
UNITED STATES
SECURITIES AND EXCHANGE COMMISSION
Washington, D.C. 20549
FORM N-CSRS
CERTIFIED SHAREHOLDER REPORT OF REGISTERED
MANAGEMENT INVESTMENT COMPANIES
Investment Company Act file number: 811-09253
Allspring Funds Trust
(Exact name of registrant as specified in charter)
1415 Vantage Park Drive, 3rd Floor, Charlotte, NC 28203
(Address of principal executive offices) (Zip code)
Matthew Prasse
Allspring Funds Management, LLC
1415 Vantage Park Drive, 3rd Floor, Charlotte, NC 28203
(Name and address of agent for service)
Registrant’s telephone number, including area code: 800-222-8222
Date of fiscal year end: September 30
Registrant is making a filing for 10 of its series: Allspring Common Stock Fund, Allspring Discovery Mid Cap Growth Fund, Allspring Discovery SMID Cap Growth Fund, Allspring Diversified Capital Builder Fund, Allspring Diversified Income Builder Fund, Allspring Global Investment Grade Credit Fund, Allspring Income Plus Fund, Allspring Index Asset Allocation Fund, Allspring Opportunity Fund and Allspring Special Mid Cap Value Fund.
Date of reporting period: March 31, 2024
ITEM 1. REPORT TO STOCKHOLDERS
2

Allspring Funds

President
Allspring Funds
Notice to Shareholders |
Beginning in July 2024, the Fund will be required by the Securities and Exchange Commission to send shareholders a paper copy of a new tailored shareholder report in place of the full shareholder report that you are now receiving. The tailored shareholder report will contain concise information about the Fund, including certain expense and performance information and fund statistics. If you wish to receive this new tailored shareholder report electronically, please follow the instructions on the back cover of this report. |
Other information that is currently included in the shareholder report, such as the Fund’s financial statements, will be available online and upon request, free of charge, in paper or electronic format. |
Investment objective | The Fund seeks long-term capital appreciation. |
Manager | Allspring Funds Management, LLC |
Subadviser | Allspring Global Investments, LLC |
Portfolio managers | Christopher G. Miller, CFA, Garth B. Newport, CFA |
Average annual total returns (%) as of March 31, 2024 | |||||||||
Including sales charge | Excluding sales charge | Expense ratios1 (%) | |||||||
Inception date | 1 year | 5 year | 10 year | 1 year | 5 year | 10 year | Gross | Net2 | |
Class A (SCSAX) | 11-30-2000 | 9.89 | 8.47 | 7.60 | 16.62 | 9.77 | 8.24 | 1.27 | 1.26 |
Class C (STSAX) | 11-30-2000 | 14.74 | 9.05 | 7.64 | 15.74 | 9.05 | 7.64 | 2.02 | 2.01 |
Class R6 (SCSRX) | 6-28-2013 | – | – | – | 17.14 | 10.23 | 8.70 | 0.85 | 0.84 |
Administrator Class (SCSDX) | 7-30-2010 | – | – | – | 16.84 | 10.33 | 8.60 | 1.20 | 1.11 |
Institutional Class (SCNSX) | 7-30-2010 | – | – | – | 17.08 | 10.19 | 8.67 | 0.95 | 0.86 |
Russell 3000® Index3 | – | – | – | – | 29.29 | 14.34 | 12.33 | – | – |
Russell 2500™ Index4 | – | – | – | – | 21.43 | 9.90 | 8.84 | – | – |
1 | Reflects the expense ratios as stated in the most recent prospectuses, which include the impact of 0.01% in acquired fund fees and expenses. The expense ratios shown are subject to change and may differ from the annualized expense ratios shown in the Financial Highlights of this report, which do not include acquired fund fees and expenses. |
2 | The manager has contractually committed through January 31, 2025, to waive fees and/or reimburse expenses to the extent necessary to cap total annual fund operating expenses after fee waivers at 1.25% for Class A, 2.00% for Class C, 0.83% for Class R6, 1.10% for Administrator Class and 0.85% for Institutional Class. Brokerage commissions, stamp duty fees, interest, taxes, acquired fund fees and expenses (if any), and extraordinary expenses are excluded from the expense caps. Prior to or after the commitment expiration date, the caps may be increased or the commitment to maintain the caps may be terminated only with the approval of the Board of Trustees. Without these caps, the Fund’s returns would have been lower. The expense ratio paid by an investor is the net expense ratio (the total annual fund operating expenses after fee waivers) as stated in the prospectuses. |
3 | The Russell 3000® Index measures the performance of the 3,000 largest U.S. companies based on total market capitalization, which represents approximately 98% of the investable U.S. equity market. You cannot invest directly in an index. |
4 | The Russell 2500TM Index measures the performance of the 2,500 smallest companies in the Russell 3000® Index, which represents approximately 16% of the total market capitalization of the Russell 3000® Index. You cannot invest directly in an index. |
CFA® and Chartered Financial Analyst® are trademarks owned by CFA Institute. |
Ten largest holdings (%) as of March 31, 20241 | |
Atkore, Inc. | 2.64 |
Regal Rexnord Corp. | 2.33 |
Ashland, Inc. | 2.15 |
Carlisle Cos., Inc. | 2.12 |
Burlington Stores, Inc. | 2.11 |
Melrose Industries PLC | 2.11 |
Bio-Rad Laboratories, Inc. Class A | 2.07 |
Teledyne Technologies, Inc. | 2.01 |
Sun Communities, Inc. | 1.84 |
Marvell Technology, Inc. | 1.78 |
1 | Figures represent the percentage of the Fund’s net assets. Holdings are subject to change and may have changed since the date specified. |
Sector allocation as of March 31, 20241 |
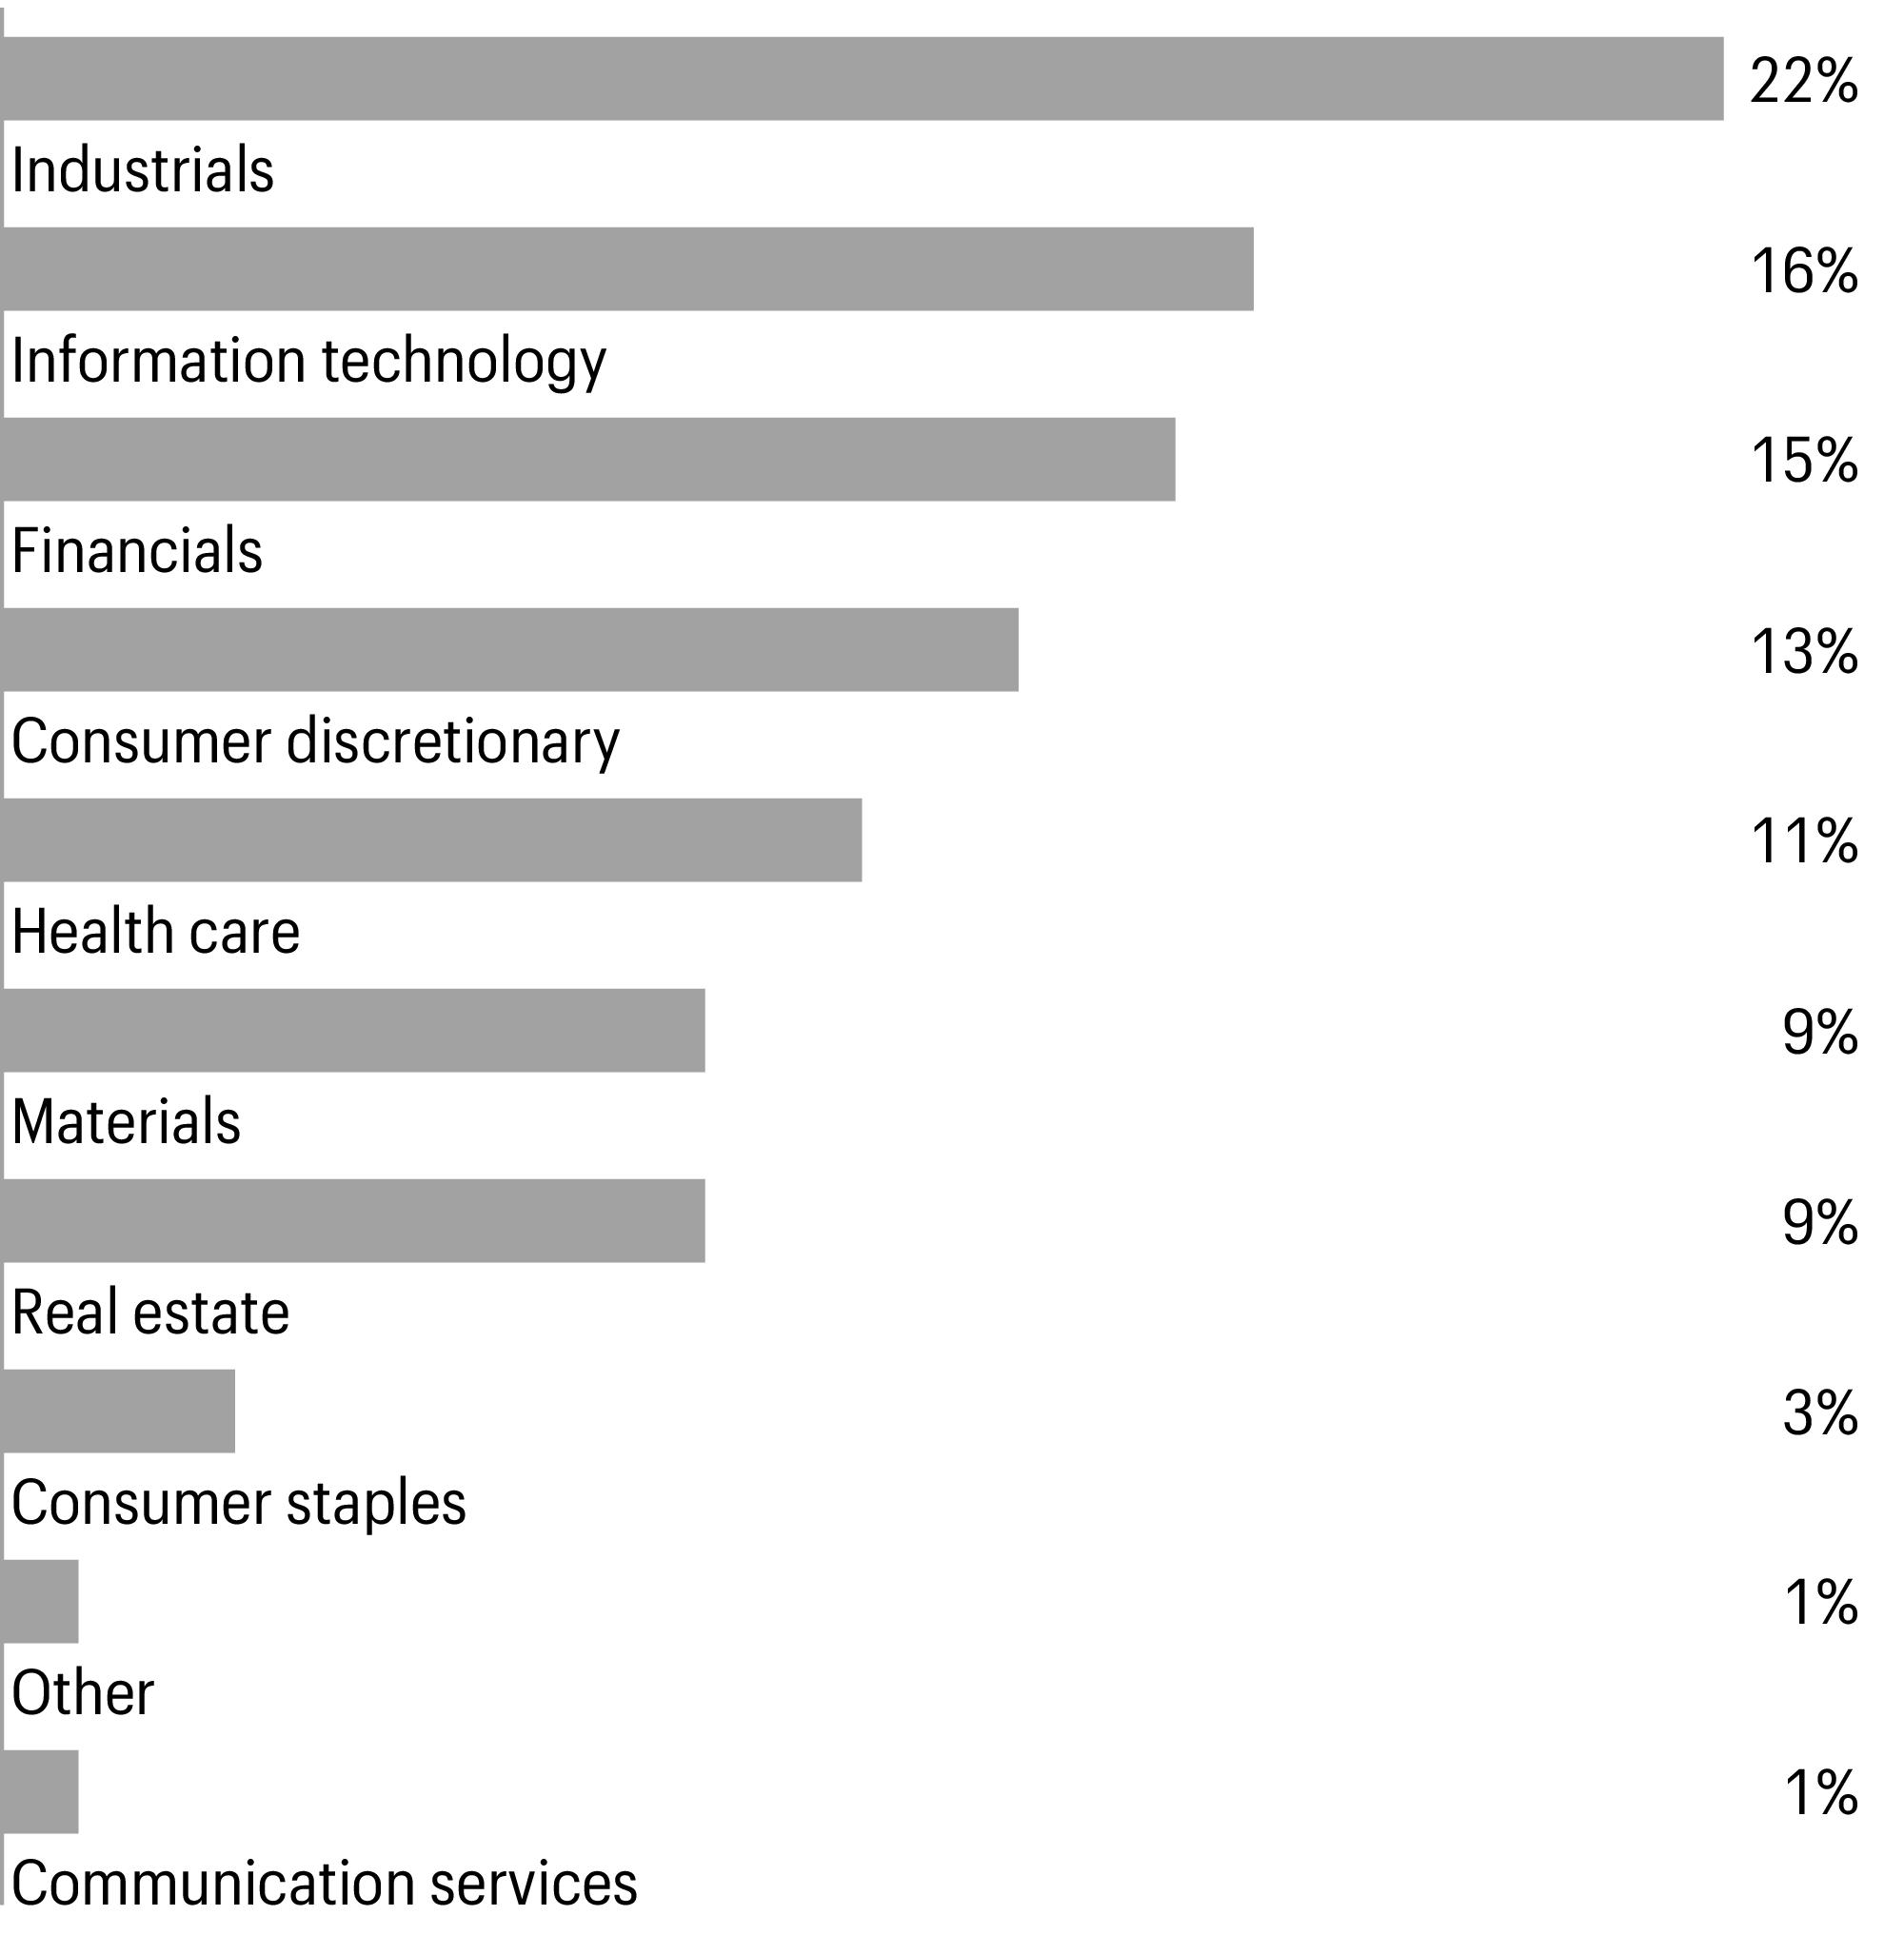
1 | Figures represent the percentage of the Fund’s long-term investments. Allocations are subject to change and may have changed since the date specified. |
Beginning account value 10-1-2023 | Ending account value 3-31-2024 | Expenses paid during the period1 | Annualized net expense ratio | |
Class A | ||||
Actual | $1,000.00 | $1,197.05 | $6.83 | 1.25 % |
Hypothetical (5% return before expenses) | $1,000.00 | $1,018.65 | $6.27 | 1.25 % |
Class C | ||||
Actual | $1,000.00 | $1,192.75 | $10.69 | 1.96 % |
Hypothetical (5% return before expenses) | $1,000.00 | $1,015.12 | $9.82 | 1.96 % |
Class R6 | ||||
Actual | $1,000.00 | $1,199.67 | $4.54 | 0.83 % |
Hypothetical (5% return before expenses) | $1,000.00 | $1,020.74 | $4.17 | 0.83 % |
Administrator Class | ||||
Actual | $1,000.00 | $1,198.56 | $6.01 | 1.10 % |
Hypothetical (5% return before expenses) | $1,000.00 | $1,019.39 | $5.52 | 1.10 % |
Institutional Class | ||||
Actual | $1,000.00 | $1,199.88 | $4.65 | 0.85 % |
Hypothetical (5% return before expenses) | $1,000.00 | $1,020.64 | $4.27 | 0.85 % |
1 | Expenses paid is equal to the annualized net expense ratio of each class multiplied by the average account value over the period, multiplied by 182 divided by 366 (to reflect the one-half-year period). |
Shares | Value | |||||
Common stocks: 97.70% | ||||||
Communication services: 0.60% | ||||||
Interactive media & services: 0.60% | ||||||
Bumble, Inc. Class A† | 447,052 | $5,074,040 | ||||
Consumer discretionary: 12.39% | ||||||
Automobile components: 1.32% | ||||||
Gentherm, Inc.† | 192,190 | 11,066,300 | ||||
Distributors: 1.42% | ||||||
LKQ Corp. | 224,457 | 11,988,248 | ||||
Diversified consumer services: 1.07% | ||||||
Service Corp. International | 121,469 | 9,014,215 | ||||
Hotels, restaurants & leisure: 1.19% | ||||||
Planet Fitness, Inc. Class A† | 159,623 | 9,997,189 | ||||
Household durables: 1.28% | ||||||
Mohawk Industries, Inc.† | 82,207 | 10,760,074 | ||||
Specialty retail: 6.11% | ||||||
Burlington Stores, Inc.† | 76,325 | 17,721,902 | ||||
Leslie’s, Inc.† | 1,703,548 | 11,073,062 | ||||
National Vision Holdings, Inc.† | 294,562 | 6,527,494 | ||||
Revolve Group, Inc.† | 515,952 | 10,922,704 | ||||
Tractor Supply Co. | 19,649 | 5,142,536 | ||||
51,387,698 | ||||||
Consumer staples: 2.79% | ||||||
Food products: 1.40% | ||||||
Nomad Foods Ltd. | 601,966 | 11,774,455 | ||||
Household products: 1.39% | ||||||
Church & Dwight Co., Inc. | 112,154 | 11,698,784 | ||||
Financials: 15.06% | ||||||
Banks: 5.20% | ||||||
Ameris Bancorp | 135,188 | 6,540,395 | ||||
Pinnacle Financial Partners, Inc. | 134,660 | 11,564,601 | ||||
Prosperity Bancshares, Inc. | 104,886 | 6,899,401 | ||||
Webster Financial Corp. | 239,057 | 12,136,924 | ||||
Wintrust Financial Corp. | 63,444 | 6,622,919 | ||||
43,764,240 | ||||||
Capital markets: 2.23% | ||||||
Cboe Global Markets, Inc. | 42,641 | 7,834,431 | ||||
Raymond James Financial, Inc. | 84,940 | 10,907,995 | ||||
18,742,426 | ||||||
Financial services: 1.55% | ||||||
Essent Group Ltd. | 219,324 | 13,051,971 | ||||
Shares | Value | |||||
Insurance: 6.08% | ||||||
Arch Capital Group Ltd.† | 153,859 | $14,222,726 | ||||
Axis Capital Holdings Ltd. | 192,613 | 12,523,697 | ||||
First American Financial Corp. | 206,314 | 12,595,470 | ||||
Reinsurance Group of America, Inc. | 61,349 | 11,832,995 | ||||
51,174,888 | ||||||
Health care: 11.32% | ||||||
Biotechnology: 0.08% | ||||||
Sage Therapeutics, Inc.† | 34,670 | 649,716 | ||||
Health care equipment & supplies: 4.22% | ||||||
Haemonetics Corp.† | 125,314 | 10,695,550 | ||||
Integer Holdings Corp.† | 101,398 | 11,831,119 | ||||
LivaNova PLC† | 231,990 | 12,977,520 | ||||
35,504,189 | ||||||
Health care providers & services: 2.58% | ||||||
HealthEquity, Inc.† | 155,275 | 12,675,098 | ||||
Humana, Inc. | 26,162 | 9,070,889 | ||||
21,745,987 | ||||||
Health care technology: 0.36% | ||||||
Schrodinger, Inc.† | 113,190 | 3,056,130 | ||||
Life sciences tools & services: 4.08% | ||||||
Azenta, Inc.† | 202,956 | 12,234,188 | ||||
Bio-Rad Laboratories, Inc. Class A† | 50,219 | 17,369,245 | ||||
Sotera Health Co.† | 389,945 | 4,683,239 | ||||
34,286,672 | ||||||
Industrials: 21.90% | ||||||
Aerospace & defense: 2.11% | ||||||
Melrose Industries PLC | 2,085,682 | 17,716,342 | ||||
Building products: 3.25% | ||||||
AZEK Co., Inc.† | 189,464 | 9,514,882 | ||||
Carlisle Cos., Inc. | 45,567 | 17,855,429 | ||||
27,370,311 | ||||||
Commercial services & supplies: 2.35% | ||||||
Republic Services, Inc. | 41,068 | 7,862,058 | ||||
Stericycle, Inc.† | 225,545 | 11,897,499 | ||||
19,759,557 | ||||||
Construction & engineering: 1.30% | ||||||
API Group Corp.† | 279,053 | 10,958,411 | ||||
Shares | Value | |||||
Electrical equipment: 4.97% | ||||||
Atkore, Inc. | 116,576 | $22,191,407 | ||||
Regal Rexnord Corp. | 108,978 | 19,626,938 | ||||
41,818,345 | ||||||
Machinery: 0.81% | ||||||
Ingersoll Rand, Inc. | 71,854 | 6,822,537 | ||||
Professional services: 4.78% | ||||||
CACI International, Inc. Class A† | 25,104 | 9,510,148 | ||||
Dun & Bradstreet Holdings, Inc. | 995,814 | 9,997,973 | ||||
TransUnion | 133,217 | 10,630,717 | ||||
WNS Holdings Ltd.† | 198,535 | 10,031,973 | ||||
40,170,811 | ||||||
Trading companies & distributors: 2.33% | ||||||
Air Lease Corp. | 253,312 | 13,030,369 | ||||
United Rentals, Inc. | 9,078 | 6,546,237 | ||||
19,576,606 | ||||||
Information technology: 16.16% | ||||||
Electronic equipment, instruments & components: 3.43% | ||||||
Littelfuse, Inc. | 49,456 | 11,985,662 | ||||
Teledyne Technologies, Inc.† | 39,351 | 16,894,171 | ||||
28,879,833 | ||||||
IT services: 1.62% | ||||||
Okta, Inc.† | 130,321 | 13,634,183 | ||||
Semiconductors & semiconductor equipment: 3.32% | ||||||
Marvell Technology, Inc. | 211,241 | 14,972,762 | ||||
ON Semiconductor Corp.† | 175,624 | 12,917,145 | ||||
27,889,907 | ||||||
Software: 7.79% | ||||||
CCC Intelligent Solutions Holdings, Inc.† | 804,953 | 9,627,238 | ||||
Instructure Holdings, Inc.† | 470,403 | 10,057,216 | ||||
PagerDuty, Inc.† | 520,343 | 11,801,379 | ||||
Q2 Holdings, Inc.† | 233,820 | 12,289,579 | ||||
Riskified Ltd. Class A† | 580,236 | 3,139,077 | ||||
Sprinklr, Inc. Class A† | 507,553 | 6,227,675 | ||||
SPS Commerce, Inc.† | 37,184 | 6,875,322 | ||||
WalkMe Ltd.† | 641,308 | 5,515,249 | ||||
65,532,735 | ||||||
Materials: 8.79% | ||||||
Chemicals: 5.31% | ||||||
Ashland, Inc. | 185,493 | 18,061,453 | ||||
Shares | Value | |||||
Chemicals(continued) | ||||||
Olin Corp. | 254,357 | $14,956,192 | ||||
Westlake Corp. | 76,339 | 11,664,599 | ||||
44,682,244 | ||||||
Containers & packaging: 1.24% | ||||||
Crown Holdings, Inc. | 131,474 | 10,420,629 | ||||
Metals & mining: 1.09% | ||||||
Commercial Metals Co. | 155,624 | 9,146,023 | ||||
Paper & forest products: 1.15% | ||||||
Louisiana-Pacific Corp. | 115,670 | 9,705,870 | ||||
Real estate: 8.69% | ||||||
Industrial REITs : 1.67% | ||||||
Terreno Realty Corp. | 211,037 | 14,012,857 | ||||
Residential REITs : 4.31% | ||||||
American Homes 4 Rent Class A | 283,610 | 10,431,176 | ||||
Mid-America Apartment Communities, Inc. | 78,514 | 10,330,872 | ||||
Sun Communities, Inc. | 120,588 | 15,505,205 | ||||
36,267,253 | ||||||
Specialized REITs : 2.71% | ||||||
Gaming & Leisure Properties, Inc. | 212,399 | 9,785,222 | ||||
SBA Communications Corp. | 59,997 | 13,001,350 | ||||
22,786,572 | ||||||
Total common stocks (Cost $608,012,776) | 821,888,248 | |||||
Investment companies: 1.48% | ||||||
Exchange-traded funds: 1.48% | ||||||
SPDR S&P Biotech ETF | 130,675 | 12,399,751 | ||||
Total investment companies (Cost $7,457,008) | 12,399,751 | |||||
Yield | ||||||
Short-term investments: 1.06% | ||||||
Investment companies: 1.06% | ||||||
Allspring Government Money Market Fund Select Class♠∞ | 5.25 % | 8,957,803 | 8,957,803 | |||
Total short-term investments (Cost $8,957,803) | 8,957,803 | |||||
Total investments in securities (Cost $624,427,587) | 100.24 % | 843,245,802 | ||||
Other assets and liabilities, net | (0.24 ) | (2,030,264 ) | ||||
Total net assets | 100.00 % | $841,215,538 | ||||
† | Non-income-earning security |
♠ | The issuer of the security is an affiliated person of the Fund as defined in the Investment Company Act of 1940. |
∞ | The rate represents the 7-day annualized yield at period end. |
Abbreviations: | |
REIT | Real estate investment trust |
Value, beginning of period | Purchases | Sales proceeds | Net realized gains (losses) | Net change in unrealized gains (losses) | Value, end of period | Shares, end of period | Income from affiliated securities | |
Short-term investments | ||||||||
Allspring Government Money Market Fund Select Class | $31,402,705 | $105,017,503 | $(127,462,405 ) | $0 | $0 | $8,957,803 | 8,957,803 | $305,438 |
Assets | |
Investments in unaffiliated securities, at value (cost $615,469,784) | $834,287,999 |
Investments in affiliated securities, at value (cost $8,957,803) | 8,957,803 |
Cash | 162,584 |
Foreign currency, at value (cost $71) | 71 |
Receivable for investments sold | 2,353,751 |
Receivable for dividends | 743,988 |
Receivable for Fund shares sold | 21,705 |
Prepaid expenses and other assets | 74,206 |
Total assets | 846,602,107 |
Liabilities | |
Payable for investments purchased | 3,530,134 |
Payable for Fund shares redeemed | 613,146 |
Management fee payable | 539,251 |
Administration fees payable | 135,732 |
Trustees’ fees and expenses payable | 3,426 |
Distribution fee payable | 716 |
Accrued expenses and other liabilities | 564,164 |
Total liabilities | 5,386,569 |
Total net assets | $841,215,538 |
Net assets consist of | |
Paid-in capital | $614,745,814 |
Total distributable earnings | 226,469,724 |
Total net assets | $841,215,538 |
Computation of net asset value and offering price per share | |
Net assets–Class A | $766,908,620 |
Shares outstanding–Class A1 | 41,829,337 |
Net asset value per share–Class A | $18.33 |
Maximum offering price per share – Class A2 | $19.45 |
Net assets–Class C | $1,227,927 |
Shares outstanding–Class C1 | 148,242 |
Net asset value per share–Class C | $8.28 |
Net assets–Class R6 | $6,648,614 |
Shares outstanding–Class R61 | 320,964 |
Net asset value per share–Class R6 | $20.71 |
Net assets–Administrator Class | $1,189,813 |
Shares outstanding–Administrator Class1 | 60,339 |
Net asset value per share–Administrator Class | $19.72 |
Net assets–Institutional Class | $65,240,564 |
Shares outstanding–Institutional Class1 | 3,171,542 |
Net asset value per share–Institutional Class | $20.57 |
Investment income | |
Dividends | $4,051,837 |
Income from affiliated securities | 305,438 |
Interest | 1,194 |
Total investment income | 4,358,469 |
Expenses | |
Management fee | 3,062,486 |
Administration fees | |
Class A | 706,154 |
Class C | 1,129 |
Class R6 | 930 |
Administrator Class | 766 |
Institutional Class | 44,752 |
Shareholder servicing fees | |
Class A | 880,066 |
Class C | 1,409 |
Administrator Class | 1,462 |
Distribution fee | |
Class C | 3,916 |
Custody and accounting fees | 13,775 |
Professional fees | 33,469 |
Registration fees | 32,369 |
Shareholder report expenses | 17,916 |
Trustees’ fees and expenses | 12,369 |
Other fees and expenses | 13,054 |
Total expenses | 4,826,022 |
Less: Fee waivers and/or expense reimbursements | |
Fund-level | (47,870 ) |
Administrator Class | (542 ) |
Institutional Class | (28,293 ) |
Net expenses | 4,749,317 |
Net investment loss | (390,848 ) |
Realized and unrealized gains (losses) on investments | |
Net realized gains (losses) on | |
Unaffiliated securities | 30,742,072 |
Foreign currency and foreign currency translations | (2,907 ) |
Net realized gains on investments | 30,739,165 |
Net change in unrealized gains (losses) on | |
Unaffiliated securities | 113,935,154 |
Foreign currency and foreign currency translations | 1,721 |
Net change in unrealized gains (losses) on investments | 113,936,875 |
Net realized and unrealized gains (losses) on investments | 144,676,040 |
Net increase in net assets resulting from operations | $144,285,192 |
Six months ended March 31, 2024 (unaudited) | Year ended September 30, 2023 | |||
Operations | ||||
Net investment loss | $(390,848 ) | $(2,066,136 ) | ||
Net realized gains on investments | 30,739,165 | 35,325,393 | ||
Net change in unrealized gains (losses) on investments | 113,936,875 | 80,775,317 | ||
Net increase in net assets resulting from operations | 144,285,192 | 114,034,574 | ||
Distributions to shareholders from | ||||
Net investment income and net realized gains | ||||
Class A | (25,647,705 ) | (110,542,437 ) | ||
Class C | (87,239 ) | (373,786 ) | ||
Class R6 | (201,162 ) | (4,204,252 ) | ||
Administrator Class | (37,933 ) | (273,959 ) | ||
Institutional Class | (2,465,513 ) | (10,704,809 ) | ||
Total distributions to shareholders | (28,439,552 ) | (126,099,243 ) | ||
Capital share transactions | Shares | Shares | ||
Proceeds from shares sold | ||||
Class A | 148,166 | 2,468,705 | 370,730 | 6,090,073 |
Class C | 2,112 | 16,062 | 13,315 | 108,580 |
Class R6 | 52,189 | 984,875 | 521,832 | 9,524,927 |
Administrator Class | 1,061 | 18,220 | 5,981 | 104,688 |
Institutional Class | 93,912 | 1,737,331 | 799,852 | 14,991,385 |
5,225,193 | 30,819,653 | |||
Reinvestment of distributions | ||||
Class A | 1,496,401 | 24,256,663 | 6,756,457 | 104,725,081 |
Class C | 11,493 | 84,361 | 48,548 | 358,288 |
Class R6 | 10,913 | 199,591 | 242,080 | 4,197,673 |
Administrator Class | 2,062 | 35,933 | 14,790 | 245,511 |
Institutional Class | 135,423 | 2,460,641 | 619,643 | 10,682,657 |
27,037,189 | 120,209,210 | |||
Payment for shares redeemed | ||||
Class A | (3,008,728 ) | (50,163,468 ) | (5,886,339 ) | (96,911,567 ) |
Class C | (9,934 ) | (76,317 ) | (62,549 ) | (498,591 ) |
Class R6 | (99,721 ) | (1,867,934 ) | (1,922,973 ) | (35,010,107 ) |
Administrator Class | (19,931 ) | (349,134 ) | (48,522 ) | (858,685 ) |
Institutional Class | (1,299,016 ) | (24,505,412 ) | (1,363,389 ) | (24,831,314 ) |
(76,962,265 ) | (158,110,264 ) | |||
Net decrease in net assets resulting from capital share transactions | (44,699,883 ) | (7,081,401 ) | ||
Total increase (decrease) in net assets | 71,145,757 | (19,146,070 ) | ||
Net assets | ||||
Beginning of period | 770,069,781 | 789,215,851 | ||
End of period | $841,215,538 | $770,069,781 | ||
Six months ended March 31, 2024 (unaudited) | Year ended September 30 | |||||
Class A | 2023 | 2022 | 2021 | 2020 | 2019 | |
Net asset value, beginning of period | $15.89 | $16.31 | $24.46 | $17.88 | $21.07 | $24.58 |
Net investment loss | (0.01 )1 | (0.05 )1 | (0.12 ) | (0.12 ) | (0.03 ) | (0.01 ) |
Net realized and unrealized gains (losses) on investments | 3.06 | 2.34 | (3.79 ) | 7.75 | (0.52 ) | (0.20 ) |
Total from investment operations | 3.05 | 2.29 | (3.91 ) | 7.63 | (0.55 ) | (0.21 ) |
Distributions to shareholders from | ||||||
Net investment income | 0.00 | 0.00 | 0.00 | 0.00 | (0.00 )2 | 0.00 |
Net realized gains | (0.61 ) | (2.71 ) | (4.24 ) | (1.05 ) | (2.64 ) | (3.30 ) |
Total distributions to shareholders | (0.61 ) | (2.71 ) | (4.24 ) | (1.05 ) | (2.64 ) | (3.30 ) |
Net asset value, end of period | $18.33 | $15.89 | $16.31 | $24.46 | $17.88 | $21.07 |
Total return3 | 19.71 % | 14.48 % | (20.08 )% | 43.77 % | (3.48 )% | 0.91 % |
Ratios to average net assets (annualized) | ||||||
Gross expenses | 1.26 % | 1.27 % | 1.26 % | 1.25 % | 1.27 % | 1.26 % |
Net expenses | 1.25 % | 1.23 % | 1.23 % | 1.23 % | 1.23 % | 1.26 % |
Net investment loss | (0.14 )% | (0.30 )% | (0.58 )% | (0.50 )% | (0.14 )% | (0.03 )% |
Supplemental data | ||||||
Portfolio turnover rate | 27 % | 36 % | 40 % | 48 % | 61 % | 40 % |
Net assets, end of period (000s omitted) | $766,909 | $686,143 | $684,178 | $945,399 | $722,547 | $870,369 |
1 | Calculated based upon average shares outstanding |
2 | Amount is less than $0.005. |
3 | Total return calculations do not include any sales charges. Returns for periods of less than one year are not annualized. |
Six months ended March 31, 2024 (unaudited) | Year ended September 30 | |||||
Class C | 2023 | 2022 | 2021 | 2020 | 2019 | |
Net asset value, beginning of period | $7.52 | $9.05 | $15.45 | $11.70 | $14.72 | $18.40 |
Net investment loss | (0.03 )1 | (0.08 )1 | (0.14 )1 | (0.18 )1 | (0.11 )1 | (0.11 )1 |
Payment from affiliate | 0.00 | 0.00 | 0.00 | 0.00 | 0.05 | 0.00 |
Net realized and unrealized gains (losses) on investments | 1.40 | 1.26 | (2.02 ) | 4.98 | (0.32 ) | (0.27 ) |
Total from investment operations | 1.37 | 1.18 | (2.16 ) | 4.80 | (0.38 ) | (0.38 ) |
Distributions to shareholders from | ||||||
Net realized gains | (0.61 ) | (2.71 ) | (4.24 ) | (1.05 ) | (2.64 ) | (3.30 ) |
Net asset value, end of period | $8.28 | $7.52 | $9.05 | $15.45 | $11.70 | $14.72 |
Total return2 | 19.27 % | 13.64 % | (20.56 )% | 42.64 % | (3.88 )%3 | 0.17 % |
Ratios to average net assets (annualized) | ||||||
Gross expenses | 1.96 % | 1.95 % | 1.88 % | 1.99 % | 2.01 % | 2.01 % |
Net expenses | 1.96 % | 1.95 % | 1.88 % | 1.99 % | 2.01 % | 2.01 % |
Net investment loss | (0.84 )% | (1.02 )% | (1.23 )% | (1.26 )% | (0.92 )% | (0.78 )% |
Supplemental data | ||||||
Portfolio turnover rate | 27 % | 36 % | 40 % | 48 % | 61 % | 40 % |
Net assets, end of period (000s omitted) | $1,228 | $1,087 | $1,314 | $2,405 | $3,020 | $7,925 |
1 | Calculated based upon average shares outstanding |
2 | Total return calculations do not include any sales charges. Returns for periods of less than one year are not annualized. |
3 | During the year ended September 30, 2020, the Fund received a payment from an affiliate which had a 0.39% impact on the total return. |
Six months ended March 31, 2024 (unaudited) | Year ended September 30 | |||||
Class R6 | 2023 | 2022 | 2021 | 2020 | 2019 | |
Net asset value, beginning of period | $17.84 | $17.94 | $26.41 | $19.16 | $22.39 | $25.80 |
Net investment income (loss) | 0.03 1 | 0.02 1 | (0.04 )1 | (0.02 )1 | 0.05 1 | 0.09 1 |
Net realized and unrealized gains (losses) on investments | 3.45 | 2.59 | (4.19 ) | 8.32 | (0.56 ) | (0.20 ) |
Total from investment operations | 3.48 | 2.61 | (4.23 ) | 8.30 | (0.51 ) | (0.11 ) |
Distributions to shareholders from | ||||||
Net investment income | 0.00 | 0.00 | 0.00 | 0.00 | (0.08 ) | 0.00 |
Net realized gains | (0.61 ) | (2.71 ) | (4.24 ) | (1.05 ) | (2.64 ) | (3.30 ) |
Total distributions to shareholders | (0.61 ) | (2.71 ) | (4.24 ) | (1.05 ) | (2.72 ) | (3.30 ) |
Net asset value, end of period | $20.71 | $17.84 | $17.94 | $26.41 | $19.16 | $22.39 |
Total return2 | 19.97 % | 15.00 % | (19.77 )% | 44.37 % | (3.10 )% | 1.31 % |
Ratios to average net assets (annualized) | ||||||
Gross expenses | 0.84 % | 0.84 % | 0.83 % | 0.82 % | 0.84 % | 0.83 % |
Net expenses | 0.83 % | 0.83 % | 0.83 % | 0.82 % | 0.83 % | 0.83 % |
Net investment income (loss) | 0.28 % | 0.09 % | (0.17 )% | (0.09 )% | 0.27 % | 0.40 % |
Supplemental data | ||||||
Portfolio turnover rate | 27 % | 36 % | 40 % | 48 % | 61 % | 40 % |
Net assets, end of period (000s omitted) | $6,649 | $6,378 | $27,209 | $35,280 | $27,628 | $36,069 |
1 | Calculated based upon average shares outstanding |
2 | Returns for periods of less than one year are not annualized. |
Six months ended March 31, 2024 (unaudited) | Year ended September 30 | |||||
Administrator Class | 2023 | 2022 | 2021 | 2020 | 2019 | |
Net asset value, beginning of period | $17.03 | $17.28 | $25.63 | $18.67 | $21.56 | $25.04 |
Net investment income (loss) | 0.00 1,2 | (0.03 )2 | (0.10 )2 | (0.09 )2 | 0.00 1,2 | 0.03 |
Payment from affiliate | 0.00 | 0.00 | 0.00 | 0.00 | 0.32 | 0.00 |
Net realized and unrealized gains (losses) on investments | 3.30 | 2.49 | (4.01 ) | 8.10 | (0.54 ) | (0.21 ) |
Total from investment operations | 3.30 | 2.46 | (4.11 ) | 8.01 | (0.22 ) | (0.18 ) |
Distributions to shareholders from | ||||||
Net investment income | 0.00 | 0.00 | 0.00 | 0.00 | (0.03 ) | 0.00 |
Net realized gains | (0.61 ) | (2.71 ) | (4.24 ) | (1.05 ) | (2.64 ) | (3.30 ) |
Total distributions to shareholders | (0.61 ) | (2.71 ) | (4.24 ) | (1.05 ) | (2.67 ) | (3.30 ) |
Net asset value, end of period | $19.72 | $17.03 | $17.28 | $25.63 | $18.67 | $21.56 |
Total return3 | 19.86 % | 14.59 % | (19.87 )%4 | 43.96 % | (1.68 )%5 | 1.03 % |
Ratios to average net assets (annualized) | ||||||
Gross expenses | 1.19 % | 1.19 % | 1.17 % | 1.17 % | 1.17 % | 1.18 % |
Net expenses | 1.10 % | 1.10 % | 1.10 % | 1.10 % | 1.10 % | 1.10 % |
Net investment income (loss) | 0.00 % | (0.18 )% | (0.45 )% | (0.36 )% | 0.01 % | 0.14 % |
Supplemental data | ||||||
Portfolio turnover rate | 27 % | 36 % | 40 % | 48 % | 61 % | 40 % |
Net assets, end of period (000s omitted) | $1,190 | $1,314 | $1,813 | $2,918 | $2,239 | $3,572 |
1 | Amount is less than $0.005. |
2 | Calculated based upon average shares outstanding |
3 | Returns for periods of less than one year are not annualized. |
4 | During the year ended September 30, 2022, the Fund received payments from a service provider which had a 0.09% impact on the total return. |
5 | During the year ended September 30, 2020, the Fund received a payment from an affiliate which had a 1.69% impact on the total return. |
Six months ended March 31, 2024 (unaudited) | Year ended September 30 | |||||
Institutional Class | 2023 | 2022 | 2021 | 2020 | 2019 | |
Net asset value, beginning of period | $17.72 | $17.85 | $26.30 | $19.09 | $22.32 | $25.73 |
Net investment income (loss) | 0.02 1 | 0.02 1 | (0.04 )1 | (0.03 )1 | 0.05 1 | 0.08 1 |
Net realized and unrealized gains (losses) on investments | 3.44 | 2.56 | (4.17 ) | 8.29 | (0.56 ) | (0.19 ) |
Total from investment operations | 3.46 | 2.58 | (4.21 ) | 8.26 | (0.51 ) | (0.11 ) |
Distributions to shareholders from | ||||||
Net investment income | 0.00 | 0.00 | 0.00 | 0.00 | (0.08 ) | 0.00 |
Net realized gains | (0.61 ) | (2.71 ) | (4.24 ) | (1.05 ) | (2.64 ) | (3.30 ) |
Total distributions to shareholders | (0.61 ) | (2.71 ) | (4.24 ) | (1.05 ) | (2.72 ) | (3.30 ) |
Net asset value, end of period | $20.57 | $17.72 | $17.85 | $26.30 | $19.09 | $22.32 |
Total return2 | 19.99 % | 14.89 % | (19.78 )% | 44.32 % | (3.13 )% | 1.31 % |
Ratios to average net assets (annualized) | ||||||
Gross expenses | 0.94 % | 0.94 % | 0.93 % | 0.92 % | 0.94 % | 0.93 % |
Net expenses | 0.85 % | 0.85 % | 0.85 % | 0.85 % | 0.85 % | 0.85 % |
Net investment income (loss) | 0.25 % | 0.09 % | (0.20 )% | (0.14 )% | 0.24 % | 0.37 % |
Supplemental data | ||||||
Portfolio turnover rate | 27 % | 36 % | 40 % | 48 % | 61 % | 40 % |
Net assets, end of period (000s omitted) | $65,241 | $75,148 | $74,701 | $98,202 | $126,279 | $159,426 |
1 | Calculated based upon average shares outstanding |
2 | Returns for periods of less than one year are not annualized. |
Gross unrealized gains | $280,718,598 |
Gross unrealized losses | (43,276,185 ) |
Net unrealized gains | $237,442,413 |
Quoted prices (Level 1) | Other significant observable inputs (Level 2) | Significant unobservable inputs (Level 3) | Total | |
Assets | ||||
Investments in: | ||||
Common stocks | ||||
Communication services | $5,074,040 | $0 | $0 | $5,074,040 |
Consumer discretionary | 104,213,724 | 0 | 0 | 104,213,724 |
Consumer staples | 23,473,239 | 0 | 0 | 23,473,239 |
Financials | 126,733,525 | 0 | 0 | 126,733,525 |
Health care | 95,242,694 | 0 | 0 | 95,242,694 |
Industrials | 184,192,920 | 0 | 0 | 184,192,920 |
Information technology | 135,936,658 | 0 | 0 | 135,936,658 |
Materials | 73,954,766 | 0 | 0 | 73,954,766 |
Real estate | 73,066,682 | 0 | 0 | 73,066,682 |
Investment companies | 12,399,751 | 0 | 0 | 12,399,751 |
Short-term investments | ||||
Investment companies | 8,957,803 | 0 | 0 | 8,957,803 |
Total assets | $843,245,802 | $0 | $0 | $843,245,802 |
Average daily net assets | Management fee |
First $500 million | 0.800 % |
Next $500 million | 0.750 |
Next $1 billion | 0.700 |
Next $2 billion | 0.675 |
Next $1 billion | 0.650 |
Next $5 billion | 0.640 |
Over $10 billion | 0.630 |
Class-level administration fee | |
Class A | 0.20 % |
Class C | 0.20 |
Class R6 | 0.03 |
Administrator Class | 0.13 |
Institutional Class | 0.13 |
EXPENSE RATIO CAPS | |
Class A | 1.25 % |
Class C | 2.00 |
Class R6 | 0.83 |
Administrator Class | 1.10 |
Institutional Class | 0.85 |
Name and year of birth | Position held and length of service* | Principal occupations during past five years or longer | Current other public company or investment company directorships |
William R. Ebsworth (Born 1957) | Trustee, since 2015 | Retired. From 1984 to 2013, equities analyst, portfolio manager, research director and chief investment officer at Fidelity Management and Research Company in Boston, Tokyo, and Hong Kong, and retired in 2013 as Chief Investment Officer of Fidelity Strategic Advisers, Inc. where he led a team of investment professionals managing client assets. Prior thereto, Board member of Hong Kong Securities Clearing Co., Hong Kong Options Clearing Corp., the Thailand International Fund, Ltd., Fidelity Investments Life Insurance Company, and Empire Fidelity Investments Life Insurance Company. Serves on the Investment Company Institute’s Board of Governors since 2022 and Executive Committee since 2023 as well as the Vice Chairman of the Governing Council of the Independent Directors Council since 2023. Audit Committee Chair and Investment Committee Chair of the Vincent Memorial Hospital Foundation (non-profit organization). Mr. Ebsworth is a CFA charterholder. | N/A |
Jane A. Freeman (Born 1953) | Trustee, since 2015; Chair Liaison, since January 2018# | Retired. From 2012 to 2014 and 1999 to 2008, Chief Financial Officer of Scientific Learning Corporation. From 2008 to 2012, Ms. Freeman provided consulting services related to strategic business projects. Prior to 1999, Portfolio Manager at Rockefeller & Co. and Scudder, Stevens & Clark. Board member of the Harding Loevner Funds from 1996 to 2014, serving as both Lead Independent Director and chair of the Audit Committee. Board member of the Russell Exchange Traded Funds Trust from 2011 to 2012 and the chair of the Audit Committee. Ms. Freeman is also an inactive Chartered Financial Analyst. | N/A |
Isaiah Harris, Jr. (Born 1952) | Trustee, since 2009; Audit Committee Chair, since 2019 | Retired. Member of the Advisory Board of CEF of East Central Florida. Chairman of the Board of CIGNA Corporation from 2009 to 2021, and Director from 2005 to 2008. From 2003 to 2011, Director of Deluxe Corporation. Prior thereto, President and CEO of BellSouth Advertising and Publishing Corp. from 2005 to 2007, President and CEO of BellSouth Enterprises from 2004 to 2005 and President of BellSouth Consumer Services from 2000 to 2003. Emeritus member of the Iowa State University Foundation Board of Governors. Emeritus Member of the Advisory board of Iowa State University School of Business. Advisory Board Member, Palm Harbor Academy (private school). Advisory Board Member, Fellowship of Christian Athletes. Mr. Harris is a certified public accountant (inactive status). | N/A |
David F. Larcker (Born 1950) | Trustee, since 2009 | Distinguished Visiting Fellow at the Hoover Institution since 2022. James Irvin Miller Professor of Accounting at the Graduate School of Business (Emeritus), Stanford University, Director of the Corporate Governance Research Initiative and Senior Faculty of The Rock Center for Corporate Governance since 2006. From 2005 to 2008, Professor of Accounting at the Graduate School of Business, Stanford University. Prior thereto, Ernst & Young Professor of Accounting at The Wharton School, University of Pennsylvania from 1985 to 2005. | N/A |
Olivia S. Mitchell (Born 1953) | Trustee, since 2006; Nominating and Governance Committee Chair, since 2018 | International Foundation of Employee Benefit Plans Professor since 1993, Wharton School of the University of Pennsylvania. Director of Wharton’s Pension Research Council and Boettner Center on Pensions & Retirement Research, and Research Associate at the National Bureau of Economic Research. Previously taught at Cornell University from 1978 to 1993. | N/A |
Name and year of birth | Position held and length of service* | Principal occupations during past five years or longer | Current other public company or investment company directorships |
Timothy J. Penny (Born 1951) | Trustee, since 1996; Chair, since 2018 | President and Chief Executive Officer of Southern Minnesota Initiative Foundation, a non-profit organization, since 2007. Vice Chair of the Economic Club of Minnesota, since 2007. Co-Chair of the Committee for a Responsible Federal Budget, since 1995. Member of the Board of Trustees of NorthStar Education Finance, Inc., a non-profit organization, from 2007-2022. Senior Fellow of the University of Minnesota Humphrey Institute from 1995 to 2017. | N/A |
James G. Polisson (Born 1959) | Trustee, since 2018 | Retired. Chief Marketing Officer, Source (ETF) UK Services, Ltd, from 2015 to 2017. From 2012 to 2015, Principal of The Polisson Group, LLC, a management consulting, corporate advisory and principal investing company. Chief Executive Officer and Managing Director at Russell Investments, Global Exchange Traded Funds from 2010 to 2012. Managing Director of Barclays Global Investors from 1998 to 2010 and Global Chief Marketing Officer for iShares and Barclays Global Investors from 2000 to 2010. Trustee of the San Francisco Mechanics’ Institute, a non- profit organization, from 2013 to 2015. Board member of the Russell Exchange Traded Fund Trust from 2011 to 2012. Director of Barclays Global Investors Holdings Deutschland GmbH from 2006 to 2009. Mr. Polisson is an attorney and has a retired status with the Massachusetts and District of Columbia Bar Associations. | N/A |
Pamela Wheelock (Born 1959) | Trustee, since January 2020; previously Trustee from January 2018 to July 2019# | Retired. Executive and Senior Financial leadership positions in the public, private and nonprofit sectors. Interim President and CEO, McKnight Foundation, 2020. Interim Commissioner, Minnesota Department of Human Services, 2019. Chief Operating Officer, Twin Cities Habitat for Humanity, 2017-2019. Vice President for University Services, University of Minnesota, 2012- 2016. Interim President and CEO, Blue Cross and Blue Shield of Minnesota, 2011-2012. Executive Vice-President and Chief Financial Officer, Minnesota Wild, 2002-2008. Commissioner, Minnesota Department of Finance, 1999-2002. Chair of the Board of Directors of Destination Medical Center Corporation. Board member of the Minnesota Wild Foundation. | N/A |
Name and year of birth | Position held and length of service | Principal occupations during past five years or longer |
Andrew Owen (Born 1960) | President, since 2017 | President and Chief Executive Officer of Allspring Funds Management, LLC since 2017 and Head of Global Fund Governance of Allspring Global Investments since 2022. Prior thereto, co-president of Galliard Capital Management, LLC, an affiliate of Allspring Funds Management, LLC, from 2019 to 2022 and Head of Affiliated Managers, Allspring Global Investments, from 2014 to 2019 and Executive Vice President responsible for marketing, investments and product development for Allspring Funds Management, LLC, from 2009 to 2014. |
Jeremy DePalma (Born 1974) | Treasurer, since 2012 (for certain funds in the Fund Complex); since 2021 (for the remaining funds in the Complex) | Senior Vice President of Allspring Funds Management, LLC since 2009. Senior Vice President of Evergreen Investment Management Company, LLC from 2008 to 2010 and head of the Fund Reporting and Control Team within Fund Administration from 2005 to 2010. |
Christopher Baker (Born 1976) | Chief Compliance Officer, since 2022 | Global Chief Compliance Officer for Allspring Global Investments since 2022. Prior thereto, Chief Compliance Officer for State Street Global Advisors from 2018 to 2021. Senior Compliance Officer for the State Street divisions of Alternative Investment Solutions, Sector Solutions, and Global Marketing from 2015 to 2018. From 2010 to 2015 Vice President, Global Head of Investment and Marketing Compliance for State Street Global Advisors. |
Matthew Prasse (Born 1983) | Chief Legal Officer, since 2022; Secretary, since 2021 | Senior Counsel of the Allspring Legal Department since 2021. Senior Counsel of the Wells Fargo Legal Department from 2018 to 2021. Previously, Counsel for Barings LLC from 2015 to 2018. Prior to joining Barings, Associate at Morgan, Lewis & Bockius LLP from 2008 to 2015. |

P.O. Box 219967
Kansas City, MO 64121-9967

SAR3301 03-24

Allspring Funds

President
Allspring Funds
Notice to Shareholders |
Beginning in July 2024, the Fund will be required by the Securities and Exchange Commission to send shareholders a paper copy of a new tailored shareholder report in place of the full shareholder report that you are now receiving. The tailored shareholder report will contain concise information about the Fund, including certain expense and performance information and fund statistics. If you wish to receive this new tailored shareholder report electronically, please follow the instructions on the back cover of this report. |
Other information that is currently included in the shareholder report, such as the Fund’s financial statements, will be available online and upon request, free of charge, in paper or electronic format. |
Investment objective | The Fund seeks long-term capital appreciation. |
Manager | Allspring Funds Management, LLC |
Subadviser | Allspring Global Investments, LLC |
Portfolio managers | Michael T. Smith, CFA, Christopher J. Warner, CFA |
Average annual total returns (%) as of March 31, 2024 | |||||||||
Including sales charge | Excluding sales charge | Expense ratios1 (%) | |||||||
Inception date | 1 year | 5 year | 10 year | 1 year | 5 year | 10 year | Gross | Net2 | |
Class A (SENAX) | 2-24-2000 | 16.52 | 7.10 | 8.22 | 23.61 | 8.38 | 8.87 | 1.24 | 1.18 |
Class C (WENCX) | 3-31-2008 | 21.68 | 7.56 | 8.21 | 22.68 | 7.56 | 8.21 | 1.99 | 1.93 |
Class R6 (WENRX)3 | 10-31-2014 | – | – | – | 24.05 | 8.78 | 9.28 | 0.82 | 0.80 |
Administrator Class (SEPKX) | 8-30-2002 | – | – | – | 23.68 | 8.46 | 8.97 | 1.17 | 1.10 |
Institutional Class (WFEIX) | 6-30-2003 | – | – | – | 24.00 | 8.72 | 9.22 | 0.92 | 0.85 |
Russell 3000® Index4 | – | – | – | – | 29.29 | 14.34 | 12.33 | – | – |
Russell Midcap® Growth Index5 | – | – | – | – | 26.28 | 11.82 | 11.35 | – | – |
1 | Reflects the expense ratios as stated in the most recent prospectuses. The expense ratios shown are subject to change and may differ from the annualized expense ratios shown in the Financial Highlights of this report. |
2 | The manager has contractually committed through January 31, 2025, to waive fees and/or reimburse expenses to the extent necessary to cap total annual fund operating expenses after fee waivers at 1.18% for Class A, 1.93% for Class C, 0.80% for Class R6, 1.10% for Administrator Class and 0.85% for Institutional Class. Brokerage commissions, stamp duty fees, interest, taxes, acquired fund fees and expenses (if any), and extraordinary expenses are excluded from the expense caps. Prior to or after the commitment expiration date, the caps may be increased or the commitment to maintain the caps may be terminated only with the approval of the Board of Trustees. Without these caps, the Fund’s returns would have been lower. The expense ratio paid by an investor is the net expense ratio (the total annual fund operating expenses after fee waivers) as stated in the prospectuses. |
3 | Historical performance shown for the Class R6 shares prior to their inception reflects the performance of the Institutional Class shares, and includes the higher expenses applicable to the Institutional Class shares. If these expenses had not been included, returns for the Class R6 shares would be higher. |
4 | The Russell 3000® Index measures the performance of the 3,000 largest U.S. companies based on total market capitalization, which represents approximately 98% of the investable U.S. equity market. You cannot invest directly in an index. |
5 | The Russell Midcap® Growth Index measures the performance of those Russell Midcap companies with higher price/book ratios and higher forecasted growth values. The stocks are also members of the Russell 1000® Growth index. You cannot invest directly in an index. |
CFA® and Chartered Financial Analyst® are trademarks owned by CFA Institute. |
Ten largest holdings (%) as of March 31, 20241 | |
DexCom, Inc. | 3.13 |
Crowdstrike Holdings, Inc. Class A | 3.04 |
Trade Desk, Inc. Class A | 2.76 |
Gartner, Inc. | 2.49 |
IDEXX Laboratories, Inc. | 2.33 |
Datadog, Inc. Class A | 2.29 |
Tetra Tech, Inc. | 2.22 |
Monolithic Power Systems, Inc. | 2.21 |
Veeva Systems, Inc. Class A | 2.20 |
Vertiv Holdings Co. | 2.10 |
1 | Figures represent the percentage of the Fund’s net assets. Holdings are subject to change and may have changed since the date specified. |
Sector allocation as of March 31, 20241 |
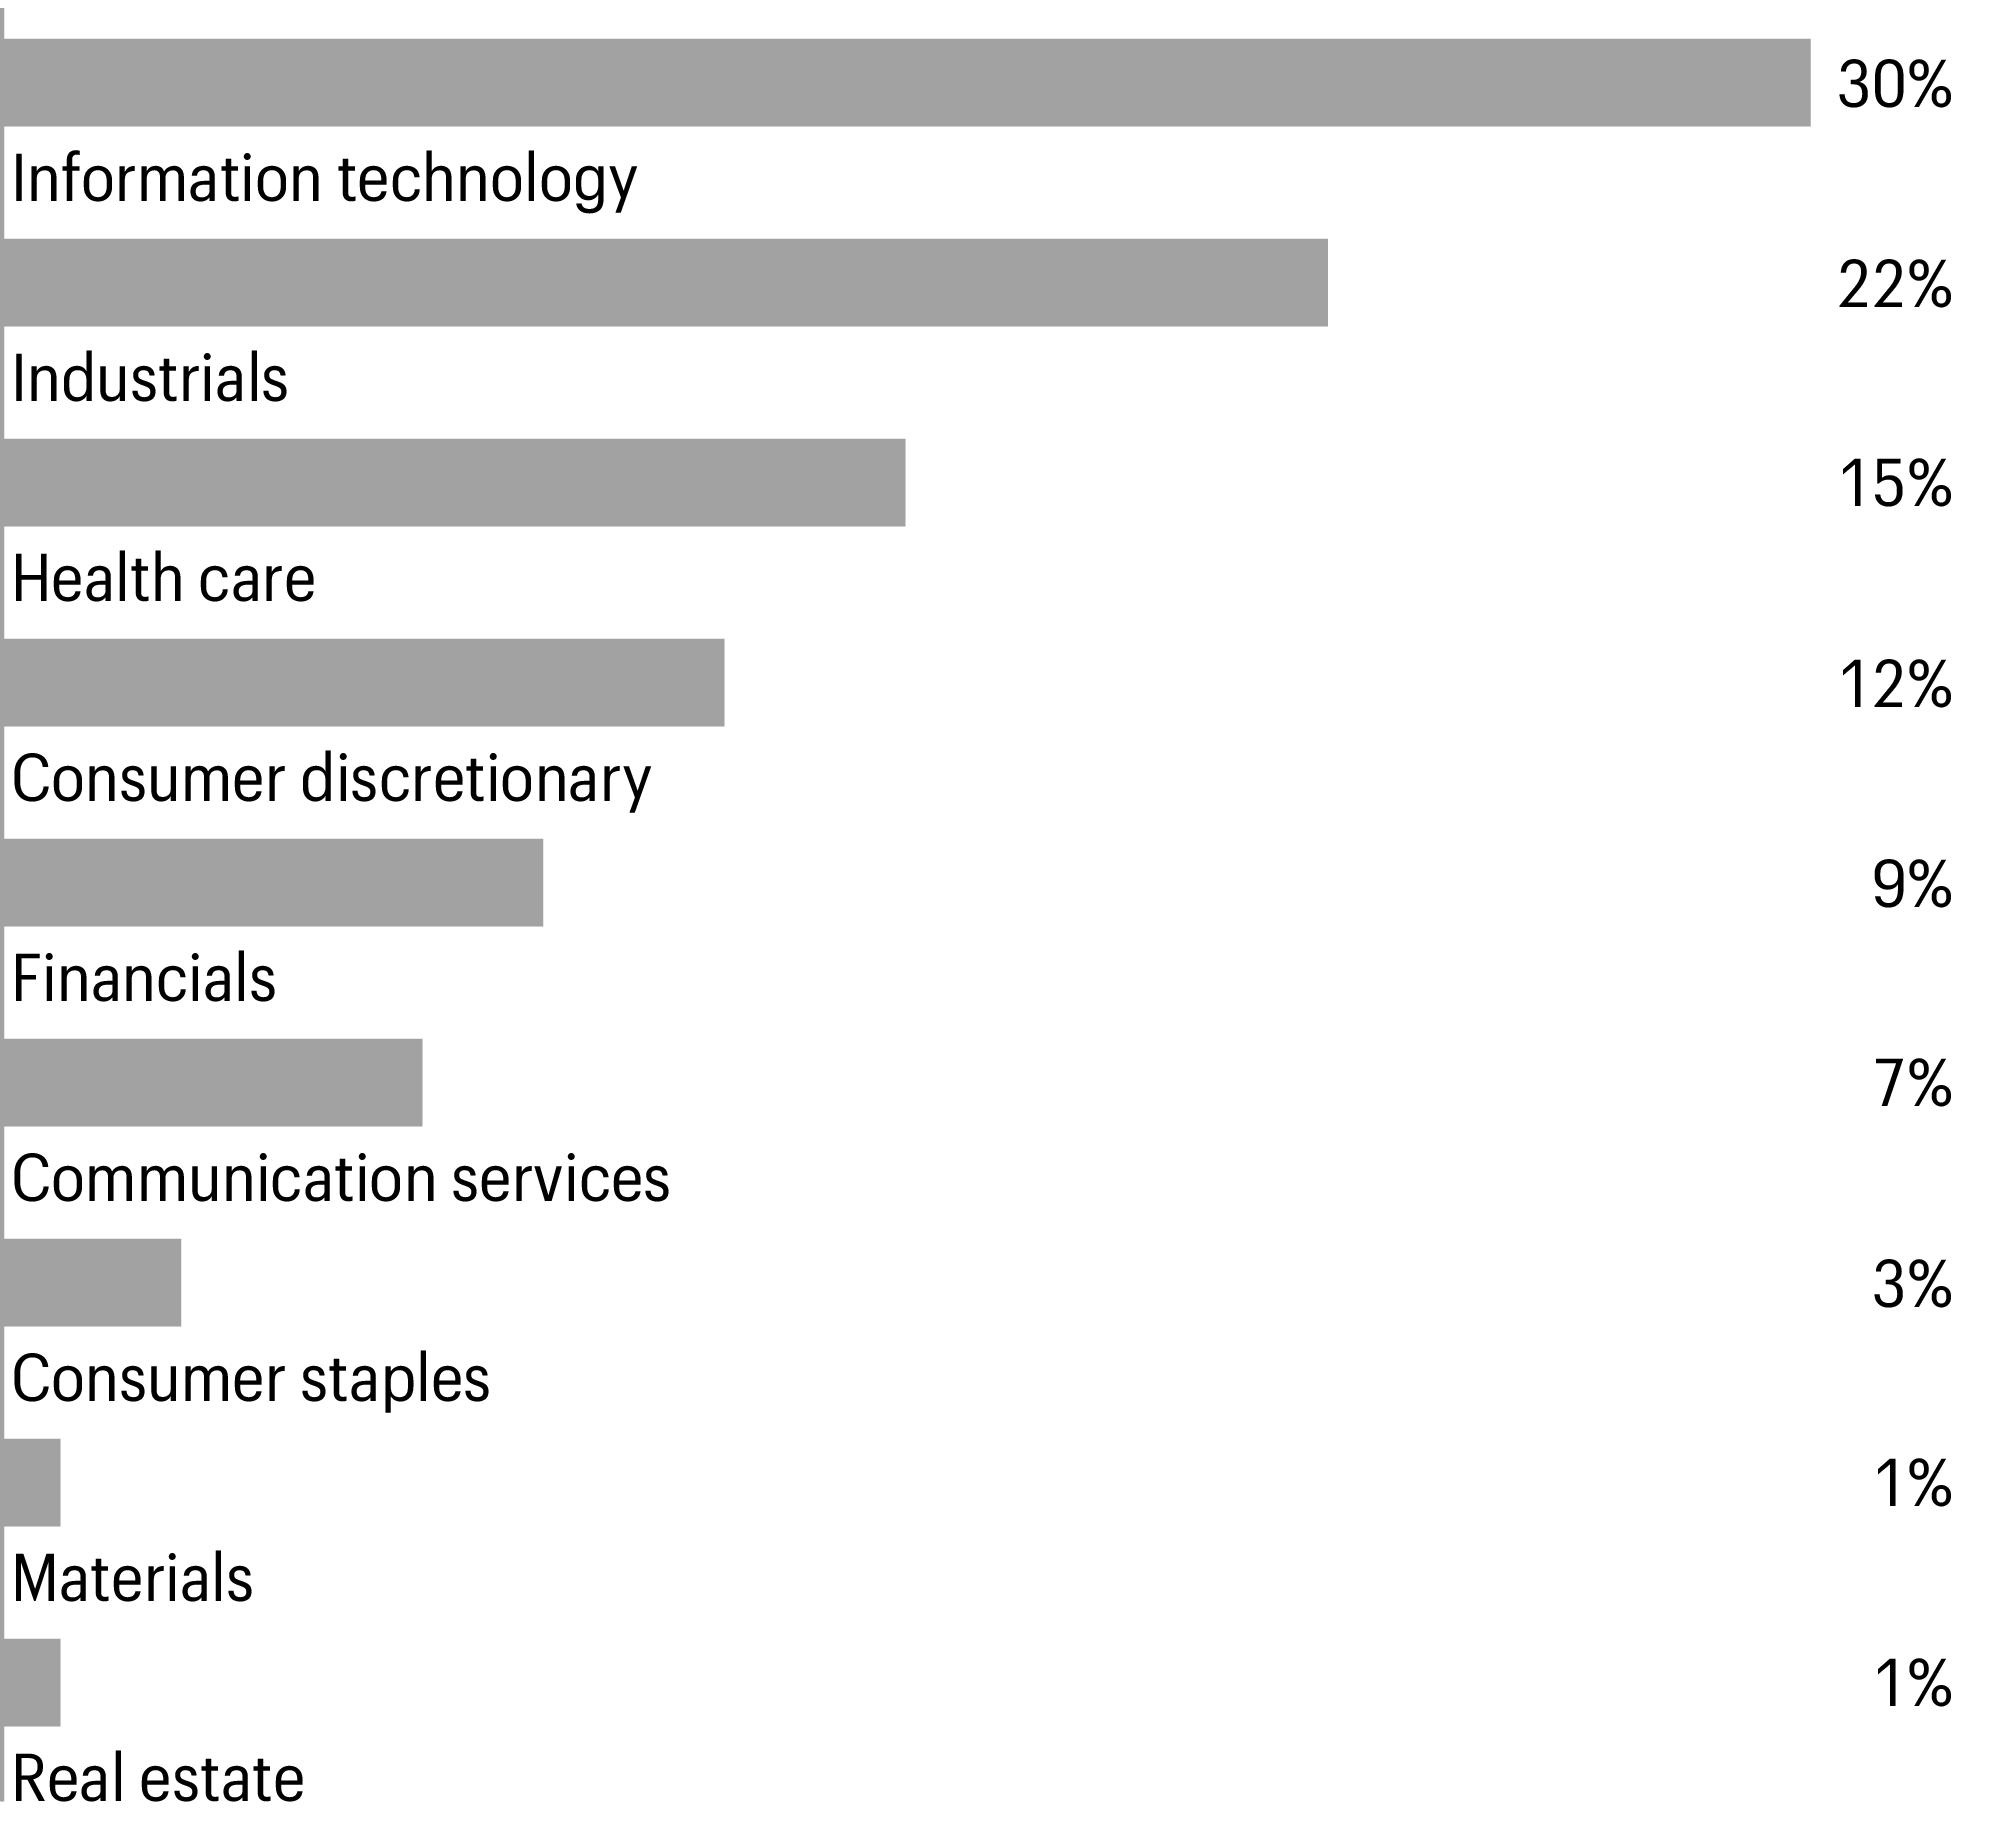
1 | Figures represent the percentage of the Fund’s long-term investments. Allocations are subject to change and may have changed since the date specified. |
Beginning account value 10-1-2023 | Ending account value 3-31-2024 | Expenses paid during the period1 | Annualized net expense ratio | |
Class A | ||||
Actual | $1,000.00 | $1,270.44 | $6.66 | 1.18 % |
Hypothetical (5% return before expenses) | $1,000.00 | $1,019.00 | $5.92 | 1.18 % |
Class C | ||||
Actual | $1,000.00 | $1,265.49 | $10.87 | 1.93 % |
Hypothetical (5% return before expenses) | $1,000.00 | $1,015.27 | $9.67 | 1.93 % |
Class R6 | ||||
Actual | $1,000.00 | $1,272.61 | $4.52 | 0.80 % |
Hypothetical (5% return before expenses) | $1,000.00 | $1,020.89 | $4.02 | 0.80 % |
Administrator Class | ||||
Actual | $1,000.00 | $1,270.84 | $6.21 | 1.10 % |
Hypothetical (5% return before expenses) | $1,000.00 | $1,019.39 | $5.52 | 1.10 % |
Institutional Class | ||||
Actual | $1,000.00 | $1,272.33 | $4.80 | 0.85 % |
Hypothetical (5% return before expenses) | $1,000.00 | $1,020.64 | $4.27 | 0.85 % |
1 | Expenses paid is equal to the annualized net expense ratio of each class multiplied by the average account value over the period, multiplied by 182 divided by 366 (to reflect the one-half-year period). |
Shares | Value | |||||
Common stocks: 99.08% | ||||||
Communication services: 7.22% | ||||||
Entertainment: 4.46% | ||||||
Live Nation Entertainment, Inc.† | 104,000 | $11,000,080 | ||||
Spotify Technology SA† | 41,533 | 10,960,559 | ||||
TKO Group Holdings, Inc. | 103,000 | 8,900,230 | ||||
30,860,869 | ||||||
Media: 2.76% | ||||||
Trade Desk, Inc. Class A† | 218,000 | 19,057,560 | ||||
Consumer discretionary: 12.38% | ||||||
Automobiles: 1.55% | ||||||
Ferrari NV | 24,616 | 10,731,099 | ||||
Broadline retail: 3.15% | ||||||
Global-E Online Ltd.† | 277,480 | 10,086,398 | ||||
MercadoLibre, Inc.† | 7,742 | 11,705,594 | ||||
21,791,992 | ||||||
Hotels, restaurants & leisure: 3.87% | ||||||
Chipotle Mexican Grill, Inc.† | 2,815 | 8,182,558 | ||||
DraftKings, Inc. Class A† | 218,100 | 9,903,921 | ||||
Hyatt Hotels Corp. Class A | 54,300 | 8,667,366 | ||||
26,753,845 | ||||||
Household durables: 1.35% | ||||||
PulteGroup, Inc. | 77,300 | 9,323,926 | ||||
Specialty retail: 1.01% | ||||||
Burlington Stores, Inc.† | 30,200 | 7,012,138 | ||||
Textiles, apparel & luxury goods: 1.45% | ||||||
On Holding AG Class A† | 282,400 | 9,991,312 | ||||
Consumer staples: 2.57% | ||||||
Beverages: 1.39% | ||||||
Celsius Holdings, Inc.† | 116,100 | 9,627,012 | ||||
Personal care products: 1.18% | ||||||
Coty, Inc. Class A† | 679,000 | 8,120,840 | ||||
Financials: 8.97% | ||||||
Capital markets: 5.57% | ||||||
Blue Owl Capital, Inc. | 307,500 | 5,799,450 | ||||
Morningstar, Inc. | 39,900 | 12,303,963 | ||||
MSCI, Inc. | 20,100 | 11,265,045 | ||||
Tradeweb Markets, Inc. Class A | 87,400 | 9,104,458 | ||||
38,472,916 | ||||||
Shares | Value | |||||
Financial services: 1.85% | ||||||
Adyen NV ADR† | 755,400 | $12,773,814 | ||||
Insurance: 1.55% | ||||||
Allstate Corp. | 62,100 | 10,743,921 | ||||
Health care: 14.38% | ||||||
Biotechnology: 1.76% | ||||||
Natera, Inc.† | 132,800 | 12,145,888 | ||||
Health care equipment & supplies: 7.22% | ||||||
DexCom, Inc.† | 156,268 | 21,674,371 | ||||
IDEXX Laboratories, Inc.† | 29,800 | 16,089,914 | ||||
Shockwave Medical, Inc.† | 37,300 | 12,145,999 | ||||
49,910,284 | ||||||
Health care technology: 2.20% | ||||||
Veeva Systems, Inc. Class A† | 65,600 | 15,198,864 | ||||
Life sciences tools & services: 3.20% | ||||||
Bio-Techne Corp. | 184,084 | 12,957,673 | ||||
Repligen Corp.† | 49,900 | 9,177,608 | ||||
22,135,281 | ||||||
Industrials: 21.96% | ||||||
Aerospace & defense: 2.06% | ||||||
Axon Enterprise, Inc.† | 45,528 | 14,244,801 | ||||
Commercial services & supplies: 7.62% | ||||||
RB Global, Inc. | 149,200 | 11,364,564 | ||||
Rollins, Inc. | 268,300 | 12,414,241 | ||||
Tetra Tech, Inc. | 83,000 | 15,330,930 | ||||
Waste Connections, Inc. | 78,806 | 13,555,420 | ||||
52,665,155 | ||||||
Electrical equipment: 2.10% | ||||||
Vertiv Holdings Co. | 177,300 | 14,480,091 | ||||
Ground transportation: 3.36% | ||||||
J.B. Hunt Transport Services, Inc. | 49,300 | 9,823,025 | ||||
Saia, Inc.† | 22,867 | 13,377,195 | ||||
23,200,220 | ||||||
Machinery: 1.50% | ||||||
RBC Bearings, Inc.† | 38,400 | 10,381,440 | ||||
Trading companies & distributors: 5.32% | ||||||
Applied Industrial Technologies, Inc. | 65,900 | 13,018,545 | ||||
SiteOne Landscape Supply, Inc.† | 82,288 | 14,363,370 | ||||
Watsco, Inc. | 21,800 | 9,416,946 | ||||
36,798,861 | ||||||
Shares | Value | |||||
Information technology: 29.25% | ||||||
Electronic equipment, instruments & components: 4.01% | ||||||
Novanta, Inc.† | 57,900 | $10,119,183 | ||||
Teledyne Technologies, Inc.† | 20,138 | 8,645,646 | ||||
Zebra Technologies Corp. Class A† | 29,587 | 8,918,706 | ||||
27,683,535 | ||||||
IT services: 5.59% | ||||||
Gartner, Inc.† | 36,100 | 17,207,787 | ||||
Globant SA† | 45,218 | 9,129,514 | ||||
MongoDB, Inc.† | 34,300 | 12,301,352 | ||||
38,638,653 | ||||||
Semiconductors & semiconductor equipment: 5.95% | ||||||
Advanced Micro Devices, Inc.† | 43,228 | 7,802,222 | ||||
Entegris, Inc. | 51,700 | 7,265,918 | ||||
Monolithic Power Systems, Inc. | 22,600 | 15,309,692 | ||||
Onto Innovation, Inc.† | 59,500 | 10,774,260 | ||||
41,152,092 | ||||||
Software: 13.70% | ||||||
Cadence Design Systems, Inc.† | 27,265 | 8,487,049 | ||||
CCC Intelligent Solutions Holdings, Inc.† | 1,101,985 | 13,179,741 | ||||
Crowdstrike Holdings, Inc. Class A† | 65,663 | 21,050,901 | ||||
Datadog, Inc. Class A† | 127,954 | 15,815,114 | ||||
Fair Isaac Corp.† | 8,800 | 10,996,568 | ||||
HubSpot, Inc.† | 20,100 | 12,593,856 | ||||
Tyler Technologies, Inc.† | 29,600 | 12,580,296 | ||||
94,703,525 | ||||||
Materials: 1.18% | ||||||
Metals & mining: 1.18% | ||||||
ATI, Inc.† | 158,800 | 8,125,796 | ||||
Real estate: 1.17% | ||||||
Industrial REITs : 1.17% | ||||||
Rexford Industrial Realty, Inc. | 160,600 | 8,078,180 | ||||
Total common stocks (Cost $479,178,611) | 684,803,910 | |||||
Yield | ||||||
Short-term investments: 0.55% | ||||||
Investment companies: 0.55% | ||||||
Allspring Government Money Market Fund Select Class♠∞ | 5.25 % | 3,842,270 | 3,842,270 | |||
Total short-term investments (Cost $3,842,270) | 3,842,270 | |||||
Total investments in securities (Cost $483,020,881) | 99.63 % | 688,646,180 | ||||
Other assets and liabilities, net | 0.37 | 2,536,192 | ||||
Total net assets | 100.00 % | $691,182,372 | ||||
† | Non-income-earning security |
♠ | The issuer of the security is an affiliated person of the Fund as defined in the Investment Company Act of 1940. |
∞ | The rate represents the 7-day annualized yield at period end. |
Abbreviations: | |
ADR | American depositary receipt |
REIT | Real estate investment trust |
Value, beginning of period | Purchases | Sales proceeds | Net realized gains (losses) | Net change in unrealized gains (losses) | Value, end of period | Shares, end of period | Income from affiliated securities | |
Short-term investments | ||||||||
Allspring Government Money Market Fund Select Class | $6,226,757 | $55,042,697 | $(57,427,184 ) | $0 | $0 | $3,842,270 | 3,842,270 | $87,713 |
Assets | |
Investments in unaffiliated securities, at value (cost $479,178,611) | $684,803,910 |
Investments in affiliated securities, at value (cost $3,842,270) | 3,842,270 |
Cash | 98 |
Receivable for investments sold | 6,013,133 |
Receivable for dividends | 187,411 |
Receivable for Fund shares sold | 89,625 |
Prepaid expenses and other assets | 170,567 |
Total assets | 695,107,014 |
Liabilities | |
Payable for investments purchased | 2,789,557 |
Management fee payable | 408,470 |
Payable for Fund shares redeemed | 203,972 |
Administration fees payable | 104,339 |
Trustees’ fees and expenses payable | 3,432 |
Distribution fee payable | 408 |
Accrued expenses and other liabilities | 414,464 |
Total liabilities | 3,924,642 |
Total net assets | $691,182,372 |
Net assets consist of | |
Paid-in capital | $494,260,396 |
Total distributable earnings | 196,921,976 |
Total net assets | $691,182,372 |
Computation of net asset value and offering price per share | |
Net assets–Class A | $588,156,289 |
Shares outstanding–Class A1 | 11,986,106 |
Net asset value per share–Class A | $49.07 |
Maximum offering price per share – Class A2 | $52.06 |
Net assets–Class C | $649,423 |
Shares outstanding–Class C1 | 17,231 |
Net asset value per share–Class C | $37.69 |
Net assets–Class R6 | $66,720,315 |
Shares outstanding–Class R61 | 1,135,666 |
Net asset value per share–Class R6 | $58.75 |
Net assets–Administrator Class | $1,912,758 |
Shares outstanding–Administrator Class1 | 35,682 |
Net asset value per share–Administrator Class | $53.61 |
Net assets–Institutional Class | $33,743,587 |
Shares outstanding–Institutional Class1 | 578,502 |
Net asset value per share–Institutional Class | $58.33 |
Investment income | |
Dividends (net of foreign withholdings taxes of $18,724) | $882,142 |
Income from affiliated securities | 87,713 |
Interest | 439 |
Total investment income | 970,294 |
Expenses | |
Management fee | 2,300,459 |
Administration fees | |
Class A | 526,272 |
Class C | 621 |
Class R6 | 8,901 |
Administrator Class | 1,640 |
Institutional Class | 18,657 |
Shareholder servicing fees | |
Class A | 657,409 |
Class C | 773 |
Administrator Class | 2,725 |
Distribution fee | |
Class C | 2,308 |
Custody and accounting fees | 2 |
Professional fees | 32,191 |
Registration fees | 24,099 |
Shareholder report expenses | 19,304 |
Trustees’ fees and expenses | 12,366 |
Other fees and expenses | 19,260 |
Total expenses | 3,626,987 |
Less: Fee waivers and/or expense reimbursements | |
Fund-level | (30,794 ) |
Class A | (104,491 ) |
Class C | (97 ) |
Administrator Class | (202 ) |
Institutional Class | (7,171 ) |
Net expenses | 3,484,232 |
Net investment loss | (2,513,938 ) |
Realized and unrealized gains (losses) on investments | |
Net realized gains (losses) on | |
Unaffiliated securities | 245,586 |
Foreign currency and foreign currency translations | (117 ) |
Net realized gains on investments | 245,469 |
Net change in unrealized gains (losses) on investments | 152,291,429 |
Net realized and unrealized gains (losses) on investments | 152,536,898 |
Net increase in net assets resulting from operations | $150,022,960 |
Six months ended March 31, 2024 (unaudited) | Year ended September 30, 2023 | |||
Operations | ||||
Net investment loss | $(2,513,938 ) | $(4,563,128 ) | ||
Net realized gains on investments | 245,469 | 37,055,521 | ||
Net change in unrealized gains (losses) on investments | 152,291,429 | 27,144,906 | ||
Net increase in net assets resulting from operations | 150,022,960 | 59,637,299 | ||
Distributions to shareholders from | ||||
Net investment income and net realized gains | ||||
Class A | (13,133,463 ) | 0 | ||
Class C | (20,718 ) | 0 | ||
Class R6 | (1,220,732 ) | 0 | ||
Administrator Class | (66,556 ) | 0 | ||
Institutional Class | (591,818 ) | 0 | ||
Total distributions to shareholders | (15,033,287 ) | 0 | ||
Capital share transactions | Shares | Shares | ||
Proceeds from shares sold | ||||
Class A | 55,981 | 2,453,510 | 82,363 | 3,267,070 |
Class C | 569 | 19,416 | 3,960 | 127,320 |
Class R6 | 44,940 | 2,319,555 | 159,633 | 7,692,659 |
Administrator Class | 16,559 | 757,060 | 3,496 | 151,996 |
Institutional Class | 84,177 | 4,447,026 | 138,827 | 6,417,435 |
9,996,567 | 17,656,480 | |||
Reinvestment of distributions | ||||
Class A | 293,587 | 12,389,381 | 0 | 0 |
Class C | 602 | 19,563 | 0 | 0 |
Class R6 | 24,178 | 1,220,262 | 0 | 0 |
Administrator Class | 1,437 | 66,252 | 0 | 0 |
Institutional Class | 11,499 | 576,313 | 0 | 0 |
14,271,771 | 0 | |||
Payment for shares redeemed | ||||
Class A | (742,955 ) | (31,927,519 ) | (1,362,482 ) | (53,883,730 ) |
Class C | (5,678 ) | (186,780 ) | (15,752 ) | (489,096 ) |
Class R6 | (132,391 ) | (6,540,438 ) | (159,957 ) | (7,483,014 ) |
Administrator Class | (38,621 ) | (1,919,591 ) | (27,611 ) | (1,199,819 ) |
Institutional Class | (83,589 ) | (4,203,271 ) | (416,044 ) | (19,110,754 ) |
(44,777,599 ) | (82,166,413 ) | |||
Net decrease in net assets resulting from capital share transactions | (20,509,261 ) | (64,509,933 ) | ||
Total increase (decrease) in net assets | 114,480,412 | (4,872,634 ) | ||
Net assets | ||||
Beginning of period | 576,701,960 | 581,574,594 | ||
End of period | $691,182,372 | $576,701,960 | ||
Six months ended March 31, 2024 (unaudited) | Year ended September 30 | |||||
Class A | 2023 | 2022 | 2021 | 2020 | 2019 | |
Net asset value, beginning of period | $39.62 | $35.92 | $76.01 | $64.21 | $49.98 | $52.96 |
Net investment loss | (0.19 )1 | (0.32 )1 | (0.55 ) | (0.77 )1 | (0.41 )1 | (0.29 ) |
Net realized and unrealized gains (losses) on investments | 10.73 | 4.02 | (28.31 ) | 19.17 | 17.93 | 3.05 |
Total from investment operations | 10.54 | 3.70 | (28.86 ) | 18.40 | 17.52 | 2.76 |
Distributions to shareholders from | ||||||
Net realized gains | (1.09 ) | 0.00 | (11.23 ) | (6.60 ) | (3.29 ) | (5.74 ) |
Net asset value, end of period | $49.07 | $39.62 | $35.92 | $76.01 | $64.21 | $49.98 |
Total return2 | 27.04 % | 10.27 % | (44.27 )% | 29.90 % | 37.19 % | 8.00 % |
Ratios to average net assets (annualized) | ||||||
Gross expenses | 1.23 % | 1.25 % | 1.23 % | 1.21 % | 1.24 % | 1.25 % |
Net expenses | 1.18 % | 1.17 % | 1.16 % | 1.17 % | 1.16 % | 1.18 % |
Net investment loss | (0.87 )% | (0.80 )% | (1.03 )% | (1.06 )% | (0.79 )% | (0.59 )% |
Supplemental data | ||||||
Portfolio turnover rate | 28 % | 49 % | 46 % | 41 % | 62 % | 50 % |
Net assets, end of period (000s omitted) | $588,156 | $490,533 | $490,694 | $990,030 | $813,725 | $649,106 |
1 | Calculated based upon average shares outstanding |
2 | Total return calculations do not include any sales charges. Returns for periods of less than one year are not annualized. |
Six months ended March 31, 2024 (unaudited) | Year ended September 30 | |||||
Class C | 2023 | 2022 | 2021 | 2020 | 2019 | |
Net asset value, beginning of period | $30.78 | $28.12 | $62.41 | $54.11 | $42.93 | $46.74 |
Net investment loss | (0.27 )1 | (0.48 )1 | (0.75 )1 | (1.10 )1 | (0.68 )1 | (0.52 )1 |
Net realized and unrealized gains (losses) on investments | 8.27 | 3.14 | (22.31 ) | 16.00 | 15.15 | 2.45 |
Total from investment operations | 8.00 | 2.66 | (23.06 ) | 14.90 | 14.47 | 1.93 |
Distributions to shareholders from | ||||||
Net realized gains | (1.09 ) | 0.00 | (11.23 ) | (6.60 ) | (3.29 ) | (5.74 ) |
Net asset value, end of period | $37.69 | $30.78 | $28.12 | $62.41 | $54.11 | $42.93 |
Total return2 | 26.55 % | 9.46 % | (44.71 )% | 28.92 % | 36.13 % | 7.20 % |
Ratios to average net assets (annualized) | ||||||
Gross expenses | 1.97 % | 1.99 % | 1.96 % | 1.96 % | 1.98 % | 2.00 % |
Net expenses | 1.93 % | 1.93 % | 1.93 % | 1.93 % | 1.93 % | 1.93 % |
Net investment loss | (1.62 )% | (1.57 )% | (1.80 )% | (1.82 )% | (1.55 )% | (1.29 )% |
Supplemental data | ||||||
Portfolio turnover rate | 28 % | 49 % | 46 % | 41 % | 62 % | 50 % |
Net assets, end of period (000s omitted) | $649 | $669 | $943 | $2,509 | $2,224 | $2,513 |
1 | Calculated based upon average shares outstanding |
2 | Total return calculations do not include any sales charges. Returns for periods of less than one year are not annualized. |
Six months ended March 31, 2024 (unaudited) | Year ended September 30 | |||||
Class R6 | 2023 | 2022 | 2021 | 2020 | 2019 | |
Net asset value, beginning of period | $47.16 | $42.59 | $87.70 | $72.94 | $56.15 | $58.47 |
Net investment loss | (0.13 )1 | (0.20 )1 | (0.40 )1 | (0.57 )1 | (0.25 )1 | (0.11 )1 |
Net realized and unrealized gains (losses) on investments | 12.81 | 4.77 | (33.48 ) | 21.93 | 20.33 | 3.53 |
Total from investment operations | 12.68 | 4.57 | (33.88 ) | 21.36 | 20.08 | 3.42 |
Distributions to shareholders from | ||||||
Net realized gains | (1.09 ) | 0.00 | (11.23 ) | (6.60 ) | (3.29 ) | (5.74 ) |
Net asset value, end of period | $58.75 | $47.16 | $42.59 | $87.70 | $72.94 | $56.15 |
Total return2 | 27.26 % | 10.70 % | (44.07 )% | 30.41 % | 37.69 % | 8.41 % |
Ratios to average net assets (annualized) | ||||||
Gross expenses | 0.81 % | 0.83 % | 0.80 % | 0.78 % | 0.81 % | 0.82 % |
Net expenses | 0.80 % | 0.80 % | 0.79 % | 0.78 % | 0.80 % | 0.80 % |
Net investment loss | (0.49 )% | (0.43 )% | (0.66 )% | (0.68 )% | (0.43 )% | (0.21 )% |
Supplemental data | ||||||
Portfolio turnover rate | 28 % | 49 % | 46 % | 41 % | 62 % | 50 % |
Net assets, end of period (000s omitted) | $66,720 | $56,539 | $51,082 | $94,430 | $71,641 | $52,783 |
1 | Calculated based upon average shares outstanding |
2 | Returns for periods of less than one year are not annualized. |
Six months ended March 31, 2024 (unaudited) | Year ended September 30 | |||||
Administrator Class | 2023 | 2022 | 2021 | 2020 | 2019 | |
Net asset value, beginning of period | $43.18 | $39.12 | $81.70 | $68.54 | $53.10 | $55.82 |
Net investment loss | (0.19 )1 | (0.32 )1 | (0.58 )1 | (0.79 )1 | (0.40 )1 | (0.25 )1 |
Net realized and unrealized gains (losses) on investments | 11.71 | 4.38 | (30.77 ) | 20.55 | 19.13 | 3.27 |
Total from investment operations | 11.52 | 4.06 | (31.35 ) | 19.76 | 18.73 | 3.02 |
Distributions to shareholders from | ||||||
Net realized gains | (1.09 ) | 0.00 | (11.23 ) | (6.60 ) | (3.29 ) | (5.74 ) |
Net asset value, end of period | $53.61 | $43.18 | $39.12 | $81.70 | $68.54 | $53.10 |
Total return2 | 27.08 % | 10.38 % | (44.25 )% | 30.00 % | 37.29 % | 8.06 % |
Ratios to average net assets (annualized) | ||||||
Gross expenses | 1.13 % | 1.14 % | 1.12 % | 1.13 % | 1.15 % | 1.16 % |
Net expenses | 1.10 % | 1.10 % | 1.09 % | 1.10 % | 1.10 % | 1.10 % |
Net investment loss | (0.80 )% | (0.74 )% | (0.98 )% | (1.00 )% | (0.72 )% | (0.51 )% |
Supplemental data | ||||||
Portfolio turnover rate | 28 % | 49 % | 46 % | 41 % | 62 % | 50 % |
Net assets, end of period (000s omitted) | $1,913 | $2,431 | $3,146 | $10,818 | $4,205 | $3,687 |
1 | Calculated based upon average shares outstanding |
2 | Returns for periods of less than one year are not annualized. |
Six months ended March 31, 2024 (unaudited) | Year ended September 30 | |||||
Institutional Class | 2023 | 2022 | 2021 | 2020 | 2019 | |
Net asset value, beginning of period | $46.84 | $42.33 | $87.27 | $72.66 | $55.97 | $58.33 |
Net investment loss | (0.14 )1 | (0.23 )1 | (0.44 )1 | (0.62 )1 | (0.28 )1 | (0.14 )1 |
Net realized and unrealized gains (losses) on investments | 12.72 | 4.74 | (33.27 ) | 21.83 | 20.26 | 3.52 |
Total from investment operations | 12.58 | 4.51 | (33.71 ) | 21.21 | 19.98 | 3.38 |
Distributions to shareholders from | ||||||
Net realized gains | (1.09 ) | 0.00 | (11.23 ) | (6.60 ) | (3.29 ) | (5.74 ) |
Net asset value, end of period | $58.33 | $46.84 | $42.33 | $87.27 | $72.66 | $55.97 |
Total return2 | 27.23 % | 10.65 % | (44.11 )% | 30.31 % | 37.63 % | 8.36 % |
Ratios to average net assets (annualized) | ||||||
Gross expenses | 0.91 % | 0.92 % | 0.90 % | 0.88 % | 0.91 % | 0.92 % |
Net expenses | 0.85 % | 0.85 % | 0.85 % | 0.85 % | 0.85 % | 0.85 % |
Net investment loss | (0.54 )% | (0.49 )% | (0.72 )% | (0.74 )% | (0.48 )% | (0.26 )% |
Supplemental data | ||||||
Portfolio turnover rate | 28 % | 49 % | 46 % | 41 % | 62 % | 50 % |
Net assets, end of period (000s omitted) | $33,744 | $26,530 | $35,710 | $78,349 | $67,735 | $52,296 |
1 | Calculated based upon average shares outstanding |
2 | Returns for periods of less than one year are not annualized. |
Gross unrealized gains | $218,713,430 |
Gross unrealized losses | (9,952,529 ) |
Net unrealized gains | $208,760,901 |
Quoted prices (Level 1) | Other significant observable inputs (Level 2) | Significant unobservable inputs (Level 3) | Total | |
Assets | ||||
Investments in: | ||||
Common stocks | ||||
Communication services | $49,918,429 | $0 | $0 | $49,918,429 |
Consumer discretionary | 85,604,312 | 0 | 0 | 85,604,312 |
Consumer staples | 17,747,852 | 0 | 0 | 17,747,852 |
Financials | 61,990,651 | 0 | 0 | 61,990,651 |
Health care | 99,390,317 | 0 | 0 | 99,390,317 |
Industrials | 151,770,568 | 0 | 0 | 151,770,568 |
Information technology | 202,177,805 | 0 | 0 | 202,177,805 |
Materials | 8,125,796 | 0 | 0 | 8,125,796 |
Real estate | 8,078,180 | 0 | 0 | 8,078,180 |
Short-term investments | ||||
Investment companies | 3,842,270 | 0 | 0 | 3,842,270 |
Total assets | $688,646,180 | $0 | $0 | $688,646,180 |
Average daily net assets | Management fee |
First $500 million | 0.750 % |
Next $500 million | 0.725 |
Next $1 billion | 0.700 |
Next $2 billion | 0.675 |
Next $1 billion | 0.650 |
Next $5 billion | 0.640 |
Next $2 billion | 0.630 |
Next $4 billion | 0.620 |
Over $16 billion | 0.610 |
Class-level administration fee | |
Class A | 0.20 % |
Class C | 0.20 |
Class R6 | 0.03 |
Administrator Class | 0.13 |
Institutional Class | 0.13 |
EXPENSE RATIO CAPS | |
Class A | 1.18 % |
Class C | 1.93 |
Class R6 | 0.80 |
Administrator Class | 1.10 |
Institutional Class | 0.85 |
Name and year of birth | Position held and length of service* | Principal occupations during past five years or longer | Current other public company or investment company directorships |
William R. Ebsworth (Born 1957) | Trustee, since 2015 | Retired. From 1984 to 2013, equities analyst, portfolio manager, research director and chief investment officer at Fidelity Management and Research Company in Boston, Tokyo, and Hong Kong, and retired in 2013 as Chief Investment Officer of Fidelity Strategic Advisers, Inc. where he led a team of investment professionals managing client assets. Prior thereto, Board member of Hong Kong Securities Clearing Co., Hong Kong Options Clearing Corp., the Thailand International Fund, Ltd., Fidelity Investments Life Insurance Company, and Empire Fidelity Investments Life Insurance Company. Serves on the Investment Company Institute’s Board of Governors since 2022 and Executive Committee since 2023 as well as the Vice Chairman of the Governing Council of the Independent Directors Council since 2023. Audit Committee Chair and Investment Committee Chair of the Vincent Memorial Hospital Foundation (non-profit organization). Mr. Ebsworth is a CFA charterholder. | N/A |
Jane A. Freeman (Born 1953) | Trustee, since 2015; Chair Liaison, since January 2018# | Retired. From 2012 to 2014 and 1999 to 2008, Chief Financial Officer of Scientific Learning Corporation. From 2008 to 2012, Ms. Freeman provided consulting services related to strategic business projects. Prior to 1999, Portfolio Manager at Rockefeller & Co. and Scudder, Stevens & Clark. Board member of the Harding Loevner Funds from 1996 to 2014, serving as both Lead Independent Director and chair of the Audit Committee. Board member of the Russell Exchange Traded Funds Trust from 2011 to 2012 and the chair of the Audit Committee. Ms. Freeman is also an inactive Chartered Financial Analyst. | N/A |
Isaiah Harris, Jr. (Born 1952) | Trustee, since 2009; Audit Committee Chair, since 2019 | Retired. Member of the Advisory Board of CEF of East Central Florida. Chairman of the Board of CIGNA Corporation from 2009 to 2021, and Director from 2005 to 2008. From 2003 to 2011, Director of Deluxe Corporation. Prior thereto, President and CEO of BellSouth Advertising and Publishing Corp. from 2005 to 2007, President and CEO of BellSouth Enterprises from 2004 to 2005 and President of BellSouth Consumer Services from 2000 to 2003. Emeritus member of the Iowa State University Foundation Board of Governors. Emeritus Member of the Advisory board of Iowa State University School of Business. Advisory Board Member, Palm Harbor Academy (private school). Advisory Board Member, Fellowship of Christian Athletes. Mr. Harris is a certified public accountant (inactive status). | N/A |
David F. Larcker (Born 1950) | Trustee, since 2009 | Distinguished Visiting Fellow at the Hoover Institution since 2022. James Irvin Miller Professor of Accounting at the Graduate School of Business (Emeritus), Stanford University, Director of the Corporate Governance Research Initiative and Senior Faculty of The Rock Center for Corporate Governance since 2006. From 2005 to 2008, Professor of Accounting at the Graduate School of Business, Stanford University. Prior thereto, Ernst & Young Professor of Accounting at The Wharton School, University of Pennsylvania from 1985 to 2005. | N/A |
Olivia S. Mitchell (Born 1953) | Trustee, since 2006; Nominating and Governance Committee Chair, since 2018 | International Foundation of Employee Benefit Plans Professor since 1993, Wharton School of the University of Pennsylvania. Director of Wharton’s Pension Research Council and Boettner Center on Pensions & Retirement Research, and Research Associate at the National Bureau of Economic Research. Previously taught at Cornell University from 1978 to 1993. | N/A |
Name and year of birth | Position held and length of service* | Principal occupations during past five years or longer | Current other public company or investment company directorships |
Timothy J. Penny (Born 1951) | Trustee, since 1996; Chair, since 2018 | President and Chief Executive Officer of Southern Minnesota Initiative Foundation, a non-profit organization, since 2007. Vice Chair of the Economic Club of Minnesota, since 2007. Co-Chair of the Committee for a Responsible Federal Budget, since 1995. Member of the Board of Trustees of NorthStar Education Finance, Inc., a non-profit organization, from 2007-2022. Senior Fellow of the University of Minnesota Humphrey Institute from 1995 to 2017. | N/A |
James G. Polisson (Born 1959) | Trustee, since 2018 | Retired. Chief Marketing Officer, Source (ETF) UK Services, Ltd, from 2015 to 2017. From 2012 to 2015, Principal of The Polisson Group, LLC, a management consulting, corporate advisory and principal investing company. Chief Executive Officer and Managing Director at Russell Investments, Global Exchange Traded Funds from 2010 to 2012. Managing Director of Barclays Global Investors from 1998 to 2010 and Global Chief Marketing Officer for iShares and Barclays Global Investors from 2000 to 2010. Trustee of the San Francisco Mechanics’ Institute, a non- profit organization, from 2013 to 2015. Board member of the Russell Exchange Traded Fund Trust from 2011 to 2012. Director of Barclays Global Investors Holdings Deutschland GmbH from 2006 to 2009. Mr. Polisson is an attorney and has a retired status with the Massachusetts and District of Columbia Bar Associations. | N/A |
Pamela Wheelock (Born 1959) | Trustee, since January 2020; previously Trustee from January 2018 to July 2019# | Retired. Executive and Senior Financial leadership positions in the public, private and nonprofit sectors. Interim President and CEO, McKnight Foundation, 2020. Interim Commissioner, Minnesota Department of Human Services, 2019. Chief Operating Officer, Twin Cities Habitat for Humanity, 2017-2019. Vice President for University Services, University of Minnesota, 2012- 2016. Interim President and CEO, Blue Cross and Blue Shield of Minnesota, 2011-2012. Executive Vice-President and Chief Financial Officer, Minnesota Wild, 2002-2008. Commissioner, Minnesota Department of Finance, 1999-2002. Chair of the Board of Directors of Destination Medical Center Corporation. Board member of the Minnesota Wild Foundation. | N/A |
Name and year of birth | Position held and length of service | Principal occupations during past five years or longer |
Andrew Owen (Born 1960) | President, since 2017 | President and Chief Executive Officer of Allspring Funds Management, LLC since 2017 and Head of Global Fund Governance of Allspring Global Investments since 2022. Prior thereto, co-president of Galliard Capital Management, LLC, an affiliate of Allspring Funds Management, LLC, from 2019 to 2022 and Head of Affiliated Managers, Allspring Global Investments, from 2014 to 2019 and Executive Vice President responsible for marketing, investments and product development for Allspring Funds Management, LLC, from 2009 to 2014. |
Jeremy DePalma (Born 1974) | Treasurer, since 2012 (for certain funds in the Fund Complex); since 2021 (for the remaining funds in the Complex) | Senior Vice President of Allspring Funds Management, LLC since 2009. Senior Vice President of Evergreen Investment Management Company, LLC from 2008 to 2010 and head of the Fund Reporting and Control Team within Fund Administration from 2005 to 2010. |
Christopher Baker (Born 1976) | Chief Compliance Officer, since 2022 | Global Chief Compliance Officer for Allspring Global Investments since 2022. Prior thereto, Chief Compliance Officer for State Street Global Advisors from 2018 to 2021. Senior Compliance Officer for the State Street divisions of Alternative Investment Solutions, Sector Solutions, and Global Marketing from 2015 to 2018. From 2010 to 2015 Vice President, Global Head of Investment and Marketing Compliance for State Street Global Advisors. |
Matthew Prasse (Born 1983) | Chief Legal Officer, since 2022; Secretary, since 2021 | Senior Counsel of the Allspring Legal Department since 2021. Senior Counsel of the Wells Fargo Legal Department from 2018 to 2021. Previously, Counsel for Barings LLC from 2015 to 2018. Prior to joining Barings, Associate at Morgan, Lewis & Bockius LLP from 2008 to 2015. |

P.O. Box 219967
Kansas City, MO 64121-9967

SAR3018 03-24

Allspring Funds

President
Allspring Funds
Notice to Shareholders |
Beginning in July 2024, the Fund will be required by the Securities and Exchange Commission to send shareholders a paper copy of a new tailored shareholder report in place of the full shareholder report that you are now receiving. The tailored shareholder report will contain concise information about the Fund, including certain expense and performance information and fund statistics. If you wish to receive this new tailored shareholder report electronically, please follow the instructions on the back cover of this report. |
Other information that is currently included in the shareholder report, such as the Fund’s financial statements, will be available online and upon request, free of charge, in paper or electronic format. |
Investment objective | The Fund seeks long-term capital appreciation. |
Manager | Allspring Funds Management, LLC |
Subadviser | Allspring Global Investments, LLC |
Portfolio managers | Michael T. Smith, CFA, Christopher J. Warner, CFA |
Average annual total returns (%) as of March 31, 2024 | |||||||||
Including sales charge | Excluding sales charge | Expense ratios1 (%) | |||||||
Inception date | 1 year | 5 year | 10 year | 1 year | 5 year | 10 year | Gross | Net2 | |
Class A (WFDAX) | 7-31-2007 | 12.63 | 6.18 | 7.93 | 19.48 | 7.45 | 8.57 | 1.23 | 1.21 |
Class C (WDSCX) | 7-31-2007 | 17.53 | 6.64 | 7.93 | 18.53 | 6.64 | 7.93 | 1.98 | 1.96 |
Class R6 (WFDRX) | 6-28-2013 | – | – | – | 19.94 | 7.89 | 9.03 | 0.81 | 0.79 |
Administrator Class (WFDDX) | 4-8-2005 | – | – | – | 19.58 | 7.53 | 8.67 | 1.16 | 1.14 |
Institutional Class (WFDSX) | 8-31-2006 | – | – | – | 19.84 | 7.78 | 8.93 | 0.91 | 0.89 |
Russell 3000® Index3 | – | – | – | – | 29.29 | 14.34 | 12.33 | – | – |
Russell 2500™ Growth Index4 | – | – | – | – | 21.12 | 9.39 | 9.56 | – | – |
1 | Reflects the expense ratios as stated in the most recent prospectuses. The expense ratios shown are subject to change and may differ from the annualized expense ratios shown in the Financial Highlights of this report. |
2 | The manager has contractually committed through January 31, 2025, to waive fees and/or reimburse expenses to the extent necessary to cap total annual fund operating expenses after fee waivers at 1.21% for Class A, 1.96% for Class C, 0.79% for Class R6, 1.14% for Administrator Class and 0.89% for Institutional Class. Brokerage commissions, stamp duty fees, interest, taxes, acquired fund fees and expenses (if any), and extraordinary expenses are excluded from the expense caps. Prior to or after the commitment expiration date, the caps may be increased or the commitment to maintain the caps may be terminated only with the approval of the Board of Trustees. Without these caps, the Fund’s returns would have been lower. The expense ratio paid by an investor is the net expense ratio (the total annual fund operating expenses after fee waivers) as stated in the prospectuses. |
3 | The Russell 3000® Index measures the performance of the 3,000 largest U.S. companies based on total market capitalization, which represents approximately 98% of the investable U.S. equity market. You cannot invest directly in an index. |
4 | The Russell 2500TM Growth Index measures the performance of those Russell 2500TM companies with higher price/book ratios and higher forecasted growth values. You cannot invest directly in an index. |
CFA® and Chartered Financial Analyst® are trademarks owned by CFA Institute. |
Ten largest holdings (%) as of March 31, 20241 | |
Vertiv Holdings Co. | 2.82 |
Casella Waste Systems, Inc. Class A | 2.65 |
Axon Enterprise, Inc. | 2.37 |
SiteOne Landscape Supply, Inc. | 2.18 |
Natera, Inc. | 2.09 |
Celsius Holdings, Inc. | 2.07 |
Morningstar, Inc. | 2.04 |
CCC Intelligent Solutions Holdings, Inc. | 2.04 |
Tetra Tech, Inc. | 1.96 |
Shockwave Medical, Inc. | 1.93 |
1 | Figures represent the percentage of the Fund’s net assets. Holdings are subject to change and may have changed since the date specified. |
Sector allocation as of March 31, 20241 |
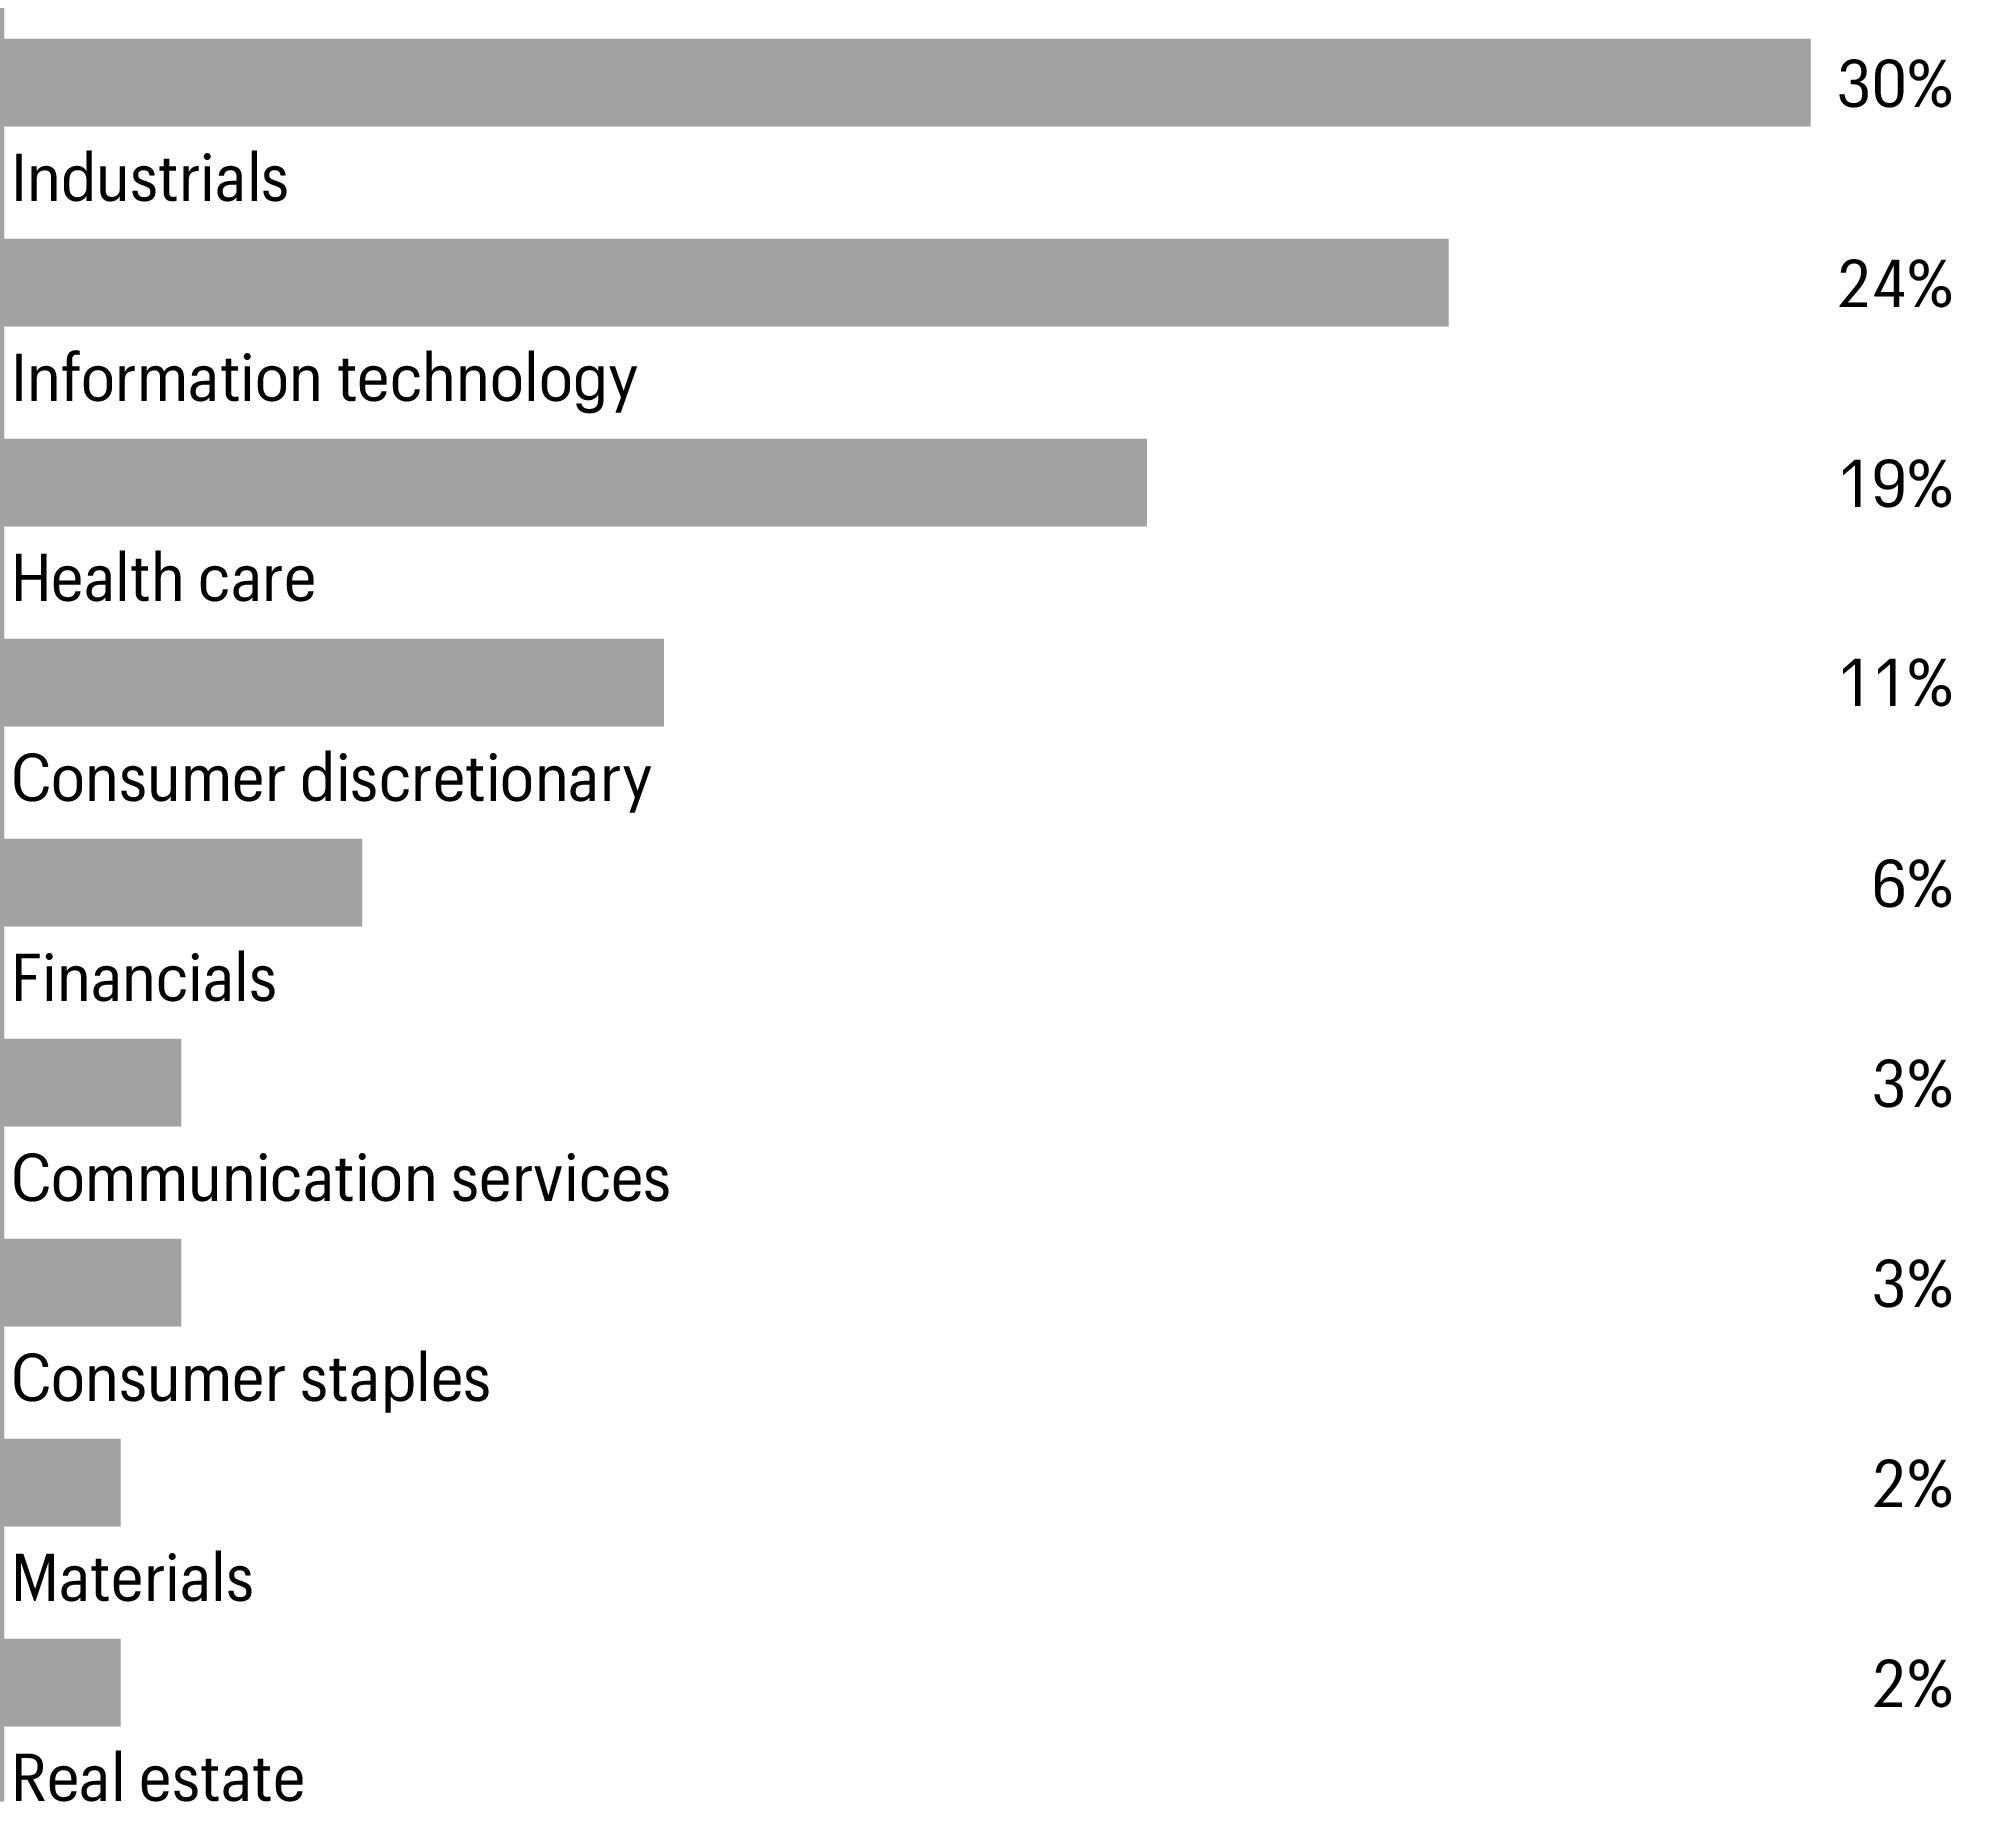
1 | Figures represent the percentage of the Fund’s long-term investments. Allocations are subject to change and may have changed since the date specified. |
Beginning account value 10-1-2023 | Ending account value 3-31-2024 | Expenses paid during the period1 | Annualized net expense ratio | |
Class A | ||||
Actual | $1,000.00 | $1,227.72 | $6.70 | 1.21 % |
Hypothetical (5% return before expenses) | $1,000.00 | $1,018.85 | $6.07 | 1.21 % |
Class C | ||||
Actual | $1,000.00 | $1,222.44 | $10.83 | 1.96 % |
Hypothetical (5% return before expenses) | $1,000.00 | $1,015.12 | $9.82 | 1.96 % |
Class R6 | ||||
Actual | $1,000.00 | $1,229.58 | $4.38 | 0.79 % |
Hypothetical (5% return before expenses) | $1,000.00 | $1,020.94 | $3.97 | 0.79 % |
Administrator Class | ||||
Actual | $1,000.00 | $1,228.12 | $6.32 | 1.14 % |
Hypothetical (5% return before expenses) | $1,000.00 | $1,019.20 | $5.72 | 1.14 % |
Institutional Class | ||||
Actual | $1,000.00 | $1,229.04 | $4.93 | 0.89 % |
Hypothetical (5% return before expenses) | $1,000.00 | $1,020.44 | $4.47 | 0.89 % |
1 | Expenses paid is equal to the annualized net expense ratio of each class multiplied by the average account value over the period, multiplied by 182 divided by 366 (to reflect the one-half-year period). |
Shares | Value | |||||
Common stocks: 99.03% | ||||||
Communication services: 3.57% | ||||||
Entertainment: 2.75% | ||||||
Liberty Media Corp.-Liberty Live Class C† | 366,091 | $16,042,108 | ||||
TKO Group Holdings, Inc. | 201,200 | 17,385,692 | ||||
33,427,800 | ||||||
Interactive media & services: 0.82% | ||||||
IAC, Inc.† | 186,015 | 9,922,040 | ||||
Consumer discretionary: 11.10% | ||||||
Broadline retail: 2.78% | ||||||
Global-E Online Ltd.† | 496,143 | 18,034,798 | ||||
MercadoLibre, Inc.† | 10,432 | 15,772,767 | ||||
33,807,565 | ||||||
Hotels, restaurants & leisure: 3.62% | ||||||
Chipotle Mexican Grill, Inc.† | 3,821 | 11,106,768 | ||||
DraftKings, Inc. Class A† | 310,400 | 14,095,264 | ||||
Wingstop, Inc. | 51,000 | 18,686,400 | ||||
43,888,432 | ||||||
Household durables: 1.26% | ||||||
Taylor Morrison Home Corp.† | 246,600 | 15,331,122 | ||||
Specialty retail: 1.97% | ||||||
Burlington Stores, Inc.† | 58,000 | 13,467,020 | ||||
Wayfair, Inc. Class A† | 153,500 | 10,419,580 | ||||
23,886,600 | ||||||
Textiles, apparel & luxury goods: 1.47% | ||||||
On Holding AG Class A† | 505,600 | 17,888,128 | ||||
Consumer staples: 3.12% | ||||||
Beverages: 2.07% | ||||||
Celsius Holdings, Inc.† | 302,900 | 25,116,468 | ||||
Personal care products: 1.05% | ||||||
Coty, Inc. Class A† | 1,069,900 | 12,796,004 | ||||
Financials: 6.15% | ||||||
Capital markets: 4.38% | ||||||
Blue Owl Capital, Inc. | 716,500 | 13,513,190 | ||||
Morningstar, Inc. | 80,500 | 24,823,785 | ||||
Tradeweb Markets, Inc. Class A | 143,200 | 14,917,144 | ||||
53,254,119 | ||||||
Financial services: 1.77% | ||||||
Jack Henry & Associates, Inc. | 123,400 | 21,438,282 | ||||
Shares | Value | |||||
Health care: 18.92% | ||||||
Biotechnology: 6.22% | ||||||
Ascendis Pharma AS ADR† | 72,747 | $10,997,164 | ||||
Exact Sciences Corp.† | 205,400 | 14,184,924 | ||||
Halozyme Therapeutics, Inc.† | 234,200 | 9,527,256 | ||||
Krystal Biotech, Inc.† | 35,600 | 6,334,308 | ||||
Natera, Inc.† | 277,700 | 25,398,442 | ||||
Sarepta Therapeutics, Inc.† | 70,400 | 9,113,984 | ||||
75,556,078 | ||||||
Health care equipment & supplies: 6.70% | ||||||
DexCom, Inc.† | 121,856 | 16,901,427 | ||||
Inspire Medical Systems, Inc.† | 65,000 | 13,961,350 | ||||
iRhythm Technologies, Inc.† | 156,900 | 18,200,400 | ||||
Shockwave Medical, Inc.† | 72,065 | 23,466,526 | ||||
TransMedics Group, Inc.† | 119,200 | 8,813,648 | ||||
81,343,351 | ||||||
Health care providers & services: 3.03% | ||||||
HealthEquity, Inc.† | 255,000 | 20,815,650 | ||||
Option Care Health, Inc.† | 476,709 | 15,988,820 | ||||
36,804,470 | ||||||
Life sciences tools & services: 2.97% | ||||||
Bio-Techne Corp. | 300,300 | 21,138,117 | ||||
Repligen Corp.† | 81,000 | 14,897,520 | ||||
36,035,637 | ||||||
Industrials: 29.39% | ||||||
Aerospace & defense: 3.07% | ||||||
AAR Corp.† | 140,799 | 8,429,636 | ||||
Axon Enterprise, Inc.† | 92,058 | 28,803,107 | ||||
37,232,743 | ||||||
Building products: 1.47% | ||||||
Advanced Drainage Systems, Inc. | 103,876 | 17,891,602 | ||||
Commercial services & supplies: 7.26% | ||||||
Casella Waste Systems, Inc. Class A† | 325,883 | 32,220,052 | ||||
RB Global, Inc. | 210,000 | 15,995,700 | ||||
Rollins, Inc. | 350,000 | 16,194,500 | ||||
Tetra Tech, Inc. | 128,500 | 23,735,235 | ||||
88,145,487 | ||||||
Construction & engineering: 1.90% | ||||||
EMCOR Group, Inc. | 65,800 | 23,043,160 | ||||
Electrical equipment: 2.82% | ||||||
Vertiv Holdings Co. | 420,000 | 34,301,400 | ||||
Shares | Value | |||||
Ground transportation: 3.14% | ||||||
J.B. Hunt Transport Services, Inc. | 73,600 | $14,664,800 | ||||
Saia, Inc.† | 40,048 | 23,428,080 | ||||
38,092,880 | ||||||
Machinery: 2.84% | ||||||
Esab Corp. | 151,100 | 16,707,127 | ||||
RBC Bearings, Inc.† | 65,800 | 17,789,030 | ||||
34,496,157 | ||||||
Professional services: 1.47% | ||||||
Parsons Corp.† | 215,500 | 17,875,725 | ||||
Trading companies & distributors: 5.42% | ||||||
Applied Industrial Technologies, Inc. | 110,500 | 21,829,275 | ||||
SiteOne Landscape Supply, Inc.† | 151,957 | 26,524,095 | ||||
Watsco, Inc. | 40,500 | 17,494,785 | ||||
65,848,155 | ||||||
Information technology: 23.52% | ||||||
Electronic equipment, instruments & components: 3.49% | ||||||
Novanta, Inc.† | 130,694 | 22,841,390 | ||||
Teledyne Technologies, Inc.† | 45,572 | 19,564,971 | ||||
42,406,361 | ||||||
IT services: 3.02% | ||||||
Globant SA† | 102,245 | 20,643,266 | ||||
MongoDB, Inc.† | 44,463 | 15,946,210 | ||||
36,589,476 | ||||||
Semiconductors & semiconductor equipment: 5.83% | ||||||
Entegris, Inc. | 139,100 | 19,549,114 | ||||
Impinj, Inc.† | 137,700 | 17,682,057 | ||||
Monolithic Power Systems, Inc. | 17,600 | 11,922,592 | ||||
Onto Innovation, Inc.† | 119,700 | 21,675,276 | ||||
70,829,039 | ||||||
Software: 11.18% | ||||||
BILL Holdings, Inc.† | 134,914 | 9,271,290 | ||||
CCC Intelligent Solutions Holdings, Inc.† | 2,068,100 | 24,734,476 | ||||
Clearwater Analytics Holdings, Inc. Class A† | 976,400 | 17,272,516 | ||||
Descartes Systems Group, Inc.† | 141,100 | 12,914,883 | ||||
Dynatrace, Inc.† | 246,200 | 11,433,528 | ||||
HubSpot, Inc.† | 28,200 | 17,668,992 | ||||
Procore Technologies, Inc.† | 151,700 | 12,465,189 | ||||
Tyler Technologies, Inc.† | 40,000 | 17,000,400 | ||||
Zscaler, Inc.† | 67,700 | 13,041,051 | ||||
135,802,325 | ||||||
Shares | Value | |||||
Materials: 1.64% | ||||||
Metals & mining: 1.64% | ||||||
ATI, Inc.† | 388,700 | $19,889,779 | ||||
Real estate: 1.62% | ||||||
Industrial REITs : 1.62% | ||||||
Rexford Industrial Realty, Inc. | 391,465 | 19,690,689 | ||||
Total common stocks (Cost $829,085,088) | 1,202,631,074 | |||||
Yield | ||||||
Short-term investments: 1.49% | ||||||
Investment companies: 1.49% | ||||||
Allspring Government Money Market Fund Select Class♠∞ | 5.25 % | 18,134,831 | 18,134,831 | |||
Total short-term investments (Cost $18,134,831) | 18,134,831 | |||||
Total investments in securities (Cost $847,219,919) | 100.52 % | 1,220,765,905 | ||||
Other assets and liabilities, net | (0.52 ) | (6,357,429 ) | ||||
Total net assets | 100.00 % | $1,214,408,476 | ||||
† | Non-income-earning security |
♠ | The issuer of the security is an affiliated person of the Fund as defined in the Investment Company Act of 1940. |
∞ | The rate represents the 7-day annualized yield at period end. |
Abbreviations: | |
ADR | American depositary receipt |
REIT | Real estate investment trust |
Value, beginning of period | Purchases | Sales proceeds | Net realized gains (losses) | Net change in unrealized gains (losses) | Value, end of period | Shares, end of period | Income from affiliated securities | |
Short-term investments | ||||||||
Allspring Government Money Market Fund Select Class | $13,072,799 | $237,003,907 | $(231,941,875 ) | $0 | $0 | $18,134,831 | 18,134,831 | $679,194 |
Assets | |
Investments in unaffiliated securities, at value (cost $829,085,088) | $1,202,631,074 |
Investments in affiliated securities, at value (cost $18,134,831) | 18,134,831 |
Cash | 13,156 |
Receivable for investments sold | 10,599,398 |
Receivable for Fund shares sold | 818,372 |
Receivable for dividends | 288,091 |
Prepaid expenses and other assets | 81,956 |
Total assets | 1,232,566,878 |
Liabilities | |
Payable for investments purchased | 12,852,910 |
Payable for Fund shares redeemed | 4,089,712 |
Management fee payable | 758,796 |
Administration fees payable | 135,084 |
Trustees’ fees and expenses payable | 3,411 |
Distribution fee payable | 1,909 |
Accrued expenses and other liabilities | 316,580 |
Total liabilities | 18,158,402 |
Total net assets | $1,214,408,476 |
Net assets consist of | |
Paid-in capital | $890,281,987 |
Total distributable earnings | 324,126,489 |
Total net assets | $1,214,408,476 |
Computation of net asset value and offering price per share | |
Net assets–Class A | $428,476,038 |
Shares outstanding–Class A1 | 16,288,611 |
Net asset value per share–Class A | $26.31 |
Maximum offering price per share – Class A2 | $27.92 |
Net assets–Class C | $3,028,719 |
Shares outstanding–Class C1 | 161,584 |
Net asset value per share–Class C | $18.74 |
Net assets–Class R6 | $276,799,213 |
Shares outstanding–Class R61 | 8,714,200 |
Net asset value per share–Class R6 | $31.76 |
Net assets–Administrator Class | $55,952,335 |
Shares outstanding–Administrator Class1 | 1,983,746 |
Net asset value per share–Administrator Class | $28.21 |
Net assets–Institutional Class | $450,152,171 |
Shares outstanding–Institutional Class1 | 14,412,287 |
Net asset value per share–Institutional Class | $31.23 |
Investment income | |
Dividends (net of foreign withholdings taxes of $16,091) | $1,632,446 |
Income from affiliated securities | 679,194 |
Total investment income | 2,311,640 |
Expenses | |
Management fee | 4,404,305 |
Administration fees | |
Class A | 395,800 |
Class C | 3,039 |
Class R6 | 40,681 |
Administrator Class | 34,320 |
Institutional Class | 278,831 |
Shareholder servicing fees | |
Class A | 493,958 |
Class C | 3,788 |
Administrator Class | 62,629 |
Distribution fee | |
Class C | 11,336 |
Custody and accounting fees | 2 |
Professional fees | 30,295 |
Registration fees | 38,102 |
Shareholder report expenses | 31,449 |
Trustees’ fees and expenses | 12,374 |
Other fees and expenses | 46,656 |
Total expenses | 5,887,565 |
Less: Fee waivers and/or expense reimbursements | |
Fund-level | (115,146 ) |
Class A | (24,037 ) |
Class C | (119 ) |
Class R6 | (16,557 ) |
Institutional Class | (26,237 ) |
Net expenses | 5,705,469 |
Net investment loss | (3,393,829 ) |
Realized and unrealized gains (losses) on investments | |
Net realized gains on investments | 30,913,552 |
Net change in unrealized gains (losses) on investments | 213,620,695 |
Net realized and unrealized gains (losses) on investments | 244,534,247 |
Net increase in net assets resulting from operations | $241,140,418 |
Six months ended March 31, 2024 (unaudited) | Year ended September 30, 2023 | |||
Operations | ||||
Net investment loss | $(3,393,829 ) | $(7,282,988 ) | ||
Net realized gains (losses) on investments | 30,913,552 | (52,362,650 ) | ||
Net change in unrealized gains (losses) on investments | 213,620,695 | 203,981,000 | ||
Net increase in net assets resulting from operations | 241,140,418 | 144,335,362 | ||
Distributions to shareholders from | ||||
Net investment income and net realized gains | ||||
Class A | 0 | (5,764,741 ) | ||
Class C | 0 | (68,656 ) | ||
Class R6 | 0 | (4,198,420 ) | ||
Administrator Class | 0 | (911,280 ) | ||
Institutional Class | 0 | (6,049,430 ) | ||
Total distributions to shareholders | 0 | (16,992,527 ) | ||
Capital share transactions | Shares | Shares | ||
Proceeds from shares sold | ||||
Class A | 310,403 | 7,305,795 | 945,587 | 20,440,310 |
Class C | 6,644 | 115,038 | 31,008 | 489,723 |
Class R6 | 599,589 | 16,595,921 | 2,455,010 | 62,993,105 |
Administrator Class | 276,977 | 6,506,594 | 282,396 | 6,606,411 |
Institutional Class | 870,660 | 23,685,807 | 3,490,270 | 89,016,562 |
54,209,155 | 179,546,111 | |||
Reinvestment of distributions | ||||
Class A | 0 | 0 | 273,924 | 5,609,967 |
Class C | 0 | 0 | 4,404 | 64,912 |
Class R6 | 0 | 0 | 162,483 | 3,997,088 |
Administrator Class | 0 | 0 | 41,485 | 910,181 |
Institutional Class | 0 | 0 | 236,456 | 5,726,963 |
0 | 16,309,111 | |||
Payment for shares redeemed | ||||
Class A | (2,036,830 ) | (47,649,998 ) | (4,183,450 ) | (90,170,856 ) |
Class C | (50,593 ) | (843,515 ) | (83,169 ) | (1,288,357 ) |
Class R6 | (3,006,239 ) | (83,288,344 ) | (6,443,189 ) | (168,938,632 ) |
Administrator Class | (418,557 ) | (10,621,594 ) | (1,547,799 ) | (35,906,334 ) |
Institutional Class | (3,196,856 ) | (89,155,746 ) | (9,221,518 ) | (235,288,061 ) |
(231,559,197 ) | (531,592,240 ) | |||
Net decrease in net assets resulting from capital share transactions | (177,350,042 ) | (335,737,018 ) | ||
Total increase (decrease) in net assets | 63,790,376 | (208,394,183 ) | ||
Net assets | ||||
Beginning of period | 1,150,618,100 | 1,359,012,283 | ||
End of period | $1,214,408,476 | $1,150,618,100 | ||
Six months ended March 31, 2024 (unaudited) | Year ended September 30 | |||||
Class A | 2023 | 2022 | 2021 | 2020 | 2019 | |
Net asset value, beginning of period | $21.43 | $19.73 | $47.48 | $39.95 | $33.24 | $38.03 |
Net investment loss | (0.09 )1 | (0.17 )1 | (0.30 )1 | (0.53 ) | (0.31 ) | (0.26 ) |
Net realized and unrealized gains (losses) on investments | 4.97 | 2.16 | (14.84 ) | 10.51 | 11.37 | 0.53 |
Total from investment operations | 4.88 | 1.99 | (15.14 ) | 9.98 | 11.06 | 0.27 |
Distributions to shareholders from | ||||||
Net realized gains | 0.00 | (0.29 ) | (12.61 ) | (2.45 ) | (4.35 ) | (5.06 ) |
Net asset value, end of period | $26.31 | $21.43 | $19.73 | $47.48 | $39.95 | $33.24 |
Total return2 | 22.77 % | 10.08 % | (42.03 )% | 25.48 % | 37.49 % | 3.81 % |
Ratios to average net assets (annualized) | ||||||
Gross expenses | 1.24 % | 1.24 % | 1.21 % | 1.19 % | 1.21 % | 1.21 % |
Net expenses | 1.21 % | 1.20 % | 1.19 % | 1.18 % | 1.19 % | 1.20 % |
Net investment loss | (0.81 )% | (0.77 )% | (1.08 )% | (1.08 )% | (0.91 )% | (0.77 )% |
Supplemental data | ||||||
Portfolio turnover rate | 32 % | 52 % | 58 % | 51 % | 53 % | 71 % |
Net assets, end of period (000s omitted) | $428,476 | $386,119 | $414,018 | $875,257 | $762,758 | $627,336 |
1 | Calculated based upon average shares outstanding |
2 | Total return calculations do not include any sales charges. Returns for periods of less than one year are not annualized. |
Six months ended March 31, 2024 (unaudited) | Year ended September 30 | |||||
Class C | 2023 | 2022 | 2021 | 2020 | 2019 | |
Net asset value, beginning of period | $15.33 | $14.30 | $38.31 | $32.88 | $28.27 | $33.46 |
Net investment loss | (0.13 )1 | (0.24 )1 | (0.42 )1 | (0.70 )1 | (0.45 )1 | (0.41 )1 |
Net realized and unrealized gains (losses) on investments | 3.54 | 1.56 | (10.98 ) | 8.58 | 9.41 | 0.28 |
Total from investment operations | 3.41 | 1.32 | (11.40 ) | 7.88 | 8.96 | (0.13 ) |
Distributions to shareholders from | ||||||
Net realized gains | 0.00 | (0.29 ) | (12.61 ) | (2.45 ) | (4.35 ) | (5.06 ) |
Net asset value, end of period | $18.74 | $15.33 | $14.30 | $38.31 | $32.88 | $28.27 |
Total return2 | 22.24 % | 9.28 % | (42.48 )% | 24.52 % | 36.54 % | 3.01 % |
Ratios to average net assets (annualized) | ||||||
Gross expenses | 1.99 % | 1.98 % | 1.94 % | 1.94 % | 1.96 % | 1.95 % |
Net expenses | 1.96 % | 1.97 % | 1.94 % | 1.94 % | 1.96 % | 1.95 % |
Net investment loss | (1.56 )% | (1.54 )% | (1.84 )% | (1.84 )% | (1.66 )% | (1.51 )% |
Supplemental data | ||||||
Portfolio turnover rate | 32 % | 52 % | 58 % | 51 % | 53 % | 71 % |
Net assets, end of period (000s omitted) | $3,029 | $3,151 | $3,622 | $17,909 | $28,509 | $30,982 |
1 | Calculated based upon average shares outstanding |
2 | Total return calculations do not include any sales charges. Returns for periods of less than one year are not annualized. |
Six months ended March 31, 2024 (unaudited) | Year ended September 30 | |||||
Class R6 | 2023 | 2022 | 2021 | 2020 | 2019 | |
Net asset value, beginning of period | $25.83 | $23.63 | $54.02 | $44.98 | $36.76 | $41.26 |
Net investment loss | (0.05 )1 | (0.09 )1 | (0.22 )1 | (0.35 )1 | (0.18 )1 | (0.12 )1 |
Net realized and unrealized gains (losses) on investments | 5.98 | 2.58 | (17.56 ) | 11.84 | 12.75 | 0.68 |
Total from investment operations | 5.93 | 2.49 | (17.78 ) | 11.49 | 12.57 | 0.56 |
Distributions to shareholders from | ||||||
Net realized gains | 0.00 | (0.29 ) | (12.61 ) | (2.45 ) | (4.35 ) | (5.06 ) |
Net asset value, end of period | $31.76 | $25.83 | $23.63 | $54.02 | $44.98 | $36.76 |
Total return2 | 22.96 % | 10.58 % | (41.80 )% | 26.01 % | 38.06 % | 4.26 % |
Ratios to average net assets (annualized) | ||||||
Gross expenses | 0.82 % | 0.81 % | 0.78 % | 0.76 % | 0.78 % | 0.77 % |
Net expenses | 0.79 % | 0.79 % | 0.78 % | 0.76 % | 0.78 % | 0.77 % |
Net investment loss | (0.39 )% | (0.36 )% | (0.66 )% | (0.66 )% | (0.50 )% | (0.33 )% |
Supplemental data | ||||||
Portfolio turnover rate | 32 % | 52 % | 58 % | 51 % | 53 % | 71 % |
Net assets, end of period (000s omitted) | $276,799 | $287,218 | $353,183 | $771,279 | $597,851 | $405,610 |
1 | Calculated based upon average shares outstanding |
2 | Returns for periods of less than one year are not annualized. |
Six months ended March 31, 2024 (unaudited) | Year ended September 30 | |||||
Administrator Class | 2023 | 2022 | 2021 | 2020 | 2019 | |
Net asset value, beginning of period | $22.97 | $21.12 | $49.83 | $41.79 | $34.55 | $39.27 |
Net investment loss | (0.09 )1 | (0.16 )1 | (0.30 )1 | (0.49 )1 | (0.29 )1 | (0.23 )1 |
Net realized and unrealized gains (losses) on investments | 5.33 | 2.30 | (15.80 ) | 10.98 | 11.88 | 0.57 |
Total from investment operations | 5.24 | 2.14 | (16.10 ) | 10.49 | 11.59 | 0.34 |
Distributions to shareholders from | ||||||
Net realized gains | 0.00 | (0.29 ) | (12.61 ) | (2.45 ) | (4.35 ) | (5.06 ) |
Net asset value, end of period | $28.21 | $22.97 | $21.12 | $49.83 | $41.79 | $34.55 |
Total return2 | 22.81 % | 10.18 % | (41.98 )% | 25.58 % | 37.61 % | 3.88 % |
Ratios to average net assets (annualized) | ||||||
Gross expenses | 1.16 % | 1.12 % | 1.09 % | 1.11 % | 1.13 % | 1.13 % |
Net expenses | 1.14 % | 1.11 % | 1.09 % | 1.11 % | 1.13 % | 1.13 % |
Net investment loss | (0.74 )% | (0.69 )% | (0.98 )% | (1.01 )% | (0.84 )% | (0.70 )% |
Supplemental data | ||||||
Portfolio turnover rate | 32 % | 52 % | 58 % | 51 % | 53 % | 71 % |
Net assets, end of period (000s omitted) | $55,952 | $48,826 | $70,724 | $189,022 | $374,366 | $333,814 |
1 | Calculated based upon average shares outstanding |
2 | Returns for periods of less than one year are not annualized. |
Six months ended March 31, 2024 (unaudited) | Year ended September 30 | |||||
Institutional Class | 2023 | 2022 | 2021 | 2020 | 2019 | |
Net asset value, beginning of period | $25.41 | $23.27 | $53.45 | $44.57 | $36.50 | $41.05 |
Net investment loss | (0.07 )1 | (0.12 )1 | (0.25 )1 | (0.40 )1 | (0.21 )1 | (0.15 )1 |
Net realized and unrealized gains (losses) on investments | 5.89 | 2.55 | (17.32 ) | 11.73 | 12.63 | 0.66 |
Total from investment operations | 5.82 | 2.43 | (17.57 ) | 11.33 | 12.42 | 0.51 |
Distributions to shareholders from | ||||||
Net realized gains | 0.00 | (0.29 ) | (12.61 ) | (2.45 ) | (4.35 ) | (5.06 ) |
Net asset value, end of period | $31.23 | $25.41 | $23.27 | $53.45 | $44.57 | $36.50 |
Total return2 | 22.90 % | 10.49 % | (41.88 )% | 25.91 % | 37.91 % | 4.15 % |
Ratios to average net assets (annualized) | ||||||
Gross expenses | 0.92 % | 0.91 % | 0.88 % | 0.86 % | 0.88 % | 0.87 % |
Net expenses | 0.89 % | 0.89 % | 0.88 % | 0.86 % | 0.88 % | 0.87 % |
Net investment loss | (0.49 )% | (0.46 )% | (0.76 )% | (0.76 )% | (0.58 )% | (0.42 )% |
Supplemental data | ||||||
Portfolio turnover rate | 32 % | 52 % | 58 % | 51 % | 53 % | 71 % |
Net assets, end of period (000s omitted) | $450,152 | $425,304 | $517,465 | $1,090,159 | $908,157 | $1,096,888 |
1 | Calculated based upon average shares outstanding |
2 | Returns for periods of less than one year are not annualized. |
Gross unrealized gains | $413,486,977 |
Gross unrealized losses | (12,158,737 ) |
Net unrealized gains | $401,328,240 |
Quoted prices (Level 1) | Other significant observable inputs (Level 2) | Significant unobservable inputs (Level 3) | Total | |
Assets | ||||
Investments in: | ||||
Common stocks | ||||
Communication services | $43,349,840 | $0 | $0 | $43,349,840 |
Consumer discretionary | 134,801,847 | 0 | 0 | 134,801,847 |
Consumer staples | 37,912,472 | 0 | 0 | 37,912,472 |
Financials | 74,692,401 | 0 | 0 | 74,692,401 |
Health care | 229,739,536 | 0 | 0 | 229,739,536 |
Industrials | 356,927,309 | 0 | 0 | 356,927,309 |
Information technology | 285,627,201 | 0 | 0 | 285,627,201 |
Materials | 19,889,779 | 0 | 0 | 19,889,779 |
Real estate | 19,690,689 | 0 | 0 | 19,690,689 |
Short-term investments | ||||
Investment companies | 18,134,831 | 0 | 0 | 18,134,831 |
Total assets | $1,220,765,905 | $0 | $0 | $1,220,765,905 |
Average daily net assets | Management fee |
First $500 million | 0.800 % |
Next $500 million | 0.750 |
Next $1 billion | 0.700 |
Next $2 billion | 0.675 |
Next $1 billion | 0.650 |
Next $5 billion | 0.640 |
Over $10 billion | 0.630 |
Class-level administration fee | |
Class A | 0.20 % |
Class C | 0.20 |
Class R6 | 0.03 |
Administrator Class | 0.13 |
Institutional Class | 0.13 |
EXPENSE RATIO CAPS | |
Class A | 1.21 % |
Class C | 1.96 |
Class R6 | 0.79 |
Administrator Class | 1.14 |
Institutional Class | 0.89 |
Name and year of birth | Position held and length of service* | Principal occupations during past five years or longer | Current other public company or investment company directorships |
William R. Ebsworth (Born 1957) | Trustee, since 2015 | Retired. From 1984 to 2013, equities analyst, portfolio manager, research director and chief investment officer at Fidelity Management and Research Company in Boston, Tokyo, and Hong Kong, and retired in 2013 as Chief Investment Officer of Fidelity Strategic Advisers, Inc. where he led a team of investment professionals managing client assets. Prior thereto, Board member of Hong Kong Securities Clearing Co., Hong Kong Options Clearing Corp., the Thailand International Fund, Ltd., Fidelity Investments Life Insurance Company, and Empire Fidelity Investments Life Insurance Company. Serves on the Investment Company Institute’s Board of Governors since 2022 and Executive Committee since 2023 as well as the Vice Chairman of the Governing Council of the Independent Directors Council since 2023. Audit Committee Chair and Investment Committee Chair of the Vincent Memorial Hospital Foundation (non-profit organization). Mr. Ebsworth is a CFA charterholder. | N/A |
Jane A. Freeman (Born 1953) | Trustee, since 2015; Chair Liaison, since January 2018# | Retired. From 2012 to 2014 and 1999 to 2008, Chief Financial Officer of Scientific Learning Corporation. From 2008 to 2012, Ms. Freeman provided consulting services related to strategic business projects. Prior to 1999, Portfolio Manager at Rockefeller & Co. and Scudder, Stevens & Clark. Board member of the Harding Loevner Funds from 1996 to 2014, serving as both Lead Independent Director and chair of the Audit Committee. Board member of the Russell Exchange Traded Funds Trust from 2011 to 2012 and the chair of the Audit Committee. Ms. Freeman is also an inactive Chartered Financial Analyst. | N/A |
Isaiah Harris, Jr. (Born 1952) | Trustee, since 2009; Audit Committee Chair, since 2019 | Retired. Member of the Advisory Board of CEF of East Central Florida. Chairman of the Board of CIGNA Corporation from 2009 to 2021, and Director from 2005 to 2008. From 2003 to 2011, Director of Deluxe Corporation. Prior thereto, President and CEO of BellSouth Advertising and Publishing Corp. from 2005 to 2007, President and CEO of BellSouth Enterprises from 2004 to 2005 and President of BellSouth Consumer Services from 2000 to 2003. Emeritus member of the Iowa State University Foundation Board of Governors. Emeritus Member of the Advisory board of Iowa State University School of Business. Advisory Board Member, Palm Harbor Academy (private school). Advisory Board Member, Fellowship of Christian Athletes. Mr. Harris is a certified public accountant (inactive status). | N/A |
David F. Larcker (Born 1950) | Trustee, since 2009 | Distinguished Visiting Fellow at the Hoover Institution since 2022. James Irvin Miller Professor of Accounting at the Graduate School of Business (Emeritus), Stanford University, Director of the Corporate Governance Research Initiative and Senior Faculty of The Rock Center for Corporate Governance since 2006. From 2005 to 2008, Professor of Accounting at the Graduate School of Business, Stanford University. Prior thereto, Ernst & Young Professor of Accounting at The Wharton School, University of Pennsylvania from 1985 to 2005. | N/A |
Olivia S. Mitchell (Born 1953) | Trustee, since 2006; Nominating and Governance Committee Chair, since 2018 | International Foundation of Employee Benefit Plans Professor since 1993, Wharton School of the University of Pennsylvania. Director of Wharton’s Pension Research Council and Boettner Center on Pensions & Retirement Research, and Research Associate at the National Bureau of Economic Research. Previously taught at Cornell University from 1978 to 1993. | N/A |
Name and year of birth | Position held and length of service* | Principal occupations during past five years or longer | Current other public company or investment company directorships |
Timothy J. Penny (Born 1951) | Trustee, since 1996; Chair, since 2018 | President and Chief Executive Officer of Southern Minnesota Initiative Foundation, a non-profit organization, since 2007. Vice Chair of the Economic Club of Minnesota, since 2007. Co-Chair of the Committee for a Responsible Federal Budget, since 1995. Member of the Board of Trustees of NorthStar Education Finance, Inc., a non-profit organization, from 2007-2022. Senior Fellow of the University of Minnesota Humphrey Institute from 1995 to 2017. | N/A |
James G. Polisson (Born 1959) | Trustee, since 2018 | Retired. Chief Marketing Officer, Source (ETF) UK Services, Ltd, from 2015 to 2017. From 2012 to 2015, Principal of The Polisson Group, LLC, a management consulting, corporate advisory and principal investing company. Chief Executive Officer and Managing Director at Russell Investments, Global Exchange Traded Funds from 2010 to 2012. Managing Director of Barclays Global Investors from 1998 to 2010 and Global Chief Marketing Officer for iShares and Barclays Global Investors from 2000 to 2010. Trustee of the San Francisco Mechanics’ Institute, a non- profit organization, from 2013 to 2015. Board member of the Russell Exchange Traded Fund Trust from 2011 to 2012. Director of Barclays Global Investors Holdings Deutschland GmbH from 2006 to 2009. Mr. Polisson is an attorney and has a retired status with the Massachusetts and District of Columbia Bar Associations. | N/A |
Pamela Wheelock (Born 1959) | Trustee, since January 2020; previously Trustee from January 2018 to July 2019# | Retired. Executive and Senior Financial leadership positions in the public, private and nonprofit sectors. Interim President and CEO, McKnight Foundation, 2020. Interim Commissioner, Minnesota Department of Human Services, 2019. Chief Operating Officer, Twin Cities Habitat for Humanity, 2017-2019. Vice President for University Services, University of Minnesota, 2012- 2016. Interim President and CEO, Blue Cross and Blue Shield of Minnesota, 2011-2012. Executive Vice-President and Chief Financial Officer, Minnesota Wild, 2002-2008. Commissioner, Minnesota Department of Finance, 1999-2002. Chair of the Board of Directors of Destination Medical Center Corporation. Board member of the Minnesota Wild Foundation. | N/A |
Name and year of birth | Position held and length of service | Principal occupations during past five years or longer |
Andrew Owen (Born 1960) | President, since 2017 | President and Chief Executive Officer of Allspring Funds Management, LLC since 2017 and Head of Global Fund Governance of Allspring Global Investments since 2022. Prior thereto, co-president of Galliard Capital Management, LLC, an affiliate of Allspring Funds Management, LLC, from 2019 to 2022 and Head of Affiliated Managers, Allspring Global Investments, from 2014 to 2019 and Executive Vice President responsible for marketing, investments and product development for Allspring Funds Management, LLC, from 2009 to 2014. |
Jeremy DePalma (Born 1974) | Treasurer, since 2012 (for certain funds in the Fund Complex); since 2021 (for the remaining funds in the Complex) | Senior Vice President of Allspring Funds Management, LLC since 2009. Senior Vice President of Evergreen Investment Management Company, LLC from 2008 to 2010 and head of the Fund Reporting and Control Team within Fund Administration from 2005 to 2010. |
Christopher Baker (Born 1976) | Chief Compliance Officer, since 2022 | Global Chief Compliance Officer for Allspring Global Investments since 2022. Prior thereto, Chief Compliance Officer for State Street Global Advisors from 2018 to 2021. Senior Compliance Officer for the State Street divisions of Alternative Investment Solutions, Sector Solutions, and Global Marketing from 2015 to 2018. From 2010 to 2015 Vice President, Global Head of Investment and Marketing Compliance for State Street Global Advisors. |
Matthew Prasse (Born 1983) | Chief Legal Officer, since 2022; Secretary, since 2021 | Senior Counsel of the Allspring Legal Department since 2021. Senior Counsel of the Wells Fargo Legal Department from 2018 to 2021. Previously, Counsel for Barings LLC from 2015 to 2018. Prior to joining Barings, Associate at Morgan, Lewis & Bockius LLP from 2008 to 2015. |

P.O. Box 219967
Kansas City, MO 64121-9967

SAR3321 03-24

Allspring Funds

President
Allspring Funds
Notice to Shareholders |
Beginning in July 2024, the Fund will be required by the Securities and Exchange Commission to send shareholders a paper copy of a new tailored shareholder report in place of the full shareholder report that you are now receiving. The tailored shareholder report will contain concise information about the Fund, including certain expense and performance information and fund statistics. If you wish to receive this new tailored shareholder report electronically, please follow the instructions on the back cover of this report. |
Other information that is currently included in the shareholder report, such as the Fund’s financial statements, will be available online and upon request, free of charge, in paper or electronic format. |
Investment objective | The Fund seeks long-term total return, consisting of capital appreciation and current income. |
Manager | Allspring Funds Management, LLC |
Subadviser | Allspring Global Investments, LLC |
Portfolio managers | Robert Junkin, Margaret Patel |
Average annual total returns (%) as of March 31, 2024 | |||||||||
Including sales charge | Excluding sales charge | Expense ratios1 (%) | |||||||
Inception date | 1 year | 5 year | 10 year | 1 year | 5 year | 10 year | Gross | Net2 | |
Class A (EKBAX) | 1-20-1998 | 23.27 | 11.17 | 10.43 | 30.84 | 12.50 | 11.09 | 1.10 | 1.10 |
Class C (EKBCX) | 1-22-1998 | 28.85 | 11.66 | 10.42 | 29.85 | 11.66 | 10.42 | 1.85 | 1.85 |
Administrator Class (EKBDX) | 7-30-2010 | – | – | – | 30.93 | 12.57 | 11.20 | 1.03 | 1.03 |
Institutional Class (EKBYX) | 1-26-1998 | – | – | – | 31.23 | 12.85 | 11.47 | 0.78 | 0.78 |
Russell 3000® Index3 | – | – | – | – | 29.29 | 14.34 | 12.33 | – | – |
Diversified Capital Builder Blended Index4 | – | – | – | – | 24.98 | 12.13 | 10.65 | – | – |
Russell 1000® Index5 | – | – | – | – | 29.87 | 14.76 | 12.68 | – | – |
ICE BofA U.S. Cash Pay High Yield Index6 | – | – | – | – | 10.98 | 4.03 | 4.35 | – | – |
1 | Reflects the expense ratios as stated in the most recent prospectuses. The expense ratios shown are subject to change and may differ from the annualized expense ratios shown in the Financial Highlights of this report. |
2 | The manager has contractually committed through January 31, 2025, to waive fees and/or reimburse expenses to the extent necessary to cap total annual fund operating expenses after fee waivers at 1.11% for Class A, 1.86% for Class C, 1.05% for Administrator Class and 0.78% for Institutional Class. Brokerage commissions, stamp duty fees, interest, taxes, acquired fund fees and expenses (if any), and extraordinary expenses are excluded from the expense caps. Prior to or after the commitment expiration date, the caps may be increased or the commitment to maintain the caps may be terminated only with the approval of the Board of Trustees. Without these caps, the Fund’s returns would have been lower. The expense ratio paid by an investor is the net expense ratio (the total annual fund operating expenses after fee waivers) as stated in the prospectuses. |
3 | The Russell 3000® Index measures the performance of the 3,000 largest U.S. companies based on total market capitalization, which represents approximately 98% of the investable U.S. equity market. You cannot invest directly in an index. |
4 | Source: Allspring Funds Management, LLC. The Diversified Capital Builder Blended Index is composed 75% of the Russell 1000® Index and 25% of the ICE BofA U.S. Cash Pay High Yield Index. You cannot invest directly in an index. |
5 | The Russell 1000® Index measures the performance of the 1,000 largest companies in the Russell 3000® Index, which represents approximately 92% of the total market capitalization of the Russell 3000® Index. You cannot invest directly in an index. |
6 | The ICE BofA U.S. Cash Pay High Yield Index is an unmanaged market index that provides a broad-based performance measure of the non-investment grade U.S. domestic bond index. You cannot invest directly in an index. Returns shown are net of transaction costs beginning on July 1, 2022. Copyright 2024. ICE Data Indices, LLC. All rights reserved. |
Ten largest holdings (%) as of March 31, 20241 | |
Broadcom, Inc. | 5.23 |
Alphabet, Inc. Class A | 4.87 |
Advanced Micro Devices, Inc. | 4.79 |
Microsoft Corp. | 4.53 |
Leidos Holdings, Inc. | 4.04 |
NVIDIA Corp. | 3.30 |
Micron Technology, Inc. | 3.26 |
IQVIA Holdings, Inc. | 2.90 |
Marvell Technology, Inc. | 2.85 |
Amphenol Corp. Class A | 2.65 |
1 | Figures represent the percentage of the Fund’s net assets. Holdings are subject to change and may have changed since the date specified. |
Portfolio composition as of March 31, 20241 |

1 | Figures represent the percentage of the Fund’s long-term investments. Allocations are subject to change and may have changed since the date specified. |
Beginning account value 10-1-2023 | Ending account value 3-31-2024 | Expenses paid during the period1 | Annualized net expense ratio | |
Class A | ||||
Actual | $1,000.00 | $1,271.33 | $6.16 | 1.09 % |
Hypothetical (5% return before expenses) | $1,000.00 | $1,019.44 | $5.47 | 1.09 % |
Class C | ||||
Actual | $1,000.00 | $1,266.38 | $10.37 | 1.84 % |
Hypothetical (5% return before expenses) | $1,000.00 | $1,015.71 | $9.22 | 1.84 % |
Administrator Class | ||||
Actual | $1,000.00 | $1,271.73 | $5.76 | 1.02 % |
Hypothetical (5% return before expenses) | $1,000.00 | $1,019.79 | $5.12 | 1.02 % |
Institutional Class | ||||
Actual | $1,000.00 | $1,272.79 | $4.35 | 0.77 % |
Hypothetical (5% return before expenses) | $1,000.00 | $1,021.03 | $3.87 | 0.77 % |
1 | Expenses paid is equal to the annualized net expense ratio of each class multiplied by the average account value over the period, multiplied by 182 divided by 366 (to reflect the one-half-year period). |
Shares | Value | |||||
Common stocks: 85.04% | ||||||
Communication services: 4.87% | ||||||
Interactive media & services: 4.87% | ||||||
Alphabet, Inc. Class A† | 450,000 | $67,918,500 | ||||
Consumer discretionary: 0.55% | ||||||
Distributors: 0.55% | ||||||
Genuine Parts Co. | 50,000 | 7,746,500 | ||||
Consumer staples: 0.23% | ||||||
Food products: 0.23% | ||||||
J M Smucker Co. | 25,000 | 3,146,750 | ||||
Energy: 4.74% | ||||||
Oil, gas & consumable fuels: 4.74% | ||||||
Cheniere Energy, Inc. | 145,000 | 23,385,600 | ||||
EOG Resources, Inc. | 20,000 | 2,556,800 | ||||
ONEOK, Inc. | 165,000 | 13,228,050 | ||||
Targa Resources Corp. | 240,000 | 26,877,600 | ||||
66,048,050 | ||||||
Health care: 10.23% | ||||||
Biotechnology: 2.71% | ||||||
BioMarin Pharmaceutical, Inc.† | 100,000 | 8,734,000 | ||||
Neurocrine Biosciences, Inc.† | 210,000 | 28,963,200 | ||||
37,697,200 | ||||||
Health care equipment & supplies: 0.08% | ||||||
STERIS PLC | 5,000 | 1,124,100 | ||||
Health care providers & services: 2.31% | ||||||
McKesson Corp. | 60,000 | 32,211,000 | ||||
Life sciences tools & services: 2.90% | ||||||
IQVIA Holdings, Inc.† | 160,000 | 40,462,400 | ||||
Pharmaceuticals: 2.23% | ||||||
Eli Lilly & Co. | 40,000 | 31,118,400 | ||||
Industrials: 19.92% | ||||||
Aerospace & defense: 3.35% | ||||||
Curtiss-Wright Corp. | 70,000 | 17,915,800 | ||||
HEICO Corp. | 50,000 | 9,550,000 | ||||
L3Harris Technologies, Inc. | 90,000 | 19,179,000 | ||||
46,644,800 | ||||||
Commercial services & supplies: 2.28% | ||||||
Cintas Corp. | 20,000 | 13,740,600 | ||||
Clean Harbors, Inc.† | 90,000 | 18,117,900 | ||||
31,858,500 | ||||||
Shares | Value | |||||
Electrical equipment: 5.21% | ||||||
AMETEK, Inc. | 145,000 | $26,520,500 | ||||
Eaton Corp. PLC | 35,000 | 10,943,800 | ||||
Emerson Electric Co. | 310,000 | 35,160,200 | ||||
72,624,500 | ||||||
Machinery: 5.04% | ||||||
Crane Co. | 64,000 | 8,648,320 | ||||
IDEX Corp. | 60,000 | 14,641,200 | ||||
ITT, Inc. | 60,000 | 8,161,800 | ||||
Oshkosh Corp. | 20,000 | 2,494,200 | ||||
Parker-Hannifin Corp. | 15,000 | 8,336,850 | ||||
Timken Co. | 320,000 | 27,977,600 | ||||
70,259,970 | ||||||
Professional services: 4.04% | ||||||
Leidos Holdings, Inc. | 430,000 | 56,368,700 | ||||
Information technology: 41.35% | ||||||
Communications equipment: 1.15% | ||||||
Motorola Solutions, Inc. | 45,000 | 15,974,100 | ||||
Electronic equipment, instruments & components: 6.46% | ||||||
Amphenol Corp. Class A | 320,000 | 36,912,000 | ||||
Crane NXT Co. | 90,000 | 5,571,000 | ||||
Jabil, Inc. | 115,000 | 15,404,250 | ||||
Teledyne Technologies, Inc.† | 75,000 | 32,199,000 | ||||
90,086,250 | ||||||
IT services: 2.46% | ||||||
International Business Machines Corp. | 180,000 | 34,372,800 | ||||
Semiconductors & semiconductor equipment: 19.53% | ||||||
Advanced Micro Devices, Inc.† | 370,000 | 66,781,300 | ||||
Broadcom, Inc. | 55,000 | 72,897,550 | ||||
Marvell Technology, Inc. | 560,000 | 39,692,800 | ||||
Micron Technology, Inc. | 385,000 | 45,387,650 | ||||
NVIDIA Corp. | 51,000 | 46,081,560 | ||||
Synaptics, Inc.† | 15,000 | 1,463,400 | ||||
272,304,260 | ||||||
Software: 11.75% | ||||||
Adobe, Inc.† | 52,000 | 26,239,200 | ||||
ANSYS, Inc.† | 45,000 | 15,622,200 | ||||
Autodesk, Inc.† | 110,000 | 28,646,200 | ||||
Microsoft Corp. | 150,000 | 63,108,000 | ||||
Roper Technologies, Inc. | 3,000 | 1,682,520 | ||||
Synopsys, Inc.† | 50,000 | 28,575,000 | ||||
163,873,120 | ||||||
Shares | Value | |||||
Materials: 2.49% | ||||||
Chemicals: 1.15% | ||||||
Westlake Corp. | 105,000 | $16,044,000 | ||||
Containers & packaging: 0.79% | ||||||
AptarGroup, Inc. | 76,500 | 11,007,585 | ||||
Metals & mining: 0.55% | ||||||
ATI, Inc.† | 150,000 | 7,675,500 | ||||
Real estate: 0.46% | ||||||
Specialized REITs : 0.46% | ||||||
Iron Mountain, Inc. | 80,000 | 6,416,800 | ||||
Utilities: 0.20% | ||||||
Independent power and renewable electricity producers: 0.20% | ||||||
Vistra Corp. | 40,000 | 2,786,000 | ||||
Total common stocks (Cost $753,041,294) | 1,185,769,785 | |||||
Interest rate | Maturity date | Principal | ||||
Corporate bonds and notes: 14.65% | ||||||
Basic materials: 0.75% | ||||||
Iron/steel: 0.75% | ||||||
ATI, Inc. | 7.25 % | 8-15-2030 | $ | 400,000 | 413,449 | |
Cleveland-Cliffs, Inc.144A | 6.75 | 4-15-2030 | 10,000,000 | 10,029,082 | ||
10,442,531 | ||||||
Consumer, cyclical: 0.40% | ||||||
Retail: 0.40% | ||||||
Genuine Parts Co. | 6.88 | 11-1-2033 | 5,000,000 | 5,528,865 | ||
Consumer, non-cyclical: 4.72% | ||||||
Commercial services: 1.00% | ||||||
AMN Healthcare, Inc.144A## | 4.00 | 4-15-2029 | 1,000,000 | 898,079 | ||
AMN Healthcare, Inc.144A | 4.63 | 10-1-2027 | 1,000,000 | 949,790 | ||
Gartner, Inc.144A | 3.63 | 6-15-2029 | 4,350,000 | 3,938,411 | ||
Valvoline, Inc.144A | 3.63 | 6-15-2031 | 9,495,000 | 8,184,781 | ||
13,971,061 | ||||||
Food: 0.83% | ||||||
Post Holdings, Inc.144A | 4.50 | 9-15-2031 | 8,435,000 | 7,587,216 | ||
Post Holdings, Inc.144A | 6.25 | 2-15-2032 | 4,000,000 | 4,029,152 | ||
11,616,368 | ||||||
Healthcare-products: 0.35% | ||||||
Hologic, Inc.144A | 3.25 | 2-15-2029 | 5,440,000 | 4,875,285 | ||
Healthcare-services: 1.98% | ||||||
Charles River Laboratories International, Inc.144A | 4.00 | 3-15-2031 | 8,000,000 | 7,148,364 | ||
DaVita, Inc.144A | 4.63 | 6-1-2030 | 10,550,000 | 9,445,245 | ||
Interest rate | Maturity date | Principal | Value | |||
Healthcare-services(continued) | ||||||
Encompass Health Corp. | 4.63 % | 4-1-2031 | $ | 5,500,000 | $5,000,604 | |
IQVIA, Inc.144A | 6.50 | 5-15-2030 | 5,884,000 | 6,004,711 | ||
27,598,924 | ||||||
Household products/wares: 0.56% | ||||||
ACCO Brands Corp.144A | 4.25 | 3-15-2029 | 2,000,000 | 1,800,373 | ||
Spectrum Brands, Inc.144A | 3.88 | 3-15-2031 | 6,200,000 | 5,972,250 | ||
7,772,623 | ||||||
Financial: 1.43% | ||||||
REITS: 1.43% | ||||||
Iron Mountain, Inc.144A | 4.50 | 2-15-2031 | 12,350,000 | 11,142,635 | ||
SBA Communications Corp. | 3.13 | 2-1-2029 | 10,000,000 | 8,825,056 | ||
19,967,691 | ||||||
Industrial: 4.53% | ||||||
Aerospace/defense: 0.89% | ||||||
TransDigm, Inc. | 4.63 | 1-15-2029 | 9,000,000 | 8,352,048 | ||
TransDigm, Inc.144A | 6.63 | 3-1-2032 | 4,000,000 | 4,041,164 | ||
12,393,212 | ||||||
Electronics: 0.58% | ||||||
TTM Technologies, Inc.144A | 4.00 | 3-1-2029 | 8,890,000 | 8,063,230 | ||
Engineering & construction: 0.65% | ||||||
Dycom Industries, Inc.144A | 4.50 | 4-15-2029 | 9,720,000 | 9,085,973 | ||
Environmental control: 0.92% | ||||||
Clean Harbors, Inc.144A | 6.38 | 2-1-2031 | 11,500,000 | 11,584,456 | ||
Stericycle, Inc.144A | 3.88 | 1-15-2029 | 1,310,000 | 1,187,400 | ||
12,771,856 | ||||||
Machinery-diversified: 0.50% | ||||||
Esab Corp.144A%% | 6.25 | 4-15-2029 | 7,000,000 | 7,032,781 | ||
Packaging & containers: 0.99% | ||||||
Ball Corp. | 2.88 | 8-15-2030 | 7,000,000 | 5,972,748 | ||
Sealed Air Corp.144A | 5.00 | 4-15-2029 | 5,000,000 | 4,799,356 | ||
Sealed Air Corp./Sealed Air Corp. U.S.144A | 6.13 | 2-1-2028 | 3,000,000 | 3,006,225 | ||
13,778,329 | ||||||
Technology: 1.43% | ||||||
Computers: 0.71% | ||||||
Seagate HDD Cayman | 3.13 | 7-15-2029 | 1,500,000 | 1,262,086 | ||
Seagate HDD Cayman | 4.09 | 6-1-2029 | 3,488,000 | 3,217,680 | ||
Seagate HDD Cayman144A | 8.50 | 7-15-2031 | 5,000,000 | 5,403,315 | ||
9,883,081 | ||||||
Interest rate | Maturity date | Principal | Value | |||
Semiconductors: 0.72% | ||||||
Synaptics, Inc.144A | 4.00 % | 6-15-2029 | $ | 11,185,000 | $10,066,430 | |
Utilities: 1.39% | ||||||
Electric: 1.39% | ||||||
NRG Energy, Inc.144A | 5.25 | 6-15-2029 | 1,000,000 | 956,013 | ||
Vistra Operations Co. LLC144A | 4.38 | 5-1-2029 | 12,000,000 | 11,116,617 | ||
Vistra Operations Co. LLC144A | 7.75 | 10-15-2031 | 7,000,000 | 7,330,960 | ||
19,403,590 | ||||||
Total corporate bonds and notes (Cost $214,218,626) | 204,251,830 | |||||
Yankee corporate bonds and notes: 0.41% | ||||||
Basic materials: 0.22% | ||||||
Chemicals: 0.22% | ||||||
Methanex Corp. | 5.25 | 12-15-2029 | 3,293,000 | 3,150,658 | ||
Industrial: 0.19% | ||||||
Electronics: 0.19% | ||||||
Sensata Technologies BV144A | 4.00 | 4-15-2029 | 2,880,000 | 2,629,691 | ||
Total yankee corporate bonds and notes (Cost $6,286,270) | 5,780,349 | |||||
Yield | Shares | |||||
Short-term investments: 0.48% | ||||||
Investment companies: 0.48% | ||||||
Allspring Government Money Market Fund Select Class♠∞## | 5.25 | 6,606,615 | 6,606,615 | |||
Total short-term investments (Cost $6,606,615) | 6,606,615 | |||||
Total investments in securities (Cost $980,152,805) | 100.58 % | 1,402,408,579 | ||||
Other assets and liabilities, net | (0.58 ) | (8,021,019 ) | ||||
Total net assets | 100.00 % | $1,394,387,560 | ||||
† | Non-income-earning security |
144A | The security may be resold in transactions exempt from registration, normally to qualified institutional buyers, pursuant to Rule 144A under the Securities Act of 1933. |
## | All or a portion of this security is segregated as collateral for when-issued securities. |
%% | The security is purchased on a when-issued basis. |
♠ | The issuer of the security is an affiliated person of the Fund as defined in the Investment Company Act of 1940. |
∞ | The rate represents the 7-day annualized yield at period end. |
Abbreviations: | |
REIT | Real estate investment trust |
Value, beginning of period | Purchases | Sales proceeds | Net realized gains (losses) | Net change in unrealized gains (losses) | Value, end of period | Shares, end of period | Income from affiliated securities | |
Short-term investments | ||||||||
Allspring Government Money Market Fund Select Class | $19,374,619 | $176,368,874 | $(189,136,878 ) | $0 | $0 | $6,606,615 | 6,606,615 | $129,278 |
Assets | |
Investments in unaffiliated securities, at value (cost $973,546,190) | $1,395,801,964 |
Investments in affiliated securities, at value (cost $6,606,615) | 6,606,615 |
Cash | 297,654 |
Receivable for dividends and interest | 3,233,447 |
Receivable for Fund shares sold | 2,748,565 |
Prepaid expenses and other assets | 152,737 |
Total assets | 1,408,840,982 |
Liabilities | |
Payable for when-issued transactions | 7,036,250 |
Payable for investments purchased | 5,712,042 |
Management fee payable | 697,033 |
Payable for Fund shares redeemed | 454,264 |
Administration fees payable | 200,540 |
Distribution fee payable | 80,859 |
Trustees’ fees and expenses payable | 1,335 |
Accrued expenses and other liabilities | 271,099 |
Total liabilities | 14,453,422 |
Total net assets | $1,394,387,560 |
Net assets consist of | |
Paid-in capital | $935,470,788 |
Total distributable earnings | 458,916,772 |
Total net assets | $1,394,387,560 |
Computation of net asset value and offering price per share | |
Net assets–Class A | $740,771,234 |
Shares outstanding–Class A1 | 55,999,273 |
Net asset value per share–Class A | $13.23 |
Maximum offering price per share – Class A2 | $14.04 |
Net assets–Class C | $129,540,110 |
Shares outstanding–Class C1 | 9,852,771 |
Net asset value per share–Class C | $13.15 |
Net assets–Administrator Class | $8,407,075 |
Shares outstanding–Administrator Class1 | 635,042 |
Net asset value per share–Administrator Class | $13.24 |
Net assets–Institutional Class | $515,669,141 |
Shares outstanding–Institutional Class1 | 39,349,431 |
Net asset value per share–Institutional Class | $13.10 |
Investment income | |
Interest | $4,751,664 |
Dividends | 4,742,341 |
Income from affiliated securities | 129,278 |
Total investment income | 9,623,283 |
Expenses | |
Management fee | 3,568,184 |
Administration fees | |
Class A | 645,317 |
Class C | 115,884 |
Administrator Class | 6,055 |
Institutional Class | 254,446 |
Shareholder servicing fees | |
Class A | 806,167 |
Class C | 144,812 |
Administrator Class | 11,644 |
Distribution fee | |
Class C | 434,312 |
Custody and accounting fees | 16,453 |
Professional fees | 34,963 |
Registration fees | 18,154 |
Shareholder report expenses | 40,942 |
Trustees’ fees and expenses | 13,264 |
Other fees and expenses | 26,754 |
Total expenses | 6,137,351 |
Less: Fee waivers and/or expense reimbursements | |
Institutional Class | (1,877 ) |
Net expenses | 6,135,474 |
Net investment income | 3,487,809 |
Realized and unrealized gains (losses) on investments | |
Net realized gains on investments | 43,017,125 |
Net change in unrealized gains (losses) on investments | 236,110,445 |
Net realized and unrealized gains (losses) on investments | 279,127,570 |
Net increase in net assets resulting from operations | $282,615,379 |
Six months ended March 31, 2024 (unaudited) | Year ended September 30, 2023 | |||
Operations | ||||
Net investment income | $3,487,809 | $10,446,074 | ||
Net realized gains on investments | 43,017,125 | 51,953,014 | ||
Net change in unrealized gains (losses) on investments | 236,110,445 | 121,947,084 | ||
Net increase in net assets resulting from operations | 282,615,379 | 184,346,172 | ||
Distributions to shareholders from | ||||
Net investment income and net realized gains | ||||
Class A | (34,891,391 ) | (65,626,762 ) | ||
Class C | (5,986,522 ) | (11,368,684 ) | ||
Administrator Class | (512,514 ) | (886,041 ) | ||
Institutional Class | (20,910,448 ) | (37,216,908 ) | ||
Total distributions to shareholders | (62,300,875 ) | (115,098,395 ) | ||
Capital share transactions | Shares | Shares | ||
Proceeds from shares sold | ||||
Class A | 3,700,162 | 44,812,526 | 2,356,347 | 25,592,345 |
Class C | 1,082,221 | 13,067,562 | 1,107,737 | 11,941,492 |
Administrator Class | 201,623 | 2,416,864 | 148,783 | 1,644,524 |
Institutional Class | 11,119,450 | 134,975,381 | 5,599,746 | 60,537,183 |
195,272,333 | 99,715,544 | |||
Reinvestment of distributions | ||||
Class A | 2,926,689 | 33,222,303 | 5,952,319 | 62,386,181 |
Class C | 523,170 | 5,886,415 | 1,075,440 | 11,190,077 |
Administrator Class | 44,949 | 510,920 | 84,169 | 883,153 |
Institutional Class | 1,687,386 | 19,033,141 | 3,324,215 | 34,590,783 |
58,652,779 | 109,050,194 | |||
Payment for shares redeemed | ||||
Class A | (3,578,567 ) | (42,393,293 ) | (7,352,031 ) | (79,844,349 ) |
Class C | (1,439,130 ) | (17,299,661 ) | (2,295,738 ) | (24,787,554 ) |
Administrator Class | (365,969 ) | (4,575,016 ) | (205,960 ) | (2,238,564 ) |
Institutional Class | (3,741,018 ) | (43,566,211 ) | (7,116,503 ) | (76,424,780 ) |
(107,834,181 ) | (183,295,247 ) | |||
Net increase in net assets resulting from capital share transactions | 146,090,931 | 25,470,491 | ||
Total increase in net assets | 366,405,435 | 94,718,268 | ||
Net assets | ||||
Beginning of period | 1,027,982,125 | 933,263,857 | ||
End of period | $1,394,387,560 | $1,027,982,125 | ||
Six months ended March 31, 2024 (unaudited) | Year ended September 30 | |||||
Class A | 2023 | 2022 | 2021 | 2020 | 2019 | |
Net asset value, beginning of period | $11.01 | $10.29 | $12.64 | $10.88 | $10.71 | $10.88 |
Net investment income | 0.03 1 | 0.11 | 0.10 1 | 0.09 | 0.11 | 0.14 |
Net realized and unrealized gains (losses) on investments | 2.85 | 1.89 | (1.50 ) | 1.87 | 0.63 | 0.37 |
Total from investment operations | 2.88 | 2.00 | (1.40 ) | 1.96 | 0.74 | 0.51 |
Distributions to shareholders from | ||||||
Net investment income | (0.04 ) | (0.11 ) | (0.10 ) | (0.10 ) | (0.13 ) | (0.14 ) |
Net realized gains | (0.62 ) | (1.17 ) | (0.85 ) | (0.10 ) | (0.44 ) | (0.54 ) |
Total distributions to shareholders | (0.66 ) | (1.28 ) | (0.95 ) | (0.20 ) | (0.57 ) | (0.68 ) |
Net asset value, end of period | $13.23 | $11.01 | $10.29 | $12.64 | $10.88 | $10.71 |
Total return2 | 27.13 % | 20.16 % | (12.45 )% | 18.18 % | 7.26 % | 5.60 % |
Ratios to average net assets (annualized) | ||||||
Gross expenses | 1.09 % | 1.11 % | 1.11 % | 1.11 % | 1.11 % | 1.12 % |
Net expenses | 1.09 % | 1.11 % | 1.10 % | 1.11 % | 1.11 % | 1.12 % |
Net investment income | 0.57 % | 0.99 % | 0.77 % | 0.76 % | 1.09 % | 1.38 % |
Supplemental data | ||||||
Portfolio turnover rate | 23 % | 38 % | 19 % | 28 % | 44 % | 61 % |
Net assets, end of period (000s omitted) | $740,771 | $583,064 | $534,863 | $657,696 | $601,951 | $616,346 |
1 | Calculated based upon average shares outstanding |
2 | Total return calculations do not include any sales charges. Returns for periods of less than one year are not annualized. |
Six months ended March 31, 2024 (unaudited) | Year ended September 30 | |||||
Class C | 2023 | 2022 | 2021 | 2020 | 2019 | |
Net asset value, beginning of period | $10.96 | $10.24 | $12.58 | $10.86 | $10.69 | $10.86 |
Net investment income (loss) | (0.01 )1 | 0.02 | 0.00 1,2 | 0.00 1,2 | 0.03 | 0.06 |
Net realized and unrealized gains (losses) on investments | 2.82 | 1.89 | (1.48 ) | 1.86 | 0.63 | 0.37 |
Total from investment operations | 2.81 | 1.91 | (1.48 ) | 1.86 | 0.66 | 0.43 |
Distributions to shareholders from | ||||||
Net investment income | (0.00 ) | (0.02 ) | (0.01 ) | (0.04 ) | (0.05 ) | (0.06 ) |
Net realized gains | (0.62 ) | (1.17 ) | (0.85 ) | (0.10 ) | (0.44 ) | (0.54 ) |
Total distributions to shareholders | (0.62 ) | (1.19 ) | (0.86 ) | (0.14 ) | (0.49 ) | (0.60 ) |
Net asset value, end of period | $13.15 | $10.96 | $10.24 | $12.58 | $10.86 | $10.69 |
Total return3 | 26.64 % | 19.36 % | (13.12 )% | 17.25 % | 6.44 % | 4.81 % |
Ratios to average net assets (annualized) | ||||||
Gross expenses | 1.84 % | 1.86 % | 1.85 % | 1.86 % | 1.86 % | 1.87 % |
Net expenses | 1.84 % | 1.86 % | 1.85 % | 1.86 % | 1.86 % | 1.87 % |
Net investment income (loss) | (0.18 )% | 0.24 % | 0.02 % | 0.01 % | 0.34 % | 0.65 % |
Supplemental data | ||||||
Portfolio turnover rate | 23 % | 38 % | 19 % | 28 % | 44 % | 61 % |
Net assets, end of period (000s omitted) | $129,540 | $106,152 | $100,367 | $127,209 | $121,947 | $118,297 |
1 | Calculated based upon average shares outstanding |
2 | Amount is less than $0.005. |
3 | Total return calculations do not include any sales charges. Returns for periods of less than one year are not annualized. |
Six months ended March 31, 2024 (unaudited) | Year ended September 30 | |||||
Administrator Class | 2023 | 2022 | 2021 | 2020 | 2019 | |
Net asset value, beginning of period | $11.02 | $10.30 | $12.64 | $10.89 | $10.72 | $10.89 |
Net investment income | 0.04 1 | 0.11 | 0.11 1 | 0.10 1 | 0.12 1 | 0.15 1 |
Net realized and unrealized gains (losses) on investments | 2.84 | 1.89 | (1.49 ) | 1.86 | 0.63 | 0.37 |
Total from investment operations | 2.88 | 2.00 | (1.38 ) | 1.96 | 0.75 | 0.52 |
Distributions to shareholders from | ||||||
Net investment income | (0.04 ) | (0.11 ) | (0.11 ) | (0.11 ) | (0.14 ) | (0.15 ) |
Net realized gains | (0.62 ) | (1.17 ) | (0.85 ) | (0.10 ) | (0.44 ) | (0.54 ) |
Total distributions to shareholders | (0.66 ) | (1.28 ) | (0.96 ) | (0.21 ) | (0.58 ) | (0.69 ) |
Net asset value, end of period | $13.24 | $11.02 | $10.30 | $12.64 | $10.89 | $10.72 |
Total return2 | 27.17 % | 20.24 % | (12.30 )% | 18.17 % | 7.33 % | 5.67 % |
Ratios to average net assets (annualized) | ||||||
Gross expenses | 1.02 % | 1.03 % | 1.03 % | 1.03 % | 1.03 % | 1.04 % |
Net expenses | 1.02 % | 1.03 % | 1.03 % | 1.03 % | 1.03 % | 1.04 % |
Net investment income | 0.64 % | 1.07 % | 0.86 % | 0.84 % | 1.19 % | 1.47 % |
Supplemental data | ||||||
Portfolio turnover rate | 23 % | 38 % | 19 % | 28 % | 44 % | 61 % |
Net assets, end of period (000s omitted) | $8,407 | $8,314 | $7,489 | $8,234 | $6,429 | $9,708 |
1 | Calculated based upon average shares outstanding |
2 | Returns for periods of less than one year are not annualized. |
Six months ended March 31, 2024 (unaudited) | Year ended September 30 | |||||
Institutional Class | 2023 | 2022 | 2021 | 2020 | 2019 | |
Net asset value, beginning of period | $10.91 | $10.20 | $12.54 | $10.79 | $10.64 | $10.81 |
Net investment income | 0.05 1 | 0.14 | 0.13 1 | 0.13 | 0.14 | 0.18 |
Net realized and unrealized gains (losses) on investments | 2.81 | 1.88 | (1.48 ) | 1.86 | 0.62 | 0.36 |
Total from investment operations | 2.86 | 2.02 | (1.35 ) | 1.99 | 0.76 | 0.54 |
Distributions to shareholders from | ||||||
Net investment income | (0.05 ) | (0.14 ) | (0.14 ) | (0.14 ) | (0.17 ) | (0.17 ) |
Net realized gains | (0.62 ) | (1.17 ) | (0.85 ) | (0.10 ) | (0.44 ) | (0.54 ) |
Total distributions to shareholders | (0.67 ) | (1.31 ) | (0.99 ) | (0.24 ) | (0.61 ) | (0.71 ) |
Net asset value, end of period | $13.10 | $10.91 | $10.20 | $12.54 | $10.79 | $10.64 |
Total return2 | 27.28 % | 20.62 % | (12.19 )% | 18.51 % | 7.48 % | 5.98 % |
Ratios to average net assets (annualized) | ||||||
Gross expenses | 0.77 % | 0.78 % | 0.78 % | 0.78 % | 0.78 % | 0.79 % |
Net expenses | 0.77 % | 0.78 % | 0.77 % | 0.78 % | 0.78 % | 0.78 % |
Net investment income | 0.89 % | 1.32 % | 1.10 % | 1.09 % | 1.42 % | 1.73 % |
Supplemental data | ||||||
Portfolio turnover rate | 23 % | 38 % | 19 % | 28 % | 44 % | 61 % |
Net assets, end of period (000s omitted) | $515,669 | $330,452 | $290,545 | $358,519 | $319,229 | $359,278 |
1 | Calculated based upon average shares outstanding |
2 | Returns for periods of less than one year are not annualized. |
Gross unrealized gains | $437,822,820 |
Gross unrealized losses | (15,567,003 ) |
Net unrealized gains | $422,255,817 |
Quoted prices (Level 1) | Other significant observable inputs (Level 2) | Significant unobservable inputs (Level 3) | Total | |
Assets | ||||
Investments in: | ||||
Common stocks | ||||
Communication services | $67,918,500 | $0 | $0 | $67,918,500 |
Consumer discretionary | 7,746,500 | 0 | 0 | 7,746,500 |
Consumer staples | 3,146,750 | 0 | 0 | 3,146,750 |
Energy | 66,048,050 | 0 | 0 | 66,048,050 |
Health care | 142,613,100 | 0 | 0 | 142,613,100 |
Industrials | 277,756,470 | 0 | 0 | 277,756,470 |
Information technology | 576,610,530 | 0 | 0 | 576,610,530 |
Materials | 34,727,085 | 0 | 0 | 34,727,085 |
Real estate | 6,416,800 | 0 | 0 | 6,416,800 |
Utilities | 2,786,000 | 0 | 0 | 2,786,000 |
Corporate bonds and notes | 0 | 204,251,830 | 0 | 204,251,830 |
Yankee corporate bonds and notes | 0 | 5,780,349 | 0 | 5,780,349 |
Short-term investments | ||||
Investment companies | 6,606,615 | 0 | 0 | 6,606,615 |
Total assets | $1,192,376,400 | $210,032,179 | $0 | $1,402,408,579 |
Average daily net assets | Management fee |
First $500 million | 0.650 % |
Next $500 million | 0.600 |
Next $2 billion | 0.550 |
Next $2 billion | 0.525 |
Next $5 billion | 0.490 |
Over $10 billion | 0.480 |
Class-level administration fee | |
Class A | 0.20 % |
Class C | 0.20 |
Administrator Class | 0.13 |
Institutional Class | 0.13 |
EXPENSE RATIO CAPS | |
Class A | 1.11 % |
Class C | 1.86 |
Administrator Class | 1.05 |
Institutional Class | 0.78 |
Name and year of birth | Position held and length of service* | Principal occupations during past five years or longer | Current other public company or investment company directorships |
William R. Ebsworth (Born 1957) | Trustee, since 2015 | Retired. From 1984 to 2013, equities analyst, portfolio manager, research director and chief investment officer at Fidelity Management and Research Company in Boston, Tokyo, and Hong Kong, and retired in 2013 as Chief Investment Officer of Fidelity Strategic Advisers, Inc. where he led a team of investment professionals managing client assets. Prior thereto, Board member of Hong Kong Securities Clearing Co., Hong Kong Options Clearing Corp., the Thailand International Fund, Ltd., Fidelity Investments Life Insurance Company, and Empire Fidelity Investments Life Insurance Company. Serves on the Investment Company Institute’s Board of Governors since 2022 and Executive Committee since 2023 as well as the Vice Chairman of the Governing Council of the Independent Directors Council since 2023. Audit Committee Chair and Investment Committee Chair of the Vincent Memorial Hospital Foundation (non-profit organization). Mr. Ebsworth is a CFA charterholder. | N/A |
Jane A. Freeman (Born 1953) | Trustee, since 2015; Chair Liaison, since January 2018# | Retired. From 2012 to 2014 and 1999 to 2008, Chief Financial Officer of Scientific Learning Corporation. From 2008 to 2012, Ms. Freeman provided consulting services related to strategic business projects. Prior to 1999, Portfolio Manager at Rockefeller & Co. and Scudder, Stevens & Clark. Board member of the Harding Loevner Funds from 1996 to 2014, serving as both Lead Independent Director and chair of the Audit Committee. Board member of the Russell Exchange Traded Funds Trust from 2011 to 2012 and the chair of the Audit Committee. Ms. Freeman is also an inactive Chartered Financial Analyst. | N/A |
Isaiah Harris, Jr. (Born 1952) | Trustee, since 2009; Audit Committee Chair, since 2019 | Retired. Member of the Advisory Board of CEF of East Central Florida. Chairman of the Board of CIGNA Corporation from 2009 to 2021, and Director from 2005 to 2008. From 2003 to 2011, Director of Deluxe Corporation. Prior thereto, President and CEO of BellSouth Advertising and Publishing Corp. from 2005 to 2007, President and CEO of BellSouth Enterprises from 2004 to 2005 and President of BellSouth Consumer Services from 2000 to 2003. Emeritus member of the Iowa State University Foundation Board of Governors. Emeritus Member of the Advisory board of Iowa State University School of Business. Advisory Board Member, Palm Harbor Academy (private school). Advisory Board Member, Fellowship of Christian Athletes. Mr. Harris is a certified public accountant (inactive status). | N/A |
David F. Larcker (Born 1950) | Trustee, since 2009 | Distinguished Visiting Fellow at the Hoover Institution since 2022. James Irvin Miller Professor of Accounting at the Graduate School of Business (Emeritus), Stanford University, Director of the Corporate Governance Research Initiative and Senior Faculty of The Rock Center for Corporate Governance since 2006. From 2005 to 2008, Professor of Accounting at the Graduate School of Business, Stanford University. Prior thereto, Ernst & Young Professor of Accounting at The Wharton School, University of Pennsylvania from 1985 to 2005. | N/A |
Olivia S. Mitchell (Born 1953) | Trustee, since 2006; Nominating and Governance Committee Chair, since 2018 | International Foundation of Employee Benefit Plans Professor since 1993, Wharton School of the University of Pennsylvania. Director of Wharton’s Pension Research Council and Boettner Center on Pensions & Retirement Research, and Research Associate at the National Bureau of Economic Research. Previously taught at Cornell University from 1978 to 1993. | N/A |
Name and year of birth | Position held and length of service* | Principal occupations during past five years or longer | Current other public company or investment company directorships |
Timothy J. Penny (Born 1951) | Trustee, since 1996; Chair, since 2018 | President and Chief Executive Officer of Southern Minnesota Initiative Foundation, a non-profit organization, since 2007. Vice Chair of the Economic Club of Minnesota, since 2007. Co-Chair of the Committee for a Responsible Federal Budget, since 1995. Member of the Board of Trustees of NorthStar Education Finance, Inc., a non-profit organization, from 2007-2022. Senior Fellow of the University of Minnesota Humphrey Institute from 1995 to 2017. | N/A |
James G. Polisson (Born 1959) | Trustee, since 2018 | Retired. Chief Marketing Officer, Source (ETF) UK Services, Ltd, from 2015 to 2017. From 2012 to 2015, Principal of The Polisson Group, LLC, a management consulting, corporate advisory and principal investing company. Chief Executive Officer and Managing Director at Russell Investments, Global Exchange Traded Funds from 2010 to 2012. Managing Director of Barclays Global Investors from 1998 to 2010 and Global Chief Marketing Officer for iShares and Barclays Global Investors from 2000 to 2010. Trustee of the San Francisco Mechanics’ Institute, a non- profit organization, from 2013 to 2015. Board member of the Russell Exchange Traded Fund Trust from 2011 to 2012. Director of Barclays Global Investors Holdings Deutschland GmbH from 2006 to 2009. Mr. Polisson is an attorney and has a retired status with the Massachusetts and District of Columbia Bar Associations. | N/A |
Pamela Wheelock (Born 1959) | Trustee, since January 2020; previously Trustee from January 2018 to July 2019# | Retired. Executive and Senior Financial leadership positions in the public, private and nonprofit sectors. Interim President and CEO, McKnight Foundation, 2020. Interim Commissioner, Minnesota Department of Human Services, 2019. Chief Operating Officer, Twin Cities Habitat for Humanity, 2017-2019. Vice President for University Services, University of Minnesota, 2012- 2016. Interim President and CEO, Blue Cross and Blue Shield of Minnesota, 2011-2012. Executive Vice-President and Chief Financial Officer, Minnesota Wild, 2002-2008. Commissioner, Minnesota Department of Finance, 1999-2002. Chair of the Board of Directors of Destination Medical Center Corporation. Board member of the Minnesota Wild Foundation. | N/A |
Name and year of birth | Position held and length of service | Principal occupations during past five years or longer |
Andrew Owen (Born 1960) | President, since 2017 | President and Chief Executive Officer of Allspring Funds Management, LLC since 2017 and Head of Global Fund Governance of Allspring Global Investments since 2022. Prior thereto, co-president of Galliard Capital Management, LLC, an affiliate of Allspring Funds Management, LLC, from 2019 to 2022 and Head of Affiliated Managers, Allspring Global Investments, from 2014 to 2019 and Executive Vice President responsible for marketing, investments and product development for Allspring Funds Management, LLC, from 2009 to 2014. |
Jeremy DePalma (Born 1974) | Treasurer, since 2012 (for certain funds in the Fund Complex); since 2021 (for the remaining funds in the Complex) | Senior Vice President of Allspring Funds Management, LLC since 2009. Senior Vice President of Evergreen Investment Management Company, LLC from 2008 to 2010 and head of the Fund Reporting and Control Team within Fund Administration from 2005 to 2010. |
Christopher Baker (Born 1976) | Chief Compliance Officer, since 2022 | Global Chief Compliance Officer for Allspring Global Investments since 2022. Prior thereto, Chief Compliance Officer for State Street Global Advisors from 2018 to 2021. Senior Compliance Officer for the State Street divisions of Alternative Investment Solutions, Sector Solutions, and Global Marketing from 2015 to 2018. From 2010 to 2015 Vice President, Global Head of Investment and Marketing Compliance for State Street Global Advisors. |
Matthew Prasse (Born 1983) | Chief Legal Officer, since 2022; Secretary, since 2021 | Senior Counsel of the Allspring Legal Department since 2021. Senior Counsel of the Wells Fargo Legal Department from 2018 to 2021. Previously, Counsel for Barings LLC from 2015 to 2018. Prior to joining Barings, Associate at Morgan, Lewis & Bockius LLP from 2008 to 2015. |

P.O. Box 219967
Kansas City, MO 64121-9967

SAR4324 03-24

Allspring Funds

President
Allspring Funds
Notice to Shareholders |
Beginning in July 2024, the Fund will be required by the Securities and Exchange Commission to send shareholders a paper copy of a new tailored shareholder report in place of the full shareholder report that you are now receiving. The tailored shareholder report will contain concise information about the Fund, including certain expense and performance information and fund statistics. If you wish to receive this new tailored shareholder report electronically, please follow the instructions on the back cover of this report. |
Other information that is currently included in the shareholder report, such as the Fund’s financial statements, will be available online and upon request, free of charge, in paper or electronic format. |
Investment objective | The Fund seeks long-term total return, consisting of current income and capital appreciation. |
Manager | Allspring Funds Management, LLC |
Subadviser | Allspring Global Investments, LLC |
Portfolio managers | Petros N. Bocray, CFA, FRM, David Kowalske, Jr.† |
Average annual total returns (%) as of March 31, 2024 | |||||||||
Including sales charge | Excluding sales charge | Expense ratios1 (%) | |||||||
Inception date | 1 year | 5 year | 10 year | 1 year | 5 year | 10 year | Gross | Net2 | |
Class A (EKSAX) | 4-14-1987 | 9.05 | 2.61 | 4.11 | 15.70 | 3.84 | 4.73 | 1.17 | 0.84 |
Class C (EKSCX) | 2-1-1993 | 13.76 | 3.07 | 4.11 | 14.76 | 3.07 | 4.11 | 1.92 | 1.59 |
Class R6 (EKSRX)3 | 7-31-2018 | – | – | – | 16.27 | 4.32 | 5.15 | 0.75 | 0.42 |
Administrator Class (EKSDX) | 7-30-2010 | – | – | – | 15.61 | 3.92 | 4.84 | 1.10 | 0.77 |
Institutional Class (EKSYX) | 1-13-1997 | – | – | – | 15.96 | 4.16 | 5.08 | 0.85 | 0.52 |
Bloomberg U.S. Universal Bond Index4 | – | – | – | – | 2.67 | 0.69 | 1.83 | – | – |
Diversified Income Builder Blended Index5 | – | – | – | – | 12.54 | 5.62 | 5.95 | – | – |
ICE BofA U.S. Cash Pay High Yield Index6 | – | – | – | – | 10.98 | 4.03 | 4.35 | – | – |
MSCI ACWI (Net)7 | – | – | – | – | 23.22 | 10.92 | 8.66 | – | – |
Bloomberg U.S. Aggregate Bond Index8 | – | – | – | – | 1.70 | 0.36 | 1.54 | – | – |
1 | Reflects the expense ratios as stated in the most recent prospectuses. The expense ratios shown are subject to change and may differ from the annualized expense ratios shown in the Financial Highlights of this report. |
2 | The manager has contractually committed through January 31, 2025, to waive fees and/or reimburse expenses to the extent necessary to cap total annual fund operating expenses after fee waivers at 0.84% for Class A, 1.59% for Class C, 0.42% for Class R6, 0.77% for Administrator Class and 0.52% for Institutional Class. Brokerage commissions, stamp duty fees, interest, taxes, acquired fund fees and expenses (if any), and extraordinary expenses are excluded from the expense caps. Prior to or after the commitment expiration date, the caps may be increased or the commitment to maintain the caps may be terminated only with the approval of the Board of Trustees. Without these caps, the Fund’s returns would have been lower. The expense ratio paid by an investor is the net expense ratio (the total annual fund operating expenses after fee waivers) as stated in the prospectuses. |
3 | Historical performance shown for the Class R6 shares prior to their inception reflects the performance of the Institutional Class shares, and includes the higher expenses applicable to the Institutional Class shares. If these expenses had not been included, returns for the Class R6 shares would be higher. |
4 | The Bloomberg U.S. Universal Bond Index is an unmanaged market-value-weighted performance benchmark for the U.S.-dollar-denominated bond market, which includes investment-grade, high-yield, and emerging markets debt securities with maturities of one year or more. You cannot invest directly in an index. |
5 | Source: Allspring Funds Management, LLC. The Diversified Income Builder Blended Index is composed 60% of the ICE BofA U.S. Cash Pay High Yield Index, 25% of the Morgan Stanley Capital International (MSCI) All Country World Index (ACWI) (Net) and 15% of the Bloomberg U.S. Aggregate Bond Index. Prior to February 1, 2020, the Diversified Income Builder Blended Index was composed 65% of the ICE BofA U.S. Cash Pay High Yield Index, and 35% of the Russell 1000® Index. Prior to January 2, 2018, the Diversified Income Builder Blended Index was composed 75% of the ICE BofA U.S. Cash Pay High Yield Index, and 25% the Russell 1000® Index. You cannot invest directly in an index. |
6 | The ICE BofA U.S. Cash Pay High Yield Index is an unmanaged market index that provides a broad-based performance measure of the non-investment grade U.S. domestic bond index. You cannot invest directly in an index. Returns shown are net of transaction costs beginning on July 1, 2022. Copyright 2024. ICE Data Indices, LLC. All rights reserved. |
† | Mr. Kowalske became a portfolio manager of the Fund effective January 16, 2024. |
CFA® and Chartered Financial Analyst® are trademarks owned by CFA Institute. | |
Footnotes continued from previous page | |
7 | The MSCI ACWI (Net) is a free-float-adjusted market-capitalization-weighted index that is designed to measure the equity market performance of developed and emerging markets. Source: MSCI. MSCI makes no express or implied warranties or representations and shall have no liability whatsoever with respect to any MSCI data contained herein. The MSCI data may not be further redistributed or used as a basis for other indices or any securities or financial products. This report is not approved, reviewed, or produced by MSCI. You cannot invest directly in an index. |
8 | The Bloomberg U.S. Aggregate Bond Index is a broad-based benchmark that measures the investment-grade, U.S.–dollar–denominated, fixed-rate taxable bond market, including Treasuries, government-related and corporate securities, mortgage-backed securities (agency fixed-rate and hybrid adjustable-rate mortgage pass-throughs), asset-backed securities, and commercial mortgage-backed securities. You cannot invest directly in an index. |
Ten largest holdings (%) as of March 31, 20241 | |
Microsoft Corp. | 2.30 |
NVIDIA Corp. | 1.74 |
Amazon.com, Inc. | 1.56 |
Apple, Inc. | 1.21 |
Meta Platforms, Inc. Class A | 1.05 |
ING Groep NV, 6.75%, 4-16-2024 | 1.03 |
Alphabet, Inc. Class A | 1.02 |
Lloyds Banking Group PLC, 7.50%, 6-27-2024 | 0.99 |
Societe Generale SA, 8.00%, 9-29-2025 | 0.96 |
ABN AMRO Bank NV, 4.75%, 9-22-2027 | 0.83 |
1 | Figures represent the percentage of the Fund’s net assets. Holdings are subject to change and may have changed since the date specified. |
Portfolio composition as of March 31, 20241 |
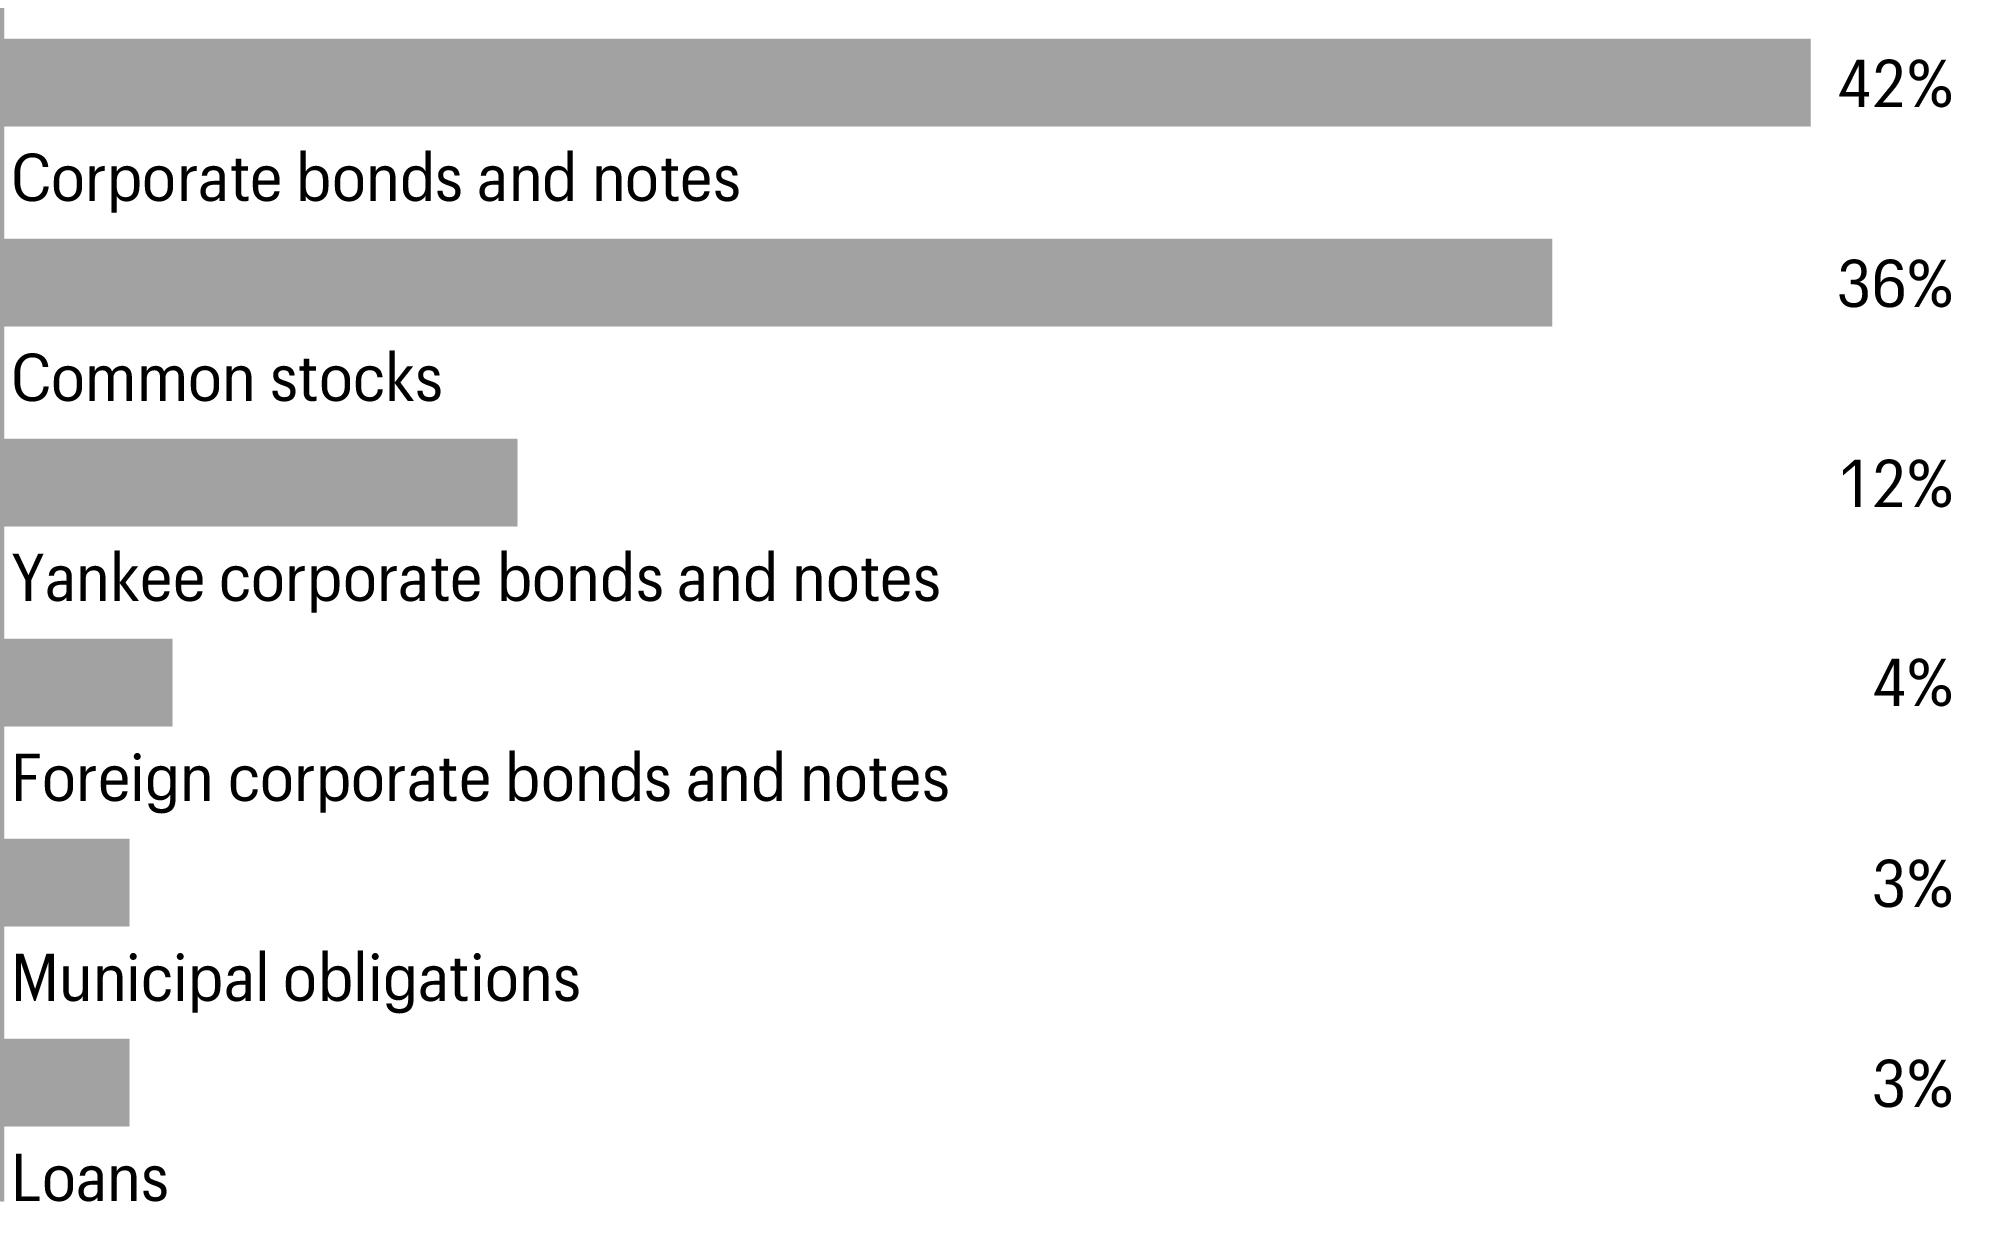
1 | Figures represent the percentage of the Fund’s long-term investments. Allocations are subject to change and may have changed since the date specified. |
Beginning account value 10-1-2023 | Ending account value 3-31-2024 | Expenses paid during the period1 | Annualized net expense ratio | |
Class A | ||||
Actual | $1,000.00 | $1,133.30 | $4.46 | 0.84 % |
Hypothetical (5% return before expenses) | $1,000.00 | $1,020.69 | $4.22 | 0.84 % |
Class C | ||||
Actual | $1,000.00 | $1,128.50 | $8.41 | 1.59 % |
Hypothetical (5% return before expenses) | $1,000.00 | $1,016.96 | $7.97 | 1.59 % |
Class R6 | ||||
Actual | $1,000.00 | $1,135.74 | $2.23 | 0.42 % |
Hypothetical (5% return before expenses) | $1,000.00 | $1,022.78 | $2.11 | 0.42 % |
Administrator Class | ||||
Actual | $1,000.00 | $1,133.78 | $4.09 | 0.77 % |
Hypothetical (5% return before expenses) | $1,000.00 | $1,021.03 | $3.87 | 0.77 % |
Institutional Class | ||||
Actual | $1,000.00 | $1,133.28 | $2.76 | 0.52 % |
Hypothetical (5% return before expenses) | $1,000.00 | $1,022.28 | $2.61 | 0.52 % |
1 | Expenses paid is equal to the annualized net expense ratio of each class multiplied by the average account value over the period, multiplied by 182 divided by 366 (to reflect the one-half-year period). |
Shares | Value | |||||
Common stocks: 34.46% | ||||||
Communication services: 3.82% | ||||||
Diversified telecommunication services: 0.21% | ||||||
AT&T, Inc.# | 42,997 | $756,747 | ||||
Entertainment: 0.37% | ||||||
Live Nation Entertainment, Inc.†# | 3,379 | 357,397 | ||||
NetEase, Inc. | 37,000 | 769,602 | ||||
Netflix, Inc.†# | 386 | 234,430 | ||||
1,361,429 | ||||||
Interactive media & services: 2.36% | ||||||
Alphabet, Inc. Class A†# | 24,876 | 3,754,535 | ||||
Alphabet, Inc. Class C†# | 2,889 | 439,879 | ||||
Baidu, Inc. Class A† | 4,858 | 63,744 | ||||
Meta Platforms, Inc. Class A# | 7,985 | 3,877,356 | ||||
Tencent Holdings Ltd. | 14,860 | 576,789 | ||||
8,712,303 | ||||||
Media: 0.45% | ||||||
Comcast Corp. Class A# | 12,535 | 543,392 | ||||
Publicis Groupe SA | 10,114 | 1,102,606 | ||||
1,645,998 | ||||||
Wireless telecommunication services: 0.43% | ||||||
America Movil SAB de CV ADR | 3,017 | 56,297 | ||||
Etihad Etisalat Co. | 6,632 | 93,012 | ||||
Freenet AG | 16,039 | 451,280 | ||||
SK Telecom Co. Ltd. | 24,999 | 989,747 | ||||
1,590,336 | ||||||
Consumer discretionary: 4.66% | ||||||
Automobile components: 0.02% | ||||||
Fuyao Glass Industry Group Co. Ltd. Class H144A | 16,000 | 80,543 | ||||
Automobiles: 1.15% | ||||||
Bajaj Auto Ltd. | 1,959 | 214,876 | ||||
Bayerische Motoren Werke AG | 5,860 | 676,208 | ||||
General Motors Co.# | 17,773 | 806,006 | ||||
Great Wall Motor Co. Ltd. Class H | 74,000 | 82,255 | ||||
Honda Motor Co. Ltd. | 76,800 | 945,414 | ||||
Kia Corp. | 2,264 | 188,351 | ||||
Stellantis NV | 35,080 | 997,054 | ||||
Tesla, Inc.†# | 1,789 | 314,488 | ||||
4,224,652 | ||||||
Broadline retail: 1.79% | ||||||
Alibaba Group Holding Ltd. | 26,600 | 238,747 | ||||
Amazon.com, Inc.†# | 31,983 | 5,769,094 | ||||
MercadoLibre, Inc.†# | 318 | 480,803 | ||||
Shares | Value | |||||
Broadline retail(continued) | ||||||
momo.com, Inc. | 5,000 | $61,400 | ||||
Naspers Ltd. Class N | 331 | 58,677 | ||||
6,608,721 | ||||||
Hotels, restaurants & leisure: 0.69% | ||||||
Booking Holdings, Inc.# | 185 | 671,158 | ||||
Chipotle Mexican Grill, Inc.†# | 141 | 409,854 | ||||
DoorDash, Inc. Class A†# | 1,544 | 212,640 | ||||
DraftKings, Inc. Class A†# | 5,598 | 254,205 | ||||
Evolution AB144A | 4,361 | 542,110 | ||||
Flutter Entertainment† | 590 | 116,519 | ||||
Wingstop, Inc.# | 865 | 316,936 | ||||
2,523,422 | ||||||
Household durables: 0.28% | ||||||
Gree Electric Appliances, Inc. of Zhuhai Class A | 12,600 | 68,340 | ||||
Midea Group Co. Ltd. Class A | 28,699 | 256,436 | ||||
Panasonic Holdings Corp. | 73,600 | 699,390 | ||||
1,024,166 | ||||||
Specialty retail: 0.47% | ||||||
AutoZone, Inc.†# | 95 | 299,407 | ||||
Boot Barn Holdings, Inc.†# | 4,336 | 412,570 | ||||
Five Below, Inc.†# | 502 | 91,053 | ||||
Floor & Decor Holdings, Inc. Class A†# | 2,886 | 374,083 | ||||
Jumbo SA | 2,231 | 64,264 | ||||
O’Reilly Automotive, Inc.†# | 136 | 153,528 | ||||
Ulta Beauty, Inc.†# | 660 | 345,101 | ||||
1,740,006 | ||||||
Textiles, apparel & luxury goods: 0.26% | ||||||
ANTA Sports Products Ltd. | 9,520 | 101,198 | ||||
Fila Holdings Corp. | 2,447 | 69,707 | ||||
LPP SA | 23 | 88,100 | ||||
lululemon athletica, Inc.†# | 796 | 310,957 | ||||
On Holding AG Class A†# | 8,726 | 308,726 | ||||
Samsonite International SA144A† | 22,500 | 85,091 | ||||
963,779 | ||||||
Consumer staples: 0.99% | ||||||
Beverages: 0.28% | ||||||
Celsius Holdings, Inc.†# | 2,957 | 245,194 | ||||
Coca-Cola HBC AG† | 25,141 | 794,245 | ||||
1,039,439 | ||||||
Consumer staples distribution & retail: 0.38% | ||||||
BIM Birlesik Magazalar AS | 5,767 | 62,700 | ||||
Shares | Value | |||||
Consumer staples distribution & retail(continued) | ||||||
Wal-Mart de Mexico SAB de CV | 14,700 | $59,357 | ||||
Walmart, Inc.# | 21,300 | 1,281,621 | ||||
1,403,678 | ||||||
Food products: 0.06% | ||||||
Indofood CBP Sukses Makmur Tbk. PT | 100,400 | 73,456 | ||||
Inner Mongolia Yili Industrial Group Co. Ltd. Class A | 22,400 | 86,191 | ||||
Tingyi Cayman Islands Holding Corp. | 60,000 | 65,773 | ||||
225,420 | ||||||
Household products: 0.18% | ||||||
Colgate-Palmolive Co.# | 7,113 | 640,526 | ||||
Personal care products: 0.09% | ||||||
BellRing Brands, Inc.†# | 2,378 | 140,373 | ||||
e.l.f. Beauty, Inc.†# | 933 | 182,896 | ||||
323,269 | ||||||
Energy: 1.15% | ||||||
Energy equipment & services: 0.06% | ||||||
Arabian Drilling Co. | 2,856 | 129,455 | ||||
China Oilfield Services Ltd. Class H | 102,000 | 117,288 | ||||
246,743 | ||||||
Oil, gas & consumable fuels: 1.09% | ||||||
ConocoPhillips# | 9,837 | 1,252,053 | ||||
Devon Energy Corp.# | 18,103 | 908,408 | ||||
Pembina Pipeline Corp. | 25,731 | 908,198 | ||||
Petroleo Brasileiro SA ADR | 11,824 | 176,178 | ||||
PTT Exploration & Production PCL | 16,200 | 66,598 | ||||
Shell PLC | 21,006 | 695,959 | ||||
4,007,394 | ||||||
Financials: 5.61% | ||||||
Banks: 1.69% | ||||||
Akbank TAS | 49,172 | 71,148 | ||||
Al Rajhi Bank | 6,101 | 135,180 | ||||
Bank Mandiri Persero Tbk. PT | 273,300 | 124,972 | ||||
Bank Negara Indonesia Persero Tbk. PT | 323,600 | 120,419 | ||||
Bank of the Philippine Islands | 49,429 | 103,843 | ||||
Bank Polska Kasa Opieki SA | 1,779 | 80,993 | ||||
CaixaBank SA | 137,883 | 668,356 | ||||
China Construction Bank Corp. Class H | 1,347,000 | 812,306 | ||||
CIMB Group Holdings Bhd. | 50,900 | 70,509 | ||||
Citigroup, Inc.# | 17,132 | 1,083,428 | ||||
Credicorp Ltd. | 461 | 78,107 | ||||
Grupo Financiero Banorte SAB de CV Class O | 6,500 | 69,153 | ||||
ING Groep NV | 44,574 | 733,160 | ||||
KB Financial Group, Inc. | 3,366 | 175,770 | ||||
Shares | Value | |||||
Banks(continued) | ||||||
National Bank of Greece SA† | 16,489 | $129,078 | ||||
Saudi Awwal Bank | 15,513 | 171,654 | ||||
Standard Bank Group Ltd. | 7,810 | 76,385 | ||||
U.S. Bancorp# | 18,920 | 845,724 | ||||
UniCredit SpA | 17,898 | 679,203 | ||||
6,229,388 | ||||||
Capital markets: 2.03% | ||||||
360 ONE WAM Ltd. | 22,278 | 180,462 | ||||
3i Group PLC | 21,946 | 778,069 | ||||
Ares Capital Corp.# | 37,421 | 779,105 | ||||
B3 SA - Brasil Bolsa Balcao | 26,100 | 62,396 | ||||
Banco BTG Pactual SA | 18,704 | 135,859 | ||||
Blackstone Secured Lending Fund# | 32,220 | 1,003,653 | ||||
Bolsa Mexicana de Valores SAB de CV | 31,434 | 70,435 | ||||
China International Capital Corp. Ltd. Class H144A | 79,200 | 93,904 | ||||
Intermediate Capital Group PLC | 26,947 | 698,589 | ||||
LPL Financial Holdings, Inc.# | 2,867 | 757,461 | ||||
Man Group PLC | 222,189 | 749,885 | ||||
Oaktree Specialty Lending Corp.# | 46,338 | 911,005 | ||||
S&P Global, Inc.# | 1,005 | 427,577 | ||||
Tradeweb Markets, Inc. Class A# | 8,091 | 842,840 | ||||
7,491,240 | ||||||
Financial services: 1.02% | ||||||
Block, Inc.†# | 2,923 | 247,227 | ||||
Corebridge Financial, Inc.# | 29,144 | 837,307 | ||||
LIC Housing Finance Ltd. | 33,532 | 245,633 | ||||
Mastercard, Inc. Class A# | 2,834 | 1,364,769 | ||||
Power Finance Corp. Ltd. | 48,042 | 224,794 | ||||
Visa, Inc. Class A# | 2,995 | 835,845 | ||||
3,755,575 | ||||||
Insurance: 0.87% | ||||||
AXA SA | 17,117 | 642,917 | ||||
BB Seguridade Participacoes SA | 104,930 | 680,369 | ||||
Cathay Financial Holding Co. Ltd. | 58,000 | 87,444 | ||||
DB Insurance Co. Ltd. | 8,360 | 598,008 | ||||
Kinsale Capital Group, Inc.# | 123 | 64,543 | ||||
Ping An Insurance Group Co. of China, Ltd. Class A | 11,100 | 62,492 | ||||
Sanlam Ltd. | 17,087 | 62,601 | ||||
Sompo Holdings, Inc. | 48,600 | 1,014,507 | ||||
3,212,881 | ||||||
Health care: 2.66% | ||||||
Biotechnology: 0.53% | ||||||
Amgen, Inc.# | 3,150 | 895,608 | ||||
Argenx SE ADR†# | 382 | 150,401 | ||||
Shares | Value | |||||
Biotechnology(continued) | ||||||
Gilead Sciences, Inc.# | 9,015 | $660,349 | ||||
Vertex Pharmaceuticals, Inc.†# | 604 | 252,478 | ||||
1,958,836 | ||||||
Health care equipment & supplies: 0.65% | ||||||
Boston Scientific Corp.†# | 6,875 | 470,869 | ||||
DexCom, Inc.†# | 994 | 137,868 | ||||
Intuitive Surgical, Inc.†# | 743 | 296,524 | ||||
Penumbra, Inc.†# | 2,418 | 539,649 | ||||
Shockwave Medical, Inc.†# | 2,522 | 821,239 | ||||
Stryker Corp.# | 309 | 110,582 | ||||
TransMedics Group, Inc.†# | 425 | 31,424 | ||||
2,408,155 | ||||||
Health care providers & services: 0.26% | ||||||
Cencora, Inc.# | 2,877 | 699,082 | ||||
Sinopharm Group Co. Ltd. Class H | 45,700 | 117,069 | ||||
UnitedHealth Group, Inc.# | 259 | 128,127 | ||||
944,278 | ||||||
Health care technology: 0.18% | ||||||
Veeva Systems, Inc. Class A†# | 2,855 | 661,475 | ||||
Life sciences tools & services: 0.03% | ||||||
Avantor, Inc.†# | 3,606 | 92,205 | ||||
Pharmaceuticals: 1.01% | ||||||
China Medical System Holdings Ltd. | 324,000 | 340,273 | ||||
Eli Lilly & Co.# | 1,841 | 1,432,224 | ||||
GSK PLC | 35,570 | 767,070 | ||||
Novo Nordisk AS ADR# | 1,813 | 232,789 | ||||
Pfizer, Inc.# | 26,661 | 739,843 | ||||
Richter Gedeon Nyrt | 2,413 | 61,215 | ||||
Zhejiang NHU Co. Ltd. Class A | 33,148 | 76,776 | ||||
Zoetis, Inc.# | 504 | 85,282 | ||||
3,735,472 | ||||||
Industrials: 3.36% | ||||||
Aerospace & defense: 0.09% | ||||||
Embraer SA ADR† | 6,508 | 173,373 | ||||
TransDigm Group, Inc.# | 137 | 168,729 | ||||
342,102 | ||||||
Building products: 0.22% | ||||||
Owens Corning# | 4,802 | 800,974 | ||||
Commercial services & supplies: 0.32% | ||||||
Casella Waste Systems, Inc. Class A†# | 3,695 | 365,325 | ||||
Copart, Inc.†# | 13,860 | 802,771 | ||||
1,168,096 | ||||||
Shares | Value | |||||
Construction & engineering: 0.36% | ||||||
China State Construction International Holdings Ltd. | 96,100 | $104,855 | ||||
EMCOR Group, Inc.# | 2,689 | 941,688 | ||||
Quanta Services, Inc.# | 1,092 | 283,702 | ||||
1,330,245 | ||||||
Electrical equipment: 0.86% | ||||||
Emerson Electric Co.# | 8,628 | 978,588 | ||||
NEXTracker, Inc. Class A†# | 4,123 | 232,001 | ||||
nVent Electric PLC# | 14,144 | 1,066,458 | ||||
Signify NV144A | 25,705 | 792,576 | ||||
Vertiv Holdings Co.# | 1,206 | 98,494 | ||||
3,168,117 | ||||||
Ground transportation: 0.24% | ||||||
Uber Technologies, Inc.†# | 10,810 | 832,262 | ||||
United International Transportation Co. | 3,038 | 70,067 | ||||
902,329 | ||||||
Industrial conglomerates: 0.53% | ||||||
Bidvest Group Ltd. | 8,785 | 112,484 | ||||
Hitachi Ltd. | 13,500 | 1,226,665 | ||||
Siemens AG | 3,166 | 604,431 | ||||
1,943,580 | ||||||
Machinery: 0.20% | ||||||
Ashok Leyland Ltd. | 69,375 | 142,447 | ||||
Doosan Bobcat, Inc. | 3,722 | 149,295 | ||||
Fortive Corp.# | 2,917 | 250,920 | ||||
Weichai Power Co. Ltd. Class H | 40,000 | 76,250 | ||||
Yangzijiang Shipbuilding Holdings Ltd. | 79,300 | 112,174 | ||||
731,086 | ||||||
Passenger airlines: 0.02% | ||||||
Copa Holdings SA Class A | 716 | 74,579 | ||||
Professional services: 0.19% | ||||||
Legalzoom.com, Inc.†# | 15,591 | 207,984 | ||||
Paycor HCM, Inc.†# | 26,053 | 506,470 | ||||
714,454 | ||||||
Trading companies & distributors: 0.28% | ||||||
BOC Aviation Ltd.144A | 11,900 | 91,680 | ||||
Ferguson PLC# | 4,406 | 962,403 | ||||
1,054,083 | ||||||
Transportation infrastructure: 0.05% | ||||||
Grupo Aeroportuario del Sureste SAB de CV ADR | 274 | 87,318 | ||||
Malaysia Airports Holdings Bhd. | 41,900 | 87,711 | ||||
175,029 | ||||||
Shares | Value | |||||
Information technology: 10.24% | ||||||
Communications equipment: 0.30% | ||||||
Arista Networks, Inc.†# | 3,790 | $1,099,024 | ||||
Electronic equipment, instruments & components: 0.09% | ||||||
Chroma ATE, Inc. | 16,000 | 126,236 | ||||
E Ink Holdings, Inc. | 14,000 | 99,302 | ||||
Largan Precision Co. Ltd. | 1,300 | 98,708 | ||||
324,246 | ||||||
IT services: 0.39% | ||||||
Chinasoft International Ltd. | 128,000 | 77,190 | ||||
Infosys Ltd. ADR | 17,983 | 322,435 | ||||
MongoDB, Inc.†# | 2,388 | 856,433 | ||||
Wix.com Ltd.†# | 1,489 | 204,708 | ||||
1,460,766 | ||||||
Semiconductors & semiconductor equipment: 3.88% | ||||||
Advanced Micro Devices, Inc.†# | 2,573 | 464,401 | ||||
Allegro MicroSystems, Inc.†# | 22,617 | 609,754 | ||||
ASE Technology Holding Co. Ltd. | 20,000 | 96,865 | ||||
Astera Labs, Inc.†# | 1,483 | 110,024 | ||||
Broadcom, Inc.# | 942 | 1,248,536 | ||||
KLA Corp.# | 1,318 | 920,715 | ||||
Marvell Technology, Inc.# | 4,000 | 283,520 | ||||
MediaTek, Inc. | 2,500 | 90,615 | ||||
Microchip Technology, Inc.# | 7,413 | 665,020 | ||||
Monolithic Power Systems, Inc.# | 1,067 | 722,807 | ||||
NVIDIA Corp.# | 7,094 | 6,409,855 | ||||
Realtek Semiconductor Corp. | 4,000 | 69,618 | ||||
Taiwan Semiconductor Manufacturing Co. Ltd. | 52,000 | 1,249,488 | ||||
Taiwan Semiconductor Manufacturing Co. Ltd. ADR# | 9,219 | 1,254,245 | ||||
United Microelectronics Corp. | 61,000 | 99,114 | ||||
14,294,577 | ||||||
Software: 3.73% | ||||||
Clearwater Analytics Holdings, Inc. Class A†# | 15,814 | 279,750 | ||||
Crowdstrike Holdings, Inc. Class A†# | 1,938 | 621,303 | ||||
Datadog, Inc. Class A†# | 3,488 | 431,117 | ||||
DoubleVerify Holdings, Inc.†# | 6,005 | 211,136 | ||||
Dynatrace, Inc.†# | 5,582 | 259,228 | ||||
Fair Isaac Corp.†# | 472 | 589,816 | ||||
Informatica, Inc. Class A†# | 2,186 | 76,510 | ||||
Intuit, Inc.# | 534 | 347,100 | ||||
Manhattan Associates, Inc.†# | 298 | 74,569 | ||||
Microsoft Corp.# | 20,141 | 8,473,721 | ||||
Monday.com Ltd.†# | 461 | 104,126 | ||||
Open Text Corp. | 18,646 | 723,512 | ||||
Oracle Corp.# | 1,996 | 250,718 | ||||
Palo Alto Networks, Inc.†# | 940 | 267,082 | ||||
Shares | Value | |||||
Software(continued) | ||||||
Procore Technologies, Inc.†# | 4,435 | $364,424 | ||||
Salesforce, Inc.# | 567 | 170,769 | ||||
ServiceNow, Inc.†# | 447 | 340,793 | ||||
Vertex Class A†# | 4,986 | 158,355 | ||||
13,744,029 | ||||||
Technology hardware, storage & peripherals: 1.85% | ||||||
Apple, Inc.# | 26,096 | 4,474,942 | ||||
Dell Technologies, Inc. Class C# | 6,829 | 779,257 | ||||
HP, Inc.# | 25,522 | 771,275 | ||||
Lenovo Group Ltd. | 195,100 | 226,086 | ||||
Quanta Computer, Inc. | 12,700 | 111,113 | ||||
Samsung Electronics Co. Ltd. | 7,694 | 461,783 | ||||
6,824,456 | ||||||
Materials: 0.64% | ||||||
Chemicals: 0.21% | ||||||
Linde PLC# | 1,679 | 779,593 | ||||
Metals & mining: 0.43% | ||||||
Alrosa PJSC (Acquired 5-6-2021, cost $65,232)♦†˃ | 42,660 | 0 | ||||
Fortescue Ltd. | 29,250 | 489,862 | ||||
Reliance Steel & Aluminum Co.# | 2,207 | 737,535 | ||||
Southern Copper Corp. | 1,628 | 173,415 | ||||
Ternium SA ADR | 2,380 | 99,056 | ||||
Vale SA | 7,000 | 84,900 | ||||
1,584,768 | ||||||
Real estate: 0.89% | ||||||
Hotel & resort REITs: 0.17% | ||||||
Host Hotels & Resorts, Inc.# | 30,243 | 625,425 | ||||
Office REITs : 0.07% | ||||||
Embassy Office Parks REIT | 54,293 | 240,607 | ||||
Real estate management & development: 0.07% | ||||||
China Resources Land Ltd. | 49,650 | 157,002 | ||||
Corp. Inmobiliaria Vesta SAB de CV ADR | 2,300 | 90,252 | ||||
247,254 | ||||||
Retail REITs : 0.27% | ||||||
Simon Property Group, Inc.# | 6,368 | 996,528 | ||||
Specialized REITs : 0.31% | ||||||
Equinix, Inc.# | 196 | 161,765 | ||||
VICI Properties, Inc.# | 33,451 | 996,505 | ||||
1,158,270 | ||||||
Shares | Value | |||||
Utilities: 0.44% | ||||||
Electric utilities: 0.08% | ||||||
Companhia Paranaense de Energia | 33,100 | $57,087 | ||||
Power Grid Corp. of India Ltd. | 71,687 | 238,004 | ||||
295,091 | ||||||
Gas utilities: 0.09% | ||||||
ENN Energy Holdings Ltd. | 11,000 | 84,746 | ||||
GAIL India Ltd. | 114,694 | 248,978 | ||||
333,724 | ||||||
Independent power and renewable electricity producers: 0.05% | ||||||
NHPC Ltd. | 180,603 | 194,240 | ||||
Multi-utilities: 0.22% | ||||||
Engie SA | 48,766 | 815,999 | ||||
Total common stocks (Cost $89,564,770) | 127,031,347 | |||||
Interest rate | Maturity date | Principal | ||||
Corporate bonds and notes: 39.63% | ||||||
Basic materials: 0.12% | ||||||
Chemicals: 0.12% | ||||||
SCIH Salt Holdings, Inc.144A | 6.63 % | 5-1-2029 | $ | 480,000 | 444,411 | |
Communications: 4.35% | ||||||
Advertising: 0.70% | ||||||
Clear Channel Outdoor Holdings, Inc.144A | 7.50 | 6-1-2029 | 670,000 | 554,118 | ||
Clear Channel Outdoor Holdings, Inc.144A | 9.00 | 9-15-2028 | 580,000 | 604,137 | ||
Outfront Media Capital LLC/Outfront Media Capital Corp.144A | 4.63 | 3-15-2030 | 510,000 | 457,383 | ||
Outfront Media Capital LLC/Outfront Media Capital Corp.144A | 5.00 | 8-15-2027 | 290,000 | 279,113 | ||
Outfront Media Capital LLC/Outfront Media Capital Corp.144A | 7.38 | 2-15-2031 | 650,000 | 680,826 | ||
2,575,577 | ||||||
Internet: 0.71% | ||||||
Arches Buyer, Inc.144A | 4.25 | 6-1-2028 | 420,000 | 369,635 | ||
Arches Buyer, Inc.144A | 6.13 | 12-1-2028 | 415,000 | 347,635 | ||
Cablevision Lightpath LLC144A | 3.88 | 9-15-2027 | 550,000 | 493,838 | ||
Cablevision Lightpath LLC144A | 5.63 | 9-15-2028 | 375,000 | 312,944 | ||
Match Group Holdings II LLC144A | 5.63 | 2-15-2029 | 1,125,000 | 1,090,419 | ||
2,614,471 | ||||||
Media: 2.85% | ||||||
CCO Holdings LLC/CCO Holdings Capital Corp.144A | 4.25 | 1-15-2034 | 2,775,000 | 2,094,720 | ||
CCO Holdings LLC/CCO Holdings Capital Corp.144A | 4.50 | 8-15-2030 | 1,700,000 | 1,424,680 | ||
CSC Holdings LLC144A | 5.75 | 1-15-2030 | 930,000 | 492,317 | ||
CSC Holdings LLC144A | 11.25 | 5-15-2028 | 615,000 | 609,430 | ||
CSC Holdings LLC144A | 11.75 | 1-31-2029 | 555,000 | 555,866 | ||
Directv Financing LLC/Directv Financing Co-Obligor, Inc.144A | 5.88 | 8-15-2027 | 380,000 | 359,494 | ||
DISH Network Corp.144A | 11.75 | 11-15-2027 | 550,000 | 561,512 | ||
Interest rate | Maturity date | Principal | Value | |||
Media(continued) | ||||||
Nexstar Media, Inc.144A | 5.63 % | 7-15-2027 | $ | 650,000 | $623,558 | |
Scripps Escrow II, Inc.144A | 5.38 | 1-15-2031 | 585,000 | 359,931 | ||
Sirius XM Radio, Inc.144A | 4.13 | 7-1-2030 | 2,100,000 | 1,835,753 | ||
Townsquare Media, Inc.144A | 6.88 | 2-1-2026 | 1,620,000 | 1,579,500 | ||
10,496,761 | ||||||
Telecommunications: 0.09% | ||||||
CommScope, Inc.144A | 6.00 | 3-1-2026 | 365,000 | 333,975 | ||
Consumer, cyclical: 6.51% | ||||||
Airlines: 0.47% | ||||||
American Airlines, Inc./AAdvantage Loyalty IP Ltd.144A | 5.50 | 4-20-2026 | 243,750 | 242,090 | ||
Hawaiian Airlines Pass-Through Certificates Series 2013-1 Class A | 3.90 | 1-15-2026 | 379,564 | 354,617 | ||
Hawaiian Brand Intellectual Property Ltd./HawaiianMiles Loyalty Ltd.144A | 5.75 | 1-20-2026 | 790,000 | 741,380 | ||
Spirit Loyalty Cayman Ltd./Spirit IP Cayman Ltd.144A | 8.00 | 9-20-2025 | 500,000 | 379,563 | ||
1,717,650 | ||||||
Apparel: 0.60% | ||||||
Crocs, Inc.144A | 4.13 | 8-15-2031 | 385,000 | 333,576 | ||
Crocs, Inc.144A | 4.25 | 3-15-2029 | 1,000,000 | 914,222 | ||
Hanesbrands, Inc.144A | 4.88 | 5-15-2026 | 440,000 | 428,395 | ||
Tapestry, Inc. | 7.85 | 11-27-2033 | 505,000 | 548,070 | ||
2,224,263 | ||||||
Auto manufacturers: 0.16% | ||||||
Ford Motor Co. | 4.75 | 1-15-2043 | 720,000 | 597,873 | ||
Auto parts & equipment: 0.27% | ||||||
Adient Global Holdings Ltd.144A | 8.25 | 4-15-2031 | 405,000 | 427,371 | ||
American Axle & Manufacturing, Inc. | 5.00 | 10-1-2029 | 635,000 | 571,923 | ||
999,294 | ||||||
Distribution/wholesale: 0.22% | ||||||
G-III Apparel Group Ltd.144A | 7.88 | 8-15-2025 | 805,000 | 806,139 | ||
Entertainment: 1.23% | ||||||
CCM Merger, Inc.144A | 6.38 | 5-1-2026 | 2,015,000 | 2,013,131 | ||
Churchill Downs, Inc.144A | 4.75 | 1-15-2028 | 570,000 | 542,620 | ||
Churchill Downs, Inc.144A | 6.75 | 5-1-2031 | 185,000 | 186,033 | ||
Cinemark USA, Inc.144A | 5.25 | 7-15-2028 | 540,000 | 511,193 | ||
Cinemark USA, Inc.144A | 5.88 | 3-15-2026 | 200,000 | 197,462 | ||
Cinemark USA, Inc.144A | 8.75 | 5-1-2025 | 561,000 | 562,402 | ||
Live Nation Entertainment, Inc.144A | 5.63 | 3-15-2026 | 545,000 | 539,024 | ||
4,551,865 | ||||||
Interest rate | Maturity date | Principal | Value | |||
Home builders: 0.20% | ||||||
Taylor Morrison Communities, Inc.144A | 5.13 % | 8-1-2030 | $ | 225,000 | $214,868 | |
Tri Pointe Homes, Inc. | 5.70 | 6-15-2028 | 530,000 | 521,854 | ||
736,722 | ||||||
Housewares: 0.25% | ||||||
Newell Brands, Inc. | 5.70 | 4-1-2026 | 930,000 | 913,421 | ||
Leisure time: 0.76% | ||||||
Carnival Holdings Bermuda Ltd.144A | 10.38 | 5-1-2028 | 1,130,000 | 1,232,671 | ||
NCL Corp. Ltd.144A | 5.88 | 3-15-2026 | 450,000 | 444,218 | ||
NCL Corp. Ltd.144A | 5.88 | 2-15-2027 | 405,000 | 400,137 | ||
NCL Corp. Ltd.144A | 7.75 | 2-15-2029 | 495,000 | 513,946 | ||
NCL Corp. Ltd.144A | 8.13 | 1-15-2029 | 210,000 | 222,219 | ||
2,813,191 | ||||||
Retail: 2.35% | ||||||
Bath & Body Works, Inc.144A | 6.63 | 10-1-2030 | 640,000 | 653,759 | ||
Dave & Buster’s, Inc.144A | 7.63 | 11-1-2025 | 325,000 | 327,528 | ||
FirstCash, Inc.144A | 4.63 | 9-1-2028 | 910,000 | 856,507 | ||
FirstCash, Inc.144A | 6.88 | 3-1-2032 | 375,000 | 374,825 | ||
Gap, Inc.144A | 3.88 | 10-1-2031 | 500,000 | 422,950 | ||
Kohl’s Corp. | 4.63 | 5-1-2031 | 700,000 | 589,068 | ||
LSF9 Atlantis Holdings LLC/Victra Finance Corp.144A | 7.75 | 2-15-2026 | 695,000 | 688,736 | ||
Macy’s Retail Holdings LLC144A | 5.88 | 4-1-2029 | 515,000 | 505,224 | ||
Macy’s Retail Holdings LLC144A | 6.13 | 3-15-2032 | 940,000 | 911,129 | ||
Michaels Cos., Inc.144A | 7.88 | 5-1-2029 | 530,000 | 397,624 | ||
NMG Holding Co., Inc./Neiman Marcus Group LLC144A | 7.13 | 4-1-2026 | 735,000 | 719,763 | ||
PetSmart, Inc./PetSmart Finance Corp.144A | 4.75 | 2-15-2028 | 270,000 | 252,786 | ||
PetSmart, Inc./PetSmart Finance Corp.144A | 7.75 | 2-15-2029 | 930,000 | 905,394 | ||
Raising Cane’s Restaurants LLC144A | 9.38 | 5-1-2029 | 640,000 | 691,674 | ||
Sally Holdings LLC/Sally Capital Inc | 6.75 | 3-1-2032 | 350,000 | 347,264 | ||
8,644,231 | ||||||
Consumer, non-cyclical: 5.93% | ||||||
Commercial services: 2.70% | ||||||
Allied Universal Holdco LLC144A | 7.88 | 2-15-2031 | 300,000 | 303,839 | ||
Allied Universal Holdco LLC/Allied Universal Finance Corp.144A | 6.00 | 6-1-2029 | 1,425,000 | 1,226,105 | ||
Allied Universal Holdco LLC/Allied Universal Finance Corp.144A | 6.63 | 7-15-2026 | 247,000 | 246,838 | ||
CoreCivic, Inc. | 8.25 | 4-15-2029 | 1,475,000 | 1,542,820 | ||
Grand Canyon University | 5.13 | 10-1-2028 | 1,000,000 | 904,370 | ||
MPH Acquisition Holdings LLC144A | 5.50 | 9-1-2028 | 180,000 | 153,069 | ||
MPH Acquisition Holdings LLC144A | 5.75 | 11-1-2028 | 1,405,000 | 1,108,014 | ||
PECF USS Intermediate Holding III Corp.144A | 8.00 | 11-15-2029 | 1,140,000 | 598,742 | ||
Prime Security Services Borrower LLC/Prime Finance, Inc.144A | 6.25 | 1-15-2028 | 650,000 | 636,726 | ||
Sabre Global, Inc.144A | 11.25 | 12-15-2027 | 1,350,000 | 1,266,986 | ||
Sotheby’s/Bidfair Holdings, Inc.144A | 5.88 | 6-1-2029 | 740,000 | 621,979 | ||
Upbound Group, Inc.144A | 6.38 | 2-15-2029 | 1,390,000 | 1,349,432 | ||
9,958,920 | ||||||
Interest rate | Maturity date | Principal | Value | |||
Food: 0.40% | ||||||
B&G Foods, Inc.144A | 8.00 % | 9-15-2028 | $ | 1,390,000 | $1,447,420 | |
Healthcare-services: 2.66% | ||||||
Catalent Pharma Solutions, Inc.144A | 5.00 | 7-15-2027 | 920,000 | 905,942 | ||
CHS/Community Health Systems, Inc.144A | 5.25 | 5-15-2030 | 750,000 | 611,559 | ||
CHS/Community Health Systems, Inc.144A | 5.63 | 3-15-2027 | 475,000 | 437,190 | ||
CHS/Community Health Systems, Inc.144A | 8.00 | 3-15-2026 | 225,000 | 224,546 | ||
Eastern Maine Healthcare Systems | 5.02 | 7-1-2036 | 1,000,000 | 910,837 | ||
IQVIA, Inc.144A | 6.50 | 5-15-2030 | 760,000 | 775,591 | ||
ModivCare Escrow Issuer, Inc.144A | 5.00 | 10-1-2029 | 750,000 | 543,821 | ||
Pediatrix Medical Group, Inc.144A | 5.38 | 2-15-2030 | 1,050,000 | 953,962 | ||
Select Medical Corp.144A | 6.25 | 8-15-2026 | 750,000 | 751,392 | ||
Star Parent, Inc.144A | 9.00 | 10-1-2030 | 930,000 | 984,225 | ||
Surgery Center Holdings, Inc.144A%% | 7.25 | 4-15-2032 | 350,000 | 352,718 | ||
Tenet Healthcare Corp.144A | 6.75 | 5-15-2031 | 1,490,000 | 1,517,163 | ||
Toledo Hospital | 6.02 | 11-15-2048 | 1,000,000 | 840,000 | ||
9,808,946 | ||||||
Pharmaceuticals: 0.17% | ||||||
AdaptHealth LLC144A | 5.13 | 3-1-2030 | 725,000 | 632,299 | ||
Energy: 7.44% | ||||||
Energy-alternate sources: 0.83% | ||||||
Enviva Partners LP/Enviva Partners Finance Corp.144A† | 6.50 | 1-15-2026 | 2,460,000 | 1,070,100 | ||
TerraForm Power Operating LLC144A | 5.00 | 1-31-2028 | 2,070,000 | 1,971,496 | ||
3,041,596 | ||||||
Oil & gas: 1.71% | ||||||
Aethon United BR LP/Aethon United Finance Corp.144A | 8.25 | 2-15-2026 | 1,345,000 | 1,360,520 | ||
Crescent Energy Finance LLC144A | 7.63 | 4-1-2032 | 10,000 | 10,077 | ||
Encino Acquisition Partners Holdings LLC144A | 8.50 | 5-1-2028 | 1,225,000 | 1,238,316 | ||
Hilcorp Energy I LP/Hilcorp Finance Co.144A | 5.75 | 2-1-2029 | 375,000 | 365,264 | ||
Hilcorp Energy I LP/Hilcorp Finance Co.144A | 6.25 | 11-1-2028 | 1,470,000 | 1,468,395 | ||
Hilcorp Energy I LP/Hilcorp Finance Co.144A | 8.38 | 11-1-2033 | 60,000 | 65,052 | ||
Nabors Industries Ltd.144A | 7.50 | 1-15-2028 | 725,000 | 679,990 | ||
Nabors Industries, Inc.144A | 7.38 | 5-15-2027 | 890,000 | 888,361 | ||
Nabors Industries, Inc.144A | 9.13 | 1-31-2030 | 60,000 | 62,379 | ||
Talos Production, Inc.144A | 9.00 | 2-1-2029 | 170,000 | 180,534 | ||
6,318,888 | ||||||
Oil & gas services: 0.78% | ||||||
Bristow Group, Inc.144A | 6.88 | 3-1-2028 | 1,885,000 | 1,844,982 | ||
Oceaneering International, Inc. | 6.00 | 2-1-2028 | 1,060,000 | 1,044,333 | ||
2,889,315 | ||||||
Pipelines: 4.12% | ||||||
Antero Midstream Partners LP/Antero Midstream Finance Corp.144A | 6.63 | 2-1-2032 | 1,380,000 | 1,386,025 | ||
Buckeye Partners LP144A | 4.50 | 3-1-2028 | 475,000 | 451,259 | ||
Interest rate | Maturity date | Principal | Value | |||
Pipelines(continued) | ||||||
Buckeye Partners LP | 5.85 % | 11-15-2043 | $ | 425,000 | $362,091 | |
CQP Holdco LP/BIP-V Chinook Holdco LLC144A | 5.50 | 6-15-2031 | 1,425,000 | 1,346,791 | ||
CQP Holdco LP/BIP-V Chinook Holdco LLC144A | 7.50 | 12-15-2033 | 540,000 | 555,777 | ||
DT Midstream, Inc.144A | 4.13 | 6-15-2029 | 190,000 | 174,673 | ||
DT Midstream, Inc.144A | 4.38 | 6-15-2031 | 950,000 | 860,343 | ||
Energy Transfer LP (5 Year Treasury Constant Maturity+4.02%)± | 8.00 | 5-15-2054 | 435,000 | 456,259 | ||
EnLink Midstream LLC144A | 6.50 | 9-1-2030 | 400,000 | 411,530 | ||
EnLink Midstream Partners LP | 5.60 | 4-1-2044 | 1,045,000 | 930,415 | ||
Harvest Midstream I LP144A | 7.50 | 9-1-2028 | 965,000 | 978,443 | ||
Hess Midstream Operations LP144A | 5.50 | 10-15-2030 | 315,000 | 305,218 | ||
Kinetik Holdings LP144A | 5.88 | 6-15-2030 | 975,000 | 953,673 | ||
Kinetik Holdings LP144A | 6.63 | 12-15-2028 | 175,000 | 178,107 | ||
Prairie Acquiror LP144A | 9.00 | 8-1-2029 | 690,000 | 710,314 | ||
Rockies Express Pipeline LLC144A | 6.88 | 4-15-2040 | 855,000 | 839,090 | ||
Tallgrass Energy Partners LP/Tallgrass Energy Finance Corp.144A | 6.00 | 12-31-2030 | 1,115,000 | 1,059,176 | ||
Venture Global Calcasieu Pass LLC144A | 6.25 | 1-15-2030 | 1,340,000 | 1,348,124 | ||
Venture Global LNG, Inc.144A | 8.38 | 6-1-2031 | 1,200,000 | 1,237,523 | ||
Venture Global LNG, Inc.144A | 9.88 | 2-1-2032 | 595,000 | 641,258 | ||
15,186,089 | ||||||
Financial: 8.07% | ||||||
Banks: 2.56% | ||||||
Bank of America Corp. Series JJ (U.S. SOFR 3 Month+3.55%)ʊ± | 5.13 | 6-20-2024 | 460,000 | 460,423 | ||
Bank of America Corp. Series RR (5 Year Treasury Constant Maturity+2.76%)ʊ± | 4.38 | 1-27-2027 | 2,015,000 | 1,888,947 | ||
Citigroup, Inc. Series V (U.S. SOFR+3.23%)ʊ± | 4.70 | 1-30-2025 | 1,000,000 | 975,492 | ||
Citigroup, Inc. Series X (5 Year Treasury Constant Maturity+3.42%)ʊ± | 3.88 | 2-18-2026 | 815,000 | 769,175 | ||
Citizens Financial Group, Inc. Series F (5 Year Treasury Constant Maturity+5.31%)ʊ± | 5.65 | 10-6-2025 | 2,000,000 | 1,954,182 | ||
Fifth Third Bancorp Series L (5 Year Treasury Constant Maturity+4.22%)ʊ± | 4.50 | 9-30-2025 | 2,000,000 | 1,926,371 | ||
JPMorgan Chase & Co. Series HH (U.S. SOFR 3 Month+3.13%)ʊ± | 4.60 | 2-1-2025 | 1,465,000 | 1,440,262 | ||
9,414,852 | ||||||
Diversified financial services: 2.61% | ||||||
Aircastle Ltd. Series A (5 Year Treasury Constant Maturity+4.41%)144Aʊ± | 5.25 | 6-15-2026 | 840,000 | 800,120 | ||
Enact Holdings, Inc.144A | 6.50 | 8-15-2025 | 1,295,000 | 1,294,741 | ||
Encore Capital Group, Inc.144A | 9.25 | 4-1-2029 | 430,000 | 440,482 | ||
Jefferies Finance LLC144A | 5.00 | 8-15-2028 | 485,000 | 446,000 | ||
Nationstar Mortgage Holdings, Inc.144A | 5.00 | 2-1-2026 | 855,000 | 836,707 | ||
Nationstar Mortgage Holdings, Inc.144A | 7.13 | 2-1-2032 | 610,000 | 605,823 | ||
Navient Corp. | 5.00 | 3-15-2027 | 495,000 | 474,231 | ||
Navient Corp. | 11.50 | 3-15-2031 | 60,000 | 66,776 | ||
Interest rate | Maturity date | Principal | Value | |||
Diversified financial services(continued) | ||||||
OneMain Finance Corp. | 7.13 % | 3-15-2026 | $ | 720,000 | $733,065 | |
Oppenheimer Holdings, Inc. | 5.50 | 10-1-2025 | 1,215,000 | 1,193,737 | ||
PRA Group, Inc.144A | 5.00 | 10-1-2029 | 1,630,000 | 1,373,573 | ||
Rocket Mortgage LLC/Rocket Mortgage Co.-Issuer, Inc.144A | 4.00 | 10-15-2033 | 615,000 | 520,961 | ||
United Wholesale Mortgage LLC144A | 5.50 | 11-15-2025 | 360,000 | 356,755 | ||
United Wholesale Mortgage LLC144A | 5.50 | 4-15-2029 | 515,000 | 487,086 | ||
9,630,057 | ||||||
Insurance: 1.22% | ||||||
AmWINS Group, Inc.144A | 4.88 | 6-30-2029 | 910,000 | 849,378 | ||
AmWINS Group, Inc.144A | 6.38 | 2-15-2029 | 445,000 | 447,402 | ||
AssuredPartners, Inc.144A | 5.63 | 1-15-2029 | 1,150,000 | 1,059,472 | ||
BroadStreet Partners, Inc.144A | 5.88 | 4-15-2029 | 765,000 | 708,057 | ||
HUB International Ltd.144A | 5.63 | 12-1-2029 | 365,000 | 342,234 | ||
HUB International Ltd.144A | 7.25 | 6-15-2030 | 125,000 | 128,462 | ||
HUB International Ltd.144A | 7.38 | 1-31-2032 | 840,000 | 845,657 | ||
Panther Escrow Issuer LLC144A%% | 7.13 | 6-1-2031 | 120,000 | 122,005 | ||
4,502,667 | ||||||
Private equity: 0.09% | ||||||
HAT Holdings I LLC/HAT Holdings II LLC144A | 6.00 | 4-15-2025 | 345,000 | 343,603 | ||
REITS: 1.59% | ||||||
Iron Mountain, Inc.144A | 4.50 | 2-15-2031 | 670,000 | 604,499 | ||
Iron Mountain, Inc.144A | 5.25 | 7-15-2030 | 1,615,000 | 1,527,754 | ||
Ladder Capital Finance Holdings LLLP/Ladder Capital Finance Corp.144A | 5.25 | 10-1-2025 | 800,000 | 785,769 | ||
Service Properties Trust | 4.75 | 10-1-2026 | 615,000 | 573,227 | ||
Service Properties Trust144A | 8.63 | 11-15-2031 | 1,035,000 | 1,103,762 | ||
Starwood Property Trust, Inc.144A | 4.38 | 1-15-2027 | 930,000 | 874,805 | ||
Starwood Property Trust, Inc. | 4.75 | 3-15-2025 | 400,000 | 393,021 | ||
5,862,837 | ||||||
Industrial: 3.69% | ||||||
Aerospace/defense: 0.46% | ||||||
Spirit AeroSystems, Inc.144A | 9.38 | 11-30-2029 | 230,000 | 250,881 | ||
TransDigm, Inc.144A | 6.63 | 3-1-2032 | 650,000 | 656,689 | ||
TransDigm, Inc. | 7.50 | 3-15-2027 | 800,000 | 800,660 | ||
1,708,230 | ||||||
Building materials: 0.70% | ||||||
Camelot Return Merger Sub, Inc.144A | 8.75 | 8-1-2028 | 1,580,000 | 1,623,061 | ||
Emerald Debt Merger Sub LLC144A | 6.63 | 12-15-2030 | 935,000 | 943,970 | ||
2,567,031 | ||||||
Interest rate | Maturity date | Principal | Value | |||
Hand/machine tools: 0.53% | ||||||
Werner FinCo LP/Werner FinCo, Inc.144A | 11.50 % | 6-15-2028 | $ | 775,000 | $846,188 | |
Werner FinCo LP/Werner FinCo, Inc. (PIK at 5.75%)144A¥ | 14.50 | 10-15-2028 | 1,215,613 | 1,127,481 | ||
1,973,669 | ||||||
Machinery-diversified: 0.56% | ||||||
Chart Industries, Inc.144A | 7.50 | 1-1-2030 | 390,000 | 404,994 | ||
Chart Industries, Inc.144A | 9.50 | 1-1-2031 | 315,000 | 343,028 | ||
TK Elevator U.S. Newco, Inc.144A | 5.25 | 7-15-2027 | 1,365,000 | 1,318,712 | ||
2,066,734 | ||||||
Packaging & containers: 0.99% | ||||||
Ardagh Metal Packaging Finance USA LLC/Ardagh Metal Packaging Finance PLC144A | 6.00 | 6-15-2027 | 600,000 | 582,461 | ||
Berry Global, Inc.144A | 5.63 | 7-15-2027 | 1,205,000 | 1,190,131 | ||
Clydesdale Acquisition Holdings, Inc.144A | 8.75 | 4-15-2030 | 780,000 | 766,381 | ||
Mauser Packaging Solutions Holding Co.144A | 7.88 | 8-15-2026 | 300,000 | 305,625 | ||
Owens-Brockway Glass Container, Inc.144A | 7.25 | 5-15-2031 | 550,000 | 560,176 | ||
Sealed Air Corp./Sealed Air Corp. U.S.144A | 7.25 | 2-15-2031 | 225,000 | 233,929 | ||
3,638,703 | ||||||
Trucking & leasing: 0.45% | ||||||
Fortress Transportation & Infrastructure Investors LLC144A | 5.50 | 5-1-2028 | 560,000 | 542,594 | ||
Fortress Transportation & Infrastructure Investors LLC144A | 6.50 | 10-1-2025 | 1,107,000 | 1,105,342 | ||
1,647,936 | ||||||
Technology: 1.14% | ||||||
Computers: 0.37% | ||||||
McAfee Corp.144A | 7.38 | 2-15-2030 | 390,000 | 357,648 | ||
Seagate HDD Cayman144A | 8.25 | 12-15-2029 | 125,000 | 134,308 | ||
Seagate HDD Cayman144A | 8.50 | 7-15-2031 | 805,000 | 869,934 | ||
1,361,890 | ||||||
Software: 0.77% | ||||||
AthenaHealth Group, Inc.144A | 6.50 | 2-15-2030 | 570,000 | 521,333 | ||
Cloud Software Group, Inc.144A | 6.50 | 3-31-2029 | 635,000 | 602,591 | ||
Cloud Software Group, Inc.144A | 9.00 | 9-30-2029 | 1,165,000 | 1,117,371 | ||
SS&C Technologies, Inc.144A | 5.50 | 9-30-2027 | 600,000 | 586,654 | ||
2,827,949 | ||||||
Utilities: 2.38% | ||||||
Electric: 2.38% | ||||||
Edison International (5 Year Treasury Constant Maturity+3.86%)± | 8.13 | 6-15-2053 | 475,000 | 491,242 | ||
NextEra Energy Operating Partners LP144A | 4.50 | 9-15-2027 | 495,000 | 463,302 | ||
NextEra Energy Operating Partners LP144A | 7.25 | 1-15-2029 | 515,000 | 526,929 | ||
NSG Holdings LLC/NSG Holdings, Inc.144A | 7.75 | 12-15-2025 | 209,041 | 206,951 | ||
Pattern Energy Operations LP/Pattern Energy Operations, Inc.144A | 4.50 | 8-15-2028 | 2,425,000 | 2,260,452 | ||
Interest rate | Maturity date | Principal | Value | |||
Electric(continued) | ||||||
PG&E Corp. | 5.25 % | 7-1-2030 | $ | 1,950,000 | $1,852,957 | |
Sempra (5 Year Treasury Constant Maturity+2.87%)± | 4.13 | 4-1-2052 | 825,000 | 761,101 | ||
Vistra Corp. (5 Year Treasury Constant Maturity+5.74%)144Aʊ± | 7.00 | 12-15-2026 | 1,155,000 | 1,143,618 | ||
Vistra Corp. Series C (5 Year Treasury Constant Maturity+5.05%)144Aʊ± | 8.88 | 1-15-2029 | 420,000 | 433,184 | ||
Vistra Operations Co. LLC144A | 7.75 | 10-15-2031 | 620,000 | 649,314 | ||
8,789,050 | ||||||
Total corporate bonds and notes (Cost $150,107,244) | 146,088,525 | |||||
Foreign corporate bonds and notes: 3.91% | ||||||
Financial: 3.91% | ||||||
Banks: 3.91% | ||||||
ABN AMRO Bank NV (EUR Swap Annual (vs. 6 Month EURIBOR) 5 Year+3.90%)ʊ± | 4.75 | 9-22-2027 | EUR | 3,000,000 | 3,038,311 | |
AIB Group PLC (EUR Swap Annual (vs. 6 Month EURIBOR) 5 Year+6.63%)ʊ± | 6.25 | 6-23-2025 | EUR | 2,000,000 | 2,144,214 | |
Banco Santander SA (EUR Swap Annual (vs. 6 Month EURIBOR) 5 Year+4.53%)ʊ± | 4.38 | 1-14-2026 | EUR | 3,000,000 | 3,029,501 | |
CaixaBank SA (EURIBOR ICE Swap Rate 11:00am+5.14%)ʊ± | 8.25 | 3-13-2029 | EUR | 1,400,000 | 1,604,155 | |
Commerzbank AG (EUR Swap Annual (vs. 6 Month EURIBOR) 5 Year+6.36%)ʊ± | 6.13 | 10-9-2025 | EUR | 2,600,000 | 2,766,441 | |
Credit Agricole SA (EURIBOR ICE Swap Rate 11:00am+4.44%)ʊ± | 7.25 | 9-23-2028 | EUR | 1,600,000 | 1,817,750 | |
14,400,372 | ||||||
Total foreign corporate bonds and notes (Cost $15,741,669) | 14,400,372 | |||||
Loans: 2.61% | ||||||
Communications: 0.11% | ||||||
Media: 0.11% | ||||||
DirecTV Financing LLC (U.S. SOFR 1 Month+5.00%)± | 10.44 | 8-2-2027 | $ | 203,908 | 203,993 | |
Hubbard Radio LLC (U.S. SOFR 1 Month+4.25%)± | 9.58 | 3-28-2025 | 325,641 | 209,224 | ||
413,217 | ||||||
Consumer, cyclical: 0.64% | ||||||
Airlines: 0.44% | ||||||
Mileage Plus Holdings LLC (U.S. SOFR 3 Month+5.25%)± | 10.73 | 6-21-2027 | 991,250 | 1,019,520 | ||
SkyMiles IP Ltd. (U.S. SOFR 3 Month+3.75%)± | 9.07 | 10-20-2027 | 561,118 | 578,188 | ||
1,597,708 | ||||||
Auto parts & equipment: 0.07% | ||||||
First Brands Group LLC (U.S. SOFR 3 Month+5.00%)± | 10.57 | 3-30-2027 | 255,000 | 255,128 | ||
Leisure time: 0.02% | ||||||
Carnival Corp. (U.S. SOFR 1 Month+3.00%)± | 8.32 | 8-8-2027 | 84,363 | 84,416 | ||
Retail: 0.11% | ||||||
Petco Health & Wellness Co., Inc. (U.S. SOFR 3 Month+3.25%)± | 8.82 | 3-3-2028 | 450,000 | 415,462 | ||
Interest rate | Maturity date | Principal | Value | |||
Consumer, non-cyclical: 0.82% | ||||||
Commercial services: 0.82% | ||||||
Geo Group, Inc. (U.S. SOFR 1 Month+6.88%)± | 12.21 % | 3-23-2027 | $ | 2,593,446 | $2,662,821 | |
MPH Acquisition Holdings LLC (U.S. SOFR 3 Month+4.25%)± | 9.85 | 9-1-2028 | 198,521 | 191,490 | ||
PECF USS Intermediate Holding III Corp. (U.S. SOFR 3 Month+4.25%)± | 9.82 | 12-15-2028 | 238,273 | 180,701 | ||
3,035,012 | ||||||
Energy: 0.40% | ||||||
Energy-alternate sources: 0.08% | ||||||
Enviva, Inc. (U.S. SOFR 3 Month+8.00%)ౠ| 13.33 | 12-13-2024 | 250,348 | 292,907 | ||
Pipelines: 0.32% | ||||||
GIP III Stetson I LP (U.S. SOFR 1 Month+4.25%)± | 9.68 | 10-31-2028 | 891,302 | 893,753 | ||
Prairie ECI Acquiror LP (U.S. SOFR 1 Month+4.75%)± | 10.08 | 8-1-2029 | 270,000 | 268,796 | ||
1,162,549 | ||||||
Financial: 0.64% | ||||||
Diversified financial services: 0.11% | ||||||
Resolute Investment Managers, Inc. (U.S. SOFR 3 Month+4.25%)ౠ| 9.57 | 4-30-2024 | 636,344 | 404,079 | ||
Insurance: 0.53% | ||||||
Asurion LLC (U.S. SOFR 1 Month+3.25%)± | 8.69 | 12-23-2026 | 1,580,807 | 1,546,361 | ||
Asurion LLC (U.S. SOFR 1 Month+5.25%)± | 10.69 | 1-31-2028 | 440,000 | 394,900 | ||
1,941,261 | ||||||
Total loans (Cost $9,684,374) | 9,601,739 | |||||
Municipal obligations: 3.24% | ||||||
California: 0.58% | ||||||
Education revenue: 0.37% | ||||||
California PFA EEC, Inc. Series B144A | 5.00 | 6-15-2031 | 1,115,000 | 1,043,803 | ||
California School Finance Authority Fenton Charter Public Schools Series B144A | 4.25 | 7-1-2025 | 325,000 | 323,928 | ||
1,367,731 | ||||||
Tobacco revenue: 0.21% | ||||||
Golden State Tobacco Securitization Corp. Series A-1 | 4.21 | 6-1-2050 | 1,000,000 | 759,370 | ||
2,127,101 | ||||||
Colorado: 0.12% | ||||||
Health revenue: 0.12% | ||||||
Denver Health & Hospital Authority Series B | 5.15 | 12-1-2026 | 445,000 | 439,614 | ||
Florida: 0.48% | ||||||
Education revenue: 0.18% | ||||||
Florida Higher Educational Facilities Financial Authority Jacksonville University Series A-2144A | 5.43 | 6-1-2027 | 650,000 | 646,489 | ||
Interest rate | Maturity date | Principal | Value | |||
Water & sewer revenue: 0.30% | ||||||
Charlotte County IDA MSKP Town & Country Utility LLC Series B144A | 5.00 % | 10-1-2036 | $ | 1,250,000 | $1,123,480 | |
1,769,969 | ||||||
Georgia: 0.05% | ||||||
Health revenue: 0.05% | ||||||
Development Authority of Cobb County Presbyterian Village Austell, Inc. Series B144A | 5.75 | 12-1-2028 | 200,000 | 193,918 | ||
Guam: 0.15% | ||||||
Airport revenue: 0.15% | ||||||
Antonio B Won Pat International Airport Authority Series A | 4.46 | 10-1-2043 | 675,000 | 544,532 | ||
Illinois: 0.34% | ||||||
GO revenue: 0.34% | ||||||
Chicago Board of Education Series E | 6.04 | 12-1-2029 | 1,255,000 | 1,235,727 | ||
Indiana: 0.13% | ||||||
Health revenue: 0.13% | ||||||
County of Knox Good Samaritan Hospital Obligated Group Series B | 5.90 | 4-1-2034 | 480,000 | 464,851 | ||
Iowa: 0.31% | ||||||
Housing revenue: 0.31% | ||||||
City of Coralville Series C | 5.00 | 5-1-2030 | 1,200,000 | 1,156,685 | ||
Louisiana: 0.16% | ||||||
Health revenue: 0.16% | ||||||
Louisiana Local Government Environmental Facilities & CDA Glen Retirement System Obligated Group Series B | 5.75 | 1-1-2029 | 630,000 | 602,140 | ||
New Jersey: 0.25% | ||||||
Education revenue: 0.25% | ||||||
New Jersey Educational Facilities Authority Georgian Court University A New Jersey Non Profit Corp. Series H | 4.25 | 7-1-2028 | 1,000,000 | 929,152 | ||
New York: 0.17% | ||||||
Education revenue: 0.07% | ||||||
Yonkers Economic Development Corp. Charter School of Educational Excellence Series B | 4.50 | 10-15-2024 | 275,000 | 271,969 | ||
Health revenue: 0.05% | ||||||
Jefferson County Civic Facility Development Corp. Samaritan Medical Center Obligated Group Series B | 4.25 | 11-1-2028 | 180,000 | 169,913 | ||
Utilities revenue: 0.05% | ||||||
New York State Energy Research & Development Authority Series A | 4.81 | 4-1-2034 | 195,000 | 189,994 | ||
631,876 | ||||||
Interest rate | Maturity date | Principal | Value | |||
Oklahoma: 0.12% | ||||||
Health revenue: 0.12% | ||||||
Oklahoma Development Finance Authority OU Medicine Obligated Group Series C | 5.45 % | 8-15-2028 | $ | 500,000 | $452,785 | |
Texas: 0.16% | ||||||
Industrial development revenue: 0.16% | ||||||
Port of Beaumont IDA Jefferson 2020 Bond Lessee & Borrower LLC Obligated Group Series B144A | 4.10 | 1-1-2028 | 700,000 | 599,806 | ||
Wisconsin: 0.22% | ||||||
Education revenue: 0.22% | ||||||
PFA Burrell College of Osteopathic Medicine LLC144A | 5.13 | 6-1-2028 | 830,000 | 811,990 | ||
Total municipal obligations (Cost $12,825,504) | 11,960,146 | |||||
Dividend rate | Shares | |||||
Preferred stocks: 0.35% | ||||||
Energy: 0.16% | ||||||
Oil, gas & consumable fuels: 0.16% | ||||||
Petroleo Brasileiro SA | 0.14 | 78,047 | 581,376 | |||
Financials: 0.04% | ||||||
Banks: 0.04% | ||||||
Itau Unibanco Holding SA | 0.04 | 18,100 | 125,012 | |||
Information technology: 0.13% | ||||||
Technology hardware, storage & peripherals: 0.13% | ||||||
Samsung Electronics Co. Ltd. | 0.27 | 9,695 | 483,940 | |||
Materials: 0.02% | ||||||
Chemicals: 0.02% | ||||||
LG Chem Ltd. | 2.63 | 369 | 82,228 | |||
Total preferred stocks (Cost $1,252,302) | 1,272,556 | |||||
Interest rate | Principal | |||||
Yankee corporate bonds and notes: 11.09% | ||||||
Basic materials: 0.14% | ||||||
Chemicals: 0.14% | ||||||
Braskem Netherlands Finance BV144A | 4.50 | 1-31-2030 | $ | 610,000 | 524,523 | |
Communications: 0.17% | ||||||
Telecommunications: 0.17% | ||||||
Altice France SA144A | 8.13 | 2-1-2027 | 795,000 | 621,418 | ||
Interest rate | Maturity date | Principal | Value | |||
Consumer, cyclical: 2.37% | ||||||
Airlines: 0.59% | ||||||
Air Canada Pass-Through Trust Series 2020-1 Class C144A | 10.50 % | 7-15-2026 | $ | 1,355,000 | $1,476,950 | |
VistaJet Malta Finance PLC/Vista Management Holding, Inc.144A | 9.50 | 6-1-2028 | 820,000 | 697,257 | ||
2,174,207 | ||||||
Auto manufacturers: 0.10% | ||||||
Aston Martin Capital Holdings Ltd.144A | 10.00 | 3-31-2029 | 360,000 | 366,541 | ||
Entertainment: 0.20% | ||||||
Banijay Entertainment SASU144A | 8.13 | 5-1-2029 | 725,000 | 747,758 | ||
Leisure time: 1.48% | ||||||
Carnival Corp.144A | 6.00 | 5-1-2029 | 1,200,000 | 1,184,052 | ||
Carnival Corp.144A | 7.00 | 8-15-2029 | 245,000 | 255,531 | ||
Carnival Corp.144A | 7.63 | 3-1-2026 | 340,000 | 343,998 | ||
Royal Caribbean Cruises Ltd.144A | 5.38 | 7-15-2027 | 160,000 | 157,744 | ||
Royal Caribbean Cruises Ltd.144A | 5.50 | 4-1-2028 | 1,525,000 | 1,507,316 | ||
Royal Caribbean Cruises Ltd.144A | 6.25 | 3-15-2032 | 1,350,000 | 1,360,746 | ||
Royal Caribbean Cruises Ltd.144A | 9.25 | 1-15-2029 | 585,000 | 627,450 | ||
5,436,837 | ||||||
Consumer, non-cyclical: 0.18% | ||||||
Pharmaceuticals: 0.18% | ||||||
Teva Pharmaceutical Finance Netherlands III BV | 8.13 | 9-15-2031 | 600,000 | 658,079 | ||
Energy: 0.82% | ||||||
Oil & gas: 0.23% | ||||||
Borr IHC Ltd./Borr Finance LLC144A | 10.00 | 11-15-2028 | 820,000 | 851,608 | ||
Pipelines: 0.59% | ||||||
Enbridge, Inc. (5 Year Treasury Constant Maturity+4.42%)± | 7.63 | 1-15-2083 | 725,000 | 744,033 | ||
Northriver Midstream Finance LP144A | 5.63 | 2-15-2026 | 1,430,000 | 1,417,770 | ||
2,161,803 | ||||||
Financial: 6.29% | ||||||
Banks: 5.69% | ||||||
BBVA Bancomer SA (5 Year Treasury Constant Maturity+4.21%)144A± | 8.13 | 1-8-2039 | 260,000 | 269,378 | ||
BNP Paribas SA (5 Year Treasury Constant Maturity+3.73%)144Aʊ± | 8.00 | 8-22-2031 | 200,000 | 204,126 | ||
Danske Bank AS (7 Year Treasury Constant Maturity+4.13%)ʊ± | 7.00 | 6-26-2025 | 2,300,000 | 2,279,875 | ||
HSBC Holdings PLC (USD ICE Swap Rate 11:00am NY 5 Year+3.75%)ʊ± | 6.00 | 5-22-2027 | 475,000 | 457,220 | ||
HSBC Holdings PLC (USD ICE Swap Rate 11:00am NY 5 Year+4.37%)ʊ± | 6.38 | 3-30-2025 | 2,000,000 | 1,985,842 | ||
ING Groep NV (USD ICE Swap Rate 11:00am NY 5 Year+4.20%)ʊ± | 6.75 | 4-16-2024 | 3,800,000 | 3,800,000 | ||
Interest rate | Maturity date | Principal | Value | |||
Banks(continued) | ||||||
Intesa Sanpaolo SpA (USD Swap Semi Annual (vs. 3Month LIBOR) 5 Year+5.46%)144Aʊ± | 7.70 % | 9-17-2025 | $ | 710,000 | $707,145 | |
Lloyds Banking Group PLC (USD Swap Semi Annual (vs. 3Month LIBOR) 5 Year+4.76%)ʊ± | 7.50 | 6-27-2024 | 3,665,000 | 3,642,965 | ||
NatWest Group PLC (5 Year Treasury Constant Maturity+3.10%)ʊ± | 4.60 | 6-28-2031 | 1,500,000 | 1,166,665 | ||
Skandinaviska Enskilda Banken AB (5 Year Treasury Constant Maturity+3.46%)ʊ± | 5.13 | 5-13-2025 | 2,000,000 | 1,950,000 | ||
Societe Generale SA (USD ICE Swap Rate 11:00am NY 5 Year+5.87%)144Aʊ± | 8.00 | 9-29-2025 | 3,535,000 | 3,551,378 | ||
UBS Group AG (5 Year Treasury Constant Maturity+3.40%)144Aʊ± | 4.88 | 2-12-2027 | 790,000 | 725,392 | ||
UBS Group AG (USD SOFR ICE Swap Rate 11:00am NY 5 Year+4.16%)144Aʊ± | 7.75 | 4-12-2031 | 245,000 | 251,975 | ||
20,991,961 | ||||||
Diversified financial services: 0.60% | ||||||
Castlelake Aviation Finance DAC144A | 5.00 | 4-15-2027 | 970,000 | 934,255 | ||
Macquarie Airfinance Holdings Ltd.144A | 6.50 | 3-26-2031 | 210,000 | 213,745 | ||
Macquarie Airfinance Holdings Ltd.144A | 8.38 | 5-1-2028 | 1,000,000 | 1,059,966 | ||
2,207,966 | ||||||
Industrial: 0.57% | ||||||
Aerospace/defense: 0.18% | ||||||
Bombardier, Inc.144A | 8.75 | 11-15-2030 | 625,000 | 667,360 | ||
Electronics: 0.27% | ||||||
Sensata Technologies BV144A | 4.00 | 4-15-2029 | 475,000 | 433,716 | ||
Sensata Technologies BV144A | 5.88 | 9-1-2030 | 580,000 | 567,444 | ||
1,001,160 | ||||||
Machinery-diversified: 0.12% | ||||||
TK Elevator Holdco GmbH144A | 7.63 | 7-15-2028 | 445,000 | 436,292 | ||
Utilities: 0.55% | ||||||
Electric: 0.55% | ||||||
Drax Finco PLC144A | 6.63 | 11-1-2025 | 1,165,000 | 1,153,350 | ||
Emera, Inc. Series 16-A (3 Month LIBOR+5.44%)± | 6.75 | 6-15-2076 | 895,000 | 883,924 | ||
2,037,274 | ||||||
Total yankee corporate bonds and notes (Cost $40,243,752) | 40,884,787 | |||||
Yield | Shares | Value | ||||
Short-term investments: 3.52% | ||||||
Investment companies: 3.52% | ||||||
Allspring Government Money Market Fund Select Class♠∞## | 5.25 % | 12,958,506 | $12,958,506 | |||
Total short-term investments (Cost $12,958,506) | 12,958,506 | |||||
Total investments in securities (Cost $332,378,121) | 98.81 % | 364,197,978 | ||||
Other assets and liabilities, net | 1.19 | 4,396,977 | ||||
Total net assets | 100.00 % | $368,594,955 | ||||
# | All or a portion of this security is segregated as collateral for investments in derivative instruments. |
† | Non-income-earning security |
144A | The security may be resold in transactions exempt from registration, normally to qualified institutional buyers, pursuant to Rule 144A under the Securities Act of 1933. |
♦ | The security is fair valued in accordance with procedures approved by the Board of Trustees. |
˃ | Restricted security as to resale, excluding Rule 144A securities. The Fund held restricted securities with an aggregate current value of $0 (original aggregate cost of $65,232), representing 0.00% of its net assets as of period end. |
%% | The security is purchased on a when-issued basis. |
± | Variable rate investment. The rate shown is the rate in effect at period end. |
ʊ | Security is perpetual in nature and has no stated maturity date. The date shown reflects the next call date. |
¥ | A payment-in-kind (PIK) security is a security in which the issuer may make interest or dividend payments in cash or additional securities or a combination of both. The rate shown is the rate in effect at period end. |
‡ | Security is valued using significant unobservable inputs. |
♠ | The issuer of the security is an affiliated person of the Fund as defined in the Investment Company Act of 1940. |
∞ | The rate represents the 7-day annualized yield at period end. |
## | All or a portion of this security is segregated for when-issued securities and unfunded loans. |
Abbreviations: | |
ADR | American depositary receipt |
CDA | Community Development Authority |
EUR | Euro |
EURIBOR | Euro Interbank Offered Rate |
GO | General obligation |
IDA | Industrial Development Authority |
LIBOR | London Interbank Offered Rate |
PFA | Public Finance Authority |
REIT | Real estate investment trust |
SOFR | Secured Overnight Financing Rate |
Value, beginning of period | Purchases | Sales proceeds | Net realized gains (losses) | Net change in unrealized gains (losses) | Value, end of period | Shares, end of period | Income from affiliated securities | |
Short-term investments | ||||||||
Allspring Government Money Market Fund Select Class | $11,367,286 | $48,894,366 | $(47,303,146 ) | $0 | $0 | $12,958,506 | 12,958,506 | $312,681 |
Currency to be received | Currency to be delivered | Counterparty | Settlement date | Unrealized gains | Unrealized losses | ||
USD | 14,031,410 | EUR | 12,785,000 | Citibank N.A. | 4-2-2024 | $237,265 | $0 |
Currency to be received | Currency to be delivered | Counterparty | Settlement date | Unrealized gains | Unrealized losses | ||
EUR | 12,785,000 | USD | 13,889,368 | Citibank N.A. | 4-2-2024 | $0 | $(95,224 ) |
USD | 13,933,157 | EUR | 12,785,000 | Citibank N.A. | 6-28-2024 | 90,505 | 0 |
USD | 804,020 | EUR | 735,000 | Citibank N.A. | 6-28-2024 | 8,217 | 0 |
$335,987 | $(95,224 ) | ||||||
Description | Number of contracts | Expiration date | Notional cost | Notional value | Unrealized gains | Unrealized losses |
Long | ||||||
10-Year U.S. Treasury Notes | 40 | 6-18-2024 | $4,409,529 | $4,431,875 | $22,346 | $0 |
Description | Counterparty | Number of contracts | Notional amount | Exercise price | Expiration date | Value |
Call | ||||||
iShares MSCI EAFE ETF | Morgan Stanley Co. | (293 ) | $(2,431,900 ) | $83.00 | 4-5-2024 | $(14 ) |
iShares MSCI EAFE ETF | Morgan Stanley Co. | (83 ) | (684,750 ) | 82.50 | 4-12-2024 | (232 ) |
iShares MSCI EAFE ETF | Morgan Stanley Co. | (496 ) | (4,166,400 ) | 84.00 | 4-19-2024 | (518 ) |
iShares MSCI EAFE ETF | Morgan Stanley Co. | (608 ) | (5,016,000 ) | 82.50 | 4-26-2024 | (9,728 ) |
iShares MSCI Emerging Markets ETF | Morgan Stanley Co. | (1,047 ) | (4,554,450 ) | 43.50 | 4-5-2024 | (1 ) |
iShares MSCI Emerging Markets ETF | Morgan Stanley Co. | (1,806 ) | (7,856,100 ) | 43.50 | 4-12-2024 | (223 ) |
iShares MSCI Emerging Markets ETF | Morgan Stanley Co. | (867 ) | (3,728,100 ) | 43.00 | 4-19-2024 | (3,901 ) |
iShares MSCI Emerging Markets ETF | Morgan Stanley Co. | (880 ) | (3,784,000 ) | 43.00 | 4-26-2024 | (7,040 ) |
Nasdaq 100 Stock Index | Morgan Stanley Co. | (2 ) | (3,865,000 ) | 19,325.00 | 4-5-2024 | (130 ) |
Nasdaq 100 Stock Index | Morgan Stanley Co. | (4 ) | (7,810,000 ) | 19,525.00 | 4-5-2024 | (180 ) |
Nasdaq 100 Stock Index | Morgan Stanley Co. | (5 ) | (9,950,000 ) | 19,900.00 | 4-12-2024 | (350 ) |
Nasdaq 100 Stock Index | Morgan Stanley Co. | (5 ) | (10,000,000 ) | 20,000.00 | 4-19-2024 | (688 ) |
Nasdaq 100 Stock Index | Morgan Stanley Co. | (7 ) | (14,000,000 ) | 20,000.00 | 4-26-2024 | (3,430 ) |
Russell 2000 Index | Morgan Stanley Co. | (13 ) | (2,957,500 ) | 2,275.00 | 4-5-2024 | (260 ) |
Russell 2000 Index | Morgan Stanley Co. | (1 ) | (218,500 ) | 2,185.00 | 4-12-2024 | (1,030 ) |
Russell 2000 Index | Morgan Stanley Co. | (7 ) | (1,589,000 ) | 2,270.00 | 4-12-2024 | (998 ) |
Russell 2000 Index | Morgan Stanley Co. | (5 ) | (1,160,000 ) | 2,320.00 | 4-12-2024 | (313 ) |
Russell 2000 Index | Morgan Stanley Co. | (19 ) | (4,180,000 ) | 2,200.00 | 4-19-2024 | (22,420 ) |
Russell 2000 Index | Morgan Stanley Co. | (10 ) | (2,255,000 ) | 2,255.00 | 4-26-2024 | (7,250 ) |
Russell 2000 Index | Morgan Stanley Co. | (10 ) | (2,410,000 ) | 2,410.00 | 4-26-2024 | (800 ) |
S&P 500 Index | Morgan Stanley Co. | (20 ) | (11,100,000 ) | 5,550.00 | 4-5-2024 | (150 ) |
S&P 500 Index | Morgan Stanley Co. | (20 ) | (11,000,000 ) | 5,500.00 | 4-12-2024 | (750 ) |
S&P 500 Index | Morgan Stanley Co. | (19 ) | (10,545,000 ) | 5,550.00 | 4-19-2024 | (1,235 ) |
S&P 500 Index | Morgan Stanley Co. | (12 ) | (6,690,000 ) | 5,575.00 | 4-26-2024 | (1,710 ) |
$(63,351 ) |
Assets | |
Investments in unaffiliated securities, at value (cost $319,419,615) | $351,239,472 |
Investments in affiliated securities, at value (cost $12,958,506) | 12,958,506 |
Cash | 199,082 |
Cash at broker segregated for futures contracts | 193,000 |
Foreign currency, at value (cost $40,249) | 40,181 |
Receivable for dividends and interest | 4,335,950 |
Receivable for investments sold | 1,055,509 |
Receivable for Fund shares sold | 508,014 |
Unrealized gains on forward foreign currency contracts | 335,987 |
Prepaid expenses and other assets | 138,356 |
Total assets | 371,004,057 |
Liabilities | |
Payable for investments purchased | 1,101,817 |
Payable for when-issued transactions | 470,550 |
Payable for Fund shares redeemed | 147,024 |
Custody and accounting fees payable | 126,167 |
Management fee payable | 103,093 |
Unrealized losses on forward foreign currency contracts | 95,224 |
Contingent tax liability | 70,776 |
Written options, at value (premiums received $97,683) | 63,351 |
Administration fees payable | 47,488 |
Distribution fee payable | 32,603 |
Cash due to broker | 6,963 |
Payable for dividends on securities sold short | 6,515 |
Trustees’ fees and expenses payable | 2,791 |
Payable for daily variation margin on open futures contracts | 2,022 |
Accrued expenses and other liabilities | 132,718 |
Total liabilities | 2,409,102 |
Total net assets | $368,594,955 |
Net assets consist of | |
Paid-in capital | $397,269,401 |
Total distributable loss | (28,674,446 ) |
Total net assets | $368,594,955 |
Computation of net asset value and offering price per share | |
Net assets–Class A | $143,999,041 |
Shares outstanding–Class A1 | 24,164,707 |
Net asset value per share–Class A | $5.96 |
Maximum offering price per share – Class A2 | $6.32 |
Net assets–Class C | $50,937,612 |
Shares outstanding–Class C1 | 8,517,323 |
Net asset value per share–Class C | $5.98 |
Net assets–Class R6 | $53,411,805 |
Shares outstanding–Class R61 | 9,228,839 |
Net asset value per share–Class R6 | $5.79 |
Net assets–Administrator Class | $1,845,867 |
Shares outstanding–Administrator Class1 | 318,870 |
Net asset value per share–Administrator Class | $5.79 |
Net assets–Institutional Class | $118,400,630 |
Shares outstanding–Institutional Class1 | 20,479,810 |
Net asset value per share–Institutional Class | $5.78 |
Investment income | |
Interest | $7,939,253 |
Dividends (net of foreign withholdings taxes of $68,559) | 1,087,933 |
Income from affiliated securities | 312,681 |
Total investment income | 9,339,867 |
Expenses | |
Management fee | 973,529 |
Administration fees | |
Class A | 138,637 |
Class C | 52,667 |
Class R6 | 7,335 |
Administrator Class | 1,192 |
Institutional Class | 72,784 |
Shareholder servicing fees | |
Class A | 173,011 |
Class C | 65,716 |
Administrator Class | 2,261 |
Distribution fee | |
Class C | 197,147 |
Custody and accounting fees | 25,995 |
Professional fees | 38,713 |
Registration fees | 40,117 |
Shareholder report expenses | 24,013 |
Trustees’ fees and expenses | 11,913 |
Dividends on securities sold short | 6,515 |
Other fees and expenses | 5,301 |
Total expenses | 1,836,846 |
Less: Fee waivers and/or expense reimbursements | |
Fund-level | (428,474 ) |
Net expenses | 1,408,372 |
Net investment income | 7,931,495 |
Realized and unrealized gains (losses) on investments | |
Net realized gains (losses) on | |
Unaffiliated securities | $(1,216,199 ) |
Foreign currency and foreign currency translations | 3,566 |
Forward foreign currency contracts | (303,799 ) |
Futures contracts | 144,940 |
Swap contracts | 18,397 |
Written options | (413,005 ) |
Net realized losses on investments | (1,766,100 ) |
Net change in unrealized gains (losses) on | |
Unaffiliated securities (net of deferred foreign capital gains tax of $70,775) | 37,937,763 |
Foreign currency and foreign currency translations | 5,052 |
Forward foreign currency contracts | 143,090 |
Futures contracts | 88,266 |
Swap contracts | 4,190 |
Written options | (32,710 ) |
Net change in unrealized gains (losses) on investments | 38,145,651 |
Net realized and unrealized gains (losses) on investments | 36,379,551 |
Net increase in net assets resulting from operations | $44,311,046 |
Six months ended March 31, 2024 (unaudited) | Year ended September 30, 2023 | |||
Operations | ||||
Net investment income | $7,931,495 | $17,845,850 | ||
Net realized losses on investments | (1,766,100 ) | (35,210,291 ) | ||
Net change in unrealized gains (losses) on investments | 38,145,651 | 56,943,012 | ||
Net increase in net assets resulting from operations | 44,311,046 | 39,578,571 | ||
Distributions to shareholders from | ||||
Net investment income and net realized gains | ||||
Class A | (3,436,248 ) | (7,007,755 ) | ||
Class C | (1,092,669 ) | (2,418,524 ) | ||
Class R6 | (1,357,671 ) | (2,692,147 ) | ||
Administrator Class | (47,264 ) | (185,819 ) | ||
Institutional Class | (3,047,389 ) | (6,329,195 ) | ||
Total distributions to shareholders | (8,981,241 ) | (18,633,440 ) | ||
Capital share transactions | Shares | Shares | ||
Proceeds from shares sold | ||||
Class A | 1,071,910 | 6,138,243 | 1,621,519 | 8,774,775 |
Class C | 194,176 | 1,112,220 | 576,307 | 3,104,301 |
Class R6 | 930,488 | 5,252,647 | 184,462 | 958,209 |
Administrator Class | 6,995 | 39,026 | 55,327 | 291,812 |
Institutional Class | 2,930,107 | 16,049,650 | 4,051,329 | 21,512,127 |
28,591,786 | 34,641,224 | |||
Reinvestment of distributions | ||||
Class A | 556,572 | 3,144,772 | 1,185,752 | 6,408,586 |
Class C | 186,644 | 1,056,208 | 430,383 | 2,333,739 |
Class R6 | 243,650 | 1,338,591 | 511,693 | 2,689,696 |
Administrator Class | 8,553 | 46,927 | 35,174 | 184,487 |
Institutional Class | 502,385 | 2,753,749 | 1,064,656 | 5,592,932 |
8,340,247 | 17,209,440 | |||
Payment for shares redeemed | ||||
Class A | (2,988,336 ) | (16,835,929 ) | (7,738,824 ) | (41,838,907 ) |
Class C | (1,912,015 ) | (10,894,520 ) | (4,271,012 ) | (23,166,340 ) |
Class R6 | (1,019,209 ) | (5,602,426 ) | (1,838,741 ) | (9,712,477 ) |
Administrator Class | (52,655 ) | (289,723 ) | (678,478 ) | (3,616,675 ) |
Institutional Class | (4,406,412 ) | (23,820,671 ) | (13,379,397 ) | (70,107,303 ) |
(57,443,269 ) | (148,441,702 ) | |||
Net decrease in net assets resulting from capital share transactions | (20,511,236 ) | (96,591,038 ) | ||
Total increase (decrease) in net assets | 14,818,569 | (75,645,907 ) | ||
Net assets | ||||
Beginning of period | 353,776,386 | 429,422,293 | ||
End of period | $368,594,955 | $353,776,386 | ||
Six months ended March 31, 2024 (unaudited) | Year ended September 30 | |||||
Class A | 2023 | 2022 | 2021 | 2020 | 2019 | |
Net asset value, beginning of period | $5.39 | $5.14 | $6.42 | $5.95 | $6.06 | $6.33 |
Net investment income | 0.12 1 | 0.25 1 | 0.21 1 | 0.19 1 | 0.21 | 0.22 |
Net realized and unrealized gains (losses) on investments | 0.59 | 0.26 | (1.27 ) | 0.49 | (0.12 ) | 0.02 |
Total from investment operations | 0.71 | 0.51 | (1.06 ) | 0.68 | 0.09 | 0.24 |
Distributions to shareholders from | ||||||
Net investment income | (0.14 ) | (0.26 ) | (0.22 ) | (0.21 ) | (0.20 ) | (0.23 ) |
Net realized gains | 0.00 | 0.00 | 0.00 | 0.00 | 0.00 | (0.28 ) |
Total distributions to shareholders | (0.14 ) | (0.26 ) | (0.22 ) | (0.21 ) | (0.20 ) | (0.51 ) |
Net asset value, end of period | $5.96 | $5.39 | $5.14 | $6.42 | $5.95 | $6.06 |
Total return2 | 13.33 % | 9.95 % | (16.86 )% | 11.58 % | 1.59 % | 4.51 % |
Ratios to average net assets (annualized) | ||||||
Gross expenses | 1.09 %* | 1.18 % | 1.13 % | 1.08 % | 1.07 % | 1.05 % |
Net expenses | 0.84 %* | 0.84 % | 0.85 % | 0.85 % | 0.85 % | 0.85 % |
Net investment income | 4.43 %* | 4.56 % | 3.38 % | 3.07 % | 3.50 % | 3.75 % |
Supplemental data | ||||||
Portfolio turnover rate | 23 % | 45 % | 86 % | 87 % | 39 % | 43 % |
Net assets, end of period (000s omitted) | $143,999 | $137,643 | $156,487 | $218,615 | $213,551 | $251,673 |
* | Ratios include dividends on securities sold short in the amount of 0.00%. |
1 | Calculated based upon average shares outstanding |
2 | Total return calculations do not include any sales charges. Returns for periods of less than one year are not annualized. |
Six months ended March 31, 2024 (unaudited) | Year ended September 30 | |||||
Class C | 2023 | 2022 | 2021 | 2020 | 2019 | |
Net asset value, beginning of period | $5.41 | $5.15 | $6.44 | $5.97 | $6.07 | $6.34 |
Net investment income | 0.10 1 | 0.21 1 | 0.17 | 0.15 | 0.17 | 0.18 |
Net realized and unrealized gains (losses) on investments | 0.59 | 0.26 | (1.28 ) | 0.48 | (0.11 ) | 0.02 |
Total from investment operations | 0.69 | 0.47 | (1.11 ) | 0.63 | 0.06 | 0.20 |
Distributions to shareholders from | ||||||
Net investment income | (0.12 ) | (0.21 ) | (0.18 ) | (0.16 ) | (0.16 ) | (0.19 ) |
Net realized gains | 0.00 | 0.00 | 0.00 | 0.00 | 0.00 | (0.28 ) |
Total distributions to shareholders | (0.12 ) | (0.21 ) | (0.18 ) | (0.16 ) | (0.16 ) | (0.47 ) |
Net asset value, end of period | $5.98 | $5.41 | $5.15 | $6.44 | $5.97 | $6.07 |
Total return2 | 12.85 % | 9.28 % | (17.61 )% | 10.70 % | 0.98 % | 3.71 % |
Ratios to average net assets (annualized) | ||||||
Gross expenses | 1.83 %* | 1.93 % | 1.87 % | 1.83 % | 1.82 % | 1.80 % |
Net expenses | 1.59 %* | 1.60 % | 1.60 % | 1.60 % | 1.60 % | 1.60 % |
Net investment income | 3.67 %* | 3.80 % | 2.61 % | 2.31 % | 2.75 % | 2.99 % |
Supplemental data | ||||||
Portfolio turnover rate | 23 % | 45 % | 86 % | 87 % | 39 % | 43 % |
Net assets, end of period (000s omitted) | $50,938 | $54,373 | $68,612 | $103,956 | $115,929 | $140,722 |
* | Ratios include dividends on securities sold short in the amount of 0.00%. |
1 | Calculated based upon average shares outstanding |
2 | Total return calculations do not include any sales charges. Returns for periods of less than one year are not annualized. |
Six months ended March 31, 2024 (unaudited) | Year ended September 30 | |||||
Class R6 | 2023 | 2022 | 2021 | 2020 | 2019 | |
Net asset value, beginning of period | $5.24 | $5.00 | $6.26 | $5.81 | $5.91 | $6.18 |
Net investment income | 0.13 1 | 0.26 1 | 0.24 | 0.23 | 0.22 | 0.24 1 |
Net realized and unrealized gains (losses) on investments | 0.57 | 0.26 | (1.25 ) | 0.46 | (0.09 ) | 0.03 |
Total from investment operations | 0.70 | 0.52 | (1.01 ) | 0.69 | 0.13 | 0.27 |
Distributions to shareholders from | ||||||
Net investment income | (0.15 ) | (0.28 ) | (0.25 ) | (0.24 ) | (0.23 ) | (0.26 ) |
Net realized gains | 0.00 | 0.00 | 0.00 | 0.00 | 0.00 | (0.28 ) |
Total distributions to shareholders | (0.15 ) | (0.28 ) | (0.25 ) | (0.24 ) | (0.23 ) | (0.54 ) |
Net asset value, end of period | $5.79 | $5.24 | $5.00 | $6.26 | $5.81 | $5.91 |
Total return2 | 13.57 % | 10.52 % | (16.61 )% | 11.99 % | 2.25 % | 5.07 % |
Ratios to average net assets (annualized) | ||||||
Gross expenses | 0.67 %* | 0.76 % | 0.70 % | 0.65 % | 0.64 % | 0.61 % |
Net expenses | 0.42 %* | 0.42 % | 0.42 % | 0.42 % | 0.42 % | 0.42 % |
Net investment income | 4.87 %* | 4.99 % | 3.83 % | 3.52 % | 3.89 % | 4.17 % |
Supplemental data | ||||||
Portfolio turnover rate | 23 % | 45 % | 86 % | 87 % | 39 % | 43 % |
Net assets, end of period (000s omitted) | $53,412 | $47,557 | $51,102 | $47,544 | $2,605 | $24 |
* | Ratios include dividends on securities sold short in the amount of 0.00%. |
1 | Calculated based upon average shares outstanding |
2 | Returns for periods of less than one year are not annualized. |
Six months ended March 31, 2024 (unaudited) | Year ended September 30 | |||||
Administrator Class | 2023 | 2022 | 2021 | 2020 | 2019 | |
Net asset value, beginning of period | $5.24 | $5.00 | $6.26 | $5.81 | $5.91 | $6.19 |
Net investment income | 0.12 1 | 0.24 1 | 0.21 1 | 0.19 1 | 0.21 1 | 0.22 1 |
Net realized and unrealized gains (losses) on investments | 0.57 | 0.26 | (1.24 ) | 0.48 | (0.10 ) | 0.02 |
Total from investment operations | 0.69 | 0.50 | (1.03 ) | 0.67 | 0.11 | 0.24 |
Distributions to shareholders from | ||||||
Net investment income | (0.14 ) | (0.26 ) | (0.23 ) | (0.22 ) | (0.21 ) | (0.24 ) |
Net realized gains | 0.00 | 0.00 | 0.00 | 0.00 | 0.00 | (0.28 ) |
Total distributions to shareholders | (0.14 ) | (0.26 ) | (0.23 ) | (0.22 ) | (0.21 ) | (0.52 ) |
Net asset value, end of period | $5.79 | $5.24 | $5.00 | $6.26 | $5.81 | $5.91 |
Total return2 | 13.38 % | 10.09 % | (16.91 )% | 11.61 % | 1.89 % | 4.52 % |
Ratios to average net assets (annualized) | ||||||
Gross expenses | 1.01 %* | 1.11 % | 1.04 % | 1.00 % | 0.99 % | 0.97 % |
Net expenses | 0.77 %* | 0.77 % | 0.77 % | 0.77 % | 0.77 % | 0.77 % |
Net investment income | 4.50 %* | 4.62 % | 3.43 % | 3.15 % | 3.57 % | 3.77 % |
Supplemental data | ||||||
Portfolio turnover rate | 23 % | 45 % | 86 % | 87 % | 39 % | 43 % |
Net assets, end of period (000s omitted) | $1,846 | $1,866 | $4,722 | $7,486 | $7,868 | $11,916 |
* | Ratios include dividends on securities sold short in the amount of 0.00%. |
1 | Calculated based upon average shares outstanding |
2 | Returns for periods of less than one year are not annualized. |
Six months ended March 31, 2024 (unaudited) | Year ended September 30 | |||||
Institutional Class | 2023 | 2022 | 2021 | 2020 | 2019 | |
Net asset value, beginning of period | $5.24 | $5.00 | $6.26 | $5.80 | $5.91 | $6.19 |
Net investment income | 0.13 1 | 0.26 1 | 0.22 1 | 0.21 | 0.22 1 | 0.24 |
Net realized and unrealized gains (losses) on investments | 0.56 | 0.25 | (1.24 ) | 0.48 | (0.11 ) | 0.01 |
Total from investment operations | 0.69 | 0.51 | (1.02 ) | 0.69 | 0.11 | 0.25 |
Distributions to shareholders from | ||||||
Net investment income | (0.15 ) | (0.27 ) | (0.24 ) | (0.23 ) | (0.22 ) | (0.25 ) |
Net realized gains | 0.00 | 0.00 | 0.00 | 0.00 | 0.00 | (0.28 ) |
Total distributions to shareholders | (0.15 ) | (0.27 ) | (0.24 ) | (0.23 ) | (0.22 ) | (0.53 ) |
Net asset value, end of period | $5.78 | $5.24 | $5.00 | $6.26 | $5.80 | $5.91 |
Total return2 | 13.33 % | 10.41 % | (16.69 )% | 12.08 % | 1.98 % | 4.80 % |
Ratios to average net assets (annualized) | ||||||
Gross expenses | 0.77 %* | 0.85 % | 0.79 % | 0.75 % | 0.74 % | 0.72 % |
Net expenses | 0.52 %* | 0.52 % | 0.52 % | 0.52 % | 0.52 % | 0.52 % |
Net investment income | 4.75 %* | 4.87 % | 3.67 % | 3.40 % | 3.83 % | 4.07 % |
Supplemental data | ||||||
Portfolio turnover rate | 23 % | 45 % | 86 % | 87 % | 39 % | 43 % |
Net assets, end of period (000s omitted) | $118,401 | $112,338 | $148,499 | $249,764 | $254,963 | $312,093 |
* | Ratios include dividends on securities sold short in the amount of 0.00%. |
1 | Calculated based upon average shares outstanding |
2 | Returns for periods of less than one year are not annualized. |
The Fund may enter into credit default swaps for hedging or speculative purposes to provide or receive a measure of protection against default on a referenced entity, obligation or index or a basket of single-name issuers or traded indexes. An index credit default swap references all the names in the index, and if a credit event is triggered, the credit event is settled based on that name’s weight in the index. Credit default swaps are agreements in which the protection buyer pays fixed periodic payments to the protection seller in consideration for a promise from the protection seller to make a specific payment should a negative credit event take place with respect to the referenced entity (e.g., bankruptcy, failure to pay, obligation acceleration, repudiation, moratorium or restructuring).
Gross unrealized gains | $45,691,848 |
Gross unrealized losses | (12,532,843 ) |
Net unrealized gains | $33,159,005 |
Quoted prices (Level 1) | Other significant observable inputs (Level 2) | Significant unobservable inputs (Level 3) | Total | |
Assets | ||||
Investments in: | ||||
Common stocks | ||||
Communication services | $14,066,813 | $0 | $0 | $14,066,813 |
Consumer discretionary | 17,165,289 | 0 | 0 | 17,165,289 |
Consumer staples | 3,572,975 | 59,357 | 0 | 3,632,332 |
Energy | 4,254,137 | 0 | 0 | 4,254,137 |
Financials | 20,478,987 | 210,097 | 0 | 20,689,084 |
Health care | 9,800,421 | 0 | 0 | 9,800,421 |
Industrials | 12,316,963 | 87,711 | 0 | 12,404,674 |
Information technology | 37,747,098 | 0 | 0 | 37,747,098 |
Materials | 2,364,361 | 0 | 0 | 2,364,361 |
Real estate | 3,268,084 | 0 | 0 | 3,268,084 |
Utilities | 1,639,054 | 0 | 0 | 1,639,054 |
Corporate bonds and notes | 0 | 146,088,525 | 0 | 146,088,525 |
Foreign corporate bonds and notes | 0 | 14,400,372 | 0 | 14,400,372 |
Loans | 0 | 8,904,753 | 696,986 | 9,601,739 |
Municipal obligations | 0 | 11,960,146 | 0 | 11,960,146 |
Preferred stocks | ||||
Energy | 581,376 | 0 | 0 | 581,376 |
Financials | 125,012 | 0 | 0 | 125,012 |
Information technology | 483,940 | 0 | 0 | 483,940 |
Materials | 82,228 | 0 | 0 | 82,228 |
Yankee corporate bonds and notes | 0 | 40,884,787 | 0 | 40,884,787 |
Short-term investments | ||||
Investment companies | 12,958,506 | 0 | 0 | 12,958,506 |
140,905,244 | 222,595,748 | 696,986 | 364,197,978 | |
Forward foreign currency contracts | 0 | 335,987 | 0 | 335,987 |
Futures contracts | 22,346 | 0 | 0 | 22,346 |
Total assets | $140,927,590 | $222,931,735 | $696,986 | $364,556,311 |
Liabilities | ||||
Forward foreign currency contracts | $0 | $95,224 | $0 | $95,224 |
Written options | 62,363 | 988 | 0 | 63,351 |
Total liabilities | $62,363 | $96,212 | $0 | $158,575 |
Average daily net assets | Management fee |
First $500 million | 0.550 % |
Next $500 million | 0.525 |
Next $2 billion | 0.500 |
Next $2 billion | 0.475 |
Next $5 billion | 0.440 |
Over $10 billion | 0.430 |
Class-level administration fee | |
Class A | 0.20 % |
Class C | 0.20 |
Class R6 | 0.03 |
Administrator Class | 0.13 |
Institutional Class | 0.13 |
EXPENSE RATIO CAPS | |
Class A | 0.84 % |
Class C | 1.59 |
Class R6 | 0.42 |
Administrator Class | 0.77 |
Institutional Class | 0.52 |
Unfunded commitments | Unrealized gain (loss) | |
Enviva Partners LP/Fin C, 4.00%, 12-13-2024 | $417,246 | $0 |
Enviva, Inc., 4.00%, 12-13-2024 | 166,899 | 0 |
$584,145 | $0 |
Forward foreign currency contracts | |
Average contract amounts to buy | $1,984,195 |
Average contract amounts to sell | 15,984,123 |
Futures contracts | |
Average notional balance on long futures | $4,717,864 |
Swap contracts | |
Average notional balance | $557,143 |
Written options | |
Average number of contracts written | 5,990 |
Interest rate risk | Equity risk | Foreign currency risk | Total | |
Asset derivatives | ||||
Forward foreign currency contracts | $0 | $0 | $335,987 | $335,987 |
Futures contracts | 22,346 * | 0 | 0 | 22,346 |
$22,346 | $0 | $335,987 | $358,333 | |
Liability derivatives | ||||
Forward foreign currency contracts | $0 | $0 | $95,224 | $95,224 |
Written options | 0 | 63,351 | 0 | 63,351 |
$0 | $63,351 | $95,224 | $158,575 | |
* | Amount represents the cumulative unrealized gains (losses) as reported in the table following the Portfolio of Investments. For futures contracts, only the current day’s variation margin as of March 31, 2024 is reported separately on the Statement of Assets and Liabilities. |
INTEREST RATE RISK | Credit risk | Equity risk | Foreign currency risk | TOTAL | |
Net realized gains (losses) on derivatives | |||||
Forward foreign currency contracts | $0 | $0 | $0 | $(303,799 ) | $(303,799 ) |
Futures contracts | 144,940 | 0 | 0 | 0 | 144,940 |
Swap contracts | 0 | 18,397 | 0 | 0 | 18,397 |
Written options | 0 | 0 | (413,005 ) | 0 | (413,005 ) |
$144,940 | $18,397 | $(413,005 ) | $(303,799 ) | $(553,467 ) | |
Net change in unrealized gains (losses) on derivatives | |||||
Forward foreign currency contracts | $0 | $0 | $0 | $143,090 | $143,090 |
Futures contracts | 88,266 | 0 | 0 | 0 | 88,266 |
Swap contracts | 0 | 4,190 | 0 | 0 | 4,190 |
Written options | 0 | 0 | (32,710 ) | 0 | (32,710 ) |
$88,266 | $4,190 | $(32,710 ) | $143,090 | $202,836 | |
Counterparty | Gross amounts of assets in the Statement of Assets and Liabilities | Amounts subject to netting agreements | Collateral received | Net amount of assets |
Citibank N.A. | $335,987 | $(95,224 ) | $0 | $240,763 |
Counterparty | Gross amounts of liabilities in the Statement of Assets and Liabilities | Amounts subject to netting agreements | Collateral pledged1 | Net amount of liabilities |
Citibank N.A. | $95,224 | $(95,224 ) | $0 | $0 |
Morgan Stanley Co. | 63,351 | 0 | (63,351 ) | 0 |
1 | Collateral pledged within this table is limited to the collateral for the net transaction with the counterparty. |
Name and year of birth | Position held and length of service* | Principal occupations during past five years or longer | Current other public company or investment company directorships |
William R. Ebsworth (Born 1957) | Trustee, since 2015 | Retired. From 1984 to 2013, equities analyst, portfolio manager, research director and chief investment officer at Fidelity Management and Research Company in Boston, Tokyo, and Hong Kong, and retired in 2013 as Chief Investment Officer of Fidelity Strategic Advisers, Inc. where he led a team of investment professionals managing client assets. Prior thereto, Board member of Hong Kong Securities Clearing Co., Hong Kong Options Clearing Corp., the Thailand International Fund, Ltd., Fidelity Investments Life Insurance Company, and Empire Fidelity Investments Life Insurance Company. Serves on the Investment Company Institute’s Board of Governors since 2022 and Executive Committee since 2023 as well as the Vice Chairman of the Governing Council of the Independent Directors Council since 2023. Audit Committee Chair and Investment Committee Chair of the Vincent Memorial Hospital Foundation (non-profit organization). Mr. Ebsworth is a CFA charterholder. | N/A |
Jane A. Freeman (Born 1953) | Trustee, since 2015; Chair Liaison, since January 2018# | Retired. From 2012 to 2014 and 1999 to 2008, Chief Financial Officer of Scientific Learning Corporation. From 2008 to 2012, Ms. Freeman provided consulting services related to strategic business projects. Prior to 1999, Portfolio Manager at Rockefeller & Co. and Scudder, Stevens & Clark. Board member of the Harding Loevner Funds from 1996 to 2014, serving as both Lead Independent Director and chair of the Audit Committee. Board member of the Russell Exchange Traded Funds Trust from 2011 to 2012 and the chair of the Audit Committee. Ms. Freeman is also an inactive Chartered Financial Analyst. | N/A |
Isaiah Harris, Jr. (Born 1952) | Trustee, since 2009; Audit Committee Chair, since 2019 | Retired. Member of the Advisory Board of CEF of East Central Florida. Chairman of the Board of CIGNA Corporation from 2009 to 2021, and Director from 2005 to 2008. From 2003 to 2011, Director of Deluxe Corporation. Prior thereto, President and CEO of BellSouth Advertising and Publishing Corp. from 2005 to 2007, President and CEO of BellSouth Enterprises from 2004 to 2005 and President of BellSouth Consumer Services from 2000 to 2003. Emeritus member of the Iowa State University Foundation Board of Governors. Emeritus Member of the Advisory board of Iowa State University School of Business. Advisory Board Member, Palm Harbor Academy (private school). Advisory Board Member, Fellowship of Christian Athletes. Mr. Harris is a certified public accountant (inactive status). | N/A |
David F. Larcker (Born 1950) | Trustee, since 2009 | Distinguished Visiting Fellow at the Hoover Institution since 2022. James Irvin Miller Professor of Accounting at the Graduate School of Business (Emeritus), Stanford University, Director of the Corporate Governance Research Initiative and Senior Faculty of The Rock Center for Corporate Governance since 2006. From 2005 to 2008, Professor of Accounting at the Graduate School of Business, Stanford University. Prior thereto, Ernst & Young Professor of Accounting at The Wharton School, University of Pennsylvania from 1985 to 2005. | N/A |
Olivia S. Mitchell (Born 1953) | Trustee, since 2006; Nominating and Governance Committee Chair, since 2018 | International Foundation of Employee Benefit Plans Professor since 1993, Wharton School of the University of Pennsylvania. Director of Wharton’s Pension Research Council and Boettner Center on Pensions & Retirement Research, and Research Associate at the National Bureau of Economic Research. Previously taught at Cornell University from 1978 to 1993. | N/A |
Name and year of birth | Position held and length of service* | Principal occupations during past five years or longer | Current other public company or investment company directorships |
Timothy J. Penny (Born 1951) | Trustee, since 1996; Chair, since 2018 | President and Chief Executive Officer of Southern Minnesota Initiative Foundation, a non-profit organization, since 2007. Vice Chair of the Economic Club of Minnesota, since 2007. Co-Chair of the Committee for a Responsible Federal Budget, since 1995. Member of the Board of Trustees of NorthStar Education Finance, Inc., a non-profit organization, from 2007-2022. Senior Fellow of the University of Minnesota Humphrey Institute from 1995 to 2017. | N/A |
James G. Polisson (Born 1959) | Trustee, since 2018 | Retired. Chief Marketing Officer, Source (ETF) UK Services, Ltd, from 2015 to 2017. From 2012 to 2015, Principal of The Polisson Group, LLC, a management consulting, corporate advisory and principal investing company. Chief Executive Officer and Managing Director at Russell Investments, Global Exchange Traded Funds from 2010 to 2012. Managing Director of Barclays Global Investors from 1998 to 2010 and Global Chief Marketing Officer for iShares and Barclays Global Investors from 2000 to 2010. Trustee of the San Francisco Mechanics’ Institute, a non- profit organization, from 2013 to 2015. Board member of the Russell Exchange Traded Fund Trust from 2011 to 2012. Director of Barclays Global Investors Holdings Deutschland GmbH from 2006 to 2009. Mr. Polisson is an attorney and has a retired status with the Massachusetts and District of Columbia Bar Associations. | N/A |
Pamela Wheelock (Born 1959) | Trustee, since January 2020; previously Trustee from January 2018 to July 2019# | Retired. Executive and Senior Financial leadership positions in the public, private and nonprofit sectors. Interim President and CEO, McKnight Foundation, 2020. Interim Commissioner, Minnesota Department of Human Services, 2019. Chief Operating Officer, Twin Cities Habitat for Humanity, 2017-2019. Vice President for University Services, University of Minnesota, 2012- 2016. Interim President and CEO, Blue Cross and Blue Shield of Minnesota, 2011-2012. Executive Vice-President and Chief Financial Officer, Minnesota Wild, 2002-2008. Commissioner, Minnesota Department of Finance, 1999-2002. Chair of the Board of Directors of Destination Medical Center Corporation. Board member of the Minnesota Wild Foundation. | N/A |
Name and year of birth | Position held and length of service | Principal occupations during past five years or longer |
Andrew Owen (Born 1960) | President, since 2017 | President and Chief Executive Officer of Allspring Funds Management, LLC since 2017 and Head of Global Fund Governance of Allspring Global Investments since 2022. Prior thereto, co-president of Galliard Capital Management, LLC, an affiliate of Allspring Funds Management, LLC, from 2019 to 2022 and Head of Affiliated Managers, Allspring Global Investments, from 2014 to 2019 and Executive Vice President responsible for marketing, investments and product development for Allspring Funds Management, LLC, from 2009 to 2014. |
Jeremy DePalma (Born 1974) | Treasurer, since 2012 (for certain funds in the Fund Complex); since 2021 (for the remaining funds in the Complex) | Senior Vice President of Allspring Funds Management, LLC since 2009. Senior Vice President of Evergreen Investment Management Company, LLC from 2008 to 2010 and head of the Fund Reporting and Control Team within Fund Administration from 2005 to 2010. |
Christopher Baker (Born 1976) | Chief Compliance Officer, since 2022 | Global Chief Compliance Officer for Allspring Global Investments since 2022. Prior thereto, Chief Compliance Officer for State Street Global Advisors from 2018 to 2021. Senior Compliance Officer for the State Street divisions of Alternative Investment Solutions, Sector Solutions, and Global Marketing from 2015 to 2018. From 2010 to 2015 Vice President, Global Head of Investment and Marketing Compliance for State Street Global Advisors. |
Matthew Prasse (Born 1983) | Chief Legal Officer, since 2022; Secretary, since 2021 | Senior Counsel of the Allspring Legal Department since 2021. Senior Counsel of the Wells Fargo Legal Department from 2018 to 2021. Previously, Counsel for Barings LLC from 2015 to 2018. Prior to joining Barings, Associate at Morgan, Lewis & Bockius LLP from 2008 to 2015. |

P.O. Box 219967
Kansas City, MO 64121-9967

SAR4304 03-24

Allspring Funds

President
Allspring Funds
Notice to Shareholders |
Beginning in July 2024, the Fund will be required by the Securities and Exchange Commission to send shareholders a paper copy of a new tailored shareholder report in place of the full shareholder report that you are now receiving. The tailored shareholder report will contain concise information about the Fund, including certain expense and performance information and fund statistics. If you wish to receive this new tailored shareholder report electronically, please follow the instructions on the back cover of this report. |
Other information that is currently included in the shareholder report, such as the Fund’s financial statements, will be available online and upon request, free of charge, in paper or electronic format. |
Investment objective | The Fund seeks total return, consisting of income and capital appreciation. |
Manager | Allspring Funds Management, LLC |
Subadvisers | Allspring Global Investments, LLC |
Allspring Global Investments (UK) Limited | |
Portfolio managers | Henrietta Pacquement, CFA, Scott M. Smith, CFA, Alex Temple, Jonathan Terry, CFA |
Average annual total returns (%) as of March 31, 2024 | |||||||||
Including sales charge | Excluding sales charge | Expense ratios1 (%) | |||||||
Inception date | 1 year | 5 year | Since inception | 1 year | 5 year | Since inception | Gross | Net2 | |
Class A (WGCAX)3 | 6-1-2022 | 1.49 | 0.35 | 0.71 | 6.33 | 1.28 | 1.63 | 1.49 | 0.82 |
Class C (WGCCX)4 | 6-1-2022 | 4.80 | 0.60 | 0.95 | 5.80 | 0.60 | 0.95 | 2.24 | 1.57 |
Class R6 (WGCRX) | 2-28-2019 | – | – | – | 6.85 | 1.66 | 2.01 | 1.12 | 0.45 |
Institutional Class (WGCIX) | 2-28-2019 | – | – | – | 6.80 | 1.61 | 1.96 | 1.17 | 0.50 |
Bloomberg Global Aggregate Bond Index5 | – | – | – | – | 0.49 | -1.17 | -0.90 * | – | – |
Bloomberg Global Aggregate Credit Index (USD Hedged)6 | – | – | – | – | 5.59 | 1.31 | 1.70 * | – | – |
* | Based on the inception date of the oldest Fund class. |
1 | Reflects the expense ratios as stated in the most recent prospectuses. The expense ratios shown are subject to change and may differ from the annualized expense ratios shown in the Financial Highlights of this report. |
2 | The manager has contractually committed through January 31, 2025, to waive fees and/or reimburse expenses to the extent necessary to cap total annual fund operating expenses after fee waivers at 0.82% for Class A, 1.57% for Class C, 0.45% for Class R6 and 0.50% for Institutional Class. Brokerage commissions, stamp duty fees, interest, taxes, acquired fund fees and expenses (if any), and extraordinary expenses are excluded from the expense caps. Prior to or after the commitment expiration date, the caps may be increased or the commitment to maintain the caps may be terminated only with the approval of the Board of Trustees. Without these caps, the Fund’s returns would have been lower. The expense ratio paid by an investor is the net expense ratio (the total annual fund operating expenses after fee waivers) as stated in the prospectuses. |
3 | Historical performance shown for the Class A shares prior to their inception reflects the performance of the Institutional Class shares and includes the higher expenses applicable to the Class A shares. |
4 | Historical performance shown for the Class C shares prior to their inception reflects the performance of the Institutional Class shares and includes the higher expenses applicable to the Class C shares. |
5 | The Bloomberg Global Aggregate Bond Index is a measure of global investment-grade debt performance. This multicurrency benchmark includes Treasury, government- related, corporate, and securitized fixed-rate bonds from both developed and emerging market issuers. You cannot invest directly in an index. |
6 | Bloomberg Global Aggregate Credit Index (USD Hedged) measures the credit sector of the global investment grade fixed-rate bond market, including corporate, government and agency securities, hedged in USD. You cannot invest directly in an index. |
CFA® and Chartered Financial Analyst® are trademarks owned by CFA Institute. |
Ten largest holdings (%) as of March 31, 20241 | |
Morgan Stanley, 3.13%, 7-27-2026 | 1.87 |
U.S. Treasury Notes, 4.00%, 1-31-2029 | 1.72 |
Citigroup, Inc., 3.30%, 4-27-2025 | 1.59 |
Reckitt Benckiser Treasury Services PLC, 2.75%, 6-26-2024 | 1.22 |
Verizon Communications, Inc., 3.40%, 3-22-2041 | 1.21 |
Motorola Solutions, Inc., 4.60%, 2-23-2028 | 1.20 |
Credit Suisse AG, 3.63%, 9-9-2024 | 1.13 |
Oracle Corp., 2.88%, 3-25-2031 | 1.07 |
British Airways Pass-Through Trust, 3.30%, 12-15-2032 | 1.06 |
American International Group, Inc., 4.75%, 4-1-2048 | 1.06 |
1 | Figures represent the percentage of the Fund’s net assets. Holdings are subject to change and may have changed since the date specified. |
Portfolio composition as of March 31, 20241 |
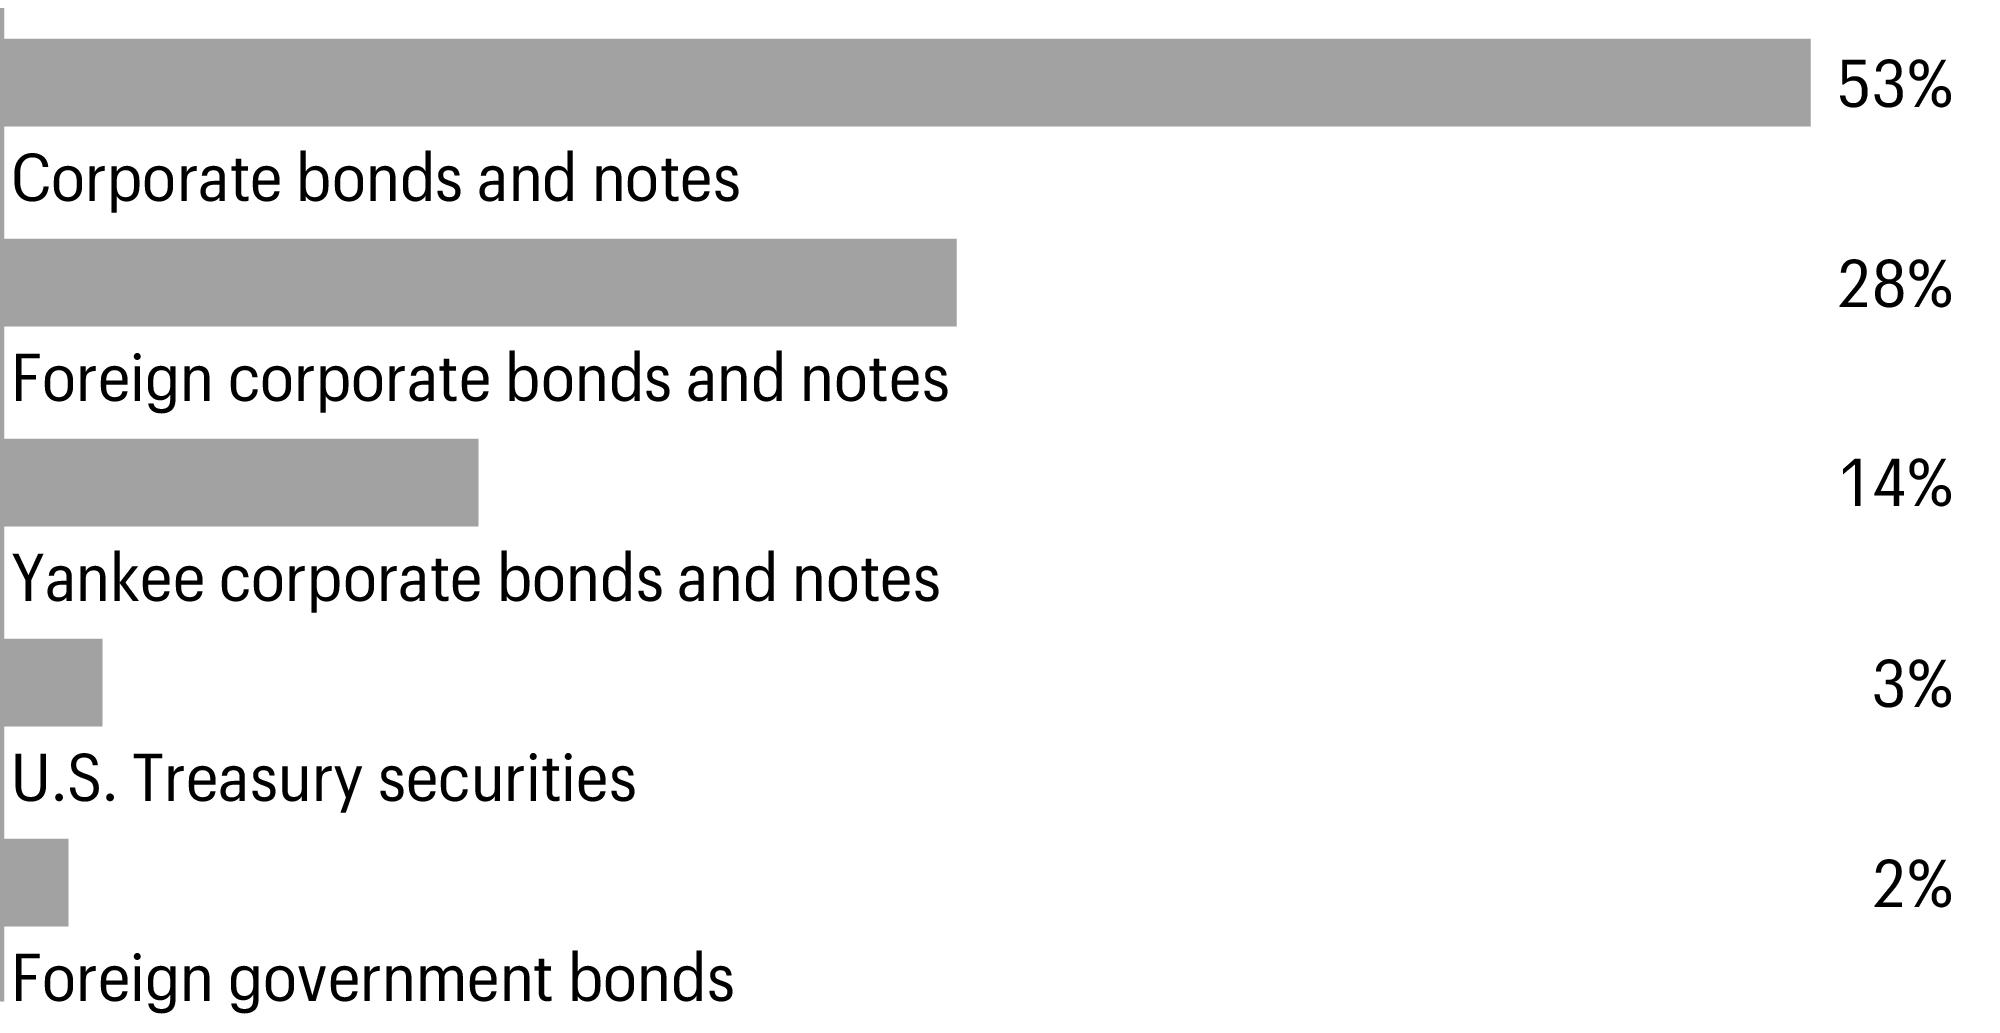
1 | Figures represent the percentage of the Fund’s long-term investments. Allocations are subject to change and may have changed since the date specified. |
Credit quality as of March 31, 20241 |
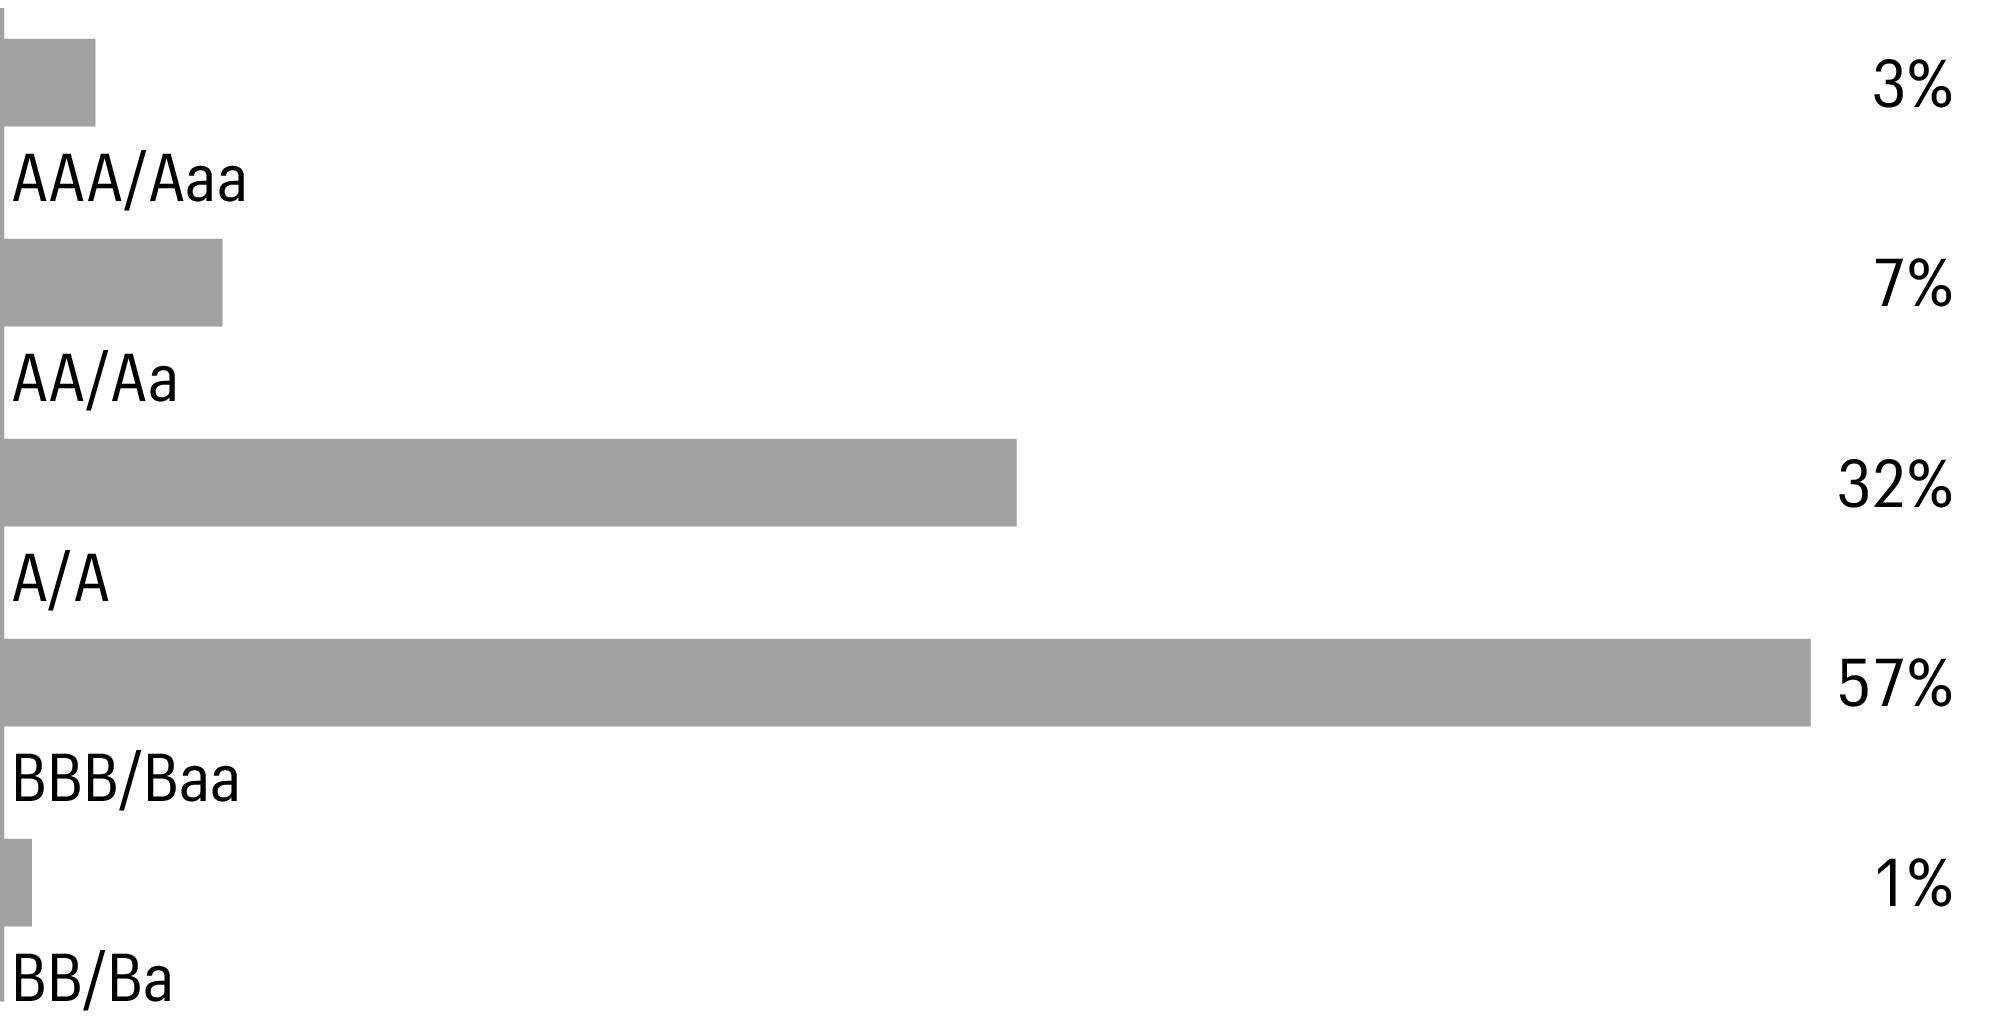
1 | The credit quality distribution of portfolio holdings reflected in the chart is based on ratings from Standard & Poor’s, Moody’s Investors Service, and/or Fitch Ratings Ltd. Credit quality ratings apply to the underlying holdings of the Fund and not to the Fund itself. The percentages of the portfolio with the ratings depicted in the chart are calculated based on the market value of fixed income securities held by the Fund. If a security was rated by all three rating agencies, the middle rating was utilized. If rated by two of the three rating agencies, the lower rating was utilized, and if rated by one of the rating agencies, that rating was utilized. Standard & Poor’s rates the creditworthiness of bonds, ranging from AAA (highest) to D (lowest). Ratings from A to CCC may be modified by the addition of a plus (+) or minus (-) sign to show relative standing within the rating categories. Standard & Poor’s rates the creditworthiness of short-term notes from SP-1 (highest) to SP-3 (lowest). Moody’s rates the creditworthiness of bonds, ranging from Aaa (highest) to C (lowest). Ratings Aa to B may be modified by the addition of a number 1 (highest) to 3 (lowest) to show relative standing within the ratings categories. Moody’s rates the creditworthiness of short-term U.S. tax-exempt municipal securities from MIG 1/VMIG 1 (highest) to SG (lowest). Fitch rates the creditworthiness of bonds, ranging from AAA (highest) to D (lowest). Credit quality distribution is subject to change and may have changed since the date specified. |
Effective maturity distribution as of March 31, 20241 |
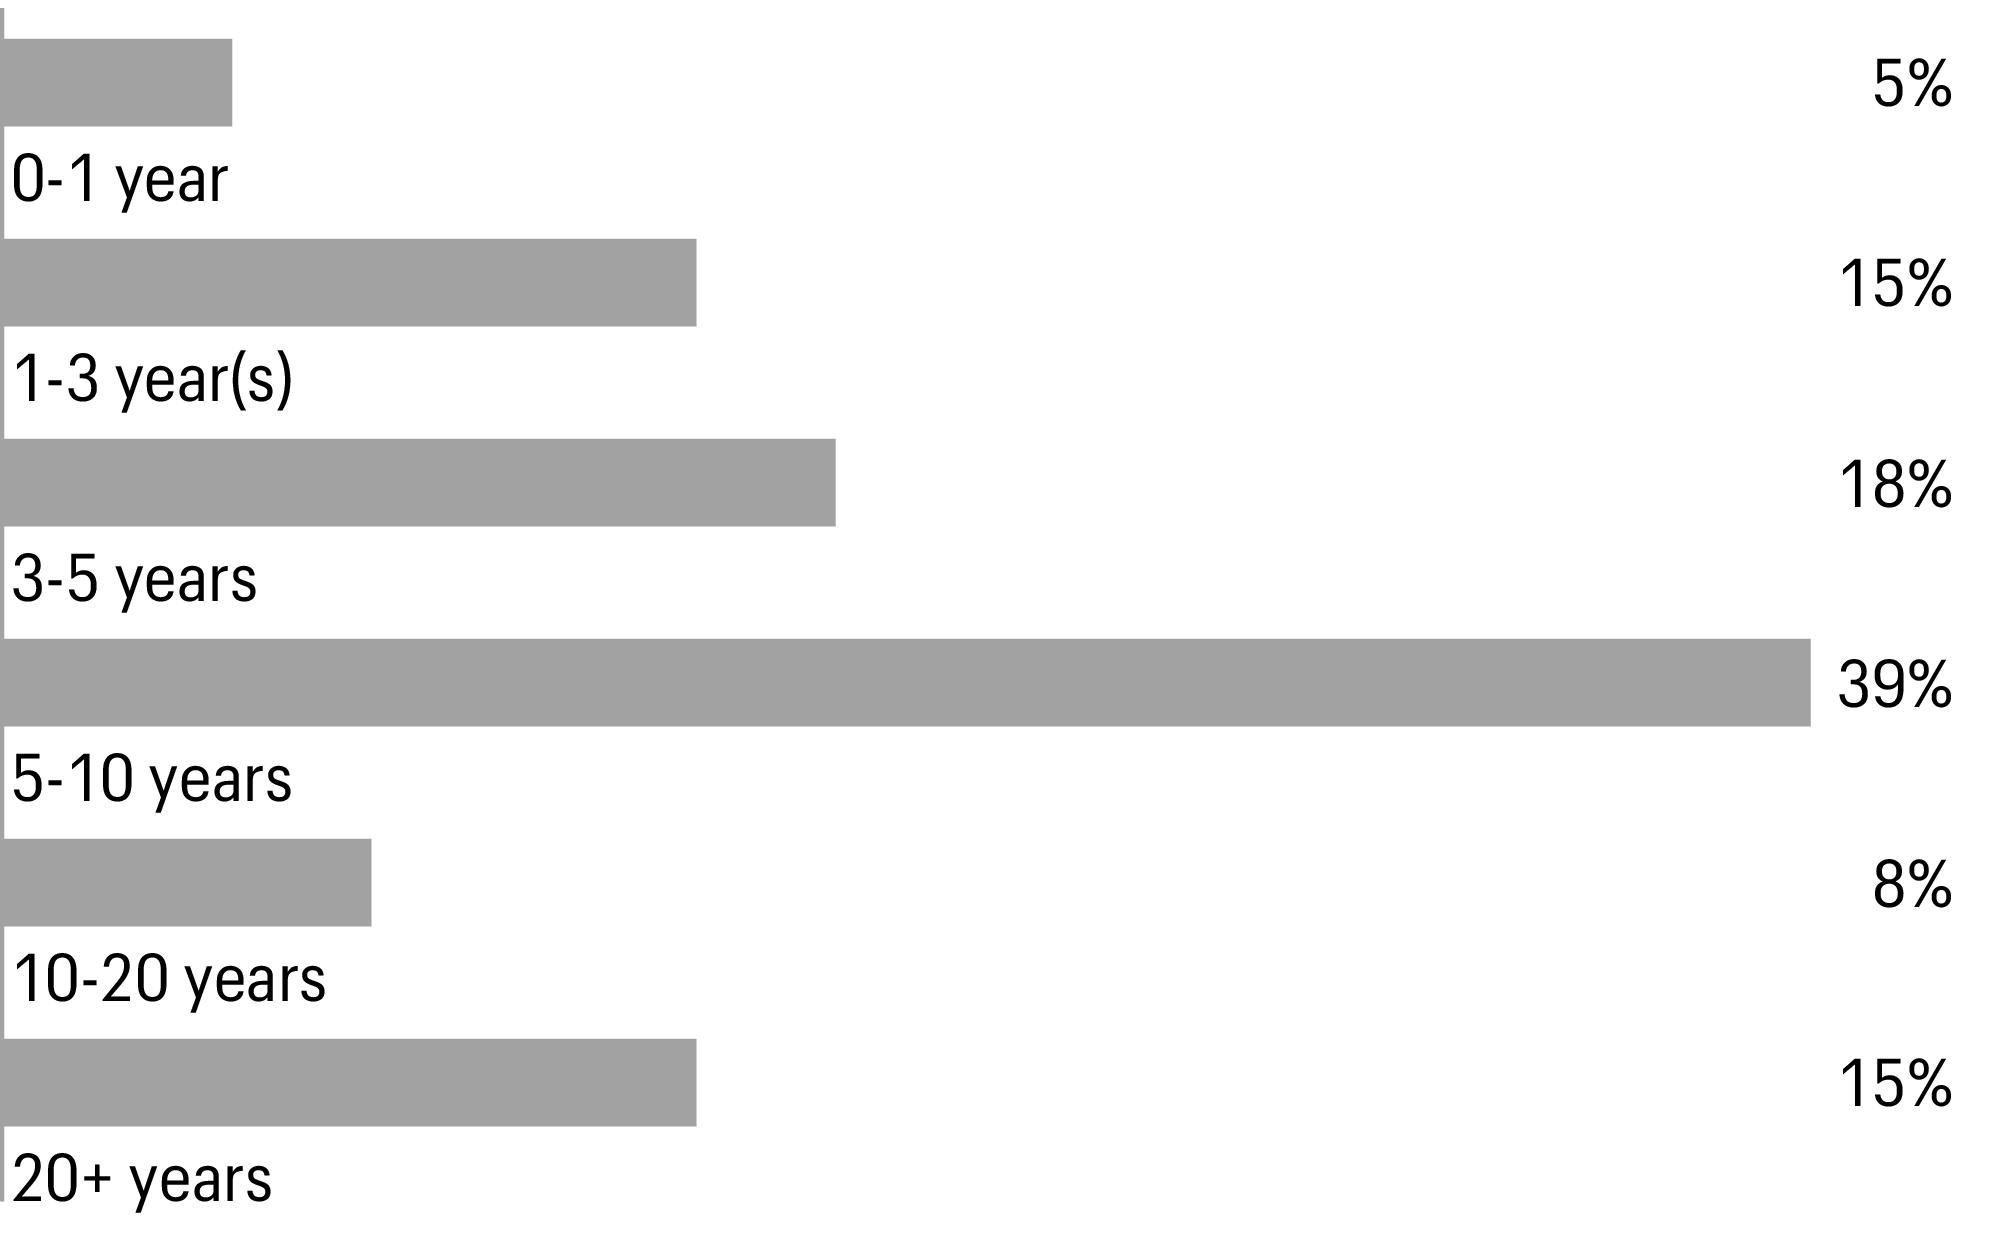
1 | Figures represent the percentage of the Fund’s long-term investments. Allocations are subject to change and may have changed since the date specified. |
Beginning account value 10-1-2023 | Ending account value 3-31-2024 | Expenses paid during the period1 | Annualized net expense ratio | |
Class A | ||||
Actual | $1,000.00 | $1,078.61 | $4.24 | 0.82 % |
Hypothetical (5% return before expenses) | $1,000.00 | $1,020.79 | $4.12 | 0.82 % |
Class C | ||||
Actual | $1,000.00 | $1,076.14 | $7.43 | 1.44 % |
Hypothetical (5% return before expenses) | $1,000.00 | $1,017.70 | $7.22 | 1.44 % |
Class R6 | ||||
Actual | $1,000.00 | $1,081.89 | $2.33 | 0.45 % |
Hypothetical (5% return before expenses) | $1,000.00 | $1,022.63 | $2.26 | 0.45 % |
Institutional Class | ||||
Actual | $1,000.00 | $1,081.64 | $2.59 | 0.50 % |
Hypothetical (5% return before expenses) | $1,000.00 | $1,022.38 | $2.51 | 0.50 % |
1 | Expenses paid is equal to the annualized net expense ratio of each class multiplied by the average account value over the period, multiplied by 182 divided by 366 (to reflect the one-half-year period). |
Interest rate | Maturity date | Principal | Value | |||
Corporate bonds and notes: 50.67% | ||||||
Communications: 6.46% | ||||||
Media: 1.56% | ||||||
Charter Communications Operating LLC/Charter Communications Operating Capital | 2.80 % | 4-1-2031 | $ | 90,000 | $73,744 | |
Charter Communications Operating LLC/Charter Communications Operating Capital | 4.20 | 3-15-2028 | 180,000 | 169,655 | ||
Comcast Corp. | 3.40 | 4-1-2030 | 100,000 | 92,478 | ||
Paramount Global | 4.95 | 1-15-2031 | 130,000 | 115,772 | ||
451,649 | ||||||
Telecommunications: 4.90% | ||||||
AT&T, Inc. | 3.65 | 6-1-2051 | 225,000 | 165,181 | ||
Motorola Solutions, Inc. | 4.60 | 2-23-2028 | 350,000 | 345,198 | ||
T-Mobile USA, Inc. | 2.55 | 2-15-2031 | 40,000 | 34,073 | ||
T-Mobile USA, Inc. | 3.30 | 2-15-2051 | 155,000 | 108,381 | ||
T-Mobile USA, Inc. | 3.75 | 4-15-2027 | 145,000 | 139,650 | ||
Verizon Communications, Inc. | 3.40 | 3-22-2041 | 445,000 | 347,813 | ||
Verizon Communications, Inc. | 4.13 | 8-15-2046 | 325,000 | 272,619 | ||
1,412,915 | ||||||
Consumer, cyclical: 7.11% | ||||||
Airlines: 2.33% | ||||||
American Airlines Pass-Through Trust Series 2014-1 Class A | 3.70 | 10-1-2026 | 192,774 | 184,914 | ||
British Airways Pass-Through Trust Series 2019-1 Class AA144A | 3.30 | 12-15-2032 | 341,373 | 306,327 | ||
U.S. Airways Pass-Through Trust Series 2012-2 Class A | 4.63 | 6-3-2025 | 185,434 | 182,361 | ||
673,602 | ||||||
Apparel: 0.33% | ||||||
Tapestry, Inc. | 7.35 | 11-27-2028 | 90,000 | 94,834 | ||
Auto manufacturers: 2.86% | ||||||
Cummins, Inc. | 5.45 | 2-20-2054 | 170,000 | 173,801 | ||
General Motors Co. | 6.13 | 10-1-2025 | 185,000 | 186,556 | ||
Hyundai Capital America144A | 1.80 | 10-15-2025 | 295,000 | 278,818 | ||
Hyundai Capital America144A | 1.80 | 1-10-2028 | 85,000 | 74,864 | ||
Toyota Motor Credit Corp. | 4.05 | 9-13-2029 | 100,000 | 111,672 | ||
825,711 | ||||||
Entertainment: 1.19% | ||||||
Warnermedia Holdings, Inc. | 5.05 | 3-15-2042 | 75,000 | 64,462 | ||
Warnermedia Holdings, Inc. | 5.14 | 3-15-2052 | 335,000 | 278,049 | ||
342,511 | ||||||
Retail: 0.40% | ||||||
Lowe’s Cos., Inc. | 4.25 | 4-1-2052 | 70,000 | 57,351 | ||
McDonald’s Corp. | 1.45 | 9-1-2025 | 30,000 | 28,465 | ||
McDonald’s Corp. | 4.20 | 4-1-2050 | 35,000 | 29,226 | ||
115,042 | ||||||
Interest rate | Maturity date | Principal | Value | |||
Consumer, non-cyclical: 7.53% | ||||||
Agriculture: 0.69% | ||||||
BAT Capital Corp. | 4.54 % | 8-15-2047 | $ | 260,000 | $200,744 | |
Biotechnology: 0.13% | ||||||
Amgen, Inc. | 4.20 | 2-22-2052 | 45,000 | 37,013 | ||
Commercial services: 1.43% | ||||||
Equifax, Inc. | 2.35 | 9-15-2031 | 155,000 | 128,017 | ||
Equifax, Inc. | 3.10 | 5-15-2030 | 175,000 | 156,117 | ||
S&P Global, Inc. | 1.25 | 8-15-2030 | 100,000 | 80,785 | ||
S&P Global, Inc. | 2.30 | 8-15-2060 | 90,000 | 49,377 | ||
414,296 | ||||||
Food: 0.42% | ||||||
Smithfield Foods, Inc.144A | 3.00 | 10-15-2030 | 145,000 | 120,039 | ||
Healthcare-services: 2.52% | ||||||
Centene Corp. | 2.45 | 7-15-2028 | 210,000 | 186,210 | ||
Elevance Health, Inc. | 2.25 | 5-15-2030 | 20,000 | 17,104 | ||
HCA, Inc. | 3.63 | 3-15-2032 | 130,000 | 115,081 | ||
HCA, Inc. | 4.38 | 3-15-2042 | 130,000 | 109,104 | ||
UnitedHealth Group, Inc. | 5.88 | 2-15-2053 | 190,000 | 205,562 | ||
UnitedHealth Group, Inc. | 6.05 | 2-15-2063 | 85,000 | 93,466 | ||
726,527 | ||||||
Pharmaceuticals: 2.34% | ||||||
AbbVie, Inc. | 4.25 | 11-21-2049 | 145,000 | 125,578 | ||
AbbVie, Inc. | 5.05 | 3-15-2034 | 200,000 | 202,479 | ||
Bristol-Myers Squibb Co. | 2.55 | 11-13-2050 | 175,000 | 107,702 | ||
Bristol-Myers Squibb Co. | 5.55 | 2-22-2054 | 80,000 | 82,271 | ||
Bristol-Myers Squibb Co. | 5.65 | 2-22-2064 | 40,000 | 41,151 | ||
CVS Health Corp. | 4.25 | 4-1-2050 | 110,000 | 89,134 | ||
CVS Health Corp. | 4.30 | 3-25-2028 | 27,000 | 26,348 | ||
674,663 | ||||||
Energy: 5.21% | ||||||
Oil & gas: 2.02% | ||||||
BP Capital Markets America, Inc. | 2.94 | 6-4-2051 | 345,000 | 230,327 | ||
Exxon Mobil Corp. | 2.61 | 10-15-2030 | 160,000 | 141,773 | ||
Marathon Petroleum Corp. | 3.80 | 4-1-2028 | 220,000 | 211,080 | ||
583,180 | ||||||
Pipelines: 3.19% | ||||||
Energy Transfer LP | 3.75 | 5-15-2030 | 160,000 | 147,472 | ||
Kinder Morgan Energy Partners LP | 5.40 | 9-1-2044 | 200,000 | 185,980 | ||
MPLX LP | 4.00 | 3-15-2028 | 315,000 | 303,310 | ||
ONEOK, Inc. | 6.10 | 11-15-2032 | 75,000 | 78,577 | ||
Interest rate | Maturity date | Principal | Value | |||
Pipelines(continued) | ||||||
Sabine Pass Liquefaction LLC | 4.50 % | 5-15-2030 | $ | 110,000 | $105,788 | |
Sabine Pass Liquefaction LLC | 5.75 | 5-15-2024 | 100,000 | 99,970 | ||
921,097 | ||||||
Financial: 15.38% | ||||||
Banks: 6.83% | ||||||
Citigroup, Inc. | 3.30 | 4-27-2025 | 470,000 | 459,830 | ||
Citigroup, Inc. (U.S. SOFR+1.17%)± | 2.56 | 5-1-2032 | 170,000 | 141,781 | ||
Goldman Sachs Group, Inc. (U.S. SOFR+1.41%)± | 3.10 | 2-24-2033 | 115,000 | 98,353 | ||
JPMorgan Chase & Co. (U.S. SOFR 3 Month+1.25%)± | 2.58 | 4-22-2032 | 150,000 | 126,815 | ||
JPMorgan Chase & Co. (U.S. SOFR 3 Month+1.60%)± | 3.78 | 2-1-2028 | 145,000 | 139,641 | ||
JPMorgan Chase & Co. (U.S. SOFR 3 Month+2.52%)± | 2.96 | 5-13-2031 | 145,000 | 126,753 | ||
Morgan Stanley | 3.13 | 7-27-2026 | 565,000 | 540,416 | ||
Santander Holdings USA, Inc. | 4.40 | 7-13-2027 | 230,000 | 223,103 | ||
State Street Corp. | 2.40 | 1-24-2030 | 130,000 | 114,420 | ||
1,971,112 | ||||||
Diversified financial services: 2.09% | ||||||
Aviation Capital Group LLC144A | 5.50 | 12-15-2024 | 305,000 | 303,838 | ||
BlackRock, Inc. | 1.90 | 1-28-2031 | 35,000 | 29,127 | ||
Computershare U.S., Inc. | 1.13 | 10-7-2031 | 200,000 | 175,340 | ||
Intercontinental Exchange, Inc. | 3.00 | 6-15-2050 | 140,000 | 93,896 | ||
602,201 | ||||||
Insurance: 3.69% | ||||||
American International Group, Inc. | 4.75 | 4-1-2048 | 330,000 | 304,959 | ||
Aon North America, Inc. | 5.75 | 3-1-2054 | 50,000 | 51,260 | ||
Athene Holding Ltd. | 3.50 | 1-15-2031 | 295,000 | 259,230 | ||
Belrose Funding Trust144A | 2.33 | 8-15-2030 | 185,000 | 148,636 | ||
Berkshire Hathaway Finance Corp. | 2.38 | 6-19-2039 | 100,000 | 91,967 | ||
Brighthouse Financial, Inc. | 4.70 | 6-22-2047 | 77,000 | 61,059 | ||
New York Life Global Funding | 3.45 | 1-30-2031 | 100,000 | 108,666 | ||
Unum Group | 4.50 | 12-15-2049 | 50,000 | 40,432 | ||
1,066,209 | ||||||
Investment Companies: 0.51% | ||||||
FS KKR Capital Corp. | 3.40 | 1-15-2026 | 155,000 | 147,091 | ||
REITS: 2.26% | ||||||
American Tower Corp. | 5.45 | 2-15-2034 | 60,000 | 60,098 | ||
Equinix, Inc. | 2.15 | 7-15-2030 | 275,000 | 227,901 | ||
Sabra Health Care LP | 3.20 | 12-1-2031 | 110,000 | 91,375 | ||
Simon Property Group LP | 1.75 | 2-1-2028 | 60,000 | 53,449 | ||
Simon Property Group LP | 3.25 | 9-13-2049 | 255,000 | 178,379 | ||
Vornado Realty LP | 3.40 | 6-1-2031 | 50,000 | 39,571 | ||
650,773 | ||||||
Interest rate | Maturity date | Principal | Value | |||
Industrial: 2.43% | ||||||
Aerospace/defense: 0.90% | ||||||
RTX Corp. | 4.13 % | 11-16-2028 | $ | 270,000 | $261,166 | |
Electronics: 0.47% | ||||||
Jabil, Inc. | 3.60 | 1-15-2030 | 150,000 | 136,084 | ||
Transportation: 0.23% | ||||||
Union Pacific Corp. | 2.40 | 2-5-2030 | 75,000 | 65,698 | ||
Trucking & leasing: 0.83% | ||||||
Penske Truck Leasing Co. LP/PTL Finance Corp.144A | 3.45 | 7-1-2024 | 240,000 | 238,529 | ||
Technology: 4.30% | ||||||
Computers: 0.77% | ||||||
Dell International LLC/EMC Corp. | 6.20 | 7-15-2030 | 95,000 | 99,958 | ||
Kyndryl Holdings, Inc. | 6.35 | 2-20-2034 | 85,000 | 87,249 | ||
NetApp, Inc. | 2.70 | 6-22-2030 | 40,000 | 34,650 | ||
221,857 | ||||||
Semiconductors: 1.22% | ||||||
Intel Corp. | 2.80 | 8-12-2041 | 265,000 | 191,593 | ||
Marvell Technology, Inc. | 4.88 | 6-22-2028 | 80,000 | 78,943 | ||
Texas Instruments, Inc. | 4.85 | 2-8-2034 | 80,000 | 80,385 | ||
350,921 | ||||||
Software: 2.31% | ||||||
Fiserv, Inc. | 2.65 | 6-1-2030 | 45,000 | 39,180 | ||
Fiserv, Inc. | 3.50 | 7-1-2029 | 140,000 | 130,363 | ||
Intuit, Inc. | 5.20 | 9-15-2033 | 90,000 | 91,663 | ||
Intuit, Inc. | 5.50 | 9-15-2053 | 55,000 | 57,094 | ||
Oracle Corp. | 2.88 | 3-25-2031 | 355,000 | 308,664 | ||
Oracle Corp. | 3.60 | 4-1-2050 | 55,000 | 39,736 | ||
666,700 | ||||||
Utilities: 2.25% | ||||||
Electric: 2.25% | ||||||
Duke Energy Florida LLC | 1.75 | 6-15-2030 | 90,000 | 74,764 | ||
New York State Electric & Gas Corp.144A | 3.25 | 12-1-2026 | 145,000 | 136,234 | ||
Oglethorpe Power Corp. | 3.75 | 8-1-2050 | 125,000 | 90,311 | ||
PacifiCorp | 3.50 | 6-15-2029 | 295,000 | 274,754 | ||
Union Electric Co. | 2.95 | 3-15-2030 | 80,000 | 71,452 | ||
647,515 | ||||||
Total corporate bonds and notes (Cost $16,468,546) | 14,619,679 | |||||
Foreign corporate bonds and notes: 25.97% | ||||||
Basic materials: 0.37% | ||||||
Chemicals: 0.37% | ||||||
Syngenta Finance NV | 3.38 | 4-16-2026 | EUR | 100,000 | 106,326 | |
Interest rate | Maturity date | Principal | Value | |||
Communications: 1.84% | ||||||
Telecommunications: 1.84% | ||||||
Chorus Ltd. | 3.63 % | 9-7-2029 | EUR | 100,000 | $108,048 | |
Koninklijke KPN NV | 3.88 | 2-16-2036 | EUR | 100,000 | 109,039 | |
O2 Telefonica Deutschland Finanzierungs GmbH | 1.75 | 7-5-2025 | EUR | 200,000 | 210,166 | |
Tele2 AB | 2.13 | 5-15-2028 | EUR | 100,000 | 102,303 | |
529,556 | ||||||
Consumer, cyclical: 1.13% | ||||||
Auto manufacturers: 0.75% | ||||||
PACCAR Financial Europe BV | 3.25 | 11-29-2025 | EUR | 100,000 | 107,346 | |
Volkswagen Leasing GmbH | 4.00 | 4-11-2031 | EUR | 100,000 | 108,932 | |
216,278 | ||||||
Auto parts & equipment: 0.38% | ||||||
Continental AG | 4.00 | 6-1-2028 | EUR | 100,000 | 110,362 | |
Consumer, non-cyclical: 4.82% | ||||||
Beverages: 0.65% | ||||||
Anheuser-Busch InBev SA | 1.13 | 7-1-2027 | EUR | 100,000 | 101,180 | |
CCEP Finance Ireland DAC | 0.88 | 5-6-2033 | EUR | 100,000 | 86,992 | |
188,172 | ||||||
Commercial services: 1.55% | ||||||
ALD SA | 3.88 | 1-24-2028 | EUR | 100,000 | 108,441 | |
Motability Operations Group PLC | 2.38 | 7-3-2039 | GBP | 150,000 | 136,178 | |
Rentokil Initial PLC | 0.50 | 10-14-2028 | EUR | 100,000 | 95,266 | |
Worldline SA | 4.13 | 9-12-2028 | EUR | 100,000 | 106,297 | |
446,182 | ||||||
Healthcare-products: 0.68% | ||||||
American Medical Systems Europe BV | 3.50 | 3-8-2032 | EUR | 100,000 | 108,748 | |
Molnlycke Holding AB | 0.63 | 1-15-2031 | EUR | 100,000 | 86,858 | |
195,606 | ||||||
Pharmaceuticals: 1.94% | ||||||
AstraZeneca | 1.25 | 5-12-2028 | EUR | 100,000 | 100,508 | |
AstraZeneca PLC | 3.75 | 3-3-2032 | EUR | 100,000 | 112,335 | |
Bayer AG | 4.63 | 5-26-2033 | EUR | 100,000 | 111,351 | |
Bayer AG (EUR Swap Annual (vs. 6 Month EURIBOR) 5 Year+3.11%)± | 3.13 | 11-12-2079 | EUR | 100,000 | 95,200 | |
GlaxoSmithKline Capital PLC | 1.63 | 5-12-2035 | GBP | 150,000 | 139,956 | |
559,350 | ||||||
Energy: 1.63% | ||||||
Energy-alternate sources: 0.31% | ||||||
Acciona Energia Financiacion Filiales SA | 1.38 | 1-26-2032 | EUR | 100,000 | 89,271 | |
Oil & gas: 1.32% | ||||||
BP Capital Markets PLC (UK Gilts 5 Year+3.89%)ʊ± | 4.25 | 3-22-2027 | GBP | 100,000 | 119,273 | |
Interest rate | Maturity date | Principal | Value | |||
Oil & gas(continued) | ||||||
Eni SpA | 3.88 % | 1-15-2034 | EUR | 100,000 | $109,104 | |
Shell International Finance BV | 1.00 | 12-10-2030 | GBP | 150,000 | 152,937 | |
381,314 | ||||||
Financial: 11.97% | ||||||
Banks: 8.35% | ||||||
ABN AMRO Bank NV | 3.88 | 1-15-2032 | EUR | 100,000 | 109,192 | |
Argenta Spaarbank NV (EUR Swap Annual (vs. 6 Month EURIBOR) 1 Year+1.10%)± | 1.38 | 2-8-2029 | EUR | 200,000 | 195,296 | |
Belfius Bank SA (EUR Swap Annual (vs. 6 Month EURIBOR) 5 Year+1.30%)± | 1.25 | 4-6-2034 | EUR | 200,000 | 185,308 | |
BNP Paribas SA (3 Month EURIBOR+0.92%)± | 3.88 | 1-10-2031 | EUR | 100,000 | 110,335 | |
Cooperatieve Rabobank UA | 3.82 | 7-26-2034 | EUR | 100,000 | 110,050 | |
Credit Agricole SA | 3.75 | 1-22-2034 | EUR | 100,000 | 110,107 | |
Credit Agricole SA | 4.13 | 3-7-2030 | EUR | 100,000 | 112,480 | |
De Volksbank NV | 4.88 | 3-7-2030 | EUR | 100,000 | 113,267 | |
DNB Bank ASA (3 Month EURIBOR+0.65%)± | 4.00 | 3-14-2029 | EUR | 100,000 | 110,058 | |
ING Groep NV (3 Month EURIBOR+1.72%)± | 3.88 | 8-12-2029 | EUR | 100,000 | 108,474 | |
Intesa Sanpaolo SpA (3 Month EURIBOR+1.70%)± | 5.00 | 3-8-2028 | EUR | 150,000 | 167,113 | |
Investec PLC (UK Gilts 5 Year+5.91%)± | 9.13 | 3-6-2033 | GBP | 100,000 | 134,168 | |
Lloyds Bank Corporate Markets PLC | 4.13 | 5-30-2027 | EUR | 100,000 | 109,909 | |
Mizuho Financial Group, Inc. (3 Month EURIBOR+0.72%)± | 0.47 | 9-6-2029 | EUR | 100,000 | 94,028 | |
NatWest Group PLC (GBP Swap Semi Annual (vs. 6Month LIBOR) 1 Year+1.49%)± | 2.88 | 9-19-2026 | GBP | 100,000 | 121,629 | |
Raiffeisen Bank International AG (EURIBOR ICE Swap Rate 11:00am+3.15%)± | 2.88 | 6-18-2032 | EUR | 100,000 | 97,387 | |
Svenska Handelsbanken AB | 3.75 | 5-5-2026 | EUR | 100,000 | 108,557 | |
Toronto-Dominion Bank | 3.63 | 12-13-2029 | EUR | 100,000 | 109,052 | |
Zuercher Kantonalbank (3 Month EURIBOR+0.90%)± | 2.02 | 4-13-2028 | EUR | 200,000 | 204,178 | |
2,410,588 | ||||||
Insurance: 1.75% | ||||||
Credit Agricole Assurances SA | 2.00 | 7-17-2030 | EUR | 200,000 | 190,587 | |
Mandatum Life Insurance Co. Ltd. (3 Month EURIBOR+2.30%)± | 1.88 | 10-4-2049 | EUR | 200,000 | 212,442 | |
Sampo Oyj (3 Month EURIBOR+4.05%)± | 3.38 | 5-23-2049 | EUR | 100,000 | 102,370 | |
505,399 | ||||||
Real estate: 1.55% | ||||||
Grand City Properties SA (EUR Swap Annual (vs. 6 Month EURIBOR) 5 Year+2.18%)ʊ± | 1.50 | 3-11-2026 | EUR | 100,000 | 68,371 | |
Heimstaden Bostad AB (EUR Swap Annual (vs. 6 Month EURIBOR) 5 Year+3.90%)ʊ± | 3.63 | 10-13-2026 | EUR | 100,000 | 70,125 | |
LEG Immobilien SE | 0.75 | 6-30-2031 | EUR | 100,000 | 86,165 | |
Logicor Financing SARL | 4.63 | 7-25-2028 | EUR | 100,000 | 109,076 | |
Prologis International Funding II SA | 4.63 | 2-21-2035 | EUR | 100,000 | 113,181 | |
446,918 | ||||||
Interest rate | Maturity date | Principal | Value | |||
REITS: 0.32% | ||||||
Tritax Big Box REIT PLC | 1.50 % | 11-27-2033 | GBP | 100,000 | $91,195 | |
Industrial: 1.28% | ||||||
Building materials: 0.96% | ||||||
Aliaxis Finance SA | 0.88 | 11-8-2028 | EUR | 200,000 | 188,586 | |
Holcim Finance Luxembourg SA | 0.50 | 4-23-2031 | EUR | 100,000 | 87,263 | |
275,849 | ||||||
Engineering & construction: 0.32% | ||||||
Cellnex Finance Co. SA | 2.00 | 2-15-2033 | EUR | 100,000 | 93,560 | |
Utilities: 2.93% | ||||||
Electric: 1.38% | ||||||
Electricite de France SA | 5.50 | 10-17-2041 | GBP | 100,000 | 118,203 | |
EnBW International Finance BV | 3.85 | 5-23-2030 | EUR | 100,000 | 110,633 | |
Engie SA | 1.00 | 10-26-2036 | EUR | 100,000 | 79,401 | |
RTE Reseau de Transport d’Electricite SADIR | 1.88 | 10-23-2037 | EUR | 100,000 | 89,463 | |
397,700 | ||||||
Gas: 1.24% | ||||||
APA Infrastructure Ltd. | 2.00 | 7-15-2030 | EUR | 180,000 | 176,251 | |
National Gas Transmission PLC | 1.13 | 1-14-2033 | GBP | 200,000 | 181,019 | |
357,270 | ||||||
Water: 0.31% | ||||||
Thames Water Utilities Finance PLC | 0.88 | 1-31-2028 | EUR | 100,000 | 90,496 | |
Total foreign corporate bonds and notes (Cost $8,323,650) | 7,491,392 | |||||
Foreign government bonds: 2.01% | ||||||
Belgium: 0.73% | ||||||
European Union | 2.75 | 12-4-2037 | EUR | 200,000 | 210,453 | |
Germany: 1.28% | ||||||
Bundesrepublik Deutschland Bundesanleihe¤ | 0.00 | 8-15-2030 | EUR | 200,000 | 187,534 | |
Bundesrepublik Deutschland Bundesanleihe | 1.00 | 5-15-2038 | EUR | 100,000 | 89,458 | |
Bundesrepublik Deutschland Bundesanleihe | 1.80 | 8-15-2053 | EUR | 100,000 | 93,482 | |
370,474 | ||||||
Total foreign government bonds (Cost $550,919) | 580,927 | |||||
U.S. Treasury securities: 2.98% | ||||||
U.S. Treasury Notes | 3.50 | 4-30-2030 | $ | 80,000 | 76,875 | |
U.S. Treasury Notes | 3.50 | 2-15-2033 | 50,000 | 47,354 | ||
U.S. Treasury Notes | 4.00 | 1-31-2029 | 500,000 | 494,844 | ||
U.S. Treasury Notes | 4.00 | 2-15-2034 | 245,000 | 240,942 | ||
Total U.S. Treasury securities (Cost $861,514) | 860,015 | |||||
Interest rate | Maturity date | Principal | Value | |||
Yankee corporate bonds and notes: 13.48% | ||||||
Communications: 1.18% | ||||||
Internet: 0.49% | ||||||
Prosus NV144A | 3.83 % | 2-8-2051 | $ | 230,000 | $141,564 | |
Telecommunications: 0.69% | ||||||
Rogers Communications, Inc. | 5.00 | 2-15-2029 | 200,000 | 198,611 | ||
Consumer, non-cyclical: 1.32% | ||||||
Household products/wares: 1.22% | ||||||
Reckitt Benckiser Treasury Services PLC144A | 2.75 | 6-26-2024 | 355,000 | 352,514 | ||
Pharmaceuticals: 0.10% | ||||||
Pfizer Investment Enterprises Pte. Ltd. | 4.75 | 5-19-2033 | 30,000 | 29,538 | ||
Energy: 0.31% | ||||||
Oil & gas: 0.31% | ||||||
Equinor ASA | 2.38 | 5-22-2030 | 30,000 | 26,270 | ||
Saudi Arabian Oil Co.144A | 4.38 | 4-16-2049 | 75,000 | 62,205 | ||
88,475 | ||||||
Financial: 8.86% | ||||||
Banks: 7.18% | ||||||
Banco Santander SA | 3.49 | 5-28-2030 | 200,000 | 181,327 | ||
Credit Suisse AG | 3.63 | 9-9-2024 | 330,000 | 326,907 | ||
Danske Bank A/S (1 Year Treasury Constant Maturity+1.40%)144A± | 5.71 | 3-1-2030 | 200,000 | 201,278 | ||
HSBC Holdings PLC | 4.30 | 3-8-2026 | 230,000 | 225,756 | ||
HSBC Holdings PLC (U.S. SOFR+2.39%)± | 2.85 | 6-4-2031 | 200,000 | 172,508 | ||
National Australia Bank Ltd.144A | 2.33 | 8-21-2030 | 260,000 | 214,122 | ||
Santander U.K. Group Holdings PLC (U.S. SOFR+2.75%)± | 6.83 | 11-21-2026 | 200,000 | 203,299 | ||
Sumitomo Mitsui Financial Group, Inc. | 2.13 | 7-8-2030 | 200,000 | 167,513 | ||
UBS Group AG (1 Year Treasury Constant Maturity+1.10%)144A± | 2.75 | 2-11-2033 | 200,000 | 163,386 | ||
UBS Group AG (5 Year Treasury Constant Maturity+4.75%)144Aʊ± | 9.25 | 11-13-2028 | 200,000 | 216,695 | ||
2,072,791 | ||||||
Diversified financial services: 1.50% | ||||||
AerCap Ireland Capital DAC/AerCap Global Aviation Trust | 3.30 | 1-30-2032 | 150,000 | 128,648 | ||
Avolon Holdings Funding Ltd.144A | 4.38 | 5-1-2026 | 315,000 | 304,223 | ||
432,871 | ||||||
Insurance: 0.18% | ||||||
Fairfax Financial Holdings Ltd.144A | 6.35 | 3-22-2054 | 50,000 | 51,005 | ||
Industrial: 0.70% | ||||||
Aerospace/defense: 0.70% | ||||||
BAE Systems PLC144A | 5.30 | 3-26-2034 | 100,000 | 100,501 | ||
BAE Systems PLC144A | 5.50 | 3-26-2054 | 100,000 | 100,949 | ||
201,450 | ||||||
Interest rate | Maturity date | Principal | Value | |||
Technology: 1.11% | ||||||
Semiconductors: 1.11% | ||||||
NXP BV/NXP Funding LLC/NXP USA, Inc. | 3.40 % | 5-1-2030 | $ | 85,000 | $77,149 | |
NXP BV/NXP Funding LLC/NXP USA, Inc. | 3.88 | 6-18-2026 | 250,000 | 242,681 | ||
319,830 | ||||||
Total yankee corporate bonds and notes (Cost $4,204,626) | 3,888,649 | |||||
Yield | Shares | |||||
Short-term investments: 3.06% | ||||||
Investment companies: 3.06% | ||||||
Allspring Government Money Market Fund Select Class♠∞ | 5.25 | 882,462 | 882,462 | |||
Total short-term investments (Cost $882,462) | 882,462 | |||||
Total investments in securities (Cost $31,291,717) | 98.17 % | 28,323,124 | ||||
Other assets and liabilities, net | 1.83 | 527,924 | ||||
Total net assets | 100.00 % | $28,851,048 | ||||
144A | The security may be resold in transactions exempt from registration, normally to qualified institutional buyers, pursuant to Rule 144A under the Securities Act of 1933. |
± | Variable rate investment. The rate shown is the rate in effect at period end. |
ʊ | Security is perpetual in nature and has no stated maturity date. The date shown reflects the next call date. |
¤ | The security is issued in zero coupon form with no periodic interest payments. |
♠ | The issuer of the security is an affiliated person of the Fund as defined in the Investment Company Act of 1940. |
∞ | The rate represents the 7-day annualized yield at period end. |
Abbreviations: | |
EUR | Euro |
EURIBOR | Euro Interbank Offered Rate |
GBP | Great British pound |
LIBOR | London Interbank Offered Rate |
REIT | Real estate investment trust |
SOFR | Secured Overnight Financing Rate |
Value, beginning of period | Purchases | Sales proceeds | Net realized gains (losses) | Net change in unrealized gains (losses) | Value, end of period | Shares, end of period | Income from affiliated securities | |
Short-term investments | ||||||||
Allspring Government Money Market Fund Select Class | $381,027 | $6,853,942 | $(6,352,507 ) | $0 | $0 | $882,462 | 882,462 | $16,418 |
Currency to be received | Currency to be delivered | Counterparty | Settlement date | Unrealized gains | Unrealized losses | ||
USD | 7,336,253 | EUR | 6,770,000 | State Street Bank & Trust Co. | 5-8-2024 | $22,225 | $0 |
USD | 1,286,540 | GBP | 1,020,000 | State Street Bank & Trust Co. | 5-8-2024 | 0 | (1,100 ) |
$22,225 | $(1,100 ) | ||||||
Assets | |
Investments in unaffiliated securities, at value (cost $30,409,255) | $27,440,662 |
Investments in affiliated securities, at value (cost $882,462) | 882,462 |
Foreign currency, at value (cost $5,604) | 5,591 |
Receivable for interest | 286,562 |
Receivable for investments sold | 163,556 |
Unrealized gains on forward foreign currency contracts | 22,225 |
Receivable from manager | 3,033 |
Receivable for Fund shares sold | 163 |
Receivable for daily variation margin on open futures contracts | 27 |
Prepaid expenses and other assets | 142,299 |
Total assets | 28,946,580 |
Liabilities | |
Overdraft due to custodian bank | 37,824 |
Professional fees payable | 36,299 |
Custody and accounting fees payable | 12,282 |
Trustees’ fees and expenses payable | 3,521 |
Unrealized losses on forward foreign currency contracts | 1,100 |
Administration fees payable | 739 |
Accrued expenses and other liabilities | 3,767 |
Total liabilities | 95,532 |
Total net assets | $28,851,048 |
Net assets consist of | |
Paid-in capital | $32,557,707 |
Total distributable loss | (3,706,659 ) |
Total net assets | $28,851,048 |
Computation of net asset value and offering price per share | |
Net assets–Class A | $39,901 |
Shares outstanding–Class A1 | 4,541 |
Net asset value per share–Class A | $8.79 |
Maximum offering price per share – Class A2 | $9.20 |
Net assets–Class C | $25,822 |
Shares outstanding–Class C1 | 2,958 |
Net asset value per share–Class C | $8.73 |
Net assets–Class R6 | $28,760,592 |
Shares outstanding–Class R61 | 3,273,750 |
Net asset value per share–Class R6 | $8.79 |
Net assets–Institutional Class | $24,733 |
Shares outstanding–Institutional Class1 | 2,815 |
Net asset value per share–Institutional Class | $8.79 |
Investment income | |
Interest | $475,902 |
Income from affiliated securities | 16,418 |
Total investment income | 492,320 |
Expenses | |
Management fee | 52,570 |
Administration fees | |
Class A | 25 |
Class C | 19 |
Class R6 | 3,930 |
Institutional Class | 9 |
Shareholder servicing fees | |
Class A | 42 |
Class C | 31 |
Distribution fee | |
Class C | 3 |
Custody and accounting fees | 4,359 |
Professional fees | 40,684 |
Registration fees | 10,130 |
Shareholder report expenses | 10,313 |
Trustees’ fees and expenses | 12,465 |
Other fees and expenses | 3,822 |
Total expenses | 138,402 |
Less: Fee waivers and/or expense reimbursements | |
Fund-level | (79,071 ) |
Net expenses | 59,331 |
Net investment income | 432,989 |
Realized and unrealized gains (losses) on investments | |
Net realized losses on | |
Unaffiliated securities | (460,408 ) |
Foreign currency and foreign currency translations | (42,471 ) |
Forward foreign currency contracts | (59,518 ) |
Net realized losses on investments | (562,397 ) |
Net change in unrealized gains (losses) on | |
Unaffiliated securities | 2,175,310 |
Foreign currency and foreign currency translations | 2,182 |
Forward foreign currency contracts | (19,835 ) |
Net change in unrealized gains (losses) on investments | 2,157,657 |
Net realized and unrealized gains (losses) on investments | 1,595,260 |
Net increase in net assets resulting from operations | $2,028,249 |
Six months ended March 31, 2024 (unaudited) | Year ended September 30, 2023 | |||
Operations | ||||
Net investment income | $432,989 | $879,643 | ||
Net realized losses on investments | (562,397 ) | (1,399,208 ) | ||
Net change in unrealized gains (losses) on investments | 2,157,657 | 2,017,539 | ||
Net increase in net assets resulting from operations | 2,028,249 | 1,497,974 | ||
Distributions to shareholders from | ||||
Net investment income and net realized gains | ||||
Class A | (760 ) | (798 ) | ||
Class C | (624 ) | (695 ) | ||
Class R6 | (710,146 ) | (926,251 ) | ||
Institutional Class | (640 ) | (751 ) | ||
Total distributions to shareholders | (712,170 ) | (928,495 ) | ||
Capital share transactions | Shares | Shares | ||
Proceeds from shares sold | ||||
Class A | 1,326 | 11,687 | 230 | 2,000 |
Class R6 | 346,273 | 3,014,211 | 55,117 | 455,208 |
3,025,898 | 457,208 | |||
Reinvestment of distributions | ||||
Class A | 89 | 760 | 94 | 798 |
Class C | 73 | 624 | 82 | 695 |
Class R6 | 82,789 | 703,473 | 109,214 | 926,251 |
Institutional Class | 75 | 640 | 89 | 751 |
705,497 | 928,495 | |||
Payment for shares redeemed | ||||
Class A | 0 | 0 | (4,077 ) | (33,299 ) |
Class R6 | (237,153 ) | (2,014,057 ) | (535,375 ) | (4,545,451 ) |
(2,014,057 ) | (4,578,750 ) | |||
Net increase (decrease) in net assets resulting from capital share transactions | 1,717,338 | (3,193,047 ) | ||
Total increase (decrease) in net assets | 3,033,417 | (2,623,568 ) | ||
Net assets | ||||
Beginning of period | 25,817,631 | 28,441,199 | ||
End of period | $28,851,048 | $25,817,631 | ||
Six months ended March 31, 2024 (unaudited) | Year ended September 30 | ||
Class A | 2023 | 20221 | |
Net asset value, beginning of period | $8.36 | $8.21 | $8.97 |
Net investment income | 0.13 2 | 0.23 2 | 0.07 2 |
Net realized and unrealized gains (losses) on investments | 0.52 | 0.17 | (0.76 ) |
Total from investment operations | 0.65 | 0.40 | (0.69 ) |
Distributions to shareholders from | |||
Net investment income | (0.22 ) | (0.25 ) | (0.07 ) |
Net asset value, end of period | $8.79 | $8.36 | $8.21 |
Total return3 | 7.86 % | 4.86 % | (7.76 )% |
Ratios to average net assets (annualized) | |||
Gross expenses | 1.42 % | 1.49 % | 1.18 % |
Net expenses | 0.82 % | 0.82 % | 0.83 % |
Net investment income | 2.94 % | 2.79 % | 2.45 % |
Supplemental data | |||
Portfolio turnover rate | 17 % | 12 % | 21 % |
Net assets, end of period (000s omitted) | $40 | $26 | $56 |
1 | For the period from June 1, 2022 (commencement of class operations) to September 30, 2022 |
2 | Calculated based upon average shares outstanding |
3 | Total return calculations do not include any sales charges. Returns for periods of less than one year are not annualized. |
Six months ended March 31, 2024 (unaudited) | Year ended September 30 | ||
Class C | 2023 | 20221 | |
Net asset value, beginning of period | $8.32 | $8.21 | $8.97 |
Net investment income | 0.10 2 | 0.20 2 | 0.05 2 |
Net realized and unrealized gains (losses) on investments | 0.52 | 0.15 | (0.76 ) |
Total from investment operations | 0.62 | 0.35 | (0.71 ) |
Distributions to shareholders from | |||
Net investment income | (0.21 ) | (0.24 ) | (0.05 ) |
Net asset value, end of period | $8.73 | $8.32 | $8.21 |
Total return3 | 7.61 % | 4.30 % | (7.96 )% |
Ratios to average net assets (annualized) | |||
Gross expenses | 1.44 % | 1.63 % | 1.80 % |
Net expenses | 1.44 % | 1.30 % | 1.51 % |
Net investment income | 2.30 % | 2.32 % | 1.75 % |
Supplemental data | |||
Portfolio turnover rate | 17 % | 12 % | 21 % |
Net assets, end of period (000s omitted) | $26 | $24 | $23 |
1 | For the period from June 1, 2022 (commencement of class operations) to September 30, 2022 |
2 | Calculated based upon average shares outstanding |
3 | Total return calculations do not include any sales charges. Returns for periods of less than one year are not annualized. |
Six months ended March 31, 2024 (unaudited) | Year ended September 30 | |||||
Class R6 | 2023 | 2022 | 2021 | 2020 | 20191 | |
Net asset value, beginning of period | $8.35 | $8.21 | $10.66 | $10.91 | $10.75 | $10.00 |
Net investment income | 0.14 2 | 0.27 2 | 0.24 2 | 0.24 2 | 0.24 2 | 0.13 |
Net realized and unrealized gains (losses) on investments | 0.53 | 0.15 | (2.06 ) | 0.07 | 0.39 | 0.73 |
Total from investment operations | 0.67 | 0.42 | (1.82 ) | 0.31 | 0.63 | 0.86 |
Distributions to shareholders from | ||||||
Net investment income | (0.23 ) | (0.28 ) | (0.23 ) | (0.31 ) | (0.34 ) | (0.11 ) |
Net realized gains | 0.00 | 0.00 | (0.40 ) | (0.25 ) | (0.13 ) | 0.00 |
Total distributions to shareholders | (0.23 ) | (0.28 ) | (0.63 ) | (0.56 ) | (0.47 ) | (0.11 ) |
Net asset value, end of period | $8.79 | $8.35 | $8.21 | $10.66 | $10.91 | $10.75 |
Total return3 | 8.19 % | 5.16 % | (17.97 )% | 2.86 % | 6.10 % | 8.64 % |
Ratios to average net assets (annualized) | ||||||
Gross expenses | 1.05 % | 1.12 % | 0.76 % | 0.68 % | 0.77 % | 0.86 % |
Net expenses | 0.45 % | 0.45 % | 0.45 % | 0.45 % | 0.45 % | 0.45 % |
Net investment income | 3.30 % | 3.16 % | 2.48 % | 2.22 % | 2.29 % | 2.34 % |
Supplemental data | ||||||
Portfolio turnover rate | 17 % | 12 % | 21 % | 28 % | 79 % | 36 % |
Net assets, end of period (000s omitted) | $28,761 | $25,745 | $28,340 | $45,313 | $76,847 | $96,835 |
1 | For the period from February 28, 2019 (commencement of class operations) to September 30, 2019 |
2 | Calculated based upon average shares outstanding |
3 | Returns for periods of less than one year are not annualized. |
Six months ended March 31, 2024 (unaudited) | Year ended September 30 | |||||
Institutional Class | 2023 | 2022 | 2021 | 2020 | 20191 | |
Net asset value, beginning of period | $8.35 | $8.21 | $10.66 | $10.91 | $10.75 | $10.00 |
Net investment income | 0.14 2 | 0.27 2 | 0.23 2 | 0.23 | 0.24 | 0.14 |
Net realized and unrealized gains (losses) on investments | 0.53 | 0.15 | (2.05 ) | 0.07 | 0.38 | 0.72 |
Total from investment operations | 0.67 | 0.42 | (1.82 ) | 0.30 | 0.62 | 0.86 |
Distributions to shareholders from | ||||||
Net investment income | (0.23 ) | (0.28 ) | (0.23 ) | (0.30 ) | (0.33 ) | (0.11 ) |
Net realized gains | 0.00 | 0.00 | (0.40 ) | (0.25 ) | (0.13 ) | 0.00 |
Total distributions to shareholders | (0.23 ) | (0.28 ) | (0.63 ) | (0.55 ) | (0.46 ) | (0.11 ) |
Net asset value, end of period | $8.79 | $8.35 | $8.21 | $10.66 | $10.91 | $10.75 |
Total return3 | 8.16 % | 5.10 % | (18.01 )% | 2.81 % | 6.04 % | 8.64 % |
Ratios to average net assets (annualized) | ||||||
Gross expenses | 1.09 % | 1.18 % | 0.81 % | 0.73 % | 0.83 % | 0.97 % |
Net expenses | 0.50 % | 0.50 % | 0.50 % | 0.50 % | 0.50 % | 0.50 % |
Net investment income | 3.24 % | 3.13 % | 2.47 % | 2.18 % | 2.24 % | 2.34 % |
Supplemental data | ||||||
Portfolio turnover rate | 17 % | 12 % | 21 % | 28 % | 79 % | 36 % |
Net assets, end of period (000s omitted) | $25 | $23 | $22 | $27 | $27 | $27 |
1 | For the period from February 28, 2019 (commencement of class operations) to September 30, 2019 |
2 | Calculated based upon average shares outstanding |
3 | Returns for periods of less than one year are not annualized. |
Gross unrealized gains | $228,832 |
Gross unrealized losses | (3,639,632 ) |
Net unrealized losses | $(3,410,800 ) |
Quoted prices (Level 1) | Other significant observable inputs (Level 2) | Significant unobservable inputs (Level 3) | Total | |
Assets | ||||
Investments in: | ||||
Corporate bonds and notes | $0 | $14,619,679 | $0 | $14,619,679 |
Foreign corporate bonds and notes | 0 | 7,491,392 | 0 | 7,491,392 |
Foreign government bonds | 0 | 580,927 | 0 | 580,927 |
U.S. Treasury securities | 860,015 | 0 | 0 | 860,015 |
Yankee corporate bonds and notes | 0 | 3,888,649 | 0 | 3,888,649 |
Short-term investments | ||||
Investment companies | 882,462 | 0 | 0 | 882,462 |
1,742,477 | 26,580,647 | 0 | 28,323,124 | |
Forward foreign currency contracts | 0 | 22,225 | 0 | 22,225 |
Total assets | $1,742,477 | $26,602,872 | $0 | $28,345,349 |
Liabilities | ||||
Forward foreign currency contracts | $0 | $1,100 | $0 | $1,100 |
Total liabilities | $0 | $1,100 | $0 | $1,100 |
Average daily net assets | Management fee |
First $500 million | 0.400 % |
Next $500 million | 0.375 |
Next $2 billion | 0.350 |
Next $2 billion | 0.325 |
Next $5 billion | 0.290 |
Over $10 billion | 0.280 |
Class-level administration fee | |
Class A | 0.15 % |
Class C | 0.15 |
Class R6 | 0.03 |
Institutional Class | 0.08 |
EXPENSE RATIO CAPS | |
Class A | 0.82 % |
Class C | 1.57 |
Class R6 | 0.45 |
Institutional Class | 0.50 |
Purchases at cost | Sales proceeds | ||
U.S. government | Non-U.S. government | U.S. government | Non-U.S. government |
$1,281,023 | $4,198,139 | $818,056 | $3,579,989 |
Counterparty | Gross amounts of assets in the Statement of Assets and Liabilities | Amounts subject to netting agreements | Collateral received | Net amount of assets |
State Street Bank & Trust Co. | $22,225 | $(1,100 ) | $0 | $21,125 |
Counterparty | Gross amounts of liabilities in the Statement of Assets and Liabilities | Amounts subject to netting agreements | Collateral pledged | Net amount of liabilities |
State Street Bank & Trust Co. | $1,100 | $(1,100 ) | $0 | $0 |
Name and year of birth | Position held and length of service* | Principal occupations during past five years or longer | Current other public company or investment company directorships |
William R. Ebsworth (Born 1957) | Trustee, since 2015 | Retired. From 1984 to 2013, equities analyst, portfolio manager, research director and chief investment officer at Fidelity Management and Research Company in Boston, Tokyo, and Hong Kong, and retired in 2013 as Chief Investment Officer of Fidelity Strategic Advisers, Inc. where he led a team of investment professionals managing client assets. Prior thereto, Board member of Hong Kong Securities Clearing Co., Hong Kong Options Clearing Corp., the Thailand International Fund, Ltd., Fidelity Investments Life Insurance Company, and Empire Fidelity Investments Life Insurance Company. Serves on the Investment Company Institute’s Board of Governors since 2022 and Executive Committee since 2023 as well as the Vice Chairman of the Governing Council of the Independent Directors Council since 2023. Audit Committee Chair and Investment Committee Chair of the Vincent Memorial Hospital Foundation (non-profit organization). Mr. Ebsworth is a CFA charterholder. | N/A |
Jane A. Freeman (Born 1953) | Trustee, since 2015; Chair Liaison, since January 2018# | Retired. From 2012 to 2014 and 1999 to 2008, Chief Financial Officer of Scientific Learning Corporation. From 2008 to 2012, Ms. Freeman provided consulting services related to strategic business projects. Prior to 1999, Portfolio Manager at Rockefeller & Co. and Scudder, Stevens & Clark. Board member of the Harding Loevner Funds from 1996 to 2014, serving as both Lead Independent Director and chair of the Audit Committee. Board member of the Russell Exchange Traded Funds Trust from 2011 to 2012 and the chair of the Audit Committee. Ms. Freeman is also an inactive Chartered Financial Analyst. | N/A |
Isaiah Harris, Jr. (Born 1952) | Trustee, since 2009; Audit Committee Chair, since 2019 | Retired. Member of the Advisory Board of CEF of East Central Florida. Chairman of the Board of CIGNA Corporation from 2009 to 2021, and Director from 2005 to 2008. From 2003 to 2011, Director of Deluxe Corporation. Prior thereto, President and CEO of BellSouth Advertising and Publishing Corp. from 2005 to 2007, President and CEO of BellSouth Enterprises from 2004 to 2005 and President of BellSouth Consumer Services from 2000 to 2003. Emeritus member of the Iowa State University Foundation Board of Governors. Emeritus Member of the Advisory board of Iowa State University School of Business. Advisory Board Member, Palm Harbor Academy (private school). Advisory Board Member, Fellowship of Christian Athletes. Mr. Harris is a certified public accountant (inactive status). | N/A |
David F. Larcker (Born 1950) | Trustee, since 2009 | Distinguished Visiting Fellow at the Hoover Institution since 2022. James Irvin Miller Professor of Accounting at the Graduate School of Business (Emeritus), Stanford University, Director of the Corporate Governance Research Initiative and Senior Faculty of The Rock Center for Corporate Governance since 2006. From 2005 to 2008, Professor of Accounting at the Graduate School of Business, Stanford University. Prior thereto, Ernst & Young Professor of Accounting at The Wharton School, University of Pennsylvania from 1985 to 2005. | N/A |
Olivia S. Mitchell (Born 1953) | Trustee, since 2006; Nominating and Governance Committee Chair, since 2018 | International Foundation of Employee Benefit Plans Professor since 1993, Wharton School of the University of Pennsylvania. Director of Wharton’s Pension Research Council and Boettner Center on Pensions & Retirement Research, and Research Associate at the National Bureau of Economic Research. Previously taught at Cornell University from 1978 to 1993. | N/A |
Name and year of birth | Position held and length of service* | Principal occupations during past five years or longer | Current other public company or investment company directorships |
Timothy J. Penny (Born 1951) | Trustee, since 1996; Chair, since 2018 | President and Chief Executive Officer of Southern Minnesota Initiative Foundation, a non-profit organization, since 2007. Vice Chair of the Economic Club of Minnesota, since 2007. Co-Chair of the Committee for a Responsible Federal Budget, since 1995. Member of the Board of Trustees of NorthStar Education Finance, Inc., a non-profit organization, from 2007-2022. Senior Fellow of the University of Minnesota Humphrey Institute from 1995 to 2017. | N/A |
James G. Polisson (Born 1959) | Trustee, since 2018 | Retired. Chief Marketing Officer, Source (ETF) UK Services, Ltd, from 2015 to 2017. From 2012 to 2015, Principal of The Polisson Group, LLC, a management consulting, corporate advisory and principal investing company. Chief Executive Officer and Managing Director at Russell Investments, Global Exchange Traded Funds from 2010 to 2012. Managing Director of Barclays Global Investors from 1998 to 2010 and Global Chief Marketing Officer for iShares and Barclays Global Investors from 2000 to 2010. Trustee of the San Francisco Mechanics’ Institute, a non- profit organization, from 2013 to 2015. Board member of the Russell Exchange Traded Fund Trust from 2011 to 2012. Director of Barclays Global Investors Holdings Deutschland GmbH from 2006 to 2009. Mr. Polisson is an attorney and has a retired status with the Massachusetts and District of Columbia Bar Associations. | N/A |
Pamela Wheelock (Born 1959) | Trustee, since January 2020; previously Trustee from January 2018 to July 2019# | Retired. Executive and Senior Financial leadership positions in the public, private and nonprofit sectors. Interim President and CEO, McKnight Foundation, 2020. Interim Commissioner, Minnesota Department of Human Services, 2019. Chief Operating Officer, Twin Cities Habitat for Humanity, 2017-2019. Vice President for University Services, University of Minnesota, 2012- 2016. Interim President and CEO, Blue Cross and Blue Shield of Minnesota, 2011-2012. Executive Vice-President and Chief Financial Officer, Minnesota Wild, 2002-2008. Commissioner, Minnesota Department of Finance, 1999-2002. Chair of the Board of Directors of Destination Medical Center Corporation. Board member of the Minnesota Wild Foundation. | N/A |
Name and year of birth | Position held and length of service | Principal occupations during past five years or longer |
Andrew Owen (Born 1960) | President, since 2017 | President and Chief Executive Officer of Allspring Funds Management, LLC since 2017 and Head of Global Fund Governance of Allspring Global Investments since 2022. Prior thereto, co-president of Galliard Capital Management, LLC, an affiliate of Allspring Funds Management, LLC, from 2019 to 2022 and Head of Affiliated Managers, Allspring Global Investments, from 2014 to 2019 and Executive Vice President responsible for marketing, investments and product development for Allspring Funds Management, LLC, from 2009 to 2014. |
Jeremy DePalma (Born 1974) | Treasurer, since 2012 (for certain funds in the Fund Complex); since 2021 (for the remaining funds in the Complex) | Senior Vice President of Allspring Funds Management, LLC since 2009. Senior Vice President of Evergreen Investment Management Company, LLC from 2008 to 2010 and head of the Fund Reporting and Control Team within Fund Administration from 2005 to 2010. |
Christopher Baker (Born 1976) | Chief Compliance Officer, since 2022 | Global Chief Compliance Officer for Allspring Global Investments since 2022. Prior thereto, Chief Compliance Officer for State Street Global Advisors from 2018 to 2021. Senior Compliance Officer for the State Street divisions of Alternative Investment Solutions, Sector Solutions, and Global Marketing from 2015 to 2018. From 2010 to 2015 Vice President, Global Head of Investment and Marketing Compliance for State Street Global Advisors. |
Matthew Prasse (Born 1983) | Chief Legal Officer, since 2022; Secretary, since 2021 | Senior Counsel of the Allspring Legal Department since 2021. Senior Counsel of the Wells Fargo Legal Department from 2018 to 2021. Previously, Counsel for Barings LLC from 2015 to 2018. Prior to joining Barings, Associate at Morgan, Lewis & Bockius LLP from 2008 to 2015. |

P.O. Box 219967
Kansas City, MO 64121-9967

SAR4337 03-24
2 | |
6 | |
8 | |
9 | |
28 | |
30 | |
32 | |
33 | |
37 | |
46 |

Allspring Funds

President
Allspring Funds
Notice to Shareholders |
Beginning in July 2024, the Fund will be required by the Securities and Exchange Commission to send shareholders a paper copy of a new tailored shareholder report in place of the full shareholder report that you are now receiving. The tailored shareholder report will contain concise information about the Fund, including certain expense and performance information and fund statistics. If you wish to receive this new tailored shareholder report electronically, please follow the instructions on the back cover of this report. |
Other information that is currently included in the shareholder report, such as the Fund’s financial statements, will be available online and upon request, free of charge, in paper or electronic format. |
Investment objective | The Fund seeks total return, consisting of a high level of current income and capital appreciation. |
Manager | Allspring Funds Management, LLC |
Subadviser | Allspring Global Investments, LLC |
Portfolio managers | Christopher Kauffman, CFA, Janet Rilling, CFA, Michael Schueller, CFA, Michal Stanczyk, Noah Wise, CFA |
Average annual total returns (%) as of March 31, 2024 | |||||||||
Including sales charge | Excluding sales charge | Expense ratios1 (%) | |||||||
Inception date | 1 year | 5 year | 10 year | 1 year | 5 year | 10 year | Gross | Net2 | |
Class A (WSIAX) | 1-31-2013 | 3.04 | 2.13 | 2.11 | 7.34 | 2.96 | 2.53 | 1.09 | 0.72 |
Class C (WSICX) | 1-31-2013 | 5.47 | 2.34 | 1.98 | 6.47 | 2.34 | 1.98 | 1.84 | 1.47 |
Administrator Class (WSIDX) | 1-31-2013 | – | – | – | 7.28 | 3.04 | 2.61 | 1.04 | 0.67 |
Institutional Class (WSINX) | 1-31-2013 | – | – | – | 7.71 | 3.28 | 2.84 | 0.77 | 0.40 |
Bloomberg U.S. Aggregate Bond Index3 | – | – | – | – | 1.70 | 0.36 | 1.54 | – | – |
1 | Reflects the expense ratios as stated in the most recent prospectuses, which include the impact of 0.01% in acquired fund fees and expenses. The expense ratios shown are subject to change and may differ from the annualized expense ratios shown in the Financial Highlights of this report, which do not include acquired fund fees and expenses. |
2 | The manager has contractually committed through January 31, 2025, to waive fees and/or reimburse expenses to the extent necessary to cap total annual fund operating expenses after fee waivers at 0.71% for Class A, 1.46% for Class C, 0.66% for Administrator Class and 0.39% for Institutional Class. Brokerage commissions, stamp duty fees, interest, taxes, acquired fund fees and expenses (if any), and extraordinary expenses are excluded from the expense caps. Prior to or after the commitment expiration date, the caps may be increased or the commitment to maintain the caps may be terminated only with the approval of the Board of Trustees. Without these caps, the Fund’s returns would have been lower. The expense ratio paid by an investor is the net expense ratio (the total annual fund operating expenses after fee waivers) as stated in the prospectuses. |
3 | The Bloomberg U.S. Aggregate Bond Index is a broad-based benchmark that measures the investment-grade, U.S.–dollar–denominated, fixed-rate taxable bond market, including Treasuries, government-related and corporate securities, mortgage-backed securities (agency fixed-rate and hybrid adjustable-rate mortgage pass-throughs), asset-backed securities, and commercial mortgage-backed securities. You cannot invest directly in an index. |
CFA® and Chartered Financial Analyst® are trademarks owned by CFA Institute. |
Ten largest holdings (%) as of March 31, 20241 | |
GNMA, 6.00%, 4-18-2054 | 5.99 |
GNMA, 6.50%, 4-18-2054 | 5.98 |
FNMA, 6.00%, 4-11-2054 | 5.12 |
FNMA, 6.50%, 4-11-2054 | 5.11 |
U.S. Treasury Notes, 4.25%, 12-31-2025 | 4.49 |
U.K. Gilts, 3.25%, 1-31-2033 | 3.60 |
Spain, 0.00%, 1-31-2028 | 2.15 |
French Republic, 0.75%, 2-25-2028 | 2.00 |
U.S. Treasury Notes, 4.25%, 1-31-2026 | 1.50 |
Malaysia, 3.88%, 3-14-2025 | 1.49 |
1 | Figures represent the percentage of the Fund’s net assets. Holdings are subject to change and may have changed since the date specified. |
Portfolio composition as of March 31, 20241 |
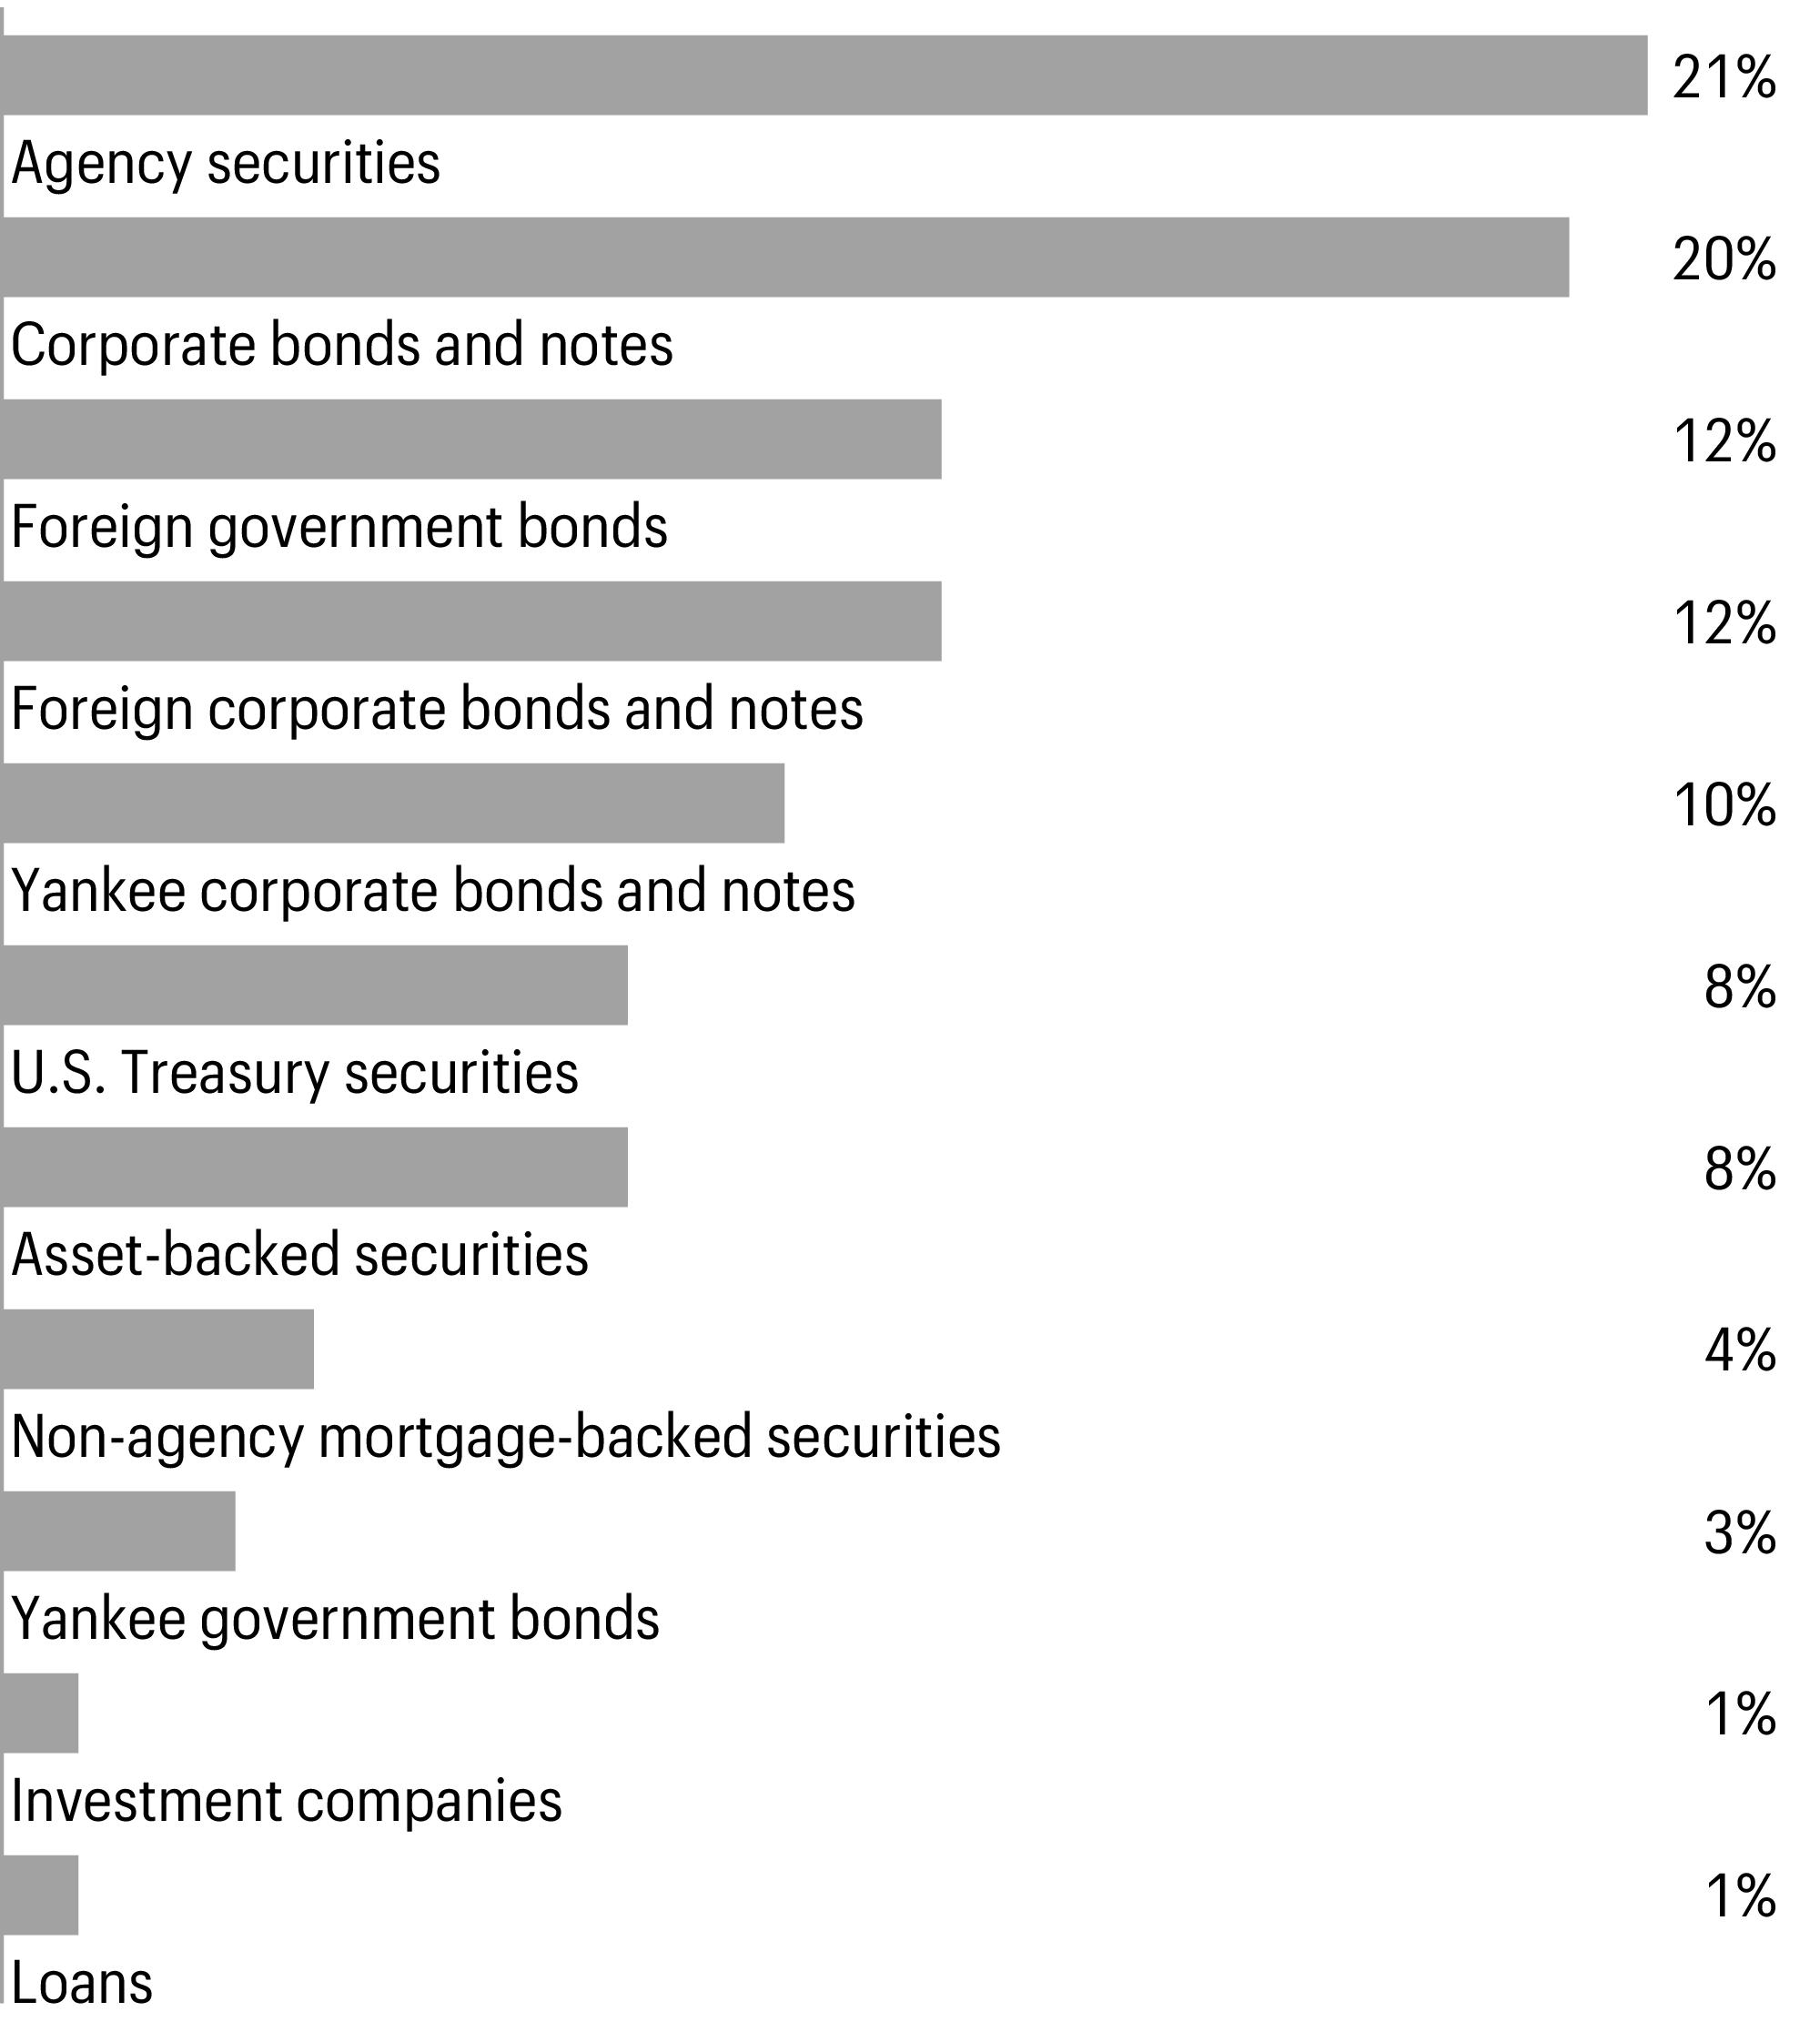
1 | Figures represent the percentage of the Fund’s long-term investments. Allocations are subject to change and may have changed since the date specified. |
Credit quality as of March 31, 20241 |
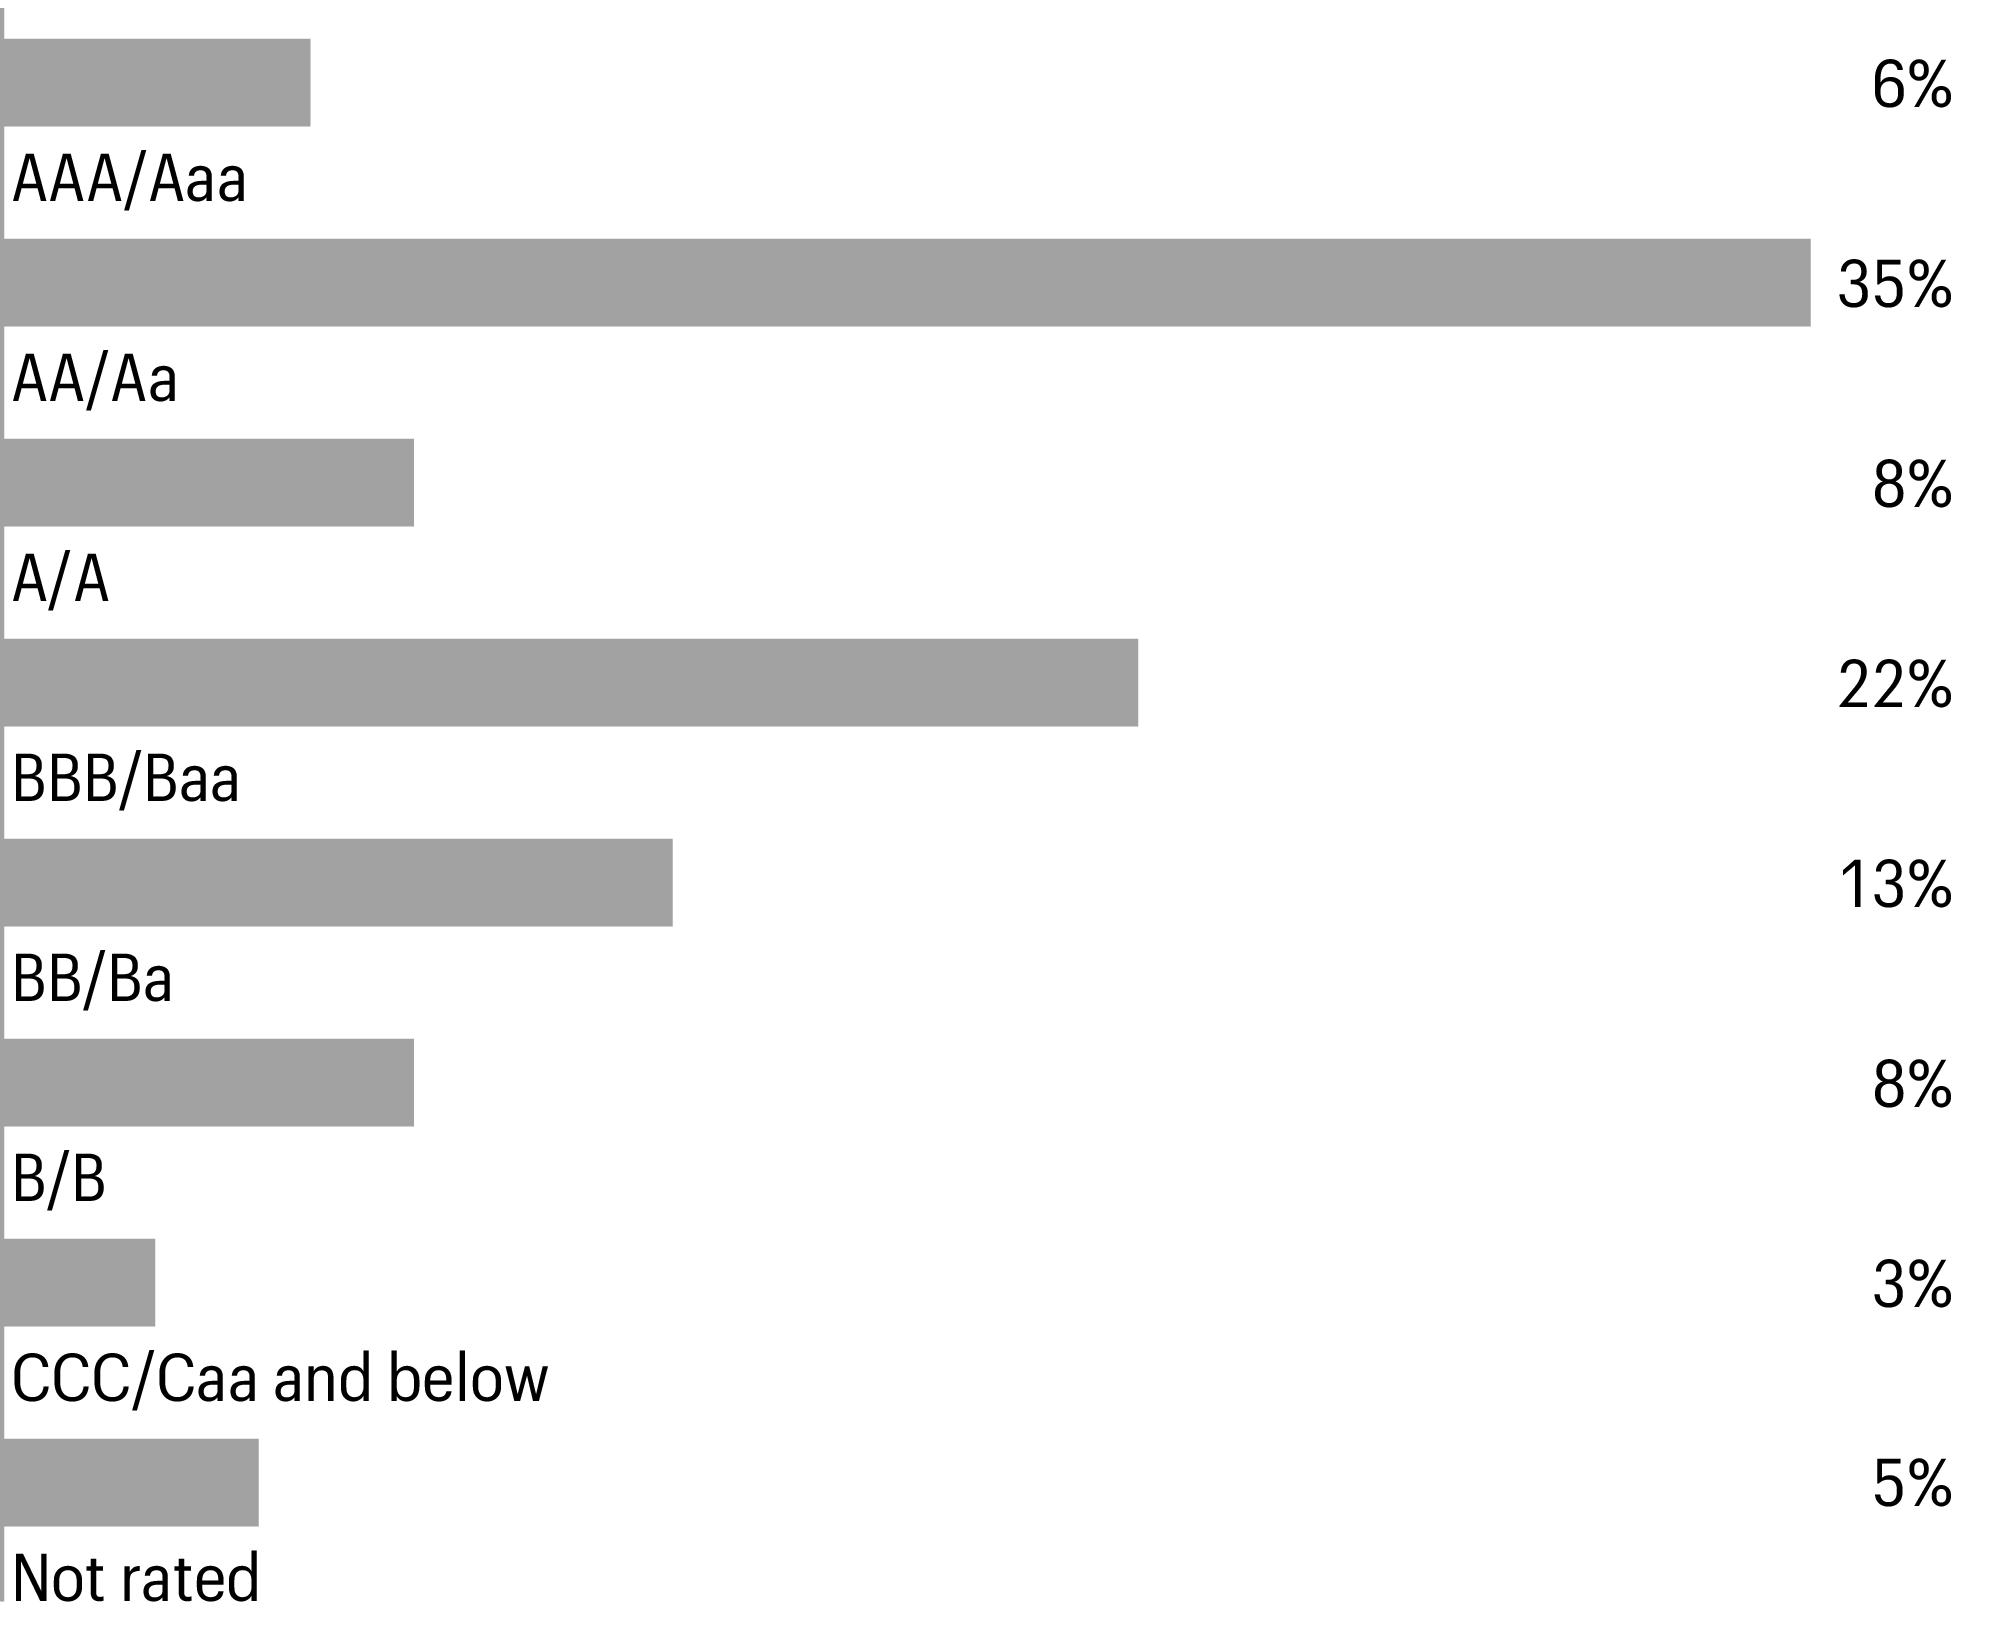
1 | The credit quality distribution of portfolio holdings reflected in the chart is based on ratings from Standard & Poor’s, Moody’s Investors Service, and/or Fitch Ratings Ltd. Credit quality ratings apply to the underlying holdings of the Fund and not to the Fund itself. The percentages of the portfolio with the ratings depicted in the chart are calculated based on the market value of fixed income securities held by the Fund. If a security was rated by all three rating agencies, the middle rating was utilized. If rated by two of the three rating agencies, the lower rating was utilized, and if rated by one of the rating agencies, that rating was utilized. Standard & Poor’s rates the creditworthiness of bonds, ranging from AAA (highest) to D (lowest). Ratings from A to CCC may be modified by the addition of a plus (+) or minus (-) sign to show relative standing within the rating categories. Standard & Poor’s rates the creditworthiness of short-term notes from SP-1 (highest) to SP-3 (lowest). Moody’s rates the creditworthiness of bonds, ranging from Aaa (highest) to C (lowest). Ratings Aa to B may be modified by the addition of a number 1 (highest) to 3 (lowest) to show relative standing within the ratings categories. Moody’s rates the creditworthiness of short-term U.S. tax-exempt municipal securities from MIG 1/VMIG 1 (highest) to SG (lowest). Fitch rates the creditworthiness of bonds, ranging from AAA (highest) to D (lowest). Credit quality distribution is subject to change and may have changed since the date specified. |
Effective maturity distribution as of March 31, 20241 |
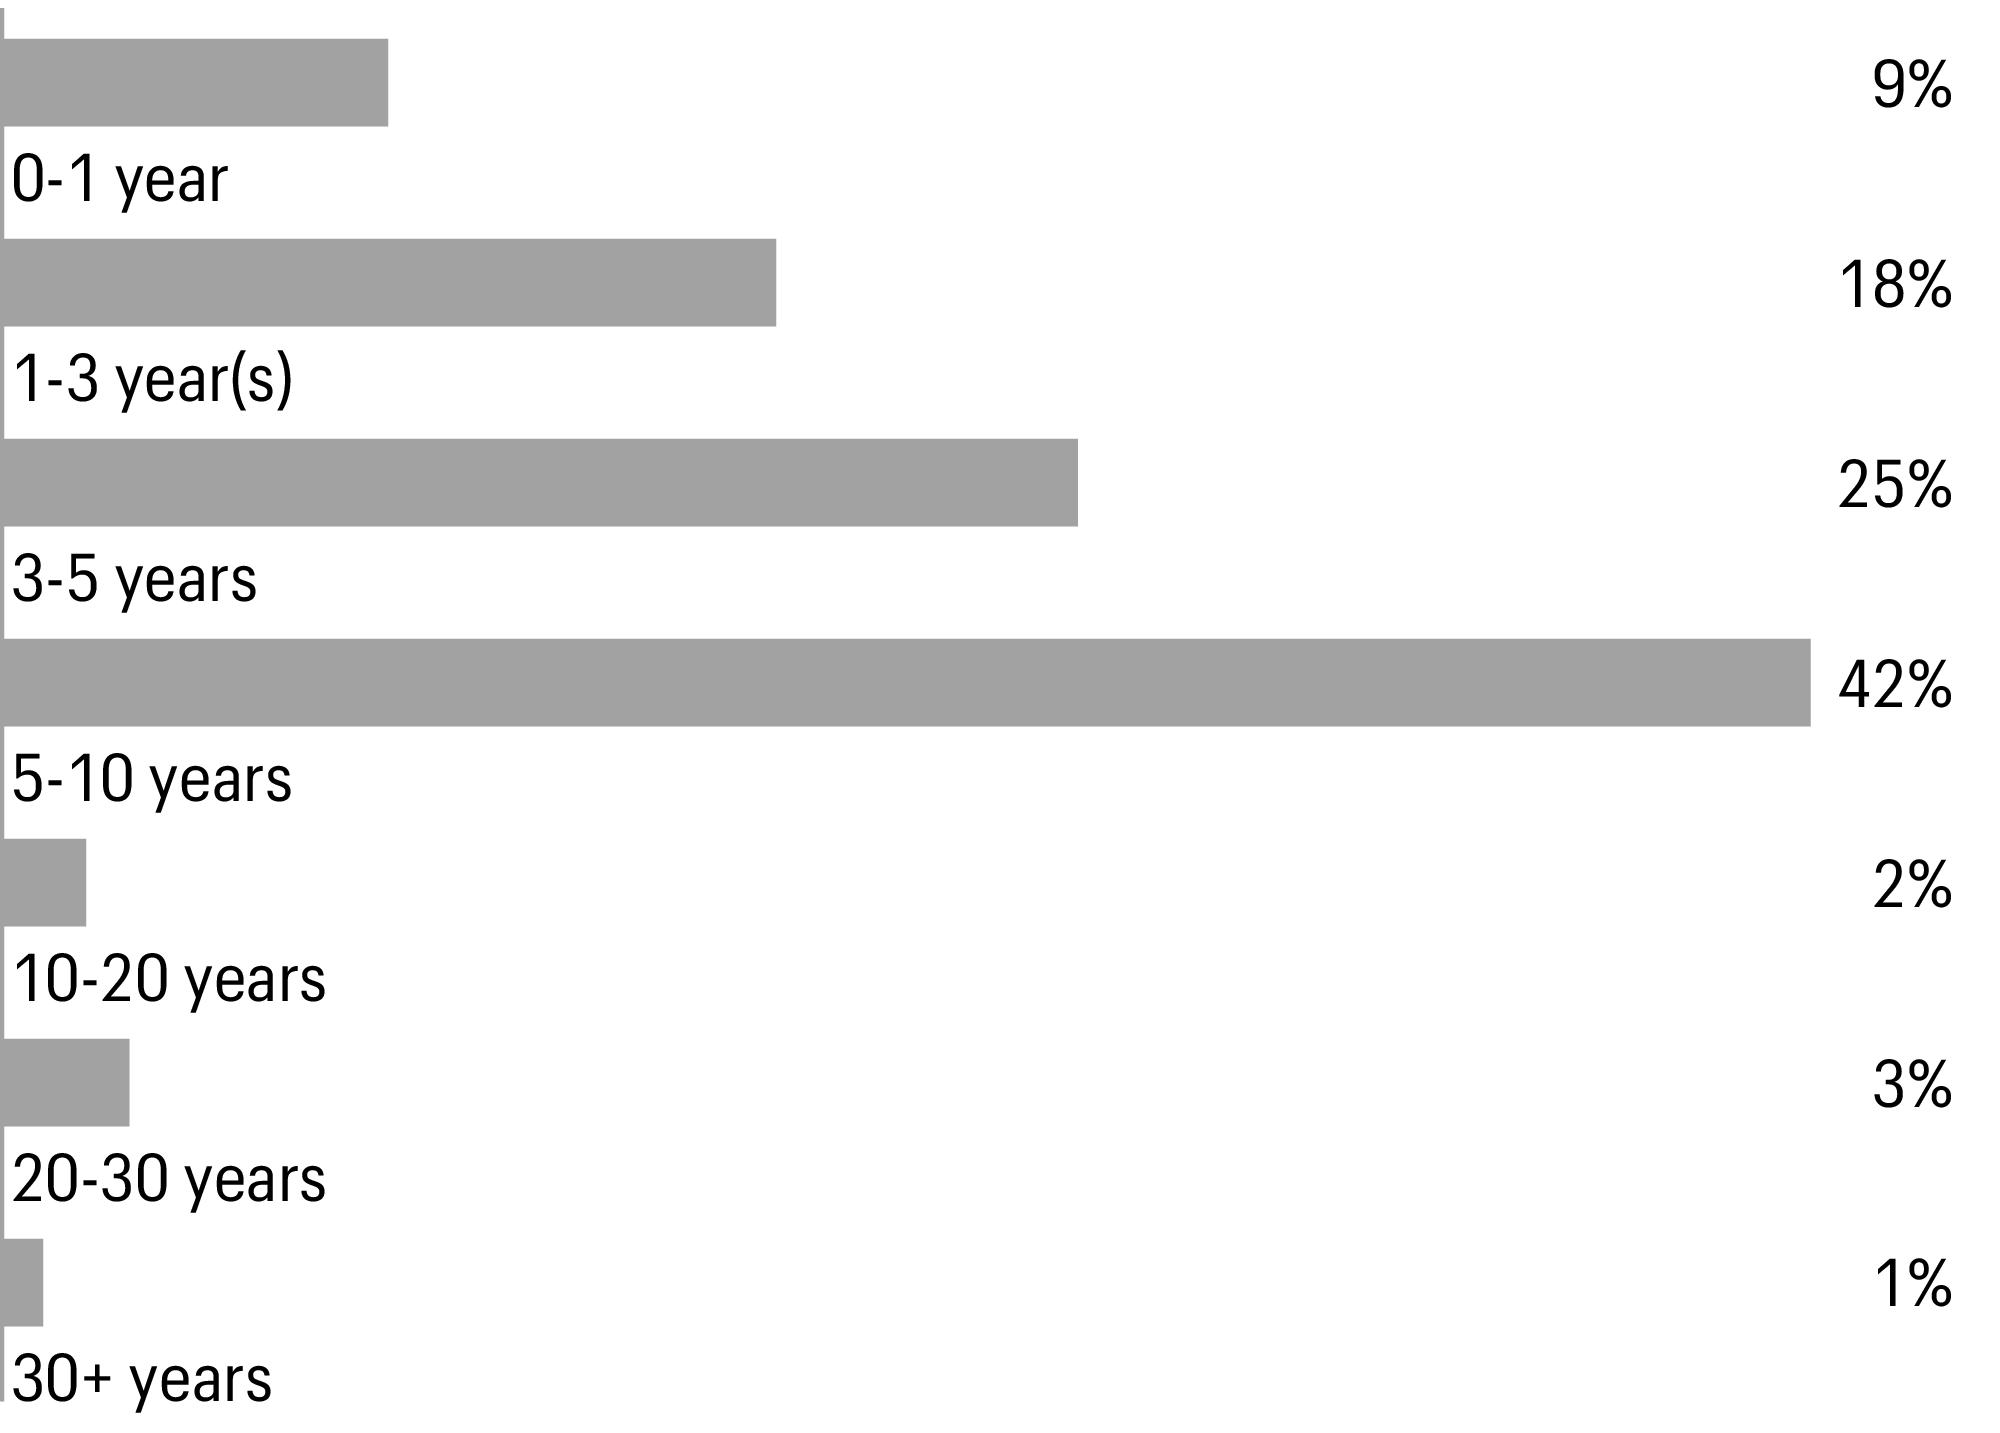
1 | Figures represent the percentage of the Fund’s long-term investments. Allocations are subject to change and may have changed since the date specified. |
Beginning account value 10-1-2023 | Ending account value 3-31-2024 | Consolidated expenses paid during the period1 | Annualized net expense ratio | |
Class A | ||||
Actual | $1,000.00 | $1,073.16 | $3.66 | 0.71 % |
Hypothetical (5% return before expenses) | $1,000.00 | $1,021.33 | $3.57 | 0.71 % |
Class C | ||||
Actual | $1,000.00 | $1,068.49 | $7.51 | 1.46 % |
Hypothetical (5% return before expenses) | $1,000.00 | $1,017.60 | $7.32 | 1.46 % |
Administrator Class | ||||
Actual | $1,000.00 | $1,072.67 | $3.40 | 0.66 % |
Hypothetical (5% return before expenses) | $1,000.00 | $1,021.58 | $3.32 | 0.66 % |
Institutional Class | ||||
Actual | $1,000.00 | $1,075.14 | $2.01 | 0.39 % |
Hypothetical (5% return before expenses) | $1,000.00 | $1,022.92 | $1.96 | 0.39 % |
1 | Consolidated expenses paid is equal to the annualized net expense ratio of each class multiplied by the average account value over the period, multiplied by 182 divided by 366 (to reflect the one-half-year period). |
Interest rate | Maturity date | Principal | Value | |||
Agency securities: 23.43% | ||||||
FNMA%% | 6.00 % | 4-11-2054 | $ | 13,460,000 | $13,582,539 | |
FNMA%% | 6.50 | 4-11-2054 | 13,285,000 | 13,572,198 | ||
GNMA%% | 6.00 | 4-18-2054 | 15,755,000 | 15,892,700 | ||
GNMA%% | 6.50 | 4-18-2054 | 15,595,000 | 15,855,013 | ||
GNMA%% | 7.00 | 4-18-2054 | 3,200,000 | 3,268,353 | ||
Total agency securities (Cost $61,966,648) | 62,170,803 | |||||
Asset-backed securities: 8.87% | ||||||
ACHM Trust Series 2023-HE2 Class A144A±± | 7.50 | 10-25-2038 | 540,975 | 555,866 | ||
AFN Series 2019-1A Class A2144A | 4.46 | 5-20-2049 | 689,915 | 544,010 | ||
Apidos CLO XXXI Series 2019-31A Class DR (U.S. SOFR 3 Month+3.36%)144A± | 8.68 | 4-15-2031 | 500,000 | 499,182 | ||
Aqua Finance Trust Series 2019-A Class A144A | 3.14 | 7-16-2040 | 122,010 | 114,695 | ||
Aqua Finance Trust Series 2021-A Class A144A | 1.54 | 7-17-2046 | 362,321 | 323,916 | ||
BHG Securitization Trust Series 2021-A Class A144A | 1.42 | 11-17-2033 | 234,429 | 223,725 | ||
Bojangles Issuer LLC Series 2020-1A Class A2144A | 3.83 | 10-20-2050 | 692,663 | 653,534 | ||
BRSP Ltd. Series 2021-FL1 Class A (U.S. SOFR 1 Month+1.26%)144A± | 6.59 | 8-19-2038 | 879,844 | 866,725 | ||
Cajun Global LLC Series 2021-1 Class A2144A | 3.93 | 11-20-2051 | 970,000 | 879,237 | ||
Carlyle Global Market Strategies CLO Ltd. Series 2016-1A Class CR2 (U.S. SOFR 3 Month+3.61%)144A± | 8.93 | 4-20-2034 | 1,000,000 | 995,424 | ||
Carlyle U.S. CLO Ltd. Series 2017-2A Class A2R (U.S. SOFR 3 Month+1.86%)144A± | 7.18 | 7-20-2031 | 750,000 | 750,758 | ||
CFMT LLC Series 2021-HB7 Class M2144A±± | 2.68 | 10-27-2031 | 1,000,000 | 949,142 | ||
Coinstar Funding LLC Series 2017-1A Class A2144A | 5.22 | 4-25-2047 | 1,039,737 | 922,754 | ||
Commonbond Student Loan Trust Series 2018-CGS Class C144A | 4.35 | 2-25-2046 | 66,652 | 57,548 | ||
CPS Auto Receivables Trust Series 2021-A Class D144A | 1.16 | 12-15-2026 | 779,125 | 764,312 | ||
DataBank Issuer Series 2024-1A Class A2144A | 5.30 | 1-26-2054 | 790,000 | 743,159 | ||
Driven Brands Funding, LLC Series 2019-2A Class A2144A | 3.98 | 10-20-2049 | 335,125 | 315,256 | ||
FIGRE Trust Series 2023-HE1 Class A144A | 5.85 | 3-25-2053 | 557,303 | 556,347 | ||
FIGRE Trust Series 2023-HE2 Class A144A±± | 6.51 | 5-25-2053 | 371,530 | 376,014 | ||
Five Guys Holdings, Inc. Series 2023-1A Class A2144A | 7.55 | 1-26-2054 | 180,000 | 186,845 | ||
Foundation Finance Trust Series 2019-1A Class A144A | 3.86 | 11-15-2034 | 25,885 | 25,748 | ||
FREED Mortgage Trust Series 2022-HE1 Class A144A | 7.00 | 10-25-2037 | 445,800 | 449,921 | ||
FS Rialto Issuer LLC Series 2021-FL3 Class B (U.S. SOFR 1 Month+1.91%)144A± | 7.24 | 11-16-2036 | 1,000,000 | 985,096 | ||
Jonah Energy ABS I LLC Series 2022-1 Class A1144A | 7.20 | 12-10-2037 | 558,195 | 556,165 | ||
Laurel Road Prime Student Loan Trust Series 2017-C Class C144A | 3.29 | 11-25-2042 | 295,202 | 276,544 | ||
Longtrain Leasing III LLC Series 2015-1A Class A2144A | 4.06 | 1-15-2045 | 1,555,563 | 1,523,299 | ||
Madison Park Funding XXIX Ltd. Series 2018-29A Class B (U.S. SOFR 3 Month+2.01%)144A± | 7.31 | 10-18-2030 | 700,000 | 700,000 | ||
MF1 Ltd. Series 2021-FL7 Class C (U.S. SOFR 1 Month+2.16%)144A± | 7.49 | 10-16-2036 | 1,000,000 | 956,875 | ||
MF1 Ltd. Series 2022-FL8 Class A (U.S. SOFR 1 Month+1.35%)144A± | 6.68 | 2-19-2037 | 971,806 | 961,481 | ||
MNR ABS Issuer I LLC‡ | 8.12 | 12-15-2038 | 292,213 | 294,784 | ||
Interest rate | Maturity date | Principal | Value | |||
Asset-backed securities(continued) | ||||||
Neuberger Berman Loan Advisers CLO 25 Ltd. Series 2017- 25A Class BR (U.S. SOFR 3 Month+1.61%)144A± | 6.91 % | 10-18-2029 | $ | 250,000 | $250,317 | |
Octane Receivables Trust Series 2023-1A Class A144A | 5.87 | 5-21-2029 | 105,814 | 105,901 | ||
Octane Receivables Trust Series 2023-1A Class B144A | 5.96 | 7-20-2029 | 160,000 | 159,580 | ||
OnDeck Asset Securitization Trust III LLC Series 2021-1A Class A144A | 1.59 | 5-17-2027 | 725,000 | 720,027 | ||
Pagaya AI Debt Selection Trust Series 2021-3 Class B144A | 1.74 | 5-15-2029 | 363,534 | 361,610 | ||
Pagaya AI Debt Trust Series 2023-1 Class A144A | 7.56 | 7-15-2030 | 820,592 | 824,363 | ||
RCKT Mortgage Trust Series 2023-CES3 Class A1A144A±± | 7.11 | 11-25-2043 | 564,224 | 572,319 | ||
SMB Private Education Loan Trust Series 2015-C Class C144A | 4.50 | 9-17-2046 | 970,000 | 910,866 | ||
SoFi Professional Loan Program LLC Series 2017-E Class B144A | 3.49 | 11-26-2040 | 219,158 | 211,856 | ||
Store Master Funding I-VII XIV XIX XX XXIV Series 2023-1A Class A1144A | 6.19 | 6-20-2053 | 497,917 | 494,617 | ||
Wingstop Funding LLC Series 2020-1A Class A2144A | 2.84 | 12-5-2050 | 354,600 | 321,813 | ||
Zaxby’s Funding LLC Series 2021-1A Class A2144A | 3.24 | 7-30-2051 | 682,500 | 604,016 | ||
Total asset-backed securities (Cost $24,247,246) | 23,545,647 | |||||
Shares | ||||||
Common stocks: 0.03% | ||||||
Consumer discretionary: 0.03% | ||||||
Hotels, restaurants & leisure: 0.03% | ||||||
Royal Caribbean Cruises Ltd.† | 535 | 74,371 | ||||
Consumer staples: 0.00% | ||||||
Consumer staples distribution & retail : 0.00% | ||||||
Casino Guichard Perrachon SA† | 128,399 | 5,416 | ||||
Total common stocks (Cost $489,195) | 79,787 | |||||
Principal | ||||||
Corporate bonds and notes: 22.40% | ||||||
Basic materials: 0.27% | ||||||
Chemicals: 0.27% | ||||||
Westlake Corp. | 1.63 | 7-17-2029 | $ | 750,000 | 725,999 | |
Communications: 2.43% | ||||||
Advertising: 0.38% | ||||||
Clear Channel Outdoor Holdings, Inc.144A | 9.00 | 9-15-2028 | 350,000 | 364,565 | ||
Outfront Media Capital LLC/Outfront Media Capital Corp.144A | 4.63 | 3-15-2030 | 730,000 | 654,686 | ||
1,019,251 | ||||||
Internet: 0.90% | ||||||
Arches Buyer, Inc.144A | 6.13 | 12-1-2028 | 425,000 | 356,011 | ||
Booking Holdings, Inc. | 4.13 | 5-12-2033 | 1,000,000 | 1,132,745 | ||
Interest rate | Maturity date | Principal | Value | |||
Internet(continued) | ||||||
Cablevision Lightpath LLC144A | 5.63 % | 9-15-2028 | $ | 330,000 | $275,391 | |
MercadoLibre, Inc. | 3.13 | 1-14-2031 | 750,000 | 627,929 | ||
2,392,076 | ||||||
Media: 1.15% | ||||||
CCO Holdings LLC/CCO Holdings Capital Corp.144A | 4.25 | 1-15-2034 | 875,000 | 660,497 | ||
Charter Communications Operating LLC/Charter Communications Operating Capital | 3.90 | 6-1-2052 | 275,000 | 174,891 | ||
CSC Holdings LLC144A | 4.63 | 12-1-2030 | 250,000 | 126,954 | ||
CSC Holdings LLC144A | 11.75 | 1-31-2029 | 540,000 | 540,842 | ||
DISH Network Corp.144A | 11.75 | 11-15-2027 | 355,000 | 362,430 | ||
Nexstar Media, Inc.144A | 5.63 | 7-15-2027 | 400,000 | 383,728 | ||
Scripps Escrow II, Inc.144A | 5.38 | 1-15-2031 | 215,000 | 132,282 | ||
Sirius XM Radio, Inc.144A | 5.50 | 7-1-2029 | 690,000 | 657,198 | ||
3,038,822 | ||||||
Consumer, cyclical: 3.35% | ||||||
Airlines: 0.38% | ||||||
Spirit Loyalty Cayman Ltd./Spirit IP Cayman Ltd.144A | 8.00 | 9-20-2025 | 140,000 | 106,278 | ||
U.S. Airways Pass-Through Trust Series 2013-1 Class A | 3.95 | 11-15-2025 | 762,175 | 743,882 | ||
United Airlines Pass-Through Trust Series 2020-1 Class A | 5.88 | 10-15-2027 | 161,722 | 161,175 | ||
1,011,335 | ||||||
Apparel: 0.49% | ||||||
Crocs, Inc.144A | 4.13 | 8-15-2031 | 330,000 | 285,922 | ||
Tapestry, Inc. | 7.70 | 11-27-2030 | 555,000 | 591,860 | ||
Tapestry, Inc. | 7.85 | 11-27-2033 | 385,000 | 417,835 | ||
1,295,617 | ||||||
Auto manufacturers: 0.82% | ||||||
Ford Motor Credit Co. LLC | 4.39 | 1-8-2026 | 175,000 | 170,692 | ||
Ford Motor Credit Co. LLC | 5.11 | 5-3-2029 | 475,000 | 461,142 | ||
General Motors Financial Co., Inc. Series C (5 Year Treasury Constant Maturity+5.00%)ʊ± | 5.70 | 9-30-2030 | 650,000 | 623,254 | ||
Hyundai Capital America144A | 5.30 | 3-19-2027 | 500,000 | 500,090 | ||
Nissan Motor Acceptance Co. LLC144A | 2.45 | 9-15-2028 | 500,000 | 430,767 | ||
2,185,945 | ||||||
Auto parts & equipment: 0.03% | ||||||
Adient Global Holdings Ltd.144A | 3.50 | 8-15-2024 | 76,968 | 82,407 | ||
Entertainment: 0.35% | ||||||
CDI Escrow Issuer, Inc.144A | 5.75 | 4-1-2030 | 490,000 | 472,998 | ||
Warnermedia Holdings, Inc. | 4.28 | 3-15-2032 | 500,000 | 446,619 | ||
919,617 | ||||||
Home builders: 0.05% | ||||||
Taylor Morrison Communities, Inc.144A | 5.13 | 8-1-2030 | 135,000 | 128,921 | ||
Interest rate | Maturity date | Principal | Value | |||
Retail: 0.86% | ||||||
Kohl’s Corp. | 4.63 % | 5-1-2031 | $ | 465,000 | $391,309 | |
Macy’s Retail Holdings LLC144A | 6.13 | 3-15-2032 | 600,000 | 581,572 | ||
Michaels Cos., Inc.144A | 7.88 | 5-1-2029 | 510,000 | 382,619 | ||
NMG Holding Co., Inc./Neiman Marcus Group LLC144A | 7.13 | 4-1-2026 | 935,000 | 915,617 | ||
2,271,117 | ||||||
Toys/games/hobbies: 0.37% | ||||||
Mattel, Inc.144A | 5.88 | 12-15-2027 | 985,000 | 988,830 | ||
Consumer, non-cyclical: 2.61% | ||||||
Biotechnology: 0.02% | ||||||
Amgen, Inc. | 5.75 | 3-2-2063 | 50,000 | 50,998 | ||
Commercial services: 1.08% | ||||||
Allied Universal Holdco LLC/Allied Universal Finance Corp.144A | 6.00 | 6-1-2029 | 880,000 | 757,173 | ||
Global Payments, Inc. | 5.95 | 8-15-2052 | 290,000 | 289,310 | ||
MPH Acquisition Holdings LLC144A | 5.50 | 9-1-2028 | 100,000 | 85,038 | ||
MPH Acquisition Holdings LLC144A | 5.75 | 11-1-2028 | 290,000 | 228,700 | ||
PECF USS Intermediate Holding III Corp.144A | 8.00 | 11-15-2029 | 200,000 | 105,042 | ||
Sabre Global, Inc.144A | 11.25 | 12-15-2027 | 780,000 | 732,037 | ||
Upbound Group, Inc.144A | 6.38 | 2-15-2029 | 690,000 | 669,862 | ||
2,867,162 | ||||||
Healthcare-products: 0.31% | ||||||
Danaher Corp. | 2.50 | 3-30-2030 | 800,000 | 831,552 | ||
Healthcare-services: 0.55% | ||||||
ModivCare Escrow Issuer, Inc.144A | 5.00 | 10-1-2029 | 700,000 | 507,566 | ||
Pediatrix Medical Group, Inc.144A | 5.38 | 2-15-2030 | 430,000 | 390,670 | ||
Star Parent, Inc.144A | 9.00 | 10-1-2030 | 530,000 | 560,902 | ||
1,459,138 | ||||||
Pharmaceuticals: 0.65% | ||||||
AdaptHealth LLC144A | 5.13 | 3-1-2030 | 450,000 | 392,461 | ||
Bristol-Myers Squibb | 5.20 | 2-22-2034 | 1,310,000 | 1,330,076 | ||
1,722,537 | ||||||
Energy: 3.22% | ||||||
Energy-alternate sources: 0.19% | ||||||
Enviva Partners LP/Enviva Partners Finance Corp.144A† | 6.50 | 1-15-2026 | 400,000 | 174,000 | ||
TerraForm Power Operating LLC144A | 4.75 | 1-15-2030 | 369,000 | 338,240 | ||
512,240 | ||||||
Oil & gas: 1.21% | ||||||
Aethon United BR LP/Aethon United Finance Corp.144A | 8.25 | 2-15-2026 | 750,000 | 758,654 | ||
Apache Corp. | 5.25 | 2-1-2042 | 655,000 | 552,635 | ||
Encino Acquisition Partners Holdings LLC144A | 8.50 | 5-1-2028 | 370,000 | 374,022 | ||
Hilcorp Energy I LP/Hilcorp Finance Co.144A | 5.75 | 2-1-2029 | 55,000 | 53,572 | ||
Interest rate | Maturity date | Principal | Value | |||
Oil & gas(continued) | ||||||
Hilcorp Energy I LP/Hilcorp Finance Co.144A | 6.00 % | 2-1-2031 | $ | 555,000 | $539,639 | |
Occidental Petroleum Corp. | 6.45 | 9-15-2036 | 550,000 | 586,446 | ||
Talos Production, Inc.144A | 9.00 | 2-1-2029 | 315,000 | 334,520 | ||
3,199,488 | ||||||
Oil & gas services: 0.45% | ||||||
Bristow Group, Inc.144A | 6.88 | 3-1-2028 | 680,000 | 665,564 | ||
Oceaneering International, Inc. | 6.00 | 2-1-2028 | 550,000 | 541,871 | ||
1,207,435 | ||||||
Pipelines: 1.37% | ||||||
Antero Midstream Partners LP/Antero Midstream Finance Corp.144A | 6.63 | 2-1-2032 | 300,000 | 301,310 | ||
Buckeye Partners LP | 5.85 | 11-15-2043 | 100,000 | 85,198 | ||
Energy Transfer LP (5 Year Treasury Constant Maturity+4.02%)± | 8.00 | 5-15-2054 | 365,000 | 382,838 | ||
EnLink Midstream Partners LP | 5.05 | 4-1-2045 | 115,000 | 94,967 | ||
Prairie Acquiror LP144A | 9.00 | 8-1-2029 | 740,000 | 761,786 | ||
Rockies Express Pipeline LLC144A | 6.88 | 4-15-2040 | 340,000 | 333,673 | ||
Tallgrass Energy Partners LP/Tallgrass Energy Finance Corp.144A | 6.00 | 12-31-2030 | 495,000 | 470,217 | ||
Venture Global Calcasieu Pass LLC144A | 6.25 | 1-15-2030 | 375,000 | 377,274 | ||
Venture Global LNG, Inc.144A | 8.38 | 6-1-2031 | 810,000 | 835,328 | ||
3,642,591 | ||||||
Financial: 7.79% | ||||||
Banks: 2.03% | ||||||
Bank of America Corp. (U.S. SOFR+1.33%)± | 2.97 | 2-4-2033 | 785,000 | 667,596 | ||
Bank of America Corp. Series DD (U.S. SOFR 3 Month+4.81%)ʊ± | 6.30 | 3-10-2026 | 345,000 | 345,310 | ||
Goldman Sachs Group, Inc. Series T (5 Year Treasury Constant Maturity+2.97%)ʊ± | 3.80 | 5-10-2026 | 550,000 | 512,287 | ||
JPMorgan Chase & Co. (5 Year Treasury Constant Maturity+2.74%)ʊ± | 6.88 | 6-1-2029 | 470,000 | 486,343 | ||
JPMorgan Chase & Co. Series HH (U.S. SOFR 3 Month+3.13%)ʊ± | 4.60 | 2-1-2025 | 655,000 | 643,939 | ||
JPMorgan Chase & Co. Series Q (U.S. SOFR 3 Month+3.51%)ʊ± | 8.82 | 5-1-2024 | 350,000 | 349,835 | ||
JPMorgan Chase & Co. Series R (U.S. SOFR 3 Month+3.56%)ʊ± | 8.87 | 5-1-2024 | 100,000 | 99,828 | ||
Morgan Stanley (U.S. SOFR+1.29%)± | 2.94 | 1-21-2033 | 1,965,000 | 1,610,240 | ||
Santander Holdings USA, Inc. (U.S. SOFR+3.28%)± | 7.66 | 11-9-2031 | 605,000 | 657,600 | ||
5,372,978 | ||||||
Diversified financial services: 1.19% | ||||||
Aircastle Ltd.144A | 5.95 | 2-15-2029 | 655,000 | 655,257 | ||
Computershare U.S., Inc. | 1.13 | 10-7-2031 | 1,250,000 | 1,095,877 | ||
Enact Holdings, Inc.144A | 6.50 | 8-15-2025 | 525,000 | 524,895 | ||
Interest rate | Maturity date | Principal | Value | |||
Diversified financial services(continued) | ||||||
PRA Group, Inc.144A | 5.00 % | 10-1-2029 | $ | 865,000 | $728,921 | |
Toll Road Investors Partnership II LP Series 1999-B (NPFGC Insured)144A¤ | 0.00 | 2-15-2027 | 200,000 | 159,942 | ||
3,164,892 | ||||||
Insurance: 1.64% | ||||||
AssuredPartners, Inc.144A | 5.63 | 1-15-2029 | 700,000 | 644,896 | ||
BroadStreet Partners, Inc.144A | 5.88 | 4-15-2029 | 710,000 | 657,151 | ||
Guardian Life Insurance Co. of America144A | 4.85 | 1-24-2077 | 260,000 | 218,940 | ||
MetLife, Inc. | 6.40 | 12-15-2036 | 1,570,000 | 1,607,622 | ||
OneAmerica Financial Partners, Inc.144A | 4.25 | 10-15-2050 | 45,000 | 31,580 | ||
PartnerRe Finance B LLC (5 Year Treasury Constant Maturity+3.82%)± | 4.50 | 10-1-2050 | 170,000 | 154,937 | ||
Prudential Financial, Inc. (5 Year Treasury Constant Maturity+3.04%)± | 3.70 | 10-1-2050 | 355,000 | 310,303 | ||
Reinsurance Group of America, Inc. | 6.00 | 9-15-2033 | 330,000 | 342,214 | ||
RGA Global Funding144A | 6.00 | 11-21-2028 | 370,000 | 381,567 | ||
4,349,210 | ||||||
Investment Companies: 0.62% | ||||||
Ares Capital Corp. | 2.88 | 6-15-2028 | 500,000 | 445,632 | ||
Blue Owl Capital Corp. | 2.63 | 1-15-2027 | 1,310,000 | 1,196,509 | ||
1,642,141 | ||||||
Real estate: 0.19% | ||||||
CBRE Services, Inc. | 5.50 | 4-1-2029 | 500,000 | 503,019 | ||
REITS: 2.12% | ||||||
American Tower Corp. | 5.45 | 2-15-2034 | 175,000 | 175,285 | ||
Brandywine Operating Partnership LP | 8.05 | 3-15-2028 | 555,000 | 563,674 | ||
EPR Properties | 3.75 | 8-15-2029 | 655,000 | 578,448 | ||
GLP Capital LP/GLP Financing II, Inc. | 4.00 | 1-15-2031 | 1,310,000 | 1,168,934 | ||
Invitation Homes Operating Partnership LP | 5.45 | 8-15-2030 | 275,000 | 275,831 | ||
Iron Mountain, Inc.144A | 4.50 | 2-15-2031 | 825,000 | 744,346 | ||
Omega Healthcare Investors, Inc. | 3.63 | 10-1-2029 | 500,000 | 446,307 | ||
Piedmont Operating Partnership LP | 9.25 | 7-20-2028 | 590,000 | 628,295 | ||
Tanger Properties LP | 2.75 | 9-1-2031 | 655,000 | 536,358 | ||
WEA Finance LLC/Westfield U.K. & Europe Finance PLC144A | 4.75 | 9-17-2044 | 700,000 | 516,447 | ||
5,633,925 | ||||||
Industrial: 0.86% | ||||||
Aerospace/defense: 0.19% | ||||||
RTX Corp. | 6.00 | 3-15-2031 | 340,000 | 357,410 | ||
Spirit AeroSystems, Inc.144A | 9.38 | 11-30-2029 | 140,000 | 152,710 | ||
510,120 | ||||||
Building materials: 0.21% | ||||||
Camelot Return Merger Sub, Inc.144A | 8.75 | 8-1-2028 | 550,000 | 564,990 | ||
Interest rate | Maturity date | Principal | Value | |||
Packaging & containers: 0.26% | ||||||
Ardagh Metal Packaging Finance USA LLC/Ardagh Metal Packaging Finance PLC144A | 6.00 % | 6-15-2027 | $ | 400,000 | $388,307 | |
Clydesdale Acquisition Holdings, Inc.144A | 8.75 | 4-15-2030 | 300,000 | 294,762 | ||
683,069 | ||||||
Trucking & leasing: 0.20% | ||||||
Penske Truck Leasing Co. LP/PTL Finance Corp.144A | 6.20 | 6-15-2030 | 500,000 | 519,770 | ||
Technology: 1.15% | ||||||
Computers: 0.29% | ||||||
Kyndryl Holdings, Inc. | 6.35 | 2-20-2034 | 290,000 | 297,674 | ||
Seagate HDD Cayman | 4.13 | 1-15-2031 | 540,000 | 478,100 | ||
775,774 | ||||||
Semiconductors: 0.18% | ||||||
Entegris, Inc.144A | 4.75 | 4-15-2029 | 500,000 | 479,178 | ||
Software: 0.68% | ||||||
AthenaHealth Group, Inc.144A | 6.50 | 2-15-2030 | 630,000 | 576,210 | ||
Cloud Software Group, Inc.144A | 9.00 | 9-30-2029 | 300,000 | 287,735 | ||
Oracle Corp. | 4.10 | 3-25-2061 | 1,240,000 | 931,159 | ||
1,795,104 | ||||||
Utilities: 0.72% | ||||||
Electric: 0.72% | ||||||
Duke Energy Corp. | 3.10 | 6-15-2028 | 200,000 | 211,681 | ||
Duke Energy Corp. | 3.85 | 6-15-2034 | 400,000 | 427,160 | ||
NSG Holdings LLC/NSG Holdings, Inc.144A | 7.75 | 12-15-2025 | 4,531 | 4,485 | ||
Oglethorpe Power Corp. | 4.25 | 4-1-2046 | 525,000 | 408,825 | ||
PG&E Corp. | 5.25 | 7-1-2030 | 400,000 | 380,094 | ||
Southern Co. Series B (5 Year Treasury Constant Maturity+3.73%)± | 4.00 | 1-15-2051 | 430,000 | 413,386 | ||
Vistra Operations Co. LLC144A | 6.95 | 10-15-2033 | 60,000 | 64,042 | ||
1,909,673 | ||||||
Total corporate bonds and notes (Cost $60,032,551) | 59,456,921 | |||||
Foreign corporate bonds and notes: 13.65% | ||||||
Basic materials: 0.26% | ||||||
Mining: 0.26% | ||||||
Anglo American Capital plc | 4.75 | 9-21-2032 | EUR | 600,000 | 678,963 | |
Communications: 2.54% | ||||||
Advertising: 0.36% | ||||||
WPP Finance Deutschland GmbH | 1.63 | 3-23-2030 | EUR | 1,000,000 | 959,932 | |
Interest rate | Maturity date | Principal | Value | |||
Media: 0.25% | ||||||
Tele Columbus AG (PIK at 10%)144A¥ | 10.00 % | 3-19-2029 | EUR | 517,093 | $382,696 | |
Ziggo Bond Co. BV144A | 3.38 | 2-28-2030 | EUR | 300,000 | 275,764 | |
658,460 | ||||||
Telecommunications: 1.93% | ||||||
British Telecommunications PLC (UK Gilts 5 Year+3.82%)± | 8.38 | 12-20-2083 | GBP | 500,000 | 672,802 | |
Chorus Ltd. | 3.63 | 9-7-2029 | EUR | 500,000 | 540,238 | |
Eutelsat SA | 1.50 | 10-13-2028 | EUR | 500,000 | 401,548 | |
Koninklijke KPN NV | 3.88 | 7-3-2031 | EUR | 800,000 | 887,916 | |
SES SA (EUR Swap Annual (vs. 6 Month EURIBOR) 5 Year+3.19%)ʊ± | 2.88 | 5-27-2026 | EUR | 575,000 | 586,220 | |
Telecom Italia S.p.A. | 1.63 | 1-18-2029 | EUR | 1,000,000 | 926,697 | |
Telefonica Emisiones SA | 4.18 | 11-21-2033 | EUR | 1,000,000 | 1,119,965 | |
5,135,386 | ||||||
Consumer, cyclical: 2.15% | ||||||
Auto manufacturers: 0.30% | ||||||
Volkswagen Leasing GmbH | 0.38 | 7-20-2026 | EUR | 800,000 | 800,567 | |
Auto parts & equipment: 0.43% | ||||||
Forvia SE | 7.25 | 6-15-2026 | EUR | 416,000 | 470,681 | |
Goodyear Europe BV | 2.75 | 8-15-2028 | EUR | 700,000 | 678,731 | |
1,149,412 | ||||||
Distribution/wholesale: 0.42% | ||||||
Azelis Finance NV144A | 5.75 | 3-15-2028 | EUR | 1,000,000 | 1,108,622 | |
Entertainment: 0.75% | ||||||
Cirsa Finance International Sarl144A | 10.38 | 11-30-2027 | EUR | 675,000 | 784,661 | |
International Game Technology PLC144A | 3.50 | 6-15-2026 | EUR | 350,000 | 372,864 | |
Universal Music Group NV | 4.00 | 6-13-2031 | EUR | 750,000 | 836,402 | |
1,993,927 | ||||||
Leisure time: 0.25% | ||||||
Pinnacle Bidco PLC144A | 10.00 | 10-11-2028 | GBP | 500,000 | 657,901 | |
Consumer, non-cyclical: 2.15% | ||||||
Agriculture: 0.28% | ||||||
BAT International Finance PLC | 2.25 | 1-16-2030 | EUR | 750,000 | 742,690 | |
Commercial services: 1.00% | ||||||
Prosegur Cash SA | 1.38 | 2-4-2026 | EUR | 400,000 | 412,854 | |
Rentokil Initial Finance BV | 3.88 | 6-27-2027 | EUR | 1,100,000 | 1,199,127 | |
Transurban Finance Co. Pty Ltd. | 4.23 | 4-26-2033 | EUR | 750,000 | 844,353 | |
Verisure Holding AB144A | 9.25 | 10-15-2027 | EUR | 175,000 | 201,778 | |
2,658,112 | ||||||
Interest rate | Maturity date | Principal | Value | |||
Food: 0.60% | ||||||
Iceland Bondco PLC144A | 4.38 % | 5-15-2028 | GBP | 1,000,000 | $1,066,542 | |
Sigma Holdco BV144A | 5.75 | 5-15-2026 | EUR | 500,000 | 507,674 | |
1,574,216 | ||||||
Pharmaceuticals: 0.27% | ||||||
Bayer AG (EURIBOR ICE Swap Rate 11:00am+2.65%)± | 2.38 | 11-12-2079 | EUR | 700,000 | 723,968 | |
Energy: 0.27% | ||||||
Oil & gas: 0.27% | ||||||
Aker BP ASA | 1.13 | 5-12-2029 | EUR | 750,000 | 715,027 | |
Financial: 3.44% | ||||||
Banks: 2.34% | ||||||
ABN AMRO Bank NV (EUR Swap Annual (vs. 6 Month EURIBOR) 5 Year+3.90%)ʊ± | 4.75 | 9-22-2027 | EUR | 500,000 | 506,385 | |
Banco de Credito Social Cooperativo SA (EURIBOR ICE Swap Rate 11:00am+4.27%)± | 7.50 | 9-14-2029 | EUR | 400,000 | 475,990 | |
Banco de Sabadell SA (EURIBOR ICE Swap Rate 11:00am+2.40%)± | 5.50 | 9-8-2029 | EUR | 500,000 | 568,108 | |
BPER Banca (EUR Swap Annual (vs. 6 Month EURIBOR) 5 Year+4.08%)± | 3.63 | 11-30-2030 | EUR | 650,000 | 688,455 | |
CaixaBank SA (EUR Swap Annual (vs. 6 Month EURIBOR) 5 Year+3.55%)± | 6.25 | 2-23-2033 | EUR | 800,000 | 913,315 | |
Commerzbank AG (3 Month EURIBOR+2.10%)± | 4.63 | 1-17-2031 | EUR | 1,000,000 | 1,105,392 | |
Deutsche Bank AG (3 Month EURIBOR+2.95%)± | 5.00 | 9-5-2030 | EUR | 700,000 | 784,045 | |
Intesa Sanpaolo SpA (EUR Swap Annual (vs. 6 Month EURIBOR) 5 Year+7.19%)ʊ± | 7.75 | 1-11-2027 | EUR | 300,000 | 335,142 | |
KBC Group NV (EURIBOR ICE Swap Rate 11:00am+4.93%)ʊ± | 8.00 | 9-5-2028 | EUR | 400,000 | 461,208 | |
Raiffeisen Bank International AG (EURIBOR ICE Swap Rate 11:00am+1.60%)± | 1.38 | 6-17-2033 | EUR | 400,000 | 357,181 | |
6,195,221 | ||||||
Insurance: 0.46% | ||||||
NN Group NV (3 Month EURIBOR+4.20%)± | 5.25 | 3-1-2043 | EUR | 600,000 | 670,895 | |
Sampo (3 Month EURIBOR+3.60%)± | 2.50 | 9-3-2052 | EUR | 600,000 | 559,133 | |
1,230,028 | ||||||
Real estate: 0.47% | ||||||
Aedas Homes Opco SLU144A | 4.00 | 8-15-2026 | EUR | 500,000 | 530,220 | |
Castellum AB (EUR Swap Annual (vs. 6 Month EURIBOR) 5 Year+3.45%)ʊ± | 3.13 | 12-2-2026 | EUR | 750,000 | 710,018 | |
1,240,238 | ||||||
REITS: 0.17% | ||||||
Unibail Rodamco Westfield (EURIBOR ICE Swap Rate 11:00am+4.00%)ʊ± | 7.25 | 7-3-2028 | EUR | 400,000 | 456,906 | |
Interest rate | Maturity date | Principal | Value | |||
Government securities: 0.28% | ||||||
Multi-national: 0.28% | ||||||
Asian Development Bank | 6.20 % | 10-6-2026 | INR | 18,450,000 | $218,387 | |
International Finance Corp. | 6.30 | 11-25-2024 | INR | 45,000,000 | 537,262 | |
755,649 | ||||||
Industrial: 1.28% | ||||||
Engineering & construction: 0.62% | ||||||
Bouygues SA | 4.63 | 6-7-2032 | EUR | 1,000,000 | 1,168,295 | |
Cellnex Finance Co. SA | 2.00 | 9-15-2032 | EUR | 500,000 | 471,645 | |
1,639,940 | ||||||
Environmental control: 0.35% | ||||||
Derichebourg S.A. | 2.25 | 7-15-2028 | EUR | 950,000 | 941,429 | |
Machinery-diversified: 0.12% | ||||||
Novafives SAS | 5.00 | 6-15-2025 | EUR | 300,000 | 320,418 | |
Packaging & containers: 0.19% | ||||||
Canpack SA/Canpack U.S. LLC144A | 2.38 | 11-1-2027 | EUR | 500,000 | 498,591 | |
Utilities: 1.28% | ||||||
Electric: 0.70% | ||||||
Enel Finance International NV | 0.50 | 6-17-2030 | EUR | 750,000 | 684,013 | |
Energia Group Roi Financeco DAC144A | 6.88 | 7-31-2028 | EUR | 500,000 | 557,404 | |
RWE AG | 2.75 | 5-24-2030 | EUR | 600,000 | 620,338 | |
1,861,755 | ||||||
Gas: 0.20% | ||||||
Snam SpA | 0.63 | 6-30-2031 | EUR | 590,000 | 522,962 | |
Water: 0.38% | ||||||
Thames Water Utilities Finance | 4.38 | 1-18-2031 | EUR | 1,000,000 | 999,089 | |
Total foreign corporate bonds and notes (Cost $37,046,807) | 36,219,409 | |||||
Foreign government bonds: 14.03% | ||||||
Australia: 1.99% | ||||||
Australia | 2.75 | 11-21-2028 | AUD | 4,210,000 | 2,642,879 | |
Australia## | 3.00 | 11-21-2033 | AUD | 4,395,000 | 2,643,456 | |
5,286,335 | ||||||
Brazil: 2.48% | ||||||
Brazil¤ | 0.00 | 7-1-2024 | BRL | 10,500,000 | 2,043,807 | |
Brazil¤ | 0.00 | 10-1-2025 | BRL | 11,750,000 | 2,031,164 | |
Brazil | 10.00 | 1-1-2027 | BRL | 12,250,000 | 2,490,701 | |
6,565,672 | ||||||
France: 2.00% | ||||||
French Republic144A## | 0.75 | 2-25-2028 | EUR | 5,295,000 | 5,310,955 | |
Interest rate | Maturity date | Principal | Value | |||
Indonesia: 0.32% | ||||||
Indonesia | 6.50 % | 6-15-2025 | IDR | 13,500,000,000 | $852,744 | |
Malaysia: 1.49% | ||||||
Malaysia## | 3.88 | 3-14-2025 | MYR | 18,555,000 | 3,940,762 | |
Spain: 2.15% | ||||||
Spain¤## | 0.00 | 1-31-2028 | EUR | 5,895,000 | 5,714,298 | |
United Kingdom: 3.60% | ||||||
U.K. Gilts## | 3.25 | 1-31-2033 | GBP | 7,940,000 | 9,558,066 | |
Total foreign government bonds (Cost $37,413,223) | 37,228,832 | |||||
Shares | ||||||
Investment companies: 1.70% | ||||||
Exchange-traded funds: 1.70% | ||||||
SPDR Portfolio High Yield Bond ETF | 61,701 | 1,447,505 | ||||
VanEck J. P. Morgan EM Local Currency Bond ETF | 46,200 | 1,132,362 | ||||
Xtrackers USD High Yield Corporate Bond ETF | 54,208 | 1,935,768 | ||||
Total investment companies (Cost $4,646,117) | 4,515,635 | |||||
Principal | ||||||
Loans: 0.94% | ||||||
Communications: 0.06% | ||||||
Media: 0.06% | ||||||
DirecTV Financing LLC (U.S. SOFR 1 Month+5.00%)± | 10.44 | 8-2-2027 | $ | 150,296 | 150,359 | |
Consumer, cyclical: 0.41% | ||||||
Airlines: 0.26% | ||||||
AAdvantage Loyalty IP Ltd. (U.S. SOFR 3 Month+4.75%)± | 10.33 | 4-20-2028 | 226,100 | 234,547 | ||
Mileage Plus Holdings LLC (U.S. SOFR 3 Month+5.25%)± | 10.73 | 6-21-2027 | 438,750 | 451,263 | ||
685,810 | ||||||
Retail: 0.15% | ||||||
Petco Health & Wellness Co., Inc. (U.S. SOFR 3 Month+3.25%)± | 8.82 | 3-3-2028 | 450,000 | 415,463 | ||
Consumer, non-cyclical: 0.34% | ||||||
Commercial services: 0.34% | ||||||
Geo Group, Inc. (U.S. SOFR 1 Month+6.88%)± | 12.21 | 3-23-2027 | 505,729 | 519,258 | ||
MPH Acquisition Holdings LLC (U.S. SOFR 3 Month+4.25%)± | 9.85 | 9-1-2028 | 255,457 | 246,408 | ||
PECF USS Intermediate Holding III Corp. (U.S. SOFR 3 Month+4.25%)± | 9.82 | 12-15-2028 | 198,477 | 150,521 | ||
916,187 | ||||||
Interest rate | Maturity date | Principal | Value | |||
Financial: 0.13% | ||||||
Insurance: 0.13% | ||||||
Asurion LLC (U.S. SOFR 1 Month+5.25%)± | 10.69 % | 1-31-2028 | $ | 375,000 | $336,562 | |
Total loans (Cost $2,489,893) | 2,504,381 | |||||
Municipal obligations: 0.01% | ||||||
Illinois: 0.01% | ||||||
GO revenue: 0.01% | ||||||
City of Chicago Taxable Project Series E | 6.05 | 1-1-2029 | 35,000 | 35,059 | ||
Total municipal obligations (Cost $35,843) | 35,059 | |||||
Non-agency mortgage-backed securities: 4.52% | ||||||
Brean Asset-Backed Securities Trust Series 2021-RM2 Class A144A±± | 1.75 | 10-25-2061 | 849,200 | 756,034 | ||
BX Trust Series 2019-OC11 Class D144A±± | 3.94 | 12-9-2041 | 500,000 | 440,612 | ||
BX Trust Series 2021-ARIA Class D (U.S. SOFR 1 Month+2.01%)144A± | 7.33 | 10-15-2036 | 550,000 | 539,000 | ||
BX Trust Series 2022-CLS Class C144A | 6.79 | 10-13-2027 | 750,000 | 684,735 | ||
CFCRE Commercial Mortgage Trust Series 2016-C7 Class AM | 4.16 | 12-10-2054 | 400,000 | 375,655 | ||
COLT Mortgage Loan Trust Series 2022-7 Class A1144A±± | 5.16 | 4-25-2067 | 389,347 | 383,316 | ||
FREMF Mortgage Trust Series 2020-KF76 Class B (30 Day Average U.S. SOFR+2.86%)144A± | 8.18 | 1-25-2030 | 164,262 | 154,043 | ||
GS Mortgage Securities Corp. Trust Series 2018-LUAU Class B (U.S. SOFR 1 Month+1.70%)144A± | 7.02 | 11-15-2032 | 1,600,000 | 1,584,000 | ||
Hudsons Bay Simon JV Trust Series 2015-HB10 Class A10144A | 4.15 | 8-5-2034 | 535,000 | 500,522 | ||
Imperial Fund Mortgage Trust Series 2022-NQM3 Class A3144A±± | 4.43 | 5-25-2067 | 1,130,000 | 940,955 | ||
JP Morgan Mortgage Trust Series 2017-6 Class B5144A±± | 3.78 | 12-25-2048 | 426,227 | 316,522 | ||
Med Trust Series 2021-MDLN Class B (U.S. SOFR 1 Month+1.56%)144A± | 6.89 | 11-15-2038 | 995,224 | 992,425 | ||
MFA Trust Series 2020-NQM3 Class M1144A±± | 2.65 | 1-26-2065 | 1,000,000 | 837,182 | ||
MFA Trust Series 2021-NQM1 Class A1144A±± | 1.15 | 4-25-2065 | 73,829 | 67,081 | ||
Morgan Stanley Capital I Trust Series 2014-150E Class A144A | 3.91 | 9-9-2032 | 1,195,000 | 1,046,474 | ||
Residential Mortgage Loan Trust Series 2019-3 Class A3144A±± | 3.04 | 9-25-2059 | 81,487 | 79,144 | ||
SFAVE Commercial Mortgage Securities Trust Series 2015- 5AVE Class D144A±± | 4.39 | 1-5-2043 | 700,000 | 397,258 | ||
TRK Trust Series 2021-INV2 Class A2144A±± | 2.12 | 11-25-2056 | 742,170 | 631,510 | ||
Verus Securitization Trust Series 2021-2 Class A1144A±± | 1.03 | 2-25-2066 | 77,106 | 66,493 | ||
Verus Securitization Trust Series 2021-8 Class A2144A±± | 2.29 | 11-25-2066 | 1,082,972 | 909,260 | ||
Verus Securitization Trust Series 2021-R3 Class A2144A±± | 1.28 | 4-25-2064 | 314,447 | 279,482 | ||
Total non-agency mortgage-backed securities (Cost $13,301,942) | 11,981,703 | |||||
Interest rate | Maturity date | Principal | Value | |||
U.S. Treasury securities: 9.03% | ||||||
U.S. Treasury Bonds## | 1.88 % | 11-15-2051 | $ | 605,000 | $362,362 | |
U.S. Treasury Bonds## | 2.25 | 2-15-2052 | 3,235,000 | 2,127,897 | ||
U.S. Treasury Bonds## | 2.38 | 5-15-2051 | 45,000 | 30,549 | ||
U.S. Treasury Bonds## | 3.00 | 2-15-2049 | 150,000 | 116,947 | ||
U.S. Treasury Bonds## | 4.00 | 11-15-2052 | 35,000 | 32,907 | ||
U.S. Treasury Bonds## | 4.75 | 11-15-2053 | 1,520,000 | 1,622,600 | ||
U.S. Treasury Notes## | 4.00 | 1-31-2029 | 3,720,000 | 3,681,637 | ||
U.S. Treasury Notes## | 4.00 | 2-15-2034 | 110,000 | 108,178 | ||
U.S. Treasury Notes## | 4.25 | 12-31-2025 | 12,000,000 | 11,901,094 | ||
U.S. Treasury Notes## | 4.25 | 1-31-2026 | 4,000,000 | 3,968,438 | ||
Total U.S. Treasury securities (Cost $24,750,207) | 23,952,609 | |||||
Expiration date | Shares | |||||
Warrants: 0.00% | ||||||
Consumer staples: 0.00% | ||||||
Consumer staples distribution & retail : 0.00% | ||||||
Casino Guichard Perrachon SA♦† | 4-27-2029 | 128,399 | 1,662 | |||
Total warrants (Cost $0) | 1,662 | |||||
Maturity date | Principal | |||||
Yankee corporate bonds and notes: 11.04% | ||||||
Basic materials: 0.22% | ||||||
Chemicals: 0.22% | ||||||
Braskem Netherlands Finance BV144A | 7.25 | 2-13-2033 | $ | 600,000 | 577,149 | |
Communications: 0.17% | ||||||
Internet: 0.17% | ||||||
Prosus NV144A | 4.03 | 8-3-2050 | 700,000 | 445,813 | ||
Consumer, cyclical: 1.00% | ||||||
Airlines: 0.18% | ||||||
VistaJet Malta Finance PLC/Vista Management Holding, Inc.144A | 9.50 | 6-1-2028 | 550,000 | 467,672 | ||
Auto manufacturers: 0.09% | ||||||
Aston Martin Capital Holdings Ltd.144A | 10.00 | 3-31-2029 | 250,000 | 254,542 | ||
Leisure time: 0.73% | ||||||
Carnival Corp.144A | 6.00 | 5-1-2029 | 250,000 | 246,677 | ||
Carnival Corp.144A | 10.50 | 6-1-2030 | 600,000 | 656,257 | ||
Royal Caribbean Cruises Ltd.144A | 6.25 | 3-15-2032 | 1,035,000 | 1,043,239 | ||
1,946,173 | ||||||
Consumer, non-cyclical: 0.56% | ||||||
Beverages: 0.35% | ||||||
Coca-Cola Icecek AS144A | 4.50 | 1-20-2029 | 1,000,000 | 932,660 | ||
Interest rate | Maturity date | Principal | Value | |||
Pharmaceuticals: 0.21% | ||||||
Teva Pharmaceutical Finance Netherlands III BV | 8.13 % | 9-15-2031 | $ | 500,000 | $548,400 | |
Energy: 0.98% | ||||||
Oil & gas: 0.51% | ||||||
Borr IHC Ltd./Borr Finance LLC144A | 10.00 | 11-15-2028 | 720,000 | 747,753 | ||
BP Capital Markets PLC (5 Year Treasury Constant Maturity+4.40%)ʊ± | 4.88 | 3-22-2030 | 425,000 | 405,459 | ||
Petroleos Mexicanos | 6.70 | 2-16-2032 | 250,000 | 207,910 | ||
1,361,122 | ||||||
Pipelines: 0.47% | ||||||
Enbridge, Inc. Series 20-A (5 Year Treasury Constant Maturity+5.31%)± | 5.75 | 7-15-2080 | 1,310,000 | 1,239,782 | ||
Financial: 7.13% | ||||||
Banks: 6.15% | ||||||
Banco do Brasil SA/Cayman144A | 6.00 | 3-18-2031 | 650,000 | 650,813 | ||
Banco Industrial SA (5 Year Treasury Constant Maturity+4.44%)144A± | 4.88 | 1-29-2031 | 500,000 | 476,505 | ||
Banco Mercantil del Norte SA (5 Year Treasury Constant Maturity+4.64%)144Aʊ± | 5.88 | 1-24-2027 | 750,000 | 714,755 | ||
Banco Nacional de Comercio Exterior SNC (5 Year Treasury Constant Maturity+2.00%)144A± | 2.72 | 8-11-2031 | 650,000 | 586,332 | ||
Bank of Ireland Group PLC (U.S. SOFR+1.62%)144A± | 5.60 | 3-20-2030 | 500,000 | 499,380 | ||
Barclays PLC (U.S. SOFR+2.42%)± | 6.04 | 3-12-2055 | 655,000 | 681,953 | ||
BBVA Bancomer SA (5 Year Treasury Constant Maturity+4.31%)144A± | 5.88 | 9-13-2034 | 500,000 | 473,183 | ||
BNP Paribas SA (5 Year Treasury Constant Maturity+4.90%)144Aʊ± | 7.75 | 8-16-2029 | 600,000 | 614,210 | ||
Credit Agricole SA (USD Swap Semi Annual (vs. 3Month LIBOR) 5 Year+6.19%)144Aʊ± | 8.13 | 12-23-2025 | 1,310,000 | 1,336,200 | ||
Danske Bank AS (1 Year Treasury Constant Maturity+1.75%)144A± | 4.30 | 4-1-2028 | 1,300,000 | 1,254,362 | ||
Federation des Caisses Desjardins du Quebec144A | 5.70 | 3-14-2028 | 1,300,000 | 1,319,765 | ||
HSBC Holdings PLC (U.S. SOFR+1.97%)± | 6.16 | 3-9-2029 | 895,000 | 919,575 | ||
Intesa Sanpaolo SpA144A | 5.71 | 1-15-2026 | 635,000 | 629,480 | ||
Intesa Sanpaolo SpA144A | 7.20 | 11-28-2033 | 500,000 | 538,581 | ||
Lloyds Banking Group PLC (5 Year Treasury Constant Maturity+4.82%)ʊ± | 6.75 | 6-27-2026 | 700,000 | 691,602 | ||
Macquarie Bank Ltd. (5 Year Treasury Constant Maturity+1.70%)144A± | 3.05 | 3-3-2036 | 350,000 | 289,359 | ||
National Australia Bank Ltd. (5 Year Treasury Constant Maturity+1.70%)144A± | 3.35 | 1-12-2037 | 1,310,000 | 1,107,963 | ||
NatWest Group PLC (5 Year Treasury Constant Maturity+5.63%)ʊ± | 6.00 | 12-29-2025 | 600,000 | 585,895 | ||
Societe Generale SA (1 Year Treasury Constant Maturity+3.20%)144A± | 6.22 | 6-15-2033 | 1,310,000 | 1,312,549 | ||
UBS Group AG (1 Year Treasury Constant Maturity+1.77%)144A± | 5.70 | 2-8-2035 | 700,000 | 703,542 | ||
Interest rate | Maturity date | Principal | Value | |||
Banks(continued) | ||||||
UBS Group AG (5 Year Treasury Constant Maturity+3.40%)144Aʊ± | 4.88 % | 2-12-2027 | $ | 400,000 | $367,287 | |
Unicredit SpA (5 Year Treasury Constant Maturity+4.75%)144A± | 5.46 | 6-30-2035 | 600,000 | 563,432 | ||
16,316,723 | ||||||
Diversified financial services: 0.28% | ||||||
Castlelake Aviation Finance DAC144A | 5.00 | 4-15-2027 | 375,000 | 361,181 | ||
CI Financial Corp. | 4.10 | 6-15-2051 | 545,000 | 340,435 | ||
Unifin Financiera SAB de CV144A | 9.88 | 1-28-2029 | 600,000 | 39,750 | ||
741,366 | ||||||
Insurance: 0.31% | ||||||
Fairfax Financial Holdings Ltd.144A | 6.35 | 3-22-2054 | 240,000 | 244,825 | ||
Swiss Re Finance Luxembourg SA (5 Year Treasury Constant Maturity+3.58%)144A± | 5.00 | 4-2-2049 | 600,000 | 582,000 | ||
826,825 | ||||||
Private equity: 0.39% | ||||||
Brookfield Finance, Inc. | 6.35 | 1-5-2034 | 985,000 | 1,047,852 | ||
Government securities: 0.08% | ||||||
Multi-national: 0.08% | ||||||
African Export-Import Bank144A | 3.80 | 5-17-2031 | 260,000 | 220,740 | ||
Industrial: 0.43% | ||||||
Engineering & construction: 0.07% | ||||||
CIMIC Finance USA Pty Ltd.144A | 7.00 | 3-25-2034 | 185,000 | 189,958 | ||
Machinery-diversified: 0.17% | ||||||
TK Elevator Holdco GmbH144A | 7.63 | 7-15-2028 | 450,000 | 441,194 | ||
Trucking & leasing: 0.19% | ||||||
SMBC Aviation Capital Finance DAC144A | 5.45 | 5-3-2028 | 500,000 | 501,411 | ||
Technology: 0.17% | ||||||
Semiconductors: 0.17% | ||||||
Renesas Electronics Corp.144A | 2.17 | 11-25-2026 | 500,000 | 457,117 | ||
Utilities: 0.30% | ||||||
Electric: 0.30% | ||||||
Comision Federal de Electricidad144A | 3.35 | 2-9-2031 | 260,000 | 217,013 | ||
Comision Federal de Electricidad144A | 3.88 | 7-26-2033 | 700,000 | 571,865 | ||
788,878 | ||||||
Total yankee corporate bonds and notes (Cost $30,312,297) | 29,305,377 | |||||
Interest rate | Maturity date | Principal | Value | |||
Yankee government bonds: 3.21% | ||||||
Argentina: 0.20% | ||||||
Provincia de Cordoba144Aøø | 6.88 % | 12-10-2025 | $ | 169,652 | $146,573 | |
Provincia de Cordoba144Aøø | 6.88 | 2-1-2029 | 557,619 | 378,866 | ||
525,439 | ||||||
Bahamas: 0.26% | ||||||
Bahamas144A | 6.00 | 11-21-2028 | 785,000 | 704,134 | ||
Benin: 0.48% | ||||||
Benin144A | 7.96 | 2-13-2038 | 1,300,000 | 1,264,211 | ||
Bermuda: 0.09% | ||||||
Bermuda144A | 5.00 | 7-15-2032 | 260,000 | 250,120 | ||
Colombia: 0.41% | ||||||
Colombia | 7.50 | 2-2-2034 | 550,000 | 561,771 | ||
Colombia | 8.00 | 11-14-2035 | 500,000 | 524,913 | ||
1,086,684 | ||||||
Dominican Republic: 0.29% | ||||||
Dominican Republic144A | 4.50 | 1-30-2030 | 200,000 | 181,986 | ||
Dominican Republic144A | 4.88 | 9-23-2032 | 200,000 | 179,055 | ||
Dominican Republic144A | 5.50 | 2-22-2029 | 200,000 | 193,902 | ||
Dominican Republic144A | 7.05 | 2-3-2031 | 200,000 | 206,929 | ||
761,872 | ||||||
Israel: 0.29% | ||||||
Israel | 5.75 | 3-12-2054 | 800,000 | 765,776 | ||
Ivory Coast: 0.33% | ||||||
Ivory Coast144A | 8.25 | 1-30-2037 | 880,000 | 881,760 | ||
Kenya: 0.16% | ||||||
Kenya144A | 8.25 | 2-28-2048 | 500,000 | 429,100 | ||
Oman: 0.12% | ||||||
Oman144A | 6.25 | 1-25-2031 | 300,000 | 310,089 | ||
Panama: 0.27% | ||||||
Panama | 2.25 | 9-29-2032 | 1,000,000 | 713,202 | ||
Romania: 0.06% | ||||||
Romania144A | 6.38 | 1-30-2034 | 155,000 | 157,006 | ||
Senegal: 0.25% | ||||||
Senegal144A | 6.25 | 5-23-2033 | 800,000 | 680,093 | ||
Total yankee government bonds (Cost $8,569,763) | 8,529,486 | |||||
Yield | Shares | Value | ||||
Short-term investments: 8.06% | ||||||
Investment companies: 5.05% | ||||||
Allspring Government Money Market Fund Select Class♠∞*## | 5.25 % | 13,396,200 | $13,396,200 | |||
Maturity date | Principal | |||||
U.S. Treasury securities: 3.01% | ||||||
U.S. Treasury Bills☼ | 2.61 | 4-2-2024 | $ | 4,000,000 | 3,999,420 | |
U.S. Treasury Bills☼ | 4.66 | 4-9-2024 | 4,000,000 | 3,995,341 | ||
7,994,761 | ||||||
Total short-term investments (Cost $21,390,969) | 21,390,961 | |||||
Total investments in securities (Cost $326,692,701) | 120.92 % | 320,918,272 | ||||
Other assets and liabilities, net | (20.92 ) | (55,518,226 ) | ||||
Total net assets | 100.00 % | $265,400,046 | ||||
%% | The security is purchased on a when-issued basis. |
144A | The security may be resold in transactions exempt from registration, normally to qualified institutional buyers, pursuant to Rule 144A under the Securities Act of 1933. |
±± | The coupon of the security is adjusted based on the principal and/or interest payments received from the underlying pool of mortgages as well as the credit quality and the actual prepayment speed of the underlying mortgages. The rate shown is the rate in effect at period end. |
± | Variable rate investment. The rate shown is the rate in effect at period end. |
‡ | Security is valued using significant unobservable inputs. |
† | Non-income-earning security |
ʊ | Security is perpetual in nature and has no stated maturity date. The date shown reflects the next call date. |
¤ | The security is issued in zero coupon form with no periodic interest payments. |
¥ | A payment-in-kind (PIK) security is a security in which the issuer may make interest or dividend payments in cash or additional securities or a combination of both. The rate shown is the rate in effect at period end. |
## | All or a portion of this security is segregated as collateral for when-issued securities. |
♦ | The security is fair valued in accordance with procedures approved by the Board of Trustees. |
øø | The interest rate is determined and reset by the issuer periodically depending upon the terms of the security. The rate shown is the rate in effect at period end. |
♠ | The issuer of the security is an affiliated person of the Fund as defined in the Investment Company Act of 1940. |
∞ | The rate represents the 7-day annualized yield at period end. |
* | A portion of the holding represents an investment held in Income Plus Special Investment (Cayman) Ltd., the consolidated entity. |
☼ | Zero coupon security. The rate represents the current yield to maturity. |
Abbreviations: | |
AUD | Australian dollar |
BRL | Brazilian real |
EUR | Euro |
EURIBOR | Euro Interbank Offered Rate |
FNMA | Federal National Mortgage Association |
GBP | Great British pound |
GNMA | Government National Mortgage Association |
GO | General obligation |
IDR | Indonesian rupiah |
INR | Indian rupee |
LIBOR | London Interbank Offered Rate |
MYR | Malaysian ringgit |
NPFGC | National Public Finance Guarantee Corporation |
REIT | Real estate investment trust |
SOFR | Secured Overnight Financing Rate |
Value, beginning of period | Purchases | Sales proceeds | Net realized gains (losses) | Net change in unrealized gains (losses) | Value, end of period | Shares, end of period | Income from affiliated securities | |
Short-term investments | ||||||||
Allspring Government Money Market Fund Select Class | $9,086,155 | $143,816,937 | $(139,506,892 ) | $0 | $0 | $13,396,200 | 13,396,200 | $374,823 |
Currency to be received | Currency to be delivered | Counterparty | Settlement date | Unrealized gains | Unrealized losses | ||
USD | 1,644,660 | AUD | 2,400,000 | Morgan Stanley, Inc. | 4-2-2024 | $80,700 | $0 |
USD | 650,760 | AUD | 990,000 | Morgan Stanley, Inc. | 4-2-2024 | 5,626 | 0 |
USD | 242,150 | AUD | 370,000 | Morgan Stanley, Inc. | 4-2-2024 | 1,039 | 0 |
USD | 560,270 | AUD | 850,000 | Morgan Stanley, Inc. | 4-2-2024 | 6,367 | 0 |
AUD | 4,610,000 | USD | 3,011,602 | Morgan Stanley, Inc. | 4-2-2024 | 0 | (7,496 ) |
USD | 22,349,286 | EUR | 20,364,000 | Citibank N.A | 4-2-2024 | 379,587 | 0 |
USD | 1,430,776 | EUR | 1,300,000 | Citibank N.A | 4-2-2024 | 28,272 | 0 |
USD | 989,698 | EUR | 900,000 | Citibank N.A | 4-2-2024 | 18,733 | 0 |
USD | 903,604 | EUR | 830,000 | Citibank N.A | 4-2-2024 | 8,159 | 0 |
USD | 2,378,069 | EUR | 2,185,000 | Citibank N.A | 4-2-2024 | 20,782 | 0 |
USD | 2,128,298 | EUR | 1,950,000 | Citibank N.A | 4-2-2024 | 24,541 | 0 |
EUR | 830,000 | USD | 903,157 | Citibank N.A | 4-2-2024 | 0 | (7,711 ) |
USD | 2,913,381 | EUR | 2,700,000 | Citibank N.A | 4-2-2024 | 486 | 0 |
USD | 1,245,727 | EUR | 1,150,000 | Citibank N.A | 4-2-2024 | 5,049 | 0 |
USD | 641,167 | EUR | 590,000 | Citibank N.A | 4-2-2024 | 4,646 | 0 |
USD | 12,849,943 | EUR | 11,800,000 | Citibank N.A | 4-2-2024 | 119,514 | 0 |
USD | 3,054,290 | EUR | 2,800,000 | Citibank N.A | 4-2-2024 | 33,510 | 0 |
USD | 642,543 | EUR | 590,000 | Citibank N.A | 4-2-2024 | 6,022 | 0 |
EUR | 46,329,000 | USD | 50,335,532 | Citibank N.A | 4-2-2024 | 0 | (353,495 ) |
USD | 8,512,465 | GBP | 6,726,000 | Citibank N.A | 4-2-2024 | 23,246 | 0 |
USD | 633,402 | GBP | 500,000 | Citibank N.A | 4-2-2024 | 2,327 | 0 |
USD | 2,271,996 | GBP | 1,780,000 | Citibank N.A | 4-2-2024 | 25,369 | 0 |
GBP | 9,006,000 | USD | 11,452,528 | Citibank N.A | 4-2-2024 | 0 | (85,607 ) |
USD | 512,715 | IDR | 7,950,000,000 | Morgan Stanley, Inc. | 4-2-2024 | 11,296 | 0 |
IDR | 7,950,000,000 | USD | 505,983 | Morgan Stanley, Inc. | 4-2-2024 | 0 | (4,564 ) |
JPY | 48,000,000 | USD | 339,432 | Citibank N.A | 4-2-2024 | 0 | (22,349 ) |
USD | 318,655 | JPY | 48,000,000 | Citibank N.A | 4-2-2024 | 1,573 | 0 |
USD | 1,566,524 | MYR | 7,300,000 | Morgan Stanley, Inc. | 4-2-2024 | 24,162 | 0 |
USD | 858,942 | MYR | 4,025,000 | Morgan Stanley, Inc. | 4-2-2024 | 8,530 | 0 |
MYR | 11,325,000 | USD | 2,393,786 | Morgan Stanley, Inc. | 4-2-2024 | 0 | (1,011 ) |
USD | 3,018,946 | AUD | 4,610,000 | Morgan Stanley, Inc. | 6-28-2024 | 7,624 | 0 |
USD | 50,494,209 | EUR | 46,329,000 | Citibank N.A | 6-28-2024 | 337,044 | 0 |
EUR | 625,000 | USD | 683,898 | Citibank N.A | 6-28-2024 | 0 | (7,255 ) |
USD | 11,454,166 | GBP | 9,006,000 | Citibank N.A | 6-28-2024 | 82,142 | 0 |
USD | 630,318 | GBP | 495,000 | Citibank N.A | 6-28-2024 | 5,274 | 0 |
USD | 504,650 | IDR | 7,950,000,000 | Morgan Stanley, Inc. | 6-28-2024 | 4,395 | 0 |
JPY | 48,000,000 | USD | 322,889 | Citibank N.A | 6-28-2024 | 0 | (1,580 ) |
Currency to be received | Currency to be delivered | Counterparty | Settlement date | Unrealized gains | Unrealized losses | ||
USD | 2,399,975 | MYR | 11,325,000 | Morgan Stanley, Inc. | 6-28-2024 | $0 | $(5,962 ) |
USD | 1,555,858 | MYR | 7,350,000 | Morgan Stanley, Inc. | 6-28-2024 | 0 | (5,610 ) |
$1,276,015 | $(502,640 ) | ||||||
Description | Number of contracts | Expiration date | Notional cost | Notional value | Unrealized gains | Unrealized losses |
Long | ||||||
2-Year U.S. Treasury Notes | 199 | 6-28-2024 | $40,737,790 | $40,692,391 | $0 | $(45,399 ) |
5-Year U.S. Treasury Notes | 88 | 6-28-2024 | 9,451,203 | 9,417,375 | 0 | (33,828 ) |
Short | ||||||
10-Year Euro BUND Index | (42 ) | 6-6-2024 | (6,034,559 ) | (6,043,674 ) | 0 | (9,115 ) |
2-Year Euro SCHATZ | (41 ) | 6-6-2024 | (4,678,446 ) | (4,675,412 ) | 3,034 | 0 |
5-Year Euro-BOBL Futures | (72 ) | 6-6-2024 | (9,176,675 ) | (9,185,328 ) | 0 | (8,653 ) |
10-Year Japanese Bond | (13 ) | 6-13-2024 | (12,490,752 ) | (12,509,645 ) | 0 | (18,893 ) |
Ultra 10-Year U.S. Treasury Notes | (83 ) | 6-18-2024 | (9,443,020 ) | (9,512,578 ) | 0 | (69,558 ) |
$3,034 | $(185,446 ) |
Reference index | Fixed rate received | Payment frequency | Maturity date | Notional amount | Value | Premiums paid (received) | Unrealized gains | Unrealized losses | |
Buy Protection | |||||||||
Markit CDX.NA.IG.S42 * | 1.00% | Quarterly | 6-20-2029 | USD | 10,000,000 | $228,993 | $226,824 | $2,169 | $0 |
Markit iTraxx Europe Crossover S40 * | 5.00 | Quarterly | 12-20-2028 | EUR | 4,875,000 | 410,730 | 266,344 | 144,386 | 0 |
Markit iTraxx Europe Crossover S41 * | 5.00 | Quarterly | 6-20-2029 | EUR | 3,000,000 | 290,819 | 300,096 | 0 | (9,277 ) |
Sell Protection | |||||||||
Markit CDX Emerging Markets Index S35 * | 1.00 | Quarterly | 6-20-2026 | USD | 920,000 | (2,064 ) | (11,891 ) | 9,827 | 0 |
Markit CDX.NA.HY.S41 * | 5.00 | Quarterly | 12-20-2028 | USD | 2,386,000 | 179,189 | 44,717 | 134,472 | 0 |
Markit iTraxx Europe Subordinated Financial Index S35 * | 1.00 | Quarterly | 6-20-2026 | EUR | 10,500,000 | 134,985 | (18,837 ) | 153,822 | 0 |
$444,676 | $(9,277 ) | ||||||||
* | A portion of the holding represents an investment held in Income Plus Special Investment (Cayman) Ltd., the consolidated entity. |
Assets | |
Investments in unaffiliated securities, at value (cost $313,296,501) | $307,522,072 |
Investments in affiliated securities, at value (cost $13,396,200) | 13,396,200 |
Cash | 333,057 |
Cash at broker segregated for futures contracts | 1,459,000 |
Segregated cash for swap contracts | 1,621,902 |
Foreign currency, at value (cost $92,975) | 105,092 |
Receivable for interest | 2,823,449 |
Unrealized gains on forward foreign currency contracts | 1,276,015 |
Receivable for Fund shares sold | 1,124,065 |
Receivable for investments sold | 916,887 |
Receivable for daily variation margin on open futures contracts | 7,338 |
Prepaid expenses and other assets | 219,927 |
Total assets | 330,805,004 |
Liabilities | |
Payable for when-issued transactions | 62,121,305 |
Payable for investments purchased | 1,103,025 |
Payable for Fund shares redeemed | 970,222 |
Cash due to broker | 510,000 |
Unrealized losses on forward foreign currency contracts | 502,640 |
Payable for daily variation margin on open futures contracts | 52,484 |
Management fee payable | 45,511 |
Administration fees payable | 16,977 |
Payable for daily variation margin on centrally cleared swap contracts | 10,055 |
Trustees’ fees and expenses payable | 3,522 |
Distribution fee payable | 591 |
Accrued expenses and other liabilities | 68,626 |
Total liabilities | 65,404,958 |
Total net assets | $265,400,046 |
Net assets consist of | |
Paid-in capital | $280,054,045 |
Total distributable loss | (14,653,999 ) |
Total net assets | $265,400,046 |
Computation of net asset value and offering price per share | |
Net assets–Class A | $14,095,567 |
Shares outstanding–Class A1 | 1,609,528 |
Net asset value per share–Class A | $8.76 |
Maximum offering price per share – Class A2 | $9.13 |
Net assets–Class C | $908,807 |
Shares outstanding–Class C1 | 103,114 |
Net asset value per share–Class C | $8.81 |
Net assets–Administrator Class | $534,562 |
Shares outstanding–Administrator Class1 | 60,445 |
Net asset value per share–Administrator Class | $8.84 |
Net assets–Institutional Class | $249,861,110 |
Shares outstanding–Institutional Class1 | 28,596,339 |
Net asset value per share–Institutional Class | $8.74 |
Investment income | |
Interest (net of foreign withholding taxes of $3,024) | $4,723,829 |
Income from affiliated securities | 374,823 |
Dividends | 117,057 |
Total investment income | 5,215,709 |
Expenses | |
Management fee | 475,773 |
Administration fees | |
Class A | 12,641 |
Class C | 881 |
Administrator Class | 328 |
Institutional Class | 65,025 |
Shareholder servicing fees | |
Class A | 21,068 |
Class C | 1,468 |
Administrator Class | 819 |
Distribution fee | |
Class C | 4,405 |
Custody and accounting fees | 9,934 |
Professional fees | 46,789 |
Registration fees | 19,410 |
Shareholder report expenses | 12,146 |
Trustees’ fees and expenses | 12,465 |
Other fees and expenses | 5,772 |
Total expenses | 688,924 |
Less: Fee waivers and/or expense reimbursements | |
Fund-level | (301,304 ) |
Class C | (30 ) |
Administrator Class | (22 ) |
Net expenses | 387,568 |
Net investment income | 4,828,141 |
Realized and unrealized gains (losses) on investments | |
Net realized gains (losses) on | |
Unaffiliated securities | $(1,941,069 ) |
Foreign currency and foreign currency translations | (185,450 ) |
Forward foreign currency contracts | (800,083 ) |
Futures contracts | (171,998 ) |
Swap contracts | 299,142 |
Net realized losses on investments | (2,799,458 ) |
Net change in unrealized gains (losses) on | |
Unaffiliated securities | 9,606,280 |
Foreign currency and foreign currency translations | 157,576 |
Forward foreign currency contracts | 477,044 |
Futures contracts | (65,638 ) |
Swap contracts | 463,163 |
Net change in unrealized gains (losses) on investments | 10,638,425 |
Net realized and unrealized gains (losses) on investments | 7,838,967 |
Net increase in net assets resulting from operations | $12,667,108 |
Six months ended March 31, 2024 (unaudited) | Year ended September 30, 2023 | |||
Operations | ||||
Net investment income | $4,828,141 | $7,710,787 | ||
Net realized losses on investments | (2,799,458 ) | (6,271,761 ) | ||
Net change in unrealized gains (losses) on investments | 10,638,425 | 7,086,881 | ||
Net increase in net assets resulting from operations | 12,667,108 | 8,525,907 | ||
Distributions to shareholders from | ||||
Net investment income and net realized gains | ||||
Class A | (535,691 ) | (663,472 ) | ||
Class C | (33,692 ) | (45,475 ) | ||
Administrator Class | (22,189 ) | (67,747 ) | ||
Institutional Class | (5,447,512 ) | (6,933,269 ) | ||
Total distributions to shareholders | (6,039,084 ) | (7,709,963 ) | ||
Capital share transactions | Shares | Shares | ||
Proceeds from shares sold | ||||
Class A | 391,857 | 3,409,683 | 494,451 | 4,234,852 |
Class C | 9,114 | 79,109 | 33,984 | 292,830 |
Administrator Class | 1,457 | 12,850 | 31,973 | 280,485 |
Institutional Class | 13,012,480 | 113,076,162 | 4,894,170 | 42,046,540 |
116,577,804 | 46,854,707 | |||
Reinvestment of distributions | ||||
Class A | 62,594 | 534,628 | 77,537 | 661,527 |
Class C | 3,929 | 33,692 | 5,297 | 45,475 |
Administrator Class | 2,580 | 22,189 | 7,871 | 67,747 |
Institutional Class | 634,247 | 5,418,793 | 814,378 | 6,933,211 |
6,009,302 | 7,707,960 | |||
Payment for shares redeemed | ||||
Class A | (768,977 ) | (6,704,223 ) | (314,526 ) | (2,688,269 ) |
Class C | (57,152 ) | (499,544 ) | (17,777 ) | (153,836 ) |
Administrator Class | (45,807 ) | (399,898 ) | (165,034 ) | (1,434,877 ) |
Institutional Class | (1,760,809 ) | (15,032,636 ) | (5,943,514 ) | (50,890,751 ) |
(22,636,301 ) | (55,167,733 ) | |||
Net increase (decrease) in net assets resulting from capital share transactions | 99,950,805 | (605,066 ) | ||
Total increase in net assets | 106,578,829 | 210,878 | ||
Net assets | ||||
Beginning of period | 158,821,217 | 158,610,339 | ||
End of period | $265,400,046 | $158,821,217 | ||
Six months ended March 31, 2024 (unaudited) | Year ended September 30 | |||||
Class A | 2023 | 2022 | 2021 | 2020 | 2019 | |
Net asset value, beginning of period | $8.43 | $8.38 | $10.12 | $9.64 | $9.50 | $9.43 |
Net investment income | 0.22 1 | 0.38 1 | 0.28 1 | 0.27 | 0.29 | 0.34 1 |
Net realized and unrealized gains (losses) on investments | 0.39 | 0.05 | (1.41 ) | 0.51 | 0.14 | 0.09 |
Total from investment operations | 0.61 | 0.43 | (1.13 ) | 0.78 | 0.43 | 0.43 |
Distributions to shareholders from | ||||||
Net investment income | (0.28 ) | (0.38 ) | (0.36 ) | (0.30 ) | (0.29 ) | (0.36 ) |
Net realized gains | 0.00 | 0.00 | (0.25 ) | 0.00 | 0.00 | 0.00 |
Total distributions to shareholders | (0.28 ) | (0.38 ) | (0.61 ) | (0.30 ) | (0.29 ) | (0.36 ) |
Net asset value, end of period | $8.76 | $8.43 | $8.38 | $10.12 | $9.64 | $9.50 |
Total return2 | 7.32 % | 5.14 % | (11.77 )% | 8.18 % | 4.60 % | 4.66 % |
Ratios to average net assets (annualized) | ||||||
Gross expenses | 1.04 % | 1.09 % | 1.07 % | 1.07 % | 1.08 % | 1.09 % |
Net expenses | 0.71 % | 0.81 % | 0.90 % | 0.90 % | 0.90 % | 0.90 % |
Net investment income | 5.02 % | 4.44 % | 3.09 % | 3.00 % | 3.43 % | 3.65 % |
Supplemental data | ||||||
Portfolio turnover rate | 132 % | 182 % | 113 % | 128 % | 88 % | 116 % |
Net assets, end of period (000s omitted) | $14,096 | $16,212 | $13,960 | $2,667 | $1,662 | $1,394 |
1 | Calculated based upon average shares outstanding |
2 | Total return calculations do not include any sales charges. Returns for periods of less than one year are not annualized. |
Six months ended March 31, 2024 (unaudited) | Year ended September 30 | |||||
Class C | 2023 | 2022 | 2021 | 2020 | 2019 | |
Net asset value, beginning of period | $8.48 | $8.42 | $10.16 | $9.68 | $9.49 | $9.41 |
Net investment income | 0.18 1 | 0.32 1 | 0.21 1 | 0.22 | 0.23 | 0.27 |
Payment from affiliate | 0.00 | 0.00 | 0.00 | 0.00 | 0.07 | 0.00 |
Net realized and unrealized gains (losses) on investments | 0.39 | 0.05 | (1.41 ) | 0.49 | 0.12 | 0.10 |
Total from investment operations | 0.57 | 0.37 | (1.20 ) | 0.71 | 0.42 | 0.37 |
Distributions to shareholders from | ||||||
Net investment income | (0.24 ) | (0.31 ) | (0.29 ) | (0.23 ) | (0.23 ) | (0.29 ) |
Net realized gains | 0.00 | 0.00 | (0.25 ) | 0.00 | 0.00 | 0.00 |
Total distributions to shareholders | (0.24 ) | (0.31 ) | (0.54 ) | (0.23 ) | (0.23 ) | (0.29 ) |
Net asset value, end of period | $8.81 | $8.48 | $8.42 | $10.16 | $9.68 | $9.49 |
Total return2 | 6.85 % | 4.45 % | (12.38 )%3 | 7.36 % | 4.45 %4 | 4.00 % |
Ratios to average net assets (annualized) | ||||||
Gross expenses | 1.80 % | 1.83 % | 1.77 % | 1.82 % | 1.83 % | 1.84 % |
Net expenses | 1.46 % | 1.56 % | 1.63 % | 1.65 % | 1.65 % | 1.65 % |
Net investment income | 4.25 % | 3.68 % | 2.30 % | 2.23 % | 2.67 % | 2.92 % |
Supplemental data | ||||||
Portfolio turnover rate | 132 % | 182 % | 113 % | 128 % | 88 % | 116 % |
Net assets, end of period (000s omitted) | $909 | $1,248 | $1,059 | $1,290 | $647 | $520 |
1 | Calculated based upon average shares outstanding |
2 | Total return calculations do not include any sales charges. Returns for periods of less than one year are not annualized. |
3 | During the year ended September 30, 2022, the Fund received payments from a service provider which had a 0.10% impact on the total return. |
4 | During the year ended September 30, 2020, the Fund received a payment from an affiliate which had a 0.79% impact on the total return. |
Six months ended March 31, 2024 (unaudited) | Year ended September 30 | |||||
Administrator Class | 2023 | 2022 | 2021 | 2020 | 2019 | |
Net asset value, beginning of period | $8.51 | $8.45 | $10.20 | $9.71 | $9.56 | $9.46 |
Net investment income | 0.22 1 | 0.38 1 | 0.29 1 | 0.29 1 | 0.34 1 | 0.36 1 |
Net realized and unrealized gains (losses) on investments | 0.39 | 0.06 | (1.43 ) | 0.51 | 0.11 | 0.09 |
Total from investment operations | 0.61 | 0.44 | (1.14 ) | 0.80 | 0.45 | 0.45 |
Distributions to shareholders from | ||||||
Net investment income | (0.28 ) | (0.38 ) | (0.36 ) | (0.31 ) | (0.30 ) | (0.35 ) |
Net realized gains | 0.00 | 0.00 | (0.25 ) | 0.00 | 0.00 | 0.00 |
Total distributions to shareholders | (0.28 ) | (0.38 ) | (0.61 ) | (0.31 ) | (0.30 ) | (0.35 ) |
Net asset value, end of period | $8.84 | $8.51 | $8.45 | $10.20 | $9.71 | $9.56 |
Total return2 | 7.27 % | 5.24 % | (11.77 )% | 8.31 % | 4.72 % | 4.83 % |
Ratios to average net assets (annualized) | ||||||
Gross expenses | 1.00 % | 1.01 % | 1.01 % | 1.00 % | 1.02 % | 1.08 % |
Net expenses | 0.66 % | 0.72 % | 0.75 % | 0.75 % | 0.75 % | 0.75 % |
Net investment income | 5.07 % | 4.46 % | 2.97 % | 2.83 % | 3.61 % | 3.80 % |
Supplemental data | ||||||
Portfolio turnover rate | 132 % | 182 % | 113 % | 128 % | 88 % | 116 % |
Net assets, end of period (000s omitted) | $535 | $869 | $1,921 | $7,215 | $40 | $75 |
1 | Calculated based upon average shares outstanding |
2 | Returns for periods of less than one year are not annualized. |
Six months ended March 31, 2024 (unaudited) | Year ended September 30 | |||||
Institutional Class | 2023 | 2022 | 2021 | 2020 | 2019 | |
Net asset value, beginning of period | $8.41 | $8.36 | $10.10 | $9.63 | $9.49 | $9.42 |
Net investment income | 0.23 1 | 0.40 1 | 0.32 | 0.33 | 0.36 | 0.37 1 |
Net realized and unrealized gains (losses) on investments | 0.39 | 0.06 | (1.43 ) | 0.47 | 0.10 | 0.09 |
Total from investment operations | 0.62 | 0.46 | (1.11 ) | 0.80 | 0.46 | 0.46 |
Distributions to shareholders from | ||||||
Net investment income | (0.29 ) | (0.41 ) | (0.38 ) | (0.33 ) | (0.32 ) | (0.39 ) |
Net realized gains | 0.00 | 0.00 | (0.25 ) | 0.00 | 0.00 | 0.00 |
Total distributions to shareholders | (0.29 ) | (0.41 ) | (0.63 ) | (0.33 ) | (0.32 ) | (0.39 ) |
Net asset value, end of period | $8.74 | $8.41 | $8.36 | $10.10 | $9.63 | $9.49 |
Total return2 | 7.51 % | 5.50 % | (11.53 )% | 8.43 % | 4.96 % | 5.00 % |
Ratios to average net assets (annualized) | ||||||
Gross expenses | 0.72 % | 0.76 % | 0.74 % | 0.74 % | 0.75 % | 0.75 % |
Net expenses | 0.39 % | 0.50 % | 0.60 % | 0.60 % | 0.60 % | 0.60 % |
Net investment income | 5.37 % | 4.74 % | 3.33 % | 3.34 % | 3.72 % | 3.97 % |
Supplemental data | ||||||
Portfolio turnover rate | 132 % | 182 % | 113 % | 128 % | 88 % | 116 % |
Net assets, end of period (000s omitted) | $249,861 | $140,492 | $141,671 | $163,806 | $149,722 | $153,414 |
1 | Calculated based upon average shares outstanding |
2 | Returns for periods of less than one year are not annualized. |
The Fund may enter into credit default swaps for hedging or speculative purposes to provide or receive a measure of protection against default on a referenced entity, obligation or index or a basket of single-name issuers or traded indexes. An index credit default swap references all the names in the index, and if a credit event is triggered, the credit event is settled based on that name’s weight in the index. Credit default swaps are agreements in which the protection buyer pays fixed periodic payments to the protection seller in consideration for a promise from the protection seller to make a specific payment should a negative credit event take place with respect to the referenced entity (e.g., bankruptcy, failure to pay, obligation acceleration, repudiation, moratorium or restructuring).
Gross unrealized gains | $4,543,542 |
Gross unrealized losses | (9,591,360 ) |
Net unrealized losses | $(5,047,818 ) |
Quoted prices (Level 1) | Other significant observable inputs (Level 2) | Significant unobservable inputs (Level 3) | Total | |
Assets | ||||
Investments in: | ||||
Agency securities | $0 | $62,170,803 | $0 | $62,170,803 |
Asset-backed securities | 0 | 23,250,863 | 294,784 | 23,545,647 |
Common stocks | ||||
Consumer discretionary | 74,371 | 0 | 0 | 74,371 |
Consumer staples | 5,416 | 0 | 0 | 5,416 |
Corporate bonds and notes | 0 | 59,456,921 | 0 | 59,456,921 |
Foreign corporate bonds and notes | 0 | 36,219,409 | 0 | 36,219,409 |
Foreign government bonds | 0 | 37,228,832 | 0 | 37,228,832 |
Investment companies | 4,515,635 | 0 | 0 | 4,515,635 |
Loans | 0 | 2,504,381 | 0 | 2,504,381 |
Municipal obligations | 0 | 35,059 | 0 | 35,059 |
Non-agency mortgage-backed securities | 0 | 11,981,703 | 0 | 11,981,703 |
U.S. Treasury securities | 23,952,609 | 0 | 0 | 23,952,609 |
Warrants | ||||
Consumer staples | 0 | 1,662 | 0 | 1,662 |
Yankee corporate bonds and notes | 0 | 29,305,377 | 0 | 29,305,377 |
Yankee government bonds | 0 | 8,529,486 | 0 | 8,529,486 |
Short-term investments | ||||
Investment companies | 13,396,200 | 0 | 0 | 13,396,200 |
U.S. Treasury securities | 7,994,761 | 0 | 0 | 7,994,761 |
49,938,992 | 270,684,496 | 294,784 | 320,918,272 | |
Forward foreign currency contracts | 0 | 1,276,015 | 0 | 1,276,015 |
Futures contracts | 3,034 | 0 | 0 | 3,034 |
Swap contracts | 0 | 444,676 | 0 | 444,676 |
Total assets | $49,942,026 | $272,405,187 | $294,784 | $322,641,997 |
Liabilities | ||||
Forward foreign currency contracts | $0 | $502,640 | $0 | $502,640 |
Futures contracts | 185,446 | 0 | 0 | 185,446 |
Swap contracts | 0 | 9,277 | 0 | 9,277 |
Total liabilities | $185,446 | $511,917 | $0 | $697,363 |
Average daily net assets | Management fee |
First $500 million | 0.525 % |
Next $500 million | 0.500 |
Next $2 billion | 0.475 |
Next $2 billion | 0.450 |
Next $5 billion | 0.415 |
Over $10 billion | 0.405 |
Class-level administration fee | |
Class A | 0.15 % |
Class C | 0.15 |
Administrator Class | 0.10 |
Institutional Class | 0.08 |
EXPENSE RATIO CAPS | |
Class A | 0.71 % |
Class C | 1.46 |
Administrator Class | 0.66 |
Institutional Class | 0.39 |
Purchases at cost | Sales proceeds | ||
U.S. government | Non-U.S. government | U.S. government | Non-U.S. government |
$275,149,846 | $112,223,575 | $226,180,860 | $41,931,272 |
Forward foreign currency contracts | |
Average contract amounts to buy | $11,120,336 |
Average contract amounts to sell | 54,570,690 |
Futures contracts | |
Average notional balance on long futures | $51,982,080 |
Average notional balance on short futures | 18,701,968 |
Swap contracts | |
Average notional balance | $21,138,429 |
Interest rate risk | Credit risk | Foreign currency risk | Total | |
Asset derivatives | ||||
Forward foreign currency contracts | $0 | $0 | $1,276,015 | $1,276,015 |
Futures contracts | 3,034 * | 0 | 0 | 3,034 |
Swap contracts | 0 | 444,676 * | 0 | 444,676 |
$3,034 | $444,676 | $1,276,015 | $1,723,725 | |
Liability derivatives | ||||
Forward foreign currency contracts | $0 | $0 | $502,640 | $502,640 |
Futures contracts | 185,446 * | 0 | 0 | 185,446 |
Swap contracts | 0 | 9,277 * | 0 | 9,277 |
$185,446 | $9,277 | $502,640 | $697,363 | |
* | Amount represents the cumulative unrealized gains (losses) as reported in the table following the Consolidated Portfolio of Investments. For futures contracts and centrally cleared swap contracts, only the current day’s variation margin as of March 31, 2024 is reported separately on the Consolidated Statement of Assets and Liabilities. |
INTEREST RATE RISK | Credit risk | Foreign currency risk | TOTAL | |
Net realized gains (losses) on derivatives | ||||
Forward foreign currency contracts | $0 | $0 | $(800,083 ) | $(800,083 ) |
Futures contracts | (171,998 ) | 0 | 0 | (171,998 ) |
Swap contracts | 0 | 299,142 | 0 | 299,142 |
$(171,998 ) | $299,142 | $(800,083 ) | $(672,939 ) | |
Net change in unrealized gains (losses) on derivatives | ||||
Forward foreign currency contracts | $0 | $0 | $477,044 | $477,044 |
Futures contracts | (65,638 ) | 0 | 0 | (65,638 ) |
Swap contracts | 0 | 463,163 | 0 | 463,163 |
$(65,638 ) | $463,163 | $477,044 | $874,569 | |
Counterparty | Gross amounts of assets in the Consolidated Statement of Assets and Liabilities | Amounts subject to netting agreements | Collateral received | Net amount of assets |
Citibank N.A | $1,126,276 | $(477,997 ) | $0 | $648,279 |
Morgan Stanley, Inc. | 149,739 | (24,643 ) | 0 | 125,096 |
Counterparty | Gross amounts of liabilities in the Consolidated Statement of Assets and Liabilities | Amounts subject to netting agreements | Collateral pledged | Net amount of liabilities |
Citibank N.A | $477,997 | $(477,997 ) | $0 | $0 |
Morgan Stanley, Inc. | 24,643 | (24,643 ) | 0 | 0 |
Name and year of birth | Position held and length of service* | Principal occupations during past five years or longer | Current other public company or investment company directorships |
William R. Ebsworth (Born 1957) | Trustee, since 2015 | Retired. From 1984 to 2013, equities analyst, portfolio manager, research director and chief investment officer at Fidelity Management and Research Company in Boston, Tokyo, and Hong Kong, and retired in 2013 as Chief Investment Officer of Fidelity Strategic Advisers, Inc. where he led a team of investment professionals managing client assets. Prior thereto, Board member of Hong Kong Securities Clearing Co., Hong Kong Options Clearing Corp., the Thailand International Fund, Ltd., Fidelity Investments Life Insurance Company, and Empire Fidelity Investments Life Insurance Company. Serves on the Investment Company Institute’s Board of Governors since 2022 and Executive Committee since 2023 as well as the Vice Chairman of the Governing Council of the Independent Directors Council since 2023. Audit Committee Chair and Investment Committee Chair of the Vincent Memorial Hospital Foundation (non-profit organization). Mr. Ebsworth is a CFA charterholder. | N/A |
Jane A. Freeman (Born 1953) | Trustee, since 2015; Chair Liaison, since January 2018# | Retired. From 2012 to 2014 and 1999 to 2008, Chief Financial Officer of Scientific Learning Corporation. From 2008 to 2012, Ms. Freeman provided consulting services related to strategic business projects. Prior to 1999, Portfolio Manager at Rockefeller & Co. and Scudder, Stevens & Clark. Board member of the Harding Loevner Funds from 1996 to 2014, serving as both Lead Independent Director and chair of the Audit Committee. Board member of the Russell Exchange Traded Funds Trust from 2011 to 2012 and the chair of the Audit Committee. Ms. Freeman is also an inactive Chartered Financial Analyst. | N/A |
Isaiah Harris, Jr. (Born 1952) | Trustee, since 2009; Audit Committee Chair, since 2019 | Retired. Member of the Advisory Board of CEF of East Central Florida. Chairman of the Board of CIGNA Corporation from 2009 to 2021, and Director from 2005 to 2008. From 2003 to 2011, Director of Deluxe Corporation. Prior thereto, President and CEO of BellSouth Advertising and Publishing Corp. from 2005 to 2007, President and CEO of BellSouth Enterprises from 2004 to 2005 and President of BellSouth Consumer Services from 2000 to 2003. Emeritus member of the Iowa State University Foundation Board of Governors. Emeritus Member of the Advisory board of Iowa State University School of Business. Advisory Board Member, Palm Harbor Academy (private school). Advisory Board Member, Fellowship of Christian Athletes. Mr. Harris is a certified public accountant (inactive status). | N/A |
David F. Larcker (Born 1950) | Trustee, since 2009 | Distinguished Visiting Fellow at the Hoover Institution since 2022. James Irvin Miller Professor of Accounting at the Graduate School of Business (Emeritus), Stanford University, Director of the Corporate Governance Research Initiative and Senior Faculty of The Rock Center for Corporate Governance since 2006. From 2005 to 2008, Professor of Accounting at the Graduate School of Business, Stanford University. Prior thereto, Ernst & Young Professor of Accounting at The Wharton School, University of Pennsylvania from 1985 to 2005. | N/A |
Olivia S. Mitchell (Born 1953) | Trustee, since 2006; Nominating and Governance Committee Chair, since 2018 | International Foundation of Employee Benefit Plans Professor since 1993, Wharton School of the University of Pennsylvania. Director of Wharton’s Pension Research Council and Boettner Center on Pensions & Retirement Research, and Research Associate at the National Bureau of Economic Research. Previously taught at Cornell University from 1978 to 1993. | N/A |
Name and year of birth | Position held and length of service* | Principal occupations during past five years or longer | Current other public company or investment company directorships |
Timothy J. Penny (Born 1951) | Trustee, since 1996; Chair, since 2018 | President and Chief Executive Officer of Southern Minnesota Initiative Foundation, a non-profit organization, since 2007. Vice Chair of the Economic Club of Minnesota, since 2007. Co-Chair of the Committee for a Responsible Federal Budget, since 1995. Member of the Board of Trustees of NorthStar Education Finance, Inc., a non-profit organization, from 2007-2022. Senior Fellow of the University of Minnesota Humphrey Institute from 1995 to 2017. | N/A |
James G. Polisson (Born 1959) | Trustee, since 2018 | Retired. Chief Marketing Officer, Source (ETF) UK Services, Ltd, from 2015 to 2017. From 2012 to 2015, Principal of The Polisson Group, LLC, a management consulting, corporate advisory and principal investing company. Chief Executive Officer and Managing Director at Russell Investments, Global Exchange Traded Funds from 2010 to 2012. Managing Director of Barclays Global Investors from 1998 to 2010 and Global Chief Marketing Officer for iShares and Barclays Global Investors from 2000 to 2010. Trustee of the San Francisco Mechanics’ Institute, a non- profit organization, from 2013 to 2015. Board member of the Russell Exchange Traded Fund Trust from 2011 to 2012. Director of Barclays Global Investors Holdings Deutschland GmbH from 2006 to 2009. Mr. Polisson is an attorney and has a retired status with the Massachusetts and District of Columbia Bar Associations. | N/A |
Pamela Wheelock (Born 1959) | Trustee, since January 2020; previously Trustee from January 2018 to July 2019# | Retired. Executive and Senior Financial leadership positions in the public, private and nonprofit sectors. Interim President and CEO, McKnight Foundation, 2020. Interim Commissioner, Minnesota Department of Human Services, 2019. Chief Operating Officer, Twin Cities Habitat for Humanity, 2017-2019. Vice President for University Services, University of Minnesota, 2012- 2016. Interim President and CEO, Blue Cross and Blue Shield of Minnesota, 2011-2012. Executive Vice-President and Chief Financial Officer, Minnesota Wild, 2002-2008. Commissioner, Minnesota Department of Finance, 1999-2002. Chair of the Board of Directors of Destination Medical Center Corporation. Board member of the Minnesota Wild Foundation. | N/A |
Name and year of birth | Position held and length of service | Principal occupations during past five years or longer |
Andrew Owen (Born 1960) | President, since 2017 | President and Chief Executive Officer of Allspring Funds Management, LLC since 2017 and Head of Global Fund Governance of Allspring Global Investments since 2022. Prior thereto, co-president of Galliard Capital Management, LLC, an affiliate of Allspring Funds Management, LLC, from 2019 to 2022 and Head of Affiliated Managers, Allspring Global Investments, from 2014 to 2019 and Executive Vice President responsible for marketing, investments and product development for Allspring Funds Management, LLC, from 2009 to 2014. |
Jeremy DePalma (Born 1974) | Treasurer, since 2012 (for certain funds in the Fund Complex); since 2021 (for the remaining funds in the Complex) | Senior Vice President of Allspring Funds Management, LLC since 2009. Senior Vice President of Evergreen Investment Management Company, LLC from 2008 to 2010 and head of the Fund Reporting and Control Team within Fund Administration from 2005 to 2010. |
Christopher Baker (Born 1976) | Chief Compliance Officer, since 2022 | Global Chief Compliance Officer for Allspring Global Investments since 2022. Prior thereto, Chief Compliance Officer for State Street Global Advisors from 2018 to 2021. Senior Compliance Officer for the State Street divisions of Alternative Investment Solutions, Sector Solutions, and Global Marketing from 2015 to 2018. From 2010 to 2015 Vice President, Global Head of Investment and Marketing Compliance for State Street Global Advisors. |
Matthew Prasse (Born 1983) | Chief Legal Officer, since 2022; Secretary, since 2021 | Senior Counsel of the Allspring Legal Department since 2021. Senior Counsel of the Wells Fargo Legal Department from 2018 to 2021. Previously, Counsel for Barings LLC from 2015 to 2018. Prior to joining Barings, Associate at Morgan, Lewis & Bockius LLP from 2008 to 2015. |

P.O. Box 219967
Kansas City, MO 64121-9967

SAR3365 03-24

Allspring Funds

President
Allspring Funds
Notice to Shareholders |
Beginning in July 2024, the Fund will be required by the Securities and Exchange Commission to send shareholders a paper copy of a new tailored shareholder report in place of the full shareholder report that you are now receiving. The tailored shareholder report will contain concise information about the Fund, including certain expense and performance information and fund statistics. If you wish to receive this new tailored shareholder report electronically, please follow the instructions on the back cover of this report. |
Other information that is currently included in the shareholder report, such as the Fund’s financial statements, will be available online and upon request, free of charge, in paper or electronic format. |
Investment objective | The Fund seeks long-term total return, consisting of capital appreciation and current income. |
Manager | Allspring Funds Management, LLC |
Subadviser | Allspring Global Investments, LLC |
Portfolio managers | Manjunath Boraiah, Petros N. Bocray, CFA, FRM, John R. Campbell, CFA, Travis L. Keshemberg, CFA, CIPM, FRM, David Kowalske, Jr.†, David Neal, CFA, Nick Toporkov, Ph.D., CFA, Robert M. Wicentowski, CFA, Limin Xiao, Ph.D., CFA |
Average annual total returns (%) as of March 31, 2024 | |||||||||
Including sales charge | Excluding sales charge | Expense ratios1 (%) | |||||||
Inception date | 1 year | 5 year | 10 year | 1 year | 5 year | 10 year | Gross | Net2 | |
Class A (SFAAX) | 11-13-1986 | 10.54 | 7.37 | 7.65 | 17.28 | 8.65 | 8.29 | 1.12 | 1.07 |
Class C (WFALX) | 4-1-1998 | 15.40 | 7.83 | 7.64 | 16.40 | 7.83 | 7.64 | 1.87 | 1.82 |
Administrator Class (WFAIX) | 11-8-1999 | – | – | – | 17.47 | 8.83 | 8.49 | 1.05 | 0.90 |
Institutional Class (WFATX)3 | 10-31-2016 | – | – | – | 17.64 | 8.99 | 8.62 | 0.80 | 0.75 |
Russell 3000® Index4 | – | – | – | – | 29.29 | 14.34 | 12.33 | – | – |
Bloomberg U.S. Aggregate Bond Index5 | – | – | – | – | 1.70 | 0.36 | 1.54 | – | – |
Index Asset Allocation Blended Index6 | – | – | – | – | 17.23 | 9.18 | 9.06 | – | – |
S&P 500 Index7 | – | – | – | – | 29.88 | 15.05 | 12.96 | – | – |
Bloomberg U.S. Treasury Index8 | – | – | – | – | 0.05 | -0.08 | 1.03 | – | – |
1 | Reflects the expense ratios as stated in the most recent prospectuses. The expense ratios shown are subject to change and may differ from the annualized expense ratios shown in the Financial Highlights of this report. |
2 | The manager has contractually committed through January 31, 2025, to waive fees and/or reimburse expenses to the extent necessary to cap total annual fund operating expenses after fee waivers at 1.07% for Class A, 1.82% for Class C, 0.90% for Administrator Class and 0.75% for Institutional Class. Brokerage commissions, stamp duty fees, interest, taxes, acquired fund fees and expenses (if any), and extraordinary expenses are excluded from the expense caps. Prior to or after the commitment expiration date, the caps may be increased or the commitment to maintain the caps may be terminated only with the approval of the Board of Trustees. Without these caps, the Fund’s returns would have been lower. The expense ratio paid by an investor is the net expense ratio (the total annual fund operating expenses after fee waivers) as stated in the prospectuses. |
3 | Historical performance shown for the Institutional Class shares prior to their inception reflects the performance of the Administrator Class shares, and includes the higher expenses applicable to the Administrator Class shares. If these expenses had not been included, returns for the Institutional Class shares would be higher. |
4 | The Russell 3000® Index measures the performance of the 3,000 largest U.S. companies based on total market capitalization, which represents approximately 98% of the investable U.S. equity market. You cannot invest directly in an index. |
5 | The Bloomberg U.S. Aggregate Bond Index is a broad-based benchmark that measures the investment-grade, U.S.–dollar–denominated, fixed-rate taxable bond market, including Treasuries, government-related and corporate securities, mortgage-backed securities (agency fixed-rate and hybrid adjustable-rate mortgage pass-throughs), asset-backed securities, and commercial mortgage-backed securities. You cannot invest directly in an index. |
6 | Source: Allspring Funds Management, LLC. Index Asset Allocation Blended Index is composed 60% of the S&P 500 Index and 40% of the Bloomberg U.S. Treasury Index. Prior to April 1, 2015, the Index Asset Allocation Blended Index was composed 60% of the S&P 500 Index and 40% of the Bloomberg U.S. Treasury 20+ Year Index. You cannot invest directly in an index. |
7 | The S&P 500 Index consists of 500 stocks chosen for market size, liquidity, and industry group representation. It is a market-value-weighted index with each stock’s weight in the index proportionate to its market value. You cannot invest directly in an index. |
8 | The Bloomberg U.S. Treasury Index is an unmanaged index of prices of U.S. Treasury bonds with maturities of 1 to 30 years. You cannot invest directly in an index. |
† | Mr. Kowalske became a portfolio manager of the Fund effective January 16, 2024. |
CFA® and Chartered Financial Analyst® are trademarks owned by CFA Institute. | |
Ten largest holdings (%) as of March 31, 20241 | |
Microsoft Corp. | 4.21 |
Apple, Inc. | 3.35 |
NVIDIA Corp. | 3.01 |
Amazon.com, Inc. | 2.22 |
U.S. Treasury Bonds, 6.00%, 2-15-2026 | 1.73 |
U.S. Treasury Bonds, 6.88%, 8-15-2025 | 1.59 |
U.S. Treasury Notes, 1.38%, 10-31-2028 | 1.59 |
Meta Platforms, Inc. Class A | 1.44 |
U.S. Treasury Notes, 1.38%, 11-15-2031 | 1.42 |
U.S. Treasury Bonds, 6.75%, 8-15-2026 | 1.32 |
1 | Figures represent the percentage of the Fund’s net assets. Holdings are subject to change and may have changed since the date specified. |
Allocation (%) as of March 31, 2024 | ||
Neutral allocation | Effective allocation1 | |
Stock Funds | 60 | 66 |
Bond Funds | 40 | 49 |
Effective Cash | 0 | (15 ) |
1 | Effective allocation reflects the effect of the tactical futures overlay that may be in place. Effective cash, if any, represents the net offset to such future positions. Effective allocations are subject to change and may have changed since the date specified. |
Beginning account value 10-1-2023 | Ending account value 3-31-2024 | Expenses paid during the period1 | Annualized net expense ratio | |
Class A | ||||
Actual | $1,000.00 | $1,167.10 | $5.77 | 1.07 % |
Hypothetical (5% return before expenses) | $1,000.00 | $1,019.54 | $5.37 | 1.07 % |
Class C | ||||
Actual | $1,000.00 | $1,163.00 | $9.79 | 1.82 % |
Hypothetical (5% return before expenses) | $1,000.00 | $1,015.81 | $9.12 | 1.82 % |
Administrator Class | ||||
Actual | $1,000.00 | $1,167.93 | $4.85 | 0.90 % |
Hypothetical (5% return before expenses) | $1,000.00 | $1,020.39 | $4.52 | 0.90 % |
Institutional Class | ||||
Actual | $1,000.00 | $1,168.76 | $4.04 | 0.75 % |
Hypothetical (5% return before expenses) | $1,000.00 | $1,021.13 | $3.77 | 0.75 % |
1 | Expenses paid is equal to the annualized net expense ratio of each class multiplied by the average account value over the period, multiplied by 182 divided by 366 (to reflect the one-half-year period). |
Interest rate | Maturity date | Principal | Value | |||
Agency securities: 0.00% | ||||||
FNMA Series 2002-T1 Class A4 | 9.50 % | 11-25-2031 | $ | 14,644 | $15,873 | |
Total agency securities (Cost $14,644) | 15,873 | |||||
Shares | ||||||
Common stocks: 59.38% | ||||||
Communication services: 5.32% | ||||||
Diversified telecommunication services: 0.41% | ||||||
AT&T, Inc. | 128,429 | 2,260,351 | ||||
Verizon Communications, Inc. | 75,518 | 3,168,735 | ||||
5,429,086 | ||||||
Entertainment: 0.78% | ||||||
Electronic Arts, Inc. | 4,370 | 579,768 | ||||
Live Nation Entertainment, Inc.† | 2,549 | 269,608 | ||||
Netflix, Inc.† | 7,773 | 4,720,776 | ||||
Take-Two Interactive Software, Inc.† | 2,848 | 422,899 | ||||
Walt Disney Co. | 32,948 | 4,031,517 | ||||
Warner Bros Discovery, Inc.† | 39,860 | 347,978 | ||||
10,372,546 | ||||||
Interactive media & services: 3.66% | ||||||
Alphabet, Inc. Class A† | 105,851 | 15,976,091 | ||||
Alphabet, Inc. Class C† | 88,621 | 13,493,434 | ||||
Match Group, Inc.† | 4,882 | 177,119 | ||||
Meta Platforms, Inc. Class A | 39,518 | 19,189,150 | ||||
48,835,794 | ||||||
Media: 0.35% | ||||||
Charter Communications, Inc. Class A† | 1,774 | 515,578 | ||||
Comcast Corp. Class A | 71,173 | 3,085,350 | ||||
Fox Corp. Class A | 4,298 | 134,398 | ||||
Fox Corp. Class B | 2,370 | 67,829 | ||||
Interpublic Group of Cos., Inc. | 6,880 | 224,494 | ||||
News Corp. Class A | 6,826 | 178,705 | ||||
News Corp. Class B | 2,059 | 55,716 | ||||
Omnicom Group, Inc. | 3,556 | 344,079 | ||||
Paramount Global Class B | 8,666 | 101,999 | ||||
4,708,148 | ||||||
Wireless telecommunication services: 0.12% | ||||||
T-Mobile U.S., Inc. | 9,380 | 1,531,004 | ||||
Consumer discretionary: 6.14% | ||||||
Automobile components: 0.04% | ||||||
Aptiv PLC† | 5,012 | 399,206 | ||||
BorgWarner, Inc. | 4,127 | 143,372 | ||||
542,578 | ||||||
Shares | Value | |||||
Automobiles: 0.80% | ||||||
Ford Motor Co. | 70,102 | $930,955 | ||||
General Motors Co. | 20,736 | 940,378 | ||||
Tesla, Inc.† | 49,769 | 8,748,892 | ||||
10,620,225 | ||||||
Broadline retail: 2.27% | ||||||
Amazon.com, Inc.† | 164,190 | 29,616,592 | ||||
eBay, Inc. | 9,322 | 492,015 | ||||
Etsy, Inc.† | 2,151 | 147,817 | ||||
30,256,424 | ||||||
Distributors: 0.07% | ||||||
Genuine Parts Co. | 2,518 | 390,114 | ||||
LKQ Corp. | 4,807 | 256,742 | ||||
Pool Corp. | 695 | 280,432 | ||||
927,288 | ||||||
Hotels, restaurants & leisure: 1.22% | ||||||
Airbnb, Inc. Class A† | 7,824 | 1,290,647 | ||||
Booking Holdings, Inc. | 627 | 2,274,681 | ||||
Caesars Entertainment, Inc.† | 3,875 | 169,492 | ||||
Carnival Corp.† | 18,097 | 295,705 | ||||
Chipotle Mexican Grill, Inc.† | 493 | 1,433,038 | ||||
Darden Restaurants, Inc. | 2,145 | 358,537 | ||||
Domino’s Pizza, Inc. | 627 | 311,544 | ||||
Expedia Group, Inc.† | 2,349 | 323,575 | ||||
Hilton Worldwide Holdings, Inc. | 4,529 | 966,081 | ||||
Las Vegas Sands Corp. | 6,633 | 342,926 | ||||
Marriott International, Inc. Class A | 4,431 | 1,117,986 | ||||
McDonald’s Corp. | 13,029 | 3,673,526 | ||||
MGM Resorts International† | 4,908 | 231,707 | ||||
Norwegian Cruise Line Holdings Ltd.† | 7,642 | 159,947 | ||||
Royal Caribbean Cruises Ltd.† | 4,237 | 588,985 | ||||
Starbucks Corp. | 20,337 | 1,858,598 | ||||
Wynn Resorts Ltd. | 1,712 | 175,018 | ||||
Yum! Brands, Inc. | 5,047 | 699,766 | ||||
16,271,759 | ||||||
Household durables: 0.23% | ||||||
D.R. Horton, Inc. | 5,364 | 882,646 | ||||
Garmin Ltd. | 2,749 | 409,244 | ||||
Lennar Corp. Class A | 4,440 | 763,591 | ||||
Mohawk Industries, Inc.† | 949 | 124,214 | ||||
NVR, Inc.† | 57 | 461,698 | ||||
PulteGroup, Inc. | 3,810 | 459,562 | ||||
3,100,955 | ||||||
Leisure products: 0.01% | ||||||
Hasbro, Inc. | 2,343 | 132,426 | ||||
Shares | Value | |||||
Specialty retail: 1.22% | ||||||
AutoZone, Inc.† | 311 | $980,163 | ||||
Bath & Body Works, Inc. | 4,058 | 202,981 | ||||
Best Buy Co., Inc. | 3,443 | 282,429 | ||||
CarMax, Inc.† | 2,837 | 247,131 | ||||
Home Depot, Inc. | 17,877 | 6,857,617 | ||||
Lowe’s Cos., Inc. | 10,330 | 2,631,361 | ||||
O’Reilly Automotive, Inc.† | 1,061 | 1,197,742 | ||||
Ross Stores, Inc. | 6,047 | 887,458 | ||||
TJX Cos., Inc. | 20,471 | 2,076,169 | ||||
Tractor Supply Co. | 1,942 | 508,260 | ||||
Ulta Beauty, Inc.† | 872 | 455,952 | ||||
16,327,263 | ||||||
Textiles, apparel & luxury goods: 0.28% | ||||||
Deckers Outdoor Corp.† | 461 | 433,921 | ||||
lululemon athletica, Inc.† | 2,063 | 805,911 | ||||
NIKE, Inc. Class B | 21,864 | 2,054,779 | ||||
Ralph Lauren Corp. | 701 | 131,620 | ||||
Tapestry, Inc. | 4,120 | 195,617 | ||||
VF Corp. | 5,936 | 91,058 | ||||
3,712,906 | ||||||
Consumer staples: 3.54% | ||||||
Beverages: 0.83% | ||||||
Brown-Forman Corp. Class B | 3,248 | 167,662 | ||||
Coca-Cola Co. | 69,892 | 4,275,992 | ||||
Constellation Brands, Inc. Class A | 2,889 | 785,115 | ||||
Keurig Dr Pepper, Inc. | 18,707 | 573,744 | ||||
Molson Coors Beverage Co. Class B | 3,326 | 223,673 | ||||
Monster Beverage Corp.† | 13,269 | 786,586 | ||||
PepsiCo, Inc. | 24,688 | 4,320,647 | ||||
11,133,419 | ||||||
Consumer staples distribution & retail: 1.10% | ||||||
Costco Wholesale Corp. | 7,970 | 5,839,061 | ||||
Dollar General Corp. | 3,943 | 615,345 | ||||
Dollar Tree, Inc.† | 3,718 | 495,052 | ||||
Kroger Co. | 11,889 | 679,219 | ||||
Sysco Corp. | 8,942 | 725,912 | ||||
Target Corp. | 8,292 | 1,469,425 | ||||
Walgreens Boots Alliance, Inc. | 12,857 | 278,868 | ||||
Walmart, Inc. | 76,890 | 4,626,471 | ||||
14,729,353 | ||||||
Food products: 0.48% | ||||||
Archer-Daniels-Midland Co. | 9,581 | 601,783 | ||||
Bunge Global SA | 2,610 | 267,577 | ||||
Campbell Soup Co. | 3,534 | 157,086 | ||||
Conagra Brands, Inc. | 8,586 | 254,489 | ||||
Shares | Value | |||||
Food products(continued) | ||||||
General Mills, Inc. | 10,201 | $713,764 | ||||
Hershey Co. | 2,692 | 523,594 | ||||
Hormel Foods Corp. | 5,206 | 181,637 | ||||
J M Smucker Co. | 1,907 | 240,034 | ||||
Kellanova | 4,737 | 271,383 | ||||
Kraft Heinz Co. | 14,320 | 528,408 | ||||
Lamb Weston Holdings, Inc. | 2,593 | 276,232 | ||||
McCormick & Co., Inc. | 4,516 | 346,874 | ||||
Mondelez International, Inc. Class A | 24,186 | 1,693,020 | ||||
Tyson Foods, Inc. Class A | 5,143 | 302,049 | ||||
6,357,930 | ||||||
Household products: 0.73% | ||||||
Church & Dwight Co., Inc. | 4,426 | 461,676 | ||||
Clorox Co. | 2,229 | 341,282 | ||||
Colgate-Palmolive Co. | 14,790 | 1,331,840 | ||||
Kimberly-Clark Corp. | 6,051 | 782,697 | ||||
Procter & Gamble Co. | 42,265 | 6,857,496 | ||||
9,774,991 | ||||||
Personal care products: 0.10% | ||||||
Estee Lauder Cos., Inc. Class A | 4,184 | 644,963 | ||||
Kenvue, Inc. | 30,958 | 664,359 | ||||
1,309,322 | ||||||
Tobacco: 0.30% | ||||||
Altria Group, Inc. | 31,676 | 1,381,707 | ||||
Philip Morris International, Inc. | 27,885 | 2,554,824 | ||||
3,936,531 | ||||||
Energy: 2.35% | ||||||
Energy equipment & services: 0.20% | ||||||
Baker Hughes Co. | 17,978 | 602,263 | ||||
Halliburton Co. | 15,988 | 630,247 | ||||
Schlumberger NV | 25,639 | 1,405,273 | ||||
2,637,783 | ||||||
Oil, gas & consumable fuels: 2.15% | ||||||
APA Corp. | 6,488 | 223,057 | ||||
Chevron Corp. | 31,154 | 4,914,232 | ||||
ConocoPhillips | 21,161 | 2,693,372 | ||||
Coterra Energy, Inc. | 13,511 | 376,687 | ||||
Devon Energy Corp. | 11,508 | 577,471 | ||||
Diamondback Energy, Inc. | 3,215 | 637,117 | ||||
EOG Resources, Inc. | 10,475 | 1,339,124 | ||||
EQT Corp. | 7,388 | 273,873 | ||||
Exxon Mobil Corp. | 71,328 | 8,291,167 | ||||
Hess Corp. | 4,944 | 754,652 | ||||
Kinder Morgan, Inc. | 34,735 | 637,040 | ||||
Shares | Value | |||||
Oil, gas & consumable fuels(continued) | ||||||
Marathon Oil Corp. | 10,512 | $297,910 | ||||
Marathon Petroleum Corp. | 6,610 | 1,331,915 | ||||
Occidental Petroleum Corp. | 11,822 | 768,312 | ||||
ONEOK, Inc. | 10,464 | 838,899 | ||||
Phillips 66 | 7,724 | 1,261,638 | ||||
Pioneer Natural Resources Co. | 4,196 | 1,101,450 | ||||
Targa Resources Corp. | 4,005 | 448,520 | ||||
Valero Energy Corp. | 6,115 | 1,043,769 | ||||
Williams Cos., Inc. | 21,851 | 851,534 | ||||
28,661,739 | ||||||
Financials: 7.81% | ||||||
Banks: 2.00% | ||||||
Bank of America Corp. | 123,668 | 4,689,491 | ||||
Citigroup, Inc. | 34,184 | 2,161,796 | ||||
Citizens Financial Group, Inc. | 8,374 | 303,892 | ||||
Comerica, Inc. | 2,369 | 130,271 | ||||
Fifth Third Bancorp | 12,234 | 455,227 | ||||
Huntington Bancshares, Inc. | 26,015 | 362,909 | ||||
JPMorgan Chase & Co. | 51,929 | 10,401,379 | ||||
KeyCorp | 16,823 | 265,972 | ||||
M&T Bank Corp. | 2,984 | 433,993 | ||||
PNC Financial Services Group, Inc. | 7,149 | 1,155,278 | ||||
Regions Financial Corp. | 16,597 | 349,201 | ||||
Truist Financial Corp. | 23,957 | 933,844 | ||||
U.S. Bancorp | 27,967 | 1,250,125 | ||||
Wells Fargo & Co. | 64,643 | 3,746,708 | ||||
26,640,086 | ||||||
Capital markets: 1.66% | ||||||
Ameriprise Financial, Inc. | 1,800 | 789,192 | ||||
Bank of New York Mellon Corp. | 13,639 | 785,879 | ||||
BlackRock, Inc. | 2,512 | 2,094,254 | ||||
Blackstone, Inc. | 12,921 | 1,697,432 | ||||
Cboe Global Markets, Inc. | 1,896 | 348,352 | ||||
Charles Schwab Corp. | 26,731 | 1,933,721 | ||||
CME Group, Inc. | 6,466 | 1,392,065 | ||||
FactSet Research Systems, Inc. | 684 | 310,803 | ||||
Franklin Resources, Inc. | 5,391 | 151,541 | ||||
Goldman Sachs Group, Inc. | 5,858 | 2,446,828 | ||||
Intercontinental Exchange, Inc. | 10,285 | 1,413,468 | ||||
Invesco Ltd. | 8,074 | 133,948 | ||||
MarketAxess Holdings, Inc. | 681 | 149,309 | ||||
Moody’s Corp. | 2,827 | 1,111,096 | ||||
Morgan Stanley | 22,503 | 2,118,882 | ||||
MSCI, Inc. | 1,421 | 796,399 | ||||
Nasdaq, Inc. | 6,826 | 430,721 | ||||
Northern Trust Corp. | 3,685 | 327,670 | ||||
Raymond James Financial, Inc. | 3,379 | 433,931 | ||||
Shares | Value | |||||
Capital markets(continued) | ||||||
S&P Global, Inc. | 5,771 | $2,455,272 | ||||
State Street Corp. | 5,424 | 419,384 | ||||
T Rowe Price Group, Inc. | 4,022 | 490,362 | ||||
22,230,509 | ||||||
Consumer finance: 0.32% | ||||||
American Express Co. | 10,272 | 2,338,832 | ||||
Capital One Financial Corp. | 6,833 | 1,017,365 | ||||
Discover Financial Services | 4,492 | 588,856 | ||||
Synchrony Financial | 7,308 | 315,121 | ||||
4,260,174 | ||||||
Financial services: 2.54% | ||||||
Berkshire Hathaway, Inc. Class B† | 32,681 | 13,743,014 | ||||
Corpay, Inc.† | 1,297 | 400,176 | ||||
Fidelity National Information Services, Inc. | 10,642 | 789,424 | ||||
Fiserv, Inc.† | 10,781 | 1,723,019 | ||||
Global Payments, Inc. | 4,677 | 625,128 | ||||
Jack Henry & Associates, Inc. | 1,309 | 227,413 | ||||
Mastercard, Inc. Class A | 14,819 | 7,136,386 | ||||
PayPal Holdings, Inc.† | 19,251 | 1,289,624 | ||||
Visa, Inc. Class A | 28,409 | 7,928,384 | ||||
33,862,568 | ||||||
Insurance: 1.29% | ||||||
Aflac, Inc. | 9,456 | 811,892 | ||||
Allstate Corp. | 4,715 | 815,742 | ||||
American International Group, Inc. | 12,610 | 985,724 | ||||
Aon PLC Class A | 3,596 | 1,200,057 | ||||
Arch Capital Group Ltd.† | 6,664 | 616,020 | ||||
Arthur J Gallagher & Co. | 3,894 | 973,656 | ||||
Assurant, Inc. | 933 | 175,628 | ||||
Brown & Brown, Inc. | 4,243 | 371,432 | ||||
Chubb Ltd. | 7,280 | 1,886,467 | ||||
Cincinnati Financial Corp. | 2,820 | 350,159 | ||||
Everest Group Ltd. | 780 | 310,050 | ||||
Globe Life, Inc. | 1,538 | 178,977 | ||||
Hartford Financial Services Group, Inc. | 5,362 | 552,554 | ||||
Loews Corp. | 3,273 | 256,243 | ||||
Marsh & McLennan Cos., Inc. | 8,837 | 1,820,245 | ||||
MetLife, Inc. | 11,026 | 817,137 | ||||
Principal Financial Group, Inc. | 3,940 | 340,061 | ||||
Progressive Corp. | 10,513 | 2,174,299 | ||||
Prudential Financial, Inc. | 6,484 | 761,222 | ||||
Travelers Cos., Inc. | 4,099 | 943,344 | ||||
W R Berkley Corp. | 3,640 | 321,922 | ||||
Willis Towers Watson PLC | 1,842 | 506,550 | ||||
17,169,381 | ||||||
Shares | Value | |||||
Health care: 7.37% | ||||||
Biotechnology: 1.15% | ||||||
AbbVie, Inc. | 31,713 | $5,774,937 | ||||
Amgen, Inc. | 9,610 | 2,732,315 | ||||
Biogen, Inc.† | 2,603 | 561,285 | ||||
Gilead Sciences, Inc. | 22,381 | 1,639,408 | ||||
Incyte Corp.† | 3,341 | 190,337 | ||||
Moderna, Inc.† | 5,958 | 634,885 | ||||
Regeneron Pharmaceuticals, Inc.† | 1,898 | 1,826,806 | ||||
Vertex Pharmaceuticals, Inc.† | 4,629 | 1,934,968 | ||||
15,294,941 | ||||||
Health care equipment & supplies: 1.53% | ||||||
Abbott Laboratories | 31,183 | 3,544,260 | ||||
Align Technology, Inc.† | 1,279 | 419,410 | ||||
Baxter International, Inc. | 9,122 | 389,874 | ||||
Becton Dickinson & Co. | 5,189 | 1,284,018 | ||||
Boston Scientific Corp.† | 26,314 | 1,802,246 | ||||
Cooper Cos., Inc. | 3,570 | 362,212 | ||||
Dentsply Sirona, Inc. | 3,805 | 126,288 | ||||
DexCom, Inc.† | 6,925 | 960,498 | ||||
Edwards Lifesciences Corp.† | 10,894 | 1,041,031 | ||||
GE HealthCare Technologies, Inc. | 7,607 | 691,552 | ||||
Hologic, Inc.† | 4,216 | 328,679 | ||||
IDEXX Laboratories, Inc.† | 1,492 | 805,576 | ||||
Insulet Corp.† | 1,254 | 214,936 | ||||
Intuitive Surgical, Inc.† | 6,329 | 2,525,841 | ||||
Medtronic PLC | 23,883 | 2,081,403 | ||||
ResMed, Inc. | 2,642 | 523,195 | ||||
STERIS PLC | 1,775 | 399,056 | ||||
Stryker Corp. | 6,074 | 2,173,702 | ||||
Teleflex, Inc. | 844 | 190,887 | ||||
Zimmer Biomet Holdings, Inc. | 3,754 | 495,453 | ||||
20,360,117 | ||||||
Health care providers & services: 1.56% | ||||||
Cardinal Health, Inc. | 4,369 | 488,891 | ||||
Cencora, Inc. | 2,974 | 722,652 | ||||
Centene Corp.† | 9,600 | 753,408 | ||||
Cigna Group | 5,254 | 1,908,200 | ||||
CVS Health Corp. | 22,604 | 1,802,895 | ||||
DaVita, Inc.† | 968 | 133,632 | ||||
Elevance Health, Inc. | 4,220 | 2,188,239 | ||||
HCA Healthcare, Inc. | 3,558 | 1,186,700 | ||||
Henry Schein, Inc.† | 2,334 | 176,264 | ||||
Humana, Inc. | 2,195 | 761,050 | ||||
Laboratory Corp. of America Holdings | 1,525 | 333,152 | ||||
McKesson Corp. | 2,360 | 1,266,966 | ||||
Molina Healthcare, Inc.† | 1,042 | 428,085 | ||||
Quest Diagnostics, Inc. | 1,994 | 265,421 | ||||
Shares | Value | |||||
Health care providers & services(continued) | ||||||
UnitedHealth Group, Inc. | 16,614 | $8,218,946 | ||||
Universal Health Services, Inc. Class B | 1,096 | 199,976 | ||||
20,834,477 | ||||||
Life sciences tools & services: 0.84% | ||||||
Agilent Technologies, Inc. | 5,264 | 765,965 | ||||
Bio-Rad Laboratories, Inc. Class A† | 376 | 130,047 | ||||
Bio-Techne Corp. | 2,824 | 198,781 | ||||
Charles River Laboratories International, Inc.† | 921 | 249,545 | ||||
Danaher Corp. | 11,813 | 2,949,942 | ||||
Illumina, Inc.† | 2,852 | 391,637 | ||||
IQVIA Holdings, Inc.† | 3,278 | 828,974 | ||||
Mettler-Toledo International, Inc.† | 386 | 513,878 | ||||
Revvity, Inc. | 2,217 | 232,785 | ||||
Thermo Fisher Scientific, Inc. | 6,940 | 4,033,597 | ||||
Waters Corp.† | 1,062 | 365,572 | ||||
West Pharmaceutical Services, Inc. | 1,329 | 525,899 | ||||
11,186,622 | ||||||
Pharmaceuticals: 2.29% | ||||||
Bristol-Myers Squibb Co. | 36,549 | 1,982,052 | ||||
Catalent, Inc.† | 3,246 | 183,237 | ||||
Eli Lilly & Co. | 14,323 | 11,142,721 | ||||
Johnson & Johnson | 43,240 | 6,840,136 | ||||
Merck & Co., Inc. | 45,516 | 6,005,836 | ||||
Pfizer, Inc. | 101,422 | 2,814,460 | ||||
Viatris, Inc. | 21,549 | 257,295 | ||||
Zoetis, Inc. | 8,247 | 1,395,475 | ||||
30,621,212 | ||||||
Industrials: 5.23% | ||||||
Aerospace & defense: 0.89% | ||||||
Axon Enterprise, Inc.† | 1,265 | 395,793 | ||||
Boeing Co.† | 10,302 | 1,988,183 | ||||
General Dynamics Corp. | 4,078 | 1,151,994 | ||||
Howmet Aerospace, Inc. | 7,026 | 480,789 | ||||
Huntington Ingalls Industries, Inc. | 711 | 207,235 | ||||
L3Harris Technologies, Inc. | 3,405 | 725,606 | ||||
Lockheed Martin Corp. | 3,863 | 1,757,163 | ||||
Northrop Grumman Corp. | 2,533 | 1,212,446 | ||||
RTX Corp. | 23,833 | 2,324,432 | ||||
Textron, Inc. | 3,521 | 337,770 | ||||
TransDigm Group, Inc. | 999 | 1,230,368 | ||||
11,811,779 | ||||||
Air freight & logistics: 0.27% | ||||||
CH Robinson Worldwide, Inc. | 2,095 | 159,513 | ||||
Expeditors International of Washington, Inc. | 2,611 | 317,419 | ||||
Shares | Value | |||||
Air freight & logistics(continued) | ||||||
FedEx Corp. | 4,130 | $1,196,626 | ||||
United Parcel Service, Inc. Class B | 12,991 | 1,930,853 | ||||
3,604,411 | ||||||
Building products: 0.31% | ||||||
A O Smith Corp. | 2,206 | 197,349 | ||||
Allegion PLC | 1,577 | 212,438 | ||||
Builders FirstSource, Inc.† | 2,216 | 462,147 | ||||
Carrier Global Corp. | 15,007 | 872,357 | ||||
Johnson Controls International PLC | 12,241 | 799,582 | ||||
Masco Corp. | 3,947 | 311,339 | ||||
Trane Technologies PLC | 4,087 | 1,226,917 | ||||
4,082,129 | ||||||
Commercial services & supplies: 0.35% | ||||||
Cintas Corp. | 1,548 | 1,063,522 | ||||
Copart, Inc.† | 15,696 | 909,112 | ||||
Republic Services, Inc. | 3,674 | 703,350 | ||||
Rollins, Inc. | 5,043 | 233,340 | ||||
Veralto Corp. | 3,939 | 349,232 | ||||
Waste Management, Inc. | 6,584 | 1,403,380 | ||||
4,661,936 | ||||||
Construction & engineering: 0.05% | ||||||
Quanta Services, Inc. | 2,610 | 678,078 | ||||
Electrical equipment: 0.40% | ||||||
AMETEK, Inc. | 4,146 | 758,303 | ||||
Eaton Corp. PLC | 7,172 | 2,242,541 | ||||
Emerson Electric Co. | 10,269 | 1,164,710 | ||||
Generac Holdings, Inc.† | 1,103 | 139,133 | ||||
Hubbell, Inc. | 963 | 399,693 | ||||
Rockwell Automation, Inc. | 2,058 | 599,557 | ||||
5,303,937 | ||||||
Ground transportation: 0.67% | ||||||
CSX Corp. | 35,496 | 1,315,837 | ||||
J.B. Hunt Transport Services, Inc. | 1,465 | 291,901 | ||||
Norfolk Southern Corp. | 4,057 | 1,034,008 | ||||
Old Dominion Freight Line, Inc. | 3,214 | 704,862 | ||||
Uber Technologies, Inc.† | 36,964 | 2,845,859 | ||||
Union Pacific Corp. | 10,953 | 2,693,671 | ||||
8,886,138 | ||||||
Industrial conglomerates: 0.52% | ||||||
3M Co. | 9,928 | 1,053,063 | ||||
General Electric Co. | 19,549 | 3,431,436 | ||||
Honeywell International, Inc. | 11,842 | 2,430,571 | ||||
6,915,070 | ||||||
Shares | Value | |||||
Machinery: 1.09% | ||||||
Caterpillar, Inc. | 9,144 | $3,350,636 | ||||
Cummins, Inc. | 2,448 | 721,303 | ||||
Deere & Co. | 4,677 | 1,921,031 | ||||
Dover Corp. | 2,513 | 445,279 | ||||
Fortive Corp. | 6,299 | 541,840 | ||||
IDEX Corp. | 1,358 | 331,379 | ||||
Illinois Tool Works, Inc. | 4,884 | 1,310,524 | ||||
Ingersoll Rand, Inc. | 7,271 | 690,381 | ||||
Nordson Corp. | 975 | 267,677 | ||||
Otis Worldwide Corp. | 7,283 | 722,983 | ||||
PACCAR, Inc. | 9,396 | 1,164,070 | ||||
Parker-Hannifin Corp. | 2,307 | 1,282,208 | ||||
Pentair PLC | 2,969 | 253,671 | ||||
Snap-on, Inc. | 948 | 280,817 | ||||
Stanley Black & Decker, Inc. | 2,754 | 269,699 | ||||
Westinghouse Air Brake Technologies Corp. | 3,218 | 468,798 | ||||
Xylem, Inc. | 4,330 | 559,609 | ||||
14,581,905 | ||||||
Passenger airlines: 0.10% | ||||||
American Airlines Group, Inc.† | 11,752 | 180,393 | ||||
Delta Air Lines, Inc. | 11,502 | 550,601 | ||||
Southwest Airlines Co. | 10,717 | 312,829 | ||||
United Airlines Holdings, Inc.† | 5,892 | 282,109 | ||||
1,325,932 | ||||||
Professional services: 0.40% | ||||||
Automatic Data Processing, Inc. | 7,379 | 1,842,831 | ||||
Broadridge Financial Solutions, Inc. | 2,115 | 433,279 | ||||
Ceridian HCM Holding, Inc.† | 2,804 | 185,653 | ||||
Equifax, Inc. | 2,215 | 592,557 | ||||
Jacobs Solutions, Inc. | 2,257 | 346,969 | ||||
Leidos Holdings, Inc. | 2,470 | 323,792 | ||||
Paychex, Inc. | 5,752 | 706,345 | ||||
Paycom Software, Inc. | 863 | 171,746 | ||||
Robert Half, Inc. | 1,871 | 148,333 | ||||
Verisk Analytics, Inc. | 2,604 | 613,841 | ||||
5,365,346 | ||||||
Trading companies & distributors: 0.18% | ||||||
Fastenal Co. | 10,279 | 792,922 | ||||
United Rentals, Inc. | 1,207 | 870,380 | ||||
WW Grainger, Inc. | 793 | 806,719 | ||||
2,470,021 | ||||||
Information technology: 17.55% | ||||||
Communications equipment: 0.48% | ||||||
Arista Networks, Inc.† | 4,526 | 1,312,450 | ||||
Cisco Systems, Inc. | 72,989 | 3,642,881 | ||||
Shares | Value | |||||
Communications equipment(continued) | ||||||
F5, Inc.† | 1,056 | $200,207 | ||||
Juniper Networks, Inc. | 5,782 | 214,281 | ||||
Motorola Solutions, Inc. | 2,981 | 1,058,195 | ||||
6,428,014 | ||||||
Electronic equipment, instruments & components: 0.36% | ||||||
Amphenol Corp. Class A | 10,775 | 1,242,896 | ||||
CDW Corp. | 2,406 | 615,407 | ||||
Corning, Inc. | 13,792 | 454,584 | ||||
Jabil, Inc. | 2,291 | 306,880 | ||||
Keysight Technologies, Inc.† | 3,137 | 490,564 | ||||
TE Connectivity Ltd. | 5,547 | 805,646 | ||||
Teledyne Technologies, Inc.† | 848 | 364,063 | ||||
Trimble, Inc.† | 4,468 | 287,561 | ||||
Zebra Technologies Corp. Class A† | 923 | 278,229 | ||||
4,845,830 | ||||||
IT services: 0.69% | ||||||
Accenture PLC Class A | 11,262 | 3,903,522 | ||||
Akamai Technologies, Inc.† | 2,709 | 294,631 | ||||
Cognizant Technology Solutions Corp. Class A | 8,945 | 655,579 | ||||
EPAM Systems, Inc.† | 1,036 | 286,102 | ||||
Gartner, Inc.† | 1,400 | 667,338 | ||||
International Business Machines Corp. | 16,436 | 3,138,618 | ||||
VeriSign, Inc.† | 1,583 | 299,994 | ||||
9,245,784 | ||||||
Semiconductors & semiconductor equipment: 6.09% | ||||||
Advanced Micro Devices, Inc.† | 29,023 | 5,238,361 | ||||
Analog Devices, Inc. | 8,906 | 1,761,518 | ||||
Applied Materials, Inc. | 14,946 | 3,082,314 | ||||
Broadcom, Inc. | 7,904 | 10,476,041 | ||||
Enphase Energy, Inc.† | 2,439 | 295,070 | ||||
First Solar, Inc.† | 1,919 | 323,927 | ||||
Intel Corp. | 75,944 | 3,354,446 | ||||
KLA Corp. | 2,429 | 1,696,827 | ||||
Lam Research Corp. | 2,355 | 2,288,047 | ||||
Microchip Technology, Inc. | 9,707 | 870,815 | ||||
Micron Technology, Inc. | 19,829 | 2,337,641 | ||||
Monolithic Power Systems, Inc. | 863 | 584,613 | ||||
NVIDIA Corp. | 44,366 | 40,087,343 | ||||
NXP Semiconductors NV | 4,630 | 1,147,175 | ||||
ON Semiconductor Corp.† | 7,676 | 564,570 | ||||
Qorvo, Inc.† | 1,734 | 199,115 | ||||
QUALCOMM, Inc. | 20,046 | 3,393,788 | ||||
Skyworks Solutions, Inc. | 2,878 | 311,745 | ||||
Teradyne, Inc. | 2,746 | 309,831 | ||||
Texas Instruments, Inc. | 16,333 | 2,845,372 | ||||
81,168,559 | ||||||
Shares | Value | |||||
Software: 6.36% | ||||||
Adobe, Inc.† | 8,119 | $4,096,847 | ||||
ANSYS, Inc.† | 1,561 | 541,917 | ||||
Autodesk, Inc.† | 3,842 | 1,000,534 | ||||
Cadence Design Systems, Inc.† | 4,887 | 1,521,225 | ||||
Fair Isaac Corp.† | 446 | 557,326 | ||||
Fortinet, Inc.† | 11,448 | 782,013 | ||||
Gen Digital, Inc. | 10,067 | 225,501 | ||||
Intuit, Inc. | 5,028 | 3,268,200 | ||||
Microsoft Corp. | 133,467 | 56,152,236 | ||||
Oracle Corp. | 28,638 | 3,597,219 | ||||
Palo Alto Networks, Inc.† | 5,663 | 1,609,028 | ||||
PTC, Inc.† | 2,147 | 405,654 | ||||
Roper Technologies, Inc. | 1,919 | 1,076,252 | ||||
Salesforce, Inc. | 17,387 | 5,236,617 | ||||
ServiceNow, Inc.† | 3,682 | 2,807,157 | ||||
Synopsys, Inc.† | 2,740 | 1,565,910 | ||||
Tyler Technologies, Inc.† | 757 | 321,733 | ||||
84,765,369 | ||||||
Technology hardware, storage & peripherals: 3.57% | ||||||
Apple, Inc. | 260,727 | 44,709,466 | ||||
Hewlett Packard Enterprise Co. | 23,351 | 414,013 | ||||
HP, Inc. | 15,663 | 473,336 | ||||
NetApp, Inc. | 3,701 | 388,494 | ||||
Seagate Technology Holdings PLC | 3,500 | 325,675 | ||||
Super Micro Computer, Inc.† | 904 | 913,067 | ||||
Western Digital Corp.† | 5,824 | 397,430 | ||||
47,621,481 | ||||||
Materials: 1.41% | ||||||
Chemicals: 0.94% | ||||||
Air Products & Chemicals, Inc. | 3,993 | 967,384 | ||||
Albemarle Corp. | 2,108 | 277,708 | ||||
Celanese Corp. | 1,799 | 309,176 | ||||
CF Industries Holdings, Inc. | 3,432 | 285,577 | ||||
Corteva, Inc. | 12,606 | 726,988 | ||||
Dow, Inc. | 12,615 | 730,787 | ||||
DuPont de Nemours, Inc. | 7,726 | 592,352 | ||||
Eastman Chemical Co. | 2,107 | 211,164 | ||||
Ecolab, Inc. | 4,558 | 1,052,442 | ||||
FMC Corp. | 2,241 | 142,752 | ||||
International Flavors & Fragrances, Inc. | 4,585 | 394,264 | ||||
Linde PLC | 8,710 | 4,044,227 | ||||
LyondellBasell Industries NV Class A | 4,598 | 470,283 | ||||
Mosaic Co. | 5,871 | 190,573 | ||||
PPG Industries, Inc. | 4,235 | 613,652 | ||||
Sherwin-Williams Co. | 4,230 | 1,469,206 | ||||
12,478,535 | ||||||
Shares | Value | |||||
Construction materials: 0.10% | ||||||
Martin Marietta Materials, Inc. | 1,110 | $681,473 | ||||
Vulcan Materials Co. | 2,387 | 651,460 | ||||
1,332,933 | ||||||
Containers & packaging: 0.13% | ||||||
Amcor PLC | 25,961 | 246,889 | ||||
Avery Dennison Corp. | 1,447 | 323,043 | ||||
Ball Corp. | 5,663 | 381,460 | ||||
International Paper Co. | 6,215 | 242,509 | ||||
Packaging Corp. of America | 1,598 | 303,268 | ||||
Westrock Co. | 4,616 | 228,261 | ||||
1,725,430 | ||||||
Metals & mining: 0.24% | ||||||
Freeport-McMoRan, Inc. | 25,757 | 1,211,094 | ||||
Newmont Corp.-U.S. Exchange Traded Shares | 20,701 | 741,924 | ||||
Nucor Corp. | 4,416 | 873,927 | ||||
Steel Dynamics, Inc. | 2,732 | 404,964 | ||||
3,231,909 | ||||||
Real estate: 1.35% | ||||||
Health care REITs: 0.11% | ||||||
Healthpeak Properties, Inc. | 12,716 | 238,425 | ||||
Ventas, Inc. | 7,228 | 314,707 | ||||
Welltower, Inc. | 9,941 | 928,887 | ||||
1,482,019 | ||||||
Hotel & resort REITs: 0.02% | ||||||
Host Hotels & Resorts, Inc. | 12,671 | 262,036 | ||||
Industrial REITs : 0.16% | ||||||
Prologis, Inc. | 16,596 | 2,161,131 | ||||
Office REITs : 0.04% | ||||||
Alexandria Real Estate Equities, Inc. | 2,829 | 364,686 | ||||
Boston Properties, Inc. | 2,593 | 169,349 | ||||
534,035 | ||||||
Real estate management & development: 0.09% | ||||||
CBRE Group, Inc. Class A† | 5,342 | 519,456 | ||||
CoStar Group, Inc.† | 7,335 | 708,561 | ||||
1,228,017 | ||||||
Residential REITs : 0.17% | ||||||
AvalonBay Communities, Inc. | 2,548 | 472,807 | ||||
Camden Property Trust | 1,918 | 188,731 | ||||
Equity Residential | 6,200 | 391,282 | ||||
Essex Property Trust, Inc. | 1,153 | 282,266 | ||||
Invitation Homes, Inc. | 10,333 | 367,958 | ||||
Shares | Value | |||||
Residential REITs (continued) | ||||||
Mid-America Apartment Communities, Inc. | 2,096 | $275,792 | ||||
UDR, Inc. | 5,436 | 203,361 | ||||
2,182,197 | ||||||
Retail REITs : 0.17% | ||||||
Federal Realty Investment Trust | 1,320 | 134,798 | ||||
Kimco Realty Corp. | 11,965 | 234,634 | ||||
Realty Income Corp. | 14,938 | 808,146 | ||||
Regency Centers Corp. | 2,951 | 178,713 | ||||
Simon Property Group, Inc. | 5,854 | 916,092 | ||||
2,272,383 | ||||||
Specialized REITs : 0.59% | ||||||
American Tower Corp. | 8,373 | 1,654,421 | ||||
Crown Castle, Inc. | 7,790 | 824,416 | ||||
Digital Realty Trust, Inc. | 5,440 | 783,578 | ||||
Equinix, Inc. | 1,686 | 1,391,506 | ||||
Extra Space Storage, Inc. | 3,795 | 557,865 | ||||
Iron Mountain, Inc. | 5,245 | 420,701 | ||||
Public Storage | 2,843 | 824,641 | ||||
SBA Communications Corp. | 1,938 | 419,965 | ||||
VICI Properties, Inc. | 18,582 | 553,558 | ||||
Weyerhaeuser Co. | 13,108 | 470,708 | ||||
7,901,359 | ||||||
Utilities: 1.31% | ||||||
Electric utilities: 0.88% | ||||||
Alliant Energy Corp. | 4,584 | 231,034 | ||||
American Electric Power Co., Inc. | 9,446 | 813,301 | ||||
Constellation Energy Corp. | 5,737 | 1,060,484 | ||||
Duke Energy Corp. | 13,849 | 1,339,337 | ||||
Edison International | 6,890 | 487,330 | ||||
Entergy Corp. | 3,799 | 401,478 | ||||
Evergy, Inc. | 4,126 | 220,246 | ||||
Eversource Energy | 6,275 | 375,057 | ||||
Exelon Corp. | 17,880 | 671,752 | ||||
FirstEnergy Corp. | 9,276 | 358,239 | ||||
NextEra Energy, Inc. | 36,853 | 2,355,275 | ||||
NRG Energy, Inc. | 4,055 | 274,483 | ||||
PG&E Corp. | 38,322 | 642,277 | ||||
Pinnacle West Capital Corp. | 2,037 | 152,225 | ||||
PPL Corp. | 13,240 | 364,497 | ||||
Southern Co. | 19,590 | 1,405,386 | ||||
Xcel Energy, Inc. | 9,912 | 532,770 | ||||
11,685,171 | ||||||
Gas utilities: 0.02% | ||||||
Atmos Energy Corp. | 2,709 | 322,019 | ||||
Shares | Value | |||||
Independent power and renewable electricity producers: 0.02% | ||||||
AES Corp. | 12,028 | $215,662 | ||||
Multi-utilities: 0.36% | ||||||
Ameren Corp. | 4,723 | 349,313 | ||||
CenterPoint Energy, Inc. | 11,338 | 323,020 | ||||
CMS Energy Corp. | 5,289 | 319,138 | ||||
Consolidated Edison, Inc. | 6,201 | 563,113 | ||||
Dominion Energy, Inc. | 15,031 | 739,375 | ||||
DTE Energy Co. | 3,708 | 415,815 | ||||
NiSource, Inc. | 7,426 | 205,403 | ||||
Public Service Enterprise Group, Inc. | 8,951 | 597,748 | ||||
Sempra | 11,304 | 811,966 | ||||
WEC Energy Group, Inc. | 5,666 | 465,292 | ||||
4,790,183 | ||||||
Water utilities: 0.03% | ||||||
American Water Works Co., Inc. | 3,497 | 427,368 | ||||
Total common stocks (Cost $178,172,875) | 791,763,663 | |||||
Interest rate | Maturity date | Principal | ||||
Non-agency mortgage-backed securities: 0.00% | ||||||
Citigroup Mortgage Loan Trust, Inc. Series 2004-HYB4 Class AA (U.S. SOFR 1 Month+0.44%)± | 5.77 % | 12-25-2034 | $ | 2,244 | 2,053 | |
Total non-agency mortgage-backed securities (Cost $2,244) | 2,053 | |||||
U.S. Treasury securities: 34.90% | ||||||
U.S. Treasury Bonds | 1.13 | 5-15-2040 | 15,806,000 | 9,875,663 | ||
U.S. Treasury Bonds | 1.13 | 8-15-2040 | 2,981,000 | 1,845,309 | ||
U.S. Treasury Bonds | 1.38 | 11-15-2040 | 1,746,000 | 1,122,760 | ||
U.S. Treasury Bonds | 1.38 | 8-15-2050 | 4,388,000 | 2,317,241 | ||
U.S. Treasury Bonds | 1.63 | 11-15-2050 | 4,394,000 | 2,481,752 | ||
U.S. Treasury Bonds | 1.75 | 8-15-2041 | 4,938,000 | 3,332,378 | ||
U.S. Treasury Bonds | 1.88 | 2-15-2041 | 7,384,000 | 5,147,744 | ||
U.S. Treasury Bonds | 1.88 | 2-15-2051 | 4,844,000 | 2,918,132 | ||
U.S. Treasury Bonds | 1.88 | 11-15-2051 | 3,485,000 | 2,087,324 | ||
U.S. Treasury Bonds | 2.00 | 2-15-2050 | 3,135,000 | 1,963,539 | ||
U.S. Treasury Bonds | 2.00 | 8-15-2051 | 4,900,000 | 3,035,895 | ||
U.S. Treasury Bonds | 2.25 | 5-15-2041 | 4,397,000 | 3,248,627 | ||
U.S. Treasury Bonds | 2.25 | 8-15-2046 | 556,000 | 380,534 | ||
U.S. Treasury Bonds | 2.25 | 8-15-2049 | 3,118,000 | 2,079,194 | ||
U.S. Treasury Bonds | 2.25 | 2-15-2052 | 11,040,000 | 7,261,819 | ||
U.S. Treasury Bonds | 2.38 | 5-15-2051 | 4,919,000 | 3,339,348 | ||
U.S. Treasury Bonds | 2.50 | 2-15-2046 | 1,960,000 | 1,417,478 | ||
U.S. Treasury Bonds | 2.50 | 5-15-2046 | 1,949,000 | 1,406,021 | ||
U.S. Treasury Bonds | 2.75 | 8-15-2047 | 1,864,000 | 1,394,942 | ||
U.S. Treasury Bonds | 2.75 | 11-15-2047 | 1,853,000 | 1,384,538 | ||
U.S. Treasury Bonds | 2.88 | 8-15-2045 | 1,430,000 | 1,113,110 | ||
Interest rate | Maturity date | Principal | Value | |||
U.S. Treasury securities(continued) | ||||||
U.S. Treasury Bonds | 2.88 % | 11-15-2046 | $ | 3,221,000 | $2,482,057 | |
U.S. Treasury Bonds | 2.88 | 5-15-2049 | 2,582,000 | 1,964,035 | ||
U.S. Treasury Bonds | 3.00 | 5-15-2042 | 776,000 | 635,138 | ||
U.S. Treasury Bonds | 3.00 | 5-15-2045 | 1,115,000 | 888,951 | ||
U.S. Treasury Bonds | 3.00 | 11-15-2045 | 834,000 | 662,411 | ||
U.S. Treasury Bonds | 3.00 | 2-15-2047 | 1,889,000 | 1,486,038 | ||
U.S. Treasury Bonds | 3.00 | 5-15-2047 | 1,921,000 | 1,508,960 | ||
U.S. Treasury Bonds | 3.00 | 2-15-2048 | 2,119,000 | 1,657,373 | ||
U.S. Treasury Bonds | 3.00 | 8-15-2048 | 2,099,000 | 1,638,204 | ||
U.S. Treasury Bonds | 3.00 | 2-15-2049 | 2,614,000 | 2,038,001 | ||
U.S. Treasury Bonds | 3.13 | 11-15-2041 | 846,000 | 710,739 | ||
U.S. Treasury Bonds | 3.13 | 2-15-2042 | 919,000 | 769,016 | ||
U.S. Treasury Bonds | 3.13 | 5-15-2048 | 2,283,000 | 1,825,865 | ||
U.S. Treasury Bonds | 3.38 | 5-15-2044 | 1,432,000 | 1,221,955 | ||
U.S. Treasury Bonds | 3.38 | 11-15-2048 | 2,541,000 | 2,123,422 | ||
U.S. Treasury Bonds | 3.50 | 2-15-2039 | 731,000 | 671,578 | ||
U.S. Treasury Bonds | 3.63 | 2-15-2044 | 1,547,000 | 1,372,660 | ||
U.S. Treasury Bonds | 3.63 | 2-15-2053 | 615,000 | 540,047 | ||
U.S. Treasury Bonds | 3.75 | 8-15-2041 | 929,000 | 855,152 | ||
U.S. Treasury Bonds | 3.75 | 11-15-2043 | 1,660,000 | 1,501,587 | ||
U.S. Treasury Bonds | 3.88 | 8-15-2040 | 946,000 | 892,935 | ||
U.S. Treasury Bonds | 4.25 | 5-15-2039 | 681,000 | 679,537 | ||
U.S. Treasury Bonds | 4.25 | 11-15-2040 | 977,000 | 963,719 | ||
U.S. Treasury Bonds | 4.38 | 2-15-2038 | 381,000 | 388,650 | ||
U.S. Treasury Bonds | 4.38 | 11-15-2039 | 757,000 | 763,683 | ||
U.S. Treasury Bonds | 4.38 | 5-15-2040 | 1,078,000 | 1,083,727 | ||
U.S. Treasury Bonds | 4.38 | 5-15-2041 | 842,000 | 840,388 | ||
U.S. Treasury Bonds | 4.50 | 5-15-2038 | 428,000 | 441,425 | ||
U.S. Treasury Bonds | 4.50 | 8-15-2039 | 721,000 | 738,715 | ||
U.S. Treasury Bonds | 4.63 | 2-15-2040 | 730,000 | 756,348 | ||
U.S. Treasury Bonds | 4.75 | 2-15-2037 | 264,000 | 280,789 | ||
U.S. Treasury Bonds | 4.75 | 2-15-2041 | 1,084,000 | 1,134,516 | ||
U.S. Treasury Bonds | 5.00 | 5-15-2037 | 375,000 | 407,593 | ||
U.S. Treasury Bonds | 5.25 | 11-15-2028 | 479,000 | 498,609 | ||
U.S. Treasury Bonds | 5.25 | 2-15-2029 | 11,599,000 | 12,111,440 | ||
U.S. Treasury Bonds | 5.38 | 2-15-2031 | 752,000 | 807,372 | ||
U.S. Treasury Bonds | 5.50 | 8-15-2028 | 369,000 | 387,248 | ||
U.S. Treasury Bonds | 6.00 | 2-15-2026 | 22,565,000 | 23,137,058 | ||
U.S. Treasury Bonds | 6.13 | 11-15-2027 | 525,000 | 556,008 | ||
U.S. Treasury Bonds | 6.13 | 8-15-2029 | 293,000 | 319,267 | ||
U.S. Treasury Bonds | 6.25 | 5-15-2030 | 478,000 | 528,974 | ||
U.S. Treasury Bonds | 6.38 | 8-15-2027 | 224,000 | 237,807 | ||
U.S. Treasury Bonds | 6.50 | 11-15-2026 | 296,000 | 311,089 | ||
U.S. Treasury Bonds | 6.63 | 2-15-2027 | 215,000 | 227,967 | ||
U.S. Treasury Bonds | 6.75 | 8-15-2026 | 16,836,000 | 17,662,016 | ||
U.S. Treasury Bonds | 6.88 | 8-15-2025 | 20,634,000 | 21,243,348 | ||
U.S. Treasury Notes | 0.25 | 5-31-2025 | 10,364,000 | 9,815,842 | ||
U.S. Treasury Notes | 0.25 | 8-31-2025 | 7,398,000 | 6,936,203 | ||
Interest rate | Maturity date | Principal | Value | |||
U.S. Treasury securities(continued) | ||||||
U.S. Treasury Notes | 0.25 % | 10-31-2025 | $ | 3,586,000 | $3,340,303 | |
U.S. Treasury Notes | 0.38 | 11-30-2025 | 3,685,000 | 3,428,345 | ||
U.S. Treasury Notes | 0.38 | 1-31-2026 | 2,923,000 | 2,702,519 | ||
U.S. Treasury Notes | 0.38 | 7-31-2027 | 2,771,000 | 2,430,578 | ||
U.S. Treasury Notes | 0.38 | 9-30-2027 | 3,141,000 | 2,739,418 | ||
U.S. Treasury Notes | 0.50 | 3-31-2025 | 2,469,000 | 2,361,257 | ||
U.S. Treasury Notes | 0.50 | 2-28-2026 | 4,104,000 | 3,793,154 | ||
U.S. Treasury Notes | 0.50 | 4-30-2027 | 2,015,000 | 1,789,965 | ||
U.S. Treasury Notes | 0.50 | 5-31-2027 | 2,282,000 | 2,021,085 | ||
U.S. Treasury Notes | 0.50 | 6-30-2027 | 2,520,000 | 2,226,262 | ||
U.S. Treasury Notes | 0.50 | 8-31-2027 | 2,918,000 | 2,563,281 | ||
U.S. Treasury Notes | 0.50 | 10-31-2027 | 3,418,000 | 2,984,742 | ||
U.S. Treasury Notes | 0.63 | 3-31-2027 | 1,681,000 | 1,503,904 | ||
U.S. Treasury Notes | 0.63 | 11-30-2027 | 7,236,000 | 6,332,913 | ||
U.S. Treasury Notes | 0.63 | 12-31-2027 | 3,852,000 | 3,361,773 | ||
U.S. Treasury Notes | 0.63 | 5-15-2030 | 3,025,000 | 2,443,042 | ||
U.S. Treasury Notes | 0.63 | 8-15-2030 | 4,582,000 | 3,669,359 | ||
U.S. Treasury Notes | 0.75 | 4-30-2026 | 4,130,000 | 3,815,410 | ||
U.S. Treasury Notes | 0.75 | 5-31-2026 | 4,136,000 | 3,810,452 | ||
U.S. Treasury Notes | 0.75 | 1-31-2028 | 4,214,000 | 3,686,921 | ||
U.S. Treasury Notes | 0.88 | 11-15-2030 | 2,681,000 | 2,170,039 | ||
U.S. Treasury Notes | 1.13 | 1-15-2025 | 1,445,000 | 1,400,719 | ||
U.S. Treasury Notes | 1.13 | 2-28-2025 | 2,444,000 | 2,358,293 | ||
U.S. Treasury Notes | 1.13 | 2-29-2028 | 4,178,000 | 3,700,957 | ||
U.S. Treasury Notes | 1.13 | 2-15-2031 | 7,183,000 | 5,890,341 | ||
U.S. Treasury Notes | 1.25 | 3-31-2028 | 4,152,000 | 3,688,955 | ||
U.S. Treasury Notes | 1.25 | 4-30-2028 | 4,224,000 | 3,745,005 | ||
U.S. Treasury Notes | 1.25 | 5-31-2028 | 4,167,000 | 3,686,656 | ||
U.S. Treasury Notes | 1.25 | 9-30-2028 | 15,145,000 | 13,287,963 | ||
U.S. Treasury Notes | 1.25 | 8-15-2031 | 7,687,000 | 6,261,602 | ||
U.S. Treasury Notes | 1.38 | 1-31-2025 | 2,372,000 | 2,300,099 | ||
U.S. Treasury Notes | 1.38 | 8-31-2026 | 1,787,000 | 1,658,908 | ||
U.S. Treasury Notes | 1.38 | 10-31-2028 | 24,085,000 | 21,215,498 | ||
U.S. Treasury Notes | 1.38 | 11-15-2031 | 23,180,000 | 18,933,352 | ||
U.S. Treasury Notes | 1.50 | 8-15-2026 | 3,430,000 | 3,196,599 | ||
U.S. Treasury Notes | 1.50 | 1-31-2027 | 1,873,000 | 1,727,257 | ||
U.S. Treasury Notes | 1.50 | 2-15-2030 | 4,305,000 | 3,701,123 | ||
U.S. Treasury Notes | 1.63 | 2-15-2026 | 3,342,000 | 3,160,279 | ||
U.S. Treasury Notes | 1.63 | 5-15-2026 | 3,385,000 | 3,181,503 | ||
U.S. Treasury Notes | 1.63 | 10-31-2026 | 1,800,000 | 1,675,477 | ||
U.S. Treasury Notes | 1.63 | 8-15-2029 | 2,854,000 | 2,504,942 | ||
U.S. Treasury Notes | 1.63 | 5-15-2031 | 7,512,000 | 6,330,621 | ||
U.S. Treasury Notes | 1.88 | 7-31-2026 | 1,828,000 | 1,720,534 | ||
U.S. Treasury Notes | 2.00 | 2-15-2025 | 3,537,000 | 3,442,979 | ||
U.S. Treasury Notes | 2.00 | 8-15-2025 | 3,491,000 | 3,360,087 | ||
U.S. Treasury Notes | 2.00 | 11-15-2026 | 3,370,000 | 3,163,587 | ||
U.S. Treasury Notes | 2.13 | 5-15-2025 | 3,005,000 | 2,912,150 | ||
U.S. Treasury Notes | 2.13 | 5-31-2026 | 1,793,000 | 1,702,369 | ||
Interest rate | Maturity date | Principal | Value | |||
U.S. Treasury securities(continued) | ||||||
U.S. Treasury Notes | 2.25 % | 11-15-2025 | $ | 3,473,000 | $3,336,115 | |
U.S. Treasury Notes | 2.25 | 2-15-2027 | 3,350,000 | 3,153,711 | ||
U.S. Treasury Notes | 2.25 | 8-15-2027 | 3,338,000 | 3,116,727 | ||
U.S. Treasury Notes | 2.25 | 11-15-2027 | 3,248,000 | 3,021,147 | ||
U.S. Treasury Notes | 2.38 | 4-30-2026 | 1,812,000 | 1,731,734 | ||
U.S. Treasury Notes | 2.38 | 5-15-2027 | 3,375,000 | 3,175,928 | ||
U.S. Treasury Notes | 2.38 | 5-15-2029 | 3,295,000 | 3,014,281 | ||
U.S. Treasury Notes | 2.50 | 1-31-2025 | 1,936,000 | 1,894,784 | ||
U.S. Treasury Notes | 2.50 | 2-28-2026 | 1,888,000 | 1,813,513 | ||
U.S. Treasury Notes | 2.63 | 3-31-2025 | 1,884,000 | 1,840,338 | ||
U.S. Treasury Notes | 2.63 | 12-31-2025 | 1,914,000 | 1,847,085 | ||
U.S. Treasury Notes | 2.63 | 2-15-2029 | 3,512,000 | 3,262,456 | ||
U.S. Treasury Notes | 2.75 | 2-28-2025 | 1,955,000 | 1,914,697 | ||
U.S. Treasury Notes | 2.75 | 6-30-2025 | 1,959,000 | 1,908,341 | ||
U.S. Treasury Notes | 2.75 | 8-31-2025 | 2,020,000 | 1,962,162 | ||
U.S. Treasury Notes | 2.75 | 2-15-2028 | 4,229,000 | 3,992,110 | ||
U.S. Treasury Notes | 2.75 | 8-15-2032 | 2,430,000 | 2,179,501 | ||
U.S. Treasury Notes | 2.88 | 4-30-2025 | 1,884,000 | 1,842,052 | ||
U.S. Treasury Notes | 2.88 | 5-31-2025 | 1,939,000 | 1,893,555 | ||
U.S. Treasury Notes | 2.88 | 7-31-2025 | 1,949,000 | 1,898,905 | ||
U.S. Treasury Notes | 2.88 | 11-30-2025 | 1,880,000 | 1,823,527 | ||
U.S. Treasury Notes | 2.88 | 5-15-2028 | 4,397,000 | 4,160,833 | ||
U.S. Treasury Notes | 2.88 | 8-15-2028 | 4,422,000 | 4,175,681 | ||
U.S. Treasury Notes | 3.00 | 9-30-2025 | 1,994,000 | 1,942,125 | ||
U.S. Treasury Notes | 3.00 | 10-31-2025 | 1,814,000 | 1,764,753 | ||
U.S. Treasury Notes | 3.13 | 11-15-2028 | 3,621,000 | 3,448,861 | ||
U.S. Treasury Notes | 3.38 | 5-15-2033 | 2,640,000 | 2,473,144 | ||
U.S. Treasury Notes | 3.88 | 8-15-2033 | 12,035,000 | 11,715,320 | ||
U.S. Treasury Notes | 4.00 | 10-31-2029 | 2,100,000 | 2,075,145 | ||
Total U.S. Treasury securities (Cost $517,235,223) | 465,319,918 | |||||
Yield | Shares | |||||
Short-term investments: 3.69% | ||||||
Investment companies: 3.69% | ||||||
Allspring Government Money Market Fund Select Class♠∞ | 5.25 | 49,196,731 | 49,196,731 | |||
Total short-term investments (Cost $49,196,731) | 49,196,731 | |||||
Total investments in securities (Cost $744,621,717) | 97.97 % | 1,306,298,238 | ||||
Other assets and liabilities, net | 2.03 | 27,122,846 | ||||
Total net assets | 100.00 % | $1,333,421,084 | ||||
† | Non-income-earning security |
± | Variable rate investment. The rate shown is the rate in effect at period end. |
♠ | The issuer of the security is an affiliated person of the Fund as defined in the Investment Company Act of 1940. |
∞ | The rate represents the 7-day annualized yield at period end. |
Abbreviations: | |
FNMA | Federal National Mortgage Association |
REIT | Real estate investment trust |
SOFR | Secured Overnight Financing Rate |
Value, beginning of period | Purchases | Sales proceeds | Net realized gains (losses) | Net change in unrealized gains (losses) | Value, end of period | Shares, end of period | Income from affiliated securities | |
Short-term investments | ||||||||
Allspring Government Money Market Fund Select Class | $35,935,442 | $151,009,052 | $(137,747,763 ) | $0 | $0 | $49,196,731 | 49,196,731 | $1,085,158 |
Description | Number of contracts | Expiration date | Notional cost | Notional value | Unrealized gains | Unrealized losses |
Long | ||||||
10-Year U.S. Treasury Notes | 1,310 | 6-18-2024 | $144,170,931 | $145,143,906 | $972,975 | $0 |
U.S. Long Term Bond | 94 | 6-18-2024 | 11,254,458 | 11,321,125 | 66,667 | 0 |
Ultra Long Term U.S. Treasury Bond | 41 | 6-18-2024 | 5,223,128 | 5,289,000 | 65,872 | 0 |
E-Mini S&P 500 Index | 335 | 6-21-2024 | 87,083,500 | 88,917,375 | 1,833,875 | 0 |
2-Year U.S. Treasury Notes | 53 | 6-28-2024 | 10,849,127 | 10,837,672 | 0 | (11,455 ) |
5-Year U.S. Treasury Notes | 165 | 6-28-2024 | 17,639,955 | 17,657,578 | 17,623 | 0 |
Short | ||||||
Ultra Long Term U.S. Treasury Bond | (152 ) | 6-18-2024 | (19,144,459 ) | (19,608,000 ) | 0 | (463,541 ) |
$2,957,012 | $(474,996 ) |
Assets | |
Investments in unaffiliated securities, at value (cost $695,424,986) | $1,257,101,507 |
Investments in affiliated securities, at value (cost $49,196,731) | 49,196,731 |
Cash | 33,271 |
Cash at broker segregated for futures contracts | 7,312,660 |
Receivable for investments sold | 17,800,101 |
Receivable for dividends and interest | 3,558,456 |
Receivable for Fund shares sold | 513,377 |
Receivable for daily variation margin on open futures contracts | 43,124 |
Prepaid expenses and other assets | 180,105 |
Total assets | 1,335,739,332 |
Liabilities | |
Payable for Fund shares redeemed | 800,090 |
Management fee payable | 630,572 |
Shareholder servicing fees payable | 249,674 |
Administration fees payable | 205,311 |
Payable for daily variation margin on open futures contracts | 191,544 |
Distribution fee payable | 56,535 |
Payable for investments purchased | 31,702 |
Trustees’ fees and expenses payable | 3,393 |
Accrued expenses and other liabilities | 149,427 |
Total liabilities | 2,318,248 |
Total net assets | $1,333,421,084 |
Net assets consist of | |
Paid-in capital | $704,066,861 |
Total distributable earnings | 629,354,223 |
Total net assets | $1,333,421,084 |
Computation of net asset value and offering price per share | |
Net assets–Class A | $918,435,568 |
Shares outstanding–Class A1 | 22,988,364 |
Net asset value per share–Class A | $39.95 |
Maximum offering price per share – Class A2 | $42.39 |
Net assets–Class C | $88,693,518 |
Shares outstanding–Class C1 | 3,826,516 |
Net asset value per share–Class C | $23.18 |
Net assets–Administrator Class | $180,429,752 |
Shares outstanding–Administrator Class1 | 4,515,932 |
Net asset value per share–Administrator Class | $39.95 |
Net assets–Institutional Class | $145,862,246 |
Shares outstanding–Institutional Class1 | 3,656,239 |
Net asset value per share–Institutional Class | $39.89 |
Investment income | |
Interest | $6,678,841 |
Dividends (net of foreign withholdings taxes of $1,503) | 6,204,005 |
Income from affiliated securities | 1,085,158 |
Total investment income | 13,968,004 |
Expenses | |
Management fee | 3,908,038 |
Administration fees | |
Class A | 861,842 |
Class C | 91,773 |
Administrator Class | 126,008 |
Institutional Class | 89,708 |
Shareholder servicing fees | |
Class A | 1,077,303 |
Class C | 114,414 |
Administrator Class | 239,002 |
Distribution fee | |
Class C | 343,186 |
Custody and accounting fees | 11,185 |
Professional fees | 31,861 |
Registration fees | 125,063 |
Shareholder report expenses | 34,902 |
Trustees’ fees and expenses | 12,319 |
Other fees and expenses | 100,081 |
Total expenses | 7,166,685 |
Less: Fee waivers and/or expense reimbursements | |
Fund-level | (194,437 ) |
Class A | (31,678 ) |
Administrator Class | (99,645 ) |
Institutional Class | (5,030 ) |
Net expenses | 6,835,895 |
Net investment income | 7,132,109 |
Realized and unrealized gains (losses) on investments | |
Net realized gains on | |
Unaffiliated securities | 83,620,963 |
Futures contracts | 13,263,872 |
Net realized gains on investments | 96,884,835 |
Net change in unrealized gains (losses) on | |
Unaffiliated securities | 88,691,227 |
Futures contracts | 6,791,818 |
Net change in unrealized gains (losses) on investments | 95,483,045 |
Net realized and unrealized gains (losses) on investments | 192,367,880 |
Net increase in net assets resulting from operations | $199,499,989 |
Six months ended March 31, 2024 (unaudited) | Year ended September 30, 2023 | |||
Operations | ||||
Net investment income | $7,132,109 | $12,142,192 | ||
Net realized gains on investments | 96,884,835 | 104,050,598 | ||
Net change in unrealized gains (losses) on investments | 95,483,045 | 18,347,116 | ||
Net increase in net assets resulting from operations | 199,499,989 | 134,539,906 | ||
Distributions to shareholders from | ||||
Net investment income and net realized gains | ||||
Class A | (58,785,399 ) | (41,253,554 ) | ||
Class C | (9,788,073 ) | (4,535,716 ) | ||
Administrator Class | (13,424,884 ) | (12,512,380 ) | ||
Institutional Class | (9,623,538 ) | (7,993,165 ) | ||
Total distributions to shareholders | (91,621,894 ) | (66,294,815 ) | ||
Capital share transactions | Shares | Shares | ||
Proceeds from shares sold | ||||
Class A | 633,159 | 24,174,525 | 806,319 | 29,549,090 |
Class C | 166,987 | 3,742,037 | 306,574 | 6,806,459 |
Administrator Class | 249,019 | 9,473,102 | 582,853 | 21,356,900 |
Institutional Class | 424,766 | 16,187,443 | 592,766 | 21,741,984 |
53,577,107 | 79,454,433 | |||
Reinvestment of distributions | ||||
Class A | 1,541,103 | 56,804,693 | 1,107,495 | 39,713,342 |
Class C | 443,319 | 9,429,245 | 204,027 | 4,402,900 |
Administrator Class | 362,959 | 13,379,726 | 347,693 | 12,472,668 |
Institutional Class | 225,224 | 8,299,847 | 189,431 | 6,791,294 |
87,913,511 | 63,380,204 | |||
Payment for shares redeemed | ||||
Class A | (1,551,948 ) | (58,944,068 ) | (2,503,116 ) | (92,077,661 ) |
Class C | (1,038,676 ) | (23,280,449 ) | (1,503,730 ) | (33,335,177 ) |
Administrator Class | (1,925,953 ) | (73,174,299 ) | (2,529,928 ) | (93,030,861 ) |
Institutional Class | (642,454 ) | (24,395,412 ) | (1,457,041 ) | (52,865,750 ) |
(179,794,228 ) | (271,309,449 ) | |||
Net decrease in net assets resulting from capital share transactions | (38,303,610 ) | (128,474,812 ) | ||
Total increase (decrease) in net assets | 69,574,485 | (60,229,721 ) | ||
Net assets | ||||
Beginning of period | 1,263,846,599 | 1,324,076,320 | ||
End of period | $1,333,421,084 | $1,263,846,599 | ||
Six months ended March 31, 2024 (unaudited) | Year ended September 30 | |||||
Class A | 2023 | 2022 | 2021 | 2020 | 2019 | |
Net asset value, beginning of period | $36.72 | $34.96 | $43.74 | $38.89 | $35.13 | $34.63 |
Net investment income | 0.21 1 | 0.33 1 | 0.21 | 0.19 | 0.30 | 0.33 |
Net realized and unrealized gains (losses) on investments | 5.69 | 3.25 | (6.23 ) | 5.97 | 4.22 | 1.46 |
Total from investment operations | 5.90 | 3.58 | (6.02 ) | 6.16 | 4.52 | 1.79 |
Distributions to shareholders from | ||||||
Net investment income | (0.22 ) | (0.34 ) | (0.30 ) | (0.12 ) | (0.30 ) | (0.33 ) |
Net realized gains | (2.45 ) | (1.48 ) | (2.46 ) | (1.19 ) | (0.46 ) | (0.96 ) |
Total distributions to shareholders | (2.67 ) | (1.82 ) | (2.76 ) | (1.31 ) | (0.76 ) | (1.29 ) |
Net asset value, end of period | $39.95 | $36.72 | $34.96 | $43.74 | $38.89 | $35.13 |
Total return2 | 16.71 % | 10.41 % | (14.91 )% | 16.18 % | 13.08 % | 5.54 % |
Ratios to average net assets (annualized) | ||||||
Gross expenses | 1.11 % | 1.13 % | 1.10 % | 1.09 % | 1.10 % | 1.11 % |
Net expenses | 1.07 % | 1.07 % | 1.08 % | 1.08 % | 1.08 % | 1.08 % |
Net investment income | 1.10 % | 0.91 % | 0.52 % | 0.46 % | 0.83 % | 0.99 % |
Supplemental data | ||||||
Portfolio turnover rate | 4 % | 11 % | 13 % | 11 % | 19 % | 14 % |
Net assets, end of period (000s omitted) | $918,436 | $821,312 | $802,444 | $1,013,263 | $907,134 | $834,289 |
1 | Calculated based upon average shares outstanding |
2 | Total return calculations do not include any sales charges. Returns for periods of less than one year are not annualized. |
Six months ended March 31, 2024 (unaudited) | Year ended September 30 | |||||
Class C | 2023 | 2022 | 2021 | 2020 | 2019 | |
Net asset value, beginning of period | $22.25 | $21.15 | $26.46 | $23.64 | $21.36 | $21.07 |
Net investment income (loss) | 0.04 1 | 0.03 1 | (0.07 ) | (0.08 ) | 0.01 | 0.05 |
Net realized and unrealized gains (losses) on investments | 3.36 | 1.97 | (3.75 ) | 3.63 | 2.57 | 0.88 |
Total from investment operations | 3.40 | 2.00 | (3.82 ) | 3.55 | 2.58 | 0.93 |
Distributions to shareholders from | ||||||
Net investment income | (0.02 ) | 0.00 | 0.00 | (0.01 ) | (0.02 ) | (0.06 ) |
Net realized gains | (2.45 ) | (0.90 ) | (1.49 ) | (0.72 ) | (0.28 ) | (0.58 ) |
Total distributions to shareholders | (2.47 ) | (0.90 ) | (1.49 ) | (0.73 ) | (0.30 ) | (0.64 ) |
Net asset value, end of period | $23.18 | $22.25 | $21.15 | $26.46 | $23.64 | $21.36 |
Total return2 | 16.30 % | 9.57 % | (15.56 )% | 15.31 % | 12.22 % | 4.75 % |
Ratios to average net assets (annualized) | ||||||
Gross expenses | 1.85 % | 1.87 % | 1.85 % | 1.84 % | 1.85 % | 1.86 % |
Net expenses | 1.82 % | 1.83 % | 1.83 % | 1.83 % | 1.83 % | 1.83 % |
Net investment income (loss) | 0.35 % | 0.15 % | (0.24 )% | (0.29 )% | 0.08 % | 0.24 % |
Supplemental data | ||||||
Portfolio turnover rate | 4 % | 11 % | 13 % | 11 % | 19 % | 14 % |
Net assets, end of period (000s omitted) | $88,694 | $94,684 | $110,992 | $150,795 | $144,828 | $144,264 |
1 | Calculated based upon average shares outstanding |
2 | Total return calculations do not include any sales charges. Returns for periods of less than one year are not annualized. |
Six months ended March 31, 2024 (unaudited) | Year ended September 30 | |||||
Administrator Class | 2023 | 2022 | 2021 | 2020 | 2019 | |
Net asset value, beginning of period | $36.72 | $34.96 | $43.80 | $38.89 | $35.14 | $34.64 |
Net investment income | 0.24 1 | 0.40 1 | 0.28 | 0.26 | 0.37 | 0.39 |
Net realized and unrealized gains (losses) on investments | 5.68 | 3.25 | (6.22 ) | 5.98 | 4.20 | 1.46 |
Total from investment operations | 5.92 | 3.65 | (5.94 ) | 6.24 | 4.57 | 1.85 |
Distributions to shareholders from | ||||||
Net investment income | (0.24 ) | (0.40 ) | (0.43 ) | (0.14 ) | (0.36 ) | (0.39 ) |
Net realized gains | (2.45 ) | (1.49 ) | (2.47 ) | (1.19 ) | (0.46 ) | (0.96 ) |
Total distributions to shareholders | (2.69 ) | (1.89 ) | (2.90 ) | (1.33 ) | (0.82 ) | (1.35 ) |
Net asset value, end of period | $39.95 | $36.72 | $34.96 | $43.80 | $38.89 | $35.14 |
Total return2 | 16.79 % | 10.61 % | (14.77 )% | 16.40 % | 13.26 % | 5.73 % |
Ratios to average net assets (annualized) | ||||||
Gross expenses | 1.03 % | 1.05 % | 1.02 % | 1.01 % | 1.02 % | 1.03 % |
Net expenses | 0.90 % | 0.90 % | 0.90 % | 0.90 % | 0.90 % | 0.90 % |
Net investment income | 1.27 % | 1.08 % | 0.69 % | 0.63 % | 1.01 % | 1.17 % |
Supplemental data | ||||||
Portfolio turnover rate | 4 % | 11 % | 13 % | 11 % | 19 % | 14 % |
Net assets, end of period (000s omitted) | $180,430 | $214,064 | $259,704 | $358,573 | $281,988 | $229,390 |
1 | Calculated based upon average shares outstanding |
2 | Returns for periods of less than one year are not annualized. |
Six months ended March 31, 2024 (unaudited) | Year ended September 30 | |||||
Institutional Class | 2023 | 2022 | 2021 | 2020 | 2019 | |
Net asset value, beginning of period | $36.67 | $34.91 | $43.79 | $38.84 | $35.09 | $34.59 |
Net investment income | 0.27 1 | 0.45 1 | 0.33 | 0.33 | 0.42 | 0.44 |
Net realized and unrealized gains (losses) on investments | 5.67 | 3.25 | (6.20 ) | 5.97 | 4.21 | 1.46 |
Total from investment operations | 5.94 | 3.70 | (5.87 ) | 6.30 | 4.63 | 1.90 |
Distributions to shareholders from | ||||||
Net investment income | (0.27 ) | (0.46 ) | (0.54 ) | (0.16 ) | (0.42 ) | (0.44 ) |
Net realized gains | (2.45 ) | (1.48 ) | (2.47 ) | (1.19 ) | (0.46 ) | (0.96 ) |
Total distributions to shareholders | (2.72 ) | (1.94 ) | (3.01 ) | (1.35 ) | (0.88 ) | (1.40 ) |
Net asset value, end of period | $39.89 | $36.67 | $34.91 | $43.79 | $38.84 | $35.09 |
Total return2 | 16.88 % | 10.79 % | (14.64 )% | 16.57 % | 13.44 % | 5.89 % |
Ratios to average net assets (annualized) | ||||||
Gross expenses | 0.79 % | 0.80 % | 0.77 % | 0.76 % | 0.77 % | 0.78 % |
Net expenses | 0.75 % | 0.75 % | 0.75 % | 0.75 % | 0.75 % | 0.75 % |
Net investment income | 1.42 % | 1.23 % | 0.85 % | 0.79 % | 1.16 % | 1.32 % |
Supplemental data | ||||||
Portfolio turnover rate | 4 % | 11 % | 13 % | 11 % | 19 % | 14 % |
Net assets, end of period (000s omitted) | $145,862 | $133,787 | $150,936 | $165,569 | $139,896 | $123,504 |
1 | Calculated based upon average shares outstanding |
2 | Returns for periods of less than one year are not annualized. |
Gross unrealized gains | $655,222,085 |
Gross unrealized losses | (60,368,710 ) |
Net unrealized gains | $594,853,375 |
Quoted prices (Level 1) | Other significant observable inputs (Level 2) | Significant unobservable inputs (Level 3) | Total | |
Assets | ||||
Investments in: | ||||
Agency securities | $0 | $15,873 | $0 | $15,873 |
Common stocks | ||||
Communication services | 70,876,578 | 0 | 0 | 70,876,578 |
Consumer discretionary | 81,891,824 | 0 | 0 | 81,891,824 |
Consumer staples | 47,241,546 | 0 | 0 | 47,241,546 |
Energy | 31,299,522 | 0 | 0 | 31,299,522 |
Financials | 104,162,718 | 0 | 0 | 104,162,718 |
Health care | 98,297,369 | 0 | 0 | 98,297,369 |
Industrials | 69,686,682 | 0 | 0 | 69,686,682 |
Information technology | 234,075,037 | 0 | 0 | 234,075,037 |
Materials | 18,768,807 | 0 | 0 | 18,768,807 |
Real estate | 18,023,177 | 0 | 0 | 18,023,177 |
Utilities | 17,440,403 | 0 | 0 | 17,440,403 |
Non-agency mortgage-backed securities | 0 | 2,053 | 0 | 2,053 |
U.S. Treasury securities | 465,319,918 | 0 | 0 | 465,319,918 |
Short-term investments | ||||
Investment companies | 49,196,731 | 0 | 0 | 49,196,731 |
1,306,280,312 | 17,926 | 0 | 1,306,298,238 | |
Futures contracts | 2,957,012 | 0 | 0 | 2,957,012 |
Total assets | $1,309,237,324 | $17,926 | $0 | $1,309,255,250 |
Liabilities | ||||
Futures contracts | $474,996 | $0 | $0 | $474,996 |
Total liabilities | $474,996 | $0 | $0 | $474,996 |
Average daily net assets | Management fee |
First $500 million | 0.650 % |
Next $500 million | 0.600 |
Next $2 billion | 0.550 |
Next $2 billion | 0.525 |
Next $5 billion | 0.490 |
Over $10 billion | 0.480 |
Class-level administration fee | |
Class A | 0.20 % |
Class C | 0.20 |
Administrator Class | 0.13 |
Institutional Class | 0.13 |
EXPENSE RATIO CAPS | |
Class A | 1.07 % |
Class C | 1.82 |
Administrator Class | 0.90 |
Institutional Class | 0.75 |
Purchases at cost | Sales proceeds | ||
U.S. government | Non-U.S. government | U.S. government | Non-U.S. government |
$36,311,225 | $11,113,378 | $44,483,447 | $127,793,448 |
Interest rate risk | Equity risk | Total | |
Asset derivatives | |||
Futures contracts | $1,123,137 * | $1,833,875 * | $2,957,012 |
Liability derivatives | |||
Futures contracts | $474,996 * | $0 * | $474,996 |
* | Amount represents the cumulative unrealized gains (losses) as reported in the table following the Portfolio of Investments. For futures contracts, only the current day’s variation margin as of March 31, 2024 is reported separately on the Statement of Assets and Liabilities. |
INTEREST RATE RISK | Equity risk | TOTAL | |
Net realized gains (losses) on derivatives | |||
Futures contracts | $(421,928 ) | $13,685,800 | $13,263,872 |
Net change in unrealized gains (losses) on derivatives | |||
Futures contracts | $1,944,710 | $4,847,108 | $6,791,818 |
Name and year of birth | Position held and length of service* | Principal occupations during past five years or longer | Current other public company or investment company directorships |
William R. Ebsworth (Born 1957) | Trustee, since 2015 | Retired. From 1984 to 2013, equities analyst, portfolio manager, research director and chief investment officer at Fidelity Management and Research Company in Boston, Tokyo, and Hong Kong, and retired in 2013 as Chief Investment Officer of Fidelity Strategic Advisers, Inc. where he led a team of investment professionals managing client assets. Prior thereto, Board member of Hong Kong Securities Clearing Co., Hong Kong Options Clearing Corp., the Thailand International Fund, Ltd., Fidelity Investments Life Insurance Company, and Empire Fidelity Investments Life Insurance Company. Serves on the Investment Company Institute’s Board of Governors since 2022 and Executive Committee since 2023 as well as the Vice Chairman of the Governing Council of the Independent Directors Council since 2023. Audit Committee Chair and Investment Committee Chair of the Vincent Memorial Hospital Foundation (non-profit organization). Mr. Ebsworth is a CFA charterholder. | N/A |
Jane A. Freeman (Born 1953) | Trustee, since 2015; Chair Liaison, since January 2018# | Retired. From 2012 to 2014 and 1999 to 2008, Chief Financial Officer of Scientific Learning Corporation. From 2008 to 2012, Ms. Freeman provided consulting services related to strategic business projects. Prior to 1999, Portfolio Manager at Rockefeller & Co. and Scudder, Stevens & Clark. Board member of the Harding Loevner Funds from 1996 to 2014, serving as both Lead Independent Director and chair of the Audit Committee. Board member of the Russell Exchange Traded Funds Trust from 2011 to 2012 and the chair of the Audit Committee. Ms. Freeman is also an inactive Chartered Financial Analyst. | N/A |
Isaiah Harris, Jr. (Born 1952) | Trustee, since 2009; Audit Committee Chair, since 2019 | Retired. Member of the Advisory Board of CEF of East Central Florida. Chairman of the Board of CIGNA Corporation from 2009 to 2021, and Director from 2005 to 2008. From 2003 to 2011, Director of Deluxe Corporation. Prior thereto, President and CEO of BellSouth Advertising and Publishing Corp. from 2005 to 2007, President and CEO of BellSouth Enterprises from 2004 to 2005 and President of BellSouth Consumer Services from 2000 to 2003. Emeritus member of the Iowa State University Foundation Board of Governors. Emeritus Member of the Advisory board of Iowa State University School of Business. Advisory Board Member, Palm Harbor Academy (private school). Advisory Board Member, Fellowship of Christian Athletes. Mr. Harris is a certified public accountant (inactive status). | N/A |
David F. Larcker (Born 1950) | Trustee, since 2009 | Distinguished Visiting Fellow at the Hoover Institution since 2022. James Irvin Miller Professor of Accounting at the Graduate School of Business (Emeritus), Stanford University, Director of the Corporate Governance Research Initiative and Senior Faculty of The Rock Center for Corporate Governance since 2006. From 2005 to 2008, Professor of Accounting at the Graduate School of Business, Stanford University. Prior thereto, Ernst & Young Professor of Accounting at The Wharton School, University of Pennsylvania from 1985 to 2005. | N/A |
Olivia S. Mitchell (Born 1953) | Trustee, since 2006; Nominating and Governance Committee Chair, since 2018 | International Foundation of Employee Benefit Plans Professor since 1993, Wharton School of the University of Pennsylvania. Director of Wharton’s Pension Research Council and Boettner Center on Pensions & Retirement Research, and Research Associate at the National Bureau of Economic Research. Previously taught at Cornell University from 1978 to 1993. | N/A |
Name and year of birth | Position held and length of service* | Principal occupations during past five years or longer | Current other public company or investment company directorships |
Timothy J. Penny (Born 1951) | Trustee, since 1996; Chair, since 2018 | President and Chief Executive Officer of Southern Minnesota Initiative Foundation, a non-profit organization, since 2007. Vice Chair of the Economic Club of Minnesota, since 2007. Co-Chair of the Committee for a Responsible Federal Budget, since 1995. Member of the Board of Trustees of NorthStar Education Finance, Inc., a non-profit organization, from 2007-2022. Senior Fellow of the University of Minnesota Humphrey Institute from 1995 to 2017. | N/A |
James G. Polisson (Born 1959) | Trustee, since 2018 | Retired. Chief Marketing Officer, Source (ETF) UK Services, Ltd, from 2015 to 2017. From 2012 to 2015, Principal of The Polisson Group, LLC, a management consulting, corporate advisory and principal investing company. Chief Executive Officer and Managing Director at Russell Investments, Global Exchange Traded Funds from 2010 to 2012. Managing Director of Barclays Global Investors from 1998 to 2010 and Global Chief Marketing Officer for iShares and Barclays Global Investors from 2000 to 2010. Trustee of the San Francisco Mechanics’ Institute, a non- profit organization, from 2013 to 2015. Board member of the Russell Exchange Traded Fund Trust from 2011 to 2012. Director of Barclays Global Investors Holdings Deutschland GmbH from 2006 to 2009. Mr. Polisson is an attorney and has a retired status with the Massachusetts and District of Columbia Bar Associations. | N/A |
Pamela Wheelock (Born 1959) | Trustee, since January 2020; previously Trustee from January 2018 to July 2019# | Retired. Executive and Senior Financial leadership positions in the public, private and nonprofit sectors. Interim President and CEO, McKnight Foundation, 2020. Interim Commissioner, Minnesota Department of Human Services, 2019. Chief Operating Officer, Twin Cities Habitat for Humanity, 2017-2019. Vice President for University Services, University of Minnesota, 2012- 2016. Interim President and CEO, Blue Cross and Blue Shield of Minnesota, 2011-2012. Executive Vice-President and Chief Financial Officer, Minnesota Wild, 2002-2008. Commissioner, Minnesota Department of Finance, 1999-2002. Chair of the Board of Directors of Destination Medical Center Corporation. Board member of the Minnesota Wild Foundation. | N/A |
Name and year of birth | Position held and length of service | Principal occupations during past five years or longer |
Andrew Owen (Born 1960) | President, since 2017 | President and Chief Executive Officer of Allspring Funds Management, LLC since 2017 and Head of Global Fund Governance of Allspring Global Investments since 2022. Prior thereto, co-president of Galliard Capital Management, LLC, an affiliate of Allspring Funds Management, LLC, from 2019 to 2022 and Head of Affiliated Managers, Allspring Global Investments, from 2014 to 2019 and Executive Vice President responsible for marketing, investments and product development for Allspring Funds Management, LLC, from 2009 to 2014. |
Jeremy DePalma (Born 1974) | Treasurer, since 2012 (for certain funds in the Fund Complex); since 2021 (for the remaining funds in the Complex) | Senior Vice President of Allspring Funds Management, LLC since 2009. Senior Vice President of Evergreen Investment Management Company, LLC from 2008 to 2010 and head of the Fund Reporting and Control Team within Fund Administration from 2005 to 2010. |
Christopher Baker (Born 1976) | Chief Compliance Officer, since 2022 | Global Chief Compliance Officer for Allspring Global Investments since 2022. Prior thereto, Chief Compliance Officer for State Street Global Advisors from 2018 to 2021. Senior Compliance Officer for the State Street divisions of Alternative Investment Solutions, Sector Solutions, and Global Marketing from 2015 to 2018. From 2010 to 2015 Vice President, Global Head of Investment and Marketing Compliance for State Street Global Advisors. |
Matthew Prasse (Born 1983) | Chief Legal Officer, since 2022; Secretary, since 2021 | Senior Counsel of the Allspring Legal Department since 2021. Senior Counsel of the Wells Fargo Legal Department from 2018 to 2021. Previously, Counsel for Barings LLC from 2015 to 2018. Prior to joining Barings, Associate at Morgan, Lewis & Bockius LLP from 2008 to 2015. |

P.O. Box 219967
Kansas City, MO 64121-9967

SAR0458 03-24

Allspring Funds

President
Allspring Funds
Notice to Shareholders |
Beginning in July 2024, the Fund will be required by the Securities and Exchange Commission to send shareholders a paper copy of a new tailored shareholder report in place of the full shareholder report that you are now receiving. The tailored shareholder report will contain concise information about the Fund, including certain expense and performance information and fund statistics. If you wish to receive this new tailored shareholder report electronically, please follow the instructions on the back cover of this report. |
Other information that is currently included in the shareholder report, such as the Fund’s financial statements, will be available online and upon request, free of charge, in paper or electronic format. |
Investment objective | The Fund seeks long-term capital appreciation. |
Manager | Allspring Funds Management, LLC |
Subadviser | Allspring Global Investments, LLC |
Portfolio manager | Christopher G. Miller, CFA |
Average annual total returns (%) as of March 31, 2024 | |||||||||
Including sales charge | Excluding sales charge | Expense ratios1 (%) | |||||||
Inception date | 1 year | 5 year | 10 year | 1 year | 5 year | 10 year | Gross | Net2 | |
Class A (SOPVX) | 2-24-2000 | 19.49 | 12.00 | 10.08 | 26.77 | 13.34 | 10.73 | 1.19 | 1.17 |
Class C (WFOPX) | 3-31-2008 | 24.87 | 12.81 | 10.21 | 25.87 | 12.81 | 10.21 | 1.94 | 1.92 |
Class R6 (WOFRX)3 | 5-29-2020 | – | – | – | 27.31 | 13.83 | 11.23 | 0.77 | 0.72 |
Administrator Class (WOFDX) | 8-30-2002 | – | – | – | 26.99 | 13.54 | 10.95 | 1.12 | 1.00 |
Institutional Class (WOFNX) | 7-30-2010 | – | – | – | 27.30 | 13.81 | 11.22 | 0.87 | 0.75 |
Russell 3000® Index4 | – | – | – | – | 29.29 | 14.34 | 12.33 | – | – |
1 | Reflects the expense ratios as stated in the most recent prospectuses. The expense ratios shown are subject to change and may differ from the annualized expense ratios shown in the Financial Highlights of this report. |
2 | The manager has contractually committed through January 31, 2025, to waive fees and/or reimburse expenses to the extent necessary to cap total annual fund operating expenses after fee waivers at 1.17% for Class A, 1.92% for Class C, 0.72% for Class R6, 1.00% for Administrator Class and 0.75% for Institutional Class. Brokerage commissions, stamp duty fees, interest, taxes, acquired fund fees and expenses (if any), and extraordinary expenses are excluded from the expense caps. Prior to or after the commitment expiration date, the caps may be increased or the commitment to maintain the caps may be terminated only with the approval of the Board of Trustees. Without these caps, the Fund’s returns would have been lower. The expense ratio paid by an investor is the net expense ratio (the total annual fund operating expenses after fee waivers) as stated in the prospectuses. |
3 | Historical performance shown for the Class R6 shares prior to their inception reflects the performance of the Institutional Class shares, and includes the higher expenses applicable to the Institutional Class shares. If these expenses had not been included, returns for the Class R6 shares would be higher. |
4 | The Russell 3000® Index measures the performance of the 3,000 largest U.S. companies based on total market capitalization, which represents approximately 98% of the investable U.S. equity market. You cannot invest directly in an index. |
CFA® and Chartered Financial Analyst® are trademarks owned by CFA Institute. |
Ten largest holdings (%) as of March 31, 20241 | |
Amazon.com, Inc. | 5.15 |
Alphabet, Inc. Class C | 4.49 |
Apple, Inc. | 4.43 |
Salesforce, Inc. | 4.31 |
Mastercard, Inc. Class A | 3.78 |
Meta Platforms, Inc. Class A | 3.13 |
Texas Instruments, Inc. | 2.67 |
Regal Rexnord Corp. | 2.47 |
HEICO Corp. Class A | 2.33 |
Burlington Stores, Inc. | 2.12 |
1 | Figures represent the percentage of the Fund’s net assets. Holdings are subject to change and may have changed since the date specified. |
Sector allocation as of March 31, 20241 |
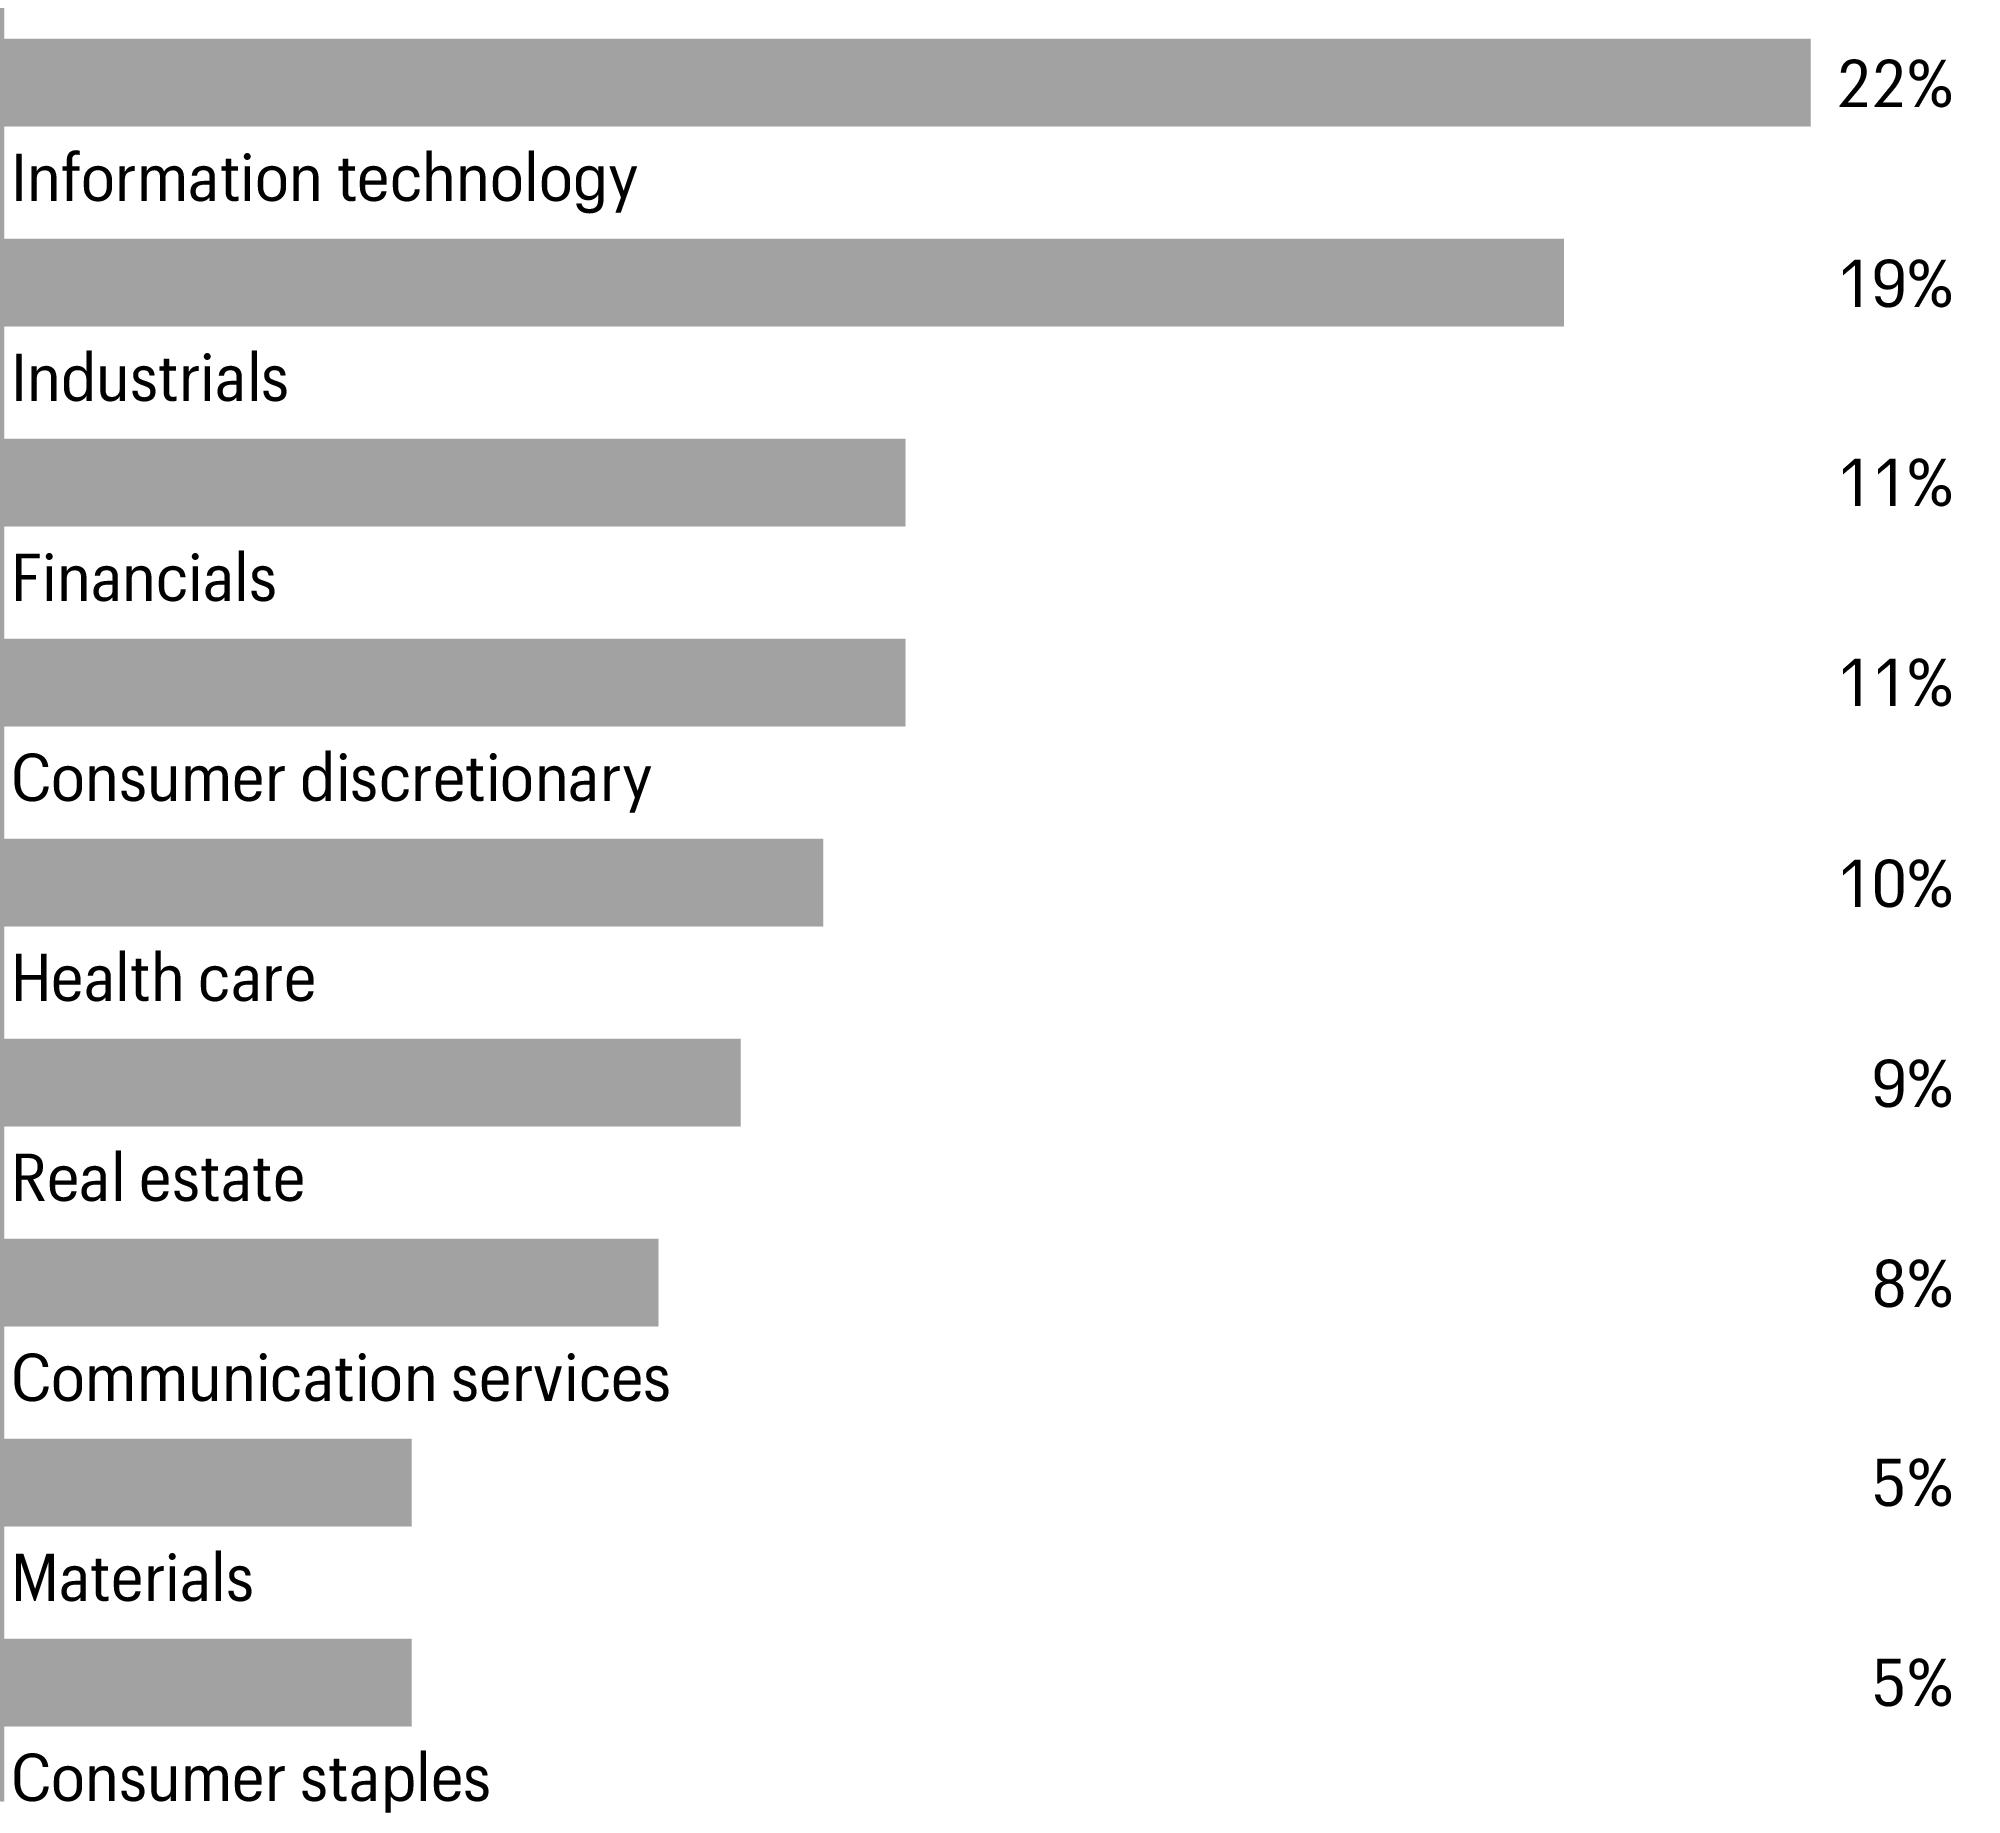
1 | Figures represent the percentage of the Fund’s long-term investments. Allocations are subject to change and may have changed since the date specified. |
Beginning account value 10-1-2023 | Ending account value 3-31-2024 | Expenses paid during the period1 | Annualized net expense ratio | |
Class A | ||||
Actual | $1,000.00 | $1,232.32 | $6.49 | 1.17 % |
Hypothetical (5% return before expenses) | $1,000.00 | $1,019.05 | $5.87 | 1.17 % |
Class C | ||||
Actual | $1,000.00 | $1,227.85 | $10.52 | 1.90 % |
Hypothetical (5% return before expenses) | $1,000.00 | $1,015.42 | $9.52 | 1.90 % |
Class R6 | ||||
Actual | $1,000.00 | $1,235.08 | $4.00 | 0.72 % |
Hypothetical (5% return before expenses) | $1,000.00 | $1,021.28 | $3.62 | 0.72 % |
Administrator Class | ||||
Actual | $1,000.00 | $1,233.39 | $5.55 | 1.00 % |
Hypothetical (5% return before expenses) | $1,000.00 | $1,019.89 | $5.02 | 1.00 % |
Institutional Class | ||||
Actual | $1,000.00 | $1,235.11 | $4.17 | 0.75 % |
Hypothetical (5% return before expenses) | $1,000.00 | $1,021.13 | $3.77 | 0.75 % |
1 | Expenses paid is equal to the annualized net expense ratio of each class multiplied by the average account value over the period, multiplied by 182 divided by 366 (to reflect the one-half-year period). |
Shares | Value | |||||
Common stocks: 96.63% | ||||||
Communication services: 7.62% | ||||||
Interactive media & services: 7.62% | ||||||
Alphabet, Inc. Class C† | 581,236 | $88,498,993 | ||||
Meta Platforms, Inc. Class A | 127,246 | 61,788,113 | ||||
150,287,106 | ||||||
Consumer discretionary: 10.25% | ||||||
Broadline retail: 5.15% | ||||||
Amazon.com, Inc.† | 563,698 | 101,679,845 | ||||
Hotels, restaurants & leisure: 1.03% | ||||||
Starbucks Corp. | 221,461 | 20,239,321 | ||||
Specialty retail: 4.07% | ||||||
Burlington Stores, Inc.† | 180,024 | 41,799,773 | ||||
Home Depot, Inc. | 100,615 | 38,595,914 | ||||
80,395,687 | ||||||
Consumer staples: 4.71% | ||||||
Consumer staples distribution & retail: 3.36% | ||||||
Dollar General Corp. | 245,478 | 38,309,297 | ||||
Sysco Corp. | 343,466 | 27,882,570 | ||||
66,191,867 | ||||||
Household products: 1.35% | ||||||
Church & Dwight Co., Inc. | 255,962 | 26,699,396 | ||||
Financials: 10.38% | ||||||
Capital markets: 5.12% | ||||||
Charles Schwab Corp. | 518,059 | 37,476,388 | ||||
Intercontinental Exchange, Inc. | 246,693 | 33,903,019 | ||||
S&P Global, Inc. | 69,575 | 29,600,684 | ||||
100,980,091 | ||||||
Financial services: 3.78% | ||||||
Mastercard, Inc. Class A | 154,971 | 74,629,385 | ||||
Insurance: 1.48% | ||||||
Marsh & McLennan Cos., Inc. | 142,232 | 29,296,947 | ||||
Health care: 9.85% | ||||||
Health care equipment & supplies: 3.20% | ||||||
Align Technology, Inc.† | 60,002 | 19,675,856 | ||||
LivaNova PLC† | 410,750 | 22,977,355 | ||||
Medtronic PLC | 235,475 | 20,521,646 | ||||
63,174,857 | ||||||
Health care providers & services: 1.83% | ||||||
UnitedHealth Group, Inc. | 72,966 | 36,096,280 | ||||
Shares | Value | |||||
Life sciences tools & services: 4.82% | ||||||
Agilent Technologies, Inc. | 232,051 | $33,765,741 | ||||
Bio-Rad Laboratories, Inc. Class A† | 77,408 | 26,773,105 | ||||
Thermo Fisher Scientific, Inc. | 59,571 | 34,623,261 | ||||
95,162,107 | ||||||
Industrials: 18.48% | ||||||
Aerospace & defense: 4.10% | ||||||
HEICO Corp. Class A | 298,811 | 45,998,966 | ||||
Melrose Industries PLC | 4,105,901 | 34,876,623 | ||||
80,875,589 | ||||||
Building products: 3.00% | ||||||
AZEK Co., Inc.† | 406,634 | 20,421,159 | ||||
Carlisle Cos., Inc. | 99,175 | 38,861,724 | ||||
59,282,883 | ||||||
Commercial services & supplies: 1.85% | ||||||
Republic Services, Inc. | 190,830 | 36,532,495 | ||||
Electrical equipment: 3.39% | ||||||
Atkore, Inc. | 95,018 | 18,087,627 | ||||
Regal Rexnord Corp. | 271,060 | 48,817,906 | ||||
66,905,533 | ||||||
Machinery: 2.10% | ||||||
Fortive Corp. | 294,972 | 25,373,492 | ||||
Ingersoll Rand, Inc. | 168,296 | 15,979,705 | ||||
41,353,197 | ||||||
Professional services: 2.35% | ||||||
Dun & Bradstreet Holdings, Inc. | 2,075,942 | 20,842,458 | ||||
TransUnion | 319,037 | 25,459,152 | ||||
46,301,610 | ||||||
Trading companies & distributors: 1.69% | ||||||
Air Lease Corp. | 648,130 | 33,339,807 | ||||
Information technology: 21.30% | ||||||
Electronic equipment, instruments & components: 3.97% | ||||||
Amphenol Corp. Class A | 333,884 | 38,513,519 | ||||
Teledyne Technologies, Inc.† | 92,756 | 39,822,006 | ||||
78,335,525 | ||||||
Semiconductors & semiconductor equipment: 4.72% | ||||||
Marvell Technology, Inc. | 570,183 | 40,414,571 | ||||
Texas Instruments, Inc. | 302,513 | 52,700,790 | ||||
93,115,361 | ||||||
Software: 8.18% | ||||||
Palo Alto Networks, Inc.† | 63,761 | 18,116,413 | ||||
Shares | Value | |||||
Software(continued) | ||||||
Salesforce, Inc. | 282,813 | $85,177,620 | ||||
ServiceNow, Inc.† | 36,718 | 27,993,803 | ||||
Workday, Inc. Class A† | 110,516 | 30,143,239 | ||||
161,431,075 | ||||||
Technology hardware, storage & peripherals: 4.43% | ||||||
Apple, Inc. | 509,140 | 87,307,327 | ||||
Materials: 4.88% | ||||||
Chemicals: 4.88% | ||||||
Ashland, Inc. | 356,536 | 34,715,910 | ||||
Olin Corp. | 615,810 | 36,209,628 | ||||
Sherwin-Williams Co. | 73,234 | 25,436,365 | ||||
96,361,903 | ||||||
Real estate: 9.16% | ||||||
Industrial REITs : 1.72% | ||||||
Prologis, Inc. | 260,333 | 33,900,563 | ||||
Real estate management & development: 1.72% | ||||||
CoStar Group, Inc.† | 350,874 | 33,894,428 | ||||
Residential REITs : 1.67% | ||||||
Sun Communities, Inc. | 256,737 | 33,011,244 | ||||
Specialized REITs : 4.05% | ||||||
American Tower Corp. | 176,517 | 34,877,994 | ||||
Equinix, Inc. | 20,074 | 16,567,674 | ||||
VICI Properties, Inc. | 953,054 | 28,391,479 | ||||
79,837,147 | ||||||
Total common stocks (Cost $1,017,351,983) | 1,906,618,576 | |||||
Yield | ||||||
Short-term investments: 3.43% | ||||||
Investment companies: 3.43% | ||||||
Allspring Government Money Market Fund Select Class♠∞ | 5.25 % | 67,679,485 | 67,679,485 | |||
Total short-term investments (Cost $67,679,485) | 67,679,485 | |||||
Total investments in securities (Cost $1,085,031,468) | 100.06 % | 1,974,298,061 | ||||
Other assets and liabilities, net | (0.06 ) | (1,204,800 ) | ||||
Total net assets | 100.00 % | $1,973,093,261 | ||||
† | Non-income-earning security |
♠ | The issuer of the security is an affiliated person of the Fund as defined in the Investment Company Act of 1940. |
∞ | The rate represents the 7-day annualized yield at period end. |
Abbreviations: | |
REIT | Real estate investment trust |
Value, beginning of period | Purchases | Sales proceeds | Net realized gains (losses) | Net change in unrealized gains (losses) | Value, end of period | Shares, end of period | Income from affiliated securities | |
Short-term investments | ||||||||
Allspring Government Money Market Fund Select Class | $34,872,865 | $183,972,217 | $(151,165,597 ) | $0 | $0 | $67,679,485 | 67,679,485 | $1,635,430 |
Assets | |
Investments in unaffiliated securities, at value (cost $1,017,351,983) | $1,906,618,576 |
Investments in affiliated securities, at value (cost $67,679,485) | 67,679,485 |
Cash | 361,085 |
Foreign currency, at value (cost $109) | 109 |
Receivable for dividends | 2,296,857 |
Receivable for Fund shares sold | 23,094 |
Prepaid expenses and other assets | 159,071 |
Total assets | 1,977,138,277 |
Liabilities | |
Payable for Fund shares redeemed | 1,352,196 |
Management fee payable | 1,138,929 |
Shareholder servicing fee payable | 406,271 |
Administration fees payable | 312,569 |
Trustees’ fees and expenses payable | 3,523 |
Distribution fee payable | 874 |
Accrued expenses and other liabilities | 830,654 |
Total liabilities | 4,045,016 |
Total net assets | $1,973,093,261 |
Net assets consist of | |
Paid-in capital | $995,995,964 |
Total distributable earnings | 977,097,297 |
Total net assets | $1,973,093,261 |
Computation of net asset value and offering price per share | |
Net assets–Class A | $1,668,787,349 |
Shares outstanding–Class A1 | 32,010,694 |
Net asset value per share–Class A | $52.13 |
Maximum offering price per share – Class A2 | $55.31 |
Net assets–Class C | $1,462,548 |
Shares outstanding–Class C1 | 32,194 |
Net asset value per share–Class C | $45.43 |
Net assets–Class R6 | $299,657 |
Shares outstanding–Class R61 | 4,778 |
Net asset value per share–Class R6 | $62.71 |
Net assets–Administrator Class | $271,895,845 |
Shares outstanding–Administrator Class1 | 4,502,401 |
Net asset value per share–Administrator Class | $60.39 |
Net assets–Institutional Class | $30,647,862 |
Shares outstanding–Institutional Class1 | 489,213 |
Net asset value per share–Institutional Class | $62.65 |
Investment income | |
Dividends | $8,879,677 |
Income from affiliated securities | 1,635,430 |
Interest | 315 |
Total investment income | 10,515,422 |
Expenses | |
Management fee | 6,478,434 |
Administration fees | |
Class A | 1,520,464 |
Class C | 1,427 |
Class R6 | 38 |
Administrator Class | 160,544 |
Institutional Class | 18,569 |
Shareholder servicing fees | |
Class A | 1,899,656 |
Class C | 1,782 |
Administrator Class | 306,325 |
Distribution fee | |
Class C | 5,059 |
Custody and accounting fees | 23,296 |
Professional fees | 33,786 |
Registration fees | 27,784 |
Shareholder report expenses | 34,059 |
Trustees’ fees and expenses | 12,465 |
Other fees and expenses | 23,839 |
Total expenses | 10,547,527 |
Less: Fee waivers and/or expense reimbursements | |
Fund-level | (163,536 ) |
Class R6 | (34 ) |
Administrator Class | (118,653 ) |
Institutional Class | (14,065 ) |
Net expenses | 10,251,239 |
Net investment income | 264,183 |
Realized and unrealized gains (losses) on investments | |
Net realized gains (losses) on | |
Unaffiliated securities | 97,173,448 |
Foreign currency and foreign currency translations | (4,210 ) |
Net realized gains on investments | 97,169,238 |
Net change in unrealized gains (losses) on | |
Unaffiliated securities | 283,117,802 |
Foreign currency and foreign currency translations | 1,801 |
Net change in unrealized gains (losses) on investments | 283,119,603 |
Net realized and unrealized gains (losses) on investments | 380,288,841 |
Net increase in net assets resulting from operations | $380,553,024 |
Six months ended March 31, 2024 (unaudited) | Year ended September 30, 2023 | |||
Operations | ||||
Net investment income (loss) | $264,183 | $(2,542,945 ) | ||
Net realized gains on investments | 97,169,238 | 74,803,987 | ||
Net change in unrealized gains (losses) on investments | 283,119,603 | 221,925,619 | ||
Net increase in net assets resulting from operations | 380,553,024 | 294,186,661 | ||
Distributions to shareholders from | ||||
Net investment income and net realized gains | ||||
Class A | (60,356,131 ) | (135,924,779 ) | ||
Class C | (67,168 ) | (163,434 ) | ||
Class R6 | (8,935 ) | (2,539 ) | ||
Administrator Class | (8,509,577 ) | (19,167,609 ) | ||
Institutional Class | (992,927 ) | (2,217,648 ) | ||
Total distributions to shareholders | (69,934,738 ) | (157,476,009 ) | ||
Capital share transactions | Shares | Shares | ||
Proceeds from shares sold | ||||
Class A | 104,188 | 4,882,489 | 248,448 | 10,637,541 |
Class C | 656 | 27,468 | 3,536 | 133,304 |
Class R6 | 1,378 | 71,527 | 2,670 | 141,114 |
Administrator Class | 6,160 | 331,411 | 19,568 | 968,586 |
Institutional Class | 122,091 | 6,815,136 | 259,731 | 13,329,935 |
12,128,031 | 25,210,480 | |||
Reinvestment of distributions | ||||
Class A | 1,278,860 | 58,622,947 | 3,274,219 | 131,918,309 |
Class C | 1,652 | 66,111 | 4,525 | 161,301 |
Class R6 | 162 | 8,935 | 53 | 2,539 |
Administrator Class | 148,123 | 7,860,908 | 386,357 | 17,892,203 |
Institutional Class | 17,989 | 989,756 | 44,993 | 2,152,021 |
67,548,657 | 152,126,373 | |||
Payment for shares redeemed | ||||
Class A | (1,697,425 ) | (80,162,624 ) | (3,264,464 ) | (140,859,583 ) |
Class C | (6,045 ) | (251,644 ) | (11,702 ) | (446,521 ) |
Class R6 | (75 ) | (4,156 ) | 0 | 0 |
Administrator Class | (210,300 ) | (11,420,261 ) | (365,545 ) | (17,990,967 ) |
Institutional Class | (167,357 ) | (9,410,903 ) | (279,551 ) | (14,417,041 ) |
(101,249,588 ) | (173,714,112 ) | |||
Net increase (decrease) in net assets resulting from capital share transactions | (21,572,900 ) | 3,622,741 | ||
Total increase in net assets | 289,045,386 | 140,333,393 | ||
Net assets | ||||
Beginning of period | 1,684,047,875 | 1,543,714,482 | ||
End of period | $1,973,093,261 | $1,684,047,875 | ||
Six months ended March 31, 2024 (unaudited) | Year ended September 30 | |||||
Class A | 2023 | 2022 | 2021 | 2020 | 2019 | |
Net asset value, beginning of period | $44.06 | $40.84 | $57.30 | $45.64 | $43.37 | $46.31 |
Net investment income (loss) | (0.00 )1,2 | (0.08 )2 | (0.22 ) | (0.20 ) | 0.01 | 0.10 |
Payment from affiliate | 0.00 | 0.00 | 0.00 | 0.00 | 0.00 3 | 0.00 |
Net realized and unrealized gains (losses) on investments | 9.97 | 7.61 | (9.64 ) | 14.95 | 4.85 | 1.54 |
Total from investment operations | 9.97 | 7.53 | (9.86 ) | 14.75 | 4.86 | 1.64 |
Distributions to shareholders from | ||||||
Net investment income | 0.00 | 0.00 | 0.00 | (0.02 ) | (0.10 ) | 0.00 |
Net realized gains | (1.90 ) | (4.31 ) | (6.60 ) | (3.07 ) | (2.49 ) | (4.58 ) |
Total distributions to shareholders | (1.90 ) | (4.31 ) | (6.60 ) | (3.09 ) | (2.59 ) | (4.58 ) |
Net asset value, end of period | $52.13 | $44.06 | $40.84 | $57.30 | $45.64 | $43.37 |
Total return4 | 23.23 % | 19.42 % | (20.07 )% | 33.63 % | 11.62 %5 | 5.18 % |
Ratios to average net assets (annualized) | ||||||
Gross expenses | 1.19 % | 1.20 % | 1.19 % | 1.20 % | 1.21 % | 1.21 % |
Net expenses | 1.17 % | 1.17 % | 1.16 % | 1.17 % | 1.16 % | 1.19 % |
Net investment income (loss) | (0.00 )% | (0.18 )% | (0.43 )% | (0.37 )% | 0.04 % | 0.23 % |
Supplemental data | ||||||
Portfolio turnover rate | 9 % | 26 % | 22 % | 29 % | 43 % | 28 % |
Net assets, end of period (000s omitted) | $1,668,787 | $1,424,188 | $1,309,459 | $1,782,585 | $1,453,975 | $1,461,345 |
1 | Amount is more than $(0.005). |
2 | Calculated based upon average shares outstanding |
3 | Amount is less than $0.005. |
4 | Total return calculations do not include any sales charges. Returns for periods of less than one year are not annualized. |
5 | During the year ended September 30, 2020, the Fund received a payment from an affiliate which had an impact of less than 0.005% to the total return. |
Six months ended March 31, 2024 (unaudited) | Year ended September 30 | |||||
Class C | 2023 | 2022 | 2021 | 2020 | 2019 | |
Net asset value, beginning of period | $38.76 | $36.63 | $52.32 | $42.19 | $40.02 | $43.43 |
Net investment loss | (0.15 )1 | (0.35 )1 | (0.50 )1 | (0.55 )1 | (0.28 )1 | (0.26 )1 |
Payment from affiliate | 0.00 | 0.00 | 0.00 | 0.00 | 0.54 | 0.00 |
Net realized and unrealized gains (losses) on investments | 8.72 | 6.79 | (8.59 ) | 13.75 | 4.40 | 1.43 |
Total from investment operations | 8.57 | 6.44 | (9.09 ) | 13.20 | 4.66 | 1.17 |
Distributions to shareholders from | ||||||
Net realized gains | (1.90 ) | (4.31 ) | (6.60 ) | (3.07 ) | (2.49 ) | (4.58 ) |
Net asset value, end of period | $45.43 | $38.76 | $36.63 | $52.32 | $42.19 | $40.02 |
Total return2 | 22.79 % | 18.60 % | (20.55 )%3 | 32.65 % | 12.13 %4 | 4.37 % |
Ratios to average net assets (annualized) | ||||||
Gross expenses | 1.90 % | 1.90 % | 1.85 % | 1.92 % | 1.94 % | 1.96 % |
Net expenses | 1.90 % | 1.89 % | 1.84 % | 1.91 % | 1.92 % | 1.95 % |
Net investment loss | (0.73 )% | (0.90 )% | (1.11 )% | (1.12 )% | (0.71 )% | (0.69 )% |
Supplemental data | ||||||
Portfolio turnover rate | 9 % | 26 % | 22 % | 29 % | 43 % | 28 % |
Net assets, end of period (000s omitted) | $1,463 | $1,393 | $1,450 | $2,073 | $2,268 | $3,739 |
1 | Calculated based upon average shares outstanding |
2 | Total return calculations do not include any sales charges. Returns for periods of less than one year are not annualized. |
3 | During the year ended September 30, 2022, the Fund received payments from a service provider which had a 0.09% impact on the total return. |
4 | During the year ended September 30, 2020, the Fund received a payment from an affiliate which had a 1.44% impact on the total return. |
Six months ended March 31, 2024 (unaudited) | Year ended September 30 | ||||
Class R6 | 2023 | 2022 | 2021 | 20201 | |
Net asset value, beginning of period | $52.53 | $47.73 | $65.66 | $51.83 | $46.84 |
Net investment income | 0.13 2 | 0.16 2 | 0.01 2 | 0.04 | 0.04 |
Net realized and unrealized gains (losses) on investments | 11.95 | 8.95 | (11.34 ) | 17.06 | 4.95 |
Total from investment operations | 12.08 | 9.11 | (11.33 ) | 17.10 | 4.99 |
Distributions to shareholders from | |||||
Net investment income | 0.00 | 0.00 | 0.00 | (0.20 ) | 0.00 |
Net realized gains | (1.90 ) | (4.31 ) | (6.60 ) | (3.07 ) | 0.00 |
Total distributions to shareholders | (1.90 ) | (4.31 ) | (6.60 ) | (3.27 ) | 0.00 |
Net asset value, end of period | $62.71 | $52.53 | $47.73 | $65.66 | $51.83 |
Total return3 | 23.51 % | 19.96 % | (19.72 )% | 34.23 % | 10.65 % |
Ratios to average net assets (annualized) | |||||
Gross expenses | 0.77 % | 0.79 % | 0.75 % | 0.76 % | 0.76 % |
Net expenses | 0.72 % | 0.73 % | 0.72 % | 0.72 % | 0.72 % |
Net investment income | 0.46 % | 0.31 % | 0.01 % | 0.08 % | 0.25 % |
Supplemental data | |||||
Portfolio turnover rate | 9 % | 26 % | 22 % | 29 % | 43 % |
Net assets, end of period (000s omitted) | $300 | $174 | $28 | $35 | $28 |
1 | For the period from May 29, 2020 (commencement of class operations) to September 30, 2020 |
2 | Calculated based upon average shares outstanding |
3 | Returns for periods of less than one year are not annualized. |
Six months ended March 31, 2024 (unaudited) | Year ended September 30 | |||||
Administrator Class | 2023 | 2022 | 2021 | 2020 | 2019 | |
Net asset value, beginning of period | $50.72 | $46.33 | $64.07 | $50.68 | $47.85 | $50.50 |
Net investment income (loss) | 0.05 1 | (0.00 )1,2 | (0.14 )1 | (0.10 ) | 0.18 | 0.21 |
Net realized and unrealized gains (losses) on investments | 11.52 | 8.70 | (11.00 ) | 16.65 | 5.30 | 1.73 |
Total from investment operations | 11.57 | 8.70 | (11.14 ) | 16.55 | 5.48 | 1.94 |
Distributions to shareholders from | ||||||
Net investment income | 0.00 | 0.00 | 0.00 | (0.09 ) | (0.16 ) | (0.01 ) |
Net realized gains | (1.90 ) | (4.31 ) | (6.60 ) | (3.07 ) | (2.49 ) | (4.58 ) |
Total distributions to shareholders | (1.90 ) | (4.31 ) | (6.60 ) | (3.16 ) | (2.65 ) | (4.59 ) |
Net asset value, end of period | $60.39 | $50.72 | $46.33 | $64.07 | $50.68 | $47.85 |
Total return3 | 23.34 % | 19.63 % | (19.91 )% | 33.87 % | 11.85 % | 5.37 % |
Ratios to average net assets (annualized) | ||||||
Gross expenses | 1.12 % | 1.12 % | 1.11 % | 1.12 % | 1.13 % | 1.13 % |
Net expenses | 1.00 % | 0.99 % | 0.97 % | 0.98 % | 0.97 % | 1.00 % |
Net investment income (loss) | 0.17 % | (0.00 )% | (0.24 )% | (0.18 )% | 0.22 % | 0.42 % |
Supplemental data | ||||||
Portfolio turnover rate | 9 % | 26 % | 22 % | 29 % | 43 % | 28 % |
Net assets, end of period (000s omitted) | $271,896 | $231,186 | $209,340 | $281,217 | $225,604 | $227,963 |
1 | Calculated based upon average shares outstanding |
2 | Amount is more than $(0.005). |
3 | Returns for periods of less than one year are not annualized. |
Six months ended March 31, 2024 (unaudited) | Year ended September 30 | |||||
Institutional Class | 2023 | 2022 | 2021 | 2020 | 2019 | |
Net asset value, beginning of period | $52.48 | $47.70 | $65.64 | $51.83 | $48.89 | $51.50 |
Net investment income (loss) | 0.12 1 | 0.13 1 | (0.01 )1 | 0.03 1 | 0.34 | 0.35 |
Net realized and unrealized gains (losses) on investments | 11.95 | 8.96 | (11.33 ) | 17.04 | 5.37 | 1.74 |
Total from investment operations | 12.07 | 9.09 | (11.34 ) | 17.07 | 5.71 | 2.09 |
Distributions to shareholders from | ||||||
Net investment income | 0.00 | 0.00 | 0.00 | (0.19 ) | (0.28 ) | (0.12 ) |
Net realized gains | (1.90 ) | (4.31 ) | (6.60 ) | (3.07 ) | (2.49 ) | (4.58 ) |
Total distributions to shareholders | (1.90 ) | (4.31 ) | (6.60 ) | (3.26 ) | (2.77 ) | (4.70 ) |
Net asset value, end of period | $62.65 | $52.48 | $47.70 | $65.64 | $51.83 | $48.89 |
Total return2 | 23.51 % | 19.93 % | (19.76 )% | 34.20 % | 12.09 % | 5.63 % |
Ratios to average net assets (annualized) | ||||||
Gross expenses | 0.87 % | 0.87 % | 0.86 % | 0.87 % | 0.88 % | 0.88 % |
Net expenses | 0.75 % | 0.75 % | 0.75 % | 0.75 % | 0.75 % | 0.75 % |
Net investment income (loss) | 0.42 % | 0.24 % | (0.01 )% | 0.05 % | 0.44 % | 0.66 % |
Supplemental data | ||||||
Portfolio turnover rate | 9 % | 26 % | 22 % | 29 % | 43 % | 28 % |
Net assets, end of period (000s omitted) | $30,648 | $27,107 | $23,437 | $29,303 | $24,710 | $26,447 |
1 | Calculated based upon average shares outstanding |
2 | Returns for periods of less than one year are not annualized. |
Gross unrealized gains | $925,225,489 |
Gross unrealized losses | (28,877,941 ) |
Net unrealized gains | $896,347,548 |
Quoted prices (Level 1) | Other significant observable inputs (Level 2) | Significant unobservable inputs (Level 3) | Total | |
Assets | ||||
Investments in: | ||||
Common stocks | ||||
Communication services | $150,287,106 | $0 | $0 | $150,287,106 |
Consumer discretionary | 202,314,853 | 0 | 0 | 202,314,853 |
Consumer staples | 92,891,263 | 0 | 0 | 92,891,263 |
Financials | 204,906,423 | 0 | 0 | 204,906,423 |
Health care | 194,433,244 | 0 | 0 | 194,433,244 |
Industrials | 364,591,114 | 0 | 0 | 364,591,114 |
Information technology | 420,189,288 | 0 | 0 | 420,189,288 |
Materials | 96,361,903 | 0 | 0 | 96,361,903 |
Real estate | 180,643,382 | 0 | 0 | 180,643,382 |
Short-term investments | ||||
Investment companies | 67,679,485 | 0 | 0 | 67,679,485 |
Total assets | $1,974,298,061 | $0 | $0 | $1,974,298,061 |
Average daily net assets | Management fee |
First $500 million | 0.750 % |
Next $500 million | 0.725 |
Next $1 billion | 0.700 |
Next $2 billion | 0.675 |
Next $1 billion | 0.650 |
Next $5 billion | 0.640 |
Next $2 billion | 0.630 |
Next $4 billion | 0.620 |
Over $16 billion | 0.610 |
Class-level administration fee | |
Class A | 0.20 % |
Class C | 0.20 |
Class R6 | 0.03 |
Administrator Class | 0.13 |
Institutional Class | 0.13 |
EXPENSE RATIO CAPS | |
Class A | 1.17 % |
Class C | 1.92 |
Class R6 | 0.72 |
Administrator Class | 1.00 |
Institutional Class | 0.75 |
Name and year of birth | Position held and length of service* | Principal occupations during past five years or longer | Current other public company or investment company directorships |
William R. Ebsworth (Born 1957) | Trustee, since 2015 | Retired. From 1984 to 2013, equities analyst, portfolio manager, research director and chief investment officer at Fidelity Management and Research Company in Boston, Tokyo, and Hong Kong, and retired in 2013 as Chief Investment Officer of Fidelity Strategic Advisers, Inc. where he led a team of investment professionals managing client assets. Prior thereto, Board member of Hong Kong Securities Clearing Co., Hong Kong Options Clearing Corp., the Thailand International Fund, Ltd., Fidelity Investments Life Insurance Company, and Empire Fidelity Investments Life Insurance Company. Serves on the Investment Company Institute’s Board of Governors since 2022 and Executive Committee since 2023 as well as the Vice Chairman of the Governing Council of the Independent Directors Council since 2023. Audit Committee Chair and Investment Committee Chair of the Vincent Memorial Hospital Foundation (non-profit organization). Mr. Ebsworth is a CFA charterholder. | N/A |
Jane A. Freeman (Born 1953) | Trustee, since 2015; Chair Liaison, since January 2018# | Retired. From 2012 to 2014 and 1999 to 2008, Chief Financial Officer of Scientific Learning Corporation. From 2008 to 2012, Ms. Freeman provided consulting services related to strategic business projects. Prior to 1999, Portfolio Manager at Rockefeller & Co. and Scudder, Stevens & Clark. Board member of the Harding Loevner Funds from 1996 to 2014, serving as both Lead Independent Director and chair of the Audit Committee. Board member of the Russell Exchange Traded Funds Trust from 2011 to 2012 and the chair of the Audit Committee. Ms. Freeman is also an inactive Chartered Financial Analyst. | N/A |
Isaiah Harris, Jr. (Born 1952) | Trustee, since 2009; Audit Committee Chair, since 2019 | Retired. Member of the Advisory Board of CEF of East Central Florida. Chairman of the Board of CIGNA Corporation from 2009 to 2021, and Director from 2005 to 2008. From 2003 to 2011, Director of Deluxe Corporation. Prior thereto, President and CEO of BellSouth Advertising and Publishing Corp. from 2005 to 2007, President and CEO of BellSouth Enterprises from 2004 to 2005 and President of BellSouth Consumer Services from 2000 to 2003. Emeritus member of the Iowa State University Foundation Board of Governors. Emeritus Member of the Advisory board of Iowa State University School of Business. Advisory Board Member, Palm Harbor Academy (private school). Advisory Board Member, Fellowship of Christian Athletes. Mr. Harris is a certified public accountant (inactive status). | N/A |
David F. Larcker (Born 1950) | Trustee, since 2009 | Distinguished Visiting Fellow at the Hoover Institution since 2022. James Irvin Miller Professor of Accounting at the Graduate School of Business (Emeritus), Stanford University, Director of the Corporate Governance Research Initiative and Senior Faculty of The Rock Center for Corporate Governance since 2006. From 2005 to 2008, Professor of Accounting at the Graduate School of Business, Stanford University. Prior thereto, Ernst & Young Professor of Accounting at The Wharton School, University of Pennsylvania from 1985 to 2005. | N/A |
Olivia S. Mitchell (Born 1953) | Trustee, since 2006; Nominating and Governance Committee Chair, since 2018 | International Foundation of Employee Benefit Plans Professor since 1993, Wharton School of the University of Pennsylvania. Director of Wharton’s Pension Research Council and Boettner Center on Pensions & Retirement Research, and Research Associate at the National Bureau of Economic Research. Previously taught at Cornell University from 1978 to 1993. | N/A |
Name and year of birth | Position held and length of service* | Principal occupations during past five years or longer | Current other public company or investment company directorships |
Timothy J. Penny (Born 1951) | Trustee, since 1996; Chair, since 2018 | President and Chief Executive Officer of Southern Minnesota Initiative Foundation, a non-profit organization, since 2007. Vice Chair of the Economic Club of Minnesota, since 2007. Co-Chair of the Committee for a Responsible Federal Budget, since 1995. Member of the Board of Trustees of NorthStar Education Finance, Inc., a non-profit organization, from 2007-2022. Senior Fellow of the University of Minnesota Humphrey Institute from 1995 to 2017. | N/A |
James G. Polisson (Born 1959) | Trustee, since 2018 | Retired. Chief Marketing Officer, Source (ETF) UK Services, Ltd, from 2015 to 2017. From 2012 to 2015, Principal of The Polisson Group, LLC, a management consulting, corporate advisory and principal investing company. Chief Executive Officer and Managing Director at Russell Investments, Global Exchange Traded Funds from 2010 to 2012. Managing Director of Barclays Global Investors from 1998 to 2010 and Global Chief Marketing Officer for iShares and Barclays Global Investors from 2000 to 2010. Trustee of the San Francisco Mechanics’ Institute, a non- profit organization, from 2013 to 2015. Board member of the Russell Exchange Traded Fund Trust from 2011 to 2012. Director of Barclays Global Investors Holdings Deutschland GmbH from 2006 to 2009. Mr. Polisson is an attorney and has a retired status with the Massachusetts and District of Columbia Bar Associations. | N/A |
Pamela Wheelock (Born 1959) | Trustee, since January 2020; previously Trustee from January 2018 to July 2019# | Retired. Executive and Senior Financial leadership positions in the public, private and nonprofit sectors. Interim President and CEO, McKnight Foundation, 2020. Interim Commissioner, Minnesota Department of Human Services, 2019. Chief Operating Officer, Twin Cities Habitat for Humanity, 2017-2019. Vice President for University Services, University of Minnesota, 2012- 2016. Interim President and CEO, Blue Cross and Blue Shield of Minnesota, 2011-2012. Executive Vice-President and Chief Financial Officer, Minnesota Wild, 2002-2008. Commissioner, Minnesota Department of Finance, 1999-2002. Chair of the Board of Directors of Destination Medical Center Corporation. Board member of the Minnesota Wild Foundation. | N/A |
Name and year of birth | Position held and length of service | Principal occupations during past five years or longer |
Andrew Owen (Born 1960) | President, since 2017 | President and Chief Executive Officer of Allspring Funds Management, LLC since 2017 and Head of Global Fund Governance of Allspring Global Investments since 2022. Prior thereto, co-president of Galliard Capital Management, LLC, an affiliate of Allspring Funds Management, LLC, from 2019 to 2022 and Head of Affiliated Managers, Allspring Global Investments, from 2014 to 2019 and Executive Vice President responsible for marketing, investments and product development for Allspring Funds Management, LLC, from 2009 to 2014. |
Jeremy DePalma (Born 1974) | Treasurer, since 2012 (for certain funds in the Fund Complex); since 2021 (for the remaining funds in the Complex) | Senior Vice President of Allspring Funds Management, LLC since 2009. Senior Vice President of Evergreen Investment Management Company, LLC from 2008 to 2010 and head of the Fund Reporting and Control Team within Fund Administration from 2005 to 2010. |
Christopher Baker (Born 1976) | Chief Compliance Officer, since 2022 | Global Chief Compliance Officer for Allspring Global Investments since 2022. Prior thereto, Chief Compliance Officer for State Street Global Advisors from 2018 to 2021. Senior Compliance Officer for the State Street divisions of Alternative Investment Solutions, Sector Solutions, and Global Marketing from 2015 to 2018. From 2010 to 2015 Vice President, Global Head of Investment and Marketing Compliance for State Street Global Advisors. |
Matthew Prasse (Born 1983) | Chief Legal Officer, since 2022; Secretary, since 2021 | Senior Counsel of the Allspring Legal Department since 2021. Senior Counsel of the Wells Fargo Legal Department from 2018 to 2021. Previously, Counsel for Barings LLC from 2015 to 2018. Prior to joining Barings, Associate at Morgan, Lewis & Bockius LLP from 2008 to 2015. |

P.O. Box 219967
Kansas City, MO 64121-9967

SAR3002 03-24

Allspring Funds

President
Allspring Funds
Notice to Shareholders |
Beginning in July 2024, the Fund will be required by the Securities and Exchange Commission to send shareholders a paper copy of a new tailored shareholder report in place of the full shareholder report that you are now receiving. The tailored shareholder report will contain concise information about the Fund, including certain expense and performance information and fund statistics. If you wish to receive this new tailored shareholder report electronically, please follow the instructions on the back cover of this report. |
Other information that is currently included in the shareholder report, such as the Fund’s financial statements, will be available online and upon request, free of charge, in paper or electronic format. |
Investment objective | The Fund seeks long-term capital appreciation. |
Manager | Allspring Funds Management, LLC |
Subadviser | Allspring Global Investments, LLC |
Portfolio managers | James M. Tringas, CFA, Bryant VonCronkhite, CFA, CPA, Shane Zweck, CFA |
Average annual total returns (%) as of March 31, 2024 | |||||||||
Including sales charge | Excluding sales charge | Expense ratios1 (%) | |||||||
Inception date | 1 year | 5 year | 10 year | 1 year | 5 year | 10 year | Gross | Net2 | |
Class A (WFPAX) | 7-31-2007 | 11.38 | 10.41 | 8.75 | 18.17 | 11.73 | 9.39 | 1.12 | 1.12 |
Class C (WFPCX) | 7-31-2007 | 16.28 | 10.90 | 8.74 | 17.28 | 10.90 | 8.74 | 1.87 | 1.87 |
Class R6 (WFPRX) | 6-28-2013 | – | – | – | 18.66 | 12.21 | 9.87 | 0.70 | 0.70 |
Administrator Class (WFMDX) | 4-8-2005 | – | – | – | 18.26 | 11.82 | 9.49 | 1.05 | 1.05 |
Institutional Class (WFMIX) | 4-8-2005 | – | – | – | 18.54 | 12.09 | 9.77 | 0.80 | 0.80 |
Russell 3000® Index3 | – | – | – | – | 29.29 | 14.34 | 12.33 | – | – |
Russell Midcap® Value Index4 | – | – | – | – | 20.40 | 9.94 | 8.57 | – | – |
1 | Reflects the expense ratios as stated in the most recent prospectuses. The expense ratios shown are subject to change and may differ from the annualized expense ratios shown in the Financial Highlights of this report. |
2 | The manager has contractually committed through January 31, 2025, to waive fees and/or reimburse expenses to the extent necessary to cap total annual fund operating expenses after fee waivers at 1.15% for Class A, 1.90% for Class C, 0.73% for Class R6, 1.08% for Administrator Class and 0.83% for Institutional Class. Brokerage commissions, stamp duty fees, interest, taxes, acquired fund fees and expenses (if any), and extraordinary expenses are excluded from the expense caps. Prior to or after the commitment expiration date, the caps may be increased or the commitment to maintain the caps may be terminated only with the approval of the Board of Trustees. Without these caps, the Fund’s returns would have been lower. The expense ratio paid by an investor is the net expense ratio (the total annual fund operating expenses after fee waivers) as stated in the prospectuses. |
3 | The Russell 3000® Index measures the performance of the 3,000 largest U.S. companies based on total market capitalization, which represents approximately 98% of the investable U.S. equity market. You cannot invest directly in an index. |
4 | The Russell Midcap® Value Index measures the performance of those Russell Midcap companies with lower price/book ratios and lower forecasted growth values. The stocks are also members of the Russell 1000® Value Index. You cannot invest directly in an index. |
CFA® and Chartered Financial Analyst® are trademarks owned by CFA Institute. |
Ten largest holdings (%) as of March 31, 20241 | |
AerCap Holdings NV | 3.71 |
Carlisle Cos., Inc. | 3.67 |
CBRE Group, Inc. Class A | 3.28 |
Arch Capital Group Ltd. | 3.23 |
Republic Services, Inc. | 3.13 |
Allstate Corp. | 3.13 |
Vulcan Materials Co. | 2.96 |
LKQ Corp. | 2.92 |
Jacobs Solutions, Inc. | 2.89 |
Keurig Dr Pepper, Inc. | 2.61 |
1 | Figures represent the percentage of the Fund’s net assets. Holdings are subject to change and may have changed since the date specified. |
Sector allocation as of March 31, 20241 |
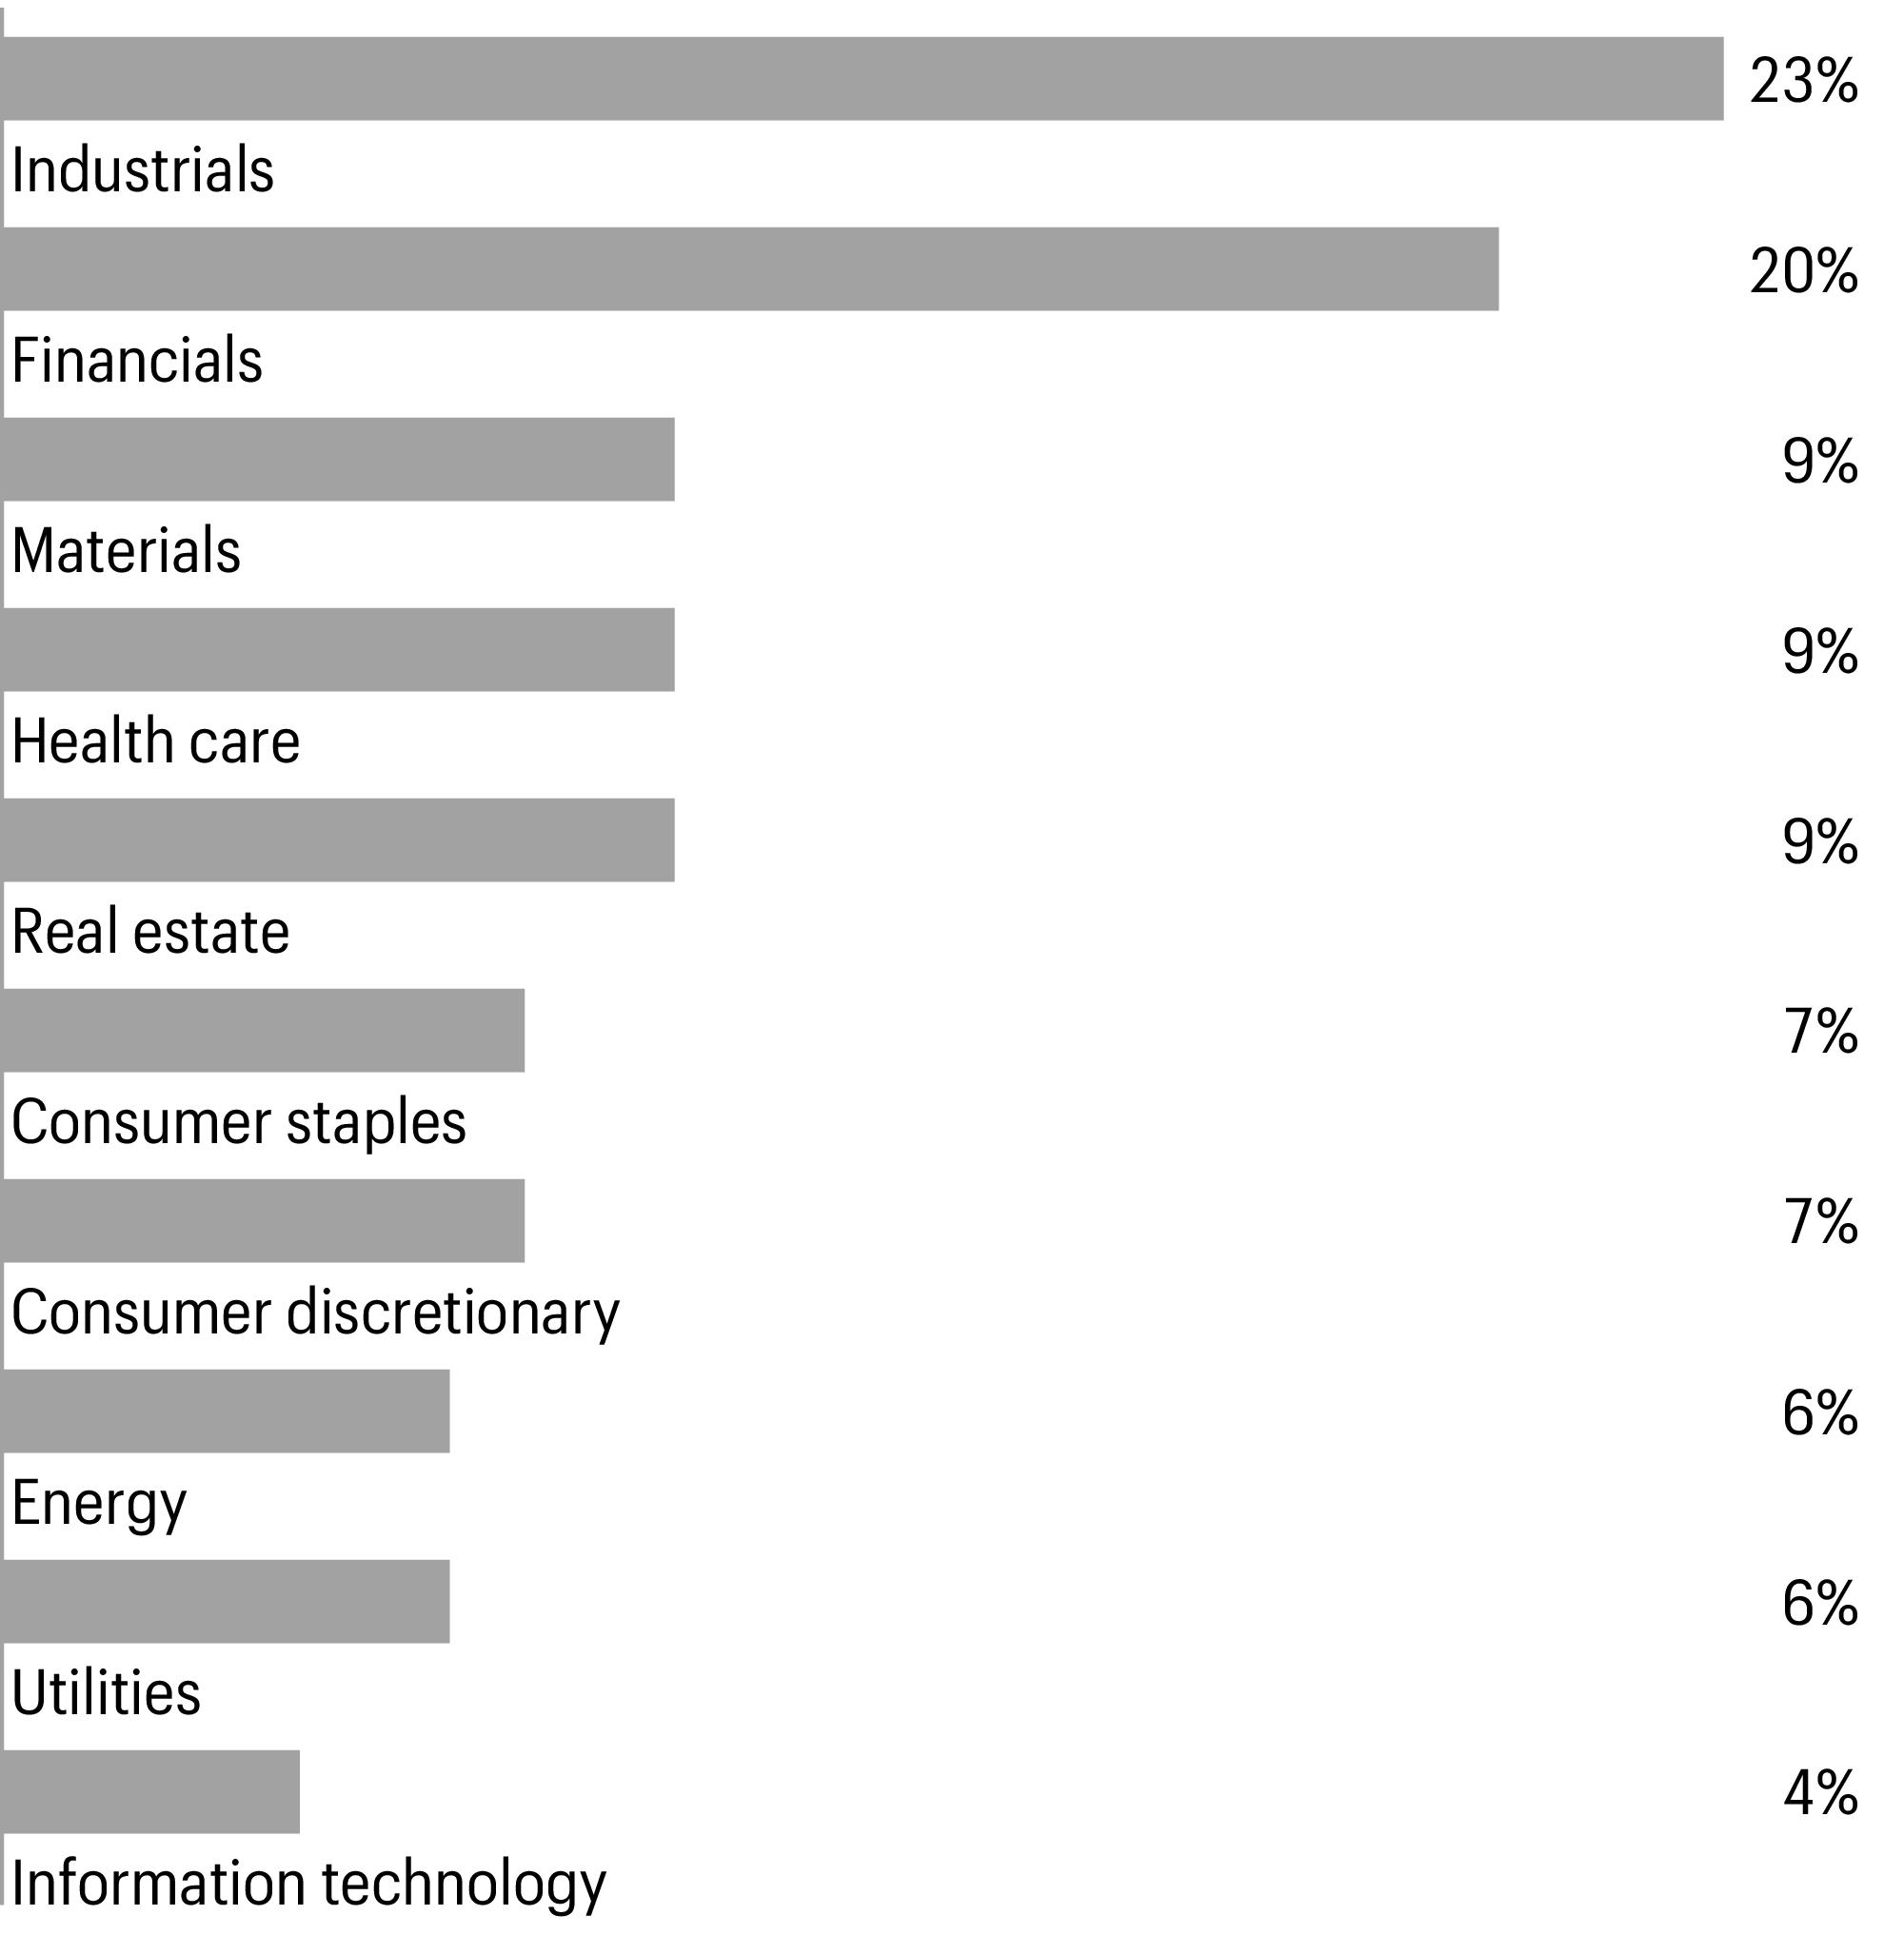
1 | Figures represent the percentage of the Fund’s long-term investments. Allocations are subject to change and may have changed since the date specified. |
Beginning account value 10-1-2023 | Ending account value 3-31-2024 | Expenses paid during the period1 | Annualized net expense ratio | |
Class A | ||||
Actual | $1,000.00 | $1,190.83 | $6.10 | 1.12 % |
Hypothetical (5% return before expenses) | $1,000.00 | $1,019.29 | $5.62 | 1.12 % |
Class C | ||||
Actual | $1,000.00 | $1,186.57 | $10.17 | 1.87 % |
Hypothetical (5% return before expenses) | $1,000.00 | $1,015.56 | $9.37 | 1.87 % |
Class R6 | ||||
Actual | $1,000.00 | $1,193.31 | $3.82 | 0.70 % |
Hypothetical (5% return before expenses) | $1,000.00 | $1,021.38 | $3.52 | 0.70 % |
Administrator Class | ||||
Actual | $1,000.00 | $1,191.21 | $5.72 | 1.05 % |
Hypothetical (5% return before expenses) | $1,000.00 | $1,019.64 | $5.27 | 1.05 % |
Institutional Class | ||||
Actual | $1,000.00 | $1,192.84 | $4.36 | 0.80 % |
Hypothetical (5% return before expenses) | $1,000.00 | $1,020.89 | $4.02 | 0.80 % |
1 | Expenses paid is equal to the annualized net expense ratio of each class multiplied by the average account value over the period, multiplied by 182 divided by 366 (to reflect the one-half-year period). |
Shares | Value | |||||
Common stocks: 98.32% | ||||||
Communication services: 0.09% | ||||||
Entertainment: 0.09% | ||||||
TKO Group Holdings, Inc. | 140,100 | $12,106,041 | ||||
Consumer discretionary: 6.38% | ||||||
Automobile components: 1.18% | ||||||
Aptiv PLC† | 1,994,830 | 158,888,210 | ||||
Distributors: 2.92% | ||||||
LKQ Corp. | 7,362,500 | 393,231,125 | ||||
Hotels, restaurants & leisure: 1.50% | ||||||
Wendy’s Co. | 3,892,750 | 73,339,410 | ||||
Yum China Holdings, Inc. | 3,232,450 | 128,619,185 | ||||
201,958,595 | ||||||
Specialty retail: 0.78% | ||||||
Foot Locker, Inc. | 1,818,750 | 51,834,375 | ||||
RH† | 153,850 | 53,579,801 | ||||
105,414,176 | ||||||
Consumer staples: 6.76% | ||||||
Beverages: 2.61% | ||||||
Keurig Dr Pepper, Inc. | 11,447,914 | 351,107,522 | ||||
Household products: 4.15% | ||||||
Church & Dwight Co., Inc. | 2,411,050 | 251,496,626 | ||||
Reynolds Consumer Products, Inc.♠ | 10,759,100 | 307,279,896 | ||||
558,776,522 | ||||||
Energy: 6.21% | ||||||
Energy equipment & services: 1.54% | ||||||
Baker Hughes Co. | 4,265,400 | 142,890,900 | ||||
NOV, Inc. | 3,313,250 | 64,674,640 | ||||
207,565,540 | ||||||
Oil, gas & consumable fuels: 4.67% | ||||||
Devon Energy Corp. | 2,513,350 | 126,119,903 | ||||
EOG Resources, Inc. | 1,717,250 | 219,533,240 | ||||
Targa Resources Corp. | 653,250 | 73,157,468 | ||||
Valero Energy Corp. | 1,230,150 | 209,974,303 | ||||
628,784,914 | ||||||
Financials: 19.87% | ||||||
Banks: 3.00% | ||||||
Fifth Third Bancorp | 7,287,850 | 271,180,899 | ||||
Regions Financial Corp. | 6,331,650 | 133,217,916 | ||||
404,398,815 | ||||||
Shares | Value | |||||
Capital markets: 1.67% | ||||||
Jefferies Financial Group, Inc. | 5,116,550 | $225,639,855 | ||||
Pershing Square Tontine Holdings Ltd.♦† | 7,483,000 | 7 | ||||
225,639,862 | ||||||
Financial services: 2.26% | ||||||
Euronet Worldwide, Inc.♠† | 2,769,450 | 304,445,639 | ||||
Insurance: 10.86% | ||||||
Allstate Corp. | 2,436,200 | 421,486,962 | ||||
Arch Capital Group Ltd.† | 4,702,550 | 434,703,722 | ||||
Axis Capital Holdings Ltd. | 887,650 | 57,715,003 | ||||
Brown & Brown, Inc. | 3,824,350 | 334,783,599 | ||||
Loews Corp. | 2,723,150 | 213,195,413 | ||||
1,461,884,699 | ||||||
Mortgage real estate investment trusts (REITs): 2.08% | ||||||
Annaly Capital Management, Inc. | 14,219,299 | 279,977,997 | ||||
Health care: 8.84% | ||||||
Health care equipment & supplies: 3.57% | ||||||
Alcon, Inc. | 2,278,050 | 189,738,784 | ||||
Zimmer Biomet Holdings, Inc. | 2,207,750 | 291,378,845 | ||||
481,117,629 | ||||||
Health care providers & services: 2.93% | ||||||
Humana, Inc. | 360,700 | 125,061,904 | ||||
Laboratory Corp. of America Holdings | 1,234,150 | 269,612,409 | ||||
394,674,313 | ||||||
Life sciences tools & services: 2.34% | ||||||
Charles River Laboratories International, Inc.† | 936,764 | 253,816,206 | ||||
Qiagen NV | 1,410,515 | 60,638,040 | ||||
314,454,246 | ||||||
Industrials: 22.53% | ||||||
Aerospace & defense: 2.50% | ||||||
L3Harris Technologies, Inc. | 1,580,850 | 336,879,135 | ||||
Building products: 3.67% | ||||||
Carlisle Cos., Inc. | 1,262,550 | 494,730,218 | ||||
Commercial services & supplies: 3.13% | ||||||
Republic Services, Inc. | 2,202,450 | 421,637,028 | ||||
Construction & engineering: 2.36% | ||||||
API Group Corp.† | 4,097,266 | 160,899,639 | ||||
MasTec, Inc.† | 1,686,100 | 157,228,825 | ||||
318,128,464 | ||||||
Shares | Value | |||||
Ground transportation: 1.15% | ||||||
Knight-Swift Transportation Holdings, Inc. | 2,811,100 | $154,666,722 | ||||
Machinery: 2.30% | ||||||
Donaldson Co., Inc. | 1,867,000 | 139,427,560 | ||||
Gates Industrial Corp. PLC† | 9,604,927 | 170,103,257 | ||||
309,530,817 | ||||||
Professional services: 3.71% | ||||||
Dun & Bradstreet Holdings, Inc. | 10,952,546 | 109,963,562 | ||||
Jacobs Solutions, Inc. | 2,532,200 | 389,275,106 | ||||
499,238,668 | ||||||
Trading companies & distributors: 3.71% | ||||||
AerCap Holdings NV† | 5,739,950 | 498,859,054 | ||||
Information technology: 3.93% | ||||||
IT services: 1.15% | ||||||
Amdocs Ltd. | 1,713,450 | 154,844,477 | ||||
Semiconductors & semiconductor equipment: 2.55% | ||||||
ON Semiconductor Corp.† | 1,857,450 | 136,615,447 | ||||
Teradyne, Inc. | 1,829,900 | 206,467,617 | ||||
343,083,064 | ||||||
Software: 0.23% | ||||||
Informatica, Inc. Class A† | 911,800 | 31,913,000 | ||||
Materials: 9.03% | ||||||
Chemicals: 1.68% | ||||||
Ashland, Inc. | 843,550 | 82,136,464 | ||||
Huntsman Corp. | 5,534,550 | 144,064,336 | ||||
226,200,800 | ||||||
Construction materials: 2.96% | ||||||
Vulcan Materials Co. | 1,462,250 | 399,077,270 | ||||
Containers & packaging: 2.70% | ||||||
AptarGroup, Inc. | 836,700 | 120,392,763 | ||||
Graphic Packaging Holding Co. | 8,317,200 | 242,695,896 | ||||
363,088,659 | ||||||
Metals & mining: 1.69% | ||||||
Freeport-McMoRan, Inc. | 4,834,050 | 227,297,031 | ||||
Real estate: 8.81% | ||||||
Office REITs : 1.69% | ||||||
Boston Properties, Inc. | 3,492,550 | 228,098,440 | ||||
Real estate management & development: 3.28% | ||||||
CBRE Group, Inc. Class A† | 4,542,800 | 441,741,872 | ||||
Shares | Value | |||||
Specialized REITs : 3.84% | ||||||
CubeSmart | 3,241,900 | $146,598,718 | ||||
Gaming & Leisure Properties, Inc. | 4,268,550 | 196,652,098 | ||||
Weyerhaeuser Co. | 4,832,750 | 173,544,053 | ||||
516,794,869 | ||||||
Utilities: 5.87% | ||||||
Electric utilities: 4.31% | ||||||
American Electric Power Co., Inc. | 3,442,400 | 296,390,640 | ||||
FirstEnergy Corp. | 7,336,350 | 283,329,837 | ||||
579,720,477 | ||||||
Water utilities: 1.56% | ||||||
American Water Works Co., Inc. | 1,722,750 | 210,537,278 | ||||
Total common stocks (Cost $9,410,067,941) | 13,240,493,188 | |||||
Expiration date | ||||||
Rights: 0.00% | ||||||
Financials: 0.00% | ||||||
Capital markets: 0.00% | ||||||
Pershing Square Holdings Ltd.♦† | 9-23-2033 | 2,255,595 | 0 | |||
Total rights (Cost $0) | 0 | |||||
Warrants: 0.00% | ||||||
Financials: 0.00% | ||||||
Capital markets: 0.00% | ||||||
Pershing Square Holdings Ltd.♦† | 7-24-2027 | 769,690 | 0 | |||
Total warrants (Cost $4,560,928) | 0 | |||||
Yield | ||||||
Short-term investments: 0.86% | ||||||
Investment companies: 0.86% | ||||||
Allspring Government Money Market Fund Select Class♠∞ | 5.25 % | 115,461,876 | 115,461,876 | |||
Total short-term investments (Cost $115,461,876) | 115,461,876 | |||||
Total investments in securities (Cost $9,530,090,745) | 99.18 % | 13,355,955,064 | ||||
Other assets and liabilities, net | 0.82 | 110,575,539 | ||||
Total net assets | 100.00 % | $13,466,530,603 | ||||
† | Non-income-earning security |
♠ | The issuer of the security is an affiliated person of the Fund as defined in the Investment Company Act of 1940. |
♦ | The security is fair valued in accordance with procedures approved by the Board of Trustees. |
∞ | The rate represents the 7-day annualized yield at period end. |
Abbreviations: | |
REIT | Real estate investment trust |
Value, beginning of period | Purchases | Sales proceeds | Net realized gains (losses) | Net change in unrealized gains (losses) | Value, end of period | Shares, end of period | Income from affiliated securities | |
Common stocks | ||||||||
Euronet Worldwide, Inc.† | $223,073,676 | $4,695,448 | $(8,581,393 ) | $(894,424 ) | $86,152,332 | $304,445,639 | 2,769,450 | $0 |
Reynolds Consumer Products, Inc. | 271,124,392 | 5,152,662 | 0 | 0 | 31,002,842 | 307,279,896 | 10,759,100 | 4,907,625 |
Short-term investments | ||||||||
Allspring Government Money Market Fund Select Class | 502,383,050 | 746,690,664 | (1,133,611,838 ) | 0 | 0 | 115,461,876 | 115,461,876 | 6,931,934 |
$(894,424 ) | $117,155,174 | $727,187,411 | $11,839,559 | |||||
† | Non-income-earning security |
Description | Counterparty | Number of contracts | Notional amount | Exercise price | Expiration date | Value |
Put | ||||||
Trimble, Inc. | Bank of America Securities, Inc. | 4,000 | $18,000,000 | $45.00 | 5-17-2024 | $(22 ) |
$(22 ) |
Assets | |
Investments in unaffiliated securities, at value (cost $8,870,545,179) | $12,628,767,653 |
Investments in affiliated securities, at value (cost $659,545,566) | 727,187,411 |
Cash | 9,867,495 |
Cash at broker segregated for written options | 18,000,000 |
Receivable for investments sold | 105,920,223 |
Receivable for dividends | 27,245,605 |
Receivable for Fund shares sold | 22,623,282 |
Prepaid expenses and other assets | 752,819 |
Total assets | 13,540,364,488 |
Liabilities | |
Payable for investments purchased | 40,733,751 |
Payable for Fund shares redeemed | 23,798,468 |
Management fee payable | 7,282,295 |
Administration fees payable | 1,249,012 |
Distribution fees payable | 67,111 |
Trustees’ fees and expenses payable | 7,199 |
Written options, at value (premiums received $528,876) | 22 |
Accrued expenses and other liabilities | 696,027 |
Total liabilities | 73,833,885 |
Total net assets | $13,466,530,603 |
Net assets consist of | |
Paid-in capital | $9,326,854,151 |
Total distributable earnings | 4,139,676,452 |
Total net assets | $13,466,530,603 |
Computation of net asset value and offering price per share | |
Net assets–Class A | $1,542,021,962 |
Shares outstanding–Class A1 | 31,853,452 |
Net asset value per share–Class A | $48.41 |
Maximum offering price per share – Class A2 | $51.36 |
Net assets–Class C | $107,187,277 |
Shares outstanding–Class C1 | 2,365,743 |
Net asset value per share–Class C | $45.31 |
Net assets–Class R6 | $3,549,092,407 |
Shares outstanding–Class R61 | 70,675,494 |
Net asset value per share–Class R6 | $50.22 |
Net assets–Administrator Class | $316,363,609 |
Shares outstanding–Administrator Class1 | 6,365,804 |
Net asset value per share–Administrator Class | $49.70 |
Net assets–Institutional Class | $7,951,865,348 |
Shares outstanding–Institutional Class1 | 158,624,441 |
Net asset value per share–Institutional Class | $50.13 |
Investment income | |
Dividends | $123,645,871 |
Income from affiliated securities | 11,839,559 |
Interest | 136,068 |
Total investment income | 135,621,498 |
Expenses | |
Management fee | 40,055,910 |
Administration fees | |
Class A | 1,362,653 |
Class C | 103,467 |
Class R6 | 488,593 |
Administrator Class | 195,395 |
Institutional Class | 4,657,428 |
Shareholder servicing fees | |
Class A | 1,703,315 |
Class C | 129,082 |
Administrator Class | 375,110 |
Distribution fees | |
Class C | 387,245 |
Custody and accounting fees | 163,785 |
Professional fees | 43,853 |
Registration fees | 26,411 |
Shareholder report expenses | 451,196 |
Trustees’ fees and expenses | 14,967 |
Other fees and expenses | 196,320 |
Total expenses | 50,354,730 |
Net investment income | 85,266,768 |
Realized and unrealized gains (losses) on investments | |
Net realized gains (losses) on | |
Unaffiliated securities | 334,286,838 |
Affiliated securities | (894,424 ) |
Net realized gains on investments | 333,392,414 |
Net change in unrealized gains (losses) on | |
Unaffiliated securities | 1,662,499,269 |
Affiliated securities | 117,155,174 |
Written options | 528,854 |
Net change in unrealized gains (losses) on investments | 1,780,183,297 |
Net realized and unrealized gains (losses) on investments | 2,113,575,711 |
Net increase in net assets resulting from operations | $2,198,842,479 |
Six months ended March 31, 2024 (unaudited) | Year ended September 30, 2023 | |||
Operations | ||||
Net investment income | $85,266,768 | $145,773,253 | ||
Net realized gains on investments | 333,392,414 | 546,955,331 | ||
Net change in unrealized gains (losses) on investments | 1,780,183,297 | 744,968,122 | ||
Net increase in net assets resulting from operations | 2,198,842,479 | 1,437,696,706 | ||
Distributions to shareholders from | ||||
Net investment income and net realized gains | ||||
Class A | (72,575,389 ) | (102,285,172 ) | ||
Class C | (4,859,037 ) | (9,430,371 ) | ||
Class R | N/A | (1,960,608 )1 | ||
Class R6 | (180,956,781 ) | (237,972,215 ) | ||
Administrator Class | (16,081,852 ) | (24,865,616 ) | ||
Institutional Class | (390,251,708 ) | (562,285,015 ) | ||
Total distributions to shareholders | (664,724,767 ) | (938,798,997 ) | ||
Capital share transactions | Shares | Shares | ||
Proceeds from shares sold | ||||
Class A | 2,289,225 | 101,018,064 | 7,552,518 | 332,109,508 |
Class C | 102,294 | 4,188,682 | 466,057 | 19,285,083 |
Class R | N/A | N/A | 78,409 1 | 3,492,357 1 |
Class R6 | 7,920,083 | 361,752,575 | 20,291,959 | 929,463,236 |
Administrator Class | 308,745 | 13,945,241 | 1,483,366 | 67,588,980 |
Institutional Class | 20,336,149 | 927,845,767 | 40,965,841 | 1,874,760,310 |
1,408,750,329 | 3,226,699,474 | |||
Reinvestment of distributions | ||||
Class A | 1,562,560 | 67,331,371 | 2,185,133 | 94,493,842 |
Class C | 115,958 | 4,623,250 | 223,322 | 9,002,114 |
Class R | N/A | N/A | 44,728 1 | 1,960,608 1 |
Class R6 | 3,705,131 | 166,003,937 | 4,822,812 | 216,198,148 |
Administrator Class | 361,867 | 16,007,557 | 558,463 | 24,747,212 |
Institutional Class | 8,381,897 | 374,702,181 | 12,091,678 | 540,975,336 |
628,668,296 | 887,377,260 | |||
Payment for shares redeemed | ||||
Class A | (5,202,573 ) | (229,871,576 ) | (6,040,100 ) | (266,711,307 ) |
Class C | (537,168 ) | (22,161,496 ) | (850,350 ) | (35,205,264 ) |
Class R | N/A | N/A | (122,396 )1 | (5,491,609 )1 |
Class R6 | (13,282,435 ) | (606,877,829 ) | (12,961,260 ) | (592,331,314 ) |
Administrator Class | (1,509,940 ) | (68,531,135 ) | (2,052,760 ) | (93,411,794 ) |
Institutional Class | (27,576,805 ) | (1,257,373,464 ) | (43,859,807 ) | (1,999,538,758 ) |
(2,184,815,500 ) | (2,992,690,046 ) | |||
Six months ended March 31, 2024 (unaudited) | Year ended September 30, 2023 | |||
Shares | Shares | |||
Net asset value of shares issued in acquisition | ||||
Class A | 2,119,683 | $96,889,975 | 0 | $0 |
Class C | 27,382 | 1,172,263 | 0 | 0 |
Class R6 | 283,445 | 13,434,335 | 0 | 0 |
Administrator Class | 216,950 | 10,179,714 | 0 | 0 |
Institutional Class | 1,445,839 | 68,416,152 | 0 | 0 |
190,092,439 | 0 | |||
Share conversions | ||||
Class A | 0 | 0 | 564,940 2 | 25,168,076 2 |
Class R | 0 | 0 | (556,158 )2 | (25,168,076 )2 |
0 | 0 | |||
Net increase in net assets resulting from capital share transactions | 42,695,564 | 1,121,386,688 | ||
Total increase in net assets | 1,576,813,276 | 1,620,284,397 | ||
Net assets | ||||
Beginning of period | 11,889,717,327 | 10,269,432,930 | ||
End of period | $13,466,530,603 | $11,889,717,327 | ||
Six months ended March 31, 2024 (unaudited) | Year ended September 30 | |||||
Class A | 2023 | 2022 | 2021 | 2020 | 2019 | |
Net asset value, beginning of period | $42.93 | $40.97 | $49.22 | $35.33 | $39.63 | $37.59 |
Net investment income | 0.24 1 | 0.37 | 0.22 | 0.13 | 0.18 | 0.26 |
Net realized and unrealized gains (losses) on investments | 7.64 | 5.32 | (3.63 ) | 13.91 | (2.85 ) | 2.54 |
Total from investment operations | 7.88 | 5.69 | (3.41 ) | 14.04 | (2.67 ) | 2.80 |
Distributions to shareholders from | ||||||
Net investment income | (0.45 ) | (0.32 ) | (0.11 ) | (0.15 ) | (0.23 ) | (0.17 ) |
Net realized gains | (1.95 ) | (3.41 ) | (4.73 ) | 0.00 | (1.40 ) | (0.59 ) |
Total distributions to shareholders | (2.40 ) | (3.73 ) | (4.84 ) | (0.15 ) | (1.63 ) | (0.76 ) |
Net asset value, end of period | $48.41 | $42.93 | $40.97 | $49.22 | $35.33 | $39.63 |
Total return2 | 19.08 % | 13.89 % | (8.32 )% | 39.83 % | (7.22 )% | 7.81 % |
Ratios to average net assets (annualized) | ||||||
Gross expenses | 1.12 % | 1.13 % | 1.12 % | 1.13 % | 1.14 % | 1.15 % |
Net expenses | 1.12 % | 1.13 % | 1.12 % | 1.13 % | 1.14 % | 1.15 % |
Net investment income | 1.11 % | 0.94 % | 0.55 % | 0.17 % | 0.56 % | 0.67 % |
Supplemental data | ||||||
Portfolio turnover rate | 9 % | 27 % | 24 % | 38 % | 51 % | 37 % |
Net assets, end of period (000s omitted) | $1,542,022 | $1,334,415 | $1,098,924 | $1,131,411 | $969,508 | $1,003,560 |
1 | Calculated based upon average shares outstanding |
2 | Total return calculations do not include any sales charges. Returns for periods of less than one year are not annualized. |
Six months ended March 31, 2024 (unaudited) | Year ended September 30 | |||||
Class C | 2023 | 2022 | 2021 | 2020 | 2019 | |
Net asset value, beginning of period | $40.05 | $38.43 | $46.68 | $33.63 | $37.85 | $36.02 |
Net investment income (loss) | 0.07 1 | 0.03 | (0.11 ) | (0.25 )1 | (0.11 ) | (0.07 ) |
Net realized and unrealized gains (losses) on investments | 7.14 | 5.00 | (3.41 ) | 13.30 | (2.71 ) | 2.49 |
Total from investment operations | 7.21 | 5.03 | (3.52 ) | 13.05 | (2.82 ) | 2.42 |
Distributions to shareholders from | ||||||
Net realized gains | (1.95 ) | (3.41 ) | (4.73 ) | 0.00 | (1.40 ) | (0.59 ) |
Net asset value, end of period | $45.31 | $40.05 | $38.43 | $46.68 | $33.63 | $37.85 |
Total return2 | 18.66 % | 13.03 % | (9.03 )% | 38.80 % | (7.89 )% | 7.00 % |
Ratios to average net assets (annualized) | ||||||
Gross expenses | 1.87 % | 1.88 % | 1.87 % | 1.88 % | 1.89 % | 1.90 % |
Net expenses | 1.87 % | 1.88 % | 1.87 % | 1.88 % | 1.89 % | 1.90 % |
Net investment income (loss) | 0.34 % | 0.17 % | (0.22 )% | (0.58 )% | (0.19 )% | (0.09 )% |
Supplemental data | ||||||
Portfolio turnover rate | 9 % | 27 % | 24 % | 38 % | 51 % | 37 % |
Net assets, end of period (000s omitted) | $107,187 | $106,431 | $108,314 | $132,741 | $110,318 | $147,086 |
1 | Calculated based upon average shares outstanding |
2 | Total return calculations do not include any sales charges. Returns for periods of less than one year are not annualized. |
Six months ended March 31, 2024 (unaudited) | Year ended September 30 | |||||
Class R6 | 2023 | 2022 | 2021 | 2020 | 2019 | |
Net asset value, beginning of period | $44.53 | $42.36 | $50.72 | $36.39 | $40.76 | $38.67 |
Net investment income | 0.35 1 | 0.59 | 0.46 | 0.29 | 0.36 | 0.40 |
Net realized and unrealized gains (losses) on investments | 7.92 | 5.49 | (3.79 ) | 14.36 | (2.94 ) | 2.62 |
Total from investment operations | 8.27 | 6.08 | (3.33 ) | 14.65 | (2.58 ) | 3.02 |
Distributions to shareholders from | ||||||
Net investment income | (0.63 ) | (0.50 ) | (0.30 ) | (0.32 ) | (0.39 ) | (0.34 ) |
Net realized gains | (1.95 ) | (3.41 ) | (4.73 ) | 0.00 | (1.40 ) | (0.59 ) |
Total distributions to shareholders | (2.58 ) | (3.91 ) | (5.03 ) | (0.32 ) | (1.79 ) | (0.93 ) |
Net asset value, end of period | $50.22 | $44.53 | $42.36 | $50.72 | $36.39 | $40.76 |
Total return2 | 19.33 % | 14.38 % | (7.93 )% | 40.44 % | (6.84 )% | 8.28 % |
Ratios to average net assets (annualized) | ||||||
Gross expenses | 0.70 % | 0.70 % | 0.69 % | 0.70 % | 0.71 % | 0.72 % |
Net expenses | 0.70 % | 0.70 % | 0.69 % | 0.70 % | 0.71 % | 0.72 % |
Net investment income | 1.52 % | 1.37 % | 0.96 % | 0.60 % | 0.99 % | 1.12 % |
Supplemental data | ||||||
Portfolio turnover rate | 9 % | 27 % | 24 % | 38 % | 51 % | 37 % |
Net assets, end of period (000s omitted) | $3,549,092 | $3,208,044 | $2,537,407 | $2,925,693 | $2,103,895 | $2,094,860 |
1 | Calculated based upon average shares outstanding |
2 | Returns for periods of less than one year are not annualized. |
Six months ended March 31, 2024 (unaudited) | Year ended September 30 | |||||
Administrator Class | 2023 | 2022 | 2021 | 2020 | 2019 | |
Net asset value, beginning of period | $44.02 | $41.90 | $50.22 | $36.02 | $40.35 | $38.23 |
Net investment income | 0.26 1 | 0.46 | 0.39 | 0.23 | 0.24 1 | 0.27 1 |
Net realized and unrealized gains (losses) on investments | 7.84 | 5.40 | (3.85 ) | 14.13 | (2.93 ) | 2.61 |
Total from investment operations | 8.10 | 5.86 | (3.46 ) | 14.36 | (2.69 ) | 2.88 |
Distributions to shareholders from | ||||||
Net investment income | (0.47 ) | (0.33 ) | (0.13 ) | (0.16 ) | (0.24 ) | (0.17 ) |
Net realized gains | (1.95 ) | (3.41 ) | (4.73 ) | 0.00 | (1.40 ) | (0.59 ) |
Total distributions to shareholders | (2.42 ) | (3.74 ) | (4.86 ) | (0.16 ) | (1.64 ) | (0.76 ) |
Net asset value, end of period | $49.70 | $44.02 | $41.90 | $50.22 | $36.02 | $40.35 |
Total return2 | 19.12 % | 13.99 % | (8.26 )% | 39.96 % | (7.15 )% | 7.88 % |
Ratios to average net assets (annualized) | ||||||
Gross expenses | 1.05 % | 1.05 % | 1.04 % | 1.05 % | 1.06 % | 1.07 % |
Net expenses | 1.05 % | 1.05 % | 1.04 % | 1.05 % | 1.06 % | 1.07 % |
Net investment income | 1.16 % | 1.00 % | 0.60 % | 0.25 % | 0.65 % | 0.72 % |
Supplemental data | ||||||
Portfolio turnover rate | 9 % | 27 % | 24 % | 38 % | 51 % | 37 % |
Net assets, end of period (000s omitted) | $316,364 | $307,586 | $293,286 | $389,512 | $324,727 | $604,126 |
1 | Calculated based upon average shares outstanding |
2 | Returns for periods of less than one year are not annualized. |
Six months ended March 31, 2024 (unaudited) | Year ended September 30 | |||||
Institutional Class | 2023 | 2022 | 2021 | 2020 | 2019 | |
Net asset value, beginning of period | $44.43 | $42.28 | $50.63 | $36.33 | $40.70 | $38.61 |
Net investment income | 0.32 1 | 0.56 | 0.42 | 0.24 | 0.32 | 0.38 1 |
Net realized and unrealized gains (losses) on investments | 7.92 | 5.45 | (3.78 ) | 14.35 | (2.94 ) | 2.60 |
Total from investment operations | 8.24 | 6.01 | (3.36 ) | 14.59 | (2.62 ) | 2.98 |
Distributions to shareholders from | ||||||
Net investment income | (0.59 ) | (0.45 ) | (0.26 ) | (0.29 ) | (0.35 ) | (0.30 ) |
Net realized gains | (1.95 ) | (3.41 ) | (4.73 ) | 0.00 | (1.40 ) | (0.59 ) |
Total distributions to shareholders | (2.54 ) | (3.86 ) | (4.99 ) | (0.29 ) | (1.75 ) | (0.89 ) |
Net asset value, end of period | $50.13 | $44.43 | $42.28 | $50.63 | $36.33 | $40.70 |
Total return2 | 19.28 % | 14.24 % | (8.01 )% | 40.30 % | (6.93 )% | 8.17 % |
Ratios to average net assets (annualized) | ||||||
Gross expenses | 0.80 % | 0.80 % | 0.79 % | 0.80 % | 0.81 % | 0.82 % |
Net expenses | 0.80 % | 0.80 % | 0.79 % | 0.80 % | 0.81 % | 0.82 % |
Net investment income | 1.43 % | 1.26 % | 0.86 % | 0.50 % | 0.89 % | 1.00 % |
Supplemental data | ||||||
Portfolio turnover rate | 9 % | 27 % | 24 % | 38 % | 51 % | 37 % |
Net assets, end of period (000s omitted) | $7,951,865 | $6,933,240 | $6,208,455 | $7,209,810 | $5,197,362 | $5,349,953 |
1 | Calculated based upon average shares outstanding |
2 | Returns for periods of less than one year are not annualized. |
Gross unrealized gains | $4,066,007,331 |
Gross unrealized losses | (228,607,050 ) |
Net unrealized gains | $3,837,400,281 |
Quoted prices (Level 1) | Other significant observable inputs (Level 2) | Significant unobservable inputs (Level 3) | Total | |
Assets | ||||
Investments in: | ||||
Common stocks | ||||
Communication services | $12,106,041 | $0 | $0 | $12,106,041 |
Consumer discretionary | 859,492,106 | 0 | 0 | 859,492,106 |
Consumer staples | 909,884,044 | 0 | 0 | 909,884,044 |
Energy | 836,350,454 | 0 | 0 | 836,350,454 |
Financials | 2,676,347,005 | 7 | 0 | 2,676,347,012 |
Health care | 1,190,246,188 | 0 | 0 | 1,190,246,188 |
Industrials | 3,033,670,106 | 0 | 0 | 3,033,670,106 |
Information technology | 529,840,541 | 0 | 0 | 529,840,541 |
Materials | 1,215,663,760 | 0 | 0 | 1,215,663,760 |
Real estate | 1,186,635,181 | 0 | 0 | 1,186,635,181 |
Utilities | 790,257,755 | 0 | 0 | 790,257,755 |
Rights | ||||
Financials | 0 | 0 | 0 | 0 |
Warrants | ||||
Financials | 0 | 0 | 0 | 0 |
Short-term investments | ||||
Investment companies | 115,461,876 | 0 | 0 | 115,461,876 |
Total assets | $13,355,955,057 | $7 | $0 | $13,355,955,064 |
Liabilities | ||||
Written options | $0 | $22 | $0 | $22 |
Total liabilities | $0 | $22 | $0 | $22 |
Average daily net assets | Management fee |
First $500 million | 0.750 % |
Next $500 million | 0.725 |
Next $1 billion | 0.700 |
Next $2 billion | 0.675 |
Next $1 billion | 0.650 |
Next $5 billion | 0.640 |
Next $2 billion | 0.630 |
Next $4 billion | 0.620 |
Over $16 billion | 0.610 |
Class-level administration fee | |
Class A | 0.20 % |
Class C | 0.20 |
Class R6 | 0.03 |
Administrator Class | 0.13 |
Institutional Class | 0.13 |
EXPENSE RATIO CAPS | |
Class A | 1.15 % |
Class C | 1.90 |
Class R6 | 0.73 |
Administrator Class | 1.08 |
Institutional Class | 0.83 |
Counterparty | Gross amounts of liabilities in the Statement of Assets and Liabilities | Amounts subject to netting agreements | Collateral pledged1 | Net amount of liabilities |
Bank of America Securities, Inc. | $22 | $0 | $(22 ) | $0 |
1 | Collateral pledged within this table is limited to the collateral for the net transaction with the counterparty. |
Net investment income | $85,911,070 |
Net realized and unrealized gains (losses) on investments | 2,192,881,219 |
Net increase in net assets resulting from operations | $2,278,792,289 |
Name and year of birth | Position held and length of service* | Principal occupations during past five years or longer | Current other public company or investment company directorships |
William R. Ebsworth (Born 1957) | Trustee, since 2015 | Retired. From 1984 to 2013, equities analyst, portfolio manager, research director and chief investment officer at Fidelity Management and Research Company in Boston, Tokyo, and Hong Kong, and retired in 2013 as Chief Investment Officer of Fidelity Strategic Advisers, Inc. where he led a team of investment professionals managing client assets. Prior thereto, Board member of Hong Kong Securities Clearing Co., Hong Kong Options Clearing Corp., the Thailand International Fund, Ltd., Fidelity Investments Life Insurance Company, and Empire Fidelity Investments Life Insurance Company. Serves on the Investment Company Institute’s Board of Governors since 2022 and Executive Committee since 2023 as well as the Vice Chairman of the Governing Council of the Independent Directors Council since 2023. Audit Committee Chair and Investment Committee Chair of the Vincent Memorial Hospital Foundation (non-profit organization). Mr. Ebsworth is a CFA charterholder. | N/A |
Jane A. Freeman (Born 1953) | Trustee, since 2015; Chair Liaison, since January 2018# | Retired. From 2012 to 2014 and 1999 to 2008, Chief Financial Officer of Scientific Learning Corporation. From 2008 to 2012, Ms. Freeman provided consulting services related to strategic business projects. Prior to 1999, Portfolio Manager at Rockefeller & Co. and Scudder, Stevens & Clark. Board member of the Harding Loevner Funds from 1996 to 2014, serving as both Lead Independent Director and chair of the Audit Committee. Board member of the Russell Exchange Traded Funds Trust from 2011 to 2012 and the chair of the Audit Committee. Ms. Freeman is also an inactive Chartered Financial Analyst. | N/A |
Isaiah Harris, Jr. (Born 1952) | Trustee, since 2009; Audit Committee Chair, since 2019 | Retired. Member of the Advisory Board of CEF of East Central Florida. Chairman of the Board of CIGNA Corporation from 2009 to 2021, and Director from 2005 to 2008. From 2003 to 2011, Director of Deluxe Corporation. Prior thereto, President and CEO of BellSouth Advertising and Publishing Corp. from 2005 to 2007, President and CEO of BellSouth Enterprises from 2004 to 2005 and President of BellSouth Consumer Services from 2000 to 2003. Emeritus member of the Iowa State University Foundation Board of Governors. Emeritus Member of the Advisory board of Iowa State University School of Business. Advisory Board Member, Palm Harbor Academy (private school). Advisory Board Member, Fellowship of Christian Athletes. Mr. Harris is a certified public accountant (inactive status). | N/A |
David F. Larcker (Born 1950) | Trustee, since 2009 | Distinguished Visiting Fellow at the Hoover Institution since 2022. James Irvin Miller Professor of Accounting at the Graduate School of Business (Emeritus), Stanford University, Director of the Corporate Governance Research Initiative and Senior Faculty of The Rock Center for Corporate Governance since 2006. From 2005 to 2008, Professor of Accounting at the Graduate School of Business, Stanford University. Prior thereto, Ernst & Young Professor of Accounting at The Wharton School, University of Pennsylvania from 1985 to 2005. | N/A |
Olivia S. Mitchell (Born 1953) | Trustee, since 2006; Nominating and Governance Committee Chair, since 2018 | International Foundation of Employee Benefit Plans Professor since 1993, Wharton School of the University of Pennsylvania. Director of Wharton’s Pension Research Council and Boettner Center on Pensions & Retirement Research, and Research Associate at the National Bureau of Economic Research. Previously taught at Cornell University from 1978 to 1993. | N/A |
Name and year of birth | Position held and length of service* | Principal occupations during past five years or longer | Current other public company or investment company directorships |
Timothy J. Penny (Born 1951) | Trustee, since 1996; Chair, since 2018 | President and Chief Executive Officer of Southern Minnesota Initiative Foundation, a non-profit organization, since 2007. Vice Chair of the Economic Club of Minnesota, since 2007. Co-Chair of the Committee for a Responsible Federal Budget, since 1995. Member of the Board of Trustees of NorthStar Education Finance, Inc., a non-profit organization, from 2007-2022. Senior Fellow of the University of Minnesota Humphrey Institute from 1995 to 2017. | N/A |
James G. Polisson (Born 1959) | Trustee, since 2018 | Retired. Chief Marketing Officer, Source (ETF) UK Services, Ltd, from 2015 to 2017. From 2012 to 2015, Principal of The Polisson Group, LLC, a management consulting, corporate advisory and principal investing company. Chief Executive Officer and Managing Director at Russell Investments, Global Exchange Traded Funds from 2010 to 2012. Managing Director of Barclays Global Investors from 1998 to 2010 and Global Chief Marketing Officer for iShares and Barclays Global Investors from 2000 to 2010. Trustee of the San Francisco Mechanics’ Institute, a non- profit organization, from 2013 to 2015. Board member of the Russell Exchange Traded Fund Trust from 2011 to 2012. Director of Barclays Global Investors Holdings Deutschland GmbH from 2006 to 2009. Mr. Polisson is an attorney and has a retired status with the Massachusetts and District of Columbia Bar Associations. | N/A |
Pamela Wheelock (Born 1959) | Trustee, since January 2020; previously Trustee from January 2018 to July 2019# | Retired. Executive and Senior Financial leadership positions in the public, private and nonprofit sectors. Interim President and CEO, McKnight Foundation, 2020. Interim Commissioner, Minnesota Department of Human Services, 2019. Chief Operating Officer, Twin Cities Habitat for Humanity, 2017-2019. Vice President for University Services, University of Minnesota, 2012- 2016. Interim President and CEO, Blue Cross and Blue Shield of Minnesota, 2011-2012. Executive Vice-President and Chief Financial Officer, Minnesota Wild, 2002-2008. Commissioner, Minnesota Department of Finance, 1999-2002. Chair of the Board of Directors of Destination Medical Center Corporation. Board member of the Minnesota Wild Foundation. | N/A |
Name and year of birth | Position held and length of service | Principal occupations during past five years or longer |
Andrew Owen (Born 1960) | President, since 2017 | President and Chief Executive Officer of Allspring Funds Management, LLC since 2017 and Head of Global Fund Governance of Allspring Global Investments since 2022. Prior thereto, co-president of Galliard Capital Management, LLC, an affiliate of Allspring Funds Management, LLC, from 2019 to 2022 and Head of Affiliated Managers, Allspring Global Investments, from 2014 to 2019 and Executive Vice President responsible for marketing, investments and product development for Allspring Funds Management, LLC, from 2009 to 2014. |
Jeremy DePalma (Born 1974) | Treasurer, since 2012 (for certain funds in the Fund Complex); since 2021 (for the remaining funds in the Complex) | Senior Vice President of Allspring Funds Management, LLC since 2009. Senior Vice President of Evergreen Investment Management Company, LLC from 2008 to 2010 and head of the Fund Reporting and Control Team within Fund Administration from 2005 to 2010. |
Christopher Baker (Born 1976) | Chief Compliance Officer, since 2022 | Global Chief Compliance Officer for Allspring Global Investments since 2022. Prior thereto, Chief Compliance Officer for State Street Global Advisors from 2018 to 2021. Senior Compliance Officer for the State Street divisions of Alternative Investment Solutions, Sector Solutions, and Global Marketing from 2015 to 2018. From 2010 to 2015 Vice President, Global Head of Investment and Marketing Compliance for State Street Global Advisors. |
Matthew Prasse (Born 1983) | Chief Legal Officer, since 2022; Secretary, since 2021 | Senior Counsel of the Allspring Legal Department since 2021. Senior Counsel of the Wells Fargo Legal Department from 2018 to 2021. Previously, Counsel for Barings LLC from 2015 to 2018. Prior to joining Barings, Associate at Morgan, Lewis & Bockius LLP from 2008 to 2015. |

P.O. Box 219967
Kansas City, MO 64121-9967

SAR3323 03-24
ITEM 2. CODE OF ETHICS
Not applicable.
ITEM 3. AUDIT COMMITTEE FINANCIAL EXPERT
Not applicable.
ITEM 4. PRINCIPAL ACCOUNTANT FEES AND SERVICES
Not applicable.
ITEM 5. AUDIT COMMITTEE OF LISTED REGISTRANTS
Not applicable.
ITEM 6. INVESTMENTS
A Portfolio of Investments for the series of Allspring Funds Trust is included as part of the report to shareholders filed under Item 1 of this Form.
ITEM 7. DISCLOSURE OF PROXY VOTING POLICIES AND PROCEDURES FOR CLOSED-END MANAGEMENT INVESTMENT COMPANIES
Not applicable.
ITEM 8. PORTFOLIO MANAGERS OF CLOSED-END MANAGEMENT INVESTMENT COMPANIES
Not applicable.
ITEM 9. PURCHASES OF EQUITY SECURITIES BY CLOSED-END MANAGEMENT INVESTMENT COMPANY AND AFFILIATED PURCHASERS
Not applicable.
ITEM 10. SUBMISSION OF MATTERS TO A VOTE OF SECURITY HOLDERS
There have been no material changes to the procedures by which shareholders may recommend nominees to the registrant’s Board of Trustees that have been implemented since the registrant’s last provided disclosure in response to the requirements of this Item.
ITEM 11. CONTROLS AND PROCEDURES
(a) The President and Treasurer have concluded that the Allspring Funds Trust disclosure controls and procedures (as defined in Rule 30a-3(c) under the Investment Company Act of 1940) provide reasonable assurances that material information relating to the registrant is made known to them by the appropriate persons, based on their evaluation of these controls and procedures as of a date within 90 days of the filing of this report.
3
(b) There were no significant changes in the registrant’s internal control over financial reporting (as defined in Rule 30a-3(d) under the Investment Company Act of 1940) that occurred during the period covered by this report that materially affected, or is reasonably likely to materially affect, the registrant’s internal control over financial reporting.
ITEM 12. DISCLOSURES OF SECURITIES LENDING ACTIVITES FOR CLOSED-END MANAGEMENT INVESTMENT COMPANIES
Not applicable.
ITEM 13. EXHIBITS
(a)(1) Not applicable.
(a)(2) Certifications pursuant to Section 302 of the Sarbanes-Oxley Act of 2002.
(a)(3) Not applicable.
(a)(4) Not applicable.
(b) Certifications pursuant to Section 906 of the Sarbanes-Oxley Act of 2002.
4
SIGNATURES
Pursuant to the requirements of the Securities Exchange Act of 1934 and the Investment Company Act of 1940, the registrant has duly caused this report to be signed on its behalf by the undersigned, thereunto duly authorized.
| Allspring Funds Trust | ||
| By: | /s/ Andrew Owen | |
| Andrew Owen | ||
| President | ||
| Date: May 23, 2024 | ||
Pursuant to the requirements of the Securities Exchange Act of 1934 and the Investment Company Act of 1940, this report has been signed below by the following persons on behalf of the registrant and in the capacities and on the date indicated.
| Allspring Funds Trust | ||
| By: | /s/ Andrew Owen | |
| Andrew Owen | ||
| President | ||
| Date: May 23, 2024 | ||
| By: | /s/Jeremy DePalma | |
| Jeremy DePalma | ||
| Treasurer | ||
| Date: May 23, 2024 | ||
1