0001081400allspring:C000020145Memberallspring:FR42226A107CTIMember2024-09-300001081400allspring:C000130040Memberallspring:FR03820C105CTIMember2024-09-300001081400allspring:C000053345Memberallspring:FR88162G103CTIMember2024-09-300001081400allspring:ALLSPRINGIndexBloombergUSUniversalBondIndex15801AdditionalIndexMember2024-07-310001081400allspring:C000089465Member2023-03-310001081400allspring:ALLSPRINGIndexRussellMidcapGrowthIndex25224BroadBasedIndexMember2022-04-300001081400allspring:ALLSPRINGIndexIndexAssetAllocationBlendedIndex15922BroadBasedIndexMember2019-04-300001081400allspring:C000219846Member2018-08-310001081400allspring:ALLSPRINGIndexRussell3000Index16049AdditionalIndexMember2020-12-310001081400allspring:C000053347Member2020-10-31

UNITED STATES
SECURITIES AND EXCHANGE COMMISSION
Washington, D.C. 20549
FORM N-CSR
CERTIFIED SHAREHOLDER REPORT OF REGISTERED
MANAGEMENT INVESTMENT COMPANIES
Investment Company Act file number: 811-09253
Allspring Funds Trust
(Exact name of registrant as specified in charter)
1415 Vantage Park Drive, 3rd Floor, Charlotte, NC 28203
(Address of principal executive offices) (Zip code)
Matthew Prasse
Allspring Funds Management, LLC
1415 Vantage Park Drive, 3rd Floor, Charlotte, NC 28203
(Name and address of agent for service)
Registrant’s telephone number, including area code: 800-222-8222
Date of fiscal year end: September 30
Registrant is making a filing for 10 of its series: Allspring Common Stock Fund, Allspring Diversified Capital Builder Fund, Allspring Diversified Income Builder Fund, Allspring Global Investment Grade Credit Fund, Allspring Income Plus Fund, Allspring Index Asset Allocation Fund, Allspring Mid Cap Growth Fund, Allspring Opportunity Fund, Allspring SMID Cap Growth Fund and Allspring Special Mid Cap Value Fund
Date of reporting period: September 30, 2024
ITEM 1. REPORT TO STOCKHOLDERS
Annual Shareholder Report
This annual shareholder report contains important information about Common Stock Fund for the period of October 1, 2023 to September 30, 2024. You can find additional information about the Fund at allspringglobal.com. You can also request this information by contacting us at 1-800-222-8222.
What were the Fund costs for the past year?
The table explains the costs you would have paid within the reporting period based on a hypothetical $10,000 investment.
| CLASS NAME | COSTS OF A $10,000 INVESTMENT | COSTS PAID AS A % OF A $10,000 INVESTMENT |
|---|
| Institutional Class | $94 | 0.85% |
The manager has contractually committed to waive fees and/or reimburse certain expenses to the extent necessary to cap the Fund's total annual fund operating expense ratio at a specific amount. Without this cap, the costs shown above may have been higher. Please see the prospectus for the amount and the expiration date of the cap. Prior to or after the commitment expiration date, the cap may be increased or the commitment to maintain the cap may be terminated only with the approval of the Board of Trustees.
How did the Fund perform last year and what affected its performance?
Over the 12-month period that ended September 30, 2024, the equity markets soared to all-time highs, fueled by positive earnings surprises, robust economic growth, a decline in both inflation and interest rates, and a fervor around artificial intelligence (AI). Driven by semiconductor chip designer NVIDIA Corp., the AI theme significantly boosted the mega-cap growth sector to unprecedented heights. By contrast, small- and mid-cap stocks substantially underperformed large caps, partly due to their inferior balance sheet profiles. However, with the Federal Reserve pivoting to a more accommodative stance, future rate cuts could lower borrowing costs and be a catalyst for smaller-cap companies.
Key detractors during the period included Atkore Inc., which endured a cyclical downturn, citing weaker customer spending, and Leslie’s Inc., which toiled with a decline in chlorine prices, a CEO change, and softness in new pool and renovation construction. Going forward, we remain optimistic about the Fund’s prospects given the attractive private market valuations of many of our holdings.
Total return based on a $10,000 investment
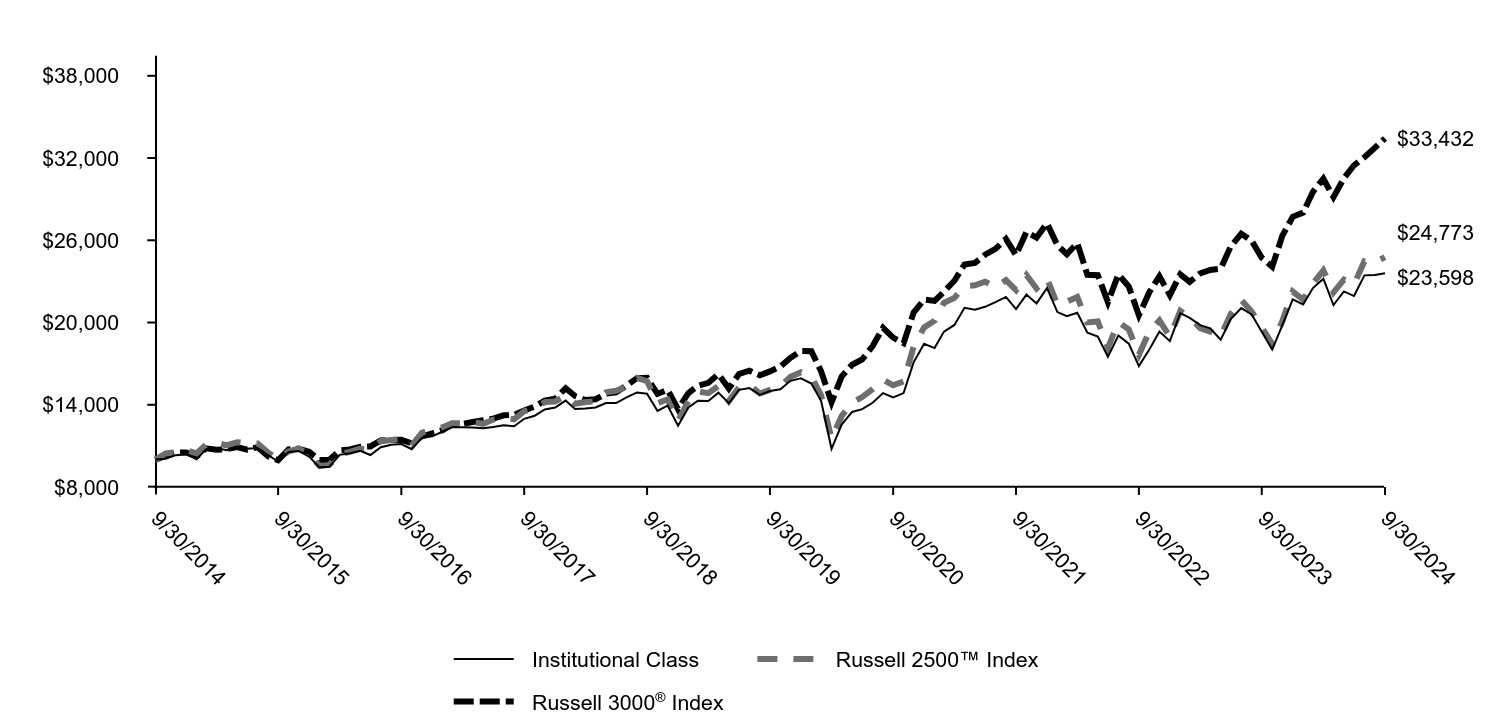
| Institutional Class | Russell 2500™ Index | Russell 3000® Index |
|---|
| 9/30/2014 | $10,000 | $10,000 | $10,000 |
| 10/31/2014 | $10,063 | $10,443 | $10,275 |
| 11/30/2014 | $10,325 | $10,533 | $10,524 |
| 12/31/2014 | $10,392 | $10,677 | $10,524 |
| 1/31/2015 | $10,027 | $10,458 | $10,231 |
| 2/28/2015 | $10,761 | $11,081 | $10,824 |
| 3/31/2015 | $10,837 | $11,229 | $10,713 |
| 4/30/2015 | $10,677 | $11,032 | $10,762 |
| 5/31/2015 | $10,864 | $11,268 | $10,911 |
| 6/30/2015 | $10,797 | $11,190 | $10,728 |
| 7/31/2015 | $10,850 | $11,169 | $10,908 |
| 8/31/2015 | $10,334 | $10,508 | $10,249 |
| 9/30/2015 | $9,862 | $10,038 | $9,951 |
| 10/31/2015 | $10,548 | $10,599 | $10,736 |
| 11/30/2015 | $10,632 | $10,807 | $10,796 |
| 12/31/2015 | $10,220 | $10,367 | $10,574 |
| 1/31/2016 | $9,433 | $9,540 | $9,978 |
| 2/29/2016 | $9,478 | $9,607 | $9,975 |
| 3/31/2016 | $10,345 | $10,408 | $10,677 |
| 4/30/2016 | $10,466 | $10,561 | $10,743 |
| 5/31/2016 | $10,636 | $10,784 | $10,935 |
| 6/30/2016 | $10,335 | $10,779 | $10,958 |
| 7/31/2016 | $10,902 | $11,342 | $11,393 |
| 8/31/2016 | $11,087 | $11,432 | $11,422 |
| 9/30/2016 | $11,133 | $11,487 | $11,440 |
| 10/31/2016 | $10,756 | $11,021 | $11,192 |
| 11/30/2016 | $11,584 | $11,958 | $11,693 |
| 12/31/2016 | $11,697 | $12,190 | $11,921 |
| 1/31/2017 | $12,050 | $12,360 | $12,145 |
| 2/28/2017 | $12,351 | $12,657 | $12,597 |
| 3/31/2017 | $12,367 | $12,648 | $12,606 |
| 4/30/2017 | $12,341 | $12,746 | $12,739 |
| 5/31/2017 | $12,294 | $12,603 | $12,870 |
| 6/30/2017 | $12,382 | $12,918 | $12,986 |
| 7/31/2017 | $12,497 | $13,052 | $13,231 |
| 8/31/2017 | $12,434 | $12,944 | $13,256 |
| 9/30/2017 | $12,975 | $13,531 | $13,579 |
| 10/31/2017 | $13,198 | $13,740 | $13,876 |
| 11/30/2017 | $13,661 | $14,192 | $14,297 |
| 12/31/2017 | $13,800 | $14,240 | $14,440 |
| 1/31/2018 | $14,306 | $14,674 | $15,201 |
| 2/28/2018 | $13,684 | $14,070 | $14,641 |
| 3/31/2018 | $13,725 | $14,206 | $14,347 |
| 4/30/2018 | $13,800 | $14,239 | $14,402 |
| 5/31/2018 | $14,128 | $14,909 | $14,808 |
| 6/30/2018 | $14,128 | $15,017 | $14,905 |
| 7/31/2018 | $14,536 | $15,307 | $15,400 |
| 8/31/2018 | $14,899 | $15,964 | $15,940 |
| 9/30/2018 | $14,807 | $15,722 | $15,967 |
| 10/31/2018 | $13,552 | $14,126 | $14,791 |
| 11/30/2018 | $13,938 | $14,392 | $15,087 |
| 12/31/2018 | $12,473 | $12,815 | $13,683 |
| 1/31/2019 | $13,797 | $14,291 | $14,858 |
| 2/28/2019 | $14,301 | $14,966 | $15,380 |
| 3/31/2019 | $14,274 | $14,842 | $15,605 |
| 4/30/2019 | $14,886 | $15,363 | $16,228 |
| 5/31/2019 | $14,106 | $14,270 | $15,178 |
| 6/30/2019 | $15,088 | $15,282 | $16,244 |
| 7/31/2019 | $15,215 | $15,441 | $16,485 |
| 8/31/2019 | $14,725 | $14,823 | $16,149 |
| 9/30/2019 | $15,000 | $15,086 | $16,433 |
| 10/31/2019 | $15,135 | $15,375 | $16,786 |
| 11/30/2019 | $15,746 | $16,035 | $17,424 |
| 12/31/2019 | $15,924 | $16,374 | $17,928 |
| 1/31/2020 | $15,551 | $16,041 | $17,908 |
| 2/29/2020 | $14,288 | $14,696 | $16,442 |
| 3/31/2020 | $10,786 | $11,507 | $14,181 |
| 4/30/2020 | $12,552 | $13,182 | $16,059 |
| 5/31/2020 | $13,473 | $14,155 | $16,918 |
| 6/30/2020 | $13,679 | $14,564 | $17,304 |
| 7/31/2020 | $14,143 | $15,144 | $18,287 |
| 8/31/2020 | $14,851 | $15,830 | $19,612 |
| 9/30/2020 | $14,531 | $15,421 | $18,898 |
| 10/31/2020 | $14,851 | $15,700 | $18,490 |
| 11/30/2020 | $17,104 | $18,258 | $20,739 |
| 12/31/2020 | $18,444 | $19,647 | $21,672 |
| 1/31/2021 | $18,133 | $20,129 | $21,576 |
| 2/28/2021 | $19,337 | $21,442 | $22,250 |
| 3/31/2021 | $19,823 | $21,795 | $23,048 |
| 4/30/2021 | $21,075 | $22,665 | $24,236 |
| 5/31/2021 | $20,940 | $22,712 | $24,346 |
| 6/30/2021 | $21,147 | $22,981 | $24,947 |
| 7/31/2021 | $21,482 | $22,578 | $25,369 |
| 8/31/2021 | $21,865 | $23,091 | $26,092 |
| 9/30/2021 | $20,972 | $22,364 | $24,921 |
| 10/31/2021 | $22,040 | $23,461 | $26,607 |
| 11/30/2021 | $21,394 | $22,482 | $26,202 |
| 12/31/2021 | $22,516 | $23,220 | $27,234 |
| 1/31/2022 | $20,763 | $21,287 | $25,631 |
| 2/28/2022 | $20,462 | $21,527 | $24,986 |
| 3/31/2022 | $20,716 | $21,869 | $25,796 |
| 4/30/2022 | $19,265 | $20,006 | $23,481 |
| 5/31/2022 | $18,982 | $20,073 | $23,450 |
| 6/30/2022 | $17,502 | $18,155 | $21,488 |
| 7/31/2022 | $19,057 | $20,034 | $23,504 |
| 8/31/2022 | $18,454 | $19,501 | $22,627 |
| 9/30/2022 | $16,824 | $17,644 | $20,528 |
| 10/31/2022 | $18,030 | $19,337 | $22,212 |
| 11/30/2022 | $19,340 | $20,153 | $23,371 |
| 12/31/2022 | $18,642 | $18,954 | $22,003 |
| 1/31/2023 | $20,681 | $20,850 | $23,518 |
| 2/28/2023 | $20,343 | $20,360 | $22,968 |
| 3/31/2023 | $19,809 | $19,597 | $23,583 |
| 4/30/2023 | $19,580 | $19,341 | $23,834 |
| 5/31/2023 | $18,740 | $19,002 | $23,927 |
| 6/30/2023 | $20,245 | $20,621 | $25,560 |
| 7/31/2023 | $21,052 | $21,646 | $26,477 |
| 8/31/2023 | $20,583 | $20,796 | $25,966 |
| 9/30/2023 | $19,329 | $19,635 | $24,729 |
| 10/31/2023 | $18,031 | $18,442 | $24,073 |
| 11/30/2023 | $19,798 | $20,102 | $26,318 |
| 12/31/2023 | $21,682 | $22,257 | $27,714 |
| 1/31/2024 | $21,321 | $21,675 | $28,021 |
| 2/29/2024 | $22,516 | $22,854 | $29,538 |
| 3/31/2024 | $23,192 | $23,797 | $30,491 |
| 4/30/2024 | $21,276 | $22,203 | $29,149 |
| 5/31/2024 | $22,268 | $23,126 | $30,526 |
| 6/30/2024 | $21,930 | $22,780 | $31,471 |
| 7/31/2024 | $23,440 | $24,472 | $32,056 |
| 8/31/2024 | $23,463 | $24,409 | $32,754 |
| 9/30/2024 | $23,598 | $24,773 | $33,432 |
Annual Shareholder Report | September 30, 2024
AVERAGE ANNUAL TOTAL RETURNS (%)
| 1 Year | 5 Years | 10 Years |
|---|
| Institutional Class | 22.09 | 9.49 | 8.97 |
| Russell 2500™ Index (Strategy) | 26.17 | 10.43 | 9.50 |
Russell 3000® Index (Regulatory) | 35.19 | 15.26 | 12.83 |
| Total net assets | $799,373,723 |
| # of portfolio holdings | 78 |
| Portfolio turnover rate | 46% |
| Total advisory fees paid | $6,047,377 |
Figures quoted represent past performance, which is no guarantee of future results, and do not reflect taxes that a shareholder may pay on an investment in a fund.
What did the Fund invest in?
(Based on long-term investments)
SECTOR ALLOCATION (% OF LONG-TERM INVESTMENTS)
| Industrials | 20.0 |
| Information technology | 17.3 |
| Financials | 16.1 |
| Health care | 12.8 |
| Materials | 10.2 |
| Consumer discretionary | 9.8 |
| Real estate | 9.3 |
| Consumer staples | 2.6 |
| Domestic Equity | 1.5 |
| Communication services | 0.4 |
TOP TEN HOLDINGS (% OF NET ASSETS)
| Regal Rexnord Corp. | 2.2 |
| Teledyne Technologies, Inc. | 2.1 |
| Marvell Technology, Inc. | 2.0 |
| Carlisle Cos., Inc. | 2.0 |
| Melrose Industries PLC | 1.9 |
| SBA Communications Corp., Class A | 1.9 |
| HealthEquity, Inc. | 1.9 |
| Westlake Corp. | 1.9 |
| Sun Communities, Inc. | 1.8 |
| Bio-Rad Laboratories, Inc., Class A | 1.8 |
You can find additional information on the Fund's website at allspringglobal.com, including its:
- Prospectus - Financial Information - Fund holdings - Proxy voting information
Annual Shareholder Report
This annual shareholder report contains important information about Common Stock Fund for the period of October 1, 2023 to September 30, 2024. You can find additional information about the Fund at allspringglobal.com. You can also request this information by contacting us at 1-800-222-8222.
What were the Fund costs for the past year?
The table explains the costs you would have paid within the reporting period based on a hypothetical $10,000 investment.
| CLASS NAME | COSTS OF A $10,000 INVESTMENT | COSTS PAID AS A % OF A $10,000 INVESTMENT |
|---|
| Class R6 | $92 | 0.83% |
The manager has contractually committed to waive fees and/or reimburse certain expenses to the extent necessary to cap the Fund's total annual fund operating expense ratio at a specific amount. Without this cap, the costs shown above may have been higher. Please see the prospectus for the amount and the expiration date of the cap. Prior to or after the commitment expiration date, the cap may be increased or the commitment to maintain the cap may be terminated only with the approval of the Board of Trustees.
How did the Fund perform last year and what affected its performance?
Over the 12-month period that ended September 30, 2024, the equity markets soared to all-time highs, fueled by positive earnings surprises, robust economic growth, a decline in both inflation and interest rates, and a fervor around artificial intelligence (AI). Driven by semiconductor chip designer NVIDIA Corp., the AI theme significantly boosted the mega-cap growth sector to unprecedented heights. By contrast, small- and mid-cap stocks substantially underperformed large caps, partly due to their inferior balance sheet profiles. However, with the Federal Reserve pivoting to a more accommodative stance, future rate cuts could lower borrowing costs and be a catalyst for smaller-cap companies.
Key detractors during the period included Atkore Inc., which endured a cyclical downturn, citing weaker customer spending, and Leslie’s Inc., which toiled with a decline in chlorine prices, a CEO change, and softness in new pool and renovation construction. Going forward, we remain optimistic about the Fund’s prospects given the attractive private market valuations of many of our holdings.
Total return based on a $10,000 investment
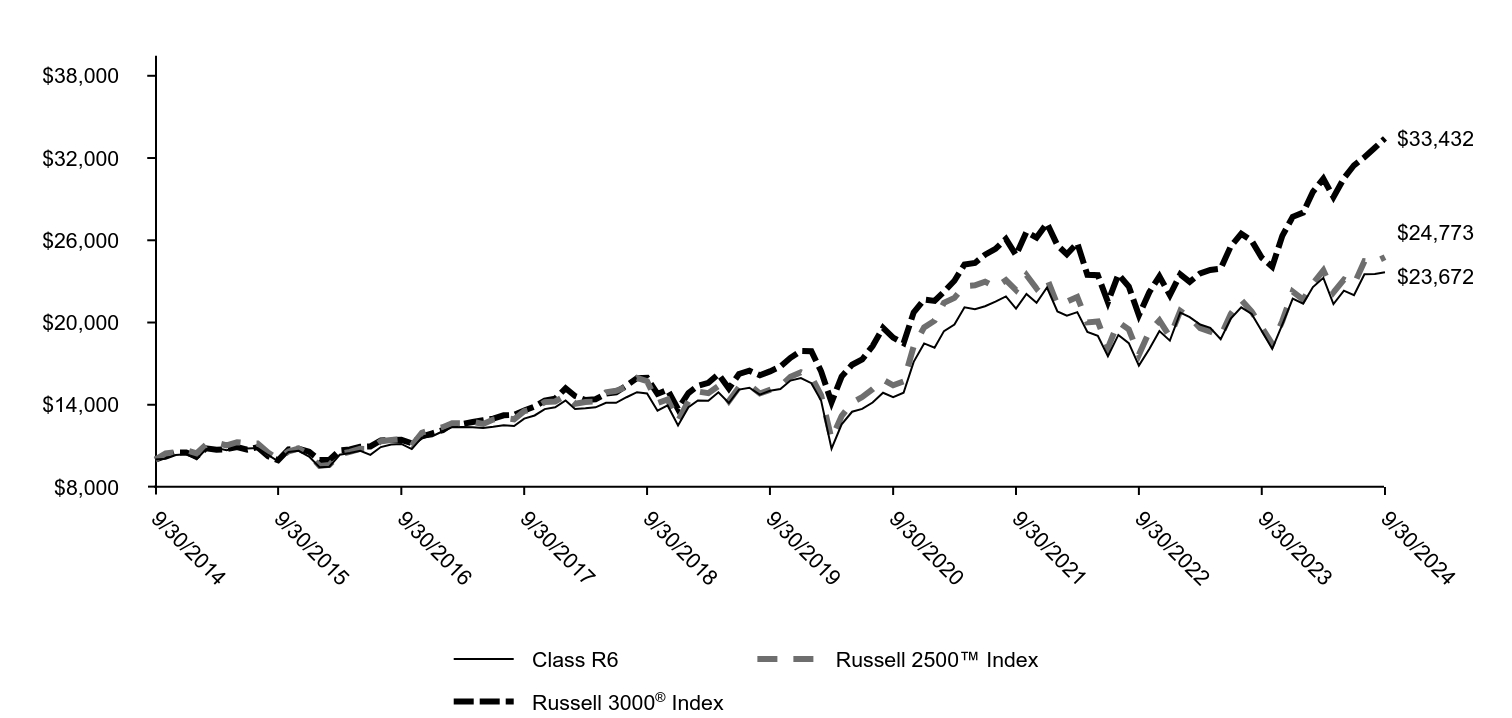
| Class R6 | Russell 2500™ Index | Russell 3000® Index |
|---|
| 9/30/2014 | $10,000 | $10,000 | $10,000 |
| 10/31/2014 | $10,063 | $10,443 | $10,275 |
| 11/30/2014 | $10,328 | $10,533 | $10,524 |
| 12/31/2014 | $10,395 | $10,677 | $10,524 |
| 1/31/2015 | $10,031 | $10,458 | $10,231 |
| 2/28/2015 | $10,764 | $11,081 | $10,824 |
| 3/31/2015 | $10,840 | $11,229 | $10,713 |
| 4/30/2015 | $10,684 | $11,032 | $10,762 |
| 5/31/2015 | $10,871 | $11,268 | $10,911 |
| 6/30/2015 | $10,804 | $11,190 | $10,728 |
| 7/31/2015 | $10,853 | $11,169 | $10,908 |
| 8/31/2015 | $10,338 | $10,508 | $10,249 |
| 9/30/2015 | $9,871 | $10,038 | $9,951 |
| 10/31/2015 | $10,555 | $10,599 | $10,736 |
| 11/30/2015 | $10,636 | $10,807 | $10,796 |
| 12/31/2015 | $10,224 | $10,367 | $10,574 |
| 1/31/2016 | $9,437 | $9,540 | $9,978 |
| 2/29/2016 | $9,482 | $9,607 | $9,975 |
| 3/31/2016 | $10,354 | $10,408 | $10,677 |
| 4/30/2016 | $10,474 | $10,561 | $10,743 |
| 5/31/2016 | $10,644 | $10,784 | $10,935 |
| 6/30/2016 | $10,349 | $10,779 | $10,958 |
| 7/31/2016 | $10,915 | $11,342 | $11,393 |
| 8/31/2016 | $11,100 | $11,432 | $11,422 |
| 9/30/2016 | $11,145 | $11,487 | $11,440 |
| 10/31/2016 | $10,765 | $11,021 | $11,192 |
| 11/30/2016 | $11,596 | $11,958 | $11,693 |
| 12/31/2016 | $11,704 | $12,190 | $11,921 |
| 1/31/2017 | $12,067 | $12,360 | $12,145 |
| 2/28/2017 | $12,368 | $12,657 | $12,597 |
| 3/31/2017 | $12,378 | $12,648 | $12,606 |
| 4/30/2017 | $12,357 | $12,746 | $12,739 |
| 5/31/2017 | $12,306 | $12,603 | $12,870 |
| 6/30/2017 | $12,394 | $12,918 | $12,986 |
| 7/31/2017 | $12,513 | $13,052 | $13,231 |
| 8/31/2017 | $12,451 | $12,944 | $13,256 |
| 9/30/2017 | $12,991 | $13,531 | $13,579 |
| 10/31/2017 | $13,219 | $13,740 | $13,876 |
| 11/30/2017 | $13,681 | $14,192 | $14,297 |
| 12/31/2017 | $13,814 | $14,240 | $14,440 |
| 1/31/2018 | $14,319 | $14,674 | $15,201 |
| 2/28/2018 | $13,699 | $14,070 | $14,641 |
| 3/31/2018 | $13,739 | $14,206 | $14,347 |
| 4/30/2018 | $13,814 | $14,239 | $14,402 |
| 5/31/2018 | $14,141 | $14,909 | $14,808 |
| 6/30/2018 | $14,141 | $15,017 | $14,905 |
| 7/31/2018 | $14,549 | $15,307 | $15,400 |
| 8/31/2018 | $14,917 | $15,964 | $15,940 |
| 9/30/2018 | $14,825 | $15,722 | $15,967 |
| 10/31/2018 | $13,567 | $14,126 | $14,791 |
| 11/30/2018 | $13,952 | $14,392 | $15,087 |
| 12/31/2018 | $12,490 | $12,815 | $13,683 |
| 1/31/2019 | $13,818 | $14,291 | $14,858 |
| 2/28/2019 | $14,314 | $14,966 | $15,380 |
| 3/31/2019 | $14,288 | $14,842 | $15,605 |
| 4/30/2019 | $14,905 | $15,363 | $16,228 |
| 5/31/2019 | $14,127 | $14,270 | $15,178 |
| 6/30/2019 | $15,106 | $15,282 | $16,244 |
| 7/31/2019 | $15,240 | $15,441 | $16,485 |
| 8/31/2019 | $14,744 | $14,823 | $16,149 |
| 9/30/2019 | $15,019 | $15,086 | $16,433 |
| 10/31/2019 | $15,153 | $15,375 | $16,786 |
| 11/30/2019 | $15,763 | $16,035 | $17,424 |
| 12/31/2019 | $15,951 | $16,374 | $17,928 |
| 1/31/2020 | $15,572 | $16,041 | $17,908 |
| 2/29/2020 | $14,311 | $14,696 | $16,442 |
| 3/31/2020 | $10,801 | $11,507 | $14,181 |
| 4/30/2020 | $12,571 | $13,182 | $16,059 |
| 5/31/2020 | $13,490 | $14,155 | $16,918 |
| 6/30/2020 | $13,695 | $14,564 | $17,304 |
| 7/31/2020 | $14,166 | $15,144 | $18,287 |
| 8/31/2020 | $14,873 | $15,830 | $19,612 |
| 9/30/2020 | $14,554 | $15,421 | $18,898 |
| 10/31/2020 | $14,873 | $15,700 | $18,490 |
| 11/30/2020 | $17,129 | $18,258 | $20,739 |
| 12/31/2020 | $18,473 | $19,647 | $21,672 |
| 1/31/2021 | $18,163 | $20,129 | $21,576 |
| 2/28/2021 | $19,372 | $21,442 | $22,250 |
| 3/31/2021 | $19,849 | $21,795 | $23,048 |
| 4/30/2021 | $21,106 | $22,665 | $24,236 |
| 5/31/2021 | $20,971 | $22,712 | $24,346 |
| 6/30/2021 | $21,186 | $22,981 | $24,947 |
| 7/31/2021 | $21,520 | $22,578 | $25,369 |
| 8/31/2021 | $21,902 | $23,091 | $26,092 |
| 9/30/2021 | $21,011 | $22,364 | $24,921 |
| 10/31/2021 | $22,085 | $23,461 | $26,607 |
| 11/30/2021 | $21,441 | $22,482 | $26,202 |
| 12/31/2021 | $22,552 | $23,220 | $27,234 |
| 1/31/2022 | $20,804 | $21,287 | $25,631 |
| 2/28/2022 | $20,503 | $21,527 | $24,986 |
| 3/31/2022 | $20,757 | $21,869 | $25,796 |
| 4/30/2022 | $19,310 | $20,006 | $23,481 |
| 5/31/2022 | $19,028 | $20,073 | $23,450 |
| 6/30/2022 | $17,543 | $18,155 | $21,488 |
| 7/31/2022 | $19,094 | $20,034 | $23,504 |
| 8/31/2022 | $18,492 | $19,501 | $22,627 |
| 9/30/2022 | $16,857 | $17,644 | $20,528 |
| 10/31/2022 | $18,070 | $19,337 | $22,212 |
| 11/30/2022 | $19,376 | $20,153 | $23,371 |
| 12/31/2022 | $18,680 | $18,954 | $22,003 |
| 1/31/2023 | $20,722 | $20,850 | $23,518 |
| 2/28/2023 | $20,396 | $20,360 | $22,968 |
| 3/31/2023 | $19,853 | $19,597 | $23,583 |
| 4/30/2023 | $19,614 | $19,341 | $23,834 |
| 5/31/2023 | $18,777 | $19,002 | $23,927 |
| 6/30/2023 | $20,288 | $20,621 | $25,560 |
| 7/31/2023 | $21,103 | $21,646 | $26,477 |
| 8/31/2023 | $20,625 | $20,796 | $25,966 |
| 9/30/2023 | $19,386 | $19,635 | $24,729 |
| 10/31/2023 | $18,082 | $18,442 | $24,073 |
| 11/30/2023 | $19,853 | $20,102 | $26,318 |
| 12/31/2023 | $21,741 | $22,257 | $27,714 |
| 1/31/2024 | $21,381 | $21,675 | $28,021 |
| 2/29/2024 | $22,583 | $22,854 | $29,538 |
| 3/31/2024 | $23,257 | $23,797 | $30,491 |
| 4/30/2024 | $21,348 | $22,203 | $29,149 |
| 5/31/2024 | $22,325 | $23,126 | $30,526 |
| 6/30/2024 | $21,999 | $22,780 | $31,471 |
| 7/31/2024 | $23,515 | $24,472 | $32,056 |
| 8/31/2024 | $23,537 | $24,409 | $32,754 |
| 9/30/2024 | $23,672 | $24,773 | $33,432 |
Annual Shareholder Report | September 30, 2024
AVERAGE ANNUAL TOTAL RETURNS (%)
| 1 Year | 5 Years | 10 Years |
|---|
| Class R6 | 22.11 | 9.53 | 9.00 |
| Russell 2500™ Index (Strategy) | 26.17 | 10.43 | 9.50 |
Russell 3000® Index (Regulatory) | 35.19 | 15.26 | 12.83 |
| Total net assets | $799,373,723 |
| # of portfolio holdings | 78 |
| Portfolio turnover rate | 46% |
| Total advisory fees paid | $6,047,377 |
Figures quoted represent past performance, which is no guarantee of future results, and do not reflect taxes that a shareholder may pay on an investment in a fund.
What did the Fund invest in?
(Based on long-term investments)
SECTOR ALLOCATION (% OF LONG-TERM INVESTMENTS)
| Industrials | 20.0 |
| Information technology | 17.3 |
| Financials | 16.1 |
| Health care | 12.8 |
| Materials | 10.2 |
| Consumer discretionary | 9.8 |
| Real estate | 9.3 |
| Consumer staples | 2.6 |
| Domestic Equity | 1.5 |
| Communication services | 0.4 |
TOP TEN HOLDINGS (% OF NET ASSETS)
| Regal Rexnord Corp. | 2.2 |
| Teledyne Technologies, Inc. | 2.1 |
| Marvell Technology, Inc. | 2.0 |
| Carlisle Cos., Inc. | 2.0 |
| Melrose Industries PLC | 1.9 |
| SBA Communications Corp., Class A | 1.9 |
| HealthEquity, Inc. | 1.9 |
| Westlake Corp. | 1.9 |
| Sun Communities, Inc. | 1.8 |
| Bio-Rad Laboratories, Inc., Class A | 1.8 |
You can find additional information on the Fund's website at allspringglobal.com, including its:
- Prospectus - Financial Information - Fund holdings - Proxy voting information
Annual Shareholder Report
This annual shareholder report contains important information about Common Stock Fund for the period of October 1, 2023 to September 30, 2024. You can find additional information about the Fund at allspringglobal.com. You can also request this information by contacting us at 1-800-222-8222.
What were the Fund costs for the past year?
The table explains the costs you would have paid within the reporting period based on a hypothetical $10,000 investment.
| CLASS NAME | COSTS OF A $10,000 INVESTMENT | COSTS PAID AS A % OF A $10,000 INVESTMENT |
|---|
| Class C | $214 | 1.94% |
The manager has contractually committed to waive fees and/or reimburse certain expenses to the extent necessary to cap the Fund's total annual fund operating expense ratio at a specific amount. Without this cap, the costs shown above may have been higher. Please see the prospectus for the amount and the expiration date of the cap. Prior to or after the commitment expiration date, the cap may be increased or the commitment to maintain the cap may be terminated only with the approval of the Board of Trustees.
How did the Fund perform last year and what affected its performance?
Over the 12-month period that ended September 30, 2024, the equity markets soared to all-time highs, fueled by positive earnings surprises, robust economic growth, a decline in both inflation and interest rates, and a fervor around artificial intelligence (AI). Driven by semiconductor chip designer NVIDIA Corp., the AI theme significantly boosted the mega-cap growth sector to unprecedented heights. By contrast, small- and mid-cap stocks substantially underperformed large caps, partly due to their inferior balance sheet profiles. However, with the Federal Reserve pivoting to a more accommodative stance, future rate cuts could lower borrowing costs and be a catalyst for smaller-cap companies.
Key detractors during the period included Atkore Inc., which endured a cyclical downturn, citing weaker customer spending, and Leslie’s Inc., which toiled with a decline in chlorine prices, a CEO change, and softness in new pool and renovation construction. Going forward, we remain optimistic about the Fund’s prospects given the attractive private market valuations of many of our holdings.
Total return based on a $10,000 investment
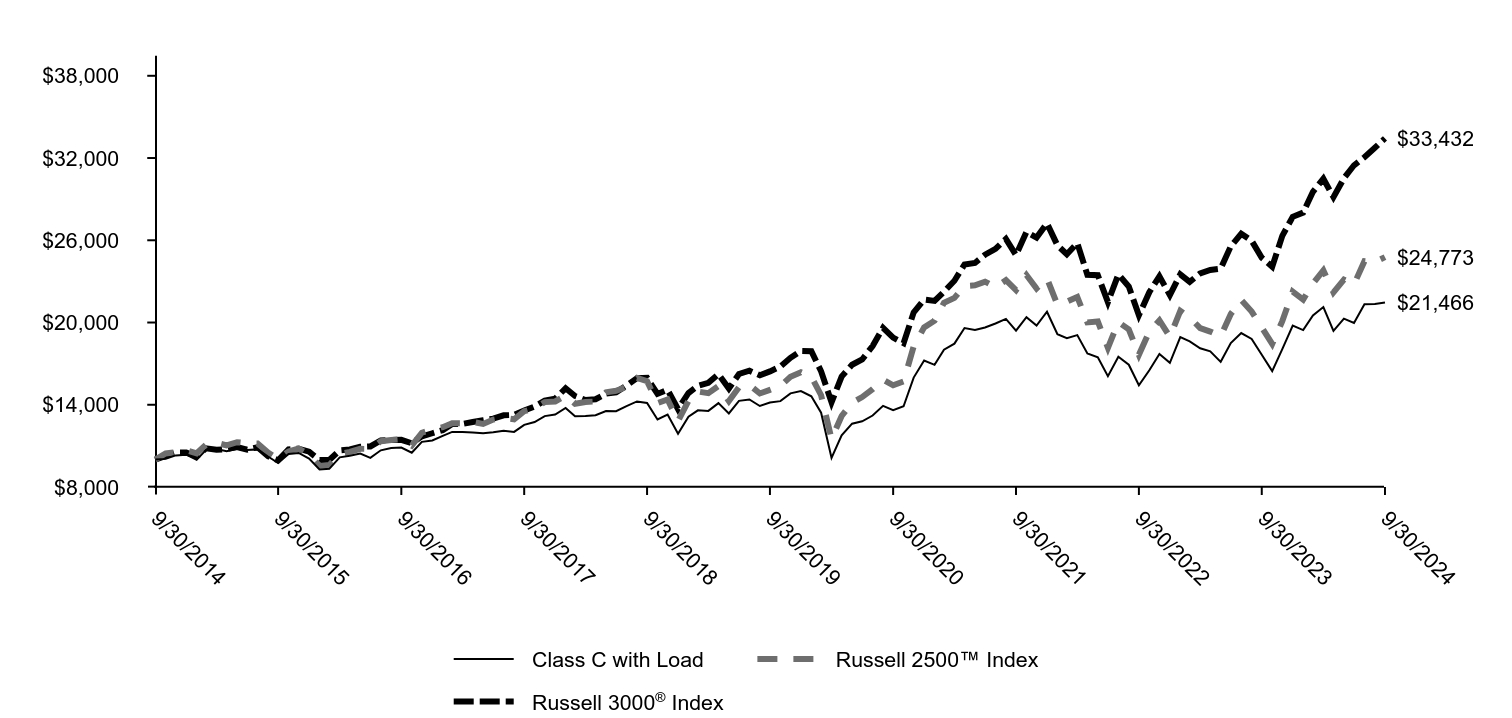
| Class C with Load | Russell 2500™ Index | Russell 3000® Index |
|---|
| 9/30/2014 | $10,000 | $10,000 | $10,000 |
| 10/31/2014 | $10,052 | $10,443 | $10,275 |
| 11/30/2014 | $10,304 | $10,533 | $10,524 |
| 12/31/2014 | $10,360 | $10,677 | $10,524 |
| 1/31/2015 | $9,987 | $10,458 | $10,231 |
| 2/28/2015 | $10,706 | $11,081 | $10,824 |
| 3/31/2015 | $10,772 | $11,229 | $10,713 |
| 4/30/2015 | $10,607 | $11,032 | $10,762 |
| 5/31/2015 | $10,782 | $11,268 | $10,911 |
| 6/30/2015 | $10,700 | $11,190 | $10,728 |
| 7/31/2015 | $10,744 | $11,169 | $10,908 |
| 8/31/2015 | $10,223 | $10,508 | $10,249 |
| 9/30/2015 | $9,751 | $10,038 | $9,951 |
| 10/31/2015 | $10,415 | $10,599 | $10,736 |
| 11/30/2015 | $10,486 | $10,807 | $10,796 |
| 12/31/2015 | $10,070 | $10,367 | $10,574 |
| 1/31/2016 | $9,285 | $9,540 | $9,978 |
| 2/29/2016 | $9,324 | $9,607 | $9,975 |
| 3/31/2016 | $10,166 | $10,408 | $10,677 |
| 4/30/2016 | $10,275 | $10,561 | $10,743 |
| 5/31/2016 | $10,434 | $10,784 | $10,935 |
| 6/30/2016 | $10,128 | $10,779 | $10,958 |
| 7/31/2016 | $10,677 | $11,342 | $11,393 |
| 8/31/2016 | $10,843 | $11,432 | $11,422 |
| 9/30/2016 | $10,874 | $11,487 | $11,440 |
| 10/31/2016 | $10,498 | $11,021 | $11,192 |
| 11/30/2016 | $11,296 | $11,958 | $11,693 |
| 12/31/2016 | $11,394 | $12,190 | $11,921 |
| 1/31/2017 | $11,728 | $12,360 | $12,145 |
| 2/28/2017 | $12,016 | $12,657 | $12,597 |
| 3/31/2017 | $12,016 | $12,648 | $12,606 |
| 4/30/2017 | $11,982 | $12,746 | $12,739 |
| 5/31/2017 | $11,922 | $12,603 | $12,870 |
| 6/30/2017 | $11,996 | $12,918 | $12,986 |
| 7/31/2017 | $12,096 | $13,052 | $13,231 |
| 8/31/2017 | $12,022 | $12,944 | $13,256 |
| 9/30/2017 | $12,537 | $13,531 | $13,579 |
| 10/31/2017 | $12,738 | $13,740 | $13,876 |
| 11/30/2017 | $13,172 | $14,192 | $14,297 |
| 12/31/2017 | $13,290 | $14,240 | $14,440 |
| 1/31/2018 | $13,766 | $14,674 | $15,201 |
| 2/28/2018 | $13,159 | $14,070 | $14,641 |
| 3/31/2018 | $13,182 | $14,206 | $14,347 |
| 4/30/2018 | $13,236 | $14,239 | $14,402 |
| 5/31/2018 | $13,543 | $14,909 | $14,808 |
| 6/30/2018 | $13,528 | $15,017 | $14,905 |
| 7/31/2018 | $13,904 | $15,307 | $15,400 |
| 8/31/2018 | $14,242 | $15,964 | $15,940 |
| 9/30/2018 | $14,135 | $15,722 | $15,967 |
| 10/31/2018 | $12,929 | $14,126 | $14,791 |
| 11/30/2018 | $13,282 | $14,392 | $15,087 |
| 12/31/2018 | $11,879 | $12,815 | $13,683 |
| 1/31/2019 | $13,130 | $14,291 | $14,858 |
| 2/28/2019 | $13,591 | $14,966 | $15,380 |
| 3/31/2019 | $13,553 | $14,842 | $15,605 |
| 4/30/2019 | $14,120 | $15,363 | $16,228 |
| 5/31/2019 | $13,370 | $14,270 | $15,178 |
| 6/30/2019 | $14,284 | $15,282 | $16,244 |
| 7/31/2019 | $14,390 | $15,441 | $16,485 |
| 8/31/2019 | $13,909 | $14,823 | $16,149 |
| 9/30/2019 | $14,159 | $15,086 | $16,433 |
| 10/31/2019 | $14,265 | $15,375 | $16,786 |
| 11/30/2019 | $14,832 | $16,035 | $17,424 |
| 12/31/2019 | $14,994 | $16,374 | $17,928 |
| 1/31/2020 | $14,621 | $16,041 | $17,908 |
| 2/29/2020 | $13,423 | $14,696 | $16,442 |
| 3/31/2020 | $10,120 | $11,507 | $14,181 |
| 4/30/2020 | $11,772 | $13,182 | $16,059 |
| 5/31/2020 | $12,621 | $14,155 | $16,918 |
| 6/30/2020 | $12,795 | $14,564 | $17,304 |
| 7/31/2020 | $13,214 | $15,144 | $18,287 |
| 8/31/2020 | $13,923 | $15,830 | $19,612 |
| 9/30/2020 | $13,609 | $15,421 | $18,898 |
| 10/31/2020 | $13,889 | $15,700 | $18,490 |
| 11/30/2020 | $15,982 | $18,258 | $20,739 |
| 12/31/2020 | $17,226 | $19,647 | $21,672 |
| 1/31/2021 | $16,912 | $20,129 | $21,576 |
| 2/28/2021 | $18,018 | $21,442 | $22,250 |
| 3/31/2021 | $18,458 | $21,795 | $23,048 |
| 4/30/2021 | $19,601 | $22,665 | $24,236 |
| 5/31/2021 | $19,463 | $22,712 | $24,346 |
| 6/30/2021 | $19,639 | $22,981 | $24,947 |
| 7/31/2021 | $19,928 | $22,578 | $25,369 |
| 8/31/2021 | $20,267 | $23,091 | $26,092 |
| 9/30/2021 | $19,412 | $22,364 | $24,921 |
| 10/31/2021 | $20,393 | $23,461 | $26,607 |
| 11/30/2021 | $19,777 | $22,482 | $26,202 |
| 12/31/2021 | $20,788 | $23,220 | $27,234 |
| 1/31/2022 | $19,152 | $21,287 | $25,631 |
| 2/28/2022 | $18,863 | $21,527 | $24,986 |
| 3/31/2022 | $19,084 | $21,869 | $25,796 |
| 4/30/2022 | $17,738 | $20,006 | $23,481 |
| 5/31/2022 | $17,465 | $20,073 | $23,450 |
| 6/30/2022 | $16,085 | $18,155 | $21,488 |
| 7/31/2022 | $17,500 | $20,034 | $23,504 |
| 8/31/2022 | $16,920 | $19,501 | $22,627 |
| 9/30/2022 | $15,421 | $17,644 | $20,528 |
| 10/31/2022 | $16,517 | $19,337 | $22,212 |
| 11/30/2022 | $17,709 | $20,153 | $23,371 |
| 12/31/2022 | $17,064 | $18,954 | $22,003 |
| 1/31/2023 | $18,930 | $20,850 | $23,518 |
| 2/28/2023 | $18,619 | $20,360 | $22,968 |
| 3/31/2023 | $18,120 | $19,597 | $23,583 |
| 4/30/2023 | $17,897 | $19,341 | $23,834 |
| 5/31/2023 | $17,131 | $19,002 | $23,927 |
| 6/30/2023 | $18,497 | $20,621 | $25,560 |
| 7/31/2023 | $19,230 | $21,646 | $26,477 |
| 8/31/2023 | $18,797 | $20,796 | $25,966 |
| 9/30/2023 | $17,653 | $19,635 | $24,729 |
| 10/31/2023 | $16,453 | $18,442 | $24,073 |
| 11/30/2023 | $18,064 | $20,102 | $26,318 |
| 12/31/2023 | $19,771 | $22,257 | $27,714 |
| 1/31/2024 | $19,448 | $21,675 | $28,021 |
| 2/29/2024 | $20,520 | $22,854 | $29,538 |
| 3/31/2024 | $21,131 | $23,797 | $30,491 |
| 4/30/2024 | $19,391 | $22,203 | $29,149 |
| 5/31/2024 | $20,278 | $23,126 | $30,526 |
| 6/30/2024 | $19,967 | $22,780 | $31,471 |
| 7/31/2024 | $21,339 | $24,472 | $32,056 |
| 8/31/2024 | $21,350 | $24,409 | $32,754 |
| 9/30/2024 | $21,466 | $24,773 | $33,432 |
Annual Shareholder Report | September 30, 2024
AVERAGE ANNUAL TOTAL RETURNS (%)
| 1 Year | 5 Years | 10 Years |
|---|
| Class C | 20.72 | 8.36 | 7.94 |
| Class C with Load | 19.72 | 8.36 | 7.94 |
| Russell 2500™ Index (Strategy) | 26.17 | 10.43 | 9.50 |
Russell 3000® Index (Regulatory) | 35.19 | 15.26 | 12.83 |
| Total net assets | $799,373,723 |
| # of portfolio holdings | 78 |
| Portfolio turnover rate | 46% |
| Total advisory fees paid | $6,047,377 |
Figures quoted represent past performance, which is no guarantee of future results, and do not reflect taxes that a shareholder may pay on an investment in a fund.
What did the Fund invest in?
(Based on long-term investments)
SECTOR ALLOCATION (% OF LONG-TERM INVESTMENTS)
| Industrials | 20.0 |
| Information technology | 17.3 |
| Financials | 16.1 |
| Health care | 12.8 |
| Materials | 10.2 |
| Consumer discretionary | 9.8 |
| Real estate | 9.3 |
| Consumer staples | 2.6 |
| Domestic Equity | 1.5 |
| Communication services | 0.4 |
TOP TEN HOLDINGS (% OF NET ASSETS)
| Regal Rexnord Corp. | 2.2 |
| Teledyne Technologies, Inc. | 2.1 |
| Marvell Technology, Inc. | 2.0 |
| Carlisle Cos., Inc. | 2.0 |
| Melrose Industries PLC | 1.9 |
| SBA Communications Corp., Class A | 1.9 |
| HealthEquity, Inc. | 1.9 |
| Westlake Corp. | 1.9 |
| Sun Communities, Inc. | 1.8 |
| Bio-Rad Laboratories, Inc., Class A | 1.8 |
You can find additional information on the Fund's website at allspringglobal.com, including its:
- Prospectus - Financial Information - Fund holdings - Proxy voting information
Annual Shareholder Report
This annual shareholder report contains important information about Common Stock Fund for the period of October 1, 2023 to September 30, 2024. You can find additional information about the Fund at allspringglobal.com. You can also request this information by contacting us at 1-800-222-8222.
What were the Fund costs for the past year?
The table explains the costs you would have paid within the reporting period based on a hypothetical $10,000 investment.
| CLASS NAME | COSTS OF A $10,000 INVESTMENT | COSTS PAID AS A % OF A $10,000 INVESTMENT |
|---|
| Class A | $134 | 1.21% |
The manager has contractually committed to waive fees and/or reimburse certain expenses to the extent necessary to cap the Fund's total annual fund operating expense ratio at a specific amount. Without this cap, the costs shown above may have been higher. Please see the prospectus for the amount and the expiration date of the cap. Prior to or after the commitment expiration date, the cap may be increased or the commitment to maintain the cap may be terminated only with the approval of the Board of Trustees.
How did the Fund perform last year and what affected its performance?
Over the 12-month period that ended September 30, 2024, the equity markets soared to all-time highs, fueled by positive earnings surprises, robust economic growth, a decline in both inflation and interest rates, and a fervor around artificial intelligence (AI). Driven by semiconductor chip designer NVIDIA Corp., the AI theme significantly boosted the mega-cap growth sector to unprecedented heights. By contrast, small- and mid-cap stocks substantially underperformed large caps, partly due to their inferior balance sheet profiles. However, with the Federal Reserve pivoting to a more accommodative stance, future rate cuts could lower borrowing costs and be a catalyst for smaller-cap companies.
Key detractors during the period included Atkore Inc., which endured a cyclical downturn, citing weaker customer spending, and Leslie’s Inc., which toiled with a decline in chlorine prices, a CEO change, and softness in new pool and renovation construction. Going forward, we remain optimistic about the Fund’s prospects given the attractive private market valuations of many of our holdings.
Total return based on a $10,000 investment
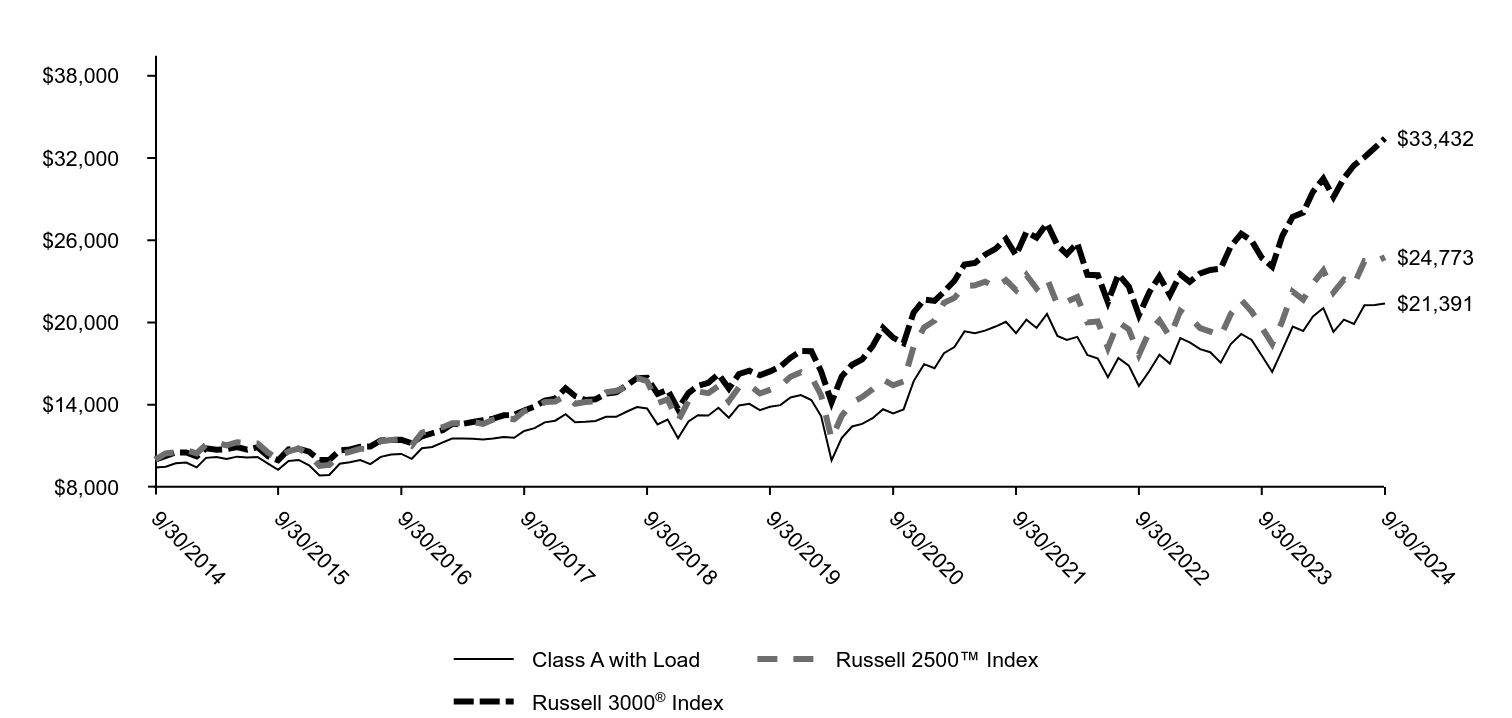
| Class A with Load | Russell 2500™ Index | Russell 3000® Index |
|---|
| 9/30/2014 | $9,426 | $10,000 | $10,000 |
| 10/31/2014 | $9,479 | $10,443 | $10,275 |
| 11/30/2014 | $9,726 | $10,533 | $10,524 |
| 12/31/2014 | $9,782 | $10,677 | $10,524 |
| 1/31/2015 | $9,435 | $10,458 | $10,231 |
| 2/28/2015 | $10,125 | $11,081 | $10,824 |
| 3/31/2015 | $10,193 | $11,229 | $10,713 |
| 4/30/2015 | $10,039 | $11,032 | $10,762 |
| 5/31/2015 | $10,215 | $11,268 | $10,911 |
| 6/30/2015 | $10,146 | $11,190 | $10,728 |
| 7/31/2015 | $10,193 | $11,169 | $10,908 |
| 8/31/2015 | $9,701 | $10,508 | $10,249 |
| 9/30/2015 | $9,260 | $10,038 | $9,951 |
| 10/31/2015 | $9,898 | $10,599 | $10,736 |
| 11/30/2015 | $9,971 | $10,807 | $10,796 |
| 12/31/2015 | $9,582 | $10,367 | $10,574 |
| 1/31/2016 | $8,841 | $9,540 | $9,978 |
| 2/29/2016 | $8,880 | $9,607 | $9,975 |
| 3/31/2016 | $9,694 | $10,408 | $10,677 |
| 4/30/2016 | $9,800 | $10,561 | $10,743 |
| 5/31/2016 | $9,960 | $10,784 | $10,935 |
| 6/30/2016 | $9,674 | $10,779 | $10,958 |
| 7/31/2016 | $10,202 | $11,342 | $11,393 |
| 8/31/2016 | $10,371 | $11,432 | $11,422 |
| 9/30/2016 | $10,410 | $11,487 | $11,440 |
| 10/31/2016 | $10,057 | $11,021 | $11,192 |
| 11/30/2016 | $10,827 | $11,958 | $11,693 |
| 12/31/2016 | $10,921 | $12,190 | $11,921 |
| 1/31/2017 | $11,252 | $12,360 | $12,145 |
| 2/28/2017 | $11,533 | $12,657 | $12,597 |
| 3/31/2017 | $11,538 | $12,648 | $12,606 |
| 4/30/2017 | $11,513 | $12,746 | $12,739 |
| 5/31/2017 | $11,463 | $12,603 | $12,870 |
| 6/30/2017 | $11,543 | $12,918 | $12,986 |
| 7/31/2017 | $11,649 | $13,052 | $13,231 |
| 8/31/2017 | $11,589 | $12,944 | $13,256 |
| 9/30/2017 | $12,086 | $13,531 | $13,579 |
| 10/31/2017 | $12,292 | $13,740 | $13,876 |
| 11/30/2017 | $12,714 | $14,192 | $14,297 |
| 12/31/2017 | $12,838 | $14,240 | $14,440 |
| 1/31/2018 | $13,307 | $14,674 | $15,201 |
| 2/28/2018 | $12,726 | $14,070 | $14,641 |
| 3/31/2018 | $12,760 | $14,206 | $14,347 |
| 4/30/2018 | $12,821 | $14,239 | $14,402 |
| 5/31/2018 | $13,123 | $14,909 | $14,808 |
| 6/30/2018 | $13,117 | $15,017 | $14,905 |
| 7/31/2018 | $13,491 | $15,307 | $15,400 |
| 8/31/2018 | $13,827 | $15,964 | $15,940 |
| 9/30/2018 | $13,732 | $15,722 | $15,967 |
| 10/31/2018 | $12,570 | $14,126 | $14,791 |
| 11/30/2018 | $12,922 | $14,392 | $15,087 |
| 12/31/2018 | $11,561 | $12,815 | $13,683 |
| 1/31/2019 | $12,784 | $14,291 | $14,858 |
| 2/28/2019 | $13,238 | $14,966 | $15,380 |
| 3/31/2019 | $13,212 | $14,842 | $15,605 |
| 4/30/2019 | $13,777 | $15,363 | $16,228 |
| 5/31/2019 | $13,054 | $14,270 | $15,178 |
| 6/30/2019 | $13,948 | $15,282 | $16,244 |
| 7/31/2019 | $14,066 | $15,441 | $16,485 |
| 8/31/2019 | $13,606 | $14,823 | $16,149 |
| 9/30/2019 | $13,856 | $15,086 | $16,433 |
| 10/31/2019 | $13,974 | $15,375 | $16,786 |
| 11/30/2019 | $14,533 | $16,035 | $17,424 |
| 12/31/2019 | $14,705 | $16,374 | $17,928 |
| 1/31/2020 | $14,346 | $16,041 | $17,908 |
| 2/29/2020 | $13,179 | $14,696 | $16,442 |
| 3/31/2020 | $9,948 | $11,507 | $14,181 |
| 4/30/2020 | $11,571 | $13,182 | $16,059 |
| 5/31/2020 | $12,416 | $14,155 | $16,918 |
| 6/30/2020 | $12,603 | $14,564 | $17,304 |
| 7/31/2020 | $13,022 | $15,144 | $18,287 |
| 8/31/2020 | $13,672 | $15,830 | $19,612 |
| 9/30/2020 | $13,373 | $15,421 | $18,898 |
| 10/31/2020 | $13,658 | $15,700 | $18,490 |
| 11/30/2020 | $15,729 | $18,258 | $20,739 |
| 12/31/2020 | $16,963 | $19,647 | $21,672 |
| 1/31/2021 | $16,665 | $20,129 | $21,576 |
| 2/28/2021 | $17,765 | $21,442 | $22,250 |
| 3/31/2021 | $18,205 | $21,795 | $23,048 |
| 4/30/2021 | $19,353 | $22,665 | $24,236 |
| 5/31/2021 | $19,219 | $22,712 | $24,346 |
| 6/30/2021 | $19,408 | $22,981 | $24,947 |
| 7/31/2021 | $19,707 | $22,578 | $25,369 |
| 8/31/2021 | $20,053 | $23,091 | $26,092 |
| 9/30/2021 | $19,227 | $22,364 | $24,921 |
| 10/31/2021 | $20,202 | $23,461 | $26,607 |
| 11/30/2021 | $19,605 | $22,482 | $26,202 |
| 12/31/2021 | $20,624 | $23,220 | $27,234 |
| 1/31/2022 | $19,013 | $21,287 | $25,631 |
| 2/28/2022 | $18,730 | $21,527 | $24,986 |
| 3/31/2022 | $18,956 | $21,869 | $25,796 |
| 4/30/2022 | $17,628 | $20,006 | $23,481 |
| 5/31/2022 | $17,364 | $20,073 | $23,450 |
| 6/30/2022 | $16,007 | $18,155 | $21,488 |
| 7/31/2022 | $17,411 | $20,034 | $23,504 |
| 8/31/2022 | $16,855 | $19,501 | $22,627 |
| 9/30/2022 | $15,367 | $17,644 | $20,528 |
| 10/31/2022 | $16,460 | $19,337 | $22,212 |
| 11/30/2022 | $17,647 | $20,153 | $23,371 |
| 12/31/2022 | $17,004 | $18,954 | $22,003 |
| 1/31/2023 | $18,864 | $20,850 | $23,518 |
| 2/28/2023 | $18,554 | $20,360 | $22,968 |
| 3/31/2023 | $18,056 | $19,597 | $23,583 |
| 4/30/2023 | $17,835 | $19,341 | $23,834 |
| 5/31/2023 | $17,071 | $19,002 | $23,927 |
| 6/30/2023 | $18,432 | $20,621 | $25,560 |
| 7/31/2023 | $19,163 | $21,646 | $26,477 |
| 8/31/2023 | $18,731 | $20,796 | $25,966 |
| 9/30/2023 | $17,591 | $19,635 | $24,729 |
| 10/31/2023 | $16,395 | $18,442 | $24,073 |
| 11/30/2023 | $18,001 | $20,102 | $26,318 |
| 12/31/2023 | $19,702 | $22,257 | $27,714 |
| 1/31/2024 | $19,380 | $21,675 | $28,021 |
| 2/29/2024 | $20,448 | $22,854 | $29,538 |
| 3/31/2024 | $21,057 | $23,797 | $30,491 |
| 4/30/2024 | $19,323 | $22,203 | $29,149 |
| 5/31/2024 | $20,207 | $23,126 | $30,526 |
| 6/30/2024 | $19,897 | $22,780 | $31,471 |
| 7/31/2024 | $21,264 | $24,472 | $32,056 |
| 8/31/2024 | $21,276 | $24,409 | $32,754 |
| 9/30/2024 | $21,391 | $24,773 | $33,432 |
Annual Shareholder Report | September 30, 2024
AVERAGE ANNUAL TOTAL RETURNS (%)
| 1 Year | 5 Years | 10 Years |
|---|
| Class A | 21.60 | 9.07 | 8.54 |
| Class A with Load | 14.60 | 7.78 | 7.90 |
| Russell 2500™ Index (Strategy) | 26.17 | 10.43 | 9.50 |
Russell 3000® Index (Regulatory) | 35.19 | 15.26 | 12.83 |
| Total net assets | $799,373,723 |
| # of portfolio holdings | 78 |
| Portfolio turnover rate | 46% |
| Total advisory fees paid | $6,047,377 |
Figures quoted represent past performance, which is no guarantee of future results, and do not reflect taxes that a shareholder may pay on an investment in a fund.
What did the Fund invest in?
(Based on long-term investments)
SECTOR ALLOCATION (% OF LONG-TERM INVESTMENTS)
| Industrials | 20.0 |
| Information technology | 17.3 |
| Financials | 16.1 |
| Health care | 12.8 |
| Materials | 10.2 |
| Consumer discretionary | 9.8 |
| Real estate | 9.3 |
| Consumer staples | 2.6 |
| Domestic Equity | 1.5 |
| Communication services | 0.4 |
TOP TEN HOLDINGS (% OF NET ASSETS)
| Regal Rexnord Corp. | 2.2 |
| Teledyne Technologies, Inc. | 2.1 |
| Marvell Technology, Inc. | 2.0 |
| Carlisle Cos., Inc. | 2.0 |
| Melrose Industries PLC | 1.9 |
| SBA Communications Corp., Class A | 1.9 |
| HealthEquity, Inc. | 1.9 |
| Westlake Corp. | 1.9 |
| Sun Communities, Inc. | 1.8 |
| Bio-Rad Laboratories, Inc., Class A | 1.8 |
You can find additional information on the Fund's website at allspringglobal.com, including its:
- Prospectus - Financial Information - Fund holdings - Proxy voting information
Annual Shareholder Report
This annual shareholder report contains important information about Common Stock Fund for the period of October 1, 2023 to September 30, 2024. You can find additional information about the Fund at allspringglobal.com. You can also request this information by contacting us at 1-800-222-8222.
What were the Fund costs for the past year?
The table explains the costs you would have paid within the reporting period based on a hypothetical $10,000 investment.
| CLASS NAME | COSTS OF A $10,000 INVESTMENT | COSTS PAID AS A % OF A $10,000 INVESTMENT |
|---|
| Administrator Class | $122 | 1.10% |
The manager has contractually committed to waive fees and/or reimburse certain expenses to the extent necessary to cap the Fund's total annual fund operating expense ratio at a specific amount. Without this cap, the costs shown above may have been higher. Please see the prospectus for the amount and the expiration date of the cap. Prior to or after the commitment expiration date, the cap may be increased or the commitment to maintain the cap may be terminated only with the approval of the Board of Trustees.
How did the Fund perform last year and what affected its performance?
Over the 12-month period that ended September 30, 2024, the equity markets soared to all-time highs, fueled by positive earnings surprises, robust economic growth, a decline in both inflation and interest rates, and a fervor around artificial intelligence (AI). Driven by semiconductor chip designer NVIDIA Corp., the AI theme significantly boosted the mega-cap growth sector to unprecedented heights. By contrast, small- and mid-cap stocks substantially underperformed large caps, partly due to their inferior balance sheet profiles. However, with the Federal Reserve pivoting to a more accommodative stance, future rate cuts could lower borrowing costs and be a catalyst for smaller-cap companies.
Key detractors during the period included Atkore Inc., which endured a cyclical downturn, citing weaker customer spending, and Leslie’s Inc., which toiled with a decline in chlorine prices, a CEO change, and softness in new pool and renovation construction. Going forward, we remain optimistic about the Fund’s prospects given the attractive private market valuations of many of our holdings.
Total return based on a $10,000 investment

| Administrator Class | Russell 2500™ Index | Russell 3000® Index |
|---|
| 9/30/2014 | $10,000 | $10,000 | $10,000 |
| 10/31/2014 | $10,060 | $10,443 | $10,275 |
| 11/30/2014 | $10,320 | $10,533 | $10,524 |
| 12/31/2014 | $10,388 | $10,677 | $10,524 |
| 1/31/2015 | $10,019 | $10,458 | $10,231 |
| 2/28/2015 | $10,748 | $11,081 | $10,824 |
| 3/31/2015 | $10,825 | $11,229 | $10,713 |
| 4/30/2015 | $10,663 | $11,032 | $10,762 |
| 5/31/2015 | $10,847 | $11,268 | $10,911 |
| 6/30/2015 | $10,775 | $11,190 | $10,728 |
| 7/31/2015 | $10,829 | $11,169 | $10,908 |
| 8/31/2015 | $10,307 | $10,508 | $10,249 |
| 9/30/2015 | $9,838 | $10,038 | $9,951 |
| 10/31/2015 | $10,519 | $10,599 | $10,736 |
| 11/30/2015 | $10,600 | $10,807 | $10,796 |
| 12/31/2015 | $10,187 | $10,367 | $10,574 |
| 1/31/2016 | $9,399 | $9,540 | $9,978 |
| 2/29/2016 | $9,445 | $9,607 | $9,975 |
| 3/31/2016 | $10,309 | $10,408 | $10,677 |
| 4/30/2016 | $10,421 | $10,561 | $10,743 |
| 5/31/2016 | $10,594 | $10,784 | $10,935 |
| 6/30/2016 | $10,294 | $10,779 | $10,958 |
| 7/31/2016 | $10,853 | $11,342 | $11,393 |
| 8/31/2016 | $11,036 | $11,432 | $11,422 |
| 9/30/2016 | $11,077 | $11,487 | $11,440 |
| 10/31/2016 | $10,701 | $11,021 | $11,192 |
| 11/30/2016 | $11,520 | $11,958 | $11,693 |
| 12/31/2016 | $11,629 | $12,190 | $11,921 |
| 1/31/2017 | $11,982 | $12,360 | $12,145 |
| 2/28/2017 | $12,277 | $12,657 | $12,597 |
| 3/31/2017 | $12,288 | $12,648 | $12,606 |
| 4/30/2017 | $12,261 | $12,746 | $12,739 |
| 5/31/2017 | $12,209 | $12,603 | $12,870 |
| 6/30/2017 | $12,293 | $12,918 | $12,986 |
| 7/31/2017 | $12,409 | $13,052 | $13,231 |
| 8/31/2017 | $12,346 | $12,944 | $13,256 |
| 9/30/2017 | $12,878 | $13,531 | $13,579 |
| 10/31/2017 | $13,100 | $13,740 | $13,876 |
| 11/30/2017 | $13,553 | $14,192 | $14,297 |
| 12/31/2017 | $13,689 | $14,240 | $14,440 |
| 1/31/2018 | $14,187 | $14,674 | $15,201 |
| 2/28/2018 | $13,572 | $14,070 | $14,641 |
| 3/31/2018 | $13,607 | $14,206 | $14,347 |
| 4/30/2018 | $13,677 | $14,239 | $14,402 |
| 5/31/2018 | $13,999 | $14,909 | $14,808 |
| 6/30/2018 | $13,994 | $15,017 | $14,905 |
| 7/31/2018 | $14,398 | $15,307 | $15,400 |
| 8/31/2018 | $14,755 | $15,964 | $15,940 |
| 9/30/2018 | $14,661 | $15,722 | $15,967 |
| 10/31/2018 | $13,414 | $14,126 | $14,791 |
| 11/30/2018 | $13,794 | $14,392 | $15,087 |
| 12/31/2018 | $12,338 | $12,815 | $13,683 |
| 1/31/2019 | $13,650 | $14,291 | $14,858 |
| 2/28/2019 | $14,138 | $14,966 | $15,380 |
| 3/31/2019 | $14,111 | $14,842 | $15,605 |
| 4/30/2019 | $14,715 | $15,363 | $16,228 |
| 5/31/2019 | $13,946 | $14,270 | $15,178 |
| 6/30/2019 | $14,908 | $15,282 | $16,244 |
| 7/31/2019 | $15,038 | $15,441 | $16,485 |
| 8/31/2019 | $14,544 | $14,823 | $16,149 |
| 9/30/2019 | $14,811 | $15,086 | $16,433 |
| 10/31/2019 | $14,942 | $15,375 | $16,786 |
| 11/30/2019 | $15,540 | $16,035 | $17,424 |
| 12/31/2019 | $15,716 | $16,374 | $17,928 |
| 1/31/2020 | $15,342 | $16,041 | $17,908 |
| 2/29/2020 | $14,102 | $14,696 | $16,442 |
| 3/31/2020 | $10,639 | $11,507 | $14,181 |
| 4/30/2020 | $12,378 | $13,182 | $16,059 |
| 5/31/2020 | $13,283 | $14,155 | $16,918 |
| 6/30/2020 | $13,486 | $14,564 | $17,304 |
| 7/31/2020 | $13,938 | $15,144 | $18,287 |
| 8/31/2020 | $14,882 | $15,830 | $19,612 |
| 9/30/2020 | $14,562 | $15,421 | $18,898 |
| 10/31/2020 | $14,874 | $15,700 | $18,490 |
| 11/30/2020 | $17,128 | $18,258 | $20,739 |
| 12/31/2020 | $18,470 | $19,647 | $21,672 |
| 1/31/2021 | $18,159 | $20,129 | $21,576 |
| 2/28/2021 | $19,361 | $21,442 | $22,250 |
| 3/31/2021 | $19,836 | $21,795 | $23,048 |
| 4/30/2021 | $21,087 | $22,665 | $24,236 |
| 5/31/2021 | $20,948 | $22,712 | $24,346 |
| 6/30/2021 | $21,161 | $22,981 | $24,947 |
| 7/31/2021 | $21,480 | $22,578 | $25,369 |
| 8/31/2021 | $21,864 | $23,091 | $26,092 |
| 9/30/2021 | $20,964 | $22,364 | $24,921 |
| 10/31/2021 | $22,028 | $23,461 | $26,607 |
| 11/30/2021 | $21,381 | $22,482 | $26,202 |
| 12/31/2021 | $22,491 | $23,220 | $27,234 |
| 1/31/2022 | $20,733 | $21,287 | $25,631 |
| 2/28/2022 | $20,432 | $21,527 | $24,986 |
| 3/31/2022 | $20,684 | $21,869 | $25,796 |
| 4/30/2022 | $19,237 | $20,006 | $23,481 |
| 5/31/2022 | $18,945 | $20,073 | $23,450 |
| 6/30/2022 | $17,468 | $18,155 | $21,488 |
| 7/31/2022 | $19,033 | $20,034 | $23,504 |
| 8/31/2022 | $18,420 | $19,501 | $22,627 |
| 9/30/2022 | $16,798 | $17,644 | $20,528 |
| 10/31/2022 | $17,993 | $19,337 | $22,212 |
| 11/30/2022 | $19,295 | $20,153 | $23,371 |
| 12/31/2022 | $18,594 | $18,954 | $22,003 |
| 1/31/2023 | $20,628 | $20,850 | $23,518 |
| 2/28/2023 | $20,289 | $20,360 | $22,968 |
| 3/31/2023 | $19,746 | $19,597 | $23,583 |
| 4/30/2023 | $19,509 | $19,341 | $23,834 |
| 5/31/2023 | $18,673 | $19,002 | $23,927 |
| 6/30/2023 | $20,165 | $20,621 | $25,560 |
| 7/31/2023 | $20,967 | $21,646 | $26,477 |
| 8/31/2023 | $20,504 | $20,796 | $25,966 |
| 9/30/2023 | $19,249 | $19,635 | $24,729 |
| 10/31/2023 | $17,949 | $18,442 | $24,073 |
| 11/30/2023 | $19,701 | $20,102 | $26,318 |
| 12/31/2023 | $21,574 | $22,257 | $27,714 |
| 1/31/2024 | $21,223 | $21,675 | $28,021 |
| 2/29/2024 | $22,404 | $22,854 | $29,538 |
| 3/31/2024 | $23,071 | $23,797 | $30,491 |
| 4/30/2024 | $21,164 | $22,203 | $29,149 |
| 5/31/2024 | $22,135 | $23,126 | $30,526 |
| 6/30/2024 | $21,796 | $22,780 | $31,471 |
| 7/31/2024 | $23,294 | $24,472 | $32,056 |
| 8/31/2024 | $23,317 | $24,409 | $32,754 |
| 9/30/2024 | $23,446 | $24,773 | $33,432 |
Annual Shareholder Report | September 30, 2024
AVERAGE ANNUAL TOTAL RETURNS (%)
| 1 Year | 5 Years | 10 Years |
|---|
| Administrator Class | 21.80 | 9.62 | 8.89 |
| Russell 2500™ Index (Strategy) | 26.17 | 10.43 | 9.50 |
Russell 3000® Index (Regulatory) | 35.19 | 15.26 | 12.83 |
| Total net assets | $799,373,723 |
| # of portfolio holdings | 78 |
| Portfolio turnover rate | 46% |
| Total advisory fees paid | $6,047,377 |
Figures quoted represent past performance, which is no guarantee of future results, and do not reflect taxes that a shareholder may pay on an investment in a fund.
What did the Fund invest in?
(Based on long-term investments)
SECTOR ALLOCATION (% OF LONG-TERM INVESTMENTS)
| Industrials | 20.0 |
| Information technology | 17.3 |
| Financials | 16.1 |
| Health care | 12.8 |
| Materials | 10.2 |
| Consumer discretionary | 9.8 |
| Real estate | 9.3 |
| Consumer staples | 2.6 |
| Domestic Equity | 1.5 |
| Communication services | 0.4 |
TOP TEN HOLDINGS (% OF NET ASSETS)
| Regal Rexnord Corp. | 2.2 |
| Teledyne Technologies, Inc. | 2.1 |
| Marvell Technology, Inc. | 2.0 |
| Carlisle Cos., Inc. | 2.0 |
| Melrose Industries PLC | 1.9 |
| SBA Communications Corp., Class A | 1.9 |
| HealthEquity, Inc. | 1.9 |
| Westlake Corp. | 1.9 |
| Sun Communities, Inc. | 1.8 |
| Bio-Rad Laboratories, Inc., Class A | 1.8 |
You can find additional information on the Fund's website at allspringglobal.com, including its:
- Prospectus - Financial Information - Fund holdings - Proxy voting information
Annual Shareholder Report
This annual shareholder report contains important information about SMID Cap Growth Fund for the period of October 1, 2023 to September 30, 2024. You can find additional information about the Fund at allspringglobal.com. You can also request this information by contacting us at 1-800-222-8222.
This report describes changes to the Fund that occurred either during or after the reporting period.
What were the Fund costs for the past year?
The table explains the costs you would have paid within the reporting period based on a hypothetical $10,000 investment.
| CLASS NAME | COSTS OF A $10,000 INVESTMENT | COSTS PAID AS A % OF A $10,000 INVESTMENT |
|---|
| Class R6 | $91 | 0.79% |
The manager has contractually committed to waive fees and/or reimburse certain expenses to the extent necessary to cap the Fund's total annual fund operating expense ratio at a specific amount. Without this cap, the costs shown above may have been higher. Please see the prospectus for the amount and the expiration date of the cap. Prior to or after the commitment expiration date, the cap may be increased or the commitment to maintain the cap may be terminated only with the approval of the Board of Trustees.
How did the Fund perform last year and what affected its performance?
Positive earnings results fueled a bull market for U.S. equities during the 12-month period that ended September 30, 2024. Despite lingering macroeconomic concerns, the S&P 500 Index marked its fourth straight quarter of favorable year-over-year earnings growth. Companies tied to artificial intelligence (AI) saw their valuations soar, with the so called “Magnificent 7” stocks substantially outperforming the market. Late in the fiscal year, market leadership broadened as several mega-cap companies struggled to meet high expectations and the Federal Reserve reduced policy rates. As a result, small- and mid-cap stocks narrowed the performance gap relative to large caps. This aided the Fund’s performance.
The portfolio benefited from security selection within the industrials and consumer discretionary sectors. In particular, exposure to companies that are facilitating the buildout of AI contributed to performance. To the contrary, enterprise software spending slumped as information technology budgets were pointed toward AI-related projects. Portfolio holdings with software-related products detracted from returns. While we adjusted individual holdings, we have not made material changes within positioning.
Total return based on a $10,000 investment
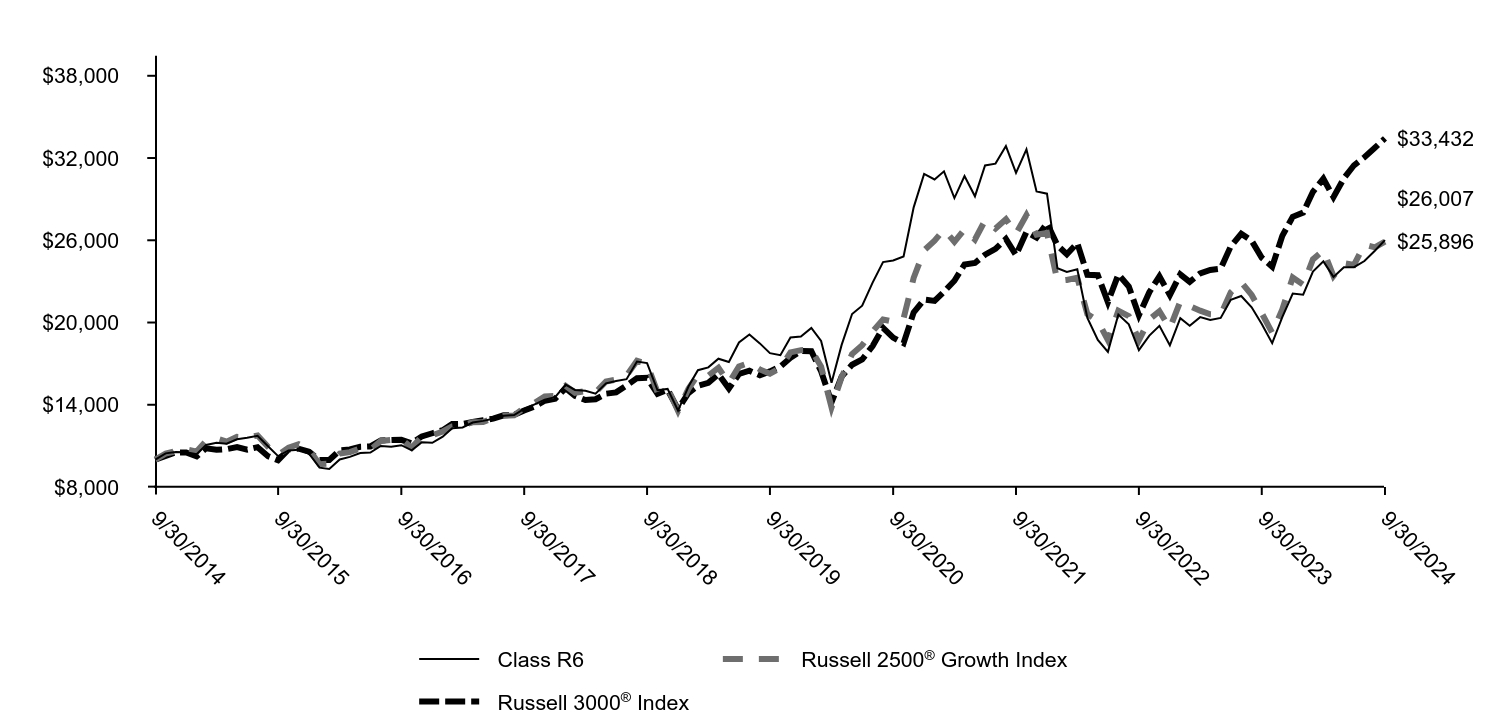
| Class R6 | Russell 2500® Growth Index | Russell 3000® Index |
|---|
| 9/30/2014 | $10,000 | $10,000 | $10,000 |
| 10/31/2014 | $10,456 | $10,440 | $10,275 |
| 11/30/2014 | $10,553 | $10,614 | $10,524 |
| 12/31/2014 | $10,538 | $10,749 | $10,524 |
| 1/31/2015 | $10,384 | $10,583 | $10,231 |
| 2/28/2015 | $11,071 | $11,362 | $10,824 |
| 3/31/2015 | $11,234 | $11,548 | $10,713 |
| 4/30/2015 | $11,158 | $11,308 | $10,762 |
| 5/31/2015 | $11,484 | $11,657 | $10,911 |
| 6/30/2015 | $11,592 | $11,619 | $10,728 |
| 7/31/2015 | $11,739 | $11,757 | $10,908 |
| 8/31/2015 | $10,976 | $10,933 | $10,249 |
| 9/30/2015 | $10,253 | $10,335 | $9,951 |
| 10/31/2015 | $10,666 | $10,875 | $10,736 |
| 11/30/2015 | $10,723 | $11,122 | $10,796 |
| 12/31/2015 | $10,428 | $10,729 | $10,574 |
| 1/31/2016 | $9,409 | $9,668 | $9,978 |
| 2/29/2016 | $9,309 | $9,697 | $9,975 |
| 3/31/2016 | $10,007 | $10,443 | $10,677 |
| 4/30/2016 | $10,195 | $10,544 | $10,743 |
| 5/31/2016 | $10,473 | $10,805 | $10,935 |
| 6/30/2016 | $10,515 | $10,725 | $10,958 |
| 7/31/2016 | $10,991 | $11,363 | $11,393 |
| 8/31/2016 | $10,939 | $11,442 | $11,422 |
| 9/30/2016 | $11,050 | $11,475 | $11,440 |
| 10/31/2016 | $10,678 | $10,875 | $11,192 |
| 11/30/2016 | $11,259 | $11,668 | $11,693 |
| 12/31/2016 | $11,226 | $11,772 | $11,921 |
| 1/31/2017 | $11,673 | $12,051 | $12,145 |
| 2/28/2017 | $12,289 | $12,417 | $12,597 |
| 3/31/2017 | $12,345 | $12,508 | $12,606 |
| 4/30/2017 | $12,704 | $12,728 | $12,739 |
| 5/31/2017 | $12,824 | $12,734 | $12,870 |
| 6/30/2017 | $12,986 | $13,024 | $12,986 |
| 7/31/2017 | $13,204 | $13,198 | $13,231 |
| 8/31/2017 | $13,249 | $13,224 | $13,256 |
| 9/30/2017 | $13,700 | $13,777 | $13,579 |
| 10/31/2017 | $14,031 | $14,146 | $13,876 |
| 11/30/2017 | $14,369 | $14,612 | $14,297 |
| 12/31/2017 | $14,551 | $14,651 | $14,440 |
| 1/31/2018 | $15,472 | $15,383 | $15,201 |
| 2/28/2018 | $15,080 | $14,878 | $14,641 |
| 3/31/2018 | $15,022 | $15,000 | $14,347 |
| 4/30/2018 | $14,807 | $14,905 | $14,402 |
| 5/31/2018 | $15,563 | $15,698 | $14,808 |
| 6/30/2018 | $15,728 | $15,829 | $14,905 |
| 7/31/2018 | $15,869 | $16,126 | $15,400 |
| 8/31/2018 | $17,153 | $17,215 | $15,940 |
| 9/30/2018 | $17,042 | $16,964 | $15,967 |
| 10/31/2018 | $15,059 | $14,926 | $14,791 |
| 11/30/2018 | $15,154 | $15,208 | $15,087 |
| 12/31/2018 | $13,578 | $13,558 | $13,683 |
| 1/31/2019 | $15,327 | $15,172 | $14,858 |
| 2/28/2019 | $16,521 | $16,172 | $15,380 |
| 3/31/2019 | $16,729 | $16,132 | $15,605 |
| 4/30/2019 | $17,362 | $16,696 | $16,228 |
| 5/31/2019 | $17,116 | $15,587 | $15,178 |
| 6/30/2019 | $18,547 | $16,800 | $16,244 |
| 7/31/2019 | $19,122 | $17,062 | $16,485 |
| 8/31/2019 | $18,479 | $16,577 | $16,149 |
| 9/30/2019 | $17,768 | $16,266 | $16,433 |
| 10/31/2019 | $17,614 | $16,683 | $16,786 |
| 11/30/2019 | $18,904 | $17,819 | $17,424 |
| 12/31/2019 | $18,974 | $17,985 | $17,928 |
| 1/31/2020 | $19,601 | $18,004 | $17,908 |
| 2/29/2020 | $18,652 | $16,783 | $16,442 |
| 3/31/2020 | $15,598 | $13,809 | $14,181 |
| 4/30/2020 | $18,368 | $16,023 | $16,059 |
| 5/31/2020 | $20,621 | $17,696 | $16,918 |
| 6/30/2020 | $21,226 | $18,348 | $17,304 |
| 7/31/2020 | $22,911 | $19,352 | $18,287 |
| 8/31/2020 | $24,411 | $20,223 | $19,612 |
| 9/30/2020 | $24,531 | $20,067 | $18,898 |
| 10/31/2020 | $24,815 | $20,304 | $18,490 |
| 11/30/2020 | $28,403 | $23,262 | $20,739 |
| 12/31/2020 | $30,836 | $25,263 | $21,672 |
| 1/31/2021 | $30,436 | $25,969 | $21,576 |
| 2/28/2021 | $31,031 | $26,785 | $22,250 |
| 3/31/2021 | $29,080 | $25,891 | $23,048 |
| 4/30/2021 | $30,682 | $26,801 | $24,236 |
| 5/31/2021 | $29,206 | $26,056 | $24,346 |
| 6/30/2021 | $31,460 | $27,454 | $24,947 |
| 7/31/2021 | $31,592 | $26,860 | $25,369 |
| 8/31/2021 | $32,873 | $27,532 | $26,092 |
| 9/30/2021 | $30,911 | $26,484 | $24,921 |
| 10/31/2021 | $32,627 | $27,842 | $26,607 |
| 11/30/2021 | $29,566 | $26,408 | $26,202 |
| 12/31/2021 | $29,401 | $26,537 | $27,234 |
| 1/31/2022 | $23,958 | $23,036 | $25,631 |
| 2/28/2022 | $23,684 | $23,105 | $24,986 |
| 3/31/2022 | $23,881 | $23,272 | $25,796 |
| 4/30/2022 | $20,334 | $20,615 | $23,481 |
| 5/31/2022 | $18,728 | $20,114 | $23,450 |
| 6/30/2022 | $17,860 | $18,722 | $21,488 |
| 7/31/2022 | $20,578 | $20,858 | $23,504 |
| 8/31/2022 | $19,870 | $20,462 | $22,627 |
| 9/30/2022 | $17,989 | $18,699 | $20,528 |
| 10/31/2022 | $19,047 | $20,219 | $22,212 |
| 11/30/2022 | $19,755 | $20,821 | $23,371 |
| 12/31/2022 | $18,337 | $19,582 | $22,003 |
| 1/31/2023 | $20,316 | $21,542 | $23,518 |
| 2/28/2023 | $19,769 | $21,201 | $22,968 |
| 3/31/2023 | $20,393 | $20,863 | $23,583 |
| 4/30/2023 | $20,178 | $20,600 | $23,834 |
| 5/31/2023 | $20,332 | $20,577 | $23,927 |
| 6/30/2023 | $21,656 | $22,201 | $25,560 |
| 7/31/2023 | $21,933 | $22,943 | $26,477 |
| 8/31/2023 | $21,109 | $22,009 | $25,966 |
| 9/30/2023 | $19,893 | $20,683 | $24,729 |
| 10/31/2023 | $18,491 | $19,248 | $24,073 |
| 11/30/2023 | $20,401 | $20,954 | $26,318 |
| 12/31/2023 | $22,118 | $23,288 | $27,714 |
| 1/31/2024 | $22,034 | $22,762 | $28,021 |
| 2/29/2024 | $23,720 | $24,606 | $29,538 |
| 3/31/2024 | $24,459 | $25,270 | $30,491 |
| 4/30/2024 | $23,327 | $23,387 | $29,149 |
| 5/31/2024 | $24,028 | $24,335 | $30,526 |
| 6/30/2024 | $24,036 | $24,205 | $31,471 |
| 7/31/2024 | $24,483 | $25,679 | $32,056 |
| 8/31/2024 | $25,237 | $25,480 | $32,754 |
| 9/30/2024 | $26,007 | $25,896 | $33,432 |
Annual Shareholder Report | September 30, 2024
AVERAGE ANNUAL TOTAL RETURNS (%)
| 1 Year | 5 Years | 10 Years |
|---|
| Class R6 | 30.74 | 7.92 | 10.03 |
Russell 2500® Growth Index (Strategy) | 25.20 | 9.75 | 9.98 |
Russell 3000® Index (Regulatory) | 35.19 | 15.26 | 12.83 |
| Total net assets | $1,129,551,146 |
| # of portfolio holdings | 75 |
| Portfolio turnover rate | 64% |
| Total advisory fees paid | $8,525,068 |
Figures quoted represent past performance, which is no guarantee of future results, and do not reflect taxes that a shareholder may pay on an investment in a fund.
What did the Fund invest in?
(Based on long-term investments)
SECTOR ALLOCATION (% OF LONG-TERM INVESTMENTS)
| Industrials | 26.5 |
| Information technology | 23.7 |
| Health care | 21.0 |
| Consumer discretionary | 13.1 |
| Financials | 8.0 |
| Communication services | 3.5 |
| Materials | 1.6 |
| Real estate | 1.4 |
| Consumer staples | 1.2 |
TOP TEN HOLDINGS (% OF NET ASSETS)
| Natera, Inc. | 2.7 |
| Tetra Tech, Inc. | 2.3 |
| Clearwater Analytics Holdings, Inc., Class A | 2.2 |
| Casella Waste Systems, Inc., Class A | 2.2 |
| Dynatrace, Inc. | 2.1 |
| Morningstar, Inc. | 2.0 |
| EMCOR Group, Inc. | 1.9 |
| Applied Industrial Technologies, Inc. | 1.9 |
| Saia, Inc. | 1.9 |
| TKO Group Holdings, Inc., Class A | 1.9 |
This is a summary of certain changes and planned changes to the Fund since October 1, 2023.
On May 31, 2024, Robert Gruendyke was added as a portfolio manager to the Fund. On August 9, 2024, the Fund’s name was changed from the Allspring Discovery SMID Cap Growth Fund to the Allspring SMID Cap Growth Fund.
You can find additional information on the Fund's website at allspringglobal.com, including its:
- Prospectus - Financial Information - Fund holdings - Proxy voting information
Annual Shareholder Report
This annual shareholder report contains important information about SMID Cap Growth Fund for the period of October 1, 2023 to September 30, 2024. You can find additional information about the Fund at allspringglobal.com. You can also request this information by contacting us at 1-800-222-8222.
This report describes changes to the Fund that occurred either during or after the reporting period.
What were the Fund costs for the past year?
The table explains the costs you would have paid within the reporting period based on a hypothetical $10,000 investment.
| CLASS NAME | COSTS OF A $10,000 INVESTMENT | COSTS PAID AS A % OF A $10,000 INVESTMENT |
|---|
| Institutional Class | $103 | 0.89% |
The manager has contractually committed to waive fees and/or reimburse certain expenses to the extent necessary to cap the Fund's total annual fund operating expense ratio at a specific amount. Without this cap, the costs shown above may have been higher. Please see the prospectus for the amount and the expiration date of the cap. Prior to or after the commitment expiration date, the cap may be increased or the commitment to maintain the cap may be terminated only with the approval of the Board of Trustees.
How did the Fund perform last year and what affected its performance?
Positive earnings results fueled a bull market for U.S. equities during the 12-month period that ended September 30, 2024. Despite lingering macroeconomic concerns, the S&P 500 Index marked its fourth straight quarter of favorable year-over-year earnings growth. Companies tied to artificial intelligence (AI) saw their valuations soar, with the so called “Magnificent 7” stocks substantially outperforming the market. Late in the fiscal year, market leadership broadened as several mega-cap companies struggled to meet high expectations and the Federal Reserve reduced policy rates. As a result, small- and mid-cap stocks narrowed the performance gap relative to large caps. This aided the Fund’s performance.
The portfolio benefited from security selection within the industrials and consumer discretionary sectors. In particular, exposure to companies that are facilitating the buildout of AI contributed to performance. To the contrary, enterprise software spending slumped as information technology budgets were pointed toward AI-related projects. Portfolio holdings with software-related products detracted from returns. While we adjusted individual holdings, we have not made material changes within positioning.
Total return based on a $10,000 investment
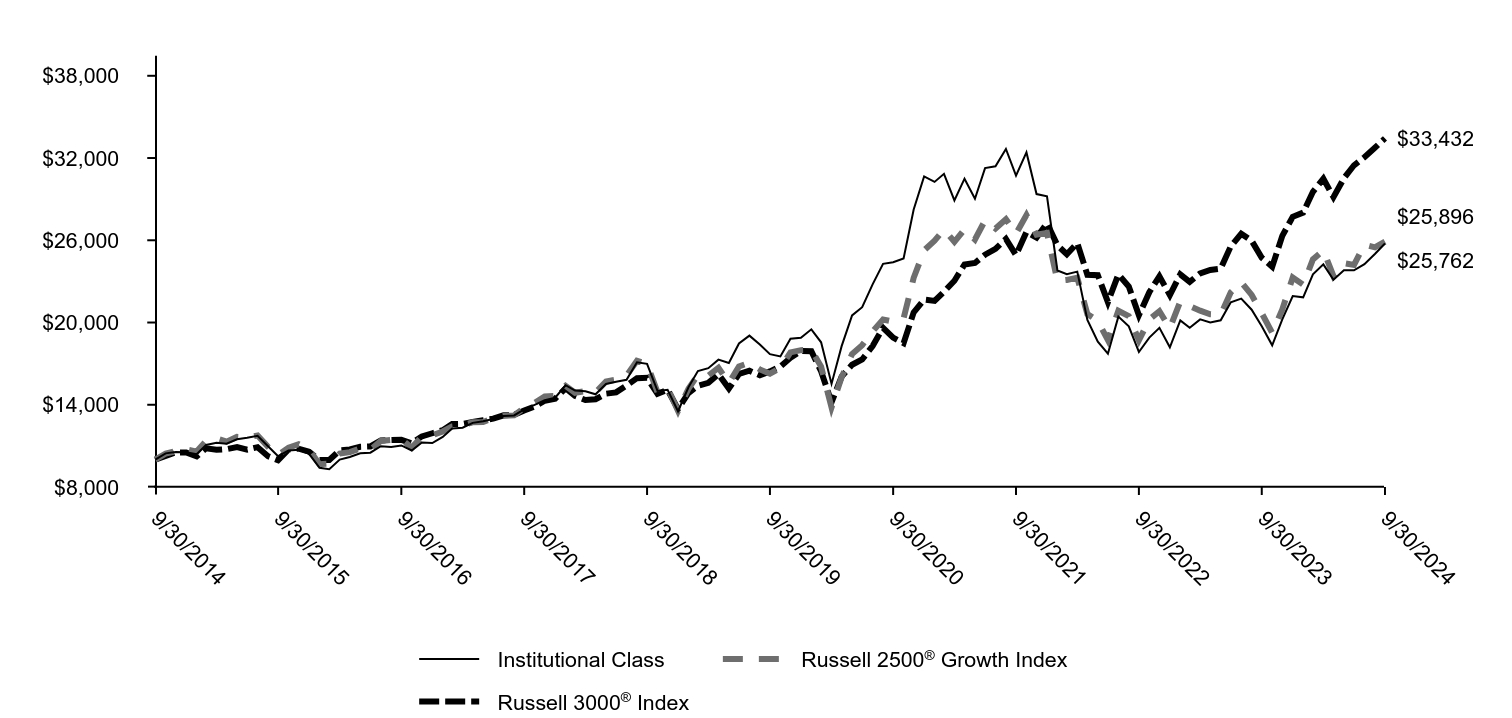
| Institutional Class | Russell 2500® Growth Index | Russell 3000® Index |
|---|
| 9/30/2014 | $10,000 | $10,000 | $10,000 |
| 10/31/2014 | $10,456 | $10,440 | $10,275 |
| 11/30/2014 | $10,554 | $10,614 | $10,524 |
| 12/31/2014 | $10,538 | $10,749 | $10,524 |
| 1/31/2015 | $10,385 | $10,583 | $10,231 |
| 2/28/2015 | $11,069 | $11,362 | $10,824 |
| 3/31/2015 | $11,232 | $11,548 | $10,713 |
| 4/30/2015 | $11,156 | $11,308 | $10,762 |
| 5/31/2015 | $11,479 | $11,657 | $10,911 |
| 6/30/2015 | $11,591 | $11,619 | $10,728 |
| 7/31/2015 | $11,735 | $11,757 | $10,908 |
| 8/31/2015 | $10,973 | $10,933 | $10,249 |
| 9/30/2015 | $10,247 | $10,335 | $9,951 |
| 10/31/2015 | $10,660 | $10,875 | $10,736 |
| 11/30/2015 | $10,717 | $11,122 | $10,796 |
| 12/31/2015 | $10,422 | $10,729 | $10,574 |
| 1/31/2016 | $9,402 | $9,668 | $9,978 |
| 2/29/2016 | $9,298 | $9,697 | $9,975 |
| 3/31/2016 | $10,001 | $10,443 | $10,677 |
| 4/30/2016 | $10,185 | $10,544 | $10,743 |
| 5/31/2016 | $10,464 | $10,805 | $10,935 |
| 6/30/2016 | $10,502 | $10,725 | $10,958 |
| 7/31/2016 | $10,979 | $11,363 | $11,393 |
| 8/31/2016 | $10,927 | $11,442 | $11,422 |
| 9/30/2016 | $11,034 | $11,475 | $11,440 |
| 10/31/2016 | $10,662 | $10,875 | $11,192 |
| 11/30/2016 | $11,243 | $11,668 | $11,693 |
| 12/31/2016 | $11,207 | $11,772 | $11,921 |
| 1/31/2017 | $11,654 | $12,051 | $12,145 |
| 2/28/2017 | $12,267 | $12,417 | $12,597 |
| 3/31/2017 | $12,324 | $12,508 | $12,606 |
| 4/30/2017 | $12,680 | $12,728 | $12,739 |
| 5/31/2017 | $12,796 | $12,734 | $12,870 |
| 6/30/2017 | $12,958 | $13,024 | $12,986 |
| 7/31/2017 | $13,173 | $13,198 | $13,231 |
| 8/31/2017 | $13,219 | $13,224 | $13,256 |
| 9/30/2017 | $13,670 | $13,777 | $13,579 |
| 10/31/2017 | $13,997 | $14,146 | $13,876 |
| 11/30/2017 | $14,332 | $14,612 | $14,297 |
| 12/31/2017 | $14,511 | $14,651 | $14,440 |
| 1/31/2018 | $15,429 | $15,383 | $15,201 |
| 2/28/2018 | $15,036 | $14,878 | $14,641 |
| 3/31/2018 | $14,978 | $15,000 | $14,347 |
| 4/30/2018 | $14,763 | $14,905 | $14,402 |
| 5/31/2018 | $15,512 | $15,698 | $14,808 |
| 6/30/2018 | $15,677 | $15,829 | $14,905 |
| 7/31/2018 | $15,818 | $16,126 | $15,400 |
| 8/31/2018 | $17,097 | $17,215 | $15,940 |
| 9/30/2018 | $16,985 | $16,964 | $15,967 |
| 10/31/2018 | $15,007 | $14,926 | $14,791 |
| 11/30/2018 | $15,098 | $15,208 | $15,087 |
| 12/31/2018 | $13,527 | $13,558 | $13,683 |
| 1/31/2019 | $15,272 | $15,172 | $14,858 |
| 2/28/2019 | $16,459 | $16,172 | $15,380 |
| 3/31/2019 | $16,668 | $16,132 | $15,605 |
| 4/30/2019 | $17,293 | $16,696 | $16,228 |
| 5/31/2019 | $17,046 | $15,587 | $15,178 |
| 6/30/2019 | $18,471 | $16,800 | $16,244 |
| 7/31/2019 | $19,043 | $17,062 | $16,485 |
| 8/31/2019 | $18,398 | $16,577 | $16,149 |
| 9/30/2019 | $17,690 | $16,266 | $16,433 |
| 10/31/2019 | $17,530 | $16,683 | $16,786 |
| 11/30/2019 | $18,820 | $17,819 | $17,424 |
| 12/31/2019 | $18,884 | $17,985 | $17,928 |
| 1/31/2020 | $19,503 | $18,004 | $17,908 |
| 2/29/2020 | $18,556 | $16,783 | $16,442 |
| 3/31/2020 | $15,523 | $13,809 | $14,181 |
| 4/30/2020 | $18,277 | $16,023 | $16,059 |
| 5/31/2020 | $20,515 | $17,696 | $16,918 |
| 6/30/2020 | $21,118 | $18,348 | $17,304 |
| 7/31/2020 | $22,787 | $19,352 | $18,287 |
| 8/31/2020 | $24,281 | $20,223 | $19,612 |
| 9/30/2020 | $24,396 | $20,067 | $18,898 |
| 10/31/2020 | $24,675 | $20,304 | $18,490 |
| 11/30/2020 | $28,244 | $23,262 | $20,739 |
| 12/31/2020 | $30,659 | $25,263 | $21,672 |
| 1/31/2021 | $30,257 | $25,969 | $21,576 |
| 2/28/2021 | $30,849 | $26,785 | $22,250 |
| 3/31/2021 | $28,907 | $25,891 | $23,048 |
| 4/30/2021 | $30,492 | $26,801 | $24,236 |
| 5/31/2021 | $29,027 | $26,056 | $24,346 |
| 6/30/2021 | $31,268 | $27,454 | $24,947 |
| 7/31/2021 | $31,394 | $26,860 | $25,369 |
| 8/31/2021 | $32,664 | $27,532 | $26,092 |
| 9/30/2021 | $30,716 | $26,484 | $24,921 |
| 10/31/2021 | $32,411 | $27,842 | $26,607 |
| 11/30/2021 | $29,372 | $26,408 | $26,202 |
| 12/31/2021 | $29,205 | $26,537 | $27,234 |
| 1/31/2022 | $23,797 | $23,036 | $25,631 |
| 2/28/2022 | $23,521 | $23,105 | $24,986 |
| 3/31/2022 | $23,713 | $23,272 | $25,796 |
| 4/30/2022 | $20,191 | $20,615 | $23,481 |
| 5/31/2022 | $18,596 | $20,114 | $23,450 |
| 6/30/2022 | $17,729 | $18,722 | $21,488 |
| 7/31/2022 | $20,429 | $20,858 | $23,504 |
| 8/31/2022 | $19,723 | $20,462 | $22,627 |
| 9/30/2022 | $17,852 | $18,699 | $20,528 |
| 10/31/2022 | $18,903 | $20,219 | $22,212 |
| 11/30/2022 | $19,608 | $20,821 | $23,371 |
| 12/31/2022 | $18,194 | $19,582 | $22,003 |
| 1/31/2023 | $20,158 | $21,542 | $23,518 |
| 2/28/2023 | $19,615 | $21,201 | $22,968 |
| 3/31/2023 | $20,228 | $20,863 | $23,583 |
| 4/30/2023 | $20,011 | $20,600 | $23,834 |
| 5/31/2023 | $20,166 | $20,577 | $23,927 |
| 6/30/2023 | $21,478 | $22,201 | $25,560 |
| 7/31/2023 | $21,749 | $22,943 | $26,477 |
| 8/31/2023 | $20,934 | $22,009 | $25,966 |
| 9/30/2023 | $19,723 | $20,683 | $24,729 |
| 10/31/2023 | $18,334 | $19,248 | $24,073 |
| 11/30/2023 | $20,228 | $20,954 | $26,318 |
| 12/31/2023 | $21,928 | $23,288 | $27,714 |
| 1/31/2024 | $21,835 | $22,762 | $28,021 |
| 2/29/2024 | $23,511 | $24,606 | $29,538 |
| 3/31/2024 | $24,241 | $25,270 | $30,491 |
| 4/30/2024 | $23,115 | $23,387 | $29,149 |
| 5/31/2024 | $23,806 | $24,335 | $30,526 |
| 6/30/2024 | $23,814 | $24,205 | $31,471 |
| 7/31/2024 | $24,256 | $25,679 | $32,056 |
| 8/31/2024 | $25,002 | $25,480 | $32,754 |
| 9/30/2024 | $25,762 | $25,896 | $33,432 |
Annual Shareholder Report | September 30, 2024
AVERAGE ANNUAL TOTAL RETURNS (%)
| 1 Year | 5 Years | 10 Years |
|---|
| Institutional Class | 30.62 | 7.81 | 9.93 |
Russell 2500® Growth Index (Strategy) | 25.20 | 9.75 | 9.98 |
Russell 3000® Index (Regulatory) | 35.19 | 15.26 | 12.83 |
| Total net assets | $1,129,551,146 |
| # of portfolio holdings | 75 |
| Portfolio turnover rate | 64% |
| Total advisory fees paid | $8,525,068 |
Figures quoted represent past performance, which is no guarantee of future results, and do not reflect taxes that a shareholder may pay on an investment in a fund.
What did the Fund invest in?
(Based on long-term investments)
SECTOR ALLOCATION (% OF LONG-TERM INVESTMENTS)
| Industrials | 26.5 |
| Information technology | 23.7 |
| Health care | 21.0 |
| Consumer discretionary | 13.1 |
| Financials | 8.0 |
| Communication services | 3.5 |
| Materials | 1.6 |
| Real estate | 1.4 |
| Consumer staples | 1.2 |
TOP TEN HOLDINGS (% OF NET ASSETS)
| Natera, Inc. | 2.7 |
| Tetra Tech, Inc. | 2.3 |
| Clearwater Analytics Holdings, Inc., Class A | 2.2 |
| Casella Waste Systems, Inc., Class A | 2.2 |
| Dynatrace, Inc. | 2.1 |
| Morningstar, Inc. | 2.0 |
| EMCOR Group, Inc. | 1.9 |
| Applied Industrial Technologies, Inc. | 1.9 |
| Saia, Inc. | 1.9 |
| TKO Group Holdings, Inc., Class A | 1.9 |
This is a summary of certain changes and planned changes to the Fund since October 1, 2023.
On May 31, 2024, Robert Gruendyke was added as a portfolio manager to the Fund. On August 9, 2024, the Fund’s name was changed from the Allspring Discovery SMID Cap Growth Fund to the Allspring SMID Cap Growth Fund.
You can find additional information on the Fund's website at allspringglobal.com, including its:
- Prospectus - Financial Information - Fund holdings - Proxy voting information
Annual Shareholder Report
This annual shareholder report contains important information about SMID Cap Growth Fund for the period of October 1, 2023 to September 30, 2024. You can find additional information about the Fund at allspringglobal.com. You can also request this information by contacting us at 1-800-222-8222.
This report describes changes to the Fund that occurred either during or after the reporting period.
What were the Fund costs for the past year?
The table explains the costs you would have paid within the reporting period based on a hypothetical $10,000 investment.
| CLASS NAME | COSTS OF A $10,000 INVESTMENT | COSTS PAID AS A % OF A $10,000 INVESTMENT |
|---|
| Class C | $225 | 1.96% |
The manager has contractually committed to waive fees and/or reimburse certain expenses to the extent necessary to cap the Fund's total annual fund operating expense ratio at a specific amount. Without this cap, the costs shown above may have been higher. Please see the prospectus for the amount and the expiration date of the cap. Prior to or after the commitment expiration date, the cap may be increased or the commitment to maintain the cap may be terminated only with the approval of the Board of Trustees.
How did the Fund perform last year and what affected its performance?
Positive earnings results fueled a bull market for U.S. equities during the 12-month period that ended September 30, 2024. Despite lingering macroeconomic concerns, the S&P 500 Index marked its fourth straight quarter of favorable year-over-year earnings growth. Companies tied to artificial intelligence (AI) saw their valuations soar, with the so called “Magnificent 7” stocks substantially outperforming the market. Late in the fiscal year, market leadership broadened as several mega-cap companies struggled to meet high expectations and the Federal Reserve reduced policy rates. As a result, small- and mid-cap stocks narrowed the performance gap relative to large caps. This aided the Fund’s performance.
The portfolio benefited from security selection within the industrials and consumer discretionary sectors. In particular, exposure to companies that are facilitating the buildout of AI contributed to performance. To the contrary, enterprise software spending slumped as information technology budgets were pointed toward AI-related projects. Portfolio holdings with software-related products detracted from returns. While we adjusted individual holdings, we have not made material changes within positioning.
Total return based on a $10,000 investment
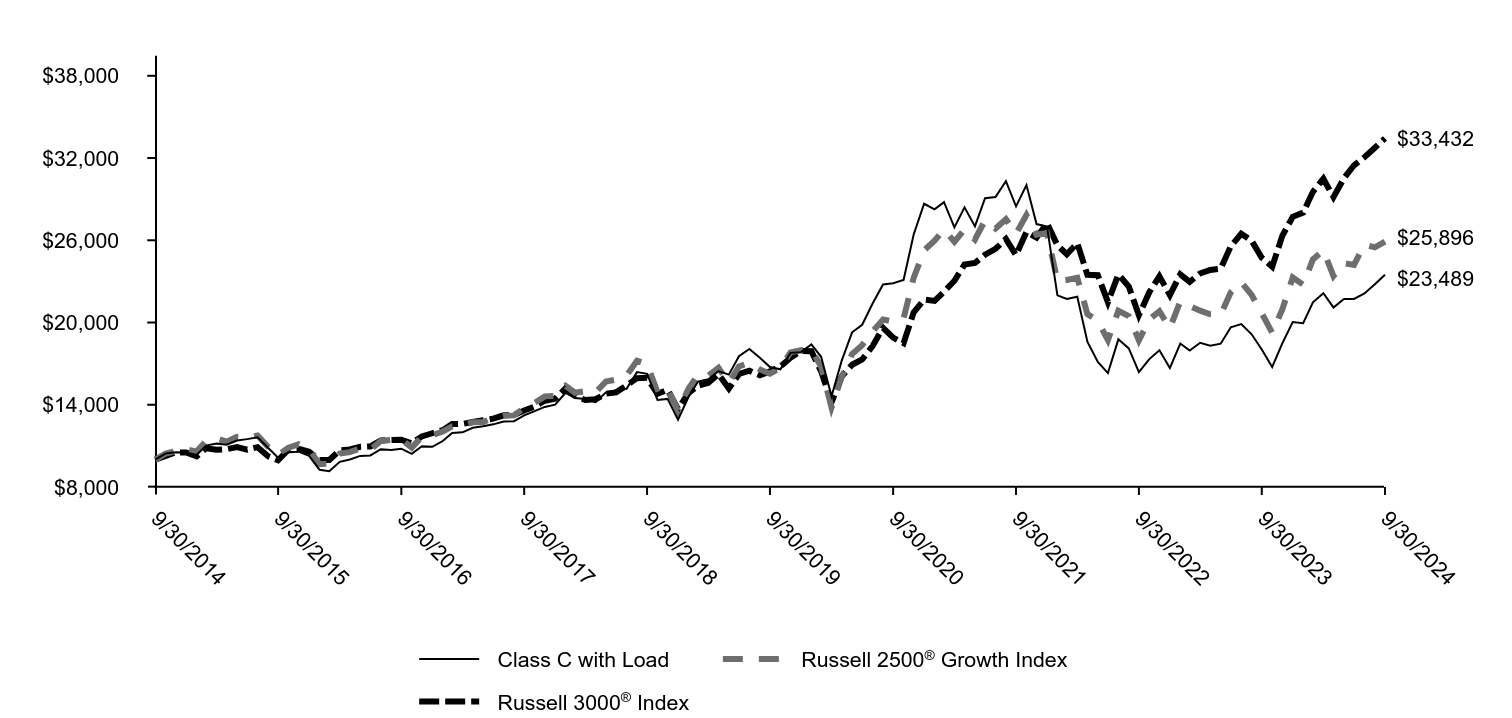
| Class C with Load | Russell 2500® Growth Index | Russell 3000® Index |
|---|
| 9/30/2014 | $10,000 | $10,000 | $10,000 |
| 10/31/2014 | $10,448 | $10,440 | $10,275 |
| 11/30/2014 | $10,537 | $10,614 | $10,524 |
| 12/31/2014 | $10,509 | $10,749 | $10,524 |
| 1/31/2015 | $10,344 | $10,583 | $10,231 |
| 2/28/2015 | $11,018 | $11,362 | $10,824 |
| 3/31/2015 | $11,169 | $11,548 | $10,713 |
| 4/30/2015 | $11,083 | $11,308 | $10,762 |
| 5/31/2015 | $11,392 | $11,657 | $10,911 |
| 6/30/2015 | $11,492 | $11,619 | $10,728 |
| 7/31/2015 | $11,625 | $11,757 | $10,908 |
| 8/31/2015 | $10,860 | $10,933 | $10,249 |
| 9/30/2015 | $10,135 | $10,335 | $9,951 |
| 10/31/2015 | $10,530 | $10,875 | $10,736 |
| 11/30/2015 | $10,580 | $11,122 | $10,796 |
| 12/31/2015 | $10,273 | $10,729 | $10,574 |
| 1/31/2016 | $9,262 | $9,668 | $9,978 |
| 2/29/2016 | $9,155 | $9,697 | $9,975 |
| 3/31/2016 | $9,835 | $10,443 | $10,677 |
| 4/30/2016 | $10,009 | $10,544 | $10,743 |
| 5/31/2016 | $10,269 | $10,805 | $10,935 |
| 6/30/2016 | $10,301 | $10,725 | $10,958 |
| 7/31/2016 | $10,755 | $11,363 | $11,393 |
| 8/31/2016 | $10,696 | $11,442 | $11,422 |
| 9/30/2016 | $10,795 | $11,475 | $11,440 |
| 10/31/2016 | $10,419 | $10,875 | $11,192 |
| 11/30/2016 | $10,977 | $11,668 | $11,693 |
| 12/31/2016 | $10,931 | $11,772 | $11,921 |
| 1/31/2017 | $11,356 | $12,051 | $12,145 |
| 2/28/2017 | $11,946 | $12,417 | $12,597 |
| 3/31/2017 | $11,990 | $12,508 | $12,606 |
| 4/30/2017 | $12,322 | $12,728 | $12,739 |
| 5/31/2017 | $12,427 | $12,734 | $12,870 |
| 6/30/2017 | $12,571 | $13,024 | $12,986 |
| 7/31/2017 | $12,771 | $13,198 | $13,231 |
| 8/31/2017 | $12,803 | $13,224 | $13,256 |
| 9/30/2017 | $13,224 | $13,777 | $13,579 |
| 10/31/2017 | $13,533 | $14,146 | $13,876 |
| 11/30/2017 | $13,842 | $14,612 | $14,297 |
| 12/31/2017 | $14,004 | $14,651 | $14,440 |
| 1/31/2018 | $14,873 | $15,383 | $15,201 |
| 2/28/2018 | $14,485 | $14,878 | $14,641 |
| 3/31/2018 | $14,417 | $15,000 | $14,347 |
| 4/30/2018 | $14,193 | $14,905 | $14,402 |
| 5/31/2018 | $14,903 | $15,698 | $14,808 |
| 6/30/2018 | $15,048 | $15,829 | $14,905 |
| 7/31/2018 | $15,170 | $16,126 | $15,400 |
| 8/31/2018 | $16,380 | $17,215 | $15,940 |
| 9/30/2018 | $16,258 | $16,964 | $15,967 |
| 10/31/2018 | $14,354 | $14,926 | $14,791 |
| 11/30/2018 | $14,426 | $15,208 | $15,087 |
| 12/31/2018 | $12,915 | $13,558 | $13,683 |
| 1/31/2019 | $14,562 | $15,172 | $14,858 |
| 2/28/2019 | $15,682 | $16,172 | $15,380 |
| 3/31/2019 | $15,866 | $16,132 | $15,605 |
| 4/30/2019 | $16,446 | $16,696 | $16,228 |
| 5/31/2019 | $16,197 | $15,587 | $15,178 |
| 6/30/2019 | $17,536 | $16,800 | $16,244 |
| 7/31/2019 | $18,064 | $17,062 | $16,485 |
| 8/31/2019 | $17,436 | $16,577 | $16,149 |
| 9/30/2019 | $16,748 | $16,266 | $16,433 |
| 10/31/2019 | $16,588 | $16,683 | $16,786 |
| 11/30/2019 | $17,785 | $17,819 | $17,424 |
| 12/31/2019 | $17,832 | $17,985 | $17,928 |
| 1/31/2020 | $18,403 | $18,004 | $17,908 |
| 2/29/2020 | $17,498 | $16,783 | $16,442 |
| 3/31/2020 | $14,619 | $13,809 | $14,181 |
| 4/30/2020 | $17,199 | $16,023 | $16,059 |
| 5/31/2020 | $19,286 | $17,696 | $16,918 |
| 6/30/2020 | $19,835 | $18,348 | $17,304 |
| 7/31/2020 | $21,386 | $19,352 | $18,287 |
| 8/31/2020 | $22,777 | $20,223 | $19,612 |
| 9/30/2020 | $22,868 | $20,067 | $18,898 |
| 10/31/2020 | $23,111 | $20,304 | $18,490 |
| 11/30/2020 | $26,421 | $23,262 | $20,739 |
| 12/31/2020 | $28,661 | $25,263 | $21,672 |
| 1/31/2021 | $28,259 | $25,969 | $21,576 |
| 2/28/2021 | $28,780 | $26,785 | $22,250 |
| 3/31/2021 | $26,944 | $25,891 | $23,048 |
| 4/30/2021 | $28,401 | $26,801 | $24,236 |
| 5/31/2021 | $27,011 | $26,056 | $24,346 |
| 6/30/2021 | $29,070 | $27,454 | $24,947 |
| 7/31/2021 | $29,159 | $26,860 | $25,369 |
| 8/31/2021 | $30,311 | $27,532 | $26,092 |
| 9/30/2021 | $28,475 | $26,484 | $24,921 |
| 10/31/2021 | $30,028 | $27,842 | $26,607 |
| 11/30/2021 | $27,182 | $26,408 | $26,202 |
| 12/31/2021 | $27,007 | $26,537 | $27,234 |
| 1/31/2022 | $21,979 | $23,036 | $25,631 |
| 2/28/2022 | $21,716 | $23,105 | $24,986 |
| 3/31/2022 | $21,876 | $23,272 | $25,796 |
| 4/30/2022 | $18,600 | $20,615 | $23,481 |
| 5/31/2022 | $17,123 | $20,114 | $23,450 |
| 6/30/2022 | $16,310 | $18,722 | $21,488 |
| 7/31/2022 | $18,772 | $20,858 | $23,504 |
| 8/31/2022 | $18,108 | $20,462 | $22,627 |
| 9/30/2022 | $16,378 | $18,699 | $20,528 |
| 10/31/2022 | $17,333 | $20,219 | $22,212 |
| 11/30/2022 | $17,971 | $20,821 | $23,371 |
| 12/31/2022 | $16,674 | $19,582 | $22,003 |
| 1/31/2023 | $18,466 | $21,542 | $23,518 |
| 2/28/2023 | $17,962 | $21,201 | $22,968 |
| 3/31/2023 | $18,525 | $20,863 | $23,583 |
| 4/30/2023 | $18,315 | $20,600 | $23,834 |
| 5/31/2023 | $18,458 | $20,577 | $23,927 |
| 6/30/2023 | $19,653 | $22,201 | $25,560 |
| 7/31/2023 | $19,888 | $22,943 | $26,477 |
| 8/31/2023 | $19,139 | $22,009 | $25,966 |
| 9/30/2023 | $18,029 | $20,683 | $24,729 |
| 10/31/2023 | $16,759 | $19,248 | $24,073 |
| 11/30/2023 | $18,483 | $20,954 | $26,318 |
| 12/31/2023 | $20,031 | $23,288 | $27,714 |
| 1/31/2024 | $19,947 | $22,762 | $28,021 |
| 2/29/2024 | $21,470 | $24,606 | $29,538 |
| 3/31/2024 | $22,134 | $25,270 | $30,491 |
| 4/30/2024 | $21,100 | $23,387 | $29,149 |
| 5/31/2024 | $21,722 | $24,335 | $30,526 |
| 6/30/2024 | $21,722 | $24,205 | $31,471 |
| 7/31/2024 | $22,118 | $25,679 | $32,056 |
| 8/31/2024 | $22,791 | $25,480 | $32,754 |
| 9/30/2024 | $23,489 | $25,896 | $33,432 |
Annual Shareholder Report | September 30, 2024
AVERAGE ANNUAL TOTAL RETURNS (%)
| 1 Year | 5 Years | 10 Years |
|---|
| Class C | 29.22 | 6.67 | 8.91 |
| Class C with Load | 28.22 | 6.67 | 8.91 |
Russell 2500® Growth Index (Strategy) | 25.20 | 9.75 | 9.98 |
Russell 3000® Index (Regulatory) | 35.19 | 15.26 | 12.83 |
| Total net assets | $1,129,551,146 |
| # of portfolio holdings | 75 |
| Portfolio turnover rate | 64% |
| Total advisory fees paid | $8,525,068 |
Figures quoted represent past performance, which is no guarantee of future results, and do not reflect taxes that a shareholder may pay on an investment in a fund.
What did the Fund invest in?
(Based on long-term investments)
SECTOR ALLOCATION (% OF LONG-TERM INVESTMENTS)
| Industrials | 26.5 |
| Information technology | 23.7 |
| Health care | 21.0 |
| Consumer discretionary | 13.1 |
| Financials | 8.0 |
| Communication services | 3.5 |
| Materials | 1.6 |
| Real estate | 1.4 |
| Consumer staples | 1.2 |
TOP TEN HOLDINGS (% OF NET ASSETS)
| Natera, Inc. | 2.7 |
| Tetra Tech, Inc. | 2.3 |
| Clearwater Analytics Holdings, Inc., Class A | 2.2 |
| Casella Waste Systems, Inc., Class A | 2.2 |
| Dynatrace, Inc. | 2.1 |
| Morningstar, Inc. | 2.0 |
| EMCOR Group, Inc. | 1.9 |
| Applied Industrial Technologies, Inc. | 1.9 |
| Saia, Inc. | 1.9 |
| TKO Group Holdings, Inc., Class A | 1.9 |
This is a summary of certain changes and planned changes to the Fund since October 1, 2023.
On May 31, 2024, Robert Gruendyke was added as a portfolio manager to the Fund. On August 9, 2024, the Fund’s name was changed from the Allspring Discovery SMID Cap Growth Fund to the Allspring SMID Cap Growth Fund.
You can find additional information on the Fund's website at allspringglobal.com, including its:
- Prospectus - Financial Information - Fund holdings - Proxy voting information
Annual Shareholder Report
This annual shareholder report contains important information about SMID Cap Growth Fund for the period of October 1, 2023 to September 30, 2024. You can find additional information about the Fund at allspringglobal.com. You can also request this information by contacting us at 1-800-222-8222.
This report describes changes to the Fund that occurred either during or after the reporting period.
What were the Fund costs for the past year?
The table explains the costs you would have paid within the reporting period based on a hypothetical $10,000 investment.
| CLASS NAME | COSTS OF A $10,000 INVESTMENT | COSTS PAID AS A % OF A $10,000 INVESTMENT |
|---|
| Class A | $136 | 1.18% |
The manager has contractually committed to waive fees and/or reimburse certain expenses to the extent necessary to cap the Fund's total annual fund operating expense ratio at a specific amount. Without this cap, the costs shown above may have been higher. Please see the prospectus for the amount and the expiration date of the cap. Prior to or after the commitment expiration date, the cap may be increased or the commitment to maintain the cap may be terminated only with the approval of the Board of Trustees.
How did the Fund perform last year and what affected its performance?
Positive earnings results fueled a bull market for U.S. equities during the 12-month period that ended September 30, 2024. Despite lingering macroeconomic concerns, the S&P 500 Index marked its fourth straight quarter of favorable year-over-year earnings growth. Companies tied to artificial intelligence (AI) saw their valuations soar, with the so called “Magnificent 7” stocks substantially outperforming the market. Late in the fiscal year, market leadership broadened as several mega-cap companies struggled to meet high expectations and the Federal Reserve reduced policy rates. As a result, small- and mid-cap stocks narrowed the performance gap relative to large caps. This aided the Fund’s performance.
The portfolio benefited from security selection within the industrials and consumer discretionary sectors. In particular, exposure to companies that are facilitating the buildout of AI contributed to performance. To the contrary, enterprise software spending slumped as information technology budgets were pointed toward AI-related projects. Portfolio holdings with software-related products detracted from returns. While we adjusted individual holdings, we have not made material changes within positioning.
Total return based on a $10,000 investment
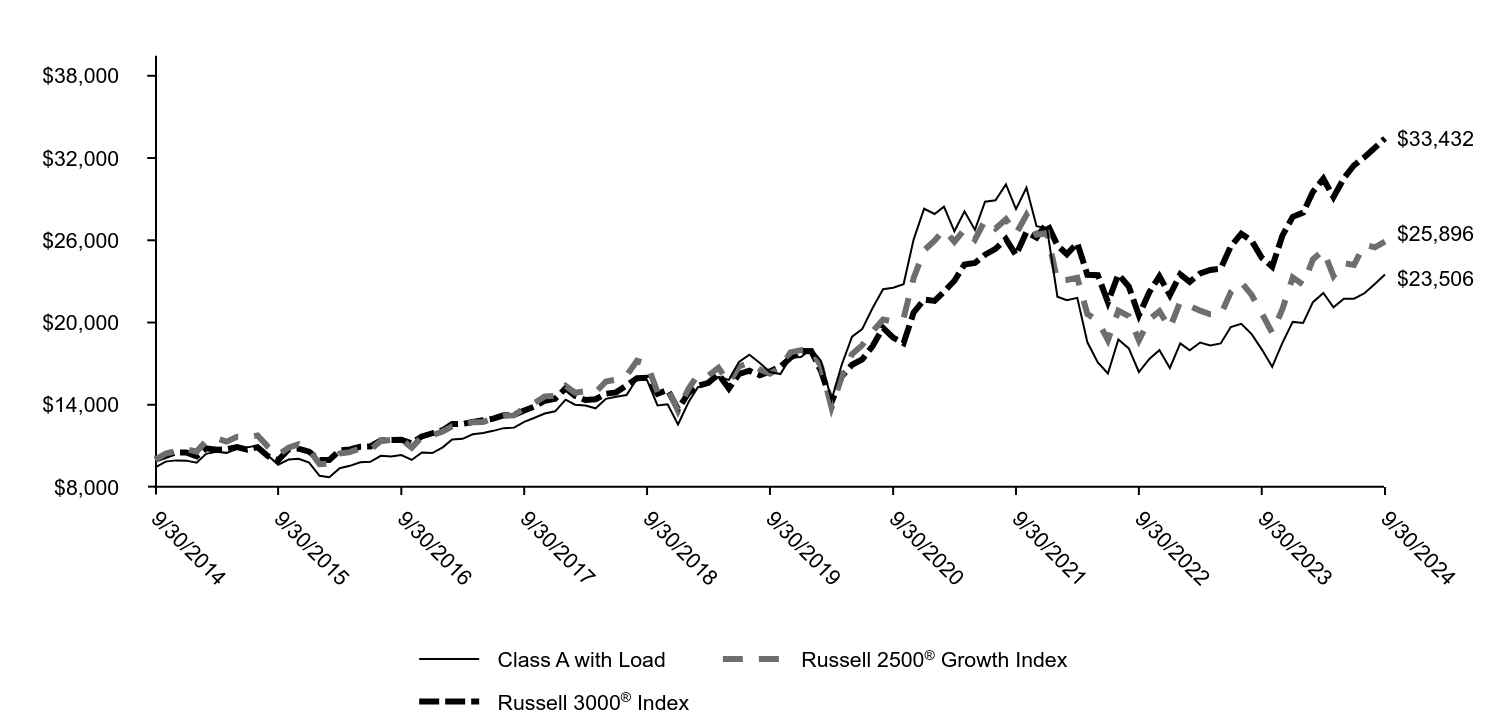
| Class A with Load | Russell 2500® Growth Index | Russell 3000® Index |
|---|
| 9/30/2014 | $9,426 | $10,000 | $10,000 |
| 10/31/2014 | $9,851 | $10,440 | $10,275 |
| 11/30/2014 | $9,942 | $10,614 | $10,524 |
| 12/31/2014 | $9,923 | $10,749 | $10,524 |
| 1/31/2015 | $9,775 | $10,583 | $10,231 |
| 2/28/2015 | $10,416 | $11,362 | $10,824 |
| 3/31/2015 | $10,567 | $11,548 | $10,713 |
| 4/30/2015 | $10,491 | $11,308 | $10,762 |
| 5/31/2015 | $10,791 | $11,657 | $10,911 |
| 6/30/2015 | $10,892 | $11,619 | $10,728 |
| 7/31/2015 | $11,025 | $11,757 | $10,908 |
| 8/31/2015 | $10,305 | $10,933 | $10,249 |
| 9/30/2015 | $9,623 | $10,335 | $9,951 |
| 10/31/2015 | $10,005 | $10,875 | $10,736 |
| 11/30/2015 | $10,059 | $11,122 | $10,796 |
| 12/31/2015 | $9,777 | $10,729 | $10,574 |
| 1/31/2016 | $8,818 | $9,668 | $9,978 |
| 2/29/2016 | $8,717 | $9,697 | $9,975 |
| 3/31/2016 | $9,373 | $10,443 | $10,677 |
| 4/30/2016 | $9,545 | $10,544 | $10,743 |
| 5/31/2016 | $9,801 | $10,805 | $10,935 |
| 6/30/2016 | $9,839 | $10,725 | $10,958 |
| 7/31/2016 | $10,277 | $11,363 | $11,393 |
| 8/31/2016 | $10,225 | $11,442 | $11,422 |
| 9/30/2016 | $10,329 | $11,475 | $11,440 |
| 10/31/2016 | $9,973 | $10,875 | $11,192 |
| 11/30/2016 | $10,515 | $11,668 | $11,693 |
| 12/31/2016 | $10,479 | $11,772 | $11,921 |
| 1/31/2017 | $10,895 | $12,051 | $12,145 |
| 2/28/2017 | $11,465 | $12,417 | $12,597 |
| 3/31/2017 | $11,513 | $12,508 | $12,606 |
| 4/30/2017 | $11,842 | $12,728 | $12,739 |
| 5/31/2017 | $11,947 | $12,734 | $12,870 |
| 6/30/2017 | $12,097 | $13,024 | $12,986 |
| 7/31/2017 | $12,293 | $13,198 | $13,231 |
| 8/31/2017 | $12,331 | $13,224 | $13,256 |
| 9/30/2017 | $12,747 | $13,777 | $13,579 |
| 10/31/2017 | $13,051 | $14,146 | $13,876 |
| 11/30/2017 | $13,359 | $14,612 | $14,297 |
| 12/31/2017 | $13,522 | $14,651 | $14,440 |
| 1/31/2018 | $14,373 | $15,383 | $15,201 |
| 2/28/2018 | $14,003 | $14,878 | $14,641 |
| 3/31/2018 | $13,950 | $15,000 | $14,347 |
| 4/30/2018 | $13,742 | $14,905 | $14,402 |
| 5/31/2018 | $14,435 | $15,698 | $14,808 |
| 6/30/2018 | $14,585 | $15,829 | $14,905 |
| 7/31/2018 | $14,713 | $16,126 | $15,400 |
| 8/31/2018 | $15,897 | $17,215 | $15,940 |
| 9/30/2018 | $15,789 | $16,964 | $15,967 |
| 10/31/2018 | $13,950 | $14,926 | $14,791 |
| 11/30/2018 | $14,028 | $15,208 | $15,087 |
| 12/31/2018 | $12,563 | $13,558 | $13,683 |
| 1/31/2019 | $14,181 | $15,172 | $14,858 |
| 2/28/2019 | $15,280 | $16,172 | $15,380 |
| 3/31/2019 | $15,468 | $16,132 | $15,605 |
| 4/30/2019 | $16,044 | $16,696 | $16,228 |
| 5/31/2019 | $15,813 | $15,587 | $15,178 |
| 6/30/2019 | $17,129 | $16,800 | $16,244 |
| 7/31/2019 | $17,652 | $17,062 | $16,485 |
| 8/31/2019 | $17,050 | $16,577 | $16,149 |
| 9/30/2019 | $16,390 | $16,266 | $16,433 |
| 10/31/2019 | $16,242 | $16,683 | $16,786 |
| 11/30/2019 | $17,425 | $17,819 | $17,424 |
| 12/31/2019 | $17,486 | $17,985 | $17,928 |
| 1/31/2020 | $18,055 | $18,004 | $17,908 |
| 2/29/2020 | $17,175 | $16,783 | $16,442 |
| 3/31/2020 | $14,361 | $13,809 | $14,181 |
| 4/30/2020 | $16,905 | $16,023 | $16,059 |
| 5/31/2020 | $18,969 | $17,696 | $16,918 |
| 6/30/2020 | $19,522 | $18,348 | $17,304 |
| 7/31/2020 | $21,056 | $19,352 | $18,287 |
| 8/31/2020 | $22,432 | $20,223 | $19,612 |
| 9/30/2020 | $22,534 | $20,067 | $18,898 |
| 10/31/2020 | $22,788 | $20,304 | $18,490 |
| 11/30/2020 | $26,070 | $23,262 | $20,739 |
| 12/31/2020 | $28,299 | $25,263 | $21,672 |
| 1/31/2021 | $27,918 | $25,969 | $21,576 |
| 2/28/2021 | $28,454 | $26,785 | $22,250 |
| 3/31/2021 | $26,655 | $25,891 | $23,048 |
| 4/30/2021 | $28,114 | $26,801 | $24,236 |
| 5/31/2021 | $26,757 | $26,056 | $24,346 |
| 6/30/2021 | $28,811 | $27,454 | $24,947 |
| 7/31/2021 | $28,918 | $26,860 | $25,369 |
| 8/31/2021 | $30,080 | $27,532 | $26,092 |
| 9/30/2021 | $28,275 | $26,484 | $24,921 |
| 10/31/2021 | $29,835 | $27,842 | $26,607 |
| 11/30/2021 | $27,030 | $26,408 | $26,202 |
| 12/31/2021 | $26,869 | $26,537 | $27,234 |
| 1/31/2022 | $21,887 | $23,036 | $25,631 |
| 2/28/2022 | $21,630 | $23,105 | $24,986 |
| 3/31/2022 | $21,796 | $23,272 | $25,796 |
| 4/30/2022 | $18,558 | $20,615 | $23,481 |
| 5/31/2022 | $17,080 | $20,114 | $23,450 |
| 6/30/2022 | $16,283 | $18,722 | $21,488 |
| 7/31/2022 | $18,757 | $20,858 | $23,504 |
| 8/31/2022 | $18,109 | $20,462 | $22,627 |
| 9/30/2022 | $16,390 | $18,699 | $20,528 |
| 10/31/2022 | $17,345 | $20,219 | $22,212 |
| 11/30/2022 | $17,985 | $20,821 | $23,371 |
| 12/31/2022 | $16,687 | $19,582 | $22,003 |
| 1/31/2023 | $18,480 | $21,542 | $23,518 |
| 2/28/2023 | $17,975 | $21,201 | $22,968 |
| 3/31/2023 | $18,539 | $20,863 | $23,583 |
| 4/30/2023 | $18,328 | $20,600 | $23,834 |
| 5/31/2023 | $18,472 | $20,577 | $23,927 |
| 6/30/2023 | $19,667 | $22,201 | $25,560 |
| 7/31/2023 | $19,903 | $22,943 | $26,477 |
| 8/31/2023 | $19,153 | $22,009 | $25,966 |
| 9/30/2023 | $18,042 | $20,683 | $24,729 |
| 10/31/2023 | $16,771 | $19,248 | $24,073 |
| 11/30/2023 | $18,497 | $20,954 | $26,318 |
| 12/31/2023 | $20,046 | $23,288 | $27,714 |
| 1/31/2024 | $19,962 | $22,762 | $28,021 |
| 2/29/2024 | $21,486 | $24,606 | $29,538 |
| 3/31/2024 | $22,151 | $25,270 | $30,491 |
| 4/30/2024 | $21,115 | $23,387 | $29,149 |
| 5/31/2024 | $21,738 | $24,335 | $30,526 |
| 6/30/2024 | $21,738 | $24,205 | $31,471 |
| 7/31/2024 | $22,134 | $25,679 | $32,056 |
| 8/31/2024 | $22,807 | $25,480 | $32,754 |
| 9/30/2024 | $23,506 | $25,896 | $33,432 |
Annual Shareholder Report | September 30, 2024
AVERAGE ANNUAL TOTAL RETURNS (%)
| 1 Year | 5 Years | 10 Years |
|---|
| Class A | 30.28 | 7.48 | 9.57 |
| Class A with Load | 22.78 | 6.21 | 8.92 |
Russell 2500® Growth Index (Strategy) | 25.20 | 9.75 | 9.98 |
Russell 3000® Index (Regulatory) | 35.19 | 15.26 | 12.83 |
| Total net assets | $1,129,551,146 |
| # of portfolio holdings | 75 |
| Portfolio turnover rate | 64% |
| Total advisory fees paid | $8,525,068 |
Figures quoted represent past performance, which is no guarantee of future results, and do not reflect taxes that a shareholder may pay on an investment in a fund.
What did the Fund invest in?
(Based on long-term investments)
SECTOR ALLOCATION (% OF LONG-TERM INVESTMENTS)
| Industrials | 26.5 |
| Information technology | 23.7 |
| Health care | 21.0 |
| Consumer discretionary | 13.1 |
| Financials | 8.0 |
| Communication services | 3.5 |
| Materials | 1.6 |
| Real estate | 1.4 |
| Consumer staples | 1.2 |
TOP TEN HOLDINGS (% OF NET ASSETS)
| Natera, Inc. | 2.7 |
| Tetra Tech, Inc. | 2.3 |
| Clearwater Analytics Holdings, Inc., Class A | 2.2 |
| Casella Waste Systems, Inc., Class A | 2.2 |
| Dynatrace, Inc. | 2.1 |
| Morningstar, Inc. | 2.0 |
| EMCOR Group, Inc. | 1.9 |
| Applied Industrial Technologies, Inc. | 1.9 |
| Saia, Inc. | 1.9 |
| TKO Group Holdings, Inc., Class A | 1.9 |
This is a summary of certain changes and planned changes to the Fund since October 1, 2023.
On May 31, 2024, Robert Gruendyke was added as a portfolio manager to the Fund. On August 9, 2024, the Fund’s name was changed from the Allspring Discovery SMID Cap Growth Fund to the Allspring SMID Cap Growth Fund.
You can find additional information on the Fund's website at allspringglobal.com, including its:
- Prospectus - Financial Information - Fund holdings - Proxy voting information
Annual Shareholder Report
This annual shareholder report contains important information about SMID Cap Growth Fund for the period of October 1, 2023 to September 30, 2024. You can find additional information about the Fund at allspringglobal.com. You can also request this information by contacting us at 1-800-222-8222.
This report describes changes to the Fund that occurred either during or after the reporting period.
What were the Fund costs for the past year?
The table explains the costs you would have paid within the reporting period based on a hypothetical $10,000 investment.
| CLASS NAME | COSTS OF A $10,000 INVESTMENT | COSTS PAID AS A % OF A $10,000 INVESTMENT |
|---|
| Administrator Class | $131 | 1.14% |
The manager has contractually committed to waive fees and/or reimburse certain expenses to the extent necessary to cap the Fund's total annual fund operating expense ratio at a specific amount. Without this cap, the costs shown above may have been higher. Please see the prospectus for the amount and the expiration date of the cap. Prior to or after the commitment expiration date, the cap may be increased or the commitment to maintain the cap may be terminated only with the approval of the Board of Trustees.
How did the Fund perform last year and what affected its performance?
Positive earnings results fueled a bull market for U.S. equities during the 12-month period that ended September 30, 2024. Despite lingering macroeconomic concerns, the S&P 500 Index marked its fourth straight quarter of favorable year-over-year earnings growth. Companies tied to artificial intelligence (AI) saw their valuations soar, with the so called “Magnificent 7” stocks substantially outperforming the market. Late in the fiscal year, market leadership broadened as several mega-cap companies struggled to meet high expectations and the Federal Reserve reduced policy rates. As a result, small- and mid-cap stocks narrowed the performance gap relative to large caps. This aided the Fund’s performance.
The portfolio benefited from security selection within the industrials and consumer discretionary sectors. In particular, exposure to companies that are facilitating the buildout of AI contributed to performance. To the contrary, enterprise software spending slumped as information technology budgets were pointed toward AI-related projects. Portfolio holdings with software-related products detracted from returns. While we adjusted individual holdings, we have not made material changes within positioning.
Total return based on a $10,000 investment

| Administrator Class | Russell 2500® Growth Index | Russell 3000® Index |
|---|
| 9/30/2014 | $10,000 | $10,000 | $10,000 |
| 10/31/2014 | $10,458 | $10,440 | $10,275 |
| 11/30/2014 | $10,552 | $10,614 | $10,524 |
| 12/31/2014 | $10,532 | $10,749 | $10,524 |
| 1/31/2015 | $10,375 | $10,583 | $10,231 |
| 2/28/2015 | $11,061 | $11,362 | $10,824 |
| 3/31/2015 | $11,218 | $11,548 | $10,713 |
| 4/30/2015 | $11,139 | $11,308 | $10,762 |
| 5/31/2015 | $11,461 | $11,657 | $10,911 |
| 6/30/2015 | $11,569 | $11,619 | $10,728 |
| 7/31/2015 | $11,710 | $11,757 | $10,908 |
| 8/31/2015 | $10,946 | $10,933 | $10,249 |
| 9/30/2015 | $10,224 | $10,335 | $9,951 |
| 10/31/2015 | $10,631 | $10,875 | $10,736 |
| 11/30/2015 | $10,687 | $11,122 | $10,796 |
| 12/31/2015 | $10,387 | $10,729 | $10,574 |
| 1/31/2016 | $9,371 | $9,668 | $9,978 |
| 2/29/2016 | $9,267 | $9,697 | $9,975 |
| 3/31/2016 | $9,961 | $10,443 | $10,677 |
| 4/30/2016 | $10,144 | $10,544 | $10,743 |
| 5/31/2016 | $10,419 | $10,805 | $10,935 |
| 6/30/2016 | $10,458 | $10,725 | $10,958 |
| 7/31/2016 | $10,927 | $11,363 | $11,393 |
| 8/31/2016 | $10,873 | $11,442 | $11,422 |
| 9/30/2016 | $10,981 | $11,475 | $11,440 |
| 10/31/2016 | $10,605 | $10,875 | $11,192 |
| 11/30/2016 | $11,181 | $11,668 | $11,693 |
| 12/31/2016 | $11,144 | $11,772 | $11,921 |
| 1/31/2017 | $11,586 | $12,051 | $12,145 |
| 2/28/2017 | $12,194 | $12,417 | $12,597 |
| 3/31/2017 | $12,245 | $12,508 | $12,606 |
| 4/30/2017 | $12,596 | $12,728 | $12,739 |
| 5/31/2017 | $12,712 | $12,734 | $12,870 |
| 6/30/2017 | $12,868 | $13,024 | $12,986 |
| 7/31/2017 | $13,082 | $13,198 | $13,231 |
| 8/31/2017 | $13,122 | $13,224 | $13,256 |
| 9/30/2017 | $13,564 | $13,777 | $13,579 |
| 10/31/2017 | $13,890 | $14,146 | $13,876 |
| 11/30/2017 | $14,219 | $14,612 | $14,297 |
| 12/31/2017 | $14,391 | $14,651 | $14,440 |
| 1/31/2018 | $15,299 | $15,383 | $15,201 |
| 2/28/2018 | $14,905 | $14,878 | $14,641 |
| 3/31/2018 | $14,850 | $15,000 | $14,347 |
| 4/30/2018 | $14,631 | $14,905 | $14,402 |
| 5/31/2018 | $15,372 | $15,698 | $14,808 |
| 6/30/2018 | $15,530 | $15,829 | $14,905 |
| 7/31/2018 | $15,667 | $16,126 | $15,400 |
| 8/31/2018 | $16,926 | $17,215 | $15,940 |
| 9/30/2018 | $16,815 | $16,964 | $15,967 |
| 10/31/2018 | $14,854 | $14,926 | $14,791 |
| 11/30/2018 | $14,940 | $15,208 | $15,087 |
| 12/31/2018 | $13,382 | $13,558 | $13,683 |
| 1/31/2019 | $15,106 | $15,172 | $14,858 |
| 2/28/2019 | $16,279 | $16,172 | $15,380 |
| 3/31/2019 | $16,481 | $16,132 | $15,605 |
| 4/30/2019 | $17,093 | $16,696 | $16,228 |
| 5/31/2019 | $16,850 | $15,587 | $15,178 |
| 6/30/2019 | $18,251 | $16,800 | $16,244 |
| 7/31/2019 | $18,812 | $17,062 | $16,485 |
| 8/31/2019 | $18,170 | $16,577 | $16,149 |
| 9/30/2019 | $17,467 | $16,266 | $16,433 |
| 10/31/2019 | $17,310 | $16,683 | $16,786 |
| 11/30/2019 | $18,574 | $17,819 | $17,424 |
| 12/31/2019 | $18,636 | $17,985 | $17,928 |
| 1/31/2020 | $19,246 | $18,004 | $17,908 |
| 2/29/2020 | $18,308 | $16,783 | $16,442 |
| 3/31/2020 | $15,311 | $13,809 | $14,181 |
| 4/30/2020 | $18,020 | $16,023 | $16,059 |
| 5/31/2020 | $20,223 | $17,696 | $16,918 |
| 6/30/2020 | $20,816 | $18,348 | $17,304 |
| 7/31/2020 | $22,461 | $19,352 | $18,287 |
| 8/31/2020 | $23,922 | $20,223 | $19,612 |
| 9/30/2020 | $24,037 | $20,067 | $18,898 |
| 10/31/2020 | $24,307 | $20,304 | $18,490 |
| 11/30/2020 | $27,810 | $23,262 | $20,739 |
| 12/31/2020 | $30,186 | $25,263 | $21,672 |
| 1/31/2021 | $29,780 | $25,969 | $21,576 |
| 2/28/2021 | $30,356 | $26,785 | $22,250 |
| 3/31/2021 | $28,441 | $25,891 | $23,048 |
| 4/30/2021 | $29,998 | $26,801 | $24,236 |
| 5/31/2021 | $28,550 | $26,056 | $24,346 |
| 6/30/2021 | $30,743 | $27,454 | $24,947 |
| 7/31/2021 | $30,864 | $26,860 | $25,369 |
| 8/31/2021 | $32,106 | $27,532 | $26,092 |
| 9/30/2021 | $30,186 | $26,484 | $24,921 |
| 10/31/2021 | $31,846 | $27,842 | $26,607 |
| 11/30/2021 | $28,853 | $26,408 | $26,202 |
| 12/31/2021 | $28,684 | $26,537 | $27,234 |
| 1/31/2022 | $23,368 | $23,036 | $25,631 |
| 2/28/2022 | $23,086 | $23,105 | $24,986 |
| 3/31/2022 | $23,277 | $23,272 | $25,796 |
| 4/30/2022 | $19,819 | $20,615 | $23,481 |
| 5/31/2022 | $18,252 | $20,114 | $23,450 |
| 6/30/2022 | $17,398 | $18,722 | $21,488 |
| 7/31/2022 | $20,043 | $20,858 | $23,504 |
| 8/31/2022 | $19,347 | $20,462 | $22,627 |
| 9/30/2022 | $17,514 | $18,699 | $20,528 |
| 10/31/2022 | $18,534 | $20,219 | $22,212 |
| 11/30/2022 | $19,222 | $20,821 | $23,371 |
| 12/31/2022 | $17,835 | $19,582 | $22,003 |
| 1/31/2023 | $19,758 | $21,542 | $23,518 |
| 2/28/2023 | $19,221 | $21,201 | $22,968 |
| 3/31/2023 | $19,817 | $20,863 | $23,583 |
| 4/30/2023 | $19,607 | $20,600 | $23,834 |
| 5/31/2023 | $19,750 | $20,577 | $23,927 |
| 6/30/2023 | $21,035 | $22,201 | $25,560 |
| 7/31/2023 | $21,296 | $22,943 | $26,477 |
| 8/31/2023 | $20,489 | $22,009 | $25,966 |
| 9/30/2023 | $19,296 | $20,683 | $24,729 |
| 10/31/2023 | $17,935 | $19,248 | $24,073 |
| 11/30/2023 | $19,783 | $20,954 | $26,318 |
| 12/31/2023 | $21,447 | $23,288 | $27,714 |
| 1/31/2024 | $21,354 | $22,762 | $28,021 |
| 2/29/2024 | $22,984 | $24,606 | $29,538 |
| 3/31/2024 | $23,698 | $25,270 | $30,491 |
| 4/30/2024 | $22,589 | $23,387 | $29,149 |
| 5/31/2024 | $23,261 | $24,335 | $30,526 |
| 6/30/2024 | $23,261 | $24,205 | $31,471 |
| 7/31/2024 | $23,681 | $25,679 | $32,056 |
| 8/31/2024 | $24,404 | $25,480 | $32,754 |
| 9/30/2024 | $25,152 | $25,896 | $33,432 |
Annual Shareholder Report | September 30, 2024
AVERAGE ANNUAL TOTAL RETURNS (%)
| 1 Year | 5 Years | 10 Years |
|---|
| Administrator Class | 30.34 | 7.56 | 9.66 |
Russell 2500® Growth Index (Strategy) | 25.20 | 9.75 | 9.98 |
Russell 3000® Index (Regulatory) | 35.19 | 15.26 | 12.83 |
| Total net assets | $1,129,551,146 |
| # of portfolio holdings | 75 |
| Portfolio turnover rate | 64% |
| Total advisory fees paid | $8,525,068 |
Figures quoted represent past performance, which is no guarantee of future results, and do not reflect taxes that a shareholder may pay on an investment in a fund.
What did the Fund invest in?
(Based on long-term investments)
SECTOR ALLOCATION (% OF LONG-TERM INVESTMENTS)
| Industrials | 26.5 |
| Information technology | 23.7 |
| Health care | 21.0 |
| Consumer discretionary | 13.1 |
| Financials | 8.0 |
| Communication services | 3.5 |
| Materials | 1.6 |
| Real estate | 1.4 |
| Consumer staples | 1.2 |
TOP TEN HOLDINGS (% OF NET ASSETS)
| Natera, Inc. | 2.7 |
| Tetra Tech, Inc. | 2.3 |
| Clearwater Analytics Holdings, Inc., Class A | 2.2 |
| Casella Waste Systems, Inc., Class A | 2.2 |
| Dynatrace, Inc. | 2.1 |
| Morningstar, Inc. | 2.0 |
| EMCOR Group, Inc. | 1.9 |
| Applied Industrial Technologies, Inc. | 1.9 |
| Saia, Inc. | 1.9 |
| TKO Group Holdings, Inc., Class A | 1.9 |
This is a summary of certain changes and planned changes to the Fund since October 1, 2023.
On May 31, 2024, Robert Gruendyke was added as a portfolio manager to the Fund. On August 9, 2024, the Fund’s name was changed from the Allspring Discovery SMID Cap Growth Fund to the Allspring SMID Cap Growth Fund.
You can find additional information on the Fund's website at allspringglobal.com, including its:
- Prospectus - Financial Information - Fund holdings - Proxy voting information
Annual Shareholder Report
Diversified Capital Builder Fund
This annual shareholder report contains important information about Diversified Capital Builder Fund for the period of October 1, 2023 to September 30, 2024. You can find additional information about the Fund at allspringglobal.com. You can also request this information by contacting us at 1-800-222-8222.
What were the Fund costs for the past year?
The table explains the costs you would have paid within the reporting period based on a hypothetical $10,000 investment.
| CLASS NAME | COSTS OF A $10,000 INVESTMENT | COSTS PAID AS A % OF A $10,000 INVESTMENT |
|---|
| Institutional Class | $89 | 0.76% |
The manager has contractually committed to waive fees and/or reimburse certain expenses to the extent necessary to cap the Fund's total annual fund operating expense ratio at a specific amount. Without this cap, the costs shown above may have been higher. Please see the prospectus for the amount and the expiration date of the cap. Prior to or after the commitment expiration date, the cap may be increased or the commitment to maintain the cap may be terminated only with the approval of the Board of Trustees.
How did the Fund perform last year and what affected its performance?
U.S. equity markets rallied as inflation moderated in 2024, leading the Federal Reserve to cut its key rate in September 2024. Globally, inflation, geopolitical tensions, and sovereign debt burdens led to lower growth. In high yield, lower-quality issues outperformed higher-rated issues, as CCC-rated bond spreads tightened. Our asset allocation is weighted toward equities, where we see capital appreciation and dividends exceeding the returns of fixed income. We seek sectors with long-term growth potential, pricing power, and higher profit margins. We are concerned inflation could persist, leading to tightening liquidity and lower asset prices.
The Fund outperformed its blended benchmark, the Diversified Capital Builder Index, during the 12 months that ended September 30, 2024. Top equity contributors were holdings in information technology, industrials, and energy along with underweights in consumer staples and consumer discretionary. Broadcom, Leidos Holdings, and Micro Devices were among the top contributors. Underperformers included Adobe, McKesson Corp., and Neurocrine Biosciences. Bond contributors were our underweights in consumer cyclicals, energy, and communications. Individual bond detractors included Post Holdings, Spectrum Brands, and Iron Mountain.
Total return based on a $10,000 investment
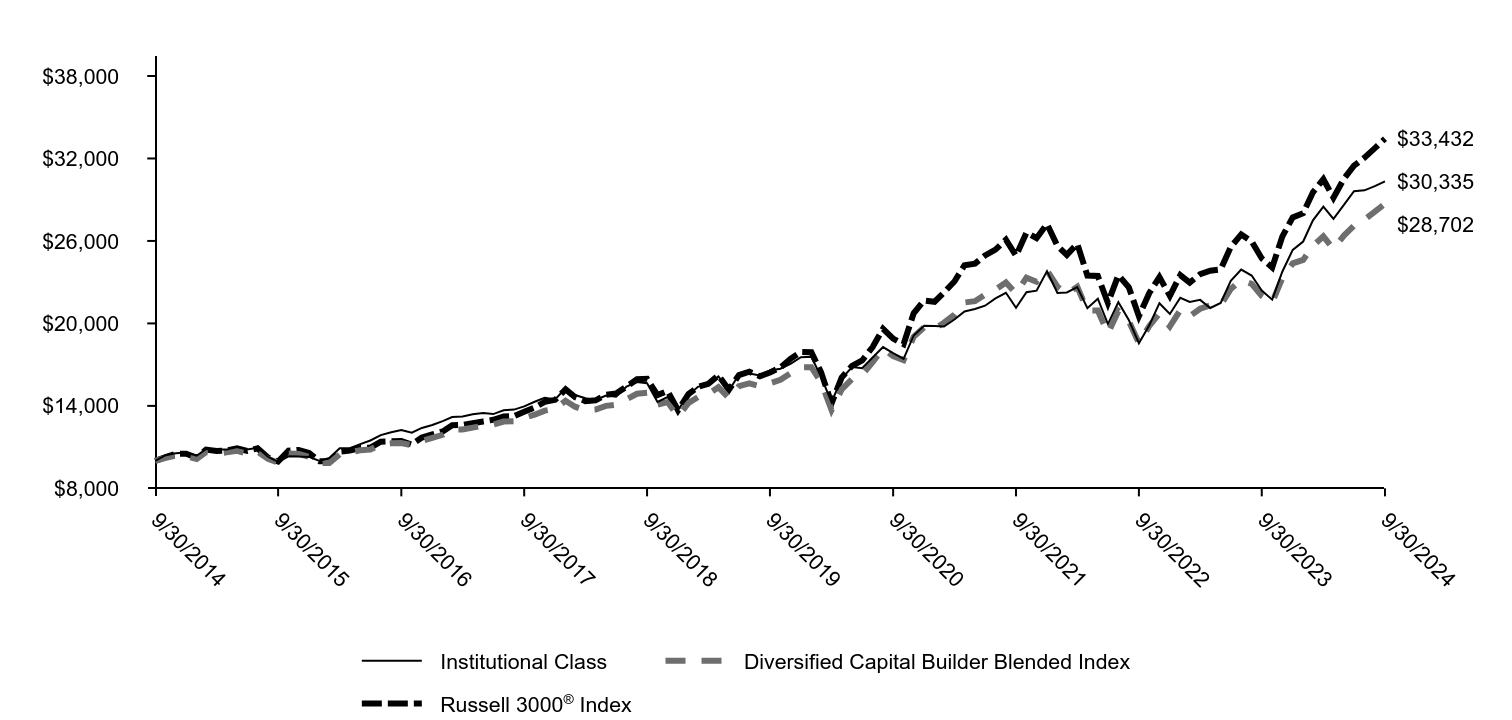
| Institutional Class | Diversified Capital Builder Blended Index | Russell 3000® Index |
|---|
| 9/30/2014 | $10,000 | $10,000 | $10,000 |
| 10/31/2014 | $10,410 | $10,212 | $10,275 |
| 11/30/2014 | $10,550 | $10,395 | $10,524 |
| 12/31/2014 | $10,602 | $10,338 | $10,524 |
| 1/31/2015 | $10,374 | $10,143 | $10,231 |
| 2/28/2015 | $10,862 | $10,643 | $10,824 |
| 3/31/2015 | $10,830 | $10,529 | $10,713 |
| 4/30/2015 | $10,819 | $10,617 | $10,762 |
| 5/31/2015 | $11,015 | $10,729 | $10,911 |
| 6/30/2015 | $10,820 | $10,537 | $10,728 |
| 7/31/2015 | $10,951 | $10,674 | $10,908 |
| 8/31/2015 | $10,297 | $10,145 | $10,249 |
| 9/30/2015 | $9,925 | $9,871 | $9,951 |
| 10/31/2015 | $10,330 | $10,538 | $10,736 |
| 11/30/2015 | $10,319 | $10,505 | $10,796 |
| 12/31/2015 | $10,289 | $10,296 | $10,574 |
| 1/31/2016 | $9,997 | $9,840 | $9,978 |
| 2/29/2016 | $10,204 | $9,849 | $9,975 |
| 3/31/2016 | $10,912 | $10,472 | $10,677 |
| 4/30/2016 | $10,924 | $10,619 | $10,743 |
| 5/31/2016 | $11,217 | $10,776 | $10,935 |
| 6/30/2016 | $11,482 | $10,823 | $10,958 |
| 7/31/2016 | $11,874 | $11,201 | $11,393 |
| 8/31/2016 | $12,083 | $11,274 | $11,422 |
| 9/30/2016 | $12,236 | $11,299 | $11,440 |
| 10/31/2016 | $12,051 | $11,142 | $11,192 |
| 11/30/2016 | $12,397 | $11,461 | $11,693 |
| 12/31/2016 | $12,610 | $11,678 | $11,921 |
| 1/31/2017 | $12,893 | $11,894 | $12,145 |
| 2/28/2017 | $13,189 | $12,286 | $12,597 |
| 3/31/2017 | $13,221 | $12,285 | $12,606 |
| 4/30/2017 | $13,384 | $12,417 | $12,739 |
| 5/31/2017 | $13,478 | $12,564 | $12,870 |
| 6/30/2017 | $13,403 | $12,633 | $12,986 |
| 7/31/2017 | $13,676 | $12,857 | $13,231 |
| 8/31/2017 | $13,730 | $12,887 | $13,256 |
| 9/30/2017 | $13,962 | $13,122 | $13,579 |
| 10/31/2017 | $14,302 | $13,360 | $13,876 |
| 11/30/2017 | $14,589 | $13,656 | $14,297 |
| 12/31/2017 | $14,471 | $13,780 | $14,440 |
| 1/31/2018 | $15,303 | $14,369 | $15,201 |
| 2/28/2018 | $14,787 | $13,940 | $14,641 |
| 3/31/2018 | $14,553 | $13,680 | $14,347 |
| 4/30/2018 | $14,438 | $13,738 | $14,402 |
| 5/31/2018 | $14,754 | $14,000 | $14,808 |
| 6/30/2018 | $14,676 | $14,081 | $14,905 |
| 7/31/2018 | $15,412 | $14,485 | $15,400 |
| 8/31/2018 | $15,729 | $14,885 | $15,940 |
| 9/30/2018 | $15,643 | $14,949 | $15,967 |
| 10/31/2018 | $14,282 | $14,094 | $14,791 |
| 11/30/2018 | $14,644 | $14,278 | $15,087 |
| 12/31/2018 | $13,709 | $13,225 | $13,683 |
| 1/31/2019 | $14,771 | $14,208 | $14,858 |
| 2/28/2019 | $15,386 | $14,629 | $15,380 |
| 3/31/2019 | $15,570 | $14,855 | $15,605 |
| 4/30/2019 | $16,142 | $15,357 | $16,228 |
| 5/31/2019 | $15,106 | $14,574 | $15,178 |
| 6/30/2019 | $16,286 | $15,432 | $16,244 |
| 7/31/2019 | $16,348 | $15,631 | $16,485 |
| 8/31/2019 | $16,209 | $15,432 | $16,149 |
| 9/30/2019 | $16,579 | $15,645 | $16,433 |
| 10/31/2019 | $16,703 | $15,903 | $16,786 |
| 11/30/2019 | $17,062 | $16,364 | $17,424 |
| 12/31/2019 | $17,542 | $16,803 | $17,928 |
| 1/31/2020 | $17,575 | $16,817 | $17,908 |
| 2/29/2020 | $16,106 | $15,722 | $16,442 |
| 3/31/2020 | $14,278 | $13,703 | $14,181 |
| 4/30/2020 | $15,985 | $15,191 | $16,059 |
| 5/31/2020 | $16,822 | $15,966 | $16,918 |
| 6/30/2020 | $16,744 | $16,269 | $17,304 |
| 7/31/2020 | $17,518 | $17,178 | $18,287 |
| 8/31/2020 | $18,275 | $18,166 | $19,612 |
| 9/30/2020 | $17,835 | $17,621 | $18,898 |
| 10/31/2020 | $17,422 | $17,323 | $18,490 |
| 11/30/2020 | $19,123 | $19,025 | $20,739 |
| 12/31/2020 | $19,826 | $19,719 | $21,672 |
| 1/31/2021 | $19,810 | $19,613 | $21,576 |
| 2/28/2021 | $19,776 | $20,056 | $22,250 |
| 3/31/2021 | $20,281 | $20,633 | $23,048 |
| 4/30/2021 | $20,868 | $21,522 | $24,236 |
| 5/31/2021 | $21,053 | $21,614 | $24,346 |
| 6/30/2021 | $21,288 | $22,093 | $24,947 |
| 7/31/2021 | $21,826 | $22,458 | $25,369 |
| 8/31/2021 | $22,230 | $22,976 | $26,092 |
| 9/30/2021 | $21,136 | $22,186 | $24,921 |
| 10/31/2021 | $22,265 | $23,331 | $26,607 |
| 11/30/2021 | $22,383 | $23,036 | $26,202 |
| 12/31/2021 | $23,804 | $23,847 | $27,234 |
| 1/31/2022 | $22,219 | $22,674 | $25,631 |
| 2/28/2022 | $22,255 | $22,156 | $24,986 |
| 3/31/2022 | $22,649 | $22,666 | $25,796 |
| 4/30/2022 | $21,112 | $20,944 | $23,481 |
| 5/31/2022 | $21,799 | $20,936 | $23,450 |
| 6/30/2022 | $19,949 | $19,265 | $21,488 |
| 7/31/2022 | $21,544 | $20,902 | $23,504 |
| 8/31/2022 | $20,257 | $20,173 | $22,627 |
| 9/30/2022 | $18,560 | $18,571 | $20,528 |
| 10/31/2022 | $19,870 | $19,822 | $22,212 |
| 11/30/2022 | $21,471 | $20,722 | $23,371 |
| 12/31/2022 | $20,690 | $19,779 | $22,003 |
| 1/31/2023 | $21,869 | $20,965 | $23,518 |
| 2/28/2023 | $21,564 | $20,523 | $22,968 |
| 3/31/2023 | $21,712 | $21,067 | $23,583 |
| 4/30/2023 | $21,121 | $21,313 | $23,834 |
| 5/31/2023 | $21,488 | $21,336 | $23,927 |
| 6/30/2023 | $23,097 | $22,504 | $25,560 |
| 7/31/2023 | $23,915 | $23,164 | $26,477 |
| 8/31/2023 | $23,485 | $22,877 | $25,966 |
| 9/30/2023 | $22,387 | $22,004 | $24,729 |
| 10/31/2023 | $21,730 | $21,537 | $24,073 |
| 11/30/2023 | $23,762 | $23,291 | $26,318 |
| 12/31/2023 | $25,352 | $24,368 | $27,714 |
| 1/31/2024 | $25,960 | $24,624 | $28,021 |
| 2/29/2024 | $27,502 | $25,638 | $29,538 |
| 3/31/2024 | $28,494 | $26,330 | $30,491 |
| 4/30/2024 | $27,602 | $25,423 | $29,149 |
| 5/31/2024 | $28,625 | $26,391 | $30,526 |
| 6/30/2024 | $29,618 | $27,108 | $31,471 |
| 7/31/2024 | $29,683 | $27,536 | $32,056 |
| 8/31/2024 | $29,988 | $28,137 | $32,754 |
| 9/30/2024 | $30,335 | $28,702 | $33,432 |
Diversified Capital Builder Fund
Annual Shareholder Report | September 30, 2024
AVERAGE ANNUAL TOTAL RETURNS (%)
| 1 Year | 5 Years | 10 Years |
|---|
| Institutional Class | 35.50 | 12.84 | 11.74 |
Diversified Capital Builder Blended Index (Strategy)Footnote Reference* | 30.44 | 12.90 | 11.12 |
Russell 3000® Index (Regulatory) | 35.19 | 15.26 | 12.83 |
| Total net assets | $1,556,667,861 |
| # of portfolio holdings | 92 |
| Portfolio turnover rate | 30% |
| Total advisory fees paid | $7,987,880 |
Figures quoted represent past performance, which is no guarantee of future results, and do not reflect taxes that a shareholder may pay on an investment in a fund.
| Footnote | Description |
Footnote* | The Diversified Capital Builder Blended Index is composed 75% of the Russell 1000® Index and 25% of the ICE BofA U.S. Cash Pay High Yield Index. You cannot invest directly in an index. |
What did the Fund invest in?
(Based on long-term investments)
PORTFOLIO COMPOSITION (% OF LONG-TERM INVESTMENTS)
| Common stocks | 84.5 |
| Corporate bonds and notes | 15.1 |
| Yankee corporate bonds and notes | 0.4 |
TOP TEN HOLDINGS (% OF NET ASSETS)
| Broadcom, Inc. | 5.9 |
| Leidos Holdings, Inc. | 4.3 |
| Advanced Micro Devices, Inc. | 4.2 |
| Microsoft Corp. | 4.1 |
| NVIDIA Corp. | 3.9 |
| Micron Technology, Inc. | 3.8 |
| Amphenol Corp., Class A | 2.7 |
| Marvell Technology, Inc. | 2.6 |
| Targa Resources Corp. | 2.5 |
| Schlumberger NV | 2.4 |
You can find additional information on the Fund's website at allspringglobal.com, including its:
- Prospectus - Financial Information - Fund holdings - Proxy voting information
Annual Shareholder Report
Diversified Capital Builder Fund
This annual shareholder report contains important information about Diversified Capital Builder Fund for the period of October 1, 2023 to September 30, 2024. You can find additional information about the Fund at allspringglobal.com. You can also request this information by contacting us at 1-800-222-8222.
What were the Fund costs for the past year?
The table explains the costs you would have paid within the reporting period based on a hypothetical $10,000 investment.
| CLASS NAME | COSTS OF A $10,000 INVESTMENT | COSTS PAID AS A % OF A $10,000 INVESTMENT |
|---|
| Class C | $214 | 1.83% |
The manager has contractually committed to waive fees and/or reimburse certain expenses to the extent necessary to cap the Fund's total annual fund operating expense ratio at a specific amount. Without this cap, the costs shown above may have been higher. Please see the prospectus for the amount and the expiration date of the cap. Prior to or after the commitment expiration date, the cap may be increased or the commitment to maintain the cap may be terminated only with the approval of the Board of Trustees.
How did the Fund perform last year and what affected its performance?
U.S. equity markets rallied as inflation moderated in 2024, leading the Federal Reserve to cut its key rate in September 2024. Globally, inflation, geopolitical tensions, and sovereign debt burdens led to lower growth. In high yield, lower-quality issues outperformed higher-rated issues, as CCC-rated bond spreads tightened. Our asset allocation is weighted toward equities, where we see capital appreciation and dividends exceeding the returns of fixed income. We seek sectors with long-term growth potential, pricing power, and higher profit margins. We are concerned inflation could persist, leading to tightening liquidity and lower asset prices.
The Fund outperformed its blended benchmark, the Diversified Capital Builder Index, during the 12 months that ended September 30, 2024. Top equity contributors were holdings in information technology, industrials, and energy along with underweights in consumer staples and consumer discretionary. Broadcom, Leidos Holdings, and Micro Devices were among the top contributors. Underperformers included Adobe, McKesson Corp., and Neurocrine Biosciences. Bond contributors were our underweights in consumer cyclicals, energy, and communications. Individual bond detractors included Post Holdings, Spectrum Brands, and Iron Mountain.
Total return based on a $10,000 investment

| Class C with Load | Diversified Capital Builder Blended Index | Russell 3000® Index |
|---|
| 9/30/2014 | $10,000 | $10,000 | $10,000 |
| 10/31/2014 | $10,408 | $10,212 | $10,275 |
| 11/30/2014 | $10,536 | $10,395 | $10,524 |
| 12/31/2014 | $10,573 | $10,338 | $10,524 |
| 1/31/2015 | $10,337 | $10,143 | $10,231 |
| 2/28/2015 | $10,820 | $10,643 | $10,824 |
| 3/31/2015 | $10,774 | $10,529 | $10,713 |
| 4/30/2015 | $10,752 | $10,617 | $10,762 |
| 5/31/2015 | $10,946 | $10,729 | $10,911 |
| 6/30/2015 | $10,733 | $10,537 | $10,728 |
| 7/31/2015 | $10,852 | $10,674 | $10,908 |
| 8/31/2015 | $10,185 | $10,145 | $10,249 |
| 9/30/2015 | $9,812 | $9,871 | $9,951 |
| 10/31/2015 | $10,210 | $10,538 | $10,736 |
| 11/30/2015 | $10,188 | $10,505 | $10,796 |
| 12/31/2015 | $10,144 | $10,296 | $10,574 |
| 1/31/2016 | $9,858 | $9,840 | $9,978 |
| 2/29/2016 | $10,037 | $9,849 | $9,975 |
| 3/31/2016 | $10,737 | $10,472 | $10,677 |
| 4/30/2016 | $10,737 | $10,619 | $10,743 |
| 5/31/2016 | $11,011 | $10,776 | $10,935 |
| 6/30/2016 | $11,262 | $10,823 | $10,958 |
| 7/31/2016 | $11,645 | $11,201 | $11,393 |
| 8/31/2016 | $11,824 | $11,274 | $11,422 |
| 9/30/2016 | $11,966 | $11,299 | $11,440 |
| 10/31/2016 | $11,774 | $11,142 | $11,192 |
| 11/30/2016 | $12,110 | $11,461 | $11,693 |
| 12/31/2016 | $12,309 | $11,678 | $11,921 |
| 1/31/2017 | $12,570 | $11,894 | $12,145 |
| 2/28/2017 | $12,844 | $12,286 | $12,597 |
| 3/31/2017 | $12,862 | $12,285 | $12,606 |
| 4/30/2017 | $13,019 | $12,417 | $12,739 |
| 5/31/2017 | $13,085 | $12,564 | $12,870 |
| 6/30/2017 | $13,004 | $12,633 | $12,986 |
| 7/31/2017 | $13,254 | $12,857 | $13,231 |
| 8/31/2017 | $13,306 | $12,887 | $13,256 |
| 9/30/2017 | $13,503 | $13,122 | $13,579 |
| 10/31/2017 | $13,832 | $13,360 | $13,876 |
| 11/30/2017 | $14,081 | $13,656 | $14,297 |
| 12/31/2017 | $13,964 | $13,780 | $14,440 |
| 1/31/2018 | $14,749 | $14,369 | $15,201 |
| 2/28/2018 | $14,239 | $13,940 | $14,641 |
| 3/31/2018 | $14,011 | $13,680 | $14,347 |
| 4/30/2018 | $13,887 | $13,738 | $14,402 |
| 5/31/2018 | $14,162 | $14,000 | $14,808 |
| 6/30/2018 | $14,089 | $14,081 | $14,905 |
| 7/31/2018 | $14,778 | $14,485 | $15,400 |
| 8/31/2018 | $15,067 | $14,885 | $15,940 |
| 9/30/2018 | $14,972 | $14,949 | $15,967 |
| 10/31/2018 | $13,663 | $14,094 | $14,791 |
| 11/30/2018 | $13,993 | $14,278 | $15,087 |
| 12/31/2018 | $13,088 | $13,225 | $13,683 |
| 1/31/2019 | $14,082 | $14,208 | $14,858 |
| 2/28/2019 | $14,666 | $14,629 | $15,380 |
| 3/31/2019 | $14,819 | $14,855 | $15,605 |
| 4/30/2019 | $15,346 | $15,357 | $16,228 |
| 5/31/2019 | $14,365 | $14,574 | $15,178 |
| 6/30/2019 | $15,458 | $15,432 | $16,244 |
| 7/31/2019 | $15,502 | $15,631 | $16,485 |
| 8/31/2019 | $15,355 | $15,432 | $16,149 |
| 9/30/2019 | $15,693 | $15,645 | $16,433 |
| 10/31/2019 | $15,796 | $15,903 | $16,786 |
| 11/30/2019 | $16,119 | $16,364 | $17,424 |
| 12/31/2019 | $16,567 | $16,803 | $17,928 |
| 1/31/2020 | $16,582 | $16,817 | $17,908 |
| 2/29/2020 | $15,172 | $15,722 | $16,442 |
| 3/31/2020 | $13,449 | $13,703 | $14,181 |
| 4/30/2020 | $15,032 | $15,191 | $16,059 |
| 5/31/2020 | $15,800 | $15,966 | $16,918 |
| 6/30/2020 | $15,732 | $16,269 | $17,304 |
| 7/31/2020 | $16,440 | $17,178 | $18,287 |
| 8/31/2020 | $17,132 | $18,166 | $19,612 |
| 9/30/2020 | $16,704 | $17,621 | $18,898 |
| 10/31/2020 | $16,304 | $17,323 | $18,490 |
| 11/30/2020 | $17,889 | $19,025 | $20,739 |
| 12/31/2020 | $18,515 | $19,719 | $21,672 |
| 1/31/2021 | $18,484 | $19,613 | $21,576 |
| 2/28/2021 | $18,437 | $20,056 | $22,250 |
| 3/31/2021 | $18,904 | $20,633 | $23,048 |
| 4/30/2021 | $19,433 | $21,522 | $24,236 |
| 5/31/2021 | $19,589 | $21,614 | $24,346 |
| 6/30/2021 | $19,791 | $22,093 | $24,947 |
| 7/31/2021 | $20,273 | $22,458 | $25,369 |
| 8/31/2021 | $20,616 | $22,976 | $26,092 |
| 9/30/2021 | $19,586 | $22,186 | $24,921 |
| 10/31/2021 | $20,630 | $23,331 | $26,607 |
| 11/30/2021 | $20,707 | $23,036 | $26,202 |
| 12/31/2021 | $22,003 | $23,847 | $27,234 |
| 1/31/2022 | $20,508 | $22,674 | $25,631 |
| 2/28/2022 | $20,542 | $22,156 | $24,986 |
| 3/31/2022 | $20,876 | $22,666 | $25,796 |
| 4/30/2022 | $19,447 | $20,944 | $23,481 |
| 5/31/2022 | $20,062 | $20,936 | $23,450 |
| 6/30/2022 | $18,341 | $19,265 | $21,488 |
| 7/31/2022 | $19,786 | $20,902 | $23,504 |
| 8/31/2022 | $18,590 | $20,173 | $22,627 |
| 9/30/2022 | $17,017 | $18,571 | $20,528 |
| 10/31/2022 | $18,191 | $19,822 | $22,212 |
| 11/30/2022 | $19,663 | $20,722 | $23,371 |
| 12/31/2022 | $18,938 | $19,779 | $22,003 |
| 1/31/2023 | $20,026 | $20,965 | $23,518 |
| 2/28/2023 | $19,731 | $20,523 | $22,968 |
| 3/31/2023 | $19,869 | $21,067 | $23,583 |
| 4/30/2023 | $19,333 | $21,313 | $23,834 |
| 5/31/2023 | $19,648 | $21,336 | $23,927 |
| 6/30/2023 | $21,109 | $22,504 | $25,560 |
| 7/31/2023 | $21,869 | $23,164 | $26,477 |
| 8/31/2023 | $21,461 | $22,877 | $25,966 |
| 9/30/2023 | $20,448 | $22,004 | $24,729 |
| 10/31/2023 | $19,836 | $21,537 | $24,073 |
| 11/30/2023 | $21,693 | $23,291 | $26,318 |
| 12/31/2023 | $23,133 | $24,368 | $27,714 |
| 1/31/2024 | $23,683 | $24,624 | $28,021 |
| 2/29/2024 | $25,097 | $25,638 | $29,538 |
| 3/31/2024 | $25,997 | $26,330 | $30,491 |
| 4/30/2024 | $25,171 | $25,423 | $29,149 |
| 5/31/2024 | $26,095 | $26,391 | $30,526 |
| 6/30/2024 | $26,992 | $27,108 | $31,471 |
| 7/31/2024 | $27,051 | $27,536 | $32,056 |
| 8/31/2024 | $27,327 | $28,137 | $32,754 |
| 9/30/2024 | $27,617 | $28,702 | $33,432 |
Diversified Capital Builder Fund
Annual Shareholder Report | September 30, 2024
AVERAGE ANNUAL TOTAL RETURNS (%)
| 1 Year | 5 Years | 10 Years |
|---|
| Class C | 33.96 | 11.63 | 10.69 |
| Class C with Load | 32.96 | 11.63 | 10.69 |
Diversified Capital Builder Blended Index (Strategy)Footnote Reference* | 30.44 | 12.90 | 11.12 |
Russell 3000® Index (Regulatory) | 35.19 | 15.26 | 12.83 |
| Total net assets | $1,556,667,861 |
| # of portfolio holdings | 92 |
| Portfolio turnover rate | 30% |
| Total advisory fees paid | $7,987,880 |
Figures quoted represent past performance, which is no guarantee of future results, and do not reflect taxes that a shareholder may pay on an investment in a fund.
| Footnote | Description |
Footnote* | The Diversified Capital Builder Blended Index is composed 75% of the Russell 1000® Index and 25% of the ICE BofA U.S. Cash Pay High Yield Index. You cannot invest directly in an index. |
What did the Fund invest in?
(Based on long-term investments)
PORTFOLIO COMPOSITION (% OF LONG-TERM INVESTMENTS)
| Common stocks | 84.5 |
| Corporate bonds and notes | 15.1 |
| Yankee corporate bonds and notes | 0.4 |
TOP TEN HOLDINGS (% OF NET ASSETS)
| Broadcom, Inc. | 5.9 |
| Leidos Holdings, Inc. | 4.3 |
| Advanced Micro Devices, Inc. | 4.2 |
| Microsoft Corp. | 4.1 |
| NVIDIA Corp. | 3.9 |
| Micron Technology, Inc. | 3.8 |
| Amphenol Corp., Class A | 2.7 |
| Marvell Technology, Inc. | 2.6 |
| Targa Resources Corp. | 2.5 |
| Schlumberger NV | 2.4 |
You can find additional information on the Fund's website at allspringglobal.com, including its:
- Prospectus - Financial Information - Fund holdings - Proxy voting information
Annual Shareholder Report
Diversified Capital Builder Fund
This annual shareholder report contains important information about Diversified Capital Builder Fund for the period of October 1, 2023 to September 30, 2024. You can find additional information about the Fund at allspringglobal.com. You can also request this information by contacting us at 1-800-222-8222.
What were the Fund costs for the past year?
The table explains the costs you would have paid within the reporting period based on a hypothetical $10,000 investment.
| CLASS NAME | COSTS OF A $10,000 INVESTMENT | COSTS PAID AS A % OF A $10,000 INVESTMENT |
|---|
| Class A | $126 | 1.07% |
The manager has contractually committed to waive fees and/or reimburse certain expenses to the extent necessary to cap the Fund's total annual fund operating expense ratio at a specific amount. Without this cap, the costs shown above may have been higher. Please see the prospectus for the amount and the expiration date of the cap. Prior to or after the commitment expiration date, the cap may be increased or the commitment to maintain the cap may be terminated only with the approval of the Board of Trustees.
How did the Fund perform last year and what affected its performance?
U.S. equity markets rallied as inflation moderated in 2024, leading the Federal Reserve to cut its key rate in September 2024. Globally, inflation, geopolitical tensions, and sovereign debt burdens led to lower growth. In high yield, lower-quality issues outperformed higher-rated issues, as CCC-rated bond spreads tightened. Our asset allocation is weighted toward equities, where we see capital appreciation and dividends exceeding the returns of fixed income. We seek sectors with long-term growth potential, pricing power, and higher profit margins. We are concerned inflation could persist, leading to tightening liquidity and lower asset prices.
The Fund outperformed its blended benchmark, the Diversified Capital Builder Index, during the 12 months that ended September 30, 2024. Top equity contributors were holdings in information technology, industrials, and energy along with underweights in consumer staples and consumer discretionary. Broadcom, Leidos Holdings, and Micro Devices were among the top contributors. Underperformers included Adobe, McKesson Corp., and Neurocrine Biosciences. Bond contributors were our underweights in consumer cyclicals, energy, and communications. Individual bond detractors included Post Holdings, Spectrum Brands, and Iron Mountain.
Total return based on a $10,000 investment
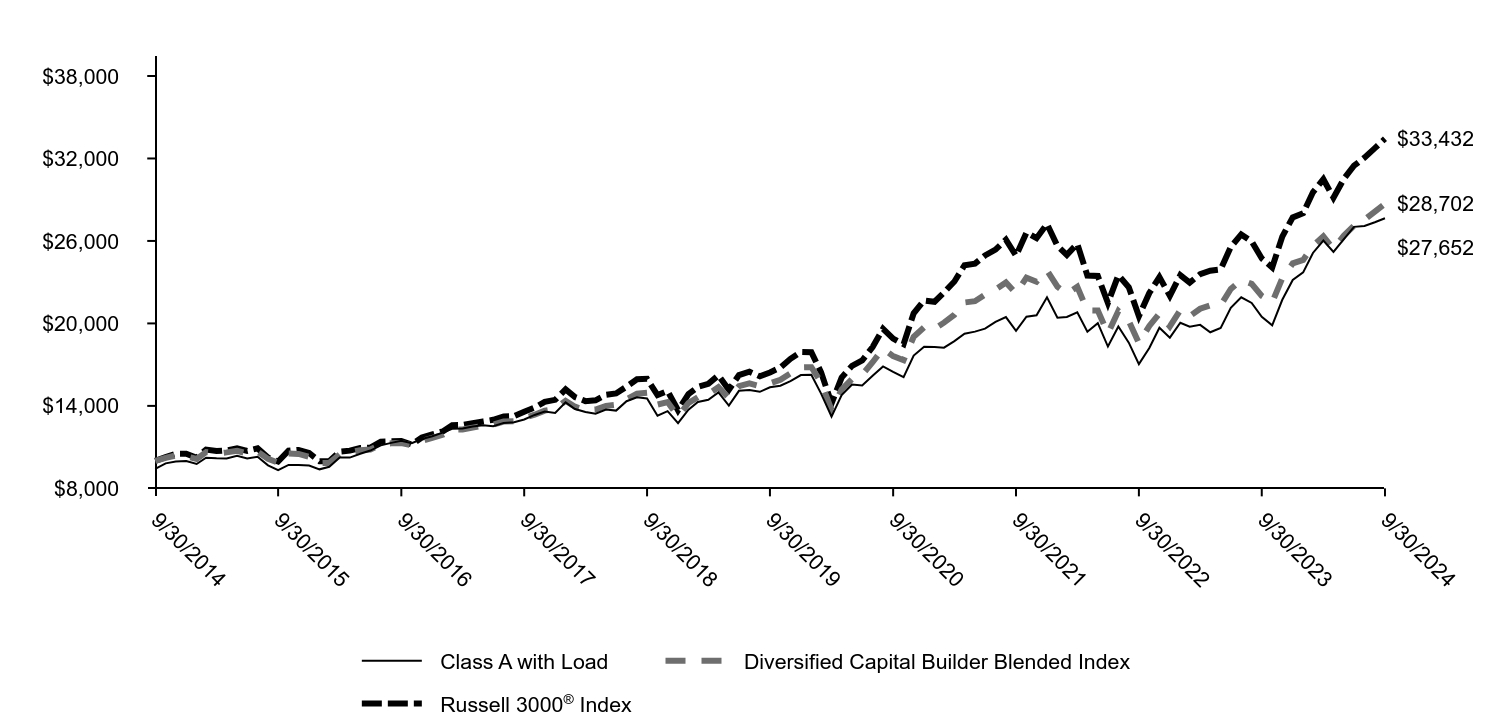
| Class A with Load | Diversified Capital Builder Blended Index | Russell 3000® Index |
|---|
| 9/30/2014 | $9,423 | $10,000 | $10,000 |
| 10/31/2014 | $9,818 | $10,212 | $10,275 |
| 11/30/2014 | $9,949 | $10,395 | $10,524 |
| 12/31/2014 | $9,985 | $10,338 | $10,524 |
| 1/31/2015 | $9,772 | $10,143 | $10,231 |
| 2/28/2015 | $10,229 | $10,643 | $10,824 |
| 3/31/2015 | $10,190 | $10,529 | $10,713 |
| 4/30/2015 | $10,180 | $10,617 | $10,762 |
| 5/31/2015 | $10,363 | $10,729 | $10,911 |
| 6/30/2015 | $10,170 | $10,537 | $10,728 |
| 7/31/2015 | $10,293 | $10,674 | $10,908 |
| 8/31/2015 | $9,671 | $10,145 | $10,249 |
| 9/30/2015 | $9,324 | $9,871 | $9,951 |
| 10/31/2015 | $9,702 | $10,538 | $10,736 |
| 11/30/2015 | $9,692 | $10,505 | $10,796 |
| 12/31/2015 | $9,656 | $10,296 | $10,574 |
| 1/31/2016 | $9,384 | $9,840 | $9,978 |
| 2/29/2016 | $9,566 | $9,849 | $9,975 |
| 3/31/2016 | $10,240 | $10,472 | $10,677 |
| 4/30/2016 | $10,240 | $10,619 | $10,743 |
| 5/31/2016 | $10,513 | $10,776 | $10,935 |
| 6/30/2016 | $10,750 | $10,823 | $10,958 |
| 7/31/2016 | $11,127 | $11,201 | $11,393 |
| 8/31/2016 | $11,310 | $11,274 | $11,422 |
| 9/30/2016 | $11,454 | $11,299 | $11,440 |
| 10/31/2016 | $11,282 | $11,142 | $11,192 |
| 11/30/2016 | $11,592 | $11,461 | $11,693 |
| 12/31/2016 | $11,791 | $11,678 | $11,921 |
| 1/31/2017 | $12,053 | $11,894 | $12,145 |
| 2/28/2017 | $12,328 | $12,286 | $12,597 |
| 3/31/2017 | $12,363 | $12,285 | $12,606 |
| 4/30/2017 | $12,501 | $12,417 | $12,739 |
| 5/31/2017 | $12,589 | $12,564 | $12,870 |
| 6/30/2017 | $12,521 | $12,633 | $12,986 |
| 7/31/2017 | $12,761 | $12,857 | $13,231 |
| 8/31/2017 | $12,812 | $12,887 | $13,256 |
| 9/30/2017 | $13,014 | $13,122 | $13,579 |
| 10/31/2017 | $13,342 | $13,360 | $13,876 |
| 11/30/2017 | $13,595 | $13,656 | $14,297 |
| 12/31/2017 | $13,489 | $13,780 | $14,440 |
| 1/31/2018 | $14,260 | $14,369 | $15,201 |
| 2/28/2018 | $13,768 | $13,940 | $14,641 |
| 3/31/2018 | $13,556 | $13,680 | $14,347 |
| 4/30/2018 | $13,436 | $13,738 | $14,402 |
| 5/31/2018 | $13,729 | $14,000 | $14,808 |
| 6/30/2018 | $13,658 | $14,081 | $14,905 |
| 7/31/2018 | $14,338 | $14,485 | $15,400 |
| 8/31/2018 | $14,631 | $14,885 | $15,940 |
| 9/30/2018 | $14,539 | $14,949 | $15,967 |
| 10/31/2018 | $13,283 | $14,094 | $14,791 |
| 11/30/2018 | $13,617 | $14,278 | $15,087 |
| 12/31/2018 | $12,741 | $13,225 | $13,683 |
| 1/31/2019 | $13,720 | $14,208 | $14,858 |
| 2/28/2019 | $14,287 | $14,629 | $15,380 |
| 3/31/2019 | $14,448 | $14,855 | $15,605 |
| 4/30/2019 | $14,975 | $15,357 | $16,228 |
| 5/31/2019 | $14,020 | $14,574 | $15,178 |
| 6/30/2019 | $15,096 | $15,432 | $16,244 |
| 7/31/2019 | $15,153 | $15,631 | $16,485 |
| 8/31/2019 | $15,025 | $15,432 | $16,149 |
| 9/30/2019 | $15,353 | $15,645 | $16,433 |
| 10/31/2019 | $15,468 | $15,903 | $16,786 |
| 11/30/2019 | $15,798 | $16,364 | $17,424 |
| 12/31/2019 | $16,240 | $16,803 | $17,928 |
| 1/31/2020 | $16,270 | $16,817 | $17,908 |
| 2/29/2020 | $14,890 | $15,722 | $16,442 |
| 3/31/2020 | $13,215 | $13,703 | $14,181 |
| 4/30/2020 | $14,782 | $15,191 | $16,059 |
| 5/31/2020 | $15,550 | $15,966 | $16,918 |
| 6/30/2020 | $15,481 | $16,269 | $17,304 |
| 7/31/2020 | $16,191 | $17,178 | $18,287 |
| 8/31/2020 | $16,870 | $18,166 | $19,612 |
| 9/30/2020 | $16,468 | $17,621 | $18,898 |
| 10/31/2020 | $16,090 | $17,323 | $18,490 |
| 11/30/2020 | $17,664 | $19,025 | $20,739 |
| 12/31/2020 | $18,296 | $19,719 | $21,672 |
| 1/31/2021 | $18,281 | $19,613 | $21,576 |
| 2/28/2021 | $18,235 | $20,056 | $22,250 |
| 3/31/2021 | $18,711 | $20,633 | $23,048 |
| 4/30/2021 | $19,249 | $21,522 | $24,236 |
| 5/31/2021 | $19,402 | $21,614 | $24,346 |
| 6/30/2021 | $19,617 | $22,093 | $24,947 |
| 7/31/2021 | $20,109 | $22,458 | $25,369 |
| 8/31/2021 | $20,463 | $22,976 | $26,092 |
| 9/30/2021 | $19,462 | $22,186 | $24,921 |
| 10/31/2021 | $20,493 | $23,331 | $26,607 |
| 11/30/2021 | $20,586 | $23,036 | $26,202 |
| 12/31/2021 | $21,896 | $23,847 | $27,234 |
| 1/31/2022 | $20,417 | $22,674 | $25,631 |
| 2/28/2022 | $20,466 | $22,156 | $24,986 |
| 3/31/2022 | $20,813 | $22,666 | $25,796 |
| 4/30/2022 | $19,396 | $20,944 | $23,481 |
| 5/31/2022 | $20,022 | $20,936 | $23,450 |
| 6/30/2022 | $18,319 | $19,265 | $21,488 |
| 7/31/2022 | $19,772 | $20,902 | $23,504 |
| 8/31/2022 | $18,599 | $20,173 | $22,627 |
| 9/30/2022 | $17,039 | $18,571 | $20,528 |
| 10/31/2022 | $18,214 | $19,822 | $22,212 |
| 11/30/2022 | $19,688 | $20,722 | $23,371 |
| 12/31/2022 | $18,962 | $19,779 | $22,003 |
| 1/31/2023 | $20,051 | $20,965 | $23,518 |
| 2/28/2023 | $19,756 | $20,523 | $22,968 |
| 3/31/2023 | $19,895 | $21,067 | $23,583 |
| 4/30/2023 | $19,358 | $21,313 | $23,834 |
| 5/31/2023 | $19,673 | $21,336 | $23,927 |
| 6/30/2023 | $21,136 | $22,504 | $25,560 |
| 7/31/2023 | $21,896 | $23,164 | $26,477 |
| 8/31/2023 | $21,488 | $22,877 | $25,966 |
| 9/30/2023 | $20,474 | $22,004 | $24,729 |
| 10/31/2023 | $19,861 | $21,537 | $24,073 |
| 11/30/2023 | $21,720 | $23,291 | $26,318 |
| 12/31/2023 | $23,162 | $24,368 | $27,714 |
| 1/31/2024 | $23,713 | $24,624 | $28,021 |
| 2/29/2024 | $25,128 | $25,638 | $29,538 |
| 3/31/2024 | $26,030 | $26,330 | $30,491 |
| 4/30/2024 | $25,203 | $25,423 | $29,149 |
| 5/31/2024 | $26,128 | $26,391 | $30,526 |
| 6/30/2024 | $27,026 | $27,108 | $31,471 |
| 7/31/2024 | $27,085 | $27,536 | $32,056 |
| 8/31/2024 | $27,361 | $28,137 | $32,754 |
| 9/30/2024 | $27,652 | $28,702 | $33,432 |
Diversified Capital Builder Fund
Annual Shareholder Report | September 30, 2024
AVERAGE ANNUAL TOTAL RETURNS (%)
| 1 Year | 5 Years | 10 Years |
|---|
| Class A | 35.05 | 12.49 | 11.37 |
| Class A with Load | 27.31 | 11.17 | 10.71 |
Diversified Capital Builder Blended Index (Strategy)Footnote Reference* | 30.44 | 12.90 | 11.12 |
Russell 3000® Index (Regulatory) | 35.19 | 15.26 | 12.83 |
| Total net assets | $1,556,667,861 |
| # of portfolio holdings | 92 |
| Portfolio turnover rate | 30% |
| Total advisory fees paid | $7,987,880 |
Figures quoted represent past performance, which is no guarantee of future results, and do not reflect taxes that a shareholder may pay on an investment in a fund.
| Footnote | Description |
Footnote* | The Diversified Capital Builder Blended Index is composed 75% of the Russell 1000® Index and 25% of the ICE BofA U.S. Cash Pay High Yield Index. You cannot invest directly in an index. |
What did the Fund invest in?
(Based on long-term investments)
PORTFOLIO COMPOSITION (% OF LONG-TERM INVESTMENTS)
| Common stocks | 84.5 |
| Corporate bonds and notes | 15.1 |
| Yankee corporate bonds and notes | 0.4 |
TOP TEN HOLDINGS (% OF NET ASSETS)
| Broadcom, Inc. | 5.9 |
| Leidos Holdings, Inc. | 4.3 |
| Advanced Micro Devices, Inc. | 4.2 |
| Microsoft Corp. | 4.1 |
| NVIDIA Corp. | 3.9 |
| Micron Technology, Inc. | 3.8 |
| Amphenol Corp., Class A | 2.7 |
| Marvell Technology, Inc. | 2.6 |
| Targa Resources Corp. | 2.5 |
| Schlumberger NV | 2.4 |
You can find additional information on the Fund's website at allspringglobal.com, including its:
- Prospectus - Financial Information - Fund holdings - Proxy voting information
Annual Shareholder Report
Diversified Capital Builder Fund
This annual shareholder report contains important information about Diversified Capital Builder Fund for the period of October 1, 2023 to September 30, 2024. You can find additional information about the Fund at allspringglobal.com. You can also request this information by contacting us at 1-800-222-8222.
What were the Fund costs for the past year?
The table explains the costs you would have paid within the reporting period based on a hypothetical $10,000 investment.
| CLASS NAME | COSTS OF A $10,000 INVESTMENT | COSTS PAID AS A % OF A $10,000 INVESTMENT |
|---|
| Administrator Class | $119 | 1.01% |
The manager has contractually committed to waive fees and/or reimburse certain expenses to the extent necessary to cap the Fund's total annual fund operating expense ratio at a specific amount. Without this cap, the costs shown above may have been higher. Please see the prospectus for the amount and the expiration date of the cap. Prior to or after the commitment expiration date, the cap may be increased or the commitment to maintain the cap may be terminated only with the approval of the Board of Trustees.
How did the Fund perform last year and what affected its performance?
U.S. equity markets rallied as inflation moderated in 2024, leading the Federal Reserve to cut its key rate in September 2024. Globally, inflation, geopolitical tensions, and sovereign debt burdens led to lower growth. In high yield, lower-quality issues outperformed higher-rated issues, as CCC-rated bond spreads tightened. Our asset allocation is weighted toward equities, where we see capital appreciation and dividends exceeding the returns of fixed income. We seek sectors with long-term growth potential, pricing power, and higher profit margins. We are concerned inflation could persist, leading to tightening liquidity and lower asset prices.
The Fund outperformed its blended benchmark, the Diversified Capital Builder Index, during the 12 months that ended September 30, 2024. Top equity contributors were holdings in information technology, industrials, and energy along with underweights in consumer staples and consumer discretionary. Broadcom, Leidos Holdings, and Micro Devices were among the top contributors. Underperformers included Adobe, McKesson Corp., and Neurocrine Biosciences. Bond contributors were our underweights in consumer cyclicals, energy, and communications. Individual bond detractors included Post Holdings, Spectrum Brands, and Iron Mountain.
Total return based on a $10,000 investment
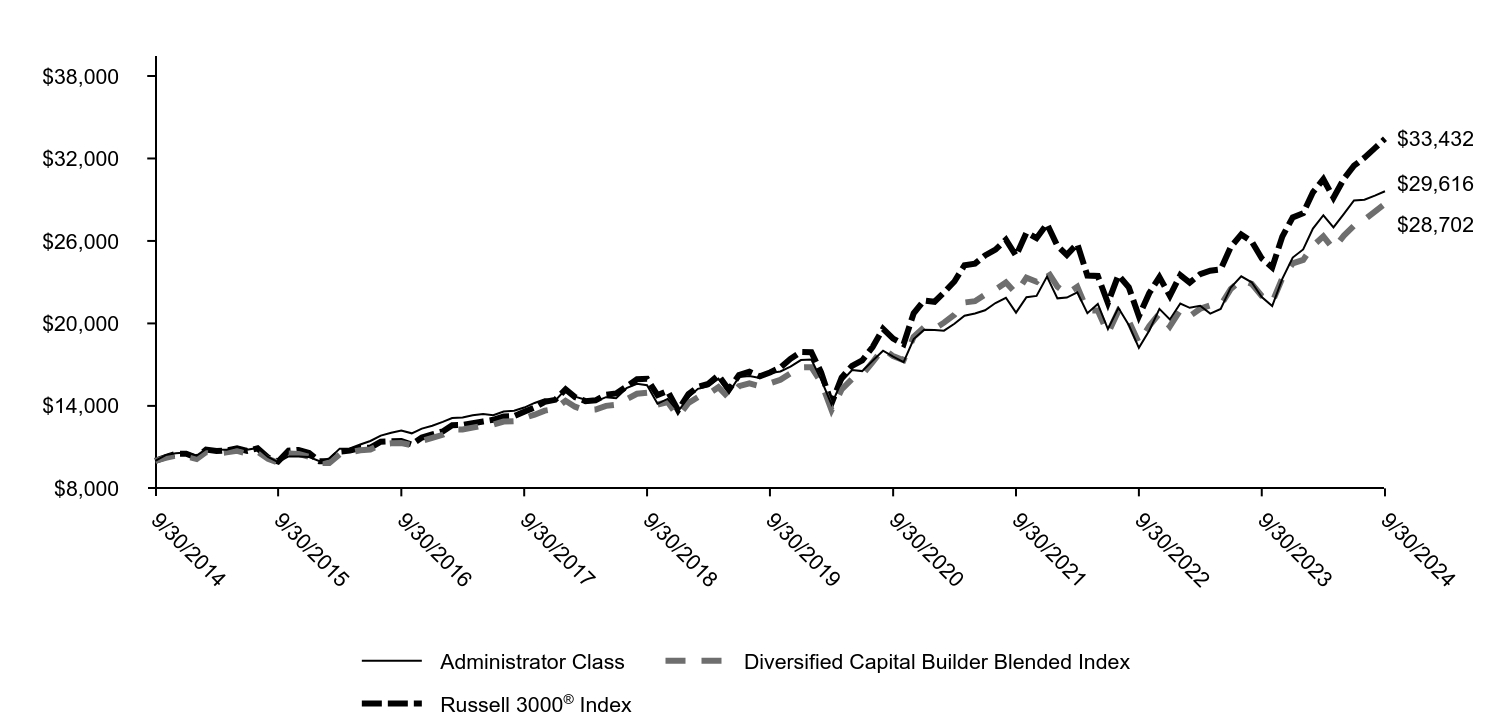
| Administrator Class | Diversified Capital Builder Blended Index | Russell 3000® Index |
|---|
| 9/30/2014 | $10,000 | $10,000 | $10,000 |
| 10/31/2014 | $10,418 | $10,212 | $10,275 |
| 11/30/2014 | $10,558 | $10,395 | $10,524 |
| 12/31/2014 | $10,604 | $10,338 | $10,524 |
| 1/31/2015 | $10,378 | $10,143 | $10,231 |
| 2/28/2015 | $10,863 | $10,643 | $10,824 |
| 3/31/2015 | $10,828 | $10,529 | $10,713 |
| 4/30/2015 | $10,817 | $10,617 | $10,762 |
| 5/31/2015 | $11,011 | $10,729 | $10,911 |
| 6/30/2015 | $10,813 | $10,537 | $10,728 |
| 7/31/2015 | $10,943 | $10,674 | $10,908 |
| 8/31/2015 | $10,282 | $10,145 | $10,249 |
| 9/30/2015 | $9,908 | $9,871 | $9,951 |
| 10/31/2015 | $10,321 | $10,538 | $10,736 |
| 11/30/2015 | $10,310 | $10,505 | $10,796 |
| 12/31/2015 | $10,273 | $10,296 | $10,574 |
| 1/31/2016 | $9,984 | $9,840 | $9,978 |
| 2/29/2016 | $10,176 | $9,849 | $9,975 |
| 3/31/2016 | $10,890 | $10,472 | $10,677 |
| 4/30/2016 | $10,902 | $10,619 | $10,743 |
| 5/31/2016 | $11,192 | $10,776 | $10,935 |
| 6/30/2016 | $11,448 | $10,823 | $10,958 |
| 7/31/2016 | $11,837 | $11,201 | $11,393 |
| 8/31/2016 | $12,044 | $11,274 | $11,422 |
| 9/30/2016 | $12,200 | $11,299 | $11,440 |
| 10/31/2016 | $12,004 | $11,142 | $11,192 |
| 11/30/2016 | $12,347 | $11,461 | $11,693 |
| 12/31/2016 | $12,560 | $11,678 | $11,921 |
| 1/31/2017 | $12,839 | $11,894 | $12,145 |
| 2/28/2017 | $13,118 | $12,286 | $12,597 |
| 3/31/2017 | $13,157 | $12,285 | $12,606 |
| 4/30/2017 | $13,318 | $12,417 | $12,739 |
| 5/31/2017 | $13,411 | $12,564 | $12,870 |
| 6/30/2017 | $13,326 | $12,633 | $12,986 |
| 7/31/2017 | $13,595 | $12,857 | $13,231 |
| 8/31/2017 | $13,649 | $12,887 | $13,256 |
| 9/30/2017 | $13,877 | $13,122 | $13,579 |
| 10/31/2017 | $14,214 | $13,360 | $13,876 |
| 11/30/2017 | $14,483 | $13,656 | $14,297 |
| 12/31/2017 | $14,377 | $13,780 | $14,440 |
| 1/31/2018 | $15,197 | $14,369 | $15,201 |
| 2/28/2018 | $14,674 | $13,940 | $14,641 |
| 3/31/2018 | $14,450 | $13,680 | $14,347 |
| 4/30/2018 | $14,322 | $13,738 | $14,402 |
| 5/31/2018 | $14,634 | $14,000 | $14,808 |
| 6/30/2018 | $14,564 | $14,081 | $14,905 |
| 7/31/2018 | $15,288 | $14,485 | $15,400 |
| 8/31/2018 | $15,601 | $14,885 | $15,940 |
| 9/30/2018 | $15,506 | $14,949 | $15,967 |
| 10/31/2018 | $14,153 | $14,094 | $14,791 |
| 11/30/2018 | $14,509 | $14,278 | $15,087 |
| 12/31/2018 | $13,594 | $13,225 | $13,683 |
| 1/31/2019 | $14,637 | $14,208 | $14,858 |
| 2/28/2019 | $15,242 | $14,629 | $15,380 |
| 3/31/2019 | $15,415 | $14,855 | $15,605 |
| 4/30/2019 | $15,977 | $15,357 | $16,228 |
| 5/31/2019 | $14,959 | $14,574 | $15,178 |
| 6/30/2019 | $16,109 | $15,432 | $16,244 |
| 7/31/2019 | $16,170 | $15,631 | $16,485 |
| 8/31/2019 | $16,033 | $15,432 | $16,149 |
| 9/30/2019 | $16,385 | $15,645 | $16,433 |
| 10/31/2019 | $16,507 | $15,903 | $16,786 |
| 11/30/2019 | $16,859 | $16,364 | $17,424 |
| 12/31/2019 | $17,334 | $16,803 | $17,928 |
| 1/31/2020 | $17,366 | $16,817 | $17,908 |
| 2/29/2020 | $15,911 | $15,722 | $16,442 |
| 3/31/2020 | $14,112 | $13,703 | $14,181 |
| 4/30/2020 | $15,783 | $15,191 | $16,059 |
| 5/31/2020 | $16,603 | $15,966 | $16,918 |
| 6/30/2020 | $16,530 | $16,269 | $17,304 |
| 7/31/2020 | $17,287 | $17,178 | $18,287 |
| 8/31/2020 | $18,012 | $18,166 | $19,612 |
| 9/30/2020 | $17,587 | $17,621 | $18,898 |
| 10/31/2020 | $17,183 | $17,323 | $18,490 |
| 11/30/2020 | $18,862 | $19,025 | $20,739 |
| 12/31/2020 | $19,541 | $19,719 | $21,672 |
| 1/31/2021 | $19,524 | $19,613 | $21,576 |
| 2/28/2021 | $19,475 | $20,056 | $22,250 |
| 3/31/2021 | $19,973 | $20,633 | $23,048 |
| 4/30/2021 | $20,563 | $21,522 | $24,236 |
| 5/31/2021 | $20,726 | $21,614 | $24,346 |
| 6/30/2021 | $20,960 | $22,093 | $24,947 |
| 7/31/2021 | $21,486 | $22,458 | $25,369 |
| 8/31/2021 | $21,863 | $22,976 | $26,092 |
| 9/30/2021 | $20,783 | $22,186 | $24,921 |
| 10/31/2021 | $21,901 | $23,331 | $26,607 |
| 11/30/2021 | $21,999 | $23,036 | $26,202 |
| 12/31/2021 | $23,404 | $23,847 | $27,234 |
| 1/31/2022 | $21,824 | $22,674 | $25,631 |
| 2/28/2022 | $21,877 | $22,156 | $24,986 |
| 3/31/2022 | $22,259 | $22,666 | $25,796 |
| 4/30/2022 | $20,743 | $20,944 | $23,481 |
| 5/31/2022 | $21,413 | $20,936 | $23,450 |
| 6/30/2022 | $19,589 | $19,265 | $21,488 |
| 7/31/2022 | $21,142 | $20,902 | $23,504 |
| 8/31/2022 | $19,889 | $20,173 | $22,627 |
| 9/30/2022 | $18,226 | $18,571 | $20,528 |
| 10/31/2022 | $19,482 | $19,822 | $22,212 |
| 11/30/2022 | $21,057 | $20,722 | $23,371 |
| 12/31/2022 | $20,285 | $19,779 | $22,003 |
| 1/31/2023 | $21,449 | $20,965 | $23,518 |
| 2/28/2023 | $21,134 | $20,523 | $22,968 |
| 3/31/2023 | $21,286 | $21,067 | $23,583 |
| 4/30/2023 | $20,712 | $21,313 | $23,834 |
| 5/31/2023 | $21,049 | $21,336 | $23,927 |
| 6/30/2023 | $22,617 | $22,504 | $25,560 |
| 7/31/2023 | $23,430 | $23,164 | $26,477 |
| 8/31/2023 | $22,994 | $22,877 | $25,966 |
| 9/30/2023 | $21,915 | $22,004 | $24,729 |
| 10/31/2023 | $21,259 | $21,537 | $24,073 |
| 11/30/2023 | $23,247 | $23,291 | $26,318 |
| 12/31/2023 | $24,793 | $24,368 | $27,714 |
| 1/31/2024 | $25,381 | $24,624 | $28,021 |
| 2/29/2024 | $26,895 | $25,638 | $29,538 |
| 3/31/2024 | $27,870 | $26,330 | $30,491 |
| 4/30/2024 | $26,986 | $25,423 | $29,149 |
| 5/31/2024 | $27,975 | $26,391 | $30,526 |
| 6/30/2024 | $28,941 | $27,108 | $31,471 |
| 7/31/2024 | $29,004 | $27,536 | $32,056 |
| 8/31/2024 | $29,300 | $28,137 | $32,754 |
| 9/30/2024 | $29,616 | $28,702 | $33,432 |
Diversified Capital Builder Fund
Annual Shareholder Report | September 30, 2024
AVERAGE ANNUAL TOTAL RETURNS (%)
| 1 Year | 5 Years | 10 Years |
|---|
| Administrator Class | 35.14 | 12.57 | 11.47 |
Diversified Capital Builder Blended Index (Strategy)Footnote Reference* | 30.44 | 12.90 | 11.12 |
Russell 3000® Index (Regulatory) | 35.19 | 15.26 | 12.83 |
| Total net assets | $1,556,667,861 |
| # of portfolio holdings | 92 |
| Portfolio turnover rate | 30% |
| Total advisory fees paid | $7,987,880 |
Figures quoted represent past performance, which is no guarantee of future results, and do not reflect taxes that a shareholder may pay on an investment in a fund.
| Footnote | Description |
Footnote* | The Diversified Capital Builder Blended Index is composed 75% of the Russell 1000® Index and 25% of the ICE BofA U.S. Cash Pay High Yield Index. You cannot invest directly in an index. |
What did the Fund invest in?
(Based on long-term investments)
PORTFOLIO COMPOSITION (% OF LONG-TERM INVESTMENTS)
| Common stocks | 84.5 |
| Corporate bonds and notes | 15.1 |
| Yankee corporate bonds and notes | 0.4 |
TOP TEN HOLDINGS (% OF NET ASSETS)
| Broadcom, Inc. | 5.9 |
| Leidos Holdings, Inc. | 4.3 |
| Advanced Micro Devices, Inc. | 4.2 |
| Microsoft Corp. | 4.1 |
| NVIDIA Corp. | 3.9 |
| Micron Technology, Inc. | 3.8 |
| Amphenol Corp., Class A | 2.7 |
| Marvell Technology, Inc. | 2.6 |
| Targa Resources Corp. | 2.5 |
| Schlumberger NV | 2.4 |
You can find additional information on the Fund's website at allspringglobal.com, including its:
- Prospectus - Financial Information - Fund holdings - Proxy voting information
Annual Shareholder Report
Diversified Income Builder Fund
This annual shareholder report contains important information about Diversified Income Builder Fund for the period of October 1, 2023 to September 30, 2024. You can find additional information about the Fund at allspringglobal.com. You can also request this information by contacting us at 1-800-222-8222.
This report describes changes to the Fund that occurred either during or after the reporting period.
What were the Fund costs for the past year?
The table explains the costs you would have paid within the reporting period based on a hypothetical $10,000 investment.
| CLASS NAME | COSTS OF A $10,000 INVESTMENT | COSTS PAID AS A % OF A $10,000 INVESTMENT |
|---|
| Institutional Class | $57 | 0.52% |
The manager has contractually committed to waive fees and/or reimburse certain expenses to the extent necessary to cap the Fund's total annual fund operating expense ratio at a specific amount. Without this cap, the costs shown above may have been higher. Please see the prospectus for the amount and the expiration date of the cap. Prior to or after the commitment expiration date, the cap may be increased or the commitment to maintain the cap may be terminated only with the approval of the Board of Trustees.
How did the Fund perform last year and what affected its performance?
Over the past year, equity and fixed income markets benefited from steady growth and lower inflation based on the assumption that the Federal Reserve will follow a path to lower interest rates. U.S. consumers remained resilient in the face of interest rates not seen since before the Global Financial Crisis. The largest change we made to the portfolio was to remove an allocation to U.S. large-cap growth and emerging market equities. This allocation was added to our existing global dividend yield equity strategy. The top contributor to performance was an overweight to equity over the past year. The biggest detractor from performance was selection within high yield bonds.
Total return based on a $10,000 investment
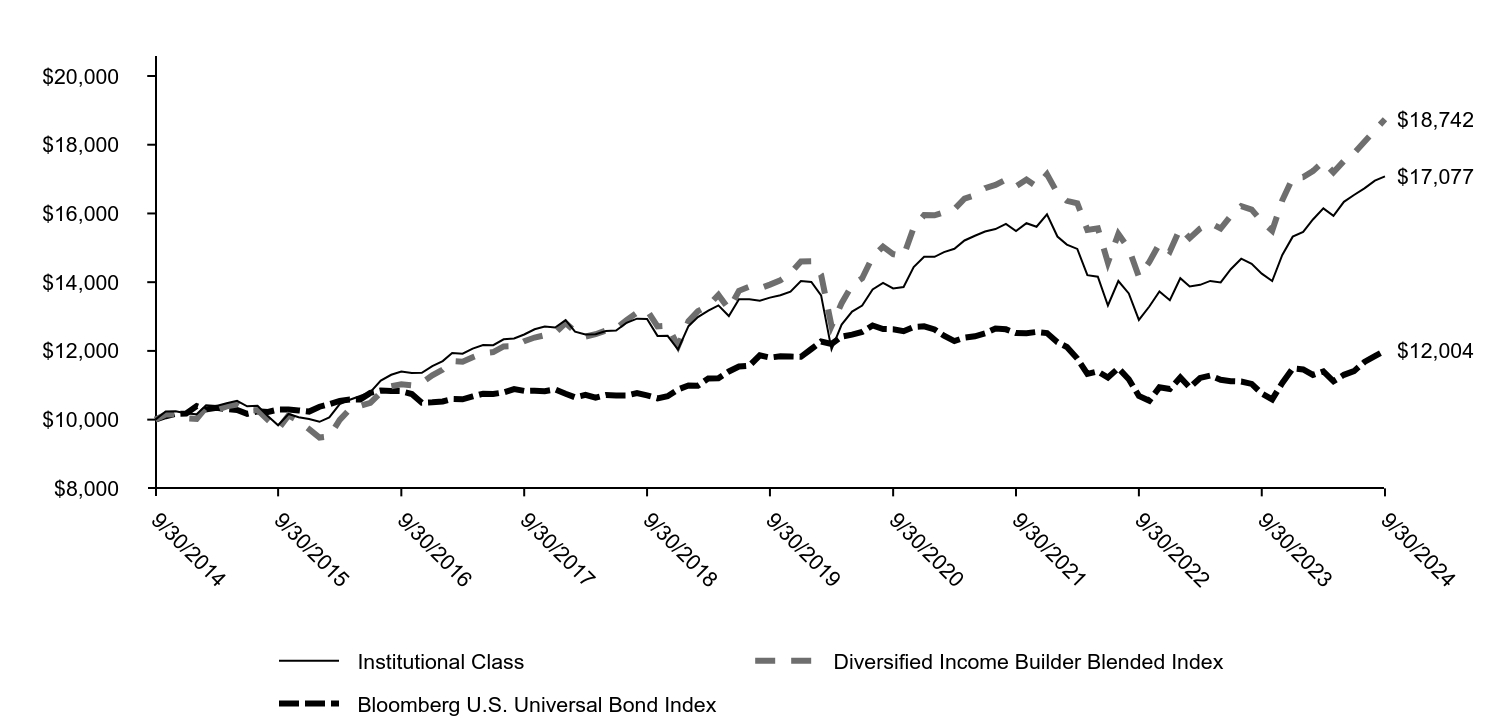
| Institutional Class | Diversified Income Builder Blended Index | Bloomberg U.S. Universal Bond Index |
|---|
| 9/30/2014 | $10,000 | $10,000 | $10,000 |
| 10/31/2014 | $10,240 | $10,148 | $10,098 |
| 11/30/2014 | $10,242 | $10,160 | $10,170 |
| 12/31/2014 | $10,179 | $10,041 | $10,179 |
| 1/31/2015 | $10,158 | $10,024 | $10,393 |
| 2/28/2015 | $10,419 | $10,348 | $10,295 |
| 3/31/2015 | $10,397 | $10,274 | $10,343 |
| 4/30/2015 | $10,479 | $10,385 | $10,306 |
| 5/31/2015 | $10,548 | $10,442 | $10,281 |
| 6/30/2015 | $10,388 | $10,274 | $10,169 |
| 7/31/2015 | $10,401 | $10,277 | $10,240 |
| 8/31/2015 | $10,100 | $9,987 | $10,225 |
| 9/30/2015 | $9,835 | $9,724 | $10,294 |
| 10/31/2015 | $10,164 | $10,122 | $10,296 |
| 11/30/2015 | $10,072 | $9,961 | $10,269 |
| 12/31/2015 | $10,020 | $9,726 | $10,235 |
| 1/31/2016 | $9,937 | $9,480 | $10,376 |
| 2/29/2016 | $10,063 | $9,513 | $10,450 |
| 3/31/2016 | $10,451 | $9,992 | $10,546 |
| 4/30/2016 | $10,577 | $10,303 | $10,586 |
| 5/31/2016 | $10,687 | $10,400 | $10,589 |
| 6/30/2016 | $10,798 | $10,489 | $10,779 |
| 7/31/2016 | $11,134 | $10,788 | $10,847 |
| 8/31/2016 | $11,305 | $10,972 | $10,835 |
| 9/30/2016 | $11,397 | $11,028 | $10,829 |
| 10/31/2016 | $11,356 | $10,999 | $10,746 |
| 11/30/2016 | $11,363 | $11,075 | $10,492 |
| 12/31/2016 | $11,556 | $11,289 | $10,506 |
| 1/31/2017 | $11,704 | $11,459 | $10,527 |
| 2/28/2017 | $11,939 | $11,705 | $10,598 |
| 3/31/2017 | $11,918 | $11,688 | $10,592 |
| 4/30/2017 | $12,068 | $11,818 | $10,674 |
| 5/31/2017 | $12,170 | $11,936 | $10,756 |
| 6/30/2017 | $12,166 | $11,966 | $10,745 |
| 7/31/2017 | $12,339 | $12,129 | $10,792 |
| 8/31/2017 | $12,361 | $12,137 | $10,888 |
| 9/30/2017 | $12,478 | $12,283 | $10,836 |
| 10/31/2017 | $12,630 | $12,389 | $10,843 |
| 11/30/2017 | $12,710 | $12,457 | $10,829 |
| 12/31/2017 | $12,682 | $12,519 | $10,879 |
| 1/31/2018 | $12,897 | $12,811 | $10,753 |
| 2/28/2018 | $12,560 | $12,568 | $10,651 |
| 3/31/2018 | $12,478 | $12,417 | $10,720 |
| 4/30/2018 | $12,484 | $12,485 | $10,640 |
| 5/31/2018 | $12,581 | $12,595 | $10,716 |
| 6/30/2018 | $12,592 | $12,653 | $10,703 |
| 7/31/2018 | $12,819 | $12,898 | $10,705 |
| 8/31/2018 | $12,939 | $13,114 | $10,774 |
| 9/30/2018 | $12,930 | $13,181 | $10,705 |
| 10/31/2018 | $12,437 | $12,714 | $10,620 |
| 11/30/2018 | $12,438 | $12,731 | $10,683 |
| 12/31/2018 | $12,040 | $12,144 | $10,880 |
| 1/31/2019 | $12,720 | $12,863 | $10,995 |
| 2/28/2019 | $12,983 | $13,156 | $10,989 |
| 3/31/2019 | $13,171 | $13,320 | $11,200 |
| 4/30/2019 | $13,325 | $13,630 | $11,203 |
| 5/31/2019 | $13,014 | $13,213 | $11,402 |
| 6/30/2019 | $13,504 | $13,749 | $11,545 |
| 7/31/2019 | $13,506 | $13,869 | $11,570 |
| 8/31/2019 | $13,460 | $13,817 | $11,870 |
| 9/30/2019 | $13,550 | $13,929 | $11,807 |
| 10/31/2019 | $13,621 | $14,053 | $11,842 |
| 11/30/2019 | $13,726 | $14,263 | $11,836 |
| 12/31/2019 | $14,035 | $14,600 | $11,828 |
| 1/31/2020 | $14,006 | $14,606 | $12,056 |
| 2/29/2020 | $13,617 | $14,215 | $12,273 |
| 3/31/2020 | $12,046 | $12,725 | $12,200 |
| 4/30/2020 | $12,768 | $13,389 | $12,417 |
| 5/31/2020 | $13,144 | $13,912 | $12,475 |
| 6/30/2020 | $13,318 | $14,116 | $12,554 |
| 7/31/2020 | $13,788 | $14,739 | $12,741 |
| 8/31/2020 | $13,978 | $15,034 | $12,638 |
| 9/30/2020 | $13,818 | $14,818 | $12,632 |
| 10/31/2020 | $13,858 | $14,760 | $12,575 |
| 11/30/2020 | $14,440 | $15,588 | $12,698 |
| 12/31/2020 | $14,739 | $15,951 | $12,716 |
| 1/31/2021 | $14,739 | $15,946 | $12,625 |
| 2/28/2021 | $14,874 | $16,036 | $12,443 |
| 3/31/2021 | $14,973 | $16,128 | $12,287 |
| 4/30/2021 | $15,214 | $16,429 | $12,384 |
| 5/31/2021 | $15,350 | $16,528 | $12,425 |
| 6/30/2021 | $15,473 | $16,735 | $12,512 |
| 7/31/2021 | $15,545 | $16,829 | $12,652 |
| 8/31/2021 | $15,697 | $16,985 | $12,628 |
| 9/30/2021 | $15,488 | $16,789 | $12,518 |
| 10/31/2021 | $15,716 | $16,986 | $12,515 |
| 11/30/2021 | $15,614 | $16,786 | $12,552 |
| 12/31/2021 | $15,972 | $17,141 | $12,520 |
| 1/31/2022 | $15,329 | $16,593 | $12,250 |
| 2/28/2022 | $15,094 | $16,367 | $12,114 |
| 3/31/2022 | $14,967 | $16,297 | $11,777 |
| 4/30/2022 | $14,205 | $15,521 | $11,330 |
| 5/31/2022 | $14,159 | $15,569 | $11,403 |
| 6/30/2022 | $13,321 | $14,570 | $11,224 |
| 7/31/2022 | $14,034 | $15,406 | $11,498 |
| 8/31/2022 | $13,673 | $14,974 | $11,174 |
| 9/30/2022 | $12,903 | $14,159 | $10,691 |
| 10/31/2022 | $13,292 | $14,589 | $10,552 |
| 11/30/2022 | $13,732 | $15,122 | $10,940 |
| 12/31/2022 | $13,474 | $14,894 | $10,891 |
| 1/31/2023 | $14,115 | $15,576 | $11,226 |
| 2/28/2023 | $13,876 | $15,282 | $10,936 |
| 3/31/2023 | $13,923 | $15,561 | $11,214 |
| 4/30/2023 | $14,037 | $15,721 | $11,282 |
| 5/31/2023 | $13,993 | $15,562 | $11,159 |
| 6/30/2023 | $14,378 | $15,931 | $11,119 |
| 7/31/2023 | $14,684 | $16,212 | $11,111 |
| 8/31/2023 | $14,532 | $16,111 | $11,040 |
| 9/30/2023 | $14,247 | $15,770 | $10,760 |
| 10/31/2023 | $14,033 | $15,497 | $10,590 |
| 11/30/2023 | $14,792 | $16,384 | $11,069 |
| 12/31/2023 | $15,325 | $17,037 | $11,493 |
| 1/31/2024 | $15,463 | $17,056 | $11,462 |
| 2/29/2024 | $15,825 | $17,231 | $11,300 |
| 3/31/2024 | $16,146 | $17,512 | $11,404 |
| 4/30/2024 | $15,929 | $17,196 | $11,116 |
| 5/31/2024 | $16,339 | $17,528 | $11,304 |
| 6/30/2024 | $16,537 | $17,749 | $11,411 |
| 7/31/2024 | $16,729 | $18,090 | $11,678 |
| 8/31/2024 | $16,954 | $18,419 | $11,846 |
| 9/30/2024 | $17,077 | $18,742 | $12,004 |
Diversified Income Builder Fund
Annual Shareholder Report | September 30, 2024
AVERAGE ANNUAL TOTAL RETURNS (%)
| 1 Year | 5 Years | 10 Years |
|---|
| Institutional Class | 19.87 | 4.74 | 5.50 |
Diversified Income Builder Blended Index (Strategy)Footnote Reference* | 18.85 | 6.12 | 6.48 |
| Bloomberg U.S. Universal Bond Index (Regulatory) | 12.08 | 0.70 | 2.15 |
| Total net assets | $350,544,835 |
| # of portfolio holdings | 416 |
| Portfolio turnover rate | 67% |
| Total advisory fees paid | $1,095,568 |
Figures quoted represent past performance, which is no guarantee of future results, and do not reflect taxes that a shareholder may pay on an investment in a fund.
| Footnote | Description |
Footnote* | The Diversified Income Builder Blended Index is composed 60% of the ICE BofA U.S. Cash Pay High Yield Index, 25% of the Morgan Stanley Capital International (MSCI) All Country World Index (ACWI) (Net) and 15% of the Bloomberg U.S. Aggregate Bond Index. Prior to February 1, 2020, the Diversified Income Builder Blended Index was composed 65% of the ICE BofA U.S. Cash Pay High Yield Index, and 35% of the Russell 1000® Index. Prior to January 2, 2018, the Diversified Income Builder Blended Index was composed 75% of the ICE BofA U.S. Cash Pay High Yield Index, and 25% of the Russell 1000® Index. You cannot invest directly in an index. |
What did the Fund invest in?
(Based on long-term investments)
PORTFOLIO COMPOSITION (% OF LONG-TERM INVESTMENTS)
| Corporate bonds and notes | 45.1 |
| Common stocks | 30.1 |
| Yankee corporate bonds and notes | 11.0 |
| Foreign corporate bonds and notes | 4.5 |
| Municipal obligations | 3.7 |
| Investment companies | 2.8 |
| Loans | 2.4 |
| Preferred stocks | 0.3 |
| Asset-backed securities | 0.1 |
TOP TEN HOLDINGS (% OF NET ASSETS)
| iShares iBoxx $ High Yield Corporate Bond ETF | 2.7 |
| Apple, Inc. | 1.2 |
| Microsoft Corp. | 1.0 |
| Societe Generale SA, 8.00%, 9/29/2025 | 1.0 |
| Banco Santander SA, 4.38%, 1/14/2026 | 0.9 |
| ABN AMRO Bank NV, 4.75%, 9/22/2027 | 0.9 |
| NVIDIA Corp. | 0.9 |
| Commerzbank AG, 6.13%, 10/9/2025 | 0.8 |
| Walmart, Inc. | 0.8 |
| Alphabet, Inc., Class A | 0.7 |
This is a summary of certain changes and planned changes to the Fund since October 1, 2023.
On November 8, 2024, Allspring Global Investments (UK) Limited became a sub-adviser to the Fund and Matthias Scheiber was added as a portfolio manager to the Fund.
You can find additional information on the Fund's website at allspringglobal.com, including its:
- Prospectus - Financial Information - Fund holdings - Proxy voting information
Annual Shareholder Report
Diversified Income Builder Fund
This annual shareholder report contains important information about Diversified Income Builder Fund for the period of October 1, 2023 to September 30, 2024. You can find additional information about the Fund at allspringglobal.com. You can also request this information by contacting us at 1-800-222-8222.
This report describes changes to the Fund that occurred either during or after the reporting period.
What were the Fund costs for the past year?
The table explains the costs you would have paid within the reporting period based on a hypothetical $10,000 investment.
| CLASS NAME | COSTS OF A $10,000 INVESTMENT | COSTS PAID AS A % OF A $10,000 INVESTMENT |
|---|
| Class R6 | $46 | 0.42% |
The manager has contractually committed to waive fees and/or reimburse certain expenses to the extent necessary to cap the Fund's total annual fund operating expense ratio at a specific amount. Without this cap, the costs shown above may have been higher. Please see the prospectus for the amount and the expiration date of the cap. Prior to or after the commitment expiration date, the cap may be increased or the commitment to maintain the cap may be terminated only with the approval of the Board of Trustees.
How did the Fund perform last year and what affected its performance?
Over the past year, equity and fixed income markets benefited from steady growth and lower inflation based on the assumption that the Federal Reserve will follow a path to lower interest rates. U.S. consumers remained resilient in the face of interest rates not seen since before the Global Financial Crisis. The largest change we made to the portfolio was to remove an allocation to U.S. large-cap growth and emerging market equities. This allocation was added to our existing global dividend yield equity strategy. The top contributor to performance was an overweight to equity over the past year. The biggest detractor from performance was selection within high yield bonds.
Total return based on a $10,000 investment
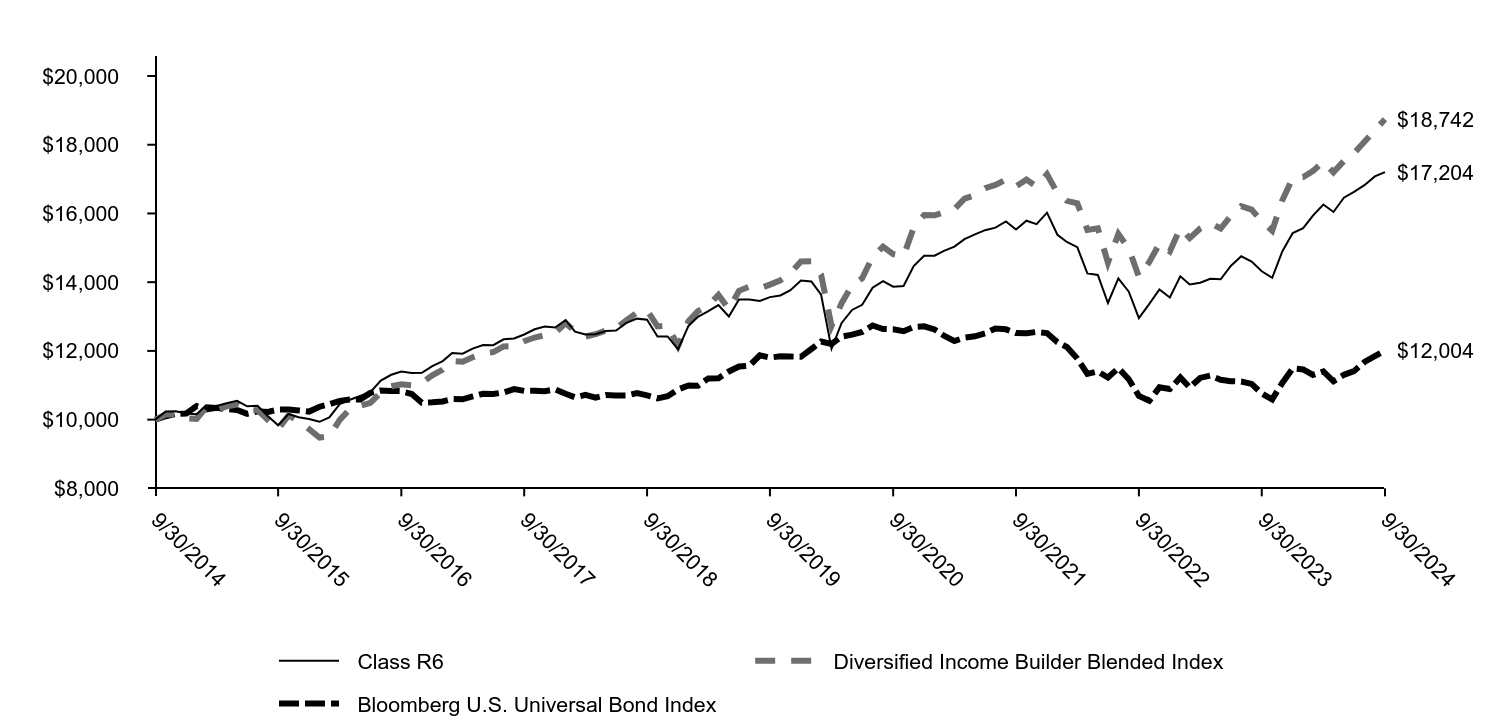
| Class R6 | Diversified Income Builder Blended Index | Bloomberg U.S. Universal Bond Index |
|---|
| 9/30/2014 | $10,000 | $10,000 | $10,000 |
| 10/31/2014 | $10,240 | $10,148 | $10,098 |
| 11/30/2014 | $10,242 | $10,160 | $10,170 |
| 12/31/2014 | $10,179 | $10,041 | $10,179 |
| 1/31/2015 | $10,158 | $10,024 | $10,393 |
| 2/28/2015 | $10,419 | $10,348 | $10,295 |
| 3/31/2015 | $10,397 | $10,274 | $10,343 |
| 4/30/2015 | $10,479 | $10,385 | $10,306 |
| 5/31/2015 | $10,548 | $10,442 | $10,281 |
| 6/30/2015 | $10,388 | $10,274 | $10,169 |
| 7/31/2015 | $10,401 | $10,277 | $10,240 |
| 8/31/2015 | $10,100 | $9,987 | $10,225 |
| 9/30/2015 | $9,835 | $9,724 | $10,294 |
| 10/31/2015 | $10,164 | $10,122 | $10,296 |
| 11/30/2015 | $10,072 | $9,961 | $10,269 |
| 12/31/2015 | $10,020 | $9,726 | $10,235 |
| 1/31/2016 | $9,937 | $9,480 | $10,376 |
| 2/29/2016 | $10,063 | $9,513 | $10,450 |
| 3/31/2016 | $10,451 | $9,992 | $10,546 |
| 4/30/2016 | $10,577 | $10,303 | $10,586 |
| 5/31/2016 | $10,687 | $10,400 | $10,589 |
| 6/30/2016 | $10,798 | $10,489 | $10,779 |
| 7/31/2016 | $11,134 | $10,788 | $10,847 |
| 8/31/2016 | $11,305 | $10,972 | $10,835 |
| 9/30/2016 | $11,397 | $11,028 | $10,829 |
| 10/31/2016 | $11,356 | $10,999 | $10,746 |
| 11/30/2016 | $11,363 | $11,075 | $10,492 |
| 12/31/2016 | $11,556 | $11,289 | $10,506 |
| 1/31/2017 | $11,704 | $11,459 | $10,527 |
| 2/28/2017 | $11,939 | $11,705 | $10,598 |
| 3/31/2017 | $11,918 | $11,688 | $10,592 |
| 4/30/2017 | $12,068 | $11,818 | $10,674 |
| 5/31/2017 | $12,170 | $11,936 | $10,756 |
| 6/30/2017 | $12,166 | $11,966 | $10,745 |
| 7/31/2017 | $12,339 | $12,129 | $10,792 |
| 8/31/2017 | $12,361 | $12,137 | $10,888 |
| 9/30/2017 | $12,478 | $12,283 | $10,836 |
| 10/31/2017 | $12,630 | $12,389 | $10,843 |
| 11/30/2017 | $12,710 | $12,457 | $10,829 |
| 12/31/2017 | $12,682 | $12,519 | $10,879 |
| 1/31/2018 | $12,897 | $12,811 | $10,753 |
| 2/28/2018 | $12,560 | $12,568 | $10,651 |
| 3/31/2018 | $12,478 | $12,417 | $10,720 |
| 4/30/2018 | $12,484 | $12,485 | $10,640 |
| 5/31/2018 | $12,581 | $12,595 | $10,716 |
| 6/30/2018 | $12,592 | $12,653 | $10,703 |
| 7/31/2018 | $12,819 | $12,898 | $10,705 |
| 8/31/2018 | $12,939 | $13,114 | $10,774 |
| 9/30/2018 | $12,910 | $13,181 | $10,705 |
| 10/31/2018 | $12,419 | $12,714 | $10,620 |
| 11/30/2018 | $12,420 | $12,731 | $10,683 |
| 12/31/2018 | $12,045 | $12,144 | $10,880 |
| 1/31/2019 | $12,727 | $12,863 | $10,995 |
| 2/28/2019 | $12,991 | $13,156 | $10,989 |
| 3/31/2019 | $13,157 | $13,320 | $11,200 |
| 4/30/2019 | $13,335 | $13,630 | $11,203 |
| 5/31/2019 | $13,002 | $13,213 | $11,402 |
| 6/30/2019 | $13,494 | $13,749 | $11,545 |
| 7/31/2019 | $13,497 | $13,869 | $11,570 |
| 8/31/2019 | $13,452 | $13,817 | $11,870 |
| 9/30/2019 | $13,565 | $13,929 | $11,807 |
| 10/31/2019 | $13,613 | $14,053 | $11,842 |
| 11/30/2019 | $13,765 | $14,263 | $11,836 |
| 12/31/2019 | $14,050 | $14,600 | $11,828 |
| 1/31/2020 | $14,023 | $14,606 | $12,056 |
| 2/29/2020 | $13,634 | $14,215 | $12,273 |
| 3/31/2020 | $12,062 | $12,725 | $12,200 |
| 4/30/2020 | $12,814 | $13,389 | $12,417 |
| 5/31/2020 | $13,191 | $13,912 | $12,475 |
| 6/30/2020 | $13,342 | $14,116 | $12,554 |
| 7/31/2020 | $13,838 | $14,739 | $12,741 |
| 8/31/2020 | $14,029 | $15,034 | $12,638 |
| 9/30/2020 | $13,870 | $14,818 | $12,632 |
| 10/31/2020 | $13,887 | $14,760 | $12,575 |
| 11/30/2020 | $14,471 | $15,588 | $12,698 |
| 12/31/2020 | $14,771 | $15,951 | $12,716 |
| 1/31/2021 | $14,772 | $15,946 | $12,625 |
| 2/28/2021 | $14,910 | $16,036 | $12,443 |
| 3/31/2021 | $15,034 | $16,128 | $12,287 |
| 4/30/2021 | $15,253 | $16,429 | $12,384 |
| 5/31/2021 | $15,390 | $16,528 | $12,425 |
| 6/30/2021 | $15,514 | $16,735 | $12,512 |
| 7/31/2021 | $15,588 | $16,829 | $12,652 |
| 8/31/2021 | $15,766 | $16,985 | $12,628 |
| 9/30/2021 | $15,534 | $16,789 | $12,518 |
| 10/31/2021 | $15,788 | $16,986 | $12,515 |
| 11/30/2021 | $15,688 | $16,786 | $12,552 |
| 12/31/2021 | $16,023 | $17,141 | $12,520 |
| 1/31/2022 | $15,379 | $16,593 | $12,250 |
| 2/28/2022 | $15,169 | $16,367 | $12,114 |
| 3/31/2022 | $15,018 | $16,297 | $11,777 |
| 4/30/2022 | $14,255 | $15,521 | $11,330 |
| 5/31/2022 | $14,209 | $15,569 | $11,403 |
| 6/30/2022 | $13,395 | $14,570 | $11,224 |
| 7/31/2022 | $14,112 | $15,406 | $11,498 |
| 8/31/2022 | $13,725 | $14,974 | $11,174 |
| 9/30/2022 | $12,953 | $14,159 | $10,691 |
| 10/31/2022 | $13,370 | $14,589 | $10,552 |
| 11/30/2022 | $13,788 | $15,122 | $10,940 |
| 12/31/2022 | $13,555 | $14,894 | $10,891 |
| 1/31/2023 | $14,173 | $15,576 | $11,226 |
| 2/28/2023 | $13,935 | $15,282 | $10,936 |
| 3/31/2023 | $13,984 | $15,561 | $11,214 |
| 4/30/2023 | $14,099 | $15,721 | $11,282 |
| 5/31/2023 | $14,083 | $15,562 | $11,159 |
| 6/30/2023 | $14,471 | $15,931 | $11,119 |
| 7/31/2023 | $14,753 | $16,212 | $11,111 |
| 8/31/2023 | $14,601 | $16,111 | $11,040 |
| 9/30/2023 | $14,316 | $15,770 | $10,760 |
| 10/31/2023 | $14,129 | $15,497 | $10,590 |
| 11/30/2023 | $14,894 | $16,384 | $11,069 |
| 12/31/2023 | $15,430 | $17,037 | $11,493 |
| 1/31/2024 | $15,571 | $17,056 | $11,462 |
| 2/29/2024 | $15,935 | $17,231 | $11,300 |
| 3/31/2024 | $16,259 | $17,512 | $11,404 |
| 4/30/2024 | $16,043 | $17,196 | $11,116 |
| 5/31/2024 | $16,457 | $17,528 | $11,304 |
| 6/30/2024 | $16,628 | $17,749 | $11,411 |
| 7/31/2024 | $16,822 | $18,090 | $11,678 |
| 8/31/2024 | $17,079 | $18,419 | $11,846 |
| 9/30/2024 | $17,204 | $18,742 | $12,004 |
Diversified Income Builder Fund
Annual Shareholder Report | September 30, 2024
AVERAGE ANNUAL TOTAL RETURNS (%)
| 1 Year | 5 Years | 10 Years |
|---|
Class R6Footnote Reference* | 20.18 | 4.87 | 5.58 |
Diversified Income Builder Blended Index (Strategy)Footnote Reference† | 18.85 | 6.12 | 6.48 |
| Bloomberg U.S. Universal Bond Index (Regulatory) | 12.08 | 0.70 | 2.15 |
| Total net assets | $350,544,835 |
| # of portfolio holdings | 416 |
| Portfolio turnover rate | 67% |
| Total advisory fees paid | $1,095,568 |
Figures quoted represent past performance, which is no guarantee of future results, and do not reflect taxes that a shareholder may pay on an investment in a fund.
| Footnote | Description |
Footnote* | Historical performance shown for the Class R6 shares prior to their inception on July 31, 2018 reflects the performance of the Institutional Class shares, and includes the higher expenses applicable to the Institutional Class shares. If these expenses had not been included, returns for the Class R6 shares would be higher. |
Footnote† | The Diversified Income Builder Blended Index is composed 60% of the ICE BofA U.S. Cash Pay High Yield Index, 25% of the Morgan Stanley Capital International (MSCI) All Country World Index (ACWI) (Net) and 15% of the Bloomberg U.S. Aggregate Bond Index. Prior to February 1, 2020, the Diversified Income Builder Blended Index was composed 65% of the ICE BofA U.S. Cash Pay High Yield Index, and 35% of the Russell 1000® Index. Prior to January 2, 2018, the Diversified Income Builder Blended Index was composed 75% of the ICE BofA U.S. Cash Pay High Yield Index, and 25% of the Russell 1000® Index. You cannot invest directly in an index. |
What did the Fund invest in?
(Based on long-term investments)
PORTFOLIO COMPOSITION (% OF LONG-TERM INVESTMENTS)
| Corporate bonds and notes | 45.1 |
| Common stocks | 30.1 |
| Yankee corporate bonds and notes | 11.0 |
| Foreign corporate bonds and notes | 4.5 |
| Municipal obligations | 3.7 |
| Investment companies | 2.8 |
| Loans | 2.4 |
| Preferred stocks | 0.3 |
| Asset-backed securities | 0.1 |
TOP TEN HOLDINGS (% OF NET ASSETS)
| iShares iBoxx $ High Yield Corporate Bond ETF | 2.7 |
| Apple, Inc. | 1.2 |
| Microsoft Corp. | 1.0 |
| Societe Generale SA, 8.00%, 9/29/2025 | 1.0 |
| Banco Santander SA, 4.38%, 1/14/2026 | 0.9 |
| ABN AMRO Bank NV, 4.75%, 9/22/2027 | 0.9 |
| NVIDIA Corp. | 0.9 |
| Commerzbank AG, 6.13%, 10/9/2025 | 0.8 |
| Walmart, Inc. | 0.8 |
| Alphabet, Inc., Class A | 0.7 |
This is a summary of certain changes and planned changes to the Fund since October 1, 2023.
On November 8, 2024, Allspring Global Investments (UK) Limited became a sub-adviser to the Fund and Matthias Scheiber was added as a portfolio manager to the Fund.
You can find additional information on the Fund's website at allspringglobal.com, including its:
- Prospectus - Financial Information - Fund holdings - Proxy voting information
Annual Shareholder Report
Diversified Income Builder Fund
This annual shareholder report contains important information about Diversified Income Builder Fund for the period of October 1, 2023 to September 30, 2024. You can find additional information about the Fund at allspringglobal.com. You can also request this information by contacting us at 1-800-222-8222.
This report describes changes to the Fund that occurred either during or after the reporting period.
What were the Fund costs for the past year?
The table explains the costs you would have paid within the reporting period based on a hypothetical $10,000 investment.
| CLASS NAME | COSTS OF A $10,000 INVESTMENT | COSTS PAID AS A % OF A $10,000 INVESTMENT |
|---|
| Class C | $174 | 1.59% |
The manager has contractually committed to waive fees and/or reimburse certain expenses to the extent necessary to cap the Fund's total annual fund operating expense ratio at a specific amount. Without this cap, the costs shown above may have been higher. Please see the prospectus for the amount and the expiration date of the cap. Prior to or after the commitment expiration date, the cap may be increased or the commitment to maintain the cap may be terminated only with the approval of the Board of Trustees.
How did the Fund perform last year and what affected its performance?
Over the past year, equity and fixed income markets benefited from steady growth and lower inflation based on the assumption that the Federal Reserve will follow a path to lower interest rates. U.S. consumers remained resilient in the face of interest rates not seen since before the Global Financial Crisis. The largest change we made to the portfolio was to remove an allocation to U.S. large-cap growth and emerging market equities. This allocation was added to our existing global dividend yield equity strategy. The top contributor to performance was an overweight to equity over the past year. The biggest detractor from performance was selection within high yield bonds.
Total return based on a $10,000 investment
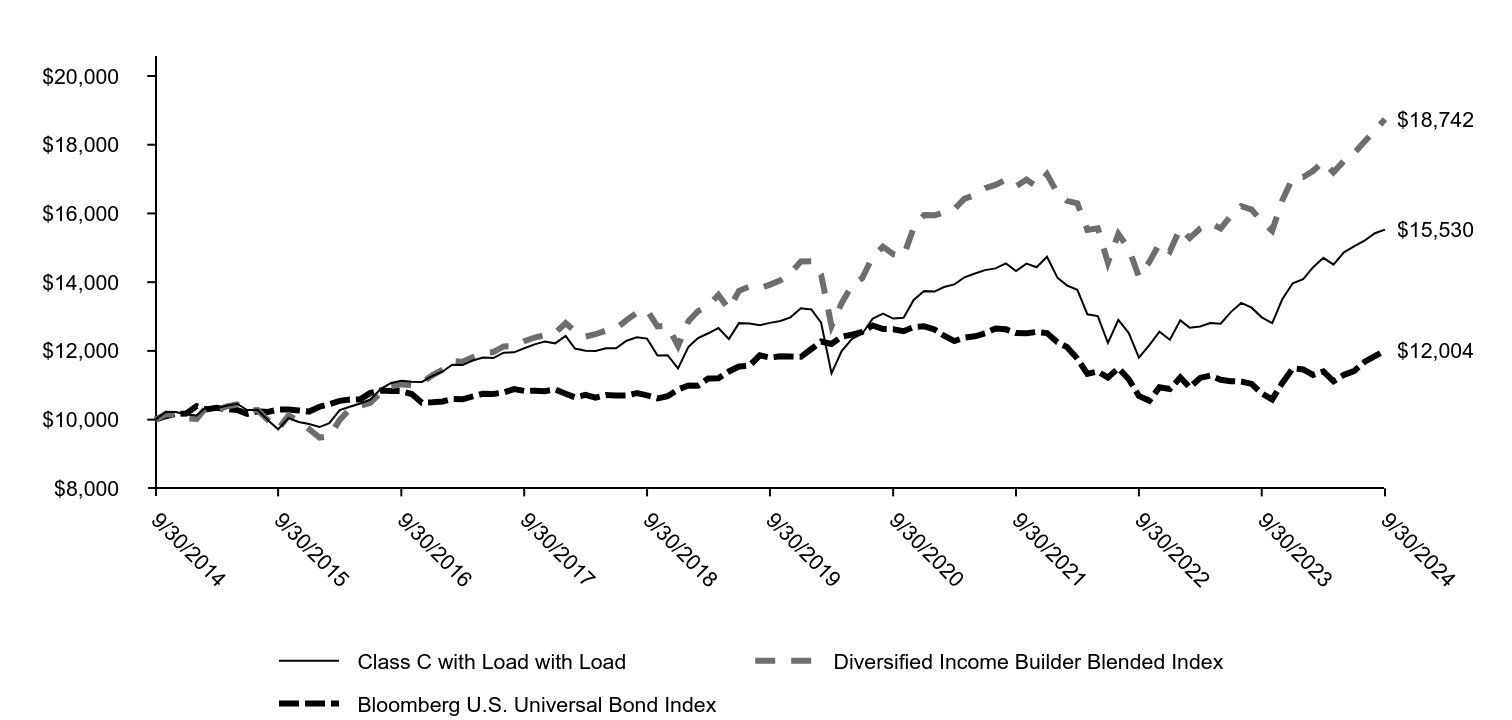
| Class C with Load with Load | Diversified Income Builder Blended Index | Bloomberg U.S. Universal Bond Index |
|---|
| 9/30/2014 | $10,000 | $10,000 | $10,000 |
| 10/31/2014 | $10,226 | $10,148 | $10,098 |
| 11/30/2014 | $10,219 | $10,160 | $10,170 |
| 12/31/2014 | $10,148 | $10,041 | $10,179 |
| 1/31/2015 | $10,118 | $10,024 | $10,393 |
| 2/28/2015 | $10,364 | $10,348 | $10,295 |
| 3/31/2015 | $10,334 | $10,274 | $10,343 |
| 4/30/2015 | $10,404 | $10,385 | $10,306 |
| 5/31/2015 | $10,462 | $10,442 | $10,281 |
| 6/30/2015 | $10,281 | $10,274 | $10,169 |
| 7/31/2015 | $10,284 | $10,277 | $10,240 |
| 8/31/2015 | $9,984 | $9,987 | $10,225 |
| 9/30/2015 | $9,719 | $9,724 | $10,294 |
| 10/31/2015 | $10,045 | $10,122 | $10,296 |
| 11/30/2015 | $9,931 | $9,961 | $10,269 |
| 12/31/2015 | $9,872 | $9,726 | $10,235 |
| 1/31/2016 | $9,784 | $9,480 | $10,376 |
| 2/29/2016 | $9,897 | $9,513 | $10,450 |
| 3/31/2016 | $10,279 | $9,992 | $10,546 |
| 4/30/2016 | $10,373 | $10,303 | $10,586 |
| 5/31/2016 | $10,470 | $10,400 | $10,589 |
| 6/30/2016 | $10,585 | $10,489 | $10,779 |
| 7/31/2016 | $10,897 | $10,788 | $10,847 |
| 8/31/2016 | $11,069 | $10,972 | $10,835 |
| 9/30/2016 | $11,130 | $11,028 | $10,829 |
| 10/31/2016 | $11,099 | $10,999 | $10,746 |
| 11/30/2016 | $11,097 | $11,075 | $10,492 |
| 12/31/2016 | $11,271 | $11,289 | $10,506 |
| 1/31/2017 | $11,402 | $11,459 | $10,527 |
| 2/28/2017 | $11,598 | $11,705 | $10,598 |
| 3/31/2017 | $11,587 | $11,688 | $10,592 |
| 4/30/2017 | $11,720 | $11,818 | $10,674 |
| 5/31/2017 | $11,806 | $11,936 | $10,756 |
| 6/30/2017 | $11,793 | $11,966 | $10,745 |
| 7/31/2017 | $11,947 | $12,129 | $10,792 |
| 8/31/2017 | $11,958 | $12,137 | $10,888 |
| 9/30/2017 | $12,077 | $12,283 | $10,836 |
| 10/31/2017 | $12,191 | $12,389 | $10,843 |
| 11/30/2017 | $12,276 | $12,457 | $10,829 |
| 12/31/2017 | $12,220 | $12,519 | $10,879 |
| 1/31/2018 | $12,436 | $12,811 | $10,753 |
| 2/28/2018 | $12,070 | $12,568 | $10,651 |
| 3/31/2018 | $12,002 | $12,417 | $10,720 |
| 4/30/2018 | $11,996 | $12,485 | $10,640 |
| 5/31/2018 | $12,077 | $12,595 | $10,716 |
| 6/30/2018 | $12,075 | $12,653 | $10,703 |
| 7/31/2018 | $12,296 | $12,898 | $10,705 |
| 8/31/2018 | $12,396 | $13,114 | $10,774 |
| 9/30/2018 | $12,358 | $13,181 | $10,705 |
| 10/31/2018 | $11,867 | $12,714 | $10,620 |
| 11/30/2018 | $11,876 | $12,731 | $10,683 |
| 12/31/2018 | $11,491 | $12,144 | $10,880 |
| 1/31/2019 | $12,117 | $12,863 | $10,995 |
| 2/28/2019 | $12,371 | $13,156 | $10,989 |
| 3/31/2019 | $12,513 | $13,320 | $11,200 |
| 4/30/2019 | $12,666 | $13,630 | $11,203 |
| 5/31/2019 | $12,346 | $13,213 | $11,402 |
| 6/30/2019 | $12,808 | $13,749 | $11,545 |
| 7/31/2019 | $12,799 | $13,869 | $11,570 |
| 8/31/2019 | $12,744 | $13,817 | $11,870 |
| 9/30/2019 | $12,816 | $13,929 | $11,807 |
| 10/31/2019 | $12,869 | $14,053 | $11,842 |
| 11/30/2019 | $12,976 | $14,263 | $11,836 |
| 12/31/2019 | $13,241 | $14,600 | $11,828 |
| 1/31/2020 | $13,208 | $14,606 | $12,056 |
| 2/29/2020 | $12,821 | $14,215 | $12,273 |
| 3/31/2020 | $11,347 | $12,725 | $12,200 |
| 4/30/2020 | $11,998 | $13,389 | $12,417 |
| 5/31/2020 | $12,352 | $13,912 | $12,475 |
| 6/30/2020 | $12,499 | $14,116 | $12,554 |
| 7/31/2020 | $12,937 | $14,739 | $12,741 |
| 8/31/2020 | $13,088 | $15,034 | $12,638 |
| 9/30/2020 | $12,941 | $14,818 | $12,632 |
| 10/31/2020 | $12,964 | $14,760 | $12,575 |
| 11/30/2020 | $13,482 | $15,588 | $12,698 |
| 12/31/2020 | $13,741 | $15,951 | $12,716 |
| 1/31/2021 | $13,727 | $15,946 | $12,625 |
| 2/28/2021 | $13,860 | $16,036 | $12,443 |
| 3/31/2021 | $13,937 | $16,128 | $12,287 |
| 4/30/2021 | $14,142 | $16,429 | $12,384 |
| 5/31/2021 | $14,253 | $16,528 | $12,425 |
| 6/30/2021 | $14,351 | $16,735 | $12,512 |
| 7/31/2021 | $14,402 | $16,829 | $12,652 |
| 8/31/2021 | $14,548 | $16,985 | $12,628 |
| 9/30/2021 | $14,326 | $16,789 | $12,518 |
| 10/31/2021 | $14,539 | $16,986 | $12,515 |
| 11/30/2021 | $14,435 | $16,786 | $12,552 |
| 12/31/2021 | $14,741 | $17,141 | $12,520 |
| 1/31/2022 | $14,130 | $16,593 | $12,250 |
| 2/28/2022 | $13,908 | $16,367 | $12,114 |
| 3/31/2022 | $13,781 | $16,297 | $11,777 |
| 4/30/2022 | $13,067 | $15,521 | $11,330 |
| 5/31/2022 | $13,012 | $15,569 | $11,403 |
| 6/30/2022 | $12,230 | $14,570 | $11,224 |
| 7/31/2022 | $12,900 | $15,406 | $11,498 |
| 8/31/2022 | $12,521 | $14,974 | $11,174 |
| 9/30/2022 | $11,803 | $14,159 | $10,691 |
| 10/31/2022 | $12,168 | $14,589 | $10,552 |
| 11/30/2022 | $12,557 | $15,122 | $10,940 |
| 12/31/2022 | $12,323 | $14,894 | $10,891 |
| 1/31/2023 | $12,889 | $15,576 | $11,226 |
| 2/28/2023 | $12,673 | $15,282 | $10,936 |
| 3/31/2023 | $12,711 | $15,561 | $11,214 |
| 4/30/2023 | $12,809 | $15,721 | $11,282 |
| 5/31/2023 | $12,790 | $15,562 | $11,159 |
| 6/30/2023 | $13,129 | $15,931 | $11,119 |
| 7/31/2023 | $13,396 | $16,212 | $11,111 |
| 8/31/2023 | $13,257 | $16,111 | $11,040 |
| 9/30/2023 | $12,977 | $15,770 | $10,760 |
| 10/31/2023 | $12,808 | $15,497 | $10,590 |
| 11/30/2023 | $13,501 | $16,384 | $11,069 |
| 12/31/2023 | $13,969 | $17,037 | $11,493 |
| 1/31/2024 | $14,087 | $17,056 | $11,462 |
| 2/29/2024 | $14,428 | $17,231 | $11,300 |
| 3/31/2024 | $14,707 | $17,512 | $11,404 |
| 4/30/2024 | $14,512 | $17,196 | $11,116 |
| 5/31/2024 | $14,870 | $17,528 | $11,304 |
| 6/30/2024 | $15,040 | $17,749 | $11,411 |
| 7/31/2024 | $15,206 | $18,090 | $11,678 |
| 8/31/2024 | $15,425 | $18,419 | $11,846 |
| 9/30/2024 | $15,530 | $18,742 | $12,004 |
Diversified Income Builder Fund
Annual Shareholder Report | September 30, 2024
AVERAGE ANNUAL TOTAL RETURNS (%)
| 1 Year | 5 Years | 10 Years |
|---|
| Class C | 18.88 | 3.65 | 4.50 |
| Class C with Load | 17.88 | 3.65 | 4.50 |
Diversified Income Builder Blended Index (Strategy)Footnote Reference* | 18.85 | 6.12 | 6.48 |
| Bloomberg U.S. Universal Bond Index (Regulatory) | 12.08 | 0.70 | 2.15 |
| Total net assets | $350,544,835 |
| # of portfolio holdings | 416 |
| Portfolio turnover rate | 67% |
| Total advisory fees paid | $1,095,568 |
Figures quoted represent past performance, which is no guarantee of future results, and do not reflect taxes that a shareholder may pay on an investment in a fund.
| Footnote | Description |
Footnote* | The Diversified Income Builder Blended Index is composed 60% of the ICE BofA U.S. Cash Pay High Yield Index, 25% of the Morgan Stanley Capital International (MSCI) All Country World Index (ACWI) (Net) and 15% of the Bloomberg U.S. Aggregate Bond Index. Prior to February 1, 2020, the Diversified Income Builder Blended Index was composed 65% of the ICE BofA U.S. Cash Pay High Yield Index, and 35% of the Russell 1000® Index. Prior to January 2, 2018, the Diversified Income Builder Blended Index was composed 75% of the ICE BofA U.S. Cash Pay High Yield Index, and 25% of the Russell 1000® Index. You cannot invest directly in an index. |
What did the Fund invest in?
(Based on long-term investments)
PORTFOLIO COMPOSITION (% OF LONG-TERM INVESTMENTS)
| Corporate bonds and notes | 45.1 |
| Common stocks | 30.1 |
| Yankee corporate bonds and notes | 11.0 |
| Foreign corporate bonds and notes | 4.5 |
| Municipal obligations | 3.7 |
| Investment companies | 2.8 |
| Loans | 2.4 |
| Preferred stocks | 0.3 |
| Asset-backed securities | 0.1 |
TOP TEN HOLDINGS (% OF NET ASSETS)
| iShares iBoxx $ High Yield Corporate Bond ETF | 2.7 |
| Apple, Inc. | 1.2 |
| Microsoft Corp. | 1.0 |
| Societe Generale SA, 8.00%, 9/29/2025 | 1.0 |
| Banco Santander SA, 4.38%, 1/14/2026 | 0.9 |
| ABN AMRO Bank NV, 4.75%, 9/22/2027 | 0.9 |
| NVIDIA Corp. | 0.9 |
| Commerzbank AG, 6.13%, 10/9/2025 | 0.8 |
| Walmart, Inc. | 0.8 |
| Alphabet, Inc., Class A | 0.7 |
This is a summary of certain changes and planned changes to the Fund since October 1, 2023.
On November 8, 2024, Allspring Global Investments (UK) Limited became a sub-adviser to the Fund and Matthias Scheiber was added as a portfolio manager to the Fund.
You can find additional information on the Fund's website at allspringglobal.com, including its:
- Prospectus - Financial Information - Fund holdings - Proxy voting information
Annual Shareholder Report
Diversified Income Builder Fund
This annual shareholder report contains important information about Diversified Income Builder Fund for the period of October 1, 2023 to September 30, 2024. You can find additional information about the Fund at allspringglobal.com. You can also request this information by contacting us at 1-800-222-8222.
This report describes changes to the Fund that occurred either during or after the reporting period.
What were the Fund costs for the past year?
The table explains the costs you would have paid within the reporting period based on a hypothetical $10,000 investment.
| CLASS NAME | COSTS OF A $10,000 INVESTMENT | COSTS PAID AS A % OF A $10,000 INVESTMENT |
|---|
| Class A | $92 | 0.84% |
The manager has contractually committed to waive fees and/or reimburse certain expenses to the extent necessary to cap the Fund's total annual fund operating expense ratio at a specific amount. Without this cap, the costs shown above may have been higher. Please see the prospectus for the amount and the expiration date of the cap. Prior to or after the commitment expiration date, the cap may be increased or the commitment to maintain the cap may be terminated only with the approval of the Board of Trustees.
How did the Fund perform last year and what affected its performance?
Over the past year, equity and fixed income markets benefited from steady growth and lower inflation based on the assumption that the Federal Reserve will follow a path to lower interest rates. U.S. consumers remained resilient in the face of interest rates not seen since before the Global Financial Crisis. The largest change we made to the portfolio was to remove an allocation to U.S. large-cap growth and emerging market equities. This allocation was added to our existing global dividend yield equity strategy. The top contributor to performance was an overweight to equity over the past year. The biggest detractor from performance was selection within high yield bonds.
Total return based on a $10,000 investment
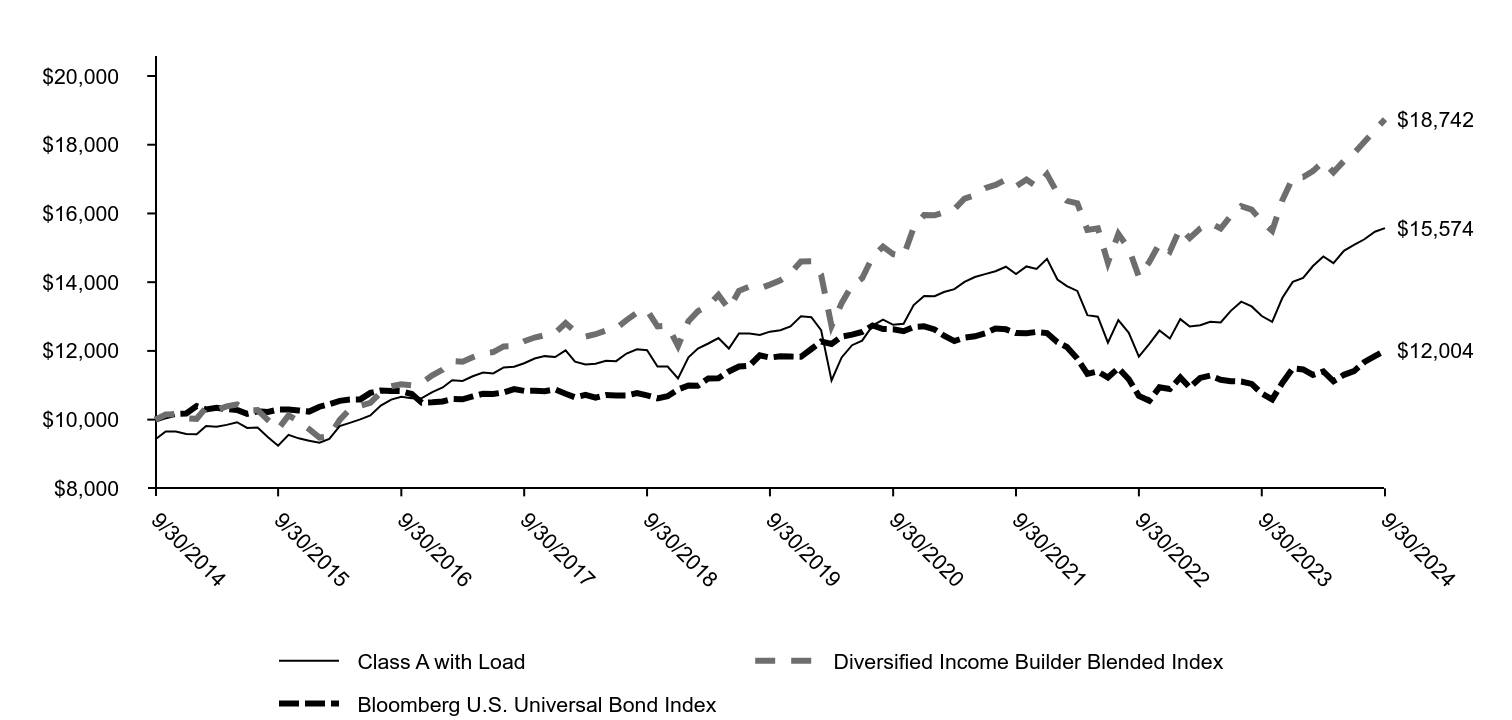
| Class A with Load | Diversified Income Builder Blended Index | Bloomberg U.S. Universal Bond Index |
|---|
| 9/30/2014 | $9,423 | $10,000 | $10,000 |
| 10/31/2014 | $9,657 | $10,148 | $10,098 |
| 11/30/2014 | $9,656 | $10,160 | $10,170 |
| 12/31/2014 | $9,581 | $10,041 | $10,179 |
| 1/31/2015 | $9,575 | $10,024 | $10,393 |
| 2/28/2015 | $9,813 | $10,348 | $10,295 |
| 3/31/2015 | $9,791 | $10,274 | $10,343 |
| 4/30/2015 | $9,847 | $10,385 | $10,306 |
| 5/31/2015 | $9,924 | $10,442 | $10,281 |
| 6/30/2015 | $9,758 | $10,274 | $10,169 |
| 7/31/2015 | $9,768 | $10,277 | $10,240 |
| 8/31/2015 | $9,488 | $9,987 | $10,225 |
| 9/30/2015 | $9,242 | $9,724 | $10,294 |
| 10/31/2015 | $9,558 | $10,122 | $10,296 |
| 11/30/2015 | $9,456 | $9,961 | $10,269 |
| 12/31/2015 | $9,388 | $9,726 | $10,235 |
| 1/31/2016 | $9,327 | $9,480 | $10,376 |
| 2/29/2016 | $9,440 | $9,513 | $10,450 |
| 3/31/2016 | $9,812 | $9,992 | $10,546 |
| 4/30/2016 | $9,907 | $10,303 | $10,586 |
| 5/31/2016 | $10,006 | $10,400 | $10,589 |
| 6/30/2016 | $10,122 | $10,489 | $10,779 |
| 7/31/2016 | $10,411 | $10,788 | $10,847 |
| 8/31/2016 | $10,583 | $10,972 | $10,835 |
| 9/30/2016 | $10,664 | $11,028 | $10,829 |
| 10/31/2016 | $10,625 | $10,999 | $10,746 |
| 11/30/2016 | $10,629 | $11,075 | $10,492 |
| 12/31/2016 | $10,803 | $11,289 | $10,506 |
| 1/31/2017 | $10,935 | $11,459 | $10,527 |
| 2/28/2017 | $11,148 | $11,705 | $10,598 |
| 3/31/2017 | $11,127 | $11,688 | $10,592 |
| 4/30/2017 | $11,262 | $11,818 | $10,674 |
| 5/31/2017 | $11,370 | $11,936 | $10,756 |
| 6/30/2017 | $11,346 | $11,966 | $10,745 |
| 7/31/2017 | $11,519 | $12,129 | $10,792 |
| 8/31/2017 | $11,537 | $12,137 | $10,888 |
| 9/30/2017 | $11,642 | $12,283 | $10,836 |
| 10/31/2017 | $11,777 | $12,389 | $10,843 |
| 11/30/2017 | $11,848 | $12,457 | $10,829 |
| 12/31/2017 | $11,820 | $12,519 | $10,879 |
| 1/31/2018 | $12,015 | $12,811 | $10,753 |
| 2/28/2018 | $11,686 | $12,568 | $10,651 |
| 3/31/2018 | $11,608 | $12,417 | $10,720 |
| 4/30/2018 | $11,628 | $12,485 | $10,640 |
| 5/31/2018 | $11,714 | $12,595 | $10,716 |
| 6/30/2018 | $11,701 | $12,653 | $10,703 |
| 7/31/2018 | $11,924 | $12,898 | $10,705 |
| 8/31/2018 | $12,048 | $13,114 | $10,774 |
| 9/30/2018 | $12,018 | $13,181 | $10,705 |
| 10/31/2018 | $11,548 | $12,714 | $10,620 |
| 11/30/2018 | $11,545 | $12,731 | $10,683 |
| 12/31/2018 | $11,199 | $12,144 | $10,880 |
| 1/31/2019 | $11,814 | $12,863 | $10,995 |
| 2/28/2019 | $12,070 | $13,156 | $10,989 |
| 3/31/2019 | $12,216 | $13,320 | $11,200 |
| 4/30/2019 | $12,373 | $13,630 | $11,203 |
| 5/31/2019 | $12,068 | $13,213 | $11,402 |
| 6/30/2019 | $12,508 | $13,749 | $11,545 |
| 7/31/2019 | $12,507 | $13,869 | $11,570 |
| 8/31/2019 | $12,461 | $13,817 | $11,870 |
| 9/30/2019 | $12,560 | $13,929 | $11,807 |
| 10/31/2019 | $12,600 | $14,053 | $11,842 |
| 11/30/2019 | $12,712 | $14,263 | $11,836 |
| 12/31/2019 | $13,007 | $14,600 | $11,828 |
| 1/31/2020 | $12,979 | $14,606 | $12,056 |
| 2/29/2020 | $12,604 | $14,215 | $12,273 |
| 3/31/2020 | $11,140 | $12,725 | $12,200 |
| 4/30/2020 | $11,810 | $13,389 | $12,417 |
| 5/31/2020 | $12,166 | $13,912 | $12,475 |
| 6/30/2020 | $12,299 | $14,116 | $12,554 |
| 7/31/2020 | $12,739 | $14,739 | $12,741 |
| 8/31/2020 | $12,910 | $15,034 | $12,638 |
| 9/30/2020 | $12,760 | $14,818 | $12,632 |
| 10/31/2020 | $12,791 | $14,760 | $12,575 |
| 11/30/2020 | $13,334 | $15,588 | $12,698 |
| 12/31/2020 | $13,599 | $15,951 | $12,716 |
| 1/31/2021 | $13,594 | $15,946 | $12,625 |
| 2/28/2021 | $13,713 | $16,036 | $12,443 |
| 3/31/2021 | $13,798 | $16,128 | $12,287 |
| 4/30/2021 | $14,010 | $16,429 | $12,384 |
| 5/31/2021 | $14,151 | $16,528 | $12,425 |
| 6/30/2021 | $14,235 | $16,735 | $12,512 |
| 7/31/2021 | $14,318 | $16,829 | $12,652 |
| 8/31/2021 | $14,450 | $16,985 | $12,628 |
| 9/30/2021 | $14,237 | $16,789 | $12,518 |
| 10/31/2021 | $14,459 | $16,986 | $12,515 |
| 11/30/2021 | $14,387 | $16,786 | $12,552 |
| 12/31/2021 | $14,680 | $17,141 | $12,520 |
| 1/31/2022 | $14,079 | $16,593 | $12,250 |
| 2/28/2022 | $13,887 | $16,367 | $12,114 |
| 3/31/2022 | $13,747 | $16,297 | $11,777 |
| 4/30/2022 | $13,040 | $15,521 | $11,330 |
| 5/31/2022 | $12,995 | $15,569 | $11,403 |
| 6/30/2022 | $12,242 | $14,570 | $11,224 |
| 7/31/2022 | $12,899 | $15,406 | $11,498 |
| 8/31/2022 | $12,527 | $14,974 | $11,174 |
| 9/30/2022 | $11,836 | $14,159 | $10,691 |
| 10/31/2022 | $12,203 | $14,589 | $10,552 |
| 11/30/2022 | $12,593 | $15,122 | $10,940 |
| 12/31/2022 | $12,358 | $14,894 | $10,891 |
| 1/31/2023 | $12,925 | $15,576 | $11,226 |
| 2/28/2023 | $12,710 | $15,282 | $10,936 |
| 3/31/2023 | $12,747 | $15,561 | $11,214 |
| 4/30/2023 | $12,846 | $15,721 | $11,282 |
| 5/31/2023 | $12,827 | $15,562 | $11,159 |
| 6/30/2023 | $13,166 | $15,931 | $11,119 |
| 7/31/2023 | $13,434 | $16,212 | $11,111 |
| 8/31/2023 | $13,295 | $16,111 | $11,040 |
| 9/30/2023 | $13,014 | $15,770 | $10,760 |
| 10/31/2023 | $12,844 | $15,497 | $10,590 |
| 11/30/2023 | $13,540 | $16,384 | $11,069 |
| 12/31/2023 | $14,009 | $17,037 | $11,493 |
| 1/31/2024 | $14,127 | $17,056 | $11,462 |
| 2/29/2024 | $14,469 | $17,231 | $11,300 |
| 3/31/2024 | $14,749 | $17,512 | $11,404 |
| 4/30/2024 | $14,553 | $17,196 | $11,116 |
| 5/31/2024 | $14,912 | $17,528 | $11,304 |
| 6/30/2024 | $15,083 | $17,749 | $11,411 |
| 7/31/2024 | $15,249 | $18,090 | $11,678 |
| 8/31/2024 | $15,468 | $18,419 | $11,846 |
| 9/30/2024 | $15,574 | $18,742 | $12,004 |
Diversified Income Builder Fund
Annual Shareholder Report | September 30, 2024
AVERAGE ANNUAL TOTAL RETURNS (%)
| 1 Year | 5 Years | 10 Years |
|---|
| Class A | 19.67 | 4.40 | 5.15 |
| Class A with Load | 12.77 | 3.17 | 4.53 |
Diversified Income Builder Blended Index (Strategy)Footnote Reference* | 18.85 | 6.12 | 6.48 |
| Bloomberg U.S. Universal Bond Index (Regulatory) | 12.08 | 0.70 | 2.15 |
| Total net assets | $350,544,835 |
| # of portfolio holdings | 416 |
| Portfolio turnover rate | 67% |
| Total advisory fees paid | $1,095,568 |
Figures quoted represent past performance, which is no guarantee of future results, and do not reflect taxes that a shareholder may pay on an investment in a fund.
| Footnote | Description |
Footnote* | The Diversified Income Builder Blended Index is composed 60% of the ICE BofA U.S. Cash Pay High Yield Index, 25% of the Morgan Stanley Capital International (MSCI) All Country World Index (ACWI) (Net) and 15% of the Bloomberg U.S. Aggregate Bond Index. Prior to February 1, 2020, the Diversified Income Builder Blended Index was composed 65% of the ICE BofA U.S. Cash Pay High Yield Index, and 35% of the Russell 1000® Index. Prior to January 2, 2018, the Diversified Income Builder Blended Index was composed 75% of the ICE BofA U.S. Cash Pay High Yield Index, and 25% of the Russell 1000® Index. You cannot invest directly in an index. |
What did the Fund invest in?
(Based on long-term investments)
PORTFOLIO COMPOSITION (% OF LONG-TERM INVESTMENTS)
| Corporate bonds and notes | 45.1 |
| Common stocks | 30.1 |
| Yankee corporate bonds and notes | 11.0 |
| Foreign corporate bonds and notes | 4.5 |
| Municipal obligations | 3.7 |
| Investment companies | 2.8 |
| Loans | 2.4 |
| Preferred stocks | 0.3 |
| Asset-backed securities | 0.1 |
TOP TEN HOLDINGS (% OF NET ASSETS)
| iShares iBoxx $ High Yield Corporate Bond ETF | 2.7 |
| Apple, Inc. | 1.2 |
| Microsoft Corp. | 1.0 |
| Societe Generale SA, 8.00%, 9/29/2025 | 1.0 |
| Banco Santander SA, 4.38%, 1/14/2026 | 0.9 |
| ABN AMRO Bank NV, 4.75%, 9/22/2027 | 0.9 |
| NVIDIA Corp. | 0.9 |
| Commerzbank AG, 6.13%, 10/9/2025 | 0.8 |
| Walmart, Inc. | 0.8 |
| Alphabet, Inc., Class A | 0.7 |
This is a summary of certain changes and planned changes to the Fund since October 1, 2023.
On November 8, 2024, Allspring Global Investments (UK) Limited became a sub-adviser to the Fund and Matthias Scheiber was added as a portfolio manager to the Fund.
You can find additional information on the Fund's website at allspringglobal.com, including its:
- Prospectus - Financial Information - Fund holdings - Proxy voting information
Annual Shareholder Report
Diversified Income Builder Fund
This annual shareholder report contains important information about Diversified Income Builder Fund for the period of October 1, 2023 to September 30, 2024. You can find additional information about the Fund at allspringglobal.com. You can also request this information by contacting us at 1-800-222-8222.
This report describes changes to the Fund that occurred either during or after the reporting period.
What were the Fund costs for the past year?
The table explains the costs you would have paid within the reporting period based on a hypothetical $10,000 investment.
| CLASS NAME | COSTS OF A $10,000 INVESTMENT | COSTS PAID AS A % OF A $10,000 INVESTMENT |
|---|
| Administrator Class | $85 | 0.77% |
The manager has contractually committed to waive fees and/or reimburse certain expenses to the extent necessary to cap the Fund's total annual fund operating expense ratio at a specific amount. Without this cap, the costs shown above may have been higher. Please see the prospectus for the amount and the expiration date of the cap. Prior to or after the commitment expiration date, the cap may be increased or the commitment to maintain the cap may be terminated only with the approval of the Board of Trustees.
How did the Fund perform last year and what affected its performance?
Over the past year, equity and fixed income markets benefited from steady growth and lower inflation based on the assumption that the Federal Reserve will follow a path to lower interest rates. U.S. consumers remained resilient in the face of interest rates not seen since before the Global Financial Crisis. The largest change we made to the portfolio was to remove an allocation to U.S. large-cap growth and emerging market equities. This allocation was added to our existing global dividend yield equity strategy. The top contributor to performance was an overweight to equity over the past year. The biggest detractor from performance was selection within high yield bonds.
Total return based on a $10,000 investment

| Administrator Class | Diversified Income Builder Blended Index | Bloomberg U.S. Universal Bond Index |
|---|
| 9/30/2014 | $10,000 | $10,000 | $10,000 |
| 10/31/2014 | $10,254 | $10,148 | $10,098 |
| 11/30/2014 | $10,254 | $10,160 | $10,170 |
| 12/31/2014 | $10,173 | $10,041 | $10,179 |
| 1/31/2015 | $10,167 | $10,024 | $10,393 |
| 2/28/2015 | $10,426 | $10,348 | $10,295 |
| 3/31/2015 | $10,403 | $10,274 | $10,343 |
| 4/30/2015 | $10,465 | $10,385 | $10,306 |
| 5/31/2015 | $10,550 | $10,442 | $10,281 |
| 6/30/2015 | $10,371 | $10,274 | $10,169 |
| 7/31/2015 | $10,382 | $10,277 | $10,240 |
| 8/31/2015 | $10,098 | $9,987 | $10,225 |
| 9/30/2015 | $9,831 | $9,724 | $10,294 |
| 10/31/2015 | $10,158 | $10,122 | $10,296 |
| 11/30/2015 | $10,048 | $9,961 | $10,269 |
| 12/31/2015 | $9,993 | $9,726 | $10,235 |
| 1/31/2016 | $9,928 | $9,480 | $10,376 |
| 2/29/2016 | $10,051 | $9,513 | $10,450 |
| 3/31/2016 | $10,437 | $9,992 | $10,546 |
| 4/30/2016 | $10,542 | $10,303 | $10,586 |
| 5/31/2016 | $10,650 | $10,400 | $10,589 |
| 6/30/2016 | $10,777 | $10,489 | $10,779 |
| 7/31/2016 | $11,091 | $10,788 | $10,847 |
| 8/31/2016 | $11,279 | $10,972 | $10,835 |
| 9/30/2016 | $11,350 | $11,028 | $10,829 |
| 10/31/2016 | $11,327 | $10,999 | $10,746 |
| 11/30/2016 | $11,332 | $11,075 | $10,492 |
| 12/31/2016 | $11,522 | $11,289 | $10,506 |
| 1/31/2017 | $11,667 | $11,459 | $10,527 |
| 2/28/2017 | $11,881 | $11,705 | $10,598 |
| 3/31/2017 | $11,858 | $11,688 | $10,592 |
| 4/30/2017 | $12,006 | $11,818 | $10,674 |
| 5/31/2017 | $12,124 | $11,936 | $10,756 |
| 6/30/2017 | $12,099 | $11,966 | $10,745 |
| 7/31/2017 | $12,269 | $12,129 | $10,792 |
| 8/31/2017 | $12,289 | $12,137 | $10,888 |
| 9/30/2017 | $12,423 | $12,283 | $10,836 |
| 10/31/2017 | $12,552 | $12,389 | $10,843 |
| 11/30/2017 | $12,650 | $12,457 | $10,829 |
| 12/31/2017 | $12,600 | $12,519 | $10,879 |
| 1/31/2018 | $12,833 | $12,811 | $10,753 |
| 2/28/2018 | $12,475 | $12,568 | $10,651 |
| 3/31/2018 | $12,391 | $12,417 | $10,720 |
| 4/30/2018 | $12,414 | $12,485 | $10,640 |
| 5/31/2018 | $12,508 | $12,595 | $10,716 |
| 6/30/2018 | $12,495 | $12,653 | $10,703 |
| 7/31/2018 | $12,739 | $12,898 | $10,705 |
| 8/31/2018 | $12,855 | $13,114 | $10,774 |
| 9/30/2018 | $12,822 | $13,181 | $10,705 |
| 10/31/2018 | $12,331 | $12,714 | $10,620 |
| 11/30/2018 | $12,329 | $12,731 | $10,683 |
| 12/31/2018 | $11,928 | $12,144 | $10,880 |
| 1/31/2019 | $12,601 | $12,863 | $10,995 |
| 2/28/2019 | $12,859 | $13,156 | $10,989 |
| 3/31/2019 | $13,043 | $13,320 | $11,200 |
| 4/30/2019 | $13,193 | $13,630 | $11,203 |
| 5/31/2019 | $12,882 | $13,213 | $11,402 |
| 6/30/2019 | $13,365 | $13,749 | $11,545 |
| 7/31/2019 | $13,364 | $13,869 | $11,570 |
| 8/31/2019 | $13,315 | $13,817 | $11,870 |
| 9/30/2019 | $13,401 | $13,929 | $11,807 |
| 10/31/2019 | $13,469 | $14,053 | $11,842 |
| 11/30/2019 | $13,570 | $14,263 | $11,836 |
| 12/31/2019 | $13,871 | $14,600 | $11,828 |
| 1/31/2020 | $13,840 | $14,606 | $12,056 |
| 2/29/2020 | $13,454 | $14,215 | $12,273 |
| 3/31/2020 | $11,899 | $12,725 | $12,200 |
| 4/30/2020 | $12,609 | $13,389 | $12,417 |
| 5/31/2020 | $12,978 | $13,912 | $12,475 |
| 6/30/2020 | $13,146 | $14,116 | $12,554 |
| 7/31/2020 | $13,607 | $14,739 | $12,741 |
| 8/31/2020 | $13,795 | $15,034 | $12,638 |
| 9/30/2020 | $13,655 | $14,818 | $12,632 |
| 10/31/2020 | $13,667 | $14,760 | $12,575 |
| 11/30/2020 | $14,238 | $15,588 | $12,698 |
| 12/31/2020 | $14,530 | $15,951 | $12,716 |
| 1/31/2021 | $14,526 | $15,946 | $12,625 |
| 2/28/2021 | $14,657 | $16,036 | $12,443 |
| 3/31/2021 | $14,775 | $16,128 | $12,287 |
| 4/30/2021 | $14,986 | $16,429 | $12,384 |
| 5/31/2021 | $15,117 | $16,528 | $12,425 |
| 6/30/2021 | $15,234 | $16,735 | $12,512 |
| 7/31/2021 | $15,302 | $16,829 | $12,652 |
| 8/31/2021 | $15,472 | $16,985 | $12,628 |
| 9/30/2021 | $15,240 | $16,789 | $12,518 |
| 10/31/2021 | $15,485 | $16,986 | $12,515 |
| 11/30/2021 | $15,382 | $16,786 | $12,552 |
| 12/31/2021 | $15,730 | $17,141 | $12,520 |
| 1/31/2022 | $15,070 | $16,593 | $12,250 |
| 2/28/2022 | $14,860 | $16,367 | $12,114 |
| 3/31/2022 | $14,708 | $16,297 | $11,777 |
| 4/30/2022 | $13,956 | $15,521 | $11,330 |
| 5/31/2022 | $13,907 | $15,569 | $11,403 |
| 6/30/2022 | $13,106 | $14,570 | $11,224 |
| 7/31/2022 | $13,804 | $15,406 | $11,498 |
| 8/31/2022 | $13,421 | $14,974 | $11,174 |
| 9/30/2022 | $12,663 | $14,159 | $10,691 |
| 10/31/2022 | $13,067 | $14,589 | $10,552 |
| 11/30/2022 | $13,471 | $15,122 | $10,940 |
| 12/31/2022 | $13,240 | $14,894 | $10,891 |
| 1/31/2023 | $13,839 | $15,576 | $11,226 |
| 2/28/2023 | $13,628 | $15,282 | $10,936 |
| 3/31/2023 | $13,671 | $15,561 | $11,214 |
| 4/30/2023 | $13,755 | $15,721 | $11,282 |
| 5/31/2023 | $13,734 | $15,562 | $11,159 |
| 6/30/2023 | $14,105 | $15,931 | $11,119 |
| 7/31/2023 | $14,375 | $16,212 | $11,111 |
| 8/31/2023 | $14,249 | $16,111 | $11,040 |
| 9/30/2023 | $13,940 | $15,770 | $10,760 |
| 10/31/2023 | $13,755 | $15,497 | $10,590 |
| 11/30/2023 | $14,495 | $16,384 | $11,069 |
| 12/31/2023 | $15,013 | $17,037 | $11,493 |
| 1/31/2024 | $15,145 | $17,056 | $11,462 |
| 2/29/2024 | $15,495 | $17,231 | $11,300 |
| 3/31/2024 | $15,805 | $17,512 | $11,404 |
| 4/30/2024 | $15,591 | $17,196 | $11,116 |
| 5/31/2024 | $15,988 | $17,528 | $11,304 |
| 6/30/2024 | $16,150 | $17,749 | $11,411 |
| 7/31/2024 | $16,334 | $18,090 | $11,678 |
| 8/31/2024 | $16,577 | $18,419 | $11,846 |
| 9/30/2024 | $16,695 | $18,742 | $12,004 |
Diversified Income Builder Fund
Annual Shareholder Report | September 30, 2024
AVERAGE ANNUAL TOTAL RETURNS (%)
| 1 Year | 5 Years | 10 Years |
|---|
| Administrator Class | 19.76 | 4.49 | 5.26 |
Diversified Income Builder Blended Index (Strategy)Footnote Reference* | 18.85 | 6.12 | 6.48 |
| Bloomberg U.S. Universal Bond Index (Regulatory) | 12.08 | 0.70 | 2.15 |
| Total net assets | $350,544,835 |
| # of portfolio holdings | 416 |
| Portfolio turnover rate | 67% |
| Total advisory fees paid | $1,095,568 |
Figures quoted represent past performance, which is no guarantee of future results, and do not reflect taxes that a shareholder may pay on an investment in a fund.
| Footnote | Description |
Footnote* | The Diversified Income Builder Blended Index is composed 60% of the ICE BofA U.S. Cash Pay High Yield Index, 25% of the Morgan Stanley Capital International (MSCI) All Country World Index (ACWI) (Net) and 15% of the Bloomberg U.S. Aggregate Bond Index. Prior to February 1, 2020, the Diversified Income Builder Blended Index was composed 65% of the ICE BofA U.S. Cash Pay High Yield Index, and 35% of the Russell 1000® Index. Prior to January 2, 2018, the Diversified Income Builder Blended Index was composed 75% of the ICE BofA U.S. Cash Pay High Yield Index, and 25% of the Russell 1000® Index. You cannot invest directly in an index. |
What did the Fund invest in?
(Based on long-term investments)
PORTFOLIO COMPOSITION (% OF LONG-TERM INVESTMENTS)
| Corporate bonds and notes | 45.1 |
| Common stocks | 30.1 |
| Yankee corporate bonds and notes | 11.0 |
| Foreign corporate bonds and notes | 4.5 |
| Municipal obligations | 3.7 |
| Investment companies | 2.8 |
| Loans | 2.4 |
| Preferred stocks | 0.3 |
| Asset-backed securities | 0.1 |
TOP TEN HOLDINGS (% OF NET ASSETS)
| iShares iBoxx $ High Yield Corporate Bond ETF | 2.7 |
| Apple, Inc. | 1.2 |
| Microsoft Corp. | 1.0 |
| Societe Generale SA, 8.00%, 9/29/2025 | 1.0 |
| Banco Santander SA, 4.38%, 1/14/2026 | 0.9 |
| ABN AMRO Bank NV, 4.75%, 9/22/2027 | 0.9 |
| NVIDIA Corp. | 0.9 |
| Commerzbank AG, 6.13%, 10/9/2025 | 0.8 |
| Walmart, Inc. | 0.8 |
| Alphabet, Inc., Class A | 0.7 |
This is a summary of certain changes and planned changes to the Fund since October 1, 2023.
On November 8, 2024, Allspring Global Investments (UK) Limited became a sub-adviser to the Fund and Matthias Scheiber was added as a portfolio manager to the Fund.
You can find additional information on the Fund's website at allspringglobal.com, including its:
- Prospectus - Financial Information - Fund holdings - Proxy voting information
Annual Shareholder Report
This annual shareholder report contains important information about Mid Cap Growth Fund for the period of October 1, 2023 to September 30, 2024. You can find additional information about the Fund at allspringglobal.com. You can also request this information by contacting us at 1-800-222-8222.
This report describes changes to the Fund that occurred either during or after the reporting period.
What were the Fund costs for the past year?
The table explains the costs you would have paid within the reporting period based on a hypothetical $10,000 investment.
| CLASS NAME | COSTS OF A $10,000 INVESTMENT | COSTS PAID AS A % OF A $10,000 INVESTMENT |
|---|
| Class R6 | $94 | 0.80% |
The manager has contractually committed to waive fees and/or reimburse certain expenses to the extent necessary to cap the Fund's total annual fund operating expense ratio at a specific amount. Without this cap, the costs shown above may have been higher. Please see the prospectus for the amount and the expiration date of the cap. Prior to or after the commitment expiration date, the cap may be increased or the commitment to maintain the cap may be terminated only with the approval of the Board of Trustees.
How did the Fund perform last year and what affected its performance?
Positive earnings results fueled a bull market for U.S. equities during the 12-month period that ended September 30, 2024. Despite lingering macroeconomic concerns, the S&P 500 Index marked its fourth straight quarter of favorable year-over-year earnings growth. Companies tied to artificial intelligence (AI) saw their valuations soar, with the so called “Magnificent 7” stocks substantially outperforming the market. Late in the fiscal year, market leadership broadened as several mega-cap companies struggled to meet high expectations and the Federal Reserve reduced policy rates. As a result, small- and mid-cap stocks narrowed the performance gap relative to large caps. This aided the Fund’s performance.
The portfolio benefited from security selection within the industrials and consumer discretionary sectors. In particular, exposure to companies that are facilitating the buildout of AI contributed to performance. To the contrary, enterprise software spending slumped as IT budgets were pointed toward AI-related projects. Portfolio holdings with software-related products detracted from returns. While we adjusted individual holdings, we have not made material changes within positioning.
Total return based on a $10,000 investment
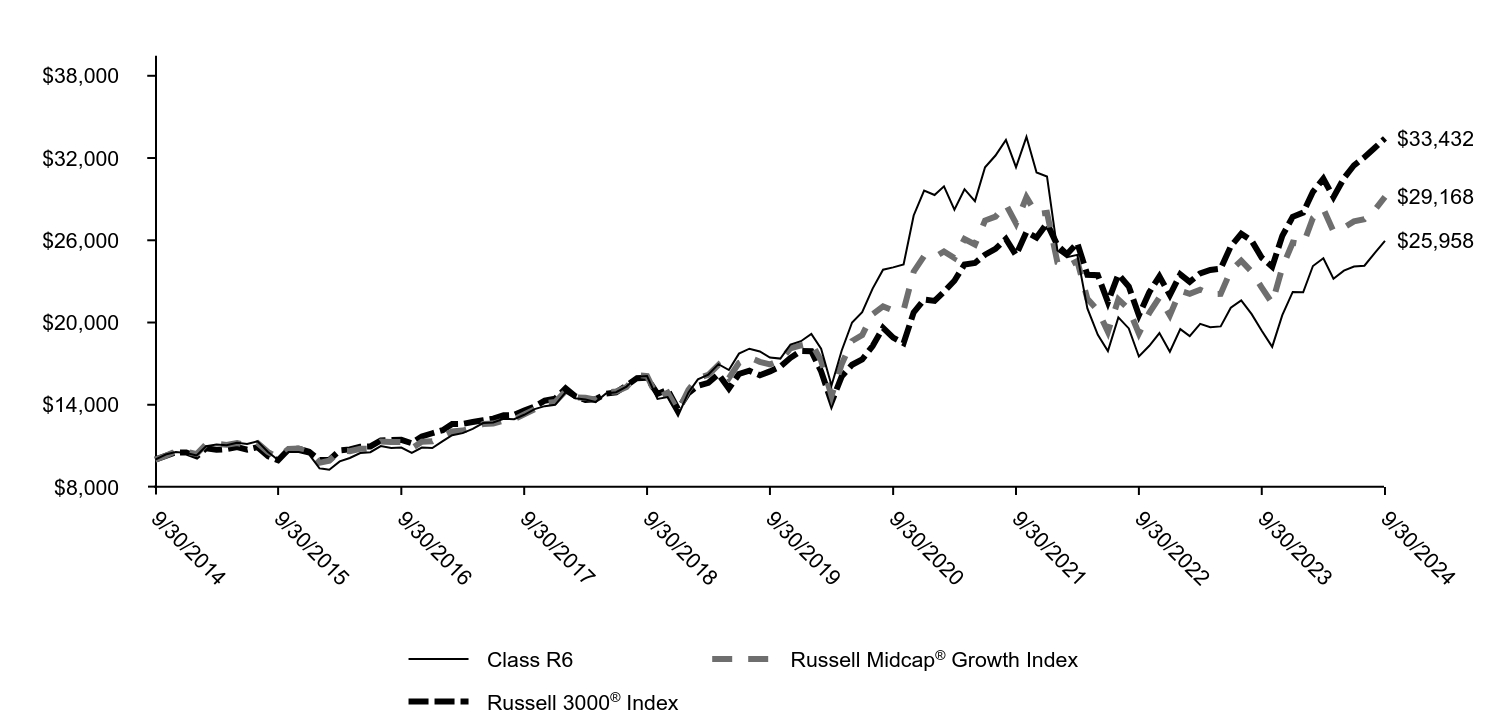
| Class R6 | Russell Midcap® Growth Index | Russell 3000® Index |
|---|
| 9/30/2014 | $10,000 | $10,000 | $10,000 |
| 10/31/2014 | $10,370 | $10,276 | $10,275 |
| 11/30/2014 | $10,555 | $10,614 | $10,524 |
| 12/31/2014 | $10,474 | $10,584 | $10,524 |
| 1/31/2015 | $10,305 | $10,405 | $10,231 |
| 2/28/2015 | $10,976 | $11,122 | $10,824 |
| 3/31/2015 | $11,096 | $11,153 | $10,713 |
| 4/30/2015 | $11,047 | $11,075 | $10,762 |
| 5/31/2015 | $11,234 | $11,206 | $10,911 |
| 6/30/2015 | $11,145 | $11,026 | $10,728 |
| 7/31/2015 | $11,331 | $11,204 | $10,908 |
| 8/31/2015 | $10,552 | $10,553 | $10,249 |
| 9/30/2015 | $9,972 | $10,145 | $9,951 |
| 10/31/2015 | $10,552 | $10,783 | $10,736 |
| 11/30/2015 | $10,558 | $10,807 | $10,796 |
| 12/31/2015 | $10,377 | $10,563 | $10,574 |
| 1/31/2016 | $9,363 | $9,763 | $9,978 |
| 2/29/2016 | $9,258 | $9,916 | $9,975 |
| 3/31/2016 | $9,866 | $10,624 | $10,677 |
| 4/30/2016 | $10,116 | $10,617 | $10,743 |
| 5/31/2016 | $10,475 | $10,791 | $10,935 |
| 6/30/2016 | $10,540 | $10,790 | $10,958 |
| 7/31/2016 | $10,986 | $11,324 | $11,393 |
| 8/31/2016 | $10,854 | $11,291 | $11,422 |
| 9/30/2016 | $10,875 | $11,285 | $11,440 |
| 10/31/2016 | $10,487 | $10,827 | $11,192 |
| 11/30/2016 | $10,880 | $11,297 | $11,693 |
| 12/31/2016 | $10,848 | $11,337 | $11,921 |
| 1/31/2017 | $11,342 | $11,715 | $12,145 |
| 2/28/2017 | $11,779 | $12,052 | $12,597 |
| 3/31/2017 | $11,931 | $12,118 | $12,606 |
| 4/30/2017 | $12,246 | $12,298 | $12,739 |
| 5/31/2017 | $12,667 | $12,592 | $12,870 |
| 6/30/2017 | $12,712 | $12,629 | $12,986 |
| 7/31/2017 | $12,974 | $12,840 | $13,231 |
| 8/31/2017 | $12,949 | $12,931 | $13,256 |
| 9/30/2017 | $13,269 | $13,296 | $13,579 |
| 10/31/2017 | $13,683 | $13,668 | $13,876 |
| 11/30/2017 | $13,898 | $14,125 | $14,297 |
| 12/31/2017 | $13,995 | $14,201 | $14,440 |
| 1/31/2018 | $14,906 | $15,005 | $15,201 |
| 2/28/2018 | $14,479 | $14,534 | $14,641 |
| 3/31/2018 | $14,383 | $14,510 | $14,347 |
| 4/30/2018 | $14,198 | $14,373 | $14,402 |
| 5/31/2018 | $14,829 | $14,911 | $14,808 |
| 6/30/2018 | $14,919 | $14,968 | $14,905 |
| 7/31/2018 | $15,327 | $15,289 | $15,400 |
| 8/31/2018 | $16,051 | $16,171 | $15,940 |
| 9/30/2018 | $16,095 | $16,102 | $15,967 |
| 10/31/2018 | $14,421 | $14,507 | $14,791 |
| 11/30/2018 | $14,556 | $14,877 | $15,087 |
| 12/31/2018 | $13,201 | $13,527 | $13,683 |
| 1/31/2019 | $14,901 | $15,081 | $14,858 |
| 2/28/2019 | $15,852 | $15,965 | $15,380 |
| 3/31/2019 | $16,203 | $16,181 | $15,605 |
| 4/30/2019 | $16,961 | $16,908 | $16,228 |
| 5/31/2019 | $16,535 | $15,936 | $15,178 |
| 6/30/2019 | $17,732 | $17,055 | $16,244 |
| 7/31/2019 | $18,089 | $17,453 | $16,485 |
| 8/31/2019 | $17,887 | $17,135 | $16,149 |
| 9/30/2019 | $17,449 | $16,940 | $16,433 |
| 10/31/2019 | $17,368 | $17,254 | $16,786 |
| 11/30/2019 | $18,397 | $18,112 | $17,424 |
| 12/31/2019 | $18,636 | $18,324 | $17,928 |
| 1/31/2020 | $19,170 | $18,496 | $17,908 |
| 2/29/2020 | $18,089 | $17,220 | $16,442 |
| 3/31/2020 | $15,411 | $14,652 | $14,181 |
| 4/30/2020 | $17,944 | $16,947 | $16,059 |
| 5/31/2020 | $20,006 | $18,649 | $16,918 |
| 6/30/2020 | $20,754 | $19,086 | $17,304 |
| 7/31/2020 | $22,476 | $20,611 | $18,287 |
| 8/31/2020 | $23,856 | $21,172 | $19,612 |
| 9/30/2020 | $24,024 | $20,875 | $18,898 |
| 10/31/2020 | $24,235 | $20,901 | $18,490 |
| 11/30/2020 | $27,812 | $23,708 | $20,739 |
| 12/31/2020 | $29,622 | $24,845 | $21,672 |
| 1/31/2021 | $29,300 | $24,762 | $21,576 |
| 2/28/2021 | $29,936 | $25,185 | $22,250 |
| 3/31/2021 | $28,236 | $24,705 | $23,048 |
| 4/30/2021 | $29,726 | $26,093 | $24,236 |
| 5/31/2021 | $28,854 | $25,694 | $24,346 |
| 6/30/2021 | $31,322 | $27,440 | $24,947 |
| 7/31/2021 | $32,183 | $27,723 | $25,369 |
| 8/31/2021 | $33,323 | $28,618 | $26,092 |
| 9/30/2021 | $31,330 | $27,232 | $24,921 |
| 10/31/2021 | $33,548 | $29,141 | $26,607 |
| 11/30/2021 | $30,944 | $27,910 | $26,202 |
| 12/31/2021 | $30,654 | $28,008 | $27,234 |
| 1/31/2022 | $25,250 | $24,394 | $25,631 |
| 2/28/2022 | $24,760 | $24,097 | $24,986 |
| 3/31/2022 | $24,937 | $24,484 | $25,796 |
| 4/30/2022 | $21,030 | $21,727 | $23,481 |
| 5/31/2022 | $19,105 | $20,886 | $23,450 |
| 6/30/2022 | $17,916 | $19,325 | $21,488 |
| 7/31/2022 | $20,372 | $21,690 | $23,504 |
| 8/31/2022 | $19,570 | $20,980 | $22,627 |
| 9/30/2022 | $17,521 | $19,199 | $20,528 |
| 10/31/2022 | $18,303 | $20,708 | $22,212 |
| 11/30/2022 | $19,232 | $21,834 | $23,371 |
| 12/31/2022 | $17,867 | $20,524 | $22,003 |
| 1/31/2023 | $19,520 | $22,315 | $23,518 |
| 2/28/2023 | $19,010 | $22,095 | $22,968 |
| 3/31/2023 | $19,899 | $22,399 | $23,583 |
| 4/30/2023 | $19,664 | $22,074 | $23,834 |
| 5/31/2023 | $19,718 | $22,088 | $23,927 |
| 6/30/2023 | $21,075 | $23,795 | $25,560 |
| 7/31/2023 | $21,614 | $24,515 | $26,477 |
| 8/31/2023 | $20,610 | $23,707 | $25,966 |
| 9/30/2023 | $19,397 | $22,552 | $24,729 |
| 10/31/2023 | $18,221 | $21,401 | $24,073 |
| 11/30/2023 | $20,540 | $24,012 | $26,318 |
| 12/31/2023 | $22,231 | $25,833 | $27,714 |
| 1/31/2024 | $22,210 | $25,694 | $28,021 |
| 2/29/2024 | $24,122 | $27,625 | $29,538 |
| 3/31/2024 | $24,685 | $28,286 | $30,491 |
| 4/30/2024 | $23,197 | $26,643 | $29,149 |
| 5/31/2024 | $23,786 | $26,927 | $30,526 |
| 6/30/2024 | $24,088 | $27,377 | $31,471 |
| 7/31/2024 | $24,147 | $27,543 | $32,056 |
| 8/31/2024 | $25,088 | $28,227 | $32,754 |
| 9/30/2024 | $25,958 | $29,168 | $33,432 |
Annual Shareholder Report | September 30, 2024
AVERAGE ANNUAL TOTAL RETURNS (%)
| 1 Year | 5 Years | 10 Years |
|---|
Class R6Footnote Reference* | 33.82 | 8.27 | 10.01 |
Russell Midcap® Growth Index (Strategy) | 29.33 | 11.48 | 11.30 |
Russell 3000® Index (Regulatory) | 35.19 | 15.26 | 12.83 |
| Total net assets | $626,241,763 |
| # of portfolio holdings | 61 |
| Portfolio turnover rate | 57% |
| Total advisory fees paid | $4,561,386 |
Figures quoted represent past performance, which is no guarantee of future results, and do not reflect taxes that a shareholder may pay on an investment in a fund.
| Footnote | Description |
Footnote* | Historical performance shown for the Class R6 shares prior to their inception on October 31, 2014 reflects the performance of the Institutional Class shares, and includes the higher expenses applicable to the Institutional Class shares. If these expenses had not been included, returns for the Class R6 shares would be higher. |
What did the Fund invest in?
(Based on long-term investments)
SECTOR ALLOCATION (% OF LONG-TERM INVESTMENTS)
| Information technology | 27.1 |
| Industrials | 24.4 |
| Consumer discretionary | 12.9 |
| Health care | 11.8 |
| Communication services | 10.4 |
| Financials | 9.1 |
| Materials | 3.3 |
| Consumer staples | 1.0 |
TOP TEN HOLDINGS (% OF NET ASSETS)
| Trade Desk, Inc., Class A | 3.5 |
| Monolithic Power Systems, Inc. | 3.0 |
| Vertiv Holdings Co., Class A | 3.1 |
| Gartner, Inc. | 3.0 |
| Axon Enterprise, Inc. | 2.6 |
| Natera, Inc. | 2.5 |
| MercadoLibre, Inc. | 2.3 |
| Fair Isaac Corp. | 2.3 |
| Tetra Tech, Inc. | 2.2 |
| DraftKings, Inc., Class A | 2.2 |
This is a summary of certain changes and planned changes to the Fund since October 1, 2023.
On May 31, 2024, Robert Gruendyke was added as a portfolio manager to the Fund. On August 9, 2024, the Fund’s name was changed from the Allspring Discovery Mid Cap Growth Fund to the Allspring Mid Cap Growth Fund.
You can find additional information on the Fund's website at allspringglobal.com, including its:
- Prospectus - Financial Information - Fund holdings - Proxy voting information
Annual Shareholder Report
This annual shareholder report contains important information about Mid Cap Growth Fund for the period of October 1, 2023 to September 30, 2024. You can find additional information about the Fund at allspringglobal.com. You can also request this information by contacting us at 1-800-222-8222.
This report describes changes to the Fund that occurred either during or after the reporting period.
What were the Fund costs for the past year?
The table explains the costs you would have paid within the reporting period based on a hypothetical $10,000 investment.
| CLASS NAME | COSTS OF A $10,000 INVESTMENT | COSTS PAID AS A % OF A $10,000 INVESTMENT |
|---|
| Institutional Class | $99 | 0.85% |
The manager has contractually committed to waive fees and/or reimburse certain expenses to the extent necessary to cap the Fund's total annual fund operating expense ratio at a specific amount. Without this cap, the costs shown above may have been higher. Please see the prospectus for the amount and the expiration date of the cap. Prior to or after the commitment expiration date, the cap may be increased or the commitment to maintain the cap may be terminated only with the approval of the Board of Trustees.
How did the Fund perform last year and what affected its performance?
Positive earnings results fueled a bull market for U.S. equities during the 12-month period that ended September 30, 2024. Despite lingering macroeconomic concerns, the S&P 500 Index marked its fourth straight quarter of favorable year-over-year earnings growth. Companies tied to artificial intelligence (AI) saw their valuations soar, with the so called “Magnificent 7” stocks substantially outperforming the market. Late in the fiscal year, market leadership broadened as several mega-cap companies struggled to meet high expectations and the Federal Reserve reduced policy rates. As a result, small- and mid-cap stocks narrowed the performance gap relative to large caps. This aided the Fund’s performance.
The portfolio benefited from security selection within the industrials and consumer discretionary sectors. In particular, exposure to companies that are facilitating the buildout of AI contributed to performance. To the contrary, enterprise software spending slumped as IT budgets were pointed toward AI-related projects. Portfolio holdings with software-related products detracted from returns. While we adjusted individual holdings, we have not made material changes within positioning.
Total return based on a $10,000 investment
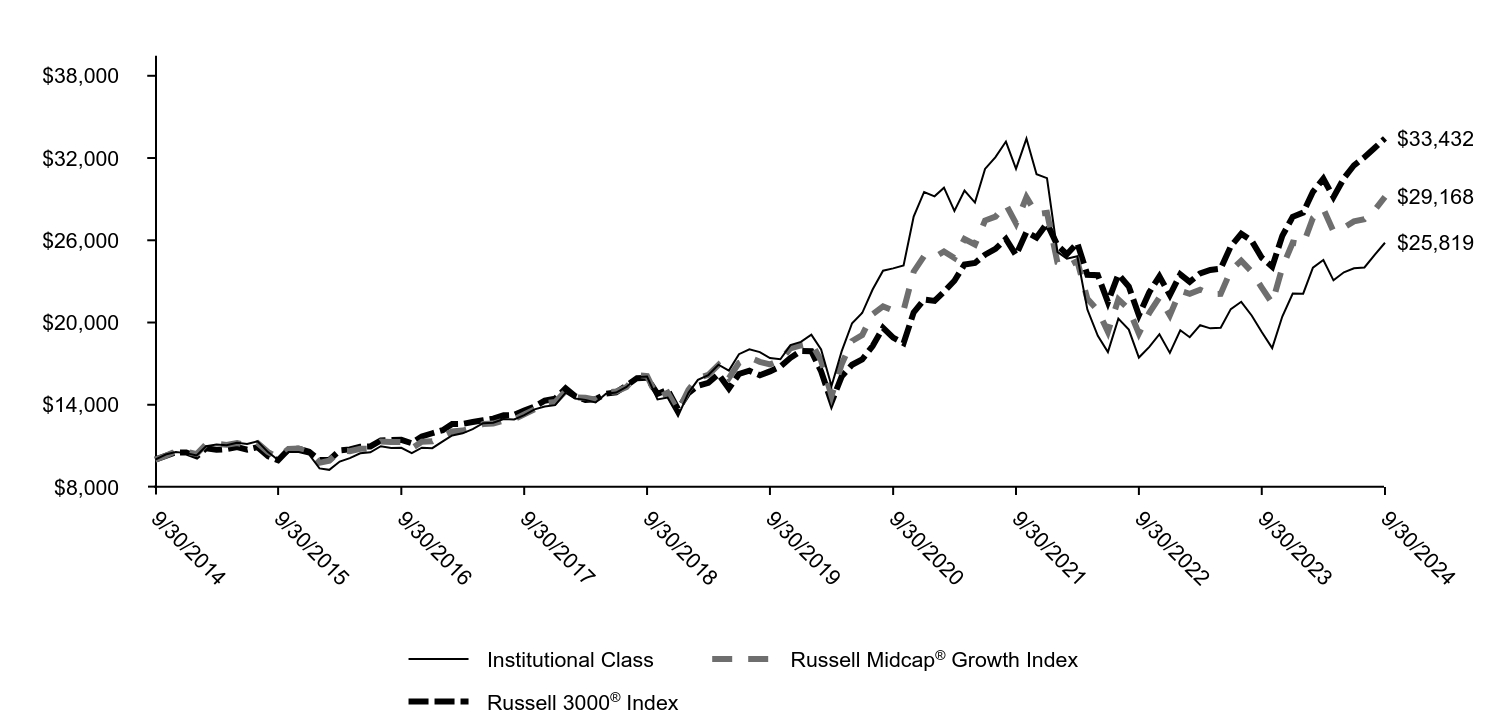
| Institutional Class | Russell Midcap® Growth Index | Russell 3000® Index |
|---|
| 9/30/2014 | $10,000 | $10,000 | $10,000 |
| 10/31/2014 | $10,370 | $10,276 | $10,275 |
| 11/30/2014 | $10,555 | $10,614 | $10,524 |
| 12/31/2014 | $10,472 | $10,584 | $10,524 |
| 1/31/2015 | $10,303 | $10,405 | $10,231 |
| 2/28/2015 | $10,974 | $11,122 | $10,824 |
| 3/31/2015 | $11,094 | $11,153 | $10,713 |
| 4/30/2015 | $11,045 | $11,075 | $10,762 |
| 5/31/2015 | $11,229 | $11,206 | $10,911 |
| 6/30/2015 | $11,143 | $11,026 | $10,728 |
| 7/31/2015 | $11,327 | $11,204 | $10,908 |
| 8/31/2015 | $10,547 | $10,553 | $10,249 |
| 9/30/2015 | $9,968 | $10,145 | $9,951 |
| 10/31/2015 | $10,547 | $10,783 | $10,736 |
| 11/30/2015 | $10,554 | $10,807 | $10,796 |
| 12/31/2015 | $10,370 | $10,563 | $10,574 |
| 1/31/2016 | $9,359 | $9,763 | $9,978 |
| 2/29/2016 | $9,251 | $9,916 | $9,975 |
| 3/31/2016 | $9,857 | $10,624 | $10,677 |
| 4/30/2016 | $10,107 | $10,617 | $10,743 |
| 5/31/2016 | $10,464 | $10,791 | $10,935 |
| 6/30/2016 | $10,531 | $10,790 | $10,958 |
| 7/31/2016 | $10,974 | $11,324 | $11,393 |
| 8/31/2016 | $10,842 | $11,291 | $11,422 |
| 9/30/2016 | $10,862 | $11,285 | $11,440 |
| 10/31/2016 | $10,476 | $10,827 | $11,192 |
| 11/30/2016 | $10,866 | $11,297 | $11,693 |
| 12/31/2016 | $10,834 | $11,337 | $11,921 |
| 1/31/2017 | $11,328 | $11,715 | $12,145 |
| 2/28/2017 | $11,763 | $12,052 | $12,597 |
| 3/31/2017 | $11,915 | $12,118 | $12,606 |
| 4/30/2017 | $12,227 | $12,298 | $12,739 |
| 5/31/2017 | $12,651 | $12,592 | $12,870 |
| 6/30/2017 | $12,694 | $12,629 | $12,986 |
| 7/31/2017 | $12,953 | $12,840 | $13,231 |
| 8/31/2017 | $12,931 | $12,931 | $13,256 |
| 9/30/2017 | $13,248 | $13,296 | $13,579 |
| 10/31/2017 | $13,662 | $13,668 | $13,876 |
| 11/30/2017 | $13,874 | $14,125 | $14,297 |
| 12/31/2017 | $13,971 | $14,201 | $14,440 |
| 1/31/2018 | $14,880 | $15,005 | $15,201 |
| 2/28/2018 | $14,450 | $14,534 | $14,641 |
| 3/31/2018 | $14,357 | $14,510 | $14,347 |
| 4/30/2018 | $14,172 | $14,373 | $14,402 |
| 5/31/2018 | $14,800 | $14,911 | $14,808 |
| 6/30/2018 | $14,891 | $14,968 | $14,905 |
| 7/31/2018 | $15,296 | $15,289 | $15,400 |
| 8/31/2018 | $16,017 | $16,171 | $15,940 |
| 9/30/2018 | $16,061 | $16,102 | $15,967 |
| 10/31/2018 | $14,392 | $14,507 | $14,791 |
| 11/30/2018 | $14,525 | $14,877 | $15,087 |
| 12/31/2018 | $13,172 | $13,527 | $13,683 |
| 1/31/2019 | $14,870 | $15,081 | $14,858 |
| 2/28/2019 | $15,818 | $15,965 | $15,380 |
| 3/31/2019 | $16,166 | $16,181 | $15,605 |
| 4/30/2019 | $16,919 | $16,908 | $16,228 |
| 5/31/2019 | $16,496 | $15,936 | $15,178 |
| 6/30/2019 | $17,687 | $17,055 | $16,244 |
| 7/31/2019 | $18,044 | $17,453 | $16,485 |
| 8/31/2019 | $17,842 | $17,135 | $16,149 |
| 9/30/2019 | $17,404 | $16,940 | $16,433 |
| 10/31/2019 | $17,320 | $17,254 | $16,786 |
| 11/30/2019 | $18,349 | $18,112 | $17,424 |
| 12/31/2019 | $18,586 | $18,324 | $17,928 |
| 1/31/2020 | $19,120 | $18,496 | $17,908 |
| 2/29/2020 | $18,038 | $17,220 | $16,442 |
| 3/31/2020 | $15,368 | $14,652 | $14,181 |
| 4/30/2020 | $17,893 | $16,947 | $16,059 |
| 5/31/2020 | $19,947 | $18,649 | $16,918 |
| 6/30/2020 | $20,692 | $19,086 | $17,304 |
| 7/31/2020 | $22,409 | $20,611 | $18,287 |
| 8/31/2020 | $23,781 | $21,172 | $19,612 |
| 9/30/2020 | $23,952 | $20,875 | $18,898 |
| 10/31/2020 | $24,160 | $20,901 | $18,490 |
| 11/30/2020 | $27,723 | $23,708 | $20,739 |
| 12/31/2020 | $29,525 | $24,845 | $21,672 |
| 1/31/2021 | $29,206 | $24,762 | $21,576 |
| 2/28/2021 | $29,836 | $25,185 | $22,250 |
| 3/31/2021 | $28,137 | $24,705 | $23,048 |
| 4/30/2021 | $29,621 | $26,093 | $24,236 |
| 5/31/2021 | $28,752 | $25,694 | $24,346 |
| 6/30/2021 | $31,209 | $27,440 | $24,947 |
| 7/31/2021 | $32,068 | $27,723 | $25,369 |
| 8/31/2021 | $33,201 | $28,618 | $26,092 |
| 9/30/2021 | $31,213 | $27,232 | $24,921 |
| 10/31/2021 | $33,420 | $29,141 | $26,607 |
| 11/30/2021 | $30,823 | $27,910 | $26,202 |
| 12/31/2021 | $30,533 | $28,008 | $27,234 |
| 1/31/2022 | $25,151 | $24,394 | $25,631 |
| 2/28/2022 | $24,660 | $24,097 | $24,986 |
| 3/31/2022 | $24,833 | $24,484 | $25,796 |
| 4/30/2022 | $20,943 | $21,727 | $23,481 |
| 5/31/2022 | $19,027 | $20,886 | $23,450 |
| 6/30/2022 | $17,840 | $19,325 | $21,488 |
| 7/31/2022 | $20,284 | $21,690 | $23,504 |
| 8/31/2022 | $19,484 | $20,980 | $22,627 |
| 9/30/2022 | $17,444 | $19,199 | $20,528 |
| 10/31/2022 | $18,223 | $20,708 | $22,212 |
| 11/30/2022 | $19,146 | $21,834 | $23,371 |
| 12/31/2022 | $17,786 | $20,524 | $22,003 |
| 1/31/2023 | $19,431 | $22,315 | $23,518 |
| 2/28/2023 | $18,924 | $22,095 | $22,968 |
| 3/31/2023 | $19,806 | $22,399 | $23,583 |
| 4/30/2023 | $19,575 | $22,074 | $23,834 |
| 5/31/2023 | $19,624 | $22,088 | $23,927 |
| 6/30/2023 | $20,976 | $23,795 | $25,560 |
| 7/31/2023 | $21,512 | $24,515 | $26,477 |
| 8/31/2023 | $20,515 | $23,707 | $25,966 |
| 9/30/2023 | $19,303 | $22,552 | $24,729 |
| 10/31/2023 | $18,133 | $21,401 | $24,073 |
| 11/30/2023 | $20,436 | $24,012 | $26,318 |
| 12/31/2023 | $22,118 | $25,833 | $27,714 |
| 1/31/2024 | $22,101 | $25,694 | $28,021 |
| 2/29/2024 | $24,000 | $27,625 | $29,538 |
| 3/31/2024 | $24,560 | $28,286 | $30,491 |
| 4/30/2024 | $23,078 | $26,643 | $29,149 |
| 5/31/2024 | $23,663 | $26,927 | $30,526 |
| 6/30/2024 | $23,958 | $27,377 | $31,471 |
| 7/31/2024 | $24,017 | $27,543 | $32,056 |
| 8/31/2024 | $24,951 | $28,227 | $32,754 |
| 9/30/2024 | $25,819 | $29,168 | $33,432 |
Annual Shareholder Report | September 30, 2024
AVERAGE ANNUAL TOTAL RETURNS (%)
| 1 Year | 5 Years | 10 Years |
|---|
| Institutional Class | 33.75 | 8.21 | 9.95 |
Russell Midcap® Growth Index (Strategy) | 29.33 | 11.48 | 11.30 |
Russell 3000® Index (Regulatory) | 35.19 | 15.26 | 12.83 |
| Total net assets | $626,241,763 |
| # of portfolio holdings | 61 |
| Portfolio turnover rate | 57% |
| Total advisory fees paid | $4,561,386 |
Figures quoted represent past performance, which is no guarantee of future results, and do not reflect taxes that a shareholder may pay on an investment in a fund.
What did the Fund invest in?
(Based on long-term investments)
SECTOR ALLOCATION (% OF LONG-TERM INVESTMENTS)
| Information technology | 27.1 |
| Industrials | 24.4 |
| Consumer discretionary | 12.9 |
| Health care | 11.8 |
| Communication services | 10.4 |
| Financials | 9.1 |
| Materials | 3.3 |
| Consumer staples | 1.0 |
TOP TEN HOLDINGS (% OF NET ASSETS)
| Trade Desk, Inc., Class A | 3.5 |
| Monolithic Power Systems, Inc. | 3.0 |
| Vertiv Holdings Co., Class A | 3.1 |
| Gartner, Inc. | 3.0 |
| Axon Enterprise, Inc. | 2.6 |
| Natera, Inc. | 2.5 |
| MercadoLibre, Inc. | 2.3 |
| Fair Isaac Corp. | 2.3 |
| Tetra Tech, Inc. | 2.2 |
| DraftKings, Inc., Class A | 2.2 |
This is a summary of certain changes and planned changes to the Fund since October 1, 2023.
On May 31, 2024, Robert Gruendyke was added as a portfolio manager to the Fund. On August 9, 2024, the Fund’s name was changed from the Allspring Discovery Mid Cap Growth Fund to the Allspring Mid Cap Growth Fund.
You can find additional information on the Fund's website at allspringglobal.com, including its:
- Prospectus - Financial Information - Fund holdings - Proxy voting information
Annual Shareholder Report
This annual shareholder report contains important information about Mid Cap Growth Fund for the period of October 1, 2023 to September 30, 2024. You can find additional information about the Fund at allspringglobal.com. You can also request this information by contacting us at 1-800-222-8222.
This report describes changes to the Fund that occurred either during or after the reporting period.
What were the Fund costs for the past year?
The table explains the costs you would have paid within the reporting period based on a hypothetical $10,000 investment.
| CLASS NAME | COSTS OF A $10,000 INVESTMENT | COSTS PAID AS A % OF A $10,000 INVESTMENT |
|---|
| Class C | $224 | 1.93% |
The manager has contractually committed to waive fees and/or reimburse certain expenses to the extent necessary to cap the Fund's total annual fund operating expense ratio at a specific amount. Without this cap, the costs shown above may have been higher. Please see the prospectus for the amount and the expiration date of the cap. Prior to or after the commitment expiration date, the cap may be increased or the commitment to maintain the cap may be terminated only with the approval of the Board of Trustees.
How did the Fund perform last year and what affected its performance?
Positive earnings results fueled a bull market for U.S. equities during the 12-month period that ended September 30, 2024. Despite lingering macroeconomic concerns, the S&P 500 Index marked its fourth straight quarter of favorable year-over-year earnings growth. Companies tied to artificial intelligence (AI) saw their valuations soar, with the so called “Magnificent 7” stocks substantially outperforming the market. Late in the fiscal year, market leadership broadened as several mega-cap companies struggled to meet high expectations and the Federal Reserve reduced policy rates. As a result, small- and mid-cap stocks narrowed the performance gap relative to large caps. This aided the Fund’s performance.
The portfolio benefited from security selection within the industrials and consumer discretionary sectors. In particular, exposure to companies that are facilitating the buildout of AI contributed to performance. To the contrary, enterprise software spending slumped as IT budgets were pointed toward AI-related projects. Portfolio holdings with software-related products detracted from returns. While we adjusted individual holdings, we have not made material changes within positioning.
Total return based on a $10,000 investment

| Class C with Load | Russell Midcap® Growth Index | Russell 3000® Index |
|---|
| 9/30/2014 | $10,000 | $10,000 | $10,000 |
| 10/31/2014 | $10,359 | $10,276 | $10,275 |
| 11/30/2014 | $10,537 | $10,614 | $10,524 |
| 12/31/2014 | $10,444 | $10,584 | $10,524 |
| 1/31/2015 | $10,266 | $10,405 | $10,231 |
| 2/28/2015 | $10,925 | $11,122 | $10,824 |
| 3/31/2015 | $11,032 | $11,153 | $10,713 |
| 4/30/2015 | $10,974 | $11,075 | $10,762 |
| 5/31/2015 | $11,149 | $11,206 | $10,911 |
| 6/30/2015 | $11,053 | $11,026 | $10,728 |
| 7/31/2015 | $11,226 | $11,204 | $10,908 |
| 8/31/2015 | $10,442 | $10,553 | $10,249 |
| 9/30/2015 | $9,859 | $10,145 | $9,951 |
| 10/31/2015 | $10,422 | $10,783 | $10,736 |
| 11/30/2015 | $10,422 | $10,807 | $10,796 |
| 12/31/2015 | $10,228 | $10,563 | $10,574 |
| 1/31/2016 | $9,222 | $9,763 | $9,978 |
| 2/29/2016 | $9,111 | $9,916 | $9,975 |
| 3/31/2016 | $9,700 | $10,624 | $10,677 |
| 4/30/2016 | $9,934 | $10,617 | $10,743 |
| 5/31/2016 | $10,278 | $10,791 | $10,935 |
| 6/30/2016 | $10,334 | $10,790 | $10,958 |
| 7/31/2016 | $10,759 | $11,324 | $11,393 |
| 8/31/2016 | $10,620 | $11,291 | $11,422 |
| 9/30/2016 | $10,629 | $11,285 | $11,440 |
| 10/31/2016 | $10,242 | $10,827 | $11,192 |
| 11/30/2016 | $10,615 | $11,297 | $11,693 |
| 12/31/2016 | $10,574 | $11,337 | $11,921 |
| 1/31/2017 | $11,047 | $11,715 | $12,145 |
| 2/28/2017 | $11,459 | $12,052 | $12,597 |
| 3/31/2017 | $11,596 | $12,118 | $12,606 |
| 4/30/2017 | $11,890 | $12,298 | $12,739 |
| 5/31/2017 | $12,290 | $12,592 | $12,870 |
| 6/30/2017 | $12,322 | $12,629 | $12,986 |
| 7/31/2017 | $12,561 | $12,840 | $13,231 |
| 8/31/2017 | $12,529 | $12,931 | $13,256 |
| 9/30/2017 | $12,824 | $13,296 | $13,579 |
| 10/31/2017 | $13,212 | $13,668 | $13,876 |
| 11/30/2017 | $13,408 | $14,125 | $14,297 |
| 12/31/2017 | $13,485 | $14,201 | $14,440 |
| 1/31/2018 | $14,354 | $15,005 | $15,201 |
| 2/28/2018 | $13,926 | $14,534 | $14,641 |
| 3/31/2018 | $13,824 | $14,510 | $14,347 |
| 4/30/2018 | $13,633 | $14,373 | $14,402 |
| 5/31/2018 | $14,225 | $14,911 | $14,808 |
| 6/30/2018 | $14,298 | $14,968 | $14,905 |
| 7/31/2018 | $14,676 | $15,289 | $15,400 |
| 8/31/2018 | $15,351 | $16,171 | $15,940 |
| 9/30/2018 | $15,380 | $16,102 | $15,967 |
| 10/31/2018 | $13,768 | $14,507 | $14,791 |
| 11/30/2018 | $13,883 | $14,877 | $15,087 |
| 12/31/2018 | $12,577 | $13,527 | $13,683 |
| 1/31/2019 | $14,187 | $15,081 | $14,858 |
| 2/28/2019 | $15,078 | $15,965 | $15,380 |
| 3/31/2019 | $15,396 | $16,181 | $15,605 |
| 4/30/2019 | $16,099 | $16,908 | $16,228 |
| 5/31/2019 | $15,684 | $15,936 | $15,178 |
| 6/30/2019 | $16,802 | $17,055 | $16,244 |
| 7/31/2019 | $17,125 | $17,453 | $16,485 |
| 8/31/2019 | $16,913 | $17,135 | $16,149 |
| 9/30/2019 | $16,487 | $16,940 | $16,433 |
| 10/31/2019 | $16,395 | $17,254 | $16,786 |
| 11/30/2019 | $17,347 | $18,112 | $17,424 |
| 12/31/2019 | $17,558 | $18,324 | $17,928 |
| 1/31/2020 | $18,043 | $18,496 | $17,908 |
| 2/29/2020 | $17,010 | $17,220 | $16,442 |
| 3/31/2020 | $14,480 | $14,652 | $14,181 |
| 4/30/2020 | $16,844 | $16,947 | $16,059 |
| 5/31/2020 | $18,761 | $18,649 | $16,918 |
| 6/30/2020 | $19,445 | $19,086 | $17,304 |
| 7/31/2020 | $21,038 | $20,611 | $18,287 |
| 8/31/2020 | $22,307 | $21,172 | $19,612 |
| 9/30/2020 | $22,444 | $20,875 | $18,898 |
| 10/31/2020 | $22,618 | $20,901 | $18,490 |
| 11/30/2020 | $25,932 | $23,708 | $20,739 |
| 12/31/2020 | $27,591 | $24,845 | $21,672 |
| 1/31/2021 | $27,271 | $24,762 | $21,576 |
| 2/28/2021 | $27,837 | $25,185 | $22,250 |
| 3/31/2021 | $26,228 | $24,705 | $23,048 |
| 4/30/2021 | $27,586 | $26,093 | $24,236 |
| 5/31/2021 | $26,752 | $25,694 | $24,346 |
| 6/30/2021 | $29,014 | $27,440 | $24,947 |
| 7/31/2021 | $29,779 | $27,723 | $25,369 |
| 8/31/2021 | $30,808 | $28,618 | $26,092 |
| 9/30/2021 | $28,935 | $27,232 | $24,921 |
| 10/31/2021 | $30,952 | $29,141 | $26,607 |
| 11/30/2021 | $28,523 | $27,910 | $26,202 |
| 12/31/2021 | $28,226 | $28,008 | $27,234 |
| 1/31/2022 | $23,231 | $24,394 | $25,631 |
| 2/28/2022 | $22,759 | $24,097 | $24,986 |
| 3/31/2022 | $22,901 | $24,484 | $25,796 |
| 4/30/2022 | $19,294 | $21,727 | $23,481 |
| 5/31/2022 | $17,513 | $20,886 | $23,450 |
| 6/30/2022 | $16,409 | $19,325 | $21,488 |
| 7/31/2022 | $18,639 | $21,690 | $23,504 |
| 8/31/2022 | $17,888 | $20,980 | $22,627 |
| 9/30/2022 | $15,999 | $19,199 | $20,528 |
| 10/31/2022 | $16,707 | $20,708 | $22,212 |
| 11/30/2022 | $17,549 | $21,834 | $23,371 |
| 12/31/2022 | $16,298 | $20,524 | $22,003 |
| 1/31/2023 | $17,803 | $22,315 | $23,518 |
| 2/28/2023 | $17,331 | $22,095 | $22,968 |
| 3/31/2023 | $18,132 | $22,399 | $23,583 |
| 4/30/2023 | $17,914 | $22,074 | $23,834 |
| 5/31/2023 | $17,959 | $22,088 | $23,927 |
| 6/30/2023 | $19,188 | $23,795 | $25,560 |
| 7/31/2023 | $19,673 | $24,515 | $26,477 |
| 8/31/2023 | $18,756 | $23,707 | $25,966 |
| 9/30/2023 | $17,642 | $22,552 | $24,729 |
| 10/31/2023 | $16,569 | $21,401 | $24,073 |
| 11/30/2023 | $18,671 | $24,012 | $26,318 |
| 12/31/2023 | $20,203 | $25,833 | $27,714 |
| 1/31/2024 | $20,180 | $25,694 | $28,021 |
| 2/29/2024 | $21,911 | $27,625 | $29,538 |
| 3/31/2024 | $22,414 | $28,286 | $30,491 |
| 4/30/2024 | $21,057 | $26,643 | $29,149 |
| 5/31/2024 | $21,582 | $26,927 | $30,526 |
| 6/30/2024 | $21,847 | $27,377 | $31,471 |
| 7/31/2024 | $21,893 | $27,543 | $32,056 |
| 8/31/2024 | $22,738 | $28,227 | $32,754 |
| 9/30/2024 | $23,528 | $29,168 | $33,432 |
Annual Shareholder Report | September 30, 2024
AVERAGE ANNUAL TOTAL RETURNS (%)
| 1 Year | 5 Years | 10 Years |
|---|
| Class C | 32.32 | 7.05 | 8.93 |
| Class C with Load | 31.32 | 7.05 | 8.93 |
Russell Midcap® Growth Index (Strategy) | 29.33 | 11.48 | 11.30 |
Russell 3000® Index (Regulatory) | 35.19 | 15.26 | 12.83 |
| Total net assets | $626,241,763 |
| # of portfolio holdings | 61 |
| Portfolio turnover rate | 57% |
| Total advisory fees paid | $4,561,386 |
Figures quoted represent past performance, which is no guarantee of future results, and do not reflect taxes that a shareholder may pay on an investment in a fund.
What did the Fund invest in?
(Based on long-term investments)
SECTOR ALLOCATION (% OF LONG-TERM INVESTMENTS)
| Information technology | 27.1 |
| Industrials | 24.4 |
| Consumer discretionary | 12.9 |
| Health care | 11.8 |
| Communication services | 10.4 |
| Financials | 9.1 |
| Materials | 3.3 |
| Consumer staples | 1.0 |
TOP TEN HOLDINGS (% OF NET ASSETS)
| Trade Desk, Inc., Class A | 3.5 |
| Monolithic Power Systems, Inc. | 3.0 |
| Vertiv Holdings Co., Class A | 3.1 |
| Gartner, Inc. | 3.0 |
| Axon Enterprise, Inc. | 2.6 |
| Natera, Inc. | 2.5 |
| MercadoLibre, Inc. | 2.3 |
| Fair Isaac Corp. | 2.3 |
| Tetra Tech, Inc. | 2.2 |
| DraftKings, Inc., Class A | 2.2 |
This is a summary of certain changes and planned changes to the Fund since October 1, 2023.
On May 31, 2024, Robert Gruendyke was added as a portfolio manager to the Fund. On August 9, 2024, the Fund’s name was changed from the Allspring Discovery Mid Cap Growth Fund to the Allspring Mid Cap Growth Fund.
You can find additional information on the Fund's website at allspringglobal.com, including its:
- Prospectus - Financial Information - Fund holdings - Proxy voting information
Annual Shareholder Report
This annual shareholder report contains important information about Mid Cap Growth Fund for the period of October 1, 2023 to September 30, 2024. You can find additional information about the Fund at allspringglobal.com. You can also request this information by contacting us at 1-800-222-8222.
This report describes changes to the Fund that occurred either during or after the reporting period.
What were the Fund costs for the past year?
The table explains the costs you would have paid within the reporting period based on a hypothetical $10,000 investment.
| CLASS NAME | COSTS OF A $10,000 INVESTMENT | COSTS PAID AS A % OF A $10,000 INVESTMENT |
|---|
| Class A | $135 | 1.16% |
The manager has contractually committed to waive fees and/or reimburse certain expenses to the extent necessary to cap the Fund's total annual fund operating expense ratio at a specific amount. Without this cap, the costs shown above may have been higher. Please see the prospectus for the amount and the expiration date of the cap. Prior to or after the commitment expiration date, the cap may be increased or the commitment to maintain the cap may be terminated only with the approval of the Board of Trustees.
How did the Fund perform last year and what affected its performance?
Positive earnings results fueled a bull market for U.S. equities during the 12-month period that ended September 30, 2024. Despite lingering macroeconomic concerns, the S&P 500 Index marked its fourth straight quarter of favorable year-over-year earnings growth. Companies tied to artificial intelligence (AI) saw their valuations soar, with the so called “Magnificent 7” stocks substantially outperforming the market. Late in the fiscal year, market leadership broadened as several mega-cap companies struggled to meet high expectations and the Federal Reserve reduced policy rates. As a result, small- and mid-cap stocks narrowed the performance gap relative to large caps. This aided the Fund’s performance.
The portfolio benefited from security selection within the industrials and consumer discretionary sectors. In particular, exposure to companies that are facilitating the buildout of AI contributed to performance. To the contrary, enterprise software spending slumped as IT budgets were pointed toward AI-related projects. Portfolio holdings with software-related products detracted from returns. While we adjusted individual holdings, we have not made material changes within positioning.
Total return based on a $10,000 investment
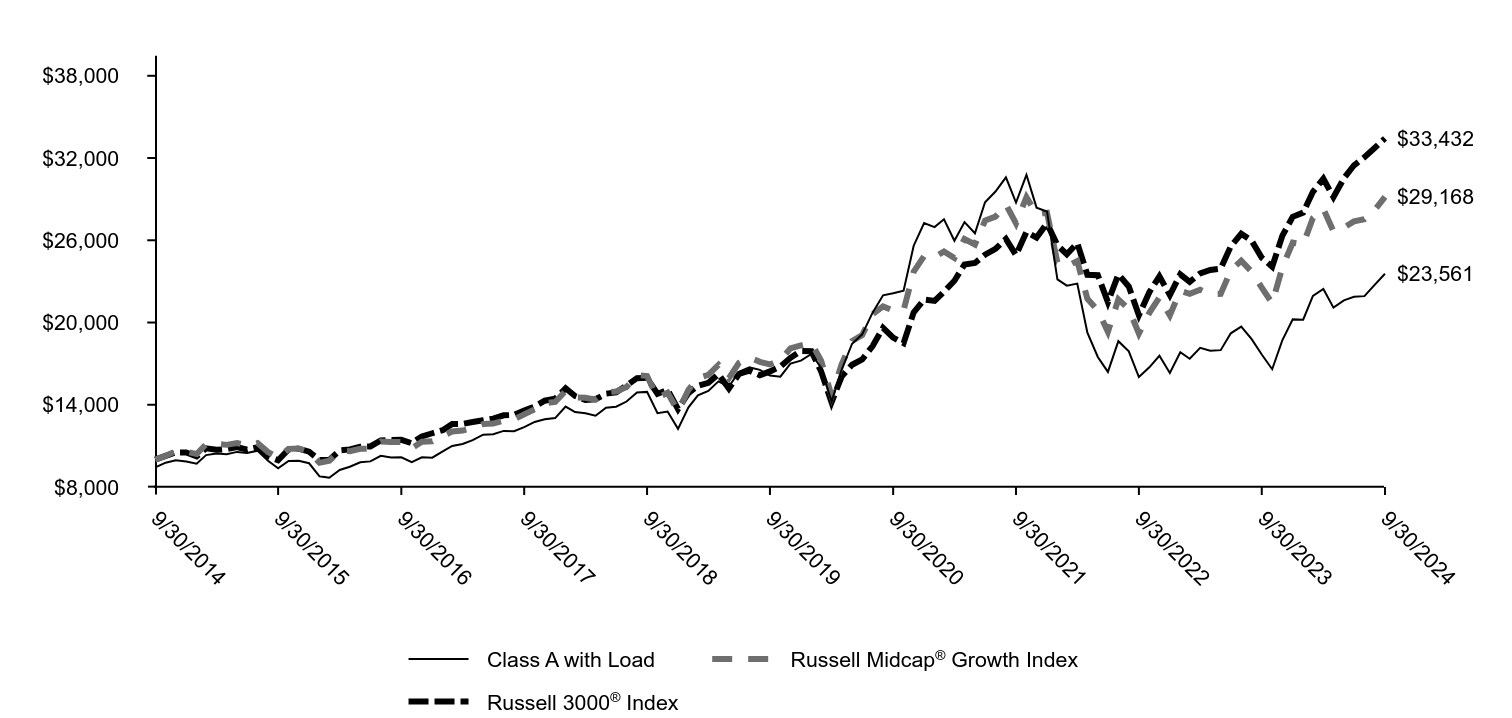
| Class A with Load | Russell Midcap® Growth Index | Russell 3000® Index |
|---|
| 9/30/2014 | $9,426 | $10,000 | $10,000 |
| 10/31/2014 | $9,772 | $10,276 | $10,275 |
| 11/30/2014 | $9,943 | $10,614 | $10,524 |
| 12/31/2014 | $9,861 | $10,584 | $10,524 |
| 1/31/2015 | $9,700 | $10,405 | $10,231 |
| 2/28/2015 | $10,328 | $11,122 | $10,824 |
| 3/31/2015 | $10,438 | $11,153 | $10,713 |
| 4/30/2015 | $10,389 | $11,075 | $10,762 |
| 5/31/2015 | $10,561 | $11,206 | $10,911 |
| 6/30/2015 | $10,476 | $11,026 | $10,728 |
| 7/31/2015 | $10,648 | $11,204 | $10,908 |
| 8/31/2015 | $9,910 | $10,553 | $10,249 |
| 9/30/2015 | $9,363 | $10,145 | $9,951 |
| 10/31/2015 | $9,904 | $10,783 | $10,736 |
| 11/30/2015 | $9,908 | $10,807 | $10,796 |
| 12/31/2015 | $9,732 | $10,563 | $10,574 |
| 1/31/2016 | $8,782 | $9,763 | $9,978 |
| 2/29/2016 | $8,677 | $9,916 | $9,975 |
| 3/31/2016 | $9,245 | $10,624 | $10,677 |
| 4/30/2016 | $9,475 | $10,617 | $10,743 |
| 5/31/2016 | $9,807 | $10,791 | $10,935 |
| 6/30/2016 | $9,868 | $10,790 | $10,958 |
| 7/31/2016 | $10,280 | $11,324 | $11,393 |
| 8/31/2016 | $10,154 | $11,291 | $11,422 |
| 9/30/2016 | $10,171 | $11,285 | $11,440 |
| 10/31/2016 | $9,805 | $10,827 | $11,192 |
| 11/30/2016 | $10,168 | $11,297 | $11,693 |
| 12/31/2016 | $10,136 | $11,337 | $11,921 |
| 1/31/2017 | $10,595 | $11,715 | $12,145 |
| 2/28/2017 | $10,997 | $12,052 | $12,597 |
| 3/31/2017 | $11,137 | $12,118 | $12,606 |
| 4/30/2017 | $11,425 | $12,298 | $12,739 |
| 5/31/2017 | $11,818 | $12,592 | $12,870 |
| 6/30/2017 | $11,856 | $12,629 | $12,986 |
| 7/31/2017 | $12,094 | $12,840 | $13,231 |
| 8/31/2017 | $12,069 | $12,931 | $13,256 |
| 9/30/2017 | $12,363 | $13,296 | $13,579 |
| 10/31/2017 | $12,745 | $13,668 | $13,876 |
| 11/30/2017 | $12,940 | $14,125 | $14,297 |
| 12/31/2017 | $13,026 | $14,201 | $14,440 |
| 1/31/2018 | $13,869 | $15,005 | $15,201 |
| 2/28/2018 | $13,469 | $14,534 | $14,641 |
| 3/31/2018 | $13,376 | $14,510 | $14,347 |
| 4/30/2018 | $13,198 | $14,373 | $14,402 |
| 5/31/2018 | $13,782 | $14,911 | $14,808 |
| 6/30/2018 | $13,861 | $14,968 | $14,905 |
| 7/31/2018 | $14,236 | $15,289 | $15,400 |
| 8/31/2018 | $14,902 | $16,171 | $15,940 |
| 9/30/2018 | $14,938 | $16,102 | $15,967 |
| 10/31/2018 | $13,381 | $14,507 | $14,791 |
| 11/30/2018 | $13,503 | $14,877 | $15,087 |
| 12/31/2018 | $12,240 | $13,527 | $13,683 |
| 1/31/2019 | $13,812 | $15,081 | $14,858 |
| 2/28/2019 | $14,690 | $15,965 | $15,380 |
| 3/31/2019 | $15,010 | $16,181 | $15,605 |
| 4/30/2019 | $15,707 | $16,908 | $16,228 |
| 5/31/2019 | $15,310 | $15,936 | $15,178 |
| 6/30/2019 | $16,411 | $17,055 | $16,244 |
| 7/31/2019 | $16,737 | $17,453 | $16,485 |
| 8/31/2019 | $16,543 | $17,135 | $16,149 |
| 9/30/2019 | $16,133 | $16,940 | $16,433 |
| 10/31/2019 | $16,053 | $17,254 | $16,786 |
| 11/30/2019 | $16,998 | $18,112 | $17,424 |
| 12/31/2019 | $17,218 | $18,324 | $17,928 |
| 1/31/2020 | $17,704 | $18,496 | $17,908 |
| 2/29/2020 | $16,701 | $17,220 | $16,442 |
| 3/31/2020 | $14,226 | $14,652 | $14,181 |
| 4/30/2020 | $16,556 | $16,947 | $16,059 |
| 5/31/2020 | $18,452 | $18,649 | $16,918 |
| 6/30/2020 | $19,138 | $19,086 | $17,304 |
| 7/31/2020 | $20,720 | $20,611 | $18,287 |
| 8/31/2020 | $21,982 | $21,172 | $19,612 |
| 9/30/2020 | $22,133 | $20,875 | $18,898 |
| 10/31/2020 | $22,319 | $20,901 | $18,490 |
| 11/30/2020 | $25,604 | $23,708 | $20,739 |
| 12/31/2020 | $27,260 | $24,845 | $21,672 |
| 1/31/2021 | $26,961 | $24,762 | $21,576 |
| 2/28/2021 | $27,536 | $25,185 | $22,250 |
| 3/31/2021 | $25,962 | $24,705 | $23,048 |
| 4/30/2021 | $27,324 | $26,093 | $24,236 |
| 5/31/2021 | $26,515 | $25,694 | $24,346 |
| 6/30/2021 | $28,773 | $27,440 | $24,947 |
| 7/31/2021 | $29,556 | $27,723 | $25,369 |
| 8/31/2021 | $30,592 | $28,618 | $26,092 |
| 9/30/2021 | $28,750 | $27,232 | $24,921 |
| 10/31/2021 | $30,777 | $29,141 | $26,607 |
| 11/30/2021 | $28,379 | $27,910 | $26,202 |
| 12/31/2021 | $28,102 | $28,008 | $27,234 |
| 1/31/2022 | $23,143 | $24,394 | $25,631 |
| 2/28/2022 | $22,688 | $24,097 | $24,986 |
| 3/31/2022 | $22,840 | $24,484 | $25,796 |
| 4/30/2022 | $19,259 | $21,727 | $23,481 |
| 5/31/2022 | $17,489 | $20,886 | $23,450 |
| 6/30/2022 | $16,396 | $19,325 | $21,488 |
| 7/31/2022 | $18,639 | $21,690 | $23,504 |
| 8/31/2022 | $17,899 | $20,980 | $22,627 |
| 9/30/2022 | $16,022 | $19,199 | $20,528 |
| 10/31/2022 | $16,731 | $20,708 | $22,212 |
| 11/30/2022 | $17,574 | $21,834 | $23,371 |
| 12/31/2022 | $16,321 | $20,524 | $22,003 |
| 1/31/2023 | $17,828 | $22,315 | $23,518 |
| 2/28/2023 | $17,355 | $22,095 | $22,968 |
| 3/31/2023 | $18,158 | $22,399 | $23,583 |
| 4/30/2023 | $17,939 | $22,074 | $23,834 |
| 5/31/2023 | $17,984 | $22,088 | $23,927 |
| 6/30/2023 | $19,214 | $23,795 | $25,560 |
| 7/31/2023 | $19,701 | $24,515 | $26,477 |
| 8/31/2023 | $18,782 | $23,707 | $25,966 |
| 9/30/2023 | $17,667 | $22,552 | $24,729 |
| 10/31/2023 | $16,593 | $21,401 | $24,073 |
| 11/30/2023 | $18,697 | $24,012 | $26,318 |
| 12/31/2023 | $20,231 | $25,833 | $27,714 |
| 1/31/2024 | $20,208 | $25,694 | $28,021 |
| 2/29/2024 | $21,942 | $27,625 | $29,538 |
| 3/31/2024 | $22,445 | $28,286 | $30,491 |
| 4/30/2024 | $21,086 | $26,643 | $29,149 |
| 5/31/2024 | $21,613 | $26,927 | $30,526 |
| 6/30/2024 | $21,878 | $27,377 | $31,471 |
| 7/31/2024 | $21,924 | $27,543 | $32,056 |
| 8/31/2024 | $22,770 | $28,227 | $32,754 |
| 9/30/2024 | $23,561 | $29,168 | $33,432 |
Annual Shareholder Report | September 30, 2024
AVERAGE ANNUAL TOTAL RETURNS (%)
| 1 Year | 5 Years | 10 Years |
|---|
| Class A | 33.36 | 7.87 | 9.59 |
| Class A with Load | 25.68 | 6.60 | 8.95 |
Russell Midcap® Growth Index (Strategy) | 29.33 | 11.48 | 11.30 |
Russell 3000® Index (Regulatory) | 35.19 | 15.26 | 12.83 |
| Total net assets | $626,241,763 |
| # of portfolio holdings | 61 |
| Portfolio turnover rate | 57% |
| Total advisory fees paid | $4,561,386 |
Figures quoted represent past performance, which is no guarantee of future results, and do not reflect taxes that a shareholder may pay on an investment in a fund.
What did the Fund invest in?
(Based on long-term investments)
SECTOR ALLOCATION (% OF LONG-TERM INVESTMENTS)
| Information technology | 27.1 |
| Industrials | 24.4 |
| Consumer discretionary | 12.9 |
| Health care | 11.8 |
| Communication services | 10.4 |
| Financials | 9.1 |
| Materials | 3.3 |
| Consumer staples | 1.0 |
TOP TEN HOLDINGS (% OF NET ASSETS)
| Trade Desk, Inc., Class A | 3.5 |
| Monolithic Power Systems, Inc. | 3.0 |
| Vertiv Holdings Co., Class A | 3.1 |
| Gartner, Inc. | 3.0 |
| Axon Enterprise, Inc. | 2.6 |
| Natera, Inc. | 2.5 |
| MercadoLibre, Inc. | 2.3 |
| Fair Isaac Corp. | 2.3 |
| Tetra Tech, Inc. | 2.2 |
| DraftKings, Inc., Class A | 2.2 |
This is a summary of certain changes and planned changes to the Fund since October 1, 2023.
On May 31, 2024, Robert Gruendyke was added as a portfolio manager to the Fund. On August 9, 2024, the Fund’s name was changed from the Allspring Discovery Mid Cap Growth Fund to the Allspring Mid Cap Growth Fund.
You can find additional information on the Fund's website at allspringglobal.com, including its:
- Prospectus - Financial Information - Fund holdings - Proxy voting information
Annual Shareholder Report
This annual shareholder report contains important information about Mid Cap Growth Fund for the period of October 1, 2023 to September 30, 2024. You can find additional information about the Fund at allspringglobal.com. You can also request this information by contacting us at 1-800-222-8222.
This report describes changes to the Fund that occurred either during or after the reporting period.
What were the Fund costs for the past year?
The table explains the costs you would have paid within the reporting period based on a hypothetical $10,000 investment.
| CLASS NAME | COSTS OF A $10,000 INVESTMENT | COSTS PAID AS A % OF A $10,000 INVESTMENT |
|---|
| Administrator Class | $128 | 1.10% |
The manager has contractually committed to waive fees and/or reimburse certain expenses to the extent necessary to cap the Fund's total annual fund operating expense ratio at a specific amount. Without this cap, the costs shown above may have been higher. Please see the prospectus for the amount and the expiration date of the cap. Prior to or after the commitment expiration date, the cap may be increased or the commitment to maintain the cap may be terminated only with the approval of the Board of Trustees.
How did the Fund perform last year and what affected its performance?
Positive earnings results fueled a bull market for U.S. equities during the 12-month period that ended September 30, 2024. Despite lingering macroeconomic concerns, the S&P 500 Index marked its fourth straight quarter of favorable year-over-year earnings growth. Companies tied to artificial intelligence (AI) saw their valuations soar, with the so called “Magnificent 7” stocks substantially outperforming the market. Late in the fiscal year, market leadership broadened as several mega-cap companies struggled to meet high expectations and the Federal Reserve reduced policy rates. As a result, small- and mid-cap stocks narrowed the performance gap relative to large caps. This aided the Fund’s performance.
The portfolio benefited from security selection within the industrials and consumer discretionary sectors. In particular, exposure to companies that are facilitating the buildout of AI contributed to performance. To the contrary, enterprise software spending slumped as IT budgets were pointed toward AI-related projects. Portfolio holdings with software-related products detracted from returns. While we adjusted individual holdings, we have not made material changes within positioning.
Total return based on a $10,000 investment
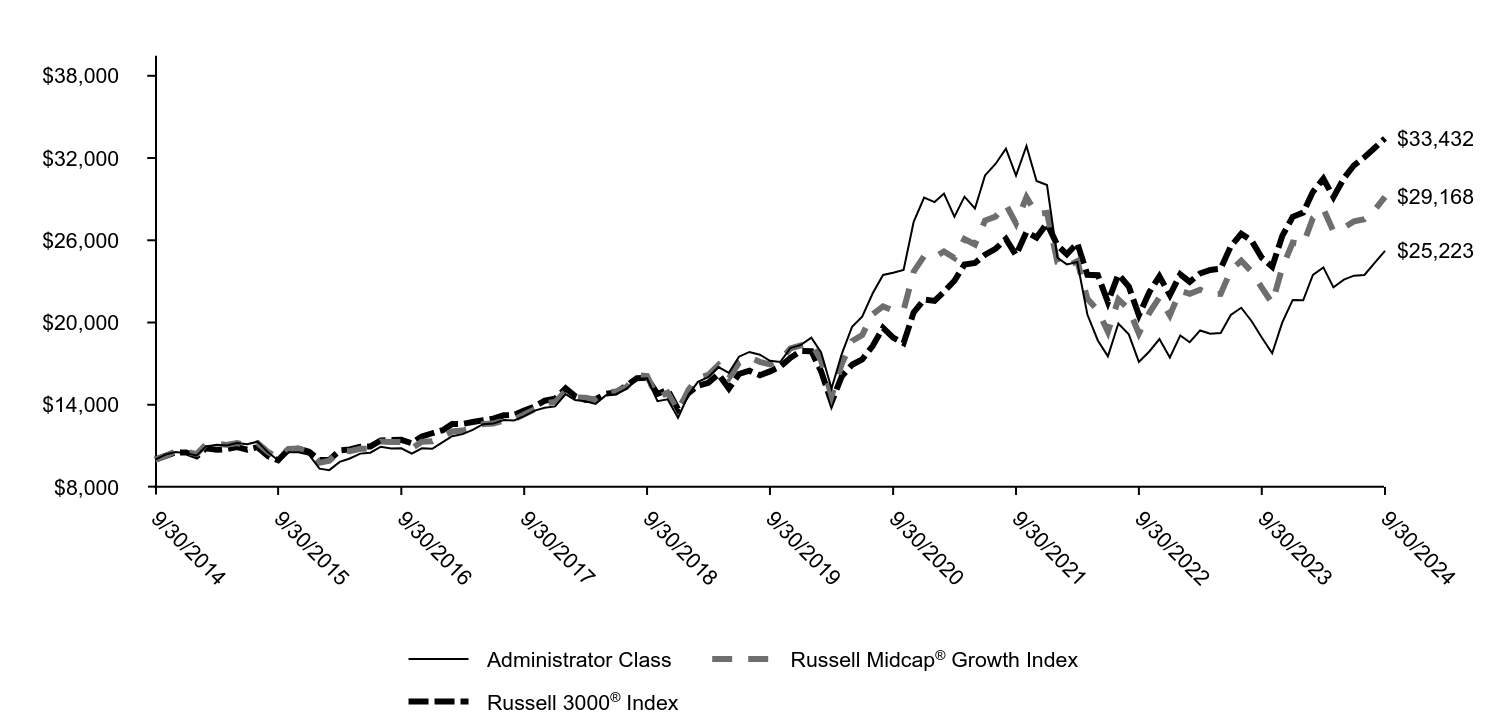
| Administrator Class | Russell Midcap® Growth Index | Russell 3000® Index |
|---|
| 9/30/2014 | $10,000 | $10,000 | $10,000 |
| 10/31/2014 | $10,369 | $10,276 | $10,275 |
| 11/30/2014 | $10,553 | $10,614 | $10,524 |
| 12/31/2014 | $10,467 | $10,584 | $10,524 |
| 1/31/2015 | $10,296 | $10,405 | $10,231 |
| 2/28/2015 | $10,965 | $11,122 | $10,824 |
| 3/31/2015 | $11,082 | $11,153 | $10,713 |
| 4/30/2015 | $11,032 | $11,075 | $10,762 |
| 5/31/2015 | $11,214 | $11,206 | $10,911 |
| 6/30/2015 | $11,123 | $11,026 | $10,728 |
| 7/31/2015 | $11,308 | $11,204 | $10,908 |
| 8/31/2015 | $10,527 | $10,553 | $10,249 |
| 9/30/2015 | $9,954 | $10,145 | $9,951 |
| 10/31/2015 | $10,529 | $10,783 | $10,736 |
| 11/30/2015 | $10,538 | $10,807 | $10,796 |
| 12/31/2015 | $10,351 | $10,563 | $10,574 |
| 1/31/2016 | $9,339 | $9,763 | $9,978 |
| 2/29/2016 | $9,230 | $9,916 | $9,975 |
| 3/31/2016 | $9,835 | $10,624 | $10,677 |
| 4/30/2016 | $10,080 | $10,617 | $10,743 |
| 5/31/2016 | $10,435 | $10,791 | $10,935 |
| 6/30/2016 | $10,500 | $10,790 | $10,958 |
| 7/31/2016 | $10,939 | $11,324 | $11,393 |
| 8/31/2016 | $10,806 | $11,291 | $11,422 |
| 9/30/2016 | $10,823 | $11,285 | $11,440 |
| 10/31/2016 | $10,435 | $10,827 | $11,192 |
| 11/30/2016 | $10,823 | $11,297 | $11,693 |
| 12/31/2016 | $10,790 | $11,337 | $11,921 |
| 1/31/2017 | $11,279 | $11,715 | $12,145 |
| 2/28/2017 | $11,710 | $12,052 | $12,597 |
| 3/31/2017 | $11,856 | $12,118 | $12,606 |
| 4/30/2017 | $12,166 | $12,298 | $12,739 |
| 5/31/2017 | $12,583 | $12,592 | $12,870 |
| 6/30/2017 | $12,627 | $12,629 | $12,986 |
| 7/31/2017 | $12,882 | $12,840 | $13,231 |
| 8/31/2017 | $12,856 | $12,931 | $13,256 |
| 9/30/2017 | $13,168 | $13,296 | $13,579 |
| 10/31/2017 | $13,577 | $13,668 | $13,876 |
| 11/30/2017 | $13,786 | $14,125 | $14,297 |
| 12/31/2017 | $13,878 | $14,201 | $14,440 |
| 1/31/2018 | $14,780 | $15,005 | $15,201 |
| 2/28/2018 | $14,349 | $14,534 | $14,641 |
| 3/31/2018 | $14,252 | $14,510 | $14,347 |
| 4/30/2018 | $14,066 | $14,373 | $14,402 |
| 5/31/2018 | $14,688 | $14,911 | $14,808 |
| 6/30/2018 | $14,771 | $14,968 | $14,905 |
| 7/31/2018 | $15,173 | $15,289 | $15,400 |
| 8/31/2018 | $15,884 | $16,171 | $15,940 |
| 9/30/2018 | $15,927 | $16,102 | $15,967 |
| 10/31/2018 | $14,266 | $14,507 | $14,791 |
| 11/30/2018 | $14,394 | $14,877 | $15,087 |
| 12/31/2018 | $13,052 | $13,527 | $13,683 |
| 1/31/2019 | $14,731 | $15,081 | $14,858 |
| 2/28/2019 | $15,668 | $15,965 | $15,380 |
| 3/31/2019 | $16,008 | $16,181 | $15,605 |
| 4/30/2019 | $16,750 | $16,908 | $16,228 |
| 5/31/2019 | $16,329 | $15,936 | $15,178 |
| 6/30/2019 | $17,505 | $17,055 | $16,244 |
| 7/31/2019 | $17,852 | $17,453 | $16,485 |
| 8/31/2019 | $17,648 | $17,135 | $16,149 |
| 9/30/2019 | $17,211 | $16,940 | $16,433 |
| 10/31/2019 | $17,129 | $17,254 | $16,786 |
| 11/30/2019 | $18,141 | $18,112 | $17,424 |
| 12/31/2019 | $18,371 | $18,324 | $17,928 |
| 1/31/2020 | $18,891 | $18,496 | $17,908 |
| 2/29/2020 | $17,823 | $17,220 | $16,442 |
| 3/31/2020 | $15,182 | $14,652 | $14,181 |
| 4/30/2020 | $17,671 | $16,947 | $16,059 |
| 5/31/2020 | $19,694 | $18,649 | $16,918 |
| 6/30/2020 | $20,429 | $19,086 | $17,304 |
| 7/31/2020 | $22,118 | $20,611 | $18,287 |
| 8/31/2020 | $23,469 | $21,172 | $19,612 |
| 9/30/2020 | $23,628 | $20,875 | $18,898 |
| 10/31/2020 | $23,831 | $20,901 | $18,490 |
| 11/30/2020 | $27,341 | $23,708 | $20,739 |
| 12/31/2020 | $29,110 | $24,845 | $21,672 |
| 1/31/2021 | $28,787 | $24,762 | $21,576 |
| 2/28/2021 | $29,403 | $25,185 | $22,250 |
| 3/31/2021 | $27,727 | $24,705 | $23,048 |
| 4/30/2021 | $29,182 | $26,093 | $24,236 |
| 5/31/2021 | $28,317 | $25,694 | $24,346 |
| 6/30/2021 | $30,734 | $27,440 | $24,947 |
| 7/31/2021 | $31,569 | $27,723 | $25,369 |
| 8/31/2021 | $32,678 | $28,618 | $26,092 |
| 9/30/2021 | $30,715 | $27,232 | $24,921 |
| 10/31/2021 | $32,881 | $29,141 | $26,607 |
| 11/30/2021 | $30,321 | $27,910 | $26,202 |
| 12/31/2021 | $30,026 | $28,008 | $27,234 |
| 1/31/2022 | $24,729 | $24,394 | $25,631 |
| 2/28/2022 | $24,243 | $24,097 | $24,986 |
| 3/31/2022 | $24,410 | $24,484 | $25,796 |
| 4/30/2022 | $20,584 | $21,727 | $23,481 |
| 5/31/2022 | $18,692 | $20,886 | $23,450 |
| 6/30/2022 | $17,528 | $19,325 | $21,488 |
| 7/31/2022 | $19,923 | $21,690 | $23,504 |
| 8/31/2022 | $19,135 | $20,980 | $22,627 |
| 9/30/2022 | $17,125 | $19,199 | $20,528 |
| 10/31/2022 | $17,887 | $20,708 | $22,212 |
| 11/30/2022 | $18,789 | $21,834 | $23,371 |
| 12/31/2022 | $17,449 | $20,524 | $22,003 |
| 1/31/2023 | $19,060 | $22,315 | $23,518 |
| 2/28/2023 | $18,561 | $22,095 | $22,968 |
| 3/31/2023 | $19,423 | $22,399 | $23,583 |
| 4/30/2023 | $19,187 | $22,074 | $23,834 |
| 5/31/2023 | $19,235 | $22,088 | $23,927 |
| 6/30/2023 | $20,553 | $23,795 | $25,560 |
| 7/31/2023 | $21,078 | $24,515 | $26,477 |
| 8/31/2023 | $20,093 | $23,707 | $25,966 |
| 9/30/2023 | $18,903 | $22,552 | $24,729 |
| 10/31/2023 | $17,756 | $21,401 | $24,073 |
| 11/30/2023 | $20,006 | $24,012 | $26,318 |
| 12/31/2023 | $21,647 | $25,833 | $27,714 |
| 1/31/2024 | $21,625 | $25,694 | $28,021 |
| 2/29/2024 | $23,480 | $27,625 | $29,538 |
| 3/31/2024 | $24,022 | $28,286 | $30,491 |
| 4/30/2024 | $22,566 | $26,643 | $29,149 |
| 5/31/2024 | $23,130 | $26,927 | $30,526 |
| 6/30/2024 | $23,417 | $27,377 | $31,471 |
| 7/31/2024 | $23,471 | $27,543 | $32,056 |
| 8/31/2024 | $24,376 | $28,227 | $32,754 |
| 9/30/2024 | $25,223 | $29,168 | $33,432 |
Annual Shareholder Report | September 30, 2024
AVERAGE ANNUAL TOTAL RETURNS (%)
| 1 Year | 5 Years | 10 Years |
|---|
| Administrator Class | 33.44 | 7.94 | 9.69 |
Russell Midcap® Growth Index (Strategy) | 29.33 | 11.48 | 11.30 |
Russell 3000® Index (Regulatory) | 35.19 | 15.26 | 12.83 |
| Total net assets | $626,241,763 |
| # of portfolio holdings | 61 |
| Portfolio turnover rate | 57% |
| Total advisory fees paid | $4,561,386 |
Figures quoted represent past performance, which is no guarantee of future results, and do not reflect taxes that a shareholder may pay on an investment in a fund.
What did the Fund invest in?
(Based on long-term investments)
SECTOR ALLOCATION (% OF LONG-TERM INVESTMENTS)
| Information technology | 27.1 |
| Industrials | 24.4 |
| Consumer discretionary | 12.9 |
| Health care | 11.8 |
| Communication services | 10.4 |
| Financials | 9.1 |
| Materials | 3.3 |
| Consumer staples | 1.0 |
TOP TEN HOLDINGS (% OF NET ASSETS)
| Trade Desk, Inc., Class A | 3.5 |
| Monolithic Power Systems, Inc. | 3.0 |
| Vertiv Holdings Co., Class A | 3.1 |
| Gartner, Inc. | 3.0 |
| Axon Enterprise, Inc. | 2.6 |
| Natera, Inc. | 2.5 |
| MercadoLibre, Inc. | 2.3 |
| Fair Isaac Corp. | 2.3 |
| Tetra Tech, Inc. | 2.2 |
| DraftKings, Inc., Class A | 2.2 |
This is a summary of certain changes and planned changes to the Fund since October 1, 2023.
On May 31, 2024, Robert Gruendyke was added as a portfolio manager to the Fund. On August 9, 2024, the Fund’s name was changed from the Allspring Discovery Mid Cap Growth Fund to the Allspring Mid Cap Growth Fund.
You can find additional information on the Fund's website at allspringglobal.com, including its:
- Prospectus - Financial Information - Fund holdings - Proxy voting information
Annual Shareholder Report
Global Investment Grade Credit Fund
This annual shareholder report contains important information about Global Investment Grade Credit Fund for the period of October 1, 2023 to September 30, 2024. You can find additional information about the Fund at allspringglobal.com. You can also request this information by contacting us at 1-800-222-8222.
This report describes changes to the Fund that occurred either during or after the reporting period.
What were the Fund costs for the past year?
The table explains the costs you would have paid within the reporting period based on a hypothetical $10,000 investment.
| CLASS NAME | COSTS OF A $10,000 INVESTMENT | COSTS PAID AS A % OF A $10,000 INVESTMENT |
|---|
| Institutional Class | $53 | 0.50% |
The manager has contractually committed to waive fees and/or reimburse certain expenses to the extent necessary to cap the Fund's total annual fund operating expense ratio at a specific amount. Without this cap, the costs shown above may have been higher. Please see the prospectus for the amount and the expiration date of the cap. Prior to or after the commitment expiration date, the cap may be increased or the commitment to maintain the cap may be terminated only with the approval of the Board of Trustees.
How did the Fund perform last year and what affected its performance?
Over the 12 months that ended September 30, 2024, credit spreads as measured by the Bloomberg Global Aggregate Credit Index (USD Hedged) tightened by 29 basis points (bps; 100 bps equal 1.00%) relative to government bonds, from 120 bps to 91 bps, leading to an excess return of 3.29%. The 10-year U.S. Treasury bond repriced 79 bps lower in yield to finish at 3.78%, with the Federal Reserve making its initial rate cut—by 50 bps—in September, much later than the market had initially anticipated. Over the period, the Fund reduced its allocation to high yield from 3% to below 1% as valuations became stretched. The BBB-rated bond overweight was reduced from a 21% overweight to 17%, with the proceeds recycled into single-A-rated bonds, taking profits as BBBs outperformed. Security selection was the main contributor to the Fund’s relative performance, adding 101 bps, with allocation contributing 37 bps. Interest rate positioning had no meaningful contribution to Fund performance. An overweight to real estate added 39 bps as spreads in the sector normalized. An underweight to supranational bonds added 33 bps. A 3% allocation to Treasuries detracted by 9 bps.
Total return based on a $10,000 investment
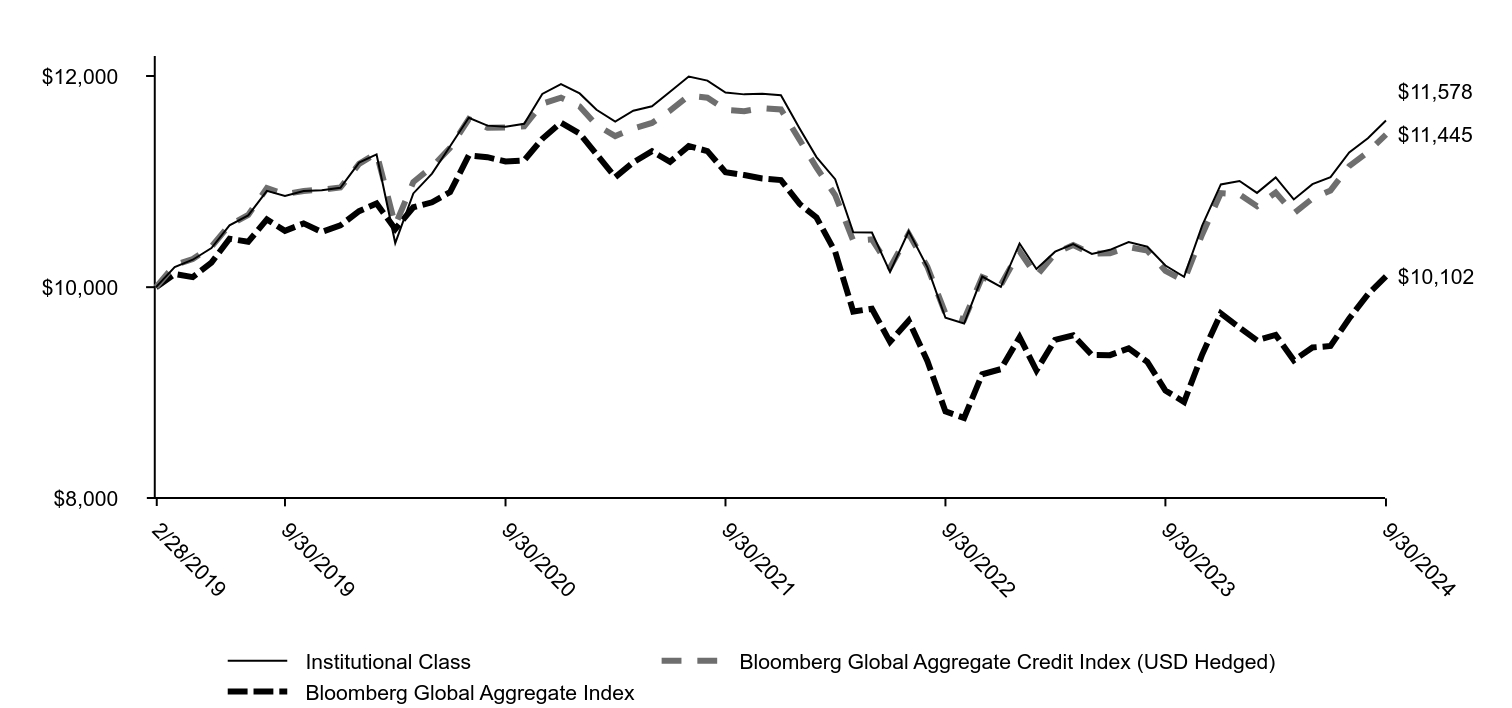
| Institutional Class | Bloomberg Global Aggregate Credit Index (USD Hedged) | Bloomberg Global Aggregate Index |
|---|
| 2/28/2019 | $10,000 | $10,000 | $10,000 |
| 3/31/2019 | $10,190 | $10,210 | $10,125 |
| 4/30/2019 | $10,260 | $10,267 | $10,095 |
| 5/31/2019 | $10,370 | $10,383 | $10,232 |
| 6/30/2019 | $10,585 | $10,589 | $10,459 |
| 7/31/2019 | $10,680 | $10,684 | $10,430 |
| 8/31/2019 | $10,912 | $10,938 | $10,642 |
| 9/30/2019 | $10,864 | $10,881 | $10,534 |
| 10/31/2019 | $10,910 | $10,911 | $10,604 |
| 11/30/2019 | $10,917 | $10,924 | $10,523 |
| 12/31/2019 | $10,941 | $10,944 | $10,585 |
| 1/31/2020 | $11,180 | $11,168 | $10,720 |
| 2/29/2020 | $11,257 | $11,268 | $10,792 |
| 3/31/2020 | $10,418 | $10,587 | $10,550 |
| 4/30/2020 | $10,888 | $10,996 | $10,757 |
| 5/31/2020 | $11,076 | $11,139 | $10,804 |
| 6/30/2020 | $11,335 | $11,319 | $10,900 |
| 7/31/2020 | $11,605 | $11,592 | $11,248 |
| 8/31/2020 | $11,530 | $11,511 | $11,231 |
| 9/30/2020 | $11,520 | $11,512 | $11,190 |
| 10/31/2020 | $11,548 | $11,523 | $11,201 |
| 11/30/2020 | $11,830 | $11,738 | $11,405 |
| 12/31/2020 | $11,923 | $11,795 | $11,558 |
| 1/31/2021 | $11,835 | $11,712 | $11,456 |
| 2/28/2021 | $11,680 | $11,536 | $11,259 |
| 3/31/2021 | $11,569 | $11,431 | $11,042 |
| 4/30/2021 | $11,671 | $11,503 | $11,182 |
| 5/31/2021 | $11,713 | $11,555 | $11,287 |
| 6/30/2021 | $11,851 | $11,672 | $11,187 |
| 7/31/2021 | $11,995 | $11,813 | $11,336 |
| 8/31/2021 | $11,956 | $11,795 | $11,289 |
| 9/30/2021 | $11,843 | $11,680 | $11,089 |
| 10/31/2021 | $11,826 | $11,667 | $11,062 |
| 11/30/2021 | $11,833 | $11,696 | $11,029 |
| 12/31/2021 | $11,818 | $11,683 | $11,014 |
| 1/31/2022 | $11,503 | $11,394 | $10,788 |
| 2/28/2022 | $11,232 | $11,133 | $10,660 |
| 3/31/2022 | $11,023 | $10,872 | $10,335 |
| 4/30/2022 | $10,519 | $10,440 | $9,769 |
| 5/31/2022 | $10,517 | $10,453 | $9,796 |
| 6/30/2022 | $10,144 | $10,184 | $9,482 |
| 7/31/2022 | $10,529 | $10,506 | $9,683 |
| 8/31/2022 | $10,190 | $10,194 | $9,301 |
| 9/30/2022 | $9,710 | $9,750 | $8,823 |
| 10/31/2022 | $9,656 | $9,694 | $8,762 |
| 11/30/2022 | $10,101 | $10,096 | $9,175 |
| 12/31/2022 | $10,003 | $10,022 | $9,224 |
| 1/31/2023 | $10,414 | $10,340 | $9,527 |
| 2/28/2023 | $10,172 | $10,105 | $9,211 |
| 3/31/2023 | $10,336 | $10,321 | $9,502 |
| 4/30/2023 | $10,409 | $10,400 | $9,544 |
| 5/31/2023 | $10,315 | $10,316 | $9,357 |
| 6/30/2023 | $10,354 | $10,322 | $9,356 |
| 7/31/2023 | $10,428 | $10,380 | $9,421 |
| 8/31/2023 | $10,383 | $10,346 | $9,292 |
| 9/30/2023 | $10,205 | $10,155 | $9,021 |
| 10/31/2023 | $10,098 | $10,061 | $8,913 |
| 11/30/2023 | $10,583 | $10,500 | $9,362 |
| 12/31/2023 | $10,973 | $10,891 | $9,752 |
| 1/31/2024 | $11,006 | $10,879 | $9,617 |
| 2/29/2024 | $10,893 | $10,767 | $9,496 |
| 3/31/2024 | $11,039 | $10,897 | $9,548 |
| 4/30/2024 | $10,831 | $10,698 | $9,307 |
| 5/31/2024 | $10,976 | $10,840 | $9,429 |
| 6/30/2024 | $11,042 | $10,916 | $9,443 |
| 7/31/2024 | $11,276 | $11,146 | $9,704 |
| 8/31/2024 | $11,411 | $11,280 | $9,933 |
| 9/30/2024 | $11,578 | $11,445 | $10,102 |
Global Investment Grade Credit Fund
Annual Shareholder Report | September 30, 2024
AVERAGE ANNUAL TOTAL RETURNS (%)
| Total net assets | $27,587,910 |
| # of portfolio holdings | 199 |
| Portfolio turnover rate | 31% |
| Total advisory fees paid | $0 |
| 1 Year | 5 Years | Since Inception (02/28/2019) |
|---|
| Institutional Class | 13.45 | 1.28 | 2.66 |
| Bloomberg Global Aggregate Credit Index (USD Hedged) (Strategy) | 12.71 | 1.02 | 2.45 |
| Bloomberg Global Aggregate Index (Regulatory) | 11.99 | (0.83) | 0.18 |
Figures quoted represent past performance, which is no guarantee of future results, and do not reflect taxes that a shareholder may pay on an investment in a fund.
What did the Fund invest in?
(Based on long-term investments)
CREDIT QUALITY (% OF LONG-TERM FIXED INCOME INVESTMENTS)Footnote Reference*
| AAA/Aaa | 1.1 |
| AA/Aa | 6.6 |
| A/A | 34.5 |
| BBB/Baa | 56.9 |
| BB/Ba | 0.9 |
| Footnote | Description |
Footnote* | The ratings indicated are from Standard & Poor's, Fitch Ratings Ltd., and/or Moody's Investors Service.The percentage of the Fund's portfolio with the ratings depicted in the chart are calculated based on long-term fixed income investments of the Fund. If the security was rated by all three ratings agencies, the middle rating was used. If rated by two out of the three ratings agencies, the lower was used, and if rated by one of the agencies, that rating was used. Credit quality is subject to change and may have changed since the date specified. |
TOP TEN HOLDINGS (% OF NET ASSETS)
| Morgan Stanley, 3.13%, 7/27/2026 | 2.0 |
| Citigroup, Inc., 3.30%, 4/27/2025 | 1.7 |
| Verizon Communications, Inc., 3.40%, 3/22/2041 | 1.3 |
| Motorola Solutions, Inc., 4.60%, 2/23/2028 | 1.3 |
| Oracle Corp., 2.88%, 3/25/2031 | 1.2 |
| American International Group, Inc., 4.75%, 4/1/2048 | 1.1 |
| Avolon Holdings Funding Ltd., 4.38%, 5/1/2026 | 1.1 |
| MPLX LP, 4.00%, 3/15/2028 | 1.1 |
| British Airways Pass-Through Trust, Series 2019-1, Class AA, 3.30%, 12/15/2032 | 1.1 |
| Aviation Capital Group LLC, 5.50%, 12/15/2024 | 1.1 |
EFFECTIVE MATURITY (% OF LONG-TERM FIXED INCOME INVESTMENTS)
| 0-1 year | 6.3 |
| 1-3 years | 12.1 |
| 3-5 years | 21.0 |
| 5-10 years | 37.5 |
| 10-20 years | 7.9 |
| 20-30 years | 13.2 |
| 30+ years | 2.0 |
This is a summary of certain changes and planned changes to the Fund since October 1, 2023.
At the meeting held on November 11-13, 2024, the Board of Trustees of the Fund approved the Fund’s liquidation. The Fund closed to new investors and to additional investments from existing shareholders with certain exceptions on November 15, 2024. The liquidation of the Fund is expected to occur after close of business on or about January 16, 2025.
You can find additional information on the Fund's website at allspringglobal.com, including its:
- Prospectus - Financial Information - Fund holdings - Proxy voting information
Annual Shareholder Report
Global Investment Grade Credit Fund
This annual shareholder report contains important information about Global Investment Grade Credit Fund for the period of October 1, 2023 to September 30, 2024. You can find additional information about the Fund at allspringglobal.com. You can also request this information by contacting us at 1-800-222-8222.
This report describes changes to the Fund that occurred either during or after the reporting period.
What were the Fund costs for the past year?
The table explains the costs you would have paid within the reporting period based on a hypothetical $10,000 investment.
| CLASS NAME | COSTS OF A $10,000 INVESTMENT | COSTS PAID AS A % OF A $10,000 INVESTMENT |
|---|
| Class R6 | $48 | 0.45% |
The manager has contractually committed to waive fees and/or reimburse certain expenses to the extent necessary to cap the Fund's total annual fund operating expense ratio at a specific amount. Without this cap, the costs shown above may have been higher. Please see the prospectus for the amount and the expiration date of the cap. Prior to or after the commitment expiration date, the cap may be increased or the commitment to maintain the cap may be terminated only with the approval of the Board of Trustees.
How did the Fund perform last year and what affected its performance?
Over the 12 months that ended September 30, 2024, credit spreads as measured by the Bloomberg Global Aggregate Credit Index (USD Hedged) tightened by 29 basis points (bps; 100 bps equal 1.00%) relative to government bonds, from 120 bps to 91 bps, leading to an excess return of 3.29%. The 10-year U.S. Treasury bond repriced 79 bps lower in yield to finish at 3.78%, with the Federal Reserve making its initial rate cut—by 50 bps—in September, much later than the market had initially anticipated. Over the period, the Fund reduced its allocation to high yield from 3% to below 1% as valuations became stretched. The BBB-rated bond overweight was reduced from a 21% overweight to 17%, with the proceeds recycled into single-A-rated bonds, taking profits as BBBs outperformed. Security selection was the main contributor to the Fund’s relative performance, adding 101 bps, with allocation contributing 37 bps. Interest rate positioning had no meaningful contribution to Fund performance. An overweight to real estate added 39 bps as spreads in the sector normalized. An underweight to supranational bonds added 33 bps. A 3% allocation to Treasuries detracted by 9 bps.
Total return based on a $10,000 investment
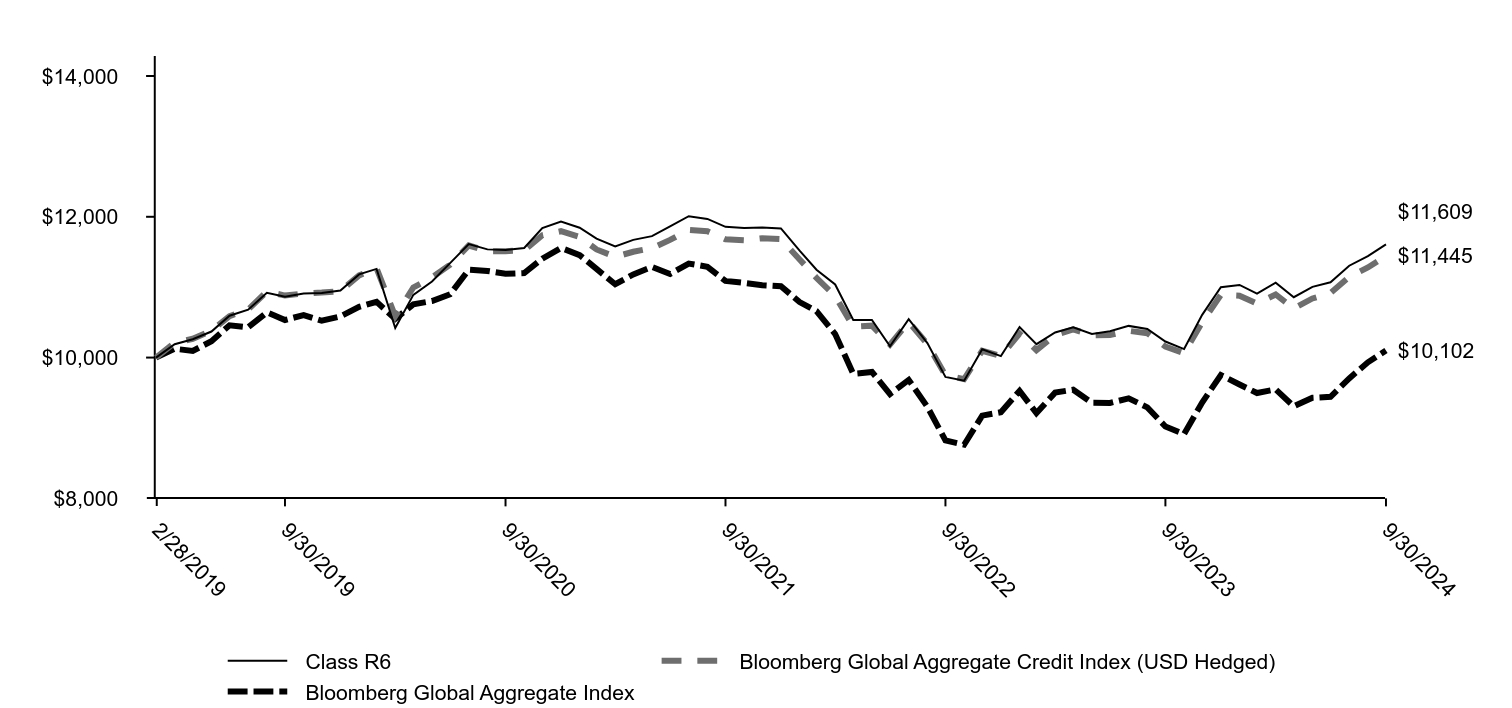
| Class R6 | Bloomberg Global Aggregate Credit Index (USD Hedged) | Bloomberg Global Aggregate Index |
|---|
| 2/28/2019 | $10,000 | $10,000 | $10,000 |
| 3/31/2019 | $10,190 | $10,210 | $10,125 |
| 4/30/2019 | $10,260 | $10,267 | $10,095 |
| 5/31/2019 | $10,370 | $10,383 | $10,232 |
| 6/30/2019 | $10,594 | $10,589 | $10,459 |
| 7/31/2019 | $10,680 | $10,684 | $10,430 |
| 8/31/2019 | $10,921 | $10,938 | $10,642 |
| 9/30/2019 | $10,864 | $10,881 | $10,534 |
| 10/31/2019 | $10,911 | $10,911 | $10,604 |
| 11/30/2019 | $10,918 | $10,924 | $10,523 |
| 12/31/2019 | $10,953 | $10,944 | $10,585 |
| 1/31/2020 | $11,182 | $11,168 | $10,720 |
| 2/29/2020 | $11,260 | $11,268 | $10,792 |
| 3/31/2020 | $10,421 | $10,587 | $10,550 |
| 4/30/2020 | $10,891 | $10,996 | $10,757 |
| 5/31/2020 | $11,081 | $11,139 | $10,804 |
| 6/30/2020 | $11,342 | $11,319 | $10,900 |
| 7/31/2020 | $11,612 | $11,592 | $11,248 |
| 8/31/2020 | $11,537 | $11,511 | $11,231 |
| 9/30/2020 | $11,528 | $11,512 | $11,190 |
| 10/31/2020 | $11,556 | $11,523 | $11,201 |
| 11/30/2020 | $11,839 | $11,738 | $11,405 |
| 12/31/2020 | $11,933 | $11,795 | $11,558 |
| 1/31/2021 | $11,845 | $11,712 | $11,456 |
| 2/28/2021 | $11,690 | $11,536 | $11,259 |
| 3/31/2021 | $11,580 | $11,431 | $11,042 |
| 4/30/2021 | $11,672 | $11,503 | $11,182 |
| 5/31/2021 | $11,725 | $11,555 | $11,287 |
| 6/30/2021 | $11,863 | $11,672 | $11,187 |
| 7/31/2021 | $12,008 | $11,813 | $11,336 |
| 8/31/2021 | $11,970 | $11,795 | $11,289 |
| 9/30/2021 | $11,857 | $11,680 | $11,089 |
| 10/31/2021 | $11,840 | $11,667 | $11,062 |
| 11/30/2021 | $11,848 | $11,696 | $11,029 |
| 12/31/2021 | $11,834 | $11,683 | $11,014 |
| 1/31/2022 | $11,518 | $11,394 | $10,788 |
| 2/28/2022 | $11,248 | $11,133 | $10,660 |
| 3/31/2022 | $11,039 | $10,872 | $10,335 |
| 4/30/2022 | $10,535 | $10,440 | $9,769 |
| 5/31/2022 | $10,533 | $10,453 | $9,796 |
| 6/30/2022 | $10,160 | $10,184 | $9,482 |
| 7/31/2022 | $10,546 | $10,506 | $9,683 |
| 8/31/2022 | $10,206 | $10,194 | $9,301 |
| 9/30/2022 | $9,726 | $9,750 | $8,823 |
| 10/31/2022 | $9,672 | $9,694 | $8,762 |
| 11/30/2022 | $10,119 | $10,096 | $9,175 |
| 12/31/2022 | $10,021 | $10,022 | $9,224 |
| 1/31/2023 | $10,434 | $10,340 | $9,527 |
| 2/28/2023 | $10,191 | $10,105 | $9,211 |
| 3/31/2023 | $10,356 | $10,321 | $9,502 |
| 4/30/2023 | $10,430 | $10,400 | $9,544 |
| 5/31/2023 | $10,336 | $10,316 | $9,357 |
| 6/30/2023 | $10,375 | $10,322 | $9,356 |
| 7/31/2023 | $10,450 | $10,380 | $9,421 |
| 8/31/2023 | $10,406 | $10,346 | $9,292 |
| 9/30/2023 | $10,228 | $10,155 | $9,021 |
| 10/31/2023 | $10,121 | $10,061 | $8,913 |
| 11/30/2023 | $10,607 | $10,500 | $9,362 |
| 12/31/2023 | $10,999 | $10,891 | $9,752 |
| 1/31/2024 | $11,032 | $10,879 | $9,617 |
| 2/29/2024 | $10,907 | $10,767 | $9,496 |
| 3/31/2024 | $11,065 | $10,897 | $9,548 |
| 4/30/2024 | $10,857 | $10,698 | $9,307 |
| 5/31/2024 | $11,004 | $10,840 | $9,429 |
| 6/30/2024 | $11,070 | $10,916 | $9,443 |
| 7/31/2024 | $11,305 | $11,146 | $9,704 |
| 8/31/2024 | $11,441 | $11,280 | $9,933 |
| 9/30/2024 | $11,609 | $11,445 | $10,102 |
Global Investment Grade Credit Fund
Annual Shareholder Report | September 30, 2024
AVERAGE ANNUAL TOTAL RETURNS (%)
| Total net assets | $27,587,910 |
| # of portfolio holdings | 199 |
| Portfolio turnover rate | 31% |
| Total advisory fees paid | $0 |
| 1 Year | 5 Years | Since Inception (02/28/2019) |
|---|
| Class R6 | 13.50 | 1.33 | 2.71 |
| Bloomberg Global Aggregate Credit Index (USD Hedged) (Strategy) | 12.71 | 1.02 | 2.45 |
| Bloomberg Global Aggregate Index (Regulatory) | 11.99 | (0.83) | 0.18 |
Figures quoted represent past performance, which is no guarantee of future results, and do not reflect taxes that a shareholder may pay on an investment in a fund.
What did the Fund invest in?
(Based on long-term investments)
CREDIT QUALITY (% OF LONG-TERM FIXED INCOME INVESTMENTS)Footnote Reference*
| AAA/Aaa | 1.1 |
| AA/Aa | 6.6 |
| A/A | 34.5 |
| BBB/Baa | 56.9 |
| BB/Ba | 0.9 |
| Footnote | Description |
Footnote* | The ratings indicated are from Standard & Poor's, Fitch Ratings Ltd., and/or Moody's Investors Service.The percentage of the Fund's portfolio with the ratings depicted in the chart are calculated based on long-term fixed income investments of the Fund. If the security was rated by all three ratings agencies, the middle rating was used. If rated by two out of the three ratings agencies, the lower was used, and if rated by one of the agencies, that rating was used. Credit quality is subject to change and may have changed since the date specified. |
TOP TEN HOLDINGS (% OF NET ASSETS)
| Morgan Stanley, 3.13%, 7/27/2026 | 2.0 |
| Citigroup, Inc., 3.30%, 4/27/2025 | 1.7 |
| Verizon Communications, Inc., 3.40%, 3/22/2041 | 1.3 |
| Motorola Solutions, Inc., 4.60%, 2/23/2028 | 1.3 |
| Oracle Corp., 2.88%, 3/25/2031 | 1.2 |
| American International Group, Inc., 4.75%, 4/1/2048 | 1.1 |
| Avolon Holdings Funding Ltd., 4.38%, 5/1/2026 | 1.1 |
| MPLX LP, 4.00%, 3/15/2028 | 1.1 |
| British Airways Pass-Through Trust, Series 2019-1, Class AA, 3.30%, 12/15/2032 | 1.1 |
| Aviation Capital Group LLC, 5.50%, 12/15/2024 | 1.1 |
EFFECTIVE MATURITY (% OF LONG-TERM FIXED INCOME INVESTMENTS)
| 0-1 year | 6.3 |
| 1-3 years | 12.1 |
| 3-5 years | 21.0 |
| 5-10 years | 37.5 |
| 10-20 years | 7.9 |
| 20-30 years | 13.2 |
| 30+ years | 2.0 |
This is a summary of certain changes and planned changes to the Fund since October 1, 2023.
At the meeting held on November 11-13, 2024, the Board of Trustees of the Fund approved the Fund’s liquidation. The Fund closed to new investors and to additional investments from existing shareholders with certain exceptions on November 15, 2024. The liquidation of the Fund is expected to occur after close of business on or about January 16, 2025.
You can find additional information on the Fund's website at allspringglobal.com, including its:
- Prospectus - Financial Information - Fund holdings - Proxy voting information
Annual Shareholder Report
Global Investment Grade Credit Fund
This annual shareholder report contains important information about Global Investment Grade Credit Fund for the period of October 1, 2023 to September 30, 2024. You can find additional information about the Fund at allspringglobal.com. You can also request this information by contacting us at 1-800-222-8222.
This report describes changes to the Fund that occurred either during or after the reporting period.
What were the Fund costs for the past year?
The table explains the costs you would have paid within the reporting period based on a hypothetical $10,000 investment.
| CLASS NAME | COSTS OF A $10,000 INVESTMENT | COSTS PAID AS A % OF A $10,000 INVESTMENT |
|---|
| Class C | $147 | 1.38% |
The manager has contractually committed to waive fees and/or reimburse certain expenses to the extent necessary to cap the Fund's total annual fund operating expense ratio at a specific amount. Without this cap, the costs shown above may have been higher. Please see the prospectus for the amount and the expiration date of the cap. Prior to or after the commitment expiration date, the cap may be increased or the commitment to maintain the cap may be terminated only with the approval of the Board of Trustees.
How did the Fund perform last year and what affected its performance?
Over the 12 months that ended September 30, 2024, credit spreads as measured by the Bloomberg Global Aggregate Credit Index (USD Hedged) tightened by 29 basis points (bps; 100 bps equal 1.00%) relative to government bonds, from 120 bps to 91 bps, leading to an excess return of 3.29%. The 10-year U.S. Treasury bond repriced 79 bps lower in yield to finish at 3.78%, with the Federal Reserve making its initial rate cut—by 50 bps—in September, much later than the market had initially anticipated. Over the period, the Fund reduced its allocation to high yield from 3% to below 1% as valuations became stretched. The BBB-rated bond overweight was reduced from a 21% overweight to 17%, with the proceeds recycled into single-A-rated bonds, taking profits as BBBs outperformed. Security selection was the main contributor to the Fund’s relative performance, adding 101 bps, with allocation contributing 37 bps. Interest rate positioning had no meaningful contribution to Fund performance. An overweight to real estate added 39 bps as spreads in the sector normalized. An underweight to supranational bonds added 33 bps. A 3% allocation to Treasuries detracted by 9 bps.
Total return based on a $10,000 investment
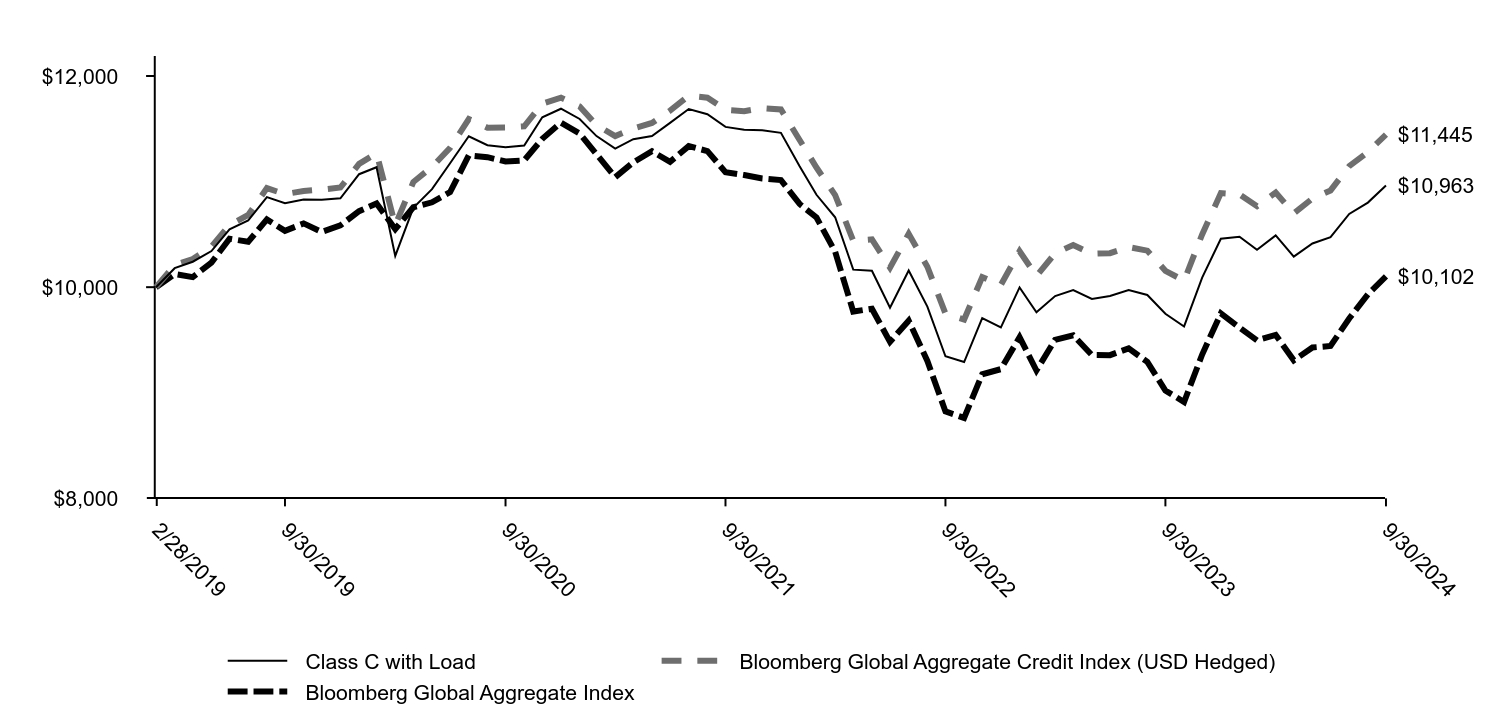
| Class C with Load | Bloomberg Global Aggregate Credit Index (USD Hedged) | Bloomberg Global Aggregate Index |
|---|
| 2/28/2019 | $10,000 | $10,000 | $10,000 |
| 3/31/2019 | $10,180 | $10,210 | $10,125 |
| 4/30/2019 | $10,241 | $10,267 | $10,095 |
| 5/31/2019 | $10,342 | $10,383 | $10,232 |
| 6/30/2019 | $10,547 | $10,589 | $10,459 |
| 7/31/2019 | $10,632 | $10,684 | $10,430 |
| 8/31/2019 | $10,853 | $10,938 | $10,642 |
| 9/30/2019 | $10,795 | $10,881 | $10,534 |
| 10/31/2019 | $10,831 | $10,911 | $10,604 |
| 11/30/2019 | $10,828 | $10,924 | $10,523 |
| 12/31/2019 | $10,842 | $10,944 | $10,585 |
| 1/31/2020 | $11,070 | $11,168 | $10,720 |
| 2/29/2020 | $11,136 | $11,268 | $10,792 |
| 3/31/2020 | $10,296 | $10,587 | $10,550 |
| 4/30/2020 | $10,751 | $10,996 | $10,757 |
| 5/31/2020 | $10,928 | $11,139 | $10,804 |
| 6/30/2020 | $11,174 | $11,319 | $10,900 |
| 7/31/2020 | $11,429 | $11,592 | $11,248 |
| 8/31/2020 | $11,344 | $11,511 | $11,231 |
| 9/30/2020 | $11,325 | $11,512 | $11,190 |
| 10/31/2020 | $11,342 | $11,523 | $11,201 |
| 11/30/2020 | $11,609 | $11,738 | $11,405 |
| 12/31/2020 | $11,690 | $11,795 | $11,558 |
| 1/31/2021 | $11,593 | $11,712 | $11,456 |
| 2/28/2021 | $11,431 | $11,536 | $11,259 |
| 3/31/2021 | $11,312 | $11,431 | $11,042 |
| 4/30/2021 | $11,402 | $11,503 | $11,182 |
| 5/31/2021 | $11,432 | $11,555 | $11,287 |
| 6/30/2021 | $11,556 | $11,672 | $11,187 |
| 7/31/2021 | $11,687 | $11,813 | $11,336 |
| 8/31/2021 | $11,638 | $11,795 | $11,289 |
| 9/30/2021 | $11,518 | $11,680 | $11,089 |
| 10/31/2021 | $11,490 | $11,667 | $11,062 |
| 11/30/2021 | $11,487 | $11,696 | $11,029 |
| 12/31/2021 | $11,462 | $11,683 | $11,014 |
| 1/31/2022 | $11,146 | $11,394 | $10,788 |
| 2/28/2022 | $10,875 | $11,133 | $10,660 |
| 3/31/2022 | $10,662 | $10,872 | $10,335 |
| 4/30/2022 | $10,166 | $10,440 | $9,769 |
| 5/31/2022 | $10,155 | $10,453 | $9,796 |
| 6/30/2022 | $9,806 | $10,184 | $9,482 |
| 7/31/2022 | $10,158 | $10,506 | $9,683 |
| 8/31/2022 | $9,816 | $10,194 | $9,301 |
| 9/30/2022 | $9,346 | $9,750 | $8,823 |
| 10/31/2022 | $9,291 | $9,694 | $8,762 |
| 11/30/2022 | $9,706 | $10,096 | $9,175 |
| 12/31/2022 | $9,618 | $10,022 | $9,224 |
| 1/31/2023 | $9,998 | $10,340 | $9,527 |
| 2/28/2023 | $9,762 | $10,105 | $9,211 |
| 3/31/2023 | $9,916 | $10,321 | $9,502 |
| 4/30/2023 | $9,972 | $10,400 | $9,544 |
| 5/31/2023 | $9,889 | $10,316 | $9,357 |
| 6/30/2023 | $9,917 | $10,322 | $9,356 |
| 7/31/2023 | $9,972 | $10,380 | $9,421 |
| 8/31/2023 | $9,926 | $10,346 | $9,292 |
| 9/30/2023 | $9,748 | $10,155 | $9,021 |
| 10/31/2023 | $9,628 | $10,061 | $8,913 |
| 11/30/2023 | $10,090 | $10,500 | $9,362 |
| 12/31/2023 | $10,459 | $10,891 | $9,752 |
| 1/31/2024 | $10,477 | $10,879 | $9,617 |
| 2/29/2024 | $10,355 | $10,767 | $9,496 |
| 3/31/2024 | $10,490 | $10,897 | $9,548 |
| 4/30/2024 | $10,289 | $10,698 | $9,307 |
| 5/31/2024 | $10,414 | $10,840 | $9,429 |
| 6/30/2024 | $10,474 | $10,916 | $9,443 |
| 7/31/2024 | $10,694 | $11,146 | $9,704 |
| 8/31/2024 | $10,801 | $11,280 | $9,933 |
| 9/30/2024 | $10,963 | $11,445 | $10,102 |
Global Investment Grade Credit Fund
Annual Shareholder Report | September 30, 2024
AVERAGE ANNUAL TOTAL RETURNS (%)
| Total net assets | $27,587,910 |
| # of portfolio holdings | 199 |
| Portfolio turnover rate | 31% |
| Total advisory fees paid | $0 |
| 1 Year | 5 Years | Since Inception (02/28/2019) |
|---|
Class CFootnote Reference* | 12.47 | 0.31 | 1.66 |
Class C with LoadFootnote Reference* | 11.47 | 0.31 | 1.66 |
| Bloomberg Global Aggregate Credit Index (USD Hedged) (Strategy) | 12.71 | 1.02 | 2.45 |
| Bloomberg Global Aggregate Index (Regulatory) | 11.99 | (0.83) | 0.18 |
Figures quoted represent past performance, which is no guarantee of future results, and do not reflect taxes that a shareholder may pay on an investment in a fund.
| Footnote | Description |
Footnote* | Historical performance shown for the Class C shares prior to their inception on June 1, 2022 reflects the performance of the Institutional Class shares and includes the higher expenses applicable to the Class C shares. |
What did the Fund invest in?
(Based on long-term investments)
CREDIT QUALITY (% OF LONG-TERM FIXED INCOME INVESTMENTS)Footnote Reference*
| AAA/Aaa | 1.1 |
| AA/Aa | 6.6 |
| A/A | 34.5 |
| BBB/Baa | 56.9 |
| BB/Ba | 0.9 |
| Footnote | Description |
Footnote* | The ratings indicated are from Standard & Poor's, Fitch Ratings Ltd., and/or Moody's Investors Service.The percentage of the Fund's portfolio with the ratings depicted in the chart are calculated based on long-term fixed income investments of the Fund. If the security was rated by all three ratings agencies, the middle rating was used. If rated by two out of the three ratings agencies, the lower was used, and if rated by one of the agencies, that rating was used. Credit quality is subject to change and may have changed since the date specified. |
TOP TEN HOLDINGS (% OF NET ASSETS)
| Morgan Stanley, 3.13%, 7/27/2026 | 2.0 |
| Citigroup, Inc., 3.30%, 4/27/2025 | 1.7 |
| Verizon Communications, Inc., 3.40%, 3/22/2041 | 1.3 |
| Motorola Solutions, Inc., 4.60%, 2/23/2028 | 1.3 |
| Oracle Corp., 2.88%, 3/25/2031 | 1.2 |
| American International Group, Inc., 4.75%, 4/1/2048 | 1.1 |
| Avolon Holdings Funding Ltd., 4.38%, 5/1/2026 | 1.1 |
| MPLX LP, 4.00%, 3/15/2028 | 1.1 |
| British Airways Pass-Through Trust, Series 2019-1, Class AA, 3.30%, 12/15/2032 | 1.1 |
| Aviation Capital Group LLC, 5.50%, 12/15/2024 | 1.1 |
EFFECTIVE MATURITY (% OF LONG-TERM FIXED INCOME INVESTMENTS)
| 0-1 year | 6.3 |
| 1-3 years | 12.1 |
| 3-5 years | 21.0 |
| 5-10 years | 37.5 |
| 10-20 years | 7.9 |
| 20-30 years | 13.2 |
| 30+ years | 2.0 |
This is a summary of certain changes and planned changes to the Fund since October 1, 2023.
At the meeting held on November 11-13, 2024, the Board of Trustees of the Fund approved the Fund’s liquidation. The Fund closed to new investors and to additional investments from existing shareholders with certain exceptions on November 15, 2024. The liquidation of the Fund is expected to occur after close of business on or about January 16, 2025.
You can find additional information on the Fund's website at allspringglobal.com, including its:
- Prospectus - Financial Information - Fund holdings - Proxy voting information
Annual Shareholder Report
Global Investment Grade Credit Fund
This annual shareholder report contains important information about Global Investment Grade Credit Fund for the period of October 1, 2023 to September 30, 2024. You can find additional information about the Fund at allspringglobal.com. You can also request this information by contacting us at 1-800-222-8222.
This report describes changes to the Fund that occurred either during or after the reporting period.
What were the Fund costs for the past year?
The table explains the costs you would have paid within the reporting period based on a hypothetical $10,000 investment.
| CLASS NAME | COSTS OF A $10,000 INVESTMENT | COSTS PAID AS A % OF A $10,000 INVESTMENT |
|---|
| Class A | $87 | 0.82% |
The manager has contractually committed to waive fees and/or reimburse certain expenses to the extent necessary to cap the Fund's total annual fund operating expense ratio at a specific amount. Without this cap, the costs shown above may have been higher. Please see the prospectus for the amount and the expiration date of the cap. Prior to or after the commitment expiration date, the cap may be increased or the commitment to maintain the cap may be terminated only with the approval of the Board of Trustees.
How did the Fund perform last year and what affected its performance?
Over the 12 months that ended September 30, 2024, credit spreads as measured by the Bloomberg Global Aggregate Credit Index (USD Hedged) tightened by 29 basis points (bps; 100 bps equal 1.00%) relative to government bonds, from 120 bps to 91 bps, leading to an excess return of 3.29%. The 10-year U.S. Treasury bond repriced 79 bps lower in yield to finish at 3.78%, with the Federal Reserve making its initial rate cut—by 50 bps—in September, much later than the market had initially anticipated. Over the period, the Fund reduced its allocation to high yield from 3% to below 1% as valuations became stretched. The BBB-rated bond overweight was reduced from a 21% overweight to 17%, with the proceeds recycled into single-A-rated bonds, taking profits as BBBs outperformed. Security selection was the main contributor to the Fund’s relative performance, adding 101 bps, with allocation contributing 37 bps. Interest rate positioning had no meaningful contribution to Fund performance. An overweight to real estate added 39 bps as spreads in the sector normalized. An underweight to supranational bonds added 33 bps. A 3% allocation to Treasuries detracted by 9 bps.
Total return based on a $10,000 investment
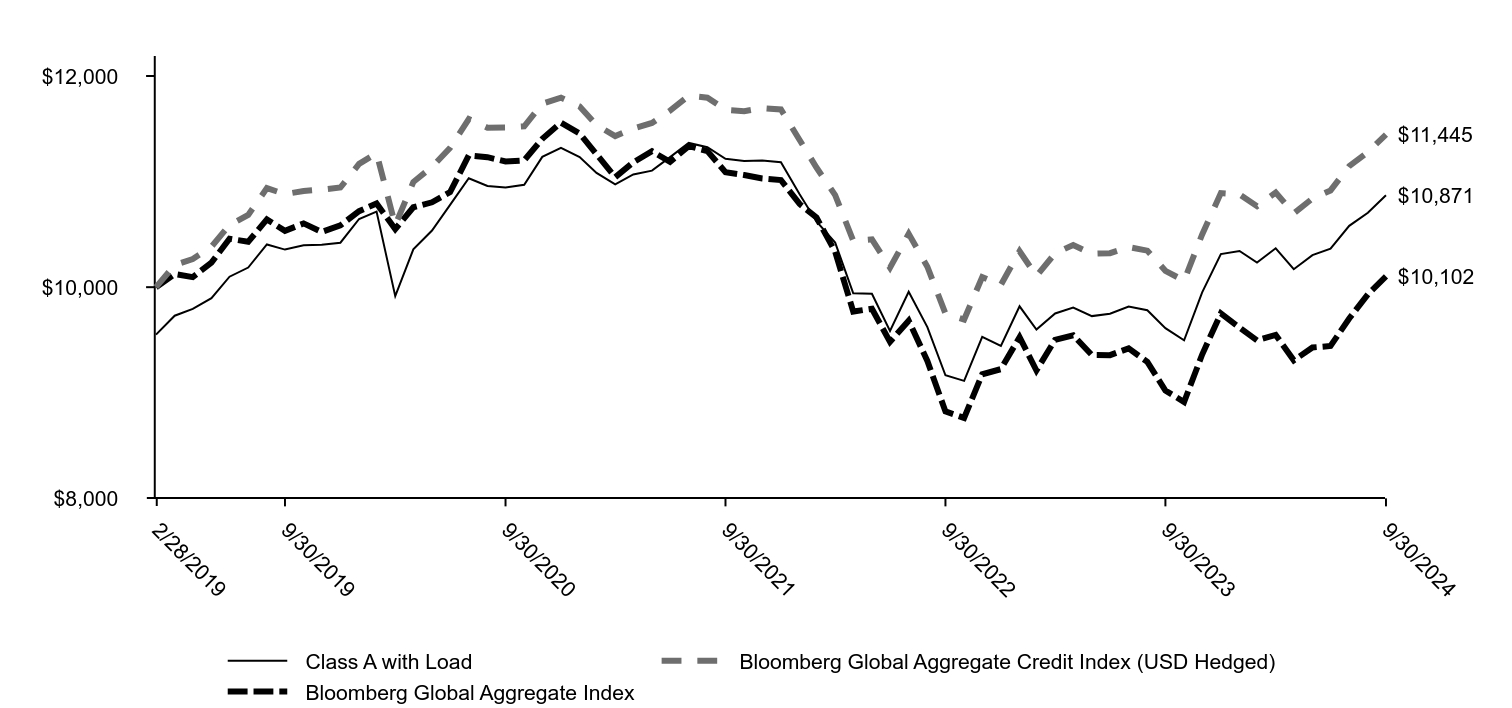
| Class A with Load | Bloomberg Global Aggregate Credit Index (USD Hedged) | Bloomberg Global Aggregate Index |
|---|
| 2/28/2019 | $9,551 | $10,000 | $10,000 |
| 3/31/2019 | $9,730 | $10,210 | $10,125 |
| 4/30/2019 | $9,794 | $10,267 | $10,095 |
| 5/31/2019 | $9,896 | $10,383 | $10,232 |
| 6/30/2019 | $10,099 | $10,589 | $10,459 |
| 7/31/2019 | $10,186 | $10,684 | $10,430 |
| 8/31/2019 | $10,405 | $10,938 | $10,642 |
| 9/30/2019 | $10,356 | $10,881 | $10,534 |
| 10/31/2019 | $10,397 | $10,911 | $10,604 |
| 11/30/2019 | $10,401 | $10,924 | $10,523 |
| 12/31/2019 | $10,421 | $10,944 | $10,585 |
| 1/31/2020 | $10,646 | $11,168 | $10,720 |
| 2/29/2020 | $10,716 | $11,268 | $10,792 |
| 3/31/2020 | $9,915 | $10,587 | $10,550 |
| 4/30/2020 | $10,359 | $10,996 | $10,757 |
| 5/31/2020 | $10,536 | $11,139 | $10,804 |
| 6/30/2020 | $10,779 | $11,319 | $10,900 |
| 7/31/2020 | $11,032 | $11,592 | $11,248 |
| 8/31/2020 | $10,958 | $11,511 | $11,231 |
| 9/30/2020 | $10,945 | $11,512 | $11,190 |
| 10/31/2020 | $10,969 | $11,523 | $11,201 |
| 11/30/2020 | $11,234 | $11,738 | $11,405 |
| 12/31/2020 | $11,319 | $11,795 | $11,558 |
| 1/31/2021 | $11,233 | $11,712 | $11,456 |
| 2/28/2021 | $11,082 | $11,536 | $11,259 |
| 3/31/2021 | $10,974 | $11,431 | $11,042 |
| 4/30/2021 | $11,068 | $11,503 | $11,182 |
| 5/31/2021 | $11,104 | $11,555 | $11,287 |
| 6/30/2021 | $11,232 | $11,672 | $11,187 |
| 7/31/2021 | $11,366 | $11,813 | $11,336 |
| 8/31/2021 | $11,326 | $11,795 | $11,289 |
| 9/30/2021 | $11,216 | $11,680 | $11,089 |
| 10/31/2021 | $11,196 | $11,667 | $11,062 |
| 11/30/2021 | $11,200 | $11,696 | $11,029 |
| 12/31/2021 | $11,183 | $11,683 | $11,014 |
| 1/31/2022 | $10,881 | $11,394 | $10,788 |
| 2/28/2022 | $10,622 | $11,133 | $10,660 |
| 3/31/2022 | $10,422 | $10,872 | $10,335 |
| 4/30/2022 | $9,942 | $10,440 | $9,769 |
| 5/31/2022 | $9,938 | $10,453 | $9,796 |
| 6/30/2022 | $9,586 | $10,184 | $9,482 |
| 7/31/2022 | $9,957 | $10,506 | $9,683 |
| 8/31/2022 | $9,622 | $10,194 | $9,301 |
| 9/30/2022 | $9,166 | $9,750 | $8,823 |
| 10/31/2022 | $9,113 | $9,694 | $8,762 |
| 11/30/2022 | $9,529 | $10,096 | $9,175 |
| 12/31/2022 | $9,443 | $10,022 | $9,224 |
| 1/31/2023 | $9,819 | $10,340 | $9,527 |
| 2/28/2023 | $9,599 | $10,105 | $9,211 |
| 3/31/2023 | $9,751 | $10,321 | $9,502 |
| 4/30/2023 | $9,806 | $10,400 | $9,544 |
| 5/31/2023 | $9,726 | $10,316 | $9,357 |
| 6/30/2023 | $9,748 | $10,322 | $9,356 |
| 7/31/2023 | $9,816 | $10,380 | $9,421 |
| 8/31/2023 | $9,782 | $10,346 | $9,292 |
| 9/30/2023 | $9,612 | $10,155 | $9,021 |
| 10/31/2023 | $9,497 | $10,061 | $8,913 |
| 11/30/2023 | $9,951 | $10,500 | $9,362 |
| 12/31/2023 | $10,313 | $10,891 | $9,752 |
| 1/31/2024 | $10,343 | $10,879 | $9,617 |
| 2/29/2024 | $10,234 | $10,767 | $9,496 |
| 3/31/2024 | $10,368 | $10,897 | $9,548 |
| 4/30/2024 | $10,170 | $10,698 | $9,307 |
| 5/31/2024 | $10,304 | $10,840 | $9,429 |
| 6/30/2024 | $10,365 | $10,916 | $9,443 |
| 7/31/2024 | $10,581 | $11,146 | $9,704 |
| 8/31/2024 | $10,705 | $11,280 | $9,933 |
| 9/30/2024 | $10,871 | $11,445 | $10,102 |
Global Investment Grade Credit Fund
Annual Shareholder Report | September 30, 2024
AVERAGE ANNUAL TOTAL RETURNS (%)
| Total net assets | $27,587,910 |
| # of portfolio holdings | 199 |
| Portfolio turnover rate | 31% |
| Total advisory fees paid | $0 |
| 1 Year | 5 Years | Since Inception (02/28/2019) |
|---|
Class AFootnote Reference* | 13.10 | 0.97 | 2.34 |
Class A with LoadFootnote Reference* | 8.05 | 0.04 | 1.51 |
| Bloomberg Global Aggregate Credit Index (USD Hedged) (Strategy) | 12.71 | 1.02 | 2.45 |
| Bloomberg Global Aggregate Index (Regulatory) | 11.99 | (0.83) | 0.18 |
Figures quoted represent past performance, which is no guarantee of future results, and do not reflect taxes that a shareholder may pay on an investment in a fund.
| Footnote | Description |
Footnote* | Historical performance shown for the Class A shares prior to their inception on June 1, 2022 reflects the performance of the Institutional Class shares and includes the higher expenses applicable to the Class A shares. |
What did the Fund invest in?
(Based on long-term investments)
CREDIT QUALITY (% OF LONG-TERM FIXED INCOME INVESTMENTS)Footnote Reference*
| AAA/Aaa | 1.1 |
| AA/Aa | 6.6 |
| A/A | 34.5 |
| BBB/Baa | 56.9 |
| BB/Ba | 0.9 |
| Footnote | Description |
Footnote* | The ratings indicated are from Standard & Poor's, Fitch Ratings Ltd., and/or Moody's Investors Service.The percentage of the Fund's portfolio with the ratings depicted in the chart are calculated based on long-term fixed income investments of the Fund. If the security was rated by all three ratings agencies, the middle rating was used. If rated by two out of the three ratings agencies, the lower was used, and if rated by one of the agencies, that rating was used. Credit quality is subject to change and may have changed since the date specified. |
TOP TEN HOLDINGS (% OF NET ASSETS)
| Morgan Stanley, 3.13%, 7/27/2026 | 2.0 |
| Citigroup, Inc., 3.30%, 4/27/2025 | 1.7 |
| Verizon Communications, Inc., 3.40%, 3/22/2041 | 1.3 |
| Motorola Solutions, Inc., 4.60%, 2/23/2028 | 1.3 |
| Oracle Corp., 2.88%, 3/25/2031 | 1.2 |
| American International Group, Inc., 4.75%, 4/1/2048 | 1.1 |
| Avolon Holdings Funding Ltd., 4.38%, 5/1/2026 | 1.1 |
| MPLX LP, 4.00%, 3/15/2028 | 1.1 |
| British Airways Pass-Through Trust, Series 2019-1, Class AA, 3.30%, 12/15/2032 | 1.1 |
| Aviation Capital Group LLC, 5.50%, 12/15/2024 | 1.1 |
EFFECTIVE MATURITY (% OF LONG-TERM FIXED INCOME INVESTMENTS)
| 0-1 year | 6.3 |
| 1-3 years | 12.1 |
| 3-5 years | 21.0 |
| 5-10 years | 37.5 |
| 10-20 years | 7.9 |
| 20-30 years | 13.2 |
| 30+ years | 2.0 |
This is a summary of certain changes and planned changes to the Fund since October 1, 2023.
At the meeting held on November 11-13, 2024, the Board of Trustees of the Fund approved the Fund’s liquidation. The Fund closed to new investors and to additional investments from existing shareholders with certain exceptions on November 15, 2024. The liquidation of the Fund is expected to occur after close of business on or about January 16, 2025.
You can find additional information on the Fund's website at allspringglobal.com, including its:
- Prospectus - Financial Information - Fund holdings - Proxy voting information
Annual Shareholder Report
This annual shareholder report contains important information about Income Plus Fund for the period of October 1, 2023 to September 30, 2024. You can find additional information about the Fund at allspringglobal.com. You can also request this information by contacting us at 1-800-222-8222.
What were the Fund costs for the past year?
The table explains the consolidated costs you would have paid within the reporting period based on a hypothetical $10,000 investment.
| CLASS NAME | CONSOLIDATED COSTS OF A $10,000 INVESTMENT | COSTS PAID AS A % OF A $10,000 INVESTMENT |
|---|
| Institutional Class | $42 | 0.39% |
The manager has contractually committed to waive fees and/or reimburse certain expenses to the extent necessary to cap the Fund's total annual fund operating expense ratio at a specific amount. Without this cap, the costs shown above may have been higher. Please see the prospectus for the amount and the expiration date of the cap. Prior to or after the commitment expiration date, the cap may be increased or the commitment to maintain the cap may be terminated only with the approval of the Board of Trustees.
How did the Fund perform last year and what affected its performance?
Although they were volatile throughout the 12-month period that ended September 30, 2024, yields fell as expectations for a shift in monetary policy evolved. Investors began the period pricing in additional rate hikes and ended it with the Federal Reserve cutting rates for an initial time. Credit spreads narrowed and remained subdued—near the tightest levels in years for many credit sectors. Portfolio duration was lowered early in the period. The portfolio was generally managed near its strategic neutral position, though it ended the year modestly long. It was positioned higher in quality, and credit exposure was reduced as valuations became more extreme. The portfolio was positioned to benefit from diversified non-benchmark exposures. Top contributors to performance were allocations in U.S. and European high yield bonds, European investment-grade bonds, emerging market debt, non-U.S. developed market government bonds, and U.S. securitized bonds; credit quality allocation; and security selection. Curve positioning also contributed. The main detractor was duration positioning. The portfolio's strategic neutral is shorter than the benchmark. Portfolio positioning near neutral detracted as rates fell.
Total return based on a $10,000 investment
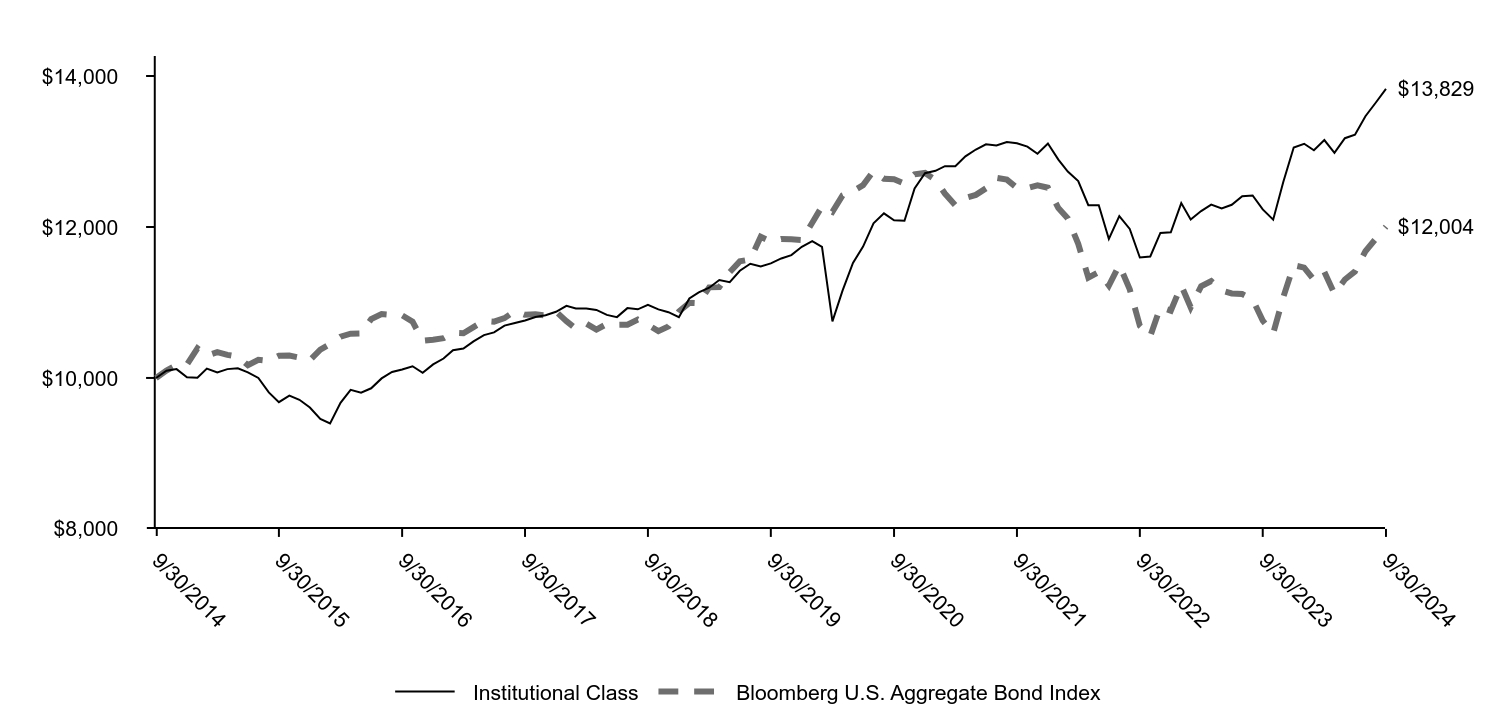
| Institutional Class | Bloomberg U.S. Aggregate Bond Index |
|---|
| 9/30/2014 | $10,000 | $10,000 |
| 10/31/2014 | $10,096 | $10,098 |
| 11/30/2014 | $10,117 | $10,170 |
| 12/31/2014 | $10,009 | $10,179 |
| 1/31/2015 | $10,002 | $10,393 |
| 2/28/2015 | $10,124 | $10,295 |
| 3/31/2015 | $10,074 | $10,343 |
| 4/30/2015 | $10,117 | $10,306 |
| 5/31/2015 | $10,128 | $10,281 |
| 6/30/2015 | $10,075 | $10,169 |
| 7/31/2015 | $10,000 | $10,240 |
| 8/31/2015 | $9,808 | $10,225 |
| 9/30/2015 | $9,679 | $10,294 |
| 10/31/2015 | $9,765 | $10,296 |
| 11/30/2015 | $9,711 | $10,269 |
| 12/31/2015 | $9,609 | $10,235 |
| 1/31/2016 | $9,458 | $10,376 |
| 2/29/2016 | $9,397 | $10,450 |
| 3/31/2016 | $9,670 | $10,546 |
| 4/30/2016 | $9,842 | $10,586 |
| 5/31/2016 | $9,805 | $10,589 |
| 6/30/2016 | $9,863 | $10,779 |
| 7/31/2016 | $9,994 | $10,847 |
| 8/31/2016 | $10,079 | $10,835 |
| 9/30/2016 | $10,111 | $10,829 |
| 10/31/2016 | $10,155 | $10,746 |
| 11/30/2016 | $10,069 | $10,492 |
| 12/31/2016 | $10,179 | $10,506 |
| 1/31/2017 | $10,257 | $10,527 |
| 2/28/2017 | $10,368 | $10,598 |
| 3/31/2017 | $10,390 | $10,592 |
| 4/30/2017 | $10,485 | $10,674 |
| 5/31/2017 | $10,567 | $10,756 |
| 6/30/2017 | $10,604 | $10,745 |
| 7/31/2017 | $10,693 | $10,792 |
| 8/31/2017 | $10,729 | $10,888 |
| 9/30/2017 | $10,761 | $10,836 |
| 10/31/2017 | $10,808 | $10,843 |
| 11/30/2017 | $10,831 | $10,829 |
| 12/31/2017 | $10,876 | $10,879 |
| 1/31/2018 | $10,955 | $10,753 |
| 2/28/2018 | $10,921 | $10,651 |
| 3/31/2018 | $10,920 | $10,720 |
| 4/30/2018 | $10,901 | $10,640 |
| 5/31/2018 | $10,835 | $10,716 |
| 6/30/2018 | $10,806 | $10,703 |
| 7/31/2018 | $10,925 | $10,705 |
| 8/31/2018 | $10,909 | $10,774 |
| 9/30/2018 | $10,969 | $10,705 |
| 10/31/2018 | $10,908 | $10,620 |
| 11/30/2018 | $10,871 | $10,683 |
| 12/31/2018 | $10,804 | $10,880 |
| 1/31/2019 | $11,053 | $10,995 |
| 2/28/2019 | $11,134 | $10,989 |
| 3/31/2019 | $11,195 | $11,200 |
| 4/30/2019 | $11,297 | $11,203 |
| 5/31/2019 | $11,268 | $11,402 |
| 6/30/2019 | $11,420 | $11,545 |
| 7/31/2019 | $11,513 | $11,570 |
| 8/31/2019 | $11,477 | $11,870 |
| 9/30/2019 | $11,518 | $11,807 |
| 10/31/2019 | $11,583 | $11,842 |
| 11/30/2019 | $11,627 | $11,836 |
| 12/31/2019 | $11,738 | $11,828 |
| 1/31/2020 | $11,813 | $12,056 |
| 2/29/2020 | $11,735 | $12,273 |
| 3/31/2020 | $10,750 | $12,200 |
| 4/30/2020 | $11,156 | $12,417 |
| 5/31/2020 | $11,524 | $12,475 |
| 6/30/2020 | $11,740 | $12,554 |
| 7/31/2020 | $12,048 | $12,741 |
| 8/31/2020 | $12,180 | $12,638 |
| 9/30/2020 | $12,089 | $12,632 |
| 10/31/2020 | $12,083 | $12,575 |
| 11/30/2020 | $12,511 | $12,698 |
| 12/31/2020 | $12,713 | $12,716 |
| 1/31/2021 | $12,744 | $12,625 |
| 2/28/2021 | $12,806 | $12,443 |
| 3/31/2021 | $12,804 | $12,287 |
| 4/30/2021 | $12,936 | $12,384 |
| 5/31/2021 | $13,026 | $12,425 |
| 6/30/2021 | $13,095 | $12,512 |
| 7/31/2021 | $13,079 | $12,652 |
| 8/31/2021 | $13,126 | $12,628 |
| 9/30/2021 | $13,108 | $12,518 |
| 10/31/2021 | $13,064 | $12,515 |
| 11/30/2021 | $12,969 | $12,552 |
| 12/31/2021 | $13,105 | $12,520 |
| 1/31/2022 | $12,893 | $12,250 |
| 2/28/2022 | $12,734 | $12,114 |
| 3/31/2022 | $12,609 | $11,777 |
| 4/30/2022 | $12,288 | $11,330 |
| 5/31/2022 | $12,287 | $11,403 |
| 6/30/2022 | $11,841 | $11,224 |
| 7/31/2022 | $12,143 | $11,498 |
| 8/31/2022 | $11,974 | $11,174 |
| 9/30/2022 | $11,596 | $10,691 |
| 10/31/2022 | $11,609 | $10,552 |
| 11/30/2022 | $11,921 | $10,940 |
| 12/31/2022 | $11,930 | $10,891 |
| 1/31/2023 | $12,316 | $11,226 |
| 2/28/2023 | $12,100 | $10,936 |
| 3/31/2023 | $12,211 | $11,214 |
| 4/30/2023 | $12,297 | $11,282 |
| 5/31/2023 | $12,245 | $11,159 |
| 6/30/2023 | $12,294 | $11,119 |
| 7/31/2023 | $12,408 | $11,111 |
| 8/31/2023 | $12,418 | $11,040 |
| 9/30/2023 | $12,233 | $10,760 |
| 10/31/2023 | $12,097 | $10,590 |
| 11/30/2023 | $12,596 | $11,069 |
| 12/31/2023 | $13,053 | $11,493 |
| 1/31/2024 | $13,102 | $11,462 |
| 2/29/2024 | $13,016 | $11,300 |
| 3/31/2024 | $13,152 | $11,404 |
| 4/30/2024 | $12,981 | $11,116 |
| 5/31/2024 | $13,176 | $11,304 |
| 6/30/2024 | $13,223 | $11,411 |
| 7/31/2024 | $13,467 | $11,678 |
| 8/31/2024 | $13,649 | $11,846 |
| 9/30/2024 | $13,829 | $12,004 |
Annual Shareholder Report | September 30, 2024
AVERAGE ANNUAL TOTAL RETURNS (%)
| Consolidated Total net assets | $263,649,484 |
| Consolidated # of portfolio holdings | 361 |
| Consolidated Portfolio turnover rate | 350% |
| Consolidated Total advisory fees paid | $489,144 |
| 1 Year | 5 Years | 10 Years |
|---|
| Institutional Class | 13.04 | 3.72 | 3.29 |
| Bloomberg U.S. Aggregate Bond Index (Strategy and Regulatory) | 11.57 | 0.33 | 1.84 |
Figures quoted represent past performance, which is no guarantee of future results, and do not reflect taxes that a shareholder may pay on an investment in a fund.
What did the Fund invest in?
(Based on long-term investments)
CONSOLIDATED CREDIT QUALITY
(% OF LONG-TERM FIXED INCOME INVESTMENTS)Footnote Reference*
| AAA/Aaa | 2.3 |
| AA/Aa | 38.1 |
| A/A | 8.3 |
| BBB/Baa | 24.7 |
| BB/Ba | 11.3 |
| B/B | 9.2 |
| CCC/Caa and below | 2.5 |
| Not rated | 3.6 |
| Footnote | Description |
Footnote* | The ratings indicated are from Standard & Poor's, Fitch Ratings Ltd., and/or Moody's Investors Service.The percentage of the Fund's portfolio with the ratings depicted in the chart are calculated based on long-term fixed income investments of the Fund. If the security was rated by all three ratings agencies, the middle rating was used. If rated by two out of the three ratings agencies, the lower was used, and if rated by one of the agencies, that rating was used. Credit quality is subject to change and may have changed since the date specified. |
CONSOLIDATED TOP TEN HOLDINGS (% OF NET ASSETS)
| GNMA, 6.50%, 10/15/2054 | 11.8 |
| GNMA, 6.00%, 10/15/2054 | 7.4 |
| FNMA, 6.50%, 10/15/2054 | 6.5 |
| FNMA, 6.00%, 10/15/2054 | 5.2 |
| U.K. Gilts, 3.25%, 1/31/2033 | 4.0 |
| French Republic, 2.75%, 2/25/2029 | 3.0 |
| Republic of South Africa, 8.00%, 1/31/2030 | 1.9 |
| Malaysia, 3.88%, 3/14/2025 | 1.7 |
| U.S. Treasury Bonds, 4.63%, 5/15/2054 | 1.7 |
| U.S. Treasury Notes, 4.63%, 6/30/2026 | 1.5 |
CONSOLIDATED PORTFOLIO ALLOCATION
(% OF LONG-TERM INVESTMENT)
| Agency securities | 25.5 |
| Corporate bonds and notes | 21.6 |
| Foreign corporate bonds and notes | 12.1 |
| Foreign government bonds | 11.6 |
| Yankee corporate bonds and notes | 8.9 |
| U.S. Treasury securities | 5.9 |
| Asset-backed securities | 5.2 |
| Yankee government bonds | 3.2 |
| Non-agency mortgage-backed securities | 3.1 |
| Investment companies | 2.3 |
| Loans | 0.6 |
You can find additional information on the Fund's website at allspringglobal.com, including its:
- Prospectus - Financial Information - Fund holdings - Proxy voting information
Annual Shareholder Report
This annual shareholder report contains important information about Income Plus Fund for the period of October 1, 2023 to September 30, 2024. You can find additional information about the Fund at allspringglobal.com. You can also request this information by contacting us at 1-800-222-8222.
What were the Fund costs for the past year?
The table explains the consolidated costs you would have paid within the reporting period based on a hypothetical $10,000 investment.
| CLASS NAME | CONSOLIDATED COSTS OF A $10,000 INVESTMENT | COSTS PAID AS A % OF A $10,000 INVESTMENT |
|---|
| Class C | $155 | 1.46% |
The manager has contractually committed to waive fees and/or reimburse certain expenses to the extent necessary to cap the Fund's total annual fund operating expense ratio at a specific amount. Without this cap, the costs shown above may have been higher. Please see the prospectus for the amount and the expiration date of the cap. Prior to or after the commitment expiration date, the cap may be increased or the commitment to maintain the cap may be terminated only with the approval of the Board of Trustees.
How did the Fund perform last year and what affected its performance?
Although they were volatile throughout the 12-month period that ended September 30, 2024, yields fell as expectations for a shift in monetary policy evolved. Investors began the period pricing in additional rate hikes and ended it with the Federal Reserve cutting rates for an initial time. Credit spreads narrowed and remained subdued—near the tightest levels in years for many credit sectors. Portfolio duration was lowered early in the period. The portfolio was generally managed near its strategic neutral position, though it ended the year modestly long. It was positioned higher in quality, and credit exposure was reduced as valuations became more extreme. The portfolio was positioned to benefit from diversified non-benchmark exposures. Top contributors to performance were allocations in U.S. and European high yield bonds, European investment-grade bonds, emerging market debt, non-U.S. developed market government bonds, and U.S. securitized bonds; credit quality allocation; and security selection. Curve positioning also contributed. The main detractor was duration positioning. The portfolio's strategic neutral is shorter than the benchmark. Portfolio positioning near neutral detracted as rates fell.
Total return based on a $10,000 investment
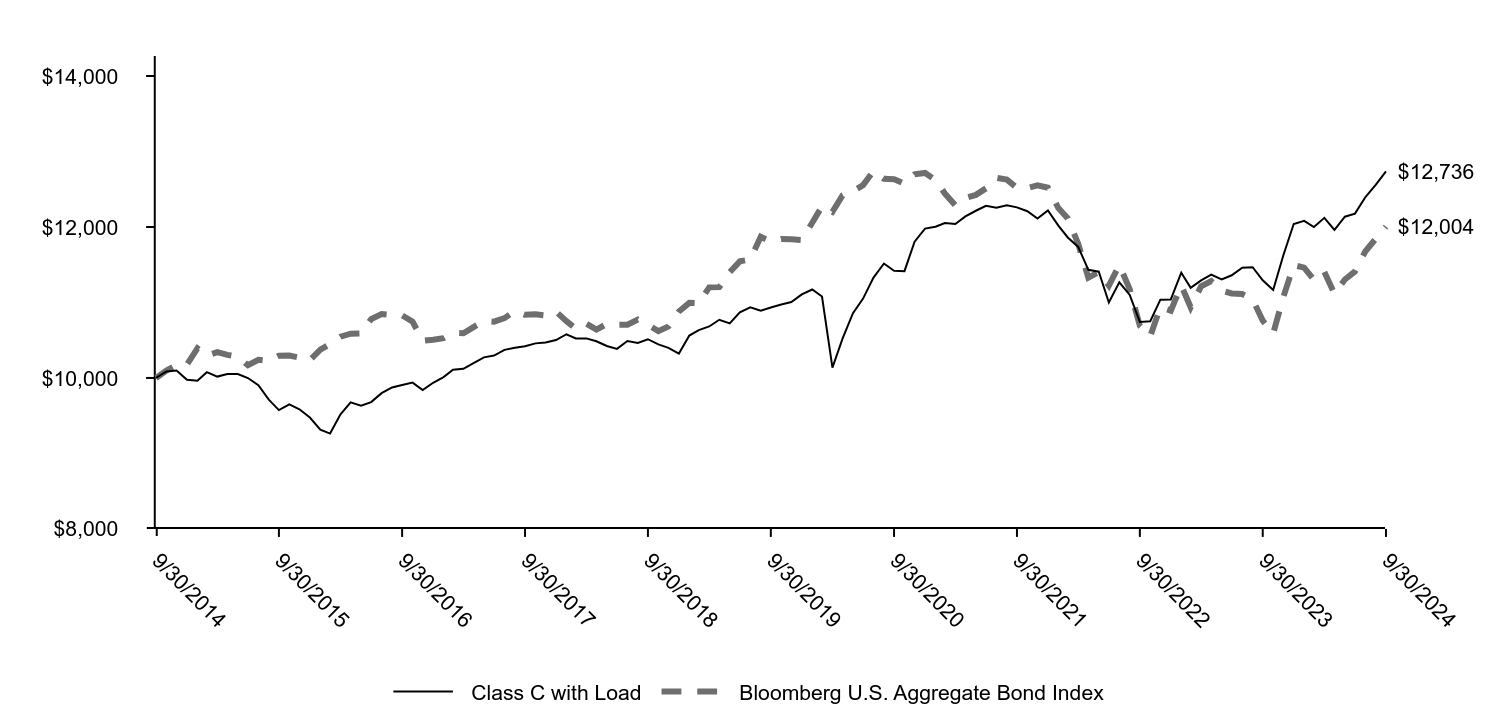
| Class C with Load | Bloomberg U.S. Aggregate Bond Index |
|---|
| 9/30/2014 | $10,000 | $10,000 |
| 10/31/2014 | $10,087 | $10,098 |
| 11/30/2014 | $10,099 | $10,170 |
| 12/31/2014 | $9,977 | $10,179 |
| 1/31/2015 | $9,964 | $10,393 |
| 2/28/2015 | $10,077 | $10,295 |
| 3/31/2015 | $10,018 | $10,343 |
| 4/30/2015 | $10,052 | $10,306 |
| 5/31/2015 | $10,052 | $10,281 |
| 6/30/2015 | $9,999 | $10,169 |
| 7/31/2015 | $9,903 | $10,240 |
| 8/31/2015 | $9,712 | $10,225 |
| 9/30/2015 | $9,574 | $10,294 |
| 10/31/2015 | $9,649 | $10,296 |
| 11/30/2015 | $9,585 | $10,269 |
| 12/31/2015 | $9,476 | $10,235 |
| 1/31/2016 | $9,316 | $10,376 |
| 2/29/2016 | $9,263 | $10,450 |
| 3/31/2016 | $9,519 | $10,546 |
| 4/30/2016 | $9,677 | $10,586 |
| 5/31/2016 | $9,631 | $10,589 |
| 6/30/2016 | $9,680 | $10,779 |
| 7/31/2016 | $9,798 | $10,847 |
| 8/31/2016 | $9,874 | $10,835 |
| 9/30/2016 | $9,906 | $10,829 |
| 10/31/2016 | $9,938 | $10,746 |
| 11/30/2016 | $9,841 | $10,492 |
| 12/31/2016 | $9,936 | $10,506 |
| 1/31/2017 | $10,012 | $10,527 |
| 2/28/2017 | $10,110 | $10,598 |
| 3/31/2017 | $10,121 | $10,592 |
| 4/30/2017 | $10,197 | $10,674 |
| 5/31/2017 | $10,273 | $10,756 |
| 6/30/2017 | $10,296 | $10,745 |
| 7/31/2017 | $10,372 | $10,792 |
| 8/31/2017 | $10,401 | $10,888 |
| 9/30/2017 | $10,421 | $10,836 |
| 10/31/2017 | $10,458 | $10,843 |
| 11/30/2017 | $10,470 | $10,829 |
| 12/31/2017 | $10,502 | $10,879 |
| 1/31/2018 | $10,579 | $10,753 |
| 2/28/2018 | $10,524 | $10,651 |
| 3/31/2018 | $10,524 | $10,720 |
| 4/30/2018 | $10,486 | $10,640 |
| 5/31/2018 | $10,423 | $10,716 |
| 6/30/2018 | $10,385 | $10,703 |
| 7/31/2018 | $10,489 | $10,705 |
| 8/31/2018 | $10,464 | $10,774 |
| 9/30/2018 | $10,513 | $10,705 |
| 10/31/2018 | $10,444 | $10,620 |
| 11/30/2018 | $10,399 | $10,683 |
| 12/31/2018 | $10,323 | $10,880 |
| 1/31/2019 | $10,561 | $10,995 |
| 2/28/2019 | $10,634 | $10,989 |
| 3/31/2019 | $10,682 | $11,200 |
| 4/30/2019 | $10,771 | $11,203 |
| 5/31/2019 | $10,723 | $11,402 |
| 6/30/2019 | $10,869 | $11,545 |
| 7/31/2019 | $10,936 | $11,570 |
| 8/31/2019 | $10,892 | $11,870 |
| 9/30/2019 | $10,934 | $11,807 |
| 10/31/2019 | $10,974 | $11,842 |
| 11/30/2019 | $11,006 | $11,836 |
| 12/31/2019 | $11,107 | $11,828 |
| 1/31/2020 | $11,172 | $12,056 |
| 2/29/2020 | $11,079 | $12,273 |
| 3/31/2020 | $10,136 | $12,200 |
| 4/30/2020 | $10,520 | $12,417 |
| 5/31/2020 | $10,858 | $12,475 |
| 6/30/2020 | $11,051 | $12,554 |
| 7/31/2020 | $11,330 | $12,741 |
| 8/31/2020 | $11,516 | $12,638 |
| 9/30/2020 | $11,420 | $12,632 |
| 10/31/2020 | $11,415 | $12,575 |
| 11/30/2020 | $11,806 | $12,698 |
| 12/31/2020 | $11,978 | $12,716 |
| 1/31/2021 | $12,003 | $12,625 |
| 2/28/2021 | $12,052 | $12,443 |
| 3/31/2021 | $12,040 | $12,287 |
| 4/30/2021 | $12,140 | $12,384 |
| 5/31/2021 | $12,215 | $12,425 |
| 6/30/2021 | $12,281 | $12,512 |
| 7/31/2021 | $12,254 | $12,652 |
| 8/31/2021 | $12,287 | $12,628 |
| 9/30/2021 | $12,260 | $12,518 |
| 10/31/2021 | $12,209 | $12,515 |
| 11/30/2021 | $12,111 | $12,552 |
| 12/31/2021 | $12,220 | $12,520 |
| 1/31/2022 | $12,018 | $12,250 |
| 2/28/2022 | $11,861 | $12,114 |
| 3/31/2022 | $11,736 | $11,777 |
| 4/30/2022 | $11,432 | $11,330 |
| 5/31/2022 | $11,408 | $11,403 |
| 6/30/2022 | $11,000 | $11,224 |
| 7/31/2022 | $11,267 | $11,498 |
| 8/31/2022 | $11,100 | $11,174 |
| 9/30/2022 | $10,742 | $10,691 |
| 10/31/2022 | $10,752 | $10,552 |
| 11/30/2022 | $11,037 | $10,940 |
| 12/31/2022 | $11,040 | $10,891 |
| 1/31/2023 | $11,394 | $11,226 |
| 2/28/2023 | $11,193 | $10,936 |
| 3/31/2023 | $11,292 | $11,214 |
| 4/30/2023 | $11,368 | $11,282 |
| 5/31/2023 | $11,304 | $11,159 |
| 6/30/2023 | $11,360 | $11,119 |
| 7/31/2023 | $11,461 | $11,111 |
| 8/31/2023 | $11,467 | $11,040 |
| 9/30/2023 | $11,294 | $10,760 |
| 10/31/2023 | $11,166 | $10,590 |
| 11/30/2023 | $11,622 | $11,069 |
| 12/31/2023 | $12,039 | $11,493 |
| 1/31/2024 | $12,082 | $11,462 |
| 2/29/2024 | $12,000 | $11,300 |
| 3/31/2024 | $12,121 | $11,404 |
| 4/30/2024 | $11,960 | $11,116 |
| 5/31/2024 | $12,136 | $11,304 |
| 6/30/2024 | $12,177 | $11,411 |
| 7/31/2024 | $12,397 | $11,678 |
| 8/31/2024 | $12,560 | $11,846 |
| 9/30/2024 | $12,736 | $12,004 |
Annual Shareholder Report | September 30, 2024
AVERAGE ANNUAL TOTAL RETURNS (%)
| Consolidated Total net assets | $263,649,484 |
| Consolidated # of portfolio holdings | 361 |
| Consolidated Portfolio turnover rate | 350% |
| Consolidated Total advisory fees paid | $489,144 |
| 1 Year | 5 Years | 10 Years |
|---|
| Class C | 11.83 | 2.79 | 2.45 |
| Class C with Load | 10.83 | 2.79 | 2.45 |
| Bloomberg U.S. Aggregate Bond Index (Strategy and Regulatory) | 11.57 | 0.33 | 1.84 |
Figures quoted represent past performance, which is no guarantee of future results, and do not reflect taxes that a shareholder may pay on an investment in a fund.
What did the Fund invest in?
(Based on long-term investments)
CONSOLIDATED CREDIT QUALITY
(% OF LONG-TERM FIXED INCOME INVESTMENTS)Footnote Reference*
| AAA/Aaa | 2.3 |
| AA/Aa | 38.1 |
| A/A | 8.3 |
| BBB/Baa | 24.7 |
| BB/Ba | 11.3 |
| B/B | 9.2 |
| CCC/Caa and below | 2.5 |
| Not rated | 3.6 |
| Footnote | Description |
Footnote* | The ratings indicated are from Standard & Poor's, Fitch Ratings Ltd., and/or Moody's Investors Service.The percentage of the Fund's portfolio with the ratings depicted in the chart are calculated based on long-term fixed income investments of the Fund. If the security was rated by all three ratings agencies, the middle rating was used. If rated by two out of the three ratings agencies, the lower was used, and if rated by one of the agencies, that rating was used. Credit quality is subject to change and may have changed since the date specified. |
CONSOLIDATED TOP TEN HOLDINGS (% OF NET ASSETS)
| GNMA, 6.50%, 10/15/2054 | 11.8 |
| GNMA, 6.00%, 10/15/2054 | 7.4 |
| FNMA, 6.50%, 10/15/2054 | 6.5 |
| FNMA, 6.00%, 10/15/2054 | 5.2 |
| U.K. Gilts, 3.25%, 1/31/2033 | 4.0 |
| French Republic, 2.75%, 2/25/2029 | 3.0 |
| Republic of South Africa, 8.00%, 1/31/2030 | 1.9 |
| Malaysia, 3.88%, 3/14/2025 | 1.7 |
| U.S. Treasury Bonds, 4.63%, 5/15/2054 | 1.7 |
| U.S. Treasury Notes, 4.63%, 6/30/2026 | 1.5 |
CONSOLIDATED PORTFOLIO ALLOCATION
(% OF LONG-TERM INVESTMENT)
| Agency securities | 25.5 |
| Corporate bonds and notes | 21.6 |
| Foreign corporate bonds and notes | 12.1 |
| Foreign government bonds | 11.6 |
| Yankee corporate bonds and notes | 8.9 |
| U.S. Treasury securities | 5.9 |
| Asset-backed securities | 5.2 |
| Yankee government bonds | 3.2 |
| Non-agency mortgage-backed securities | 3.1 |
| Investment companies | 2.3 |
| Loans | 0.6 |
You can find additional information on the Fund's website at allspringglobal.com, including its:
- Prospectus - Financial Information - Fund holdings - Proxy voting information
Annual Shareholder Report
This annual shareholder report contains important information about Income Plus Fund for the period of October 1, 2023 to September 30, 2024. You can find additional information about the Fund at allspringglobal.com. You can also request this information by contacting us at 1-800-222-8222.
What were the Fund costs for the past year?
The table explains the consolidated costs you would have paid within the reporting period based on a hypothetical $10,000 investment.
| CLASS NAME | CONSOLIDATED COSTS OF A $10,000 INVESTMENT | COSTS PAID AS A % OF A $10,000 INVESTMENT |
|---|
| Class A | $76 | 0.71% |
The manager has contractually committed to waive fees and/or reimburse certain expenses to the extent necessary to cap the Fund's total annual fund operating expense ratio at a specific amount. Without this cap, the costs shown above may have been higher. Please see the prospectus for the amount and the expiration date of the cap. Prior to or after the commitment expiration date, the cap may be increased or the commitment to maintain the cap may be terminated only with the approval of the Board of Trustees.
How did the Fund perform last year and what affected its performance?
Although they were volatile throughout the 12-month period that ended September 30, 2024, yields fell as expectations for a shift in monetary policy evolved. Investors began the period pricing in additional rate hikes and ended it with the Federal Reserve cutting rates for an initial time. Credit spreads narrowed and remained subdued—near the tightest levels in years for many credit sectors. Portfolio duration was lowered early in the period. The portfolio was generally managed near its strategic neutral position, though it ended the year modestly long. It was positioned higher in quality, and credit exposure was reduced as valuations became more extreme. The portfolio was positioned to benefit from diversified non-benchmark exposures. Top contributors to performance were allocations in U.S. and European high yield bonds, European investment-grade bonds, emerging market debt, non-U.S. developed market government bonds, and U.S. securitized bonds; credit quality allocation; and security selection. Curve positioning also contributed. The main detractor was duration positioning. The portfolio's strategic neutral is shorter than the benchmark. Portfolio positioning near neutral detracted as rates fell.
Total return based on a $10,000 investment
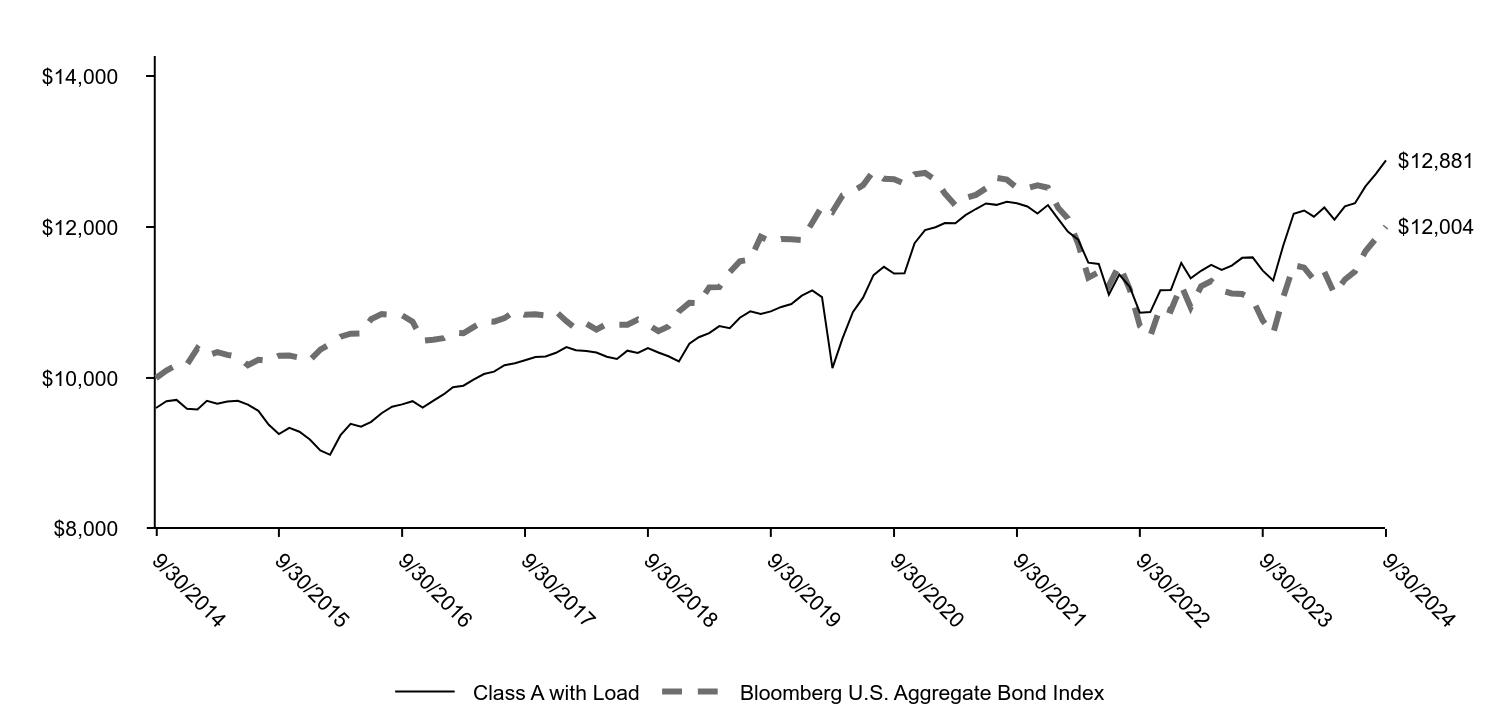
| Class A with Load | Bloomberg U.S. Aggregate Bond Index |
|---|
| 9/30/2014 | $9,602 | $10,000 |
| 10/31/2014 | $9,691 | $10,098 |
| 11/30/2014 | $9,709 | $10,170 |
| 12/31/2014 | $9,592 | $10,179 |
| 1/31/2015 | $9,583 | $10,393 |
| 2/28/2015 | $9,698 | $10,295 |
| 3/31/2015 | $9,658 | $10,343 |
| 4/30/2015 | $9,687 | $10,306 |
| 5/31/2015 | $9,697 | $10,281 |
| 6/30/2015 | $9,646 | $10,169 |
| 7/31/2015 | $9,564 | $10,240 |
| 8/31/2015 | $9,380 | $10,225 |
| 9/30/2015 | $9,257 | $10,294 |
| 10/31/2015 | $9,339 | $10,296 |
| 11/30/2015 | $9,288 | $10,269 |
| 12/31/2015 | $9,184 | $10,235 |
| 1/31/2016 | $9,040 | $10,376 |
| 2/29/2016 | $8,982 | $10,450 |
| 3/31/2016 | $9,242 | $10,546 |
| 4/30/2016 | $9,393 | $10,586 |
| 5/31/2016 | $9,355 | $10,589 |
| 6/30/2016 | $9,418 | $10,779 |
| 7/31/2016 | $9,533 | $10,847 |
| 8/31/2016 | $9,619 | $10,835 |
| 9/30/2016 | $9,650 | $10,829 |
| 10/31/2016 | $9,692 | $10,746 |
| 11/30/2016 | $9,607 | $10,492 |
| 12/31/2016 | $9,697 | $10,506 |
| 1/31/2017 | $9,781 | $10,527 |
| 2/28/2017 | $9,876 | $10,598 |
| 3/31/2017 | $9,897 | $10,592 |
| 4/30/2017 | $9,977 | $10,674 |
| 5/31/2017 | $10,052 | $10,756 |
| 6/30/2017 | $10,084 | $10,745 |
| 7/31/2017 | $10,169 | $10,792 |
| 8/31/2017 | $10,196 | $10,888 |
| 9/30/2017 | $10,234 | $10,836 |
| 10/31/2017 | $10,276 | $10,843 |
| 11/30/2017 | $10,284 | $10,829 |
| 12/31/2017 | $10,333 | $10,879 |
| 1/31/2018 | $10,409 | $10,753 |
| 2/28/2018 | $10,366 | $10,651 |
| 3/31/2018 | $10,357 | $10,720 |
| 4/30/2018 | $10,337 | $10,640 |
| 5/31/2018 | $10,281 | $10,716 |
| 6/30/2018 | $10,251 | $10,703 |
| 7/31/2018 | $10,361 | $10,705 |
| 8/31/2018 | $10,332 | $10,774 |
| 9/30/2018 | $10,397 | $10,705 |
| 10/31/2018 | $10,337 | $10,620 |
| 11/30/2018 | $10,287 | $10,683 |
| 12/31/2018 | $10,219 | $10,880 |
| 1/31/2019 | $10,454 | $10,995 |
| 2/28/2019 | $10,539 | $10,989 |
| 3/31/2019 | $10,593 | $11,200 |
| 4/30/2019 | $10,687 | $11,203 |
| 5/31/2019 | $10,658 | $11,402 |
| 6/30/2019 | $10,798 | $11,545 |
| 7/31/2019 | $10,883 | $11,570 |
| 8/31/2019 | $10,847 | $11,870 |
| 9/30/2019 | $10,882 | $11,807 |
| 10/31/2019 | $10,941 | $11,842 |
| 11/30/2019 | $10,979 | $11,836 |
| 12/31/2019 | $11,090 | $11,828 |
| 1/31/2020 | $11,159 | $12,056 |
| 2/29/2020 | $11,071 | $12,273 |
| 3/31/2020 | $10,131 | $12,200 |
| 4/30/2020 | $10,525 | $12,417 |
| 5/31/2020 | $10,875 | $12,475 |
| 6/30/2020 | $11,064 | $12,554 |
| 7/31/2020 | $11,362 | $12,741 |
| 8/31/2020 | $11,472 | $12,638 |
| 9/30/2020 | $11,383 | $12,632 |
| 10/31/2020 | $11,386 | $12,575 |
| 11/30/2020 | $11,785 | $12,698 |
| 12/31/2020 | $11,958 | $12,716 |
| 1/31/2021 | $11,997 | $12,625 |
| 2/28/2021 | $12,053 | $12,443 |
| 3/31/2021 | $12,048 | $12,287 |
| 4/30/2021 | $12,157 | $12,384 |
| 5/31/2021 | $12,238 | $12,425 |
| 6/30/2021 | $12,312 | $12,512 |
| 7/31/2021 | $12,293 | $12,652 |
| 8/31/2021 | $12,334 | $12,628 |
| 9/30/2021 | $12,314 | $12,518 |
| 10/31/2021 | $12,271 | $12,515 |
| 11/30/2021 | $12,179 | $12,552 |
| 12/31/2021 | $12,290 | $12,520 |
| 1/31/2022 | $12,103 | $12,250 |
| 2/28/2022 | $11,938 | $12,114 |
| 3/31/2022 | $11,831 | $11,777 |
| 4/30/2022 | $11,527 | $11,330 |
| 5/31/2022 | $11,510 | $11,403 |
| 6/30/2022 | $11,103 | $11,224 |
| 7/31/2022 | $11,369 | $11,498 |
| 8/31/2022 | $11,207 | $11,174 |
| 9/30/2022 | $10,864 | $10,691 |
| 10/31/2022 | $10,873 | $10,552 |
| 11/30/2022 | $11,162 | $10,940 |
| 12/31/2022 | $11,165 | $10,891 |
| 1/31/2023 | $11,524 | $11,226 |
| 2/28/2023 | $11,320 | $10,936 |
| 3/31/2023 | $11,420 | $11,214 |
| 4/30/2023 | $11,497 | $11,282 |
| 5/31/2023 | $11,432 | $11,159 |
| 6/30/2023 | $11,489 | $11,119 |
| 7/31/2023 | $11,591 | $11,111 |
| 8/31/2023 | $11,597 | $11,040 |
| 9/30/2023 | $11,422 | $10,760 |
| 10/31/2023 | $11,292 | $10,590 |
| 11/30/2023 | $11,754 | $11,069 |
| 12/31/2023 | $12,175 | $11,493 |
| 1/31/2024 | $12,218 | $11,462 |
| 2/29/2024 | $12,136 | $11,300 |
| 3/31/2024 | $12,258 | $11,404 |
| 4/30/2024 | $12,096 | $11,116 |
| 5/31/2024 | $12,274 | $11,304 |
| 6/30/2024 | $12,314 | $11,411 |
| 7/31/2024 | $12,537 | $11,678 |
| 8/31/2024 | $12,703 | $11,846 |
| 9/30/2024 | $12,881 | $12,004 |
Annual Shareholder Report | September 30, 2024
AVERAGE ANNUAL TOTAL RETURNS (%)
| Consolidated Total net assets | $263,649,484 |
| Consolidated # of portfolio holdings | 361 |
| Consolidated Portfolio turnover rate | 350% |
| Consolidated Total advisory fees paid | $489,144 |
| 1 Year | 5 Years | 10 Years |
|---|
| Class A | 12.64 | 3.43 | 2.98 |
| Class A with Load | 8.15 | 2.58 | 2.56 |
| Bloomberg U.S. Aggregate Bond Index (Strategy and Regulatory) | 11.57 | 0.33 | 1.84 |
Figures quoted represent past performance, which is no guarantee of future results, and do not reflect taxes that a shareholder may pay on an investment in a fund.
What did the Fund invest in?
(Based on long-term investments)
CONSOLIDATED CREDIT QUALITY
(% OF LONG-TERM FIXED INCOME INVESTMENTS)Footnote Reference*
| AAA/Aaa | 2.3 |
| AA/Aa | 38.1 |
| A/A | 8.3 |
| BBB/Baa | 24.7 |
| BB/Ba | 11.3 |
| B/B | 9.2 |
| CCC/Caa and below | 2.5 |
| Not rated | 3.6 |
| Footnote | Description |
Footnote* | The ratings indicated are from Standard & Poor's, Fitch Ratings Ltd., and/or Moody's Investors Service.The percentage of the Fund's portfolio with the ratings depicted in the chart are calculated based on long-term fixed income investments of the Fund. If the security was rated by all three ratings agencies, the middle rating was used. If rated by two out of the three ratings agencies, the lower was used, and if rated by one of the agencies, that rating was used. Credit quality is subject to change and may have changed since the date specified. |
CONSOLIDATED TOP TEN HOLDINGS (% OF NET ASSETS)
| GNMA, 6.50%, 10/15/2054 | 11.8 |
| GNMA, 6.00%, 10/15/2054 | 7.4 |
| FNMA, 6.50%, 10/15/2054 | 6.5 |
| FNMA, 6.00%, 10/15/2054 | 5.2 |
| U.K. Gilts, 3.25%, 1/31/2033 | 4.0 |
| French Republic, 2.75%, 2/25/2029 | 3.0 |
| Republic of South Africa, 8.00%, 1/31/2030 | 1.9 |
| Malaysia, 3.88%, 3/14/2025 | 1.7 |
| U.S. Treasury Bonds, 4.63%, 5/15/2054 | 1.7 |
| U.S. Treasury Notes, 4.63%, 6/30/2026 | 1.5 |
CONSOLIDATED PORTFOLIO ALLOCATION
(% OF LONG-TERM INVESTMENT)
| Agency securities | 25.5 |
| Corporate bonds and notes | 21.6 |
| Foreign corporate bonds and notes | 12.1 |
| Foreign government bonds | 11.6 |
| Yankee corporate bonds and notes | 8.9 |
| U.S. Treasury securities | 5.9 |
| Asset-backed securities | 5.2 |
| Yankee government bonds | 3.2 |
| Non-agency mortgage-backed securities | 3.1 |
| Investment companies | 2.3 |
| Loans | 0.6 |
You can find additional information on the Fund's website at allspringglobal.com, including its:
- Prospectus - Financial Information - Fund holdings - Proxy voting information
Annual Shareholder Report
This annual shareholder report contains important information about Income Plus Fund for the period of October 1, 2023 to September 30, 2024. You can find additional information about the Fund at allspringglobal.com. You can also request this information by contacting us at 1-800-222-8222.
What were the Fund costs for the past year?
The table explains the consolidated costs you would have paid within the reporting period based on a hypothetical $10,000 investment.
| CLASS NAME | CONSOLIDATED COSTS OF A $10,000 INVESTMENT | COSTS PAID AS A % OF A $10,000 INVESTMENT |
|---|
| Administrator Class | $70 | 0.66% |
The manager has contractually committed to waive fees and/or reimburse certain expenses to the extent necessary to cap the Fund's total annual fund operating expense ratio at a specific amount. Without this cap, the costs shown above may have been higher. Please see the prospectus for the amount and the expiration date of the cap. Prior to or after the commitment expiration date, the cap may be increased or the commitment to maintain the cap may be terminated only with the approval of the Board of Trustees.
How did the Fund perform last year and what affected its performance?
Although they were volatile throughout the 12-month period that ended September 30, 2024, yields fell as expectations for a shift in monetary policy evolved. Investors began the period pricing in additional rate hikes and ended it with the Federal Reserve cutting rates for an initial time. Credit spreads narrowed and remained subdued—near the tightest levels in years for many credit sectors. Portfolio duration was lowered early in the period. The portfolio was generally managed near its strategic neutral position, though it ended the year modestly long. It was positioned higher in quality, and credit exposure was reduced as valuations became more extreme. The portfolio was positioned to benefit from diversified non-benchmark exposures. Top contributors to performance were allocations in U.S. and European high yield bonds, European investment-grade bonds, emerging market debt, non-U.S. developed market government bonds, and U.S. securitized bonds; credit quality allocation; and security selection. Curve positioning also contributed. The main detractor was duration positioning. The portfolio's strategic neutral is shorter than the benchmark. Portfolio positioning near neutral detracted as rates fell.
Total return based on a $10,000 investment
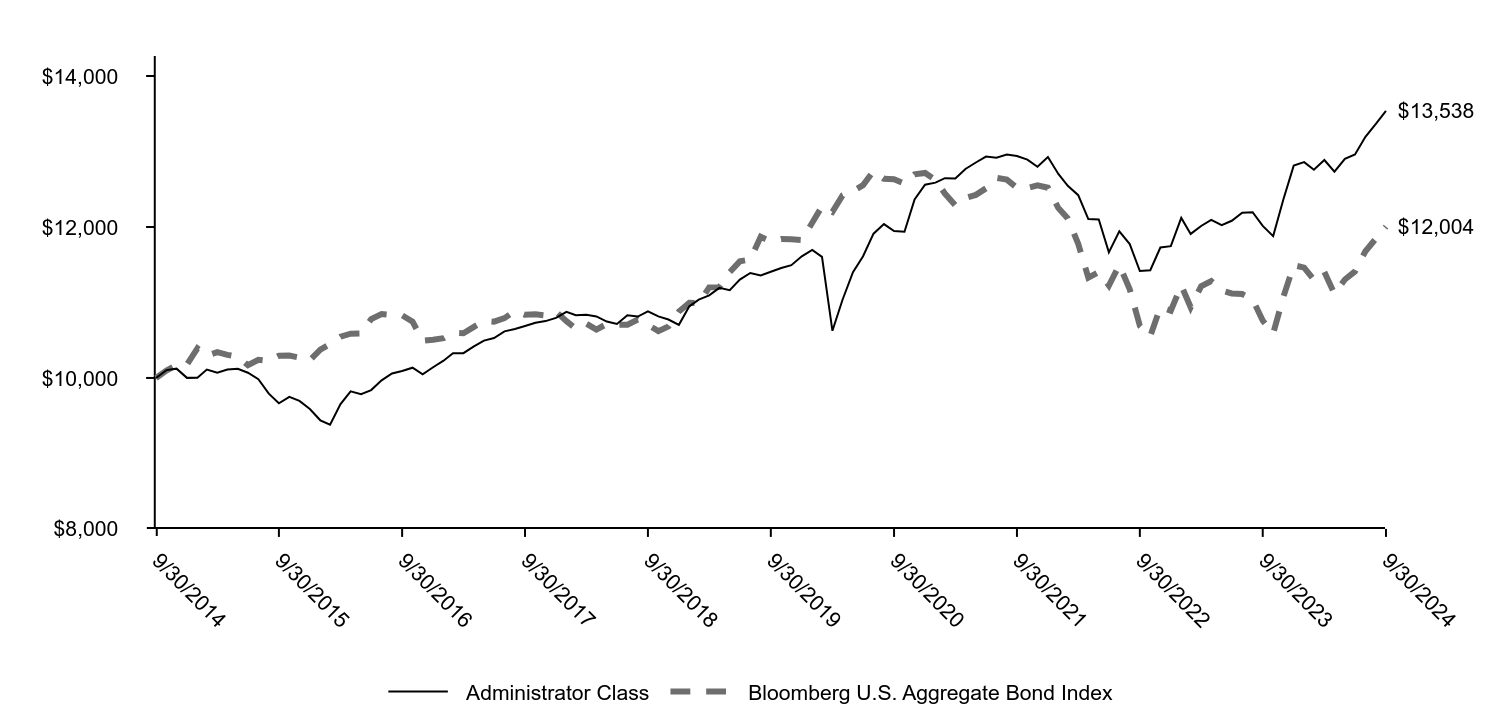
| Administrator Class | Bloomberg U.S. Aggregate Bond Index |
|---|
| 9/30/2014 | $10,000 | $10,000 |
| 10/31/2014 | $10,104 | $10,098 |
| 11/30/2014 | $10,123 | $10,170 |
| 12/31/2014 | $10,001 | $10,179 |
| 1/31/2015 | $10,003 | $10,393 |
| 2/28/2015 | $10,112 | $10,295 |
| 3/31/2015 | $10,070 | $10,343 |
| 4/30/2015 | $10,111 | $10,306 |
| 5/31/2015 | $10,122 | $10,281 |
| 6/30/2015 | $10,069 | $10,169 |
| 7/31/2015 | $9,984 | $10,240 |
| 8/31/2015 | $9,792 | $10,225 |
| 9/30/2015 | $9,664 | $10,294 |
| 10/31/2015 | $9,749 | $10,296 |
| 11/30/2015 | $9,696 | $10,269 |
| 12/31/2015 | $9,589 | $10,235 |
| 1/31/2016 | $9,439 | $10,376 |
| 2/29/2016 | $9,382 | $10,450 |
| 3/31/2016 | $9,654 | $10,546 |
| 4/30/2016 | $9,823 | $10,586 |
| 5/31/2016 | $9,784 | $10,589 |
| 6/30/2016 | $9,839 | $10,779 |
| 7/31/2016 | $9,969 | $10,847 |
| 8/31/2016 | $10,060 | $10,835 |
| 9/30/2016 | $10,092 | $10,829 |
| 10/31/2016 | $10,136 | $10,746 |
| 11/30/2016 | $10,047 | $10,492 |
| 12/31/2016 | $10,142 | $10,506 |
| 1/31/2017 | $10,229 | $10,527 |
| 2/28/2017 | $10,328 | $10,598 |
| 3/31/2017 | $10,328 | $10,592 |
| 4/30/2017 | $10,416 | $10,674 |
| 5/31/2017 | $10,495 | $10,756 |
| 6/30/2017 | $10,529 | $10,745 |
| 7/31/2017 | $10,617 | $10,792 |
| 8/31/2017 | $10,649 | $10,888 |
| 9/30/2017 | $10,689 | $10,836 |
| 10/31/2017 | $10,732 | $10,843 |
| 11/30/2017 | $10,753 | $10,829 |
| 12/31/2017 | $10,796 | $10,879 |
| 1/31/2018 | $10,875 | $10,753 |
| 2/28/2018 | $10,830 | $10,651 |
| 3/31/2018 | $10,836 | $10,720 |
| 4/30/2018 | $10,815 | $10,640 |
| 5/31/2018 | $10,747 | $10,716 |
| 6/30/2018 | $10,716 | $10,703 |
| 7/31/2018 | $10,831 | $10,705 |
| 8/31/2018 | $10,813 | $10,774 |
| 9/30/2018 | $10,882 | $10,705 |
| 10/31/2018 | $10,816 | $10,620 |
| 11/30/2018 | $10,774 | $10,683 |
| 12/31/2018 | $10,704 | $10,880 |
| 1/31/2019 | $10,949 | $10,995 |
| 2/28/2019 | $11,037 | $10,989 |
| 3/31/2019 | $11,094 | $11,200 |
| 4/30/2019 | $11,193 | $11,203 |
| 5/31/2019 | $11,162 | $11,402 |
| 6/30/2019 | $11,303 | $11,545 |
| 7/31/2019 | $11,391 | $11,570 |
| 8/31/2019 | $11,358 | $11,870 |
| 9/30/2019 | $11,407 | $11,807 |
| 10/31/2019 | $11,457 | $11,842 |
| 11/30/2019 | $11,494 | $11,836 |
| 12/31/2019 | $11,611 | $11,828 |
| 1/31/2020 | $11,696 | $12,056 |
| 2/29/2020 | $11,604 | $12,273 |
| 3/31/2020 | $10,625 | $12,200 |
| 4/30/2020 | $11,036 | $12,417 |
| 5/31/2020 | $11,402 | $12,475 |
| 6/30/2020 | $11,612 | $12,554 |
| 7/31/2020 | $11,911 | $12,741 |
| 8/31/2020 | $12,038 | $12,638 |
| 9/30/2020 | $11,946 | $12,632 |
| 10/31/2020 | $11,937 | $12,575 |
| 11/30/2020 | $12,366 | $12,698 |
| 12/31/2020 | $12,559 | $12,716 |
| 1/31/2021 | $12,587 | $12,625 |
| 2/28/2021 | $12,646 | $12,443 |
| 3/31/2021 | $12,642 | $12,287 |
| 4/30/2021 | $12,769 | $12,384 |
| 5/31/2021 | $12,854 | $12,425 |
| 6/30/2021 | $12,932 | $12,512 |
| 7/31/2021 | $12,917 | $12,652 |
| 8/31/2021 | $12,959 | $12,628 |
| 9/30/2021 | $12,939 | $12,518 |
| 10/31/2021 | $12,893 | $12,515 |
| 11/30/2021 | $12,798 | $12,552 |
| 12/31/2021 | $12,926 | $12,520 |
| 1/31/2022 | $12,703 | $12,250 |
| 2/28/2022 | $12,545 | $12,114 |
| 3/31/2022 | $12,421 | $11,777 |
| 4/30/2022 | $12,104 | $11,330 |
| 5/31/2022 | $12,100 | $11,403 |
| 6/30/2022 | $11,664 | $11,224 |
| 7/31/2022 | $11,942 | $11,498 |
| 8/31/2022 | $11,774 | $11,174 |
| 9/30/2022 | $11,416 | $10,691 |
| 10/31/2022 | $11,427 | $10,552 |
| 11/30/2022 | $11,728 | $10,940 |
| 12/31/2022 | $11,746 | $10,891 |
| 1/31/2023 | $12,120 | $11,226 |
| 2/28/2023 | $11,908 | $10,936 |
| 3/31/2023 | $12,013 | $11,214 |
| 4/30/2023 | $12,093 | $11,282 |
| 5/31/2023 | $12,024 | $11,159 |
| 6/30/2023 | $12,082 | $11,119 |
| 7/31/2023 | $12,189 | $11,111 |
| 8/31/2023 | $12,196 | $11,040 |
| 9/30/2023 | $12,014 | $10,760 |
| 10/31/2023 | $11,879 | $10,590 |
| 11/30/2023 | $12,360 | $11,069 |
| 12/31/2023 | $12,813 | $11,493 |
| 1/31/2024 | $12,859 | $11,462 |
| 2/29/2024 | $12,758 | $11,300 |
| 3/31/2024 | $12,887 | $11,404 |
| 4/30/2024 | $12,732 | $11,116 |
| 5/31/2024 | $12,903 | $11,304 |
| 6/30/2024 | $12,961 | $11,411 |
| 7/31/2024 | $13,194 | $11,678 |
| 8/31/2024 | $13,367 | $11,846 |
| 9/30/2024 | $13,538 | $12,004 |
Annual Shareholder Report | September 30, 2024
AVERAGE ANNUAL TOTAL RETURNS (%)
| Consolidated Total net assets | $263,649,484 |
| Consolidated # of portfolio holdings | 361 |
| Consolidated Portfolio turnover rate | 350% |
| Consolidated Total advisory fees paid | $489,144 |
| 1 Year | 5 Years | 10 Years |
|---|
| Administrator Class | 12.68 | 3.48 | 3.08 |
| Bloomberg U.S. Aggregate Bond Index (Strategy and Regulatory) | 11.57 | 0.33 | 1.84 |
Figures quoted represent past performance, which is no guarantee of future results, and do not reflect taxes that a shareholder may pay on an investment in a fund.
What did the Fund invest in?
(Based on long-term investments)
CONSOLIDATED CREDIT QUALITY
(% OF LONG-TERM FIXED INCOME INVESTMENTS)Footnote Reference*
| AAA/Aaa | 2.3 |
| AA/Aa | 38.1 |
| A/A | 8.3 |
| BBB/Baa | 24.7 |
| BB/Ba | 11.3 |
| B/B | 9.2 |
| CCC/Caa and below | 2.5 |
| Not rated | 3.6 |
| Footnote | Description |
Footnote* | The ratings indicated are from Standard & Poor's, Fitch Ratings Ltd., and/or Moody's Investors Service.The percentage of the Fund's portfolio with the ratings depicted in the chart are calculated based on long-term fixed income investments of the Fund. If the security was rated by all three ratings agencies, the middle rating was used. If rated by two out of the three ratings agencies, the lower was used, and if rated by one of the agencies, that rating was used. Credit quality is subject to change and may have changed since the date specified. |
CONSOLIDATED TOP TEN HOLDINGS (% OF NET ASSETS)
| GNMA, 6.50%, 10/15/2054 | 11.8 |
| GNMA, 6.00%, 10/15/2054 | 7.4 |
| FNMA, 6.50%, 10/15/2054 | 6.5 |
| FNMA, 6.00%, 10/15/2054 | 5.2 |
| U.K. Gilts, 3.25%, 1/31/2033 | 4.0 |
| French Republic, 2.75%, 2/25/2029 | 3.0 |
| Republic of South Africa, 8.00%, 1/31/2030 | 1.9 |
| Malaysia, 3.88%, 3/14/2025 | 1.7 |
| U.S. Treasury Bonds, 4.63%, 5/15/2054 | 1.7 |
| U.S. Treasury Notes, 4.63%, 6/30/2026 | 1.5 |
CONSOLIDATED PORTFOLIO ALLOCATION
(% OF LONG-TERM INVESTMENT)
| Agency securities | 25.5 |
| Corporate bonds and notes | 21.6 |
| Foreign corporate bonds and notes | 12.1 |
| Foreign government bonds | 11.6 |
| Yankee corporate bonds and notes | 8.9 |
| U.S. Treasury securities | 5.9 |
| Asset-backed securities | 5.2 |
| Yankee government bonds | 3.2 |
| Non-agency mortgage-backed securities | 3.1 |
| Investment companies | 2.3 |
| Loans | 0.6 |
You can find additional information on the Fund's website at allspringglobal.com, including its:
- Prospectus - Financial Information - Fund holdings - Proxy voting information
Annual Shareholder Report
Index Asset Allocation Fund
This annual shareholder report contains important information about Index Asset Allocation Fund for the period of October 1, 2023 to September 30, 2024. You can find additional information about the Fund at allspringglobal.com. You can also request this information by contacting us at 1-800-222-8222.
What were the Fund costs for the past year?
The table explains the costs you would have paid within the reporting period based on a hypothetical $10,000 investment.
| CLASS NAME | COSTS OF A $10,000 INVESTMENT | COSTS PAID AS A % OF A $10,000 INVESTMENT |
|---|
| Institutional Class | $85 | 0.75% |
The manager has contractually committed to waive fees and/or reimburse certain expenses to the extent necessary to cap the Fund's total annual fund operating expense ratio at a specific amount. Without this cap, the costs shown above may have been higher. Please see the prospectus for the amount and the expiration date of the cap. Prior to or after the commitment expiration date, the cap may be increased or the commitment to maintain the cap may be terminated only with the approval of the Board of Trustees.
How did the Fund perform last year and what affected its performance?
Over the trailing 12 months, the U.S. saw stable employment, solid economic growth, falling inflation, and the promise and delivery of an initial rate cut by the Federal Reserve. This created a strong environment for the performance of both stocks and bonds. The neutral allocation has 60% of the Fund’s assets invested in the S&P 500 Index, which posted a 36.35% return. The stock market was led by information technology stocks (+52.65%), but the rally was broad based as all 11 of the index’s sectors posted positive returns. The neutral allocation has 40% of the Fund’s assets invested in the Bloomberg U.S. Treasury Index, which posted a 9.72% gain for the period. The Fund’s Tactical Asset Allocation (TAA) activity was the largest contributor to relative performance. Our TAA activity resulted in overweights to both stocks and bonds and favorable yield curve positioning, which benefited from the rally in stocks and bonds. At period-end, the Fund’s effective exposure was 67.7% stocks, 46.5% bonds, and -14.2% cash. Over the period, the TAA activity added more than 230 basis points (bps; 100 bps equal 1.00%) to relative performance.
Total return based on a $10,000 investment

| Institutional Class | Index Asset Allocation Blended Index | Russell 3000® Index | Bloomberg U.S. Aggregate Bond Index |
|---|
| 9/30/2014 | $10,000 | $10,000 | $10,000 | $10,000 |
| 10/31/2014 | $10,294 | $10,264 | $10,275 | $10,098 |
| 11/30/2014 | $10,578 | $10,550 | $10,524 | $10,170 |
| 12/31/2014 | $10,646 | $10,669 | $10,524 | $10,179 |
| 1/31/2015 | $10,657 | $10,874 | $10,231 | $10,393 |
| 2/28/2015 | $10,884 | $10,997 | $10,824 | $10,295 |
| 3/31/2015 | $10,790 | $10,945 | $10,713 | $10,343 |
| 4/30/2015 | $10,837 | $10,985 | $10,762 | $10,306 |
| 5/31/2015 | $10,906 | $11,062 | $10,911 | $10,281 |
| 6/30/2015 | $10,740 | $10,894 | $10,728 | $10,169 |
| 7/31/2015 | $10,913 | $11,068 | $10,908 | $10,240 |
| 8/31/2015 | $10,505 | $10,669 | $10,249 | $10,225 |
| 9/30/2015 | $10,389 | $10,548 | $9,951 | $10,294 |
| 10/31/2015 | $10,895 | $11,067 | $10,736 | $10,296 |
| 11/30/2015 | $10,895 | $11,068 | $10,796 | $10,269 |
| 12/31/2015 | $10,780 | $10,956 | $10,574 | $10,235 |
| 1/31/2016 | $10,527 | $10,723 | $9,978 | $10,376 |
| 2/29/2016 | $10,523 | $10,753 | $9,975 | $10,450 |
| 3/31/2016 | $10,988 | $11,197 | $10,677 | $10,546 |
| 4/30/2016 | $11,003 | $11,219 | $10,743 | $10,586 |
| 5/31/2016 | $11,111 | $11,339 | $10,935 | $10,589 |
| 6/30/2016 | $11,172 | $11,457 | $10,958 | $10,779 |
| 7/31/2016 | $11,423 | $11,729 | $11,393 | $10,847 |
| 8/31/2016 | $11,415 | $11,713 | $11,422 | $10,835 |
| 9/30/2016 | $11,419 | $11,708 | $11,440 | $10,829 |
| 10/31/2016 | $11,280 | $11,529 | $11,192 | $10,746 |
| 11/30/2016 | $11,488 | $11,662 | $11,693 | $10,492 |
| 12/31/2016 | $11,620 | $11,795 | $11,921 | $10,506 |
| 1/31/2017 | $11,757 | $11,940 | $12,145 | $10,527 |
| 2/28/2017 | $12,046 | $12,248 | $12,597 | $10,598 |
| 3/31/2017 | $12,053 | $12,254 | $12,606 | $10,592 |
| 4/30/2017 | $12,139 | $12,364 | $12,739 | $10,674 |
| 5/31/2017 | $12,245 | $12,501 | $12,870 | $10,756 |
| 6/30/2017 | $12,282 | $12,539 | $12,986 | $10,745 |
| 7/31/2017 | $12,431 | $12,702 | $13,231 | $10,792 |
| 8/31/2017 | $12,467 | $12,781 | $13,256 | $10,888 |
| 9/30/2017 | $12,600 | $12,895 | $13,579 | $10,836 |
| 10/31/2017 | $12,765 | $13,069 | $13,876 | $10,843 |
| 11/30/2017 | $12,994 | $13,303 | $14,297 | $10,829 |
| 12/31/2017 | $13,082 | $13,408 | $14,440 | $10,879 |
| 1/31/2018 | $13,495 | $13,796 | $15,201 | $10,753 |
| 2/28/2018 | $13,161 | $13,449 | $14,641 | $10,651 |
| 3/31/2018 | $12,951 | $13,295 | $14,347 | $10,720 |
| 4/30/2018 | $12,955 | $13,282 | $14,402 | $10,640 |
| 5/31/2018 | $13,194 | $13,522 | $14,808 | $10,716 |
| 6/30/2018 | $13,247 | $13,573 | $14,905 | $10,703 |
| 7/31/2018 | $13,555 | $13,853 | $15,400 | $10,705 |
| 8/31/2018 | $13,875 | $14,167 | $15,940 | $10,774 |
| 9/30/2018 | $13,874 | $14,162 | $15,967 | $10,705 |
| 10/31/2018 | $13,232 | $13,554 | $14,791 | $10,620 |
| 11/30/2018 | $13,457 | $13,768 | $15,087 | $10,683 |
| 12/31/2018 | $12,756 | $13,141 | $13,683 | $10,880 |
| 1/31/2019 | $13,468 | $13,797 | $14,858 | $10,995 |
| 2/28/2019 | $13,700 | $14,048 | $15,380 | $10,989 |
| 3/31/2019 | $13,960 | $14,319 | $15,605 | $11,200 |
| 4/30/2019 | $14,255 | $14,651 | $16,228 | $11,203 |
| 5/31/2019 | $13,868 | $14,230 | $15,178 | $11,402 |
| 6/30/2019 | $14,448 | $14,884 | $16,244 | $11,545 |
| 7/31/2019 | $14,561 | $15,006 | $16,485 | $11,570 |
| 8/31/2019 | $14,607 | $15,067 | $16,149 | $11,870 |
| 9/30/2019 | $14,692 | $15,185 | $16,433 | $11,807 |
| 10/31/2019 | $14,851 | $15,387 | $16,786 | $11,842 |
| 11/30/2019 | $15,131 | $15,703 | $17,424 | $11,836 |
| 12/31/2019 | $15,353 | $15,953 | $17,928 | $11,828 |
| 1/31/2020 | $15,523 | $16,105 | $17,908 | $12,056 |
| 2/29/2020 | $14,915 | $15,480 | $16,442 | $12,273 |
| 3/31/2020 | $14,057 | $14,512 | $14,181 | $12,200 |
| 4/30/2020 | $15,188 | $15,665 | $16,059 | $12,417 |
| 5/31/2020 | $15,636 | $16,097 | $16,918 | $12,475 |
| 6/30/2020 | $15,839 | $16,295 | $17,304 | $12,554 |
| 7/31/2020 | $16,459 | $16,921 | $18,287 | $12,741 |
| 8/31/2020 | $17,101 | $17,576 | $19,612 | $12,638 |
| 9/30/2020 | $16,667 | $17,185 | $18,898 | $12,632 |
| 10/31/2020 | $16,375 | $16,846 | $18,490 | $12,575 |
| 11/30/2020 | $17,491 | $17,976 | $20,739 | $12,698 |
| 12/31/2020 | $17,902 | $18,374 | $21,672 | $12,716 |
| 1/31/2021 | $17,689 | $18,193 | $21,576 | $12,625 |
| 2/28/2021 | $17,893 | $18,362 | $22,250 | $12,443 |
| 3/31/2021 | $18,284 | $18,731 | $23,048 | $12,287 |
| 4/30/2021 | $18,976 | $19,387 | $24,236 | $12,384 |
| 5/31/2021 | $19,065 | $19,495 | $24,346 | $12,425 |
| 6/30/2021 | $19,406 | $19,818 | $24,947 | $12,512 |
| 7/31/2021 | $19,783 | $20,208 | $25,369 | $12,652 |
| 8/31/2021 | $20,161 | $20,563 | $26,092 | $12,628 |
| 9/30/2021 | $19,429 | $19,900 | $24,921 | $12,518 |
| 10/31/2021 | $20,294 | $20,731 | $26,607 | $12,515 |
| 11/30/2021 | $20,254 | $20,708 | $26,202 | $12,552 |
| 12/31/2021 | $20,794 | $21,222 | $27,234 | $12,520 |
| 1/31/2022 | $19,921 | $20,403 | $25,631 | $12,250 |
| 2/28/2022 | $19,473 | $19,982 | $24,986 | $12,114 |
| 3/31/2022 | $19,638 | $20,179 | $25,796 | $11,777 |
| 4/30/2022 | $18,303 | $18,873 | $23,481 | $11,330 |
| 5/31/2022 | $18,336 | $18,907 | $23,450 | $11,403 |
| 6/30/2022 | $17,391 | $17,905 | $21,488 | $11,224 |
| 7/31/2022 | $18,434 | $19,009 | $23,504 | $11,498 |
| 8/31/2022 | $17,775 | $18,355 | $22,627 | $11,174 |
| 9/30/2022 | $16,584 | $17,088 | $20,528 | $10,691 |
| 10/31/2022 | $17,273 | $17,822 | $22,212 | $10,552 |
| 11/30/2022 | $18,028 | $18,611 | $23,371 | $10,940 |
| 12/31/2022 | $17,318 | $17,929 | $22,003 | $10,891 |
| 1/31/2023 | $18,152 | $18,785 | $23,518 | $11,226 |
| 2/28/2023 | $17,641 | $18,334 | $22,968 | $10,936 |
| 3/31/2023 | $18,253 | $18,950 | $23,583 | $11,214 |
| 4/30/2023 | $18,452 | $19,168 | $23,834 | $11,282 |
| 5/31/2023 | $18,408 | $19,129 | $23,927 | $11,159 |
| 6/30/2023 | $19,070 | $19,830 | $25,560 | $11,119 |
| 7/31/2023 | $19,405 | $20,184 | $26,477 | $11,111 |
| 8/31/2023 | $19,165 | $19,949 | $25,966 | $11,040 |
| 9/30/2023 | $18,373 | $19,202 | $24,729 | $10,760 |
| 10/31/2023 | $17,987 | $18,867 | $24,073 | $10,590 |
| 11/30/2023 | $19,380 | $20,163 | $26,318 | $11,069 |
| 12/31/2023 | $20,259 | $20,984 | $27,714 | $11,493 |
| 1/31/2024 | $20,447 | $21,172 | $28,021 | $11,462 |
| 2/29/2024 | $21,000 | $21,739 | $29,538 | $11,300 |
| 3/31/2024 | $21,474 | $22,215 | $30,491 | $11,404 |
| 4/30/2024 | $20,650 | $21,464 | $29,149 | $11,116 |
| 5/31/2024 | $21,457 | $22,227 | $30,526 | $11,304 |
| 6/30/2024 | $22,062 | $22,796 | $31,471 | $11,411 |
| 7/31/2024 | $22,424 | $23,162 | $32,056 | $11,678 |
| 8/31/2024 | $22,916 | $23,617 | $32,754 | $11,846 |
| 9/30/2024 | $23,361 | $24,033 | $33,432 | $12,004 |
Index Asset Allocation Fund
Annual Shareholder Report | September 30, 2024
AVERAGE ANNUAL TOTAL RETURNS (%)
| 1 Year | 5 Years | 10 Years |
|---|
Institutional ClassFootnote Reference* | 27.15 | 9.72 | 8.86 |
Index Asset Allocation Blended Index (Strategy)Footnote Reference† | 25.16 | 9.62 | 9.16 |
Russell 3000® Index (Regulatory) | 35.19 | 15.26 | 12.83 |
| Bloomberg U.S. Aggregate Bond Index (Regulatory) | 11.57 | 0.33 | 1.84 |
| Total net assets | $1,359,112,080 |
| # of portfolio holdings | 641 |
| Portfolio turnover rate | 12% |
| Total advisory fees paid | $7,517,394 |
Figures quoted represent past performance, which is no guarantee of future results, and do not reflect taxes that a shareholder may pay on an investment in a fund.
| Footnote | Description |
Footnote* | Historical performance shown for the Institutional Class shares prior to their inception on October 31, 2016 reflects the performance of the Administrator Class shares, and includes the higher expenses applicable to the Administrator Class shares. If these expenses had not been included, returns for the Institutional Class shares would be higher. |
Footnote† | Index Asset Allocation Blended Index is composed 60% of the S&P 500 Index and 40% of the Bloomberg U.S. Treasury Index. Prior to April 1, 2015, the Index Asset Allocation Blended Index was composed 60% of the S&P 500 Index and 40% of the Bloomberg U.S. Treasury 20+ Year Index. You cannot invest directly in an index. |
What did the Fund invest in?
(Based on long-term investments)
ALLOCATION (% OF TOTAL INVESTMENTS)
| Neutral Allocation | Effective Allocation |
| Stock Funds | 60.0 | 67.7 |
| Bond Funds | 40.0 | 46.5 |
| Effective Cash | 0.0 | (14.2) |
TOP TEN HOLDINGS (% OF NET ASSETS)
| Apple, Inc. | 4.3 |
| Microsoft Corp. | 3.9 |
| NVIDIA Corp. | 3.7 |
| iShares 20+ Year Treasury Bond ETF | 2.7 |
| Amazon.com, Inc. | 2.1 |
| U.S. Treasury Bonds, 6.00%, 2/15/2026 | 1.7 |
| U.S. Treasury Notes, 1.38%, 10/31/2028 | 1.6 |
| U.S. Treasury Bonds, 6.75%, 8/15/2026 | 1.6 |
| U.S. Treasury Bonds, 6.88%, 8/15/2025 | 1.6 |
| Meta Platforms, Inc., Class A | 1.5 |
You can find additional information on the Fund's website at allspringglobal.com, including its:
- Prospectus - Financial Information - Fund holdings - Proxy voting information
Annual Shareholder Report
Index Asset Allocation Fund
This annual shareholder report contains important information about Index Asset Allocation Fund for the period of October 1, 2023 to September 30, 2024. You can find additional information about the Fund at allspringglobal.com. You can also request this information by contacting us at 1-800-222-8222.
What were the Fund costs for the past year?
The table explains the costs you would have paid within the reporting period based on a hypothetical $10,000 investment.
| CLASS NAME | COSTS OF A $10,000 INVESTMENT | COSTS PAID AS A % OF A $10,000 INVESTMENT |
|---|
| Class C | $205 | 1.82% |
The manager has contractually committed to waive fees and/or reimburse certain expenses to the extent necessary to cap the Fund's total annual fund operating expense ratio at a specific amount. Without this cap, the costs shown above may have been higher. Please see the prospectus for the amount and the expiration date of the cap. Prior to or after the commitment expiration date, the cap may be increased or the commitment to maintain the cap may be terminated only with the approval of the Board of Trustees.
How did the Fund perform last year and what affected its performance?
Over the trailing 12 months, the U.S. saw stable employment, solid economic growth, falling inflation, and the promise and delivery of an initial rate cut by the Federal Reserve. This created a strong environment for the performance of both stocks and bonds. The neutral allocation has 60% of the Fund’s assets invested in the S&P 500 Index, which posted a 36.35% return. The stock market was led by information technology stocks (+52.65%), but the rally was broad based as all 11 of the index’s sectors posted positive returns. The neutral allocation has 40% of the Fund’s assets invested in the Bloomberg U.S. Treasury Index, which posted a 9.72% gain for the period. The Fund’s Tactical Asset Allocation (TAA) activity was the largest contributor to relative performance. Our TAA activity resulted in overweights to both stocks and bonds and favorable yield curve positioning, which benefited from the rally in stocks and bonds. At period-end, the Fund’s effective exposure was 67.7% stocks, 46.5% bonds, and -14.2% cash. Over the period, the TAA activity added more than 230 basis points (bps; 100 bps equal 1.00%) to relative performance.
Total return based on a $10,000 investment

| Class C with Load | Index Asset Allocation Blended Index | Russell 3000® Index | Bloomberg U.S. Aggregate Bond Index |
|---|
| 9/30/2014 | $10,000 | $10,000 | $10,000 | $10,000 |
| 10/31/2014 | $10,285 | $10,264 | $10,275 | $10,098 |
| 11/30/2014 | $10,564 | $10,550 | $10,524 | $10,170 |
| 12/31/2014 | $10,618 | $10,669 | $10,524 | $10,179 |
| 1/31/2015 | $10,618 | $10,874 | $10,231 | $10,393 |
| 2/28/2015 | $10,835 | $10,997 | $10,824 | $10,295 |
| 3/31/2015 | $10,739 | $10,945 | $10,713 | $10,343 |
| 4/30/2015 | $10,774 | $10,985 | $10,762 | $10,306 |
| 5/31/2015 | $10,833 | $11,062 | $10,911 | $10,281 |
| 6/30/2015 | $10,657 | $10,894 | $10,728 | $10,169 |
| 7/31/2015 | $10,822 | $11,068 | $10,908 | $10,240 |
| 8/31/2015 | $10,410 | $10,669 | $10,249 | $10,225 |
| 9/30/2015 | $10,286 | $10,548 | $9,951 | $10,294 |
| 10/31/2015 | $10,781 | $11,067 | $10,736 | $10,296 |
| 11/30/2015 | $10,769 | $11,068 | $10,796 | $10,269 |
| 12/31/2015 | $10,646 | $10,956 | $10,574 | $10,235 |
| 1/31/2016 | $10,385 | $10,723 | $9,978 | $10,376 |
| 2/29/2016 | $10,379 | $10,753 | $9,975 | $10,450 |
| 3/31/2016 | $10,822 | $11,197 | $10,677 | $10,546 |
| 4/30/2016 | $10,835 | $11,219 | $10,743 | $10,586 |
| 5/31/2016 | $10,928 | $11,339 | $10,935 | $10,589 |
| 6/30/2016 | $10,980 | $11,457 | $10,958 | $10,779 |
| 7/31/2016 | $11,217 | $11,729 | $11,393 | $10,847 |
| 8/31/2016 | $11,204 | $11,713 | $11,422 | $10,835 |
| 9/30/2016 | $11,198 | $11,708 | $11,440 | $10,829 |
| 10/31/2016 | $11,049 | $11,529 | $11,192 | $10,746 |
| 11/30/2016 | $11,242 | $11,662 | $11,693 | $10,492 |
| 12/31/2016 | $11,364 | $11,795 | $11,921 | $10,506 |
| 1/31/2017 | $11,490 | $11,940 | $12,145 | $10,527 |
| 2/28/2017 | $11,760 | $12,248 | $12,597 | $10,598 |
| 3/31/2017 | $11,756 | $12,254 | $12,606 | $10,592 |
| 4/30/2017 | $11,826 | $12,364 | $12,739 | $10,674 |
| 5/31/2017 | $11,920 | $12,501 | $12,870 | $10,756 |
| 6/30/2017 | $11,945 | $12,539 | $12,986 | $10,745 |
| 7/31/2017 | $12,083 | $12,702 | $13,231 | $10,792 |
| 8/31/2017 | $12,108 | $12,781 | $13,256 | $10,888 |
| 9/30/2017 | $12,221 | $12,895 | $13,579 | $10,836 |
| 10/31/2017 | $12,372 | $13,069 | $13,876 | $10,843 |
| 11/30/2017 | $12,586 | $13,303 | $14,297 | $10,829 |
| 12/31/2017 | $12,654 | $13,408 | $14,440 | $10,879 |
| 1/31/2018 | $13,046 | $13,796 | $15,201 | $10,753 |
| 2/28/2018 | $12,711 | $13,449 | $14,641 | $10,651 |
| 3/31/2018 | $12,496 | $13,295 | $14,347 | $10,720 |
| 4/30/2018 | $12,490 | $13,282 | $14,402 | $10,640 |
| 5/31/2018 | $12,711 | $13,522 | $14,808 | $10,716 |
| 6/30/2018 | $12,749 | $13,573 | $14,905 | $10,703 |
| 7/31/2018 | $13,033 | $13,853 | $15,400 | $10,705 |
| 8/31/2018 | $13,330 | $14,167 | $15,940 | $10,774 |
| 9/30/2018 | $13,318 | $14,162 | $15,967 | $10,705 |
| 10/31/2018 | $12,686 | $13,554 | $14,791 | $10,620 |
| 11/30/2018 | $12,888 | $13,768 | $15,087 | $10,683 |
| 12/31/2018 | $12,210 | $13,141 | $13,683 | $10,880 |
| 1/31/2019 | $12,874 | $13,797 | $14,858 | $10,995 |
| 2/28/2019 | $13,089 | $14,048 | $15,380 | $10,989 |
| 3/31/2019 | $13,326 | $14,319 | $15,605 | $11,200 |
| 4/30/2019 | $13,593 | $14,651 | $16,228 | $11,203 |
| 5/31/2019 | $13,215 | $14,230 | $15,178 | $11,402 |
| 6/30/2019 | $13,754 | $14,884 | $16,244 | $11,545 |
| 7/31/2019 | $13,852 | $15,006 | $16,485 | $11,570 |
| 8/31/2019 | $13,885 | $15,067 | $16,149 | $11,870 |
| 9/30/2019 | $13,951 | $15,185 | $16,433 | $11,807 |
| 10/31/2019 | $14,088 | $15,387 | $16,786 | $11,842 |
| 11/30/2019 | $14,343 | $15,703 | $17,424 | $11,836 |
| 12/31/2019 | $14,539 | $15,953 | $17,928 | $11,828 |
| 1/31/2020 | $14,684 | $16,105 | $17,908 | $12,056 |
| 2/29/2020 | $14,095 | $15,480 | $16,442 | $12,273 |
| 3/31/2020 | $13,275 | $14,512 | $14,181 | $12,200 |
| 4/30/2020 | $14,327 | $15,665 | $16,059 | $12,417 |
| 5/31/2020 | $14,738 | $16,097 | $16,918 | $12,475 |
| 6/30/2020 | $14,913 | $16,295 | $17,304 | $12,554 |
| 7/31/2020 | $15,490 | $16,921 | $18,287 | $12,741 |
| 8/31/2020 | $16,079 | $17,576 | $19,612 | $12,638 |
| 9/30/2020 | $15,655 | $17,185 | $18,898 | $12,632 |
| 10/31/2020 | $15,364 | $16,846 | $18,490 | $12,575 |
| 11/30/2020 | $16,403 | $17,976 | $20,739 | $12,698 |
| 12/31/2020 | $16,769 | $18,374 | $21,672 | $12,716 |
| 1/31/2021 | $16,551 | $18,193 | $21,576 | $12,625 |
| 2/28/2021 | $16,729 | $18,362 | $22,250 | $12,443 |
| 3/31/2021 | $17,083 | $18,731 | $23,048 | $12,287 |
| 4/30/2021 | $17,711 | $19,387 | $24,236 | $12,384 |
| 5/31/2021 | $17,779 | $19,495 | $24,346 | $12,425 |
| 6/30/2021 | $18,079 | $19,818 | $24,947 | $12,512 |
| 7/31/2021 | $18,414 | $20,208 | $25,369 | $12,652 |
| 8/31/2021 | $18,748 | $20,563 | $26,092 | $12,628 |
| 9/30/2021 | $18,052 | $19,900 | $24,921 | $12,518 |
| 10/31/2021 | $18,843 | $20,731 | $26,607 | $12,515 |
| 11/30/2021 | $18,789 | $20,708 | $26,202 | $12,552 |
| 12/31/2021 | $19,272 | $21,222 | $27,234 | $12,520 |
| 1/31/2022 | $18,443 | $20,403 | $25,631 | $12,250 |
| 2/28/2022 | $18,018 | $19,982 | $24,986 | $12,114 |
| 3/31/2022 | $18,148 | $20,179 | $25,796 | $11,777 |
| 4/30/2022 | $16,901 | $18,873 | $23,481 | $11,330 |
| 5/31/2022 | $16,915 | $18,907 | $23,450 | $11,403 |
| 6/30/2022 | $16,029 | $17,905 | $21,488 | $11,224 |
| 7/31/2022 | $16,973 | $19,009 | $23,504 | $11,498 |
| 8/31/2022 | $16,353 | $18,355 | $22,627 | $11,174 |
| 9/30/2022 | $15,243 | $17,088 | $20,528 | $10,691 |
| 10/31/2022 | $15,871 | $17,822 | $22,212 | $10,552 |
| 11/30/2022 | $16,560 | $18,611 | $23,371 | $10,940 |
| 12/31/2022 | $15,902 | $17,929 | $22,003 | $10,891 |
| 1/31/2023 | $16,663 | $18,785 | $23,518 | $11,226 |
| 2/28/2023 | $16,194 | $18,334 | $22,968 | $10,936 |
| 3/31/2023 | $16,748 | $18,950 | $23,583 | $11,214 |
| 4/30/2023 | $16,926 | $19,168 | $23,834 | $11,282 |
| 5/31/2023 | $16,880 | $19,129 | $23,927 | $11,159 |
| 6/30/2023 | $17,483 | $19,830 | $25,560 | $11,119 |
| 7/31/2023 | $17,784 | $20,184 | $26,477 | $11,111 |
| 8/31/2023 | $17,560 | $19,949 | $25,966 | $11,040 |
| 9/30/2023 | $16,830 | $19,202 | $24,729 | $10,760 |
| 10/31/2023 | $16,472 | $18,867 | $24,073 | $10,590 |
| 11/30/2023 | $17,742 | $20,163 | $26,318 | $11,069 |
| 12/31/2023 | $18,545 | $20,984 | $27,714 | $11,493 |
| 1/31/2024 | $18,712 | $21,172 | $28,021 | $11,462 |
| 2/29/2024 | $19,212 | $21,739 | $29,538 | $11,300 |
| 3/31/2024 | $19,642 | $22,215 | $30,491 | $11,404 |
| 4/30/2024 | $18,880 | $21,464 | $29,149 | $11,116 |
| 5/31/2024 | $19,612 | $22,227 | $30,526 | $11,304 |
| 6/30/2024 | $20,160 | $22,796 | $31,471 | $11,411 |
| 7/31/2024 | $20,490 | $23,162 | $32,056 | $11,678 |
| 8/31/2024 | $20,929 | $23,617 | $32,754 | $11,846 |
| 9/30/2024 | $21,332 | $24,033 | $33,432 | $12,004 |
Index Asset Allocation Fund
Annual Shareholder Report | September 30, 2024
AVERAGE ANNUAL TOTAL RETURNS (%)
| 1 Year | 5 Years | 10 Years |
|---|
| Class C | 25.80 | 8.54 | 7.87 |
| Class C with Load | 24.80 | 8.54 | 7.87 |
Index Asset Allocation Blended Index (Strategy)Footnote Reference* | 25.16 | 9.62 | 9.16 |
Russell 3000® Index (Regulatory) | 35.19 | 15.26 | 12.83 |
| Bloomberg U.S. Aggregate Bond Index (Regulatory) | 11.57 | 0.33 | 1.84 |
| Total net assets | $1,359,112,080 |
| # of portfolio holdings | 641 |
| Portfolio turnover rate | 12% |
| Total advisory fees paid | $7,517,394 |
Figures quoted represent past performance, which is no guarantee of future results, and do not reflect taxes that a shareholder may pay on an investment in a fund.
| Footnote | Description |
Footnote* | Index Asset Allocation Blended Index is composed 60% of the S&P 500 Index and 40% of the Bloomberg U.S. Treasury Index. Prior to April 1, 2015, the Index Asset Allocation Blended Index was composed 60% of the S&P 500 Index and 40% of the Bloomberg U.S. Treasury 20+ Year Index. You cannot invest directly in an index. |
What did the Fund invest in?
(Based on long-term investments)
ALLOCATION (% OF TOTAL INVESTMENTS)
| Neutral Allocation | Effective Allocation |
| Stock Funds | 60.0 | 67.7 |
| Bond Funds | 40.0 | 46.5 |
| Effective Cash | 0.0 | (14.2) |
TOP TEN HOLDINGS (% OF NET ASSETS)
| Apple, Inc. | 4.3 |
| Microsoft Corp. | 3.9 |
| NVIDIA Corp. | 3.7 |
| iShares 20+ Year Treasury Bond ETF | 2.7 |
| Amazon.com, Inc. | 2.1 |
| U.S. Treasury Bonds, 6.00%, 2/15/2026 | 1.7 |
| U.S. Treasury Notes, 1.38%, 10/31/2028 | 1.6 |
| U.S. Treasury Bonds, 6.75%, 8/15/2026 | 1.6 |
| U.S. Treasury Bonds, 6.88%, 8/15/2025 | 1.6 |
| Meta Platforms, Inc., Class A | 1.5 |
You can find additional information on the Fund's website at allspringglobal.com, including its:
- Prospectus - Financial Information - Fund holdings - Proxy voting information
Annual Shareholder Report
Index Asset Allocation Fund
This annual shareholder report contains important information about Index Asset Allocation Fund for the period of October 1, 2023 to September 30, 2024. You can find additional information about the Fund at allspringglobal.com. You can also request this information by contacting us at 1-800-222-8222.
What were the Fund costs for the past year?
The table explains the costs you would have paid within the reporting period based on a hypothetical $10,000 investment.
| CLASS NAME | COSTS OF A $10,000 INVESTMENT | COSTS PAID AS A % OF A $10,000 INVESTMENT |
|---|
| Class A | $120 | 1.06% |
The manager has contractually committed to waive fees and/or reimburse certain expenses to the extent necessary to cap the Fund's total annual fund operating expense ratio at a specific amount. Without this cap, the costs shown above may have been higher. Please see the prospectus for the amount and the expiration date of the cap. Prior to or after the commitment expiration date, the cap may be increased or the commitment to maintain the cap may be terminated only with the approval of the Board of Trustees.
How did the Fund perform last year and what affected its performance?
Over the trailing 12 months, the U.S. saw stable employment, solid economic growth, falling inflation, and the promise and delivery of an initial rate cut by the Federal Reserve. This created a strong environment for the performance of both stocks and bonds. The neutral allocation has 60% of the Fund’s assets invested in the S&P 500 Index, which posted a 36.35% return. The stock market was led by information technology stocks (+52.65%), but the rally was broad based as all 11 of the index’s sectors posted positive returns. The neutral allocation has 40% of the Fund’s assets invested in the Bloomberg U.S. Treasury Index, which posted a 9.72% gain for the period. The Fund’s Tactical Asset Allocation (TAA) activity was the largest contributor to relative performance. Our TAA activity resulted in overweights to both stocks and bonds and favorable yield curve positioning, which benefited from the rally in stocks and bonds. At period-end, the Fund’s effective exposure was 67.7% stocks, 46.5% bonds, and -14.2% cash. Over the period, the TAA activity added more than 230 basis points (bps; 100 bps equal 1.00%) to relative performance.
Total return based on a $10,000 investment

| Class A with Load | Index Asset Allocation Blended Index | Russell 3000® Index | Bloomberg U.S. Aggregate Bond Index |
|---|
| 9/30/2014 | $9,425 | $10,000 | $10,000 | $10,000 |
| 10/31/2014 | $9,699 | $10,264 | $10,275 | $10,098 |
| 11/30/2014 | $9,967 | $10,550 | $10,524 | $10,170 |
| 12/31/2014 | $10,027 | $10,669 | $10,524 | $10,179 |
| 1/31/2015 | $10,034 | $10,874 | $10,231 | $10,393 |
| 2/28/2015 | $10,244 | $10,997 | $10,824 | $10,295 |
| 3/31/2015 | $10,157 | $10,945 | $10,713 | $10,343 |
| 4/30/2015 | $10,197 | $10,985 | $10,762 | $10,306 |
| 5/31/2015 | $10,258 | $11,062 | $10,911 | $10,281 |
| 6/30/2015 | $10,103 | $10,894 | $10,728 | $10,169 |
| 7/31/2015 | $10,263 | $11,068 | $10,908 | $10,240 |
| 8/31/2015 | $9,878 | $10,669 | $10,249 | $10,225 |
| 9/30/2015 | $9,766 | $10,548 | $9,951 | $10,294 |
| 10/31/2015 | $10,239 | $11,067 | $10,736 | $10,296 |
| 11/30/2015 | $10,235 | $11,068 | $10,796 | $10,269 |
| 12/31/2015 | $10,130 | $10,956 | $10,574 | $10,235 |
| 1/31/2016 | $9,888 | $10,723 | $9,978 | $10,376 |
| 2/29/2016 | $9,881 | $10,753 | $9,975 | $10,450 |
| 3/31/2016 | $10,316 | $11,197 | $10,677 | $10,546 |
| 4/30/2016 | $10,331 | $11,219 | $10,743 | $10,586 |
| 5/31/2016 | $10,428 | $11,339 | $10,935 | $10,589 |
| 6/30/2016 | $10,484 | $11,457 | $10,958 | $10,779 |
| 7/31/2016 | $10,719 | $11,729 | $11,393 | $10,847 |
| 8/31/2016 | $10,708 | $11,713 | $11,422 | $10,835 |
| 9/30/2016 | $10,712 | $11,708 | $11,440 | $10,829 |
| 10/31/2016 | $10,578 | $11,529 | $11,192 | $10,746 |
| 11/30/2016 | $10,769 | $11,662 | $11,693 | $10,492 |
| 12/31/2016 | $10,889 | $11,795 | $11,921 | $10,506 |
| 1/31/2017 | $11,017 | $11,940 | $12,145 | $10,527 |
| 2/28/2017 | $11,285 | $12,248 | $12,597 | $10,598 |
| 3/31/2017 | $11,286 | $12,254 | $12,606 | $10,592 |
| 4/30/2017 | $11,363 | $12,364 | $12,739 | $10,674 |
| 5/31/2017 | $11,462 | $12,501 | $12,870 | $10,756 |
| 6/30/2017 | $11,493 | $12,539 | $12,986 | $10,745 |
| 7/31/2017 | $11,629 | $12,702 | $13,231 | $10,792 |
| 8/31/2017 | $11,663 | $12,781 | $13,256 | $10,888 |
| 9/30/2017 | $11,781 | $12,895 | $13,579 | $10,836 |
| 10/31/2017 | $11,936 | $13,069 | $13,876 | $10,843 |
| 11/30/2017 | $12,142 | $13,303 | $14,297 | $10,829 |
| 12/31/2017 | $12,223 | $13,408 | $14,440 | $10,879 |
| 1/31/2018 | $12,605 | $13,796 | $15,201 | $10,753 |
| 2/28/2018 | $12,290 | $13,449 | $14,641 | $10,651 |
| 3/31/2018 | $12,089 | $13,295 | $14,347 | $10,720 |
| 4/30/2018 | $12,089 | $13,282 | $14,402 | $10,640 |
| 5/31/2018 | $12,308 | $13,522 | $14,808 | $10,716 |
| 6/30/2018 | $12,358 | $13,573 | $14,905 | $10,703 |
| 7/31/2018 | $12,641 | $13,853 | $15,400 | $10,705 |
| 8/31/2018 | $12,936 | $14,167 | $15,940 | $10,774 |
| 9/30/2018 | $12,931 | $14,162 | $15,967 | $10,705 |
| 10/31/2018 | $12,330 | $13,554 | $14,791 | $10,620 |
| 11/30/2018 | $12,532 | $13,768 | $15,087 | $10,683 |
| 12/31/2018 | $11,879 | $13,141 | $13,683 | $10,880 |
| 1/31/2019 | $12,537 | $13,797 | $14,858 | $10,995 |
| 2/28/2019 | $12,749 | $14,048 | $15,380 | $10,989 |
| 3/31/2019 | $12,986 | $14,319 | $15,605 | $11,200 |
| 4/30/2019 | $13,261 | $14,651 | $16,228 | $11,203 |
| 5/31/2019 | $12,897 | $14,230 | $15,178 | $11,402 |
| 6/30/2019 | $13,433 | $14,884 | $16,244 | $11,545 |
| 7/31/2019 | $13,530 | $15,006 | $16,485 | $11,570 |
| 8/31/2019 | $13,573 | $15,067 | $16,149 | $11,870 |
| 9/30/2019 | $13,648 | $15,185 | $16,433 | $11,807 |
| 10/31/2019 | $13,792 | $15,387 | $16,786 | $11,842 |
| 11/30/2019 | $14,048 | $15,703 | $17,424 | $11,836 |
| 12/31/2019 | $14,248 | $15,953 | $17,928 | $11,828 |
| 1/31/2020 | $14,402 | $16,105 | $17,908 | $12,056 |
| 2/29/2020 | $13,834 | $15,480 | $16,442 | $12,273 |
| 3/31/2020 | $13,037 | $14,512 | $14,181 | $12,200 |
| 4/30/2020 | $14,081 | $15,665 | $16,059 | $12,417 |
| 5/31/2020 | $14,492 | $16,097 | $16,918 | $12,475 |
| 6/30/2020 | $14,676 | $16,295 | $17,304 | $12,554 |
| 7/31/2020 | $15,247 | $16,921 | $18,287 | $12,741 |
| 8/31/2020 | $15,837 | $17,576 | $19,612 | $12,638 |
| 9/30/2020 | $15,434 | $17,185 | $18,898 | $12,632 |
| 10/31/2020 | $15,156 | $16,846 | $18,490 | $12,575 |
| 11/30/2020 | $16,188 | $17,976 | $20,739 | $12,698 |
| 12/31/2020 | $16,561 | $18,374 | $21,672 | $12,716 |
| 1/31/2021 | $16,360 | $18,193 | $21,576 | $12,625 |
| 2/28/2021 | $16,544 | $18,362 | $22,250 | $12,443 |
| 3/31/2021 | $16,901 | $18,731 | $23,048 | $12,287 |
| 4/30/2021 | $17,536 | $19,387 | $24,236 | $12,384 |
| 5/31/2021 | $17,614 | $19,495 | $24,346 | $12,425 |
| 6/30/2021 | $17,922 | $19,818 | $24,947 | $12,512 |
| 7/31/2021 | $18,266 | $20,208 | $25,369 | $12,652 |
| 8/31/2021 | $18,610 | $20,563 | $26,092 | $12,628 |
| 9/30/2021 | $17,930 | $19,900 | $24,921 | $12,518 |
| 10/31/2021 | $18,725 | $20,731 | $26,607 | $12,515 |
| 11/30/2021 | $18,684 | $20,708 | $26,202 | $12,552 |
| 12/31/2021 | $19,176 | $21,222 | $27,234 | $12,520 |
| 1/31/2022 | $18,363 | $20,403 | $25,631 | $12,250 |
| 2/28/2022 | $17,946 | $19,982 | $24,986 | $12,114 |
| 3/31/2022 | $18,094 | $20,179 | $25,796 | $11,777 |
| 4/30/2022 | $16,860 | $18,873 | $23,481 | $11,330 |
| 5/31/2022 | $16,886 | $18,907 | $23,450 | $11,403 |
| 6/30/2022 | $16,007 | $17,905 | $21,488 | $11,224 |
| 7/31/2022 | $16,966 | $19,009 | $23,504 | $11,498 |
| 8/31/2022 | $16,356 | $18,355 | $22,627 | $11,174 |
| 9/30/2022 | $15,256 | $17,088 | $20,528 | $10,691 |
| 10/31/2022 | $15,884 | $17,822 | $22,212 | $10,552 |
| 11/30/2022 | $16,574 | $18,611 | $23,371 | $10,940 |
| 12/31/2022 | $15,916 | $17,929 | $22,003 | $10,891 |
| 1/31/2023 | $16,677 | $18,785 | $23,518 | $11,226 |
| 2/28/2023 | $16,207 | $18,334 | $22,968 | $10,936 |
| 3/31/2023 | $16,762 | $18,950 | $23,583 | $11,214 |
| 4/30/2023 | $16,940 | $19,168 | $23,834 | $11,282 |
| 5/31/2023 | $16,894 | $19,129 | $23,927 | $11,159 |
| 6/30/2023 | $17,497 | $19,830 | $25,560 | $11,119 |
| 7/31/2023 | $17,799 | $20,184 | $26,477 | $11,111 |
| 8/31/2023 | $17,575 | $19,949 | $25,966 | $11,040 |
| 9/30/2023 | $16,844 | $19,202 | $24,729 | $10,760 |
| 10/31/2023 | $16,486 | $18,867 | $24,073 | $10,590 |
| 11/30/2023 | $17,757 | $20,163 | $26,318 | $11,069 |
| 12/31/2023 | $18,561 | $20,984 | $27,714 | $11,493 |
| 1/31/2024 | $18,728 | $21,172 | $28,021 | $11,462 |
| 2/29/2024 | $19,228 | $21,739 | $29,538 | $11,300 |
| 3/31/2024 | $19,658 | $22,215 | $30,491 | $11,404 |
| 4/30/2024 | $18,896 | $21,464 | $29,149 | $11,116 |
| 5/31/2024 | $19,629 | $22,227 | $30,526 | $11,304 |
| 6/30/2024 | $20,177 | $22,796 | $31,471 | $11,411 |
| 7/31/2024 | $20,507 | $23,162 | $32,056 | $11,678 |
| 8/31/2024 | $20,946 | $23,617 | $32,754 | $11,846 |
| 9/30/2024 | $21,350 | $24,033 | $33,432 | $12,004 |
Index Asset Allocation Fund
Annual Shareholder Report | September 30, 2024
AVERAGE ANNUAL TOTAL RETURNS (%)
| 1 Year | 5 Years | 10 Years |
|---|
| Class A | 26.75 | 9.36 | 8.52 |
| Class A with Load | 19.47 | 8.08 | 7.88 |
Index Asset Allocation Blended Index (Strategy)Footnote Reference* | 25.16 | 9.62 | 9.16 |
Russell 3000® Index (Regulatory) | 35.19 | 15.26 | 12.83 |
| Bloomberg U.S. Aggregate Bond Index (Regulatory) | 11.57 | 0.33 | 1.84 |
| Total net assets | $1,359,112,080 |
| # of portfolio holdings | 641 |
| Portfolio turnover rate | 12% |
| Total advisory fees paid | $7,517,394 |
Figures quoted represent past performance, which is no guarantee of future results, and do not reflect taxes that a shareholder may pay on an investment in a fund.
| Footnote | Description |
Footnote* | Index Asset Allocation Blended Index is composed 60% of the S&P 500 Index and 40% of the Bloomberg U.S. Treasury Index. Prior to April 1, 2015, the Index Asset Allocation Blended Index was composed 60% of the S&P 500 Index and 40% of the Bloomberg U.S. Treasury 20+ Year Index. You cannot invest directly in an index. |
What did the Fund invest in?
(Based on long-term investments)
ALLOCATION (% OF TOTAL INVESTMENTS)
| Neutral Allocation | Effective Allocation |
| Stock Funds | 60.0 | 67.7 |
| Bond Funds | 40.0 | 46.5 |
| Effective Cash | 0.0 | (14.2) |
TOP TEN HOLDINGS (% OF NET ASSETS)
| Apple, Inc. | 4.3 |
| Microsoft Corp. | 3.9 |
| NVIDIA Corp. | 3.7 |
| iShares 20+ Year Treasury Bond ETF | 2.7 |
| Amazon.com, Inc. | 2.1 |
| U.S. Treasury Bonds, 6.00%, 2/15/2026 | 1.7 |
| U.S. Treasury Notes, 1.38%, 10/31/2028 | 1.6 |
| U.S. Treasury Bonds, 6.75%, 8/15/2026 | 1.6 |
| U.S. Treasury Bonds, 6.88%, 8/15/2025 | 1.6 |
| Meta Platforms, Inc., Class A | 1.5 |
You can find additional information on the Fund's website at allspringglobal.com, including its:
- Prospectus - Financial Information - Fund holdings - Proxy voting information
Annual Shareholder Report
Index Asset Allocation Fund
This annual shareholder report contains important information about Index Asset Allocation Fund for the period of October 1, 2023 to September 30, 2024. You can find additional information about the Fund at allspringglobal.com. You can also request this information by contacting us at 1-800-222-8222.
What were the Fund costs for the past year?
The table explains the costs you would have paid within the reporting period based on a hypothetical $10,000 investment.
| CLASS NAME | COSTS OF A $10,000 INVESTMENT | COSTS PAID AS A % OF A $10,000 INVESTMENT |
|---|
| Administrator Class | $102 | 0.90% |
The manager has contractually committed to waive fees and/or reimburse certain expenses to the extent necessary to cap the Fund's total annual fund operating expense ratio at a specific amount. Without this cap, the costs shown above may have been higher. Please see the prospectus for the amount and the expiration date of the cap. Prior to or after the commitment expiration date, the cap may be increased or the commitment to maintain the cap may be terminated only with the approval of the Board of Trustees.
How did the Fund perform last year and what affected its performance?
Over the trailing 12 months, the U.S. saw stable employment, solid economic growth, falling inflation, and the promise and delivery of an initial rate cut by the Federal Reserve. This created a strong environment for the performance of both stocks and bonds. The neutral allocation has 60% of the Fund’s assets invested in the S&P 500 Index, which posted a 36.35% return. The stock market was led by information technology stocks (+52.65%), but the rally was broad based as all 11 of the index’s sectors posted positive returns. The neutral allocation has 40% of the Fund’s assets invested in the Bloomberg U.S. Treasury Index, which posted a 9.72% gain for the period. The Fund’s Tactical Asset Allocation (TAA) activity was the largest contributor to relative performance. Our TAA activity resulted in overweights to both stocks and bonds and favorable yield curve positioning, which benefited from the rally in stocks and bonds. At period-end, the Fund’s effective exposure was 67.7% stocks, 46.5% bonds, and -14.2% cash. Over the period, the TAA activity added more than 230 basis points (bps; 100 bps equal 1.00%) to relative performance.
Total return based on a $10,000 investment
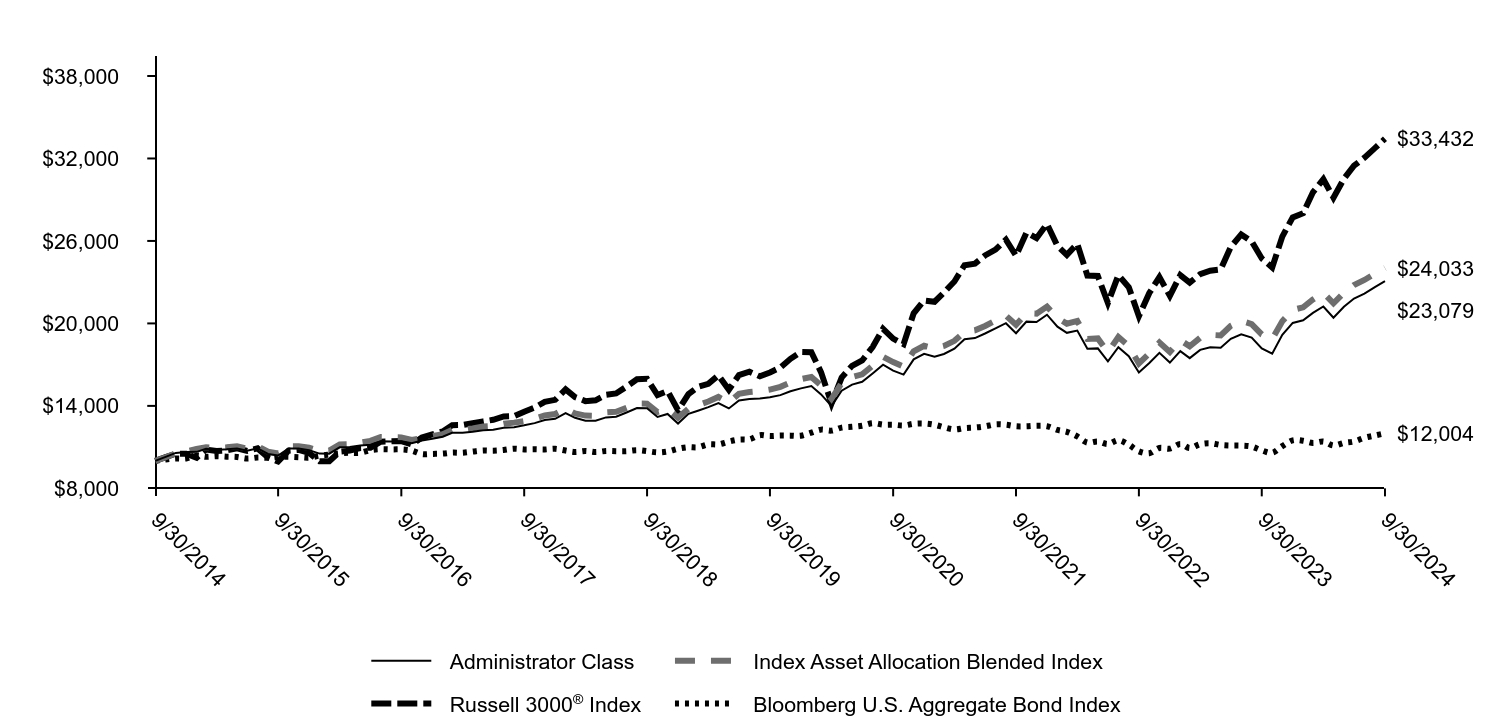
| Administrator Class | Index Asset Allocation Blended Index | Russell 3000® Index | Bloomberg U.S. Aggregate Bond Index |
|---|
| 9/30/2014 | $10,000 | $10,000 | $10,000 | $10,000 |
| 10/31/2014 | $10,294 | $10,264 | $10,275 | $10,098 |
| 11/30/2014 | $10,578 | $10,550 | $10,524 | $10,170 |
| 12/31/2014 | $10,646 | $10,669 | $10,524 | $10,179 |
| 1/31/2015 | $10,657 | $10,874 | $10,231 | $10,393 |
| 2/28/2015 | $10,884 | $10,997 | $10,824 | $10,295 |
| 3/31/2015 | $10,790 | $10,945 | $10,713 | $10,343 |
| 4/30/2015 | $10,837 | $10,985 | $10,762 | $10,306 |
| 5/31/2015 | $10,906 | $11,062 | $10,911 | $10,281 |
| 6/30/2015 | $10,740 | $10,894 | $10,728 | $10,169 |
| 7/31/2015 | $10,913 | $11,068 | $10,908 | $10,240 |
| 8/31/2015 | $10,505 | $10,669 | $10,249 | $10,225 |
| 9/30/2015 | $10,389 | $10,548 | $9,951 | $10,294 |
| 10/31/2015 | $10,895 | $11,067 | $10,736 | $10,296 |
| 11/30/2015 | $10,895 | $11,068 | $10,796 | $10,269 |
| 12/31/2015 | $10,780 | $10,956 | $10,574 | $10,235 |
| 1/31/2016 | $10,527 | $10,723 | $9,978 | $10,376 |
| 2/29/2016 | $10,523 | $10,753 | $9,975 | $10,450 |
| 3/31/2016 | $10,988 | $11,197 | $10,677 | $10,546 |
| 4/30/2016 | $11,003 | $11,219 | $10,743 | $10,586 |
| 5/31/2016 | $11,111 | $11,339 | $10,935 | $10,589 |
| 6/30/2016 | $11,172 | $11,457 | $10,958 | $10,779 |
| 7/31/2016 | $11,423 | $11,729 | $11,393 | $10,847 |
| 8/31/2016 | $11,415 | $11,713 | $11,422 | $10,835 |
| 9/30/2016 | $11,419 | $11,708 | $11,440 | $10,829 |
| 10/31/2016 | $11,280 | $11,529 | $11,192 | $10,746 |
| 11/30/2016 | $11,484 | $11,662 | $11,693 | $10,492 |
| 12/31/2016 | $11,616 | $11,795 | $11,921 | $10,506 |
| 1/31/2017 | $11,752 | $11,940 | $12,145 | $10,527 |
| 2/28/2017 | $12,042 | $12,248 | $12,597 | $10,598 |
| 3/31/2017 | $12,043 | $12,254 | $12,606 | $10,592 |
| 4/30/2017 | $12,125 | $12,364 | $12,739 | $10,674 |
| 5/31/2017 | $12,231 | $12,501 | $12,870 | $10,756 |
| 6/30/2017 | $12,267 | $12,539 | $12,986 | $10,745 |
| 7/31/2017 | $12,416 | $12,702 | $13,231 | $10,792 |
| 8/31/2017 | $12,452 | $12,781 | $13,256 | $10,888 |
| 9/30/2017 | $12,584 | $12,895 | $13,579 | $10,836 |
| 10/31/2017 | $12,745 | $13,069 | $13,876 | $10,843 |
| 11/30/2017 | $12,973 | $13,303 | $14,297 | $10,829 |
| 12/31/2017 | $13,057 | $13,408 | $14,440 | $10,879 |
| 1/31/2018 | $13,469 | $13,796 | $15,201 | $10,753 |
| 2/28/2018 | $13,132 | $13,449 | $14,641 | $10,651 |
| 3/31/2018 | $12,923 | $13,295 | $14,347 | $10,720 |
| 4/30/2018 | $12,923 | $13,282 | $14,402 | $10,640 |
| 5/31/2018 | $13,161 | $13,522 | $14,808 | $10,716 |
| 6/30/2018 | $13,216 | $13,573 | $14,905 | $10,703 |
| 7/31/2018 | $13,519 | $13,853 | $15,400 | $10,705 |
| 8/31/2018 | $13,838 | $14,167 | $15,940 | $10,774 |
| 9/30/2018 | $13,835 | $14,162 | $15,967 | $10,705 |
| 10/31/2018 | $13,192 | $13,554 | $14,791 | $10,620 |
| 11/30/2018 | $13,411 | $13,768 | $15,087 | $10,683 |
| 12/31/2018 | $12,712 | $13,141 | $13,683 | $10,880 |
| 1/31/2019 | $13,421 | $13,797 | $14,858 | $10,995 |
| 2/28/2019 | $13,651 | $14,048 | $15,380 | $10,989 |
| 3/31/2019 | $13,906 | $14,319 | $15,605 | $11,200 |
| 4/30/2019 | $14,200 | $14,651 | $16,228 | $11,203 |
| 5/31/2019 | $13,815 | $14,230 | $15,178 | $11,402 |
| 6/30/2019 | $14,391 | $14,884 | $16,244 | $11,545 |
| 7/31/2019 | $14,499 | $15,006 | $16,485 | $11,570 |
| 8/31/2019 | $14,545 | $15,067 | $16,149 | $11,870 |
| 9/30/2019 | $14,628 | $15,185 | $16,433 | $11,807 |
| 10/31/2019 | $14,782 | $15,387 | $16,786 | $11,842 |
| 11/30/2019 | $15,061 | $15,703 | $17,424 | $11,836 |
| 12/31/2019 | $15,275 | $15,953 | $17,928 | $11,828 |
| 1/31/2020 | $15,444 | $16,105 | $17,908 | $12,056 |
| 2/29/2020 | $14,835 | $15,480 | $16,442 | $12,273 |
| 3/31/2020 | $13,982 | $14,512 | $14,181 | $12,200 |
| 4/30/2020 | $15,106 | $15,665 | $16,059 | $12,417 |
| 5/31/2020 | $15,551 | $16,097 | $16,918 | $12,475 |
| 6/30/2020 | $15,751 | $16,295 | $17,304 | $12,554 |
| 7/31/2020 | $16,363 | $16,921 | $18,287 | $12,741 |
| 8/31/2020 | $17,001 | $17,576 | $19,612 | $12,638 |
| 9/30/2020 | $16,567 | $17,185 | $18,898 | $12,632 |
| 10/31/2020 | $16,273 | $16,846 | $18,490 | $12,575 |
| 11/30/2020 | $17,385 | $17,976 | $20,739 | $12,698 |
| 12/31/2020 | $17,787 | $18,374 | $21,672 | $12,716 |
| 1/31/2021 | $17,576 | $18,193 | $21,576 | $12,625 |
| 2/28/2021 | $17,774 | $18,362 | $22,250 | $12,443 |
| 3/31/2021 | $18,161 | $18,731 | $23,048 | $12,287 |
| 4/30/2021 | $18,844 | $19,387 | $24,236 | $12,384 |
| 5/31/2021 | $18,932 | $19,495 | $24,346 | $12,425 |
| 6/30/2021 | $19,266 | $19,818 | $24,947 | $12,512 |
| 7/31/2021 | $19,641 | $20,208 | $25,369 | $12,652 |
| 8/31/2021 | $20,015 | $20,563 | $26,092 | $12,628 |
| 9/30/2021 | $19,284 | $19,900 | $24,921 | $12,518 |
| 10/31/2021 | $20,142 | $20,731 | $26,607 | $12,515 |
| 11/30/2021 | $20,098 | $20,708 | $26,202 | $12,552 |
| 12/31/2021 | $20,633 | $21,222 | $27,234 | $12,520 |
| 1/31/2022 | $19,764 | $20,403 | $25,631 | $12,250 |
| 2/28/2022 | $19,315 | $19,982 | $24,986 | $12,114 |
| 3/31/2022 | $19,479 | $20,179 | $25,796 | $11,777 |
| 4/30/2022 | $18,151 | $18,873 | $23,481 | $11,330 |
| 5/31/2022 | $18,183 | $18,907 | $23,450 | $11,403 |
| 6/30/2022 | $17,238 | $17,905 | $21,488 | $11,224 |
| 7/31/2022 | $18,270 | $19,009 | $23,504 | $11,498 |
| 8/31/2022 | $17,618 | $18,355 | $22,627 | $11,174 |
| 9/30/2022 | $16,436 | $17,088 | $20,528 | $10,691 |
| 10/31/2022 | $17,118 | $17,822 | $22,212 | $10,552 |
| 11/30/2022 | $17,861 | $18,611 | $23,371 | $10,940 |
| 12/31/2022 | $17,151 | $17,929 | $22,003 | $10,891 |
| 1/31/2023 | $17,981 | $18,785 | $23,518 | $11,226 |
| 2/28/2023 | $17,475 | $18,334 | $22,968 | $10,936 |
| 3/31/2023 | $18,075 | $18,950 | $23,583 | $11,214 |
| 4/30/2023 | $18,272 | $19,168 | $23,834 | $11,282 |
| 5/31/2023 | $18,223 | $19,129 | $23,927 | $11,159 |
| 6/30/2023 | $18,876 | $19,830 | $25,560 | $11,119 |
| 7/31/2023 | $19,207 | $20,184 | $26,477 | $11,111 |
| 8/31/2023 | $18,965 | $19,949 | $25,966 | $11,040 |
| 9/30/2023 | $18,180 | $19,202 | $24,729 | $10,760 |
| 10/31/2023 | $17,799 | $18,867 | $24,073 | $10,590 |
| 11/30/2023 | $19,170 | $20,163 | $26,318 | $11,069 |
| 12/31/2023 | $20,035 | $20,984 | $27,714 | $11,493 |
| 1/31/2024 | $20,226 | $21,172 | $28,021 | $11,462 |
| 2/29/2024 | $20,766 | $21,739 | $29,538 | $11,300 |
| 3/31/2024 | $21,233 | $22,215 | $30,491 | $11,404 |
| 4/30/2024 | $20,414 | $21,464 | $29,149 | $11,116 |
| 5/31/2024 | $21,211 | $22,227 | $30,526 | $11,304 |
| 6/30/2024 | $21,806 | $22,796 | $31,471 | $11,411 |
| 7/31/2024 | $22,163 | $23,162 | $32,056 | $11,678 |
| 8/31/2024 | $22,643 | $23,617 | $32,754 | $11,846 |
| 9/30/2024 | $23,079 | $24,033 | $33,432 | $12,004 |
Index Asset Allocation Fund
Annual Shareholder Report | September 30, 2024
AVERAGE ANNUAL TOTAL RETURNS (%)
| 1 Year | 5 Years | 10 Years |
|---|
| Administrator Class | 26.95 | 9.55 | 8.72 |
Index Asset Allocation Blended Index (Strategy)Footnote Reference* | 25.16 | 9.62 | 9.16 |
Russell 3000® Index (Regulatory) | 35.19 | 15.26 | 12.83 |
| Bloomberg U.S. Aggregate Bond Index (Regulatory) | 11.57 | 0.33 | 1.84 |
| Total net assets | $1,359,112,080 |
| # of portfolio holdings | 641 |
| Portfolio turnover rate | 12% |
| Total advisory fees paid | $7,517,394 |
Figures quoted represent past performance, which is no guarantee of future results, and do not reflect taxes that a shareholder may pay on an investment in a fund.
| Footnote | Description |
Footnote* | Index Asset Allocation Blended Index is composed 60% of the S&P 500 Index and 40% of the Bloomberg U.S. Treasury Index. Prior to April 1, 2015, the Index Asset Allocation Blended Index was composed 60% of the S&P 500 Index and 40% of the Bloomberg U.S. Treasury 20+ Year Index. You cannot invest directly in an index. |
What did the Fund invest in?
(Based on long-term investments)
ALLOCATION (% OF TOTAL INVESTMENTS)
| Neutral Allocation | Effective Allocation |
| Stock Funds | 60.0 | 67.7 |
| Bond Funds | 40.0 | 46.5 |
| Effective Cash | 0.0 | (14.2) |
TOP TEN HOLDINGS (% OF NET ASSETS)
| Apple, Inc. | 4.3 |
| Microsoft Corp. | 3.9 |
| NVIDIA Corp. | 3.7 |
| iShares 20+ Year Treasury Bond ETF | 2.7 |
| Amazon.com, Inc. | 2.1 |
| U.S. Treasury Bonds, 6.00%, 2/15/2026 | 1.7 |
| U.S. Treasury Notes, 1.38%, 10/31/2028 | 1.6 |
| U.S. Treasury Bonds, 6.75%, 8/15/2026 | 1.6 |
| U.S. Treasury Bonds, 6.88%, 8/15/2025 | 1.6 |
| Meta Platforms, Inc., Class A | 1.5 |
You can find additional information on the Fund's website at allspringglobal.com, including its:
- Prospectus - Financial Information - Fund holdings - Proxy voting information
Annual Shareholder Report
This annual shareholder report contains important information about Opportunity Fund for the period of October 1, 2023 to September 30, 2024. You can find additional information about the Fund at allspringglobal.com. You can also request this information by contacting us at 1-800-222-8222.
What were the Fund costs for the past year?
The table explains the costs you would have paid within the reporting period based on a hypothetical $10,000 investment.
| CLASS NAME | COSTS OF A $10,000 INVESTMENT | COSTS PAID AS A % OF A $10,000 INVESTMENT |
|---|
| Institutional Class | $86 | 0.75% |
The manager has contractually committed to waive fees and/or reimburse certain expenses to the extent necessary to cap the Fund's total annual fund operating expense ratio at a specific amount. Without this cap, the costs shown above may have been higher. Please see the prospectus for the amount and the expiration date of the cap. Prior to or after the commitment expiration date, the cap may be increased or the commitment to maintain the cap may be terminated only with the approval of the Board of Trustees.
How did the Fund perform last year and what affected its performance?
Over the 12-month period that ended September 30, 2024, the equity markets soared to all-time highs, fueled by positive earnings surprises, robust economic growth, a decline in both inflation and interest rates, and a fervor around artificial intelligence (AI). Driven by semiconductor chip designer NVIDIA Corp., the AI theme significantly boosted the mega-cap growth sector to unprecedented heights. By contrast, small- and mid-cap stocks substantially underperformed large caps, partly due to their inferior balance sheet profiles. However, with the Federal Reserve pivoting to a more accommodative stance, future rate cuts could lower borrowing costs and be a catalyst for smaller-cap companies.
The Fund’s underweight to NVIDIA was a meaningful source of its underperformance. Other key detractors include Dollar General Corp., which faltered due to execution issues and weakness from its lower-end consumer, and Atkore Inc., which endured a cyclical downturn, citing weaker customer spending. Going forward, we remain optimistic about the Fund’s prospects given the attractive private market valuations of many of our holdings.
Total return based on a $10,000 investment
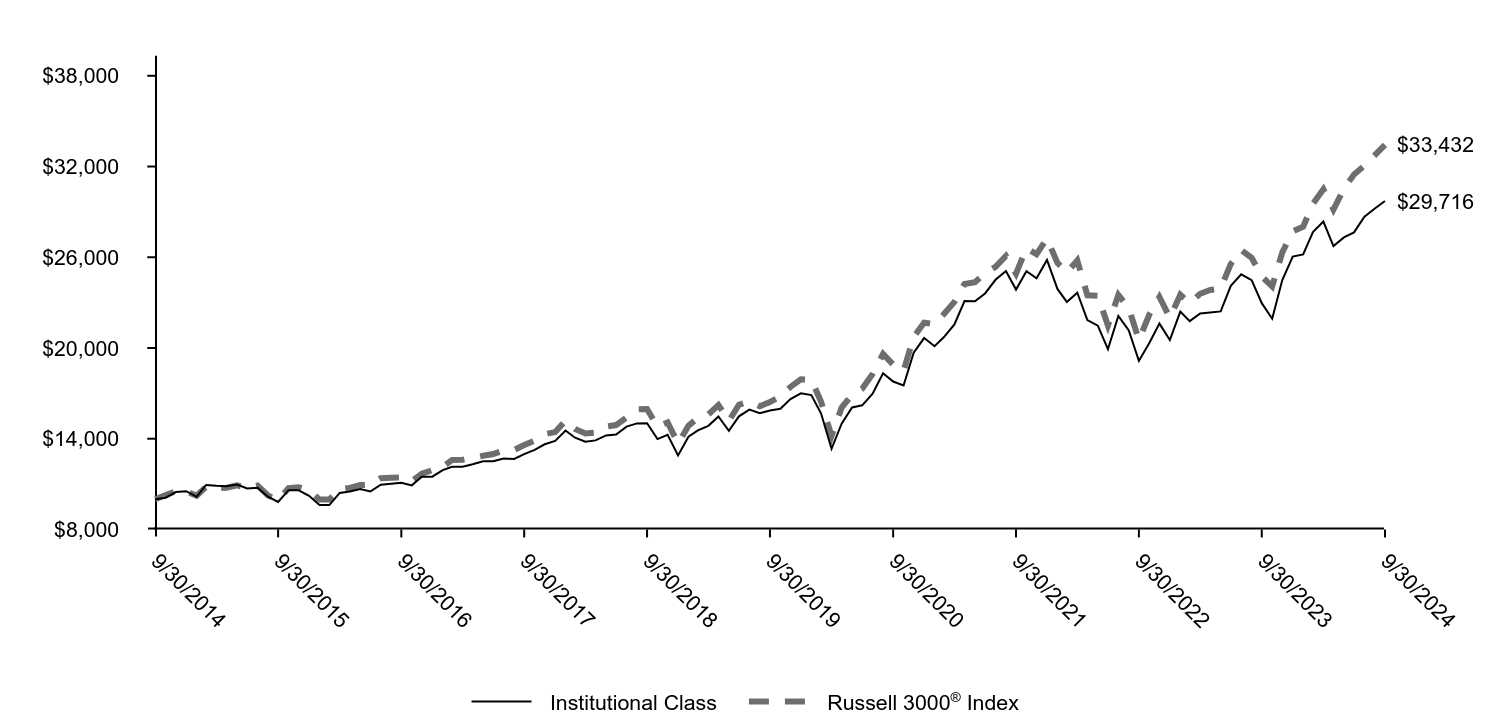
| Institutional Class | Russell 3000® Index |
|---|
| 9/30/2014 | $10,000 | $10,000 |
| 10/31/2014 | $10,098 | $10,275 |
| 11/30/2014 | $10,475 | $10,524 |
| 12/31/2014 | $10,527 | $10,524 |
| 1/31/2015 | $10,159 | $10,231 |
| 2/28/2015 | $10,945 | $10,824 |
| 3/31/2015 | $10,892 | $10,713 |
| 4/30/2015 | $10,859 | $10,762 |
| 5/31/2015 | $10,974 | $10,911 |
| 6/30/2015 | $10,714 | $10,728 |
| 7/31/2015 | $10,764 | $10,908 |
| 8/31/2015 | $10,166 | $10,249 |
| 9/30/2015 | $9,819 | $9,951 |
| 10/31/2015 | $10,596 | $10,736 |
| 11/30/2015 | $10,588 | $10,796 |
| 12/31/2015 | $10,225 | $10,574 |
| 1/31/2016 | $9,613 | $9,978 |
| 2/29/2016 | $9,615 | $9,975 |
| 3/31/2016 | $10,417 | $10,677 |
| 4/30/2016 | $10,505 | $10,743 |
| 5/31/2016 | $10,680 | $10,935 |
| 6/30/2016 | $10,512 | $10,958 |
| 7/31/2016 | $10,962 | $11,393 |
| 8/31/2016 | $11,028 | $11,422 |
| 9/30/2016 | $11,093 | $11,440 |
| 10/31/2016 | $10,916 | $11,192 |
| 11/30/2016 | $11,489 | $11,693 |
| 12/31/2016 | $11,492 | $11,921 |
| 1/31/2017 | $11,926 | $12,145 |
| 2/28/2017 | $12,148 | $12,597 |
| 3/31/2017 | $12,150 | $12,606 |
| 4/30/2017 | $12,315 | $12,739 |
| 5/31/2017 | $12,506 | $12,870 |
| 6/30/2017 | $12,509 | $12,986 |
| 7/31/2017 | $12,687 | $13,231 |
| 8/31/2017 | $12,661 | $13,256 |
| 9/30/2017 | $12,981 | $13,579 |
| 10/31/2017 | $13,263 | $13,876 |
| 11/30/2017 | $13,632 | $14,297 |
| 12/31/2017 | $13,852 | $14,440 |
| 1/31/2018 | $14,540 | $15,201 |
| 2/28/2018 | $14,068 | $14,641 |
| 3/31/2018 | $13,799 | $14,347 |
| 4/30/2018 | $13,890 | $14,402 |
| 5/31/2018 | $14,216 | $14,808 |
| 6/30/2018 | $14,278 | $14,905 |
| 7/31/2018 | $14,797 | $15,400 |
| 8/31/2018 | $15,013 | $15,940 |
| 9/30/2018 | $15,018 | $15,967 |
| 10/31/2018 | $13,974 | $14,791 |
| 11/30/2018 | $14,263 | $15,087 |
| 12/31/2018 | $12,895 | $13,683 |
| 1/31/2019 | $14,131 | $14,858 |
| 2/28/2019 | $14,546 | $15,380 |
| 3/31/2019 | $14,855 | $15,605 |
| 4/30/2019 | $15,471 | $16,228 |
| 5/31/2019 | $14,524 | $15,178 |
| 6/30/2019 | $15,481 | $16,244 |
| 7/31/2019 | $15,922 | $16,485 |
| 8/31/2019 | $15,682 | $16,149 |
| 9/30/2019 | $15,864 | $16,433 |
| 10/31/2019 | $15,984 | $16,786 |
| 11/30/2019 | $16,626 | $17,424 |
| 12/31/2019 | $17,006 | $17,928 |
| 1/31/2020 | $16,886 | $17,908 |
| 2/29/2020 | $15,665 | $16,442 |
| 3/31/2020 | $13,332 | $14,181 |
| 4/30/2020 | $14,996 | $16,059 |
| 5/31/2020 | $16,069 | $16,918 |
| 6/30/2020 | $16,207 | $17,304 |
| 7/31/2020 | $16,975 | $18,287 |
| 8/31/2020 | $18,323 | $19,612 |
| 9/30/2020 | $17,781 | $18,898 |
| 10/31/2020 | $17,521 | $18,490 |
| 11/30/2020 | $19,689 | $20,739 |
| 12/31/2020 | $20,657 | $21,672 |
| 1/31/2021 | $20,119 | $21,576 |
| 2/28/2021 | $20,722 | $22,250 |
| 3/31/2021 | $21,558 | $23,048 |
| 4/30/2021 | $23,099 | $24,236 |
| 5/31/2021 | $23,085 | $24,346 |
| 6/30/2021 | $23,608 | $24,947 |
| 7/31/2021 | $24,509 | $25,369 |
| 8/31/2021 | $25,095 | $26,092 |
| 9/30/2021 | $23,862 | $24,921 |
| 10/31/2021 | $25,073 | $26,607 |
| 11/30/2021 | $24,604 | $26,202 |
| 12/31/2021 | $25,819 | $27,234 |
| 1/31/2022 | $23,904 | $25,631 |
| 2/28/2022 | $23,045 | $24,986 |
| 3/31/2022 | $23,651 | $25,796 |
| 4/30/2022 | $21,849 | $23,481 |
| 5/31/2022 | $21,476 | $23,450 |
| 6/30/2022 | $19,918 | $21,488 |
| 7/31/2022 | $22,126 | $23,504 |
| 8/31/2022 | $21,167 | $22,627 |
| 9/30/2022 | $19,147 | $20,528 |
| 10/31/2022 | $20,332 | $22,212 |
| 11/30/2022 | $21,612 | $23,371 |
| 12/31/2022 | $20,526 | $22,003 |
| 1/31/2023 | $22,403 | $23,518 |
| 2/28/2023 | $21,778 | $22,968 |
| 3/31/2023 | $22,281 | $23,583 |
| 4/30/2023 | $22,342 | $23,834 |
| 5/31/2023 | $22,417 | $23,927 |
| 6/30/2023 | $24,106 | $25,560 |
| 7/31/2023 | $24,871 | $26,477 |
| 8/31/2023 | $24,486 | $25,966 |
| 9/30/2023 | $22,963 | $24,729 |
| 10/31/2023 | $21,935 | $24,073 |
| 11/30/2023 | $24,491 | $26,318 |
| 12/31/2023 | $26,045 | $27,714 |
| 1/31/2024 | $26,189 | $28,021 |
| 2/29/2024 | $27,670 | $29,538 |
| 3/31/2024 | $28,362 | $30,491 |
| 4/30/2024 | $26,737 | $29,149 |
| 5/31/2024 | $27,312 | $30,526 |
| 6/30/2024 | $27,643 | $31,471 |
| 7/31/2024 | $28,675 | $32,056 |
| 8/31/2024 | $29,223 | $32,754 |
| 9/30/2024 | $29,716 | $33,432 |
Annual Shareholder Report | September 30, 2024
AVERAGE ANNUAL TOTAL RETURNS (%)
| 1 Year | 5 Years | 10 Years |
|---|
| Institutional Class | 29.41 | 13.38 | 11.51 |
Russell 3000® Index (Strategy and Regulatory) | 35.19 | 15.26 | 12.83 |
| Total net assets | $1,976,855,107 |
| # of portfolio holdings | 56 |
| Portfolio turnover rate | 20% |
| Total advisory fees paid | $13,006,340 |
Figures quoted represent past performance, which is no guarantee of future results, and do not reflect taxes that a shareholder may pay on an investment in a fund.
What did the Fund invest in?
(Based on long-term investments)
SECTOR ALLOCATION (% OF LONG-TERM INVESTMENTS)
| Information technology | 25.2 |
| Industrials | 16.6 |
| Consumer discretionary | 10.3 |
| Financials | 10.0 |
| Health care | 9.9 |
| Real estate | 9.2 |
| Communication services | 8.4 |
| Materials | 6.6 |
| Consumer staples | 3.8 |
TOP TEN HOLDINGS (% OF NET ASSETS)
| Apple, Inc. | 5.6 |
| Amazon.com, Inc. | 5.1 |
| Alphabet, Inc., Class C | 4.7 |
| Salesforce, Inc. | 4.0 |
| Meta Platforms, Inc., Class A | 3.5 |
| Mastercard, Inc., Class A | 3.5 |
| Texas Instruments, Inc. | 3.0 |
| Marvell Technology, Inc. | 2.2 |
| UnitedHealth Group, Inc. | 2.2 |
| Regal Rexnord Corp. | 2.2 |
You can find additional information on the Fund's website at allspringglobal.com, including its:
- Prospectus - Financial Information - Fund holdings - Proxy voting information
Annual Shareholder Report
This annual shareholder report contains important information about Opportunity Fund for the period of October 1, 2023 to September 30, 2024. You can find additional information about the Fund at allspringglobal.com. You can also request this information by contacting us at 1-800-222-8222.
What were the Fund costs for the past year?
The table explains the costs you would have paid within the reporting period based on a hypothetical $10,000 investment.
| CLASS NAME | COSTS OF A $10,000 INVESTMENT | COSTS PAID AS A % OF A $10,000 INVESTMENT |
|---|
| Class R6 | $83 | 0.72% |
The manager has contractually committed to waive fees and/or reimburse certain expenses to the extent necessary to cap the Fund's total annual fund operating expense ratio at a specific amount. Without this cap, the costs shown above may have been higher. Please see the prospectus for the amount and the expiration date of the cap. Prior to or after the commitment expiration date, the cap may be increased or the commitment to maintain the cap may be terminated only with the approval of the Board of Trustees.
How did the Fund perform last year and what affected its performance?
Over the 12-month period that ended September 30, 2024, the equity markets soared to all-time highs, fueled by positive earnings surprises, robust economic growth, a decline in both inflation and interest rates, and a fervor around artificial intelligence (AI). Driven by semiconductor chip designer NVIDIA Corp., the AI theme significantly boosted the mega-cap growth sector to unprecedented heights. By contrast, small- and mid-cap stocks substantially underperformed large caps, partly due to their inferior balance sheet profiles. However, with the Federal Reserve pivoting to a more accommodative stance, future rate cuts could lower borrowing costs and be a catalyst for smaller-cap companies.
The Fund’s underweight to NVIDIA was a meaningful source of its underperformance. Other key detractors include Dollar General Corp., which faltered due to execution issues and weakness from its lower-end consumer, and Atkore Inc., which endured a cyclical downturn, citing weaker customer spending. Going forward, we remain optimistic about the Fund’s prospects given the attractive private market valuations of many of our holdings.
Total return based on a $10,000 investment
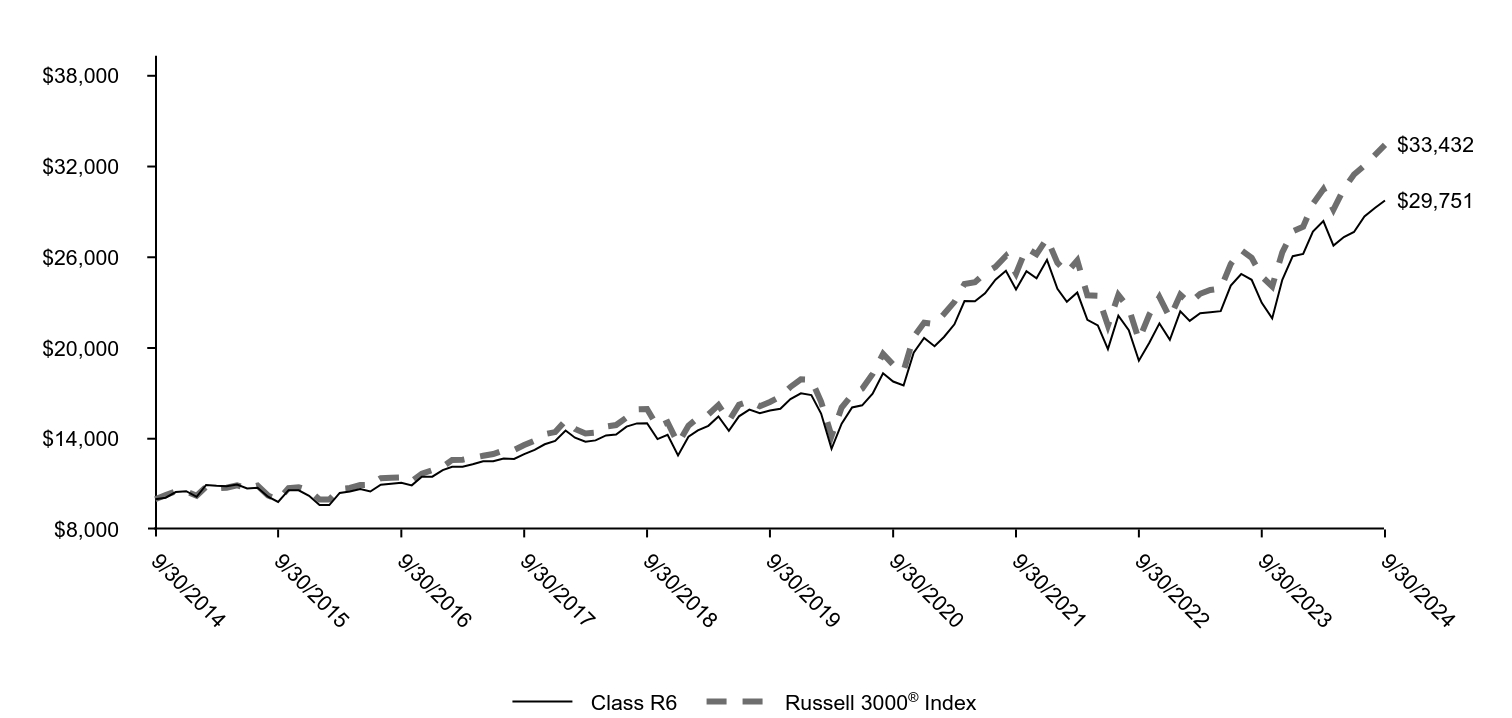
| Class R6 | Russell 3000® Index |
|---|
| 9/30/2014 | $10,000 | $10,000 |
| 10/31/2014 | $10,098 | $10,275 |
| 11/30/2014 | $10,475 | $10,524 |
| 12/31/2014 | $10,527 | $10,524 |
| 1/31/2015 | $10,159 | $10,231 |
| 2/28/2015 | $10,945 | $10,824 |
| 3/31/2015 | $10,892 | $10,713 |
| 4/30/2015 | $10,859 | $10,762 |
| 5/31/2015 | $10,974 | $10,911 |
| 6/30/2015 | $10,714 | $10,728 |
| 7/31/2015 | $10,764 | $10,908 |
| 8/31/2015 | $10,166 | $10,249 |
| 9/30/2015 | $9,819 | $9,951 |
| 10/31/2015 | $10,596 | $10,736 |
| 11/30/2015 | $10,588 | $10,796 |
| 12/31/2015 | $10,225 | $10,574 |
| 1/31/2016 | $9,613 | $9,978 |
| 2/29/2016 | $9,615 | $9,975 |
| 3/31/2016 | $10,417 | $10,677 |
| 4/30/2016 | $10,505 | $10,743 |
| 5/31/2016 | $10,680 | $10,935 |
| 6/30/2016 | $10,512 | $10,958 |
| 7/31/2016 | $10,962 | $11,393 |
| 8/31/2016 | $11,028 | $11,422 |
| 9/30/2016 | $11,093 | $11,440 |
| 10/31/2016 | $10,916 | $11,192 |
| 11/30/2016 | $11,489 | $11,693 |
| 12/31/2016 | $11,492 | $11,921 |
| 1/31/2017 | $11,926 | $12,145 |
| 2/28/2017 | $12,148 | $12,597 |
| 3/31/2017 | $12,150 | $12,606 |
| 4/30/2017 | $12,315 | $12,739 |
| 5/31/2017 | $12,506 | $12,870 |
| 6/30/2017 | $12,509 | $12,986 |
| 7/31/2017 | $12,687 | $13,231 |
| 8/31/2017 | $12,661 | $13,256 |
| 9/30/2017 | $12,981 | $13,579 |
| 10/31/2017 | $13,263 | $13,876 |
| 11/30/2017 | $13,632 | $14,297 |
| 12/31/2017 | $13,852 | $14,440 |
| 1/31/2018 | $14,540 | $15,201 |
| 2/28/2018 | $14,068 | $14,641 |
| 3/31/2018 | $13,799 | $14,347 |
| 4/30/2018 | $13,890 | $14,402 |
| 5/31/2018 | $14,216 | $14,808 |
| 6/30/2018 | $14,278 | $14,905 |
| 7/31/2018 | $14,797 | $15,400 |
| 8/31/2018 | $15,013 | $15,940 |
| 9/30/2018 | $15,018 | $15,967 |
| 10/31/2018 | $13,974 | $14,791 |
| 11/30/2018 | $14,263 | $15,087 |
| 12/31/2018 | $12,895 | $13,683 |
| 1/31/2019 | $14,131 | $14,858 |
| 2/28/2019 | $14,546 | $15,380 |
| 3/31/2019 | $14,855 | $15,605 |
| 4/30/2019 | $15,471 | $16,228 |
| 5/31/2019 | $14,524 | $15,178 |
| 6/30/2019 | $15,481 | $16,244 |
| 7/31/2019 | $15,922 | $16,485 |
| 8/31/2019 | $15,682 | $16,149 |
| 9/30/2019 | $15,864 | $16,433 |
| 10/31/2019 | $15,984 | $16,786 |
| 11/30/2019 | $16,626 | $17,424 |
| 12/31/2019 | $17,006 | $17,928 |
| 1/31/2020 | $16,886 | $17,908 |
| 2/29/2020 | $15,665 | $16,442 |
| 3/31/2020 | $13,332 | $14,181 |
| 4/30/2020 | $14,996 | $16,059 |
| 5/31/2020 | $16,069 | $16,918 |
| 6/30/2020 | $16,207 | $17,304 |
| 7/31/2020 | $16,975 | $18,287 |
| 8/31/2020 | $18,323 | $19,612 |
| 9/30/2020 | $17,781 | $18,898 |
| 10/31/2020 | $17,521 | $18,490 |
| 11/30/2020 | $19,689 | $20,739 |
| 12/31/2020 | $20,658 | $21,672 |
| 1/31/2021 | $20,120 | $21,576 |
| 2/28/2021 | $20,727 | $22,250 |
| 3/31/2021 | $21,563 | $23,048 |
| 4/30/2021 | $23,104 | $24,236 |
| 5/31/2021 | $23,090 | $24,346 |
| 6/30/2021 | $23,613 | $24,947 |
| 7/31/2021 | $24,515 | $25,369 |
| 8/31/2021 | $25,104 | $26,092 |
| 9/30/2021 | $23,868 | $24,921 |
| 10/31/2021 | $25,082 | $26,607 |
| 11/30/2021 | $24,613 | $26,202 |
| 12/31/2021 | $25,832 | $27,234 |
| 1/31/2022 | $23,917 | $25,631 |
| 2/28/2022 | $23,058 | $24,986 |
| 3/31/2022 | $23,664 | $25,796 |
| 4/30/2022 | $21,862 | $23,481 |
| 5/31/2022 | $21,488 | $23,450 |
| 6/30/2022 | $19,927 | $21,488 |
| 7/31/2022 | $22,139 | $23,504 |
| 8/31/2022 | $21,179 | $22,627 |
| 9/30/2022 | $19,160 | $20,528 |
| 10/31/2022 | $20,344 | $22,212 |
| 11/30/2022 | $21,625 | $23,371 |
| 12/31/2022 | $20,543 | $22,003 |
| 1/31/2023 | $22,420 | $23,518 |
| 2/28/2023 | $21,795 | $22,968 |
| 3/31/2023 | $22,298 | $23,583 |
| 4/30/2023 | $22,359 | $23,834 |
| 5/31/2023 | $22,434 | $23,927 |
| 6/30/2023 | $24,123 | $25,560 |
| 7/31/2023 | $24,893 | $26,477 |
| 8/31/2023 | $24,508 | $25,966 |
| 9/30/2023 | $22,985 | $24,729 |
| 10/31/2023 | $21,957 | $24,073 |
| 11/30/2023 | $24,512 | $26,318 |
| 12/31/2023 | $26,070 | $27,714 |
| 1/31/2024 | $26,215 | $28,021 |
| 2/29/2024 | $27,696 | $29,538 |
| 3/31/2024 | $28,388 | $30,491 |
| 4/30/2024 | $26,768 | $29,149 |
| 5/31/2024 | $27,338 | $30,526 |
| 6/30/2024 | $27,673 | $31,471 |
| 7/31/2024 | $28,705 | $32,056 |
| 8/31/2024 | $29,257 | $32,754 |
| 9/30/2024 | $29,751 | $33,432 |
Annual Shareholder Report | September 30, 2024
AVERAGE ANNUAL TOTAL RETURNS (%)
| 1 Year | 5 Years | 10 Years |
|---|
Class R6Footnote Reference* | 29.44 | 13.40 | 11.52 |
Russell 3000® Index (Strategy and Regulatory) | 35.19 | 15.26 | 12.83 |
| Total net assets | $1,976,855,107 |
| # of portfolio holdings | 56 |
| Portfolio turnover rate | 20% |
| Total advisory fees paid | $13,006,340 |
Figures quoted represent past performance, which is no guarantee of future results, and do not reflect taxes that a shareholder may pay on an investment in a fund.
| Footnote | Description |
Footnote* | Historical performance shown for the Class R6 shares prior to their inception on May 29, 2020 reflects the performance of the Institutional Class shares, and includes the higher expenses applicable to the Institutional Class shares. If these expenses had not been included, returns for the Class R6 shares would be higher. |
What did the Fund invest in?
(Based on long-term investments)
SECTOR ALLOCATION (% OF LONG-TERM INVESTMENTS)
| Information technology | 25.2 |
| Industrials | 16.6 |
| Consumer discretionary | 10.3 |
| Financials | 10.0 |
| Health care | 9.9 |
| Real estate | 9.2 |
| Communication services | 8.4 |
| Materials | 6.6 |
| Consumer staples | 3.8 |
TOP TEN HOLDINGS (% OF NET ASSETS)
| Apple, Inc. | 5.6 |
| Amazon.com, Inc. | 5.1 |
| Alphabet, Inc., Class C | 4.7 |
| Salesforce, Inc. | 4.0 |
| Meta Platforms, Inc., Class A | 3.5 |
| Mastercard, Inc., Class A | 3.5 |
| Texas Instruments, Inc. | 3.0 |
| Marvell Technology, Inc. | 2.2 |
| UnitedHealth Group, Inc. | 2.2 |
| Regal Rexnord Corp. | 2.2 |
You can find additional information on the Fund's website at allspringglobal.com, including its:
- Prospectus - Financial Information - Fund holdings - Proxy voting information
Annual Shareholder Report
This annual shareholder report contains important information about Opportunity Fund for the period of October 1, 2023 to September 30, 2024. You can find additional information about the Fund at allspringglobal.com. You can also request this information by contacting us at 1-800-222-8222.
What were the Fund costs for the past year?
The table explains the costs you would have paid within the reporting period based on a hypothetical $10,000 investment.
| CLASS NAME | COSTS OF A $10,000 INVESTMENT | COSTS PAID AS A % OF A $10,000 INVESTMENT |
|---|
| Class C | $215 | 1.89% |
The manager has contractually committed to waive fees and/or reimburse certain expenses to the extent necessary to cap the Fund's total annual fund operating expense ratio at a specific amount. Without this cap, the costs shown above may have been higher. Please see the prospectus for the amount and the expiration date of the cap. Prior to or after the commitment expiration date, the cap may be increased or the commitment to maintain the cap may be terminated only with the approval of the Board of Trustees.
How did the Fund perform last year and what affected its performance?
Over the 12-month period that ended September 30, 2024, the equity markets soared to all-time highs, fueled by positive earnings surprises, robust economic growth, a decline in both inflation and interest rates, and a fervor around artificial intelligence (AI). Driven by semiconductor chip designer NVIDIA Corp., the AI theme significantly boosted the mega-cap growth sector to unprecedented heights. By contrast, small- and mid-cap stocks substantially underperformed large caps, partly due to their inferior balance sheet profiles. However, with the Federal Reserve pivoting to a more accommodative stance, future rate cuts could lower borrowing costs and be a catalyst for smaller-cap companies.
The Fund’s underweight to NVIDIA was a meaningful source of its underperformance. Other key detractors include Dollar General Corp., which faltered due to execution issues and weakness from its lower-end consumer, and Atkore Inc., which endured a cyclical downturn, citing weaker customer spending. Going forward, we remain optimistic about the Fund’s prospects given the attractive private market valuations of many of our holdings.
Total return based on a $10,000 investment
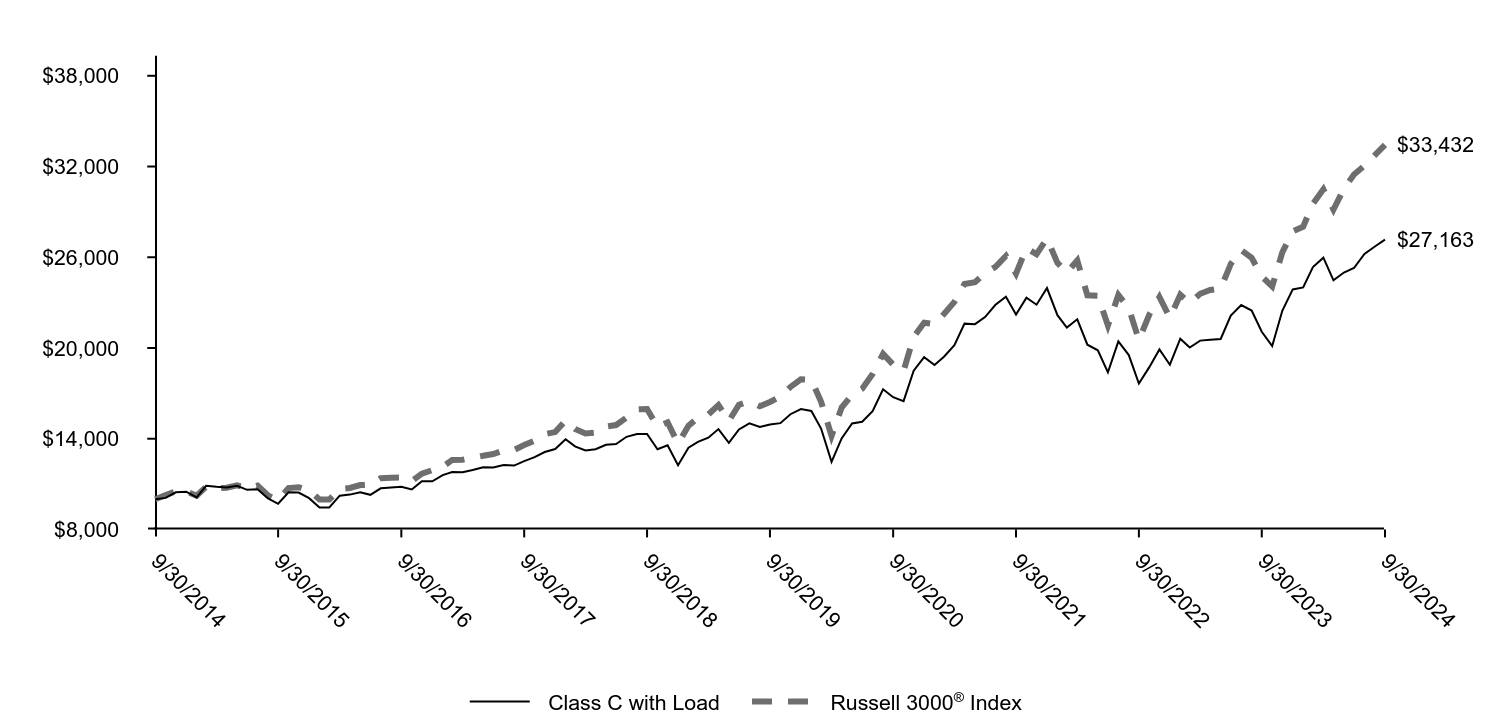
| Class C with Load | Russell 3000® Index |
|---|
| 9/30/2014 | $10,000 | $10,000 |
| 10/31/2014 | $10,087 | $10,275 |
| 11/30/2014 | $10,453 | $10,524 |
| 12/31/2014 | $10,495 | $10,524 |
| 1/31/2015 | $10,117 | $10,231 |
| 2/28/2015 | $10,889 | $10,824 |
| 3/31/2015 | $10,826 | $10,713 |
| 4/30/2015 | $10,781 | $10,762 |
| 5/31/2015 | $10,886 | $10,911 |
| 6/30/2015 | $10,618 | $10,728 |
| 7/31/2015 | $10,655 | $10,908 |
| 8/31/2015 | $10,052 | $10,249 |
| 9/30/2015 | $9,699 | $9,951 |
| 10/31/2015 | $10,457 | $10,736 |
| 11/30/2015 | $10,439 | $10,796 |
| 12/31/2015 | $10,069 | $10,574 |
| 1/31/2016 | $9,457 | $9,978 |
| 2/29/2016 | $9,452 | $9,975 |
| 3/31/2016 | $10,231 | $10,677 |
| 4/30/2016 | $10,304 | $10,743 |
| 5/31/2016 | $10,464 | $10,935 |
| 6/30/2016 | $10,291 | $10,958 |
| 7/31/2016 | $10,721 | $11,393 |
| 8/31/2016 | $10,775 | $11,422 |
| 9/30/2016 | $10,827 | $11,440 |
| 10/31/2016 | $10,643 | $11,192 |
| 11/30/2016 | $11,192 | $11,693 |
| 12/31/2016 | $11,181 | $11,921 |
| 1/31/2017 | $11,593 | $12,145 |
| 2/28/2017 | $11,797 | $12,597 |
| 3/31/2017 | $11,786 | $12,606 |
| 4/30/2017 | $11,936 | $12,739 |
| 5/31/2017 | $12,109 | $12,870 |
| 6/30/2017 | $12,100 | $12,986 |
| 7/31/2017 | $12,258 | $13,231 |
| 8/31/2017 | $12,224 | $13,256 |
| 9/30/2017 | $12,517 | $13,579 |
| 10/31/2017 | $12,777 | $13,876 |
| 11/30/2017 | $13,119 | $14,297 |
| 12/31/2017 | $13,317 | $14,440 |
| 1/31/2018 | $13,966 | $15,201 |
| 2/28/2018 | $13,498 | $14,641 |
| 3/31/2018 | $13,228 | $14,347 |
| 4/30/2018 | $13,304 | $14,402 |
| 5/31/2018 | $13,600 | $14,808 |
| 6/30/2018 | $13,643 | $14,905 |
| 7/31/2018 | $14,127 | $15,400 |
| 8/31/2018 | $14,315 | $15,940 |
| 9/30/2018 | $14,308 | $15,967 |
| 10/31/2018 | $13,300 | $14,791 |
| 11/30/2018 | $13,560 | $15,087 |
| 12/31/2018 | $12,247 | $13,683 |
| 1/31/2019 | $13,407 | $14,858 |
| 2/28/2019 | $13,788 | $15,380 |
| 3/31/2019 | $14,068 | $15,605 |
| 4/30/2019 | $14,635 | $16,228 |
| 5/31/2019 | $13,725 | $15,178 |
| 6/30/2019 | $14,617 | $16,244 |
| 7/31/2019 | $15,020 | $16,485 |
| 8/31/2019 | $14,773 | $16,149 |
| 9/30/2019 | $14,934 | $16,433 |
| 10/31/2019 | $15,031 | $16,786 |
| 11/30/2019 | $15,620 | $17,424 |
| 12/31/2019 | $15,963 | $17,928 |
| 1/31/2020 | $15,833 | $17,908 |
| 2/29/2020 | $14,674 | $16,442 |
| 3/31/2020 | $12,475 | $14,181 |
| 4/30/2020 | $14,019 | $16,059 |
| 5/31/2020 | $15,011 | $16,918 |
| 6/30/2020 | $15,122 | $17,304 |
| 7/31/2020 | $15,825 | $18,287 |
| 8/31/2020 | $17,273 | $19,612 |
| 9/30/2020 | $16,745 | $18,898 |
| 10/31/2020 | $16,483 | $18,490 |
| 11/30/2020 | $18,504 | $20,739 |
| 12/31/2020 | $19,393 | $21,672 |
| 1/31/2021 | $18,871 | $21,576 |
| 2/28/2021 | $19,423 | $22,250 |
| 3/31/2021 | $20,187 | $23,048 |
| 4/30/2021 | $21,609 | $24,236 |
| 5/31/2021 | $21,575 | $24,346 |
| 6/30/2021 | $22,042 | $24,947 |
| 7/31/2021 | $22,858 | $25,369 |
| 8/31/2021 | $23,384 | $26,092 |
| 9/30/2021 | $22,212 | $24,921 |
| 10/31/2021 | $23,320 | $26,607 |
| 11/30/2021 | $22,862 | $26,202 |
| 12/31/2021 | $23,965 | $27,234 |
| 1/31/2022 | $22,168 | $25,631 |
| 2/28/2022 | $21,354 | $24,986 |
| 3/31/2022 | $21,898 | $25,796 |
| 4/30/2022 | $20,216 | $23,481 |
| 5/31/2022 | $19,850 | $23,450 |
| 6/30/2022 | $18,390 | $21,488 |
| 7/31/2022 | $20,438 | $23,504 |
| 8/31/2022 | $19,532 | $22,627 |
| 9/30/2022 | $17,648 | $20,528 |
| 10/31/2022 | $18,733 | $22,212 |
| 11/30/2022 | $19,900 | $23,371 |
| 12/31/2022 | $18,894 | $22,003 |
| 1/31/2023 | $20,616 | $23,518 |
| 2/28/2023 | $20,033 | $22,968 |
| 3/31/2023 | $20,487 | $23,583 |
| 4/30/2023 | $20,540 | $23,834 |
| 5/31/2023 | $20,597 | $23,927 |
| 6/30/2023 | $22,142 | $25,560 |
| 7/31/2023 | $22,836 | $26,477 |
| 8/31/2023 | $22,477 | $25,966 |
| 9/30/2023 | $21,076 | $24,729 |
| 10/31/2023 | $20,124 | $24,073 |
| 11/30/2023 | $22,458 | $26,318 |
| 12/31/2023 | $23,874 | $27,714 |
| 1/31/2024 | $24,004 | $28,021 |
| 2/29/2024 | $25,349 | $29,538 |
| 3/31/2024 | $25,972 | $30,491 |
| 4/30/2024 | $24,477 | $29,149 |
| 5/31/2024 | $24,990 | $30,526 |
| 6/30/2024 | $25,289 | $31,471 |
| 7/31/2024 | $26,221 | $32,056 |
| 8/31/2024 | $26,714 | $32,754 |
| 9/30/2024 | $27,163 | $33,432 |
Annual Shareholder Report | September 30, 2024
AVERAGE ANNUAL TOTAL RETURNS (%)
| 1 Year | 5 Years | 10 Years |
|---|
| Class C | 27.92 | 12.39 | 10.51 |
| Class C with Load | 26.92 | 12.39 | 10.51 |
Russell 3000® Index (Strategy and Regulatory) | 35.19 | 15.26 | 12.83 |
| Total net assets | $1,976,855,107 |
| # of portfolio holdings | 56 |
| Portfolio turnover rate | 20% |
| Total advisory fees paid | $13,006,340 |
Figures quoted represent past performance, which is no guarantee of future results, and do not reflect taxes that a shareholder may pay on an investment in a fund.
What did the Fund invest in?
(Based on long-term investments)
SECTOR ALLOCATION (% OF LONG-TERM INVESTMENTS)
| Information technology | 25.2 |
| Industrials | 16.6 |
| Consumer discretionary | 10.3 |
| Financials | 10.0 |
| Health care | 9.9 |
| Real estate | 9.2 |
| Communication services | 8.4 |
| Materials | 6.6 |
| Consumer staples | 3.8 |
TOP TEN HOLDINGS (% OF NET ASSETS)
| Apple, Inc. | 5.6 |
| Amazon.com, Inc. | 5.1 |
| Alphabet, Inc., Class C | 4.7 |
| Salesforce, Inc. | 4.0 |
| Meta Platforms, Inc., Class A | 3.5 |
| Mastercard, Inc., Class A | 3.5 |
| Texas Instruments, Inc. | 3.0 |
| Marvell Technology, Inc. | 2.2 |
| UnitedHealth Group, Inc. | 2.2 |
| Regal Rexnord Corp. | 2.2 |
You can find additional information on the Fund's website at allspringglobal.com, including its:
- Prospectus - Financial Information - Fund holdings - Proxy voting information
Annual Shareholder Report
This annual shareholder report contains important information about Opportunity Fund for the period of October 1, 2023 to September 30, 2024. You can find additional information about the Fund at allspringglobal.com. You can also request this information by contacting us at 1-800-222-8222.
What were the Fund costs for the past year?
The table explains the costs you would have paid within the reporting period based on a hypothetical $10,000 investment.
| CLASS NAME | COSTS OF A $10,000 INVESTMENT | COSTS PAID AS A % OF A $10,000 INVESTMENT |
|---|
| Class A | $132 | 1.15% |
The manager has contractually committed to waive fees and/or reimburse certain expenses to the extent necessary to cap the Fund's total annual fund operating expense ratio at a specific amount. Without this cap, the costs shown above may have been higher. Please see the prospectus for the amount and the expiration date of the cap. Prior to or after the commitment expiration date, the cap may be increased or the commitment to maintain the cap may be terminated only with the approval of the Board of Trustees.
How did the Fund perform last year and what affected its performance?
Over the 12-month period that ended September 30, 2024, the equity markets soared to all-time highs, fueled by positive earnings surprises, robust economic growth, a decline in both inflation and interest rates, and a fervor around artificial intelligence (AI). Driven by semiconductor chip designer NVIDIA Corp., the AI theme significantly boosted the mega-cap growth sector to unprecedented heights. By contrast, small- and mid-cap stocks substantially underperformed large caps, partly due to their inferior balance sheet profiles. However, with the Federal Reserve pivoting to a more accommodative stance, future rate cuts could lower borrowing costs and be a catalyst for smaller-cap companies.
The Fund’s underweight to NVIDIA was a meaningful source of its underperformance. Other key detractors include Dollar General Corp., which faltered due to execution issues and weakness from its lower-end consumer, and Atkore Inc., which endured a cyclical downturn, citing weaker customer spending. Going forward, we remain optimistic about the Fund’s prospects given the attractive private market valuations of many of our holdings.
Total return based on a $10,000 investment
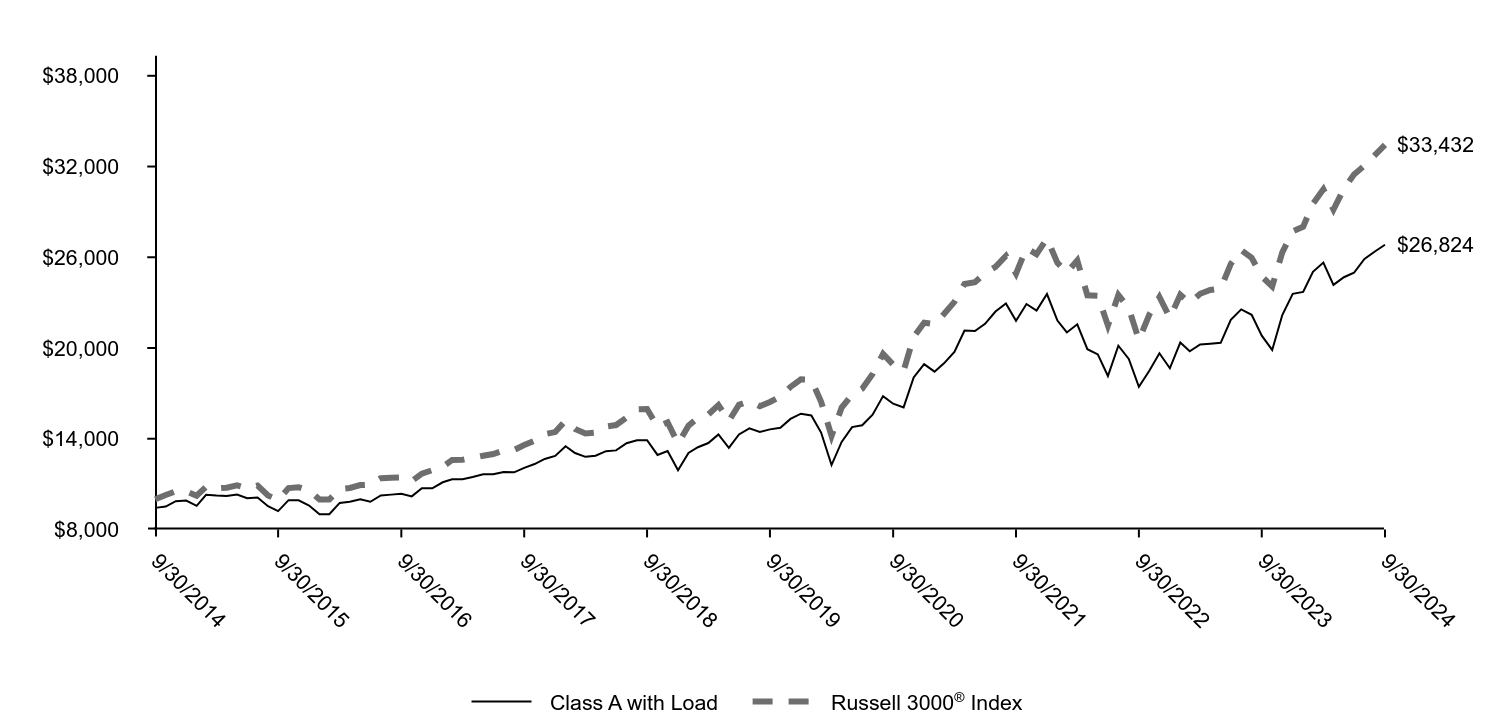
| Class A with Load | Russell 3000® Index |
|---|
| 9/30/2014 | $9,426 | $10,000 |
| 10/31/2014 | $9,513 | $10,275 |
| 11/30/2014 | $9,867 | $10,524 |
| 12/31/2014 | $9,911 | $10,524 |
| 1/31/2015 | $9,560 | $10,231 |
| 2/28/2015 | $10,295 | $10,824 |
| 3/31/2015 | $10,242 | $10,713 |
| 4/30/2015 | $10,206 | $10,762 |
| 5/31/2015 | $10,312 | $10,911 |
| 6/30/2015 | $10,064 | $10,728 |
| 7/31/2015 | $10,106 | $10,908 |
| 8/31/2015 | $9,541 | $10,249 |
| 9/30/2015 | $9,212 | $9,951 |
| 10/31/2015 | $9,938 | $10,736 |
| 11/30/2015 | $9,926 | $10,796 |
| 12/31/2015 | $9,582 | $10,574 |
| 1/31/2016 | $9,006 | $9,978 |
| 2/29/2016 | $9,003 | $9,975 |
| 3/31/2016 | $9,753 | $10,677 |
| 4/30/2016 | $9,830 | $10,743 |
| 5/31/2016 | $9,988 | $10,935 |
| 6/30/2016 | $9,830 | $10,958 |
| 7/31/2016 | $10,246 | $11,393 |
| 8/31/2016 | $10,303 | $11,422 |
| 9/30/2016 | $10,359 | $11,440 |
| 10/31/2016 | $10,189 | $11,192 |
| 11/30/2016 | $10,723 | $11,693 |
| 12/31/2016 | $10,720 | $11,921 |
| 1/31/2017 | $11,120 | $12,145 |
| 2/28/2017 | $11,323 | $12,597 |
| 3/31/2017 | $11,320 | $12,606 |
| 4/30/2017 | $11,470 | $12,739 |
| 5/31/2017 | $11,644 | $12,870 |
| 6/30/2017 | $11,644 | $12,986 |
| 7/31/2017 | $11,805 | $13,231 |
| 8/31/2017 | $11,776 | $13,256 |
| 9/30/2017 | $12,068 | $13,579 |
| 10/31/2017 | $12,326 | $13,876 |
| 11/30/2017 | $12,663 | $14,297 |
| 12/31/2017 | $12,865 | $14,440 |
| 1/31/2018 | $13,498 | $15,201 |
| 2/28/2018 | $13,054 | $14,641 |
| 3/31/2018 | $12,802 | $14,347 |
| 4/30/2018 | $12,880 | $14,402 |
| 5/31/2018 | $13,177 | $14,808 |
| 6/30/2018 | $13,228 | $14,905 |
| 7/31/2018 | $13,705 | $15,400 |
| 8/31/2018 | $13,897 | $15,940 |
| 9/30/2018 | $13,897 | $15,967 |
| 10/31/2018 | $12,928 | $14,791 |
| 11/30/2018 | $13,189 | $15,087 |
| 12/31/2018 | $11,921 | $13,683 |
| 1/31/2019 | $13,057 | $14,858 |
| 2/28/2019 | $13,435 | $15,380 |
| 3/31/2019 | $13,715 | $15,605 |
| 4/30/2019 | $14,281 | $16,228 |
| 5/31/2019 | $13,401 | $15,178 |
| 6/30/2019 | $14,281 | $16,244 |
| 7/31/2019 | $14,682 | $16,485 |
| 8/31/2019 | $14,453 | $16,149 |
| 9/30/2019 | $14,618 | $16,433 |
| 10/31/2019 | $14,722 | $16,786 |
| 11/30/2019 | $15,309 | $17,424 |
| 12/31/2019 | $15,655 | $17,928 |
| 1/31/2020 | $15,537 | $17,908 |
| 2/29/2020 | $14,408 | $16,442 |
| 3/31/2020 | $12,259 | $14,181 |
| 4/30/2020 | $13,786 | $16,059 |
| 5/31/2020 | $14,769 | $16,918 |
| 6/30/2020 | $14,887 | $17,304 |
| 7/31/2020 | $15,587 | $18,287 |
| 8/31/2020 | $16,817 | $19,612 |
| 9/30/2020 | $16,317 | $18,898 |
| 10/31/2020 | $16,070 | $18,490 |
| 11/30/2020 | $18,054 | $20,739 |
| 12/31/2020 | $18,934 | $21,672 |
| 1/31/2021 | $18,436 | $21,576 |
| 2/28/2021 | $18,984 | $22,250 |
| 3/31/2021 | $19,741 | $23,048 |
| 4/30/2021 | $21,149 | $24,236 |
| 5/31/2021 | $21,126 | $24,346 |
| 6/30/2021 | $21,598 | $24,947 |
| 7/31/2021 | $22,412 | $25,369 |
| 8/31/2021 | $22,941 | $26,092 |
| 9/30/2021 | $21,803 | $24,921 |
| 10/31/2021 | $22,907 | $26,607 |
| 11/30/2021 | $22,469 | $26,202 |
| 12/31/2021 | $23,569 | $27,234 |
| 1/31/2022 | $21,815 | $25,631 |
| 2/28/2022 | $21,026 | $24,986 |
| 3/31/2022 | $21,568 | $25,796 |
| 4/30/2022 | $19,920 | $23,481 |
| 5/31/2022 | $19,575 | $23,450 |
| 6/30/2022 | $18,145 | $21,488 |
| 7/31/2022 | $20,151 | $23,504 |
| 8/31/2022 | $19,272 | $22,627 |
| 9/30/2022 | $17,428 | $20,528 |
| 10/31/2022 | $18,499 | $22,212 |
| 11/30/2022 | $19,652 | $23,371 |
| 12/31/2022 | $18,659 | $22,003 |
| 1/31/2023 | $20,359 | $23,518 |
| 2/28/2023 | $19,783 | $22,968 |
| 3/31/2023 | $20,232 | $23,583 |
| 4/30/2023 | $20,284 | $23,834 |
| 5/31/2023 | $20,340 | $23,927 |
| 6/30/2023 | $21,866 | $25,560 |
| 7/31/2023 | $22,551 | $26,477 |
| 8/31/2023 | $22,197 | $25,966 |
| 9/30/2023 | $20,813 | $24,729 |
| 10/31/2023 | $19,873 | $24,073 |
| 11/30/2023 | $22,178 | $26,318 |
| 12/31/2023 | $23,577 | $27,714 |
| 1/31/2024 | $23,704 | $28,021 |
| 2/29/2024 | $25,033 | $29,538 |
| 3/31/2024 | $25,648 | $30,491 |
| 4/30/2024 | $24,172 | $29,149 |
| 5/31/2024 | $24,679 | $30,526 |
| 6/30/2024 | $24,974 | $31,471 |
| 7/31/2024 | $25,894 | $32,056 |
| 8/31/2024 | $26,381 | $32,754 |
| 9/30/2024 | $26,824 | $33,432 |
Annual Shareholder Report | September 30, 2024
AVERAGE ANNUAL TOTAL RETURNS (%)
| 1 Year | 5 Years | 10 Years |
|---|
| Class A | 28.88 | 12.91 | 11.02 |
| Class A with Load | 21.47 | 11.58 | 10.37 |
Russell 3000® Index (Strategy and Regulatory) | 35.19 | 15.26 | 12.83 |
| Total net assets | $1,976,855,107 |
| # of portfolio holdings | 56 |
| Portfolio turnover rate | 20% |
| Total advisory fees paid | $13,006,340 |
Figures quoted represent past performance, which is no guarantee of future results, and do not reflect taxes that a shareholder may pay on an investment in a fund.
What did the Fund invest in?
(Based on long-term investments)
SECTOR ALLOCATION (% OF LONG-TERM INVESTMENTS)
| Information technology | 25.2 |
| Industrials | 16.6 |
| Consumer discretionary | 10.3 |
| Financials | 10.0 |
| Health care | 9.9 |
| Real estate | 9.2 |
| Communication services | 8.4 |
| Materials | 6.6 |
| Consumer staples | 3.8 |
TOP TEN HOLDINGS (% OF NET ASSETS)
| Apple, Inc. | 5.6 |
| Amazon.com, Inc. | 5.1 |
| Alphabet, Inc., Class C | 4.7 |
| Salesforce, Inc. | 4.0 |
| Meta Platforms, Inc., Class A | 3.5 |
| Mastercard, Inc., Class A | 3.5 |
| Texas Instruments, Inc. | 3.0 |
| Marvell Technology, Inc. | 2.2 |
| UnitedHealth Group, Inc. | 2.2 |
| Regal Rexnord Corp. | 2.2 |
You can find additional information on the Fund's website at allspringglobal.com, including its:
- Prospectus - Financial Information - Fund holdings - Proxy voting information
Annual Shareholder Report
This annual shareholder report contains important information about Opportunity Fund for the period of October 1, 2023 to September 30, 2024. You can find additional information about the Fund at allspringglobal.com. You can also request this information by contacting us at 1-800-222-8222.
What were the Fund costs for the past year?
The table explains the costs you would have paid within the reporting period based on a hypothetical $10,000 investment.
| CLASS NAME | COSTS OF A $10,000 INVESTMENT | COSTS PAID AS A % OF A $10,000 INVESTMENT |
|---|
| Administrator Class | $112 | 0.98% |
The manager has contractually committed to waive fees and/or reimburse certain expenses to the extent necessary to cap the Fund's total annual fund operating expense ratio at a specific amount. Without this cap, the costs shown above may have been higher. Please see the prospectus for the amount and the expiration date of the cap. Prior to or after the commitment expiration date, the cap may be increased or the commitment to maintain the cap may be terminated only with the approval of the Board of Trustees.
How did the Fund perform last year and what affected its performance?
Over the 12-month period that ended September 30, 2024, the equity markets soared to all-time highs, fueled by positive earnings surprises, robust economic growth, a decline in both inflation and interest rates, and a fervor around artificial intelligence (AI). Driven by semiconductor chip designer NVIDIA Corp., the AI theme significantly boosted the mega-cap growth sector to unprecedented heights. By contrast, small- and mid-cap stocks substantially underperformed large caps, partly due to their inferior balance sheet profiles. However, with the Federal Reserve pivoting to a more accommodative stance, future rate cuts could lower borrowing costs and be a catalyst for smaller-cap companies.
The Fund’s underweight to NVIDIA was a meaningful source of its underperformance. Other key detractors include Dollar General Corp., which faltered due to execution issues and weakness from its lower-end consumer, and Atkore Inc., which endured a cyclical downturn, citing weaker customer spending. Going forward, we remain optimistic about the Fund’s prospects given the attractive private market valuations of many of our holdings.
Total return based on a $10,000 investment
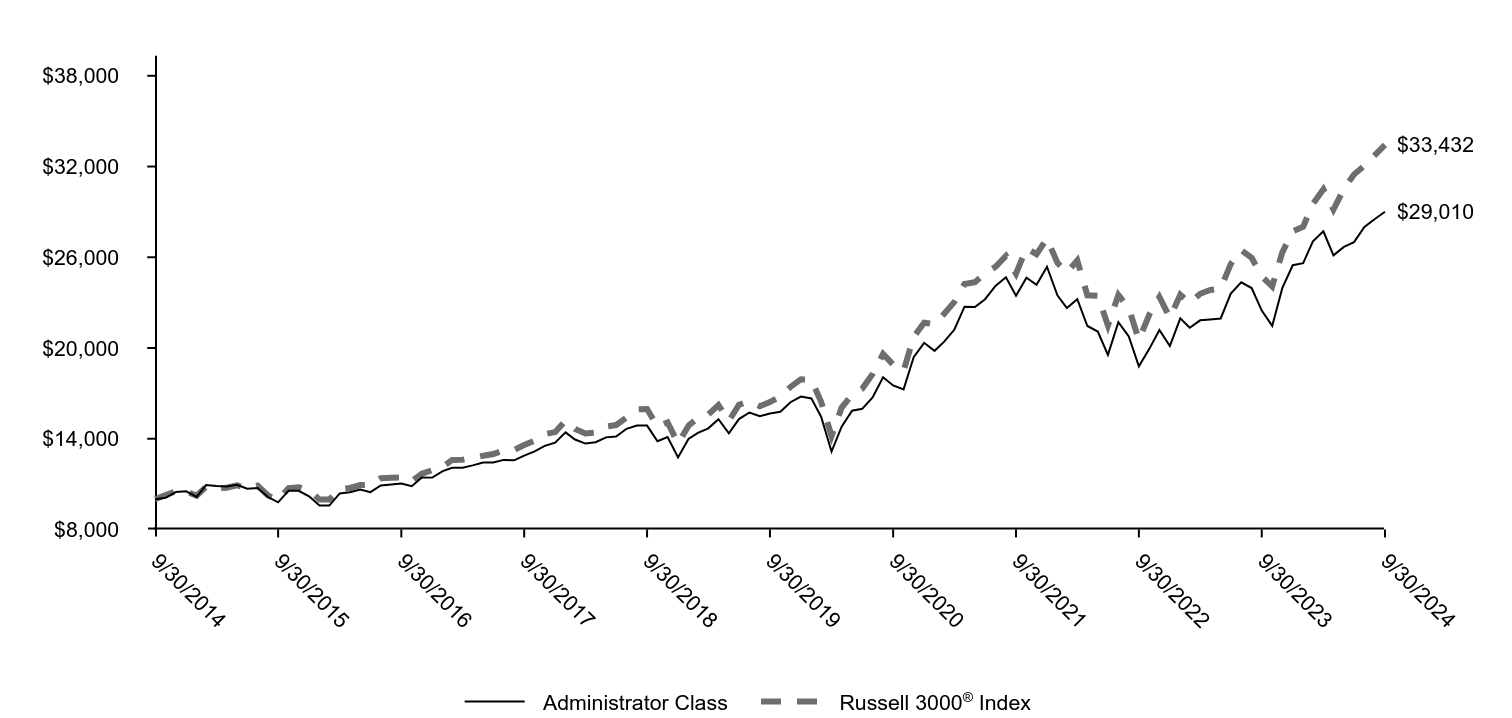
| Administrator Class | Russell 3000® Index |
|---|
| 9/30/2014 | $10,000 | $10,000 |
| 10/31/2014 | $10,096 | $10,275 |
| 11/30/2014 | $10,471 | $10,524 |
| 12/31/2014 | $10,521 | $10,524 |
| 1/31/2015 | $10,151 | $10,231 |
| 2/28/2015 | $10,935 | $10,824 |
| 3/31/2015 | $10,878 | $10,713 |
| 4/30/2015 | $10,842 | $10,762 |
| 5/31/2015 | $10,956 | $10,911 |
| 6/30/2015 | $10,695 | $10,728 |
| 7/31/2015 | $10,742 | $10,908 |
| 8/31/2015 | $10,143 | $10,249 |
| 9/30/2015 | $9,796 | $9,951 |
| 10/31/2015 | $10,567 | $10,736 |
| 11/30/2015 | $10,557 | $10,796 |
| 12/31/2015 | $10,193 | $10,574 |
| 1/31/2016 | $9,582 | $9,978 |
| 2/29/2016 | $9,582 | $9,975 |
| 3/31/2016 | $10,380 | $10,677 |
| 4/30/2016 | $10,464 | $10,743 |
| 5/31/2016 | $10,636 | $10,935 |
| 6/30/2016 | $10,468 | $10,958 |
| 7/31/2016 | $10,913 | $11,393 |
| 8/31/2016 | $10,975 | $11,422 |
| 9/30/2016 | $11,038 | $11,440 |
| 10/31/2016 | $10,859 | $11,192 |
| 11/30/2016 | $11,429 | $11,693 |
| 12/31/2016 | $11,427 | $11,921 |
| 1/31/2017 | $11,857 | $12,145 |
| 2/28/2017 | $12,076 | $12,597 |
| 3/31/2017 | $12,076 | $12,606 |
| 4/30/2017 | $12,235 | $12,739 |
| 5/31/2017 | $12,423 | $12,870 |
| 6/30/2017 | $12,425 | $12,986 |
| 7/31/2017 | $12,600 | $13,231 |
| 8/31/2017 | $12,571 | $13,256 |
| 9/30/2017 | $12,886 | $13,579 |
| 10/31/2017 | $13,163 | $13,876 |
| 11/30/2017 | $13,525 | $14,297 |
| 12/31/2017 | $13,741 | $14,440 |
| 1/31/2018 | $14,421 | $15,201 |
| 2/28/2018 | $13,947 | $14,641 |
| 3/31/2018 | $13,679 | $14,347 |
| 4/30/2018 | $13,768 | $14,402 |
| 5/31/2018 | $14,089 | $14,808 |
| 6/30/2018 | $14,145 | $14,905 |
| 7/31/2018 | $14,657 | $15,400 |
| 8/31/2018 | $14,866 | $15,940 |
| 9/30/2018 | $14,869 | $15,967 |
| 10/31/2018 | $13,833 | $14,791 |
| 11/30/2018 | $14,115 | $15,087 |
| 12/31/2018 | $12,759 | $13,683 |
| 1/31/2019 | $13,981 | $14,858 |
| 2/28/2019 | $14,387 | $15,380 |
| 3/31/2019 | $14,688 | $15,605 |
| 4/30/2019 | $15,294 | $16,228 |
| 5/31/2019 | $14,354 | $15,178 |
| 6/30/2019 | $15,300 | $16,244 |
| 7/31/2019 | $15,732 | $16,485 |
| 8/31/2019 | $15,490 | $16,149 |
| 9/30/2019 | $15,667 | $16,433 |
| 10/31/2019 | $15,782 | $16,786 |
| 11/30/2019 | $16,413 | $17,424 |
| 12/31/2019 | $16,787 | $17,928 |
| 1/31/2020 | $16,666 | $17,908 |
| 2/29/2020 | $15,456 | $16,442 |
| 3/31/2020 | $13,153 | $14,181 |
| 4/30/2020 | $14,792 | $16,059 |
| 5/31/2020 | $15,850 | $16,918 |
| 6/30/2020 | $15,978 | $17,304 |
| 7/31/2020 | $16,735 | $18,287 |
| 8/31/2020 | $18,059 | $19,612 |
| 9/30/2020 | $17,523 | $18,898 |
| 10/31/2020 | $17,261 | $18,490 |
| 11/30/2020 | $19,394 | $20,739 |
| 12/31/2020 | $20,342 | $21,672 |
| 1/31/2021 | $19,811 | $21,576 |
| 2/28/2021 | $20,404 | $22,250 |
| 3/31/2021 | $21,221 | $23,048 |
| 4/30/2021 | $22,733 | $24,236 |
| 5/31/2021 | $22,715 | $24,346 |
| 6/30/2021 | $23,224 | $24,947 |
| 7/31/2021 | $24,106 | $25,369 |
| 8/31/2021 | $24,677 | $26,092 |
| 9/30/2021 | $23,458 | $24,921 |
| 10/31/2021 | $24,648 | $26,607 |
| 11/30/2021 | $24,179 | $26,202 |
| 12/31/2021 | $25,370 | $27,234 |
| 1/31/2022 | $23,485 | $25,631 |
| 2/28/2022 | $22,638 | $24,986 |
| 3/31/2022 | $23,226 | $25,796 |
| 4/30/2022 | $21,454 | $23,481 |
| 5/31/2022 | $21,085 | $23,450 |
| 6/30/2022 | $19,549 | $21,488 |
| 7/31/2022 | $21,713 | $23,504 |
| 8/31/2022 | $20,769 | $22,627 |
| 9/30/2022 | $18,786 | $20,528 |
| 10/31/2022 | $19,942 | $22,212 |
| 11/30/2022 | $21,190 | $23,371 |
| 12/31/2022 | $20,122 | $22,003 |
| 1/31/2023 | $21,961 | $23,518 |
| 2/28/2023 | $21,340 | $22,968 |
| 3/31/2023 | $21,828 | $23,583 |
| 4/30/2023 | $21,885 | $23,834 |
| 5/31/2023 | $21,952 | $23,927 |
| 6/30/2023 | $23,600 | $25,560 |
| 7/31/2023 | $24,345 | $26,477 |
| 8/31/2023 | $23,963 | $25,966 |
| 9/30/2023 | $22,475 | $24,729 |
| 10/31/2023 | $21,460 | $24,073 |
| 11/30/2023 | $23,955 | $26,318 |
| 12/31/2023 | $25,471 | $27,714 |
| 1/31/2024 | $25,608 | $28,021 |
| 2/29/2024 | $27,050 | $29,538 |
| 3/31/2024 | $27,720 | $30,491 |
| 4/30/2024 | $26,127 | $29,149 |
| 5/31/2024 | $26,683 | $30,526 |
| 6/30/2024 | $26,999 | $31,471 |
| 7/31/2024 | $28,000 | $32,056 |
| 8/31/2024 | $28,532 | $32,754 |
| 9/30/2024 | $29,010 | $33,432 |
Annual Shareholder Report | September 30, 2024
AVERAGE ANNUAL TOTAL RETURNS (%)
| 1 Year | 5 Years | 10 Years |
|---|
| Administrator Class | 29.08 | 13.11 | 11.24 |
Russell 3000® Index (Strategy and Regulatory) | 35.19 | 15.26 | 12.83 |
| Total net assets | $1,976,855,107 |
| # of portfolio holdings | 56 |
| Portfolio turnover rate | 20% |
| Total advisory fees paid | $13,006,340 |
Figures quoted represent past performance, which is no guarantee of future results, and do not reflect taxes that a shareholder may pay on an investment in a fund.
What did the Fund invest in?
(Based on long-term investments)
SECTOR ALLOCATION (% OF LONG-TERM INVESTMENTS)
| Information technology | 25.2 |
| Industrials | 16.6 |
| Consumer discretionary | 10.3 |
| Financials | 10.0 |
| Health care | 9.9 |
| Real estate | 9.2 |
| Communication services | 8.4 |
| Materials | 6.6 |
| Consumer staples | 3.8 |
TOP TEN HOLDINGS (% OF NET ASSETS)
| Apple, Inc. | 5.6 |
| Amazon.com, Inc. | 5.1 |
| Alphabet, Inc., Class C | 4.7 |
| Salesforce, Inc. | 4.0 |
| Meta Platforms, Inc., Class A | 3.5 |
| Mastercard, Inc., Class A | 3.5 |
| Texas Instruments, Inc. | 3.0 |
| Marvell Technology, Inc. | 2.2 |
| UnitedHealth Group, Inc. | 2.2 |
| Regal Rexnord Corp. | 2.2 |
You can find additional information on the Fund's website at allspringglobal.com, including its:
- Prospectus - Financial Information - Fund holdings - Proxy voting information
Annual Shareholder Report
Special Mid Cap Value Fund
This annual shareholder report contains important information about Special Mid Cap Value Fund for the period of October 1, 2023 to September 30, 2024. You can find additional information about the Fund at allspringglobal.com. You can also request this information by contacting us at 1-800-222-8222.
What were the Fund costs for the past year?
The table explains the costs you would have paid within the reporting period based on a hypothetical $10,000 investment.
| CLASS NAME | COSTS OF A $10,000 INVESTMENT | COSTS PAID AS A % OF A $10,000 INVESTMENT |
|---|
| Institutional Class | $91 | 0.80% |
The manager has contractually committed to waive fees and/or reimburse certain expenses to the extent necessary to cap the Fund's total annual fund operating expense ratio at a specific amount. Without this cap, the costs shown above may have been higher. Please see the prospectus for the amount and the expiration date of the cap. Prior to or after the commitment expiration date, the cap may be increased or the commitment to maintain the cap may be terminated only with the approval of the Board of Trustees.
How did the Fund perform last year and what affected its performance?
Equities were volatile, with ongoing inflation concerns, varying economic data points, and a hope that a soft landing can be achieved.
Minor changes to sector positioning included an increase in materials while reducing the weight in industrials as reward/risk ratios dictated.
Carlisle Companies, Inc., the largest relative contributor, focuses on commercial building products and is the largest U.S. manufacturer of commercial roofing. Carlisle has benefited from price discipline in its end markets and a divestiture of a non-core segment. We believe management’s focus on complementary products should strengthen its free cash flow and fortify its balance sheet, creating significant value.
The largest detractor was LKQ Corp., a leading provider of specialty parts to repair vehicles. For most of our holding period, LKQ actively optimized the efficiency of the asset base after a prolonged period of acquisitions, leading to excess free cash flow generation. Management also repurchased shares. This drove reasonable returns early in the period. However, a series of missteps by LKQ caused us concern regarding the stability of future free cash flow.
Total return based on a $10,000 investment
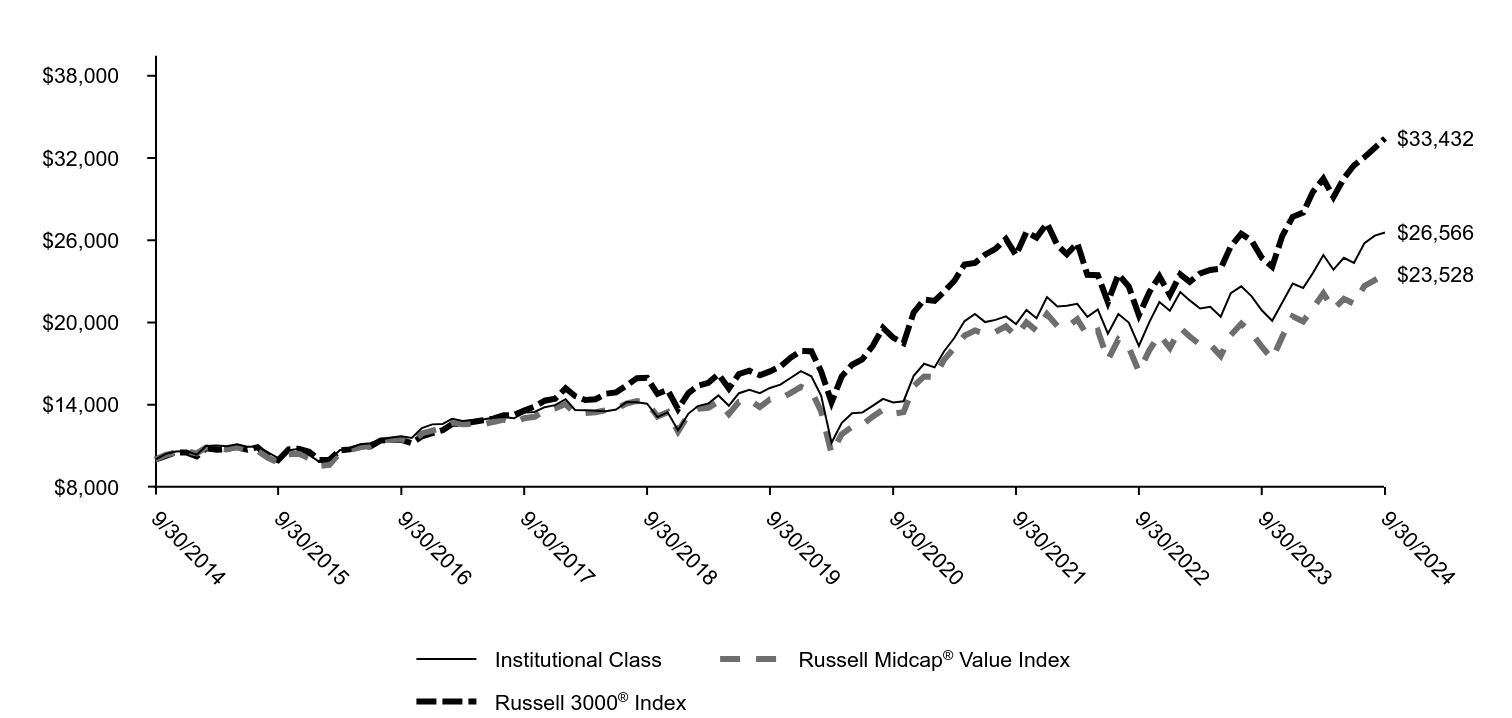
| Institutional Class | Russell Midcap® Value Index | Russell 3000® Index |
|---|
| 9/30/2014 | $10,000 | $10,000 | $10,000 |
| 10/31/2014 | $10,407 | $10,343 | $10,275 |
| 11/30/2014 | $10,590 | $10,527 | $10,524 |
| 12/31/2014 | $10,627 | $10,605 | $10,524 |
| 1/31/2015 | $10,363 | $10,454 | $10,231 |
| 2/28/2015 | $10,989 | $10,882 | $10,824 |
| 3/31/2015 | $11,025 | $10,862 | $10,713 |
| 4/30/2015 | $10,979 | $10,739 | $10,762 |
| 5/31/2015 | $11,118 | $10,929 | $10,911 |
| 6/30/2015 | $10,940 | $10,649 | $10,728 |
| 7/31/2015 | $10,963 | $10,634 | $10,908 |
| 8/31/2015 | $10,531 | $10,131 | $10,249 |
| 9/30/2015 | $10,110 | $9,793 | $9,951 |
| 10/31/2015 | $10,660 | $10,391 | $10,736 |
| 11/30/2015 | $10,792 | $10,421 | $10,796 |
| 12/31/2015 | $10,337 | $10,099 | $10,574 |
| 1/31/2016 | $9,831 | $9,541 | $9,978 |
| 2/29/2016 | $9,938 | $9,607 | $9,975 |
| 3/31/2016 | $10,685 | $10,494 | $10,677 |
| 4/30/2016 | $10,833 | $10,720 | $10,743 |
| 5/31/2016 | $11,118 | $10,895 | $10,935 |
| 6/30/2016 | $11,191 | $10,994 | $10,958 |
| 7/31/2016 | $11,462 | $11,460 | $11,393 |
| 8/31/2016 | $11,617 | $11,436 | $11,422 |
| 9/30/2016 | $11,700 | $11,484 | $11,440 |
| 10/31/2016 | $11,573 | $11,205 | $11,192 |
| 11/30/2016 | $12,299 | $11,906 | $11,693 |
| 12/31/2016 | $12,569 | $12,118 | $11,921 |
| 1/31/2017 | $12,600 | $12,322 | $12,145 |
| 2/28/2017 | $12,981 | $12,666 | $12,597 |
| 3/31/2017 | $12,824 | $12,574 | $12,606 |
| 4/30/2017 | $12,893 | $12,597 | $12,739 |
| 5/31/2017 | $12,928 | $12,558 | $12,870 |
| 6/30/2017 | $13,047 | $12,745 | $12,986 |
| 7/31/2017 | $13,110 | $12,914 | $13,231 |
| 8/31/2017 | $13,015 | $12,673 | $13,256 |
| 9/30/2017 | $13,427 | $13,019 | $13,579 |
| 10/31/2017 | $13,473 | $13,123 | $13,876 |
| 11/30/2017 | $13,822 | $13,567 | $14,297 |
| 12/31/2017 | $13,971 | $13,735 | $14,440 |
| 1/31/2018 | $14,405 | $14,051 | $15,201 |
| 2/28/2018 | $13,625 | $13,358 | $14,641 |
| 3/31/2018 | $13,596 | $13,391 | $14,347 |
| 4/30/2018 | $13,563 | $13,458 | $14,402 |
| 5/31/2018 | $13,519 | $13,604 | $14,808 |
| 6/30/2018 | $13,658 | $13,713 | $14,905 |
| 7/31/2018 | $14,194 | $14,086 | $15,400 |
| 8/31/2018 | $14,190 | $14,278 | $15,940 |
| 9/30/2018 | $14,077 | $14,165 | $15,967 |
| 10/31/2018 | $13,100 | $13,145 | $14,791 |
| 11/30/2018 | $13,446 | $13,460 | $15,087 |
| 12/31/2018 | $12,141 | $12,047 | $13,683 |
| 1/31/2019 | $13,356 | $13,287 | $14,858 |
| 2/28/2019 | $13,903 | $13,710 | $15,380 |
| 3/31/2019 | $14,086 | $13,778 | $15,605 |
| 4/30/2019 | $14,681 | $14,233 | $16,228 |
| 5/31/2019 | $13,929 | $13,319 | $15,178 |
| 6/30/2019 | $14,842 | $14,218 | $16,244 |
| 7/31/2019 | $15,089 | $14,337 | $16,485 |
| 8/31/2019 | $14,849 | $13,831 | $16,149 |
| 9/30/2019 | $15,227 | $14,392 | $16,433 |
| 10/31/2019 | $15,470 | $14,470 | $16,786 |
| 11/30/2019 | $15,953 | $14,855 | $17,424 |
| 12/31/2019 | $16,454 | $15,307 | $17,928 |
| 1/31/2020 | $16,072 | $15,009 | $17,908 |
| 2/29/2020 | $14,664 | $13,523 | $16,442 |
| 3/31/2020 | $11,231 | $10,454 | $14,181 |
| 4/30/2020 | $12,666 | $11,850 | $16,059 |
| 5/31/2020 | $13,380 | $12,399 | $16,918 |
| 6/30/2020 | $13,427 | $12,539 | $17,304 |
| 7/31/2020 | $13,915 | $13,131 | $18,287 |
| 8/31/2020 | $14,426 | $13,651 | $19,612 |
| 9/30/2020 | $14,172 | $13,342 | $18,898 |
| 10/31/2020 | $14,258 | $13,466 | $18,490 |
| 11/30/2020 | $16,111 | $15,357 | $20,739 |
| 12/31/2020 | $16,993 | $16,067 | $21,672 |
| 1/31/2021 | $16,726 | $16,030 | $21,576 |
| 2/28/2021 | $17,885 | $17,272 | $22,250 |
| 3/31/2021 | $18,890 | $18,164 | $23,048 |
| 4/30/2021 | $20,104 | $19,042 | $24,236 |
| 5/31/2021 | $20,630 | $19,418 | $24,346 |
| 6/30/2021 | $20,033 | $19,192 | $24,947 |
| 7/31/2021 | $20,194 | $19,311 | $25,369 |
| 8/31/2021 | $20,449 | $19,725 | $26,092 |
| 9/30/2021 | $19,884 | $18,998 | $24,921 |
| 10/31/2021 | $20,917 | $20,010 | $26,607 |
| 11/30/2021 | $20,316 | $19,402 | $26,202 |
| 12/31/2021 | $21,859 | $20,620 | $27,234 |
| 1/31/2022 | $21,172 | $19,740 | $25,631 |
| 2/28/2022 | $21,219 | $19,648 | $24,986 |
| 3/31/2022 | $21,362 | $20,245 | $25,796 |
| 4/30/2022 | $20,410 | $19,042 | $23,481 |
| 5/31/2022 | $20,955 | $19,407 | $23,450 |
| 6/30/2022 | $19,182 | $17,274 | $21,488 |
| 7/31/2022 | $20,622 | $18,761 | $23,504 |
| 8/31/2022 | $19,995 | $18,186 | $22,627 |
| 9/30/2022 | $18,290 | $16,423 | $20,528 |
| 10/31/2022 | $20,030 | $17,974 | $22,212 |
| 11/30/2022 | $21,492 | $19,110 | $23,371 |
| 12/31/2022 | $20,858 | $18,139 | $22,003 |
| 1/31/2023 | $22,226 | $19,604 | $23,518 |
| 2/28/2023 | $21,615 | $18,976 | $22,968 |
| 3/31/2023 | $21,027 | $18,379 | $23,583 |
| 4/30/2023 | $21,154 | $18,380 | $23,834 |
| 5/31/2023 | $20,425 | $17,565 | $23,927 |
| 6/30/2023 | $22,146 | $19,088 | $25,560 |
| 7/31/2023 | $22,636 | $19,919 | $26,477 |
| 8/31/2023 | $21,911 | $19,214 | $25,966 |
| 9/30/2023 | $20,895 | $18,237 | $24,729 |
| 10/31/2023 | $20,129 | $17,334 | $24,073 |
| 11/30/2023 | $21,460 | $18,968 | $26,318 |
| 12/31/2023 | $22,842 | $20,445 | $27,714 |
| 1/31/2024 | $22,523 | $20,079 | $28,021 |
| 2/29/2024 | $23,607 | $21,038 | $29,538 |
| 3/31/2024 | $24,925 | $22,127 | $30,491 |
| 4/30/2024 | $23,851 | $20,969 | $29,149 |
| 5/31/2024 | $24,721 | $21,722 | $30,526 |
| 6/30/2024 | $24,348 | $21,374 | $31,471 |
| 7/31/2024 | $25,790 | $22,666 | $32,056 |
| 8/31/2024 | $26,342 | $23,093 | $32,754 |
| 9/30/2024 | $26,566 | $23,528 | $33,432 |
Special Mid Cap Value Fund
Annual Shareholder Report | September 30, 2024
AVERAGE ANNUAL TOTAL RETURNS (%)
| 1 Year | 5 Years | 10 Years |
|---|
| Institutional Class | 27.14 | 11.77 | 10.26 |
Russell Midcap® Value Index (Strategy) | 29.01 | 10.33 | 8.93 |
Russell 3000® Index (Regulatory) | 35.19 | 15.26 | 12.83 |
| Total net assets | $14,226,954,885 |
| # of portfolio holdings | 67 |
| Portfolio turnover rate | 19% |
| Total advisory fees paid | $82,662,725 |
Figures quoted represent past performance, which is no guarantee of future results, and do not reflect taxes that a shareholder may pay on an investment in a fund.
What did the Fund invest in?
(Based on long-term investments)
SECTOR ALLOCATION (% OF LONG-TERM INVESTMENTS)
| Financials | 20.5 |
| Industrials | 19.3 |
| Real estate | 11.3 |
| Materials | 10.3 |
| Health care | 9.2 |
| Consumer staples | 7.4 |
| Utilities | 6.9 |
| Information technology | 5.5 |
| Energy | 5.1 |
| Consumer discretionary | 4.5 |
TOP TEN HOLDINGS (% OF NET ASSETS)
| CBRE Group, Inc., Class A | 4.0 |
| Arch Capital Group Ltd. | 3.2 |
| Keurig Dr Pepper, Inc. | 3.1 |
| AerCap Holdings NV | 3.0 |
| Allstate Corp. | 2.8 |
| Vulcan Materials Co. | 2.7 |
| Republic Services, Inc., Class A | 2.6 |
| L3Harris Technologies, Inc. | 2.5 |
| American Electric Power Co., Inc. | 2.5 |
| Graphic Packaging Holding Co. | 2.5 |
You can find additional information on the Fund's website at allspringglobal.com, including its:
- Prospectus - Financial Information - Fund holdings - Proxy voting information
Annual Shareholder Report
Special Mid Cap Value Fund
This annual shareholder report contains important information about Special Mid Cap Value Fund for the period of October 1, 2023 to September 30, 2024. You can find additional information about the Fund at allspringglobal.com. You can also request this information by contacting us at 1-800-222-8222.
What were the Fund costs for the past year?
The table explains the costs you would have paid within the reporting period based on a hypothetical $10,000 investment.
| CLASS NAME | COSTS OF A $10,000 INVESTMENT | COSTS PAID AS A % OF A $10,000 INVESTMENT |
|---|
| Class R6 | $80 | 0.70% |
The manager has contractually committed to waive fees and/or reimburse certain expenses to the extent necessary to cap the Fund's total annual fund operating expense ratio at a specific amount. Without this cap, the costs shown above may have been higher. Please see the prospectus for the amount and the expiration date of the cap. Prior to or after the commitment expiration date, the cap may be increased or the commitment to maintain the cap may be terminated only with the approval of the Board of Trustees.
How did the Fund perform last year and what affected its performance?
Equities were volatile, with ongoing inflation concerns, varying economic data points, and a hope that a soft landing can be achieved.
Minor changes to sector positioning included an increase in materials while reducing the weight in industrials as reward/risk ratios dictated.
Carlisle Companies, Inc., the largest relative contributor, focuses on commercial building products and is the largest U.S. manufacturer of commercial roofing. Carlisle has benefited from price discipline in its end markets and a divestiture of a non-core segment. We believe management’s focus on complementary products should strengthen its free cash flow and fortify its balance sheet, creating significant value.
The largest detractor was LKQ Corp., a leading provider of specialty parts to repair vehicles. For most of our holding period, LKQ actively optimized the efficiency of the asset base after a prolonged period of acquisitions, leading to excess free cash flow generation. Management also repurchased shares. This drove reasonable returns early in the period. However, a series of missteps by LKQ caused us concern regarding the stability of future free cash flow.
Total return based on a $10,000 investment
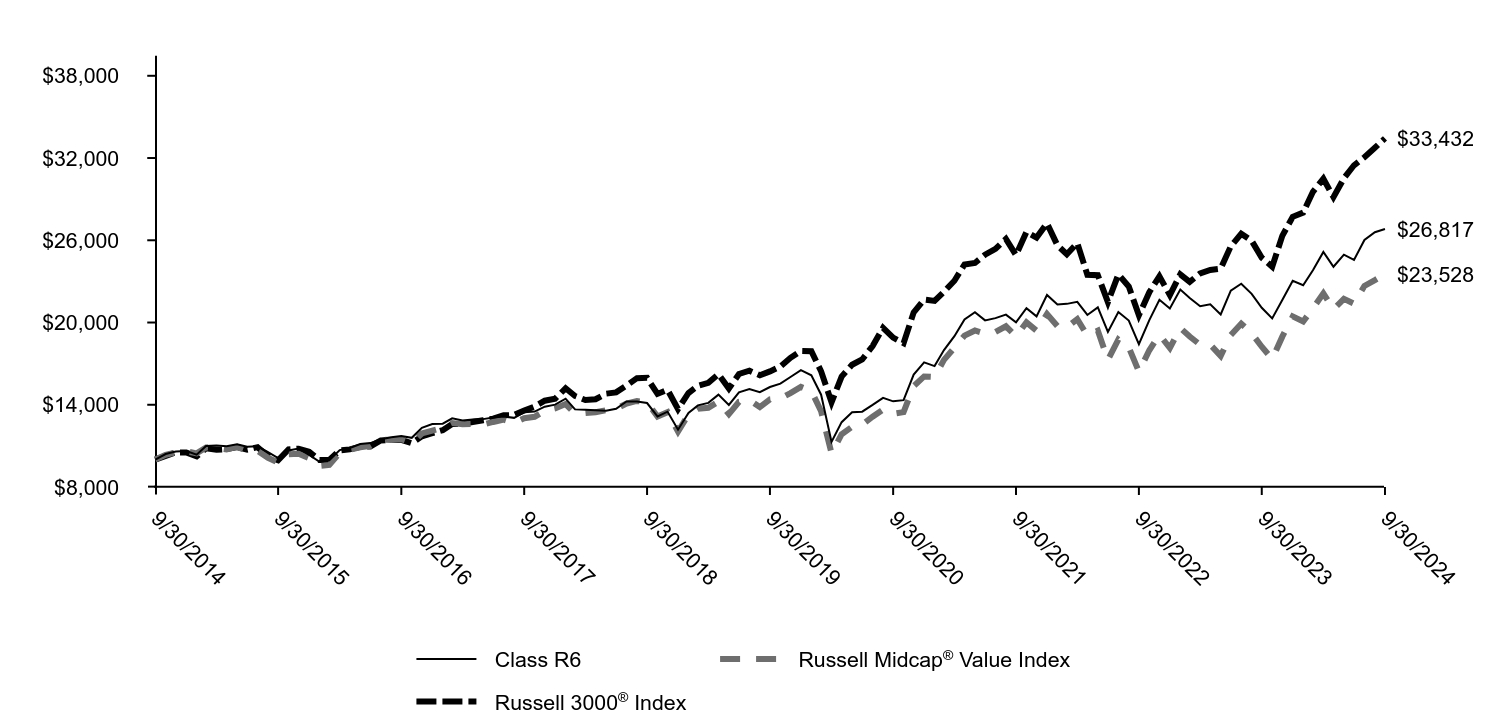
| Class R6 | Russell Midcap® Value Index | Russell 3000® Index |
|---|
| 9/30/2014 | $10,000 | $10,000 | $10,000 |
| 10/31/2014 | $10,407 | $10,343 | $10,275 |
| 11/30/2014 | $10,590 | $10,527 | $10,524 |
| 12/31/2014 | $10,628 | $10,605 | $10,524 |
| 1/31/2015 | $10,361 | $10,454 | $10,231 |
| 2/28/2015 | $10,990 | $10,882 | $10,824 |
| 3/31/2015 | $11,026 | $10,862 | $10,713 |
| 4/30/2015 | $10,980 | $10,739 | $10,762 |
| 5/31/2015 | $11,119 | $10,929 | $10,911 |
| 6/30/2015 | $10,941 | $10,649 | $10,728 |
| 7/31/2015 | $10,967 | $10,634 | $10,908 |
| 8/31/2015 | $10,536 | $10,131 | $10,249 |
| 9/30/2015 | $10,114 | $9,793 | $9,951 |
| 10/31/2015 | $10,664 | $10,391 | $10,736 |
| 11/30/2015 | $10,799 | $10,421 | $10,796 |
| 12/31/2015 | $10,346 | $10,099 | $10,574 |
| 1/31/2016 | $9,837 | $9,541 | $9,978 |
| 2/29/2016 | $9,947 | $9,607 | $9,975 |
| 3/31/2016 | $10,694 | $10,494 | $10,677 |
| 4/30/2016 | $10,842 | $10,720 | $10,743 |
| 5/31/2016 | $11,131 | $10,895 | $10,935 |
| 6/30/2016 | $11,203 | $10,994 | $10,958 |
| 7/31/2016 | $11,479 | $11,460 | $11,393 |
| 8/31/2016 | $11,634 | $11,436 | $11,422 |
| 9/30/2016 | $11,716 | $11,484 | $11,440 |
| 10/31/2016 | $11,589 | $11,205 | $11,192 |
| 11/30/2016 | $12,319 | $11,906 | $11,693 |
| 12/31/2016 | $12,590 | $12,118 | $11,921 |
| 1/31/2017 | $12,621 | $12,322 | $12,145 |
| 2/28/2017 | $13,005 | $12,666 | $12,597 |
| 3/31/2017 | $12,845 | $12,574 | $12,606 |
| 4/30/2017 | $12,918 | $12,597 | $12,739 |
| 5/31/2017 | $12,953 | $12,558 | $12,870 |
| 6/30/2017 | $13,075 | $12,745 | $12,986 |
| 7/31/2017 | $13,142 | $12,914 | $13,231 |
| 8/31/2017 | $13,044 | $12,673 | $13,256 |
| 9/30/2017 | $13,460 | $13,019 | $13,579 |
| 10/31/2017 | $13,505 | $13,123 | $13,876 |
| 11/30/2017 | $13,858 | $13,567 | $14,297 |
| 12/31/2017 | $14,009 | $13,735 | $14,440 |
| 1/31/2018 | $14,444 | $14,051 | $15,201 |
| 2/28/2018 | $13,662 | $13,358 | $14,641 |
| 3/31/2018 | $13,633 | $13,391 | $14,347 |
| 4/30/2018 | $13,604 | $13,458 | $14,402 |
| 5/31/2018 | $13,560 | $13,604 | $14,808 |
| 6/30/2018 | $13,702 | $13,713 | $14,905 |
| 7/31/2018 | $14,239 | $14,086 | $15,400 |
| 8/31/2018 | $14,235 | $14,278 | $15,940 |
| 9/30/2018 | $14,126 | $14,165 | $15,967 |
| 10/31/2018 | $13,147 | $13,145 | $14,791 |
| 11/30/2018 | $13,494 | $13,460 | $15,087 |
| 12/31/2018 | $12,184 | $12,047 | $13,683 |
| 1/31/2019 | $13,404 | $13,287 | $14,858 |
| 2/28/2019 | $13,956 | $13,710 | $15,380 |
| 3/31/2019 | $14,139 | $13,778 | $15,605 |
| 4/30/2019 | $14,740 | $14,233 | $16,228 |
| 5/31/2019 | $13,986 | $13,319 | $15,178 |
| 6/30/2019 | $14,905 | $14,218 | $16,244 |
| 7/31/2019 | $15,153 | $14,337 | $16,485 |
| 8/31/2019 | $14,912 | $13,831 | $16,149 |
| 9/30/2019 | $15,295 | $14,392 | $16,433 |
| 10/31/2019 | $15,539 | $14,470 | $16,786 |
| 11/30/2019 | $16,027 | $14,855 | $17,424 |
| 12/31/2019 | $16,532 | $15,307 | $17,928 |
| 1/31/2020 | $16,148 | $15,009 | $17,908 |
| 2/29/2020 | $14,735 | $13,523 | $16,442 |
| 3/31/2020 | $11,289 | $10,454 | $14,181 |
| 4/30/2020 | $12,730 | $11,850 | $16,059 |
| 5/31/2020 | $13,447 | $12,399 | $16,918 |
| 6/30/2020 | $13,497 | $12,539 | $17,304 |
| 7/31/2020 | $13,987 | $13,131 | $18,287 |
| 8/31/2020 | $14,504 | $13,651 | $19,612 |
| 9/30/2020 | $14,249 | $13,342 | $18,898 |
| 10/31/2020 | $14,335 | $13,466 | $18,490 |
| 11/30/2020 | $16,199 | $15,357 | $20,739 |
| 12/31/2020 | $17,088 | $16,067 | $21,672 |
| 1/31/2021 | $16,820 | $16,030 | $21,576 |
| 2/28/2021 | $17,992 | $17,272 | $22,250 |
| 3/31/2021 | $19,002 | $18,164 | $23,048 |
| 4/30/2021 | $20,221 | $19,042 | $24,236 |
| 5/31/2021 | $20,754 | $19,418 | $24,346 |
| 6/30/2021 | $20,158 | $19,192 | $24,947 |
| 7/31/2021 | $20,320 | $19,311 | $25,369 |
| 8/31/2021 | $20,576 | $19,725 | $26,092 |
| 9/30/2021 | $20,012 | $18,998 | $24,921 |
| 10/31/2021 | $21,050 | $20,010 | $26,607 |
| 11/30/2021 | $20,450 | $19,402 | $26,202 |
| 12/31/2021 | $22,009 | $20,620 | $27,234 |
| 1/31/2022 | $21,313 | $19,740 | $25,631 |
| 2/28/2022 | $21,361 | $19,648 | $24,986 |
| 3/31/2022 | $21,509 | $20,245 | $25,796 |
| 4/30/2022 | $20,552 | $19,042 | $23,481 |
| 5/31/2022 | $21,104 | $19,407 | $23,450 |
| 6/30/2022 | $19,317 | $17,274 | $21,488 |
| 7/31/2022 | $20,769 | $18,761 | $23,504 |
| 8/31/2022 | $20,143 | $18,186 | $22,627 |
| 9/30/2022 | $18,425 | $16,423 | $20,528 |
| 10/31/2022 | $20,178 | $17,974 | $22,212 |
| 11/30/2022 | $21,657 | $19,110 | $23,371 |
| 12/31/2022 | $21,018 | $18,139 | $22,003 |
| 1/31/2023 | $22,400 | $19,604 | $23,518 |
| 2/28/2023 | $21,785 | $18,976 | $22,968 |
| 3/31/2023 | $21,193 | $18,379 | $23,583 |
| 4/30/2023 | $21,326 | $18,380 | $23,834 |
| 5/31/2023 | $20,588 | $17,565 | $23,927 |
| 6/30/2023 | $22,329 | $19,088 | $25,560 |
| 7/31/2023 | $22,826 | $19,919 | $26,477 |
| 8/31/2023 | $22,093 | $19,214 | $25,966 |
| 9/30/2023 | $21,075 | $18,237 | $24,729 |
| 10/31/2023 | $20,299 | $17,334 | $24,073 |
| 11/30/2023 | $21,643 | $18,968 | $26,318 |
| 12/31/2023 | $23,041 | $20,445 | $27,714 |
| 1/31/2024 | $22,720 | $20,079 | $28,021 |
| 2/29/2024 | $23,817 | $21,038 | $29,538 |
| 3/31/2024 | $25,149 | $22,127 | $30,491 |
| 4/30/2024 | $24,067 | $20,969 | $29,149 |
| 5/31/2024 | $24,949 | $21,722 | $30,526 |
| 6/30/2024 | $24,568 | $21,374 | $31,471 |
| 7/31/2024 | $26,025 | $22,666 | $32,056 |
| 8/31/2024 | $26,591 | $23,093 | $32,754 |
| 9/30/2024 | $26,817 | $23,528 | $33,432 |
Special Mid Cap Value Fund
Annual Shareholder Report | September 30, 2024
AVERAGE ANNUAL TOTAL RETURNS (%)
| 1 Year | 5 Years | 10 Years |
|---|
| Class R6 | 27.24 | 11.88 | 10.37 |
Russell Midcap® Value Index (Strategy) | 29.01 | 10.33 | 8.93 |
Russell 3000® Index (Regulatory) | 35.19 | 15.26 | 12.83 |
| Total net assets | $14,226,954,885 |
| # of portfolio holdings | 67 |
| Portfolio turnover rate | 19% |
| Total advisory fees paid | $82,662,725 |
Figures quoted represent past performance, which is no guarantee of future results, and do not reflect taxes that a shareholder may pay on an investment in a fund.
What did the Fund invest in?
(Based on long-term investments)
SECTOR ALLOCATION (% OF LONG-TERM INVESTMENTS)
| Financials | 20.5 |
| Industrials | 19.3 |
| Real estate | 11.3 |
| Materials | 10.3 |
| Health care | 9.2 |
| Consumer staples | 7.4 |
| Utilities | 6.9 |
| Information technology | 5.5 |
| Energy | 5.1 |
| Consumer discretionary | 4.5 |
TOP TEN HOLDINGS (% OF NET ASSETS)
| CBRE Group, Inc., Class A | 4.0 |
| Arch Capital Group Ltd. | 3.2 |
| Keurig Dr Pepper, Inc. | 3.1 |
| AerCap Holdings NV | 3.0 |
| Allstate Corp. | 2.8 |
| Vulcan Materials Co. | 2.7 |
| Republic Services, Inc., Class A | 2.6 |
| L3Harris Technologies, Inc. | 2.5 |
| American Electric Power Co., Inc. | 2.5 |
| Graphic Packaging Holding Co. | 2.5 |
You can find additional information on the Fund's website at allspringglobal.com, including its:
- Prospectus - Financial Information - Fund holdings - Proxy voting information
Annual Shareholder Report
Special Mid Cap Value Fund
This annual shareholder report contains important information about Special Mid Cap Value Fund for the period of October 1, 2023 to September 30, 2024. You can find additional information about the Fund at allspringglobal.com. You can also request this information by contacting us at 1-800-222-8222.
What were the Fund costs for the past year?
The table explains the costs you would have paid within the reporting period based on a hypothetical $10,000 investment.
| CLASS NAME | COSTS OF A $10,000 INVESTMENT | COSTS PAID AS A % OF A $10,000 INVESTMENT |
|---|
| Class C | $211 | 1.87% |
The manager has contractually committed to waive fees and/or reimburse certain expenses to the extent necessary to cap the Fund's total annual fund operating expense ratio at a specific amount. Without this cap, the costs shown above may have been higher. Please see the prospectus for the amount and the expiration date of the cap. Prior to or after the commitment expiration date, the cap may be increased or the commitment to maintain the cap may be terminated only with the approval of the Board of Trustees.
How did the Fund perform last year and what affected its performance?
Equities were volatile, with ongoing inflation concerns, varying economic data points, and a hope that a soft landing can be achieved.
Minor changes to sector positioning included an increase in materials while reducing the weight in industrials as reward/risk ratios dictated.
Carlisle Companies, Inc., the largest relative contributor, focuses on commercial building products and is the largest U.S. manufacturer of commercial roofing. Carlisle has benefited from price discipline in its end markets and a divestiture of a non-core segment. We believe management’s focus on complementary products should strengthen its free cash flow and fortify its balance sheet, creating significant value.
The largest detractor was LKQ Corp., a leading provider of specialty parts to repair vehicles. For most of our holding period, LKQ actively optimized the efficiency of the asset base after a prolonged period of acquisitions, leading to excess free cash flow generation. Management also repurchased shares. This drove reasonable returns early in the period. However, a series of missteps by LKQ caused us concern regarding the stability of future free cash flow.
Total return based on a $10,000 investment
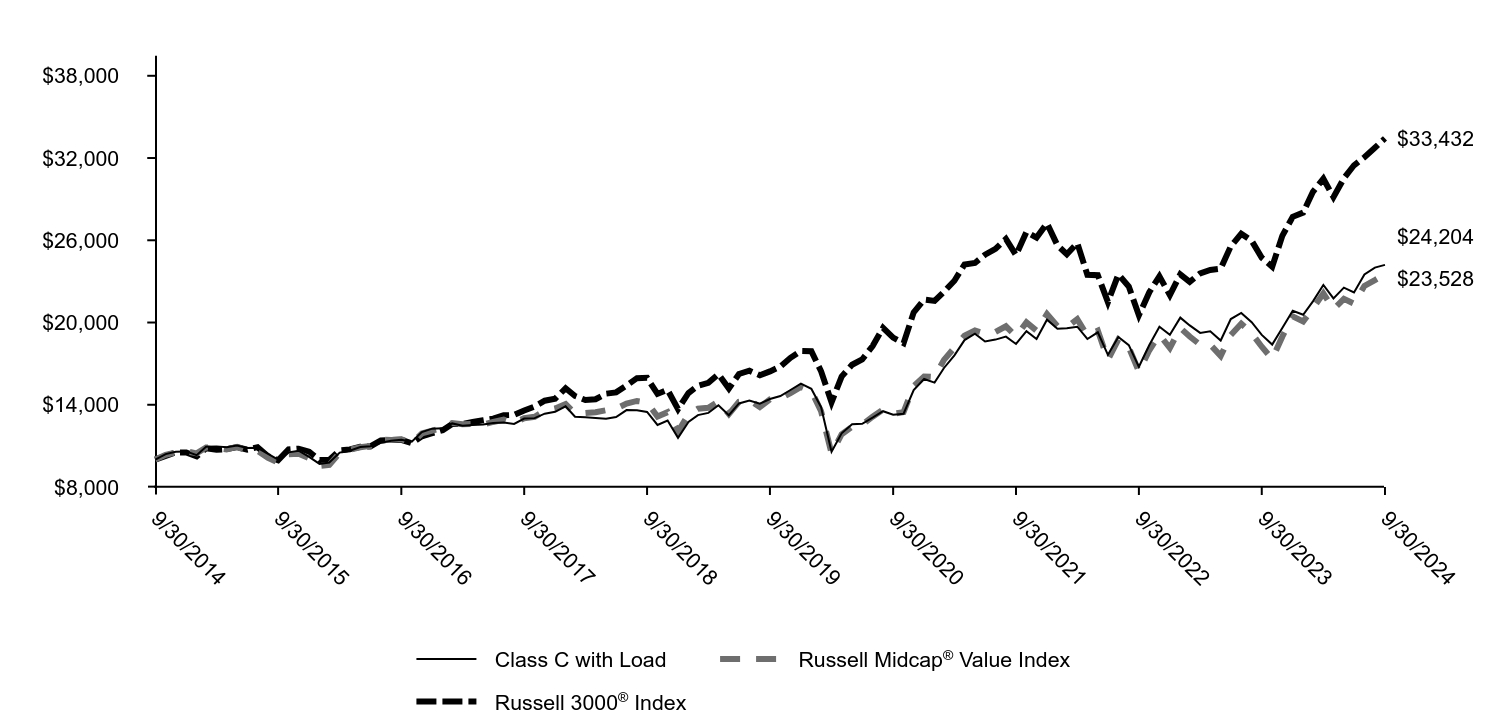
| Class C with Load | Russell Midcap® Value Index | Russell 3000® Index |
|---|
| 9/30/2014 | $10,000 | $10,000 | $10,000 |
| 10/31/2014 | $10,399 | $10,343 | $10,275 |
| 11/30/2014 | $10,572 | $10,527 | $10,524 |
| 12/31/2014 | $10,598 | $10,605 | $10,524 |
| 1/31/2015 | $10,323 | $10,454 | $10,231 |
| 2/28/2015 | $10,936 | $10,882 | $10,824 |
| 3/31/2015 | $10,964 | $10,862 | $10,713 |
| 4/30/2015 | $10,905 | $10,739 | $10,762 |
| 5/31/2015 | $11,033 | $10,929 | $10,911 |
| 6/30/2015 | $10,846 | $10,649 | $10,728 |
| 7/31/2015 | $10,860 | $10,634 | $10,908 |
| 8/31/2015 | $10,423 | $10,131 | $10,249 |
| 9/30/2015 | $9,995 | $9,793 | $9,951 |
| 10/31/2015 | $10,529 | $10,391 | $10,736 |
| 11/30/2015 | $10,650 | $10,421 | $10,796 |
| 12/31/2015 | $10,193 | $10,099 | $10,574 |
| 1/31/2016 | $9,684 | $9,541 | $9,978 |
| 2/29/2016 | $9,781 | $9,607 | $9,975 |
| 3/31/2016 | $10,509 | $10,494 | $10,677 |
| 4/30/2016 | $10,642 | $10,720 | $10,743 |
| 5/31/2016 | $10,914 | $10,895 | $10,935 |
| 6/30/2016 | $10,975 | $10,994 | $10,958 |
| 7/31/2016 | $11,233 | $11,460 | $11,393 |
| 8/31/2016 | $11,373 | $11,436 | $11,422 |
| 9/30/2016 | $11,441 | $11,484 | $11,440 |
| 10/31/2016 | $11,308 | $11,205 | $11,192 |
| 11/30/2016 | $12,008 | $11,906 | $11,693 |
| 12/31/2016 | $12,257 | $12,118 | $11,921 |
| 1/31/2017 | $12,282 | $12,322 | $12,145 |
| 2/28/2017 | $12,639 | $12,666 | $12,597 |
| 3/31/2017 | $12,473 | $12,574 | $12,606 |
| 4/30/2017 | $12,531 | $12,597 | $12,739 |
| 5/31/2017 | $12,552 | $12,558 | $12,870 |
| 6/30/2017 | $12,661 | $12,745 | $12,986 |
| 7/31/2017 | $12,711 | $12,914 | $13,231 |
| 8/31/2017 | $12,603 | $12,673 | $13,256 |
| 9/30/2017 | $12,992 | $13,019 | $13,579 |
| 10/31/2017 | $13,025 | $13,123 | $13,876 |
| 11/30/2017 | $13,349 | $13,567 | $14,297 |
| 12/31/2017 | $13,483 | $13,735 | $14,440 |
| 1/31/2018 | $13,887 | $14,051 | $15,201 |
| 2/28/2018 | $13,124 | $13,358 | $14,641 |
| 3/31/2018 | $13,083 | $13,391 | $14,347 |
| 4/30/2018 | $13,042 | $13,458 | $14,402 |
| 5/31/2018 | $12,986 | $13,604 | $14,808 |
| 6/30/2018 | $13,109 | $13,713 | $14,905 |
| 7/31/2018 | $13,614 | $14,086 | $15,400 |
| 8/31/2018 | $13,592 | $14,278 | $15,940 |
| 9/30/2018 | $13,476 | $14,165 | $15,967 |
| 10/31/2018 | $12,529 | $13,145 | $14,791 |
| 11/30/2018 | $12,847 | $13,460 | $15,087 |
| 12/31/2018 | $11,588 | $12,047 | $13,683 |
| 1/31/2019 | $12,739 | $13,287 | $14,858 |
| 2/28/2019 | $13,245 | $13,710 | $15,380 |
| 3/31/2019 | $13,409 | $13,778 | $15,605 |
| 4/30/2019 | $13,965 | $14,233 | $16,228 |
| 5/31/2019 | $13,238 | $13,319 | $15,178 |
| 6/30/2019 | $14,095 | $14,218 | $16,244 |
| 7/31/2019 | $14,316 | $14,337 | $16,485 |
| 8/31/2019 | $14,072 | $13,831 | $16,149 |
| 9/30/2019 | $14,419 | $14,392 | $16,433 |
| 10/31/2019 | $14,636 | $14,470 | $16,786 |
| 11/30/2019 | $15,078 | $14,855 | $17,424 |
| 12/31/2019 | $15,539 | $15,307 | $17,928 |
| 1/31/2020 | $15,164 | $15,009 | $17,908 |
| 2/29/2020 | $13,821 | $13,523 | $16,442 |
| 3/31/2020 | $10,579 | $10,454 | $14,181 |
| 4/30/2020 | $11,918 | $11,850 | $16,059 |
| 5/31/2020 | $12,577 | $12,399 | $16,918 |
| 6/30/2020 | $12,613 | $12,539 | $17,304 |
| 7/31/2020 | $13,059 | $13,131 | $18,287 |
| 8/31/2020 | $13,529 | $13,651 | $19,612 |
| 9/30/2020 | $13,280 | $13,342 | $18,898 |
| 10/31/2020 | $13,347 | $13,466 | $18,490 |
| 11/30/2020 | $15,065 | $15,357 | $20,739 |
| 12/31/2020 | $15,879 | $16,067 | $21,672 |
| 1/31/2021 | $15,614 | $16,030 | $21,576 |
| 2/28/2021 | $16,684 | $17,272 | $22,250 |
| 3/31/2021 | $17,604 | $18,164 | $23,048 |
| 4/30/2021 | $18,718 | $19,042 | $24,236 |
| 5/31/2021 | $19,192 | $19,418 | $24,346 |
| 6/30/2021 | $18,619 | $19,192 | $24,947 |
| 7/31/2021 | $18,754 | $19,311 | $25,369 |
| 8/31/2021 | $18,971 | $19,725 | $26,092 |
| 9/30/2021 | $18,434 | $18,998 | $24,921 |
| 10/31/2021 | $19,370 | $20,010 | $26,607 |
| 11/30/2021 | $18,797 | $19,402 | $26,202 |
| 12/31/2021 | $20,208 | $20,620 | $27,234 |
| 1/31/2022 | $19,553 | $19,740 | $25,631 |
| 2/28/2022 | $19,580 | $19,648 | $24,986 |
| 3/31/2022 | $19,693 | $20,245 | $25,796 |
| 4/30/2022 | $18,798 | $19,042 | $23,481 |
| 5/31/2022 | $19,287 | $19,407 | $23,450 |
| 6/30/2022 | $17,638 | $17,274 | $21,488 |
| 7/31/2022 | $18,942 | $18,761 | $23,504 |
| 8/31/2022 | $18,353 | $18,186 | $22,627 |
| 9/30/2022 | $16,769 | $16,423 | $20,528 |
| 10/31/2022 | $18,357 | $17,974 | $22,212 |
| 11/30/2022 | $19,696 | $19,110 | $23,371 |
| 12/31/2022 | $19,112 | $18,139 | $22,003 |
| 1/31/2023 | $20,357 | $19,604 | $23,518 |
| 2/28/2023 | $19,788 | $18,976 | $22,968 |
| 3/31/2023 | $19,245 | $18,379 | $23,583 |
| 4/30/2023 | $19,361 | $18,380 | $23,834 |
| 5/31/2023 | $18,685 | $17,565 | $23,927 |
| 6/30/2023 | $20,255 | $19,088 | $25,560 |
| 7/31/2023 | $20,700 | $19,919 | $26,477 |
| 8/31/2023 | $20,028 | $19,214 | $25,966 |
| 9/30/2023 | $19,098 | $18,237 | $24,729 |
| 10/31/2023 | $18,391 | $17,334 | $24,073 |
| 11/30/2023 | $19,601 | $18,968 | $26,318 |
| 12/31/2023 | $20,859 | $20,445 | $27,714 |
| 1/31/2024 | $20,563 | $20,079 | $28,021 |
| 2/29/2024 | $21,545 | $21,038 | $29,538 |
| 3/31/2024 | $22,743 | $22,127 | $30,491 |
| 4/30/2024 | $21,756 | $20,969 | $29,149 |
| 5/31/2024 | $22,546 | $21,722 | $30,526 |
| 6/30/2024 | $22,198 | $21,374 | $31,471 |
| 7/31/2024 | $23,504 | $22,666 | $32,056 |
| 8/31/2024 | $24,007 | $23,093 | $32,754 |
| 9/30/2024 | $24,204 | $23,528 | $33,432 |
Special Mid Cap Value Fund
Annual Shareholder Report | September 30, 2024
AVERAGE ANNUAL TOTAL RETURNS (%)
| 1 Year | 5 Years | 10 Years |
|---|
| Class C | 25.81 | 10.59 | 9.24 |
| Class C with Load | 24.81 | 10.59 | 9.24 |
Russell Midcap® Value Index (Strategy) | 29.01 | 10.33 | 8.93 |
Russell 3000® Index (Regulatory) | 35.19 | 15.26 | 12.83 |
| Total net assets | $14,226,954,885 |
| # of portfolio holdings | 67 |
| Portfolio turnover rate | 19% |
| Total advisory fees paid | $82,662,725 |
Figures quoted represent past performance, which is no guarantee of future results, and do not reflect taxes that a shareholder may pay on an investment in a fund.
What did the Fund invest in?
(Based on long-term investments)
SECTOR ALLOCATION (% OF LONG-TERM INVESTMENTS)
| Financials | 20.5 |
| Industrials | 19.3 |
| Real estate | 11.3 |
| Materials | 10.3 |
| Health care | 9.2 |
| Consumer staples | 7.4 |
| Utilities | 6.9 |
| Information technology | 5.5 |
| Energy | 5.1 |
| Consumer discretionary | 4.5 |
TOP TEN HOLDINGS (% OF NET ASSETS)
| CBRE Group, Inc., Class A | 4.0 |
| Arch Capital Group Ltd. | 3.2 |
| Keurig Dr Pepper, Inc. | 3.1 |
| AerCap Holdings NV | 3.0 |
| Allstate Corp. | 2.8 |
| Vulcan Materials Co. | 2.7 |
| Republic Services, Inc., Class A | 2.6 |
| L3Harris Technologies, Inc. | 2.5 |
| American Electric Power Co., Inc. | 2.5 |
| Graphic Packaging Holding Co. | 2.5 |
You can find additional information on the Fund's website at allspringglobal.com, including its:
- Prospectus - Financial Information - Fund holdings - Proxy voting information
Annual Shareholder Report
Special Mid Cap Value Fund
This annual shareholder report contains important information about Special Mid Cap Value Fund for the period of October 1, 2023 to September 30, 2024. You can find additional information about the Fund at allspringglobal.com. You can also request this information by contacting us at 1-800-222-8222.
What were the Fund costs for the past year?
The table explains the costs you would have paid within the reporting period based on a hypothetical $10,000 investment.
| CLASS NAME | COSTS OF A $10,000 INVESTMENT | COSTS PAID AS A % OF A $10,000 INVESTMENT |
|---|
| Class A | $126 | 1.11% |
The manager has contractually committed to waive fees and/or reimburse certain expenses to the extent necessary to cap the Fund's total annual fund operating expense ratio at a specific amount. Without this cap, the costs shown above may have been higher. Please see the prospectus for the amount and the expiration date of the cap. Prior to or after the commitment expiration date, the cap may be increased or the commitment to maintain the cap may be terminated only with the approval of the Board of Trustees.
How did the Fund perform last year and what affected its performance?
Equities were volatile, with ongoing inflation concerns, varying economic data points, and a hope that a soft landing can be achieved.
Minor changes to sector positioning included an increase in materials while reducing the weight in industrials as reward/risk ratios dictated.
Carlisle Companies, Inc., the largest relative contributor, focuses on commercial building products and is the largest U.S. manufacturer of commercial roofing. Carlisle has benefited from price discipline in its end markets and a divestiture of a non-core segment. We believe management’s focus on complementary products should strengthen its free cash flow and fortify its balance sheet, creating significant value.
The largest detractor was LKQ Corp., a leading provider of specialty parts to repair vehicles. For most of our holding period, LKQ actively optimized the efficiency of the asset base after a prolonged period of acquisitions, leading to excess free cash flow generation. Management also repurchased shares. This drove reasonable returns early in the period. However, a series of missteps by LKQ caused us concern regarding the stability of future free cash flow.
Total return based on a $10,000 investment
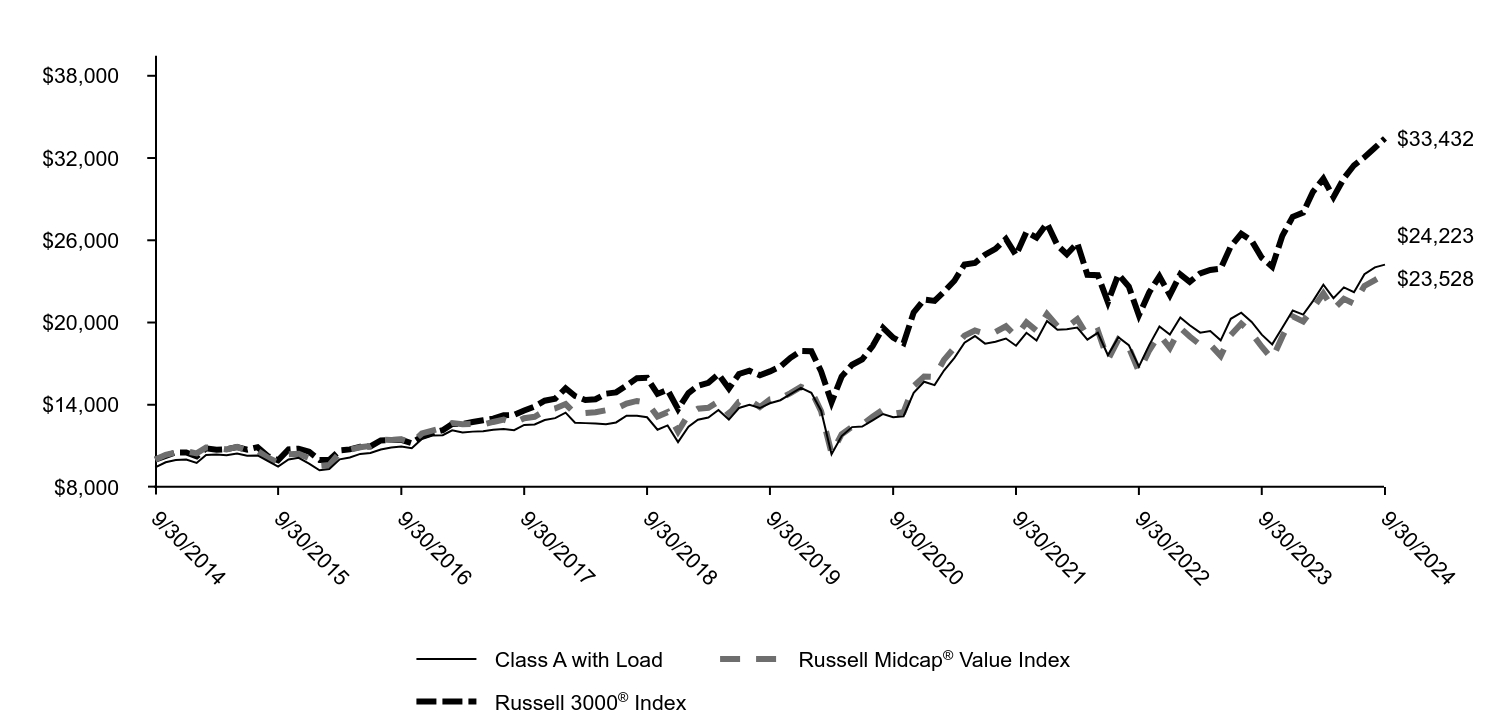
| Class A with Load | Russell Midcap® Value Index | Russell 3000® Index |
|---|
| 9/30/2014 | $9,426 | $10,000 | $10,000 |
| 10/31/2014 | $9,807 | $10,343 | $10,275 |
| 11/30/2014 | $9,977 | $10,527 | $10,524 |
| 12/31/2014 | $10,009 | $10,605 | $10,524 |
| 1/31/2015 | $9,755 | $10,454 | $10,231 |
| 2/28/2015 | $10,342 | $10,882 | $10,824 |
| 3/31/2015 | $10,370 | $10,862 | $10,713 |
| 4/30/2015 | $10,323 | $10,739 | $10,762 |
| 5/31/2015 | $10,450 | $10,929 | $10,911 |
| 6/30/2015 | $10,281 | $10,649 | $10,728 |
| 7/31/2015 | $10,301 | $10,634 | $10,908 |
| 8/31/2015 | $9,891 | $10,131 | $10,249 |
| 9/30/2015 | $9,491 | $9,793 | $9,951 |
| 10/31/2015 | $10,005 | $10,391 | $10,736 |
| 11/30/2015 | $10,126 | $10,421 | $10,796 |
| 12/31/2015 | $9,698 | $10,099 | $10,574 |
| 1/31/2016 | $9,219 | $9,541 | $9,978 |
| 2/29/2016 | $9,318 | $9,607 | $9,975 |
| 3/31/2016 | $10,015 | $10,494 | $10,677 |
| 4/30/2016 | $10,151 | $10,720 | $10,743 |
| 5/31/2016 | $10,415 | $10,895 | $10,935 |
| 6/30/2016 | $10,481 | $10,994 | $10,958 |
| 7/31/2016 | $10,733 | $11,460 | $11,393 |
| 8/31/2016 | $10,875 | $11,436 | $11,422 |
| 9/30/2016 | $10,948 | $11,484 | $11,440 |
| 10/31/2016 | $10,825 | $11,205 | $11,192 |
| 11/30/2016 | $11,503 | $11,906 | $11,693 |
| 12/31/2016 | $11,750 | $12,118 | $11,921 |
| 1/31/2017 | $11,780 | $12,322 | $12,145 |
| 2/28/2017 | $12,131 | $12,666 | $12,597 |
| 3/31/2017 | $11,980 | $12,574 | $12,606 |
| 4/30/2017 | $12,040 | $12,597 | $12,739 |
| 5/31/2017 | $12,071 | $12,558 | $12,870 |
| 6/30/2017 | $12,181 | $12,745 | $12,986 |
| 7/31/2017 | $12,234 | $12,914 | $13,231 |
| 8/31/2017 | $12,144 | $12,673 | $13,256 |
| 9/30/2017 | $12,525 | $13,019 | $13,579 |
| 10/31/2017 | $12,562 | $13,123 | $13,876 |
| 11/30/2017 | $12,886 | $13,567 | $14,297 |
| 12/31/2017 | $13,022 | $13,735 | $14,440 |
| 1/31/2018 | $13,423 | $14,051 | $15,201 |
| 2/28/2018 | $12,692 | $13,358 | $14,641 |
| 3/31/2018 | $12,660 | $13,391 | $14,347 |
| 4/30/2018 | $12,625 | $13,458 | $14,402 |
| 5/31/2018 | $12,580 | $13,604 | $14,808 |
| 6/30/2018 | $12,709 | $13,713 | $14,905 |
| 7/31/2018 | $13,203 | $14,086 | $15,400 |
| 8/31/2018 | $13,193 | $14,278 | $15,940 |
| 9/30/2018 | $13,088 | $14,165 | $15,967 |
| 10/31/2018 | $12,176 | $13,145 | $14,791 |
| 11/30/2018 | $12,493 | $13,460 | $15,087 |
| 12/31/2018 | $11,276 | $12,047 | $13,683 |
| 1/31/2019 | $12,401 | $13,287 | $14,858 |
| 2/28/2019 | $12,907 | $13,710 | $15,380 |
| 3/31/2019 | $13,074 | $13,778 | $15,605 |
| 4/30/2019 | $13,622 | $14,233 | $16,228 |
| 5/31/2019 | $12,921 | $13,319 | $15,178 |
| 6/30/2019 | $13,765 | $14,218 | $16,244 |
| 7/31/2019 | $13,989 | $14,337 | $16,485 |
| 8/31/2019 | $13,761 | $13,831 | $16,149 |
| 9/30/2019 | $14,110 | $14,392 | $16,433 |
| 10/31/2019 | $14,331 | $14,470 | $16,786 |
| 11/30/2019 | $14,772 | $14,855 | $17,424 |
| 12/31/2019 | $15,234 | $15,307 | $17,928 |
| 1/31/2020 | $14,874 | $15,009 | $17,908 |
| 2/29/2020 | $13,570 | $13,523 | $16,442 |
| 3/31/2020 | $10,390 | $10,454 | $14,181 |
| 4/30/2020 | $11,713 | $11,850 | $16,059 |
| 5/31/2020 | $12,369 | $12,399 | $16,918 |
| 6/30/2020 | $12,414 | $12,539 | $17,304 |
| 7/31/2020 | $12,858 | $13,131 | $18,287 |
| 8/31/2020 | $13,325 | $13,651 | $19,612 |
| 9/30/2020 | $13,092 | $13,342 | $18,898 |
| 10/31/2020 | $13,162 | $13,466 | $18,490 |
| 11/30/2020 | $14,871 | $15,357 | $20,739 |
| 12/31/2020 | $15,680 | $16,067 | $21,672 |
| 1/31/2021 | $15,431 | $16,030 | $21,576 |
| 2/28/2021 | $16,499 | $17,272 | $22,250 |
| 3/31/2021 | $17,417 | $18,164 | $23,048 |
| 4/30/2021 | $18,529 | $19,042 | $24,236 |
| 5/31/2021 | $19,013 | $19,418 | $24,346 |
| 6/30/2021 | $18,459 | $19,192 | $24,947 |
| 7/31/2021 | $18,600 | $19,311 | $25,369 |
| 8/31/2021 | $18,831 | $19,725 | $26,092 |
| 9/30/2021 | $18,306 | $18,998 | $24,921 |
| 10/31/2021 | $19,251 | $20,010 | $26,607 |
| 11/30/2021 | $18,689 | $19,402 | $26,202 |
| 12/31/2021 | $20,109 | $20,620 | $27,234 |
| 1/31/2022 | $19,466 | $19,740 | $25,631 |
| 2/28/2022 | $19,507 | $19,648 | $24,986 |
| 3/31/2022 | $19,634 | $20,245 | $25,796 |
| 4/30/2022 | $18,753 | $19,042 | $23,481 |
| 5/31/2022 | $19,248 | $19,407 | $23,450 |
| 6/30/2022 | $17,614 | $17,274 | $21,488 |
| 7/31/2022 | $18,933 | $18,761 | $23,504 |
| 8/31/2022 | $18,351 | $18,186 | $22,627 |
| 9/30/2022 | $16,782 | $16,423 | $20,528 |
| 10/31/2022 | $18,372 | $17,974 | $22,212 |
| 11/30/2022 | $19,711 | $19,110 | $23,371 |
| 12/31/2022 | $19,127 | $18,139 | $22,003 |
| 1/31/2023 | $20,373 | $19,604 | $23,518 |
| 2/28/2023 | $19,804 | $18,976 | $22,968 |
| 3/31/2023 | $19,260 | $18,379 | $23,583 |
| 4/30/2023 | $19,376 | $18,380 | $23,834 |
| 5/31/2023 | $18,699 | $17,565 | $23,927 |
| 6/30/2023 | $20,271 | $19,088 | $25,560 |
| 7/31/2023 | $20,716 | $19,919 | $26,477 |
| 8/31/2023 | $20,044 | $19,214 | $25,966 |
| 9/30/2023 | $19,113 | $18,237 | $24,729 |
| 10/31/2023 | $18,406 | $17,334 | $24,073 |
| 11/30/2023 | $19,617 | $18,968 | $26,318 |
| 12/31/2023 | $20,875 | $20,445 | $27,714 |
| 1/31/2024 | $20,579 | $20,079 | $28,021 |
| 2/29/2024 | $21,562 | $21,038 | $29,538 |
| 3/31/2024 | $22,761 | $22,127 | $30,491 |
| 4/30/2024 | $21,773 | $20,969 | $29,149 |
| 5/31/2024 | $22,563 | $21,722 | $30,526 |
| 6/30/2024 | $22,215 | $21,374 | $31,471 |
| 7/31/2024 | $23,522 | $22,666 | $32,056 |
| 8/31/2024 | $24,026 | $23,093 | $32,754 |
| 9/30/2024 | $24,223 | $23,528 | $33,432 |
Special Mid Cap Value Fund
Annual Shareholder Report | September 30, 2024
AVERAGE ANNUAL TOTAL RETURNS (%)
| 1 Year | 5 Years | 10 Years |
|---|
| Class A | 26.73 | 11.41 | 9.90 |
| Class A with Load | 19.44 | 10.10 | 9.25 |
Russell Midcap® Value Index (Strategy) | 29.01 | 10.33 | 8.93 |
Russell 3000® Index (Regulatory) | 35.19 | 15.26 | 12.83 |
| Total net assets | $14,226,954,885 |
| # of portfolio holdings | 67 |
| Portfolio turnover rate | 19% |
| Total advisory fees paid | $82,662,725 |
Figures quoted represent past performance, which is no guarantee of future results, and do not reflect taxes that a shareholder may pay on an investment in a fund.
What did the Fund invest in?
(Based on long-term investments)
SECTOR ALLOCATION (% OF LONG-TERM INVESTMENTS)
| Financials | 20.5 |
| Industrials | 19.3 |
| Real estate | 11.3 |
| Materials | 10.3 |
| Health care | 9.2 |
| Consumer staples | 7.4 |
| Utilities | 6.9 |
| Information technology | 5.5 |
| Energy | 5.1 |
| Consumer discretionary | 4.5 |
TOP TEN HOLDINGS (% OF NET ASSETS)
| CBRE Group, Inc., Class A | 4.0 |
| Arch Capital Group Ltd. | 3.2 |
| Keurig Dr Pepper, Inc. | 3.1 |
| AerCap Holdings NV | 3.0 |
| Allstate Corp. | 2.8 |
| Vulcan Materials Co. | 2.7 |
| Republic Services, Inc., Class A | 2.6 |
| L3Harris Technologies, Inc. | 2.5 |
| American Electric Power Co., Inc. | 2.5 |
| Graphic Packaging Holding Co. | 2.5 |
You can find additional information on the Fund's website at allspringglobal.com, including its:
- Prospectus - Financial Information - Fund holdings - Proxy voting information
Annual Shareholder Report
Special Mid Cap Value Fund
This annual shareholder report contains important information about Special Mid Cap Value Fund for the period of October 1, 2023 to September 30, 2024. You can find additional information about the Fund at allspringglobal.com. You can also request this information by contacting us at 1-800-222-8222.
What were the Fund costs for the past year?
The table explains the costs you would have paid within the reporting period based on a hypothetical $10,000 investment.
| CLASS NAME | COSTS OF A $10,000 INVESTMENT | COSTS PAID AS A % OF A $10,000 INVESTMENT |
|---|
| Administrator Class | $119 | 1.05% |
The manager has contractually committed to waive fees and/or reimburse certain expenses to the extent necessary to cap the Fund's total annual fund operating expense ratio at a specific amount. Without this cap, the costs shown above may have been higher. Please see the prospectus for the amount and the expiration date of the cap. Prior to or after the commitment expiration date, the cap may be increased or the commitment to maintain the cap may be terminated only with the approval of the Board of Trustees.
How did the Fund perform last year and what affected its performance?
Equities were volatile, with ongoing inflation concerns, varying economic data points, and a hope that a soft landing can be achieved.
Minor changes to sector positioning included an increase in materials while reducing the weight in industrials as reward/risk ratios dictated.
Carlisle Companies, Inc., the largest relative contributor, focuses on commercial building products and is the largest U.S. manufacturer of commercial roofing. Carlisle has benefited from price discipline in its end markets and a divestiture of a non-core segment. We believe management’s focus on complementary products should strengthen its free cash flow and fortify its balance sheet, creating significant value.
The largest detractor was LKQ Corp., a leading provider of specialty parts to repair vehicles. For most of our holding period, LKQ actively optimized the efficiency of the asset base after a prolonged period of acquisitions, leading to excess free cash flow generation. Management also repurchased shares. This drove reasonable returns early in the period. However, a series of missteps by LKQ caused us concern regarding the stability of future free cash flow.
Total return based on a $10,000 investment
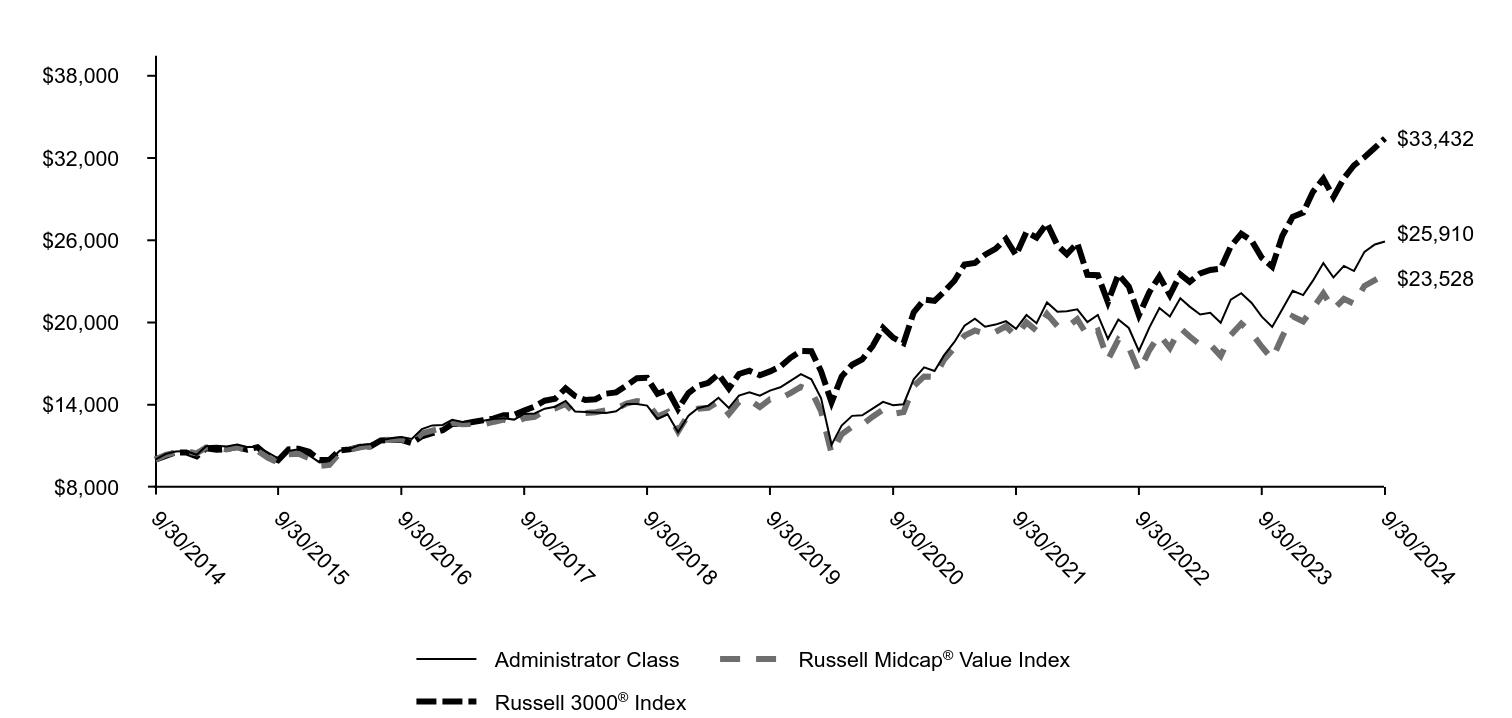
| Administrator Class | Russell Midcap® Value Index | Russell 3000® Index |
|---|
| 9/30/2014 | $10,000 | $10,000 | $10,000 |
| 10/31/2014 | $10,404 | $10,343 | $10,275 |
| 11/30/2014 | $10,585 | $10,527 | $10,524 |
| 12/31/2014 | $10,620 | $10,605 | $10,524 |
| 1/31/2015 | $10,352 | $10,454 | $10,231 |
| 2/28/2015 | $10,978 | $10,882 | $10,824 |
| 3/31/2015 | $11,011 | $10,862 | $10,713 |
| 4/30/2015 | $10,961 | $10,739 | $10,762 |
| 5/31/2015 | $11,097 | $10,929 | $10,911 |
| 6/30/2015 | $10,918 | $10,649 | $10,728 |
| 7/31/2015 | $10,938 | $10,634 | $10,908 |
| 8/31/2015 | $10,504 | $10,131 | $10,249 |
| 9/30/2015 | $10,084 | $9,793 | $9,951 |
| 10/31/2015 | $10,627 | $10,391 | $10,736 |
| 11/30/2015 | $10,759 | $10,421 | $10,796 |
| 12/31/2015 | $10,305 | $10,099 | $10,574 |
| 1/31/2016 | $9,796 | $9,541 | $9,978 |
| 2/29/2016 | $9,900 | $9,607 | $9,975 |
| 3/31/2016 | $10,643 | $10,494 | $10,677 |
| 4/30/2016 | $10,788 | $10,720 | $10,743 |
| 5/31/2016 | $11,072 | $10,895 | $10,935 |
| 6/30/2016 | $11,141 | $10,994 | $10,958 |
| 7/31/2016 | $11,407 | $11,460 | $11,393 |
| 8/31/2016 | $11,559 | $11,436 | $11,422 |
| 9/30/2016 | $11,639 | $11,484 | $11,440 |
| 10/31/2016 | $11,511 | $11,205 | $11,192 |
| 11/30/2016 | $12,230 | $11,906 | $11,693 |
| 12/31/2016 | $12,494 | $12,118 | $11,921 |
| 1/31/2017 | $12,526 | $12,322 | $12,145 |
| 2/28/2017 | $12,900 | $12,666 | $12,597 |
| 3/31/2017 | $12,739 | $12,574 | $12,606 |
| 4/30/2017 | $12,806 | $12,597 | $12,739 |
| 5/31/2017 | $12,841 | $12,558 | $12,870 |
| 6/30/2017 | $12,956 | $12,745 | $12,986 |
| 7/31/2017 | $13,015 | $12,914 | $13,231 |
| 8/31/2017 | $12,917 | $12,673 | $13,256 |
| 9/30/2017 | $13,327 | $13,019 | $13,579 |
| 10/31/2017 | $13,365 | $13,123 | $13,876 |
| 11/30/2017 | $13,711 | $13,567 | $14,297 |
| 12/31/2017 | $13,856 | $13,735 | $14,440 |
| 1/31/2018 | $14,282 | $14,051 | $15,201 |
| 2/28/2018 | $13,506 | $13,358 | $14,641 |
| 3/31/2018 | $13,473 | $13,391 | $14,347 |
| 4/30/2018 | $13,441 | $13,458 | $14,402 |
| 5/31/2018 | $13,393 | $13,604 | $14,808 |
| 6/30/2018 | $13,528 | $13,713 | $14,905 |
| 7/31/2018 | $14,056 | $14,086 | $15,400 |
| 8/31/2018 | $14,049 | $14,278 | $15,940 |
| 9/30/2018 | $13,936 | $14,165 | $15,967 |
| 10/31/2018 | $12,963 | $13,145 | $14,791 |
| 11/30/2018 | $13,306 | $13,460 | $15,087 |
| 12/31/2018 | $12,012 | $12,047 | $13,683 |
| 1/31/2019 | $13,208 | $13,287 | $14,858 |
| 2/28/2019 | $13,745 | $13,710 | $15,380 |
| 3/31/2019 | $13,924 | $13,778 | $15,605 |
| 4/30/2019 | $14,513 | $14,233 | $16,228 |
| 5/31/2019 | $13,767 | $13,319 | $15,178 |
| 6/30/2019 | $14,665 | $14,218 | $16,244 |
| 7/31/2019 | $14,904 | $14,337 | $16,485 |
| 8/31/2019 | $14,665 | $13,831 | $16,149 |
| 9/30/2019 | $15,034 | $14,392 | $16,433 |
| 10/31/2019 | $15,273 | $14,470 | $16,786 |
| 11/30/2019 | $15,746 | $14,855 | $17,424 |
| 12/31/2019 | $16,239 | $15,307 | $17,928 |
| 1/31/2020 | $15,855 | $15,009 | $17,908 |
| 2/29/2020 | $14,464 | $13,523 | $16,442 |
| 3/31/2020 | $11,076 | $10,454 | $14,181 |
| 4/30/2020 | $12,487 | $11,850 | $16,059 |
| 5/31/2020 | $13,189 | $12,399 | $16,918 |
| 6/30/2020 | $13,235 | $12,539 | $17,304 |
| 7/31/2020 | $13,712 | $13,131 | $18,287 |
| 8/31/2020 | $14,212 | $13,651 | $19,612 |
| 9/30/2020 | $13,960 | $13,342 | $18,898 |
| 10/31/2020 | $14,041 | $13,466 | $18,490 |
| 11/30/2020 | $15,859 | $15,357 | $20,739 |
| 12/31/2020 | $16,729 | $16,067 | $21,672 |
| 1/31/2021 | $16,460 | $16,030 | $21,576 |
| 2/28/2021 | $17,600 | $17,272 | $22,250 |
| 3/31/2021 | $18,580 | $18,164 | $23,048 |
| 4/30/2021 | $19,771 | $19,042 | $24,236 |
| 5/31/2021 | $20,284 | $19,418 | $24,346 |
| 6/30/2021 | $19,697 | $19,192 | $24,947 |
| 7/31/2021 | $19,849 | $19,311 | $25,369 |
| 8/31/2021 | $20,094 | $19,725 | $26,092 |
| 9/30/2021 | $19,537 | $18,998 | $24,921 |
| 10/31/2021 | $20,545 | $20,010 | $26,607 |
| 11/30/2021 | $19,950 | $19,402 | $26,202 |
| 12/31/2021 | $21,467 | $20,620 | $27,234 |
| 1/31/2022 | $20,782 | $19,740 | $25,631 |
| 2/28/2022 | $20,825 | $19,648 | $24,986 |
| 3/31/2022 | $20,962 | $20,245 | $25,796 |
| 4/30/2022 | $20,025 | $19,042 | $23,481 |
| 5/31/2022 | $20,555 | $19,407 | $23,450 |
| 6/30/2022 | $18,810 | $17,274 | $21,488 |
| 7/31/2022 | $20,217 | $18,761 | $23,504 |
| 8/31/2022 | $19,601 | $18,186 | $22,627 |
| 9/30/2022 | $17,924 | $16,423 | $20,528 |
| 10/31/2022 | $19,627 | $17,974 | $22,212 |
| 11/30/2022 | $21,056 | $19,110 | $23,371 |
| 12/31/2022 | $20,432 | $18,139 | $22,003 |
| 1/31/2023 | $21,768 | $19,604 | $23,518 |
| 2/28/2023 | $21,160 | $18,976 | $22,968 |
| 3/31/2023 | $20,580 | $18,379 | $23,583 |
| 4/30/2023 | $20,705 | $18,380 | $23,834 |
| 5/31/2023 | $19,981 | $17,565 | $23,927 |
| 6/30/2023 | $21,666 | $19,088 | $25,560 |
| 7/31/2023 | $22,140 | $19,919 | $26,477 |
| 8/31/2023 | $21,425 | $19,214 | $25,966 |
| 9/30/2023 | $20,432 | $18,237 | $24,729 |
| 10/31/2023 | $19,675 | $17,334 | $24,073 |
| 11/30/2023 | $20,970 | $18,968 | $26,318 |
| 12/31/2023 | $22,316 | $20,445 | $27,714 |
| 1/31/2024 | $22,002 | $20,079 | $28,021 |
| 2/29/2024 | $23,055 | $21,038 | $29,538 |
| 3/31/2024 | $24,338 | $22,127 | $30,491 |
| 4/30/2024 | $23,285 | $20,969 | $29,149 |
| 5/31/2024 | $24,128 | $21,722 | $30,526 |
| 6/30/2024 | $23,756 | $21,374 | $31,471 |
| 7/31/2024 | $25,156 | $22,666 | $32,056 |
| 8/31/2024 | $25,695 | $23,093 | $32,754 |
| 9/30/2024 | $25,910 | $23,528 | $33,432 |
Special Mid Cap Value Fund
Annual Shareholder Report | September 30, 2024
AVERAGE ANNUAL TOTAL RETURNS (%)
| 1 Year | 5 Years | 10 Years |
|---|
| Administrator Class | 26.81 | 11.50 | 9.99 |
Russell Midcap® Value Index (Strategy) | 29.01 | 10.33 | 8.93 |
Russell 3000® Index (Regulatory) | 35.19 | 15.26 | 12.83 |
| Total net assets | $14,226,954,885 |
| # of portfolio holdings | 67 |
| Portfolio turnover rate | 19% |
| Total advisory fees paid | $82,662,725 |
Figures quoted represent past performance, which is no guarantee of future results, and do not reflect taxes that a shareholder may pay on an investment in a fund.
What did the Fund invest in?
(Based on long-term investments)
SECTOR ALLOCATION (% OF LONG-TERM INVESTMENTS)
| Financials | 20.5 |
| Industrials | 19.3 |
| Real estate | 11.3 |
| Materials | 10.3 |
| Health care | 9.2 |
| Consumer staples | 7.4 |
| Utilities | 6.9 |
| Information technology | 5.5 |
| Energy | 5.1 |
| Consumer discretionary | 4.5 |
TOP TEN HOLDINGS (% OF NET ASSETS)
| CBRE Group, Inc., Class A | 4.0 |
| Arch Capital Group Ltd. | 3.2 |
| Keurig Dr Pepper, Inc. | 3.1 |
| AerCap Holdings NV | 3.0 |
| Allstate Corp. | 2.8 |
| Vulcan Materials Co. | 2.7 |
| Republic Services, Inc., Class A | 2.6 |
| L3Harris Technologies, Inc. | 2.5 |
| American Electric Power Co., Inc. | 2.5 |
| Graphic Packaging Holding Co. | 2.5 |
You can find additional information on the Fund's website at allspringglobal.com, including its:
- Prospectus - Financial Information - Fund holdings - Proxy voting information
ITEM 2. CODE OF ETHICS
(a) As of the end of the period covered by the report, Allspring Funds Trust has adopted a code of ethics that applies to its President and Treasurer. A copy of the code of ethics is filed as an exhibit to this Form N-CSR.
(c) During the period covered by this report, there were no amendments to the provisions of the code of ethics adopted in Item 2(a) above.
(d) During the period covered by this report, there were no implicit or explicit waivers to the provisions of the code of ethics adopted in Item 2(a) above.
ITEM 3. AUDIT COMMITTEE FINANCIAL EXPERT
The Board of Trustees of Allspring Funds Trust has determined that Isaiah Harris is an audit committee financial expert, as defined in Item 3 of Form N-CSR. Mr. Harris is independent for purposes of Item 3 of Form N-CSR.
ITEM 4. PRINCIPAL ACCOUNTANT FEES AND SERVICES
(a), (b), (c), (d) The following table presents aggregate fees billed in each of the last two fiscal years for services rendered to the registrant by the registrant’s principal accountant. These fees were billed to the registrant and were approved by the registrant’s audit committee.
| | | | | | | | |
| | | Fiscal year ended
September 30, 2024 | | | Fiscal year ended
September 30, 2023 | |
Audit fees | | $ | 440,180 | | | $ | 433,070 | |
Audit-related fees | | | — | | | | — | |
Tax fees (1) | | | 53,520 | | | | 56,900 | |
All other fees | | | — | | | | — | |
| | | | | | | | |
| | $ | 493,700 | | | $ | 489,970 | |
| (1) | Tax fees consist of fees for tax compliance, tax advice, tax planning and excise tax. |
(e)(1) The Chair of the Audit Committees is authorized to pre-approve: (1) audit services for the mutual funds of Allspring Funds Trust; (2) non-audit tax or compliance consulting or training services provided to the Funds by the independent auditors (“Auditors”) if the fees for any particular engagement are not anticipated to exceed $50,000; and (3) non-audit tax or compliance consulting or training services provided by the Auditors to a Fund’s investment adviser and its controlling entities (where pre-approval is required because the engagement relates directly to the operations and financial reporting of the Fund) if the fee to the Auditors for any particular engagement is not anticipated to exceed $50,000. For any such pre-approval sought from the Chair, Management shall prepare a brief description of the proposed services.
If the Chair approves of such service, he or she shall sign the statement prepared by Management. Such written statement shall be presented to the full Committees at their next regularly scheduled meetings.
(e)(2) Not applicable.
(f) Not applicable.
(g) Not applicable.
(h) Not applicable.
(i) Not applicable.
(j) Not applicable.
ITEM 5. AUDIT COMMITTEE OF LISTED REGISTRANTS
Not applicable.
ITEM 6. INVESTMENTS
(a) The registrant’s Schedule of Investments is included as part of the Financial Statements filed under Item 7(a) of this Form.
(b) Not Applicable due to no such divestments during the semi-annual period covered since the previous Form N-CSR filing.
ITEM 7. FINANCIAL STATEMENTS AND FINANCIAL HIGHLIGHTS FOR OPEN-END MANAGEMENT INVESTMENT COMPANIES
(a) The registrant’s Financial Statements are attached herewith.
(b) The registrant’s Financial Highlights are included as part of the Financial Statements filed under Item 7(a) of this Form.
Allspring Diversified Income Builder Fund
Long Form Financial Statements
Annual Report
Allspring Diversified Income Builder Fund | 1
Portfolio of investments—September 30, 2024
| | | | | |
Asset-backed securities: 0.06% | | | | | | |
Frontier Issuer LLC Series 2024-1 Class C144A | | | | | | |
Total asset-backed securities (Cost $180,000) | | | | | | |
| | | | | |
| | | | | | |
Communication services: 2.89% | | | | | | |
Diversified telecommunication services: 0.41% | | | | | | |
| | | | | | |
| | | | | | |
| | | | | | |
Interactive media & services: 1.19% | | | | | | |
| | | | | | |
Meta Platforms, Inc. Class A# | | | | | | |
| | | | | | |
| | | | | | |
| | | | | | |
Wireless telecommunication services: 0.42% | | | | | | |
| | | | | | |
Consumer discretionary: 2.40% | | | | | | |
| | | | | | |
| | | | | | |
| | | | | | |
| | | | | | |
| | | | | | |
| | | | | | |
| | | | | | |
| | | | | | |
Hotels, restaurants & leisure: 0.37% | | | | | | |
| | | | | | |
| | | | | | |
| | | | | | |
| | | | | | |
| | | | | | |
| | | | | | |
Consumer staples distribution & retail : 0.80% | | | | | | |
| | | | | | |
The accompanying notes are an integral part of these financial statements.
2 | Allspring Diversified Income Builder Fund
Portfolio of investments—September 30, 2024
| | | | | |
Household products: 1.04% | | | | | | |
| | | | | | |
| | | | | | |
| | | | | | |
| | | | | | |
Oil, gas & consumable fuels: 1.33% | | | | | | |
| | | | | | |
| | | | | | |
Diamondback Energy, Inc.# | | | | | | |
| | | | | | |
| | | | | | |
| | | | | | |
| | | | | | |
| | | | | | |
China Construction Bank Corp. Class H | | | | | | |
| | | | | | |
| | | | | | |
| | | | | | |
| | | | | | |
| | | | | | |
| | | | | | |
| | | | | | |
| | | | | | |
| | | | | | |
Blackstone Secured Lending Fund BDC# | | | | | | |
| | | | | | |
| | | | | | |
| | | | | | |
| | | | | | |
BB Seguridade Participacoes SA | | | | | | |
| | | | | | |
| | | | | | |
| | | | | | |
| | | | | | |
| | | | | | |
| | | | | | |
Health care equipment & supplies: 0.67% | | | | | | |
Intuitive Surgical, Inc.†# | | | | | | |
Lantheus Holdings, Inc.†# | | | | | | |
| | | | | | |
| | | | | | |
| | | | | | |
| | | | | | |
The accompanying notes are an integral part of these financial statements.
Allspring Diversified Income Builder Fund | 3
Portfolio of investments—September 30, 2024
| | | | | |
Pharmaceuticals(continued) | | | | | | |
| | | | | | |
| | | | | | |
| | | | | | |
| | | | | | |
| | | | | | |
| | | | | | |
Commercial services & supplies: 0.34% | | | | | | |
| | | | | | |
Construction & engineering: 0.40% | | | | | | |
| | | | | | |
Electrical equipment: 0.68% | | | | | | |
| | | | | | |
| | | | | | |
| | | | | | |
Industrial conglomerates: 0.93% | | | | | | |
| | | | | | |
| | | | | | |
| | | | | | |
Trading companies & distributors: 0.38% | | | | | | |
Ferguson Enterprises, Inc.# | | | | | | |
Information technology: 6.61% | | | | | | |
Communications equipment: 0.44% | | | | | | |
| | | | | | |
| | | | | | |
| | | | | | |
Semiconductors & semiconductor equipment: 2.44% | | | | | | |
| | | | | | |
| | | | | | |
| | | | | | |
Taiwan Semiconductor Manufacturing Co. Ltd. ADR# | | | | | | |
| | | | | | |
| | | | | | |
| | | | | | |
| | | | | | |
| | | | | | |
| | | | | | |
The accompanying notes are an integral part of these financial statements.
4 | Allspring Diversified Income Builder Fund
Portfolio of investments—September 30, 2024
| | | | | |
Technology hardware, storage & peripherals: 1.64% | | | | | | |
| | | | | | |
Dell Technologies, Inc. Class C# | | | | | | |
| | | | | | |
| | | | | | |
| | | | | | |
Alrosa PJSC (Acquired 5-6-2021, cost $65,232)♦†˃ | | | | | | |
| | | | | | |
| | | | | | |
| | | | | | |
Hotel & resort REITs: 0.28% | | | | | | |
Host Hotels & Resorts, Inc.# | | | | | | |
| | | | | | |
Simon Property Group, Inc.# | | | | | | |
Specialized REITs : 0.53% | | | | | | |
VICI Properties, Inc. Class A# | | | | | | |
| | | | | | |
| | | | | | |
| | | | | | |
Investment Companies: 0.00% | | | | | | |
| | | | | | |
Total common stocks (Cost $76,892,755) | | | | | | |
| | | | | |
Corporate bonds and notes: 43.06% | | | | | | |
| | | | | | |
| | | | | | |
SCIH Salt Holdings, Inc.144A | | | | | | |
| | | | | | |
Cleveland-Cliffs, Inc.144A | | | | | | |
| | | | | | |
| | | | | | |
Clear Channel Outdoor Holdings, Inc.144A | | | | | | |
Clear Channel Outdoor Holdings, Inc.144A | | | | | | |
Outfront Media Capital LLC/Outfront Media Capital Corp.144A | | | | | | |
Outfront Media Capital LLC/Outfront Media Capital Corp.144A | | | | | | |
| | | | | | |
| | | | | | |
| | | | | | |
| | | | | | |
Cablevision Lightpath LLC144A | | | | | | |
The accompanying notes are an integral part of these financial statements.
Allspring Diversified Income Builder Fund | 5
Portfolio of investments—September 30, 2024
| | | | | |
| | | | | | |
Cablevision Lightpath LLC144A | | | | | | |
Match Group Holdings II LLC144A | | | | | | |
| | | | | | |
| | | | | | |
CCO Holdings LLC/CCO Holdings Capital Corp.144A | | | | | | |
CCO Holdings LLC/CCO Holdings Capital Corp.144A | | | | | | |
CCO Holdings LLC/CCO Holdings Capital Corp.144A | | | | | | |
| | | | | | |
| | | | | | |
Directv Financing LLC/Directv Financing Co-Obligor, Inc.144A | | | | | | |
| | | | | | |
| | | | | | |
| | | | | | |
| | | | | | |
Paramount Global (3 Month LIBOR+3.90%)± | | | | | | |
Sirius XM Radio, Inc.144A | | | | | | |
Townsquare Media, Inc.144A | | | | | | |
| | | | | | |
Telecommunications: 1.27% | | | | | | |
| | | | | | |
| | | | | | |
Level 3 Financing, Inc.144A | | | | | | |
Level 3 Financing, Inc.144A | | | | | | |
Level 3 Financing, Inc.144A | | | | | | |
Lumen Technologies, Inc.144A | | | | | | |
| | | | | | |
Windstream Escrow LLC/Windstream Escrow Finance Corp.144A | | | | | | |
Windstream Escrow LLC/Windstream Escrow Finance Corp.144A%% | | | | | | |
| | | | | | |
Consumer, cyclical: 7.40% | | | | | | |
| | | | | | |
American Airlines, Inc./AAdvantage Loyalty IP Ltd.144A | | | | | | |
American Airlines, Inc./AAdvantage Loyalty IP Ltd.144A | | | | | | |
Hawaiian Airlines Pass-Through Certificates Series 2013-1 Class 1A | | | | | | |
Hawaiian Brand Intellectual Property Ltd./HawaiianMiles Loyalty Ltd.144A | | | | | | |
| | | | | | |
| | | | | | |
| | | | | | |
| | | | | | |
| | | | | | |
The accompanying notes are an integral part of these financial statements.
6 | Allspring Diversified Income Builder Fund
Portfolio of investments—September 30, 2024
| | | | | |
Auto parts & equipment: 0.35% | | | | | | |
American Axle & Manufacturing, Inc. | | | | | | |
ZF North America Capital, Inc.144A | | | | | | |
| | | | | | |
| | | | | | |
| | | | | | |
Churchill Downs, Inc.144A | | | | | | |
| | | | | | |
Six Flags Entertainment Corp./Six Flags Theme Parks, Inc.144A | | | | | | |
| | | | | | |
| | | | | | |
| | | | | | |
Taylor Morrison Communities, Inc.144A | | | | | | |
| | | | | | |
| | | | | | |
| | | | | | |
Carnival Holdings Bermuda Ltd.144A | | | | | | |
| | | | | | |
| | | | | | |
| | | | | | |
| | | | | | |
| | | | | | |
| | | | | | |
| | | | | | |
Genting New York LLC/GENNY Capital, Inc.144A | | | | | | |
| | | | | | |
Bath & Body Works, Inc.144A | | | | | | |
Dave & Buster’s, Inc.144A | | | | | | |
| | | | | | |
| | | | | | |
| | | | | | |
Group 1 Automotive, Inc.144A | | | | | | |
| | | | | | |
| | | | | | |
Macy’s Retail Holdings LLC144A | | | | | | |
Macy’s Retail Holdings LLC144A | | | | | | |
| | | | | | |
NMG Holding Co., Inc./Neiman Marcus Group LLC144A | | | | | | |
PetSmart, Inc./PetSmart Finance Corp.144A | | | | | | |
Sally Holdings LLC/Sally Capital, Inc. | | | | | | |
Sonic Automotive, Inc.144A | | | | | | |
Victra Holdings LLC/Victra Finance Corp.144A | | | | | | |
The accompanying notes are an integral part of these financial statements.
Allspring Diversified Income Builder Fund | 7
Portfolio of investments—September 30, 2024
| | | | | |
| | | | | | |
Walgreens Boots Alliance, Inc. | | | | | | |
| | | | | | |
| | | | | | |
Consumer, non-cyclical: 6.04% | | | | | | |
Commercial services: 1.87% | | | | | | |
Allied Universal Holdco LLC144A | | | | | | |
Allied Universal Holdco LLC/Allied Universal Finance Corp.144A | | | | | | |
| | | | | | |
| | | | | | |
| | | | | | |
| | | | | | |
| | | | | | |
Service Corp. International | | | | | | |
Sotheby’s/Bidfair Holdings, Inc.144A | | | | | | |
| | | | | | |
| | | | | | |
| | | | | | |
| | | | | | |
Performance Food Group, Inc.144A | | | | | | |
| | | | | | |
| | | | | | |
Healthcare-services: 2.90% | | | | | | |
CHS/Community Health Systems, Inc.144A | | | | | | |
CHS/Community Health Systems, Inc.144A | | | | | | |
CHS/Community Health Systems, Inc.144A | | | | | | |
Concentra Escrow Issuer Corp.144A | | | | | | |
| | | | | | |
Eastern Maine Healthcare Systems | | | | | | |
| | | | | | |
ModivCare Escrow Issuer, Inc.144A | | | | | | |
MPH Acquisition Holdings LLC144A | | | | | | |
MPH Acquisition Holdings LLC144A | | | | | | |
Pediatrix Medical Group, Inc.144A | | | | | | |
| | | | | | |
Surgery Center Holdings, Inc.144A | | | | | | |
| | | | | | |
| | | | | | |
| | | | | | |
Household products/wares: 0.13% | | | | | | |
| | | | | | |
The accompanying notes are an integral part of these financial statements.
8 | Allspring Diversified Income Builder Fund
Portfolio of investments—September 30, 2024
| | | | | |
| | | | | | |
| | | | | | |
Endo Finance Holdings, Inc.144A | | | | | | |
| | | | | | |
| | | | | | |
Energy-alternate sources: 0.54% | | | | | | |
Enviva Partners LP/Enviva Partners Finance Corp.144A† | | | | | | |
TerraForm Power Operating LLC144A | | | | | | |
| | | | | | |
| | | | | | |
Aethon United BR LP/Aethon United Finance Corp.144A%% | | | | | | |
California Resources Corp.144A | | | | | | |
Encino Acquisition Partners Holdings LLC144A | | | | | | |
Encino Acquisition Partners Holdings LLC144A | | | | | | |
Hilcorp Energy I LP/Hilcorp Finance Co.144A | | | | | | |
Hilcorp Energy I LP/Hilcorp Finance Co.144A | | | | | | |
Kraken Oil & Gas Partners LLC144A | | | | | | |
| | | | | | |
Nabors Industries Ltd.144A | | | | | | |
Nabors Industries, Inc.144A | | | | | | |
| | | | | | |
Oil & gas services: 0.77% | | | | | | |
Archrock Partners LP/Archrock Partners Finance Corp.144A | | | | | | |
| | | | | | |
Oceaneering International, Inc. | | | | | | |
| | | | | | |
| | | | | | |
Antero Midstream Partners LP/Antero Midstream Finance Corp.144A | | | | | | |
| | | | | | |
| | | | | | |
CQP Holdco LP/BIP-V Chinook Holdco LLC144A | | | | | | |
CQP Holdco LP/BIP-V Chinook Holdco LLC144A | | | | | | |
Energy Transfer LP (5 Year Treasury Constant Maturity+4.02%)± | | | | | | |
Energy Transfer LP Series H (5 Year Treasury Constant Maturity+5.69%)ʊ± | | | | | | |
Harvest Midstream I LP144A | | | | | | |
Harvest Midstream I LP144A | | | | | | |
Hess Midstream Operations LP144A | | | | | | |
Hess Midstream Operations LP144A | | | | | | |
| | | | | | |
| | | | | | |
Rockies Express Pipeline LLC144A | | | | | | |
Tallgrass Energy Partners LP/Tallgrass Energy Finance Corp.144A | | | | | | |
The accompanying notes are an integral part of these financial statements.
Allspring Diversified Income Builder Fund | 9
Portfolio of investments—September 30, 2024
| | | | | |
| | | | | | |
Venture Global Calcasieu Pass LLC144A | | | | | | |
Venture Global LNG, Inc.144A | | | | | | |
Venture Global LNG, Inc.144A | | | | | | |
Venture Global LNG, Inc. (5 Year Treasury Constant Maturity+5.44%)144Aʊ± | | | | | | |
| | | | | | |
| | | | | | |
| | | | | | |
Bank of America Corp. Series RR (5 Year Treasury Constant Maturity+2.76%)ʊ± | | | | | | |
Citigroup, Inc. Series V (U.S. SOFR+3.23%)ʊ± | | | | | | |
Citigroup, Inc. Series X (5 Year Treasury Constant Maturity+3.42%)ʊ± | | | | | | |
Citizens Financial Group, Inc. Series F (5 Year Treasury Constant Maturity+5.31%)ʊ± | | | | | | |
Fifth Third Bancorp Series L (5 Year Treasury Constant Maturity+4.22%)ʊ± | | | | | | |
JPMorgan Chase & Co. Series HH (U.S. SOFR 3 Month+3.13%)ʊ± | | | | | | |
| | | | | | |
Diversified financial services: 2.75% | | | | | | |
Aircastle Ltd. Series A (5 Year Treasury Constant Maturity+4.41%)144Aʊ± | | | | | | |
Discover Financial Services Series C (U.S. SOFR 3 Month+3.34%)ʊ± | | | | | | |
Encore Capital Group, Inc.144A | | | | | | |
Jane Street Group/JSG Finance, Inc.144A | | | | | | |
Jefferies Finance LLC/JFIN Co-Issuer Corp.144A | | | | | | |
Jefferson Capital Holdings LLC144A | | | | | | |
Nationstar Mortgage Holdings, Inc.144A | | | | | | |
Nationstar Mortgage Holdings, Inc.144A | | | | | | |
| | | | | | |
| | | | | | |
| | | | | | |
Oppenheimer Holdings, Inc. | | | | | | |
| | | | | | |
Rocket Mortgage LLC/Rocket Mortgage Co-Issuer, Inc.144A | | | | | | |
United Wholesale Mortgage LLC144A | | | | | | |
| | | | | | |
| | | | | | |
Alliant Holdings Intermediate LLC/Alliant Holdings Co- Issuer144A | | | | | | |
| | | | | | |
| | | | | | |
AssuredPartners, Inc.144A | | | | | | |
BroadStreet Partners, Inc.144A | | | | | | |
The accompanying notes are an integral part of these financial statements.
10 | Allspring Diversified Income Builder Fund
Portfolio of investments—September 30, 2024
| | | | | |
| | | | | | |
HUB International Ltd.144A | | | | | | |
HUB International Ltd.144A | | | | | | |
HUB International Ltd.144A | | | | | | |
| | | | | | |
Investment Companies: 0.13% | | | | | | |
Icahn Enterprises LP/Icahn Enterprises Finance Corp. | | | | | | |
Icahn Enterprises LP/Icahn Enterprises Finance Corp.144A | | | | | | |
| | | | | | |
| | | | | | |
Brandywine Operating Partnership LP | | | | | | |
| | | | | | |
| | | | | | |
Ladder Capital Finance Holdings LLLP/Ladder Capital Finance Corp.144A | | | | | | |
MPT Operating Partnership LP/MPT Finance Corp. | | | | | | |
| | | | | | |
Service Properties Trust144A | | | | | | |
Uniti Group LP/Uniti Fiber Holdings, Inc./CSL Capital LLC144A | | | | | | |
Uniti Group LP/Uniti Group Finance, Inc./CSL Capital LLC144A | | | | | | |
| | | | | | |
| | | | | | |
| | | | | | |
Spirit AeroSystems, Inc.144A | | | | | | |
| | | | | | |
| | | | | | |
Building materials: 0.74% | | | | | | |
Camelot Return Merger Sub, Inc.144A | | | | | | |
| | | | | | |
EMRLD Borrower LP/Emerald Co-Issuer, Inc.144A | | | | | | |
| | | | | | |
Electrical components & equipment: 0.12% | | | | | | |
WESCO Distribution, Inc.144A | | | | | | |
| | | | | | |
Sensata Technologies, Inc.144A | | | | | | |
Hand/machine tools: 0.52% | | | | | | |
Werner FinCo LP/Werner FinCo, Inc.144A | | | | | | |
Werner FinCo LP/Werner FinCo, Inc. (PIK at 5.75%)144A¥ | | | | | | |
| | | | | | |
The accompanying notes are an integral part of these financial statements.
Allspring Diversified Income Builder Fund | 11
Portfolio of investments—September 30, 2024
| | | | | |
Machinery-diversified: 0.22% | | | | | | |
Chart Industries, Inc.144A | | | | | | |
Chart Industries, Inc.144A | | | | | | |
| | | | | | |
Packaging & containers: 1.00% | | | | | | |
Ardagh Metal Packaging Finance USA LLC/Ardagh Metal Packaging Finance PLC144A | | | | | | |
Clydesdale Acquisition Holdings, Inc.144A | | | | | | |
Clydesdale Acquisition Holdings, Inc.144A | | | | | | |
Mauser Packaging Solutions Holding Co.144A | | | | | | |
Owens-Brockway Glass Container, Inc.144A | | | | | | |
Owens-Brockway Glass Container, Inc.144A | | | | | | |
Sealed Air Corp./Sealed Air Corp. U.S.144A | | | | | | |
| | | | | | |
| | | | | | |
Genesee & Wyoming, Inc.144A | | | | | | |
Trucking & leasing: 0.70% | | | | | | |
AerCap Global Aviation Trust (U.S. SOFR 3 Month+4.56%)144A± | | | | | | |
Fortress Transportation & Infrastructure Investors LLC144A | | | | | | |
Fortress Transportation & Infrastructure Investors LLC144A | | | | | | |
Fortress Transportation & Infrastructure Investors LLC144A | | | | | | |
Fortress Transportation and Infrastructure Investors LLC144A%% | | | | | | |
| | | | | | |
| | | | | | |
| | | | | | |
Insight Enterprises, Inc.144A | | | | | | |
| | | | | | |
| | | | | | |
| | | | | | |
Office/business equipment: 0.20% | | | | | | |
Zebra Technologies Corp.144A | | | | | | |
| | | | | | |
| | | | | | |
| | | | | | |
AthenaHealth Group, Inc.144A | | | | | | |
Cloud Software Group, Inc.144A | | | | | | |
Cloud Software Group, Inc.144A | | | | | | |
Cloud Software Group, Inc.144A | | | | | | |
Rocket Software, Inc.144A | | | | | | |
SS&C Technologies, Inc.144A | | | | | | |
| | | | | | |
The accompanying notes are an integral part of these financial statements.
12 | Allspring Diversified Income Builder Fund
Portfolio of investments—September 30, 2024
| | | | | |
| | | | | | |
| | | | | | |
AES Corp. (5 Year Treasury Constant Maturity+3.20%)± | | | | | | |
| | | | | | |
Edison International (5 Year Treasury Constant Maturity+3.86%)± | | | | | | |
EUSHI Finance, Inc. (5 Year Treasury Constant Maturity+3.14%)144A± | | | | | | |
NextEra Energy Operating Partners LP144A | | | | | | |
Pattern Energy Operations LP/Pattern Energy Operations, Inc.144A | | | | | | |
| | | | | | |
PG&E Corp. (5 Year Treasury Constant Maturity+3.88%)± | | | | | | |
Sempra (5 Year Treasury Constant Maturity+2.87%)± | | | | | | |
Vistra Corp. (5 Year Treasury Constant Maturity+5.74%)144Aʊ± | | | | | | |
Vistra Corp. Series C (5 Year Treasury Constant Maturity+5.05%)144Aʊ± | | | | | | |
Vistra Operations Co. LLC144A | | | | | | |
| | | | | | |
Total corporate bonds and notes (Cost $150,655,320) | | | | | | |
Foreign corporate bonds and notes: 4.33% | | | | | | |
| | | | | | |
| | | | | | |
ABN AMRO Bank NV (EUR Swap Annual (vs. 6 Month EURIBOR) 5 Year+3.90%)ʊ± | | | | | | |
AIB Group PLC (EUR Swap Annual (vs. 6 Month EURIBOR) 5 Year+6.63%)ʊ± | | | | | | |
Banco Santander SA (EUR Swap Annual (vs. 6 Month EURIBOR) 5 Year+4.53%)ʊ± | | | | | | |
CaixaBank SA (EURIBOR ICE Swap Rate 11:00am+5.14%)ʊ± | | | | | | |
Commerzbank AG (EUR Swap Annual (vs. 6 Month EURIBOR) 5 Year+6.36%)ʊ± | | | | | | |
Credit Agricole SA (EURIBOR ICE Swap Rate 11:00am+4.44%)ʊ± | | | | | | |
| | | | | | |
Total foreign corporate bonds and notes (Cost $15,741,550) | | | | | | |
| | | | | |
Investment companies: 2.69% | | | | | | |
Exchange-traded funds: 2.69% | | | | | | |
iShares iBoxx $ High Yield Corporate Bond ETF | | | | | | |
Total investment companies (Cost $9,046,549) | | | | | | |
The accompanying notes are an integral part of these financial statements.
Allspring Diversified Income Builder Fund | 13
Portfolio of investments—September 30, 2024
| | | | | |
| | | | | | |
| | | | | | |
| | | | | | |
CSC Holdings LLC (U.S. SOFR 1 Month+4.50%)± | | | | | | |
Hubbard Radio LLC (U.S. SOFR 1 Month+4.50%)± | | | | | | |
| | | | | | |
Consumer, cyclical: 0.71% | | | | | | |
| | | | | | |
SkyMiles IP Ltd. (U.S. SOFR 3 Month+3.75%)± | | | | | | |
Auto parts & equipment: 0.16% | | | | | | |
First Brands Group LLC (U.S. SOFR 3 Month+5.00%)± | | | | | | |
| | | | | | |
American Greetings Corp. (U.S. SOFR 1 Month+5.75%)± | | | | | | |
| | | | | | |
Carnival Corp. (U.S. SOFR 1 Month+2.75%)± | | | | | | |
| | | | | | |
Chinos Intermediate 2 LLC (U.S. SOFR 3 Month+5.00%)ౠ| | | | | | |
Petco Health & Wellness Co., Inc. (U.S. SOFR 3 Month+3.25%)± | | | | | | |
PetSmart, Inc. (U.S. SOFR 1 Month+3.75%)± | | | | | | |
| | | | | | |
Consumer, non-cyclical: 0.45% | | | | | | |
Commercial services: 0.09% | | | | | | |
GEO Group, Inc. (U.S. SOFR 1 Month+5.25%)± | | | | | | |
Healthcare-services: 0.36% | | | | | | |
LifePoint Health, Inc. (U.S. SOFR 1 Month+4.00%)± | | | | | | |
LifePoint Health, Inc. (U.S. SOFR 3 Month+4.75%)± | | | | | | |
Modivcare Inc. (U.S. SOFR 3 Month+4.68%)± | | | | | | |
| | | | | | |
| | | | | | |
Energy-alternate sources: 0.18% | | | | | | |
Enviva Partners LP/Enviva Partners Finance Corp. (U.S. SOFR 3 Month+8.00%)± | | | | | | |
Enviva Partners LP/Enviva Partners Finance Corp. (U.S. SOFR 3 Month+8.00%)± | | | | | | |
Enviva Partners LP/Enviva Partners Finance Corp. (U.S. SOFR 3 Month+8.00%)± | | | | | | |
| | | | | | |
| | | | | | |
GIP III Stetson I LP (U.S. SOFR 1 Month+3.50%)± | | | | | | |
Prairie ECI Acquiror LP (U.S. SOFR 1 Month+4.75%)± | | | | | | |
| | | | | | |
The accompanying notes are an integral part of these financial statements.
14 | Allspring Diversified Income Builder Fund
Portfolio of investments—September 30, 2024
| | | | | |
| | | | | | |
Diversified financial services: 0.11% | | | | | | |
Resolute Investment Managers, Inc. (U.S. SOFR 3 Month+6.50%)ౠ| | | | | | |
| | | | | | |
Asurion LLC (U.S. SOFR 1 Month+3.25%)± | | | | | | |
Asurion LLC (U.S. SOFR 1 Month+5.25%)± | | | | | | |
Truist Insurance Holdings LLC (U.S. SOFR 3 Month+4.75%)± | | | | | | |
| | | | | | |
| | | | | | |
| | | | | | |
Rocket Software, Inc. (U.S. SOFR 1 Month+4.75%)± | | | | | | |
Total loans (Cost $7,802,125) | | | | | | |
Municipal obligations: 3.59% | | | | | | |
| | | | | | |
| | | | | | |
California PFA EEC, Inc. Series B144A | | | | | | |
California School Finance Authority Fenton Charter Public Schools Series B144A | | | | | | |
| | | | | | |
| | | | | | |
Golden State Tobacco Securitization Corp. Series A-1 | | | | | | |
| | | | | | |
| | | | | | |
| | | | | | |
Denver Health & Hospital Authority Series B | | | | | | |
| | | | | | |
| | | | | | |
Florida Higher Educational Facilities Financial Authority Jacksonville University Series A-2144A | | | | | | |
Water & sewer revenue: 0.31% | | | | | | |
Charlotte County IDA MSKP Town & Country Utility LLC Series B144A | | | | | | |
| | | | | | |
| | | | | | |
| | | | | | |
Development Authority of Cobb County Presbyterian Village Austell, Inc. Series B144A | | | | | | |
The accompanying notes are an integral part of these financial statements.
Allspring Diversified Income Builder Fund | 15
Portfolio of investments—September 30, 2024
| | | | | |
| | | | | | |
| | | | | | |
Antonio B Won Pat International Airport Authority Series A | | | | | | |
| | | | | | |
| | | | | | |
Chicago Board of Education Series E | | | | | | |
| | | | | | |
| | | | | | |
County of Knox Good Samaritan Hospital Obligated Group Series B | | | | | | |
| | | | | | |
| | | | | | |
City of Coralville Series C | | | | | | |
| | | | | | |
| | | | | | |
Louisiana Local Government Environmental Facilities & CDA Glen Retirement System Obligated Group Series B | | | | | | |
| | | | | | |
| | | | | | |
New Jersey Educational Facilities Authority Georgian Court University A New Jersey Non Profit Corp. Series H | | | | | | |
| | | | | | |
| | | | | | |
Yonkers Economic Development Corp. Charter School of Educational Excellence Series B | | | | | | |
| | | | | | |
Jefferson County Civic Facility Development Corp. Samaritan Medical Center Obligated Group Series B | | | | | | |
| | | | | | |
New York State Energy Research & Development Authority Series A | | | | | | |
| | | | | | |
| | | | | | |
| | | | | | |
Oklahoma Development Finance Authority OU Medicine Obligated Group Series C | | | | | | |
The accompanying notes are an integral part of these financial statements.
16 | Allspring Diversified Income Builder Fund
Portfolio of investments—September 30, 2024
| | | | | |
| | | | | | |
Industrial development revenue: 0.47% | | | | | | |
Port of Beaumont IDA Jefferson 2020 Bond Lessee & Borrower LLC Obligated Group Series B144A | | | | | | |
Port of Beaumont Navigation District Jefferson 2020 Bond Lessee & Borrower LLC Obligated Group Series B144A | | | | | | |
| | | | | | |
| | | | | | |
| | | | | | |
PFA Burrell College of Osteopathic Medicine LLC144A | | | | | | |
Total municipal obligations (Cost $13,075,355) | | | | | | |
| | | | | |
| | | | | | |
| | | | | | |
Oil, gas & consumable fuels: 0.28% | | | | | | |
| | | | | | |
Total preferred stocks (Cost $1,135,222) | | | | | | |
| | | | | |
Yankee corporate bonds and notes: 10.48% | | | | | | |
| | | | | | |
| | | | | | |
Braskem Netherlands Finance BV144A | | | | | | |
| | | | | | |
| | | | | | |
Virgin Media Secured Finance PLC144A | | | | | | |
Telecommunications: 0.35% | | | | | | |
| | | | | | |
| | | | | | |
| | | | | | |
| | | | | | |
Consumer, cyclical: 2.06% | | | | | | |
| | | | | | |
Air Canada Pass-Through Trust Series 2020-1 Class C144A | | | | | | |
Latam Airlines Group SA144A | | | | | | |
VistaJet Malta Finance PLC/Vista Management Holding, Inc.144A | | | | | | |
| | | | | | |
Auto manufacturers: 0.16% | | | | | | |
Aston Martin Capital Holdings Ltd.144A | | | | | | |
The accompanying notes are an integral part of these financial statements.
Allspring Diversified Income Builder Fund | 17
Portfolio of investments—September 30, 2024
| | | | | |
| | | | | | |
Banijay Entertainment SAS144A | | | | | | |
| | | | | | |
| | | | | | |
Royal Caribbean Cruises Ltd.144A | | | | | | |
Royal Caribbean Cruises Ltd.144A | | | | | | |
Royal Caribbean Cruises Ltd.144A | | | | | | |
| | | | | | |
Consumer, non-cyclical: 0.70% | | | | | | |
Cosmetics/Personal Care: 0.21% | | | | | | |
Perrigo Finance Unlimited Co. Series USD | | | | | | |
| | | | | | |
Bausch Health Cos., Inc.144A | | | | | | |
Bausch Health Cos., Inc.144A | | | | | | |
Teva Pharmaceutical Finance Netherlands III BV | | | | | | |
| | | | | | |
| | | | | | |
| | | | | | |
| | | | | | |
Borr IHC Ltd./Borr Finance LLC144A | | | | | | |
Saturn Oil & Gas, Inc.144A | | | | | | |
| | | | | | |
| | | | | | |
Enbridge, Inc. (5 Year Treasury Constant Maturity+4.42%)± | | | | | | |
Northriver Midstream Finance LP144A | | | | | | |
South Bow Canadian Infrastructure Holdings Ltd. (5 Year Treasury Constant Maturity+3.95%)144A± | | | | | | |
| | | | | | |
| | | | | | |
| | | | | | |
Banco del Estado de Chile (5 Year Treasury Constant Maturity+3.23%)144Aʊ± | | | | | | |
Bancolombia SA (5 Year Treasury Constant Maturity+4.32%)± | | | | | | |
BNP Paribas SA (5 Year Treasury Constant Maturity+3.73%)144Aʊ± | | | | | | |
Danske Bank AS (7 Year Treasury Constant Maturity+4.13%)ʊ± | | | | | | |
HSBC Holdings PLC (USD ICE Swap Rate 11:00am NY 5 Year+3.75%)ʊ± | | | | | | |
HSBC Holdings PLC (USD ICE Swap Rate 11:00am NY 5 Year+4.37%)ʊ± | | | | | | |
Intesa Sanpaolo SpA (5 Year USD Swap Rate+5.46%)144Aʊ± | | | | | | |
NatWest Group PLC (5 Year Treasury Constant Maturity+3.10%)ʊ± | | | | | | |
The accompanying notes are an integral part of these financial statements.
18 | Allspring Diversified Income Builder Fund
Portfolio of investments—September 30, 2024
| | | | | |
| | | | | | |
Skandinaviska Enskilda Banken AB (5 Year Treasury Constant Maturity+3.46%)ʊ± | | | | | | |
Societe Generale SA (USD ICE Swap Rate 11:00am NY 5 Year+5.87%)144Aʊ± | | | | | | |
UBS Group AG (5 Year Treasury Constant Maturity+3.40%)144Aʊ± | | | | | | |
UBS Group AG (USD SOFR ICE Swap Rate 11:00am NY 5 Year+4.16%)144Aʊ± | | | | | | |
| | | | | | |
Diversified financial services: 0.59% | | | | | | |
AerCap Holdings NV (5 Year Treasury Constant Maturity+4.54%)± | | | | | | |
AerCap Ireland Capital DAC/AerCap Global Aviation Trust (5 Year Treasury Constant Maturity+2.72%)± | | | | | | |
Castlelake Aviation Finance DAC144A | | | | | | |
| | | | | | |
Macquarie Airfinance Holdings Ltd.144A | | | | | | |
| | | | | | |
| | | | | | |
| | | | | | |
| | | | | | |
| | | | | | |
Sensata Technologies BV144A | | | | | | |
Sensata Technologies BV144A | | | | | | |
| | | | | | |
Machinery-diversified: 0.13% | | | | | | |
TK Elevator Holdco GmbH144A | | | | | | |
Packaging & containers: 0.24% | | | | | | |
Trivium Packaging Finance BV144A | | | | | | |
| | | | | | |
| | | | | | |
Algonquin Power & Utilities Corp. (5 Year Treasury Constant Maturity+3.25%)± | | | | | | |
Total yankee corporate bonds and notes (Cost $35,522,054) | | | | | | |
The accompanying notes are an integral part of these financial statements.
Allspring Diversified Income Builder Fund | 19
Portfolio of investments—September 30, 2024
| | | | | |
Short-term investments: 4.05% | | | | | | |
Investment companies: 4.05% | | | | | | |
Allspring Government Money Market Fund Select Class♠∞## | | | | | | |
Total short-term investments (Cost $14,205,284) | | | | | | |
Total investments in securities (Cost $324,256,214) | | | | | | |
Other assets and liabilities, net | | | | | | |
| | | | | | |
| The security may be resold in transactions exempt from registration, normally to qualified institutional buyers, pursuant to Rule 144A under the Securities Act of 1933. |
| All or a portion of this security is segregated as collateral for investments in derivative instruments. |
| Non-income-earning security |
| The security is fair valued in accordance with procedures approved by the Board of Trustees. |
| Restricted security as to resale, excluding Rule 144A securities. The Fund held restricted securities with an aggregate current value of $0 (original an aggregate cost of $65,232), representing 0.00% of its net assets as of period end. |
| Variable rate investment. The rate shown is the rate in effect at period end. |
| The security is purchased on a when-issued basis. |
| Security is perpetual in nature and has no stated maturity date. The date shown reflects the next call date. |
| A payment-in-kind (PIK) security is a security in which the issuer may make interest or dividend payments in cash or additional securities or a combination of both. The rate shown is the rate in effect at period end. |
| Security is valued using significant unobservable inputs. |
| The issuer of the security is an affiliated person of the Fund as defined in the Investment Company Act of 1940. |
| The rate represents the 7-day annualized yield at period end. |
| All or a portion of this security is segregated for when-issued securities and unfunded loans. |
|
| American depositary receipt |
| Business Development Company |
| Community Development Authority |
| |
| Euro Interbank Offered Rate |
| |
| Industrial Development Authority |
| London Interbank Offered Rate |
| |
| Real estate investment trust |
| Secured Overnight Financing Rate |
Investments in affiliates
An affiliated investment is an investment in which the Fund owns at least 5% of the outstanding voting shares of the issuer or as a result of other relationships, such as the Fund and the issuer having the same investment manager. Transactions with issuers that were affiliates of the Fund at the end of the period were as follows:
| | | | | Net
change in
unrealized
gains
(losses) | | | Income
from
affiliated
securities |
| | | | | | | | |
Allspring Government Money Market Fund Select Class | | | | | | | | |
The accompanying notes are an integral part of these financial statements.
20 | Allspring Diversified Income Builder Fund
Portfolio of investments—September 30, 2024
Forward foreign currency contracts
| | | | | | |
| | | | | | |
10-Year U.S. Treasury Notes | | | | | | |
| | | | | | |
| | | | | | |
| | | | | | |
| | | | | | |
| | | | | | |
| | | | | | |
iShares MSCI Emerging Markets ETF | | | | | | |
iShares MSCI Emerging Markets ETF | | | | | | |
iShares MSCI Emerging Markets ETF | | | | | | |
iShares MSCI Emerging Markets ETF | | | | | | |
| | | | | | |
| | | | | | |
| | | | | | |
| | | | | | |
| | | | | | |
| | | | | | |
| | | | | | |
| | | | | | |
| | | | | | |
SPDR Dow Jones Industrial Average ETF | | | | | | |
SPDR Dow Jones Industrial Average ETF | | | | | | |
| | | | | | |
The accompanying notes are an integral part of these financial statements.
Allspring Diversified Income Builder Fund | 21
Statement of assets and liabilities—September 30, 2024
Financial statements
Statement of assets and liabilities
| |
Investments in unaffiliated securities, at value (cost $310,050,930) | |
Investments in affiliated securities, at value (cost $14,205,284) | |
Cash at broker segregated for futures contracts | |
Segregated cash for forward foreign currency contracts | |
Foreign currency, at value (cost $1,040) | |
Receivable for dividends and interest | |
Receivable for investments sold | |
Receivable for Fund shares sold | |
Unrealized gains on unfunded loan commitments | |
Prepaid expenses and other assets | |
| |
| |
Payable for investments purchased | |
Payable for when-issued transactions | |
Written options, at value (premiums received $118,971) | |
Payable for Fund shares redeemed | |
| |
Administration fees payable | |
Shareholder servicing fee payable | |
| |
Unrealized losses on forward foreign currency contracts | |
Payable for daily variation margin on open futures contracts | |
Trustees’ fees and expenses payable | |
Overdraft due to custodian bank | |
Accrued expenses and other liabilities | |
| |
Commitments and contingent liabilities (see Note 6) | |
| |
| |
| |
| |
| |
The accompanying notes are an integral part of these financial statements.
22 | Allspring Diversified Income Builder Fund
Statement of assets and liabilities—September 30, 2024
Statement of assets and liabilities
Computation of net asset value and offering price per share | |
| |
Shares outstanding–Class A1 | |
Net asset value per share–Class A | |
Maximum offering price per share – Class A2 | |
| |
Shares outstanding–Class C1 | |
Net asset value per share–Class C | |
| |
Shares outstanding–Class R61 | |
Net asset value per share–Class R6 | |
Net assets–Administrator Class | |
Shares outstanding–Administrator Class1 | |
Net asset value per share–Administrator Class | |
Net assets–Institutional Class | |
Shares outstanding–Institutional Class1 | |
Net asset value per share–Institutional Class | |
1 The Fund has an unlimited number of authorized shares.
2 Maximum offering price is computed as 100/94.25 of net asset value. On investments of $50,000 or more, the offering price is reduced.
The accompanying notes are an integral part of these financial statements.
Allspring Diversified Income Builder Fund | 23
Statement of operations—year ended September 30, 2024
Statement of operations
| |
Interest (net of foreign withholding taxes of $592) | |
Dividends (net of foreign withholdings taxes of $183,400) | |
Income from affiliated securities | |
| |
| |
| |
| |
| |
| |
| |
| |
| |
Shareholder servicing fees | |
| |
| |
| |
| |
| |
Custody and accounting fees | |
| |
| |
Shareholder report expenses | |
Trustees’ fees and expenses | |
Dividends on securities sold short | |
| |
| |
Less: Fee waivers and/or expense reimbursements | |
| |
| |
| |
| |
The accompanying notes are an integral part of these financial statements.
24 | Allspring Diversified Income Builder Fund
Statement of operations—year ended September 30, 2024
Statement of operations
Realized and unrealized gains (losses) on investments | |
Net realized gains (losses) on | |
| |
| |
Foreign currency and foreign currency translations | |
Forward foreign currency contracts | |
| |
| |
| |
Net realized gains on investments | |
Net change in unrealized gains (losses) on | |
| |
Foreign currency and foreign currency translations | |
Forward foreign currency contracts | |
| |
| |
| |
Unfunded loan commitments | |
Net change in unrealized gains (losses) on investments | |
Net realized and unrealized gains (losses) on investments | |
Net increase in net assets resulting from operations | |
The accompanying notes are an integral part of these financial statements.
Allspring Diversified Income Builder Fund | 25
Statement of changes in net assets
Statement of changes in net assets
| Year ended September 30, 2024 | Year ended September 30, 2023 |
| | | | |
| | | | |
Net realized gains (losses) on investments | | | | |
Net change in unrealized gains (losses) on investments | | | | |
Net increase in net assets resulting from operations | | | | |
Distributions to shareholders from | | | | |
Net investment income and net realized gains | | | | |
| | | | |
| | | | |
| | | | |
| | | | |
| | | | |
Total distributions to shareholders | | | | |
Capital share transactions | | | | |
Proceeds from shares sold | | | | |
| | | | |
| | | | |
| | | | |
| | | | |
| | | | |
| | | | |
Reinvestment of distributions | | | | |
| | | | |
| | | | |
| | | | |
| | | | |
| | | | |
| | | | |
Payment for shares redeemed | | | | |
| | | | |
| | | | |
| | | | |
| | | | |
| | | | |
| | | | |
Net decrease in net assets resulting from capital share transactions | | | | |
Total decrease in net assets | | | | |
| | | | |
| | | | |
| | | | |
The accompanying notes are an integral part of these financial statements.
26 | Allspring Diversified Income Builder Fund
Financial highlights
(For a share outstanding throughout each period)
| |
| | | | | |
Net asset value, beginning of period | | | | | |
| | | | | |
Net realized and unrealized gains (losses) on investments | | | | | |
Total from investment operations | | | | | |
Distributions to shareholders from | | | | | |
| | | | | |
Net asset value, end of period | | | | | |
| | | | | |
Ratios to average net assets (annualized) | | | | | |
| | | | | |
| | | | | |
| | | | | |
| | | | | |
| | | | | |
Net assets, end of period (000s omitted) | | | | | |
| Ratios include dividends on securities sold short in the amount of 0.00%. |
| Calculated based upon average shares outstanding |
| Total return calculations do not include any sales charges. Returns include adjustments required by U.S. GAAP and may differ from net asset values and performance reported elsewhere. |
The accompanying notes are an integral part of these financial statements.
Allspring Diversified Income Builder Fund | 27
(For a share outstanding throughout each period)
| |
| | | | | |
Net asset value, beginning of period | | | | | |
| | | | | |
Net realized and unrealized gains (losses) on investments | | | | | |
Total from investment operations | | | | | |
Distributions to shareholders from | | | | | |
| | | | | |
Net asset value, end of period | | | | | |
| | | | | |
Ratios to average net assets (annualized) | | | | | |
| | | | | |
| | | | | |
| | | | | |
| | | | | |
| | | | | |
Net assets, end of period (000s omitted) | | | | | |
| Ratios include dividends on securities sold short in the amount of 0.00%. |
| Calculated based upon average shares outstanding |
| Total return calculations do not include any sales charges. Returns include adjustments required by U.S. GAAP and may differ from net asset values and performance reported elsewhere. |
The accompanying notes are an integral part of these financial statements.
28 | Allspring Diversified Income Builder Fund
(For a share outstanding throughout each period)
| |
| | | | | |
Net asset value, beginning of period | | | | | |
| | | | | |
Net realized and unrealized gains (losses) on investments | | | | | |
Total from investment operations | | | | | |
Distributions to shareholders from | | | | | |
| | | | | |
Net asset value, end of period | | | | | |
| | | | | |
Ratios to average net assets (annualized) | | | | | |
| | | | | |
| | | | | |
| | | | | |
| | | | | |
| | | | | |
Net assets, end of period (000s omitted) | | | | | |
| Ratios include dividends on securities sold short in the amount of 0.00%. |
| Calculated based upon average shares outstanding |
| Returns include adjustments required by U.S. GAAP and may differ from net asset values and performance reported elsewhere. |
The accompanying notes are an integral part of these financial statements.
Allspring Diversified Income Builder Fund | 29
(For a share outstanding throughout each period)
| |
| | | | | |
Net asset value, beginning of period | | | | | |
| | | | | |
Net realized and unrealized gains (losses) on investments | | | | | |
Total from investment operations | | | | | |
Distributions to shareholders from | | | | | |
| | | | | |
Net asset value, end of period | | | | | |
| | | | | |
Ratios to average net assets (annualized) | | | | | |
| | | | | |
| | | | | |
| | | | | |
| | | | | |
| | | | | |
Net assets, end of period (000s omitted) | | | | | |
| Ratios include dividends on securities sold short in the amount of 0.00%. |
| Calculated based upon average shares outstanding |
| Returns include adjustments required by U.S. GAAP and may differ from net asset values and performance reported elsewhere. |
The accompanying notes are an integral part of these financial statements.
30 | Allspring Diversified Income Builder Fund
(For a share outstanding throughout each period)
| |
| | | | | |
Net asset value, beginning of period | | | | | |
| | | | | |
Net realized and unrealized gains (losses) on investments | | | | | |
Total from investment operations | | | | | |
Distributions to shareholders from | | | | | |
| | | | | |
Net asset value, end of period | | | | | |
| | | | | |
Ratios to average net assets (annualized) | | | | | |
| | | | | |
| | | | | |
| | | | | |
| | | | | |
| | | | | |
Net assets, end of period (000s omitted) | | | | | |
| Ratios include dividends on securities sold short in the amount of 0.00%. |
| Calculated based upon average shares outstanding |
| Returns include adjustments required by U.S. GAAP and may differ from net asset values and performance reported elsewhere. |
The accompanying notes are an integral part of these financial statements.
Allspring Diversified Income Builder Fund | 31
Notes to financial statements
Notes to financial statements
Allspring Funds Trust (the “Trust”), a Delaware statutory trust organized on March 10, 1999, is an open-end management investment company registered under the Investment Company Act of 1940, as amended (the “1940 Act”). As an investment company, the Trust follows the accounting and reporting guidance in Financial Accounting Standards Board (“FASB”) Accounting Standards Codification Topic 946, Financial Services – Investment Companies. These financial statements report on the Allspring Diversified Income Builder Fund (the “Fund”) which is a diversified series of the Trust.
2.
SIGNIFICANT ACCOUNTING POLICIES
The following significant accounting policies, which are consistently followed in the preparation of the financial statements of the Fund, are in conformity with U.S. generally accepted accounting principles (“GAAP”) which require management to make estimates and assumptions that affect the reported amounts of assets and liabilities, disclosure of contingent assets and liabilities at the date of the financial statements, and the reported amounts of income and expenses during the reporting period. Actual results could differ from those estimates.
All investments are valued each business day as of the close of regular trading on the New York Stock Exchange (generally 4 p.m. Eastern Time), although the Fund may deviate from this calculation time under unusual or unexpected circumstances.
Debt securities are valued at the evaluated bid price provided by an independent pricing service (e.g., taking into account various factors, including yields, maturities, or credit ratings) or, if a reliable price is not available, the quoted bid price from an independent broker-dealer.
Equity securities, exchange-traded funds and futures contracts that are listed on a foreign or domestic exchange or market are valued at the official closing price or, if none, the last sales price.
The values of securities denominated in foreign currencies are translated into U.S. dollars at rates provided by an independent foreign currency pricing source at a time each business day specified by the Valuation Committee at Allspring Funds Management, LLC (“Allspring Funds Management”).
Many securities markets and exchanges outside the U.S. close prior to the close of the New York Stock Exchange and therefore may not fully reflect trading or events that occur after the close of the principal exchange in which the foreign securities are traded, but before the close of the New York Stock Exchange. If such trading or events are expected to materially affect the value of such securities, then fair value pricing procedures implemented by Allspring Funds Management are applied. These procedures take into account multiple factors including movements in U.S. securities markets after foreign exchanges close. Foreign securities that are fair valued under these procedures are categorized as Level 2 and the application of these procedures may result in transfers between Level 1 and Level 2. Depending on market activity, such fair valuations may be frequent. Such fair value pricing may result in net asset values that are higher or lower than net asset values based on the last reported sales price or latest quoted bid price. On September 30, 2024, such fair value pricing was not used in pricing foreign securities.
Forward foreign currency contracts are recorded at the forward rate provided by an independent foreign currency pricing source at a time each business day specified by the Valuation Committee at Allspring Funds Management.
Options that are listed on a foreign or domestic exchange or market are valued at the closing mid-price. Non-listed options and swap contracts are valued at the evaluated price provided by an independent pricing service or, if a reliable price is not available, the quoted bid price from an independent broker-dealer.
Swap contracts are valued at the evaluated price provided by an independent pricing service or, if a reliable price is not available, the quoted bid price from an independent broker-dealer.
Investments in registered open-end investment companies (other than those listed on a foreign or domestic exchange or market) are valued at net asset value.
Investments which are not valued using the methods discussed above are valued at their fair value, as determined in good faith by Allspring Funds Management, which was named the valuation designee by the Board of Trustees. As the valuation designee, Allspring Funds Management is responsible for day-to-day valuation activities for the Allspring Funds. In connection with these responsibilities, Allspring Funds Management has established a Valuation Committee and has delegated to it the authority to take any actions regarding the valuation of portfolio securities that the Valuation Committee deems necessary or appropriate, including determining the fair value of portfolio securities. On a quarterly basis, the Board of Trustees receives reports of valuation actions taken by the Valuation Committee. On at least an annual basis, the Board of Trustees receives an assessment of the adequacy and effectiveness of Allspring Funds Management’s process for determining the fair value of the portfolio of investments.
Foreign currency translation
The accounting records of the Fund are maintained in U.S. dollars. The values of other assets and liabilities denominated in foreign currencies are translated into U.S. dollars at rates provided by an independent foreign currency pricing source at a time each business day specified by the Valuation Committee. Purchases and sales of securities, and income and expenses are converted at the rate of exchange on the respective dates of such transactions. Net realized foreign exchange gains or losses arise from sales of foreign currencies, currency gains or losses realized between the trade
32 | Allspring Diversified Income Builder Fund
Notes to financial statements
and settlement dates on securities transactions, and the difference between the amounts of dividends, interest and foreign withholding taxes recorded and the U.S. dollar equivalent of the amounts actually paid or received. Net unrealized foreign exchange gains and losses arise from changes in the fair value of assets and liabilities other than investments in securities resulting from changes in exchange rates. The changes in net assets arising from changes in exchange rates of securities and the changes in net assets resulting from changes in market prices of securities are not separately presented. Such changes are included in net realized and unrealized gains or losses from investments.
The Fund may purchase securities on a forward commitment or when-issued basis. The Fund records a when-issued transaction on the trade date and will segregate assets in an amount at least equal in value to the Fund’s commitment to purchase when-issued securities. Securities purchased on a when-issued basis are marked-to-market daily and the Fund begins earning interest on the settlement date. Losses may arise due to changes in the market value of the underlying securities or if the counterparty does not perform under the contract.
The Fund may invest in direct debt instruments which are interests in amounts owed to lenders by corporate or other borrowers. The loans pay interest at rates which are periodically reset by reference to a base lending rate plus a spread. Investments in loans may be in the form of participations in loans or assignments of all or a portion of loans from third parties. When the Fund purchases participations, it generally has no rights to enforce compliance with the terms of the loan agreement with the borrower. As a result, the Fund assumes the credit risk of both the borrower and the lender that is selling the participation. When the Fund purchases assignments from lenders, it acquires direct rights against the borrower on the loan and may enforce compliance by the borrower with the terms of the loan agreement. Loans may include fully funded term loans or unfunded loan commitments, which are contractual obligations for future funding. Unfunded loan commitments represent the remaining obligation of the Fund to the borrower. At any point in time, up to the maturity date of the issue, the borrower may demand the unfunded portion. Unfunded amounts, if any, are marked to market and any unrealized gains or losses are recorded in the Statement of Assets and Liabilities.
Forward foreign currency contracts
A forward foreign currency contract is an agreement between two parties to purchase or sell a specific currency for an agreed-upon price at a future date. The Fund enters into forward foreign currency contracts to facilitate transactions in foreign-denominated securities and to attempt to minimize the risk to the Fund from adverse changes in the relationship between currencies. Forward foreign currency contracts are recorded at the forward rate and marked-to-market daily. When the contracts are closed, realized gains and losses arising from such transactions are recorded as realized gains or losses on forward foreign currency contracts. The Fund is subject to foreign currency risk and may be exposed to risks if the counterparties to the contracts are unable to meet the terms of their contracts or if the value of the foreign currency changes unfavorably. The Fund’s maximum risk of loss from counterparty credit risk is the unrealized gains on the contracts. This risk may be mitigated if there is a master netting arrangement between the Fund and the counterparty.
Futures contracts are agreements between the Fund and a counterparty to buy or sell a specific amount of a commodity, financial instrument or currency at a specified price and on a specified date. The Fund may buy and sell futures contracts in order to gain exposure to, or protect against, changes in interest rates and is subject to interest rate risk. The primary risks associated with the use of futures contracts are the imperfect correlation between changes in market values of securities held by the Fund and the prices of futures contracts, and the possibility of an illiquid market. Futures contracts are generally entered into on a regulated futures exchange and cleared through a clearinghouse associated with the exchange. With futures contracts, there is minimal counterparty risk to the Fund since futures contracts are exchange-traded and the exchange’s clearinghouse, as the counterparty to all exchange-traded futures, guarantees the futures contracts against default.
Upon entering into a futures contract, the Fund is required to deposit either cash or securities (initial margin) with the broker in an amount equal to a certain percentage of the contract value. Subsequent payments (variation margin) are paid to or received from the broker each day equal to the daily changes in the contract value. Such payments are recorded as unrealized gains or losses and, if any, shown as variation margin receivable (payable) in the Statement of Assets and Liabilities. Should the Fund fail to make requested variation margin payments, the broker can gain access to the initial margin to satisfy the Fund’s payment obligations. When the contracts are closed, a realized gain or loss is recorded in the Statement of Operations.
The Fund may write covered call options or secured put options on individual securities and/or indexes. When the Fund writes an option, an amount equal to the premium received is recorded as a liability and is subsequently adjusted to the current market value of the written option. Premiums received from written options that expire unexercised are recognized as realized gains on the expiration date. For exercised options, the difference between the premium received and the amount paid on effecting a closing purchase transaction, including brokerage commissions, is treated as a realized gain or loss. If a call option is exercised, the premium is added to the proceeds from the sale of the underlying security in calculating the realized gain or loss on the sale. If a put option is exercised, the premium reduces the cost of the security purchased. The Fund, as a writer of an option, bears the market risk of an unfavorable change in the price of the security and/or index underlying the written option.
The Fund may also purchase call or put options. Premiums paid are included in the Statement of Assets and Liabilities as investments, the values of which are subsequently adjusted based on the current market values of the options. Premiums paid for purchased options that expire are recognized as realized
Allspring Diversified Income Builder Fund | 33
Notes to financial statements
losses on the expiration date. Premiums paid for purchased options that are exercised or closed are added to the amount paid or offset against the proceeds received for the underlying security to determine the realized gain or loss. The risk of loss associated with purchased options is limited to the premium paid.
Options traded on an exchange are regulated and terms of the options are standardized. The Fund is subject to equity price risk. Purchased options traded over-the-counter expose the Fund to counterparty risk in the event the counterparty does not perform. This risk can be mitigated by having a master netting arrangement between the Fund and the counterparty and by having the counterparty post collateral to cover the Fund’s exposure to the counterparty.
Swap contracts are agreements between the Fund and a counterparty to exchange a series of cash flows over a specified period. Swap agreements are privately negotiated contracts between the Fund that are entered into as bilateral contracts in the over-the-counter market or centrally cleared (“centrally cleared swaps”) with a central clearinghouse.
The Fund entered into centrally cleared swaps. In a centrally cleared swap, immediately following execution of the swap contract, the swap contract is novated to a central counterparty (the “CCP”) and the Fund’s counterparty on the swap agreement becomes the CCP. Upon entering into a centrally cleared swap, the Fund is required to deposit an initial margin with the broker in the form of cash or securities. Securities deposited as initial margin are designated in the Portfolio of Investments and cash deposited is shown as cash segregated for centrally cleared swaps in the Statement of Assets and Liabilities. Pursuant to the contract, the Fund agrees to receive from or pay to the broker an amount of cash equal to the daily fluctuation in market value of the contract (“variation margin”). The variation margin is recorded as an unrealized gain (or loss) and shown as variation margin receivable (or payable) on centrally cleared swaps in the Statement of Assets and Liabilities. Payments received from (paid to) the counterparty are recorded as realized gains (losses) in the Statement of Operations when the contract is closed.
Credit default swaps
The Fund may enter into credit default swaps for hedging or speculative purposes to provide or receive a measure of protection against default on a referenced entity, obligation or index or a basket of single-name issuers or traded indexes. An index credit default swap references all the names in the index, and if a credit event is triggered, the credit event is settled based on that name’s weight in the index. Credit default swaps are agreements in which the protection buyer pays fixed periodic payments to the protection seller in consideration for a promise from the protection seller to make a specific payment should a negative credit event take place with respect to the referenced entity (e.g., bankruptcy, failure to pay, obligation acceleration, repudiation, moratorium or restructuring).
The Fund may enter into credit default swaps as either the seller of protection or the buyer of protection. If the Fund is the buyer of protection and a credit event occurs, the Fund will either receive from the seller an amount equal to the notional amount of the swap and deliver the referenced security or underlying securities comprising the index, or receive a net settlement of cash equal to the notional amount of the swap less the recovery value of the security or underlying securities comprising the index. If the Fund is the seller of protection and a credit event occurs, the Fund will either pay the buyer an amount equal to the notional amount of the swap and take delivery of the referenced security or underlying securities comprising the index or pay a net settlement of cash equal to the notional amount of the swap less the recovery value of the security or underlying securities comprising the index.
As the seller of protection, the Fund is subject to investment exposure on the notional amount of the swap and has assumed the risk of default of the underlying security or index. As the buyer of protection, the Fund could be exposed to risks if the seller of the protection defaults on its obligation to perform, or if there are unfavorable changes in the fluctuation of interest rates.
By entering into credit default swap contracts, the Fund is exposed to credit risk. In addition, certain credit default swap contracts entered into by the Fund provide for conditions that result in events of default or termination that enable the counterparty to the agreement to cause an early termination of the transactions under those agreements.
Security transactions and income recognition
Securities transactions are recorded on a trade date basis. Realized gains or losses are recorded on the basis of identified cost.
Interest income is accrued daily and bond discounts are accreted and premiums are amortized daily. To the extent debt obligations are placed on non-accrual status, any related interest income may be reduced by writing off interest receivables when the collection of all or a portion of interest has been determined to be doubtful based on consistently applied procedures and the fair value has decreased. If the issuer subsequently resumes interest payments or when the collectability of interest is reasonably assured, the debt obligation is removed from non-accrual status. Paydown gains and losses are included in interest income.
Dividend income is recognized on the ex-dividend date, except for certain dividends from foreign securities, which are recorded as soon as the custodian verifies the ex-dividend date.
Interest earned on cash balances held at the custodian is recorded as interest income.
Income is recorded net of foreign taxes withheld where recovery of such taxes is not assured.
34 | Allspring Diversified Income Builder Fund
Notes to financial statements
Distributions received from REIT investments may be characterized as ordinary income, capital gains, or a return of capital to the Fund based on information provided by the REIT. The proper characterization of REIT distributions is generally not known until after the end of each calendar year. As such, estimates may be used in reporting the character of income and distributions for financial statement purposes.
Distributions to shareholders
Distributions to shareholders are recorded on the ex-dividend date and paid from net investment income monthly and any net realized gains are paid at least annually. Such distributions are determined in accordance with income tax regulations and may differ from U.S. GAAP. Dividend sources are estimated at the time of declaration. The tax character of distributions is determined as of the Fund’s fiscal year end. Therefore, a portion of the Fund’s distributions made prior to the Fund’s fiscal year end may be categorized as a tax return of capital at year end.
The Fund intends to continue to qualify as a regulated investment company by distributing substantially all of its investment company taxable income and any net realized capital gains (after reduction for capital loss carryforwards) sufficient to relieve it from all, or substantially all, federal income taxes. Accordingly, no provision for federal income taxes was required.
The Fund’s income and federal excise tax returns and all financial records supporting those returns for the prior three fiscal years are subject to examination by the federal and Delaware revenue authorities. Management has analyzed the Fund’s tax positions taken on federal, state, and foreign tax returns, as applicable, for all open tax years and does not believe that there are any uncertain tax positions that require recognition of a tax liability.
As of September 30, 2024, the aggregate cost of all investments for federal income tax purposes was $325,878,899 and the unrealized gains (losses) consisted of:
As of September 30, 2024, the Fund had capital loss carryforwards which consist of $34,403,078 in short-term capital losses and $9,622,347 in long-term capital losses.
The separate classes of shares offered by the Fund differ principally in applicable sales charges, distribution, shareholder servicing, and administration fees. Class specific expenses are charged directly to that share class. Investment income, common fund-level expenses, and realized and unrealized gains (losses) on investments are allocated daily to each class of shares based on the relative proportion of net assets of each class.
3.
FAIR VALUATION MEASUREMENTS
Fair value measurements of investments are determined within a framework that has established a fair value hierarchy based upon the various data inputs utilized in determining the value of the Fund’s investments. The three-level hierarchy gives the highest priority to unadjusted quoted prices in active markets for identical assets or liabilities (Level 1) and the lowest priority to unobservable inputs (Level 3). The Fund’s investments are classified within the fair value hierarchy based on the lowest level of input that is significant to the fair value measurement. The inputs are summarized into three broad levels as follows:
•Level 1—quoted prices in active markets for identical securities
•Level 2—other significant observable inputs (including quoted prices for similar securities, interest rates, prepayment speeds, credit risk, etc.)
•Level 3—significant unobservable inputs (including the Fund’s own assumptions in determining the fair value of investments)
The inputs or methodologies used for valuing investments in securities are not necessarily an indication of the risk associated with investing in those securities.
Allspring Diversified Income Builder Fund | 35
Notes to financial statements
The following is a summary of the inputs used in valuing the Fund’s assets and liabilities as of September 30, 2024:
| | Other significant
observable inputs
(Level 2) | Significant
unobservable inputs
(Level 3) | |
| | | | |
| | | | |
| | | | |
| | | | |
| | | | |
| | | | |
| | | | |
| | | | |
| | | | |
| | | | |
| | | | |
| | | | |
| | | | |
| | | | |
| | | | |
| | | | |
Corporate bonds and notes | | | | |
Foreign corporate bonds and notes | | | | |
| | | | |
| | | | |
| | | | |
| | | | |
| | | | |
Yankee corporate bonds and notes | | | | |
| | | | |
| | | | |
| | | | |
| | | | |
| | | | |
|
Forward foreign currency contracts | | | | |
| | | | |
| | | | |
Futures contracts and forward foreign currency contracts are reported at their cumulative unrealized gains (losses) at measurement date as reported in the tables following the Portfolio of Investments. For futures contracts, the current day’s variation margin is reported on the Statement of Assets and Liabilities. All other assets and liabilities are reported at their market value at measurement date.
Additional sector, industry or geographic detail, if any, is included in the Portfolio of Investments.
At September 30, 2024, the Fund did not have any transfers into/out of Level 3.
4.
TRANSACTIONS WITH AFFILIATES
Allspring Funds Management, a wholly owned subsidiary of Allspring Global Investments Holdings, LLC, a holding company indirectly owned by certain private funds of GTCR LLC and Reverence Capital Partners, L.P., is the manager of the Fund and provides advisory and fund-level administrative services under an investment management agreement. Under the investment management agreement, Allspring Funds Management is responsible for, among other services, implementing the investment objectives and strategies of the Fund, supervising the subadviser and providing fund-level administrative services in connection with the Fund’s operations. As compensation for its services under the investment management agreement, Allspring Funds
36 | Allspring Diversified Income Builder Fund
Notes to financial statements
Management is entitled to receive a management fee, which is generally paid monthly, at the following annual rate based on the Fund’s average daily net assets:
For the year ended September 30, 2024, the management fee was equivalent to an annual rate of 0.55% of the Fund’s average daily net assets.
Allspring Funds Management has retained the services of a subadviser to provide daily portfolio management to the Fund. The fee for subadvisory services is borne by Allspring Funds Management. Allspring Global Investments, LLC, an affiliate of Allspring Funds Management and a wholly owned subsidiary of Allspring Global Investments Holdings, LLC, is the subadviser to the Fund and is entitled to receive a fee from Allspring Funds Management at an annual rate starting at 0.35% and declining to 0.20% as the average daily net assets of the Fund increase.
Under a class-level administration agreement, Allspring Funds Management provides class-level administrative services to the Fund, which includes paying fees and expenses for services provided by the transfer agent, sub-transfer agents, omnibus account servicers and record-keepers. As compensation for its services under the class-level administration agreement, Allspring Funds Management receives an annual fee which is calculated based on the average daily net assets of each class and generally paid monthly, as follows:
| Class-level
administration fee |
| |
| |
| |
| |
| |
Waivers and/or expense reimbursements
Allspring Funds Management has contractually committed to waive and/or reimburse management and administration fees to the extent necessary to maintain certain net operating expense ratios for the Fund. When each class of the Fund has exceeded its expense cap, Allspring Funds Management will waive fees and/or reimburse expenses from fund-level expenses on a proportionate basis and then from class specific expenses. When only certain classes exceed their expense caps, waivers and/or reimbursements are applied against class specific expenses before fund-level expenses. Allspring Funds Management has contractually committed through January 31, 2025 to waive fees and/or reimburse expenses to the extent necessary to cap the Fund’s expenses. Prior to or after the commitment expiration date, the cap may be increased or the commitment to maintain the cap may be terminated only with the approval of the Board of Trustees. As of September 30, 2024, the contractual caps are as follows:
The Trust has adopted a distribution plan for Class C shares pursuant to Rule 12b-1 under the 1940 Act. A distribution fee is charged to Class C shares and paid to Allspring Funds Distributor, LLC (“Allspring Funds Distributor”), the principal underwriter, an affiliate of Allspring Funds Management, at an annual rate up to 0.75% of the average daily net assets of Class C shares. Such fees are generally paid on a monthly basis.
In addition, Allspring Funds Distributor is entitled to receive the front-end sales charge from the purchase of Class A shares and a contingent deferred sales charge on the redemption of certain Class A shares. Allspring Funds Distributor is also entitled to receive the contingent deferred sales charges from redemptions of Class C shares. For the year ended September 30, 2024, Allspring Funds Distributor received $2,497 from the sale of Class A shares. No contingent deferred sales charges were incurred by Class A and Class C shares for the year ended September 30, 2024.
Allspring Diversified Income Builder Fund | 37
Notes to financial statements
Shareholder servicing fees
The Trust has entered into contracts with one or more shareholder servicing agents, whereby Class A, Class C and Administrator Class are charged a fee at an annual rate up to 0.25% of the average daily net assets of each respective class and are generally paid on a monthly basis. A portion of these total shareholder servicing fees were paid to affiliates of the Fund.
The Fund may purchase or sell portfolio investment securities to certain affiliates pursuant to Rule 17a-7 under the 1940 Act and under procedures adopted by the Board of Trustees. The procedures have been designed to ensure that these interfund transactions, which do not incur broker commissions, are effected at current market prices. Pursuant to these procedures, the Fund did not have any interfund transactions during the year ended September 30, 2024.
5.
INVESTMENT PORTFOLIO TRANSACTIONS
Purchases and sales of investments, excluding U.S. government obligations (if any) and short-term securities, for the year ended September 30, 2024 were $225,539,137 and $261,117,968, respectively.
As of September 30, 2024, the Fund had the following unfunded loan commitments which are available until the maturity date:
| | |
Enviva Partners LP/Enviva Partners Finance Corp., 13.28%, 12-13-2024 Tranche B | | |
Based on the nature of the terms of the loans and comparative market rates, the carrying amount of the unfunded loan commitments at September 30, 2024, approximates its fair value. If measured at fair value, the unfunded loan commitments would be categorized as Level 2 under the fair value hierarchy.
7.
DERIVATIVE TRANSACTIONS
During the year ended September 30, 2024,the Fund entered into futures contracts and written options for economic hedging purposes. The Fund also entered into forward foreign currency contracts for economic hedging purposes and entered into credit default swap contracts for hedging or cash management purposes.
The volume of the Fund’s derivative activity during the year ended September 30, 2024 was as follows:
Forward foreign currency contracts | |
Average contract amounts to buy | |
Average contract amounts to sell | |
| |
Average notional balance on long futures | |
| |
| |
| |
Average number of contracts written | |
The credit default swap transactions may contain provisions for early termination in the event the net assets of the Fund declines below specific levels identified by the counterparty. If these levels are triggered, the counterparty may terminate the transaction and seek payment or request full collateralization of the derivative transactions in net liability positions.
A summary of the location of derivative instruments on the financial statements by primary risk exposure is outlined in the following tables.
38 | Allspring Diversified Income Builder Fund
Notes to financial statements
The fair value of derivative instruments as of September 30, 2024 by primary risk type was as follows for the Fund:
| | | | |
|
| | | | |
|
Forward foreign currency contracts | | | | |
| | | | |
| | | | |
| Amount represents the cumulative unrealized gains (losses) as reported in the table following the Portfolio of Investments. For futures contracts, only the current day’s variation margin as of September 30, 2024 is reported separately on the Statement of Assets and Liabilities. |
The effect of derivative instruments on the Statement of Operations for the year ended September 30, 2024 was as follows:
| | | | | |
Net realized gains (losses) on derivatives |
Forward foreign currency contracts | | | | | |
| | | | | |
| | | | | |
| | | | | |
| | | | | |
Net change in unrealized gains (losses) on derivatives |
Forward foreign currency contracts | | | | | |
| | | | | |
| | | | | |
| | | | | |
| | | | | |
For certain types of derivative transactions, the Fund has entered into International Swaps and Derivatives Association, Inc. master agreements (“ISDA Master Agreements”) or similar agreements with approved counterparties. The ISDA Master Agreements or similar agreements may have requirements to deliver/deposit securities or cash to/with an exchange or broker-dealer as collateral and allows the Fund to offset, with each counterparty, certain derivative financial instrument’s assets and/or liabilities with collateral held or pledged. Collateral requirements differ by type of derivative. Collateral or margin requirements are set by the broker or exchange clearinghouse for exchange traded derivatives while collateral terms are contract specific for over-the-counter traded derivatives. Cash collateral that has been pledged to cover obligations of the Fund under ISDA Master Agreements or similar agreements, if any, are reported separately in the Statement of Assets and Liabilities. Securities pledged as collateral, if any, are noted in the Portfolio of Investments. With respect to balance sheet offsetting, absent an event of default by the counterparty or a termination of the agreement, the reported amounts of financial assets and financial liabilities in the Statement of Assets and Liabilities are not offset across transactions between the Fund and the applicable counterparty. A reconciliation of the gross amounts on the Statement of Assets and Liabilities to the net amounts by counterparty, including any collateral exposure, for OTC derivatives is as follows:
| Gross amounts
of liabilities in the
Statement of
Assets and
Liabilities | Amounts
subject to
netting
agreements | | |
| | | | |
| | | | |
| Collateral pledged within this table is limited to the collateral for the net transaction with the counterparty. |
The Trust (excluding the money market funds), Allspring Master Trust and Allspring Variable Trust are parties to a $275,000,000 (prior to July 9, 2024: $350,000,000), revolving credit agreement whereby the Fund is permitted to use bank borrowings for temporary or emergency purposes, such as to fund shareholder redemption requests. Interest under the credit agreement is charged to the Fund based on a borrowing rate equal to the higher of the Federal Funds rate or the overnight bank funding rate in effect on that day plus a spread. In addition, an annual commitment fee based on the unused balance is allocated to each participating fund.
For the year ended September 30, 2024, there were no borrowings by the Fund under the agreement.
Allspring Diversified Income Builder Fund | 39
Notes to financial statements
9.
DISTRIBUTIONS TO SHAREHOLDERS
The tax character of distributions paid were as follows:
As of September 30, 2024, the components of distributable earnings on a tax basis were as follows:
Undistributed
ordinary
income | | |
| | |
Under the Fund’s organizational documents, the officers and Trustees have been granted certain indemnification rights against certain liabilities that may arise out of performance of their duties to the Fund. The Fund has entered into a separate agreement with each Trustee that converts indemnification rights currently existing under the Fund’s organizational documents into contractual rights that cannot be changed in the future without the consent of the Trustee. Additionally, in the normal course of business, the Fund may enter into contracts with service providers that contain a variety of indemnification clauses. The Fund’s maximum exposure under these arrangements is dependent on future claims that may be made against the Fund and, therefore, cannot be estimated.
40 | Allspring Diversified Income Builder Fund
Report of independent registered public accounting firm
To the Shareholders of the Fund and Board of Trustees
Allspring Funds Trust:
Opinion on the Financial Statements
We have audited the accompanying statement of assets and liabilities of Allspring Diversified Income Builder Fund (the Fund), one of the Funds constituting Allspring Funds Trust, including the portfolio of investments, as of September 30, 2024, the related statement of operations for the year then ended, the statements of changes in net assets for each of the years in the two-year period then ended, and the related notes (collectively, the financial statements) and the financial highlights for each of the years in the five-year period then ended. In our opinion, the financial statements and financial highlights present fairly, in all material respects, the financial position of the Fund as of September 30, 2024, the results of its operations for the year then ended, the changes in its net assets for each of the years in the two-year period then ended, and the financial highlights for each of the years in the five-year period then ended, in conformity with U.S. generally accepted accounting principles.
These financial statements and financial highlights are the responsibility of the Fund’s management. Our responsibility is to express an opinion on these financial statements and financial highlights based on our audits. We are a public accounting firm registered with the Public Company Accounting Oversight Board (United States) (PCAOB) and are required to be independent with respect to the Fund in accordance with the U.S. federal securities laws and the applicable rules and regulations of the Securities and Exchange Commission and the PCAOB.
We conducted our audits in accordance with the standards of the PCAOB. Those standards require that we plan and perform the audit to obtain reasonable assurance about whether the financial statements and financial highlights are free of material misstatement, whether due to error or fraud. Our audits included performing procedures to assess the risks of material misstatement of the financial statements and financial highlights, whether due to error or fraud, and performing procedures that respond to those risks. Such procedures included examining, on a test basis, evidence regarding the amounts and disclosures in the financial statements and financial highlights. Such procedures also included confirmation of securities owned as of September 30, 2024, by correspondence with the custodian, transfer agent, agent banks and brokers, or by other appropriate auditing procedures. Our audits also included evaluating the accounting principles used and significant estimates made by management, as well as evaluating the overall presentation of the financial statements and financial highlights. We believe that our audits provide a reasonable basis for our opinion.

We have not been able to determine the specific year that we began serving as the auditor of one or more Allspring Funds investment companies; however, we are aware that we have served as the auditor of one or more Allspring Funds investment companies since at least 1955.
November 25, 2024
Allspring Diversified Income Builder Fund | 41
Other information (unaudited)
Other information
For corporate shareholders, pursuant to Section 854 of the Internal Revenue Code, 4% of ordinary income dividends qualify for the corporate dividends-received deduction for the fiscal year ended September 30, 2024.
Pursuant to Section 854 of the Internal Revenue Code, $2,060,288 of income dividends paid during the fiscal year ended September 30, 2024 has been designated as qualified dividend income (QDI).
For the fiscal year ended September 30, 2024, $9,505,423 has been designated as interest-related dividends for nonresident alien shareholders pursuant to Section 871 of the Internal Revenue Code.
A description of the policies and procedures used to determine how to vote proxies relating to portfolio securities is available without charge, upon request, by calling 1-866-259-3305, visiting our website at allspringglobal.com, or visiting the SEC website at sec.gov. Information regarding how the proxies related to portfolio securities were voted during the most recent 12-month period ended June 30 is available on the website at allspringglobal.com or by visiting the SEC website at sec.gov.
Quarterly portfolio holdings information
The Fund files its complete schedule of portfolio holdings with the SEC for the first and third quarters of each fiscal year as an exhibit to its reports on Form N-PORT. Shareholders may view the filed Form N-PORT by visiting the SEC website at sec.gov.
42 | Allspring Diversified Income Builder Fund
Other information (unaudited)
Item 8. Changes in and disagreements with accountants
Item 9. Matters submitted to fund shareholders for a vote
Item 10. Remuneration paid to directors, officers and others
Refer to information in the Statement of operations.
Allspring Diversified Income Builder Fund | 43
Other information (unaudited)
Item 11. Statement regarding basis for the board’s approval of investment advisory contract
Board consideration of investment management and sub-advisory agreements:
Under the Investment Company Act of 1940 (the “1940 Act”), the Board of Trustees (the “Board”) of Allspring Funds Trust (the “Trust”) must determine annually whether to approve the continuation of the Trust’s investment management and sub-advisory agreements. In this regard, at a Board meeting held on May 28-30, 2024 (the “Meeting”), the Board, all the members of which have no direct or indirect interest in the investment management and sub-advisory agreements and are not “interested persons” of the Trust, as defined in the 1940 Act (the “Independent Trustees”), reviewed and approved for the Allspring Diversified Income Builder Fund (the “Fund”): (i) an investment management agreement (the “Management Agreement”) with Allspring Funds Management, LLC (“Allspring Funds Management”); and (ii) an investment sub-advisory agreement (the “Sub-Advisory Agreement”) with Allspring Global Investments, LLC (the “Sub-Adviser”), an affiliate of Allspring Funds Management. The Management Agreement and the Sub-Advisory Agreement are collectively referred to as the “Advisory Agreements.”
At the Meeting, the Board considered the factors and reached the conclusions described below relating to the selection of Allspring Funds Management and the Sub-Adviser and the approval of the Advisory Agreements. Prior to the Meeting, including at a meeting of the Board held in April 2024, and at the Meeting, the Trustees conferred extensively among themselves and with representatives of Allspring Funds Management about these matters. The Board has adopted a team-based approach, with each team consisting of a sub-set of Trustees, to assist the full Board in the discharge of its duties in reviewing investment performance and other matters throughout the year. The Independent Trustees were assisted in their evaluation of the Advisory Agreements by independent legal counsel, from whom they received separate legal advice and with whom they met separately.
In providing information to the Board, Allspring Funds Management and the Sub-Adviser were guided by a detailed set of requests for information submitted to them by independent legal counsel on behalf of the Independent Trustees at the start of the Board’s annual contract renewal process earlier in 2024. In considering and approving the Advisory Agreements, the Trustees considered the information they believed relevant, including but not limited to the information discussed below. The Board considered not only the specific information presented in connection with the Meeting, but also the knowledge gained over time through interactions with Allspring Funds Management and the Sub-Adviser about various topics. In this regard, the Board reviewed reports of Allspring Funds Management at each of its quarterly meetings, which included, among other things, portfolio reviews and investment performance reports. In addition, the Board and the teams mentioned above confer with portfolio managers at various times throughout the year. The Board did not identify any particular information or consideration that was all-important or controlling, and each individual Trustee may have attributed different weights to various factors.
After its deliberations, the Board unanimously determined that the compensation payable to Allspring Funds Management and the Sub-Adviser under each of the Advisory Agreements was reasonable, and approved the continuation of the Advisory Agreements for a one-year term. The Board considered the approval of the Advisory Agreements for the Fund as part of its consideration of agreements for funds across the complex, but its approvals were made on a fund-by-fund basis. The following summarizes a number of important, but not necessarily all, factors considered by the Board in support of its approvals.
Nature, extent, and quality of services
The Board received and considered various information regarding the nature, extent, and quality of services provided to the Fund by Allspring Funds Management and the Sub-Adviser under the Advisory Agreements. This information included a description of the investment advisory services and Fund-level administrative services covered by the Management Agreement, as well as, among other things, a summary of the background and experience of senior management of Allspring Global Investments, of which Allspring Funds Management and the Sub-Adviser are a part, and a summary of investments made in the Allspring Global Investments business.* The Board also received information about the services that continue to be provided by Wells Fargo & Co. and/or its affiliates (“Wells Fargo”) since the sale of Wells Fargo Asset Management to Allspring Global Investments Holdings, LLC, a holding company indirectly owned by certain private funds of GTCR LLC and Reverence Capital Partners, L.P., under a transition services agreement and an update on the anticipated timeline for exiting the transition services agreement. In addition, the Board received and considered information about the full range of services provided to the Fund by Allspring Funds Management and its affiliates.
The Board considered the qualifications, background, tenure, and responsibilities of each of the portfolio managers primarily responsible for the day-to-day portfolio management of the Fund. The Board evaluated the ability of Allspring Funds Management and the Sub-Adviser to attract and retain qualified investment professionals, including research, advisory, and supervisory personnel.
The Board further considered the compliance programs and compliance records of Allspring Funds Management and the Sub-Adviser. The Board received and considered information about Allspring Global Investments’ risk management functions, which included information about Allspring Funds
*
The trade name for the asset management firm that includes Allspring Funds Management and the Sub-Adviser is “Allspring Global Investments.”
44 | Allspring Diversified Income Builder Fund
Other information (unaudited)
Management’s and the Sub-Adviser’s business continuity plans, their approaches to data privacy and cybersecurity, Allspring Funds Management’s role as administrator of the Fund’s liquidity risk management program, fair valuation designee, and derivatives risk management program manager. The Board also received and considered information about Allspring Funds Management’s intermediary and vendor oversight program.
Fund investment performance and expenses
The Board considered the investment performance results for the Fund over various time periods ended December 31, 2023. The Board considered these results in comparison to the investment performance of funds in a universe that was determined by Broadridge Inc. (“Broadridge”) to be similar to the Fund (the “Universe”), and in comparison to the Fund’s benchmark index and to other comparative data. Broadridge is an independent provider of investment company data. The Board received a description of the methodology used by Broadridge to select the mutual funds in the performance Universe. The Board noted that the investment performance of the Fund (Administrator Class) was higher than the average investment performance of the Universe for all periods under review. The Board also noted that the investment performance of the Fund was lower than the investment performance of its benchmark index, the Diversified Income Builder Blended Index, for all periods under review.
The Board also received and considered information regarding the Fund’s net operating expense ratios and their various components, including actual management fees, custodian and other non-management fees, and Rule 12b-1 and non-Rule 12b-1 shareholder service fees. The Board considered these ratios in comparison to the median ratios of funds in class-specific expense groups that were determined by Broadridge to be similar to the Fund (the “Groups”). The Board received a description of the methodology used by Broadridge to select the mutual funds in the expense Groups and an explanation of how funds comprising expense Groups and their expense ratios may vary from year-to-year. Based on the Broadridge reports, the Board noted that the net operating expense ratios of the Fund were lower than the median net operating expense ratios of the expense Groups for each share class.
The Board took into account the Fund’s investment performance and expense information provided to it among the factors considered in deciding to re-approve the Advisory Agreements.
Investment management and sub-advisory fee rates
The Board reviewed and considered the contractual fee rates payable by the Fund to Allspring Funds Management under the Management Agreement, as well as the contractual fee rates payable by the Fund to Allspring Funds Management for class-level administrative services under a Class-Level Administration Agreement, which include, among other things, class-level transfer agency and sub-transfer agency costs (collectively, the “Management Rates”). The Board also reviewed and considered the contractual investment sub-advisory fee rates payable by Allspring Funds Management to the Sub-Adviser for investment sub-advisory services. It was noted that advisory fee waivers, if any, are at the fund level and not class level.
Among other information reviewed by the Board was a comparison of the Fund’s Management Rates with the average contractual investment management fee rates of funds in the expense Groups at a common asset level as well as transfer agency costs of the funds in the expense Groups. The Board noted that the Management Rates of the Fund were in range of the sum of these average rates for the Fund’s expense Groups for each share class.
The Board also received and considered information about the portion of the total management fee that was retained by Allspring Funds Management after payment of the fee to the Sub-Adviser for sub-advisory services. In assessing the reasonableness of this amount, the Board received and evaluated information about the nature and extent of responsibilities retained and risks assumed by Allspring Funds Management and not delegated to or assumed by the Sub-Adviser, and about Allspring Funds Management’s on-going oversight services. Given the affiliation between Allspring Funds Management and the Sub-Adviser, the Board ascribed limited relevance to the allocation of fees between them.
Based on its consideration of the factors and information it deemed relevant, including those described here, the Board determined that the compensation payable to Allspring Funds Management under the Management Agreement and to the Sub-Adviser under the Sub-Advisory Agreement was reasonable.
The Board received and considered information concerning the profitability of Allspring Funds Management, as well as the profitability of Allspring Global Investments, from providing services to the fund complex as a whole. The Board noted that the Sub-Adviser’s profitability information with respect to providing services to the Fund and other funds in the complex was subsumed in the Allspring Global Investments profitability analysis.
Allspring Funds Management reported on the methodologies and estimates used in calculating profitability, including a description of the methodology used to allocate certain expenses. Among other things, the Board noted that the levels of profitability reported on a fund-by-fund basis varied widely, depending on factors such as the size, type, and age of fund.
Based on its review, the Board did not deem the profits reported by Allspring Funds Management or Allspring Global Investments from services provided to the Fund to be at a level that would prevent it from approving the continuation of the Advisory Agreements.
Allspring Diversified Income Builder Fund | 45
Other information (unaudited)
Economies of scale
The Board received and considered information about the potential for Allspring Funds Management to experience economies of scale in the provision of management services to the Fund, the difficulties of isolating and quantifying economies of scale at an individual fund level, and the extent to which potential scale benefits are shared with Fund shareholders. The Board noted the existence of breakpoints in the Fund’s management fee structure, which operate generally to reduce the Fund’s expense ratios as the Fund grows in size, and the size of the Fund in relation to such breakpoints. The Board considered that in addition to management fee breakpoints, Allspring Funds Management shares potential economies of scale from its management business in a variety of ways, including through fee waiver and expense reimbursement arrangements, competitive management fee rates set at the outset without regard to breakpoints, and investments in the business intended to enhance services available to shareholders.
The Board concluded that Allspring Funds Management’s arrangements with respect to the Fund, including contractual breakpoints, constituted a reasonable approach to sharing potential economies of scale with the Fund and its shareholders.
Other benefits to Allspring Funds Management and the Sub-Adviser
The Board received and considered information regarding potential “fall-out” or ancillary benefits received by Allspring Funds Management and its affiliates, including the Sub-Adviser, as a result of their relationships with the Fund. Ancillary benefits could include, among others, benefits directly attributable to other relationships with the Fund and benefits potentially derived from an increase in Allspring Funds Management’s and the Sub-Adviser’s business as a result of their relationships with the Fund. The Board noted that Allspring Funds Distributor, LLC, an affiliate of Allspring Funds Management, receives distribution-related fees in respect of shares sold or held through it. The Board also reviewed information about soft dollar credits earned and utilized by the Sub-Adviser.
Based on its consideration of the factors and information it deemed relevant, including those described here, the Board did not find that any ancillary benefits received by Allspring Funds Management and its affiliates, including the Sub-Adviser, were unreasonable.
At the Meeting, after considering the above-described factors and based on its deliberations and its evaluation of the information described above, the Board unanimously determined that the compensation payable to Allspring Funds Management and the Sub-Adviser under each of the Advisory Agreements was reasonable, and approved the continuation of the Advisory Agreements for a one-year term.
46 | Allspring Diversified Income Builder Fund
This page is intentionally left blank.
This page is intentionally left blank.
For more information
More information about Allspring Funds is available free upon request. To obtain literature, please write, visit the Fund’s website, or call:
Allspring Funds
P.O. Box 219967
Kansas City, MO 64121-9967
Website: allspringglobal.com
Individual investors: 1-800-222-8222
Retail investment professionals: 1-888-877-9275
Institutional investment professionals: 1-800-260-5969
This report and the financial statements contained herein are submitted for the general information of the shareholders of the Fund. If this report is used for promotional purposes, distribution of the report must be accompanied or preceded by a current prospectus. Before investing, please consider the investment objectives, risks, charges, and expenses of the investment. For a current prospectus and, if available, a summary prospectus, containing this information, call 1-800-222-8222 or visit the Fund’s website at allspringglobal.com. Read the prospectus carefully before you invest or send money.
Allspring Global InvestmentsTM is the trade name for the asset management firms of Allspring Global Investments Holdings, LLC, a holding company indirectly owned by certain private funds of GTCR LLC and Reverence Capital Partners, L.P. These firms include but are not limited to Allspring Global Investments, LLC, and Allspring Funds Management, LLC. Certain products managed by Allspring entities are distributed by Allspring Funds Distributor, LLC (a broker-dealer and Member FINRA/SIPC).
This material is for general informational and educational purposes only and is NOT intended to provide investment advice or a recommendation of any kind - including a recommendation for any specific investment, strategy, or plan.
© 2024 Allspring Global Investments Holdings, LLC. All rights reserved.
NCSR4304 09-24
Allspring Diversified Capital Builder Fund
Long Form Financial Statements
Annual Report
Allspring Diversified Capital Builder Fund | 1
Portfolio of investments—September 30, 2024
| | | | | |
| | | | | | |
Communication services: 1.28% | | | | | | |
Interactive media & services: 1.28% | | | | | | |
| | | | | | |
Consumer discretionary: 0.45% | | | | | | |
| | | | | | |
| | | | | | |
| | | | | | |
Energy equipment & services: 3.65% | | | | | | |
| | | | | | |
| | | | | | |
| | | | | | |
Oil, gas & consumable fuels: 8.93% | | | | | | |
| | | | | | |
| | | | | | |
| | | | | | |
| | | | | | |
| | | | | | |
| | | | | | |
| | | | | | |
| | | | | | |
| | | | | | |
BioMarin Pharmaceutical, Inc.† | | | | | | |
Neurocrine Biosciences, Inc.† | | | | | | |
| | | | | | |
Health care providers & services: 1.91% | | | | | | |
| | | | | | |
Life sciences tools & services: 0.99% | | | | | | |
| | | | | | |
| | | | | | |
| | | | | | |
| | | | | | |
Aerospace & defense: 3.67% | | | | | | |
| | | | | | |
| | | | | | |
L3Harris Technologies, Inc. | | | | | | |
| | | | | | |
Commercial services & supplies: 2.46% | | | | | | |
| | | | | | |
| | | | | | |
| | | | | | |
The accompanying notes are an integral part of these financial statements.
2 | Allspring Diversified Capital Builder Fund
Portfolio of investments—September 30, 2024
| | | | | |
Electrical equipment: 5.04% | | | | | | |
| | | | | | |
| | | | | | |
| | | | | | |
| | | | | | |
| | | | | | |
| | | | | | |
| | | | | | |
| | | | | | |
| | | | | | |
| | | | | | |
| | | | | | |
| | | | | | |
| | | | | | |
Professional services: 4.34% | | | | | | |
| | | | | | |
Information technology: 40.30% | | | | | | |
Communications equipment: 1.30% | | | | | | |
| | | | | | |
Electronic equipment, instruments & components: 6.00% | | | | | | |
| | | | | | |
| | | | | | |
| | | | | | |
Teledyne Technologies, Inc.† | | | | | | |
| | | | | | |
| | | | | | |
International Business Machines Corp. | | | | | | |
Semiconductors & semiconductor equipment: 20.42% | | | | | | |
Advanced Micro Devices, Inc.† | | | | | | |
| | | | | | |
| | | | | | |
| | | | | | |
| | | | | | |
| | | | | | |
| | | | | | |
| | | | | | |
| | | | | | |
| | | | | | |
| | | | | | |
| | | | | | |
| | | | | | |
| | | | | | |
The accompanying notes are an integral part of these financial statements.
Allspring Diversified Capital Builder Fund | 3
Portfolio of investments—September 30, 2024
| | | | | |
| | | | | | |
| | | | | | |
| | | | | | |
Containers & packaging: 0.62% | | | | | | |
| | | | | | |
| | | | | | |
| | | | | | |
| | | | | | |
Specialized REITs : 0.61% | | | | | | |
| | | | | | |
| | | | | | |
Independent power and renewable electricity producers: 0.57% | | | | | | |
| | | | | | |
Total common stocks (Cost $827,520,812) | | | | | | |
| | | | | |
Corporate bonds and notes: 15.04% | | | | | | |
| | | | | | |
| | | | | | |
| | | | | | |
Cleveland-Cliffs, Inc.144A | | | | | | |
| | | | | | |
Consumer, cyclical: 0.37% | | | | | | |
| | | | | | |
| | | | | | |
Consumer, non-cyclical: 4.35% | | | | | | |
Commercial services: 0.67% | | | | | | |
| | | | | | |
| | | | | | |
| | | | | | |
| | | | | | |
| | | | | | |
| | | | | | |
| | | | | | |
| | | | | | |
| | | | | | |
Healthcare-products: 0.32% | | | | | | |
| | | | | | |
Healthcare-services: 1.99% | | | | | | |
Charles River Laboratories International, Inc.144A | | | | | | |
| | | | | | |
The accompanying notes are an integral part of these financial statements.
4 | Allspring Diversified Capital Builder Fund
Portfolio of investments—September 30, 2024
| | | | | |
Healthcare-services(continued) | | | | | | |
| | | | | | |
| | | | | | |
| | | | | | |
Household products/wares: 0.47% | | | | | | |
| | | | | | |
Spectrum Brands, Inc.144A | | | | | | |
| | | | | | |
| | | | | | |
| | | | | | |
| | | | | | |
| | | | | | |
| | | | | | |
| | | | | | |
| | | | | | |
| | | | | | |
| | | | | | |
| | | | | | |
| | | | | | |
TTM Technologies, Inc.144A | | | | | | |
Engineering & construction: 0.60% | | | | | | |
Dycom Industries, Inc.144A | | | | | | |
Environmental control: 1.04% | | | | | | |
| | | | | | |
| | | | | | |
| | | | | | |
Machinery-diversified: 0.73% | | | | | | |
| | | | | | |
Packaging & containers: 0.91% | | | | | | |
| | | | | | |
| | | | | | |
Sealed Air Corp./Sealed Air Corp. U.S.144A | | | | | | |
| | | | | | |
| | | | | | |
| | | | | | |
| | | | | | |
| | | | | | |
| | | | | | |
| | | | | | |
| | | | | | |
The accompanying notes are an integral part of these financial statements.
Allspring Diversified Capital Builder Fund | 5
Portfolio of investments—September 30, 2024
| | | | | |
| | | | | | |
| | | | | | |
| | | | | | |
| | | | | | |
| | | | | | |
Vistra Operations Co. LLC144A | | | | | | |
Vistra Operations Co. LLC144A | | | | | | |
| | | | | | |
Total corporate bonds and notes (Cost $237,052,186) | | | | | | |
Yankee corporate bonds and notes: 0.38% | | | | | | |
| | | | | | |
| | | | | | |
| | | | | | |
| | | | | | |
| | | | | | |
Sensata Technologies BV144A | | | | | | |
Total yankee corporate bonds and notes (Cost $6,277,298) | | | | | | |
| | | | | |
Short-term investments: 0.11% | | | | | | |
Investment companies: 0.11% | | | | | | |
Allspring Government Money Market Fund Select Class♠∞ | | | | | | |
Total short-term investments (Cost $1,654,794) | | | | | | |
Total investments in securities (Cost $1,072,505,090) | | | | | | |
Other assets and liabilities, net | | | | | | |
| | | | | | |
| Non-income-earning security |
| The security may be resold in transactions exempt from registration, normally to qualified institutional buyers, pursuant to Rule 144A under the Securities Act of 1933. |
| The issuer of the security is an affiliated person of the Fund as defined in the Investment Company Act of 1940. |
| The rate represents the 7-day annualized yield at period end. |
|
| Real estate investment trust |
The accompanying notes are an integral part of these financial statements.
6 | Allspring Diversified Capital Builder Fund
Portfolio of investments—September 30, 2024
Investments in affiliates
An affiliated investment is an investment in which the Fund owns at least 5% of the outstanding voting shares of the issuer or as a result of other relationships, such as the Fund and the issuer having the same investment manager. Transactions with issuers that were affiliates of the Fund at the end of the period were as follows:
| | | | | Net
change in
unrealized
gains
(losses) | | | Income
from
affiliated
securities |
| | | | | | | | |
Allspring Government Money Market Fund Select Class | | | | | | | | |
The accompanying notes are an integral part of these financial statements.
Allspring Diversified Capital Builder Fund | 7
Statement of assets and liabilities—September 30, 2024
Financial statements
Statement of assets and liabilities
| |
Investments in unaffiliated securities, at value (cost $1,070,850,296) | |
Investments in affiliated securities, at value (cost $1,654,794) | |
Receivable for dividends and interest | |
Receivable for Fund shares sold | |
Prepaid expenses and other assets | |
| |
| |
| |
Payable for Fund shares redeemed | |
Administration fees payable | |
Shareholder servicing fee payable | |
| |
Trustees’ fees and expenses payable | |
| |
Accrued expenses and other liabilities | |
| |
| |
| |
| |
Total distributable earnings | |
| |
Computation of net asset value and offering price per share | |
| |
Shares outstanding–Class A1 | |
Net asset value per share–Class A | |
Maximum offering price per share – Class A2 | |
| |
Shares outstanding–Class C1 | |
Net asset value per share–Class C | |
Net assets–Administrator Class | |
Shares outstanding–Administrator Class1 | |
Net asset value per share–Administrator Class | |
Net assets–Institutional Class | |
Shares outstanding–Institutional Class1 | |
Net asset value per share–Institutional Class | |
1 The Fund has an unlimited number of authorized shares.
2 Maximum offering price is computed as 100/94.25 of net asset value. On investments of $50,000 or more, the offering price is reduced.
The accompanying notes are an integral part of these financial statements.
8 | Allspring Diversified Capital Builder Fund
Statement of operations—year ended September 30, 2024
Statement of operations
| |
| |
Dividends (net of foreign withholdings taxes of $13,907) | |
Income from affiliated securities | |
| |
| |
| |
| |
| |
| |
| |
| |
Shareholder servicing fees | |
| |
| |
| |
| |
| |
Custody and accounting fees | |
| |
| |
Shareholder report expenses | |
Trustees’ fees and expenses | |
| |
| |
Less: Fee waivers and/or expense reimbursements | |
| |
| |
| |
| |
| |
| |
Realized and unrealized gains (losses) on investments | |
Net realized gains on investments | |
Net change in unrealized gains (losses) on investments | |
Net realized and unrealized gains (losses) on investments | |
Net increase in net assets resulting from operations | |
The accompanying notes are an integral part of these financial statements.
Allspring Diversified Capital Builder Fund | 9
Statement of changes in net assets
Statement of changes in net assets
| Year ended September 30, 2024 | Year ended September 30, 2023 |
| | | | |
| | | | |
Net realized gains on investments | | | | |
Net change in unrealized gains (losses) on investments | | | | |
Net increase in net assets resulting from operations | | | | |
Distributions to shareholders from | | | | |
Net investment income and net realized gains | | | | |
| | | | |
| | | | |
| | | | |
| | | | |
Total distributions to shareholders | | | | |
Capital share transactions | | | | |
Proceeds from shares sold | | | | |
| | | | |
| | | | |
| | | | |
| | | | |
| | | | |
Reinvestment of distributions | | | | |
| | | | |
| | | | |
| | | | |
| | | | |
| | | | |
Payment for shares redeemed | | | | |
| | | | |
| | | | |
| | | | |
| | | | |
| | | | |
Net increase in net assets resulting from capital share transactions | | | | |
Total increase in net assets | | | | |
| | | | |
| | | | |
| | | | |
The accompanying notes are an integral part of these financial statements.
10 | Allspring Diversified Capital Builder Fund
Financial highlights
(For a share outstanding throughout each period)
| |
| | | | | |
Net asset value, beginning of period | | | | | |
| | | | | |
Net realized and unrealized gains (losses) on investments | | | | | |
Total from investment operations | | | | | |
Distributions to shareholders from | | | | | |
| | | | | |
| | | | | |
Total distributions to shareholders | | | | | |
Net asset value, end of period | | | | | |
| | | | | |
Ratios to average net assets (annualized) | | | | | |
| | | | | |
| | | | | |
| | | | | |
| | | | | |
| | | | | |
Net assets, end of period (000s omitted) | | | | | |
| Calculated based upon average shares outstanding |
| Total return calculations do not include any sales charges. Returns include adjustments required by U.S. GAAP and may differ from net asset values and performance reported elsewhere. |
The accompanying notes are an integral part of these financial statements.
Allspring Diversified Capital Builder Fund | 11
(For a share outstanding throughout each period)
| |
| | | | | |
Net asset value, beginning of period | | | | | |
Net investment income (loss) | | | | | |
Net realized and unrealized gains (losses) on investments | | | | | |
Total from investment operations | | | | | |
Distributions to shareholders from | | | | | |
| | | | | |
| | | | | |
Total distributions to shareholders | | | | | |
Net asset value, end of period | | | | | |
| | | | | |
Ratios to average net assets (annualized) | | | | | |
| | | | | |
| | | | | |
Net investment income (loss) | | | | | |
| | | | | |
| | | | | |
Net assets, end of period (000s omitted) | | | | | |
| Calculated based upon average shares outstanding |
| Amount is less than $0.005. |
| Total return calculations do not include any sales charges. Returns include adjustments required by U.S. GAAP and may differ from net asset values and performance reported elsewhere. |
The accompanying notes are an integral part of these financial statements.
12 | Allspring Diversified Capital Builder Fund
(For a share outstanding throughout each period)
| |
| | | | | |
Net asset value, beginning of period | | | | | |
| | | | | |
Net realized and unrealized gains (losses) on investments | | | | | |
Total from investment operations | | | | | |
Distributions to shareholders from | | | | | |
| | | | | |
| | | | | |
Total distributions to shareholders | | | | | |
Net asset value, end of period | | | | | |
| | | | | |
Ratios to average net assets (annualized) | | | | | |
| | | | | |
| | | | | |
| | | | | |
| | | | | |
| | | | | |
Net assets, end of period (000s omitted) | | | | | |
| Calculated based upon average shares outstanding |
| Returns include adjustments required by U.S. GAAP and may differ from net asset values and performance reported elsewhere. |
The accompanying notes are an integral part of these financial statements.
Allspring Diversified Capital Builder Fund | 13
(For a share outstanding throughout each period)
| |
| | | | | |
Net asset value, beginning of period | | | | | |
| | | | | |
Net realized and unrealized gains (losses) on investments | | | | | |
Total from investment operations | | | | | |
Distributions to shareholders from | | | | | |
| | | | | |
| | | | | |
Total distributions to shareholders | | | | | |
Net asset value, end of period | | | | | |
| | | | | |
Ratios to average net assets (annualized) | | | | | |
| | | | | |
| | | | | |
| | | | | |
| | | | | |
| | | | | |
Net assets, end of period (000s omitted) | | | | | |
| Calculated based upon average shares outstanding |
| Returns include adjustments required by U.S. GAAP and may differ from net asset values and performance reported elsewhere. |
The accompanying notes are an integral part of these financial statements.
14 | Allspring Diversified Capital Builder Fund
Notes to financial statements
Notes to financial statements
Allspring Funds Trust (the “Trust”), a Delaware statutory trust organized on March 10, 1999, is an open-end management investment company registered under the Investment Company Act of 1940, as amended (the “1940 Act”). As an investment company, the Trust follows the accounting and reporting guidance in Financial Accounting Standards Board (“FASB”) Accounting Standards Codification Topic 946, Financial Services – Investment Companies. These financial statements report on the Allspring Diversified Capital Builder Fund (the “Fund”) which is a diversified series of the Trust.
2.
SIGNIFICANT ACCOUNTING POLICIES
The following significant accounting policies, which are consistently followed in the preparation of the financial statements of the Fund, are in conformity with U.S. generally accepted accounting principles (“GAAP”) which require management to make estimates and assumptions that affect the reported amounts of assets and liabilities, disclosure of contingent assets and liabilities at the date of the financial statements, and the reported amounts of income and expenses during the reporting period. Actual results could differ from those estimates.
All investments are valued each business day as of the close of regular trading on the New York Stock Exchange (generally 4 p.m. Eastern Time), although the Fund may deviate from this calculation time under unusual or unexpected circumstances.
Equity securities and exchange-traded funds that are listed on a foreign or domestic exchange or market are valued at the official closing price or, if none, the last sales price.
Debt securities are valued at the evaluated bid price provided by an independent pricing service (e.g., taking into account various factors, including yields, maturities, or credit ratings) or, if a reliable price is not available, the quoted bid price from an independent broker-dealer.
Investments in registered open-end investment companies (other than those listed on a foreign or domestic exchange or market) are valued at net asset value.
Investments which are not valued using the methods discussed above are valued at their fair value, as determined in good faith by Allspring Funds Management, LLC (“Allspring Funds Management”), which was named the valuation designee by the Board of Trustees. As the valuation designee, Allspring Funds Management is responsible for day-to-day valuation activities for the Allspring Funds. In connection with these responsibilities, Allspring Funds Management has established a Valuation Committee and has delegated to it the authority to take any actions regarding the valuation of portfolio securities that the Valuation Committee deems necessary or appropriate, including determining the fair value of portfolio securities. On a quarterly basis, the Board of Trustees receives reports of valuation actions taken by the Valuation Committee. On at least an annual basis, the Board of Trustees receives an assessment of the adequacy and effectiveness of Allspring Funds Management’s process for determining the fair value of the portfolio of investments.
Security transactions and income recognition
Securities transactions are recorded on a trade date basis. Realized gains or losses are recorded on the basis of identified cost.
Dividend income is recognized on the ex-dividend date. Dividend income is recorded net of foreign taxes withheld where recovery of such taxes is not assured.
Interest income is accrued daily and bond discounts are accreted and premiums are amortized daily. To the extent debt obligations are placed on non-accrual status, any related interest income may be reduced by writing off interest receivables when the collection of all or a portion of interest has been determined to be doubtful based on consistently applied procedures and the fair value has decreased. If the issuer subsequently resumes interest payments or when the collectability of interest is reasonably assured, the debt obligation is removed from non-accrual status.
Interest earned on cash balances held at the custodian is recorded as interest income.
Distributions received from REIT investments may be characterized as ordinary income, capital gains, or a return of capital to the Fund based on information provided by the REIT. The proper characterization of REIT distributions is generally not known until after the end of each calendar year. As such, estimates may be used in reporting the character of income and distributions for financial statement purposes.
Distributions to shareholders
Distributions to shareholders are recorded on the ex-dividend date and paid from net investment income quarterly and any net realized gains are paid at least annually. Such distributions are determined in accordance with income tax regulations and may differ from U.S. GAAP. Dividend sources are estimated at the time of declaration. The tax character of distributions is determined as of the Fund’s fiscal year end. Therefore, a portion of the Fund’s distributions made prior to the Fund’s fiscal year end may be categorized as a tax return of capital at year end.
The Fund intends to continue to qualify as a regulated investment company by distributing substantially all of its investment company taxable income and any net realized capital gains (after reduction for capital loss carryforwards) sufficient to relieve it from all, or substantially all, federal income taxes. Accordingly, no provision for federal income taxes was required.
Allspring Diversified Capital Builder Fund | 15
Notes to financial statements
The Fund’s income and federal excise tax returns and all financial records supporting those returns for the prior three fiscal years are subject to examination by the federal and Delaware revenue authorities. Management has analyzed the Fund’s tax positions taken on federal, state, and foreign tax returns, as applicable, for all open tax years and does not believe that there are any uncertain tax positions that require recognition of a tax liability.
As of September 30, 2024, the aggregate cost of all investments for federal income tax purposes was $1,072,524,028 and the unrealized gains (losses) consisted of:
The separate classes of shares offered by the Fund differ principally in applicable sales charges, distribution, shareholder servicing, and administration fees. Class specific expenses are charged directly to that share class. Investment income, common fund-level expenses, and realized and unrealized gains (losses) on investments are allocated daily to each class of shares based on the relative proportion of net assets of each class.
3.
FAIR VALUATION MEASUREMENTS
Fair value measurements of investments are determined within a framework that has established a fair value hierarchy based upon the various data inputs utilized in determining the value of the Fund’s investments. The three-level hierarchy gives the highest priority to unadjusted quoted prices in active markets for identical assets or liabilities (Level 1) and the lowest priority to unobservable inputs (Level 3). The Fund’s investments are classified within the fair value hierarchy based on the lowest level of input that is significant to the fair value measurement. The inputs are summarized into three broad levels as follows:
•Level 1—quoted prices in active markets for identical securities
•Level 2—other significant observable inputs (including quoted prices for similar securities, interest rates, prepayment speeds, credit risk, etc.)
•Level 3—significant unobservable inputs (including the Fund’s own assumptions in determining the fair value of investments)
The inputs or methodologies used for valuing investments in securities are not necessarily an indication of the risk associated with investing in those securities.
The following is a summary of the inputs used in valuing the Fund’s assets and liabilities as of September 30, 2024:
| | Other significant
observable inputs
(Level 2) | Significant
unobservable inputs
(Level 3) | |
| | | | |
| | | | |
| | | | |
| | | | |
| | | | |
| | | | |
| | | | |
| | | | |
| | | | |
| | | | |
| | | | |
| | | | |
Corporate bonds and notes | | | | |
Yankee corporate bonds and notes | | | | |
| | | | |
| | | | |
| | | | |
Additional sector, industry or geographic detail, if any, is included in the Portfolio of Investments.
At September 30, 2024, the Fund did not have any transfers into/out of Level 3.
16 | Allspring Diversified Capital Builder Fund
Notes to financial statements
4.
TRANSACTIONS WITH AFFILIATES
Allspring Funds Management, a wholly owned subsidiary of Allspring Global Investments Holdings, LLC, a holding company indirectly owned by certain private funds of GTCR LLC and Reverence Capital Partners, L.P., is the manager of the Fund and provides advisory and fund-level administrative services under an investment management agreement. Under the investment management agreement, Allspring Funds Management is responsible for, among other services, implementing the investment objectives and strategies of the Fund, supervising the subadviser and providing fund-level administrative services in connection with the Fund’s operations. As compensation for its services under the investment management agreement, Allspring Funds Management is entitled to receive a management fee, which is generally paid monthly, at the following annual rate based on the Fund’s average daily net assets:
For the year ended September 30, 2024, the management fee was equivalent to an annual rate of 0.61% of the Fund’s average daily net assets.
Allspring Funds Management has retained the services of a subadviser to provide daily portfolio management to the Fund. The fee for subadvisory services is borne by Allspring Funds Management. Allspring Global Investments, LLC, an affiliate of Allspring Funds Management and a wholly owned subsidiary of Allspring Global Investments Holdings, LLC, is the subadviser to the Fund and is entitled to receive a fee from Allspring Funds Management at an annual rate starting at 0.35% and declining to 0.20% as the average daily net assets of the Fund increase.
Under a class-level administration agreement, Allspring Funds Management provides class-level administrative services to the Fund, which includes paying fees and expenses for services provided by the transfer agent, sub-transfer agents, omnibus account servicers and record-keepers. As compensation for its services under the class-level administration agreement, Allspring Funds Management receives an annual fee which is calculated based on the average daily net assets of each class and generally paid monthly, as follows:
| Class-level
administration fee |
| |
| |
| |
| |
Waivers and/or expense reimbursements
Allspring Funds Management has contractually committed to waive and/or reimburse management and administration fees to the extent necessary to maintain certain net operating expense ratios for the Fund. When each class of the Fund has exceeded its expense cap, Allspring Funds Management will waive fees and/or reimburse expenses from fund-level expenses on a proportionate basis and then from class specific expenses. When only certain classes exceed their expense caps, waivers and/or reimbursements are applied against class specific expenses before fund-level expenses. Allspring Funds Management has contractually committed through January 31, 2025 to waive fees and/or reimburse expenses to the extent necessary to cap the Fund’s expenses. Prior to or after the commitment expiration date, the cap may be increased or the commitment to maintain the cap may be terminated only with the approval of the Board of Trustees. As of September 30, 2024, the contractual caps are as follows:
The Trust has adopted a distribution plan for Class C shares pursuant to Rule 12b-1 under the 1940 Act. A distribution fee is charged to Class C shares and paid to Allspring Funds Distributor, LLC (“Allspring Funds Distributor”), the principal underwriter, an affiliate of Allspring Funds Management, at an annual rate up to 0.75% of the average daily net assets of Class C shares. Such fees are generally paid on a monthly basis.
Allspring Diversified Capital Builder Fund | 17
Notes to financial statements
In addition, Allspring Funds Distributor is entitled to receive the front-end sales charge from the purchase of Class A shares and a contingent deferred sales charge on the redemption of certain Class A shares. Allspring Funds Distributor is also entitled to receive the contingent deferred sales charges from redemptions of Class C shares. For the year ended September 30, 2024, Allspring Funds Distributor received $53,860 from the sale of Class A shares. No contingent deferred sales charges were incurred by Class A and Class C shares for the year ended September 30, 2024.
Shareholder servicing fees
The Trust has entered into contracts with one or more shareholder servicing agents, whereby Class A, Class C and Administrator Class are charged a fee at an annual rate up to 0.25% of the average daily net assets of each respective class and are generally paid on a monthly basis. A portion of these total shareholder servicing fees were paid to affiliates of the Fund.
The Fund may purchase or sell portfolio investment securities to certain affiliates pursuant to Rule 17a-7 under the 1940 Act and under procedures adopted by the Board of Trustees. The procedures have been designed to ensure that these interfund transactions, which do not incur broker commissions, are effected at current market prices. Pursuant to these procedures, the Fund did not have any interfund transactions during the year ended September 30, 2024.
5.
INVESTMENT PORTFOLIO TRANSACTIONS
Purchases and sales of investments, excluding U.S. government obligations (if any) and short-term securities, for the year ended September 30, 2024 were $567,614,808 and $390,598,524, respectively.
The Trust (excluding the money market funds), Allspring Master Trust and Allspring Variable Trust are parties to a $275,000,000 (prior to July 9, 2024: $350,000,000), revolving credit agreement whereby the Fund is permitted to use bank borrowings for temporary or emergency purposes, such as to fund shareholder redemption requests. Interest under the credit agreement is charged to the Fund based on a borrowing rate equal to the higher of the Federal Funds rate or the overnight bank funding rate in effect on that day plus a spread. In addition, an annual commitment fee based on the unused balance is allocated to each participating fund.
For the year ended September 30, 2024, there were no borrowings by the Fund under the agreement.
7.
DISTRIBUTIONS TO SHAREHOLDERS
The tax character of distributions paid were as follows:
As of September 30, 2024, the components of distributable earnings on a tax basis were as follows:
Undistributed
ordinary
income | Undistributed
long-term
gain | |
| | |
As of the end of the period, the Fund concentrated its portfolio of investments in the information technology sector. A fund that invests a substantial portion of its assets in any sector may be more affected by changes in that sector than would be a fund whose investments are not heavily weighted in any sector.
Under the Fund’s organizational documents, the officers and Trustees have been granted certain indemnification rights against certain liabilities that may arise out of performance of their duties to the Fund. The Fund has entered into a separate agreement with each Trustee that converts indemnification rights currently existing under the Fund’s organizational documents into contractual rights that cannot be changed in the future without the consent of the Trustee. Additionally, in the normal course of business, the Fund may enter into contracts with service providers that contain a variety of indemnification clauses. The Fund’s maximum exposure under these arrangements is dependent on future claims that may be made against the Fund and, therefore, cannot be estimated.
18 | Allspring Diversified Capital Builder Fund
Report of independent registered public accounting firm
To the Shareholders of the Fund and Board of Trustees
Allspring Funds Trust:
Opinion on the Financial Statements
We have audited the accompanying statement of assets and liabilities of Allspring Diversified Capital Builder Fund (the Fund), one of the Funds constituting Allspring Funds Trust, including the portfolio of investments, as of September 30, 2024, the related statement of operations for the year then ended, the statements of changes in net assets for each of the years in the two-year period then ended, and the related notes (collectively, the financial statements) and the financial highlights for each of the years in the five-year period then ended. In our opinion, the financial statements and financial highlights present fairly, in all material respects, the financial position of the Fund as of September 30, 2024, the results of its operations for the year then ended, the changes in its net assets for each of the years in the two-year period then ended, and the financial highlights for each of the years in the five-year period then ended, in conformity with U.S. generally accepted accounting principles.
These financial statements and financial highlights are the responsibility of the Fund’s management. Our responsibility is to express an opinion on these financial statements and financial highlights based on our audits. We are a public accounting firm registered with the Public Company Accounting Oversight Board (United States) (PCAOB) and are required to be independent with respect to the Fund in accordance with the U.S. federal securities laws and the applicable rules and regulations of the Securities and Exchange Commission and the PCAOB.
We conducted our audits in accordance with the standards of the PCAOB. Those standards require that we plan and perform the audit to obtain reasonable assurance about whether the financial statements and financial highlights are free of material misstatement, whether due to error or fraud. Our audits included performing procedures to assess the risks of material misstatement of the financial statements and financial highlights, whether due to error or fraud, and performing procedures that respond to those risks. Such procedures included examining, on a test basis, evidence regarding the amounts and disclosures in the financial statements and financial highlights. Such procedures also included confirmation of securities owned as of September 30, 2024, by correspondence with the custodian and transfer agent. Our audits also included evaluating the accounting principles used and significant estimates made by management, as well as evaluating the overall presentation of the financial statements and financial highlights. We believe that our audits provide a reasonable basis for our opinion.

We have not been able to determine the specific year that we began serving as the auditor of one or more Allspring Funds investment companies; however, we are aware that we have served as the auditor of one or more Allspring Funds investment companies since at least 1955.
November 25, 2024
Allspring Diversified Capital Builder Fund | 19
Other information (unaudited)
Other information
For corporate shareholders, pursuant to Section 854 of the Internal Revenue Code, 100% of ordinary income dividends qualify for the corporate dividends-received deduction for the fiscal year ended September 30, 2024.
Pursuant to Section 852 of the Internal Revenue Code, $58,417,381 was designated as a 20% rate gain distribution for the fiscal year ended
September 30, 2024.
Pursuant to Section 854 of the Internal Revenue Code, $8,242,100 of income dividends paid during the fiscal year ended September 30, 2024 has been designated as qualified dividend income (QDI).
For the fiscal year ended September 30, 2024, $3,860,192 has been designated as interest-related dividends for nonresident alien shareholders pursuant to Section 871 of the Internal Revenue Code.
A description of the policies and procedures used to determine how to vote proxies relating to portfolio securities is available without charge, upon request, by calling 1-866-259-3305, visiting our website at allspringglobal.com, or visiting the SEC website at sec.gov. Information regarding how the proxies related to portfolio securities were voted during the most recent 12-month period ended June 30 is available on the website at allspringglobal.com or by visiting the SEC website at sec.gov.
Quarterly portfolio holdings information
The Fund files its complete schedule of portfolio holdings with the SEC for the first and third quarters of each fiscal year as an exhibit to its reports on Form N-PORT. Shareholders may view the filed Form N-PORT by visiting the SEC website at sec.gov.
20 | Allspring Diversified Capital Builder Fund
Other information (unaudited)
Item 8. Changes in and disagreements with accountants
Item 9. Matters submitted to fund shareholders for a vote
Item 10. Remuneration paid to directors, officers and others
Refer to information in the Statement of operations.
Allspring Diversified Capital Builder Fund | 21
Other information (unaudited)
Item 11. Statement regarding basis for the board’s approval of investment advisory contract
Board consideration of investment management and sub-advisory agreements:
Under the Investment Company Act of 1940 (the “1940 Act”), the Board of Trustees (the “Board”) of Allspring Funds Trust (the “Trust”) must determine annually whether to approve the continuation of the Trust’s investment management and sub-advisory agreements. In this regard, at a Board meeting held on May 28-30, 2024 (the “Meeting”), the Board, all the members of which have no direct or indirect interest in the investment management and sub-advisory agreements and are not “interested persons” of the Trust, as defined in the 1940 Act (the “Independent Trustees”), reviewed and approved for the Allspring Diversified Capital Builder Fund (the “Fund”): (i) an investment management agreement (the “Management Agreement”) with Allspring Funds Management, LLC (“Allspring Funds Management”); and (ii) an investment sub-advisory agreement (the “Sub-Advisory Agreement”) with Allspring Global Investments, LLC (the “Sub-Adviser”), an affiliate of Allspring Funds Management. The Management Agreement and the Sub-Advisory Agreement are collectively referred to as the “Advisory Agreements.”
At the Meeting, the Board considered the factors and reached the conclusions described below relating to the selection of Allspring Funds Management and the Sub-Adviser and the approval of the Advisory Agreements. Prior to the Meeting, including at a meeting of the Board held in April 2024, and at the Meeting, the Trustees conferred extensively among themselves and with representatives of Allspring Funds Management about these matters. The Board has adopted a team-based approach, with each team consisting of a sub-set of Trustees, to assist the full Board in the discharge of its duties in reviewing investment performance and other matters throughout the year. The Independent Trustees were assisted in their evaluation of the Advisory Agreements by independent legal counsel, from whom they received separate legal advice and with whom they met separately.
In providing information to the Board, Allspring Funds Management and the Sub-Adviser were guided by a detailed set of requests for information submitted to them by independent legal counsel on behalf of the Independent Trustees at the start of the Board’s annual contract renewal process earlier in 2024. In considering and approving the Advisory Agreements, the Trustees considered the information they believed relevant, including but not limited to the information discussed below. The Board considered not only the specific information presented in connection with the Meeting, but also the knowledge gained over time through interactions with Allspring Funds Management and the Sub-Adviser about various topics. In this regard, the Board reviewed reports of Allspring Funds Management at each of its quarterly meetings, which included, among other things, portfolio reviews and investment performance reports. In addition, the Board and the teams mentioned above confer with portfolio managers at various times throughout the year. The Board did not identify any particular information or consideration that was all-important or controlling, and each individual Trustee may have attributed different weights to various factors.
After its deliberations, the Board unanimously determined that the compensation payable to Allspring Funds Management and the Sub-Adviser under each of the Advisory Agreements was reasonable, and approved the continuation of the Advisory Agreements for a one-year term. The Board considered the approval of the Advisory Agreements for the Fund as part of its consideration of agreements for funds across the complex, but its approvals were made on a fund-by-fund basis. The following summarizes a number of important, but not necessarily all, factors considered by the Board in support of its approvals.
Nature, extent, and quality of services
The Board received and considered various information regarding the nature, extent, and quality of services provided to the Fund by Allspring Funds Management and the Sub-Adviser under the Advisory Agreements. This information included a description of the investment advisory services and Fund-level administrative services covered by the Management Agreement, as well as, among other things, a summary of the background and experience of senior management of Allspring Global Investments, of which Allspring Funds Management and the Sub-Adviser are a part, and a summary of investments made in the Allspring Global Investments business.* The Board also received information about the services that continue to be provided by Wells Fargo & Co. and/or its affiliates (“Wells Fargo”) since the sale of Wells Fargo Asset Management to Allspring Global Investments Holdings, LLC, a holding company indirectly owned by certain private funds of GTCR LLC and Reverence Capital Partners, L.P., under a transition services agreement and an update on the anticipated timeline for exiting the transition services agreement. In addition, the Board received and considered information about the full range of services provided to the Fund by Allspring Funds Management and its affiliates.
The Board considered the qualifications, background, tenure, and responsibilities of each of the portfolio managers primarily responsible for the day-to-day portfolio management of the Fund. The Board evaluated the ability of Allspring Funds Management and the Sub-Adviser to attract and retain qualified investment professionals, including research, advisory, and supervisory personnel.
The Board further considered the compliance programs and compliance records of Allspring Funds Management and the Sub-Adviser. The Board received and considered information about Allspring Global Investments’ risk management functions, which included information about Allspring Funds
*
The trade name for the asset management firm that includes Allspring Funds Management and the Sub-Adviser is “Allspring Global Investments.”
22 | Allspring Diversified Capital Builder Fund
Other information (unaudited)
Management’s and the Sub-Adviser’s business continuity plans, their approaches to data privacy and cybersecurity, Allspring Funds Management’s role as administrator of the Fund’s liquidity risk management program, and fair valuation designee. The Board also received and considered information about Allspring Funds Management’s intermediary and vendor oversight program.
Fund investment performance and expenses
The Board considered the investment performance results for the Fund over various time periods ended December 31, 2023. The Board considered these results in comparison to the investment performance of funds in a universe that was determined by Broadridge Inc. (“Broadridge”) to be similar to the Fund (the “Universe”), and in comparison to the Fund’s benchmark index and to other comparative data. Broadridge is an independent provider of investment company data. The Board received a description of the methodology used by Broadridge to select the mutual funds in the performance Universe. The Board noted that the investment performance of the Fund (Administrator Class) was higher than the average investment performance of the Universe for all periods under review. The Board also noted that the investment performance of the Fund was higher than the investment performance of its benchmark index, the Diversified Capital Builder Blended Index, for the three- and ten-year periods under review, and lower for the one- and five-year periods under review.
The Board also received and considered information regarding the Fund’s net operating expense ratios and their various components, including actual management fees, custodian and other non-management fees, and Rule 12b-1 and non-Rule 12b-1 shareholder service fees. The Board considered these ratios in comparison to the median ratios of funds in class-specific expense groups that were determined by Broadridge to be similar to the Fund (the “Groups”). The Board received a description of the methodology used by Broadridge to select the mutual funds in the expense Groups and an explanation of how funds comprising expense Groups and their expense ratios may vary from year-to-year. Based on the Broadridge reports, the Board noted that the net operating expense ratio of the Fund was lower than or in range of the median net operating expense ratios of the expense Groups for each share class.
The Board took into account the Fund’s investment performance and expense information provided to it among the factors considered in deciding to re-approve the Advisory Agreements.
Investment management and sub-advisory fee rates
The Board reviewed and considered the contractual fee rates payable by the Fund to Allspring Funds Management under the Management Agreement, as well as the contractual fee rates payable by the Fund to Allspring Funds Management for class-level administrative services under a Class-Level Administration Agreement, which include, among other things, class-level transfer agency and sub-transfer agency costs (collectively, the “Management Rates”). The Board also reviewed and considered the contractual investment sub-advisory fee rates payable by Allspring Funds Management to the Sub-Adviser for investment sub-advisory services. It was noted that advisory fee waivers, if any, are at the fund level and not class level.
Among other information reviewed by the Board was a comparison of the Fund’s Management Rates with the average contractual investment management fee rates of funds in the expense Groups at a common asset level as well as transfer agency costs of the funds in the expense Groups. The Board noted that the Management Rates of the Fund were lower than or in range of the sum of these average rates for the Fund’s expense Groups for each share class.
The Board also received and considered information about the portion of the total management fee that was retained by Allspring Funds Management after payment of the fee to the Sub-Adviser for sub-advisory services. In assessing the reasonableness of this amount, the Board received and evaluated information about the nature and extent of responsibilities retained and risks assumed by Allspring Funds Management and not delegated to or assumed by the Sub-Adviser, and about Allspring Funds Management’s on-going oversight services. Given the affiliation between Allspring Funds Management and the Sub-Adviser, the Board ascribed limited relevance to the allocation of fees between them.
Based on its consideration of the factors and information it deemed relevant, including those described here, the Board determined that the compensation payable to Allspring Funds Management under the Management Agreement and to the Sub-Adviser under the Sub-Advisory Agreement was reasonable.
The Board received and considered information concerning the profitability of Allspring Funds Management, as well as the profitability of Allspring Global Investments, from providing services to the fund complex as a whole. The Board noted that the Sub-Adviser’s profitability information with respect to providing services to the Fund and other funds in the complex was subsumed in the Allspring Global Investments profitability analysis.
Allspring Funds Management reported on the methodologies and estimates used in calculating profitability, including a description of the methodology used to allocate certain expenses. Among other things, the Board noted that the levels of profitability reported on a fund-by-fund basis varied widely, depending on factors such as the size, type, and age of fund.
Based on its review, the Board did not deem the profits reported by Allspring Funds Management or Allspring Global Investments from services provided to the Fund to be at a level that would prevent it from approving the continuation of the Advisory Agreements.
Allspring Diversified Capital Builder Fund | 23
Other information (unaudited)
Economies of scale
The Board received and considered information about the potential for Allspring Funds Management to experience economies of scale in the provision of management services to the Fund, the difficulties of isolating and quantifying economies of scale at an individual fund level, and the extent to which potential scale benefits are shared with Fund shareholders. The Board noted the existence of breakpoints in the Fund’s management fee structure, which operate generally to reduce the Fund’s expense ratios as the Fund grows in size, and the size of the Fund in relation to such breakpoints. The Board considered that in addition to management fee breakpoints, Allspring Funds Management shares potential economies of scale from its management business in a variety of ways, including through fee waiver and expense reimbursement arrangements, competitive management fee rates set at the outset without regard to breakpoints, and investments in the business intended to enhance services available to shareholders.
The Board concluded that Allspring Funds Management’s arrangements with respect to the Fund, including contractual breakpoints, constituted a reasonable approach to sharing potential economies of scale with the Fund and its shareholders.
Other benefits to Allspring Funds Management and the Sub-Adviser
The Board received and considered information regarding potential “fall-out” or ancillary benefits received by Allspring Funds Management and its affiliates, including the Sub-Adviser, as a result of their relationships with the Fund. Ancillary benefits could include, among others, benefits directly attributable to other relationships with the Fund and benefits potentially derived from an increase in Allspring Funds Management’s and the Sub-Adviser’s business as a result of their relationships with the Fund. The Board noted that Allspring Funds Distributor, LLC, an affiliate of Allspring Funds Management, receives distribution-related fees in respect of shares sold or held through it. The Board also reviewed information about soft dollar credits earned and utilized by the Sub-Adviser.
Based on its consideration of the factors and information it deemed relevant, including those described here, the Board did not find that any ancillary benefits received by Allspring Funds Management and its affiliates, including the Sub-Adviser, were unreasonable.
At the Meeting, after considering the above-described factors and based on its deliberations and its evaluation of the information described above, the Board unanimously determined that the compensation payable to Allspring Funds Management and the Sub-Adviser under each of the Advisory Agreements was reasonable, and approved the continuation of the Advisory Agreements for a one-year term.
24 | Allspring Diversified Capital Builder Fund
For more information
More information about Allspring Funds is available free upon request. To obtain literature, please write, visit the Fund’s website, or call:
Allspring Funds
P.O. Box 219967
Kansas City, MO 64121-9967
Website: allspringglobal.com
Individual investors: 1-800-222-8222
Retail investment professionals: 1-888-877-9275
Institutional investment professionals: 1-800-260-5969
This report and the financial statements contained herein are submitted for the general information of the shareholders of the Fund. If this report is used for promotional purposes, distribution of the report must be accompanied or preceded by a current prospectus. Before investing, please consider the investment objectives, risks, charges, and expenses of the investment. For a current prospectus and, if available, a summary prospectus, containing this information, call 1-800-222-8222 or visit the Fund’s website at allspringglobal.com. Read the prospectus carefully before you invest or send money.
Allspring Global InvestmentsTM is the trade name for the asset management firms of Allspring Global Investments Holdings, LLC, a holding company indirectly owned by certain private funds of GTCR LLC and Reverence Capital Partners, L.P. These firms include but are not limited to Allspring Global Investments, LLC, and Allspring Funds Management, LLC. Certain products managed by Allspring entities are distributed by Allspring Funds Distributor, LLC (a broker-dealer and Member FINRA/SIPC).
This material is for general informational and educational purposes only and is NOT intended to provide investment advice or a recommendation of any kind - including a recommendation for any specific investment, strategy, or plan.
© 2024 Allspring Global Investments Holdings, LLC. All rights reserved.
NCSR4324 09-24
Allspring Common Stock Fund
Long Form Financial Statements
Annual Report
Allspring Common Stock Fund | 1
Portfolio of investments—September 30, 2024
| | | | | |
| | | | | | |
Communication services: 0.39% | | | | | | |
Interactive media & services: 0.39% | | | | | | |
| | | | | | |
Consumer discretionary: 9.75% | | | | | | |
Automobile components: 1.06% | | | | | | |
| | | | | | |
| | | | | | |
| | | | | | |
Diversified consumer services: 1.28% | | | | | | |
Service Corp. International | | | | | | |
Hotels, restaurants & leisure: 1.32% | | | | | | |
Planet Fitness, Inc. Class A† | | | | | | |
Household durables: 1.62% | | | | | | |
| | | | | | |
| | | | | | |
| | | | | | |
| | | | | | |
National Vision Holdings, Inc.† | | | | | | |
| | | | | | |
| | | | | | |
| | | | | | |
| | | | | | |
| | | | | | |
Household products: 1.33% | | | | | | |
Church & Dwight Co., Inc. | | | | | | |
| | | | | | |
| | | | | | |
| | | | | | |
Pinnacle Financial Partners, Inc. | | | | | | |
Prosperity Bancshares, Inc. | | | | | | |
| | | | | | |
| | | | | | |
| | | | | | |
| | | | | | |
Cboe Global Markets, Inc. | | | | | | |
Raymond James Financial, Inc. | | | | | | |
| | | | | | |
Financial services: 1.49% | | | | | | |
| | | | | | |
The accompanying notes are an integral part of these financial statements.
2 | Allspring Common Stock Fund
Portfolio of investments—September 30, 2024
| | | | | |
| | | | | | |
| | | | | | |
Axis Capital Holdings Ltd. | | | | | | |
First American Financial Corp. | | | | | | |
| | | | | | |
Reinsurance Group of America, Inc. | | | | | | |
| | | | | | |
| | | | | | |
Health care equipment & supplies: 4.11% | | | | | | |
| | | | | | |
| | | | | | |
| | | | | | |
| | | | | | |
Health care providers & services: 2.82% | | | | | | |
| | | | | | |
| | | | | | |
| | | | | | |
Health care technology: 0.24% | | | | | | |
| | | | | | |
Life sciences tools & services: 5.63% | | | | | | |
| | | | | | |
Bio-Rad Laboratories, Inc. Class A† | | | | | | |
| | | | | | |
Charles River Laboratories International, Inc.† | | | | | | |
| | | | | | |
| | | | | | |
Aerospace & defense: 1.89% | | | | | | |
| | | | | | |
| | | | | | |
| | | | | | |
| | | | | | |
| | | | | | |
| | | | | | |
Commercial services & supplies: 0.94% | | | | | | |
Republic Services, Inc. Class A | | | | | | |
Construction & engineering: 1.22% | | | | | | |
| | | | | | |
Electrical equipment: 3.35% | | | | | | |
| | | | | | |
| | | | | | |
| | | | | | |
The accompanying notes are an integral part of these financial statements.
Allspring Common Stock Fund | 3
Portfolio of investments—September 30, 2024
| | | | | |
| | | | | | |
| | | | | | |
Professional services: 4.82% | | | | | | |
CACI International, Inc. Class A† | | | | | | |
Dun & Bradstreet Holdings, Inc. | | | | | | |
| | | | | | |
| | | | | | |
| | | | | | |
Trading companies & distributors: 2.12% | | | | | | |
| | | | | | |
| | | | | | |
| | | | | | |
Information technology: 17.22% | | | | | | |
Electronic equipment, instruments & components: 3.72% | | | | | | |
| | | | | | |
Teledyne Technologies, Inc.† | | | | | | |
| | | | | | |
| | | | | | |
| | | | | | |
Semiconductors & semiconductor equipment: 3.75% | | | | | | |
| | | | | | |
| | | | | | |
| | | | | | |
| | | | | | |
CCC Intelligent Solutions Holdings, Inc.† | | | | | | |
| | | | | | |
| | | | | | |
| | | | | | |
| | | | | | |
| | | | | | |
| | | | | | |
| | | | | | |
| | | | | | |
| | | | | | |
| | | | | | |
| | | | | | |
| | | | | | |
| | | | | | |
| | | | | | |
The accompanying notes are an integral part of these financial statements.
4 | Allspring Common Stock Fund
Portfolio of investments—September 30, 2024
| | | | | |
Containers & packaging: 2.83% | | | | | | |
| | | | | | |
| | | | | | |
| | | | | | |
| | | | | | |
| | | | | | |
Paper & forest products: 1.19% | | | | | | |
| | | | | | |
| | | | | | |
| | | | | | |
| | | | | | |
Residential REITs : 4.30% | | | | | | |
American Homes 4 Rent Class A | | | | | | |
Mid-America Apartment Communities, Inc. | | | | | | |
| | | | | | |
| | | | | | |
Specialized REITs : 3.21% | | | | | | |
| | | | | | |
SBA Communications Corp. Class A | | | | | | |
| | | | | | |
Total common stocks (Cost $576,252,993) | | | | | | |
Investment companies: 1.47% | | | | | | |
Exchange-traded funds: 1.47% | | | | | | |
| | | | | | |
Total investment companies (Cost $6,461,422) | | | | | | |
| | | | | |
Short-term investments: 0.53% | | | | | | |
Investment companies: 0.53% | | | | | | |
Allspring Government Money Market Fund Select Class♠∞ | | | | | | |
Total short-term investments (Cost $4,265,814) | | | | | | |
Total investments in securities (Cost $586,980,229) | | | | | | |
Other assets and liabilities, net | | | | | | |
| | | | | | |
| Non-income-earning security |
| The issuer of the security is an affiliated person of the Fund as defined in the Investment Company Act of 1940. |
| The rate represents the 7-day annualized yield at period end. |
|
| Real estate investment trust |
The accompanying notes are an integral part of these financial statements.
Allspring Common Stock Fund | 5
Portfolio of investments—September 30, 2024
Investments in affiliates
An affiliated investment is an investment in which the Fund owns at least 5% of the outstanding voting shares of the issuer or as a result of other relationships, such as the Fund and the issuer having the same investment manager. Transactions with issuers that were affiliates of the Fund at the end of the period were as follows:
| | | | | Net
change in
unrealized
gains
(losses) | | | Income
from
affiliated
securities |
| | | | | | | | |
Allspring Government Money Market Fund Select Class | | | | | | | | |
The accompanying notes are an integral part of these financial statements.
6 | Allspring Common Stock Fund
Statement of assets and liabilities—September 30, 2024
Financial statements
Statement of assets and liabilities
| |
Investments in unaffiliated securities, at value (cost $582,714,415) | |
Investments in affiliated securities, at value (cost $4,265,814) | |
Foreign currency, at value (cost $71) | |
| |
Receivable for Fund shares sold | |
Prepaid expenses and other assets | |
| |
| |
Payable for Fund shares redeemed | |
| |
Shareholder servicing fee payable | |
Administration fees payable | |
Trustees’ fees and expenses payable | |
| |
Accrued expenses and other liabilities | |
| |
| |
| |
| |
Total distributable earnings | |
| |
Computation of net asset value and offering price per share | |
| |
Shares outstanding–Class A1 | |
Net asset value per share–Class A | |
Maximum offering price per share – Class A2 | |
| |
Shares outstanding–Class C1 | |
Net asset value per share–Class C | |
| |
Shares outstanding–Class R61 | |
Net asset value per share–Class R6 | |
Net assets–Administrator Class | |
Shares outstanding–Administrator Class1 | |
Net asset value per share–Administrator Class | |
Net assets–Institutional Class | |
Shares outstanding–Institutional Class1 | |
Net asset value per share–Institutional Class | |
1 The Fund has an unlimited number of authorized shares.
2 Maximum offering price is computed as 100/94.25 of net asset value. On investments of $50,000 or more, the offering price is reduced.
The accompanying notes are an integral part of these financial statements.
Allspring Common Stock Fund | 7
Statement of operations—year ended September 30, 2024
Statement of operations
| |
| |
Income from affiliated securities | |
| |
| |
| |
| |
| |
| |
| |
| |
| |
| |
Shareholder servicing fees | |
| |
| |
| |
| |
| |
Custody and accounting fees | |
| |
| |
Shareholder report expenses | |
Trustees’ fees and expenses | |
| |
| |
Less: Fee waivers and/or expense reimbursements | |
| |
| |
| |
| |
| |
| |
Realized and unrealized gains (losses) on investments | |
| |
| |
Foreign currency and foreign currency translations | |
Net realized gains on investments | |
Net change in unrealized gains (losses) on | |
| |
Foreign currency and foreign currency translations | |
Net change in unrealized gains (losses) on investments | |
Net realized and unrealized gains (losses) on investments | |
Net increase in net assets resulting from operations | |
The accompanying notes are an integral part of these financial statements.
8 | Allspring Common Stock Fund
Statement of changes in net assets
Statement of changes in net assets
| Year ended September 30, 2024 | Year ended September 30, 2023 |
| | | | |
| | | | |
Net realized gains on investments | | | | |
Net change in unrealized gains (losses) on investments | | | | |
Net increase in net assets resulting from operations | | | | |
Distributions to shareholders from | | | | |
Net investment income and net realized gains | | | | |
| | | | |
| | | | |
| | | | |
| | | | |
| | | | |
Total distributions to shareholders | | | | |
Capital share transactions | | | | |
Proceeds from shares sold | | | | |
| | | | |
| | | | |
| | | | |
| | | | |
| | | | |
| | | | |
Reinvestment of distributions | | | | |
| | | | |
| | | | |
| | | | |
| | | | |
| | | | |
| | | | |
Payment for shares redeemed | | | | |
| | | | |
| | | | |
| | | | |
| | | | |
| | | | |
| | | | |
Net decrease in net assets resulting from capital share transactions | | | | |
Total increase (decrease) in net assets | | | | |
| | | | |
| | | | |
| | | | |
The accompanying notes are an integral part of these financial statements.
Allspring Common Stock Fund | 9
Financial highlights
(For a share outstanding throughout each period)
| |
| | | | | |
Net asset value, beginning of period | | | | | |
| | | | | |
Net realized and unrealized gains (losses) on investments | | | | | |
Total from investment operations | | | | | |
Distributions to shareholders from | | | | | |
| | | | | |
| | | | | |
Total distributions to shareholders | | | | | |
Net asset value, end of period | | | | | |
| | | | | |
Ratios to average net assets (annualized) | | | | | |
| | | | | |
| | | | | |
| | | | | |
| | | | | |
| | | | | |
Net assets, end of period (000s omitted) | | | | | |
| Calculated based upon average shares outstanding |
| Amount is less than $0.005. |
| Total return calculations do not include any sales charges. Returns include adjustments required by U.S. GAAP and may differ from net asset values and performance reported elsewhere. |
The accompanying notes are an integral part of these financial statements.
10 | Allspring Common Stock Fund
(For a share outstanding throughout each period)
| |
| | | | | |
Net asset value, beginning of period | | | | | |
| | | | | |
| | | | | |
Net realized and unrealized gains (losses) on investments | | | | | |
Total from investment operations | | | | | |
Distributions to shareholders from | | | | | |
| | | | | |
Net asset value, end of period | | | | | |
| | | | | |
Ratios to average net assets (annualized) | | | | | |
| | | | | |
| | | | | |
| | | | | |
| | | | | |
| | | | | |
Net assets, end of period (000s omitted) | | | | | |
| Calculated based upon average shares outstanding |
| Total return calculations do not include any sales charges. Returns include adjustments required by U.S. GAAP and may differ from net asset values and performance reported elsewhere. |
| During the year ended September 30, 2020, the Fund received a payment from an affiliate which had a 0.39% impact on the total return. |
The accompanying notes are an integral part of these financial statements.
Allspring Common Stock Fund | 11
(For a share outstanding throughout each period)
| |
| | | | | |
Net asset value, beginning of period | | | | | |
Net investment income (loss) | | | | | |
Net realized and unrealized gains (losses) on investments | | | | | |
Total from investment operations | | | | | |
Distributions to shareholders from | | | | | |
| | | | | |
| | | | | |
Total distributions to shareholders | | | | | |
Net asset value, end of period | | | | | |
| | | | | |
Ratios to average net assets (annualized) | | | | | |
| | | | | |
| | | | | |
Net investment income (loss) | | | | | |
| | | | | |
| | | | | |
Net assets, end of period (000s omitted) | | | | | |
| Calculated based upon average shares outstanding |
| Returns include adjustments required by U.S. GAAP and may differ from net asset values and performance reported elsewhere. |
The accompanying notes are an integral part of these financial statements.
12 | Allspring Common Stock Fund
(For a share outstanding throughout each period)
| |
| | | | | |
Net asset value, beginning of period | | | | | |
| | | | | |
| | | | | |
Net realized and unrealized gains (losses) on investments | | | | | |
Total from investment operations | | | | | |
Distributions to shareholders from | | | | | |
| | | | | |
| | | | | |
Total distributions to shareholders | | | | | |
Net asset value, end of period | | | | | |
| | | | | |
Ratios to average net assets (annualized) | | | | | |
| | | | | |
| | | | | |
Net investment income (loss) | | | | | |
| | | | | |
| | | | | |
Net assets, end of period (000s omitted) | | | | | |
| Calculated based upon average shares outstanding |
| Amount is less than $0.005. |
| Returns include adjustments required by U.S. GAAP and may differ from net asset values and performance reported elsewhere. |
| During the year ended September 30, 2022, the Fund received payments from a service provider which had a 0.09% impact on the total return. |
| During the year ended September 30, 2020, the Fund received a payment from an affiliate which had a 1.69% impact on the total return. |
The accompanying notes are an integral part of these financial statements.
Allspring Common Stock Fund | 13
(For a share outstanding throughout each period)
| |
| | | | | |
Net asset value, beginning of period | | | | | |
Net investment income (loss) | | | | | |
Net realized and unrealized gains (losses) on investments | | | | | |
Total from investment operations | | | | | |
Distributions to shareholders from | | | | | |
| | | | | |
| | | | | |
Total distributions to shareholders | | | | | |
Net asset value, end of period | | | | | |
| | | | | |
Ratios to average net assets (annualized) | | | | | |
| | | | | |
| | | | | |
Net investment income (loss) | | | | | |
| | | | | |
| | | | | |
Net assets, end of period (000s omitted) | | | | | |
| Calculated based upon average shares outstanding |
| Returns include adjustments required by U.S. GAAP and may differ from net asset values and performance reported elsewhere. |
The accompanying notes are an integral part of these financial statements.
14 | Allspring Common Stock Fund
Notes to financial statements
Notes to financial statements
Allspring Funds Trust (the “Trust”), a Delaware statutory trust organized on March 10, 1999, is an open-end management investment company registered under the Investment Company Act of 1940, as amended (the “1940 Act”). As an investment company, the Trust follows the accounting and reporting guidance in Financial Accounting Standards Board (“FASB”) Accounting Standards Codification Topic 946, Financial Services – Investment Companies. These financial statements report on the Allspring Common Stock Fund (the “Fund”) which is a diversified series of the Trust.
2.
SIGNIFICANT ACCOUNTING POLICIES
The following significant accounting policies, which are consistently followed in the preparation of the financial statements of the Fund, are in conformity with U.S. generally accepted accounting principles (“GAAP”) which require management to make estimates and assumptions that affect the reported amounts of assets and liabilities, disclosure of contingent assets and liabilities at the date of the financial statements, and the reported amounts of income and expenses during the reporting period. Actual results could differ from those estimates.
All investments are valued each business day as of the close of regular trading on the New York Stock Exchange (generally 4 p.m. Eastern Time), although the Fund may deviate from this calculation time under unusual or unexpected circumstances.
Equity securities and exchange-traded funds that are listed on a foreign or domestic exchange or market are valued at the official closing price or, if none, the last sales price.
The values of securities denominated in foreign currencies are translated into U.S. dollars at rates provided by an independent foreign currency pricing source at a time each business day specified by the Valuation Committee at Allspring Funds Management, LLC (“Allspring Funds Management”).
Many securities markets and exchanges outside the U.S. close prior to the close of the New York Stock Exchange and therefore may not fully reflect trading or events that occur after the close of the principal exchange in which the foreign securities are traded, but before the close of the New York Stock Exchange. If such trading or events are expected to materially affect the value of such securities, then fair value pricing procedures implemented by Allspring Funds Management are applied. These procedures take into account multiple factors including movements in U.S. securities markets after foreign exchanges close. Foreign securities that are fair valued under these procedures are categorized as Level 2 and the application of these procedures may result in transfers between Level 1 and Level 2. Depending on market activity, such fair valuations may be frequent. Such fair value pricing may result in net asset values that are higher or lower than net asset values based on the last reported sales price or latest quoted bid price. On September 30, 2024, such fair value pricing was not used in pricing foreign securities.
Investments in registered open-end investment companies (other than those listed on a foreign or domestic exchange or market) are valued at net asset value.
Investments which are not valued using the methods discussed above are valued at their fair value, as determined in good faith by Allspring Funds Management, which was named the valuation designee by the Board of Trustees. As the valuation designee, Allspring Funds Management is responsible for day-to-day valuation activities for the Allspring Funds. In connection with these responsibilities, Allspring Funds Management has established a Valuation Committee and has delegated to it the authority to take any actions regarding the valuation of portfolio securities that the Valuation Committee deems necessary or appropriate, including determining the fair value of portfolio securities. On a quarterly basis, the Board of Trustees receives reports of valuation actions taken by the Valuation Committee. On at least an annual basis, the Board of Trustees receives an assessment of the adequacy and effectiveness of Allspring Funds Management’s process for determining the fair value of the portfolio of investments.
Foreign currency translation
The accounting records of the Fund are maintained in U.S. dollars. The values of other assets and liabilities denominated in foreign currencies are translated into U.S. dollars at rates provided by an independent foreign currency pricing source at a time each business day specified by the Valuation Committee. Purchases and sales of securities, and income and expenses are converted at the rate of exchange on the respective dates of such transactions. Net realized foreign exchange gains or losses arise from sales of foreign currencies, currency gains or losses realized between the trade and settlement dates on securities transactions, and the difference between the amounts of dividends, interest and foreign withholding taxes recorded and the U.S. dollar equivalent of the amounts actually paid or received. Net unrealized foreign exchange gains and losses arise from changes in the fair value of assets and liabilities other than investments in securities resulting from changes in exchange rates. The changes in net assets arising from changes in exchange rates of securities and the changes in net assets resulting from changes in market prices of securities are not separately presented. Such changes are included in net realized and unrealized gains or losses from investments.
Security transactions and income recognition
Securities transactions are recorded on a trade date basis. Realized gains or losses are recorded on the basis of identified cost.
Dividend income is recognized on the ex-dividend date, except for certain dividends from foreign securities, which are recorded as soon as the custodian verifies the ex-dividend date.
Allspring Common Stock Fund | 15
Notes to financial statements
Interest earned on cash balances held at the custodian is recorded as interest income.
Income dividends and capital gain distributions from investment companies are recorded on the ex-dividend date. Capital gain distributions from investment companies are treated as realized gains.
Distributions received from REIT investments may be characterized as ordinary income, capital gains, or a return of capital to the Fund based on information provided by the REIT. The proper characterization of REIT distributions is generally not known until after the end of each calendar year. As such, estimates may be used in reporting the character of income and distributions for financial statement purposes.
Distributions to shareholders
Distributions to shareholders from net investment income and any net realized gains are recorded on the ex-dividend date and paid at least annually. Such distributions are determined in accordance with income tax regulations and may differ from U.S. GAAP. Dividend sources are estimated at the time of declaration. The tax character of distributions is determined as of the Fund’s fiscal year end. Therefore, a portion of the Fund’s distributions made prior to the Fund’s fiscal year end may be categorized as a tax return of capital at year end.
The Fund intends to continue to qualify as a regulated investment company by distributing substantially all of its investment company taxable income and any net realized capital gains (after reduction for capital loss carryforwards) sufficient to relieve it from all, or substantially all, federal income taxes. Accordingly, no provision for federal income taxes was required.
The Fund’s income and federal excise tax returns and all financial records supporting those returns for the prior three fiscal years are subject to examination by the federal and Delaware revenue authorities. Management has analyzed the Fund’s tax positions taken on federal, state, and foreign tax returns, as applicable, for all open tax years and does not believe that there are any uncertain tax positions that require recognition of a tax liability.
As of September 30, 2024, the aggregate cost of all investments for federal income tax purposes was $607,858,326 and the unrealized gains (losses) consisted of:
The separate classes of shares offered by the Fund differ principally in applicable sales charges, distribution, shareholder servicing, and administration fees. Class specific expenses are charged directly to that share class. Investment income, common fund-level expenses, and realized and unrealized gains (losses) on investments are allocated daily to each class of shares based on the relative proportion of net assets of each class.
3.
FAIR VALUATION MEASUREMENTS
Fair value measurements of investments are determined within a framework that has established a fair value hierarchy based upon the various data inputs utilized in determining the value of the Fund’s investments. The three-level hierarchy gives the highest priority to unadjusted quoted prices in active markets for identical assets or liabilities (Level 1) and the lowest priority to unobservable inputs (Level 3). The Fund’s investments are classified within the fair value hierarchy based on the lowest level of input that is significant to the fair value measurement. The inputs are summarized into three broad levels as follows:
•Level 1—quoted prices in active markets for identical securities
•Level 2—other significant observable inputs (including quoted prices for similar securities, interest rates, prepayment speeds, credit risk, etc.)
•Level 3—significant unobservable inputs (including the Fund’s own assumptions in determining the fair value of investments)
The inputs or methodologies used for valuing investments in securities are not necessarily an indication of the risk associated with investing in those securities.
16 | Allspring Common Stock Fund
Notes to financial statements
The following is a summary of the inputs used in valuing the Fund’s assets and liabilities as of September 30, 2024:
| | Other significant
observable inputs
(Level 2) | Significant
unobservable inputs
(Level 3) | |
| | | | |
| | | | |
| | | | |
| | | | |
| | | | |
| | | | |
| | | | |
| | | | |
| | | | |
| | | | |
| | | | |
| | | | |
| | | | |
| | | | |
| | | | |
| | | | |
Additional sector, industry or geographic detail, if any, is included in the Portfolio of Investments.
At September 30, 2024, the Fund did not have any transfers into/out of Level 3.
4.
TRANSACTIONS WITH AFFILIATES
Allspring Funds Management, a wholly owned subsidiary of Allspring Global Investments Holdings, LLC, a holding company indirectly owned by certain private funds of GTCR LLC and Reverence Capital Partners, L.P., is the manager of the Fund and provides advisory and fund-level administrative services under an investment management agreement. Under the investment management agreement, Allspring Funds Management is responsible for, among other services, implementing the investment objectives and strategies of the Fund, supervising the subadviser and providing fund-level administrative services in connection with the Fund’s operations. As compensation for its services under the investment management agreement, Allspring Funds Management is entitled to receive a management fee, which is generally paid monthly, at the following annual rate based on the Fund’s average daily net assets:
For the year ended September 30, 2024, the management fee was equivalent to an annual rate of 0.78% of the Fund’s average daily net assets.
Allspring Funds Management has retained the services of a subadviser to provide daily portfolio management to the Fund. The fee for subadvisory services is borne by Allspring Funds Management. Allspring Global Investments, LLC, an affiliate of Allspring Funds Management and a wholly owned subsidiary of Allspring Global Investments Holdings, LLC, is the subadviser to the Fund and is entitled to receive a fee from Allspring Funds Management at an annual rate starting at 0.45% and declining to 0.30% as the average daily net assets of the Fund increase.
Under a class-level administration agreement, Allspring Funds Management provides class-level administrative services to the Fund, which includes paying fees and expenses for services provided by the transfer agent, sub-transfer agents, omnibus account servicers and record-keepers. As
Allspring Common Stock Fund | 17
Notes to financial statements
compensation for its services under the class-level administration agreement, Allspring Funds Management receives an annual fee which is calculated based on the average daily net assets of each class and generally paid monthly, as follows:
| Class-level
administration fee |
| |
| |
| |
| |
| |
Waivers and/or expense reimbursements
Allspring Funds Management has contractually committed to waive and/or reimburse management and administration fees to the extent necessary to maintain certain net operating expense ratios for the Fund. When each class of the Fund has exceeded its expense cap, Allspring Funds Management will waive fees and/or reimburse expenses from fund-level expenses on a proportionate basis and then from class specific expenses. When only certain classes exceed their expense caps, waivers and/or reimbursements are applied against class specific expenses before fund-level expenses. Allspring Funds Management has contractually committed through January 31, 2025 to waive fees and/or reimburse expenses to the extent necessary to cap the Fund’s expenses. Prior to or after the commitment expiration date, the cap may be increased or the commitment to maintain the cap may be terminated only with the approval of the Board of Trustees. As of September 30, 2024, the contractual caps are as follows:
The Trust has adopted a distribution plan for Class C shares pursuant to Rule 12b-1 under the 1940 Act. A distribution fee is charged to Class C shares and paid to Allspring Funds Distributor, LLC (“Allspring Funds Distributor”), the principal underwriter, an affiliate of Allspring Funds Management, at an annual rate up to 0.75% of the average daily net assets of Class C shares. Such fees are generally paid on a monthly basis.
In addition, Allspring Funds Distributor is entitled to receive the front-end sales charge from the purchase of Class A shares and a contingent deferred sales charge on the redemption of certain Class A shares. Allspring Funds Distributor is also entitled to receive the contingent deferred sales charges from redemptions of Class C shares. For the year ended September 30, 2024, Allspring Funds Distributor received $208 from the sale of Class A shares. No contingent deferred sales charges were incurred by Class A and Class C shares for the year ended September 30, 2024.
Shareholder servicing fees
The Trust has entered into contracts with one or more shareholder servicing agents, whereby Class A, Class C and Administrator Class are charged a fee at an annual rate up to 0.25% of the average daily net assets of each respective class and are generally paid on a monthly basis. A portion of these total shareholder servicing fees were paid to affiliates of the Fund.
The Fund may purchase or sell portfolio investment securities to certain affiliates pursuant to Rule 17a-7 under the 1940 Act and under procedures adopted by the Board of Trustees. The procedures have been designed to ensure that these interfund transactions, which do not incur broker commissions, are effected at current market prices. Pursuant to these procedures, the Fund did not have any interfund transactions during the year ended September 30, 2024.
5.
INVESTMENT PORTFOLIO TRANSACTIONS
Purchases and sales of investments, excluding U.S. government obligations (if any) and short-term securities, for the year ended September 30, 2024 were $354,798,020 and $453,179,234, respectively.
The Trust (excluding the money market funds), Allspring Master Trust and Allspring Variable Trust are parties to a $275,000,000 (prior to July 9, 2024: $350,000,000), revolving credit agreement whereby the Fund is permitted to use bank borrowings for temporary or emergency purposes, such as to fund shareholder redemption requests. Interest under the credit agreement is charged to the Fund based on a borrowing rate equal to the higher of
18 | Allspring Common Stock Fund
Notes to financial statements
the Federal Funds rate or the overnight bank funding rate in effect on that day plus a spread. In addition, an annual commitment fee based on the unused balance is allocated to each participating fund.
For the year ended September 30, 2024, there were no borrowings by the Fund under the agreement.
7.
DISTRIBUTIONS TO SHAREHOLDERS
The tax character of distributions paid were as follows:
As of September 30, 2024, the components of distributable earnings on a tax basis were as follows:
Undistributed
ordinary
income | Undistributed
long-term
gain | |
| | |
Under the Fund’s organizational documents, the officers and Trustees have been granted certain indemnification rights against certain liabilities that may arise out of performance of their duties to the Fund. The Fund has entered into a separate agreement with each Trustee that converts indemnification rights currently existing under the Fund’s organizational documents into contractual rights that cannot be changed in the future without the consent of the Trustee. Additionally, in the normal course of business, the Fund may enter into contracts with service providers that contain a variety of indemnification clauses. The Fund’s maximum exposure under these arrangements is dependent on future claims that may be made against the Fund and, therefore, cannot be estimated.
Allspring Common Stock Fund | 19
Report of independent registered public accounting firm
To the Shareholders of the Fund and Board of Trustees
Allspring Funds Trust:
Opinion on the Financial Statements
We have audited the accompanying statement of assets and liabilities of Allspring Common Stock Fund (the Fund), one of the Funds constituting Allspring Funds Trust, including the portfolio of investments, as of September 30, 2024, the related statement of operations for the year then ended, the statements of changes in net assets for each of the years in the two-year period then ended, and the related notes (collectively, the financial statements) and the financial highlights for each of the years in the five-year period then ended. In our opinion, the financial statements and financial highlights present fairly, in all material respects, the financial position of the Fund as of September 30, 2024, the results of its operations for the year then ended, the changes in its net assets for each of the years in the two-year period then ended, and the financial highlights for each of the years in the five-year period then ended, in conformity with U.S. generally accepted accounting principles.
These financial statements and financial highlights are the responsibility of the Fund’s management. Our responsibility is to express an opinion on these financial statements and financial highlights based on our audits. We are a public accounting firm registered with the Public Company Accounting Oversight Board (United States) (PCAOB) and are required to be independent with respect to the Fund in accordance with the U.S. federal securities laws and the applicable rules and regulations of the Securities and Exchange Commission and the PCAOB.
We conducted our audits in accordance with the standards of the PCAOB. Those standards require that we plan and perform the audit to obtain reasonable assurance about whether the financial statements and financial highlights are free of material misstatement, whether due to error or fraud. Our audits included performing procedures to assess the risks of material misstatement of the financial statements and financial highlights, whether due to error or fraud, and performing procedures that respond to those risks. Such procedures included examining, on a test basis, evidence regarding the amounts and disclosures in the financial statements and financial highlights. Such procedures also included confirmation of securities owned as of September 30, 2024, by correspondence with the custodian and transfer agents. Our audits also included evaluating the accounting principles used and significant estimates made by management, as well as evaluating the overall presentation of the financial statements and financial highlights. We believe that our audits provide a reasonable basis for our opinion.

We have not been able to determine the specific year that we began serving as the auditor of one or more Allspring Funds investment companies; however, we are aware that we have served as the auditor of one or more Allspring Funds investment companies since at least 1955.
November 25, 2024
20 | Allspring Common Stock Fund
Other information (unaudited)
Other information
For corporate shareholders, pursuant to Section 854 of the Internal Revenue Code, 44% of ordinary income dividends qualify for the corporate dividends-received deduction for the fiscal year ended September 30, 2024.
Pursuant to Section 852 of the Internal Revenue Code, $21,110,505 was designated as a 20% rate gain distribution for the fiscal year ended
September 30, 2024.
Pursuant to Section 854 of the Internal Revenue Code, $3,989,400 of income dividends paid during the fiscal year ended September 30, 2024 has been designated as qualified dividend income (QDI).
For the fiscal year ended September 30, 2024, $7,329,047 has been designated as short-term capital gain dividends for nonresident alien shareholders pursuant to Section 871 of the Internal Revenue Code.
A description of the policies and procedures used to determine how to vote proxies relating to portfolio securities is available without charge, upon request, by calling 1-866-259-3305, visiting our website at allspringglobal.com, or visiting the SEC website at sec.gov. Information regarding how the proxies related to portfolio securities were voted during the most recent 12-month period ended June 30 is available on the website at allspringglobal.com or by visiting the SEC website at sec.gov.
Quarterly portfolio holdings information
The Fund files its complete schedule of portfolio holdings with the SEC for the first and third quarters of each fiscal year as an exhibit to its reports on Form N-PORT. Shareholders may view the filed Form N-PORT by visiting the SEC website at sec.gov.
Allspring Common Stock Fund | 21
Other information (unaudited)
Item 8. Changes in and disagreements with accountants
Item 9. Matters submitted to fund shareholders for a vote
Item 10. Remuneration paid to directors, officers and others
Refer to information in the Statement of operations.
22 | Allspring Common Stock Fund
Other information (unaudited)
Item 11. Statement regarding basis for the board’s approval of investment advisory contract
Board consideration of investment management and sub-advisory agreements:
Under the Investment Company Act of 1940 (the “1940 Act”), the Board of Trustees (the “Board”) of Allspring Funds Trust (the “Trust”) must determine annually whether to approve the continuation of the Trust’s investment management and sub-advisory agreements. In this regard, at a Board meeting held on May 28-30, 2024 (the “Meeting”), the Board, all the members of which have no direct or indirect interest in the investment management and sub-advisory agreements and are not “interested persons” of the Trust, as defined in the 1940 Act (the “Independent Trustees”), reviewed and approved for the Allspring Common Stock Fund (the “Fund”): (i) an investment management agreement (the “Management Agreement”) with Allspring Funds Management, LLC (“Allspring Funds Management”); and (ii) an investment sub-advisory agreement (the “Sub-Advisory Agreement”) with Allspring Global Investments, LLC (the “Sub-Adviser”), an affiliate of Allspring Funds Management. The Management Agreement and the Sub-Advisory Agreement are collectively referred to as the “Advisory Agreements.”
At the Meeting, the Board considered the factors and reached the conclusions described below relating to the selection of Allspring Funds Management and the Sub-Adviser and the approval of the Advisory Agreements. Prior to the Meeting, including at a meeting of the Board held in April 2024, and at the Meeting, the Trustees conferred extensively among themselves and with representatives of Allspring Funds Management about these matters. The Board has adopted a team-based approach, with each team consisting of a sub-set of Trustees, to assist the full Board in the discharge of its duties in reviewing investment performance and other matters throughout the year. The Independent Trustees were assisted in their evaluation of the Advisory Agreements by independent legal counsel, from whom they received separate legal advice and with whom they met separately.
In providing information to the Board, Allspring Funds Management and the Sub-Adviser were guided by a detailed set of requests for information submitted to them by independent legal counsel on behalf of the Independent Trustees at the start of the Board’s annual contract renewal process earlier in 2024. In considering and approving the Advisory Agreements, the Trustees considered the information they believed relevant, including but not limited to the information discussed below. The Board considered not only the specific information presented in connection with the Meeting, but also the knowledge gained over time through interactions with Allspring Funds Management and the Sub-Adviser about various topics. In this regard, the Board reviewed reports of Allspring Funds Management at each of its quarterly meetings, which included, among other things, portfolio reviews and investment performance reports. In addition, the Board and the teams mentioned above confer with portfolio managers at various times throughout the year. The Board did not identify any particular information or consideration that was all-important or controlling, and each individual Trustee may have attributed different weights to various factors.
After its deliberations, the Board unanimously determined that the compensation payable to Allspring Funds Management and the Sub-Adviser under each of the Advisory Agreements was reasonable, and approved the continuation of the Advisory Agreements for a one-year term. The Board considered the approval of the Advisory Agreements for the Fund as part of its consideration of agreements for funds across the complex, but its approvals were made on a fund-by-fund basis. The following summarizes a number of important, but not necessarily all, factors considered by the Board in support of its approvals.
Nature, extent, and quality of services
The Board received and considered various information regarding the nature, extent, and quality of services provided to the Fund by Allspring Funds Management and the Sub-Adviser under the Advisory Agreements. This information included a description of the investment advisory services and Fund-level administrative services covered by the Management Agreement, as well as, among other things, a summary of the background and experience of senior management of Allspring Global Investments, of which Allspring Funds Management and the Sub-Adviser are a part, and a summary of investments made in the Allspring Global Investments business.* The Board also received information about the services that continue to be provided by Wells Fargo & Co. and/or its affiliates (“Wells Fargo”) since the sale of Wells Fargo Asset Management to Allspring Global Investments Holdings, LLC, a holding company indirectly owned by certain private funds of GTCR LLC and Reverence Capital Partners, L.P., under a transition services agreement and an update on the anticipated timeline for exiting the transition services agreement. In addition, the Board received and considered information about the full range of services provided to the Fund by Allspring Funds Management and its affiliates.
The Board considered the qualifications, background, tenure, and responsibilities of each of the portfolio managers primarily responsible for the day-to-day portfolio management of the Fund. The Board evaluated the ability of Allspring Funds Management and the Sub-Adviser to attract and retain qualified investment professionals, including research, advisory, and supervisory personnel.
The Board further considered the compliance programs and compliance records of Allspring Funds Management and the Sub-Adviser. The Board received and considered information about Allspring Global Investments’ risk management functions, which included information about Allspring Funds
*
The trade name for the asset management firm that includes Allspring Funds Management and the Sub-Adviser is “Allspring Global Investments.”
Allspring Common Stock Fund | 23
Other information (unaudited)
Management’s and the Sub-Adviser’s business continuity plans, their approaches to data privacy and cybersecurity, Allspring Funds Management’s role as administrator of the Fund’s liquidity risk management program and fair valuation designee. The Board also received and considered information about Allspring Funds Management’s intermediary and vendor oversight program.
Fund investment performance and expenses
The Board considered the investment performance results for the Fund over various time periods ended December 31, 2023. The Board considered these results in comparison to the investment performance of funds in a universe that was determined by Broadridge Inc. (“Broadridge”) to be similar to the Fund (the “Universe”), and in comparison to the Fund’s benchmark index and to other comparative data. Broadridge is an independent provider of investment company data. The Board received a description of the methodology used by Broadridge to select the mutual funds in the performance Universe. The Board noted that the investment performance of the Fund (Administrator Class) was higher than the average investment performance of the Universe for the one- and ten-year periods under review, in range of the average investment performance of the Universe for the five-year period under review, and lower than the average investment performance of the Universe for the three-year period under review. The Board also noted that the investment performance of the Fund was higher than the investment performance of its benchmark index, the Russell 2500™ Index, for the three- and five-year periods under review, in range of the investment performance of its benchmark index for the ten-year period under review, and lower than the investment performance of its benchmark index for the one-year period under review.
The Board received information concerning, and discussed factors contributing to, the underperformance of the Fund relative to the Universe and benchmark for the periods identified above. The Board took note of the explanations for the relative underperformance during these periods, including with respect to the investment decisions and market factors that affected the Fund’s investment performance.
The Board also received and considered information regarding the Fund’s net operating expense ratios and their various components, including actual management fees, custodian and other non-management fees, and Rule 12b-1 and non-Rule 12b-1 shareholder service fees. The Board considered these ratios in comparison to the median ratios of funds in class-specific expense groups that were determined by Broadridge to be similar to the Fund (the “Groups”). The Board received a description of the methodology used by Broadridge to select the mutual funds in the expense Groups and an explanation of how funds comprising expense Groups and their expense ratios may vary from year-to-year. Based on the Broadridge reports, the Board noted that the net operating expense ratios of the Fund were equal to or in range of the median net operating expense ratios of the expense Groups for each share class, except for the Administrator Class shares in which it was higher than the median net operating expense ratio of the expense Group.
The Board took into account the Fund’s investment performance and expense information provided to it among the factors considered in deciding to re-approve the Advisory Agreements.
Investment management and sub-advisory fee rates
The Board reviewed and considered the contractual fee rates payable by the Fund to Allspring Funds Management under the Management Agreement, as well as the contractual fee rates payable by the Fund to Allspring Funds Management for class-level administrative services under a Class-Level Administration Agreement, which include, among other things, class-level transfer agency and sub-transfer agency costs (collectively, the “Management Rates”). The Board also reviewed and considered the contractual investment sub-advisory fee rates payable by Allspring Funds Management to the Sub-Adviser for investment sub-advisory services. It was noted that advisory fee waivers, if any, are at the fund level and not class level.
Among other information reviewed by the Board was a comparison of the Fund’s Management Rates with the average contractual investment management fee rates of funds in the expense Groups at a common asset level as well as transfer agency costs of the funds in the expense Groups. The Board noted that the Management Rates of the Fund were in range of the sum of these average rates for the Fund’s expense Groups for each share class, except for the Administrator Class shares in which it was higher than the average rates for the Fund’s expense Group.
The Board also received and considered information about the portion of the total management fee that was retained by Allspring Funds Management after payment of the fee to the Sub-Adviser for sub-advisory services. In assessing the reasonableness of this amount, the Board received and evaluated information about the nature and extent of responsibilities retained and risks assumed by Allspring Funds Management and not delegated to or assumed by the Sub-Adviser, and about Allspring Funds Management’s on-going oversight services. Given the affiliation between Allspring Funds Management and the Sub-Adviser, the Board ascribed limited relevance to the allocation of fees between them.
The Board also received and considered information about the nature and extent of services offered and fee rates charged by Allspring Funds Management and the Sub-Adviser to other types of clients with investment strategies similar to those of the Fund. In this regard, the Board received information about the significantly greater scope of services, and compliance, reporting and other legal and regulatory obligations and risks of managing proprietary mutual funds compared with those associated with managing assets of other types of clients, including third-party sub-advised fund clients and non-mutual fund clients such as institutional separate accounts.
Based on its consideration of the factors and information it deemed relevant, including those described here, the Board determined that the compensation payable to Allspring Funds Management under the Management Agreement and to the Sub-Adviser under the Sub-Advisory Agreement was reasonable.
24 | Allspring Common Stock Fund
Other information (unaudited)
Profitability
The Board received and considered information concerning the profitability of Allspring Funds Management, as well as the profitability of Allspring Global Investments, from providing services to the fund complex as a whole. The Board noted that the Sub-Adviser’s profitability information with respect to providing services to the Fund and other funds in the complex was subsumed in the Allspring Global Investments profitability analysis.
Allspring Funds Management reported on the methodologies and estimates used in calculating profitability, including a description of the methodology used to allocate certain expenses. Among other things, the Board noted that the levels of profitability reported on a fund-by-fund basis varied widely, depending on factors such as the size, type, and age of fund.
Based on its review, the Board did not deem the profits reported by Allspring Funds Management or Allspring Global Investments from services provided to the Fund to be at a level that would prevent it from approving the continuation of the Advisory Agreements.
The Board received and considered information about the potential for Allspring Funds Management to experience economies of scale in the provision of management services to the Fund, the difficulties of isolating and quantifying economies of scale at an individual fund level, and the extent to which potential scale benefits are shared with Fund shareholders. The Board noted the existence of breakpoints in the Fund’s management fee structure, which operate generally to reduce the Fund’s expense ratios as the Fund grows in size, and the size of the Fund in relation to such breakpoints. The Board considered that in addition to management fee breakpoints, Allspring Funds Management shares potential economies of scale from its management business in a variety of ways, including through fee waiver and expense reimbursement arrangements, competitive management fee rates set at the outset without regard to breakpoints, and investments in the business intended to enhance services available to shareholders.
The Board concluded that Allspring Funds Management’s arrangements with respect to the Fund, including contractual breakpoints, constituted a reasonable approach to sharing potential economies of scale with the Fund and its shareholders.
Other benefits to Allspring Funds Management and the Sub-Adviser
The Board received and considered information regarding potential “fall-out” or ancillary benefits received by Allspring Funds Management and its affiliates, including the Sub-Adviser, as a result of their relationships with the Fund. Ancillary benefits could include, among others, benefits directly attributable to other relationships with the Fund and benefits potentially derived from an increase in Allspring Funds Management’s and the Sub-Adviser’s business as a result of their relationships with the Fund. The Board noted that Allspring Funds Distributor, LLC, an affiliate of Allspring Funds Management, receives distribution-related fees in respect of shares sold or held through it. The Board also reviewed information about soft dollar credits earned and utilized by the Sub-Adviser.
Based on its consideration of the factors and information it deemed relevant, including those described here, the Board did not find that any ancillary benefits received by Allspring Funds Management and its affiliates, including the Sub-Adviser, were unreasonable.
At the Meeting, after considering the above-described factors and based on its deliberations and its evaluation of the information described above, the Board unanimously determined that the compensation payable to Allspring Funds Management and the Sub-Adviser under each of the Advisory Agreements was reasonable, and approved the continuation of the Advisory Agreements for a one-year term.
Allspring Common Stock Fund | 25
For more information
More information about Allspring Funds is available free upon request. To obtain literature, please write, visit the Fund’s website, or call:
Allspring Funds
P.O. Box 219967
Kansas City, MO 64121-9967
Website: allspringglobal.com
Individual investors: 1-800-222-8222
Retail investment professionals: 1-888-877-9275
Institutional investment professionals: 1-800-260-5969
This report and the financial statements contained herein are submitted for the general information of the shareholders of the Fund. If this report is used for promotional purposes, distribution of the report must be accompanied or preceded by a current prospectus. Before investing, please consider the investment objectives, risks, charges, and expenses of the investment. For a current prospectus and, if available, a summary prospectus, containing this information, call 1-800-222-8222 or visit the Fund’s website at allspringglobal.com. Read the prospectus carefully before you invest or send money.
Allspring Global InvestmentsTM is the trade name for the asset management firms of Allspring Global Investments Holdings, LLC, a holding company indirectly owned by certain private funds of GTCR LLC and Reverence Capital Partners, L.P. These firms include but are not limited to Allspring Global Investments, LLC, and Allspring Funds Management, LLC. Certain products managed by Allspring entities are distributed by Allspring Funds Distributor, LLC (a broker-dealer and Member FINRA/SIPC).
This material is for general informational and educational purposes only and is NOT intended to provide investment advice or a recommendation of any kind - including a recommendation for any specific investment, strategy, or plan.
© 2024 Allspring Global Investments Holdings, LLC. All rights reserved.
NCSR3301 09-24
Allspring SMID Cap Growth Fund
(formerly, Allspring Discovery SMID Cap Growth Fund)
Long Form Financial Statements
Annual Report
Allspring SMID Cap Growth Fund | 1
Portfolio of investments—September 30, 2024
| | | | | |
| | | | | | |
Communication services: 3.47% | | | | | | |
| | | | | | |
Liberty Media Corp.-Liberty Live Class C† | | | | | | |
TKO Group Holdings, Inc. Class A† | | | | | | |
| | | | | | |
Consumer discretionary: 13.08% | | | | | | |
| | | | | | |
| | | | | | |
| | | | | | |
| | | | | | |
Diversified consumer services: 1.02% | | | | | | |
Bright Horizons Family Solutions, Inc.† | | | | | | |
Hotels, restaurants & leisure: 6.81% | | | | | | |
DraftKings, Inc. Class A† | | | | | | |
Dutch Bros, Inc. Class A† | | | | | | |
Hyatt Hotels Corp. Class A | | | | | | |
Sweetgreen, Inc. Class A† | | | | | | |
| | | | | | |
| | | | | | |
| | | | | | |
Household durables: 1.50% | | | | | | |
Taylor Morrison Home Corp. Class A† | | | | | | |
| | | | | | |
| | | | | | |
| | | | | | |
Personal care products: 1.17% | | | | | | |
| | | | | | |
| | | | | | |
| | | | | | |
Blue Owl Capital, Inc. Class A | | | | | | |
| | | | | | |
Robinhood Markets, Inc. Class A† | | | | | | |
Tradeweb Markets, Inc. Class A | | | | | | |
| | | | | | |
Financial services: 1.32% | | | | | | |
Jack Henry & Associates, Inc. | | | | | | |
| | | | | | |
Kinsale Capital Group, Inc. | | | | | | |
The accompanying notes are an integral part of these financial statements.
2 | Allspring SMID Cap Growth Fund
Portfolio of investments—September 30, 2024
| | | | | |
| | | | | | |
| | | | | | |
| | | | | | |
Halozyme Therapeutics, Inc.† | | | | | | |
| | | | | | |
| | | | | | |
| | | | | | |
Neurocrine Biosciences, Inc.† | | | | | | |
| | | | | | |
| | | | | | |
Health care equipment & supplies: 5.81% | | | | | | |
| | | | | | |
Inspire Medical Systems, Inc.† | | | | | | |
iRhythm Technologies, Inc.† | | | | | | |
| | | | | | |
| | | | | | |
| | | | | | |
Health care providers & services: 4.42% | | | | | | |
| | | | | | |
| | | | | | |
| | | | | | |
| | | | | | |
Life sciences tools & services: 3.49% | | | | | | |
| | | | | | |
| | | | | | |
| | | | | | |
| | | | | | |
| | | | | | |
Aerospace & defense: 3.63% | | | | | | |
| | | | | | |
| | | | | | |
| | | | | | |
| | | | | | |
| | | | | | |
Advanced Drainage Systems, Inc. | | | | | | |
Commercial services & supplies: 5.84% | | | | | | |
Casella Waste Systems, Inc. Class A† | | | | | | |
| | | | | | |
| | | | | | |
| | | | | | |
The accompanying notes are an integral part of these financial statements.
Allspring SMID Cap Growth Fund | 3
Portfolio of investments—September 30, 2024
| | | | | |
Construction & engineering: 3.62% | | | | | | |
| | | | | | |
Sterling Infrastructure, Inc.† | | | | | | |
| | | | | | |
Electrical equipment: 1.27% | | | | | | |
Vertiv Holdings Co. Class A | | | | | | |
Ground transportation: 1.87% | | | | | | |
| | | | | | |
| | | | | | |
| | | | | | |
| | | | | | |
| | | | | | |
Professional services: 1.64% | | | | | | |
| | | | | | |
Trading companies & distributors: 4.84% | | | | | | |
Applied Industrial Technologies, Inc. | | | | | | |
SiteOne Landscape Supply, Inc.† | | | | | | |
| | | | | | |
| | | | | | |
Information technology: 23.66% | | | | | | |
Electronic equipment, instruments & components: 2.66% | | | | | | |
| | | | | | |
Teledyne Technologies, Inc.† | | | | | | |
| | | | | | |
| | | | | | |
| | | | | | |
| | | | | | |
| | | | | | |
Semiconductors & semiconductor equipment: 5.35% | | | | | | |
| | | | | | |
| | | | | | |
Monolithic Power Systems, Inc. | | | | | | |
| | | | | | |
| | | | | | |
| | | | | | |
CCC Intelligent Solutions Holdings, Inc.† | | | | | | |
Clearwater Analytics Holdings, Inc. Class A† | | | | | | |
| | | | | | |
Descartes Systems Group, Inc.† | | | | | | |
| | | | | | |
| | | | | | |
Procore Technologies, Inc.† | | | | | | |
The accompanying notes are an integral part of these financial statements.
4 | Allspring SMID Cap Growth Fund
Portfolio of investments—September 30, 2024
| | | | | |
| | | | | | |
| | | | | | |
Tyler Technologies, Inc.† | | | | | | |
| | | | | | |
| | | | | | |
| | | | | | |
| | | | | | |
| | | | | | |
| | | | | | |
Rexford Industrial Realty, Inc. | | | | | | |
Total common stocks (Cost $812,265,329) | | | | | | |
| | | | | |
Short-term investments: 0.33% | | | | | | |
Investment companies: 0.33% | | | | | | |
Allspring Government Money Market Fund Select Class♠∞ | | | | | | |
Total short-term investments (Cost $3,714,757) | | | | | | |
Total investments in securities (Cost $815,980,086) | | | | | | |
Other assets and liabilities, net | | | | | | |
| | | | | | |
| Non-income-earning security |
| The issuer of the security is an affiliated person of the Fund as defined in the Investment Company Act of 1940. |
| The rate represents the 7-day annualized yield at period end. |
|
| American depositary receipt |
| Real estate investment trust |
Investments in affiliates
An affiliated investment is an investment in which the Fund owns at least 5% of the outstanding voting shares of the issuer or as a result of other relationships, such as the Fund and the issuer having the same investment manager. Transactions with issuers that were affiliates of the Fund at the end of the period were as follows:
| | | | | Net
change in
unrealized
gains
(losses) | | | Income
from
affiliated
securities |
| | | | | | | | |
Allspring Government Money Market Fund Select Class | | | | | | | | |
The accompanying notes are an integral part of these financial statements.
Allspring SMID Cap Growth Fund | 5
Statement of assets and liabilities—September 30, 2024
Financial statements
Statement of assets and liabilities
| |
Investments in unaffiliated securities, at value (cost $812,265,329) | |
Investments in affiliated securities, at value (cost $3,714,757) | |
Receivable for Fund shares sold | |
| |
Prepaid expenses and other assets | |
| |
| |
Payable for Fund shares redeemed | |
| |
Administration fees payable | |
Shareholder servicing fee payable | |
Trustees’ fees and expenses payable | |
| |
Accrued expenses and other liabilities | |
| |
| |
| |
| |
Total distributable earnings | |
| |
Computation of net asset value and offering price per share | |
| |
Shares outstanding–Class A1 | |
Net asset value per share–Class A | |
Maximum offering price per share – Class A2 | |
| |
Shares outstanding–Class C1 | |
Net asset value per share–Class C | |
| |
Shares outstanding–Class R61 | |
Net asset value per share–Class R6 | |
Net assets–Administrator Class | |
Shares outstanding–Administrator Class1 | |
Net asset value per share–Administrator Class | |
Net assets–Institutional Class | |
Shares outstanding–Institutional Class1 | |
Net asset value per share–Institutional Class | |
1 The Fund has an unlimited number of authorized shares.
2 Maximum offering price is computed as 100/94.25 of net asset value. On investments of $50,000 or more, the offering price is reduced.
The accompanying notes are an integral part of these financial statements.
6 | Allspring SMID Cap Growth Fund
Statement of operations—year ended September 30, 2024
Statement of operations
| |
Dividends (net of foreign withholdings taxes of $32,358) | |
Income from affiliated securities | |
| |
| |
| |
| |
| |
| |
| |
| |
| |
Shareholder servicing fees | |
| |
| |
| |
| |
| |
Custody and accounting fees | |
| |
| |
Shareholder report expenses | |
Trustees’ fees and expenses | |
| |
| |
Less: Fee waivers and/or expense reimbursements | |
| |
| |
| |
| |
| |
| |
| |
| |
Realized and unrealized gains (losses) on investments | |
Net realized gains on investments | |
Net change in unrealized gains (losses) on investments | |
Net realized and unrealized gains (losses) on investments | |
Net increase in net assets resulting from operations | |
The accompanying notes are an integral part of these financial statements.
Allspring SMID Cap Growth Fund | 7
Statement of changes in net assets
Statement of changes in net assets
| Year ended September 30, 2024 | Year ended September 30, 2023 |
| | | | |
| | | | |
Net realized gains (losses) on investments | | | | |
Net change in unrealized gains (losses) on investments | | | | |
Net increase in net assets resulting from operations | | | | |
Distributions to shareholders from | | | | |
Net investment income and net realized gains | | | | |
| | | | |
| | | | |
| | | | |
| | | | |
| | | | |
Total distributions to shareholders | | | | |
Capital share transactions | | | | |
Proceeds from shares sold | | | | |
| | | | |
| | | | |
| | | | |
| | | | |
| | | | |
| | | | |
Reinvestment of distributions | | | | |
| | | | |
| | | | |
| | | | |
| | | | |
| | | | |
| | | | |
Payment for shares redeemed | | | | |
| | | | |
| | | | |
| | | | |
| | | | |
| | | | |
| | | | |
Net decrease in net assets resulting from capital share transactions | | | | |
Total decrease in net assets | | | | |
| | | | |
| | | | |
| | | | |
The accompanying notes are an integral part of these financial statements.
8 | Allspring SMID Cap Growth Fund
Financial highlights
(For a share outstanding throughout each period)
| |
| | | | | |
Net asset value, beginning of period | | | | | |
| | | | | |
Net realized and unrealized gains (losses) on investments | | | | | |
Total from investment operations | | | | | |
Distributions to shareholders from | | | | | |
| | | | | |
Net asset value, end of period | | | | | |
| | | | | |
Ratios to average net assets (annualized) | | | | | |
| | | | | |
| | | | | |
| | | | | |
| | | | | |
| | | | | |
Net assets, end of period (000s omitted) | | | | | |
| Calculated based upon average shares outstanding |
| Total return calculations do not include any sales charges. Returns include adjustments required by U.S. GAAP and may differ from net asset values and performance reported elsewhere. |
The accompanying notes are an integral part of these financial statements.
Allspring SMID Cap Growth Fund | 9
(For a share outstanding throughout each period)
| |
| | | | | |
Net asset value, beginning of period | | | | | |
| | | | | |
Net realized and unrealized gains (losses) on investments | | | | | |
Total from investment operations | | | | | |
Distributions to shareholders from | | | | | |
| | | | | |
Net asset value, end of period | | | | | |
| | | | | |
Ratios to average net assets (annualized) | | | | | |
| | | | | |
| | | | | |
| | | | | |
| | | | | |
| | | | | |
Net assets, end of period (000s omitted) | | | | | |
| Calculated based upon average shares outstanding |
| Total return calculations do not include any sales charges. Returns include adjustments required by U.S. GAAP and may differ from net asset values and performance reported elsewhere. |
The accompanying notes are an integral part of these financial statements.
10 | Allspring SMID Cap Growth Fund
(For a share outstanding throughout each period)
| |
| | | | | |
Net asset value, beginning of period | | | | | |
| | | | | |
Net realized and unrealized gains (losses) on investments | | | | | |
Total from investment operations | | | | | |
Distributions to shareholders from | | | | | |
| | | | | |
Net asset value, end of period | | | | | |
| | | | | |
Ratios to average net assets (annualized) | | | | | |
| | | | | |
| | | | | |
| | | | | |
| | | | | |
| | | | | |
Net assets, end of period (000s omitted) | | | | | |
| Calculated based upon average shares outstanding |
| Returns include adjustments required by U.S. GAAP and may differ from net asset values and performance reported elsewhere. |
The accompanying notes are an integral part of these financial statements.
Allspring SMID Cap Growth Fund | 11
(For a share outstanding throughout each period)
| |
| | | | | |
Net asset value, beginning of period | | | | | |
| | | | | |
Net realized and unrealized gains (losses) on investments | | | | | |
Total from investment operations | | | | | |
Distributions to shareholders from | | | | | |
| | | | | |
Net asset value, end of period | | | | | |
| | | | | |
Ratios to average net assets (annualized) | | | | | |
| | | | | |
| | | | | |
| | | | | |
| | | | | |
| | | | | |
Net assets, end of period (000s omitted) | | | | | |
| Calculated based upon average shares outstanding |
| Returns include adjustments required by U.S. GAAP and may differ from net asset values and performance reported elsewhere. |
The accompanying notes are an integral part of these financial statements.
12 | Allspring SMID Cap Growth Fund
(For a share outstanding throughout each period)
| |
| | | | | |
Net asset value, beginning of period | | | | | |
| | | | | |
Net realized and unrealized gains (losses) on investments | | | | | |
Total from investment operations | | | | | |
Distributions to shareholders from | | | | | |
| | | | | |
Net asset value, end of period | | | | | |
| | | | | |
Ratios to average net assets (annualized) | | | | | |
| | | | | |
| | | | | |
| | | | | |
| | | | | |
| | | | | |
Net assets, end of period (000s omitted) | | | | | |
| Calculated based upon average shares outstanding |
| Returns include adjustments required by U.S. GAAP and may differ from net asset values and performance reported elsewhere. |
The accompanying notes are an integral part of these financial statements.
Allspring SMID Cap Growth Fund | 13
Notes to financial statements
Notes to financial statements
Allspring Funds Trust (the “Trust”), a Delaware statutory trust organized on March 10, 1999, is an open-end management investment company registered under the Investment Company Act of 1940, as amended (the “1940 Act”). As an investment company, the Trust follows the accounting and reporting guidance in Financial Accounting Standards Board (“FASB”) Accounting Standards Codification Topic 946, Financial Services – Investment Companies. These financial statements report on the Allspring SMID Cap Growth Fund (formerly, Allspring Discovery SMID Cap Growth Fund) (the “Fund”) which is a diversified series of the Trust.
2.
SIGNIFICANT ACCOUNTING POLICIES
The following significant accounting policies, which are consistently followed in the preparation of the financial statements of the Fund, are in conformity with U.S. generally accepted accounting principles (“GAAP”) which require management to make estimates and assumptions that affect the reported amounts of assets and liabilities, disclosure of contingent assets and liabilities at the date of the financial statements, and the reported amounts of income and expenses during the reporting period. Actual results could differ from those estimates.
All investments are valued each business day as of the close of regular trading on the New York Stock Exchange (generally 4 p.m. Eastern Time), although the Fund may deviate from this calculation time under unusual or unexpected circumstances.
Equity securities and exchange-traded funds that are listed on a foreign or domestic exchange or market are valued at the official closing price or, if none, the last sales price.
Investments in registered open-end investment companies (other than those listed on a foreign or domestic exchange or market) are valued at net asset value.
Investments which are not valued using the methods discussed above are valued at their fair value, as determined in good faith by Allspring Funds Management, LLC (“Allspring Funds Management”), which was named the valuation designee by the Board of Trustees. As the valuation designee, Allspring Funds Management is responsible for day-to-day valuation activities for the Allspring Funds. In connection with these responsibilities, Allspring Funds Management has established a Valuation Committee and has delegated to it the authority to take any actions regarding the valuation of portfolio securities that the Valuation Committee deems necessary or appropriate, including determining the fair value of portfolio securities. On a quarterly basis, the Board of Trustees receives reports of valuation actions taken by the Valuation Committee. On at least an annual basis, the Board of Trustees receives an assessment of the adequacy and effectiveness of Allspring Funds Management’s process for determining the fair value of the portfolio of investments.
Security transactions and income recognition
Securities transactions are recorded on a trade date basis. Realized gains or losses are recorded on the basis of identified cost.
Dividend income is recognized on the ex-dividend date. Dividend income is recorded net of foreign taxes withheld where recovery of such taxes is not assured.
Distributions received from REIT investments may be characterized as ordinary income, capital gains, or a return of capital to the Fund based on information provided by the REIT. The proper characterization of REIT distributions is generally not known until after the end of each calendar year. As such, estimates may be used in reporting the character of income and distributions for financial statement purposes.
Distributions to shareholders
Distributions to shareholders from net investment income and any net realized gains are recorded on the ex-dividend date and paid at least annually. Such distributions are determined in accordance with income tax regulations and may differ from U.S. GAAP. Dividend sources are estimated at the time of declaration. The tax character of distributions is determined as of the Fund’s fiscal year end. Therefore, a portion of the Fund’s distributions made prior to the Fund’s fiscal year end may be categorized as a tax return of capital at year end.
The Fund intends to continue to qualify as a regulated investment company by distributing substantially all of its investment company taxable income and any net realized capital gains (after reduction for capital loss carryforwards) sufficient to relieve it from all, or substantially all, federal income taxes. Accordingly, no provision for federal income taxes was required.
The Fund’s income and federal excise tax returns and all financial records supporting those returns for the prior three fiscal years are subject to examination by the federal and Delaware revenue authorities. Management has analyzed the Fund’s tax positions taken on federal, state, and foreign tax returns, as applicable, for all open tax years and does not believe that there are any uncertain tax positions that require recognition of a tax liability.
14 | Allspring SMID Cap Growth Fund
Notes to financial statements
As of September 30, 2024, the aggregate cost of all investments for federal income tax purposes was $833,575,181 and the unrealized gains (losses) consisted of:
The separate classes of shares offered by the Fund differ principally in applicable sales charges, distribution, shareholder servicing, and administration fees. Class specific expenses are charged directly to that share class. Investment income, common fund-level expenses, and realized and unrealized gains (losses) on investments are allocated daily to each class of shares based on the relative proportion of net assets of each class.
3.
FAIR VALUATION MEASUREMENTS
Fair value measurements of investments are determined within a framework that has established a fair value hierarchy based upon the various data inputs utilized in determining the value of the Fund’s investments. The three-level hierarchy gives the highest priority to unadjusted quoted prices in active markets for identical assets or liabilities (Level 1) and the lowest priority to unobservable inputs (Level 3). The Fund’s investments are classified within the fair value hierarchy based on the lowest level of input that is significant to the fair value measurement. The inputs are summarized into three broad levels as follows:
•Level 1—quoted prices in active markets for identical securities
•Level 2—other significant observable inputs (including quoted prices for similar securities, interest rates, prepayment speeds, credit risk, etc.)
•Level 3—significant unobservable inputs (including the Fund’s own assumptions in determining the fair value of investments)
The inputs or methodologies used for valuing investments in securities are not necessarily an indication of the risk associated with investing in those securities.
The following is a summary of the inputs used in valuing the Fund’s assets and liabilities as of September 30, 2024:
| | Other significant
observable inputs
(Level 2) | Significant
unobservable inputs
(Level 3) | |
| | | | |
| | | | |
| | | | |
| | | | |
| | | | |
| | | | |
| | | | |
| | | | |
| | | | |
| | | | |
| | | | |
| | | | |
| | | | |
| | | | |
| | | | |
Additional sector, industry or geographic detail, if any, is included in the Portfolio of Investments.
At September 30, 2024, the Fund did not have any transfers into/out of Level 3.
4.
TRANSACTIONS WITH AFFILIATES
Allspring Funds Management, a wholly owned subsidiary of Allspring Global Investments Holdings, LLC, a holding company indirectly owned by certain private funds of GTCR LLC and Reverence Capital Partners, L.P., is the manager of the Fund and provides advisory and fund-level administrative services under an investment management agreement. Under the investment management agreement, Allspring Funds Management is responsible for, among other services, implementing the investment objectives and strategies of the Fund, supervising the subadviser and providing fund-level administrative services in connection with the Fund’s operations. As compensation for its services under the investment management agreement, Allspring Funds
Allspring SMID Cap Growth Fund | 15
Notes to financial statements
Management is entitled to receive a management fee, which is generally paid monthly, at the following annual rate based on the Fund’s average daily net assets:
For the year ended September 30, 2024, the management fee was equivalent to an annual rate of 0.77% of the Fund’s average daily net assets.
Allspring Funds Management has retained the services of a subadviser to provide daily portfolio management to the Fund. The fee for subadvisory services is borne by Allspring Funds Management. Allspring Global Investments, LLC, an affiliate of Allspring Funds Management and a wholly owned subsidiary of Allspring Global Investments Holdings, LLC, is the subadviser to the Fund and is entitled to receive a fee from Allspring Funds Management at an annual rate starting at 0.45% and declining to 0.35% as the average daily net assets of the Fund increase.
Under a class-level administration agreement, Allspring Funds Management provides class-level administrative services to the Fund, which includes paying fees and expenses for services provided by the transfer agent, sub-transfer agents, omnibus account servicers and record-keepers. As compensation for its services under the class-level administration agreement, Allspring Funds Management receives an annual fee which is calculated based on the average daily net assets of each class and generally paid monthly, as follows:
| Class-level
administration fee |
| |
| |
| |
| |
| |
Waivers and/or expense reimbursements
Allspring Funds Management has contractually committed to waive and/or reimburse management and administration fees to the extent necessary to maintain certain net operating expense ratios for the Fund. When each class of the Fund has exceeded its expense cap, Allspring Funds Management will waive fees and/or reimburse expenses from fund-level expenses on a proportionate basis and then from class specific expenses. When only certain classes exceed their expense caps, waivers and/or reimbursements are applied against class specific expenses before fund-level expenses. Allspring Funds Management has contractually committed through January 31, 2025 to waive fees and/or reimburse expenses to the extent necessary to cap the Fund’s expenses. Prior to or after the commitment expiration date, the cap may be increased or the commitment to maintain the cap may be terminated only with the approval of the Board of Trustees. As of September 30, 2024, the contractual caps are as follows:
The Trust has adopted a distribution plan for Class C shares pursuant to Rule 12b-1 under the 1940 Act. A distribution fee is charged to Class C shares and paid to Allspring Funds Distributor, LLC (“Allspring Funds Distributor”), the principal underwriter, an affiliate of Allspring Funds Management, at an annual rate up to 0.75% of the average daily net assets of Class C shares. Such fees are generally paid on a monthly basis.
In addition, Allspring Funds Distributor is entitled to receive the front-end sales charge from the purchase of Class A shares and a contingent deferred sales charge on the redemption of certain Class A shares. Allspring Funds Distributor is also entitled to receive the contingent deferred sales charges from redemptions of Class C shares. For the year ended September 30, 2024, Allspring Funds Distributor received $1,382 from the sale of Class A shares. No contingent deferred sales charges were incurred by Class A and Class C shares for the year ended September 30, 2024.
16 | Allspring SMID Cap Growth Fund
Notes to financial statements
Shareholder servicing fees
The Trust has entered into contracts with one or more shareholder servicing agents, whereby Class A, Class C and Administrator Class are charged a fee at an annual rate up to 0.25% of the average daily net assets of each respective class and are generally paid on a monthly basis. A portion of these total shareholder servicing fees were paid to affiliates of the Fund.
The Fund may purchase or sell portfolio investment securities to certain affiliates pursuant to Rule 17a-7 under the 1940 Act and under procedures adopted by the Board of Trustees. The procedures have been designed to ensure that these interfund transactions, which do not incur broker commissions, are effected at current market prices. Pursuant to these procedures, the Fund did not have any interfund transactions during the year ended September 30, 2024.
5.
INVESTMENT PORTFOLIO TRANSACTIONS
Purchases and sales of investments, excluding U.S. government obligations (if any) and short-term securities, for the year ended September 30, 2024 were $722,418,648 and $1,036,720,765, respectively.
The Trust (excluding the money market funds), Allspring Master Trust and Allspring Variable Trust are parties to a $275,000,000 (prior to July 9, 2024: $350,000,000), revolving credit agreement whereby the Fund is permitted to use bank borrowings for temporary or emergency purposes, such as to fund shareholder redemption requests. Interest under the credit agreement is charged to the Fund based on a borrowing rate equal to the higher of the Federal Funds rate or the overnight bank funding rate in effect on that day plus a spread. In addition, an annual commitment fee based on the unused balance is allocated to each participating fund.
For the year ended September 30, 2024, there were no borrowings by the Fund under the agreement.
7.
DISTRIBUTIONS TO SHAREHOLDERS
The tax character of distributions paid were as follows:
As of September 30, 2024, the components of distributable earnings on a tax basis were as follows:
Undistributed
ordinary
income | Undistributed
long-term
gain | |
| | |
As of the end of the period, the Fund concentrated its portfolio of investments in the industrials sector. A fund that invests a substantial portion of its assets in any sector may be more affected by changes in that sector than would be a fund whose investments are not heavily weighted in any sector.
Under the Fund’s organizational documents, the officers and Trustees have been granted certain indemnification rights against certain liabilities that may arise out of performance of their duties to the Fund. The Fund has entered into a separate agreement with each Trustee that converts indemnification rights currently existing under the Fund’s organizational documents into contractual rights that cannot be changed in the future without the consent of the Trustee. Additionally, in the normal course of business, the Fund may enter into contracts with service providers that contain a variety of indemnification clauses. The Fund’s maximum exposure under these arrangements is dependent on future claims that may be made against the Fund and, therefore, cannot be estimated.
Allspring SMID Cap Growth Fund | 17
Report of independent registered public accounting firm
To the Shareholders of the Fund and Board of Trustees
Allspring Funds Trust:
Opinion on the Financial Statements
We have audited the accompanying statement of assets and liabilities of Allspring SMID Cap Growth Fund (formerly, Allspring Discovery SMID Cap Growth Fund) (the Fund), one of the Funds constituting Allspring Funds Trust, including the portfolio of investments, as of September 30, 2024, the related statement of operations for the year then ended, the statements of changes in net assets for each of the years in the two-year period then ended, and the related notes (collectively, the financial statements) and the financial highlights for each of the years in the five-year period then ended. In our opinion, the financial statements and financial highlights present fairly, in all material respects, the financial position of the Fund as of September 30, 2024, the results of its operations for the year then ended, the changes in its net assets for each of the years in the two-year period then ended, and the financial highlights for each of the years in the five-year period then ended, in conformity with U.S. generally accepted accounting principles.
These financial statements and financial highlights are the responsibility of the Fund’s management. Our responsibility is to express an opinion on these financial statements and financial highlights based on our audits. We are a public accounting firm registered with the Public Company Accounting Oversight Board (United States) (PCAOB) and are required to be independent with respect to the Fund in accordance with the U.S. federal securities laws and the applicable rules and regulations of the Securities and Exchange Commission and the PCAOB.
We conducted our audits in accordance with the standards of the PCAOB. Those standards require that we plan and perform the audit to obtain reasonable assurance about whether the financial statements and financial highlights are free of material misstatement, whether due to error or fraud. Our audits included performing procedures to assess the risks of material misstatement of the financial statements and financial highlights, whether due to error or fraud, and performing procedures that respond to those risks. Such procedures included examining, on a test basis, evidence regarding the amounts and disclosures in the financial statements and financial highlights. Such procedures also included confirmation of securities owned as of September 30, 2024, by correspondence with the custodian and transfer agent. Our audits also included evaluating the accounting principles used and significant estimates made by management, as well as evaluating the overall presentation of the financial statements and financial highlights. We believe that our audits provide a reasonable basis for our opinion.

We have not been able to determine the specific year that we began serving as the auditor of one or more Allspring Funds investment companies; however, we are aware that we have served as the auditor of one or more Allspring Funds investment companies since at least 1955.
November 25, 2024
18 | Allspring SMID Cap Growth Fund
Other information (unaudited)
Other information
A description of the policies and procedures used to determine how to vote proxies relating to portfolio securities is available without charge, upon request, by calling 1-866-259-3305, visiting our website at allspringglobal.com, or visiting the SEC website at sec.gov. Information regarding how the proxies related to portfolio securities were voted during the most recent 12-month period ended June 30 is available on the website at allspringglobal.com or by visiting the SEC website at sec.gov.
Quarterly portfolio holdings information
The Fund files its complete schedule of portfolio holdings with the SEC for the first and third quarters of each fiscal year as an exhibit to its reports on Form N-PORT. Shareholders may view the filed Form N-PORT by visiting the SEC website at sec.gov.
Allspring SMID Cap Growth Fund | 19
Other information (unaudited)
Item 8. Changes in and disagreements with accountants
Item 9. Matters submitted to fund shareholders for a vote
Item 10. Remuneration paid to directors, officers and others
Refer to information in the Statement of operations.
20 | Allspring SMID Cap Growth Fund
Other information (unaudited)
Item 11. Statement regarding basis for the board’s approval of investment advisory contract
Board consideration of investment management and sub-advisory agreements:
Under the Investment Company Act of 1940 (the “1940 Act”), the Board of Trustees (the “Board”) of Allspring Funds Trust (the “Trust”) must determine annually whether to approve the continuation of the Trust’s investment management and sub-advisory agreements. In this regard, at a Board meeting held on May 28-30, 2024 (the “Meeting”), the Board, all the members of which have no direct or indirect interest in the investment management and sub-advisory agreements and are not “interested persons” of the Trust, as defined in the 1940 Act (the “Independent Trustees”), reviewed and approved for the Allspring SMID Cap Growth Fund* (the “Fund”): (i) an investment management agreement (the “Management Agreement”) with Allspring Funds Management, LLC (“Allspring Funds Management”); and (ii) an investment sub-advisory agreement (the “Sub-Advisory Agreement”) with Allspring Global Investments, LLC (the “Sub-Adviser”), an affiliate of Allspring Funds Management. The Management Agreement and the Sub-Advisory Agreement are collectively referred to as the “Advisory Agreements.”
At the Meeting, the Board considered the factors and reached the conclusions described below relating to the selection of Allspring Funds Management and the Sub-Adviser and the approval of the Advisory Agreements. Prior to the Meeting, including at a meeting of the Board held in April 2024, and at the Meeting, the Trustees conferred extensively among themselves and with representatives of Allspring Funds Management about these matters. The Board has adopted a team-based approach, with each team consisting of a sub-set of Trustees, to assist the full Board in the discharge of its duties in reviewing investment performance and other matters throughout the year. The Independent Trustees were assisted in their evaluation of the Advisory Agreements by independent legal counsel, from whom they received separate legal advice and with whom they met separately.
In providing information to the Board, Allspring Funds Management and the Sub-Adviser were guided by a detailed set of requests for information submitted to them by independent legal counsel on behalf of the Independent Trustees at the start of the Board’s annual contract renewal process earlier in 2024. In considering and approving the Advisory Agreements, the Trustees considered the information they believed relevant, including but not limited to the information discussed below. The Board considered not only the specific information presented in connection with the Meeting, but also the knowledge gained over time through interactions with Allspring Funds Management and the Sub-Adviser about various topics. In this regard, the Board reviewed reports of Allspring Funds Management at each of its quarterly meetings, which included, among other things, portfolio reviews and investment performance reports. In addition, the Board and the teams mentioned above confer with portfolio managers at various times throughout the year. The Board did not identify any particular information or consideration that was all-important or controlling, and each individual Trustee may have attributed different weights to various factors. The Board noted that the name of the Fund would be renamed to the Allspring SMID Cap Growth Fund, effective August 2024.
After its deliberations, the Board unanimously determined that the compensation payable to Allspring Funds Management and the Sub-Adviser under each of the Advisory Agreements was reasonable, and approved the continuation of the Advisory Agreements for a one-year term. The Board considered the approval of the Advisory Agreements for the Fund as part of its consideration of agreements for funds across the complex, but its approvals were made on a fund-by-fund basis. The following summarizes a number of important, but not necessarily all, factors considered by the Board in support of its approvals.
Nature, extent, and quality of services
The Board received and considered various information regarding the nature, extent, and quality of services provided to the Fund by Allspring Funds Management and the Sub-Adviser under the Advisory Agreements. This information included a description of the investment advisory services and Fund-level administrative services covered by the Management Agreement, as well as, among other things, a summary of the background and experience of senior management of Allspring Global Investments, of which Allspring Funds Management and the Sub-Adviser are a part, and a summary of investments made in the Allspring Global Investments business.** The Board also received information about the services that continue to be provided by Wells Fargo & Co. and/or its affiliates (“Wells Fargo”) since the sale of Wells Fargo Asset Management to Allspring Global Investments Holdings, LLC, a holding company indirectly owned by certain private funds of GTCR LLC and Reverence Capital Partners, L.P., under a transition services agreement and an update on the anticipated timeline for exiting the transition services agreement. In addition, the Board received and considered information about the full range of services provided to the Fund by Allspring Funds Management and its affiliates.
The Board considered the qualifications, background, tenure, and responsibilities of each of the portfolio managers primarily responsible for the day-to-day portfolio management of the Fund. The Board noted that the portfolio managers responsible for the day-to-day portfolio management of the Fund would be changing during the Summer of 2024, and the Board considered the revised portfolio management team that would be taking over portfolio
*
It was noted that the Board had approved changing the Fund’s name to the “Allspring SMID Cap Growth Fund,” effective on or about August 9, 2024.
**
The trade name for the asset management firm that includes Allspring Funds Management and the Sub-Adviser is “Allspring Global Investments.”
Allspring SMID Cap Growth Fund | 21
Other information (unaudited)
management responsibilities. The Board evaluated the ability of Allspring Funds Management and the Sub-Adviser to attract and retain qualified investment professionals, including research, advisory, and supervisory personnel.
The Board further considered the compliance programs and compliance records of Allspring Funds Management and the Sub-Adviser. The Board received and considered information about Allspring Global Investments’ risk management functions, which included information about Allspring Funds Management’s and the Sub-Adviser’s business continuity plans, their approaches to data privacy and cybersecurity, Allspring Funds Management’s role as administrator of the Fund’s liquidity risk management program, and fair valuation designee. The Board also received and considered information about Allspring Funds Management’s intermediary and vendor oversight program.
Fund investment performance and expenses
The Board considered the investment performance results for the Fund over various time periods ended December 31, 2023. The Board considered these results in comparison to the investment performance of funds in a universe that was determined by Broadridge Inc. (“Broadridge”) to be similar to the Fund (the “Universe”), and in comparison to the Fund’s benchmark index and to other comparative data. Broadridge is an independent provider of investment company data. The Board received a description of the methodology used by Broadridge to select the mutual funds in the performance Universe. The Board noted that the investment performance of the Fund (Administrator Class) was lower than the average investment performance of the Universe for all periods under review. The Board also noted that the investment performance of the Fund was higher than the investment performance of its benchmark index, the Russell 2500™ Growth Index, for the one-year period under review, but lower for all other periods under review.
The Board received information concerning, and discussed factors contributing to, the underperformance of the Fund relative to the Universe and benchmark for the periods identified above. The Board took note of the explanations for the relative underperformance during these periods, including with respect to the investment decisions and market factors that affected the Fund’s investment performance.
The Board also received and considered information regarding the Fund’s net operating expense ratios and their various components, including actual management fees, custodian and other non-management fees, and Rule 12b-1 and non-Rule 12b-1 shareholder service fees. The Board considered these ratios in comparison to the median ratios of funds in class-specific expense groups that were determined by Broadridge to be similar to the Fund (the “Groups”). The Board received a description of the methodology used by Broadridge to select the mutual funds in the expense Groups and an explanation of how funds comprising expense Groups and their expense ratios may vary from year-to-year. Based on the Broadridge reports, the Board noted that the net operating expense ratios of the Fund were lower than or in range of the median net operating expense ratios of the expense Groups for each share class.
The Board took into account the Fund’s investment performance and expense information provided to it among the factors considered in deciding to re-approve the Advisory Agreements.
Investment management and sub-advisory fee rates
The Board reviewed and considered the contractual fee rates payable by the Fund to Allspring Funds Management under the Management Agreement, as well as the contractual fee rates payable by the Fund to Allspring Funds Management for class-level administrative services under a Class-Level Administration Agreement, which include, among other things, class-level transfer agency and sub-transfer agency costs (collectively, the “Management Rates”). The Board also reviewed and considered the contractual investment sub-advisory fee rates payable by Allspring Funds Management to the Sub-Adviser for investment sub-advisory services. It was noted that advisory fee waivers, if any, are at the fund level and not class level.
Among other information reviewed by the Board was a comparison of the Fund’s Management Rates with the average contractual investment management fee rates of funds in the expense Groups at a common asset level as well as transfer agency costs of the funds in the expense Groups. The Board noted that the Management Rates of the Fund were in range of the sum of these average rates for the Fund’s expense Groups for the Institutional Class and the Class R6 shares and higher than the sum of these average rates for the Fund’s expense Groups for the Class A and the Administrator Class shares.
The Board also received and considered information about the portion of the total management fee that was retained by Allspring Funds Management after payment of the fee to the Sub-Adviser for sub-advisory services. In assessing the reasonableness of this amount, the Board received and evaluated information about the nature and extent of responsibilities retained and risks assumed by Allspring Funds Management and not delegated to or assumed by the Sub-Adviser, and about Allspring Funds Management’s on-going oversight services. Given the affiliation between Allspring Funds Management and the Sub-Adviser, the Board ascribed limited relevance to the allocation of fees between them.
The Board also received and considered information about the nature and extent of services offered and fee rates charged by Allspring Funds Management and the Sub-Adviser to other types of clients with investment strategies similar to those of the Fund. In this regard, the Board received information about the significantly greater scope of services, and compliance, reporting and other legal and regulatory obligations and risks of managing proprietary mutual funds compared with those associated with managing assets of other types of clients, including third-party sub-advised fund clients and non-mutual fund clients such as institutional separate accounts.
22 | Allspring SMID Cap Growth Fund
Other information (unaudited)
Based on its consideration of the factors and information it deemed relevant, including those described here, the Board determined that the compensation payable to Allspring Funds Management under the Management Agreement and to the Sub-Adviser under the Sub-Advisory Agreement was reasonable.
The Board received and considered information concerning the profitability of Allspring Funds Management, as well as the profitability of Allspring Global Investments, from providing services to the fund complex as a whole. The Board noted that the Sub-Adviser’s profitability information with respect to providing services to the Fund and other funds in the complex was subsumed in the Allspring Global Investments profitability analysis.
Allspring Funds Management reported on the methodologies and estimates used in calculating profitability, including a description of the methodology used to allocate certain expenses. Among other things, the Board noted that the levels of profitability reported on a fund-by-fund basis varied widely, depending on factors such as the size, type, and age of fund.
Based on its review, the Board did not deem the profits reported by Allspring Funds Management or Allspring Global Investments from services provided to the Fund to be at a level that would prevent it from approving the continuation of the Advisory Agreements.
The Board received and considered information about the potential for Allspring Funds Management to experience economies of scale in the provision of management services to the Fund, the difficulties of isolating and quantifying economies of scale at an individual fund level, and the extent to which potential scale benefits are shared with Fund shareholders. The Board noted the existence of breakpoints in the Fund’s management fee structure, which operate generally to reduce the Fund’s expense ratios as the Fund grows in size, and the size of the Fund in relation to such breakpoints. The Board considered that in addition to management fee breakpoints, Allspring Funds Management shares potential economies of scale from its management business in a variety of ways, including through fee waiver and expense reimbursement arrangements, competitive management fee rates set at the outset without regard to breakpoints, and investments in the business intended to enhance services available to shareholders.
The Board concluded that Allspring Funds Management’s arrangements with respect to the Fund, including contractual breakpoints, constituted a reasonable approach to sharing potential economies of scale with the Fund and its shareholders.
Other benefits to Allspring Funds Management and the Sub-Adviser
The Board received and considered information regarding potential “fall-out” or ancillary benefits received by Allspring Funds Management and its affiliates, including the Sub-Adviser, as a result of their relationships with the Fund. Ancillary benefits could include, among others, benefits directly attributable to other relationships with the Fund and benefits potentially derived from an increase in Allspring Funds Management’s and the Sub-Adviser’s business as a result of their relationships with the Fund. The Board noted that Allspring Funds Distributor, LLC, an affiliate of Allspring Funds Management, receives distribution-related fees in respect of shares sold or held through it. The Board also reviewed information about soft dollar credits earned and utilized by the Sub-Adviser.
Based on its consideration of the factors and information it deemed relevant, including those described here, the Board did not find that any ancillary benefits received by Allspring Funds Management and its affiliates, including the Sub-Adviser, were unreasonable.
At the Meeting, after considering the above-described factors and based on its deliberations and its evaluation of the information described above, the Board unanimously determined that the compensation payable to Allspring Funds Management and the Sub-Adviser under each of the Advisory Agreements was reasonable, and approved the continuation of the Advisory Agreements for a one-year term.
Allspring SMID Cap Growth Fund | 23
This page is intentionally left blank.
For more information
More information about Allspring Funds is available free upon request. To obtain literature, please write, visit the Fund’s website, or call:
Allspring Funds
P.O. Box 219967
Kansas City, MO 64121-9967
Website: allspringglobal.com
Individual investors: 1-800-222-8222
Retail investment professionals: 1-888-877-9275
Institutional investment professionals: 1-800-260-5969
This report and the financial statements contained herein are submitted for the general information of the shareholders of the Fund. If this report is used for promotional purposes, distribution of the report must be accompanied or preceded by a current prospectus. Before investing, please consider the investment objectives, risks, charges, and expenses of the investment. For a current prospectus and, if available, a summary prospectus, containing this information, call 1-800-222-8222 or visit the Fund’s website at allspringglobal.com. Read the prospectus carefully before you invest or send money.
Allspring Global InvestmentsTM is the trade name for the asset management firms of Allspring Global Investments Holdings, LLC, a holding company indirectly owned by certain private funds of GTCR LLC and Reverence Capital Partners, L.P. These firms include but are not limited to Allspring Global Investments, LLC, and Allspring Funds Management, LLC. Certain products managed by Allspring entities are distributed by Allspring Funds Distributor, LLC (a broker-dealer and Member FINRA/SIPC).
This material is for general informational and educational purposes only and is NOT intended to provide investment advice or a recommendation of any kind - including a recommendation for any specific investment, strategy, or plan.
© 2024 Allspring Global Investments Holdings, LLC. All rights reserved.
NCSR3321 09-24
Allspring Mid Cap Growth Fund
(formerly, Allspring Discovery Mid Cap Growth Fund)
Long Form Financial Statements
Annual Report
Allspring Mid Cap Growth Fund | 1
Portfolio of investments—September 30, 2024
| | | | | |
| | | | | | |
Communication services: 10.41% | | | | | | |
| | | | | | |
Live Nation Entertainment, Inc.† | | | | | | |
| | | | | | |
| | | | | | |
TKO Group Holdings, Inc. Class A† | | | | | | |
| | | | | | |
| | | | | | |
Trade Desk, Inc. Class A† | | | | | | |
Consumer discretionary: 12.89% | | | | | | |
| | | | | | |
| | | | | | |
| | | | | | |
| | | | | | |
Hotels, restaurants & leisure: 5.95% | | | | | | |
| | | | | | |
DraftKings, Inc. Class A† | | | | | | |
Hyatt Hotels Corp. Class A | | | | | | |
| | | | | | |
| | | | | | |
Household durables: 1.61% | | | | | | |
| | | | | | |
| | | | | | |
| | | | | | |
| | | | | | |
Personal care products: 1.03% | | | | | | |
| | | | | | |
| | | | | | |
| | | | | | |
Blue Owl Capital, Inc. Class A | | | | | | |
| | | | | | |
Robinhood Markets, Inc. Class A† | | | | | | |
Tradeweb Markets, Inc. Class A | | | | | | |
| | | | | | |
Financial services: 1.72% | | | | | | |
| | | | | | |
| | | | | | |
| | | | | | |
The accompanying notes are an integral part of these financial statements.
2 | Allspring Mid Cap Growth Fund
Portfolio of investments—September 30, 2024
| | | | | |
| | | | | | |
| | | | | | |
| | | | | | |
Neurocrine Biosciences, Inc.† | | | | | | |
| | | | | | |
| | | | | | |
Health care equipment & supplies: 4.06% | | | | | | |
IDEXX Laboratories, Inc.† | | | | | | |
Inspire Medical Systems, Inc.† | | | | | | |
| | | | | | |
| | | | | | |
Health care providers & services: 1.03% | | | | | | |
| | | | | | |
Life sciences tools & services: 3.28% | | | | | | |
| | | | | | |
| | | | | | |
| | | | | | |
| | | | | | |
| | | | | | |
Aerospace & defense: 2.65% | | | | | | |
| | | | | | |
Commercial services & supplies: 7.27% | | | | | | |
| | | | | | |
| | | | | | |
| | | | | | |
| | | | | | |
| | | | | | |
Construction & engineering: 1.50% | | | | | | |
Sterling Infrastructure, Inc.† | | | | | | |
Electrical equipment: 3.05% | | | | | | |
Vertiv Holdings Co. Class A | | | | | | |
Ground transportation: 1.87% | | | | | | |
| | | | | | |
| | | | | | |
| | | | | | |
Professional services: 1.58% | | | | | | |
| | | | | | |
Trading companies & distributors: 4.96% | | | | | | |
Applied Industrial Technologies, Inc. | | | | | | |
The accompanying notes are an integral part of these financial statements.
Allspring Mid Cap Growth Fund | 3
Portfolio of investments—September 30, 2024
| | | | | |
Trading companies & distributors(continued) | | | | | | |
SiteOne Landscape Supply, Inc.† | | | | | | |
| | | | | | |
| | | | | | |
Information technology: 27.06% | | | | | | |
Electronic equipment, instruments & components: 3.30% | | | | | | |
| | | | | | |
Zebra Technologies Corp. Class A† | | | | | | |
| | | | | | |
| | | | | | |
| | | | | | |
| | | | | | |
| | | | | | |
| | | | | | |
Semiconductors & semiconductor equipment: 5.92% | | | | | | |
| | | | | | |
Monolithic Power Systems, Inc. | | | | | | |
| | | | | | |
| | | | | | |
| | | | | | |
CCC Intelligent Solutions Holdings, Inc.† | | | | | | |
Crowdstrike Holdings, Inc. Class A† | | | | | | |
| | | | | | |
| | | | | | |
| | | | | | |
| | | | | | |
Tyler Technologies, Inc.† | | | | | | |
| | | | | | |
| | | | | | |
Construction materials: 1.73% | | | | | | |
| | | | | | |
| | | | | | |
| | | | | | |
Total common stocks (Cost $452,260,732) | | | | | | |
The accompanying notes are an integral part of these financial statements.
4 | Allspring Mid Cap Growth Fund
Portfolio of investments—September 30, 2024
| | | | | |
Short-term investments: 0.77% | | | | | | |
Investment companies: 0.77% | | | | | | |
Allspring Government Money Market Fund Select Class♠∞ | | | | | | |
Total short-term investments (Cost $4,789,725) | | | | | | |
Total investments in securities (Cost $457,050,457) | | | | | | |
Other assets and liabilities, net | | | | | | |
| | | | | | |
| Non-income-earning security |
| The issuer of the security is an affiliated person of the Fund as defined in the Investment Company Act of 1940. |
| The rate represents the 7-day annualized yield at period end. |
|
| American depositary receipt |
Investments in affiliates
An affiliated investment is an investment in which the Fund owns at least 5% of the outstanding voting shares of the issuer or as a result of other relationships, such as the Fund and the issuer having the same investment manager. Transactions with issuers that were affiliates of the Fund at the end of the period were as follows:
| | | | | Net
change in
unrealized
gains
(losses) | | | Income
from
affiliated
securities |
| | | | | | | | |
Allspring Government Money Market Fund Select Class | | | | | | | | |
The accompanying notes are an integral part of these financial statements.
Allspring Mid Cap Growth Fund | 5
Statement of assets and liabilities—September 30, 2024
Financial statements
Statement of assets and liabilities
| |
Investments in unaffiliated securities, at value (cost $452,260,732) | |
Investments in affiliated securities, at value (cost $4,789,725) | |
| |
| |
Receivable for Fund shares sold | |
Prepaid expenses and other assets | |
| |
| |
Payable for Fund shares redeemed | |
| |
Shareholder servicing fees payable | |
Administration fees payable | |
Trustees’ fees and expenses payable | |
| |
Accrued expenses and other liabilities | |
| |
| |
| |
| |
Total distributable earnings | |
| |
Computation of net asset value and offering price per share | |
| |
Shares outstanding–Class A1 | |
Net asset value per share–Class A | |
Maximum offering price per share – Class A2 | |
| |
Shares outstanding–Class C1 | |
Net asset value per share–Class C | |
| |
Shares outstanding–Class R61 | |
Net asset value per share–Class R6 | |
Net assets–Administrator Class | |
Shares outstanding–Administrator Class1 | |
Net asset value per share–Administrator Class | |
Net assets–Institutional Class | |
Shares outstanding–Institutional Class1 | |
Net asset value per share–Institutional Class | |
1 The Fund has an unlimited number of authorized shares.
2 Maximum offering price is computed as 100/94.25 of net asset value. On investments of $50,000 or more, the offering price is reduced.
The accompanying notes are an integral part of these financial statements.
6 | Allspring Mid Cap Growth Fund
Statement of operations—year ended September 30, 2024
Statement of operations
| |
Dividends (net of foreign withholdings taxes of $37,430) | |
Income from affiliated securities | |
| |
| |
| |
| |
| |
| |
| |
| |
| |
| |
Shareholder servicing fees | |
| |
| |
| |
| |
| |
Custody and accounting fees | |
| |
| |
Shareholder report expenses | |
Trustees’ fees and expenses | |
| |
| |
Less: Fee waivers and/or expense reimbursements | |
| |
| |
| |
| |
| |
| |
| |
Realized and unrealized gains (losses) on investments | |
Net realized gains (losses) on | |
| |
Foreign currency and foreign currency translations | |
Net realized gains on investments | |
Net change in unrealized gains (losses) on investments | |
Net realized and unrealized gains (losses) on investments | |
Net increase in net assets resulting from operations | |
The accompanying notes are an integral part of these financial statements.
Allspring Mid Cap Growth Fund | 7
Statement of changes in net assets
Statement of changes in net assets
| Year ended September 30, 2024 | Year ended September 30, 2023 |
| | | | |
| | | | |
Net realized gains on investments | | | | |
Net change in unrealized gains (losses) on investments | | | | |
Net increase in net assets resulting from operations | | | | |
Distributions to shareholders from | | | | |
Net investment income and net realized gains | | | | |
| | | | |
| | | | |
| | | | |
| | | | |
| | | | |
Total distributions to shareholders | | | | |
Capital share transactions | | | | |
Proceeds from shares sold | | | | |
| | | | |
| | | | |
| | | | |
| | | | |
| | | | |
| | | | |
Reinvestment of distributions | | | | |
| | | | |
| | | | |
| | | | |
| | | | |
| | | | |
| | | | |
Payment for shares redeemed | | | | |
| | | | |
| | | | |
| | | | |
| | | | |
| | | | |
| | | | |
Net decrease in net assets resulting from capital share transactions | | | | |
Total increase (decrease) in net assets | | | | |
| | | | |
| | | | |
| | | | |
The accompanying notes are an integral part of these financial statements.
8 | Allspring Mid Cap Growth Fund
Financial highlights
(For a share outstanding throughout each period)
| |
| | | | | |
Net asset value, beginning of period | | | | | |
| | | | | |
Net realized and unrealized gains (losses) on investments | | | | | |
Total from investment operations | | | | | |
Distributions to shareholders from | | | | | |
| | | | | |
Net asset value, end of period | | | | | |
| | | | | |
Ratios to average net assets (annualized) | | | | | |
| | | | | |
| | | | | |
| | | | | |
| | | | | |
| | | | | |
Net assets, end of period (000s omitted) | | | | | |
| Calculated based upon average shares outstanding |
| Total return calculations do not include any sales charges. Returns include adjustments required by U.S. GAAP and may differ from net asset values and performance reported elsewhere. |
The accompanying notes are an integral part of these financial statements.
Allspring Mid Cap Growth Fund | 9
(For a share outstanding throughout each period)
| |
| | | | | |
Net asset value, beginning of period | | | | | |
| | | | | |
Net realized and unrealized gains (losses) on investments | | | | | |
Total from investment operations | | | | | |
Distributions to shareholders from | | | | | |
| | | | | |
Net asset value, end of period | | | | | |
| | | | | |
Ratios to average net assets (annualized) | | | | | |
| | | | | |
| | | | | |
| | | | | |
| | | | | |
| | | | | |
Net assets, end of period (000s omitted) | | | | | |
| Calculated based upon average shares outstanding |
| Total return calculations do not include any sales charges. Returns include adjustments required by U.S. GAAP and may differ from net asset values and performance reported elsewhere. |
The accompanying notes are an integral part of these financial statements.
10 | Allspring Mid Cap Growth Fund
(For a share outstanding throughout each period)
| |
| | | | | |
Net asset value, beginning of period | | | | | |
| | | | | |
Net realized and unrealized gains (losses) on investments | | | | | |
Total from investment operations | | | | | |
Distributions to shareholders from | | | | | |
| | | | | |
Net asset value, end of period | | | | | |
| | | | | |
Ratios to average net assets (annualized) | | | | | |
| | | | | |
| | | | | |
| | | | | |
| | | | | |
| | | | | |
Net assets, end of period (000s omitted) | | | | | |
| Calculated based upon average shares outstanding |
| Returns include adjustments required by U.S. GAAP and may differ from net asset values and performance reported elsewhere. |
The accompanying notes are an integral part of these financial statements.
Allspring Mid Cap Growth Fund | 11
(For a share outstanding throughout each period)
| |
| | | | | |
Net asset value, beginning of period | | | | | |
| | | | | |
Net realized and unrealized gains (losses) on investments | | | | | |
Total from investment operations | | | | | |
Distributions to shareholders from | | | | | |
| | | | | |
Net asset value, end of period | | | | | |
| | | | | |
Ratios to average net assets (annualized) | | | | | |
| | | | | |
| | | | | |
| | | | | |
| | | | | |
| | | | | |
Net assets, end of period (000s omitted) | | | | | |
| Calculated based upon average shares outstanding |
| Returns include adjustments required by U.S. GAAP and may differ from net asset values and performance reported elsewhere. |
The accompanying notes are an integral part of these financial statements.
12 | Allspring Mid Cap Growth Fund
(For a share outstanding throughout each period)
| |
| | | | | |
Net asset value, beginning of period | | | | | |
| | | | | |
Net realized and unrealized gains (losses) on investments | | | | | |
Total from investment operations | | | | | |
Distributions to shareholders from | | | | | |
| | | | | |
Net asset value, end of period | | | | | |
| | | | | |
Ratios to average net assets (annualized) | | | | | |
| | | | | |
| | | | | |
| | | | | |
| | | | | |
| | | | | |
Net assets, end of period (000s omitted) | | | | | |
| Calculated based upon average shares outstanding |
| Returns include adjustments required by U.S. GAAP and may differ from net asset values and performance reported elsewhere. |
The accompanying notes are an integral part of these financial statements.
Allspring Mid Cap Growth Fund | 13
Notes to financial statements
Notes to financial statements
Allspring Funds Trust (the “Trust”), a Delaware statutory trust organized on March 10, 1999, is an open-end management investment company registered under the Investment Company Act of 1940, as amended (the “1940 Act”). As an investment company, the Trust follows the accounting and reporting guidance in Financial Accounting Standards Board (“FASB”) Accounting Standards Codification Topic 946, Financial Services – Investment Companies. These financial statements report on the Allspring Mid Cap Growth Fund (formerly, Allspring Discovery Mid Cap Growth Fund) (the “Fund”) which is a diversified series of the Trust.
2.
SIGNIFICANT ACCOUNTING POLICIES
The following significant accounting policies, which are consistently followed in the preparation of the financial statements of the Fund, are in conformity with U.S. generally accepted accounting principles (“GAAP”) which require management to make estimates and assumptions that affect the reported amounts of assets and liabilities, disclosure of contingent assets and liabilities at the date of the financial statements, and the reported amounts of income and expenses during the reporting period. Actual results could differ from those estimates.
All investments are valued each business day as of the close of regular trading on the New York Stock Exchange (generally 4 p.m. Eastern Time), although the Fund may deviate from this calculation time under unusual or unexpected circumstances.
Equity securities and exchange-traded funds that are listed on a foreign or domestic exchange or market are valued at the official closing price or, if none, the last sales price.
Investments in registered open-end investment companies (other than those listed on a foreign or domestic exchange or market) are valued at net asset value.
Investments which are not valued using the methods discussed above are valued at their fair value, as determined in good faith by Allspring Funds Management, LLC (“Allspring Funds Management”), which was named the valuation designee by the Board of Trustees. As the valuation designee, Allspring Funds Management is responsible for day-to-day valuation activities for the Allspring Funds. In connection with these responsibilities, Allspring Funds Management has established a Valuation Committee and has delegated to it the authority to take any actions regarding the valuation of portfolio securities that the Valuation Committee deems necessary or appropriate, including determining the fair value of portfolio securities. On a quarterly basis, the Board of Trustees receives reports of valuation actions taken by the Valuation Committee. On at least an annual basis, the Board of Trustees receives an assessment of the adequacy and effectiveness of Allspring Funds Management’s process for determining the fair value of the portfolio of investments.
Foreign currency translation
The accounting records of the Fund are maintained in U.S. dollars. The values of other assets and liabilities denominated in foreign currencies are translated into U.S. dollars at rates provided by an independent foreign currency pricing source at a time each business day specified by the Valuation Committee. Purchases and sales of securities, and income and expenses are converted at the rate of exchange on the respective dates of such transactions. Net realized foreign exchange gains or losses arise from sales of foreign currencies, currency gains or losses realized between the trade and settlement dates on securities transactions, and the difference between the amounts of dividends, interest and foreign withholding taxes recorded and the U.S. dollar equivalent of the amounts actually paid or received. Net unrealized foreign exchange gains and losses arise from changes in the fair value of assets and liabilities other than investments in securities resulting from changes in exchange rates. The changes in net assets arising from changes in exchange rates of securities and the changes in net assets resulting from changes in market prices of securities are not separately presented. Such changes are included in net realized and unrealized gains or losses from investments.
Security transactions and income recognition
Securities transactions are recorded on a trade date basis. Realized gains or losses are recorded on the basis of identified cost.
Dividend income is recognized on the ex-dividend date. Dividend income is recorded net of foreign taxes withheld where recovery of such taxes is not assured.
Interest earned on cash balances held at the custodian is recorded as interest income.
Distributions to shareholders
Distributions to shareholders from net investment income and any net realized gains are recorded on the ex-dividend date and paid at least annually. Such distributions are determined in accordance with income tax regulations and may differ from U.S. GAAP. Dividend sources are estimated at the time of declaration. The tax character of distributions is determined as of the Fund’s fiscal year end. Therefore, a portion of the Fund’s distributions made prior to the Fund’s fiscal year end may be categorized as a tax return of capital at year end.
14 | Allspring Mid Cap Growth Fund
Notes to financial statements
Federal and other taxes
The Fund intends to continue to qualify as a regulated investment company by distributing substantially all of its investment company taxable income and any net realized capital gains (after reduction for capital loss carryforwards) sufficient to relieve it from all, or substantially all, federal income taxes. Accordingly, no provision for federal income taxes was required.
The Fund’s income and federal excise tax returns and all financial records supporting those returns for the prior three fiscal years are subject to examination by the federal and Delaware revenue authorities. Management has analyzed the Fund’s tax positions taken on federal, state, and foreign tax returns, as applicable, for all open tax years and does not believe that there are any uncertain tax positions that require recognition of a tax liability.
As of September 30, 2024, the aggregate cost of all investments for federal income tax purposes was $459,016,491 and the unrealized gains (losses) consisted of:
As of September 30, 2024, the Fund had a qualified late-year ordinary loss of $2,381,153 which will be recognized on the first day of the following fiscal year.
The separate classes of shares offered by the Fund differ principally in applicable sales charges, distribution, shareholder servicing, and administration fees. Class specific expenses are charged directly to that share class. Investment income, common fund-level expenses, and realized and unrealized gains (losses) on investments are allocated daily to each class of shares based on the relative proportion of net assets of each class.
3.
FAIR VALUATION MEASUREMENTS
Fair value measurements of investments are determined within a framework that has established a fair value hierarchy based upon the various data inputs utilized in determining the value of the Fund’s investments. The three-level hierarchy gives the highest priority to unadjusted quoted prices in active markets for identical assets or liabilities (Level 1) and the lowest priority to unobservable inputs (Level 3). The Fund’s investments are classified within the fair value hierarchy based on the lowest level of input that is significant to the fair value measurement. The inputs are summarized into three broad levels as follows:
•Level 1—quoted prices in active markets for identical securities
•Level 2—other significant observable inputs (including quoted prices for similar securities, interest rates, prepayment speeds, credit risk, etc.)
•Level 3—significant unobservable inputs (including the Fund’s own assumptions in determining the fair value of investments)
The inputs or methodologies used for valuing investments in securities are not necessarily an indication of the risk associated with investing in those securities.
The following is a summary of the inputs used in valuing the Fund’s assets and liabilities as of September 30, 2024:
| | Other significant
observable inputs
(Level 2) | Significant
unobservable inputs
(Level 3) | |
| | | | |
| | | | |
| | | | |
| | | | |
| | | | |
| | | | |
| | | | |
| | | | |
| | | | |
| | | | |
| | | | |
| | | | |
| | | | |
| | | | |
Additional sector, industry or geographic detail, if any, is included in the Portfolio of Investments.
Allspring Mid Cap Growth Fund | 15
Notes to financial statements
At September 30, 2024, the Fund did not have any transfers into/out of Level 3.
4.
TRANSACTIONS WITH AFFILIATES
Allspring Funds Management, a wholly owned subsidiary of Allspring Global Investments Holdings, LLC, a holding company indirectly owned by certain private funds of GTCR LLC and Reverence Capital Partners, L.P., is the manager of the Fund and provides advisory and fund-level administrative services under an investment management agreement. Under the investment management agreement, Allspring Funds Management is responsible for, among other services, implementing the investment objectives and strategies of the Fund, supervising the subadviser and providing fund-level administrative services in connection with the Fund’s operations. As compensation for its services under the investment management agreement, Allspring Funds Management is entitled to receive a management fee, which is generally paid monthly, at the following annual rate based on the Fund’s average daily net assets:
For the year ended September 30, 2024, the management fee was equivalent to an annual rate of 0.75% of the Fund’s average daily net assets.
Allspring Funds Management has retained the services of a subadviser to provide daily portfolio management to the Fund. The fee for subadvisory services is borne by Allspring Funds Management. Allspring Global Investments, LLC, an affiliate of Allspring Funds Management and a wholly owned subsidiary of Allspring Global Investments Holdings, LLC, is the subadviser to the Fund and is entitled to receive a fee from Allspring Funds Management at an annual rate starting at 0.45% and declining to 0.30% as the average daily net assets of the Fund increase.
Under a class-level administration agreement, Allspring Funds Management provides class-level administrative services to the Fund, which includes paying fees and expenses for services provided by the transfer agent, sub-transfer agents, omnibus account servicers and record-keepers. As compensation for its services under the class-level administration agreement, Allspring Funds Management receives an annual fee which is calculated based on the average daily net assets of each class and generally paid monthly, as follows:
| Class-level
administration fee |
| |
| |
| |
| |
| |
Waivers and/or expense reimbursements
Allspring Funds Management has contractually committed to waive and/or reimburse management and administration fees to the extent necessary to maintain certain net operating expense ratios for the Fund. When each class of the Fund has exceeded its expense cap, Allspring Funds Management will waive fees and/or reimburse expenses from fund-level expenses on a proportionate basis and then from class specific expenses. When only certain classes exceed their expense caps, waivers and/or reimbursements are applied against class specific expenses before fund-level expenses. Allspring Funds Management has contractually committed through January 31, 2025 to waive fees and/or reimburse expenses to the extent necessary to cap the Fund’s expenses. Prior to or after the commitment expiration date, the cap may be increased or the commitment to maintain the cap may be terminated only with the approval of the Board of Trustees. As of September 30, 2024, the contractual caps are as follows:
16 | Allspring Mid Cap Growth Fund
Notes to financial statements
The Trust has adopted a distribution plan for Class C shares pursuant to Rule 12b-1 under the 1940 Act. A distribution fee is charged to Class C shares and paid to Allspring Funds Distributor, LLC (“Allspring Funds Distributor”), the principal underwriter, an affiliate of Allspring Funds Management, at an annual rate up to 0.75% of the average daily net assets of Class C shares. Such fees are generally paid on a monthly basis.
In addition, Allspring Funds Distributor is entitled to receive the front-end sales charge from the purchase of Class A shares and a contingent deferred sales charge on the redemption of certain Class A shares. Allspring Funds Distributor is also entitled to receive the contingent deferred sales charges from redemptions of Class C shares. For the year ended September 30, 2024, Allspring Funds Distributor received $662 from the sale of Class A shares. No contingent deferred sales charges were incurred by Class A and Class C shares for the year ended September 30, 2024.
Shareholder servicing fees
The Trust has entered into contracts with one or more shareholder servicing agents, whereby Class A, Class C and Administrator Class are charged a fee at an annual rate up to 0.25% of the average daily net assets of each respective class and are generally paid on a monthly basis. A portion of these total shareholder servicing fees were paid to affiliates of the Fund.
The Fund may purchase or sell portfolio investment securities to certain affiliates pursuant to Rule 17a-7 under the 1940 Act and under procedures adopted by the Board of Trustees. The procedures have been designed to ensure that these interfund transactions, which do not incur broker commissions, are effected at current market prices. Pursuant to these procedures, the Fund did not have any interfund transactions during the year ended September 30, 2024.
5.
INVESTMENT PORTFOLIO TRANSACTIONS
Purchases and sales of investments, excluding U.S. government obligations (if any) and short-term securities, for the year ended September 30, 2024 were $351,689,953 and $481,151,674, respectively.
The Trust (excluding the money market funds), Allspring Master Trust and Allspring Variable Trust are parties to a $275,000,000 (prior to July 9, 2024: $350,000,000), revolving credit agreement whereby the Fund is permitted to use bank borrowings for temporary or emergency purposes, such as to fund shareholder redemption requests. Interest under the credit agreement is charged to the Fund based on a borrowing rate equal to the higher of the Federal Funds rate or the overnight bank funding rate in effect on that day plus a spread. In addition, an annual commitment fee based on the unused balance is allocated to each participating fund.
For the year ended September 30, 2024, there were no borrowings by the Fund under the agreement.
7.
DISTRIBUTIONS TO SHAREHOLDERS
The tax character of distributions paid were as follows:
As of September 30, 2024, the components of distributable earnings on a tax basis were as follows:
Undistributed
long-term
gain | | Late-year
ordinary
losses
deferred |
| | |
Allspring Mid Cap Growth Fund | 17
Notes to financial statements
As of the end of the period, the Fund concentrated its portfolio of investments in the information technology sector. A fund that invests a substantial portion of its assets in any sector may be more affected by changes in that sector than would be a fund whose investments are not heavily weighted in any sector.
Under the Fund’s organizational documents, the officers and Trustees have been granted certain indemnification rights against certain liabilities that may arise out of performance of their duties to the Fund. The Fund has entered into a separate agreement with each Trustee that converts indemnification rights currently existing under the Fund’s organizational documents into contractual rights that cannot be changed in the future without the consent of the Trustee. Additionally, in the normal course of business, the Fund may enter into contracts with service providers that contain a variety of indemnification clauses. The Fund’s maximum exposure under these arrangements is dependent on future claims that may be made against the Fund and, therefore, cannot be estimated.
18 | Allspring Mid Cap Growth Fund
Report of independent registered public accounting firm
To the Shareholders of the Fund and Board of Trustees
Allspring Funds Trust:
Opinion on the Financial Statements
We have audited the accompanying statement of assets and liabilities of Allspring Mid Cap Growth Fund (formerly, Allspring Discovery Mid Cap Growth Fund) (the Fund), one of the Funds constituting Allspring Funds Trust, including the portfolio of investments, as of September 30, 2024, the related statement of operations for the year then ended, the statements of changes in net assets for each of the years in the two-year period then ended, and the related notes (collectively, the financial statements) and the financial highlights for each of the years in the five-year period then ended. In our opinion, the financial statements and financial highlights present fairly, in all material respects, the financial position of the Fund as of September 30, 2024, the results of its operations for the year then ended, the changes in its net assets for each of the years in the two-year period then ended, and the financial highlights for each of the years in the five-year period then ended, in conformity with U.S. generally accepted accounting principles.
These financial statements and financial highlights are the responsibility of the Fund’s management. Our responsibility is to express an opinion on these financial statements and financial highlights based on our audits. We are a public accounting firm registered with the Public Company Accounting Oversight Board (United States) (PCAOB) and are required to be independent with respect to the Fund in accordance with the U.S. federal securities laws and the applicable rules and regulations of the Securities and Exchange Commission and the PCAOB.
We conducted our audits in accordance with the standards of the PCAOB. Those standards require that we plan and perform the audit to obtain reasonable assurance about whether the financial statements and financial highlights are free of material misstatement, whether due to error or fraud. Our audits included performing procedures to assess the risks of material misstatement of the financial statements and financial highlights, whether due to error or fraud, and performing procedures that respond to those risks. Such procedures included examining, on a test basis, evidence regarding the amounts and disclosures in the financial statements and financial highlights. Such procedures also included confirmation of securities owned as of September 30, 2024, by correspondence with the custodian and transfer agent. Our audits also included evaluating the accounting principles used and significant estimates made by management, as well as evaluating the overall presentation of the financial statements and financial highlights. We believe that our audits provide a reasonable basis for our opinion.

We have not been able to determine the specific year that we began serving as the auditor of one or more Allspring Funds investment companies; however, we are aware that we have served as the auditor of one or more Allspring Funds investment companies since at least 1955.
November 25, 2024
Allspring Mid Cap Growth Fund | 19
Other information (unaudited)
Other information
Pursuant to Section 852 of the Internal Revenue Code, $15,033,287 was designated as a 20% rate gain distribution for the fiscal year ended
September 30, 2024.
A description of the policies and procedures used to determine how to vote proxies relating to portfolio securities is available without charge, upon request, by calling 1-866-259-3305, visiting our website at allspringglobal.com, or visiting the SEC website at sec.gov. Information regarding how the proxies related to portfolio securities were voted during the most recent 12-month period ended June 30 is available on the website at allspringglobal.com or by visiting the SEC website at sec.gov.
Quarterly portfolio holdings information
The Fund files its complete schedule of portfolio holdings with the SEC for the first and third quarters of each fiscal year as an exhibit to its reports on Form N-PORT. Shareholders may view the filed Form N-PORT by visiting the SEC website at sec.gov.
20 | Allspring Mid Cap Growth Fund
Other information (unaudited)
Item 8. Changes in and disagreements with accountants
Item 9. Matters submitted to fund shareholders for a vote
Item 10. Remuneration paid to directors, officers and others
Refer to information in the Statement of operations.
Allspring Mid Cap Growth Fund | 21
Other information (unaudited)
Item 11. Statement regarding basis for the board’s approval of investment advisory contract
Board consideration of investment management and sub-advisory agreements:
Under the Investment Company Act of 1940 (the “1940 Act”), the Board of Trustees (the “Board”) of Allspring Funds Trust (the “Trust”) must determine annually whether to approve the continuation of the Trust’s investment management and sub-advisory agreements. In this regard, at a Board meeting held on May 28-30, 2024 (the “Meeting”), the Board, all the members of which have no direct or indirect interest in the investment management and sub-advisory agreements and are not “interested persons” of the Trust, as defined in the 1940 Act (the “Independent Trustees”), reviewed and approved for the Allspring Mid Cap Growth Fund* (the “Fund”): (i) an investment management agreement (the “Management Agreement”) with Allspring Funds Management, LLC (“Allspring Funds Management”); and (ii) an investment sub-advisory agreement (the “Sub-Advisory Agreement”) with Allspring Global Investments, LLC (the “Sub-Adviser”), an affiliate of Allspring Funds Management. The Management Agreement and the Sub-Advisory Agreement are collectively referred to as the “Advisory Agreements.”
At the Meeting, the Board considered the factors and reached the conclusions described below relating to the selection of Allspring Funds Management and the Sub-Adviser and the approval of the Advisory Agreements. Prior to the Meeting, including at a meeting of the Board held in April 2024, and at the Meeting, the Trustees conferred extensively among themselves and with representatives of Allspring Funds Management about these matters. The Board has adopted a team-based approach, with each team consisting of a sub-set of Trustees, to assist the full Board in the discharge of its duties in reviewing investment performance and other matters throughout the year. The Independent Trustees were assisted in their evaluation of the Advisory Agreements by independent legal counsel, from whom they received separate legal advice and with whom they met separately.
In providing information to the Board, Allspring Funds Management and the Sub-Adviser were guided by a detailed set of requests for information submitted to them by independent legal counsel on behalf of the Independent Trustees at the start of the Board’s annual contract renewal process earlier in 2024. In considering and approving the Advisory Agreements, the Trustees considered the information they believed relevant, including but not limited to the information discussed below. The Board considered not only the specific information presented in connection with the Meeting, but also the knowledge gained over time through interactions with Allspring Funds Management and the Sub-Adviser about various topics. In this regard, the Board reviewed reports of Allspring Funds Management at each of its quarterly meetings, which included, among other things, portfolio reviews and investment performance reports. In addition, the Board and the teams mentioned above confer with portfolio managers at various times throughout the year. The Board did not identify any particular information or consideration that was all-important or controlling, and each individual Trustee may have attributed different weights to various factors. The Board noted that the name of the Fund would be renamed to the Allspring Mid Cap Growth Fund, effective August 2024.
After its deliberations, the Board unanimously determined that the compensation payable to Allspring Funds Management and the Sub-Adviser under each of the Advisory Agreements was reasonable, and approved the continuation of the Advisory Agreements for a one-year term. The Board considered the approval of the Advisory Agreements for the Fund as part of its consideration of agreements for funds across the complex, but its approvals were made on a fund-by-fund basis. The following summarizes a number of important, but not necessarily all, factors considered by the Board in support of its approvals.
Nature, extent, and quality of services
The Board received and considered various information regarding the nature, extent, and quality of services provided to the Fund by Allspring Funds Management and the Sub-Adviser under the Advisory Agreements. This information included a description of the investment advisory services and Fund-level administrative services covered by the Management Agreement, as well as, among other things, a summary of the background and experience of senior management of Allspring Global Investments, of which Allspring Funds Management and the Sub-Adviser are a part, and a summary of investments made in the Allspring Global Investments business.** The Board also received information about the services that continue to be provided by Wells Fargo & Co. and/or its affiliates (“Wells Fargo”) since the sale of Wells Fargo Asset Management to Allspring Global Investments Holdings, LLC, a holding company indirectly owned by certain private funds of GTCR LLC and Reverence Capital Partners, L.P., under a transition services agreement and an update on the anticipated timeline for exiting the transition services agreement. In addition, the Board received and considered information about the full range of services provided to the Fund by Allspring Funds Management and its affiliates.
The Board considered the qualifications, background, tenure, and responsibilities of each of the portfolio managers primarily responsible for the day-to-day portfolio management of the Fund. The Board noted that the portfolio managers responsible for the day-to-day portfolio management of the Fund would be changing during the Summer of 2024, and the Board considered the revised portfolio management team that would be taking over portfolio
*
It was noted that the Board had approved changing the Fund’s name to the “Allspring Mid Growth Fund,” effective on or about August 9, 2024.
**
The trade name for the asset management firm that includes Allspring Funds Management and the Sub-Adviser is “Allspring Global Investments.”
22 | Allspring Mid Cap Growth Fund
Other information (unaudited)
management responsibilities. The Board evaluated the ability of Allspring Funds Management and the Sub-Adviser to attract and retain qualified investment professionals, including research, advisory, and supervisory personnel.
The Board further considered the compliance programs and compliance records of Allspring Funds Management and the Sub-Adviser. The Board received and considered information about Allspring Global Investments’ risk management functions, which included information about Allspring Funds Management’s and the Sub-Adviser’s business continuity plans, their approaches to data privacy and cybersecurity, Allspring Funds Management’s role as administrator of the Fund’s liquidity risk management program, and fair valuation designee. The Board also received and considered information about Allspring Funds Management’s intermediary and vendor oversight program.
Fund investment performance and expenses
The Board considered the investment performance results for the Fund over various time periods ended December 31, 2023. The Board considered these results in comparison to the investment performance of funds in a universe that was determined by Broadridge Inc. (“Broadridge”) to be similar to the Fund (the “Universe”), and in comparison to the Fund’s benchmark index and to other comparative data. Broadridge is an independent provider of investment company data. The Board received a description of the methodology used by Broadridge to select the mutual funds in the performance Universe. The Board noted that the investment performance of the Fund (Administrator Class) was lower than the average investment performance of the Universe for all periods under review. The Board also noted that the investment performance of the Fund was lower than the investment performance of its benchmark index, the Russell Midcap® Growth Index, for all periods under review.
The Board received information concerning, and discussed factors contributing to, the underperformance of the Fund relative to the Universe and benchmark for the periods identified above. The Board took note of the explanations for the relative underperformance during these periods, including with respect to the investment decisions and market factors that affected the Fund’s investment performance.
The Board also received and considered information regarding the Fund’s net operating expense ratios and their various components, including actual management fees, custodian and other non-management fees, and Rule 12b-1 and non-Rule 12b-1 shareholder service fees. The Board considered these ratios in comparison to the median ratios of funds in class-specific expense groups that were determined by Broadridge to be similar to the Fund (the “Groups”). The Board received a description of the methodology used by Broadridge to select the mutual funds in the expense Groups and an explanation of how funds comprising expense Groups and their expense ratios may vary from year-to-year. Based on the Broadridge reports, the Board noted that the net operating expense ratios of the Fund were lower than or in range of the median net operating expense ratios of the expense Groups for each share class.
The Board took into account the Fund’s investment performance and expense information provided to it among the factors considered in deciding to re-approve the Advisory Agreements.
Investment management and sub-advisory fee rates
The Board reviewed and considered the contractual fee rates payable by the Fund to Allspring Funds Management under the Management Agreement, as well as the contractual fee rates payable by the Fund to Allspring Funds Management for class-level administrative services under a Class-Level Administration Agreement, which include, among other things, class-level transfer agency and sub-transfer agency costs (collectively, the “Management Rates”). The Board also reviewed and considered the contractual investment sub-advisory fee rates payable by Allspring Funds Management to the Sub-Adviser for investment sub-advisory services. It was noted that advisory fee waivers, if any, are at the fund level and not class level.
Among other information reviewed by the Board was a comparison of the Fund’s Management Rates with the average contractual investment management fee rates of funds in the expense Groups at a common asset level as well as transfer agency costs of the funds in the expense Groups. The Board noted that the Management Rates of the Fund were lower than or in range of the sum of these average rates for the Fund’s expense Groups for each share class.
The Board also received and considered information about the portion of the total management fee that was retained by Allspring Funds Management after payment of the fee to the Sub-Adviser for sub-advisory services. In assessing the reasonableness of this amount, the Board received and evaluated information about the nature and extent of responsibilities retained and risks assumed by Allspring Funds Management and not delegated to or assumed by the Sub-Adviser, and about Allspring Funds Management’s on-going oversight services. Given the affiliation between Allspring Funds Management and the Sub-Adviser, the Board ascribed limited relevance to the allocation of fees between them.
The Board also received and considered information about the nature and extent of services offered and fee rates charged by Allspring Funds Management and the Sub-Adviser to other types of clients with investment strategies similar to those of the Fund. In this regard, the Board received information about the significantly greater scope of services, and compliance, reporting and other legal and regulatory obligations and risks of managing proprietary mutual funds compared with those associated with managing assets of other types of clients, including third-party sub-advised fund clients and non-mutual fund clients such as institutional separate accounts.
Allspring Mid Cap Growth Fund | 23
Other information (unaudited)
Based on its consideration of the factors and information it deemed relevant, including those described here, the Board determined that the compensation payable to Allspring Funds Management under the Management Agreement and to the Sub-Adviser under the Sub-Advisory Agreement was reasonable.
The Board received and considered information concerning the profitability of Allspring Funds Management, as well as the profitability of Allspring Global Investments, from providing services to the fund complex as a whole. The Board noted that the Sub-Adviser’s profitability information with respect to providing services to the Fund and other funds in the complex was subsumed in the Allspring Global Investments profitability analysis.
Allspring Funds Management reported on the methodologies and estimates used in calculating profitability, including a description of the methodology used to allocate certain expenses. Among other things, the Board noted that the levels of profitability reported on a fund-by-fund basis varied widely, depending on factors such as the size, type, and age of fund.
Based on its review, the Board did not deem the profits reported by Allspring Funds Management or Allspring Global Investments from services provided to the Fund to be at a level that would prevent it from approving the continuation of the Advisory Agreements.
The Board received and considered information about the potential for Allspring Funds Management to experience economies of scale in the provision of management services to the Fund, the difficulties of isolating and quantifying economies of scale at an individual fund level, and the extent to which potential scale benefits are shared with Fund shareholders. The Board noted the existence of breakpoints in the Fund’s management fee structure, which operate generally to reduce the Fund’s expense ratios as the Fund grows in size, and the size of the Fund in relation to such breakpoints. The Board considered that in addition to management fee breakpoints, Allspring Funds Management shares potential economies of scale from its management business in a variety of ways, including through fee waiver and expense reimbursement arrangements, competitive management fee rates set at the outset without regard to breakpoints, and investments in the business intended to enhance services available to shareholders.
The Board concluded that Allspring Funds Management’s arrangements with respect to the Fund, including contractual breakpoints, constituted a reasonable approach to sharing potential economies of scale with the Fund and its shareholders.
Other benefits to Allspring Funds Management and the Sub-Adviser
The Board received and considered information regarding potential “fall-out” or ancillary benefits received by Allspring Funds Management and its affiliates, including the Sub-Adviser, as a result of their relationships with the Fund. Ancillary benefits could include, among others, benefits directly attributable to other relationships with the Fund and benefits potentially derived from an increase in Allspring Funds Management’s and the Sub-Adviser’s business as a result of their relationships with the Fund. The Board noted that Allspring Funds Distributor, LLC, an affiliate of Allspring Funds Management, receives distribution-related fees in respect of shares sold or held through it. The Board also reviewed information about soft dollar credits earned and utilized by the Sub-Adviser.
Based on its consideration of the factors and information it deemed relevant, including those described here, the Board did not find that any ancillary benefits received by Allspring Funds Management and its affiliates, including the Sub-Adviser, were unreasonable.
At the Meeting, after considering the above-described factors and based on its deliberations and its evaluation of the information described above, the Board unanimously determined that the compensation payable to Allspring Funds Management and the Sub-Adviser under each of the Advisory Agreements was reasonable, and approved the continuation of the Advisory Agreements for a one-year term.
24 | Allspring Mid Cap Growth Fund
For more information
More information about Allspring Funds is available free upon request. To obtain literature, please write, visit the Fund’s website, or call:
Allspring Funds
P.O. Box 219967
Kansas City, MO 64121-9967
Website: allspringglobal.com
Individual investors: 1-800-222-8222
Retail investment professionals: 1-888-877-9275
Institutional investment professionals: 1-800-260-5969
This report and the financial statements contained herein are submitted for the general information of the shareholders of the Fund. If this report is used for promotional purposes, distribution of the report must be accompanied or preceded by a current prospectus. Before investing, please consider the investment objectives, risks, charges, and expenses of the investment. For a current prospectus and, if available, a summary prospectus, containing this information, call 1-800-222-8222 or visit the Fund’s website at allspringglobal.com. Read the prospectus carefully before you invest or send money.
Allspring Global InvestmentsTM is the trade name for the asset management firms of Allspring Global Investments Holdings, LLC, a holding company indirectly owned by certain private funds of GTCR LLC and Reverence Capital Partners, L.P. These firms include but are not limited to Allspring Global Investments, LLC, and Allspring Funds Management, LLC. Certain products managed by Allspring entities are distributed by Allspring Funds Distributor, LLC (a broker-dealer and Member FINRA/SIPC).
This material is for general informational and educational purposes only and is NOT intended to provide investment advice or a recommendation of any kind - including a recommendation for any specific investment, strategy, or plan.
© 2024 Allspring Global Investments Holdings, LLC. All rights reserved.
NCSR3018 09-24
Allspring Special Mid Cap Value Fund
Long Form Financial Statements
Annual Report
Allspring Special Mid Cap Value Fund | 1
Portfolio of investments—September 30, 2024
| | | | | |
| | | | | | |
Consumer discretionary: 4.27% | | | | | | |
Automobile components: 1.00% | | | | | | |
| | | | | | |
| | | | | | |
| | | | | | |
Hotels, restaurants & leisure: 1.34% | | | | | | |
| | | | | | |
| | | | | | |
| | | | | | |
| | | | | | |
| | | | | | |
| | | | | | |
| | | | | | |
| | | | | | |
| | | | | | |
| | | | | | |
Household products: 4.04% | | | | | | |
Church & Dwight Co., Inc. | | | | | | |
Reynolds Consumer Products, Inc. | | | | | | |
| | | | | | |
| | | | | | |
Energy equipment & services: 1.29% | | | | | | |
| | | | | | |
| | | | | | |
| | | | | | |
Oil, gas & consumable fuels: 3.59% | | | | | | |
| | | | | | |
| | | | | | |
| | | | | | |
| | | | | | |
| | | | | | |
| | | | | | |
| | | | | | |
| | | | | | |
| | | | | | |
| | | | | | |
| | | | | | |
The accompanying notes are an integral part of these financial statements.
2 | Allspring Special Mid Cap Value Fund
Portfolio of investments—September 30, 2024
| | | | | |
| | | | | | |
Jefferies Financial Group, Inc. | | | | | | |
Pershing Square Tontine Holdings Ltd.♦† | | | | | | |
| | | | | | |
Financial services: 1.69% | | | | | | |
Euronet Worldwide, Inc.♠† | | | | | | |
| | | | | | |
| | | | | | |
| | | | | | |
Axis Capital Holdings Ltd. | | | | | | |
| | | | | | |
| | | | | | |
| | | | | | |
Mortgage real estate investment trusts (REITs): 2.04% | | | | | | |
Annaly Capital Management, Inc. | | | | | | |
| | | | | | |
Health care equipment & supplies: 3.04% | | | | | | |
| | | | | | |
Zimmer Biomet Holdings, Inc. | | | | | | |
| | | | | | |
Health care providers & services: 3.15% | | | | | | |
| | | | | | |
| | | | | | |
| | | | | | |
Life sciences tools & services: 2.55% | | | | | | |
Charles River Laboratories International, Inc.† | | | | | | |
| | | | | | |
| | | | | | |
| | | | | | |
Aerospace & defense: 2.54% | | | | | | |
L3Harris Technologies, Inc. | | | | | | |
| | | | | | |
| | | | | | |
Commercial services & supplies: 2.60% | | | | | | |
Republic Services, Inc. Class A | | | | | | |
Construction & engineering: 1.36% | | | | | | |
| | | | | | |
| | | | | | |
| | | | | | |
The accompanying notes are an integral part of these financial statements.
Allspring Special Mid Cap Value Fund | 3
Portfolio of investments—September 30, 2024
| | | | | |
Ground transportation: 1.27% | | | | | | |
Knight-Swift Transportation Holdings, Inc. | | | | | | |
| | | | | | |
| | | | | | |
Gates Industrial Corp. PLC† | | | | | | |
| | | | | | |
Professional services: 3.54% | | | | | | |
| | | | | | |
Dun & Bradstreet Holdings, Inc. | | | | | | |
| | | | | | |
| | | | | | |
Trading companies & distributors: 3.04% | | | | | | |
| | | | | | |
Information technology: 5.26% | | | | | | |
| | | | | | |
| | | | | | |
Semiconductors & semiconductor equipment: 2.88% | | | | | | |
| | | | | | |
| | | | | | |
| | | | | | |
| | | | | | |
Informatica, Inc. Class A† | | | | | | |
| | | | | | |
| | | | | | |
| | | | | | |
| | | | | | |
| | | | | | |
| | | | | | |
Construction materials: 2.67% | | | | | | |
| | | | | | |
Containers & packaging: 3.31% | | | | | | |
| | | | | | |
Graphic Packaging Holding Co. | | | | | | |
| | | | | | |
| | | | | | |
| | | | | | |
| | | | | | |
| | | | | | |
| | | | | | |
The accompanying notes are an integral part of these financial statements.
4 | Allspring Special Mid Cap Value Fund
Portfolio of investments—September 30, 2024
| | | | | |
Real estate management & development: 4.02% | | | | | | |
CBRE Group, Inc. Class A† | | | | | | |
Specialized REITs : 4.64% | | | | | | |
| | | | | | |
Gaming & Leisure Properties, Inc. | | | | | | |
| | | | | | |
| | | | | | |
| | | | | | |
Electric utilities: 4.79% | | | | | | |
American Electric Power Co., Inc. | | | | | | |
| | | | | | |
| | | | | | |
| | | | | | |
American Water Works Co., Inc. | | | | | | |
Total common stocks (Cost $9,454,855,875) | | | | | | |
| | | | | |
| | | | | | |
| | | | | | |
| | | | | | |
Pershing Square Holdings Ltd.♦† | | | | | | |
| | | | | | |
| | | | | | |
| | | | | | |
| | | | | | |
Pershing Square Holdings Ltd.♦† | | | | | | |
Total warrants (Cost $4,560,928) | | | | | | |
| | | | | |
Short-term investments: 4.65% | | | | | | |
Investment companies: 4.65% | | | | | | |
Allspring Government Money Market Fund Select Class♠∞ | | | | | | |
Total short-term investments (Cost $662,433,599) | | | | | | |
Total investments in securities (Cost $10,121,850,402) | | | | | | |
Other assets and liabilities, net | | | | | | |
| | | | | | |
| Non-income-earning security |
| The security is fair valued in accordance with procedures approved by the Board of Trustees. |
| The issuer of the security is an affiliated person of the Fund as defined in the Investment Company Act of 1940. |
| The rate represents the 7-day annualized yield at period end. |
The accompanying notes are an integral part of these financial statements.
Allspring Special Mid Cap Value Fund | 5
Portfolio of investments—September 30, 2024
|
| Real estate investment trust |
Investments in affiliates
An affiliated investment is an investment in which the Fund owns at least 5% of the outstanding voting shares of the issuer or as a result of other relationships, such as the Fund and the issuer having the same investment manager. Transactions with issuers that were affiliates of the Fund at the end of the period were as follows:
| | | | | Net
change in
unrealized
gains
(losses) | | | Income
from
affiliated
securities |
| | | | | | | | |
| | | | | | | | |
| | | | | | | | |
Allspring Government Money Market Fund Select Class | | | | | | | | |
| | | | | | | | |
| Non-income-earning security |
Transactions with issuers that were no longer affiliates of the Fund at the end of the period were as follows:
| | | | | Net
change in
unrealized
gains
(losses) | | | Income
from
affiliated
securities |
| | | | | | | | |
Reynolds Consumer Products, Inc. | | | | | | | | |
The accompanying notes are an integral part of these financial statements.
6 | Allspring Special Mid Cap Value Fund
Statement of assets and liabilities—September 30, 2024
Financial statements
Statement of assets and liabilities
| |
Investments in unaffiliated securities, at value (cost $9,248,603,899) | |
Investments in affiliated securities, at value (cost $873,246,503) | |
| |
| |
Receivable for Fund shares sold | |
Receivable for investments sold | |
Prepaid expenses and other assets | |
| |
| |
Payable for investments purchased | |
Payable for Fund shares redeemed | |
| |
Administration fees payable | |
Shareholder servicing fee payable | |
Distribution fees payable | |
Accrued expenses and other liabilities | |
| |
| |
| |
| |
Total distributable earnings | |
| |
Computation of net asset value and offering price per share | |
| |
Shares outstanding–Class A1 | |
Net asset value per share–Class A | |
Maximum offering price per share – Class A2 | |
| |
Shares outstanding–Class C1 | |
Net asset value per share–Class C | |
| |
Shares outstanding–Class R61 | |
Net asset value per share–Class R6 | |
Net assets–Administrator Class | |
Shares outstanding–Administrator Class1 | |
Net asset value per share–Administrator Class | |
Net assets–Institutional Class | |
Shares outstanding–Institutional Class1 | |
Net asset value per share–Institutional Class | |
1 The Fund has an unlimited number of authorized shares.
2 Maximum offering price is computed as 100/94.25 of net asset value. On investments of $50,000 or more, the offering price is reduced.
The accompanying notes are an integral part of these financial statements.
Allspring Special Mid Cap Value Fund | 7
Statement of operations—year ended September 30, 2024
Statement of operations
| |
Dividends (net of foreign withholdings taxes of $87,406) | |
Income from affiliated securities | |
| |
| |
| |
| |
| |
| |
| |
| |
| |
| |
Shareholder servicing fees | |
| |
| |
| |
| |
| |
Custody and accounting fees | |
| |
| |
Shareholder report expenses | |
Trustees’ fees and expenses | |
| |
| |
| |
| |
| |
| |
Realized and unrealized gains (losses) on investments | |
Net realized gains (losses) on | |
| |
| |
| |
Net realized gains on investments | |
Net change in unrealized gains (losses) on | |
| |
| |
Net change in unrealized gains (losses) on investments | |
Net realized and unrealized gains (losses) on investments | |
Net increase in net assets resulting from operations | |
The accompanying notes are an integral part of these financial statements.
8 | Allspring Special Mid Cap Value Fund
Statement of changes in net assets
Statement of changes in net assets
| Year ended September 30, 2024 | Year ended September 30, 2023 |
| | | | |
| | | | |
Net realized gains on investments | | | | |
Net change in unrealized gains (losses) on investments | | | | |
Net increase in net assets resulting from operations | | | | |
Distributions to shareholders from | | | | |
Net investment income and net realized gains | | | | |
| | | | |
| | | | |
| | | | |
| | | | |
| | | | |
| | | | |
Total distributions to shareholders | | | | |
Capital share transactions | | | | |
Proceeds from shares sold | | | | |
| | | | |
| | | | |
| | | | |
| | | | |
| | | | |
| | | | |
| | | | |
Reinvestment of distributions | | | | |
| | | | |
| | | | |
| | | | |
| | | | |
| | | | |
| | | | |
| | | | |
Payment for shares redeemed | | | | |
| | | | |
| | | | |
| | | | |
| | | | |
| | | | |
| | | | |
| | | | |
1 For the period from October 1, 2022 to June 16, 2023
The accompanying notes are an integral part of these financial statements.
Allspring Special Mid Cap Value Fund | 9
Statement of changes in net assets
Statement of changes in net assets
| Year ended September 30, 2024 | Year ended September 30, 2023 |
| | | | |
Net asset value of shares issued in acquisition | | | | |
| | | | |
| | | | |
| | | | |
| | | | |
| | | | |
| | | | |
| | | | |
| | | | |
| | | | |
| | | | |
Net increase (decrease) in net assets resulting from capital share transactions | | | | |
Total increase in net assets | | | | |
| | | | |
| | | | |
| | | | |
2 Effective at the close of business on June 16, 2023, Class R shares were converted to Class A shares and are no longer offered by the Fund.
The accompanying notes are an integral part of these financial statements.
10 | Allspring Special Mid Cap Value Fund
Financial highlights
(For a share outstanding throughout each period)
| |
| | | | | |
Net asset value, beginning of period | | | | | |
| | | | | |
Net realized and unrealized gains (losses) on investments | | | | | |
Total from investment operations | | | | | |
Distributions to shareholders from | | | | | |
| | | | | |
| | | | | |
Total distributions to shareholders | | | | | |
Net asset value, end of period | | | | | |
| | | | | |
Ratios to average net assets (annualized) | | | | | |
| | | | | |
| | | | | |
| | | | | |
| | | | | |
| | | | | |
Net assets, end of period (000s omitted) | | | | | |
| Calculated based upon average shares outstanding |
| Total return calculations do not include any sales charges. Returns include adjustments required by U.S. GAAP and may differ from net asset values and performance reported elsewhere. |
The accompanying notes are an integral part of these financial statements.
Allspring Special Mid Cap Value Fund | 11
(For a share outstanding throughout each period)
| |
| | | | | |
Net asset value, beginning of period | | | | | |
Net investment income (loss) | | | | | |
Net realized and unrealized gains (losses) on investments | | | | | |
Total from investment operations | | | | | |
Distributions to shareholders from | | | | | |
| | | | | |
Net asset value, end of period | | | | | |
| | | | | |
Ratios to average net assets (annualized) | | | | | |
| | | | | |
| | | | | |
Net investment income (loss) | | | | | |
| | | | | |
| | | | | |
Net assets, end of period (000s omitted) | | | | | |
| Calculated based upon average shares outstanding |
| Total return calculations do not include any sales charges. Returns include adjustments required by U.S. GAAP and may differ from net asset values and performance reported elsewhere. |
The accompanying notes are an integral part of these financial statements.
12 | Allspring Special Mid Cap Value Fund
(For a share outstanding throughout each period)
| |
| | | | | |
Net asset value, beginning of period | | | | | |
| | | | | |
Net realized and unrealized gains (losses) on investments | | | | | |
Total from investment operations | | | | | |
Distributions to shareholders from | | | | | |
| | | | | |
| | | | | |
Total distributions to shareholders | | | | | |
Net asset value, end of period | | | | | |
| | | | | |
Ratios to average net assets (annualized) | | | | | |
| | | | | |
| | | | | |
| | | | | |
| | | | | |
| | | | | |
Net assets, end of period (000s omitted) | | | | | |
| Calculated based upon average shares outstanding |
| Returns include adjustments required by U.S. GAAP and may differ from net asset values and performance reported elsewhere. |
The accompanying notes are an integral part of these financial statements.
Allspring Special Mid Cap Value Fund | 13
(For a share outstanding throughout each period)
| |
| | | | | |
Net asset value, beginning of period | | | | | |
| | | | | |
Net realized and unrealized gains (losses) on investments | | | | | |
Total from investment operations | | | | | |
Distributions to shareholders from | | | | | |
| | | | | |
| | | | | |
Total distributions to shareholders | | | | | |
Net asset value, end of period | | | | | |
| | | | | |
Ratios to average net assets (annualized) | | | | | |
| | | | | |
| | | | | |
| | | | | |
| | | | | |
| | | | | |
Net assets, end of period (000s omitted) | | | | | |
| Calculated based upon average shares outstanding |
| Returns include adjustments required by U.S. GAAP and may differ from net asset values and performance reported elsewhere. |
The accompanying notes are an integral part of these financial statements.
14 | Allspring Special Mid Cap Value Fund
(For a share outstanding throughout each period)
| |
| | | | | |
Net asset value, beginning of period | | | | | |
| | | | | |
Net realized and unrealized gains (losses) on investments | | | | | |
Total from investment operations | | | | | |
Distributions to shareholders from | | | | | |
| | | | | |
| | | | | |
Total distributions to shareholders | | | | | |
Net asset value, end of period | | | | | |
| | | | | |
Ratios to average net assets (annualized) | | | | | |
| | | | | |
| | | | | |
| | | | | |
| | | | | |
| | | | | |
Net assets, end of period (000s omitted) | | | | | |
| Calculated based upon average shares outstanding |
| Returns include adjustments required by U.S. GAAP and may differ from net asset values and performance reported elsewhere. |
The accompanying notes are an integral part of these financial statements.
Allspring Special Mid Cap Value Fund | 15
Notes to financial statements
Notes to financial statements
Allspring Funds Trust (the “Trust”), a Delaware statutory trust organized on March 10, 1999, is an open-end management investment company registered under the Investment Company Act of 1940, as amended (the “1940 Act”). As an investment company, the Trust follows the accounting and reporting guidance in Financial Accounting Standards Board (“FASB”) Accounting Standards Codification Topic 946, Financial Services – Investment Companies. These financial statements report on the Allspring Special Mid Cap Value Fund (the “Fund”) which is a diversified series of the Trust.
Effective at the close of business on June 16, 2023, Class R shares became Class A shares in a tax-free conversion. Shareholders of Class R received Class A shares at a value equal to the value of their Class R shares immediately prior to the conversion. Class R shares are no longer offered by the Fund.
2.
SIGNIFICANT ACCOUNTING POLICIES
The following significant accounting policies, which are consistently followed in the preparation of the financial statements of the Fund, are in conformity with U.S. generally accepted accounting principles (“GAAP”) which require management to make estimates and assumptions that affect the reported amounts of assets and liabilities, disclosure of contingent assets and liabilities at the date of the financial statements, and the reported amounts of income and expenses during the reporting period. Actual results could differ from those estimates.
All investments are valued each business day as of the close of regular trading on the New York Stock Exchange (generally 4 p.m. Eastern Time), although the Fund may deviate from this calculation time under unusual or unexpected circumstances.
Equity securities and exchange-traded funds that are listed on a foreign or domestic exchange or market are valued at the official closing price or, if none, the last sales price.
Options that are listed on a foreign or domestic exchange or market are valued at the closing mid-price. Non-listed options are valued at the evaluated price provided by an independent pricing service or, if a reliable price is not available, the quoted bid price from an independent broker-dealer.
Investments in registered open-end investment companies (other than those listed on a foreign or domestic exchange or market) are valued at net asset value.
Investments which are not valued using the methods discussed above are valued at their fair value, as determined in good faith by Allspring Funds Management, LLC (“Allspring Funds Management”), which was named the valuation designee by the Board of Trustees. As the valuation designee, Allspring Funds Management is responsible for day-to-day valuation activities for the Allspring Funds. In connection with these responsibilities, Allspring Funds Management has established a Valuation Committee and has delegated to it the authority to take any actions regarding the valuation of portfolio securities that the Valuation Committee deems necessary or appropriate, including determining the fair value of portfolio securities. On a quarterly basis, the Board of Trustees receives reports of valuation actions taken by the Valuation Committee. On at least an annual basis, the Board of Trustees receives an assessment of the adequacy and effectiveness of Allspring Funds Management’s process for determining the fair value of the portfolio of investments.
The Fund may write covered call options or secured put options on individual securities and/or indexes. When the Fund writes an option, an amount equal to the premium received is recorded as a liability and is subsequently adjusted to the current market value of the written option. Premiums received from written options that expire unexercised are recognized as realized gains on the expiration date. For exercised options, the difference between the premium received and the amount paid on effecting a closing purchase transaction, including brokerage commissions, is treated as a realized gain or loss. If a call option is exercised, the premium is added to the proceeds from the sale of the underlying security in calculating the realized gain or loss on the sale. If a put option is exercised, the premium reduces the cost of the security purchased. The Fund, as a writer of an option, bears the market risk of an unfavorable change in the price of the security and/or index underlying the written option.
The Fund may also purchase call or put options. Premiums paid are included in the Statement of Assets and Liabilities as investments, the values of which are subsequently adjusted based on the current market values of the options. Premiums paid for purchased options that expire are recognized as realized losses on the expiration date. Premiums paid for purchased options that are exercised or closed are added to the amount paid or offset against the proceeds received for the underlying security to determine the realized gain or loss. The risk of loss associated with purchased options is limited to the premium paid.
Options traded on an exchange are regulated and terms of the options are standardized. The Fund is subject to equity price risk. Purchased options traded over-the-counter expose the Fund to counterparty risk in the event the counterparty does not perform. This risk can be mitigated by having a master netting arrangement between the Fund and the counterparty and by having the counterparty post collateral to cover the Fund’s exposure to the counterparty.
Security transactions and income recognition
Securities transactions are recorded on a trade date basis. Realized gains or losses are recorded on the basis of identified cost.
16 | Allspring Special Mid Cap Value Fund
Notes to financial statements
Dividend income is recognized on the ex-dividend date. Dividend income is recorded net of foreign taxes withheld where recovery of such taxes is not assured.
Interest earned on cash balances held at the custodian is recorded as interest income.
Distributions received from REIT investments may be characterized as ordinary income, capital gains, or a return of capital to the Fund based on information provided by the REIT. The proper characterization of REIT distributions is generally not known until after the end of each calendar year. As such, estimates may be used in reporting the character of income and distributions for financial statement purposes.
Distributions to shareholders
Distributions to shareholders from net investment income and any net realized gains are recorded on the ex-dividend date and paid at least annually. Such distributions are determined in accordance with income tax regulations and may differ from U.S. GAAP. Dividend sources are estimated at the time of declaration. The tax character of distributions is determined as of the Fund’s fiscal year end. Therefore, a portion of the Fund’s distributions made prior to the Fund’s fiscal year end may be categorized as a tax return of capital at year end.
The Fund intends to continue to qualify as a regulated investment company by distributing substantially all of its investment company taxable income and any net realized capital gains (after reduction for capital loss carryforwards) sufficient to relieve it from all, or substantially all, federal income taxes. Accordingly, no provision for federal income taxes was required.
The Fund’s income and federal excise tax returns and all financial records supporting those returns for the prior three fiscal years are subject to examination by the federal and Delaware revenue authorities. Management has analyzed the Fund’s tax positions taken on federal, state, and foreign tax returns, as applicable, for all open tax years and does not believe that there are any uncertain tax positions that require recognition of a tax liability.
As of September 30, 2024, the aggregate cost of all investments for federal income tax purposes was $10,140,431,053 and the unrealized gains (losses) consisted of:
Reclassifications are made to the Fund’s capital accounts for permanent tax differences to reflect income and gains available for distribution (or available capital loss carryforwards) under federal income tax regulations. U.S. GAAP require that certain components of net assets be adjusted to reflect permanent differences between financial and tax reporting. These reclassifications have no effect on net assets or net asset values per share. At September 30, 2024, as a result of permanent book-to-tax differences, the following reclassification adjustments were made on the Statements of Assets and Liabilities:
| Total distributable
earnings |
| |
The separate classes of shares offered by the Fund differ principally in applicable sales charges, distribution, shareholder servicing, and administration fees. Class specific expenses are charged directly to that share class. Investment income, common fund-level expenses, and realized and unrealized gains (losses) on investments are allocated daily to each class of shares based on the relative proportion of net assets of each class.
3.
FAIR VALUATION MEASUREMENTS
Fair value measurements of investments are determined within a framework that has established a fair value hierarchy based upon the various data inputs utilized in determining the value of the Fund’s investments. The three-level hierarchy gives the highest priority to unadjusted quoted prices in active markets for identical assets or liabilities (Level 1) and the lowest priority to unobservable inputs (Level 3). The Fund’s investments are classified within the fair value hierarchy based on the lowest level of input that is significant to the fair value measurement. The inputs are summarized into three broad levels as follows:
•Level 1—quoted prices in active markets for identical securities
•Level 2—other significant observable inputs (including quoted prices for similar securities, interest rates, prepayment speeds, credit risk, etc.)
•Level 3—significant unobservable inputs (including the Fund’s own assumptions in determining the fair value of investments)
The inputs or methodologies used for valuing investments in securities are not necessarily an indication of the risk associated with investing in those securities.
Allspring Special Mid Cap Value Fund | 17
Notes to financial statements
The following is a summary of the inputs used in valuing the Fund’s assets and liabilities as of September 30, 2024:
| | Other significant
observable inputs
(Level 2) | Significant
unobservable inputs
(Level 3) | |
| | | | |
| | | | |
| | | | |
| | | | |
| | | | |
| | | | |
| | | | |
| | | | |
| | | | |
| | | | |
| | | | |
| | | | |
| | | | |
| | | | |
| | | | |
| | | | |
| | | | |
| | | | |
| | | | |
| | | | |
Additional sector, industry or geographic detail, if any, is included in the Portfolio of Investments.
At September 30, 2024, the Fund did not have any transfers into/out of Level 3.
4.
TRANSACTIONS WITH AFFILIATES
Allspring Funds Management, a wholly owned subsidiary of Allspring Global Investments Holdings, LLC, a holding company indirectly owned by certain private funds of GTCR LLC and Reverence Capital Partners, L.P., is the manager of the Fund and provides advisory and fund-level administrative services under an investment management agreement. Under the investment management agreement, Allspring Funds Management is responsible for, among other services, implementing the investment objectives and strategies of the Fund, supervising the subadviser and providing fund-level administrative services in connection with the Fund’s operations. As compensation for its services under the investment management agreement, Allspring Funds Management is entitled to receive a management fee, which is generally paid monthly, at the following annual rate based on the Fund’s average daily net assets:
For the year ended September 30, 2024, the management fee was equivalent to an annual rate of 0.66% of the Fund’s average daily net assets.
Allspring Funds Management has retained the services of a subadviser to provide daily portfolio management to the Fund. The fee for subadvisory services is borne by Allspring Funds Management. Allspring Global Investments, LLC, an affiliate of Allspring Funds Management and a wholly owned subsidiary of Allspring Global Investments Holdings, LLC, is the subadviser to the Fund and is entitled to receive a fee from Allspring Funds Management at an annual rate starting at 0.45% and declining to 0.30% as the average daily net assets of the Fund increase.
18 | Allspring Special Mid Cap Value Fund
Notes to financial statements
Administration fees
Under a class-level administration agreement, Allspring Funds Management provides class-level administrative services to the Fund, which includes paying fees and expenses for services provided by the transfer agent, sub-transfer agents, omnibus account servicers and record-keepers. As compensation for its services under the class-level administration agreement, Allspring Funds Management receives an annual fee which is calculated based on the average daily net assets of each class and generally paid monthly, as follows:
| Class-level
administration fee |
| |
| |
| |
| |
| |
Waivers and/or expense reimbursements
Allspring Funds Management has contractually committed to waive and/or reimburse management and administration fees to the extent necessary to maintain certain net operating expense ratios for the Fund. When each class of the Fund has exceeded its expense cap, Allspring Funds Management will waive fees and/or reimburse expenses from fund-level expenses on a proportionate basis and then from class specific expenses. When only certain classes exceed their expense caps, waivers and/or reimbursements are applied against class specific expenses before fund-level expenses. Allspring Funds Management has contractually committed through January 31, 2025 to waive fees and/or reimburse expenses to the extent necessary to cap the Fund’s expenses. Prior to or after the commitment expiration date, the cap may be increased or the commitment to maintain the cap may be terminated only with the approval of the Board of Trustees. As of September 30, 2024, the contractual caps are as follows:
The Trust has adopted a distribution plan for Class C and Class R shares pursuant to Rule 12b-1 under the 1940 Act. Distribution fees are charged to Class C and paid to Allspring Funds Distributor, LLC (“Allspring Funds Distributor”), the principal underwriter, an affiliate of Allspring Funds Management, at an annual rate up to 0.75% of the average daily net assets of Class C shares.
In addition, Allspring Funds Distributor is entitled to receive the front-end sales charge from the purchase of Class A shares and a contingent deferred sales charge on the redemption of certain Class A shares. Allspring Funds Distributor is also entitled to receive the contingent deferred sales charges from redemptions of Class C shares. For the year ended September 30, 2024, Allspring Funds Distributor received $20,877 from the sale of Class A shares. No contingent deferred sales charges were incurred by Class A and Class C shares for the year ended September 30, 2024.
Shareholder servicing fees
The Trust has entered into contracts with one or more shareholder servicing agents, whereby Class A, Class C and Administrator Class are charged a fee at an annual rate up to 0.25% of the average daily net assets of each respective class and are generally paid on a monthly basis. A portion of these total shareholder servicing fees were paid to affiliates of the Fund.
The Fund may purchase or sell portfolio investment securities to certain affiliates pursuant to Rule 17a-7 under the 1940 Act and under procedures adopted by the Board of Trustees. The procedures have been designed to ensure that these interfund transactions, which do not incur broker commissions, are effected at current market prices. Pursuant to these procedures, the Fund did not have any interfund transactions during the year ended September 30, 2024.
5.
INVESTMENT PORTFOLIO TRANSACTIONS
Purchases and sales of investments, excluding U.S. government obligations (if any) and short-term securities, for the year ended September 30, 2024 were $2,357,436,889 and $3,241,712,378, respectively.
Allspring Special Mid Cap Value Fund | 19
Notes to financial statements
6.
DERIVATIVE TRANSACTIONS
During the year ended September 30, 2024, the Fund entered into written options for income generation and hedging purposes. The Fund had an average of 1,231 written option contracts during year ended September 30, 2024.
For the year ended September 30, 2024, there were no open written option contracts.
After the close of business on February 23, 2024, the Fund acquired the net assets of Allspring C&B Mid Cap Value Fund. The purpose of the transaction was to combine two funds with similar investment objectives and strategies. Shareholders holding Class A, Class C, Class R6, Administrator Class and Institutional Class shares of Allspring C&B Mid Cap Value Fund received Class A, Class C, Class R6, Administrator Class and Institutional Class shares, respectively, of the Fund in the reorganization. The acquisition was accomplished by a tax-free exchange of all of the shares of Allspring C&B Mid Cap Value Fund for 4,093,299 shares of the Fund valued at $190,092,439 at an exchange ratio of 0.66, 0.61, 0.65, 0.66 and 0.65 for Class A, Class C, Class R6, Administrator Class and Institutional Class shares, respectively. The investment portfolio of Allspring C&B Mid Cap Value Fund with a fair value of $197,862,214, identified cost of $184,956,851 and unrealized gains (losses) of $12,905,363 at February 23, 2024 was the principal assets acquired by the Fund. The aggregate net assets of Allspring C&B Mid Cap Value Fund and the Fund immediately prior to the acquisition were $190,092,439 and $12,652,366,791, respectively. The aggregate net assets of the Fund immediately after the acquisition were $12,842,459,230. For financial reporting purposes, assets received and shares issued by the Fund were recorded at fair value; however, the cost basis of the investments received from Allspring C&B Mid Cap Value Fund was carried forward to align with ongoing reporting of the Fund’s realized and unrealized gains and losses with amounts distributable to shareholders for tax purposes.
Assuming the acquisition had been completed October 1, 2023, the beginning of the annual reporting period for the Fund, the pro forma results of operations for the year ended September 30, 2024 would have been as follows:
| |
Net realized and unrealized gains (losses) on investments | |
Net increase in net assets resulting from operations | |
Because the combined investment portfolios have been managed as a single integrated portfolio since the acquisition was completed, it is not practicable to separate the amounts of revenue and earnings of the Allspring C&B Mid Cap Value Fund that have been included in the Fund’s Statement of Operations since February 24, 2024.
The Trust (excluding the money market funds), Allspring Master Trust and Allspring Variable Trust are parties to a $275,000,000 (prior to July 9, 2024: $350,000,000), revolving credit agreement whereby the Fund is permitted to use bank borrowings for temporary or emergency purposes, such as to fund shareholder redemption requests. Interest under the credit agreement is charged to the Fund based on a borrowing rate equal to the higher of the Federal Funds rate or the overnight bank funding rate in effect on that day plus a spread. In addition, an annual commitment fee based on the unused balance is allocated to each participating fund.
For the year ended September 30, 2024, there were no borrowings by the Fund under the agreement.
9.
DISTRIBUTIONS TO SHAREHOLDERS
The tax character of distributions paid were as follows:
As of September 30, 2024, the components of distributable earnings on a tax basis were as follows:
Undistributed
ordinary
income | Undistributed
long-term
gain | |
| | |
Under the Fund’s organizational documents, the officers and Trustees have been granted certain indemnification rights against certain liabilities that may arise out of performance of their duties to the Fund. The Fund has entered into a separate agreement with each Trustee that converts
20 | Allspring Special Mid Cap Value Fund
Notes to financial statements
indemnification rights currently existing under the Fund’s organizational documents into contractual rights that cannot be changed in the future without the consent of the Trustee. Additionally, in the normal course of business, the Fund may enter into contracts with service providers that contain a variety of indemnification clauses. The Fund’s maximum exposure under these arrangements is dependent on future claims that may be made against the Fund and, therefore, cannot be estimated.
Allspring Special Mid Cap Value Fund | 21
Report of independent registered public accounting firm
To the Shareholders of the Fund and Board of Trustees
Allspring Funds Trust:
Opinion on the Financial Statements
We have audited the accompanying statement of assets and liabilities of Allspring Special Mid Cap Value Fund (the Fund), one of the Funds constituting Allspring Funds Trust, including the portfolio of investments, as of September 30, 2024, the related statement of operations for the year then ended, the statements of changes in net assets for each of the years in the two-year period then ended, and the related notes (collectively, the financial statements) and the financial highlights for each of the years in the five-year period then ended. In our opinion, the financial statements and financial highlights present fairly, in all material respects, the financial position of the Fund as of September 30, 2024, the results of its operations for the year then ended, the changes in its net assets for each of the years in the two-year period then ended, and the financial highlights for each of the years in the five-year period then ended, in conformity with U.S. generally accepted accounting principles.
These financial statements and financial highlights are the responsibility of the Fund’s management. Our responsibility is to express an opinion on these financial statements and financial highlights based on our audits. We are a public accounting firm registered with the Public Company Accounting Oversight Board (United States) (PCAOB) and are required to be independent with respect to the Fund in accordance with the U.S. federal securities laws and the applicable rules and regulations of the Securities and Exchange Commission and the PCAOB.
We conducted our audits in accordance with the standards of the PCAOB. Those standards require that we plan and perform the audit to obtain reasonable assurance about whether the financial statements and financial highlights are free of material misstatement, whether due to error or fraud. Our audits included performing procedures to assess the risks of material misstatement of the financial statements and financial highlights, whether due to error or fraud, and performing procedures that respond to those risks. Such procedures included examining, on a test basis, evidence regarding the amounts and disclosures in the financial statements and financial highlights. Such procedures also included confirmation of securities owned as of September 30, 2024, by correspondence with the custodian, transfer agent and brokers, or by other appropriate auditing procedures. Our audits also included evaluating the accounting principles used and significant estimates made by management, as well as evaluating the overall presentation of the financial statements and financial highlights. We believe that our audits provide a reasonable basis for our opinion.

We have not been able to determine the specific year that we began serving as the auditor of one or more Allspring Funds investment companies; however, we are aware that we have served as the auditor of one or more Allspring Funds investment companies since at least 1955.
November 25, 2024
22 | Allspring Special Mid Cap Value Fund
Other information (unaudited)
Other information
For corporate shareholders, pursuant to Section 854 of the Internal Revenue Code, 82% of ordinary income dividends qualify for the corporate dividends-received deduction for the fiscal year ended September 30, 2024.
Pursuant to Section 852 of the Internal Revenue Code, $469,451,478 was designated as a 20% rate gain distribution for the fiscal year ended
September 30, 2024.
Pursuant to Section 854 of the Internal Revenue Code, $168,460,273 of income dividends paid during the fiscal year ended September 30, 2024 has been designated as qualified dividend income (QDI).
For the fiscal year ended September 30, 2024, $13,356,438 has been designated as interest-related dividends for nonresident alien shareholders pursuant to Section 871 of the Internal Revenue Code.
For the fiscal year ended September 30, 2024, $40,050,611 has been designated as short-term capital gain dividends for nonresident alien shareholders pursuant to Section 871 of the Internal Revenue Code.
A description of the policies and procedures used to determine how to vote proxies relating to portfolio securities is available without charge, upon request, by calling 1-866-259-3305, visiting our website at allspringglobal.com, or visiting the SEC website at sec.gov. Information regarding how the proxies related to portfolio securities were voted during the most recent 12-month period ended June 30 is available on the website at allspringglobal.com or by visiting the SEC website at sec.gov.
Quarterly portfolio holdings information
The Fund files its complete schedule of portfolio holdings with the SEC for the first and third quarters of each fiscal year as an exhibit to its reports on Form N-PORT. Shareholders may view the filed Form N-PORT by visiting the SEC website at sec.gov.
Allspring Special Mid Cap Value Fund | 23
Other information (unaudited)
Item 8. Changes in and disagreements with accountants
Item 9. Matters submitted to fund shareholders for a vote
Item 10. Remuneration paid to directors, officers and others
Refer to information in the Statement of operations.
24 | Allspring Special Mid Cap Value Fund
Other information (unaudited)
Item 11. Statement regarding basis for the board’s approval of investment advisory contract
Board consideration of investment management and sub-advisory agreements:
Under the Investment Company Act of 1940 (the “1940 Act”), the Board of Trustees (the “Board”) of Allspring Funds Trust (the “Trust”) must determine annually whether to approve the continuation of the Trust’s investment management and sub-advisory agreements. In this regard, at a Board meeting held on May 28-30, 2024 (the “Meeting”), the Board, all the members of which have no direct or indirect interest in the investment management and sub-advisory agreements and are not “interested persons” of the Trust, as defined in the 1940 Act (the “Independent Trustees”), reviewed and approved for the Allspring Special Mid Cap Value Fund (the “Fund”): (i) an investment management agreement (the “Management Agreement”) with Allspring Funds Management, LLC (“Allspring Funds Management”); and (ii) an investment sub-advisory agreement (the “Sub-Advisory Agreement”) with Allspring Global Investments, LLC (the “Sub-Adviser”), an affiliate of Allspring Funds Management. The Management Agreement and the Sub-Advisory Agreement are collectively referred to as the “Advisory Agreements.”
At the Meeting, the Board considered the factors and reached the conclusions described below relating to the selection of Allspring Funds Management and the Sub-Adviser and the approval of the Advisory Agreements. Prior to the Meeting, including at a meeting of the Board held in April 2024, and at the Meeting, the Trustees conferred extensively among themselves and with representatives of Allspring Funds Management about these matters. The Board has adopted a team-based approach, with each team consisting of a sub-set of Trustees, to assist the full Board in the discharge of its duties in reviewing investment performance and other matters throughout the year. The Independent Trustees were assisted in their evaluation of the Advisory Agreements by independent legal counsel, from whom they received separate legal advice and with whom they met separately.
In providing information to the Board, Allspring Funds Management and the Sub-Adviser were guided by a detailed set of requests for information submitted to them by independent legal counsel on behalf of the Independent Trustees at the start of the Board’s annual contract renewal process earlier in 2024. In considering and approving the Advisory Agreements, the Trustees considered the information they believed relevant, including but not limited to the information discussed below. The Board considered not only the specific information presented in connection with the Meeting, but also the knowledge gained over time through interactions with Allspring Funds Management and the Sub-Adviser about various topics. In this regard, the Board reviewed reports of Allspring Funds Management at each of its quarterly meetings, which included, among other things, portfolio reviews and investment performance reports. In addition, the Board and the teams mentioned above confer with portfolio managers at various times throughout the year. The Board did not identify any particular information or consideration that was all-important or controlling, and each individual Trustee may have attributed different weights to various factors.
After its deliberations, the Board unanimously determined that the compensation payable to Allspring Funds Management and the Sub-Adviser under each of the Advisory Agreements was reasonable, and approved the continuation of the Advisory Agreements for a one-year term. The Board considered the approval of the Advisory Agreements for the Fund as part of its consideration of agreements for funds across the complex, but its approvals were made on a fund-by-fund basis. The following summarizes a number of important, but not necessarily all, factors considered by the Board in support of its approvals.
Nature, extent, and quality of services
The Board received and considered various information regarding the nature, extent, and quality of services provided to the Fund by Allspring Funds Management and the Sub-Adviser under the Advisory Agreements. This information included a description of the investment advisory services and Fund-level administrative services covered by the Management Agreement, as well as, among other things, a summary of the background and experience of senior management of Allspring Global Investments, of which Allspring Funds Management and the Sub-Adviser are a part, and a summary of investments made in the Allspring Global Investments business.* The Board also received information about the services that continue to be provided by Wells Fargo & Co. and/or its affiliates (“Wells Fargo”) since the sale of Wells Fargo Asset Management to Allspring Global Investments Holdings, LLC, a holding company indirectly owned by certain private funds of GTCR LLC and Reverence Capital Partners, L.P., under a transition services agreement and an update on the anticipated timeline for exiting the transition services agreement. In addition, the Board received and considered information about the full range of services provided to the Fund by Allspring Funds Management and its affiliates.
The Board considered the qualifications, background, tenure, and responsibilities of each of the portfolio managers primarily responsible for the day-to-day portfolio management of the Fund. The Board evaluated the ability of Allspring Funds Management and the Sub-Adviser to attract and retain qualified investment professionals, including research, advisory, and supervisory personnel.
The Board further considered the compliance programs and compliance records of Allspring Funds Management and the Sub-Adviser. The Board received and considered information about Allspring Global Investments’ risk management functions, which included information about Allspring Funds
*
The trade name for the asset management firm that includes Allspring Funds Management and the Sub-Adviser is “Allspring Global Investments.”
Allspring Special Mid Cap Value Fund | 25
Other information (unaudited)
Management’s and the Sub-Adviser’s business continuity plans, their approaches to data privacy and cybersecurity, Allspring Funds Management’s role as administrator of the Fund’s liquidity risk management program, and fair valuation designee. The Board also received and considered information about Allspring Funds Management’s intermediary and vendor oversight program.
Fund investment performance and expenses
The Board considered the investment performance results for the Fund over various time periods ended December 31, 2023. The Board considered these results in comparison to the investment performance of funds in a universe that was determined by Broadridge Inc. (“Broadridge”) to be similar to the Fund (the “Universe”), and in comparison to the Fund’s benchmark index and to other comparative data. Broadridge is an independent provider of investment company data. The Board received a description of the methodology used by Broadridge to select the mutual funds in the performance Universe. The Board noted that the investment performance of the Fund (Administrator Class) was higher than the average investment performance of the Universe for three-, five-, and ten-year periods under review, and lower than the average investment performance of the Universe for one-year period under review. The Board also noted that the investment performance of the Fund was higher than the investment performance of its benchmark index, the Russell Midcap® Value Index, for the three-, five-, and ten-year periods under review, and higher for the one-year period under review.
The Board received information concerning, and discussed factors contributing to, the underperformance of the Fund relative to the Universe and benchmark for the periods identified above. The Board took note of the explanations for the relative underperformance during these periods, including with respect to the investment decisions that affected the Fund’s investment performance. The Board also took note of the Fund’s outperformance relative to the Universe and benchmark over the longer time periods under review.
The Board also received and considered information regarding the Fund’s net operating expense ratios and their various components, including actual management fees, custodian and other non-management fees, and Rule 12b-1 and non-Rule 12b-1 shareholder service fees. The Board considered these ratios in comparison to the median ratios of funds in class-specific expense groups that were determined by Broadridge to be similar to the Fund (the “Groups”). The Board received a description of the methodology used by Broadridge to select the mutual funds in the expense Groups and an explanation of how funds comprising expense Groups and their expense ratios may vary from year-to-year. Based on the Broadridge reports, the Board noted that the net operating expense ratios of the Fund were lower than, equal to or in range of the median net operating expense ratios of the expense Groups for each share class.
The Board took into account the Fund’s investment performance and expense information provided to it among the factors considered in deciding to re-approve the Advisory Agreements.
Investment management and sub-advisory fee rates
The Board reviewed and considered the contractual fee rates payable by the Fund to Allspring Funds Management under the Management Agreement, as well as the contractual fee rates payable by the Fund to Allspring Funds Management for class-level administrative services under a Class-Level Administration Agreement, which include, among other things, class-level transfer agency and sub-transfer agency costs (collectively, the “Management Rates”). The Board also reviewed and considered the contractual investment sub-advisory fee rates payable by Allspring Funds Management to the Sub-Adviser for investment sub-advisory services. It was noted that advisory fee waivers, if any, are at the fund level and not class level.
Among other information reviewed by the Board was a comparison of the Fund’s Management Rates with the average contractual investment management fee rates of funds in the expense Groups at a common asset level as well as transfer agency costs of the funds in the expense Groups. The Board noted that the Management Rates of the Fund were lower than or in range of the sum of these average rates for the Fund’s expense Groups for each share class.
The Board also received and considered information about the portion of the total management fee that was retained by Allspring Funds Management after payment of the fee to the Sub-Adviser for sub-advisory services. In assessing the reasonableness of this amount, the Board received and evaluated information about the nature and extent of responsibilities retained and risks assumed by Allspring Funds Management and not delegated to or assumed by the Sub-Adviser, and about Allspring Funds Management’s on-going oversight services. Given the affiliation between Allspring Funds Management and the Sub-Adviser, the Board ascribed limited relevance to the allocation of fees between them.
The Board also received and considered information about the nature and extent of services offered and fee rates charged by Allspring Funds Management and the Sub-Adviser to other types of clients with investment strategies similar to those of the Fund. In this regard, the Board received information about the significantly greater scope of services, and compliance, reporting and other legal and regulatory obligations and risks of managing proprietary mutual funds compared with those associated with managing assets of other types of clients, including third-party sub-advised fund clients and non-mutual fund clients such as institutional separate accounts.
Based on its consideration of the factors and information it deemed relevant, including those described here, the Board determined that the compensation payable to Allspring Funds Management under the Management Agreement and to the Sub-Adviser under the Sub-Advisory Agreement was reasonable.
26 | Allspring Special Mid Cap Value Fund
Other information (unaudited)
Profitability
The Board received and considered information concerning the profitability of Allspring Funds Management, as well as the profitability of Allspring Global Investments, from providing services to the fund complex as a whole. The Board noted that the Sub-Adviser’s profitability information with respect to providing services to the Fund and other funds in the complex was subsumed in the Allspring Global Investments profitability analysis.
Allspring Funds Management reported on the methodologies and estimates used in calculating profitability, including a description of the methodology used to allocate certain expenses. Among other things, the Board noted that the levels of profitability reported on a fund-by-fund basis varied widely, depending on factors such as the size, type, and age of fund.
Based on its review, the Board did not deem the profits reported by Allspring Funds Management or Allspring Global Investments from services provided to the Fund to be at a level that would prevent it from approving the continuation of the Advisory Agreements.
The Board received and considered information about the potential for Allspring Funds Management to experience economies of scale in the provision of management services to the Fund, the difficulties of isolating and quantifying economies of scale at an individual fund level, and the extent to which potential scale benefits are shared with Fund shareholders. The Board noted the existence of breakpoints in the Fund’s management fee structure, which operate generally to reduce the Fund’s expense ratios as the Fund grows in size, and the size of the Fund in relation to such breakpoints. The Board considered that in addition to management fee breakpoints, Allspring Funds Management shares potential economies of scale from its management business in a variety of ways, including through fee waiver and expense reimbursement arrangements, competitive management fee rates set at the outset without regard to breakpoints, and investments in the business intended to enhance services available to shareholders.
The Board concluded that Allspring Funds Management’s arrangements with respect to the Fund, including contractual breakpoints, constituted a reasonable approach to sharing potential economies of scale with the Fund and its shareholders.
Other benefits to Allspring Funds Management and the Sub-Adviser
The Board received and considered information regarding potential “fall-out” or ancillary benefits received by Allspring Funds Management and its affiliates, including the Sub-Adviser, as a result of their relationships with the Fund. Ancillary benefits could include, among others, benefits directly attributable to other relationships with the Fund and benefits potentially derived from an increase in Allspring Funds Management’s and the Sub-Adviser’s business as a result of their relationships with the Fund. The Board noted that Allspring Funds Distributor, LLC, an affiliate of Allspring Funds Management, receives distribution-related fees in respect of shares sold or held through it. The Board also reviewed information about soft dollar credits earned and utilized by the Sub-Adviser.
Based on its consideration of the factors and information it deemed relevant, including those described here, the Board did not find that any ancillary benefits received by Allspring Funds Management and its affiliates, including the Sub-Adviser, were unreasonable.
At the Meeting, after considering the above-described factors and based on its deliberations and its evaluation of the information described above, the Board unanimously determined that the compensation payable to Allspring Funds Management and the Sub-Adviser under each of the Advisory Agreements was reasonable, and approved the continuation of the Advisory Agreements for a one-year term.
Allspring Special Mid Cap Value Fund | 27
This page is intentionally left blank.
For more information
More information about Allspring Funds is available free upon request. To obtain literature, please write, visit the Fund’s website, or call:
Allspring Funds
P.O. Box 219967
Kansas City, MO 64121-9967
Website: allspringglobal.com
Individual investors: 1-800-222-8222
Retail investment professionals: 1-888-877-9275
Institutional investment professionals: 1-800-260-5969
This report and the financial statements contained herein are submitted for the general information of the shareholders of the Fund. If this report is used for promotional purposes, distribution of the report must be accompanied or preceded by a current prospectus. Before investing, please consider the investment objectives, risks, charges, and expenses of the investment. For a current prospectus and, if available, a summary prospectus, containing this information, call 1-800-222-8222 or visit the Fund’s website at allspringglobal.com. Read the prospectus carefully before you invest or send money.
Allspring Global InvestmentsTM is the trade name for the asset management firms of Allspring Global Investments Holdings, LLC, a holding company indirectly owned by certain private funds of GTCR LLC and Reverence Capital Partners, L.P. These firms include but are not limited to Allspring Global Investments, LLC, and Allspring Funds Management, LLC. Certain products managed by Allspring entities are distributed by Allspring Funds Distributor, LLC (a broker-dealer and Member FINRA/SIPC).
This material is for general informational and educational purposes only and is NOT intended to provide investment advice or a recommendation of any kind - including a recommendation for any specific investment, strategy, or plan.
© 2024 Allspring Global Investments Holdings, LLC. All rights reserved.
NCSR3323 09-24
Allspring Opportunity Fund
Long Form Financial Statements
Annual Report
Allspring Opportunity Fund | 1
Portfolio of investments—September 30, 2024
| | | | | |
| | | | | | |
Communication services: 8.22% | | | | | | |
Interactive media & services: 8.22% | | | | | | |
| | | | | | |
Meta Platforms, Inc. Class A | | | | | | |
| | | | | | |
Consumer discretionary: 10.11% | | | | | | |
| | | | | | |
| | | | | | |
Hotels, restaurants & leisure: 1.64% | | | | | | |
| | | | | | |
| | | | | | |
| | | | | | |
| | | | | | |
| | | | | | |
| | | | | | |
Consumer staples distribution & retail: 2.45% | | | | | | |
| | | | | | |
| | | | | | |
| | | | | | |
Household products: 1.29% | | | | | | |
Church & Dwight Co., Inc. | | | | | | |
| | | | | | |
| | | | | | |
| | | | | | |
Intercontinental Exchange, Inc. | | | | | | |
| | | | | | |
| | | | | | |
Financial services: 3.45% | | | | | | |
| | | | | | |
| | | | | | |
Marsh & McLennan Cos., Inc. | | | | | | |
| | | | | | |
Health care equipment & supplies: 3.02% | | | | | | |
| | | | | | |
| | | | | | |
| | | | | | |
| | | | | | |
Health care providers & services: 2.22% | | | | | | |
| | | | | | |
The accompanying notes are an integral part of these financial statements.
2 | Allspring Opportunity Fund
Portfolio of investments—September 30, 2024
| | | | | |
Life sciences tools & services: 4.49% | | | | | | |
Agilent Technologies, Inc. | | | | | | |
Bio-Rad Laboratories, Inc. Class A† | | | | | | |
Thermo Fisher Scientific, Inc. | | | | | | |
| | | | | | |
| | | | | | |
Aerospace & defense: 3.42% | | | | | | |
| | | | | | |
| | | | | | |
| | | | | | |
| | | | | | |
| | | | | | |
| | | | | | |
| | | | | | |
Commercial services & supplies: 1.45% | | | | | | |
Republic Services, Inc. Class A | | | | | | |
Electrical equipment: 2.73% | | | | | | |
| | | | | | |
| | | | | | |
| | | | | | |
| | | | | | |
| | | | | | |
Professional services: 3.15% | | | | | | |
Dun & Bradstreet Holdings, Inc. | | | | | | |
| | | | | | |
| | | | | | |
| | | | | | |
Trading companies & distributors: 1.55% | | | | | | |
| | | | | | |
Information technology: 24.75% | | | | | | |
Electronic equipment, instruments & components: 3.59% | | | | | | |
| | | | | | |
Teledyne Technologies, Inc.† | | | | | | |
| | | | | | |
Semiconductors & semiconductor equipment: 5.26% | | | | | | |
| | | | | | |
| | | | | | |
| | | | | | |
| | | | | | |
| | | | | | |
Palo Alto Networks, Inc.† | | | | | | |
The accompanying notes are an integral part of these financial statements.
Allspring Opportunity Fund | 3
Portfolio of investments—September 30, 2024
| | | | | |
| | | | | | |
| | | | | | |
| | | | | | |
| | | | | | |
| | | | | | |
| | | | | | |
Technology hardware, storage & peripherals: 5.64% | | | | | | |
| | | | | | |
| | | | | | |
| | | | | | |
| | | | | | |
| | | | | | |
| | | | | | |
| | | | | | |
| | | | | | |
Containers & packaging: 1.25% | | | | | | |
| | | | | | |
| | | | | | |
| | | | | | |
| | | | | | |
Real estate management & development: 1.45% | | | | | | |
| | | | | | |
Residential REITs : 2.81% | | | | | | |
Mid-America Apartment Communities, Inc. | | | | | | |
| | | | | | |
| | | | | | |
Specialized REITs : 3.04% | | | | | | |
| | | | | | |
| | | | | | |
| | | | | | |
Total common stocks (Cost $1,040,883,654) | | | | | | |
| | | | | |
Short-term investments: 1.87% | | | | | | |
Investment companies: 1.87% | | | | | | |
Allspring Government Money Market Fund Select Class♠∞ | | | | | | |
Total short-term investments (Cost $36,958,073) | | | | | | |
Total investments in securities (Cost $1,077,841,727) | | | | | | |
Other assets and liabilities, net | | | | | | |
| | | | | | |
The accompanying notes are an integral part of these financial statements.
4 | Allspring Opportunity Fund
Portfolio of investments—September 30, 2024
| Non-income-earning security |
| The issuer of the security is an affiliated person of the Fund as defined in the Investment Company Act of 1940. |
| The rate represents the 7-day annualized yield at period end. |
|
| Real estate investment trust |
Investments in affiliates
An affiliated investment is an investment in which the Fund owns at least 5% of the outstanding voting shares of the issuer or as a result of other relationships, such as the Fund and the issuer having the same investment manager. Transactions with issuers that were affiliates of the Fund at the end of the period were as follows:
| | | | | Net
change in
unrealized
gains
(losses) | | | Income
from
affiliated
securities |
| | | | | | | | |
Allspring Government Money Market Fund Select Class | | | | | | | | |
The accompanying notes are an integral part of these financial statements.
Allspring Opportunity Fund | 5
Statement of assets and liabilities—September 30, 2024
Financial statements
Statement of assets and liabilities
| |
Investments in unaffiliated securities, at value (cost $1,040,883,654) | |
Investments in affiliated securities, at value (cost $36,958,073) | |
Foreign currency, at value (cost $109) | |
| |
Receivable for Fund shares sold | |
Prepaid expenses and other assets | |
| |
| |
Payable for Fund shares redeemed | |
| |
Shareholder servicing fee payable | |
Administration fees payable | |
| |
Trustees’ fees and expenses payable | |
Accrued expenses and other liabilities | |
| |
| |
| |
| |
Total distributable earnings | |
| |
Computation of net asset value and offering price per share | |
| |
Shares outstanding–Class A1 | |
Net asset value per share–Class A | |
Maximum offering price per share – Class A2 | |
| |
Shares outstanding–Class C1 | |
Net asset value per share–Class C | |
| |
Shares outstanding–Class R61 | |
Net asset value per share–Class R6 | |
Net assets–Administrator Class | |
Shares outstanding–Administrator Class1 | |
Net asset value per share–Administrator Class | |
Net assets–Institutional Class | |
Shares outstanding–Institutional Class1 | |
Net asset value per share–Institutional Class | |
1 The Fund has an unlimited number of authorized shares.
2 Maximum offering price is computed as 100/94.25 of net asset value. On investments of $50,000 or more, the offering price is reduced.
The accompanying notes are an integral part of these financial statements.
6 | Allspring Opportunity Fund
Statement of operations—year ended September 30, 2024
Statement of operations
| |
| |
Income from affiliated securities | |
| |
| |
| |
| |
| |
| |
| |
| |
| |
| |
Shareholder servicing fees | |
| |
| |
| |
| |
| |
Custody and accounting fees | |
| |
| |
Shareholder report expenses | |
Trustees’ fees and expenses | |
| |
| |
Less: Fee waivers and/or expense reimbursements | |
| |
| |
| |
| |
| |
| |
| |
Realized and unrealized gains (losses) on investments | |
| |
| |
Foreign currency and foreign currency translations | |
Net realized gains on investments | |
Net change in unrealized gains (losses) on | |
| |
Foreign currency and foreign currency translations | |
Net change in unrealized gains (losses) on investments | |
Net realized and unrealized gains (losses) on investments | |
Net increase in net assets resulting from operations | |
The accompanying notes are an integral part of these financial statements.
Allspring Opportunity Fund | 7
Statement of changes in net assets
Statement of changes in net assets
| Year ended September 30, 2024 | Year ended September 30, 2023 |
| | | | |
| | | | |
Net realized gains on investments | | | | |
Net change in unrealized gains (losses) on investments | | | | |
Net increase in net assets resulting from operations | | | | |
Distributions to shareholders from | | | | |
Net investment income and net realized gains | | | | |
| | | | |
| | | | |
| | | | |
| | | | |
| | | | |
Total distributions to shareholders | | | | |
Capital share transactions | | | | |
Proceeds from shares sold | | | | |
| | | | |
| | | | |
| | | | |
| | | | |
| | | | |
| | | | |
Reinvestment of distributions | | | | |
| | | | |
| | | | |
| | | | |
| | | | |
| | | | |
| | | | |
Payment for shares redeemed | | | | |
| | | | |
| | | | |
| | | | |
| | | | |
| | | | |
| | | | |
Net increase (decrease) in net assets resulting from capital share transactions | | | | |
Total increase in net assets | | | | |
| | | | |
| | | | |
| | | | |
The accompanying notes are an integral part of these financial statements.
8 | Allspring Opportunity Fund
Financial highlights
(For a share outstanding throughout each period)
| |
| | | | | |
Net asset value, beginning of period | | | | | |
Net investment income (loss) | | | | | |
| | | | | |
Net realized and unrealized gains (losses) on investments | | | | | |
Total from investment operations | | | | | |
Distributions to shareholders from | | | | | |
| | | | | |
| | | | | |
Total distributions to shareholders | | | | | |
Net asset value, end of period | | | | | |
| | | | | |
Ratios to average net assets (annualized) | | | | | |
| | | | | |
| | | | | |
Net investment income (loss) | | | | | |
| | | | | |
| | | | | |
Net assets, end of period (000s omitted) | | | | | |
| Calculated based upon average shares outstanding |
| Amount is less than $0.005. |
| Total return calculations do not include any sales charges. Returns include adjustments required by U.S. GAAP and may differ from net asset values and performance reported elsewhere. |
| During the year ended September 30, 2020, the Fund received a payment from an affiliate which had an impact of less than 0.005% to the total return. |
The accompanying notes are an integral part of these financial statements.
Allspring Opportunity Fund | 9
(For a share outstanding throughout each period)
| |
| | | | | |
Net asset value, beginning of period | | | | | |
| | | | | |
| | | | | |
Net realized and unrealized gains (losses) on investments | | | | | |
Total from investment operations | | | | | |
Distributions to shareholders from | | | | | |
| | | | | |
Net asset value, end of period | | | | | |
| | | | | |
Ratios to average net assets (annualized) | | | | | |
| | | | | |
| | | | | |
| | | | | |
| | | | | |
| | | | | |
Net assets, end of period (000s omitted) | | | | | |
| Calculated based upon average shares outstanding |
| Total return calculations do not include any sales charges. Returns include adjustments required by U.S. GAAP and may differ from net asset values and performance reported elsewhere. |
| During the year ended September 30, 2022, the Fund received payments from a service provider which had a 0.09% impact on the total return. |
| During the year ended September 30, 2020, the Fund received a payment from an affiliate which had a 1.44% impact on the total return. |
The accompanying notes are an integral part of these financial statements.
10 | Allspring Opportunity Fund
(For a share outstanding throughout each period)
| |
| | | | | |
Net asset value, beginning of period | | | | | |
| | | | | |
Net realized and unrealized gains (losses) on investments | | | | | |
Total from investment operations | | | | | |
Distributions to shareholders from | | | | | |
| | | | | |
| | | | | |
Total distributions to shareholders | | | | | |
Net asset value, end of period | | | | | |
| | | | | |
Ratios to average net assets (annualized) | | | | | |
| | | | | |
| | | | | |
| | | | | |
| | | | | |
| | | | | |
Net assets, end of period (000s omitted) | | | | | |
| For the period from May 29, 2020 (commencement of class operations) to September 30, 2020 |
| Calculated based upon average shares outstanding |
| Returns include adjustments required by U.S. GAAP and may differ from net asset values and performance reported elsewhere. Returns for periods of less than one year are not annualized. |
The accompanying notes are an integral part of these financial statements.
Allspring Opportunity Fund | 11
(For a share outstanding throughout each period)
| |
| | | | | |
Net asset value, beginning of period | | | | | |
Net investment income (loss) | | | | | |
Net realized and unrealized gains (losses) on investments | | | | | |
Total from investment operations | | | | | |
Distributions to shareholders from | | | | | |
| | | | | |
| | | | | |
Total distributions to shareholders | | | | | |
Net asset value, end of period | | | | | |
| | | | | |
Ratios to average net assets (annualized) | | | | | |
| | | | | |
| | | | | |
Net investment income (loss) | | | | | |
| | | | | |
| | | | | |
Net assets, end of period (000s omitted) | | | | | |
| Calculated based upon average shares outstanding |
| Amount is more than $(0.005). |
| Returns include adjustments required by U.S. GAAP and may differ from net asset values and performance reported elsewhere. |
The accompanying notes are an integral part of these financial statements.
12 | Allspring Opportunity Fund
(For a share outstanding throughout each period)
| |
| | | | | |
Net asset value, beginning of period | | | | | |
Net investment income (loss) | | | | | |
Net realized and unrealized gains (losses) on investments | | | | | |
Total from investment operations | | | | | |
Distributions to shareholders from | | | | | |
| | | | | |
| | | | | |
Total distributions to shareholders | | | | | |
Net asset value, end of period | | | | | |
| | | | | |
Ratios to average net assets (annualized) | | | | | |
| | | | | |
| | | | | |
Net investment income (loss) | | | | | |
| | | | | |
| | | | | |
Net assets, end of period (000s omitted) | | | | | |
| Calculated based upon average shares outstanding |
| Returns include adjustments required by U.S. GAAP and may differ from net asset values and performance reported elsewhere. |
The accompanying notes are an integral part of these financial statements.
Allspring Opportunity Fund | 13
Notes to financial statements
Notes to financial statements
Allspring Funds Trust (the “Trust”), a Delaware statutory trust organized on March 10, 1999, is an open-end management investment company registered under the Investment Company Act of 1940, as amended (the “1940 Act”). As an investment company, the Trust follows the accounting and reporting guidance in Financial Accounting Standards Board (“FASB”) Accounting Standards Codification Topic 946, Financial Services – Investment Companies. These financial statements report on the Allspring Opportunity Fund (the “Fund”) which is a diversified series of the Trust.
2.
SIGNIFICANT ACCOUNTING POLICIES
The following significant accounting policies, which are consistently followed in the preparation of the financial statements of the Fund, are in conformity with U.S. generally accepted accounting principles (“GAAP”) which require management to make estimates and assumptions that affect the reported amounts of assets and liabilities, disclosure of contingent assets and liabilities at the date of the financial statements, and the reported amounts of income and expenses during the reporting period. Actual results could differ from those estimates.
All investments are valued each business day as of the close of regular trading on the New York Stock Exchange (generally 4 p.m. Eastern Time), although the Fund may deviate from this calculation time under unusual or unexpected circumstances.
Equity securities and exchange-traded funds that are listed on a foreign or domestic exchange or market are valued at the official closing price or, if none, the last sales price.
The values of securities denominated in foreign currencies are translated into U.S. dollars at rates provided by an independent foreign currency pricing source at a time each business day specified by the Valuation Committee at Allspring Funds Management, LLC (“Allspring Funds Management”).
Many securities markets and exchanges outside the U.S. close prior to the close of the New York Stock Exchange and therefore may not fully reflect trading or events that occur after the close of the principal exchange in which the foreign securities are traded, but before the close of the New York Stock Exchange. If such trading or events are expected to materially affect the value of such securities, then fair value pricing procedures implemented by Allspring Funds Management are applied. These procedures take into account multiple factors including movements in U.S. securities markets after foreign exchanges close. Foreign securities that are fair valued under these procedures are categorized as Level 2 and the application of these procedures may result in transfers between Level 1 and Level 2. Depending on market activity, such fair valuations may be frequent. Such fair value pricing may result in net asset values that are higher or lower than net asset values based on the last reported sales price or latest quoted bid price. On September 30, 2024, such fair value pricing was not used in pricing foreign securities.
Investments in registered open-end investment companies (other than those listed on a foreign or domestic exchange or market) are valued at net asset value.
Investments which are not valued using the methods discussed above are valued at their fair value, as determined in good faith by Allspring Funds Management, which was named the valuation designee by the Board of Trustees. As the valuation designee, Allspring Funds Management is responsible for day-to-day valuation activities for the Allspring Funds. In connection with these responsibilities, Allspring Funds Management has established a Valuation Committee and has delegated to it the authority to take any actions regarding the valuation of portfolio securities that the Valuation Committee deems necessary or appropriate, including determining the fair value of portfolio securities. On a quarterly basis, the Board of Trustees receives reports of valuation actions taken by the Valuation Committee. On at least an annual basis, the Board of Trustees receives an assessment of the adequacy and effectiveness of Allspring Funds Management’s process for determining the fair value of the portfolio of investments.
Foreign currency translation
The accounting records of the Fund are maintained in U.S. dollars. The values of other assets and liabilities denominated in foreign currencies are translated into U.S. dollars at rates provided by an independent foreign currency pricing source at a time each business day specified by the Valuation Committee. Purchases and sales of securities, and income and expenses are converted at the rate of exchange on the respective dates of such transactions. Net realized foreign exchange gains or losses arise from sales of foreign currencies, currency gains or losses realized between the trade and settlement dates on securities transactions, and the difference between the amounts of dividends, interest and foreign withholding taxes recorded and the U.S. dollar equivalent of the amounts actually paid or received. Net unrealized foreign exchange gains and losses arise from changes in the fair value of assets and liabilities other than investments in securities resulting from changes in exchange rates. The changes in net assets arising from changes in exchange rates of securities and the changes in net assets resulting from changes in market prices of securities are not separately presented. Such changes are included in net realized and unrealized gains or losses from investments.
Security transactions and income recognition
Securities transactions are recorded on a trade date basis. Realized gains or losses are recorded on the basis of identified cost.
Dividend income is recognized on the ex-dividend date, except for certain dividends from foreign securities, which are recorded as soon as the custodian verifies the ex-dividend date.
14 | Allspring Opportunity Fund
Notes to financial statements
Interest earned on cash balances held at the custodian is recorded as interest income.
Distributions received from REIT investments may be characterized as ordinary income, capital gains, or a return of capital to the Fund based on information provided by the REIT. The proper characterization of REIT distributions is generally not known until after the end of each calendar year. As such, estimates may be used in reporting the character of income and distributions for financial statement purposes.
Distributions to shareholders
Distributions to shareholders from net investment income and any net realized gains are recorded on the ex-dividend date and paid at least annually. Such distributions are determined in accordance with income tax regulations and may differ from U.S. GAAP. Dividend sources are estimated at the time of declaration. The tax character of distributions is determined as of the Fund’s fiscal year end. Therefore, a portion of the Fund’s distributions made prior to the Fund’s fiscal year end may be categorized as a tax return of capital at year end.
The Fund intends to continue to qualify as a regulated investment company by distributing substantially all of its investment company taxable income and any net realized capital gains (after reduction for capital loss carryforwards) sufficient to relieve it from all, or substantially all, federal income taxes. Accordingly, no provision for federal income taxes was required.
The Fund’s income and federal excise tax returns and all financial records supporting those returns for the prior three fiscal years are subject to examination by the federal and Delaware revenue authorities. Management has analyzed the Fund’s tax positions taken on federal, state, and foreign tax returns, as applicable, for all open tax years and does not believe that there are any uncertain tax positions that require recognition of a tax liability.
As of September 30, 2024, the aggregate cost of all investments for federal income tax purposes was $1,084,275,369 and the unrealized gains (losses) consisted of:
The separate classes of shares offered by the Fund differ principally in applicable sales charges, distribution, shareholder servicing, and administration fees. Class specific expenses are charged directly to that share class. Investment income, common fund-level expenses, and realized and unrealized gains (losses) on investments are allocated daily to each class of shares based on the relative proportion of net assets of each class.
3.
FAIR VALUATION MEASUREMENTS
Fair value measurements of investments are determined within a framework that has established a fair value hierarchy based upon the various data inputs utilized in determining the value of the Fund’s investments. The three-level hierarchy gives the highest priority to unadjusted quoted prices in active markets for identical assets or liabilities (Level 1) and the lowest priority to unobservable inputs (Level 3). The Fund’s investments are classified within the fair value hierarchy based on the lowest level of input that is significant to the fair value measurement. The inputs are summarized into three broad levels as follows:
•Level 1—quoted prices in active markets for identical securities
•Level 2—other significant observable inputs (including quoted prices for similar securities, interest rates, prepayment speeds, credit risk, etc.)
•Level 3—significant unobservable inputs (including the Fund’s own assumptions in determining the fair value of investments)
The inputs or methodologies used for valuing investments in securities are not necessarily an indication of the risk associated with investing in those securities.
Allspring Opportunity Fund | 15
Notes to financial statements
The following is a summary of the inputs used in valuing the Fund’s assets and liabilities as of September 30, 2024:
| | Other significant
observable inputs
(Level 2) | Significant
unobservable inputs
(Level 3) | |
| | | | |
| | | | |
| | | | |
| | | | |
| | | | |
| | | | |
| | | | |
| | | | |
| | | | |
| | | | |
| | | | |
| | | | |
| | | | |
| | | | |
| | | | |
Additional sector, industry or geographic detail, if any, is included in the Portfolio of Investments.
At September 30, 2024, the Fund did not have any transfers into/out of Level 3.
4.
TRANSACTIONS WITH AFFILIATES
Allspring Funds Management, a wholly owned subsidiary of Allspring Global Investments Holdings, LLC, a holding company indirectly owned by certain private funds of GTCR LLC and Reverence Capital Partners, L.P., is the manager of the Fund and provides advisory and fund-level administrative services under an investment management agreement. Under the investment management agreement, Allspring Funds Management is responsible for, among other services, implementing the investment objectives and strategies of the Fund, supervising the subadviser and providing fund-level administrative services in connection with the Fund’s operations. As compensation for its services under the investment management agreement, Allspring Funds Management is entitled to receive a management fee, which is generally paid monthly, at the following annual rate based on the Fund’s average daily net assets:
For the year ended September 30, 2024, the management fee was equivalent to an annual rate of 0.72% of the Fund’s average daily net assets.
Allspring Funds Management has retained the services of a subadviser to provide daily portfolio management to the Fund. The fee for subadvisory services is borne by Allspring Funds Management. Allspring Global Investments, LLC, an affiliate of Allspring Funds Management and a wholly owned subsidiary of Allspring Global Investments Holdings, LLC, is the subadviser to the Fund and is entitled to receive a fee from Allspring Funds Management at an annual rate starting at 0.45% and declining to 0.30% as the average daily net assets of the Fund increase.
Under a class-level administration agreement, Allspring Funds Management provides class-level administrative services to the Fund, which includes paying fees and expenses for services provided by the transfer agent, sub-transfer agents, omnibus account servicers and record-keepers. As
16 | Allspring Opportunity Fund
Notes to financial statements
compensation for its services under the class-level administration agreement, Allspring Funds Management receives an annual fee which is calculated based on the average daily net assets of each class and generally paid monthly, as follows:
| Class-level
administration fee |
| |
| |
| |
| |
| |
Waivers and/or expense reimbursements
Allspring Funds Management has contractually committed to waive and/or reimburse management and administration fees to the extent necessary to maintain certain net operating expense ratios for the Fund. When each class of the Fund has exceeded its expense cap, Allspring Funds Management will waive fees and/or reimburse expenses from fund-level expenses on a proportionate basis and then from class specific expenses. When only certain classes exceed their expense caps, waivers and/or reimbursements are applied against class specific expenses before fund-level expenses. Allspring Funds Management has contractually committed through January 31, 2025 to waive fees and/or reimburse expenses to the extent necessary to cap the Fund’s expenses. Prior to or after the commitment expiration date, the cap may be increased or the commitment to maintain the cap may be terminated only with the approval of the Board of Trustees. As of September 30, 2024, the contractual caps are as follows:
The Trust has adopted a distribution plan for Class C shares pursuant to Rule 12b-1 under the 1940 Act. A distribution fee is charged to Class C shares and paid to Allspring Funds Distributor, LLC (“Allspring Funds Distributor”), the principal underwriter, an affiliate of Allspring Funds Management, at an annual rate up to 0.75% of the average daily net assets of Class C shares. Such fees are generally paid on a monthly basis.
In addition, Allspring Funds Distributor is entitled to receive the front-end sales charge from the purchase of Class A shares and a contingent deferred sales charge on the redemption of certain Class A shares. Allspring Funds Distributor is also entitled to receive the contingent deferred sales charges from redemptions of Class C shares. For the year ended September 30, 2024, Allspring Funds Distributor received $1,627 from the sale of Class A shares. No contingent deferred sales charges were incurred by Class A and Class C shares for the year ended September 30, 2024.
Shareholder servicing fees
The Trust has entered into contracts with one or more shareholder servicing agents, whereby Class A, Class C and Administrator Class are charged a fee at an annual rate up to 0.25% of the average daily net assets of each respective class and are generally paid on a monthly basis. A portion of these total shareholder servicing fees were paid to affiliates of the Fund.
The Fund may purchase or sell portfolio investment securities to certain affiliates pursuant to Rule 17a-7 under the 1940 Act and under procedures adopted by the Board of Trustees. The procedures have been designed to ensure that these interfund transactions, which do not incur broker commissions, are effected at current market prices. Pursuant to these procedures, the Fund did not have any interfund transactions during the year ended September 30, 2024.
5.
INVESTMENT PORTFOLIO TRANSACTIONS
Purchases and sales of investments, excluding U.S. government obligations (if any) and short-term securities, for the year ended September 30, 2024 were $358,682,072 and $534,201,665, respectively.
The Trust (excluding the money market funds), Allspring Master Trust and Allspring Variable Trust are parties to a $275,000,000 (prior to July 9, 2024: $350,000,000), revolving credit agreement whereby the Fund is permitted to use bank borrowings for temporary or emergency purposes, such as to fund shareholder redemption requests. Interest under the credit agreement is charged to the Fund based on a borrowing rate equal to the higher of
Allspring Opportunity Fund | 17
Notes to financial statements
the Federal Funds rate or the overnight bank funding rate in effect on that day plus a spread. In addition, an annual commitment fee based on the unused balance is allocated to each participating fund.
For the year ended September 30, 2024, there were no borrowings by the Fund under the agreement.
7.
DISTRIBUTIONS TO SHAREHOLDERS
The tax character of distributions paid were as follows:
As of September 30, 2024, the components of distributable earnings on a tax basis were as follows:
Undistributed
ordinary
income | Undistributed
long-term
gain | |
| | |
As of the end of the period, the Fund concentrated its portfolio of investments in the information technology sector. A fund that invests a substantial portion of its assets in any sector may be more affected by changes in that sector than would be a fund whose investments are not heavily weighted in any sector.
Under the Fund’s organizational documents, the officers and Trustees have been granted certain indemnification rights against certain liabilities that may arise out of performance of their duties to the Fund. The Fund has entered into a separate agreement with each Trustee that converts indemnification rights currently existing under the Fund’s organizational documents into contractual rights that cannot be changed in the future without the consent of the Trustee. Additionally, in the normal course of business, the Fund may enter into contracts with service providers that contain a variety of indemnification clauses. The Fund’s maximum exposure under these arrangements is dependent on future claims that may be made against the Fund and, therefore, cannot be estimated.
18 | Allspring Opportunity Fund
Report of independent registered public accounting firm
To the Shareholders of the Fund and Board of Trustees
Allspring Funds Trust:
Opinion on the Financial Statements
We have audited the accompanying statement of assets and liabilities of Allspring Opportunity Fund (the Fund), one of the Funds constituting Allspring Funds Trust, including the portfolio of investments, as of September 30, 2024, the related statement of operations for the year then ended, the statements of changes in net assets for each of the years in the two-year period then ended, and the related notes (collectively, the financial statements) and the financial highlights for each of the years or periods in the five-year period then ended. In our opinion, the financial statements and financial highlights present fairly, in all material respects, the financial position of the Fund as of September 30, 2024, the results of its operations for the year then ended, the changes in its net assets for each of the years in the two-year period then ended, and the financial highlights for each of the years or periods in the five-year period then ended, in conformity with U.S. generally accepted accounting principles.
These financial statements and financial highlights are the responsibility of the Fund’s management. Our responsibility is to express an opinion on these financial statements and financial highlights based on our audits. We are a public accounting firm registered with the Public Company Accounting Oversight Board (United States) (PCAOB) and are required to be independent with respect to the Fund in accordance with the U.S. federal securities laws and the applicable rules and regulations of the Securities and Exchange Commission and the PCAOB.
We conducted our audits in accordance with the standards of the PCAOB. Those standards require that we plan and perform the audit to obtain reasonable assurance about whether the financial statements and financial highlights are free of material misstatement, whether due to error or fraud. Our audits included performing procedures to assess the risks of material misstatement of the financial statements and financial highlights, whether due to error or fraud, and performing procedures that respond to those risks. Such procedures included examining, on a test basis, evidence regarding the amounts and disclosures in the financial statements and financial highlights. Such procedures also included confirmation of securities owned as of September 30, 2024, by correspondence with the custodian and transfer agents. Our audits also included evaluating the accounting principles used and significant estimates made by management, as well as evaluating the overall presentation of the financial statements and financial highlights. We believe that our audits provide a reasonable basis for our opinion.

We have not been able to determine the specific year that we began serving as the auditor of one or more Allspring Funds investment companies; however, we are aware that we have served as the auditor of one or more Allspring Funds investment companies since at least 1955.
November 25, 2024
Allspring Opportunity Fund | 19
Other information (unaudited)
Other information
Pursuant to Section 852 of the Internal Revenue Code, $69,934,738 was designated as a 20% rate gain distribution for the fiscal year ended
September 30, 2024.
A description of the policies and procedures used to determine how to vote proxies relating to portfolio securities is available without charge, upon request, by calling 1-866-259-3305, visiting our website at allspringglobal.com, or visiting the SEC website at sec.gov. Information regarding how the proxies related to portfolio securities were voted during the most recent 12-month period ended June 30 is available on the website at allspringglobal.com or by visiting the SEC website at sec.gov.
Quarterly portfolio holdings information
The Fund files its complete schedule of portfolio holdings with the SEC for the first and third quarters of each fiscal year as an exhibit to its reports on Form N-PORT. Shareholders may view the filed Form N-PORT by visiting the SEC website at sec.gov.
20 | Allspring Opportunity Fund
Other information (unaudited)
Item 8. Changes in and disagreements with accountants
Item 9. Matters submitted to fund shareholders for a vote
Item 10. Remuneration paid to directors, officers and others
Refer to information in the Statement of operations.
Allspring Opportunity Fund | 21
Other information (unaudited)
Item 11. Statement regarding basis for the board’s approval of investment advisory contract
Board consideration of investment management and sub-advisory agreements:
Under the Investment Company Act of 1940 (the “1940 Act”), the Board of Trustees (the “Board”) of Allspring Funds Trust (the “Trust”) must determine annually whether to approve the continuation of the Trust’s investment management and sub-advisory agreements. In this regard, at a Board meeting held on May 28-30, 2024 (the “Meeting”), the Board, all the members of which have no direct or indirect interest in the investment management and sub-advisory agreements and are not “interested persons” of the Trust, as defined in the 1940 Act (the “Independent Trustees”), reviewed and approved for the Allspring Opportunity Fund (the “Fund”): (i) an investment management agreement (the “Management Agreement”) with Allspring Funds Management, LLC (“Allspring Funds Management”); and (ii) an investment sub-advisory agreement (the “Sub-Advisory Agreement”) with Allspring Global Investments, LLC (the “Sub-Adviser”), an affiliate of Allspring Funds Management. The Management Agreement and the Sub-Advisory Agreement are collectively referred to as the “Advisory Agreements.”
At the Meeting, the Board considered the factors and reached the conclusions described below relating to the selection of Allspring Funds Management and the Sub-Adviser and the approval of the Advisory Agreements. Prior to the Meeting, including at a meeting of the Board held in April 2024, and at the Meeting, the Trustees conferred extensively among themselves and with representatives of Allspring Funds Management about these matters. The Board has adopted a team-based approach, with each team consisting of a sub-set of Trustees, to assist the full Board in the discharge of its duties in reviewing investment performance and other matters throughout the year. The Independent Trustees were assisted in their evaluation of the Advisory Agreements by independent legal counsel, from whom they received separate legal advice and with whom they met separately.
In providing information to the Board, Allspring Funds Management and the Sub-Adviser were guided by a detailed set of requests for information submitted to them by independent legal counsel on behalf of the Independent Trustees at the start of the Board’s annual contract renewal process earlier in 2024. In considering and approving the Advisory Agreements, the Trustees considered the information they believed relevant, including but not limited to the information discussed below. The Board considered not only the specific information presented in connection with the Meeting, but also the knowledge gained over time through interactions with Allspring Funds Management and the Sub-Adviser about various topics. In this regard, the Board reviewed reports of Allspring Funds Management at each of its quarterly meetings, which included, among other things, portfolio reviews and investment performance reports. In addition, the Board and the teams mentioned above confer with portfolio managers at various times throughout the year. The Board did not identify any particular information or consideration that was all-important or controlling, and each individual Trustee may have attributed different weights to various factors.
After its deliberations, the Board unanimously determined that the compensation payable to Allspring Funds Management and the Sub-Adviser under each of the Advisory Agreements was reasonable, and approved the continuation of the Advisory Agreements for a one-year term. The Board considered the approval of the Advisory Agreements for the Fund as part of its consideration of agreements for funds across the complex, but its approvals were made on a fund-by-fund basis. The following summarizes a number of important, but not necessarily all, factors considered by the Board in support of its approvals.
Nature, extent, and quality of services
The Board received and considered various information regarding the nature, extent, and quality of services provided to the Fund by Allspring Funds Management and the Sub-Adviser under the Advisory Agreements. This information included a description of the investment advisory services and Fund-level administrative services covered by the Management Agreement, as well as, among other things, a summary of the background and experience of senior management of Allspring Global Investments, of which Allspring Funds Management and the Sub-Adviser are a part, and a summary of investments made in the Allspring Global Investments business.* The Board also received information about the services that continue to be provided by Wells Fargo & Co. and/or its affiliates (“Wells Fargo”) since the sale of Wells Fargo Asset Management to Allspring Global Investments Holdings, LLC, a holding company indirectly owned by certain private funds of GTCR LLC and Reverence Capital Partners, L.P., under a transition services agreement and an update on the anticipated timeline for exiting the transition services agreement. In addition, the Board received and considered information about the full range of services provided to the Fund by Allspring Funds Management and its affiliates.
The Board considered the qualifications, background, tenure, and responsibilities of each of the portfolio managers primarily responsible for the day-to-day portfolio management of the Fund. The Board evaluated the ability of Allspring Funds Management and the Sub-Adviser to attract and retain qualified investment professionals, including research, advisory, and supervisory personnel.
The Board further considered the compliance programs and compliance records of Allspring Funds Management and the Sub-Adviser. The Board received and considered information about Allspring Global Investments’ risk management functions, which included information about Allspring Funds
*
The trade name for the asset management firm that includes Allspring Funds Management and the Sub-Adviser is “Allspring Global Investments.”
22 | Allspring Opportunity Fund
Other information (unaudited)
Management’s and the Sub-Adviser’s business continuity plans, their approaches to data privacy and cybersecurity, Allspring Funds Management’s role as administrator of the Fund’s liquidity risk management program, and fair valuation designee. The Board also received and considered information about Allspring Funds Management’s intermediary and vendor oversight program.
Fund investment performance and expenses
The Board considered the investment performance results for the Fund over various time periods ended December 31, 2023. The Board considered these results in comparison to the investment performance of funds in a universe that was determined by Broadridge Inc. (“Broadridge”) to be similar to the Fund (the “Universe”), and in comparison to the Fund’s benchmark index and to other comparative data. Broadridge is an independent provider of investment company data. The Board received a description of the methodology used by Broadridge to select the mutual funds in the performance Universe. The Board noted that the investment performance of the Fund (Administrator Class) was higher than the average investment performance of the Universe for all periods under review. The Board also noted that the investment performance of the Fund was higher than the investment performance of its benchmark index, the Russell 3000® Index, for the one-year period under review, in range of the investment performance of its benchmark index for the five-year period under review, and lower than the investment performance of its benchmark index for the three and ten-year periods under review.
The Board also received and considered information regarding the Fund’s net operating expense ratios and their various components, including actual management fees, custodian and other non-management fees, and Rule 12b-1 and non-Rule 12b-1 shareholder service fees. The Board considered these ratios in comparison to the median ratios of funds in class-specific expense groups that were determined by Broadridge to be similar to the Fund (the “Groups”). The Board received a description of the methodology used by Broadridge to select the mutual funds in the expense Groups and an explanation of how funds comprising expense Groups and their expense ratios may vary from year-to-year. Based on the Broadridge reports, the Board noted that the net operating expense ratios of the Fund were in range of the median net operating expense ratios of the expense Groups for each share class, except for the net operating expense ratio of the Fund’s Class A shares which were higher than the median net operating expense ratio of the expense Group.
The Board received information concerning, and discussed factors contributing to, the net operating expense ratios of the Fund relative to the expense Groups for each share class. The Board took note of the explanations for the net operating expense ratios of the Fund.
The Board took into account the Fund’s investment performance and expense information provided to it among the factors considered in deciding to re-approve the Advisory Agreements.
Investment management and sub-advisory fee rates
The Board reviewed and considered the contractual fee rates payable by the Fund to Allspring Funds Management under the Management Agreement, as well as the contractual fee rates payable by the Fund to Allspring Funds Management for class-level administrative services under a Class-Level Administration Agreement, which include, among other things, class-level transfer agency and sub-transfer agency costs (collectively, the “Management Rates”). The Board also reviewed and considered the contractual investment sub-advisory fee rates payable by Allspring Funds Management to the Sub-Adviser for investment sub-advisory services. It was noted that advisory fee waivers, if any, are at the fund level and not class level.
Among other information reviewed by the Board was a comparison of the Fund’s Management Rates with the average contractual investment management fee rates of funds in the expense Groups at a common asset level as well as transfer agency costs of the funds in the expense Groups. The Board noted that the Management Rates of the Fund were in range of the sum of these average rates for the Fund’s expense Groups for Administrator Class and Class R6 shares and higher than the sum of these average rates for the Fund’s expense Groups for Class A and Institutional Class shares.
The Board also received and considered information about the portion of the total management fee that was retained by Allspring Funds Management after payment of the fee to the Sub-Adviser for sub-advisory services. In assessing the reasonableness of this amount, the Board received and evaluated information about the nature and extent of responsibilities retained and risks assumed by Allspring Funds Management and not delegated to or assumed by the Sub-Adviser, and about Allspring Funds Management’s on-going oversight services. Given the affiliation between Allspring Funds Management and the Sub-Adviser, the Board ascribed limited relevance to the allocation of fees between them.
The Board also received and considered information about the nature and extent of services offered and fee rates charged by Allspring Funds Management and the Sub-Adviser to other types of clients with investment strategies similar to those of the Fund. In this regard, the Board received information about the significantly greater scope of services, and compliance, reporting and other legal and regulatory obligations and risks of managing proprietary mutual funds compared with those associated with managing assets of other types of clients, including third-party sub-advised fund clients and non-mutual fund clients such as institutional separate accounts.
Based on its consideration of the factors and information it deemed relevant, including those described here, the Board determined that the compensation payable to Allspring Funds Management under the Management Agreement and to the Sub-Adviser under the Sub-Advisory Agreement was reasonable.
Allspring Opportunity Fund | 23
Other information (unaudited)
Profitability
The Board received and considered information concerning the profitability of Allspring Funds Management, as well as the profitability of Allspring Global Investments, from providing services to the fund complex as a whole. The Board noted that the Sub-Adviser’s profitability information with respect to providing services to the Fund and other funds in the complex was subsumed in the Allspring Global Investments profitability analysis.
Allspring Funds Management reported on the methodologies and estimates used in calculating profitability, including a description of the methodology used to allocate certain expenses. Among other things, the Board noted that the levels of profitability reported on a fund-by-fund basis varied widely, depending on factors such as the size, type, and age of fund.
Based on its review, the Board did not deem the profits reported by Allspring Funds Management or Allspring Global Investments from services provided to the Fund to be at a level that would prevent it from approving the continuation of the Advisory Agreements.
The Board received and considered information about the potential for Allspring Funds Management to experience economies of scale in the provision of management services to the Fund, the difficulties of isolating and quantifying economies of scale at an individual fund level, and the extent to which potential scale benefits are shared with Fund shareholders. The Board noted the existence of breakpoints in the Fund’s management fee structure, which operate generally to reduce the Fund’s expense ratios as the Fund grows in size, and the size of the Fund in relation to such breakpoints. The Board considered that in addition to management fee breakpoints, Allspring Funds Management shares potential economies of scale from its management business in a variety of ways, including through fee waiver and expense reimbursement arrangements, competitive management fee rates set at the outset without regard to breakpoints, and investments in the business intended to enhance services available to shareholders.
The Board concluded that Allspring Funds Management’s arrangements with respect to the Fund, including contractual breakpoints, constituted a reasonable approach to sharing potential economies of scale with the Fund and its shareholders.
Other benefits to Allspring Funds Management and the Sub-Adviser
The Board received and considered information regarding potential “fall-out” or ancillary benefits received by Allspring Funds Management and its affiliates, including the Sub-Adviser, as a result of their relationships with the Fund. Ancillary benefits could include, among others, benefits directly attributable to other relationships with the Fund and benefits potentially derived from an increase in Allspring Funds Management’s and the Sub-Adviser’s business as a result of their relationships with the Fund. The Board noted that Allspring Funds Distributor, LLC, an affiliate of Allspring Funds Management, receives distribution-related fees in respect of shares sold or held through it. The Board also reviewed information about soft dollar credits earned and utilized by the Sub-Adviser.
Based on its consideration of the factors and information it deemed relevant, including those described here, the Board did not find that any ancillary benefits received by Allspring Funds Management and its affiliates, including the Sub-Adviser, were unreasonable.
At the Meeting, after considering the above-described factors and based on its deliberations and its evaluation of the information described above, the Board unanimously determined that the compensation payable to Allspring Funds Management and the Sub-Adviser under each of the Advisory Agreements was reasonable, and approved the continuation of the Advisory Agreements for a one-year term.
24 | Allspring Opportunity Fund
For more information
More information about Allspring Funds is available free upon request. To obtain literature, please write, visit the Fund’s website, or call:
Allspring Funds
P.O. Box 219967
Kansas City, MO 64121-9967
Website: allspringglobal.com
Individual investors: 1-800-222-8222
Retail investment professionals: 1-888-877-9275
Institutional investment professionals: 1-800-260-5969
This report and the financial statements contained herein are submitted for the general information of the shareholders of the Fund. If this report is used for promotional purposes, distribution of the report must be accompanied or preceded by a current prospectus. Before investing, please consider the investment objectives, risks, charges, and expenses of the investment. For a current prospectus and, if available, a summary prospectus, containing this information, call 1-800-222-8222 or visit the Fund’s website at allspringglobal.com. Read the prospectus carefully before you invest or send money.
Allspring Global InvestmentsTM is the trade name for the asset management firms of Allspring Global Investments Holdings, LLC, a holding company indirectly owned by certain private funds of GTCR LLC and Reverence Capital Partners, L.P. These firms include but are not limited to Allspring Global Investments, LLC, and Allspring Funds Management, LLC. Certain products managed by Allspring entities are distributed by Allspring Funds Distributor, LLC (a broker-dealer and Member FINRA/SIPC).
This material is for general informational and educational purposes only and is NOT intended to provide investment advice or a recommendation of any kind - including a recommendation for any specific investment, strategy, or plan.
© 2024 Allspring Global Investments Holdings, LLC. All rights reserved.
NCSR3002 09-24
Allspring Income Plus Fund
Long Form Financial Statements
Annual Report
Allspring Income Plus Fund | 1
Consolidated portfolio of investments—September 30, 2024
Consolidated portfolio of investments
| | | | | |
Agency securities: 30.93% | | | | | | |
| | | | | | |
| | | | | | |
| | | | | | |
| | | | | | |
Total agency securities (Cost $81,552,520) | | | | | | |
Asset-backed securities: 6.33% | | | | | | |
ACHM Trust Series 2023-HE2 Class A144A±± | | | | | | |
AFN ABSPROP001 LLC Series 2019-1A Class A2144A | | | | | | |
Apidos CLO XXXI Ltd. Series 2019-31A Class DR (U.S. SOFR 3 Month+3.36%)144A± | | | | | | |
Aqua Finance Trust Series 2019-A Class A144A | | | | | | |
Aqua Finance Trust Series 2021-A Class A144A | | | | | | |
BHG Securitization Trust Series 2021-A Class A144A | | | | | | |
Bojangles Issuer LLC Series 2020-1A Class A2144A | | | | | | |
BRSP Ltd. Series 2021-FL1 Class A (U.S. SOFR 1 Month+1.26%)144A± | | | | | | |
Cajun Global LLC Series 2021-1 Class A2144A | | | | | | |
Carlyle Global Market Strategies CLO Ltd. Series 2016-1A Class CR2 (U.S. SOFR 3 Month+3.61%)144A± | | | | | | |
Coinstar Funding LLC Series 2017-1A Class A2144A | | | | | | |
Commonbond Student Loan Trust Series 2018-CGS Class C144A | | | | | | |
DataBank Issuer LLC Series 2024-1A Class A2144A | | | | | | |
Driven Brands Funding LLC Series 2019-2A Class A2144A | | | | | | |
FIGRE Trust Series 2023-HE1 Class A144A | | | | | | |
FIGRE Trust Series 2023-HE2 Class A144A±± | | | | | | |
Five Guys Holdings, Inc. Series 2023-1A Class A2144A | | | | | | |
FREED Mortgage Trust Series 2022-HE1 Class A144A | | | | | | |
FS Rialto Issuer LLC Series 2021-FL3 Class B (U.S. SOFR 1 Month+1.91%)144A± | | | | | | |
Jimmy Johns Funding LLC Series 2017-1A Class A2II144A | | | | | | |
Jonah Energy ABS I LLC Series 2022-1 Class A1144A | | | | | | |
Laurel Road Prime Student Loan Trust Series 2017-C Class C144A | | | | | | |
| | | | | | |
NBC Funding LLC Series 2024-1A Class A2144A | | | | | | |
Octane Receivables Trust Series 2023-1A Class A144A | | | | | | |
Octane Receivables Trust Series 2023-1A Class B144A | | | | | | |
RCKT Mortgage Trust Series 2023-CES3 Class A1A144A±± | | | | | | |
SMB Private Education Loan Trust Series 2015-C Class C144A | | | | | | |
SoFi Professional Loan Program LLC Series 2017-E Class B144A | | | | | | |
STORE Master Funding LLC Series 2023-1A Class A1144A | | | | | | |
The accompanying notes are an integral part of these consolidated financial statements.
2 | Allspring Income Plus Fund
Consolidated portfolio of investments—September 30, 2024
| | | | | |
Asset-backed securities(continued) | | | | | | |
TierPoint Issuer LLC Series 2023-1A Class A2144A | | | | | | |
Zaxby’s Funding LLC Series 2021-1A Class A2144A | | | | | | |
Total asset-backed securities (Cost $16,876,996) | | | | | | |
| | | | | |
| | | | | | |
| | | | | | |
Consumer staples distribution & retail : 0.00% | | | | | | |
Casino Guichard Perrachon SA† | | | | | | |
| | | | | | |
Financial services: 0.00% | | | | | | |
Unifin Financiera SAB de CV♦† | | | | | | |
Total common stocks (Cost $427,059) | | | | | | |
| | | | | |
Corporate bonds and notes: 25.97% | | | | | | |
| | | | | | |
| | | | | | |
LYB International Finance III LLC | | | | | | |
| | | | | | |
| | | | | | |
| | | | | | |
Cleveland-Cliffs, Inc.144A | | | | | | |
| | | | | | |
| | | | | | |
Clear Channel Outdoor Holdings, Inc.144A | | | | | | |
Outfront Media Capital LLC/Outfront Media Capital Corp.144A | | | | | | |
| | | | | | |
| | | | | | |
| | | | | | |
| | | | | | |
Cablevision Lightpath LLC144A | | | | | | |
| | | | | | |
Uber Technologies, Inc.144A | | | | | | |
| | | | | | |
| | | | | | |
CCO Holdings LLC/CCO Holdings Capital Corp.144A | | | | | | |
Charter Communications Operating LLC/Charter Communications Operating Capital | | | | | | |
Charter Communications Operating LLC/Charter Communications Operating Capital | | | | | | |
The accompanying notes are an integral part of these consolidated financial statements.
Allspring Income Plus Fund | 3
Consolidated portfolio of investments—September 30, 2024
| | | | | |
| | | | | | |
| | | | | | |
| | | | | | |
| | | | | | |
Sirius XM Radio, Inc.144A | | | | | | |
| | | | | | |
Telecommunications: 0.53% | | | | | | |
| | | | | | |
Level 3 Financing, Inc.144A | | | | | | |
Level 3 Financing, Inc.144A | | | | | | |
Level 3 Financing, Inc.144A | | | | | | |
| | | | | | |
| | | | | | |
Consumer, cyclical: 4.77% | | | | | | |
| | | | | | |
Hawaiian Brand Intellectual Property Ltd./HawaiianMiles Loyalty Ltd.144A | | | | | | |
U.S. Airways Pass-Through Trust Series 2013-1 Class A | | | | | | |
United Airlines Pass-Through Trust Series 2020-1 Class A | | | | | | |
| | | | | | |
| | | | | | |
| | | | | | |
| | | | | | |
| | | | | | |
| | | | | | |
Auto manufacturers: 1.04% | | | | | | |
| | | | | | |
Ford Motor Credit Co. LLC | | | | | | |
Ford Motor Credit Co. LLC | | | | | | |
Hyundai Capital America144A | | | | | | |
Hyundai Capital America144A | | | | | | |
| | | | | | |
| | | | | | |
Churchill Downs, Inc.144A | | | | | | |
Warnermedia Holdings, Inc. | | | | | | |
Warnermedia Holdings, Inc. | | | | | | |
| | | | | | |
| | | | | | |
Taylor Morrison Communities, Inc.144A | | | | | | |
| | | | | | |
| | | | | | |
The accompanying notes are an integral part of these consolidated financial statements.
4 | Allspring Income Plus Fund
Consolidated portfolio of investments—September 30, 2024
| | | | | |
| | | | | | |
| | | | | | |
| | | | | | |
| | | | | | |
| | | | | | |
Macy’s Retail Holdings LLC144A | | | | | | |
| | | | | | |
NMG Holding Co., Inc./Neiman Marcus Group LLC144A | | | | | | |
Victra Holdings LLC/Victra Finance Corp.144A | | | | | | |
| | | | | | |
Toys/games/hobbies: 0.37% | | | | | | |
| | | | | | |
Consumer, non-cyclical: 2.83% | | | | | | |
Commercial services: 1.32% | | | | | | |
Allied Universal Holdco LLC/Allied Universal Finance Corp.144A | | | | | | |
| | | | | | |
| | | | | | |
| | | | | | |
| | | | | | |
Service Corp. International | | | | | | |
Toll Road Investors Partnership II LP Series 1999-B (NPFGC Insured)144A¤ | | | | | | |
| | | | | | |
| | | | | | |
| | | | | | |
| | | | | | |
Healthcare-services: 0.85% | | | | | | |
CHS/Community Health Systems, Inc.144A | | | | | | |
| | | | | | |
ModivCare Escrow Issuer, Inc.144A | | | | | | |
Pediatrix Medical Group, Inc.144A | | | | | | |
| | | | | | |
| | | | | | |
| | | | | | |
| | | | | | |
| | | | | | |
| | | | | | |
| | | | | | |
Energy-alternate sources: 0.14% | | | | | | |
Enviva Partners LP/Enviva Partners Finance Corp.144A† | | | | | | |
TerraForm Power Operating LLC144A | | | | | | |
| | | | | | |
The accompanying notes are an integral part of these consolidated financial statements.
Allspring Income Plus Fund | 5
Consolidated portfolio of investments—September 30, 2024
| | | | | |
| | | | | | |
| | | | | | |
California Resources Corp.144A | | | | | | |
Encino Acquisition Partners Holdings LLC144A | | | | | | |
Encino Acquisition Partners Holdings LLC144A | | | | | | |
Hilcorp Energy I LP/Hilcorp Finance Co.144A | | | | | | |
Hilcorp Energy I LP/Hilcorp Finance Co.144A | | | | | | |
Nabors Industries, Inc.144A | | | | | | |
| | | | | | |
Oil & gas services: 0.23% | | | | | | |
| | | | | | |
Oceaneering International, Inc. | | | | | | |
| | | | | | |
| | | | | | |
Antero Midstream Partners LP/Antero Midstream Finance Corp.144A | | | | | | |
| | | | | | |
| | | | | | |
Energy Transfer LP (5 Year Treasury Constant Maturity+4.02%)± | | | | | | |
Energy Transfer LP Series H (5 Year Treasury Constant Maturity+5.69%)ʊ± | | | | | | |
EnLink Midstream Partners LP | | | | | | |
| | | | | | |
Rockies Express Pipeline LLC144A | | | | | | |
Tallgrass Energy Partners LP/Tallgrass Energy Finance Corp.144A | | | | | | |
Venture Global LNG, Inc.144A | | | | | | |
Venture Global LNG, Inc. (5 Year Treasury Constant Maturity+5.44%)144Aʊ± | | | | | | |
| | | | | | |
| | | | | | |
| | | | | | |
Bank of America Corp. (U.S. SOFR+1.33%)± | | | | | | |
Bank of America Corp. (U.S. SOFR+1.91%)± | | | | | | |
Bank of America Corp. Series DD (U.S. SOFR 3 Month+4.81%)ʊ± | | | | | | |
Goldman Sachs Group, Inc. Series T (5 Year Treasury Constant Maturity+2.97%)ʊ± | | | | | | |
JPMorgan Chase & Co. (U.S. SOFR+1.75%)± | | | | | | |
Morgan Stanley (U.S. SOFR+1.29%)±## | | | | | | |
Santander Holdings USA, Inc. (U.S. SOFR+3.28%)± | | | | | | |
| | | | | | |
Diversified financial services: 1.31% | | | | | | |
| | | | | | |
The accompanying notes are an integral part of these consolidated financial statements.
6 | Allspring Income Plus Fund
Consolidated portfolio of investments—September 30, 2024
| | | | | |
Diversified financial services(continued) | | | | | | |
Charles Schwab Corp. (U.S. SOFR+2.01%)± | | | | | | |
| | | | | | |
| | | | | | |
| | | | | | |
| | | | | | |
AssuredPartners, Inc.144A | | | | | | |
BroadStreet Partners, Inc.144A | | | | | | |
CNO Financial Group, Inc. | | | | | | |
Guardian Life Insurance Co. of America144A | | | | | | |
| | | | | | |
PartnerRe Finance B LLC (5 Year Treasury Constant Maturity+3.82%)± | | | | | | |
Pine Street Trust III144A | | | | | | |
Prudential Financial, Inc. (5 Year Treasury Constant Maturity+3.04%)± | | | | | | |
Reinsurance Group of America, Inc. | | | | | | |
| | | | | | |
| | | | | | |
Investment Companies: 0.64% | | | | | | |
| | | | | | |
| | | | | | |
| | | | | | |
| | | | | | |
Brandywine Operating Partnership LP | | | | | | |
| | | | | | |
| | | | | | |
GLP Capital LP/GLP Financing II, Inc. | | | | | | |
| | | | | | |
Omega Healthcare Investors, Inc. | | | | | | |
Piedmont Operating Partnership LP | | | | | | |
| | | | | | |
WEA Finance LLC/Westfield U.K. & Europe Finance PLC144A | | | | | | |
| | | | | | |
| | | | | | |
Building materials: 0.31% | | | | | | |
Camelot Return Merger Sub, Inc.144A | | | | | | |
| | | | | | |
| | | | | | |
The accompanying notes are an integral part of these consolidated financial statements.
Allspring Income Plus Fund | 7
Consolidated portfolio of investments—September 30, 2024
| | | | | |
Packaging & containers: 0.27% | | | | | | |
Ardagh Metal Packaging Finance USA LLC/Ardagh Metal Packaging Finance PLC144A | | | | | | |
Clydesdale Acquisition Holdings, Inc.144A | | | | | | |
| | | | | | |
Trucking & leasing: 0.20% | | | | | | |
| | | | | | |
| | | | | | |
| | | | | | |
| | | | | | |
| | | | | | |
| | | | | | |
| | | | | | |
| | | | | | |
| | | | | | |
AthenaHealth Group, Inc.144A | | | | | | |
Cloud Software Group, Inc.144A | | | | | | |
Cloud Software Group, Inc.144A | | | | | | |
| | | | | | |
| | | | | | |
| | | | | | |
| | | | | | |
| | | | | | |
| | | | | | |
| | | | | | |
| | | | | | |
EUSHI Finance, Inc. (5 Year Treasury Constant Maturity+3.14%)144A± | | | | | | |
| | | | | | |
Southern Co. Series B (5 Year Treasury Constant Maturity+3.73%)± | | | | | | |
Vistra Operations Co. LLC144A | | | | | | |
| | | | | | |
Total corporate bonds and notes (Cost $66,847,208) | | | | | | |
Foreign corporate bonds and notes: 14.86% | | | | | | |
| | | | | | |
| | | | | | |
Anglo American Capital PLC | | | | | | |
| | | | | | |
| | | | | | |
Engineering - Ingegneria Informatica - SpA | | | | | | |
The accompanying notes are an integral part of these consolidated financial statements.
8 | Allspring Income Plus Fund
Consolidated portfolio of investments—September 30, 2024
| | | | | |
| | | | | | |
Tele Columbus AG (PIK at 10.00%)144A¥ | | | | | | |
| | | | | | |
| | | | | | |
Telecommunications: 2.36% | | | | | | |
British Telecommunications PLC (UK Gilts 5 Year+3.82%)± | | | | | | |
| | | | | | |
| | | | | | |
| | | | | | |
| | | | | | |
SES SA (EURIBOR ICE Swap Rate 11:00am+3.19%)ʊ± | | | | | | |
| | | | | | |
| | | | | | |
| | | | | | |
| | | | | | |
Consumer, cyclical: 1.87% | | | | | | |
| | | | | | |
| | | | | | |
Auto manufacturers: 0.32% | | | | | | |
| | | | | | |
| | | | | | |
888 Acquisitions Ltd.144A | | | | | | |
Cirsa Finance International Sarl144A | | | | | | |
| | | | | | |
| | | | | | |
| | | | | | |
| | | | | | |
Consumer, non-cyclical: 1.94% | | | | | | |
| | | | | | |
BAT International Finance PLC | | | | | | |
Commercial services: 0.89% | | | | | | |
Rentokil Initial Finance BV | | | | | | |
Transurban Finance Co. Pty. Ltd. | | | | | | |
| | | | | | |
| | | | | | |
| | | | | | |
| | | | | | |
| | | | | | |
Bayer AG (EURIBOR ICE Swap Rate 11:00am+2.65%)± | | | | | | |
The accompanying notes are an integral part of these consolidated financial statements.
Allspring Income Plus Fund | 9
Consolidated portfolio of investments—September 30, 2024
| | | | | |
| | | | | | |
| | | | | | |
| | | | | | |
| | | | | | |
| | | | | | |
ABN AMRO Bank NV (EUR Swap Annual (vs. 6 Month EURIBOR) 5 Year+3.90%)ʊ± | | | | | | |
Banco de Sabadell SA (EURIBOR ICE Swap Rate 11:00am+2.40%)± | | | | | | |
CaixaBank SA (EUR Swap Annual (vs. 6 Month EURIBOR) 5 Year+3.55%)± | | | | | | |
Commerzbank AG (3 Month EURIBOR+2.10%)± | | | | | | |
Deutsche Bank AG (3 Month EURIBOR+2.95%)± | | | | | | |
KBC Group NV (EURIBOR ICE Swap Rate 11:00am+4.93%)ʊ± | | | | | | |
Raiffeisen Bank International AG (EURIBOR ICE Swap Rate 11:00am+1.60%)± | | | | | | |
Raiffeisen Bank International AG (EURIBOR ICE Swap Rate 11:00am+5.20%)± | | | | | | |
| | | | | | |
Diversified financial services: 0.16% | | | | | | |
| | | | | | |
| | | | | | |
| | | | | | |
NN Group NV (3 Month EURIBOR+4.20%)± | | | | | | |
Sampo (3 Month EURIBOR+3.60%)± | | | | | | |
| | | | | | |
| | | | | | |
| | | | | | |
Castellum AB (EUR Swap Annual (vs. 6 Month EURIBOR) 5 Year+3.45%)ʊ± | | | | | | |
| | | | | | |
| | | | | | |
Unibail-Rodamco-Westfield SE (EURIBOR ICE Swap Rate 11:00am+4.00%)ʊ± | | | | | | |
Government securities: 0.57% | | | | | | |
| | | | | | |
| | | | | | |
Banque Ouest Africaine de Developpement | | | | | | |
International Finance Corp. | | | | | | |
| | | | | | |
The accompanying notes are an integral part of these consolidated financial statements.
10 | Allspring Income Plus Fund
Consolidated portfolio of investments—September 30, 2024
| | | | | |
| | | | | | |
Engineering & construction: 0.65% | | | | | | |
| | | | | | |
| | | | | | |
| | | | | | |
Machinery-diversified: 0.06% | | | | | | |
Nova Alexandre III SAS (3 Month EURIBOR+5.25%)144A± | | | | | | |
| | | | | | |
| | | | | | |
| | | | | | |
| | | | | | |
| | | | | | |
Enel Finance International NVøø | | | | | | |
Energia Group Roi Financeco DAC144A | | | | | | |
| | | | | | |
| | | | | | |
| | | | | | |
| | | | | | |
| | | | | | |
| | | | | | |
| | | | | | |
Total foreign corporate bonds and notes (Cost $37,891,177) | | | | | | |
Foreign government bonds: 13.98% | | | | | | |
| | | | | | |
| | | | | | |
| | | | | | |
| | | | | | |
| | | | | | |
| | | | | | |
| | | | | | |
| | | | | | |
| | | | | | |
| | | | | | |
| | | | | | |
| | | | | | |
| | | | | | |
| | | | | | |
| | | | | | |
Republic of South Africa## | | | | | | |
The accompanying notes are an integral part of these consolidated financial statements.
Allspring Income Plus Fund | 11
Consolidated portfolio of investments—September 30, 2024
| | | | | |
| | | | | | |
| | | | | | |
Total foreign government bonds (Cost $35,237,396) | | | | | | |
| | | | | |
Investment companies: 2.74% | | | | | | |
Exchange-traded funds: 2.74% | | | | | | |
SPDR Portfolio High Yield Bond ETF | | | | | | |
VanEck J. P. Morgan EM Local Currency Bond ETF | | | | | | |
Xtrackers USD High Yield Corporate Bond ETF | | | | | | |
Total investment companies (Cost $7,122,256) | | | | | | |
| | | | | |
| | | | | | |
| | | | | | |
| | | | | | |
Directv Financing LLC (U.S. SOFR 1 Month+5.00%)± | | | | | | |
Consumer, cyclical: 0.46% | | | | | | |
| | | | | | |
American Airlines, Inc. (U.S. SOFR 3 Month+4.75%)± | | | | | | |
Auto parts & equipment: 0.12% | | | | | | |
First Brands Group LLC (U.S. SOFR 3 Month+5.00%)± | | | | | | |
| | | | | | |
American Greetings Corp. (U.S. SOFR 1 Month+5.75%)± | | | | | | |
| | | | | | |
Petco Health & Wellness Co., Inc. (U.S. SOFR 3 Month+3.25%)± | | | | | | |
| | | | | | |
| | | | | | |
Asurion LLC (U.S. SOFR 1 Month+5.25%)± | | | | | | |
| | | | | | |
| | | | | | |
Rocket Software, Inc. (U.S. SOFR 1 Month+4.75%)± | | | | | | |
Total loans (Cost $1,798,728) | | | | | | |
Municipal obligations: 0.01% | | | | | | |
| | | | | | |
| | | | | | |
City of Chicago Series E## | | | | | | |
Total municipal obligations (Cost $35,764) | | | | | | |
The accompanying notes are an integral part of these consolidated financial statements.
12 | Allspring Income Plus Fund
Consolidated portfolio of investments—September 30, 2024
| | | | | |
Non-agency mortgage-backed securities: 3.73% | | | | | | |
Brean Asset-Backed Securities Trust Series 2021-RM2 Class A144A±± | | | | | | |
BX Trust Series 2019-OC11 Class D144A±± | | | | | | |
BX Trust Series 2021-ARIA Class D (U.S. SOFR 1 Month+2.01%)144A± | | | | | | |
BX Trust Series 2022-CLS Class C144A | | | | | | |
CFCRE Commercial Mortgage Trust Series 2016-C7 Class AM | | | | | | |
COLT Mortgage Loan Trust Series 2022-7 Class A1144A±± | | | | | | |
FREMF Mortgage Trust Series 2020-KF76 Class B (30 Day Average U.S. SOFR+2.86%)144A± | | | | | | |
Hudsons Bay Simon JV Trust Series 2015-HB10 Class A10144A | | | | | | |
Imperial Fund Mortgage Trust Series 2022-NQM3 Class A3144A±± | | | | | | |
JP Morgan Mortgage Trust Series 2017-6 Class B5144A±± | | | | | | |
MFA Trust Series 2020-NQM3 Class M1144A±± | | | | | | |
MFA Trust Series 2021-NQM1 Class A1144A±± | | | | | | |
Morgan Stanley Capital I Trust Series 2014-150E Class A144A | | | | | | |
Residential Mortgage Loan Trust Series 2019-3 Class A3144A±± | | | | | | |
SFAVE Commercial Mortgage Securities Trust Series 2015- 5AVE Class D144A±± | | | | | | |
TRK Trust Series 2021-INV2 Class A2144A±± | | | | | | |
Verus Securitization Trust Series 2021-2 Class A1144A±± | | | | | | |
Verus Securitization Trust Series 2021-8 Class A2144A±± | | | | | | |
Verus Securitization Trust Series 2021-R3 Class A2144A±± | | | | | | |
VM Master Issuer LLC Series 2022-1 Class B144A±± | | | | | | |
Total non-agency mortgage-backed securities (Cost $10,729,375) | | | | | | |
U.S. Treasury securities: 7.21% | | | | | | |
| | | | | | |
| | | | | | |
| | | | | | |
| | | | | | |
| | | | | | |
| | | | | | |
| | | | | | |
| | | | | | |
Total U.S. Treasury securities (Cost $18,985,471) | | | | | | |
The accompanying notes are an integral part of these consolidated financial statements.
Allspring Income Plus Fund | 13
Consolidated portfolio of investments—September 30, 2024
| | | | | |
| | | | | | |
| | | | | | |
Consumer staples distribution & retail : 0.00% | | | | | | |
Casino Guichard Perrachon SA Euronext Paris Exchange† | | | | | | |
| | | | | | |
| | | | | |
Yankee corporate bonds and notes: 10.71% | | | | | | |
| | | | | | |
| | | | | | |
Braskem Netherlands Finance BV144A | | | | | | |
| | | | | | |
| | | | | | |
| | | | | | |
| | | | | | |
| | | | | | |
Consumer, cyclical: 0.68% | | | | | | |
| | | | | | |
VistaJet Malta Finance PLC/Vista Management Holding, Inc.144A | | | | | | |
Auto manufacturers: 0.09% | | | | | | |
Aston Martin Capital Holdings Ltd.144A | | | | | | |
Auto parts & equipment: 0.29% | | | | | | |
Aptiv PLC/Aptiv Global Financing DAC (5 Year Treasury Constant Maturity+3.39%)± | | | | | | |
| | | | | | |
| | | | | | |
Royal Caribbean Cruises Ltd.144A | | | | | | |
| | | | | | |
Consumer, non-cyclical: 0.37% | | | | | | |
| | | | | | |
| | | | | | |
| | | | | | |
| | | | | | |
Borr IHC Ltd./Borr Finance LLC144A | | | | | | |
BP Capital Markets PLC (5 Year Treasury Constant Maturity+4.40%)ʊ± | | | | | | |
| | | | | | |
| | | | | | |
The accompanying notes are an integral part of these consolidated financial statements.
14 | Allspring Income Plus Fund
Consolidated portfolio of investments—September 30, 2024
| | | | | |
| | | | | | |
| | | | | | |
| | | | | | |
| | | | | | |
| | | | | | |
| | | | | | |
Enbridge, Inc. Series 20-A (5 Year Treasury Constant Maturity+5.31%)± | | | | | | |
| | | | | | |
| | | | | | |
| | | | | | |
| | | | | | |
Banco Industrial SA (5 Year Treasury Constant Maturity+4.44%)144A± | | | | | | |
Banco Nacional de Comercio Exterior SNC (5 Year Treasury Constant Maturity+2.00%)144A± | | | | | | |
Bancolombia SA (5 Year Treasury Constant Maturity+4.32%)± | | | | | | |
Bank of Ireland Group PLC (U.S. SOFR+1.62%)144A± | | | | | | |
BBVA Bancomer SA (5 Year Treasury Constant Maturity+4.31%)144A± | | | | | | |
BNP Paribas SA (5 Year Treasury Constant Maturity+4.90%)144Aʊ± | | | | | | |
Credit Agricole SA (5 Year USD Swap Rate+6.19%)144Aʊ± | | | | | | |
Danske Bank AS (1 Year Treasury Constant Maturity+1.75%)144A± | | | | | | |
Federation des Caisses Desjardins du Quebec144A | | | | | | |
| | | | | | |
Lloyds Banking Group PLC (5 Year Treasury Constant Maturity+4.82%)ʊ± | | | | | | |
Macquarie Bank Ltd. (5 Year Treasury Constant Maturity+1.70%)144A± | | | | | | |
National Australia Bank Ltd. (5 Year Treasury Constant Maturity+1.70%)144A± | | | | | | |
NatWest Group PLC (5 Year Treasury Constant Maturity+5.63%)ʊ± | | | | | | |
Societe Generale SA (1 Year Treasury Constant Maturity+3.20%)144A± | | | | | | |
UBS Group AG (1 Year Treasury Constant Maturity+1.77%)144A± | | | | | | |
UBS Group AG (5 Year Treasury Constant Maturity+3.40%)144Aʊ± | | | | | | |
| | | | | | |
Diversified financial services: 0.35% | | | | | | |
AerCap Ireland Capital DAC/AerCap Global Aviation Trust (5 Year Treasury Constant Maturity+2.72%)± | | | | | | |
The accompanying notes are an integral part of these consolidated financial statements.
Allspring Income Plus Fund | 15
Consolidated portfolio of investments—September 30, 2024
| | | | | |
Diversified financial services(continued) | | | | | | |
Castlelake Aviation Finance DAC144A | | | | | | |
Unifin Financiera SAB de CV144A† | | | | | | |
| | | | | | |
| | | | | | |
Swiss Re Finance Luxembourg SA (5 Year Treasury Constant Maturity+3.58%)144A± | | | | | | |
Government securities: 0.09% | | | | | | |
| | | | | | |
African Export-Import Bank144A | | | | | | |
| | | | | | |
Engineering & construction: 0.08% | | | | | | |
CIMIC Finance USA Pty. Ltd.144A | | | | | | |
Machinery-diversified: 0.17% | | | | | | |
TK Elevator Holdco GmbH144A | | | | | | |
Trucking & leasing: 0.19% | | | | | | |
SMBC Aviation Capital Finance DAC144A | | | | | | |
| | | | | | |
| | | | | | |
Renesas Electronics Corp.144A | | | | | | |
| | | | | | |
| | | | | | |
| | | | | | |
| | | | | | |
Comision Federal de Electricidad144A | | | | | | |
Comision Federal de Electricidad144A | | | | | | |
| | | | | | |
Total yankee corporate bonds and notes (Cost $28,407,532) | | | | | | |
Yankee government bonds: 3.91% | | | | | | |
| | | | | | |
Provincia de Cordoba144Aøø## | | | | | | |
Provincia de Cordoba144Aøø## | | | | | | |
| | | | | | |
| | | | | | |
| | | | | | |
| | | | | | |
| | | | | | |
The accompanying notes are an integral part of these consolidated financial statements.
16 | Allspring Income Plus Fund
Consolidated portfolio of investments—September 30, 2024
| | | | | |
| | | | | | |
| | | | | | |
| | | | | | |
| | | | | | |
Dominican Republic: 0.30% | | | | | | |
| | | | | | |
| | | | | | |
| | | | | | |
| | | | | | |
| | | | | | |
| | | | | | |
| | | | | | |
| | | | | | |
| | | | | | |
| | | | | | |
| | | | | | |
| | | | | | |
| | | | | | |
| | | | | | |
| | | | | | |
| | | | | | |
| | | | | | |
| | | | | | |
Corp. Financiera de Desarrollo SA144A## | | | | | | |
| | | | | | |
| | | | | | |
| | | | | | |
| | | | | | |
| | | | | | |
| | | | | | |
Total yankee government bonds (Cost $9,962,252) | | | | | | |
The accompanying notes are an integral part of these consolidated financial statements.
Allspring Income Plus Fund | 17
Consolidated portfolio of investments—September 30, 2024
| | | | | |
Short-term investments: 5.74% | | | | | | |
Investment companies: 5.74% | | | | | | |
Allspring Government Money Market Fund Select Class♠∞## | | | | | | |
Total short-term investments (Cost $15,122,046) | | | | | | |
Total investments in securities (Cost $330,995,780) | | | | | | |
Other assets and liabilities, net | | | | | | |
| | | | | | |
| The security is purchased on a when-issued basis. |
| The security may be resold in transactions exempt from registration, normally to qualified institutional buyers, pursuant to Rule 144A under the Securities Act of 1933. |
| The coupon of the security is adjusted based on the principal and/or interest payments received from the underlying pool of mortgages as well as the credit quality and the actual prepayment speed of the underlying mortgages. The rate shown is the rate in effect at period end. |
| Variable rate investment. The rate shown is the rate in effect at period end. |
| Security is valued using significant unobservable inputs. |
| Non-income-earning security |
| The security is fair valued in accordance with procedures approved by the Board of Trustees. |
| The security is issued in zero coupon form with no periodic interest payments. |
| Security is perpetual in nature and has no stated maturity date. The date shown reflects the next call date. |
| All or a portion of this security is segregated as collateral for when-issued securities. |
| A payment-in-kind (PIK) security is a security in which the issuer may make interest or dividend payments in cash or additional securities or a combination of both. The rate shown is the rate in effect at period end. |
| The interest rate is determined and reset by the issuer periodically depending upon the terms of the security. The rate shown is the rate in effect at period end. |
| The issuer of the security is an affiliated person of the Fund as defined in the Investment Company Act of 1940. |
| The rate represents the 7-day annualized yield at period end. |
|
| |
| |
| Collateralized loan obligation |
| |
| Euro Interbank Offered Rate |
| Federal National Mortgage Association |
| |
| Government National Mortgage Association |
| |
| |
| |
| |
| National Public Finance Guarantee Corporation |
| Real estate investment trust |
| Secured Overnight Financing Rate |
| |
The accompanying notes are an integral part of these consolidated financial statements.
18 | Allspring Income Plus Fund
Consolidated portfolio of investments—September 30, 2024
Investments in affiliates
An affiliated investment is an investment in which the Fund owns at least 5% of the outstanding voting shares of the issuer or as a result of other relationships, such as the Fund and the issuer having the same investment manager. Transactions with issuers that were affiliates of the Fund at the end of the period were as follows:
| | | | | Net
change in
unrealized
gains
(losses) | | | Income
from
affiliated
securities |
| | | | | | | | |
Allspring Government Money Market Fund Select Class | | | | | | | | |
Forward foreign currency contracts
| | | | | | |
| | | | | | |
2-Year U.S. Treasury Notes | | | | | | |
| | | | | | |
| | | | | | |
| | | | | | |
| | | | | | |
Ultra 10-Year U.S. Treasury Notes | | | | | | |
Ultra Long Term U.S. Treasury Bond | | | | | | |
5-Year U.S. Treasury Notes | | | | | | |
| | | | | | |
Centrally cleared credit default swap contracts
| | | | | | | | |
| | | | | | | | | |
Markit CDX Emerging Markets Index S42 | | | | | | | | | |
Markit iTraxx Europe Crossover S42 | | | | | | | | | |
| | | | | | | | | |
| | | | | | | | | |
| | | | | | | | | |
The accompanying notes are an integral part of these consolidated financial statements.
Allspring Income Plus Fund | 19
Consolidated statement of assets and liabilities—September 30, 2024
Consolidated financial statements
Consolidated statement of assets and liabilities
| |
Investments in unaffiliated securities, at value (cost $315,873,734) | |
Investments in affiliated securities, at value (cost $15,122,046) | |
| |
Cash at broker segregated for futures contracts | |
Segregated cash for forward foreign currency contracts | |
Foreign currency, at value (cost $114,263) | |
| |
Receivable for Fund shares sold | |
Receivable for daily variation margin on open futures contracts | |
Receivable for daily variation margin on centrally cleared swap contracts | |
Receivable for investments sold | |
Prepaid expenses and other assets | |
| |
| |
Payable for when-issued transactions | |
Payable for Fund shares redeemed | |
Unrealized losses on forward foreign currency contracts | |
| |
Payable for investments purchased | |
Administration fees payable | |
Payable for daily variation margin on open futures contracts | |
Shareholder servicing fee payable | |
Payable for daily variation margin on centrally cleared swap contracts | |
Trustees’ fees and expenses payable | |
| |
Cash collateral due to broker | |
Accrued expenses and other liabilities | |
| |
| |
| |
| |
| |
| |
The accompanying notes are an integral part of these consolidated financial statements.
20 | Allspring Income Plus Fund
Consolidated statement of assets and liabilities—September 30, 2024
Consolidated statement of assets and liabilities
Computation of net asset value and offering price per share | |
| |
Shares outstanding–Class A1 | |
Net asset value per share–Class A | |
Maximum offering price per share – Class A2 | |
| |
Shares outstanding–Class C1 | |
Net asset value per share–Class C | |
Net assets–Administrator Class | |
Shares outstanding–Administrator Class1 | |
Net asset value per share–Administrator Class | |
Net assets–Institutional Class | |
Shares outstanding–Institutional Class1 | |
Net asset value per share–Institutional Class | |
1 The Fund has an unlimited number of authorized shares.
2 Maximum offering price is computed as 100/96 of net asset value. On investments of $50,000 or more, the offering price is reduced.
The accompanying notes are an integral part of these consolidated financial statements.
Allspring Income Plus Fund | 21
Consolidated Statement of operations— year ended September 30, 2024
Consolidated statement of operations
| |
Interest (net of foreign withholding taxes of $9,925) | |
Income from affiliated securities | |
| |
| |
| |
| |
| |
| |
| |
| |
| |
Shareholder servicing fees | |
| |
| |
| |
| |
| |
Custody and accounting fees | |
| |
| |
Shareholder report expenses | |
Trustees’ fees and expenses | |
| |
| |
Less: Fee waivers and/or expense reimbursements | |
| |
| |
| |
| |
| |
The accompanying notes are an integral part of these consolidated financial statements.
22 | Allspring Income Plus Fund
Consolidated Statement of operations— year ended September 30, 2024
Consolidated statement of operations
Realized and unrealized gains (losses) on investments | |
Net realized gains (losses) on | |
| |
Foreign currency and foreign currency translations | |
Forward foreign currency contracts | |
| |
| |
Net realized losses on investments | |
Net change in unrealized gains (losses) on | |
| |
Foreign currency and foreign currency translations | |
Forward foreign currency contracts | |
| |
| |
Net change in unrealized gains (losses) on investments | |
Net realized and unrealized gains (losses) on investments | |
Net increase in net assets resulting from operations | |
The accompanying notes are an integral part of these consolidated financial statements.
Allspring Income Plus Fund | 23
Consolidated statement of changes in net assets
Consolidated statement of changes in net assets
| Year ended September 30, 2024 | Year ended September 30, 2023 |
| | | | |
| | | | |
Net realized losses on investments | | | | |
Net change in unrealized gains (losses) on investments | | | | |
Net increase in net assets resulting from operations | | | | |
Distributions to shareholders from | | | | |
Net investment income and net realized gains | | | | |
| | | | |
| | | | |
| | | | |
| | | | |
Total distributions to shareholders | | | | |
Capital share transactions | | | | |
Proceeds from shares sold | | | | |
| | | | |
| | | | |
| | | | |
| | | | |
| | | | |
Reinvestment of distributions | | | | |
| | | | |
| | | | |
| | | | |
| | | | |
| | | | |
Payment for shares redeemed | | | | |
| | | | |
| | | | |
| | | | |
| | | | |
| | | | |
Net increase (decrease) in net assets resulting from capital share transactions | | | | |
Total increase in net assets | | | | |
| | | | |
| | | | |
| | | | |
The accompanying notes are an integral part of these consolidated financial statements.
24 | Allspring Income Plus Fund
Consolidated financial highlights
Consolidated financial highlights
(For a share outstanding throughout each period)
| |
| | | | | |
Net asset value, beginning of period | | | | | |
| | | | | |
Net realized and unrealized gains (losses) on investments | | | | | |
Total from investment operations | | | | | |
Distributions to shareholders from | | | | | |
| | | | | |
| | | | | |
Total distributions to shareholders | | | | | |
Net asset value, end of period | | | | | |
| | | | | |
Ratios to average net assets (annualized) | | | | | |
| | | | | |
| | | | | |
| | | | | |
| | | | | |
| | | | | |
Net assets, end of period (000s omitted) | | | | | |
| Calculated based upon average shares outstanding |
| Total return calculations do not include any sales charges. Returns include adjustments required by U.S. GAAP and may differ from net asset values and performance reported elsewhere. |
The accompanying notes are an integral part of these consolidated financial statements.
Allspring Income Plus Fund | 25
Consolidated financial highlights
(For a share outstanding throughout each period)
| |
| | | | | |
Net asset value, beginning of period | | | | | |
| | | | | |
| | | | | |
Net realized and unrealized gains (losses) on investments | | | | | |
Total from investment operations | | | | | |
Distributions to shareholders from | | | | | |
| | | | | |
| | | | | |
Total distributions to shareholders | | | | | |
Net asset value, end of period | | | | | |
| | | | | |
Ratios to average net assets (annualized) | | | | | |
| | | | | |
| | | | | |
| | | | | |
| | | | | |
| | | | | |
Net assets, end of period (000s omitted) | | | | | |
| Calculated based upon average shares outstanding |
| Total return calculations do not include any sales charges. Returns include adjustments required by U.S. GAAP and may differ from net asset values and performance reported elsewhere. |
| During the year ended September 30, 2022, the Fund received payments from a service provider which had a 0.10% impact on the total return. |
| During the year ended September 30, 2020, the Fund received a payment from an affiliate which had a 0.79% impact on the total return. |
The accompanying notes are an integral part of these consolidated financial statements.
26 | Allspring Income Plus Fund
Consolidated financial highlights
(For a share outstanding throughout each period)
| |
| | | | | |
Net asset value, beginning of period | | | | | |
| | | | | |
Net realized and unrealized gains (losses) on investments | | | | | |
Total from investment operations | | | | | |
Distributions to shareholders from | | | | | |
| | | | | |
| | | | | |
Total distributions to shareholders | | | | | |
Net asset value, end of period | | | | | |
| | | | | |
Ratios to average net assets (annualized) | | | | | |
| | | | | |
| | | | | |
| | | | | |
| | | | | |
| | | | | |
Net assets, end of period (000s omitted) | | | | | |
| Calculated based upon average shares outstanding |
| Returns include adjustments required by U.S. GAAP and may differ from net asset values and performance reported elsewhere. |
The accompanying notes are an integral part of these consolidated financial statements.
Allspring Income Plus Fund | 27
Consolidated financial highlights
(For a share outstanding throughout each period)
| |
| | | | | |
Net asset value, beginning of period | | | | | |
| | | | | |
Net realized and unrealized gains (losses) on investments | | | | | |
Total from investment operations | | | | | |
Distributions to shareholders from | | | | | |
| | | | | |
| | | | | |
Total distributions to shareholders | | | | | |
Net asset value, end of period | | | | | |
| | | | | |
Ratios to average net assets (annualized) | | | | | |
| | | | | |
| | | | | |
| | | | | |
| | | | | |
| | | | | |
Net assets, end of period (000s omitted) | | | | | |
| Calculated based upon average shares outstanding |
| Returns include adjustments required by U.S. GAAP and may differ from net asset values and performance reported elsewhere. |
The accompanying notes are an integral part of these consolidated financial statements.
28 | Allspring Income Plus Fund
Notes to consolidated financial statements
Notes to consolidated financial statements
Allspring Funds Trust (the “Trust”), a Delaware statutory trust organized on March 10, 1999, is an open-end management investment company registered under the Investment Company Act of 1940, as amended (the “1940 Act”). As an investment company, the Trust follows the accounting and reporting guidance in Financial Accounting Standards Board (“FASB”) Accounting Standards Codification Topic 946, Financial Services – Investment Companies. These consolidated financial statements report on the Allspring Income Plus Fund (the “Fund”) which is a diversified series of the Trust.
2.
INVESTMENT IN SUBSIDIARY
The Fund invests in Income Plus Special Investments (Cayman) Ltd. (the “Subsidiary”), a wholly owned subsidiary incorporated on July 11, 2019 under the laws of the Cayman Islands as an exempted segregated portfolio company with limited liability. As of September 30, 2024 the Subsidiary had $2,127,583 in cash which represented 98.60% of its net assets. The Fund is the sole shareholder of the Subsidiary. As of September 30, 2024, the Fund held $2,158,726 in the Subsidiary, representing 0.82% of the Fund’s net assets prior to consolidation.
The consolidated financial statements of the Fund include the financial results of the Subsidiary. The Consolidated Portfolio of Investments includes positions of the Fund and the Subsidiary and the consolidated financial statements include the accounts of the Fund and the Subsidiary. Accordingly, all interfund balances and transactions between the Fund and the Subsidiary have been eliminated in consolidation.
The Subsidiary was liquidated on October 22, 2024 after all assets and liabilities of the Subsidiary were transferred to the Fund upon redemption of its interest in the Subsidiary. After elimination of interfund balances between the Fund and the Subsidiary, there was no change to the net assets of the Fund as a result of the liquidation.
3.
SIGNIFICANT ACCOUNTING POLICIES
The following significant accounting policies, which are consistently followed in the preparation of the consolidated financial statements of the Fund, are in conformity with U.S. generally accepted accounting principles (“GAAP”) which require management to make estimates and assumptions that affect the reported amounts of assets and liabilities, disclosure of contingent assets and liabilities at the date of the consolidated financial statements, and the reported amounts of income and expenses during the reporting period. Actual results could differ from those estimates.
All investments are valued each business day as of the close of regular trading on the New York Stock Exchange (generally 4 p.m. Eastern Time), although the Fund may deviate from this calculation time under unusual or unexpected circumstances.
Debt securities are valued at the evaluated bid price provided by an independent pricing service (e.g., taking into account various factors, including yields, maturities, or credit ratings) or, if a reliable price is not available, the quoted bid price from an independent broker-dealer.
Equity securities, exchange-traded funds and futures contracts that are listed on a foreign or domestic exchange or market are valued at the official closing price or, if none, the last sales price.
The values of securities denominated in foreign currencies are translated into U.S. dollars at rates provided by an independent foreign currency pricing source at a time each business day specified by the Valuation Committee at Allspring Funds Management, LLC (“Allspring Funds Management”).
Many securities markets and exchanges outside the U.S. close prior to the close of the New York Stock Exchange and therefore may not fully reflect trading or events that occur after the close of the principal exchange in which the foreign securities are traded, but before the close of the New York Stock Exchange. If such trading or events are expected to materially affect the value of such securities, then fair value pricing procedures implemented by Allspring Funds Management are applied. These procedures take into account multiple factors including movements in U.S. securities markets after foreign exchanges close. Foreign securities that are fair valued under these procedures are categorized as Level 2 and the application of these procedures may result in transfers between Level 1 and Level 2. Depending on market activity, such fair valuations may be frequent. Such fair value pricing may result in net asset values that are higher or lower than net asset values based on the last reported sales price or latest quoted bid price. On September 30, 2024, such fair value pricing was not used in pricing foreign securities.
Forward foreign currency contracts are recorded at the forward rate provided by an independent foreign currency pricing source at a time each business day specified by the Valuation Committee at Allspring Funds Management.
Swap contracts are valued at the evaluated price provided by an independent pricing service or, if a reliable price is not available, the quoted bid price from an independent broker-dealer.
Investments in registered open-end investment companies (other than those listed on a foreign or domestic exchange or market) are valued at net asset value.
Investments which are not valued using the methods discussed above are valued at their fair value, as determined in good faith by Allspring Funds Management, which was named the valuation designee by the Board of Trustees. As the valuation designee, Allspring Funds Management is responsible for day-to-day valuation activities for the Allspring Funds. In connection with these responsibilities, Allspring Funds Management has established a
Allspring Income Plus Fund | 29
Notes to consolidated financial statements
Valuation Committee and has delegated to it the authority to take any actions regarding the valuation of portfolio securities that the Valuation Committee deems necessary or appropriate, including determining the fair value of portfolio securities. On a quarterly basis, the Board of Trustees receives reports of valuation actions taken by the Valuation Committee. On at least an annual basis, the Board of Trustees receives an assessment of the adequacy and effectiveness of Allspring Funds Management’s process for determining the fair value of the portfolio of investments.
Foreign currency translation
The accounting records of the Fund are maintained in U.S. dollars. The values of other assets and liabilities denominated in foreign currencies are translated into U.S. dollars at rates provided by an independent foreign currency pricing source at a time each business day specified by the Valuation Committee. Purchases and sales of securities, and income and expenses are converted at the rate of exchange on the respective dates of such transactions. Net realized foreign exchange gains or losses arise from sales of foreign currencies, currency gains or losses realized between the trade and settlement dates on securities transactions, and the difference between the amounts of dividends, interest and foreign withholding taxes recorded and the U.S. dollar equivalent of the amounts actually paid or received. Net unrealized foreign exchange gains and losses arise from changes in the fair value of assets and liabilities other than investments in securities resulting from changes in exchange rates. The changes in net assets arising from changes in exchange rates of securities and the changes in net assets resulting from changes in market prices of securities are not separately presented. Such changes are included in net realized and unrealized gains or losses from investments.
The Fund may purchase securities on a forward commitment or when-issued basis. The Fund records a when-issued transaction on the trade date and will segregate assets in an amount at least equal in value to the Fund’s commitment to purchase when-issued securities. Securities purchased on a when-issued basis are marked-to-market daily and the Fund begins earning interest on the settlement date. Losses may arise due to changes in the market value of the underlying securities or if the counterparty does not perform under the contract.
The Fund may invest in direct debt instruments which are interests in amounts owed to lenders by corporate or other borrowers. The loans pay interest at rates which are periodically reset by reference to a base lending rate plus a spread. Investments in loans may be in the form of participations in loans or assignments of all or a portion of loans from third parties. When the Fund purchases participations, it generally has no rights to enforce compliance with the terms of the loan agreement with the borrower. As a result, the Fund assumes the credit risk of both the borrower and the lender that is selling the participation. When the Fund purchases assignments from lenders, it acquires direct rights against the borrower on the loan and may enforce compliance by the borrower with the terms of the loan agreement. Loans may include fully funded term loans or unfunded loan commitments, which are contractual obligations for future funding. Unfunded loan commitments represent the remaining obligation of the Fund to the borrower. At any point in time, up to the maturity date of the issue, the borrower may demand the unfunded portion. Unfunded amounts, if any, are marked to market and any unrealized gains or losses are recorded in the Consolidated Statement of Assets and Liabilities.
Forward foreign currency contracts
A forward foreign currency contract is an agreement between two parties to purchase or sell a specific currency for an agreed-upon price at a future date. The Fund enters into forward foreign currency contracts to facilitate transactions in foreign-denominated securities and to attempt to minimize the risk to the Fund from adverse changes in the relationship between currencies. Forward foreign currency contracts are recorded at the forward rate and marked-to-market daily. When the contracts are closed, realized gains and losses arising from such transactions are recorded as realized gains or losses on forward foreign currency contracts. The Fund is subject to foreign currency risk and may be exposed to risks if the counterparties to the contracts are unable to meet the terms of their contracts or if the value of the foreign currency changes unfavorably. The Fund’s maximum risk of loss from counterparty credit risk is the unrealized gains on the contracts. This risk may be mitigated if there is a master netting arrangement between the Fund and the counterparty.
Futures contracts are agreements between the Fund and a counterparty to buy or sell a specific amount of a commodity, financial instrument or currency at a specified price and on a specified date. The Fund may buy and sell futures contracts in order to gain exposure to, or protect against, changes in interest rates and is subject to interest rate risk. The primary risks associated with the use of futures contracts are the imperfect correlation between changes in market values of securities held by the Fund and the prices of futures contracts, and the possibility of an illiquid market. Futures contracts are generally entered into on a regulated futures exchange and cleared through a clearinghouse associated with the exchange. With futures contracts, there is minimal counterparty risk to the Fund since futures contracts are exchange-traded and the exchange’s clearinghouse, as the counterparty to all exchange-traded futures, guarantees the futures contracts against default.
Upon entering into a futures contract, the Fund is required to deposit either cash or securities (initial margin) with the broker in an amount equal to a certain percentage of the contract value. Subsequent payments (variation margin) are paid to or received from the broker each day equal to the daily changes in the contract value. Such payments are recorded as unrealized gains or losses and, if any, shown as variation margin receivable (payable) in the Consolidated Statement of Assets and Liabilities. Should the Fund fail to make requested variation margin payments, the broker can gain access to the initial margin to satisfy the Fund’s payment obligations. When the contracts are closed, a realized gain or loss is recorded in the Consolidated Statement of Operations.
30 | Allspring Income Plus Fund
Notes to consolidated financial statements
Swap contracts
Swap contracts are agreements between the Fund and a counterparty to exchange a series of cash flows over a specified period. Swap agreements are privately negotiated contracts between the Fund that are entered into as bilateral contracts in the over-the-counter market or centrally cleared (“centrally cleared swaps”) with a central clearinghouse.
The Fund entered into centrally cleared swaps. In a centrally cleared swap, immediately following execution of the swap contract, the swap contract is novated to a central counterparty (the “CCP”) and the Fund’s counterparty on the swap agreement becomes the CCP. Upon entering into a centrally cleared swap, the Fund is required to deposit an initial margin with the broker in the form of cash or securities. Securities deposited as initial margin are designated in the Consolidated Portfolio of Investments and cash deposited is shown as cash segregated for centrally cleared swaps in the Consolidated Statement of Assets and Liabilities. Pursuant to the contract, the Fund agrees to receive from or pay to the broker an amount of cash equal to the daily fluctuation in market value of the contract (“variation margin”). The variation margin is recorded as an unrealized gain (or loss) and shown as variation margin receivable (or payable) on centrally cleared swaps in the Consolidated Statement of Assets and Liabilities. Payments received from (paid to) the counterparty are recorded as realized gains (losses) in the Consolidated Statement of Operations when the contract is closed.
Credit default swaps
The Fund may enter into credit default swaps for hedging or speculative purposes to provide or receive a measure of protection against default on a referenced entity, obligation or index or a basket of single-name issuers or traded indexes. An index credit default swap references all the names in the index, and if a credit event is triggered, the credit event is settled based on that name’s weight in the index. Credit default swaps are agreements in which the protection buyer pays fixed periodic payments to the protection seller in consideration for a promise from the protection seller to make a specific payment should a negative credit event take place with respect to the referenced entity (e.g., bankruptcy, failure to pay, obligation acceleration, repudiation, moratorium or restructuring).
The Fund may enter into credit default swaps as either the seller of protection or the buyer of protection. If the Fund is the buyer of protection and a credit event occurs, the Fund will either receive from the seller an amount equal to the notional amount of the swap and deliver the referenced security or underlying securities comprising the index, or receive a net settlement of cash equal to the notional amount of the swap less the recovery value of the security or underlying securities comprising the index. If the Fund is the seller of protection and a credit event occurs, the Fund will either pay the buyer an amount equal to the notional amount of the swap and take delivery of the referenced security or underlying securities comprising the index or pay a net settlement of cash equal to the notional amount of the swap less the recovery value of the security or underlying securities comprising the index.
As the seller of protection, the Fund is subject to investment exposure on the notional amount of the swap and has assumed the risk of default of the underlying security or index. As the buyer of protection, the Fund could be exposed to risks if the seller of the protection defaults on its obligation to perform, or if there are unfavorable changes in the fluctuation of interest rates.
By entering into credit default swap contracts, the Fund is exposed to credit risk. In addition, certain credit default swap contracts entered into by the Fund provide for conditions that result in events of default or termination that enable the counterparty to the agreement to cause an early termination of the transactions under those agreements.
Security transactions and income recognition
Securities transactions are recorded on a trade date basis. Realized gains or losses are recorded on the basis of identified cost.
Interest income is accrued daily and bond discounts are accreted and premiums are amortized daily. To the extent debt obligations are placed on non-accrual status, any related interest income may be reduced by writing off interest receivables when the collection of all or a portion of interest has been determined to be doubtful based on consistently applied procedures and the fair value has decreased. If the issuer subsequently resumes interest payments or when the collectability of interest is reasonably assured, the debt obligation is removed from non-accrual status. Paydown gains and losses are included in interest income.
Dividend income is recognized on the ex-dividend date.
Interest earned on cash balances held at the custodian is recorded as interest income.
Income is recorded net of foreign taxes withheld where recovery of such taxes is not assured.
Income dividends and capital gain distributions from investment companies are recorded on the ex-dividend date. Capital gain distributions from investment companies are treated as realized gains.
Distributions to shareholders
Distributions to shareholders are recorded on the ex-dividend date and paid from net investment income monthly and any net realized gains are paid at least annually. Such distributions are determined in accordance with income tax regulations and may differ from U.S. GAAP. Dividend sources are estimated at the time of declaration. The tax character of distributions is determined as of the Fund’s fiscal year end. Therefore, a portion of the Fund’s distributions made prior to the Fund’s fiscal year end may be categorized as a tax return of capital at year end.
Allspring Income Plus Fund | 31
Notes to consolidated financial statements
Federal and other taxes
The Fund intends to continue to qualify as a regulated investment company by distributing substantially all of its investment company taxable income and any net realized capital gains (after reduction for capital loss carryforwards) sufficient to relieve it from all, or substantially all, federal income taxes. Accordingly, no provision for federal income taxes was required.
The Subsidiary is classified as a controlled foreign corporation under Subchapter N of the Internal Revenue Code. Therefore, the Fund is required to increase its taxable income by its share of the Subsidiary’s income. Net investment losses of the Subsidiary cannot be deducted by the Fund in the current period nor carried forward to offset taxable income in future periods.
The Fund’s income and federal excise tax returns and all financial records supporting those returns for the prior three fiscal years are subject to examination by the federal and Delaware revenue authorities. Management has analyzed the Fund’s tax positions taken on federal, state, and foreign tax returns, as applicable, for all open tax years and does not believe that there are any uncertain tax positions that require recognition of a tax liability.
As of September 30, 2024, the aggregate cost of all investments for federal income tax purposes was $334,463,084 and the unrealized gains (losses) consisted of:
As of September 30, 2024, the Fund had capital loss carryforwards which consist of $2,406,869 in short-term capital losses and $7,061,909 in long-term capital losses.
The separate classes of shares offered by the Fund differ principally in applicable sales charges, distribution, shareholder servicing, and administration fees. Class specific expenses are charged directly to that share class. Investment income, common fund-level expenses, and realized and unrealized gains (losses) on investments are allocated daily to each class of shares based on the relative proportion of net assets of each class.
4.
FAIR VALUATION MEASUREMENTS
Fair value measurements of investments are determined within a framework that has established a fair value hierarchy based upon the various data inputs utilized in determining the value of the Fund’s investments. The three-level hierarchy gives the highest priority to unadjusted quoted prices in active markets for identical assets or liabilities (Level 1) and the lowest priority to unobservable inputs (Level 3). The Fund’s investments are classified within the fair value hierarchy based on the lowest level of input that is significant to the fair value measurement. The inputs are summarized into three broad levels as follows:
•Level 1—quoted prices in active markets for identical securities
•Level 2—other significant observable inputs (including quoted prices for similar securities, interest rates, prepayment speeds, credit risk, etc.)
•Level 3—significant unobservable inputs (including the Fund’s own assumptions in determining the fair value of investments)
The inputs or methodologies used for valuing investments in securities are not necessarily an indication of the risk associated with investing in those securities.
32 | Allspring Income Plus Fund
Notes to consolidated financial statements
The following is a summary of the inputs used in valuing the Fund’s assets and liabilities as of September 30, 2024:
| | Other significant
observable inputs
(Level 2) | Significant
unobservable inputs
(Level 3) | |
| | | | |
| | | | |
| | | | |
| | | | |
| | | | |
| | | | |
| | | | |
Corporate bonds and notes | | | | |
Foreign corporate bonds and notes | | | | |
| | | | |
| | | | |
| | | | |
| | | | |
Non-agency mortgage-backed securities | | | | |
| | | | |
| | | | |
| | | | |
Yankee corporate bonds and notes | | | | |
| | | | |
| | | | |
| | | | |
| | | | |
| | | | |
| | | | |
| | | | |
|
Forward foreign currency contracts | | | | |
| | | | |
| | | | |
Futures contracts, forward foreign currency contracts and swap contracts are reported at their cumulative unrealized gains (losses) at measurement date as reported in the tables following the Consolidated Portfolio of Investments. For futures contracts and centrally cleared swap contracts, the current day’s variation margin is reported on the Consolidated Statement of Assets and Liabilities. All other assets and liabilities are reported at their market value at measurement date.
Additional sector, industry or geographic detail, if any, is included in the Consolidated Portfolio of Investments.
At September 30, 2024, the Fund did not have any transfers into/out of Level 3.
5.
TRANSACTIONS WITH AFFILIATES
Allspring Funds Management, a wholly owned subsidiary of Allspring Global Investments Holdings, LLC, a holding company indirectly owned by certain private funds of GTCR LLC and Reverence Capital Partners, L.P., is the manager of the Fund and provides advisory and fund-level administrative services under an investment management agreement. Under the investment management agreement, Allspring Funds Management is responsible for, among other services, implementing the investment objectives and strategies of the Fund, supervising the subadviser and providing fund-level administrative services in connection with the Fund’s operations. As compensation for its services under the investment management agreement, Allspring Funds
Allspring Income Plus Fund | 33
Notes to consolidated financial statements
Management is entitled to receive a management fee, which is generally paid monthly, at the following annual rate based on the Fund’s average daily net assets:
For the year ended September 30, 2024, the management fee was equivalent to an annual rate of 0.525% of the Fund’s average daily net assets.
The Subsidiary has entered into a separate advisory contract with Allspring Funds Management to manage the investment and reinvestment of its assets in conformity with its investment objectives and restrictions. Under this agreement, the Subsidiary does not pay Allspring Funds Management a fee for its services.
Allspring Funds Management has retained the services of a subadviser to provide daily portfolio management to the Fund. The fee for subadvisory services is borne by Allspring Funds Management. Allspring Global Investments, LLC, an affiliate of Allspring Funds Management and a wholly owned subsidiary of Allspring Global Investments Holdings, LLC, is the subadviser to the Fund and is entitled to receive a fee from Allspring Funds Management at an annual rate starting at 0.30% and declining to 0.15% as the average daily net assets of the Fund increase.
Under a class-level administration agreement, Allspring Funds Management provides class-level administrative services to the Fund, which includes paying fees and expenses for services provided by the transfer agent, sub-transfer agents, omnibus account servicers and record-keepers. As compensation for its services under the class-level administration agreement, Allspring Funds Management receives an annual fee which is calculated based on the average daily net assets of each class and generally paid monthly, as follows:
| Class-level
administration fee |
| |
| |
| |
| |
Waivers and/or expense reimbursements
Allspring Funds Management has contractually committed to waive and/or reimburse management and administration fees to the extent necessary to maintain certain net operating expense ratios for the Fund. When each class of the Fund has exceeded its expense cap, Allspring Funds Management will waive fees and/or reimburse expenses from fund-level expenses on a proportionate basis and then from class specific expenses. When only certain classes exceed their expense caps, waivers and/or reimbursements are applied against class specific expenses before fund-level expenses. Allspring Funds Management has contractually committed through January 31, 2025 to waive fees and/or reimburse expenses to the extent necessary to cap the Fund’s expenses. Prior to or after the commitment expiration date, the cap may be increased or the commitment to maintain the cap may be terminated only with the approval of the Board of Trustees. As of September 30, 2024, the contractual caps are as follows:
The Trust has adopted a distribution plan for Class C shares pursuant to Rule 12b-1 under the 1940 Act. A distribution fee is charged to Class C shares and paid to Allspring Funds Distributor, LLC (“Allspring Funds Distributor”), the principal underwriter, an affiliate of Allspring Funds Management, at an annual rate up to 0.75% of the average daily net assets of Class C shares. Such fees are generally paid on a monthly basis.
In addition, Allspring Funds Distributor is entitled to receive the front-end sales charge from the purchase of Class A shares and a contingent deferred sales charge on the redemption of certain Class A shares. Allspring Funds Distributor is also entitled to receive the contingent deferred sales charges from redemptions of Class C shares. For the year ended September 30, 2024, Allspring Funds Distributor received $135 from the sale of Class A shares. No contingent deferred sales charges were incurred by Class A and Class C shares for the year ended September 30, 2024.
34 | Allspring Income Plus Fund
Notes to consolidated financial statements
Shareholder servicing fees
The Trust has entered into contracts with one or more shareholder servicing agents, whereby Class A, Class C and Administrator Class are charged a fee at an annual rate up to 0.25% of the average daily net assets of each respective class and are generally paid on a monthly basis. A portion of these total shareholder servicing fees were paid to affiliates of the Fund.
The Fund may purchase or sell portfolio investment securities to certain affiliates pursuant to Rule 17a-7 under the 1940 Act and under procedures adopted by the Board of Trustees. The procedures have been designed to ensure that these interfund transactions, which do not incur broker commissions, are effected at current market prices. Pursuant to these procedures, the Fund did not have any interfund transactions during the year ended September 30, 2024.
6.
INVESTMENT PORTFOLIO TRANSACTIONS
Purchases and sales of investments, excluding short-term securities, for the year ended September 30, 2024 were as follows:
7.
DERIVATIVE TRANSACTIONS
During the year ended September 30, 2024, the Fund entered into futures contracts and forward foreign currency contracts for hedging purpose and entered into swap contracts as a substitute for taking a position in the underlying security or basket of securities or to potentially enhance the Fund’s total return.
The volume of the Fund’s derivative activity during the year ended September 30, 2024 was as follows:
Forward foreign currency contracts | |
Average contract amounts to buy | |
Average contract amounts to sell | |
| |
Average notional balance on long futures | |
Average notional balance on short futures | |
| |
| |
The credit default swap transactions may contain provisions for early termination in the event the net assets of the Fund declines below specific levels identified by the counterparty. If these levels are triggered, the counterparty may terminate the transaction and seek payment or request full collateralization of the derivative transactions in net liability positions.
A summary of the location of derivative instruments on the financial statements by primary risk exposure is outlined in the following tables.
Allspring Income Plus Fund | 35
Notes to consolidated financial statements
The fair value of derivative instruments as of September 30, 2024 by primary risk type was as follows for the Fund:
| | | | |
|
| | | | |
| | | | |
| | | | |
|
Forward foreign currency contracts | | | | |
| | | | |
| | | | |
| Amount represents the cumulative unrealized gains (losses) as reported in the table following the Consolidated Portfolio of Investments. For futures contracts and centrally cleared swap contracts, only the current day’s variation margin as of September 30, 2024 is reported separately on the Consolidated Statement of Assets and Liabilities. |
The effect of derivative instruments on the Consolidated Statement of Operations for the year ended September 30, 2024 was as follows:
| | | | |
Net realized gains (losses) on derivatives |
Forward foreign currency contracts | | | | |
| | | | |
| | | | |
| | | | |
Net change in unrealized gains (losses) on derivatives |
Forward foreign currency contracts | | | | |
| | | | |
| | | | |
| | | | |
For certain types of derivative transactions, the Fund has entered into International Swaps and Derivatives Association, Inc. master agreements (“ISDA Master Agreements”) or similar agreements with approved counterparties. The ISDA Master Agreements or similar agreements may have requirements to deliver/deposit securities or cash to/with an exchange or broker-dealer as collateral and allows the Fund to offset, with each counterparty, certain derivative financial instrument’s assets and/or liabilities with collateral held or pledged. Collateral requirements differ by type of derivative. Collateral or margin requirements are set by the broker or exchange clearinghouse for exchange traded derivatives while collateral terms are contract specific for over-the-counter traded derivatives. Cash collateral that has been pledged to cover obligations of the Fund under ISDA Master Agreements or similar agreements, if any, are reported separately in the Consolidated Statement of Assets and Liabilities. Securities pledged as collateral, if any, are noted in the Consolidated Portfolio of Investments. With respect to balance sheet offsetting, absent an event of default by the counterparty or a termination of the agreement, the reported amounts of financial assets and financial liabilities in the Consolidated Statement of Assets and Liabilities are not offset across transactions between the Fund and the applicable counterparty. A reconciliation of the gross amounts on the Consolidated Statement of Assets and Liabilities to the net amounts by counterparty, including any collateral exposure, for OTC derivatives is as follows:
| Gross amounts
of liabilities in the
Consolidated
Statement of
Assets and
Liabilities | Amounts
subject to
netting
agreements | | |
| | | | |
| | | | |
| Collateral pledged within this table is limited to the collateral for the net transaction with the counterparty. |
The Trust (excluding the money market funds), Allspring Master Trust and Allspring Variable Trust are parties to a $275,000,000 (prior to July 9, 2024: $350,000,000), revolving credit agreement whereby the Fund is permitted to use bank borrowings for temporary or emergency purposes, such as to fund shareholder redemption requests. Interest under the credit agreement is charged to the Fund based on a borrowing rate equal to the higher of the Federal Funds rate or the overnight bank funding rate in effect on that day plus a spread. In addition, an annual commitment fee based on the unused balance is allocated to each participating fund.
36 | Allspring Income Plus Fund
Notes to consolidated financial statements
For the year ended September 30, 2024, there were no borrowings by the Fund under the agreement.
9.
DISTRIBUTIONS TO SHAREHOLDERS
The tax character of distributions paid were as follows:
As of September 30, 2024, the components of distributable earnings on a tax basis were as follows:
Undistributed
ordinary
income | | |
| | |
Under the Fund’s organizational documents, the officers and Trustees have been granted certain indemnification rights against certain liabilities that may arise out of performance of their duties to the Fund. The Fund has entered into a separate agreement with each Trustee that converts indemnification rights currently existing under the Fund’s organizational documents into contractual rights that cannot be changed in the future without the consent of the Trustee. Additionally, in the normal course of business, the Fund may enter into contracts with service providers that contain a variety of indemnification clauses. The Fund’s maximum exposure under these arrangements is dependent on future claims that may be made against the Fund and, therefore, cannot be estimated.
Allspring Income Plus Fund | 37
Report of independent registered public accounting firm
To the Shareholders of the Fund and Board of Trustees
Allspring Funds Trust:
Opinion on the Consolidated Financial Statements
We have audited the accompanying consolidated statement of assets and liabilities of Allspring Income Plus Fund and subsidiary (the Fund), one of the funds constituting Allspring Funds Trust, including the consolidated portfolio of investments, as of September 30, 2024, the related consolidated statement of operations for the year then ended, the consolidated statements of changes in net assets for each of the years in the two-year period then ended, and the related notes (collectively, the consolidated financial statements) and the consolidated financial highlights for each of the years in the five-year period then ended. In our opinion, the consolidated financial statements and consolidated financial highlights present fairly, in all material respects, the financial position of the Fund as of September 30, 2024, the results of its operations for the year then ended, the changes in its net assets for each of the years in the two-year period then ended, and the financial highlights for each of the years in the five-year period then ended, in conformity with U.S. generally accepted accounting principles.
These consolidated financial statements and consolidated financial highlights are the responsibility of the Fund’s management. Our responsibility is to express an opinion on these consolidated financial statements and consolidated financial highlights based on our audits. We are a public accounting firm registered with the Public Company Accounting Oversight Board (United States) (PCAOB) and are required to be independent with respect to the Fund in accordance with the U.S. federal securities laws and the applicable rules and regulations of the Securities and Exchange Commission and the PCAOB.
We conducted our audits in accordance with the standards of the PCAOB. Those standards require that we plan and perform the audit to obtain reasonable assurance about whether the consolidated financial statements and consolidated financial highlights are free of material misstatement, whether due to error or fraud. Our audits included performing procedures to assess the risks of material misstatement of the consolidated financial statements and consolidated financial highlights, whether due to error or fraud, and performing procedures that respond to those risks. Such procedures included examining, on a test basis, evidence regarding the amounts and disclosures in the consolidated financial statements and consolidated financial highlights. Such procedures also included confirmation of securities owned as of September 30, 2024, by correspondence with the custodian, transfer agent, agent banks and brokers, or by other appropriate auditing procedures. Our audits also included evaluating the accounting principles used and significant estimates made by management, as well as evaluating the overall presentation of the consolidated financial statements and consolidated financial highlights. We believe that our audits provide a reasonable basis for our opinion.

We have not been able to determine the specific year that we began serving as the auditor of one or more Allspring Funds investment companies; however, we are aware that we have served as the auditor of one or more Allspring Funds investment companies since at least 1955.
November 25, 2024
38 | Allspring Income Plus Fund
Other information (unaudited)
Other information
For the fiscal year ended September 30, 2024, $5,930,531 has been designated as interest-related dividends for nonresident alien shareholders pursuant to Section 871 of the Internal Revenue Code.
For the fiscal year ended September 30, 2024, 9% of the ordinary income distributed was derived from interest on U.S. government securities.
A description of the policies and procedures used to determine how to vote proxies relating to portfolio securities is available without charge, upon request, by calling 1-866-259-3305, visiting our website at allspringglobal.com, or visiting the SEC website at sec.gov. Information regarding how the proxies related to portfolio securities were voted during the most recent 12-month period ended June 30 is available on the website at allspringglobal.com or by visiting the SEC website at sec.gov.
Quarterly portfolio holdings information
The Fund files its complete schedule of portfolio holdings with the SEC for the first and third quarters of each fiscal year as an exhibit to its reports on Form N-PORT. Shareholders may view the filed Form N-PORT by visiting the SEC website at sec.gov.
Allspring Income Plus Fund | 39
Other information (unaudited)
Item 8. Changes in and disagreements with accountants
Item 9. Matters submitted to fund shareholders for a vote
Item 10. Remuneration paid to directors, officers and others
Refer to information in the Statement of operations.
40 | Allspring Income Plus Fund
Other information (unaudited)
Item 11. Statement regarding basis for the board’s approval of investment advisory contract
Board consideration of investment management and sub-advisory agreements:
Under the Investment Company Act of 1940 (the “1940 Act”), the Board of Trustees (the “Board”) of Allspring Funds Trust (the “Trust”) must determine annually whether to approve the continuation of the Trust’s investment management and sub-advisory agreements. In this regard, at a Board meeting held on May 28-30, 2024 (the “Meeting”), the Board, all the members of which have no direct or indirect interest in the investment management and sub-advisory agreements and are not “interested persons” of the Trust, as defined in the 1940 Act (the “Independent Trustees”), reviewed and approved for the Allspring Income Plus Fund (the “Fund”): (i) an investment management agreement (the “Management Agreement”) with Allspring Funds Management, LLC (“Allspring Funds Management”); and (ii) an investment sub-advisory agreement (the “Sub-Advisory Agreement”) with Allspring Global Investments, LLC (the “Sub-Adviser”), an affiliate of Allspring Funds Management. The Management Agreement and the Sub-Advisory Agreement are collectively referred to as the “Advisory Agreements.”
At the Meeting, the Board considered the factors and reached the conclusions described below relating to the selection of Allspring Funds Management and the Sub-Adviser and the approval of the Advisory Agreements. Prior to the Meeting, including at a meeting of the Board held in April 2024, and at the Meeting, the Trustees conferred extensively among themselves and with representatives of Allspring Funds Management about these matters. The Board has adopted a team-based approach, with each team consisting of a sub-set of Trustees, to assist the full Board in the discharge of its duties in reviewing investment performance and other matters throughout the year. The Independent Trustees were assisted in their evaluation of the Advisory Agreements by independent legal counsel, from whom they received separate legal advice and with whom they met separately.
In providing information to the Board, Allspring Funds Management and the Sub-Adviser were guided by a detailed set of requests for information submitted to them by independent legal counsel on behalf of the Independent Trustees at the start of the Board’s annual contract renewal process earlier in 2024. In considering and approving the Advisory Agreements, the Trustees considered the information they believed relevant, including but not limited to the information discussed below. The Board considered not only the specific information presented in connection with the Meeting, but also the knowledge gained over time through interactions with Allspring Funds Management and the Sub-Adviser about various topics. In this regard, the Board reviewed reports of Allspring Funds Management at each of its quarterly meetings, which included, among other things, portfolio reviews and investment performance reports. In addition, the Board and the teams mentioned above confer with portfolio managers at various times throughout the year. The Board did not identify any particular information or consideration that was all-important or controlling, and each individual Trustee may have attributed different weights to various factors.
After its deliberations, the Board unanimously determined that the compensation payable to Allspring Funds Management and the Sub-Adviser under each of the Advisory Agreements was reasonable, and approved the continuation of the Advisory Agreements for a one-year term. The Board considered the approval of the Advisory Agreements for the Fund as part of its consideration of agreements for funds across the complex, but its approvals were made on a fund-by-fund basis. The following summarizes a number of important, but not necessarily all, factors considered by the Board in support of its approvals.
Nature, extent, and quality of services
The Board received and considered various information regarding the nature, extent, and quality of services provided to the Fund by Allspring Funds Management and the Sub-Adviser under the Advisory Agreements. This information included a description of the investment advisory services and Fund-level administrative services covered by the Management Agreement, as well as, among other things, a summary of the background and experience of senior management of Allspring Global Investments, of which Allspring Funds Management and the Sub-Adviser are a part, and a summary of investments made in the Allspring Global Investments business.* The Board also received information about the services that continue to be provided by Wells Fargo & Co. and/or its affiliates (“Wells Fargo”) since the sale of Wells Fargo Asset Management to Allspring Global Investments Holdings, LLC, a holding company indirectly owned by certain private funds of GTCR LLC and Reverence Capital Partners, L.P., under a transition services agreement and an update on the anticipated timeline for exiting the transition services agreement. In addition, the Board received and considered information about the full range of services provided to the Fund by Allspring Funds Management and its affiliates.
The Board considered the qualifications, background, tenure, and responsibilities of each of the portfolio managers primarily responsible for the day-to-day portfolio management of the Fund. The Board evaluated the ability of Allspring Funds Management and the Sub-Adviser to attract and retain qualified investment professionals, including research, advisory, and supervisory personnel.
The Board further considered the compliance programs and compliance records of Allspring Funds Management and the Sub-Adviser. The Board received and considered information about Allspring Global Investments’ risk management functions, which included information about Allspring Funds
*
The trade name for the asset management firm that includes Allspring Funds Management and the Sub-Adviser is “Allspring Global Investments.”
Allspring Income Plus Fund | 41
Other information (unaudited)
Management’s and the Sub-Adviser’s business continuity plans, their approaches to data privacy and cybersecurity, Allspring Funds Management’s role as administrator of the Fund’s liquidity risk management program, fair valuation designee, and derivatives risk management program manager. The Board also received and considered information about Allspring Funds Management’s intermediary and vendor oversight program.
Fund investment performance and expenses
The Board considered the investment performance results for the Fund over various time periods ended December 31, 2023. The Board considered these results in comparison to the investment performance of funds in a universe that was determined by Broadridge Inc. (“Broadridge”) to be similar to the Fund (the “Universe”), and in comparison to the Fund’s benchmark index and to other comparative data. Broadridge is an independent provider of investment company data. The Board received a description of the methodology used by Broadridge to select the mutual funds in the performance Universe. The Board noted that the investment performance of the Fund (Administrator Class) was higher than the average investment performance of the Universe for the one-, three- and five-year periods under review, and in range of the average investment performance of the Universe for the ten-year period under review. The Board also noted that the investment performance of the Fund was higher than the investment performance of its benchmark index, the Bloomberg U.S. Aggregate Bond Index, for all periods under review.
The Board also received and considered information regarding the Fund’s net operating expense ratios and their various components, including actual management fees, custodian and other non-management fees, and Rule 12b-1 and non-Rule 12b-1 shareholder service fees. The Board considered these ratios in comparison to the median ratios of funds in class-specific expense groups that were determined by Broadridge to be similar to the Fund (the “Groups”). The Board received a description of the methodology used by Broadridge to select the mutual funds in the expense Groups and an explanation of how funds comprising expense Groups and their expense ratios may vary from year-to-year. Based on the Broadridge reports, the Board noted that the net operating expense ratios of the Fund were lower than the median net operating expense ratios of the expense Groups for each share class.
The Board took into account the Fund’s investment performance and expense information provided to it among the factors considered in deciding to re-approve the Advisory Agreements.
Investment management and sub-advisory fee rates
The Board reviewed and considered the contractual fee rates payable by the Fund to Allspring Funds Management under the Management Agreement, as well as the contractual fee rates payable by the Fund to Allspring Funds Management for class-level administrative services under a Class-Level Administration Agreement, which include, among other things, class-level transfer agency and sub-transfer agency costs (collectively, the “Management Rates”). The Board also reviewed and considered the contractual investment sub-advisory fee rates payable by Allspring Funds Management to the Sub-Adviser for investment sub-advisory services. It was noted that advisory fee waivers, if any, are at the fund level and not class level.
Among other information reviewed by the Board was a comparison of the Fund’s Management Rates with the average contractual investment management fee rates of funds in the expense Groups at a common asset level as well as transfer agency costs of the funds in the expense Groups. The Board noted that the Management Rates of the Fund were lower than the sum of these average rates for the Fund’s expense Groups for each share class, except the Administrator Class, which was in range of the sum of the average rates for the expense Group.
The Board also received and considered information about the portion of the total management fee that was retained by Allspring Funds Management after payment of the fee to the Sub-Adviser for sub-advisory services. In assessing the reasonableness of this amount, the Board received and evaluated information about the nature and extent of responsibilities retained and risks assumed by Allspring Funds Management and not delegated to or assumed by the Sub-Adviser, and about Allspring Funds Management’s on-going oversight services. Given the affiliation between Allspring Funds Management and the Sub-Adviser, the Board ascribed limited relevance to the allocation of fees between them.
Based on its consideration of the factors and information it deemed relevant, including those described here, the Board determined that the compensation payable to Allspring Funds Management under the Management Agreement and to the Sub-Adviser under the Sub-Advisory Agreement was reasonable.
The Board received and considered information concerning the profitability of Allspring Funds Management, as well as the profitability of Allspring Global Investments, from providing services to the fund complex as a whole. The Board noted that the Sub-Adviser’s profitability information with respect to providing services to the Fund and other funds in the complex was subsumed in the Allspring Global Investments profitability analysis.
Allspring Funds Management reported on the methodologies and estimates used in calculating profitability, including a description of the methodology used to allocate certain expenses. Among other things, the Board noted that the levels of profitability reported on a fund-by-fund basis varied widely, depending on factors such as the size, type, and age of fund.
Based on its review, the Board did not deem the profits reported by Allspring Funds Management or Allspring Global Investments from services provided to the Fund to be at a level that would prevent it from approving the continuation of the Advisory Agreements.
42 | Allspring Income Plus Fund
Other information (unaudited)
Economies of scale
The Board received and considered information about the potential for Allspring Funds Management to experience economies of scale in the provision of management services to the Fund, the difficulties of isolating and quantifying economies of scale at an individual fund level, and the extent to which potential scale benefits are shared with Fund shareholders. The Board noted the existence of breakpoints in the Fund’s management fee structure, which operate generally to reduce the Fund’s expense ratios as the Fund grows in size, and the size of the Fund in relation to such breakpoints. The Board considered that in addition to management fee breakpoints, Allspring Funds Management shares potential economies of scale from its management business in a variety of ways, including through fee waiver and expense reimbursement arrangements, competitive management fee rates set at the outset without regard to breakpoints, and investments in the business intended to enhance services available to shareholders.
The Board concluded that Allspring Funds Management’s arrangements with respect to the Fund, including contractual breakpoints, constituted a reasonable approach to sharing potential economies of scale with the Fund and its shareholders.
Other benefits to Allspring Funds Management and the Sub-Adviser
The Board received and considered information regarding potential “fall-out” or ancillary benefits received by Allspring Funds Management and its affiliates, including the Sub-Adviser, as a result of their relationships with the Fund. Ancillary benefits could include, among others, benefits directly attributable to other relationships with the Fund and benefits potentially derived from an increase in Allspring Funds Management’s and the Sub-Adviser’s business as a result of their relationships with the Fund. The Board noted that Allspring Funds Distributor, LLC, an affiliate of Allspring Funds Management, receives distribution-related fees in respect of shares sold or held through it. The Board also reviewed information about soft dollar credits earned and utilized by the Sub-Adviser.
Based on its consideration of the factors and information it deemed relevant, including those described here, the Board did not find that any ancillary benefits received by Allspring Funds Management and its affiliates, including the Sub-Adviser, were unreasonable.
At the Meeting, after considering the above-described factors and based on its deliberations and its evaluation of the information described above, the Board unanimously determined that the compensation payable to Allspring Funds Management and the Sub-Adviser under each of the Advisory Agreements was reasonable, and approved the continuation of the Advisory Agreements for a one-year term.
Allspring Income Plus Fund | 43
This page is intentionally left blank.
For more information
More information about Allspring Funds is available free upon request. To obtain literature, please write, visit the Fund’s website, or call:
Allspring Funds
P.O. Box 219967
Kansas City, MO 64121-9967
Website: allspringglobal.com
Individual investors: 1-800-222-8222
Retail investment professionals: 1-888-877-9275
Institutional investment professionals: 1-800-260-5969
This report and the financial statements contained herein are submitted for the general information of the shareholders of the Fund. If this report is used for promotional purposes, distribution of the report must be accompanied or preceded by a current prospectus. Before investing, please consider the investment objectives, risks, charges, and expenses of the investment. For a current prospectus and, if available, a summary prospectus, containing this information, call 1-800-222-8222 or visit the Fund’s website at allspringglobal.com. Read the prospectus carefully before you invest or send money.
Allspring Global InvestmentsTM is the trade name for the asset management firms of Allspring Global Investments Holdings, LLC, a holding company indirectly owned by certain private funds of GTCR LLC and Reverence Capital Partners, L.P. These firms include but are not limited to Allspring Global Investments, LLC, and Allspring Funds Management, LLC. Certain products managed by Allspring entities are distributed by Allspring Funds Distributor, LLC (a broker-dealer and Member FINRA/SIPC).
This material is for general informational and educational purposes only and is NOT intended to provide investment advice or a recommendation of any kind - including a recommendation for any specific investment, strategy, or plan.
© 2024 Allspring Global Investments Holdings, LLC. All rights reserved.
NCSR3365 09-24
Allspring Index Asset Allocation Fund
Long Form Financial Statements
Annual Report
Allspring Index Asset Allocation Fund | 1
Portfolio of investments—September 30, 2024
| | | | | |
| | | | | | |
FNMA Series 2002-T1 Class A4 | | | | | | |
Total agency securities (Cost $11,840) | | | | | | |
| | | | | |
| | | | | | |
Communication services: 5.28% | | | | | | |
Diversified telecommunication services: 0.43% | | | | | | |
| | | | | | |
Verizon Communications, Inc. | | | | | | |
| | | | | | |
| | | | | | |
| | | | | | |
Live Nation Entertainment, Inc.† | | | | | | |
| | | | | | |
Take-Two Interactive Software, Inc.† | | | | | | |
| | | | | | |
Warner Bros Discovery, Inc.† | | | | | | |
| | | | | | |
Interactive media & services: 3.71% | | | | | | |
| | | | | | |
| | | | | | |
| | | | | | |
Meta Platforms, Inc. Class A | | | | | | |
| | | | | | |
| | | | | | |
Charter Communications, Inc. Class A† | | | | | | |
| | | | | | |
| | | | | | |
| | | | | | |
Interpublic Group of Cos., Inc. | | | | | | |
| | | | | | |
| | | | | | |
| | | | | | |
| | | | | | |
| | | | | | |
Wireless telecommunication services: 0.12% | | | | | | |
| | | | | | |
Consumer discretionary: 6.01% | | | | | | |
Automobile components: 0.03% | | | | | | |
| | | | | | |
| | | | | | |
| | | | | | |
The accompanying notes are an integral part of these financial statements.
2 | Allspring Index Asset Allocation Fund
Portfolio of investments—September 30, 2024
| | | | | |
| | | | | | |
| | | | | | |
| | | | | | |
| | | | | | |
| | | | | | |
| | | | | | |
| | | | | | |
| | | | | | |
| | | | | | |
| | | | | | |
| | | | | | |
| | | | | | |
| | | | | | |
| | | | | | |
Hotels, restaurants & leisure: 1.13% | | | | | | |
| | | | | | |
| | | | | | |
Caesars Entertainment, Inc.† | | | | | | |
| | | | | | |
Chipotle Mexican Grill, Inc. Class A† | | | | | | |
| | | | | | |
| | | | | | |
| | | | | | |
Hilton Worldwide Holdings, Inc. | | | | | | |
| | | | | | |
Marriott International, Inc. Class A | | | | | | |
| | | | | | |
MGM Resorts International† | | | | | | |
Norwegian Cruise Line Holdings Ltd.† | | | | | | |
Royal Caribbean Cruises Ltd. | | | | | | |
| | | | | | |
| | | | | | |
| | | | | | |
| | | | | | |
Household durables: 0.24% | | | | | | |
| | | | | | |
| | | | | | |
| | | | | | |
| | | | | | |
| | | | | | |
| | | | | | |
| | | | | | |
| | | | | | |
| | | | | | |
The accompanying notes are an integral part of these financial statements.
Allspring Index Asset Allocation Fund | 3
Portfolio of investments—September 30, 2024
| | | | | |
| | | | | | |
| | | | | | |
| | | | | | |
| | | | | | |
| | | | | | |
| | | | | | |
O’Reilly Automotive, Inc.† | | | | | | |
| | | | | | |
| | | | | | |
| | | | | | |
| | | | | | |
| | | | | | |
Textiles, apparel & luxury goods: 0.22% | | | | | | |
| | | | | | |
lululemon athletica, Inc.† | | | | | | |
| | | | | | |
Ralph Lauren Corp. Class A | | | | | | |
| | | | | | |
| | | | | | |
| | | | | | |
| | | | | | |
Brown-Forman Corp. Class B | | | | | | |
| | | | | | |
Constellation Brands, Inc. Class A | | | | | | |
| | | | | | |
Molson Coors Beverage Co. Class B | | | | | | |
| | | | | | |
| | | | | | |
| | | | | | |
Consumer staples distribution & retail: 1.14% | | | | | | |
| | | | | | |
| | | | | | |
| | | | | | |
| | | | | | |
| | | | | | |
| | | | | | |
Walgreens Boots Alliance, Inc. | | | | | | |
| | | | | | |
| | | | | | |
| | | | | | |
Archer-Daniels-Midland Co. | | | | | | |
| | | | | | |
| | | | | | |
| | | | | | |
| | | | | | |
| | | | | | |
The accompanying notes are an integral part of these financial statements.
4 | Allspring Index Asset Allocation Fund
Portfolio of investments—September 30, 2024
| | | | | |
| | | | | | |
| | | | | | |
| | | | | | |
| | | | | | |
| | | | | | |
Lamb Weston Holdings, Inc. | | | | | | |
| | | | | | |
Mondelez International, Inc. Class A | | | | | | |
Tyson Foods, Inc. Class A | | | | | | |
| | | | | | |
Household products: 0.72% | | | | | | |
Church & Dwight Co., Inc. | | | | | | |
| | | | | | |
| | | | | | |
| | | | | | |
| | | | | | |
| | | | | | |
Personal care products: 0.08% | | | | | | |
Estee Lauder Cos., Inc. Class A | | | | | | |
| | | | | | |
| | | | | | |
| | | | | | |
| | | | | | |
Philip Morris International, Inc. | | | | | | |
| | | | | | |
| | | | | | |
Energy equipment & services: 0.15% | | | | | | |
| | | | | | |
| | | | | | |
| | | | | | |
| | | | | | |
Oil, gas & consumable fuels: 1.82% | | | | | | |
| | | | | | |
| | | | | | |
| | | | | | |
| | | | | | |
| | | | | | |
| | | | | | |
| | | | | | |
| | | | | | |
| | | | | | |
| | | | | | |
| | | | | | |
| | | | | | |
| | | | | | |
The accompanying notes are an integral part of these financial statements.
Allspring Index Asset Allocation Fund | 5
Portfolio of investments—September 30, 2024
| | | | | |
Oil, gas & consumable fuels(continued) | | | | | | |
Occidental Petroleum Corp. | | | | | | |
| | | | | | |
| | | | | | |
| | | | | | |
| | | | | | |
| | | | | | |
| | | | | | |
| | | | | | |
| | | | | | |
| | | | | | |
| | | | | | |
Citizens Financial Group, Inc. | | | | | | |
| | | | | | |
Huntington Bancshares, Inc. | | | | | | |
| | | | | | |
| | | | | | |
| | | | | | |
PNC Financial Services Group, Inc. | | | | | | |
| | | | | | |
| | | | | | |
| | | | | | |
| | | | | | |
| | | | | | |
| | | | | | |
Ameriprise Financial, Inc. | | | | | | |
Bank of New York Mellon Corp. | | | | | | |
| | | | | | |
| | | | | | |
Cboe Global Markets, Inc. | | | | | | |
| | | | | | |
| | | | | | |
FactSet Research Systems, Inc. | | | | | | |
| | | | | | |
Goldman Sachs Group, Inc. | | | | | | |
Intercontinental Exchange, Inc. | | | | | | |
| | | | | | |
| | | | | | |
MarketAxess Holdings, Inc. | | | | | | |
| | | | | | |
| | | | | | |
| | | | | | |
| | | | | | |
| | | | | | |
Raymond James Financial, Inc. | | | | | | |
| | | | | | |
The accompanying notes are an integral part of these financial statements.
6 | Allspring Index Asset Allocation Fund
Portfolio of investments—September 30, 2024
| | | | | |
Capital markets(continued) | | | | | | |
| | | | | | |
T. Rowe Price Group, Inc. | | | | | | |
| | | | | | |
| | | | | | |
| | | | | | |
Capital One Financial Corp. | | | | | | |
Discover Financial Services | | | | | | |
| | | | | | |
| | | | | | |
Financial services: 2.44% | | | | | | |
Berkshire Hathaway, Inc. Class B† | | | | | | |
| | | | | | |
Fidelity National Information Services, Inc. | | | | | | |
| | | | | | |
| | | | | | |
Jack Henry & Associates, Inc. | | | | | | |
| | | | | | |
| | | | | | |
| | | | | | |
| | | | | | |
| | | | | | |
| | | | | | |
| | | | | | |
American International Group, Inc. | | | | | | |
| | | | | | |
| | | | | | |
| | | | | | |
| | | | | | |
| | | | | | |
| | | | | | |
Cincinnati Financial Corp. | | | | | | |
Erie Indemnity Co. Class A | | | | | | |
| | | | | | |
| | | | | | |
Hartford Financial Services Group, Inc. | | | | | | |
| | | | | | |
Marsh & McLennan Cos., Inc. | | | | | | |
| | | | | | |
Principal Financial Group, Inc. | | | | | | |
| | | | | | |
Prudential Financial, Inc. | | | | | | |
| | | | | | |
| | | | | | |
| | | | | | |
| | | | | | |
The accompanying notes are an integral part of these financial statements.
Allspring Index Asset Allocation Fund | 7
Portfolio of investments—September 30, 2024
| | | | | |
| | | | | | |
| | | | | | |
| | | | | | |
| | | | | | |
| | | | | | |
| | | | | | |
| | | | | | |
| | | | | | |
Regeneron Pharmaceuticals, Inc.† | | | | | | |
Vertex Pharmaceuticals, Inc.† | | | | | | |
| | | | | | |
Health care equipment & supplies: 1.41% | | | | | | |
| | | | | | |
| | | | | | |
Baxter International, Inc. | | | | | | |
| | | | | | |
| | | | | | |
| | | | | | |
| | | | | | |
Edwards Lifesciences Corp.† | | | | | | |
GE HealthCare Technologies, Inc. | | | | | | |
| | | | | | |
IDEXX Laboratories, Inc.† | | | | | | |
| | | | | | |
Intuitive Surgical, Inc.† | | | | | | |
| | | | | | |
| | | | | | |
| | | | | | |
| | | | | | |
| | | | | | |
| | | | | | |
Zimmer Biomet Holdings, Inc. | | | | | | |
| | | | | | |
Health care providers & services: 1.48% | | | | | | |
| | | | | | |
| | | | | | |
| | | | | | |
| | | | | | |
| | | | | | |
| | | | | | |
| | | | | | |
| | | | | | |
| | | | | | |
| | | | | | |
| | | | | | |
| | | | | | |
| | | | | | |
| | | | | | |
The accompanying notes are an integral part of these financial statements.
8 | Allspring Index Asset Allocation Fund
Portfolio of investments—September 30, 2024
| | | | | |
Health care providers & services(continued) | | | | | | |
| | | | | | |
Universal Health Services, Inc. Class B | | | | | | |
| | | | | | |
Life sciences tools & services: 0.75% | | | | | | |
Agilent Technologies, Inc. | | | | | | |
| | | | | | |
Charles River Laboratories International, Inc.† | | | | | | |
| | | | | | |
| | | | | | |
Mettler-Toledo International, Inc.† | | | | | | |
| | | | | | |
Thermo Fisher Scientific, Inc. | | | | | | |
| | | | | | |
West Pharmaceutical Services, Inc. | | | | | | |
| | | | | | |
| | | | | | |
| | | | | | |
| | | | | | |
| | | | | | |
| | | | | | |
| | | | | | |
| | | | | | |
| | | | | | |
| | | | | | |
| | | | | | |
| | | | | | |
Aerospace & defense: 1.16% | | | | | | |
| | | | | | |
| | | | | | |
| | | | | | |
| | | | | | |
| | | | | | |
Huntington Ingalls Industries, Inc. | | | | | | |
L3Harris Technologies, Inc. | | | | | | |
| | | | | | |
| | | | | | |
| | | | | | |
| | | | | | |
| | | | | | |
| | | | | | |
Air freight & logistics: 0.24% | | | | | | |
CH Robinson Worldwide, Inc. | | | | | | |
Expeditors International of Washington, Inc. | | | | | | |
The accompanying notes are an integral part of these financial statements.
Allspring Index Asset Allocation Fund | 9
Portfolio of investments—September 30, 2024
| | | | | |
Air freight & logistics(continued) | | | | | | |
| | | | | | |
United Parcel Service, Inc. Class B | | | | | | |
| | | | | | |
| | | | | | |
| | | | | | |
| | | | | | |
Builders FirstSource, Inc.† | | | | | | |
| | | | | | |
Johnson Controls International PLC | | | | | | |
| | | | | | |
| | | | | | |
| | | | | | |
Commercial services & supplies: 0.34% | | | | | | |
| | | | | | |
| | | | | | |
Republic Services, Inc. Class A | | | | | | |
| | | | | | |
| | | | | | |
| | | | | | |
| | | | | | |
Construction & engineering: 0.05% | | | | | | |
| | | | | | |
Electrical equipment: 0.45% | | | | | | |
| | | | | | |
| | | | | | |
| | | | | | |
| | | | | | |
| | | | | | |
| | | | | | |
Rockwell Automation, Inc. | | | | | | |
| | | | | | |
Ground transportation: 0.59% | | | | | | |
| | | | | | |
J.B. Hunt Transport Services, Inc. | | | | | | |
| | | | | | |
Old Dominion Freight Line, Inc. | | | | | | |
| | | | | | |
| | | | | | |
| | | | | | |
Industrial conglomerates: 0.26% | | | | | | |
| | | | | | |
Honeywell International, Inc. | | | | | | |
| | | | | | |
The accompanying notes are an integral part of these financial statements.
10 | Allspring Index Asset Allocation Fund
Portfolio of investments—September 30, 2024
| | | | | |
| | | | | | |
| | | | | | |
| | | | | | |
| | | | | | |
| | | | | | |
| | | | | | |
| | | | | | |
Illinois Tool Works, Inc. | | | | | | |
| | | | | | |
| | | | | | |
| | | | | | |
| | | | | | |
| | | | | | |
| | | | | | |
| | | | | | |
Stanley Black & Decker, Inc. | | | | | | |
Westinghouse Air Brake Technologies Corp. | | | | | | |
| | | | | | |
| | | | | | |
Passenger airlines: 0.08% | | | | | | |
| | | | | | |
| | | | | | |
United Airlines Holdings, Inc.† | | | | | | |
| | | | | | |
Professional services: 0.39% | | | | | | |
| | | | | | |
Automatic Data Processing, Inc. | | | | | | |
Broadridge Financial Solutions, Inc. | | | | | | |
| | | | | | |
| | | | | | |
| | | | | | |
| | | | | | |
| | | | | | |
| | | | | | |
Verisk Analytics, Inc. Class A | | | | | | |
| | | | | | |
Trading companies & distributors: 0.17% | | | | | | |
| | | | | | |
| | | | | | |
| | | | | | |
| | | | | | |
Information technology: 18.88% | | | | | | |
Communications equipment: 0.51% | | | | | | |
| | | | | | |
| | | | | | |
| | | | | | |
The accompanying notes are an integral part of these financial statements.
Allspring Index Asset Allocation Fund | 11
Portfolio of investments—September 30, 2024
| | | | | |
Communications equipment(continued) | | | | | | |
| | | | | | |
| | | | | | |
| | | | | | |
Electronic equipment, instruments & components: 0.35% | | | | | | |
| | | | | | |
| | | | | | |
| | | | | | |
| | | | | | |
Keysight Technologies, Inc.† | | | | | | |
| | | | | | |
Teledyne Technologies, Inc.† | | | | | | |
| | | | | | |
Zebra Technologies Corp. Class A† | | | | | | |
| | | | | | |
| | | | | | |
| | | | | | |
Akamai Technologies, Inc.† | | | | | | |
Cognizant Technology Solutions Corp. Class A | | | | | | |
| | | | | | |
| | | | | | |
| | | | | | |
International Business Machines Corp. | | | | | | |
| | | | | | |
| | | | | | |
Semiconductors & semiconductor equipment: 6.62% | | | | | | |
Advanced Micro Devices, Inc.† | | | | | | |
| | | | | | |
| | | | | | |
| | | | | | |
| | | | | | |
| | | | | | |
| | | | | | |
| | | | | | |
| | | | | | |
Microchip Technology, Inc. | | | | | | |
| | | | | | |
Monolithic Power Systems, Inc. | | | | | | |
| | | | | | |
| | | | | | |
| | | | | | |
| | | | | | |
| | | | | | |
| | | | | | |
| | | | | | |
| | | | | | |
| | | | | | |
The accompanying notes are an integral part of these financial statements.
12 | Allspring Index Asset Allocation Fund
Portfolio of investments—September 30, 2024
| | | | | |
| | | | | | |
| | | | | | |
| | | | | | |
| | | | | | |
Cadence Design Systems, Inc.† | | | | | | |
Crowdstrike Holdings, Inc. Class A† | | | | | | |
| | | | | | |
| | | | | | |
| | | | | | |
| | | | | | |
| | | | | | |
| | | | | | |
Palantir Technologies, Inc. Class A† | | | | | | |
Palo Alto Networks, Inc.† | | | | | | |
| | | | | | |
| | | | | | |
| | | | | | |
| | | | | | |
| | | | | | |
Tyler Technologies, Inc.† | | | | | | |
| | | | | | |
Technology hardware, storage & peripherals: 4.56% | | | | | | |
| | | | | | |
Dell Technologies, Inc. Class C | | | | | | |
Hewlett Packard Enterprise Co. | | | | | | |
| | | | | | |
| | | | | | |
Seagate Technology Holdings PLC | | | | | | |
Super Micro Computer, Inc.† | | | | | | |
| | | | | | |
| | | | | | |
| | | | | | |
| | | | | | |
Air Products & Chemicals, Inc. | | | | | | |
| | | | | | |
| | | | | | |
CF Industries Holdings, Inc. | | | | | | |
| | | | | | |
| | | | | | |
| | | | | | |
| | | | | | |
| | | | | | |
| | | | | | |
International Flavors & Fragrances, Inc. | | | | | | |
| | | | | | |
LyondellBasell Industries NV Class A | | | | | | |
| | | | | | |
The accompanying notes are an integral part of these financial statements.
Allspring Index Asset Allocation Fund | 13
Portfolio of investments—September 30, 2024
| | | | | |
| | | | | | |
| | | | | | |
| | | | | | |
| | | | | | |
Construction materials: 0.08% | | | | | | |
Martin Marietta Materials, Inc. | | | | | | |
| | | | | | |
| | | | | | |
Containers & packaging: 0.14% | | | | | | |
| | | | | | |
| | | | | | |
| | | | | | |
| | | | | | |
Packaging Corp. of America | | | | | | |
| | | | | | |
| | | | | | |
| | | | | | |
| | | | | | |
| | | | | | |
| | | | | | |
| | | | | | |
| | | | | | |
| | | | | | |
| | | | | | |
Alexandria Real Estate Equities, Inc. | | | | | | |
Healthpeak Properties, Inc. | | | | | | |
| | | | | | |
| | | | | | |
| | | | | | |
Hotel & resort REITs: 0.02% | | | | | | |
Host Hotels & Resorts, Inc. | | | | | | |
| | | | | | |
| | | | | | |
| | | | | | |
| | | | | | |
Real estate management & development: 0.08% | | | | | | |
CBRE Group, Inc. Class A† | | | | | | |
| | | | | | |
| | | | | | |
Residential REITs : 0.17% | | | | | | |
AvalonBay Communities, Inc. | | | | | | |
| | | | | | |
The accompanying notes are an integral part of these financial statements.
14 | Allspring Index Asset Allocation Fund
Portfolio of investments—September 30, 2024
| | | | | |
Residential REITs (continued) | | | | | | |
| | | | | | |
Essex Property Trust, Inc. | | | | | | |
| | | | | | |
Mid-America Apartment Communities, Inc. | | | | | | |
| | | | | | |
| | | | | | |
| | | | | | |
Federal Realty Investment Trust | | | | | | |
| | | | | | |
| | | | | | |
| | | | | | |
Simon Property Group, Inc. | | | | | | |
| | | | | | |
Specialized REITs : 0.62% | | | | | | |
| | | | | | |
| | | | | | |
Digital Realty Trust, Inc. | | | | | | |
| | | | | | |
Extra Space Storage, Inc. | | | | | | |
| | | | | | |
| | | | | | |
SBA Communications Corp. Class A | | | | | | |
VICI Properties, Inc. Class A | | | | | | |
| | | | | | |
| | | | | | |
| | | | | | |
Electric utilities: 0.99% | | | | | | |
| | | | | | |
American Electric Power Co., Inc. | | | | | | |
Constellation Energy Corp. | | | | | | |
| | | | | | |
| | | | | | |
| | | | | | |
| | | | | | |
| | | | | | |
| | | | | | |
| | | | | | |
| | | | | | |
| | | | | | |
| | | | | | |
Pinnacle West Capital Corp. | | | | | | |
| | | | | | |
| | | | | | |
| | | | | | |
| | | | | | |
The accompanying notes are an integral part of these financial statements.
Allspring Index Asset Allocation Fund | 15
Portfolio of investments—September 30, 2024
| | | | | |
| | | | | | |
| | | | | | |
Independent power and renewable electricity producers: 0.07% | | | | | | |
| | | | | | |
| | | | | | |
| | | | | | |
| | | | | | |
| | | | | | |
| | | | | | |
| | | | | | |
Consolidated Edison, Inc. | | | | | | |
| | | | | | |
| | | | | | |
| | | | | | |
Public Service Enterprise Group, Inc. | | | | | | |
| | | | | | |
| | | | | | |
| | | | | | |
| | | | | | |
American Water Works Co., Inc. | | | | | | |
Total common stocks (Cost $169,464,483) | | | | | | |
Investment companies: 2.65% | | | | | | |
Exchange-traded funds: 2.65% | | | | | | |
iShares 20+ Year Treasury Bond ETF | | | | | | |
Total investment companies (Cost $36,062,197) | | | | | | |
| | | | | |
Non-agency mortgage-backed securities: 0.00% | | | | | | |
Citigroup Mortgage Loan Trust, Inc. Series 2004-HYB4 Class AA (U.S. SOFR 1 Month+0.44%)± | | | | | | |
Total non-agency mortgage-backed securities (Cost $2,161) | | | | | | |
U.S. Treasury securities: 33.26% | | | | | | |
| | | | | | |
| | | | | | |
| | | | | | |
| | | | | | |
| | | | | | |
| | | | | | |
| | | | | | |
| | | | | | |
| | | | | | |
| | | | | | |
The accompanying notes are an integral part of these financial statements.
16 | Allspring Index Asset Allocation Fund
Portfolio of investments—September 30, 2024
| | | | | |
U.S. Treasury securities(continued) | | | | | | |
| | | | | | |
| | | | | | |
| | | | | | |
| | | | | | |
| | | | | | |
| | | | | | |
| | | | | | |
| | | | | | |
| | | | | | |
| | | | | | |
| | | | | | |
| | | | | | |
| | | | | | |
| | | | | | |
| | | | | | |
| | | | | | |
| | | | | | |
| | | | | | |
| | | | | | |
| | | | | | |
| | | | | | |
| | | | | | |
| | | | | | |
| | | | | | |
| | | | | | |
| | | | | | |
| | | | | | |
| | | | | | |
| | | | | | |
| | | | | | |
| | | | | | |
| | | | | | |
| | | | | | |
| | | | | | |
| | | | | | |
| | | | | | |
| | | | | | |
| | | | | | |
| | | | | | |
| | | | | | |
| | | | | | |
| | | | | | |
| | | | | | |
| | | | | | |
| | | | | | |
| | | | | | |
| | | | | | |
| | | | | | |
The accompanying notes are an integral part of these financial statements.
Allspring Index Asset Allocation Fund | 17
Portfolio of investments—September 30, 2024
| | | | | |
U.S. Treasury securities(continued) | | | | | | |
| | | | | | |
| | | | | | |
| | | | | | |
| | | | | | |
| | | | | | |
| | | | | | |
| | | | | | |
| | | | | | |
| | | | | | |
| | | | | | |
| | | | | | |
| | | | | | |
| | | | | | |
| | | | | | |
| | | | | | |
| | | | | | |
| | | | | | |
| | | | | | |
| | | | | | |
| | | | | | |
| | | | | | |
| | | | | | |
| | | | | | |
| | | | | | |
| | | | | | |
| | | | | | |
| | | | | | |
| | | | | | |
| | | | | | |
| | | | | | |
| | | | | | |
| | | | | | |
| | | | | | |
| | | | | | |
| | | | | | |
| | | | | | |
| | | | | | |
| | | | | | |
| | | | | | |
| | | | | | |
| | | | | | |
| | | | | | |
| | | | | | |
| | | | | | |
| | | | | | |
| | | | | | |
| | | | | | |
| | | | | | |
The accompanying notes are an integral part of these financial statements.
18 | Allspring Index Asset Allocation Fund
Portfolio of investments—September 30, 2024
| | | | | |
U.S. Treasury securities(continued) | | | | | | |
| | | | | | |
| | | | | | |
| | | | | | |
| | | | | | |
| | | | | | |
| | | | | | |
| | | | | | |
| | | | | | |
| | | | | | |
| | | | | | |
| | | | | | |
| | | | | | |
| | | | | | |
| | | | | | |
| | | | | | |
| | | | | | |
| | | | | | |
| | | | | | |
| | | | | | |
Total U.S. Treasury securities (Cost $467,886,383) | | | | | | |
| | | | | |
Short-term investments: 2.64% | | | | | | |
Investment companies: 2.64% | | | | | | |
Allspring Government Money Market Fund Select Class♠∞ | | | | | | |
Total short-term investments (Cost $35,830,226) | | | | | | |
Total investments in securities (Cost $709,257,290) | | | | | | |
Other assets and liabilities, net | | | | | | |
| | | | | | |
| Non-income-earning security |
| Variable rate investment. The rate shown is the rate in effect at period end. |
| The issuer of the security is an affiliated person of the Fund as defined in the Investment Company Act of 1940. |
| The rate represents the 7-day annualized yield at period end. |
|
| Federal National Mortgage Association |
| Real estate investment trust |
| Secured Overnight Financing Rate |
The accompanying notes are an integral part of these financial statements.
Allspring Index Asset Allocation Fund | 19
Portfolio of investments—September 30, 2024
Investments in affiliates
An affiliated investment is an investment in which the Fund owns at least 5% of the outstanding voting shares of the issuer or as a result of other relationships, such as the Fund and the issuer having the same investment manager. Transactions with issuers that were affiliates of the Fund at the end of the period were as follows:
| | | | | Net
change in
unrealized
gains
(losses) | | | Income
from
affiliated
securities |
| | | | | | | | |
Allspring Government Money Market Fund Select Class | | | | | | | | |
| | | | | | |
| | | | | | |
10-Year U.S. Treasury Notes | | | | | | |
| | | | | | |
Ultra 10-Year U.S. Treasury Notes | | | | | | |
Ultra Long Term U.S. Treasury Bond | | | | | | |
| | | | | | |
2-Year U.S. Treasury Notes | | | | | | |
5-Year U.S. Treasury Notes | | | | | | |
| | | | | | |
Ultra Long Term U.S. Treasury Bond | | | | | | |
| | | | | | |
The accompanying notes are an integral part of these financial statements.
20 | Allspring Index Asset Allocation Fund
Statement of assets and liabilities—September 30, 2024
Financial statements
Statement of assets and liabilities
| |
Investments in unaffiliated securities, at value (cost $673,427,064) | |
Investments in affiliated securities, at value (cost $35,830,226) | |
| |
Cash at broker segregated for futures contracts | |
Receivable for investments sold | |
Receivable for dividends and interest | |
Receivable for daily variation margin on open futures contracts | |
Receivable for Fund shares sold | |
Prepaid expenses and other assets | |
| |
| |
Payable for investments purchased | |
Payable for daily variation margin on open futures contracts | |
| |
Payable for Fund shares redeemed | |
Shareholder servicing fees payable | |
Administration fees payable | |
| |
Trustees’ fees and expenses payable | |
Accrued expenses and other liabilities | |
| |
| |
| |
| |
Total distributable earnings | |
| |
Computation of net asset value and offering price per share | |
| |
Shares outstanding–Class A1 | |
Net asset value per share–Class A | |
Maximum offering price per share – Class A2 | |
| |
Shares outstanding–Class C1 | |
Net asset value per share–Class C | |
Net assets–Administrator Class | |
Shares outstanding–Administrator Class1 | |
Net asset value per share–Administrator Class | |
Net assets–Institutional Class | |
Shares outstanding–Institutional Class1 | |
Net asset value per share–Institutional Class | |
1 The Fund has an unlimited number of authorized shares.
2 Maximum offering price is computed as 100/94.25 of net asset value. On investments of $50,000 or more, the offering price is reduced.
The accompanying notes are an integral part of these financial statements.
Allspring Index Asset Allocation Fund | 21
Statement of operations—year ended September 30, 2024
Statement of operations
| |
| |
Dividends (net of foreign withholdings taxes of $2,854) | |
Income from affiliated securities | |
| |
| |
| |
| |
| |
| |
| |
| |
Shareholder servicing fees | |
| |
| |
| |
| |
| |
Custody and accounting fees | |
| |
| |
Shareholder report expenses | |
Trustees’ fees and expenses | |
| |
| |
Less: Fee waivers and/or expense reimbursements | |
| |
| |
| |
| |
| |
| |
| |
Realized and unrealized gains (losses) on investments | |
| |
| |
| |
Net realized gains on investments | |
Net change in unrealized gains (losses) on | |
| |
| |
Net change in unrealized gains (losses) on investments | |
Net realized and unrealized gains (losses) on investments | |
Net increase in net assets resulting from operations | |
The accompanying notes are an integral part of these financial statements.
22 | Allspring Index Asset Allocation Fund
Statement of changes in net assets
Statement of changes in net assets
| Year ended September 30, 2024 | Year ended September 30, 2023 |
| | | | |
| | | | |
Net realized gains on investments | | | | |
Net change in unrealized gains (losses) on investments | | | | |
Net increase in net assets resulting from operations | | | | |
Distributions to shareholders from | | | | |
Net investment income and net realized gains | | | | |
| | | | |
| | | | |
| | | | |
| | | | |
Total distributions to shareholders | | | | |
Capital share transactions | | | | |
Proceeds from shares sold | | | | |
| | | | |
| | | | |
| | | | |
| | | | |
| | | | |
Reinvestment of distributions | | | | |
| | | | |
| | | | |
| | | | |
| | | | |
| | | | |
Payment for shares redeemed | | | | |
| | | | |
| | | | |
| | | | |
| | | | |
| | | | |
Net decrease in net assets resulting from capital share transactions | | | | |
Total increase (decrease) in net assets | | | | |
| | | | |
| | | | |
| | | | |
The accompanying notes are an integral part of these financial statements.
Allspring Index Asset Allocation Fund | 23
Financial highlights
(For a share outstanding throughout each period)
| |
| | | | | |
Net asset value, beginning of period | | | | | |
| | | | | |
Net realized and unrealized gains (losses) on investments | | | | | |
Total from investment operations | | | | | |
Distributions to shareholders from | | | | | |
| | | | | |
| | | | | |
Total distributions to shareholders | | | | | |
Net asset value, end of period | | | | | |
| | | | | |
Ratios to average net assets (annualized) | | | | | |
| | | | | |
| | | | | |
| | | | | |
| | | | | |
| | | | | |
Net assets, end of period (000s omitted) | | | | | |
| Calculated based upon average shares outstanding |
| Total return calculations do not include any sales charges. Returns include adjustments required by U.S. GAAP and may differ from net asset values and performance reported elsewhere. |
The accompanying notes are an integral part of these financial statements.
24 | Allspring Index Asset Allocation Fund
(For a share outstanding throughout each period)
| |
| | | | | |
Net asset value, beginning of period | | | | | |
Net investment income (loss) | | | | | |
Net realized and unrealized gains (losses) on investments | | | | | |
Total from investment operations | | | | | |
Distributions to shareholders from | | | | | |
| | | | | |
| | | | | |
Total distributions to shareholders | | | | | |
Net asset value, end of period | | | | | |
| | | | | |
Ratios to average net assets (annualized) | | | | | |
| | | | | |
| | | | | |
Net investment income (loss) | | | | | |
| | | | | |
| | | | | |
Net assets, end of period (000s omitted) | | | | | |
| Calculated based upon average shares outstanding |
| Total return calculations do not include any sales charges. Returns include adjustments required by U.S. GAAP and may differ from net asset values and performance reported elsewhere. |
The accompanying notes are an integral part of these financial statements.
Allspring Index Asset Allocation Fund | 25
(For a share outstanding throughout each period)
| |
| | | | | |
Net asset value, beginning of period | | | | | |
| | | | | |
Net realized and unrealized gains (losses) on investments | | | | | |
Total from investment operations | | | | | |
Distributions to shareholders from | | | | | |
| | | | | |
| | | | | |
Total distributions to shareholders | | | | | |
Net asset value, end of period | | | | | |
| | | | | |
Ratios to average net assets (annualized) | | | | | |
| | | | | |
| | | | | |
| | | | | |
| | | | | |
| | | | | |
Net assets, end of period (000s omitted) | | | | | |
| Calculated based upon average shares outstanding |
| Returns include adjustments required by U.S. GAAP and may differ from net asset values and performance reported elsewhere. |
The accompanying notes are an integral part of these financial statements.
26 | Allspring Index Asset Allocation Fund
(For a share outstanding throughout each period)
| |
| | | | | |
Net asset value, beginning of period | | | | | |
| | | | | |
Net realized and unrealized gains (losses) on investments | | | | | |
Total from investment operations | | | | | |
Distributions to shareholders from | | | | | |
| | | | | |
| | | | | |
Total distributions to shareholders | | | | | |
Net asset value, end of period | | | | | |
| | | | | |
Ratios to average net assets (annualized) | | | | | |
| | | | | |
| | | | | |
| | | | | |
| | | | | |
| | | | | |
Net assets, end of period (000s omitted) | | | | | |
| Calculated based upon average shares outstanding |
| Returns include adjustments required by U.S. GAAP and may differ from net asset values and performance reported elsewhere. |
The accompanying notes are an integral part of these financial statements.
Allspring Index Asset Allocation Fund | 27
Notes to financial statements
Notes to financial statements
Allspring Funds Trust (the “Trust”), a Delaware statutory trust organized on March 10, 1999, is an open-end management investment company registered under the Investment Company Act of 1940, as amended (the “1940 Act”). As an investment company, the Trust follows the accounting and reporting guidance in Financial Accounting Standards Board (“FASB”) Accounting Standards Codification Topic 946, Financial Services – Investment Companies. These financial statements report on the Allspring Index Asset Allocation Fund (the “Fund”) which is a diversified series of the Trust.
2.
SIGNIFICANT ACCOUNTING POLICIES
The following significant accounting policies, which are consistently followed in the preparation of the financial statements of the Fund, are in conformity with U.S. generally accepted accounting principles (“GAAP”) which require management to make estimates and assumptions that affect the reported amounts of assets and liabilities, disclosure of contingent assets and liabilities at the date of the financial statements, and the reported amounts of income and expenses during the reporting period. Actual results could differ from those estimates.
All investments are valued each business day as of the close of regular trading on the New York Stock Exchange (generally 4 p.m. Eastern Time), although the Fund may deviate from this calculation time under unusual or unexpected circumstances.
Equity securities, exchange-traded funds and futures contracts that are listed on a foreign or domestic exchange or market are valued at the official closing price or, if none, the last sales price.
Debt securities are valued at the evaluated bid price provided by an independent pricing service (e.g., taking into account various factors, including yields, maturities, or credit ratings) or, if a reliable price is not available, the quoted bid price from an independent broker-dealer.
Investments in registered open-end investment companies (other than those listed on a foreign or domestic exchange or market) are valued at net asset value.
Investments which are not valued using the methods discussed above are valued at their fair value, as determined in good faith by Allspring Funds Management, LLC (“Allspring Funds Management”), which was named the valuation designee by the Board of Trustees. As the valuation designee, Allspring Funds Management is responsible for day-to-day valuation activities for the Allspring Funds. In connection with these responsibilities, Allspring Funds Management has established a Valuation Committee and has delegated to it the authority to take any actions regarding the valuation of portfolio securities that the Valuation Committee deems necessary or appropriate, including determining the fair value of portfolio securities. On a quarterly basis, the Board of Trustees receives reports of valuation actions taken by the Valuation Committee. On at least an annual basis, the Board of Trustees receives an assessment of the adequacy and effectiveness of Allspring Funds Management’s process for determining the fair value of the portfolio of investments.
Futures contracts are agreements between the Fund and a counterparty to buy or sell a specific amount of a commodity, financial instrument or currency at a specified price and on a specified date. The Fund may buy and sell futures contracts in order to gain exposure to, or protect against, changes in interest rates and security values and is subject to interest rate risk and equity price risk. The primary risks associated with the use of futures contracts are the imperfect correlation between changes in market values of securities held by the Fund and the prices of futures contracts, and the possibility of an illiquid market. Futures contracts are generally entered into on a regulated futures exchange and cleared through a clearinghouse associated with the exchange. With futures contracts, there is minimal counterparty risk to the Fund since futures contracts are exchange-traded and the exchange’s clearinghouse, as the counterparty to all exchange-traded futures, guarantees the futures contracts against default.
Upon entering into a futures contract, the Fund is required to deposit either cash or securities (initial margin) with the broker in an amount equal to a certain percentage of the contract value. Subsequent payments (variation margin) are paid to or received from the broker each day equal to the daily changes in the contract value. Such payments are recorded as unrealized gains or losses and, if any, shown as variation margin receivable (payable) in the Statement of Assets and Liabilities. Should the Fund fail to make requested variation margin payments, the broker can gain access to the initial margin to satisfy the Fund’s payment obligations. When the contracts are closed, a realized gain or loss is recorded in the Statement of Operations.
Security transactions and income recognition
Securities transactions are recorded on a trade date basis. Realized gains or losses are recorded on the basis of identified cost.
Dividend income is recognized on the ex-dividend date.
Interest income is accrued daily and bond discounts are accreted and premiums are amortized daily. To the extent debt obligations are placed on non-accrual status, any related interest income may be reduced by writing off interest receivables when the collection of all or a portion of interest has been determined to be doubtful based on consistently applied procedures and the fair value has decreased. If the issuer subsequently resumes interest payments or when the collectability of interest is reasonably assured, the debt obligation is removed from non-accrual status.
Interest earned on cash balances held at the custodian is recorded as interest income.
28 | Allspring Index Asset Allocation Fund
Notes to financial statements
Income is recorded net of foreign taxes withheld where recovery of such taxes is not assured.
Distributions received from REIT investments may be characterized as ordinary income, capital gains, or a return of capital to the Fund based on information provided by the REIT. The proper characterization of REIT distributions is generally not known until after the end of each calendar year. As such, estimates may be used in reporting the character of income and distributions for financial statement purposes.
Distributions to shareholders
Distributions to shareholders are recorded on the ex-dividend date and paid from net investment income quarterly and any net realized gains are paid at least annually. Such distributions are determined in accordance with income tax regulations and may differ from U.S. GAAP. Dividend sources are estimated at the time of declaration. The tax character of distributions is determined as of the Fund’s fiscal year end. Therefore, a portion of the Fund’s distributions made prior to the Fund’s fiscal year end may be categorized as a tax return of capital at year end.
The Fund intends to continue to qualify as a regulated investment company by distributing substantially all of its investment company taxable income and any net realized capital gains (after reduction for capital loss carryforwards) sufficient to relieve it from all, or substantially all, federal income taxes. Accordingly, no provision for federal income taxes was required.
The Fund’s income and federal excise tax returns and all financial records supporting those returns for the prior three fiscal years are subject to examination by the federal and Delaware revenue authorities. Management has analyzed the Fund’s tax positions taken on federal, state, and foreign tax returns, as applicable, for all open tax years and does not believe that there are any uncertain tax positions that require recognition of a tax liability.
As of September 30, 2024, the aggregate cost of all investments for federal income tax purposes was $745,838,726 and the unrealized gains (losses) consisted of:
The separate classes of shares offered by the Fund differ principally in applicable sales charges, distribution, shareholder servicing, and administration fees. Class specific expenses are charged directly to that share class. Investment income, common fund-level expenses, and realized and unrealized gains (losses) on investments are allocated daily to each class of shares based on the relative proportion of net assets of each class.
3.
FAIR VALUATION MEASUREMENTS
Fair value measurements of investments are determined within a framework that has established a fair value hierarchy based upon the various data inputs utilized in determining the value of the Fund’s investments. The three-level hierarchy gives the highest priority to unadjusted quoted prices in active markets for identical assets or liabilities (Level 1) and the lowest priority to unobservable inputs (Level 3). The Fund’s investments are classified within the fair value hierarchy based on the lowest level of input that is significant to the fair value measurement. The inputs are summarized into three broad levels as follows:
•Level 1—quoted prices in active markets for identical securities
•Level 2—other significant observable inputs (including quoted prices for similar securities, interest rates, prepayment speeds, credit risk, etc.)
•Level 3—significant unobservable inputs (including the Fund’s own assumptions in determining the fair value of investments)
The inputs or methodologies used for valuing investments in securities are not necessarily an indication of the risk associated with investing in those securities.
Allspring Index Asset Allocation Fund | 29
Notes to financial statements
The following is a summary of the inputs used in valuing the Fund’s assets and liabilities as of September 30, 2024:
| | Other significant
observable inputs
(Level 2) | Significant
unobservable inputs
(Level 3) | |
| | | | |
| | | | |
| | | | |
| | | | |
| | | | |
| | | | |
| | | | |
| | | | |
| | | | |
| | | | |
| | | | |
| | | | |
| | | | |
| | | | |
| | | | |
| | | | |
Non-agency mortgage-backed securities | | | | |
| | | | |
| | | | |
| | | | |
| | | | |
| | | | |
| | | | |
|
| | | | |
| | | | |
Futures contracts are reported at their cumulative unrealized gains (losses) at measurement date as reported in the table following the Portfolio of Investments. For futures contracts, the current day’s variation margin is reported on the Statement of Assets and Liabilities. All other assets and liabilities are reported at their market value at measurement date.
Additional sector, industry or geographic detail, if any, is included in the Portfolio of Investments.
At September 30, 2024, the Fund did not have any transfers into/out of Level 3.
4.
TRANSACTIONS WITH AFFILIATES
Allspring Funds Management, a wholly owned subsidiary of Allspring Global Investments Holdings, LLC, a holding company indirectly owned by certain private funds of GTCR LLC and Reverence Capital Partners, L.P., is the manager of the Fund and provides advisory and fund-level administrative services under an investment management agreement. Under the investment management agreement, Allspring Funds Management is responsible for, among other services, implementing the investment objectives and strategies of the Fund, supervising the subadviser and providing fund-level administrative services in connection with the Fund’s operations. As compensation for its services under the investment management agreement, Allspring Funds Management is entitled to receive a management fee, which is generally paid monthly, at the following annual rate based on the Fund’s average daily net assets:
30 | Allspring Index Asset Allocation Fund
Notes to financial statements
For the year ended September 30, 2024, the management fee was equivalent to an annual rate of 0.61% of the Fund’s average daily net assets.
Allspring Funds Management has retained the services of a subadviser to provide daily portfolio management to the Fund. The fee for subadvisory services is borne by Allspring Funds Management. Allspring Global Investments, LLC, an affiliate of Allspring Funds Management and a wholly owned subsidiary of Allspring Global Investments Holdings, LLC, is the subadviser to the Fund and is entitled to receive a fee from Allspring Funds Management at an annual rate starting at 0.15% and declining to 0.10% as the average daily net assets of the Fund increase.
Under a class-level administration agreement, Allspring Funds Management provides class-level administrative services to the Fund, which includes paying fees and expenses for services provided by the transfer agent, sub-transfer agents, omnibus account servicers and record-keepers. As compensation for its services under the class-level administration agreement, Allspring Funds Management receives an annual fee which is calculated based on the average daily net assets of each class and generally paid monthly, as follows:
| Class-level
administration fee |
| |
| |
| |
| |
Waivers and/or expense reimbursements
Allspring Funds Management has contractually committed to waive and/or reimburse management and administration fees to the extent necessary to maintain certain net operating expense ratios for the Fund. When each class of the Fund has exceeded its expense cap, Allspring Funds Management will waive fees and/or reimburse expenses from fund-level expenses on a proportionate basis and then from class specific expenses. When only certain classes exceed their expense caps, waivers and/or reimbursements are applied against class specific expenses before fund-level expenses. Allspring Funds Management has contractually committed through January 31, 2025 to waive fees and/or reimburse expenses to the extent necessary to cap the Fund’s expenses. Prior to or after the commitment expiration date, the cap may be increased or the commitment to maintain the cap may be terminated only with the approval of the Board of Trustees. As of September 30, 2024, the contractual caps are as follows:
The Trust has adopted a distribution plan for Class C shares pursuant to Rule 12b-1 under the 1940 Act. A distribution fee is charged to Class C shares and paid to Allspring Funds Distributor, LLC (“Allspring Funds Distributor”), the principal underwriter, an affiliate of Allspring Funds Management, at an annual rate up to 0.75% of the average daily net assets of Class C shares. Such fees are generally paid on a monthly basis.
In addition, Allspring Funds Distributor is entitled to receive the front-end sales charge from the purchase of Class A shares and a contingent deferred sales charge on the redemption of certain Class A shares. Allspring Funds Distributor is also entitled to receive the contingent deferred sales charges from redemptions of Class C shares. For the year ended September 30, 2024, Allspring Funds Distributor received $25,090 from the sale of Class A shares and $340 in contingent deferred sales charges from redemptions of Class A shares. No contingent deferred sales charges were incurred by Class C shares for the year ended September 30, 2024.
Shareholder servicing fees
The Trust has entered into contracts with one or more shareholder servicing agents, whereby Class A, Class C and Administrator Class are charged a fee at an annual rate up to 0.25% of the average daily net assets of each respective class and are generally paid on a monthly basis. A portion of these total shareholder servicing fees were paid to affiliates of the Fund.
The Fund may purchase or sell portfolio investment securities to certain affiliates pursuant to Rule 17a-7 under the 1940 Act and under procedures adopted by the Board of Trustees. The procedures have been designed to ensure that these interfund transactions, which do not incur broker commissions, are effected at current market prices. Pursuant to these procedures, the Fund did not have any interfund transactions during the year ended September 30, 2024.
Allspring Index Asset Allocation Fund | 31
Notes to financial statements
5.
INVESTMENT PORTFOLIO TRANSACTIONS
Purchases and sales of investments, excluding short-term securities, for the year ended September 30, 2024 were as follows:
6.
DERIVATIVE TRANSACTIONS
During the year ended September 30, 2024, the Fund entered into futures contracts to manage the duration of the portfolio and to gain market exposure to certain asset classes by implementing tactical asset allocation shifts. The Fund had an average notional amount of $245,925,663 in long futures contracts and $10,931,000 in short futures contracts during the year ended September 30, 2024.
The fair value, realized gains or losses and change in unrealized gains or losses, if any, on derivative instruments are reflected in the corresponding financial statement captions.
The fair value of derivative instruments as of September 30, 2024 by primary risk type was as follows for the Fund:
| Amount represents the cumulative unrealized gains (losses) as reported in the table following the Portfolio of Investments. For futures contracts, only the current day’s variation margin as of September 30, 2024 is reported separately on the Statement of Assets and Liabilities. |
The effect of derivative instruments on the Statement of Operations for the year ended September 30, 2024 was as follows:
| | | |
Net realized gains (losses) on derivatives |
| | | |
Net change in unrealized gains (losses) on derivatives |
| | | |
The Trust (excluding the money market funds), Allspring Master Trust and Allspring Variable Trust are parties to a $275,000,000 (prior to July 9, 2024: $350,000,000), revolving credit agreement whereby the Fund is permitted to use bank borrowings for temporary or emergency purposes, such as to fund shareholder redemption requests. Interest under the credit agreement is charged to the Fund based on a borrowing rate equal to the higher of the Federal Funds rate or the overnight bank funding rate in effect on that day plus a spread. In addition, an annual commitment fee based on the unused balance is allocated to each participating fund.
For the year ended September 30, 2024, there were no borrowings by the Fund under the agreement.
8.
DISTRIBUTIONS TO SHAREHOLDERS
The tax character of distributions paid were as follows:
As of September 30, 2024, the components of distributable earnings on a tax basis were as follows:
Undistributed
ordinary
income | Undistributed
long-term
gain | |
| | |
32 | Allspring Index Asset Allocation Fund
Notes to financial statements
Under the Fund’s organizational documents, the officers and Trustees have been granted certain indemnification rights against certain liabilities that may arise out of performance of their duties to the Fund. The Fund has entered into a separate agreement with each Trustee that converts indemnification rights currently existing under the Fund’s organizational documents into contractual rights that cannot be changed in the future without the consent of the Trustee. Additionally, in the normal course of business, the Fund may enter into contracts with service providers that contain a variety of indemnification clauses. The Fund’s maximum exposure under these arrangements is dependent on future claims that may be made against the Fund and, therefore, cannot be estimated.
Allspring Index Asset Allocation Fund | 33
Report of independent registered public accounting firm
To the Shareholders of the Fund and Board of Trustees
Allspring Funds Trust:
Opinion on the Financial Statements
We have audited the accompanying statement of assets and liabilities of Allspring Index Asset Allocation Fund (the Fund), one of the Funds constituting Allspring Funds Trust, including the portfolio of investments, as of September 30, 2024, the related statement of operations for the year then ended, the statements of changes in net assets for each of the years in the two-year period then ended, and the related notes (collectively, the financial statements) and the financial highlights for each of the years in the five-year period then ended. In our opinion, the financial statements and financial highlights present fairly, in all material respects, the financial position of the Fund as of September 30, 2024, the results of its operations for the year then ended, the changes in its net assets for each of the years in the two-year period then ended, and the financial highlights for each of the years in the five-year period then ended, in conformity with U.S. generally accepted accounting principles.
These financial statements and financial highlights are the responsibility of the Fund’s management. Our responsibility is to express an opinion on these financial statements and financial highlights based on our audits. We are a public accounting firm registered with the Public Company Accounting Oversight Board (United States) (PCAOB) and are required to be independent with respect to the Fund in accordance with the U.S. federal securities laws and the applicable rules and regulations of the Securities and Exchange Commission and the PCAOB.
We conducted our audits in accordance with the standards of the PCAOB. Those standards require that we plan and perform the audit to obtain reasonable assurance about whether the financial statements and financial highlights are free of material misstatement, whether due to error or fraud. Our audits included performing procedures to assess the risks of material misstatement of the financial statements and financial highlights, whether due to error or fraud, and performing procedures that respond to those risks. Such procedures included examining, on a test basis, evidence regarding the amounts and disclosures in the financial statements and financial highlights. Such procedures also included confirmation of securities owned as of September 30, 2024, by correspondence with the custodian, transfer agent and brokers, or by other appropriate auditing procedures. Our audits also included evaluating the accounting principles used and significant estimates made by management, as well as evaluating the overall presentation of the financial statements and financial highlights. We believe that our audits provide a reasonable basis for our opinion.

We have not been able to determine the specific year that we began serving as the auditor of one or more Allspring Funds investment companies; however, we are aware that we have served as the auditor of one or more Allspring Funds investment companies since at least 1955.
November 25, 2024
34 | Allspring Index Asset Allocation Fund
Other information (unaudited)
Other information
For corporate shareholders, pursuant to Section 854 of the Internal Revenue Code, 54% of ordinary income dividends qualify for the corporate dividends-received deduction for the fiscal year ended September 30, 2024.
Pursuant to Section 852 of the Internal Revenue Code, $84,277,184 was designated as a 20% rate gain distribution for the fiscal year ended
September 30, 2024.
Pursuant to Section 854 of the Internal Revenue Code, $7,750,868 of income dividends paid during the fiscal year ended September 30, 2024 has been designated as qualified dividend income (QDI).
For the fiscal year ended September 30, 2024, $8,055,637 has been designated as interest-related dividends for nonresident alien shareholders pursuant to Section 871 of the Internal Revenue Code.
For the fiscal year ended September 30, 2024, 49% of the ordinary income distributed was derived from interest on U.S. government securities.
A description of the policies and procedures used to determine how to vote proxies relating to portfolio securities is available without charge, upon request, by calling 1-866-259-3305, visiting our website at allspringglobal.com, or visiting the SEC website at sec.gov. Information regarding how the proxies related to portfolio securities were voted during the most recent 12-month period ended June 30 is available on the website at allspringglobal.com or by visiting the SEC website at sec.gov.
Quarterly portfolio holdings information
The Fund files its complete schedule of portfolio holdings with the SEC for the first and third quarters of each fiscal year as an exhibit to its reports on Form N-PORT. Shareholders may view the filed Form N-PORT by visiting the SEC website at sec.gov.
Allspring Index Asset Allocation Fund | 35
Other information (unaudited)
Item 8. Changes in and disagreements with accountants
Item 9. Matters submitted to fund shareholders for a vote
Item 10. Remuneration paid to directors, officers and others
Refer to information in the Statement of operations.
36 | Allspring Index Asset Allocation Fund
Other information (unaudited)
Item 11. Statement regarding basis for the board’s approval of investment advisory contract
Board consideration of investment management and sub-advisory agreements:
Under the Investment Company Act of 1940 (the “1940 Act”), the Board of Trustees (the “Board”) of Allspring Funds Trust (the “Trust”) must determine annually whether to approve the continuation of the Trust’s investment management and sub-advisory agreements. In this regard, at a Board meeting held on May 28-30, 2024 (the “Meeting”), the Board, all the members of which have no direct or indirect interest in the investment management and sub-advisory agreements and are not “interested persons” of the Trust, as defined in the 1940 Act (the “Independent Trustees”), reviewed and approved for the Allspring Index Asset Allocation Fund (the “Fund”): (i) an investment management agreement (the “Management Agreement”) with Allspring Funds Management, LLC (“Allspring Funds Management”); and (ii) an investment sub-advisory agreement (the “Sub-Advisory Agreement”) with Allspring Global Investments, LLC (the “Sub-Adviser”), an affiliate of Allspring Funds Management. The Management Agreement and the Sub-Advisory Agreement are collectively referred to as the “Advisory Agreements.”
At the Meeting, the Board considered the factors and reached the conclusions described below relating to the selection of Allspring Funds Management and the Sub-Adviser and the approval of the Advisory Agreements. Prior to the Meeting, including at a meeting of the Board held in April 2024, and at the Meeting, the Trustees conferred extensively among themselves and with representatives of Allspring Funds Management about these matters. The Board has adopted a team-based approach, with each team consisting of a sub-set of Trustees, to assist the full Board in the discharge of its duties in reviewing investment performance and other matters throughout the year. The Independent Trustees were assisted in their evaluation of the Advisory Agreements by independent legal counsel, from whom they received separate legal advice and with whom they met separately.
In providing information to the Board, Allspring Funds Management and the Sub-Adviser were guided by a detailed set of requests for information submitted to them by independent legal counsel on behalf of the Independent Trustees at the start of the Board’s annual contract renewal process earlier in 2024. In considering and approving the Advisory Agreements, the Trustees considered the information they believed relevant, including but not limited to the information discussed below. The Board considered not only the specific information presented in connection with the Meeting, but also the knowledge gained over time through interactions with Allspring Funds Management and the Sub-Adviser about various topics. In this regard, the Board reviewed reports of Allspring Funds Management at each of its quarterly meetings, which included, among other things, portfolio reviews and investment performance reports. In addition, the Board and the teams mentioned above confer with portfolio managers at various times throughout the year. The Board did not identify any particular information or consideration that was all-important or controlling, and each individual Trustee may have attributed different weights to various factors.
After its deliberations, the Board unanimously determined that the compensation payable to Allspring Funds Management and the Sub-Adviser under each of the Advisory Agreements was reasonable, and approved the continuation of the Advisory Agreements for a one-year term. The Board considered the approval of the Advisory Agreements for the Fund as part of its consideration of agreements for funds across the complex, but its approvals were made on a fund-by-fund basis. The following summarizes a number of important, but not necessarily all, factors considered by the Board in support of its approvals.
Nature, extent, and quality of services
The Board received and considered various information regarding the nature, extent, and quality of services provided to the Fund by Allspring Funds Management and the Sub-Adviser under the Advisory Agreements. This information included a description of the investment advisory services and Fund-level administrative services covered by the Management Agreement, as well as, among other things, a summary of the background and experience of senior management of Allspring Global Investments, of which Allspring Funds Management and the Sub-Adviser are a part, and a summary of investments made in the Allspring Global Investments business.0The trade name for the asset management firm that includes Allspring Funds Management and the Sub-Adviser is “Allspring Global Investments.” The Board also received information about the services that continue to be provided by Wells Fargo & Co. and/or its affiliates (“Wells Fargo”) since the sale of Wells Fargo Asset Management to Allspring Global Investments Holdings, LLC, a holding company indirectly owned by certain private funds of GTCR LLC and Reverence Capital Partners, L.P., under a transition services agreement and an update on the anticipated timeline for exiting the transition services agreement. In addition, the Board received and considered information about the full range of services provided to the Fund by Allspring Funds Management and its affiliates.
The Board considered the qualifications, background, tenure, and responsibilities of each of the portfolio managers primarily responsible for the day-to-day portfolio management of the Fund. The Board evaluated the ability of Allspring Funds Management and the Sub-Adviser to attract and retain qualified investment professionals, including research, advisory, and supervisory personnel.
The Board further considered the compliance programs and compliance records of Allspring Funds Management and the Sub-Adviser. The Board received and considered information about Allspring Global Investments’ risk management functions, which included information about Allspring Funds Management’s and the Sub-Adviser’s business continuity plans, their approaches to data privacy and cybersecurity, Allspring Funds Management’s role
Allspring Index Asset Allocation Fund | 37
Other information (unaudited)
as administrator of the Fund’s liquidity risk management program, fair valuation designee, and derivatives risk management program manager. The Board also received and considered information about Allspring Funds Management’s intermediary and vendor oversight program.
Fund investment performance and expenses
The Board considered the investment performance results for the Fund over various time periods ended December 31, 2023. The Board considered these results in comparison to the investment performance of funds in a universe that was determined by Broadridge Inc. (“Broadridge”) to be similar to the Fund (the “Universe”), and in comparison to the Fund’s benchmark index and to other comparative data. Broadridge is an independent provider of investment company data. The Board received a description of the methodology used by Broadridge to select the mutual funds in the performance Universe. The Board noted that the investment performance of the Fund (Administrator Class) was higher than the average investment performance of the Universe for all periods under review. The Board also noted that the investment performance of the Fund was lower than the investment performance of its benchmark index, the Index Asset Allocation Blended Index, for all periods under review.
The Board also received and considered information regarding the Fund’s net operating expense ratios and their various components, including actual management fees, custodian and other non-management fees, and Rule 12b-1 and non-Rule 12b-1 shareholder service fees. The Board considered these ratios in comparison to the median ratios of funds in class-specific expense groups that were determined by Broadridge to be similar to the Fund (the “Groups”). The Board received a description of the methodology used by Broadridge to select the mutual funds in the expense Groups and an explanation of how funds comprising expense Groups and their expense ratios may vary from year-to-year. Based on the Broadridge reports, the Board noted that the net operating expense ratio of the Fund was lower than the median net operating expense ratio of the expense Group for the Administrator Class, equal to the median net operating expense ratio of the expense Group for the Institutional Class, and in range of the median net operating expense ratio of the expense Group for Class A.
The Board took into account the Fund’s investment performance and expense information provided to it among the factors considered in deciding to re-approve the Advisory Agreements.
Investment management and sub-advisory fee rates
The Board reviewed and considered the contractual fee rates payable by the Fund to Allspring Funds Management under the Management Agreement, as well as the contractual fee rates payable by the Fund to Allspring Funds Management for class-level administrative services under a Class-Level Administration Agreement, which include, among other things, class-level transfer agency and sub-transfer agency costs (collectively, the “Management Rates”). The Board also reviewed and considered the contractual investment sub-advisory fee rates payable by Allspring Funds Management to the Sub-Adviser for investment sub-advisory services. It was noted that advisory fee waivers, if any, are at the fund level and not class level.
Among other information reviewed by the Board was a comparison of the Fund’s Management Rates with the average contractual investment management fee rates of funds in the expense Groups at a common asset level as well as transfer agency costs of the funds in the expense Groups. The Board noted that the Management Rates of the Fund were lower than the sum of these average rates for the Fund’s expense Group for the Administrator Class, in range of the sum of the average rates for the expense Group for the Institutional Class, and higher than the sum of the average rates for the expense Group for Class A.
The Board also received and considered information about the portion of the total management fee that was retained by Allspring Funds Management after payment of the fee to the Sub-Adviser for sub-advisory services. In assessing the reasonableness of this amount, the Board received and evaluated information about the nature and extent of responsibilities retained and risks assumed by Allspring Funds Management and not delegated to or assumed by the Sub-Adviser, and about Allspring Funds Management’s on-going oversight services. Given the affiliation between Allspring Funds Management and the Sub-Adviser, the Board ascribed limited relevance to the allocation of fees between them.
The Board also received and considered information about the nature and extent of services offered and fee rates charged by Allspring Funds Management and the Sub-Adviser to other types of clients with investment strategies similar to those of the Fund. In this regard, the Board received information about the significantly greater scope of services, and compliance, reporting and other legal and regulatory obligations and risks of managing proprietary mutual funds compared with those associated with managing assets of other types of clients, including third-party sub-advised fund clients and non-mutual fund clients such as institutional separate accounts.
Based on its consideration of the factors and information it deemed relevant, including those described here, the Board determined that the compensation payable to Allspring Funds Management under the Management Agreement and to the Sub-Adviser under the Sub-Advisory Agreement was reasonable.
The Board received and considered information concerning the profitability of Allspring Funds Management, as well as the profitability of Allspring Global Investments, from providing services to the fund complex as a whole. The Board noted that the Sub-Adviser’s profitability information with respect to providing services to the Fund and other funds in the complex was subsumed in the Allspring Global Investments profitability analysis.
38 | Allspring Index Asset Allocation Fund
Other information (unaudited)
Allspring Funds Management reported on the methodologies and estimates used in calculating profitability, including a description of the methodology used to allocate certain expenses. Among other things, the Board noted that the levels of profitability reported on a fund-by-fund basis varied widely, depending on factors such as the size, type, and age of fund.
Based on its review, the Board did not deem the profits reported by Allspring Funds Management or Allspring Global Investments from services provided to the Fund to be at a level that would prevent it from approving the continuation of the Advisory Agreements.
The Board received and considered information about the potential for Allspring Funds Management to experience economies of scale in the provision of management services to the Fund, the difficulties of isolating and quantifying economies of scale at an individual fund level, and the extent to which potential scale benefits are shared with Fund shareholders. The Board noted the existence of breakpoints in the Fund’s management fee structure, which operate generally to reduce the Fund’s expense ratios as the Fund grows in size, and the size of the Fund in relation to such breakpoints. The Board considered that in addition to management fee breakpoints, Allspring Funds Management shares potential economies of scale from its management business in a variety of ways, including through fee waiver and expense reimbursement arrangements, competitive management fee rates set at the outset without regard to breakpoints, and investments in the business intended to enhance services available to shareholders.
The Board concluded that Allspring Funds Management’s arrangements with respect to the Fund, including contractual breakpoints, constituted a reasonable approach to sharing potential economies of scale with the Fund and its shareholders.
Other benefits to Allspring Funds Management and the Sub-Adviser
The Board received and considered information regarding potential “fall-out” or ancillary benefits received by Allspring Funds Management and its affiliates, including the Sub-Adviser, as a result of their relationships with the Fund. Ancillary benefits could include, among others, benefits directly attributable to other relationships with the Fund and benefits potentially derived from an increase in Allspring Funds Management’s and the Sub-Adviser’s business as a result of their relationships with the Fund. The Board noted that Allspring Funds Distributor, LLC, an affiliate of Allspring Funds Management, receives distribution-related fees in respect of shares sold or held through it. The Board also reviewed information about soft dollar credits earned and utilized by the Sub-Adviser.
Based on its consideration of the factors and information it deemed relevant, including those described here, the Board did not find that any ancillary benefits received by Allspring Funds Management and its affiliates, including the Sub-Adviser, were unreasonable.
At the Meeting, after considering the above-described factors and based on its deliberations and its evaluation of the information described above, the Board unanimously determined that the compensation payable to Allspring Funds Management and the Sub-Adviser under each of the Advisory Agreements was reasonable, and approved the continuation of the Advisory Agreements for a one-year term.
Allspring Index Asset Allocation Fund | 39
This page is intentionally left blank.
For more information
More information about Allspring Funds is available free upon request. To obtain literature, please write, visit the Fund’s website, or call:
Allspring Funds
P.O. Box 219967
Kansas City, MO 64121-9967
Website: allspringglobal.com
Individual investors: 1-800-222-8222
Retail investment professionals: 1-888-877-9275
Institutional investment professionals: 1-800-260-5969
This report and the financial statements contained herein are submitted for the general information of the shareholders of the Fund. If this report is used for promotional purposes, distribution of the report must be accompanied or preceded by a current prospectus. Before investing, please consider the investment objectives, risks, charges, and expenses of the investment. For a current prospectus and, if available, a summary prospectus, containing this information, call 1-800-222-8222 or visit the Fund’s website at allspringglobal.com. Read the prospectus carefully before you invest or send money.
Allspring Global InvestmentsTM is the trade name for the asset management firms of Allspring Global Investments Holdings, LLC, a holding company indirectly owned by certain private funds of GTCR LLC and Reverence Capital Partners, L.P. These firms include but are not limited to Allspring Global Investments, LLC, and Allspring Funds Management, LLC. Certain products managed by Allspring entities are distributed by Allspring Funds Distributor, LLC (a broker-dealer and Member FINRA/SIPC).
This material is for general informational and educational purposes only and is NOT intended to provide investment advice or a recommendation of any kind - including a recommendation for any specific investment, strategy, or plan.
© 2024 Allspring Global Investments Holdings, LLC. All rights reserved.
NCSR0458 09-24
Allspring Global Investment Grade Credit Fund
Long Form Financial Statements
Annual Report
Allspring Global Investment Grade Credit Fund | 1
Portfolio of investments—September 30, 2024
| | | | | |
Corporate bonds and notes: 54.97% | | | | | | |
| | | | | | |
| | | | | | |
Charter Communications Operating LLC/Charter Communications Operating Capital | | | | | | |
Charter Communications Operating LLC/Charter Communications Operating Capital | | | | | | |
| | | | | | |
| | | | | | |
| | | | | | |
Telecommunications: 5.30% | | | | | | |
| | | | | | |
| | | | | | |
| | | | | | |
| | | | | | |
| | | | | | |
Verizon Communications, Inc. | | | | | | |
Verizon Communications, Inc. | | | | | | |
| | | | | | |
Consumer, cyclical: 7.29% | | | | | | |
| | | | | | |
American Airlines Pass-Through Trust Series 2014-1 Class A | | | | | | |
British Airways Pass-Through Trust Series 2019-1 Class AA144A | | | | | | |
U.S. Airways Pass-Through Trust Series 2012-2 Class A | | | | | | |
| | | | | | |
| | | | | | |
| | | | | | |
Auto manufacturers: 3.07% | | | | | | |
| | | | | | |
| | | | | | |
Hyundai Capital America144A | | | | | | |
Hyundai Capital America144A | | | | | | |
Toyota Motor Credit Corp. | | | | | | |
| | | | | | |
| | | | | | |
Warnermedia Holdings, Inc. | | | | | | |
Warnermedia Holdings, Inc. | | | | | | |
| | | | | | |
| | | | | | |
| | | | | | |
| | | | | | |
| | | | | | |
The accompanying notes are an integral part of these financial statements.
2 | Allspring Global Investment Grade Credit Fund
Portfolio of investments—September 30, 2024
| | | | | |
Consumer, non-cyclical: 9.06% | | | | | | |
| | | | | | |
| | | | | | |
| | | | | | |
| | | | | | |
Commercial services: 1.58% | | | | | | |
| | | | | | |
| | | | | | |
| | | | | | |
| | | | | | |
| | | | | | |
| | | | | | |
| | | | | | |
| | | | | | |
Smithfield Foods, Inc.144A | | | | | | |
| | | | | | |
Healthcare-products: 0.84% | | | | | | |
| | | | | | |
| | | | | | |
| | | | | | |
Healthcare-services: 2.73% | | | | | | |
| | | | | | |
| | | | | | |
| | | | | | |
| | | | | | |
| | | | | | |
| | | | | | |
| | | | | | |
| | | | | | |
| | | | | | |
| | | | | | |
| | | | | | |
| | | | | | |
| | | | | | |
| | | | | | |
| | | | | | |
| | | | | | |
| | | | | | |
BP Capital Markets America, Inc. | | | | | | |
| | | | | | |
| | | | | | |
| | | | | | |
The accompanying notes are an integral part of these financial statements.
Allspring Global Investment Grade Credit Fund | 3
Portfolio of investments—September 30, 2024
| | | | | |
| | | | | | |
| | | | | | |
Kinder Morgan Energy Partners LP | | | | | | |
| | | | | | |
| | | | | | |
Sabine Pass Liquefaction LLC | | | | | | |
| | | | | | |
| | | | | | |
| | | | | | |
| | | | | | |
Citigroup, Inc. (U.S. SOFR+1.17%)± | | | | | | |
Goldman Sachs Group, Inc. (U.S. SOFR+1.41%)± | | | | | | |
JPMorgan Chase & Co. (U.S. SOFR 3 Month+1.25%)± | | | | | | |
JPMorgan Chase & Co. (U.S. SOFR 3 Month+1.60%)± | | | | | | |
JPMorgan Chase & Co. (U.S. SOFR 3 Month+2.52%)± | | | | | | |
| | | | | | |
Santander Holdings USA, Inc. | | | | | | |
| | | | | | |
| | | | | | |
Diversified financial services: 2.25% | | | | | | |
Aviation Capital Group LLC144A | | | | | | |
| | | | | | |
| | | | | | |
Intercontinental Exchange, Inc. | | | | | | |
| | | | | | |
| | | | | | |
American International Group, Inc. | | | | | | |
| | | | | | |
| | | | | | |
Belrose Funding Trust144A | | | | | | |
Berkshire Hathaway Finance Corp. | | | | | | |
Brighthouse Financial, Inc. | | | | | | |
New York Life Global Funding | | | | | | |
| | | | | | |
| | | | | | |
Investment Companies: 0.55% | | | | | | |
| | | | | | |
| | | | | | |
| | | | | | |
| | | | | | |
| | | | | | |
| | | | | | |
The accompanying notes are an integral part of these financial statements.
4 | Allspring Global Investment Grade Credit Fund
Portfolio of investments—September 30, 2024
| | | | | |
| | | | | | |
| | | | | | |
| | | | | | |
| | | | | | |
| | | | | | |
| | | | | | |
| | | | | | |
| | | | | | |
| | | | | | |
| | | | | | |
| | | | | | |
| | | | | | |
| | | | | | |
Dell International LLC/EMC Corp. | | | | | | |
Hewlett Packard Enterprise Co. | | | | | | |
Hewlett Packard Enterprise Co. | | | | | | |
| | | | | | |
| | | | | | |
| | | | | | |
| | | | | | |
| | | | | | |
| | | | | | |
| | | | | | |
| | | | | | |
| | | | | | |
| | | | | | |
| | | | | | |
| | | | | | |
| | | | | | |
| | | | | | |
| | | | | | |
| | | | | | |
| | | | | | |
| | | | | | |
| | | | | | |
| | | | | | |
New York State Electric & Gas Corp.144A | | | | | | |
| | | | | | |
| | | | | | |
| | | | | | |
| | | | | | |
Total corporate bonds and notes (Cost $16,500,123) | | | | | | |
The accompanying notes are an integral part of these financial statements.
Allspring Global Investment Grade Credit Fund | 5
Portfolio of investments—September 30, 2024
| | | | | |
Foreign corporate bonds and notes: 28.49% | | | | | | |
| | | | | | |
| | | | | | |
| | | | | | |
| | | | | | |
Telecommunications: 2.01% | | | | | | |
| | | | | | |
| | | | | | |
O2 Telefonica Deutschland Finanzierungs GmbH | | | | | | |
| | | | | | |
| | | | | | |
Consumer, cyclical: 0.81% | | | | | | |
Auto manufacturers: 0.81% | | | | | | |
| | | | | | |
| | | | | | |
| | | | | | |
Consumer, non-cyclical: 5.83% | | | | | | |
| | | | | | |
| | | | | | |
Commercial services: 1.35% | | | | | | |
| | | | | | |
| | | | | | |
Motability Operations Group PLC | | | | | | |
| | | | | | |
Healthcare-products: 1.16% | | | | | | |
American Medical Systems Europe BV | | | | | | |
| | | | | | |
| | | | | | |
| | | | | | |
Household products/wares: 0.83% | | | | | | |
Reckitt Benckiser Treasury Services PLC | | | | | | |
| | | | | | |
| | | | | | |
| | | | | | |
| | | | | | |
Bayer AG (EUR Swap Annual (vs. 6 Month EURIBOR) 5 Year+3.11%)± | | | | | | |
GlaxoSmithKline Capital PLC | | | | | | |
| | | | | | |
| | | | | | |
Energy-alternate sources: 0.34% | | | | | | |
Acciona Energia Financiacion Filiales SA | | | | | | |
The accompanying notes are an integral part of these financial statements.
6 | Allspring Global Investment Grade Credit Fund
Portfolio of investments—September 30, 2024
| | | | | |
| | | | | | |
BP Capital Markets PLC (UK Gilts 5 Year+3.89%)ʊ± | | | | | | |
DCC Group Finance Ireland DAC | | | | | | |
| | | | | | |
Shell International Finance BV | | | | | | |
| | | | | | |
| | | | | | |
| | | | | | |
| | | | | | |
Argenta Spaarbank NV (EUR Swap Annual (vs. 6 Month EURIBOR) 1 Year+1.10%)± | | | | | | |
Bankinter SA (EURIBOR ICE Swap Rate 11:00am+1.10%)± | | | | | | |
BAWAG PSK Bank fuer Arbeit und Wirtschaft und Oesterreichische Postsparkasse AG (3 Month EURIBOR+0.95%)±%% | | | | | | |
Belfius Bank SA (EUR Swap Annual (vs. 6 Month EURIBOR) 5 Year+1.30%)± | | | | | | |
BNP Paribas SA (3 Month EURIBOR+0.92%)± | | | | | | |
DNB Bank ASA (3 Month EURIBOR+0.65%)± | | | | | | |
ING Groep NV (3 Month EURIBOR+1.72%)± | | | | | | |
Investec PLC (UK Gilts 5 Year+5.91%)± | | | | | | |
Lloyds Bank Corporate Markets PLC | | | | | | |
Lloyds Banking Group PLC (EURIBOR ICE Swap Rate 11:00am+1.18%)± | | | | | | |
NatWest Group PLC (GBP Swap Semi Annual (vs. 6 Month LIBOR) 1 Year+1.49%)± | | | | | | |
Permanent TSB Group Holdings PLC (EURIBOR ICE Swap Rate 11:00am+1.60%)± | | | | | | |
Raiffeisen Bank International AG (EURIBOR ICE Swap Rate 11:00am+3.15%)± | | | | | | |
| | | | | | |
| | | | | | |
Zuercher Kantonalbank (3 Month EURIBOR+0.90%)± | | | | | | |
| | | | | | |
| | | | | | |
Credit Agricole Assurances SA | | | | | | |
Mandatum Life Insurance Co. Ltd. (3 Month EURIBOR+2.30%)± | | | | | | |
Sampo Oyj (3 Month EURIBOR+4.05%)± | | | | | | |
| | | | | | |
| | | | | | |
| | | | | | |
Grand City Properties SA (EUR Swap Annual (vs. 6 Month EURIBOR) 5 Year+2.18%)ʊ± | | | | | | |
Heimstaden Bostad AB (EUR Swap Annual (vs. 6 Month EURIBOR) 5 Year+3.90%)ʊ± | | | | | | |
The accompanying notes are an integral part of these financial statements.
Allspring Global Investment Grade Credit Fund | 7
Portfolio of investments—September 30, 2024
| | | | | |
| | | | | | |
| | | | | | |
Prologis International Funding II SA | | | | | | |
| | | | | | |
| | | | | | |
| | | | | | |
| | | | | | |
| | | | | | |
| | | | | | |
Building materials: 0.70% | | | | | | |
| | | | | | |
Holcim Finance Luxembourg SA | | | | | | |
| | | | | | |
Electrical components & equipment: 0.41% | | | | | | |
| | | | | | |
Engineering & construction: 0.36% | | | | | | |
| | | | | | |
| | | | | | |
| | | | | | |
| | | | | | |
EnBW International Finance BV | | | | | | |
| | | | | | |
RTE Reseau de Transport d’Electricite SADIR | | | | | | |
RTE Reseau de Transport d’Electricite SADIR | | | | | | |
| | | | | | |
| | | | | | |
| | | | | | |
National Gas Transmission PLC | | | | | | |
| | | | | | |
Total foreign corporate bonds and notes (Cost $8,167,702) | | | | | | |
Foreign government bonds: 0.69% | | | | | | |
| | | | | | |
Bundesrepublik Deutschland Bundesanleihe | | | | | | |
Bundesrepublik Deutschland Bundesanleihe | | | | | | |
| | | | | | |
Total foreign government bonds (Cost $180,084) | | | | | | |
U.S. Treasury securities: 1.63% | | | | | | |
| | | | | | |
| | | | | | |
The accompanying notes are an integral part of these financial statements.
8 | Allspring Global Investment Grade Credit Fund
Portfolio of investments—September 30, 2024
| | | | | |
U.S. Treasury securities(continued) | | | | | | |
| | | | | | |
| | | | | | |
Total U.S. Treasury securities (Cost $437,880) | | | | | | |
Yankee corporate bonds and notes: 12.09% | | | | | | |
| | | | | | |
| | | | | | |
| | | | | | |
Telecommunications: 0.74% | | | | | | |
Rogers Communications, Inc. | | | | | | |
Consumer, non-cyclical: 0.11% | | | | | | |
| | | | | | |
Pfizer Investment Enterprises Pte. Ltd. | | | | | | |
| | | | | | |
| | | | | | |
| | | | | | |
Saudi Arabian Oil Co.144A | | | | | | |
| | | | | | |
| | | | | | |
| | | | | | |
| | | | | | |
Danske Bank AS (1 Year Treasury Constant Maturity+1.40%)144A± | | | | | | |
| | | | | | |
HSBC Holdings PLC (U.S. SOFR+2.39%)± | | | | | | |
National Australia Bank Ltd.144A | | | | | | |
Santander U.K. Group Holdings PLC (U.S. SOFR+2.75%)± | | | | | | |
Sumitomo Mitsui Financial Group, Inc. | | | | | | |
UBS Group AG (1 Year Treasury Constant Maturity+1.10%)144A± | | | | | | |
UBS Group AG (5 Year Treasury Constant Maturity+4.75%)144Aʊ± | | | | | | |
| | | | | | |
Diversified financial services: 1.62% | | | | | | |
AerCap Ireland Capital DAC/AerCap Global Aviation Trust | | | | | | |
Avolon Holdings Funding Ltd.144A | | | | | | |
| | | | | | |
| | | | | | |
Fairfax Financial Holdings Ltd.144A | | | | | | |
| | | | | | |
| | | | | | |
| | | | | | |
| | | | | | |
| | | | | | |
The accompanying notes are an integral part of these financial statements.
Allspring Global Investment Grade Credit Fund | 9
Portfolio of investments—September 30, 2024
| | | | | |
| | | | | | |
| | | | | | |
NXP BV/NXP Funding LLC/NXP USA, Inc. | | | | | | |
NXP BV/NXP Funding LLC/NXP USA, Inc. | | | | | | |
| | | | | | |
Total yankee corporate bonds and notes (Cost $3,516,588) | | | | | | |
| | | | | |
Short-term investments: 0.89% | | | | | | |
Investment companies: 0.89% | | | | | | |
Allspring Government Money Market Fund Select Class♠∞## | | | | | | |
Total short-term investments (Cost $245,123) | | | | | | |
Total investments in securities (Cost $29,047,500) | | | | | | |
Other assets and liabilities, net | | | | | | |
| | | | | | |
| The security may be resold in transactions exempt from registration, normally to qualified institutional buyers, pursuant to Rule 144A under the Securities Act of 1933. |
| Variable rate investment. The rate shown is the rate in effect at period end. |
| The security is purchased on a when-issued basis. |
| Security is perpetual in nature and has no stated maturity date. The date shown reflects the next call date. |
| All or a portion of this security is segregated as collateral for when-issued securities. |
| The issuer of the security is an affiliated person of the Fund as defined in the Investment Company Act of 1940. |
| The rate represents the 7-day annualized yield at period end. |
|
| |
| Euro Interbank Offered Rate |
| |
| London Interbank Offered Rate |
| Real estate investment trust |
| Secured Overnight Financing Rate |
Investments in affiliates
An affiliated investment is an investment in which the Fund owns at least 5% of the outstanding voting shares of the issuer or as a result of other relationships, such as the Fund and the issuer having the same investment manager. Transactions with issuers that were affiliates of the Fund at the end of the period were as follows:
| | | | | Net
change in
unrealized
gains
(losses) | | | Income
from
affiliated
securities |
| | | | | | | | |
Allspring Government Money Market Fund Select Class | | | | | | | | |
The accompanying notes are an integral part of these financial statements.
10 | Allspring Global Investment Grade Credit Fund
Portfolio of investments—September 30, 2024
Forward foreign currency contracts
| | | | | |
| | | | State Street Bank & Trust Co. | | | |
| | | | State Street Bank & Trust Co. | | | |
| | | | | | | |
The accompanying notes are an integral part of these financial statements.
Allspring Global Investment Grade Credit Fund | 11
Statement of assets and liabilities—September 30, 2024
Financial statements
Statement of assets and liabilities
| |
Investments in unaffiliated securities, at value (cost $28,802,377) | |
Investments in affiliated securities, at value (cost $245,123) | |
Foreign currency, at value (cost $245,607) | |
| |
| |
Unrealized gains on forward foreign currency contracts | |
Prepaid expenses and other assets | |
| |
| |
Payable for when-issued transactions | |
Trustees’ fees and expenses payable | |
Payable for Fund shares redeemed | |
Administration fees payable | |
Shareholder servicing fee payable | |
Accrued expenses and other liabilities | |
| |
| |
| |
| |
| |
| |
Computation of net asset value and offering price per share | |
| |
Shares outstanding–Class A1 | |
Net asset value per share–Class A | |
Maximum offering price per share – Class A2 | |
| |
Shares outstanding–Class C1 | |
Net asset value per share–Class C | |
| |
Shares outstanding–Class R61 | |
Net asset value per share–Class R6 | |
Net assets–Institutional Class | |
Shares outstanding–Institutional Class1 | |
Net asset value per share–Institutional Class | |
1 The Fund has an unlimited number of authorized shares.
2 Maximum offering price is computed as 100/95.50 of net asset value. On investments of $50,000 or more, the offering price is reduced.
The accompanying notes are an integral part of these financial statements.
12 | Allspring Global Investment Grade Credit Fund
Statement of operations—year ended September 30, 2024
Statement of operations
| |
| |
Income from affiliated securities | |
| |
| |
| |
| |
| |
| |
| |
| |
Shareholder servicing fees | |
| |
| |
| |
| |
Custody and accounting fees | |
| |
| |
Shareholder report expenses | |
Trustees’ fees and expenses | |
| |
| |
Less: Fee waivers and/or expense reimbursements | |
| |
| |
| |
| |
| |
| |
Realized and unrealized gains (losses) on investments | |
| |
| |
Foreign currency and foreign currency translations | |
Forward foreign currency contracts | |
Net realized losses on investments | |
Net change in unrealized gains (losses) on | |
| |
Foreign currency and foreign currency translations | |
Forward foreign currency contracts | |
Net change in unrealized gains (losses) on investments | |
Net realized and unrealized gains (losses) on investments | |
Net increase in net assets resulting from operations | |
The accompanying notes are an integral part of these financial statements.
Allspring Global Investment Grade Credit Fund | 13
Statement of changes in net assets
Statement of changes in net assets
| Year ended September 30, 2024 | Year ended September 30, 2023 |
| | | | |
| | | | |
Net realized losses on investments | | | | |
Net change in unrealized gains (losses) on investments | | | | |
Net increase in net assets resulting from operations | | | | |
Distributions to shareholders from | | | | |
Net investment income and net realized gains | | | | |
| | | | |
| | | | |
| | | | |
| | | | |
Total distributions to shareholders | | | | |
Capital share transactions | | | | |
Proceeds from shares sold | | | | |
| | | | |
| | | | |
| | | | |
Reinvestment of distributions | | | | |
| | | | |
| | | | |
| | | | |
| | | | |
| | | | |
Payment for shares redeemed | | | | |
| | | | |
| | | | |
| | | | |
Net decrease in net assets resulting from capital share transactions | | | | |
Total increase (decrease) in net assets | | | | |
| | | | |
| | | | |
| | | | |
The accompanying notes are an integral part of these financial statements.
14 | Allspring Global Investment Grade Credit Fund
Financial highlights
(For a share outstanding throughout each period)
| |
| | | |
Net asset value, beginning of period | | | |
| | | |
Net realized and unrealized gains (losses) on investments | | | |
Total from investment operations | | | |
Distributions to shareholders from | | | |
| | | |
Net asset value, end of period | | | |
| | | |
Ratios to average net assets (annualized) | | | |
| | | |
| | | |
| | | |
| | | |
| | | |
Net assets, end of period (000s omitted) | | | |
| For the period from June 1, 2022 (commencement of class operations) to September 30, 2022 |
| Calculated based upon average shares outstanding |
| Total return calculations do not include any sales charges. Returns include adjustments required by U.S. GAAP and may differ from net asset values and performance reported elsewhere. Returns for periods of less than one year are not annualized. |
The accompanying notes are an integral part of these financial statements.
Allspring Global Investment Grade Credit Fund | 15
(For a share outstanding throughout each period)
| |
| | | |
Net asset value, beginning of period | | | |
| | | |
Net realized and unrealized gains (losses) on investments | | | |
Total from investment operations | | | |
Distributions to shareholders from | | | |
| | | |
Net asset value, end of period | | | |
| | | |
Ratios to average net assets (annualized) | | | |
| | | |
| | | |
| | | |
| | | |
| | | |
Net assets, end of period (000s omitted) | | | |
| For the period from June 1, 2022 (commencement of class operations) to September 30, 2022 |
| Calculated based upon average shares outstanding |
| Total return calculations do not include any sales charges. Returns include adjustments required by U.S. GAAP and may differ from net asset values and performance reported elsewhere. Returns for periods of less than one year are not annualized. |
The accompanying notes are an integral part of these financial statements.
16 | Allspring Global Investment Grade Credit Fund
(For a share outstanding throughout each period)
| |
| | | | | |
Net asset value, beginning of period | | | | | |
| | | | | |
Net realized and unrealized gains (losses) on investments | | | | | |
Total from investment operations | | | | | |
Distributions to shareholders from | | | | | |
| | | | | |
| | | | | |
Total distributions to shareholders | | | | | |
Net asset value, end of period | | | | | |
| | | | | |
Ratios to average net assets (annualized) | | | | | |
| | | | | |
| | | | | |
| | | | | |
| | | | | |
| | | | | |
Net assets, end of period (000s omitted) | | | | | |
| Calculated based upon average shares outstanding |
| Returns include adjustments required by U.S. GAAP and may differ from net asset values and performance reported elsewhere. |
The accompanying notes are an integral part of these financial statements.
Allspring Global Investment Grade Credit Fund | 17
(For a share outstanding throughout each period)
| |
| | | | | |
Net asset value, beginning of period | | | | | |
| | | | | |
Net realized and unrealized gains (losses) on investments | | | | | |
Total from investment operations | | | | | |
Distributions to shareholders from | | | | | |
| | | | | |
| | | | | |
Total distributions to shareholders | | | | | |
Net asset value, end of period | | | | | |
| | | | | |
Ratios to average net assets (annualized) | | | | | |
| | | | | |
| | | | | |
| | | | | |
| | | | | |
| | | | | |
Net assets, end of period (000s omitted) | | | | | |
| Calculated based upon average shares outstanding |
| Returns include adjustments required by U.S. GAAP and may differ from net asset values and performance reported elsewhere. |
The accompanying notes are an integral part of these financial statements.
18 | Allspring Global Investment Grade Credit Fund
Notes to financial statements
Notes to financial statements
Allspring Funds Trust (the “Trust”), a Delaware statutory trust organized on March 10, 1999, is an open-end management investment company registered under the Investment Company Act of 1940, as amended (the “1940 Act”). As an investment company, the Trust follows the accounting and reporting guidance in Financial Accounting Standards Board (“FASB”) Accounting Standards Codification Topic 946, Financial Services – Investment Companies. These financial statements report on the Allspring Global Investment Grade Credit Fund (the “Fund”) which is a diversified series of the Trust.
2.
SIGNIFICANT ACCOUNTING POLICIES
The following significant accounting policies, which are consistently followed in the preparation of the financial statements of the Fund, are in conformity with U.S. generally accepted accounting principles (“GAAP”) which require management to make estimates and assumptions that affect the reported amounts of assets and liabilities, disclosure of contingent assets and liabilities at the date of the financial statements, and the reported amounts of income and expenses during the reporting period. Actual results could differ from those estimates.
All investments are valued each business day as of the close of regular trading on the New York Stock Exchange (generally 4 p.m. Eastern Time), although the Fund may deviate from this calculation time under unusual or unexpected circumstances.
Debt securities are valued at the evaluated bid price provided by an independent pricing service (e.g., taking into account various factors, including yields, maturities, or credit ratings) or, if a reliable price is not available, the quoted bid price from an independent broker-dealer.
The values of securities denominated in foreign currencies are translated into U.S. dollars at rates provided by an independent foreign currency pricing source at a time each business day specified by the Valuation Committee at Allspring Funds Management, LLC (“Allspring Funds Management”).
Forward foreign currency contracts are recorded at the forward rate provided by an independent foreign currency pricing source at a time each business day specified by the Valuation Committee at Allspring Funds Management.
Investments in registered open-end investment companies (other than those listed on a foreign or domestic exchange or market) are valued at net asset value.
Investments which are not valued using the methods discussed above are valued at their fair value, as determined in good faith by Allspring Funds Management, which was named the valuation designee by the Board of Trustees. As the valuation designee, Allspring Funds Management is responsible for day-to-day valuation activities for the Allspring Funds. In connection with these responsibilities, Allspring Funds Management has established a Valuation Committee and has delegated to it the authority to take any actions regarding the valuation of portfolio securities that the Valuation Committee deems necessary or appropriate, including determining the fair value of portfolio securities. On a quarterly basis, the Board of Trustees receives reports of valuation actions taken by the Valuation Committee. On at least an annual basis, the Board of Trustees receives an assessment of the adequacy and effectiveness of Allspring Funds Management’s process for determining the fair value of the portfolio of investments.
Foreign currency translation
The accounting records of the Fund are maintained in U.S. dollars. The values of other assets and liabilities denominated in foreign currencies are translated into U.S. dollars at rates provided by an independent foreign currency pricing source at a time each business day specified by the Valuation Committee. Purchases and sales of securities, and income and expenses are converted at the rate of exchange on the respective dates of such transactions. Net realized foreign exchange gains or losses arise from sales of foreign currencies, currency gains or losses realized between the trade and settlement dates on securities transactions, and the difference between the amounts of dividends, interest and foreign withholding taxes recorded and the U.S. dollar equivalent of the amounts actually paid or received. Net unrealized foreign exchange gains and losses arise from changes in the fair value of assets and liabilities other than investments in securities resulting from changes in exchange rates. The changes in net assets arising from changes in exchange rates of securities and the changes in net assets resulting from changes in market prices of securities are not separately presented. Such changes are included in net realized and unrealized gains or losses from investments.
The Fund may purchase securities on a forward commitment or when-issued basis. The Fund records a when-issued transaction on the trade date and will segregate assets in an amount at least equal in value to the Fund’s commitment to purchase when-issued securities. Securities purchased on a when-issued basis are marked-to-market daily and the Fund begins earning interest on the settlement date. Losses may arise due to changes in the market value of the underlying securities or if the counterparty does not perform under the contract.
Forward foreign currency contracts
A forward foreign currency contract is an agreement between two parties to purchase or sell a specific currency for an agreed-upon price at a future date. The Fund enters into forward foreign currency contracts to facilitate transactions in foreign-denominated securities and to attempt to minimize the risk to the Fund from adverse changes in the relationship between currencies. Forward foreign currency contracts are recorded at the forward rate and marked-to-market daily. When the contracts are closed, realized gains and losses arising from such transactions are recorded as realized gains or losses
Allspring Global Investment Grade Credit Fund | 19
Notes to financial statements
on forward foreign currency contracts. The Fund is subject to foreign currency risk and may be exposed to risks if the counterparties to the contracts are unable to meet the terms of their contracts or if the value of the foreign currency changes unfavorably. The Fund’s maximum risk of loss from counterparty credit risk is the unrealized gains on the contracts. This risk may be mitigated if there is a master netting arrangement between the Fund and the counterparty.
Security transactions and income recognition
Securities transactions are recorded on a trade date basis. Realized gains or losses are recorded on the basis of identified cost.
Interest income is accrued daily and bond discounts are accreted and premiums are amortized daily. To the extent debt obligations are placed on non-accrual status, any related interest income may be reduced by writing off interest receivables when the collection of all or a portion of interest has been determined to be doubtful based on consistently applied procedures and the fair value has decreased. If the issuer subsequently resumes interest payments or when the collectability of interest is reasonably assured, the debt obligation is removed from non-accrual status. Paydown gains and losses are included in interest income.
Interest earned on cash balances held at the custodian is recorded as interest income.
Distributions to shareholders
Distributions to shareholders are recorded on the ex-dividend date and paid from net investment income monthly and any net realized gains are paid at least annually. Such distributions are determined in accordance with income tax regulations and may differ from U.S. GAAP. Dividend sources are estimated at the time of declaration. The tax character of distributions is determined as of the Fund’s fiscal year end. Therefore, a portion of the Fund’s distributions made prior to the Fund’s fiscal year end may be categorized as a tax return of capital at year end.
The Fund intends to continue to qualify as a regulated investment company by distributing substantially all of its investment company taxable income and any net realized capital gains (after reduction for capital loss carryforwards) sufficient to relieve it from all, or substantially all, federal income taxes. Accordingly, no provision for federal income taxes was required.
The Fund’s income and federal excise tax returns and all financial records supporting those returns for the prior three fiscal years are subject to examination by the federal and Delaware revenue authorities. Management has analyzed the Fund’s tax positions taken on federal, state, and foreign tax returns, as applicable, for all open tax years and does not believe that there are any uncertain tax positions that require recognition of a tax liability.
As of September 30, 2024, the aggregate cost of all investments for federal income tax purposes was $29,191,833 and the unrealized gains (losses) consisted of:
As of September 30, 2024, the Fund had capital loss carryforwards which consist of $269,010 in short-term capital losses and $829,267 in long-term capital losses.
The separate classes of shares offered by the Fund differ principally in applicable sales charges, distribution, shareholder servicing, and administration fees. Class specific expenses are charged directly to that share class. Investment income, common fund-level expenses, and realized and unrealized gains (losses) on investments are allocated daily to each class of shares based on the relative proportion of net assets of each class.
3.
FAIR VALUATION MEASUREMENTS
Fair value measurements of investments are determined within a framework that has established a fair value hierarchy based upon the various data inputs utilized in determining the value of the Fund’s investments. The three-level hierarchy gives the highest priority to unadjusted quoted prices in active markets for identical assets or liabilities (Level 1) and the lowest priority to unobservable inputs (Level 3). The Fund’s investments are classified within the fair value hierarchy based on the lowest level of input that is significant to the fair value measurement. The inputs are summarized into three broad levels as follows:
•Level 1—quoted prices in active markets for identical securities
•Level 2—other significant observable inputs (including quoted prices for similar securities, interest rates, prepayment speeds, credit risk, etc.)
•Level 3—significant unobservable inputs (including the Fund’s own assumptions in determining the fair value of investments)
The inputs or methodologies used for valuing investments in securities are not necessarily an indication of the risk associated with investing in those securities.
20 | Allspring Global Investment Grade Credit Fund
Notes to financial statements
The following is a summary of the inputs used in valuing the Fund’s assets and liabilities as of September 30, 2024:
| | Other significant
observable inputs
(Level 2) | Significant
unobservable inputs
(Level 3) | |
| | | | |
| | | | |
Corporate bonds and notes | | | | |
Foreign corporate bonds and notes | | | | |
| | | | |
| | | | |
Yankee corporate bonds and notes | | | | |
| | | | |
| | | | |
| | | | |
Forward foreign currency contracts | | | | |
| | | | |
Forward foreign currency contracts are reported at their cumulative unrealized gains (losses) at measurement date as reported in the table following the Portfolio of Investments. All other assets and liabilities are reported at their market value at measurement date.
Additional sector, industry or geographic detail, if any, is included in the Portfolio of Investments.
At September 30, 2024, the Fund did not have any transfers into/out of Level 3.
4.
TRANSACTIONS WITH AFFILIATES
Allspring Funds Management, a wholly owned subsidiary of Allspring Global Investments Holdings, LLC, a holding company indirectly owned by certain private funds of GTCR LLC and Reverence Capital Partners, L.P., is the manager of the Fund and provides advisory and fund-level administrative services under an investment management agreement. Under the investment management agreement, Allspring Funds Management is responsible for, among other services, implementing the investment objectives and strategies of the Fund, supervising the subadviser and providing fund-level administrative services in connection with the Fund’s operations. As compensation for its services under the investment management agreement, Allspring Funds Management is entitled to receive a management fee, which is generally paid monthly, at the following annual rate based on the Fund’s average daily net assets:
For the year ended September 30, 2024, the management fee was equivalent to an annual rate of 0.40% of the Fund’s average daily net assets.
Allspring Funds Management has retained the services of a subavisers to provide daily portfolio management to the Fund. The fee for subadvisory services is borne by Allspring Funds Management. Allspring Global Investments, LLC and Allspring Global Investments (UK) Limited, each an affiliate of Allspring Funds Management and a wholly owned subsidiary of Allspring Global Investments Holdings, LLC, are subadvisers to the Fund and are each entitled to receive a fee from Allspring Funds Management at an annual rate starting at 0.10% and declining to 0.05% as the average daily net assets of the Fund increase.
Under a class-level administration agreement, Allspring Funds Management provides class-level administrative services to the Fund, which includes paying fees and expenses for services provided by the transfer agent, sub-transfer agents, omnibus account servicers and record-keepers. As
Allspring Global Investment Grade Credit Fund | 21
Notes to financial statements
compensation for its services under the class-level administration agreement, Allspring Funds Management receives an annual fee which is calculated based on the average daily net assets of each class and generally paid monthly, as follows:
| Class-level
administration fee |
| |
| |
| |
| |
Waivers and/or expense reimbursements
Allspring Funds Management has contractually committed to waive and/or reimburse management and administration fees to the extent necessary to maintain certain net operating expense ratios for the Fund. When each class of the Fund has exceeded its expense cap, Allspring Funds Management will waive fees and/or reimburse expenses from fund-level expenses on a proportionate basis and then from class specific expenses. When only certain classes exceed their expense caps, waivers and/or reimbursements are applied against class specific expenses before fund-level expenses. Allspring Funds Management has contractually committed through January 31, 2025 to waive fees and/or reimburse expenses to the extent necessary to cap the Fund’s expenses. Prior to or after the commitment expiration date, the cap may be increased or the commitment to maintain the cap may be terminated only with the approval of the Board of Trustees. As of September 30, 2024, the contractual caps are as follows:
The Trust has adopted a distribution plan for Class C shares pursuant to Rule 12b-1 under the 1940 Act. A distribution fee is charged to Class C shares and paid to Allspring Funds Distributor, LLC (“Allspring Funds Distributor”), the principal underwriter, an affiliate of Allspring Funds Management, at an annual rate up to 0.75% of the average daily net assets of Class C shares. Such fees are generally paid on a monthly basis.
In addition, Allspring Funds Distributor is entitled to receive the front-end sales charge from the purchase of Class A shares and a contingent deferred sales charge on the redemption of certain Class A shares. Allspring Funds Distributor is also entitled to receive the contingent deferred sales charges from redemptions of Class C shares. Allspring Funds Distributor did not receive any front-end or contingent deferred sales charges from Class A or Class C shares for the year ended September 30, 2024.
Shareholder servicing fees
The Trust has entered into contracts with one or more shareholder servicing agents, whereby Class A and Class C are charged a fee at an annual rate up to 0.25% of the average daily net assets of each respective class and are generally paid on a monthly basis. A portion of these total shareholder servicing fees were paid to affiliates of the Fund.
The Fund may purchase or sell portfolio investment securities to certain affiliates pursuant to Rule 17a-7 under the 1940 Act and under procedures adopted by the Board of Trustees. The procedures have been designed to ensure that these interfund transactions, which do not incur broker commissions, are effected at current market prices. Pursuant to these procedures, the Fund did not have any interfund transactions during the year ended September 30, 2024.
5.
INVESTMENT PORTFOLIO TRANSACTIONS
Purchases and sales of investments, excluding short-term securities, for the year ended September 30, 2024 were as follows:
22 | Allspring Global Investment Grade Credit Fund
Notes to financial statements
6.
DERIVATIVE TRANSACTIONS
During the year ended September 30, 2024, the Fund entered into forward foreign currency contracts for economic hedging purposes. The Fund had average contract amounts of $30,114 in forward foreign currency contracts to buy and $8,322,562 in forward foreign currency contracts to sell during the year ended September 30, 2024.
For certain types of derivative transactions, the Fund has entered into International Swaps and Derivatives Association, Inc. master agreements (“ISDA Master Agreements”) or similar agreements with approved counterparties. The ISDA Master Agreements or similar agreements may have requirements to deliver/deposit securities or cash to/with an exchange or broker-dealer as collateral and allows the Fund to offset, with each counterparty, certain derivative financial instrument’s assets and/or liabilities with collateral held or pledged. Collateral requirements differ by type of derivative. Collateral or margin requirements are set by the broker or exchange clearinghouse for exchange traded derivatives while collateral terms are contract specific for over-the-counter traded derivatives. Cash collateral that has been pledged to cover obligations of the Fund under ISDA Master Agreements or similar agreements, if any, are reported separately in the Statement of Assets and Liabilities. Securities pledged as collateral, if any, are noted in the Portfolio of Investments. With respect to balance sheet offsetting, absent an event of default by the counterparty or a termination of the agreement, the reported amounts of financial assets and financial liabilities in the Statement of Assets and Liabilities are not offset across transactions between the Fund and the applicable counterparty. A reconciliation of the gross amounts on the Statement of Assets and Liabilities to the net amounts by counterparty, including any collateral exposure, for OTC derivatives is as follows:
| Gross amounts
of assets in the
Statement of
Assets and
Liabilities | Amounts
subject to
netting
agreements | | |
State Street Bank & Trust Co. | | | | |
The Trust (excluding the money market funds), Allspring Master Trust and Allspring Variable Trust are parties to a $275,000,000 (prior to July 9, 2024: $350,000,000), revolving credit agreement whereby the Fund is permitted to use bank borrowings for temporary or emergency purposes, such as to fund shareholder redemption requests. Interest under the credit agreement is charged to the Fund based on a borrowing rate equal to the higher of the Federal Funds rate or the overnight bank funding rate in effect on that day plus a spread. In addition, an annual commitment fee based on the unused balance is allocated to each participating fund.
For the year ended September 30, 2024, there were no borrowings by the Fund under the agreement.
8.
DISTRIBUTIONS TO SHAREHOLDERS
The tax character of distributions paid were as follows:
As of September 30, 2024, the components of distributable earnings on a tax basis were as follows:
Undistributed
ordinary
income | | |
| | |
Under the Fund’s organizational documents, the officers and Trustees have been granted certain indemnification rights against certain liabilities that may arise out of performance of their duties to the Fund. The Fund has entered into a separate agreement with each Trustee that converts indemnification rights currently existing under the Fund’s organizational documents into contractual rights that cannot be changed in the future without the consent of the Trustee. Additionally, in the normal course of business, the Fund may enter into contracts with service providers that contain a variety of indemnification clauses. The Fund’s maximum exposure under these arrangements is dependent on future claims that may be made against the Fund and, therefore, cannot be estimated.
Allspring Global Investment Grade Credit Fund | 23
Notes to financial statements
10.SUBSEQUENT EVENT
At the meeting held on November 11-13, 2024, the Board of Trustees of the Fund approved the Fund’s liquidation. The Fund closed to new investors and to additional investments from existing shareholders with certain exceptions on November 15, 2024. The liquidation of the Fund is expected to occur after close of business on or about January 16, 2025.
24 | Allspring Global Investment Grade Credit Fund
Report of independent registered public accounting firm
To the Shareholders of the Fund and Board of Trustees
Allspring Funds Trust:
Opinion on the Financial Statements
We have audited the accompanying statement of assets and liabilities of Allspring Global Investment Grade Credit Fund (the Fund), one of the Funds constituting Allspring Funds Trust, including the portfolio of investments, as of September 30, 2024, the related statement of operations for the year then ended, the statements of changes in net assets for each of the years in the two-year period then ended, and the related notes (collectively, the financial statements) and the financial highlights for each of the years or periods in the five-year period then ended. In our opinion, the financial statements and financial highlights present fairly, in all material respects, the financial position of the Fund as of September 30, 2024, the results of its operations for the year then ended, the changes in its net assets for each of the years in the two-year period then ended, and the financial highlights for each of the years or periods in the five-year period then ended, in conformity with U.S. generally accepted accounting principles.
These financial statements and financial highlights are the responsibility of the Fund’s management. Our responsibility is to express an opinion on these financial statements and financial highlights based on our audits. We are a public accounting firm registered with the Public Company Accounting Oversight Board (United States) (PCAOB) and are required to be independent with respect to the Fund in accordance with the U.S. federal securities laws and the applicable rules and regulations of the Securities and Exchange Commission and the PCAOB.
We conducted our audits in accordance with the standards of the PCAOB. Those standards require that we plan and perform the audit to obtain reasonable assurance about whether the financial statements and financial highlights are free of material misstatement, whether due to error or fraud. Our audits included performing procedures to assess the risks of material misstatement of the financial statements and financial highlights, whether due to error or fraud, and performing procedures that respond to those risks. Such procedures included examining, on a test basis, evidence regarding the amounts and disclosures in the financial statements and financial highlights. Such procedures also included confirmation of securities owned as of September 30, 2024, by correspondence with the custodian, transfer agent and brokers, or by other appropriate auditing procedures. Our audits also included evaluating the accounting principles used and significant estimates made by management, as well as evaluating the overall presentation of the financial statements and financial highlights. We believe that our audits provide a reasonable basis for our opinion.

We have not been able to determine the specific year that we began serving as the auditor of one or more Allspring Funds investment companies; however, we are aware that we have served as the auditor of one or more Allspring Funds investment companies since at least 1955.
November 25, 2024
Allspring Global Investment Grade Credit Fund | 25
Other information (unaudited)
Other information
For the fiscal year ended September 30, 2024, $610,843 has been designated as interest-related dividends for nonresident alien shareholders pursuant to Section 871 of the Internal Revenue Code.
A description of the policies and procedures used to determine how to vote proxies relating to portfolio securities is available without charge, upon request, by calling 1-866-259-3305, visiting our website at allspringglobal.com, or visiting the SEC website at sec.gov. Information regarding how the proxies related to portfolio securities were voted during the most recent 12-month period ended June 30 is available on the website at allspringglobal.com or by visiting the SEC website at sec.gov.
Quarterly portfolio holdings information
The Fund files its complete schedule of portfolio holdings with the SEC for the first and third quarters of each fiscal year as an exhibit to its reports on Form N-PORT. Shareholders may view the filed Form N-PORT by visiting the SEC website at sec.gov.
26 | Allspring Global Investment Grade Credit Fund
Other information (unaudited)
Item 8. Changes in and disagreements with accountants
Item 9. Matters submitted to fund shareholders for a vote
Item 10. Remuneration paid to directors, officers and others
Refer to information in the Statement of operations.
Allspring Global Investment Grade Credit Fund | 27
Other information (unaudited)
Item 11. Statement regarding basis for the board’s approval of investment advisory contract
Board consideration of investment management and sub-advisory agreements:
Under the Investment Company Act of 1940 (the “1940 Act”), the Board of Trustees (the “Board”) of Allspring Funds Trust (the “Trust”) must determine annually whether to approve the continuation of the Trust’s investment management and sub-advisory agreements. In this regard, at a Board meeting held on May 28-30, 2024 (the “Meeting”), the Board, all the members of which have no direct or indirect interest in the investment management and sub-advisory agreements and are not “interested persons” of the Trust, as defined in the 1940 Act (the “Independent Trustees”), reviewed and approved for the Allspring Global Investment Grade Credit Fund (the “Fund”): (i) an investment management agreement (the “Management Agreement”) with Allspring Funds Management, LLC (“Allspring Funds Management”); and (ii) investment sub-advisory agreements (the “Sub-Advisory Agreements”) with Allspring Global Investments, LLC and Allspring Global Investments (UK) Limited (together, the “Sub-Advisers”), each an affiliate of Allspring Funds Management. The Management Agreement and the Sub-Advisory Agreements are collectively referred to as the “Advisory Agreements.”
At the Meeting, the Board considered the factors and reached the conclusions described below relating to the selection of Allspring Funds Management and the Sub-Advisers and the approval of the Advisory Agreements. Prior to the Meeting, including at a meeting of the Board held in April 2024, and at the Meeting, the Trustees conferred extensively among themselves and with representatives of Allspring Funds Management about these matters. The Board has adopted a team-based approach, with each team consisting of a sub-set of Trustees, to assist the full Board in the discharge of its duties in reviewing investment performance and other matters throughout the year. The Independent Trustees were assisted in their evaluation of the Advisory Agreements by independent legal counsel, from whom they received separate legal advice and with whom they met separately.
In providing information to the Board, Allspring Funds Management and the Sub-Advisers were guided by a detailed set of requests for information submitted to them by independent legal counsel on behalf of the Independent Trustees at the start of the Board’s annual contract renewal process earlier in 2024. In considering and approving the Advisory Agreements, the Trustees considered the information they believed relevant, including but not limited to the information discussed below. The Board considered not only the specific information presented in connection with the Meeting, but also the knowledge gained over time through interactions with Allspring Funds Management and the Sub-Advisers about various topics. In this regard, the Board reviewed reports of Allspring Funds Management at each of its quarterly meetings, which included, among other things, portfolio reviews and investment performance reports. In addition, the Board and the teams mentioned above confer with portfolio managers at various times throughout the year. The Board did not identify any particular information or consideration that was all-important or controlling, and each individual Trustee may have attributed different weights to various factors.
After its deliberations, the Board unanimously determined that the compensation payable to Allspring Funds Management and the Sub-Advisers under each of the Advisory Agreements was reasonable, and approved the continuation of the Advisory Agreements for a one-year term. The Board considered the approval of the Advisory Agreements for the Fund as part of its consideration of agreements for funds across the complex, but its approvals were made on a fund-by-fund basis. The following summarizes a number of important, but not necessarily all, factors considered by the Board in support of its approvals.
Nature, extent, and quality of services
The Board received and considered various information regarding the nature, extent, and quality of services provided to the Fund by Allspring Funds Management and the Sub-Advisers under the Advisory Agreements. This information included a description of the investment advisory services and Fund-level administrative services covered by the Management Agreement, as well as, among other things, a summary of the background and experience of senior management of Allspring Global Investments, of which Allspring Funds Management and the Sub-Advisers are a part, and a summary of investments made in the Allspring Global Investments business.* The Board also received information about the services that continue to be provided by Wells Fargo & Co. and/or its affiliates (“Wells Fargo”) since the sale of Wells Fargo Asset Management to Allspring Global Investments Holdings, LLC, a holding company indirectly owned by certain private funds of GTCR LLC and Reverence Capital Partners, L.P., under a transition services agreement and an update on the anticipated timeline for exiting the transition services agreement. In addition, the Board received and considered information about the full range of services provided to the Fund by Allspring Funds Management and its affiliates.
The Board considered the qualifications, background, tenure, and responsibilities of each of the portfolio managers primarily responsible for the day-to-day portfolio management of the Fund. The Board evaluated the ability of Allspring Funds Management and the Sub-Advisers to attract and retain qualified investment professionals, including research, advisory, and supervisory personnel.
The Board further considered the compliance programs and compliance records of Allspring Funds Management and the Sub-Advisers. The Board received and considered information about Allspring Global Investments’ risk management functions, which included information about Allspring Funds
*
The trade name for the asset management firm that includes Allspring Funds Management and the Sub-Advisers is “Allspring Global Investments.”
28 | Allspring Global Investment Grade Credit Fund
Other information (unaudited)
Management’s and the Sub-Advisers’ business continuity plans, their approaches to data privacy and cybersecurity, Allspring Funds Management’s role as administrator of the Fund’s liquidity risk management program, fair valuation designee, and derivatives risk management program manager. The Board also received and considered information about Allspring Funds Management’s intermediary and vendor oversight program.
Fund investment performance and expenses
The Board considered the investment performance results for the Fund over various time periods ended December 31, 2023. The Board considered these results in comparison to the investment performance of funds in a universe that was determined by Broadridge Inc. (“Broadridge”) to be similar to the Fund (the “Universe”), and in comparison to the Fund’s benchmark index and to other comparative data. Broadridge is an independent provider of investment company data. The Board received a description of the methodology used by Broadridge to select the mutual funds in the performance Universe. The Board noted that the investment performance of the Fund (Institutional Class) was higher than the average investment performance of the Universe for all periods under review. The Board also noted that the investment performance of the Fund was higher than the investment performance of its benchmark index, the Bloomberg Global Aggregate Credit Index (USD Hedged), for the one-year period under review, and in range of the investment performance of its benchmark index for the three-year period under review.
The Board also received and considered information regarding the Fund’s net operating expense ratios and their various components, including actual management fees, custodian and other non-management fees, and Rule 12b-1 and non-Rule 12b-1 shareholder service fees. The Board considered these ratios in comparison to the median ratios of funds in class-specific expense groups that were determined by Broadridge to be similar to the Fund (the “Groups”). The Board received a description of the methodology used by Broadridge to select the mutual funds in the expense Groups and an explanation of how funds comprising expense Groups and their expense ratios may vary from year-to-year. Based on the Broadridge reports, the Board noted that the net operating expense ratios of the Fund were lower than the median net operating expense ratios of the expense Groups for each share class.
The Board took into account the Fund’s investment performance and expense information provided to it among the factors considered in deciding to re-approve the Advisory Agreements.
Investment management and sub-advisory fee rates
The Board reviewed and considered the contractual fee rates payable by the Fund to Allspring Funds Management under the Management Agreement, as well as the contractual fee rates payable by the Fund to Allspring Funds Management for class-level administrative services under a Class-Level Administration Agreement, which include, among other things, class-level transfer agency and sub-transfer agency costs (collectively, the “Management Rates”). The Board also reviewed and considered the contractual investment sub-advisory fee rates payable by Allspring Funds Management to the Sub-Advisers for investment sub-advisory services. It was noted that advisory fee waivers, if any, are at the fund level and not class level.
Among other information reviewed by the Board was a comparison of the Fund’s Management Rates with the average contractual investment management fee rates of funds in the expense Groups at a common asset level as well as transfer agency costs of the funds in the expense Groups. The Board noted that the Management Rates of the Fund were lower than the sum of these average rates for the Fund’s expense Groups for each share class.
The Board also received and considered information about the portion of the total management fee that was retained by Allspring Funds Management after payment of the fee to the Sub-Advisers for sub-advisory services. In assessing the reasonableness of this amount, the Board received and evaluated information about the nature and extent of responsibilities retained and risks assumed by Allspring Funds Management and not delegated to or assumed by the Sub-Advisers, and about Allspring Funds Management’s on-going oversight services. Given the affiliation between Allspring Funds Management and the Sub-Advisers, the Board ascribed limited relevance to the allocation of fees between them.
The Board also received and considered information about the nature and extent of services offered and fee rates charged by Allspring Funds Management and the Sub-Advisers to other types of clients with investment strategies similar to those of the Fund. In this regard, the Board received information about the significantly greater scope of services, and compliance, reporting and other legal and regulatory obligations and risks of managing proprietary mutual funds compared with those associated with managing assets of other types of clients, including third-party sub-advised fund clients and non-mutual fund clients such as institutional separate accounts.
Based on its consideration of the factors and information it deemed relevant, including those described here, the Board determined that the compensation payable to Allspring Funds Management under the Management Agreement and to the Sub-Advisers under the Sub-Advisory Agreements was reasonable.
The Board received and considered information concerning the profitability of Allspring Funds Management, as well as the profitability of Allspring Global Investments, from providing services to the fund complex as a whole. The Board noted that the Sub-Advisers’ profitability information with respect to providing services to the Fund and other funds in the complex was subsumed in the Allspring Global Investments profitability analysis.
Allspring Global Investment Grade Credit Fund | 29
Other information (unaudited)
Allspring Funds Management reported on the methodologies and estimates used in calculating profitability, including a description of the methodology used to allocate certain expenses. Among other things, the Board noted that the levels of profitability reported on a fund-by-fund basis varied widely, depending on factors such as the size, type, and age of fund.
Based on its review, the Board did not deem the profits reported by Allspring Funds Management or Allspring Global Investments from services provided to the Fund to be at a level that would prevent it from approving the continuation of the Advisory Agreements.
The Board received and considered information about the potential for Allspring Funds Management to experience economies of scale in the provision of management services to the Fund, the difficulties of isolating and quantifying economies of scale at an individual fund level, and the extent to which potential scale benefits are shared with Fund shareholders. The Board noted the existence of breakpoints in the Fund’s management fee structure, which operate generally to reduce the Fund’s expense ratios as the Fund grows in size, and the size of the Fund in relation to such breakpoints. The Board considered that in addition to management fee breakpoints, Allspring Funds Management shares potential economies of scale from its management business in a variety of ways, including through fee waiver and expense reimbursement arrangements, competitive management fee rates set at the outset without regard to breakpoints, and investments in the business intended to enhance services available to shareholders.
The Board concluded that Allspring Funds Management’s arrangements with respect to the Fund, including contractual breakpoints, constituted a reasonable approach to sharing potential economies of scale with the Fund and its shareholders.
Other benefits to Allspring Funds Management and the Sub-Advisers
The Board received and considered information regarding potential “fall-out” or ancillary benefits received by Allspring Funds Management and its affiliates, including the Sub-Advisers, as a result of their relationships with the Fund. Ancillary benefits could include, among others, benefits directly attributable to other relationships with the Fund and benefits potentially derived from an increase in Allspring Funds Management’s and the Sub-Advisers’ business as a result of their relationships with the Fund. The Board noted that Allspring Funds Distributor, LLC, an affiliate of Allspring Funds Management, receives distribution-related fees in respect of shares sold or held through it. The Board also reviewed information about soft dollar credits earned and utilized by the Sub-Advisers.
Based on its consideration of the factors and information it deemed relevant, including those described here, the Board did not find that any ancillary benefits received by Allspring Funds Management and its affiliates, including the Sub-Advisers, were unreasonable.
At the Meeting, after considering the above-described factors and based on its deliberations and its evaluation of the information described above, the Board unanimously determined that the compensation payable to Allspring Funds Management and the Sub-Advisers under each of the Advisory Agreements was reasonable, and approved the continuation of the Advisory Agreements for a one-year term.
30 | Allspring Global Investment Grade Credit Fund
This page is intentionally left blank.
This page is intentionally left blank.
For more information
More information about Allspring Funds is available free upon request. To obtain literature, please write, visit the Fund’s website, or call:
Allspring Funds
P.O. Box 219967
Kansas City, MO 64121-9967
Website: allspringglobal.com
Individual investors: 1-800-222-8222
Retail investment professionals: 1-888-877-9275
Institutional investment professionals: 1-800-260-5969
This report and the financial statements contained herein are submitted for the general information of the shareholders of the Fund. If this report is used for promotional purposes, distribution of the report must be accompanied or preceded by a current prospectus. Before investing, please consider the investment objectives, risks, charges, and expenses of the investment. For a current prospectus and, if available, a summary prospectus, containing this information, call 1-800-222-8222 or visit the Fund’s website at allspringglobal.com. Read the prospectus carefully before you invest or send money.
Allspring Global InvestmentsTM is the trade name for the asset management firms of Allspring Global Investments Holdings, LLC, a holding company indirectly owned by certain private funds of GTCR LLC and Reverence Capital Partners, L.P. These firms include but are not limited to Allspring Global Investments, LLC, and Allspring Funds Management, LLC. Certain products managed by Allspring entities are distributed by Allspring Funds Distributor, LLC (a broker-dealer and Member FINRA/SIPC).
This material is for general informational and educational purposes only and is NOT intended to provide investment advice or a recommendation of any kind - including a recommendation for any specific investment, strategy, or plan.
© 2024 Allspring Global Investments Holdings, LLC. All rights reserved.
NCSR4337 09-24
ITEM 8. CHANGES IN AND DISAGREEMENTS WITH ACCOUNTANTS FOR OPEN-END MANAGEMENT INVESTMENT COMPANIES
Changes in and Disagreements with Accountants for Open-End Management Investment Companies are included as part of the Financial Statements filed under Item 7(a) of this Form.
ITEM 9. PROXY DISCLOSURES FOR OPEN-END MANAGEMENT INVESTMENT COMPANIES
Proxy Disclosures for Open-End Management Investment Companies are included as part of the Financial Statements filed under Item 7(a) of this Form.
ITEM 10. REMUNERATION PAID TO DIRECTORS, OFFICERS, AND OTHERS OF OPEN-END MANAGEMENT INVESTMENT COMPANIES
Renumeration Paid to Directors, Officers, and Others of Open-End Investment Companies is included as part of the Financial Statements filed under Item 7(a) of this Form.
ITEM 11. STATEMENT REGARDING BASIS FOR APPROVAL OF INVESTMENT ADVISORY CONTRACT
The registrant’s Statement Regarding Basis for Approval of Investment Advisory Contract is included as part of the Financial Statements filed under Item 7(a) of this Form.
ITEM 12. DISCLOSURE OF PROXY VOTING POLICIES AND PROCEDURES FOR CLOSED-END MANAGEMENT INVESTMENT COMPANIES
Not applicable.
ITEM 13. PORTFOLIO MANAGERS OF CLOSED-END MANAGEMENT INVESTMENT COMPANIES
Not applicable.
ITEM 14. PURCHASES OF EQUITY SECURITIES BY CLOSED-END MANAGEMENT INVESTMENT COMPANY AND AFFILIATED PURCHASERS
Not applicable.
ITEM 15. SUBMISSION OF MATTERS TO A VOTE OF SECURITY HOLDERS
There have been no material changes to the procedures by which shareholders may recommend nominees to the registrant’s Board of Trustees that have been implemented since the registrant’s last provided disclosure in response to the requirements of this Item.
ITEM 16. CONTROLS AND PROCEDURES
(a) The President and Treasurer have concluded that the Allspring Funds Trust disclosure controls and procedures (as defined in Rule 30a-3(c) under the Investment Company Act of 1940) provide reasonable assurances that material information relating to the registrant is made known to them by the appropriate persons based on their evaluation of these controls and procedures as of a date within 90 days of the filing of this report.
(b) There were no significant changes in the registrant’s internal control over financial reporting (as defined in Rule 30a-3(d) under the Investment Company Act of 1940) that occurred during the period covered by this report that materially affected, or is reasonably likely to materially affect, the registrant’s internal control over financial reporting.
ITEM 17. DISCLOSURES OF SECURITIES LENDING ACTIVITES FOR CLOSED-END MANAGEMENT INVESTMENT COMPANIES
Not applicable.
ITEM 18. RECOVERY OF ERRONEOUSLY AWARDED COMPENSATION
Not applicable.
ITEM 19. EXHIBITS
SIGNATURES
Pursuant to the requirements of the Securities Exchange Act of 1934 and the Investment Company Act of 1940, the registrant has duly caused this report to be signed on its behalf by the undersigned, thereunto duly authorized.
| | |
| Allspring Funds Trust |
| |
| By: | | /s/ Andrew Owen |
| | Andrew Owen |
| | President (Principal Executive Officer) |
|
| Date: November 25, 2024 |
Pursuant to the requirements of the Securities Exchange Act of 1934 and the Investment Company Act of 1940, this report has been signed below by the following persons on behalf of the registrant and in the capacities and on the date indicated.
| | |
| Allspring Funds Trust |
| |
| By: | | /s/ Andrew Owen |
| | Andrew Owen |
| | President (Principal Executive Officer) |
|
| Date: November 25, 2024 |
| |
| By: | | /s/ Jeremy DePalma |
| | Jeremy DePalma |
| | Treasurer (Principal Financial Officer) |
|
| Date: November 25, 2024 |