UNITED STATES
SECURITIES AND EXCHANGE COMMISSION
Washington, D.C. 20549
FORM N-CSRS
CERTIFIED SHAREHOLDER REPORT OF REGISTERED
MANAGEMENT INVESTMENT COMPANIES
Investment Company Act file number: 811-09255
Wells Fargo Variable Trust
(Exact name of registrant as specified in charter)
525 Market St., San Francisco, CA 94105
(Address of principal executive offices) (Zip code)
Catherine Kennedy
Wells Fargo Funds Management, LLC
525 Market St., San Francisco, CA 94105
(Name and address of agent for service)
Registrant’s telephone number, including area code: 800-222-8222
Date of fiscal year end: December 31
Registrant is making a filing for 6 of its series:
Wells Fargo VT Discovery Fund, Wells Fargo VT Index Asset Allocation Fund, Wells Fargo VT International Equity Fund, Wells Fargo VT Omega Growth Fund, Wells Fargo VT Opportunity Fund, and VT Small Cap Growth Fund.
Date of reporting period: June 30, 2021
ITEM 1. REPORT TO STOCKHOLDERS
Semi-Annual Report
June 30, 2021
Wells Fargo VT Discovery Fund
Reduce clutter.
Save trees.
Sign up for electronic delivery of prospectuses and shareholder reports at wellsfargo.com/ advantagedelivery
The views expressed and any forward-looking statements are as of June 30, 2021, unless otherwise noted, and are those of the Fund's portfolio managers and/or Wells Fargo Asset Management. Discussions of individual securities or the markets generally are not intended as individual recommendations. Future events or results may vary significantly from those expressed in any forward-looking statements. The views expressed are subject to change at any time in response to changing circumstances in the market. Wells Fargo Asset Management disclaims any obligation to publicly update or revise any views expressed or forward-looking statements.
INVESTMENT PRODUCTS: NOT FDIC INSURED ■ NO BANK GUARANTEE ■ MAY LOSE VALUE
Wells Fargo VT Discovery Fund | 1
Letter to shareholders (unaudited)
Andrew Owen
President
Wells Fargo Funds
Dear Shareholder:
We are pleased to offer you this semi-annual report for the Wells Fargo VT Discovery Fund for the six-month period that ended June 30, 2021. Global stocks continued to rally as the global economy continued to emerge from the haze of COVID-19. Tailwinds were provided by global stimulus programs, a rapid vaccination rollout, and recovering consumer and corporate sentiment. Bonds were mixed during the period, with municipal bonds and high-yield bonds delivering positive returns.
For the six-month period, U.S. stocks, based on the S&P 500 Index,1 gained 15.25%. International stocks, as measured by the MSCI ACWI ex USA Index (Net),2 returned 9.16%, while the MSCI EM Index (Net),3 trailed its developed market counterparts with a 7.45% gain. Among bond indexes, the Bloomberg Barclays U.S. Aggregate Bond Index,4 returned -1.60%, the Bloomberg Barclays Global Aggregate ex-USD Index (unhedged),5 returned -4.42%, the Bloomberg Barclays Municipal Bond Index,6 returned 1.06%, and the ICE BofA U.S. High Yield Index,7 returned 3.70%.
Vaccination rollout drove the stock markets to new highs.
The year 2021 began with emerging market stocks leading all major asset classes in January, driven by China’s strong economic growth and a broad recovery in corporate earnings, which propelled China’s stock market higher. In the United States, positive news on vaccine trials and January expansion in both the manufacturing and services sectors was offset by a weak December monthly jobs report. This was compounded by technical factors as some hedge funds were forced to sell stocks to protect themselves against a well-publicized short squeeze coordinated by a group of retail investors. Eurozone sentiment and economic growth were particularly weak, reflecting the impact of a new lockdown with stricter social distancing along with a slow vaccine rollout.
February saw major domestic equity indexes driven higher on the hope of a new stimulus bill, improving COVID-19 vaccination numbers, and the gradual reopening of the economy. Most S&P 500 companies reported better-than-expected earnings, with positive surprises coming from the financials, information technology, health care, and materials sectors. Japan saw its economy strengthen as a result of strong export numbers. Meanwhile, crude oil prices continued their climb, rising more than 25% for the year. Domestic government bonds experienced a sharp sell-off in late February as markets priced in a more robust economic recovery and higher future growth and inflation expectations.
| 1 | The S&P 500 Index consists of 500 stocks chosen for market size, liquidity, and industry group representation. It is a market-value-weighted index with each stock's weight in the index proportionate to its market value. You cannot invest directly in an index. |
| 2 | The Morgan Stanley Capital International (MSCI) All Country World Index (ACWI) ex USA Index (Net) is a free-float-adjusted market-capitalization-weighted index that is designed to measure the equity market performance of developed and emerging markets, excluding the United States. Source: MSCI. MSCI makes no express or implied warranties or representations and shall have no liability whatsoever with respect to any MSCI data contained herein. The MSCI data may not be further redistributed or used as a basis for other indices or any securities or financial products. This report is not approved, reviewed, or produced by MSCI. You cannot invest directly in an index. |
| 3 | The MSCI Emerging Markets (EM) Index (Net) is a free-float-adjusted market-capitalization-weighted index that is designed to measure equity market performance of emerging markets. You cannot invest directly in an index. |
| 4 | The Bloomberg Barclays U.S. Aggregate Bond Index is a broad-based benchmark that measures the investment-grade, U.S. dollar-denominated, fixed-rate taxable bond market, including Treasuries, government-related and corporate securities, mortgage-backed securities (agency fixed-rate and hybrid adjustable-rate mortgage pass-throughs), asset-backed securities, and commercial mortgage-backed securities. You cannot invest directly in an index. |
| 5 | The Bloomberg Barclays Global Aggregate ex-USD Index (unhedged) is an unmanaged index that provides a broad-based measure of the global investment-grade fixed-income markets excluding the U.S. dollar-denominated debt market. You cannot invest directly in an index. |
| 6 | The Bloomberg Barclays Municipal Bond Index is an unmanaged index composed of long-term tax-exempt bonds with a minimum credit rating of Baa. You cannot invest directly in an index. |
| 7 | The ICE BofA U.S. High Yield Index is a market-capitalization-weighted index of domestic and Yankee high-yield bonds. The index tracks the performance of high-yield securities traded in the U.S. bond market. You cannot invest directly in an index. Copyright 2021. ICE Data Indices, LLC. All rights reserved. |
2 | Wells Fargo VT Discovery Fund
Letter to shareholders (unaudited)
The passage of the massive domestic stimulus bill highlighted March activity, leading to increased forecasts for U.S. growth in 2021. Domestic employment surged as COVID-19 vaccinations and an increasingly open economy spurred hiring. A majority of U.S. small companies reported they were operating at pre-pandemic capacity or higher. Value stocks continued its outperformance of growth stocks in the month, continuing the trend that started in late 2020. Meanwhile, most major developed global equity indexes were up month to date on the back of rising optimism regarding the outlook for global growth. While the U.S. and U.K. had been most successful in terms of the vaccine rollout, even in markets where the vaccine lagged, such as in the eurozone and Japan, equity indexes in many of those countries had also been in positive territory for the year.
Equity markets produced another strong showing in April. Domestically, the continued reopening of the economy had a strong impact on positive equity performance, as people started leaving their households and jobless claims continued to fall. Domestic corporate bonds performed well and the U.S. dollar weakened. Meanwhile, the U.S. government continued to seek to invest in the recovery, this time by outlining a package of over $2 trillion to improve infrastructure. The primary headwind in April was inflation, as investors tried to determine the breadth and longevity of recent price increases. Developed Europe has been supported by a meaningful increase in the pace of vaccinations. Unfortunately many emerging market countries have not been as successful. India in particular has seen COVID-19 cases surge, serving as an example of the need to get vaccinations rolled out to less developed nations.
Vaccine rollouts continued in May, leading to loosened restrictions globally. As a result, equity markets in general saw a minor increase in returns. Concerns that the continued economic rebound could result in inflation increases becoming more than transitory were supported by the higher input costs businesses were experiencing. Meanwhile, those inflation concerns were tempered by the U.S. Federal Reserve Board (Fed), which stayed steady on its view of the economy and eased fears of a sudden and substantial policy change. Positive performance in the emerging market equity space was supported this month by steady consumer demand and strong commodity prices. Fixed-income markets were also slightly positive for the month, driven by inflation uncertainty and a softer U.S. dollar.
June witnessed the S&P 500 Index reach a new all-time high. 2021 economic growth and inflation forecasts were revised higher to reflect a strong economic recovery and some supply and demand imbalances. Late June saw a deal reached on a U.S. infrastructure package of approximately $1 trillion for road, bridge, and broadband network upgrades over the next eight years. The Fed’s June meeting yielded no change to policy, but its projections pointed to a possible interest rate rise in 2023. This, combined with a rebound in economic activity and investors searching for yield, led to U.S. Treasury yields being down for the month. Many European and Asian countries saw vaccination momentum increase, while the U.K. dealt with a rise in COVID-19 infections, specifically the Delta variant. Meanwhile, crude oil jumped over 10% in June on the back of the pickup in global economic activity and the Organization of the Petroleum Exporting Countries’ slow pace of supply growth.
Don’t let short-term uncertainty derail long-term investment goals.
Periods of investment uncertainty can present challenges, but experience has taught us that maintaining long-term investment goals can be an effective way to plan for the future. Although diversification cannot guarantee an investment profit or prevent losses, we believe it can be an effective way to manage investment risk and potentially smooth out overall portfolio performance. We encourage investors to know their investments and to understand that appropriate levels of risk-taking may unlock opportunities.
Thank you for choosing to invest with Wells Fargo Funds. We appreciate your confidence in us and remain committed to helping you meet your financial needs.
Sincerely,
Andrew Owen
President
Wells Fargo Funds
“The passage of the massive domestic stimulus bill highlighted March activity, leading to increased forecasts for U.S. growth in 2021.”
“2021 economic growth and inflation forecasts were revised higher to reflect a strong economic recovery and some supply and demand imbalances.”
For further information about your Fund, contact your investment professional, visit our website at wfam.com, or call us directly at 1-800-222-8222.
Wells Fargo VT Discovery Fund | 3
Performance highlights (unaudited)
| Investment objective | The Fund seeks long-term capital appreciation. |
| Manager | Wells Fargo Funds Management, LLC |
| Subadviser | Wells Capital Management, LLC |
| Portfolio managers | Michael T. Smith, CFA®‡, Christopher J. Warner, CFA®‡ |
| Average annual total returns (%) as of June 30, 2021 |
| | | | | | Expense ratios1 (%) |
| | Inception date | 1 year | 5 year | 10 year | Gross | Net 2 |
| Class 2 | 5-8-1992 | 47.59 | 24.14 | 16.34 | 1.14 | 1.14 |
| Russell 2500™ Growth Index3 | – | 49.63 | 20.68 | 14.83 | – | – |
| 1 | Reflects the expense ratios as stated in the most recent prospectus. The expense ratios shown are subject to change and may differ from the annualized expense ratios shown in the financial highlights of this report. |
| 2 | The manager has contractually committed through April 30, 2022, to waive fees and/or reimburse expenses to the extent necessary to cap total annual fund operating expenses after fee waivers at 1.15% for Class 2 shares. Brokerage commissions, stamp duty fees, interest, taxes, acquired fund fees and expenses (if any), and extraordinary expenses are excluded from the expense cap. Prior to or after the commitment expiration date, the cap may be increased or the commitment to maintain the cap may be terminated only with the approval of the Board of Trustees. Without this cap, the Fund’s returns would have been lower. The expense ratio paid by an investor is the net expense ratio (the total annual fund operating expenses after fee waivers) as stated in the prospectus. |
| 3 | The Russell 2500™ Growth Index measures the performance of those Russell 2500 companies with higher price/book ratios and higher forecasted growth values. You cannot invest directly in an index. |
Figures quoted represent past performance, which is no guarantee of future results. Investment return and principal value of an investment will fluctuate so that an investor’s shares, when redeemed, may be worth more or less than their original cost. Current performance may be lower or higher than the performance data quoted and assumes the reinvestment of dividends and capital gains. Current month-end performance is available by calling 1-800-260-5969. Performance figures of the Fund do not reflect fees and expenses charged pursuant to the terms of variable life insurance policies and variable annuity contracts. If these fees and expenses had been reflected, performance would have been lower.
Please keep in mind that high double-digit returns were primarily achieved during favorable market conditions. You should not expect that such favorable returns can be consistently achieved. A fund’s performance, especially for short time periods, should not be the sole factor in making your investment decision.
Index returns do not include transaction costs associated with buying and selling securities, any mutual fund fees or expenses, or any taxes. It is not possible to invest directly in an index.
Shares are sold without a front-end sales charge or contingent deferred sales charge.
Stock values fluctuate in response to the activities of individual companies and general market and economic conditions. Smaller company stocks tend to be more volatile and less liquid than those of larger companies. Certain investment strategies tend to increase the total risk of an investment (relative to the broader market). This fund is exposed to foreign investment risk. Consult the Fund’s prospectus for additional information on these and other risks.
Please refer to the prospectus provided by your participating insurance company for detailed information describing the separate accounts for information regarding surrender charges, mortality and expense risk fees, and other charges that may be assessed by the participating insurance companies.
| ‡ | CFA® and Chartered Financial Analyst® are trademarks owned by CFA Institute. |
4 | Wells Fargo VT Discovery Fund
Performance highlights (unaudited)
| Ten largest holdings (%) as of June 30, 20211 |
| MercadoLibre Incorporated | 2.72 |
| MongoDB Incorporated | 2.63 |
| Five9 Incorporated | 2.30 |
| Avalara Incorporated | 2.27 |
| Chipotle Mexican Grill Incorporated | 2.20 |
| Twilio Incorporated Class A | 2.18 |
| Align Technology Incorporated | 2.08 |
| Black Knight Incorporated | 2.08 |
| Generac Holdings Incorporated | 2.07 |
| Crowdstrike Holdings Incorporated Class A | 2.05 |
| 1 | Figures represent the percentage of the Fund's net assets. Holdings are subject to change and may have changed since the date specified. |
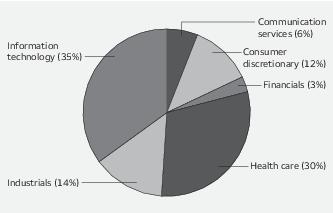
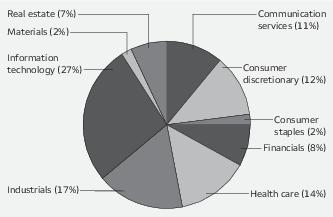
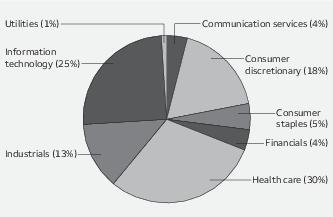
| Sector allocation as of June 30, 20211 |
| 1 | Figures represent the percentage of the Fund's long-term investments. These amounts are subject to change and may have changed since the date specified. |
Wells Fargo VT Discovery Fund | 5
Fund expenses (unaudited)
As a shareholder of the Fund, you incur ongoing costs, including management fees, distribution (12b-1) fees, and other Fund expenses. This example is intended to help you understand your ongoing costs (in dollars) of investing in the Fund and to compare these costs with the ongoing costs of investing in other mutual funds.
The example is based on an investment of $1,000 invested at the beginning of the six-month period and held for the entire period from January 1, 2021 to June 30, 2021.
Actual expenses
The “Actual” line of the table below provides information about actual account values and actual expenses. You may use the information in this line, together with the amount you invested, to estimate the expenses that you paid over the period. Simply divide your account value by $1,000 (for example, an $8,600 account value divided by $1,000 = 8.6), then multiply the result by the number in the “Actual” line under the heading entitled “Expenses paid during period” for your applicable class of shares to estimate the expenses you paid on your account during this period.
Hypothetical example for comparison purposes
The “Hypothetical” line of the table below provides information about hypothetical account values and hypothetical expenses based on the Fund’s actual expense ratio and an assumed rate of return of 5% per year before expenses, which is not the Fund’s actual return. The hypothetical account values and expenses may not be used to estimate the actual ending account balance or expenses you paid for the period. You may use this information to compare the ongoing costs of investing in the Fund and other funds. To do so, compare this 5% hypothetical example with the 5% hypothetical examples that appear in the shareholder reports of the other funds.
Please note that the expenses shown in the table are meant to highlight your ongoing costs only and do not reflect any separate account charges assessed by participating insurance companies. Therefore, the “Hypothetical” line of the table is useful in comparing ongoing costs only, and will not help you determine the relative total costs of owning different funds. In addition, if these separate account charges assessed by participating insurance companies were included, your costs would have been higher.
| | Beginning
account value
1-1-2021 | Ending
account value
6-30-2021 | Expenses
paid during
the period1 | Annualized net
expense ratio |
| Class 2 | | | | |
| Actual | $1,000.00 | $1,017.65 | $5.65 | 1.13% |
| Hypothetical (5% return before expenses) | $1,000.00 | $1,019.19 | $5.66 | 1.13% |
1 Expenses paid is equal to the annualized net expense ratio multiplied by the average account value over the period, multiplied by the number of days in the most recent fiscal half-year divided by the number of days in the fiscal year (to reflect the one-half-year period).
6 | Wells Fargo VT Discovery Fund
Portfolio of investments—June 30, 2021 (unaudited)
| | | | | Shares | Value |
| Common stocks: 97.73% | | | | | |
| Communication services: 5.46% | | | | | |
| Interactive media & services: 3.86% | | | | | |
| Bumble Incorporated Class A † | | | | 34,000 | $ 1,958,400 |
| IAC/InterActiveCorp | | | | 16,272 | 2,508,654 |
| Vimeo Incorporated † | | | | 49,217 | 2,411,633 |
| ZoomInfo Technologies Incorporated † | | | | 50,500 | 2,634,585 |
| | | | | | 9,513,272 |
| Media: 1.60% | | | | | |
| Magnite Incorporated † | | | | 57,600 | 1,949,184 |
| Match Group Incorporated † | | | | 12,400 | 1,999,500 |
| | | | | | 3,948,684 |
| Consumer discretionary: 11.96% | | | | | |
| Diversified consumer services: 2.39% | | | | | |
| Chegg Incorporated † | | | | 50,600 | 4,205,366 |
| Mister Car Wash Incorporated † | | | | 78,346 | 1,686,789 |
| | | | | | 5,892,155 |
| Hotels, restaurants & leisure: 3.53% | | | | | |
| Chipotle Mexican Grill Incorporated † | | | | 3,500 | 5,426,190 |
| Domino's Pizza Incorporated | | | | 6,994 | 3,262,631 |
| | | | | | 8,688,821 |
| Internet & direct marketing retail: 4.44% | | | | | |
| Etsy Incorporated † | | | | 20,611 | 4,242,568 |
| MercadoLibre Incorporated † | | | | 4,303 | 6,703,170 |
| | | | | | 10,945,738 |
| Leisure products: 1.60% | | | | | |
| Callaway Golf Company † | | | | 117,110 | 3,950,120 |
| Financials: 3.12% | | | | | |
| Capital markets: 1.53% | | | | | |
| MarketAxess Holdings Incorporated | | | | 8,100 | 3,755,079 |
| Consumer finance: 0.66% | | | | | |
| LendingTree Incorporated † | | | | 7,700 | 1,631,476 |
| Insurance: 0.93% | | | | | |
| Goosehead Insurance Incorporated Class A | | | | 18,024 | 2,294,455 |
| Health care: 29.74% | | | | | |
| Biotechnology: 6.21% | | | | | |
| CRISPR Therapeutics AG † | | | | 9,027 | 1,461,381 |
| Deciphera Pharmaceuticals Incorporated † | | | | 6,335 | 231,924 |
| Mirati Therapeutics Incorporated † | | | | 9,300 | 1,502,229 |
| Natera Incorporated † | | | | 36,323 | 4,123,750 |
| ORIC Pharmaceuticals Incorporated † | | | | 41,640 | 736,612 |
| Turning Point Therapeutics Incorporated † | | | | 17,837 | 1,391,643 |
| Twist Bioscience Corporation † | | | | 14,510 | 1,933,458 |
The accompanying notes are an integral part of these financial statements.
Wells Fargo VT Discovery Fund | 7
Portfolio of investments—June 30, 2021 (unaudited)
| | | | | Shares | Value |
| Biotechnology (continued) | | | | | |
| Zai Lab Limited ADR † | | | | 17,112 | $ 3,028,653 |
| Zentalis Pharmaceuticals Incorporated † | | | | 16,800 | 893,760 |
| | | | | | 15,303,410 |
| Health care equipment & supplies: 10.12% | | | | | |
| ABIOMED Incorporated † | | | | 5,800 | 1,810,238 |
| Align Technology Incorporated † | | | | 8,400 | 5,132,400 |
| DexCom Incorporated † | | | | 9,200 | 3,928,400 |
| Heska Corporation † | | | | 7,538 | 1,731,705 |
| Inari Medical Incorporated † | | | | 43,600 | 4,067,008 |
| Insulet Corporation † | | | | 12,199 | 3,348,747 |
| Shockwave Medical Incorporated † | | | | 25,952 | 4,923,873 |
| | | | | | 24,942,371 |
| Health care providers & services: 8.16% | | | | | |
| Amedisys Incorporated † | | | | 12,254 | 3,001,372 |
| Chemed Corporation | | | | 6,500 | 3,084,250 |
| Guardant Health Incorporated † | | | | 29,200 | 3,626,348 |
| HealthEquity Incorporated † | | | | 43,183 | 3,475,368 |
| Oak Street Health Incorporated † | | | | 55,824 | 3,269,612 |
| Option Care Health Incorporated † | | | | 167,900 | 3,671,973 |
| | | | | | 20,128,923 |
| Health care technology: 1.01% | | | | | |
| Doximity Incorporated Class A †« | | | | 21,851 | 1,271,728 |
| Schrodinger Incorporated † | | | | 16,100 | 1,217,321 |
| | | | | | 2,489,049 |
| Life sciences tools & services: 4.24% | | | | | |
| 10x Genomics Incorporated Class A † | | | | 22,300 | 4,366,786 |
| Berkeley Lights Incorporated † | | | | 49,328 | 2,210,388 |
| Bio-Rad Laboratories Incorporated Class A † | | | | 6,000 | 3,865,740 |
| | | | | | 10,442,914 |
| Industrials: 13.64% | | | | | |
| Aerospace & defense: 2.82% | | | | | |
| Axon Enterprise Incorporated † | | | | 15,846 | 2,801,573 |
| Teledyne Technologies Incorporated † | | | | 9,900 | 4,146,417 |
| | | | | | 6,947,990 |
| Building products: 1.78% | | | | | |
| Trex Company Incorporated † | | | | 43,000 | 4,395,030 |
| Commercial services & supplies: 1.93% | | | | | |
| Casella Waste Systems Incorporated Class A † | | | | 75,119 | 4,764,798 |
| Electrical equipment: 2.07% | | | | | |
| Generac Holdings Incorporated † | | | | 12,300 | 5,106,345 |
| Machinery: 0.28% | | | | | |
| Desktop Metal Incorporated †« | | | | 58,700 | 675,050 |
| Professional services: 1.63% | | | | | |
| Clarivate plc † | | | | 145,811 | 4,014,177 |
The accompanying notes are an integral part of these financial statements.
8 | Wells Fargo VT Discovery Fund
Portfolio of investments—June 30, 2021 (unaudited)
| | | | | Shares | Value |
| Road & rail: 1.59% | | | | | |
| Saia Incorporated † | | | | 18,700 | $ 3,917,463 |
| Trading companies & distributors: 1.54% | | | | | |
| SiteOne Landscape Supply Incorporated † | | | | 22,461 | 3,801,749 |
| Information technology: 33.81% | | | | | |
| Electronic equipment, instruments & components: 1.11% | | | | | |
| Novanta Incorporated † | | | | 20,300 | 2,735,628 |
| IT services: 15.54% | | | | | |
| Black Knight Incorporated † | | | | 65,800 | 5,131,084 |
| EPAM Systems Incorporated † | | | | 6,619 | 3,382,044 |
| Globant SA † | | | | 19,600 | 4,295,928 |
| Marqeta Incorporated †« | | | | 14,014 | 393,373 |
| MongoDB Incorporated † | | | | 17,900 | 6,471,208 |
| Paysafe Limited †« | | | | 223,300 | 2,704,163 |
| Shift4 Payments Incorporated Class A † | | | | 29,500 | 2,764,740 |
| StoneCo Limited Class A † | | | | 66,619 | 4,467,470 |
| Twilio Incorporated Class A † | | | | 13,598 | 5,359,788 |
| WNS Holdings Limited ADR † | | | | 41,800 | 3,338,566 |
| | | | | | 38,308,364 |
| Semiconductors & semiconductor equipment: 4.96% | | | | | |
| Enphase Energy Incorporated † | | | | 24,000 | 4,407,120 |
| MKS Instruments Incorporated | | | | 25,900 | 4,608,905 |
| Universal Display Corporation | | | | 14,400 | 3,201,553 |
| | | | | | 12,217,578 |
| Software: 12.20% | | | | | |
| Avalara Incorporated † | | | | 34,600 | 5,598,280 |
| Bill.com Holdings Incorporated † | | | | 25,666 | 4,701,498 |
| Crowdstrike Holdings Incorporated Class A † | | | | 20,100 | 5,051,331 |
| Elastic NV † | | | | 34,100 | 4,970,416 |
| Five9 Incorporated † | | | | 30,918 | 5,670,052 |
| Lightspeed POS Incorporated † | | | | 48,700 | 4,071,807 |
| | | | | | 30,063,384 |
| Total Common stocks (Cost $153,839,196) | | | | | 240,874,023 |
| | | Yield | | | |
| Short-term investments: 5.14% | | | | | |
| Investment companies: 5.14% | | | | | |
| Securities Lending Cash Investments LLC ♠∩∞ | | 0.03% | | 4,735,575 | 4,735,575 |
| Wells Fargo Government Money Market Fund Select Class ♠∞ | | 0.03 | | 7,920,281 | 7,920,281 |
| Total Short-term investments (Cost $12,655,856) | | | | | 12,655,856 |
| Total investments in securities (Cost $166,495,052) | 102.87% | | | | 253,529,879 |
| Other assets and liabilities, net | (2.87) | | | | (7,064,044) |
| Total net assets | 100.00% | | | | $246,465,835 |
The accompanying notes are an integral part of these financial statements.
Wells Fargo VT Discovery Fund | 9
Portfolio of investments—June 30, 2021 (unaudited)
| † | Non-income-earning security |
| « | All or a portion of this security is on loan. |
| ♠ | The issuer of the security is an affiliated person of the Fund as defined in the Investment Company Act of 1940. |
| ∩ | The investment is a non-registered investment company purchased with cash collateral received from securities on loan. |
| ∞ | The rate represents the 7-day annualized yield at period end. |
| Abbreviations: |
| ADR | American depositary receipt |
Investments in affiliates
An affiliated investment is an investment in which the Fund owns at least 5% of the outstanding voting shares of the issuer or as a result of other relationships, such as the Fund and the issuer having the same investment manager. Transactions with issuers that were either affiliates of the Fund at the beginning of the period or the end of the period were as follows:
| | Value,
beginning of
period | Purchases | Sales
proceeds | Net
realized
gains
(losses) | | Net
change in
unrealized
gains
(losses) | | Value,
end of
period | | % of
net
assets | Shares,
end
of period | Income
from
affiliated
securities |
| Short-term investments | | | | | | | | | | | | |
| Investment companies | | | | | | | | | | | | |
| Securities Lending Cash Investments LLC | $3,816,800 | $40,557,494 | $(39,638,719) | $0 | | $0 | | $ 4,735,575 | | | 4,735,575 | $ 1,202# |
| Wells Fargo Government Money Market Fund Select Class | 3,400,578 | 29,518,500 | (24,998,797) | 0 | | 0 | | 7,920,281 | | | 7,920,281 | 400 |
| | | | | $0 | | $0 | | $12,655,856 | | 5.14% | | $1,602 |
| # | Amount shown represents income before fees and rebates. |
The accompanying notes are an integral part of these financial statements.
10 | Wells Fargo VT Discovery Fund
Statement of assets and liabilities—June 30, 2021 (unaudited)
| | |
| Assets | |
Investments in unaffiliated securities (including $4,574,169 of securities loaned), at value (cost $153,839,196)
| $ 240,874,023 |
Investments in affiliated securites, at value (cost $12,655,856)
| 12,655,856 |
Receivable for Fund shares sold
| 104,428 |
Receivable for investments sold
| 77,401 |
Receivable for dividends
| 23,422 |
Receivable for securities lending income, net
| 4,145 |
Prepaid expenses and other assets
| 2,713 |
Total assets
| 253,741,988 |
| Liabilities | |
Payable upon receipt of securities loaned
| 4,735,575 |
Payable for investments purchased
| 2,196,703 |
Management fee payable
| 145,134 |
Payable for Fund shares redeemed
| 114,476 |
Distribution fee payable
| 48,237 |
Administration fee payable
| 15,481 |
Trustees’ fees and expenses payable
| 1,980 |
Accrued expenses and other liabilities
| 18,567 |
Total liabilities
| 7,276,153 |
Total net assets
| $246,465,835 |
| Net assets consist of | |
Paid-in capital
| $ 105,983,444 |
Total distributable earnings
| 140,482,391 |
Total net assets
| $246,465,835 |
| Computation of net asset value per share | |
Net assets – Class 2
| $ 246,465,835 |
Share outstanding – Class 21
| 4,970,456 |
Net asset value per share – Class 2
| $49.59 |
| 1 | The Fund has an unlimited number of authorized shares |
The accompanying notes are an integral part of these financial statements.
Wells Fargo VT Discovery Fund | 11
Statement of operations—six months ended June 30, 2021 (unaudited)
| | |
| Investment income | |
Dividends
| $ 95,621 |
Securities lending income from affiliates, net
| 20,395 |
Income from affiliated securities
| 400 |
Total investment income
| 116,416 |
| Expenses | |
Management fee
| 895,834 |
Administration fee – Class 2
| 95,556 |
Distribution fee – Class 2
| 298,422 |
Custody and accounting fees
| 11,321 |
Professional fees
| 22,370 |
Shareholder report expenses
| 12,596 |
Trustees’ fees and expenses
| 9,398 |
Other fees and expenses
| 3,207 |
Total expenses
| 1,348,704 |
Net investment loss
| (1,232,288) |
| Realized and unrealized gains (losses) on investments | |
Net realized gains on investments
| 36,917,723 |
Net change in unrealized gains (losses) on investments
| (31,694,025) |
Net realized and unrealized gains (losses) on investments
| 5,223,698 |
Net increase in net assets resulting from operations
| $ 3,991,410 |
The accompanying notes are an integral part of these financial statements.
12 | Wells Fargo VT Discovery Fund
Statement of changes in net assets
| | | | | |
| | Six months ended
June 30, 2021
(unaudited) | Year ended
December 31, 2020 |
| Operations | | | | |
Net investment loss
| | $ (1,232,288) | | $ (1,764,482) |
Net realized gains on investments
| | 36,917,723 | | 17,877,734 |
Net change in unrealized gains (losses) on investments
| | (31,694,025) | | 82,373,027 |
Net increase in net assets resulting from operations
| | 3,991,410 | | 98,486,279 |
| Distributions to shareholders from | | | | |
Net investment income and net realized gains – Class 2
| | 0 | | (16,114,396) |
| Capital share transactions | Shares | | Shares | |
Proceeds from shares sold – Class 2
| 285,002 | 13,849,511 | 674,102 | 24,912,455 |
Reinvestment of distributions – Class 2
| 0 | 0 | 468,578 | 16,114,396 |
Payment for shares redeemed – Class 2
| (567,549) | (27,328,730) | (1,018,571) | (35,934,160) |
Net increase (decrease) in net assets resulting from capital share transactions
| | (13,479,219) | | 5,092,691 |
Total increase (decrease) in net assets
| | (9,487,809) | | 87,464,574 |
| Net assets | | | | |
Beginning of period
| | 255,953,644 | | 168,489,070 |
End of period
| | $246,465,835 | | $255,953,644 |
The accompanying notes are an integral part of these financial statements.
Wells Fargo VT Discovery Fund | 13
Financial highlights
(For a share outstanding throughout each period)
| | | Year ended December 31 |
| Class 2 | Six months ended
June 30, 2021
(unaudited) | 2020 | 2019 | 2018 | 2017 | 2016 |
Net asset value, beginning of period
| $48.73 | $32.85 | $26.14 | $31.74 | $25.91 | $25.99 |
Net investment loss
| (0.25) | (0.34) | (0.25) | (0.17) | (0.20) | (0.13) |
Net realized and unrealized gains (losses) on investments
| 1.11 | 19.54 | 10.47 | (1.39) | 7.60 | 2.00 |
Total from investment operations
| 0.86 | 19.20 | 10.22 | (1.56) | 7.40 | 1.87 |
| Distributions to shareholders from | | | | | | |
Net realized gains
| 0.00 | (3.32) | (3.51) | (4.04) | (1.57) | (1.95) |
Net asset value, end of period
| $49.59 | $48.73 | $32.85 | $26.14 | $31.74 | $25.91 |
Total return1
| 1.76% | 62.65% | 39.02% | (7.06)% | 29.13% | 7.65% |
| Ratios to average net assets (annualized) | | | | | | |
Gross expenses
| 1.13% | 1.14% | 1.16% | 1.16% | 1.16% | 1.18% |
Net expenses
| 1.13% | 1.14% | 1.15% | 1.15% | 1.15% | 1.15% |
Net investment loss
| (1.03)% | (0.93)% | (0.79)% | (0.55)% | (0.68)% | (0.52)% |
| Supplemental data | | | | | | |
Portfolio turnover rate
| 29% | 47% | 71% | 60% | 75% | 85% |
Net assets, end of period (000s omitted)
| $246,466 | $255,954 | $168,489 | $125,806 | $145,175 | $119,919 |
| 1 | Returns for periods of less than one year are not annualized. Returns do not reflect fees and expenses charged pursuant to the terms of variable life insurance policies and variable annuity contracts. |
The accompanying notes are an integral part of these financial statements.
14 | Wells Fargo VT Discovery Fund
Notes to financial statements (unaudited)
1. ORGANIZATION
Wells Fargo Variable Trust (the "Trust"), a Delaware statutory trust organized on March 10, 1999, is an open-end management investment company registered under the Investment Company Act of 1940, as amended (the "1940 Act"). As an investment company, the Trust follows the accounting and reporting guidance in Financial Accounting Standards Board ("FASB") Accounting Standards Codification Topic 946, Financial Services – Investment Companies. These financial statements report on the Wells Fargo VT Discovery Fund (the "Fund") which is a diversified series of the Trust. The Trust offers shares of the Fund to separate accounts of various life insurance companies as funding vehicles for certain variable annuity contracts and variable life insurance policies.
On February 23, 2021, Wells Fargo & Company announced that it has entered into a definitive agreement to sell Wells Fargo Asset Management ("WFAM") to GTCR LLC and Reverence Capital Partners, L.P. WFAM is the trade name used by the asset management businesses of Wells Fargo & Company and includes Wells Fargo Funds Management, LLC, the investment manager to the Fund, Wells Capital Management, LLC and Wells Fargo Asset Management (International) Limited, both registered investment advisers providing sub-advisory services to certain funds, and Wells Fargo Funds Distributor, LLC, the Fund's principal underwriter. As part of the transaction, Wells Fargo & Company will own a 9.9% equity interest and will continue to serve as an important client and distribution partner.
Consummation of the transaction will result in the automatic termination of the Fund's investment management agreement and subadvisory agreement. The Fund's Board of Trustees approved a new investment management and new subadvisory agreement and approved submitting the agreements to the Fund’s shareholders for approval at a special meeting of shareholders expected to be held on August 16, 2021. Shareholders of record of the Fund at the close of business on May 28, 2021 are entitled to vote at the meeting. If shareholders approve the new agreements, they would take effect upon the closing of the transaction. The transaction is expected to close in the second half of 2021, subject to customary closing conditions.
2. SIGNIFICANT ACCOUNTING POLICIES
The following significant accounting policies, which are consistently followed in the preparation of the financial statements of the Fund, are in conformity with U.S. generally accepted accounting principles which require management to make estimates and assumptions that affect the reported amounts of assets and liabilities, disclosure of contingent assets and liabilities at the date of the financial statements, and the reported amounts of income and expenses during the reporting period. Actual results could differ from those estimates.
Securities valuation
All investments are valued each business day as of the close of regular trading on the New York Stock Exchange (generally 4 p.m. Eastern Time), although the Fund may deviate from this calculation time under unusual or unexpected circumstances.
Equity securities that are listed on a foreign or domestic exchange or market are valued at the official closing price or, if none, the last sales price. If no sale occurs on the principal exchange or market that day, a fair value price will be determined in accordance with the Fund’s Valuation Procedures.
Investments in registered open-end investment companies are valued at net asset value. Interests in non-registered investment companies that are redeemable at net asset value are fair valued normally at net asset value.
Investments which are not valued using any of the methods discussed above are valued at their fair value, as determined in good faith by the Board of Trustees. The Board of Trustees has established a Valuation Committee comprised of the Trustees and has delegated to it the authority to take any actions regarding the valuation of portfolio securities that the Valuation Committee deems necessary or appropriate, including determining the fair value of portfolio securities, unless the determination has been delegated to the Wells Fargo Asset Management Pricing Committee at Wells Fargo Funds Management, LLC ("Funds Management"). The Board of Trustees retains the authority to make or ratify any valuation decisions or approve any changes to the Valuation Procedures as it deems appropriate. On a quarterly basis, the Board of Trustees receives reports on any valuation actions taken by the Valuation Committee or the Wells Fargo Asset Management Pricing Committee which may include items for ratification.
Securities lending
The Fund may lend its securities from time to time in order to earn additional income in the form of fees or interest on securities received as collateral or the investment of any cash received as collateral. When securities are on loan, the Fund receives interest or dividends on those securities. Cash collateral received in connection with its securities lending transactions is invested in Securities Lending Cash Investments, LLC (the "Securities Lending Fund"). Investments in Securities Lending Fund
Wells Fargo VT Discovery Fund | 15
Notes to financial statements (unaudited)
are valued at the evaluated bid price provided by an independent pricing service. Income earned from investment in the Securities Lending Fund, if any, is included in securities lending income from affiliates (net of fees and rebates) on the Statement of Operations.
In a securities lending transaction, the net asset value of the Fund is affected by an increase or decrease in the value of the securities loaned and by an increase or decrease in the value of the instrument in which collateral is invested. The amount of securities lending activity undertaken by the Fund fluctuates from time to time. The Fund has the right under the lending agreement to recover the securities from the borrower on demand. In the event of default or bankruptcy by the borrower, the Fund may be prevented from recovering the loaned securities or gaining access to the collateral or may experience delays or costs in doing so. In such an event, the terms of the agreement allow the unaffiliated securities lending agent to use the collateral to purchase replacement securities on behalf of the Fund or pay the Fund the market value of the loaned securities. The Fund bears the risk of loss with respect to depreciation of its investment of the cash collateral.
Security transactions and income recognition
Securities transactions are recorded on a trade date basis. Realized gains or losses are recorded on the basis of identified cost.
Dividend income is recognized on the ex-dividend date.
Distributions to shareholders
Distributions to shareholders from net investment income and any net realized gains are recorded on the ex-dividend date and paid at least annually. Such distributions are determined in accordance with income tax regulations and may differ from U.S. generally accepted accounting principles. Dividend sources are estimated at the time of declaration. The tax character of distributions is determined as of the Fund's fiscal year end. Therefore, a portion of the Fund's distributions made prior to the Fund’s fiscal year end may be categorized as a tax return of capital at year end.
Federal and other taxes
The Fund intends to continue to qualify as a regulated investment company by distributing substantially all of its investment company taxable income and any net realized capital gains (after reduction for capital loss carryforwards) sufficient to relieve it from all, or substantially all, federal income taxes. Accordingly, no provision for federal income taxes was required.
The Fund’s income and federal excise tax returns and all financial records supporting those returns for the prior three fiscal years are subject to examination by the federal and Delaware revenue authorities. Management has analyzed the Fund's tax positions taken on federal, state, and foreign tax returns for all open tax years and does not believe that there are any uncertain tax positions that require recognition of a tax liability.
As of June 30, 2021, the aggregate cost of all investments for federal income tax purposes was $166,337,568 and the unrealized gains (losses) consisted of:
| Gross unrealized gains | $92,475,685 |
| Gross unrealized losses | (5,283,374) |
| Net unrealized gains | $87,192,311 |
3. FAIR VALUATION MEASUREMENTS
Fair value measurements of investments are determined within a framework that has established a fair value hierarchy based upon the various data inputs utilized in determining the value of the Fund’s investments. The three-level hierarchy gives the highest priority to unadjusted quoted prices in active markets for identical assets or liabilities (Level 1) and the lowest priority to unobservable inputs (Level 3). The Fund’s investments are classified within the fair value hierarchy based on the lowest level of input that is significant to the fair value measurement. The inputs are summarized into three broad levels as follows:
| ■ | Level 1 – quoted prices in active markets for identical securities |
| ■ | Level 2 – other significant observable inputs (including quoted prices for similar securities, interest rates, prepayment speeds, credit risk, etc.) |
| ■ | Level 3 – significant unobservable inputs (including the Fund’s own assumptions in determining the fair value of investments) |
The inputs or methodologies used for valuing investments in securities are not necessarily an indication of the risk associated with investing in those securities.
16 | Wells Fargo VT Discovery Fund
Notes to financial statements (unaudited)
The following is a summary of the inputs used in valuing the Fund’s assets and liabilities as of June 30, 2021:
| | Quoted prices
(Level 1) | Other significant
observable inputs
(Level 2) | Significant
unobservable inputs
(Level 3) | Total |
| Assets | | | | |
| Investments in: | | | | |
| Common stocks | | | | |
| Communication services | $ 13,461,956 | $0 | $0 | $ 13,461,956 |
| Consumer discretionary | 29,476,834 | 0 | 0 | 29,476,834 |
| Financials | 7,681,010 | 0 | 0 | 7,681,010 |
| Health care | 73,306,667 | 0 | 0 | 73,306,667 |
| Industrials | 33,622,602 | 0 | 0 | 33,622,602 |
| Information technology | 83,324,954 | 0 | 0 | 83,324,954 |
| Short-term investments | | | | |
| Investment companies | 12,655,856 | 0 | 0 | 12,655,856 |
| Total assets | $253,529,879 | $0 | $0 | $253,529,879 |
Additional sector, industry or geographic detail, if any, is included in the Portfolio of Investments.
For the six months ended June 30, 2021, the Fund did not have any transfers into/out of Level 3.
4. TRANSACTIONS WITH AFFILIATES
Management fee
Funds Management, an indirect wholly owned subsidiary of Wells Fargo & Company ("Wells Fargo"), is the manager of the Fund and provides advisory and fund-level administrative services under an investment management agreement. Under the investment management agreement, Funds Management is responsible for, among other services, implementing the investment objectives and strategies of the Fund, supervising the subadviser and providing fund-level administrative services in connection with the Fund’s operations. As compensation for its services under the investment management agreement, Funds Management is entitled to receive a management fee at the following annual rate based on the Fund’s average daily net assets:
| Average daily net assets | Management fee |
| First $500 million | 0.750% |
| Next $500 million | 0.700 |
| Next $1 billion | 0.650 |
| Next $2 billion | 0.625 |
| Next $1 billion | 0.600 |
| Next $5 billion | 0.590 |
| Over $10 billion | 0.580 |
For the six months ended June 30, 2021, the management fee was equivalent to an annual rate of 0.75% of the Fund’s average daily net assets.
Funds Management has retained the services of a subadviser to provide daily portfolio management to the Fund. The fee for subadvisory services is borne by Funds Management. Wells Capital Management, LLC ("WellsCap"), an affiliate of Funds Management and an indirect wholly owned subsidiary of Wells Fargo, is the subadviser to the Fund and is entitled to receive a fee from Funds Management at an annual rate starting at 0.45% and declining to 0.35% as the average daily net assets of the Fund increase.
Administration fee
Under a class-level administration agreement, Funds Management provides class-level administrative services to the Fund, which includes paying fees and expenses for services provided by the transfer agent, sub-transfer agents, omnibus account
Wells Fargo VT Discovery Fund | 17
Notes to financial statements (unaudited)
servicers and record-keepers. As compensation for its services under the class-level administration agreement, Funds Management receives an annual fee of 0.08% which is calculated based on the average daily net assets of Class 2 shares.
Waivers and/or expense reimbursements
Funds Management has contractually committed through April 30, 2022 to waive fees and/or reimburse expenses to the extent necessary to cap the Fund’s expenses at 1.15% for Class 2 shares. Prior to or after the commitment expiration date, the cap may be increased or the commitment to maintain the cap may be terminated only with the approval of the Board of Trustees.
Distribution fee
The Trust has adopted a distribution plan for Class 2 shares of the Fund pursuant to Rule 12b-1 under the 1940 Act. A distribution fee is charged to Class 2 shares and paid to Wells Fargo Funds Distributor, LLC, the principal underwriter, at an annual rate of 0.25% of the average daily net assets of Class 2 shares.
Interfund transactions
The Fund may purchase or sell portfolio investment securities to certain other Wells Fargo affiliates pursuant to Rule 17a-7 under the 1940 Act and under procedures adopted by the Board of Trustees. The procedures have been designed to ensure that these interfund transactions, which do not incur broker commissions, are effected at current market prices.
5. INVESTMENT PORTFOLIO TRANSACTIONS
Purchases and sales of investments, excluding U.S. government obligations (if any) and short-term securities, for the six months ended June 30, 2021 were $70,645,519 and $86,066,045, respectively.
6. SECURITIES LENDING TRANSACTIONS
The Fund lends its securities through an unaffiliated securities lending agent and receives collateral in the form of cash or securities with a value at least equal to the value of the securities on loan. The value of the loaned securities is determined at the close of each business day and any increases or decreases in the required collateral are exchanged between the Fund and the counterparty on the next business day. Cash collateral received is invested in the Securities Lending Fund which seeks to provide a positive return compared to the daily Federal Funds Open Rate by investing in high-quality, U.S. dollar-denominated short-term money market instruments and is exempt from registration under Section 3(c)(7) of the 1940 Act. Securities Lending Fund is managed by Funds Management and is subadvised by WellsCap. Funds Management receives an advisory fee starting at 0.05% and declining to 0.01% as the average daily net assets of the Securities Lending Fund increase. All of the fees received by Funds Management are paid to WellsCap for its services as subadviser.
In the event of counterparty default or the failure of a borrower to return a loaned security, the Fund has the right to use the collateral to offset any losses incurred. As of June 30, 2021, the Fund had securities lending transactions with the following counterparties which are subject to offset:
| Counterparty | Value of
securities on
loan | Collateral
received1 | Net amount |
| Barclays Capital Incorporated | $ 749,424 | $ (749,424) | $0 |
| BNP Paribas Securities Corporation | 1,897,176 | (1,897,176) | 0 |
| Morgan Stanley & Company LLC | 945,187 | (945,187) | 0 |
| UBS Securities LLC | 982,382 | (982,382) | 0 |
1 Collateral received within this table is limited to the collateral for the net transaction with the counterparty.
7. BANK BORROWINGS
The Trust, Wells Fargo Master Trust and Wells Fargo Funds Trust (excluding the money market funds) are parties to a $350,000,000 revolving credit agreement whereby the Fund is permitted to use bank borrowings for temporary or emergency purposes, such as to fund shareholder redemption requests. Interest under the credit agreement is charged to the Fund based on a borrowing rate equal to the higher of the Federal Funds rate in effect on that day plus 1.25% or the overnight bank funding rate in effect on that day plus 1.25%. In addition, an annual commitment fee equal to 0.25% of the unused balance is allocated to each participating fund.
For the six months ended June 30, 2021, there were no borrowings by the Fund under the agreement.
18 | Wells Fargo VT Discovery Fund
Notes to financial statements (unaudited)
8. CONCENTRATION RISKS
As of the end of the period, the Fund concentrated its portfolio of investments in the health care and information technology sectors. A fund that invests a substantial portion of its assets in any sector may be more affected by changes in that sector than would be a fund whose investments are not heavily weighted in any sector.
9. INDEMNIFICATION
Under the Fund's organizational documents, the officers and Trustees have been granted certain indemnification rights against certain liabilities that may arise out of performance of their duties to the Fund. The Fund has entered into a separate agreement with each Trustee that converts indemnification rights currently existing under the Fund’s organizational documents into contractual rights that cannot be changed in the future without the consent of the Trustee. Additionally, in the normal course of business, the Fund may enter into contracts with service providers that contain a variety of indemnification clauses. The Fund’s maximum exposure under these arrangements is dependent on future claims that may be made against the Fund and, therefore, cannot be estimated.
10. CORONAVIRUS (COVID-19) PANDEMIC
On March 11, 2020, the World Health Organization announced that it had made the assessment that coronavirus disease 2019 (“COVID-19”) is a pandemic. The impacts of COVID-19 are affecting the entire global economy, individual companies and investment products, the funds, and the market in general. There is significant uncertainty around the extent and duration of business disruptions related to COVID-19 and the impacts may last for an extended period of time. COVID-19 has led to significant uncertainty and volatility in the financial markets.
11. SUBSEQUENT EVENTS
Wells Fargo Asset Management ("WFAM") announced that it will be changing its company name to Allspring Global Investments upon the closing of the previously announced sale transaction of WFAM by Wells Fargo & Company to GTCR LLC and Reverence Capital Partners, L.P. The new corporate name is expected to go into effect on the closing date of the transaction, which is anticipated to occur in the second half of 2021, subject to customary closing conditions.
At a meeting held July 15, 2021, the Board of Trustees of the Wells Fargo Funds approved a change in the Fund's name to remove “Wells Fargo” from the Fund's name and replace with “Allspring”. The change is expected to go into effect on October 11, 2021.
Following the closing of the transaction, Wells Fargo Funds Management, LLC, the Fund's investment manager, Wells Capital Management, LLC and Wells Fargo Asset Management (International) Limited, each subadvisers to certain funds, and Wells Fargo Funds Distributor, LLC, the Fund's principal underwriter, will each be rebranded as Allspring.
At a special meeting of shareholders held on August 16, 2021, shareholders of the Fund approved a new investment management and a new subadvisory agreement that will be effective at the closing of the sale transaction.
Wells Fargo VT Discovery Fund | 19
Other information (unaudited)
PROXY VOTING INFORMATION
A description of the policies and procedures used to determine how to vote proxies relating to portfolio securities is available without charge, upon request, by calling 1-800-260-5969, visiting our website at wfam.com, or visiting the SEC website at sec.gov. Information regarding how the proxies related to portfolio securities were voted during the most recent 12-month period ended June 30 is available on the website at wfam.com or by visiting the SEC website at sec.gov.
QUARTERLY PORTFOLIO HOLDINGS INFORMATION
The Fund files its complete schedule of portfolio holdings with the SEC for the first and third quarters of each fiscal year as an exhibit to its reports on Form N-PORT. Shareholders may view the filed Form N-PORT by visiting the SEC website at sec.gov.
20 | Wells Fargo VT Discovery Fund
Other information (unaudited)
BOARD OF TRUSTEES AND OFFICERS
Each of the Trustees and Officers listed in the table below acts in identical capacities for each fund in the Wells Fargo family of funds, which consists of 139 mutual funds comprising the Wells Fargo Funds Trust, Wells Fargo Variable Trust, Wells Fargo Master Trust and four closed-end funds (collectively the “Fund Complex”). This table should be read in conjunction with the Prospectus and the Statement of Additional Information1. The mailing address of each Trustee and Officer is 525 Market Street, 12th Floor, San Francisco, CA 94105. Each Trustee and Officer serves an indefinite term, however, each Trustee serves such term until reaching the mandatory retirement age established by the Trustees.
Independent Trustees
Name and
year of birth | Position held and
length of service* | Principal occupations during past five years or longer | Current other
public company or
investment
company
directorships |
William R. Ebsworth
(Born 1957) | Trustee,
since 2015 | Retired. From 1984 to 2013, equities analyst, portfolio manager, research director and chief investment officer at Fidelity Management and Research Company in Boston, Tokyo, and Hong Kong, and retired in 2013 as Chief Investment Officer of Fidelity Strategic Advisers, Inc. where he led a team of investment professionals managing client assets. Prior thereto, Board member of Hong Kong Securities Clearing Co., Hong Kong Options Clearing Corp., the Thailand International Fund, Ltd., Fidelity Investments Life Insurance Company, and Empire Fidelity Investments Life Insurance Company. Audit Committee Chair and Investment Committee Chair of the Vincent Memorial Hospital Endowment (non-profit organization). Mr. Ebsworth is a CFA® charterholder. | N/A |
Jane A. Freeman
(Born 1953) | Trustee,
since 2015;
Chair Liaison,
since 2018 | Retired. From 2012 to 2014 and 1999 to 2008, Chief Financial Officer of Scientific Learning Corporation. From 2008 to 2012, Ms. Freeman provided consulting services related to strategic business projects. Prior to 1999, Portfolio Manager at Rockefeller & Co. and Scudder, Stevens & Clark. Board member of the Harding Loevner Funds from 1996 to 2014, serving as both Lead Independent Director and chair of the Audit Committee. Board member of the Russell Exchange Traded Funds Trust from 2011 to 2012 and the chair of the Audit Committee. Ms. Freeman is also an inactive Chartered Financial Analyst. | N/A |
Isaiah Harris, Jr.
(Born 1952) | Trustee,
since 2009; Audit
Committee
Chair,
since 2019 | Retired. Chairman of the Board of CIGNA Corporation since 2009, and Director since 2005. From 2003 to 2011, Director of Deluxe Corporation. Prior thereto, President and CEO of BellSouth Advertising and Publishing Corp. from 2005 to 2007, President and CEO of BellSouth Enterprises from 2004 to 2005 and President of BellSouth Consumer Services from 2000 to 2003. Emeritus member of the Iowa State University Foundation Board of Governors. Emeritus Member of the Advisory Board of Iowa State University School of Business. Advisory Board Member, Palm Harbor Academy (private school). Mr. Harris is a certified public accountant (inactive status). | CIGNA Corporation |
Judith M. Johnson
(Born 1949) | Trustee,
since 2008 | Retired. Prior thereto, Chief Executive Officer and Chief Investment Officer of Minneapolis Employees Retirement Fund from 1996 to 2008. Ms. Johnson is an attorney, certified public accountant and a certified managerial accountant. | N/A |
David F. Larcker
(Born 1950) | Trustee,
since 2009 | James Irvin Miller Professor of Accounting at the Graduate School of Business (Emeritus), Stanford University, Director of the Corporate Governance Research Initiative and Senior Faculty of The Rock Center for Corporate Governance since 2006. From 2005 to 2008, Professor of Accounting at the Graduate School of Business, Stanford University. Prior thereto, Ernst & Young Professor of Accounting at The Wharton School, University of Pennsylvania from 1985 to 2005. | N/A |
Wells Fargo VT Discovery Fund | 21
Other information (unaudited)
Name and
year of birth | Position held and
length of service* | Principal occupations during past five years or longer | Current other
public company or
investment
company
directorships |
Olivia S. Mitchell
(Born 1953) | Trustee,
since 2006;
Nominating and
Governance
Committee Chair,
since 2018 | International Foundation of Employee Benefit Plans Professor, Wharton School of the University of Pennsylvania since 1993. Director of Wharton’s Pension Research Council and Boettner Center on Pensions & Retirement Research, and Research Associate at the National Bureau of Economic Research. Previously, Cornell University Professor from 1978 to 1993. | N/A |
Timothy J. Penny
(Born 1951) | Trustee,
since 1996;
Chair,
since 2018 | President and Chief Executive Officer of Southern Minnesota Initiative Foundation, a non-profit organization, since 2007. Member of the Board of Trustees of NorthStar Education Finance, Inc., a non-profit organization, since 2007. | N/A |
James G. Polisson
(Born 1959) | Trustee,
since 2018 | Retired. Chief Marketing Officer, Source (ETF) UK Services, Ltd, from 2015 to 2017. From 2012 to 2015, Principal of The Polisson Group, LLC, a management consulting, corporate advisory and principal investing company. Chief Executive Officer and Managing Director at Russell Investments, Global Exchange Traded Funds from 2010 to 2012. Managing Director of Barclays Global Investors from 1998 to 2010 and Global Chief Marketing Officer for iShares and Barclays Global Investors from 2000 to 2010. Trustee of the San Francisco Mechanics’ Institute, a non-profit organization, from 2013 to 2015. Board member of the Russell Exchange Traded Fund Trust from 2011 to 2012. Director of Barclays Global Investors Holdings Deutschland GmbH from 2006 to 2009. Mr. Polisson is an attorney and has a retired status with the Massachusetts and District of Columbia Bar Associations. | N/A |
Pamela Wheelock
(Born 1959) | Trustee,
since January
2020; previously
Trustee from
January 2018 to
July 2019 | Board member of the Destination Medical Center Economic Development Agency, Rochester, Minnesota since 2019. Interim President of the McKnight Foundation from January to September 2020. Acting Commissioner, Minnesota Department of Human Services, July 2019 through September 2019. Human Services Manager (part-time), Minnesota Department of Human Services, October 2019 through December 2019. Chief Operating Officer, Twin Cities Habitat for Humanity from 2017 to 2019. Vice President of University Services, University of Minnesota from 2012 to 2016. Prior thereto, on the Board of Directors, Governance Committee and Finance Committee for the Minnesota Philanthropy Partners (Saint Paul Foundation) from 2012 to 2018, Interim Chief Executive Officer of Blue Cross Blue Shield of Minnesota from 2011 to 2012, Chairman of the Board from 2009 to 2012 and Board Director from 2003 to 2015. Vice President, Leadership and Community Engagement, Bush Foundation, Saint Paul, Minnesota (a private foundation) from 2009 to 2011. Executive Vice President and Chief Financial Officer, Minnesota Sports and Entertainment from 2004 to 2009 and Senior Vice President from 2002 to 2004. Executive Vice President of the Minnesota Wild Foundation from 2004 to 2008. Commissioner of Finance, State of Minnesota, from 1999 to 2002. Currently Board Chair of the Minnesota Wild Foundation since 2010. | N/A |
* Length of service dates reflect the Trustee’s commencement of service with the Trust’s predecessor entities, where applicable.
22 | Wells Fargo VT Discovery Fund
Other information (unaudited)
Officers
Name and
year of birth | Position held and
length of service | Principal occupations during past five years or longer |
Andrew Owen
(Born 1960) | President,
since 2017 | Executive Vice President of Wells Fargo & Company and Head of Affiliated Managers, Wells Fargo Asset Management, since 2014. In addition, Mr. Owen is currently President, Chief Executive Officer and Director of Wells Fargo Funds Management, LLC since 2017. Prior thereto, Executive Vice President responsible for marketing, investments and product development for Wells Fargo Funds Management, LLC, from 2009 to 2014. |
Jeremy DePalma
(Born 1974) | Treasurer,
since 2012
(for certain funds in
the Fund Complex);
since 2021 (for
the remaining funds in the
Fund Complex) | Senior Vice President of Wells Fargo Funds Management, LLC since 2009. Senior Vice President of Evergreen Investment Management Company, LLC from 2008 to 2010 and head of the Fund Reporting and Control Team within Fund Administration from 2005 to 2010. |
Michelle Rhee
(Born 1966) | Chief Legal Officer,
since 2019 | Secretary of Wells Fargo Funds Management, LLC and Chief Legal Counsel of Wells Fargo Asset Management since 2018. Deputy General Counsel of Wells Fargo Bank, N.A. since 2020 and Assistant General Counsel of Wells Fargo Bank, N.A. from 2018 to 2020. Associate General Counsel and Managing Director of Bank of America Corporation from 2004 to 2018. |
Catherine Kennedy
(Born 1969) | Secretary,
since 2019 | Vice President of Wells Fargo Funds Management, LLC and Senior Counsel of the Wells Fargo Legal Department since 2010. Vice President and Senior Counsel of Evergreen Investment Management Company, LLC from 1998 to 2010. |
Michael H. Whitaker
(Born 1967) | Chief Compliance Officer,
since 2016 | Chief Compliance Officer of Wells Fargo Asset Management since 2016. Senior Vice President and Chief Compliance Officer for Fidelity Investments from 2007 to 2016. |
1 The Statement of Additional Information includes additional information about the Trustees and is available, without charge, upon request, by calling 1-800-222-8222 or by visiting the website at wfam.com.
Wells Fargo VT Discovery Fund | 23
Board considerations (unaudited)
BOARD CONSIDERATION OF INVESTMENT MANAGEMENT AND SUB-ADVISORY AGREEMENTS:
Board Considerations – Current Agreements
Under the Investment Company Act of 1940 (the “1940 Act”), the Board of Trustees (the “Board”) of Wells Fargo Variable Trust (the “Trust”) must determine annually whether to approve the continuation of the Trust’s investment management and sub-advisory agreements. In this regard, at a Board meeting held on May 17-19, 2021 (the “Meeting”), the Board, all the members of which have no direct or indirect interest in the investment management and sub-advisory agreements and are not “interested persons” of the Trust, as defined in the 1940 Act (the “Independent Trustees”), reviewed and approved for Wells Fargo VT Discovery Fund (the “Fund”): (i) an investment management agreement (the “Management Agreement”) with Wells Fargo Funds Management, LLC (“Funds Management”); and (ii) an investment sub-advisory agreement (the “Sub-Advisory Agreement”) with Wells Capital Management Incorporated (the “Sub-Adviser”), an affiliate of Funds Management. The Management Agreement and the Sub-Advisory Agreement are collectively referred to as the “Advisory Agreements.”
The Board noted that Wells Fargo & Company recently announced that it had entered into a definitive agreement to sell Wells Fargo Asset Management (“WFAM”), which includes Funds Management and the Sub-Adviser, to GTCR LLC and Reverence Capital Partners, L.P. and/or their affiliates (the “Transaction”). The Board further noted that the Transaction would result in a change-of-control of Funds Management and the Sub-Adviser, which would be considered to be an assignment that would result in the termination of the Advisory Agreements. In light of the Transaction, the Board separately considered for approval a new investment management agreement with Funds Management and a new sub-advisory agreement with the Sub-Adviser (the “New Agreements”) that would replace the Advisory Agreements upon consummation of the Transaction, subject to approval of the New Agreements by the Fund’s shareholders. The Board also considered for approval interim agreements to go into effect in the event shareholders do not approve the New Agreements before the Transaction is completed. The interim agreements would allow the Manager and the Sub-Adviser to continue providing services to the Fund while the Fund continues to seek shareholder approval of the New Agreements. The Board noted that the terms of the interim agreements would be identical to those of the current Advisory Agreements, except for the term and certain escrow provisions.
At the Meeting, the Board considered the factors and reached the conclusions described below relating to the selection of Funds Management and the Sub-Adviser and the approval of the Advisory Agreements. Prior to the Meeting, including at Board meetings held in April and May 2021, the Trustees conferred extensively among themselves and with representatives of Funds Management about these matters. Also, the Board has adopted a team-based approach, with each team consisting of a sub-set of Trustees, to assist the full Board in the discharge of its duties in reviewing investment performance and other matters throughout the year. The Independent Trustees were assisted in their evaluation of the Advisory Agreements by independent legal counsel, from whom they received separate legal advice and with whom they met separately.
In providing information to the Board, Funds Management and the Sub-Adviser were guided by a detailed set of requests for information submitted to them by independent legal counsel on behalf of the Independent Trustees at the start of the Board’s annual contract renewal process earlier in 2021. In considering and approving the Advisory Agreements, the Trustees considered the information they believed relevant, including but not limited to the information discussed below. The Board considered not only the specific information presented in connection with the Meeting, but also the knowledge gained over time through interaction with Funds Management and the Sub-Adviser about various topics. In this regard, the Board reviewed reports of Funds Management at each of its quarterly meetings, which included, among other things, portfolio reviews and investment performance reports. In addition, the Board and the teams mentioned above confer with portfolio managers at various times throughout the year. The Board did not identify any particular information or consideration that was all-important or controlling, and each individual Trustee may have attributed different weights to various factors.
After its deliberations, the Board unanimously determined that the compensation payable to Funds Management and the Sub-Adviser under each of the Advisory Agreements was reasonable, and approved the continuation of the Advisory Agreements for a one-year term. The Board considered the approval of the Advisory Agreements for the Fund as part of its consideration of agreements for funds across the complex, but its approvals were made on a fund-by-fund basis. The following summarizes a number of important, but not necessarily all, factors considered by the Board in support of its approvals.
Nature, extent and quality of services
The Board received and considered various information regarding the nature, extent and quality of services provided to the Fund by Funds Management and the Sub-Adviser under the Advisory Agreements. This information included a description of the investment advisory services and Fund-level administrative services covered by the Management Agreement, as well as, among other things, a summary of the background and experience of senior management of WFAM, of which Funds Management and the Sub-Adviser are a part, and a summary of investments made in the business of WFAM. The Board also received a description of
24 | Wells Fargo VT Discovery Fund
Board considerations (unaudited)
Funds Management’s and the Sub-Adviser’s business continuity plans, including a summary of the performance of such plans and any changes thereto during the COVID-19 pandemic, and of their approaches to data privacy and cybersecurity. The Board also received and reviewed information about Funds Management’s role as administrator of the Fund’s liquidity risk management program, Funds Management’s approach to risk management, and Funds Management’s intermediary and vendor oversight program.
The Board also considered the qualifications, background, tenure and responsibilities of each of the portfolio managers primarily responsible for the day-to-day portfolio management of the Fund. The Board evaluated the ability of Funds Management and the Sub-Adviser to attract and retain qualified investment professionals, including research, advisory and supervisory personnel.
The Board further considered the compliance programs and compliance records of Funds Management and the Sub-Adviser. In addition, the Board took into account the full range of services provided to the Fund by Funds Management and its affiliates. The Board also considered information about retention and back-up arrangements that have been put into place with respect to key personnel of WFAM in connection with the anticipated Transaction, noting that WFAM provided assurances that the announcement and eventual culmination of the Transaction is not expected to result in any diminution in the nature or quality of services provided to the Fund.
Fund investment performance and expenses
The Board considered the investment performance results for the Fund over various time periods ended December 31, 2020. The Board considered these results in comparison to the investment performance of funds in a universe that was determined by Broadridge Inc. (“Broadridge”) to be similar to the Fund (the “Universe”), and in comparison to the Fund’s benchmark index and to other comparative data. Broadridge is an independent provider of investment company data. The Board received a description of the methodology used by Broadridge to select the mutual funds in the performance Universe. The Board noted that the investment performance of the Fund was higher than the average investment performance of the Universe for all periods under review. The Board also noted that the investment performance of the Fund was higher than its benchmark index, the Russell 2500™ Growth Index, for all periods under review.
The Board also received and considered information regarding the Fund’s net operating expense ratio and its various components, including actual management fees, custodian and other non-management fees, and Rule 12b-1 and non-Rule 12b-1 shareholder service fees. The Board considered this ratio in comparison to the median ratios of funds in an expense group that was determined by Broadridge to be similar to the Fund (the “Group”). The Board received a description of the methodology used by Broadridge to select the mutual funds in the expense Group and an explanation of how funds comprising expense group and their expense ratios may vary from year-to-year. Based on the Broadridge reports, the Board noted that the net operating expense ratio of the Fund was in range of the median net operating expense ratio of the expense Group.
The Board took into account the Fund’s investment performance and expense information provided to it among the factors considered in deciding to re-approve the Advisory Agreements.
Investment management and sub-advisory fee rates
The Board reviewed and considered the contractual fee rates payable by the Fund to Funds Management under the Management Agreement, as well as the contractual fee rates payable by the Fund to Funds Management for class-level administrative services under a Class-Level Administration Agreement, which include, among other things, class-level transfer agency and sub-transfer agency costs (collectively, the “Management Rate”). The Board also reviewed and considered the contractual investment sub-advisory fee rates that are payable by Funds Management to the Sub-Adviser for investment sub-advisory services.
Among other information reviewed by the Board was a comparison of the Fund’s Management Rate with the average contractual investment management fee rates of funds in the expense Group at a common asset level as well as transfer agency costs of the funds in the expense Group. The Board noted that the Management Rate of the Fund were lower than the sum of these average rates for the Fund’s expense Group.
The Board also received and considered information about the portion of the total management fee that was retained by Funds Management after payment of the fee to the Sub-Adviser for sub-advisory services. In assessing the reasonableness of this amount, the Board received and evaluated information about the nature and extent of responsibilities retained and risks assumed by Funds Management and not delegated to or assumed by the Sub-Adviser, and about Funds Management’s on-going oversight services. Given the affiliation between Funds Management and the Sub-Adviser, the Board ascribed limited relevance to the allocation of fees between them.
The Board also received and considered information about the nature and extent of services offered and fee rates charged by Funds Management and the Sub-Adviser to other types of clients with investment strategies similar to those of the Fund. In this regard, the Board received information about the significantly greater scope of services, and compliance, reporting and other legal
Wells Fargo VT Discovery Fund | 25
Board considerations (unaudited)
burdens and risks of managing proprietary mutual funds compared with those associated with managing assets of other types of clients, including third-party sub-advised fund clients and non-mutual fund clients such as institutional separate accounts.
Based on its consideration of the factors and information it deemed relevant, including those described here, the Board determined that the compensation payable to Funds Management under the Management Agreement and to the Sub-Adviser under the Sub-Advisory Agreement was reasonable.
Profitability
The Board received and considered information concerning the profitability of Funds Management, as well as the profitability of both WFAM and Wells Fargo & Co. (“Wells Fargo”) from providing services to the fund family as a whole. The Board noted that the Sub-Adviser’s profitability information with respect to providing services to the Fund and other funds in the family was subsumed in the WFAM and Wells Fargo profitability analysis.
Funds Management reported on the methodologies and estimates used in calculating profitability, including a description of the methodology used to allocate certain expenses. Among other things, the Board noted that the levels of profitability reported on a fund-by-fund basis varied widely, depending on factors such as the size, type and age of fund.
Based on its review, the Board did not deem the profits reported by Funds Management, WFAM or Wells Fargo from services provided to the Fund to be at a level that would prevent it from approving the continuation of the Advisory Agreements.
Economies of scale
The Board received and considered information about the potential for Funds Management to experience economies of scale in the provision of management services to the Fund, the difficulties of calculating economies of scale at an individual fund level, and the extent to which potential scale benefits are shared with Fund shareholders. The Board noted the existence of breakpoints in the Fund’s management fee structure, which operate generally to reduce the Fund’s expense ratios as the Fund grows in size, and the size of the Fund in relation to such breakpoints. The Board considered that in addition to management fee breakpoints, Funds Management shares potential economies of scale from its management business in a variety of ways, including through fee waiver and expense reimbursement arrangements, competitive management fee rates set at the outset without regard to breakpoints, and investments in the business intended to enhance services available to shareholders.
The Board concluded that Funds Management’s arrangements with respect to the Fund, including contractual breakpoints, constituted a reasonable approach to sharing potential economies of scale with the Fund and its shareholders.
Other benefits to Funds Management and the Sub-Adviser
The Board received and considered information regarding potential “fall-out” or ancillary benefits received by Funds Management and its affiliates, including the Sub-Adviser, as a result of their relationships with the Fund. Ancillary benefits could include, among others, benefits directly attributable to other relationships with the Fund and benefits potentially derived from an increase in Funds Management’s and the Sub-Adviser’s business as a result of their relationships with the Fund. The Board noted that various affiliates of Funds Management may receive distribution-related fees, shareholder servicing payments and sub-transfer agency fees in respect of shares sold or held through them and services provided.
The Board also reviewed information about soft dollar credits earned and utilized by the Sub-Adviser, fees earned by Funds Management and the Sub-Adviser from managing a private investment vehicle for the fund family’s securities lending collateral and commissions earned by an affiliated broker from portfolio transactions.
Based on its consideration of the factors and information it deemed relevant, including those described here, the Board did not find that any ancillary benefits received by Funds Management and its affiliates, including the Sub-Adviser, were unreasonable.
Conclusion
At the Meeting, after considering the above-described factors and based on its deliberations and its evaluation of the information described above, the Board unanimously determined that the compensation payable to Funds Management and the Sub-Adviser under each of the Advisory Agreements was reasonable, and approved the continuation of the Advisory Agreements for a one-year term.
26 | Wells Fargo VT Discovery Fund
Board considerations (unaudited)
Board Considerations – New Agreements
Overview of the Board evaluation process
At a meeting held on May 17-19, 2021 (the “Board Meeting”), the Board of Trustees (the “Board”) of Wells Fargo Variable Trust (the “Trust”, and the series thereof, the “Funds”) approved the continuation of each Fund’s current Investment Management Agreement (the “Current Investment Management Agreement”) and the current Wells Cap Sub-Advisory Agreement (the “Current Wells Cap Sub-Advisory Agreement”, and collectively, the “Current Agreements”). Each Trustee on the Board is not an “interested person” (as defined in the Investment Company Act of 1940 (the “1940 Act”)) of the Funds (collectively, the “Independent Trustees”). The process followed by the Board in considering and approving the continuation of the Current Agreements is referred to herein as the “2021 Annual Approval Process.”
As noted above, the closing of the sale of Wells Fargo Asset Management (“WFAM”) to a holding company (“NewCo”) affiliated with private funds of GTCR LLC (“GTCR”) and of Reverence Capital Partners, L.P. (“Reverence Capital”, and such transaction, the “Transaction”) will result in a change of control of Wells Fargo Funds Management LLC (“Funds Management”) and Wells Capital Management Incorporated (“Wells Capital” or the “Sub-Adviser”, and together with Funds Management, the “Advisers”), which will be considered to be an “assignment” of each Fund’s Current Agreements under the 1940 Act that will result in the automatic termination of each Fund’s Current Agreements. In light of the expected termination of each Fund’s Current Agreements upon the closing, at the Board Meeting the Board also considered and approved: (i) a new Investment Management Agreement between the Trust, on behalf of each Fund, and Funds Management (the “New Investment Management Agreement”); and (ii) a new Sub-Advisory Agreement among the Trust, on behalf of each Fund, Funds Management and Wells Capital (the “New Sub-Advisory Agreement”, and collectively, the “New Agreements”), each of which is intended to go into effect upon the closing. The process followed by the Board in reviewing and approving the New Agreements is referred to herein as the “New Agreement Approval Process.”
At a series of meetings held in April and May 2021 (collectively, “April and May 2021 Meetings”) and at the Board Meeting, the Trustees conferred extensively among themselves and with senior representatives of Funds Management, GTCR and Reverence Capital about the New Agreements and related matters. The Board reviewed and discussed information furnished by Funds Management, GTCR and Reverence Capital that the Board considered reasonably necessary to evaluate the terms of the New Agreements and the services to be provided. At these meetings, senior representatives from Funds Management, GTCR and Reverence Capital made presentations to, and responded to questions from, the Board.
In providing information to the Board in connection with the 2021 annual approval process for the Current Agreements (the “2021 Annual Approval Process”) and the New Agreement Approval Process, Funds Management, GTCR and Reverence Capital (as applicable) were guided by requests for information submitted by independent legal counsel on behalf of the Independent Trustees. In considering and approving the New Agreements, the Trustees considered the information they believed relevant, including but not limited to the information discussed herein. The Board considered not only the specific information presented in connection with the April and May 2021 Meetings as well as the Board Meeting, but also the knowledge gained over time through interaction with Funds Management and the Sub-Adviser about various topics. In this regard, the Board reviews reports of Funds Management at each of its regular Board meetings, which includes, among other things, portfolio reviews and investment performance reports. In addition, the Board confers with portfolio managers at various times throughout the year. The Board was assisted in its evaluation of the New Agreements by independent legal counsel, from whom the Independent Trustees received separate legal advice and with whom the Independent Trustees met separately. The Board did not identify any particular information or consideration that was all-important or controlling, and each individual Trustee may have attributed different weights to various factors.
Among other information considered by the Board in connection with the Transaction was:
| ■ | Information regarding the Transaction: information about the structure, financing sources and material terms and conditions of the Transaction, including the expected impact on the businesses conducted by the Advisers and by Wells Fargo Funds Distributor LLC, as the distributor of Fund shares. |
| ■ | Information regarding NewCo, GTCR and Reverence Capital: (i) information about NewCo, including information about its expected financial condition and access to capital, and senior leadership team; (ii) the experience of senior management at GTCR and Reverence Capital in acquiring portfolio companies; (iii) the plan to operationalize NewCo, including the transition of necessary infrastructure services through a transition services agreement with Wells Fargo under which Wells Fargo will continue to provide NewCo with certain services for a specified period of time after the closing; and (iv) information regarding regulatory matters, compliance, and risk management functions at NewCo, including resources to be dedicated thereto. |
Wells Fargo VT Discovery Fund | 27
Board considerations (unaudited)
| ■ | Impact of the Transaction on WFAM and Service Providers: (i) information regarding any changes to personnel and/or other resources of the Advisers as a result of the Transaction, including assurances regarding comparable and competitive compensation arrangements to attract and retain highly qualified personnel; and (ii) information about the organizational and operating structure with respect to NewCo, the Advisers and the Funds. |
| ■ | Impact of the Transaction on the Funds and their Shareholders: (i) information regarding anticipated benefits to the Funds as a result of the Transaction; (ii) a commitment that the Funds would not bear any expenses, directly or indirectly, in connection with the Transaction; (iii) confirmation that the Advisers intend to continue to manage the Funds in a manner consistent with each Fund’s current investment objectives and principal investments strategies; and (iv) a commitment that neither NewCo nor WFAM will take any steps that would impose any “unfair burden” (as that term is used in section 15(f)(1)(B) of the 1940 Act) on the Funds as a result of the Transaction. |
With respect to the New Agreements, the Board considered: (i) a representation that, after the closing, all of the Funds will continue to be managed and advised by their current Advisers, and that the same portfolio managers of the Sub-Adviser are expected to continue to manage the Funds after the Transaction; (ii) information regarding the terms of the New Agreements, including changes as compared to the Current Agreements; (iii) information confirming that the fee rates payable under the New Agreements will not increase as a result of the Transaction as compared to the rates under the Current Agreements; and (iv) assurances that the Transaction is not expected to cause any diminution with respect to the nature, extent and quality of any of the services currently provided to the Funds by the Advisers as a result of the Transaction.
In addition to considering information furnished specifically to evaluate the impact of the Transaction on the Funds and their respective shareholders in connection with the New Agreement Approval Process, the Board considered information furnished at prior meetings of the Board and its committees, including detailed information provided in connection with the 2021 Annual Approval Process. In this regard, in connection with the 2021 Annual Approval Process, the Board received information about complex-wide and individual Fund performance, fees and expenses, including: (i) a report from an independent data provider comparing the investment performance of each Fund to the investment performance of comparable funds and benchmark indices, over various time periods; (ii) a report from an independent data provider comparing each Fund’s total expense ratio (and its components) to those of comparable funds; (iii) comparative information concerning the fees charged and services provided by the Advisers to each Fund in managing other accounts (which may include other mutual funds, collective investment funds and institutional accounts), if any, that employ investment strategies and techniques similar to those used in managing such Fund(s); and (iv) profitability analyses of Funds Management, as well as the profitability of both WFAM and Wells Fargo from providing services to the fund family as a whole.
After its deliberations, the Board unanimously determined that the compensation payable to Funds Management and the Sub-Adviser under the New Agreements is reasonable, approved the New Agreements for a two-year term, and voted to recommend that Fund shareholders approve the New Agreements. The Board considered the approval of the New Agreements as part of its consideration of agreements for funds across the complex, but its approvals were made on a fund-by-fund basis. The following summarizes a number of important, but not necessarily all, factors considered by the Board in support of its approvals.
Nature, extent and quality of services
In connection with the 2021 Annual Approval Process, the Board received and considered various information regarding the nature, extent and quality of services provided to each Fund by Funds Management and the Sub-Adviser under the Current Agreements. This information included a description of the investment advisory services and Fund-level administrative services covered by the Current Management Agreement, as well as, among other things, a summary of the background and experience of senior management of WFAM, of which Funds Management and the Sub-Adviser are a part, and a summary of investments made in the business of WFAM. The Board also received a description of Funds Management’s and the Sub-Adviser’s business continuity plans, including a summary of the performance of such plans and any changes thereto during the COVID-19 pandemic, and of their approaches to data privacy and cybersecurity. The Board also received and reviewed information about Funds Management’s role as administrator of the Funds’ liquidity risk management program, Funds Management’s approach to risk management, and Funds Management’s intermediary and vendor oversight program.
In connection with the 2021 Annual Approval Process, the Board also considered the qualifications, background, tenure and responsibilities of each of the portfolio managers primarily responsible for the day-to-day portfolio management of the Funds. The Board evaluated the ability of Funds Management and the Sub-Adviser to attract and retain qualified investment professionals, including research, advisory and supervisory personnel.
In connection with the 2021 Annual Approval Process, the Board further considered the compliance programs and compliance records of Funds Management and the Sub-Adviser. In addition, the Board took into account the full range of services provided to the Funds by Funds Management and its affiliates.
28 | Wells Fargo VT Discovery Fund
Board considerations (unaudited)
In connection with the New Agreement Approval Process, the Board considered, among other information, the structure of the Transaction and expected impact, if any, of the Transaction on the operations, facilities, organization and personnel of the Advisers. The Board received assurances from Funds Management that each Fund will continue to be advised by its current Sub-Adviser after the closing, and that the same individual portfolio managers are expected to continue to manage the Funds after the closing. With respect to the recruitment and retention of key personnel, the Board noted information from GTCR, Reverence Capital and the Advisers regarding the potential benefits for employees of joining NewCo. The Board recognized that the personnel who had been extended offers may not accept such offers, and personnel changes may occur in the future in the ordinary course.
In addition, the Board considered information regarding the infrastructure, operational capabilities and support staff in place to assist in the portfolio management and operations of the Funds, including the provision of administrative services, and the anticipated impact of the Transaction on such matters. The Board also considered the business-related and other risks to which the Advisers may be subject in managing the Funds and in connection with the Transaction. The Board also considered the transition and integration plans as a result of the change in ownership of the Advisers from Wells Fargo to NewCo. The Board considered the resources and infrastructure that NewCo intends to devote to its compliance program to ensure compliance with applicable laws and regulations, as well as its risk management program and cybersecurity program. The Board also took into account assurances received from the Advisers, GTCR and Reverence Capital that the Transaction is not expected to cause any diminution in the nature, extent and quality of services provided by the Advisers to the Funds and their shareholders.
Fund investment performance and expenses
In connection with the 2021 Annual Approval Process, the Board considered the investment performance results for each Fund over various time periods ended December 31, 2020. The Board considered these results in comparison to the investment performance of funds in a universe that was determined by Broadridge Inc. (“Broadridge”) to be similar to each Fund (the “Universe”), and in comparison to each Fund’s benchmark index and to other comparative data. Broadridge is an independent provider of investment company data. The Board received a description of the methodology used by Broadridge to select the mutual funds in the performance Universe. Where applicable, the Board received information concerning, and discussed factors contributing to, underperformance of Funds relative to the Universe and benchmark for any underperformance periods.
In connection with the 2021 Annual Approval Process, the Board also received and considered information regarding each Fund’s net operating expense ratios and their various components, including actual management fees, custodian and other non-management fees, and Rule 12b-1 and non-Rule 12b-1 shareholder service fees. The Board considered these ratios in comparison to the median ratios of funds in class-specific expense groups that were determined by Broadridge to be similar to the Fund (the “Groups”). The Board received a description of the methodology used by Broadridge to select the mutual funds in the expense Groups and an explanation of how funds comprising expense groups and their expense ratios may vary from year-to-year.
In connection with the New Agreement Approval Process, the Board received a commitment that WFAM will maintain fee and expense commitments for at least two years after the closing. The Board took into account each Fund’s investment performance and expense information among the factors considered in deciding to approve the New Agreements.
Investment management and sub-advisory fee rates
In connection with the 2021 Annual Approval Process, the Board reviewed and considered the contractual fee rates payable by each Fund to Funds Management under the Current Management Agreement, as well as the contractual fee rates payable by each Fund to Funds Management for class-level administrative services under a Class-Level Administration Agreement, which include, among other things, class-level transfer agency and sub-transfer agency costs (collectively, the “Management Rates”). The Board also reviewed and considered the contractual investment sub-advisory fee rates that are payable by Funds Management to the Sub-Adviser under the Current Sub-Advisory Agreements for investment sub-advisory services (the “Sub-Advisory Fee Rates”).
Among other information reviewed by the Board in connection with the 2021 Annual Approval Process, was a comparison of each Fund’s Management Rates with the average contractual investment management fee rates of funds in the expense Groups at a common asset level as well as transfer agency costs of the funds in the expense Groups.
In connection with the 2021 Annual Approval Process, the Board also received and considered information about the portion of the total management fee that was retained by Funds Management after payment of the Sub-Advisory Fee Rates. In assessing the reasonableness of this amount, the Board received and evaluated information about the nature and extent of responsibilities retained and risks assumed by Funds Management and not delegated to or assumed by the Sub-Adviser, and about Funds Management’s on-going oversight services. Given the affiliation between Funds Management and the Sub-Adviser, the Board ascribed limited relevance to the allocation of fees between them.
Wells Fargo VT Discovery Fund | 29
Board considerations (unaudited)
In connection with the 2021 Annual Approval Process, the Board also received and considered information about the nature and extent of services offered and fee rates charged by Funds Management and the Sub-Adviser to other types of clients, if any, with investment strategies similar to those of each Fund. In this regard, the Board received information about the significantly greater scope of services, and compliance, reporting and other legal burdens and risks of managing proprietary mutual funds compared with those associated with managing assets of other types of clients, including third-party sub-advised fund clients and non-mutual fund clients such as institutional separate accounts.
In connection with the New Agreement Approval Process, the Board noted the assurances received by it that there would be no increases to any of the Management Rates or the Sub-Advisory Fee Rates as a result of the Transaction. The Board also considered that the New Agreements do not change the computation method for calculating such fees, and there is no present intention to reduce expense waiver and reimbursement arrangements that are currently in effect. Based on its consideration of the factors and information it deemed relevant, including those described here, the Board determined that the compensation payable to Funds Management under the New Management Agreement and to the Sub-Adviser under the New Sub-Advisory Agreement was reasonable.
Profitability
In connection with the 2021 Annual Approval Process, the Board received and considered information concerning the profitability of Funds Management, as well as the profitability of both WFAM and Wells Fargo from providing services to the fund family as a whole. The Board noted that the Sub-Adviser’s profitability information with respect to providing services to each Fund and other funds in the family was subsumed in the WFAM and Wells Fargo profitability analysis.
Funds Management reported on the methodologies and estimates used in calculating profitability in connection with the 2021 Annual Approval Process, including a description of the methodology used to allocate certain expenses. Among other things, the Board noted that the levels of profitability reported on a fund-by-fund basis varied widely, depending on factors such as the size, type and age of fund.
In connection with the New Agreement Approval Process, the Board received certain information about NewCo’s projected financial condition, and reviewed with senior representatives of Funds Management, GTCR and Reverence Capital the underlying assumptions on which such information was based. The Board considered that NewCo is a newly formed entity, with no historical operations, revenues or expenses, and that it is difficult to predict with any degree of certainty the future profitability of NewCo and the Advisers from advisory activities under the New Agreements. The Board considered that the fee rates payable under the New Agreements will not increase as a result of the Transaction as compared to the rates under the Current Agreements, and that the current contractual expense limitations applicable to each Fund will not increase. The Board noted that if the New Agreements are approved by shareholders and the Transaction closes, the Board will have the opportunity in the future to review the profitability of NewCo and the Advisers from advisory activities under the New Agreements.
Economies of scale
In connection with the 2021 Annual Approval Process, the Board received and considered information about the potential for Funds Management to experience economies of scale in the provision of management services to the Funds, the difficulties of calculating economies of scale at an individual fund level, and the extent to which potential scale benefits are shared with Fund shareholders. The Board noted the existence of breakpoints in each Fund’s management fee structure, which operate generally to reduce the Fund’s expense ratios as the Fund grows in size, and the size of the Fund in relation to such breakpoints. The Board considered that, in addition to management fee breakpoints, Funds Management shares potential economies of scale from its management business in a variety of ways, including through fee waiver and expense reimbursement arrangements, competitive management fee rates set at the outset without regard to breakpoints, and investments in the business intended to enhance services available to shareholders.
In connection with the New Agreement Approval Process, the Board noted that NewCo and the Advisers may benefit from possible growth of the Funds resulting from enhanced distribution capabilities. However, the Board noted that other factors could also affect the potential for economies of scale, and that it was not possible to quantify any potential future economies of scale. Based upon the information furnished to the Board in connection with the 2021 Annual Approval Process and the New Agreement Approval Process, the Board concluded that Funds Management’s arrangements with respect to each Fund, including contractual breakpoints and expense limitation arrangements, constitute a reasonable approach to sharing potential economies of scale with the Fund and its shareholders.
“Fall-out” benefits to Funds Management and the Sub-Adviser
In connection with the 2021 Annual Approval Process, the Board received and considered information regarding potential “fall-out” or ancillary benefits received by Funds Management and its affiliates, including the Sub-Adviser, as a result of their relationships with the Funds. Ancillary benefits could include, among others, benefits directly attributable to other relationships
30 | Wells Fargo VT Discovery Fund
Board considerations (unaudited)
with the Funds and benefits potentially derived from an increase in Funds Management’s and the Sub-Adviser’s business as a result of their relationships with the Funds. The Board noted that various current affiliates of Funds Management may receive distribution-related fees, shareholder servicing payments and sub-transfer agency fees in respect of shares sold or held through them and services provided.
In connection with the 2021 Annual Approval Process, the Board also reviewed information about soft dollar credits earned and utilized by the Sub-Adviser, fees earned by Funds Management and the Sub-Adviser from managing a private investment vehicle for the fund family’s securities lending collateral, and commissions earned by an affiliated broker of Wells Fargo from portfolio transactions.
In connection with the New Agreement Approval Process, the Board received information to the effect that the Transaction is not expected to have a material impact on the fall-out benefits currently realized by Funds Management and its affiliates, including the Sub-Adviser. The information reviewed by the Board also noted that several of the ancillary benefits identified for WFAM would be potential ancillary benefits for NewCo, including that the scale and reputation of the Funds might benefit NewCo’s broader reputation, product initiatives, technology investment and talent acquisition. Based on its consideration of the factors and information it deemed relevant, including those described here, the Board did not find that any ancillary benefits expected to be received by Funds Management and its affiliates, including NewCo and the Sub-Adviser, under the New Agreements were unreasonable.
Conclusion
At the Board Meeting, after considering the above-described factors and based on its deliberations and its evaluation of the information described above, the Board unanimously determined that the compensation payable to Funds Management and the Sub-Adviser under the New Agreements is reasonable, approved the New Agreements for a two-year term, and voted to recommend that Fund shareholders approve the New Agreements.
Wells Fargo VT Discovery Fund | 31
Board considerations (unaudited)
Board Considerations - Interim Agreements
At a meeting held on May 17-19, 2021 (the “Board Meeting”), the Boards of Trustees (each, a “Board”, and collectively, the “Boards”) of Wells Fargo Funds Trust, Wells Fargo Master Trust, Wells Fargo Variable Trust, Wells Fargo Global Dividend Opportunity Fund, Wells Fargo Income Opportunities Fund, Wells Fargo Multi-Sector Income Fund and Wells Fargo Utilities and High Income Fund (each a “Trust”, and the series thereof, a “Fund”) reviewed and approved for the Trusts and Funds, as applicable: (i) interim investment management agreements (the “Interim Management Agreements”) with Wells Fargo Funds Management, LLC (“Funds Management”); (ii) interim investment advisory agreements (the “Interim Advisory Agreements”) with Funds Management; and (iii) interim sub-advisory agreements (the “Interim Sub-Advisory Agreements”) with each of Cooke & Bieler, L.P., Galliard Capital Management, LLC (“Galliard”), Peregrine Capital Management Inc., Wells Capital Management, LLC (“WellsCap”), and Wells Fargo Asset Management (International) Limited (“WFAMI”, and collectively, the “Sub-Advisers”). Each Trustee on the Board is not an “interested person” (as defined in the Investment Company Act of 1940 (the “1940 Act”) of the Funds (collectively, the “Independent Trustees”). The Interim Management Agreements, Interim Advisory Agreements, and Interim Sub-Advisory Agreements are collectively referred to as the “Interim Advisory Agreements.”
At the Board Meeting, the Boards reviewed and approved the continuation of existing investment management, advisory and sub-advisory agreements (the “Current Advisory Agreements”) for each Trust and Fund, as applicable. The factors considered and conclusions reached by the Boards in approving the Current Advisory Agreements are summarized in the section entitled “Board Considerations – Current Agreements” of this shareholder report. The Boards noted that Wells Fargo & Company has entered into a definitive agreement to sell Wells Fargo Asset Management (“WFAM”), which includes Funds Management, Galliard, WellsCap and WFAMI (the “Affiliated Sub-Advisers”), to a holding company affiliated with private funds of GTCR LLC and Reverence Capital Partners, L.P. (the “Transaction”). The Boards further noted that the Transaction would result in a change-of-control of Funds Management and the Affiliated Sub-Advisers, which would be considered to be an “assignment” under the 1940 Act that would terminate the Current Advisory Agreements. At the Board Meeting, the Boards also reviewed and approved new investment management, advisory and sub-advisory agreements (the “New Advisory Agreements”) for each Trust and Fund, as applicable, that would replace the Current Advisory Agreements upon consummation of the Transaction, subject to approval of the New Advisory Agreements by the applicable Trust’s or Fund’s shareholders. The factors considered and conclusions reached by the Boards in approving the New Advisory Agreements are summarized in the section entitled “Board Considerations – New Agreements” of this shareholder report.
At the Board Meeting, the Boards also approved the Interim Advisory Agreements, which will go into effect for a Trust or Fund only in the event that shareholders of such Trust or Fund do not approve the New Advisory Agreement(s) for the Trust or Fund by the closing date of the Transaction, when the Current Advisory Agreements will terminate. The Board noted that, in such a circumstance, the Interim Advisory Agreements will permit continuity of management by allowing Funds Management and the Sub-Advisers to continue providing services to the Trust or Fund pursuant to the Interim Advisory Agreements while the Trust or Fund continues to solicit shareholder approval of such New Advisory Agreement(s). The Boards noted that the terms of the Interim Advisory Agreements are identical to those of the Current Advisory Agreements, except for the term and the addition of escrow provisions with respect to the advisory fees. The Boards also noted that the entities that would service the Funds and Trusts under the Interim Advisory Agreements are identical to those that provide services under the Current Advisory Agreements and those that will provide services under the New Advisory Agreements.
In approving the Interim Advisory Agreements, the Boards considered the same factors and reached the same conclusions as they considered and reached with respect to the Boards’ approvals of the Current Advisory Agreements and New Advisory Agreements, as applicable, which are described in separate Board Consideration sections within this shareholder report. Prior to the Board Meeting, including at a series of meetings held in April and May 2021, the Trustees conferred extensively among themselves and with senior representatives of Funds Management, GTCR LLC and Reverence Capital Partners, L.P. about the Interim Advisory Agreements and related matters. The Independent Trustees were assisted in their evaluation of the Interim Advisory Agreements by independent legal counsel, from whom they received separate legal advice and with whom they met separately.
At the Board Meeting, after considering the factors and reaching the conclusions described in the separate Board Consideration sections within this shareholder report, the Boards unanimously determined that the compensation payable to Funds Management and to each Sub-Adviser under each of the Interim Advisory Agreements was reasonable, and approved the Interim Advisory Agreements.
32 | Wells Fargo VT Discovery Fund
For more information
More information about Wells Fargo Funds is available free upon request. To obtain literature, please write, visit the Fund's website, or call:
Wells Fargo Funds
P.O. Box 219967
Kansas City, MO 64121-9967
Website: wfam.com
Individual investors: 1-800-222-8222
Retail investment professionals: 1-888-877-9275
Institutional investment professionals: 1-866-765-0778
This report and the financial statements contained herein are submitted for the general information of the shareholders of the Fund. If this report is used for promotional purposes, distribution of the report must be accompanied or preceded by a current prospectus. Before investing, please consider the investment objectives, risks, charges, and expenses of the investment. For a current prospectus and, if available, a summary prospectus, containing this information, call 1-800-260-5969 or visit the Fund's website at wfam.com. Read the prospectus carefully before you invest or send money.
Wells Fargo Asset Management (WFAM) is the trade name for certain investment advisory/management firms owned by Wells Fargo & Company. These firms include but are not limited to Wells Capital Management, LLC and Wells Fargo Funds Management, LLC. Certain products managed by WFAM entities are distributed by Wells Fargo Funds Distributor, LLC (a broker-dealer and Member FINRA).
This material is for general informational and educational purposes only and is NOT intended to provide investment advice or a recommendation of any kind - including a recommendation for any specific investment, strategy, or plan.
INVESTMENT PRODUCTS: NOT FDIC INSURED ■ NO BANK GUARANTEE ■ MAY LOSE VALUE
© 2021 Wells Fargo & Company. All rights reserved.
PAR-0721-00692 08-21
SVT1/SAR138 06-21
Semi-Annual Report
June 30, 2021
Wells Fargo
VT Index Asset Allocation Fund
Reduce clutter.
Save trees.
Sign up for electronic delivery of prospectuses and shareholder reports at wellsfargo.com/ advantagedelivery
The views expressed and any forward-looking statements are as of June 30, 2021, unless otherwise noted, and are those of the Fund's portfolio managers and/or Wells Fargo Asset Management. Discussions of individual securities or the markets generally are not intended as individual recommendations. Future events or results may vary significantly from those expressed in any forward-looking statements. The views expressed are subject to change at any time in response to changing circumstances in the market. Wells Fargo Asset Management disclaims any obligation to publicly update or revise any views expressed or forward-looking statements.
INVESTMENT PRODUCTS: NOT FDIC INSURED ■ NO BANK GUARANTEE ■ MAY LOSE VALUE
Wells Fargo VT Index Asset Allocation Fund | 1
Letter to shareholders (unaudited)
Andrew Owen
President
Wells Fargo Funds
Dear Shareholder:
We are pleased to offer you this semi-annual report for the Wells Fargo VT Index Asset Allocation Fund for the six-month period that ended June 30, 2021. Global stocks continued to rally as the global economy continued to emerge from the haze of COVID-19. Tailwinds were provided by global stimulus programs, a rapid vaccination rollout, and recovering consumer and corporate sentiment. Bonds were mixed during the period, with municipal bonds and high-yield bonds delivering positive returns.
For the six-month period, U.S. stocks, based on the S&P 500 Index,1 gained 15.25%. International stocks, as measured by the MSCI ACWI ex USA Index (Net),2 returned 9.16%, while the MSCI EM Index (Net),3 trailed its developed market counterparts with a 7.45% gain. Among bond indexes, the Bloomberg Barclays U.S. Aggregate Bond Index,4 returned -1.60%, the Bloomberg Barclays Global Aggregate ex-USD Index (unhedged),5 returned -4.42%, the Bloomberg Barclays Municipal Bond Index,6 returned 1.06%, and the ICE BofA U.S. High Yield Index,7 returned 3.70%.
Vaccination rollout drove the stock markets to new highs.
The year 2021 began with emerging market stocks leading all major asset classes in January, driven by China’s strong economic growth and a broad recovery in corporate earnings, which propelled China’s stock market higher. In the United States, positive news on vaccine trials and January expansion in both the manufacturing and services sectors was offset by a weak December monthly jobs report. This was compounded by technical factors as some hedge funds were forced to sell stocks to protect themselves against a well-publicized short squeeze coordinated by a group of retail investors. Eurozone sentiment and economic growth were particularly weak, reflecting the impact of a new lockdown with stricter social distancing along with a slow vaccine rollout.
February saw major domestic equity indexes driven higher on the hope of a new stimulus bill, improving COVID-19 vaccination numbers, and the gradual reopening of the economy. Most S&P 500 companies reported better-than-expected earnings, with positive surprises coming from the financials, information technology, health care, and materials sectors. Japan saw its economy strengthen as a result of strong export numbers. Meanwhile, crude oil prices continued their climb, rising more than 25% for the year. Domestic government bonds experienced a sharp sell-off in late February as markets priced in a more robust economic recovery and higher future growth and inflation expectations.
| 1 | The S&P 500 Index consists of 500 stocks chosen for market size, liquidity, and industry group representation. It is a market-value-weighted index with each stock's weight in the index proportionate to its market value. You cannot invest directly in an index. |
| 2 | The Morgan Stanley Capital International (MSCI) All Country World Index (ACWI) ex USA Index (Net) is a free-float-adjusted market-capitalization-weighted index that is designed to measure the equity market performance of developed and emerging markets, excluding the United States. Source: MSCI. MSCI makes no express or implied warranties or representations and shall have no liability whatsoever with respect to any MSCI data contained herein. The MSCI data may not be further redistributed or used as a basis for other indices or any securities or financial products. This report is not approved, reviewed, or produced by MSCI. You cannot invest directly in an index. |
| 3 | The MSCI Emerging Markets (EM) Index (Net) is a free-float-adjusted market-capitalization-weighted index that is designed to measure equity market performance of emerging markets. You cannot invest directly in an index. |
| 4 | The Bloomberg Barclays U.S. Aggregate Bond Index is a broad-based benchmark that measures the investment-grade, U.S. dollar-denominated, fixed-rate taxable bond market, including Treasuries, government-related and corporate securities, mortgage-backed securities (agency fixed-rate and hybrid adjustable-rate mortgage pass-throughs), asset-backed securities, and commercial mortgage-backed securities. You cannot invest directly in an index. |
| 5 | The Bloomberg Barclays Global Aggregate ex-USD Index (unhedged) is an unmanaged index that provides a broad-based measure of the global investment-grade fixed-income markets excluding the U.S. dollar-denominated debt market. You cannot invest directly in an index. |
| 6 | The Bloomberg Barclays Municipal Bond Index is an unmanaged index composed of long-term tax-exempt bonds with a minimum credit rating of Baa. You cannot invest directly in an index. |
| 7 | The ICE BofA U.S. High Yield Index is a market-capitalization-weighted index of domestic and Yankee high-yield bonds. The index tracks the performance of high-yield securities traded in the U.S. bond market. You cannot invest directly in an index. Copyright 2021. ICE Data Indices, LLC. All rights reserved. |
2 | Wells Fargo VT Index Asset Allocation Fund
Letter to shareholders (unaudited)
The passage of the massive domestic stimulus bill highlighted March activity, leading to increased forecasts for U.S. growth in 2021. Domestic employment surged as COVID-19 vaccinations and an increasingly open economy spurred hiring. A majority of U.S. small companies reported they were operating at pre-pandemic capacity or higher. Value stocks continued its outperformance of growth stocks in the month, continuing the trend that started in late 2020. Meanwhile, most major developed global equity indexes were up month to date on the back of rising optimism regarding the outlook for global growth. While the U.S. and U.K. had been most successful in terms of the vaccine rollout, even in markets where the vaccine lagged, such as in the eurozone and Japan, equity indexes in many of those countries had also been in positive territory for the year.
Equity markets produced another strong showing in April. Domestically, the continued reopening of the economy had a strong impact on positive equity performance, as people started leaving their households and jobless claims continued to fall. Domestic corporate bonds performed well and the U.S. dollar weakened. Meanwhile, the U.S. government continued to seek to invest in the recovery, this time by outlining a package of over $2 trillion to improve infrastructure. The primary headwind in April was inflation, as investors tried to determine the breadth and longevity of recent price increases. Developed Europe has been supported by a meaningful increase in the pace of vaccinations. Unfortunately many emerging market countries have not been as successful. India in particular has seen COVID-19 cases surge, serving as an example of the need to get vaccinations rolled out to less developed nations.
Vaccine rollouts continued in May, leading to loosened restrictions globally. As a result, equity markets in general saw a minor increase in returns. Concerns that the continued economic rebound could result in inflation increases becoming more than transitory were supported by the higher input costs businesses were experiencing. Meanwhile, those inflation concerns were tempered by the U.S. Federal Reserve Board (Fed), which stayed steady on its view of the economy and eased fears of a sudden and substantial policy change. Positive performance in the emerging market equity space was supported this month by steady consumer demand and strong commodity prices. Fixed-income markets were also slightly positive for the month, driven by inflation uncertainty and a softer U.S. dollar.
June witnessed the S&P 500 Index reach a new all-time high. 2021 economic growth and inflation forecasts were revised higher to reflect a strong economic recovery and some supply and demand imbalances. Late June saw a deal reached on a U.S. infrastructure package of approximately $1 trillion for road, bridge, and broadband network upgrades over the next eight years. The Fed’s June meeting yielded no change to policy, but its projections pointed to a possible interest rate rise in 2023. This, combined with a rebound in economic activity and investors searching for yield, led to U.S. Treasury yields being down for the month. Many European and Asian countries saw vaccination momentum increase, while the U.K. dealt with a rise in COVID-19 infections, specifically the Delta variant. Meanwhile, crude oil jumped over 10% in June on the back of the pickup in global economic activity and the Organization of the Petroleum Exporting Countries’ slow pace of supply growth.
Don’t let short-term uncertainty derail long-term investment goals.
Periods of investment uncertainty can present challenges, but experience has taught us that maintaining long-term investment goals can be an effective way to plan for the future. Although diversification cannot guarantee an investment profit or prevent losses, we believe it can be an effective way to manage investment risk and potentially smooth out overall portfolio performance. We encourage investors to know their investments and to understand that appropriate levels of risk-taking may unlock opportunities.
Thank you for choosing to invest with Wells Fargo Funds. We appreciate your confidence in us and remain committed to helping you meet your financial needs.
Sincerely,
Andrew Owen
President
Wells Fargo Funds
“The passage of the massive domestic stimulus bill highlighted March activity, leading to increased forecasts for U.S. growth in 2021.”
“2021 economic growth and inflation forecasts were revised higher to reflect a strong economic recovery and some supply and demand imbalances.”
For further information about your Fund, contact your investment professional, visit our website at wfam.com, or call us directly at 1-800-222-8222.
Wells Fargo VT Index Asset Allocation Fund | 3
Letter to shareholders (unaudited)
Preparing for LIBOR Transition
The global financial industry is preparing to transition away from the London Interbank Offered Rate (LIBOR), a key benchmark interest rate, to new alternative rates. LIBOR underpins trillions of dollars of financial contracts. It is the benchmark rate for a wide spectrum of products ranging from residential mortgages to corporate bonds to derivatives. Regulators have called for a market-wide transition away from LIBOR to successor reference rates by the end of 2021 (by June 30, 2023 for most tenors of the U.S. dollar LIBOR), which requires proactive steps be taken by issuers, counterparties, and asset managers to identify impacted products and adopt new reference rates.
The Fund holds one or more securities that use LIBOR as a floating reference rate and has a maturity date after December 31, 2021.
Although the transition process away from LIBOR has become increasingly well-defined in advance of the anticipated discontinuation date, there remains uncertainty regarding the nature of successor reference rates, and any potential effects of the transition away from LIBOR on investment instruments that use it as a benchmark rate. The transition process may result in, among other things, increased volatility or illiquidity in markets for instruments that currently rely on LIBOR and could negatively impact the value of certain instruments held by the Fund.
Wells Fargo Asset Management is monitoring LIBOR exposure closely and has put resources and controls in place to manage this transition effectively. The Fund’s portfolio management team is evaluating LIBOR holdings to understand what happens to those securities when LIBOR ceases to exist, including examining security documentation to identify the presence or absence of fallback language identifying a replacement rate to LIBOR.
While the pace of transition away from LIBOR will differ by asset class and investment strategy, the portfolio management team will monitor market conditions for those holdings to identify and mitigate deterioration or volatility in pricing and liquidity and ensure appropriate actions are taken in a timely manner.
Further information regarding the potential risks associated with the discontinuation of LIBOR can be found in the Fund’s Statement of Additional Information.
4 | Wells Fargo VT Index Asset Allocation Fund
This page is intentionally left blank.
Performance highlights (unaudited)
| Investment objective | The Fund seeks long-term total return, consisting of capital appreciation and current income. |
| Manager | Wells Fargo Funds Management, LLC |
| Subadviser | Wells Capital Management, LLC |
| Portfolio managers | Kandarp R. Acharya, CFA®‡, FRM, Petros N. Bocray, CFA®‡, FRM, Christian L. Chan, CFA®‡ |
| Average annual total returns (%) as of June 30, 2021 |
| | | | | | Expense ratios1 (%) |
| | Inception date | 1 year | 5 year | 10 year | Gross | Net 2 |
| Class 2 | 4-15-1994 | 22.30 | 11.44 | 11.36 | 1.14 | 1.00 |
| Index Asset Allocation Blended Index3 | – | 21.62 | 11.58 | 11.77 | – | – |
| Bloomberg Barclays U.S. Treasury Index4 | – | -3.22 | 2.15 | 2.84 | – | – |
| S&P 500 Index5 | – | 40.79 | 17.65 | 14.84 | – | – |
| 1 | Reflects the expense ratios as stated in the most recent prospectus. The expense ratios shown are subject to change and may differ from the annualized expense ratios shown in the financial highlights of this report. |
| 2 | The manager has contractually committed through April 30, 2022, to waive fees and/or reimburse expenses to the extent necessary to cap total annual fund operating expenses after fee waivers at 1.00% for Class 2 shares. Brokerage commissions, stamp duty fees, interest, taxes, acquired fund fees and expenses (if any), and extraordinary expenses are excluded from the expense cap. Prior to or after the commitment expiration date, the cap may be increased or the commitment to maintain the cap may be terminated only with the approval of the Board of Trustees. Without this cap, the Fund’s returns would have been lower. The expense ratio paid by an investor is the net expense ratio (the total annual fund operating expenses after fee waivers) as stated in the prospectus. |
| 3 | Source: Wells Fargo Funds Management, LLC. Index Asset Allocation Blended Index is composed 60% of the S&P 500 Index and 40% of the Bloomberg Barclays U.S. Treasury Index. Prior to April 1, 2015, the Index Asset Allocation Blended Index was composed 60% of the S&P 500 Index and 40% of the Bloomberg Barclays U.S. Treasury 20+ Year Index. You cannot invest directly in an index. |
| 4 | The Bloomberg Barclays U.S. Treasury Index is an unmanaged index of prices of U.S. Treasury bonds with maturities of 1 to 30 years. You cannot invest directly in an index. |
| 5 | The S&P 500 Index consists of 500 stocks chosen for market size, liquidity, and industry group representation. It is a market-value weighted index with each stock’s weight in the index proportionate to its market value. You cannot invest directly in an index. |
Figures quoted represent past performance, which is no guarantee of future results. Investment return and principal value of an investment will fluctuate so that an investor’s shares, when redeemed, may be worth more or less than their original cost. Current performance may be lower or higher than the performance data quoted and assumes the reinvestment of dividends and capital gains. Current month-end performance is available by calling 1-800-260-5969. Performance figures of the Fund do not reflect fees and expenses charged pursuant to the terms of variable life insurance policies and variable annuity contracts. If these fees and expenses had been reflected, performance would have been lower.
Index returns do not include transaction costs associated with buying and selling securities, any mutual fund fees or expenses, or any taxes. It is not possible to invest directly in an index.
Shares are sold without a front-end sales charge or contingent deferred sales charge.
Balanced funds may invest in stocks and bonds. Stock values fluctuate in response to the activities of individual companies and general market and economic conditions. Bond values fluctuate in response to the financial condition of individual issuers, general market and economic conditions, and changes in interest rates. Changes in market conditions and government policies may lead to periods of heightened volatility in the bond market and reduced liquidity for certain bonds held by the Fund. In general, when interest rates rise, bond values fall and investors may lose principal value. Interest rate changes and their impact on the Fund and its share price can be sudden and unpredictable. The use of derivatives may reduce returns and/or increase volatility. Consult the Fund’s prospectus for additional information on these and other risks.
Please refer to the prospectus provided by your participating insurance company for detailed information describing the separate accounts for information regarding surrender charges, mortality and expense risk fees, and other charges that may be assessed by the participating insurance companies.
| ‡ | CFA® and Chartered Financial Analyst® are trademarks owned by CFA Institute. |
6 | Wells Fargo VT Index Asset Allocation Fund
Performance highlights (unaudited)
| Ten largest holdings (%) as of June 30, 20211 |
| Apple Incorporated | 3.57 |
| Microsoft Corporation | 3.39 |
| Amazon.com Incorporated | 2.45 |
| Facebook Incorporated Class A | 1.38 |
| Alphabet Incorporated Class A | 1.22 |
| Alphabet Incorporated Class C | 1.18 |
| Berkshire Hathaway Incorporated Class B | 0.87 |
| Tesla Motors Incorporated | 0.87 |
| Nvidia Corporation | 0.83 |
| JPMorgan Chase & Company | 0.78 |
| 1 | Figures represent the percentage of the Fund's net assets. Holdings are subject to change and may have changed since the date specified. |
| Sector allocation as of June 30, 20211 |
| 1 | Figures represent the percentage of the Fund's long-term investments. These amounts are subject to change and may have changed since the date specified. |
| Allocation (%) as of June 30, 2021 |
| | Neutral
allocation | Effective
allocation1 |
| Stocks | 60 | 67 |
| Bonds | 40 | 37 |
| Effective cash | 0 | (4) |
| 1 | Effective allocation reflects the effect of the tactical futures overlay that may be in place. Effective cash, if any, represents the net offset to such future positions. Effective allocations are subject to change and may have changed since the date specified. |
Wells Fargo VT Index Asset Allocation Fund | 7
Fund expenses (unaudited)
As a shareholder of the Fund, you incur ongoing costs, including management fees, distribution (12b-1) fees, and other Fund expenses. This example is intended to help you understand your ongoing costs (in dollars) of investing in the Fund and to compare these costs with the ongoing costs of investing in other mutual funds.
The example is based on an investment of $1,000 invested at the beginning of the six-month period and held for the entire period from January 1, 2021 to June 30, 2021.
Actual expenses
The “Actual” line of the table below provides information about actual account values and actual expenses. You may use the information in this line, together with the amount you invested, to estimate the expenses that you paid over the period. Simply divide your account value by $1,000 (for example, an $8,600 account value divided by $1,000 = 8.6), then multiply the result by the number in the “Actual” line under the heading entitled “Expenses paid during period” for your applicable class of shares to estimate the expenses you paid on your account during this period.
Hypothetical example for comparison purposes
The “Hypothetical” line of the table below provides information about hypothetical account values and hypothetical expenses based on the Fund’s actual expense ratio and an assumed rate of return of 5% per year before expenses, which is not the Fund’s actual return. The hypothetical account values and expenses may not be used to estimate the actual ending account balance or expenses you paid for the period. You may use this information to compare the ongoing costs of investing in the Fund and other funds. To do so, compare this 5% hypothetical example with the 5% hypothetical examples that appear in the shareholder reports of the other funds.
Please note that the expenses shown in the table are meant to highlight your ongoing costs only and do not reflect any separate account charges assessed by participating insurance companies. Therefore, the “Hypothetical” line of the table is useful in comparing ongoing costs only, and will not help you determine the relative total costs of owning different funds. In addition, if these separate account charges assessed by participating insurance companies were included, your costs would have been higher.
| | Beginning
account value
1-1-2021 | Ending
account value
6-30-2021 | Expenses
paid during
the period1 | Annualized net
expense ratio |
| Class 2 | | | | |
| Actual | $1,000.00 | $1,083.29 | $5.17 | 1.00% |
| Hypothetical (5% return before expenses) | $1,000.00 | $1,019.84 | $5.01 | 1.00% |
1 Expenses paid is equal to the annualized net expense ratio multiplied by the average account value over the period, multiplied by the number of days in the most recent fiscal half-year divided by the number of days in the fiscal year (to reflect the one-half-year period).
8 | Wells Fargo VT Index Asset Allocation Fund
Portfolio of investments—June 30, 2021 (unaudited)
| | | | | Shares | Value |
| Common stocks: 60.08% | | | | | |
| Communication services: 6.69% | | | | | |
| Diversified telecommunication services: 0.74% | | | | | |
| AT&T Incorporated | | | | 9,646 | $ 277,612 |
| Lumen Technologies Incorporated | | | | 1,338 | 18,183 |
| Verizon Communications Incorporated | | | | 5,597 | 313,600 |
| | | | | | 609,395 |
| Entertainment: 1.16% | | | | | |
| Activision Blizzard Incorporated | | | | 1,058 | 100,976 |
| Electronic Arts Incorporated | | | | 388 | 55,806 |
| Live Nation Entertainment Incorporated † | | | | 195 | 17,080 |
| Netflix Incorporated † | | | | 603 | 318,511 |
| Take-Two Interactive Software Incorporated † | | | | 156 | 27,615 |
| The Walt Disney Company † | | | | 2,454 | 431,340 |
| | | | | | 951,328 |
| Interactive media & services: 3.87% | | | | | |
| Alphabet Incorporated Class A † | | | | 408 | 996,250 |
| Alphabet Incorporated Class C † | | | | 386 | 967,440 |
| Facebook Incorporated Class A † | | | | 3,251 | 1,130,405 |
| Twitter Incorporated † | | | | 1,086 | 74,728 |
| | | | | | 3,168,823 |
| Media: 0.78% | | | | | |
| Charter Communications Incorporated Class A † | | | | 187 | 134,911 |
| Comcast Corporation Class A | | | | 6,208 | 353,980 |
| Discovery Incorporated Class A † | | | | 228 | 6,995 |
| Discovery Incorporated Class C † | | | | 406 | 11,766 |
| DISH Network Corporation Class A † | | | | 334 | 13,961 |
| Fox Corporation Class A | | | | 439 | 16,300 |
| Fox Corporation Class B | | | | 204 | 7,181 |
| Interpublic Group of Companies Incorporated | | | | 532 | 17,285 |
| News Corporation Class A | | | | 526 | 13,555 |
| News Corporation Class B | | | | 163 | 3,969 |
| Omnicom Group Incorporated | | | | 291 | 23,277 |
| ViacomCBS Incorporated Class B | | | | 810 | 36,612 |
| | | | | | 639,792 |
| Wireless telecommunication services: 0.14% | | | | | |
| T-Mobile US Incorporated † | | | | 795 | 115,140 |
| Consumer discretionary: 7.38% | | | | | |
| Auto components: 0.09% | | | | | |
| Aptiv plc † | | | | 368 | 57,897 |
| BorgWarner Incorporated | | | | 325 | 15,776 |
| | | | | | 73,673 |
| Automobiles: 1.09% | | | | | |
| Ford Motor Company † | | | | 5,318 | 79,025 |
| General Motors Company † | | | | 1,727 | 102,187 |
| Tesla Motors Incorporated | | | | 1,046 | 710,966 |
| | | | | | 892,178 |
The accompanying notes are an integral part of these financial statements.
Wells Fargo VT Index Asset Allocation Fund | 9
Portfolio of investments—June 30, 2021 (unaudited)
| | | | | Shares | Value |
| Distributors: 0.08% | | | | | |
| Genuine Parts Company | | | | 195 | $ 24,662 |
| LKQ Corporation † | | | | 376 | 18,507 |
| Pool Corporation | | | | 55 | 25,226 |
| | | | | | 68,395 |
| Hotels, restaurants & leisure: 1.21% | | | | | |
| Booking Holdings Incorporated † | | | | 56 | 122,533 |
| Caesars Entertainment Incorporated † | | | | 282 | 29,258 |
| Carnival Corporation † | | | | 1,073 | 28,284 |
| Chipotle Mexican Grill Incorporated † | | | | 38 | 58,913 |
| Darden Restaurants Incorporated | | | | 177 | 25,840 |
| Domino's Pizza Incorporated | | | | 53 | 24,724 |
| Expedia Group Incorporated † | | | | 190 | 31,105 |
| Hilton Worldwide Holdings Incorporated † | | | | 375 | 45,233 |
| Las Vegas Sands Corporation † | | | | 442 | 23,289 |
| Marriott International Incorporated Class A † | | | | 360 | 49,147 |
| McDonald's Corporation | | | | 1,010 | 233,300 |
| MGM Resorts International | | | | 548 | 23,372 |
| Norwegian Cruise Line Holdings Limited † | | | | 496 | 14,587 |
| Penn National Gaming Incorporated † | | | | 200 | 15,298 |
| Royal Caribbean Cruises Limited † | | | | 295 | 25,158 |
| Starbucks Corporation | | | | 1,599 | 178,784 |
| Wynn Resorts Limited † | | | | 142 | 17,367 |
| Yum! Brands Incorporated | | | | 402 | 46,242 |
| | | | | | 992,434 |
| Household durables: 0.25% | | | | | |
| D.R. Horton Incorporated | | | | 444 | 40,124 |
| Garmin Limited | | | | 203 | 29,362 |
| Leggett & Platt Incorporated | | | | 179 | 9,274 |
| Lennar Corporation Class A | | | | 372 | 36,958 |
| Mohawk Industries Incorporated † | | | | 79 | 15,183 |
| Newell Rubbermaid Incorporated | | | | 510 | 14,010 |
| NVR Incorporated † | | | | 4 | 19,893 |
| PulteGroup Incorporated | | | | 357 | 19,481 |
| Whirlpool Corporation | | | | 84 | 18,314 |
| | | | | | 202,599 |
| Internet & direct marketing retail: 2.57% | | | | | |
| Amazon.com Incorporated † | | | | 583 | 2,005,613 |
| eBay Incorporated | | | | 884 | 62,066 |
| Etsy Incorporated † | | | | 173 | 35,610 |
| | | | | | 2,103,289 |
| Leisure products: 0.02% | | | | | |
| Hasbro Incorporated | | | | 172 | 16,257 |
| Multiline retail: 0.32% | | | | | |
| Dollar General Corporation | | | | 318 | 68,812 |
| Dollar Tree Incorporated † | | | | 313 | 31,144 |
| Target Corporation | | | | 670 | 161,966 |
| | | | | | 261,922 |
| Specialty retail: 1.32% | | | | | |
| Advance Auto Parts Incorporated | | | | 88 | 18,052 |
The accompanying notes are an integral part of these financial statements.
10 | Wells Fargo VT Index Asset Allocation Fund
Portfolio of investments—June 30, 2021 (unaudited)
| | | | | Shares | Value |
| Specialty retail (continued) | | | | | |
| AutoZone Incorporated † | | | | 29 | $ 43,274 |
| Best Buy Company Incorporated | | | | 300 | 34,494 |
| CarMax Incorporated † | | | | 221 | 28,542 |
| L Brands Incorporated | | | | 315 | 22,699 |
| Lowe's Companies Incorporated | | | | 956 | 185,435 |
| O'Reilly Automotive Incorporated † | | | | 94 | 53,224 |
| Ross Stores Incorporated | | | | 482 | 59,768 |
| The Gap Incorporated | | | | 280 | 9,422 |
| The Home Depot Incorporated | | | | 1,442 | 459,839 |
| The TJX Companies Incorporated | | | | 1,631 | 109,962 |
| Tractor Supply Company | | | | 155 | 28,839 |
| Ulta Beauty Incorporated † | | | | 75 | 25,933 |
| | | | | | 1,079,483 |
| Textiles, apparel & luxury goods: 0.43% | | | | | |
| HanesBrands Incorporated | | | | 469 | 8,756 |
| Nike Incorporated Class B | | | | 1,736 | 268,195 |
| PVH Corporation † | | | | 95 | 10,221 |
| Ralph Lauren Corporation | | | | 65 | 7,658 |
| Tapestry Incorporated † | | | | 375 | 16,305 |
| Under Armour Incorporated Class A † | | | | 254 | 5,372 |
| Under Armour Incorporated Class C † | | | | 264 | 4,902 |
| VF Corporation | | | | 434 | 35,605 |
| | | | | | 357,014 |
| Consumer staples: 3.52% | | | | | |
| Beverages: 0.85% | | | | | |
| Brown-Forman Corporation Class B | | | | 246 | 18,435 |
| Constellation Brands Incorporated Class A | | | | 229 | 53,561 |
| Molson Coors Brewing Company Class B † | | | | 253 | 13,584 |
| Monster Beverage Corporation † | | | | 502 | 45,858 |
| PepsiCo Incorporated | | | | 1,874 | 277,671 |
| The Coca-Cola Company | | | | 5,255 | 284,348 |
| | | | | | 693,457 |
| Food & staples retailing: 0.78% | | | | | |
| Costco Wholesale Corporation | | | | 601 | 237,798 |
| Sysco Corporation | | | | 690 | 53,648 |
| The Kroger Company | | | | 1,019 | 39,038 |
| Walgreens Boots Alliance Incorporated | | | | 967 | 50,874 |
| Walmart Incorporated | | | | 1,859 | 262,156 |
| | | | | | 643,514 |
| Food products: 0.56% | | | | | |
| Archer Daniels Midland Company | | | | 756 | 45,814 |
| Campbell Soup Company | | | | 274 | 12,492 |
| ConAgra Foods Incorporated | | | | 650 | 23,647 |
| General Mills Incorporated | | | | 825 | 50,267 |
| Hormel Foods Corporation | | | | 382 | 18,241 |
| Kellogg Company | | | | 340 | 21,872 |
| Lamb Weston Holdings Incorporated | | | | 197 | 15,890 |
| McCormick & Company Incorporated | | | | 336 | 29,676 |
| Mondelez International Incorporated Class A | | | | 1,903 | 118,823 |
| The Hershey Company | | | | 197 | 34,313 |
The accompanying notes are an integral part of these financial statements.
Wells Fargo VT Index Asset Allocation Fund | 11
Portfolio of investments—June 30, 2021 (unaudited)
| | | | | Shares | Value |
| Food products (continued) | | | | | |
| The J.M. Smucker Company | | | | 148 | $ 19,176 |
| The Kraft Heinz Company | | | | 877 | 35,764 |
| Tyson Foods Incorporated Class A | | | | 398 | 29,356 |
| | | | | | 455,331 |
| Household products: 0.81% | | | | | |
| Church & Dwight Company Incorporated | | | | 331 | 28,208 |
| Colgate-Palmolive Company | | | | 1,145 | 93,146 |
| Kimberly-Clark Corporation | | | | 457 | 61,137 |
| The Clorox Company | | | | 167 | 30,045 |
| The Procter & Gamble Company | | | | 3,316 | 447,428 |
| | | | | | 659,964 |
| Personal products: 0.12% | | | | | |
| The Estee Lauder Companies Incorporated Class A | | | | 314 | 99,877 |
| Tobacco: 0.40% | | | | | |
| Altria Group Incorporated | | | | 2,502 | 119,295 |
| Philip Morris International Incorporated | | | | 2,111 | 209,221 |
| | | | | | 328,516 |
| Energy: 1.71% | | | | | |
| Energy equipment & services: 0.15% | | | | | |
| Baker Hughes Incorporated | | | | 981 | 22,435 |
| Halliburton Company | | | | 1,194 | 27,605 |
| NOV Incorporated † | | | | 526 | 8,058 |
| Schlumberger Limited | | | | 1,881 | 60,211 |
| | | | | | 118,309 |
| Oil, gas & consumable fuels: 1.56% | | | | | |
| APA Corporation | | | | 508 | 10,988 |
| Cabot Oil & Gas Corporation | | | | 537 | 9,376 |
| Chevron Corporation | | | | 2,614 | 273,790 |
| ConocoPhillips | | | | 1,821 | 110,899 |
| Devon Energy Corporation | | | | 799 | 23,323 |
| Diamondback Energy Incorporated | | | | 242 | 22,721 |
| EOG Resources Incorporated | | | | 787 | 65,667 |
| Exxon Mobil Corporation | | | | 5,711 | 360,250 |
| Hess Corporation | | | | 368 | 32,134 |
| Kinder Morgan Incorporated | | | | 2,630 | 47,945 |
| Marathon Oil Corporation | | | | 1,060 | 14,437 |
| Marathon Petroleum Corporation | | | | 859 | 51,901 |
| Occidental Petroleum Corporation | | | | 1,124 | 35,147 |
| ONEOK Incorporated | | | | 602 | 33,495 |
| Phillips 66 | | | | 593 | 50,891 |
| Pioneer Natural Resources Company | | | | 312 | 50,706 |
| The Williams Companies Incorporated | | | | 1,646 | 43,701 |
| Valero Energy Corporation | | | | 549 | 42,866 |
| | | | | | 1,280,237 |
| Financials: 6.76% | | | | | |
| Banks: 2.57% | | | | | |
| Bank of America Corporation | | | | 10,162 | 418,979 |
| Citigroup Incorporated | | | | 2,779 | 196,614 |
The accompanying notes are an integral part of these financial statements.
12 | Wells Fargo VT Index Asset Allocation Fund
Portfolio of investments—June 30, 2021 (unaudited)
| | | | | Shares | Value |
| Banks (continued) | | | | | |
| Citizens Financial Group Incorporated | | | | 574 | $ 26,329 |
| Comerica Incorporated | | | | 188 | 13,412 |
| Fifth Third Bancorp | | | | 949 | 36,280 |
| First Republic Bank | | | | 237 | 44,359 |
| Huntington Bancshares Incorporated | | | | 1,999 | 28,526 |
| JPMorgan Chase & Company | | | | 4,090 | 636,159 |
| KeyCorp | | | | 1,310 | 27,052 |
| M&T Bank Corporation | | | | 173 | 25,139 |
| People's United Financial Incorporated | | | | 577 | 9,890 |
| PNC Financial Services Group Incorporated | | | | 573 | 109,305 |
| Regions Financial Corporation | | | | 1,293 | 26,093 |
| SVB Financial Group † | | | | 74 | 41,176 |
| Truist Financial Corporation | | | | 1,815 | 100,733 |
| US Bancorp | | | | 1,834 | 104,483 |
| Wells Fargo & Company ♠ | | | | 5,569 | 252,220 |
| Zions Bancorporation | | | | 220 | 11,629 |
| | | | | | 2,108,378 |
| Capital markets: 1.81% | | | | | |
| Ameriprise Financial Incorporated | | | | 157 | 39,074 |
| Bank of New York Mellon Corporation | | | | 1,090 | 55,841 |
| BlackRock Incorporated | | | | 192 | 167,994 |
| Cboe Global Markets Incorporated | | | | 144 | 17,143 |
| CME Group Incorporated | | | | 484 | 102,937 |
| Franklin Resources Incorporated | | | | 368 | 11,772 |
| Intercontinental Exchange Incorporated | | | | 762 | 90,449 |
| Invesco Limited | | | | 509 | 13,606 |
| MarketAxess Holdings Incorporated | | | | 52 | 24,107 |
| Moody's Corporation | | | | 219 | 79,359 |
| Morgan Stanley | | | | 2,016 | 184,847 |
| MSCI Incorporated | | | | 112 | 59,705 |
| Northern Trust Corporation | | | | 281 | 32,489 |
| Raymond James Financial Incorporated | | | | 165 | 21,434 |
| S&P Global Incorporated | | | | 328 | 134,628 |
| State Street Corporation | | | | 469 | 38,589 |
| T. Rowe Price Group Incorporated | | | | 307 | 60,777 |
| The Charles Schwab Corporation | | | | 2,028 | 147,659 |
| The Goldman Sachs Group Incorporated | | | | 460 | 174,584 |
| The NASDAQ Incorporated | | | | 154 | 27,073 |
| | | | | | 1,484,067 |
| Consumer finance: 0.40% | | | | | |
| American Express Company | | | | 881 | 145,568 |
| Capital One Financial Corporation | | | | 609 | 94,206 |
| Discover Financial Services | | | | 411 | 48,617 |
| Synchrony Financial | | | | 731 | 35,468 |
| | | | | | 323,859 |
| Diversified financial services: 0.87% | | | | | |
| Berkshire Hathaway Incorporated Class B † | | | | 2,570 | 714,254 |
| Insurance: 1.11% | | | | | |
| AFLAC Incorporated | | | | 856 | 45,933 |
| American International Group Incorporated | | | | 1,158 | 55,121 |
| Aon plc Class A | | | | 306 | 73,061 |
| Arthur J. Gallagher & Company | | | | 277 | 38,802 |
The accompanying notes are an integral part of these financial statements.
Wells Fargo VT Index Asset Allocation Fund | 13
Portfolio of investments—June 30, 2021 (unaudited)
| | | | | Shares | Value |
| Insurance (continued) | | | | | |
| Assurant Incorporated | | | | 80 | $ 12,494 |
| Chubb Limited | | | | 609 | 96,794 |
| Cincinnati Financial Corporation | | | | 202 | 23,557 |
| Everest Reinsurance Group Limited | | | | 55 | 13,861 |
| Globe Life Incorporated | | | | 127 | 12,097 |
| Lincoln National Corporation | | | | 240 | 15,082 |
| Loews Corporation | | | | 302 | 16,504 |
| Marsh & McLennan Companies Incorporated | | | | 689 | 96,929 |
| MetLife Incorporated | | | | 1,005 | 60,149 |
| Principal Financial Group Incorporated | | | | 341 | 21,548 |
| Progressive Corporation | | | | 793 | 77,881 |
| Prudential Financial Incorporated | | | | 533 | 54,617 |
| The Allstate Corporation | | | | 404 | 52,698 |
| The Hartford Financial Services Group Incorporated | | | | 483 | 29,932 |
| The Travelers Companies Incorporated | | | | 340 | 50,901 |
| UnumProvident Corporation | | | | 274 | 7,782 |
| W.R. Berkley Corporation | | | | 189 | 14,067 |
| Willis Towers Watson plc | | | | 173 | 39,793 |
| | | | | | 909,603 |
| Health care: 7.80% | | | | | |
| Biotechnology: 1.07% | | | | | |
| AbbVie Incorporated | | | | 2,400 | 270,336 |
| Alexion Pharmaceuticals Incorporated † | | | | 299 | 54,929 |
| Amgen Incorporated | | | | 778 | 189,638 |
| Biogen Incorporated † | | | | 206 | 71,332 |
| Gilead Sciences Incorporated | | | | 1,704 | 117,337 |
| Incyte Corporation † | | | | 252 | 21,201 |
| Regeneron Pharmaceuticals Incorporated † | | | | 143 | 79,871 |
| Vertex Pharmaceuticals Incorporated † | | | | 349 | 70,369 |
| | | | | | 875,013 |
| Health care equipment & supplies: 2.17% | | | | | |
| Abbott Laboratories | | | | 2,402 | 278,464 |
| ABIOMED Incorporated † | | | | 62 | 19,351 |
| Align Technology Incorporated † | | | | 97 | 59,267 |
| Baxter International Incorporated | | | | 683 | 54,982 |
| Becton Dickinson & Company | | | | 394 | 95,817 |
| Boston Scientific Corporation † | | | | 1,928 | 82,441 |
| Danaher Corporation | | | | 862 | 231,326 |
| Dentsply Sirona Incorporated | | | | 296 | 18,725 |
| DexCom Incorporated † | | | | 132 | 56,364 |
| Edwards Lifesciences Corporation † | | | | 844 | 87,413 |
| Hologic Incorporated † | | | | 347 | 23,152 |
| IDEXX Laboratories Incorporated † | | | | 116 | 73,260 |
| Intuitive Surgical Incorporated † | | | | 160 | 147,142 |
| Medtronic plc | | | | 1,827 | 226,786 |
| ResMed Incorporated | | | | 196 | 48,318 |
| STERIS plc | | | | 132 | 27,232 |
| Stryker Corporation | | | | 443 | 115,060 |
| Teleflex Incorporated | | | | 64 | 25,715 |
| The Cooper Companies Incorporated | | | | 67 | 26,550 |
The accompanying notes are an integral part of these financial statements.
14 | Wells Fargo VT Index Asset Allocation Fund
Portfolio of investments—June 30, 2021 (unaudited)
| | | | | Shares | Value |
| Health care equipment & supplies (continued) | | | | | |
| West Pharmaceutical Services Incorporated | | | | 100 | $ 35,910 |
| Zimmer Biomet Holdings Incorporated | | | | 281 | 45,190 |
| | | | | | 1,778,465 |
| Health care providers & services: 1.57% | | | | | |
| AmerisourceBergen Corporation | | | | 199 | 22,784 |
| Anthem Incorporated | | | | 332 | 126,758 |
| Cardinal Health Incorporated | | | | 391 | 22,322 |
| Centene Corporation † | | | | 789 | 57,542 |
| Cigna Corporation | | | | 461 | 109,289 |
| CVS Health Corporation | | | | 1,774 | 148,023 |
| DaVita HealthCare Partners Incorporated † | | | | 94 | 11,320 |
| HCA Healthcare Incorporated | | | | 354 | 73,186 |
| Henry Schein Incorporated † | | | | 189 | 14,022 |
| Humana Incorporated | | | | 175 | 77,476 |
| Laboratory Corporation of America Holdings † | | | | 132 | 36,412 |
| McKesson Corporation | | | | 213 | 40,734 |
| Quest Diagnostics Incorporated | | | | 176 | 23,227 |
| UnitedHealth Group Incorporated | | | | 1,277 | 511,362 |
| Universal Health Services Incorporated Class B | | | | 105 | 15,375 |
| | | | | | 1,289,832 |
| Health care technology: 0.04% | | | | | |
| Cerner Corporation | | | | 408 | 31,889 |
| Life sciences tools & services: 0.77% | | | | | |
| Agilent Technologies Incorporated | | | | 411 | 60,750 |
| Bio-Rad Laboratories Incorporated Class A † | | | | 29 | 18,684 |
| Charles River Laboratories International Incorporated † | | | | 69 | 25,524 |
| Illumina Incorporated † | | | | 198 | 93,696 |
| IQVIA Holdings Incorporated † | | | | 258 | 62,519 |
| Mettler-Toledo International Incorporated † | | | | 32 | 44,331 |
| PerkinElmer Incorporated | | | | 151 | 23,316 |
| Thermo Fisher Scientific Incorporated | | | | 534 | 269,387 |
| Waters Corporation † | | | | 84 | 29,031 |
| | | | | | 627,238 |
| Pharmaceuticals: 2.18% | | | | | |
| Bristol-Myers Squibb Company | | | | 3,029 | 202,398 |
| Catalent Incorporated † | | | | 229 | 24,759 |
| Eli Lilly & Company | | | | 1,078 | 247,423 |
| Johnson & Johnson | | | | 3,573 | 588,616 |
| Merck & Company Incorporated | | | | 3,442 | 267,684 |
| Organon & Company † | | | | 341 | 10,319 |
| Perrigo Company plc | | | | 180 | 8,253 |
| Pfizer Incorporated | | | | 7,596 | 297,459 |
| Viatris Incorporated | | | | 1,644 | 23,493 |
| Zoetis Incorporated | | | | 644 | 120,016 |
| | | | | | 1,790,420 |
| Industrials: 5.12% | | | | | |
| Aerospace & defense: 0.96% | | | | | |
| General Dynamics Corporation | | | | 308 | 57,984 |
| Howmet Aerospace Incorporated † | | | | 526 | 18,131 |
| Huntington Ingalls Industries Incorporated | | | | 54 | 11,381 |
The accompanying notes are an integral part of these financial statements.
Wells Fargo VT Index Asset Allocation Fund | 15
Portfolio of investments—June 30, 2021 (unaudited)
| | | | | Shares | Value |
| Aerospace & defense (continued) | | | | | |
| L3Harris Technologies Incorporated | | | | 275 | $ 59,441 |
| Lockheed Martin Corporation | | | | 330 | 124,856 |
| Northrop Grumman Corporation | | | | 202 | 73,413 |
| Raytheon Technologies Corporation | | | | 2,047 | 174,630 |
| Teledyne Technologies Incorporated † | | | | 63 | 26,386 |
| Textron Incorporated | | | | 302 | 20,769 |
| The Boeing Company † | | | | 732 | 175,358 |
| TransDigm Group Incorporated † | | | | 75 | 48,547 |
| | | | | | 790,896 |
| Air freight & logistics: 0.43% | | | | | |
| C.H. Robinson Worldwide Incorporated | | | | 179 | 16,767 |
| Expeditors International of Washington Incorporated | | | | 229 | 28,991 |
| FedEx Corporation | | | | 331 | 98,747 |
| United Parcel Service Incorporated Class B | | | | 983 | 204,435 |
| | | | | | 348,940 |
| Airlines: 0.16% | | | | | |
| Alaska Air Group Incorporated † | | | | 167 | 10,072 |
| American Airlines Group Incorporated † | | | | 865 | 18,347 |
| Delta Air Lines Incorporated † | | | | 862 | 37,290 |
| Southwest Airlines Company † | | | | 798 | 42,366 |
| United Airlines Holdings Incorporated † | | | | 435 | 22,746 |
| | | | | | 130,821 |
| Building products: 0.30% | | | | | |
| A.O. Smith Corporation | | | | 182 | 13,115 |
| Allegion plc | | | | 121 | 16,855 |
| Carrier Global Corporation | | | | 1,106 | 53,752 |
| Fortune Brands Home & Security Incorporated | | | | 186 | 18,527 |
| Johnson Controls International plc | | | | 972 | 66,708 |
| Masco Corporation | | | | 342 | 20,147 |
| Trane Technologies plc | | | | 322 | 59,293 |
| | | | | | 248,397 |
| Commercial services & supplies: 0.24% | | | | | |
| Cintas Corporation | | | | 120 | 45,840 |
| Copart Incorporated † | | | | 282 | 37,176 |
| Republic Services Incorporated | | | | 285 | 31,353 |
| Rollins Incorporated | | | | 300 | 10,260 |
| Waste Management Incorporated | | | | 526 | 73,698 |
| | | | | | 198,327 |
| Construction & engineering: 0.02% | | | | | |
| Quanta Services Incorporated | | | | 188 | 17,027 |
| Electrical equipment: 0.34% | | | | | |
| AMETEK Incorporated | | | | 311 | 41,519 |
| Eaton Corporation plc | | | | 538 | 79,721 |
| Emerson Electric Company | | | | 811 | 78,051 |
| Generac Holdings Incorporated † | | | | 85 | 35,288 |
| Rockwell Automation Incorporated | | | | 157 | 44,905 |
| | | | | | 279,484 |
The accompanying notes are an integral part of these financial statements.
16 | Wells Fargo VT Index Asset Allocation Fund
Portfolio of investments—June 30, 2021 (unaudited)
| | | | | Shares | Value |
| Industrial conglomerates: 0.72% | | | | | |
| 3M Company | | | | 784 | $ 155,726 |
| General Electric Company | | | | 11,903 | 160,214 |
| Honeywell International Incorporated | | | | 939 | 205,970 |
| Roper Technologies Incorporated | | | | 143 | 67,239 |
| | | | | | 589,149 |
| Machinery: 1.00% | | | | | |
| Caterpillar Incorporated | | | | 741 | 161,264 |
| Cummins Incorporated | | | | 197 | 48,031 |
| Deere & Company | | | | 423 | 149,196 |
| Dover Corporation | | | | 194 | 29,216 |
| Fortive Corporation | | | | 459 | 32,011 |
| IDEX Corporation | | | | 102 | 22,445 |
| Illinois Tool Works Incorporated | | | | 388 | 86,741 |
| Ingersoll Rand Incorporated † | | | | 503 | 24,551 |
| Otis Worldwide Corporation | | | | 546 | 44,646 |
| PACCAR Incorporated | | | | 470 | 41,948 |
| Parker-Hannifin Corporation | | | | 174 | 53,437 |
| Pentair plc | | | | 225 | 15,185 |
| Snap-on Incorporated | | | | 73 | 16,310 |
| Stanley Black & Decker Incorporated | | | | 218 | 44,688 |
| Wabtec Corporation | | | | 239 | 19,670 |
| Xylem Incorporated | | | | 243 | 29,150 |
| | | | | | 818,489 |
| Professional services: 0.25% | | | | | |
| Equifax Incorporated | | | | 164 | 39,280 |
| IHS Markit Limited | | | | 511 | 57,569 |
| Jacobs Engineering Group Incorporated | | | | 175 | 23,349 |
| Leidos Holdings Incorporated | | | | 179 | 18,097 |
| Nielsen Holdings plc | | | | 483 | 11,916 |
| Robert Half International Incorporated | | | | 152 | 13,523 |
| Verisk Analytics Incorporated | | | | 219 | 38,264 |
| | | | | | 201,998 |
| Road & rail: 0.58% | | | | | |
| CSX Corporation | | | | 3,123 | 100,186 |
| J.B. Hunt Transport Services Incorporated | | | | 113 | 18,413 |
| Kansas City Southern | | | | 123 | 34,855 |
| Norfolk Southern Corporation | | | | 338 | 89,709 |
| Old Dominion Freight Line Incorporated | | | | 128 | 32,486 |
| Union Pacific Corporation | | | | 899 | 197,717 |
| | | | | | 473,366 |
| Trading companies & distributors: 0.12% | | | | | |
| Fastenal Company | | | | 778 | 40,456 |
| United Rentals Incorporated † | | | | 97 | 30,944 |
| W.W. Grainger Incorporated | | | | 60 | 26,280 |
| | | | | | 97,680 |
| Information technology: 16.53% | | | | | |
| Communications equipment: 0.50% | | | | | |
| Arista Networks Incorporated † | | | | 75 | 27,173 |
| Cisco Systems Incorporated | | | | 5,716 | 302,948 |
The accompanying notes are an integral part of these financial statements.
Wells Fargo VT Index Asset Allocation Fund | 17
Portfolio of investments—June 30, 2021 (unaudited)
| | | | | Shares | Value |
| Communications equipment (continued) | | | | | |
| F5 Networks Incorporated † | | | | 81 | $ 15,119 |
| Juniper Networks Incorporated | | | | 444 | 12,143 |
| Motorola Solutions Incorporated | | | | 229 | 49,659 |
| | | | | | 407,042 |
| Electronic equipment, instruments & components: 0.37% | | | | | |
| Amphenol Corporation Class A | | | | 808 | 55,275 |
| CDW Corporation of Delaware | | | | 190 | 33,184 |
| Corning Incorporated | | | | 1,047 | 42,822 |
| IPG Photonics Corporation † | | | | 48 | 10,117 |
| Keysight Technologies Incorporated † | | | | 249 | 38,448 |
| TE Connectivity Limited | | | | 448 | 60,574 |
| Trimble Incorporated † | | | | 340 | 27,822 |
| Zebra Technologies Corporation Class A † | | | | 73 | 38,653 |
| | | | | | 306,895 |
| IT services: 3.09% | | | | | |
| Accenture plc Class A | | | | 861 | 253,814 |
| Akamai Technologies Incorporated † | | | | 221 | 25,769 |
| Automatic Data Processing Incorporated | | | | 576 | 114,405 |
| Broadridge Financial Solutions Incorporated | | | | 156 | 25,199 |
| Cognizant Technology Solutions Corporation Class A | | | | 712 | 49,313 |
| DXC Technology Company † | | | | 343 | 13,356 |
| Fidelity National Information Services Incorporated | | | | 837 | 118,578 |
| Fiserv Incorporated † | | | | 802 | 85,726 |
| FleetCor Technologies Incorporated † | | | | 112 | 28,679 |
| Gartner Incorporated † | | | | 116 | 28,095 |
| Global Payments Incorporated | | | | 398 | 74,641 |
| International Business Machines Corporation | | | | 1,210 | 177,374 |
| Jack Henry & Associates Incorporated | | | | 99 | 16,187 |
| MasterCard Incorporated Class A | | | | 1,183 | 431,901 |
| Paychex Incorporated | | | | 435 | 46,676 |
| PayPal Holdings Incorporated † | | | | 1,592 | 464,036 |
| The Western Union Company | | | | 552 | 12,679 |
| VeriSign Incorporated † | | | | 134 | 30,510 |
| Visa Incorporated Class A | | | | 2,297 | 537,085 |
| | | | | | 2,534,023 |
| Semiconductors & semiconductor equipment: 3.46% | | | | | |
| Advanced Micro Devices Incorporated † | | | | 1,652 | 155,172 |
| Analog Devices Incorporated | | | | 500 | 86,080 |
| Applied Materials Incorporated | | | | 1,247 | 177,573 |
| Broadcom Incorporated | | | | 556 | 265,123 |
| Enphase Energy Incorporated † | | | | 181 | 33,237 |
| Intel Corporation | | | | 5,500 | 308,770 |
| KLA Corporation | | | | 209 | 67,760 |
| Lam Research Corporation | | | | 194 | 126,236 |
| Maxim Integrated Products Incorporated | | | | 364 | 38,351 |
| Microchip Technology Incorporated | | | | 372 | 55,703 |
| Micron Technology Incorporated † | | | | 1,524 | 129,510 |
| Monolithic Power Systems Incorporated | | | | 59 | 22,034 |
| Nvidia Corporation | | | | 851 | 680,885 |
| NXP Semiconductors NV | | | | 375 | 77,145 |
| Qorvo Incorporated † | | | | 153 | 29,934 |
| QUALCOMM Incorporated | | | | 1,538 | 219,826 |
The accompanying notes are an integral part of these financial statements.
18 | Wells Fargo VT Index Asset Allocation Fund
Portfolio of investments—June 30, 2021 (unaudited)
| | | | | Shares | Value |
| Semiconductors & semiconductor equipment (continued) | | | | | |
| Skyworks Solutions Incorporated | | | | 225 | $ 43,144 |
| Teradyne Incorporated | | | | 225 | 30,141 |
| Texas Instruments Incorporated | | | | 1,254 | 241,144 |
| Xilinx Incorporated | | | | 334 | 48,310 |
| | | | | | 2,836,078 |
| Software: 5.35% | | | | | |
| Adobe Incorporated † | | | | 650 | 380,666 |
| ANSYS Incorporated † | | | | 119 | 41,300 |
| Autodesk Incorporated † | | | | 299 | 87,278 |
| Cadence Design Systems Incorporated † | | | | 379 | 51,855 |
| Citrix Systems Incorporated | | | | 168 | 19,701 |
| Fortinet Incorporated † | | | | 183 | 43,589 |
| Intuit Incorporated | | | | 372 | 182,343 |
| Microsoft Corporation | | | | 10,253 | 2,777,538 |
| NortonLifeLock Incorporated | | | | 787 | 21,422 |
| Oracle Corporation | | | | 2,461 | 191,564 |
| Paycom Software Incorporated † | | | | 67 | 24,352 |
| PTC Incorporated † | | | | 143 | 20,200 |
| Salesforce.com Incorporated † | | | | 1,259 | 307,536 |
| ServiceNow Incorporated † | | | | 268 | 147,279 |
| Synopsys Incorporated † | | | | 207 | 57,089 |
| Tyler Technologies Incorporated † | | | | 56 | 25,333 |
| | | | | | 4,379,045 |
| Technology hardware, storage & peripherals: 3.76% | | | | | |
| Apple Incorporated | | | | 21,348 | 2,923,819 |
| Hewlett Packard Enterprise Company | | | | 1,769 | 25,792 |
| HP Incorporated | | | | 1,629 | 49,180 |
| NetApp Incorporated | | | | 302 | 24,710 |
| Seagate Technology Holdings plc | | | | 270 | 23,741 |
| Western Digital Corporation † | | | | 416 | 29,607 |
| | | | | | 3,076,849 |
| Materials: 1.56% | | | | | |
| Chemicals: 1.06% | | | | | |
| Air Products & Chemicals Incorporated | | | | 300 | 86,304 |
| Albemarle Corporation | | | | 157 | 26,448 |
| Celanese Corporation Series A | | | | 152 | 23,043 |
| CF Industries Holdings Incorporated | | | | 290 | 14,921 |
| Corteva Incorporated | | | | 996 | 44,173 |
| Dow Incorporated | | | | 1,012 | 64,039 |
| DuPont de Nemours Incorporated | | | | 721 | 55,813 |
| Eastman Chemical Company | | | | 184 | 21,482 |
| Ecolab Incorporated | | | | 336 | 69,206 |
| FMC Corporation | | | | 173 | 18,719 |
| International Flavors & Fragrances Incorporated | | | | 336 | 50,198 |
| Linde plc | | | | 704 | 203,526 |
| LyondellBasell Industries NV Class A | | | | 349 | 35,902 |
| PPG Industries Incorporated | | | | 320 | 54,326 |
| The Mosaic Company | | | | 469 | 14,966 |
| The Sherwin-Williams Company | | | | 323 | 88,001 |
| | | | | | 871,067 |
The accompanying notes are an integral part of these financial statements.
Wells Fargo VT Index Asset Allocation Fund | 19
Portfolio of investments—June 30, 2021 (unaudited)
| | | | | Shares | Value |
| Construction materials: 0.08% | | | | | |
| Martin Marietta Materials Incorporated | | | | 84 | $ 29,552 |
| Vulcan Materials Company | | | | 179 | 31,159 |
| | | | | | 60,711 |
| Containers & packaging: 0.20% | | | | | |
| Amcor plc | | | | 2,085 | 23,894 |
| Avery Dennison Corporation | | | | 111 | 23,337 |
| Ball Corporation | | | | 444 | 35,973 |
| International Paper Company | | | | 530 | 32,494 |
| Packaging Corporation of America | | | | 128 | 17,334 |
| Sealed Air Corporation | | | | 205 | 12,146 |
| WestRock Company | | | | 360 | 19,159 |
| | | | | | 164,337 |
| Metals & mining: 0.22% | | | | | |
| Freeport-McMoRan Incorporated | | | | 1,986 | 73,700 |
| Newmont Corporation | | | | 1,087 | 68,894 |
| Nucor Corporation | | | | 403 | 38,660 |
| | | | | | 181,254 |
| Real estate: 1.54% | | | | | |
| Equity REITs: 1.49% | | | | | |
| Alexandria Real Estate Equities Incorporated | | | | 185 | 33,659 |
| American Tower Corporation | | | | 616 | 166,406 |
| AvalonBay Communities Incorporated | | | | 188 | 39,234 |
| Boston Properties Incorporated | | | | 191 | ��21,887 |
| Crown Castle International Corporation | | | | 585 | 114,134 |
| Digital Realty Trust Incorporated | | | | 381 | 57,325 |
| Duke Realty Corporation | | | | 507 | 24,006 |
| Equinix Incorporated | | | | 122 | 97,917 |
| Equity Residential | | | | 464 | 35,728 |
| Essex Property Trust Incorporated | | | | 88 | 26,401 |
| Extra Space Storage Incorporated | | | | 180 | 29,488 |
| Federal Realty Investment Trust | | | | 95 | 11,131 |
| Healthpeak Properties Incorporated | | | | 731 | 24,335 |
| Host Hotels & Resorts Incorporated † | | | | 953 | 16,287 |
| Iron Mountain Incorporated | | | | 389 | 16,462 |
| Kimco Realty Corporation | | | | 584 | 12,176 |
| Mid-America Apartment Communities Incorporated | | | | 154 | 25,937 |
| Prologis Incorporated | | | | 1,000 | 119,530 |
| Public Storage Incorporated | | | | 205 | 61,641 |
| Realty Income Corporation | | | | 505 | 33,704 |
| Regency Centers Corporation | | | | 213 | 13,647 |
| SBA Communications Corporation | | | | 148 | 47,168 |
| Simon Property Group Incorporated | | | | 444 | 57,933 |
| UDR Incorporated | | | | 400 | 19,592 |
| Ventas Incorporated | | | | 509 | 29,064 |
| Vornado Realty Trust | | | | 211 | 9,847 |
| Welltower Incorporated | | | | 566 | 47,035 |
| Weyerhaeuser Company | | | | 1,013 | 34,867 |
| | | | | | 1,226,541 |
| Real estate management & development: 0.05% | | | | | |
| CBRE Group Incorporated Class A † | | | | 453 | 38,836 |
The accompanying notes are an integral part of these financial statements.
20 | Wells Fargo VT Index Asset Allocation Fund
Portfolio of investments—June 30, 2021 (unaudited)
| | | | | Shares | Value |
| Utilities: 1.47% | | | | | |
| Electric utilities: 0.93% | | | | | |
| Alliant Energy Corporation | | | | 337 | $ 18,791 |
| American Electric Power Company Incorporated | | | | 675 | 57,098 |
| Duke Energy Corporation | | | | 1,037 | 102,373 |
| Edison International | | | | 512 | 29,604 |
| Entergy Corporation | | | | 270 | 26,919 |
| Evergy Incorporated | | | | 308 | 18,612 |
| Eversource Energy | | | | 462 | 37,071 |
| Exelon Corporation | | | | 1,319 | 58,445 |
| FirstEnergy Corporation | | | | 732 | 27,238 |
| NextEra Energy Incorporated | | | | 2,642 | 193,606 |
| NRG Energy Incorporated | | | | 327 | 13,178 |
| Pinnacle West Capital Corporation | | | | 152 | 12,459 |
| PPL Corporation | | | | 1,037 | 29,005 |
| The Southern Company | | | | 1,429 | 86,469 |
| Xcel Energy Incorporated | | | | 725 | 47,763 |
| | | | | | 758,631 |
| Gas utilities: 0.02% | | | | | |
| Atmos Energy Corporation | | | | 175 | 16,819 |
| Independent power & renewable electricity producers: 0.03% | | | | | |
| AES Corporation | | | | 897 | 23,385 |
| Multi-utilities: 0.44% | | | | | |
| Ameren Corporation | | | | 344 | 27,534 |
| CenterPoint Energy Incorporated | | | | 784 | 19,224 |
| CMS Energy Corporation | | | | 389 | 22,982 |
| Consolidated Edison Incorporated | | | | 461 | 33,063 |
| Dominion Energy Incorporated | | | | 1,088 | 80,044 |
| DTE Energy Company | | | | 261 | 33,826 |
| NiSource Incorporated | | | | 529 | 12,961 |
| Public Service Enterprise Group Incorporated | | | | 683 | 40,802 |
| Sempra Energy | | | | 426 | 56,436 |
| WEC Energy Group Incorporated | | | | 424 | 37,715 |
| | | | | | 364,587 |
| Water utilities: 0.05% | | | | | |
| American Water Works Company Incorporated | | | | 244 | 37,608 |
| Total Common stocks (Cost $21,198,428) | | | | | 49,222,227 |
| | | Interest
rate | Maturity
date | Principal | |
| U.S. Treasury securities: 34.21% | | | | | |
| U.S. Treasury Bond | | 1.13% | 5-15-2040 | $ 109,000 | 94,098 |
| U.S. Treasury Bond | | 1.13 | 8-15-2040 | 145,000 | 124,745 |
| U.S. Treasury Bond | | 1.25 | 5-15-2050 | 120,000 | 97,983 |
| U.S. Treasury Bond | | 1.38 | 11-15-2040 | 87,000 | 78,150 |
| U.S. Treasury Bond | | 1.38 | 8-15-2050 | 151,000 | 127,294 |
| U.S. Treasury Bond | | 1.63 | 11-15-2050 | 87,000 | 78,137 |
| U.S. Treasury Bond | | 2.00 | 2-15-2050 | 152,000 | 149,328 |
| U.S. Treasury Bond | | 2.25 | 8-15-2046 | 106,000 | 109,602 |
| U.S. Treasury Bond | | 2.25 | 8-15-2049 | 108,000 | 111,881 |
| U.S. Treasury Bond | | 2.38 | 11-15-2049 | 127,000 | 135,235 |
The accompanying notes are an integral part of these financial statements.
Wells Fargo VT Index Asset Allocation Fund | 21
Portfolio of investments—June 30, 2021 (unaudited)
| | | Interest
rate | Maturity
date | Principal | Value |
| U.S. Treasury securities (continued) | | | | | |
| U.S. Treasury Bond | | 2.50% | 2-15-2045 | $ 116,000 | $ 125,507 |
| U.S. Treasury Bond | | 2.50 | 2-15-2046 | 106,000 | 114,828 |
| U.S. Treasury Bond | | 2.50 | 5-15-2046 | 105,000 | 113,753 |
| U.S. Treasury Bond | | 2.75 | 8-15-2042 | 66,000 | 74,371 |
| U.S. Treasury Bond | | 2.75 | 11-15-2042 | 78,000 | 87,832 |
| U.S. Treasury Bond | | 2.75 | 8-15-2047 | 101,000 | 114,888 |
| U.S. Treasury Bond | | 2.75 | 11-15-2047 | 100,000 | 113,836 |
| U.S. Treasury Bond | | 2.88 | 5-15-2043 | 111,000 | 127,659 |
| U.S. Treasury Bond | | 2.88 | 8-15-2045 | 115,000 | 132,942 |
| U.S. Treasury Bond | | 2.88 | 11-15-2046 | 104,000 | 120,705 |
| U.S. Treasury Bond | | 2.88 | 5-15-2049 | 140,000 | 163,937 |
| U.S. Treasury Bond | | 3.00 | 5-15-2042 | 40,000 | 46,822 |
| U.S. Treasury Bond | | 3.00 | 11-15-2044 | 114,000 | 134,208 |
| U.S. Treasury Bond | | 3.00 | 5-15-2045 | 116,000 | 136,798 |
| U.S. Treasury Bond | | 3.00 | 11-15-2045 | 115,000 | 135,965 |
| U.S. Treasury Bond | | 3.00 | 2-15-2047 | 106,000 | 125,925 |
| U.S. Treasury Bond | | 3.00 | 5-15-2047 | 104,000 | 123,667 |
| U.S. Treasury Bond | | 3.00 | 2-15-2048 | 114,000 | 135,892 |
| U.S. Treasury Bond | | 3.00 | 8-15-2048 | 121,000 | 144,472 |
| U.S. Treasury Bond | | 3.00 | 2-15-2049 | 140,000 | 167,612 |
| U.S. Treasury Bond | | 3.13 | 11-15-2041 | 37,000 | 44,105 |
| U.S. Treasury Bond | | 3.13 | 2-15-2042 | 46,000 | 54,871 |
| U.S. Treasury Bond | | 3.13 | 2-15-2043 | 79,000 | 94,393 |
| U.S. Treasury Bond | | 3.13 | 8-15-2044 | 115,000 | 138,013 |
| U.S. Treasury Bond | | 3.13 | 5-15-2048 | 123,000 | 150,007 |
| U.S. Treasury Bond | | 3.38 | 5-15-2044 | 110,000 | 137,161 |
| U.S. Treasury Bond | | 3.38 | 11-15-2048 | 135,000 | 172,368 |
| U.S. Treasury Bond | | 3.50 | 2-15-2039 | 29,000 | 36,276 |
| U.S. Treasury Bond | | 3.63 | 8-15-2043 | 88,000 | 113,341 |
| U.S. Treasury Bond | | 3.63 | 2-15-2044 | 113,000 | 146,057 |
| U.S. Treasury Bond | | 3.75 | 8-15-2041 | 36,000 | 46,769 |
| U.S. Treasury Bond | | 3.75 | 11-15-2043 | 110,000 | 144,392 |
| U.S. Treasury Bond | | 3.88 | 8-15-2040 | 37,000 | 48,645 |
| U.S. Treasury Bond | | 4.25 | 5-15-2039 | 31,000 | 42,423 |
| U.S. Treasury Bond | | 4.25 | 11-15-2040 | 40,000 | 55,178 |
| U.S. Treasury Bond | | 4.38 | 2-15-2038 | 18,000 | 24,777 |
| U.S. Treasury Bond | | 4.38 | 11-15-2039 | 35,000 | 48,690 |
| U.S. Treasury Bond | | 4.38 | 5-15-2040 | 35,000 | 48,911 |
| U.S. Treasury Bond | | 4.38 | 5-15-2041 | 33,000 | 46,364 |
| U.S. Treasury Bond | | 4.50 | 2-15-2036 | 26,000 | 35,693 |
| U.S. Treasury Bond | | 4.50 | 5-15-2038 | 21,000 | 29,331 |
| U.S. Treasury Bond | | 4.50 | 8-15-2039 | 33,000 | 46,527 |
| U.S. Treasury Bond | | 4.63 | 2-15-2040 | 38,000 | 54,548 |
| U.S. Treasury Bond | | 4.75 | 2-15-2037 | 13,000 | 18,454 |
| U.S. Treasury Bond | | 4.75 | 2-15-2041 | 44,000 | 64,524 |
| U.S. Treasury Bond | | 5.00 | 5-15-2037 | 17,000 | 24,776 |
| U.S. Treasury Bond | | 5.25 | 11-15-2028 | 45,000 | 57,762 |
| U.S. Treasury Bond | | 5.25 | 2-15-2029 | 33,000 | 42,557 |
| U.S. Treasury Bond | | 5.38 | 2-15-2031 | 31,000 | 42,155 |
| U.S. Treasury Bond | | 5.50 | 8-15-2028 | 35,000 | 45,274 |
| U.S. Treasury Bond | | 6.13 | 11-15-2027 | 49,000 | 64,211 |
| U.S. Treasury Bond | | 6.13 | 8-15-2029 | 25,000 | 34,363 |
| U.S. Treasury Bond | | 6.25 | 5-15-2030 | 21,000 | 29,633 |
| U.S. Treasury Bond | | 6.38 | 8-15-2027 | 21,000 | 27,636 |
| U.S. Treasury Bond | | 6.88 | 8-15-2025 | 21,000 | 26,269 |
The accompanying notes are an integral part of these financial statements.
22 | Wells Fargo VT Index Asset Allocation Fund
Portfolio of investments—June 30, 2021 (unaudited)
| | | Interest
rate | Maturity
date | Principal | Value |
| U.S. Treasury securities (continued) | | | | | |
| U.S. Treasury Note | | 0.13% | 11-30-2022 | $ 178,000 | $ 177,882 |
| U.S. Treasury Note | | 0.13 | 5-15-2023 | 117,000 | 116,781 |
| U.S. Treasury Note | | 0.13 | 7-15-2023 | 123,000 | 122,678 |
| U.S. Treasury Note | | 0.13 | 8-15-2023 | 128,000 | 127,605 |
| U.S. Treasury Note | | 0.13 | 9-15-2023 | 143,000 | 142,475 |
| U.S. Treasury Note | | 0.13 | 10-15-2023 | 146,000 | 145,373 |
| U.S. Treasury Note | | 0.25 | 4-15-2023 | 119,000 | 119,065 |
| U.S. Treasury Note | | 0.25 | 6-15-2023 | 122,000 | 122,010 |
| U.S. Treasury Note | | 0.25 | 11-15-2023 | 172,000 | 171,711 |
| U.S. Treasury Note | | 0.25 | 5-31-2025 | 132,000 | 129,783 |
| U.S. Treasury Note | | 0.25 | 6-30-2025 | 142,000 | 139,482 |
| U.S. Treasury Note | | 0.25 | 7-31-2025 | 147,000 | 144,221 |
| U.S. Treasury Note | | 0.25 | 8-31-2025 | 153,000 | 149,928 |
| U.S. Treasury Note | | 0.25 | 10-31-2025 | 176,000 | 172,074 |
| U.S. Treasury Note | | 0.38 | 4-30-2025 | 126,000 | 124,646 |
| U.S. Treasury Note | | 0.38 | 11-30-2025 | 181,000 | 177,741 |
| U.S. Treasury Note | | 0.38 | 7-31-2027 | 134,000 | 128,431 |
| U.S. Treasury Note | | 0.38 | 9-30-2027 | 155,000 | 148,073 |
| U.S. Treasury Note | | 0.50 | 3-15-2023 | 104,000 | 104,528 |
| U.S. Treasury Note | | 0.50 | 3-31-2025 | 120,000 | 119,405 |
| U.S. Treasury Note | | 0.50 | 4-30-2027 | 98,000 | 95,049 |
| U.S. Treasury Note | | 0.50 | 5-31-2027 | 111,000 | 107,462 |
| U.S. Treasury Note | | 0.50 | 6-30-2027 | 122,000 | 117,997 |
| U.S. Treasury Note | | 0.50 | 8-31-2027 | 142,000 | 136,930 |
| U.S. Treasury Note | | 0.50 | 10-31-2027 | 168,000 | 161,523 |
| U.S. Treasury Note | | 0.63 | 3-31-2027 | 81,000 | 79,247 |
| U.S. Treasury Note | | 0.63 | 11-30-2027 | 179,000 | 173,266 |
| U.S. Treasury Note | | 0.63 | 5-15-2030 | 178,000 | 166,381 |
| U.S. Treasury Note | | 0.63 | 8-15-2030 | 222,000 | 206,824 |
| U.S. Treasury Note | | 0.88 | 11-15-2030 | 132,000 | 125,524 |
| U.S. Treasury Note | | 1.13 | 2-28-2025 | 118,000 | 120,157 |
| U.S. Treasury Note | | 1.13 | 2-28-2027 | 47,000 | 47,336 |
| U.S. Treasury Note | | 1.25 | 7-31-2023 | 67,000 | 68,371 |
| U.S. Treasury Note | | 1.25 | 8-31-2024 | 104,000 | 106,454 |
| U.S. Treasury Note | | 1.38 | 2-15-2023 | 82,000 | 83,576 |
| U.S. Treasury Note | | 1.38 | 6-30-2023 | 64,000 | 65,438 |
| U.S. Treasury Note | | 1.38 | 8-31-2023 | 124,000 | 126,930 |
| U.S. Treasury Note | | 1.38 | 9-30-2023 | 90,000 | 92,169 |
| U.S. Treasury Note | | 1.38 | 1-31-2025 | 105,000 | 107,883 |
| U.S. Treasury Note | | 1.38 | 8-31-2026 | 95,000 | 97,253 |
| U.S. Treasury Note | | 1.50 | 1-31-2022 | 128,000 | 129,080 |
| U.S. Treasury Note | | 1.50 | 1-15-2023 | 79,000 | 80,602 |
| U.S. Treasury Note | | 1.50 | 2-28-2023 | 126,000 | 128,712 |
| U.S. Treasury Note | | 1.50 | 3-31-2023 | 126,000 | 128,810 |
| U.S. Treasury Note | | 1.50 | 9-30-2024 | 108,000 | 111,421 |
| U.S. Treasury Note | | 1.50 | 10-31-2024 | 114,000 | 117,634 |
| U.S. Treasury Note | | 1.50 | 11-30-2024 | 122,000 | 125,884 |
| U.S. Treasury Note | | 1.50 | 8-15-2026 | 102,000 | 105,028 |
| U.S. Treasury Note | | 1.50 | 1-31-2027 | 98,000 | 100,745 |
| U.S. Treasury Note | | 1.50 | 2-15-2030 | 209,000 | 211,066 |
| U.S. Treasury Note | | 1.63 | 8-15-2022 | 117,000 | 118,993 |
| U.S. Treasury Note | | 1.63 | 8-31-2022 | 151,000 | 153,613 |
| U.S. Treasury Note | | 1.63 | 11-15-2022 | 150,000 | 153,023 |
| U.S. Treasury Note | | 1.63 | 12-15-2022 | 104,000 | 106,210 |
| U.S. Treasury Note | | 1.63 | 4-30-2023 | 66,000 | 67,671 |
The accompanying notes are an integral part of these financial statements.
Wells Fargo VT Index Asset Allocation Fund | 23
Portfolio of investments—June 30, 2021 (unaudited)
| | | Interest
rate | Maturity
date | Principal | Value |
| U.S. Treasury securities (continued) | | | | | |
| U.S. Treasury Note | | 1.63% | 5-31-2023 | $ 64,000 | $ 65,690 |
| U.S. Treasury Note | | 1.63 | 10-31-2023 | 90,000 | 92,735 |
| U.S. Treasury Note | | 1.63 | 2-15-2026 | 102,000 | 105,729 |
| U.S. Treasury Note | | 1.63 | 5-15-2026 | 105,000 | 108,835 |
| U.S. Treasury Note | | 1.63 | 9-30-2026 | 97,000 | 100,497 |
| U.S. Treasury Note | | 1.63 | 10-31-2026 | 94,000 | 97,360 |
| U.S. Treasury Note | | 1.63 | 11-30-2026 | 97,000 | 100,452 |
| U.S. Treasury Note | | 1.63 | 8-15-2029 | 157,000 | 160,575 |
| U.S. Treasury Note | | 1.75 | 2-28-2022 | 129,000 | 130,441 |
| U.S. Treasury Note | | 1.75 | 3-31-2022 | 128,000 | 129,600 |
| U.S. Treasury Note | | 1.75 | 4-30-2022 | 126,000 | 127,742 |
| U.S. Treasury Note | | 1.75 | 5-15-2022 | 111,000 | 112,613 |
| U.S. Treasury Note | | 1.75 | 5-31-2022 | 149,000 | 151,258 |
| U.S. Treasury Note | | 1.75 | 6-30-2022 | 149,000 | 151,445 |
| U.S. Treasury Note | | 1.75 | 9-30-2022 | 144,000 | 146,897 |
| U.S. Treasury Note | | 1.75 | 1-31-2023 | 129,000 | 132,159 |
| U.S. Treasury Note | | 1.75 | 5-15-2023 | 113,000 | 116,178 |
| U.S. Treasury Note | | 1.75 | 7-31-2024 | 110,000 | 114,310 |
| U.S. Treasury Note | | 1.75 | 12-31-2024 | 99,000 | 103,022 |
| U.S. Treasury Note | | 1.75 | 12-31-2026 | 99,000 | 103,184 |
| U.S. Treasury Note | | 1.75 | 11-15-2029 | 178,000 | 183,729 |
| U.S. Treasury Note | | 1.88 | 1-31-2022 | 157,000 | 158,662 |
| U.S. Treasury Note | | 1.88 | 2-28-2022 | 153,000 | 154,841 |
| U.S. Treasury Note | | 1.88 | 3-31-2022 | 153,000 | 155,056 |
| U.S. Treasury Note | | 1.88 | 4-30-2022 | 153,000 | 155,271 |
| U.S. Treasury Note | | 1.88 | 5-31-2022 | 128,000 | 130,090 |
| U.S. Treasury Note | | 1.88 | 7-31-2022 | 149,000 | 151,840 |
| U.S. Treasury Note | | 1.88 | 8-31-2022 | 142,000 | 144,873 |
| U.S. Treasury Note | | 1.88 | 9-30-2022 | 144,000 | 147,116 |
| U.S. Treasury Note | | 1.88 | 10-31-2022 | 143,000 | 146,285 |
| U.S. Treasury Note | | 1.88 | 8-31-2024 | 125,000 | 130,400 |
| U.S. Treasury Note | | 1.88 | 6-30-2026 | 98,000 | 102,758 |
| U.S. Treasury Note | | 1.88 | 7-31-2026 | 99,000 | 103,861 |
| U.S. Treasury Note | | 2.00 | 12-31-2021 | 155,000 | 156,489 |
| U.S. Treasury Note | | 2.00 | 2-15-2022 | 133,000 | 134,611 |
| U.S. Treasury Note | | 2.00 | 7-31-2022 | 144,000 | 146,948 |
| U.S. Treasury Note | | 2.00 | 10-31-2022 | 143,000 | 146,525 |
| U.S. Treasury Note | | 2.00 | 11-30-2022 | 129,000 | 132,336 |
| U.S. Treasury Note | | 2.00 | 2-15-2023 | 118,000 | 121,448 |
| U.S. Treasury Note | | 2.00 | 4-30-2024 | 123,000 | 128,458 |
| U.S. Treasury Note | | 2.00 | 5-31-2024 | 123,000 | 128,540 |
| U.S. Treasury Note | | 2.00 | 6-30-2024 | 123,000 | 128,631 |
| U.S. Treasury Note | | 2.00 | 2-15-2025 | 289,000 | 303,450 |
| U.S. Treasury Note | | 2.00 | 8-15-2025 | 220,000 | 231,516 |
| U.S. Treasury Note | | 2.00 | 11-15-2026 | 170,000 | 179,403 |
| U.S. Treasury Note | | 2.13 | 12-31-2021 | 126,000 | 127,290 |
| U.S. Treasury Note | | 2.13 | 6-30-2022 | 126,000 | 128,545 |
| U.S. Treasury Note | | 2.13 | 12-31-2022 | 129,000 | 132,749 |
| U.S. Treasury Note | | 2.13 | 11-30-2023 | 110,000 | 114,757 |
| U.S. Treasury Note | | 2.13 | 2-29-2024 | 128,000 | 133,925 |
| U.S. Treasury Note | | 2.13 | 3-31-2024 | 127,000 | 132,963 |
| U.S. Treasury Note | | 2.13 | 7-31-2024 | 123,000 | 129,188 |
| U.S. Treasury Note | | 2.13 | 9-30-2024 | 118,000 | 124,112 |
| U.S. Treasury Note | | 2.13 | 11-30-2024 | 119,000 | 125,340 |
| U.S. Treasury Note | | 2.13 | 5-15-2025 | 234,000 | 247,080 |
The accompanying notes are an integral part of these financial statements.
24 | Wells Fargo VT Index Asset Allocation Fund
Portfolio of investments—June 30, 2021 (unaudited)
| | | Interest
rate | Maturity
date | Principal | Value |
| U.S. Treasury securities (continued) | | | | | |
| U.S. Treasury Note | | 2.13% | 5-31-2026 | $ 97,000 | $ 102,873 |
| U.S. Treasury Note | | 2.25 | 12-31-2023 | 127,000 | 132,988 |
| U.S. Treasury Note | | 2.25 | 1-31-2024 | 127,000 | 133,157 |
| U.S. Treasury Note | | 2.25 | 4-30-2024 | 120,000 | 126,150 |
| U.S. Treasury Note | | 2.25 | 10-31-2024 | 121,000 | 127,858 |
| U.S. Treasury Note | | 2.25 | 11-15-2024 | 290,000 | 306,562 |
| U.S. Treasury Note | | 2.25 | 12-31-2024 | 118,000 | 124,868 |
| U.S. Treasury Note | | 2.25 | 11-15-2025 | 219,000 | 232,995 |
| U.S. Treasury Note | | 2.25 | 3-31-2026 | 99,000 | 105,512 |
| U.S. Treasury Note | | 2.25 | 2-15-2027 | 196,000 | 209,483 |
| U.S. Treasury Note | | 2.25 | 8-15-2027 | 101,000 | 108,015 |
| U.S. Treasury Note | | 2.25 | 11-15-2027 | 99,000 | 105,899 |
| U.S. Treasury Note | | 2.38 | 1-31-2023 | 144,000 | 148,978 |
| U.S. Treasury Note | | 2.38 | 2-29-2024 | 84,000 | 88,426 |
| U.S. Treasury Note | | 2.38 | 8-15-2024 | 289,000 | 305,967 |
| U.S. Treasury Note | | 2.38 | 4-30-2026 | 98,000 | 105,074 |
| U.S. Treasury Note | | 2.38 | 5-15-2027 | 164,000 | 176,550 |
| U.S. Treasury Note | | 2.38 | 5-15-2029 | 90,000 | 97,119 |
| U.S. Treasury Note | | 2.50 | 3-31-2023 | 83,000 | 86,310 |
| U.S. Treasury Note | | 2.50 | 8-15-2023 | 102,000 | 106,793 |
| U.S. Treasury Note | | 2.50 | 1-31-2024 | 103,000 | 108,669 |
| U.S. Treasury Note | | 2.50 | 5-15-2024 | 281,000 | 297,651 |
| U.S. Treasury Note | | 2.50 | 1-31-2025 | 116,000 | 123,880 |
| U.S. Treasury Note | | 2.50 | 2-28-2026 | 97,000 | 104,442 |
| U.S. Treasury Note | | 2.63 | 2-28-2023 | 146,000 | 151,891 |
| U.S. Treasury Note | | 2.63 | 6-30-2023 | 83,000 | 86,917 |
| U.S. Treasury Note | | 2.63 | 12-31-2023 | 97,000 | 102,490 |
| U.S. Treasury Note | | 2.63 | 3-31-2025 | 114,000 | 122,448 |
| U.S. Treasury Note | | 2.63 | 12-31-2025 | 97,000 | 104,859 |
| U.S. Treasury Note | | 2.63 | 1-31-2026 | 95,000 | 102,763 |
| U.S. Treasury Note | | 2.63 | 2-15-2029 | 181,000 | 198,478 |
| U.S. Treasury Note | | 2.75 | 4-30-2023 | 82,000 | 85,764 |
| U.S. Treasury Note | | 2.75 | 5-31-2023 | 82,000 | 85,933 |
| U.S. Treasury Note | | 2.75 | 7-31-2023 | 80,000 | 84,131 |
| U.S. Treasury Note | | 2.75 | 8-31-2023 | 145,000 | 152,720 |
| U.S. Treasury Note | | 2.75 | 11-15-2023 | 134,000 | 141,689 |
| U.S. Treasury Note | | 2.75 | 2-15-2024 | 217,000 | 230,452 |
| U.S. Treasury Note | | 2.75 | 2-28-2025 | 121,000 | 130,392 |
| U.S. Treasury Note | | 2.75 | 6-30-2025 | 119,000 | 128,701 |
| U.S. Treasury Note | | 2.75 | 8-31-2025 | 122,000 | 132,146 |
| U.S. Treasury Note | | 2.75 | 2-15-2028 | 189,000 | 208,247 |
| U.S. Treasury Note | | 2.88 | 9-30-2023 | 148,000 | 156,550 |
| U.S. Treasury Note | | 2.88 | 10-31-2023 | 84,000 | 88,988 |
| U.S. Treasury Note | | 2.88 | 11-30-2023 | 76,000 | 80,649 |
| U.S. Treasury Note | | 2.88 | 4-30-2025 | 114,000 | 123,645 |
| U.S. Treasury Note | | 2.88 | 5-31-2025 | 117,000 | 127,018 |
| U.S. Treasury Note | | 2.88 | 7-31-2025 | 118,000 | 128,288 |
| U.S. Treasury Note | | 2.88 | 11-30-2025 | 96,000 | 104,745 |
| U.S. Treasury Note | | 2.88 | 5-15-2028 | 178,000 | 197,733 |
| U.S. Treasury Note | | 2.88 | 8-15-2028 | 190,000 | 211,308 |
| U.S. Treasury Note | | 3.00 | 9-30-2025 | 121,000 | 132,462 |
| U.S. Treasury Note | | 3.00 | 10-31-2025 | 76,000 | 83,262 |
| U.S. Treasury Note | | 3.13 | 11-15-2028 | 226,000 | 255,671 |
| U.S. Treasury Note | | 6.00 | 2-15-2026 | 42,000 | 51,923 |
| U.S. Treasury Note | | 6.25 | 8-15-2023 | 17,000 | 19,146 |
The accompanying notes are an integral part of these financial statements.
Wells Fargo VT Index Asset Allocation Fund | 25
Portfolio of investments—June 30, 2021 (unaudited)
| | | Interest
rate | Maturity
date | Principal | Value |
| U.S. Treasury securities (continued) | | | | | |
| U.S. Treasury Note | | 6.50% | 11-15-2026 | $ 28,000 | $ 36,173 |
| U.S. Treasury Note | | 6.63 | 2-15-2027 | 18,000 | 23,578 |
| U.S. Treasury Note | | 6.75 | 8-15-2026 | 21,000 | 27,165 |
| U.S. Treasury Note | | 7.13 | 2-15-2023 | 24,000 | 26,698 |
| U.S. Treasury Note | | 7.25 | 8-15-2022 | 24,000 | 25,913 |
| U.S. Treasury Note | | 7.50 | 11-15-2024 | 22,000 | 27,159 |
| U.S. Treasury Note | | 7.63 | 11-15-2022 | 12,000 | 13,223 |
| U.S. Treasury Note | | 7.63 | 2-15-2025 | 20,000 | 25,059 |
| Total U.S. Treasury securities (Cost $26,847,150) | | | | | 28,025,084 |
| | | Yield | | Shares | |
| Short-term investments: 4.27% | | | | | |
| Investment companies: 4.27% | | | | | |
| Wells Fargo Government Money Market Fund Select Class ♠∞ | | 0.03 | | 3,499,550 | 3,499,550 |
| Total Short-term investments (Cost $3,499,550) | | | | | 3,499,550 |
| Total investments in securities (Cost $51,545,128) | 98.56% | | | | 80,746,861 |
| Other assets and liabilities, net | 1.44 | | | | 1,182,273 |
| Total net assets | 100.00% | | | | $81,929,134 |
| † | Non-income-earning security |
| ♠ | The issuer of the security is an affiliated person of the Fund as defined in the Investment Company Act of 1940. |
| ∞ | The rate represents the 7-day annualized yield at period end. |
| Abbreviations: |
| REIT | Real estate investment trust |
The accompanying notes are an integral part of these financial statements.
26 | Wells Fargo VT Index Asset Allocation Fund
Portfolio of investments—June 30, 2021 (unaudited)
Investments in affiliates
An affiliated investment is an investment in which the Fund owns at least 5% of the outstanding voting shares of the issuer or as a result of other relationships, such as the Fund and the issuer having the same investment manager. Transactions with issuers that were either affiliates of the Fund at the beginning of the period or the end of the period were as follows:
| | Value,
beginning of
period | Purchases | Sales
proceeds | Net
realized
gains
(losses) | | Net
change in
unrealized
gains
(losses) | | Value,
end of
period | | % of
net
assets | Shares,
end
of period | Income
from
affiliated
securities |
| Common stocks | | | | | | | | | | | |
| Financials | | | | | | | | | |
| Banks | | | | | | | | | |
| Wells Fargo & Company | $187,086 | $ 83 | $ (26,061) | $ 9,130 | | $ 81,982 | | $ 252,220 | | 0.31% | 5,569 | $ 1,193 |
| Short-term investments | | | | | | | | | | | | |
| Investment companies | | | | | | | | | | | | |
| Securities Lending Cash Investments LLC | 11,350 | 14,207 | (25,557) | 0 | | 0 | | 0 | | | 0 | 2 # |
| Wells Fargo Government Money Market Fund Select Class | 898,399 | 6,985,540 | (4,384,389) | 0 | | 0 | | 3,499,550 | | | 3,499,550 | 397 |
| | | | | | | | | 3,499,550 | | 4.27 | | |
| | | | | $9,130 | | $81,982 | | $3,751,770 | | 4.58% | | $1,592 |
| # | Amount shown represents income before fees and rebates. |
Futures contracts
| Description | Number of
contracts | Expiration
date | Notional
cost | Notional
value | Unrealized
gains | | Unrealized
losses |
| Long | | | | | | | |
| E-Mini S&P 500 Index | 29 | 9-17-2021 | $ 6,143,210 | $ 6,218,470 | $ 75,260 | | $ 0 |
| U.S. Treasury Bonds | 2 | 9-21-2021 | 316,521 | 321,500 | 4,979 | | 0 |
| Ultra U.S. Treasury Bonds | 4 | 9-21-2021 | 744,758 | 770,750 | 25,992 | | 0 |
| 2-Year U.S. Treasury Notes | 3 | 9-30-2021 | 661,906 | 660,961 | 0 | | (945) |
| 5-Year U.S. Treasury Notes | 10 | 9-30-2021 | 1,236,067 | 1,234,297 | 0 | | (1,770) |
| Short | | | | | | | |
| 10-Year U.S. Treasury Notes | (15) | 9-21-2021 | (1,973,824) | (1,987,500) | 0 | | (13,676) |
| | | | | | $106,231 | | $(16,391) |
The accompanying notes are an integral part of these financial statements.
Wells Fargo VT Index Asset Allocation Fund | 27
Statement of assets and liabilities—June 30, 2021 (unaudited)
| | |
| Assets | |
Investments in unaffiliated securities, at value (cost $47,873,375)
| $ 76,995,091 |
Investments in affiliated securites, at value (cost $3,671,753)
| 3,751,770 |
Cash
| 238 |
Cash at broker segregated for futures contracts
| 410,981 |
Receivable for investments sold
| 690,525 |
Receivable for dividends and interest
| 157,779 |
Receivable for daily variation margin on open futures contracts
| 9,815 |
Prepaid expenses and other assets
| 25,805 |
Total assets
| 82,042,004 |
| Liabilities | |
Payable for Fund shares redeemed
| 35,604 |
Management fee payable
| 31,834 |
Professional fees payable
| 17,855 |
Distribution fee payable
| 16,446 |
Administration fee payable
| 5,350 |
Payable for investments purchased
| 1,834 |
Trustees’ fees and expenses payable
| 1,039 |
Accrued expenses and other liabilities
| 2,908 |
Total liabilities
| 112,870 |
Total net assets
| $81,929,134 |
| Net assets consist of | |
Paid-in capital
| $ 42,598,944 |
Total distributable earnings
| 39,330,190 |
Total net assets
| $81,929,134 |
| Computation of net asset value per share | |
Net assets - Class 2
| $ 81,929,134 |
Share outstanding - Class 21
| 3,469,496 |
Net asset value per share - Class 2
| $23.61 |
| 1 | The Fund has an unlimited number of authorized shares |
The accompanying notes are an integral part of these financial statements.
28 | Wells Fargo VT Index Asset Allocation Fund
Statement of operations—six months ended June 30, 2021 (unaudited)
| | |
| Investment income | |
Dividends (net of foreign withholdings taxes of $32)
| $ 353,936 |
Interest
| 231,821 |
Income from affiliated securities
| 1,638 |
Total investment income
| 587,395 |
| Expenses | |
Management fee
| 234,485 |
Administration fee - Class 2
| 31,265 |
Distribution fee - Class 2
| 96,467 |
Custody and accounting fees
| 17,775 |
Professional fees
| 24,646 |
Shareholder report expenses
| 14,242 |
Trustees’ fees and expenses
| 9,398 |
Other fees and expenses
| 14,610 |
Total expenses
| 442,888 |
| Less: Fee waivers and/or expense reimbursements | |
Fund-level
| (52,423) |
Net expenses
| 390,465 |
Net investment income
| 196,930 |
| Realized and unrealized gains (losses) on investments | |
| Net realized gains on | |
Unaffiliated securities
| 3,455,693 |
Affiliated securities
| 9,130 |
Futures contracts
| 674,305 |
Net realized gains on investments
| 4,139,128 |
| Net change in unrealized gains (losses) on | |
Unaffiliated securities
| 2,037,178 |
Affiliated securities
| 81,982 |
Futures contracts
| (17,039) |
Net change in unrealized gains (losses) on investments
| 2,102,121 |
Net realized and unrealized gains (losses) on investments
| 6,241,249 |
Net increase in net assets resulting from operations
| $6,438,179 |
The accompanying notes are an integral part of these financial statements.
Wells Fargo VT Index Asset Allocation Fund | 29
Statement of changes in net assets
| | | | | |
| | Six months ended
June 30, 2021
(unaudited) | Year ended
December 31, 2020 |
| Operations | | | | |
Net investment income
| | $ 196,930 | | $ 570,640 |
Net realized gains on investments
| | 4,139,128 | | 7,532,027 |
Net change in unrealized gains (losses) on investments
| | 2,102,121 | | 3,213,094 |
Net increase in net assets resulting from operations
| | 6,438,179 | | 11,315,761 |
| Distributions to shareholders from | | | | |
Net investment income and net realized gains - Class 2
| | (309,661) | | (6,314,848) |
| Capital share transactions | Shares | | Shares | |
Proceeds from shares sold - Class 2
| 46,434 | 1,030,630 | 180,317 | 3,691,931 |
Reinvestment of distributions - Class 2
| 13,774 | 309,661 | 318,519 | 6,314,848 |
Payment for shares redeemed - Class 2
| (191,227) | (4,330,923) | (411,678) | (8,409,040) |
Net increase (decrease) in net assets resulting from capital share transactions
| | (2,990,632) | | 1,597,739 |
Total increase in net assets
| | 3,137,886 | | 6,598,652 |
| Net assets | | | | |
Beginning of period
| | 78,791,248 | | 72,192,596 |
End of period
| | $81,929,134 | | $78,791,248 |
The accompanying notes are an integral part of these financial statements.
30 | Wells Fargo VT Index Asset Allocation Fund
Financial highlights
(For a share outstanding throughout each period)
| | | Year ended December 31 |
| Class 2 | Six months ended
June 30, 2021
(unaudited) | 2020 | 2019 | 2018 | 2017 | 2016 |
Net asset value, beginning of period
| $21.88 | $20.55 | $18.42 | $20.45 | $19.16 | $18.47 |
Net investment income
| 0.06 | 0.16 | 0.22 | 0.20 | 0.17 | 0.17 |
Net realized and unrealized gains (losses) on investments
| 1.76 | 3.04 | 3.42 | (0.70) | 2.12 | 1.22 |
Total from investment operations
| 1.82 | 3.20 | 3.64 | (0.50) | 2.29 | 1.39 |
| Distributions to shareholders from | | | | | | |
Net investment income
| (0.09) | (0.17) | (0.22) | (0.20) | (0.15) | (0.17) |
Net realized gains
| 0.00 | (1.70) | (1.29) | (1.33) | (0.85) | (0.53) |
Total distributions to shareholders
| (0.09) | (1.87) | (1.51) | (1.53) | (1.00) | (0.70) |
Net asset value, end of period
| $23.61 | $21.88 | $20.55 | $18.42 | $20.45 | $19.16 |
Total return1
| 8.33% | 16.59% | 20.16% | (2.90)% | 12.25% | 7.67% |
| Ratios to average net assets (annualized) | | | | | | |
Gross expenses
| 1.13% | 1.14% | 1.05% | 1.05% | 1.16% | 1.10% |
Net expenses
| 1.00% | 1.00% | 1.00% | 1.00% | 1.00% | 1.00% |
Net investment income
| 0.50% | 0.78% | 1.07% | 0.94% | 0.86% | 0.93% |
| Supplemental data | | | | | | |
Portfolio turnover rate
| 1% | 21% | 4% | 10% | 10% | 15% |
Net assets, end of period (000s omitted)
| $81,929 | $78,791 | $72,193 | $68,851 | $81,956 | $81,505 |
| 1 | Returns for periods of less than one year are not annualized. Returns do not reflect fees and expenses charged pursuant to the terms of variable life insurance policies and variable annuity contracts. |
The accompanying notes are an integral part of these financial statements.
Wells Fargo VT Index Asset Allocation Fund | 31
Notes to financial statements (unaudited)
1. ORGANIZATION
Wells Fargo Variable Trust (the "Trust"), a Delaware statutory trust organized on March 10, 1999, is an open-end management investment company registered under the Investment Company Act of 1940, as amended (the "1940 Act"). As an investment company, the Trust follows the accounting and reporting guidance in Financial Accounting Standards Board ("FASB") Accounting Standards Codification Topic 946, Financial Services – Investment Companies. These financial statements report on the Wells Fargo VT Index Asset Allocation Fund (the "Fund") which is a diversified series of the Trust. The Trust offers shares of the Fund to separate accounts of various life insurance companies as funding vehicles for certain variable annuity contracts and variable life insurance policies.
On February 23, 2021, Wells Fargo & Company announced that it has entered into a definitive agreement to sell Wells Fargo Asset Management ("WFAM") to GTCR LLC and Reverence Capital Partners, L.P. WFAM is the trade name used by the asset management businesses of Wells Fargo & Company and includes Wells Fargo Funds Management, LLC, the investment manager to the Fund, Wells Capital Management, LLC and Wells Fargo Asset Management (International) Limited, both registered investment advisers providing sub-advisory services to certain funds, and Wells Fargo Funds Distributor, LLC, the Fund's principal underwriter. As part of the transaction, Wells Fargo & Company will own a 9.9% equity interest and will continue to serve as an important client and distribution partner.
Consummation of the transaction will result in the automatic termination of the Fund's investment management agreement and subadvisory agreement. The Fund's Board of Trustees approved a new investment management and new subadvisory agreement and approved submitting the agreements to the Fund’s shareholders for approval at a special meeting of shareholders expected to be held on August 16, 2021. Shareholders of record of the Fund at the close of business on May 28, 2021 are entitled to vote at the meeting. If shareholders approve the new agreements, they would take effect upon the closing of the transaction. The transaction is expected to close in the second half of 2021, subject to customary closing conditions.
2. SIGNIFICANT ACCOUNTING POLICIES
The following significant accounting policies, which are consistently followed in the preparation of the financial statements of the Fund, are in conformity with U.S. generally accepted accounting principles which require management to make estimates and assumptions that affect the reported amounts of assets and liabilities, disclosure of contingent assets and liabilities at the date of the financial statements, and the reported amounts of income and expenses during the reporting period. Actual results could differ from those estimates.
Securities valuation
All investments are valued each business day as of the close of regular trading on the New York Stock Exchange (generally 4 p.m. Eastern Time), although the Fund may deviate from this calculation time under unusual or unexpected circumstances.
Equity securities and futures contracts that are listed on a foreign or domestic exchange or market are valued at the official closing price or, if none, the last sales price. If no sale occurs on the principal exchange or market that day, a fair value price will be determined in accordance with the Fund’s Valuation Procedures.
Debt securities are valued at the evaluated bid price provided by an independent pricing service (e.g. taking into account various factors, including yields, maturities, or credit ratings) or, if a reliable price is not available, the quoted bid price from an independent broker-dealer.
Investments in registered open-end investment companies are valued at net asset value. Interests in non-registered investment companies that are redeemable at net asset value are fair valued normally at net asset value.
Investments which are not valued using any of the methods discussed above are valued at their fair value, as determined in good faith by the Board of Trustees. The Board of Trustees has established a Valuation Committee comprised of the Trustees and has delegated to it the authority to take any actions regarding the valuation of portfolio securities that the Valuation Committee deems necessary or appropriate, including determining the fair value of portfolio securities, unless the determination has been delegated to the Wells Fargo Asset Management Pricing Committee at Wells Fargo Funds Management, LLC ("Funds Management"). The Board of Trustees retains the authority to make or ratify any valuation decisions or approve any changes to the Valuation Procedures as it deems appropriate. On a quarterly basis, the Board of Trustees receives reports on any valuation actions taken by the Valuation Committee or the Wells Fargo Asset Management Pricing Committee which may include items for ratification.
32 | Wells Fargo VT Index Asset Allocation Fund
Notes to financial statements (unaudited)
Securities lending
The Fund may lend its securities from time to time in order to earn additional income in the form of fees or interest on securities received as collateral or the investment of any cash received as collateral. When securities are on loan, the Fund receives interest or dividends on those securities. Cash collateral received in connection with its securities lending transactions is invested in Securities Lending Cash Investments, LLC (the "Securities Lending Fund"). Investments in Securities Lending Fund are valued at the evaluated bid price provided by an independent pricing service. Income earned from investment in the Securities Lending Fund (net of fees and rebates), if any, is included in income from affiliated securities on the Statement of Operations.
In a securities lending transaction, the net asset value of the Fund is affected by an increase or decrease in the value of the securities loaned and by an increase or decrease in the value of the instrument in which collateral is invested. The amount of securities lending activity undertaken by the Fund fluctuates from time to time. The Fund has the right under the lending agreement to recover the securities from the borrower on demand. In the event of default or bankruptcy by the borrower, the Fund may be prevented from recovering the loaned securities or gaining access to the collateral or may experience delays or costs in doing so. In such an event, the terms of the agreement allow the unaffiliated securities lending agent to use the collateral to purchase replacement securities on behalf of the Fund or pay the Fund the market value of the loaned securities. The Fund bears the risk of loss with respect to depreciation of its investment of the cash collateral.
Futures contracts
Futures contracts are agreements between the Fund and a counterparty to buy or sell a specific amount of a commodity, financial instrument or currency at a specified price on a specified date. The Fund may buy and sell futures contracts in order to gain exposure to, or protect against, changes in interest rates and security values and is subject to interest rate risk and equity price risk. The primary risks associated with the use of futures contracts are the imperfect correlation between changes in market values of securities held by the Fund and the prices of futures contracts, and the possibility of an illiquid market. Futures contracts are generally entered into on a regulated futures exchange and cleared through a clearinghouse associated with the exchange. With futures contracts, there is minimal counterparty risk to the Fund since futures contracts are exchange traded and the exchange’s clearinghouse, as the counterparty to all exchange traded futures, guarantees the futures contracts against default.
Upon entering into a futures contract, the Fund is required to deposit either cash or securities (initial margin) with the broker in an amount equal to a certain percentage of the contract value. Subsequent payments (variation margin) are paid to or from the broker each day equal to the daily changes in the contract value. Such payments are recorded as unrealized gains or losses and, if any, shown as variation margin receivable (payable) in the Statement of Assets and Liabilities. Should the Fund fail to make requested variation margin payments, the broker can gain access to the initial margin to satisfy the Fund’s payment obligations. When the contracts are closed, a realized gain or loss is recorded in the Statement of Operations.
Security transactions and income recognition
Securities transactions are recorded on a trade date basis. Realized gains or losses are recorded on the basis of identified cost.
Dividend income is recognized on the ex-dividend date.
Interest income is accrued daily and bond discounts are accreted and premiums are amortized daily. To the extent debt obligations are placed on non-accrual status, any related interest income may be reduced by writing off interest receivables when the collection of all or a portion of interest has been determined to be doubtful based on consistently applied procedures and the fair value has decreased. If the issuer subsequently resumes interest payments or when the collectability of interest is reasonably assured, the debt obligation is removed from non-accrual status.
Income is recorded net of foreign taxes withheld where recovery of such taxes is not assured.
Distributions to shareholders
Distributions to shareholders are recorded on the ex-dividend date and paid from net investment income quarterly and any net realized gains are paid at least annually. Such distributions are determined in accordance with income tax regulations and may differ from U.S. generally accepted accounting principles. Dividend sources are estimated at the time of declaration. The tax character of distributions is determined as of the Fund's fiscal year end. Therefore, a portion of the Fund's distributions made prior to the Fund’s fiscal year end may be categorized as a tax return of capital at year end.
Federal and other taxes
The Fund intends to continue to qualify as a regulated investment company by distributing substantially all of its investment company taxable income and any net realized capital gains (after reduction for capital loss carryforwards) sufficient to relieve it from all, or substantially all, federal income taxes. Accordingly, no provision for federal income taxes was required.
Wells Fargo VT Index Asset Allocation Fund | 33
Notes to financial statements (unaudited)
The Fund’s income and federal excise tax returns and all financial records supporting those returns for the prior three fiscal years are subject to examination by the federal and Delaware revenue authorities. Management has analyzed the Fund's tax positions taken on federal, state, and foreign tax returns for all open tax years and does not believe that there are any uncertain tax positions that require recognition of a tax liability.
As of June 30, 2021, the aggregate cost of all investments for federal income tax purposes was $52,189,912 and the unrealized gains (losses) consisted of:
| Gross unrealized gains | $29,936,443 |
| Gross unrealized losses | (1,289,654) |
| Net unrealized gains | $28,646,789 |
3. FAIR VALUATION MEASUREMENTS
Fair value measurements of investments are determined within a framework that has established a fair value hierarchy based upon the various data inputs utilized in determining the value of the Fund’s investments. The three-level hierarchy gives the highest priority to unadjusted quoted prices in active markets for identical assets or liabilities (Level 1) and the lowest priority to unobservable inputs (Level 3). The Fund’s investments are classified within the fair value hierarchy based on the lowest level of input that is significant to the fair value measurement. The inputs are summarized into three broad levels as follows:
| ■ | Level 1 – quoted prices in active markets for identical securities |
| ■ | Level 2 – other significant observable inputs (including quoted prices for similar securities, interest rates, prepayment speeds, credit risk, etc.) |
| ■ | Level 3 – significant unobservable inputs (including the Fund’s own assumptions in determining the fair value of investments) |
The inputs or methodologies used for valuing investments in securities are not necessarily an indication of the risk associated with investing in those securities.
34 | Wells Fargo VT Index Asset Allocation Fund
Notes to financial statements (unaudited)
The following is a summary of the inputs used in valuing the Fund’s assets and liabilities as of June 30, 2021:
| | Quoted prices
(Level 1) | Other significant
observable inputs
(Level 2) | Significant
unobservable inputs
(Level 3) | Total |
| Assets | | | | |
| Investments in: | | | | |
| Common stocks | | | | |
| Communication services | $ 5,484,478 | $0 | $0 | $ 5,484,478 |
| Consumer discretionary | 6,047,244 | 0 | 0 | 6,047,244 |
| Consumer staples | 2,880,659 | 0 | 0 | 2,880,659 |
| Energy | 1,398,546 | 0 | 0 | 1,398,546 |
| Financials | 5,540,161 | 0 | 0 | 5,540,161 |
| Health care | 6,392,857 | 0 | 0 | 6,392,857 |
| Industrials | 4,194,574 | 0 | 0 | 4,194,574 |
| Information technology | 13,539,932 | 0 | 0 | 13,539,932 |
| Materials | 1,277,369 | 0 | 0 | 1,277,369 |
| Real estate | 1,265,377 | 0 | 0 | 1,265,377 |
| Utilities | 1,201,030 | 0 | 0 | 1,201,030 |
| U.S. Treasury securities | 28,025,084 | 0 | 0 | 28,025,084 |
| Short-term investments | | | | |
| Investment companies | 3,499,550 | 0 | 0 | 3,499,550 |
| | 80,746,861 | 0 | 0 | 80,746,861 |
| Futures contracts | 106,231 | 0 | 0 | 106,231 |
| Total assets | $80,853,092 | $0 | $0 | $80,853,092 |
| Liabilities | | | | |
| Futures contracts | $ 16,391 | $0 | $0 | $ 16,391 |
| Total liabilities | $ 16,391 | $0 | $0 | $ 16,391 |
Futures contracts are reported at their cumulative unrealized gains (losses) at measurement date as reported in the table following the Portfolio of Investments. For futures contracts, the current day’s variation margin is reported on the Statement of Assets and Liabilities. All other assets and liabilities are reported at their market value at measurement date.
Additional sector, industry or geographic detail, if any, is included in the Portfolio of Investments.
For the six months ended June 30, 2021, the Fund did not have any transfers into/out of Level 3.
4. TRANSACTIONS WITH AFFILIATES
Management fee
Funds Management, an indirect wholly owned subsidiary of Wells Fargo & Company ("Wells Fargo"), is the manager of the Fund and provides advisory and fund-level administrative services under an investment management agreement. Under the investment management agreement, Funds Management is responsible for, among other services, implementing the investment objectives and strategies of the Fund, supervising the subadviser and providing fund-level administrative services in connection with the Fund’s operations. As compensation for its services under the investment management agreement, Funds Management is entitled to receive a management fee at the following annual rate based on the Fund’s average daily net assets:
Wells Fargo VT Index Asset Allocation Fund | 35
Notes to financial statements (unaudited)
| Average daily net assets | Management fee |
| First $500 million | 0.600% |
| Next $500 million | 0.550 |
| Next $2 billion | 0.500 |
| Next $2 billion | 0.475 |
| Next $5 billion | 0.440 |
| Over $10 billion | 0.430 |
For the six months ended June 30, 2021, the management fee was equivalent to an annual rate of 0.60% of the Fund’s average daily net assets.
Funds Management has retained the services of a subadviser to provide daily portfolio management to the Fund. The fee for subadvisory services is borne by Funds Management. Wells Capital Management, LLC ("WellsCap"), an affiliate of Funds Management and an indirect wholly owned subsidiary of Wells Fargo, is the subadviser to the Fund and is entitled to receive a fee from Funds Management at an annual rate starting at 0.15% and declining to 0.10% as the average daily net assets of the Fund increase.
Administration fee
Under a class-level administration agreement, Funds Management provides class-level administrative services to the Fund, which includes paying fees and expenses for services provided by the transfer agent, sub-transfer agents, omnibus account servicers and record-keepers. As compensation for its services under the class-level administration agreement, Funds Management receives an annual fee of 0.08% which is calculated based on the average daily net assets of Class 2 shares.
Waivers and/or expense reimbursements
Funds Management has contractually committed through April 30, 2022 to waive fees and/or reimburse expenses to the extent necessary to cap the Fund’s expenses at 1.00% for Class 2 shares. Prior to or after the commitment expiration date, the cap may be increased or the commitment to maintain the cap may be terminated only with the approval of the Board of Trustees.
Distribution fee
The Trust has adopted a distribution plan for Class 2 shares of the Fund pursuant to Rule 12b-1 under the 1940 Act. A distribution fee is charged to Class 2 shares and paid to Wells Fargo Funds Distributor, LLC, the principal underwriter, at an annual rate of 0.25% of the average daily net assets of Class 2 shares.
Interfund transactions
The Fund may purchase or sell portfolio investment securities to certain other Wells Fargo affiliates pursuant to Rule 17a-7 under the 1940 Act and under procedures adopted by the Board of Trustees. The procedures have been designed to ensure that these interfund transactions, which do not incur broker commissions, are effected at current market prices.
5. INVESTMENT PORTFOLIO TRANSACTIONS
Purchases and sales of investments, excluding U.S. government obligations (if any) and short-term securities, for the six months ended June 30, 2021 were $620,784 and $5,336,780, respectively.
6. SECURITIES LENDING TRANSACTIONS
The Fund lends its securities through an unaffiliated securities lending agent and receives collateral in the form of cash or securities with a value at least equal to the value of the securities on loan. The value of the loaned securities is determined at the close of each business day and any increases or decreases in the required collateral are exchanged between the Fund and the counterparty on the next business day. Cash collateral received is invested in the Securities Lending Fund which seeks to provide a positive return compared to the daily Federal Funds Open Rate by investing in high-quality, U.S. dollar-denominated short-term money market instruments and is exempt from registration under Section 3(c)(7) of the 1940 Act. Securities Lending Fund is managed by Funds Management and is subadvised by WellsCap. Funds Management receives an advisory fee starting at 0.05% and declining to 0.01% as the average daily net assets of the Securities Lending Fund increase. All of the fees received by Funds Management are paid to WellsCap for its services as subadviser.
In the event of counterparty default or the failure of a borrower to return a loaned security, the Fund has the right to use the collateral to offset any losses incurred. As of June 30, 2021, the Fund did not have any securities on loan.
36 | Wells Fargo VT Index Asset Allocation Fund
Notes to financial statements (unaudited)
7. DERIVATIVE TRANSACTIONS
During the six months ended June 30, 2021, the Fund entered into futures contracts to gain market exposure to certain asset classes consistent with an active asset allocation strategy. The Fund had an average notional amount of $9,748,911 in long futures contracts and $2,164,038 in short futures contracts during the six months ended June 30, 2021.
The cumulative unrealized gains (losses) reported in the table following the Portfolio of Investments represents the fair value of futures contracts at the end of the period. Only the current day’s variation margin as of June 30, 2021 is reported separately on the Statement of Assets and Liabilities.
The effect of derivative instruments on the Statement of Operations for the six months ended June 30, 2021 was as follows:
| | Amount of realized
gains (losses) on
derivatives | Change in unrealized
gains (losses) on
derivatives |
| Equity risk | $ 690,024 | $ (8,201) |
| Interest rate risk | (15,719) | (8,838) |
| | $674,305 | $(17,039) |
8. BANK BORROWINGS
The Trust, Wells Fargo Master Trust and Wells Fargo Funds Trust (excluding the money market funds) are parties to a $350,000,000 revolving credit agreement whereby the Fund is permitted to use bank borrowings for temporary or emergency purposes, such as to fund shareholder redemption requests. Interest under the credit agreement is charged to the Fund based on a borrowing rate equal to the higher of the Federal Funds rate in effect on that day plus 1.25% or the overnight bank funding rate in effect on that day plus 1.25%. In addition, an annual commitment fee equal to 0.25% of the unused balance is allocated to each participating fund.
For the six months ended June 30, 2021, there were no borrowings by the Fund under the agreement.
9. CONCENTRATION RISKS
As of the end of the period, the Fund concentrated its portfolio of investments in information technology sector. A fund that invests a substantial portion of its assets in any sector may be more affected by changes in that sector than would be a fund whose investments are not heavily weighted in any sector.
10. INDEMNIFICATION
Under the Fund's organizational documents, the officers and Trustees have been granted certain indemnification rights against certain liabilities that may arise out of performance of their duties to the Fund. The Fund has entered into a separate agreement with each Trustee that converts indemnification rights currently existing under the Fund’s organizational documents into contractual rights that cannot be changed in the future without the consent of the Trustee. Additionally, in the normal course of business, the Fund may enter into contracts with service providers that contain a variety of indemnification clauses. The Fund’s maximum exposure under these arrangements is dependent on future claims that may be made against the Fund and, therefore, cannot be estimated.
11. CORONAVIRUS (COVID-19) PANDEMIC
On March 11, 2020, the World Health Organization announced that it had made the assessment that coronavirus disease 2019 (“COVID-19”) is a pandemic. The impacts of COVID-19 are affecting the entire global economy, individual companies and investment products, the funds, and the market in general. There is significant uncertainty around the extent and duration of business disruptions related to COVID-19 and the impacts may last for an extended period of time. COVID-19 has led to significant uncertainty and volatility in the financial markets.
12. SUBSEQUENT EVENTS
Wells Fargo Asset Management ("WFAM") announced that it will be changing its company name to Allspring Global Investments upon the closing of the previously announced sale transaction of WFAM by Wells Fargo & Company to GTCR LLC and Reverence Capital Partners, L.P. The new corporate name is expected to go into effect on the closing date of the transaction, which is anticipated to occur in the second half of 2021, subject to customary closing conditions.
Wells Fargo VT Index Asset Allocation Fund | 37
Notes to financial statements (unaudited)
At a meeting held July 15, 2021, the Board of Trustees of the Wells Fargo Funds approved a change in the Fund's name to remove “Wells Fargo” from the Fund's name and replace with “Allspring”. The change is expected to go into effect on October 11, 2021.
Following the closing of the transaction, Wells Fargo Funds Management, LLC, the Fund's investment manager, Wells Capital Management, LLC and Wells Fargo Asset Management (International) Limited, each subadvisers to certain funds, and Wells Fargo Funds Distributor, LLC, the Fund's principal underwriter, will each be rebranded as Allspring.
At a special meeting of shareholders held on August 16, 2021, shareholders of the Fund approved a new investment management and a new subadvisory agreement that will be effective at the closing of the sale transaction.
38 | Wells Fargo VT Index Asset Allocation Fund
Other information (unaudited)
PROXY VOTING INFORMATION
A description of the policies and procedures used to determine how to vote proxies relating to portfolio securities is available without charge, upon request, by calling 1-800-260-5969, visiting our website at wfam.com, or visiting the SEC website at sec.gov. Information regarding how the proxies related to portfolio securities were voted during the most recent 12-month period ended June 30 is available on the website at wfam.com or by visiting the SEC website at sec.gov.
QUARTERLY PORTFOLIO HOLDINGS INFORMATION
The Fund files its complete schedule of portfolio holdings with the SEC for the first and third quarters of each fiscal year as an exhibit to its reports on Form N-PORT. Shareholders may view the filed Form N-PORT by visiting the SEC website at sec.gov.
Wells Fargo VT Index Asset Allocation Fund | 39
Other information (unaudited)
BOARD OF TRUSTEES AND OFFICERS
Each of the Trustees and Officers listed in the table below acts in identical capacities for each fund in the Wells Fargo family of funds, which consists of 139 mutual funds comprising the Wells Fargo Funds Trust, Wells Fargo Variable Trust, Wells Fargo Master Trust and four closed-end funds (collectively the “Fund Complex”). This table should be read in conjunction with the Prospectus and the Statement of Additional Information1. The mailing address of each Trustee and Officer is 525 Market Street, 12th Floor, San Francisco, CA 94105. Each Trustee and Officer serves an indefinite term, however, each Trustee serves such term until reaching the mandatory retirement age established by the Trustees.
Independent Trustees
Name and
year of birth | Position held and
length of service* | Principal occupations during past five years or longer | Current other
public company or
investment
company
directorships |
William R. Ebsworth
(Born 1957) | Trustee,
since 2015 | Retired. From 1984 to 2013, equities analyst, portfolio manager, research director and chief investment officer at Fidelity Management and Research Company in Boston, Tokyo, and Hong Kong, and retired in 2013 as Chief Investment Officer of Fidelity Strategic Advisers, Inc. where he led a team of investment professionals managing client assets. Prior thereto, Board member of Hong Kong Securities Clearing Co., Hong Kong Options Clearing Corp., the Thailand International Fund, Ltd., Fidelity Investments Life Insurance Company, and Empire Fidelity Investments Life Insurance Company. Audit Committee Chair and Investment Committee Chair of the Vincent Memorial Hospital Endowment (non-profit organization). Mr. Ebsworth is a CFA® charterholder. | N/A |
Jane A. Freeman
(Born 1953) | Trustee,
since 2015;
Chair Liaison,
since 2018 | Retired. From 2012 to 2014 and 1999 to 2008, Chief Financial Officer of Scientific Learning Corporation. From 2008 to 2012, Ms. Freeman provided consulting services related to strategic business projects. Prior to 1999, Portfolio Manager at Rockefeller & Co. and Scudder, Stevens & Clark. Board member of the Harding Loevner Funds from 1996 to 2014, serving as both Lead Independent Director and chair of the Audit Committee. Board member of the Russell Exchange Traded Funds Trust from 2011 to 2012 and the chair of the Audit Committee. Ms. Freeman is also an inactive Chartered Financial Analyst. | N/A |
Isaiah Harris, Jr.
(Born 1952) | Trustee,
since 2009; Audit
Committee
Chair,
since 2019 | Retired. Chairman of the Board of CIGNA Corporation since 2009, and Director since 2005. From 2003 to 2011, Director of Deluxe Corporation. Prior thereto, President and CEO of BellSouth Advertising and Publishing Corp. from 2005 to 2007, President and CEO of BellSouth Enterprises from 2004 to 2005 and President of BellSouth Consumer Services from 2000 to 2003. Emeritus member of the Iowa State University Foundation Board of Governors. Emeritus Member of the Advisory Board of Iowa State University School of Business. Advisory Board Member, Palm Harbor Academy (private school). Mr. Harris is a certified public accountant (inactive status). | CIGNA Corporation |
Judith M. Johnson
(Born 1949) | Trustee,
since 2008 | Retired. Prior thereto, Chief Executive Officer and Chief Investment Officer of Minneapolis Employees Retirement Fund from 1996 to 2008. Ms. Johnson is an attorney, certified public accountant and a certified managerial accountant. | N/A |
David F. Larcker
(Born 1950) | Trustee,
since 2009 | James Irvin Miller Professor of Accounting at the Graduate School of Business (Emeritus), Stanford University, Director of the Corporate Governance Research Initiative and Senior Faculty of The Rock Center for Corporate Governance since 2006. From 2005 to 2008, Professor of Accounting at the Graduate School of Business, Stanford University. Prior thereto, Ernst & Young Professor of Accounting at The Wharton School, University of Pennsylvania from 1985 to 2005. | N/A |
40 | Wells Fargo VT Index Asset Allocation Fund
Other information (unaudited)
Name and
year of birth | Position held and
length of service* | Principal occupations during past five years or longer | Current other
public company or
investment
company
directorships |
Olivia S. Mitchell
(Born 1953) | Trustee,
since 2006;
Nominating and
Governance
Committee Chair,
since 2018 | International Foundation of Employee Benefit Plans Professor, Wharton School of the University of Pennsylvania since 1993. Director of Wharton’s Pension Research Council and Boettner Center on Pensions & Retirement Research, and Research Associate at the National Bureau of Economic Research. Previously, Cornell University Professor from 1978 to 1993. | N/A |
Timothy J. Penny
(Born 1951) | Trustee,
since 1996;
Chair,
since 2018 | President and Chief Executive Officer of Southern Minnesota Initiative Foundation, a non-profit organization, since 2007. Member of the Board of Trustees of NorthStar Education Finance, Inc., a non-profit organization, since 2007. | N/A |
James G. Polisson
(Born 1959) | Trustee,
since 2018 | Retired. Chief Marketing Officer, Source (ETF) UK Services, Ltd, from 2015 to 2017. From 2012 to 2015, Principal of The Polisson Group, LLC, a management consulting, corporate advisory and principal investing company. Chief Executive Officer and Managing Director at Russell Investments, Global Exchange Traded Funds from 2010 to 2012. Managing Director of Barclays Global Investors from 1998 to 2010 and Global Chief Marketing Officer for iShares and Barclays Global Investors from 2000 to 2010. Trustee of the San Francisco Mechanics’ Institute, a non-profit organization, from 2013 to 2015. Board member of the Russell Exchange Traded Fund Trust from 2011 to 2012. Director of Barclays Global Investors Holdings Deutschland GmbH from 2006 to 2009. Mr. Polisson is an attorney and has a retired status with the Massachusetts and District of Columbia Bar Associations. | N/A |
Pamela Wheelock
(Born 1959) | Trustee,
since January
2020; previously
Trustee from
January 2018 to
July 2019 | Board member of the Destination Medical Center Economic Development Agency, Rochester, Minnesota since 2019. Interim President of the McKnight Foundation from January to September 2020. Acting Commissioner, Minnesota Department of Human Services, July 2019 through September 2019. Human Services Manager (part-time), Minnesota Department of Human Services, October 2019 through December 2019. Chief Operating Officer, Twin Cities Habitat for Humanity from 2017 to 2019. Vice President of University Services, University of Minnesota from 2012 to 2016. Prior thereto, on the Board of Directors, Governance Committee and Finance Committee for the Minnesota Philanthropy Partners (Saint Paul Foundation) from 2012 to 2018, Interim Chief Executive Officer of Blue Cross Blue Shield of Minnesota from 2011 to 2012, Chairman of the Board from 2009 to 2012 and Board Director from 2003 to 2015. Vice President, Leadership and Community Engagement, Bush Foundation, Saint Paul, Minnesota (a private foundation) from 2009 to 2011. Executive Vice President and Chief Financial Officer, Minnesota Sports and Entertainment from 2004 to 2009 and Senior Vice President from 2002 to 2004. Executive Vice President of the Minnesota Wild Foundation from 2004 to 2008. Commissioner of Finance, State of Minnesota, from 1999 to 2002. Currently Board Chair of the Minnesota Wild Foundation since 2010. | N/A |
* Length of service dates reflect the Trustee’s commencement of service with the Trust’s predecessor entities, where applicable.
Wells Fargo VT Index Asset Allocation Fund | 41
Other information (unaudited)
Officers
Name and
year of birth | Position held and
length of service | Principal occupations during past five years or longer |
Andrew Owen
(Born 1960) | President,
since 2017 | Executive Vice President of Wells Fargo & Company and Head of Affiliated Managers, Wells Fargo Asset Management, since 2014. In addition, Mr. Owen is currently President, Chief Executive Officer and Director of Wells Fargo Funds Management, LLC since 2017. Prior thereto, Executive Vice President responsible for marketing, investments and product development for Wells Fargo Funds Management, LLC, from 2009 to 2014. |
Jeremy DePalma
(Born 1974) | Treasurer,
since 2012
(for certain funds in
the Fund Complex);
since 2021 (for
the remaining funds in the
Fund Complex) | Senior Vice President of Wells Fargo Funds Management, LLC since 2009. Senior Vice President of Evergreen Investment Management Company, LLC from 2008 to 2010 and head of the Fund Reporting and Control Team within Fund Administration from 2005 to 2010. |
Michelle Rhee
(Born 1966) | Chief Legal Officer,
since 2019 | Secretary of Wells Fargo Funds Management, LLC and Chief Legal Counsel of Wells Fargo Asset Management since 2018. Deputy General Counsel of Wells Fargo Bank, N.A. since 2020 and Assistant General Counsel of Wells Fargo Bank, N.A. from 2018 to 2020. Associate General Counsel and Managing Director of Bank of America Corporation from 2004 to 2018. |
Catherine Kennedy
(Born 1969) | Secretary,
since 2019 | Vice President of Wells Fargo Funds Management, LLC and Senior Counsel of the Wells Fargo Legal Department since 2010. Vice President and Senior Counsel of Evergreen Investment Management Company, LLC from 1998 to 2010. |
Michael H. Whitaker
(Born 1967) | Chief Compliance Officer,
since 2016 | Chief Compliance Officer of Wells Fargo Asset Management since 2016. Senior Vice President and Chief Compliance Officer for Fidelity Investments from 2007 to 2016. |
1 The Statement of Additional Information includes additional information about the Trustees and is available, without charge, upon request, by calling 1-800-222-8222 or by visiting the website at wfam.com.
42 | Wells Fargo VT Index Asset Allocation Fund
Board considerations (unaudited)
BOARD CONSIDERATION OF INVESTMENT MANAGEMENT AND SUB-ADVISORY AGREEMENTS:
Board Considerations – Current Agreements
Under the Investment Company Act of 1940 (the “1940 Act”), the Board of Trustees (the “Board”) of Wells Fargo Variable Trust (the “Trust”) must determine annually whether to approve the continuation of the Trust’s investment management and sub-advisory agreements. In this regard, at a Board meeting held on May 17-19, 2021 (the “Meeting”), the Board, all the members of which have no direct or indirect interest in the investment management and sub-advisory agreements and are not “interested persons” of the Trust, as defined in the 1940 Act (the “Independent Trustees”), reviewed and approved for Wells Fargo VT Index Asset Allocation Fund (the “Fund”): (i) an investment management agreement (the “Management Agreement”) with Wells Fargo Funds Management, LLC (“Funds Management”); and (ii) an investment sub-advisory agreement (the “Sub-Advisory Agreement”) with Wells Capital Management Incorporated (the “Sub-Adviser”), an affiliate of Funds Management. The Management Agreement and the Sub-Advisory Agreement are collectively referred to as the “Advisory Agreements.”
The Board noted that Wells Fargo & Company recently announced that it had entered into a definitive agreement to sell Wells Fargo Asset Management (“WFAM”), which includes Funds Management and the Sub-Adviser, to GTCR LLC and Reverence Capital Partners, L.P. and/or their affiliates (the “Transaction”). The Board further noted that the Transaction would result in a change-of-control of Funds Management and the Sub-Adviser, which would be considered to be an assignment that would result in the termination of the Advisory Agreements. In light of the Transaction, the Board separately considered for approval a new investment management agreement with Funds Management and a new sub-advisory agreement with the Sub-Adviser (the “New Agreements”) that would replace the Advisory Agreements upon consummation of the Transaction, subject to approval of the New Agreements by the Fund’s shareholders. The Board also considered for approval interim agreements to go into effect in the event shareholders do not approve the New Agreements before the Transaction is completed. The interim agreements would allow the Manager and the Sub-Adviser to continue providing services to the Fund while the Fund continues to seek shareholder approval of the New Agreements. The Board noted that the terms of the interim agreements would be identical to those of the current Advisory Agreements, except for the term and certain escrow provisions.
At the Meeting, the Board considered the factors and reached the conclusions described below relating to the selection of Funds Management and the Sub-Adviser and the approval of the Advisory Agreements. Prior to the Meeting, including at Board meetings held in April and May 2021, the Trustees conferred extensively among themselves and with representatives of Funds Management about these matters. Also, the Board has adopted a team-based approach, with each team consisting of a sub-set of Trustees, to assist the full Board in the discharge of its duties in reviewing investment performance and other matters throughout the year. The Independent Trustees were assisted in their evaluation of the Advisory Agreements by independent legal counsel, from whom they received separate legal advice and with whom they met separately.
In providing information to the Board, Funds Management and the Sub-Adviser were guided by a detailed set of requests for information submitted to them by independent legal counsel on behalf of the Independent Trustees at the start of the Board’s annual contract renewal process earlier in 2021. In considering and approving the Advisory Agreements, the Trustees considered the information they believed relevant, including but not limited to the information discussed below. The Board considered not only the specific information presented in connection with the Meeting, but also the knowledge gained over time through interaction with Funds Management and the Sub-Adviser about various topics. In this regard, the Board reviewed reports of Funds Management at each of its quarterly meetings, which included, among other things, portfolio reviews and investment performance reports. In addition, the Board and the teams mentioned above confer with portfolio managers at various times throughout the year. The Board did not identify any particular information or consideration that was all-important or controlling, and each individual Trustee may have attributed different weights to various factors.
After its deliberations, the Board unanimously determined that the compensation payable to Funds Management and the Sub-Adviser under each of the Advisory Agreements was reasonable, and approved the continuation of the Advisory Agreements for a one-year term. The Board considered the approval of the Advisory Agreements for the Fund as part of its consideration of agreements for funds across the complex, but its approvals were made on a fund-by-fund basis. The following summarizes a number of important, but not necessarily all, factors considered by the Board in support of its approvals.
Nature, extent and quality of services
The Board received and considered various information regarding the nature, extent and quality of services provided to the Fund by Funds Management and the Sub-Adviser under the Advisory Agreements. This information included a description of the investment advisory services and Fund-level administrative services covered by the Management Agreement, as well as, among other things, a summary of the background and experience of senior management of WFAM, of which Funds Management and the Sub-Adviser are a part, and a summary of investments made in the business of WFAM. The Board also received a description of
Wells Fargo VT Index Asset Allocation Fund | 43
Board considerations (unaudited)
Funds Management’s and the Sub-Adviser’s business continuity plans, including a summary of the performance of such plans and any changes thereto during the COVID-19 pandemic, and of their approaches to data privacy and cybersecurity. The Board also received and reviewed information about Funds Management’s role as administrator of the Fund’s liquidity risk management program, Funds Management’s approach to risk management, and Funds Management’s intermediary and vendor oversight program.
The Board also considered the qualifications, background, tenure and responsibilities of each of the portfolio managers primarily responsible for the day-to-day portfolio management of the Fund. The Board evaluated the ability of Funds Management and the Sub-Adviser to attract and retain qualified investment professionals, including research, advisory and supervisory personnel.
The Board further considered the compliance programs and compliance records of Funds Management and the Sub-Adviser. In addition, the Board took into account the full range of services provided to the Fund by Funds Management and its affiliates. The Board also considered information about retention and back-up arrangements that have been put into place with respect to key personnel of WFAM in connection with the anticipated Transaction, noting that WFAM provided assurances that the announcement and eventual culmination of the Transaction is not expected to result in any diminution in the nature or quality of services provided to the Fund.
Fund investment performance and expenses
The Board considered the investment performance results for the Fund over various time periods ended December 31, 2020. The Board considered these results in comparison to the investment performance of funds in a universe that was determined by Broadridge Inc. (“Broadridge”) to be similar to the Fund (the “Universe”), and in comparison to the Fund’s benchmark index and to other comparative data. Broadridge is an independent provider of investment company data. The Board received a description of the methodology used by Broadridge to select the mutual funds in the performance Universe. The Board noted that the investment performance of the Fund was higher than the average investment performance of the Universe for all periods under review. The Board also noted that the investment performance of the Fund was lower than its benchmark index, the Index Asset Allocation Blended Index, for all periods under review except the one-year period, which was higher than its benchmark index.
The Board received information concerning, and discussed factors contributing to, the underperformance of the Fund relative to the Universe and benchmark for the periods identified above. The Board took note of the explanations for the relative underperformance during these periods, including with respect to investment decisions and market factors that affected the Fund’s investment performance.
The Board also received and considered information regarding the Fund’s net operating expense ratio and its various components, including actual management fees, custodian and other non-management fees, and Rule 12b-1 and non-Rule 12b-1 shareholder service fees. The Board considered this ratio in comparison to the median ratios of funds in an expense group that was determined by Broadridge to be similar to the Fund (the “Group”). The Board received a description of the methodology used by Broadridge to select the mutual funds in the expense Group and an explanation of how funds comprising expense group and their expense ratios may vary from year-to-year. Based on the Broadridge reports, the Board noted that the net operating expense ratio of the Fund was in range of the median net operating expense ratio of the expense Group.
The Board took into account the Fund’s investment performance and expense information provided to it among the factors considered in deciding to re-approve the Advisory Agreements.
Investment management and sub-advisory fee rates
The Board reviewed and considered the contractual fee rates payable by the Fund to Funds Management under the Management Agreement, as well as the contractual fee rates payable by the Fund to Funds Management for class-level administrative services under a Class-Level Administration Agreement, which include, among other things, class-level transfer agency and sub-transfer agency costs (collectively, the “Management Rate”). The Board also reviewed and considered the contractual investment sub-advisory fee rates that are payable by Funds Management to the Sub-Adviser for investment sub-advisory services.
Among other information reviewed by the Board was a comparison of the Fund’s Management Rate with the average contractual investment management fee rates of funds in the expense Group at a common asset level as well as transfer agency costs of the funds in the expense Group. The Board noted that the Management Rate of the Fund were lower than the sum of these average rates for the Fund’s expense Group.
The Board also received and considered information about the portion of the total management fee that was retained by Funds Management after payment of the fee to the Sub-Adviser for sub-advisory services. In assessing the reasonableness of this amount, the Board received and evaluated information about the nature and extent of responsibilities retained and risks assumed
44 | Wells Fargo VT Index Asset Allocation Fund
Board considerations (unaudited)
by Funds Management and not delegated to or assumed by the Sub-Adviser, and about Funds Management’s on-going oversight services. Given the affiliation between Funds Management and the Sub-Adviser, the Board ascribed limited relevance to the allocation of fees between them.
The Board also received and considered information about the nature and extent of services offered and fee rates charged by Funds Management and the Sub-Adviser to other types of clients with investment strategies similar to those of the Fund. In this regard, the Board received information about the significantly greater scope of services, and compliance, reporting and other legal burdens and risks of managing proprietary mutual funds compared with those associated with managing assets of other types of clients, including third-party sub-advised fund clients and non-mutual fund clients such as institutional separate accounts.
Based on its consideration of the factors and information it deemed relevant, including those described here, the Board determined that the compensation payable to Funds Management under the Management Agreement and to the Sub-Adviser under the Sub-Advisory Agreement was reasonable.
Profitability
The Board received and considered information concerning the profitability of Funds Management, as well as the profitability of both WFAM and Wells Fargo & Co. (“Wells Fargo”) from providing services to the fund family as a whole. The Board noted that the Sub-Adviser’s profitability information with respect to providing services to the Fund and other funds in the family was subsumed in the WFAM and Wells Fargo profitability analysis.
Funds Management reported on the methodologies and estimates used in calculating profitability, including a description of the methodology used to allocate certain expenses. Among other things, the Board noted that the levels of profitability reported on a fund-by-fund basis varied widely, depending on factors such as the size, type and age of fund.
Based on its review, the Board did not deem the profits reported by Funds Management, WFAM or Wells Fargo from services provided to the Fund to be at a level that would prevent it from approving the continuation of the Advisory Agreements.
Economies of scale
The Board received and considered information about the potential for Funds Management to experience economies of scale in the provision of management services to the Fund, the difficulties of calculating economies of scale at an individual fund level, and the extent to which potential scale benefits are shared with Fund shareholders. The Board noted the existence of breakpoints in the Fund’s management fee structure, which operate generally to reduce the Fund’s expense ratios as the Fund grows in size, and the size of the Fund in relation to such breakpoints. The Board considered that in addition to management fee breakpoints, Funds Management shares potential economies of scale from its management business in a variety of ways, including through fee waiver and expense reimbursement arrangements, competitive management fee rates set at the outset without regard to breakpoints, and investments in the business intended to enhance services available to shareholders.
The Board concluded that Funds Management’s arrangements with respect to the Fund, including contractual breakpoints, constituted a reasonable approach to sharing potential economies of scale with the Fund and its shareholders.
Other benefits to Funds Management and the Sub-Adviser
The Board received and considered information regarding potential “fall-out” or ancillary benefits received by Funds Management and its affiliates, including the Sub-Adviser, as a result of their relationships with the Fund. Ancillary benefits could include, among others, benefits directly attributable to other relationships with the Fund and benefits potentially derived from an increase in Funds Management’s and the Sub-Adviser’s business as a result of their relationships with the Fund. The Board noted that various affiliates of Funds Management may receive distribution-related fees, shareholder servicing payments and sub-transfer agency fees in respect of shares sold or held through them and services provided.
The Board also reviewed information about soft dollar credits earned and utilized by the Sub-Adviser, fees earned by Funds Management and the Sub-Adviser from managing a private investment vehicle for the fund family’s securities lending collateral, and commissions earned by an affiliated broker from portfolio transactions.
Based on its consideration of the factors and information it deemed relevant, including those described here, the Board did not find that any ancillary benefits received by Funds Management and its affiliates, including the Sub-Adviser, were unreasonable.
Conclusion
At the Meeting, after considering the above-described factors and based on its deliberations and its evaluation of the information described above, the Board unanimously determined that the compensation payable to Funds Management and the Sub-Adviser under each of the Advisory Agreements was reasonable, and approved the continuation of the Advisory Agreements for a one-year term.
Wells Fargo VT Index Asset Allocation Fund | 45
Board considerations (unaudited)
Board Considerations – New Agreements
Overview of the Board evaluation process
At a meeting held on May 17-19, 2021 (the “Board Meeting”), the Board of Trustees (the “Board”) of Wells Fargo Variable Trust (the “Trust”, and the series thereof, the “Funds”) approved the continuation of each Fund’s current Investment Management Agreement (the “Current Investment Management Agreement”) and the current Wells Cap Sub-Advisory Agreement (the “Current Wells Cap Sub-Advisory Agreement”, and collectively, the “Current Agreements”). Each Trustee on the Board is not an “interested person” (as defined in the Investment Company Act of 1940 (the “1940 Act”)) of the Funds (collectively, the “Independent Trustees”). The process followed by the Board in considering and approving the continuation of the Current Agreements is referred to herein as the “2021 Annual Approval Process.”
As noted above, the closing of the sale of Wells Fargo Asset Management (“WFAM”) to a holding company (“NewCo”) affiliated with private funds of GTCR LLC (“GTCR”) and of Reverence Capital Partners, L.P. (“Reverence Capital”, and such transaction, the “Transaction”) will result in a change of control of Wells Fargo Funds Management LLC (“Funds Management”) and Wells Capital Management Incorporated (“Wells Capital” or the “Sub-Adviser”, and together with Funds Management, the “Advisers”), which will be considered to be an “assignment” of each Fund’s Current Agreements under the 1940 Act that will result in the automatic termination of each Fund’s Current Agreements. In light of the expected termination of each Fund’s Current Agreements upon the closing, at the Board Meeting the Board also considered and approved: (i) a new Investment Management Agreement between the Trust, on behalf of each Fund, and Funds Management (the “New Investment Management Agreement”); and (ii) a new Sub-Advisory Agreement among the Trust, on behalf of each Fund, Funds Management and Wells Capital (the “New Sub-Advisory Agreement”, and collectively, the “New Agreements”), each of which is intended to go into effect upon the closing. The process followed by the Board in reviewing and approving the New Agreements is referred to herein as the “New Agreement Approval Process.”
At a series of meetings held in April and May 2021 (collectively, “April and May 2021 Meetings”) and at the Board Meeting, the Trustees conferred extensively among themselves and with senior representatives of Funds Management, GTCR and Reverence Capital about the New Agreements and related matters. The Board reviewed and discussed information furnished by Funds Management, GTCR and Reverence Capital that the Board considered reasonably necessary to evaluate the terms of the New Agreements and the services to be provided. At these meetings, senior representatives from Funds Management, GTCR and Reverence Capital made presentations to, and responded to questions from, the Board.
In providing information to the Board in connection with the 2021 annual approval process for the Current Agreements (the “2021 Annual Approval Process”) and the New Agreement Approval Process, Funds Management, GTCR and Reverence Capital (as applicable) were guided by requests for information submitted by independent legal counsel on behalf of the Independent Trustees. In considering and approving the New Agreements, the Trustees considered the information they believed relevant, including but not limited to the information discussed herein. The Board considered not only the specific information presented in connection with the April and May 2021 Meetings as well as the Board Meeting, but also the knowledge gained over time through interaction with Funds Management and the Sub-Adviser about various topics. In this regard, the Board reviews reports of Funds Management at each of its regular Board meetings, which includes, among other things, portfolio reviews and investment performance reports. In addition, the Board confers with portfolio managers at various times throughout the year. The Board was assisted in its evaluation of the New Agreements by independent legal counsel, from whom the Independent Trustees received separate legal advice and with whom the Independent Trustees met separately. The Board did not identify any particular information or consideration that was all-important or controlling, and each individual Trustee may have attributed different weights to various factors.
Among other information considered by the Board in connection with the Transaction was:
| ■ | Information regarding the Transaction: information about the structure, financing sources and material terms and conditions of the Transaction, including the expected impact on the businesses conducted by the Advisers and by Wells Fargo Funds Distributor LLC, as the distributor of Fund shares. |
| ■ | Information regarding NewCo, GTCR and Reverence Capital: (i) information about NewCo, including information about its expected financial condition and access to capital, and senior leadership team; (ii) the experience of senior management at GTCR and Reverence Capital in acquiring portfolio companies; (iii) the plan to operationalize NewCo, including the transition of necessary infrastructure services through a transition services agreement with Wells Fargo under which Wells Fargo will continue to provide NewCo with certain services for a specified period of time after the closing; and (iv) information regarding regulatory matters, compliance, and risk management functions at NewCo, including resources to be dedicated thereto. |
46 | Wells Fargo VT Index Asset Allocation Fund
Board considerations (unaudited)
| ■ | Impact of the Transaction on WFAM and Service Providers: (i) information regarding any changes to personnel and/or other resources of the Advisers as a result of the Transaction, including assurances regarding comparable and competitive compensation arrangements to attract and retain highly qualified personnel; and (ii) information about the organizational and operating structure with respect to NewCo, the Advisers and the Funds. |
| ■ | Impact of the Transaction on the Funds and their Shareholders: (i) information regarding anticipated benefits to the Funds as a result of the Transaction; (ii) a commitment that the Funds would not bear any expenses, directly or indirectly, in connection with the Transaction; (iii) confirmation that the Advisers intend to continue to manage the Funds in a manner consistent with each Fund’s current investment objectives and principal investments strategies; and (iv) a commitment that neither NewCo nor WFAM will take any steps that would impose any “unfair burden” (as that term is used in section 15(f)(1)(B) of the 1940 Act) on the Funds as a result of the Transaction. |
With respect to the New Agreements, the Board considered: (i) a representation that, after the closing, all of the Funds will continue to be managed and advised by their current Advisers, and that the same portfolio managers of the Sub-Adviser are expected to continue to manage the Funds after the Transaction; (ii) information regarding the terms of the New Agreements, including changes as compared to the Current Agreements; (iii) information confirming that the fee rates payable under the New Agreements will not increase as a result of the Transaction as compared to the rates under the Current Agreements; and (iv) assurances that the Transaction is not expected to cause any diminution with respect to the nature, extent and quality of any of the services currently provided to the Funds by the Advisers as a result of the Transaction.
In addition to considering information furnished specifically to evaluate the impact of the Transaction on the Funds and their respective shareholders in connection with the New Agreement Approval Process, the Board considered information furnished at prior meetings of the Board and its committees, including detailed information provided in connection with the 2021 Annual Approval Process. In this regard, in connection with the 2021 Annual Approval Process, the Board received information about complex-wide and individual Fund performance, fees and expenses, including: (i) a report from an independent data provider comparing the investment performance of each Fund to the investment performance of comparable funds and benchmark indices, over various time periods; (ii) a report from an independent data provider comparing each Fund’s total expense ratio (and its components) to those of comparable funds; (iii) comparative information concerning the fees charged and services provided by the Advisers to each Fund in managing other accounts (which may include other mutual funds, collective investment funds and institutional accounts), if any, that employ investment strategies and techniques similar to those used in managing such Fund(s); and (iv) profitability analyses of Funds Management, as well as the profitability of both WFAM and Wells Fargo from providing services to the fund family as a whole.
After its deliberations, the Board unanimously determined that the compensation payable to Funds Management and the Sub-Adviser under the New Agreements is reasonable, approved the New Agreements for a two-year term, and voted to recommend that Fund shareholders approve the New Agreements. The Board considered the approval of the New Agreements as part of its consideration of agreements for funds across the complex, but its approvals were made on a fund-by-fund basis. The following summarizes a number of important, but not necessarily all, factors considered by the Board in support of its approvals.
Nature, extent and quality of services
In connection with the 2021 Annual Approval Process, the Board received and considered various information regarding the nature, extent and quality of services provided to each Fund by Funds Management and the Sub-Adviser under the Current Agreements. This information included a description of the investment advisory services and Fund-level administrative services covered by the Current Management Agreement, as well as, among other things, a summary of the background and experience of senior management of WFAM, of which Funds Management and the Sub-Adviser are a part, and a summary of investments made in the business of WFAM. The Board also received a description of Funds Management’s and the Sub-Adviser’s business continuity plans, including a summary of the performance of such plans and any changes thereto during the COVID-19 pandemic, and of their approaches to data privacy and cybersecurity. The Board also received and reviewed information about Funds Management’s role as administrator of the Funds’ liquidity risk management program, Funds Management’s approach to risk management, and Funds Management’s intermediary and vendor oversight program.
In connection with the 2021 Annual Approval Process, the Board also considered the qualifications, background, tenure and responsibilities of each of the portfolio managers primarily responsible for the day-to-day portfolio management of the Funds. The Board evaluated the ability of Funds Management and the Sub-Adviser to attract and retain qualified investment professionals, including research, advisory and supervisory personnel.
In connection with the 2021 Annual Approval Process, the Board further considered the compliance programs and compliance records of Funds Management and the Sub-Adviser. In addition, the Board took into account the full range of services provided to the Funds by Funds Management and its affiliates.
Wells Fargo VT Index Asset Allocation Fund | 47
Board considerations (unaudited)
In connection with the New Agreement Approval Process, the Board considered, among other information, the structure of the Transaction and expected impact, if any, of the Transaction on the operations, facilities, organization and personnel of the Advisers. The Board received assurances from Funds Management that each Fund will continue to be advised by its current Sub-Adviser after the closing, and that the same individual portfolio managers are expected to continue to manage the Funds after the closing. With respect to the recruitment and retention of key personnel, the Board noted information from GTCR, Reverence Capital and the Advisers regarding the potential benefits for employees of joining NewCo. The Board recognized that the personnel who had been extended offers may not accept such offers, and personnel changes may occur in the future in the ordinary course.
In addition, the Board considered information regarding the infrastructure, operational capabilities and support staff in place to assist in the portfolio management and operations of the Funds, including the provision of administrative services, and the anticipated impact of the Transaction on such matters. The Board also considered the business-related and other risks to which the Advisers may be subject in managing the Funds and in connection with the Transaction. The Board also considered the transition and integration plans as a result of the change in ownership of the Advisers from Wells Fargo to NewCo. The Board considered the resources and infrastructure that NewCo intends to devote to its compliance program to ensure compliance with applicable laws and regulations, as well as its risk management program and cybersecurity program. The Board also took into account assurances received from the Advisers, GTCR and Reverence Capital that the Transaction is not expected to cause any diminution in the nature, extent and quality of services provided by the Advisers to the Funds and their shareholders.
Fund investment performance and expenses
In connection with the 2021 Annual Approval Process, the Board considered the investment performance results for each Fund over various time periods ended December 31, 2020. The Board considered these results in comparison to the investment performance of funds in a universe that was determined by Broadridge Inc. (“Broadridge”) to be similar to each Fund (the “Universe”), and in comparison to each Fund’s benchmark index and to other comparative data. Broadridge is an independent provider of investment company data. The Board received a description of the methodology used by Broadridge to select the mutual funds in the performance Universe. Where applicable, the Board received information concerning, and discussed factors contributing to, underperformance of Funds relative to the Universe and benchmark for any underperformance periods.
In connection with the 2021 Annual Approval Process, the Board also received and considered information regarding each Fund’s net operating expense ratios and their various components, including actual management fees, custodian and other non-management fees, and Rule 12b-1 and non-Rule 12b-1 shareholder service fees. The Board considered these ratios in comparison to the median ratios of funds in class-specific expense groups that were determined by Broadridge to be similar to the Fund (the “Groups”). The Board received a description of the methodology used by Broadridge to select the mutual funds in the expense Groups and an explanation of how funds comprising expense groups and their expense ratios may vary from year-to-year.
In connection with the New Agreement Approval Process, the Board received a commitment that WFAM will maintain fee and expense commitments for at least two years after the closing. The Board took into account each Fund’s investment performance and expense information among the factors considered in deciding to approve the New Agreements.
Investment management and sub-advisory fee rates
In connection with the 2021 Annual Approval Process, the Board reviewed and considered the contractual fee rates payable by each Fund to Funds Management under the Current Management Agreement, as well as the contractual fee rates payable by each Fund to Funds Management for class-level administrative services under a Class-Level Administration Agreement, which include, among other things, class-level transfer agency and sub-transfer agency costs (collectively, the “Management Rates”). The Board also reviewed and considered the contractual investment sub-advisory fee rates that are payable by Funds Management to the Sub-Adviser under the Current Sub-Advisory Agreements for investment sub-advisory services (the “Sub-Advisory Fee Rates”).
Among other information reviewed by the Board in connection with the 2021 Annual Approval Process, was a comparison of each Fund’s Management Rates with the average contractual investment management fee rates of funds in the expense Groups at a common asset level as well as transfer agency costs of the funds in the expense Groups.
In connection with the 2021 Annual Approval Process, the Board also received and considered information about the portion of the total management fee that was retained by Funds Management after payment of the Sub-Advisory Fee Rates. In assessing the reasonableness of this amount, the Board received and evaluated information about the nature and extent of responsibilities retained and risks assumed by Funds Management and not delegated to or assumed by the Sub-Adviser, and about Funds Management’s on-going oversight services. Given the affiliation between Funds Management and the Sub-Adviser, the Board ascribed limited relevance to the allocation of fees between them.
48 | Wells Fargo VT Index Asset Allocation Fund
Board considerations (unaudited)
In connection with the 2021 Annual Approval Process, the Board also received and considered information about the nature and extent of services offered and fee rates charged by Funds Management and the Sub-Adviser to other types of clients, if any, with investment strategies similar to those of each Fund. In this regard, the Board received information about the significantly greater scope of services, and compliance, reporting and other legal burdens and risks of managing proprietary mutual funds compared with those associated with managing assets of other types of clients, including third-party sub-advised fund clients and non-mutual fund clients such as institutional separate accounts.
In connection with the New Agreement Approval Process, the Board noted the assurances received by it that there would be no increases to any of the Management Rates or the Sub-Advisory Fee Rates as a result of the Transaction. The Board also considered that the New Agreements do not change the computation method for calculating such fees, and there is no present intention to reduce expense waiver and reimbursement arrangements that are currently in effect. Based on its consideration of the factors and information it deemed relevant, including those described here, the Board determined that the compensation payable to Funds Management under the New Management Agreement and to the Sub-Adviser under the New Sub-Advisory Agreement was reasonable.
Profitability
In connection with the 2021 Annual Approval Process, the Board received and considered information concerning the profitability of Funds Management, as well as the profitability of both WFAM and Wells Fargo from providing services to the fund family as a whole. The Board noted that the Sub-Adviser’s profitability information with respect to providing services to each Fund and other funds in the family was subsumed in the WFAM and Wells Fargo profitability analysis.
Funds Management reported on the methodologies and estimates used in calculating profitability in connection with the 2021 Annual Approval Process, including a description of the methodology used to allocate certain expenses. Among other things, the Board noted that the levels of profitability reported on a fund-by-fund basis varied widely, depending on factors such as the size, type and age of fund.
In connection with the New Agreement Approval Process, the Board received certain information about NewCo’s projected financial condition, and reviewed with senior representatives of Funds Management, GTCR and Reverence Capital the underlying assumptions on which such information was based. The Board considered that NewCo is a newly formed entity, with no historical operations, revenues or expenses, and that it is difficult to predict with any degree of certainty the future profitability of NewCo and the Advisers from advisory activities under the New Agreements. The Board considered that the fee rates payable under the New Agreements will not increase as a result of the Transaction as compared to the rates under the Current Agreements, and that the current contractual expense limitations applicable to each Fund will not increase. The Board noted that if the New Agreements are approved by shareholders and the Transaction closes, the Board will have the opportunity in the future to review the profitability of NewCo and the Advisers from advisory activities under the New Agreements.
Economies of scale
In connection with the 2021 Annual Approval Process, the Board received and considered information about the potential for Funds Management to experience economies of scale in the provision of management services to the Funds, the difficulties of calculating economies of scale at an individual fund level, and the extent to which potential scale benefits are shared with Fund shareholders. The Board noted the existence of breakpoints in each Fund’s management fee structure, which operate generally to reduce the Fund’s expense ratios as the Fund grows in size, and the size of the Fund in relation to such breakpoints. The Board considered that, in addition to management fee breakpoints, Funds Management shares potential economies of scale from its management business in a variety of ways, including through fee waiver and expense reimbursement arrangements, competitive management fee rates set at the outset without regard to breakpoints, and investments in the business intended to enhance services available to shareholders.
In connection with the New Agreement Approval Process, the Board noted that NewCo and the Advisers may benefit from possible growth of the Funds resulting from enhanced distribution capabilities. However, the Board noted that other factors could also affect the potential for economies of scale, and that it was not possible to quantify any potential future economies of scale. Based upon the information furnished to the Board in connection with the 2021 Annual Approval Process and the New Agreement Approval Process, the Board concluded that Funds Management’s arrangements with respect to each Fund, including contractual breakpoints and expense limitation arrangements, constitute a reasonable approach to sharing potential economies of scale with the Fund and its shareholders.
“Fall-out” benefits to Funds Management and the Sub-Adviser
In connection with the 2021 Annual Approval Process, the Board received and considered information regarding potential “fall-out” or ancillary benefits received by Funds Management and its affiliates, including the Sub-Adviser, as a result of their relationships with the Funds. Ancillary benefits could include, among others, benefits directly attributable to other relationships
Wells Fargo VT Index Asset Allocation Fund | 49
Board considerations (unaudited)
with the Funds and benefits potentially derived from an increase in Funds Management’s and the Sub-Adviser’s business as a result of their relationships with the Funds. The Board noted that various current affiliates of Funds Management may receive distribution-related fees, shareholder servicing payments and sub-transfer agency fees in respect of shares sold or held through them and services provided.
In connection with the 2021 Annual Approval Process, the Board also reviewed information about soft dollar credits earned and utilized by the Sub-Adviser, fees earned by Funds Management and the Sub-Adviser from managing a private investment vehicle for the fund family’s securities lending collateral, and commissions earned by an affiliated broker of Wells Fargo from portfolio transactions.
In connection with the New Agreement Approval Process, the Board received information to the effect that the Transaction is not expected to have a material impact on the fall-out benefits currently realized by Funds Management and its affiliates, including the Sub-Adviser. The information reviewed by the Board also noted that several of the ancillary benefits identified for WFAM would be potential ancillary benefits for NewCo, including that the scale and reputation of the Funds might benefit NewCo’s broader reputation, product initiatives, technology investment and talent acquisition. Based on its consideration of the factors and information it deemed relevant, including those described here, the Board did not find that any ancillary benefits expected to be received by Funds Management and its affiliates, including NewCo and the Sub-Adviser, under the New Agreements were unreasonable.
Conclusion
At the Board Meeting, after considering the above-described factors and based on its deliberations and its evaluation of the information described above, the Board unanimously determined that the compensation payable to Funds Management and the Sub-Adviser under the New Agreements is reasonable, approved the New Agreements for a two-year term, and voted to recommend that Fund shareholders approve the New Agreements.
50 | Wells Fargo VT Index Asset Allocation Fund
Board considerations (unaudited)
Board Considerations - Interim Agreements
At a meeting held on May 17-19, 2021 (the “Board Meeting”), the Boards of Trustees (each, a “Board”, and collectively, the “Boards”) of Wells Fargo Funds Trust, Wells Fargo Master Trust, Wells Fargo Variable Trust, Wells Fargo Global Dividend Opportunity Fund, Wells Fargo Income Opportunities Fund, Wells Fargo Multi-Sector Income Fund and Wells Fargo Utilities and High Income Fund (each a “Trust”, and the series thereof, a “Fund”) reviewed and approved for the Trusts and Funds, as applicable: (i) interim investment management agreements (the “Interim Management Agreements”) with Wells Fargo Funds Management, LLC (“Funds Management”); (ii) interim investment advisory agreements (the “Interim Advisory Agreements”) with Funds Management; and (iii) interim sub-advisory agreements (the “Interim Sub-Advisory Agreements”) with each of Cooke & Bieler, L.P., Galliard Capital Management, LLC (“Galliard”), Peregrine Capital Management Inc., Wells Capital Management, LLC (“WellsCap”), and Wells Fargo Asset Management (International) Limited (“WFAMI”, and collectively, the “Sub-Advisers”). Each Trustee on the Board is not an “interested person” (as defined in the Investment Company Act of 1940 (the “1940 Act”) of the Funds (collectively, the “Independent Trustees”). The Interim Management Agreements, Interim Advisory Agreements, and Interim Sub-Advisory Agreements are collectively referred to as the “Interim Advisory Agreements.”
At the Board Meeting, the Boards reviewed and approved the continuation of existing investment management, advisory and sub-advisory agreements (the “Current Advisory Agreements”) for each Trust and Fund, as applicable. The factors considered and conclusions reached by the Boards in approving the Current Advisory Agreements are summarized in the section entitled “Board Considerations – Current Agreements” of this shareholder report. The Boards noted that Wells Fargo & Company has entered into a definitive agreement to sell Wells Fargo Asset Management (“WFAM”), which includes Funds Management, Galliard, WellsCap and WFAMI (the “Affiliated Sub-Advisers”), to a holding company affiliated with private funds of GTCR LLC and Reverence Capital Partners, L.P. (the “Transaction”). The Boards further noted that the Transaction would result in a change-of-control of Funds Management and the Affiliated Sub-Advisers, which would be considered to be an “assignment” under the 1940 Act that would terminate the Current Advisory Agreements. At the Board Meeting, the Boards also reviewed and approved new investment management, advisory and sub-advisory agreements (the “New Advisory Agreements”) for each Trust and Fund, as applicable, that would replace the Current Advisory Agreements upon consummation of the Transaction, subject to approval of the New Advisory Agreements by the applicable Trust’s or Fund’s shareholders. The factors considered and conclusions reached by the Boards in approving the New Advisory Agreements are summarized in the section entitled “Board Considerations – New Agreements” of this shareholder report.
At the Board Meeting, the Boards also approved the Interim Advisory Agreements, which will go into effect for a Trust or Fund only in the event that shareholders of such Trust or Fund do not approve the New Advisory Agreement(s) for the Trust or Fund by the closing date of the Transaction, when the Current Advisory Agreements will terminate. The Board noted that, in such a circumstance, the Interim Advisory Agreements will permit continuity of management by allowing Funds Management and the Sub-Advisers to continue providing services to the Trust or Fund pursuant to the Interim Advisory Agreements while the Trust or Fund continues to solicit shareholder approval of such New Advisory Agreement(s). The Boards noted that the terms of the Interim Advisory Agreements are identical to those of the Current Advisory Agreements, except for the term and the addition of escrow provisions with respect to the advisory fees. The Boards also noted that the entities that would service the Funds and Trusts under the Interim Advisory Agreements are identical to those that provide services under the Current Advisory Agreements and those that will provide services under the New Advisory Agreements.
In approving the Interim Advisory Agreements, the Boards considered the same factors and reached the same conclusions as they considered and reached with respect to the Boards’ approvals of the Current Advisory Agreements and New Advisory Agreements, as applicable, which are described in separate Board Consideration sections within this shareholder report. Prior to the Board Meeting, including at a series of meetings held in April and May 2021, the Trustees conferred extensively among themselves and with senior representatives of Funds Management, GTCR LLC and Reverence Capital Partners, L.P. about the Interim Advisory Agreements and related matters. The Independent Trustees were assisted in their evaluation of the Interim Advisory Agreements by independent legal counsel, from whom they received separate legal advice and with whom they met separately.
At the Board Meeting, after considering the factors and reaching the conclusions described in the separate Board Consideration sections within this shareholder report, the Boards unanimously determined that the compensation payable to Funds Management and to each Sub-Adviser under each of the Interim Advisory Agreements was reasonable, and approved the Interim Advisory Agreements.
Wells Fargo VT Index Asset Allocation Fund | 51
For more information
More information about Wells Fargo Funds is available free upon request. To obtain literature, please write, visit the Fund's website, or call:
Wells Fargo Funds
P.O. Box 219967
Kansas City, MO 64121-9967
Website: wfam.com
Individual investors: 1-800-222-8222
Retail investment professionals: 1-888-877-9275
Institutional investment professionals: 1-866-765-0778
This report and the financial statements contained herein are submitted for the general information of the shareholders of the Fund. If this report is used for promotional purposes, distribution of the report must be accompanied or preceded by a current prospectus. Before investing, please consider the investment objectives, risks, charges, and expenses of the investment. For a current prospectus and, if available, a summary prospectus, containing this information, call 1-800-260-5969 or visit the Fund's website at wfam.com. Read the prospectus carefully before you invest or send money.
Wells Fargo Asset Management (WFAM) is the trade name for certain investment advisory/management firms owned by Wells Fargo & Company. These firms include but are not limited to Wells Capital Management, LLC and Wells Fargo Funds Management, LLC. Certain products managed by WFAM entities are distributed by Wells Fargo Funds Distributor, LLC (a broker-dealer and Member FINRA).
This material is for general informational and educational purposes only and is NOT intended to provide investment advice or a recommendation of any kind - including a recommendation for any specific investment, strategy, or plan.
INVESTMENT PRODUCTS: NOT FDIC INSURED ■ NO BANK GUARANTEE ■ MAY LOSE VALUE
© 2021 Wells Fargo & Company. All rights reserved.
PAR-0721-00693 08-21
SVT2/SAR136 06-21
Semi-Annual Report
June 30, 2021
Wells Fargo
VT International Equity Fund
Reduce clutter.
Save trees.
Sign up for electronic delivery of prospectuses and shareholder reports at wellsfargo.com/ advantagedelivery
The views expressed and any forward-looking statements are as of June 30, 2021, unless otherwise noted, and are those of the Fund's portfolio managers and/or Wells Fargo Asset Management. Discussions of individual securities or the markets generally are not intended as individual recommendations. Future events or results may vary significantly from those expressed in any forward-looking statements. The views expressed are subject to change at any time in response to changing circumstances in the market. Wells Fargo Asset Management disclaims any obligation to publicly update or revise any views expressed or forward-looking statements.
INVESTMENT PRODUCTS: NOT FDIC INSURED ■ NO BANK GUARANTEE ■ MAY LOSE VALUE
Wells Fargo VT International Equity Fund | 1
Letter to shareholders (unaudited)
Andrew Owen
President
Wells Fargo Funds
Dear Shareholder:
We are pleased to offer you this semi-annual report for the Wells Fargo VT International Equity Fund for the six-month period that ended June 30, 2021. Global stocks continued to rally as the global economy continued to emerge from the haze of COVID-19. Tailwinds were provided by global stimulus programs, a rapid vaccination rollout, and recovering consumer and corporate sentiment. Bonds were mixed during the period, with municipal bonds and high-yield bonds delivering positive returns.
For the six-month period, U.S. stocks, based on the S&P 500 Index,1 gained 15.25%. International stocks, as measured by the MSCI ACWI ex USA Index (Net),2 returned 9.16%, while the MSCI EM Index (Net),3 trailed its developed market counterparts with a 7.45% gain. Among bond indexes, the Bloomberg Barclays U.S. Aggregate Bond Index,4 returned -1.60%, the Bloomberg Barclays Global Aggregate ex-USD Index (unhedged),5 returned -4.42%, the Bloomberg Barclays Municipal Bond Index,6 returned 1.06%, and the ICE BofA U.S. High Yield Index,7 returned 3.70%.
Vaccination rollout drove the stock markets to new highs.
The year 2021 began with emerging market stocks leading all major asset classes in January, driven by China’s strong economic growth and a broad recovery in corporate earnings, which propelled China’s stock market higher. In the United States, positive news on vaccine trials and January expansion in both the manufacturing and services sectors was offset by a weak December monthly jobs report. This was compounded by technical factors as some hedge funds were forced to sell stocks to protect themselves against a well-publicized short squeeze coordinated by a group of retail investors. Eurozone sentiment and economic growth were particularly weak, reflecting the impact of a new lockdown with stricter social distancing along with a slow vaccine rollout.
February saw major domestic equity indexes driven higher on the hope of a new stimulus bill, improving COVID-19 vaccination numbers, and the gradual reopening of the economy. Most S&P 500 companies reported better-than-expected earnings, with positive surprises coming from the financials, information technology, health care, and materials sectors. Japan saw its economy strengthen as a result of strong export numbers. Meanwhile, crude oil prices continued their climb, rising more than 25% for the year. Domestic government bonds experienced a sharp sell-off in late February as markets priced in a more robust economic recovery and higher future growth and inflation expectations.
| 1 | The S&P 500 Index consists of 500 stocks chosen for market size, liquidity, and industry group representation. It is a market-value-weighted index with each stock's weight in the index proportionate to its market value. You cannot invest directly in an index. |
| 2 | The Morgan Stanley Capital International (MSCI) All Country World Index (ACWI) ex USA Index (Net) is a free-float-adjusted market-capitalization-weighted index that is designed to measure the equity market performance of developed and emerging markets, excluding the United States. Source: MSCI. MSCI makes no express or implied warranties or representations and shall have no liability whatsoever with respect to any MSCI data contained herein. The MSCI data may not be further redistributed or used as a basis for other indices or any securities or financial products. This report is not approved, reviewed, or produced by MSCI. You cannot invest directly in an index. |
| 3 | The MSCI Emerging Markets (EM) Index (Net) is a free-float-adjusted market-capitalization-weighted index that is designed to measure equity market performance of emerging markets. You cannot invest directly in an index. |
| 4 | The Bloomberg Barclays U.S. Aggregate Bond Index is a broad-based benchmark that measures the investment-grade, U.S. dollar-denominated, fixed-rate taxable bond market, including Treasuries, government-related and corporate securities, mortgage-backed securities (agency fixed-rate and hybrid adjustable-rate mortgage pass-throughs), asset-backed securities, and commercial mortgage-backed securities. You cannot invest directly in an index. |
| 5 | The Bloomberg Barclays Global Aggregate ex-USD Index (unhedged) is an unmanaged index that provides a broad-based measure of the global investment-grade fixed-income markets excluding the U.S. dollar-denominated debt market. You cannot invest directly in an index. |
| 6 | The Bloomberg Barclays Municipal Bond Index is an unmanaged index composed of long-term tax-exempt bonds with a minimum credit rating of Baa. You cannot invest directly in an index. |
| 7 | The ICE BofA U.S. High Yield Index is a market-capitalization-weighted index of domestic and Yankee high-yield bonds. The index tracks the performance of high-yield securities traded in the U.S. bond market. You cannot invest directly in an index. Copyright 2021. ICE Data Indices, LLC. All rights reserved. |
2 | Wells Fargo VT International Equity Fund
Letter to shareholders (unaudited)
The passage of the massive domestic stimulus bill highlighted March activity, leading to increased forecasts for U.S. growth in 2021. Domestic employment surged as COVID-19 vaccinations and an increasingly open economy spurred hiring. A majority of U.S. small companies reported they were operating at pre-pandemic capacity or higher. Value stocks continued its outperformance of growth stocks in the month, continuing the trend that started in late 2020. Meanwhile, most major developed global equity indexes were up month to date on the back of rising optimism regarding the outlook for global growth. While the U.S. and U.K. had been most successful in terms of the vaccine rollout, even in markets where the vaccine lagged, such as in the eurozone and Japan, equity indexes in many of those countries had also been in positive territory for the year.
Equity markets produced another strong showing in April. Domestically, the continued reopening of the economy had a strong impact on positive equity performance, as people started leaving their households and jobless claims continued to fall. Domestic corporate bonds performed well and the U.S. dollar weakened. Meanwhile, the U.S. government continued to seek to invest in the recovery, this time by outlining a package of over $2 trillion to improve infrastructure. The primary headwind in April was inflation, as investors tried to determine the breadth and longevity of recent price increases. Developed Europe has been supported by a meaningful increase in the pace of vaccinations. Unfortunately many emerging market countries have not been as successful. India in particular has seen COVID-19 cases surge, serving as an example of the need to get vaccinations rolled out to less developed nations.
Vaccine rollouts continued in May, leading to loosened restrictions globally. As a result, equity markets in general saw a minor increase in returns. Concerns that the continued economic rebound could result in inflation increases becoming more than transitory were supported by the higher input costs businesses were experiencing. Meanwhile, those inflation concerns were tempered by the U.S. Federal Reserve Board (Fed), which stayed steady on its view of the economy and eased fears of a sudden and substantial policy change. Positive performance in the emerging market equity space was supported this month by steady consumer demand and strong commodity prices. Fixed-income markets were also slightly positive for the month, driven by inflation uncertainty and a softer U.S. dollar.
June witnessed the S&P 500 Index reach a new all-time high. 2021 economic growth and inflation forecasts were revised higher to reflect a strong economic recovery and some supply and demand imbalances. Late June saw a deal reached on a U.S. infrastructure package of approximately $1 trillion for road, bridge, and broadband network upgrades over the next eight years. The Fed’s June meeting yielded no change to policy, but its projections pointed to a possible interest rate rise in 2023. This, combined with a rebound in economic activity and investors searching for yield, led to U.S. Treasury yields being down for the month. Many European and Asian countries saw vaccination momentum increase, while the U.K. dealt with a rise in COVID-19 infections, specifically the Delta variant. Meanwhile, crude oil jumped over 10% in June on the back of the pickup in global economic activity and the Organization of the Petroleum Exporting Countries’ slow pace of supply growth.
Don’t let short-term uncertainty derail long-term investment goals.
Periods of investment uncertainty can present challenges, but experience has taught us that maintaining long-term investment goals can be an effective way to plan for the future. Although diversification cannot guarantee an investment profit or prevent losses, we believe it can be an effective way to manage investment risk and potentially smooth out overall portfolio performance. We encourage investors to know their investments and to understand that appropriate levels of risk-taking may unlock opportunities.
Thank you for choosing to invest with Wells Fargo Funds. We appreciate your confidence in us and remain committed to helping you meet your financial needs.
Sincerely,
Andrew Owen
President
Wells Fargo Funds
“The passage of the massive domestic stimulus bill highlighted March activity, leading to increased forecasts for U.S. growth in 2021.”
“2021 economic growth and inflation forecasts were revised higher to reflect a strong economic recovery and some supply and demand imbalances.”
For further information about your Fund, contact your investment professional, visit our website at wfam.com, or call us directly at 1-800-222-8222.
Wells Fargo VT International Equity Fund | 3
Performance highlights (unaudited)
| Investment objective | The Fund seeks long-term capital appreciation. |
| Manager | Wells Fargo Funds Management, LLC |
| Subadviser | Wells Capital Management, LLC |
| Portfolio managers | Venkateshwar (Venk) Lal, Dale A. Winner, CFA®‡ |
| Average annual total returns (%) as of June 30, 2021 |
| | | | | | Expense ratios1 (%) |
| | Inception date | 1 year | 5 year | 10 year | Gross | Net 2 |
| Class 1 | 8-17-1998 | 42.66 | 9.00 | 4.86 | 1.13 | 0.69 |
| Class 2 | 7-31-2002 | 42.11 | 8.73 | 4.60 | 1.38 | 0.94 |
| MSCI ACWI ex USA Index (Net)3 | – | 35.72 | 11.08 | 5.45 | – | – |
| MSCI ACWI ex USA Value Index (Net)4 | – | 37.56 | 8.54 | 3.48 | – | – |
| 1 | Reflects the expense ratios as stated in the most recent prospectuses. The expense ratios shown are subject to change and may differ from the annualized expense ratios shown in the financial highlights of this report. |
| 2 | The manager has contractually committed through April 30, 2022, to waive fees and/or reimburse expenses to the extent necessary to cap total annual fund operating expenses after fee waivers at 0.69% for Class 1 shares and 0.94% for Class 2 shares. Brokerage commissions, stamp duty fees, interest, taxes, acquired fund fees and expenses (if any), and extraordinary expenses are excluded from the expense caps. Prior to or after the commitment expiration date, the caps may be increased or the commitment to maintain the caps may be terminated only with the approval of the Board of Trustees. Without these caps, the Fund’s returns would have been lower. The expense ratio paid by an investor is the net expense ratio (the total annual fund operating expenses after fee waivers) as stated in the prospectuses. |
| 3 | The Morgan Stanley Capital International (MSCI) All Country World Index (ACWI) ex USA Index (Net) is a free-float-adjusted market capitalization-weighted index that is designed to measure the equity market performance of developed and emerging markets, excluding the United States. Source: MSCI. MSCI makes no express or implied warranties or representations and shall have no liability whatsoever with respect to any MSCI data contained herein. The MSCI data may not be further redistributed or used as a basis for other indexes or any securities or financial products. This report is not approved, reviewed, or produced by MSCI. You cannot invest directly in an index. |
| 4 | The MSCI ACWI ex USA Value Index (Net) measures the equity market performance of large- and mid-cap securities exhibiting overall value style characteristics across developed and emerging market countries, excluding the U.S. The value investment style characteristics for index construction are defined using three variables: book value to price, 12-month forward earnings to price, and dividend yield. You cannot invest directly in an index. |
Figures quoted represent past performance, which is no guarantee of future results. Investment return and principal value of an investment will fluctuate so that an investor’s shares, when redeemed, may be worth more or less than their original cost. Current performance may be lower or higher than the performance data quoted and assumes the reinvestment of dividends and capital gains. Current month-end performance is available by calling 1-800-260-5969. Performance figures of the Fund do not reflect fees and expenses charged pursuant to the terms of variable life insurance policies and variable annuity contracts. If these fees and expenses had been reflected, performance would have been lower.
Please keep in mind that high double-digit returns were primarily achieved during favorable market conditions. You should not expect that such favorable returns can be consistently achieved. A fund’s performance, especially for short time periods, should not be the sole factor in making your investment decision.
Index returns do not include transaction costs associated with buying and selling securities, any mutual fund fees or expenses, or any taxes. It is not possible to invest directly in an index.
Shares are sold without a front-end sales charge or contingent deferred sales charge.
Stock values fluctuate in response to the activities of individual companies and general market and economic conditions. Foreign investments are especially volatile and can rise or fall dramatically due to differences in the political and economic conditions of the host country. These risks are generally intensified in emerging markets. The use of derivatives may reduce returns and/or increase volatility. Certain investment strategies tend to increase the total risk of an investment (relative to the broader market). This fund is exposed to smaller-company securities risk. Consult the Fund’s prospectus for additional information on these and other risks.
Please refer to the prospectus provided by your participating insurance company for detailed information describing the separate accounts for information regarding surrender charges, mortality and expense risk fees, and other charges that may be assessed by the participating insurance companies.
| ‡ | CFA® and Chartered Financial Analyst® are trademarks owned by CFA Institute. |
4 | Wells Fargo VT International Equity Fund
Performance highlights (unaudited)
| Ten largest holdings (%) as of June 30, 20211 |
| Hitachi Limited | 3.09 |
| Tech Mahindra Limited | 3.02 |
| Stellantis NV | 3.00 |
| Compagnie de Saint-Gobain SA | 3.00 |
| Xinyi Glass Holdings Limited | 3.00 |
| LafargeHolcim Limited | 2.99 |
| LONGi Green Energy Technology Company Limited Class A | 2.81 |
| Mitsubishi UFJ Financial Group Incorporated | 2.56 |
| Smiths Group plc | 2.52 |
| Samsonite International SA | 2.52 |
| 1 | Figures represent the percentage of the Fund's net assets. Holdings are subject to change and may have changed since the date specified. |
| Sector allocation as of June 30, 20211 |
| 1 | Figures represent the percentage of the Fund's long-term investments. These amounts are subject to change and may have changed since the date specified. |
| Geographic allocation as of June 30, 20211 |
| 1 | Figures represent the percentage of the Fund's long-term investments. These amounts are subject to change and may have changed since the date specified. |
Wells Fargo VT International Equity Fund | 5
Fund expenses (unaudited)
As a shareholder of the Fund, you incur ongoing costs, including management fees, distribution (12b-1) fees, and other Fund expenses. This example is intended to help you understand your ongoing costs (in dollars) of investing in the Fund and to compare these costs with the ongoing costs of investing in other mutual funds.
The example is based on an investment of $1,000 invested at the beginning of the six-month period and held for the entire period from January 1, 2021 to June 30, 2021.
Actual expenses
The “Actual” line of the table below provides information about actual account values and actual expenses. You may use the information in this line, together with the amount you invested, to estimate the expenses that you paid over the period. Simply divide your account value by $1,000 (for example, an $8,600 account value divided by $1,000 = 8.6), then multiply the result by the number in the “Actual” line under the heading entitled “Expenses paid during period” for your applicable class of shares to estimate the expenses you paid on your account during this period.
Hypothetical example for comparison purposes
The “Hypothetical” line of the table below provides information about hypothetical account values and hypothetical expenses based on the Fund’s actual expense ratio and an assumed rate of return of 5% per year before expenses, which is not the Fund’s actual return. The hypothetical account values and expenses may not be used to estimate the actual ending account balance or expenses you paid for the period. You may use this information to compare the ongoing costs of investing in the Fund and other funds. To do so, compare this 5% hypothetical example with the 5% hypothetical examples that appear in the shareholder reports of the other funds.
Please note that the expenses shown in the table are meant to highlight your ongoing costs only and do not reflect any separate account charges assessed by participating insurance companies. Therefore, the “Hypothetical” line of the table is useful in comparing ongoing costs only, and will not help you determine the relative total costs of owning different funds. In addition, if these separate account charges assessed by participating insurance companies were included, your costs would have been higher.
| | Beginning
account value
1-1-2021 | Ending
account value
6-30-2021 | Expenses
paid during
the period1 | Annualized net
expense ratio |
| Class 1 | | | | |
| Actual | $1,000.00 | $1,113.51 | $3.62 | 0.69% |
| Hypothetical (5% return before expenses) | $1,000.00 | $1,021.37 | $3.46 | 0.69% |
| Class 2 | | | | |
| Actual | $1,000.00 | $1,109.37 | $4.92 | 0.94% |
| Hypothetical (5% return before expenses) | $1,000.00 | $1,020.13 | $4.71 | 0.94% |
1 Expenses paid is equal to the annualized net expense ratio of each class multiplied by the average account value over the period, multiplied by the number of days in the most recent fiscal half-year divided by the number of days in the fiscal year (to reflect the one-half-year period).
6 | Wells Fargo VT International Equity Fund
Portfolio of investments—June 30, 2021 (unaudited)
| | | | | | Shares | Value |
| Common stocks: 96.34% | | | | | | |
| Australia: 2.33% | | | | | | |
| Qantas Airways Limited (Industrials, Airlines) † | | | | | 524,885 | $ 1,834,351 |
| Brazil: 0.85% | | | | | | |
| CPFL Energia SA (Utilities, Electric utilities) | | | | | 123,200 | 666,555 |
| Canada: 2.50% | | | | | | |
| Home Capital Group Incorporated (Financials, Thrifts & mortgage finance) † | | | | | 38,900 | 1,167,377 |
| Lundin Mining Corporation (Materials, Metals & mining) | | | | | 88,572 | 798,834 |
| | | | | | | 1,966,211 |
| China: 16.59% | | | | | | |
| Alibaba Group Holding Limited ADR (Consumer discretionary, Internet & direct marketing retail) † | | | | | 66,104 | 1,873,045 |
| China Resources Land Limited (Real estate, Real estate management & development) | | | | | 346,000 | 1,401,504 |
| LONGi Green Energy Technology Company Limited Class A (Information technology, Semiconductors & semiconductor equipment) | | | | | 160,600 | 2,208,127 |
| Midea Group Company Limited Class A (Consumer discretionary, Household durables) | | | | | 149,398 | 1,650,177 |
| Oppein Home Group Incorporated Class A (Consumer discretionary, Household durables) | | | | | 43,740 | 960,981 |
| Sands China Limited (Consumer discretionary, Hotels, restaurants & leisure) † | | | | | 370,800 | 1,561,655 |
| Shanghai Pharmaceuticals Holding Company Limited Class H (Health care, Health care providers & services) | | | | | 725,300 | 1,584,314 |
| Topsports International Holdings Limited (Consumer discretionary, Specialty retail) 144A | | | | | 1,104,000 | 1,808,647 |
| | | | | | | 13,048,450 |
| Denmark: 1.76% | | | | | | |
| Danske Bank AS (Financials, Banks) | | | | | 78,749 | 1,385,681 |
| France: 3.64% | | | | | | |
| Compagnie de Saint-Gobain SA (Industrials, Building products) | | | | | 35,791 | 2,357,072 |
| Faurecia SE (Consumer discretionary, Auto components) | | | | | 1,821 | 89,069 |
| Sanofi SA (Health care, Pharmaceuticals) | | | | | 3,984 | 417,415 |
| | | | | | | 2,863,556 |
| Germany: 2.29% | | | | | | |
| Rheinmetall AG (Industrials, Industrial conglomerates) | | | | | 9,157 | 904,464 |
| Siemens AG (Industrials, Industrial conglomerates) | | | | | 5,178 | 820,402 |
| Siemens Energy AG (Industrials, Electrical equipment) † | | | | | 2,589 | 78,037 |
| | | | | | | 1,802,903 |
| Hong Kong: 3.00% | | | | | | |
| Xinyi Glass Holdings Limited (Consumer discretionary, Auto components) | | | | | 578,000 | 2,356,130 |
| India: 3.02% | | | | | | |
| Tech Mahindra Limited (Information technology, IT services) | | | | | 161,129 | 2,374,664 |
| Ireland: 1.04% | | | | | | |
| Greencore Group plc (Consumer staples, Food products) † | | | | | 472,935 | 821,689 |
| Israel: 0.90% | | | | | | |
| Check Point Software Technologies Limited (Information technology, Software) † | | | | | 6,091 | 707,348 |
The accompanying notes are an integral part of these financial statements.
Wells Fargo VT International Equity Fund | 7
Portfolio of investments—June 30, 2021 (unaudited)
| | | | | | Shares | Value |
| Italy: 0.57% | | | | | | |
| Prysmian SpA (Industrials, Electrical equipment) | | | | | 12,493 | $ 447,814 |
| Japan: 11.88% | | | | | | |
| Daiwa Securities Group Incorporated (Financials, Capital markets) | | | | | 332,000 | 1,823,243 |
| Hitachi Limited (Industrials, Industrial conglomerates) | | | | | 42,500 | 2,433,435 |
| Mitsubishi UFJ Financial Group Incorporated (Financials, Banks) | | | | | 372,400 | 2,011,592 |
| ORIX Corporation (Financials, Diversified financial services) | | | | | 102,100 | 1,722,728 |
| Takeda Pharmaceutical Company Limited (Health care, Pharmaceuticals) | | | | | 40,500 | 1,355,772 |
| | | | | | | 9,346,770 |
| Luxembourg: 1.19% | | | | | | |
| ArcelorMittal SA (Materials, Metals & mining) | | | | | 30,655 | 939,626 |
| Mexico: 0.29% | | | | | | |
| Fresnillo plc (Materials, Metals & mining) | | | | | 21,717 | 231,797 |
| Netherlands: 8.26% | | | | | | |
| Koninklijke Philips NV (Health care, Health care equipment & supplies) « | | | | | 27,608 | 1,368,045 |
| NN Group NV (Financials, Insurance) | | | | | 40,131 | 1,892,945 |
| OCI NV (Materials, Chemicals) † | | | | | 35,980 | 875,451 |
| Stellantis NV (Consumer discretionary, Automobiles) | | | | | 120,460 | 2,364,498 |
| | | | | | | 6,500,939 |
| Norway: 2.07% | | | | | | |
| Den Norske Bank ASA (Financials, Banks) | | | | | 74,658 | 1,626,666 |
| South Korea: 8.11% | | | | | | |
| Coway Company Limited (Consumer discretionary, Household durables) | | | | | 26,051 | 1,820,551 |
| Hana Financial Group Incorporated (Financials, Banks) | | | | | 43,378 | 1,773,793 |
| Samsung Electronics Company Limited GDR (Information technology, Technology hardware, storage & peripherals) 144A | | | | | 946 | 1,687,191 |
| SK Telecom Company Limited (Communication services, Wireless telecommunication services) | | | | | 3,866 | 1,098,539 |
| | | | | | | 6,380,074 |
| Switzerland: 2.99% | | | | | | |
| LafargeHolcim Limited (Materials, Construction materials) | | | | | 39,237 | 2,353,584 |
| Thailand: 2.40% | | | | | | |
| Siam Commercial Bank plc (Financials, Banks) | | | | | 616,700 | 1,885,697 |
| United Kingdom: 11.41% | | | | | | |
| ConvaTec Group plc (Health care, Health care equipment & supplies) 144A | | | | | 351,420 | 1,169,603 |
| Kingfisher plc (Consumer discretionary, Specialty retail) | | | | | 243,629 | 1,228,409 |
| Man Group plc (Financials, Capital markets) | | | | | 736,171 | 1,832,512 |
| Nomad Foods Limited (Consumer staples, Food products) † | | | | | 64,389 | 1,820,277 |
| Sensata Technologies Holding plc (Industrials, Electrical equipment) † | | | | | 16,242 | 941,549 |
| Smiths Group plc (Industrials, Industrial conglomerates) | | | | | 90,165 | 1,983,131 |
| | | | | | | 8,975,481 |
| United States: 9.25% | | | | | | |
| Advance Auto Parts Incorporated (Consumer discretionary, Specialty retail) | | | | | 5,038 | 1,033,495 |
| Baker Hughes Incorporated (Energy, Energy equipment & services) | | | | | 71,189 | 1,628,092 |
| Berry Global Group Incorporated (Materials, Containers & packaging) † | | | | | 22,893 | 1,493,081 |
The accompanying notes are an integral part of these financial statements.
8 | Wells Fargo VT International Equity Fund
Portfolio of investments—June 30, 2021 (unaudited)
| | | | | | Shares | Value |
| United States: (continued) | | | | | | |
| Gentex Corporation (Consumer discretionary, Auto components) | | | | | 34,492 | $ 1,141,340 |
| Samsonite International SA (Consumer discretionary, Textiles, apparel & luxury goods) 144A† | | | | | 969,000 | 1,981,855 |
| | | | | | | 7,277,863 |
| Total Common stocks (Cost $60,135,870) | | | | | | 75,793,849 |
| | | Yield | | | | |
| Short-term investments: 2.79% | | | | | | |
| Investment companies: 2.79% | | | | | | |
| Securities Lending Cash Investments LLC ♠∩∞ | | 0.03% | | | 24,995 | 24,995 |
| Wells Fargo Government Money Market Fund Select Class ♠∞ | | 0.03 | | | 2,169,753 | 2,169,753 |
| Total Short-term investments (Cost $2,194,748) | | | | | | 2,194,748 |
| Total investments in securities (Cost $62,330,618) | 99.13% | | | | | 77,988,597 |
| Other assets and liabilities, net | 0.87 | | | | | 682,765 |
| Total net assets | 100.00% | | | | | $78,671,362 |
| † | Non-income-earning security |
| 144A | The security may be resold in transactions exempt from registration, normally to qualified institutional buyers, pursuant to Rule 144A under the Securities Act of 1933. |
| « | All or a portion of this security is on loan. |
| ♠ | The issuer of the security is an affiliated person of the Fund as defined in the Investment Company Act of 1940. |
| ∩ | The investment is a non-registered investment company purchased with cash collateral received from securities on loan. |
| ∞ | The rate represents the 7-day annualized yield at period end. |
| Abbreviations: |
| ADR | American depositary receipt |
| GDR | Global depositary receipt |
Investments in affiliates
An affiliated investment is an investment in which the Fund owns at least 5% of the outstanding voting shares of the issuer or as a result of other relationships, such as the Fund and the issuer having the same investment manager. Transactions with issuers that were either affiliates of the Fund at the beginning of the period or the end of the period were as follows:
| | Value,
beginning of
period | Purchases | Sales
proceeds | Net
realized
gains
(losses) | | Net
change in
unrealized
gains
(losses) | | Value,
end of
period | | % of
net
assets | Shares,
end
of period | Income
from
affiliated
securities |
| Short-term investments | | | | | | | | | | | | |
| Investment companies | | | | | | | | | | | | |
| Securities Lending Cash Investments LLC | $ 0 | $ 5,377,739 | $ (5,352,744) | $0 | | $0 | | $ 24,995 | | | 24,995 | $ 38# |
| Wells Fargo Government Money Market Fund Select Class | 1,508,148 | 13,922,829 | (13,261,224) | 0 | | 0 | | 2,169,753 | | | 2,169,753 | 142 |
| | | | | $0 | | $0 | | $2,194,748 | | 2.79% | | $180 |
| # | Amount shown represents income before fees and rebates. |
The accompanying notes are an integral part of these financial statements.
Wells Fargo VT International Equity Fund | 9
Statement of assets and liabilities—June 30, 2021 (unaudited)
| | |
| Assets | |
Investments in unaffiliated securities (including $23,797 of securities loaned), at value (cost $60,135,870)
| $ 75,793,849 |
Investments in affiliated securites, at value (cost $2,194,748)
| 2,194,748 |
Foreign currency, at value (cost $238,255)
| 236,713 |
Receivable for dividends
| 476,963 |
Receivable for investments sold
| 67,209 |
Receivable for Fund shares sold
| 4,007 |
Receivable for securities lending income, net
| 7 |
Prepaid expenses and other assets
| 89,131 |
Total assets
| 78,862,627 |
| Liabilities | |
Payable for Fund shares redeemed
| 99,683 |
Payable upon receipt of securities loaned
| 24,995 |
Management fee payable
| 24,492 |
Professional fees payable
| 21,889 |
Distribution fee payable
| 12,797 |
Administration fees payable
| 5,297 |
Trustees’ fees and expenses payable
| 2,112 |
Total liabilities
| 191,265 |
Total net assets
| $78,671,362 |
| Net assets consist of | |
Paid-in capital
| $ 69,481,092 |
Total distributable earnings
| 9,190,270 |
Total net assets
| $78,671,362 |
| Computation of net asset value per share | |
Net assets – Class 1
| $ 17,779,081 |
Shares outstanding – Class 11
| 8,638,474 |
Net asset value per share – Class 1
| $2.06 |
Net assets – Class 2
| $ 60,892,281 |
Shares outstanding – Class 21
| 28,628,030 |
Net asset value per share – Class 2
| $2.13 |
| 1 | The Fund has an unlimited number of authorized shares |
The accompanying notes are an integral part of these financial statements.
10 | Wells Fargo VT International Equity Fund
Statement of operations—six months ended June 30, 2021 (unaudited)
| | |
| Investment income | |
Dividends (net of foreign withholdings taxes of $110,724)
| $ 1,230,993 |
Income from affiliated securities
| 6,251 |
Total investment income
| 1,237,244 |
| Expenses | |
Management fee
| 303,150 |
| Administration fees | |
Class 1
| 6,924 |
Class 2
| 23,391 |
| Distribution fee | |
Class 2
| 73,092 |
Custody and accounting fees
| 26,291 |
Professional fees
| 26,741 |
Shareholder report expenses
| 9,884 |
Trustees’ fees and expenses
| 9,399 |
Other fees and expenses
| 9,469 |
Total expenses
| 488,341 |
| Less: Fee waivers and/or expense reimbursements | |
Fund-level
| (153,777) |
Net expenses
| 334,564 |
Net investment income
| 902,680 |
| Realized and unrealized gains (losses) on investments | |
| Net realized gains (losses) on | |
Unaffiliated securities
| 2,845,164 |
Forward foreign currency contracts
| (8,714) |
Net realized gains on investments
| 2,836,450 |
| Net change in unrealized gains (losses) on | |
Unaffiliated securities (net of deferred foreign capital gain tax refund of $(3,138))
| 4,370,362 |
Forward foreign currency contracts
| 8,738 |
Net change in unrealized gains (losses) on investments
| 4,379,100 |
Net realized and unrealized gains (losses) on investments
| 7,215,550 |
Net increase in net assets resulting from operations
| $8,118,230 |
The accompanying notes are an integral part of these financial statements.
Wells Fargo VT International Equity Fund | 11
Statement of changes in net assets
| | | | | |
| | Six months ended
June 30, 2021
(unaudited) | Year ended
December 31, 2020 |
| Operations | | | | |
Net investment income
| | $ 902,680 | | $ 945,532 |
Net realized gains (losses) on investments
| | 2,836,450 | | (9,412,420) |
Net change in unrealized gains (losses) on investments
| | 4,379,100 | | 10,559,779 |
Net increase in net assets resulting from operations
| | 8,118,230 | | 2,092,891 |
| Distributions to shareholders from | | | | |
| Net investment income and net realized gains | | | | |
Class 1
| | 0 | | (472,932) |
Class 2
| | 0 | | (1,308,572) |
Total distributions to shareholders
| | 0 | | (1,781,504) |
| Capital share transactions | Shares | | Shares | |
| Proceeds from shares sold | | | | |
Class 1
| 300,670 | 597,937 | 514,844 | 744,962 |
Class 2
| 581,081 | 1,207,440 | 1,093,316 | 1,614,560 |
| | | 1,805,377 | | 2,359,522 |
| Reinvestment of distributions | | | | |
Class 1
| 0 | 0 | 319,548 | 472,932 |
Class 2
| 0 | 0 | 849,722 | 1,308,572 |
| | | 0 | | 1,781,504 |
| Payment for shares redeemed | | | | |
Class 1
| (1,101,079) | (2,157,673) | (2,281,763) | (3,640,125) |
Class 2
| (1,823,557) | (3,721,349) | (4,910,668) | (7,964,863) |
| | | (5,879,022) | | (11,604,988) |
Net decrease in net assets resulting from capital share transactions
| | (4,073,645) | | (7,463,962) |
Total increase (decrease) in net assets
| | 4,044,585 | | (7,152,575) |
| Net assets | | | | |
Beginning of period
| | 74,626,777 | | 81,779,352 |
End of period
| | $78,671,362 | | $ 74,626,777 |
The accompanying notes are an integral part of these financial statements.
12 | Wells Fargo VT International Equity Fund
Financial highlights
(For a share outstanding throughout each period)
| | | Year ended December 31 |
| Class 1 | Six months ended
June 30, 2021
(unaudited) | 2020 | 2019 | 2018 | 2017 | 2016 |
Net asset value, beginning of period
| $1.85 | $1.83 | $2.85 | $5.34 | $4.41 | $4.82 |
Net investment income
| 0.04 | 0.03 1 | 0.06 1 | 0.10 1 | 0.12 1 | 0.11 1 |
Net realized and unrealized gains (losses) on investments
| 0.17 | 0.04 | 0.34 | (0.77) | 0.96 | (0.01) |
Total from investment operations
| 0.21 | 0.07 | 0.40 | (0.67) | 1.08 | 0.10 |
| Distributions to shareholders from | | | | | | |
Net investment income
| 0.00 | (0.05) | (0.13) | (0.61) | (0.15) | (0.15) |
Net realized gains
| 0.00 | 0.00 | (1.29) | (1.21) | 0.00 | (0.36) |
Total distributions to shareholders
| 0.00 | (0.05) | (1.42) | (1.82) | (0.15) | (0.51) |
Net asset value, end of period
| $2.06 | $1.85 | $1.83 | $2.85 | $5.34 | $4.41 |
Total return2
| 11.35% | 4.31% | 16.14% | (16.86)% | 24.86% | 3.25% |
| Ratios to average net assets (annualized) | | | | | | |
Gross expenses
| 1.10% | 1.13% | 1.13% | 1.12% | 0.95% | 0.95% |
Net expenses
| 0.69% | 0.69% | 0.69% | 0.69% | 0.69% | 0.69% |
Net investment income
| 2.57% | 1.59% | 2.55% | 2.41% | 2.41% | 2.49% |
| Supplemental data | | | | | | |
Portfolio turnover rate
| 24% | 80% | 48% | 51% | 55% | 77% |
Net assets, end of period (000s omitted)
| $17,779 | $17,459 | $19,872 | $19,315 | $28,001 | $25,137 |
| 1 | Calculated based upon average shares outstanding |
| 2 | Returns for periods of less than one year are not annualized. Returns do not reflect fees and expenses charged pursuant to the terms of variable life insurance policies and variable annuity contracts. |
The accompanying notes are an integral part of these financial statements.
Wells Fargo VT International Equity Fund | 13
Financial highlights
(For a share outstanding throughout each period)
| | | Year ended December 31 |
| Class 2 | Six months ended
June 30, 2021
(unaudited) | 2020 | 2019 | 2018 | 2017 | 2016 |
Net asset value, beginning of period
| $1.91 | $1.89 | $2.89 | $5.38 | $4.45 | $4.84 |
Net investment income
| 0.03 | 0.03 1 | 0.05 1 | 0.09 1 | 0.11 1 | 0.10 |
Net realized and unrealized gains (losses) on investments
| 0.19 | 0.03 | 0.36 | (0.78) | 0.96 | 0.00 |
Total from investment operations
| 0.22 | 0.06 | 0.41 | (0.69) | 1.07 | 0.10 |
| Distributions to shareholders from | | | | | | |
Net investment income
| 0.00 | (0.04) | (0.12) | (0.59) | (0.14) | (0.13) |
Net realized gains
| 0.00 | 0.00 | (1.29) | (1.21) | 0.00 | (0.36) |
Total distributions to shareholders
| 0.00 | (0.04) | (1.41) | (1.80) | (0.14) | (0.49) |
Net asset value, end of period
| $2.13 | $1.91 | $1.89 | $2.89 | $5.38 | $4.45 |
Total return2
| 11.52% | 3.83% | 16.10% | (17.28)% | 24.34% | 3.30% |
| Ratios to average net assets (annualized) | | | | | | |
Gross expenses
| 1.35% | 1.38% | 1.38% | 1.30% | 1.20% | 1.20% |
Net expenses
| 0.94% | 0.94% | 0.94% | 0.94% | 0.94% | 0.94% |
Net investment income
| 2.33% | 1.34% | 2.30% | 1.82% | 2.18% | 2.25% |
| Supplemental data | | | | | | |
Portfolio turnover rate
| 24% | 80% | 48% | 51% | 55% | 77% |
Net assets, end of period (000s omitted)
| $60,892 | $57,167 | $61,907 | $59,004 | $318,202 | $288,628 |
| 1 | Calculated based upon average shares outstanding |
| 2 | Returns for periods of less than one year are not annualized. Returns do not reflect fees and expenses charged pursuant to the terms of variable life insurance policies and variable annuity contracts. |
The accompanying notes are an integral part of these financial statements.
14 | Wells Fargo VT International Equity Fund
Notes to financial statements (unaudited)
1. ORGANIZATION
Wells Fargo Variable Trust (the "Trust"), a Delaware statutory trust organized on March 10, 1999, is an open-end management investment company registered under the Investment Company Act of 1940, as amended (the "1940 Act"). As an investment company, the Trust follows the accounting and reporting guidance in Financial Accounting Standards Board ("FASB") Accounting Standards Codification Topic 946, Financial Services – Investment Companies. These financial statements report on the Wells Fargo VT International Equity Fund (the "Fund") which is a diversified series of the Trust. The Trust offers shares of the Fund to separate accounts of various life insurance companies as funding vehicles for certain variable annuity contracts and variable life insurance policies.
On February 23, 2021, Wells Fargo & Company announced that it has entered into a definitive agreement to sell Wells Fargo Asset Management ("WFAM") to GTCR LLC and Reverence Capital Partners, L.P. WFAM is the trade name used by the asset management businesses of Wells Fargo & Company and includes Wells Fargo Funds Management, LLC, the investment manager to the Fund, Wells Capital Management, LLC and Wells Fargo Asset Management (International) Limited, both registered investment advisers providing sub-advisory services to certain funds, and Wells Fargo Funds Distributor, LLC, the Fund's principal underwriter. As part of the transaction, Wells Fargo & Company will own a 9.9% equity interest and will continue to serve as an important client and distribution partner.
Consummation of the transaction will result in the automatic termination of the Fund's investment management agreement and subadvisory agreement. The Fund's Board of Trustees approved a new investment management and new subadvisory agreement and approved submitting the agreements to the Fund’s shareholders for approval at a special meeting of shareholders expected to be held on August 16, 2021. Shareholders of record of the Fund at the close of business on May 28, 2021 are entitled to vote at the meeting. If shareholders approve the new agreements, they would take effect upon the closing of the transaction. The transaction is expected to close in the second half of 2021, subject to customary closing conditions.
2. SIGNIFICANT ACCOUNTING POLICIES
The following significant accounting policies, which are consistently followed in the preparation of the financial statements of the Fund, are in conformity with U.S. generally accepted accounting principles which require management to make estimates and assumptions that affect the reported amounts of assets and liabilities, disclosure of contingent assets and liabilities at the date of the financial statements, and the reported amounts of income and expenses during the reporting period. Actual results could differ from those estimates.
Securities valuation
All investments are valued each business day as of the close of regular trading on the New York Stock Exchange (generally 4 p.m. Eastern Time), although the Fund may deviate from this calculation time under unusual or unexpected circumstances.
Equity securities that are listed on a foreign or domestic exchange or market are valued at the official closing price or, if none, the last sales price. If no sale occurs on the principal exchange or market that day, a fair value price will be determined in accordance with the Fund’s Valuation Procedures.
The values of securities denominated in foreign currencies are translated into U.S. dollars at rates provided by an independent foreign currency pricing source at a time each business day specified by the Wells Fargo Asset Management Pricing Committee at Wells Fargo Funds Management, LLC ("Funds Management").
Many securities markets and exchanges outside the U.S. close prior to the close of the New York Stock Exchange and therefore may not fully reflect trading or events that occur after the close of the principal exchange in which the foreign securities are traded, but before the close of the New York Stock Exchange. If such trading or events are expected to materially affect the value of such securities, then fair value pricing procedures approved by the Board of Trustees of the Fund are applied. These procedures take into account multiple factors including movements in U.S. securities markets after foreign exchanges close. Foreign securities that are fair valued under these procedures are categorized as Level 2 and the application of these procedures may result in transfers between Level 1 and Level 2. Depending on market activity, such fair valuations may be frequent. Such fair value pricing may result in net asset values that are higher or lower than net asset values based on the last reported sales price or latest quoted bid price. On June 30, 2021, such fair value pricing was not used in pricing foreign securities.
Forward foreign currency contracts are recorded at the forward rate provided by an independent foreign currency pricing source at a time each business day specified by the Wells Fargo Asset Management Pricing Committee.
Wells Fargo VT International Equity Fund | 15
Notes to financial statements (unaudited)
Investments in registered open-end investment companies are valued at net asset value. Interests in non-registered investment companies that are redeemable at net asset value are fair valued normally at net asset value.
Investments which are not valued using any of the methods discussed above are valued at their fair value, as determined in good faith by the Board of Trustees. The Board of Trustees has established a Valuation Committee comprised of the Trustees and has delegated to it the authority to take any actions regarding the valuation of portfolio securities that the Valuation Committee deems necessary or appropriate, including determining the fair value of portfolio securities, unless the determination has been delegated to the Wells Fargo Asset Management Pricing Committee. The Board of Trustees retains the authority to make or ratify any valuation decisions or approve any changes to the Valuation Procedures as it deems appropriate. On a quarterly basis, the Board of Trustees receives reports on any valuation actions taken by the Valuation Committee or the Wells Fargo Asset Management Pricing Committee which may include items for ratification.
Foreign currency translation
The accounting records of the Fund are maintained in U.S. dollars. The values of other assets and liabilities denominated in foreign currencies are translated into U.S. dollars at rates provided by an independent foreign currency pricing source at a time each business day specified by the Wells Fargo Asset Management Pricing Committee. Purchases and sales of securities, and income and expenses are converted at the rate of exchange on the respective dates of such transactions. Net realized foreign exchange gains or losses arise from sales of foreign currencies, currency gains or losses realized between the trade and settlement dates on securities transactions, and the difference between the amounts of dividends, interest and foreign withholding taxes recorded and the U.S. dollar equivalent of the amounts actually paid or received. Net unrealized foreign exchange gains and losses arise from changes in the fair value of assets and liabilities other than investments in securities resulting from changes in exchange rates. The changes in net assets arising from changes in exchange rates of securities and the changes in net assets resulting from changes in market prices of securities are not separately presented. Such changes are included in net realized and unrealized gains or losses from investments.
Forward foreign currency contracts
A forward foreign currency contract is an agreement between two parties to purchase or sell a specific currency for an agreed-upon price at a future date. The Fund enters into forward foreign currency contracts to facilitate transactions in foreign-denominated securities and to attempt to minimize the risk to the Fund from adverse changes in the relationship between currencies. Forward foreign currency contracts are recorded at the forward rate and marked-to-market daily. When the contracts are closed, realized gains and losses arising from such transactions are recorded as realized gains or losses on forward foreign currency contracts. The Fund is subject to foreign currency risk and may be exposed to risks if the counterparties to the contracts are unable to meet the terms of their contracts or if the value of the foreign currency changes unfavorably. The Fund's maximum risk of loss from counterparty credit risk is the unrealized gains on the contracts. This risk may be mitigated if there is a master netting arrangement between the Fund and the counterparty.
Securities lending
The Fund may lend its securities from time to time in order to earn additional income in the form of fees or interest on securities received as collateral or the investment of any cash received as collateral. When securities are on loan, the Fund receives interest or dividends on those securities. Cash collateral received in connection with its securities lending transactions is invested in Securities Lending Cash Investments, LLC (the "Securities Lending Fund"). Investments in Securities Lending Fund are valued at the evaluated bid price provided by an independent pricing service. Income earned from investment in the Securities Lending Fund (net of fees and rebates), if any, is included in income from affiliated securities on the Statement of Operations.
In a securities lending transaction, the net asset value of the Fund is affected by an increase or decrease in the value of the securities loaned and by an increase or decrease in the value of the instrument in which collateral is invested. The amount of securities lending activity undertaken by the Fund fluctuates from time to time. The Fund has the right under the lending agreement to recover the securities from the borrower on demand. In the event of default or bankruptcy by the borrower, the Fund may be prevented from recovering the loaned securities or gaining access to the collateral or may experience delays or costs in doing so. In such an event, the terms of the agreement allow the unaffiliated securities lending agent to use the collateral to purchase replacement securities on behalf of the Fund or pay the Fund the market value of the loaned securities. The Fund bears the risk of loss with respect to depreciation of its investment of the cash collateral.
Security transactions and income recognition
Securities transactions are recorded on a trade date basis. Realized gains or losses are recorded on the basis of identified cost.
16 | Wells Fargo VT International Equity Fund
Notes to financial statements (unaudited)
Dividend income is recognized on the ex-dividend date, except for certain dividends from foreign securities, which are recorded as soon as the custodian verifies the ex-dividend date. Dividend income is recorded net of foreign taxes withheld where recovery of such taxes is not assured.
Distributions to shareholders
Distributions to shareholders from net investment income and any net realized gains are recorded on the ex-dividend date and paid at least annually. Such distributions are determined in accordance with income tax regulations and may differ from U.S. generally accepted accounting principles. Dividend sources are estimated at the time of declaration. The tax character of distributions is determined as of the Fund's fiscal year end. Therefore, a portion of the Fund's distributions made prior to the Fund’s fiscal year end may be categorized as a tax return of capital at year end.
Federal and other taxes
The Fund intends to continue to qualify as a regulated investment company by distributing substantially all of its investment company taxable income and any net realized capital gains (after reduction for capital loss carryforwards) sufficient to relieve it from all, or substantially all, federal income taxes. Accordingly, no provision for federal income taxes was required.
The Fund’s income and federal excise tax returns and all financial records supporting those returns for the prior three fiscal years are subject to examination by the federal and Delaware revenue authorities. Management has analyzed the Fund's tax positions taken on federal, state, and foreign tax returns for all open tax years and does not believe that there are any uncertain tax positions that require recognition of a tax liability.
As of June 30, 2021, the aggregate cost of all investments for federal income tax purposes was $59,606,172 and the unrealized gains (losses) consisted of:
| Gross unrealized gains | $19,519,138 |
| Gross unrealized losses | (1,136,713) |
| Net unrealized gains | $18,382,425 |
As of December 31, 2020, the Fund had capital loss carryforwards which consisted of $1,749,723 in short-term capital losses and $7,609,870 in long-term capital losses.
Class allocations
The separate classes of shares offered by the Fund differ principally in distribution fees. Class specific expenses are charged directly to that share class. Investment income, common fund-level expenses, and realized and unrealized gains (losses) on investments are allocated daily to each class of shares based on the relative proportion of net assets of each class.
3. FAIR VALUATION MEASUREMENTS
Fair value measurements of investments are determined within a framework that has established a fair value hierarchy based upon the various data inputs utilized in determining the value of the Fund’s investments. The three-level hierarchy gives the highest priority to unadjusted quoted prices in active markets for identical assets or liabilities (Level 1) and the lowest priority to unobservable inputs (Level 3). The Fund’s investments are classified within the fair value hierarchy based on the lowest level of input that is significant to the fair value measurement. The inputs are summarized into three broad levels as follows:
| ■ | Level 1 – quoted prices in active markets for identical securities |
| ■ | Level 2 – other significant observable inputs (including quoted prices for similar securities, interest rates, prepayment speeds, credit risk, etc.) |
| ■ | Level 3 – significant unobservable inputs (including the Fund’s own assumptions in determining the fair value of investments) |
The inputs or methodologies used for valuing investments in securities are not necessarily an indication of the risk associated with investing in those securities.
Wells Fargo VT International Equity Fund | 17
Notes to financial statements (unaudited)
The following is a summary of the inputs used in valuing the Fund’s assets and liabilities as of June 30, 2021:
| | Quoted prices
(Level 1) | Other significant
observable inputs
(Level 2) | Significant
unobservable inputs
(Level 3) | Total |
| Assets | | | | |
| Investments in: | | | | |
| Common stocks | | | | |
| Australia | $ 1,834,351 | $0 | $0 | $ 1,834,351 |
| Brazil | 666,555 | 0 | 0 | 666,555 |
| Canada | 1,966,211 | 0 | 0 | 1,966,211 |
| China | 13,048,450 | 0 | 0 | 13,048,450 |
| Denmark | 1,385,681 | 0 | 0 | 1,385,681 |
| France | 2,863,556 | 0 | 0 | 2,863,556 |
| Germany | 1,802,903 | 0 | 0 | 1,802,903 |
| Hong Kong | 2,356,130 | 0 | 0 | 2,356,130 |
| India | 2,374,664 | 0 | 0 | 2,374,664 |
| Ireland | 821,689 | 0 | 0 | 821,689 |
| Israel | 707,348 | 0 | 0 | 707,348 |
| Italy | 447,814 | 0 | 0 | 447,814 |
| Japan | 9,346,770 | 0 | 0 | 9,346,770 |
| Luxembourg | 939,626 | 0 | 0 | 939,626 |
| Mexico | 231,797 | 0 | 0 | 231,797 |
| Netherlands | 6,500,939 | 0 | 0 | 6,500,939 |
| Norway | 1,626,666 | 0 | 0 | 1,626,666 |
| South Korea | 6,380,074 | 0 | 0 | 6,380,074 |
| Switzerland | 2,353,584 | 0 | 0 | 2,353,584 |
| Thailand | 1,885,697 | 0 | 0 | 1,885,697 |
| United Kingdom | 8,975,481 | 0 | 0 | 8,975,481 |
| United States | 7,277,863 | 0 | 0 | 7,277,863 |
| Short-term investments | | | | |
| Investment companies | 2,194,748 | 0 | 0 | 2,194,748 |
| Total assets | $77,988,597 | $0 | $0 | $77,988,597 |
Additional sector, industry or geographic detail, if any, is included in the Portfolio of Investments.
For the six months ended June 30, 2021, the Fund did not have any transfers into/out of Level 3.
4. TRANSACTIONS WITH AFFILIATES
Management fee
Funds Management, an indirect wholly owned subsidiary of Wells Fargo & Company ("Wells Fargo"), is the manager of the Fund and provides advisory and fund-level administrative services under an investment management agreement. Under the investment management agreement, Funds Management is responsible for, among other services, implementing the investment objectives and strategies of the Fund, supervising the subadviser and providing fund-level administrative services in connection with the Fund’s operations. As compensation for its services under the investment management agreement, Funds Management is entitled to receive a management fee at the following annual rate based on the Fund’s average daily net assets:
18 | Wells Fargo VT International Equity Fund
Notes to financial statements (unaudited)
| Average daily net assets | Management fee |
| First $500 million | 0.800% |
| Next $500 million | 0.750 |
| Next $1 billion | 0.700 |
| Next $2 billion | 0.675 |
| Next $1 billion | 0.650 |
| Next $5 billion | 0.640 |
| Over $10 billion | 0.630 |
For the six months ended June 30, 2021, the management fee was equivalent to an annual rate of 0.80% of the Fund’s average daily net assets.
Funds Management has retained the services of a subadviser to provide daily portfolio management to the Fund. The fee for subadvisory services is borne by Funds Management. Wells Capital Management, LLC ("WellsCap"), an affiliate of Funds Management and an indirect wholly owned subsidiary of Wells Fargo, is the subadviser to the Fund and is entitled to receive a fee from Funds Management at an annual rate starting at 0.45% and declining to 0.40% as the average daily net assets of the Fund increase.
Administration fees
Under a class-level administration agreement, Funds Management provides class-level administrative services to the Fund, which includes paying fees and expenses for services provided by the transfer agent, sub-transfer agents, omnibus account services and record-keepers. As compensation for its services under the class-level administration agreement, Funds Management receives an annual fee of 0.08% which is calculated based on the average daily net assets of each class.
Waivers and/or expense reimbursements
Funds Management has contractually committed to waive and/or reimburse management and administration fees to the extent necessary to maintain certain net operating expense ratios for the Fund. When each class of the Fund has exceeded its expense cap, Funds Management will waive fees and/or reimbursed expenses from fund-level expenses on a proportionate basis and then from class specific expenses. When only certain classes exceed their expense caps, waivers and/or reimbursements are applied against class specific expenses before fund-level expenses. Funds Management has contractually committed through April 30, 2022 to waive fees and/or reimburse expenses to the extent necessary to cap expenses. Prior to or after the commitment expiration date, the caps may be increased or the commitment to maintain the caps may be terminated only with the approval of the Board of Trustees. The contractual expense caps are as follows:
| | Expense ratio caps |
| Class 1 | 0.69% |
| Class 2 | 0.94 |
Distribution fee
The Trust has adopted a distribution plan for Class 2 shares of the Fund pursuant to Rule 12b-1 under the 1940 Act. A distribution fee is charged to Class 2 shares and paid to Wells Fargo Funds Distributor, LLC, the principal underwriter, at an annual rate of 0.25% of the average daily net assets of Class 2 shares.
Interfund transactions
The Fund may purchase or sell portfolio investment securities to certain other Wells Fargo affiliates pursuant to Rule 17a-7 under the 1940 Act and under procedures adopted by the Board of Trustees. The procedures have been designed to ensure that these interfund transactions, which do not incur broker commissions, are effected at current market prices.
5. INVESTMENT PORTFOLIO TRANSACTIONS
Purchases and sales of investments, excluding U.S. government obligations (if any) and short-term securities, for the six months ended June 30, 2021 were $18,275,240 and $22,905,673, respectively.
Wells Fargo VT International Equity Fund | 19
Notes to financial statements (unaudited)
6. SECURITIES LENDING TRANSACTIONS
The Fund lends its securities through an unaffiliated securities lending agent and receives collateral in the form of cash or securities with a value at least equal to the value of the securities on loan. The value of the loaned securities is determined at the close of each business day and any increases or decreases in the required collateral are exchanged between the Fund and the counterparty on the next business day. Cash collateral received is invested in the Securities Lending Fund which seeks to provide a positive return compared to the daily Federal Funds Open Rate by investing in high-quality, U.S. dollar-denominated short-term money market instruments and is exempt from registration under Section 3(c)(7) of the 1940 Act. Securities Lending Fund is managed by Funds Management and is subadvised by WellsCap. Funds Management receives an advisory fee starting at 0.05% and declining to 0.01% as the average daily net assets of the Securities Lending Fund increase. All of the fees received by Funds Management are paid to WellsCap for its services as subadviser.
In the event of counterparty default or the failure of a borrower to return a loaned security, the Fund has the right to use the collateral to offset any losses incurred. As of June 30, 2021, the Fund had securities lending transactions with the following counterparties which are subject to offset:
| Counterparty | Value of
securities on
loan | Collateral
received1 | Net amount |
| BMO Capital Markets Corp. | $23,797 | $(23,797) | $0 |
1 Collateral received within this table is limited to the collateral for the net transaction with the counterparty.
7. DERIVATIVE TRANSACTIONS
During the six months ended June 30, 2021, the Fund entered into forward foreign currency contracts for economic hedging purposes. The Fund had average contract amounts of $326,446 and $316,074 in forward foreign currency contracts to buy and forward foreign currency contracts to sell, respectively, during the six months ended June 30, 2021.
8. BANK BORROWINGS
The Trust, Wells Fargo Master Trust and Wells Fargo Funds Trust (excluding the money market funds) are parties to a $350,000,000 revolving credit agreement whereby the Fund is permitted to use bank borrowings for temporary or emergency purposes, such as to fund shareholder redemption requests. Interest under the credit agreement is charged to the Fund based on a borrowing rate equal to the higher of the Federal Funds rate in effect on that day plus 1.25% or the overnight bank funding rate in effect on that day plus 1.25%. In addition, an annual commitment fee equal to 0.25% of the unused balance is allocated to each participating fund.
For the six months ended June 30, 2021, there were no borrowings by the Fund under the agreement.
9. CONCENTRATION RISKS
As of the end of the period, the Fund concentrated its portfolio of investments in consumer discretionary sector and in Asia/Pacific ex-Japan and Europe. A fund that invests a substantial portion of its assets in any sector or geographic region may be more affected by changes in that sector or geographic region than would be a fund whose investments are not heavily weighted in any sector or geographic region.
10. INDEMNIFICATION
Under the Fund's organizational documents, the officers and Trustees have been granted certain indemnification rights against certain liabilities that may arise out of performance of their duties to the Fund. The Fund has entered into a separate agreement with each Trustee that converts indemnification rights currently existing under the Fund’s organizational documents into contractual rights that cannot be changed in the future without the consent of the Trustee. Additionally, in the normal course of business, the Fund may enter into contracts with service providers that contain a variety of indemnification clauses. The Fund’s maximum exposure under these arrangements is dependent on future claims that may be made against the Fund and, therefore, cannot be estimated.
11. CORONAVIRUS (COVID-19) PANDEMIC
On March 11, 2020, the World Health Organization announced that it had made the assessment that coronavirus disease 2019 (“COVID-19”) is a pandemic. The impacts of COVID-19 are affecting the entire global economy, individual companies and investment products, the funds, and the market in general. There is significant uncertainty around the extent and duration of
20 | Wells Fargo VT International Equity Fund
Notes to financial statements (unaudited)
business disruptions related to COVID-19 and the impacts may last for an extended period of time. COVID-19 has led to significant uncertainty and volatility in the financial markets.
12. SUBSEQUENT EVENTS
Wells Fargo Asset Management ("WFAM") announced that it will be changing its company name to Allspring Global Investments upon the closing of the previously announced sale transaction of WFAM by Wells Fargo & Company to GTCR LLC and Reverence Capital Partners, L.P. The new corporate name is expected to go into effect on the closing date of the transaction, which is anticipated to occur in the second half of 2021, subject to customary closing conditions.
At a meeting held July 15, 2021, the Board of Trustees of the Wells Fargo Funds approved a change in the Fund's name to remove “Wells Fargo” from the Fund's name and replace with “Allspring”. The change is expected to go into effect on October 11, 2021.
Following the closing of the transaction, Wells Fargo Funds Management, LLC, the Fund's investment manager, Wells Capital Management, LLC and Wells Fargo Asset Management (International) Limited, each subadvisers to certain funds, and Wells Fargo Funds Distributor, LLC, the Fund's principal underwriter, will each be rebranded as Allspring.
At a special meeting of shareholders held on August 16, 2021, shareholders of the Fund approved a new investment management and a new subadvisory agreement that will be effective at the closing of the sale transaction.
Wells Fargo VT International Equity Fund | 21
Other information (unaudited)
PROXY VOTING INFORMATION
A description of the policies and procedures used to determine how to vote proxies relating to portfolio securities is available without charge, upon request, by calling 1-800-260-5969, visiting our website at wfam.com, or visiting the SEC website at sec.gov. Information regarding how the proxies related to portfolio securities were voted during the most recent 12-month period ended June 30 is available on the website at wfam.com or by visiting the SEC website at sec.gov.
QUARTERLY PORTFOLIO HOLDINGS INFORMATION
The Fund files its complete schedule of portfolio holdings with the SEC for the first and third quarters of each fiscal year as an exhibit to its reports on Form N-PORT. Shareholders may view the filed Form N-PORT by visiting the SEC website at sec.gov.
22 | Wells Fargo VT International Equity Fund
Other information (unaudited)
BOARD OF TRUSTEES AND OFFICERS
Each of the Trustees and Officers listed in the table below acts in identical capacities for each fund in the Wells Fargo family of funds, which consists of 139 mutual funds comprising the Wells Fargo Funds Trust, Wells Fargo Variable Trust, Wells Fargo Master Trust and four closed-end funds (collectively the “Fund Complex”). This table should be read in conjunction with the Prospectus and the Statement of Additional Information1. The mailing address of each Trustee and Officer is 525 Market Street, 12th Floor, San Francisco, CA 94105. Each Trustee and Officer serves an indefinite term, however, each Trustee serves such term until reaching the mandatory retirement age established by the Trustees.
Independent Trustees
Name and
year of birth | Position held and
length of service* | Principal occupations during past five years or longer | Current other
public company or
investment
company
directorships |
William R. Ebsworth
(Born 1957) | Trustee,
since 2015 | Retired. From 1984 to 2013, equities analyst, portfolio manager, research director and chief investment officer at Fidelity Management and Research Company in Boston, Tokyo, and Hong Kong, and retired in 2013 as Chief Investment Officer of Fidelity Strategic Advisers, Inc. where he led a team of investment professionals managing client assets. Prior thereto, Board member of Hong Kong Securities Clearing Co., Hong Kong Options Clearing Corp., the Thailand International Fund, Ltd., Fidelity Investments Life Insurance Company, and Empire Fidelity Investments Life Insurance Company. Audit Committee Chair and Investment Committee Chair of the Vincent Memorial Hospital Endowment (non-profit organization). Mr. Ebsworth is a CFA® charterholder. | N/A |
Jane A. Freeman
(Born 1953) | Trustee,
since 2015;
Chair Liaison,
since 2018 | Retired. From 2012 to 2014 and 1999 to 2008, Chief Financial Officer of Scientific Learning Corporation. From 2008 to 2012, Ms. Freeman provided consulting services related to strategic business projects. Prior to 1999, Portfolio Manager at Rockefeller & Co. and Scudder, Stevens & Clark. Board member of the Harding Loevner Funds from 1996 to 2014, serving as both Lead Independent Director and chair of the Audit Committee. Board member of the Russell Exchange Traded Funds Trust from 2011 to 2012 and the chair of the Audit Committee. Ms. Freeman is also an inactive Chartered Financial Analyst. | N/A |
Isaiah Harris, Jr.
(Born 1952) | Trustee,
since 2009; Audit
Committee
Chair,
since 2019 | Retired. Chairman of the Board of CIGNA Corporation since 2009, and Director since 2005. From 2003 to 2011, Director of Deluxe Corporation. Prior thereto, President and CEO of BellSouth Advertising and Publishing Corp. from 2005 to 2007, President and CEO of BellSouth Enterprises from 2004 to 2005 and President of BellSouth Consumer Services from 2000 to 2003. Emeritus member of the Iowa State University Foundation Board of Governors. Emeritus Member of the Advisory Board of Iowa State University School of Business. Advisory Board Member, Palm Harbor Academy (private school). Mr. Harris is a certified public accountant (inactive status). | CIGNA Corporation |
Judith M. Johnson
(Born 1949) | Trustee,
since 2008 | Retired. Prior thereto, Chief Executive Officer and Chief Investment Officer of Minneapolis Employees Retirement Fund from 1996 to 2008. Ms. Johnson is an attorney, certified public accountant and a certified managerial accountant. | N/A |
David F. Larcker
(Born 1950) | Trustee,
since 2009 | James Irvin Miller Professor of Accounting at the Graduate School of Business (Emeritus), Stanford University, Director of the Corporate Governance Research Initiative and Senior Faculty of The Rock Center for Corporate Governance since 2006. From 2005 to 2008, Professor of Accounting at the Graduate School of Business, Stanford University. Prior thereto, Ernst & Young Professor of Accounting at The Wharton School, University of Pennsylvania from 1985 to 2005. | N/A |
Wells Fargo VT International Equity Fund | 23
Other information (unaudited)
Name and
year of birth | Position held and
length of service* | Principal occupations during past five years or longer | Current other
public company or
investment
company
directorships |
Olivia S. Mitchell
(Born 1953) | Trustee,
since 2006;
Nominating and
Governance
Committee Chair,
since 2018 | International Foundation of Employee Benefit Plans Professor, Wharton School of the University of Pennsylvania since 1993. Director of Wharton’s Pension Research Council and Boettner Center on Pensions & Retirement Research, and Research Associate at the National Bureau of Economic Research. Previously, Cornell University Professor from 1978 to 1993. | N/A |
Timothy J. Penny
(Born 1951) | Trustee,
since 1996;
Chair,
since 2018 | President and Chief Executive Officer of Southern Minnesota Initiative Foundation, a non-profit organization, since 2007. Member of the Board of Trustees of NorthStar Education Finance, Inc., a non-profit organization, since 2007. | N/A |
James G. Polisson
(Born 1959) | Trustee,
since 2018 | Retired. Chief Marketing Officer, Source (ETF) UK Services, Ltd, from 2015 to 2017. From 2012 to 2015, Principal of The Polisson Group, LLC, a management consulting, corporate advisory and principal investing company. Chief Executive Officer and Managing Director at Russell Investments, Global Exchange Traded Funds from 2010 to 2012. Managing Director of Barclays Global Investors from 1998 to 2010 and Global Chief Marketing Officer for iShares and Barclays Global Investors from 2000 to 2010. Trustee of the San Francisco Mechanics’ Institute, a non-profit organization, from 2013 to 2015. Board member of the Russell Exchange Traded Fund Trust from 2011 to 2012. Director of Barclays Global Investors Holdings Deutschland GmbH from 2006 to 2009. Mr. Polisson is an attorney and has a retired status with the Massachusetts and District of Columbia Bar Associations. | N/A |
Pamela Wheelock
(Born 1959) | Trustee,
since January
2020; previously
Trustee from
January 2018 to
July 2019 | Board member of the Destination Medical Center Economic Development Agency, Rochester, Minnesota since 2019. Interim President of the McKnight Foundation from January to September 2020. Acting Commissioner, Minnesota Department of Human Services, July 2019 through September 2019. Human Services Manager (part-time), Minnesota Department of Human Services, October 2019 through December 2019. Chief Operating Officer, Twin Cities Habitat for Humanity from 2017 to 2019. Vice President of University Services, University of Minnesota from 2012 to 2016. Prior thereto, on the Board of Directors, Governance Committee and Finance Committee for the Minnesota Philanthropy Partners (Saint Paul Foundation) from 2012 to 2018, Interim Chief Executive Officer of Blue Cross Blue Shield of Minnesota from 2011 to 2012, Chairman of the Board from 2009 to 2012 and Board Director from 2003 to 2015. Vice President, Leadership and Community Engagement, Bush Foundation, Saint Paul, Minnesota (a private foundation) from 2009 to 2011. Executive Vice President and Chief Financial Officer, Minnesota Sports and Entertainment from 2004 to 2009 and Senior Vice President from 2002 to 2004. Executive Vice President of the Minnesota Wild Foundation from 2004 to 2008. Commissioner of Finance, State of Minnesota, from 1999 to 2002. Currently Board Chair of the Minnesota Wild Foundation since 2010. | N/A |
* Length of service dates reflect the Trustee’s commencement of service with the Trust’s predecessor entities, where applicable.
24 | Wells Fargo VT International Equity Fund
Other information (unaudited)
Officers
Name and
year of birth | Position held and
length of service | Principal occupations during past five years or longer |
Andrew Owen
(Born 1960) | President,
since 2017 | Executive Vice President of Wells Fargo & Company and Head of Affiliated Managers, Wells Fargo Asset Management, since 2014. In addition, Mr. Owen is currently President, Chief Executive Officer and Director of Wells Fargo Funds Management, LLC since 2017. Prior thereto, Executive Vice President responsible for marketing, investments and product development for Wells Fargo Funds Management, LLC, from 2009 to 2014. |
Jeremy DePalma
(Born 1974) | Treasurer,
since 2012
(for certain funds in
the Fund Complex);
since 2021 (for
the remaining funds in the
Fund Complex) | Senior Vice President of Wells Fargo Funds Management, LLC since 2009. Senior Vice President of Evergreen Investment Management Company, LLC from 2008 to 2010 and head of the Fund Reporting and Control Team within Fund Administration from 2005 to 2010. |
Michelle Rhee
(Born 1966) | Chief Legal Officer,
since 2019 | Secretary of Wells Fargo Funds Management, LLC and Chief Legal Counsel of Wells Fargo Asset Management since 2018. Deputy General Counsel of Wells Fargo Bank, N.A. since 2020 and Assistant General Counsel of Wells Fargo Bank, N.A. from 2018 to 2020. Associate General Counsel and Managing Director of Bank of America Corporation from 2004 to 2018. |
Catherine Kennedy
(Born 1969) | Secretary,
since 2019 | Vice President of Wells Fargo Funds Management, LLC and Senior Counsel of the Wells Fargo Legal Department since 2010. Vice President and Senior Counsel of Evergreen Investment Management Company, LLC from 1998 to 2010. |
Michael H. Whitaker
(Born 1967) | Chief Compliance Officer,
since 2016 | Chief Compliance Officer of Wells Fargo Asset Management since 2016. Senior Vice President and Chief Compliance Officer for Fidelity Investments from 2007 to 2016. |
1 The Statement of Additional Information includes additional information about the Trustees and is available, without charge, upon request, by calling 1-800-222-8222 or by visiting the website at wfam.com.
Wells Fargo VT International Equity Fund | 25
Board considerations (unaudited)
BOARD CONSIDERATION OF INVESTMENT MANAGEMENT AND SUB-ADVISORY AGREEMENTS:
Board Considerations – Current Agreements
Under the Investment Company Act of 1940 (the “1940 Act”), the Board of Trustees (the “Board”) of Wells Fargo Variable Trust (the “Trust”) must determine annually whether to approve the continuation of the Trust’s investment management and sub-advisory agreements. In this regard, at a Board meeting held on May 17-19, 2021 (the “Meeting”), the Board, all the members of which have no direct or indirect interest in the investment management and sub-advisory agreements and are not “interested persons” of the Trust, as defined in the 1940 Act (the “Independent Trustees”), reviewed and approved for Wells Fargo VT International Equity Fund (the “Fund”): (i) an investment management agreement (the “Management Agreement”) with Wells Fargo Funds Management, LLC (“Funds Management”); and (ii) an investment sub-advisory agreement (the “Sub-Advisory Agreement”) with Wells Capital Management Incorporated (the “Sub-Adviser”), an affiliate of Funds Management. The Management Agreement and the Sub-Advisory Agreement are collectively referred to as the “Advisory Agreements.”
The Board noted that Wells Fargo & Company recently announced that it had entered into a definitive agreement to sell Wells Fargo Asset Management (“WFAM”), which includes Funds Management and the Sub-Adviser, to GTCR LLC and Reverence Capital Partners, L.P. and/or their affiliates (the “Transaction”). The Board further noted that the Transaction would result in a change-of-control of Funds Management and the Sub-Adviser, which would be considered to be an assignment that would result in the termination of the Advisory Agreements. In light of the Transaction, the Board separately considered for approval a new investment management agreement with Funds Management and a new sub-advisory agreement with the Sub-Adviser (the “New Agreements”) that would replace the Advisory Agreements upon consummation of the Transaction, subject to approval of the New Agreements by the Fund’s shareholders. The Board also considered for approval interim agreements to go into effect in the event shareholders do not approve the New Agreements before the Transaction is completed. The interim agreements would allow the Manager and the Sub-Adviser to continue providing services to the Fund while the Fund continues to seek shareholder approval of the New Agreements. The Board noted that the terms of the interim agreements would be identical to those of the current Advisory Agreements, except for the term and certain escrow provisions.
At the Meeting, the Board considered the factors and reached the conclusions described below relating to the selection of Funds Management and the Sub-Adviser and the approval of the Advisory Agreements. Prior to the Meeting, including at Board meetings held in April and May 2021, the Trustees conferred extensively among themselves and with representatives of Funds Management about these matters. Also, the Board has adopted a team-based approach, with each team consisting of a sub-set of Trustees, to assist the full Board in the discharge of its duties in reviewing investment performance and other matters throughout the year. The Independent Trustees were assisted in their evaluation of the Advisory Agreements by independent legal counsel, from whom they received separate legal advice and with whom they met separately.
In providing information to the Board, Funds Management and the Sub-Adviser were guided by a detailed set of requests for information submitted to them by independent legal counsel on behalf of the Independent Trustees at the start of the Board’s annual contract renewal process earlier in 2021. In considering and approving the Advisory Agreements, the Trustees considered the information they believed relevant, including but not limited to the information discussed below. The Board considered not only the specific information presented in connection with the Meeting, but also the knowledge gained over time through interaction with Funds Management and the Sub-Adviser about various topics. In this regard, the Board reviewed reports of Funds Management at each of its quarterly meetings, which included, among other things, portfolio reviews and investment performance reports. In addition, the Board and the teams mentioned above confer with portfolio managers at various times throughout the year. The Board did not identify any particular information or consideration that was all-important or controlling, and each individual Trustee may have attributed different weights to various factors.
After its deliberations, the Board unanimously determined that the compensation payable to Funds Management and the Sub-Adviser under each of the Advisory Agreements was reasonable, and approved the continuation of the Advisory Agreements for a one-year term. The Board considered the approval of the Advisory Agreements for the Fund as part of its consideration of agreements for funds across the complex, but its approvals were made on a fund-by-fund basis. The following summarizes a number of important, but not necessarily all, factors considered by the Board in support of its approvals.
Nature, extent and quality of services
The Board received and considered various information regarding the nature, extent and quality of services provided to the Fund by Funds Management and the Sub-Adviser under the Advisory Agreements. This information included a description of the investment advisory services and Fund-level administrative services covered by the Management Agreement, as well as, among other things, a summary of the background and experience of senior management of WFAM, of which Funds Management and the Sub-Adviser are a part, and a summary of investments made in the business of WFAM. The Board also received a description of
26 | Wells Fargo VT International Equity Fund
Board considerations (unaudited)
Funds Management’s and the Sub-Adviser’s business continuity plans, including a summary of the performance of such plans and any changes thereto during the COVID-19 pandemic, and of their approaches to data privacy and cybersecurity. The Board also received and reviewed information about Funds Management’s role as administrator of the Fund’s liquidity risk management program, Funds Management’s approach to risk management, and Funds Management’s intermediary and vendor oversight program.
The Board also considered the qualifications, background, tenure and responsibilities of each of the portfolio managers primarily responsible for the day-to-day portfolio management of the Fund. The Board evaluated the ability of Funds Management and the Sub-Adviser to attract and retain qualified investment professionals, including research, advisory and supervisory personnel. The Board further considered the compliance programs and compliance records of Funds Management and the Sub-Adviser. In addition, the Board took into account the full range of services provided to the Fund by Funds Management and its affiliates. The Board also considered information about retention and back-up arrangements that have been put into place with respect to key personnel of WFAM in connection with the anticipated Transaction, noting that WFAM provided assurances that the announcement and eventual culmination of the Transaction is not expected to result in any diminution in the nature or quality of services provided to the Fund.
Fund investment performance and expenses
The Board considered the investment performance results for the Fund over various time periods ended December 31, 2020. The Board considered these results in comparison to the investment performance of funds in a universe that was determined by Broadridge Inc. (“Broadridge”) to be similar to the Fund (the “Universe”), and in comparison to the Fund’s benchmark index and to other comparative data. Broadridge is an independent provider of investment company data. The Board received a description of the methodology used by Broadridge to select the mutual funds in the performance Universe. The Board noted that the investment performance of the Fund was higher than the average investment performance of the Universe for the one-, three-, five- and ten-year periods ended December 31, 2020. The Board also noted that the investment performance of the Fund was lower than its benchmark index, the MSCI ACWI ex USA Index (Net), for all periods under review.
The Board received information concerning, and discussed factors contributing to, the underperformance of the Fund relative to its benchmark index for the periods identified above. The Board took note of the explanations for the relative underperformance during these periods, including with respect to investment decisions that affected the Fund’s investment performance.
The Board also received and considered information regarding the Fund’s net operating expense ratios and their various components, including actual management fees, custodian and other non-management fees, and Rule 12b-1 and non-Rule 12b-1 shareholder service fees. The Board considered these ratios in comparison to the median ratios of funds in class-specific expense groups that were determined by Broadridge to be similar to the Fund (the “Groups”). The Board received a description of the methodology used by Broadridge to select the mutual funds in the expense Groups and an explanation of how funds comprising expense groups and their expense ratios may vary from year-to-year. Based on the Broadridge reports, the Board noted that the net operating expense ratios of the Fund were lower than the median net operating expense ratios of the expense Groups for all share classes.
The Board took into account the Fund’s investment performance and expense information provided to it among the factors considered in deciding to re-approve the Advisory Agreements.
Investment management and sub-advisory fee rates
The Board reviewed and considered the contractual fee rates payable by the Fund to Funds Management under the Management Agreement, as well as the contractual fee rates payable by the Fund to Funds Management for class-level administrative services under a Class-Level Administration Agreement, which include, among other things, class-level transfer agency and sub-transfer agency costs (collectively, the “Management Rates”). The Board also reviewed and considered the contractual investment sub-advisory fee rates that are payable by Funds Management to the Sub-Adviser for investment sub-advisory services.
Among other information reviewed by the Board was a comparison of the Fund’s Management Rates with the average contractual investment management fee rates of funds in the expense Groups at a common asset level as well as transfer agency costs of the funds in the expense Groups. The Board noted that the Management Rates of the Fund were higher than the sum of these average rates for the Fund’s expense Groups, but noted that the net operating expense ratios of the Fund were lower than the median net operating expense ratios of the expense Groups for all share classes.
The Board also received and considered information about the portion of the total management fee that was retained by Funds Management after payment of the fee to the Sub-Adviser for sub-advisory services. In assessing the reasonableness of this amount, the Board received and evaluated information about the nature and extent of responsibilities retained and risks assumed
Wells Fargo VT International Equity Fund | 27
Board considerations (unaudited)
by Funds Management and not delegated to or assumed by the Sub-Adviser, and about Funds Management’s on-going oversight services. Given the affiliation between Funds Management and the Sub-Adviser, the Board ascribed limited relevance to the allocation of fees between them.
The Board also received and considered information about the nature and extent of services offered and fee rates charged by Funds Management and the Sub-Adviser to other types of clients with investment strategies similar to those of the Fund. In this regard, the Board received information about the significantly greater scope of services, and compliance, reporting and other legal burdens and risks of managing proprietary mutual funds compared with those associated with managing assets of other types of clients, including third-party sub-advised fund clients and non-mutual fund clients such as institutional separate accounts.
Based on its consideration of the factors and information it deemed relevant, including those described here, the Board determined that the compensation payable to Funds Management under the Management Agreement and to the Sub-Adviser under the Sub-Advisory Agreement was reasonable.
Profitability
The Board received and considered information concerning the profitability of Funds Management, as well as the profitability of both WFAM and Wells Fargo & Co. (“Wells Fargo”) from providing services to the fund family as a whole. The Board noted that the Sub-Adviser’s profitability information with respect to providing services to the Fund and other funds in the family was subsumed in the WFAM and Wells Fargo profitability analysis.
Funds Management reported on the methodologies and estimates used in calculating profitability, including a description of the methodology used to allocate certain expenses. Among other things, the Board noted that the levels of profitability reported on a fund-by-fund basis varied widely, depending on factors such as the size, type and age of fund.
Based on its review, the Board did not deem the profits reported by Funds Management, WFAM or Wells Fargo from services provided to the Fund to be at a level that would prevent it from approving the continuation of the Advisory Agreements.
Economies of scale
The Board received and considered information about the potential for Funds Management to experience economies of scale in the provision of management services to the Fund, the difficulties of calculating economies of scale at an individual fund level, and the extent to which potential scale benefits are shared with Fund shareholders. The Board noted the existence of breakpoints in the Fund’s management fee structure, which operate generally to reduce the Fund’s expense ratios as the Fund grows in size, and the size of the Fund in relation to such breakpoints. The Board considered that in addition to management fee breakpoints, Funds Management shares potential economies of scale from its management business in a variety of ways, including through fee waiver and expense reimbursement arrangements, competitive management fee rates set at the outset without regard to breakpoints, and investments in the business intended to enhance services available to shareholders.
The Board concluded that Funds Management’s arrangements with respect to the Fund, including contractual breakpoints, constituted a reasonable approach to sharing potential economies of scale with the Fund and its shareholders.
Other benefits to Funds Management and the Sub-Adviser
The Board received and considered information regarding potential “fall-out” or ancillary benefits received by Funds Management and its affiliates, including the Sub-Adviser, as a result of their relationships with the Fund. Ancillary benefits could include, among others, benefits directly attributable to other relationships with the Fund and benefits potentially derived from an increase in Funds Management’s and the Sub-Adviser’s business as a result of their relationships with the Fund. The Board noted that various affiliates of Funds Management may receive distribution-related fees, shareholder servicing payments and sub-transfer agency fees in respect of shares sold or held through them and services provided.
The Board also reviewed information about soft dollar credits earned and utilized by the Sub-Adviser, fees earned by Funds Management and the Sub-Adviser from managing a private investment vehicle for the fund family’s securities lending collateral, and commissions earned by an affiliated broker from portfolio transactions.
Based on its consideration of the factors and information it deemed relevant, including those described here, the Board did not find that any ancillary benefits received by Funds Management and its affiliates, including the Sub-Adviser, were unreasonable.
Conclusion
At the Meeting, after considering the above-described factors and based on its deliberations and its evaluation of the information described above, the Board unanimously determined that the compensation payable to Funds Management and the Sub-Adviser under each of the Advisory Agreements was reasonable, and approved the continuation of the Advisory Agreements for a one-year term.
28 | Wells Fargo VT International Equity Fund
Board considerations (unaudited)
Board Considerations – New Agreements
Overview of the Board evaluation process
At a meeting held on May 17-19, 2021 (the “Board Meeting”), the Board of Trustees (the “Board”) of Wells Fargo Variable Trust (the “Trust”, and the series thereof, the “Funds”) approved the continuation of each Fund’s current Investment Management Agreement (the “Current Investment Management Agreement”) and the current Wells Cap Sub-Advisory Agreement (the “Current Wells Cap Sub-Advisory Agreement”, and collectively, the “Current Agreements”). Each Trustee on the Board is not an “interested person” (as defined in the Investment Company Act of 1940 (the “1940 Act”)) of the Funds (collectively, the “Independent Trustees”). The process followed by the Board in considering and approving the continuation of the Current Agreements is referred to herein as the “2021 Annual Approval Process.”
As noted above, the closing of the sale of Wells Fargo Asset Management (“WFAM”) to a holding company (“NewCo”) affiliated with private funds of GTCR LLC (“GTCR”) and of Reverence Capital Partners, L.P. (“Reverence Capital”, and such transaction, the “Transaction”) will result in a change of control of Wells Fargo Funds Management LLC (“Funds Management”) and Wells Capital Management Incorporated (“Wells Capital” or the “Sub-Adviser”, and together with Funds Management, the “Advisers”), which will be considered to be an “assignment” of each Fund’s Current Agreements under the 1940 Act that will result in the automatic termination of each Fund’s Current Agreements. In light of the expected termination of each Fund’s Current Agreements upon the closing, at the Board Meeting the Board also considered and approved: (i) a new Investment Management Agreement between the Trust, on behalf of each Fund, and Funds Management (the “New Investment Management Agreement”); and (ii) a new Sub-Advisory Agreement among the Trust, on behalf of each Fund, Funds Management and Wells Capital (the “New Sub-Advisory Agreement”, and collectively, the “New Agreements”), each of which is intended to go into effect upon the closing. The process followed by the Board in reviewing and approving the New Agreements is referred to herein as the “New Agreement Approval Process.”
At a series of meetings held in April and May 2021 (collectively, “April and May 2021 Meetings”) and at the Board Meeting, the Trustees conferred extensively among themselves and with senior representatives of Funds Management, GTCR and Reverence Capital about the New Agreements and related matters. The Board reviewed and discussed information furnished by Funds Management, GTCR and Reverence Capital that the Board considered reasonably necessary to evaluate the terms of the New Agreements and the services to be provided. At these meetings, senior representatives from Funds Management, GTCR and Reverence Capital made presentations to, and responded to questions from, the Board.
In providing information to the Board in connection with the 2021 annual approval process for the Current Agreements (the “2021 Annual Approval Process”) and the New Agreement Approval Process, Funds Management, GTCR and Reverence Capital (as applicable) were guided by requests for information submitted by independent legal counsel on behalf of the Independent Trustees. In considering and approving the New Agreements, the Trustees considered the information they believed relevant, including but not limited to the information discussed herein. The Board considered not only the specific information presented in connection with the April and May 2021 Meetings as well as the Board Meeting, but also the knowledge gained over time through interaction with Funds Management and the Sub-Adviser about various topics. In this regard, the Board reviews reports of Funds Management at each of its regular Board meetings, which includes, among other things, portfolio reviews and investment performance reports. In addition, the Board confers with portfolio managers at various times throughout the year. The Board was assisted in its evaluation of the New Agreements by independent legal counsel, from whom the Independent Trustees received separate legal advice and with whom the Independent Trustees met separately. The Board did not identify any particular information or consideration that was all-important or controlling, and each individual Trustee may have attributed different weights to various factors.
Among other information considered by the Board in connection with the Transaction was:
| ■ | Information regarding the Transaction: information about the structure, financing sources and material terms and conditions of the Transaction, including the expected impact on the businesses conducted by the Advisers and by Wells Fargo Funds Distributor LLC, as the distributor of Fund shares. |
| ■ | Information regarding NewCo, GTCR and Reverence Capital: (i) information about NewCo, including information about its expected financial condition and access to capital, and senior leadership team; (ii) the experience of senior management at GTCR and Reverence Capital in acquiring portfolio companies; (iii) the plan to operationalize NewCo, including the transition of necessary infrastructure services through a transition services agreement with Wells Fargo under which Wells Fargo will continue to provide NewCo with certain services for a specified period of time after the closing; and (iv) information regarding regulatory matters, compliance, and risk management functions at NewCo, including resources to be dedicated thereto. |
Wells Fargo VT International Equity Fund | 29
Board considerations (unaudited)
| ■ | Impact of the Transaction on WFAM and Service Providers: (i) information regarding any changes to personnel and/or other resources of the Advisers as a result of the Transaction, including assurances regarding comparable and competitive compensation arrangements to attract and retain highly qualified personnel; and (ii) information about the organizational and operating structure with respect to NewCo, the Advisers and the Funds. |
| ■ | Impact of the Transaction on the Funds and their Shareholders: (i) information regarding anticipated benefits to the Funds as a result of the Transaction; (ii) a commitment that the Funds would not bear any expenses, directly or indirectly, in connection with the Transaction; (iii) confirmation that the Advisers intend to continue to manage the Funds in a manner consistent with each Fund’s current investment objectives and principal investments strategies; and (iv) a commitment that neither NewCo nor WFAM will take any steps that would impose any “unfair burden” (as that term is used in section 15(f)(1)(B) of the 1940 Act) on the Funds as a result of the Transaction. |
With respect to the New Agreements, the Board considered: (i) a representation that, after the closing, all of the Funds will continue to be managed and advised by their current Advisers, and that the same portfolio managers of the Sub-Adviser are expected to continue to manage the Funds after the Transaction; (ii) information regarding the terms of the New Agreements, including changes as compared to the Current Agreements; (iii) information confirming that the fee rates payable under the New Agreements will not increase as a result of the Transaction as compared to the rates under the Current Agreements; and (iv) assurances that the Transaction is not expected to cause any diminution with respect to the nature, extent and quality of any of the services currently provided to the Funds by the Advisers as a result of the Transaction.
In addition to considering information furnished specifically to evaluate the impact of the Transaction on the Funds and their respective shareholders in connection with the New Agreement Approval Process, the Board considered information furnished at prior meetings of the Board and its committees, including detailed information provided in connection with the 2021 Annual Approval Process. In this regard, in connection with the 2021 Annual Approval Process, the Board received information about complex-wide and individual Fund performance, fees and expenses, including: (i) a report from an independent data provider comparing the investment performance of each Fund to the investment performance of comparable funds and benchmark indices, over various time periods; (ii) a report from an independent data provider comparing each Fund’s total expense ratio (and its components) to those of comparable funds; (iii) comparative information concerning the fees charged and services provided by the Advisers to each Fund in managing other accounts (which may include other mutual funds, collective investment funds and institutional accounts), if any, that employ investment strategies and techniques similar to those used in managing such Fund(s); and (iv) profitability analyses of Funds Management, as well as the profitability of both WFAM and Wells Fargo from providing services to the fund family as a whole.
After its deliberations, the Board unanimously determined that the compensation payable to Funds Management and the Sub-Adviser under the New Agreements is reasonable, approved the New Agreements for a two-year term, and voted to recommend that Fund shareholders approve the New Agreements. The Board considered the approval of the New Agreements as part of its consideration of agreements for funds across the complex, but its approvals were made on a fund-by-fund basis. The following summarizes a number of important, but not necessarily all, factors considered by the Board in support of its approvals.
Nature, extent and quality of services
In connection with the 2021 Annual Approval Process, the Board received and considered various information regarding the nature, extent and quality of services provided to each Fund by Funds Management and the Sub-Adviser under the Current Agreements. This information included a description of the investment advisory services and Fund-level administrative services covered by the Current Management Agreement, as well as, among other things, a summary of the background and experience of senior management of WFAM, of which Funds Management and the Sub-Adviser are a part, and a summary of investments made in the business of WFAM. The Board also received a description of Funds Management’s and the Sub-Adviser’s business continuity plans, including a summary of the performance of such plans and any changes thereto during the COVID-19 pandemic, and of their approaches to data privacy and cybersecurity. The Board also received and reviewed information about Funds Management’s role as administrator of the Funds’ liquidity risk management program, Funds Management’s approach to risk management, and Funds Management’s intermediary and vendor oversight program.
In connection with the 2021 Annual Approval Process, the Board also considered the qualifications, background, tenure and responsibilities of each of the portfolio managers primarily responsible for the day-to-day portfolio management of the Funds. The Board evaluated the ability of Funds Management and the Sub-Adviser to attract and retain qualified investment professionals, including research, advisory and supervisory personnel.
In connection with the 2021 Annual Approval Process, the Board further considered the compliance programs and compliance records of Funds Management and the Sub-Adviser. In addition, the Board took into account the full range of services provided to the Funds by Funds Management and its affiliates.
30 | Wells Fargo VT International Equity Fund
Board considerations (unaudited)
In connection with the New Agreement Approval Process, the Board considered, among other information, the structure of the Transaction and expected impact, if any, of the Transaction on the operations, facilities, organization and personnel of the Advisers. The Board received assurances from Funds Management that each Fund will continue to be advised by its current Sub-Adviser after the closing, and that the same individual portfolio managers are expected to continue to manage the Funds after the closing. With respect to the recruitment and retention of key personnel, the Board noted information from GTCR, Reverence Capital and the Advisers regarding the potential benefits for employees of joining NewCo. The Board recognized that the personnel who had been extended offers may not accept such offers, and personnel changes may occur in the future in the ordinary course.
In addition, the Board considered information regarding the infrastructure, operational capabilities and support staff in place to assist in the portfolio management and operations of the Funds, including the provision of administrative services, and the anticipated impact of the Transaction on such matters. The Board also considered the business-related and other risks to which the Advisers may be subject in managing the Funds and in connection with the Transaction. The Board also considered the transition and integration plans as a result of the change in ownership of the Advisers from Wells Fargo to NewCo. The Board considered the resources and infrastructure that NewCo intends to devote to its compliance program to ensure compliance with applicable laws and regulations, as well as its risk management program and cybersecurity program. The Board also took into account assurances received from the Advisers, GTCR and Reverence Capital that the Transaction is not expected to cause any diminution in the nature, extent and quality of services provided by the Advisers to the Funds and their shareholders.
Fund investment performance and expenses
In connection with the 2021 Annual Approval Process, the Board considered the investment performance results for each Fund over various time periods ended December 31, 2020. The Board considered these results in comparison to the investment performance of funds in a universe that was determined by Broadridge Inc. (“Broadridge”) to be similar to each Fund (the “Universe”), and in comparison to each Fund’s benchmark index and to other comparative data. Broadridge is an independent provider of investment company data. The Board received a description of the methodology used by Broadridge to select the mutual funds in the performance Universe. Where applicable, the Board received information concerning, and discussed factors contributing to, underperformance of Funds relative to the Universe and benchmark for any underperformance periods.
In connection with the 2021 Annual Approval Process, the Board also received and considered information regarding each Fund’s net operating expense ratios and their various components, including actual management fees, custodian and other non-management fees, and Rule 12b-1 and non-Rule 12b-1 shareholder service fees. The Board considered these ratios in comparison to the median ratios of funds in class-specific expense groups that were determined by Broadridge to be similar to the Fund (the “Groups”). The Board received a description of the methodology used by Broadridge to select the mutual funds in the expense Groups and an explanation of how funds comprising expense groups and their expense ratios may vary from year-to-year.
In connection with the New Agreement Approval Process, the Board received a commitment that WFAM will maintain fee and expense commitments for at least two years after the closing. The Board took into account each Fund’s investment performance and expense information among the factors considered in deciding to approve the New Agreements.
Investment management and sub-advisory fee rates
In connection with the 2021 Annual Approval Process, the Board reviewed and considered the contractual fee rates payable by each Fund to Funds Management under the Current Management Agreement, as well as the contractual fee rates payable by each Fund to Funds Management for class-level administrative services under a Class-Level Administration Agreement, which include, among other things, class-level transfer agency and sub-transfer agency costs (collectively, the “Management Rates”). The Board also reviewed and considered the contractual investment sub-advisory fee rates that are payable by Funds Management to the Sub-Adviser under the Current Sub-Advisory Agreements for investment sub-advisory services (the “Sub-Advisory Fee Rates”).
Among other information reviewed by the Board in connection with the 2021 Annual Approval Process, was a comparison of each Fund’s Management Rates with the average contractual investment management fee rates of funds in the expense Groups at a common asset level as well as transfer agency costs of the funds in the expense Groups.
In connection with the 2021 Annual Approval Process, the Board also received and considered information about the portion of the total management fee that was retained by Funds Management after payment of the Sub-Advisory Fee Rates. In assessing the reasonableness of this amount, the Board received and evaluated information about the nature and extent of responsibilities retained and risks assumed by Funds Management and not delegated to or assumed by the Sub-Adviser, and about Funds Management’s on-going oversight services. Given the affiliation between Funds Management and the Sub-Adviser, the Board ascribed limited relevance to the allocation of fees between them.
Wells Fargo VT International Equity Fund | 31
Board considerations (unaudited)
In connection with the 2021 Annual Approval Process, the Board also received and considered information about the nature and extent of services offered and fee rates charged by Funds Management and the Sub-Adviser to other types of clients, if any, with investment strategies similar to those of each Fund. In this regard, the Board received information about the significantly greater scope of services, and compliance, reporting and other legal burdens and risks of managing proprietary mutual funds compared with those associated with managing assets of other types of clients, including third-party sub-advised fund clients and non-mutual fund clients such as institutional separate accounts.
In connection with the New Agreement Approval Process, the Board noted the assurances received by it that there would be no increases to any of the Management Rates or the Sub-Advisory Fee Rates as a result of the Transaction. The Board also considered that the New Agreements do not change the computation method for calculating such fees, and there is no present intention to reduce expense waiver and reimbursement arrangements that are currently in effect. Based on its consideration of the factors and information it deemed relevant, including those described here, the Board determined that the compensation payable to Funds Management under the New Management Agreement and to the Sub-Adviser under the New Sub-Advisory Agreement was reasonable.
Profitability
In connection with the 2021 Annual Approval Process, the Board received and considered information concerning the profitability of Funds Management, as well as the profitability of both WFAM and Wells Fargo from providing services to the fund family as a whole. The Board noted that the Sub-Adviser’s profitability information with respect to providing services to each Fund and other funds in the family was subsumed in the WFAM and Wells Fargo profitability analysis.
Funds Management reported on the methodologies and estimates used in calculating profitability in connection with the 2021 Annual Approval Process, including a description of the methodology used to allocate certain expenses. Among other things, the Board noted that the levels of profitability reported on a fund-by-fund basis varied widely, depending on factors such as the size, type and age of fund.
In connection with the New Agreement Approval Process, the Board received certain information about NewCo’s projected financial condition, and reviewed with senior representatives of Funds Management, GTCR and Reverence Capital the underlying assumptions on which such information was based. The Board considered that NewCo is a newly formed entity, with no historical operations, revenues or expenses, and that it is difficult to predict with any degree of certainty the future profitability of NewCo and the Advisers from advisory activities under the New Agreements. The Board considered that the fee rates payable under the New Agreements will not increase as a result of the Transaction as compared to the rates under the Current Agreements, and that the current contractual expense limitations applicable to each Fund will not increase. The Board noted that if the New Agreements are approved by shareholders and the Transaction closes, the Board will have the opportunity in the future to review the profitability of NewCo and the Advisers from advisory activities under the New Agreements.
Economies of scale
In connection with the 2021 Annual Approval Process, the Board received and considered information about the potential for Funds Management to experience economies of scale in the provision of management services to the Funds, the difficulties of calculating economies of scale at an individual fund level, and the extent to which potential scale benefits are shared with Fund shareholders. The Board noted the existence of breakpoints in each Fund’s management fee structure, which operate generally to reduce the Fund’s expense ratios as the Fund grows in size, and the size of the Fund in relation to such breakpoints. The Board considered that, in addition to management fee breakpoints, Funds Management shares potential economies of scale from its management business in a variety of ways, including through fee waiver and expense reimbursement arrangements, competitive management fee rates set at the outset without regard to breakpoints, and investments in the business intended to enhance services available to shareholders.
In connection with the New Agreement Approval Process, the Board noted that NewCo and the Advisers may benefit from possible growth of the Funds resulting from enhanced distribution capabilities. However, the Board noted that other factors could also affect the potential for economies of scale, and that it was not possible to quantify any potential future economies of scale. Based upon the information furnished to the Board in connection with the 2021 Annual Approval Process and the New Agreement Approval Process, the Board concluded that Funds Management’s arrangements with respect to each Fund, including contractual breakpoints and expense limitation arrangements, constitute a reasonable approach to sharing potential economies of scale with the Fund and its shareholders.
“Fall-out” benefits to Funds Management and the Sub-Adviser
In connection with the 2021 Annual Approval Process, the Board received and considered information regarding potential “fall-out” or ancillary benefits received by Funds Management and its affiliates, including the Sub-Adviser, as a result of their relationships with the Funds. Ancillary benefits could include, among others, benefits directly attributable to other relationships
32 | Wells Fargo VT International Equity Fund
Board considerations (unaudited)
with the Funds and benefits potentially derived from an increase in Funds Management’s and the Sub-Adviser’s business as a result of their relationships with the Funds. The Board noted that various current affiliates of Funds Management may receive distribution-related fees, shareholder servicing payments and sub-transfer agency fees in respect of shares sold or held through them and services provided.
In connection with the 2021 Annual Approval Process, the Board also reviewed information about soft dollar credits earned and utilized by the Sub-Adviser, fees earned by Funds Management and the Sub-Adviser from managing a private investment vehicle for the fund family’s securities lending collateral, and commissions earned by an affiliated broker of Wells Fargo from portfolio transactions.
In connection with the New Agreement Approval Process, the Board received information to the effect that the Transaction is not expected to have a material impact on the fall-out benefits currently realized by Funds Management and its affiliates, including the Sub-Adviser. The information reviewed by the Board also noted that several of the ancillary benefits identified for WFAM would be potential ancillary benefits for NewCo, including that the scale and reputation of the Funds might benefit NewCo’s broader reputation, product initiatives, technology investment and talent acquisition. Based on its consideration of the factors and information it deemed relevant, including those described here, the Board did not find that any ancillary benefits expected to be received by Funds Management and its affiliates, including NewCo and the Sub-Adviser, under the New Agreements were unreasonable.
Conclusion
At the Board Meeting, after considering the above-described factors and based on its deliberations and its evaluation of the information described above, the Board unanimously determined that the compensation payable to Funds Management and the Sub-Adviser under the New Agreements is reasonable, approved the New Agreements for a two-year term, and voted to recommend that Fund shareholders approve the New Agreements.
Wells Fargo VT International Equity Fund | 33
Board considerations (unaudited)
Board Considerations - Interim Agreements
At a meeting held on May 17-19, 2021 (the “Board Meeting”), the Boards of Trustees (each, a “Board”, and collectively, the “Boards”) of Wells Fargo Funds Trust, Wells Fargo Master Trust, Wells Fargo Variable Trust, Wells Fargo Global Dividend Opportunity Fund, Wells Fargo Income Opportunities Fund, Wells Fargo Multi-Sector Income Fund and Wells Fargo Utilities and High Income Fund (each a “Trust”, and the series thereof, a “Fund”) reviewed and approved for the Trusts and Funds, as applicable: (i) interim investment management agreements (the “Interim Management Agreements”) with Wells Fargo Funds Management, LLC (“Funds Management”); (ii) interim investment advisory agreements (the “Interim Advisory Agreements”) with Funds Management; and (iii) interim sub-advisory agreements (the “Interim Sub-Advisory Agreements”) with each of Cooke & Bieler, L.P., Galliard Capital Management, LLC (“Galliard”), Peregrine Capital Management Inc., Wells Capital Management, LLC (“WellsCap”), and Wells Fargo Asset Management (International) Limited (“WFAMI”, and collectively, the “Sub-Advisers”). Each Trustee on the Board is not an “interested person” (as defined in the Investment Company Act of 1940 (the “1940 Act”) of the Funds (collectively, the “Independent Trustees”). The Interim Management Agreements, Interim Advisory Agreements, and Interim Sub-Advisory Agreements are collectively referred to as the “Interim Advisory Agreements.”
At the Board Meeting, the Boards reviewed and approved the continuation of existing investment management, advisory and sub-advisory agreements (the “Current Advisory Agreements”) for each Trust and Fund, as applicable. The factors considered and conclusions reached by the Boards in approving the Current Advisory Agreements are summarized in the section entitled “Board Considerations – Current Agreements” of this shareholder report. The Boards noted that Wells Fargo & Company has entered into a definitive agreement to sell Wells Fargo Asset Management (“WFAM”), which includes Funds Management, Galliard, WellsCap and WFAMI (the “Affiliated Sub-Advisers”), to a holding company affiliated with private funds of GTCR LLC and Reverence Capital Partners, L.P. (the “Transaction”). The Boards further noted that the Transaction would result in a change-of-control of Funds Management and the Affiliated Sub-Advisers, which would be considered to be an “assignment” under the 1940 Act that would terminate the Current Advisory Agreements. At the Board Meeting, the Boards also reviewed and approved new investment management, advisory and sub-advisory agreements (the “New Advisory Agreements”) for each Trust and Fund, as applicable, that would replace the Current Advisory Agreements upon consummation of the Transaction, subject to approval of the New Advisory Agreements by the applicable Trust’s or Fund’s shareholders. The factors considered and conclusions reached by the Boards in approving the New Advisory Agreements are summarized in the section entitled “Board Considerations – New Agreements” of this shareholder report.
At the Board Meeting, the Boards also approved the Interim Advisory Agreements, which will go into effect for a Trust or Fund only in the event that shareholders of such Trust or Fund do not approve the New Advisory Agreement(s) for the Trust or Fund by the closing date of the Transaction, when the Current Advisory Agreements will terminate. The Board noted that, in such a circumstance, the Interim Advisory Agreements will permit continuity of management by allowing Funds Management and the Sub-Advisers to continue providing services to the Trust or Fund pursuant to the Interim Advisory Agreements while the Trust or Fund continues to solicit shareholder approval of such New Advisory Agreement(s). The Boards noted that the terms of the Interim Advisory Agreements are identical to those of the Current Advisory Agreements, except for the term and the addition of escrow provisions with respect to the advisory fees. The Boards also noted that the entities that would service the Funds and Trusts under the Interim Advisory Agreements are identical to those that provide services under the Current Advisory Agreements and those that will provide services under the New Advisory Agreements.
In approving the Interim Advisory Agreements, the Boards considered the same factors and reached the same conclusions as they considered and reached with respect to the Boards’ approvals of the Current Advisory Agreements and New Advisory Agreements, as applicable, which are described in separate Board Consideration sections within this shareholder report. Prior to the Board Meeting, including at a series of meetings held in April and May 2021, the Trustees conferred extensively among themselves and with senior representatives of Funds Management, GTCR LLC and Reverence Capital Partners, L.P. about the Interim Advisory Agreements and related matters. The Independent Trustees were assisted in their evaluation of the Interim Advisory Agreements by independent legal counsel, from whom they received separate legal advice and with whom they met separately.
At the Board Meeting, after considering the factors and reaching the conclusions described in the separate Board Consideration sections within this shareholder report, the Boards unanimously determined that the compensation payable to Funds Management and to each Sub-Adviser under each of the Interim Advisory Agreements was reasonable, and approved the Interim Advisory Agreements.
34 | Wells Fargo VT International Equity Fund
For more information
More information about Wells Fargo Funds is available free upon request. To obtain literature, please write, visit the Fund's website, or call:
Wells Fargo Funds
P.O. Box 219967
Kansas City, MO 64121-9967
Website: wfam.com
Individual investors: 1-800-222-8222
Retail investment professionals: 1-888-877-9275
Institutional investment professionals: 1-866-765-0778
This report and the financial statements contained herein are submitted for the general information of the shareholders of the Fund. If this report is used for promotional purposes, distribution of the report must be accompanied or preceded by a current prospectus. Before investing, please consider the investment objectives, risks, charges, and expenses of the investment. For a current prospectus and, if available, a summary prospectus, containing this information, call 1-800-260-5969 or visit the Fund's website at wfam.com. Read the prospectus carefully before you invest or send money.
Wells Fargo Asset Management (WFAM) is the trade name for certain investment advisory/management firms owned by Wells Fargo & Company. These firms include but are not limited to Wells Capital Management, LLC and Wells Fargo Funds Management, LLC. Certain products managed by WFAM entities are distributed by Wells Fargo Funds Distributor, LLC (a broker-dealer and Member FINRA).
This material is for general informational and educational purposes only and is NOT intended to provide investment advice or a recommendation of any kind - including a recommendation for any specific investment, strategy, or plan.
INVESTMENT PRODUCTS: NOT FDIC INSURED ■ NO BANK GUARANTEE ■ MAY LOSE VALUE
© 2021 Wells Fargo & Company. All rights reserved.
PAR-0721-00694 08-21
SVT3/SAR140 06-21
Semi-Annual Report
June 30, 2021
Wells Fargo
VT Omega Growth Fund
Reduce clutter.
Save trees.
Sign up for electronic delivery of prospectuses and shareholder reports at wellsfargo.com/ advantagedelivery
The views expressed and any forward-looking statements are as of June 30, 2021, unless otherwise noted, and are those of the Fund's portfolio managers and/or Wells Fargo Asset Management. Discussions of individual securities or the markets generally are not intended as individual recommendations. Future events or results may vary significantly from those expressed in any forward-looking statements. The views expressed are subject to change at any time in response to changing circumstances in the market. Wells Fargo Asset Management disclaims any obligation to publicly update or revise any views expressed or forward-looking statements.
INVESTMENT PRODUCTS: NOT FDIC INSURED ■ NO BANK GUARANTEE ■ MAY LOSE VALUE
Wells Fargo VT Omega Growth Fund | 1
Letter to shareholders (unaudited)
Andrew Owen
President
Wells Fargo Funds
Dear Shareholder:
We are pleased to offer you this semi-annual report for the Wells Fargo VT Omega Growth Fund for the six-month period that ended June 30, 2021. Global stocks continued to rally as the global economy continued to emerge from the haze of COVID-19. Tailwinds were provided by global stimulus programs, a rapid vaccination rollout, and recovering consumer and corporate sentiment. Bonds were mixed during the period, with municipal bonds and high-yield bonds delivering positive returns.
For the six-month period, U.S. stocks, based on the S&P 500 Index,1 gained 15.25%. International stocks, as measured by the MSCI ACWI ex USA Index (Net),2 returned 9.16%, while the MSCI EM Index (Net),3 trailed its developed market counterparts with a 7.45% gain. Among bond indexes, the Bloomberg Barclays U.S. Aggregate Bond Index,4 returned -1.60%, the Bloomberg Barclays Global Aggregate ex-USD Index (unhedged),5 returned -4.42%, the Bloomberg Barclays Municipal Bond Index,6 returned 1.06%, and the ICE BofA U.S. High Yield Index,7 returned 3.70%.
Vaccination rollout drove the stock markets to new highs.
The year 2021 began with emerging market stocks leading all major asset classes in January, driven by China’s strong economic growth and a broad recovery in corporate earnings, which propelled China’s stock market higher. In the United States, positive news on vaccine trials and January expansion in both the manufacturing and services sectors was offset by a weak December monthly jobs report. This was compounded by technical factors as some hedge funds were forced to sell stocks to protect themselves against a well-publicized short squeeze coordinated by a group of retail investors. Eurozone sentiment and economic growth were particularly weak, reflecting the impact of a new lockdown with stricter social distancing along with a slow vaccine rollout.
February saw major domestic equity indexes driven higher on the hope of a new stimulus bill, improving COVID-19 vaccination numbers, and the gradual reopening of the economy. Most S&P 500 companies reported better-than-expected earnings, with positive surprises coming from the financials, information technology, health care, and materials sectors. Japan saw its economy strengthen as a result of strong export numbers. Meanwhile, crude oil prices continued their climb, rising more than 25% for the year. Domestic government bonds experienced a sharp sell-off in late February as markets priced in a more robust economic recovery and higher future growth and inflation expectations.
| 1 | The S&P 500 Index consists of 500 stocks chosen for market size, liquidity, and industry group representation. It is a market-value-weighted index with each stock's weight in the index proportionate to its market value. You cannot invest directly in an index. |
| 2 | The Morgan Stanley Capital International (MSCI) All Country World Index (ACWI) ex USA Index (Net) is a free-float-adjusted market-capitalization-weighted index that is designed to measure the equity market performance of developed and emerging markets, excluding the United States. Source: MSCI. MSCI makes no express or implied warranties or representations and shall have no liability whatsoever with respect to any MSCI data contained herein. The MSCI data may not be further redistributed or used as a basis for other indices or any securities or financial products. This report is not approved, reviewed, or produced by MSCI. You cannot invest directly in an index. |
| 3 | The MSCI Emerging Markets (EM) Index (Net) is a free-float-adjusted market-capitalization-weighted index that is designed to measure equity market performance of emerging markets. You cannot invest directly in an index. |
| 4 | The Bloomberg Barclays U.S. Aggregate Bond Index is a broad-based benchmark that measures the investment-grade, U.S. dollar-denominated, fixed-rate taxable bond market, including Treasuries, government-related and corporate securities, mortgage-backed securities (agency fixed-rate and hybrid adjustable-rate mortgage pass-throughs), asset-backed securities, and commercial mortgage-backed securities. You cannot invest directly in an index. |
| 5 | The Bloomberg Barclays Global Aggregate ex-USD Index (unhedged) is an unmanaged index that provides a broad-based measure of the global investment-grade fixed-income markets excluding the U.S. dollar-denominated debt market. You cannot invest directly in an index. |
| 6 | The Bloomberg Barclays Municipal Bond Index is an unmanaged index composed of long-term tax-exempt bonds with a minimum credit rating of Baa. You cannot invest directly in an index. |
| 7 | The ICE BofA U.S. High Yield Index is a market-capitalization-weighted index of domestic and Yankee high-yield bonds. The index tracks the performance of high-yield securities traded in the U.S. bond market. You cannot invest directly in an index. Copyright 2021. ICE Data Indices, LLC. All rights reserved. |
2 | Wells Fargo VT Omega Growth Fund
Letter to shareholders (unaudited)
The passage of the massive domestic stimulus bill highlighted March activity, leading to increased forecasts for U.S. growth in 2021. Domestic employment surged as COVID-19 vaccinations and an increasingly open economy spurred hiring. A majority of U.S. small companies reported they are operating at pre-pandemic capacity or higher. Value continued its outperformance of growth in the month, continuing the trend that started in late 2020. Meanwhile, most major developed global equity indexes are up month to date on the back of rising optimism regarding the outlook for global growth. While the U.S. and the U.K. have been the most successful in terms of the vaccine rollout, even in markets where the vaccine has lagged, such as in the eurozone and Japan, equity indexes in many of those countries are also in positive territory this year.
Equity markets produced another strong showing in April. Domestically, the continued reopening of the economy had a strong impact on positive equity performance, as people started leaving their households and jobless claims continued to fall. Domestic corporate bonds performed well and the U.S. dollar weakened. Meanwhile, the U.S. government continued to seek to invest in the recovery, this time by outlining a package of over $2 trillion to improve infrastructure. The primary headwind in April was inflation, as investors tried to determine the breadth and longevity of recent price increases. Developed Europe has been supported by a meaningful increase in the pace of vaccinations. Unfortunately many emerging market countries have not been as successful. India in particular has seen COVID-19 cases surge, serving as an example of the need to get vaccinations rolled out to less developed nations.
Vaccine rollouts continued in May, leading to loosened restrictions globally. As a result, equity markets in general saw a minor increase in returns. Concerns that the continued economic rebound could result in inflation increases becoming more than transitory were supported by the higher input costs businesses are experiencing. Meanwhile, those inflation concerns were tempered by the U.S. Federal Reserve Board (Fed), which stayed steady on its view of the economy and eased fears of a sudden and substantial policy change. Positive performance in the emerging market equity space was supported this month by steady consumer demand and strong commodity prices. Fixed-income markets were also slightly positive for the month, driven by inflation uncertainty and a softer U.S. dollar.
June witnessed the S&P 500 Index reach a new all-time high. 2021 economic growth and inflation forecasts were revised higher to reflect a strong economic recovery and some supply and demand imbalances. Late June saw a deal reached on a U.S. infrastructure package of approximately $1 trillion for road, bridge, and broadband network upgrades over the next eight years. The Fed’s June meeting yielded no change to policy, but its projections pointed to a possible interest rate rise in 2023. This, combined with a rebound in economic activity and investors searching for yield, led to U.S. Treasury yields being down for the month. Many European and Asian countries saw vaccination momentum increase, while the U.K. dealt with a rise in COVID-19 infections, specifically the Delta variant. Meanwhile, crude oil jumped over 10% in June on the back of the pickup in global economic activity and the Organization of the Petroleum Exporting Countries’ slow pace of supply growth.
Don’t let short-term uncertainty derail long-term investment goals.
Periods of investment uncertainty can present challenges, but experience has taught us that maintaining long-term investment goals can be an effective way to plan for the future. Although diversification cannot guarantee an investment profit or prevent losses, we believe it can be an effective way to manage investment risk and potentially smooth out overall portfolio performance. We encourage investors to know their investments and to understand that appropriate levels of risk-taking may unlock opportunities.
Thank you for choosing to invest with Wells Fargo Funds. We appreciate your confidence in us and remain committed to helping you meet your financial needs.
Sincerely,
Andrew Owen
President
Wells Fargo Funds
“The passage of the massive domestic stimulus bill highlighted March activity, leading to increased forecasts for U.S. growth in 2021.”
“2021 economic growth and inflation forecasts were revised higher to reflect a strong economic recovery and some supply and demand imbalances.”
For further information about your Fund, contact your investment professional, visit our website at wfam.com, or call us directly at 1-800-222-8222.
Wells Fargo VT Omega Growth Fund | 3
Performance highlights (unaudited)
| Investment objective | The Fund seeks long-term capital appreciation. |
| Manager | Wells Fargo Funds Management, LLC |
| Subadviser | Wells Capital Management, LLC |
| Portfolio managers | Michael T. Smith, CFA®‡, Christopher J. Warner, CFA®‡ |
| Average annual total returns (%) as of June 30, 2021 |
| | | | | | Expense ratios1 (%) |
| | Inception date | 1 year | 5 year | 10 year | Gross | Net 2 |
| Class 1 | 3-6-1997 | 40.81 | 24.76 | 16.72 | 0.81 | 0.76 |
| Class 2 | 7-31-2002 | 40.57 | 24.47 | 16.44 | 1.06 | 1.01 |
| Russell 3000® Growth Index3 | – | 42.99 | 23.31 | 17.54 | – | – |
| 1 | Reflects the expense ratios as stated in the most recent prospectuses, which include the impact of 0.01% in acquired fund fees and expenses. The expense ratios shown are subject to change and may differ from the annualized expense ratios shown in the financial highlights of this report, which do not include acquired fund fees and expenses. |
| 2 | The manager has contractually committed through April 30, 2022, to waive fees and/or reimburse expenses to the extent necessary to cap total annual fund operating expenses after fee waivers at 0.75% for Class 1 shares and 1.00% for Class 2 shares. Brokerage commissions, stamp duty fees, interest, taxes, acquired fund fees and expenses (if any), and extraordinary expenses are excluded from the expense caps. Prior to or after the commitment expiration date, the caps may be increased or the commitment to maintain the caps may be terminated only with the approval of the Board of Trustees. Without these caps, the Fund’s returns would have been lower. The expense ratio paid by an investor is the net expense ratio (the total annual fund operating expenses after fee waivers) as stated in the prospectuses. |
| 3 | The Russell 3000® Growth Index measures the performance of those Russell 3000 ® Index companies with higher price/book ratios and higher forecasted growth values. You cannot invest directly in an index. |
Figures quoted represent past performance, which is no guarantee of future results. Investment return and principal value of an investment will fluctuate so that an investor’s shares, when redeemed, may be worth more or less than their original cost. Current performance may be lower or higher than the performance data quoted and assumes the reinvestment of dividends and capital gains. Current month-end performance is available by calling 1-800-260-5969. Performance figures of the Fund do not reflect fees and expenses charged pursuant to the terms of variable life insurance policies and variable annuity contracts. If these fees and expenses had been reflected, performance would have been lower.
Please keep in mind that high double-digit returns were primarily achieved during favorable market conditions. You should not expect that such favorable returns can be consistently achieved. A fund’s performance, especially for short time periods, should not be the sole factor in making your investment decision.
Index returns do not include transaction costs associated with buying and selling securities, any mutual fund fees or expenses, or any taxes. It is not possible to invest directly in an index.
Shares are sold without a front-end sales charge or contingent deferred sales charge.
Stock values fluctuate in response to the activities of individual companies and general market and economic conditions. Certain investment strategies tend to increase the total risk of an investment (relative to the broader market). Foreign investments are especially volatile and can rise or fall dramatically due to differences in the political and economic conditions of the host country. These risks are generally intensified in emerging markets. This fund is exposed to smaller-company securities risk. Consult the Fund’s prospectus for additional information on these and other risks.
Please refer to the prospectus provided by your participating insurance company for detailed information describing the separate accounts for information regarding surrender charges, mortality and expense risk fees, and other charges that may be assessed by the participating insurance companies.
| ‡ | CFA® and Chartered Financial Analyst® are trademarks owned by CFA Institute. |
4 | Wells Fargo VT Omega Growth Fund
Performance highlights (unaudited)
| Ten largest holdings (%) as of June 30, 20211 |
| Microsoft Corporation | 9.87 |
| Amazon.com Incorporated | 8.05 |
| Alphabet Incorporated Class A | 5.12 |
| Visa Incorporated Class A | 3.47 |
| PayPal Holdings Incorporated | 3.32 |
| UnitedHealth Group Incorporated | 2.84 |
| Chipotle Mexican Grill Incorporated | 2.39 |
| ServiceNow Incorporated | 2.23 |
| Align Technology Incorporated | 2.14 |
| MercadoLibre Incorporated | 2.11 |
| 1 | Figures represent the percentage of the Fund's net assets. Holdings are subject to change and may have changed since the date specified. |
| Sector allocation as of June 30, 20211 |
| 1 | Figures represent the percentage of the Fund's long-term investments. These amounts are subject to change and may have changed since the date specified. |
Wells Fargo VT Omega Growth Fund | 5
Fund expenses (unaudited)
As a shareholder of the Fund, you incur ongoing costs, including management fees, distribution (12b-1) fees, and other Fund expenses. This example is intended to help you understand your ongoing costs (in dollars) of investing in the Fund and to compare these costs with the ongoing costs of investing in other mutual funds.
The example is based on an investment of $1,000 invested at the beginning of the six-month period and held for the entire period from January 1, 2021 to June 30, 2021.
Actual expenses
The “Actual” line of the table below provides information about actual account values and actual expenses. You may use the information in this line, together with the amount you invested, to estimate the expenses that you paid over the period. Simply divide your account value by $1,000 (for example, an $8,600 account value divided by $1,000 = 8.6), then multiply the result by the number in the “Actual” line under the heading entitled “Expenses paid during period” for your applicable class of shares to estimate the expenses you paid on your account during this period.
Hypothetical example for comparison purposes
The “Hypothetical” line of the table below provides information about hypothetical account values and hypothetical expenses based on the Fund’s actual expense ratio and an assumed rate of return of 5% per year before expenses, which is not the Fund’s actual return. The hypothetical account values and expenses may not be used to estimate the actual ending account balance or expenses you paid for the period. You may use this information to compare the ongoing costs of investing in the Fund and other funds. To do so, compare this 5% hypothetical example with the 5% hypothetical examples that appear in the shareholder reports of the other funds.
Please note that the expenses shown in the table are meant to highlight your ongoing costs only and do not reflect any separate account charges assessed by participating insurance companies. Therefore, the “Hypothetical” line of the table is useful in comparing ongoing costs only, and will not help you determine the relative total costs of owning different funds. In addition, if these separate account charges assessed by participating insurance companies were included, your costs would have been higher.
| | Beginning
account value
1-1-2021 | Ending
account value
6-30-2021 | Expenses
paid during
the period1 | Annualized net
expense ratio |
| Class 1 | | | | |
| Actual | $1,000.00 | $1,096.74 | $3.90 | 0.75% |
| Hypothetical (5% return before expenses) | $1,000.00 | $1,021.08 | $3.76 | 0.75% |
| Class 2 | | | | |
| Actual | $1,000.00 | $1,095.20 | $5.19 | 1.00% |
| Hypothetical (5% return before expenses) | $1,000.00 | $1,019.84 | $5.01 | 1.00% |
1 Expenses paid is equal to the annualized net expense ratio of each class multiplied by the average account value over the period, multiplied by the number of days in the most recent fiscal half-year divided by the number of days in the fiscal year (to reflect the one-half-year period).
6 | Wells Fargo VT Omega Growth Fund
Portfolio of investments—June 30, 2021 (unaudited)
| | | | | Shares | Value |
| Common stocks: 99.45% | | | | | |
| Communication services: 13.09% | | | | | |
| Entertainment: 4.41% | | | | | |
| Netflix Incorporated † | | | | 3,600 | $ 1,901,556 |
| Roku Incorporated † | | | | 2,900 | 1,331,825 |
| Spotify Technology SA † | | | | 6,100 | 1,681,099 |
| | | | | | 4,914,480 |
| Interactive media & services: 7.19% | | | | | |
| Alphabet Incorporated Class A † | | | | 2,335 | 5,701,580 |
| Alphabet Incorporated Class C † | | | | 194 | 486,226 |
| IAC/InterActiveCorp | | | | 5,700 | 878,769 |
| Pinterest Incorporated Class A † | | | | 12,000 | 947,400 |
| | | | | | 8,013,975 |
| Media: 1.49% | | | | | |
| Match Group Incorporated † | | | | 10,287 | 1,658,779 |
| Consumer discretionary: 16.74% | | | | | |
| Auto components: 1.50% | | | | | |
| Aptiv plc † | | | | 10,600 | 1,667,698 |
| Automobiles: 0.87% | | | | | |
| Ferrari NV | | | | 4,700 | 968,435 |
| Hotels, restaurants & leisure: 2.39% | | | | | |
| Chipotle Mexican Grill Incorporated † | | | | 1,720 | 2,666,585 |
| Internet & direct marketing retail: 10.16% | | | | | |
| Amazon.com Incorporated † | | | | 2,607 | 8,968,497 |
| MercadoLibre Incorporated † | | | | 1,508 | 2,349,147 |
| | | | | | 11,317,644 |
| Specialty retail: 1.82% | | | | | |
| The Home Depot Incorporated | | | | 6,351 | 2,025,270 |
| Financials: 2.80% | | | | | |
| Capital markets: 2.80% | | | | | |
| Intercontinental Exchange Incorporated | | | | 13,400 | 1,590,580 |
| MarketAxess Holdings Incorporated | | | | 3,299 | 1,529,383 |
| | | | | | 3,119,963 |
| Health care: 16.92% | | | | | |
| Biotechnology: 0.84% | | | | | |
| Natera Incorporated † | | | | 8,200 | 930,946 |
| Health care equipment & supplies: 9.85% | | | | | |
| ABIOMED Incorporated † | | | | 3,200 | 998,752 |
| Alcon Incorporated | | | | 19,312 | 1,356,861 |
| Align Technology Incorporated † | | | | 3,900 | 2,382,900 |
| DexCom Incorporated † | | | | 4,600 | 1,964,200 |
| Edwards Lifesciences Corporation † | | | | 11,600 | 1,201,412 |
The accompanying notes are an integral part of these financial statements.
Wells Fargo VT Omega Growth Fund | 7
Portfolio of investments—June 30, 2021 (unaudited)
| | | | | Shares | Value |
| Health care equipment & supplies (continued) | | | | | |
| Inari Medical Incorporated † | | | | 8,800 | $ 820,864 |
| Intuitive Surgical Incorporated † | | | | 2,450 | 2,253,118 |
| | | | | | 10,978,107 |
| Health care providers & services: 4.15% | | | | | |
| Chemed Corporation | | | | 3,070 | 1,456,715 |
| UnitedHealth Group Incorporated | | | | 7,900 | 3,163,476 |
| | | | | | 4,620,191 |
| Health care technology: 2.08% | | | | | |
| Doximity Incorporated Class A †« | | | | 9,848 | 573,154 |
| Veeva Systems Incorporated Class A † | | | | 5,600 | 1,741,320 |
| | | | | | 2,314,474 |
| Industrials: 7.44% | | | | | |
| Aerospace & defense: 1.28% | | | | | |
| Teledyne Technologies Incorporated † | | | | 3,400 | 1,424,022 |
| Air freight & logistics: 1.67% | | | | | |
| United Parcel Service Incorporated Class B | | | | 8,930 | 1,857,172 |
| Commercial services & supplies: 1.62% | | | | | |
| Waste Connections Incorporated | | | | 15,146 | 1,808,887 |
| Professional services: 1.31% | | | | | |
| Equifax Incorporated | | | | 6,100 | 1,461,011 |
| Road & rail: 1.56% | | | | | |
| Union Pacific Corporation | | | | 7,900 | 1,737,447 |
| Information technology: 40.83% | | | | | |
| Communications equipment: 1.46% | | | | | |
| Motorola Solutions Incorporated | | | | 7,500 | 1,626,375 |
| Electronic equipment, instruments & components: 1.52% | | | | | |
| Zebra Technologies Corporation Class A † | | | | 3,200 | 1,694,368 |
| IT services: 19.50% | | | | | |
| Black Knight Incorporated † | | | | 22,100 | 1,723,358 |
| EPAM Systems Incorporated † | | | | 3,715 | 1,898,216 |
| Euronet Worldwide Incorporated † | | | | 10,962 | 1,483,707 |
| Fiserv Incorporated † | | | | 14,660 | 1,567,007 |
| MongoDB Incorporated † | | | | 4,600 | 1,662,992 |
| PayPal Holdings Incorporated † | | | | 12,700 | 3,701,796 |
| Shopify Incorporated Class A † | | | | 1,250 | 1,826,225 |
| Snowflake Incorporated Class A † | | | | 3,300 | 797,940 |
| Square Incorporated Class A † | | | | 8,440 | 2,057,672 |
| StoneCo Limited Class A † | | | | 16,900 | 1,133,314 |
| Visa Incorporated Class A | | | | 16,544 | 3,868,318 |
| | | | | | 21,720,545 |
| Software: 18.35% | | | | | |
| Atlassian Corporation plc Class A † | | | | 5,600 | 1,438,416 |
| Autodesk Incorporated † | | | | 5,500 | 1,605,450 |
| Cadence Design Systems Incorporated † | | | | 12,500 | 1,710,250 |
The accompanying notes are an integral part of these financial statements.
8 | Wells Fargo VT Omega Growth Fund
Portfolio of investments—June 30, 2021 (unaudited)
| | | | | Shares | Value |
| Software (continued) | | | | | |
| Microsoft Corporation | | | | 40,600 | $ 10,998,540 |
| ServiceNow Incorporated † | | | | 4,510 | 2,478,471 |
| Unity Software Incorporated † | | | | 8,262 | 907,415 |
| Zoom Video Communications Incorporated † | | | | 3,380 | 1,308,161 |
| | | | | | 20,446,703 |
| Materials: 1.63% | | | | | |
| Chemicals: 1.63% | | | | | |
| The Sherwin-Williams Company | | | | 6,670 | 1,817,242 |
| Total Common stocks (Cost $44,767,905) | | | | | 110,790,319 |
| | | Yield | | | |
| Short-term investments: 1.15% | | | | | |
| Investment companies: 1.15% | | | | | |
| Securities Lending Cash Investments LLC ♠∩∞ | | 0.03% | | 452,000 | 452,000 |
| Wells Fargo Government Money Market Fund Select Class ♠∞ | | 0.03 | | 832,531 | 832,531 |
| Total Short-term investments (Cost $1,284,531) | | | | | 1,284,531 |
| Total investments in securities (Cost $46,052,436) | 100.60% | | | | 112,074,850 |
| Other assets and liabilities, net | (0.60) | | | | (669,072) |
| Total net assets | 100.00% | | | | $111,405,778 |
| † | Non-income-earning security |
| « | All or a portion of this security is on loan. |
| ♠ | The issuer of the security is an affiliated person of the Fund as defined in the Investment Company Act of 1940. |
| ∩ | The investment is a non-registered investment company purchased with cash collateral received from securities on loan. |
| ∞ | The rate represents the 7-day annualized yield at period end. |
Investments in affiliates
An affiliated investment is an investment in which the Fund owns at least 5% of the outstanding voting shares of the issuer or as a result of other relationships, such as the Fund and the issuer having the same investment manager. Transactions with issuers that were either affiliates of the Fund at the beginning of the period or the end of the period were as follows:
| | Value,
beginning of
period | Purchases | Sales
proceeds | Net
realized
gains
(losses) | | Net
change in
unrealized
gains
(losses) | | Value,
end of
period | | % of
net
assets | Shares,
end
of period | Income
from
affiliated
securities |
| Short-term investments | | | | | | | | | | | | |
| Investment companies | | | | | | | | | | | | |
| Securities Lending Cash Investments LLC | $1,315,192 | $ 6,668,762 | $ (7,531,954) | $0 | | $0 | | $ 452,000 | | | 452,000 | $245 # |
| Wells Fargo Government Money Market Fund Select Class | 206,090 | 12,066,749 | (11,440,308) | 0 | | 0 | | 832,531 | | | 832,531 | 131 |
| | | | | $0 | | $0 | | $1,284,531 | | 1.15% | | $376 |
| # | Amount shown represents income before fees and rebates. |
The accompanying notes are an integral part of these financial statements.
Wells Fargo VT Omega Growth Fund | 9
Statement of assets and liabilities—June 30, 2021 (unaudited)
| | |
| Assets | |
Investments in unaffiliated securities (including $441,520 of securities loaned), at value (cost $44,767,905)
| $ 110,790,319 |
Investments in affiliated securites, at value (cost $1,284,531)
| 1,284,531 |
Receivable for dividends
| 7,767 |
Receivable for Fund shares sold
| 70 |
Prepaid expenses and other assets
| 842 |
Total assets
| 112,083,529 |
| Liabilities | |
Payable upon receipt of securities loaned
| 452,000 |
Payable for Fund shares redeemed
| 70,249 |
Management fee payable
| 51,872 |
Payable for investments purchased
| 48,299 |
Distribution fee payable
| 11,215 |
Administration fees payable
| 7,088 |
Trustees’ fees and expenses payable
| 2,381 |
Accrued expenses and other liabilities
| 34,647 |
Total liabilities
| 677,751 |
Total net assets
| $111,405,778 |
| Net assets consist of | |
Paid-in capital
| $ 26,849,203 |
Total distributable earnings
| 84,556,575 |
Total net assets
| $111,405,778 |
| Computation of net asset value per share | |
Net assets – Class 1
| $ 51,095,386 |
Shares outstanding – Class 11
| 1,102,005 |
Net asset value per share – Class 1
| $46.37 |
Net assets – Class 2
| $ 60,310,392 |
Shares outstanding – Class 21
| 1,361,636 |
Net asset value per share – Class 2
| $44.29 |
| 1 | The Fund has an unlimited number of authorized shares |
The accompanying notes are an integral part of these financial statements.
10 | Wells Fargo VT Omega Growth Fund
Statement of operations—six months ended June 30, 2021 (unaudited)
| | |
| Investment income | |
Dividends (net of foreign withholdings taxes of $2,558)
| $ 183,394 |
Income from affiliated securities
| 2,094 |
Total investment income
| 185,488 |
| Expenses | |
Management fee
| 313,048 |
| Administration fees | |
Class 1
| 19,146 |
Class 2
| 22,594 |
| Distribution fee | |
Class 2
| 66,758 |
Custody and accounting fees
| 6,913 |
Professional fees
| 30,672 |
Shareholder report expenses
| 10,859 |
Trustees’ fees and expenses
| 9,398 |
Other fees and expenses
| 3,165 |
Total expenses
| 482,553 |
| Less: Fee waivers and/or expense reimbursements | |
Fund-level
| (17,619) |
Class 1
| (3,021) |
Net expenses
| 461,913 |
Net investment loss
| (276,425) |
| Realized and unrealized gains (losses) on investments | |
Net realized gains on investments
| 7,417,208 |
Net change in unrealized gains (losses) on investments
| 2,720,056 |
Net realized and unrealized gains (losses) on investments
| 10,137,264 |
Net increase in net assets resulting from operations
| $ 9,860,839 |
The accompanying notes are an integral part of these financial statements.
Wells Fargo VT Omega Growth Fund | 11
Statement of changes in net assets
| | | | | |
| | Six months ended
June 30, 2021
(unaudited) | Year ended
December 31, 2020 |
| Operations | | | | |
Net investment loss
| | $ (276,425) | | $ (384,959) |
Net realized gains on investments
| | 7,417,208 | | 11,840,097 |
Net change in unrealized gains (losses) on investments
| | 2,720,056 | | 23,208,430 |
Net increase in net assets resulting from operations
| | 9,860,839 | | 34,663,568 |
| Distributions to shareholders from | | | | |
| Net investment income and net realized gains | | | | |
Class 1
| | 0 | | (3,187,408) |
Class 2
| | 0 | | (4,101,867) |
Total distributions to shareholders
| | 0 | | (7,289,275) |
| Capital share transactions | Shares | | Shares | |
| Proceeds from shares sold | | | | |
Class 1
| 31,529 | 1,378,647 | 76,567 | 2,678,319 |
Class 2
| 55,154 | 2,250,323 | 102,999 | 3,489,523 |
| | | 3,628,970 | | 6,167,842 |
| Reinvestment of distributions | | | | |
Class 1
| 0 | 0 | 92,792 | 3,187,408 |
Class 2
| 0 | 0 | 124,829 | 4,101,867 |
| | | 0 | | 7,289,275 |
| Payment for shares redeemed | | | | |
Class 1
| (115,132) | (4,978,428) | (238,236) | (7,901,466) |
Class 2
| (124,217) | (5,077,670) | (461,624) | (15,801,257) |
| | | (10,056,098) | | (23,702,723) |
Net decrease in net assets resulting from capital share transactions
| | (6,427,128) | | (10,245,606) |
Total increase in net assets
| | 3,433,711 | | 17,128,687 |
| Net assets | | | | |
Beginning of period
| | 107,972,067 | | 90,843,380 |
End of period
| | $111,405,778 | | $107,972,067 |
The accompanying notes are an integral part of these financial statements.
12 | Wells Fargo VT Omega Growth Fund
Financial highlights
(For a share outstanding throughout each period)
| | | Year ended December 31 |
| Class 1 | Six months ended
June 30, 2021
(unaudited) | 2020 | 2019 | 2018 | 2017 | 2016 |
Net asset value, beginning of period
| $42.28 | $31.89 | $26.27 | $28.99 | $22.20 | $23.30 |
Net investment income (loss)
| (0.04) | (0.07) | (0.03) 1 | (0.03) 1 | (0.02) 1 | 0.10 |
Net realized and unrealized gains (losses) on investments
| 4.13 | 13.27 | 9.69 | 0.62 | 7.68 | 0.05 |
Total from investment operations
| 4.09 | 13.20 | 9.66 | 0.59 | 7.66 | 0.15 |
| Distributions to shareholders from | | | | | | |
Net investment income
| 0.00 | 0.00 | 0.00 | 0.00 | (0.06) | 0.00 |
Net realized gains
| 0.00 | (2.81) | (4.04) | (3.31) | (0.81) | (1.25) |
Total distributions to shareholders
| 0.00 | (2.81) | (4.04) | (3.31) | (0.87) | (1.25) |
Net asset value, end of period
| $46.37 | $42.28 | $31.89 | $26.27 | $28.99 | $22.20 |
Total return2
| 9.67% | 43.41% | 37.39% | 0.52% | 34.95% | 0.77% |
| Ratios to average net assets (annualized) | | | | | | |
Gross expenses
| 0.80% | 0.80% | 0.82% | 0.81% | 0.82% | 0.82% |
Net expenses
| 0.75% | 0.75% | 0.75% | 0.75% | 0.75% | 0.75% |
Net investment income (loss)
| (0.39)% | (0.27)% | (0.08)% | (0.10)% | (0.07)% | 0.26% |
| Supplemental data | | | | | | |
Portfolio turnover rate
| 11% | 24% | 31% | 46% | 67% | 90% |
Net assets, end of period (000s omitted)
| $51,095 | $50,122 | $40,001 | $33,043 | $38,687 | $33,373 |
| 1 | Calculated based upon average shares outstanding |
| 2 | Returns for periods of less than one year are not annualized. Returns do not reflect fees and expenses charged pursuant to the terms of variable life insurance policies and variable annuity contracts. |
The accompanying notes are an integral part of these financial statements.
Wells Fargo VT Omega Growth Fund | 13
Financial highlights
(For a share outstanding throughout each period)
| | | Year ended December 31 |
| Class 2 | Six months ended
June 30, 2021
(unaudited) | 2020 | 2019 | 2018 | 2017 | 2016 |
Net asset value, beginning of period
| $40.43 | $30.55 | $25.23 | $27.91 | $21.38 | $22.54 |
Net investment income (loss)
| (0.16) | (0.17) 1 | (0.10) 1 | (0.11) | (0.08) 1 | 0.00 1,2 |
Net realized and unrealized gains (losses) on investments
| 4.02 | 12.73 | 9.29 | 0.61 | 7.39 | 0.09 |
Total from investment operations
| 3.86 | 12.56 | 9.19 | 0.50 | 7.31 | 0.09 |
| Distributions to shareholders from | | | | | | |
Net investment income
| 0.00 | 0.00 | 0.00 | 0.00 | (0.00) 2 | 0.00 |
Net realized gains
| 0.00 | (2.68) | (3.87) | (3.18) | (0.78) | (1.25) |
Total distributions to shareholders
| 0.00 | (2.68) | (3.87) | (3.18) | (0.78) | (1.25) |
Net asset value, end of period
| $44.29 | $40.43 | $30.55 | $25.23 | $27.91 | $21.38 |
Total return3
| 9.52% | 43.18% | 37.04% | 0.28% | 34.60% | 0.52% |
| Ratios to average net assets (annualized) | | | | | | |
Gross expenses
| 1.03% | 1.04% | 1.06% | 1.06% | 1.07% | 1.07% |
Net expenses
| 1.00% | 1.00% | 1.00% | 1.00% | 1.00% | 1.00% |
Net investment income (loss)
| (0.64)% | (0.52)% | (0.33)% | (0.35)% | (0.31)% | 0.01% |
| Supplemental data | | | | | | |
Portfolio turnover rate
| 11% | 24% | 31% | 46% | 67% | 90% |
Net assets, end of period (000s omitted)
| $60,310 | $57,850 | $50,843 | $48,500 | $54,334 | $42,684 |
| 1 | Calculated based upon average shares outstanding |
| 2 | Amount is less than $0.005. |
| 3 | Returns for periods of less than one year are not annualized. Returns do not reflect fees and expenses charged pursuant to the terms of variable life insurance policies and variable annuity contracts. |
The accompanying notes are an integral part of these financial statements.
14 | Wells Fargo VT Omega Growth Fund
Notes to financial statements (unaudited)
1. ORGANIZATION
Wells Fargo Variable Trust (the "Trust"), a Delaware statutory trust organized on March 10, 1999, is an open-end management investment company registered under the Investment Company Act of 1940, as amended (the "1940 Act"). As an investment company, the Trust follows the accounting and reporting guidance in Financial Accounting Standards Board ("FASB") Accounting Standards Codification Topic 946, Financial Services – Investment Companies. These financial statements report on the Wells Fargo VT Omega Growth Fund (the "Fund") which is a diversified series of the Trust. The Trust offers shares of the Fund to separate accounts of various life insurance companies as funding vehicles for certain variable annuity contracts and variable life insurance policies.
On February 23, 2021, Wells Fargo & Company announced that it has entered into a definitive agreement to sell Wells Fargo Asset Management ("WFAM") to GTCR LLC and Reverence Capital Partners, L.P. WFAM is the trade name used by the asset management businesses of Wells Fargo & Company and includes Wells Fargo Funds Management, LLC, the investment manager to the Fund, Wells Capital Management, LLC and Wells Fargo Asset Management (International) Limited, both registered investment advisers providing sub-advisory services to certain funds, and Wells Fargo Funds Distributor, LLC, the Fund's principal underwriter. As part of the transaction, Wells Fargo & Company will own a 9.9% equity interest and will continue to serve as an important client and distribution partner.
Consummation of the transaction will result in the automatic termination of the Fund's investment management agreement and subadvisory agreement. The Fund's Board of Trustees approved a new investment management and new subadvisory agreement and approved submitting the agreements to the Fund’s shareholders for approval at a special meeting of shareholders expected to be held on August 16, 2021. Shareholders of record of the Fund at the close of business on May 28, 2021 are entitled to vote at the meeting. If shareholders approve the new agreements, they would take effect upon the closing of the transaction. The transaction is expected to close in the second half of 2021, subject to customary closing conditions.
2. SIGNIFICANT ACCOUNTING POLICIES
The following significant accounting policies, which are consistently followed in the preparation of the financial statements of the Fund, are in conformity with U.S. generally accepted accounting principles which require management to make estimates and assumptions that affect the reported amounts of assets and liabilities, disclosure of contingent assets and liabilities at the date of the financial statements, and the reported amounts of income and expenses during the reporting period. Actual results could differ from those estimates.
Securities valuation
All investments are valued each business day as of the close of regular trading on the New York Stock Exchange (generally 4 p.m. Eastern Time), although the Fund may deviate from this calculation time under unusual or unexpected circumstances.
Equity securities that are listed on a foreign or domestic exchange or market are valued at the official closing price or, if none, the last sales price. If no sale occurs on the principal exchange or market that day, a fair value price will be determined in accordance with the Fund’s Valuation Procedures.
Investments in registered open-end investment companies are valued at net asset value. Interests in non-registered investment companies that are redeemable at net asset value are fair valued normally at net asset value.
Investments which are not valued using any of the methods discussed above are valued at their fair value, as determined in good faith by the Board of Trustees. The Board of Trustees has established a Valuation Committee comprised of the Trustees and has delegated to it the authority to take any actions regarding the valuation of portfolio securities that the Valuation Committee deems necessary or appropriate, including determining the fair value of portfolio securities, unless the determination has been delegated to the Wells Fargo Asset Management Pricing Committee at Wells Fargo Funds Management, LLC ("Funds Management"). The Board of Trustees retains the authority to make or ratify any valuation decisions or approve any changes to the Valuation Procedures as it deems appropriate. On a quarterly basis, the Board of Trustees receives reports on any valuation actions taken by the Valuation Committee or the Wells Fargo Asset Management Pricing Committee which may include items for ratification.
Securities lending
The Fund may lend its securities from time to time in order to earn additional income in the form of fees or interest on securities received as collateral or the investment of any cash received as collateral. When securities are on loan, the Fund receives interest or dividends on those securities. Cash collateral received in connection with its securities lending transactions is invested in Securities Lending Cash Investments, LLC (the "Securities Lending Fund"). Investments in Securities Lending Fund
Wells Fargo VT Omega Growth Fund | 15
Notes to financial statements (unaudited)
are valued at the evaluated bid price provided by an independent pricing service. Income earned from investment in the Securities Lending Fund (net of fees and rebates), if any, is included in income from affiliated securities on the Statement of Operations.
In a securities lending transaction, the net asset value of the Fund is affected by an increase or decrease in the value of the securities loaned and by an increase or decrease in the value of the instrument in which collateral is invested. The amount of securities lending activity undertaken by the Fund fluctuates from time to time. The Fund has the right under the lending agreement to recover the securities from the borrower on demand. In the event of default or bankruptcy by the borrower, the Fund may be prevented from recovering the loaned securities or gaining access to the collateral or may experience delays or costs in doing so. In such an event, the terms of the agreement allow the unaffiliated securities lending agent to use the collateral to purchase replacement securities on behalf of the Fund or pay the Fund the market value of the loaned securities. The Fund bears the risk of loss with respect to depreciation of its investment of the cash collateral.
Security transactions and income recognition
Securities transactions are recorded on a trade date basis. Realized gains or losses are recorded on the basis of identified cost.
Dividend income is recognized on the ex-dividend date. Dividend income is recorded net of foreign taxes withheld where recovery of such taxes is not assured.
Distributions to shareholders
Distributions to shareholders from net investment income and any net realized gains are recorded on the ex-dividend date and paid at least annually. Such distributions are determined in accordance with income tax regulations and may differ from U.S. generally accepted accounting principles. Dividend sources are estimated at the time of declaration. The tax character of distributions is determined as of the Fund's fiscal year end. Therefore, a portion of the Fund's distributions made prior to the Fund’s fiscal year end may be categorized as a tax return of capital at year end.
Federal and other taxes
The Fund intends to continue to qualify as a regulated investment company by distributing substantially all of its investment company taxable income and any net realized capital gains (after reduction for capital loss carryforwards) sufficient to relieve it from all, or substantially all, federal income taxes. Accordingly, no provision for federal income taxes was required.
The Fund’s income and federal excise tax returns and all financial records supporting those returns for the prior three fiscal years are subject to examination by the federal and Delaware revenue authorities. Management has analyzed the Fund's tax positions taken on federal, state, and foreign tax returns for all open tax years and does not believe that there are any uncertain tax positions that require recognition of a tax liability.
As of June 30, 2021, the aggregate cost of all investments for federal income tax purposes was $46,052,153 and the unrealized gains (losses) consisted of:
| Gross unrealized gains | $66,152,694 |
| Gross unrealized losses | (129,997) |
| Net unrealized gains | $66,022,697 |
Class allocations
The separate classes of shares offered by the Fund differ principally in distribution fees. Class specific expenses are charged directly to that share class. Investment income, common fund-level expenses, and realized and unrealized gains (losses) on investments are allocated daily to each class of shares based on the relative proportion of net assets of each class.
16 | Wells Fargo VT Omega Growth Fund
Notes to financial statements (unaudited)
3. FAIR VALUATION MEASUREMENTS
Fair value measurements of investments are determined within a framework that has established a fair value hierarchy based upon the various data inputs utilized in determining the value of the Fund’s investments. The three-level hierarchy gives the highest priority to unadjusted quoted prices in active markets for identical assets or liabilities (Level 1) and the lowest priority to unobservable inputs (Level 3). The Fund’s investments are classified within the fair value hierarchy based on the lowest level of input that is significant to the fair value measurement. The inputs are summarized into three broad levels as follows:
| ■ | Level 1 – quoted prices in active markets for identical securities |
| ■ | Level 2 – other significant observable inputs (including quoted prices for similar securities, interest rates, prepayment speeds, credit risk, etc.) |
| ■ | Level 3 – significant unobservable inputs (including the Fund’s own assumptions in determining the fair value of investments) |
The inputs or methodologies used for valuing investments in securities are not necessarily an indication of the risk associated with investing in those securities.
The following is a summary of the inputs used in valuing the Fund’s assets and liabilities as of June 30, 2021:
| | Quoted prices
(Level 1) | Other significant
observable inputs
(Level 2) | Significant
unobservable inputs
(Level 3) | Total |
| Assets | | | | |
| Investments in: | | | | |
| Common stocks | | | | |
| Communication services | $ 14,587,234 | $0 | $0 | $ 14,587,234 |
| Consumer discretionary | 18,645,632 | 0 | 0 | 18,645,632 |
| Financials | 3,119,963 | 0 | 0 | 3,119,963 |
| Health care | 18,843,718 | 0 | 0 | 18,843,718 |
| Industrials | 8,288,539 | 0 | 0 | 8,288,539 |
| Information technology | 45,487,991 | 0 | 0 | 45,487,991 |
| Materials | 1,817,242 | 0 | 0 | 1,817,242 |
| Short-term investments | | | | |
| Investment companies | 1,284,531 | 0 | 0 | 1,284,531 |
| Total assets | $112,074,850 | $0 | $0 | $112,074,850 |
Additional sector, industry or geographic detail, if any, is included in the Portfolio of Investments.
For the six months ended June 30, 2021, the Fund did not have any transfers into/out of Level 3.
4. TRANSACTIONS WITH AFFILIATES
Management fee
Funds Management, an indirect wholly owned subsidiary of Wells Fargo & Company ("Wells Fargo"), is the manager of the Fund and provides advisory and fund-level administrative services under an investment management agreement. Under the investment management agreement, Funds Management is responsible for, among other services, implementing the investment objectives and strategies of the Fund, supervising the subadviser and providing fund-level administrative services in connection with the Fund’s operations. As compensation for its services under the investment management agreement, Funds Management is entitled to receive a management fee at the following annual rate based on the Fund’s average daily net assets:
Wells Fargo VT Omega Growth Fund | 17
Notes to financial statements (unaudited)
| Average daily net assets | Management fee |
| First $500 million | 0.600% |
| Next $500 million | 0.550 |
| Next $1 billion | 0.500 |
| Next $2 billion | 0.475 |
| Next $1 billion | 0.450 |
| Next $5 billion | 0.440 |
| Over $10 billion | 0.430 |
For the six months ended June 30, 2021, the management fee was equivalent to an annual rate of 0.60% of the Fund’s average daily net assets.
Funds Management has retained the services of a subadviser to provide daily portfolio management to the Fund. The fee for subadvisory services is borne by Funds Management. Wells Capital Management, LLC ("WellsCap"), an affiliate of Funds Management and an indirect wholly owned subsidiary of Wells Fargo, is the subadviser to the Fund and is entitled to receive a fee from Funds Management at an annual rate starting at 0.45% and declining to 0.30% as the average daily net assets of the Fund increase.
Administration fees
Under a class-level administration agreement, Funds Management provides class-level administrative services to the Fund, which includes paying fees and expenses for services provided by the transfer agent, sub-transfer agents, omnibus account services and record-keepers. As compensation for its services under the class-level administration agreement, Funds Management receives an annual fee of 0.08% which is calculated based on the average daily net assets of each class.
Waivers and/or expense reimbursements
Funds Management has contractually committed to waive and/or reimburse management and administration fees to the extent necessary to maintain certain net operating expense ratios for the Fund. When each class of the Fund has exceeded its expense cap, Funds Management will waive fees and/or reimbursed expenses from fund-level expenses on a proportionate basis and then from class specific expenses. When only certain classes exceed their expense caps, waivers and/or reimbursements are applied against class specific expenses before fund-level expenses. Funds Management has contractually committed through April 30, 2022 to waive fees and/or reimburse expenses to the extent necessary to cap expenses. Prior to or after the commitment expiration date, the caps may be increased or the commitment to maintain the caps may be terminated only with the approval of the Board of Trustees. The contractual expense caps are as follows:
| | Expense ratio caps |
| Class 1 | 0.75% |
| Class 2 | 1.00 |
Distribution fee
The Trust has adopted a distribution plan for Class 2 shares of the Fund pursuant to Rule 12b-1 under the 1940 Act. A distribution fee is charged to Class 2 shares and paid to Wells Fargo Funds Distributor, LLC, the principal underwriter, at an annual rate of 0.25% of the average daily net assets of Class 2 shares.
Interfund transactions
The Fund may purchase or sell portfolio investment securities to certain other Wells Fargo affiliates pursuant to Rule 17a-7 under the 1940 Act and under procedures adopted by the Board of Trustees. The procedures have been designed to ensure that these interfund transactions, which do not incur broker commissions, are effected at current market prices.
5. INVESTMENT PORTFOLIO TRANSACTIONS
Purchases and sales of investments, excluding U.S. government obligations (if any) and short-term securities, for the six months ended June 30, 2021 were $11,580,768 and $18,361,686, respectively.
18 | Wells Fargo VT Omega Growth Fund
Notes to financial statements (unaudited)
6. SECURITIES LENDING TRANSACTIONS
The Fund lends its securities through an unaffiliated securities lending agent and receives collateral in the form of cash or securities with a value at least equal to the value of the securities on loan. The value of the loaned securities is determined at the close of each business day and any increases or decreases in the required collateral are exchanged between the Fund and the counterparty on the next business day. Cash collateral received is invested in the Securities Lending Fund which seeks to provide a positive return compared to the daily Federal Funds Open Rate by investing in high-quality, U.S. dollar-denominated short-term money market instruments and is exempt from registration under Section 3(c)(7) of the 1940 Act. Securities Lending Fund is managed by Funds Management and is subadvised by WellsCap. Funds Management receives an advisory fee starting at 0.05% and declining to 0.01% as the average daily net assets of the Securities Lending Fund increase. All of the fees received by Funds Management are paid to WellsCap for its services as subadviser.
In the event of counterparty default or the failure of a borrower to return a loaned security, the Fund has the right to use the collateral to offset any losses incurred. As of June 30, 2021, the Fund had securities lending transactions with the following counterparties which are subject to offset:
| Counterparty | Value of
securities on
loan | Collateral
received1 | Net amount |
| UBS Securities LLC | $441,520 | $(441,520) | $0 |
1 Collateral received within this table is limited to the collateral for the net transaction with the counterparty.
7. BANK BORROWINGS
The Trust, Wells Fargo Master Trust and Wells Fargo Funds Trust (excluding the money market funds) are parties to a $350,000,000 revolving credit agreement whereby the Fund is permitted to use bank borrowings for temporary or emergency purposes, such as to fund shareholder redemption requests. Interest under the credit agreement is charged to the Fund based on a borrowing rate equal to the higher of the Federal Funds rate in effect on that day plus 1.25% or the overnight bank funding rate in effect on that day plus 1.25%. In addition, an annual commitment fee equal to 0.25% of the unused balance is allocated to each participating fund.
For the six months ended June 30, 2021, there were no borrowings by the Fund under the agreement.
8. CONCENTRATION RISKS
As of the end of the period, the Fund concentrated its portfolio of investments in investments related to information technology sector. A fund that invests a substantial portion of its assets in any sector may be more affected by changes in that sector than would be a fund whose investments are not heavily weighted in any sector.
9. INDEMNIFICATION
Under the Fund's organizational documents, the officers and Trustees have been granted certain indemnification rights against certain liabilities that may arise out of performance of their duties to the Fund. The Fund has entered into a separate agreement with each Trustee that converts indemnification rights currently existing under the Fund’s organizational documents into contractual rights that cannot be changed in the future without the consent of the Trustee. Additionally, in the normal course of business, the Fund may enter into contracts with service providers that contain a variety of indemnification clauses. The Fund’s maximum exposure under these arrangements is dependent on future claims that may be made against the Fund and, therefore, cannot be estimated.
10. CORONAVIRUS (COVID-19) PANDEMIC
On March 11, 2020, the World Health Organization announced that it had made the assessment that coronavirus disease 2019 (“COVID-19”) is a pandemic. The impacts of COVID-19 are affecting the entire global economy, individual companies and investment products, the funds, and the market in general. There is significant uncertainty around the extent and duration of business disruptions related to COVID-19 and the impacts may last for an extended period of time. COVID-19 has led to significant uncertainty and volatility in the financial markets.
11. SUBSEQUENT EVENTS
Wells Fargo Asset Management ("WFAM") announced that it will be changing its company name to Allspring Global Investments upon the closing of the previously announced sale transaction of WFAM by Wells Fargo & Company to GTCR LLC
Wells Fargo VT Omega Growth Fund | 19
Notes to financial statements (unaudited)
and Reverence Capital Partners, L.P. The new corporate name is expected to go into effect on the closing date of the transaction, which is anticipated to occur in the second half of 2021, subject to customary closing conditions.
At a meeting held July 15, 2021, the Board of Trustees of the Wells Fargo Funds approved a change in the Fund's name to remove “Wells Fargo” from the Fund's name and replace with “Allspring”. The change is expected to go into effect on October 11, 2021.
Following the closing of the transaction, Wells Fargo Funds Management, LLC, the Fund's investment manager, Wells Capital Management, LLC and Wells Fargo Asset Management (International) Limited, each subadvisers to certain funds, and Wells Fargo Funds Distributor, LLC, the Fund's principal underwriter, will each be rebranded as Allspring.
At a special meeting of shareholders held on August 16, 2021, shareholders of the Fund approved a new investment management and a new subadvisory agreement that will be effective at the closing of the sale transaction.
20 | Wells Fargo VT Omega Growth Fund
Other information (unaudited)
PROXY VOTING INFORMATION
A description of the policies and procedures used to determine how to vote proxies relating to portfolio securities is available without charge, upon request, by calling 1-800-260-5969, visiting our website at wfam.com, or visiting the SEC website at sec.gov. Information regarding how the proxies related to portfolio securities were voted during the most recent 12-month period ended June 30 is available on the website at wfam.com or by visiting the SEC website at sec.gov.
QUARTERLY PORTFOLIO HOLDINGS INFORMATION
The Fund files its complete schedule of portfolio holdings with the SEC for the first and third quarters of each fiscal year as an exhibit to its reports on Form N-PORT. Shareholders may view the filed Form N-PORT by visiting the SEC website at sec.gov.
Wells Fargo VT Omega Growth Fund | 21
Other information (unaudited)
BOARD OF TRUSTEES AND OFFICERS
Each of the Trustees and Officers listed in the table below acts in identical capacities for each fund in the Wells Fargo family of funds, which consists of 139 mutual funds comprising the Wells Fargo Funds Trust, Wells Fargo Variable Trust, Wells Fargo Master Trust and four closed-end funds (collectively the “Fund Complex”). This table should be read in conjunction with the Prospectus and the Statement of Additional Information1. The mailing address of each Trustee and Officer is 525 Market Street, 12th Floor, San Francisco, CA 94105. Each Trustee and Officer serves an indefinite term, however, each Trustee serves such term until reaching the mandatory retirement age established by the Trustees.
Independent Trustees
Name and
year of birth | Position held and
length of service* | Principal occupations during past five years or longer | Current other
public company or
investment
company
directorships |
William R. Ebsworth
(Born 1957) | Trustee,
since 2015 | Retired. From 1984 to 2013, equities analyst, portfolio manager, research director and chief investment officer at Fidelity Management and Research Company in Boston, Tokyo, and Hong Kong, and retired in 2013 as Chief Investment Officer of Fidelity Strategic Advisers, Inc. where he led a team of investment professionals managing client assets. Prior thereto, Board member of Hong Kong Securities Clearing Co., Hong Kong Options Clearing Corp., the Thailand International Fund, Ltd., Fidelity Investments Life Insurance Company, and Empire Fidelity Investments Life Insurance Company. Audit Committee Chair and Investment Committee Chair of the Vincent Memorial Hospital Endowment (non-profit organization). Mr. Ebsworth is a CFA® charterholder. | N/A |
Jane A. Freeman
(Born 1953) | Trustee,
since 2015;
Chair Liaison,
since 2018 | Retired. From 2012 to 2014 and 1999 to 2008, Chief Financial Officer of Scientific Learning Corporation. From 2008 to 2012, Ms. Freeman provided consulting services related to strategic business projects. Prior to 1999, Portfolio Manager at Rockefeller & Co. and Scudder, Stevens & Clark. Board member of the Harding Loevner Funds from 1996 to 2014, serving as both Lead Independent Director and chair of the Audit Committee. Board member of the Russell Exchange Traded Funds Trust from 2011 to 2012 and the chair of the Audit Committee. Ms. Freeman is also an inactive Chartered Financial Analyst. | N/A |
Isaiah Harris, Jr.
(Born 1952) | Trustee,
since 2009; Audit
Committee
Chair,
since 2019 | Retired. Chairman of the Board of CIGNA Corporation since 2009, and Director since 2005. From 2003 to 2011, Director of Deluxe Corporation. Prior thereto, President and CEO of BellSouth Advertising and Publishing Corp. from 2005 to 2007, President and CEO of BellSouth Enterprises from 2004 to 2005 and President of BellSouth Consumer Services from 2000 to 2003. Emeritus member of the Iowa State University Foundation Board of Governors. Emeritus Member of the Advisory Board of Iowa State University School of Business. Advisory Board Member, Palm Harbor Academy (private school). Mr. Harris is a certified public accountant (inactive status). | CIGNA Corporation |
Judith M. Johnson
(Born 1949) | Trustee,
since 2008 | Retired. Prior thereto, Chief Executive Officer and Chief Investment Officer of Minneapolis Employees Retirement Fund from 1996 to 2008. Ms. Johnson is an attorney, certified public accountant and a certified managerial accountant. | N/A |
David F. Larcker
(Born 1950) | Trustee,
since 2009 | James Irvin Miller Professor of Accounting at the Graduate School of Business (Emeritus), Stanford University, Director of the Corporate Governance Research Initiative and Senior Faculty of The Rock Center for Corporate Governance since 2006. From 2005 to 2008, Professor of Accounting at the Graduate School of Business, Stanford University. Prior thereto, Ernst & Young Professor of Accounting at The Wharton School, University of Pennsylvania from 1985 to 2005. | N/A |
22 | Wells Fargo VT Omega Growth Fund
Other information (unaudited)
Name and
year of birth | Position held and
length of service* | Principal occupations during past five years or longer | Current other
public company or
investment
company
directorships |
Olivia S. Mitchell
(Born 1953) | Trustee,
since 2006;
Nominating and
Governance
Committee Chair,
since 2018 | International Foundation of Employee Benefit Plans Professor, Wharton School of the University of Pennsylvania since 1993. Director of Wharton’s Pension Research Council and Boettner Center on Pensions & Retirement Research, and Research Associate at the National Bureau of Economic Research. Previously, Cornell University Professor from 1978 to 1993. | N/A |
Timothy J. Penny
(Born 1951) | Trustee,
since 1996;
Chair,
since 2018 | President and Chief Executive Officer of Southern Minnesota Initiative Foundation, a non-profit organization, since 2007. Member of the Board of Trustees of NorthStar Education Finance, Inc., a non-profit organization, since 2007. | N/A |
James G. Polisson
(Born 1959) | Trustee,
since 2018 | Retired. Chief Marketing Officer, Source (ETF) UK Services, Ltd, from 2015 to 2017. From 2012 to 2015, Principal of The Polisson Group, LLC, a management consulting, corporate advisory and principal investing company. Chief Executive Officer and Managing Director at Russell Investments, Global Exchange Traded Funds from 2010 to 2012. Managing Director of Barclays Global Investors from 1998 to 2010 and Global Chief Marketing Officer for iShares and Barclays Global Investors from 2000 to 2010. Trustee of the San Francisco Mechanics’ Institute, a non-profit organization, from 2013 to 2015. Board member of the Russell Exchange Traded Fund Trust from 2011 to 2012. Director of Barclays Global Investors Holdings Deutschland GmbH from 2006 to 2009. Mr. Polisson is an attorney and has a retired status with the Massachusetts and District of Columbia Bar Associations. | N/A |
Pamela Wheelock
(Born 1959) | Trustee,
since January
2020; previously
Trustee from
January 2018 to
July 2019 | Board member of the Destination Medical Center Economic Development Agency, Rochester, Minnesota since 2019. Interim President of the McKnight Foundation from January to September 2020. Acting Commissioner, Minnesota Department of Human Services, July 2019 through September 2019. Human Services Manager (part-time), Minnesota Department of Human Services, October 2019 through December 2019. Chief Operating Officer, Twin Cities Habitat for Humanity from 2017 to 2019. Vice President of University Services, University of Minnesota from 2012 to 2016. Prior thereto, on the Board of Directors, Governance Committee and Finance Committee for the Minnesota Philanthropy Partners (Saint Paul Foundation) from 2012 to 2018, Interim Chief Executive Officer of Blue Cross Blue Shield of Minnesota from 2011 to 2012, Chairman of the Board from 2009 to 2012 and Board Director from 2003 to 2015. Vice President, Leadership and Community Engagement, Bush Foundation, Saint Paul, Minnesota (a private foundation) from 2009 to 2011. Executive Vice President and Chief Financial Officer, Minnesota Sports and Entertainment from 2004 to 2009 and Senior Vice President from 2002 to 2004. Executive Vice President of the Minnesota Wild Foundation from 2004 to 2008. Commissioner of Finance, State of Minnesota, from 1999 to 2002. Currently Board Chair of the Minnesota Wild Foundation since 2010. | N/A |
* Length of service dates reflect the Trustee’s commencement of service with the Trust’s predecessor entities, where applicable.
Wells Fargo VT Omega Growth Fund | 23
Other information (unaudited)
Officers
Name and
year of birth | Position held and
length of service | Principal occupations during past five years or longer |
Andrew Owen
(Born 1960) | President,
since 2017 | Executive Vice President of Wells Fargo & Company and Head of Affiliated Managers, Wells Fargo Asset Management, since 2014. In addition, Mr. Owen is currently President, Chief Executive Officer and Director of Wells Fargo Funds Management, LLC since 2017. Prior thereto, Executive Vice President responsible for marketing, investments and product development for Wells Fargo Funds Management, LLC, from 2009 to 2014. |
Jeremy DePalma
(Born 1974) | Treasurer,
since 2012
(for certain funds in
the Fund Complex);
since 2021 (for
the remaining funds in the
Fund Complex) | Senior Vice President of Wells Fargo Funds Management, LLC since 2009. Senior Vice President of Evergreen Investment Management Company, LLC from 2008 to 2010 and head of the Fund Reporting and Control Team within Fund Administration from 2005 to 2010. |
Michelle Rhee
(Born 1966) | Chief Legal Officer,
since 2019 | Secretary of Wells Fargo Funds Management, LLC and Chief Legal Counsel of Wells Fargo Asset Management since 2018. Deputy General Counsel of Wells Fargo Bank, N.A. since 2020 and Assistant General Counsel of Wells Fargo Bank, N.A. from 2018 to 2020. Associate General Counsel and Managing Director of Bank of America Corporation from 2004 to 2018. |
Catherine Kennedy
(Born 1969) | Secretary,
since 2019 | Vice President of Wells Fargo Funds Management, LLC and Senior Counsel of the Wells Fargo Legal Department since 2010. Vice President and Senior Counsel of Evergreen Investment Management Company, LLC from 1998 to 2010. |
Michael H. Whitaker
(Born 1967) | Chief Compliance Officer,
since 2016 | Chief Compliance Officer of Wells Fargo Asset Management since 2016. Senior Vice President and Chief Compliance Officer for Fidelity Investments from 2007 to 2016. |
1 The Statement of Additional Information includes additional information about the Trustees and is available, without charge, upon request, by calling 1-800-222-8222 or by visiting the website at wfam.com.
24 | Wells Fargo VT Omega Growth Fund
Board considerations (unaudited)
BOARD CONSIDERATION OF INVESTMENT MANAGEMENT AND SUB-ADVISORY AGREEMENTS:
Board Considerations – Current Agreements
Under the Investment Company Act of 1940 (the “1940 Act”), the Board of Trustees (the “Board”) of Wells Fargo Variable Trust (the “Trust”) must determine annually whether to approve the continuation of the Trust’s investment management and sub-advisory agreements. In this regard, at a Board meeting held on May 17-19, 2021 (the “Meeting”), the Board, all the members of which have no direct or indirect interest in the investment management and sub-advisory agreements and are not “interested persons” of the Trust, as defined in the 1940 Act (the “Independent Trustees”), reviewed and approved for Wells Fargo VT Omega Growth Fund (the “Fund”): (i) an investment management agreement (the “Management Agreement”) with Wells Fargo Funds Management, LLC (“Funds Management”); and (ii) an investment sub-advisory agreement (the “Sub-Advisory Agreement”) with Wells Capital Management Incorporated (the “Sub-Adviser”), an affiliate of Funds Management. The Management Agreement and the Sub-Advisory Agreement are collectively referred to as the “Advisory Agreements.”
The Board noted that Wells Fargo & Company recently announced that it had entered into a definitive agreement to sell Wells Fargo Asset Management (“WFAM”), which includes Funds Management and the Sub-Adviser, to GTCR LLC and Reverence Capital Partners, L.P. and/or their affiliates (the “Transaction”). The Board further noted that the Transaction would result in a change-of-control of Funds Management and the Sub-Adviser, which would be considered to be an assignment that would result in the termination of the Advisory Agreements. In light of the Transaction, the Board separately considered for approval a new investment management agreement with Funds Management and a new sub-advisory agreement with the Sub-Adviser (the “New Agreements”) that would replace the Advisory Agreements upon consummation of the Transaction, subject to approval of the New Agreements by the Fund’s shareholders. The Board also considered for approval interim agreements to go into effect in the event shareholders do not approve the New Agreements before the Transaction is completed. The interim agreements would allow the Manager and the Sub-Adviser to continue providing services to the Fund while the Fund continues to seek shareholder approval of the New Agreements. The Board noted that the terms of the interim agreements would be identical to those of the current Advisory Agreements, except for the term and certain escrow provisions.
At the Meeting, the Board considered the factors and reached the conclusions described below relating to the selection of Funds Management and the Sub-Adviser and the approval of the Advisory Agreements. Prior to the Meeting, including at Board meetings held in April and May 2021, the Trustees conferred extensively among themselves and with representatives of Funds Management about these matters. Also, the Board has adopted a team-based approach, with each team consisting of a sub-set of Trustees, to assist the full Board in the discharge of its duties in reviewing investment performance and other matters throughout the year. The Independent Trustees were assisted in their evaluation of the Advisory Agreements by independent legal counsel, from whom they received separate legal advice and with whom they met separately.
In providing information to the Board, Funds Management and the Sub-Adviser were guided by a detailed set of requests for information submitted to them by independent legal counsel on behalf of the Independent Trustees at the start of the Board’s annual contract renewal process earlier in 2021. In considering and approving the Advisory Agreements, the Trustees considered the information they believed relevant, including but not limited to the information discussed below. The Board considered not only the specific information presented in connection with the Meeting, but also the knowledge gained over time through interaction with Funds Management and the Sub-Adviser about various topics. In this regard, the Board reviewed reports of Funds Management at each of its quarterly meetings, which included, among other things, portfolio reviews and investment performance reports. In addition, the Board and the teams mentioned above confer with portfolio managers at various times throughout the year. The Board did not identify any particular information or consideration that was all-important or controlling, and each individual Trustee may have attributed different weights to various factors.
After its deliberations, the Board unanimously determined that the compensation payable to Funds Management and the Sub-Adviser under each of the Advisory Agreements was reasonable, and approved the continuation of the Advisory Agreements for a one-year term. The Board considered the approval of the Advisory Agreements for the Fund as part of its consideration of agreements for funds across the complex, but its approvals were made on a fund-by-fund basis. The following summarizes a number of important, but not necessarily all, factors considered by the Board in support of its approvals.
Nature, extent and quality of services
The Board received and considered various information regarding the nature, extent and quality of services provided to the Fund by Funds Management and the Sub-Adviser under the Advisory Agreements. This information included a description of the investment advisory services and Fund-level administrative services covered by the Management Agreement, as well as, among other things, a summary of the background and experience of senior management of WFAM, of which Funds Management and the Sub-Adviser are a part, and a summary of investments made in the business of WFAM. The Board also received a description of
Wells Fargo VT Omega Growth Fund | 25
Board considerations (unaudited)
Funds Management’s and the Sub-Adviser’s business continuity plans, including a summary of the performance of such plans and any changes thereto during the COVID-19 pandemic, and of their approaches to data privacy and cybersecurity. The Board also received and reviewed information about Funds Management’s role as administrator of the Fund’s liquidity risk management program, Funds Management’s approach to risk management, and Funds Management’s intermediary and vendor oversight program.
The Board also considered the qualifications, background, tenure and responsibilities of each of the portfolio managers primarily responsible for the day-to-day portfolio management of the Fund. The Board evaluated the ability of Funds Management and the Sub-Adviser to attract and retain qualified investment professionals, including research, advisory and supervisory personnel.
The Board further considered the compliance programs and compliance records of Funds Management and the Sub-Adviser. In addition, the Board took into account the full range of services provided to the Fund by Funds Management and its affiliates. The Board also considered information about retention and back-up arrangements that have been put into place with respect to key personnel of WFAM in connection with the anticipated Transaction, noting that WFAM provided assurances that the announcement and eventual culmination of the Transaction is not expected to result in any diminution in the nature or quality of services provided to the Fund.
Fund investment performance and expenses
The Board considered the investment performance results for the Fund over various time periods ended December 31, 2020. The Board considered these results in comparison to the investment performance of funds in a universe that was determined by Broadridge Inc. (“Broadridge”) to be similar to the Fund (the “Universe”), and in comparison to the Fund’s benchmark index and to other comparative data. Broadridge is an independent provider of investment company data. The Board received a description of the methodology used by Broadridge to select the mutual funds in the performance Universe. The Board noted that the investment performance of the Fund was higher than the average investment performance of the Universe for all periods under review. The Board also noted that the investment performance of the Fund was lower than its benchmark index, the Russell 3000® Growth Index, for the ten-year period under review, and higher than its benchmark index for all other periods under review.
The Board also received and considered information regarding the Fund’s net operating expense ratios and their various components, including actual management fees, custodian and other non-management fees, and Rule 12b-1 and non-Rule 12b-1 shareholder service fees. The Board considered these ratios in comparison to the median ratios of funds in class-specific expense groups that were determined by Broadridge to be similar to the Fund (the “Groups”). The Board received a description of the methodology used by Broadridge to select the mutual funds in the expense Groups and an explanation of how funds comprising expense groups and their expense ratios may vary from year-to-year. Based on the Broadridge reports, the Board noted that the net operating expense ratios of the Fund were lower than the median net operating expense ratios of the expense Groups.
The Board took into account the Fund’s investment performance and expense information provided to it among the factors considered in deciding to re-approve the Advisory Agreements.
Investment management and sub-advisory fee rates
The Board reviewed and considered the contractual fee rates payable by the Fund to Funds Management under the Management Agreement, as well as the contractual fee rates payable by the Fund to Funds Management for class-level administrative services under a Class-Level Administration Agreement, which include, among other things, class-level transfer agency and sub-transfer agency costs (collectively, the “Management Rates”). The Board also reviewed and considered the contractual investment sub-advisory fee rates that are payable by Funds Management to the Sub-Adviser for investment sub-advisory services.
Among other information reviewed by the Board was a comparison of the Fund’s Management Rates with the average contractual investment management fee rates of funds in the expense Groups at a common asset level as well as transfer agency costs of the funds in the expense Groups. The Board noted that the Management Rates of the Fund were lower than the sum of these average rates for the Fund’s expense Groups for all share classes.
The Board also received and considered information about the portion of the total management fee that was retained by Funds Management after payment of the fee to the Sub-Adviser for sub-advisory services. In assessing the reasonableness of this amount, the Board received and evaluated information about the nature and extent of responsibilities retained and risks assumed by Funds Management and not delegated to or assumed by the Sub-Adviser, and about Funds Management’s on-going oversight services. Given the affiliation between Funds Management and the Sub-Adviser, the Board ascribed limited relevance to the allocation of fees between them.
The Board also received and considered information about the nature and extent of services offered and fee rates charged by Funds Management and the Sub-Adviser to other types of clients with investment strategies similar to those of the Fund. In this regard, the Board received information about the significantly greater scope of services, and compliance, reporting and other legal
26 | Wells Fargo VT Omega Growth Fund
Board considerations (unaudited)
burdens and risks of managing proprietary mutual funds compared with those associated with managing assets of other types of clients, including third-party sub-advised fund clients and non-mutual fund clients such as institutional separate accounts.
Based on its consideration of the factors and information it deemed relevant, including those described here, the Board determined that the compensation payable to Funds Management under the Management Agreement and to the Sub-Adviser under the Sub-Advisory Agreement was reasonable.
Profitability
The Board received and considered information concerning the profitability of Funds Management, as well as the profitability of both WFAM and Wells Fargo & Co. (“Wells Fargo”) from providing services to the fund family as a whole. The Board noted that the Sub-Adviser’s profitability information with respect to providing services to the Fund and other funds in the family was subsumed in the WFAM and Wells Fargo profitability analysis.
Funds Management reported on the methodologies and estimates used in calculating profitability, including a description of the methodology used to allocate certain expenses. Among other things, the Board noted that the levels of profitability reported on a fund-by-fund basis varied widely, depending on factors such as the size, type and age of fund.
Based on its review, the Board did not deem the profits reported by Funds Management, WFAM or Wells Fargo from services provided to the Fund to be at a level that would prevent it from approving the continuation of the Advisory Agreements.
Economies of scale
The Board received and considered information about the potential for Funds Management to experience economies of scale in the provision of management services to the Fund, the difficulties of calculating economies of scale at an individual fund level, and the extent to which potential scale benefits are shared with Fund shareholders. The Board noted the existence of breakpoints in the Fund’s management fee structure, which operate generally to reduce the Fund’s expense ratios as the Fund grows in size, and the size of the Fund in relation to such breakpoints. The Board considered that in addition to management fee breakpoints, Funds Management shares potential economies of scale from its management business in a variety of ways, including through fee waiver and expense reimbursement arrangements, competitive management fee rates set at the outset without regard to breakpoints, and investments in the business intended to enhance services available to shareholders.
The Board concluded that Funds Management’s arrangements with respect to the Fund, including contractual breakpoints, constituted a reasonable approach to sharing potential economies of scale with the Fund and its shareholders.
Other benefits to Funds Management and the Sub-Adviser
The Board received and considered information regarding potential “fall-out” or ancillary benefits received by Funds Management and its affiliates, including the Sub-Adviser, as a result of their relationships with the Fund. Ancillary benefits could include, among others, benefits directly attributable to other relationships with the Fund and benefits potentially derived from an increase in Funds Management’s and the Sub-Adviser’s business as a result of their relationships with the Fund. The Board noted that various affiliates of Funds Management may receive distribution-related fees, shareholder servicing payments and sub-transfer agency fees in respect of shares sold or held through them and services provided.
The Board also reviewed information about soft dollar credits earned and utilized by the Sub-Adviser, fees earned by Funds Management and the Sub-Adviser from managing a private investment vehicle for the fund family’s securities lending collateral and commissions earned by an affiliated broker from portfolio transactions.
Based on its consideration of the factors and information it deemed relevant, including those described here, the Board did not find that any ancillary benefits received by Funds Management and its affiliates, including the Sub-Adviser, were unreasonable.
Conclusion
At the Meeting, after considering the above-described factors and based on its deliberations and its evaluation of the information described above, the Board unanimously determined that the compensation payable to Funds Management and the Sub-Adviser under each of the Advisory Agreements was reasonable, and approved the continuation of the Advisory Agreements for a one-year term.
Wells Fargo VT Omega Growth Fund | 27
Board considerations (unaudited)
Board Considerations – New Agreements
Overview of the Board evaluation process
At a meeting held on May 17-19, 2021 (the “Board Meeting”), the Board of Trustees (the “Board”) of Wells Fargo Variable Trust (the “Trust”, and the series thereof, the “Funds”) approved the continuation of each Fund’s current Investment Management Agreement (the “Current Investment Management Agreement”) and the current Wells Cap Sub-Advisory Agreement (the “Current Wells Cap Sub-Advisory Agreement”, and collectively, the “Current Agreements”). Each Trustee on the Board is not an “interested person” (as defined in the Investment Company Act of 1940 (the “1940 Act”)) of the Funds (collectively, the “Independent Trustees”). The process followed by the Board in considering and approving the continuation of the Current Agreements is referred to herein as the “2021 Annual Approval Process.”
As noted above, the closing of the sale of Wells Fargo Asset Management (“WFAM”) to a holding company (“NewCo”) affiliated with private funds of GTCR LLC (“GTCR”) and of Reverence Capital Partners, L.P. (“Reverence Capital”, and such transaction, the “Transaction”) will result in a change of control of Wells Fargo Funds Management LLC (“Funds Management”) and Wells Capital Management Incorporated (“Wells Capital” or the “Sub-Adviser”, and together with Funds Management, the “Advisers”), which will be considered to be an “assignment” of each Fund’s Current Agreements under the 1940 Act that will result in the automatic termination of each Fund’s Current Agreements. In light of the expected termination of each Fund’s Current Agreements upon the closing, at the Board Meeting the Board also considered and approved: (i) a new Investment Management Agreement between the Trust, on behalf of each Fund, and Funds Management (the “New Investment Management Agreement”); and (ii) a new Sub-Advisory Agreement among the Trust, on behalf of each Fund, Funds Management and Wells Capital (the “New Sub-Advisory Agreement”, and collectively, the “New Agreements”), each of which is intended to go into effect upon the closing. The process followed by the Board in reviewing and approving the New Agreements is referred to herein as the “New Agreement Approval Process.”
At a series of meetings held in April and May 2021 (collectively, “April and May 2021 Meetings”) and at the Board Meeting, the Trustees conferred extensively among themselves and with senior representatives of Funds Management, GTCR and Reverence Capital about the New Agreements and related matters. The Board reviewed and discussed information furnished by Funds Management, GTCR and Reverence Capital that the Board considered reasonably necessary to evaluate the terms of the New Agreements and the services to be provided. At these meetings, senior representatives from Funds Management, GTCR and Reverence Capital made presentations to, and responded to questions from, the Board.
In providing information to the Board in connection with the 2021 annual approval process for the Current Agreements (the “2021 Annual Approval Process”) and the New Agreement Approval Process, Funds Management, GTCR and Reverence Capital (as applicable) were guided by requests for information submitted by independent legal counsel on behalf of the Independent Trustees. In considering and approving the New Agreements, the Trustees considered the information they believed relevant, including but not limited to the information discussed herein. The Board considered not only the specific information presented in connection with the April and May 2021 Meetings as well as the Board Meeting, but also the knowledge gained over time through interaction with Funds Management and the Sub-Adviser about various topics. In this regard, the Board reviews reports of Funds Management at each of its regular Board meetings, which includes, among other things, portfolio reviews and investment performance reports. In addition, the Board confers with portfolio managers at various times throughout the year. The Board was assisted in its evaluation of the New Agreements by independent legal counsel, from whom the Independent Trustees received separate legal advice and with whom the Independent Trustees met separately. The Board did not identify any particular information or consideration that was all-important or controlling, and each individual Trustee may have attributed different weights to various factors.
Among other information considered by the Board in connection with the Transaction was:
| ■ | Information regarding the Transaction: information about the structure, financing sources and material terms and conditions of the Transaction, including the expected impact on the businesses conducted by the Advisers and by Wells Fargo Funds Distributor LLC, as the distributor of Fund shares. |
| ■ | Information regarding NewCo, GTCR and Reverence Capital: (i) information about NewCo, including information about its expected financial condition and access to capital, and senior leadership team; (ii) the experience of senior management at GTCR and Reverence Capital in acquiring portfolio companies; (iii) the plan to operationalize NewCo, including the transition of necessary infrastructure services through a transition services agreement with Wells Fargo under which Wells Fargo will continue to provide NewCo with certain services for a specified period of time after the closing; and (iv) information regarding regulatory matters, compliance, and risk management functions at NewCo, including resources to be dedicated thereto. |
28 | Wells Fargo VT Omega Growth Fund
Board considerations (unaudited)
| ■ | Impact of the Transaction on WFAM and Service Providers: (i) information regarding any changes to personnel and/or other resources of the Advisers as a result of the Transaction, including assurances regarding comparable and competitive compensation arrangements to attract and retain highly qualified personnel; and (ii) information about the organizational and operating structure with respect to NewCo, the Advisers and the Funds. |
| ■ | Impact of the Transaction on the Funds and their Shareholders: (i) information regarding anticipated benefits to the Funds as a result of the Transaction; (ii) a commitment that the Funds would not bear any expenses, directly or indirectly, in connection with the Transaction; (iii) confirmation that the Advisers intend to continue to manage the Funds in a manner consistent with each Fund’s current investment objectives and principal investments strategies; and (iv) a commitment that neither NewCo nor WFAM will take any steps that would impose any “unfair burden” (as that term is used in section 15(f)(1)(B) of the 1940 Act) on the Funds as a result of the Transaction. |
With respect to the New Agreements, the Board considered: (i) a representation that, after the closing, all of the Funds will continue to be managed and advised by their current Advisers, and that the same portfolio managers of the Sub-Adviser are expected to continue to manage the Funds after the Transaction; (ii) information regarding the terms of the New Agreements, including changes as compared to the Current Agreements; (iii) information confirming that the fee rates payable under the New Agreements will not increase as a result of the Transaction as compared to the rates under the Current Agreements; and (iv) assurances that the Transaction is not expected to cause any diminution with respect to the nature, extent and quality of any of the services currently provided to the Funds by the Advisers as a result of the Transaction.
In addition to considering information furnished specifically to evaluate the impact of the Transaction on the Funds and their respective shareholders in connection with the New Agreement Approval Process, the Board considered information furnished at prior meetings of the Board and its committees, including detailed information provided in connection with the 2021 Annual Approval Process. In this regard, in connection with the 2021 Annual Approval Process, the Board received information about complex-wide and individual Fund performance, fees and expenses, including: (i) a report from an independent data provider comparing the investment performance of each Fund to the investment performance of comparable funds and benchmark indices, over various time periods; (ii) a report from an independent data provider comparing each Fund’s total expense ratio (and its components) to those of comparable funds; (iii) comparative information concerning the fees charged and services provided by the Advisers to each Fund in managing other accounts (which may include other mutual funds, collective investment funds and institutional accounts), if any, that employ investment strategies and techniques similar to those used in managing such Fund(s); and (iv) profitability analyses of Funds Management, as well as the profitability of both WFAM and Wells Fargo from providing services to the fund family as a whole.
After its deliberations, the Board unanimously determined that the compensation payable to Funds Management and the Sub-Adviser under the New Agreements is reasonable, approved the New Agreements for a two-year term, and voted to recommend that Fund shareholders approve the New Agreements. The Board considered the approval of the New Agreements as part of its consideration of agreements for funds across the complex, but its approvals were made on a fund-by-fund basis. The following summarizes a number of important, but not necessarily all, factors considered by the Board in support of its approvals.
Nature, extent and quality of services
In connection with the 2021 Annual Approval Process, the Board received and considered various information regarding the nature, extent and quality of services provided to each Fund by Funds Management and the Sub-Adviser under the Current Agreements. This information included a description of the investment advisory services and Fund-level administrative services covered by the Current Management Agreement, as well as, among other things, a summary of the background and experience of senior management of WFAM, of which Funds Management and the Sub-Adviser are a part, and a summary of investments made in the business of WFAM. The Board also received a description of Funds Management’s and the Sub-Adviser’s business continuity plans, including a summary of the performance of such plans and any changes thereto during the COVID-19 pandemic, and of their approaches to data privacy and cybersecurity. The Board also received and reviewed information about Funds Management’s role as administrator of the Funds’ liquidity risk management program, Funds Management’s approach to risk management, and Funds Management’s intermediary and vendor oversight program.
In connection with the 2021 Annual Approval Process, the Board also considered the qualifications, background, tenure and responsibilities of each of the portfolio managers primarily responsible for the day-to-day portfolio management of the Funds. The Board evaluated the ability of Funds Management and the Sub-Adviser to attract and retain qualified investment professionals, including research, advisory and supervisory personnel.
In connection with the 2021 Annual Approval Process, the Board further considered the compliance programs and compliance records of Funds Management and the Sub-Adviser. In addition, the Board took into account the full range of services provided to the Funds by Funds Management and its affiliates.
Wells Fargo VT Omega Growth Fund | 29
Board considerations (unaudited)
In connection with the New Agreement Approval Process, the Board considered, among other information, the structure of the Transaction and expected impact, if any, of the Transaction on the operations, facilities, organization and personnel of the Advisers. The Board received assurances from Funds Management that each Fund will continue to be advised by its current Sub-Adviser after the closing, and that the same individual portfolio managers are expected to continue to manage the Funds after the closing. With respect to the recruitment and retention of key personnel, the Board noted information from GTCR, Reverence Capital and the Advisers regarding the potential benefits for employees of joining NewCo. The Board recognized that the personnel who had been extended offers may not accept such offers, and personnel changes may occur in the future in the ordinary course.
In addition, the Board considered information regarding the infrastructure, operational capabilities and support staff in place to assist in the portfolio management and operations of the Funds, including the provision of administrative services, and the anticipated impact of the Transaction on such matters. The Board also considered the business-related and other risks to which the Advisers may be subject in managing the Funds and in connection with the Transaction. The Board also considered the transition and integration plans as a result of the change in ownership of the Advisers from Wells Fargo to NewCo. The Board considered the resources and infrastructure that NewCo intends to devote to its compliance program to ensure compliance with applicable laws and regulations, as well as its risk management program and cybersecurity program. The Board also took into account assurances received from the Advisers, GTCR and Reverence Capital that the Transaction is not expected to cause any diminution in the nature, extent and quality of services provided by the Advisers to the Funds and their shareholders.
Fund investment performance and expenses
In connection with the 2021 Annual Approval Process, the Board considered the investment performance results for each Fund over various time periods ended December 31, 2020. The Board considered these results in comparison to the investment performance of funds in a universe that was determined by Broadridge Inc. (“Broadridge”) to be similar to each Fund (the “Universe”), and in comparison to each Fund’s benchmark index and to other comparative data. Broadridge is an independent provider of investment company data. The Board received a description of the methodology used by Broadridge to select the mutual funds in the performance Universe. Where applicable, the Board received information concerning, and discussed factors contributing to, underperformance of Funds relative to the Universe and benchmark for any underperformance periods.
In connection with the 2021 Annual Approval Process, the Board also received and considered information regarding each Fund’s net operating expense ratios and their various components, including actual management fees, custodian and other non-management fees, and Rule 12b-1 and non-Rule 12b-1 shareholder service fees. The Board considered these ratios in comparison to the median ratios of funds in class-specific expense groups that were determined by Broadridge to be similar to the Fund (the “Groups”). The Board received a description of the methodology used by Broadridge to select the mutual funds in the expense Groups and an explanation of how funds comprising expense groups and their expense ratios may vary from year-to-year.
In connection with the New Agreement Approval Process, the Board received a commitment that WFAM will maintain fee and expense commitments for at least two years after the closing. The Board took into account each Fund’s investment performance and expense information among the factors considered in deciding to approve the New Agreements.
Investment management and sub-advisory fee rates
In connection with the 2021 Annual Approval Process, the Board reviewed and considered the contractual fee rates payable by each Fund to Funds Management under the Current Management Agreement, as well as the contractual fee rates payable by each Fund to Funds Management for class-level administrative services under a Class-Level Administration Agreement, which include, among other things, class-level transfer agency and sub-transfer agency costs (collectively, the “Management Rates”). The Board also reviewed and considered the contractual investment sub-advisory fee rates that are payable by Funds Management to the Sub-Adviser under the Current Sub-Advisory Agreements for investment sub-advisory services (the “Sub-Advisory Fee Rates”).
Among other information reviewed by the Board in connection with the 2021 Annual Approval Process, was a comparison of each Fund’s Management Rates with the average contractual investment management fee rates of funds in the expense Groups at a common asset level as well as transfer agency costs of the funds in the expense Groups.
In connection with the 2021 Annual Approval Process, the Board also received and considered information about the portion of the total management fee that was retained by Funds Management after payment of the Sub-Advisory Fee Rates. In assessing the reasonableness of this amount, the Board received and evaluated information about the nature and extent of responsibilities retained and risks assumed by Funds Management and not delegated to or assumed by the Sub-Adviser, and about Funds Management’s on-going oversight services. Given the affiliation between Funds Management and the Sub-Adviser, the Board ascribed limited relevance to the allocation of fees between them.
30 | Wells Fargo VT Omega Growth Fund
Board considerations (unaudited)
In connection with the 2021 Annual Approval Process, the Board also received and considered information about the nature and extent of services offered and fee rates charged by Funds Management and the Sub-Adviser to other types of clients, if any, with investment strategies similar to those of each Fund. In this regard, the Board received information about the significantly greater scope of services, and compliance, reporting and other legal burdens and risks of managing proprietary mutual funds compared with those associated with managing assets of other types of clients, including third-party sub-advised fund clients and non-mutual fund clients such as institutional separate accounts.
In connection with the New Agreement Approval Process, the Board noted the assurances received by it that there would be no increases to any of the Management Rates or the Sub-Advisory Fee Rates as a result of the Transaction. The Board also considered that the New Agreements do not change the computation method for calculating such fees, and there is no present intention to reduce expense waiver and reimbursement arrangements that are currently in effect. Based on its consideration of the factors and information it deemed relevant, including those described here, the Board determined that the compensation payable to Funds Management under the New Management Agreement and to the Sub-Adviser under the New Sub-Advisory Agreement was reasonable.
Profitability
In connection with the 2021 Annual Approval Process, the Board received and considered information concerning the profitability of Funds Management, as well as the profitability of both WFAM and Wells Fargo from providing services to the fund family as a whole. The Board noted that the Sub-Adviser’s profitability information with respect to providing services to each Fund and other funds in the family was subsumed in the WFAM and Wells Fargo profitability analysis.
Funds Management reported on the methodologies and estimates used in calculating profitability in connection with the 2021 Annual Approval Process, including a description of the methodology used to allocate certain expenses. Among other things, the Board noted that the levels of profitability reported on a fund-by-fund basis varied widely, depending on factors such as the size, type and age of fund.
In connection with the New Agreement Approval Process, the Board received certain information about NewCo’s projected financial condition, and reviewed with senior representatives of Funds Management, GTCR and Reverence Capital the underlying assumptions on which such information was based. The Board considered that NewCo is a newly formed entity, with no historical operations, revenues or expenses, and that it is difficult to predict with any degree of certainty the future profitability of NewCo and the Advisers from advisory activities under the New Agreements. The Board considered that the fee rates payable under the New Agreements will not increase as a result of the Transaction as compared to the rates under the Current Agreements, and that the current contractual expense limitations applicable to each Fund will not increase. The Board noted that if the New Agreements are approved by shareholders and the Transaction closes, the Board will have the opportunity in the future to review the profitability of NewCo and the Advisers from advisory activities under the New Agreements.
Economies of scale
In connection with the 2021 Annual Approval Process, the Board received and considered information about the potential for Funds Management to experience economies of scale in the provision of management services to the Funds, the difficulties of calculating economies of scale at an individual fund level, and the extent to which potential scale benefits are shared with Fund shareholders. The Board noted the existence of breakpoints in each Fund’s management fee structure, which operate generally to reduce the Fund’s expense ratios as the Fund grows in size, and the size of the Fund in relation to such breakpoints. The Board considered that, in addition to management fee breakpoints, Funds Management shares potential economies of scale from its management business in a variety of ways, including through fee waiver and expense reimbursement arrangements, competitive management fee rates set at the outset without regard to breakpoints, and investments in the business intended to enhance services available to shareholders.
In connection with the New Agreement Approval Process, the Board noted that NewCo and the Advisers may benefit from possible growth of the Funds resulting from enhanced distribution capabilities. However, the Board noted that other factors could also affect the potential for economies of scale, and that it was not possible to quantify any potential future economies of scale. Based upon the information furnished to the Board in connection with the 2021 Annual Approval Process and the New Agreement Approval Process, the Board concluded that Funds Management’s arrangements with respect to each Fund, including contractual breakpoints and expense limitation arrangements, constitute a reasonable approach to sharing potential economies of scale with the Fund and its shareholders.
“Fall-out” benefits to Funds Management and the Sub-Adviser
In connection with the 2021 Annual Approval Process, the Board received and considered information regarding potential “fall-out” or ancillary benefits received by Funds Management and its affiliates, including the Sub-Adviser, as a result of their relationships with the Funds. Ancillary benefits could include, among others, benefits directly attributable to other relationships
Wells Fargo VT Omega Growth Fund | 31
Board considerations (unaudited)
with the Funds and benefits potentially derived from an increase in Funds Management’s and the Sub-Adviser’s business as a result of their relationships with the Funds. The Board noted that various current affiliates of Funds Management may receive distribution-related fees, shareholder servicing payments and sub-transfer agency fees in respect of shares sold or held through them and services provided.
In connection with the 2021 Annual Approval Process, the Board also reviewed information about soft dollar credits earned and utilized by the Sub-Adviser, fees earned by Funds Management and the Sub-Adviser from managing a private investment vehicle for the fund family’s securities lending collateral, and commissions earned by an affiliated broker of Wells Fargo from portfolio transactions.
In connection with the New Agreement Approval Process, the Board received information to the effect that the Transaction is not expected to have a material impact on the fall-out benefits currently realized by Funds Management and its affiliates, including the Sub-Adviser. The information reviewed by the Board also noted that several of the ancillary benefits identified for WFAM would be potential ancillary benefits for NewCo, including that the scale and reputation of the Funds might benefit NewCo’s broader reputation, product initiatives, technology investment and talent acquisition. Based on its consideration of the factors and information it deemed relevant, including those described here, the Board did not find that any ancillary benefits expected to be received by Funds Management and its affiliates, including NewCo and the Sub-Adviser, under the New Agreements were unreasonable.
Conclusion
At the Board Meeting, after considering the above-described factors and based on its deliberations and its evaluation of the information described above, the Board unanimously determined that the compensation payable to Funds Management and the Sub-Adviser under the New Agreements is reasonable, approved the New Agreements for a two-year term, and voted to recommend that Fund shareholders approve the New Agreements.
32 | Wells Fargo VT Omega Growth Fund
Board considerations (unaudited)
Board Considerations - Interim Agreements
At a meeting held on May 17-19, 2021 (the “Board Meeting”), the Boards of Trustees (each, a “Board”, and collectively, the “Boards”) of Wells Fargo Funds Trust, Wells Fargo Master Trust, Wells Fargo Variable Trust, Wells Fargo Global Dividend Opportunity Fund, Wells Fargo Income Opportunities Fund, Wells Fargo Multi-Sector Income Fund and Wells Fargo Utilities and High Income Fund (each a “Trust”, and the series thereof, a “Fund”) reviewed and approved for the Trusts and Funds, as applicable: (i) interim investment management agreements (the “Interim Management Agreements”) with Wells Fargo Funds Management, LLC (“Funds Management”); (ii) interim investment advisory agreements (the “Interim Advisory Agreements”) with Funds Management; and (iii) interim sub-advisory agreements (the “Interim Sub-Advisory Agreements”) with each of Cooke & Bieler, L.P., Galliard Capital Management, LLC (“Galliard”), Peregrine Capital Management Inc., Wells Capital Management, LLC (“WellsCap”), and Wells Fargo Asset Management (International) Limited (“WFAMI”, and collectively, the “Sub-Advisers”). Each Trustee on the Board is not an “interested person” (as defined in the Investment Company Act of 1940 (the “1940 Act”) of the Funds (collectively, the “Independent Trustees”). The Interim Management Agreements, Interim Advisory Agreements, and Interim Sub-Advisory Agreements are collectively referred to as the “Interim Advisory Agreements.”
At the Board Meeting, the Boards reviewed and approved the continuation of existing investment management, advisory and sub-advisory agreements (the “Current Advisory Agreements”) for each Trust and Fund, as applicable. The factors considered and conclusions reached by the Boards in approving the Current Advisory Agreements are summarized in the section entitled “Board Considerations – Current Agreements” of this shareholder report. The Boards noted that Wells Fargo & Company has entered into a definitive agreement to sell Wells Fargo Asset Management (“WFAM”), which includes Funds Management, Galliard, WellsCap and WFAMI (the “Affiliated Sub-Advisers”), to a holding company affiliated with private funds of GTCR LLC and Reverence Capital Partners, L.P. (the “Transaction”). The Boards further noted that the Transaction would result in a change-of-control of Funds Management and the Affiliated Sub-Advisers, which would be considered to be an “assignment” under the 1940 Act that would terminate the Current Advisory Agreements. At the Board Meeting, the Boards also reviewed and approved new investment management, advisory and sub-advisory agreements (the “New Advisory Agreements”) for each Trust and Fund, as applicable, that would replace the Current Advisory Agreements upon consummation of the Transaction, subject to approval of the New Advisory Agreements by the applicable Trust’s or Fund’s shareholders. The factors considered and conclusions reached by the Boards in approving the New Advisory Agreements are summarized in the section entitled “Board Considerations – New Agreements” of this shareholder report.
At the Board Meeting, the Boards also approved the Interim Advisory Agreements, which will go into effect for a Trust or Fund only in the event that shareholders of such Trust or Fund do not approve the New Advisory Agreement(s) for the Trust or Fund by the closing date of the Transaction, when the Current Advisory Agreements will terminate. The Board noted that, in such a circumstance, the Interim Advisory Agreements will permit continuity of management by allowing Funds Management and the Sub-Advisers to continue providing services to the Trust or Fund pursuant to the Interim Advisory Agreements while the Trust or Fund continues to solicit shareholder approval of such New Advisory Agreement(s). The Boards noted that the terms of the Interim Advisory Agreements are identical to those of the Current Advisory Agreements, except for the term and the addition of escrow provisions with respect to the advisory fees. The Boards also noted that the entities that would service the Funds and Trusts under the Interim Advisory Agreements are identical to those that provide services under the Current Advisory Agreements and those that will provide services under the New Advisory Agreements.
In approving the Interim Advisory Agreements, the Boards considered the same factors and reached the same conclusions as they considered and reached with respect to the Boards’ approvals of the Current Advisory Agreements and New Advisory Agreements, as applicable, which are described in separate Board Consideration sections within this shareholder report. Prior to the Board Meeting, including at a series of meetings held in April and May 2021, the Trustees conferred extensively among themselves and with senior representatives of Funds Management, GTCR LLC and Reverence Capital Partners, L.P. about the Interim Advisory Agreements and related matters. The Independent Trustees were assisted in their evaluation of the Interim Advisory Agreements by independent legal counsel, from whom they received separate legal advice and with whom they met separately.
At the Board Meeting, after considering the factors and reaching the conclusions described in the separate Board Consideration sections within this shareholder report, the Boards unanimously determined that the compensation payable to Funds Management and to each Sub-Adviser under each of the Interim Advisory Agreements was reasonable, and approved the Interim Advisory Agreements.
Wells Fargo VT Omega Growth Fund | 33
For more information
More information about Wells Fargo Funds is available free upon request. To obtain literature, please write, visit the Fund's website, or call:
Wells Fargo Funds
P.O. Box 219967
Kansas City, MO 64121-9967
Website: wfam.com
Individual investors: 1-800-222-8222
Retail investment professionals: 1-888-877-9275
Institutional investment professionals: 1-866-765-0778
This report and the financial statements contained herein are submitted for the general information of the shareholders of the Fund. If this report is used for promotional purposes, distribution of the report must be accompanied or preceded by a current prospectus. Before investing, please consider the investment objectives, risks, charges, and expenses of the investment. For a current prospectus and, if available, a summary prospectus, containing this information, call 1-800-260-5969 or visit the Fund's website at wfam.com. Read the prospectus carefully before you invest or send money.
Wells Fargo Asset Management (WFAM) is the trade name for certain investment advisory/management firms owned by Wells Fargo & Company. These firms include but are not limited to Wells Capital Management, LLC and Wells Fargo Funds Management, LLC. Certain products managed by WFAM entities are distributed by Wells Fargo Funds Distributor, LLC (a broker-dealer and Member FINRA).
This material is for general informational and educational purposes only and is NOT intended to provide investment advice or a recommendation of any kind - including a recommendation for any specific investment, strategy, or plan.
INVESTMENT PRODUCTS: NOT FDIC INSURED ■ NO BANK GUARANTEE ■ MAY LOSE VALUE
© 2021 Wells Fargo & Company. All rights reserved.
PAR-0721-00695 08-21
SVT5/SAR142 06-21
Semi-Annual Report
June 30, 2021
Wells Fargo VT Opportunity Fund
Reduce clutter.
Save trees.
Sign up for electronic delivery of prospectuses and shareholder reports at wellsfargo.com/ advantagedelivery
The views expressed and any forward-looking statements are as of June 30, 2021, unless otherwise noted, and are those of the Fund's portfolio managers and/or Wells Fargo Asset Management. Discussions of individual securities or the markets generally are not intended as individual recommendations. Future events or results may vary significantly from those expressed in any forward-looking statements. The views expressed are subject to change at any time in response to changing circumstances in the market. Wells Fargo Asset Management disclaims any obligation to publicly update or revise any views expressed or forward-looking statements.
INVESTMENT PRODUCTS: NOT FDIC INSURED ■ NO BANK GUARANTEE ■ MAY LOSE VALUE
Wells Fargo VT Opportunity Fund | 1
Letter to shareholders (unaudited)
Andrew Owen
President
Wells Fargo Funds
Dear Shareholder:
We are pleased to offer you this semi-annual report for the Wells Fargo VT Opportunity Fund for the six-month period that ended June 30, 2021. Global stocks continued to rally as the global economy continued to emerge from the haze of COVID-19. Tailwinds were provided by global stimulus programs, a rapid vaccination rollout, and recovering consumer and corporate sentiment. Bonds were mixed during the period, with municipal bonds and high-yield bonds delivering positive returns.
For the six-month period, U.S. stocks, based on the S&P 500 Index,1 gained 15.25%. International stocks, as measured by the MSCI ACWI ex USA Index (Net),2 returned 9.16%, while the MSCI EM Index (Net),3 trailed its developed market counterparts with a 7.45% gain. Among bond indexes, the Bloomberg Barclays U.S. Aggregate Bond Index,4 returned -1.60%, the Bloomberg Barclays Global Aggregate ex-USD Index (unhedged),5 returned -4.42%, the Bloomberg Barclays Municipal Bond Index,6 returned 1.06%, and the ICE BofA U.S. High Yield Index,7 returned 3.70%.
Vaccination rollout drove the stock markets to new highs.
The year 2021 began with emerging market stocks leading all major asset classes in January, driven by China’s strong economic growth and a broad recovery in corporate earnings, which propelled China’s stock market higher. In the United States, positive news on vaccine trials and January expansion in both the manufacturing and services sectors was offset by a weak December monthly jobs report. This was compounded by technical factors as some hedge funds were forced to sell stocks to protect themselves against a well-publicized short squeeze coordinated by a group of retail investors. Eurozone sentiment and economic growth were particularly weak, reflecting the impact of a new lockdown with stricter social distancing along with a slow vaccine rollout.
February saw major domestic equity indexes driven higher on the hope of a new stimulus bill, improving COVID-19 vaccination numbers, and the gradual reopening of the economy. Most S&P 500 companies reported better-than-expected earnings, with positive surprises coming from the financials, information technology, health care, and materials sectors. Japan saw its economy strengthen as a result of strong export numbers. Meanwhile, crude oil prices continued their climb, rising more than 25% for the year. Domestic government bonds experienced a sharp sell-off in late February as markets priced in a more robust economic recovery and higher future growth and inflation expectations.
| 1 | The S&P 500 Index consists of 500 stocks chosen for market size, liquidity, and industry group representation. It is a market-value-weighted index with each stock's weight in the index proportionate to its market value. You cannot invest directly in an index. |
| 2 | The Morgan Stanley Capital International (MSCI) All Country World Index (ACWI) ex USA Index (Net) is a free-float-adjusted market-capitalization-weighted index that is designed to measure the equity market performance of developed and emerging markets, excluding the United States. Source: MSCI. MSCI makes no express or implied warranties or representations and shall have no liability whatsoever with respect to any MSCI data contained herein. The MSCI data may not be further redistributed or used as a basis for other indices or any securities or financial products. This report is not approved, reviewed, or produced by MSCI. You cannot invest directly in an index. |
| 3 | The MSCI Emerging Markets (EM) Index (Net) is a free-float-adjusted market-capitalization-weighted index that is designed to measure equity market performance of emerging markets. You cannot invest directly in an index. |
| 4 | The Bloomberg Barclays U.S. Aggregate Bond Index is a broad-based benchmark that measures the investment-grade, U.S. dollar-denominated, fixed-rate taxable bond market, including Treasuries, government-related and corporate securities, mortgage-backed securities (agency fixed-rate and hybrid adjustable-rate mortgage pass-throughs), asset-backed securities, and commercial mortgage-backed securities. You cannot invest directly in an index. |
| 5 | The Bloomberg Barclays Global Aggregate ex-USD Index (unhedged) is an unmanaged index that provides a broad-based measure of the global investment-grade fixed-income markets excluding the U.S. dollar-denominated debt market. You cannot invest directly in an index. |
| 6 | The Bloomberg Barclays Municipal Bond Index is an unmanaged index composed of long-term tax-exempt bonds with a minimum credit rating of Baa. You cannot invest directly in an index. |
| 7 | The ICE BofA U.S. High Yield Index is a market-capitalization-weighted index of domestic and Yankee high-yield bonds. The index tracks the performance of high-yield securities traded in the U.S. bond market. You cannot invest directly in an index. Copyright 2021. ICE Data Indices, LLC. All rights reserved. |
2 | Wells Fargo VT Opportunity Fund
Letter to shareholders (unaudited)
The passage of the massive domestic stimulus bill highlighted March activity, leading to increased forecasts for U.S. growth in 2021. Domestic employment surged as COVID-19 vaccinations and an increasingly open economy spurred hiring. A majority of U.S. small companies reported they are operating at pre-pandemic capacity or higher. Value continued its outperformance of growth in the month, continuing the trend that started in late 2020. Meanwhile, most major developed global equity indexes are up month to date on the back of rising optimism regarding the outlook for global growth. While the U.S. and the U.K. have been the most successful in terms of the vaccine rollout, even in markets where the vaccine has lagged, such as in the eurozone and Japan, equity indexes in many of those countries are also in positive territory this year.
Equity markets produced another strong showing in April. Domestically, the continued reopening of the economy had a strong impact on positive equity performance, as people started leaving their households and jobless claims continued to fall. Domestic corporate bonds performed well and the U.S. dollar weakened. Meanwhile, the U.S. government continued to seek to invest in the recovery, this time by outlining a package of over $2 trillion to improve infrastructure. The primary headwind in April was inflation, as investors tried to determine the breadth and longevity of recent price increases. Developed Europe has been supported by a meaningful increase in the pace of vaccinations. Unfortunately many emerging market countries have not been as successful. India in particular has seen COVID-19 cases surge, serving as an example of the need to get vaccinations rolled out to less developed nations.
Vaccine rollouts continued in May, leading to loosened restrictions globally. As a result, equity markets in general saw a minor increase in returns. Concerns that the continued economic rebound could result in inflation increases becoming more than transitory were supported by the higher input costs businesses are experiencing. Meanwhile, those inflation concerns were tempered by the U.S. Federal Reserve Board (Fed), which stayed steady on its view of the economy and eased fears of a sudden and substantial policy change. Positive performance in the emerging market equity space was supported this month by steady consumer demand and strong commodity prices. Fixed-income markets were also slightly positive for the month, driven by inflation uncertainty and a softer U.S. dollar.
June witnessed the S&P 500 Index reach a new all-time high. 2021 economic growth and inflation forecasts were revised higher to reflect a strong economic recovery and some supply and demand imbalances. Late June saw a deal reached on a U.S. infrastructure package of approximately $1 trillion for road, bridge, and broadband network upgrades over the next eight years. The Fed’s June meeting yielded no change to policy, but its projections pointed to a possible interest rate rise in 2023. This, combined with a rebound in economic activity and investors searching for yield, led to U.S. Treasury yields being down for the month. Many European and Asian countries saw vaccination momentum increase, while the U.K. dealt with a rise in COVID-19 infections, specifically the Delta variant. Meanwhile, crude oil jumped over 10% in June on the back of the pickup in global economic activity and the Organization of the Petroleum Exporting Countries’ slow pace of supply growth.
Don’t let short-term uncertainty derail long-term investment goals.
Periods of investment uncertainty can present challenges, but experience has taught us that maintaining long-term investment goals can be an effective way to plan for the future. Although diversification cannot guarantee an investment profit or prevent losses, we believe it can be an effective way to manage investment risk and potentially smooth out overall portfolio performance. We encourage investors to know their investments and to understand that appropriate levels of risk-taking may unlock opportunities.
Thank you for choosing to invest with Wells Fargo Funds. We appreciate your confidence in us and remain committed to helping you meet your financial needs.
Sincerely,
Andrew Owen
President
Wells Fargo Funds
“The passage of the massive domestic stimulus bill highlighted March activity, leading to increased forecasts for U.S. growth in 2021.”
“2021 economic growth and inflation forecasts were revised higher to reflect a strong economic recovery and some supply and demand imbalances.”
For further information about your Fund, contact your investment professional, visit our website at wfam.com, or call us directly at 1-800-222-8222.
Wells Fargo VT Opportunity Fund | 3
Performance highlights (unaudited)
| Investment objective | The Fund seeks long-term capital appreciation. |
| Manager | Wells Fargo Funds Management, LLC |
| Subadviser | Wells Capital Management, LLC |
| Portfolio managers | Kurt Gunderson*, Christopher G. Miller, CFA®‡ |
| Average annual total returns (%) as of June 30, 2021 |
| | | | | | Expense ratios1 (%) |
| | Inception date | 1 year | 5 year | 10 year | Gross | Net 2 |
| Class 1 3 | 8-26-2011 | 45.82 | 17.58 | 12.79 | 0.86 | 0.75 |
| Class 2 | 5-8-1992 | 45.43 | 17.29 | 12.51 | 1.11 | 1.00 |
| Russell 3000® Index4 | – | 44.16 | 17.89 | 14.70 | – | – |
| 1 | Reflects the expense ratios as stated in the most recent prospectuses. The expense ratios shown are subject to change and may differ from the annualized expense ratios shown in the financial highlights of this report. |
| 2 | The manager has contractually committed through April 30, 2022, to waive fees and/or reimburse expenses to the extent necessary to cap total annual fund operating expenses after fee waivers at 0.75% for Class 1 shares and 1.00% for Class 2 shares. Brokerage commissions, stamp duty fees, interest, taxes, acquired fund fees and expenses (if any), and extraordinary expenses are excluded from the expense caps. Prior to or after the commitment expiration date, the caps may be increased or the commitment to maintain the caps may be terminated only with the approval of the Board of Trustees. Without these caps, the Fund’s returns would have been lower. The expense ratio paid by an investor is the net expense ratio (the total annual fund operating expenses after fee waivers) as stated in the prospectuses. |
| 3 | Historical performance shown for Class 1 shares prior to their inception reflects the performance of the Class 2 shares, and includes the higher expenses applicable to the Class 2 shares. If these expenses had not been included, returns for the Class 1 shares would be higher. |
| 4 | The Russell 3000® Index measures the performance of the 3,000 largest U.S. companies based on total market capitalization, which represents approximately 98% of the investable U.S. equity market. You cannot invest directly in an index. |
Figures quoted represent past performance, which is no guarantee of future results. Investment return and principal value of an investment will fluctuate so that an investor’s shares, when redeemed, may be worth more or less than their original cost. Current performance may be lower or higher than the performance data quoted and assumes the reinvestment of dividends and capital gains. Current month-end performance is available by calling 1-800-260-5969. Performance figures of the Fund do not reflect fees and expenses charged pursuant to the terms of variable life insurance policies and variable annuity contracts. If these fees and expenses had been reflected, performance would have been lower.
Please keep in mind that high double-digit returns were primarily achieved during favorable market conditions. You should not expect that such favorable returns can be consistently achieved. A fund’s performance, especially for short time periods, should not be the sole factor in making your investment decision.
Index returns do not include transaction costs associated with buying and selling securities, any mutual fund fees or expenses, or any taxes. It is not possible to invest directly in an index.
Shares are sold without a front-end sales charge or contingent deferred sales charge.
Stock values fluctuate in response to the activities of individual companies and general market and economic conditions. Smaller company stocks tend to be more volatile and less liquid than those of larger companies. Certain investment strategies tend to increase the total risk of an investment (relative to the broader market). This fund is exposed to foreign investment risk. Consult the Fund’s prospectus for additional information on these and other risks.
Please refer to the prospectus provided by your participating insurance company for detailed information describing the separate accounts for information regarding surrender charges, mortality and expense risk fees, and other charges that may be assessed by the participating insurance companies.
| ‡ | CFA® and Chartered Financial Analyst® are trademarks owned by CFA Institute. |
| * | Mr. Gunderson became a portfolio manager of the Fund on February 1, 2021. |
4 | Wells Fargo VT Opportunity Fund
Performance highlights (unaudited)
| Ten largest holdings (%) as of June 30, 20211 |
| Alphabet Incorporated Class C | 5.58 |
| Apple Incorporated | 3.89 |
| Amazon.com Incorporated | 3.65 |
| Facebook Incorporated Class A | 3.34 |
| Salesforce.com Incorporated | 3.14 |
| Texas Instruments Incorporated | 2.77 |
| MasterCard Incorporated Class A | 2.59 |
| Carlisle Companies Incorporated | 2.32 |
| Marvell Technology Incorporated | 2.22 |
| Equinix Incorporated | 1.96 |
| 1 | Figures represent the percentage of the Fund's net assets. Holdings are subject to change and may have changed since the date specified. |
| Sector allocation as of June 30, 20211 |
| 1 | Figures represent the percentage of the Fund's long-term investments. These amounts are subject to change and may have changed since the date specified. |
Wells Fargo VT Opportunity Fund | 5
Fund expenses (unaudited)
As a shareholder of the Fund, you incur ongoing costs, including management fees, distribution (12b-1) fees, and other Fund expenses. This example is intended to help you understand your ongoing costs (in dollars) of investing in the Fund and to compare these costs with the ongoing costs of investing in other mutual funds.
The example is based on an investment of $1,000 invested at the beginning of the six-month period and held for the entire period from January 1, 2021 to June 30, 2021.
Actual expenses
The “Actual” line of the table below provides information about actual account values and actual expenses. You may use the information in this line, together with the amount you invested, to estimate the expenses that you paid over the period. Simply divide your account value by $1,000 (for example, an $8,600 account value divided by $1,000 = 8.6), then multiply the result by the number in the “Actual” line under the heading entitled “Expenses paid during period” for your applicable class of shares to estimate the expenses you paid on your account during this period.
Hypothetical example for comparison purposes
The “Hypothetical” line of the table below provides information about hypothetical account values and hypothetical expenses based on the Fund’s actual expense ratio and an assumed rate of return of 5% per year before expenses, which is not the Fund’s actual return. The hypothetical account values and expenses may not be used to estimate the actual ending account balance or expenses you paid for the period. You may use this information to compare the ongoing costs of investing in the Fund and other funds. To do so, compare this 5% hypothetical example with the 5% hypothetical examples that appear in the shareholder reports of the other funds.
Please note that the expenses shown in the table are meant to highlight your ongoing costs only and do not reflect any separate account charges assessed by participating insurance companies. Therefore, the “Hypothetical” line of the table is useful in comparing ongoing costs only, and will not help you determine the relative total costs of owning different funds. In addition, if these separate account charges assessed by participating insurance companies were included, your costs would have been higher.
| | Beginning
account value
1-1-2021 | Ending
account value
6-30-2021 | Expenses
paid during
the period1 | Annualized net
expense ratio |
| Class 1 | | | | |
| Actual | $1,000.00 | $1,143.49 | $3.99 | 0.75% |
| Hypothetical (5% return before expenses) | $1,000.00 | $1,021.08 | $3.76 | 0.75% |
| Class 2 | | | | |
| Actual | $1,000.00 | $1,142.42 | $5.31 | 1.00% |
| Hypothetical (5% return before expenses) | $1,000.00 | $1,019.84 | $5.01 | 1.00% |
1 Expenses paid is equal to the annualized net expense ratio of each class multiplied by the average account value over the period, multiplied by the number of days in the most recent fiscal half-year divided by the number of days in the fiscal year (to reflect the one-half-year period).
6 | Wells Fargo VT Opportunity Fund
Portfolio of investments—June 30, 2021 (unaudited)
| | | | | Shares | Value |
| Common stocks: 98.52% | | | | | |
| Communication services: 10.80% | | | | | |
| Interactive media & services: 8.92% | | | | | |
| Alphabet Incorporated Class C † | | | | 4,758 | $ 11,925,071 |
| Facebook Incorporated Class A † | | | | 20,540 | 7,141,963 |
| | | | | | 19,067,034 |
| Wireless telecommunication services: 1.88% | | | | | |
| T-Mobile US Incorporated † | | | | 27,797 | 4,025,840 |
| Consumer discretionary: 11.37% | | | | | |
| Automobiles: 1.80% | | | | | |
| General Motors Company † | | | | 65,062 | 3,849,719 |
| Internet & direct marketing retail: 4.81% | | | | | |
| Amazon.com Incorporated † | | | | 2,266 | 7,795,403 |
| Farfetch Limited Class A † | | | | 49,477 | 2,491,662 |
| | | | | | 10,287,065 |
| Multiline retail: 1.65% | | | | | |
| Dollar General Corporation | | | | 16,257 | 3,517,852 |
| Specialty retail: 3.11% | | | | | |
| Burlington Stores Incorporated † | | | | 10,285 | 3,311,667 |
| Ulta Beauty Incorporated † | | | | 9,662 | 3,340,830 |
| | | | | | 6,652,497 |
| Consumer staples: 2.46% | | | | | |
| Food & staples retailing: 1.38% | | | | | |
| Sysco Corporation | | | | 37,884 | 2,945,481 |
| Household products: 1.08% | | | | | |
| Church & Dwight Company Incorporated | | | | 26,973 | 2,298,639 |
| Financials: 7.42% | | | | | |
| Capital markets: 4.89% | | | | | |
| CME Group Incorporated | | | | 6,412 | 1,363,704 |
| Intercontinental Exchange Incorporated | | | | 26,283 | 3,119,792 |
| S&P Global Incorporated | | | | 8,977 | 3,684,610 |
| The Charles Schwab Corporation | | | | 31,472 | 2,291,476 |
| | | | | | 10,459,582 |
| Insurance: 2.53% | | | | | |
| Chubb Limited | | | | 12,818 | 2,037,293 |
| Marsh & McLennan Companies Incorporated | | | | 23,933 | 3,366,894 |
| | | | | | 5,404,187 |
| Health care: 13.73% | | | | | |
| Health care equipment & supplies: 6.22% | | | | | |
| Align Technology Incorporated † | | | | 5,392 | 3,294,512 |
| Boston Scientific Corporation † | | | | 77,408 | 3,309,966 |
The accompanying notes are an integral part of these financial statements.
Wells Fargo VT Opportunity Fund | 7
Portfolio of investments—June 30, 2021 (unaudited)
| | | | | Shares | Value |
| Health care equipment & supplies (continued) | | | | | |
| LivaNova plc † | | | | 42,380 | $ 3,564,582 |
| Medtronic plc | | | | 25,166 | 3,123,856 |
| | | | | | 13,292,916 |
| Health care providers & services: 1.95% | | | | | |
| UnitedHealth Group Incorporated | | | | 10,394 | 4,162,173 |
| Health care technology: 0.47% | | | | | |
| Schrodinger Incorporated † | | | | 13,341 | 1,008,713 |
| Life sciences tools & services: 4.61% | | | | | |
| Agilent Technologies Incorporated | | | | 20,325 | 3,004,238 |
| Bio-Rad Laboratories Incorporated Class A † | | | | 4,973 | 3,204,054 |
| Thermo Fisher Scientific Incorporated | | | | 7,255 | 3,659,930 |
| | | | | | 9,868,222 |
| Pharmaceuticals: 0.48% | | | | | |
| Viatris Incorporated | | | | 71,591 | 1,023,035 |
| Industrials: 17.22% | | | | | |
| Aerospace & defense: 3.05% | | | | | |
| MTU Aero Engines AG | | | | 10,000 | 2,477,032 |
| Teledyne Technologies Incorporated † | | | | 9,651 | 4,042,128 |
| | | | | | 6,519,160 |
| Commercial services & supplies: 1.69% | | | | | |
| Republic Services Incorporated | | | | 32,891 | 3,618,339 |
| Industrial conglomerates: 2.32% | | | | | |
| Carlisle Companies Incorporated | | | | 25,888 | 4,954,445 |
| Machinery: 6.54% | | | | | |
| Fortive Corporation | | | | 54,701 | 3,814,848 |
| Ingersoll Rand Incorporated † | | | | 53,549 | 2,613,727 |
| Otis Worldwide Corporation | | | | 36,754 | 3,005,375 |
| Rexnord Corporation | | | | 50,414 | 2,522,717 |
| SPX Corporation † | | | | 33,287 | 2,033,170 |
| | | | | | 13,989,837 |
| Professional services: 1.41% | | | | | |
| Dun & Bradstreet Holdings Incorporated † | | | | 140,634 | 3,005,349 |
| Trading companies & distributors: 2.21% | | | | | |
| Air Lease Corporation | | | | 58,193 | 2,428,976 |
| United Rentals Incorporated † | | | | 7,211 | 2,300,377 |
| | | | | | 4,729,353 |
| Information technology: 25.72% | | | | | |
| Electronic equipment, instruments & components: 1.65% | | | | | |
| Amphenol Corporation Class A | | | | 51,549 | 3,526,467 |
| IT services: 5.68% | | | | | |
| Fidelity National Information Services Incorporated | | | | 22,908 | 3,245,376 |
The accompanying notes are an integral part of these financial statements.
8 | Wells Fargo VT Opportunity Fund
Portfolio of investments—June 30, 2021 (unaudited)
| | | | | Shares | Value |
| IT services (continued) | | | | | |
| Genpact Limited | | | | 73,882 | $ 3,356,459 |
| MasterCard Incorporated Class A | | | | 15,151 | 5,531,479 |
| | | | | | 12,133,314 |
| Semiconductors & semiconductor equipment: 4.99% | | | | | |
| Marvell Technology Incorporated | | | | 81,320 | 4,743,396 |
| Texas Instruments Incorporated | | | | 30,802 | 5,923,225 |
| | | | | | 10,666,621 |
| Software: 9.51% | | | | | |
| Fair Isaac Corporation † | | | | 6,227 | 3,130,188 |
| Palo Alto Networks Incorporated † | | | | 9,853 | 3,655,956 |
| Salesforce.com Incorporated † | | | | 27,480 | 6,712,540 |
| ServiceNow Incorporated † | | | | 5,553 | 3,051,651 |
| Workday Incorporated Class A † | | | | 15,790 | 3,769,705 |
| | | | | | 20,320,040 |
| Technology hardware, storage & peripherals: 3.89% | | | | | |
| Apple Incorporated | | | | 60,756 | 8,321,142 |
| Materials: 2.45% | | | | | |
| Chemicals: 1.65% | | | | | |
| Ashland Global Holdings Incorporated | | | | 22,821 | 1,996,838 |
| The Sherwin-Williams Company | | | | 5,660 | 1,542,067 |
| | | | | | 3,538,905 |
| Metals & mining: 0.80% | | | | | |
| Steel Dynamics Incorporated | | | | 28,579 | 1,703,308 |
| Real estate: 7.35% | | | | | |
| Equity REITs: 7.35% | | | | | |
| American Tower Corporation | | | | 14,398 | 3,889,476 |
| Equinix Incorporated | | | | 5,225 | 4,193,585 |
| Sun Communities Incorporated | | | | 22,708 | 3,892,151 |
| VICI Properties Incorporated | | | | 120,049 | 3,723,920 |
| | | | | | 15,699,132 |
| Total Common stocks (Cost $121,787,536) | | | | | 210,588,367 |
| | | Yield | | | |
| Short-term investments: 1.50% | | | | | |
| Investment companies: 1.50% | | | | | |
| Wells Fargo Government Money Market Fund Select Class ♠∞ | | 0.03% | | 3,214,729 | 3,214,729 |
| Total Short-term investments (Cost $3,214,729) | | | | | 3,214,729 |
| Total investments in securities (Cost $125,002,265) | 100.02% | | | | 213,803,096 |
| Other assets and liabilities, net | (0.02) | | | | (40,045) |
| Total net assets | 100.00% | | | | $213,763,051 |
| † | Non-income-earning security |
| ♠ | The issuer of the security is an affiliated person of the Fund as defined in the Investment Company Act of 1940. |
| ∞ | The rate represents the 7-day annualized yield at period end. |
The accompanying notes are an integral part of these financial statements.
Wells Fargo VT Opportunity Fund | 9
Portfolio of investments—June 30, 2021 (unaudited)
| Abbreviations: |
| REIT | Real estate investment trust |
Investments in affiliates
An affiliated investment is an investment in which the Fund owns at least 5% of the outstanding voting shares of the issuer or as a result of other relationships, such as the Fund and the issuer having the same investment manager. Transactions with issuers that were either affiliates of the Fund at the beginning of the period or the end of the period were as follows:
| | Value,
beginning of
period | Purchases | Sales
proceeds | Net
realized
gains
(losses) | Net
change in
unrealized
gains
(losses) | Value,
end of
period | % of
net
assets | Shares,
end
of period | Income
from
affiliated
securities |
| Short-term investments | | | | | | | | | |
| Investment companies | | | | | | | | | |
| Wells Fargo Government Money Market Fund Select Class | $2,161,993 | $18,752,918 | $(17,700,182) | $0 | $0 | $3,214,729 | 1.50% | 3,214,729 | $290 |
The accompanying notes are an integral part of these financial statements.
10 | Wells Fargo VT Opportunity Fund
Statement of assets and liabilities—June 30, 2021 (unaudited)
| | |
| Assets | |
Investments in unaffiliated securities, at value (cost $121,787,536)
| $ 210,588,367 |
Investments in affiliated securites, at value (cost $3,214,729)
| 3,214,729 |
Receivable for dividends
| 227,296 |
Receivable for investments sold
| 69,873 |
Receivable for Fund shares sold
| 586 |
Prepaid expenses and other assets
| 108 |
Total assets
| 214,100,959 |
| Liabilities | |
Management fee payable
| 106,038 |
Payable for Fund shares redeemed
| 101,615 |
Payable for investments purchased
| 52,857 |
Distribution fee payable
| 36,742 |
Professional fees payable
| 18,123 |
Administration fees payable
| 13,927 |
Trustees’ fees and expenses payable
| 1,900 |
Accrued expenses and other liabilities
| 6,706 |
Total liabilities
| 337,908 |
Total net assets
| $213,763,051 |
| Net assets consist of | |
Paid-in capital
| $ 98,501,729 |
Total distributable earnings
| 115,261,322 |
Total net assets
| $213,763,051 |
| Computation of net asset value per share | |
Net assets – Class 1
| $ 33,350,912 |
Shares outstanding – Class 11
| 989,230 |
Net asset value per share – Class 1
| $33.71 |
Net assets – Class 2
| $ 180,412,139 |
Shares outstanding – Class 21
| 5,330,078 |
Net asset value per share – Class 2
| $33.85 |
| 1 | The Fund has an unlimited number of authorized shares |
The accompanying notes are an integral part of these financial statements.
Wells Fargo VT Opportunity Fund | 11
Statement of operations—six months ended June 30, 2021 (unaudited)
| | |
| Investment income | |
Dividends (net of foreign withholdings taxes of $17,823)
| $ 841,427 |
Income from affiliated securities
| 290 |
Total investment income
| 841,717 |
| Expenses | |
Management fee
| 698,083 |
| Administration fees | |
Class 1
| 12,766 |
Class 2
| 67,015 |
| Distribution fee | |
Class 2
| 209,421 |
Custody and accounting fees
| 9,493 |
Professional fees
| 26,839 |
Shareholder report expenses
| 16,515 |
Trustees’ fees and expenses
| 9,398 |
Other fees and expenses
| 5,175 |
Total expenses
| 1,054,705 |
| Less: Fee waivers and/or expense reimbursements | |
Fund-level
| (97,338) |
Net expenses
| 957,367 |
Net investment loss
| (115,650) |
| Realized and unrealized gains (losses) on investments | |
Net realized gains on investments
| 16,678,888 |
Net change in unrealized gains (losses) on investments
| 10,746,468 |
Net realized and unrealized gains (losses) on investments
| 27,425,356 |
Net increase in net assets resulting from operations
| $27,309,706 |
The accompanying notes are an integral part of these financial statements.
12 | Wells Fargo VT Opportunity Fund
Statement of changes in net assets
| | | | | |
| | Six months ended
June 30, 2021
(unaudited) | Year ended
December 31, 2020 |
| Operations | | | | |
Net investment income (loss)
| | $ (115,650) | | $ 181,464 |
Net realized gains on investments
| | 16,678,888 | | 9,938,608 |
Net change in unrealized gains (losses) on investments
| | 10,746,468 | | 24,029,460 |
Net increase in net assets resulting from operations
| | 27,309,706 | | 34,149,532 |
| Distributions to shareholders from | | | | |
| Net investment income and net realized gains | | | | |
Class 1
| | 0 | | (2,328,698) |
Class 2
| | 0 | | (11,686,840) |
Total distributions to shareholders
| | 0 | | (14,015,538) |
| Capital share transactions | Shares | | Shares | |
| Proceeds from shares sold | | | | |
Class 1
| 7,923 | 257,159 | 21,174 | 498,604 |
Class 2
| 40,293 | 1,290,250 | 123,816 | 3,170,894 |
| | | 1,547,409 | | 3,669,498 |
| Reinvestment of distributions | | | | |
Class 1
| 0 | 0 | 98,715 | 2,328,698 |
Class 2
| 0 | 0 | 492,285 | 11,686,840 |
| | | 0 | | 14,015,538 |
| Payment for shares redeemed | | | | |
Class 1
| (106,518) | (3,373,328) | (192,184) | (4,908,447) |
Class 2
| (357,728) | (11,124,493) | (899,151) | (22,533,873) |
| | | (14,497,821) | | (27,442,320) |
Net decrease in net assets resulting from capital share transactions
| | (12,950,412) | | (9,757,284) |
Total increase in net assets
| | 14,359,294 | | 10,376,710 |
| Net assets | | | | |
Beginning of period
| | 199,403,757 | | 189,027,047 |
End of period
| | $213,763,051 | | $199,403,757 |
The accompanying notes are an integral part of these financial statements.
Wells Fargo VT Opportunity Fund | 13
Financial highlights
(For a share outstanding throughout each period)
| | | Year ended December 31 |
| Class 1 | Six months ended
June 30, 2021
(unaudited) | 2020 | 2019 | 2018 | 2017 | 2016 |
Net asset value, beginning of period
| $29.48 | $26.56 | $22.76 | $27.05 | $24.60 | $25.00 |
Net investment income
| 0.01 | 0.09 | 0.17 | 0.15 | 0.13 | 0.22 |
Net realized and unrealized gains (losses) on investments
| 4.22 | 5.03 | 6.84 | (1.69) | 4.77 | 2.59 |
Total from investment operations
| 4.23 | 5.12 | 7.01 | (1.54) | 4.90 | 2.81 |
| Distributions to shareholders from | | | | | | |
Net investment income
| 0.00 | (0.19) | (0.15) | (0.12) | (0.25) | (0.60) |
Net realized gains
| 0.00 | (2.01) | (3.06) | (2.63) | (2.20) | (2.61) |
Total distributions to shareholders
| 0.00 | (2.20) | (3.21) | (2.75) | (2.45) | (3.21) |
Net asset value, end of period
| $33.71 | $29.48 | $26.56 | $22.76 | $27.05 | $24.60 |
Total return1
| 14.35% | 21.32% | 31.81% | (6.93)% | 20.72% | 12.52% |
| Ratios to average net assets (annualized) | | | | | | |
Gross expenses
| 0.85% | 0.86% | 0.85% | 0.84% | 0.86% | 0.85% |
Net expenses
| 0.75% | 0.75% | 0.75% | 0.75% | 0.75% | 0.75% |
Net investment income
| 0.09% | 0.31% | 0.67% | 0.52% | 0.43% | 0.65% |
| Supplemental data | | | | | | |
Portfolio turnover rate
| 15% | 42% | 25% | 31% | 36% | 47% |
Net assets, end of period (000s omitted)
| $33,351 | $32,066 | $30,811 | $27,165 | $33,843 | $33,035 |
| 1 | Returns for periods of less than one year are not annualized. Returns do not reflect fees and expenses charged pursuant to the terms of variable life insurance policies and variable annuity contracts. |
The accompanying notes are an integral part of these financial statements.
14 | Wells Fargo VT Opportunity Fund
Financial highlights
(For a share outstanding throughout each period)
| | | Year ended December 31 |
| Class 2 | Six months ended
June 30, 2021
(unaudited) | 2020 | 2019 | 2018 | 2017 | 2016 |
Net asset value, beginning of period
| $29.63 | $26.68 | $22.85 | $27.14 | $24.67 | $25.05 |
Net investment income (loss)
| (0.02) | 0.03 | 0.11 | 0.08 | 0.06 | 0.13 |
Net realized and unrealized gains (losses) on investments
| 4.24 | 5.05 | 6.86 | (1.69) | 4.79 | 2.63 |
Total from investment operations
| 4.22 | 5.08 | 6.97 | (1.61) | 4.85 | 2.76 |
| Distributions to shareholders from | | | | | | |
Net investment income
| 0.00 | (0.12) | (0.08) | (0.05) | (0.18) | (0.53) |
Net realized gains
| 0.00 | (2.01) | (3.06) | (2.63) | (2.20) | (2.61) |
Total distributions to shareholders
| 0.00 | (2.13) | (3.14) | (2.68) | (2.38) | (3.14) |
Net asset value, end of period
| $33.85 | $29.63 | $26.68 | $22.85 | $27.14 | $24.67 |
Total return1
| 14.24% | 21.00% | 31.46% | (7.15)% | 20.44% | 12.23% |
| Ratios to average net assets (annualized) | | | | | | |
Gross expenses
| 1.10% | 1.11% | 1.10% | 1.09% | 1.11% | 1.10% |
Net expenses
| 1.00% | 1.00% | 1.00% | 1.00% | 1.00% | 1.00% |
Net investment income (loss)
| (0.16)% | 0.06% | 0.42% | 0.27% | 0.18% | 0.39% |
| Supplemental data | | | | | | |
Portfolio turnover rate
| 15% | 42% | 25% | 31% | 36% | 47% |
Net assets, end of period (000s omitted)
| $180,412 | $167,338 | $158,216 | $134,972 | $165,992 | $158,783 |
| 1 | Returns for periods of less than one year are not annualized. Returns do not reflect fees and expenses charged pursuant to the terms of variable life insurance policies and variable annuity contracts. |
The accompanying notes are an integral part of these financial statements.
Wells Fargo VT Opportunity Fund | 15
Notes to financial statements (unaudited)
1. ORGANIZATION
Wells Fargo Variable Trust (the "Trust"), a Delaware statutory trust organized on March 10, 1999, is an open-end management investment company registered under the Investment Company Act of 1940, as amended (the "1940 Act"). As an investment company, the Trust follows the accounting and reporting guidance in Financial Accounting Standards Board ("FASB") Accounting Standards Codification Topic 946, Financial Services – Investment Companies. These financial statements report on the Wells Fargo VT Opportunity Fund (the "Fund") which is a diversified series of the Trust. The Trust offers shares of the Fund to separate accounts of various life insurance companies as funding vehicles for certain variable annuity contracts and variable life insurance policies.
On February 23, 2021, Wells Fargo & Company announced that it has entered into a definitive agreement to sell Wells Fargo Asset Management ("WFAM") to GTCR LLC and Reverence Capital Partners, L.P. WFAM is the trade name used by the asset management businesses of Wells Fargo & Company and includes Wells Fargo Funds Management, LLC, the investment manager to the Fund, Wells Capital Management, LLC and Wells Fargo Asset Management (International) Limited, both registered investment advisers providing sub-advisory services to certain funds, and Wells Fargo Funds Distributor, LLC, the Fund's principal underwriter. As part of the transaction, Wells Fargo & Company will own a 9.9% equity interest and will continue to serve as an important client and distribution partner.
Consummation of the transaction will result in the automatic termination of the Fund's investment management agreement and subadvisory agreement. The Fund's Board of Trustees approved a new investment management and new subadvisory agreement and approved submitting the agreements to the Fund’s shareholders for approval at a special meeting of shareholders expected to be held on August 16, 2021. Shareholders of record of the Fund at the close of business on May 28, 2021 are entitled to vote at the meeting. If shareholders approve the new agreements, they would take effect upon the closing of the transaction. The transaction is expected to close in the second half of 2021, subject to customary closing conditions.
2. SIGNIFICANT ACCOUNTING POLICIES
The following significant accounting policies, which are consistently followed in the preparation of the financial statements of the Fund, are in conformity with U.S. generally accepted accounting principles which require management to make estimates and assumptions that affect the reported amounts of assets and liabilities, disclosure of contingent assets and liabilities at the date of the financial statements, and the reported amounts of income and expenses during the reporting period. Actual results could differ from those estimates.
Securities valuation
All investments are valued each business day as of the close of regular trading on the New York Stock Exchange (generally 4 p.m. Eastern Time), although the Fund may deviate from this calculation time under unusual or unexpected circumstances.
Equity securities that are listed on a foreign or domestic exchange or market are valued at the official closing price or, if none, the last sales price. If no sale occurs on the principal exchange or market that day, a fair value price will be determined in accordance with the Fund’s Valuation Procedures.
The values of securities denominated in foreign currencies are translated into U.S. dollars at rates provided by an independent foreign currency pricing source at a time each business day specified by the Wells Fargo Asset Management Pricing Committee at Wells Fargo Funds Management, LLC ("Funds Management").
Many securities markets and exchanges outside the U.S. close prior to the close of the New York Stock Exchange and therefore may not fully reflect trading or events that occur after the close of the principal exchange in which the foreign securities are traded, but before the close of the New York Stock Exchange. If such trading or events are expected to materially affect the value of such securities, then fair value pricing procedures approved by the Board of Trustees of the Fund are applied. These procedures take into account multiple factors including movements in U.S. securities markets after foreign exchanges close. Foreign securities that are fair valued under these procedures are categorized as Level 2 and the application of these procedures may result in transfers between Level 1 and Level 2. Depending on market activity, such fair valuations may be frequent. Such fair value pricing may result in net asset values that are higher or lower than net asset values based on the last reported sales price or latest quoted bid price. On June 30, 2021, such fair value pricing was not used in pricing foreign securities.
Investments in registered open-end investment companies are valued at net asset value.
Investments which are not valued using any of the methods discussed above are valued at their fair value, as determined in good faith by the Board of Trustees. The Board of Trustees has established a Valuation Committee comprised of the Trustees
16 | Wells Fargo VT Opportunity Fund
Notes to financial statements (unaudited)
and has delegated to it the authority to take any actions regarding the valuation of portfolio securities that the Valuation Committee deems necessary or appropriate, including determining the fair value of portfolio securities, unless the determination has been delegated to the Wells Fargo Asset Management Pricing Committee. The Board of Trustees retains the authority to make or ratify any valuation decisions or approve any changes to the Valuation Procedures as it deems appropriate. On a quarterly basis, the Board of Trustees receives reports on any valuation actions taken by the Valuation Committee or the Wells Fargo Asset Management Pricing Committee which may include items for ratification.
Foreign currency translation
The accounting records of the Fund are maintained in U.S. dollars. The values of other assets and liabilities denominated in foreign currencies are translated into U.S. dollars at rates provided by an independent foreign currency pricing source at a time each business day specified by the Wells Fargo Asset Management Pricing Committee. Purchases and sales of securities, and income and expenses are converted at the rate of exchange on the respective dates of such transactions. Net realized foreign exchange gains or losses arise from sales of foreign currencies, currency gains or losses realized between the trade and settlement dates on securities transactions, and the difference between the amounts of dividends, interest and foreign withholding taxes recorded and the U.S. dollar equivalent of the amounts actually paid or received. Net unrealized foreign exchange gains and losses arise from changes in the fair value of assets and liabilities other than investments in securities resulting from changes in exchange rates. The changes in net assets arising from changes in exchange rates of securities and the changes in net assets resulting from changes in market prices of securities are not separately presented. Such changes are included in net realized and unrealized gains or losses from investments.
Security transactions and income recognition
Securities transactions are recorded on a trade date basis. Realized gains or losses are recorded on the basis of identified cost.
Dividend income is recognized on the ex-dividend date, except for certain dividends from foreign securities, which are recorded as soon as the custodian verifies the ex-dividend date. Dividend income is recorded net of foreign taxes withheld where recovery of such taxes is not assured.
Distributions to shareholders
Distributions to shareholders from net investment income and any net realized gains are recorded on the ex-dividend date and paid at least annually. Such distributions are determined in accordance with income tax regulations and may differ from U.S. generally accepted accounting principles. Dividend sources are estimated at the time of declaration. The tax character of distributions is determined as of the Fund's fiscal year end. Therefore, a portion of the Fund's distributions made prior to the Fund’s fiscal year end may be categorized as a tax return of capital at year end.
Federal and other taxes
The Fund intends to continue to qualify as a regulated investment company by distributing substantially all of its investment company taxable income and any net realized capital gains (after reduction for capital loss carryforwards) sufficient to relieve it from all, or substantially all, federal income taxes. Accordingly, no provision for federal income taxes was required.
The Fund’s income and federal excise tax returns and all financial records supporting those returns for the prior three fiscal years are subject to examination by the federal and Delaware revenue authorities. Management has analyzed the Fund's tax positions taken on federal, state, and foreign tax returns for all open tax years and does not believe that there are any uncertain tax positions that require recognition of a tax liability.
As of June 30, 2021, the aggregate cost of all investments for federal income tax purposes was $125,098,058 and the unrealized gains (losses) consisted of:
| Gross unrealized gains | $88,705,038 |
| Gross unrealized losses | 0 |
| Net unrealized gains | $88,705,038 |
Class allocations
The separate classes of shares offered by the Fund differ principally in distribution fees. Class specific expenses are charged directly to that share class. Investment income, common fund-level expenses, and realized and unrealized gains (losses) on investments are allocated daily to each class of shares based on the relative proportion of net assets of each class.
Wells Fargo VT Opportunity Fund | 17
Notes to financial statements (unaudited)
3. FAIR VALUATION MEASUREMENTS
Fair value measurements of investments are determined within a framework that has established a fair value hierarchy based upon the various data inputs utilized in determining the value of the Fund’s investments. The three-level hierarchy gives the highest priority to unadjusted quoted prices in active markets for identical assets or liabilities (Level 1) and the lowest priority to unobservable inputs (Level 3). The Fund’s investments are classified within the fair value hierarchy based on the lowest level of input that is significant to the fair value measurement. The inputs are summarized into three broad levels as follows:
| ■ | Level 1 – quoted prices in active markets for identical securities |
| ■ | Level 2 – other significant observable inputs (including quoted prices for similar securities, interest rates, prepayment speeds, credit risk, etc.) |
| ■ | Level 3 – significant unobservable inputs (including the Fund’s own assumptions in determining the fair value of investments) |
The inputs or methodologies used for valuing investments in securities are not necessarily an indication of the risk associated with investing in those securities.
The following is a summary of the inputs used in valuing the Fund’s assets and liabilities as of June 30, 2021:
| | Quoted prices
(Level 1) | Other significant
observable inputs
(Level 2) | Significant
unobservable inputs
(Level 3) | Total |
| Assets | | | | |
| Investments in: | | | | |
| Common stocks | | | | |
| Communication services | $ 23,092,874 | $0 | $0 | $ 23,092,874 |
| Consumer discretionary | 24,307,133 | 0 | 0 | 24,307,133 |
| Consumer staples | 5,244,120 | 0 | 0 | 5,244,120 |
| Financials | 15,863,769 | 0 | 0 | 15,863,769 |
| Health care | 29,355,059 | 0 | 0 | 29,355,059 |
| Industrials | 36,816,483 | 0 | 0 | 36,816,483 |
| Information technology | 54,967,584 | 0 | 0 | 54,967,584 |
| Materials | 5,242,213 | 0 | 0 | 5,242,213 |
| Real estate | 15,699,132 | 0 | 0 | 15,699,132 |
| Short-term investments | | | | |
| Investment companies | 3,214,729 | 0 | 0 | 3,214,729 |
| Total assets | $213,803,096 | $0 | $0 | $213,803,096 |
Additional sector, industry or geographic detail, if any, is included in the Portfolio of Investments.
For the six months ended June 30, 2021, the Fund did not have any transfers into/out of Level 3.
4. TRANSACTIONS WITH AFFILIATES
Management fee
Funds Management, an indirect wholly owned subsidiary of Wells Fargo & Company ("Wells Fargo"), is the manager of the Fund and provides advisory and fund-level administrative services under an investment management agreement. Under the investment management agreement, Funds Management is responsible for, among other services, implementing the investment objectives and strategies of the Fund, supervising the subadviser and providing fund-level administrative services in connection with the Fund’s operations. As compensation for its services under the investment management agreement, Funds Management is entitled to receive a management fee at the following annual rate based on the Fund’s average daily net assets:
18 | Wells Fargo VT Opportunity Fund
Notes to financial statements (unaudited)
| Average daily net assets | Management fee |
| First $500 million | 0.700% |
| Next $500 million | 0.675 |
| Next $1 billion | 0.650 |
| Next $2 billion | 0.625 |
| Next $1 billion | 0.600 |
| Next $5 billion | 0.590 |
| Over $10 billion | 0.580 |
For the six months ended June 30, 2021, the management fee was equivalent to an annual rate of 0.70% of the Fund’s average daily net assets.
Funds Management has retained the services of a subadviser to provide daily portfolio management to the Fund. The fee for subadvisory services is borne by Funds Management. Wells Capital Management, LLC, an affiliate of Funds Management and an indirect wholly owned subsidiary of Wells Fargo, is the subadviser to the Fund and is entitled to receive a fee from Funds Management at an annual rate starting at 0.45% and declining to 0.30% as the average daily net assets of the Fund increase.
Administration fees
Under a class-level administration agreement, Funds Management provides class-level administrative services to the Fund, which includes paying fees and expenses for services provided by the transfer agent, sub-transfer agents, omnibus account services and record-keepers. As compensation for its services under the class-level administration agreement, Funds Management receives an annual fee of 0.08% which is calculated based on the average daily net assets of each class.
Waivers and/or expense reimbursements
Funds Management has contractually committed to waive and/or reimburse management and administration fees to the extent necessary to maintain certain net operating expense ratios for the Fund. When each class of the Fund has exceeded its expense cap, Funds Management will waive fees and/or reimbursed expenses from fund-level expenses on a proportionate basis and then from class specific expenses. When only certain classes exceed their expense caps, waivers and/or reimbursements are applied against class specific expenses before fund-level expenses. Funds Management has contractually committed through April 30, 2022 to waive fees and/or reimburse expenses to the extent necessary to cap expenses. Prior to or after the commitment expiration date, the caps may be increased or the commitment to maintain the caps may be terminated only with the approval of the Board of Trustees. The contractual expense caps are as follows:
| | Expense ratio caps |
| Class 1 | 0.75% |
| Class 2 | 1.00 |
Distribution fee
The Trust has adopted a distribution plan for Class 2 shares of the Fund pursuant to Rule 12b-1 under the 1940 Act. A distribution fee is charged to Class 2 shares and paid to Wells Fargo Funds Distributor, LLC, the principal underwriter, at an annual rate of 0.25% of the average daily net assets of Class 2 shares.
Interfund transactions
The Fund may purchase or sell portfolio investment securities to certain other Wells Fargo affiliates pursuant to Rule 17a-7 under the 1940 Act and under procedures adopted by the Board of Trustees. The procedures have been designed to ensure that these interfund transactions, which do not incur broker commissions, are effected at current market prices.
5. INVESTMENT PORTFOLIO TRANSACTIONS
Purchases and sales of investments, excluding U.S. government obligations (if any) and short-term securities, for the six months ended June 30, 2021 were $30,086,634 and $43,978,950, respectively.
Wells Fargo VT Opportunity Fund | 19
Notes to financial statements (unaudited)
6. BANK BORROWINGS
The Trust, Wells Fargo Master Trust and Wells Fargo Funds Trust (excluding the money market funds) are parties to a $350,000,000 revolving credit agreement whereby the Fund is permitted to use bank borrowings for temporary or emergency purposes, such as to fund shareholder redemption requests. Interest under the credit agreement is charged to the Fund based on a borrowing rate equal to the higher of the Federal Funds rate in effect on that day plus 1.25% or the overnight bank funding rate in effect on that day plus 1.25%. In addition, an annual commitment fee equal to 0.25% of the unused balance is allocated to each participating fund.
For the six months ended June 30, 2021, there were no borrowings by the Fund under the agreement.
7. CONCENTRATION RISKS
As of the end of the period, the Fund concentrated its portfolio of investments in the information technology sector. A fund that invests a substantial portion of its assets in any sector may be more affected by changes in that sector than would be a fund whose investments are not heavily weighted in any sector.
8. INDEMNIFICATION
Under the Fund's organizational documents, the officers and Trustees have been granted certain indemnification rights against certain liabilities that may arise out of performance of their duties to the Fund. The Fund has entered into a separate agreement with each Trustee that converts indemnification rights currently existing under the Fund’s organizational documents into contractual rights that cannot be changed in the future without the consent of the Trustee. Additionally, in the normal course of business, the Fund may enter into contracts with service providers that contain a variety of indemnification clauses. The Fund’s maximum exposure under these arrangements is dependent on future claims that may be made against the Fund and, therefore, cannot be estimated.
9. CORONAVIRUS (COVID-19) PANDEMIC
On March 11, 2020, the World Health Organization announced that it had made the assessment that coronavirus disease 2019 (“COVID-19”) is a pandemic. The impacts of COVID-19 are affecting the entire global economy, individual companies and investment products, the funds, and the market in general. There is significant uncertainty around the extent and duration of business disruptions related to COVID-19 and the impacts may last for an extended period of time. COVID-19 has led to significant uncertainty and volatility in the financial markets.
10. SUBSEQUENT EVENTS
Wells Fargo Asset Management ("WFAM") announced that it will be changing its company name to Allspring Global Investments upon the closing of the previously announced sale transaction of WFAM by Wells Fargo & Company to GTCR LLC and Reverence Capital Partners, L.P. The new corporate name is expected to go into effect on the closing date of the transaction, which is anticipated to occur in the second half of 2021, subject to customary closing conditions.
At a meeting held July 15, 2021, the Board of Trustees of the Wells Fargo Funds approved a change in the Fund's name to remove “Wells Fargo” from the Fund's name and replace with “Allspring”. The change is expected to go into effect on October 11, 2021.
Following the closing of the transaction, Wells Fargo Funds Management, LLC, the Fund's investment manager, Wells Capital Management, LLC and Wells Fargo Asset Management (International) Limited, each subadvisers to certain funds, and Wells Fargo Funds Distributor, LLC, the Fund's principal underwriter, will each be rebranded as Allspring.
At a special meeting of shareholders held on August 16, 2021, shareholders of the Fund approved a new investment management and a new subadvisory agreement that will be effective at the closing of the sale transaction.
20 | Wells Fargo VT Opportunity Fund
Other information (unaudited)
PROXY VOTING INFORMATION
A description of the policies and procedures used to determine how to vote proxies relating to portfolio securities is available without charge, upon request, by calling 1-800-260-5969, visiting our website at wfam.com, or visiting the SEC website at sec.gov. Information regarding how the proxies related to portfolio securities were voted during the most recent 12-month period ended June 30 is available on the website at wfam.com or by visiting the SEC website at sec.gov.
QUARTERLY PORTFOLIO HOLDINGS INFORMATION
The Fund files its complete schedule of portfolio holdings with the SEC for the first and third quarters of each fiscal year as an exhibit to its reports on Form N-PORT. Shareholders may view the filed Form N-PORT by visiting the SEC website at sec.gov.
Wells Fargo VT Opportunity Fund | 21
Other information (unaudited)
BOARD OF TRUSTEES AND OFFICERS
Each of the Trustees and Officers listed in the table below acts in identical capacities for each fund in the Wells Fargo family of funds, which consists of 139 mutual funds comprising the Wells Fargo Funds Trust, Wells Fargo Variable Trust, Wells Fargo Master Trust and four closed-end funds (collectively the “Fund Complex”). This table should be read in conjunction with the Prospectus and the Statement of Additional Information1. The mailing address of each Trustee and Officer is 525 Market Street, 12th Floor, San Francisco, CA 94105. Each Trustee and Officer serves an indefinite term, however, each Trustee serves such term until reaching the mandatory retirement age established by the Trustees.
Independent Trustees
Name and
year of birth | Position held and
length of service* | Principal occupations during past five years or longer | Current other
public company or
investment
company
directorships |
William R. Ebsworth
(Born 1957) | Trustee,
since 2015 | Retired. From 1984 to 2013, equities analyst, portfolio manager, research director and chief investment officer at Fidelity Management and Research Company in Boston, Tokyo, and Hong Kong, and retired in 2013 as Chief Investment Officer of Fidelity Strategic Advisers, Inc. where he led a team of investment professionals managing client assets. Prior thereto, Board member of Hong Kong Securities Clearing Co., Hong Kong Options Clearing Corp., the Thailand International Fund, Ltd., Fidelity Investments Life Insurance Company, and Empire Fidelity Investments Life Insurance Company. Audit Committee Chair and Investment Committee Chair of the Vincent Memorial Hospital Endowment (non-profit organization). Mr. Ebsworth is a CFA® charterholder. | N/A |
Jane A. Freeman
(Born 1953) | Trustee,
since 2015;
Chair Liaison,
since 2018 | Retired. From 2012 to 2014 and 1999 to 2008, Chief Financial Officer of Scientific Learning Corporation. From 2008 to 2012, Ms. Freeman provided consulting services related to strategic business projects. Prior to 1999, Portfolio Manager at Rockefeller & Co. and Scudder, Stevens & Clark. Board member of the Harding Loevner Funds from 1996 to 2014, serving as both Lead Independent Director and chair of the Audit Committee. Board member of the Russell Exchange Traded Funds Trust from 2011 to 2012 and the chair of the Audit Committee. Ms. Freeman is also an inactive Chartered Financial Analyst. | N/A |
Isaiah Harris, Jr.
(Born 1952) | Trustee,
since 2009; Audit
Committee
Chair,
since 2019 | Retired. Chairman of the Board of CIGNA Corporation since 2009, and Director since 2005. From 2003 to 2011, Director of Deluxe Corporation. Prior thereto, President and CEO of BellSouth Advertising and Publishing Corp. from 2005 to 2007, President and CEO of BellSouth Enterprises from 2004 to 2005 and President of BellSouth Consumer Services from 2000 to 2003. Emeritus member of the Iowa State University Foundation Board of Governors. Emeritus Member of the Advisory Board of Iowa State University School of Business. Advisory Board Member, Palm Harbor Academy (private school). Mr. Harris is a certified public accountant (inactive status). | CIGNA Corporation |
Judith M. Johnson
(Born 1949) | Trustee,
since 2008 | Retired. Prior thereto, Chief Executive Officer and Chief Investment Officer of Minneapolis Employees Retirement Fund from 1996 to 2008. Ms. Johnson is an attorney, certified public accountant and a certified managerial accountant. | N/A |
David F. Larcker
(Born 1950) | Trustee,
since 2009 | James Irvin Miller Professor of Accounting at the Graduate School of Business (Emeritus), Stanford University, Director of the Corporate Governance Research Initiative and Senior Faculty of The Rock Center for Corporate Governance since 2006. From 2005 to 2008, Professor of Accounting at the Graduate School of Business, Stanford University. Prior thereto, Ernst & Young Professor of Accounting at The Wharton School, University of Pennsylvania from 1985 to 2005. | N/A |
22 | Wells Fargo VT Opportunity Fund
Other information (unaudited)
Name and
year of birth | Position held and
length of service* | Principal occupations during past five years or longer | Current other
public company or
investment
company
directorships |
Olivia S. Mitchell
(Born 1953) | Trustee,
since 2006;
Nominating and
Governance
Committee Chair,
since 2018 | International Foundation of Employee Benefit Plans Professor, Wharton School of the University of Pennsylvania since 1993. Director of Wharton’s Pension Research Council and Boettner Center on Pensions & Retirement Research, and Research Associate at the National Bureau of Economic Research. Previously, Cornell University Professor from 1978 to 1993. | N/A |
Timothy J. Penny
(Born 1951) | Trustee,
since 1996;
Chair,
since 2018 | President and Chief Executive Officer of Southern Minnesota Initiative Foundation, a non-profit organization, since 2007. Member of the Board of Trustees of NorthStar Education Finance, Inc., a non-profit organization, since 2007. | N/A |
James G. Polisson
(Born 1959) | Trustee,
since 2018 | Retired. Chief Marketing Officer, Source (ETF) UK Services, Ltd, from 2015 to 2017. From 2012 to 2015, Principal of The Polisson Group, LLC, a management consulting, corporate advisory and principal investing company. Chief Executive Officer and Managing Director at Russell Investments, Global Exchange Traded Funds from 2010 to 2012. Managing Director of Barclays Global Investors from 1998 to 2010 and Global Chief Marketing Officer for iShares and Barclays Global Investors from 2000 to 2010. Trustee of the San Francisco Mechanics’ Institute, a non-profit organization, from 2013 to 2015. Board member of the Russell Exchange Traded Fund Trust from 2011 to 2012. Director of Barclays Global Investors Holdings Deutschland GmbH from 2006 to 2009. Mr. Polisson is an attorney and has a retired status with the Massachusetts and District of Columbia Bar Associations. | N/A |
Pamela Wheelock
(Born 1959) | Trustee,
since January
2020; previously
Trustee from
January 2018 to
July 2019 | Board member of the Destination Medical Center Economic Development Agency, Rochester, Minnesota since 2019. Interim President of the McKnight Foundation from January to September 2020. Acting Commissioner, Minnesota Department of Human Services, July 2019 through September 2019. Human Services Manager (part-time), Minnesota Department of Human Services, October 2019 through December 2019. Chief Operating Officer, Twin Cities Habitat for Humanity from 2017 to 2019. Vice President of University Services, University of Minnesota from 2012 to 2016. Prior thereto, on the Board of Directors, Governance Committee and Finance Committee for the Minnesota Philanthropy Partners (Saint Paul Foundation) from 2012 to 2018, Interim Chief Executive Officer of Blue Cross Blue Shield of Minnesota from 2011 to 2012, Chairman of the Board from 2009 to 2012 and Board Director from 2003 to 2015. Vice President, Leadership and Community Engagement, Bush Foundation, Saint Paul, Minnesota (a private foundation) from 2009 to 2011. Executive Vice President and Chief Financial Officer, Minnesota Sports and Entertainment from 2004 to 2009 and Senior Vice President from 2002 to 2004. Executive Vice President of the Minnesota Wild Foundation from 2004 to 2008. Commissioner of Finance, State of Minnesota, from 1999 to 2002. Currently Board Chair of the Minnesota Wild Foundation since 2010. | N/A |
* Length of service dates reflect the Trustee’s commencement of service with the Trust’s predecessor entities, where applicable.
Wells Fargo VT Opportunity Fund | 23
Other information (unaudited)
Officers
Name and
year of birth | Position held and
length of service | Principal occupations during past five years or longer |
Andrew Owen
(Born 1960) | President,
since 2017 | Executive Vice President of Wells Fargo & Company and Head of Affiliated Managers, Wells Fargo Asset Management, since 2014. In addition, Mr. Owen is currently President, Chief Executive Officer and Director of Wells Fargo Funds Management, LLC since 2017. Prior thereto, Executive Vice President responsible for marketing, investments and product development for Wells Fargo Funds Management, LLC, from 2009 to 2014. |
Jeremy DePalma
(Born 1974) | Treasurer,
since 2012
(for certain funds in
the Fund Complex);
since 2021 (for
the remaining funds in the
Fund Complex) | Senior Vice President of Wells Fargo Funds Management, LLC since 2009. Senior Vice President of Evergreen Investment Management Company, LLC from 2008 to 2010 and head of the Fund Reporting and Control Team within Fund Administration from 2005 to 2010. |
Michelle Rhee
(Born 1966) | Chief Legal Officer,
since 2019 | Secretary of Wells Fargo Funds Management, LLC and Chief Legal Counsel of Wells Fargo Asset Management since 2018. Deputy General Counsel of Wells Fargo Bank, N.A. since 2020 and Assistant General Counsel of Wells Fargo Bank, N.A. from 2018 to 2020. Associate General Counsel and Managing Director of Bank of America Corporation from 2004 to 2018. |
Catherine Kennedy
(Born 1969) | Secretary,
since 2019 | Vice President of Wells Fargo Funds Management, LLC and Senior Counsel of the Wells Fargo Legal Department since 2010. Vice President and Senior Counsel of Evergreen Investment Management Company, LLC from 1998 to 2010. |
Michael H. Whitaker
(Born 1967) | Chief Compliance Officer,
since 2016 | Chief Compliance Officer of Wells Fargo Asset Management since 2016. Senior Vice President and Chief Compliance Officer for Fidelity Investments from 2007 to 2016. |
1 The Statement of Additional Information includes additional information about the Trustees and is available, without charge, upon request, by calling 1-800-222-8222 or by visiting the website at wfam.com.
24 | Wells Fargo VT Opportunity Fund
Board considerations (unaudited)
BOARD CONSIDERATION OF INVESTMENT MANAGEMENT AND SUB-ADVISORY AGREEMENTS:
Board Considerations – Current Agreements
Under the Investment Company Act of 1940 (the “1940 Act”), the Board of Trustees (the “Board”) of Wells Fargo Variable Trust (the “Trust”) must determine annually whether to approve the continuation of the Trust’s investment management and sub-advisory agreements. In this regard, at a Board meeting held on May 17-19, 2021 (the “Meeting”), the Board, all the members of which have no direct or indirect interest in the investment management and sub-advisory agreements and are not “interested persons” of the Trust, as defined in the 1940 Act (the “Independent Trustees”), reviewed and approved for Wells Fargo VT Opportunity Fund (the “Fund”): (i) an investment management agreement (the “Management Agreement”) with Wells Fargo Funds Management, LLC (“Funds Management”); and (ii) an investment sub-advisory agreement (the “Sub-Advisory Agreement”) with Wells Capital Management Incorporated (the “Sub-Adviser”), an affiliate of Funds Management. The Management Agreement and the Sub-Advisory Agreement are collectively referred to as the “Advisory Agreements.”
The Board noted that Wells Fargo & Company recently announced that it had entered into a definitive agreement to sell Wells Fargo Asset Management (“WFAM”), which includes Funds Management and the Sub-Adviser, to GTCR LLC and Reverence Capital Partners, L.P. and/or their affiliates (the “Transaction”). The Board further noted that the Transaction would result in a change-of-control of Funds Management and the Sub-Adviser, which would be considered to be an assignment that would result in the termination of the Advisory Agreements. In light of the Transaction, the Board separately considered for approval a new investment management agreement with Funds Management and a new sub-advisory agreement with the Sub-Adviser (the “New Agreements”) that would replace the Advisory Agreements upon consummation of the Transaction, subject to approval of the New Agreements by the Fund’s shareholders. The Board also considered for approval interim agreements to go into effect in the event shareholders do not approve the New Agreements before the Transaction is completed. The interim agreements would allow the Manager and the Sub-Adviser to continue providing services to the Fund while the Fund continues to seek shareholder approval of the New Agreements. The Board noted that the terms of the interim agreements would be identical to those of the current Advisory Agreements, except for the term and certain escrow provisions.
At the Meeting, the Board considered the factors and reached the conclusions described below relating to the selection of Funds Management and the Sub-Adviser and the approval of the Advisory Agreements. Prior to the Meeting, including at Board meetings held in April and May 2021, the Trustees conferred extensively among themselves and with representatives of Funds Management about these matters. Also, the Board has adopted a team-based approach, with each team consisting of a sub-set of Trustees, to assist the full Board in the discharge of its duties in reviewing investment performance and other matters throughout the year. The Independent Trustees were assisted in their evaluation of the Advisory Agreements by independent legal counsel, from whom they received separate legal advice and with whom they met separately.
In providing information to the Board, Funds Management and the Sub-Adviser were guided by a detailed set of requests for information submitted to them by independent legal counsel on behalf of the Independent Trustees at the start of the Board’s annual contract renewal process earlier in 2021. In considering and approving the Advisory Agreements, the Trustees considered the information they believed relevant, including but not limited to the information discussed below. The Board considered not only the specific information presented in connection with the Meeting, but also the knowledge gained over time through interaction with Funds Management and the Sub-Adviser about various topics. In this regard, the Board reviewed reports of Funds Management at each of its quarterly meetings, which included, among other things, portfolio reviews and investment performance reports. In addition, the Board and the teams mentioned above confer with portfolio managers at various times throughout the year. The Board did not identify any particular information or consideration that was all-important or controlling, and each individual Trustee may have attributed different weights to various factors.
After its deliberations, the Board unanimously determined that the compensation payable to Funds Management and the Sub-Adviser under each of the Advisory Agreements was reasonable, and approved the continuation of the Advisory Agreements for a one-year term. The Board considered the approval of the Advisory Agreements for the Fund as part of its consideration of agreements for funds across the complex, but its approvals were made on a fund-by-fund basis. The following summarizes a number of important, but not necessarily all, factors considered by the Board in support of its approvals.
Nature, extent and quality of services
The Board received and considered various information regarding the nature, extent and quality of services provided to the Fund by Funds Management and the Sub-Adviser under the Advisory Agreements. This information included a description of the investment advisory services and Fund-level administrative services covered by the Management Agreement, as well as, among other things, a summary of the background and experience of senior management of WFAM, of which Funds Management and the Sub-Adviser are a part, and a summary of investments made in the business of WFAM. The Board also received a description of
Wells Fargo VT Opportunity Fund | 25
Board considerations (unaudited)
Funds Management’s and the Sub-Adviser’s business continuity plans, including a summary of the performance of such plans and any changes thereto during the COVID-19 pandemic, and of their approaches to data privacy and cybersecurity. The Board also received and reviewed information about Funds Management’s role as administrator of the Fund’s liquidity risk management program, Funds Management’s approach to risk management, and Funds Management’s intermediary and vendor oversight program.
The Board also considered the qualifications, background, tenure and responsibilities of each of the portfolio managers primarily responsible for the day-to-day portfolio management of the Fund. The Board evaluated the ability of Funds Management and the Sub-Adviser to attract and retain qualified investment professionals, including research, advisory and supervisory personnel.
The Board further considered the compliance programs and compliance records of Funds Management and the Sub-Adviser. In addition, the Board took into account the full range of services provided to the Fund by Funds Management and its affiliates. The Board also considered information about retention and back-up arrangements that have been put into place with respect to key personnel of WFAM in connection with the anticipated Transaction, noting that WFAM provided assurances that the announcement and eventual culmination of the Transaction is not expected to result in any diminution in the nature or quality of services provided to the Fund.
Fund investment performance and expenses
The Board considered the investment performance results for the Fund over various time periods ended December 31, 2020. The Board considered these results in comparison to the investment performance of funds in a universe that was determined by Broadridge Inc. (“Broadridge”) to be similar to the Fund (the “Universe”), and in comparison to the Fund’s benchmark index and to other comparative data. Broadridge is an independent provider of investment company data. The Board received a description of the methodology used by Broadridge to select the mutual funds in the performance Universe. The Board noted that the investment performance of the Fund was higher than or in range of the average investment performance of the Universe for all periods under review. The Board also noted that the investment performance of the Fund was lower than its benchmark index, the Russell 3000® Index, for all periods under review except the one-year period, which was higher than its benchmark index.
The Board also received and considered information regarding the Fund’s net operating expense ratios and their various components, including actual management fees, custodian and other non-management fees, and Rule 12b-1 and non-Rule 12b-1 shareholder service fees. The Board considered these ratios in comparison to the median ratios of funds in class-specific expense groups that were determined by Broadridge to be similar to the Fund (the “Groups”). The Board received a description of the methodology used by Broadridge to select the mutual funds in the expense Groups and an explanation of how funds comprising expense groups and their expense ratios may vary from year-to-year. Based on the Broadridge reports, the Board noted that the net operating expense ratios of the Fund were in range of the median net operating expense ratios of the expense Groups for each share class.
The Board took into account the Fund’s investment performance and expense information provided to it among the factors considered in deciding to re-approve the Advisory Agreements.
Investment management and sub-advisory fee rates
The Board reviewed and considered the contractual fee rates payable by the Fund to Funds Management under the Management Agreement, as well as the contractual fee rates payable by the Fund to Funds Management for class-level administrative services under a Class-Level Administration Agreement, which include, among other things, class-level transfer agency and sub-transfer agency costs (collectively, the “Management Rates”). The Board also reviewed and considered the contractual investment sub-advisory fee rates that are payable by Funds Management to the Sub-Adviser for investment sub-advisory services.
Among other information reviewed by the Board was a comparison of the Fund’s Management Rates with the average contractual investment management fee rates of funds in the expense Groups at a common asset level as well as transfer agency costs of the funds in the expense Groups. The Board noted that the Management Rates of the Fund were higher than or in range of the sum of these average rates for the Fund’s expense Groups, although the Board noted that the net operating expense ratios of the Fund were in range of the median net operating expense ratios of the expense Groups for each share class.
The Board also received and considered information about the portion of the total management fee that was retained by Funds Management after payment of the fee to the Sub-Adviser for sub-advisory services. In assessing the reasonableness of this amount, the Board received and evaluated information about the nature and extent of responsibilities retained and risks assumed by Funds Management and not delegated to or assumed by the Sub-Adviser, and about Funds Management’s on-going oversight services. Given the affiliation between Funds Management and the Sub-Adviser, the Board ascribed limited relevance to the allocation of fees between them.
26 | Wells Fargo VT Opportunity Fund
Board considerations (unaudited)
The Board also received and considered information about the nature and extent of services offered and fee rates charged by Funds Management and the Sub-Adviser to other types of clients with investment strategies similar to those of the Fund. In this regard, the Board received information about the significantly greater scope of services, and compliance, reporting and other legal burdens and risks of managing proprietary mutual funds compared with those associated with managing assets of other types of clients, including third-party sub-advised fund clients and non-mutual fund clients such as institutional separate accounts.
Based on its consideration of the factors and information it deemed relevant, including those described here, the Board determined that the compensation payable to Funds Management under the Management Agreement and to the Sub-Adviser under the Sub-Advisory Agreement was reasonable.
Profitability
The Board received and considered information concerning the profitability of Funds Management, as well as the profitability of both WFAM and Wells Fargo & Co. (“Wells Fargo”) from providing services to the fund family as a whole. The Board noted that the Sub-Adviser’s profitability information with respect to providing services to the Fund and other funds in the family was subsumed in the WFAM and Wells Fargo profitability analysis.
Funds Management reported on the methodologies and estimates used in calculating profitability, including a description of the methodology used to allocate certain expenses. Among other things, the Board noted that the levels of profitability reported on a fund-by-fund basis varied widely, depending on factors such as the size, type and age of fund.
Based on its review, the Board did not deem the profits reported by Funds Management, WFAM or Wells Fargo from services provided to the Fund to be at a level that would prevent it from approving the continuation of the Advisory Agreements.
Economies of scale
The Board received and considered information about the potential for Funds Management to experience economies of scale in the provision of management services to the Fund, the difficulties of calculating economies of scale at an individual fund level, and the extent to which potential scale benefits are shared with Fund shareholders. The Board noted the existence of breakpoints in the Fund’s management fee structure, which operate generally to reduce the Fund’s expense ratios as the Fund grows in size, and the size of the Fund in relation to such breakpoints. The Board considered that in addition to management fee breakpoints, Funds Management shares potential economies of scale from its management business in a variety of ways, including through fee waiver and expense reimbursement arrangements, competitive management fee rates set at the outset without regard to breakpoints, and investments in the business intended to enhance services available to shareholders.
The Board concluded that Funds Management’s arrangements with respect to the Fund, including contractual breakpoints, constituted a reasonable approach to sharing potential economies of scale with the Fund and its shareholders.
Other benefits to Funds Management and the Sub-Adviser
The Board received and considered information regarding potential “fall-out” or ancillary benefits received by Funds Management and its affiliates, including the Sub-Adviser, as a result of their relationships with the Fund. Ancillary benefits could include, among others, benefits directly attributable to other relationships with the Fund and benefits potentially derived from an increase in Funds Management’s and the Sub-Adviser’s business as a result of their relationships with the Fund. The Board noted that various affiliates of Funds Management may receive distribution-related fees, shareholder servicing payments and sub-transfer agency fees in respect of shares sold or held through them and services provided.
The Board also reviewed information about soft dollar credits earned and utilized by the Sub-Adviser, fees earned by Funds Management and the Sub-Adviser from managing a private investment vehicle for the fund family’s securities lending collateral and commissions earned by an affiliated broker from portfolio transactions.
Based on its consideration of the factors and information it deemed relevant, including those described here, the Board did not find that any ancillary benefits received by Funds Management and its affiliates, including the Sub-Adviser, were unreasonable.
Conclusion
At the Meeting, after considering the above-described factors and based on its deliberations and its evaluation of the information described above, the Board unanimously determined that the compensation payable to Funds Management and the Sub-Adviser under each of the Advisory Agreements was reasonable, and approved the continuation of the Advisory Agreements for a one-year term.
Wells Fargo VT Opportunity Fund | 27
Board considerations (unaudited)
Board Considerations – New Agreements
Overview of the Board evaluation process
At a meeting held on May 17-19, 2021 (the “Board Meeting”), the Board of Trustees (the “Board”) of Wells Fargo Variable Trust (the “Trust”, and the series thereof, the “Funds”) approved the continuation of each Fund’s current Investment Management Agreement (the “Current Investment Management Agreement”) and the current Wells Cap Sub-Advisory Agreement (the “Current Wells Cap Sub-Advisory Agreement”, and collectively, the “Current Agreements”). Each Trustee on the Board is not an “interested person” (as defined in the Investment Company Act of 1940 (the “1940 Act”)) of the Funds (collectively, the “Independent Trustees”). The process followed by the Board in considering and approving the continuation of the Current Agreements is referred to herein as the “2021 Annual Approval Process.”
As noted above, the closing of the sale of Wells Fargo Asset Management (“WFAM”) to a holding company (“NewCo”) affiliated with private funds of GTCR LLC (“GTCR”) and of Reverence Capital Partners, L.P. (“Reverence Capital”, and such transaction, the “Transaction”) will result in a change of control of Wells Fargo Funds Management LLC (“Funds Management”) and Wells Capital Management Incorporated (“Wells Capital” or the “Sub-Adviser”, and together with Funds Management, the “Advisers”), which will be considered to be an “assignment” of each Fund’s Current Agreements under the 1940 Act that will result in the automatic termination of each Fund’s Current Agreements. In light of the expected termination of each Fund’s Current Agreements upon the closing, at the Board Meeting the Board also considered and approved: (i) a new Investment Management Agreement between the Trust, on behalf of each Fund, and Funds Management (the “New Investment Management Agreement”); and (ii) a new Sub-Advisory Agreement among the Trust, on behalf of each Fund, Funds Management and Wells Capital (the “New Sub-Advisory Agreement”, and collectively, the “New Agreements”), each of which is intended to go into effect upon the closing. The process followed by the Board in reviewing and approving the New Agreements is referred to herein as the “New Agreement Approval Process.”
At a series of meetings held in April and May 2021 (collectively, “April and May 2021 Meetings”) and at the Board Meeting, the Trustees conferred extensively among themselves and with senior representatives of Funds Management, GTCR and Reverence Capital about the New Agreements and related matters. The Board reviewed and discussed information furnished by Funds Management, GTCR and Reverence Capital that the Board considered reasonably necessary to evaluate the terms of the New Agreements and the services to be provided. At these meetings, senior representatives from Funds Management, GTCR and Reverence Capital made presentations to, and responded to questions from, the Board.
In providing information to the Board in connection with the 2021 annual approval process for the Current Agreements (the “2021 Annual Approval Process”) and the New Agreement Approval Process, Funds Management, GTCR and Reverence Capital (as applicable) were guided by requests for information submitted by independent legal counsel on behalf of the Independent Trustees. In considering and approving the New Agreements, the Trustees considered the information they believed relevant, including but not limited to the information discussed herein. The Board considered not only the specific information presented in connection with the April and May 2021 Meetings as well as the Board Meeting, but also the knowledge gained over time through interaction with Funds Management and the Sub-Adviser about various topics. In this regard, the Board reviews reports of Funds Management at each of its regular Board meetings, which includes, among other things, portfolio reviews and investment performance reports. In addition, the Board confers with portfolio managers at various times throughout the year. The Board was assisted in its evaluation of the New Agreements by independent legal counsel, from whom the Independent Trustees received separate legal advice and with whom the Independent Trustees met separately. The Board did not identify any particular information or consideration that was all-important or controlling, and each individual Trustee may have attributed different weights to various factors.
Among other information considered by the Board in connection with the Transaction was:
| ■ | Information regarding the Transaction: information about the structure, financing sources and material terms and conditions of the Transaction, including the expected impact on the businesses conducted by the Advisers and by Wells Fargo Funds Distributor LLC, as the distributor of Fund shares. |
| ■ | Information regarding NewCo, GTCR and Reverence Capital: (i) information about NewCo, including information about its expected financial condition and access to capital, and senior leadership team; (ii) the experience of senior management at GTCR and Reverence Capital in acquiring portfolio companies; (iii) the plan to operationalize NewCo, including the transition of necessary infrastructure services through a transition services agreement with Wells Fargo under which Wells Fargo will continue to provide NewCo with certain services for a specified period of time after the closing; and (iv) information regarding regulatory matters, compliance, and risk management functions at NewCo, including resources to be dedicated thereto. |
28 | Wells Fargo VT Opportunity Fund
Board considerations (unaudited)
| ■ | Impact of the Transaction on WFAM and Service Providers: (i) information regarding any changes to personnel and/or other resources of the Advisers as a result of the Transaction, including assurances regarding comparable and competitive compensation arrangements to attract and retain highly qualified personnel; and (ii) information about the organizational and operating structure with respect to NewCo, the Advisers and the Funds. |
| ■ | Impact of the Transaction on the Funds and their Shareholders: (i) information regarding anticipated benefits to the Funds as a result of the Transaction; (ii) a commitment that the Funds would not bear any expenses, directly or indirectly, in connection with the Transaction; (iii) confirmation that the Advisers intend to continue to manage the Funds in a manner consistent with each Fund’s current investment objectives and principal investments strategies; and (iv) a commitment that neither NewCo nor WFAM will take any steps that would impose any “unfair burden” (as that term is used in section 15(f)(1)(B) of the 1940 Act) on the Funds as a result of the Transaction. |
With respect to the New Agreements, the Board considered: (i) a representation that, after the closing, all of the Funds will continue to be managed and advised by their current Advisers, and that the same portfolio managers of the Sub-Adviser are expected to continue to manage the Funds after the Transaction; (ii) information regarding the terms of the New Agreements, including changes as compared to the Current Agreements; (iii) information confirming that the fee rates payable under the New Agreements will not increase as a result of the Transaction as compared to the rates under the Current Agreements; and (iv) assurances that the Transaction is not expected to cause any diminution with respect to the nature, extent and quality of any of the services currently provided to the Funds by the Advisers as a result of the Transaction.
In addition to considering information furnished specifically to evaluate the impact of the Transaction on the Funds and their respective shareholders in connection with the New Agreement Approval Process, the Board considered information furnished at prior meetings of the Board and its committees, including detailed information provided in connection with the 2021 Annual Approval Process. In this regard, in connection with the 2021 Annual Approval Process, the Board received information about complex-wide and individual Fund performance, fees and expenses, including: (i) a report from an independent data provider comparing the investment performance of each Fund to the investment performance of comparable funds and benchmark indices, over various time periods; (ii) a report from an independent data provider comparing each Fund’s total expense ratio (and its components) to those of comparable funds; (iii) comparative information concerning the fees charged and services provided by the Advisers to each Fund in managing other accounts (which may include other mutual funds, collective investment funds and institutional accounts), if any, that employ investment strategies and techniques similar to those used in managing such Fund(s); and (iv) profitability analyses of Funds Management, as well as the profitability of both WFAM and Wells Fargo from providing services to the fund family as a whole.
After its deliberations, the Board unanimously determined that the compensation payable to Funds Management and the Sub-Adviser under the New Agreements is reasonable, approved the New Agreements for a two-year term, and voted to recommend that Fund shareholders approve the New Agreements. The Board considered the approval of the New Agreements as part of its consideration of agreements for funds across the complex, but its approvals were made on a fund-by-fund basis. The following summarizes a number of important, but not necessarily all, factors considered by the Board in support of its approvals.
Nature, extent and quality of services
In connection with the 2021 Annual Approval Process, the Board received and considered various information regarding the nature, extent and quality of services provided to each Fund by Funds Management and the Sub-Adviser under the Current Agreements. This information included a description of the investment advisory services and Fund-level administrative services covered by the Current Management Agreement, as well as, among other things, a summary of the background and experience of senior management of WFAM, of which Funds Management and the Sub-Adviser are a part, and a summary of investments made in the business of WFAM. The Board also received a description of Funds Management’s and the Sub-Adviser’s business continuity plans, including a summary of the performance of such plans and any changes thereto during the COVID-19 pandemic, and of their approaches to data privacy and cybersecurity. The Board also received and reviewed information about Funds Management’s role as administrator of the Funds’ liquidity risk management program, Funds Management’s approach to risk management, and Funds Management’s intermediary and vendor oversight program.
In connection with the 2021 Annual Approval Process, the Board also considered the qualifications, background, tenure and responsibilities of each of the portfolio managers primarily responsible for the day-to-day portfolio management of the Funds. The Board evaluated the ability of Funds Management and the Sub-Adviser to attract and retain qualified investment professionals, including research, advisory and supervisory personnel.
In connection with the 2021 Annual Approval Process, the Board further considered the compliance programs and compliance records of Funds Management and the Sub-Adviser. In addition, the Board took into account the full range of services provided to the Funds by Funds Management and its affiliates.
Wells Fargo VT Opportunity Fund | 29
Board considerations (unaudited)
In connection with the New Agreement Approval Process, the Board considered, among other information, the structure of the Transaction and expected impact, if any, of the Transaction on the operations, facilities, organization and personnel of the Advisers. The Board received assurances from Funds Management that each Fund will continue to be advised by its current Sub-Adviser after the closing, and that the same individual portfolio managers are expected to continue to manage the Funds after the closing. With respect to the recruitment and retention of key personnel, the Board noted information from GTCR, Reverence Capital and the Advisers regarding the potential benefits for employees of joining NewCo. The Board recognized that the personnel who had been extended offers may not accept such offers, and personnel changes may occur in the future in the ordinary course.
In addition, the Board considered information regarding the infrastructure, operational capabilities and support staff in place to assist in the portfolio management and operations of the Funds, including the provision of administrative services, and the anticipated impact of the Transaction on such matters. The Board also considered the business-related and other risks to which the Advisers may be subject in managing the Funds and in connection with the Transaction. The Board also considered the transition and integration plans as a result of the change in ownership of the Advisers from Wells Fargo to NewCo. The Board considered the resources and infrastructure that NewCo intends to devote to its compliance program to ensure compliance with applicable laws and regulations, as well as its risk management program and cybersecurity program. The Board also took into account assurances received from the Advisers, GTCR and Reverence Capital that the Transaction is not expected to cause any diminution in the nature, extent and quality of services provided by the Advisers to the Funds and their shareholders.
Fund investment performance and expenses
In connection with the 2021 Annual Approval Process, the Board considered the investment performance results for each Fund over various time periods ended December 31, 2020. The Board considered these results in comparison to the investment performance of funds in a universe that was determined by Broadridge Inc. (“Broadridge”) to be similar to each Fund (the “Universe”), and in comparison to each Fund’s benchmark index and to other comparative data. Broadridge is an independent provider of investment company data. The Board received a description of the methodology used by Broadridge to select the mutual funds in the performance Universe. Where applicable, the Board received information concerning, and discussed factors contributing to, underperformance of Funds relative to the Universe and benchmark for any underperformance periods.
In connection with the 2021 Annual Approval Process, the Board also received and considered information regarding each Fund’s net operating expense ratios and their various components, including actual management fees, custodian and other non-management fees, and Rule 12b-1 and non-Rule 12b-1 shareholder service fees. The Board considered these ratios in comparison to the median ratios of funds in class-specific expense groups that were determined by Broadridge to be similar to the Fund (the “Groups”). The Board received a description of the methodology used by Broadridge to select the mutual funds in the expense Groups and an explanation of how funds comprising expense groups and their expense ratios may vary from year-to-year.
In connection with the New Agreement Approval Process, the Board received a commitment that WFAM will maintain fee and expense commitments for at least two years after the closing. The Board took into account each Fund’s investment performance and expense information among the factors considered in deciding to approve the New Agreements.
Investment management and sub-advisory fee rates
In connection with the 2021 Annual Approval Process, the Board reviewed and considered the contractual fee rates payable by each Fund to Funds Management under the Current Management Agreement, as well as the contractual fee rates payable by each Fund to Funds Management for class-level administrative services under a Class-Level Administration Agreement, which include, among other things, class-level transfer agency and sub-transfer agency costs (collectively, the “Management Rates”). The Board also reviewed and considered the contractual investment sub-advisory fee rates that are payable by Funds Management to the Sub-Adviser under the Current Sub-Advisory Agreements for investment sub-advisory services (the “Sub-Advisory Fee Rates”).
Among other information reviewed by the Board in connection with the 2021 Annual Approval Process, was a comparison of each Fund’s Management Rates with the average contractual investment management fee rates of funds in the expense Groups at a common asset level as well as transfer agency costs of the funds in the expense Groups.
In connection with the 2021 Annual Approval Process, the Board also received and considered information about the portion of the total management fee that was retained by Funds Management after payment of the Sub-Advisory Fee Rates. In assessing the reasonableness of this amount, the Board received and evaluated information about the nature and extent of responsibilities retained and risks assumed by Funds Management and not delegated to or assumed by the Sub-Adviser, and about Funds Management’s on-going oversight services. Given the affiliation between Funds Management and the Sub-Adviser, the Board ascribed limited relevance to the allocation of fees between them.
30 | Wells Fargo VT Opportunity Fund
Board considerations (unaudited)
In connection with the 2021 Annual Approval Process, the Board also received and considered information about the nature and extent of services offered and fee rates charged by Funds Management and the Sub-Adviser to other types of clients, if any, with investment strategies similar to those of each Fund. In this regard, the Board received information about the significantly greater scope of services, and compliance, reporting and other legal burdens and risks of managing proprietary mutual funds compared with those associated with managing assets of other types of clients, including third-party sub-advised fund clients and non-mutual fund clients such as institutional separate accounts.
In connection with the New Agreement Approval Process, the Board noted the assurances received by it that there would be no increases to any of the Management Rates or the Sub-Advisory Fee Rates as a result of the Transaction. The Board also considered that the New Agreements do not change the computation method for calculating such fees, and there is no present intention to reduce expense waiver and reimbursement arrangements that are currently in effect. Based on its consideration of the factors and information it deemed relevant, including those described here, the Board determined that the compensation payable to Funds Management under the New Management Agreement and to the Sub-Adviser under the New Sub-Advisory Agreement was reasonable.
Profitability
In connection with the 2021 Annual Approval Process, the Board received and considered information concerning the profitability of Funds Management, as well as the profitability of both WFAM and Wells Fargo from providing services to the fund family as a whole. The Board noted that the Sub-Adviser’s profitability information with respect to providing services to each Fund and other funds in the family was subsumed in the WFAM and Wells Fargo profitability analysis.
Funds Management reported on the methodologies and estimates used in calculating profitability in connection with the 2021 Annual Approval Process, including a description of the methodology used to allocate certain expenses. Among other things, the Board noted that the levels of profitability reported on a fund-by-fund basis varied widely, depending on factors such as the size, type and age of fund.
In connection with the New Agreement Approval Process, the Board received certain information about NewCo’s projected financial condition, and reviewed with senior representatives of Funds Management, GTCR and Reverence Capital the underlying assumptions on which such information was based. The Board considered that NewCo is a newly formed entity, with no historical operations, revenues or expenses, and that it is difficult to predict with any degree of certainty the future profitability of NewCo and the Advisers from advisory activities under the New Agreements. The Board considered that the fee rates payable under the New Agreements will not increase as a result of the Transaction as compared to the rates under the Current Agreements, and that the current contractual expense limitations applicable to each Fund will not increase. The Board noted that if the New Agreements are approved by shareholders and the Transaction closes, the Board will have the opportunity in the future to review the profitability of NewCo and the Advisers from advisory activities under the New Agreements.
Economies of scale
In connection with the 2021 Annual Approval Process, the Board received and considered information about the potential for Funds Management to experience economies of scale in the provision of management services to the Funds, the difficulties of calculating economies of scale at an individual fund level, and the extent to which potential scale benefits are shared with Fund shareholders. The Board noted the existence of breakpoints in each Fund’s management fee structure, which operate generally to reduce the Fund’s expense ratios as the Fund grows in size, and the size of the Fund in relation to such breakpoints. The Board considered that, in addition to management fee breakpoints, Funds Management shares potential economies of scale from its management business in a variety of ways, including through fee waiver and expense reimbursement arrangements, competitive management fee rates set at the outset without regard to breakpoints, and investments in the business intended to enhance services available to shareholders.
In connection with the New Agreement Approval Process, the Board noted that NewCo and the Advisers may benefit from possible growth of the Funds resulting from enhanced distribution capabilities. However, the Board noted that other factors could also affect the potential for economies of scale, and that it was not possible to quantify any potential future economies of scale. Based upon the information furnished to the Board in connection with the 2021 Annual Approval Process and the New Agreement Approval Process, the Board concluded that Funds Management’s arrangements with respect to each Fund, including contractual breakpoints and expense limitation arrangements, constitute a reasonable approach to sharing potential economies of scale with the Fund and its shareholders.
“Fall-out” benefits to Funds Management and the Sub-Adviser
In connection with the 2021 Annual Approval Process, the Board received and considered information regarding potential “fall-out” or ancillary benefits received by Funds Management and its affiliates, including the Sub-Adviser, as a result of their relationships with the Funds. Ancillary benefits could include, among others, benefits directly attributable to other relationships
Wells Fargo VT Opportunity Fund | 31
Board considerations (unaudited)
with the Funds and benefits potentially derived from an increase in Funds Management’s and the Sub-Adviser’s business as a result of their relationships with the Funds. The Board noted that various current affiliates of Funds Management may receive distribution-related fees, shareholder servicing payments and sub-transfer agency fees in respect of shares sold or held through them and services provided.
In connection with the 2021 Annual Approval Process, the Board also reviewed information about soft dollar credits earned and utilized by the Sub-Adviser, fees earned by Funds Management and the Sub-Adviser from managing a private investment vehicle for the fund family’s securities lending collateral, and commissions earned by an affiliated broker of Wells Fargo from portfolio transactions.
In connection with the New Agreement Approval Process, the Board received information to the effect that the Transaction is not expected to have a material impact on the fall-out benefits currently realized by Funds Management and its affiliates, including the Sub-Adviser. The information reviewed by the Board also noted that several of the ancillary benefits identified for WFAM would be potential ancillary benefits for NewCo, including that the scale and reputation of the Funds might benefit NewCo’s broader reputation, product initiatives, technology investment and talent acquisition. Based on its consideration of the factors and information it deemed relevant, including those described here, the Board did not find that any ancillary benefits expected to be received by Funds Management and its affiliates, including NewCo and the Sub-Adviser, under the New Agreements were unreasonable.
Conclusion
At the Board Meeting, after considering the above-described factors and based on its deliberations and its evaluation of the information described above, the Board unanimously determined that the compensation payable to Funds Management and the Sub-Adviser under the New Agreements is reasonable, approved the New Agreements for a two-year term, and voted to recommend that Fund shareholders approve the New Agreements.
32 | Wells Fargo VT Opportunity Fund
Board considerations (unaudited)
Board Considerations - Interim Agreements
At a meeting held on May 17-19, 2021 (the “Board Meeting”), the Boards of Trustees (each, a “Board”, and collectively, the “Boards”) of Wells Fargo Funds Trust, Wells Fargo Master Trust, Wells Fargo Variable Trust, Wells Fargo Global Dividend Opportunity Fund, Wells Fargo Income Opportunities Fund, Wells Fargo Multi-Sector Income Fund and Wells Fargo Utilities and High Income Fund (each a “Trust”, and the series thereof, a “Fund”) reviewed and approved for the Trusts and Funds, as applicable: (i) interim investment management agreements (the “Interim Management Agreements”) with Wells Fargo Funds Management, LLC (“Funds Management”); (ii) interim investment advisory agreements (the “Interim Advisory Agreements”) with Funds Management; and (iii) interim sub-advisory agreements (the “Interim Sub-Advisory Agreements”) with each of Cooke & Bieler, L.P., Galliard Capital Management, LLC (“Galliard”), Peregrine Capital Management Inc., Wells Capital Management, LLC (“WellsCap”), and Wells Fargo Asset Management (International) Limited (“WFAMI”, and collectively, the “Sub-Advisers”). Each Trustee on the Board is not an “interested person” (as defined in the Investment Company Act of 1940 (the “1940 Act”) of the Funds (collectively, the “Independent Trustees”). The Interim Management Agreements, Interim Advisory Agreements, and Interim Sub-Advisory Agreements are collectively referred to as the “Interim Advisory Agreements.”
At the Board Meeting, the Boards reviewed and approved the continuation of existing investment management, advisory and sub-advisory agreements (the “Current Advisory Agreements”) for each Trust and Fund, as applicable. The factors considered and conclusions reached by the Boards in approving the Current Advisory Agreements are summarized in the section entitled “Board Considerations – Current Agreements” of this shareholder report. The Boards noted that Wells Fargo & Company has entered into a definitive agreement to sell Wells Fargo Asset Management (“WFAM”), which includes Funds Management, Galliard, WellsCap and WFAMI (the “Affiliated Sub-Advisers”), to a holding company affiliated with private funds of GTCR LLC and Reverence Capital Partners, L.P. (the “Transaction”). The Boards further noted that the Transaction would result in a change-of-control of Funds Management and the Affiliated Sub-Advisers, which would be considered to be an “assignment” under the 1940 Act that would terminate the Current Advisory Agreements. At the Board Meeting, the Boards also reviewed and approved new investment management, advisory and sub-advisory agreements (the “New Advisory Agreements”) for each Trust and Fund, as applicable, that would replace the Current Advisory Agreements upon consummation of the Transaction, subject to approval of the New Advisory Agreements by the applicable Trust’s or Fund’s shareholders. The factors considered and conclusions reached by the Boards in approving the New Advisory Agreements are summarized in the section entitled “Board Considerations – New Agreements” of this shareholder report.
At the Board Meeting, the Boards also approved the Interim Advisory Agreements, which will go into effect for a Trust or Fund only in the event that shareholders of such Trust or Fund do not approve the New Advisory Agreement(s) for the Trust or Fund by the closing date of the Transaction, when the Current Advisory Agreements will terminate. The Board noted that, in such a circumstance, the Interim Advisory Agreements will permit continuity of management by allowing Funds Management and the Sub-Advisers to continue providing services to the Trust or Fund pursuant to the Interim Advisory Agreements while the Trust or Fund continues to solicit shareholder approval of such New Advisory Agreement(s). The Boards noted that the terms of the Interim Advisory Agreements are identical to those of the Current Advisory Agreements, except for the term and the addition of escrow provisions with respect to the advisory fees. The Boards also noted that the entities that would service the Funds and Trusts under the Interim Advisory Agreements are identical to those that provide services under the Current Advisory Agreements and those that will provide services under the New Advisory Agreements.
In approving the Interim Advisory Agreements, the Boards considered the same factors and reached the same conclusions as they considered and reached with respect to the Boards’ approvals of the Current Advisory Agreements and New Advisory Agreements, as applicable, which are described in separate Board Consideration sections within this shareholder report. Prior to the Board Meeting, including at a series of meetings held in April and May 2021, the Trustees conferred extensively among themselves and with senior representatives of Funds Management, GTCR LLC and Reverence Capital Partners, L.P. about the Interim Advisory Agreements and related matters. The Independent Trustees were assisted in their evaluation of the Interim Advisory Agreements by independent legal counsel, from whom they received separate legal advice and with whom they met separately.
At the Board Meeting, after considering the factors and reaching the conclusions described in the separate Board Consideration sections within this shareholder report, the Boards unanimously determined that the compensation payable to Funds Management and to each Sub-Adviser under each of the Interim Advisory Agreements was reasonable, and approved the Interim Advisory Agreements.
Wells Fargo VT Opportunity Fund | 33
For more information
More information about Wells Fargo Funds is available free upon request. To obtain literature, please write, visit the Fund's website, or call:
Wells Fargo Funds
P.O. Box 219967
Kansas City, MO 64121-9967
Website: wfam.com
Individual investors: 1-800-222-8222
Retail investment professionals: 1-888-877-9275
Institutional investment professionals: 1-866-765-0778
This report and the financial statements contained herein are submitted for the general information of the shareholders of the Fund. If this report is used for promotional purposes, distribution of the report must be accompanied or preceded by a current prospectus. Before investing, please consider the investment objectives, risks, charges, and expenses of the investment. For a current prospectus and, if available, a summary prospectus, containing this information, call 1-800-260-5969 or visit the Fund's website at wfam.com. Read the prospectus carefully before you invest or send money.
Wells Fargo Asset Management (WFAM) is the trade name for certain investment advisory/management firms owned by Wells Fargo & Company. These firms include but are not limited to Wells Capital Management, LLC and Wells Fargo Funds Management, LLC. Certain products managed by WFAM entities are distributed by Wells Fargo Funds Distributor, LLC (a broker-dealer and Member FINRA).
This material is for general informational and educational purposes only and is NOT intended to provide investment advice or a recommendation of any kind - including a recommendation for any specific investment, strategy, or plan.
INVESTMENT PRODUCTS: NOT FDIC INSURED ■ NO BANK GUARANTEE ■ MAY LOSE VALUE
© 2021 Wells Fargo & Company. All rights reserved.
PAR-0721-00696 08-21
SVT6/SAR143 06-21
Semi-Annual Report
June 30, 2021
Wells Fargo
VT Small Cap Growth Fund
Reduce clutter.
Save trees.
Sign up for electronic delivery of prospectuses and shareholder reports at wellsfargo.com/ advantagedelivery
The views expressed and any forward-looking statements are as of June 30, 2021, unless otherwise noted, and are those of the Fund's portfolio managers and/or Wells Fargo Asset Management. Discussions of individual securities or the markets generally are not intended as individual recommendations. Future events or results may vary significantly from those expressed in any forward-looking statements. The views expressed are subject to change at any time in response to changing circumstances in the market. Wells Fargo Asset Management disclaims any obligation to publicly update or revise any views expressed or forward-looking statements.
INVESTMENT PRODUCTS: NOT FDIC INSURED ■ NO BANK GUARANTEE ■ MAY LOSE VALUE
Wells Fargo VT Small Cap Growth Fund | 1
Letter to shareholders (unaudited)
Andrew Owen
President
Wells Fargo Funds
Dear Shareholder:
We are pleased to offer you this semi-annual report for the Wells Fargo VT Small Cap Growth Fund for the six-month period that ended June 30, 2021. Global stocks continued to rally as the global economy continued to emerge from the haze of COVID-19. Tailwinds were provided by global stimulus programs, a rapid vaccination rollout, and recovering consumer and corporate sentiment. Bonds were mixed during the period, with municipal bonds and high-yield bonds delivering positive returns.
For the six-month period, U.S. stocks, based on the S&P 500 Index,1 gained 15.25%. International stocks, as measured by the MSCI ACWI ex USA Index (Net),2 returned 9.16%, while the MSCI EM Index (Net),3 trailed its developed market counterparts with a 7.45% gain. Among bond indexes, the Bloomberg Barclays U.S. Aggregate Bond Index,4 returned -1.60%, the Bloomberg Barclays Global Aggregate ex-USD Index (unhedged),5 returned -4.42%, the Bloomberg Barclays Municipal Bond Index,6 returned 1.06%, and the ICE BofA U.S. High Yield Index,7 returned 3.70%.
Vaccination rollout drove the stock markets to new highs.
The year 2021 began with emerging market stocks leading all major asset classes in January, driven by China’s strong economic growth and a broad recovery in corporate earnings, which propelled China’s stock market higher. In the United States, positive news on vaccine trials and January expansion in both the manufacturing and services sectors was offset by a weak December monthly jobs report. This was compounded by technical factors as some hedge funds were forced to sell stocks to protect themselves against a well-publicized short squeeze coordinated by a group of retail investors. Eurozone sentiment and economic growth were particularly weak, reflecting the impact of a new lockdown with stricter social distancing along with a slow vaccine rollout.
February saw major domestic equity indexes driven higher on the hope of a new stimulus bill, improving COVID-19 vaccination numbers, and the gradual reopening of the economy. Most S&P 500 companies reported better-than-expected earnings, with positive surprises coming from the financials, information technology, health care, and materials sectors. Japan saw its economy strengthen as a result of strong export numbers. Meanwhile, crude oil prices continued their climb, rising more than 25% for the year. Domestic government bonds experienced a sharp sell-off in late February as markets priced in a more robust economic recovery and higher future growth and inflation expectations.
| 1 | The S&P 500 Index consists of 500 stocks chosen for market size, liquidity, and industry group representation. It is a market-value-weighted index with each stock's weight in the index proportionate to its market value. You cannot invest directly in an index. |
| 2 | The Morgan Stanley Capital International (MSCI) All Country World Index (ACWI) ex USA Index (Net) is a free-float-adjusted market-capitalization-weighted index that is designed to measure the equity market performance of developed and emerging markets, excluding the United States. Source: MSCI. MSCI makes no express or implied warranties or representations and shall have no liability whatsoever with respect to any MSCI data contained herein. The MSCI data may not be further redistributed or used as a basis for other indices or any securities or financial products. This report is not approved, reviewed, or produced by MSCI. You cannot invest directly in an index. |
| 3 | The MSCI Emerging Markets (EM) Index (Net) is a free-float-adjusted market-capitalization-weighted index that is designed to measure equity market performance of emerging markets. You cannot invest directly in an index. |
| 4 | The Bloomberg Barclays U.S. Aggregate Bond Index is a broad-based benchmark that measures the investment-grade, U.S. dollar-denominated, fixed-rate taxable bond market, including Treasuries, government-related and corporate securities, mortgage-backed securities (agency fixed-rate and hybrid adjustable-rate mortgage pass-throughs), asset-backed securities, and commercial mortgage-backed securities. You cannot invest directly in an index. |
| 5 | The Bloomberg Barclays Global Aggregate ex-USD Index (unhedged) is an unmanaged index that provides a broad-based measure of the global investment-grade fixed-income markets excluding the U.S. dollar-denominated debt market. You cannot invest directly in an index. |
| 6 | The Bloomberg Barclays Municipal Bond Index is an unmanaged index composed of long-term tax-exempt bonds with a minimum credit rating of Baa. You cannot invest directly in an index. |
| 7 | The ICE BofA U.S. High Yield Index is a market-capitalization-weighted index of domestic and Yankee high-yield bonds. The index tracks the performance of high-yield securities traded in the U.S. bond market. You cannot invest directly in an index. Copyright 2021. ICE Data Indices, LLC. All rights reserved. |
2 | Wells Fargo VT Small Cap Growth Fund
Letter to shareholders (unaudited)
The passage of the massive domestic stimulus bill highlighted March activity, leading to increased forecasts for U.S. growth in 2021. Domestic employment surged as COVID-19 vaccinations and an increasingly open economy spurred hiring. A majority of U.S. small companies reported they were operating at pre-pandemic capacity or higher. Value stocks continued its outperformance of growth stocks in the month, continuing the trend that started in late 2020. Meanwhile, most major developed global equity indexes were up month to date on the back of rising optimism regarding the outlook for global growth. While the U.S. and U.K. had been most successful in terms of the vaccine rollout, even in markets where the vaccine lagged, such as in the eurozone and Japan, equity indexes in many of those countries had also been in positive territory for the year.
Equity markets produced another strong showing in April. Domestically, the continued reopening of the economy had a strong impact on positive equity performance, as people started leaving their households and jobless claims continued to fall. Domestic corporate bonds performed well and the U.S. dollar weakened. Meanwhile, the U.S. government continued to seek to invest in the recovery, this time by outlining a package of over $2 trillion to improve infrastructure. The primary headwind in April was inflation, as investors tried to determine the breadth and longevity of recent price increases. Developed Europe has been supported by a meaningful increase in the pace of vaccinations. Unfortunately many emerging market countries have not been as successful. India in particular has seen COVID-19 cases surge, serving as an example of the need to get vaccinations rolled out to less developed nations.
Vaccine rollouts continued in May, leading to loosened restrictions globally. As a result, equity markets in general saw a minor increase in returns. Concerns that the continued economic rebound could result in inflation increases becoming more than transitory were supported by the higher input costs businesses were experiencing. Meanwhile, those inflation concerns were tempered by the U.S. Federal Reserve Board (Fed), which stayed steady on its view of the economy and eased fears of a sudden and substantial policy change. Positive performance in the emerging market equity space was supported this month by steady consumer demand and strong commodity prices. Fixed-income markets were also slightly positive for the month, driven by inflation uncertainty and a softer U.S. dollar.
June witnessed the S&P 500 Index reach a new all-time high. 2021 economic growth and inflation forecasts were revised higher to reflect a strong economic recovery and some supply and demand imbalances. Late June saw a deal reached on a U.S. infrastructure package of approximately $1 trillion for road, bridge, and broadband network upgrades over the next eight years. The Fed’s June meeting yielded no change to policy, but its projections pointed to a possible interest rate rise in 2023. This, combined with a rebound in economic activity and investors searching for yield, led to U.S. Treasury yields being down for the month. Many European and Asian countries saw vaccination momentum increase, while the U.K. dealt with a rise in COVID-19 infections, specifically the Delta variant. Meanwhile, crude oil jumped over 10% in June on the back of the pickup in global economic activity and the Organization of the Petroleum Exporting Countries’ slow pace of supply growth.
Don’t let short-term uncertainty derail long-term investment goals.
Periods of investment uncertainty can present challenges, but experience has taught us that maintaining long-term investment goals can be an effective way to plan for the future. Although diversification cannot guarantee an investment profit or prevent losses, we believe it can be an effective way to manage investment risk and potentially smooth out overall portfolio performance. We encourage investors to know their investments and to understand that appropriate levels of risk-taking may unlock opportunities.
Thank you for choosing to invest with Wells Fargo Funds. We appreciate your confidence in us and remain committed to helping you meet your financial needs.
Sincerely,
Andrew Owen
President
Wells Fargo Funds
“The passage of the massive domestic stimulus bill highlighted March activity, leading to increased forecasts for U.S. growth in 2021.”
“2021 economic growth and inflation forecasts were revised higher to reflect a strong economic recovery and some supply and demand imbalances.”
For further information about your Fund, contact your investment professional, visit our website at wfam.com, or call us directly at 1-800-222-8222.
Wells Fargo VT Small Cap Growth Fund | 3
Performance highlights (unaudited)
| Investment objective | The Fund seeks long-term capital appreciation. |
| Manager | Wells Fargo Funds Management, LLC |
| Subadviser | Wells Capital Management, LLC |
| Portfolio managers | Robert Gruendyke, CFA®‡†, David Nazaret, CFA®‡†, Thomas C. Ognar, CFA®‡ |
| Average annual total returns (%) as of June 30, 2021 |
| | | | | | Expense ratios1 (%) |
| | Inception date | 1 year | 5 year | 10 year | Gross | Net 2 |
| Class 1 | 7-16-2010 | 56.73 | 24.85 | 15.56 | 0.93 | 0.93 |
| Class 2 | 5-1-1995 | 56.32 | 24.57 | 15.28 | 1.18 | 1.18 |
| Russell 2000® Growth Index3 | – | 51.36 | 18.76 | 13.52 | – | – |
| 1 | Reflects the expense ratios as stated in the most recent prospectuses. The expense ratios shown are subject to change and may differ from the annualized expense ratios shown in the financial highlights of this report. |
| 2 | The manager has contractually committed through April 30, 2022, to waive fees and/or reimburse expenses to the extent necessary to cap total annual fund operating expenses after fee waivers at 0.95% for Class 1 shares and 1.20% for Class 2 shares. Brokerage commissions, stamp duty fees, interest, taxes, acquired fund fees and expenses (if any), and extraordinary expenses are excluded from the expense caps. Prior to or after the commitment expiration date, the caps may be increased or the commitment to maintain the caps may be terminated only with the approval of the Board of Trustees. Without these caps, the Fund’s returns would have been lower. The expense ratio paid by an investor is the net expense ratio (the total annual fund operating expenses after fee waivers) as stated in the prospectuses. |
| 3 | The Russell 2000® Growth Index measures the performance of those Russell 2000 companies with higher price/book ratios and higher forecasted growth values. You cannot invest directly in an index. |
Figures quoted represent past performance, which is no guarantee of future results. Investment return and principal value of an investment will fluctuate so that an investor’s shares, when redeemed, may be worth more or less than their original cost. Current performance may be lower or higher than the performance data quoted and assumes the reinvestment of dividends and capital gains. Current month-end performance is available by calling 1-800-260-5969. Performance figures of the Fund do not reflect fees and expenses charged pursuant to the terms of variable life insurance policies and variable annuity contracts. If these fees and expenses had been reflected, performance would have been lower.
Please keep in mind that high double-digit returns were primarily achieved during favorable market conditions. You should not expect that such favorable returns can be consistently achieved. A fund’s performance, especially for short time periods, should not be the sole factor in making your investment decision.
Index returns do not include transaction costs associated with buying and selling securities, any mutual fund fees or expenses, or any taxes. It is not possible to invest directly in an index.
Shares are sold without a front-end sales charge or contingent deferred sales charge.
Stock values fluctuate in response to the activities of individual companies and general market and economic conditions. Smaller company stocks tend to be more volatile and less liquid than those of larger companies. Consult the Fund’s prospectus for additional information on these and other risks.
Please refer to the prospectus provided by your participating insurance company for detailed information describing the separate accounts for information regarding surrender charges, mortality and expense risk fees, and other charges that may be assessed by the participating insurance companies.
| ‡ | CFA® and Chartered Financial Analyst® are trademarks owned by CFA Institute. |
4 | Wells Fargo VT Small Cap Growth Fund
Performance highlights (unaudited)
| Ten largest holdings (%) as of June 30, 20211 |
| Shockwave Medical Incorporated | 2.90 |
| Rapid7 Incorporated | 2.85 |
| Crocs Incorporated | 2.73 |
| ASGN Incorporated | 2.72 |
| Boot Barn Holdings Incorporated | 2.34 |
| Vericel Corporation | 2.27 |
| SPS Commerce Incorporated | 2.24 |
| Q2 Holdings Incorporated | 2.23 |
| Rexnord Corporation | 2.22 |
| Sprout Social Incorporated Class A | 1.95 |
| 1 | Figures represent the percentage of the Fund's net assets. Holdings are subject to change and may have changed since the date specified. |
| Sector allocation as of June 30, 20211 |
| 1 | Figures represent the percentage of the Fund's long-term investments. These amounts are subject to change and may have changed since the date specified. |
Wells Fargo VT Small Cap Growth Fund | 5
Fund expenses (unaudited)
As a shareholder of the Fund, you incur ongoing costs, including management fees, distribution (12b-1) fees, and other Fund expenses. This example is intended to help you understand your ongoing costs (in dollars) of investing in the Fund and to compare these costs with the ongoing costs of investing in other mutual funds.
The example is based on an investment of $1,000 invested at the beginning of the six-month period and held for the entire period from January 1, 2021 to June 30, 2021.
Actual expenses
The “Actual” line of the table below provides information about actual account values and actual expenses. You may use the information in this line, together with the amount you invested, to estimate the expenses that you paid over the period. Simply divide your account value by $1,000 (for example, an $8,600 account value divided by $1,000 = 8.6), then multiply the result by the number in the “Actual” line under the heading entitled “Expenses paid during period” for your applicable class of shares to estimate the expenses you paid on your account during this period.
Hypothetical example for comparison purposes
The “Hypothetical” line of the table below provides information about hypothetical account values and hypothetical expenses based on the Fund’s actual expense ratio and an assumed rate of return of 5% per year before expenses, which is not the Fund’s actual return. The hypothetical account values and expenses may not be used to estimate the actual ending account balance or expenses you paid for the period. You may use this information to compare the ongoing costs of investing in the Fund and other funds. To do so, compare this 5% hypothetical example with the 5% hypothetical examples that appear in the shareholder reports of the other funds.
Please note that the expenses shown in the table are meant to highlight your ongoing costs only and do not reflect any separate account charges assessed by participating insurance companies. Therefore, the “Hypothetical” line of the table is useful in comparing ongoing costs only, and will not help you determine the relative total costs of owning different funds. In addition, if these separate account charges assessed by participating insurance companies were included, your costs would have been higher.
| | Beginning
account value
1-1-2021 | Ending
account value
6-30-2021 | Expenses
paid during
the period1 | Annualized net
expense ratio |
| Class 1 | | | | |
| Actual | $1,000.00 | $1,092.51 | $4.77 | 0.92% |
| Hypothetical (5% return before expenses) | $1,000.00 | $1,020.23 | $4.61 | 0.92% |
| Class 2 | | | | |
| Actual | $1,000.00 | $1,091.71 | $6.07 | 1.17% |
| Hypothetical (5% return before expenses) | $1,000.00 | $1,018.99 | $5.86 | 1.17% |
1 Expenses paid is equal to the annualized net expense ratio of each class multiplied by the average account value over the period, multiplied by the number of days in the most recent fiscal half-year divided by the number of days in the fiscal year (to reflect the one-half-year period).
6 | Wells Fargo VT Small Cap Growth Fund
Portfolio of investments—June 30, 2021 (unaudited)
| | | | | Shares | Value |
| Common stocks: 98.78% | | | | | |
| Communication services: 3.80% | | | | | |
| Diversified telecommunication services: 1.76% | | | | | |
| Bandwidth Incorporated Class A † | | | | 59,200 | $ 8,164,864 |
| Interactive media & services: 0.62% | | | | | |
| EverQuote Incorporated Class A † | | | | 87,751 | 2,867,703 |
| Media: 1.42% | | | | | |
| Cardlytics Incorporated † | | | | 51,870 | 6,583,859 |
| Consumer discretionary: 18.02% | | | | | |
| Auto components: 1.40% | | | | | |
| Fox Factory Holding Corporation † | | | | 41,810 | 6,508,145 |
| Hotels, restaurants & leisure: 3.65% | | | | | |
| Bally's Corporation † | | | | 71,709 | 3,880,174 |
| Papa John's International Incorporated | | | | 52,520 | 5,485,189 |
| Wingstop Incorporated | | | | 47,969 | 7,561,353 |
| | | | | | 16,926,716 |
| Household durables: 0.48% | | | | | |
| Purple Innovation Incorporated † | | | | 83,928 | 2,216,538 |
| Internet & direct marketing retail: 2.22% | | | | | |
| CarParts.com Incorporated † | | | | 118,210 | 2,406,756 |
| Fiverr International Limited † | | | | 18,950 | 4,595,186 |
| The RealReal Incorporated † | | | | 166,900 | 3,297,944 |
| | | | | | 10,299,886 |
| Leisure products: 1.65% | | | | | |
| YETI Holdings Incorporated † | | | | 83,396 | 7,657,421 |
| Specialty retail: 5.07% | | | | | |
| Boot Barn Holdings Incorporated † | | | | 129,240 | 10,862,622 |
| Cricut Incorporated Class A †« | | | | 51,924 | 2,211,962 |
| Leslie's Incorporated † | | | | 160,292 | 4,406,427 |
| Lithia Motors Incorporated Class A | | | | 15,920 | 5,470,749 |
| Petco Health & Wellness Company † | | | | 26,127 | 585,506 |
| | | | | | 23,537,266 |
| Textiles, apparel & luxury goods: 3.55% | | | | | |
| Crocs Incorporated † | | | | 108,780 | 12,675,046 |
| Deckers Outdoor Corporation † | | | | 9,980 | 3,833,019 |
| | | | | | 16,508,065 |
| Consumer staples: 4.86% | | | | | |
| Beverages: 1.78% | | | | | |
| Celsius Holdings Incorporated † | | | | 108,700 | 8,270,983 |
| Food & staples retailing: 0.51% | | | | | |
| The Chef's Warehouse Incorporated † | | | | 73,870 | 2,351,282 |
The accompanying notes are an integral part of these financial statements.
Wells Fargo VT Small Cap Growth Fund | 7
Portfolio of investments—June 30, 2021 (unaudited)
| | | | | Shares | Value |
| Food products: 2.28% | | | | | |
| Freshpet Incorporated † | | | | 50,707 | $ 8,263,213 |
| Vital Farms Incorporated †« | | | | 116,749 | 2,330,310 |
| | | | | | 10,593,523 |
| Personal products: 0.29% | | | | | |
| The Honest Company Incorporated †« | | | | 83,004 | 1,343,835 |
| Financials: 4.34% | | | | | |
| Capital markets: 1.53% | | | | | |
| Assetmark Financial Holdings † | | | | 16,515 | 413,866 |
| Stifel Financial Corporation | | | | 103,135 | 6,689,336 |
| | | | | | 7,103,202 |
| Diversified financial services: 0.20% | | | | | |
| VPC Impact Acquisition Holdings †« | | | | 94,800 | 948,948 |
| Insurance: 2.61% | | | | | |
| Goosehead Insurance Incorporated Class A | | | | 29,307 | 3,730,781 |
| Kinsale Capital Group Incorporated | | | | 50,776 | 8,366,362 |
| | | | | | 12,097,143 |
| Health care: 29.84% | | | | | |
| Biotechnology: 8.97% | | | | | |
| Arcutis Biotherapeutics Incorporated † | | | | 196,246 | 5,355,553 |
| Arena Pharmaceuticals Incorporated † | | | | 25,520 | 1,740,464 |
| Biohaven Pharmaceutical Holding Company † | | | | 18,680 | 1,813,454 |
| CareDx Incorporated † | | | | 59,284 | 5,425,672 |
| Fate Therapeutics Incorporated † | | | | 46,060 | 3,997,547 |
| Halozyme Therapeutics Incorporated † | | | | 142,240 | 6,459,118 |
| Natera Incorporated † | | | | 55,611 | 6,313,517 |
| Vericel Corporation † | | | | 200,390 | 10,520,475 |
| | | | | | 41,625,800 |
| Health care equipment & supplies: 8.67% | | | | | |
| Axonics Modulation Technologies Incorporated † | | | | 18,500 | 1,173,085 |
| Figs Incorporated Class A † | | | | 34,730 | 1,739,973 |
| Neuronetics Incorporated †« | | | | 94,322 | 1,511,038 |
| Orthopediatrics Corporation † | | | | 80,201 | 5,067,099 |
| Outset Medical Incorporated † | | | | 56,468 | 2,822,271 |
| Pulmonx Corporation † | | | | 46,623 | 2,057,007 |
| Shockwave Medical Incorporated † | | | | 70,946 | 13,460,585 |
| SI-BONE Incorporated † | | | | 177,698 | 5,592,156 |
| Silk Road Medical Incorporated † | | | | 30,110 | 1,441,065 |
| Tandem Diabetes Care Incorporated † | | | | 26,480 | 2,579,152 |
| Vapotherm Incorporated † | | | | 119,931 | 2,835,169 |
| | | | | | 40,278,600 |
| Health care providers & services: 3.72% | | | | | |
| Accolade Incorporated † | | | | 52,800 | 2,867,568 |
| Addus Homecare Corporation † | | | | 45,530 | 3,972,037 |
| Castle Biosciences Incorporated † | | | | 108,618 | 7,964,958 |
The accompanying notes are an integral part of these financial statements.
8 | Wells Fargo VT Small Cap Growth Fund
Portfolio of investments—June 30, 2021 (unaudited)
| | | | | Shares | Value |
| Health care providers & services (continued) | | | | | |
| Privia Health Group Incorporated † | | | | 33,594 | $ 1,490,566 |
| Talkspace Incorporated † | | | | 119,100 | 989,721 |
| | | | | | 17,284,850 |
| Health care technology: 3.47% | | | | | |
| CVRx Incorporated † | | | | 59,980 | 1,679,440 |
| Doximity Incorporated Class A † | | | | 8,336 | 485,155 |
| Inspire Medical Systems Incorporated † | | | | 33,540 | 6,481,940 |
| Phreesia Incorporated † | | | | 121,456 | 7,445,253 |
| | | | | | 16,091,788 |
| Life sciences tools & services: 3.28% | | | | | |
| Akoya Biosciences Incorporated † | | | | 48,052 | 929,326 |
| Alpha Teknova Incorporated † | | | | 34,013 | 807,128 |
| Codexis Incorporated † | | | | 330,867 | 7,497,446 |
| Neogenomics Incorporated † | | | | 132,962 | 6,005,894 |
| | | | | | 15,239,794 |
| Pharmaceuticals: 1.73% | | | | | |
| Pacira Pharmaceuticals Incorporated † | | | | 94,390 | 5,727,585 |
| Revance Therapeutics Incorporated † | | | | 77,700 | 2,303,028 |
| | | | | | 8,030,613 |
| Industrials: 12.32% | | | | | |
| Aerospace & defense: 0.94% | | | | | |
| Kratos Defense & Security Solutions Incorporated † | | | | 152,530 | 4,345,580 |
| Building products: 0.55% | | | | | |
| The AZEK Company Incorporated † | | | | 59,773 | 2,537,962 |
| Commercial services & supplies: 1.99% | | | | | |
| ACV Auctions Incorporated Class A † | | | | 95,392 | 2,444,896 |
| Casella Waste Systems Incorporated Class A † | | | | 107,390 | 6,811,748 |
| | | | | | 9,256,644 |
| Construction & engineering: 0.62% | | | | | |
| Construction Partners Incorporated Class A † | | | | 91,800 | 2,882,520 |
| Electrical equipment: 0.43% | | | | | |
| Bloom Energy Corporation Class A † | | | | 74,300 | 1,996,441 |
| Internet & direct marketing retail: 0.11% | | | | | |
| Xometry Incorporated Class A † | | | | 5,851 | 511,319 |
| Machinery: 2.22% | | | | | |
| Rexnord Corporation | | | | 205,750 | 10,295,730 |
| Professional services: 2.76% | | | | | |
| ASGN Incorporated † | | | | 130,141 | 12,614,567 |
| Legalzoom.com Incorporated † | | | | 5,617 | 212,603 |
| | | | | | 12,827,170 |
| Road & rail: 1.33% | | | | | |
| Saia Incorporated † | | | | 29,592 | 6,199,228 |
The accompanying notes are an integral part of these financial statements.
Wells Fargo VT Small Cap Growth Fund | 9
Portfolio of investments—June 30, 2021 (unaudited)
| | | | | Shares | Value |
| Trading companies & distributors: 1.37% | | | | | |
| SiteOne Landscape Supply Incorporated † | | | | 37,470 | $ 6,342,172 |
| Information technology: 25.01% | | | | | |
| Electronic equipment, instruments & components: 2.29% | | | | | |
| Novanta Incorporated † | | | | 64,690 | 8,717,624 |
| Par Technology Corporation †« | | | | 27,100 | 1,895,374 |
| | | | | | 10,612,998 |
| IT services: 3.98% | | | | | |
| Digitalocean Holdings Incorporated † | | | | 27,500 | 1,528,725 |
| Endava plc ADR † | | | | 56,434 | 6,398,487 |
| EVO Payments Incorporated Class A † | | | | 263,001 | 7,295,648 |
| Flywire Corporation † | | | | 57,250 | 2,103,365 |
| Paymentus Holdings Incorporated A † | | | | 32,329 | 1,147,680 |
| | | | | | 18,473,905 |
| Semiconductors & semiconductor equipment: 4.54% | | | | | |
| Allegro MicroSystems Incorporated † | | | | 160,216 | 4,437,983 |
| Diodes Incorporated † | | | | 75,690 | 6,037,791 |
| Semtech Corporation † | | | | 86,850 | 5,975,280 |
| Silicon Laboratories Incorporated † | | | | 12,070 | 1,849,728 |
| Skywater Technology Incorporated †« | | | | 97,829 | 2,802,801 |
| | | | | | 21,103,583 |
| Software: 14.20% | | | | | |
| 8x8 Incorporated † | | | | 166,200 | 4,613,709 |
| Alkami Technology Incorporated † | | | | 45,819 | 1,634,364 |
| Envestnet Incorporated † | | | | 16,551 | 1,255,559 |
| Everbridge Incorporated † | | | | 26,290 | 3,577,543 |
| Jamf Holding Corporation † | | | | 84,158 | 2,825,184 |
| Olo Incorporated Class A †« | | | | 10,534 | 393,866 |
| ON24 Incorporated †« | | | | 37,064 | 1,315,031 |
| Q2 Holdings Incorporated † | | | | 100,996 | 10,360,170 |
| Rapid7 Incorporated † | | | | 139,718 | 13,221,514 |
| Sprout Social Incorporated Class A † | | | | 101,439 | 9,070,675 |
| SPS Commerce Incorporated † | | | | 103,874 | 10,371,819 |
| Workiva Incorporated † | | | | 65,500 | 7,292,115 |
| | | | | | 65,931,549 |
| Utilities: 0.59% | | | | | |
| Independent power & renewable electricity producers: 0.59% | | | | | |
| Sunnova Energy International Incorporated † | | | | 73,024 | 2,750,084 |
| Total Common stocks (Cost $274,210,900) | | | | | 458,597,709 |
The accompanying notes are an integral part of these financial statements.
10 | Wells Fargo VT Small Cap Growth Fund
Portfolio of investments—June 30, 2021 (unaudited)
| | | Yield | | Shares | Value |
| Short-term investments: 3.30% | | | | | |
| Investment companies: 3.30% | | | | | |
| Securities Lending Cash Investments LLC ♠∩∞ | | 0.03% | | 11,377,650 | $ 11,377,650 |
| Wells Fargo Government Money Market Fund Select Class ♠∞ | | 0.03 | | 3,953,852 | 3,953,852 |
| Total Short-term investments (Cost $15,331,502) | | | | | 15,331,502 |
| Total investments in securities (Cost $289,542,402) | 102.08% | | | | 473,929,211 |
| Other assets and liabilities, net | (2.08) | | | | (9,648,067) |
| Total net assets | 100.00% | | | | $464,281,144 |
| † | Non-income-earning security |
| « | All or a portion of this security is on loan. |
| ♠ | The issuer of the security is an affiliated person of the Fund as defined in the Investment Company Act of 1940. |
| ∩ | The investment is a non-registered investment company purchased with cash collateral received from securities on loan. |
| ∞ | The rate represents the 7-day annualized yield at period end. |
| Abbreviations: |
| ADR | American depositary receipt |
Investments in affiliates
An affiliated investment is an investment in which the Fund owns at least 5% of the outstanding voting shares of the issuer or as a result of other relationships, such as the Fund and the issuer having the same investment manager. Transactions with issuers that were either affiliates of the Fund at the beginning of the period or the end of the period were as follows:
| | Value,
beginning of
period | Purchases | Sales
proceeds | Net
realized
gains
(losses) | | Net
change in
unrealized
gains
(losses) | | Value,
end of
period | | % of
net
assets | Shares,
end
of period | Income
from
affiliated
securities |
| Short-term investments | | | | | | | | | | | | |
| Investment companies | | | | | | | | | | | | |
| Securities Lending Cash Investments LLC | $13,231,250 | $48,223,648 | $(50,077,248) | $0 | | $0 | | $ 11,377,650 | | | 11,377,650 | $ 3,014# |
| Wells Fargo Government Money Market Fund Select Class | 555,598 | 50,648,802 | (47,250,548) | 0 | | 0 | | 3,953,852 | | | 3,953,852 | 921 |
| | | | | $0 | | $0 | | $15,331,502 | | 3.30% | | $3,935 |
| # | Amount shown represents income before fees and rebates. |
The accompanying notes are an integral part of these financial statements.
Wells Fargo VT Small Cap Growth Fund | 11
Statement of assets and liabilities—June 30, 2021 (unaudited)
| | |
| Assets | |
Investments in unaffiliated securities (including $11,081,433 of securities loaned), at value (cost $274,210,900)
| $ 458,597,709 |
Investments in affiliated securites, at value (cost $15,331,502)
| 15,331,502 |
Receivable for investments sold
| 4,781,782 |
Receivable for Fund shares sold
| 390,786 |
Receivable for dividends
| 14,487 |
Receivable for securities lending income, net
| 4,127 |
Prepaid expenses and other assets
| 3,115 |
Total assets
| 479,123,508 |
| Liabilities | |
Payable upon receipt of securities loaned
| 11,377,650 |
Payable for investments purchased
| 2,782,117 |
Management fee payable
| 295,057 |
Payable for Fund shares redeemed
| 271,422 |
Distribution fee payable
| 84,554 |
Administration fees payable
| 29,506 |
Trustees’ fees and expenses payable
| 1,705 |
Accrued expenses and other liabilities
| 353 |
Total liabilities
| 14,842,364 |
Total net assets
| $464,281,144 |
| Net assets consist of | |
Paid-in capital
| $ 198,416,110 |
Total distributable earnings
| 265,865,034 |
Total net assets
| $464,281,144 |
| Computation of net asset value per share | |
Net assets – Class 1
| $ 37,257,146 |
Shares outstanding – Class 11
| 2,217,174 |
Net asset value per share – Class 1
| $16.80 |
Net assets – Class 2
| $ 427,023,998 |
Shares outstanding – Class 21
| 26,528,342 |
Net asset value per share – Class 2
| $16.10 |
| 1 | The Fund has an unlimited number of authorized shares |
The accompanying notes are an integral part of these financial statements.
12 | Wells Fargo VT Small Cap Growth Fund
Statement of operations—six months ended June 30, 2021 (unaudited)
| | |
| Investment income | |
Dividends
| $ 191,673 |
Securities lending income from affiliates, net
| 49,023 |
Income from affiliated securities
| 921 |
Total investment income
| 241,617 |
| Expenses | |
Management fee
| 1,733,882 |
| Administration fees | |
Class 1
| 14,061 |
Class 2
| 159,327 |
| Distribution fee | |
Class 2
| 497,003 |
Custody and accounting fees
| 21,577 |
Professional fees
| 27,273 |
Shareholder report expenses
| 20,771 |
Trustees’ fees and expenses
| 9,398 |
Other fees and expenses
| 4,917 |
Total expenses
| 2,488,209 |
Net investment loss
| (2,246,592) |
| Realized and unrealized gains (losses) on investments | |
Net realized gains on investments
| 33,914,710 |
Net change in unrealized gains (losses) on investments
| 7,675,204 |
Net realized and unrealized gains (losses) on investments
| 41,589,914 |
Net increase in net assets resulting from operations
| $39,343,322 |
The accompanying notes are an integral part of these financial statements.
Wells Fargo VT Small Cap Growth Fund | 13
Statement of changes in net assets
| | | | | |
| | Six months ended
June 30, 2021
(unaudited) | Year ended
December 31, 2020 |
| Operations | | | | |
Net investment loss
| | $ (2,246,592) | | $ (3,125,684) |
Net realized gains on investments
| | 33,914,710 | | 53,245,715 |
Net change in unrealized gains (losses) on investments
| | 7,675,204 | | 109,023,368 |
Net increase in net assets resulting from operations
| | 39,343,322 | | 159,143,399 |
| Distributions to shareholders from | | | | |
| Net investment income and net realized gains | | | | |
Class 1
| | 0 | | (1,435,682) |
Class 2
| | 0 | | (16,630,208) |
Total distributions to shareholders
| | 0 | | (18,065,890) |
| Capital share transactions | Shares | | Shares | |
| Proceeds from shares sold | | | | |
Class 1
| 236,622 | 3,755,075 | 604,357 | 6,902,098 |
Class 2
| 1,939,472 | 30,089,381 | 3,286,731 | 35,875,297 |
| | | 33,844,456 | | 42,777,395 |
| Reinvestment of distributions | | | | |
Class 1
| 0 | 0 | 131,233 | 1,435,682 |
Class 2
| 0 | 0 | 1,582,322 | 16,630,208 |
| | | 0 | | 18,065,890 |
| Payment for shares redeemed | | | | |
Class 1
| (307,622) | (4,904,551) | (675,964) | (7,532,393) |
Class 2
| (2,056,108) | (31,446,241) | (5,426,711) | (59,526,674) |
| | | (36,350,792) | | (67,059,067) |
Net decrease in net assets resulting from capital share transactions
| | (2,506,336) | | (6,215,782) |
Total increase in net assets
| | 36,836,986 | | 134,861,727 |
| Net assets | | | | |
Beginning of period
| | 427,444,158 | | 292,582,431 |
End of period
| | $464,281,144 | | $427,444,158 |
The accompanying notes are an integral part of these financial statements.
14 | Wells Fargo VT Small Cap Growth Fund
Financial highlights
(For a share outstanding throughout each period)
| | | Year ended December 31 |
| Class 1 | Six months ended
June 30, 2021
(unaudited) | 2020 | 2019 | 2018 | 2017 | 2016 |
Net asset value, beginning of period
| $15.35 | $10.29 | $9.66 | $10.43 | $8.51 | $8.70 |
Net investment loss
| (0.05) | (0.09) | (0.07) 1 | (0.05) | (0.04) | (0.01) 1 |
Net realized and unrealized gains (losses) on investments
| 1.50 | 5.80 | 2.51 | 0.40 | 2.24 | 0.65 |
Total from investment operations
| 1.45 | 5.71 | 2.44 | 0.35 | 2.20 | 0.64 |
| Distributions to shareholders from | | | | | | |
Net realized gains
| 0.00 | (0.65) | (1.81) | (1.12) | (0.28) | (0.83) |
Net asset value, end of period
| $16.80 | $15.35 | $10.29 | $9.66 | $10.43 | $8.51 |
Total return2
| 9.45% | 58.09% | 25.31% | 1.48% | 26.14% | 8.10% |
| Ratios to average net assets (annualized) | | | | | | |
Gross expenses
| 0.92% | 0.93% | 0.93% | 0.92% | 0.94% | 0.94% |
Net expenses
| 0.92% | 0.93% | 0.93% | 0.92% | 0.94% | 0.94% |
Net investment loss
| (0.81)% | (0.76)% | (0.69)% | (0.59)% | (0.65)% | (0.10)% |
| Supplemental data | | | | | | |
Portfolio turnover rate
| 23% | 51% | 62% | 68% | 72% | 89% |
Net assets, end of period (000s omitted)
| $37,257 | $35,128 | $22,925 | $19,801 | $22,591 | $20,554 |
| 1 | Calculated based upon average shares outstanding |
| 2 | Returns for periods of less than one year are not annualized. Returns do not reflect fees and expenses charged pursuant to the terms of variable life insurance policies and variable annuity contracts. |
The accompanying notes are an integral part of these financial statements.
Wells Fargo VT Small Cap Growth Fund | 15
Financial highlights
(For a share outstanding throughout each period)
| | | Year ended December 31 |
| Class 2 | Six months ended
June 30, 2021
(unaudited) | 2020 | 2019 | 2018 | 2017 | 2016 |
Net asset value, beginning of period
| $14.72 | $9.91 | $9.38 | $10.18 | $8.33 | $8.56 |
Net investment loss
| (0.08) | (0.11) | (0.09) | (0.09) | (0.09) | (0.03) |
Net realized and unrealized gains (losses) on investments
| 1.46 | 5.57 | 2.43 | 0.41 | 2.22 | 0.63 |
Total from investment operations
| 1.38 | 5.46 | 2.34 | 0.32 | 2.13 | 0.60 |
| Distributions to shareholders from | | | | | | |
Net realized gains
| 0.00 | (0.65) | (1.81) | (1.12) | (0.28) | (0.83) |
Net asset value, end of period
| $16.10 | $14.72 | $9.91 | $9.38 | $10.18 | $8.33 |
Total return1
| 9.38% | 57.78% | 24.83% | 1.20% | 25.86% | 7.75% |
| Ratios to average net assets (annualized) | | | | | | |
Gross expenses
| 1.17% | 1.18% | 1.18% | 1.17% | 1.19% | 1.19% |
Net expenses
| 1.17% | 1.18% | 1.18% | 1.17% | 1.19% | 1.19% |
Net investment loss
| (1.06)% | (1.00)% | (0.95)% | (0.84)% | (0.90)% | (0.35)% |
| Supplemental data | | | | | | |
Portfolio turnover rate
| 23% | 51% | 62% | 68% | 72% | 89% |
Net assets, end of period (000s omitted)
| $427,024 | $392,316 | $269,657 | $243,038 | $238,460 | $202,718 |
| 1 | Returns for periods of less than one year are not annualized. Returns do not reflect fees and expenses charged pursuant to the terms of variable life insurance policies and variable annuity contracts. |
The accompanying notes are an integral part of these financial statements.
16 | Wells Fargo VT Small Cap Growth Fund
Notes to financial statements (unaudited)
1. ORGANIZATION
Wells Fargo Variable Trust (the "Trust"), a Delaware statutory trust organized on March 10, 1999, is an open-end management investment company registered under the Investment Company Act of 1940, as amended (the "1940 Act"). As an investment company, the Trust follows the accounting and reporting guidance in Financial Accounting Standards Board ("FASB") Accounting Standards Codification Topic 946, Financial Services – Investment Companies. These financial statements report on the Wells Fargo VT Small Cap Growth Fund (the "Fund") which is a diversified series of the Trust. The Trust offers shares of the Fund to separate accounts of various life insurance companies as funding vehicles for certain variable annuity contracts and variable life insurance policies.
On February 23, 2021, Wells Fargo & Company announced that it has entered into a definitive agreement to sell Wells Fargo Asset Management ("WFAM") to GTCR LLC and Reverence Capital Partners, L.P. WFAM is the trade name used by the asset management businesses of Wells Fargo & Company and includes Wells Fargo Funds Management, LLC, the investment manager to the Fund, Wells Capital Management, LLC and Wells Fargo Asset Management (International) Limited, both registered investment advisers providing sub-advisory services to certain funds, and Wells Fargo Funds Distributor, LLC, the Fund's principal underwriter. As part of the transaction, Wells Fargo & Company will own a 9.9% equity interest and will continue to serve as an important client and distribution partner.
Consummation of the transaction will result in the automatic termination of the Fund's investment management agreement and subadvisory agreement. The Fund's Board of Trustees approved a new investment management and new subadvisory agreement and approved submitting the agreements to the Fund’s shareholders for approval at a special meeting of shareholders expected to be held on August 16, 2021. Shareholders of record of the Fund at the close of business on May 28, 2021 are entitled to vote at the meeting. If shareholders approve the new agreements, they would take effect upon the closing of the transaction. The transaction is expected to close in the second half of 2021, subject to customary closing conditions.
2. SIGNIFICANT ACCOUNTING POLICIES
The following significant accounting policies, which are consistently followed in the preparation of the financial statements of the Fund, are in conformity with U.S. generally accepted accounting principles which require management to make estimates and assumptions that affect the reported amounts of assets and liabilities, disclosure of contingent assets and liabilities at the date of the financial statements, and the reported amounts of income and expenses during the reporting period. Actual results could differ from those estimates.
Securities valuation
All investments are valued each business day as of the close of regular trading on the New York Stock Exchange (generally 4 p.m. Eastern Time), although the Fund may deviate from this calculation time under unusual or unexpected circumstances.
Equity securities that are listed on a foreign or domestic exchange or market are valued at the official closing price or, if none, the last sales price. If no sale occurs on the principal exchange or market that day, a fair value price will be determined in accordance with the Fund’s Valuation Procedures.
Investments in registered open-end investment companies are valued at net asset value. Interests in non-registered investment companies that are redeemable at net asset value are fair valued normally at net asset value.
Investments which are not valued using any of the methods discussed above are valued at their fair value, as determined in good faith by the Board of Trustees. The Board of Trustees has established a Valuation Committee comprised of the Trustees and has delegated to it the authority to take any actions regarding the valuation of portfolio securities that the Valuation Committee deems necessary or appropriate, including determining the fair value of portfolio securities, unless the determination has been delegated to the Wells Fargo Asset Management Pricing Committee at Wells Fargo Funds Management, LLC ("Funds Management"). The Board of Trustees retains the authority to make or ratify any valuation decisions or approve any changes to the Valuation Procedures as it deems appropriate. On a quarterly basis, the Board of Trustees receives reports on any valuation actions taken by the Valuation Committee or the Wells Fargo Asset Management Pricing Committee which may include items for ratification.
Securities lending
The Fund may lend its securities from time to time in order to earn additional income in the form of fees or interest on securities received as collateral or the investment of any cash received as collateral. When securities are on loan, the Fund receives interest or dividends on those securities. Cash collateral received in connection with its securities lending transactions is invested in Securities Lending Cash Investments, LLC (the "Securities Lending Fund"). Investments in Securities Lending Fund
Wells Fargo VT Small Cap Growth Fund | 17
Notes to financial statements (unaudited)
are valued at the evaluated bid price provided by an independent pricing service. Income earned from investment in the Securities Lending Fund, if any, is included in securities lending income from affiliates (net of fees and rebates) on the Statement of Operations.
In a securities lending transaction, the net asset value of the Fund is affected by an increase or decrease in the value of the securities loaned and by an increase or decrease in the value of the instrument in which collateral is invested. The amount of securities lending activity undertaken by the Fund fluctuates from time to time. The Fund has the right under the lending agreement to recover the securities from the borrower on demand. In the event of default or bankruptcy by the borrower, the Fund may be prevented from recovering the loaned securities or gaining access to the collateral or may experience delays or costs in doing so. In such an event, the terms of the agreement allow the unaffiliated securities lending agent to use the collateral to purchase replacement securities on behalf of the Fund or pay the Fund the market value of the loaned securities. The Fund bears the risk of loss with respect to depreciation of its investment of the cash collateral.
Security transactions and income recognition
Securities transactions are recorded on a trade date basis. Realized gains or losses are recorded on the basis of identified cost.
Dividend income is recognized on the ex-dividend date.
Distributions to shareholders
Distributions to shareholders from net investment income and any net realized gains are recorded on the ex-dividend date and paid at least annually. Such distributions are determined in accordance with income tax regulations and may differ from U.S. generally accepted accounting principles. Dividend sources are estimated at the time of declaration. The tax character of distributions is determined as of the Fund's fiscal year end. Therefore, a portion of the Fund's distributions made prior to the Fund’s fiscal year end may be categorized as a tax return of capital at year end.
Federal and other taxes
The Fund intends to continue to qualify as a regulated investment company by distributing substantially all of its investment company taxable income and any net realized capital gains (after reduction for capital loss carryforwards) sufficient to relieve it from all, or substantially all, federal income taxes. Accordingly, no provision for federal income taxes was required.
The Fund’s income and federal excise tax returns and all financial records supporting those returns for the prior three fiscal years are subject to examination by the federal and Delaware revenue authorities. Management has analyzed the Fund's tax positions taken on federal, state, and foreign tax returns for all open tax years and does not believe that there are any uncertain tax positions that require recognition of a tax liability.
As of June 30, 2021, the aggregate cost of all investments for federal income tax purposes was $289,559,476 and the unrealized gains (losses) consisted of:
| Gross unrealized gains | $189,838,370 |
| Gross unrealized losses | (5,468,635) |
| Net unrealized gains | $184,369,735 |
Class allocations
The separate classes of shares offered by the Fund differ principally in distribution fees. Class specific expenses are charged directly to that share class. Investment income, common fund-level expenses, and realized and unrealized gains (losses) on investments are allocated daily to each class of shares based on the relative proportion of net assets of each class.
18 | Wells Fargo VT Small Cap Growth Fund
Notes to financial statements (unaudited)
3. FAIR VALUATION MEASUREMENTS
Fair value measurements of investments are determined within a framework that has established a fair value hierarchy based upon the various data inputs utilized in determining the value of the Fund’s investments. The three-level hierarchy gives the highest priority to unadjusted quoted prices in active markets for identical assets or liabilities (Level 1) and the lowest priority to unobservable inputs (Level 3). The Fund’s investments are classified within the fair value hierarchy based on the lowest level of input that is significant to the fair value measurement. The inputs are summarized into three broad levels as follows:
| ■ | Level 1 – quoted prices in active markets for identical securities |
| ■ | Level 2 – other significant observable inputs (including quoted prices for similar securities, interest rates, prepayment speeds, credit risk, etc.) |
| ■ | Level 3 – significant unobservable inputs (including the Fund’s own assumptions in determining the fair value of investments) |
The inputs or methodologies used for valuing investments in securities are not necessarily an indication of the risk associated with investing in those securities.
The following is a summary of the inputs used in valuing the Fund’s assets and liabilities as of June 30, 2021:
| | Quoted prices
(Level 1) | Other significant
observable inputs
(Level 2) | Significant
unobservable inputs
(Level 3) | Total |
| Assets | | | | |
| Investments in: | | | | |
| Common stocks | | | | |
| Communication services | $ 17,616,426 | $0 | $0 | $ 17,616,426 |
| Consumer discretionary | 83,654,037 | 0 | 0 | 83,654,037 |
| Consumer staples | 22,559,623 | 0 | 0 | 22,559,623 |
| Financials | 20,149,293 | 0 | 0 | 20,149,293 |
| Health care | 138,551,445 | 0 | 0 | 138,551,445 |
| Industrials | 57,194,766 | 0 | 0 | 57,194,766 |
| Information technology | 116,122,035 | 0 | 0 | 116,122,035 |
| Utilities | 2,750,084 | 0 | 0 | 2,750,084 |
| Short-term investments | | | | |
| Investment companies | 15,331,502 | 0 | 0 | 15,331,502 |
| Total assets | $473,929,211 | $0 | $0 | $473,929,211 |
Additional sector, industry or geographic detail, if any, is included in the Portfolio of Investments.
For the six months ended June 30, 2021, the Fund did not have any transfers into/out of Level 3.
4. TRANSACTIONS WITH AFFILIATES
Management fee
Funds Management, an indirect wholly owned subsidiary of Wells Fargo & Company ("Wells Fargo"), is the manager of the Fund and provides advisory and fund-level administrative services under an investment management agreement. Under the investment management agreement, Funds Management is responsible for, among other services, implementing the investment objectives and strategies of the Fund, supervising the subadviser and providing fund-level administrative services in connection with the Fund’s operations. As compensation for its services under the investment management agreement, Funds Management is entitled to receive a management fee at the following annual rate based on the Fund’s average daily net assets:
Wells Fargo VT Small Cap Growth Fund | 19
Notes to financial statements (unaudited)
| Average daily net assets | Management fee |
| First $500 million | 0.800% |
| Next $500 million | 0.750 |
| Next $1 billion | 0.700 |
| Next $1 billion | 0.675 |
| Next $2 billion | 0.650 |
| Next $5 billion | 0.640 |
| Over $10 billion | 0.630 |
For the six months ended June 30, 2021, the management fee was equivalent to an annual rate of 0.80% of the Fund’s average daily net assets.
Funds Management has retained the services of a subadviser to provide daily portfolio management to the Fund. The fee for subadvisory services is borne by Funds Management. Wells Capital Management, LLC ("WellsCap"), an affiliate of Funds Management and an indirect wholly owned subsidiary of Wells Fargo, is the subadviser to the Fund and is entitled to receive a fee from Funds Management at an annual rate starting at 0.55% and declining to 0.40% as the average daily net assets of the Fund increase.
Administration fees
Under a class-level administration agreement, Funds Management provides class-level administrative services to the Fund, which includes paying fees and expenses for services provided by the transfer agent, sub-transfer agents, omnibus account services and record-keepers. As compensation for its services under the class-level administration agreement, Funds Management receives an annual fee of 0.08% which is calculated based on the average daily net assets of each class.
Waivers and/or expense reimbursements
Funds Management has contractually committed to waive and/or reimburse management and administration fees to the extent necessary to maintain certain net operating expense ratios for the Fund. When each class of the Fund has exceeded its expense cap, Funds Management will waive fees and/or reimbursed expenses from fund-level expenses on a proportionate basis and then from class specific expenses. When only certain classes exceed their expense caps, waivers and/or reimbursements are applied against class specific expenses before fund-level expenses. Funds Management has contractually committed through April 30, 2022 to waive fees and/or reimburse expenses to the extent necessary to cap expenses. Prior to or after the commitment expiration date, the caps may be increased or the commitment to maintain the caps may be terminated only with the approval of the Board of Trustees. The contractual expense caps are as follows:
| | Expense ratio caps |
| Class 1 | 0.95% |
| Class 2 | 1.20 |
Distribution fee
The Trust has adopted a distribution plan for Class 2 shares of the Fund pursuant to Rule 12b-1 under the 1940 Act. A distribution fee is charged to Class 2 shares and paid to Wells Fargo Funds Distributor, LLC, the principal underwriter, at an annual rate of 0.25% of the average daily net assets of Class 2 shares.
Interfund transactions
The Fund may purchase or sell portfolio investment securities to certain other Wells Fargo affiliates pursuant to Rule 17a-7 under the 1940 Act and under procedures adopted by the Board of Trustees. The procedures have been designed to ensure that these interfund transactions, which do not incur broker commissions, are effected at current market prices.
5. INVESTMENT PORTFOLIO TRANSACTIONS
Purchases and sales of investments, excluding U.S. government obligations (if any) and short-term securities, for the six months ended June 30, 2021 were $99,026,985 and $109,295,655, respectively.
20 | Wells Fargo VT Small Cap Growth Fund
Notes to financial statements (unaudited)
6. SECURITIES LENDING TRANSACTIONS
The Fund lends its securities through an unaffiliated securities lending agent and receives collateral in the form of cash or securities with a value at least equal to the value of the securities on loan. The value of the loaned securities is determined at the close of each business day and any increases or decreases in the required collateral are exchanged between the Fund and the counterparty on the next business day. Cash collateral received is invested in the Securities Lending Fund which seeks to provide a positive return compared to the daily Federal Funds Open Rate by investing in high-quality, U.S. dollar-denominated short-term money market instruments and is exempt from registration under Section 3(c)(7) of the 1940 Act. Securities Lending Fund is managed by Funds Management and is subadvised by WellsCap. Funds Management receives an advisory fee starting at 0.05% and declining to 0.01% as the average daily net assets of the Securities Lending Fund increase. All of the fees received by Funds Management are paid to WellsCap for its services as subadviser.
In the event of counterparty default or the failure of a borrower to return a loaned security, the Fund has the right to use the collateral to offset any losses incurred. As of June 30, 2021, the Fund had securities lending transactions with the following counterparties which are subject to offset:
| Counterparty | Value of
securities on
loan | Collateral
received1 | Net amount |
| Bank of America Securities Incorporated | $4,176,769 | $(4,176,769) | $0 |
| Barclays Capital Incorporated | 105,336 | (105,336) | 0 |
| Deutsche Bank Securities Incorporated | 1,786,664 | (1,786,664) | 0 |
| JPMorgan Securties LLC | 3,147,244 | (3,147,244) | 0 |
| Morgan Stanley & Company LLC | 966,320 | (966,320) | 0 |
| UBS Securities LLC | 899,100 | (899,100) | 0 |
1 Collateral received within this table is limited to the collateral for the net transaction with the counterparty.
7. BANK BORROWINGS
The Trust, Wells Fargo Master Trust and Wells Fargo Funds Trust (excluding the money market funds) are parties to a $350,000,000 revolving credit agreement whereby the Fund is permitted to use bank borrowings for temporary or emergency purposes, such as to fund shareholder redemption requests. Interest under the credit agreement is charged to the Fund based on a borrowing rate equal to the higher of the Federal Funds rate in effect on that day plus 1.25% or the overnight bank funding rate in effect on that day plus 1.25%. In addition, an annual commitment fee equal to 0.25% of the unused balance is allocated to each participating fund.
For the six months ended June 30, 2021, there were no borrowings by the Fund under the agreement.
8. CONCENTRATION RISKS
As of the end of the period, the Fund concentrated its portfolio of investments in health care and information technology sectors. A fund that invests a substantial portion of its assets in any sector may be more affected by changes in that sector than would be a fund whose investments are not heavily weighted in any sector.
9. INDEMNIFICATION
Under the Fund's organizational documents, the officers and Trustees have been granted certain indemnification rights against certain liabilities that may arise out of performance of their duties to the Fund. The Fund has entered into a separate agreement with each Trustee that converts indemnification rights currently existing under the Fund’s organizational documents into contractual rights that cannot be changed in the future without the consent of the Trustee. Additionally, in the normal course of business, the Fund may enter into contracts with service providers that contain a variety of indemnification clauses. The Fund’s maximum exposure under these arrangements is dependent on future claims that may be made against the Fund and, therefore, cannot be estimated.
10. CORONAVIRUS (COVID-19) PANDEMIC
On March 11, 2020, the World Health Organization announced that it had made the assessment that coronavirus disease 2019 (“COVID-19”) is a pandemic. The impacts of COVID-19 are affecting the entire global economy, individual companies and investment products, the funds, and the market in general. There is significant uncertainty around the extent and duration of
Wells Fargo VT Small Cap Growth Fund | 21
Notes to financial statements (unaudited)
business disruptions related to COVID-19 and the impacts may last for an extended period of time. COVID-19 has led to significant uncertainty and volatility in the financial markets.
11. SUBSEQUENT EVENTS
Wells Fargo Asset Management ("WFAM") announced that it will be changing its company name to Allspring Global Investments upon the closing of the previously announced sale transaction of WFAM by Wells Fargo & Company to GTCR LLC and Reverence Capital Partners, L.P. The new corporate name is expected to go into effect on the closing date of the transaction, which is anticipated to occur in the second half of 2021, subject to customary closing conditions.
At a meeting held July 15, 2021, the Board of Trustees of the Wells Fargo Funds approved a change in the name to remove “Wells Fargo” from the name and replace with “Allspring”. The change is expected to go into effect on October 11, 2021.
Following the closing of the transaction, Wells Fargo Funds Management, LLC, the investment manager, Wells Capital Management, LLC and Wells Fargo Asset Management (International) Limited, each subadvisers to certain funds, and Wells Fargo Funds Distributor, LLC will each be rebranded as Allspring.
At a special meeting of shareholders held on August 16, 2021, shareholders of the Fund approved a new investment management and a new subadvisory agreement that will be effective at the closing of the sale transaction.
22 | Wells Fargo VT Small Cap Growth Fund
Other information (unaudited)
PROXY VOTING INFORMATION
A description of the policies and procedures used to determine how to vote proxies relating to portfolio securities is available without charge, upon request, by calling 1-800-260-5969, visiting our website at wfam.com, or visiting the SEC website at sec.gov. Information regarding how the proxies related to portfolio securities were voted during the most recent 12-month period ended June 30 is available on the website at wfam.com or by visiting the SEC website at sec.gov.
QUARTERLY PORTFOLIO HOLDINGS INFORMATION
The Fund files its complete schedule of portfolio holdings with the SEC for the first and third quarters of each fiscal year as an exhibit to its reports on Form N-PORT. Shareholders may view the filed Form N-PORT by visiting the SEC website at sec.gov.
Wells Fargo VT Small Cap Growth Fund | 23
Other information (unaudited)
BOARD OF TRUSTEES AND OFFICERS
Each of the Trustees and Officers listed in the table below acts in identical capacities for each fund in the Wells Fargo family of funds, which consists of 139 mutual funds comprising the Wells Fargo Funds Trust, Wells Fargo Variable Trust, Wells Fargo Master Trust and four closed-end funds (collectively the “Fund Complex”). This table should be read in conjunction with the Prospectus and the Statement of Additional Information1. The mailing address of each Trustee and Officer is 525 Market Street, 12th Floor, San Francisco, CA 94105. Each Trustee and Officer serves an indefinite term, however, each Trustee serves such term until reaching the mandatory retirement age established by the Trustees.
Independent Trustees
Name and
year of birth | Position held and
length of service* | Principal occupations during past five years or longer | Current other
public company or
investment
company
directorships |
William R. Ebsworth
(Born 1957) | Trustee,
since 2015 | Retired. From 1984 to 2013, equities analyst, portfolio manager, research director and chief investment officer at Fidelity Management and Research Company in Boston, Tokyo, and Hong Kong, and retired in 2013 as Chief Investment Officer of Fidelity Strategic Advisers, Inc. where he led a team of investment professionals managing client assets. Prior thereto, Board member of Hong Kong Securities Clearing Co., Hong Kong Options Clearing Corp., the Thailand International Fund, Ltd., Fidelity Investments Life Insurance Company, and Empire Fidelity Investments Life Insurance Company. Audit Committee Chair and Investment Committee Chair of the Vincent Memorial Hospital Endowment (non-profit organization). Mr. Ebsworth is a CFA® charterholder. | N/A |
Jane A. Freeman
(Born 1953) | Trustee,
since 2015;
Chair Liaison,
since 2018 | Retired. From 2012 to 2014 and 1999 to 2008, Chief Financial Officer of Scientific Learning Corporation. From 2008 to 2012, Ms. Freeman provided consulting services related to strategic business projects. Prior to 1999, Portfolio Manager at Rockefeller & Co. and Scudder, Stevens & Clark. Board member of the Harding Loevner Funds from 1996 to 2014, serving as both Lead Independent Director and chair of the Audit Committee. Board member of the Russell Exchange Traded Funds Trust from 2011 to 2012 and the chair of the Audit Committee. Ms. Freeman is also an inactive Chartered Financial Analyst. | N/A |
Isaiah Harris, Jr.
(Born 1952) | Trustee,
since 2009; Audit
Committee
Chair,
since 2019 | Retired. Chairman of the Board of CIGNA Corporation since 2009, and Director since 2005. From 2003 to 2011, Director of Deluxe Corporation. Prior thereto, President and CEO of BellSouth Advertising and Publishing Corp. from 2005 to 2007, President and CEO of BellSouth Enterprises from 2004 to 2005 and President of BellSouth Consumer Services from 2000 to 2003. Emeritus member of the Iowa State University Foundation Board of Governors. Emeritus Member of the Advisory Board of Iowa State University School of Business. Advisory Board Member, Palm Harbor Academy (private school). Mr. Harris is a certified public accountant (inactive status). | CIGNA Corporation |
Judith M. Johnson
(Born 1949) | Trustee,
since 2008 | Retired. Prior thereto, Chief Executive Officer and Chief Investment Officer of Minneapolis Employees Retirement Fund from 1996 to 2008. Ms. Johnson is an attorney, certified public accountant and a certified managerial accountant. | N/A |
David F. Larcker
(Born 1950) | Trustee,
since 2009 | James Irvin Miller Professor of Accounting at the Graduate School of Business (Emeritus), Stanford University, Director of the Corporate Governance Research Initiative and Senior Faculty of The Rock Center for Corporate Governance since 2006. From 2005 to 2008, Professor of Accounting at the Graduate School of Business, Stanford University. Prior thereto, Ernst & Young Professor of Accounting at The Wharton School, University of Pennsylvania from 1985 to 2005. | N/A |
24 | Wells Fargo VT Small Cap Growth Fund
Other information (unaudited)
Name and
year of birth | Position held and
length of service* | Principal occupations during past five years or longer | Current other
public company or
investment
company
directorships |
Olivia S. Mitchell
(Born 1953) | Trustee,
since 2006;
Nominating and
Governance
Committee Chair,
since 2018 | International Foundation of Employee Benefit Plans Professor, Wharton School of the University of Pennsylvania since 1993. Director of Wharton’s Pension Research Council and Boettner Center on Pensions & Retirement Research, and Research Associate at the National Bureau of Economic Research. Previously, Cornell University Professor from 1978 to 1993. | N/A |
Timothy J. Penny
(Born 1951) | Trustee,
since 1996;
Chair,
since 2018 | President and Chief Executive Officer of Southern Minnesota Initiative Foundation, a non-profit organization, since 2007. Member of the Board of Trustees of NorthStar Education Finance, Inc., a non-profit organization, since 2007. | N/A |
James G. Polisson
(Born 1959) | Trustee,
since 2018 | Retired. Chief Marketing Officer, Source (ETF) UK Services, Ltd, from 2015 to 2017. From 2012 to 2015, Principal of The Polisson Group, LLC, a management consulting, corporate advisory and principal investing company. Chief Executive Officer and Managing Director at Russell Investments, Global Exchange Traded Funds from 2010 to 2012. Managing Director of Barclays Global Investors from 1998 to 2010 and Global Chief Marketing Officer for iShares and Barclays Global Investors from 2000 to 2010. Trustee of the San Francisco Mechanics’ Institute, a non-profit organization, from 2013 to 2015. Board member of the Russell Exchange Traded Fund Trust from 2011 to 2012. Director of Barclays Global Investors Holdings Deutschland GmbH from 2006 to 2009. Mr. Polisson is an attorney and has a retired status with the Massachusetts and District of Columbia Bar Associations. | N/A |
Pamela Wheelock
(Born 1959) | Trustee,
since January
2020; previously
Trustee from
January 2018 to
July 2019 | Board member of the Destination Medical Center Economic Development Agency, Rochester, Minnesota since 2019. Interim President of the McKnight Foundation from January to September 2020. Acting Commissioner, Minnesota Department of Human Services, July 2019 through September 2019. Human Services Manager (part-time), Minnesota Department of Human Services, October 2019 through December 2019. Chief Operating Officer, Twin Cities Habitat for Humanity from 2017 to 2019. Vice President of University Services, University of Minnesota from 2012 to 2016. Prior thereto, on the Board of Directors, Governance Committee and Finance Committee for the Minnesota Philanthropy Partners (Saint Paul Foundation) from 2012 to 2018, Interim Chief Executive Officer of Blue Cross Blue Shield of Minnesota from 2011 to 2012, Chairman of the Board from 2009 to 2012 and Board Director from 2003 to 2015. Vice President, Leadership and Community Engagement, Bush Foundation, Saint Paul, Minnesota (a private foundation) from 2009 to 2011. Executive Vice President and Chief Financial Officer, Minnesota Sports and Entertainment from 2004 to 2009 and Senior Vice President from 2002 to 2004. Executive Vice President of the Minnesota Wild Foundation from 2004 to 2008. Commissioner of Finance, State of Minnesota, from 1999 to 2002. Currently Board Chair of the Minnesota Wild Foundation since 2010. | N/A |
* Length of service dates reflect the Trustee’s commencement of service with the Trust’s predecessor entities, where applicable.
Wells Fargo VT Small Cap Growth Fund | 25
Other information (unaudited)
Officers
Name and
year of birth | Position held and
length of service | Principal occupations during past five years or longer |
Andrew Owen
(Born 1960) | President,
since 2017 | Executive Vice President of Wells Fargo & Company and Head of Affiliated Managers, Wells Fargo Asset Management, since 2014. In addition, Mr. Owen is currently President, Chief Executive Officer and Director of Wells Fargo Funds Management, LLC since 2017. Prior thereto, Executive Vice President responsible for marketing, investments and product development for Wells Fargo Funds Management, LLC, from 2009 to 2014. |
Jeremy DePalma
(Born 1974) | Treasurer,
since 2012
(for certain funds in
the Fund Complex);
since 2021 (for
the remaining funds in the
Fund Complex) | Senior Vice President of Wells Fargo Funds Management, LLC since 2009. Senior Vice President of Evergreen Investment Management Company, LLC from 2008 to 2010 and head of the Fund Reporting and Control Team within Fund Administration from 2005 to 2010. |
Michelle Rhee
(Born 1966) | Chief Legal Officer,
since 2019 | Secretary of Wells Fargo Funds Management, LLC and Chief Legal Counsel of Wells Fargo Asset Management since 2018. Deputy General Counsel of Wells Fargo Bank, N.A. since 2020 and Assistant General Counsel of Wells Fargo Bank, N.A. from 2018 to 2020. Associate General Counsel and Managing Director of Bank of America Corporation from 2004 to 2018. |
Catherine Kennedy
(Born 1969) | Secretary,
since 2019 | Vice President of Wells Fargo Funds Management, LLC and Senior Counsel of the Wells Fargo Legal Department since 2010. Vice President and Senior Counsel of Evergreen Investment Management Company, LLC from 1998 to 2010. |
Michael H. Whitaker
(Born 1967) | Chief Compliance Officer,
since 2016 | Chief Compliance Officer of Wells Fargo Asset Management since 2016. Senior Vice President and Chief Compliance Officer for Fidelity Investments from 2007 to 2016. |
1 The Statement of Additional Information includes additional information about the Trustees and is available, without charge, upon request, by calling 1-800-222-8222 or by visiting the website at wfam.com.
26 | Wells Fargo VT Small Cap Growth Fund
Board considerations (unaudited)
BOARD CONSIDERATION OF INVESTMENT MANAGEMENT AND SUB-ADVISORY AGREEMENTS:
Board Considerations – Current Agreements
Under the Investment Company Act of 1940 (the “1940 Act”), the Board of Trustees (the “Board”) of Wells Fargo Variable Trust (the “Trust”) must determine annually whether to approve the continuation of the Trust’s investment management and sub-advisory agreements. In this regard, at a Board meeting held on May 17-19, 2021 (the “Meeting”), the Board, all the members of which have no direct or indirect interest in the investment management and sub-advisory agreements and are not “interested persons” of the Trust, as defined in the 1940 Act (the “Independent Trustees”), reviewed and approved for Wells Fargo VT Small Cap Growth Fund (the “Fund”): (i) an investment management agreement (the “Management Agreement”) with Wells Fargo Funds Management, LLC (“Funds Management”); and (ii) an investment sub-advisory agreement (the “Sub-Advisory Agreement”) with Wells Capital Management Incorporated (the “Sub-Adviser”), an affiliate of Funds Management. The Management Agreement and the Sub-Advisory Agreement are collectively referred to as the “Advisory Agreements.”
The Board noted that Wells Fargo & Company recently announced that it had entered into a definitive agreement to sell Wells Fargo Asset Management (“WFAM”), which includes Funds Management and the Sub-Adviser, to GTCR LLC and Reverence Capital Partners, L.P. and/or their affiliates (the “Transaction”). The Board further noted that the Transaction would result in a change-of-control of Funds Management and the Sub-Adviser, which would be considered to be an assignment that would result in the termination of the Advisory Agreements. In light of the Transaction, the Board separately considered for approval a new investment management agreement with Funds Management and a new sub-advisory agreement with the Sub-Adviser (the “New Agreements”) that would replace the Advisory Agreements upon consummation of the Transaction, subject to approval of the New Agreements by the Fund’s shareholders. The Board also considered for approval interim agreements to go into effect in the event shareholders do not approve the New Agreements before the Transaction is completed. The interim agreements would allow the Manager and the Sub-Adviser to continue providing services to the Fund while the Fund continues to seek shareholder approval of the New Agreements. The Board noted that the terms of the interim agreements would be identical to those of the current Advisory Agreements, except for the term and certain escrow provisions.
At the Meeting, the Board considered the factors and reached the conclusions described below relating to the selection of Funds Management and the Sub-Adviser and the approval of the Advisory Agreements. Prior to the Meeting, including at Board meetings held in April and May 2021, the Trustees conferred extensively among themselves and with representatives of Funds Management about these matters. Also, the Board has adopted a team-based approach, with each team consisting of a sub-set of Trustees, to assist the full Board in the discharge of its duties in reviewing investment performance and other matters throughout the year. The Independent Trustees were assisted in their evaluation of the Advisory Agreements by independent legal counsel, from whom they received separate legal advice and with whom they met separately.
In providing information to the Board, Funds Management and the Sub-Adviser were guided by a detailed set of requests for information submitted to them by independent legal counsel on behalf of the Independent Trustees at the start of the Board’s annual contract renewal process earlier in 2021. In considering and approving the Advisory Agreements, the Trustees considered the information they believed relevant, including but not limited to the information discussed below. The Board considered not only the specific information presented in connection with the Meeting, but also the knowledge gained over time through interaction with Funds Management and the Sub-Adviser about various topics. In this regard, the Board reviewed reports of Funds Management at each of its quarterly meetings, which included, among other things, portfolio reviews and investment performance reports. In addition, the Board and the teams mentioned above confer with portfolio managers at various times throughout the year. The Board did not identify any particular information or consideration that was all-important or controlling, and each individual Trustee may have attributed different weights to various factors.
After its deliberations, the Board unanimously determined that the compensation payable to Funds Management and the Sub-Adviser under each of the Advisory Agreements was reasonable, and approved the continuation of the Advisory Agreements for a one-year term. The Board considered the approval of the Advisory Agreements for the Fund as part of its consideration of agreements for funds across the complex, but its approvals were made on a fund-by-fund basis. The following summarizes a number of important, but not necessarily all, factors considered by the Board in support of its approvals.
Nature, extent and quality of services
The Board received and considered various information regarding the nature, extent and quality of services provided to the Fund by Funds Management and the Sub-Adviser under the Advisory Agreements. This information included a description of the investment advisory services and Fund-level administrative services covered by the Management Agreement, as well as, among other things, a summary of the background and experience of senior management of WFAM, of which Funds Management and the Sub-Adviser are a part, and a summary of investments made in the business of WFAM. The Board also received a description of
Wells Fargo VT Small Cap Growth Fund | 27
Board considerations (unaudited)
Funds Management’s and the Sub-Adviser’s business continuity plans, including a summary of the performance of such plans and any changes thereto during the COVID-19 pandemic, and of their approaches to data privacy and cybersecurity. The Board also received and reviewed information about Funds Management’s role as administrator of the Fund’s liquidity risk management program, Funds Management’s approach to risk management, and Funds Management’s intermediary and vendor oversight program.
The Board also considered the qualifications, background, tenure and responsibilities of each of the portfolio managers primarily responsible for the day-to-day portfolio management of the Fund. The Board evaluated the ability of Funds Management and the Sub-Adviser to attract and retain qualified investment professionals, including research, advisory and supervisory personnel.
The Board further considered the compliance programs and compliance records of Funds Management and the Sub-Adviser. In addition, the Board took into account the full range of services provided to the Fund by Funds Management and its affiliates. The Board also considered information about retention and back-up arrangements that have been put into place with respect to key personnel of WFAM in connection with the anticipated Transaction, noting that WFAM provided assurances that the announcement and eventual culmination of the Transaction is not expected to result in any diminution in the nature or quality of services provided to the Fund.
Fund investment performance and expenses
The Board considered the investment performance results for the Fund over various time periods ended December 31, 2020. The Board considered these results in comparison to the investment performance of funds in a universe that was determined by Broadridge Inc. (“Broadridge”) to be similar to the Fund (the “Universe”), and in comparison to the Fund’s benchmark index and to other comparative data. Broadridge is an independent provider of investment company data. The Board received a description of the methodology used by Broadridge to select the mutual funds in the performance Universe. The Board noted that the investment performance of the Fund was higher than the average investment performance of its Universe for the one-, three-, five- and ten-year periods ended December 31, 2020. The Board also noted that the investment performance of the Fund was higher than its benchmark, the Russell 2000® Growth Index, for all periods ended December 31, 2020.
The Board also received and considered information regarding the Fund’s net operating expense ratios and their various components, including actual management fees, custodian and other non-management fees, and Rule 12b-1 and non-Rule 12b-1 shareholder service fees. The Board considered these ratios in comparison to the median ratios of funds in class-specific expense groups that were determined by Broadridge to be similar to the Fund (the “Groups”). The Board received a description of the methodology used by Broadridge to select the mutual funds in the expense Groups and an explanation of how funds comprising expense groups and their expense ratios may vary from year-to-year. Based on the Broadridge reports, the Board noted that the net operating expense ratios of the Fund were in range of the median net operating expense ratios of the expense Groups for each share class.
The Board took into account the Fund’s investment performance and expense information provided to it among the factors considered in deciding to re-approve the Advisory Agreements.
Investment management and sub-advisory fee rates
The Board reviewed and considered the contractual fee rates payable by the Fund to Funds Management under the Management Agreement, as well as the contractual fee rates payable by the Fund to Funds Management for class-level administrative services under a Class-Level Administration Agreement, which include, among other things, class-level transfer agency and sub-transfer agency costs (collectively, the “Management Rates”). The Board also reviewed and considered the contractual investment sub-advisory fee rates that are payable by Funds Management to the Sub-Adviser for investment sub-advisory services.
Among other information reviewed by the Board was a comparison of the Fund’s Management Rates with the average contractual investment management fee rates of funds in the expense Groups at a common asset level as well as transfer agency costs of the funds in the expense Groups. The Board noted that the Management Rates of the Fund were in range of the sum of these average rates for the Fund’s expense Groups.
The Board also received and considered information about the portion of the total management fee that was retained by Funds Management after payment of the fee to the Sub-Adviser for sub-advisory services. In assessing the reasonableness of this amount, the Board received and evaluated information about the nature and extent of responsibilities retained and risks assumed by Funds Management and not delegated to or assumed by the Sub-Adviser, and about Funds Management’s on-going oversight services. Given the affiliation between Funds Management and the Sub-Adviser, the Board ascribed limited relevance to the allocation of fees between them.
The Board also received and considered information about the nature and extent of services offered and fee rates charged by Funds Management and the Sub-Adviser to other types of clients with investment strategies similar to those of the Fund. In this
28 | Wells Fargo VT Small Cap Growth Fund
Board considerations (unaudited)
regard, the Board received information about the significantly greater scope of services, and compliance, reporting and other legal burdens and risks of managing proprietary mutual funds compared with those associated with managing assets of other types of clients, including third-party sub-advised fund clients and non-mutual fund clients such as institutional separate accounts.
Based on its consideration of the factors and information it deemed relevant, including those described here, the Board determined that the compensation payable to Funds Management under the Management Agreement and to the Sub-Adviser under the Sub-Advisory Agreement was reasonable.
Profitability
The Board received and considered information concerning the profitability of Funds Management, as well as the profitability of both WFAM and Wells Fargo & Co. (“Wells Fargo”) from providing services to the fund family as a whole. The Board noted that the Sub-Adviser’s profitability information with respect to providing services to the Fund and other funds in the family was subsumed in the WFAM and Wells Fargo profitability analysis.
Funds Management reported on the methodologies and estimates used in calculating profitability, including a description of the methodology used to allocate certain expenses. Among other things, the Board noted that the levels of profitability reported on a fund-by-fund basis varied widely, depending on factors such as the size, type and age of fund.
Based on its review, the Board did not deem the profits reported by Funds Management, WFAM or Wells Fargo from services provided to the Fund to be at a level that would prevent it from approving the continuation of the Advisory Agreements.
Economies of scale
The Board received and considered information about the potential for Funds Management to experience economies of scale in the provision of management services to the Fund, the difficulties of calculating economies of scale at an individual fund level, and the extent to which potential scale benefits are shared with Fund shareholders. The Board noted the existence of breakpoints in the Fund’s management fee structure, which operate generally to reduce the Fund’s expense ratios as the Fund grows in size, and the size of the Fund in relation to such breakpoints. The Board considered that in addition to management fee breakpoints, Funds Management shares potential economies of scale from its management business in a variety of ways, including through fee waiver and expense reimbursement arrangements, competitive management fee rates set at the outset without regard to breakpoints, and investments in the business intended to enhance services available to shareholders.
The Board concluded that Funds Management’s arrangements with respect to the Fund, including contractual breakpoints, constituted a reasonable approach to sharing potential economies of scale with the Fund and its shareholders.
Other benefits to Funds Management and the Sub-Adviser
The Board received and considered information regarding potential “fall-out” or ancillary benefits received by Funds Management and its affiliates, including the Sub-Adviser, as a result of their relationships with the Fund. Ancillary benefits could include, among others, benefits directly attributable to other relationships with the Fund and benefits potentially derived from an increase in Funds Management’s and the Sub-Adviser’s business as a result of their relationships with the Fund. The Board noted that various affiliates of Funds Management may receive distribution-related fees, shareholder servicing payments and sub-transfer agency fees in respect of shares sold or held through them and services provided.
The Board also reviewed information about soft dollar credits earned and utilized by the Sub-Adviser, fees earned by Funds Management and the Sub-Adviser from managing a private investment vehicle for the fund family’s securities lending collateral and commissions earned by an affiliated broker from portfolio transactions.
Based on its consideration of the factors and information it deemed relevant, including those described here, the Board did not find that any ancillary benefits received by Funds Management and its affiliates, including the Sub-Adviser, were unreasonable.
Conclusion
At the Meeting, after considering the above-described factors and based on its deliberations and its evaluation of the information described above, the Board unanimously determined that the compensation payable to Funds Management and the Sub-Adviser under each of the Advisory Agreements was reasonable, and approved the continuation of the Advisory Agreements for a one-year term.
Wells Fargo VT Small Cap Growth Fund | 29
Board considerations (unaudited)
Board Considerations – New Agreements
Overview of the Board evaluation process
At a meeting held on May 17-19, 2021 (the “Board Meeting”), the Board of Trustees (the “Board”) of Wells Fargo Variable Trust (the “Trust”, and the series thereof, the “Funds”) approved the continuation of each Fund’s current Investment Management Agreement (the “Current Investment Management Agreement”) and the current Wells Cap Sub-Advisory Agreement (the “Current Wells Cap Sub-Advisory Agreement”, and collectively, the “Current Agreements”). Each Trustee on the Board is not an “interested person” (as defined in the Investment Company Act of 1940 (the “1940 Act”)) of the Funds (collectively, the “Independent Trustees”). The process followed by the Board in considering and approving the continuation of the Current Agreements is referred to herein as the “2021 Annual Approval Process.”
As noted above, the closing of the sale of Wells Fargo Asset Management (“WFAM”) to a holding company (“NewCo”) affiliated with private funds of GTCR LLC (“GTCR”) and of Reverence Capital Partners, L.P. (“Reverence Capital”, and such transaction, the “Transaction”) will result in a change of control of Wells Fargo Funds Management LLC (“Funds Management”) and Wells Capital Management Incorporated (“Wells Capital” or the “Sub-Adviser”, and together with Funds Management, the “Advisers”), which will be considered to be an “assignment” of each Fund’s Current Agreements under the 1940 Act that will result in the automatic termination of each Fund’s Current Agreements. In light of the expected termination of each Fund’s Current Agreements upon the closing, at the Board Meeting the Board also considered and approved: (i) a new Investment Management Agreement between the Trust, on behalf of each Fund, and Funds Management (the “New Investment Management Agreement”); and (ii) a new Sub-Advisory Agreement among the Trust, on behalf of each Fund, Funds Management and Wells Capital (the “New Sub-Advisory Agreement”, and collectively, the “New Agreements”), each of which is intended to go into effect upon the closing. The process followed by the Board in reviewing and approving the New Agreements is referred to herein as the “New Agreement Approval Process.”
At a series of meetings held in April and May 2021 (collectively, “April and May 2021 Meetings”) and at the Board Meeting, the Trustees conferred extensively among themselves and with senior representatives of Funds Management, GTCR and Reverence Capital about the New Agreements and related matters. The Board reviewed and discussed information furnished by Funds Management, GTCR and Reverence Capital that the Board considered reasonably necessary to evaluate the terms of the New Agreements and the services to be provided. At these meetings, senior representatives from Funds Management, GTCR and Reverence Capital made presentations to, and responded to questions from, the Board.
In providing information to the Board in connection with the 2021 annual approval process for the Current Agreements (the “2021 Annual Approval Process”) and the New Agreement Approval Process, Funds Management, GTCR and Reverence Capital (as applicable) were guided by requests for information submitted by independent legal counsel on behalf of the Independent Trustees. In considering and approving the New Agreements, the Trustees considered the information they believed relevant, including but not limited to the information discussed herein. The Board considered not only the specific information presented in connection with the April and May 2021 Meetings as well as the Board Meeting, but also the knowledge gained over time through interaction with Funds Management and the Sub-Adviser about various topics. In this regard, the Board reviews reports of Funds Management at each of its regular Board meetings, which includes, among other things, portfolio reviews and investment performance reports. In addition, the Board confers with portfolio managers at various times throughout the year. The Board was assisted in its evaluation of the New Agreements by independent legal counsel, from whom the Independent Trustees received separate legal advice and with whom the Independent Trustees met separately. The Board did not identify any particular information or consideration that was all-important or controlling, and each individual Trustee may have attributed different weights to various factors.
Among other information considered by the Board in connection with the Transaction was:
| ■ | Information regarding the Transaction: information about the structure, financing sources and material terms and conditions of the Transaction, including the expected impact on the businesses conducted by the Advisers and by Wells Fargo Funds Distributor LLC, as the distributor of Fund shares. |
| ■ | Information regarding NewCo, GTCR and Reverence Capital: (i) information about NewCo, including information about its expected financial condition and access to capital, and senior leadership team; (ii) the experience of senior management at GTCR and Reverence Capital in acquiring portfolio companies; (iii) the plan to operationalize NewCo, including the transition of necessary infrastructure services through a transition services agreement with Wells Fargo under which Wells Fargo will continue to provide NewCo with certain services for a specified period of time after the closing; and (iv) information regarding regulatory matters, compliance, and risk management functions at NewCo, including resources to be dedicated thereto. |
30 | Wells Fargo VT Small Cap Growth Fund
Board considerations (unaudited)
| ■ | Impact of the Transaction on WFAM and Service Providers: (i) information regarding any changes to personnel and/or other resources of the Advisers as a result of the Transaction, including assurances regarding comparable and competitive compensation arrangements to attract and retain highly qualified personnel; and (ii) information about the organizational and operating structure with respect to NewCo, the Advisers and the Funds. |
| ■ | Impact of the Transaction on the Funds and their Shareholders: (i) information regarding anticipated benefits to the Funds as a result of the Transaction; (ii) a commitment that the Funds would not bear any expenses, directly or indirectly, in connection with the Transaction; (iii) confirmation that the Advisers intend to continue to manage the Funds in a manner consistent with each Fund’s current investment objectives and principal investments strategies; and (iv) a commitment that neither NewCo nor WFAM will take any steps that would impose any “unfair burden” (as that term is used in section 15(f)(1)(B) of the 1940 Act) on the Funds as a result of the Transaction. |
With respect to the New Agreements, the Board considered: (i) a representation that, after the closing, all of the Funds will continue to be managed and advised by their current Advisers, and that the same portfolio managers of the Sub-Adviser are expected to continue to manage the Funds after the Transaction; (ii) information regarding the terms of the New Agreements, including changes as compared to the Current Agreements; (iii) information confirming that the fee rates payable under the New Agreements will not increase as a result of the Transaction as compared to the rates under the Current Agreements; and (iv) assurances that the Transaction is not expected to cause any diminution with respect to the nature, extent and quality of any of the services currently provided to the Funds by the Advisers as a result of the Transaction.
In addition to considering information furnished specifically to evaluate the impact of the Transaction on the Funds and their respective shareholders in connection with the New Agreement Approval Process, the Board considered information furnished at prior meetings of the Board and its committees, including detailed information provided in connection with the 2021 Annual Approval Process. In this regard, in connection with the 2021 Annual Approval Process, the Board received information about complex-wide and individual Fund performance, fees and expenses, including: (i) a report from an independent data provider comparing the investment performance of each Fund to the investment performance of comparable funds and benchmark indices, over various time periods; (ii) a report from an independent data provider comparing each Fund’s total expense ratio (and its components) to those of comparable funds; (iii) comparative information concerning the fees charged and services provided by the Advisers to each Fund in managing other accounts (which may include other mutual funds, collective investment funds and institutional accounts), if any, that employ investment strategies and techniques similar to those used in managing such Fund(s); and (iv) profitability analyses of Funds Management, as well as the profitability of both WFAM and Wells Fargo from providing services to the fund family as a whole.
After its deliberations, the Board unanimously determined that the compensation payable to Funds Management and the Sub-Adviser under the New Agreements is reasonable, approved the New Agreements for a two-year term, and voted to recommend that Fund shareholders approve the New Agreements. The Board considered the approval of the New Agreements as part of its consideration of agreements for funds across the complex, but its approvals were made on a fund-by-fund basis. The following summarizes a number of important, but not necessarily all, factors considered by the Board in support of its approvals.
Nature, extent and quality of services
In connection with the 2021 Annual Approval Process, the Board received and considered various information regarding the nature, extent and quality of services provided to each Fund by Funds Management and the Sub-Adviser under the Current Agreements. This information included a description of the investment advisory services and Fund-level administrative services covered by the Current Management Agreement, as well as, among other things, a summary of the background and experience of senior management of WFAM, of which Funds Management and the Sub-Adviser are a part, and a summary of investments made in the business of WFAM. The Board also received a description of Funds Management’s and the Sub-Adviser’s business continuity plans, including a summary of the performance of such plans and any changes thereto during the COVID-19 pandemic, and of their approaches to data privacy and cybersecurity. The Board also received and reviewed information about Funds Management’s role as administrator of the Funds’ liquidity risk management program, Funds Management’s approach to risk management, and Funds Management’s intermediary and vendor oversight program.
In connection with the 2021 Annual Approval Process, the Board also considered the qualifications, background, tenure and responsibilities of each of the portfolio managers primarily responsible for the day-to-day portfolio management of the Funds. The Board evaluated the ability of Funds Management and the Sub-Adviser to attract and retain qualified investment professionals, including research, advisory and supervisory personnel.
In connection with the 2021 Annual Approval Process, the Board further considered the compliance programs and compliance records of Funds Management and the Sub-Adviser. In addition, the Board took into account the full range of services provided to the Funds by Funds Management and its affiliates.
Wells Fargo VT Small Cap Growth Fund | 31
Board considerations (unaudited)
In connection with the New Agreement Approval Process, the Board considered, among other information, the structure of the Transaction and expected impact, if any, of the Transaction on the operations, facilities, organization and personnel of the Advisers. The Board received assurances from Funds Management that each Fund will continue to be advised by its current Sub-Adviser after the closing, and that the same individual portfolio managers are expected to continue to manage the Funds after the closing. With respect to the recruitment and retention of key personnel, the Board noted information from GTCR, Reverence Capital and the Advisers regarding the potential benefits for employees of joining NewCo. The Board recognized that the personnel who had been extended offers may not accept such offers, and personnel changes may occur in the future in the ordinary course.
In addition, the Board considered information regarding the infrastructure, operational capabilities and support staff in place to assist in the portfolio management and operations of the Funds, including the provision of administrative services, and the anticipated impact of the Transaction on such matters. The Board also considered the business-related and other risks to which the Advisers may be subject in managing the Funds and in connection with the Transaction. The Board also considered the transition and integration plans as a result of the change in ownership of the Advisers from Wells Fargo to NewCo. The Board considered the resources and infrastructure that NewCo intends to devote to its compliance program to ensure compliance with applicable laws and regulations, as well as its risk management program and cybersecurity program. The Board also took into account assurances received from the Advisers, GTCR and Reverence Capital that the Transaction is not expected to cause any diminution in the nature, extent and quality of services provided by the Advisers to the Funds and their shareholders.
Fund investment performance and expenses
In connection with the 2021 Annual Approval Process, the Board considered the investment performance results for each Fund over various time periods ended December 31, 2020. The Board considered these results in comparison to the investment performance of funds in a universe that was determined by Broadridge Inc. (“Broadridge”) to be similar to each Fund (the “Universe”), and in comparison to each Fund’s benchmark index and to other comparative data. Broadridge is an independent provider of investment company data. The Board received a description of the methodology used by Broadridge to select the mutual funds in the performance Universe. Where applicable, the Board received information concerning, and discussed factors contributing to, underperformance of Funds relative to the Universe and benchmark for any underperformance periods.
In connection with the 2021 Annual Approval Process, the Board also received and considered information regarding each Fund’s net operating expense ratios and their various components, including actual management fees, custodian and other non-management fees, and Rule 12b-1 and non-Rule 12b-1 shareholder service fees. The Board considered these ratios in comparison to the median ratios of funds in class-specific expense groups that were determined by Broadridge to be similar to the Fund (the “Groups”). The Board received a description of the methodology used by Broadridge to select the mutual funds in the expense Groups and an explanation of how funds comprising expense groups and their expense ratios may vary from year-to-year.
In connection with the New Agreement Approval Process, the Board received a commitment that WFAM will maintain fee and expense commitments for at least two years after the closing. The Board took into account each Fund’s investment performance and expense information among the factors considered in deciding to approve the New Agreements.
Investment management and sub-advisory fee rates
In connection with the 2021 Annual Approval Process, the Board reviewed and considered the contractual fee rates payable by each Fund to Funds Management under the Current Management Agreement, as well as the contractual fee rates payable by each Fund to Funds Management for class-level administrative services under a Class-Level Administration Agreement, which include, among other things, class-level transfer agency and sub-transfer agency costs (collectively, the “Management Rates”). The Board also reviewed and considered the contractual investment sub-advisory fee rates that are payable by Funds Management to the Sub-Adviser under the Current Sub-Advisory Agreements for investment sub-advisory services (the “Sub-Advisory Fee Rates”).
Among other information reviewed by the Board in connection with the 2021 Annual Approval Process, was a comparison of each Fund’s Management Rates with the average contractual investment management fee rates of funds in the expense Groups at a common asset level as well as transfer agency costs of the funds in the expense Groups.
In connection with the 2021 Annual Approval Process, the Board also received and considered information about the portion of the total management fee that was retained by Funds Management after payment of the Sub-Advisory Fee Rates. In assessing the reasonableness of this amount, the Board received and evaluated information about the nature and extent of responsibilities retained and risks assumed by Funds Management and not delegated to or assumed by the Sub-Adviser, and about Funds Management’s on-going oversight services. Given the affiliation between Funds Management and the Sub-Adviser, the Board ascribed limited relevance to the allocation of fees between them.
32 | Wells Fargo VT Small Cap Growth Fund
Board considerations (unaudited)
In connection with the 2021 Annual Approval Process, the Board also received and considered information about the nature and extent of services offered and fee rates charged by Funds Management and the Sub-Adviser to other types of clients, if any, with investment strategies similar to those of each Fund. In this regard, the Board received information about the significantly greater scope of services, and compliance, reporting and other legal burdens and risks of managing proprietary mutual funds compared with those associated with managing assets of other types of clients, including third-party sub-advised fund clients and non-mutual fund clients such as institutional separate accounts.
In connection with the New Agreement Approval Process, the Board noted the assurances received by it that there would be no increases to any of the Management Rates or the Sub-Advisory Fee Rates as a result of the Transaction. The Board also considered that the New Agreements do not change the computation method for calculating such fees, and there is no present intention to reduce expense waiver and reimbursement arrangements that are currently in effect. Based on its consideration of the factors and information it deemed relevant, including those described here, the Board determined that the compensation payable to Funds Management under the New Management Agreement and to the Sub-Adviser under the New Sub-Advisory Agreement was reasonable.
Profitability
In connection with the 2021 Annual Approval Process, the Board received and considered information concerning the profitability of Funds Management, as well as the profitability of both WFAM and Wells Fargo from providing services to the fund family as a whole. The Board noted that the Sub-Adviser’s profitability information with respect to providing services to each Fund and other funds in the family was subsumed in the WFAM and Wells Fargo profitability analysis.
Funds Management reported on the methodologies and estimates used in calculating profitability in connection with the 2021 Annual Approval Process, including a description of the methodology used to allocate certain expenses. Among other things, the Board noted that the levels of profitability reported on a fund-by-fund basis varied widely, depending on factors such as the size, type and age of fund.
In connection with the New Agreement Approval Process, the Board received certain information about NewCo’s projected financial condition, and reviewed with senior representatives of Funds Management, GTCR and Reverence Capital the underlying assumptions on which such information was based. The Board considered that NewCo is a newly formed entity, with no historical operations, revenues or expenses, and that it is difficult to predict with any degree of certainty the future profitability of NewCo and the Advisers from advisory activities under the New Agreements. The Board considered that the fee rates payable under the New Agreements will not increase as a result of the Transaction as compared to the rates under the Current Agreements, and that the current contractual expense limitations applicable to each Fund will not increase. The Board noted that if the New Agreements are approved by shareholders and the Transaction closes, the Board will have the opportunity in the future to review the profitability of NewCo and the Advisers from advisory activities under the New Agreements.
Economies of scale
In connection with the 2021 Annual Approval Process, the Board received and considered information about the potential for Funds Management to experience economies of scale in the provision of management services to the Funds, the difficulties of calculating economies of scale at an individual fund level, and the extent to which potential scale benefits are shared with Fund shareholders. The Board noted the existence of breakpoints in each Fund’s management fee structure, which operate generally to reduce the Fund’s expense ratios as the Fund grows in size, and the size of the Fund in relation to such breakpoints. The Board considered that, in addition to management fee breakpoints, Funds Management shares potential economies of scale from its management business in a variety of ways, including through fee waiver and expense reimbursement arrangements, competitive management fee rates set at the outset without regard to breakpoints, and investments in the business intended to enhance services available to shareholders.
In connection with the New Agreement Approval Process, the Board noted that NewCo and the Advisers may benefit from possible growth of the Funds resulting from enhanced distribution capabilities. However, the Board noted that other factors could also affect the potential for economies of scale, and that it was not possible to quantify any potential future economies of scale. Based upon the information furnished to the Board in connection with the 2021 Annual Approval Process and the New Agreement Approval Process, the Board concluded that Funds Management’s arrangements with respect to each Fund, including contractual breakpoints and expense limitation arrangements, constitute a reasonable approach to sharing potential economies of scale with the Fund and its shareholders.
“Fall-out” benefits to Funds Management and the Sub-Adviser
In connection with the 2021 Annual Approval Process, the Board received and considered information regarding potential “fall-out” or ancillary benefits received by Funds Management and its affiliates, including the Sub-Adviser, as a result of their relationships with the Funds. Ancillary benefits could include, among others, benefits directly attributable to other relationships
Wells Fargo VT Small Cap Growth Fund | 33
Board considerations (unaudited)
with the Funds and benefits potentially derived from an increase in Funds Management’s and the Sub-Adviser’s business as a result of their relationships with the Funds. The Board noted that various current affiliates of Funds Management may receive distribution-related fees, shareholder servicing payments and sub-transfer agency fees in respect of shares sold or held through them and services provided.
In connection with the 2021 Annual Approval Process, the Board also reviewed information about soft dollar credits earned and utilized by the Sub-Adviser, fees earned by Funds Management and the Sub-Adviser from managing a private investment vehicle for the fund family’s securities lending collateral, and commissions earned by an affiliated broker of Wells Fargo from portfolio transactions.
In connection with the New Agreement Approval Process, the Board received information to the effect that the Transaction is not expected to have a material impact on the fall-out benefits currently realized by Funds Management and its affiliates, including the Sub-Adviser. The information reviewed by the Board also noted that several of the ancillary benefits identified for WFAM would be potential ancillary benefits for NewCo, including that the scale and reputation of the Funds might benefit NewCo’s broader reputation, product initiatives, technology investment and talent acquisition. Based on its consideration of the factors and information it deemed relevant, including those described here, the Board did not find that any ancillary benefits expected to be received by Funds Management and its affiliates, including NewCo and the Sub-Adviser, under the New Agreements were unreasonable.
Conclusion
At the Board Meeting, after considering the above-described factors and based on its deliberations and its evaluation of the information described above, the Board unanimously determined that the compensation payable to Funds Management and the Sub-Adviser under the New Agreements is reasonable, approved the New Agreements for a two-year term, and voted to recommend that Fund shareholders approve the New Agreements.
34 | Wells Fargo VT Small Cap Growth Fund
Board considerations (unaudited)
Board Considerations - Interim Agreements
At a meeting held on May 17-19, 2021 (the “Board Meeting”), the Boards of Trustees (each, a “Board”, and collectively, the “Boards”) of Wells Fargo Funds Trust, Wells Fargo Master Trust, Wells Fargo Variable Trust, Wells Fargo Global Dividend Opportunity Fund, Wells Fargo Income Opportunities Fund, Wells Fargo Multi-Sector Income Fund and Wells Fargo Utilities and High Income Fund (each a “Trust”, and the series thereof, a “Fund”) reviewed and approved for the Trusts and Funds, as applicable: (i) interim investment management agreements (the “Interim Management Agreements”) with Wells Fargo Funds Management, LLC (“Funds Management”); (ii) interim investment advisory agreements (the “Interim Advisory Agreements”) with Funds Management; and (iii) interim sub-advisory agreements (the “Interim Sub-Advisory Agreements”) with each of Cooke & Bieler, L.P., Galliard Capital Management, LLC (“Galliard”), Peregrine Capital Management Inc., Wells Capital Management, LLC (“WellsCap”), and Wells Fargo Asset Management (International) Limited (“WFAMI”, and collectively, the “Sub-Advisers”). Each Trustee on the Board is not an “interested person” (as defined in the Investment Company Act of 1940 (the “1940 Act”) of the Funds (collectively, the “Independent Trustees”). The Interim Management Agreements, Interim Advisory Agreements, and Interim Sub-Advisory Agreements are collectively referred to as the “Interim Advisory Agreements.”
At the Board Meeting, the Boards reviewed and approved the continuation of existing investment management, advisory and sub-advisory agreements (the “Current Advisory Agreements”) for each Trust and Fund, as applicable. The factors considered and conclusions reached by the Boards in approving the Current Advisory Agreements are summarized in the section entitled “Board Considerations – Current Agreements” of this shareholder report. The Boards noted that Wells Fargo & Company has entered into a definitive agreement to sell Wells Fargo Asset Management (“WFAM”), which includes Funds Management, Galliard, WellsCap and WFAMI (the “Affiliated Sub-Advisers”), to a holding company affiliated with private funds of GTCR LLC and Reverence Capital Partners, L.P. (the “Transaction”). The Boards further noted that the Transaction would result in a change-of-control of Funds Management and the Affiliated Sub-Advisers, which would be considered to be an “assignment” under the 1940 Act that would terminate the Current Advisory Agreements. At the Board Meeting, the Boards also reviewed and approved new investment management, advisory and sub-advisory agreements (the “New Advisory Agreements”) for each Trust and Fund, as applicable, that would replace the Current Advisory Agreements upon consummation of the Transaction, subject to approval of the New Advisory Agreements by the applicable Trust’s or Fund’s shareholders. The factors considered and conclusions reached by the Boards in approving the New Advisory Agreements are summarized in the section entitled “Board Considerations – New Agreements” of this shareholder report.
At the Board Meeting, the Boards also approved the Interim Advisory Agreements, which will go into effect for a Trust or Fund only in the event that shareholders of such Trust or Fund do not approve the New Advisory Agreement(s) for the Trust or Fund by the closing date of the Transaction, when the Current Advisory Agreements will terminate. The Board noted that, in such a circumstance, the Interim Advisory Agreements will permit continuity of management by allowing Funds Management and the Sub-Advisers to continue providing services to the Trust or Fund pursuant to the Interim Advisory Agreements while the Trust or Fund continues to solicit shareholder approval of such New Advisory Agreement(s). The Boards noted that the terms of the Interim Advisory Agreements are identical to those of the Current Advisory Agreements, except for the term and the addition of escrow provisions with respect to the advisory fees. The Boards also noted that the entities that would service the Funds and Trusts under the Interim Advisory Agreements are identical to those that provide services under the Current Advisory Agreements and those that will provide services under the New Advisory Agreements.
In approving the Interim Advisory Agreements, the Boards considered the same factors and reached the same conclusions as they considered and reached with respect to the Boards’ approvals of the Current Advisory Agreements and New Advisory Agreements, as applicable, which are described in separate Board Consideration sections within this shareholder report. Prior to the Board Meeting, including at a series of meetings held in April and May 2021, the Trustees conferred extensively among themselves and with senior representatives of Funds Management, GTCR LLC and Reverence Capital Partners, L.P. about the Interim Advisory Agreements and related matters. The Independent Trustees were assisted in their evaluation of the Interim Advisory Agreements by independent legal counsel, from whom they received separate legal advice and with whom they met separately.
At the Board Meeting, after considering the factors and reaching the conclusions described in the separate Board Consideration sections within this shareholder report, the Boards unanimously determined that the compensation payable to Funds Management and to each Sub-Adviser under each of the Interim Advisory Agreements was reasonable, and approved the Interim Advisory Agreements.
Wells Fargo VT Small Cap Growth Fund | 35
For more information
More information about Wells Fargo Funds is available free upon request. To obtain literature, please write, visit the Fund's website, or call:
Wells Fargo Funds
P.O. Box 219967
Kansas City, MO 64121-9967
Website: wfam.com
Individual investors: 1-800-222-8222
Retail investment professionals: 1-888-877-9275
Institutional investment professionals: 1-866-765-0778
This report and the financial statements contained herein are submitted for the general information of the shareholders of the Fund. If this report is used for promotional purposes, distribution of the report must be accompanied or preceded by a current prospectus. Before investing, please consider the investment objectives, risks, charges, and expenses of the investment. For a current prospectus and, if available, a summary prospectus, containing this information, call 1-800-260-5969 or visit the Fund's website at wfam.com. Read the prospectus carefully before you invest or send money.
Wells Fargo Asset Management (WFAM) is the trade name for certain investment advisory/management firms owned by Wells Fargo & Company. These firms include but are not limited to Wells Capital Management, LLC and Wells Fargo Funds Management, LLC. Certain products managed by WFAM entities are distributed by Wells Fargo Funds Distributor, LLC (a broker-dealer and Member FINRA).
This material is for general informational and educational purposes only and is NOT intended to provide investment advice or a recommendation of any kind - including a recommendation for any specific investment, strategy, or plan.
INVESTMENT PRODUCTS: NOT FDIC INSURED ■ NO BANK GUARANTEE ■ MAY LOSE VALUE
© 2021 Wells Fargo & Company. All rights reserved.
PAR-0721-00698 08-21
SVT7/SAR144 06-21
ITEM 2. CODE OF ETHICS
Not applicable.
ITEM 3. AUDIT COMMITTEE FINANCIAL EXPERT
Not applicable.
ITEM 4. PRINCIPAL ACCOUNTANT FEES AND SERVICES
Not applicable.
ITEM 5. AUDIT COMMITTEE OF LISTED REGISTRANTS
Not applicable.
ITEM 6. INVESTMENTS
A Portfolio of Investments for each series of Wells Fargo Variable Trust is included as part of the report to shareholders filed under Item 1 of this Form.
ITEM 7. DISCLOSURE OF PROXY VOTING POLICIES AND PROCEDURES FOR CLOSED-END MANAGEMENT INVESTMENT COMPANIES
Not applicable.
ITEM 8. PORTFOLIO MANAGERS OF CLOSED-END MANAGEMENT INVESTMENT COMPANIES
Not applicable.
ITEM 9. PURCHASES OF EQUITY SECURITIES BY CLOSED-END MANAGEMENT INVESTMENT COMPANY AND AFFILIATED PURCHASERS
Not applicable.
ITEM 10. SUBMISSION OF MATTERS TO A VOTE OF SECURITY HOLDERS
There have been no material changes to the procedures by which shareholders may recommend nominees to the registrant’s Board of Trustees that have been implemented since the registrant’s last provided disclosure in response to the requirements of this Item.
ITEM 11. CONTROLS AND PROCEDURES
(a) The President and Treasurer have concluded that the Wells Fargo Variable Trust disclosure controls and procedures (as defined in Rule 30a-3(c) under the Investment Company Act of 1940) provide reasonable assurances that material information relating to the registrant is made known to them by the appropriate persons, based on their evaluation of these controls and procedures as of a date within 90 days of the filing of this report.
(b) There were no significant changes in the registrant’s internal controls over financial reporting (as defined in Rule 30a-3(d) under the Investment Company Act of 1940) that occurred during the most recent fiscal half-year of the period covered by this report that materially affected, or is reasonably likely to materially affect, the registrant’s internal control over financial reporting.
ITEM 12. DISCLOSURES OF SECURITIES LENDING ACTIVITES FOR CLOSED-END MANAGEMENT INVESTMENT COMPANIES
Not applicable.
ITEM 13. EXHIBITS
(a)(1) Not applicable.
(a)(2) Certifications pursuant to Section 302 of the Sarbanes-Oxley Act of 2002.
(b) Certifications pursuant to Section 906 of the Sarbanes-Oxley Act of 2002.
SIGNATURES
Pursuant to the requirements of the Securities Exchange Act of 1934 and the Investment Company Act of 1940, the registrant has duly caused this report to be signed on its behalf by the undersigned, thereunto duly authorized.
| | |
Wells Fargo Variable Trust |
| | |
| By: | | |
| | /s/ Andrew Owen |
| | Andrew Owen |
| | President |
| Date: | | August 27, 2021 |
Pursuant to the requirements of the Securities Exchange Act of 1934 and the Investment Company Act of 1940, this report has been signed below by the following persons on behalf of the registrant and in the capacities and on the date indicated.
| | |
Wells Fargo Variable Trust |
| | |
| By: | | |
| | /s/ Andrew Owen |
| | Andrew Owen |
| | President |
| Date: | | August 27, 2021 |
| By: | | |
| | /s/ Jeremy DePalma |
| | Jeremy DePalma |
| | Treasurer |
| Date: | | August 27, 2021 |