                                  UNITED STATES
                       SECURITIES AND EXCHANGE COMMISSION
                             Washington, D.C. 20549

                                   FORM N-CSR

                   CERTIFIED SHAREHOLDER REPORT OF REGISTERED
                         MANAGEMENT INVESTMENT COMPANIES

Investment Company Act file number: 811-09259

Morgan Stanley Total Market Index Fund
               (Exact name of registrant as specified in charter)

1221 Avenue of the Americas, New York, New York 10020
    (Address of principal executive offices)                   (Zip code)

Ronald E. Robison
1221 Avenue of the Americas, New York, New York 10020
                     (Name and address of agent for service)

Registrant's telephone number, including area code: 212-762-4000

Date of fiscal year end: July 31, 2003

Date of reporting period: July 31, 2003
Item 1 - Report to Stockholders
Welcome, Shareholder:
In this report, you'll learn about how your investment in Morgan Stanley Total Market Index Fund performed during the annual period. The portfolio management team will provide an overview of the market climate, and discuss some of the factors that helped or hindered performance during the reporting period. In addition, this report includes the Fund's financial statements and a list of Fund investments, as well as other information.
| This material must be preceded or accompanied by a prospectus for the fund being offered. Market forecasts provided in this report may not necessarily come to pass. There is no assurance that the Fund will achieve its investment objective. The Fund is subject to market risk. which is the possibility that the market values of securities owned by the Fund will decline and, therefore, the value of the Fund shares may be less than what you paid for them. Accordingly, you can lose money investing in this Fund. |
| Fund Report | |
| For the year ended July 31, 2003 | |
Total Return for the 12-Month Period Ended July 31, 2003
| Class A | Class B | Class C | Class D | Wilshire 5000 Total Market Index1 | Lipper Multi-Cap Core Funds Index2 | |||||||||||||||||||||||||||
| 11.23% | 10.46 | % | 10.31 | % | 11.54 | % | 12.70 | % | 12.10 | % | ||||||||||||||||||||||
| The performance of the Fund's four share classes varies because each has different expenses. The Fund's total return figures assume the reinvestment of all distributions but do not reflect the deduction of any applicable sales charges. Such costs would lower performance. Past performance is no guarantee of future results. See Performance Summary for standardized performance information. |
Market Conditions
Throughout the fiscal year ended July 31, 2003, economic data transmitted mixed signals regarding the economy's underlying strength. Investor confidence continued to waver during the early part of the period, aggravated by concerns about corporate governance and a perceived lack of balance sheet integrity. Although the weakness in equities was fairly broadly based, technology companies were hit especially hard as corporations trimmed their capital spending on equipment. In addition, downward earnings revisions continued to afflict the telecommunications sector. Investor sentiment was further dampened by geopolitical tensions leading up to the war in Iraq.
Although these negative forces held investors' attention during most of the first three months of 2003, under the surface financial conditions were improving. An accommodative fiscal and monetary policy signaled to many that the economy might potentially recover in the near future. Recognizing strong values among equities, investors began to return to the market by the end of March. The surprisingly quick and successful conclusion to the Iraq conflict triggered a strong market rally that saw the Wilshire 5000 Index appreciate more than 25 percent from its mid-March lows. By July 31, the Index had posted five consecutive positive months, a feat it hadn't accomplished since September 1998.
Performance Analysis
The Fund slightly underperformed its benchmark Wilshire 5000 Index for the 12-month period under review. Because owning all the securities in the Index is impractical, the Fund uses a statistical sampling approach in an attempt to replicate the Index in terms of industry, size, dividend yield and other characteristics. As a result, it is not unusual for the Fund to have periods of both outperformance and underperformance relative to the Index on a fee-adjusted basis.
Sector performance during the period showed a clear demarcation between the best and worst performers. Areas such as technology and financials that suffered the worst during the bear market counted among the best performers during the rebound, at least partially because of their low valuations. Conversely, bear-market stalwarts like consumer staples lagged in the late-period rally.
2
| TOP 10 HOLDINGS | ||||||
| Microsoft Corp. | 2.4 | % | ||||
| General Electric Co. | 2.4 | |||||
| Pfizer, Inc. | 2.2 | |||||
| Exxon Mobil Corp. | 2.0 | |||||
| Citigroup, Inc. | 2.0 | |||||
| Wal-Mart Stores, Inc. | 1.9 | |||||
| Intel Corp. | 1.4 | |||||
| American International Group, Inc. | 1.4 | |||||
| Johnson & Johnson | 1.3 | |||||
| Cisco Systems, Inc. | 1.2 | |||||
| TOP FIVE INDUSTRIES | ||||||
| Pharmaceuticals: Major | 6.9 | % | ||||
| Major Banks | 4.2 | |||||
| Financial Conglomerates | 3.8 | |||||
| Packaged Software | 3.7 | |||||
| Industrial Conglomerates | 3.6 | |||||
| Subject to change daily. All percentages are as a percentage of net assets. Provided for informational purposes only and should not be deemed as a recommendation to buy the securities mentioned. Morgan Stanley is a full-service securities firm engaged in securities trading and brokerage activities, investment banking, research and analysis, financing and financial advisory services. |
Investment Strategy
| 1. | The Fund substantially invests in stocks included within the Wilshire 5000 Total Market Index, which consists of substantially all the stocks actively traded in the United States (currently more than 7,000). |
| 2. | The Fund's stock selection is based on statistical sampling, used in an attempt to recreate the Index in terms of industry, size, dividend yield and other characteristics. |
| 3. | The Fund generally expects that its portfolio will include the largest 2,500 to 3,000 U.S. stocks, as measured by market capitalization. |
Annual Householding Notice
To reduce printing and mailing costs, the Fund attempts to eliminate duplicate mailings to the same address. The Fund delivers a single copy of certain shareholder documents, including shareholder reports, prospectuses and proxy materials, to investors with the same last name who reside at the same address. Your participation in this program will continue for an unlimited period of time unless you instruct us otherwise. You can request multiple copies of these documents by calling (800) 350-6414, 8:00 a.m. to 8:00 p.m. ET. Once our Customer Service Center has received your instructions, we will begin sending individual copies for each account within 30 days.
Proxy Voting Policies and Procedures
A description of the Fund's policies and procedures with respect to the voting of proxies relating to the Fund's portfolio securities is available without charge, upon request, by calling (800) 869-NEWS. This information is also available on the Securities and Exchange Commission's website at http://www.sec.gov.
3
| Performance Summary | |
Performance of a $10,000 Investment
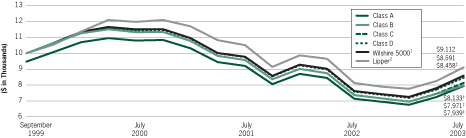
| Past performance is not predictive of future returns. Investment return and principal value will fluctuate. When you sell fund shares, they may be worth less than their original cost. The graph and table do not reflect the deduction of taxes that a shareholder would pay on fund distributions or the redemption of fund shares. Performance for Class A, Class B, Class C, and Class D shares will vary due to differences in sales charges and expenses. |
4
Average Annual Total Returns — Period Ended July 31, 2003
| Class A Shares* (since 09/28/99) | Class B Shares** (since 09/28/99) | Class C Shares† (since 09/28/99) | Class D Shares†† (since 09/28/99) | |||||||||||||||||||||||
| Symbol | TMIAX | TMIBX | TMICX | TMIDX | ||||||||||||||||||||||
| 1 Year | 11.23% | 3 | 10.46% | 3 | 10.31% | 3 | 11.54% | 3 | ||||||||||||||||||
| 5.39 | 4 | 5.46 | 4 | 9.31 | 4 | |||||||||||||||||||||
| Since Inception | (4.50) | 3 | (5.24) | 3 | (5.24) | 3 | (4.27) | 3 | ||||||||||||||||||
| (5.84) | 4 | (5.74) | 4 | (5.24) | 4 | |||||||||||||||||||||
Notes on Performance
| (1) | The Wilshire 5000 Total Market Index measures the performance of all U.S. headquartered equity securities and is the best measure of the entire U.S. stock market. Over 7,000 capitalization weighted security returns are used to adjust the Index. The Index does not include any expenses, fees or charges. Such costs would lower performance. It is not possible to invest directly in an index. |
| (2) | The Lipper Multi-Cap Core Funds Index is an equally weighted performance index of the largest qualifying funds (based on net assets) in the Lipper Multi-Cap Core Funds classification. The Index, which is adjusted for capital gains distributions and income dividends, is unmanaged and should not be considered an investment. There are currently 30 funds represented in this Index. |
| (3) | Figure shown assumes reinvestment of all distributions and does not reflect the deduction of any sales charges. |
| (4) | Figure shown assumes reinvestment of all distributions and the deduction of the maximum applicable sales charge. See the Fund's current prospectus for complete details on fees and sales charges. |
| * | The maximum front-end sales charge for Class A is 5.25%. |
| ** | The maximum contingent deferred sales charge (CDSC) for Class B is 5.0%. The CDSC declines to 0% after six years. |
| † | The maximum contingent deferred sales charge for Class C is 1.0% for shares redeemed within one year of purchase. |
| †† | Class D has no sales charge. |
| ‡ | Closing value assuming a complete redemption on July 31, 2003. |
5
Morgan Stanley Total Market Index Fund
Portfolio of Investments  July 31, 2003
| NUMBER OF SHARES | VALUE | ||||||||||
| Common Stocks and Warrants (97.8%) | |||||||||||
| Advertising/Marketing Services (0.3%) | |||||||||||
| 1,044 | Abitron Inc.* | $ | 38,837 | ||||||||
| 542 | ADVO, Inc.* | 25,176 | |||||||||
| 1,225 | Catalina Marketing Corp.* | 20,617 | |||||||||
| 3,396 | DoubleClick Inc.* | 38,103 | |||||||||
| 8,397 | Gemstar-TV Guide International, Inc.* | 39,550 | |||||||||
| 1,099 | Getty Images, Inc.* | 41,905 | |||||||||
| 34 | Grey Global Group Inc. | 26,520 | |||||||||
| 1,753 | Harte-Hanks Inc. | 33,675 | |||||||||
| 8,045 | Interpublic Group of Companies, Inc. | 111,021 | |||||||||
| 1,888 | Lamar Advertising Co.* | 64,777 | |||||||||
| 3,794 | Omnicom Group, Inc. | 280,301 | |||||||||
| 787 | R.H. Donnelley Corp.* | 31,086 | |||||||||
| 1,086 | Valassis Communications, Inc.* | 30,745 | |||||||||
| 782,313 | |||||||||||
| Aerospace & Defense (1.0%) | |||||||||||
| 834 | Alliant Techsystems, Inc.* | 45,787 | |||||||||
| 16,776 | Boeing Co. | 555,621 | |||||||||
| 481 | Cubic Corp. | 11,866 | |||||||||
| 239 | Curtiss-Wright Corp. | 14,985 | |||||||||
| 473 | DRS Technologies, Inc.* | 12,974 | |||||||||
| 351 | Engineered Support Systems, Inc. | 15,532 | |||||||||
| 764 | FLIR Systems, Inc.* | 20,704 | |||||||||
| 3,986 | General Dynamics Corp. | 316,249 | |||||||||
| 2,523 | Goodrich Corp. | 58,029 | |||||||||
| 1,892 | L-3 Communications Holdings, Inc.* | 92,859 | |||||||||
| 9,018 | Lockheed Martin Corp. | 472,002 | |||||||||
| 3,629 | Northrop Grumman Corp. | 334,739 | |||||||||
| 1,300 | Precision Castparts Corp. | 41,925 | |||||||||
| 7,890 | Raytheon Co. | 242,223 | |||||||||
| 3,768 | Rockwell Collins, Inc. | 98,081 | |||||||||
| 1,755 | Titan Corp. (The)* | 26,922 | |||||||||
| 907 | United Defense Industries, Inc.* | 23,029 | |||||||||
| 2,383,527 | |||||||||||
| Agricultural Commodities/Milling (0.1%) | |||||||||||
| 14,031 | Archer-Daniels-Midland Co. | $ | 184,367 | ||||||||
| 2,150 | Bunge Limited (Bermuda) | 64,392 | |||||||||
| 938 | Corn Products International, Inc. | 29,359 | |||||||||
| 1,066 | Delta & Pine Land Co. | 26,341 | |||||||||
| 304,459 | |||||||||||
| Air Freight/Couriers (0.9%) | |||||||||||
| 1,110 | Airborne Inc. | 25,019 | |||||||||
| 1,875 | C.H. Robinson Worldwide, Inc. | 69,225 | |||||||||
| 1,161 | CNF Inc. | 32,334 | |||||||||
| 1,217 | EGL, Inc.* | 20,105 | |||||||||
| 2,307 | Expeditors International of Washington, Inc. | 78,230 | |||||||||
| 6,066 | FedEx Corp. | 390,590 | |||||||||
| 22,777 | United Parcel Service, Inc. (Class B) | 1,436,773 | |||||||||
| 2,052,276 | |||||||||||
| Airlines (0.2%) | |||||||||||
| 1,497 | AirTran Holdings, Inc.* | 19,506 | |||||||||
| 3,203 | AMR Corp.* | 29,948 | |||||||||
| 1,498 | Continental Airlines, Inc. (Class B)* | 21,916 | |||||||||
| 2,634 | Delta Air Lines, Inc. | 31,345 | |||||||||
| 1,367 | ExpressJet Holdings, Inc.* | 18,372 | |||||||||
| 1,328 | JetBlue Airways Corp.* | 60,504 | |||||||||
| 2,003 | Northwest Airlines Corp. (Class A)* | 18,227 | |||||||||
| 1,185 | SkyWest, Inc. | 22,148 | |||||||||
| 15,655 | Southwest Airlines Co. | 256,899 | |||||||||
| 478,865 | |||||||||||
| Alternative Power Generation (0.0%) | |||||||||||
| 7,418 | Calpine Corp.* | 42,357 | |||||||||
| Aluminum (0.3%) | |||||||||||
| 28,873 | Alcoa, Inc. | 801,803 | |||||||||
See Notes to Financial Statements
6
Morgan Stanley Total Market Index Fund
Portfolio of Investments July 31, 2003 continued
| NUMBER OF SHARES | VALUE | ||||||||||
| Apparel/Footwear (0.4%) | |||||||||||
| 3,484 | Cintas Corp. | $ | 144,098 | ||||||||
| 1,770 | Coach, Inc.* | 93,810 | |||||||||
| 847 | Columbia Sportswear Co.* | 44,883 | |||||||||
| 2,660 | Jones Apparel Group, Inc. | 77,007 | |||||||||
| 562 | K-Swiss, Inc. (Class A) | 21,170 | |||||||||
| 640 | Kellwood Co. | 21,024 | |||||||||
| 2,283 | Liz Claiborne, Inc. | 78,604 | |||||||||
| 5,390 | Nike, Inc. (Class B) | 278,879 | |||||||||
| 1,189 | Polo Ralph Lauren Corp. | 31,401 | |||||||||
| 1,186 | Quiksilver, Inc.* | 20,494 | |||||||||
| 1,497 | Reebok International Ltd. | 49,251 | |||||||||
| 761 | Russell Corp. | 15,152 | |||||||||
| 923 | Timberland Co. (Class A)* | 41,369 | |||||||||
| 2,401 | VF Corp. | 91,550 | |||||||||
| 907 | Wolverine World Wide, Inc. | 17,324 | |||||||||
| 1,026,016 | |||||||||||
| Apparel/Footwear Retail (0.5%) | |||||||||||
| 2,026 | Abercrombie & Fitch Co. (Class A)* | 65,014 | |||||||||
| 725 | Aeropostale, Inc.* | 18,959 | |||||||||
| 1,510 | American Eagle Outfitters, Inc.* | 33,462 | |||||||||
| 943 | AnnTaylor Stores Corp.* | 26,640 | |||||||||
| 912 | Burlington Coat Factory Warehouse Corp. | 16,808 | |||||||||
| 1,726 | Chico's FAS, Inc.* | 46,861 | |||||||||
| 477 | Christopher & Banks Corp.* | 18,865 | |||||||||
| 3,107 | Foot Locker, Inc. | 46,481 | |||||||||
| 17,587 | Gap, Inc. (The) | 316,390 | |||||||||
| 631 | Hot Topic, Inc.* | 18,236 | |||||||||
| 10,793 | Limited Brands, Inc. | 180,351 | |||||||||
| 921 | Men's Wearhouse, Inc. (The)* | 23,311 | |||||||||
| 2,893 | Nordstrom, Inc. | 61,071 | |||||||||
| 912 | Pacific Sunwear of California, Inc.* | 27,679 | |||||||||
| 1,379 | Payless ShoeSource, Inc.* | 18,203 | |||||||||
| 1,558 | Ross Stores, Inc. | 71,201 | |||||||||
| 1,272 | Talbot's, Inc. (The) | 41,963 | |||||||||
| 10,539 | TJX Companies, Inc. (The) | 204,984 | |||||||||
| 774 | Too, Inc.* | 14,242 | |||||||||
| 366 | Urban Outfitters, Inc.* | 14,545 | |||||||||
| 1,265,266 | |||||||||||
| Auto Parts: O.E.M. (0.3%) | |||||||||||
| 1,027 | American Axle & Manufacturing Holdings, Inc.* | $ | 29,732 | ||||||||
| 1,585 | ArvinMeritor, Inc. | 28,926 | |||||||||
| 626 | BorgWarner, Inc. | 41,798 | |||||||||
| 3,239 | Dana Corp. | 49,881 | |||||||||
| 11,618 | Delphi Corp. | 97,591 | |||||||||
| 1,625 | Eaton Corp. | 136,776 | |||||||||
| 1,784 | Gentex Corp.* | 63,403 | |||||||||
| 1,932 | Johnson Controls, Inc. | 186,651 | |||||||||
| 1,459 | Lear Corp.* | 75,839 | |||||||||
| 860 | Modine Manufacturing Co. | 18,266 | |||||||||
| 770 | Superior Industries International, Inc. | 33,287 | |||||||||
| 3,098 | Visteon Corp. | 19,610 | |||||||||
| 781,760 | |||||||||||
| Automotive Aftermarket (0.0%) | |||||||||||
| 513 | Bandag, Inc. | 18,063 | |||||||||
| 729 | CLARCOR Inc. | 29,328 | |||||||||
| 1,725 | Cooper Tire & Rubber Co. | 29,325 | |||||||||
| 3,566 | Goodyear Tire & Rubber Co. (The) | 19,649 | |||||||||
| 96,365 | |||||||||||
| Beverages: Alcoholic (0.5%) | |||||||||||
| 16,948 | Anheuser-Busch Companies, Inc. | 878,245 | |||||||||
| 1,247 | Brown-Forman Corp. (Class B) | 97,141 | |||||||||
| 1,778 | Constellation Brands Inc. (Class A)* | 51,295 | |||||||||
| 749 | Coors (Adolph) Co. (Class B) | 38,484 | |||||||||
| 1,065,165 | |||||||||||
| Beverages: Non-Alcoholic (1.1%) | |||||||||||
| 48,711 | Coca-Cola Co. (The) | 2,190,534 | |||||||||
| 8,614 | Coca-Cola Enterprises Inc. | 146,869 | |||||||||
| 5,322 | Pepsi Bottling Group, Inc. (The) | 116,978 | |||||||||
| 2,846 | PepsiAmericas, Inc.* | 38,193 | |||||||||
| 2,492,574 | |||||||||||
See Notes to Financial Statements
7
Morgan Stanley Total Market Index Fund
Portfolio of Investments July 31, 2003 continued
| NUMBER OF SHARES | VALUE | ||||||||||
| Biotechnology (1.9%) | |||||||||||
| 1,999 | Abgenix, Inc.* | $ | 25,367 | ||||||||
| 1,255 | Affymetrix, Inc.* | 30,120 | |||||||||
| 1,304 | Alkermes, Inc.* | 17,213 | |||||||||
| 25,398 | Amgen Inc.* | 1,767,193 | |||||||||
| 1,940 | Amylin Pharmaceuticals, Inc.* | 46,502 | |||||||||
| 1,936 | Applera Corp. – Celera Genomics Group* | 19,476 | |||||||||
| 3,086 | Biogen, Inc.* | 118,564 | |||||||||
| 1,390 | BioMarin Pharmaceutical, Inc.* | 15,068 | |||||||||
| 1,686 | Celgene Corp.* | 61,724 | |||||||||
| 1,210 | Cephalon, Inc.* | 60,476 | |||||||||
| 816 | Charles River Laboratories International, Inc.* | 30,323 | |||||||||
| 3,674 | Chiron Corp.* | 167,534 | |||||||||
| 689 | CV Therapeutics, Inc.* | 24,590 | |||||||||
| 817 | Enzo Biochem, Inc.* | 16,936 | |||||||||
| 1,101 | Enzon, Inc.* | 14,941 | |||||||||
| 556 | Gen-Probe Inc.* | 30,580 | |||||||||
| 1,541 | Genencor International Inc.* | 25,781 | |||||||||
| 4,411 | Genentech, Inc.* | 356,188 | |||||||||
| 1,542 | Genta Inc.* | 20,401 | |||||||||
| 4,263 | Genzyme Corp.* | 215,026 | |||||||||
| 3,903 | Gilead Sciences, Inc.* | 267,551 | |||||||||
| 2,768 | Human Genome Sciences, Inc.* | 38,005 | |||||||||
| 1,309 | ICOS Corp.* | 57,099 | |||||||||
| 3,122 | IDEC Pharmaceuticals Corp.* | 105,648 | |||||||||
| 974 | IDEXX Laboratories, Inc.* | 39,418 | |||||||||
| 884 | ILEX Oncology, Inc.* | 14,754 | |||||||||
| 1,507 | ImClone Systems, Inc.* | 63,023 | |||||||||
| 713 | InterMune Inc.* | 13,404 | |||||||||
| 1,105 | Invitrogen Corp.* | 57,239 | |||||||||
| 1,321 | Ligand Pharmaceuticals Inc. (Class B)* | 16,948 | |||||||||
| 532 | Martek Biosciences Corp.* | 25,813 | |||||||||
| 1,047 | Medicines Company (The)* | 28,426 | |||||||||
| 5,040 | MedImmune, Inc.* | 197,518 | |||||||||
| 5,778 | Millennium Pharmaceuticals, Inc.* | 72,572 | |||||||||
| 666 | Neurocrine Biosciences, Inc.* | 35,751 | |||||||||
| 862 | NPS Pharmaceuticals, Inc.* | $ | 22,007 | ||||||||
| 805 | OSI Pharmaceuticals Inc.* | 27,056 | |||||||||
| 2,090 | Protein Design Labs, Inc.* | 26,668 | |||||||||
| 2,295 | SICOR Inc.* | 44,752 | |||||||||
| 948 | Tanox, Inc.* | 16,220 | |||||||||
| 927 | Techne Corp.* | 29,970 | |||||||||
| 456 | Trimeris, Inc.* | 20,224 | |||||||||
| 1,328 | Tularik Inc.* | 15,126 | |||||||||
| 1,739 | Vertex Pharmaceuticals, Inc.* | 25,198 | |||||||||
| 1,051 | Zymogenetics, Inc.* | 14,640 | |||||||||
| 4,339,033 | |||||||||||
| Broadcasting (0.5%) | |||||||||||
| 12,181 | Clear Channel Communications, Inc. | 498,812 | |||||||||
| 966 | Cox Radio, Inc. (Class A)* | 20,238 | |||||||||
| 1,046 | Cumulus Media, Inc. (Class A)* | 18,295 | |||||||||
| 1,281 | Emmis Communications Corp. (Class A)* | 25,633 | |||||||||
| 1,245 | Entercom Communications Corp.* | 59,001 | |||||||||
| 1,723 | Entravision Communications Corp. (Class A)* | 18,350 | |||||||||
| 2,111 | Hearst-Argyle Television, Inc.* | 47,709 | |||||||||
| 2,331 | Hispanic Broadcasting Corp.* | 61,026 | |||||||||
| 544 | Liberty (Corp.) (The) | 23,599 | |||||||||
| 567 | Lin TV Corp. (Class A)* | 12,349 | |||||||||
| 2,142 | Radio One, Inc. (Class A)* | 36,031 | |||||||||
| 1,191 | Sinclair Broadcast Group, Inc. (Class A)* | 12,303 | |||||||||
| 18,230 | Sirius Satellite Radio Inc. * | 32,814 | |||||||||
| 4,647 | Univision Communications Inc. (Class A)* | 144,986 | |||||||||
| 2,166 | Westwood One, Inc.* | 66,150 | |||||||||
| 2,188 | XM Satellite Radio Holdings Inc. (Class A)* | 30,085 | |||||||||
| 1,107,381 | |||||||||||
| Building Products (0.2%) | |||||||||||
| 1,650 | American Standard Companies, Inc.* | 126,060 | |||||||||
| 1,468 | Lennox International Inc. | 23,415 | |||||||||
See Notes to Financial Statements
8
Morgan Stanley Total Market Index Fund
Portfolio of Investments July 31, 2003 continued
| NUMBER OF SHARES | VALUE | ||||||||||
| 9,731 | Masco Corp. | $ | 237,144 | ||||||||
| 632 | Simpson Manufacturing Co., Inc.* | 28,225 | |||||||||
| 954 | York International Corp. | 27,962 | |||||||||
| 442,806 | |||||||||||
| Cable/Satellite TV (1.3%) | |||||||||||
| 4,693 | Cablevision Systems New York Group (Class A)* | 99,961 | |||||||||
| 5,974 | Charter Communications, Inc. (Class A)* | 29,093 | |||||||||
| 45,584 | Comcast Corp. (Class A)* | 1,382,107 | |||||||||
| 11,889 | Cox Communications, Inc. (Class A)* | 377,951 | |||||||||
| 4,948 | EchoStar Communications Corp. (Class A)* | 179,464 | |||||||||
| 22,164 | General Motors Corp. (Class H)* | 304,312 | |||||||||
| 1,229 | Insight Communications Co., Inc.* | 16,714 | |||||||||
| 49,010 | Liberty Media Corp. (Class A)* | 543,521 | |||||||||
| 2,167 | Mediacom Communications Corp. * | 20,413 | |||||||||
| 2,953,536 | |||||||||||
| Casino/Gaming (0.3%) | |||||||||||
| 1,124 | Alliance Gaming Corp.* | 23,975 | |||||||||
| 661 | Argosy Gaming Co.* | 15,335 | |||||||||
| 789 | Aztar Corp.* | 14,896 | |||||||||
| 1,194 | Boyd Gaming Corp. | 19,044 | |||||||||
| 1,227 | GTECH Holdings Corp. | 47,325 | |||||||||
| 2,218 | Harrah's Entertainment, Inc. | 96,816 | |||||||||
| 6,940 | International Game Technology | 176,623 | |||||||||
| 1,364 | Mandalay Resort Group | 47,413 | |||||||||
| 3,059 | MGM Mirage * | 104,924 | |||||||||
| 5,818 | Park Place Entertainment Corp.* | 52,071 | |||||||||
| 783 | Penn National Gaming, Inc.* | 16,834 | |||||||||
| 1,102 | Station Casinos, Inc. | 31,958 | |||||||||
| 647,214 | |||||||||||
| Chemicals: Agricultural (0.1%) | |||||||||||
| 2,422 | IMC Global Inc. | $ | 17,705 | ||||||||
| 5,196 | Monsanto Co. | 119,508 | |||||||||
| 767 | Scotts Company (The) (Class A)* | 40,651 | |||||||||
| 177,864 | |||||||||||
| Chemicals: Major Diversified (0.8%) | |||||||||||
| 1,316 | Cabot Corp. | 35,900 | |||||||||
| 18,259 | Dow Chemical Co. (The) | 644,543 | |||||||||
| 19,704 | Du Pont (E.I.) de Nemours & Co. | 865,794 | |||||||||
| 1,496 | Eastman Chemical Co. | 54,305 | |||||||||
| 2,817 | Engelhard Corp. | 74,031 | |||||||||
| 2,434 | Hercules Inc.* | 27,796 | |||||||||
| 4,387 | Rohm & Haas Co. | 155,168 | |||||||||
| 1,857,537 | |||||||||||
| Chemicals: Specialty (0.4%) | |||||||||||
| 4,496 | Air Products & Chemicals, Inc. | 208,974 | |||||||||
| 1,633 | Airgas, Inc. | 31,746 | |||||||||
| 1,081 | Albemarle Corp. | 29,500 | |||||||||
| 669 | Cambrex Corp. | 14,169 | |||||||||
| 2,198 | Crompton Corp. | 13,694 | |||||||||
| 841 | Cytec Industries, Inc.* | 32,479 | |||||||||
| 662 | FMC Corp.* | 15,822 | |||||||||
| 689 | Georgia Gulf Corp. | 15,764 | |||||||||
| 1,089 | Great Lakes Chemical Corp. | 23,740 | |||||||||
| 1,351 | Lubrizol Corp. (The) | 45,110 | |||||||||
| 3,644 | Lyondell Chemical Co. | 54,551 | |||||||||
| 1,455 | Millennium Chemicals Inc. | 16,238 | |||||||||
| 1,328 | NL Industries, Inc. | 23,692 | |||||||||
| 3,394 | Praxair, Inc. | 219,456 | |||||||||
| 1,125 | Sensient Technologies Corp. | 24,041 | |||||||||
| 1,568 | Sigma-Aldrich Corp. | 89,329 | |||||||||
| 2,846 | Valhi, Inc. | 29,541 | |||||||||
| 887,846 | |||||||||||
| Coal (0.1%) | |||||||||||
| 1,222 | Arch Coal, Inc. | 25,112 | |||||||||
| 1,635 | CONSOL Energy, Inc. | 30,493 | |||||||||
| 1,820 | Massey Energy Co. | 20,839 | |||||||||
| 1,256 | Peabody Energy Corp. | 38,547 | |||||||||
| 114,991 | |||||||||||
See Notes to Financial Statements
9
Morgan Stanley Total Market Index Fund
Portfolio of Investments July 31, 2003 continued
| NUMBER OF SHARES | VALUE | ||||||||||
| Commercial Printing/Forms (0.1%) | |||||||||||
| 567 | Banta Corp. | $ | 19,187 | ||||||||
| 1,258 | Deluxe Corp. | 55,855 | |||||||||
| 2,428 | Donnelley (R.R.) & Sons Co. | 64,245 | |||||||||
| 583 | Harland (John H.) Co. | 15,391 | |||||||||
| 154,678 | |||||||||||
| Computer Communications (1.4%) | |||||||||||
| 7,765 | 3Com Corp.* | 37,893 | |||||||||
| 3,081 | Adaptec, Inc.* | 20,858 | |||||||||
| 7,676 | Avaya Inc.* | 73,690 | |||||||||
| 1,140 | Avocent Corp.* | 30,529 | |||||||||
| 5,693 | Brocade Communications Systems, Inc.* | 31,767 | |||||||||
| 141,496 | Cisco Systems, Inc.* | 2,762,002 | |||||||||
| 1,213 | Echelon Corp.* | 18,826 | |||||||||
| 1,821 | Emulex Corp.* | 37,057 | |||||||||
| 4,875 | Enterasys Networks, Inc.* | 22,620 | |||||||||
| 2,962 | Extreme Networks, Inc.* | 18,127 | |||||||||
| 2,801 | Foundry Networks, Inc.* | 50,530 | |||||||||
| 7,852 | Juniper Networks, Inc.* | 113,304 | |||||||||
| 2,550 | McDATA Corp. (Class A)* | 27,565 | |||||||||
| 3,244,768 | |||||||||||
| Computer Peripherals (0.5%) | |||||||||||
| 1,736 | Advanced Digital Information Corp.* | 20,155 | |||||||||
| 682 | Avid Technology, Inc.* | 31,686 | |||||||||
| 1,651 | Electronics for Imaging, Inc.* | 34,671 | |||||||||
| 44,263 | EMC Corp.* | 470,958 | |||||||||
| 750 | Imation Corp. | 26,767 | |||||||||
| 2,554 | Lexmark International, Inc. * | 163,890 | |||||||||
| 5,523 | Maxtor Corp.* | 55,230 | |||||||||
| 7,082 | Network Appliance, Inc.* | 113,170 | |||||||||
| 1,564 | Pinnacle Systems, Inc.* | 12,887 | |||||||||
| 3,304 | Quantum Corp. – DLT & Storage Systems* | 9,912 | |||||||||
| 2,413 | Seagate Techology (Cayman Islands) | 52,603 | |||||||||
| 2,516 | Storage Technology Corp.* | 67,026 | |||||||||
| 3,970 | Western Digital Corp.* | 39,541 | |||||||||
| 750 | Zebra Technologies Corp. (Class A)* | 58,185 | |||||||||
| 1,156,681 | |||||||||||
| Computer Processing Hardware (1.5%) | |||||||||||
| 7,348 | Apple Computer, Inc.* | $ | 154,675 | ||||||||
| 51,218 | Dell Inc.* | 1,725,022 | |||||||||
| 6,968 | Gateway, Inc.* | 35,606 | |||||||||
| 60,377 | Hewlett-Packard Co. | 1,278,181 | |||||||||
| 2,075 | NCR Corp.* | 57,208 | |||||||||
| 64,257 | Sun Microsystems, Inc.* | 240,321 | |||||||||
| 3,491,013 | |||||||||||
| Construction Materials (0.1%) | |||||||||||
| 544 | Centex Construction Products, Inc. | 24,480 | |||||||||
| 616 | Florida Rock Industries, Inc. | 29,469 | |||||||||
| 1,588 | Lafarge North America, Inc. | 53,198 | |||||||||
| 1,045 | Martin Marietta Materials, Inc. | 40,023 | |||||||||
| 392 | Trex Co., Inc.* | 14,308 | |||||||||
| 2,003 | Vulcan Materials Co. | 80,561 | |||||||||
| 242,039 | |||||||||||
| Consumer Sundries (0.0%) | |||||||||||
| 1,388 | American Greetings Corp. (Class A)* | 24,720 | |||||||||
| 1,119 | Blyth Industries, Inc. | 29,273 | |||||||||
| 1,507 | Oakley, Inc. | 17,014 | |||||||||
| 1,156 | Yankee Candle Co., Inc. (The)* | 27,767 | |||||||||
| 98,774 | |||||||||||
| Containers/Packaging (0.3%) | |||||||||||
| 920 | Aptargroup, Inc. | 34,270 | |||||||||
| 1,132 | Ball Corp. | 56,260 | |||||||||
| 1,267 | Bemis Company, Inc. | 56,622 | |||||||||
| 3,279 | Crown Holdings, Inc.* | 24,494 | |||||||||
| 3,046 | Owens-Illinois, Inc.* | 34,816 | |||||||||
| 2,621 | Packaging Corp. of America* | 49,537 | |||||||||
| 3,391 | Pactiv Corp.* | 66,972 | |||||||||
| 1,722 | Sealed Air Corp.* | 82,191 | |||||||||
| 5,496 | Smurfit-Stone Container Corp.* | 82,275 | |||||||||
| 2,516 | Sonoco Products Co. | 57,365 | |||||||||
| 1,713 | Temple-Inland, Inc. | 79,466 | |||||||||
| 624,268 | |||||||||||
See Notes to Financial Statements
10
Morgan Stanley Total Market Index Fund
Portfolio of Investments July 31, 2003 continued
| NUMBER OF SHARES | VALUE | ||||||||||
| Contract Drilling (0.3%) | |||||||||||
| 3,095 | Diamond Offshore Drilling, Inc. | $ | 60,229 | ||||||||
| 3,070 | ENSCO International Inc. | 76,965 | |||||||||
| 4,709 | GlobalSantaFe Corp. (Cayman Islands) | 104,775 | |||||||||
| 3,712 | Grey Wolf, Inc.* | 13,103 | |||||||||
| 1,185 | Helmerich & Payne, Inc. | 31,699 | |||||||||
| 2,910 | Nabors Industries Ltd. (Bermuda)* | 104,178 | |||||||||
| 2,790 | Noble Corp. (Cayman Islands)* | 91,707 | |||||||||
| 1,663 | Patterson-UTI Energy, Inc.* | 45,899 | |||||||||
| 3,020 | Pride International, Inc.* | 49,770 | |||||||||
| 2,082 | Rowan Companies, Inc.* | 45,700 | |||||||||
| 6,498 | Transocean Inc. (Cayman Islands)* | 127,166 | |||||||||
| 751,191 | |||||||||||
| Data Processing Services (1.1%) | |||||||||||
| 1,617 | Acxiom Corp.* | 25,694 | |||||||||
| 2,614 | Affiliated Computer Services, Inc. (Class A)* | 129,524 | |||||||||
| 11,784 | Automatic Data Processing, Inc. | 436,951 | |||||||||
| 2,405 | BISYS Group, Inc. (The)* | 39,803 | |||||||||
| 3,048 | Ceridian Corp.* | 56,845 | |||||||||
| 1,443 | Certergy Inc. | 39,293 | |||||||||
| 1,684 | CheckFree Corp.* | 45,316 | |||||||||
| 3,856 | Computer Sciences Corp.* | 156,438 | |||||||||
| 10,004 | Concord EFS, Inc.* | 136,154 | |||||||||
| 3,500 | Convergys Corp.* | 59,045 | |||||||||
| 1,134 | CSG Systems International, Inc.* | 17,112 | |||||||||
| 2,372 | DST Systems, Inc.* | 87,195 | |||||||||
| 14,880 | First Data Corp. | 561,869 | |||||||||
| 3,738 | Fiserv, Inc.* | 145,932 | |||||||||
| 696 | Global Payments Inc. | 24,506 | |||||||||
| 1,026 | National Processing, Inc.* | 19,237 | |||||||||
| 7,530 | Paychex, Inc. | 244,951 | |||||||||
| 5,636 | SunGard Data Systems Inc.* | 147,889 | |||||||||
| 3,990 | Total System Services, Inc. | 92,568 | |||||||||
| 2,466,322 | |||||||||||
| Department Stores (0.5%) | |||||||||||
| 1,683 | Dillard's, Inc. (Class A) | $ | 25,363 | ||||||||
| 3,835 | Federated Department Stores, Inc. | 153,438 | |||||||||
| 6,670 | Kohl's Corp.* | 395,864 | |||||||||
| 5,809 | May Department Stores Co. | 143,540 | |||||||||
| 1,134 | Neiman Marcus Group, Inc. (The) (Class A)* | 44,566 | |||||||||
| 5,405 | Penney (J.C.) Co., Inc. | 100,425 | |||||||||
| 3,185 | Saks, Inc.* | 36,022 | |||||||||
| 6,362 | Sears, Roebuck & Co. | 258,933 | |||||||||
| 1,158,151 | |||||||||||
| Discount Stores (2.5%) | |||||||||||
| 1,394 | 99 Cents Only Stores* | 47,675 | |||||||||
| 2,369 | Big Lots, Inc.* | 36,506 | |||||||||
| 1,457 | BJ's Wholesale Club, Inc.* | 28,411 | |||||||||
| 9,005 | Costco Wholesale Corp.* | 333,635 | |||||||||
| 6,749 | Dollar General Corp. | 124,182 | |||||||||
| 2,262 | Dollar Tree Stores, Inc.* | 82,970 | |||||||||
| 3,382 | Family Dollar Stores, Inc. | 126,859 | |||||||||
| 628 | Fred's, Inc. | 18,388 | |||||||||
| 17,953 | Target Corp. | 687,959 | |||||||||
| 78,509 | Wal-Mart Stores, Inc. | 4,389,438 | |||||||||
| 5,876,023 | |||||||||||
| Drugstore Chains (0.4%) | |||||||||||
| 7,698 | CVS Corp. | 230,863 | |||||||||
| 991 | Longs Drug Stores Corp. | 19,354 | |||||||||
| 10,421 | Rite Aid Corp.* | 49,291 | |||||||||
| 20,023 | Walgreen Co. | 599,088 | |||||||||
| 898,596 | |||||||||||
| Electric Utilities (2.4%) | |||||||||||
| 10,912 | AES Corp. (The)* | 68,636 | |||||||||
| 2,648 | Allegheny Energy, Inc. | 21,899 | |||||||||
| 2,014 | Alliant Energy Corp. | 40,904 | |||||||||
| 3,685 | Ameren Corp. | 153,886 | |||||||||
| 8,166 | American Electric Power Co., Inc. | 229,138 | |||||||||
| 3,762 | Aquila, Inc. | 9,706 | |||||||||
| 1,235 | Avista Corp. | 18,216 | |||||||||
| 761 | Black Hills Corp. | 23,355 | |||||||||
| 6,620 | CenterPoint Energy, Inc. | 53,423 | |||||||||
See Notes to Financial Statements
11
Morgan Stanley Total Market Index Fund
Portfolio of Investments July 31, 2003 continued
| NUMBER OF SHARES | VALUE | ||||||||||
| 3,474 | Cinergy Corp. | $ | 118,185 | ||||||||
| 1,129 | Cleco Corp. | 18,064 | |||||||||
| 3,007 | CMS Energy Corp. | 19,545 | |||||||||
| 812 | CN Energy Group, Inc. | 35,200 | |||||||||
| 4,533 | Consolidated Edison, Inc. | 180,005 | |||||||||
| 3,577 | Constellation Energy Group, Inc. | 119,472 | |||||||||
| 6,462 | Dominion Resources, Inc. | 388,366 | |||||||||
| 2,710 | DPL, Inc. | 39,430 | |||||||||
| 1,742 | DQE, Inc. | 24,945 | |||||||||
| 3,634 | DTE Energy Co. | 129,770 | |||||||||
| 17,434 | Duke Energy Corp. | 305,967 | |||||||||
| 6,654 | Edison International* | 109,192 | |||||||||
| 1,339 | El Paso Electric Co.* | 15,492 | |||||||||
| 3,481 | Energy East Corp. | 72,092 | |||||||||
| 4,756 | Entergy Corp. | 244,982 | |||||||||
| 6,637 | Exelon Corp. | 381,428 | |||||||||
| 6,223 | FirstEnergy Corp. | 214,631 | |||||||||
| 3,838 | FPL Group, Inc. | 236,689 | |||||||||
| 1,782 | Great Plains Energy, Inc. | 50,840 | |||||||||
| 1,016 | Hawaiian Electric Industries, Inc. | 43,210 | |||||||||
| 1,078 | IDACORP, Inc. | 29,268 | |||||||||
| 669 | MGE Energy Inc. | 20,960 | |||||||||
| 3,876 | Northeast Utilities | 65,117 | |||||||||
| 1,676 | NSTAR | 74,967 | |||||||||
| 2,387 | OGE Energy Corp. | 47,549 | |||||||||
| 819 | Otter Tail Corp. | 21,466 | |||||||||
| 3,983 | Pepco Holdings, Inc. | 68,986 | |||||||||
| 8,315 | PG&E Corp.* | 178,357 | |||||||||
| 2,103 | Pinnacle West Capital Corp. | 72,175 | |||||||||
| 1,131 | PNM Resources, Inc. | 30,186 | |||||||||
| 3,696 | PPL Corp. | 146,325 | |||||||||
| 5,105 | Progress Energy, Inc. | 207,978 | |||||||||
| 4,836 | Public Service Enterprise Group, Inc. | 197,067 | |||||||||
| 2,354 | Puget Energy, Inc. | 51,482 | |||||||||
| 5,973 | Reliant Resources, Inc.* | 29,626 | |||||||||
| 2,758 | SCANA Corp. | 91,566 | |||||||||
| 2,379 | Sierra Pacific Resources* | 12,252 | |||||||||
| 14,488 | Southern Co. (The) | 412,039 | |||||||||
| 3,878 | TECO Energy, Inc. | 48,087 | |||||||||
| 6,533 | TXU Corp. | $ | 131,771 | ||||||||
| 458 | UIL Holdings Corp. | 16,685 | |||||||||
| 1,319 | UniSource Energy Corp. | 24,072 | |||||||||
| 1,559 | Westar Energy, Inc. | 26,207 | |||||||||
| 2,884 | Wisconsin Energy Corp. | 81,185 | |||||||||
| 1,149 | WPS Resources Corp. | 45,742 | |||||||||
| 8,005 | Xcel Energy, Inc. | 115,912 | |||||||||
| 5,613,695 | |||||||||||
| Electrical Products (0.4%) | |||||||||||
| 932 | Acuity Brands, Inc. | 16,916 | |||||||||
| 4,201 | American Power Conversion Corp.* | 73,223 | |||||||||
| 1,231 | Baldor Electric Co. | 25,543 | |||||||||
| 1,931 | Cooper Industries Ltd. (Class A) (Bermuda) | 85,601 | |||||||||
| 8,567 | Emerson Electric Co. | 460,048 | |||||||||
| 1,774 | Energizer Holdings, Inc.* | 60,759 | |||||||||
| 268 | Franklin Electric Co., Inc. | 15,364 | |||||||||
| 1,611 | Hubbell, Inc. (Class B) | 55,257 | |||||||||
| 4,142 | Molex Inc. | 115,645 | |||||||||
| 1,998 | Power-One, Inc.* | 21,159 | |||||||||
| 2,259 | Thomas & Betts Corp.* | 34,472 | |||||||||
| 366 | Wilson Greatbatch Technologies, Inc.* | 14,314 | |||||||||
| 978,301 | |||||||||||
| Electronic Components (0.3%) | |||||||||||
| 1,147 | Amphenol Corp. (Class A)* | 61,938 | |||||||||
| 4,512 | AVX Corp. | 49,406 | |||||||||
| 766 | Benchmark Electronics, Inc.* | 30,487 | |||||||||
| 1,728 | Cree, Inc.* | 23,086 | |||||||||
| 646 | Hutchinson Technology Inc.* | 18,553 | |||||||||
| 4,390 | Jabil Circuit, Inc.* | 101,189 | |||||||||
| 2,761 | Kemet Corp.* | 29,957 | |||||||||
| 3,937 | MEMC Electronic Materials, Inc.* | 44,409 | |||||||||
| 510 | OmniVision Technologies, Inc.* | 20,701 | |||||||||
| 2,027 | QLogic Corp.* | 85,438 | |||||||||
| 1,576 | SanDisk Corp.* | 89,343 | |||||||||
| 11,378 | Sanmina-SCI Corp.* | 90,341 | |||||||||
See Notes to Financial Statements
12
Morgan Stanley Total Market Index Fund
Portfolio of Investments July 31, 2003 continued
| NUMBER OF SHARES | VALUE | ||||||||||
| 17,429 | Solectron Corp.* | $ | 89,062 | ||||||||
| 1,228 | Technitrol, Inc.* | 23,050 | |||||||||
| 3,708 | Vishay Intertechnology, Inc.* | 49,316 | |||||||||
| 806,276 | |||||||||||
| Electronic Distributors (0.1%) | |||||||||||
| 1,527 | Anixter International, Inc.* | 34,067 | |||||||||
| 2,898 | Arrow Electronics, Inc.* | 49,411 | |||||||||
| 3,340 | Avnet, Inc. | 48,096 | |||||||||
| 1,959 | CDW Corp. | 93,797 | |||||||||
| 3,639 | Ingram Micro Inc. (Class A)* | 50,036 | |||||||||
| 1,385 | Tech Data Corp.* | 43,350 | |||||||||
| 318,757 | |||||||||||
| Electronic Equipment/Instruments (0.5%) | |||||||||||
| 9,656 | Agilent Technologies, Inc.* | 209,825 | |||||||||
| 888 | Coherent, Inc.* | 21,738 | |||||||||
| 1,654 | Diebold, Inc. | 73,123 | |||||||||
| 29,250 | JDS Uniphase Corp.* | 88,042 | |||||||||
| 451 | Kronos, Inc.* | 24,985 | |||||||||
| 1,105 | Newport Corp.* | 19,017 | |||||||||
| 3,635 | Rockwell Automation, Inc. | 93,928 | |||||||||
| 3,265 | Scientific-Atlanta, Inc. | 98,897 | |||||||||
| 4,915 | Symbol Technologies, Inc. | 62,961 | |||||||||
| 2,671 | Tektronix, Inc.* | 56,438 | |||||||||
| 4,001 | Thermo Electron Corp.* | 89,022 | |||||||||
| 1,165 | Unova, Inc.* | 15,856 | |||||||||
| 2,584 | Waters Corp.* | 81,939 | |||||||||
| 14,842 | Xerox Corp.* | 160,294 | |||||||||
| 1,096,065 | |||||||||||
| Electronic Production Equipment (0.7%) | |||||||||||
| 3,564 | Amkor Technology, Inc.* | 52,284 | |||||||||
| 33,839 | Applied Materials, Inc.* | 659,860 | |||||||||
| 1,170 | ATMI, Inc.* | 30,151 | |||||||||
| 5,681 | Cadence Design Systems, Inc.* | 77,659 | |||||||||
| 2,247 | Chippac Inc.* | 12,808 | |||||||||
| 1,155 | Cognex Corp. | 32,917 | |||||||||
| 943 | Cymer, Inc.* | 38,144 | |||||||||
| 1,795 | Entegris Inc.* | 25,704 | |||||||||
| 934 | FEI Co.* | 20,735 | |||||||||
| 4,248 | KLA-Tencor Corp.* | 219,409 | |||||||||
| 3,215 | Lam Research Corp.* | 69,958 | |||||||||
| 1,557 | Mentor Graphics Corp.* | $ | 26,531 | ||||||||
| 1,423 | MKS Instruments, Inc.* | 32,174 | |||||||||
| 3,408 | Novellus Systems, Inc.* | 122,040 | |||||||||
| 963 | Photronics, Inc.* | 17,671 | |||||||||
| 1,522 | Synopsys, Inc.* | 95,140 | |||||||||
| 3,938 | Teradyne, Inc.* | 64,780 | |||||||||
| 1,137 | Varian Semiconductor Equipment Associates, Inc.* | 37,805 | |||||||||
| 670 | Veeco Instruments, Inc.* | 12,623 | |||||||||
| 1,648,393 | |||||||||||
| Electronics/Appliance Stores (0.2%) | |||||||||||
| 6,541 | Best Buy Co., Inc.* | 285,515 | |||||||||
| 683 | Blockbuster, Inc. (Class A) | 12,185 | |||||||||
| 4,652 | Circuit City Stores – Circuit City Group | 42,705 | |||||||||
| 1,227 | Hollywood Entertainment Corp.* | 20,540 | |||||||||
| 658 | Movie Gallery, Inc. | 13,160 | |||||||||
| 3,528 | RadioShack Corp. | 93,739 | |||||||||
| 467,844 | |||||||||||
| Electronics/Appliances (0.2%) | |||||||||||
| 5,840 | Eastman Kodak Co. | 161,359 | |||||||||
| 768 | Harman International Industries, Inc. | 64,205 | |||||||||
| 1,560 | Maytag Corp. | 39,702 | |||||||||
| 1,459 | Whirlpool Corp. | 94,514 | |||||||||
| 359,780 | |||||||||||
| Engineering & Construction (0.1%) | |||||||||||
| 1,431 | Dycom Industries, Inc.* | 24,341 | |||||||||
| 352 | EMCOR Group, Inc.* | 14,538 | |||||||||
| 1,638 | Fluor Corp. | 58,362 | |||||||||
| 827 | Granite Construction Inc. | 14,861 | |||||||||
| 1,124 | Jacobs Engineering Group, Inc.* | 49,276 | |||||||||
| 161,378 | |||||||||||
| Environmental Services (0.2%) | |||||||||||
| 4,223 | Allied Waste Industries, Inc.* | 51,183 | |||||||||
| 3,376 | Republic Services, Inc. | 81,699 | |||||||||
| 1,043 | Tetra Tech, Inc.* | 16,751 | |||||||||
See Notes to Financial Statements
13
Morgan Stanley Total Market Index Fund
Portfolio of Investments July 31, 2003 continued
| NUMBER OF SHARES | VALUE | ||||||||||
| 626 | Waste Connections, Inc.* | $ | 21,253 | ||||||||
| 11,815 | Waste Management, Inc. | 282,260 | |||||||||
| 453,146 | |||||||||||
| Finance/Rental/Leasing (1.7%) | |||||||||||
| 2,397 | Allied Capital Corp. | 56,449 | |||||||||
| 1,338 | American Capital Strategies, Ltd. | 37,638 | |||||||||
| 3,187 | AmeriCredit Corp.* | 23,679 | |||||||||
| 4,305 | Capital One Financial Corp. | 206,253 | |||||||||
| 2,011 | Charter Municipal Mortgage Acceptance Co. | 37,364 | |||||||||
| 4,398 | CIT Group, Inc. | 122,616 | |||||||||
| 2,487 | Countrywide Financial Corp. | 166,156 | |||||||||
| 1,440 | Doral Financial Corp. (Puerto Rico) | 63,216 | |||||||||
| 19,653 | Fannie Mae | 1,258,578 | |||||||||
| 13,814 | Freddie Mac | 674,814 | |||||||||
| 1,547 | Fremont General Corp. | 20,235 | |||||||||
| 1,157 | GATX Corp. | 25,361 | |||||||||
| 980 | IndyMac Bancorp, Inc. | 23,853 | |||||||||
| 25,000 | MBNA Corp. | 557,250 | |||||||||
| 709 | New Century Financial Corp. | 16,413 | |||||||||
| 5,651 | Providian Financial Corp.* | 54,532 | |||||||||
| 1,333 | Ryder System, Inc. | 38,737 | |||||||||
| 9,234 | SLM Corp. | 382,842 | |||||||||
| 593 | Student Loan Corp. (The) | 72,346 | |||||||||
| 1,824 | United Rentals, Inc.* | 26,448 | |||||||||
| 810 | WFS Financial Inc.* | 30,537 | |||||||||
| 3,895,317 | |||||||||||
| Financial Conglomerates (3.8%) | |||||||||||
| 26,058 | American Express Co. | 1,150,982 | |||||||||
| 101,309 | Citigroup Inc. | 4,538,643 | |||||||||
| 52,948 | J.P. Morgan Chase & Co. | 1,855,827 | |||||||||
| 5,760 | John Hancock Financial Services, Inc. | 188,064 | |||||||||
| 1,315 | Leucadia National Corp. | 51,022 | |||||||||
| 6,571 | Principal Financial Group, Inc. | 214,215 | |||||||||
| 11,571 | Prudential Financial, Inc. | 411,696 | |||||||||
| 6,743 | State Street Corp. | 309,504 | |||||||||
| 235 | Wesco Financial Corp. | 74,730 | |||||||||
| 8,794,683 | |||||||||||
| Financial Publishing/Services (0.3%) | |||||||||||
| 429 | BARRA, Inc.* | $ | 17,074 | ||||||||
| 1,750 | Dun & Bradstreet Corp.* | 71,942 | |||||||||
| 2,842 | Equifax, Inc. | 66,190 | |||||||||
| 800 | FactSet Research Systems Inc. | 36,800 | |||||||||
| 2,131 | Interactive Data Corp.* | 35,609 | |||||||||
| 3,897 | McGraw-Hill Companies, Inc. (The) | 236,860 | |||||||||
| 2,945 | Moody's Corp. | 152,315 | |||||||||
| 2,200 | SEI Investments Co. | 76,912 | |||||||||
| 693,702 | |||||||||||
| Food Distributors (0.2%) | |||||||||||
| 1,565 | ARAMARK Corp. (Class B)* | 35,134 | |||||||||
| 1,067 | Performance Food Group Co.* | 40,311 | |||||||||
| 2,763 | Supervalu, Inc. | 65,069 | |||||||||
| 12,846 | SYSCO Corp. | 387,050 | |||||||||
| 527,564 | |||||||||||
| Food Retail (0.3%) | |||||||||||
| 2,374 | 7-Eleven, Inc.* | 27,040 | |||||||||
| 7,604 | Albertson's, Inc. | 143,411 | |||||||||
| 1,350 | Casey's General Stores, Inc. | 20,682 | |||||||||
| 15,307 | Kroger Co.* | 259,454 | |||||||||
| 1,313 | Ruddick Corp. | 21,533 | |||||||||
| 8,909 | Safeway Inc.* | 190,207 | |||||||||
| 798 | Weis Markets, Inc. | 26,111 | |||||||||
| 1,218 | Whole Foods Market, Inc.* | 62,089 | |||||||||
| 3,012 | Winn-Dixie Stores, Inc. | 34,518 | |||||||||
| 785,045 | |||||||||||
| Food: Major Diversified (1.4%) | |||||||||||
| 8,402 | Campbell Soup Co. | 202,908 | |||||||||
| 4,345 | Del Monte Foods Co.* | 38,019 | |||||||||
| 7,470 | General Mills, Inc. | 342,649 | |||||||||
| 7,843 | Heinz (H.J.) Co. | 267,133 | |||||||||
| 8,484 | Kellogg Co. | 291,256 | |||||||||
| 5,463 | Kraft Foods Inc. (Class A) | 151,926 | |||||||||
| 33,897 | PepsiCo, Inc. | 1,561,635 | |||||||||
| 15,805 | Sara Lee Corp. | 295,395 | |||||||||
| 3,150,921 | |||||||||||
See Notes to Financial Statements
14
Morgan Stanley Total Market Index Fund
Portfolio of Investments July 31, 2003 continued
| NUMBER OF SHARES | VALUE | ||||||||||
| Food: Meat/Fish/Dairy (0.3%) | |||||||||||
| 10,904 | ConAgra Foods Inc. | $ | 245,667 | ||||||||
| 2,559 | Dean Foods Co.* | 76,591 | |||||||||
| 698 | Dreyer's Grand Ice Cream Holdings, Inc. | 54,584 | |||||||||
| 3,327 | Hormel Foods Corp. | 72,462 | |||||||||
| 2,407 | Smithfield Foods, Inc.* | 51,269 | |||||||||
| 7,245 | Tyson Foods, Inc. (Class A) | 82,086 | |||||||||
| 582,659 | |||||||||||
| Food: Specialty/Candy (0.3%) | |||||||||||
| 340 | American Italian Pasta Co. (Class A)* | 13,631 | |||||||||
| 49 | Farmer Brothers Co. | 16,439 | |||||||||
| 1,032 | Flowers Foods Inc. | 21,001 | |||||||||
| 1,107 | Fresh Del Monte Produce, Inc. (Cayman Islands) | 30,808 | |||||||||
| 878 | Hain Celestial Group, Inc.* | 14,399 | |||||||||
| 2,814 | Hershey Foods Corp. | 204,887 | |||||||||
| 942 | Interstate Bakeries Corp. | 9,646 | |||||||||
| 769 | Lancaster Colony Corp. | 30,837 | |||||||||
| 2,703 | McCormick & Co., Inc. (Non-Voting) | 69,089 | |||||||||
| 1,420 | NBTY, Inc.* | 35,003 | |||||||||
| 843 | Ralcorp Holdings, Inc.* | 22,795 | |||||||||
| 1,066 | Smucker (J.M.) Co. | 42,683 | |||||||||
| 1,383 | Tootsie Roll Industries, Inc. | 42,057 | |||||||||
| 4,621 | Wrigley (Wm.) Jr. Co. (Class A) | 250,874 | |||||||||
| 804,149 | |||||||||||
| Forest Products (0.2%) | |||||||||||
| 2,686 | Louisiana-Pacific Corp.* | 32,635 | |||||||||
| 1,744 | Rayonier Inc. | 60,744 | |||||||||
| 4,983 | Weyerhaeuser Co. | 280,493 | |||||||||
| 373,872 | |||||||||||
| Gas Distributors (0.5%) | |||||||||||
| 1,659 | AGL Resources, Inc. | 45,490 | |||||||||
| 1,187 | Atmos Energy Corp. | 28,927 | |||||||||
| 7,239 | Dynegy, Inc. (Class A)* | 22,948 | |||||||||
| 1,011 | Energen Corp. | 35,082 | |||||||||
| 1,569 | Equitable Resources, Inc. | 60,610 | |||||||||
| 3,480 | KeySpan Corp. | 117,450 | |||||||||
| 2,593 | Kinder Morgan, Inc. | $ | 138,725 | ||||||||
| 1,613 | MDU Resources Group, Inc. | 51,164 | |||||||||
| 1,974 | National Fuel Gas Co. | 47,751 | |||||||||
| 1,154 | New Jersey Resources Corp. | 40,252 | |||||||||
| 732 | Nicor Inc. | 26,557 | |||||||||
| 5,429 | NiSource Inc. | 104,780 | |||||||||
| 1,070 | Northwest Natural Gas Co. | 30,463 | |||||||||
| 1,291 | ONEOK, Inc. | 26,930 | |||||||||
| 940 | Peoples Energy Corp. | 38,531 | |||||||||
| 1,060 | Piedmont Natural Gas Co., Inc. | 40,524 | |||||||||
| 1,936 | Questar Corp. | 61,855 | |||||||||
| 4,523 | Sempra Energy | 125,875 | |||||||||
| 1,372 | Southern Union Co.* | 21,148 | |||||||||
| 642 | Southwest Gas Corp. | 13,630 | |||||||||
| 844 | Southwestern Energy Co.* | 12,829 | |||||||||
| 1,261 | UGI Corp. | 39,810 | |||||||||
| 1,650 | Vectren Corp. | 38,280 | |||||||||
| 1,468 | WGL Holdings Inc. | 37,449 | |||||||||
| 1,207,060 | |||||||||||
| Home Building (0.3%) | |||||||||||
| 287 | Beazer Homes USA Inc.* | 22,145 | |||||||||
| 650 | Brookfield Homes Corp. | 10,751 | |||||||||
| 66 | Cavco Industries, Inc. | 1,271 | |||||||||
| 1,320 | Centex Corp. | 95,792 | |||||||||
| 2,712 | Clayton Homes, Inc. | 33,819 | |||||||||
| 3,138 | D.R. Horton, Inc. | 88,335 | |||||||||
| 437 | Hovnanian Enterprises, Inc.* | 21,566 | |||||||||
| 1,008 | KB HOME | 57,063 | |||||||||
| 1,384 | Lennar Corp. (Class A) | 90,223 | |||||||||
| 621 | M.D.C. Holdings, Inc. | 30,901 | |||||||||
| 316 | M/I Schottenstein Homes, Inc. | 12,890 | |||||||||
| 216 | Meritage Corp.* | 9,586 | |||||||||
| 180 | NVR, Inc.* | 73,620 | |||||||||
| 1,249 | Pulte Homes, Inc. | 76,339 | |||||||||
| 551 | Ryland Group, Inc. (The) | 35,754 | |||||||||
| 698 | Standard Pacific Corp. | 23,732 | |||||||||
| 595 | Technical Olympic USA, Inc. | 15,381 | |||||||||
| 1,399 | Toll Brothers, Inc.* | 37,073 | |||||||||
| 825 | WCI Communities, Inc.* | 14,545 | |||||||||
| 750,786 | |||||||||||
See Notes to Financial Statements
15
Morgan Stanley Total Market Index Fund
Portfolio of Investments July 31, 2003 continued
| NUMBER OF SHARES | VALUE | ||||||||||
| Home Furnishings (0.2%) | |||||||||||
| 1,031 | Ethan Allen Interiors, Inc. | $ | 36,642 | ||||||||
| 1,355 | Furniture Brands International, Inc.* | 32,195 | |||||||||
| 1,386 | La-Z-Boy, Inc. | 29,605 | |||||||||
| 4,214 | Leggett & Platt, Inc. | 93,298 | |||||||||
| 1,294 | Mohawk Industries, Inc.* | 87,229 | |||||||||
| 5,306 | Newell Rubbermaid, Inc. | 125,381 | |||||||||
| 1,275 | Tupperware Corp. | 19,775 | |||||||||
| 424,125 | |||||||||||
| Home Improvement Chains (1.0%) | |||||||||||
| 1,746 | Fastenal Co. | 66,348 | |||||||||
| 45,790 | Home Depot, Inc. (The) | 1,428,648 | |||||||||
| 15,357 | Lowe's Companies, Inc. | 730,379 | |||||||||
| 3,449 | Sherwin-Williams Co. | 103,470 | |||||||||
| 2,328,845 | |||||||||||
| Hospital/Nursing Management (0.4%) | |||||||||||
| 444 | Amsurg Corp. | 13,467 | |||||||||
| 2,039 | Community Health Care* | 45,266 | |||||||||
| 10,156 | HCA Inc. | 357,999 | |||||||||
| 4,631 | Health Management Associates, Inc. (Class A) | 92,481 | |||||||||
| 732 | LifePoint Hospitals, Inc.* | 20,664 | |||||||||
| 1,862 | Manor Care, Inc. | 53,067 | |||||||||
| 1,099 | Select Medical Corp.* | 30,882 | |||||||||
| 566 | Sunrise Assisted Living, Inc.* | 14,093 | |||||||||
| 9,197 | Tenet Healthcare Corp.* | 126,735 | |||||||||
| 1,525 | Triad Hospitals, Inc.* | 46,040 | |||||||||
| 542 | United Surgial Partners International Inc.* | 14,059 | |||||||||
| 1,316 | Universal Health Services, Inc. (Class B)* | 67,445 | |||||||||
| 1,731 | US Oncology, Inc.* | 13,883 | |||||||||
| 896,081 | |||||||||||
| Hotels/Resorts/Cruiselines (0.5%) | |||||||||||
| 12,569 | Carnival Corp. (Panama) | 431,242 | |||||||||
| 870 | Choice Hotels International, Inc.* | 26,752 | |||||||||
| 2,010 | Extended Stay America, Inc.* | 30,070 | |||||||||
| 7,737 | Hilton Hotels Corp. | 112,960 | |||||||||
| 3,606 | La Quinta Properties – Paired Real Estate Investment Trust* | $ | 18,859 | ||||||||
| 4,833 | Marriott International, Inc. (Class A) | 198,636 | |||||||||
| 3,977 | Royal Caribbean Cruises Ltd. (Liberia) | 116,327 | |||||||||
| 3,977 | Starwood Hotels & Resorts Worldwide, Inc. | 129,650 | |||||||||
| 1,064,496 | |||||||||||
| Household/Personal Care (2.0%) | |||||||||||
| 1,343 | Alberto-Culver Co. (Class B) | 74,711 | |||||||||
| 4,751 | Avon Products, Inc. | 296,415 | |||||||||
| 980 | Church & Dwight Co., Inc. | 31,752 | |||||||||
| 4,351 | Clorox Co. (The) | 188,790 | |||||||||
| 10,647 | Colgate-Palmolive Co. | 581,326 | |||||||||
| 2,097 | Dial Corp. (The) | 41,059 | |||||||||
| 2,637 | Estee Lauder Companies, Inc. (The) (Class A) | 98,439 | |||||||||
| 20,687 | Gillette Co. (The) | 636,332 | |||||||||
| 2,146 | International Flavors & Fragrances, Inc. | 64,702 | |||||||||
| 10,271 | Kimberly-Clark Corp. | 497,116 | |||||||||
| 25,520 | Procter & Gamble Co. (The) | 2,242,442 | |||||||||
| 4,753,084 | |||||||||||
| Industrial Conglomerates (3.6%) | |||||||||||
| 7,760 | 3M Co. | 1,087,952 | |||||||||
| 1,904 | ALLETE, Inc. | 51,027 | |||||||||
| 195,973 | General Electric Co.** | 5,573,472 | |||||||||
| 17,174 | Honeywell International, Inc.* | 485,681 | |||||||||
| 3,563 | Ingersoll Rand Co. (Class A) (Bermuda) | 193,257 | |||||||||
| 1,918 | ITT Industries, Inc. | 127,931 | |||||||||
| 1,690 | SPX Corp.* | 79,582 | |||||||||
| 2,915 | Textron, Inc. | 126,569 | |||||||||
| 9,429 | United Technologies Corp. | 709,344 | |||||||||
| 8,434,815 | |||||||||||
| Industrial Machinery (0.3%) | |||||||||||
| 1,244 | Flowserve Corp.* | 23,959 | |||||||||
| 1,218 | Graco Inc. | 44,396 | |||||||||
| 897 | IDEX Corp. | 33,189 | |||||||||
See Notes to Financial Statements
16
Morgan Stanley Total Market Index Fund
Portfolio of Investments July 31, 2003 continued
| NUMBER OF SHARES | VALUE | ||||||||||
| 6,305 | Illinois Tool Works Inc. | $ | 439,143 | ||||||||
| 876 | Kennametal Inc. | 33,726 | |||||||||
| 941 | Lincoln Electric Holdings, Inc. | 21,342 | |||||||||
| 942 | Nordson Corp. | 22,759 | |||||||||
| 2,630 | Parker-Hannifin Corp. | 121,243 | |||||||||
| 794 | Roper Industries, Inc. | 31,681 | |||||||||
| 377 | Tecumseh Products Co. (Class A) | 13,723 | |||||||||
| 785,161 | |||||||||||
| Industrial Specialties (0.3%) | |||||||||||
| 619 | Brady (W.H.) Co. (Class A) | 21,300 | |||||||||
| 664 | Cabot Microelectronics Corp.* | 41,241 | |||||||||
| 1,049 | Donaldson Co., Inc. | 51,139 | |||||||||
| 5,424 | Ecolab Inc. | 134,027 | |||||||||
| 1,228 | Ferro Corp. | 26,721 | |||||||||
| 625 | Fuller (H.B.) Co. | 15,163 | |||||||||
| 740 | MacDermid, Inc. | 21,245 | |||||||||
| 412 | Minerals Technologies, Inc. | 20,579 | |||||||||
| 3,469 | PPG Industries, Inc. | 195,894 | |||||||||
| 2,325 | RPM International, Inc. | 32,713 | |||||||||
| 651 | Spartech Corp. | 14,797 | |||||||||
| 1,213 | Valspar Corp. (The) | 53,032 | |||||||||
| 627,851 | |||||||||||
| Information Technology Services (1.6%) | |||||||||||
| 1,015 | American Management Systems, Inc.* | 14,738 | |||||||||
| 599 | Anteon International Corp.* | 18,928 | |||||||||
| 4,145 | BearingPoint, Inc.* | 45,595 | |||||||||
| 513 | Black Box Corp. | 20,777 | |||||||||
| 586 | CACI International Inc. (Class A)* | 23,053 | |||||||||
| 3,477 | Citrix Systems, Inc.* | 63,108 | |||||||||
| 1,429 | Cognizant Technology Solutions Corp.* | 43,985 | |||||||||
| 1,157 | Documentum, Inc.* | 19,843 | |||||||||
| 9,378 | Electronic Data Systems Corp. | 208,848 | |||||||||
| 1,949 | Henry (Jack) & Associates, Inc. | 36,427 | |||||||||
| 988 | Intergraph Corp.* | 21,835 | |||||||||
| 33,512 | International Business Machines Corp. | $ | 2,722,850 | ||||||||
| 1,745 | Keane, Inc.* | 25,355 | |||||||||
| 9,259 | Level 3 Communications, Inc.* | 42,591 | |||||||||
| 611 | Manhattan Associates, Inc.* | 16,827 | |||||||||
| 1,217 | National Instruments Corp. | 43,337 | |||||||||
| 8,264 | PeopleSoft, Inc.* | 137,761 | |||||||||
| 2,521 | Perot Systems Corp. (Class A)* | 27,353 | |||||||||
| 1,786 | Reynolds & Reynolds Co. (The) (Class A) | 51,651 | |||||||||
| 1,240 | RSA Security, Inc.* | 15,128 | |||||||||
| 1,197 | Syntel, Inc. | 26,813 | |||||||||
| 6,779 | Unisys Corp.* | 83,111 | |||||||||
| 722 | Veridian Corp.* | 25,241 | |||||||||
| 3,735,155 | |||||||||||
| Insurance Brokers/Services (0.4%) | |||||||||||
| 6,134 | AON Corp. | 147,523 | |||||||||
| 1,336 | Brown & Brown, Inc. | 41,416 | |||||||||
| 1,589 | ChoicePoint Inc.* | 60,604 | |||||||||
| 1,524 | Gallagher (Arthur J.) & Co. | 40,432 | |||||||||
| 764 | Hilb, Rogal & Hamilton Co. | 25,724 | |||||||||
| 10,390 | Marsh & McLennan Companies, Inc. | 515,552 | |||||||||
| 831,251 | |||||||||||
| Integrated Oil (3.1%) | |||||||||||
| 1,745 | Amerada Hess Corp. | 81,963 | |||||||||
| 22,855 | ChevronTexaco Corp. | 1,648,074 | |||||||||
| 502 | Cimarex Energy Co.* | 10,095 | |||||||||
| 13,512 | ConocoPhillips | 707,218 | |||||||||
| 130,428 | Exxon Mobil Corp. | 4,640,628 | |||||||||
| 1,835 | Murphy Oil Corp. | 90,612 | |||||||||
| 7,178,590 | |||||||||||
| Internet Retail (0.3%) | |||||||||||
| 7,862 | Amazon.com, Inc.* | 328,003 | |||||||||
| 10,430 | InterActiveCorp* | 422,102 | |||||||||
| 750,105 | |||||||||||
| Internet Software/Services (0.4%) | |||||||||||
| 6,074 | Ariba, Inc.* | 16,704 | |||||||||
| 951 | Ask Jeeves, Inc.* | 16,595 | |||||||||
See Notes to Financial Statements
17
Morgan Stanley Total Market Index Fund
Portfolio of Investments July 31, 2003 continued
| NUMBER OF SHARES | VALUE | ||||||||||
| 8,523 | BEA Systems, Inc.* | $ | 112,504 | ||||||||
| 1,827 | Borland Software Corp.* | 16,991 | |||||||||
| 9,125 | CMGI Inc.* | 16,334 | |||||||||
| 3,333 | CNET Networks, Inc.* | 24,331 | |||||||||
| 3,167 | Earthlink, Inc.* | 24,228 | |||||||||
| 4,035 | Intemap Network Services Corp.* | 5,124 | |||||||||
| 1,125 | Internet Security Systems, Inc.* | 13,286 | |||||||||
| 342 | Lionbridge Technologies, Inc.* | 2,370 | |||||||||
| 1,339 | Overture Services, Inc.* | 31,708 | |||||||||
| 1,098 | Progress Software Corp.* | 21,861 | |||||||||
| 2,958 | RealNetworks, Inc.* | 17,009 | |||||||||
| 9,868 | Siebel Systems, Inc.* | 92,562 | |||||||||
| 796 | United Online, Inc.* | 24,939 | |||||||||
| 4,873 | VeriSign, Inc.* | 65,055 | |||||||||
| 6,854 | Vignette Corp.* | 14,530 | |||||||||
| 11,799 | Yahoo! Inc.* | 367,303 | |||||||||
| 883,434 | |||||||||||
| Investment Banks/Brokers (1.8%) | |||||||||||
| 8,624 | AmeriTrade Holding Corp. (Class A)* | 82,790 | |||||||||
| 2,059 | Bear Stearns Companies, Inc. (The) | 137,953 | |||||||||
| 7,389 | E*TRADE Group, Inc.* | 67,683 | |||||||||
| 1,981 | Edwards (A.G.), Inc. | 73,277 | |||||||||
| 2,573 | Friedman, Billings, Ramsey Group, Inc. | 42,660 | |||||||||
| 9,527 | Goldman Sachs Group, Inc. (The) | 830,183 | |||||||||
| 1,058 | Investment Technology Group, Inc.* | 19,658 | |||||||||
| 587 | Jefferies Group, Inc. | 34,850 | |||||||||
| 3,769 | Knight Trading Group, Inc. * | 33,318 | |||||||||
| 1,355 | LaBranche & Co., Inc.* | 23,618 | |||||||||
| 1,551 | Legg Mason, Inc. | 108,570 | |||||||||
| 4,808 | Lehman Brothers Holdings, Inc. | 304,202 | |||||||||
| 17,187 | Merrill Lynch & Co., Inc. | 934,457 | |||||||||
| 23,451 | Morgan Stanley (See Note 4) | 1,112,515 | |||||||||
| 1,328 | Raymond James Financial, Inc. | $ | 46,148 | ||||||||
| 27,013 | Schwab (Charles) Corp. (The) | 281,205 | |||||||||
| 4,133,087 | |||||||||||
| Investment Managers (0.5%) | |||||||||||
| 528 | Affiliated Managers Group, Inc.* | 34,542 | |||||||||
| 1,628 | Alliance Capital Management Holding L.P. | 60,155 | |||||||||
| 490 | BlackRock, Inc.* | 22,133 | |||||||||
| 1,486 | Eaton Vance Corp. (Non-Voting) | 49,722 | |||||||||
| 2,287 | Federated Investors, Inc. (Class B) | 65,728 | |||||||||
| 5,111 | Franklin Resources, Inc. | 222,073 | |||||||||
| 1,433 | Investors Financial Services Corp. | 45,670 | |||||||||
| 4,939 | Janus Capital Group Inc. | 86,433 | |||||||||
| 8,542 | Mellon Financial Corp. | 258,396 | |||||||||
| 1,584 | Neuberger Berman Inc. | 63,819 | |||||||||
| 1,994 | Nuveen Investments (Class A) | 55,433 | |||||||||
| 2,538 | Price (T.) Rowe Group, Inc. | 103,017 | |||||||||
| 2,106 | Waddell & Reed Financial, Inc. (Class A) | 55,409 | |||||||||
| 1,122,530 | |||||||||||
| Investment Trusts/Mutual Funds (0.0%) | |||||||||||
| 1,322 | Hugoton Royalty Trust | 23,201 | |||||||||
| Life/Health Insurance (0.6%) | |||||||||||
| 10,093 | AFLAC, Inc. | 323,783 | |||||||||
| 646 | American National Insurance Co. | 57,087 | |||||||||
| 676 | AmerUs Group Co. | 20,699 | |||||||||
| 549 | Delphi Financial Group, Inc. (Class A) | 27,093 | |||||||||
| 893 | FBL Financial Group, Inc. (Class A) | 20,459 | |||||||||
| 1,075 | Great American Financial Resources, Inc. | 15,147 | |||||||||
| 2,740 | Jefferson-Pilot Corp. | 120,560 | |||||||||
| 3,595 | Lincoln National Corp. | 134,237 | |||||||||
| 13,736 | MetLife, Inc. | 380,762 | |||||||||
| 2,405 | Phoenix Companies Ltd. | 22,511 | |||||||||
See Notes to Financial Statements
18
Morgan Stanley Total Market Index Fund
Portfolio of Investments July 31, 2003 continued
| NUMBER OF SHARES | VALUE | ||||||||||
| 1,401 | Protective Life Corp. | $ | 40,825 | ||||||||
| 1,172 | Reinsurance Group of America, Inc. | 41,922 | |||||||||
| 533 | StanCorp Financial Group, Inc. | 29,741 | |||||||||
| 1,038 | The MONY Group Inc. | 28,939 | |||||||||
| 2,648 | Torchmark Corp. | 107,615 | |||||||||
| 872 | UICI * | 12,191 | |||||||||
| 4,772 | UnumProvident Corp. | 64,804 | |||||||||
| 1,448,375 | |||||||||||
| Major Banks (4.2%) | |||||||||||
| 29,600 | Bank of America Corp. | 2,444,072 | |||||||||
| 15,069 | Bank of New York Co., Inc. (The) | 453,878 | |||||||||
| 23,060 | Bank One Corp. | 912,254 | |||||||||
| 11,501 | BB&T Corp. | 401,385 | |||||||||
| 3,491 | Comerica, Inc. | 169,244 | |||||||||
| 20,473 | FleetBoston Financial Corp. | 636,506 | |||||||||
| 4,969 | Huntington Bancshares, Inc. | 101,566 | |||||||||
| 8,372 | KeyCorp | 225,291 | |||||||||
| 12,112 | National City Corp. | 399,090 | |||||||||
| 5,573 | PNC Financial Services Group | 272,798 | |||||||||
| 2,898 | Popular, Inc. | 108,791 | |||||||||
| 6,898 | SouthTrust Corp. | 197,697 | |||||||||
| 5,725 | SunTrust Banks, Inc. | 348,653 | |||||||||
| 3,002 | UnionBanCal Corp. | 134,099 | |||||||||
| 26,831 | Wachovia Corp. | 1,172,246 | |||||||||
| 33,482 | Wells Fargo & Co. | 1,691,845 | |||||||||
| 9,669,415 | |||||||||||
| Major Telecommunications (2.3%) | |||||||||||
| 6,459 | ALLTEL Corp. | 302,217 | |||||||||
| 15,146 | AT&T Corp. | 322,004 | |||||||||
| 37,285 | BellSouth Corp. | 949,649 | |||||||||
| 5,323 | Cincinnati Bell Inc.* | 30,022 | |||||||||
| 65,808 | SBC Communications, Inc. | 1,537,275 | |||||||||
| 17,907 | Sprint Corp. (FON Group) | 252,847 | |||||||||
| 54,304 | Verizon Communications Inc. | 1,893,037 | |||||||||
| 5,287,051 | |||||||||||
| Managed Health Care (0.9%) | |||||||||||
| 2,966 | Aetna Inc. | 182,765 | |||||||||
| 399 | AMERIGROUP Corp.* | 16,447 | |||||||||
| 2,804 | Anthem, Inc.* | $ | 211,730 | ||||||||
| 5,234 | Caremark Rx, Inc.* | 130,955 | |||||||||
| 2,723 | CIGNA Corp. | 127,382 | |||||||||
| 847 | Cobalt Corp.* | 17,380 | |||||||||
| 1,172 | Coventry Health Care, Inc.* | 63,136 | |||||||||
| 1,921 | First Health Group Corp.* | 49,600 | |||||||||
| 2,448 | Health Net Inc.* | 84,064 | |||||||||
| 3,025 | Humana, Inc.* | 52,998 | |||||||||
| 903 | Mid Atlantic Medical Services, Inc.* | 49,105 | |||||||||
| 1,659 | Oxford Health Plans, Inc.* | 70,839 | |||||||||
| 731 | PacifiCare Health Systems, Inc.* | 40,863 | |||||||||
| 506 | Sierra Health Services, Inc.* | 13,318 | |||||||||
| 12,040 | UnitedHealth Group Inc. | 627,164 | |||||||||
| 2,954 | WellPoint Health Networks, Inc.* | 247,102 | |||||||||
| 1,984,848 | |||||||||||
| Marine Shipping (0.0%) | |||||||||||
| 1,550 | Alexander & Baldwin, Inc. | 43,555 | |||||||||
| 629 | Kirby Corp.* | 17,172 | |||||||||
| 60,727 | |||||||||||
| Media Conglomerates (1.6%) | |||||||||||
| 88,060 | AOL Time Warner Inc.* | 1,358,766 | |||||||||
| 40,769 | Disney (Walt) Co. (The) | 893,656 | |||||||||
| 34,774 | Viacom, Inc. (Class B) (Non-Voting) | 1,513,364 | |||||||||
| 3,765,786 | |||||||||||
| Medical Distributors (0.4%) | |||||||||||
| 2,194 | AmerisourceBergen Corp. | 138,419 | |||||||||
| 1,518 | Andrx Group * | 34,428 | |||||||||
| 8,897 | Cardinal Health, Inc. | 487,111 | |||||||||
| 908 | Henry Schein, Inc.* | 53,064 | |||||||||
| 5,767 | McKesson Corp. | 186,043 | |||||||||
| 649 | Owens & Minor, Inc. | 16,225 | |||||||||
| 1,344 | Patterson Dental Co.* | 71,904 | |||||||||
| 943 | Priority Healthcare Corp. (Class B)* | 19,454 | |||||||||
| 1,006,648 | |||||||||||
See Notes to Financial Statements
19
Morgan Stanley Total Market Index Fund
Portfolio of Investments July 31, 2003 continued
| NUMBER OF SHARES | VALUE | ||||||||||
| Medical Specialties (2.0%) | |||||||||||
| 420 | Advanced Neuromodulation System* | $ | 17,270 | ||||||||
| 1,410 | Alaris Medical Systems, Inc.* | 24,605 | |||||||||
| 1,228 | Align Technology, Inc.* | 15,964 | |||||||||
| 339 | Analogic Corp. | 16,367 | |||||||||
| 2,476 | Apogent Technologies Inc.* | 55,041 | |||||||||
| 4,130 | Applera Corp. – Applied Biosystems Group | 89,415 | |||||||||
| 672 | Arrow International, Inc. | 31,510 | |||||||||
| 1,027 | Bard (C.R.), Inc. | 70,411 | |||||||||
| 1,179 | Bausch & Lomb, Inc. | 49,836 | |||||||||
| 11,671 | Baxter International, Inc. | 322,236 | |||||||||
| 1,294 | Beckman Coulter, Inc. | 57,376 | |||||||||
| 5,006 | Becton, Dickinson & Co. | 183,370 | |||||||||
| 507 | Bio-Rad Laboratories, Inc. (Class A)* | 28,392 | |||||||||
| 5,056 | Biomet, Inc. | 149,708 | |||||||||
| 375 | Biosite Diagnostics Inc.* | 16,178 | |||||||||
| 8,011 | Boston Scientific Corp.* | 506,536 | |||||||||
| 639 | CONMED Corp.* | 13,144 | |||||||||
| 762 | Cooper Companies, Inc. (The) | 26,708 | |||||||||
| 839 | CTI Molecular Imaging, Inc.* | 13,307 | |||||||||
| 435 | Cyberonics Inc.* | 12,980 | |||||||||
| 2,224 | Cytyc Corp.* | 26,288 | |||||||||
| 1,496 | Dade Behring Holdings, Inc.* | 36,951 | |||||||||
| 1,462 | DENTSPLY International, Inc. | 63,465 | |||||||||
| 576 | Diagnostic Products Corp. | 22,061 | |||||||||
| 1,429 | Edwards Lifesciences Corp.* | 40,355 | |||||||||
| 6,127 | Guidant Corp. | 289,317 | |||||||||
| 1,234 | Hillenbrand Industries, Inc. | 67,241 | |||||||||
| 556 | IGEN International, Inc.* | 31,859 | |||||||||
| 535 | INAMED Corp.* | 35,524 | |||||||||
| 604 | Integra LifeSciences Holding, Inc.* | 15,106 | |||||||||
| 669 | Invacare Corp. | 23,482 | |||||||||
| 829 | KV Pharmaceutical Co. (Class A)* | 23,560 | |||||||||
| 24,136 | Medtronic, Inc. | 1,243,004 | |||||||||
| 1,095 | Mentor Corp. | 22,349 | |||||||||
| 1,246 | Millipore Corp.* | 55,435 | |||||||||
| 2,912 | Pall Corp. | 65,724 | |||||||||
| 2,694 | PerkinElmer, Inc. | 40,033 | |||||||||
| 727 | ResMed, Inc.* | $ | 28,862 | ||||||||
| 692 | Respironics, Inc.* | 27,666 | |||||||||
| 3,584 | St. Jude Medical, Inc.* | 192,282 | |||||||||
| 1,440 | STERIS Corp.* | 33,091 | |||||||||
| 3,896 | Stryker Corp. | 298,122 | |||||||||
| 378 | SurModics, Inc. * | 14,190 | |||||||||
| 853 | Sybron Dental Specialties, Inc.* | 21,069 | |||||||||
| 1,215 | Thoratec Corp.* | 18,286 | |||||||||
| 1,554 | Varian Medical Systems, Inc.* | 95,353 | |||||||||
| 1,030 | VISX, Inc.* | 23,978 | |||||||||
| 673 | Wright Medical Group, Inc.* | 17,242 | |||||||||
| 3,948 | Zimmer Holdings, Inc.* | 188,754 | |||||||||
| 4,761,003 | |||||||||||
| Medical/Nursing Services (0.1%) | |||||||||||
| 1,213 | Apria Healthcare Group, Inc.* | 31,489 | |||||||||
| 1,296 | DaVita, Inc.* | 36,288 | |||||||||
| 2,194 | Lincare Holdings, Inc.* | 79,862 | |||||||||
| 581 | Pediatrix Medical Group, Inc.* | 23,664 | |||||||||
| 965 | Renal Care Group, Inc.* | 34,518 | |||||||||
| 1,193 | VCA Antech, Inc.* | 27,056 | |||||||||
| 232,877 | |||||||||||
| Metal Fabrications (0.1%) | |||||||||||
| 808 | Harsco Corp. | 30,203 | |||||||||
| 1,034 | Kaydon Corp. | 24,433 | |||||||||
| 1,236 | Mueller Industries, Inc.* | 35,535 | |||||||||
| 1,683 | Timken Co. (The) | 25,750 | |||||||||
| 115,921 | |||||||||||
| Miscellaneous Commercial Services (0.2%) | |||||||||||
| 1,371 | ABM Industries Inc. | 22,238 | |||||||||
| 2,011 | Copart, Inc.* | 18,843 | |||||||||
| 843 | Corporate Executive Board Co. (The)* | 36,603 | |||||||||
| 2,272 | Exult Inc.* | 22,220 | |||||||||
| 1,092 | Fair Isaac Corp. | 59,012 | |||||||||
| 765 | Fidelity National Information Solutions, Inc. | 17,924 | |||||||||
| 958 | FTI Consulting, Inc.* | 21,076 | |||||||||
| 666 | G & K Services, Inc. (Class A) | 20,826 | |||||||||
See Notes to Financial Statements
20
Morgan Stanley Total Market Index Fund
Portfolio of Investments July 31, 2003 continued
| NUMBER OF SHARES | VALUE | ||||||||||
| 2,393 | Gartner, Inc. (Class B)* | $ | 20,699 | ||||||||
| 3,400 | IKON Office Solutions, Inc. | 24,412 | |||||||||
| 1,908 | Iron Mountain Inc.* | 69,833 | |||||||||
| 745 | Kroll Inc.* | 17,001 | |||||||||
| 479 | MAXIMUS, Inc.* | 14,370 | |||||||||
| 489 | ProQuest Co.* | 12,259 | |||||||||
| 2,790 | Sabre Holdings Corp. | 64,393 | |||||||||
| 891 | Sylvan Learning Systems, Inc.* | 23,692 | |||||||||
| 1,413 | The Brink's Co. | 23,230 | |||||||||
| 2,232 | Viad Corp. | 49,528 | |||||||||
| 538,159 | |||||||||||
| Miscellaneous Manufacturing (0.3%) | |||||||||||
| 708 | Ametek, Inc. | 28,008 | |||||||||
| 733 | Carlisle Co., Inc. | 32,069 | |||||||||
| 1,509 | Crane Co. | 37,438 | |||||||||
| 398 | CUNO, Inc.* | 15,426 | |||||||||
| 3,213 | Danaher Corp. | 231,979 | |||||||||
| 688 | Dionex Corp.* | 28,043 | |||||||||
| 4,422 | Dover Corp. | 161,889 | |||||||||
| 1,215 | Pentair, Inc. | 49,025 | |||||||||
| 782 | Smith (A.O.) Corp. | 26,127 | |||||||||
| 1,048 | Teleflex Inc. | 47,925 | |||||||||
| 905 | Varian, Inc.* | 29,403 | |||||||||
| 687,332 | |||||||||||
| Motor Vehicles (0.5%) | |||||||||||
| 36,746 | Ford Motor Co. | 406,411 | |||||||||
| 11,260 | General Motors Corp. | 421,462 | |||||||||
| 6,056 | Harley-Davidson, Inc. | 283,905 | |||||||||
| 1,111,778 | |||||||||||
| Movies/Entertainment (0.2%) | |||||||||||
| 1,452 | Cedar Fair, L.P. | 39,160 | |||||||||
| 7,096 | Fox Entertainment Group, Inc. (Class A)* | 214,796 | |||||||||
| 1,101 | Gaylord Entertainment Co.* | 22,901 | |||||||||
| 1,264 | International Speedway Corp. (Class A) | 48,841 | |||||||||
| 5,029 | Metro-Goldwyn-Mayer Inc.* | 68,746 | |||||||||
| 1,156 | Pixar, Inc.* | 78,377 | |||||||||
| 1,207 | Regal Entertainment Group (Class A) | 22,269 | |||||||||
| 2,012 | Six Flags, Inc.* | $ | 9,557 | ||||||||
| 1,092 | Speedway Motorsports, Inc. | 28,261 | |||||||||
| 532,908 | |||||||||||
| Multi-Line Insurance (1.7%) | |||||||||||
| 49,621 | American International Group, Inc. | 3,185,668 | |||||||||
| 4,246 | CNA Financial Corp.* | 106,362 | |||||||||
| 4,912 | Hartford Financial Services Group, Inc. (The) | 256,357 | |||||||||
| 1,175 | HCC Insurance Holdings, Inc. | 35,109 | |||||||||
| 1,032 | Horace Mann Educators Corp. | 16,006 | |||||||||
| 3,533 | Loews Corp. | 162,518 | |||||||||
| 1,164 | Nationwide Financial Services, Inc. (Class A) | 36,026 | |||||||||
| 2,735 | Safeco Corp. | 101,824 | |||||||||
| 1,877 | Unitrin, Inc. | 57,324 | |||||||||
| 3,957,194 | |||||||||||
| Office Equipment/Supplies (0.2%) | |||||||||||
| 2,273 | Avery Dennison Corp. | 122,651 | |||||||||
| 1,940 | Hon Industries, Inc. | 64,524 | |||||||||
| 1,097 | Kimball International, Inc. (Class B) | 16,532 | |||||||||
| 2,241 | Miller (Herman), Inc. | 49,549 | |||||||||
| 5,247 | Pitney Bowes, Inc. | 199,911 | |||||||||
| 453,167 | |||||||||||
| Oil & Gas Pipelines (0.2%) | |||||||||||
| 799 | Buckeye Partners, L.P. | 31,880 | |||||||||
| 11,759 | El Paso Corp. | 82,783 | |||||||||
| 3,332 | Enterprise Products Partners L.P. | 72,971 | |||||||||
| 1,124 | Kinder Morgan Management, LLC* | 41,923 | |||||||||
| 1,490 | Plains All American Pipeline, L.P. | 46,116 | |||||||||
| 1,463 | TEPPCO Partners, L.P. | 53,400 | |||||||||
| 856 | Western Gas Resources, Inc. | 32,477 | |||||||||
| 10,218 | Williams Companies, Inc. (The) | 64,884 | |||||||||
| 426,434 | |||||||||||
See Notes to Financial Statements
21
Morgan Stanley Total Market Index Fund
Portfolio of Investments July 31, 2003 continued
| NUMBER OF SHARES | VALUE | ||||||||||
| Oil & Gas Production (0.9%) | |||||||||||
| 5,013 | Anadarko Petroleum Corp. | $ | 219,569 | ||||||||
| 3,190 | Apache Corp. | 197,652 | |||||||||
| 750 | Brown (Tom), Inc.* | 19,013 | |||||||||
| 4,241 | Burlington Resources Inc. | 195,807 | |||||||||
| 790 | Cabot Oil & Gas Corp. (Class A) | 19,790 | |||||||||
| 4,455 | Chesapeake Energy Corp. | 42,634 | |||||||||
| 1,316 | Denbury Resources Inc.* | 17,042 | |||||||||
| 4,613 | Devon Energy Corp. | 218,518 | |||||||||
| 909 | Encore Acquisition Co.* | 16,826 | |||||||||
| 2,464 | EOG Resources, Inc. | 95,554 | |||||||||
| 482 | Evergreen Resources, Inc.* | 23,970 | |||||||||
| 1,042 | Forest Oil Corp.* | 23,789 | |||||||||
| 801 | Houston Exploration Co. (The)* | 25,720 | |||||||||
| 2,186 | Kerr-McGee Corp. | 96,184 | |||||||||
| 1,212 | Newfield Exploration Co.* | 43,790 | |||||||||
| 1,345 | Noble Energy, Inc. | 49,093 | |||||||||
| 7,617 | Occidental Petroleum Corp. | 249,000 | |||||||||
| 800 | Patina Oil & Gas Corp. | 24,064 | |||||||||
| 2,445 | Pioneer Natural Resources Co.* | 58,680 | |||||||||
| 1,275 | Pogo Producing Co. | 53,933 | |||||||||
| 350 | Quicksilver Resources Inc.* | 8,383 | |||||||||
| 646 | Spinnaker Exploration Co.* | 14,115 | |||||||||
| 681 | St. Mary Land & Exploration Co. | 17,597 | |||||||||
| 559 | Stone Energy Corp.* | 21,583 | |||||||||
| 1,594 | Ultra Petroleum Corp. (Canada)* | 19,287 | |||||||||
| 940 | Unit Corp. | 18,396 | |||||||||
| 5,290 | Unocal Corp. | 154,944 | |||||||||
| 1,388 | Vintage Petroleum, Inc. | 15,920 | |||||||||
| 1,490 | Westport Resources Corp.* | 30,918 | |||||||||
| 3,900 | XTO Energy Inc. | 75,270 | |||||||||
| 2,067,041 | |||||||||||
| Oil Refining/Marketing (0.2%) | |||||||||||
| 1,816 | Ashland, Inc. | 59,547 | |||||||||
| 6,464 | Marathon Oil Corp. | 166,383 | |||||||||
| 1,251 | Premcor Inc.* | 27,284 | |||||||||
| 1,892 | Sunoco, Inc. | $ | 70,004 | ||||||||
| 2,365 | Valero Energy Corp. | 86,086 | |||||||||
| 409,304 | |||||||||||
| Oilfield Services/Equipment (0.7%) | |||||||||||
| 6,944 | Baker Hughes Inc. | 218,111 | |||||||||
| 3,278 | BJ Services Co.* | 112,272 | |||||||||
| 859 | Cal Dive International, Inc.* | 17,008 | |||||||||
| 493 | Carbo Ceramics, Inc. | 18,340 | |||||||||
| 1,256 | Cooper Cameron Corp.* | 60,049 | |||||||||
| 1,587 | FMC Technologies, Inc.* | 35,644 | |||||||||
| 2,148 | Global Industries Ltd.* | 9,881 | |||||||||
| 2,452 | Grant Prideco, Inc.* | 26,359 | |||||||||
| 8,731 | Halliburton Co. | 193,566 | |||||||||
| 1,370 | Hanover Compressor Co.* | 13,138 | |||||||||
| 484 | Hydril Co.* | 10,977 | |||||||||
| 3,095 | Key Energy Services, Inc.* | 28,814 | |||||||||
| 624 | Lone Star Technologies, Inc.* | 10,333 | |||||||||
| 819 | Maverick Tube Corp.* | 13,514 | |||||||||
| 1,674 | National Oilwell, Inc.* | 30,802 | |||||||||
| 545 | Oceaneering International, Inc.* | 13,898 | |||||||||
| 1,262 | Oil States International Inc.* | 14,198 | |||||||||
| 1,176 | Overseas Shipholding Group, Inc. | 25,978 | |||||||||
| 12,140 | Schlumberger Ltd. (Netherlands; Antilles) | 547,150 | |||||||||
| 749 | SEACOR Holdings, Inc.* | 27,114 | |||||||||
| 2,171 | Smith International, Inc.* | 77,809 | |||||||||
| 1,730 | Superior Energy Services, Inc.* | 15,605 | |||||||||
| 1,439 | Tidewater, Inc. | 38,421 | |||||||||
| 760 | Universal Compression Holdings, Inc.* | 15,086 | |||||||||
| 2,082 | Varco International, Inc.* | 35,977 | |||||||||
| 589 | W-H Energy Services Inc.* | 10,708 | |||||||||
| 2,696 | Weatherford International Ltd. (Bermuda)* | 97,784 | |||||||||
| 1,718,536 | |||||||||||
| Other Consumer Services (0.9%) | |||||||||||
| 3,466 | Apollo Group, Inc. (Class A)* | 224,458 | |||||||||
| 3,534 | Block (H.&R.), Inc. | 149,806 | |||||||||
| 925 | Career Education Corp.* | 77,145 | |||||||||
See Notes to Financial Statements
22
Morgan Stanley Total Market Index Fund
Portfolio of Investments July 31, 2003 continued
| NUMBER OF SHARES | VALUE | ||||||||||
| 20,261 | Cendant Corp.* | $ | 363,685 | ||||||||
| 918 | Corinthian Colleges, Inc.* | 50,132 | |||||||||
| 1,521 | DeVry, Inc.* | 38,846 | |||||||||
| 6,202 | eBay Inc.* | 664,854 | |||||||||
| 617 | Education Management Corp.* | 35,829 | |||||||||
| 876 | Expedia, Inc. (Class A)* | 68,512 | |||||||||
| 488 | Expedia, Inc. (Warrants) (due 2/4/09)* | 26,860 | |||||||||
| 839 | ITT Educational Services, Inc.* | 32,914 | |||||||||
| 785 | Priceline.com Inc.* | 25,827 | |||||||||
| 807 | Renaissance Learning, Inc.* | 19,860 | |||||||||
| 1,707 | Rollins, Inc. | 31,972 | |||||||||
| 6,015 | Service Corp. International* | 24,240 | |||||||||
| 7,408 | ServiceMaster Co. (The) | 74,080 | |||||||||
| 199 | Strayer Education, Inc. | 16,810 | |||||||||
| 2,154 | Weight Watchers International, Inc.* | 96,715 | |||||||||
| 2,022,545 | |||||||||||
| Other Consumer Specialties (0.1%) | |||||||||||
| 2,941 | Fortune Brands, Inc. | 163,549 | |||||||||
| 1,049 | Fossil, Inc.* | 26,666 | |||||||||
| 690 | Matthews International Corp. (Class A) | 17,774 | |||||||||
| 449 | Russ Berrie & Co., Inc. | 15,737 | |||||||||
| 223,726 | |||||||||||
| Other Metals/Minerals (0.1%) | |||||||||||
| 1,293 | Olin Corp. | 24,153 | |||||||||
| 2,051 | Phelps Dodge Corp.* | 86,532 | |||||||||
| 1,974 | USEC Inc. | 14,351 | |||||||||
| 125,036 | |||||||||||
| Packaged Software (3.7%) | |||||||||||
| 4,695 | Adobe Systems Inc. | 153,433 | |||||||||
| 1,609 | Ascential Software Corp.* | 26,178 | |||||||||
| 2,605 | Autodesk, Inc. | 38,971 | |||||||||
| 4,767 | BMC Software, Inc.* | 67,215 | |||||||||
| 11,366 | Computer Associates International, Inc. | 289,265 | |||||||||
| 7,827 | Compuware Corp.* | 40,309 | |||||||||
| 1,052 | FileNET Corp.* | 19,167 | |||||||||
| 873 | Hyperion Solutions Corp.* | $ | 23,859 | ||||||||
| 2,274 | Informatica Corp.* | 16,668 | |||||||||
| 4,070 | Intuit Inc.* | 175,091 | |||||||||
| 2,803 | Legato Systems, Inc.* | 26,404 | |||||||||
| 1,378 | Macromedia, Inc.* | 28,277 | |||||||||
| 1,144 | Macrovision Corp.* | 26,884 | |||||||||
| 745 | Magma Design Automation, Inc.* | 14,863 | |||||||||
| 1,800 | Mercury Interactive Corp.* | 70,848 | |||||||||
| 1,928 | Micromuse Inc.* | 13,843 | |||||||||
| 211,600 | Microsoft Corp. | 5,586,240 | |||||||||
| 1,315 | NetIQ Corp.* | 14,294 | |||||||||
| 2,996 | Network Associates, Inc.* | 33,855 | |||||||||
| 8,119 | Novell, Inc.* | 28,822 | |||||||||
| 104,200 | Oracle Corp.* | 1,250,400 | |||||||||
| 6,243 | Parametric Technology Corp.* | 19,915 | |||||||||
| 2,161 | Quest Software, Inc.* | 19,123 | |||||||||
| 4,026 | Red Hat, Inc.* | 25,444 | |||||||||
| 1,029 | Serena Software, Inc.* | 19,438 | |||||||||
| 2,553 | Sybase, Inc.* | 40,082 | |||||||||
| 3,013 | Symantec Corp.* | 140,918 | |||||||||
| 5,078 | TIBCO Software, Inc.* | 27,269 | |||||||||
| 8,248 | VERITAS Software Corp.* | 254,038 | |||||||||
| 831 | Verity, Inc.* | 11,061 | |||||||||
| 8,502,174 | |||||||||||
| Personnel Services (0.1%) | |||||||||||
| 485 | Gentiva Health Services, Inc.* | 4,583 | |||||||||
| 805 | Kelly Services, Inc. (Class A) | 20,656 | |||||||||
| 1,791 | Manpower, Inc. | 68,237 | |||||||||
| 2,598 | Monster Worldwide Inc.* | 68,977 | |||||||||
| 2,551 | MPS Group, Inc.* | 23,954 | |||||||||
| 3,751 | Robert Half International, Inc.* | 81,434 | |||||||||
| 942 | Watson Wyatt & Co. Holdings (Class A)* | 21,666 | |||||||||
| 289,507 | |||||||||||
| Pharmaceuticals: Generic Drugs (0.2%) | |||||||||||
| 1,113 | Alpharma Inc. (Class A) | 22,093 | |||||||||
| 1,264 | Barr Laboratories, Inc.* | 85,383 | |||||||||
| 1,025 | Eon Labs, Inc.* | 34,707 | |||||||||
See Notes to Financial Statements
23
Morgan Stanley Total Market Index Fund
Portfolio of Investments July 31, 2003 continued
| NUMBER OF SHARES | VALUE | ||||||||||
| 1,652 | ICN Pharmaceuticals, Inc. | $ | 25,788 | ||||||||
| 3,980 | IVAX Corp.* | 68,257 | |||||||||
| 3,745 | Mylan Laboratories, Inc. | 126,469 | |||||||||
| 706 | Pharmaceutical Resources, Inc.* | 39,960 | |||||||||
| 2,117 | Watson Pharmaceuticals, Inc.* | 84,553 | |||||||||
| 487,210 | |||||||||||
| Pharmaceuticals: Major (6.9%) | |||||||||||
| 30,927 | Abbott Laboratories | 1,213,885 | |||||||||
| 38,220 | Bristol-Myers Squibb Co. | 1,001,364 | |||||||||
| 58,495 | Johnson & Johnson | 3,029,456 | |||||||||
| 22,304 | Lilly (Eli) & Co. | 1,468,495 | |||||||||
| 44,400 | Merck & Co., Inc. | 2,454,432 | |||||||||
| 156,217 | Pfizer Inc. | 5,211,399 | |||||||||
| 29,185 | Schering-Plough Corp. | 495,561 | |||||||||
| 26,002 | Wyeth | 1,185,171 | |||||||||
| 16,059,763 | |||||||||||
| Pharmaceuticals: Other (0.3%) | |||||||||||
| 2,554 | Allergan, Inc. | 205,546 | |||||||||
| 730 | Connetics Corp.* | 13,257 | |||||||||
| 2,636 | Endo Pharmaceuticals Holdings, Inc.* | 41,043 | |||||||||
| 7,304 | Forest Laboratories, Inc.* | 349,716 | |||||||||
| 516 | Inveresk Research Group Inc.* | 8,767 | |||||||||
| 4,761 | King Pharmaceuticals, Inc.* | 71,701 | |||||||||
| 528 | Medicis Pharmaceutical Corp. (Class A) | 30,835 | |||||||||
| 1,732 | Perrigo Co. | 28,180 | |||||||||
| 1,764 | Sepracor, Inc.* | 42,777 | |||||||||
| 791,822 | |||||||||||
| Precious Metals (0.3%) | |||||||||||
| 3,104 | Freeport-McMoRan Copper & Gold, Inc. (Class B) | 83,156 | |||||||||
| 2,496 | Glamis Gold Ltd. (Canada)* | 31,450 | |||||||||
| 1,505 | Meridian Gold Inc. (Canada)* | 18,978 | |||||||||
| 15,661 | Newmont Mining Corp. | 565,362 | |||||||||
| 698,946 | |||||||||||
| Property – Casualty Insurers (1.8%) | |||||||||||
| 2,307 | 21st Century Insurance Group | $ | 36,612 | ||||||||
| 1,715 | Alfa Corp. | 22,278 | |||||||||
| 266 | Alleghany Corp.* | 51,325 | |||||||||
| 1,044 | Allmerica Financial Corp.* | 23,323 | |||||||||
| 13,842 | Allstate Corp. (The) | 526,411 | |||||||||
| 1,153 | American Financial Group, Inc. | 26,404 | |||||||||
| 681 | Arch Capital Group Ltd. (Bermuda)* | 23,304 | |||||||||
| 1,140 | Berkley (W.R.) Corp. | 58,471 | |||||||||
| 25 | Berkshire Hathaway, Inc. (Class A)* | 1,800,250 | |||||||||
| 3,276 | Chubb Corp. (The) | 212,285 | |||||||||
| 3,195 | Cincinnati Financial Corp. | 125,564 | |||||||||
| 667 | Commerce Group, Inc. (The) | 25,379 | |||||||||
| 1,445 | Erie Indemnity Co. (Class A) | 58,407 | |||||||||
| 617 | Harleysville Group, Inc. | 13,876 | |||||||||
| 1,163 | Mercury General Corp. | 54,196 | |||||||||
| 1,421 | Odyssey Re Holdings Corp. | 26,146 | |||||||||
| 990 | Ohio Casualty Corp.* | 14,721 | |||||||||
| 2,382 | Old Republic International Corp. | 82,227 | |||||||||
| 413 | Philadelphia Consolidated Holding Corp.* | 16,660 | |||||||||
| 4,312 | Progressive Corp. (The) | 284,333 | |||||||||
| 907 | RLI Corp. | 29,351 | |||||||||
| 661 | Selective Insurance Group, Inc. | 16,829 | |||||||||
| 4,332 | St. Paul Companies, Inc . (The) | 152,356 | |||||||||
| 1,337 | State Auto Financial Corp. | 31,353 | |||||||||
| 1,017 | Transatlantic Holdings, Inc. | 71,221 | |||||||||
| 19,777 | Travelers Property Casualty Corp. (Class B) | 319,201 | |||||||||
| 197 | White Mountains Insurance Group, Ltd. (Bermuda) | 74,762 | |||||||||
| 4,177,245 | |||||||||||
| Publishing: Books/Magazines (0.1%) | |||||||||||
| 1,218 | John Wiley & Sons, Inc. (Class A) | 32,070 | |||||||||
| 1,037 | Meredith Corp. | 47,163 | |||||||||
See Notes to Financial Statements
24
Morgan Stanley Total Market Index Fund
Portfolio of Investments July 31, 2003 continued
| NUMBER OF SHARES | VALUE | ||||||||||
| 5,580 | PRIMEDIA Inc.* | $ | 19,195 | ||||||||
| 2,367 | Reader's Digest Assoc., Inc. (The) (Class A) | 30,724 | |||||||||
| 754 | Scholastic Corp.* | 21,994 | |||||||||
| 151,146 | |||||||||||
| Publishing: Newspapers (0.7%) | |||||||||||
| 2,412 | Belo Corp. (Series A) | 53,860 | |||||||||
| 1,799 | Dow Jones & Co., Inc. | 76,152 | |||||||||
| 5,401 | Gannett Co., Inc. | 414,959 | |||||||||
| 3,043 | Hollinger International, Inc. (Class A) | 34,751 | |||||||||
| 1,399 | Journal Register Co.* | 25,714 | |||||||||
| 1,736 | Knight-Ridder, Inc. | 119,142 | |||||||||
| 1,172 | Lee Enterprises, Inc. | 43,516 | |||||||||
| 1,132 | McClatchy Co. (The) (Class A) | 64,581 | |||||||||
| 581 | Media General, Inc. (Class A) | 33,512 | |||||||||
| 3,073 | New York Times Co. (The) (Class A) | 137,056 | |||||||||
| 1,725 | Scripps (E.W.) Co. (Class A) | 143,106 | |||||||||
| 6,214 | Tribune Co. | 293,425 | |||||||||
| 207 | Washington Post Co. (The) (Class B) | 139,932 | |||||||||
| 1,579,706 | |||||||||||
| Pulp & Paper (0.3%) | |||||||||||
| 1,876 | Boise Cascade Corp. | 46,506 | |||||||||
| 1,439 | Bowater, Inc. | 55,430 | |||||||||
| 5,421 | Georgia-Pacific Corp. | 118,449 | |||||||||
| 1,110 | Glatfelter (P.H.) Co. | 13,908 | |||||||||
| 10,660 | International Paper Co. | 417,019 | |||||||||
| 4,469 | MeadWestVaco Corp. | 108,194 | |||||||||
| 1,106 | Potlatch Corp. | 29,586 | |||||||||
| 1,156 | Wausau-Mosinee Paper Corp. | 13,988 | |||||||||
| 803,080 | |||||||||||
| Railroads (0.4%) | |||||||||||
| 8,727 | Burlington Northern Santa Fe Corp. | 240,516 | |||||||||
| 5,097 | CSX Corp. | 159,536 | |||||||||
| 827 | Florida East Coast Industries, Inc. | 23,264 | |||||||||
| 1,705 | Kansas City Southern Industries, Inc.* | 20,716 | |||||||||
| 8,922 | Norfolk Southern Corp. | $ | 171,570 | ||||||||
| 5,492 | Union Pacific Corp. | 334,682 | |||||||||
| 950,284 | |||||||||||
| Real Estate Development (0.1%) | |||||||||||
| 2,652 | Catellus Development Corp.* | 61,102 | |||||||||
| 1,180 | Forest City Enterprise, Inc. (Class A) | 48,380 | |||||||||
| 627 | LNR Property Corp. | 24,829 | |||||||||
| 851 | Newhall Land & Farming Co. L.P. (The) | 32,891 | |||||||||
| 2,511 | St. Joe Co. (The) | 81,482 | |||||||||
| 1,134 | W.P. Carey & Co., LLC | 35,154 | |||||||||
| 283,838 | |||||||||||
| Real Estate Investment Trusts (1.9%) | |||||||||||
| 679 | Alexandria Real Estate Equities, Inc. | 31,064 | |||||||||
| 2,312 | AMB Property Corp. | 64,967 | |||||||||
| 1,757 | Annaly Mortgage Management Inc. | 33,647 | |||||||||
| 1,387 | Anthracite Capital, Inc. | 16,894 | |||||||||
| 2,298 | Apartment Investment & Management Co. (Class A) | 90,564 | |||||||||
| 3,838 | Archstone-Smith Trust | 99,212 | |||||||||
| 1,384 | Arden Realty, Inc. | 38,752 | |||||||||
| 1,485 | Avalonbay Communities, Inc. | 69,765 | |||||||||
| 2,038 | Boston Properties, Inc. | 88,225 | |||||||||
| 905 | Brandywine Realty Trust | 22,625 | |||||||||
| 1,632 | BRE Properties, Inc. (Class A) | 53,938 | |||||||||
| 743 | BPP Liquidating Trust | 721 | |||||||||
| 1,240 | Camden Property Trust | 46,264 | |||||||||
| 1,000 | Capital Automotive REIT | 30,730 | |||||||||
| 1,393 | CarrAmerica Realty Corp. | 40,690 | |||||||||
| 892 | CBL & Associates Properties, Inc. | 42,977 | |||||||||
| 821 | CenterPoint Properties Corp. | 52,216 | |||||||||
| 893 | Chateau Communities, Inc. | 26,352 | |||||||||
| 1,110 | Chelsea Property Group, Inc. | 48,396 | |||||||||
| 787 | Colonial Properties Trust | 27,797 | |||||||||
| 1,493 | Commercial Net Lease Realty | 26,411 | |||||||||
| 596 | Corrections Corporation of America* | 14,703 | |||||||||
| 1,674 | Cousins Properties, Inc. | 47,207 | |||||||||
See Notes to Financial Statements
25
Morgan Stanley Total Market Index Fund
Portfolio of Investments July 31, 2003 continued
| NUMBER OF SHARES | VALUE | ||||||||||
| 2,310 | Crescent Real Estate Equities Co. | $ | 38,854 | ||||||||
| 2,040 | Developers Diversified Realty Corp. | 60,588 | |||||||||
| 3,366 | Duke Realty Corp. | 97,008 | |||||||||
| 8,255 | Equity Office Properties Trust | 228,994 | |||||||||
| 1,877 | Equity One, Inc. | 31,909 | |||||||||
| 5,775 | Equity Residential | 161,123 | |||||||||
| 509 | Essex Property Trust, Inc. | 30,845 | |||||||||
| 1,077 | Federal Realty Investment Trust | 37,555 | |||||||||
| 1,118 | First Industrial Realty Trust, Inc. | 33,875 | |||||||||
| 967 | Gables Residential Trust | 30,702 | |||||||||
| 1,397 | General Growth Properties, Inc. | 95,247 | |||||||||
| 856 | Glenborough Realty Trust Inc. | 17,248 | |||||||||
| 862 | Glimcher Realty Trust | 17,955 | |||||||||
| 1,593 | Health Care Property Investors, Inc. | 69,821 | |||||||||
| 1,374 | Health Care REIT, Inc. | 43,267 | |||||||||
| 1,293 | Healthcare Realty Trust, Inc. | 42,397 | |||||||||
| 2,183 | Heritage Property Investment Trust | 62,325 | |||||||||
| 1,724 | Highwoods Properties, Inc. | 39,893 | |||||||||
| 1,259 | Home Properties of New York, Inc. | 46,822 | |||||||||
| 1,340 | Hospitality Properties Trust | 42,237 | |||||||||
| 5,877 | Host Marriott Corp.* | 58,652 | |||||||||
| 3,496 | HRPT Properties Trust | 32,478 | |||||||||
| 1,135 | Impac Mortgage Holdings, Inc. | 15,538 | |||||||||
| 2,619 | iStar Financial Inc. | 94,939 | |||||||||
| 859 | Kilroy Realty Corp. | 24,713 | |||||||||
| 2,237 | Kimco Realty Corp. | 91,560 | |||||||||
| 1,670 | Lexington Corporate Properties Trust | 30,194 | |||||||||
| 2,001 | Liberty Property Trust | 69,415 | |||||||||
| 933 | Macerich Co. (The) | 34,829 | |||||||||
| 1,234 | Mack-Cali Realty Corp. | 45,436 | |||||||||
| 1,127 | Manufactured Home Communities, Inc. | 41,248 | |||||||||
| 1,062 | Mills Corp. | 37,818 | |||||||||
| 1,683 | Nationwide Health Properties, Inc. | $ | 28,813 | ||||||||
| 2,232 | New Plan Excel Realty Trust | 49,997 | |||||||||
| 248 | Novastar Financial, Inc. | 17,298 | |||||||||
| 1,467 | Pan Pacific Retail Properties, Inc. | 62,773 | |||||||||
| 4,131 | Plum Creek Timber Co., Inc. | 112,198 | |||||||||
| 1,062 | Post Properties, Inc. | 28,727 | |||||||||
| 1,172 | Prentiss Properties Trust | 36,273 | |||||||||
| 4,540 | ProLogis Trust | 125,077 | |||||||||
| 971 | PS Business Parks, Inc. (Class A) | 35,995 | |||||||||
| 2,929 | Public Storage, Inc. | 106,030 | |||||||||
| 486 | RAIT Investment Trust | 11,713 | |||||||||
| 1,102 | Realty Income Corp. | 43,694 | |||||||||
| 1,321 | Reckson Associates Realty Corp. | 28,679 | |||||||||
| 507 | Redwood Trust, Inc. | 20,686 | |||||||||
| 1,866 | Regency Center Corp. | 67,885 | |||||||||
| 2,340 | Rouse Co. (The) | 93,577 | |||||||||
| 1,240 | Senior Housing Properties Trust | 17,174 | |||||||||
| 1,308 | Shurgard Storage Centers, Inc. (Class A) | 45,976 | |||||||||
| 4,035 | Simon Property Group, Inc. | 170,882 | |||||||||
| 668 | SL Green Realty Corp. | 23,921 | |||||||||
| 721 | Summit Properties Inc. | 15,249 | |||||||||
| 755 | Sun Communities, Inc. | 30,653 | |||||||||
| 1,271 | Taubman Centers, Inc. | 24,848 | |||||||||
| 1,397 | Thornburg Mortgage, Inc. | 37,565 | |||||||||
| 3,986 | Trizec Properties, Inc. | 47,354 | |||||||||
| 3,310 | United Dominion Realty Trust, Inc. | 59,679 | |||||||||
| 2,353 | Ventas, Inc. | 38,942 | |||||||||
| 2,326 | Vornado Realty Trust | 106,624 | |||||||||
| 910 | Washington Real Estate Investment Trust | 25,298 | |||||||||
| 1,344 | Weingarten Realty Investors | 58,262 | |||||||||
| 4,391,444 | |||||||||||
| Recreational Products (0.3%) | |||||||||||
| 2,340 | Activision, Inc.* | 27,261 | |||||||||
| 1,860 | Brunswick Corp. | 50,127 | |||||||||
| 1,831 | Callaway Golf Co. | 28,307 | |||||||||
See Notes to Financial Statements
26
Morgan Stanley Total Market Index Fund
Portfolio of Investments July 31, 2003 continued
| NUMBER OF SHARES | VALUE | ||||||||||
| 2,932 | Electronic Arts Inc.* | $ | 246,288 | ||||||||
| 3,803 | Hasbro, Inc. | 71,687 | |||||||||
| 594 | Leapfrog Enterprises, Inc. (Class A)* | 17,998 | |||||||||
| 779 | Marvel Enterprises, Inc.* | 15,268 | |||||||||
| 8,976 | Mattel, Inc. | 174,404 | |||||||||
| 546 | Polaris Industries Inc. | 43,134 | |||||||||
| 859 | Take-Two Interactive Software, Inc.* | 22,849 | |||||||||
| 596 | Thor Industries, Inc. | 26,212 | |||||||||
| 834 | THQ, Inc.* | 13,744 | |||||||||
| 396 | Winnebago Industries, Inc. | 15,666 | |||||||||
| 752,945 | |||||||||||
| Regional Banks (2.5%) | |||||||||||
| 306 | Alabama National BanCorporation | 15,297 | |||||||||
| 950 | Amcore Financial, Inc. | 23,760 | |||||||||
| 7,341 | AmSouth Bancorporation | 159,079 | |||||||||
| 1,597 | Associated Banc-Corp. | 60,015 | |||||||||
| 2,064 | BancorpSouth, Inc. | 43,757 | |||||||||
| 1,381 | Bank of Hawaii Corp. | 46,512 | |||||||||
| 3,173 | Banknorth Group, Inc. | 87,575 | |||||||||
| 1,382 | BOK Financial Corp.* | 53,345 | |||||||||
| 335 | Cathay Bancorp, Inc. | 16,264 | |||||||||
| 4,509 | Charter One Financial, Inc. | 146,633 | |||||||||
| 483 | Chemical Financial Corp. | 15,094 | |||||||||
| 854 | Chittenden Corp. | 24,937 | |||||||||
| 1,247 | Citizens Banking Corp. | 32,297 | |||||||||
| 1,024 | City National Corp. | 51,558 | |||||||||
| 2,899 | Colonial BancGroup, Inc. (The) | 43,224 | |||||||||
| 1,446 | Commerce Bancorp, Inc. | 58,577 | |||||||||
| 1,731 | Commerce Bancshares, Inc. | 75,541 | |||||||||
| 1,027 | Community First Bankshares, Inc. | 28,212 | |||||||||
| 2,667 | Compass Bancshares, Inc. | 90,118 | |||||||||
| 362 | Corus Bankshares, Inc. | 18,625 | |||||||||
| 1,158 | Cullen/Frost Bankers, Inc. | 42,406 | |||||||||
| 1,249 | CVB Financial Corp. | 24,618 | |||||||||
| 532 | East West Bancorp, Inc. | 22,998 | |||||||||
| 1,326 | F.N.B Corp. | 41,835 | |||||||||
| 11,319 | Fifth Third Bancorp | 622,658 | |||||||||
| 1,044 | First Bancorp (Puerto Rico) | 31,477 | |||||||||
| 1,027 | First Charter Corp. | $ | 19,000 | ||||||||
| 303 | First Citizens BancShares, Inc. (Class A) | 34,845 | |||||||||
| 1,523 | First Commonwealth Financial Corp. | 20,165 | |||||||||
| 1,503 | First Financial Bancorp | 22,966 | |||||||||
| 1,479 | First Midwest Bancorp, Inc. | 44,281 | |||||||||
| 2,577 | First Tennessee National Corp. | 110,553 | |||||||||
| 1,679 | FirstMerit Corp. | 40,078 | |||||||||
| 1,013 | Flagstar Bancorp | 20,068 | |||||||||
| 563 | Frontier Financial Corp. | 16,851 | |||||||||
| 3,038 | Fulton Financial Corp. | 61,398 | |||||||||
| 1,019 | Greater Bay Bancorp | 19,962 | |||||||||
| 546 | Hancock Holding Co. | 25,891 | |||||||||
| 3,759 | Hibernia Corp. (Class A) | 75,218 | |||||||||
| 1,024 | Hudson United Bancorp | 37,407 | |||||||||
| 890 | International Bancshares Corp. | 33,998 | |||||||||
| 661 | Irwin Financial Corp. | 15,401 | |||||||||
| 2,370 | M&T Bank Corp. | 209,911 | |||||||||
| 4,502 | Marshall & Ilsley Corp. | 141,003 | |||||||||
| 1,627 | Mercantile Bankshares Corp. | 66,349 | |||||||||
| 4,138 | National Commerce Financial Corp. | 101,381 | |||||||||
| 736 | National Penn Bancshares, Inc. | 21,535 | |||||||||
| 894 | NBT Bancorp, Inc. | 18,077 | |||||||||
| 3,219 | North Fork Bancorporation, Inc. | 112,826 | |||||||||
| 4,373 | Northern Trust Corp. | 190,925 | |||||||||
| 2,580 | Old National Bancorp | 61,610 | |||||||||
| 1,036 | Pacific Capital Bancorp | 34,488 | |||||||||
| 367 | Park National Corp. | 44,040 | |||||||||
| 787 | Provident Bankshares Corp. | 21,580 | |||||||||
| 1,086 | Provident Financial Group, Inc. | 28,714 | |||||||||
| 689 | R&G Financial Corp. (Class B) (Puerto Rico) | 22,048 | |||||||||
| 4,665 | Regions Financial Corp. | 168,407 | |||||||||
| 1,426 | Republic Bancorp Inc. | 19,493 | |||||||||
| 818 | S & T Bancorp, Inc. | 24,319 | |||||||||
| 968 | Santander BanCorp. (Puerto Rico) | 16,214 | |||||||||
See Notes to Financial Statements
27
Morgan Stanley Total Market Index Fund
Portfolio of Investments July 31, 2003 continued
| NUMBER OF SHARES | VALUE | ||||||||||
| 865 | Silicon Valley Bancshares* | $ | 21,305 | ||||||||
| 2,490 | Sky Financial Group, Inc. | 57,768 | |||||||||
| 1,349 | South Financial Group, Inc. (The) | 33,523 | |||||||||
| 735 | Southwest Bancorporation of Texas, Inc. | 26,093 | |||||||||
| 544 | Susquehanna Bancshares, Inc. | 14,111 | |||||||||
| 6,050 | Synovus Financial Corp. | 142,357 | |||||||||
| 1,496 | TCF Financial Corp. | 68,292 | |||||||||
| 689 | Texas Regional Bancshares, Inc. (Class A) | 22,723 | |||||||||
| 448 | Trust Co. of New Jersey (The) | 14,197 | |||||||||
| 2,142 | Trustco Bank Corp. of New York | 26,347 | |||||||||
| 1,510 | Trustmark Corp. | 40,936 | |||||||||
| 37,685 | U.S. Bancorp | 924,036 | |||||||||
| 974 | UCBH Holdings, Inc. | 30,028 | |||||||||
| 572 | UMB Financial Corp. | 26,484 | |||||||||
| 704 | Umpqua Holdings Corp. | 13,270 | |||||||||
| 4,162 | Union Planters Corp. | 133,767 | |||||||||
| 1,234 | United Bankshares, Inc. | 37,403 | |||||||||
| 417 | United Community Banks, Inc. | 12,005 | |||||||||
| 2,585 | Valley National Bancorp | 71,165 | |||||||||
| 1,004 | Westamerica Bancorporation | 44,417 | |||||||||
| 857 | Whitney Holding Corp. | 29,609 | |||||||||
| 1,552 | Wilmington Trust Corp. | 49,276 | |||||||||
| 1,825 | Zions Bancorporation | 101,908 | |||||||||
| 5,718,434 | |||||||||||
| Restaurants (0.7%) | |||||||||||
| 1,427 | Applebee's International, Inc. | 45,521 | |||||||||
| 942 | Bob Evans Farms, Inc. | 26,564 | |||||||||
| 2,086 | Brinker International, Inc.* | 73,010 | |||||||||
| 1,132 | CBRL Group, Inc. | 39,892 | |||||||||
| 720 | CEC Entertainment, Inc.* | 25,308 | |||||||||
| 1,263 | Cheesecake Factory, Inc. (The)* | 41,616 | |||||||||
| 3,520 | Darden Restaurants, Inc. | 65,859 | |||||||||
| 619 | IHOP Corp. | 20,737 | |||||||||
| 1,003 | Jack in the Box Inc.* | 21,364 | |||||||||
| 1,124 | Krispy Kreme Doughnuts, Inc.* | 49,074 | |||||||||
| 558 | Landry's Restaurants, Inc. | $ | 11,445 | ||||||||
| 25,292 | McDonald's Corp. | 581,969 | |||||||||
| 1,724 | Outback Steakhouse, Inc. | 64,391 | |||||||||
| 570 | P.F. Chang's China Bistro, Inc.* | 27,577 | |||||||||
| 604 | Panera Bread Co. (Class A)* | 24,987 | |||||||||
| 532 | RARE Hospitality International, Inc.* | 18,573 | |||||||||
| 1,447 | Ruby Tuesday, Inc. | 32,934 | |||||||||
| 1,231 | Ryan's Family Steak Houses, Inc.* | 16,619 | |||||||||
| 694 | Sonic Corp.* | 16,961 | |||||||||
| 7,784 | Starbucks Corp.* | 212,737 | |||||||||
| 934 | Triarc Co., Inc. | 27,945 | |||||||||
| 2,301 | Wendy's International, Inc. | 67,626 | |||||||||
| 6,003 | Yum! Brands, Inc.* | 179,670 | |||||||||
| 1,692,379 | |||||||||||
| Savings Banks (0.9%) | |||||||||||
| 728 | Anchor Bancorp Wisconsin, Inc. | 17,581 | |||||||||
| 1,756 | Astoria Financial Corp. | 49,414 | |||||||||
| 691 | Bank Mutual Corp. | 25,567 | |||||||||
| 1,164 | BankAtlantic Bancorp, Inc. | 16,238 | |||||||||
| 1,492 | Brookline Bancorp, Inc. | 22,216 | |||||||||
| 1,749 | Capitol Federal Financial | 52,470 | |||||||||
| 580 | Charter Financial Corp. | 17,980 | |||||||||
| 987 | Commercial Federal Corp. | 22,563 | |||||||||
| 552 | Dime Community Bancshares | 13,690 | |||||||||
| 600 | Downey Financial Corp. | 24,852 | |||||||||
| 1,577 | First Niagra Financial Group, Inc. | 25,863 | |||||||||
| 446 | Firstfed Financial Corp.* | 16,903 | |||||||||
| 3,021 | Golden West Financial Corp. | 249,535 | |||||||||
| 1,942 | GreenPoint Financial Corp. | 97,605 | |||||||||
| 513 | Harbor Florida Bancshares, Inc. | 13,292 | |||||||||
| 4,140 | Hudson City Bancorp, Inc. | 112,649 | |||||||||
| 1,161 | Independence Community Bank Corp. | 37,825 | |||||||||
| 480 | MAF Bancorp, Inc. | 19,200 | |||||||||
| 493 | MB Financial, Inc. | 20,953 | |||||||||
| 984 | Net.B@nk, Inc. | 12,211 | |||||||||
See Notes to Financial Statements
28
Morgan Stanley Total Market Index Fund
Portfolio of Investments July 31, 2003 continued
| NUMBER OF SHARES | VALUE | ||||||||||
| 2,880 | New York Community Bancorp, Inc.* | $ | 86,112 | ||||||||
| 1,139 | Northwest Bancorp, Inc. | 18,805 | |||||||||
| 402 | Pacific Northwest Bancorp | 13,970 | |||||||||
| 1,718 | People's Bank | 48,946 | |||||||||
| 1,666 | Roslyn Bancorp, Inc. | 37,202 | |||||||||
| 5,507 | Sovereign Bancorp, Inc. | 98,796 | |||||||||
| 1,269 | Staten Island Bancorp, Inc. | 27,918 | |||||||||
| 1,523 | W. Holding Co., Inc. (Puerto Rico) | 29,242 | |||||||||
| 1,658 | Washington Federal, Inc. | 40,124 | |||||||||
| 18,693 | Washington Mutual, Inc. | 738,000 | |||||||||
| 1,423 | Waypoint Financial Corp. | 24,898 | |||||||||
| 974 | Webster Financial Corp. | 36,486 | |||||||||
| 836 | Westcorp | 28,257 | |||||||||
| 2,097,363 | |||||||||||
| Semiconductors (2.9%) | |||||||||||
| 7,292 | Advanced Micro Devices, Inc.* | 53,232 | |||||||||
| 33,842 | Agere Systems Inc. (Class A)* | 95,096 | |||||||||
| 8,276 | Altera Corp.* | 159,230 | |||||||||
| 7,558 | Analog Devices, Inc.* | 286,826 | |||||||||
| 7,744 | Applied Micro Circuits Corp.* | 44,373 | |||||||||
| 10,015 | Atmel Corp.* | 32,148 | |||||||||
| 5,735 | Broadcom Corp. (Class A)* | 116,248 | |||||||||
| 6,368 | Conexant Systems, Inc.* | 31,331 | |||||||||
| 3,267 | Cypress Semiconductor Corp.* | 45,673 | |||||||||
| 964 | DSP Group, Inc.* | 25,286 | |||||||||
| 1,648 | Exar Corp.* | 23,566 | |||||||||
| 3,199 | Fairchild Semiconductor Corp. (Class A)* | 40,787 | |||||||||
| 3,316 | GlobespanVirata, Inc.* | 22,880 | |||||||||
| 1,681 | Integrated Circuit Systems, Inc.* | 50,514 | |||||||||
| 2,608 | Integrated Device Technology, Inc.* | 30,018 | |||||||||
| 133,022 | Intel Corp. | 3,318,899 | |||||||||
| 1,671 | International Rectifier Corp.* | 46,120 | |||||||||
| 2,903 | Intersil Corp. (Class A)* | 71,588 | |||||||||
| 3,152 | Lattice Semiconductor Corp.* | 24,491 | |||||||||
| 6,602 | Linear Technology Corp. | $ | 243,482 | ||||||||
| 8,821 | LSI Logic Corp.* | 82,124 | |||||||||
| 6,906 | Maxim Integrated Products, Inc. | 269,886 | |||||||||
| 2,555 | Micrel, Inc.* | 28,718 | |||||||||
| 4,350 | Microchip Technology Inc. | 114,666 | |||||||||
| 12,737 | Micron Technology, Inc.* | 186,470 | |||||||||
| 2,122 | Mindspeed Technologies Inc.* | 6,790 | |||||||||
| 4,126 | National Semiconductor Corp.* | 92,216 | |||||||||
| 3,316 | NVIDIA Corp.* | 63,402 | |||||||||
| 840 | Power Integrations, Inc.* | 24,217 | |||||||||
| 2,132 | Rambus Inc.* | 38,291 | |||||||||
| 4,982 | RF Micro Devices, Inc.* | 36,618 | |||||||||
| 1,799 | Semtech Corp.* | 29,684 | |||||||||
| 1,158 | Silicon Laboratories Inc.* | 42,510 | |||||||||
| 847 | Siliconix, Inc.* | 36,209 | |||||||||
| 3,371 | Skyworks Solutions, Inc.* | 28,687 | |||||||||
| 34,937 | Texas Instruments Inc. | 659,261 | |||||||||
| 4,484 | TriQuint Semiconductor, Inc.* | 20,313 | |||||||||
| 5,650 | Vitesse Semiconductor Corp.* | 36,443 | |||||||||
| 7,150 | Xilinx, Inc.* | 187,902 | |||||||||
| 6,746,195 | |||||||||||
| Services to the Health Industry (0.4%) | |||||||||||
| 912 | Accredo Health, Inc.* | 22,326 | |||||||||
| 1,874 | AdvancePCS* | 71,006 | |||||||||
| 262 | Advisory Board Co. (The)* | 10,847 | |||||||||
| 696 | Cerner Corp.* | 22,028 | |||||||||
| 1,141 | Covance, Inc.* | 23,619 | |||||||||
| 1,539 | Express Scripts, Inc. (Class A)* | 101,574 | |||||||||
| 4,872 | IMS Health Inc. | 94,224 | |||||||||
| 2,906 | Laboratory Corp. of America Holdings* | 92,324 | |||||||||
| 1,067 | MedQuist Inc.* | 20,881 | |||||||||
| 681 | NDC Health Corp. | 13,627 | |||||||||
| 550 | Odyssey Healthcare, Inc.* | 23,100 | |||||||||
| 1,857 | Omnicare, Inc. | 63,082 | |||||||||
| 1,144 | Pharmaceutical Product Development, Inc.* | 28,657 | |||||||||
| 1,982 | Quest Diagnostics Inc.* | 118,444 | |||||||||
See Notes to Financial Statements
29
Morgan Stanley Total Market Index Fund
Portfolio of Investments July 31, 2003 continued
| NUMBER OF SHARES | VALUE | ||||||||||
| 2,527 | Quintiles Transnational Corp.* | $ | 34,746 | ||||||||
| 804 | Stericycle, Inc.* | 36,285 | |||||||||
| 6,368 | WebMD Corp.* | 76,925 | |||||||||
| 853,695 | |||||||||||
| Specialty Insurance (0.3%) | |||||||||||
| 2,010 | Ambac Financial Group, Inc. | 132,399 | |||||||||
| 1,621 | Fidelity National Financial, Inc. | 46,506 | |||||||||
| 1,266 | First American Corp. | 30,587 | |||||||||
| 318 | LandAmerica Financial Group, Inc. | 14,657 | |||||||||
| 220 | Markel Corp.* | 59,508 | |||||||||
| 2,774 | MBIA Inc. | 140,420 | |||||||||
| 1,949 | MGIC Investment Corp. | 108,170 | |||||||||
| 1,811 | PMI Group, Inc. (The) | 59,998 | |||||||||
| 919 | Proassurance Corp.* | 25,870 | |||||||||
| 1,762 | Radian Group, Inc. | 82,479 | |||||||||
| 700,594 | |||||||||||
| Specialty Stores (0.7%) | |||||||||||
| 697 | Advance Auto Parts, Inc.* | 47,347 | |||||||||
| 5,891 | AutoNation, Inc.* | 101,266 | |||||||||
| 1,946 | AutoZone, Inc.* | 162,024 | |||||||||
| 1,307 | Barnes & Noble, Inc.* | 31,277 | |||||||||
| 5,864 | Bed Bath & Beyond Inc.* | 227,699 | |||||||||
| 1,731 | Borders Group, Inc.* | 30,812 | |||||||||
| 2,146 | CarMax Inc.* | 76,183 | |||||||||
| 1,002 | Claire's Stores, Inc. | 27,355 | |||||||||
| 445 | Cost Plus, Inc.* | 16,585 | |||||||||
| 1,037 | CSK Auto Corp.* | 15,348 | |||||||||
| 495 | Group 1 Automotive, Inc.* | 18,662 | |||||||||
| 530 | Guitar Center, Inc.* | 17,861 | |||||||||
| 960 | Linens 'N Things, Inc.* | 25,680 | |||||||||
| 1,347 | Michaels Stores, Inc. | 52,008 | |||||||||
| 1,175 | O'Reilly Automotive, Inc.* | 44,768 | |||||||||
| 6,239 | Office Depot, Inc.* | 103,567 | |||||||||
| 2,704 | Officemax, Inc.* | 24,282 | |||||||||
| 2,667 | PETSMART, Inc. | 52,887 | |||||||||
| 1,978 | Pier 1 Imports, Inc. | 36,791 | |||||||||
| 986 | Regis Corp. | 30,359 | |||||||||
| 674 | Rent-A-Center, Inc.* | 49,148 | |||||||||
| 673 | Sonic Automotive, Inc. | 17,262 | |||||||||
| 9,451 | Staples, Inc.* | $ | 190,343 | ||||||||
| 2,939 | Tiffany & Co. | 100,984 | |||||||||
| 4,822 | Toys 'R' Us, Inc.* | 53,765 | |||||||||
| 339 | Tractor Supply Company* | 18,777 | |||||||||
| 838 | Tuesday Morning Corp.* | 23,782 | |||||||||
| 721 | United Auto Group, Inc.* | 16,468 | |||||||||
| 2,379 | Williams-Sonoma, Inc.* | 67,207 | |||||||||
| 725 | Zale Corp.* | 34,474 | |||||||||
| 1,714,971 | |||||||||||
| Specialty Telecommunications (0.2%) | |||||||||||
| 3,878 | American Tower Corp. (Class A)* | 35,290 | |||||||||
| 3,036 | CenturyTel, Inc. | 104,104 | |||||||||
| 6,045 | Citizens Communications Co.* | 71,633 | |||||||||
| 579 | Commonwealth Telephone Enterprises, Inc.* | 22,002 | |||||||||
| 4,718 | Crown Castle International Corp.* | 46,708 | |||||||||
| 252 | Focal Communications Corp. (Warrants) (due 12/14/07)* | 0 | |||||||||
| 3,208 | PanAmSat Corp.* | 55,915 | |||||||||
| 33,764 | Qwest Communications International, Inc.* | 134,718 | |||||||||
| 1,490 | West Corp.* | 36,237 | |||||||||
| 506,607 | |||||||||||
| Steel (0.1%) | |||||||||||
| 1,702 | Nucor Corp. | 83,943 | |||||||||
| 921 | Reliance Steel & Aluminum Co. | 20,630 | |||||||||
| 1,225 | Steel Dynamics, Inc.* | 18,498 | |||||||||
| 2,317 | United States Steel Corp. | 36,516 | |||||||||
| 2,107 | Worthington Industries, Inc. | 30,973 | |||||||||
| 190,560 | |||||||||||
| Telecommunication Equipment (0.8%) | |||||||||||
| 16,949 | ADC Telecommunications, Inc.* | 36,949 | |||||||||
| 907 | ADTRAN, Inc. | 44,298 | |||||||||
| 1,981 | Advanced Fibre Communications, Inc.* | 33,419 | |||||||||
| 2,490 | Andrew Corp.* | 27,116 | |||||||||
See Notes to Financial Statements
30
Morgan Stanley Total Market Index Fund
Portfolio of Investments July 31, 2003 continued
| NUMBER OF SHARES | VALUE | ||||||||||
| 9,454 | CIENA Corp.* | $ | 54,928 | ||||||||
| 1,822 | CommScope, Inc.* | 18,821 | |||||||||
| 3,888 | Comverse Technology, Inc.* | 57,348 | |||||||||
| 24,231 | Corning Inc.* | 197,240 | |||||||||
| 1,534 | Harris Corp. | 49,656 | |||||||||
| 1,201 | InterDigital Communications Corp.* | 19,072 | |||||||||
| 78,388 | Lucent Technologies Inc.* | 137,963 | |||||||||
| 46,088 | Motorola, Inc. | 416,636 | |||||||||
| 1,369 | Plantronics, Inc.* | 33,185 | |||||||||
| 2,195 | Polycom, Inc.* | 36,657 | |||||||||
| 15,773 | QUALCOMM Inc. | 590,857 | |||||||||
| 4,721 | Sonus Networks, Inc.* | 32,764 | |||||||||
| 7,073 | Sycamore Networks, Inc.* | 29,211 | |||||||||
| 1,427 | Tekelec* | 20,934 | |||||||||
| 8,917 | Tellabs, Inc.* | 60,011 | |||||||||
| 813 | Trimble Navigation Ltd.* | 22,236 | |||||||||
| 1,919,301 | |||||||||||
| Textiles (0.0%) | |||||||||||
| 939 | Albany International Corp. (Class A) | 26,827 | |||||||||
| Tobacco (0.8%) | |||||||||||
| 40,717 | Altria Group, Inc. | 1,629,087 | |||||||||
| 1,649 | R. J. Reynolds Tobacco Holdings, Inc. | 58,572 | |||||||||
| 761 | Universal Corp. | 32,426 | |||||||||
| 3,402 | UST, Inc. | 113,117 | |||||||||
| 899 | Vector Group Ltd. | 15,337 | |||||||||
| 1,848,539 | |||||||||||
| Tools/Hardware (0.1%) | |||||||||||
| 1,723 | Black & Decker Corp. (The) | 70,402 | |||||||||
| 464 | Briggs & Stratton Corp. | 25,552 | |||||||||
| 1,506 | Snap-On, Inc. | 42,650 | |||||||||
| 1,832 | Stanley Works (The) | 51,901 | |||||||||
| 664 | Toro Co. (The) | 26,547 | |||||||||
| 217,052 | |||||||||||
| Trucking (0.1%) | |||||||||||
| 580 | Arkansas Best Corp. | 16,049 | |||||||||
| 1,170 | Heartland Express, Inc.* | 29,718 | |||||||||
| 818 | Hunt (J.B.) Tansport Services, Inc.* | 38,561 | |||||||||
| 803 | Knight Transportation, Inc.* | $ | 21,280 | ||||||||
| 384 | Landstar System, Inc.* | 24,637 | |||||||||
| 980 | Pacer International, Inc.* | 19,139 | |||||||||
| 450 | Roadway Corp. | 21,456 | |||||||||
| 1,809 | Swift Transportation Co., Inc.* | 39,870 | |||||||||
| 715 | USF Corp. | 22,523 | |||||||||
| 1,572 | Werner Enterprises, Inc. | 37,476 | |||||||||
| 771 | Yellow Corp.* | 21,017 | |||||||||
| 291,726 | |||||||||||
| Trucks/Construction/Farm Machinery (0.5%) | |||||||||||
| 1,496 | AGCO Corp.* | 28,693 | |||||||||
| 7,016 | Caterpillar Inc. | 473,370 | |||||||||
| 1,081 | Cummins Inc. | 50,083 | |||||||||
| 4,841 | Deere & Co. | 245,826 | |||||||||
| 1,619 | Federal Signal Corp. | 32,299 | |||||||||
| 1,172 | Joy Global Inc. | 18,506 | |||||||||
| 710 | Manitowoc Co., Inc. | 16,188 | |||||||||
| 1,633 | Navistar International Corp.* | 63,720 | |||||||||
| 348 | OshKosh Truck Corp. | 23,149 | |||||||||
| 2,404 | PACCAR, Inc. | 185,589 | |||||||||
| 1,048 | Terex Corp.* | 22,480 | |||||||||
| 1,386 | Trinity Industries, Inc. | 31,448 | |||||||||
| 1,862 | Wabtec Corp. | 27,483 | |||||||||
| 1,218,834 | |||||||||||
| Water Utilities (0.0%) | |||||||||||
| 1,674 | Philadelphia Suburban Corp. | 40,076 | |||||||||
| Wholesale Distributors (0.1%) | |||||||||||
| 1,043 | Fisher Scientific International, Inc.* | 39,425 | |||||||||
| 3,616 | Genuine Parts Co. | 111,879 | |||||||||
| 2,116 | Grainger (W.W.), Inc. | 104,107 | |||||||||
| 512 | Hughes Supply, Inc. | 18,637 | |||||||||
| 939 | MSC Industrial Direct Co., Inc. (Class A)* | 18,921 | |||||||||
| 670 | SCP Pool Corp.* | 25,969 | |||||||||
| 452 | TIMCO Aviation Services, Inc. (Warrants) (due 02/28/07) | 0 | |||||||||
| 732 | United Stationers, Inc.* | 28,050 | |||||||||
| 346,988 | |||||||||||
See Notes to Financial Statements
31
Morgan Stanley Total Market Index Fund
Portfolio of Investments July 31, 2003 continued
| NUMBER OF SHARES | VALUE | ||||||||||
| Wireless Telecommunications (0.5%) | |||||||||||
| 54,023 | AT&T Wireless Services Inc.* | $ | 460,816 | ||||||||
| 20,770 | Nextel Communications, Inc. (Class A)* | 379,260 | |||||||||
| 4,119 | Nextel Partners, Inc. (Class A)* | 36,536 | |||||||||
| 2,794 | Price Communications Corp.* | 35,484 | |||||||||
| 20,149 | Sprint Corp. (PCS Group)* | 123,916 | |||||||||
| 1,506 | Telephone & Data Systems, Inc. | 80,375 | |||||||||
| 2,088 | United States Cellular Corp.* | 60,030 | |||||||||
| 1,644 | Western Wireless Corp. (Class A)* | 24,085 | |||||||||
| 1,200,502 | |||||||||||
| Total Common Stocks and Warrants | |||||||||||
| (Cost $252,556,258) | 227,560,226 | ||||||||||
| PRINCIPAL AMOUNT IN THOUSANDS | |||||||||||
| Short-Term Investment (2.1%) | |||||||||||
| Repurchase Agreement | |||||||||||
| $ | 4,899 | Joint repurchase agreement account 1.11% due 08/01/03 (dated 07/31/03; proceeds $4,899,151) (a) (Cost $4,899,000) | 4,899,000 | ||||||||
| Total Investments (Cost $257,455,258) (b) (c) | 99.9 | % | 232,459,226 | |||||||
| Other Assets in Excess of Liabilities | 0.1 | 167,690 | ||||||||
| Net Assets | 100.0 | % | $ | 232,626,916 | ||||||
| * | Non-income producing security. |
| ** | A portion of this security has been physically segregated in connection with open futures contracts. |
| (a) | Collateralized by federal agency and U.S. Treasury obligations. |
| (b) | Securities have been designated as collateral in an amount equal to $1,809,068 in connection with open futures contracts. |
| (c) | The aggregate cost for federal income tax purposes is $257,329,073. The aggregate gross unrealized appreciation is $36,840,717 and the aggregate gross unrealized depreciation is $61,710,564, resulting in net unrealized depreciation of $24,869,847. |
Futures Contracts Open at July 31, 2003:
| NUMBER OF CONTRACTS | LONG/ SHORT | DESCRIPTION DELIVERY MONTH, AND YEAR | UNDERLYING FACE AMOUNT AT VALUE | UNREALIZED APPRECIATION/ DEPRECIATION | ||||||||||||||
| 30 | Long | Russell 2000 E-Mini Index September 2003 | $ | 1,428,300 | $ | 71,500 | ||||||||||||
| 48 | Long | S&P 500 E-Mini Index September 2003 | 2,374,320 | 7,217 | ||||||||||||||
| 6 | Long | S&P 500 Index September 2003 | 1,483,950 | (14,298 | ) | |||||||||||||
| Net unrealized appreciation | $ | 64,419 | ||||||||||||||||
See Notes to Financial Statements
32
Morgan Stanley Total Market Index Fund
Financial Statements
Statement of Assets and Liabilities
July 31, 2003
| Assets: | ||||||
| Investments in securities, at value (cost $257,455,258) | $ | 232,459,226 | ||||
| Receivable for: | ||||||
| Shares of beneficial interest sold | 357,292 | |||||
| Dividends | 261,004 | |||||
| Variation margin | 22,814 | |||||
| Prepaid expenses and other assets | 47,163 | |||||
| Total Assets | 233,147,499 | |||||
| Liabilities: | ||||||
| Payable for: | ||||||
| Shares of beneficial interest redeemed | 224,827 | |||||
| Distribution fee | 178,472 | |||||
| Investment management fee | 51,902 | |||||
| Accrued expenses and other payables | 65,382 | |||||
| Total Liabilities | 520,583 | |||||
| Net Assets | $ | 232,626,916 | ||||
| Composition of Net Assets: | ||||||
| Paid-in-capital | $ | 321,228,097 | ||||
| Net unrealized depreciation | (24,931,613 | ) | ||||
| Accumulated undistributed net investment income | 569,056 | |||||
| Accumulated net realized loss | (64,238,624 | ) | ||||
| Net Assets | $ | 232,626,916 | ||||
| Class A Shares: | ||||||
| Net Assets | $ | 12,865,191 | ||||
| Shares Outstanding (unlimited authorized, $.01 par value) | 1,545,346 | |||||
| Net Asset Value Per Share | $ | 8.33 | ||||
| Maximum Offering Price Per Share, (net asset value plus 5.54% of net asset value) | $ | 8.79 | ||||
| Class B Shares: | ||||||
| Net Assets | $ | 182,931,677 | ||||
| Shares Outstanding (unlimited authorized, $.01 par value) | 22,560,334 | |||||
| Net Asset Value Per Share | $ | 8.11 | ||||
| Class C Shares: | ||||||
| Net Assets | $ | 23,483,141 | ||||
| Shares Outstanding (unlimited authorized, $.01 par value) | 2,893,800 | |||||
| Net Asset Value Per Share | $ | 8.11 | ||||
| Class D Shares: | ||||||
| Net Assets | $ | 13,346,907 | ||||
| Shares Outstanding (unlimited authorized, $.01 par value) | 1,589,735 | |||||
| Net Asset Value Per Share | $ | 8.40 | ||||
See Notes to Financial Statements
33
Morgan Stanley Total Market Index Fund
Financial Statements continued
Statement of Operations
For the year ended July 31, 2003
| Net Investment Income: | ||||||
| Income | ||||||
| Dividends | $ | 3,802,631 | ||||
| Interest | 48,363 | |||||
| Total Income | 3,850,994 | |||||
| Expenses | ||||||
| Distribution fee (Class A shares) | 32,300 | |||||
| Distribution fee (Class B shares) | 1,752,683 | |||||
| Distribution fee (Class C shares) | 225,883 | |||||
| Investment management fee | 874,329 | |||||
| Transfer agent fees and expenses | 420,166 | |||||
| Shareholder reports and notices | 73,490 | |||||
| Registration fees | 51,594 | |||||
| Professional fees | 44,208 | |||||
| Custodian fees | 23,464 | |||||
| Trustees' fees and expenses | 14,850 | |||||
| Other | 10,016 | |||||
| Total Expenses | 3,522,983 | |||||
| Less: amounts waived/reimbursed | (419,205 | ) | ||||
| Net Expenses | 3,103,778 | |||||
| Net Investment Income | 747,216 | |||||
| Net Realized and Unrealized Gain (Loss): | ||||||
| Net Realized Gain/Loss on: | ||||||
| Investments | (15,496,730 | ) | ||||
| Futures contracts | 1,039,742 | |||||
| Net Realized Loss | (14,456,988 | ) | ||||
| Net Change in Unrealized Appreciation/Depreciation on: | ||||||
| Investments | 35,410,226 | |||||
| Futures contracts | (891,440 | ) | ||||
| Net Appreciation | 34,518,786 | |||||
| Net Gain | 20,061,798 | |||||
| Net Increase | $ | 20,809,014 | ||||
See Notes to Financial Statements
34
Morgan Stanley Total Market Index Fund
Financial Statements continued
Statement of Changes in Net Assets
| FOR THE YEAR ENDED JULY 31, 2003 | FOR THE YEAR ENDED JULY 31, 2002 | |||||||||
| Increase (Decrease) in Net Assets: | ||||||||||
| Operations: | ||||||||||
| Net investment income (loss) | $ | 747,216 | $ | (36,601 | ) | |||||
| Net realized loss | (14,456,988 | ) | (37,452,978 | ) | ||||||
| Net change in unrealized appreciation (depreciation) | 34,518,786 | (38,879,082 | ) | |||||||
| Net Increase (Decrease) | 20,809,014 | (76,368,661 | ) | |||||||
| Dividends to Shareholders from Net Investment Income: | ||||||||||
| Class A shares | (52,697 | ) | — | |||||||
| Class B shares | (194,798 | ) | — | |||||||
| Class C shares | (25,335 | ) | — | |||||||
| Class D shares | (39,178 | ) | — | |||||||
| Total Dividends | (312,008 | ) | — | |||||||
| Net decrease from transactions in shares of beneficial interest | (24,245,533 | ) | (37,628,403 | ) | ||||||
| Net Decrease | (3,748,527 | ) | (113,997,064 | ) | ||||||
| Net Assets: | ||||||||||
| Beginning of period | 236,375,443 | 350,372,507 | ||||||||
| End of Period (Including accumulated undistributed net investment income of $569,056 and $85,835, respectively) | $ | 232,626,916 | $ | 236,375,443 | ||||||
See Notes to Financial Statements
35
Morgan Stanley Total Market Index Fund
Notes to Financial Statements July 31, 2003
1. Organization and Accounting Policies
Morgan Stanley Total Market Index Fund (the "Fund") is registered under the Investment Company Act of 1940, as amended (the "Act"), as a diversified, open-end management investment company. The Fund's investment objective is to provide investment results that, before expenses, correspond to the total return of the Wilshire 5000 Equity Index (the "Index"). The Fund seeks to achieve its objective by investing at least 80% of its total assets in stocks included in the Index. The Fund was organized as a Massachusetts business trust on March 11, 1999 and commenced operations on September 28, 1999.
The Fund offers Class A shares, Class B shares, Class C shares and Class D shares. The four classes are substantially the same except that most Class A shares are subject to a sales charge imposed at the time of purchase and some Class A shares, and most Class B shares and Class C shares are subject to a contingent deferred sales charge imposed on shares redeemed within one year, six years and one year, respectively. Class D shares are not subject to a sales charge. Additionally, Class A shares, Class B shares and Class C shares incur distribution expenses.
The following is a summary of significant accounting policies:
A. Valuation of Investments — (1) an equity portfolio security listed or traded on the New York or American Stock Exchange or other exchange is valued at its latest sale price prior to the time when assets are valued; if there were no sales that day, the security is valued at the mean between the last reported bid and asked price; (2) an equity portfolio security listed or traded on the Nasdaq is valued at the Nasdaq Official Closing Price; if there were no sales that day, the security is valued at the mean between the last reported bid and asked price; (3) all other equity portfolio securities for which over-the-counter market quotations are readily available are valued at the mean between the last reported bid and asked price. In cases where a security is traded on more than one exchange, the security is valued on the exchange designated as the primary market; (4) for equity securities traded on foreign exchanges, the last reported sale price or the latest bid price may be used if there were no sales on a particular day; (5) futures are valued at the latest price published by the commodities exchange on which they trade; (6) when market quotations are not readily available or Morgan Stanley Investment Advisors Inc. (the "Investment Manager") determines that the latest sale price, the bid price or the mean between the last reported bid and asked price do not reflect a security's market value, portfolio securities are valued at their fair value as determined in good faith under procedures established by and under the general supervision of the Fund's Trustees; (7) certain portfolio securities may be valued by an outside pricing service approved by the Fund's Trustees; and (8) short-term debt securities having a maturity date of more than sixty days at time of purchase are valued on a mark-to-market basis until sixty days prior to maturity and thereafter at amortized cost based on their value on the 61st day. Short-term debt securities having a maturity date of sixty days or less at the time of purchase are valued at amortized cost.
B. Accounting for Investments — Security transactions are accounted for on the trade date (date the order to buy or sell is executed). Realized gains and losses on security transactions are determined by the identified
36
Morgan Stanley Total Market Index Fund
Notes to Financial Statements July 31, 2003 continued
cost method. Dividend income and other distributions are recorded on the ex-dividend date. Discounts are accreted and premiums are amortized over the life of the respective securities. Interest income is accrued daily.
C. Repurchase Agreements — Pursuant to an Exemptive Order issued by the Securities and Exchange Commission, the Fund, along with other affiliated entities managed by the Investment Manager, may transfer uninvested cash balances into one or more joint repurchase agreement accounts. These balances are invested in one or more repurchase agreements and are collateralized by cash, U.S. Treasury or federal agency obligations. The Fund may also invest directly with institutions in repurchase agreements. The Fund's custodian receives the collateral, which is marked-to-market daily to determine that the value of the collateral does not decrease below the repurchase price plus accrued interest.
D. Multiple Class Allocations — Investment income, expenses (other than distribution fees), and realized and unrealized gains and losses are allocated to each class of shares based upon the relative net asset value on the date such items are recognized. Distribution fees are charged directly to the respective class.
E. Futures Contracts — A futures contract is an agreement between two parties to buy and sell financial instruments or contracts based on financial indices at a set price on a future date. Upon entering into such a contract, the Fund is required to pledge to the broker cash, U.S. Government securities or other liquid portfolio securities equal to the minimum initial margin requirements of the applicable futures exchange. Pursuant to the contract, the Fund agrees to receive from or pay to the broker an amount of cash equal to the daily fluctuation in the value of the contract. Such receipts or payments known as variation margin are recorded by the Fund as unrealized gains and losses. Upon closing of the contract, the Fund realizes a gain or loss equal to the difference between the value of the contract at the time it was opened and the value at the time it was closed.
F. Federal Income Tax Policy — It is the Fund's policy to comply with the requirements of the Internal Revenue Code applicable to regulated investment companies and to distribute substantially all of its taxable income to its shareholders. Accordingly, no federal income tax provision is required.
G. Dividends and Distributions to Shareholders — Dividends and distributions to shareholders are recorded on the ex-dividend date.
H. Use of Estimates — The preparation of financial statements in accordance with generally accepted accounting principles requires management to make estimates and assumptions that affect the reported amounts and disclosures. Actual results could differ from those estimates.
2. Investment Management Agreement
Pursuant to an Investment Management Agreement, the Fund pays the Investment Manager a management fee, accrued daily and payable monthly, by applying the annual rate of 0.40% to the net assets of the Fund determined as of the close of each business day.
37
Morgan Stanley Total Market Index Fund
Notes to Financial Statements July 31, 2003 continued
The Investment Manager has agreed to assume all operating expenses (except for distribution fees) and to waive the compensation provided for in its Investment Management Agreement to the extent that such expenses and compensation on an annualized basis exceed 0.50% of the daily net assets of the Fund.
3. Plan of Distribution
Shares of the Fund are distributed by Morgan Stanley Distributors Inc. (the "Distributor"), an affiliate of the Investment Manager. The Fund has adopted a Plan of Distribution (the "Plan") pursuant to Rule 12b-1 under the Act. The Plan provides that the Fund will pay the Distributor a fee which is accrued daily and paid monthly at the following annual rates: (i) Class A – up to 0.25% of the average daily net assets of Class A; (ii) Class B – 1.0% of the average daily net assets of Class B; and (iii) Class C – up to 1.0% of the average daily net assets of Class C.
In the case of Class B shares, provided that the Plan continues in effect, any cumulative expenses incurred by the Distributor but not yet recovered may be recovered through the payment of future distribution fees from the Fund pursuant to the Plan and contingent deferred sales charges paid by investors upon redemption of Class B shares. Although there is no legal obligation for the Fund to pay expenses incurred in excess of payments made to the Distributor under the Plan and the proceeds of contingent deferred sales charges paid by investors upon redemption of shares, if for any reason the Plan is terminated, the Trustees will consider at that time the manner in which to treat such expenses. The Distributor has advised the Fund that such excess amounts totaled $14,346,906 at July 31, 2003.
In the case of Class A shares and Class C shares, expenses incurred pursuant to the Plan in any calendar year in excess of 0.25% or 1.0% of the average daily net assets of Class A or Class C, respectively, will not be reimbursed by the Fund through payments in any subsequent year, except that expenses representing a gross sales credit to Morgan Stanley Financial Advisors or other selected broker-dealer representatives may be reimbursed in the subsequent calendar year. For the year ended July 31, 2003, the distribution fee was accrued for Class A shares and Class C shares at the annual rate of 0.25% and 1.0%, respectively.
The Distributor has informed the Fund that for the year ended July 31, 2003, it received contingent deferred sales charges from certain redemptions of the Fund's Class A shares, Class B shares and Class C shares of $1,052, $559,431 and $3,001, respectively and received $45,780 in front-end sales charges from sales of the Fund's Class A shares. The respective shareholders pay such charges which are not an expense of the Fund.
4. Security Transactions and Transactions with Affiliates
The cost of purchases and proceeds from sales of portfolio securities, excluding short-term investments, for the year ended July 31, 2003 aggregated $9,178,693 and $26,233,984, respectively. Included in the aforementioned are sales of common stock of Morgan Stanley, an affiliate of the Investment Manager and Distributor, of $17,228, including realized losses of $17,447.
38
Morgan Stanley Total Market Index Fund
Notes to Financial Statements July 31, 2003 continued
Morgan Stanley Trust, an affiliate of Investment Manager and Distributor, is the Fund's transfer agent. At July 31, 2003, the Fund had transfer agent fees and expenses payable of approximately $2,900.
5. Federal Income Tax Status
The amount of dividends and distributions from net investment income and net realized capital gains are determined in accordance with federal income tax regulations which may differ from generally accepted accounting principles. These "book/tax" differences are either considered temporary or permanent in nature. To the extent these differences are permanent in nature, such amounts are reclassified within the capital accounts based on their federal tax-basis treatment; temporary differences do not require reclassification. Dividends and distributions which exceed net investment income and net realized capital gains for tax purposes are reported as distributions of paid-in-capital.
The tax character of distributions paid was as follows:
| FOR THE YEAR ENDED JULY 31, 2003 | FOR THE YEAR ENDED JULY 31, 2002 | |||||||||
| Ordinary income | $ | 312,008 | — | |||||||
As of July 31, 2003, the tax-basis components of accumulated losses were as follows:
| Undistributed ordinary income | $ | 436,291 | ||||||||
| Undistributed long-term gains | — | |||||||||
| Net accumulated earnings | 436,291 | |||||||||
| Capital loss carryforward* | (53,206,862 | ) | ||||||||
| Post-October losses | (10,960,763 | ) | ||||||||
| Net unrealized depreciation | (24,869,847 | ) | ||||||||
| Total accumulated losses | ($88,601,181 | ) | ||||||||
*As of July 31, 2003, the Fund had a net capital loss carryforward of $53,206,862 of which $1,011,048 will expire on July 31, 2009, $19,339,256 will expire on July 31, 2010 and $32,856,558 will expire on July 31, 2011 to offset future capital gains to the extent provided by regulations.
As of July 31, 2003, the Fund had temporary book/tax differences primarily attributable to post-October losses (capital losses incurred after October 31 within the taxable year which are deemed to arise on the first business day of the Fund's next taxable year) and permanent book/tax differences primarily attributable to tax adjustments on real estate investment trusts held by the Fund and a prior year net operating loss. To reflect reclassifications arising from the permanent differences, paid-in-capital was charged $78,978, accumulated net realized loss was credited $30,965 and accumulated undistributed net investment income was credited $48,013.
39
Morgan Stanley Total Market Index Fund
Notes to Financial Statements July 31, 2003 continued
6. Shares of Beneficial Interest
Transactions in shares of beneficial interest were as follows:
| FOR THE YEAR ENDED JULY 31, 2003 | FOR THE YEAR ENDED JULY 31, 2002 | ||||||||||||||||||
| SHARES | AMOUNT | SHARES | AMOUNT | ||||||||||||||||
| CLASS A SHARES | |||||||||||||||||||
| Sold | 252,945 | $ | 1,891,906 | 1,400,205 | $ | 12,155,699 | |||||||||||||
| Reinvestment of dividends | 6,409 | 47,556 | — | — | |||||||||||||||
| Redeemed | (498,025 | ) | (3,839,268 | ) | (1,335,569 | ) | (11,750,374 | ) | |||||||||||
| Net increase (decrease) – Class A | (238,671 | ) | (1,899,806 | ) | 64,636 | 405,325 | |||||||||||||
| CLASS B SHARES | |||||||||||||||||||
| Sold | 3,515,430 | 25,785,791 | 5,417,710 | 47,102,683 | |||||||||||||||
| Reinvestment of dividends | 24,256 | 176,104 | — | — | |||||||||||||||
| Redeemed | (7,065,998 | ) | (50,975,769 | ) | (9,739,403 | ) | (82,932,081 | ) | |||||||||||
| Net decrease – Class B | (3,526,312 | ) | (25,013,874 | ) | (4,321,693 | ) | (35,829,398 | ) | |||||||||||
| CLASS C SHARES | |||||||||||||||||||
| Sold | 458,830 | 3,372,957 | 679,015 | 5,812,524 | |||||||||||||||
| Reinvestment of dividends | 3,154 | 22,902 | — | — | |||||||||||||||
| Redeemed | (912,895 | ) | (6,577,269 | ) | (1,058,178 | ) | (9,052,752 | ) | |||||||||||
| Net decrease – Class C | (450,911 | ) | (3,181,410 | ) | (379,163 | ) | (3,240,228 | ) | |||||||||||
| CLASS D SHARES | |||||||||||||||||||
| Sold | 978,399 | 7,744,537 | 852,696 | 7,775,092 | |||||||||||||||
| Reinvestment of dividends | 4,311 | 32,200 | — | — | |||||||||||||||
| Redeemed | (252,541 | ) | (1,927,180 | ) | (745,496 | ) | (6,739,194 | ) | |||||||||||
| Net increase – Class D | 730,169 | 5,849,557 | 107,200 | 1,035,898 | |||||||||||||||
| Net decrease in Fund | (3,485,725 | ) | $ | (24,245,533 | ) | (4,529,020 | ) | $ | (37,628,403 | ) | |||||||||
40
Morgan Stanley Total Market Index Fund
Notes to Financial Statements July 31, 2003 continued
7. Purposes of and Risks Relating to Certain Financial Instruments
To hedge against adverse interest rate, foreign currency and market risks, the Fund may purchase and sell interest rate, currency and index futures contracts ("futures contracts").
Futures contracts involve elements of market risk in excess of the amounts reflected in the Statement of Assets and Liabilities. The Fund bears the risk of an unfavorable change in the value of the underlying securities or currencies. Risks may also arise upon entering into these contracts from the potential inability of the counterparties to meet the terms of their contracts.
At July 31, 2003, the Fund had open futures contracts.
41
Morgan Stanley Total Market Index Fund
Financial Highlights
| FOR THE YEAR ENDED JULY 31, | FOR THE PERIOD SEPTEMBER 28, 1999* THROUGH JULY 31, 2000 | |||||||||||||||||
| 2003 | 2002 | 2001 | ||||||||||||||||
| Class A Shares | ||||||||||||||||||
| Selected Per Share Data: | ||||||||||||||||||
| Net asset value, beginning of period | $ | 7.52 | $ | 9.70 | $ | 11.38 | $ | 10.00 | ||||||||||
| Income (loss) from investment operations: | ||||||||||||||||||
| Net investment income‡ | 0.08 | 0.06 | 0.06 | 0.06 | ||||||||||||||
| Net realized and unrealized gain (loss) | 0.76 | (2.24 | ) | (1.74 | ) | 1.34 | ||||||||||||
| Total income (loss) from investment operations | 0.84 | (2.18 | ) | (1.68 | ) | 1.40 | ||||||||||||
| Less dividends and distributions from: | ||||||||||||||||||
| Net investment income | (0.03 | ) | — | — | — | |||||||||||||
| Net realized gains | — | — | — | (0.02 | ) | |||||||||||||
| Total dividends and distributions | (0.03 | ) | — | — | (0.02 | ) | ||||||||||||
| Net asset value, end of period | $ | 8.33 | $ | 7.52 | $ | 9.70 | $ | 11.38 | ||||||||||
| Total Return† | 11.23 | % | (22.47 | )% | (14.76 | )% | 13.99 | % (1) | ||||||||||
| Ratios to Average Net Assets(3)(4): | ||||||||||||||||||
| Expenses | 0.75 | % | 0.75 | % | 0.71 | % | 0.75 | % (2) | ||||||||||
| Net investment income | 1.01 | % | 0.67 | % | 0.58 | % | 0.58 | % (2) | ||||||||||
| Supplemental Data: | ||||||||||||||||||
| Net assets, end of period, in thousands | $12,865 | $13,410 | $16,678 | $22,895 | ||||||||||||||
| Portfolio turnover rate | 4 | % | 4 | % | 7 | % | 2 | % (1) | ||||||||||
| * | Commencement of operations. |
| ‡ | The per share amounts were computed using an average number of shares outstanding during the period. |
| † | Does not reflect the deduction of sales charge. Calculated based on the net asset value as of the last business day of the period. |
| (1) | Not annualized. |
| (2) | Annualized. |
| (3) | Reflects overall Fund ratios for investment income and non-class specific expenses. |
| (4) | If the Fund had borne all its expenses that were reimbursed or waived by the Investment Manager, the annualized expense and net investment income ratios would have been as follows: |
| PERIOD ENDED | EXPENSE RATIO | NET INVESTMENT INCOME RATIO | ||||||||
| July 31, 2003 | 0.94 | % | 0.82 | % | ||||||
| July 31, 2002 | 0.90 | % | 0.52 | % | ||||||
| July 31, 2001 | 0.81 | % | 0.48 | % | ||||||
| July 31, 2000 | 0.90 | % | 0.43 | % | ||||||
See Notes to Financial Statements
42
Morgan Stanley Total Market Index Fund
Financial Highlights continued
| FOR THE YEAR ENDED JULY 31, | FOR THE PERIOD SEPTEMBER 28, 1999* THROUGH JULY 31, 2000 | |||||||||||||||||
| 2003 | 2002 | 2001 | ||||||||||||||||
| Class B Shares | ||||||||||||||||||
| Selected Per Share Data: | ||||||||||||||||||
| Net asset value, beginning of period | $ | 7.35 | $ | 9.56 | $ | 11.31 | $ | 10.00 | ||||||||||
| Income (loss) from investment operations: | ||||||||||||||||||
| Net investment income (loss)‡ | 0.02 | (0.01 | ) | (0.02 | ) | (0.02 | ) | |||||||||||
| Net realized and unrealized gain (loss) | 0.75 | (2.20 | ) | (1.73 | ) | 1.35 | ||||||||||||
| Total income (loss) from investment operations | 0.77 | (2.21 | ) | (1.75 | ) | 1.33 | ||||||||||||
| Less dividends and distributions from: | ||||||||||||||||||
| Net investment income | (0.01 | ) | — | — | — | |||||||||||||
| Net realized gains | — | — | — | (0.02 | ) | |||||||||||||
| Total dividends and distributions | (0.01 | ) | — | — | (0.02 | ) | ||||||||||||
| Net asset value, end of period | $ | 8.11 | $ | 7.35 | $ | 9.56 | $ | 11.31 | ||||||||||
| Total Return† | 10.46 | % | (23.12 | )% | (15.47 | )% | 13.29 | % (1) | ||||||||||
| Ratios to Average Net Assets(3)(4): | ||||||||||||||||||
| Expenses | 1.50 | % | 1.50 | % | 1.50 | % | 1.50 | %(2) | ||||||||||
| Net investment income (loss) | 0.26 | % | (0.08 | )% | (0.21 | )% | (0.17) | % (2) | ||||||||||
| Supplemental Data: | ||||||||||||||||||
| Net assets, end of period, in thousands | $182,932 | $191,843 | $290,758 | $356,899 | ||||||||||||||
| Portfolio turnover rate | 4 | % | 4 | % | 7 | % | 2 | %(1) | ||||||||||
| * | Commencement of operations. |
| ‡ | The per share amounts were computed using an average number of shares outstanding during the period. |
| † | Does not reflect the deduction of sales charge. Calculated based on the net asset value as of the last business day of the period. |
| (1) | Not annualized. |
| (2) | Annualized. |
| (3) | Reflects overall Fund ratios for investment income and non-class specific expenses. |
| (4) | If the Fund had borne all its expenses that were reimbursed or waived by the Investment Manager, the annualized expense and net investment income (loss) ratios would have been as follows: |
| PERIOD ENDED | EXPENSE RATIO | NET INVESTMENT INCOME (LOSS) RATIO | ||||||||
| July 31, 2003 | 1.69 | % | 0.07 | % | ||||||
| July 31, 2002 | 1.65 | % | (0.23 | )% | ||||||
| July 31, 2001 | 1.60 | % | (0.31 | )% | ||||||
| July 31, 2000 | 1.65 | % | (0.32 | )% | ||||||
See Notes to Financial Statements
43
Morgan Stanley Total Market Index Fund
Financial Highlights continued
| FOR THE YEAR ENDED JULY 31, | FOR THE PERIOD SEPTEMBER 28, 1999* THROUGH JULY 31, 2000 | |||||||||||||||||
| 2003 | 2002 | 2001 | ||||||||||||||||
| Class C Shares | ||||||||||||||||||
| Selected Per Share Data: | ||||||||||||||||||
| Net asset value, beginning of period | $ | 7.36 | $ | 9.56 | $ | 11.31 | $ | 10.00 | ||||||||||
| Income (loss) from investment operations: | ||||||||||||||||||
| Net investment income (loss)‡ | 0.02 | 0.00 | (0.02 | ) | (0.02 | ) | ||||||||||||
| Net realized and unrealized gain (loss) | 0.74 | (2.20 | ) | (1.73 | ) | 1.35 | ||||||||||||
| Total income (loss) from investment operations | 0.76 | (2.20 | ) | (1.75 | ) | 1.33 | ||||||||||||
| Less dividends and distributions from: | ||||||||||||||||||
| Net investment income | (0.01 | ) | — | — | — | |||||||||||||
| Net realized gains | — | — | — | (0.02 | ) | |||||||||||||
| Total dividends and distributions | (0.01 | ) | — | — | (0.02 | ) | ||||||||||||
| Net asset value, end of period | $ | 8.11 | $ | 7.36 | $ | 9.56 | $ | 11.31 | ||||||||||
| Total Return† | 10.31 | % | (23.01 | )% | (15.47 | )% | 13.29 | %(1) | ||||||||||
| Ratios to Average Net Assets(3)(4): | ||||||||||||||||||
| Expenses | 1.50 | % | 1.42 | % | 1.50 | % | 1.50 | %(2) | ||||||||||
| Net investment income (loss) | 0.26 | % | 0.00 | % | (0.21 | )% | (0.17) | % (2) | ||||||||||
| Supplemental Data: | ||||||||||||||||||
| Net assets, end of period, in thousands | $23,483 | $24,616 | $35,607 | $43,901 | ||||||||||||||
| Portfolio turnover rate | 4 | % | 4 | % | 7 | % | 2 | %(1) | ||||||||||
| * | Commencement of operations. |
| ‡ | The per share amounts were computed using an average number of shares outstanding during the period. |
| † | Does not reflect the deduction of sales charge. Calculated based on the net asset value as of the last business day of the period. |
| (1) | Not annualized. |
| (2) | Annualized. |
| (3) | Reflects overall Fund ratios for investment income and non-class specific expenses. |
| (4) | If the Fund had borne all its expenses that were reimbursed or waived by the Investment Manager, the annualized expense and net investment income (loss) ratios would have been as follows: |
| PERIOD ENDED | EXPENSE RATIO | NET INVESTMENT INCOME (LOSS) RATIO | ||||||||
| July 31, 2003 | 1.69 | % | 0.07 | % | ||||||
| July 31, 2002 | 1.57 | % | (0.15 | )% | ||||||
| July 31, 2001 | 1.60 | % | (0.31 | )% | ||||||
| July 31, 2000 | 1.65 | % | (0.32 | )% | ||||||
See Notes to Financial Statements
44
Morgan Stanley Total Market Index Fund
Financial Highlights continued
| FOR THE YEAR ENDED JULY 31, | FOR THE PERIOD SEPTEMBER 28, 1999* THROUGH JULY 31, 2000 | |||||||||||||||||
| 2003 | 2002 | 2001 | ||||||||||||||||
| Class D Shares | ||||||||||||||||||
| Selected Per Share Data: | ||||||||||||||||||
| Net asset value, beginning of period | $ | 7.57 | $ | 9.74 | $ | 11.41 | $ | 10.00 | ||||||||||
| Income (loss) from investment operations: | ||||||||||||||||||
| Net investment income‡ | 0.09 | 0.08 | 0.08 | 0.08 | ||||||||||||||
| Net realized and unrealized gain (loss) | 0.78 | (2.25 | ) | (1.75 | ) | 1.35 | ||||||||||||
| Total income (loss) from investment operations | 0.87 | (2.17 | ) | (1.67 | ) | 1.43 | ||||||||||||
| Less dividends and distributions from: | ||||||||||||||||||
| Net investment income | (0.04 | ) | — | — | — | |||||||||||||
| Net realized gains | — | — | — | (0.02 | ) | |||||||||||||
| Total dividends and distributions | (0.04 | ) | — | — | (0.02 | ) | ||||||||||||
| Net asset value, end of period | $ | 8.40 | $ | 7.57 | $ | 9.74 | $ | 11.41 | ||||||||||
| Total Return† | 11.54 | % | (22.28 | )% | (14.64 | )% | 14.30 | % (1) | ||||||||||
| Ratios to Average Net Assets(3)(4): | ||||||||||||||||||
| Expenses | 0.50 | % | 0.50 | % | 0.50 | % | 0.50 | % (2) | ||||||||||
| Net investment income | 1.26 | % | 0.92 | % | 0.79 | % | 0.83 | % (2) | ||||||||||
| Supplemental Data: | ||||||||||||||||||
| Net assets, end of period, in thousands | $13,347 | $6,506 | $7,329 | $3,628 | ||||||||||||||
| Portfolio turnover rate | 4 | % | 4 | % | 7 | % | 2 | % (1) | ||||||||||
| * | Commencement of operations. |
| ‡ | The per share amounts were computed using an average number of shares outstanding during the period. |
| † | Calculated based on the net asset value as of the last business day of the period. |
| (1) | Not annualized. |
| (2) | Annualized. |
| (3) | Reflects overall Fund ratios for investment income and non-class specific expenses. |
| (4) | If the Fund had borne all its expenses that were reimbursed or waived by the Investment Manager, the annualized expense and net investment income ratios would have been as follows: |
| PERIOD ENDED | EXPENSE RATIO | NET INVESTMENT INCOME RATIO | ||||||||
| July 31, 2003 | 0.69 | % | 1.07 | % | ||||||
| July 31, 2002 | 0.65 | % | 0.77 | % | ||||||
| July 31, 2001 | 0.60 | % | 0.69 | % | ||||||
| July 31, 2000 | 0.65 | % | 0.68 | % | ||||||
See Notes to Financial Statements
45
Morgan Stanley Total Market Index Fund
Independent Auditors' Report
To the Shareholders and Board of Trustees of
Morgan Stanley Total Market Index Fund:
We have audited the accompanying statement of assets and liabilities of Morgan Stanley Total Market Index Fund (the "Fund"), including the portfolio of investments, as of July 31, 2003, and the related statements of operations for the year then ended and changes in net assets for each of the two years in the period then ended, and the financial highlights for each of the periods presented. These financial statements and financial highlights are the responsibility of the Fund's management. Our responsibility is to express an opinion on these financial statements and financial highlights based on our audits.
We conducted our audits in accordance with auditing standards generally accepted in the United States of America. Those standards require that we plan and perform the audit to obtain reasonable assurance about whether the financial statements and financial highlights are free of material misstatement. An audit includes examining, on a test basis, evidence supporting the amounts and disclosures in the financial statements. Our procedures included confirmation of securities owned as of July 31, 2003, by correspondence with the custodian. An audit also includes assessing the accounting principles used and significant estimates made by management, as well as evaluating the overall financial statement presentation. We believe that our audits provide a reasonable basis for our opinion.
In our opinion, the financial statements and financial highlights referred to above present fairly, in all material respects, the financial position of Morgan Stanley Total Market Index Fund as of July 31, 2003, the results of its operations for the year then ended, the changes in its net assets for each of the two years in the period then ended, and the financial highlights for each of the periods presented, in conformity with accounting principles generally accepted in the United States of America.
Deloitte & Touche LLP
New York, New York
September 12, 2003
2003 Federal Tax Notice (unaudited)
For the fiscal year ended July 31, 2003, 100% of the income dividends paid by the Fund qualified for the dividends received deduction available to corporations.
46
Morgan Stanley Total Market Index Fund
Trustee and Officer Information
Independent Trustees:
| Name, Age and Address of Independent Trustee | Position(s) Held with Registrant | Term of Office and Length of Time Served* | Principal Occupation(s) During Past 5 Years** | Number of Portfolios in Fund Complex Overseen by Trustee*** | Other Directorships Held by Trustee | |||||||||||||||||
| Michael Bozic (62) c/o Mayer, Brown, Rowe & Maw LLP Counsel to the Independent Directors 1675 Broadway New York, NY | Trustee | Since April 1994 | Retired; Director or Trustee of the Retail Funds and TCW/DW Term Trust 2003 (since April 1994) and the Institutional Funds (since July 2003); formerly Vice Chairman of Kmart Corporation (December 1998-October 2000), Chairman and Chief Executive Officer of Levitz Furniture Corporation (November 1995-November 1998) and President and Chief Executive Officer of Hills Department Stores (May 1991-July 1995); formerly variously Chairman, Chief Executive Officer, President and Chief Operating Officer (1987-1991) of the Sears Merchandise Group of Sears, Roebuck & Co. | 216 | Director of Weirton Steel Corporation. | |||||||||||||||||
| Edwin J. Garn (70) c/o Summit Ventures LLC 1 Utah Center 201 S. Main Street Salt Lake City, UT | Trustee | Since January 1993 | Director or Trustee of the Retail Funds and TCW/DW Term Trust 2003 (since January 1993) and the Institutional Funds (since July 2003); member of the Utah Regional Advisory Board of Pacific Corp.; formerly United States Senator (R-Utah) (1974-1992) and Chairman, Senate Banking Committee (1980-1986), Mayor of Salt Lake City, Utah (1971-1974), Astronaut, Space Shuttle Discovery (April 12-19, 1985), and Vice Chairman, Huntsman Corporation (chemical company). | 216 | Director of Franklin Covey (time management systems), BMW Bank of North America, Inc. (industrial loan corporation), United Space Alliance (joint venture between Lockheed Martin and the Boeing Company) and Nuskin Asia Pacific (multilevel marketing); member of the board of various civic and charitable organizations. | |||||||||||||||||
| Wayne E. Hedien (69) c/o Mayer, Brown, Rowe & Maw LLP Counsel to the Independent Directors 1675 Broadway New York, NY | Trustee | Since September 1997 | Retired; Director or Trustee of the Retail Funds and TCW/DW Term Trust 2003; (Since September 1997) and the Institutional Funds (since July 2003); formerly associated with the Allstate Companies (1966-1994), most recently as Chairman of The Allstate Corporation (March 1993-December 1994) and Chairman and Chief Executive Officer of its wholly-owned subsidiary, Allstate Insurance Company (July 1989-December 1994). | 216 | Director of The PMI Group Inc. (private mortgage insurance); Trustee and Vice Chairman of The Field Museum of Natural History; director of various other business and charitable organizations. | |||||||||||||||||
47
Morgan Stanley Total Market Index Fund
Trustee and Officer Information continued
| Name, Age and Address of Independent Trustee | Position(s) Held with Registrant | Term of Office and Length of Time Served* | Principal Occupation(s) During Past 5 Years** | Number of Portfolios in Fund Complex Overseen by Trustee*** | Other Directorships Held by Trustee | |||||||||||||||||
| Dr. Manuel H. Johnson (54) c/o Johnson Smick International, Inc. 2099 Pennsylvania Avenue, N.W. Suite 950 Washington, D.C. | Trustee | Since July 1991 | Chairman of the Audit Committee and Director or Trustee of the Retail Funds and TCW/DW Term Trust 2003 (since July 1991) and the Institutional Funds (since July 2003); Senior Partner, Johnson Smick International, Inc., a consulting firm; Co-Chairman and a founder of the Group of Seven Council (G7C), an international economic commission; formerly Vice Chairman of the Board of Governors of the Federal Reserve System and Assistant Secretary of the U.S. Treasury. | 216 | Director of NVR, Inc. (home construction); Chairman and Trustee of the Financial Accounting Foundation (oversight organization of the Financial Accounting Standards Board); Director of RBS Greenwich Capital Holdings (financial holding company). | |||||||||||||||||
| Joseph J. Kearns (60) PMB754 23852 Pacific Coast Highway Malibu, CA | Trustee | Since July 2003 | Deputy Chairman of the Audit Committee and Director or Trustee of the Retail Funds and TCW/DW Term Trust 2003 (since July 2003) and the Institutional Funds (since August 1994); previously Chairman of the Audit Committee of the Institutional Funds (October 2001-July 2003); President, Kearns & Associates LLC (investment consulting); formerly CFO of the J. Paul Getty Trust. | 217 | Director of Electro Rent Corporation (equipment leasing), The Ford Family Foundation, and the UCLA Foundation. | |||||||||||||||||
| Michael E. Nugent (67) c/o Triumph Capital, L.P. 445 Park Avenue New York, NY | Trustee | Since July 1991 | Chairman of the Insurance Committee and Director or Trustee of the Retail Funds and TCW/DW Term Trust 2003 (since July 1991) and the Institutional Funds (since July 2001); General Partner of Triumph Capital, L.P., a private investment partnership; formerly Vice President, Bankers Trust Company and BT Capital Corporation (1984-1988). | 216 | Director of various business organizations. | |||||||||||||||||
| Fergus Reid (70) 85 Charles Colman Blvd. Pawling, NY | Trustee | Since July 2003 | Chairman of the Governance Committee and Director or Trustee of the Retail Funds and TCW/DW Term Trust 2003 (since July 2003) and the Institutional Funds (since June 1992); Chairman of Lumelite Plastics Corporation. | 217 | Trustee and Director of certain investment companies in the JPMorgan Funds complex managed by JP Morgan Investment Management Inc. | |||||||||||||||||
48
Morgan Stanley Total Market Index Fund
Trustee and Officer Information continued
Interested Trustees:
| Name, Age and Address of Independent Trustee | Position(s) Held with Registrant | Term of Office and Length of Time Served* | Principal Occupation(s) During Past 5 Years** | Number of Portfolios in Fund Complex Overseen by Trustee*** | Other Directorships Held by Trustee | |||||||||||||||||
| Charles A. Fiumefreddo (70) c/o Morgan Stanley Trust Harborside Financial Center, Plaza Two, Jersey City, NJ | Chairman of the Board and Trustee | Since July 1991 | Chairman and Director or Trustee of the Retail Funds and TCW/DW Term Trust 2003 (since July 1991) and the Institutional Funds (since July 2003); formerly Chief Executive Officer of the Retail Funds and the TCW/DW Term Trust 2003 (until September 2002). | 216 | None | |||||||||||||||||
| James F. Higgins (55) c/o Morgan Stanley Trust Harborside Financial Center, Plaza Two, Jersey City, NJ | Trustee | Since June 2000 | Director or Trustee of the Retail Funds and TCW/DW Term Trust 2003 (since June 2000) and the Institutional Funds (since July 2003); Senior Advisor of Morgan Stanley (since August 2000); Director of the Distributor and Dean Witter Realty Inc.; previously President and Chief Operating Officer of the Private Client Group of Morgan Stanley (May 1999-August 2000), and President and Chief Operating Officer of Individual Securities of Morgan Stanley (February 1997-May 1999). | 216 | Director of AXA Financial, Inc. and The Equitable Life Assurance Society of the United States (financial services). | |||||||||||||||||
| Philip J. Purcell (59) 1585 Broadway New York, NY | Trustee | Since April 1994 | Director or Trustee of the Retail Funds and TCW/DW Term Trust 2003 (since April 1994) and the Institutional Funds (since July 2003); Chairman of the Board of Directors and Chief Executive Officer of Morgan Stanley and Morgan Stanley DW Inc.; Director of the Distributor; Chairman of the Board of Directors and Chief Executive Officer of Novus Credit Services Inc.; Director and/or officer of various Morgan Stanley subsidiaries. | 216 | Director of American Airlines, Inc. and its parent company, AMR Corporation. | |||||||||||||||||
| * | This is the earliest date the Trustee began serving the funds advised by Morgan Stanley Investment Advisors Inc. (the "Investment Manager") (the "Retail Funds"). |
| ** | The dates referenced below indicating commencement of services as Director/Trustee for the Retail Funds and the funds advised by Morgan Stanley Investment Management Inc., Morgan Stanley Investments LP and Morgan Stanley AIP GP LP (the "Institutional Funds") reflect the earliest date the Director/Trustee began serving the Retail or Institutional Funds as applicable. |
| *** | The Fund Complex includes all open-end and closed-end funds (including all of their portfolios) advised by the Investment Manager and any funds that have an investment advisor that is an affiliated person of the Investment Manager (including but not limited to Morgan Stanley Investment Management Inc. and Morgan Stanley Investments LP). |
49
Morgan Stanley Total Market Index Fund
Trustee and Officer Information continued
Officers:
| Name, Age and Address of Executive Officer | Position(s) Held with Registrant | Term of Office and Length of Time Served* | Principal Occupation(s) During Past 5 Years** | |||||||||||
| Mitchell M. Merin (49) 1221 Avenue of the Americas New York, NY | President | Since May 1999 | President and Chief Operating Officer of Morgan Stanley Investment Management Inc.; President, Director and Chief Executive Officer of the Investment Manager and Morgan Stanley Services; Chairman, Chief Executive Officer and Director of the Distributor; Chairman and Director of the Transfer Agent; Director of various Morgan Stanley subsidiaries; President Morgan Stanley Investments LP (since February 2003); President of the Institutional Funds (since July 2003) and President of the Retail Funds and TCW/DW Term Trust 2003 (since May 1999); Trustee (since July 2003) and President (since December 2002) of the Van Kampen Closed-End Funds; Trustee (since May 1999) and President (since October 2002) of the Van Kampen Open-End Funds. | |||||||||||
| Ronald E. Robison (64) 1221 Avenue of the Americas New York, NY | Executive Vice President and Principal Executive Officer | Since April 2003 | Chief Global Operations Officer and Managing Director of Morgan Stanley Investment Management Inc.; Managing Director of Morgan Stanley & Co. Incorporated; Managing Director of Morgan Stanley; Managing Director, Chief Administrative Officer and Director of the Investment Manager and Morgan Stanley Services; Chief Executive Officer and Director of the Transfer Agent; Executive Vice President and Principal Executive Officer of the Institutional Funds (since July 2003); and the TCW/DW Term Trust 2003 (since April 2003); previously President of the Institutional Funds (March 2001-July 2003) and Director of the Institutional Funds (March 2001-July 2003). | |||||||||||
| Barry Fink (48) 1221 Avenue of the Americas New York, NY | Vice President and General Counsel | Since February 1997 | General Counsel (since May 2000) and Managing Director (since December 2000) of Morgan Stanley Investment Management; Managing Director (since December 2000), Secretary (since February 1997) and Director (since July 1998) of the Investment Manager and Morgan Stanley Services; Assistant Secretary of Morgan Stanley DW; Chief Legal Officer of Morgan Stanley Investments LP (since July 2002); Vice President of the Institutional Funds (since July 2003); Vice President and Secretary of the Distributor; previously Secretary of the Retail Funds (February 1997-July 2003); previously Vice President and Assistant General Counsel of the Investment Manager and Morgan Stanley Services (February 1997-December 2001). | |||||||||||
| Joseph J. McAlinden (60) 1221 Avenue of the Americas New York, NY | Vice President | Since July 1995 | Managing Director and Chief Investment Officer of the Investment Manager, Morgan Stanley Investment Management Inc. and Morgan Stanley Investments LP; Director of the Transfer Agent, Chief Investment Officer of the Van Kampen Funds; Vice President of the Institutional Funds (since July 2003) and the Retail Funds (since July 1995). | |||||||||||
| Stefanie V. Chang (36) 1221 Avenue of the Americas New York, NY | Vice President | Since July 2003 | Executive Director of Morgan Stanley & Co. and Morgan Stanley Investment Management Inc. and Vice President of the Institutional Funds (since December 1997) and the Retail Funds (since July 2003); formerly practiced law with the New York law firm of Rogers & Wells (now Clifford Chance LLP). | |||||||||||
50
Morgan Stanley Total Market Index Fund
Trustee and Officer Information continued
| Name, Age and Address of Executive Officer | Position(s) Held with Registrant | Term of Office and Length of Time Served* | Principal Occupation(s) During Past 5 Years** | |||||||||||
| Francis Smith (37) c/o Morgan Stanley Trust Harborside Financial Center, Plaza Two, Jersey City, NJ | Treasurer and Chief Financial Officer | Treasurer since July 2003 and Chief Financial Officer since September 2002 | Executive Director of the Investment Manager and Morgan Stanley Services (since December 2001); previously Vice President of the Retail Funds (September 2002-July 2003); previously Vice President of the Investment Manager and Morgan Stanley Services (August 2000-November 2001) and Senior Manager at PricewaterhouseCoopers LLP (January 1998-August 2000). | |||||||||||
| Thomas F. Caloia (57) c/o Morgan Stanley Trust Harborside Financial Center, Plaza Two, Jersey City, NJ | Vice President | Since July 2003 | Executive Director (since December 2002) and Assistant Treasurer of the Investment Manager, the Distributor and Morgan Stanley Services; previously Treasurer of the Retail Funds (April 1989-July 2003); formerly First Vice President of the Investment Manager, the Distributor and Morgan Stanley Services. | |||||||||||
| Mary E. Mullin (36) 1221 Avenue of the Americas New York, NY | Secretary | Since July 2003 | Vice President of Morgan Stanley & Co. Incorporated and Morgan Stanley Investment Management Inc.; Secretary of the Institutional Funds (since June 1999) and the Retail Funds (since July 2003); formerly practiced law with the New York law firms of McDermott, Will & Emery and Skadden, Arps, Slate, Meagher & Flom LLP. | |||||||||||
| * | This is the earliest date the Officer began serving the Retail Funds. Each Officer serves an indefinite term, until his or her successor is elected. |
| ** | The dates referenced below indicating commencement of service as an Officer for the Retail and Institutional Funds reflect the earliest date the Officer began serving the Retail or Institutional Funds as applicable. |
51
Trustees Michael Bozic Officers Charles A. Fiumefreddo Mitchell M. Merin Ronald E. Robison Barry Fink Joseph J. McAlinden Stefanie V. Chang Francis Smith Thomas F. Caloia Mary E. Mullin Transfer Agent Morgan Stanley Trust Independent Auditors Deloitte & Touche LLP Investment Manager Morgan Stanley Investment Advisors Inc. This report is submitted for the general information of the shareholders of the Fund. For more detailed information about the Fund, its fees and expenses and other pertinent information, please read its Prospectus. The Fund's Statement of Additional Information contains additional information about the Fund, including its trustees. It is available, without charge, by calling (800) 869-NEWS. This report is not authorized for distribution to prospective investors in the Fund unless preceded or accompanied by an effective Prospectus. Read the Prospectus carefully before investing. Investments and services offered through Morgan Stanley DW Inc., member SIPC. Morgan Stanley Distributors Inc., member NASD. © 2003 Morgan Stanley  36085RPT-12089H03-OP-8/03 | ||
Morgan Stanley Total Market Index Fund Annual Report July 31, 2003 | ||
 |
Item 2. Code of Ethics.
(a) The Fund has adopted a code of ethics (the "Code of Ethics") that applies to
its principal executive officer, principal financial officer, principal
accounting officer or controller, or persons performing similar functions,
regardless of whether these individuals are employed by the Fund or a third
party.
(b) No information need be disclosed pursuant to this paragraph.
(c) The Fund has amended its Code of Ethics during the period covered by the
shareholder report presented in Item 1 hereto
(d) The Fund has granted a waiver or an implicit waiver from a provision of its
Code of Ethics.
(e) Not applicable.
(f)
(1) The Fund's Code of Ethics is attached hereto as Exhibit A.
(2) Not applicable.
(3) Not applicable.
Item 3. Audit Committee Financial Expert.
The Fund's Board of Trustees has determined that it has two "audit committee
financial experts" serving on its audit committee, each of whom are
"independent" Trustees: Dr. Manuel H. Johnson and Joseph J. Kearns. Under
applicable securities laws, a person who is determined to be an audit committee
financial expert will not be deemed an "expert" for any purpose, including
without limitation for the purposes of Section 11 of the Securities Act of 1933,
as a result of being designated or identified as an audit committee financial
expert. The designation or identification of a person as an audit committee
financial expert does not impose on such person any duties, obligations, or
liabilities that are greater than the duties, obligations, and liabilities
imposed on such person as a member of the audit committee and Board of Trustees
in the absence of such designation or identification.
Item 9 - Controls and Procedures
(a) The Fund's principal executive officer and principal financial officer have
concluded that the Fund's disclosure controls and procedures are sufficient to
ensure that information required to be disclosed by the Fund in this Form N-CSR
was recorded, processed, summarized and reported within the time periods
specified in the Securities and Exchange Commission's rules and forms, based
upon such officers' evaluation of these controls and procedures as of a date
within 90 days of the filing date of the report.
There were no significant changes or corrective actions with regard to
significant deficiencies or material weaknesses in the Fund's internal controls
or in other factors that could significantly affect the Fund's internal controls
subsequent to the date of their evaluation.
(b) There were no changes in the registrant's internal control over financial
reporting that occurred during the registrant's most recent fiscal half-year
(the registrant's second fiscal half-year in the case of an annual report) that
has materially affected, or is reasonably likely to materially affect, the
registrant's internal control over financial reporting.
Item 10 Exhibits
(a) The Code of Ethics for Principal Executive and Senior Financial Officers is
attached hereto.
(b) A separate certification for each principal executive officer and principal
financial officer of the registrant are attached hereto as part of EX-99.CERT.
Items 4 - 8 are not applicable
SIGNATURES
Pursuant to the requirements of the Securities Exchange Act of 1934 and
the Investment Company Act of 1940, the registrant has duly caused this report
to be signed on its behalf by the undersigned, thereunto duly authorized.
Morgan Stanley Total Market Index Fund
Ronald E. Robison
Principal Executive Officer
September 22, 2003
Pursuant to the requirements of the Securities Exchange Act of 1934 and
the Investment Company Act of 1940, this report has been signed by the following
persons on behalf of the registrant and in the capacities and on the dates
indicated.
Ronald E. Robison
Principal Executive Officer
September 22, 2003
Francis Smith
Principal Financial Officer
September 22, 2003
2
EXHIBIT 10 A
CODE OF ETHICS FOR PRINCIPAL EXECUTIVE AND SENIOR FINANCIAL
OFFICERS
ADOPTED JULY 31, 2003
I. This Code of Ethics (the "Code") for the investment companies within
the Morgan Stanley complex identified in Exhibit A (collectively,
"Funds" and each, a "Fund") applies to each Fund's Principal Executive
Officer, President, Principal Financial Officer and Treasurer (or
persons performing similar functions) ("Covered Officers" each of whom
are set forth in Exhibit B) for the purpose of promoting:
o honest and ethical conduct, including the ethical handling of
actual or apparent conflicts of interest between personal and
professional relationships.
o full, fair, accurate, timely and understandable disclosure in
reports and documents that a company files with, or submits
to, the Securities and Exchange Commission ("SEC") and in
other public communications made by the Fund;
o compliance with applicable laws and governmental rules and
regulations;
o prompt internal reporting of violations of the Code to an
appropriate person or persons identified in the Code; and
o accountability for adherence to the Code.
Each Covered Officer should adhere to a high standard of
business ethics and should be sensitive to situations that may give rise to
actual as well as apparent conflicts of interest. Any question about the
application of the Code should be referred to the General Counsel or his/her
designee (who is set forth in Exhibit C).
3
II. COVERED OFFICERS SHOULD HANDLE ETHICALLY ACTUAL AND APPARENT CONFLICTS
OF INTEREST
OVERVIEW. A "conflict of interest" occurs when a Covered Officer's
private interest interferes, or appears to interfere, with the interests of, or
his service to, the Fund. For example, a conflict of interest would arise if a
Covered Officer, or a member of his family, receives improper personal benefits
as a result of his position with the Fund.
Certain conflicts of interest arise out of the relationships between
Covered Officers and the Fund and already are subject to conflict of interest
provisions in the Investment Company Act of 1940 ("Investment Company Act") and
the Investment Advisers Act of 1940 ("Investment Advisers Act"). For example,
Covered Officers may not individually engage in certain transactions (such as
the purchase or sale of securities or other property) with the Fund because of
their status as "affiliated persons" (as defined in the Investment Company Act)
of the Fund. The Fund's and its investment adviser's compliance programs and
procedures are designed to prevent, or identify and correct, violations of these
provisions. This Code does not, and is not intended to, repeat or replace these
programs and procedures, and such conflicts fall outside the parameters of this
Code, unless or until the General Counsel determines that any violation of such
programs and procedures is also a violation of this Code.
Although typically not presenting an opportunity for improper personal
benefit, conflicts may arise from, or as a result of, the contractual
relationship between the Fund and its investment adviser of which the Covered
Officers are also officers or employees. As a result, this Code recognizes that
the Covered Officers will, in the normal course of their duties (whether
formally for the Fund or for the investment adviser, or for both), be involved
in establishing policies and implementing decisions that will have different
effects on the Fund and its investment adviser. The participation of the Covered
Officers in such activities is inherent in the contractual relationship between
the Fund and the investment adviser and is consistent with the performance by
the Covered Officers of their duties as officers of the Fund. Thus, if performed
in conformity with the provisions of the Investment Company Act and the
Investment Advisers Act, such activities will be deemed to have been handled
ethically. In addition, it is recognized by the Funds' Boards of
Directors/Trustees ("Boards") that the Covered Officers may also be officers or
employees of one or more other investment companies covered by this or other
codes.
Other conflicts of interest are covered by the Code, even if such
conflicts of interest are not subject to provisions in the Investment Company
Act and the Investment Advisers Act. The following list provides examples of
conflicts of interest under the Code, but Covered Officers should keep in mind
that these examples are not exhaustive. The overarching principle is that the
personal interest of a Covered Officer should not be placed improperly before
the interest of the Fund.
Each Covered Officer must not:
o use his personal influence or personal relationships
improperly to influence investment decisions or financial
reporting by the Fund whereby the Covered Officer would
benefit personally (directly or indirectly) to the detriment
of the Fund;
4
o cause the Fund to take action, or fail to take action, for the
individual personal benefit of the Covered Officer rather than
the benefit of the Fund; or
o use material non-public knowledge of portfolio transactions
made or contemplated for, or actions proposed to be taken by,
the Fund to trade personally or cause others to trade
personally in contemplation of the market effect of such
transactions.
Each Covered Officer must, at the time of signing this Code, report to
the General Counsel all affiliations or significant business relationships
outside the Morgan Stanley complex and must update the report annually.
Conflict of interest situations should always be approved by the
General Counsel and communicated to the relevant Fund or Fund's Board. Any
activity or relationship that would present such a conflict for a Covered
Officer would likely also present a conflict for the Covered Officer if an
immediate member of the Covered Officer's family living in the same household
engages in such an activity or has such a relationship. Examples of these
include:
o service or significant business relationships as a director on
the board of any public or private company;
o accepting directly or indirectly, anything of value, including
gifts and gratuities in excess of $100 per year from any
person or entity with which the Fund has current or
prospective business dealings, not including occasional meals
or tickets for theatre or sporting events or other similar
entertainment; provided it is business-related, reasonable in
cost, appropriate as to time and place, and not so frequent as
to raise any question of impropriety;
o any ownership interest in, or any consulting or employment
relationship with, any of the Fund's service providers, other
than its investment adviser, principal underwriter, or any
affiliated person thereof; and
o a direct or indirect financial interest in commissions,
transaction charges or spreads paid by the Fund for effecting
portfolio transactions or for selling or redeeming shares
other than an interest arising from the Covered Officer's
employment, such as compensation or equity ownership.
III. DISCLOSURE AND COMPLIANCE
o Each Covered Officer should familiarize himself/herself with
the disclosure and compliance requirements generally
applicable to the Funds;
o each Covered Officer must not knowingly misrepresent, or cause
others to misrepresent, facts about the Fund to others,
whether within or outside the
5
Fund, including to the Fund's Directors/Trustees and auditors,
or to governmental regulators and self-regulatory
organizations;
o each Covered Officer should, to the extent appropriate within
his area of responsibility, consult with other officers and
employees of the Funds and their investment advisers with the
goal of promoting full, fair, accurate, timely and
understandable disclosure in the reports and documents the
Funds file with, or submit to, the SEC and in other public
communications made by the Funds; and
o it is the responsibility of each Covered Officer to promote
compliance with the standards and restrictions imposed by
applicable laws, rules and regulations.
IV. REPORTING AND ACCOUNTABILITY
Each Covered Officer must:
o upon adoption of the Code (thereafter as applicable, upon
becoming a Covered Officer), affirm in writing to the Boards
that he has received, read and understands the Code;
o annually thereafter affirm to the Boards that he has complied
with the requirements of the Code;
o not retaliate against any other Covered Officer, other officer
or any employee of the Funds or their affiliated persons for
reports of potential violations that are made in good faith;
and
o notify the General Counsel promptly if he/she knows or
suspects of any violation of this Code. Failure to do so is
itself a violation of this Code.
The General Counsel is responsible for applying this Code to specific
situations in which questions are presented under it and has the authority to
interpret this Code in any particular situation. However, any waivers1 sought by
a Covered Officer must be considered by the Board of the relevant Fund or Funds.
The Funds will follow these procedures in investigating and enforcing
this Code:
o the General Counsel will take all appropriate action to
investigate any potential violations reported to him;
- ------------
(1) Item 2 of Form N-CSR defines "waiver" as "the approval by the
registrant of a material departure from a provision of the code of
ethics."
6
o if, after such investigation, the General Counsel believes
that no violation has occurred, the General Counsel is not
required to take any further action;
o any matter that the General Counsel believes is a violation
will be reported to the relevant Fund's Audit Committee;
o if the directors/trustees/managing general partners who are
not "interested persons" as defined by the Investment Company
Act (the "Independent Directors/Trustees/Managing General
Partners") of the relevant Fund concur that a violation has
occurred, they will consider appropriate action, which may
include review of, and appropriate modifications to,
applicable policies and procedures; notification to
appropriate personnel of the investment adviser or its board;
or a recommendation to dismiss the Covered Officer or other
appropriate disciplinary actions;
o the Independent Directors/Trustees/Managing General Partners
of the relevant Fund will be responsible for granting waivers
of this Code, as appropriate; and
o any changes to or waivers of this Code will, to the extent
required, be disclosed as provided by SEC rules.
V. OTHER POLICIES AND PROCEDURES
This Code shall be the sole code of ethics adopted by the Funds for
purposes of Section 406 of the Sarbanes-Oxley Act of 2002 and the rules and
forms applicable to registered investment companies thereunder. Insofar as other
policies or procedures of the Funds, the Funds' investment advisers, principal
underwriters, or other service providers govern or purport to govern the
behavior or activities of the Covered Officers who are subject to this Code,
they are superseded by this Code to the extent that they overlap or conflict
with the provisions of this Code unless any provision of this Code conflicts
with any applicable federal or state law, in which case the requirements of such
law will govern. The Funds' and their investment advisers' and principal
underwriters' codes of ethics under Rule 17j-1 under the Investment Company Act
and Morgan Stanley's Code of Ethics are separate requirements applying to the
Covered Officers and others, and are not part of this Code.
VI. AMENDMENTS
Any amendments to this Code, other than amendments to Exhibits A, B
or C, must be approved or ratified by a majority vote of the Board of each
Fund, including a majority of Independent Directors/Trustees/Managing General
Partners.
7
VII. CONFIDENTIALITY
All reports and records prepared or maintained pursuant to this Code
will be considered confidential and shall be maintained and protected
accordingly. Except as otherwise required by law or this Code, such matters
shall not be disclosed to anyone other than the Independent
Directors/Trustees/Managing General Partners of the relevant Fund or Funds and
their counsel, the relevant Fund or Funds and their counsel and the relevant
investment adviser and its counsel.
8
VIII. INTERNAL USE
The Code is intended solely for the internal use by the Funds and does
not constitute an admission, by or on behalf of any Fund, as to any fact,
circumstance, or legal conclusion
I have read and understand the terms of the above Code. I recognize the
responsibilities and obligations incurred by me as a result of my being subject
to the Code. I hereby agree to abide by the above Code.
__________________________
Date:_____________________
9
EXHIBIT A
FUND LIST
MORGAN STANLEY
RETAIL AND INSTITUTIONAL FUNDS
AT
JULY 31, 2003
RETAIL FUNDS
OPEN-END RETAIL FUNDS
TAXABLE MONEY MARKET FUNDS
1. Active Assets Government Securities Trust ("AA Government")
2. Active Assets Institutional Government Securities Trust ("AA
Institutional Government")
3. Active Assets Institutional Money Trust ("AA Institutional Money")
4. Active Assets Money Trust ("AA Money")
5. Morgan Stanley Liquid Asset Fund Inc. ("Liquid Asset")
6. Morgan Stanley U.S. Government Money Market Trust ("Government Money")
Tax-Exempt Money Market Funds
7. Active Assets California Tax-Free Trust ("AA California")
8. Active Assets Tax-Free Trust ("AA Tax-Free")
9. Morgan Stanley California Tax-Free Daily Income Trust ("California
Tax-Free Daily")
10. Morgan Stanley New York Municipal Money Market Trust ("New York Money")
11. Morgan Stanley Tax-Free Daily Income Trust ("Tax-Free Daily")
EQUITY FUNDS
12. Morgan Stanley 21st Century Trend Fund ("21st Century Trend")*
13. Morgan Stanley Aggressive Equity Fund ("Aggressive Equity")*
14. Morgan Stanley Allocator Fund ("Allocator Fund")*
15. Morgan Stanley All Star Growth Fund ("All Star Growth")*
16. Morgan Stanley American Opportunities Fund ("American Opportunities")*
17. Morgan Stanley Biotechnology Fund ("Biotechnology Fund")*
18. Morgan Stanley Capital Opportunities Trust ("Capital Opportunities")*
19. Morgan Stanley Developing Growth Securities Trust ("Developing
Growth")*
20. Morgan Stanley Dividend Growth Securities Inc. ("Dividend Growth")*
21. Morgan Stanley Equity Fund ("Equity Fund")*
22. Morgan Stanley European Growth Fund Inc. ("European Growth")*
23. Morgan Stanley Financial Services Trust ("Financial Services")*
10
24. Morgan Stanley Fund of Funds ("Fund of Funds")*
o Domestic Portfolio
o International Portfolio
25. Morgan Stanley Fundamental Value Fund ("Fundamental Value")*
26. Morgan Stanley Global Advantage Fund ("Global Advantage")*
27. Morgan Stanley Global Dividend Growth Securities ("Global Dividend
Growth")*
28. Morgan Stanley Global Utilities Fund ("Global Utilities")*
29. Morgan Stanley Growth Fund ("Growth Fund")*
30. Morgan Stanley Health Sciences Trust ("Health Sciences")*
31. Morgan Stanley Income Builder Fund ("Income Builder")*
32. Morgan Stanley Information Fund ("Information Fund")*
33. Morgan Stanley International Fund ("International Fund")*
34. Morgan Stanley International SmallCap Fund ("International SmallCap")*
35. Morgan Stanley International Value Equity Fund ("International Value")*
36. Morgan Stanley Japan Fund ("Japan Fund")*
37. Morgan Stanley KLD Social Index Fund ("KLD Social Index")*
38. Morgan Stanley Latin American Growth Fund ("Latin American")*
39. Morgan Stanley Market Leader Trust ("Market Leader")*
40. Morgan Stanley Mid-Cap Value Fund (Mid-Cap Value")*
41. Morgan Stanley Nasdaq-100 Index Fund ("Nasdaq-100")*
42. Morgan Stanley Natural Resource Development Securities Inc.
("Natural Resource")*
43. Morgan Stanley New Discoveries Fund ("New Discoveries")*
44. Morgan Stanley Next Generation Trust ("Next Generation")*
45. Morgan Stanley Pacific Growth Fund Inc. ("Pacific Growth")*
46. Morgan Stanley Real Estate Fund ("Real Estate")*
47. Morgan Stanley Small-Mid Special Value Fund (Small-Mid Special Value")*
48. Morgan Stanley S&P 500 Index Fund ("S&P500 Index")*
49. Morgan Stanley Special Growth Fund ("Small Cap Growth")*
50. Morgan Stanley Special Value Fund ("Special Value")*
51. Morgan Stanley Tax-Managed Growth Fund ("Tax-Managed Growth")*
52. Morgan Stanley Technology Fund ("Technology Fund")*
53. Morgan Stanley Total Market Index Fund ("Total Market Index")*
54. Morgan Stanley Total Return Trust ("Total Return")*
55. Morgan Stanley Utilities Fund ("Utilities Fund")*
56. Morgan Stanley Value-Added Market Series ("Value-Added")*
57. Morgan Stanley Value Fund ("Value Fund")*
BALANCED FUNDS
58. Morgan Stanley Balanced Growth Fund ("Balanced Growth")*
59. Morgan Stanley Balanced Income Fund ("Balanced Income")*
ASSET ALLOCATION FUND
60. Morgan Stanley Strategist Fund ("Strategist Fund")*
11
TAXABLE FIXED-INCOME FUNDS
61. Morgan Stanley Convertible Securities Trust
("Convertible Securities")*
62. Morgan Stanley Diversified Income Trust ("Diversified Income")*
63. Morgan Stanley Federal Securities Trust ("Federal Securities")*
64. Morgan Stanley High Yield Securities Inc ("High Yield Securities")*
65. Morgan Stanley Intermediate Income Securities ("Intermediate Income")*
66. Morgan Stanley Limited Duration Fund ("Limited Duration Fund")
67. Morgan Stanley Limited Duration U.S. Treasury Trust
("Limited Duration Treasury")
68. Morgan Stanley Total Return Income Securities Fund
("Total Return Income")*
69. Morgan Stanley U.S. Government Securities Trust
("Government Securities")*
TAX-EXEMPT FIXED-INCOME FUNDS
70. Morgan Stanley California Tax-Free Income Fund ("California Tax-Free")*
71. Morgan Stanley Hawaii Municipal Trust ("Hawaii Municipal")
72. Morgan Stanley Limited Term Municipal Trust ("Limited Term Municipal")
73. Morgan Stanley Multi-State Municipal Series Trust
("Multi-State Series")
o Arizona Series
o Florida Series
o New Jersey Series
o Pennsylvania Series
74. Morgan Stanley New York Tax-Free Income Fund ("New York Tax-Free")*
75. Morgan Stanley Tax-Exempt Securities Trust ("Tax-Exempt Securities")*
SPECIAL PURPOSE FUNDS
76. Morgan Stanley Select Dimensions Investment Series
("Select Dimensions")
o American Opportunities Portfolio
o Balanced Growth Portfolio
o Capital Opportunities Portfolio
o Developing Growth Portfolio
o Dividend Growth Portfolio
o Flexible Income Portfolio
o Global Equity Portfolio
o Growth Portfolio
o Money Market Portfolio
o Utilities Portfolio
o Value-Added Portfolio
77. Morgan Stanley Variable Investment Series ("Variable Investment")
o Aggressive Equity Portfolio
o Dividend Growth Portfolio
12
o Equity Portfolio
o European Growth Portfolio
o Global Advantage Portfolio
o Global Dividend Growth Portfolio
o High Yield Portfolio
o Income Builder Portfolio
o Information Portfolio
o Limited Duration Portfolio
o Money Market Portfolio
o Pacific Growth Protfolio
o Quality Income Plus Portfolio
o S&P 500 Index Portfolio
o Strategist Portfolio
o Utilities Portfolio
CLOSED-END RETAIL FUNDS
TAXABLE FIXED-INCOME CLOSED-END FUNDS
78. Morgan Stanley Government Income Trust ("Government Income")
79. Morgan Stanley Income Securities Inc. ("Income Securities")
80. Morgan Stanley Prime Income Trust ("Prime Income")
TAX-EXEMPT FIXED-INCOME CLOSED-END FUNDS
81. Morgan Stanley California Insured Municipal Income Trust ("California
Insured Municipal")
82. Morgan Stanley California Quality Municipal Securities ("California
Quality Municipal")
83. Morgan Stanley Insured California Municipal Securities ("Insured
California Securities")
84. Morgan Stanley Insured Municipal Bond Trust ("Insured Municipal Bond")
85. Morgan Stanley Insured Municipal Income Trust ("Insured Municipal
Income")
86. Morgan Stanley Insured Municipal Securities ("Insured Municipal
Securities")
87. Morgan Stanley Insured Municipal Trust ("Insured Municipal Trust")
88. Morgan Stanley Municipal Income Opportunities Trust ("Municipal
Opportunities")
89. Morgan Stanley Municipal Income Opportunities Trust II ("Municipal
Opportunities II")
90. Morgan Stanley Municipal Income Opportunities Trust III ("Municipal
Opportunities III")
91. Morgan Stanley Municipal Premium Income Trust ("Municipal Premium")
92. Morgan Stanley New York Quality Municipal Securities ("New York Quality
Municipal")
93. Morgan Stanley Quality Municipal Income Trust ("Quality Municipal
Income")
94. Morgan Stanley Quality Municipal Investment Trust ("Quality Municipal
Investment")
13
95. Morgan Stanley Quality Municipal Securities ("Quality Municipal
Securities")
*- Denotes Retail Multi-Class Fund
TERM TRUST
1. TCW/DW Term Trust 2003 ("Term Trust 2003")
14
INSTITUTIONAL FUNDS
OPEN-END INSTITUTIONAL FUNDS
1. Morgan Stanley Institutional Fund, Inc. ("Institutional Fund Inc.")
Active Portfolios:
o Active International Allocation Portfolio
o Asian Equity Portfolio
o Asian Real Estate Portfolio
o Emerging Markets Portfolio
o Emerging Markets Debt Portfolio
o Equity Growth Portfolio
o European Value Equity Portfolio
o European Real Estate Portfolio
o Focus Equity Portfolio
o Global Franchise Portfolio
o Global Value Equity Portfolio
o International Equity Portfolio
o International Magnum Portfolio
o International Small Cap Portfolio
o Japanese Value Equity Portfolio
o Latin American Portfolio
o Money Market Portfolio
o Municipal Money Market Portfolio
o Small Company Growth Portfolio
o Technology Portfolio
o U.S. Real Estate Portfolio
o Value Equity Portfolio
Inactive Portfolios:
o China Growth Portfolio
o Gold Portfolio
o Micro-Cap Portfolio
o Mortgage Backed Securities Portfolio
o U.S. Equity Portfolio
o Municipal Bond Portfolio
2. Morgan Stanley Institutional Fund Trust ("Institutional Fund Trust")
Active Portfolios:
o Advisory Foreign Fixed Income Portfolio
15
o Advisory Foreign Fixed Income II Portfolio
o Advisory Mortgage Portfolio
o Balanced Portfolio
o Cash Reserves Portfolio
o U.S. Core Fixed Income Portfolio
o Equity Portfolio
o Core Plus Fixed Income Portfolio
o Investment Grade Fixed Income Portfolio
o High Yield Portfolio
o Intermediate Duration Portfolio
o International Fixed income Portfolio
o Limited Duration Portfolio
o Mid-Cap Growth Portfolio
o Multi-Asset Class Portfolio
o Municipal Portfolio
o Small-Cap Growth Portfolio
o Strategic Small Value Portfolio
o U.S. Small-Cap Growth Portfolio
o U.S. Mid-Cap Core Portfolio
o Value Portfolio
Inactive Portfolios:
o Balanced Plus Portfolio
o Growth Portfolio
o New York Municipal Portfolio
o Targeted Duration Portfolio
o Value II Portfolio
3. The Universal Institutional Funds, Inc. ("Universal Funds")
Active Portfolios:
o Active International Allocation Portfolio
o Core Plus Fixed Income Portfolio
o Emerging Markets Debt Portfolio
o Emerging Markets Equity Portfolio
o Equity and Income Portfolio
o Equity Growth Portfolio
o Global Franchise Portfolio
o Global Value Equity Portfolio
o High Yield Portfolio
o International Magnum Portfolio
o Mid-Cap Growth Portfolio
o Money Market Portfolio
o Small Company Growth Portfolio
16
o Technology Portfolio
o U.S. Mid-Cap Core Portfolio
o U.S. Real Estate Portfolio
o Value Portfolio
Inactive Portfolios:
o Asian Equity Portfolio
o Balanced Portfolio
o Capital Preservation Portfolio
o Core Equity Portfolio
o International Fixed Income Portfolio
o Investment Grade Fixed Income Portfolio
o Latin American Portfolio
o Multi-Asset Class Portfolio
o Targeted Duration Portfolio
4. Morgan Stanley Institutional Liquidity Funds ("Liquidity Funds")
CLOSED-END INSTITUTIONAL FUNDS
5. Morgan Stanley Asia-Pacific Fund, Inc. ("Asia-Pacific Fund")
6. Morgan Stanley Eastern Europe Fund, Inc. ("Eastern Europe")
7. Morgan Stanley Emerging Markets Debt Fund, Inc. ("Emerging Markets
Debt")
8. Morgan Stanley Emerging Markets Fund, Inc. ("Emerging Markets Fund")
9. Morgan Stanley Global Opportunity Bond Fund, Inc. ("Global
Opportunity")
10. Morgan Stanley High Yield Fund, Inc. ("High Yield Fund")
11. The Latin American Discovery Fund, Inc. ("Latin American Discovery")
12 The Malaysia Fund, Inc. ("Malaysia Fund")
13. The Thai Fund, Inc. ("Thai Fund")
14. The Turkish Investment Fund, Inc. ("Turkish Investment")
CLOSED-END HEDGE FUND
15. Morgan Stanley Institutional Fund of Hedge Funds ("Fund of Hedge
Funds")
17
EXHIBIT B
INSTITUTIONAL FUNDS
COVERED OFFICERS
Mitchell M. Merin - President
Ronald E. Robison - Executive Vice President and Principal Executive Officer
James W. Garrett - Chief Financial Officer and Treasurer
RETAIL FUNDS
COVERED OFFICERS
Mitchell M. Merin - President
Ronald E. Robison - Executive Vice President and Principal Executive Officer
Frank Smith - Chief Financial Officer and Treasurer
18
EXHIBIT C
GENERAL COUNSEL
Barry Fink
19
EXHIBIT 10B1
CERTIFICATION OF PRINCIPAL EXECUTIVE OFFICER
CERTIFICATIONS
I, Ronald E. Robison, certify that:
1. I have reviewed this report on Form N-CSR of Morgan Stanley Total
Market Index Fund,
2. Based on my knowledge, this report does not contain any untrue
statement of a material fact or omit to state a material fact
necessary to make the statements made, in light of the
circumstances under which such statements were made, not
misleading with respect to the period covered by this report;
3. Based on my knowledge, the financial statements, and other
financial information included in this report, fairly present in
all material respects the financial condition, results of
operations, changes in net assets, and cash flows (if the
financial statements are required to include a statement of cash
flows) of the registrant as of, and for, the periods presented in
this report;
4. The registrant's other certifying officers and I are responsible
for establishing and maintaining disclosure controls and
procedures (as defined in Rule 30a-2(c) under the Investment
Company Act of 1940) for the registrant and have:
a) designed such disclosure controls and procedures to ensure
that material information relating to the registrant,
including its consolidated subsidiaries, is made known to us
by others within those entities, particularly during the
period in which this report is being prepared;
b) evaluated the effectiveness of the registrant's disclosure
controls and procedures as of a date within 90 days prior to
the filing date of this report (the "Evaluation Date"); and
c) presented in this report our conclusions about the
effectiveness of the disclosure controls and procedures
based on our evaluation as of the Evaluation Date;
3
5. The registrant's other certifying officers and I have disclosed,
based on our most recent evaluation, to the registrant's auditors
and the audit committee of the registrant's board of directors
(or persons performing the equivalent functions):
a) all significant deficiencies in the design or operation of
internal controls which could adversely affect the
registrant's ability to record, process, summarize, and
report financial data and have identified for the
registrant's auditors any material weaknesses in internal
controls; and
b) any fraud, whether or not material, that involves management
or other employees who have a significant role in the
registrant's internal controls; and
6. The registrant's other certifying officers and I have indicated
in this report whether or not there were significant changes in
internal controls or in other factors that could significantly
affect internal controls subsequent to the date of our most
recent evaluation, including any corrective actions with regard
to significant deficiencies and material weaknesses.
Date: September 22, 2003
Ronald E. Robison
Principal Executive Officer
4
EXHIBIT 10B2
CERTIFICATION OF PRINCIPAL FINANCIAL OFFICER
CERTIFICATIONS
I, Francis Smith, certify that:
1. I have reviewed this report on Form N-CSR of Morgan Stanley Total
Market Index Fund;
2. Based on my knowledge, this report does not contain any untrue
statement of a material fact or omit to state a material fact
necessary to make the statements made, in light of the
circumstances under which such statements were made, not
misleading with respect to the period covered by this report;
3. Based on my knowledge, the financial statements, and other
financial information included in this report, fairly present in
all material respects the financial condition, results of
operations, changes in net assets, and cash flows (if the
financial statements are required to include a statement of cash
flows) of the registrant as of, and for, the periods presented in
this report;
4. The registrant's other certifying officers and I are responsible
for establishing and maintaining disclosure controls and
procedures (as defined in Rule 30a-2(c) under the Investment
Company Act of 1940) for the registrant and have:
(i) designed such disclosure controls and procedures to ensure
that material information relating to the registrant,
including its consolidated subsidiaries, is made known to us
by others within those entities, particularly during the
period in which this report is being prepared;
(ii) evaluated the effectiveness of the registrant's disclosure
controls and procedures as of a date within 90 days prior to
the filing date of this report (the "Evaluation Date"); and
(iii) presented in this report our conclusions about the
effectiveness of the disclosure controls and procedures
based on our evaluation as of the Evaluation Date;
5. The registrant's other certifying officers and I have
disclosed, based on our most recent evaluation, to the
registrant's auditors and the audit committee of the
registrant's board of directors (or persons performing the
equivalent functions):
5
a) all significant deficiencies in the design or operation
of internal controls which could adversely affect the
registrant's ability to record, process, summarize, and
report financial data and have identified for the
registrant's auditors any material weaknesses in
internal controls; and
b) any fraud, whether or not material, that involves
management or other employees who have a significant
role in the registrant's internal controls; and
6. The registrant's other certifying officers and I have
indicated in this report whether or not there were
significant changes in internal controls or in other factors
that could significantly affect internal controls subsequent
to the date of our most recent evaluation, including any
corrective actions with regard to significant deficiencies
and material weaknesses.
Date: September 22, 2003
Francis Smith
Principal Financial Officer
6
SECTION 906 CERTIFICATION
Certification Pursuant to 18 U.S.C. Section 1350,
As Adopted Pursuant to
Section 906 of the Sarbanes-Oxley Act of 2002
Morgan Stanley Total Market Index Fund
In connection with the Report on Form N-CSR (the "Report") of the
above-named issuer for the period ended July 31, 2003 that is accompanied by
this certification, the undersigned hereby certifies that:
1. The Report fully complies with the requirements of Section 13(a) or 15(d)
of the Securities Exchange Act of 1934; and
2. The information contained in the Report fairly presents, in all material
respects, the financial condition and results of operations of the Issuer.
Date: September 22, 2003 Ronald E. Robison
Principal Executive Officer
A signed original of this written statement required by Section 906 has been
provided to Morgan Stanley Total Market Index Fund will be retained by Morgan
Stanley Total Market Index Fund and furnished to the Securities and Exchange
Commission or its staff upon request.
7
SECTION 906 CERTIFICATION
Certification Pursuant to 18 U.S.C. Section 1350,
As Adopted Pursuant to
Section 906 of the Sarbanes-Oxley Act of 2002
Morgan Stanley Total Market Index Fund
In connection with the Report on Form N-CSR (the "Report") of the
above-named issuer for the period ended July 31, 2003 that is accompanied by
this certification, the undersigned hereby certifies that:
1. The Report fully complies with the requirements of Section 13(a) or 15(d)
of the Securities Exchange Act of 1934; and
2. The information contained in the Report fairly presents, in all material
respects, the financial condition and results of operations of the Issuer.
Date: September 22, 2003 Francis Smith
Principal Financial Officer
A signed original of this written statement required by Section 906 has been
provided to Morgan Stanley Total Market Index Fund and will be retained by
Morgan Stanley Total Market Index Fund and furnished to the Securities and
Exchange Commission or its staff upon request.
8