UNITED STATES
SECURITIES AND EXCHANGE COMMISSION
Washington, D.C. 20549
Form 6-K
EPORT OF FOREIGN PRIVATE ISSUER PURSUANT
TO RULE 13a-16 OR 15d-16 UNDER
THE SECURITIES EXCHANGE ACT OF 1934
For the year ended April 24, 2005
Commission File Number: 333-10100
ALIMENTATION COUCHE-TARD INC.
1600 St-Martin Boulevard East
Tower B, Suite 200
Laval, Quebec, Canada
H7G 4S7
Indicate by check mark whether the registrant files or will file annual reports under cover of Form 20-F or Form 40 F. Form 20-F o Form 40-F ý
Indicate by check mark if the registrant is submitting the Form 6-K in paper as permitted by Regulation S-T Rule 101(b)(1):
Yes o No ý
Indicate by check mark if the registrant is submitting the Form 6-K in paper as permitted by Regulation S-T Rule 101(b)(7):
Yes o No ý
Indicate by check mark whether the registrant by furnishing the information contained in this Form is also thereby furnishing the information to the Commission pursuant to Rule 12g-3 under the Securities Exchange Act of 1934.
Yes o No ý
If “Yes” is marked, indicate below the file number assigned to the registrant in connection with Rule 12g3-2(b):
SIGNATURES:
Pursuant to the requirements of the Securities Exchange Act of 1934, the registrant has duly caused this report to be signed on its behalf by the undersigned, thereunto duly authorized.
| ALIMENTATION COUCHE-TARD INC. | ||
|
| ||
July 22, 2005 |
| ||
|
| ||
| By: | /s/ Sylvain Aubry |
|
| Sylvain Aubry | ||
| Corporate Secretary | ||
2005 ANNUAL REPORT
• EXPERTISE • MATURITY • INTERNATIONAL VISION
Alimentation Couche-Tard Inc. |
|

CONTENTS
Profile • Network |
|
| |
| |
| |
Innovation Projects |
|
| |
| |
| |
| |
| |
| |
| |
| |
Other information |
|
ANNUAL GENERAL MEETING OF SHAREHOLDERS
Wednesday, September 7, 2005 at 11:00 a.m.
Sheraton Laval Hotel, 2440 Laurentian Autoroute, Laval, Quebec
|
|
|
|
|

3 STRONG BRANDS
that bring more than 25 million consumers
into our 4,845 stores every week
ENJOYABLE SHOPPING EXPERIENCE •
PROXIMITY • CREATIVITY •
QUALITY • SERVICE • PRICE
1
• EXPERTISE • MATURITY
2
• INTERNATIONAL VISION
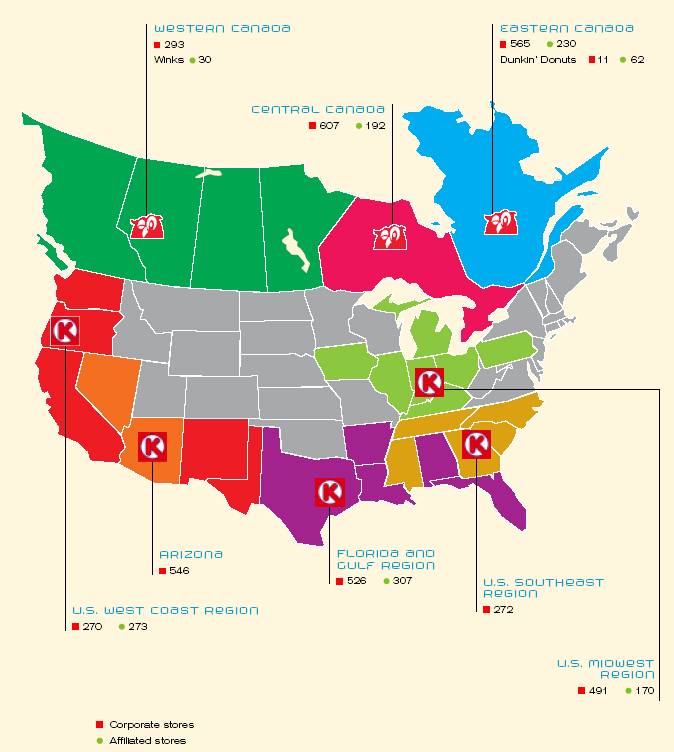
No 1 in Canada – No 2 in North America
4,845 stores, 3,013 of which sell motor fuel
1,990 in Canada and 2,855 in 23 U.S. states
More than 36,000 people working in executive offices and throughout the network
4,175 Circle K licensees

Inauguration of the first Circle K store in Macao, PRC, March 15, 2005
A complete cutting-edge concept, developed by the operator of Circle K convenience stores in Hong Kong and the Chinese Mainland
3
1st QUARTER ENDED JULY 18, 2004
• Increases of 183% in sales and 197% in net earnings
• Synergies of US$12.7 million from the Circle K integration plan (79% from lower operating, selling, administrative and general expenses and 21% from improvements in purchasing)
• Opening of 12 stores and five Quick Service Restaurants (QSRs)
• Implementation of Store 2000 concept in 36 sites
2nd QUARTER ENDED OCTOBER 10, 2004
• Increases of 155% in sales and 94% in net earnings
• Synergies of US$18.7 million from the Circle K integration plan (76% from lower operating, selling, administrative and general expenses and 24% from improvements in purchasing)
• Florida and Gulf Region hit by four hurricanes, resulting in the temporary closure of 34 stores and various material damages including lost merchandise in more than 250 other locations
• Opening of four stores and seven QSRs
• Implementation of Store 2000 concept in ten sites
• Agreement with Allied Domecq Quick Service Restaurants to develop 65 Dunkin’ Donuts in Ohio over the next six years
3rd QUARTER ENDED JANUARY 30, 2005
• Increases of 65% in sales and 506% in net earnings
• Synergies of US$24.8 million from the Circle K integration plan (80% from lower operating, selling, administrative and general expenses and 20% from improvements in purchasing)
• Acquisition of 21 sites from Shell Oil Products US in the Phoenix, Arizona Region
• Opening of four stores and seven QSRs
• Implementation of Store 2000 concept in 27 sites
4th QUARTER ENDED APRIL 24, 2005
• Increases of 5.2% in sales and 100% in net earnings
• Synergies of US$20.5 million from the Circle K integration plan (80% from lower operating, selling, administrative and general expenses and 20% from improvements in purchasing)
• Two-for-one split of all issued and outstanding Class A multiple voting shares and all Class B subordinate voting shares
• Acquisition of 19 stores in the Augusta region, Georgia and nine stores in the U.S. Midwest Region
• Opening of 23 stores and 20 QSRs
• Implementation of Store 2000 concept in 119 sites
4
5
|
| Sales |
| EBITDA (1) |
| Net Earnings (1) |
| Cash Flows (1) (2) |
|
|
| (millions of $) |
| (millions of $) |
| (millions of $) |
| (millions of $) |
|
|
|
|
|
|
|
|
|
|
|
|
|
|
|
|
| Diluted earnings per share |
| Per share |
|
|
|
|
|
|
|
|
|
|
|
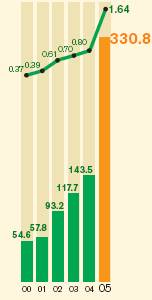
(1) Restated figures for 2000 to 2004.
(2) Cash flows resulting from net earnings, plus depreciation and amortization, write-off of financing costs, loss on disposal of assets and future taxes.
Compound Annual Growth |
| 45.6% |
| 42.7% |
| 66.7% |
| 43.4% |
|
6
Year ended April 24, 2005
(in millions of Canadian dollars, except per-share amounts, ratios, litres and gallons)
|
| 2005 |
| 2004 (1) |
| 2003 (1) |
| 2002 (1) |
| 2001 (1) |
| 2000 (1) |
|
|
| $ |
| $ |
| $ |
| $ |
| $ |
| $ |
|
|
|
|
|
|
|
|
|
|
|
|
|
|
|
Consolidated Results |
|
|
|
|
|
|
|
|
|
|
|
|
|
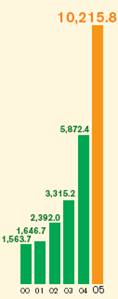
Sales |
| 10,215.8 |
| 5,872.4 |
| 3,315.2 |
| 2,392.0 |
| 1,646.7 |
| 1,563.7 |
|
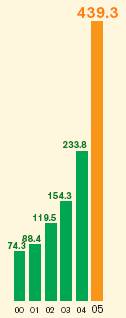
EBITDA |
| 439.3 |
| 233.8 |
| 154.3 |
| 119.5 |
| 88.4 |
| 74.3 |
|
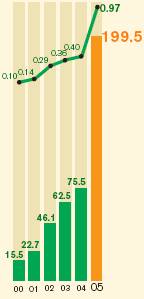
Net earnings |
| 199.5 |
| 75.5 |
| 62.5 |
| 46.1 |
| 22.7 |
| 15.5 |
|
Cash flows (2) |
| 330.8 |
| 143.5 |
| 117.7 |
| 93.2 |
| 57.8 |
| 54.6 |
|
|
|
|
|
|
|
|
|
|
|
|
|
|
|
Per Share |
|
|
|
|
|
|
|
|
|
|
|
|
|
Earnings |
|
|
|
|
|
|
|
|
|
|
|
|
|
Basic |
| 0.99 |
| 0.42 |
| 0.37 |
| 0.30 |
| 0.15 |
| 0.10 |
|
Diluted |
| 0.97 |
| 0.40 |
| 0.36 |
| 0.29 |
| 0.14 |
| 0.10 |
|
Cash flows (2) |
| 1.64 |
| 0.80 |
| 0.70 |
| 0.61 |
| 0.39 |
| 0.37 |
|
Book value |
| 4.48 |
| 3.69 |
| 2.52 |
| 2.18 |
| 1.45 |
| 1.29 |
|
|
|
|
|
|
|
|
|
|
|
|
|
|
|
Financial Position |
|
|
|
|
|
|
|
|
|
|
|
|
|
Total assets |
| 2,437.8 |
| 2,246.3 |
| 1,071.1 |
| 780.0 |
| 552.9 |
| 535.1 |
|
Fixed assets |
| 1,002.7 |
| 902.5 |
| 432.3 |
| 305.6 |
| 202.7 |
| 191.2 |
|
Interest-bearing debt |
| 655.6 |
| 730.5 |
| 296.3 |
| 180.7 |
| 149.0 |
| 183.7 |
|
Shareholders’ equity |
| 905.4 |
| 728.0 |
| 425.5 |
| 361.2 |
| 215.4 |
| 192.4 |
|
|
|
|
|
|
|
|
|
|
|
|
|
|
|
Ratios |
|
|
|
|
|
|
|
|
|
|
|
|
|
Interest-bearing net debt/total capitalization |
| 0.28:1 |
| 0.42:1 |
| 0.37:1 |
| 0.32:1 |
| 0.40:1 |
| 0.47:1 |
|
Interest-bearing net debt/EBITDA |
| 0.78:1 |
| 2.23:1 |
| 1.61:1 |
| 1.40:1 |
| 1.60:1 |
| 2.33:1 |
|
(1) Restated
(2) Cash flows resulting from net earnings, plus depreciation and amortization, write-off of financing costs, loss on disposal of assets and future taxes.
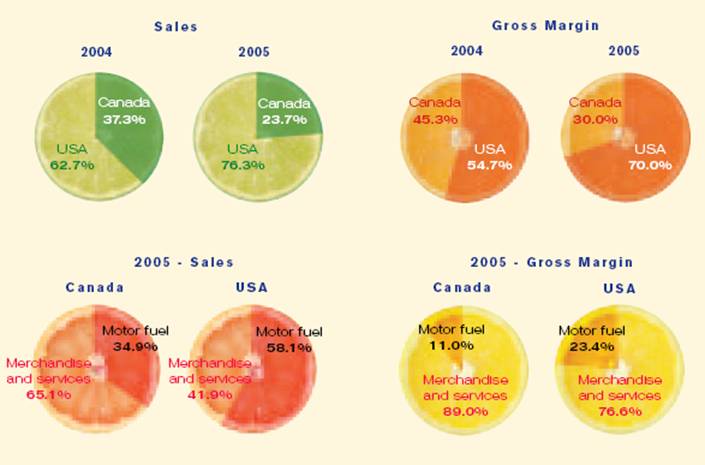
INFORMATION ON MAJOR PRODUCT CATEGORIES (CANADA - USA) (in millions)
Sales |
|
|
|
|
|
|
|
|
|
|
|
|
|
Merchandises and services |
|
|
|
|
|
|
|
|
|
|
|
|
|
• Canada |
| 1,577.1 |
| 1,510.6 |
| 1,428.6 |
| 1,298.6 |
| 1,187.3 |
| 1,175.5 |
|
• USA |
| 3,265.4 |
| 1,597.1 |
| 514.7 |
| 204.5 |
| — |
| — |
|
Motor fuel |
|
|
|
|
|
|
|
|
|
|
|
|
|
• Canada |
| 844.4 |
| 677.5 |
| 630.2 |
| 532.2 |
| 459.4 |
| 388.2 |
|
(litres) (3) |
| 1,413.5 |
| 1,329.2 |
| 1,239.2 |
| 1,177.3 |
| 1,023.8 |
| 1,002.9 |
|
• USA |
| 4,528.9 |
| 2,087.2 |
| 741.7 |
| 356.7 |
| — |
| — |
|
(gallons) (3) |
| 1,858.1 |
| 996.1 |
| 355.5 |
| 187.9 |
| — |
| — |
|
|
|
|
|
|
|
|
|
|
|
|
|
|
|
Gross Margin |
|
|
|
|
|
|
|
|
|
|
|
|
|
Merchandises and services |
|
|
|
|
|
|
|
|
|
|
|
|
|
• Canada |
| 33.54 | % | 32.52 | % | 32.37 | % | 32.85 | % | 33.34 | % | 32.22 | %(4) |
• USA |
| 32.56 | % | 32.63 | % | 32.96 | % | 31.80 | % | — |
| — |
|
Motor fuel (4) |
|
|
|
|
|
|
|
|
|
|
|
|
|
• Canada (cents/litre) (3) |
| 4.61 |
| 4.77 |
| 4.64 |
| 4.63 |
| 4.29 |
| 4.54 |
|
• USA (cents U.S./gallon) (3) |
| 14.17 |
| 11.57 |
| 12.23 |
| 13.86 |
| — |
| — |
|
(3) Unaudited
(4) Corporate stores
7
|
|
|
|
| Alain Bouchard |
| Chairman of the Board, |
| President and Chief Executive Officer |

8
Sixteen months after acquiring Circle K, we can state we have successfully integrated this leading U.S. network.
Supported by an integration committee and in partnership with our business units in Canada and the U.S. Midwest, Circle K’s team did an impressive job during this major transition, reorganization and adjustment phase, while undertaking differentiation projects to increase store sales and profitability.
We would like to highlight the vision, enthusiasm, self-discipline, team spirit and commitment of all those Company-wide who worked daily on the integration and rapidly took initiatives to leverage the network’s great potential in the coming periods.
Concurrently, we continued expanding with small acquisitions in the United States, and remain open to the consolidation opportunities this market holds. In the second half of the year, we started to explore the growth avenues offered by the Circle K network of licensees in other areas worldwide. The great quality and potential of these operations led us to assess the possibility of jointly developing some of these markets in the future.
We believe that our sound network, our financial position, our autonomous teams, the succession plans we have set up, and our evolving differentiation strategy, are all guarantees of experience and maturity for further growth.
9
This first complete integration year yielded record financial results and greater-than-expected synergies.
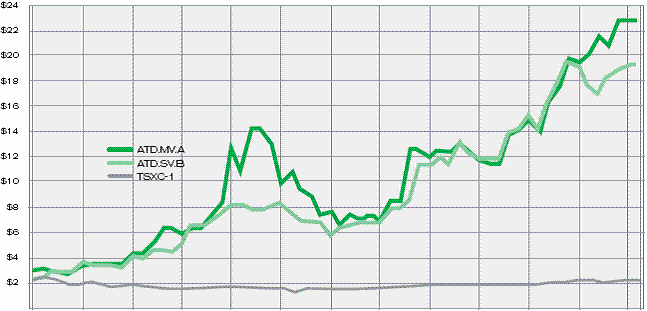
Circle K contributed substantially to our growth during its first full year as part of Couche-Tard, enabling us to almost double our sales and thereby top $10 billion in revenues and increase our net earnings by 164.2% compared with last year. Couche-Tard’s share (ATD.SV.B) price appreciated 41.6% in 2004-2005, to end the year at $16.92. This share price reflects the two-for-one split carried out in mid-March 2005 to increase the number of outstanding shares and foster trading. Over the past five years, our share price has jumped by more than 169% and yielded an average annual return of 33%.
Our results stem not only from our strong expansion, but also from the effectiveness of our business model in our North American network. Our decentralized operations and our micro-market merchandising supported by business intelligence tools allow our business model to optimize customer service and per-store sales and profitability. This model’s strengths were immediately acknowledged by our new teams who are now applying it to focus on operational excellence and their competitiveness. We have covered a lot of ground since acquiring Circle K. Our decentralized structure is now in place, and many initiatives have been taken to modernize Circle K sites, install an integrated point-of-sale system, improve pricing strategies and the product mix, develop QSRs, rebrand motor fuel dispensing sites in some markets, and further enhance training programs.
We achieved this financial performance despite fiercer competition in several markets, ongoing tobacco margin pressures and increased credit card fee expenses due to higher motor fuel retail prices. The differentiation initiatives taken by all our business units helped offset these negative factors.
Furthermore, our results would have fared even better were it not for the impact on our sales of poor weather conditions during the summer of 2004 in Canada, and of the four hurricanes in the Florida and Gulf Region during the second-quarter. The store and merchandise damages caused by these adverse conditions forced us to temporarily close 34 Circle K sites and disrupted business in some 250 others. Since then, this market has greatly recovered and has taken advantage of store rebuilding and renovations to roll out our Store 2000 concept.
10
When we acquired Circle K in December 2003, its integration was expected to produce synergies of approximately US$50 million. Improved supply conditions, business unit streamlining and cost controls based on our benchmarking process over the past 16 months have yielded greater-than-expected benefits. Synergies totalling US$86.7 million have been achieved since the acquisition, of which US$76.7 million were achieved in the year ended April 24, 2005.
After a major acquisition like Circle K, debt management was a first priority to keep financial expenses to a minimum and maintain a sound balance sheet and a financial position allowing us to pursue our growth. At year-end, our indebtedness had been reduced by $75 million from the close of the previous year, mainly due to a lower exchange rate. It stood at a very acceptable level, while our net interest-bearing debt to total capitalization ratio improved to 28% from 42% a year earlier.
We recorded over 76% of our sales and 70% of our gross margin in the United States this year, yet our three Canadian business units remain active and profitable. They continue to fine-tune the Store 2000 concept by designing, testing and launching new higher-margin projects. They further leveraged our proprietary brands with creative ideas and targeted promotional campaigns, while building on co-branding to develop QSRs and consolidate our experience in this profitable niche. Overall, our Canadian markets have attained a good degree of maturity and have made a positive contribution to the year’s results.
Our decentralized business model is a strategic lever which we reinforced with a new organizational structure for our North American operations.
In December 2004, while integrating Circle K, we reorganized our North American operations under two large markets – Eastern North America and Western North America – reporting to the Executive Vice-President and Chief Operating Officer, along with the network of international licensees.
11
These two North American divisions are each headed by a Senior Vice-President – Stéphane Gonthier and Brian Hannasch – and each division include four business units, each managed by a Vice-President, Operations. Considering the network’s current size and its development potential, we can now count on a better organized and more efficient decentralized management. Major operations between the business units within a single division are better coordinated and quality of service standards are better applied, thus improving our overall efficiency. While our eight business units each have their own specific profile and their own decision-making, they benefit from pooling their experience, practices and entrepreneurial culture.
We considered two key features when setting up this decentralized structure: first, the skills and know-how of the people working at various levels in our business units; and second, succession plans that allow us to retain the best resources. Maximum care was taken in assigning responsibilities based on individual track records.
Our responsible people have already implemented succession plans that contribute to the sense of belonging and the reduction of turnover, especially in our stores which remain the key links in the chain.
We consider having established succession plans and creating skilled dynamic teams with leadership abilities and in-depth market knowledge to be a major achievement and our best guarantee for the future.
Our growth in 2005-2006 and subsequent years will be driven by further network expansion combined with our Store 2000 concept, new higher-margin niches and operational excellence initiatives in our business units.
• Network expansion — We are better positioned than ever to act as a consolidator and an integrator in the North American convenience retailing market. We plan to take advantage of the best acquisition opportunities that arise in our current markets, and especially in the U.S. Southeast and on the U.S. West Coast where our goal is to broaden each network to 500 or 600 stores.
12
We will do so by adding mid-sized chains where possible, but also through small acquisitions, as we did in 2004-2005 by purchasing 21 stores in Arizona, followed by another 19 in Georgia and nine in the U.S. Midwest. Considering our healthy financial position, the trust built up with our creditors and our track record in negotiating and integrating acquisitions, we could also make a larger purchase should the opportunity arise. In addition, our plans for 2005-2006 include opening some 100 new stores throughout our network.
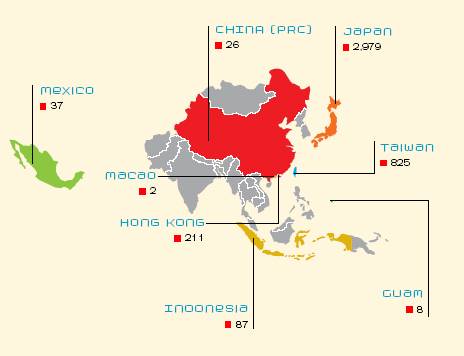
Within the medium term, we also plan to position ourselves on another continent. The potential offered by the Circle K licensees located mainly in different parts of Asia looks so promising that we aim to participate in this network’s growth. We are currently assessing various participation options.
• Internal growth – It is generally after three complete years that a corporate integration yields its full potential. Our U.S. Midwest market, where our business model has been integrated over the past three years, achieved a record performance in 2004-2005. Each of our divisions has drawn up a business plan setting targets for 2005-2006 to further improve their productivity and take greater advantage of their markets’ potential and new consumer trends. Now that they have enhanced their operations and obtained more favourable supply conditions, Circle K’s business units benefit from a more profitable product mix, better pricing strategies and marketing programs focused on the highest margin niches.
Our Store 2000 concept is now in place in 36% of our corporate sites, and we plan to implement this multi-faceted concept in another 400 during 2005-2006. This concept is retooled by each business unit which draws up its own pilot projects and carves out higher-margin niches. For instance, our Western Canadian market is successfully testing a new concept to gain a competitive edge. For its part, our Florida market has for the first time opened locations that do not sell motor fuel and is poised to develop its own QSRs, while continuing to focus on co-branding in several sites.
13
• Operational excellence – The Circle K network is now finalizing its installation of an integrated point-of-sale system. By April 2006, the entire chain will thus benefit from the most appropriate business intelligence tools to optimize the consistency between our operational and decision-making systems.
Maintaining an optimal cost structure will remain a priority, through a combination of strict control over operating, selling, administrative and general expenses and healthy debt management.
Considering our eight divisions’ plans and our network expansion projects, we look forward to another year of solid growth in 2005-2006.
The experience acquired in our differentiation strategy over the past two decades is undoubtedly one of our greatest strengths, as is our management’s great stability and skilled teams committed to our corporate vision. Every acquisition and development enhances our know-how, solidifies our organization and gives us further potential to grow our business.
We wish first and foremost to thank all our store and executive office colleagues. It is because of their commitment and professionalism that this integration year was successful and all our markets’ results were so satisfactory.
On behalf of my colleagues and Couche-Tard’s shareholders, I would like to specially thank Robert Brunet who is stepping down from our Board after providing us with his wise counsel for eighteen years. Finally, we also thank all our directors, shareholders and business partners.
![]()
(Signed) Alain Bouchard
Chairman of the Board,
President and Chief Executive Officer
14
AUTONOMOUS AND EXPERIENCED TEAMS
WITH IN-DEPTH MARKET KNOWLEDGE
|
|
|
|
| Alain Bouchard | ||
|
|
|
|
|
|
|
|
|
|
|
Réal Plourde Executive Vice-President and Chief Operating Officer |
|
| ||
|
|
|
|
|
|
| |
|
|
|
|
|
|
|
|
|
|
|
|
|
|
|
|
|
| Michel Bernard Vice-President, Operations, U.S. Midwest Region |
| Bob Campau Vice-President, Operations, U.S. Southeast Region | |||
|
|
|
|
|
|
|
|
|
|
|
|
|
|
|
|
|
| Geoff Haxel Vice-President, Operations, Arizona |
| Stéphane Gonthier Vice-President, Operations, Central Canada | |||
|
|
|
|
|
|
|
|
|
|
|
|
|
|
|
|
|
| Joy Powell Vice-President, Operations, U.S. West Coast Region |
| Jean-Luc Meunier Vice-President, Operations, Eastern Canada | |||
|
|
|
|
|
|
|
|
|
|
|
|
|
|
|
|
|
| Kim Trowbridge Vice-President, Operations, Western Canada |
| Mick Parker Vice-President, Operations, Florida and Gulf Region | |||


|
|
|
| Rick Hamlin Senior Director, Franchise Operations |
|


|
|
|
|
|
Jacques D’Amours Vice-President, Administration |
| Michael Guinard Vice-President, Development |
| Dale Pettit Vice-President and Treasurer |


15

16

Réal Plourde
Executive Vice-President
and Chief Operating Officer
While our financial results are a good measure of our business success, another is our customers’ loyalty in return for the enjoyable shopping experience and convenience we offer them every day. At the core: Nothing is left to chance, which combines selecting the best partners – carefully choosing our decision-making tools – continuously innovating – and always being ready to reassess our practices.
17
• Considering your decentralized management and your micro-marketing strategy, what do your North American business units have in common?
The bigger and denser our network gets, the closer we have to be to our local markets. So it’s vital that we have autonomous high-performance teams, who have their finger on the pulse of their markets and the autonomy to decide what is the best way to grow their stores’ business. All our geographical markets are different. They each serve several customer segments with specific consumer habits and often face rather different competitors. So their challenges are not the same. But they have a common economic denominator: ensuring that every store is profitable. They also share an entrepreneurial culture, predicated on autonomy, responsibility and accountability while being part of a cohesive system. They also share an aggressive growth strategy. The strategy’s components may vary from one market to another, but they all focus on making each business unit an autonomous marketing, service and results-driven entity. Finally, our markets share a constant reassessment of their business practices, the use of business intelligence tools that are being standardized network-wide, the priority given training, and the support of a central core of corporate services.
• How is the implementation of business intelligence tools progressing?
An integrated point-of-sale system will be installed in all the Circle K stores by December 2005. Once this stage of the integration is finalized, our entire North American network will be fully equipped with a new integrated point-of-sale system. We are also setting up an integrated motor fuel dispensing authorization system and providing each store with a back-office application. A fully integrated operational system enabling us to gather, process and standardize data will thus be in place network-wide by the end of fiscal 2005-2006. We can say that Couche-Tard stands apart in its industry in its use of these business intelligence tools. They are carefully selected to identify customers’ needs and consumer trends in order to optimize our merchandising strategies and our supply and business management. Their gradual implementation has improved our management of resources, enhanced customer service and provided more accurate management information – all of which favour differentiation, operational excellence and growth.
18
• How does your Store 2000 concept evolve?
Our merchandising strategies keep pace with consumer trends. More than ever they are focused on overall foodservice offerings that includes fresh, ready-to-serve and take-away products, breakfast solutions, fast fresh lunches for working people, quality coffees, dairy products, a highly diversified selection of beverages such as frosted drinks, beer and wine, as well as QSRs. Our business units show no lack of imagination in this regard: they have all developed different projects, such as Couche-Tard Pubs – a store specializing in wine, beer and other alcoholic beverages – a trio combining three QSR co-brands – and a proprietarybrand coffee featured in a modular coffee concept – to mention just a few. This higher-margin value-added offering helps minimize the impact of the higher taxes on tobacco products and the lower spending in this category, along with the effects of fluctuations in motor fuel retail prices.
Various projects are being tested or rolled out, including loyalty cards for milk and coffee, a gift card management solution, an optimized partnership with the CAA, ATMs, a car wash service, Internet booths and others. We focus mostly on our proprietary brands for our product mix, whereas co-branding with quick-service restaurants continues to dominate in our foodservice offering.
• Besides eventual acquisitions, what makes you so confident about growing your future results?
Our internal growth will be driven primarily by our evolving merchandising strategy which we are implementing network-wide. Backed by a good level of productivity and a dynamic innovative management team, this strategy holds great potential. It is now in place in just over one-third of our stores in North America. In 2005-2006, with our integration virtually completed, we will take another big step by implementing the Store 2000 concept in 400 locations and opening some 60 quick-service restaurants. We have just started to develop Circle K’s potential. We now have the results of our network assesment and are finalizing a three-year investment plan. Circle K’s great reputation gives further growth leverage to our differentiation strategy, and our Midwestern stores are also enjoying these benefits as most have been rebranded to Circle K.
19
INNOVATION
remains our primary internal growth driver and a guiding principle in our organization.
It applies to all aspects of management and operations, and especially to our product and services mix, pricing strategies, in-store merchandising and distribution logistics.
We draw our inspiration from the best proven retailing innovations in North America and elsewhere worldwide and we adapt them to our specialty and local market needs. The result is a differentiation concept that builds on our team’s know-how and creativity to pleasantly surprise our customers and optimize per-store sales and profitability.
It is innovation that sets us apart! It is by constantly improving our Store 2000 concept that we stand out as a unique retailer. We do so by carving out new niches, broadening our proprietary brand product mix and co-branding.
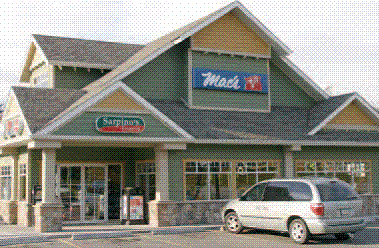
While Circle K’s integration was our major focus in fiscal 2004-2005, a number of projects and improvements emerged during the year for our three Couche-Tard, Mac’s and Circle K stores. A few examples are featured on the following pages.
20
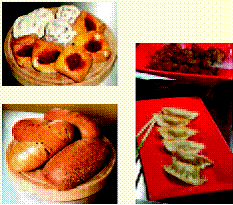
Consumers increasingly regard Couche-Tard, Mac’s and Circle K stores as practical, economical and pleasant destinations for foodservices, take-away or ready-to-eat foods, breakfast solutions and QSRs.
|
|
|
|
|
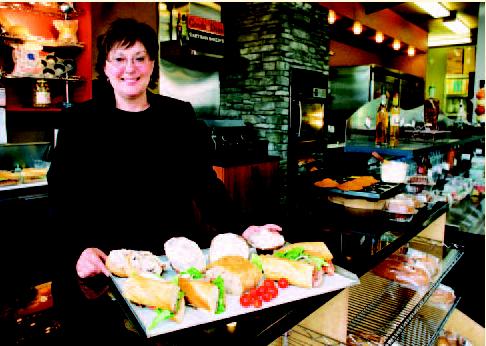
A Goode & Dunn artisan bakery in Western Canada
21
New Take Away Coffee in a Mac’s in Western Canada
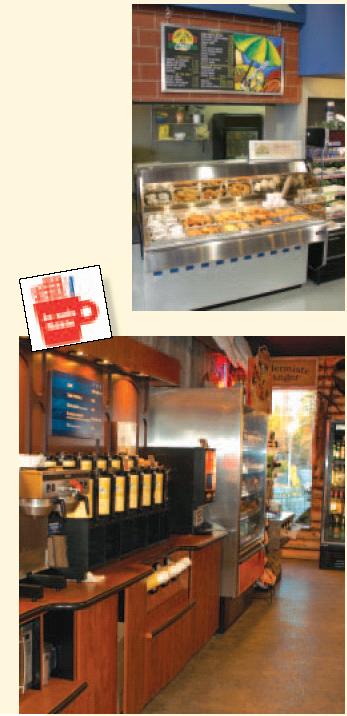
New Couche-Tard concept in Eastern Canada

![]() proprietary brand enhanced with new products — Eastern Canada
proprietary brand enhanced with new products — Eastern Canada


New fresh foodservice mix in Mac’s stores in Western Canada

New Boca proprietary brand – Florida
22
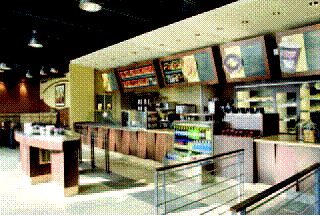
About 300 QSRs throughout our North American network welcome several thousands of customers a week. Some 60 QSRs will be opened under various co-brands in 2005-2006.
| |

| ||
|
|
|
| ||
|
|
|
| ||

23
|
|
|
|
|
|
| ||
New Dunkin’ Donuts concept in Eastern Canada | ||
|
|
|
Dunkin’ Donuts Master Franchisee Quebec Inc. exceeded expectations in 2004-2005 by tightly controlling operating costs and reaping the initial benefits of the newly launched restaurant concept: new decor, new ambience, new menu, optical scanners, touch screens and training programs… to revitalize the brand. | ||
|
|
|
| ||
|
|
|
| ||

24
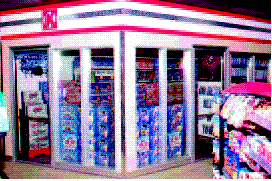
Our customers see our Couche-Tard, Mac’s and Circle K stores as unique destinations for an extensive selection of convenience retailing products and services. | |||||
| |||||
|
| ||||
|
|
|
| ||
|
|
| |||
|
|
|
|
| |
|
|
|
|
| |
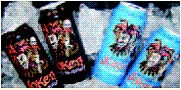
Line of drinks under the Joker proprietary brand offered in Circle K’s in the U.S. Southeast Region. | |||||
|
|
|
| ||
|
|
|
| ||
|
|
|
| ||
|
|
|
| ||
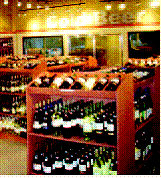
Some of our Canadian and U.S. markets continue to improve their selection of beers, by fitting out either in-store pubs or beer cellars. | |||||
|
|
|
| ||
|
|
| |||
|
|
|
| ||
It’s no longer the four traditional distributors, but some 30 taps that now distribute sodas and sloche in some Circle K stores. | |||||
|
|
|
| ||
|
|
| |||


25
| ||
|
|
|
|
|
|
|
|
|
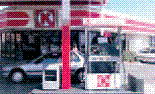
A new Circle K concept in Arizona |
|
|
|
|
|
Several hundred sites are equipped with ATMs allowing customers to make their withdrawals in-store. | ||
| ||
| ||
| ||
A Store 2000 concept in the U.S. Midwest Region | ||
| ||
| ||
| ||


26
In the heart of the Arizona desert, the Maricopa Circle K store showcases a fresco of John Wayne, the town’s hero. It welcomes several thousand customers a day for coffee, quick-serve meals, drinks and convenience retailing products.
|
|
|
|
|
|
A Spirits on Jasper pilot project in Western Canada offers an extensive mix of wines, beers and spirits. | ||
| ||
|
|
|
|
|
|
This modernized and highly welcoming Circle K in downtown Phoenix offers its large customer base a diversified range of convenience retailing products and services, including a selection of wines and beers. | ||
|
|
|
On the University of Arizona campus just outside Phoenix, another location is rolling out a thematic Store 2000 concept with a product and services mix tailored to the student population. | ||
|
|
|
|
|
|

27
One of the Florida stores rebuilt with a Store 2000 concept after the hurricanes.
|
|
|
|
|
|
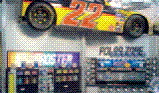
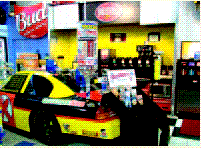
A Store 2000 concept based on the Nascar theme in the U.S. Midwest Region. | ||
|
|
|
|
|
|
|
|
|
The warm atmosphere of this new Store 2000 concept reminds customers of a traditional street in the U.S. Southeast Region. | ||
|
|
|
| ||

28
Motor fuel dispensing sites newly converted to Circle K on the U.S. West Coast.

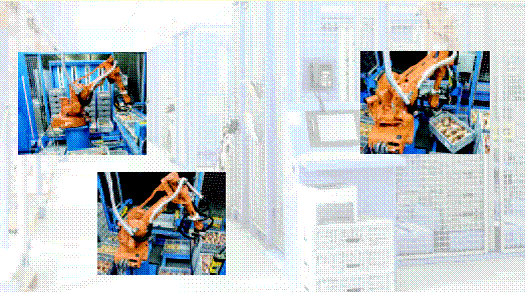
During fiscal 2004-2005, the distribution centre in Eastern Canada was equipped with four robots to handle approximately 20,000 breakfast solutions and sandwiches per day. The initial benefits of this modernization have already led to a definite improvement in this product category’s profit margin. | ||
|
|
|
| ||
29
We consider strict corporate governance practices to be important to efficiently run the Company’s business. We continue to examine our practices in light of the latest corporate governance requirements. For instance, over the past year:
• we set up whistle-blowing procedures that allow an employee to anonymously pass on his or her concerns about the Company’s auditing and accounting practices; and
• we implemented an internal financial disclosure control process and procedures program that is now under way in accordance with Canadian and U.S. regulatory requirements.
For a detailed description of our corporate governance practices, please refer to the most recent Management Proxy Circular available on our website (www.couche-tard.com).
Couche-Tard is committed to complying with the environmental legislation imposed by the various levels of government in both Canada and the United States. The Company continues to incur the capital expenditures required for compliance with such legislation, notably in regard to storing fuel in underground storage tanks.
30
|
|
|
|
All our divisions actively contribute to their communities with the assistance of our executive offices. As convenience retailing specialists, we are committed to acting as good neighbours and focus on to different causes dedicated to human respect, health and well-being.
Special attention is paid to young people, whose education, health and culture we take to heart. Whether it is through organizations such as LEUCAN, Centraide or the Kids Help Phone/Jeunesse j’écoute, which we support on a regular basis, or the commitment of the people working in our network to helping develop sports and cultural organizations, our commitment is always concrete and focused on individual well-being.
Every year, several million dollars in cash is donated by our executive offices and especially our divisions, who hold fund-raising campaigns based on their knowledge of their regions’ specific needs.
This year after the Florida and Gulf Region was particularly hard hit by four hurricanes, our on-site team made a firm commitment to helping the local people who were seriously in need. Large donations of goods were made to Florida Hurricane Relief fund.
Health in general and the well-being of people affected by serious illnesses are other key causes which we support through donations to various specialized organizations such as the Fondation québécoise de la déficience intellectuelle and the Canadian Cystic Fibrosis Foundation, as well as United Cerebral Palsy which has been supported by Circle K for over two decades. Among our latest commitments, a major project is under way, namely the Maison de Soins Palliatifs de Laval (MSPL) – a non-profit organization that will offer palliative care services free of charge to people 18 and over in the terminal phase of cancer; it will also provide their loved ones with support.
Year after year, large amounts are raised in our stores and executive offices through social events, fund-raising campaigns and community initiatives. In the future, we will continue to help improve the quality of life of young people, families and people in difficulty.
31

Richard Fortin
Executive Vice-President
and Chief Financial Officer
32
2004-2005
SUCCESSFUL INTEGRATION AND SOLID GROWTH
• Sales | + 73.8 | % |
• EBITDA | + 87.9 | % |
• Net earnings | + 164.2 | % |
• Net interest-bearing debt | - 10.3 | % |
• Shareholders’ equity | + 24.4 | % |
STOCK PERFORMANCE
• Average return over five years | 33 | % |
• Appreciation in 2004-2005 | 41.6 | % |
Two-for-one share splits (July 2001, 2002 and March 2005)
33
MANAGEMENT’S DISCUSSION AND ANALYSIS OF RESULTS AND FINANCIAL POSITION
Management’s discussion and analysis relates to the financial condition and results of operations (MD&A) of Alimentation Couche-Tard Inc. (Couche-Tard) together with its wholly owned subsidiaries, including The Circle K Corporation (Circle K). Couche-Tard consolidated Circle K as of December 18, 2003, following completion of the acquisition of all of the outstanding shares of Circle K. Accordingly, Couche-Tard’s results of operations for the year ended April 24, 2005 include the results of operations of Circle K and the results of operations for the previous year include the results of operations of Circle K as of December 18, 2003. “We”, “our”, “us” and “the Company” refer collectively to Couche-Tard and its subsidiaries, including Circle K.
Except where otherwise indicated, all financial information reflected herein is expressed in Canadian dollars and determined on the basis of Canadian generally accepted accounting principles (Canadian GAAP). You should read the following MD&A in conjunction with the annual consolidated financial statements and related notes included in this 2005 Annual Report. Additional information relating to Couche-Tard, including the Annual Information Form, is available on SEDAR at www.sedar.com and on the SEC’s website at www.sec.gov.
Forward-looking Statements
This MD&A includes certain statements that are “forward-looking statements” within the meaning of the U.S. Private Securities Litigation Reform Act of 1995. Any statement in this MD&A that is not a statement of historical fact may be deemed to be a forward-looking statement. When used in this MD&A, the words “believe”, “intend”, “expect”, “estimate” and other similar expressions are generally intended to identify forward-looking statements.
It is important to know that the forward-looking statements in this MD&A describe our expectations as at July 12, 2005 and are not guarantees of future performance of Couche-Tard or its industry and involve known and unknown risks and uncertainties which may cause the outlook, the actual results or performance of Couche-Tard or of its industry to be materially different from any future results or performance expressed or implied by such statements. Our actual results could be materially different from what we expect if known or unknown risks affect our business, or if our estimates or assumptions turn out to be inaccurate. As a result, we cannot guarantee that any forward-looking statement will materialize and, accordingly, you are cautioned not to place undue reliance on these forward-looking statements. Forward-looking statements do not take into account the effect that transactions or special items announced or occurring after the statements are made may have on our business. For example, they do not include the effect of sales of assets, monetizations, mergers, acquisitions, other business combinations or transactions, asset write-downs or other charges announced or occurring after forward-looking statements are made.
We disclaim any intention and assume no obligation to update any forward-looking statement even if new information becomes available, as a result of future events or for any other reason.
The foregoing risks and uncertainties include the risks set forth below under “Business Risks” as well as other risks detailed from time to time in reports filed by Couche-Tard with securities regulators in Canada and the United States.
34
Our Business
We are the leader in the Canadian convenience store industry. In North America, we are the fourth largest convenience store operator and the second largest independent (not integrated with a petroleum company) convenience store operator. As at April 24, 2005, our network consisted of 4,845 convenience stores, 3,013 of which include motor fuel dispensing, located in eight large geographic markets, including three in Canada and five in the United States which cover 23 American states.
We sell food and beverage items, motor fuel and other products and services targeted to meet our customers’ demand for convenience and quality in a clean and welcoming environment. We believe that our business model has differentiated Couche-Tard from its competition through its decentralized management structure, commitment to operational expertise, focus on in-store merchandise, particularly the higher growth and higher margin foodservice category and continued investment in store modernization and technology.
We conduct our business through different modes of operations including company operated stores and our affiliate program, which includes franchised and licensed stores. The amount of operating income generated from the affiliates amounted to $18.9 million or 5.7% of our total operating income for fiscal 2005, including $3.2 million or 1.0% of our total operating income generated by licensees outside North America.
The convenience store industry is fragmented, with the top ten operators representing only approximately 25% of the estimated total of 138,200 stores in the United States. Industry consolidation by highly leveraged operators in the 1990’s, combined with competition and fluctuations in motor fuel margins, has led to numerous corporate restructurings and rationalizations in recent years. As a result, we believe the opportunity exists for well-capitalized, established industry participants to grow through mergers and acquisitions.
2005 Overview
We announced record results for fiscal 2005, up 164% over last year. This performance reflects primarily Circle K’s major contribution for the full fiscal year, the progress of its integration which yielded substantial synergies and the strong motor fuel gross margin in the United States which stood at 14.17¢US per gallon.
Effective March 18, 2005, the Company split all of its issued and outstanding Class A and B shares on a two-for-one basis. All share and per share information in this MD&A has been adjusted retroactively to reflect the stock split.
During fiscal 2005, we acquired 49 stores for a total purchase price of $85.2 million including fixed assets of $78.4 million, working capital of $4.0 million and goodwill of $2.8 million. All acquired stores were in our U.S. markets. The acquisitions were recorded using the purchase method and earnings from these acquisitions have been included in the consolidated financial statements since the dates of acquisition.
Our major accomplishment during 2005 was the successful completion of the integration of our Circle K operations into the Couche-Tard operating model, with the achievement of US$76.7 million in synergies during the year and the commencement of the initial rollout of the new point of sales systems (POS) with scanning into 381 stores by April 24, 2005 with the remaining 607 stores to be completed by the end of 2005. Of the total synergies of US$76.7 million realized in fiscal 2005, US$16.1 million were improvements in purchasing and US$60.6 million related to reduction in operating, selling, general and administrative costs.
35
Last year, in our 2004 Annual Report, we mentioned that since Circle K was using different methods and rates for depreciation and amortization of fixed assets and since we had made a large number of acquisitions in recent years in the United States, we would be performing an analysis of the estimated useful lives of all of our fixed assets which could result in amendments to the depreciation and amortization methods used. In our Quarterly Report for the 40-week period ended January 30, 2005 (our 3rd quarter report for fiscal 2005) we noted that a number of retail companies had indicated that they were in the process of reviewing their accounting treatment of leasehold improvements. We indicated at that time that our analysis would address this issue with the possibility of amendments being made to the depreciation and amortization methods then in use and, if warranted, could result in adjustments to our financial statements for fiscal 2005 and one or more previous years.
We have completed our analysis and adopted a common standard for depreciating and amortizing fixed assets on a straight-line basis over the shorter of their useful lives or the lease term for certain assets located on leased properties. This change was applied on a retroactive basis. As a result of this change, total depreciation and amortization expense increased by $2.2 million for fiscal 2005 ($2.2 million in 2004 and $1.0 million in 2003). The results of our review did not have any impact on revenues and cash flows.
In addition, the Company reviewed its policy relating to rent expense under which the Company had previously recorded rent expense based on the committed lease period and did not take into account future rent escalations included in such term. As a result of its review, the Company decided it was more appropriate to record rent expense using the straight-line method and has adopted this method for 2005 with restatement of prior years. This change resulted in a $4.4 million increase in rent expense in 2005 ($2.6 million increase in 2004 and $1.8 million in 2003). The results of our review did not have any impact on revenues and cash flows.
During the year, we experienced significant increases in the retail price of motor fuel in our U.S markets, primarily attributable to the volatility in the world prices for crude oil. The average retail price of motor fuel in our U.S. markets amounted to US$1.94 per gallon in fiscal 2005 compared with US$1.37 per gallon in fiscal 2004 (including Circle K’s historical results). Motor fuel gross margin experiences volatility as a result of a number of factors, including the volatility of the cost of product. Although the motor fuel gross margins can be volatile quarter to quarter, the motor fuel gross margins generally average out to more normal levels on an annual basis. For each of our four quarters commencing in the first quarter of fiscal 2005, motor fuel gross margins for our company operated stores in our U.S. markets stood at 16.24¢US, 12.44¢US, 16.30¢US and 11.26¢US per gallon respectively with an average of
14.17¢US per gallon for the year compared with 14.30¢US per gallon for the previous year (including Circle K’s historical results). The higher retail prices for motor fuel this year has resulted in increased credit card fees which are based on a percentage of the retail selling prices. The increased costs in credit card fees in our U.S. markets are estimated to be approximately $21.3 million over fiscal 2004 (including Circle K’s historical results). Including Canada, total credit card costs increased by $22.5 million over fiscal 2004 (including Circle K’s historical results).
During the second quarter of this year, certain areas of the Company’s business in Florida experienced damages and losses resulting from four hurricanes. Losses, including damages relating to fixed assets and inventory spoilage, have resulted in net claims in the amount of US$19.8 million. The book value of fixed assets, inventory spoilage and other assets that were damaged by the hurricanes is US$4.4 million.
The Company expects to spend approximately US$18.7 million to restore buildings and equipment, including approximately US$8.9 million to restore assets on leased properties, of which approximately US$9.8 million will be recorded in fixed assets. The Company expects to record a gain representing the difference between the insurance settlements and the carrying value of the owned and leased assets. As of April 24, 2005, the Company has received US$7.0 million of insurance proceeds.
The Company estimates that the pre-tax negative impact resulting from the business interruption caused by the hurricanes amounted to approximately US$3.8 million.
36
Summary of Fourth Quarter Results: 12-Week Period Ended April 24, 2005 and 12-Week Period Ended April 25, 2004
During the 12-week period ended April 24, 2005, Couche-Tard acquired 28 stores, opened 20 quick service restaurants (QSRs) and implemented its Store 2000 Concept in 119 stores including 23 new stores.
The following table highlights certain information regarding our operations for the 12-week periods ended April 24, 2005 and April 25, 2004.
|
| 12-week periods ended |
| ||
(In millions of Canadian dollars, unless otherwise stated) |
| April 24, 2005 |
| April 25, 2004 |
|
|
|
|
| restated |
|
Total revenues |
| 2,408.9 |
| 2,289.0 |
|
Operating income |
| 57.9 |
| 53.3 |
|
Net earnings |
| 40.0 |
| 20.0 |
|
Selected Operating Data: |
|
|
|
|
|
Growth of average merchandise revenues per store (1): |
|
|
|
|
|
Canada |
| 3.3 | % | 3.5 | % |
United States |
| 6.6 | % | 4.1 | % (2) |
Growth of average motor fuel volume per store: |
|
|
|
|
|
Canada |
| 7.4 | % | 5.5 | % |
United States |
| 4.5 | % | 8.0 | % (2) |
(1) Excludes other revenues derived from franchise fees, royalties and rebates on some purchases by franchisees and licensees and is based on the average number of stores opened during each four-week period of the fiscal period. (Growth in the United States is calculated based on US dollars.)
(2) Excluding the Circle K acquisition.
Consolidated revenues at $2.41 billion were $120.0 million over last year and operating income at $57.9 million increased by $4.6 million from $53.3 million in the previous year. Although operating income increased this quarter by $4.6 million, it was negatively impacted by the increase in credit card fees of $3.9 million over last year, a decrease of $5.5 million in gas margins which stood at 11.26¢US per gallon compared to 12.30¢US per gallon last year and $2.5 million resulting from the impact of the stronger Canadian dollar.
Growth in average merchandise revenues per store in Canada stood at 3.3% for the fourth quarter of 2005, down slightly from 3.5% last year. In our U.S. operations, growth in average merchandise revenues per store stood at 6.6%, up from 4.1% in the prior year. The growth of average merchandise revenues per store reflects the efforts to increase revenues and gross margins through price optimization, changing product mix, the impact from investment in our Store 2000 Concept conversions and the increase in tobacco tax with the resultant increase in the selling price of tobacco products. Growth in average motor fuel volume per store in the fourth quarter 2005 in Canada stood at 7.4% compared with 5.5% in the prior year due to the influence of certain pricing strategies. In our U.S. operations, the growth in average motor fuel volume per store was 4.5% compared with 8.0% in the prior year. The Company completed its major rebranding of several motor fuel locations in its Midwest Operations in the summer of 2003, which resulted in significant increases in motor fuel volume in the fourth quarter of fiscal 2004 compared with the same period in fiscal 2003.
Net earnings amounted to $40.0 million or $0.20 per share ($0.19 per share on a diluted basis), compared with $20.0 million or $0.10 per share ($0.10 per share on a diluted basis), an improvement of 100%. Applying the annual effective income tax rate to the fourth quarter 2005 and without the write-off of the financing costs in the fourth quarter last year, net earnings would have totalled $33.1 million or $0.16 per share on a diluted basis for the fourth quarter of 2005 and $26.3 million or $0.13 per share on a diluted basis for the same period last year.
As of June 30, 2005, Couche-Tard had 56,594,692 Class A multiple voting shares and 145,438,378 Class B subordinate voting shares issued and outstanding.
37
Income Statement Categories
Merchandise and Service Revenues. In-store merchandise revenues are comprised primarily of the sale of tobacco products, grocery items, candy and snacks, beverages, beer/wine and fresh food offerings, including QSRs. Service revenues include the commission on sale of lottery tickets and issuance of money orders, fees from automatic teller machines, calling card commissions, fees for cashing cheques and sales of postage stamps and bus tickets. Merchandise and service revenues also include franchise fees, license fees from affiliates, royalties from franchisees and a portion of vendor rebates related to certain purchases by franchisees and affiliates.
Motor Fuel Revenues. Couche-Tard includes in its revenues the total dollar amount of motor fuel sales, including any imbedded taxes, if Couche-Tard takes ownership of the motor fuel inventory. In the United States, Couche-Tard purchases motor fuel and sells it to approximately 105 independent store operators at cost plus a mark-up. Couche-Tard records the full value of these revenues (cost plus mark-up) as motor fuel revenues. Where Couche-Tard acts as a selling agent for a petroleum distributor, only the commission earned by Couche-Tard is recorded as revenues. Gross profit from motor fuel is derived by deducting the cost of the motor fuel from the motor fuel revenues, except for commission stores where the gross profit is equal to the recorded commission from the sale.
Gross Profit. Gross profit consists primarily of revenues less the related cost of the inventories. For in-store merchandise, the cost of inventory is generally determined using the retail method (retail price less a normal margin), and for motor fuel, it is determined using the average cost method.
Operating, Selling, Administrative and General Expenses. The primary components of operating, selling, administrative and general expenses are labour, occupancy costs, commissions to dealers and overhead and include advertising expenses that are charged as incurred.
Key performance indicators used by management, which can be found under “Results of Operations-Other Operating Data”, are merchandise and service gross margin, growth of average merchandise revenues per store, motor fuel gross margin and growth of average motor fuel volume per store.
Exchange Rate Data
Our U.S. subsidiaries’ assets and liabilities are translated into Canadian dollars using the exchange rate in effect at the balance sheet date. Revenues and expenses are translated at the average rate in effect during the year.
The following table sets forth information about exchange rates based upon the Bank of Canada closing rates set forth as Canadian dollars per US$1.00.
|
| 52-week periods ended |
| ||||
|
| April 24, 2005 |
| April 25, 2004 |
| April 27 , 2003 |
|
Average for the period (1) |
| 1.2715 |
| 1.3438 |
| 1.5399 |
|
Period end |
| 1.2349 |
| 1.3607 |
| 1.4481 |
|
(1) Calculated by taking the average of the closing exchange rates of each day in the applicable period.
38
Results of Operations
The following table highlights certain information regarding our operations for the 52-week periods ended April 24, 2005, April 25, 2004 and April 27, 2003.
|
| 52-week periods ended |
| ||||
(In millions of Canadian dollars, unless otherwise stated) |
| April 24, 2005 |
| April 25, 2004 |
| April 27, 2003 |
|
|
|
|
| restated |
| restated |
|
Statement of Operations Data: |
|
|
|
|
|
|
|
Merchandise and service revenues (1): |
|
|
|
|
|
|
|
Canada |
| 1,577.1 |
| 1,510.6 |
| 1,428.6 |
|
United States |
| 3,265.4 |
| 1,597.1 |
| 514.7 |
|
Total merchandise and service revenues |
| 4,842.5 |
| 3,107.7 |
| 1,943.3 |
|
Motor fuel revenues |
|
|
|
|
|
|
|
Canada |
| 844.4 |
| 677.5 |
| 630.2 |
|
United States |
| 4,528.9 |
| 2,087.2 |
| 741.7 |
|
Total motor fuel revenues |
| 5,373.3 |
| 2,764.7 |
| 1,371.9 |
|
Total revenues |
| 10,215.8 |
| 5,872.4 |
| 3,315.2 |
|
Merchandise and service gross profit (1): |
|
|
|
|
|
|
|
Canada |
| 529.0 |
| 491.3 |
| 462.5 |
|
United States |
| 1,063.2 |
| 521.2 |
| 169.7 |
|
Total merchandise and service gross profit |
| 1,592.2 |
| 1,012.5 |
| 632.2 |
|
Motor fuel gross profit: |
|
|
|
|
|
|
|
Canada |
| 65.2 |
| 63.3 |
| 57.5 |
|
United States |
| 325.5 |
| 147.2 |
| 60.2 |
|
Total motor fuel gross profit |
| 390.7 |
| 210.5 |
| 117.7 |
|
Total gross profit |
| 1,982.9 |
| 1,223.0 |
| 749.9 |
|
Operating, selling, administrative and general expenses |
| 1,543.6 |
| 989.2 |
| 595.6 |
|
Depreciation and amortization of fixed and other assets |
| 106.3 |
| 77.2 |
| 46.1 |
|
Operating income |
| 333.0 |
| 156.6 |
| 108.2 |
|
Financial expenses |
| 38.9 |
| 31.1 |
| 14.9 |
|
Write-off of financing costs |
| — |
| 12.5 |
| — |
|
Earnings before income taxes |
| 294.1 |
| 113.0 |
| 93.3 |
|
Income taxes |
| 94.6 |
| 37.5 |
| 30.8 |
|
Net earnings |
| 199.5 |
| 75.5 |
| 62.5 |
|
Other Operating Data: |
|
|
|
|
|
|
|
Merchandise and service gross margin (1): |
|
|
|
|
|
|
|
Consolidated |
| 32.9 | % | 32.6 | % | 32.5 | % |
Canada |
| 33.5 | % | 32.5 | % | 32.4 | % |
United States |
| 32.6 | % | 32.6 | % | 33.0 | % |
Growth of average merchandise revenues per store (2) : |
|
|
|
|
|
|
|
Canada |
| 2.6 | % | 3.1 | % | 9.6 | % |
United States (3) |
| 10.4 | % | 3.9 | % | 7.9 | % |
Motor fuel gross margin: |
|
|
|
|
|
|
|
Canada (cents per litre) |
| 4.61 |
| 4.77 |
| 4.64 |
|
United States (¢US per gallon) (4) |
| 14.17 |
| 11.57 |
| 12.23 |
|
Volume of motor fuel sold (5) : |
|
|
|
|
|
|
|
Canada (millions of litres) |
| 1,413.5 |
| 1,329.2 |
| 1,239.2 |
|
United States (millions of gallons) |
| 1,858.1 |
| 996.1 |
| 355.5 |
|
Growth of average motor fuel volume per store: |
|
|
|
|
|
|
|
Canada |
| 6.6 | % | 6.7 | % | 4.7 | % |
United States (3) |
| 6.3 | % | 6.4 | % | 1.4 | % |
(1) Includes other revenues derived from franchise fees, royalties and rebates on some purchases by franchisees and licensees.
(2) Does not include services and other revenues (as described in footnote 1) and is based on the average number of stores opened during each four-week period of the fiscal period. (Growth in the United States is calculated based on US dollars.)
(3) Excluding the Circle K acquisition.
(4) For company-operated stores only.
(5) Includes volume of franchisee, dealer and commission sites.
39
52-Week Period Ended April 24, 2005 Compared to the 52-Week Period Ended April 25, 2004
During the 52-week period ended April 24, 2005, Couche-Tard completed three small business acquisitions for a total of 49 stores, opened 44 QSRs and implemented its Store 2000 Concept in 223 stores, including 54 new stores.
For the 52-week period ended April 24, 2005, Couche-Tard achieved revenues of $10.22 billion, compared with $5.87 billion in fiscal 2004, a major increase of 74.1% or $4.35 billion, including an additional $3.84 billion from Circle K. The Company recorded 76.3% of its revenues in the United States, up from 62.7% in the previous fiscal year.
• In the United States, revenues totalled $7.79 billion, an increase of $4.11 billion reflecting the additional $3.84 billion in sales from Circle K and the internal growth in the American network. Growth of average merchandise revenues per store, which is based on US dollars, (excluding Circle K for comparative purposes) was 10.4% over the prior year while growth of average motor fuel volume per store (excluding Circle K), was 6.3% over the prior year. The growth of average merchandise revenues per store reflects the efforts to increase revenues and gross margins through price optimization, changing product mix, the impact from investment in our Store 2000 Concept conversions and the increase in tobacco tax with the resultant increase in the selling price of tobacco products. The average motor fuel volume per store increase reflects the positive consumer response to our rebranding of several motor fuel locations to nationally recognized brands and the impact from investment in our Store 2000 Concept conversions.
• In Canada, revenues amounted to $2.42 billion, up 10.7%, or $233.4 million of which $66.5 million or 28.5% was generated from merchandise and service revenues and in particular in the higher margin categories including food-service. Growth of average merchandise revenues per store was 2.6% compared with the previous year which reflects the aggressive pricing on generic tobacco and certain dairy categories. Growth of average motor fuel volume per store was 6.6% over the previous year due to certain pricing strategies.
Gross profit grew by 62.3% or $760.0 million to $1.98 billion, compared with $1.22 billion for the previous year. This increase is mainly due to higher revenues, particularly additional sales from Circle K and higher motor fuel gross margins, in particular from Circle K.
• Consolidated merchandise and service gross margin was 32.9%, up from 32.6% in the previous fiscal year. The gross margin in Canada was 33.5%, up from 32.5% in previous year reflecting the impact of improvements in purchasing terms and changes in products mix with a focus on higher margin items. The gross margin in our U.S. operations was 32.6%, unchanged from last fiscal year. Efforts continue to improve gross margin through price optimization and changes to the product mix emphasizing higher margin items. These efforts resulted in higher gross margins in certain categories and lower gross margins in other categories with resultant increase in sales. Also, tobacco gross margins have come under competitive pressures in certain areas. The result of these dynamic variables, in the aggregate, was an unchanged gross margin in fiscal 2005 compared to last year.
• Motor fuel gross margin decreased slightly to 4.61¢ per litre in Canada, from 4.77¢ per litre in the previous year reflecting the increase in competitive activity, particularly in segments of our central Canada market. Motor fuel gross margin in the United States increased to 14.17¢US per gallon from 11.57¢US per gallon in the previous year. (Including Circle K’s historical results, the motor fuel gross margin in the U.S. would have been 14.30¢US per gallon for fiscal 2004).
40
Operating, selling, administrative and general expenses increased by $554.4 million or 56.0% over the previous fiscal year. The increase is mainly attributable to the acquisition of Circle K on December 17, 2003. It should be noted that there were major increases in the retail price of motor fuel this year, particularly in our U.S. markets, with a resultant increase in credit card fee expense. (Including Circle K’s historical results, our credit card fee expense has increased by approximately $22.5 million over the previous year (approximately $15.2 million after tax).) As a percentage of total revenues, operating, selling, administrative and general expenses declined by 1.7% due to lower operating costs associated with higher motor fuel revenues, which account for a larger proportion of total revenues. As a percentage of merchandise and service revenues, operating, selling, administrative and general expenses remained relatively the same as last year.
Depreciation and amortization of fixed and other assets increased by 37.7% to $106.3 million in fiscal 2005. This increase is due mainly to the acquisition of Circle K on December 17, 2003 and capital expenditures made during fiscal 2005.
Operating income for fiscal 2005 more than doubled to $333.0 million, an increase of $176.4 million or 112.6% over the $156.6 million earned in the same period of the previous fiscal year. This increase is primarily attributable to the results of Circle K.
Financial expenses totalled $38.9 million, up $7.8 million or 25.1% over last year due to the higher borrowings to finance the Circle K acquisition. The financial expenses were reduced by a $6.9 million favourable benefit from the interest rate swaps entered into in March 2004.
Income taxes increased by $57.1 million, or 152.3%, to $94.6 million, primarily due to increased pre-tax earnings. The reduction of the effective income tax rate by approximately 1% is mainly attributable to the apportionment of taxable income amongst the various jurisdictions that have different income tax rates.
Net earnings increased by $124.0 million, or 164.2%, to $199.5 million or $0.99 per share ($0.97 per share on a diluted basis), compared with $75.5 million or $0.42 per share ($0.40 per share on a diluted basis) in the previous year.
Net earnings for fiscal 2005 were negatively affected by the following items, which are presented on an after-tax basis:
• the additional credit card fee expense in our U.S. markets (primarily resulting from higher motor fuel retail prices) amounting to approximately $14.4 million ($0.07 per share on a diluted basis). Including Canada, credit card fee expense increased by approximately $15.2 million ($0.07 per share on a diluted basis);
• the foreign exchange rate which reduced net earnings by approximately $6.0 million ($0.03 per share on a diluted basis);
• the reduction of net earnings of $3.2 million ($0.01 per share on a diluted basis) related to the amended stock-based compensation accounting policy adopted retroactively this year without restatement of prior year’s earnings.
Balance Sheets
Our total consolidated assets of $2.44 billion as at April 24, 2005 increased by $191.5 million compared to last year primarily related to an increase of $102.7 million in cash and cash equivalents, a net income taxes receivable amount of $39.0 million, a net increase in fixed assets of $100.2 million, offset by a reduction in future income taxes assets. Accounts payable and accrued liabilities of $747.0 million as at April 24, 2005 increased by $86.4 million compared to April 25, 2004 which increase includes the impact of the higher motor fuel prices and the impact of higher level of capital expenditures in the last quarter this year, reduced by the lower exchange rate.
41
Shareholders’ equity of $905.4 million as at April 24, 2005 increased by $177.4 million during the year resulting mainly from net earnings of $199.5 million for fiscal 2005.

Liquidity and Capital Resources
Our principal source of liquidity is cash flows generated from operating activities. Our principal uses of cash are to meet debt service requirements, finance our capital expenditures, make acquisitions and provide for working capital. We expect that cash available from operations together with borrowings available under our revolving credit facilities will be adequate to meet our liquidity needs in the foreseeable future.
As at April 24, 2005, our total debt was $655.6 million (of which $432.2 million consisted of 7.5% Subordinated unsecured debt due in 2013, $213.2 million consisted of borrowings under our Secured term loans and $10.2 million consisted of other long-term debt).
In addition to the above, the Company has interest rate swap agreements with three banks under which the Company incurs interest on US$350.0 million at a rate of LIBOR plus an aggregate weighted average rate factor of 2.95%. The interest rate is reset every six months over the term of the agreements. The swap agreements, which expire on December 15, 2013, provide that, after December 15, 2008, each bank has the right to terminate its arrangement with the payment of a termination fee if terminated before December 15, 2011 and, if terminated after that date, without payment of a termination fee. In addition, both parties to each agreement have a mutual right to terminate the arrangement on the 5th anniversary date of the effective date of each of the three agreements. If such right was exercised by either party, one party would be required to pay the other party the mark to market value of the interest rate swap. The Company formally documents and designates each derivative financial instrument as a hedge of its Subordinated unsecured debt. The Company determines that derivative financial instruments are effective hedges, at the time of the establishment of the hedge and for the duration of the instrument, since the date to maturity, the reference amount and interest rate of the instruments correspond to all the conditions of the debt.
Capital Expenditures. Gross capital expenditures (excluding acquisitions) for fiscal 2005 were $235.0 million. Our capital expenditures primarily relate to expenditures on the implementation of our Store 2000 Concept, investment in new stores including a small number of existing stores, the replacement of equipment in some of our stores, including upgrading of petroleum infrastructure at a number of locations, and for installation of POS systems, including scanning, at the Circle K company operated stores that do not currently have this technology. In connection with the Circle K acquisition, we expect to make certain capital improvements of up to US$18.6 million at the Circle K stores, currently expected to begin in early fiscal year 2006 until December 2008, to comply with the requirements of the American with Disabilites Act. We expect to fund these improvements with cash flows generated from operations.
Over the past number of years, the Company has expended funds for maintaining stores to operating standards, renovated certain stores with our Store 2000 Concept, opened new stores and invested in small acquisitions. The Company has funded these expenditures with cash flows from operating activities. Over the past five fiscal years, total cash flows from operating activities amounted to approximately $1.0 billion and capital expenditures and investment in small acquisitions amounted to approximately $723 million over this period. We believe that we will be able to continue to fund future expenditures of this nature with cash flows from operating activities. Major acquisitions will be financed through a combination of debt, sales and leasebacks and equity.
42
Credit Facilities. We have five-year renewable operating credits, maturing in December 2008 in the amount of $50.0 million available in Canadian dollars or U.S. dollars to the Canadian borrowers and in the amount of US$75.0 million available in U.S. dollars to the U.S. borrowers, which bear interest at the Canadian prime rate, or the Canadian or U.S. base rate (as applicable) or LIBOR, plus a certain margin varying on the basis of our leverage ratio. The operating credits are also available in the form of bankers’ acceptances (for Canadian dollar advances) and in the form of letters of credits (not to exceed $10.0 million or the U.S. dollar equivalent) in respect of the Canadian facility and US$30.0 million in respect of the U.S. facility. As of April 24, 2005, the facilities are undrawn, except for letters of credits of approximately $0.9 million for the Canadian facility and US$12.2 million for the U.S facility.
Virtually all the assets of the Company secure our senior credit facility. The Company must meet certain commitments and achieve certain financial ratios under the credit agreement. In addition, the credit agreement imposes certain restrictions on capital spending if a certain ratio is not achieved, business acquisitions, debt repayments and payment of dividends. As well, the indenture governing the subordinated debt also contains certain restrictions on business acquisitions and the payment of dividends.
Cash Flows from Operating Activities. Cash provided from operating activities amounted to $404.3 million in fiscal 2005 compared with $314.2 million in fiscal 2004, an increase of $90.1 million, reflecting largely the contribution of Circle K for the full fiscal year. Cash flows at the level of net earnings plus depreciation and amortization, write-off of financing costs, loss on disposal of fixed and other assets and future income taxes amounted to $330.8 million (or $1.64 per share), an increase of $187.3 million or 130.5% over the $143.5 million (or $0.80 per share) generated during last fiscal year.
Cash Flows from Investing Activities. Net cash used in investing activities for the year ended April 24, 2005 amounted to $283.3 million, including $85.2 million for three small acquisitions comprising 49 stores. In fiscal 2004, net cash used in investing activities amounted to $761.2 million, including $984.3 million for the purchase of Circle K and $41.0 million for the purchase of 43 stores from Clark Retail Enterprise Inc. (Clark). In addition, investment in fixed assets amounted to $235.0 million, compared with $115.2 million for fiscal 2004. These capital expenditures were primarily for existing store improvements and equipment, new store development, information systems, expenditures related to motor fuel facilities in compliance with regulatory requirements and replacement of fixed assets damaged by the Florida hurricanes. Cash generated from sale and leaseback transactions amounted to $25.6 million in fiscal 2005 compared with $379.5 million in the prior year.
Cash Flows from Financing Activities. Cash generated from financing activities amounted to $4.6 million for fiscal 2005 including repayment of long-term debt of $8.1 million, offset by $0.2 million of issuance of long-term debt and $12.5 million cash received from the issue of shares on exercise of stock options. In fiscal 2004, we borrowed $1.12 billion in new long-term debt and raised an additional $220.5 million, net of related expenses, from the issue of 27.1 million Class B shares. The total proceeds were used to repay $239.3 million of the existing long-term debt and finance the Circle K acquisition. Additionally, we used the net proceeds from the sale and leaseback transactions of 322 Circle K properties and a portion of a cash surplus to repay a substantial $442.1 million of long-term debt.
Contractual Obligations and Commercial Commitments
Set out below is a summary of our material contractual cash obligations as of April 24, 2005:
|
| 2006 |
| 2007 |
| 2008 |
| 2009 |
| 2010 |
| Thereafter |
| Total |
|
|
| (in millions of dollars) |
| ||||||||||||
Long-term debt |
| 8.1 |
| 9.5 |
| 10.2 |
| 11.0 |
| 2.2 |
| 611.5 |
| 652.5 |
|
Capital lease obligations |
| 1.1 |
| 0.9 |
| 0.7 |
| 0.6 |
| 0.6 |
| 2.6 |
| 6.5 |
|
Operating lease obligations |
| 181.0 |
| 170.2 |
| 149.5 |
| 121.7 |
| 110.3 |
| 962.3 |
| 1,695.0 |
|
Purchase commitments |
| 0.6 |
| 0.6 |
| 0.6 |
| 0.7 |
| 0.7 |
| 2.0 |
| 5.2 |
|
Total |
| 190.8 |
| 181.2 |
| 161.0 |
| 134.0 |
| 113.8 |
| 1,578.4 |
| 2,359.2 |
|
43
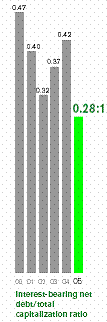
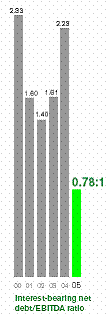
Long-Term Debt. Couche-Tard’s long-term debt consists of (i) $432.2 million (US$350.0 million) 7.5% Subordinated unsecured debt due 2013; (ii) a five-year $29.8 million (US$24.1 million) Term Loan “A” secured term loan that bears interest at the Canadian base rate or LIBOR, plus a variable margin based on our leverage ratio; (iii) a seven-year $183.4 million (US$148.5 million) Term Loan “B” secured term loan that bears interest at the U.S. base rate or LIBOR, plus a fixed margin; (iv) Circle K’s 8.75% note payable due 2019 of $6.7 million (US$5.3 million) outstanding as of April 24, 2005; and (v) other long-term debt of $3.5 million.
Capital Lease Obligations. Couche-Tard has generally not used capital leases as a mean of financing; however some capital leases were assumed in connection with certain acquisitions. These obligations and related assets are included in our Consolidated Balance Sheets.
Operating Lease Obligations. We lease a substantial portion of our real estate using conventional operating leases. Generally our real estate leases in Canada are for primary terms of five to ten years and in the United States are for ten to 20 years, in both cases, with options to renew. These obligations and related assets are not included in our Consolidated Balance Sheets. Under certain of the store leases, we are subject to additional rentals based on store revenues as well as escalations in the minimum future lease amount.
Contingencies. There are various legal proceedings and claims pending against us that are common to our operations for which, in some instances, no provision has been made. While it is not feasible to predict or determine the ultimate outcome of these matters, it is the opinion of management that these suits will not result in monetary damages not covered by insurance that in the aggregate would be material and adverse to our business or operations.
We are covered by insurance policies that have significant deductibles. At this time, we believe that we are adequately covered through the combination of insurance policies and self-insurance. Future losses which exceed insurance policy limits or, under adverse interpretations, are excluded from coverage would have to be paid out of general corporate funds. In association with our workers’ compensation policies, we issue letters of credits as collateral for certain policies.
We also issue surety bonds for a variety of business purposes, including bonds for taxes, lottery sales, wholesale distribution and alcoholic beverage sales. In most cases, the surety bonds are required by a municipality or state governmental agency as a condition of operating a store in that area.
Off-Balance Sheets Arrangements
In the normal course of business, we finance certain of our activities off-balance sheets through operating leases for properties on which we conduct our retail business. The future commitments are included under “Operating Lease Obligations” in the table above.
44
Selected Quarterly Financial Information (Unaudited)
The Company’s 52-week reporting cycle is divided into four quarters of 12 weeks each except for the third quarter, which comprises 16 weeks. When a fiscal year, such as 2000, contains 53 weeks, the fourth quarter comprises 13 weeks. The following is a summary of selected consolidated financial information derived from the Company’s unaudited interim consolidated financial statements for each of the eight most recently completed quarters. This information was prepared in accordance with Canadian GAAP and is reported in Canadian dollars.
(In millions of Canadian dollars |
| 52 weeks ended April 24, 2005 |
| 52 weeks ended April 25, 2004 |
| ||||||||||||||||||||
Quarter |
| 4th |
| 3rd |
| 2nd |
| 1st |
| 4th |
| 3rd |
| 2nd |
| 1st |
| ||||||||
Weeks |
| 12 weeks |
| 16 weeks |
| 12 weeks |
| 12 weeks |
| 12 weeks |
| 16 weeks |
| 12 weeks |
| 12 weeks |
| ||||||||
|
|
|
| restated |
| restated |
| restated |
| restated |
| restated |
| restated |
| restated |
| ||||||||
Revenues |
| 2,408.9 |
| 2,922.7 |
| 2,393.1 |
| 2,491.1 |
| 2,289.0 |
| 1,765.0 |
| 937.5 |
| 880.9 |
| ||||||||
Income before depreciation and amortization of fixed and other assets |
| 84.4 |
| 112.8 |
| 109.7 |
| 132.4 |
| 80.3 |
| 52.7 |
| 53.1 |
| 47.7 |
| ||||||||
Depreciation and amortization of fixed and other assets |
| 26.5 |
| 32.1 |
| 24.4 |
| 23.3 |
| 27.0 |
| 25.5 |
| 12.7 |
| 12.0 |
| ||||||||
Operating income |
| 57.9 |
| 80.7 |
| 85.3 |
| 109.1 |
| 53.3 |
| 27.2 |
| 40.4 |
| 35.7 |
| ||||||||
Financial expenses |
| 9.1 |
| 12.5 |
| 8.6 |
| 8.7 |
| 12.7 |
| 11.7 |
| 3.1 |
| 3.6 |
| ||||||||
Write-off of financing costs |
| — |
| — |
| — |
| — |
| 9.7 |
| 2.8 |
| — |
| — |
| ||||||||
Total financial expenses |
| 9.1 |
| 12.5 |
| 8.6 |
| 8.7 |
| 22.4 |
| 14.5 |
| 3.1 |
| 3.6 |
| ||||||||
Net earnings |
| 40.0 |
| 44.3 |
| 49.9 |
| 65.3 |
| 20.0 |
| 7.8 |
| 25.7 |
| 22.0 |
| ||||||||
Earnings per share |
|
|
|
|
|
|
|
|
|
|
|
|
|
|
|
|
| ||||||||
Basic |
| $ | 0.20 |
| $ | 0.22 |
| $ | 0.25 |
| $ | 0.32 |
| $ | 0.10 |
| $ | 0.04 |
| $ | 0.15 |
| $ | 0.13 |
|
Diluted |
| $ | 0.19 |
| $ | 0.22 |
| $ | 0.24 |
| $ | 0.32 |
| $ | 0.10 |
| $ | 0.03 |
| $ | 0.14 |
| $ | 0.13 |
|
The quarterly financial information has been restated to reflect the impact of the accounting changes, the first one being the change in accounting and reporting for obligations associated with the retirement of tangible long-lived assets and the associated asset retirement cost and was applied retroactively. The other change relates to the change in accounting for depreciation and amortization of fixed assets and lease accounting, adopted in the fourth quarter of fiscal 2005 and applied retroactively. Both changes are described in the section “Accounting changes”.
Net earnings have substantially increased generally in tandem with the Company’s major acquisitions and with earnings improvements from internal growth. It is important to note that the fourth quarter of 2004 included the results for Circle K for the entire quarter as we consolidated Circle K’s results as of December 18, 2003.
The influences of the volatility of motor fuel gross margin and seasonality have an impact on the variability of our quarterly net earnings. Since the acquisition of Circle K, motor fuel revenues have become a more significant segment of our business and therefore Couche-Tard’s results are more sensitive to the volatility of motor fuel gross margins.
52-Week Period Ended April 25, 2004 Compared to the 52-Week Period Ended April 27, 2003
During the 52-week period ended April 25, 2004, Couche-Tard completed two acquisitions for a total of 2,333 stores, opened 51 new stores and 47 QSRs, and reconfigured 173 stores with its Store 2000 Concept.
For the 52-week period ended April 25, 2004, Couche-Tard achieved revenues of $5.87 billion, compared with $3.32 billion in 2003, a major increase of 76.8% or $2.55 billion, including $2.02 billion or 79.2%, which came from Circle K for the 130 day period from December 18, 2003 to April 25, 2004. The Company recorded 62.7% of its revenues in the United States, up from 37.9% in the previous fiscal year.
45
• In the United States, revenues totalled $3.68 billion, an increase of $2.42 billion reflecting mainly the contribution of Circle K results from December 18, 2003 as well as the impact of the acquisition of the Dairy Mart Stores, the 43 Clark stores acquired in September 2003, the stores opened during the year and internal growth in the American network. Growth of average merchandise revenues per store (excluding Circle K for comparative purposes) was 3.9% over the prior year while growth of average motor fuel volume per store (excluding Circle K) was 6.4% over the prior year.
• In Canada, revenues amounted to $2.19 billion, up 6.3%, or $129.3 million. Growth of average merchandise revenues per store was 3.1% compared with the previous year. Growth of average motor fuel volume per store was 6.7% over the previous year. Overall, Canadian markets performed well in difficult business conditions, including a decline in the number of tourists under the impact of SARS and reduced exports due to the exchange rate.
Gross profit grew by 63.1% or $473.1 million to $1.22 billion, compared with $749.9 million for the previous year. This increase is mainly due to higher revenues, particularly from the Circle K acquisition, a higher motor fuel gross margin in Canada – somewhat offset by a decline in motor fuel gross margin in the United States.
• Consolidated merchandise and service gross margin was 32.6% (including the Circle K results), reflecting the lower gross margin of Circle K due to its different product mix.
• Motor fuel gross margin increased to 4.77¢ per litre in Canada, up from 4.64¢ per litre from the previous year. Motor fuel gross margin in the United States declined to 11.57¢US per gallon from 12.23¢US per gallon in the previous year. This decrease is attributable to the lower motor fuel margins experienced by Circle K in the first 45 days of the integration and the pressure on margins in the Midwest in the fourth quarter and a price war by two gasoline marketers in Kentucky.
Operating, selling, administrative and general expenses increased by $393.6 million or 66.1% over the previous year. The increase is primarily attributable to the Circle K acquisition and, to a lesser extent, the Clark stores, the full impact of the Dairy Mart stores and the growth in the Canadian network. As a percentage of total revenues, operating, selling, administrative and general expenses declined by 1.1% due to lower operating costs associated with higher motor fuel revenues, which account for a larger proportion of total revenues.
Depreciation and amortization of fixed and other assets grew by 67.5% to $77.2 million in fiscal 2004. This increase is due mainly to the acquisition of Circle K, the Clark stores, the full impact of the acquisition of Dairy Mart and store renovations.
Financial expenses totalled $31.1 million, up $16.2 million or 108.7% over last year due to the higher borrowings to finance the Circle K acquisition. In addition, the Company recorded a pre-tax write-off of financing costs of $12.5 million related to the refinancing of existing debt in connection with the Circle K acquisition ($2.8 million) and to the repayment of a portion of the new debt from the proceeds of the sale and leaseback transactions completed in March and April 2004 and from the use of a portion of cash surplus ($9.7 million).
Income taxes increased by $6.7 million, or 21.8%, to $37.5 million. The increase is due to a combination of an increase in pre-tax earnings, a rise in the provincial income tax rate in Ontario and a greater portion of pre-tax income coming from the U.S. operations which have a higher tax rate than Canada.
Net earnings increased by $13.0 million, or 20.8%, to $75.5 million or $0.42 per share ($0.40 per share on a diluted basis), compared with $62.5 million or $0.37 per share ($0.36 per share on a diluted basis) in the previous year.
46
Net earnings for fiscal 2004 were affected by the following unusual or uncontrollable items, which are presented on an after-tax basis:
• a write-off of financing costs of $8.3 million or $0.04 per share on a diluted basis, related to the refinancing of existing debt in connection with the Circle K acquisition and the repayment of a portion of the new debt;
• the rise in the corporate tax rate in Ontario, entailing an adjustment of future income taxes totalling $1.1 million and equivalent to one half a cent per share on a diluted basis;
• and the negative impact of approximately $3.1 million due to the increase in the Canadian dollar, or $0.02 per share on a diluted basis.
Critical Accounting Policies and Estimates
Estimates. This MD&A is based on Couche-Tard’s consolidated financial statements, which have been prepared in accordance with Canadian GAAP. These principles require us to make certain estimates and assumptions that affect our financial position and results of operations as reflected in our financial statements. These assumptions and estimates are based on past events and expectations of future outcomes. On an ongoing basis, management reviews its estimates, including those relating to supplier rebates, environmental costs and asset retirement obligations based on available information. These estimates are based on management’s best knowledge of current events and actions that the Company may undertake in the future. Actual results may differ from the estimates.
Inventory. Couche-Tard’s inventory is comprised mainly of products purchased for resale including grocery items, tobacco products, packaged and fresh food products, motor fuel and lottery tickets. Inventories are valued at the lesser of cost and net realizable value. Cost is generally determined by the retail method for in-store merchandise, the average cost method for motor fuel inventory and first-in first-out for distribution centres. Inherent in the determination of gross profit margins are certain management judgments and estimates, which could affect ending inventory valuations and results of operations.
Impairment of Long-lived Assets. Couche-Tard evaluates long-lived assets other than goodwill for indicators of impairment whenever events or changes in circumstances indicate their carrying value may not be recoverable. The Company’s judgments regarding the existence of impairment indicators are based on market conditions and operational performance. The variability of these factors depends on a number of conditions, including uncertainty about future events. These factors could cause the Company to conclude that impairment indicators exist and require that impairment tests be performed, which could result in determining that the value of certain long-lived assets is impaired, resulting in a write-down of such long-lived assets.
Goodwill is evaluated for impairment annually, or more often if events or changes in circumstances indicate that the value of certain goodwill may be impaired. This evaluation requires management to make judgments relating to future cash flows, growth rates, economic and market conditions. These evaluations are based on discounted cash flows. If assumptions are incorrect, the carrying value of our goodwill may be overstated. Couche-Tard’s annual impairment test is performed in the first quarter of each fiscal year.
Environmental Matters. The Company provides for estimated future site remediation costs to meet government standards for known site contamination when such costs can be reasonably estimated. Estimates of the anticipated future costs for remediation activities at such sites are based on the Company’s prior experience with remediation sites and consideration of other factors such as the condition of the site contamination, location of sites and experience with contractors that perform the environmental assessments and remediation work.
47
In each of the U.S. states in which the Company operates, except Michigan, Iowa, Florida, Texas and Washington, there is a state fund to cover the cost of certain rehabilitation and removing of motor fuel tanks. These state funds provide insurance for motor fuel facilities operations to cover the cost of cleaning up contamination to the environment caused by the usage of underground equipment. Underground motor fuel storage tank registration fees and a motor fuel tax in each of the states finance the trust funds. The Company pays the registration fees and remits the sales taxes to the states where it is a member of the trust fund. Insurance coverage is different in the various states and can be as much as US$1.0 million per site.
Should the estimated future remediation expenditures or state reimbursement amounts change, it could have a material adverse effect on the financial condition and results of operations.
Income Taxes. Future income tax assets and liabilities are recognized for the future income tax consequences attributable to temporary differences between the financial statement carrying values of assets and liabilities and their respective income tax bases. Future income tax assets or liabilities are measured using enacted or substantively enacted income tax rates expected to apply to taxable income in the years in which those temporary differences are expected to be recovered or settled. The calculation of current and future income taxes requires management to make estimates and assumptions and to exercise a certain amount of judgment regarding the financial statement carrying values of assets and liabilities which are subject to accounting estimates inherent in those balances, the interpretation of income tax legislation across various jurisdictions, expectations about future operating results and the timing of reversal of temporary differences and possible audits of tax fillings by the regulatory authorities. Management believes it has adequately provided for income taxes based on current available information.
Changes or differences in these estimates or assumptions may result in changes to the current or future income tax balances on the consolidated balance sheet, a charge or credit to income tax expense in the consolidated statement of earnings and may result in cash payments or receipts.
Insurance and Workers’ Compensation. Couche-Tard uses a combination of insurance, self-insured retention, and self-insurance for a number of risks including workers’ compensation (in certain states), property damage, and general liability claims. Accruals for loss incidences are made based on Couche-Tard’s claims experience and actuarial assumptions followed in the insurance industry. A material revision to Couche-Tard’s liability could result from a significant change to its claims experience or the actuarial assumptions of its insurers. Actual losses could differ from accrued amounts. Workers’ compensation is covered by government-imposed insurance in Canada and by third-party insurance in our United States operations, except in certain states where Couche-Tard is self-insured. With respect to the third-party insurance in the United States, independent actuarial estimates of the aggregate liabilities for claims incurred serve as a basis for Couche-Tard’s share of workers’ compensation losses.
ACCOUNTING CHANGES
Accounting for Fixed Assets and Lease Accounting
During the year, the Company undertook a review of its depreciation and amortization policies for all of its fixed assets and of its lease accounting policies. Previously, the Company used the diminishing balance method at various rates to calculate depreciation, except for Circle K where the straight-line method was used. In addition, leasehold improvements were amortized over the shorter of the term of the lease plus renewal periods or their useful lives and rent expense was recorded over the committed lease period, and did not take into account future rent escalations included in the lease term.
As a result of the review and an in depth study of the useful lives of its fixed assets, the Company decided to change its accounting policy for depreciation and amortization of fixed assets to use the straight-line method throughout the Company. This method is more representative of the actual useful lives of the assets and provides uniformity within the Company. This change has been applied retroactively and prior years financial statements have been restated.
48
Following a review of its lease accounting policies and the relevant accounting literature, the Company has determined it should amortize its leasehold improvements over the shorter of their useful lives and the term of the lease. Moreover, the Company decided it should record lease expense using the straight-line method. Accordingly, the Company has restated previously reported financial statements to reflect these changes.
The impact of those changes as of April 25, 2004 is a decrease in fixed assets of $13.6 million, an increase in net future income tax assets of $8.8 million, an increase in accounts payable and accrued liabilities of $0.8 million, an increase in deferred credits and other liabilities of $11.0 million, a reduction in retained earnings of $16.8 million and an increase to the cumulative translation adjustments balance of $0.2 million.
For 2005, the impact of this change resulted in a $2.2 million increase of the depreciation expense ($2.2 million in 2004 and $1.0 million in 2003), a $4.4 million increase in lease expense ($2.6 million in 2004 and $1.8 million in 2003) and in a $4.7 million decrease of net earnings ($3.6 million in 2004 and $2.9 million in 2003). The impact on diluted earnings per share is a decrease of $0.02 in 2005, 2004 and 2003.
Consolidation of Variable Interest Entities
During the year, the Company adopted the Canadian Institute of Chartered Accountants (CICA) Accounting Guideline No.15 (AcG-15) “Consolidation of Variable Interest Entities (VIEs)” that came into effect November 1, 2004. This guideline clarifies and addresses the application of consolidation guidance to those entities defined as VIEs which are entities that are subject to control on a basis other than voting interests. Such entities should be consolidated by the primary beneficiary, which is the entity that will absorb a majority of the VIE’s expected losses or will receive a majority of its expected residual returns, or both.
The implementation of this guideline did not have any impact on the Company’s financial statements.
Asset Retirement Obligations
During the year, the Company adopted the new CICA Handbook Section 3110, “Asset Retirement Obligations” which establishes standards for the recognition, measurement and disclosure of legal obligations associated with the costs to retire long-lived assets. Accordingly, under the new standard, the fair value of the future retirement costs of the Company’s underground motor fuel storage tanks is recorded as a liability on a discounted basis when it is incurred and an equivalent amount is capitalized to fixed assets. The initial recorded obligation, which has been discounted using the Company’s credit-adjusted risk free-rate, will be reviewed periodically to reflect the passage of time and changes in the estimated future costs underlying the obligation. The Company amortizes the initial amount capitalized to fixed assets and recognizes accretion expense in connection with the discounted liability over the estimated remaining useful life of the underground motor fuel storage tanks.
The new standard has been applied retroactively and financial statements of the prior periods have been restated. The impact of this change as of April 25, 2004 is an increase in fixed assets of $17.5 million, an increase in asset retirement obligations of $21.6 million, an increase in net future income tax asset of $1.8 million, a reduction in retained earnings of $2.5 million and an increase to the cumulative translation adjustments balance of $0.2 million.
For 2005, 2004 and 2003, the impact on net earnings is a decrease of $2.3 million, $0.4 million and $0.6 million, respectively (a decrease of $0.01 per share on a diluted basis in 2005, nil in 2004 and 2003).
49
Stock-based Compensation and Other Stock-based Payments
Effective April 26, 2004, the Company adopted the amended recommendations of the CICA relating to Section 3870, “Stock-based Compensation and Other Stock-based Payments”. These amendments require that stock-based compensation costs be measured at the grant date of the award based on the fair value method for all transactions entered into beginning on or after January 1, 2002. The Company chose to apply these amendments retroactively, without restating prior periods, for stock options granted since April 29, 2002. The fair value of the stock options is recognized over the vesting period as compensation expense with a corresponding increase in contributed surplus. When stock options are exercised, the corresponding contributed surplus is transferred to capital stock.
The retroactive treatment of these recommendations resulted in a decrease of $3.2 million in opening retained earnings with a corresponding increase in contributed surplus.
Recording of Certain Consideration Received from a Vendor
On January 31, 2005, the Company adopted both early and retroactively the amended recommendations of the Emerging Issues Committee of the CICA relating to the third topic of Abstract 144 (EIC-144), “Accounting by a Customer (including a Reseller) for Certain Consideration Received From a Vendor”. These amendments address the recognition, measurement and disclosure requirements for vendor rebates and state that those rebates must be recognized when probable and reasonably estimable. Therefore, vendor rebates recognized in earnings and for which the full requirements for entitlement have not yet been met would be disclosed.
The implementation of these new recommendations did not have any impact on the Company’s financial statements.
Recently Issued Accounting Standards
On January 27, 2005, the CICA Accounting Standards Board (AcSB) issued Section 1530, “Comprehensive Income”, Section 3855, “Financial Instruments – Recognition and Measurement” and Section 3865, “Hedges”. These new sections are effective for interim and annual periods beginning after October 1, 2006 and provide comprehensive requirements for the recognition and measurement of financial instruments, as well as standards on when and how hedge accounting may be applied. Additionally, these sections introduce a new component of equity referred to as comprehensive income.
Section 1530 requires companies to disclose comprehensive income, which includes, in addition to net income, comprehensive income consisting primarily of unrealized gains and losses that bypass the traditional earnings statement and are recorded directly into shareholders’ equity. The components of other comprehensive income consist of unrealized gains and losses related to the translation of foreign currency financial statements, certain deferred gains and losses from hedging activities, and unrealized gains and losses on certain investment securities.
In June 2005, the CICA AcSB issued Section 3831, “Non-Monetary Transactions” which replaces Section 3830, “Non-Monetary Transaction”. The main feature of this new section is a general requirement to measure an asset or liability exchanged or transferred in a non-monetary transaction at fair value, unchanged from the requirement in former Section 3830. However, an asset exchanged or transferred in a non-monetary transaction is measured at its carrying amount when certain conditions are met. The “commercial substance” criterion replaces the “culmination of the earnings process” criterion in former Section 3830. The new requirements are effective for non-monetary transactions initiated in periods beginning on or after January 1, 2006.
The Company does not expect that these recommendations will have a material impact on its consolidated results of operations and financial condition.
50
Business Risks
Increases and volatility in crude oil prices and volatility in wholesale petroleum pricing and supply could affect our revenues and gross profit. As a result of our expansion in the United States, our motor fuel revenues have become a greater component of total revenues. For the 52 weeks ending April 24, 2005, our motor fuel revenues represented approximately 53% of total revenues and our motor fuel gross profit accounted for approximately 20% of our total gross profit. Crude oil and domestic wholesale petroleum markets display significant volatility. Since we typically have no more than a four to five-day supply of motor fuel, we are susceptible to interruptions in the supply of motor fuel at our facilities. General political conditions and instability in oil producing regions, particularly in the Middle East and South America, could significantly and adversely affect crude oil supplies and wholesale petroleum costs. Local supply interruptions may also occur. For example, in August 2003, a cracked pipeline interrupted the supply of motor fuel to the greater Phoenix area. In addition, any new standards that the U.S. Environmental Protection Agency may impose on petroleum refining that would necessitate changes in the refining process could limit the volume of petroleum products available from refiners in the future. Volatility in wholesale petroleum supply and costs could result in significant changes in the retail price of petroleum products and in lower fuel gross margin per gallon or litre. In addition, changes in the retail price of petroleum products could dampen consumer demand for motor fuel. These factors could materially influence our motor fuel volume, motor fuel gross profit and overall customer traffic, which, in turn, could have a material adverse effect on our operating results and financial condition.
The convenience store and retail motor fuel industries are highly competitive and affected by new entrants. The industries and geographic areas in which we operate are highly competitive and marked by ease of entry and constant change in terms of the number and type of retailers offering the products and services found in our stores. We compete with other convenience store chains, independent convenience stores, gas station operators, large and small food retailers, local pharmacies and pharmaceutical chains, discount stores, club stores and mass merchants, many of which are well-established companies. In recent years, several non-traditional retail segments have entered the motor fuel retail business, including supermarkets, club stores and mass merchants, and this additional competition has had a negative impact on motor fuel profit margins in the convenience store industry. These non-traditional motor fuel retailers have obtained a significant share of the motor fuel market and their market share is expected to grow. In some of our markets, our competitors have been in existence longer and have greater financial, marketing and other resources than we do. We may not be able to compete successfully against current and future competitors, and competitive pressures faced by us could materially and adversely affect our business, results of operations and financial condition.
We are subject to federal, provincial, state and local environmental laws, and the costs of compliance could require substantial capital expenditures. Our operations are subject to a variety of environmental laws and regulations, including those relating to emissions to the air, discharges into water, releases of hazardous and toxic substances, and remediation of contaminated sites. Under various federal, provincial, state and local laws and regulations, we may, as the owner or operator, be liable for the costs of removal or remediation of contamination at our current stores or our former stores, whether or not we knew of, or were responsible for, the presence of such contamination. In particular, as an owner and operator of motor fuelling stations, we face risks relating to petroleum product contamination, which other convenience store operators not engaged in such activities would not face. The remediation costs and other costs required to clean up or treat contaminated sites could be substantial. Contamination on and from our current or former stores may subject us to liability to third parties or governmental authorities for injuries to persons, property or natural resources and may adversely affect our ability to sell or rent our properties or to borrow money using such properties as collateral.
In the United States, persons who dispose of or arrange for the disposal or treatment of hazardous or toxic substances away from stores may also be liable for the costs of removal or remediation of such substances at the disposal sites even if such sites are not owned by such persons. Although we do not typically arrange for the treatment or disposal of large quantities of hazardous or toxic substances from any location, our current and historic operation of many stores and the disposal of contaminated soil and groundwater wastes generated during cleanups of contamination at such stores could expose us to such liability.
51
We are subject to extensive environmental laws and regulations regulating underground storage tanks and vapour recovery systems. Compliance with existing and future environmental laws regulating such tanks and systems may require significant expenditures. In the United States, we pay fees to state “leaking underground storage tank” trust funds in states where they exist. These state trust funds are expected to pay or reimburse us for remediation expenses related to contamination associated with underground storage tanks subject to their jurisdiction. Such payments are always subject to a deductible paid by us, specified per incident caps and specified maximum annual payments which vary among the funds. As well, such funds may have eligibility requirements, which not all of our sites will meet. To the extent state funds, or other responsible parties do not pay or delay payments for remediation, we will be obligated to make these payments, which could materially adversely affect our financial condition and results of operations. We cannot assure that these funds or responsible third parties are or will continue to remain viable.
The nature of our motor fuel operations and those we acquire present risks of soil and groundwater contamination. In the future, we may incur substantial expenditures for remediation of contamination that has not been discovered at existing stores or at stores which we may acquire. We believe that a significant number of our current stores may be contaminated and expect to discover that contamination through the normal operation of our business in the future. We regularly monitor our facilities for environmental contamination and take reserves on our financial statements to cover potential environmental remediation and compliance costs, as we consider appropriate. However, we cannot assure that the liabilities for which we have taken reserves are the only environmental liabilities relating to our current and former stores, that material environmental conditions not known to us do not exist, that future laws or regulations will not impose material environmental liability on us or that our actual environmental liabilities will not exceed our reserves. In addition, failure to comply with any environmental regulations or an increase in regulations could materially and adversely affect our operating results and financial condition.
Future tobacco legislation, campaigns to discourage smoking, increases in tobacco taxes and wholesale cost increases of tobacco products could have a material adverse impact on our revenues and profit. Tobacco products represent our largest product category of merchandise and service revenues. For fiscal year ended April 24, 2005, revenues of tobacco products were approximately 37% of total merchandise and service revenues. Significant increases in wholesale cigarette costs and tax increase on tobacco products, as well as future legislation and national and local campaigns to discourage smoking in the United States and Canada, may have an adverse effect on the demand for tobacco products, and therefore reduce our revenues and profits.
Competitive pressures in our markets can make it difficult to pass price increases on to our customers. These factors could materially and adversely affect our retail price of cigarettes, cigarette unit volume and revenues, merchandise gross profit and overall customer traffic. Because we derive a large percentage of our revenues from tobacco products, reduced revenues of tobacco products or smaller margins on the revenues we make could have a material adverse effect on our operating results and financial condition.
Because we depend on the experience and industry knowledge of our management, we would be adversely affected if members of our management team left us. Our senior management team and the heads of our operating divisions who are principally responsible for our operations under our decentralized management structure are key elements of our business operations. Our future success depends on our ability to retain this team. If, for any reason, our senior executives and divisional vice-presidents do not continue to be active in management, our business, financial condition or results of operations could be adversely affected. We do not enter into employment agreements or non-competition agreements with our officers. Although we believe that current management will remain active in the business and that we will continue to be able to attract and retain other talented personnel and replace key personnel should the need arise, competition in recruiting replacement personnel could be significant. If we are not successful in retaining our key personnel or replacing them, our business, financial condition or results of operations could be adversely affected.
52
Acquisitions have been a substantial part, and are expected to continue to be a part, of our growth strategy, which could expose us to significant business risks. Acquisitions have been a significant part of our growth strategy. We expect to continue to selectively seek strategic acquisitions in the future. Our ability to consummate and to integrate effectively any future acquisitions on terms that are favorable to us may be limited by the number of attractive acquisition targets, internal demands on our resources and, to the extent necessary, our ability to obtain financing on satisfactory terms for larger acquisitions, if at all. Acquisitions may expose us to additional risks, including:
• difficulties in integrating administrative, financial reporting, operational and information systems and managing newly-acquired operations and improving their operating efficiency;
• difficulties in maintaining uniform standards, controls, procedures and policies across all of our businesses;
• entry into markets in which we have little or no direct prior experience;
• difficulties in retaining key employees of the acquired operations;
• disruptions to our ongoing business; and
• diversion of management time and resources.
In addition, future acquisitions could result in the incurrence of additional debt, costs and contingent liabilities. We may also incur costs and divert management attention for potential acquisitions, which are never consummated. For acquisitions we do consummate, expected synergies may not materialize. Our failure to effectively address any of these issues could adversely affect our results of operations, financial condition and ability to service debt, including the subordinated debt.
Although we have historically performed a due diligence investigation of the businesses or assets that we acquire, and anticipate continuing to do so for future acquisitions, there may be liabilities of the acquired business or assets that we fail or are unable to uncover during our due diligence investigation and for which we, as a successor owner, may be responsible. When feasible, we seek to minimize the impact of these types of potential liabilities by obtaining indemnities and warranties from the seller, which may in some instances be supported by deferring payment of a portion of the purchase price. However, these indemnities and warranties, if obtained, may not fully cover the liabilities because of their limited scope, amount or duration, the financial resources of the indemnitor or warrantor or other reasons.
We may experience difficulties in executing key aspects of our business strategy or in differentiating ourselves from our competitors. The future success of our business is highly dependent upon effectively implementing our business strategy and differentiating ourselves from our competitors. We may experience difficulties in executing key aspects of our business strategy. For example, we may be limited in our ability to implement our Store 2000 Concept in additional stores because of a number of factors, including limited capital expenditure resources and restrictions contained in our senior credit facility. In addition, our in-store branding strategies may be less successful than we anticipate in increasing our gross margins. We may be unable to obtain new QSR franchises, and it is possible that our existing QSR franchises would be cancelled. We may also be less successful than anticipated in achieving volume-purchasing benefits. Furthermore, we may experience difficulty in differentiating ourselves from our competitors if our competitors are able to successfully employ business strategies similar to ours or if market conditions or demographics reduce what we believe to be our competitive advantages.
We are subject to government regulations relating to, among other things, alcohol, tobacco and minimum wage. Our business and properties are subject to governmental laws and regulations including, but not limited to, employment laws and regulations, regulations governing the sale of alcohol and tobacco, minimum wage requirements and other laws and regulations.
In certain areas where our stores are located, provincial, state or local laws limit the stores’ hours of operation or their sale of alcoholic beverages, tobacco products, possible inhalants and lottery tickets, in particular to minors. Failure to comply with these laws could adversely affect our revenues and results of operations because these state and local regulatory agencies have the power to revoke, suspend or deny applications for and renewals of permits and licenses relating to the sale of these products or to seek other remedies.
53
Regulations related to wages also affect our business. Any appreciable increase in the statutory minimum wage would result in an increase in our labor costs and such cost increase, or the penalties for failing to comply with such statutory minimums, could adversely affect our business, financial condition and results of operations.
Any change in the legislation or regulations described above that is adverse to us and our properties could affect our operating and financial performance. In addition, new regulations are proposed from time to time which, if adopted, could have a material adverse effect on our operating results and financial condition.
We are subject to short-term interest rate fluctuations. Since approximately 98% of our long-term debt is directly or indirectly (through interest rate swaps) based on variable interest rate of no longer than six months in duration, the Company can experience interest expense variances solely based on changes in short-term interest rates.
We are subject to currency exchange risk. A substantial portion of our revenues comes from the United States. In our consolidated financial statements, we translate our U.S. results into Canadian dollars based on average exchange rates prevailing during a reporting period or the exchange rate at the end of the period. During times of a strengthening Canadian dollar, at a constant level of business, our reported U.S. revenues and earnings will be reduced because the U.S. results will translate into relatively lower Canadian dollars.
Substantially all of our indebtedness is denominated in U.S. dollars, while a significant portion of our revenue and cash flow is expected to be generated from our Canadian operations. To the extent that the cash flow generated from our U.S. operations is not sufficient to satisfy the ongoing payment obligations under our U.S. dollar denominated debt, we will need to convert Canadian dollars into U.S. dollars in order to make the necessary payments. Accordingly, a strengthening of the U.S. dollar against the Canadian dollar could make it more difficult for us to repay our indebtedness.
Given the volatility of exchange rates, we may not be able to manage our currency risks effectively, which could have a material adverse effect on our financial condition or results of operations.
Lawsuits relating to tobacco products. We sell cigarettes and other tobacco-related products at all of our convenience stores. In addition, Couche-Tard sells brands of cigarettes that are manufactured to be sold by it on an exclusive basis. We are not currently a named party in any health-related tobacco litigation. However, various health-related legal actions, proceedings and claims arising out of the sale, distribution, manufacture, development, advertising and marketing of cigarettes have been brought against vendors of tobacco products and may be instituted against us in the future. Damages in amounts escalating into the hundreds of millions and even billions of dollars have been pleaded in suits brought against vendors of cigarettes. An unfavorable verdict against us in any health-related suit could adversely affect our financial condition and ability to pay interest and principal on our debts. Moreover, we have not established any reserves for the payment of expenses or adverse results related to any potential health-related litigation.
Changes in regional economic conditions may influence the retail industry, consumer preferences and spending patterns. Our revenues may be negatively influenced by changes in regional or local economic variables and consumer confidence. External factors that affect economic variables and consumer confidence and over which we exercise no influence include unemployment rates, levels of personal disposable income and regional or local economic conditions. Changes in economic conditions could adversely affect consumer spending patterns, travel and tourism in certain of our market areas. Some of our stores are located in coastal, resort or tourist destinations and, historically, travel and consumer behavior in such markets is more severely affected by weak economic conditions.
54
We may be subject to losses that might not be covered in whole or in part by our insurance coverage. We carry comprehensive liability, fire and extended coverage insurance on most of our facilities, with policy specifications and insured limits customarily carried in our industry for similar properties. The cost of our insurance policies has increased recently. In addition, some types of losses, such as losses resulting from wars, acts of terrorism, or natural disasters, generally are not insured because they are either uninsurable or not economically practical. Moreover, insurers recently have become more reluctant to insure against these types of events. Should an uninsured loss or a loss in excess of insured limits occur, we could lose capital invested in that property, as well as the anticipated future revenues derived from the retailing activities conducted at that property, while remaining obligated for any mortgage debt or other financial obligations related to the property. Any such loss could adversely affect our business, results of operations or financial condition.
Acts of war and terrorism could impact our business. Acts of war and terrorism could impact general economic conditions and the supply and price of crude oil. In addition, these events may cause damage to our retail facilities and disrupt the supply of the products and services we offer in our stores. In times of uncertainty, people also tend to travel less and spend more time at home. All these factors could impact our revenues, operating results and financial condition.
Other Risks
Motor Fuel Margin risk. With the purchase of Circle K, which has a large component of its business in motor fuel, we are more sensitive to the changes in the motor fuel gross margin. For example, in fiscal 2005, a change of U.S. one cent per gallon would have resulted in a change of US$17.7 million in the motor fuel gross profit. Such amount would impact net earnings by $0.08 per share ($0.07 per share on a diluted basis).
Credit Card Expense Risk. The majority of our credit card expense is based on retail prices of motor fuel. We are exposed to significant fluctuations in credit card expense as a result of the large increase in motor fuel selling prices particularly in our U.S. markets. For example, based on fiscal 2005, for each ten cent U.S. increase in the retail selling price of a U.S. gallon of motor fuel, the credit card expense would have increased by approximately US$2.4 million. In Canada, for each ten cent increase in the selling price of a litre of motor fuel, credit card expenses would have increased by approximately $0.9 million. Such amounts would impact, in the aggregate, net earnings by $0.01 per share on a diluted basis.
Interest Rate Risk. We are exposed to market risk relating to changes in interest rates relating to our variable rate debt. We have a significant amount of debt, $645.4 million of which, in effect, bears interest at floating rates, including $432.2 million 7.5% Subordinated unsecured debt that are subject to the interest rate swap. Our total annual interest expense, assuming interest rates as they were in effect on April 24, 2005, would be approximately $39.8 million. A one-percentage point increase in interest rates would increase our total annual interest expense by $6.5 million or $0.02 per share on a diluted basis.
Foreign Exchange Risk. Our investment in assets in the United States has been financed, in part, by U.S. dollar denominated debt. This strategy reduces the impact on our net U.S. assets relating to fluctuations in the value of the Canadian dollar relative to the U.S. dollar. The foreign exchange exposure as of April 24, 2005 is set out below (in millions):
Net U.S. assets |
| US$ | 838 |
|
Interest bearing debt denominated in U.S. dollars |
| US$ | 529 |
|
Net U.S. assets less interest bearing debt denominated in U.S. dollars |
| US$ | 309 |
|
For 2005, a one cent change in the exchange rate would result approximately in a $1.9 million change in operating income.
There was a negative impact to our 2005 pre-tax income of approximately $8.9 million due to the increase in the Canadian dollar relative to the U.S. dollar.
55
Seasonality and Natural Disasters. Weather conditions can have an impact on our revenues as historical purchase patterns indicate that our customers increase their transactions and also purchase higher margin items when weather conditions are favorable. Consequently, our results are seasonal and typically more profitable during the summer months. Motor fuel volumes and margins are also seasonal as volumes increase during the summer driving season as well as margins. Motor fuel margins are subject to fluctuation due to supply changes and can differ from historical norms. We have operations in the Southeast and West coast regions of the United States and although these regions are generally known for their mild weather, these regions are susceptible to severe storms including hurricanes, like we experienced in fiscal 2005, as well as earthquakes in the West coast region and other natural disasters. We could be also impacted by other occurrences in these regions such as energy shortages or increase in energy prices. Consequently, our operating results and cash flow from operations could be adversely affected.
Outlook
The Company had a very successful year in 2005, ending the year in a strong position with $312.0 million cash, interest bearing debt of $655.6 million and total equity of $905.4 million.
The Company generated cash flows of $404.3 million while investing in $320.2 million in capital represented by fixed assets and small business acquisitions. We believe that the financial strength of the Company and the allocation of our financial resources will form the basis of continued successful implementation of our operating strategies. We will continue to invest capital in our existing store base with a target in fiscal 2006 of adding approximately 400 stores with our Store 2000 Concept, approximately 60 QSR’s and approximately 100 new store locations through new store development and small acquisitions.
For fiscal 2006, we are optimistic about our opportunities while recognizing that growth in earnings is dependent on various external factors, including the impact of the foreign exchange, motor fuel gross margin and credit card expenses.
We will continue to focus our resources on innovation, introduction of new products and services to satisfy our customers’ needs.
July 12, 2005
56
The consolidated financial statements of Alimentation Couche-Tard Inc. and financial information contained in this Annual Report are the responsibility of management. This responsibility is based on a judicious choice of accounting procedures and principles, the application of which requires the informed judgment of management. The consolidated financial statements were prepared according to generally accepted accounting principles in Canada and were approved by the Board of Directors. In addition, the financial information included in the Annual Report is consistent with the consolidated financial statements.
Alimentation Couche-Tard Inc. maintains accounting and administrative control systems which, in the opinion of management, ensure reasonable accuracy, relevance and reliability of financial information and well-ordered, efficient management of the Company’s affairs.
The Board of Directors is responsible for approving the consolidated financial statements included in this Annual Report, primarily through its Audit Committee. This Committee, which holds periodic meetings with members of management as well external auditors, reviewed the consolidated financial statements of Alimentation Couche-Tard Inc. and recommended their approval to the Board of Directors.
The enclosed consolidated financial statements were audited by Raymond Chabot Grant Thornton LLP, Chartered Accountants, and their report indicates the extent of their audit and their opinion on the consolidated financial statements.
|
|
|
|
(Signed) Alain Bouchard | (Signed) Richard Fortin |
Chairman of the Board, | Executive Vice-President |
President and Chief Executive Officer | and Chief Financial Officer |
AUDITORS’ REPORT
To the Shareholders of Alimentation Couche-Tard Inc.
We have audited the consolidated balance sheets of Alimentation Couche-Tard Inc. as at April 24, 2005 and April 25, 2004 and the consolidated statements of earnings, contributed surplus, retained earnings and cash flows for each of the years in the three-year period ended April 24, 2005. These financial statements are the responsibility of the Company’s management. Our responsibility is to express an opinion on these financial statements based on our audits.
We conducted our audits in accordance with Canadian generally accepted auditing standards. Those standards require that we plan and perform an audit to obtain reasonable assurance whether the financial statements are free of material misstatement. An audit includes examining, on a test basis, evidence supporting the amounts and disclosures in the financial statements. An audit also includes assessing the accounting principles used and significant estimates made by management, as well as evaluating the overall financial statement presentation.
In our opinion, these consolidated financial statements present fairly, in all material respects, the financial position of the Company as at April 24, 2005 and April 25, 2004 and the results of its operations and its cash flows for each of the years in the three-year period ended April 24, 2005 in accordance with Canadian generally accepted accounting principles.
![]()
(Signed Raymond Chabot Grant Thornton LLP) Chartered Accountants
Montréal, Canada
June 10, 2005
57
Years ended April 24, 2005, April 25, 2004 and April 27, 2003
(in millions of Canadian dollars, except per share amounts)
|
| 2005 |
| 2004 |
| 2003 |
|
|
|
|
| restated |
| restated |
|
|
|
|
| (Note 3) |
| (Note 3) |
|
|
| $ |
| $ |
| $ |
|
|
|
|
|
|
|
|
|
Revenues |
| 10,215.8 |
| 5,872.4 |
| 3,315.2 |
|
Cost of sales |
| 8,232.9 |
| 4,649.4 |
| 2,565.3 |
|
Gross profit |
| 1,982.9 |
| 1,223.0 |
| 749.9 |
|
|
|
|
|
|
|
|
|
Operating, selling, administrative and general expenses |
| 1,543.6 |
| 989.2 |
| 595.6 |
|
Depreciation and amortization of fixed and other assets (Note 6) |
| 106.3 |
| 77.2 |
| 46.1 |
|
|
| 1,649.9 |
| 1,066.4 |
| 641.7 |
|
Operating income |
| 333.0 |
| 156.6 |
| 108.2 |
|
Financial expenses (Note 6) |
| 38.9 |
| 31.1 |
| 14.9 |
|
Earnings before income taxes and write-off of financing costs |
| 294.1 |
| 125.5 |
| 93.3 |
|
Write-off of financing costs (Note 16) |
| — |
| 12.5 |
| — |
|
Earnings before income taxes |
| 294.1 |
| 113.0 |
| 93.3 |
|
Income taxes (Note 7) |
| 94.6 |
| 37.5 |
| 30.8 |
|
Net earnings |
| 199.5 |
| 75.5 |
| 62.5 |
|
|
|
|
|
|
|
|
|
Earnings per share (Note 8) |
|
|
|
|
|
|
|
Basic |
| 0.99 |
| 0.42 |
| 0.37 |
|
Diluted |
| 0.97 |
| 0.40 |
| 0.36 |
|
The accompanying notes are an integral part of the consolidated financial statements.
CONSOLIDATED CONTRIBUTED SURPLUS
Years ended April 24, 2005, April 25, 2004 and April 27, 2003
(in millions of Canadian dollars)
|
| 2005 |
| 2004 |
| 2003 |
|
|
| $ |
| $ |
| $ |
|
|
|
|
|
|
|
|
|
Balance, beginning of year, as previously reported |
| 1.2 |
| 1.2 |
| 1.2 |
|
Impact of change in accounting for stock options (Note 3) |
| 3.2 |
| — |
| — |
|
Balance, beginning of year, as restated |
| 4.4 |
| 1.2 |
| 1.2 |
|
Stock-based compensation |
| 3.2 |
| — |
| — |
|
Fair value of stock options exercised |
| (0.1 | ) | — |
| — |
|
Balance, end of year |
| 7.5 |
| 1.2 |
| 1.2 |
|
The accompanying notes are an integral part of the consolidated financial statements.
CONSOLIDATED RETAINED EARNINGS
Years ended April 24, 2005, April 25, 2004 and April 27, 2003
(in millions of Canadian dollars)
|
| 2005 |
| 2004 |
| 2003 |
|
|
|
|
| restated |
| restated |
|
|
|
|
| (Note 3) |
| (Note 3) |
|
|
| $ |
| $ |
| $ |
|
|
|
|
|
|
|
|
|
Balance, beginning of year, as previously reported |
| 260.9 |
| 183.5 |
| 117.5 |
|
Impact of accounting changes (Note 3) |
| (22.5 | ) | (15.2 | ) | (11.7 | ) |
Balance, beginning of year, as restated |
| 238.4 |
| 168.3 |
| 105.8 |
|
Net earnings |
| 199.5 |
| 75.5 |
| 62.5 |
|
|
| 437.9 |
| 243.8 |
| 168.3 |
|
Share issue expenses (net of future income taxes of $1.0) |
| — |
| 2.2 |
| — |
|
Balance, end of year |
| 437.9 |
| 241.6 |
| 168.3 |
|
The accompanying notes are an integral part of the consolidated financial statements.
58
CONSOLIDATED CASH FLOWS
Years ended April 24, 2005, April 25, 2004 and April 27, 2003
(in millions of Canadian dollars)
|
| 2005 |
| 2004 |
| 2003 |
|
|
|
|
| restated |
| restated |
|
|
|
|
| (Note 3) |
| (Note 3) |
|
|
| $ |
| $ |
| $ |
|
|
|
|
|
|
|
|
|
Operating activities |
|
|
|
|
|
|
|
Net earnings |
| 199.5 |
| 75.5 |
| 62.5 |
|
Adjustments to reconcile net earnings to cash flows from operating activities |
|
|
|
|
|
|
|
Depreciation and amortization of fixed and other assets, net of amortization of deferred credits |
| 95.0 |
| 69.5 |
| 43.6 |
|
Write-off of financing costs |
| — |
| 12.5 |
| — |
|
Loss on disposal of fixed and other assets |
| 2.2 |
| 3.3 |
| 3.1 |
|
Future income taxes |
| 34.1 |
| (17.3 | ) | 8.5 |
|
Deferred credits |
| 17.1 |
| 12.1 |
| 0.9 |
|
Other |
| (2.1 | ) | (0.1 | ) | 0.8 |
|
Changes in non-cash working capital items (Note 9) |
| 58.5 |
| 158.7 |
| 22.0 |
|
Cash flows from operating activities |
| 404.3 |
| 314.2 |
| 141.4 |
|
|
|
|
|
|
|
|
|
Investing activities |
|
|
|
|
|
|
|
Business acquisitions (Note 5) |
| (85.2 | ) | (1,025.3 | ) | (156.2 | ) |
Liabilities assumed on business acquisitions |
| (6.6 | ) | (2.2 | ) | — |
|
Purchase of fixed assets |
| (235.0 | ) | (115.2 | ) | (86.8 | ) |
Proceeds from sale and leaseback transactions |
| 25.6 |
| 379.5 |
| — |
|
Proceeds from disposal of fixed and other assets |
| 26.3 |
| 5.2 |
| 3.5 |
|
Other assets |
| (8.4 | ) | (3.2 | ) | (3.5 | ) |
Cash flows used in investing activities |
| (283.3 | ) | (761.2 | ) | (243.0 | ) |
|
|
|
|
|
|
|
|
Financing activities |
|
|
|
|
|
|
|
Bank indebtedness |
| — |
| — |
| (7.5 | ) |
Issuance of long-term debt, net of financing costs |
| 0.2 |
| 1,123.5 |
| 180.2 |
|
Repayment of long-term debt |
| (8.1 | ) | (741.9 | ) | (40.8 | ) |
Issuance of shares, net of share issue expenses |
| 12.5 |
| 224.0 |
| 4.5 |
|
Cash flows from financing activities |
| 4.6 |
| 605.6 |
| 136.4 |
|
Effect of exchange rate fluctuations on cash and cash equivalents |
| (22.9 | ) | 2.3 |
| 0.7 |
|
Net increase in cash and cash equivalents |
| 102.7 |
| 160.9 |
| 35.5 |
|
Cash and cash equivalents, beginning of year |
| 209.3 |
| 48.4 |
| 12.9 |
|
Cash and cash equivalents, end of year |
| 312.0 |
| 209.3 |
| 48.4 |
|
The accompanying notes are an integral part of the consolidated financial statements.
59
CONSOLIDATED BALANCE SHEETS
as at April 24, 2005 and April 25, 2004
(in millions of Canadian dollars)
|
| 2005 |
| 2004 |
|
|
|
|
| restated |
|
|
|
|
| (Note 3) |
|
|
| $ |
| $ |
|
|
|
|
|
|
|
Assets |
|
|
|
|
|
Current assets |
|
|
|
|
|
Cash and cash equivalents |
| 312.0 |
| 209.3 |
|
Accounts receivable (Note 10) |
| 135.5 |
| 128.5 |
|
Income taxes receivable |
| 39.0 |
| — |
|
Inventories (Note 11) |
| 364.8 |
| 374.8 |
|
Prepaid expenses |
| 12.4 |
| 16.4 |
|
Future income taxes (Note 7) |
| 21.3 |
| 27.8 |
|
|
| 885.0 |
| 756.8 |
|
Fixed assets (Note 12) |
| 1,002.7 |
| 902.5 |
|
Trademarks and licenses |
| 213.0 |
| 214.5 |
|
Goodwill |
| 277.7 |
| 278.9 |
|
Other assets (Note 13) |
| 57.4 |
| 59.8 |
|
Future income taxes (Note 7) |
| 2.0 |
| 33.8 |
|
|
| 2,437.8 |
| 2,246.3 |
|
|
|
|
|
|
|
Liabilities |
|
|
|
|
|
Current liabilities |
|
|
|
|
|
Accounts payable and accrued liabilities (Note 15) |
| 747.0 |
| 660.6 |
|
Income taxes payable |
| — |
| 36.5 |
|
Future income taxes (Note 7) |
| 0.1 |
| — |
|
Current portion of long-term debt (Note 16) |
| 8.6 |
| 6.0 |
|
|
| 755.7 |
| 703.1 |
|
Long-term debt (Note 16) |
| 647.0 |
| 724.5 |
|
Deferred credits and other liabilities (Note 17) |
| 89.8 |
| 77.3 |
|
Future income taxes (Note 7) |
| 39.9 |
| 13.4 |
|
|
| 1,532.4 |
| 1,518.3 |
|
Shareholders’ equity |
|
|
|
|
|
Capital stock (Note 18) |
| 498.2 |
| 485.7 |
|
Contributed surplus |
| 7.5 |
| 1.2 |
|
Retained earnings |
| 437.9 |
| 241.6 |
|
Cumulative translation adjustments (Note 20) |
| (38.2 | ) | (0.5 | ) |
|
| 905.4 |
| 728.0 |
|
|
| 2,437.8 |
| 2,246.3 |
|
The accompanying notes are an integral part of the consolidated financial statements.
| On behalf of the Board, |
|
|
|
|
|
|
|
|
|
|
|
|
|
|
|
|
|
|
| (Signed) Alain Bouchard |
| (Signed) Richard Fortin |
|
60
NOTES TO CONSOLIDATED FINANCIAL STATEMENTS
April 24, 2005, April 25, 2004 and April 27, 2003
(in millions of Canadian dollars, except per share amounts)
1 - GOVERNING STATUTES AND NATURE OF OPERATIONS
The Company is incorporated under the Companies Act (Quebec).
The Company owns and licenses approximately 4,850 convenience stores across North America of which approximately 3,600 are company operated and generate income primarily from the sales of tobacco products, grocery items, beverages, fresh food offerings, including quick service restaurants, motor fuel and other products and services.
2 - YEAR END DATE AND BASIS OF PRESENTATION
The Company’s year end is the last Sunday of April of each year. For comparative purposes, the years ended April 24, 2005, April 25, 2004 and April 27, 2003 are referred to as 2005, 2004, and 2003.
The consolidated financial statements have been prepared in accordance with Canadian generally accepted accounting principles (Canadian GAAP).
3 - ACCOUNTING CHANGES
2005
Accounting for fixed assets and lease accounting
During the year, the Company undertook a review of its depreciation and amortization policies for all of its fixed assets and of its lease accounting policies. Previously, the Company used the diminishing balance method at various rates to calculate depreciation, except for Circle K where the straight-line method was used. In addition, leasehold improvements were amortized over the shorter of the term of the lease plus renewal periods or their useful lives and rent expense was recorded over the committed lease period, and did not take into account future rent escalations included in the lease term.
As a result of the review and an in depth study of the useful lives of its fixed assets, the Company decided to change its accounting policy for depreciation and amortization of fixed assets to use the straight-line method throughout the Company. This method is more representative of the actual useful lives of the assets and provides uniformity within the Company. This change has been applied retroactively and prior years financial statements have been restated.
Following a review of its lease accounting policies and the relevant accounting literature, the Company has determined it should amortize its leasehold improvements over the shorter of their useful lives or the lease term. Moreover, the Company decided it should record lease expense using the straight-line method. Accordingly, the Company has restated previously reported financial statements to reflect these changes.
The impact of those changes as of April 25, 2004 is a decrease in fixed assets of $13.6, an increase in net future income tax assets of $8.8, an increase in accounts payable and accrued liabilities of $0.8, an increase in deferred credits and other liabilities of $11.0, a reduction in retained earnings of $16.8 and an increase to the cumulative translation adjustments balance of $0.2.
For 2005, the impact of this change resulted in a $2.2 increase of the depreciation expense ($2.2 in 2004 and $1.0 in 2003), a $4.4 increase in lease expense ($2.6 in 2004 and $1.8 in 2003) and in a $4.7 decrease of net earnings ($3.6 in 2004 and $2.9 in 2003). The impact on diluted earnings per share is a decrease of $0.02 in 2005, 2004 and 2003.
Consolidation of variable interest entities
During the year, the Company adopted the Canadian Institute of Chartered Accountants (CICA) Accounting Guideline No.15
(AcG-15) “Consolidation of Variable Interest Entities” (VIEs) that came into effect November 1, 2004. This guideline clarifies and addresses the application of consolidation guidance to those entities defined as VIEs which are entities that are subject to control on a basis other than voting interests. Such entities should be consolidated by the primary beneficiary, which is the entity that will absorb a majority of the VIE’s expected losses or will receive a majority of its expected residual returns, or both.
The implementation of this guideline did not have any impact on the Company’s financial statements.
Asset retirement obligations
During the year, the Company adopted the new CICA Handbook Section 3110, “Asset Retirement Obligations” which establishes standards for the recognition, measurement and disclosure of legal obligations associated with the costs to retire long-lived assets. Accordingly, under the new standard, the fair value of the future retirement costs of the Company’s underground motor fuel storage tanks is recorded as a liability on a discounted basis when it is incurred and an equivalent amount is capitalized to fixed assets. The initial recorded obligation, which has been discounted using the Company’s credit-adjusted risk free-rate, will be reviewed periodically to reflect the passage of time and changes in the estimated future costs underlying the obligation. The Company amortizes the initial amount capitalized to fixed assets and recognizes accretion expense in connection with the discounted liability over the estimated remaining useful life of the underground motor fuel storage tanks.
61
The new standard has been applied retroactively and financial statements of the prior periods have been restated. The impact of this change as of April 25, 2004 is an increase in fixed assets of $17.5, an increase in asset retirement obligations of $21.6, an increase in net future income tax assets of $1.8, a reduction in retained earnings of $2.5 and an increase to the cumulative translation adjustments balance of $0.2.
For 2005, 2004 and 2003, the impact on net earnings is a decrease of $2.3, $0.4 and $0.6, respectively (a decrease of $0.01 per share on a diluted basis in 2005, nil in 2004 and 2003).
Stock-based compensation and other stock-based payments
Effective April 26, 2004, the Company adopted the amended recommendations of the CICA relating to Section 3870, “Stock-based Compensation and Other Stock-based Payments”. These amendments require that stock-based compensation costs be measured at the grant date of the award based on the fair value method for all transactions entered into for years beginning on or after January 1, 2002. The Company chose to apply these amendments retroactively, without restating prior periods, for stock options granted since April 29, 2002. The fair value of the stock options is recognized over the vesting period as compensation expense with a corresponding increase in contributed surplus. When stock options are exercised, the corresponding contributed surplus is transferred to capital stock.
Prior to April 29, 2002, the Company recorded no compensation cost for its stock options granted to employees but provided, in its notes to the financial statements, pro forma disclosures of net earnings and earnings per share as if the fair value based method of accounting had been applied.
The retroactive treatment of these recommendations resulted in a decrease of $3.2 in opening retained earnings with a corresponding increase in contributed surplus (see Note 19).
Recording of certain consideration received from a vendor
On January 31, 2005, the Company adopted both early and retroactively the amended recommendations of the Emerging Issues Committee of the CICA relating to the third topic of Abstract 144 (EIC-144), “Accounting by a Customer (Including a Reseller) for Certain Consideration Received From a Vendor”. These amendments address the recognition, measurement and disclosure requirements for vendor rebates and state that those rebates must be recognized when probable and reasonably estimable. Therefore, vendor rebates recognized in earnings and for which the full requirements for entitlement have not yet been met would be disclosed. The implementation of these new recommendations did not have any impact on the Company’s financial statements.
Generally accepted accounting principles
In July 2003, the CICA issued Handbook Section 1100, “Generally Accepted Accounting Principles” which establishes standards for financial reporting in accordance with Canadian GAAP, and provides guidance on sources to consult when selecting accounting policies and determining appropriate disclosures when a matter is not dealt with explicitly in the primary sources of Canadian GAAP. The application of these new standards had no impact on the Company’s financial statements.
2004
Recording of certain consideration received from a vendor
In January 2004, the Emerging Issues Committee of the CICA released EIC-144, “Accounting by a Customer (Including a Reseller) for Certain Consideration Received From a Vendor”. Under this new standard, certain cash consideration received from a vendor should be considered as an adjustment of the prices of the vendor’s products and, therefore should be characterized as a reduction of cost of sales and related inventories when recognized in the financial statements. Certain exceptions apply if the consideration is a payment for assets or services delivered to the vendor or for reimbursement of selling costs incurred to promote the vendor’s products, provided that certain conditions are met.
The Company adopted these new recommendations both early and retroactively on January 30, 2004 and financial statements from prior years have been restated. The impact of this change as of April 27, 2003 resulted in a decrease of $8.9 of inventories, an increase of $0.9 in goodwill, an increase in net future income tax assets of $3.5, a reduction of $4.6 in retained earnings and a decrease to the cumulative translation adjustments balance of $0.1.
For the year ended April 25, 2004, application of EIC-144 resulted in a $1.0 increase ($0.3 in 2003) in the cost of goods sold and a decrease in net earnings of $0.7 ($0.2 in 2003).
62
Impairment of long-lived assets
In December 2002, the CICA issued Handbook Section 3063 entitled “Impairment of Long-lived Assets”. This section sets out standards for recognizing, measuring and reporting the impairment of long-lived assets. It supersedes the write-down provisions included in Section 3061, “Property, Plant and Equipment”. This new section requires that the Company recognizes an impairment loss for long-lived assets to be kept and used when events or changes in circumstances result in their carrying amount exceeding the sum of the undiscounted cash flows expected to result from their use and eventual disposal. The impairment loss is equivalent to the amount by which the assets’ carrying amount exceeds its fair value.
This modification of accounting principles was applied prospectively beginning April 28, 2003 and had no material impact on the carrying amount of the Company’s long-lived assets.
Guarantees
In February 2003, the CICA issued Accounting Guideline No. 14 (AcG-14), “Disclosure of Guarantees”. This guideline provides information related to financial statements disclosures to be provided under certain guarantees. The Company adopted these new recommendations as at April 28, 2003.
A guarantee is defined as a contract or an indemnification agreement contingently requiring a company to make payments to a third party based on future events. These payments are contingent on either changes in an underlying or other variables that are related to an asset, liability, or an equity security of the indemnified party or the failure of another entity to perform under an obligating agreement. It could also be an indirect guarantee of the indebtedness of another party.
4 - ACCOUNTING POLICIES
Accounting estimates
The preparation of financial statements in accordance with Canadian GAAP requires management to make estimates and assumptions that affect the amounts recorded in the financial statements and notes to financial statements. On an ongoing basis, management reviews its estimates, including those relating to supplier rebates, environmental costs and asset retirement obligations based on available information. These estimates are based on management’s best knowledge of current events and actions that the Company may undertake in the future. Actual results may differ from those estimates.
Principles of consolidation
The consolidated financial statements include the accounts of the Company and of its subsidiaries, all of which are wholly owned.
Foreign currency translation
Since the U.S. subsidiaries are considered to be self-sustaining from a financial and operational standpoint, the current rate method of translation of foreign currencies has been used. Under this method, assets and liabilities are translated into Canadian dollars using the exchange rate in effect at the balance sheet date. Revenues and expenses are translated at the average rate in effect during the year. Gains and losses are included in cumulative translation adjustments account in the shareholders’ equity.
Earnings per share
Basic earnings per share is calculated by dividing the net earnings available to Class A and Class B shareholders by the weighted average number of Class A and Class B shares outstanding during the year. Diluted earnings per share is calculated using the treasury stock method and takes into account the dilutive effect of stock options and warrants.
Revenue recognition
For its two major product categories, merchandise and motor fuel, the Company recognizes revenue at the point of sale. Merchandise sales are comprised primarily of the sale of tobacco products, grocery items, candy and snacks, beverages, beer/wine, fresh food offerings, including quick service restaurants, and services.
Services revenues include the commission on sale of lottery tickets and issuance of money orders, fees from automatic teller machines and sales of postage stamps, calling cards commission and bus tickets which are recognized at the time of sale in stores. Services revenues also include franchise and license fees, which are recognized in revenues over the period of the agreement to which the fees relate and royalties from franchisees and licensees, which are recognized when earned.
Operating, selling, administrative and general expenses
The main items comprising Operating, selling, administrative and general expenses are labour, building occupancy costs and overhead and include advertising expenses that are charged as incurred in the amount of $27.5 in 2005, $18.4 in 2004 and $10.7 in 2003.
63
Cash and cash equivalents
Cash includes cash and demand deposits. Cash equivalents include highly liquid investments that can be converted into cash for a fixed amount and that mature less than three months from the date of acquisition.
Inventories
Inventories are valued at the lesser of cost and the net realizable value. Cost of merchandise – distribution centres is determined according to the first-in first-out method, the cost of merchandise – retail is valued based on the retail price less a normal margin and the cost of motor fuel inventory is determined according to the average cost method.
Vendor rebates
The Company records cash received from a vendor related to vendor rebates as a reduction in the price of the vendor’s products and reflects them as a reduction of costs of sales and related inventory in its consolidated earnings and balance sheets when those rebates satisfy the recognition criteria.
Income taxes
The Company uses the liability method to account for income taxes. Under this method, future income tax assets and liabilities are determined based on differences between the carrying amounts and tax bases of assets and liabilities using enacted or substantively enacted tax rates and laws at the date of the financial statements for the years in which the temporary differences are expected to reverse. A valuation allowance is recognized to the extent that it is more likely than not that all of the future income tax assets will not be realized.
Depreciation and amortization
Fixed assets are stated at cost and depreciated over their estimated useful lives using the straight-line method based on the following periods:
Buildings |
| 3 to 40 years |
|
Equipment |
| 3 to 30 years |
|
Buildings under capital leases |
| Lease term |
|
Leasehold improvements and fixed assets on leased properties are amortized and depreciated over the lesser of their useful lives and the term of the lease.
��
Rent expense
Rent expense is recognized in earnings using the straight-line method.
Goodwill
Goodwill is the excess of the cost of an acquired business over the fair value of underlying net assets acquired from the business at the time of acquisition. Goodwill is not amortized. It is rather tested for impairment annually, or more frequently should events or changes in circumstances indicate that it might be impaired. Should the carrying amount of a reporting unit’s goodwill exceed its fair value, an impairment loss would be recognized.
Trademarks and licenses
Trademarks and licenses have indefinite lives and are recorded at cost and are not amortized; rather, they are tested for impairment annually, or more frequently, should events or circumstances indicate that the assets might be impaired. Should the carrying amount of a trademark or license exceed its fair value, an impairment loss in the amount of the excess would be recognized.
Other assets
Other assets include deferred charges, accrued pension benefit asset and deposits.
Deferred charges are mainly financing costs amortized using the effective interest rate method over the period of the corresponding debt. Deferred charges also include expenses incurred in connection with the analysis and signing of operating leases which are deferred and amortized on a straight-line basis over the lease term. Other deferred charges are amortized on a straight-line basis over periods of five to seven years.
Employee future benefits
The Company accrues its obligations under employee pension plans and the related costs, net of plan assets. The Company has adopted the following policies with respect to the defined benefit plans:
• The accrued benefit obligations and the cost of pension benefits earned by employees are actuarially determined using the projected benefit method prorated on service and pension expense is recorded in income as the services are rendered by employees. The calculations reflect management’s best estimate of expected plan investment performance, salary escalation and retirement ages of employees.
• For the purpose of calculating the expected return on plan assets, those assets are valued at fair value.
64
• Actuarial gains (losses) arise from the difference between actual long-term rate of return on plan assets for a period and the expected long-term rate of return on plan assets for that period or from changes in actuarial assumptions used to determine the accrued benefit obligation. The excess of the net actuarial gain (loss) over 10% of the greater of the benefit obligation and fair value of plan assets is amortized over the average remaining service period of active employees. The average remaining service period of the active employees covered by the pension plans is 10 years.
• On May 1, 2000, the Company adopted the new accounting standard on employee future benefits using the prospective application method. The Company is amortizing the transitional asset on a straight-line basis over 11 years, which was the average remaining service period of employees expected to receive benefits under the benefit plan as of May 1, 2000.
• Past service costs are amortized on a straight-line basis over the average remaining service period of active employees.
The pension costs recorded in earnings for the defined contribution plan is equivalent to the contribution which the Company is required to pay in exchange for services provided by the employees.
Environmental costs
The Company provides for estimated future site remediation costs to meet government standards for known site contaminations when such costs can be reasonably estimated. Estimates of the anticipated future costs for remediation activities at such sites are based on the Company’s prior experience with remediation sites and consideration of other factors such as the condition of the site contamination, location of sites and experience with contractors that perform the environmental assessments and remediation work.
Hedging and Derivative Financial Instruments
The Company uses derivative financial instruments by way of interest rate swaps to manage current and forecast risks related to interest rate fluctuations associated with the Company’s subordinated unsecured debt. The Company does not use freestanding derivative financial instruments for trading or speculative purposes.
The Company formally documents and designates each derivative financial instrument as a hedge of its subordinated unsecured debt. The Company determines that derivative financial instruments are effective hedges, at the time of the establishment of the hedge and for the duration of the instrument, since the date to maturity, the reference amount and interest rate of the instruments correspond to all the conditions of the debt.
The Company uses interest rate swaps as part of its program for managing the combination of fixed and variable interest rates of its debt and the corresponding aggregate cost of borrowing. Interest rate swaps involve an exchange of interest payments without an exchange of principal underlying the interest payments. They are accounted for as an adjustment of accrued interest expense on the debt instruments. The corresponding amount to be paid to counterparties or to be received from counterparties is accounted for as an adjustment of accrued interest.
In the case of an early termination of one of the interest swap agreements or if the hedge ceases to be effective prior to maturity, any realized and unrealized gains or losses would be recorded on the balance sheet and amortized to consolidated earnings over the remaining term of the related hedged debt. In the event of early extinguishment of the debt, any realized or unrealized gains or losses related to the swap would be recognized in the consolidated earnings at the time of the extinguishment of the debt.
The Company has also designated its entire long-term debt denominated in U.S. dollars as a hedge of its net investment in its self-sustaining foreign subsidiaries. Accordingly, the related exchange gains or losses are included in cumulative translation adjustments account in the shareholders’ equity.
5 - BUSINESS ACQUISITIONS
The Company has made the following business acquisitions that were accounted for using the purchase method. Earnings from the businesses acquired are included in the consolidated earnings from their respective dates of acquisition.
2005
Changes to the purchase price allocation
During the year, the Company finalized the allocation of the purchase price related to the acquisition of The Circle K Corporation (Circle K) on December 17, 2003. The final allocation resulted in an increase in fixed assets of $21.8 and an increase in asset retirement obligations of $20.1 mainly due to a change in the estimate of the asset retirement obligations and an increase in trademarks and licenses of $17.1 based on an external valuation of trademarks.
In addition, the final allocation resulted in an increase in net working capital of $2.1, an increase in other assets of $1.8, and a decrease in net future income tax asset of $22.7. The preliminary allocation of the purchase price is described below.
65
Acquisitions
During the year, the Company made the following business acquisitions:
• In April 2005: purchase of nine sites operating under the Thornton and Pit Stop banners in the Midwest region from Thorntons Inc. and Broadus Oil Corporation of Illinois Inc.;
• Effective February 2, 2005: purchase of 19 sites operating under the Pump N Shop banner in the Augusta, Georgia area from QVS Inc. and Brosious & Holt Properties LLC;
• Effective November 3, 2004: purchase of 21 sites in the Phoenix, Arizona area from Shell Oil Products US.
These three acquisitions were settled for a total cash consideration of $85.2 financed from the Company’s available cash. The net assets acquired included working capital of $4.0, fixed assets of $78.4 and goodwill of $2.8. Most of the goodwill related to these transactions is deductible for tax purposes.
2004
On December 17, 2003, the Company acquired all of the outstanding shares of Circle K from ConocoPhillips Company. The assets included a chain of 1,663 stores in 16 U.S. states, mainly in the southern United States. Circle K also holds franchise or licensing agreements with another 627 stores in the United States and 4,003 international licenses agreements.
This acquisition was made for a total cash consideration of US$831.8 (CA$1,102.5), including acquisition costs and amounts payable in accordance with a price adjustment clause, based on the working capital acquired. The acquisition was financed by issuing 27,111,076 new Class B subordinate voting shares (see Note 18) and by issuing new debt.
On September 4, 2003, the Company concluded the acquisition of assets of Clark Retail Enterprises Inc. (Clark) including 43 stores in the states of Illinois, Indiana, Iowa, Michigan and Ohio. This acquisition was made for a total cash consideration of $41.0, including acquisition costs. The transaction was financed by using the Company’s existing credit facilities. Most of the goodwill related to this transaction is deductible for tax purposes.
The preliminary allocations of the purchase prices of the acquisitions were as follows:
|
| Circle K |
| Clark |
| Total |
|
|
| $ |
| $ |
| $ |
|
Current assets |
| 314.6 |
| 4.9 |
| 319.5 |
|
Fixed assets |
| 778.8 |
| 29.9 |
| 808.7 |
|
Goodwill |
| — |
| 7.3 |
| 7.3 |
|
Trademarks, licenses and other assets |
| 211.0 |
| — |
| 211.0 |
|
Future income taxes |
| 37.0 |
| 0.1 |
| 37.1 |
|
|
| 1,341.4 |
| 42.2 |
| 1,383.6 |
|
|
|
|
|
|
|
|
|
Current liabilities assumed |
| 218.3 |
| 0.6 |
| 218.9 |
|
Long-term debt assumed |
| 8.9 |
| — |
| 8.9 |
|
Deferred credits and other liabilities assumed |
| 11.7 |
| 0.6 |
| 12.3 |
|
|
| 238.9 |
| 1.2 |
| 240.1 |
|
Net assets and total consideration |
| 1,102.5 |
| 41.0 |
| 1,143.5 |
|
Less: Cash from the acquisition |
| 106.8 |
| — |
| 106.8 |
|
Net assets excluding cash from the acquisition |
| 995.7 |
| 41.0 |
| 1,036.7 |
|
Less: Balance to be paid to vendors |
| 11.4 |
| — |
| 11.4 |
|
Cash consideration |
| 984.3 |
| 41.0 |
| 1,025.3 |
|
Subsequent to the acquisitions of Circle K and Clark, the Company entered into sale and leaseback agreements under which certain fixed assets acquired were sold to financial institutions and re-leased to the Company under long-term leases. Most of these long-term leases are for periods of 15 to 17 years, with the possibility of renewal. These transactions did not result in any gains or losses for the Company. Proceeds related to these transactions amounted to US$267.7, net of related expenses.
2003
On August 20, 2002, the Company acquired certain assets of Dairy Mart Convenience Stores Inc. (Dairy Mart), including a chain of 285 stores in the states of Ohio, Kentucky, Pennsylvania, Michigan and Indiana. This acquisition was for a total cash consideration of $120.1, including acquisition costs. The full amount of the transaction was financed through bank loans.
66
This transaction included a one-year management agreement for 169 additional stores in this network, some of which could, under certain conditions, be acquired by the Company in the months following the acquisition, sold on behalf of Dairy Mart or closed. Given the temporary nature of the management agreement, the net amount of sales, cost of sales and other operating costs associated with this agreement are shown under Operating, selling, administrative and general expenses. For the year ended April 27, 2003, the management agreement generated sales of $129.3 and operating income of $0.9.
In addition, the Company made four acquisitions of other store networks in Canada and the United States, for a total cash consideration of $36.8 including certain stores managed under the above-mentioned management agreement. These acquisitions are presented as “Other” in the following table.
Most of the goodwill related to these transactions is deductible for tax purposes.
The allocation of the purchase prices of the above-mentioned acquisitions was determined as follows:
|
| Dairy Mart |
| Other |
| Total |
|
|
| $ |
| $ |
| $ |
|
Current assets |
| 18.8 |
| 1.6 |
| 20.4 |
|
Fixed assets |
| 73.2 |
| 27.6 |
| 100.8 |
|
Goodwill |
| 31.3 |
| 8.0 |
| 39.3 |
|
Other assets |
| — |
| 0.3 |
| 0.3 |
|
Future income taxes |
| 0.6 |
| — |
| 0.6 |
|
|
| 123.9 |
| 37.5 |
| 161.4 |
|
Current liabilities assumed |
| 3.8 |
| 0.7 |
| 4.5 |
|
Net assets |
| 120.1 |
| 36.8 |
| 156.9 |
|
Less: Cash from the acquisition |
| 0.6 |
| 0.1 |
| 0.7 |
|
Cash consideration |
| 119.5 |
| 36.7 |
| 156.2 |
|
6 - INFORMATION INCLUDED IN THE CONSOLIDATED STATEMENT OF EARNINGS
|
| 2005 |
| 2004 |
| 2003 |
|
|
|
|
| restated |
| restated |
|
|
|
|
| (Note 3) |
| (Note 3) |
|
|
| $ |
| $ |
| $ |
|
Depreciation and amortization |
|
|
|
|
|
|
|
Fixed assets |
| 105.3 |
| 76.8 |
| 45.3 |
|
Other assets |
| 1.0 |
| 0.4 |
| 0.8 |
|
|
| 106.3 |
| 77.2 |
| 46.1 |
|
Financial expenses |
|
|
|
|
|
|
|
Interest on long-term debt |
| 34.3 |
| 27.4 |
| 12.7 |
|
Amortization of deferred financing costs |
| 3.9 |
| 2.9 |
| 1.0 |
|
|
| 38.2 |
| 30.3 |
| 13.7 |
|
Interest on short-term debt |
| 0.7 |
| 0.8 |
| 1.2 |
|
|
| 38.9 |
| 31.1 |
| 14.9 |
|
Interest expense
Interest on long-term debt is net of interest income. Interest income totalled $2.8 in 2005, $0.5 in 2004 and $0.1 in 2003.
Supplementary information related to the rental expense included in Operating, selling, administrative and general expenses:
|
| 2005 |
| 2004 |
| 2003 |
|
|
|
|
| restated |
| restated |
|
|
|
|
| (Note 3) |
| (Note 3) |
|
|
| $ |
| $ |
| $ |
|
Net rent expense |
|
|
|
|
|
|
|
Rent expense |
| 201.4 |
| 129.8 |
| 95.1 |
|
Sub-leasing income |
| 14.9 |
| 9.3 |
| 3.8 |
|
|
| 186.5 |
| 120.5 |
| 91.3 |
|
7 - INCOME TAXES
|
| 2005 |
| 2004 |
| 2003 |
|
|
|
|
| restated |
| restated |
|
|
|
|
| (Note 3) |
| (Note 3) |
|
|
| $ |
| $ |
| $ |
|
Current income taxes |
| 60.5 |
| 54.8 |
| 22.3 |
|
Future income taxes |
| 34.1 |
| (17.3 | ) | 8.5 |
|
|
| 94.6 |
| 37.5 |
| 30.8 |
|
|
|
|
|
|
|
|
|
Earnings before income taxes |
|
|
|
|
|
|
|
Domestic |
| 124.2 |
| 51.8 |
| 77.3 |
|
Foreign |
| 169.9 |
| 61.2 |
| 16.0 |
|
|
| 294.1 |
| 113.0 |
| 93.3 |
|
|
|
|
|
|
|
|
|
Current income taxes |
|
|
|
|
|
|
|
Domestic |
| 33.7 |
| 29.2 |
| 19.8 |
|
Foreign |
| 26.8 |
| 25.6 |
| 2.5 |
|
|
| 60.5 |
| 54.8 |
| 22.3 |
|
|
|
|
|
|
|
|
|
Future income taxes |
|
|
|
|
|
|
|
Domestic |
| 5.7 |
| (12.6 | ) | 4.1 |
|
Foreign |
| 28.4 |
| (4.7 | ) | 4.4 |
|
|
| 34.1 |
| (17.3 | ) | 8.5 |
|
67
The principal items which resulted in differences between the Company’s effective income tax rates and the combined statutory rates in Canada are detailed as follows:
|
| 2005 |
| 2004 |
| 2003 |
|
|
| % |
| % |
| % |
|
Combined statutory income tax rate in Canada (a) |
| 32.28 |
| 35.70 |
| 37.62 |
|
Impact of tax rate (decreases) increases |
| (0.32 | ) | 0.23 |
| 0.60 |
|
Other permanent differences |
| 0.21 |
| (2.74 | ) | (5.21 | ) |
Effective income tax rate |
| 32.17 |
| 33.19 |
| 33.01 |
|
(a) The Company’s combined statutory income tax rate in Canada includes the appropriate provincial income tax rates.
The components of future income tax assets (liabilities) are as follows:
|
| 2005 |
| 2004 |
|
|
|
|
| restated |
|
|
| $ |
| $ |
|
Short-term future income tax assets |
|
|
|
|
|
Expenses deductible in future years |
| 14.4 |
| 22.0 |
|
Deferred credits |
| 1.3 |
| 1.1 |
|
Other |
| 5.5 |
| 4.7 |
|
|
| 21.2 |
| 27.8 |
|
|
|
|
|
|
|
Long-term future income tax (liabilities) assets |
|
|
|
|
|
Expenses deductible in future years |
| 6.5 |
| 5.8 |
|
Fixed assets |
| (3.2 | ) | 43.4 |
|
Non-capital losses |
| 5.1 |
| 2.3 |
|
Deferred credits |
| 11.0 |
| 10.1 |
|
Borrowing and share issue costs |
| 2.5 |
| 4.6 |
|
Goodwill |
| 0.8 |
| 5.2 |
|
Trademarks and licences |
| (52.2 | ) | (59.4 | ) |
Other |
| (8.4 | ) | 8.4 |
|
|
| (37.9 | ) | 20.4 |
|
8 - EARNINGS PER SHARE
The following table presents the information for the computation of basic and diluted earnings per share, adjusted for the share splits described in Note 18:
|
| 2005 |
| 2004 |
| 2003 |
|
|
|
|
| restated |
| restated |
|
|
| $ |
| $ |
| $ |
|
Basic earnings attributable to Class A and B shares |
| 199.5 |
| 75.5 |
| 62.5 |
|
|
|
|
|
|
|
|
|
Weighted average number of shares (in thousands) |
| 201,342 |
| 179,317 |
| 168,962 |
|
Dilutive effect of stock options (in thousands) |
| 5,020 |
| 8,060 |
| 5,514 |
|
Weighted average number of diluted shares (in thousands) |
| 206,362 |
| 187,377 |
| 174,476 |
|
Basic net earnings per share available for Class A and B shareholders |
| 0.99 |
| 0.42 |
| 0.37 |
|
Diluted net earnings per share available for Class A and B shareholders |
| 0.97 |
| 0.40 |
| 0.36 |
|
In calculating diluted earnings per share for 2005, 465,000 stock options (nil in 2004 and 3,450,000 in 2003) were excluded due to their antidilutive effect.
9 - INFORMATION INCLUDED IN THE CONSOLIDATED STATEMENT OF CASH FLOWS
The changes in non-cash working capital items are detailed as follows:
|
| 2005 |
| 2004 |
| 2003 |
|
|
|
|
| restated |
| restated |
|
|
| $ |
| $ |
| $ |
|
Accounts receivable |
| (7.5 | ) | 8.0 |
| (59.4 | ) |
Inventories |
| (7.5 | ) | (10.2 | ) | (27.8 | ) |
Prepaid expenses |
| 2.3 |
| (8.7 | ) | (1.8 | ) |
Accounts payable and accrued liabilities |
| 151.4 |
| 143.3 |
| 101.5 |
|
Income taxes |
| (80.2 | ) | 26.3 |
| 9.5 |
|
|
| 58.5 |
| 158.7 |
| 22.0 |
|
68
Cash flows relating to interest and income taxes of operating activities are detailed as follows:
|
| 2005 |
| 2004 |
| 2003 |
|
|
| $ |
| $ |
| $ |
|
Interest paid |
| 39.0 |
| 17.7 |
| 12.6 |
|
Income taxes paid |
| 142.6 |
| 31.9 |
| 11.6 |
|
10 - ACCOUNTS RECEIVABLE
|
| 2005 |
| 2004 |
|
|
| $ |
| $ |
|
Trade accounts receivable and vendor rebates receivable |
| 67.3 |
| 75.6 |
|
Credit card receivable |
| 48.6 |
| 37.0 |
|
Environmental costs receivable |
| 1.1 |
| 1.4 |
|
Other accounts receivable |
| 18.5 |
| 14.5 |
|
|
| 135.5 |
| 128.5 |
|
11 - INVENTORIES
|
| 2005 |
| 2004 |
|
|
| $ |
| $ |
|
Merchandise – distribution centres |
| 34.4 |
| 36.5 |
|
Merchandise – retail |
| 251.8 |
| 273.8 |
|
Motor fuel |
| 78.6 |
| 64.5 |
|
|
| 364.8 |
| 374.8 |
|
12 - FIXED ASSETS
|
| 2005 |
| ||||
|
|
|
| Accumulated |
|
|
|
|
| Cost |
| depreciation |
| Net |
|
|
| $ |
| $ |
| $ |
|
Land |
| 237.5 |
| — |
| 237.5 |
|
Buildings |
| 200.9 |
| 57.6 |
| 143.3 |
|
Leasehold improvements |
| 176.7 |
| 55.7 |
| 121.0 |
|
Equipment |
| 747.3 |
| 247.2 |
| 500.1 |
|
|
| 1,362.4 |
| 360.5 |
| 1,001.9 |
|
Buildings under capital leases |
| 4.6 |
| 3.8 |
| 0.8 |
|
|
| 1,367.0 |
| 364.3 |
| 1,002.7 |
|
|
| 2004 |
| ||||
|
|
|
| Accumulated |
|
|
|
|
| Cost |
| depreciation |
| Net |
|
|
| $ |
| $ |
| $ |
|
Land |
| 240.0 |
| — |
| 240.0 |
|
Buildings |
| 163.2 |
| 32.9 |
| 130.3 |
|
Leasehold improvements |
| 156.3 |
| 52.2 |
| 104.1 |
|
Equipment |
| 612.3 |
| 185.2 |
| 427.1 |
|
|
| 1,171.8 |
| 270.3 |
| 901.5 |
|
Buildings under capital leases |
| 4.6 |
| 3.6 |
| 1.0 |
|
|
| 1,176.4 |
| 273.9 |
| 902.5 |
|
13 - OTHER ASSETS
|
| 2005 |
| 2004 |
|
|
| $ |
| $ |
|
Deferred charges, net |
| 37.9 |
| 43.8 |
|
Accrued pension benefit asset |
| 9.9 |
| 9.7 |
|
Deposits |
| 3.3 |
| 2.9 |
|
Other, at cost |
| 6.3 |
| 3.4 |
|
|
| 57.4 |
| 59.8 |
|
14 - BANK INDEBTEDNESS
Bank indebtedness reflects the used portion of the credit facilities available to the Company. Available credit facilities were unused as at April 24, 2005 and April 25, 2004, with the exception of certain letters of guarantee.
During 2005, the Company renegotiated the applicable interest rates and the restrictive covenants relating to its existing credit agreement consisting of a five-year renewable operating credit, maturing in December 2008, in the amount of $50.0 available in Canadian or U.S. dollars or as letters of guarantee not exceeding $10.0 or the equivalent in U.S. dollars bearing interest at the Canadian or U.S. prime rate plus 0.25% to 1.0% (0.75% to 1.50% in 2004) or at LIBOR plus 1.25% to 2.0% (1.75% to 2.50% in 2004), depending on whether certain financial ratios are achieved. The operating credit is also available in the form of bankers’ acceptances with stamping fees of 1.25% to 2.0% (1.75% to 2.50% in 2004), depending on whether certain financial ratios are achieved. As at April 24, 2005, an amount of $49.1 ($48.8 as at April 25, 2004) was available under this operating credit and the effective interest rate was 4.63% (3.63% in 2004). The credit agreement also provides for a five-year renewable operating credit, maturing in December 2008, in the amount of US$75.0 available in U.S. dollars and as letters of guarantee not exceeding US$30.0, bearing interest at the U.S. prime rate plus 0.25% to 1.0% (0.75% to 1.50% in 2004) or at LIBOR plus 1.25% to 2.0% (1.75 to 2.50% in 2004) depending on whether certain financial ratios are achieved. As at April 24, 2005, an amount of US$62.8 (US$70.2 as at April 25, 2004) was available under this operating credit and the effective interest rate was 4.63% (3.63% in 2004). These credit facilities are subject to the same guarantees and restrictive covenants which apply to the term loans described in Note 16.
69
15 - ACCOUNTS PAYABLE AND ACCRUED LIABILITIES
|
| 2005 |
| 2004 |
|
|
|
|
| restated |
|
|
| $ |
| $ |
|
Accounts payable and accrued expenses |
| 537.6 |
| 455.9 |
|
Sales and other taxes payable |
| 65.7 |
| 52.5 |
|
Environmental costs |
| 3.5 |
| 1.8 |
|
Salaries and social benefits |
| 56.7 |
| 45.9 |
|
Deferred credits |
| 11.2 |
| 10.9 |
|
Other |
| 72.3 |
| 93.6 |
|
|
| 747.0 |
| 660.6 |
|
16 - LONG-TERM DEBT
|
| 2005 |
| 2004 |
|
|
| $ |
| $ |
|
Subordinated unsecured debt (a) |
| 432.2 |
| 476.2 |
|
Secured term loans (b) Term loan “A” (US$24.1 as at April 24, 2005 and US$28.0 as at April 25, 2004) |
| 29.8 |
| 38.0 |
|
Term loan “B” (US$148.5 as at April 24, 2005 and US$150.0 as at April 25, 2004) |
| 183.4 |
| 204.1 |
|
Note payable, secured by the assets of certain stores, 8.75%, repayable in monthly instalments, maturing in 2019 |
| 6.7 |
| 7.5 |
|
Note payable without interest, repayable in May 2005 |
| 0.2 |
| 0.5 |
|
Mortgage loans secured by land and buildings, rates varying from 7.0% to 8.0% (7.0% to 13.25% in 2004), payable in monthly instalments, maturing on various dates until 2009 |
| 0.2 |
| 0.3 |
|
Obligations related to buildings under capital leases, rates varying from 5.9% to 13.25% (8.18% to 13.25% for 2004), payable on various dates until 2018 |
| 3.1 |
| 3.9 |
|
|
| 655.6 |
| 730.5 |
|
Current portion of long-term debt |
| 8.6 |
| 6.0 |
|
|
| 647.0 |
| 724.5 |
|
(a) Subordinated unsecured debt:
Subordinated unsecured debt of US$350.0, maturing December 15, 2013, bearing interest at a rate of 7.5%. Redeemable under certain conditions as of December 15, 2008.
The total amount of the loan is subject to interest rate swaps (see Note 23).
The subordinated unsecured debt agreement imposes certain restrictions on business acquisitions and the payment of dividends.
(b) Secured term loans:
• Term loan “A”:
US$24.1 maximum authorized term loan maturing on December 17, 2008, payable in quarterly instalments increasing gradually from 2.5% of the balance to 7.5%, as of July 2008, bearing interest at the Canadian prime rate plus 0.25% to 1.0% (0.75% to 1.50% in 2004) or the LIBOR rate plus 1.25% to 2.00% (1.75% to 2.50% in 2004), depending on whether certain financial ratios have been achieved. As at April 24, 2005, the effective interest rate was 4.63% (3.63% as at April 25, 2004);
• Term loan “B”:
US$148.5 maximum authorized term loan maturing on December 17, 2010, payable in quarterly instalments of 0.25% of the balance of the loan for the first six years and quarterly instalments of 23.50% for the seventh year, bearing interest at the prime U.S. rate plus 0.75% (1.25% in 2004) or the LIBOR rate plus 1.75%. As at April 24, 2005, the effective interest rate was 4.75% (3.38% as at April 25, 2004).
Substantially all of the Company’s assets have been pledged to secure these term loans.
Under the credit agreement, the Company must meet certain commitments and achieve certain financial ratios. Furthermore, the credit agreement imposes certain restrictions on capital spending if a certain ratio is not achieved, business acquisitions, debt repayments and payment of dividends.
On December 17, 2003, the Company concluded a new credit agreement. Consequently, the deferred financing costs relating to the previous agreement in the amount of $2.8 were written off. In addition, in 2004, the Company repaid its debt with proceeds from sale and leaseback transactions. The portion of deferred financing costs in the amount of $9.7 relating to the repaid debt was also written off.
70
Instalments on long-term debt for the next years are as follows:
|
| Obligations under |
| Other |
|
|
| $ |
| $ |
|
2006 |
| 1.1 |
| 8.1 |
|
2007 |
| 0.9 |
| 9.5 |
|
2008 |
| 0.7 |
| 10.2 |
|
2009 |
| 0.6 |
| 11.0 |
|
2010 |
| 0.6 |
| 2.2 |
|
2011 and subsequent years |
| 2.6 |
| 611.5 |
|
|
| 6.5 |
|
|
|
Interest expense included in minimum lease payments |
| 3.4 |
|
|
|
|
| 3.1 |
|
|
|
17 - DEFERRED CREDITS AND OTHER LIABILITIES
|
| 2005 |
| 2004 |
|
|
|
|
| restated |
|
|
| $ |
| $ |
|
Deferred credits |
| 20.1 |
| 20.5 |
|
Asset retirement obligations (a) |
| 22.1 |
| 19.7 |
|
Provision for site restoration costs |
| 5.0 |
| 4.4 |
|
Provision for workers’ compensation |
| 7.1 |
| 5.7 |
|
Accrued pension benefit liability |
| 7.2 |
| 6.5 |
|
Other liabilities |
| 28.3 |
| 20.5 |
|
|
| 89.8 |
| 77.3 |
|
(a) Asset retirement obligations relate to estimated future costs to remove underground motor fuel storage tanks and are based on the Company’s prior experience in removing these tanks, estimated tank useful life, lease terms for those tanks installed on leased properties, external estimates and governmental regulatory requirements. To determine the initial recorded liability, the future estimated cash flows have been discounted using the Company’s credit-adjusted risk-free rate of 10%. Should changes occur in estimated future removal costs, tank useful lives, lease terms or governmental regulatory requirements, revisions to the liability could be made.
The reconciliation of the Company’s liability for the asset retirement obligations related to the removal of its underground motor fuel storage tanks is as follows:
|
| 2005 |
| 2004 |
|
|
| $ |
| $ |
|
Balance, beginning of year |
| 21.6 |
| 5.7 |
|
Liabilities incurred |
| 0.1 |
| 0.2 |
|
Liabilities settled |
| (0.7 | ) | (0.1 | ) |
Accretion expense |
| 2.4 |
| 0.5 |
|
Business acquisition |
| 4.9 |
| 15.1 |
|
Effect of exchange rate fluctuations |
| (1.0 | ) | 0.2 |
|
Balance, end of year |
| 27.3 |
| 21.6 |
|
Of the total liability recorded in the consolidated balance sheets as of April 24, 2005 and April 25, 2004, $22.1 and $19.7, respectively, is included in Deferred credits and other liabilities and the remainder is included in Accounts payable and accrued liabilities.
18 - CAPITAL STOCK
Authorized
Unlimited number of shares without par value
First and second preferred shares issuable in series, non-voting, ranking prior to other classes of shares with respect to dividends and payment of capital upon dissolution. The Board of Directors is authorized to determine the designation, rights, privileges, conditions and restrictions relating to each series of shares prior to their issuance.
Class A multiple voting and participating shares, ten votes per share except for certain situations which provide for only one vote per share, convertible into Class B subordinate voting shares on a share-for-share basis at the holder’s option. Under the articles of amendment, no new Class A multiple voting share can be issued.
Class B subordinate voting and participating shares, convertible automatically into Class A multiple voting shares on a share-for-share basis upon the occurrence of certain events.
The order of priority for the payment of dividends is as follows:
• First preferred shares;
• Second preferred shares and;
• Class B subordinate voting shares and Class A multiple voting shares, ranking pari passu.
71
Issued and fully paid
The changes in number of outstanding shares are as follows:
|
| 2005 |
| 2004 |
| ||||
|
| Number |
|
|
| Number |
|
|
|
|
| of shares |
| $ |
| of shares |
| $ |
|
Class A multiple voting shares |
|
|
|
|
|
|
|
|
|
Balance, beginning of year |
| 57,041,722 |
| 12.0 |
| 57,097,648 |
| 12.0 |
|
Conversion into Class B shares |
| (447,030 | ) | (0.1 | ) | (55,926 | ) | — |
|
Balance, end of year |
| 56,594,692 |
| 11.9 |
| 57,041,722 |
| 12.0 |
|
|
|
|
|
|
|
|
|
|
|
Class B subordinate voting shares |
|
|
|
|
|
|
|
|
|
Balance, beginning of year |
| 140,490,082 |
| 473.7 |
| 112,004,270 |
| 246.5 |
|
Issued as part of the acquisition of Circle K |
| — |
| — |
| 27,111,076 |
| 223.7 |
|
Issued as part of a previous acquisition |
| 548 |
| — |
| 10 |
| — |
|
Issued on conversion of Class A shares |
| 447,030 |
| 0.1 |
| 55,926 |
| — |
|
Stock options exercised for cash |
| 4,438,000 |
| 12.5 |
| 1,318,800 |
| 3.5 |
|
Balance, end of year |
| 145,375,660 |
| 486.3 |
| 140,490,082 |
| 473.7 |
|
Total issued and fully paid |
|
|
| 498.2 |
|
|
| 485.7 |
|
|
| 2003 |
| ||
|
| Number |
|
|
|
|
| of shares |
| $ |
|
Class A multiple voting shares |
|
|
|
|
|
Balance, beginning of year |
| 57,097,648 |
| 12.0 |
|
Conversion into Class B shares |
| — |
| — |
|
Balance, end of year |
| 57,097,648 |
| 12.0 |
|
|
|
|
|
|
|
Class B subordinate voting shares |
|
|
|
|
|
Balance, beginning of year |
| 108,678,172 |
| 242.1 |
|
Issued as part of a previous acquisition |
| 98 |
| — |
|
Stock options exercised for cash |
| 3,326,000 |
| 4.4 |
|
Balance, end of year |
| 112,004,270 |
| 246.5 |
|
Total issued and fully paid |
|
|
| 258.5 |
|
During each of the years ended April 24, 2005 and April 27, 2003, the Company split all of its issued and outstanding Class A and B shares on a two-for-one basis. All share and per-share information in these consolidated financial statements has been adjusted retroactively to reflect both stock splits.
On December 17, 2003, the Company exchanged 27,111,076 warrants for Class B shares on a share-for-share basis. These warrants were issued on October 6, 2003 at a price of $8.25 each for a total consideration of $223.7. The issue costs, net of related future income taxes, amounted to $2.2.
19 - STOCK-BASED COMPENSATION AND OTHER STOCK-BASED PAYMENTS
During the year ended April 27, 2003, the Company amended its two existing stock option plans by merging them into a single plan (the Plan). Pursuant to the Plan, the Company may grant for up to 16,892,000 stock options for the purchase of Class B subordinate voting shares of the Company.
Stock options have up to a ten-year term, vest 20% on the date of the grant and cumulatively thereafter on each anniversary date of the grant and are exercisable at the designated market price. The grant price of each stock option shall not be set below the market price of the Class B shares on the Toronto Stock Exchange on the date of the grant. Each stock option is exercisable into one Class B share of the Company at the price specified in the terms of the stock option.
The table below presents the status of the Company’s stock option plan as at April 24, 2005, April 25, 2004 and April 27, 2003 and the changes therein during the years then ended:
|
| 2005 |
| 2004 |
| ||||
|
|
|
| Weighted |
|
|
| Weighted |
|
|
| Number of |
| average |
| Number of |
| average |
|
|
| stock |
| exercise |
| stock |
| exercise |
|
|
| options |
| price |
| options |
| price |
|
|
|
|
| $ |
|
|
| $ |
|
Outstanding, beginning of year |
| 12,626,200 |
| 5.05 |
| 12,313,000 |
| 4.07 |
|
Granted |
| 605,000 |
| 15.92 |
| 1,680,000 |
| 10.29 |
|
Exercised |
| (4,438,000 | ) | 2.79 |
| (1,318,800 | ) | 2.65 |
|
Cancelled |
| (47,800 | ) | 6.74 |
| (48,000 | ) | 4.04 |
|
Outstanding, end of year |
| 8,745,400 |
| 6.93 |
| 12,626,200 |
| 5.05 |
|
Exercisable stock options, end of year |
| 6,312,000 |
|
|
| 8,742,640 |
|
|
|
72
|
| 2003 |
| ||
|
|
|
| Weighted |
|
|
| Number of |
| average |
|
|
| stock |
| exercise |
|
|
| options |
| price |
|
|
|
|
| $ |
|
Outstanding, beginning of year |
| 15,126,000 |
| 3.35 |
|
Granted |
| 530,000 |
| 7.40 |
|
Exercised |
| (3,326,000 | ) | 1.34 |
|
Cancelled |
| (17,000 | ) | 2.97 |
|
Outstanding, end of year |
| 12,313,000 |
| 4.07 |
|
Exercisable stock options, end of year |
| 7,305,800 |
|
|
|
The following table presents information on the stock options outstanding and exercisable as at April 24, 2005:
|
| Options outstanding |
| Options exercisable |
| ||||||
|
|
|
| Weighted |
|
|
|
|
|
|
|
|
| Number of |
| average |
| Weighted |
| Number of |
| Weighted |
|
|
| stock options |
| remaining |
| average |
| stock options |
| average |
|
Range of |
| outstanding as at |
| contractual |
| exercise |
| exercisable as at |
| exercise |
|
exercise prices |
| April 24, 2005 |
| life |
| price |
| April 24, 2005 |
| price |
|
|
|
|
|
|
| $ |
|
|
| $ |
|
$2 - $4 |
| 2,968,000 |
| 5.43 |
| 2.69 |
| 2,804,400 |
| 2.65 |
|
$6 - $8 |
| 3,712,400 |
| 7.02 |
| 7.35 |
| 2,802,600 |
| 7.35 |
|
$8 - $14 |
| 1,600,000 |
| 8.65 |
| 10.83 |
| 612,000 |
| 10.80 |
|
$14 - $20 |
| 465,000 |
| 9.68 |
| 17.23 |
| 93,000 |
| 17.23 |
|
|
| 8,745,400 |
|
|
|
|
| 6,312,000 |
|
|
|
For 2004 and 2003, the Company did not record any compensation cost. If the compensation cost had been determined using the fair value method at the date of attribution of stock options granted beginning on April 29, 2002 to employees, net earnings and earnings per share information would have been reduced to the pro forma shown in the following table:
|
| 2004 |
| 2003 |
| ||||
|
| Disclosed |
| Pro forma |
| Disclosed |
| Pro forma |
|
|
| $ |
| $ |
| $ |
| $ |
|
Net earnings |
| 75.5 |
| 72.9 |
| 62.5 |
| 61.9 |
|
Earnings per share |
| 0.42 |
| 0.41 |
| 0.37 |
| 0.37 |
|
Diluted earnings per share |
| 0.40 |
| 0.39 |
| 0.36 |
| 0.35 |
|
The pro forma impact on net earnings for the period is not representative of the pro forma net earnings of future periods because it does not take into account the pro forma compensation relating to options granted prior to April 29, 2002.
The fair value of stock options granted is estimated at the grant date using the Black & Scholes option pricing model on the basis of the following weighted average assumptions for the stock options granted during the year:
|
| 2005 |
| 2004 |
| 2003 |
|
Expected dividends |
| None |
| None |
| None |
|
Expected volatility |
| 35 | % | 30 | % | 30 | % |
Risk-free interest rate |
| 4.26 |
| 4.45 |
| 5.26 |
|
Expected life |
| 8 years |
| 8 years |
| 8 years |
|
The weighted average fair value of stock options granted in the year ended April 24, 2005 is $7.72 ($4.61 in 2004 and $3.52 in 2003).
For the year ended April 24, 2005, compensation cost charged to consolidated earnings amounted to $3.2.
Deferred Share Unit Plan
On July 13, 2004, the Company adopted a Deferred Share Unit Plan for the benefit of its external directors allowing them to receive all or a portion of their annual compensation in the form of Deferred Share Units (DSUs). A DSU is a notional unit, equivalent in value to the Company’s Class B share. Upon resignation from the Board of Directors, participants are entitled to receive the payment of their cumulated DSUs either a) in the form of cash based on the price of the Company’s Class B shares as traded on the open market on the date of payment or b) in Class B shares bought by the Company on the open market on behalf of the Participant.
The DSU expense and the related liability are recorded at the grant date. The liability is adjusted periodically to reflect any increase in the market value of the Class B shares. As at April 24, 2005, the Company had a total of 14,665 DSUs outstanding.
Share Appreciation Rights Plan
The Board of Directors approved on July 13, 2004 a Share Appreciation Rights Plan for officers and key employees of the Company. The amount payable to the Participant is equal to the difference between the market value of the Company’s Class B shares at exercise and its value at the grant date and is payable in cash. The grant agreement describes the exercise period, the value of the shares at grant date and the duration of the plan for each Participant. No share appreciation rights were granted as at April 24, 2005.
73
20 - CUMULATIVE TRANSLATION ADJUSTMENTS
|
| 2005 |
| 2004 |
|
|
|
|
| restated |
|
|
| $ |
| $ |
|
|
|
|
|
|
|
Balance, beginning of year |
| (0.5 | ) | (2.5 | ) |
Effect of change in exchange rate during the year |
|
|
|
|
|
On the net investment in the self-sustaining foreign subsidiaries |
| (103.3 | ) | 4.6 |
|
On the long-term debt denominated in U.S. dollars designated as a hedge of the net investment in the self-sustaining foreign subsidiaries |
| 65.6 |
| (2.6 | ) |
Balance, end of year |
| (38.2 | ) | (0.5 | ) |
21 - EMPLOYEE FUTURE BENEFITS
The Company has a number of funded and unfunded defined benefits and defined contribution plans that provide retirement benefits to certain employees. Its defined benefits plans are based on years of service and on the consecutive highest five years average salary.
Total cash payments for employee future benefits consist of cash contributed by the Company to its funded pension plans, cash payments directly to beneficiaries for its unfunded pension plans, and cash contributed to its defined contribution plans amounted to $4.6 for 2005 ($1.5 for 2004).
Defined benefit plans
The Company measures its accrued benefit obligation and the fair value of plan assets for accounting purposes the last Sunday of April of each year. The most recent actuarial valuation of the pension plans for funding purposes was as of January 1, 2005 and the next required valuation will be as of January 1, 2008.
Information about the Company’s defined benefit plans, in aggregate, is as follows:
|
| 2005 |
| 2004 |
|
|
| $ |
| $ |
|
|
|
|
|
|
|
Accrued benefit obligation |
|
|
|
|
|
Balance, beginning of year |
| 31.5 |
| 29.6 |
|
Current service cost |
| 0.7 |
| 0.7 |
|
Interest cost |
| 1.9 |
| 1.9 |
|
Benefits paid |
| (2.2 | ) | (2.4 | ) |
Actuarial losses |
| 4.2 |
| 1.7 |
|
Balance, end of year |
| 36.1 |
| 31.5 |
|
|
| 2005 |
| 2004 |
|
|
| $ |
| $ |
|
|
|
|
|
|
|
Plan assets |
|
|
|
|
|
Fair value, beginning of year |
| 26.7 |
| 25.1 |
|
Actual return on plan assets |
| 1.3 |
| 3.4 |
|
Employees contributions |
| 0.1 |
| 0.1 |
|
Benefits paid |
| (1.7 | ) | (1.9 | ) |
Fair value, end of year |
| 26.4 |
| 26.7 |
|
Reconciliation of the funded status of the benefit plans to the amount recorded in the financial statements:
|
| 2005 |
| 2004 |
|
|
| $ |
| $ |
|
|
|
|
|
|
|
Fair value of plan assets |
| 26.4 |
| 26.7 |
|
Accrued benefit obligation |
| 36.1 |
| 31.5 |
|
Funded status-plan deficit |
| (9.7 | ) | (4.8 | ) |
Unamortized net actuarial loss |
| 13.5 |
| 9.4 |
|
Unamortized transitional net asset |
| (3.4 | ) | (4.0 | ) |
Unamortized past service cost |
| 2.3 |
| 2.6 |
|
Accrued benefit asset |
| 2.7 |
| 3.2 |
|
As at April 24, 2005, the accrued benefit obligation for unfunded pension plans amounted to $12.7 ($10.8 in 2004).
The accrued benefit asset is included in the Company’s balance sheets as follows:
|
| 2005 |
| 2004 |
|
|
| $ |
| $ |
|
Other assets |
| 9.9 |
| 9.7 |
|
Deferred credits and other liabilities |
| (7.2 | ) | (6.5 | ) |
Accrued benefit asset |
| 2.7 |
| 3.2 |
|
74
As of the measurement date, plan assets consist of:
|
| Percentage of plan assets |
| ||
|
| 2005 |
| 2004 |
|
|
| % |
| % |
|
Asset category |
|
|
|
|
|
Equity securities |
| 28.5 |
| 60.7 |
|
Debt securities |
| 71.5 |
| 39.3 |
|
Total |
| 100.0 |
| 100.0 |
|
The Company’s pension benefit expense for the year is determined as follows:
|
| 2005 |
| |||||
|
|
|
|
|
| Recognized |
| |
|
| Incurred during |
| Adjustments |
| during |
| |
|
| the year |
| (a) |
| the year |
| |
|
| $ |
| $ |
| $ |
| |
Current service cost, net of employee contributions |
| 0.6 |
| — |
| 0.6 |
| |
Interest |
| 1.9 |
| — |
| 1.9 |
| |
Return on plan assets |
| (1.3 | ) | (0.5 | ) | (1.8 | ) | |
Amortization of the net transitional asset |
| — |
| (0.6 | ) | (0.6 | ) | |
Net actuarial loss |
| 4.2 |
| (3.6 | ) | 0.6 |
| |
Amortization of past service cost |
| — |
| 0.3 |
| 0.3 |
| |
Pension expense for the year |
| 5.4 |
| (4.4 | ) | 1.0 |
| |
|
| 2004 |
| ||||
|
|
|
|
|
| Recognized |
|
|
| Incurred during |
| Adjustments |
| during |
|
|
| the year |
| (a) |
| the year |
|
|
| $ |
| $ |
| $ |
|
Current service cost, net of employee contributions |
| 0.6 |
| — |
| 0.6 |
|
Interest |
| 1.9 |
| — |
| 1.9 |
|
Return on plan assets |
| (3.4 | ) | 1.7 |
| (1.7 | ) |
Amortization of the net transitional asset |
| — |
| (0.6 | ) | (0.6 | ) |
Net actuarial loss |
| 1.7 |
| (1.0 | ) | 0.7 |
|
Amortization of past service cost |
| — |
| 0.3 |
| 0.3 |
|
Pension expense for the year |
| 0.8 |
| 0.4 |
| 1.2 |
|
|
| 2003 |
| ||||
|
|
|
|
|
| Recognized |
|
|
| Incurred during |
| Adjustments |
| during |
|
|
| the year |
| (a) |
| the year |
|
|
| $ |
| $ |
| $ |
|
|
|
|
|
|
|
|
|
Current service cost, net of employee contributions |
| 0.5 |
| — |
| 0.5 |
|
Interest |
| 1.9 |
| — |
| 1.9 |
|
Return on plan assets |
| 3.6 |
| (5.7 | ) | (2.1 | ) |
Amortization of the net transitional asset |
| — |
| (0.5 | ) | (0.5 | ) |
Net actuarial loss (gain) |
| (4.6 | ) | 4.7 |
| 0.1 |
|
Past service cost |
| 3.2 |
| (2.9 | ) | 0.3 |
|
Pension expense for the year |
| 4.6 |
| (4.4 | ) | 0.2 |
|
(a) Adjustments to recognize the long-term nature of employee future benefit costs.
The significant actuarial assumptions which management considers the most likely to be used to determine the accrued benefit obligation and the pension expense are the following:
Accrued benefit obligation as at the balance sheets date:
|
| 2005 |
| 2004 |
|
|
| % |
| % |
|
Discount rate |
| 5.75 |
| 6.25 |
|
Rate of compensation increase |
| 4.00 |
| 4.00 |
|
Pension expense for the years ended:
|
| 2005 |
| 2004 |
| 2003 |
|
|
| % |
| % |
| % |
|
Discount rate |
| 6.25 |
| 6.50 |
| 6.75 |
|
Expected rate of return on plan assets |
| 7.00 |
| 7.00 |
| 7.00 |
|
Rate of compensation increase |
| 4.00 |
| 4.00 |
| 4.00 |
|
Defined contribution plans
The Company’s total pension expense under its defined contribution plans for the year 2005 is $4.0 ($1.0 in 2004 and $0.9 in 2003).
Deferred compensation plans – United States operations
The Company sponsors a deferred compensation plan that allows certain employees in its US operations to defer up to 25% of their base salary and 100% of their cash bonuses for any given year. Interest accrues on the deferral and amounts due to the participants are generally payable on retirement, except in certain limited circumstances. Obligations under this plan amounted to $2.4 as at April 24, 2005 and are included in Deferred credits and other liabilities.
75
22 - ENVIRONMENT
The Company is subject to Canadian and American legislations governing the storage, handling and sale of gasoline and related products. The Company considers that it is generally in compliance with current environmental legislations.
The Company has an on-going training program for its employees on environmental issues which includes preventive site testing and site restoration in cooperation with regulatory authorities. The Company also examines its motor fuel equipment annually to make the necessary investments.
In all U.S. states in which the Company operates, except Michigan, Iowa, Florida, Texas and Washington, there is a state fund to cover the cost of certain rehabilitation and removing of gasoline tanks. These state funds provide insurance for motor fuel facilities operations to cover the cost of cleaning up damages to the environment caused by the usage of underground motor fuel equipment. Underground motor fuel storage tank registration fees and a motor fuel tax in each of the states finance the trust funds. The Company pays the registration fees and remits the sales taxes to the states where it is a member of the trust fund. Insurance coverage is different in the various states and can be as much as US$1.0 per site.
In order to provide for the above-mentioned restoration costs, the Company has recorded a $8.5 provision for environmental costs as at April 24, 2005 ($6.2 as at April 25, 2004). Of this amount, $3.5 ($1.8 as at April 25, 2004) is included in Accounts payable and accrued liabilities.
23 - FINANCIAL INSTRUMENTS
(a) Description of derivative financial instruments
Management of interest rate risk
The Company has entered into interest rate swaps to manage interest rate fluctuations. It has agreed to swap the amount of the difference between the variable interest rate and the fixed rate, calculated based on the reference amounts. These interest rate swaps have been designated as a fair value hedge of the subordinated unsecured debt.
The amounts outstanding at year end are as follows:
Maturity (i) |
| Reference |
| Pays/receives |
| Fixed rate |
| Variable rate |
|
|
| US$ |
|
|
| % |
|
|
|
December 2013 |
| 100.0 |
| pays variable |
| 7.50 |
| LIBOR 6 months |
|
|
|
|
|
|
|
|
|
|
|
December 2013 |
| 100.0 |
| pays variable |
| 7.50 |
| LIBOR 6 months |
|
|
|
|
|
|
|
|
|
|
|
December 2013 |
| 150.0 |
| pays variable |
| 7.50 |
| LIBOR 6 months |
|
(i) Under certain conditions, the maturity date of the swaps can be altered to correspond with the repurchase conditions of the corresponding subordinated notes.
(b) Fair value of financial instruments
The fair value of cash and cash equivalents, accounts receivable and accounts payable and accrued liabilities is comparable to their carrying amount given that they will mature in less than one year.
With the exception of the subordinated unsecured debt, there is no material difference between the fair value and the carrying amount of the Company’s long-term debt as at April 24, 2005 and April 25, 2004, given that the largest loans bear interest at a floating rate.
The fair value of the subordinated unsecured debt was $443.6 as at April 24, 2005 ($496.5 as at April 25, 2004) and was estimated based on the discounted cash flows of the debt at the Company’s estimated incremental borrowing rates for debt of the same remaining maturities.
The fair value of the interest rate swaps, as determined by the Company’s bank based on quoted market prices for similar instruments was $13.5 payable by the Company ($27.2 payable by the Company in 2004).
24 - CONTRACTUAL OBLIGATIONS
Minimum lease payments
As at April 24, 2005, the Company has entered into lease agreements expiring on various dates until 2027 which call for aggregate minimum lease payments of $1,695.0 for the rental of commercial space, equipment and a warehouse. Several of these leases contain renewal options and certain sites are subleased to franchise-holders. The minimum lease payments for the next five years are $181.0 in 2006, $170.2 in 2007, $149.5 in 2008, $121.7 in 2009 and $110.3 in 2010.
76
Purchase commitments
The Company has concluded agreements to acquire franchise rights which call for aggregate payments of $5.2. The minimum payments for the next five years are $0.6 from 2006 to 2008 and $0.7 in 2009 and 2010.
Moreover, the Company entered into various products purchase agreements that require it to purchase minimum amounts or quantities of products annually. The Company has generally exceeded such minimum requirements in the past and expects to continue doing so for the foreseeable future. Failure to satisfy the minimum purchase requirements could result in termination of the contracts, change in pricing of the products, payments to the applicable providers of a predetermined percentage of the commitments and repayments of a portion of rebates received.
25 - CONTINGENCIES AND GUARANTEES
Contingencies
Various claims and legal proceedings have been initiated against the Company in the normal course of its operations that relate to human resources and the environment. In management’s opinion, these claims and proceedings are unfounded. Although the outcome of these proceedings cannot be determined with certainty, management estimates that any payments resulting from their outcome are not likely to have a substantial negative impact on the Company’s results and financial position.
Guarantees
Sub-lease agreements
The Company entered into a number of agreements to sub-lease premises to third parties. The Company retains ultimate responsibility to the landlord for payment of amounts under the lease agreements should the sub-lessees fail to pay. The total future lease payments under such agreements are approximately $2.4. Historically, the Company has not made any significant payments in connection with these indemnification provisions.
Other indemnification agreements
In the normal course of its business, the Company provides indemnifications which vary in duration and given the nature of these indemnifications, the Company is unable to reasonably estimate its maximum potential liability payable to third parties. Historically, the Company has not made any significant payments in connection with these indemnification provisions.
26 - SEGMENTED INFORMATION
The Company operates convenience stores in Canada and in the United States. It essentially operates in one reportable segment, the sale of goods for immediate consumption and motor fuel through corporate stores or franchise operations. It operates a convenience store chain under several banners, including Couche-Tard, Mac’s, Bigfoot, Dairy Mart and Circle K. Revenues from outside sources mainly fall into two categories: merchandise and services and motor fuel.
Information on the principal revenue classes as well as geographic information is as follows:
|
| 2005 |
| 2004 |
| ||||||||
|
| Canada |
| U.S. |
| Total |
| Canada |
| U.S. |
| Total |
|
|
| $ |
| $ |
| $ |
| $ |
| $ |
| $ |
|
External customer revenues (a) |
|
|
|
|
|
|
|
|
|
|
|
|
|
Merchandise and services |
| 1,577.1 |
| 3,265.4 |
| 4,842.5 |
| 1,510.6 |
| 1,597.1 |
| 3,107.7 |
|
Motor fuel |
| 844.4 |
| 4,528.9 |
| 5,373.3 |
| 677.5 |
| 2,087.2 |
| 2,764.7 |
|
|
| 2,421.5 |
| 7,794.3 |
| 10,215.8 |
| 2,188.1 |
| 3,684.3 |
| 5,872.4 |
|
|
|
|
|
|
|
|
|
|
|
|
|
|
|
Gross profit |
|
|
|
|
|
|
|
|
|
|
|
|
|
Merchandise and services |
| 529.0 |
| 1,063.2 |
| 1,592.2 |
| 491.3 |
| 521.2 |
| 1,012.5 |
|
Motor fuel |
| 65.2 |
| 325.5 |
| 390.7 |
| 63.3 |
| 147.2 |
| 210.5 |
|
|
| 594.2 |
| 1,388.7 |
| 1,982.9 |
| 554.6 |
| 668.4 |
| 1,223.0 |
|
|
|
|
|
|
|
|
|
|
|
|
|
|
|
Fixed assets and goodwill (a) |
| 502.9 |
| 777.5 |
| 1,280.4 |
| 468.2 |
| 713.2 |
| 1,181.4 |
|
|
| 2003 |
| ||||
|
| Canada |
| U.S. |
| Total |
|
|
| $ |
| $ |
| $ |
|
External customer revenues (a) |
|
|
|
|
|
|
|
Merchandise and services |
| 1,428.6 |
| 514.7 |
| 1,943.3 |
|
Motor fuel |
| 630.2 |
| 741.7 |
| 1,371.9 |
|
|
| 2,058.8 |
| 1,256.4 |
| 3,315.2 |
|
|
|
|
|
|
|
|
|
Gross profit |
|
|
|
|
|
|
|
Merchandise and services |
| 462.5 |
| 169.7 |
| 632.2 |
|
Motor fuel |
| 57.5 |
| 60.2 |
| 117.7 |
|
|
| 520.0 |
| 229.9 |
| 749.9 |
|
|
|
|
|
|
|
|
|
Fixed assets and goodwill (a) |
| 446.3 |
| 255.5 |
| 701.8 |
|
(a) Geographic areas are determined according to where the Company generates operating income (where the sale takes place) and according to the location of the fixed assets and goodwill.
77
27 - HURRICANES – FLORIDA
During the second quarter of 2005, certain areas of the Company’s business in Florida experienced damages and losses resulting from four hurricanes. Losses, including damages relating to fixed assets and inventory spoilage, are estimated to result in net claims in the amount of US$19.8. The book value of fixed assets, inventory spoilage and other assets that were damaged by the hurricanes is US$4.4.
The Company expects to spend approximately US$18.7 to restore buildings and equipment, including approximately US$8.9 to restore assets on leased properties, of which approximately US$9.8 will be recorded in fixed assets. The Company expects to record a gain representing the difference between the insurance settlements and the carrying value of the owned and leased assets. As of April 24, 2005, the Company has received US$7.0 of insurance proceeds.
28 - COMPARATIVE FIGURES
Certain comparative figures have been reclassified to comply with the presentation adopted in the current year.
78
Alain Bouchard (1)
Chairman of the Board,
President and Chief Executive Officer
Richard Fortin (1)
Executive Vice-President
and Chief Financial Officer
Réal Plourde (1)
Executive Vice-President
and Chief Operating Officer
Jacques D’Amours (1)
Vice-President, Administration
Robert Brunet (3)
Lead Director
President
Socoro (Robert Brunet Consulting)
Roger Desrosiers, F.C.A. (3)
Corporate Advisor
Jean Élie (2)
Corporate Director
Josée Goulet
Corporate Director
Roger Longpré (2) (3)
President
Mergerac Inc.
Jean-Pierre Sauriol, Eng. (2)
President and Chief Executive Officer
Dessau-Soprin Inc.
Jean Turmel
President
Perseus Capital Inc.
Officers
Alain Bouchard
Chairman of the Board,
President and Chief Executive Officer
Richard Fortin
Executive Vice-President
and Chief Financial Officer
Réal Plourde
Executive Vice-President
and Chief Operating Officer
Jacques D’Amours
Vice-President, Administration
Eastern North America
Stéphane Gonthier
Senior Vice-President
Robert G. Campau
Vice-President, Operations
U.S. Southeast Region
Stéphane Gonthier
Vice-President, Operations
Central Canada
Jean-Luc Meunier
Vice-President, Operations
Eastern Canada
Charles M. Parker
Vice-President, Operations
Florida and Gulf Region
Western North America
Brian Hannasch
Senior Vice-President
Michel Bernard
Vice-President, Operations
U.S. Midwest Region
Geoffrey C. Haxel
Vice-President, Operations
Arizona
Joy A. Powell
Vice-President, Operations
U.S. West Coast Region
Kim J. Trowbridge
Vice-President, Operations
Western Canada
Sylvain Aubry
Corporate Secretary
Michael Guinard
Vice-President, Development
Dale Pettit
Vice-President and Treasurer
(1) Member of the Executive Committee
(2) Member of the Human Resources and Corporate Governance Committee
(3) Member of the Audit Committee
79
Executive Office
1600 Saint-Martin Boulevard East
Tower B, Suite 200
Laval, Quebec H7G 4S7
Telephone: (450) 662-3272
Fax: (450) 662-6648
Auditors
Raymond Chabot Grant Thornton
600 de la Gauchetière West
Suite 1900
Montreal, Quebec H3B 4L8
Transfer Agent
National Bank Trust
1100 University Street
Suite 900
Montreal, Quebec H3B 2G7
Investor Relations
Richard Fortin
Executive Vice-President
and Chief Financial Officer
For any additional information about Alimentation Couche-Tard Inc., shareholders, investors and analysts are requested to contact the Corporate Secretary by writing to the executive office address or the following e-mail address:
info@couche-tard.com
www.couche-tard.com
Stock information
Alimentation Couche-Tard Inc.’s shares are listed on the TSX under the ticker symbols ATD.MV.A and ATD.SV.B
80
![]()
www.couche-tard.com www.sloche.com www.froster.ca