UNITED STATES
SECURITIES AND EXCHANGE COMMISSION
Washington, D.C. 20549
Form 6-K
REPORT OF FOREIGN PRIVATE ISSUER PURSUANT
TO RULE 13a-16 OR 15d-16 UNDER
THE SECURITIES EXCHANGE ACT OF 1934
For the 2006 Annual Report for the year ended April 30, 2006
Commission File Number: 333-10100
ALIMENTATION COUCHE-TARD INC.
1600 St-Martin Boulevard East
Tower B, Suite 200
Laval, Quebec, Canada
H7G 4S7
Indicate by check mark whether the registrant files or will file annual reports under cover of Form 20-F or Form 40 F.
Form 20-F |_| Form 40-F |X|
Indicate by check mark if the registrant is submitting the Form 6-K in paper as permitted by Regulation S-T Rule 101(b)(1):
Yes |_| No |X|
Indicate by check mark if the registrant is submitting the Form 6-K in paper as permitted by Regulation S-T Rule 101(b)(7):
Yes |_| No |X|
Indicate by check mark whether the registrant by furnishing the information contained in this Form is also thereby furnishing the information to the Commission pursuant to Rule 12g-3 under the Securities Exchange Act of 1934.
Yes |_| No |X|
If “Yes” is marked, indicate below the file number assigned to the registrant in connection with Rule 12g3-2(b):
SIGNATURES:
Pursuant to the requirements of the Securities Exchange Act of 1934, the registrant has duly caused this report to be signed on its behalf by the undersigned, thereunto duly authorized.
| ALIMENTATION COUCHE-TARD INC. | |
| July 14, 2006 | |
| Per: /s/ Sylvain Aubry | |
| Sylvain Aubry | |
| Corporate Secretary |
 | |
| 2006 ANNUAL REPORT |
The little
corner store
is getting
bigger…
| Contents | |
| Highlights | 2 |
| Message to Shareholders | 6 |
| Human Potential | 12 |
| Brand Potential | 16 |
| Growth Potential | 18 |
| Helping People | 22 |
| Report on Operations | 26 |
| Teams | 31 |
| Financial Review | 32 |
| Management Discussion and Analysis | |
| Financial Statements | |
| Notes to Financial Statements | |
| Directors and Officers |

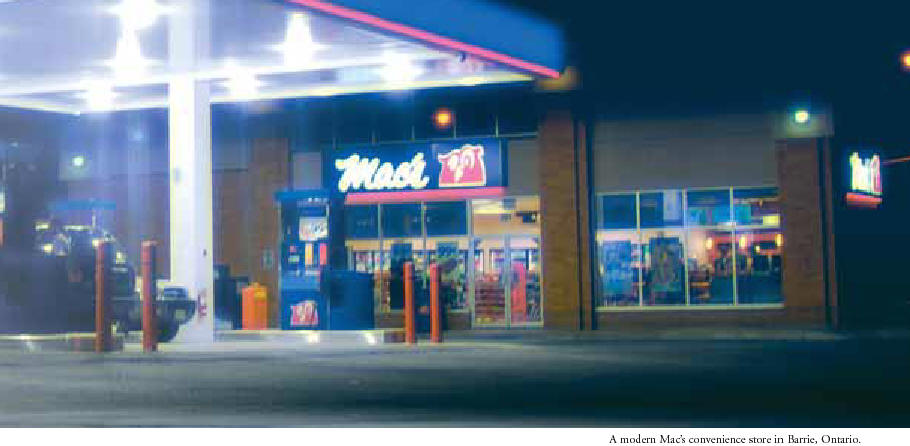
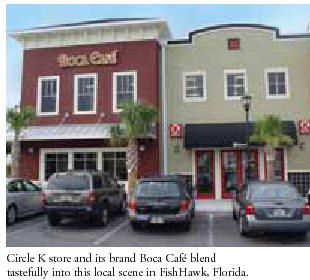
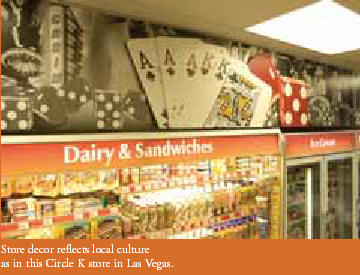
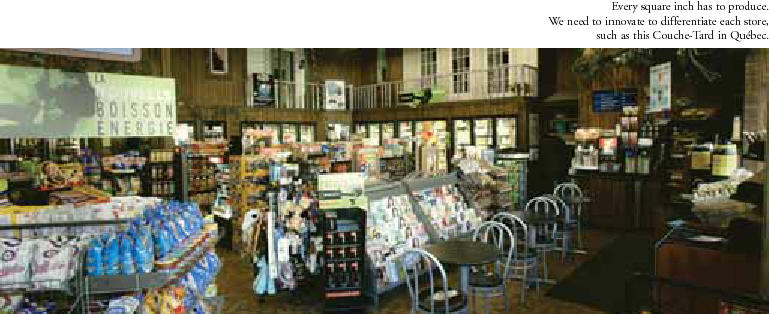
The first Couche-Tard acquisition 21 years ago was 11 corner stores in Quebec City, just like the one pictured on the cover. Today’s Couche-Tard store, such as the one here, is a multi-service convenience centre aimed at making life easier for millions of customers every day.
and bigger.
$10 billion
in revenues (US$)37,000
motivated staff members5,000
stores within the network3
powerful brands1
goal: fulfill our growth potential

Highlights
• Increase of 26.4% in revenues since last year
• Increase of 26.4% in net earnings
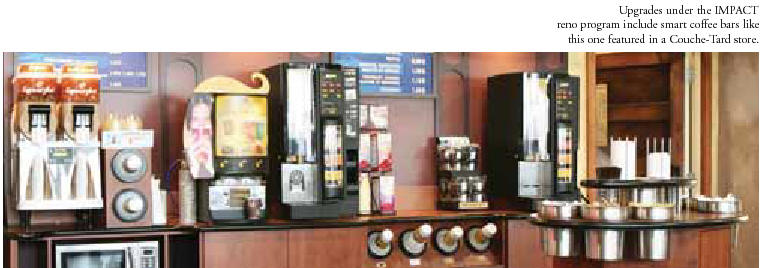
• Implementation of IMPACT program at 446 stores
• Increase of 151 corporate stores
2 / Alimentation Couche-Tard
Financial Highlights
(in millions of US dollars, except per share amounts)
2006(1) | 2005 | 2004(2) | 2003(2) | 2002(2) | 2001(2) | |
$ | $ | $ | $ | $ | $ | |
|
|
|
|
|
| |
| Consolidated Results |
|
|
|
|
|
|
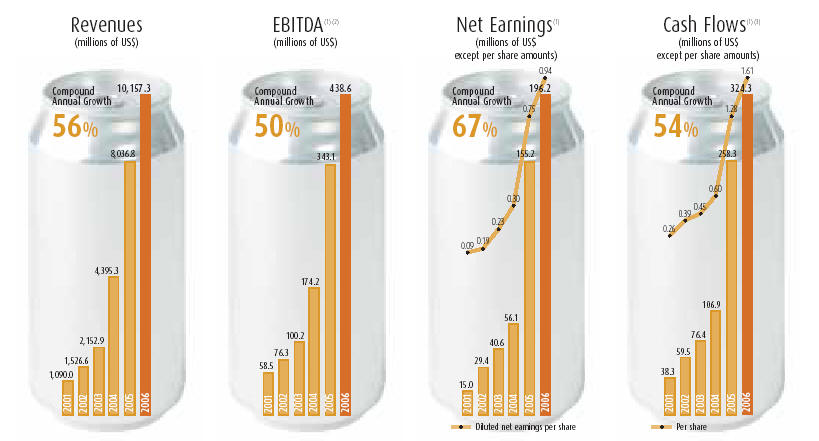
Revenues | 10,157.3 | 8,036.8 | 4,395.3 | 2,152.9 | 1,526.6 | 1,090.0 |
EBITDA(3) | 438.6 | 343.1 | 174.2 | 100.2 | 76.3 | 58.5 |
Net earnings | 196.2 | 155.2 | 56.1 | 40.6 | 29.4 | 15.0 |
Cash flows(4) | 324.3 | 258.3 | 106.9 | 76.4 | 59.5 | 38.3 |
| Per Share |
|
|
|
|
|
|
Net Earnings |
|
|
|
|
|
|
Basic | 0.97 | 0.77 | 0.31 | 0.24 | 0.19 | 0.10 |
Diluted | 0.94 | 0.75 | 0.30 | 0.23 | 0.19 | 0.09 |
Cash flows(4) | 1.61 | 1.28 | 0.60 | 0.45 | 0.39 | 0.26 |
Book value | 4.78 | 3.63 | 2.71 | 1.74 | 1.40 | 0.94 |
| Financial Position |
|
|
|
|
|
|
Total assets | 2,369.2 | 1,995.7 | 1,650.8 | 739.7 | 499.5 | 358.5 |
Property and equipment | 1,014.1 | 812.0 | 663.3 | 298.5 | 195.7 | 131.4 |
Interest-bearing debt | 524.1 | 530.9 | 536.8 | 204.6 | 115.7 | 96.6 |
Shareholders’ equity | 966.0 | 733.2 | 535.0 | 293.9 | 231.3 | 139.7 |
| Ratios |
|
|
|
|
|
|
Interest-bearing net debt/ |
|
|
|
|
|
|
total capitalization | 0.17:1 | 0.28:1 | 0.42:1 | 0.37:1 | 0.31:1 | 0.40:1 |
Interest-bearing net debt/ |
|
|
|
|
|
|
EBITDA(3) | 0.44:1 | 0.81:1 | 2.20:1 | 1.71:1 | 1.32:1 | 1.54:1 |
|
|
|
|
|
|
(1) 53 weeks.
(2) Restated.
(3) EBITDA (Earnings Before Interest, Tax, Depreciation and Amortization) is presented for information purposes only and represents a performance measure used especially in financial circles.It does not have a standardized meaning prescribed by Canadian GAAP and therefore may not be comparable to similar measures presented by other public companies.
(4) These cash flows and cash flows per share are presented for information purposes only and represent performance measures used especially in financial cir-cles.They represent cash flows from net earnings, plus depreciation and amortization, write-off of financing costs, loss on disposal of assets and future income taxes.They do not have a standardized meaning prescribed by Canadian GAAP and therefore may not be comparable to similar measures presented by other public companies.
Alimentation Couche-Tard / 3
(1) Restated figures for 2001 to 2004.
(2) EBITDA (Earnings Before Interest, Tax, Depreciation and Amortization) is presented for information purposes only and represents a performance measure used especially in financial circles.It does not have a standardized meaning prescribed by Canadian GAAP and therefore may not be comparable to similar measures presented by other public companies.
(3) These cash flows and cash flows per share are presented for information purposes only and represent performance measures used especially in financial circles. They represent cash flows from net earnings, plus depreciation and amortization, write-off of financing costs, loss on disposal of assets and future income taxes. They do not have a standardized meaning prescribed by Canadian GAAP and therefore may not be comparable to similar measures presented by other public companies.
4 / Alimentation Couche-Tard
Stock Performance
Couche-Tard’s strong stock performance has outpaced the TSX index and consistently delivered outstanding shareholder value.
Over the past fiscal year the stock appreciated 51% and the average return over five years is 37%.
Alimentation Couche-Tard / 5

GREAT RESULTS
Unlimited Potential
Fiscal 2006 was the most successful year yet in our 25-year history and brought Couche-Tard to a new level of maturity and capability. Its value is not just in the year’s accomplishments but in our excellent positioning for the future.
6 / Alimentation Couche-Tard
This year’s Annual Report presents a closer look at our strategy and identifies our strengths for moving forward.
A year ago, I wrote that we could claim to have successfully integrated the Circle K network. The mood then was one of accomplishment. Twelve months later, as both our strategies and execution perform to, and often exceed, high expectations, we are developing a greater sense of just how open-ended our future can be. And the mood is one of excitement!
As we move through the second 25 years of our journey we have, I believe, arrived at a new maturity as an enterprise.
The numbers being generated continue to set a record pace that now stretches back 12 years. At the end of the latest fiscal year, our five-year Compound Annual Growth Rate for revenues stood at 56% and for net earnings 67%. We remain the most profitable publicly held convenience store operator in North America not integrated with a petroleum company.
|
|
Alimentation Couche-Tard / 7
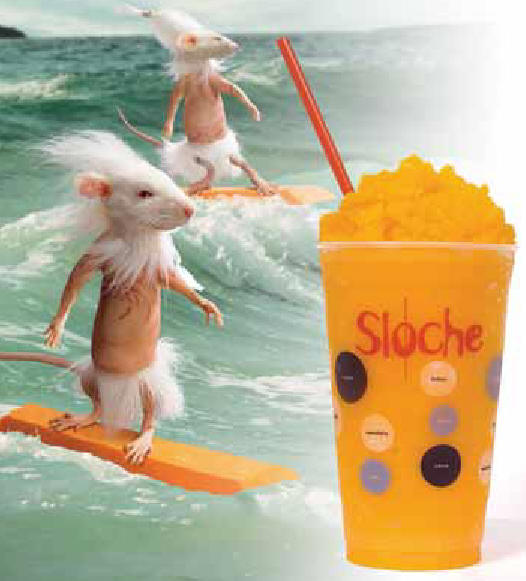 | Flavours for top-selling frozen drink Sloche, which appeals to a young crowd, include Tropical Cheddar and Winchire Wacheur.
|
| Three times, Couche-Tard has doubled its size by acquisition. Each time means a bigger bite and a tougher challenge. |
Our network continues to grow and we have added 633 stores since the big Circle K acquisition of December 2003 to complete the year at 5,097, including binding agreements.
We continue to build our financial muscle, with shareholders’ equity now close to one billion dollars US.
Although history shows us that two-thirds of merger and acquisition strategies actually diminish shareholder value, we are an established member of that other third. Our growth model has demonstrated robust and sustainable value creation: our share price has appreciated 114% in the past two years and average return over the past five years is 37%. Market capitalization since 2003 has more than tripled to Cdn$5 billion.
The Board of Directors approved a policy for a quarterly dividend of Cdn$0.025 per share, effective since the second quarter. Our cash flow makes it appropriate to share some of the benefits of our growth with shareholders.The addition of a dividend also qualifies us for investment by a wider range of investors.
On its own, this is an inspiring picture. Taken in context with the Company’s strong and consistent performance over and extended period, it is also a key inflection point. I see it as an important transition into a high-return North American business model with sustainable and internally financed organic and acquisition growth. equity
Three times, Couche-Tard has doubled its size by acquisition. Each time means a bigger bite and a tougher challenge. When the third opportunity – Circle K – meant integrating and managing 1,663 corporate stores in one go, people questioned our ability to realize the promised efficiencies and unlock the value that we were seeking.
After carefully analyzing two complete years of data with improved tools, we are fully satisfied not just with this integration, but with the effectiveness of our business model on this much grander scale. This was a tough test of our benchmarking processes, our supply and distribution logistics and our highly decentralized supervisory structure. By any business performance measurement, I am delighted to report that we passed with flying colours. Couche-Tard consistently outperforms the industry overall. This has convincingly demonstrated the power and scalability of the highly decentralized, consumer-centred structure that is uniquely ours. But, as the fine print always says, past achievement is no guarantee of future performance. The intent, therefore, of this year’s Annual Report is to present a closer look at the main elements of our strategy and identify our strengths for moving forward.
8 / Alimentation Couche-Tard
First, as they say, you have to fish where the fish are. Where is the industry going? Will it continue to remain a source of strong growth?
Only a decade ago, it was fashionable to say that convenience stores were a thing of the past. Today, the industry is undergoing a growth spurt and is teeming with opportunity. In 2004, North American c-store sales grew over 16%, for the second year in a row – significantly faster than any other major retail channel. Total store count increased almost 6%.
THE INDUSTRY IS NOT ONLY EXPANDING, BUT EVOLVING
We can no longer assume a pricing premium for convenience. Contemporary society is developing in a time-constrained environment where convenience has become a service staple.
Big supermarkets, drugstores and mass merchandisers now play the convenience game with products available sometimes 24 hours a day. Giant retailers in other sectors become our competitors with their gas fill-up service and mini-marts in a bid to build store traffic.
This does not stress our operating model. In fact, it leads to more opportunity. Convenience stores are one of the most fragmented of industry sectors with small independents, heavily reliant on motor fuel sales, representing 60% of the market. Facing more competition and the added threat of continuing high gasoline pricing, many smaller chains and family owners will consider selling as an option. In the segment of most interest to us, that of chains between 10 and 100 outlets, there are no fewer than 21,000 stores.
Alimentation Couche-Tard / 9

Convenience stores are a volume-driven business that depends for profitability on economies of scale and store-level execution. This tends to result in standardization, but even with a winning network model, a cookie-cutter approach has a built-in ceiling. A convenience store is a neighbourhood store and neighbourhoods change. Tastes and product preferences differ as you move across the continent, meaning that a hierarchical structure that standardizes inventories and merchandise display can only be optimal in one region.
By contrast, the Couche-Tard model is boundaryless. We research and analyze the market for each individual store and then respond to those local needs and preferences. We do this by pushing out the decision-making, investing in the latest technology, continually upgrading our premises and hiring and retaining truly outstanding people.
The result, we feel, is unlimited potential for growth, for the development of our brands and for our people. All three are vital components in our ongoing value creation and you will read more about them in this year’s report.
- Our financial strength increases each year and growth expectations remain high, both for internal growth and for further acquisitions. We are continually reviewing quality opportunities and we can afford to be selective.
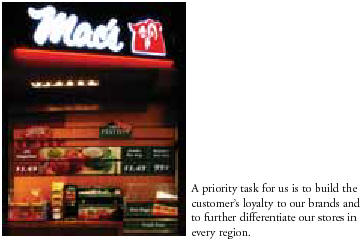
- Our brands continue to build valuable equity. During the past year, we completed the rebranding of all our corporate assets in the United States to the Circle K brand, which has a powerful consumer association. So we now have Couche-Tard in Eastern Canada, Mac’s through Central and Western Canada and Circle K throughout the U.S. A priority task for us is to build the customer’s loyalty to these brands and to further differentiate our stores in every region. We will be the destination where consumers will find ambience, quick and friendly service, proprietary products and a quick and nutritious breakfast or lunch.
- Most important of all is giving our people the opportunity to grow and excel. No industry is more driven by the people in the front lines than convenience stores. There are no big corporate contracts here; the year’s revenue is made one customer at a time. And success comes from efficiency, friendliness, an report. instinctive desire to serve and help, innovation, and the kind of will to succeed that is seen in the mirror every morning.
10 / Alimentation Couche-Tard
New hit energy drinks are sold in Couche-Tard, Mac’s and Circle K stores.
|
|

We are here to serve the store managers and we can do that best by meeting them at their place of work and getting to know their issues. |
People are without question the most important element and the greatest strength of our network. They are the first thing we look for in an acquisition opportunity; the quality people at Couche-Tard are hugely responsible for the stunning success since the acquisition of Circle K. I am proud that our beliefs, values and hard work are creating the best team in retailing.
There are two activities in particular which I enjoy. The first is being out in the stores, feeling the pulse of the Company, meeting the truly outstanding people who are managing these stores and serving our customers with flair and imagination. I spend almost half of my time on the road, as do other members of the executive group. Our corporate leadership philosophy is that we are here to serve the store managers and we can do that best by meeting them at their place of work and getting to know their issues.
The second is seeing first-hand the rollout of our IMPACT store program, which is new to the industry and a powerful business generator. As with our people, this configuration – which we have been refining over several years and which we will introduce throughout the entire network – is proving itself a winner in all of our eight markets.
In terms of both people and facilities, I feel that this year our company found a new sense of self. I view it as the most important year to date in our 25-year history. After convincingly mastering our toughest organizational challenge ever – the integration of Circle K – we find ourselves at a new level of capability and confidence, primed and ready to sustain our powerful growth.
On behalf of all my colleagues, I wish to thank our shareholders for their continued support, our Board of Directors for their wise and considered counsel - notably Josée Goulet, who is leaving after six years of precious collaboration - our business partners and our managers and employees throughout the network.
![]()
Alain Bouchard
Chairman of the Board,
President and Chief Executive Officer
Alimentation Couche-Tard / 11

Unlimited
HUMAN POTENTIAL
THE COMPANY BUILDS ON THE STRENGTH OF PEOPLE
The two most important people in Couche-Tard’s business face each other every day. On one side of the counter is the customer; on the other, the store manager or employee.
“Convenience store retailing is a people business,” says CEO Alain Bouchard. “I tell our people the only person more important than them is the customer.”
He gets to tell a lot of people. A feature of the Company’s operating methodology is the time spent by senior management in the field. In F’06, the Chief Executive and Chief Operating Officers each spent almost 50% of their time visiting stores. Two North American Division managers, each responsible for four divisions spend by far the greatest amount of their time on the road.
12 / Alimentation Couche-Tard
A very flat operating structure keeps management close to the action.
 | |||
| “I am only in the office maybe one day a week,” says Stéphane Gonthier, Senior Vice-President, Eastern North America. “There’s nothing in my desk drawers.” The Company from the beginning has an empowerment-oriented structure. Starting with our corporate stores, every management level is given a high degree of decision-making power. Two results come from this: first, most in-store decisions are taken locally to meet local opportunities, and second, management believes that people perform to a higher standard when given responsibility and a clear career path. |
| “The spirit of what Couche-Tard stands for is to put the right people in the right job and set the boundaries,” says Brian Hannasch , Senior Vice-President, Western North America. “Then give them room to do their job.” The process of empowerment is embedded in an enterprise-wide succession plan. For every manager, an individual is identified as that person’s likely successor and is trained into the job. The process can take a few years, involving just on-site and job-specific training, or it could require sending the person to college. |


Alimentation Couche-Tard / 13
Froster hits the same audience for Mac’s as Sloche does for Couche-Tard.
|
|

The performance of the stores is way above average. |
The Company’s eight business units each maintain a “school” or training facility for its corporate stores. Every store manager in the system undergoes in-school training for 7-10 days. This is followed up with regular shorter courses on technology, aspects of management or topical issues.
Employee input and training is built into the IMPACT store conversion program which will ultimately upgrade every corporate store in the network (read more on page 26). Before the conversion, the manager and staff are fully consulted on the planned changes and their input is sought. Staff follow in-depth training in customer service and needs.
The value that Couche-Tard places in its human assets became a touch point in the Circle K acquisition. Senior management insisted on personally visiting 25% of the outlets being acquired – some 400 stores – even though it would mean re-drawing deadlines and threatened to scuttle the deal.
“It turned out that the performance of the stores was way above average and the people were outstanding”, says Réal Plourde, Chief Operating Officer. “But we were prepared to end the talks if we were not able to do that evaluation. The people closest to the customer are absolutely key in this business.”
14 / Alimentation Couche-Tard
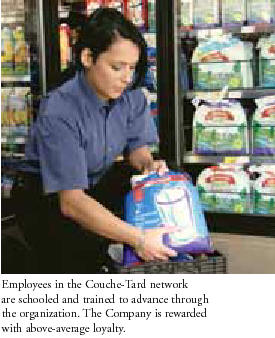 Two years later, the great majority of former Circle K employees are still in place and many have moved to more senior positions. Couche-Tard outperforms the industry average in many forms of measurement. A key area in which we are the industry leader is employee turnover – a reflection of both hiring effectiveness and good employee relations. “I think a lot of our success is due to empowering people,” says Plourde. “Each store manager is considered an owner of that store and he or she makes many decisions on their own without having to ask some superior. They really appreciate that, and the results back up the method.”
Both hiring effectiveness
|  |

Unlimited
BRAND POTENTIAL
PUTTING A FACE ON CONVENIENCE
Customer loyalty changes the game from convenience store to destination of choice. The Company is rapidly building three consistent brands in the marketplace.
Once upon a time, it didn’t matter whose name was over the doorway. It was the convenience store on the corner where you went when you ran out of basics. Because there was little or no barrier to entry, convenience stores have become the most proliferated form of retailing in North America – approximately 140,000 stores, more than three times the number of grocery stores.
But times change. As we live in an increasingly time-constrained world, every consumer wants convenience and every vendor wants to provide it. Companies across the retail spectrum are adding on services frequently outside of their core business – such as gasoline bars, ATMs and food service counters – as a means of attracting the customer by simplifying his or her day. The result is rapidly rising competitive pressure which prompts Couche-Tard to innovate more and more.
16 / Alimentation Couche-Tard
Creating loyalty requires knowing the customer’s expectations and then being able to meet them consistently.
The Company is set on making the customer experience so distinctive, so pleasant and rewarding, that the store becomes a destination of choice. |
The arrival of big, branded competitors might seem a serious threat to a convenience store operator. Unless he was already building his own brand.
“I want people to go to a Couche-Tard, Mac’s or a Circle K,” says CEO Alain Bouchard. “Not just to a convenience store. I am a big believer in evolution and I think we are at a stage where consumers will support a store that responds to their needs.”
The Company is set on making the customer experience so distinctive, so pleasant and rewarding, that the store becomes a destination of choice, not only of convenience. Capturing the customer’s loyalty means building and differentiating each of the Company’s three mega-brands – creating an identity that the consumer empathizes with and trusts.
For Couche-Tard, this relationship building is well documented. In Arizona, where the Circle K brand has been around for 50 years, customer loyalty is extraordinarily high.
“Every research survey we do will show some customers started shopping with Circle K when they were kids,” says Brian Hannasch, Senior Vice-President, Western North America. “And they are still shopping with us now –we’ve been able to grow with them and meet their expectations as they age.”
There are also indications that consumers in the Arizona markets will make purchases at multiple Circle K stores in the course of the day. They stop for gas and a coffee on the way to work, grab a sandwich at lunchtime and then stop on the way home to pick up something they need for dinner.
Creating loyalty doesn’t have to take 50 years but it does require knowing the customer’s expectations and then being able to meet them consistently. Couche-Tard is already a leader in this field through a system of benchmarking that shares best practices throughout the store network. It is also among the early leaders in deploying new technology for gathering and analyzing customer data.
In F’06, the Company completed the installation of point-of-sale scanning equipment in every store, data that greatly enhances purchasing, inventory turns and profit margins. With the addition of Business Intelligence software, product mix can be optimized, buying intentions identified and displays modified, if necessary by the hour, to capitalize on time-of-day purchasing patterns.
Customers are also drawn by specific products and brands. The Company uses in-store branding strate- loyalty means building gies, including proprietary and national brands, to three differentiate its offerings, especially fresh food, from other convenience stores, build customer loyalty and promote return shopping.
It markets its own brand in frozen drinks, sandwiches, freshly brewed coffee, milk, gasoline and financial services among a total of over 25 private or licensed brands. These include La Maisonnée fresh sandwiches and breakfast selections; Sunshine Joe coffee; Sloche, Froster, Thirst Buster and The Frozen Zone brands of beverages; new Énergie and Joker energy drinks; Lawson’s Milk; ATM’s; long distance calling cards and gift cards.
The Company also continues to build on existing partnerships with national coffee brand names such as Van Houtte, Millstone and Seattle’s Best Coffees.
Couche-Tard has branded and proprietary Quick Service Restaurants in almost 300 stores. Branded partners include Subway, Dunkin’ Donuts, Blimpie, M&M, Noble Roman’s and Quiznos.
Alimentation Couche-Tard / 17
Unlimited
GROWTH POTENTIAL
BUSINESS WITHOUT BOUNDARIES
The outlook is excellent for further growth. We have the strongest balance sheet in the industry, probably the best operating model and conditions are fertile for small and medium sized acquisitions.
Couche-Tard’s objective is to be the largest and most profitable convenience store operator in North America. In nine major deals to date, it has laid down a strong track record in the acquisition and integration of competitor stores and chains.
Acquisition is responsible for the major part of Couche-Tard’s expansion. The last major deal, the December 2003 purchase of the Circle K network, bolted on another 2,290 corporate and affiliated stores and vaulted it into the industry top tier in North America: third in total stores, second among independent chains (not integrated with an petroleum company) and first in profitability as a publicly traded company within our business sector. Since Circle K, the Company has added a further 633 corporate and affiliated stores including binding agreements.
18 / Alimentation Couche-Tard
Couche-Tard has built a reputation a shrewd acquirer and excellent integrator.
Couche-Tard has built a reputation as a shrewd acquirer and excellent integrator. Each deal creates strong revenue growth, margin improvement and significant savings through synergies.
“Our expectations with Circle K have been exceeded,” says Richard Fortin, Executive Vice-President and Chief Financial Officer. “It was the biggest deal we have made and it’s been the biggest success we have had.”
Two core strategies underpin Couche-Tard’s success in growing its network. The first is a financial strategy that has built credibility and strength. The second is an operating model that removes the boundaries limiting a fundamentally local business.
“Our financial model has been the same since the start – conservative,” says Fortin, “We don’t play the leverage game, seldom go above 50% debt, and do not take on a project unless we are confident of a 25% return on capital.”
The Company has a record of acquiring assets at very attractive prices. It will monetize acquired properties rapidly to reimburse lenders and put cash where it prefers to see it – in operating improvements. Promptly following the Circle K signing, it entered into a sale-leaseback of 322 properties for nearly US$253 million. Altogether, US$329 million was reimbursed to the banks within the first six months.
Couche-Tard’s net debt to total capitalization at the end of F’06 was at an all-time low of 17%, giving it the capacity to fund a US$1.5 billion acquisition without resorting to equity. That could be the next 2,000 U.S. stores.
|
|
Alimentation Couche-Tard / 19

| With our business structure, where you can adapt yourself to the community, you can have a store anywhere in North America. |
“Conditions are excellent for further growth,” maintains Fortin. “We have the strongest balance sheet in the industry and probably the most successful operating model, and conditions are fertile for small and medium-sized acquisitions.”
The most important characteristic of Couche-Tard’s growth philosophy is the scalability of its business model. At one end of a very flat, decentralized business structure, stores successfully adapt to meet localized customer preferences. At the other end, network growth is virtually open-ended with all but the highest level of general and administrative functions parceled out on a regional basis.
The leaders of each of the eight business units function like a CEO. They benefit from network strengths such as knowledge-sharing, technology, purchasing leverage and financial stability. At a regional level, they can respond rapidly to market changes and fine-tune merchandising and in-store layouts to meet regional or local taste –fundamental to the convenience store business.
“You can’t be everywhere with only one standardized approach,” points out Fortin. “But with our business structure, where you can adapt yourself to the community, you can have a store anywhere in North America.”
With the North American industry rapidly consolidating and U.S. real estate prices escalating, only a handful of large acquisition opportunities remain both desirable and doable. In the meantime, Couche-Tard’s network is quietly growing year-round. Development teams in each of the eight divisions are mandated to seek out and qualify acquisition opportunities from single stores up to 100 and decisions in the low ranges are taken at the regional level.
In F’06 the Company added 151 new corporate stores.
20 / Alimentation Couche-Tard
A Growing Network
Alimentation Couche-Tard / 21

HELPING PEOPLE
Weather the Storm
Couche-Tard’s business is all in the when times get tough. Each year the Company donates millions of dollars to aid others. But the past year witnessed a remarkable effort as staff, customers and suppliers rallied to help those caught in the devastation of Hurricane Katrina.
KATRINA
 | In-store fund raising and company donations raised more than US$1million for Katrina relief.
|
Back in 2004, the first year after acquiring the Circle K stores, Couche-Tard was welcomed to the U.S. Sunbelt by the most crippling storms to hit Florida in 40 years. The onsite teams showed their commitment to helping their neighbours and large donations were organized on behalf of the Florida Hurricane Relief Fund.
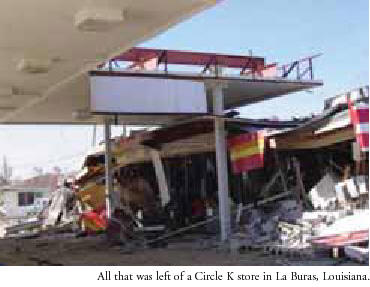
Then one year later, Hurricanes Katrina and Wilma displaced hundreds of thousands in the Gulf Coast region and caused devastation on a scale not seen since the 1906 San Francisco earthquake. Over 160 store sites were affected, 14 of them a total loss.
Employees in the region responded with two relief campaigns totaling well over half a million dollars US. One campaign was directed to their fellow employees in distress and the second to others suffering from the disasters. Other regions, all the way up to Canada, also mobilized and pushed the total raised to over one million US dollars.
“In this region, we have for years contributed to the United Cerebral Palsy campaign,” says Mick Parker, Vice-President, Operations, for the U.S. Florida and Gulf Region. “So we had a very effective donations system in place. For 60 days, we made our focus the Hurricane Katrina Employee Relief Fund and we set up fundraising activities such as car washes.”
Donations from employees and customers were supplemented at the Division and Head Office level. In total, US$418,000 was distributed to approximately 100 employees, 35 of whom had suffered total loss of all their belongings in the flooding that followed Katrina.
“It was a great outpouring of support from our colleagues,” says Kenny Hodges, Region Operations Director and the person who distributed the cheques to employees. “Especially for our employees. Those guys had lost everything and I had trouble locating everyone. I don’t think they ever expected the Company to come to their help and there were some very moving moments when I presented them with the cheques.”
Even though their place of work was scattered over the state, the Company kept managers and employees on the payroll until new jobs within the Company’s network could be found.
“People were very resilient,” says Hodges. “The attitude and the spirit were really remarkable.”
 |
Alimentation Couche-Tard / 23
 |
AN AMAZING ENGINE
For Good
CLOSE TO CDN$15 MILLION RAISED TO HELP OTHERS IN F’06
A well-run convenience store touches a lot of people. In Phoenix, for example, the equivalent of the entire metro population – 3.8 million people – passes through the city’s 350 Circle K stores every 10 days.
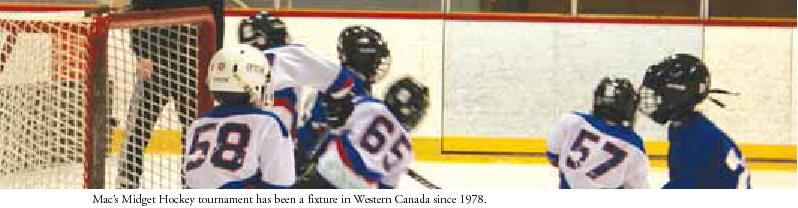
Push that out on even a more modest count and Couche-Tard’s network could conceivably access 4 to 5 million consumers on any given day. That’s a powerful capability. It’s especially powerful when the corner store is also a fixture of the community. As such, it has a major influence on mobilizing the population around it.
The Company puts this to good use. All three primary brands – Couche-Tard, Mac’s and Circle K – have long and proud histories of commitment to the communities they serve. Each year, dozens of organizations – from giant national bodies such as the Red Cross and United Way to the local centre for homeless children – become beneficiaries of a vast, supportive network anchored by canisters on thousands of counters.
In Fiscal 2006, this network contributed an extraordinary Cdn$5.9 million. In addition, Central Canada Mac’s stores turned over an amazing $8.5 million to charities within its division from the sale of Nevada lottery tickets.
Here is a cross-section of the year’s efforts by a dedicated team of tens of thousands of caring and concerned people.
24 / Alimentation Couche-Tard
Each year the Company commits at least 1% of its net earnings to the support of youth, health, welfare and humanitarian causes.
YOUTH
The welfare of young people has historically been the primary focus of the Company’s social commitment. In F’06, over $2 million US dollars was distributed to benefit such youth-related activities as:
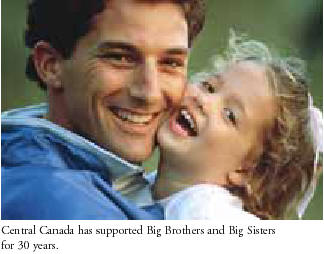
- The Big Brothers and Big Sisters, a mentoring organization for children 6-16.
The Easter Seal Campaign which helps children with disabilities.
The Boys and Girls Club of America, which helps boys and girls develop the qualities needed to become responsible citizens.
- The Children’s Miracle Network, which raises funds for 170 children’s hospitals across North America.
Opération Enfants Soleil, Jeunesse J’écoute and Le club des petits déjeuners,which seek to provide emotional and physical nourishment for children.
HEALTH & WELFARE
Providing adequate health care to people of all ages is another target of the Company fundraising, to the tune of US$2.9 million. The latter was distributed namely to the following organizations:
- The United Cerebral Palsy association has been the preferred agency of the Circle K organization since 1998. This past year over US$1.8 million was raised by stores in the U.S.
- The Canadian Cystic Fibrosis Foundation.
- The March of Dimes, which seeks to avert premature births.
- Organizations for muscular dystrophy.
- Educational and medical institutions; in Canada a five year committment was taking towards such organizations.
HUMANITARIAN AID
In addition to the campaign specifically to help relocate displaced employees, the Company’s stores across North America raised over US$670,000 for the Katrina hurricane survivors. The largest part of these contributions was turned over to the major disaster relief agencies:
- The Red Cross received donations totaling over US$623,000.
- The United Way was presented with a cheque for just under US$50,000.
 | Alimentation Couche-Tard / 25 |

STAYING ONE STEP
Ahead.
MAKING AN IMPACT
The Company’s store conversion program is creating a dynamic and differentiated new network for today’s consumer
The Company’s organic growth is driven largely by a far-reaching store conversion program known as IMPACT. The acronym, an employee contest winner, stands for Innovation-Marketing-People-Alimentation-Couche-Tard. The program is leading a radical, industry-wide makeover in convenience store concepts.
“Consumers are not buying what they bought 20 years ago,” says Réal Plourde, Executive Vice-President and Chief Operating Officer. “They have many choices now for the same product. That means our stores have to evolve and also offer more choice with better ambience.”
The IMPACT program, to which our people actively contribute, usually means the total makeover of a site.
The end result is
a more attractive ambience – brighter, with graphic themes reflecting local culture and more space to move around.
innovative merchandising displays which are tied in to a point-of-sale system scanning data for optimum results. Features differ by geographic region and include Beer Caves, premium coffee stations and food facilities.
- newly motivated, trained and skilled people (the “P” in the IMPACT system).
- enhanced product mix, especially in fresh-food products and financial services.
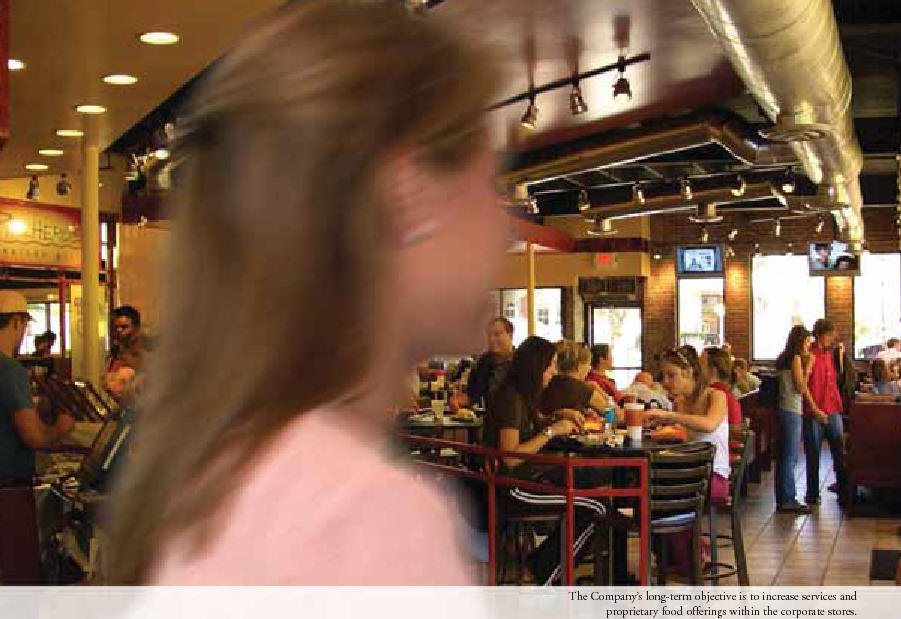
- quick service restaurants (QSR) which are either branded (Subway, Quiznos, Dunkin’ Donuts, etc) or proprietary. QSRs are in just under 300 stores or 6% of the network. The long term objective is to increase services and proprietary fresh food offerings within the corporate stores.
“The addition of prepared food services is an industry evolution over the past few years,” comments Réal Plourde. “At Couche-Tard we’re pretty good at breakfast now and we’ve got the hang of lunches. We’ve all got a long way to go, though, when it comes to the end of the day.”
26 / Alimentation Couche-Tard
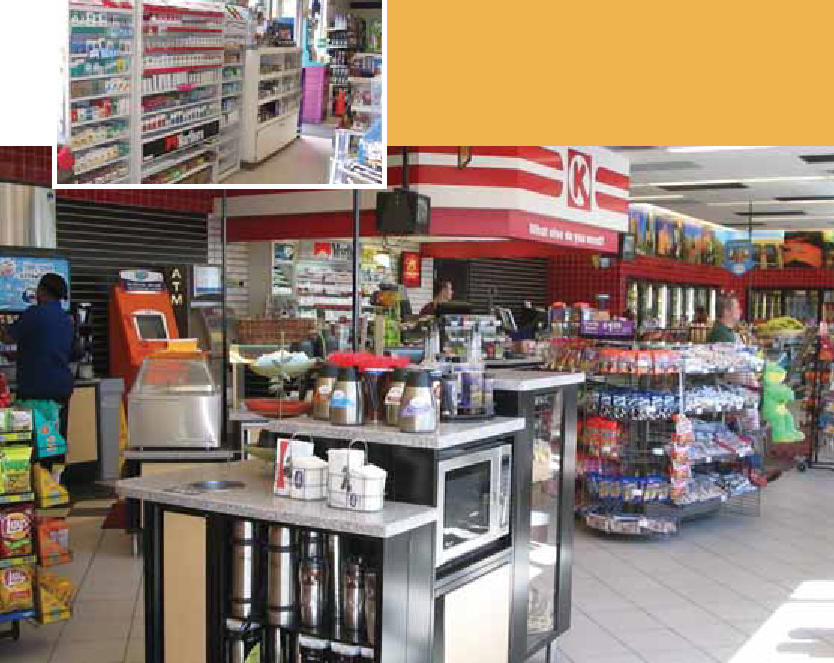
Before&AFTER
The IMPACT store conversion program is setting the pace for strong organic growth throughout the network. The small photo shows this Circle K store before conversion; the large photo shows the spacious, remodeled premises with inviting displays and a convenient coffee station.
Alimentation Couche-Tard / 27
The conversions have been hugely successful both in terms of financial returns and the presentation of a dynamic, contemporary brand.
| We focus on innovation to stimulate sales and differentiate our stores. |
The IMPACT conversions have been hugely successful both in terms of financial returns and the presentation of a dynamic, contemporary brand representing many more services than the average consumer would historically expect. The investment is usually around Cdn$100,000, ranging up to Cdn$200,000 if food services are included. Return on the investment consistently shows sales increases and margin improvements. The Company is also continually building out new stores and follows the same IMPACT formula.
The IMPACT program was first successfully rolled out under the Couche-Tard and Mac’s banners in Canada. In F’06, the Company doubled up the conversion rate–particularly with regard to updating the aged Circle K stores–and completed 406 makeovers and 40 new stores. Nearly half of the Company’s corporate network - - 1,722 stores - are now IMPACT stores and the long-term objective is to upgrade all stores in the network within an eight year cycle pursuant to such program.
The Company plans to keep up the pace in F’07 adding approximately 100 new store locations through new store development and small acquisitions.
The program is delivering significant value to Couche-Tard beyond the improved sales and margins. For one thing, it clearly differentiates the Company’s brands, stimulating customer loyalty and making them a choice whether the banner is Couche-Tard, Mac’s or Circle K.
For another, it acts as a sparkplug generating innovation and fresh in–store thinking. New products include financial services such as gift cards, cheque-cashing and ATMs, and a growing number of proprietary products such as coffee, sandwiches and energy drinks.
“We can’t push walls out and make more space,” says Plourde. “So we focus on innovation to stimulate sales and differentiate our stores.”
A third and highly important benefit is the effect on local management and staff. People and customer service are widely viewed as the means to success in the c-store business and they are integral to the IMPACT program. The makeovers are undertaken at the regional level and fully involve the local manager and staff. Employees are re-trained in service and customer needs.
“The effect on morale and motivation is tremendous,” says Plourde. “Take Circle K as an example. The previous operator stores–are now IMPACT had a different model with little or no reinvestment in the locations. Now we have really strong people, newly empowered with the IMPACT program, involved in the change process and ending up with a fantastic new atmosphere in which to serve their clients. It’s just great to see the results.”
Healthier fresh food |  |
28 / Alimentation Couche-Tard
| The Company’s stores offer as many as 3,200 items – almost twice that of a decade ago. |
GROWTH WITH INNOVATION
Store owners take an entrepreneurial approach.
With an average of 2,500 square feet in store size – roughly 5% the size of a supermarket – and as many items ininventory, getting the product mix right is an unforgiving task.
“Every square inch has to produce. You have to innovate to differentiate your store, but there’s little room for mistakes,” explains Stéphane Gonthier, Senior Vice-President, Eastern North America. “This business is not for everyone. You can’t be risk-averse and sleep at night.”
Couche-Tard’s growth can be traced in part to and entrepreneurial mindset that has become ingrained in the culture, from street level to the management of its eight divisions.
“There are several reasons for our in-store growth,” says Gonthier. “Among those, innovations and well-targeted marketing strategies.”
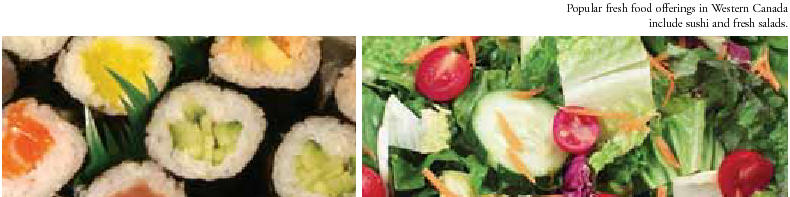
New product development tends to reflect regional preferences. In Canada, customer acceptance is strong for the proprietary breakfast product, a roller toasting station and a single-serve coffee station. Closer to the Pacific, Western Canada is seeing significant new sales from fresh fruit, sushi and Chinese food.
In the U.S. Sunbelt, where “cold” is the biggest single attribute that sells beer, Beer Caves eliminate warm beer and soft drink displays. A priority of the Arizona Division is to build a reputation for cold dispensed beverages.
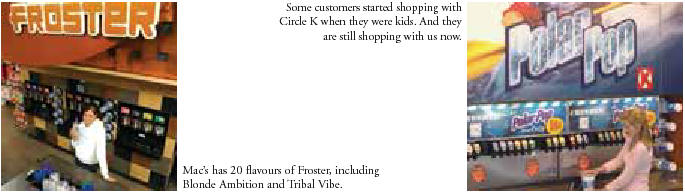
Frozen drinks are also a differentiator in Canada. In the east, Couche-Tard’s proprietary traffic builder is Sloche, and in Central and Western Canada, Mac’s has Froster.
Private and controlled brands play a major role in building customer loyalty and return traffic. Among 25 or so products are coffees (Millstone, Seattle’s Best and Van Houtte), energy drinks (Énergie and Joker) and sandwiches (La Maisonnée). Proprietary brands are oriented towards the largest gross profit contributors, those being foodservice and beverages.

Alimentation Couche-Tard / 29
We can now analyze the data to improve marketing strategies on a store-by-store basis. |
High-growth and high-margin foodservices are a staple of the IMPACT store conversion program. At the close of F’06, 6% of the network includes Quick Service Restaurant facilities. All of the IMPACT stores feature sandwiches and prepared foods. The Florida/Gulf Coast Division is getting a strong reception for its “Grab ‘n Go” breakfast and lunches.
Not all innovations are food stuffs. The US Southeast Division is generating significant revenues from 76 car wash locations. Eastern Canada boosted fuel sales with a joint promotion with the Canadian Automobile Association (CAA).
Financial services are a recent and promising addition. ATM machines are now at almost every location. Elsewhere in the network, services include bill payment, gift cards, prepaid American Express cards and cheque cashing (as many as twelve million people in the U.S. do not have a bank account).
The Company’s operations are built around a benchmarking and best practices procedure shared by all eight divisions. The result is a streamlined and effective process for bringing new winners to market rapidly and with minimum wasted effort.
“I think we are a leader in bringing to market new convenience products, especially foodstuffs, that will attract consumers to our brand,” says Brian Hannasch, Senior Vice-President, Western North America. “The slogan they use in Florida and Arizona is ‘What else do you need?’ That kind of sums it up.”
| 30 / Alimentation Couche-Tard | 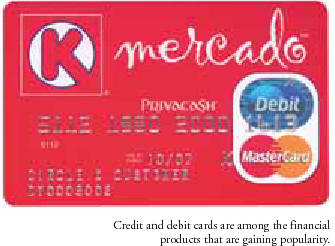 |
Teams with an Edge in Every Market
OPERATIONS TEAM

CORPORATE TEAM

Alimentation Couche-Tard / 31

STRONG ORGANIC
Growth
The fiscal year ended April 30, 2006 was marked by the continuation of the Company’s strong growth. Revenues increased 26.4% to US$10.2 billion and net earnings grew 26.4% to reach US$196.2 million.
It was a satisfying year, especially considering that this growth was almost entirely organic. The Company’s expansion has historically been by acquisition, with the last major deal being the addition of 1,663 Circle K corporate stores in December 2003. The year just ended demonstrates the effective integration of these assets and a steady increase in same-store sales. This is due to a rigorous network operating model and a commitment to customer service in each store.
“The year shows solid growth, continuing margin improvement and excellent financial health,” comments Richard Fortin, Executive Vice-President and CFO. “Frankly, I consider it quite a rarity for a company of our size to be showing such strong numbers. I believe it confirms both the vision and the business model.”
SOLID GROWTH, PROGRESSING MARGINS AND FINANCIAL HEALTH
(IN US DOLLARS)
| Revenues | $ | 10,157.3M | +26.4% |
| EBITDA(1) | $ | 438.6M | +27.8% |
| Net earnings | $ | 196.2M | +26.4% |
| Shareholders’ equity | $ | 966.0M | +31.8% |
| Merchandise and service gross margin | |||
| United States | 33.2% | ||
| Canada | 33.9% | ||
| Consolidated | 33.4% | ||
| Growth of same-store merchandise revenues(2) | |||
| United States | 5.2% | ||
| Canada | 3.9% | ||
| Growth of same-store motor fuel volume(2) | |||
| United States | 6.0% | ||
| Canada | 2.8% |
(1) EBITDA (Earnings Before Interest, Tax, Depreciation and Amortization) is presented for information purposes only and represents a performance measure used especially in financial circles. It does not have a standardized meaning prescribed by Canadian GAAP and therefore may not be comparable to similar measures presented by other public companies.
(2) Adjusted over a normal 52-week period.
Couche-Tard confirms the effectiveness of its controls over financial reporting as at April 30, 2006 thus conforming to legal and regulatory requirements in advance of the applicable implementation date set by Canada and United States regulatory authorities. For further detail, see page 46.
Full details of F’06 and comparison with the previous year will be found in the following Management Discussion & Analysis section.
32 / Alimentation Couche-Tard
MANAGEMENT’S DISCUSSION AND ANALYSIS
The purpose of this Management’s Discussion and Analysis (MD&A) is, as required by regulators, to explain management’s point of view on Alimentation Couche-Tard Inc.’s (Couche-Tard) financial condition and results of operations as well as past performance. More specifically, it outlines our development strategy, performance in relation to objectives, future expectations and how we address risk and manage our available financial resources. This MD&A also provides information to improve the reader’s understanding of the consolidated financial statements and related notes. It should therefore be read in conjunction with those documents. By “we”, “our”, “us” and “the Company”, we refer collectively to Couche-Tard and its subsidiaries.
Except where otherwise indicated, all financial information reflected herein is expressed in United States dollars (US dollars) and determined on the basis of Canadian generally accepted accounting principles (Canadian GAAP). You should read the following MD&A in conjunction with the annual consolidated financial statements and related notes included in this 2006 Annual Report. Additional information relating to Couche-Tard, including the Annual Information Form, is available on SEDAR at www.sedar.com and on the SEC’s website at www.sec.gov.
Forward-Looking Statements
This MD&A includes certain statements that are “forward-looking statements” within the meaning of the U.S. Private Securities Litigation Reform Act of 1995. Any statement in this MD&A that is not a statement of historical fact may be deemed to be a forward-looking statement. When used in this MD&A, the words “believe”, “intend”, “expect”, “estimate” and other similar expressions are generally intended to identify forward-looking statements.
It is important to know that the forward-looking statements in this MD&A describe our expectations as at July 12, 2006 and are not guarantees of future performance of Couche-Tard or its industry and involve known and unknown risks and uncertainties which may cause the Company’s or the industry’s outlook, actual results or performance to be materially different from any future results or performance expressed or implied by such statements. Our actual results could be materially different from what we expect if known or unknown risks affect our business, or if our estimates or assumptions turn out to be inaccurate. As a result, we cannot guarantee that any forward-looking statement will materialize and, accordingly, you are cautioned not to place undue reliance on these forward-looking statements. Forward-looking statements do not take into account the effect that transactions or special items announced or occurring after the statements are made may have on our business. For example, they do not include the effect of sales of assets, monetizations, mergers, acquisitions, other business combinations or transactions, asset write-downs or other charges announced or occurring after forward-looking statements are made.
Unless otherwise required by applicable securities laws, Couche-Tard disclaims any intention or obligation to update or revise any forward-looking statements, whether as a result of new information, future events or otherwise.
The foregoing risks and uncertainties include the risks set forth below under “Business Risks” as well as other risks detailed from time to time in reports filed by Couche-Tard with securities regulators in Canada and the United States.
Change in Reporting Currency
Since our first quarter of fiscal 2006, we have reported our financial results and financial position in US dollars and accordingly, our Canadian assets and liabilities are translated into US dollars using the exchange rate in effect at the balance sheet date. Revenues and expenses are translated at the average rate in effect during the period. Gains and losses are included in the Cumulative translation adjustments account in the Shareholders’ equity. The functional currency of the Company and the functional currencies of each of its subsidiaries remain unchanged. All comparative amounts for prior periods have been restated and are presented in US dollars.
Our Business
We are the leader in the Canadian convenience store industry. In North America, we are the third largest convenience store operator and the second largest independent convenience store operator (not integrated with a petroleum company) and the most profitable public company within such category. We currently operate a network of 4,983 convenience stores, 3,085 of which include motor fuel dispensing, located in eight large geographic markets, including three in Canada and five in the United States, covering 23 states. Some 37,000 people are employed throughout Couche-Tard’s retail convenience network and executive offices in North America.
We sell food and beverage items, motor fuel and other products and services targeted to meet our customers’ demand for convenience and quality in a clean and welcoming environment. We believe that our business model has differentiated Couche-Tard from its competition through its decentralized management structure, commitment to operational expertise, focus on in-store merchandise, particularly the higher growth and higher margin grocery categories, and continued investment in store modernization and technology.
Alimentation Couche-Tard / 33
In light of improvements made to the Store 2000 differentiation concept in recent years through the addition of various marketing and merchandizing approaches and components, we have renamed our various concepts under one acronym – IMPACT (Innovation, Marketing and People at Alimentation Couche-Tard). This acronym reflects not only the impact our differentiation strategies have on our customers, sales and earnings but also the diversity of the dynamic programs designed by the Couche-Tard teams in order to create a unique, warm, friendly and inviting environment for customers.
We conduct our business through different modes of operations. Although the majority of our stores are Company-operated, some are part of our affiliate program, which includes franchised and licensed stores. The amount of operating income generated from the affiliates amounted to $14.1 million or 4.3% of our total operating income for fiscal 2006, including $2.7 million or 1.0% of our total operating income generated by licensees outside North America.
The convenience store industry is fragmented, with the top ten operators representing only approximately 25% of the estimated total of 138,200 stores in the United States. Industry consolidation by highly leveraged operators in the 1990’s, combined with competition and fluctuations in motor fuel margins, has led to numerous corporate restructurings and rationalizations in recent years. As a result, we believe the opportunity exists for well-capitalized, established industry participants to grow through mergers and acquisitions.
2006 Overview
We announced record results for fiscal 2006, up 26.4% over last year to $196.2 million or $0.94 per share on a diluted basis. This performance primarily reflects growth in merchandise and service revenues and motor fuel revenues as well as an increase in the corresponding gross margins in our Canadian and American markets.
Excluding non-recurring items and items for which we have little or no control, net earnings would have been $195.8 million(1) or $0.94 per share on a diluted basis, an increase of 26.2% compared to last fiscal year.
Also, net earnings of the fourth quarter of 2006 amounted to $32.1 million or $0.15 per share on a diluted basis, a decrease of 1.2%. However, excluding the items mentioned above, net earnings would have been $36.7 million(1) or $0.18 per share on a diluted basis, which represents an increase of 35.9 % compared with the net earnings of the fourth quarter of the previous year (adjusted based on the annual effective income tax rate of 2005).
During the year, we experienced significant increases in the retail price of motor fuel in our U.S markets, primarily attributable to the volatility in the world prices for crude oil. The average retail price of motor fuel in our U.S. markets amounted to $2.40 per gallon in fiscal 2006 compared with $1.94 per gallon in fiscal 2005. The gross margin on motor fuel revenues varies primarily as a result of product cost volatility and competition. Although motor fuel gross margins can be volatile from one quarter to the next, they generally even out on an annual basis. For each of our four quarters commencing with the first quarter of fiscal 2006, motor fuel gross margins for the Company-operated stores in the U.S. markets stood at 14.86¢, 17.05¢, 17.63¢ and 10.96¢ per gallon respectively - with a weighted average of 15.14¢ per gallon for 2006 compared with 14.17¢ per gallon for the previous year. Net of electronic payment modes related expense, these same gross margins were 11.88¢(2), 13.55¢(2), 14.39¢(2) and 7.65¢ per gallon, with a weighted average of 11.88¢ per gallon in fiscal 2006, compared with 11.52¢ per gallon in fiscal 2005. In fiscal 2006, this increase in the motor fuel gross margin had a positive impact of $19.7 million on our operating income ($25.3 million including Company-operated stores in Canada). Net of the increase in electronic payment modes related expense, excluding volume effect, the positive impact is reduced to $7.2 million ($11.6 million including Company-operated stores in Canada).
Dividends
On November 15, 2005, the Company’s Board of Directors adopted a quarterly dividend policy of Cdn0.025$ per share on Class A multiple voting shares and Class B subordinate voting shares (the shares). Following the adoption of this dividend policy, the Board of Directors declared and approved quarterly dividends of Cdn0.025$ per share for both second and third quarters of fiscal 2006. Subsequent to year end, the Board of Directors declared and approved a quarterly dividend of Cdn0.025$ per share for the fourth quarter of fiscal 2006, payable July 31, 2006.
| (1) | These adjusted net earnings are presented for information purposes only. They do not have a standardized meaning prescribed by Canadian GAAP. Management believes this information is a relevant complement to information published based on Canadian GAAP. | |
| (2) | Restated following improvements in analysis and available data. | |
34 / Alimentation Couche-Tard
Business acquisitions
During fiscal 2006, we made the following business acquisitions:
| • | effective March 14, 2006: purchase of 34 Company-operated stores and 19 affiliated stores, all operating under the Shell banner in the Indianapolis area of Indiana, United States, from Shell Oil Products US. At the closing date, two Company-operated stores were closed; |
| • | effective December 14, 2005: purchase of 16 Company-operated stores operating under the Winners banner in New Mexico, United States, from Conway Oil Company and Conway Real Estate Company; |
| • | effective December 8, 2005: purchase of 18 Company-operated stores and 8 affiliated stores, all operating under the BP banner in the Memphis area of Tennessee, United States, from BP Products North America, Inc.; |
| • | effective November 3, 2005: purchase of seven Company-operated stores operating under the Fuel Mart banner in Ohio, United States, from Ports Petroleum Co. |
We expect those 73 new Company-operated stores and 27 affiliated stores to represent additional annual sales of approximately $341.0 million and to contribute to our net earnings on an annual basis.
These four acquisitions were carried out for a total cash consideration of $91.6 million, financed using the Company’s available cash. The net assets acquired include $4.6 million in working capital, $81.4 million in property and equipment, $2.0 million in trademarks and licences, $1.3 million in other assets, $3.9 million in goodwill and $1.6 million in deferred credits and other liabilities. Most of the goodwill related to the transactions is deductible for tax purposes.
Internal controls
We confirm the effectiveness of our controls over financial reporting as at April 30, 2006 thus conforming to legal and regulatory requirements prior to the applicable implementation date set by Canadian and American regulatory authorities.
Franchises and licences
During fiscal 2006, we entered into an agreement with ConocoPhillips Company resulting in the addition of 75 new franchises operating under the Circle K banner in the Western United States, which will bring the total to 251 franchises operated by ConocoPhillips Company and 672 franchises in the entire North American network. Also during fiscal 2006, we decided not to renew the agreement with the licence holder of 800 stores operated in Taiwan under the Circle K banner since we did not agree on conditions of renewal. Overall, the impact of these events on our financial position and operating results will not be significant.
Hurricanes
Fiscal 2006
During 2006, Florida and the Gulf of Mexico region was affected by three hurricanes, which resulted in some damages to certain of our sites. We estimates that assets and leased properties that were damaged have a total replacement value of approximately $16.7 million, which will result in a net claim of about $13.0 million. The net book value of the damaged assets is lower than the net claim. As at April 30, 2006, we have received $2.0 million in insurance proceeds. We do not expect these hurricanes to have a significant effect on our financial position and operating results.
In total, 163 sites were affected to various degrees, 15 of which are still closed as of today. Of these sites, we expect that approximately 13 will remain permanently closed because they did not have the potential to meet our contribution expectations, while the other two should reopen in fiscal year 2008. As at April 30, 2006, and from the date of occurrence of those events, we estimate that we have lost approximately 5,500 store-days.
As part of our risk management process, we have decided not to renew our insurance coverage for material damage related to hurricanes. This decision is based on the fact that the renewal conditions proposed by the insurance companies were considered to be unacceptable from an economic perspective. In fact, based on the proposals received, we would have had to assume the majority of the risk. In addition, we believe that we have the financial strength and available funds to absorb the risk. This decision will be reviewed and re-evaluated on a regular basis in light of changing market conditions.
Alimentation Couche-Tard / 35
Fiscal 2005
During 2005, certain areas of our business in Florida experienced damages resulting from four hurricanes. Assets and leased properties that were damaged have a total replacement value of $23.5 million, which resulted in a net claim of about $16.6 million. The net book value of the damaged assets is lower than the net claim. As at April 30, 2006, we have received $15.9 million in insurance proceeds. We consider that these hurricanes had no significant effect on our financial position and operating results.
In total, 92 sites were affected to various degrees, four of which will remain permanently closed because they did not have the potential to meet our contribution expectations. As at April 30, 2006, and from the date of occurrence of those events, we estimate that we have lost approximately 4,800 store-days.
Subsequent events
Acquisitions
On June 12, 2006, we finalized the transaction with Spectrum Holding, Inc. regarding the acquisition of 90 stores operating under the Spectrum banner in the States of Georgia and Alabama in the United States. The transaction was carried out for a cash consideration of $130.0 million, financed using the Company’s available cash. We expect that the 90 new stores will represent additional annual revenues of approximately $325.0 million and that they will contribute to our net earnings on an annual basis.
In addition, again on June 12, 2006, we signed an agreement with Moore Oil Company, LLC in order to acquire a network of 24 stores operating under the Stop-n-Save banner in the Monroe area of Louisiana in the U.S. Of the 24 stores, six are operated by the company, 17 are operated by independent store operators and one store is currently under construction. If the transaction is completed as expected in July 2006, we anticipate that these stores will contribute to our operating income on an annual basis.
Income taxes
On June 9, 2006, the Government of Québec adopted Bill 15 in the National Assembly of Québec regarding amendments to the Taxation Act and other legislative provisions. As a result, an unusual retroactive income tax expense of approximately $9.8 million, excluding other associated expenses, will be recognized in the first quarter of fiscal 2007. This modification will not have a significant impact on the effective income tax rate of the Company in the future.
Outstanding shares and stock options
As at June 30, 2006, Couche-Tard had 56,388,652 Class A multiple voting shares and 145,651,434 Class B subordinate voting shares issued and outstanding. In addition, as at the same date, Couche-Tard had 9,307,980 outstanding stock options for the purchase of Class B subordinate voting shares.
Income Statement Categories
Merchandise and Service Revenues. In-store merchandise revenues are comprised primarily of the sale of tobacco products, grocery items, candy and snacks, beverages, beer/wine and fresh food offerings, including quick service restaurants (QSRs). Service revenues include the commission on sale of lottery tickets and issuance of money orders, fees from automatic teller machines, sales of calling cards and gift cards, fees for cashing cheques and sales of postage stamps and bus tickets, as well as revenues from car washes. Service revenues also include franchise fees, license fees from affiliates and royalties from franchisees.
Motor Fuel Revenues. We include in our revenues the total dollar amount of motor fuel sales, including any imbedded taxes, if we take ownership of the motor fuel inventory. In the United States, we purchase motor fuel and sell it to approximately 112 independent store operators at cost plus a mark-up. We record the full value of these revenues (cost plus mark-up) as motor fuel revenues. Where we act as a selling agent for a petroleum distributor, only the commission we have earned is recorded as revenues. Gross profit from motor fuel is derived by deducting the cost of the motor fuel from the motor fuel revenues, except for commission stores where the gross profit is equal to the recorded commission from the sale.
Gross Profit. Gross profit consists mainly of revenues less the cost of goods and motor fuel sold. For in-store merchandise, the cost of inventory is generally determined using the retail method (retail price less a normal margin), and for motor fuel, it is determined using the average cost method.
36 / Alimentation Couche-Tard
Operating, Selling, Administrative and General Expenses. The primary components of operating, selling, administrative and general expenses are labor, occupancy costs, commissions to dealers and overhead and include advertising expenses that are charged as incurred.
Key performance indicators used by management, which can be found under “Results of Operations-Other Operating Data”, are merchandise and service gross margin, growth of same-store merchandise revenues, motor fuel gross margin and growth of same-store motor fuel volume.
Summary of Fourth Quarter Results: 13-Week Period Ended April 30, 2006 Compared to the 12-Week Period Ended April 24, 2005
The following table highlights certain information regarding the movement of our stores during the 13-week period ended April 30, 2006:
| Company-operated | Affiliated | Total | |
| stores | stores | ||
| Number of stores, beginning of period | 3,605 | 1,304 | 4,909 |
Acquired | 32 | 19 | 51 |
Opened | 22 | 33 | 55 |
Closed | (25) | (7) | (32) |
Converted into affiliated stores | (2) | 2 | - |
| Number of stores, end of period | 3,632 | 1,351 | 4,983 |
During the quarter, we also implemented our IMPACT program in 182 Company-operated stores for a total of 446 in 2006. As a result, 47.6% of our Company-operated stores have now been converted to our IMPACT program, which gives us considerable potential for future internal growth.
All of our Company-operated stores that were closed did not have the potential to meet our contribution expectations. Most of these stores were part of the Circle K network acquired December 17, 2003.
The following table highlights certain information regarding our operations for the 13-week period ended April 30, 2006 and the 12-week period ended April 24, 2005:
| (In millions of US dollars, unless otherwise stated, unaudited) | 13-week period | 12-week period |
| ended | ended | |
| April 30, 2006 | April 24, 2005 | |
| Revenues | 2,638.9 | 1,961.7 |
| Operating income | 57.2 | 47.1 |
| Net earnings | 32.1 | 32.5 |
| Selected Operating Data: | ||
| Growth of same-store merchandise revenues on a 12-week basis (1) (2): | ||
Canada | 4.3% | 3.3%(3) |
United States | 4.6% | 6.6%(3) |
| Growth of same-store motor fuel volume on a 12-week basis (2): | ||
Canada | 4.1% | 7.4%(3) |
United States | 5.8% | 4.5%(3) |
| (1) | Excludes other revenues derived from franchise fees, royalties and rebates on some purchases by franchisees and licensees. (Growth in Canada is calculated based on Canadian dollars.) | |
| (2) | Since our first quarter of fiscal 2006, growth in both merchandise revenues and motor fuel volume has been reported on a same-store basis. | |
| (3) | For the comparative period, growth in merchandise revenues and motor fuel volume is reported on an average per store basis to be constant with our prior practices. Growth in the United States excludes the Circle K acquisition. | |
Alimentation Couche-Tard / 37
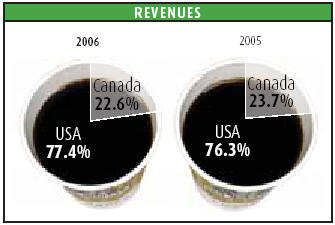
For the 13-week period ended April 30, 2006, we achieved revenues of $2.64 billion, compared with $1.96 billion for the same period in fiscal 2005, an increase of 34.5% or $677.2 million. We recorded 78.9% of our revenues in the United States, compared with 77.7% in the fourth quarter last year.
In the United States, growth of same-store merchandise revenues (on a 12-week standardized basis) was 4.6 % while it was 4.3% in Canada. In both the U.S. and Canada, this growth is partially due to the results from investment in our IMPACT program conversions, as well as the results from the launch of new products that were well received by customers and from the implementation of our pricing strategies on certain product categories. In Canada, the growth was negatively affected by growing smuggling on tobacco products.
In the United States, the growth of same-store motor fuel volume (on a 12-week standardized basis) was 5.8 % in the fourth quarter of 2006 while it was 4.1% in Canada, which reflects the positive impact, in both the U.S. and Canada, of certain pricing strategies. Growth in Canada also reflects the positive consumer response in Ontario to our rebranding of several motor fuel locations, which now operate under Mac’s in addition to a strong economy in Western Canada.
Net earnings stood at $32.1 million or $0.16 per share ($0.15 per share on a diluted basis), compared with $32.5 million or $0.16 per share ($0.16 per share on a diluted basis), which represents a decrease of 1.2%. By applying the annual effective tax rate in effect for 2005 (32.08%) to earnings of the fourth quarter of 2005, the net earnings for this quarter would have been $27.0 million or $0.13 per share on a diluted basis. In addition, net earnings in the fourth quarter of 2006 were affected by the following items, presented net of income tax:
Net earnings for the 4th quarter of 2006, as presented | Negative impact related to the increase in electronic payment modes related expense (1) | Negative impact related to non-recurring termination fees (2) | Negative impact related to the increase in the effective tax rate (3) | Positive impact related to changes in the exchange rate (4) | Positive impact related to the 13th week of the 4th quarter of 2006 | Net earnings for the fourth quarter of 2006, adjusted (5) |
$32.1 million | $4.0 million | $3.3 million | $1.0 million | ($1.0) million | ($2.7) million | $36.7 million |
(1) | Related to the increase in the retail price and sales volume of motor fuel. |
(2) | Recognition of a non-recurring charge relating to penalties for the termination of two contracts governing the operation of automatic teller machines in some of our stores in the United States. The termination of these contracts will allow us to operate the automatic teller machines in these stores ourselves and to increase their contribution. |
(3) | Impact of the increase in the effective tax rate, which was 34.09% in the fourth quarter of this year compared with 32.08% for fiscal year 2005. |
(4) | Impact of the increase in the value of the Canadian dollar compared with the US dollar. |
(5) | These adjusted net earnings are presented for information purposes only. They do not have a standardized meaning prescribed by Canadian GAAP. Management believes this information is a relevant complement to information published based on Canadian GAAP. |
Thus, by taking into account all of these factors for which the nature is non-recurring or for which the Company has little or no control, the net earnings for the fourth quarter of 2006 would have been $36.7 million ($0.18 per share on a diluted basis), which represents an increase of 35.9% compared with the net earnings of the fourth quarter of the previous year (adjusted based on the annual effective income tax rate of 2005).
Exchange Rate Data
The Company’s US dollar reporting currency provides shareholders with more relevant information giving consideration to the predominance of our operations in the United States and our US dollar denominated debt.
The following table sets forth information about exchange rates based upon the Bank of Canada closing rates expressed as US dollars per Cdn$1.00:
| 53-week period ended | 52-week periods ended | ||
| April 30, 2006 | April 24, 2005 | April 25, 2004 | |
| Average for the period (1) | 0.8417 | 0.7779 | 0.7431 |
| Period end | 0.8945 | 0.8098 | 0.7349 |
| (1) | Calculated by taking the average of the closing exchange rates of each day in the applicable period. | |
38 / Alimentation Couche-Tard
Selected Consolidated Financial Information
The following table highlights certain information regarding our operations for the 53-week period ended April 30, 2006 and the 52-week periods ended April 24, 2005 and April 25, 2004:
| (In millions of US dollars, unless otherwise stated) | 53-week period ended | 52-week periods | |
| April 30, 2006 | April 24,2005 | April 25, 2004 restated | |
| Statement of Operations Data: | |||
| Merchandise and service revenues (1) : | |||
Canada | 1,426.7 | 1,239.5 | 1,130.6 |
United States | 2,812.0 | 2,564.7 | 1,195.3 |
Total merchandise and service revenues | 4,238.7 | 3,804.2 | 2,325.9 |
| Motor fuel revenues | |||
Canada | 873.7 | 664.8 | 507.1 |
United States | 5,044.9 | 3,567.8 | 1,562.3 |
Total motor fuel revenues | 5,918.6 | 4,232.6 | 2,069.4 |
| Total revenues | 10,157.3 | 8,036.8 | 4,395.3 |
| Merchandise and service gross profit (1) : | |||
Canada | 483.1 | 415.7 | 367.4 |
United States | 932.3 | 834.9 | 389.7 |
Total merchandise and service gross profit | 1,415.4 | 1,250.6 | 757.1 |
| Motor fuel gross profit: | |||
Canada | 63.6 | 51.3 | 47.3 |
United States | 312.5 | 255.9 | 110.1 |
Total motor fuel gross profit | 376.1 | 307.2 | 157.4 |
| Total gross profit | 1,791.5 | 1,557.8 | 914.5 |
| Operating, selling, administrative and general expenses | 1,352.9 | 1,214.7 | 740.3 |
| Depreciation and amortization of property and equipment and other assets | 106.9 | 83.9 | 57.7 |
| Operating income | 331.7 | 259.2 | 116.5 |
| Financial expenses | 34.0 | 30.7 | 23.5 |
| Write-off of financing costs | - | - | 9.2 |
| Earnings before income taxes | 297.7 | 228.5 | 83.8 |
| Income taxes | 101.5 | 73.3 | 27.7 |
| Net earnings | 196.2 | 155.2 | 56.1 |
| Other Operating Data: | |||
| Merchandise and service gross margin (1) : | |||
Consolidated | 33.4% | 32.9% | 32.6% |
Canada | 33.9% | 33.5% | 32.5% |
United States | 33.2% | 32.6% | 32.6% |
| Growth of same-store merchandise revenues on a 52-week basis (2) (5): | |||
Canada | 3.9% | 2.6%(6) | 3.1%(6) |
United States | 5.2% | 10.4%(6) | 3.9%(6) |
| Motor fuel gross margin: | |||
Canada (Cdn cents per litre) | 5.00 | 4.61 | 4.77 |
United States (cents per gallon) (3) | 15.14 | 14.17 | 11.57 |
| Volume of motor fuel sold (4) : | |||
Canada (millions of litres) | 1,509.6 | 1,413.5 | 1,329.2 |
United States (millions of gallons) | 2,116.1 | 1,858.1 | 996.1 |
| Growth of same-store motor fuel volume on a 52-week basis: | |||
Canada | 2.8% | 6.6%(6) | 6.7%(6) |
United States | 6.0% | 6.3%(6) | 6.4%(6) |
| Per Share Data: | |||
Basic net earnings per share (dollars per share) | 0.97 | 0.77 | 0.31 |
Diluted net earnings per share (dollars per share) | 0.94 | 0.75 | 0.30 |
Dividends paid on common shares (Cdn dollars per share) | 0.05 | - | - |
| Balance Sheet Data: | |||
Total assets | 2,369.2 | 1,995.7 | 1,650.8 |
Interest-bearing debt | 524.1 | 530.9 | 536.9 |
| (1) | Includes other revenues derived from franchise fees, royalties and rebates on some purchases by franchisees and licensees. | |
| (2) | Does not include services and other revenues (as described in footnote 1). (Growth in Canada is calculated based on Canadian dollars.) | |
| (3) | For Company-operated stores only. | |
| (4) | Includes volume of franchisees and dealers. | |
| (5) | Since our first quarter of fiscal 2006, growth in both merchandise revenues and motor fuel volume has been reported on a same-store basis. | |
| (6) | For both comparative periods, growth in merchandise revenues and motor fuel volume is reported on an average per store basis to be constant with our prior practices. Growth in the United States excludes the Circle K acquisition. | |
Alimentation Couche-Tard / 39
53-Week Period Ended April 30, 2006 Compared to the 52-Week Period Ended April 24, 2005
The following table highlights certain information regarding the movement of our stores during the 53-week period ended April 30, 2006:
| Company-operated stores | Affiliated stores | Total | |
| Number of stores, beginning of period | 3,581 | 1,264 | 4,845 |
Acquired | 73 | 27 | 100 |
Opened | 78 | 119 | 197 |
Closed | (91) | (68) | (159) |
Converted into Company-operated stores | 1 | (1) | - |
Converted into affiliated stores | (10) | 10 | - |
| Number of stores, end of period | 3,632 | 1,351 | 4,983 |
All of our Company-operated stores that were closed did not have the potential to meet our contribution expectations. Most of these stores were part of the Circle K network acquired December 17, 2003.
For the 53-week period ended April 30, 2006, we achieved revenues of $10.16 billion, compared with $8.04 billion in fiscal 2005, a significant increase of 26.4% or $2.12 billion. We recorded 77.4% of our revenues in the United States, compared with 76.3% in the previous fiscal year.
In the United States, growth of same-store merchandise revenues (on a 52-week standardized basis) was 5.2% over the prior year while it was 3.9% in Canada. In both the U.S. and Canada, this growth reflects the results from investment in our IMPACT program conversions as well as the efforts made by implementing new pricing strategies on certain product categories and by modifying product mix. In the U.S., the increase in tobacco tax in some regions also contributed to the growth while in Canada, growing smuggling on tobacco products had a negative impact.
In the United States, the growth of same-store motor fuel volume (on a 52-week standardized basis) was 6.0% while it was 2.8% in Canada. The growth in the U.S. in part reflects the positive impact of certain pricing strategies, partially offset by the shortage of motor fuel in certain regions in the second and third quarters of 2006 due to the hurricanes. In addition, in both the U.S. and Canada, growth was negatively affected by pressure on consumer spending caused by the sharp increase in retail pump prices.
Gross profit grew by 15.0% or $233.7 million to $1.79 billion, compared with $1.56 billion for the previous year. This increase is mainly due to higher sales overall and higher margins on merchandise and service revenues and on motor fuel revenues in both Canada and the U.S.
| • | The consolidated merchandise and service gross margin was 33.4%, up from 32.9% in the previous fiscal year. The gross margin in the U.S was 33.2%, up from 32.6% in the previous year. In Canada, it was 33.9% compared with 33.5% for fiscal 2005. In both our Canadian and U.S. markets, the impact of improvements in purchasing terms, changes in product mix with a focus on higher margin items, the launch of new products that were well received by customers and that generated higher margins, as well as the implementation of our IMPACT program in an increasing number of our stores are behind the increase in gross margin. However, the increase in gross margin in the United States and Canada was also affected by our pricing strategies on certain product categories designed to increase volume. |
| • | The motor fuel gross margin increased to 15.14¢ per gallon in the United States from 14.17¢ per gallon in the previous year, whereas in Canada, it also increased, reaching Cdn5.00¢ per litre compared with Cdn4.61¢ per litre in the previous year. These increases primarily reflect the volatile nature of the motor fuel business, partially offset by our selective pricing strategies implemented in certain areas of the U.S. to increase sales volume and by strong competition in some regions. |
Operating, selling, administrative and general expenses increased by $138.2 million or 11.4% over the previous fiscal year. This includes an increase of $20.8 million in electronic payment modes related expense, which relates to the increase in the retail price of motor fuel. As a percentage of merchandise and service revenues, operating, selling, administrative and general expenses remained unchanged despite the recognition of a non-recurring charge of $5.0 million relating to the termination of certain contracts governing the operation of automatic teller machines in some of our stores in the United States. Not including this non-recurring charge, operating, selling, administrative and general expenses would have decreased by 0.1% as a percentage of merchandise and service revenues, reflecting the effectiveness of our operating model.
40 / Alimentation Couche-Tard
Depreciation and amortization of property and equipment and other assets increased by 27.4% to $106.9 million in fiscal 2006. This increase is due mainly to the impact of the capital expenditures made during fiscal 2005 and 2006.
Operating income of $331.7 million for fiscal 2006 increased by 28.0%, or $72.5 million, over the $259.2 million earned in the previous fiscal year.
Financial expenses of $34.0 million were up by $3.3 million or 10.7% over last year due to a general increase in interest rates. The average interest rate applied to our borrowings rose to 7.0% compared with 5.2% for fiscal 2005. Interest rate swaps entered into in March 2004 increased financial expenses by $1.3 million compared with a decrease of $5.6 million for fiscal 2005. In addition, financial expenses were reduced by $8.1 million of interest income earned from the investing of excess cash compared with $2.2 million in the previous year.
Income taxes increased by $28.2 million or 38.5%, to $101.5 million, primarily due to increased pre-tax earnings. The increase in the effective income tax rate by approximately 2.0% is attributable to changes made to the apportionment of taxable income among the various jurisdictions that have different income tax rates.
Net earnings increased by $41.0 million or 26.4%, to $196.2 million or $0.97 per share ($0.94 per share on a diluted basis), compared with $155.2 million or $0.77 per share ($0.75 per share on a diluted basis) in the previous year. Net earnings for 2006 were affected by the following items, presented net of income tax:
Net earnings for 2006, as presented | Negative impact related to the increase in electronic payment modes related expense (1) | Negative impact related to non-recurring termination fees (2) | Positive impact related to the increase in motor fuel margins (3) | Negative impact related to the increase in the effective tax rate (4) | Positive impact related to changes in the exchange rate (5) | Positive impact related to the 53rd week of 2006 | Net earnings for 2006, adjusted (6) |
$196.2 million | $13.7 million | $3.3 million | ($16.7) million | $6.0 million | ($4.0) million | ($2.7) million | $195.8 million |
(1) Related to the increase in the retail price and sales volume of motor fuel.
(2) Recognition of a non-recurring charge relating to penalties for the termination of certain contracts governing the operation of automatic teller machines in some of our stores in the United States.
(3) Increase in the motor fuel gross margins for our Company-operated stores.
(4) Impact of the increase in the effective tax rate, which was 34.09% for this year compared with 32.08% for fiscal year 2005.
(5) Impact of the increase in the value of the Canadian dollar compared with the American dollar.
(6) These adjusted net earnings are presented for information purposes only. They do not have a standardized meaning prescribed by Canadian GAAP. Management believes this information is a relevant complement to information published based on Canadian GAAP.
Thus, by taking into account all of these factors for which the nature is non-recurring or for which the Company has little or no control, the net earnings for 2006 would have been $195.8 million ($0.94 per share on a diluted basis), which represents an increase of 26.2% compared with the net earnings for the previous year.
Financial Position as at April 30, 2006
Our total consolidated assets of $2.37 billion as at April 30, 2006 increased by $373.5 million compared with the previous year. The following items primarily represent the change:
an increase of $202.1 million in property and equipment attributable to capital investments in 2006;
an increase of $78.8 million in cash and cash equivalents, which amounted to $331.5 million as at April 30, 2006;
an increase of $26.6 million in credit and debit card receivables generated mostly by higher motor fuel revenues;
an increase of $21.2 million in motor fuel inventory attributable to higher crude oil prices on the global market.
Alimentation Couche-Tard / 41
Shareholders’ equity of $966.0 million as at April 30, 2006 increased by $232.8 million resulting mainly from net earnings of $196.2 million in addition to the increase in cumulative translation adjustments for fiscal 2006. The increase in cumulative translation adjustments was generated by significant exchange rate fluctuations. The net interest-bearing debt to total capitalization ratio stood at 0.17:1 (1) versus 0.28:1 as at April 24, 2005.
Liquidity and Capital Resources
Our principal source of liquidity is net cash provided by operating activities. Our principal uses of cash are to finance our capital expenditures, carry out acquisitions, pay dividends, meet debt service requirements, and provide for working capital. We expect that cash available from operations together with borrowings available under our revolving credit facilities as well as potential sale and leaseback transactions will be adequate to meet our liquidity needs in the foreseeable future.
As at April 30, 2006, our total debt was $524.1 million (of which $350.0 million consisted of 7.5% Subordinated unsecured debt maturing in 2013, $166.5 million consisted of borrowings under our Secured term loans and $7.6 million consisted of other long-term debt).
In addition to the above, we have interest rate swap agreements with three banks under which we pay interest on $350.0 million at a rate of LIBOR plus an aggregate weighted average rate factor of 2.95%. The interest rate is reset every six months over the term of the agreements. The swap agreements, which expire on December 15, 2013, provide that, after December 15, 2008, each bank has the right to terminate its arrangement with the payment of a termination fee if terminated before December 15, 2011 and, if terminated after that date, without payment of a termination fee. In addition, both parties to each agreement have a mutual right to terminate the arrangement on the fifth anniversary date of the effective date of each of the three agreements. If such right was exercised by either party, that party would be required to pay the other party the mark to market value of the interest rate swap. We formally document and designate each derivative financial instrument as a hedge of our Subordinated unsecured debt. We determine that derivative financial instruments are effective hedges, at the time of the establishment of the hedge and for the duration of the instrument, since the date to maturity, the reference amount and interest rate of the instruments correspond to all the conditions of the debt.
_____________________________
(1) This ratio is presented for information purposes only and represents a measure of financial condition used especially in financial circles. It represents the following calculation: long-term interest-bearing debt, net of cash and cash equivalents divided by the addition of shareholders’ equity and long-term interest-bearing debt, net of cash and cash equivalents. It does not have a standardized meaning prescribed by Canadian GAAP and therefore may not be comparable to similar measures presented by other public companies.
42 / Alimentation Couche-Tard
Credit Facilities. We have five-year renewable operating credits, maturing in December 2008 in the amount of Cdn$50.0 million available in Canadian dollars or US dollars to the Canadian borrowers and in the amount of $75.0 million available in US dollars to the U.S. borrowers, which bear interest at the Canadian prime rate, or the Canadian or U.S. base rate (as applicable) or LIBOR, plus a certain margin varying on the basis of our leverage ratio. The operating credits are also available in the form of bankers’ acceptances (for Canadian dollar advances) and in the form of letters of credit not exceeding Cdn$10.0 million or the US dollar equivalent in respect of the Canadian facility and $30.0 million in respect of the U.S. facility. As at April 30, 2006, the facilities were undrawn, except for letters of credit of approximately Cdn$0.9 million for the Canadian facility and $15.5 million for the U.S. facility.
Virtually all of our assets secure our senior credit facility. We must meet certain commitments and achieve certain financial ratios under the credit agreement. In addition, the credit agreement imposes certain restrictions on business acquisitions, dividend payments and, if a certain ratio is not achieved, capital spending. As well, the indenture governing the subordinated debt also contains certain restrictions on business acquisitions and the payment of dividends. Compliance with the ratios, commitments and restrictions described above is tested at the end of each quarter. As at April 30, 2006, the Company was in compliance with all of these covenants.
Net Cash Provided by Operating Activities. Net cash provided by operating activities amounted to $401.5 million in fiscal 2006, compared with $316.1 million in fiscal 2005. This represents an increase of $85.4 million, which is primarily due to the increase in net earnings of $41.0 million and the receipt of income taxes receivable. Cash flows at the level of net earnings plus depreciation and amortization, loss on disposal of property and equipment and other assets and future income taxes amounted to $324.3 million(1) (or $1.61 per share(1)), an increase of $66.0 million or 25.6% over the $258.3 million(1) (or $1.28 per share(1)) generated during last fiscal year.
Net Cash Used in Investing Activities. Net cash used in investing activities for the year ended April 30, 2006 amounted to $316.8 million, including an amount of $91.6 for the acquisition of 73 Company-operated stores and 27 affiliated stores in the U.S. Net cash used in investing activities amounted to $223.6 in fiscal 2005, including $69.6 for the acquisition of 49 sites in the U.S. This year, capital expenditures amounted to $245.3 million, compared with $182.8 million for the previous year. This amount was primarily allocated for the implementation of our IMPACT program, investment in new stores and the replacement of equipment in some of our stores. Cash generated from sale and leaseback transactions amounted to $36.2 million in fiscal 2006 compared with $19.9 million in the prior year. Over the past five fiscal years, capital expenditures and investment in small acquisitions amounted to approximately $800.0 million over this period. These investments were funded by the total net cash provided by operating activities amounted to approximately $1.10 billion. We believe that we will be able to continue to fund these future expenditures in the same way.
Net Cash Used by Financing Activities. Net cash used in financing activities amounted to $15.4 million for fiscal 2006, including repayment of long-term debt of $6.9 million, a $8.7 million dividend payment to shareholders and the receipt of $0.2 million in cash from the issue of shares on exercise of stock options. In fiscal 2005, net cash of $3.2 million was generated, essentially from the $9.3 million of proceeds from the issue of shares on exercise of stock options, which was offset by the repayment of long-term debt of $6.3 million.
Contractual Obligations and Commercial Commitments
Set out below is a summary of our material contractual cash obligations as of April 30, 2006:
| 2007 | 2008 | 2009 | 2010 | 2011 | Thereafter | Total | |
| (in millions of US dollars) | |||||||
| Long-term debt | 7.6 | 8.2 | 8.9 | 1.9 | 141.3 | 353.9 | 521.8 |
| Capital lease obligations | 0.8 | 0.6 | 0.5 | 0.4 | 0.4 | 1.7 | 4.4 |
| Operating lease obligations | 159.6 | 142.3 | 119.4 | 106.0 | 93.1 | 748.7 | 1,369.1 |
| Purchase commitments | 3.5 | 0.5 | 1.3 | 0.6 | 0.6 | 1.3 | 7.8 |
| Total | 171.5 | 151.6 | 130.1 | 108.9 | 235.4 | 1,105.6 | 1,903.1 |
Business Acquisition. On April 11, 2006, we signed an agreement with Spectrum Holding, Inc. to acquire 90 sites operating under the Spectrum banner in the States of Georgia and Alabama, United States. As mentioned under subsequent events (see above), this transaction was carried out on June 12, 2006 for an amount of $130.0 million.
__________________________
(1) These cash flows and cash flows per share are presented for information purposes only and represent performance measures used especially in financial circles. They do not have a standardized meaning prescribed by Canadian GAAP and therefore may not be comparable to similar measures presented by other public companies.
Alimentation Couche-Tard / 43
Long-Term Debt. Our long-term debt consists of: (i) $350.0 million 7.5% Subordinated unsecured debt due December 15, 2013; (ii) a $19.5 million Term Loan “A” secured term loan due December 17, 2008 that bears interest at the Canadian base rate or LIBOR, plus a variable margin based on our leverage ratio; (iii) a $147.0 million Term Loan “B” secured term loan due December 17, 2010 that bears interest at the U.S. base rate or LIBOR, plus a fixed margin; (iv) 8.75% note payable due 2019 of $5.2 million outstanding as of April 30, 2006; and (v) other long-term debts of $2.4 million.
Capital Lease Obligations. We have generally not used capital leases as a mean of financing; however some capital leases were assumed in connection with certain acquisitions. These obligations and related assets are included in our consolidated balance sheets.
Operating Lease Obligations. We lease a substantial portion of our real estate using conventional operating leases. Generally our real estate leases in Canada are for primary terms of five to ten years and in the United States, they are for ten to 20 years, in both cases, with options to renew. These obligations and related assets are not included in our consolidated balance sheets. Under certain of the store leases, we are subject to additional rentals based on store revenues as well as escalations in the minimum future lease amount.
Contingencies. There are various legal proceedings and claims pending against us that are common to our operations for which, in some instances, no provision has been made. While it is not feasible to predict or determine the ultimate outcome of these matters, it is the opinion of management that these suits will not result in monetary damages not covered by insurance that in the aggregate would be material and adverse to our business or operations.
We are covered by insurance policies that have significant deductibles. At this time, we believe that we are adequately covered through the combination of insurance policies and self-insurance. Future losses which exceed insurance policy limits or, under adverse interpretations, are excluded from coverage would have to be paid out of general corporate funds. In association with our workers’ compensation policies, we issue letters of credit as collateral for certain policies.
We also issue surety bonds for a variety of business purposes, including bonds for taxes, lottery sales, wholesale distribution and alcoholic beverage sales. In most cases, the surety bonds are required by a municipality or state governmental agency as a condition of operating a store in that area.
Off-Balance Sheets Arrangements
In the normal course of business, we finance certain of our activities off-balance sheets through operating leases for properties on which we conduct our retail business. The future commitments are included under “Operating Lease Obligations” in the table above.
_____________________
(1) This ratio is presented for information purposes only and represents a measure of financial condition used especially in financial circles. It represents the following calculation: long-term interest-bearing debt, net of cash and cash equivalents divided by EBITDA (Earnings Before Interest, Tax, Depreciation and Amortization). It does not have a standardized meaning prescribed by Canadian GAAP and therefore may not be comparable to similar measures presented by other public companies.
44 / Alimentation Couche-Tard
Selected Quarterly Financial Information (Unaudited)
The Company’s 52-week reporting cycle is divided into four quarters of 12 weeks each except for the third quarter, which comprises 16 weeks. When a fiscal year, such as 2006, contains 53 weeks, the fourth quarter comprises 13 weeks. The following is a summary of selected consolidated financial information derived from the Company’s unaudited interim consolidated financial statements for each of the eight most recently completed quarters. This information was prepared in accordance with Canadian GAAP and is reported in US dollars.
| (In millions of US dollars except for per share data, unaudited) | 53 weeks ended April 30, 2006 | 52 weeks ended April 24, 2005 | ||||||
| Quarter | 4th | 3rd | 2nd | 1st | 4th | 3rd | 2nd | 1st |
| Weeks | 13 weeks | 16 weeks | 12 weeks | 12 weeks | 12 weeks | 16 weeks | 12 weeks | 12 weeks |
| restated | restated | restated | ||||||
| Revenues | 2,638.9 | 2,944.2 | 2,391.9 | 2,182.3 | 1,961.7 | 2,400.2 | 1,840.3 | 1,834.6 |
| Income before depreciation and | ||||||||
amortization of property and equipment | ||||||||
and other assets, financial expenses and | ||||||||
income taxes | 84.0 | 128.2 | 115.6 | 110.8 | 68.7 | 92.6 | 84.3 | 97.5 |
| Depreciation and amortization of property | ||||||||
and equipment and other assets | 26.8 | 33.4 | 24.0 | 22.7 | 21.6 | 26.4 | 18.8 | 17.1 |
| Operating income | 57.2 | 94.8 | 91.6 | 88.1 | 47.1 | 66.2 | 65.5 | 80.4 |
| Financial expenses | 8.5 | 10.8 | 7.5 | 7.2 | 7.4 | 10.3 | 6.6 | 6.4 |
| Net earnings | 32.1 | 54.5 | 55.5 | 54.1 | 32.5 | 36.3 | 38.3 | 48.1 |
| Net earnings per share | ||||||||
Basic | $0.16 | $0.27 | $0.27 | $0.27 | $0.16 | $0.18 | $0.19 | $0.24 |
Diluted | $0.15 | $0.26 | $0.27 | $0.26 | $0.16 | $0.18 | $0.19 | $0.23 |
The influences of the volatility of motor fuel gross margin and seasonality have an impact on the variability of our quarterly net earnings. Since the acquisition of Circle K, motor fuel revenues have become a more significant segment of our business and therefore our results are more sensitive to the volatility of motor fuel gross margins.
52-Week Period Ended April 24, 2005 Compared to the 52-Week Period Ended April 25, 2004
During the 52-week period ended April 24, 2005, we completed three small business acquisitions for a total of 49 stores, opened 44 QSRs and implemented our IMPACT program in 223 stores, including 54 new stores.
For the 52-week period ended April 24, 2005, we achieved revenues of $8.04 billion, compared with $4.40 billion in fiscal 2004, a major increase of 82.8% or $3.64 billion of which $3.37 billion come from the U.S., reflecting primarily the contribution of $3.02 billion in revenue from Circle K and the internal growth in the U.S. network. We recorded 76.3% of our revenues in the United States, compared with 62.7% in the previous fiscal year.
In the U.S., growth of average merchandise revenues per store (excluding Circle K for comparative purposes) was 10.4% over the prior year, while it was 2.6% in Canada. The growth in the U.S. reflects efforts made to increase revenues by optimizing product mix, as well as the influence from investment in our IMPACT program conversions (formerly Store 2000) and the increase in tobacco tax. Growth in Canada reflects the aggressive pricing on generic tobacco and certain dairy categories.
In the U.S., growth of average motor fuel volume per store (excluding Circle K) was 6.3% over the prior year, while it was 6.6% in Canada. In the U.S., the growth reflects the positive consumer response to our rebranding of several motor fuel locations to nationally recognized brands whereas in Canada, the growth reflects certain pricing strategies. In both markets, the implementation of our IMPACT program (formerly Store 2000) in our stores also had a positive impact on growth.
Gross profit grew by 70.3% or $643.3 million to $1.56 billion, compared with $914.5 million for the previous year. This increase is mainly due to higher revenues, particularly additional sales from Circle K and higher motor fuel gross margins, in particular from Circle K.
Consolidated merchandise and service gross margin was 32.9%, up from 32.6% in the previous fiscal year. The gross margin in Canada was 33.5%, up from 32.5% in the previous year reflecting the impact of improvements in purchasing terms and changes in products mix with a focus on higher margin items. The gross margin in our U.S. operations was 32.6% unchanged from last fiscal year. Efforts continue to improve gross margin through purchase terms optimization and changes to the product mix emphasizing higher margin items. These efforts resulted in higher gross margins in certain categories and lower gross margins in other categories with resultant increase in sales. Also, tobacco gross margins have come under competitive pressures in certain areas. The result of these dynamic variables, in the aggregate, was an unchanged gross margin in fiscal 2005 compared with the previous year.
Alimentation Couche-Tard / 45
Motor fuel gross margin decreased slightly to Cdn4.61¢ per litre in Canada, from Cdn4.77¢ per litre from the previous year reflecting the increase in competitive activity, particularly in segments of our Central Canada market. Motor fuel gross margin in the United States increased to 14.17¢ per gallon from 11.57¢ per gallon in the previous year. (Including Circle K’s historical results, the motor fuel gross margin in the U.S. would have been 14.30¢ per gallon for fiscal 2004).
Operating, selling, administrative and general expenses increased by $474.4 million or 64.1% over the previous year. The increase is mainly attributable to the acquisition of Circle K on December 17, 2003. As a percentage of merchandise and service revenues, operating, selling, administrative and general expenses remained relatively the same as last year.
Depreciation and amortization of property and equipment and other assets grew by 45.4% to $83.9 million in fiscal 2005. This increase is due mainly to the acquisition of Circle K on December 17, 2003 and capital expenditures made during fiscal 2005.
Operating income for fiscal 2005 more than doubled to $259.2 million, an increase of $142.7 million or 122.5% over the $116.5 million earned in the previous fiscal year. This increase is primarily attributable to the results of Circle K.
Financial expenses totalled $30.7 million, up $7.2 million or 30.6% over last year due to the higher borrowings to finance the Circle K acquisition. In addition, financial expenses were reduced by $2.2 million of interest income earned from the investing of excess cash compared with $0.4 million in the previous year.
Income taxes increased by $45.6 million, or 164.6%, to $73.3 million, primarily due to increased pre-tax earnings. The reduction of the effective income tax rate by approximately 1% is mainly attributable to the apportionment of taxable income amongst the various jurisdictions that have different income tax rates.
Net earnings increased by $99.1 million, or 176.6%, to $155.2 million or $0.77 per share ($0.75 per share on a diluted basis), compared with $56.1 million or $0.31 per share ($0.30 per share on a diluted basis) in the previous year.
Net earnings for fiscal 2005 were affected by the following items, which are presented on an after-tax basis:
the additional electronic payment modes related expense in our U.S. markets (primarily resulting from higher motor fuel retail prices) amounting to approximately $11.5 million ($0.06 per share on a diluted basis). Including Canada, electronic payment modes related expense increased by approximately $12.1 ($0.06 per share on a diluted basis);
the expense of $2.4 million ($0.01 per share on a diluted basis) related to the amended stock-based compensation accounting policy adopted retroactively this year without restatement of prior year’s earnings.
Internal Controls
We maintain a system of internal controls over financial reporting designed to safeguard assets and ensure that financial information is reliable. We undertake ongoing evaluations of the effectiveness of internal controls over financial reporting and implement control enhancements, when appropriate. As at April 30, 2006, our management and our external auditors reported that these internal controls were effective. By issuing this report at that date, we have complied with legal and regulatory requirements prior to the implementation date set for our Company by the Canadian and American regulatory authorities.
We also maintain a system of disclosure controls and procedures designed to ensure the reliability, completeness and timeliness of the information we disclose in this MD&A and other public disclosure documents, by taking into account materiality. Disclosure controls and procedures are designed to ensure that information required to be disclosed by the Company in reports filed with securities regulatory agencies is recorded and/or disclosed on a timely basis, as required by law, and is accumulated and communicated to the Company’s management, including its Chief Executive Officer and its Chief Financial Officer, as appropriate, to allow timely decisions regarding required disclosure.
46 / Alimentation Couche-Tard
Critical Accounting Policies and Estimates
Estimates. This MD&A is based on Couche-Tard’s consolidated financial statements, which have been prepared in accordance with Canadian GAAP. These principles require us to make certain estimates and assumptions that affect our financial position and results of operations as reflected in our financial statements. These assumptions and estimates are based on past events and expectations of future outcomes. On an ongoing basis, management reviews its estimates, including those relating to supplier rebates, environmental costs and asset retirement obligations based on available information. These estimates are based on management’s best knowledge of current events and actions that the Company may undertake in the future. Actual results may differ from the estimates.
Inventory. Our inventory is comprised mainly of products purchased for resale including grocery items, tobacco products, packaged and fresh food products, motor fuel and lottery tickets. Inventories are valued at the lesser of cost and net realizable value. Cost is generally determined by the retail method for in-store merchandise, the average cost method for motor fuel inventory and first-in first-out for distribution centres. Inherent in the determination of gross profit margins are certain management judgments and estimates, which could affect ending inventory valuations and results of operations.
Impairment of Long-lived Assets. We evaluate long-lived assets other than goodwill for indicators of impairment whenever events or changes in circumstances indicate their carrying value may not be recoverable. Management’s judgments regarding the existence of impairment indicators are based on market conditions and operational performance. The variability of these factors depends on a number of conditions, including uncertainty about future events. These factors could cause us to conclude that impairment indicators exist and require that impairment tests be performed, which could result in determining that the value of certain long-lived assets is impaired, resulting in a write-down of such long-lived assets.
Goodwill, Trademarks and Licences are evaluated for impairment annually, or more often if events or changes in circumstances indicate that the value of certain goodwill, trademarks or licences may be impaired. For the purpose of this impairment test, management uses estimates and assumptions to establish the fair value of its reporting units and intangible assets. If these assumptions and estimates prove to be incorrect, the carrying value of our goodwill, trademarks or licenses may be overstated. Our annual impairment test is performed in the first quarter of each fiscal year.
Environmental Matters. We provide for estimated future site remediation costs to meet government standards for known site contamination when such costs can be reasonably estimated. Estimates of the anticipated future costs for remediation activities at such sites are based on our prior experience with remediation sites and consideration of other factors such as the condition of the site contamination, location of sites and experience with contractors that perform the environmental assessments and remediation work.
In each of the U.S. states in which we operate, except Michigan, Iowa, Florida, Texas and Washington State, there is a state fund to cover the cost of certain rehabilitation and removing of motor fuel tanks. These state funds provide insurance for motor fuel facilities operations to cover the cost of cleaning up contamination to the environment caused by the usage of underground motor fuel equipment. Underground motor fuel storage tank registration fees and a motor fuel tax in each of the states finance the trust funds. We pay the registration fees and remit the sales taxes to the states where we are a member of the trust fund. Insurance coverage is different in the various states.
Should the estimated future remediation expenditures or state reimbursement amounts change, it could have a material adverse effect on the financial condition and results of operations.
Income Taxes. Future income tax assets and liabilities are recognized for the future income tax consequences attributable to temporary differences between the financial statement carrying values of assets and liabilities and their respective income tax bases. Future income tax assets or liabilities are measured using enacted or substantively enacted income tax rates expected to apply to taxable income in the years in which those temporary differences are expected to be recovered or settled. The calculation of current and future income taxes requires management to make estimates and assumptions and to exercise a certain amount of judgment regarding the financial statement carrying values of assets and liabilities which are subject to accounting estimates inherent in those balances, the interpretation of income tax legislation across various jurisdictions, expectations about future operating results and the timing of reversal of temporary differences and possible audits of tax fillings by the regulatory authorities. Management believes it has adequately provided for income taxes based on current available information.
Changes or differences in these estimates or assumptions may result in changes to the current or future income tax balances on the consolidated balance sheets, a charge or credit to income tax expense in the consolidated statement of earnings and may result in cash payments or receipts.
Alimentation Couche-Tard / 47
Insurance and Workers’ Compensation. We use a combination of insurance, self-insured retention, and self-insurance for a number of risks including workers’ compensation (in certain states), property damage, and general liability claims. Accruals for loss incidences are made based on our claims experience and actuarial assumptions followed in the insurance industry. A material revision to our liability could result from a significant change to our claims experience or the actuarial assumptions of our insurers. Actual losses could differ from accrued amounts. Workers’ compensation is covered by government-imposed insurance in Canada and by third-party insurance in our United States operations, except in certain states where we are self-insured. With respect to the third-party insurance in the United States, independent actuarial estimates of the aggregate liabilities for claims incurred serve as a basis for our share of workers’ compensation losses.
Accounting Changes
Non-monetary transactions
On June 1, 2005, the Canadian Institute of Chartered Accountants (CICA) issued Handbook Section 3831, “Non-Monetary Transactions”, replacing Section 3830 of the same name. Under these new standards, all non-monetary transactions initiated in periods beginning on or after January 1, 2006 have to be measured at fair value unless:
the transaction lacks commercial substance;
the transaction is an exchange of a product or property held for sale in the ordinary course of business for a product or property to be sold in the same line of business to facilitate sales to customers other than the parties to the exchange;
neither the fair value of the assets received nor the fair value of the asset given up is reliably measurable; or
the transaction is a non-monetary, non-reciprocal transfer to owners that represents a spin-off or other form of restructuring or liquidation.
We adopted these new recommendations both early and prospectively on July 18, 2005. The implementation of these new recommendations did not have any impact on our financial statements.
Recently Issued Accounting Standards
On January 27, 2005, the CICA Accounting Standards Board (AcSB) issued Section 1530, “Comprehensive Income”, Section 3855, “Financial Instruments – Recognition and Measurement” and Section 3865, “Hedges”. These new sections are effective for interim and annual periods beginning after October 1, 2006 and provide comprehensive requirements for the recognition and measurement of financial instruments, as well as standards on when and how hedge accounting may be applied. Additionally, these sections introduce a new component of equity referred to as comprehensive income.
Section 1530 requires companies to disclose comprehensive income, which includes, in addition to net income, comprehensive income consisting primarily of unrealized gains and losses that bypass the traditional earnings statement and are recorded directly into shareholders’ equity. The components of other comprehensive income consist of unrealized gains and losses related to the translation of foreign currency financial statements, certain deferred gains and losses from hedging activities, and unrealized gains and losses on certain investment securities.
We do not expect that these new recommendations will have a material impact on our consolidated results of operations and financial condition.
Business Risks
Increases and volatility in crude oil prices and volatility in wholesale petroleum pricing and supply could affect our revenues and gross profit. As a result of our expansion in the United States, our motor fuel revenues have become a greater component of revenues. For the 53-week period ended April 30, 2006, our motor fuel revenues represented approximately 60% of total revenues and our motor fuel gross profit accounted for approximately 20% of our total gross profit. Crude oil and domestic wholesale petroleum markets display significant volatility. Since we typically have no more than a four to five-day supply of motor fuel, we are susceptible to interruptions in the supply of motor fuel at our facilities. General political conditions and instability in oil producing regions, particularly in the Middle East and South America, could significantly and adversely affect crude oil supplies and wholesale petroleum costs. Local supply interruptions may also occur. For example, in August 2003, a cracked pipeline interrupted the supply of motor fuel to the greater Phoenix area. In addition, any new standards that the U.S. Environmental Protection Agency may impose on petroleum refining that would necessitate changes in the refining process could limit the volume of petroleum products available from refiners in the future. Volatility in wholesale petroleum supply and costs could result in significant changes in the retail price of petroleum products and in lower fuel gross margin per gallon or litre. In addition, changes in the retail price of petroleum products could dampen consumer demand for motor fuel. These factors could materially influence our motor fuel volume, motor fuel gross profit and overall customer traffic, which, in turn, could have a material adverse effect on our operating results and financial condition.
48 / Alimentation Couche-Tard
The convenience store and retail motor fuel industries are highly competitive and affected by new entrants. The industries and geographic areas in which we operate are highly competitive and marked by ease of entry and constant change in terms of the number and type of retailers offering the products and services found in our stores. We compete with other convenience store chains, independent convenience stores, gas station operators, large and small food retailers, local pharmacies and pharmaceutical chains, discount stores, club stores and mass merchants, many of which are well-established companies. In recent years, several non-traditional retail segments have entered the motor fuel retail business, including supermarkets, club stores and mass merchants, and this additional competition has had a negative impact on motor fuel profit margins in the convenience store industry. These non-traditional motor fuel retailers have obtained a significant share of the motor fuel market and their market share is expected to grow. In some of our markets, our competitors have been in existence longer and have greater financial, marketing and other resources than we do. We may not be able to compete successfully against current and future competitors, and competitive pressures faced by us could materially and adversely affect our business, results of operations and financial condition.
We are subject to federal, provincial, state and local environmental laws, and the costs of compliance could require substantial capital expenditures. Our operations are subject to a variety of environmental laws and regulations, including those relating to emissions to the air, discharges into water, releases of hazardous and toxic substances, and remediation of contaminated sites. Under various federal, provincial, state and local laws and regulations, we may, as the owner or operator, be liable for the costs of removal or remediation of contamination at our current stores or our former stores, whether or not we knew of, or were responsible for, the presence of such contamination. In particular, as an owner and operator of motor fuelling stations, we face risks relating to petroleum product contamination, which other convenience store operators not engaged in such activities would not face. The remediation costs and other costs required to clean up or treat contaminated sites could be substantial.
Contamination on and from our current or former stores may subject us to liability to third parties or governmental authorities for injuries to persons, property or natural resources and may adversely affect our ability to sell or rent our properties or to borrow money using such properties as collateral.
In the United States, persons who dispose of or arrange for the disposal or treatment of hazardous or toxic substances away from sites may also be liable for the costs of removal or remediation of such substances at the disposal sites even if such sites are not owned by such persons. Although we do not typically arrange for the treatment or disposal of large quantities of hazardous or toxic substances from any location, our current and historic operation of many stores and the disposal of contaminated soil and groundwater wastes generated during cleanups of contamination at such stores could expose us to such liability.
We are subject to extensive environmental laws and regulations regulating underground storage tanks and vapour recovery systems. Compliance with existing and future environmental laws regulating such tanks and systems may require significant expenditures. In the United States, we pay fees to state “leaking underground storage tank” trust funds in states where they exist. These state trust funds are expected to pay or reimburse us for remediation expenses related to contamination associated with underground storage tanks subject to their jurisdiction. Such payments are always subject to a deductible paid by us, specified per incident caps and specified maximum annual payments which vary among the funds. As well, such funds may have eligibility requirements, which not all of our sites will meet. To the extent state funds, or other responsible parties do not pay or delay payments for remediation, we will be obligated to make these payments, which could materially adversely affect our financial condition and results of operations. We cannot assure that these funds or responsible third parties are or will continue to remain viable.
The nature of our motor fuel operations and those we acquire present risks of soil and groundwater contamination. In the future, we may incur substantial expenditures for remediation of contamination that has not been discovered at existing stores or at stores which we may acquire. We believe that a significant number of our current stores may be contaminated and expect to discover that contamination through the normal operation of our business in the future. We regularly monitor our facilities for environmental contamination and take reserves on our financial statements to cover potential environmental remediation and compliance costs, as we consider appropriate. However, we cannot assure that the liabilities for which we have taken reserves are the only environmental liabilities relating to our current and former stores, that material environmental conditions not known to us do not exist, that future laws or regulations will not impose material environmental liability on us or that our actual environmental liabilities will not exceed our reserves. In addition, failure to comply with any environmental regulations or an increase in regulations could materially and adversely affect our operating results and financial condition.
Alimentation Couche-Tard / 49
Future tobacco legislation, campaigns to discourage smoking, increases in tobacco taxes and wholesale cost increases of tobacco products could have a material adverse impact on our revenues and profit. Tobacco products represent our largest product category of merchandise and service revenues. For fiscal year ended April 30, 2006, revenues of tobacco products were approximately 38% of total merchandise and service revenues. Significant increases in wholesale cigarette costs and a tax increase on tobacco products, as well as future legislation and national and local campaigns to discourage smoking in the United States and Canada, may have an adverse effect on the demand for tobacco products, and therefore reduce our revenues and profits.
Competitive pressures in our markets can make it difficult to pass price increases on to our customers. These factors could materially and adversely affect our retail price of cigarettes, cigarette unit volume and revenues, merchandise gross profit and overall customer traffic. Because we derive a large percentage of our revenues from tobacco products, reduced revenues of tobacco products or smaller margins on the revenues we make could have a material adverse effect on our operating results and financial condition.
Because we depend on the experience and industry knowledge of our management, we would be adversely affected if members of our management team left us. Our senior management team and the heads of our operating divisions who are principally responsible for our operations under our decentralized management structure are key elements of our business operations. Our future success depends on our ability to retain this team. If, for any reason, our senior executives and divisional vice-presidents do not continue to be active in management, our business, financial condition or results of operations could be adversely affected. We do not enter into employment agreements or non-competition agreements with our officers. Although we believe that current management will remain active in the business and that we will continue to be able to attract and retain other talented personnel and replace key personnel should the need arise, competition in recruiting replacement personnel could be significant. If we are not successful in retaining our key personnel or replacing them, our business, financial condition or results of operations could be adversely affected.
Acquisitions have been a substantial part, and are expected to continue to be a part, of our growth strategy, which could expose us to significant business risks. Acquisitions have been a significant part of our growth strategy. We expect to continue to selectively seek strategic acquisitions in the future. Our ability to consummate and to integrate effectively any future acquisitions on terms that are favorable to us may be limited by the number of attractive acquisition targets, internal demands on our resources and, to the extent necessary, our ability to obtain financing on satisfactory terms for larger acquisitions, if at all. Acquisitions may expose us to additional risks, including:
difficulties in integrating administrative, financial reporting, operational and information systems and managing newly-acquired operations and improving their operating efficiency;
difficulties in maintaining uniform standards, controls, procedures and policies across all of our businesses;
entry into markets in which we have little or no direct prior experience;
difficulties in retaining key employees of the acquired operations;
disruptions to our ongoing business; and
diversion of management time and resources.
In addition, future acquisitions could result in the incurrence of additional debt, costs and contingent liabilities. We may also incur costs and divert management attention for potential acquisitions, which are never consummated. For acquisitions we do consummate, expected synergies may not materialize. Our failure to effectively address any of these issues could adversely affect our results of operations, financial condition and ability to service debt, including the subordinated debt.
Although we have historically performed a due diligence investigation of the businesses or assets that we acquire and anticipate continuing to do so for future acquisitions, there may be liabilities of the acquired business or assets that we fail or are unable to uncover during our due diligence investigation and for which we, as a successor owner, may be responsible.
When feasible, we seek to minimize the impact of these types of potential liabilities by obtaining indemnities and warranties from the seller, which may in some instances be supported by deferring payment of a portion of the purchase price. However, these indemnities and warranties, if obtained, may not fully cover the liabilities because of their limited scope, amount or duration, the financial resources of the indemnitor or warrantor or other reasons.
50 / Alimentation Couche-Tard
We may experience difficulties in executing key aspects of our business strategy or in differentiating ourselves from our competitors. The future success of our business is highly dependent upon effectively implementing our business strategy and differentiating ourselves from our competitors. We may experience difficulties in executing key aspects of our business strategy. For example, we may be limited in our ability to implement our IMPACT program in additional stores because of a number of factors, including limited capital expenditure resources and restrictions contained in our senior credit facility. In addition, our in-store branding strategies may be less successful than we anticipate in increasing our gross margins. We may be unable to obtain new QSR franchises, and it is possible that our existing QSR franchises would be cancelled. We may also be less successful than anticipated in achieving volume-purchasing benefits. Furthermore, we may experience difficulty in differentiating ourselves from our competitors if our competitors are able to successfully employ business strategies similar to ours or if market conditions or demographics reduce what we believe to be our competitive advantages.
We are subject to government regulations relating to, among other things, alcohol, tobacco and minimum wage. Our business and properties are subject to governmental laws and regulations including, but not limited to, employment laws and regulations, regulations governing the sale of alcohol and tobacco, minimum wage requirements and other laws and regulations.
In certain areas where our stores are located, provincial, state or local laws limit the stores’ hours of operation or the sale of alcoholic beverages, tobacco products, possible inhalants and lottery tickets, in particular to minors. Failure to comply with these laws could adversely affect our revenues and results of operations because these state and local regulatory agencies have the power to revoke, suspend or deny applications for and renewals of permits and licenses relating to the sale of these products or to seek other remedies.
Regulations related to wages also affect our business. Any appreciable increase in the statutory minimum wage would result in an increase in our labor costs and such cost increase, or the penalties for failing to comply with such statutory minimums, could adversely affect our business, financial condition and results of operations.
Any change in the legislation or regulations described above that is adverse to us and our properties could affect our operating and financial performance. In addition, new regulations are proposed from time to time which, if adopted, could have a material adverse effect on our operating results and financial condition.
We are subject to short-term interest rate fluctuations. Since approximately 95% of our long-term debt is directly or indirectly (through interest rate swaps) based on variable interest rate of no longer than six months in duration, we can experience interest expense variances solely based on changes in short-term interest rates.
Lawsuits relating to tobacco products. We sell cigarettes and other tobacco-related products at all of our convenience stores. In addition, we sell brands of cigarettes that are manufactured to be sold by it on an exclusive basis. We are not currently a named party in any health-related tobacco litigation. However, various health-related legal actions, proceedings and claims arising out of the sale, distribution, manufacture, development, advertising and marketing of cigarettes have been brought against vendors of tobacco products and may be instituted against us in the future. Damages in amounts escalating into the hundreds of millions and even billions of dollars have been pleaded in suits brought against vendors of cigarettes. An unfavorable verdict against us in any health-related suit could adversely affect our financial condition and ability to pay interest and principal on our debts. Moreover, we have not established any reserves for the payment of expenses or adverse results related to any potential health-related litigation.
Changes in regional economic conditions may influence the retail industry, consumer preferences and spending patterns. Our revenues may be negatively influenced by changes in regional or local economic variables and consumer confidence. External factors that affect economic variables and consumer confidence and over which we exercise no influence include unemployment rates, levels of personal disposable income and regional or local economic conditions. Changes in economic conditions could adversely affect consumer spending patterns, travel and tourism in certain of our market areas. Some of our stores are located in coastal, resort or tourist destinations and, historically, travel and consumer behavior in such markets is more severely affected by weak economic conditions.
Alimentation Couche-Tard / 51
We may be subject to losses that might not be covered in whole or in part by our insurance coverage. We carry comprehensive liability, fire and extended coverage insurance on most of our facilities, with policy specifications and insured limits customarily carried in our industry for similar properties. The cost of our insurance policies has increased recently. In addition, some types of losses, such as losses resulting from wars, acts of terrorism, or natural disasters, generally are not insured because they are either uninsurable or not economically practical. Moreover, insurers recently have become more reluctant to insure against these types of events.
Should an uninsured loss or a loss in excess of insured limits occur, we could lose capital invested in that property, as well as the anticipated future revenues derived from the retailing activities conducted at that property, while remaining obligated for any mortgage debt or other financial obligations related to the property. Any such loss could adversely affect our business, results of operations or financial condition.
Acts of war and terrorism could impact our business. Acts of war and terrorism could impact general economic conditions and the supply and price of crude oil. In addition, these events may cause damage to our retail facilities and disrupt the supply of the products and services we offer in our stores. In times of uncertainty, people also tend to travel less and spend more time at home. All these factors could impact our revenues, operating results and financial condition.
Other risks
Motor Fuel Margin risk. With the purchase of Circle K, which has a large component of its business in motor fuel, we are more sensitive to the changes in the motor fuel gross margin. For example, in fiscal 2006, a change of one cent per gallon would have resulted in a change of $20.3 million in the motor fuel gross profit. Such amount would impact net earnings by $0.07 per share ($0.06 per share on a diluted basis) for our Company-operated stores in the U.S.
Electronic payment modes related expense risk. The majority of our electronic payment modes related expense is based on retail prices of motor fuel. We are exposed to significant fluctuations in electronic payment modes related expense as a result of the large increase in motor fuel selling prices particularly in our U.S. markets. For example, based on fiscal 2006, for each ten cent increase in the retail selling price of a gallon of motor fuel, the electronic payment modes related expense would have increased by approximately $2.1 million. In Canada, for each Cdn ten cent increase in the selling price of a litre of motor fuel, electronic payment modes related expense would have increased by approximately $1.4 million. Such amounts would impact, in the aggregate, net earnings by $0.01 per share on a diluted basis.
Interest Rate Risk. We are exposed to market risk relating to changes in interest rates relating to our variable rate debt. We have a significant amount of debt, $516.5 million of which, in effect, bears interest at floating rates, including the $350.0 million 7.5% Subordinated unsecured debt that is subject to interest rate swaps. Our total annual interest expense, assuming interest rates as they were in effect on April 30, 2006, would be approximately $41.0 million. A one-percentage point increase in interest rates would increase our total annual interest expense by $5.2 million or $0.02 per share on a diluted basis.
Seasonality and natural disasters. Weather conditions can have an impact on our revenues as historical purchase patterns indicate that our customers increase their transactions and also purchase higher margin items when weather conditions are favorable. Consequently, our results are seasonal and typically more profitable during the summer months. Motor fuel volumes and margins are also seasonal as volumes increase during the summer driving season as well as margins. Motor fuel margins are subject to fluctuation due to supply changes and can differ from historical norms. We have operations in the Southeast and Westcoast regions of the United States and although these regions are generally known for their mild weather, these regions are susceptible to severe storms including hurricanes, like we experienced in fiscal 2006 and 2005, as well as earthquakes in the Westcoast region and other natural disasters. We could be also impacted by other occurrences in these regions such as energy shortages or increase in energy prices. Consequently, our operating results and cash flow from operations could be adversely affected. Moreover, since we have decided, during fiscal 2006, not to renew our insurance coverage for material damages related to hurricanes, such natural disasters could adversely affect our operating results and financial condition.
52 / Alimentation Couche-Tard
Outlook
We had a very successful year in 2006, ending the year in a strong position with $331.5 million in cash, an interest bearing debt of $524.1 million and total equity of $966.0 million.
We generated net cash from operating activities of $401.5 million while investing $336.9 million in property and equipment and small business acquisitions. We believe that our financial strength and the allocation of our financial resources will form the basis of continued successful implementation of our operating strategies. We will continue to invest capital in our existing store base with a target in fiscal 2007 of converting approximately 500 stores under our IMPACT program and adding approximately 100 new store locations through new store development and small acquisitions. We anticipate that about 50 stores will be closed or converted into affiliated stores, including 28 from the Circle K store network. As a result, we plan to invest a net amount of approximately $300.0 million in property and equipment, which is expected to be financed with net cash from operations.
For fiscal 2007, we are optimistic about our opportunities while recognizing that growth in earnings is dependent on various external factors, including the impact of the foreign exchange rate, motor fuel gross margin and electronic payment modes related expenses.
We will continue to focus our resources on innovation, including the introduction of new products and services, to satisfy our customers’ needs.
July 12, 2006
Alimentation Couche-Tard / 53
MANAGEMENT’S REPORT
The consolidated financial statements of Alimentation Couche-Tard Inc. and financial information contained in this Annual Report are the responsibility of management. This responsibility is based on a judicious choice of accounting procedures and principles, the application of which requires the informed judgment of management. The consolidated financial statements were prepared according to generally accepted accounting principles in Canada and were approved by the Board of Directors. In addition, the financial information included in the Annual Report is consistent with the consolidated financial statements.
Alimentation Couche-Tard Inc. maintains accounting and administrative control systems which, in the opinion of management, ensure reasonable accuracy, relevance and reliability of financial information and well-ordered, efficient management of the Company’s affairs.
The Board of Directors is responsible for approving the consolidated financial statements included in this Annual Report, primarily through its Audit committee. This Committee, which holds periodic meetings with members of management as well external auditors, reviewed the consolidated financial statements of Alimentation Couche-Tard Inc. and recommended their approval to the Board of Directors.
The enclosed consolidated financial statements were audited by Raymond Chabot Grant Thornton LLP, our independent registered public accounting firm, and their report indicates the extent of their audit and their opinion on the consolidated financial statements.
| Alain Bouchard | Richard Fortin |
| Chairman of the Board, | Executive Vice-President |
| president and Chief Executive Officer | and Chief Financial Officer |
REPORT OF INDEPENDENT REGISTERED PUBLIC ACCOUNTING FIRM
To the Shareholders of
Alimentation Couche-Tard Inc.
We have audited the consolidated balance sheets of Alimentation Couche-Tard Inc. as at April 30, 2006 and April 24, 2005 and the consolidated statements of earnings, contributed surplus, retained earnings and cash flows for each of the years in the three-year period ended April 30, 2006. These financial statements are the responsibility of the Company’s management. Our responsibility is to express an opinion on these financial statements based on our audits.
We conducted our audits in accordance with Canadian generally accepted auditing standards and the standards of the Public Company Accounting Oversight Board (United States). Those standards require that we plan and perform an audit to obtain reasonable assurance whether the financial statements are free of material misstatement. An audit includes examining, on a test basis, evidence supporting the amounts and disclosures in the financial statements. An audit also includes assessing the accounting principles used and significant estimates made by management, as well as evaluating the overall financial statement presentation. We believe that our audits provide a reasonable basis for our opinion.
In our opinion, these consolidated financial statements present fairly, in all material respects, the financial position of the Company as at April 30, 2006 and April 24, 2005 and the results of its operations and its cash flows for each of the years in the three-year period ended April 30, 2006 in accordance with Canadian generally accepted accounting principles.
54 / Alimentation Couche-Tard
We also have audited, in accordance with the Standards of the Public Company Accounting Oversight Board (United States), the effectiveness of Alimentation Couche-Tard Inc.’s internal control over financial reporting as at April 30, 2006, based on criteria established in Internal Control - Integrated Framework issued by the Committee of Sponsoring Organizations of the Treadway Commission (COSO) and our report dated June 14, 2006 expressed an unqualified opinion on management’s assessment of the effectiveness of internal control over financial reporting and an unqualified opinion on the effectiveness of internal control over financial reporting.
![]()
Chartered Accountants
Montréal, Canada
June 14, 2006
MANAGEMENT’S REPORT ON INTERNAL CONTROL OVER FINANCIAL REPORTING
Our management is responsible for establishing and maintaining adequate internal control over financial reporting, as such term is defined in Rule 13a-15(f) under the Securities Exchange Act of 1934, for Alimentation Couche-Tard Inc. Although under Rule 13a-15(c) under the Securities Exchange Act of 1934, we would not be required to carry out an evaluation of the effectiveness of our internal control over financial reporting until required by law and regulation, we have voluntarily carried out such an evaluation, with the participation of our chief executive officer and chief financial officer, as of the end of the latest fiscal year ended April 30, 2006. The framework on which such evaluation was based is contained in the report entitled Internal Control Integrated - Framework issued by the Committee of Sponsoring Organizations of the Treadway Commission (COSO). This evaluation included review of the documentation of controls, evaluation of the design effectiveness of controls, testing of the operating effectiveness of controls and a conclusion on this evaluation. Although there are inherent limitations in the effectiveness of any system of internal control over financial reporting, based on our evaluation, we have concluded that our internal control over financial reporting was effective as of April 30, 2006.
Raymond Chabot Grant Thornton LLP, our independent registered public accounting firm, has issued an attestation report on management’s assessment of internal control over financial reporting for Alimentation Couche-Tard Inc. as of April 30, 2006, which is included herein.
| Alain Bouchard | Richard Fortin |
| Chairman, President and Chief Executive Officer | Executive Vice-President and Chief Financial Officer |
REPORT OF INDEPENDENT REGISTERED PUBLIC ACCOUNTING FIRM ON INTERNAL CONTROL OVER FINANCIAL REPORTING
To the Shareholders of
Alimentation Couche-Tard Inc.
We have audited management’s assessment, included in the accompanying Management’s Report on Internal Control Over Financial Reporting, that Alimentation Couche-Tard Inc. maintained effective internal control over financial reporting as of April 30, 2006, based on the criteria established in Internal Control—Integrated Framework issued by the Committee of Sponsoring Organizations of the Treadway Commission (COSO). Alimentation Couche-Tard Inc.’s management is responsible for maintaining effective internal control over financial reporting and for its assessment of the effectiveness of internal control over financial reporting. Our responsibility is to express an opinion on
Alimentation Couche-Tard / 55
management’s assessment and an opinion on the effectiveness of the Company’s internal control over financial reporting based on our audit.
We conducted our audit in accordance with the standards of the Public Company Accounting Oversight Board (United States). Those standards require that we plan and perform the audit to obtain reasonable assurance about whether effective internal control over financial reporting was maintained in all material respects. Our audit included obtaining an understanding of internal control over financial reporting, evaluating management’s assessment, testing and evaluating the design and operating effectiveness of internal control, and performing such other procedures as we considered necessary in the circumstances. We believe that our audit provides a reasonable basis for our opinions.
A company’s internal control over financial reporting is a process designed to provide reasonable assurance regarding the reliability of financial reporting and the preparation of financial statements for external purposes in accordance with generally accepted accounting principles. A company’s internal control over financial reporting includes those policies and procedures that (1) pertain to the maintenance of records that, in reasonable detail, accurately and fairly reflect the transactions and dispositions of the assets of the company; (2) provide reasonable assurance that transactions are recorded as necessary to permit preparation of financial statements in accordance with generally accepted accounting principles, and that receipts and expenditures of the company are being made only in accordance with authorizations of management and directors of the company; and (3) provide reasonable assurance regarding prevention or timely detection of unauthorized acquisition, use, or disposition of the company’s assets that could have a material effect on the financial statements.
Because of its inherent limitations, internal control over financial reporting may not prevent or detect misstatements. Also, projections of any evaluation of effectiveness to future periods are subject to the risk that controls may become inadequate because of changes in conditions, or that the degree of compliance with the policies or procedures may deteriorate.
In our opinion, management’s assessment that Alimentation Couche-Tard Inc. maintained effective internal control over financial reporting as of April 30, 2006, is fairly stated, in all material respects, based on the criteria established in Internal Control—Integrated Framework issued by the Committee of Sponsoring Organizations of the Treadway Commission (COSO). Also in our opinion, Alimentation Couche-Tard Inc. maintained, in all material respects, effective internal control over financial reporting as of April 30, 2006, based on the criteria established in Internal Control—Integrated Framework issued by the Committee of Sponsoring Organizations of the Treadway Commission (COSO).
We have also audited, in accordance with Canadian generally accepted auditing standards and the standards of the Public Company Accounting Oversight Board (United States), the consolidated balance sheets of Alimentation Couche-Tard Inc. as of April 30, 2006 and April 24, 2005 and the consolidated statements of earnings, contributed surplus, retained earnings and cash flows for each of the years in the three-year period ended April 30, 2006 and our report dated June 14, 2006 expressed an unqualified audit opinion on those consolidated financial statements.
![]()
Montréal, Canada
June 14, 2006
56 / Alimentation Couche-Tard
CONSOLIDATED STATEMENTS OF EARNINGS
For the years ended April 30, 2006, April 24, 2005 and April 25, 2004
(in millions of US dollars (Note 2), except per share amounts)
| 2006 | 2005 | 2004 | |
| (53 weeks) | (52 weeks) | (52 weeks) | |
| restated (Note 3) | |||
| $ | $ | $ | |
| Revenues | 10,157.3 | 8,036.8 | 4,395.3 |
| Cost of sales | 8,365.8 | 6,479.0 | 3,480.8 |
| Gross profit | 1,791.5 | 1,557.8 | 914.5 |
| Operating, selling, administrative and general expenses | 1,352.9 | 1,214.7 | 740.3 |
| Depreciation and amortization of property and equipment and other assets (Note 6) | 106.9 | 83.9 | 57.7 |
| 1,459.8 | 1,298.6 | 798.0 | |
| Operating income | 331.7 | 259.2 | 116.5 |
| Financial expenses (Note 6) | 34.0 | 30.7 | 23.5 |
| Earnings before income taxes and write-off of financing costs | 297.7 | 228.5 | 93.0 |
| Write-off of financing costs (Note 16) | - | - | 9.2 |
| Earnings before income taxes | 297.7 | 228.5 | 83.8 |
| Income taxes (Note 7) | 101.5 | 73.3 | 27.7 |
| Net earnings | 196.2 | 155.2 | 56.1 |
| Net earnings per share (Note 8) | |||
Basic | 0.97 | 0.77 | 0.31 |
Diluted | 0.94 | 0.75 | 0.30 |
CONSOLIDATED STATEMENTS OF CONTRIBUTED SURPLUS
For the years ended April 30, 2006, April 24, 2005 and April 25, 2004
(in millions of US dollars (Note 2))
| 2006 | 2005 | 2004 | |
| (53 weeks) | (52 weeks) | (52 weeks) | |
| restated (Note 3) | |||
| $ | $ | $ | |
| Balance, beginning of year, as previously reported | 5.6 | 0.8 | 0.8 |
| Impact of change in accounting for stock options (Note 3) | - | 2.4 | - |
| Balance, beginning of year, as restated | 5.6 | 3.2 | 0.8 |
| Stock-based compensation (Note 19) | 3.8 | 2.5 | - |
| Fair value of stock options exercised | - | (0.1) | - |
| Balance, end of year | 9.4 | 5.6 | 0.8 |
CONSOLIDATED STATEMENTS OF RETAINED EARNINGS
For the years ended April 30, 2006, April 24, 2005 and April 25, 2004
(in millions of US dollars (Note 2))
| 2006 | 2005 | 2004 | |
| (53 weeks) | (52 weeks) | (52 weeks) | |
| restated (Note 3) | |||
| $ | $ | $ | |
| Balance, beginning of year, as previously reported (a) | 317.5 | 164.7 | 110.2 |
| Impact of change in accounting for stock options, without restatement (Note 3) | - | (2.4) | - |
| 317.5 | 162.3 | 110.2 | |
| Net earnings | 196.2 | 155.2 | 56.1 |
| 513.7 | 317.5 | 166.3 | |
| Dividends | (8.7) | - | - |
| Share issue expenses (net of future income taxes of $0.8) | - | - | 1.6 |
| Balance, end of year | 505.0 | 317.5 | 164.7 |
| (a) Including the accounting changes done with restatement (Note 3). | |||
The accompanying notes are an integral part of the consolidated financial statements.
Alimentation Couche-Tard / 57
CONSOLIDATED STATEMENTS OF CASH FLOWS
For the years ended April 30, 2006, April 24, 2005 and April 25, 2004
(in millions of US dollars (Note 2))
| 2006 | 2005 | 2004 | |
| (53 weeks) | (52 weeks) | (52 weeks) | |
| restated (Note 3) | |||
| $ | $ | $ | |
| Operating activities | |||
| Net earnings | 196.2 | 155.2 | 56.1 |
| Adjustments to reconcile net earnings to net cash provided by operating activities | |||
Depreciation and amortization of property and equipment and other assets, net of amortization of deferred credits | 99.2 | 75.0 | 51.9 |
Future income taxes | 26.8 | 26.4 | (12.8) |
Loss on disposal of property and equipment and other assets | 2.1 | 1.7 | 2.5 |
Write-off of financing costs | - | - | 9.2 |
Deferred credits | 15.2 | 13.5 | 9.1 |
Other | 4.8 | (1.7) | (0.1) |
Changes in non-cash working capital (Note 9) | 57.2 | 46.0 | 118.8 |
| Net cash provided by operating activities | 401.5 | 316.1 | 234.7 |
| Investing activities | |||
| Purchase of property and equipment | (245.3) | (182.8) | (85.6) |
| Business acquisitions (Note 5) | (91.6) | (69.6) | (772.5) |
| Proceeds from sale and leaseback transactions | 36.2 | 19.9 | 284.1 |
| Temporary investments | (21.0) | - | - |
| Proceeds from disposal of property and equipment and other assets | 15.9 | 20.5 | 3.9 |
| Increase in other assets | (7.0) | (6.5) | (2.4) |
| Liabilities assumed on business acquisitions | (4.0) | (5.1) | (1.7) |
| Net cash used in investing activities | (316.8) | (223.6) | (574.2) |
| Financing activities | |||
| Dividends paid | (8.7) | - | - |
| Repayment of long-term debt | (6.9) | (6.3) | (557.9) |
| Issuance of shares, net of share issue expenses | 0.2 | 9.3 | 169.0 |
| Increase in long-term debt, net of financing costs | - | 0.2 | 846.9 |
| Net cash provided by (used in) financing activities | (15.4) | 3.2 | 458.0 |
| Effect of exchange rate fluctuations on cash and cash equivalents | 9.5 | 3.2 | 1.9 |
| Net increase in cash and cash equivalents | 78.8 | 98.9 | 120.4 |
| Cash and cash equivalents, beginning of year | 252.7 | 153.8 | 33.4 |
| Cash and cash equivalents, end of year | 331.5 | 252.7 | 153.8 |
| The accompanying notes are an integral part of the consolidated financial statements. |
58 / Alimentation Couche-Tard
CONSOLIDATED BALANCE SHEETS
as at April 30, 2006 and April 24, 2005
(in millions of US dollars (Note 2))
| 2006 | 2005 | |
| $ | $ | |
| Assets | ||
| Current assets | ||
Cash and cash equivalents | 331.5 | 252.7 |
Temporary investments | 21.4 | - |
Accounts receivable (Note 10) | 153.0 | 109.7 |
Income taxes receivable | 0.7 | 31.6 |
Inventories (Note 11) | 322.3 | 295.4 |
Prepaid expenses | 15.2 | 10.0 |
Future income taxes (Note 7) | 18.9 | 17.2 |
| 863.0 | 716.6 | |
| Property and equipment (Note 12) | 1,014.1 | 812.0 |
| Goodwill | 245.8 | 224.9 |
| Trademarks and licenses | 175.4 | 172.5 |
| Other assets (Note 13) | 70.3 | 68.1 |
| Future income taxes (Note 7) | 0.6 | 1.6 |
| 2,369.2 | 1,995.7 | |
| Liabilities | ||
| Current liabilities | ||
Accounts payable and accrued liabilities (Note 15) | 681.8 | 609.6 |
Current portion of long-term debt (Note 16) | 8.0 | 7.0 |
Future income taxes (Note 7) | 0.1 | 0.1 |
| 689.9 | 616.7 | |
| Long-term debt (Note 16) | 516.1 | 523.9 |
| Deferred credits and other liabilities (Note 17) | 127.2 | 89.6 |
| Future income taxes (Note 7) | 70.0 | 32.3 |
| 1,403.2 | 1,262.5 | |
| Shareholders’ equity | ||
| Capital stock (Note 18) | 351.0 | 350.8 |
| Contributed surplus | 9.4 | 5.6 |
| Retained earnings | 505.0 | 317.5 |
| Cumulative translation adjustments | 100.6 | 59.3 |
| 966.0 | 733.2 | |
| 2,369.2 | 1,995.7 | |
| The accompanying notes are an integral part of the consolidated financial statements. | ||
| On behalf of the Board, | |
| Alain Bouchard | Richard Fortin |
| Director | Director |
Alimentation Couche-Tard / 59
NOTES TO CONSOLIDATED FINANCIAL STATEMENTS
For the years ended April 30, 2006, April 24, 2005 and April 25, 2004
(in millions of US dollars, except share and stock option data)
1. Governing statutes and nature of operations
Alimentation Couche-Tard Inc. (the Company) is incorporated under the Companies Act (Quebec).
The Company owns and licenses 4,983 convenience stores across North America of which 3,632 are Company-operated and generates income primarily from the sales of tobacco products, grocery items, beverages, fresh food offerings, including quick service restaurants, motor fuel and other products and services.
2. Basis of presentation
Year end date
The Company’s year end is the last Sunday of April of each year. For comparative purposes, the years ended April 30, 2006, April 24, 2005 and April 25, 2004 are referred to as 2006, 2005 and 2004. The year ended April 30, 2006 has 53 weeks (52 weeks in 2005 and 2004).
Basis of presentation
The consolidated financial statements have been prepared in accordance with Canadian generally accepted accounting principles (Canadian GAAP).
Change in reporting currency
As at April 25, 2005, the Company has changed its reporting currency from Canadian dollars to US dollars to provide more relevant information considering its predominant operations in the United States and its US dollar denominated debt. For comparative purposes, historical consolidated financial statements and notes have been restated into US dollars using the current rate method. The functional currencies of the Company and each of its subsidiaries remained unchanged.
3. Accounting changes
2006
Non-monetary transactions
On June 1, 2005, the Canadian Institute of Chartered Accountants (CICA) issued Handbook Section 3831, “Non-Monetary Transactions”, replacing Section 3830 of the same name. Under these new standards, all non-monetary transactions initiated in periods beginning on or after January 1, 2006 have to be measured at fair value unless:
the transaction lacks commercial substance;
the transaction is an exchange of a product or property held for sale in the ordinary course of business for a product or property to be sold in the same line of business to facilitate sales to customers other than the parties to the exchange;
neither the fair value of the assets received nor the fair value of the asset given up is reliably measurable; or
the transaction is a non-monetary, non-reciprocal transfer to owners that represents a spin-off or other form of restructuring or liquidation.
The Company adopted these new recommendations both early and prospectively on July 18, 2005. The implementation of these new recommendations did not have a material impact on the Company’s consolidated financial statements.
2005
Accounting for property and equipment and lease accounting
During 2005, the Company undertook a review of its depreciation and amortization policies for all of its property and equipment and of its lease accounting policies. Previously, the Company used the decreasing charge method at various rates to calculate depreciation, except for Circle K where the straight-line method was used. In addition, leasehold improvements were amortized over the shorter of the term of the lease plus renewal periods or their useful lives and rent expense was recorded over the committed lease period and did not take into account future rent escalations included in the lease term.
As a result of the review and an in depth study of the useful lives of its property and equipment, the Company decided to change its accounting policy for depreciation and amortization of property and equipment to use the straight-line method throughout the Company. This method is more representative of the actual useful lives of the assets and provides uniformity within the Company. This change has been applied retroactively and prior years consolidated financial statements have been restated.
Following a review of its lease accounting policies and the relevant accounting literature, the Company has determined it should amortize its leasehold improvements over the shorter of their useful lives or the lease term. Moreover, the Company decided it should record lease expense using the straight-line method. Accordingly, the Company has restated previously reported consolidated financial statements to reflect these changes.
The impact of those changes as of April 25, 2004 is a decrease in property and equipment of $10.0, an increase in net future income tax assets of $6.5, an increase in accounts payable and accrued liabilities of $0.6, an increase in deferred credits and other liabilities of $8.1, a reduction in retained earnings of $11.5 and a decrease in the cumulative translation adjustments balance of $0.7.
For 2005, the impact of those changes resulted in a $1.7 increase of the depreciation expense ($1.6 in 2004), a $3.5 increase in lease expense ($1.9 in 2004) and in a $3.7 decrease in net earnings ($2.7 in 2004). The impact on diluted net earnings per share is a decrease of $0.02 in 2005 and $0.01 in 2004.
60 / Alimentation Couche-Tard
NOTES TO CONSOLIDATED FINANCIAL STATEMENTS
For the years ended April 30, 2006, April 24, 2005 and April 25, 2004
(in millions of US dollars, except share and stock option data)
3. Accounting changes (continued)
Consolidation of variable interest entities
During 2005, the Company adopted the CICA Accounting Guideline No.15 (AcG-15) “Consolidation of Variable Interest Entities” (VIEs) that came into effect November 1, 2004. This guideline clarifies and addresses the application of consolidation guidance to those entities defined as VIEs, which are entities that are subject to control on a basis other than voting interests. Such entities should be consolidated by the primary beneficiary, which is the entity that will absorb a majority of the VIE’s expected losses or will receive a majority of its expected residual returns, or both.
The implementation of this guideline did not have any material impact on the Company’s consolidated financial statements.
Asset retirement obligations
During 2005, the Company adopted the new CICA Handbook Section 3110, “Asset Retirement Obligations”, which establishes standards for the recognition, measurement and disclosure of legal obligations associated with the costs to retire long-lived assets. Accordingly, under the new standard, the fair value of the future retirement costs of the Company’s underground motor fuel storage tanks is recorded as a liability on a discounted basis when it is incurred and an equivalent amount is capitalized to property and equipment. The initial recorded obligation, which has been discounted using the Company’s credit-adjusted risk free-rate, will be reviewed periodically to reflect the passage of time and changes in the estimated future costs underlying the obligation. The Company amortizes the initial amount capitalized to property and equipment and recognizes accretion expense in connection with the discounted liability over the estimated remaining useful life of the underground motor fuel storage tanks.
The new standard has been applied retroactively and consolidated financial statements of the prior periods have been restated. The impact of this change as of April 25, 2004 is an increase in property and equipment of $12.9, an increase in asset retirement obligations of $15.9, an increase in net future income tax assets of $1.3 and a reduction in retained earnings of $1.7.
For 2005 and 2004, the impact on net earnings is a decrease of $1.8 and $0.3, respectively (a decrease of $0.01 per share on a diluted basis in 2005 and nil in 2004).
Stock-based compensation and other stock-based payments
Effective April 26, 2004, the Company adopted the amended recommendations of the CICA relating to Section 3870, “Stock-based Compensation and Other Stock-based Payments”. These amendments require that stock-based compensation costs be measured at the grant date of the award based on the fair value method for all transactions entered into for years beginning on or after January 1, 2002. The Company chose to apply these amendments retroactively, without restating prior periods, for stock options granted since April 29, 2002. The fair value of the stock options is recognized over the vesting period as compensation expense with a corresponding increase in contributed surplus. When stock options are exercised, the corresponding contributed surplus is transferred to capital stock.
Prior to April 29, 2002, the Company recorded no compensation cost for its stock options granted to employees but provided, in its notes to the consolidated financial statements, pro forma disclosures of net earnings and net earnings per share as if the fair value based method of accounting had been applied.
The retroactive treatment of these recommendations resulted in a decrease of $2.4 in opening retained earnings with a corresponding increase in contributed surplus (see Note 19).
Recording of certain consideration received from a vendor
On January 31, 2005, the Company adopted both early and retroactively the amended recommendations of the Emerging Issues Committee of the CICA relating to the third topic of Abstract 144 (EIC-144), “Accounting by a Customer (Including a Reseller) for Certain Consideration Received From a Vendor”. These amendments address the recognition, measurement and disclosure requirements for vendor rebates and state that those rebates must be recognized when probable and reasonably estimable. Therefore, vendor rebates recognized in earnings and for which the full requirements for entitlement have not yet been met would be disclosed. The implementation of these new recommendations did not have any material impact on the Company’s consolidated financial statements.
Generally accepted accounting principles
In July 2003, the CICA issued Handbook Section 1100, “Generally Accepted Accounting Principles”, which establishes standards for financial reporting in accordance with Canadian GAAP and provides guidance on sources to consult when selecting accounting policies and determining appropriate disclosures when a matter is not dealt with explicitly in the primary sources of Canadian GAAP. The application of these new standards was done prospectively starting on April 26, 2004 and had no material impact on the Company’s consolidated financial statements, except for the lease accounting described above.
2004
Recording of certain consideration received from a vendor
In January 2004, the Emerging Issues Committee of the CICA released EIC-144, “Accounting by a Customer (Including a Reseller) for Certain Consideration Received From a Vendor”. Under this new standard, certain cash consideration received from a vendor should be considered as an adjustment of the prices of the vendor’s products, and therefore should be characterized as a reduction of cost of sales and related inventories when recognized in the financial statements. Certain exceptions apply if the consideration is a payment for assets or services delivered to the vendor or for reimbursement of selling costs incurred to promote the vendor’s products, provided that certain conditions are met.
The Company adopted these new recommendations both early and retroactively on January 30, 2004 and consolidated financial statements from prior years have been restated.
For the year ended April 25, 2004, application of EIC-144 resulted in a $0.7 increase in the cost of goods sold and a decrease in net earnings of $0.5.
Alimentation Couche-Tard / 61
NOTES TO CONSOLIDATED FINANCIAL STATEMENTS
For the years ended April 30, 2006, April 24, 2005 and April 25, 2004
(in millions of US dollars, except share and stock option data)
3. Accounting changes (continued)
Impairment of long-lived assets
In December 2002, the CICA issued Handbook Section 3063 entitled “Impairment of Long-lived Assets”. This section sets out standards for recognizing, measuring and reporting the impairment of long-lived assets. It supersedes the write-down provisions included in Section 3061, “Property, Plant and Equipment”. This new section requires that the Company recognizes an impairment loss for long-lived assets to be kept and used when events or changes in circumstances result in their carrying amount exceeding the sum of the undiscounted cash flows expected to result from their use and eventual disposal. The impairment loss is equivalent to the amount by which the assets’ carrying amount exceeds its fair value.
This modification of accounting principles was applied prospectively beginning April 28, 2003 and had no material impact on the carrying amount of the Company’s long-lived assets.
Guarantees
In February 2003, the CICA issued Accounting Guideline No. 14 (AcG-14), “Disclosure of Guarantees”. This guideline provides information related to financial statements disclosures to be provided under certain guarantees. The Company adopted these new recommendations as at April 28, 2003.
A guarantee is defined as a contract or an indemnification agreement contingently requiring a company to make payments to a third party based on future events. These payments are contingent on either changes in an underlying or other variables that are related to an asset, liability, or an equity security of the indemnified party or the failure of another entity to perform under an obligating agreement. It could also be an indirect guarantee of the indebtedness of another party.
4. Accounting policies
Accounting estimates
The preparation of consolidated financial statements in accordance with Canadian GAAP requires management to make estimates and assumptions that affect the amounts reported in the consolidated financial statements and accompanying notes. On an ongoing basis, management reviews its estimates, including those relating to supplier rebates, environmental costs and asset retirement obligations based on available information. These estimates are based on management’s best knowledge of current events and actions that the Company may undertake in the future. Actual results could differ from those estimates.
Principles of consolidation
The consolidated financial statements include the accounts of the Company and of its subsidiaries, all of which are wholly owned.
Foreign currency translation
The non-consolidated financial statements of the Company and its subsidiaries are prepared based on their respective functional currencies, which is US dollar for US operations and Canadian dollar for Canadian operations and corporate activities.
As a result, in the Company’s consolidated financial statements, the Canadian and corporate operations are translated into US dollars using the current rate method. Under this method, assets and liabilities are translated using the exchange rate in effect at the balance sheet date. Revenues and expenses are translated at the average rate in effect during the year. Gains and losses are included in Cumulative translation adjustments account in the Shareholders’ equity.
Net earnings per share
Basic net earnings per share is calculated by dividing the net earnings available to Class A and Class B shareholders by the weighted average number of Class A and Class B shares outstanding during the year. Diluted net earnings per share is calculated using the treasury stock method and takes into account the dilutive effect of stock options and warrants.
Revenue recognition
For its two major product categories, merchandise and motor fuel, the Company recognizes revenue at the point of sale. Merchandise sales are comprised primarily of the sale of tobacco products, grocery items, candy and snacks, beverages, beer, wine, fresh food offerings, including quick service restaurants, and services.
Services revenues include the commission on sale of lottery tickets and issuance of money orders, fees from automatic teller machines, sales of calling cards and gift cards, fees for cashing cheques, sales of postage stamps and bus tickets and car wash revenues. These revenues are recognized at the time of transaction in stores. Services revenues also include franchise and license fees, which are recognized in revenues over the period of the agreement to which the fees relate and royalties from franchisees and licensees, which are recognized periodically based on sales reported by franchise and licence operators.
Operating, selling, administrative and general expenses
The main items comprising Operating, selling, administrative and general expenses are labour, building occupancy costs and overhead and include advertising expenses that are charged as incurred in the amount of $26.8 in 2006, $21.6 in 2005 and $13.8 in 2004.
Self-insurance
In the United States, the Company is self-insured for certain losses related to general liability and workers’ compensation. The expected ultimate cost for claims incurred as of the balance sheet date is not discounted and is recognized as a liability. This cost is estimated based upon analysis of the Company’s historical data and actuarial estimates.
62 / Alimentation Couche-Tard
NOTES TO CONSOLIDATED FINANCIAL STATEMENTS
For the years ended April 30, 2006, April 24, 2005 and April 25, 2004
(in millions of US dollars, except share and stock option data)
4. Accounting policies (continued)
Cash and cash equivalents
Cash includes cash and demand deposits. Cash equivalents include highly liquid investments that can be converted into cash for a fixed amount and that mature less than three months from the date of acquisition.
Temporary investments
Temporary investments are comprised of securities that have maturities of more than three months and are valued at lower of cost and fair value.
Inventories
Inventories are valued at the lesser of cost and net realizable value. Cost of merchandise - distribution centres is determined according to the first-in first-out method, the cost of merchandise - retail is valued based on the retail price less a normal margin and the cost of motor fuel inventory is determined according to the average cost method.
Vendor rebates
The Company records cash received from vendors related to vendor rebates as a reduction in the price of the vendors’ products and reflects them as a reduction of costs of sales and related inventory in its consolidated statements of earnings and balance sheets when those rebates satisfy the recognition criteria.
Income taxes
The Company uses the liability method to account for income taxes. Under this method, future income tax assets and liabilities are determined based on differences between the carrying amounts and tax bases of assets and liabilities using enacted or substantively enacted tax rates and laws at the date of the consolidated financial statements for the years in which the temporary differences are expected to reverse. A valuation allowance is recognized to the extent that it is more likely than not that all of the future income tax assets will not be realized.
Depreciation and amortization
Property and equipment are stated at cost and depreciated over their estimated useful lives using the straight-line method based on the following periods:
| Buildings | 3 to 40 years |
| Equipment | 3 to 30 years |
| Buildings under capital leases | Lease term |
Leasehold improvements and property and equipment on leased properties are amortized and depreciated over the lesser of their useful lives and the term of the lease.
Rent expense
Rent expense is recognized in earnings using the straight-line method.
Goodwill
Goodwill is the excess of the cost of an acquired business over the fair value of underlying net assets acquired from the business at the time of acquisition. Goodwill is not amortized. It is rather tested for impairment annually, or more frequently should events or changes in circumstances indicate that it might be impaired. Should the carrying amount of a reporting unit’s goodwill exceed its fair value, an impairment loss would be recognized.
Trademarks and licenses
Trademarks and licenses have indefinite lives, are recorded at cost and are not amortized; rather, they are tested for impairment annually, or more frequently, should events or circumstances indicate that the assets might be impaired. Should the carrying amount of a trademark or license exceed its fair value, an impairment loss in the amount of the excess would be recognized.
Other assets
Other assets include deferred charges, environmental costs receivable, accrued pension benefit asset and deposits.
Deferred charges are mainly financing costs amortized using the effective interest rate method over the period of the corresponding debt. Deferred charges also include expenses incurred in connection with the analysis and signing of operating leases which are deferred and amortized on a straight-line basis over the lease term. Other deferred charges are amortized on a straight-line basis over periods of five to seven years.
Alimentation Couche-Tard / 63
NOTES TO CONSOLIDATED FINANCIAL STATEMENTS
For the years ended April 30, 2006, April 24, 2005 and April 25, 2004
(in millions of US dollars, except share and stock option data)
4. Accounting policies (continued)
Employee future benefits
The Company accrues its obligations under employee pension plans and the related costs, net of plan assets. The Company has adopted the following policies with respect to the defined benefit plans:
the accrued benefit obligations and the cost of pension benefits earned by active employees are actuarially determined using the projected benefit method prorated on service and pension expense is recorded in income as the services are rendered by active employees. The calculations reflect management’s best estimate of expected plan investment performance, salary escalation and retirement ages of employees;
for the purpose of calculating the expected return on plan assets, those assets are valued at fair value;
actuarial gains (losses) arise from the difference between actual long-term rate of return on plan assets for a period and the expected long-term rate of return on plan assets for that period or from changes in actuarial assumptions used to determine the accrued benefit obligation. The excess of the net actuarial gain (loss) over 10% of the greater of the benefit obligation and fair value of plan assets is amortized over the average remaining service period of active employees. The average remaining service period of the active employees covered by the pension plans is 10 years;
on May 1, 2000, the Company adopted the new accounting standard on employee future benefits using the prospective application method. The Company is amortizing the transitional asset on a straight-line basis over 11 years, which was the average remaining service period of employees expected to receive benefits under the benefit plan as of May 1, 2000;
past service costs are amortized on a straight-line basis over the average remaining service period of active employees.
The pension costs recorded in earnings for the defined contribution plan is equivalent to the contribution which the Company is required to pay in exchange for services provided by the employees.
Environmental costs
The Company provides for estimated future site remediation costs to meet government standards for known site contaminations when such costs can be reasonably estimated. Estimates of the anticipated future costs for remediation activities at such sites are based on the Company’s prior experience with remediation sites and consideration of other factors such as the condition of the site contamination, location of sites and experience with contractors that perform the environmental assessments and remediation work.
Hedging and derivative financial instruments
The Company uses derivative financial instruments by way of interest rate swaps to manage current and forecast risks related to interest rate fluctuations associated with the Company’s subordinated unsecured debt. The Company does not use freestanding derivative financial instruments for trading or speculative purposes.
The Company formally documents and designates each derivative financial instrument as a hedge of its subordinated unsecured debt. The Company determines that derivative financial instruments are effective hedges, at the time of the establishment of the hedge and for the duration of the instrument, since the date to maturity, the reference amount and interest rate of the instruments correspond to all the conditions of the debt.
The Company uses interest rate swaps as part of its program for managing the combination of fixed and variable interest rates of its debt and the corresponding aggregate cost of borrowing. Interest rate swaps involve an exchange of interest payments without an exchange of principal underlying the interest payments. They are accounted for as an adjustment of accrued interest expense on the debt instruments. The corresponding amount to be paid to counterparties or to be received from counterparties is accounted for as an adjustment of accrued interest.
In the case of an early termination of one of the interest swap agreements or if the hedge ceases to be effective prior to maturity, any realized and unrealized gains or losses would be recorded on the balance sheet and amortized to consolidated statements of earnings over the remaining term of the related hedged debt. In the event of early extinguishment of the debt, any realized or unrealized gains or losses related to the swap would be recognized in the consolidated statements of earnings at the time of the extinguishment of the debt.
The Company has also designated its entire US dollars denominated long-term debt as a foreign exchange hedge of its net investment in its U.S. self-sustaining subsidiaries. Accordingly, corresponding foreign exchange gains and losses are recorded in cumulative translation adjustments account in the shareholders’ equity to offset the foreign currency translation adjustments on the investments.
5. Business acquisitions
The Company has made the following business acquisitions that were accounted for using the purchase method. Earnings from the businesses acquired are included in the consolidated statements of earnings from their respective dates of acquisition.
2006
During the year, the Company made the following business acquisitions:
effective March 14, 2006: purchase of 34 Company-operated stores and 19 affiliated stores, all operating under the Shell banner in the Indianapolis area of Indiana, United States, from Shell Oil Products US. At the closing date, two Company-operated stores were closed;
effective December 14, 2005: purchase of 16 Company-operated stores operating under the Winners banner in New Mexico, United States, from Conway Oil Company and Conway Real Estate Company;
effective December 8, 2005: purchase of 18 Company-operated stores and 8 affiliated stores, all operating under the BP banner in the Memphis area of Tennessee, United States, from BP Products North America, Inc.;
effective November 3, 2005: purchase of seven Company-operated stores operating under the Fuel Mart banner in Ohio, United States, from Ports Petroleum Co.
64 / Alimentation Couche-Tard
NOTES TO CONSOLIDATED FINANCIAL STATEMENTS
For the years ended April 30, 2006, April 24, 2005 and April 25, 2004
(in millions of US dollars, except share and stock option data)
5. Business acquisitions (continued)
These four acquisitions were settled for a total cash consideration of $91.6, financed from the Company’s available cash. The net assets acquired included working capital of $4.6, property and equipment of $81.4, goodwill of $3.9, trademarks and licences of $2.0, other assets of $1.3 and deferred credits and other liabilities of $1.6. Most of the goodwill related to these transactions is deductible for tax purposes.
2005
Changes to the purchase price allocation
During 2005, the Company finalized the allocation of the purchase price related to the acquisition of The Circle K Corporation on December 17, 2003. The final allocation resulted in an increase in property and equipment of $16.5 and an increase in asset retirement obligations of $15.2 mainly due to a change in the estimate of the asset retirement obligations and an increase in trademarks and licenses of $12.9 based on an external valuation of trademarks.
In addition, the final allocation resulted in an increase in net working capital of $1.6, an increase in other assets of $1.3 and a decrease in net future income tax asset of $17.1. The preliminary allocation of the purchase price is described below.
Acquisitions
During 2005, the Company made the following business acquisitions:
in April 2005: purchase of nine sites operating under the Thornton and Pit Stop banners in the Midwest region of United States, from Thornton Inc. and Broadus Oil Corporation of Illinois Inc.;
effective February 2, 2005: purchase of 19 sites operating under the Pump N Shop banner in the Augusta, Georgia area, United States, from QVS Inc. and Brosious & Holt Properties LLC;
effective November 3, 2004: purchase of 21 sites in the Phoenix, Arizona area, United States, from Shell Oil Products US.
These three acquisitions were settled for a total cash consideration of $69.6 financed from the Company’s available cash. The net assets acquired included working capital of $3.3, property and equipment of $64.0 and goodwill of $2.3. Most of the goodwill related to these transactions is deductible for tax purposes.
2004
On December 17, 2003, the Company acquired all of the outstanding shares of Circle K from ConocoPhillips Company. The assets included a chain of 1,663 stores in 16 U.S. states, mainly in the southern United States. At the acquisition date, Circle K also held franchise or licensing agreements with another 627 stores in the U.S. and 4,003 international licenses agreements.
This acquisition was made for a total cash consideration of $831.8, including acquisition costs and amounts payable in accordance with a price adjustment clause, based on the working capital acquired. The acquisition was financed by issuing 27,111,076 new Class B subordinate voting shares (see Note 18) and by issuing new debt.
On September 4, 2003, the Company concluded the acquisition of assets of Clark Retail Enterprises Inc. (Clark) including 43 stores in the states of Illinois, Indiana, Iowa, Michigan and Ohio. This acquisition was made for a total cash consideration of $29.9, including acquisition costs. The transaction was financed by using the Company’s existing credit facilities. Most of the goodwill related to this transaction is deductible for tax purposes.
The preliminary allocations of the purchase prices of the acquisitions were as follows:
| Circle K | Clark | Total | |
| $ | $ | $ | |
| Current assets | 237.3 | 3.5 | 240.8 |
| Property and equipment | 587.6 | 21.8 | 609.4 |
| Goodwill | - | 5.3 | 5.3 |
| Trademarks, licenses and other assets | 159.2 | - | 159.2 |
| Future income taxes | 27.9 | 0.1 | 28.0 |
| 1,012.0 | 30.7 | 1,042.7 | |
| Current liabilities assumed | 164.7 | 0.4 | 165.1 |
| Long-term debt assumed | 6.7 | - | 6.7 |
| Deferred credits and other liabilities assumed | 8.8 | 0.4 | 9.2 |
| 180.2 | 0.8 | 181.0 | |
| Net assets and total consideration | 831.8 | 29.9 | 861.7 |
| Less: cash from the acquisition | 80.6 | - | 80.6 |
| Net assets excluding cash from the acquisition | 751.2 | 29.9 | 781.1 |
| Less: balance to be paid to vendors | 8.6 | - | 8.6 |
| Cash consideration | 742.6 | 29.9 | 772.5 |
Subsequent to the acquisitions of Circle K and Clark, the Company entered into sale and leaseback agreements under which certain property and equipment acquired were sold to financial institutions and re-leased to the Company under long-term leases. Most of these long-term leases are for periods of 15 to 17 years, with the possibility of renewal. These transactions did not result in any gains or losses for the Company. Proceeds related to these transactions amounted to $267.7, net of related expenses.
Alimentation Couche-Tard / 65
NOTES TO CONSOLIDATED FINANCIAL STATEMENTS
For the years ended April 30, 2006, April 24, 2005 and April 25, 2004
(in millions of US dollars, except share and stock option data)
6. Information included in the consolidated statements of earnings
| 2006 | 2005 | 2004 | |
| restated (Note 3) | |||
| $ | $ | $ | |
| Depreciation and amortization | |||
Property and equipment | 106.1 | 83.1 | 57.4 |
Other assets | 0.8 | 0.8 | 0.3 |
| 106.9 | 83.9 | 57.7 | |
| Financial expenses | |||
Interest on long-term debt | 30.6 | 27.1 | 20.7 |
Amortization of deferred financing costs | 3.1 | 3.1 | 2.2 |
| 33.7 | 30.2 | 22.9 | |
Interest on short-term debt | 0.3 | 0.5 | 0.6 |
| 34.0 | 30.7 | 23.5 |
Interest expense
Interest expense on long-term debt is net of interest income. Interest income total $8.5 in 2006, $2.2 in 2005 and $0.4 in 2004.
Supplementary information related to the rental expense included in Operating, selling, administrative and general expenses:
| 2006 | 2005 | 2004 | |
| restated (Note 3) | |||
| $ | $ | $ | |
| Net rent expense | |||
Rent expense | 174.0 | 158.5 | 97.1 |
Sub-leasing income | 11.5 | 11.7 | 7.0 |
| 162.5 | 146.8 | 90.1 |
7. Income taxes
| 2006 | 2005 | 2004 | |
| restated (Note 3) | |||
| $ | $ | $ | |
| Current income taxes | 74.7 | 46.9 | 40.5 |
| Future income taxes | 26.8 | 26.4 | (12.8) |
| 101.5 | 73.3 | 27.7 | |
| Earnings before income taxes | |||
Domestic | 79.7 | 96.5 | 38.4 |
Foreign | 218.0 | 132.0 | 45.4 |
| 297.7 | 228.5 | 83.8 | |
| Current income taxes | |||
Domestic | 12.4 | 26.1 | 21.6 |
Foreign | 62.3 | 20.8 | 18.9 |
| 74.7 | 46.9 | 40.5 | |
| Future income taxes | |||
Domestic | 4.8 | 4.4 | (9.3) |
Foreign | 22.0 | 22.0 | (3.5) |
| 26.8 | 26.4 | (12.8) |
The principal items which resulted in differences between the Company’s effective income tax rates and the combined statutory rates in Canada are detailed as follows:
| 2006 | 2005 | 2004 | |
| % | % | % | |
| Combined statutory income tax rate in Canada (a) | 32.46 | 32.28 | 35.70 |
| Impact of tax rate increases (decreases) | (0.02) | (0.32) | 0.23 |
| Other permanent differences | 1.65 | 0.12 | (2.88) |
| Effective income tax rate | 34.09 | 32.08 | 33.05 |
(a) The Company’s combined statutory income tax rate in Canada includes the appropriate provincial income tax rates.
66 / Alimentation Couche-Tard
NOTES TO CONSOLIDATED FINANCIAL STATEMENTS
For the years ended April 30, 2006, April 24, 2005 and April 25, 2004
(in millions of US dollars, except share and stock option data)
7. Income taxes (continued)
The components of future income tax assets (liabilities) are as follows:
| 2006 | 2005 | |
| $ | $ | |
| Net future income tax assets | ||
Expenses deductible in future years | 17.1 | 11.5 |
Deferred credits | 0.2 | 1.1 |
Other | 1.5 | 4.5 |
| 18.8 | 17.1 | |
| Net future income tax liabilities | ||
Expenses deductible in future years | 5.2 | 5.3 |
Property and equipment | (21.4) | (2.6) |
Non-capital losses | 3.8 | 4.1 |
Deferred credits | 8.9 | 8.9 |
Borrowing and share issue costs | 1.2 | 2.0 |
Goodwill | (1.9) | 0.6 |
Trademarks and licences | (56.2) | (42.2) |
Other | (9.0) | (6.8) |
| (69.4) | (30.7) |
8. Net earnings per share
The following table presents the information for the computation of basic and diluted net earnings per share, adjusted for the share splits described in Note 18:
| 2006 | 2005 | 2004 | |
| restated (Note 3) | |||
| $ | $ | $ | |
| Basic net earnings attributable to Class A and B shareholders | 196.2 | 155.2 | 56.1 |
| Weighted average number of shares (in thousands) | 202,030 | 201,342 | 179,317 |
| Dilutive effect of stock options (in thousands) | 5,632 | 5,020 | 8,060 |
| Weighted average number of diluted shares (in thousands) | 207,662 | 206,362 | 187,377 |
| Basic net earnings per share available for Class A and B shareholders | 0.97 | 0.77 | 0.31 |
| Diluted net earnings per share available for Class A and B shareholders | 0.94 | 0.75 | 0.30 |
In calculating diluted net earnings per share for 2006, 170,000 stock options (465,000 in 2005 and nil in 2004) are excluded due to their antidilutive effect.
9. Information included in the consolidated statements of cash flows
The changes in non-cash working capital are detailed as follows:
| 2006 | 2005 | 2004 | |
| restated (Note 3) | |||
| $ | $ | $ | |
| Accounts receivable | (37.9) | (5.9) | 6.0 |
| Inventories | (9.9) | (5.9) | (7.6) |
| Prepaid expenses | (5.3) | 1.8 | (6.5) |
| Accounts payable and accrued liabilities | 76.8 | 119.1 | 107.2 |
| Income taxes | 33.5 | (63.1) | 19.7 |
| 57.2 | 46.0 | 118.8 |
Cash flows relating to interest and income taxes of operating activities are detailed as follows:
| 2006 | 2005 | 2004 | |
| $ | $ | $ | |
| Interest paid | 36.8 | 30.3 | 13.2 |
| Income taxes paid | 42.2 | 110.9 | 23.7 |
10. Accounts receivable
| 2006 | 2005 | |
| $ | $ | |
| Trade accounts receivable and vendor rebates receivable | 70.1 | 54.4 |
| Credit and debit cards receivable | 66.0 | 39.4 |
| Environmental costs receivable | 2.0 | 0.9 |
| Other accounts receivable | 14.9 | 15.0 |
| 153.0 | 109.7 |
Alimentation Couche-Tard / 67
NOTES TO CONSOLIDATED FINANCIAL STATEMENTS
For the years ended April 30, 2006, April 24, 2005 and April 25, 2004
(in millions of US dollars, except share and stock option data)
11. Inventories
| 2006 | 2005 | |
| $ | $ | |
| Merchandise – retail | 216.0 | 203.9 |
| Motor fuel | 84.8 | 63.6 |
| Merchandise – distribution centres | 21.5 | 27.9 |
| 322.3 | 295.4 |
12. Property and equipment
| 2006 | |||
| Accumulated | |||
| Cost | depreciation | Net | |
| $ | $ | $ | |
| Land | 240.8 | - | 240.8 |
| Buildings | 202.2 | 44.3 | 157.9 |
| Leasehold improvements | 198.6 | 74.5 | 124.1 |
| Equipment | 780.4 | 289.6 | 490.8 |
| 1,422.0 | 408.4 | 1,013.6 | |
| Buildings under capital leases | 4.1 | 3.6 | 0.5 |
| 1,426.1 | 412.0 | 1,014.1 | |
| 2005 | |||
| Accumulated | |||
| Cost | depreciation | Net | |
| $ | $ | $ | |
| Land | 192.3 | - | 192.3 |
| Buildings | 162.7 | 46.6 | 116.1 |
| Leasehold improvements | 143.1 | 45.1 | 98.0 |
| Equipment | 605.2 | 200.2 | 405.0 |
| 1,103.3 | 291.9 | 811.4 | |
| Buildings under capital leases | 3.7 | 3.1 | 0.6 |
| 1 107,0 | 295,0 | 812,0 |
13. Other assets
| 2006 | 2005 | |
| $ | $ | |
| Deferred charges, net | 28.2 | 30.7 |
| Environmental costs receivable | 19.8 | 21.6 |
| Accrued pension benefit asset | 8.6 | 8.0 |
| Deposits | 2.1 | 2.7 |
| Other, at cost | 11.6 | 5.1 |
| 70.3 | 68.1 |
14. Bank indebtedness
Bank indebtedness reflects the used portion of the credit facilities available to the Company. Available credit facilities are unused as at April 30, 2006 and April 24, 2005, with the exception of certain letters of guarantee.
The Company has a credit agreement consisting of a five-year renewable operating credit, maturing in December 2008, in the amount of Cdn$50.0 available in Canadian or US dollars or as letters of guarantee not exceeding Cdn$10.0 or the equivalent in US dollars, bearing interest at the Canadian or US prime rate plus 0.25% to 1.0% (same in 2005) or at LIBOR plus 1.25% to 2.0% (same in 2005), depending on whether certain financial ratios are achieved. The operating credit is also available in the form of bankers’ acceptances with stamping fees of 1.25% to 2.0% (same in 2005), depending on whether certain financial ratios are achieved. As at April 30, 2006, an amount of Cdn$49.1 (same as at April 24, 2005) is available under this operating credit and the effective interest rate is 6.25% (4.63% in 2005). The credit agreement also provides for a five-year renewable operating credit, maturing in December 2008, in the amount of $75.0 available in US dollars and as letters of guarantee not exceeding $30.0, bearing interest at the US prime rate plus 0.25% to 1.0% (same in 2005) or at LIBOR plus 1.25% to 2.0% (same in 2005) depending on whether certain financial ratios are achieved. As at April 30, 2006, an amount of $59.5 ($62.8 as at April 24, 2005) is available under this operating credit and the effective interest rate is 6.25% (4.63% in 2005). These credit facilities are subject to the same guarantees and restrictive covenants which apply to the term loans described in Note 16.
15. Accounts payable and accrued liabilities
| 2006 | 2005 | |
| $ | $ | |
| Accounts payable and accrued expenses | 494.1 | 435.4 |
| Sales and other taxes payable | 61.9 | 53.2 |
| Salaries and social benefits | 49.2 | 45.9 |
| Deferred credits | 11.0 | 9.1 |
| Environmental costs | 9.9 | 7.5 |
| Other | 55.7 | 58.5 |
| 681.8 | 609.6 |
68 / Alimentation Couche-Tard
NOTES TO CONSOLIDATED FINANCIAL STATEMENTS
For the years ended April 30, 2006, April 24, 2005 and April 25, 2004
(in millions of US dollars, except share and stock option data)
16. Long-term debt
| 2006 | 2005 | |
| $ | $ | |
| Subordinated unsecured debt (a) | 350.0 | 350.0 |
| Secured term loans (b) | ||
Term loan “A” | 19.5 | 24.1 |
Term loan “B” | 147.0 | 148.5 |
| Note payable, secured by the assets of certain stores, 8.75%, repayable in monthly instalments, maturing in 2019 | 5.2 | 5.4 |
| Obligations related to buildings under capital leases, rates varying from 6.89% to 13.25% (5.9% to 13.25% in 2005), payable on various dates until 2019 | 2.3 | 2.5 |
| Mortgage loans secured by land and buildings, rates varying from 7.0% to 8.0% (same in 2005), payable in monthly instalments, maturing on various dates until 2010 | 0.1 | 0.2 |
| Note payable without interest | - | 0.2 |
| 524.1 | 530.9 | |
| Current portion of long-term debt | 8.0 | 7.0 |
| 516.1 | 523.9 |
(a) Subordinated unsecured debt:
Subordinated unsecured debt, maturing December 15, 2013, bearing interest at a rate of 7.5% and redeemable under certain conditions as of December 15, 2008.
The total amount of the loan is subject to interest rate swaps (see Note 22).
The subordinated unsecured debt agreement imposes certain restrictions on business acquisitions and the payment of dividends.
(b) Secured term loans:
Term loan “A”:
Term loan “A”, maturing on December 17, 2008, payable in quarterly instalments increasing gradually from 2.5% of the balance of the loan to 7.5% of the balance of the loan from July 2008, bearing interest at the Canadian prime rate plus 0.25% to 1.0% (same in 2005) or the LIBOR rate plus 1.25% to 2.0% (same in 2005), depending on whether certain financial ratios are achieved. As at April 30, 2006, the effective interest rate is 6.25% (4.63% as at April 24, 2005);
Term loan “B”:
Term loan “B”, maturing on December 17, 2010, payable in quarterly instalments of 0.25% of the balance of the loan for the first six years and in quarterly instalments of 23.5% of the balance of the loan for the seventh year, bearing interest at the prime US rate plus 0.75% (same in 2005) or the LIBOR rate plus 1.75% (same in 2005). As at April 30, 2006, the effective interest rate is 6.75% (4.75% as at April 24, 2005).
Substantially all of the Company’s assets have been pledged to secure these term loans.
Under the credit agreement, the Company must meet certain commitments and achieve certain financial ratios. Furthermore, the credit agreement imposes certain restrictions on business acquisitions and payment of dividends and, if a certain ratio is not achieved, on capital spending.
On December 17, 2003, the Company concluded a new credit agreement. Consequently, the deferred financing costs relating to the previous agreement in the amount of $2.1 were written off. In addition, in 2004, the Company repaid its debt with proceeds from sale and leaseback transactions. The portion of deferred financing costs in the amount of $7.1 relating to the repaid debt was also written off.
Instalments on long-term debt for the next years are as follows:
| Obligations related | ||
| to buildings under | ||
| capital leases | Other loans | |
| $ | $ | |
| 2007 | 0.8 | 7.6 |
| 2008 | 0.6 | 8.2 |
| 2009 | 0.5 | 8.9 |
| 2010 | 0.4 | 1.9 |
| 2011 | 0.4 | 141.3 |
| 2012 and subsequent years | 1.7 | 353.9 |
| 4.4 | ||
| Interest expense included in minimum lease payments | 2.1 | |
| 2.3 |
Alimentation Couche-Tard / 69
NOTES TO CONSOLIDATED FINANCIAL STATEMENTS
For the years ended April 30, 2006, April 24, 2005 and April 25, 2004
(in millions of US dollars, except share and stock option data)
17. Deferred credits and other liabilities
| 2006 | 2005 | |
| $ | $ | |
| Asset retirement obligations (a) | 31.2 | 17.9 |
| Deferred credits | 19.6 | 16.3 |
| Provision for site restoration costs | 18.1 | 20.9 |
| Accrued pension benefit liability | 8.4 | 5.8 |
| Provision for workers’ compensation | 8.0 | 5.7 |
| Other liabilities | 41.9 | 23.0 |
| 127.2 | 89.6 |
(a) Asset retirement obligations relate to estimated future costs to remove underground motor fuel storage tanks and are based on the Company’s prior experience in removing these tanks, estimated tank useful life, lease terms for those tanks installed on leased properties, external estimates and governmental regulatory requirements. To determine the initial recorded liability, the future estimated cash flows have been discounted at rates of 9% and 10%, representing the Company’s credit-adjusted risk-free rates at the time the costs have been estimated and revised. The total undiscounted amount of estimated cash flows to settle the asset retirement obligations is approximately $68.1 and is expected to be incurred over the next 40 years. Should changes occur in estimated future removal costs, tank useful lives, lease terms or governmental regulatory requirements, revisions to the liability could be made.
The reconciliation of the Company’s liability for the asset retirement obligations related to the removal of its underground motor fuel storage tanks is as follows:
| 2006 | 2005 | |
| $ | $ | |
| Balance, beginning of year | 22.1 | 15.9 |
| Liabilities incurred | 0.4 | 0.1 |
| Liabilities settled | (1.3) | (0.5) |
| Accretion expense | 1.9 | 1.9 |
| Business acquisitions | 0.5 | 3.7 |
| Revision of estimations | 11.8 | - |
| Effect of exchange rate fluctuations | 0.5 | 1.0 |
| Balance, end of year | 35.9 | 22.1 |
Of the total liability recorded in the consolidated balance sheets as of April 30, 2006 and April 24, 2005, $31.2 and $17.9, respectively, are included in Deferred credits and other liabilities and the remainder is included in Accounts payable and accrued liabilities.
18. Capital stock
Authorized
Unlimited number of shares without par value
First and second preferred shares issuable in series, non-voting, ranking prior to other classes of shares with respect to dividends and payment of capital upon dissolution. The Board of Directors is authorized to determine the designation, rights, privileges, conditions and restrictions relating to each series of shares prior to their issuance.
Class A multiple voting and participating shares, ten votes per share except for certain situations which provide for only one vote per share, convertible into Class B subordinate voting shares on a share-for-share basis at the holder’s option. Under the articles of amendment, no new Class A multiple voting share can be issued.
Class B subordinate voting and participating shares, convertible automatically into Class A multiple voting shares on a share-for-share basis upon the occurrence of certain events.
The order of priority for the payment of dividends is as follows:
- first preferred shares;
- second preferred shares;
- Class B subordinate voting shares and Class A multiple voting shares, ranking pari passu.
70 / Alimentation Couche-Tard
NOTES TO CONSOLIDATED FINANCIAL STATEMENTS
For the years ended April 30, 2006, April 24, 2005 and April 25, 2004
(in millions of US dollars, except share and stock option data)
18. Capital stock (continued)
Issued and fully paid
The changes in number of outstanding shares are as follows:
| 2006 | 2005 | |||
| Number of shares | $ | Number of shares | $ | |
| Class A multiple voting shares | ||||
Balance, beginning of year | 56,594,692 | 8.0 | 57,041,722 | 8.1 |
Conversion into Class B shares | (206,040) | - | (447,030) | (0.1) |
Balance, end of year | 56,388,652 | 8.0 | 56,594,692 | 8.0 |
| Class B subordinate voting shares | ||||
Balance, beginning of year | 145,375,660 | 342.8 | 140,490,082 | 333.4 |
Issued as part of a previous acquisition | 1,630 | - | 548 | - |
Issued on conversion of Class A shares | 206,040 | - | 447,030 | 0.1 |
Stock options exercised for cash | 68,104 | 0.2 | 4,438,000 | 9.3 |
Balance, end of year | 145,651,434 | 343.0 | 145,375,660 | 342.8 |
| Total issued and fully paid | 351.0 | 350.8 | ||
| 2004 | ||||
| Number of shares | $ | |||
| Class A multiple voting shares | ||||
Balance, beginning of year | 57,097,648 | 8.1 | ||
Conversion into Class B shares | (55,926) | - | ||
Balance, end of year | 57,041,722 | 8.1 | ||
| Class B subordinate voting shares | ||||
Balance, beginning of year | 112,004,270 | 162.0 | ||
Issued as part of the acquisition of Circle K | 27,111,076 | 168.8 | ||
Issued as part of a previous acquisition | 10 | - | ||
Issued on conversion of Class A shares | 55,926 | - | ||
Stock options exercised for cash | 1,318,800 | 2.6 | ||
Balance, end of year | 140,490,082 | 333.4 | ||
| Total issued and fully paid | 341.5 |
During the year ended April 24, 2005, the Company split all of its issued and outstanding Class A and B shares on a two-for-one basis. All share and per-share information in these consolidated financial statements has been adjusted retroactively to reflect stock split.
On December 17, 2003, the Company exchanged 27,111,076 warrants for Class B shares on a share-for-share basis. These warrants were issued on October 6, 2003 at a price of Cdn$8.25 each for a total consideration of $168.8. The issue costs, net of related future income taxes, amounted to $1.6.
19. Stock-based compensation and other stock-based payments
The Company has a stock option plan (the plan) under which it may grant up to 16,892,000 stock options for the purchase of Class B subordinate voting shares of the Company.
Stock options have up to a ten-year term, vest 20% on the date of the grant and cumulatively thereafter on each anniversary date of the grant and are exercisable at the designated market price. The grant price of each stock option shall not be set below the market price of the Class B shares on the Toronto Stock Exchange on the date of the grant. Each stock option is exercisable into one Class B share of the Company at the price specified in the terms of the stock option.
The table below presents the status of the Company’s stock option plan as at April 30, 2006, April 24, 2005 and April 25, 2004 and the changes therein during the years then ended:
| 2006 | 2005 | |||
| Number of stock | Weighted average | Number of stock | Weighted average | |
| options | exercise price | options | exercise price | |
| Cdn$ | Cdn$ | |||
| Outstanding, beginning of year | 8,745,400 | 6.93 | 12,626,200 | 5.05 |
| Granted | 580,100 | 18.36 | 605,000 | 15.92 |
| Exercised | (68,104) | 4.13 | (4,438,000) | 2.79 |
| Cancelled | (5,016) | 14.33 | (47,800) | 6.74 |
| Outstanding, end of year | 9,252,380 | 7.66 | 8,745,400 | 6.93 |
| Exercisable stock options, end of year | 7,674,976 | 6,312,000 |
Alimentation Couche-Tard / 71
NOTES TO CONSOLIDATED FINANCIAL STATEMENTS
For the years ended April 30, 2006, April 24, 2005 and April 25, 2004
(in millions of US dollars, except share and stock option data)
19. Stock-based compensation and other stock-based payments (continued)
| 2004 | ||
| Number of stock | Weighted average | |
| options | exercise price | |
| Cdn$ | ||
| Outstanding, beginning of year | 12,313,000 | 4.07 |
| Granted | 1,680,000 | 10.29 |
| Exercised | (1,318,800) | 2.65 |
| Cancelled | (48,000) | 4.04 |
| Outstanding, end of year | 12,626,200 | 5.05 |
| Exercisable stock options, end of year | 8,742,640 |
The following table presents information on the stock options outstanding and exercisable as at April 30, 2006:
| Options outstanding | Options exercisable | ||||
| Number of | Weighted average | Weighted | Number of | Weighted | |
| stock options | remaining | average | stock options | average | |
| Range of | outstanding as at | contractual life | exercise | exercisable as at | exercise |
| exercise prices | April 30, 2006 | (years) | price | April 30, 2006 | price |
| Cdn$ | Cdn$ | Cdn$ | |||
| 2 - 4 | 2,908,000 | 4.40 | 2.68 | 2,908,000 | 2.68 |
| 6 - 8 | 3,707,100 | 6.01 | 7.35 | 3,535,360 | 7.35 |
| 8 - 14 | 1,595,800 | 7.63 | 10.83 | 930,320 | 10.81 |
| 14 - 20 | 921,480 | 8.87 | 17.26 | 277,296 | 17.25 |
| 20 - 26 | 120,000 | 9.64 | 22.50 | 24,000 | 22.50 |
| 9,252,380 | 7,674,976 |
For 2004, the Company did not record any compensation cost. If the compensation cost had been determined using the fair value method at the date of attribution of stock options granted beginning on April 29, 2002 to employees, net earnings and net earnings per share information would have been reduced to the pro forma shown in the following table:
| 2004 | ||
| Disclosed | Pro forma | |
| $ | $ | |
| Net earnings | 56.1 | 54.2 |
| Basic net earnings per share | 0.31 | 0.30 |
| Diluted net earnings per share | 0.30 | 0.29 |
The pro forma impact on net earnings for the period is not representative of the pro forma net earnings of future periods because it does not take into account the pro forma compensation relating to options granted prior to April 29, 2002.
The fair value of stock options granted is estimated at the grant date using the Black & Scholes option pricing model on the basis of the following weighted average assumptions for the stock options granted during the year:
| 2006 | 2005 | 2004 | |
| Expected dividends (per share) | Cdn$0.10 | None | None |
| Expected volatility | 35% | 35% | 30% |
| Risk-free interest rate | 3.92% | 4.26% | 4.45% |
| Expected life | 8 years | 8 years | 8 years |
The weighted average fair value of stock options granted in the year ended April 30, 2006 is Cdn$8.65 (Cdn$7.72 in 2005 and Cdn$4.61 in 2004).
For the year ended April 30, 2006, compensation cost charged to consolidated statement of earnings amount to $3.8 ($2.5 in 2005).
Deferred Share Unit Plan
On July 13, 2004, the Company adopted a Deferred Share Unit Plan for the benefit of its external directors allowing them to receive all or a portion of their annual compensation in the form of Deferred Share Units (DSUs). A DSU is a notional unit, equivalent in value to the Company’s Class B share. Upon resignation from the Board of Directors, participants are entitled to receive the payment of their cumulated DSUs either a) in the form of cash based on the price of the Company’s Class B shares as traded on the open market on the date of payment, or b) in Class B shares bought by the Company on the open market on behalf of the Participant.
The DSU expense and the related liability are recorded at the grant date. The liability is adjusted periodically to reflect any increase in the market value of the Class B shares. As at April 30, 2006, the Company has a total of 21,108 DSUs outstanding (14,665 as at April 24, 2005).
Share Appreciation Rights Plan
The Board of Directors approved on July 13, 2004 a Share Appreciation Rights Plan for officers and key employees of the Company. The amount payable to the Participant is equal to the difference between the market value of the Company’s Class B shares at exercise and its value at the grant date and is payable in cash. The grant agreement describes the exercise period, the value of the shares at grant date and the duration of the plan for each participant. No share appreciation right is granted as at April 30, 2006.
72 / Alimentation Couche-Tard
NOTES TO CONSOLIDATED FINANCIAL STATEMENTS
For the years ended April 30, 2006, April 24, 2005 and April 25, 2004
(in millions of US dollars, except share and stock option data)
20. Employee future benefits
The Company has a number of funded and unfunded defined benefit and defined contribution plans that provide retirement benefits to certain employees. Its defined benefit plans are based on years of service and on the consecutive highest five years average salary.
Total cash payments for employee future benefits consist of cash contributed by the Company to its funded pension plans, cash payments directly to beneficiaries for its unfunded pension plans and cash contributed to its defined contribution plans and amount to $3.3 for 2006 ($3.6 for 2005).
Defined benefit plans
The Company measures its accrued benefit obligation and the fair value of plan assets for accounting purposes the last Sunday of April of each year. The most recent actuarial valuation of the pension plans for funding purposes was as of January 1, 2005 and the next required valuation will be as of January 1, 2008.
Information about the Company’s defined benefit plans, in aggregate, is as follows:
| 2006 | 2005 | |
| $ | $ | |
| Accrued benefit obligation | ||
Balance, beginning of year | 29.2 | 23.1 |
Current service cost | 0.7 | 0.5 |
Interest cost | 1.7 | 1.5 |
Benefits paid | (1.7) | (1.7) |
Actuarial losses | - | 3.3 |
Effect of exchange rate fluctuations | 3.0 | 2.5 |
Balance, end of year | 32.9 | 29.2 |
| 2006 | 2005 | |
| $ | $ | |
| Plans assets | ||
Fair value, beginning of year | 21.4 | 19.6 |
Actual return on plans assets | 0.6 | 1.0 |
Employees contributions | 0.1 | 0.1 |
Benefits paid | (1.3) | (1.3) |
Effect of exchange rate fluctuations | 2.1 | 2.0 |
Fair value, end of year | 22.9 | 21.4 |
Reconciliation of the funded status of the benefit plans to the amount recorded in the consolidated financial statements:
| 2006 | 2005 | |
| $ | $ | |
Fair value of plans assets | 22.9 | 21.4 |
Accrued benefit obligation | 32.9 | 29.2 |
Funded status-plan deficit | (10.0) | (7.8) |
Unamortized net actuarial loss | 12.1 | 10.9 |
Unamortized transitional net asset | (2.5) | (2.8) |
Unamortized past service cost | 1.8 | 1.9 |
| Accrued benefit asset | 1.4 | 2.2 |
As at April 30, 2006, the accrued benefit obligation for unfunded pension plans amount to $11.7 ($10.3 in 2005).
The accrued benefit asset is included in the Company’s balance sheets as follows:
| 2006 | 2005 | |
| $ | $ | |
| Other assets | 8.6 | 8.0 |
| Deferred credits and other liabilities | (7.2) | (5.8) |
| Accrued benefit asset | 1.4 | 2.2 |
| As of the measurement date, plans assets consist of: | ||
| Percentage of plans assets | ||
| 2006 | 2005 | |
| % | % | |
| Assets category | ||
Equity securities | 32.1 | 28.5 |
Debt securities | 67.9 | 71.5 |
Total | 100.0 | 100.0 |
Alimentation Couche-Tard / 73
NOTES TO CONSOLIDATED FINANCIAL STATEMENTS
For the years ended April 30, 2006, April 24, 2005 and April 25, 2004
(in millions of US dollars, except share and stock option data)
20. Employee future benefits (continued)
The Company’s pension benefit expense for the year is determined as follows:
| 2006 | |||
| Incurred during the | Adjustments | Recognized during | |
| year | (a) | the year | |
| $ | $ | $ | |
Current service cost, net of employee contributions | 0.6 | - | 0.6 |
Interest cost | 1.7 | - | 1.7 |
Actual return on plan assets | (0.6) | (0.9) | (1.5) |
Amortization of the net transitional asset | - | (0.5) | (0.5) |
Net actuarial losses | - | 0.8 | 0.8 |
Amortization of past service cost | - | 0.3 | 0.3 |
| Pension expense for the year | 1.7 | (0.3) | 1.4 |
| 2005 | |||
| Incurred during | Adjustments | Recognized during the | |
| the year | (a) | year | |
| $ | $ | $ | |
Current service cost, net of employee contributions | 0.5 | - | 0.5 |
Interest cost | 1.5 | - | 1.5 |
Actual return on plan assets | (1.0) | (0.4) | (1.4) |
Amortization of the net transitional asset | - | (0.5) | (0.5) |
Net actuarial losses | 3.3 | (2.8) | 0.5 |
Amortization of past service cost | - | 0.2 | 0.2 |
| Pension expense for the year | 4.3 | (3.5) | 0.8 |
| 2004 | |||
| Incurred during | Adjustments | Recognized during the | |
| the year | (a) | year | |
| $ | $ | $ | |
Current service cost, net of employee contributions | 0.4 | - | 0.4 |
Interest cost | 1.4 | - | 1.4 |
Actual return on plan assets | (2.5) | 1.2 | (1.3) |
Amortization of the net transitional asset | - | (0.4) | (0.4) |
Net actuarial losses | 1.3 | (0.7) | 0.6 |
Amortization of past service cost | - | 0.2 | 0.2 |
| Pension expense for the year | 0.6 | 0.3 | 0.9 |
(a) Adjustments to recognize the long-term nature of employee future benefit costs.
The significant actuarial assumptions which management considers the most likely to be used to determine the accrued benefit obligations and the pension expense are the following:
| Accrued benefit obligation: | |||
| 2006 | 2005 | ||
| % | % | ||
| Discount rate | 5.75 | 5.75 | |
| Rate of compensation increase | 4.00 | 4.00 | |
| Pension expense: | |||
| 2006 | 2005 | 2004 | |
| % | % | % | |
| Discount rate | 5.75 | 6.25 | 6.50 |
| Expected rate of return on plans assets | 7.00 | 7.00 | 7.00 |
| Rate of compensation increase | 4.00 | 4.00 | 4.00 |
Defined contribution plans
The Company’s total pension expense under its defined contribution plans for the year 2006 is $2.8 ($3.1 in 2005 and $0.7 in 2004).
Deferred compensation plan – United States operations
The Company sponsors a deferred compensation plan that allows certain employees in its U.S. operations to defer up to 25% of their base salary and 100% of their cash bonuses for any given year. Interest accrues on the deferral and amounts due to the participants are generally payable on retirement, except in certain limited circumstances. Obligations under this plan amount to $4.0 as at April 30, 2006 ($1.9 as at April 24, 2005) and are included in Deferred credits and other liabilities.
74 / Alimentation Couche-Tard
NOTES TO CONSOLIDATED FINANCIAL STATEMENTS
For the years ended April 30, 2006, April 24, 2005 and April 25, 2004
(in millions of US dollars, except share and stock option data)
21. Environment
The Company is subject to Canadian and American legislations governing the storage, handling and sale of motor fuel and related products. The Company considers that it is generally in compliance with current environmental legislations.
The Company has an on-going training program for its employees on environmental issues which includes preventive site testing and site restoration in cooperation with regulatory authorities. The Company also examines its motor fuel equipment annually to make the necessary investments.
In all U.S. states in which the Company operates, except Michigan, Iowa, Florida, Texas and Washington State, there is a trust fund to cover the cost of certain rehabilitation and removing of motor fuel tanks. These state funds provide insurance for motor fuel facilities operations to cover the cost of cleaning up damages to the environment caused by the usage of underground motor fuel equipment. Underground motor fuel storage tank registration fees and a motor fuel tax in each of the states finance the trust funds. The Company pays the registration fees and remits the sales taxes to the states where it is a member of the trust fund. Insurance coverage is different in the various states.
In order to provide for the above-mentioned restoration costs, the Company has recorded a $28.0 provision for environmental costs as at April 30, 2006 ($28.4 as at April 24, 2005). Of this amount, $9.9 ($7.5 as at April 24, 2005) is included in Accounts payable and accrued liabilities and the remainder is included in Deferred credits and other liabilities. Furthermore, the Company has recorded an amount of $21.8 for environmental costs receivable as at April 30, 2006 ($22.5 as at April 24, 2005), of which $2.0 ($0.9 as at April 24, 2005) is included in Accounts receivable, the remainder being included in Other assets.
22. Financial instruments
Description of derivative financial instruments
Management of interest rate risk
The Company has entered into interest rate swaps to manage interest rate fluctuations. It has agreed to swap the amount of the difference between the variable interest rate and the fixed rate, calculated based on the reference amounts. These interest rate swaps have been designated as a fair value hedge of the subordinated unsecured debt.
The amounts outstanding at year end are as follows:
| Maturity (a) | Reference | Pays/receives | Fixed rate | Variable rate |
| $ | % | |||
| December 2013 | 100.0 | pays variable | 7.5 | LIBOR 6 month |
| receives fixed | plus 3.03% | |||
| December 2013 | 100.0 | pays variable | 7.5 | LIBOR 6 month |
| receives fixed | plus 2.98% | |||
| December 2013 | 150.0 | pays variable | 7.5 | LIBOR 6 month |
| receives fixed | plus 2.89% |
(a) Under certain conditions, the maturity date of the swaps can be altered to correspond with the repurchase conditions of the corresponding subordinated debt.
Fair value of financial instruments
The fair value of cash and cash equivalents, accounts receivable and accounts payable and accrued liabilities is comparable to their carrying amount given that they will mature in less than one year.
The fair value of the temporary investments, which bear interest at rates varying from 3.90% to 4.22%, is $21.4 as per the mark to market as at April 30, 2006.
With the exception of the subordinated unsecured debt, there is no material difference between the fair value and the carrying amount of the Company’s long-term debt as at April 30, 2006 and April 24, 2005, given that the largest loans bear interest at a floating rate.
The fair value of the subordinated unsecured debt is $357.9 as at April 30, 2006 ($359.2 as at April 24, 2005) and is estimated based on the discounted cash flows of the debt at the Company’s estimated incremental borrowing rates for debt of the same remaining maturities.
The fair value of the interest rate swaps, as determined by the Company’s banks based on quoted market prices for similar instruments, is $27.0 payable by the Company ($10.9 payable by the Company as at April 24, 2005).
Credit risk
The Company’s exposure to concentrations of credit and non-collection risks is limited considering the nature of the Company’s activities and its counterparties.
23. Contractual obligations
Minimum lease payments
As at April 30, 2006, the Company has entered into lease agreements expiring on various dates until 2031 which call for aggregate minimum lease payments of $1,369.1 for the rental of commercial space, equipment and a warehouse. Several of these leases contain renewal options and certain sites are subleased to franchise-holders. The minimum lease payments for the next years are $159.6 in 2007, $142.3 in 2008, $119.4 in 2009, $106.0 in 2010, $93.1 in 2011 and a total of $748.7 for 2012 and the subsequent years.
Alimentation Couche-Tard / 75
NOTES TO CONSOLIDATED FINANCIAL STATEMENTS
For the years ended April 30, 2006, April 24, 2005 and April 25, 2004
(in millions of US dollars, except share and stock option data)
23. Contractual obligations (continued)
Purchase commitments
The Company has concluded agreements to acquire, during the next years, franchise rights and equipment which call for aggregate payments of $7.8. The minimum payments for the next years are $3.5 in 2007, $0.5 in 2008, $1.3 in 2009, $0.6 in 2010 and 2011 and a total of $1.3 for 2012 and the subsequent years.
Moreover, the Company has entered into various products purchase agreements that require it to purchase minimum amounts or quantities of merchandise and motor fuel annually. The Company has generally exceeded such minimum requirements in the past and expects to continue doing so for the foreseeable future. Failure to satisfy the minimum purchase requirements could result in termination of the contracts, change in pricing of the products, payments to the applicable providers of a predetermined percentage of the commitments and repayments of a portion of rebates received.
24. Contingencies and guarantees
Contingencies
Various claims and legal proceedings have been initiated against the Company in the normal course of its operations that relate to human resources and the environment. In management’s opinion, these claims and proceedings are unfounded. Although the outcome of these proceedings cannot be determined with certainty, management estimates that any payments resulting from their outcome are not likely to have a substantial negative impact on the Company’s results and financial position.
Guarantees
Sub-lease agreements
The Company entered into a number of agreements to sub-lease premises to third parties. Under some of these agreements, the Company retains ultimate responsibility to the landlord for payment of amounts under the lease agreements should the sub-lessees fail to pay. The total future lease payments under such agreements are approximately $1.9. Historically, the Company has not made any significant payments in connection with these indemnification provisions.
Other indemnification agreements
In the normal course of its business, the Company provides indemnifications which vary in duration and given the nature of these indemnifications, the Company is unable to reasonably estimate its maximum potential liability payable to third parties. Historically, the Company has not made any significant payments in connection with these indemnification provisions.
25. Segmented information
The Company operates convenience stores in Canada and in the United States. It essentially operates in one reportable segment, the sale of goods for immediate consumption and motor fuel through corporate stores or franchise operations. It operates a convenience store chain under several banners, including Couche-Tard, Mac’s and Circle K. Revenues from outside sources mainly fall into two categories: merchandise and services and motor fuel.
Information on the principal revenue classes as well as geographic information is as follows:
| 2006 | 2005 | |||||
| Canada | U.S. | Total | Canada | U.S. | Total | |
| $ | $ | $ | $ | $ | $ | |
| External customer revenues (a) | ||||||
| Merchandise and services | 1,426.7 | 2,812.0 | 4,238.7 | 1,239.5 | 2,564.7 | 3,804.2 |
| Motor fuel | 873.7 | 5,044.9 | 5,918.6 | 664.8 | 3,567.8 | 4,232.6 |
| 2,300.4 | 7,856.9 | 10,157.3 | 1,904.3 | 6,132.5 | 8,036.8 | |
| Gross profit | ||||||
| Merchandise and services | 483.1 | 932.3 | 1,415.4 | 415.7 | 834.9 | 1,250.6 |
| Motor fuel | 63.6 | 312.5 | 376.1 | 51.3 | 255.9 | 307.2 |
| 546.7 | 1,244.8 | 1,791.5 | 467.0 | 1,090.8 | 1,557.8 | |
| Property and equipment and goodwill (a) | 464.2 | 795.7 | 1,259.9 | 407.2 | 629.7 | 1,036.9 |
76 / Alimentation Couche-Tard
NOTES TO CONSOLIDATED FINANCIAL STATEMENTS
For the years ended April 30, 2006, April 24, 2005 and April 25, 2004
(in millions of US dollars, except share and stock option data)
25. Segmented information (continued)
| 2004 | |||
| restated (Note 3) | |||
| Canada | U.S. | Total | |
| $ | $ | $ | |
| External customer revenues (a) | |||
| Merchandise and services | 1,130.6 | 1,195.3 | 2,325.9 |
| Motor fuel | 507.1 | 1,562.3 | 2,069.4 |
| 1,637.7 | 2,757.6 | 4,395.3 | |
| Gross profit | |||
| Merchandise and services | 367.4 | 389.7 | 757.1 |
| Motor fuel | 47.3 | 110.1 | 157.4 |
| 414.7 | 499.8 | 914.5 | |
| Property and equipment and goodwill (a) | 344.1 | 524.2 | 868.3 |
(a) Geographic areas are determined according to where the Company generates operating income (where the sale takes place) and according to the location of the property and equipment and goodwill.
26. Hurricanes - Florida
During 2006, Florida and the Gulf of Mexico region was affected by three hurricanes, which resulted in some damages to certain of the Company’s sites. The Company estimates that assets and leased properties that were damaged have a total replacement value of approximately $16.7, which will result in a net claim of about $13.0. The net book value of the damaged assets is lower than the net claim. As at April 30, 2006, the Company has received $2.0 in insurance proceeds. The Company does not expect these hurricanes to have a significant effect on its financial position and operating results.
During 2005, certain areas of the Company’s business in Florida experienced damages resulting from four hurricanes. Assets and leased properties that were damaged have a total replacement value of $23.5, which resulted in a net claim of about $16.6. The net book value of the damaged assets is lower than the net claim. As at April 30, 2006, the Company has received $15.9 in insurance proceeds. The Company considers that these hurricanes had no significant effect on the its financial position and operating results.
27. Subsequent events
Business acquisitions
On June 12, 2006, the Company finalized, with Spectrum Holding, Inc., the acquisition of 90 sites operating under the Spectrum banner in the states of Alabama and Georgia, United States. This acquisition was settled for a total cash consideration of $130.0 financed from the Company’s available cash.
On June 12, 2006, the Company signed an agreement with Moore Oil Company, LLC to acquire a network of 24 sites operating under the Stop-n-Save banner in the Monroe area of Louisiana, United States. Of these 24 stores, six are operated by the company, 17 are operated by independent store operators and one is currently under construction. The transaction amount will be determined on closing.
Income taxes
On June 9, 2006, the Government of Québec adopted Bill 15 in the National Assembly of Québec, regarding amendments to the Taxation Act and other legislative provisions. As a result, an unusual retroactive income tax expense of approximately $9.8, excluding other associated expenses, will be recognized in first quarter of fiscal 2007. This modification will not have a significant impact on the effective income tax rate of the Company in the future.
28. Comparative figures
Certain comparative figures have been reclassified to comply with the presentation adopted in the current year.
Alimentation Couche-Tard / 77
| Executive Office | For any additional information about |
| 1600, Saint-Martin Boulevard East | Alimentation Couche-Tard Inc., |
| Tower B, suite 200 | shareholders, investors and analysts |
| Laval, Quebec H7G 4S7 | are requested to contact the |
| Telephone: (450) 662-3272 | Corporate Secretary by writing to the |
| Fax: (450) 662-6648 | executive office address or the |
| following e-mail address: | |
| Auditors | |
| Raymond Chabot Grant Thornton | info@couche-tard.com |
| 600, de la Gauchetière West | |
| Suite 1900 | www.couche-tard.com |
| Montreal, Quebec H3B 4L8 | |
| Stock information | |
| Transfer Agent | Alimentation Couche-Tard Inc.’s |
| Computershare Trust Company of | shares are listed on the TSX under |
| Canada | the ticker symbols |
| 1100, University Street | ATD.A and ATD.B |
| Suite 1200 | |
| Montreal, Quebec H3B 2G7 | |
| Investor Relations | |
| Richard Fortin | |
| Executive Vice-President | |
| and Chief Financial Officer |
| DIRECTORS | OFFICERS | EASTERN NORTH AMERICA |
| Stéphane Gonthier | ||
| Alain Bouchard(1) | Alain Bouchard | Senior Vice-President |
| Chairman of the Board, | Chairman of the Board, | |
| President and Chief Executive Officer | President and Chief Executive Officer | Robert G. Campau |
| Vice-President, Operations | ||
| Richard Fortin(1) | Richard Fortin | U.S. Southeast Region |
| Executive Vice-President | Executive Vice-President | |
| and Chief Financial Officer | and Chief Financial Officer | Jean-Luc Meunier |
| Vice-President, Operations | ||
| Réal Plourde (1) | Réal Plourde | Central Canada |
| Executive Vice-President | Executive Vice-President | |
| and Chief Operating Officer | and Chief Operating Officer | Michel Bernard |
| Vice-President, Operations | ||
| Jacques D’Amours (1) | Jacques D’Amours | Eastern Canada |
| Vice-President, Administration | Vice-President, Administration | |
| C. Mick Parker | ||
| Roger Desrosiers, F.C.A.(3) | Michael Guinard | Vice-President, Operations |
| Corporate Advisor | Vice-President, Development | Florida and Gulf Region |
| Jean Élie (2) | Sylvain Aubry | |
| Corporate Director | Corporate Secretary | |
| Josée Goulet (3) | ||
| Corporate Director | WESTERN NORTH AMERICA | |
| Brian Hannasch | ||
| Roger Longpré (2) (3) | Senior Vice-President | |
| President | ||
| Mergerac Inc. | Darrell Davis | |
| Vice-President, Operations | ||
| Jean-Pierre Sauriol, Eng.(2) | U.S. Midwest Region | |
| President and Chief Executive Officer | ||
| Dessau-Soprin Inc. | Geoffrey C. Haxel | |
| Vice-President, Operations | ||
| Jean Turmel(4) | Arizona | |
| President | ||
| Perseus Capital Inc. | Joy A. Powell | |
| Vice-President, Operations | ||
| U.S. West Coast Region | ||
| (1) Member of the Executive Committee | ||
| (2) Member of the Human Resources and | Kim J. Trowbridge | |
| Corporate Governance Committee | Vice-President, Operations | |
| (3) Member of the Audit Committee | Western Canada | |
| (4) Lead Director |

www.couche-tard.com www.macs.ca www.circlek.com
www.sloche.com www.froster.ca