


(in thousands of dollars except for per share amounts, unaudited) | ||||
FOR THE THREE MONTHS ENDED | Dec 28 | Dec 29 | ||
2002 | 2001 | |||
Sales | 179,911 | 128,418 | ||
Net income | 16,468 | 13,876 | ||
Cash flow from operations | 69,978 | 58,648 | ||
Capital expenditures | 3,691 | 4,893 | ||
EBITDA* | 31,240 | 25,437 | ||
EARNINGS PER SHARE | ||||
Basic | $ | 0.41 | $ | 0.37 |
Diluted | $ | 0.39 | $ | 0.36 |
WEIGHTED AVERAGE NUMBER | ||||
OF SHARES OUTSTANDING | ||||
Basic | 40,390 | 37,938 | ||
Diluted | 41,783 | 38,351 | ||
FINANCIAL STATISTICS | ||||
Gross margin | 31.8% | 35.5% | ||
EBITDA margin* | 17.4% | 19.8% | ||
AS AT | Dec 28 | Dec 29 | ||
2002 | 2001 | |||
FINANCIAL POSITION | ||||
Total assets | 639,901 | 475,250 | ||
Shareholders’ equity | 353,145 | 293,500 | ||
Total net bank debt* | 124,693 | 98,444 | ||
Net bank debt*/equity | 1 : 2.8 | 1 : 3.0 | ||
Total net bank debt*/total capitalization | 26% | 25% |
*EBITDA is defined as earnings before the taking of any deductions in respect of interest, taxes and amortization. EBITDA is presented before deductions for interest expense, tax expense and amortization to provide financial statement users a measure of CFM’s earnings available to provide for these costs. EBITDA has been determined by taking net income for the period from the Consolidated Statement of Operations and adding to it interest expense, amortization and income taxes, which are disclosed as individual line items within the Consolidated Statement of Operations. EBITDA margin is defined as EBITDA expressed as a percentage of sales. Please refer to the EBITDA section of the MD&A in this interim report for a detailed calculation of EBITDA.
Net bank debt is defined as bank debt (current and long-term portion), plus bank indebtedness less cash. This measure is widely accepted by the financial markets as a measure of credit availability.
Capitalization is defined as net bank debt plus shareholders’ equity.
EBITDA, EBITDA margin and net debt are not recognized measures for financial statement presentation under Canadian generally accepted accounting principles (“GAAP”). Non-GAAP measures (such as EBITDA and net debt) do not have any standardized meaning and are therefore unlikely to be comparable to similar measures presented by other issuers. Investors are encouraged to consider these financial measures in the context of CFM's GAAP results, as provided in the attached financial statements.
from the chairman
ANOTHER GREAT QUARTER BY ALMOST ANY MEASURE. CFM STRENGTHENED ITS PLATFORM IN THE HOME PRODUCTS MARKET IN THE FIRST QUARTER OF FISCAL 2003, WHILE POSTING NEW RECORDS FOR SALES, CASH FLOW AND EARNINGS.
Sales of hearth and heating products reached a record $154.2 million, an increase of 20% from the prior year. Cold, winter weather, new product introductions and expanded programs and placement with distributors in the new home construction sector andseveral key mass merchant retailers helped CFM attain market share gains.
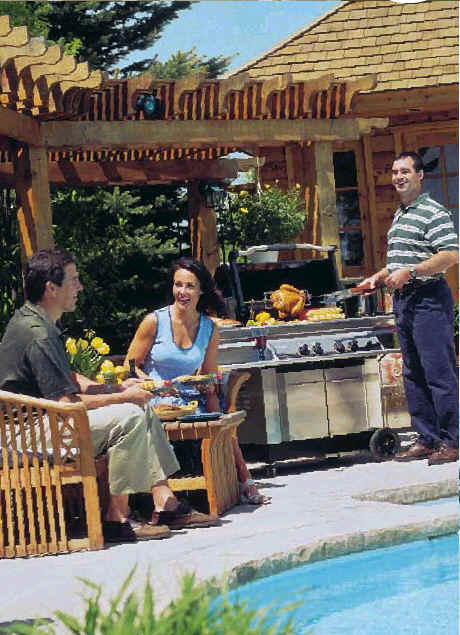
Sales of barbeque and other products reached $22.0 million during the quarter, an increase of $21.6 millionfrom the prior year. This significant increase is the result of pre-season demand for our specialty retailer and mass merchant barbeque grills, and barbeque accessories, through the CFM Keanall and The Great Outdoors operations. Although we achieved a substantial increase from last year, barbeque shipments in the quarter were lower than expected because of the continued late season consumer demand for hearth products.
Sales of water dispensing and purification products contributed $3.7 million for the quarter through our newly acquired Greenway Home Products Inc. As Greenway’s sales continue to grow in the water dispensing and purification market, we plan on introducing, this year, our new ultra-violet water purification product, for which we anticipate a good market reception. Our new ultra-violet water purification system is one of only three water purification systems in the world to earn the National Sanitation Foundation’s highest effectiveness rating.
During the quarter, negotiations began on a new collective agreement for our Mississauga employees. Negotiations continued until January when a new collective agreement was reached, after a week of minor labour disruption. The new collective agreement expires on January 8, 2006. We believe the new contract is a good one for the hourly employees as well as the Company, and we look forward to working together with our employees to continue the Company’s excellent record of growth.
Looking ahead, we remain confident that the best is yet to come. CFM is an established leader in its core hearth business, which, thanks to continuing innovation and growing market share, offers the prospect of healthy growth for some time to come. CFM is a significant participant in the barbeque market with an expanding line of barbeque grills and accessories that has rapidly gained acceptance with retailers and consumers in a very competitive market. CFM is a growing participant in the residential water dispensing and purification market with encouraging sales in its new water business and an exciting new product about to be released. In each of our product lines, we see abundant opportunity for growth and diversification through continuing product development and by expanding our relationships with retail partners. We believe that our strategy i s working and look forward to reporting our progress.
COLIN ADAMSON
Colin Adamson
Chairman and Chief Executive Officer

INTRODUCTION
The following management’s discussion and analysis (“MD&A”) provides a review of important events, the financial position of CFM Corporation (“CFM”) as at December 28, 2002 and the results of operation of CFM for the quarter ended December 28, 2002, in comparison with those for the quarter ended December 29, 2001. This MD&A should be read in conjunction with CFM’s unaudited consolidated financial statements for the three months ended December 28, 2002, included elsewhere herein, and CFM’s audited consolidated financial statements for the year ended September 28, 2002, each included in CFM’s Annual Report for 2002.
CFM is a leading vertically integrated manufacturer of home products and related accessories in North America and the United Kingdom. CFM designs, develops, manufactures and distributes a complete line of hearth products, including gas, wood-burning and electric fireplaces, free-standing stoves, gas logs, and hearth accessories. CFM also manufactures barbeques, barbeque parts and accessories, water dispensing and purification products, outdoor garden accessories and imports indoor and outdoor space heating products from South Korea. The Company maintains an ongoing program of research and development aimed at continually improving the quality, design, features and efficiency of its products.
This MD&A contains forward-looking statements that reflect CFM’s current expectations concerning future results and events. These forward-looking statements generally can be identified by the use of statements that include phrases such as “believed,” “expect,” “anticipate,” “intend,” “foresee,” “likely,” “will” or other similar words or phrases. These forward-looking statements involve certain risks and uncertainties, which could cause actual results to differ materially from future results expressed or implied by such forward-looking statements. Important factors that could affect these statements include, without limitation, those risks and uncertainties listed below. CFM considers the assumptions on which these forward-looking statements are based to be reasonable at the time they were prepared, but cautions the reader that these assumptions regarding future events, many of which are beyond the control of CFM, may ultimately prove to be incorrect. In addition, CFM does not assume any obligation to publicly update any previously issued forward-looking statements.
FIRST QUARTER ENDED DECEMBER 28, 2002
RESULTS OF OPERATIONS
CFM’s consolidated sales increased 40% to $179.9 million in the quarter ended December 28, 2002, compared to $128.4 million in the prior year.
Sales by product category and geographic segment were as follows:
FOR THE THREE MONTHS ENDED | Dec 28 | Dec 29 |
($ millions) | 2002 | 2001 |
$ | $ | |
Hearth and heating products | 154.2 | 128.0 |
Barbeque and outdoor products | 22.0 | 0.4 |
Water products | 3.7 | — |
179.9 | 128.4 | |
United States | 144.5 | 106.3 |
Canada | 25.7 | 16.0 |
Other | 9.7 | 6.1 |
179.9 | 128.4 |
Sales of hearth and heating products were $154.2 million in the quarter, an increase of 20% from the prior year. Market share gains from new product introductions and expanded programs and placement within distributors in the new home construction sector and several key mass merchant retailers contributed significantly to this growth. Cold winter weather favourably impacted sales within this product category. The overall sales growth was mitigated by lower retrofit retail hearth sales.
Sales of barbeque and outdoor products were $22.0 million in the quarter, an increase of $21.6 million from the corresponding period in the prior year. The increase was a result of pre-season shipments of specialty retailer and mass merchant barbeque grills and barbeque accessories through CFM Keanall’s operations and The Great Outdoors’ (“TGO“) operations. Barbeque shipments in the quarter were lower than expected due to continued late season activity in hearth products in most retailers.
Greenway Home Products Inc. (“Greenway“), acquired on October 3, 2002, generated $3.7 million of incremental water dispensing and purification product sales.
Sales in the quarter grew 60% in Canada and 36% in the United States. Sales increases across all product categories, as well as the incremental sales from the acquisitions of Keanall and TGO in 2002 and Greenway at the beginning of the quarter, contributed to this result. New product lines and expansion into the mass merchant retail channel at CFM Europe (formerly Kinder) led to a 59% increase in sales outside of North America.
Gross Profit
Gross profit increased by $11.7 million or 26% from the corresponding period in the prior year to $57.2 million. As a percentage of sales, gross profit declined to 31.8% from 35.5% in the corresponding period in the previous year.
Sales growth in barbeque grills and accessories at margins lower than historic margins realized on hearth products contributed to the lower gross margin percentage in the quarter. In addition, all barbeque operations, including the barbeque appliance manufacturing and accessory operations of CFM Keanall as well as TGO operated at seasonally low levels. As expected, this further reduced the overall gross margin percentage. Higher sales of hearth products in the lower margin new home construction sector and lower sales growth in specialty retail hearth products also reduced the overall gross margin percentage. Increased sales and market share gains were achieved in the quarter in space heating products but higher distribution costs reduced the gross margin percentage from historic levels.
Selling, Administrative, Research and Development Expenses
Operating expenses for the quarter increased $5.9 million or 29% to $26.0 million when compared to the corresponding period in the prior year. The incremental increase in expenses relates primarily to the addition of the Keanall, TGO and Greenway operations. As a percentage of sales, operating expenses declined to 14.4% from 15.7% in the corresponding period in the prior year. This improvement resulted from the significant sales increase without a commensurate increase in expenses.
EBITDA*
Earnings before interest, taxes, and amortization (“EBITDA”) were $31.3 million, up $5.9 million or 23% from the corresponding period in the prior year. EBITDA margins* declined to 17.4% from 19.8% last year due primarily to the impact of lower overall gross margins, with the decline being offset by lower expenses as a percent of sales as discussed above. The following is a reconciliation of EBITDA to net income for the quarter:
EBITDA for the quarter has been determined as follows:
FOR THE THREE MONTHS ENDED | Dec 28 | Dec 29 |
($ millions) | 2002 | 2001 |
$ | $ | |
Net income for the period | 16.5 | 13.9 |
Amortization | 4.1 | 3.0 |
Interest income | — | (0.1) |
Interest expense | 2.0 | 1.6 |
Income taxes | 8.7 | 7.0 |
EBITDA | 31.3 | 25.4 |
*
EBITDA is defined as earnings before the taking of any deductions in respect of interest, taxes and amortization. EBITDA is presented before deductions for interest expense, tax expense and amortization to provide financial statement users a measure of CFM’s earnings available to provide for these costs. EBITDA has been determined by taking net income for the period from the Consolidated Statement of Operations and adding to it interest expense, amortization and income taxes, which are disclosed as individual line items within the Consolidated Statement of Operations. EBITDA margin is defined as EBITDA expressed as a percentage of sales.
EBITDA and EBITDA margin are not recognized measures for financial statement presentation under Canadian generally accepted accounting principles (“GAAP”). Non-GAAP measures (such as EBITDA and EBITDA margin) do not have any standardized meaning and are therefore unlikely to be comparable to similar measures presented by other issuers. Investors are encouraged to consider these financial measures in the context of CFM’s GAAP results, as provided in the attached financial statements.
Net Interest Expense
Net interest expense of $2.0 million was up $0.5 million from the corresponding period in the prior year primarily as a result of higher borrowings to fund acquisitions made in the prior year.
Net Income
Net income for the quarter ended December 28, 2002 was $16.5 million, up 19% from $13.9 million in the corresponding period in the previous year.
Earnings Per Share
Earnings per share (“EPS”) increased 11% to $0.41 from $0.37 in the first quarter of fiscal 2002, due primarily to the 19% increase in net income, partially offset by a 6% increase in the weighted average number of shares outstanding. The weighted average number of shares outstanding increased to 40,390,000 primarily as a result of the 2,722,000 shares issued on the acquisitions of Keanall and TGO, net of the repurchases under the Company’s Normal Course Issuer Bid during the quarter.
Diluted earnings per share increased to $0.39 or 8% from $0.36 in the first quarter of fiscal 2002.
CASH FLOW
In the quarter, CFM generated $70.0 million in cash flow from operations, an increase of $11.4 million or 19% from the $58.6 million of cash generated in the first quarter of fiscal 2002. Higher earnings and a lower incremental investment in working capital in the quarter of $10.0 million, compared to the first quarter of 2002, contributed to the increase in cash flow from operations.
Despite the ramp up in pre-season barbeque inventory, consistent with prior years, strong accounts receivable collections in the quarter, combined with tightly managed vendor cash outflows, significantly reduced the Company’s working capital investment in the quarter compared to a year ago. This improvement was partially offset by increased cash tax installments of $10.5 million.
With the objective of maximizing return on capital employed, the Company repurchased and cancelled 463,700 shares at an average price of $11.66 per share during the quarter for $5.4 million.
FINANCIAL POSITION, LIQUIDITY AND CAPITAL RESOURCES
Accounts receivable at December 28, 2002 were $110.3 million compared to $156.1 million at the end of fiscal 2002 and $69.5 million a year ago. Significant collections of pre-winter season sales from 2002 contributed to the reduction in receivables since fiscal 2002 year end. Higher sales in the quarter and the incremental receivables from the acquisition of Keanall, TGO and Greenway contributed to the increase year over year.
Inventory increased by $13.1 million from the end of the most recently completed fiscal year and $41.7 million when compared to the same period in the prior year, due primarily to the incremental inventory investment attributed to the newly acquired operations and the pre-season inventory build of barbeque grills and accessories.
Accounts payable and accrued liabilities of $98.1 million was more than double the balance from a year ago, reflecting the impact of acquisitions in 2002. Compared to the end of fiscal 2002, accounts payable were up 24%, consistent with the build of pre-season barbeque inventory and the increase in business in the quarter.
Management expects the Company’s investment in working capital to increase through the second quarter as pre-season barbeque inventories are built. Barbeque inventories should decline with the start-of-season stocking of stores of our mass merchant retail customers, in the latter part of the second and the beginning of the third quarters, and will continue to decline throughout the summer season with fulfilment of replacement stock orders. Working capital is expected to decline in the early summer months as accounts receivable from the sale of these barbeque inventories are collected but is expected to increase near the end of the summer with investment in pre-season hearth inventories.
Shareholders’ equity increased by $59.6 million or 20% over the prior year to $353.1 million, with net book value per share increasing to $8.80, up 14% from $7.74 in 2001. Net earnings for the twelve months ending December 28, 2002 added $44.6 million to shareholders’ equity. The purchase and cancellation of common shares under the Normal Course Issuer Bid decreased shareholders’ equity by $6.0 million for the twelve months ended December 28, 2002. An $8.3 million decrease in cumulative currency translation adjustment was due to the weakening of the U.S. dollar against the Canadian dollar from December 29, 2001 and an adjustment of $4.0 million to reflect the future tax liability on an unrealized foreign exchange gain resulting from the Canadian dollar investment in a U.S. subsidiary.
Net bank debt* ended the quarter at $124.7 million, down $56.9 million from September 28, 2002, due to debt repayments primarily out of the significant cash collections of accounts receivable since fiscal 2002 year end. Net bank debt was up $26.2 million from a year ago due primarily to the debt associated with the acquisitions of Keanall and TGO in 2002. The Company is capitalized with net bank debt to total capitalization of 26%. The unused and available credit under the Company’s existing bank credit facilities stood at $93.0 million at the end of the first quarter. The Company will continue to have cash requirements to support its seasonal working capital needs and capital expenditures, to pay interest and service its debt and for share repurchases under its issuer bid. In order to meet its cash requirements, the Company intends to use internally generated funds and to borrow und er its existing credit facilities. Management believes that cash flow from operations and capacity under its existing credit facilities will be sufficient to meet the Company’s cash requirement over the remainder of the year.
*
Net bank debt is defined as bank debt (current and long-term portion), plus bank indebtedness less cash. This measure is widely accepted by the financial markets as a measure of credit availability.
Capitalization is defined as net bank debt plus shareholders’ equity.
Net bank debt is not a recognized measure for financial statement presentation under Canadian GAAP. Non-GAAP measures do not have any standardized meaning and are therefore unlikely to be comparable to similar measures presented by other issuers. Investors are encouraged to consider these financial measures in the context of CFM’s GAAP results, as provided in the attached statements.
RISKS AND UNCERTAINTIES
CFM is subject to a number of the usual risks associated with operating in a durable consumer products industry, including: demand for the Company’s products is affected by general economic conditions, consumer confidence and the level of housing starts, demographics, CFM’s ability to develop new products, patent protection, weather and related customer buying patterns and manufacturing issues, industry capacity, product liability, availability of gas and gas prices, mass merchant consolidation, credit and collections, supply and cost of raw materials, purchased parts and personnel, costs of certain employee benefits, the inability to increase selling prices as costs increase, competition, foreign currency fluctuations and government regulation. These risks and uncertainties are discussed in detail in CFM’s Annual Information Form dated February 1 0, 2003 and filed with Canadian and U.S. securities regulatory authorities and commissions.
OUTLOOK
The Company continues to be well positioned in its markets and has the financial capacity to implement its growth plans for 2003. The significant factors influencing the Company’s outlook for the year are more fully described in the outlook section of the Company’s 2002 management discussion and analysis contained in the Company’s 2002 Annual Report.

(in thousands of dollars, unaudited) | ||||
AS AT | Dec 28 | Dec 29 | Sept 28 | |
2002 | 2001 | 2002 | ||
$ | $ | $ | ||
ASSETS | ||||
Current | ||||
Cash and cash equivalents | 19,811 | 19,000 | 11,720 | |
Accounts receivable | 110,336 | 69,464 | 156,064 | |
Inventory | 131,378 | 89,716 | 118,232 | |
Prepaid and other expenses | 5,496 | 2,128 | 4,123 | |
Income taxes recoverable | — | 4,068 | — | |
Future income taxes | 9,831 | 5,205 | 9,588 | |
Total current assets | 276,852 | 189,581 | 299,727 | |
Capital assets, net | 115,720 | 97,354 | 116,376 | |
Other assets (note 5) | 6,474 | 7,517 | 6,780 | |
Goodwill, net (note 6) | 231,994 | 173,564 | 232,716 | |
Intangible assets (note 6) | 8,077 | 6,297 | 8,298 | |
Future income taxes | 784 | 937 | 888 | |
639,901 | 475,250 | 664,785 | ||
LIABILITIES AND SHAREHOLDERS’ EQUITY | ||||
Current | ||||
Bank indebtedness | 24,311 | 8,758 | 19,279 | |
Accounts payable and accrued liabilities | 98,088 | 43,632 | 79,152 | |
Current portion of long-term debt | 15,092 | 16,113 | 16,338 | |
Current portion of note payable (note 4c) | 14,802 | — | 14,722 | |
Income taxes payable | 346 | — | 1,370 | |
Future income taxes | 112 | 1,148 | 205 | |
Total current liabilities | 152,751 | 69,651 | 131,066 | |
Long-term debt | 105,101 | 92,573 | 157,695 | |
Note payable (note 4c) | 1,246 | — | 4,978 | |
Future income taxes | 27,622 | 19,362 | 27,662 | |
Total liabilities | 286,720 | 181,586 | 321,401 | |
Minority interest | 36 | 164 | 8 | |
SHAREHOLDERS’ EQUITY | ||||
Share capital (note 7) | 159,760 | 128,105 | 161,498 | |
Retained earnings | 169,390 | 133,147 | 156,501 | |
Cumulative translation adjustment | 23,995 | 32,248 | 25,377 | |
Total shareholders’ equity | 353,145 | 293,500 | 343,376 | |
639,901 | 475,250 | 664,785 | ||
(Thousands of common shares and options) | ||||
Common shares issued and outstanding | 40,137 | 37,900 | 40,588 | |
Stock options outstanding | 3,506 | 3,266 | 3,562 | |
Stock options exercisable | 450 | 600 | 298 | |
See accompanying notes |
(in thousands of dollars except for earnings per share, unaudited) | ||||
FOR THE THREE MONTHS ENDED | Dec 28 | Dec 29 | ||
2002 | 2001 | |||
$ | $ | |||
SALES | 179,911 | 128,418 | ||
Cost of sales | 122,682 | 82,870 | ||
Gross profit | 57,229 | 45,548 | ||
EXPENSES | ||||
Selling and administrative, research and development (notes 5 & 11) | 25,989 | 20,111 | ||
Amortization | 4,085 | 3,002 | ||
Interest income | (40) | (119) | ||
Interest expense | 1,988 | 1,651 | ||
32,022 | 24,645 | |||
Income before income taxes | 25,207 | 20,903 | ||
Income taxes | 8,739 | 7,027 | ||
Net income for the period | 16,468 | 13,876 | ||
Retained earnings, beginning of period | 156,501 | 119,942 | ||
Options repurchased (2001 – net of taxes of $10) | — | (24) | ||
Premium on repurchased common shares | (3,579) | (647) | ||
Retained earnings, end of period | 169,390 | 133,147 | ||
Earnings per share (note 8) | $ | 0.41 | $ | 0.37 |
Diluted earnings per share (note 8) | $ | 0.39 | $ | 0.36 |
See accompanying notes | ||||

(in thousands of dollars, unaudited) | ||
FOR THE THREE MONTHS ENDED | Dec 28 | Dec 29 |
2002 | 2001 | |
$ | $ | |
CASH FLOWS FROM OPERATING ACTIVITIES | ||
Net income for the period | 16,468 | 13,876 |
Add (deduct) items not involving cash | ||
Amortization | 4,085 | 3,002 |
Future income taxes | (28) | 2,509 |
Minority interest | 27 | 20 |
Loss on disposal of capital assets | 15 | — |
Non-cash interest on Keanall note payable | 99 | — |
20,666 | 19,407 | |
Change in non-cash working capital (note 9) | 49,312 | 39,241 |
Cash flows provided by operating activities | 69,978 | 58,648 |
CASH FLOWS FROM INVESTING ACTIVITIES | ||
Acquisitions, net of cash acquired (note 4a) | 7 | — |
Purchase of capital assets | (3,691) | (4,893) |
Development costs | (293) | — |
Proceeds on disposal of capital assets | 18 | — |
Cash flows used in investing activities | (3,959) | (4,893) |
CASH FLOWS FROM FINANCING ACTIVITIES | ||
Repayment of non-revolving term facilities | (9,555) | (3,780) |
Revolving term facility, net | (44,401) | (31,751) |
Bank indebtedness | 5,062 | (2,272) |
Repayment of note payable | (3,750) | — |
Repurchase of common shares | (5,423) | (1,119) |
Options repurchased | — | (24) |
Issuance of common shares | 107 | 31 |
Cash flows used in financing activities | (57,960) | (38,915) |
Effect of foreign currency translation on cash and cash equivalents |
32 |
(106) |
Net increase in cash during the period | 8,091 | 14,734 |
Cash and cash equivalents, beginning of period | 11,720 | 4,266 |
Cash and cash equivalents, end of period | 19,811 | 19,000 |
Supplementary cash flow information: | ||
Cash taxes paid | 10,464 | 542 |
Cash interest paid | 1,706 | 844 |
See accompanying notes |

DECEMBER 28, 2002 (in thousands of dollars, except earnings per share amounts, unaudited)
1. BASIS OF PRESENTATION
The accompanying unaudited consolidated interim financial statements have been prepared in accordance with Canadian Generally Accepted Accounting Principles ("GAAP"). They have been prepared on a basis consistent with the accounting policies and methods followed in CFM Corporation's (the "Company") most recent audited financial statements except for the change related to the adoption of the Canadian Institute of Chartered Accountants ("CICA") recommendation on Stock-based Compensation and Other Stock-based Payments as discussed in note 3. These unaudited consolidated interim financial statements do not include all of the information and footnotes required by GAAP for annual financial statements and therefore should be read in conjunction with the audited consolidated financial statements and notes included in the Company’s Annual Report for the year ended September 28, 2002.
2. USE OF ESTIMATES
The preparation of quarterly financial statements in conformity with GAAP requires management to make estimates and assumptions that effect the amounts reported in the financial statements and accompanying notes. Management believes that the estimates utilized in preparing its consolidated quarterly financial statements are reasonable and prudent; however, actual results could differ from these estimates.
3. ACCOUNTING POLICY
Stock-based Compensation
Effective September 29, 2002, the Company adopted the recommendations of the CICA Section 3870, “Stock-based Compensation and Other Stock-based Payments.” The new recommendations will be applied to awards granted after the date of adoption.
Pro forma disclosure of net income and earnings per share will be provided as if all awards were accounted for using the fair value method. Consideration received from employees on the exercise of stock options will be credited to share capital.
4. ACQUISITIONS
a) Greenway Home Products Inc.
On October 3, 2002, the Company acquired all the issued and outstanding shares of Greenway Home Products Inc. (“Greenway”) of Guelph, Ontario. Greenway is a participant in the residential water dispensing, purification and air treatment products market, offering a line of innovative water dispensing, water purification and air treatment appliances. The Company satisfied the purchase price by a cash payment, including acquisition costs of $1,335. Additional contingent consideration not to exceed $35,000 will be paid based upon the earnings of Greenway over a number of specified periods. The first such payment will be due following March 31, 2003 and will not exceed $5,000. The remaining contingent consideration will be payable only once the earnings of Greenway have reached a stipulated level, and any such consideration will not exceed $30,000. All future contingent consideration paid will be charged to goodwill.
The results of the operations of Greenway from the date of acquisition are included in the Company’s consolidated statement of operations for the quarter ended December 28, 2002. The acquisition was accounted for using the purchase method with the purchase price allocated to net identifiable assets at their estimated fair values. The purchase price allocation is subject to change based on final determination of these fair value amounts.
The following is a summary of the acquisition representing the estimated values assigned and consideration given:
$ | |
Current assets acquired | 6,466 |
Long-term assets acquired | 178 |
Current liabilities assumed | (5,309) |
1,335 | |
Consideration: | |
Cash, including purchase costs | 1,335 |
b) The Great Outdoors Grill Company
On May 30, 2002, the Company acquired all the issued and outstanding shares of The Great Outdoors Grill Company (“TGO”) of Joplin, Missouri. TGO is a North American manufacturer and distributor of quality cast aluminum barbeques. The Company satisfied the purchase price by a cash payment of $15,033 and the issuance of 195,366 common shares of the Company valued at $3,102. In accordance with GAAP, the fair value of CFM shares was $15.88, representing the average market price on the announcement date. Additional contingent consideration not to exceed US$12,300 in the form of a non-interest-bearing promissory note will be paid if TGO achieves an earnings target for the 2003 fiscal year. The promissory note will be repayable in equal installments over a two-year period commencing on January 2, 2004. The results of the operations of TGO are included in the Company’s consolidated statement of operations from the date of acquisition and are, therefore, not included in the first quarter 2002 comparatives.
c) Keanall Holdings Limited
On January 2, 2002, the Company acquired all the issued and outstanding shares of Keanall Holdings Limited (“Keanall”) of Mississauga, Ontario. Keanall is a leading manufacturer and distributor of quality after-market gas grill products to many of North America’s largest retailers that serve the recreational and home improvement market. Under the terms of the transaction, the Company satisfied the purchase price with a combination of a cash payment of $10,000, the issuance of a $30,000 face value non-interest-bearing note repayable monthly over 24 months with a fair value of $29,343, and a further $30,366, paid by the issuance of 2,526,314 common shares of CFM. In accordance with GAAP, the fair value of CFM common shares was $12.02, representing the average market price on the announcement date. The results of the operations of Keanall are included in the Company’s con solidated statement of operations from the date of acquisition and are, therefore, not included in the first quarter 2002 comparatives.
5. OTHER ASSETS | |||
Other assets consist of the following: | |||
AS AT | Dec 28 | Dec 29 | Sept 28 |
2002 | 2001 | 2002 | |
$ | $ | $ | |
Deferred barbeque facility start-up costs | 2,987 | 4,154 | 3,195 |
Deferred development costs | 1,921 | 2,112 | 1,792 |
Deferred financing costs | 1,235 | 923 | 1,442 |
Other | 331 | 328 | 351 |
6,474 | 7,517 | 6,780 | |
Changes in the carrying amount of deferred barbeque facility start-up costs and deferred development costs for the three months ended December 28, 2002 were: | |||
Deferred barbeque | Deferred | ||
facility start-up | development | ||
costs | costs | ||
$ | $ | ||
Balance as at September 28, 2002 | 3,195 | 1,792 | |
Additions | — | 293 | |
Amortization for three months | (208) | (164) | |
Balance as at December 28, 2002 | 2,987 | 1,921 | |
Research and development expenses for the quarter ended December 28, 2002 are $1,939 (2002 – $2,107).
Amortization of deferred barbeque facility start-up costs in the quarter were $208 (2002 – nil).
Additions to deferred development costs in the quarter were $293 (2002 – $85). Amortization of deferred development costs in the quarter were $164 (2002 – $83).
6. GOODWILL AND OTHER INTANGIBLE ASSETS | |
Goodwill | |
Changes in the carrying amount of goodwill for the twelve months ended December 28, 2002 were: | |
Total | |
$ | |
Balance as at December 29, 2001 | 173,564 |
Goodwill acquired on the purchase of TGO | 12,859 |
Goodwill acquired on the purchase of Keanall | 51,508 |
Transitional impairment loss | (2,014) |
Adjustment of future tax liabilities | (2,752) |
Foreign currency translation | (1,177) |
Other | 728 |
Balance as at September 28, 2002 | 232,716 |
Foreign currency translation | (722) |
Balance as at December 28, 2002 | 231,994 |
Intangible Assets
As part of the asset purchase of Harris Systems Inc. on November 1, 1997, the Company purchased a long-term facility operating lease. The market value of the lease exceeded the present value of the future lease commitments. This leasehold right was recognized as an asset at the time of the acquisition and has been amortized over the 22-year lease term.
Trademarks include a British hearth trademark acquired in 2002.
Dec 28 | Dec 29 | Sept 28 | |
2002 | 2001 | 2002 | |
$ | $ | $ | |
Leasehold rights | |||
Cost | 7,643 | 7,768 | 7,681 |
Accumulated amortization | 1,796 | 1,471 | 1,717 |
Net book value | 5,847 | 6,297 | 5,964 |
Trademarks | 1,696 | 0 | 1,655 |
Other | 534 | 0 | 679 |
8,077 | 6,297 | 8,298 |
Amortization expense of intangible assets for the quarter was $184 (2002 – $87).
7. SHARE CAPITAL
The Company’s authorized share capital consists of an unlimited number of common shares without nominal or par value.
a) Issued and outstanding
Number of | ||
shares | ||
(in thousands) | Amount | |
# | $ | |
Balance September 28, 2002 | 40,588 | 161,498 |
Options exercised | 10 | 74 |
Employee share purchase plan | 3 | 33 |
Shares repurchased and cancelled (i) | (464) | (1,845) |
Balance December 28, 2002 | 40,137 | 159,760 |
(i) On October 3, 2002, the Company filed a Normal Course Issuer Bid enabling it to make market purchases of up to 2,800,000 of its common shares commencing October 9, 2002 during the next twelve-month period. As at December 28, 2002, a total of 463,700 shares had been repurchased and cancelled at an average price of $11.66.
b) Stock options
The Company did not grant stock options to employees in the first quarter of 2003.
Under the Stock Option Plan, the Company is authorized to issue a maximum of 5,624,500 common shares. As at December 28, 2002, a total of 1,132,629 common shares are available for future option grants.
A summary of the Stock Option Plan as of December 28, 2002 and changes during the quarter ended is presented below:
Weighted | Number | ||
Options | average | of vested | |
outstanding | price | options | |
# | $ | # | |
Outstanding at September 28, 2002 | 3,562,036 | 10.37 | 297,582 |
Granted | — | — | |
Exercised | (10,034) | 7.33 | |
Forfeited | (46,498) | 9.45 | |
Outstanding at December 28, 2002 | 3,505,504 | 10.39 | 449,549 |
A summary of options outstanding at December 28, 2002 is as follows:
| |||||
Total options outstanding | Total options exercisable | ||||
Weighted | Weighted | Weighted | |||
Number of | Range of | average | average | Number of | average |
options | exercise | exercise | remaining | exercisable | exercise |
outstanding | prices | price | life | options | price |
3,505,504 | 6.250–14.000 | 10.39 | 5.13 | 449,549 | 8.44 |
8. EARNINGS PER SHARE
Basic earnings per share has been determined by dividing net income by the weighted average number of common shares outstanding during the quarter. Diluted earnings per share is computed in accordance with the treasury stock method and is based on the weighted average number of common shares and dilutive common share equivalents outstanding.
FOR THE THREE MONTHS ENDED | Dec 28 | Dec 29 | ||
2002 | 2001 | |||
Earnings for period | $ | 16,468 | $ | 13,876 |
Weighted average number of shares outstanding | 40,390 | 37,938 | ||
Basic earnings per share | $ | .41 | $ | .37 |
Weighted average number of shares outstanding | 40,390 | 37,938 | ||
Add: Dilutive effect of stock options | 1,393 | 413 | ||
Adjusted weighted average number of shares outstanding | 41,783 | 38,351 | ||
Diluted earnings per share | $ | .39 | $ | .36 |
9. CHANGES IN NON-CASH WORKING CAPITAL | ||
Cash flow from changes in non-cash working capital consists of the following: | ||
FOR THE THREE MONTHS ENDED | Dec 28 | Dec 29 |
2002 | 2001 | |
$ | $ | |
Accounts receivable | 48,205 | 53,593 |
Inventory | (11,272) | (9,430) |
Prepaid and other expenses | (1,369) | (143) |
Other assets | (159) | (2,222) |
Accounts payable and accrued liabilities | 15,684 | (6,459) |
Income taxes recoverable | (1,777) | 3,902 |
49,312 | 39,241 |
10. SEGMENTED INFORMATION
The Company operates in one business segment, home products, which includes the development, manufacture and sale of fireplaces, hearth and heating related products, barbeque and outdoor products and water dispensing and purification products. In light of the growth and significance of barbeque and outdoor products to the overall revenue of CFM and the Company’s entry into the water products category, revenue has been disclosed by product category.
The Chief Executive and Operating Officers of CFM review consolidated operating results to assess the performance of the business. CFM’s business organization structure and performance measurement systems are not based on product categories.
FOR THE THREE MONTHS ENDED | Dec 28 | Dec 29 |
2002 | 2001 | |
$ | $ | |
Net external sales | ||
Hearth & heating products | 154,193 | 127,954 |
Barbeque & outdoor products | 22,022 | 464 |
Water products | 3,696 | — |
179,911 | 128,418 |
Geographic information
The Company conducts substantially all of its business activities in North America. External sales are allocated on the basis of sales to external customers.
External sales | ||||
FOR THE THREE MONTHS ENDED | United States | Canada | Other | Total |
$ | $ | $ | $ | |
December 28, 2002 | 144,505 | 25,701 | 9,705 | 179,911 |
December 29, 2001 | 106,262 | 16,062 | 6,094 | 128,418 |
Capital assets, goodwill | ||||
and intangibles | ||||
United States | Canada | Other | Total | |
$ | $ | $ | $ | |
As at December 28, 2002 | 275,555 | 69,119 | 11,117 | 355,791 |
As at December 29, 2001 | 230,919 | 36,026 | 10,270 | 277,215 |
11. FOREIGN EXCHANGE
Foreign exchange losses for the quarter of $460 (2002 – $189), are included in selling and administrative, research and development expenses on the Statement of Operations.
12. COMPARATIVE INTERIM FIGURES
Certain comparative interim figures have been reclassified to conform to the current interim presentation.
CORPORATE DIRECTORY AND INVESTOR INFORMATION
Directors | Executive Officers | Wesley Ogden | Operating Facilities |
Vice President, The Great Outdoors Grill Company | |||
Colin M. Adamson | Colin Adamson | Vermont Castings Majestic Products | |
Chairman, Chief Executive | Chairman and | 410 Admiral Boulevard | |
Officer and Co-Founder | Chief Executive Officer | Doug Greenway | Mississauga, Ontario |
President, CFM Greenway | Canada L5T 2N6 | ||
David W. Colcleugh(3) | Jim Lutes | Telephone: (905) 670-7777 | |
Chairman, President and | President and | Solicitors | Facsimile: (905) 670-4676 |
Chief Executive Officer, | Chief Operating Officer | ||
Dupont Canada Inc. | Fraser Milner Casgrain LLP | 475 Admiral Boulevard Mississauga, Ontario Canada L5T 2N1 Telephone: (905) 670-7777 Facsimile: (905) 670-4650 | |
Patrick Keane | 1 First Canadian Place | ||
William A. Corbett(1) (2) | Executive Vice President, | 100 King Street West | |
Chairman, | Operations | Toronto, Ontario | |
The New Providence | Canada M5X 1B2 | ||
Development | Peter Plows | ||
Company Limited | Senior Vice President, | Foley & Lardner | 1000 East Market Street |
Operations | Three First National Plaza 70 West Madison Chicago, Illinois USA 60602-4205 | Huntington, Indiana, USA 46750 | |
William S. Cullens(1) (2) | Telephone: (260) 356-8000 | ||
Past Chairman and | J. David Wood | Facsimile: (260) 356-9672 | |
Chief Executive Officer, | Vice President and | ||
Canron Inc. | Chief Financial Officer | Route 107 | |
Auditors | Bethel, Vermont, USA 05032 | ||
Carlo De Pellegrin(1) (2) (3) (4) | Susan Marlow | Telephone: (802) 234-2300 Facsimile: (802) 234-2340 | |
Partner, | Vice President, | Ernst & Young LLP, | |
Williams & Partners, | Human Resources | Chartered Accountants | |
Chartered Accountants LLP | and Development | The Ernst & Young Tower | Beanville Road |
TD Centre, Toronto, Ontario Canada M5K 1J7 | Randolph, Vermont, USA 05060 | ||
Paul A. Houston(2) | Sonya Stark | Telephone: (802) 728-3151 | |
President and | Director, Legal Affairs, | Facsimile: (802) 728-3171 | |
Chief Executive Officer, | Investor Relations and | Bankers | |
Alderwoods Group, Inc. | Corporate Secretary | CFM Harris Systems | |
Bank of Montreal | 3501 West Howard Street | ||
Patrick S. Keane Executive Vice President, Operations | David Brash Director, Corporate Finance | First Canadian Place 11th Floor, Toronto, Ontario Canada M5X 1A1 | Skokie, Illinois, USA 60076-4012 |
Telephone: (847) 676-3556 | |||
Facsimile: (847) 676-3759 | |||
Eileen Foley | |||
Sheila O’Brien(2) | Director, Tax | Transfer Agent | CFM RMC International |
Senior Vice President, | 3501 West Howard Street | ||
Nova Chemicals | Paul Kroetsch Treasurer | Computershare Trust Company of Canada 100 University Avenue 8th Floor, Toronto, Ontario Canada M5J 2Y1 | Skokie, Illinois, USA 60076-4012 |
Telephone: (847) 676-3556 | |||
Heinz Rieger(3) | Facsimile: (847) 676-3759 | ||
Past Chairman and Co-Founder | Operating Management | ||
CFM Europe Limited | |||
Dan Downing | Trentham Lakes | ||
(1)Member of the Audit Committee | President, Vermont Castings | Share Listing Stock Symbol:CFMExchange:Toronto Stock Exchange | Stoke-on-Trent |
Majestic Products | Staffordshire, England ST4 4TJ | ||
(2)Member of the Compensation | Telephone: (178) 233-9000 | ||
and Corporate Governance Committee | Steve Haramaras | Facsimile: (178) 233-9009 | |
President, Mass Merchant | |||
(3)Member of the Business | Operations | CFM Keanall | |
Development Committee | 2695 Meadowvale Boulevard | ||
Michael Miller | Corporate Head Office CFM Corporation460 Admiral Boulevard Mississauga, Ontario Canada L5T 3A3Telephone: (905) 670-7777 Facsimile: (905) 670-7915 | Mississauga, Ontario | |
(4)Lead Director | Managing Director, | Canada L5T 8A3 | |
CFM Europe Limited | Telephone: (905) 858-8010 | ||
Facsimile: (905) 858-1165 | |||
Jamie Harrod President, The Great Outdoors Grill Company | |||
350 Admiral Boulevard | |||
Mississauga, Ontario | |||
Canada L5T 2N6 | |||
| Telephone:(905) 670-7777 |
Facsimile: (905) 565-4683 | ||||||||
Annual Meeting | The Annual and Special Meeting of the shareholders will be held onWednesday, February 26, 2003at 4:15 p.m. at the Toronto Stock Exchange, Conference Centre, 130 King Street West, Toronto, Ontario, Canada M5X 1J2.
Send inquiries to Investor Relations,CFM Corporation 460 Admiral Boulevard, Mississauga, Ontario, Canada L5T 3A3
Telephone: (905) 670-7777 Facsimile: (905) 670-7915 E-mail: cfm@cfmmajestic.com Website: www.cfmmajestic.com | |||||||
| Investor Relations | ||||||||
| 25400 Industrial Park Road | ||||||||
Ardmore, Tennessee, USA 38449 | ||||||||
Telephone: (931) 427-8170 | ||||||||
Facsimile: (931) 427-8168 | ||||||||
| ||||||||
| The Great Outdoors Grill Company | |||||||
7980 East American Drive | ||||||||
Joplin, Missouri, USA 64804 | ||||||||
Share Trading Summary | Telephone: (417) 623-2596 | |||||||
Facsimile: (417) 623-3946 | ||||||||
2002 Fiscal Year | High | Low | Close | Volume | ||||
Greenway Home Products Inc. | ||||||||
First Quarter 2003 | $ | 13.00 | $ | 10.00 | $ | 12.19 | 3,190,298 | 33 Kerr Cresent, RR#3 |
Guelph, Ontario | ||||||||
Fourth Quarter 2002 | $ | 16.85 | $ | 12.11 | $ | 12.52 | 1,640,620 | Canada N1H 6N9 |
Telephone: (519) 837-9724 | ||||||||
Third Quarter 2002 | $ | 17.50 | $ | 15.00 | $ | 15.96 | 4,394,241 | Facsimile: (519) 837-8913 |
Second Quarter 2002 | $ | 16.95 | $ | 13.00 | $ | 16.00 | 3,274,319 | |
CFM is a leading vertically integrated manufacturer of home products and related accessories in North America and the United Kingdom. The Company designs, develops and manufactures a line of hearth and heating products (including gas, wood-burning and electric fireplaces and free-standing stoves, indoor and outdoor space heaters, gas log sets and hearth product accessories including glass doors, fire screens, chimney caps, and mantel products), barbeque and outdoor products (including gas barbeques, gas and charcoal barbeque parts and accessories, smokers and outdoor garden accessories) and residential water purification, dispensing and filtration products (including water dispensers, icemakers and ultraviolet water purification systems). CFM maintains an ongoing program of research and development aimed at continually improving the quality, design, features and efficiency of its products.

corporate office
CFM Corporation
460 Admiral Boulevard
Mississauga, Ontario
Canada L5T 3A3
Telephone: (905) 670-7777
Facsimile: (905) 670-7915
This interim report contains forward-looking statements that involve certain risks and uncertainties which could cause actual results to differ materially from future results expressed or implied by such forward-looking statements. Important factors that could affect these statements include, without limitation, general economic conditions, consumer confidence and level of housing starts, demographics, CFM’s ability to develop new products, patent protection, weather and related customer buying patterns and manufacturing issues, industry capacity, product liability, availability of gas and gas prices, mass merchant consolidation, credit and collections, supply and cost of raw materials, purchased parts and personnel, costs of certain employee benefits, the inability to increase selling prices as costs increase, competition, foreign currency fluctuations and government regulation. The se factors and other risks and uncertainties are discussed in the reports and disclosure documents filed by CFM with Canadian and U.S. securities regulatory authorities and commissions. Statements made in this interim report are made as of January 22, 2003 and CFM disclaims any intention or obligation to update or revise any statements made herein, whether as a result of new information, future events or otherwise.