
UIL Holdings Corporation
42nd Annual EEI Financial Conference
Orlando, Florida
November 2007
Transforming Investment
into Future Value
EXHIBIT 99.1

UI Service Territory in Connecticut
Certain statements contained herein, regarding matters that are
not historical facts, are forward-looking statements (as defined in
the Private Securities Litigation Reform Act of 1995). These
include statements regarding management’s intentions, plans,
beliefs, expectations or forecasts for the future. Such
forward-looking statements are based on the Corporation’s
expectations and involve risks and uncertainties; consequently,
actual results may differ materially from those expressed or
implied in the statements. Such risks and uncertainties include,
but are not limited to, general economic conditions, legislative and
regulatory changes, changes in demand for electricity and other
products and services, unanticipated weather conditions, changes
in accounting principles, policies or guidelines, and other
economic, competitive, governmental, and technological factors
affecting the operations, timing, markets, products, services and
prices of the Corporation’s subsidiaries. The foregoing and other
factors are discussed and should be reviewed in the Corporation’s
most recent Annual Report on Form 10-K and other subsequent
periodic filings with the Securities and Exchange Commission.
Forward-looking statements included herein speak only as of the
date hereof and the Corporation undertakes no obligation to
revise or update such statements to reflect events or
circumstances after the date hereof or to reflect the occurrence of
unanticipated events or circumstances.
For more information, contact:
Sue Allen - V.P. IR, 203.499.2409
Susan.Allen@uinet.com
Michelle Hanson - Mgr. IR, 203.499.2481

Michelle.Hanson@uinet.com
James P. Torgerson
Chief Executive Officer
Anthony J. Vallillo
President and Chief Operating Officer, UI
Richard J. Nicholas
Executive Vice President and Chief Financial Officer
Safe Harbor Provision

Discussion Topics
lIntroduction
l2007 Accomplishments
l10-year capital expenditure plan and future opportunities
l2007 Financial results and earnings guidance
l2007-2009 Financing plan
lWhy invest in UIL?

Who We Are…
lThe United Illuminating Company, a wholly owned subsidiary of UIL Holdings
Corporation
Corporation
lPure-play utility
n320,000 customers in Connecticut
u290,000 residential customers
u30,000 commercial & industrial customers
l$1.78B Total Assets
l$885M Market Capitalization*
l920 Employees
* As of October 31, 2007
Pure-play utility with earnings growth.

Why UIL?
UIL. A smart investment for smart investors.
lCompetitively positioned for continued success
nSolid enterprise foundation
nSeasoned management team with industry expertise
nAttractive investment opportunities in both distribution and transmission
businesses
businesses
nFuture investment opportunities in generation on the horizon
nTrusted by customers and stakeholders
lFocused on regulated utility
nPure-play utility with earnings growth
lContinued committment to the dividend
nConsistent dividend for more than 12 years, returning an annual dividend of
$1.728 per share
$1.728 per share

2007 Accomplishments
lAnnounced 10-year, $1.75B capital expenditure program
n$887 in Distribution, $866 in Transmission
nTo support robust infrastructure and customer needs
lContinued progress on the Middletown/Norwalk transmission project
nNearing 50% complete
nIn service in 2009
lPartnering with NRG Energy enables new generation investment opportunities
nHybrid generation model can deliver the “best of both worlds”
nWin for customers and shareowners
lUI was honored as the winner for the Global AMI Utility Peer Group Revenue Assurance
Initiative
Initiative
nAward for best practices related to business case development, implementation and operation of
advanced metering systems
advanced metering systems
lFavorable FERC rulings
nTransmission investment incentives
nAttractive ROEs
lSuccessfully working out residual Xcelecom issues
nAchieved settlement agreements that accelerate certain collections
and reduce on-going risk
Working for our customers and shareowners.

Delivering on our commitments.
Customer
Value
lInfrastructure investments to ensure reliable service into
the future
the future
lCustomer programs with incentives to promote energy
conservation and peak reduction
conservation and peak reduction
Shareowner
Value
lValue through regulatory-supported investments
lInvestment deployment which will produce minimum
volatility at a good return
volatility at a good return
Transforming Investment Into….

Conservation
lUI energy efficiency and demand response programs are recognized
nationally for innovation and excellence
nationally for innovation and excellence
Leveraging our Core Competencies
lUpgrading aging infrastructure
lAdding capacity to meet peak demand
lMeeting customer needs
Transmission
Generation
Distribution
lUpgrading aging infrastructure
lAdding capacity to meet peak demand
lStandards compliance
l2007 legislation recognized the need for new peaking generation
lPartnering with NRG offers an innovative response to meet
generation needs while delivering customer and business value
generation needs while delivering customer and business value
Understanding what we do best.
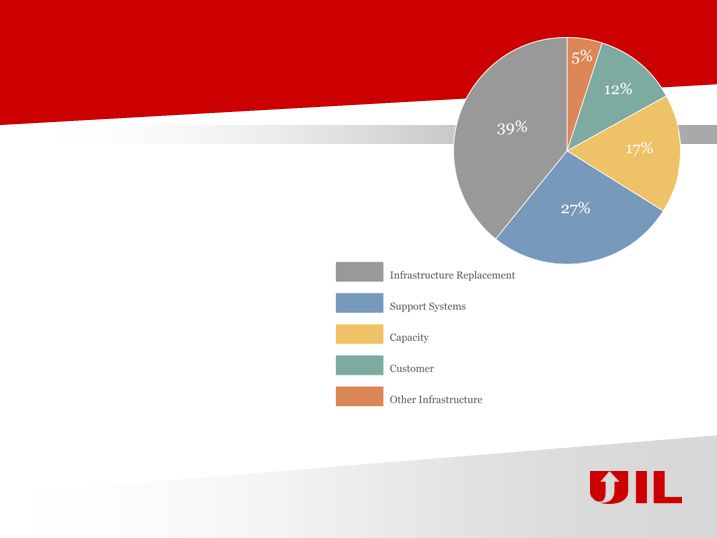
$887 MILLION IN PROJECTS (2007-2016)
Distribution Opportunities
The time to invest is now.
lInfrastructure Replacement
nUpgrading substations
nNetwork facilities
nDistribution transformers
nSplicing chambers
lSupport Systems
nIT related projects
lCapacity
nSix new substations
lCustomer
nConnecting customer loads
lOther Infrastructure
nCentral facility

Transmission Opportunities
Opportunities are largely in our control.
lCapacity
nSix new substations
lAging Infrastructure
nSubstation rebuilds
nOverhead and underground
transmission upgrades
transmission upgrades
lStandards Compliance
nFault duty mitigation
nTransmission upgrades
lMiddletown/Norwalk
nOne of, if not the largest, 345-kV
Gas Insulated Switchgear
Substations in North America
Gas Insulated Switchgear
Substations in North America
n5.6 miles of XLPE underground
cable
cable
lOther
nCustomer driven
nRegional solutions
$866 MILLION IN PROJECTS (2007-2016)

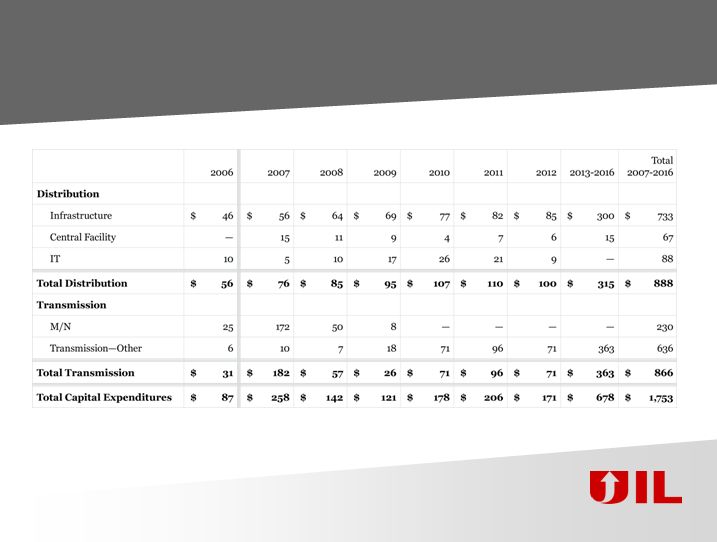
Magnitude of Our Investment
Prudently investing in infrastructure to support customer needs.
Based on current estimates
Overall CAGR - 8%
MORE THAN TRIPLING
TRANSMISSION RATE BASE
TRANSMISSION RATE BASE
Note: Includes only capital expenditures through 2012. Total capital expenditures through 2016 are $1.75B
($887 in distribution and $866 in transmission)

Recent Connecticut Legislation
An Act Concerning Electricity and Energy Efficiency
(“2007 Energy Act”)
(“2007 Energy Act”)
lProvides for:
nCost of service generation including utility-owned
nDecoupling of distribution revenues from sales
nIncreasing support for energy efficiency programs
nComprehensive procurement plan for needed resources
Constructive regulation - win, win for our customers and shareowners.

A New Opportunity:
The Hybrid Generation Model
The Hybrid Generation Model
“We’re ready to go...”
l2007 legislation recognized the need for more peaking generation in Connecticut
lUI/NRG team will propose new “cost of service” peaking generation projects that will
deliver customer value
deliver customer value
lPartnering with NRG combines UI’s record of delivering customer benefits with NRG’s
expertise in developing, building and operating generation assets
expertise in developing, building and operating generation assets
lPotential project benefits include:
nIncreased system reliability
nCompetitive cost of construction & operation
nEnvironmental benefits
nPrice stability of cost of service investment
lThe Hybrid model provides a template to expand into “base-load” generation
investments that can provide additional consumer and business value
investments that can provide additional consumer and business value
lTimeframe
nBy February 1, 2008-proposal submitted to DPUC
nJune 1, 2008-decision expected on proposal
nIf approved by DPUC, COS peaking generation potentially in 2009
THE HYBRID GENERATION MODEL CAN PROVIDE THE “BEST OF BOTH WORLDS”

Energy Efficiency and Load Management
Conservation helps the customer, community, environment and UI.
lTwo decades of success in the design and delivery of innovative CLM services that
provide significant customer, system and environmental benefits
provide significant customer, system and environmental benefits
lEnergy Efficiency
nPrograms achieve an average of 650,000 lifetime MWH reduction each year
nApproximately 1% per year of permanent peak demand reduction
nNationally recognized “on-bill” financing program
nFirst provider of Class III trading certificates in innovative energy efficiency
renewable program
renewable program
lLoad Management & Demand Response
nMore than 5% of system peak load participating in demand response programs (75
MW)
MW)
nDemand response contract for two of the nation’s largest retail providers throughout
New England (291 locations)
New England (291 locations)
nNearly 1% of system peak is shifted through thermal storage applications
UI IS ESTABLISHED AS A NATIONAL LEADER IN THE ENERGY EFFICIENCY & LOAD MANAGEMENT FIELD

Third Quarter Earnings
Decreased earnings volatility with divestiture of non-regulated businesses.
| Three Months Ended September 30, | Nine Months Ended September 30, | |||
2007 | 2006 | 2007 | 2006 | |
Continuing Operations | ||||
| United Illuminating | $0.95 | $0.96 | $1.58 | $1.73 |
| Non-Recurring Item | — | 0.27 | — | 0.27 |
Subtotal United Illuminating | $0.95 | $1.23 | $1.58 | $2.00 |
| Corporate | (0.03) | (0.02) | (0.06) | (0.10) |
| Divested Businesses–CSC & UBE | – | – | — | 0.43 |
Total Continuing Operations | $0.92 | $1.21 | $1.52 | $2.33 |
| Discontinued Operations–Xcelecom | (0.08) | (0.73) | (0.07) | (3.27) |
Total UIL Holdings | $0.84 | $0.48 | $1.45 | $(0.94) |
For Year Over Year Comparative Purposes | ||||
| Total UIL Holdings Continuing Operations, excluding non-recurring item and divested businesses | $0.92 | $0.94 | $1.52 | $1.63 |

2007 Financial Highlights
lM/N incentive rate filing decision issued and effective in May, granting 100% CWIP
in Rate Base and 50 bps incentive adder to ROE on advanced technology portion of
project (approx. 50%)
in Rate Base and 50 bps incentive adder to ROE on advanced technology portion of
project (approx. 50%)
lFinancing Plan approved by DPUC in June. Successfully priced $175M of Senior
Notes in July. Issued $100M in September, $75M to be issued in December
Notes in July. Issued $100M in September, $75M to be issued in December
lIn March, cash settlements of $2.5M for Terry’s Electric, and in
September/October, $0.5M for ABW and $7.3M for Phalcon. Significantly moves
the Xcelecom “tail” towards final resolution from both a financial and management
attention perspective
September/October, $0.5M for ABW and $7.3M for Phalcon. Significantly moves
the Xcelecom “tail” towards final resolution from both a financial and management
attention perspective
lPass through of all generation service costs
Successes to move us to the future.

On track to meet 2007 earnings guidance.
2007 Earnings Guidance & Beyond
as of November 1, 2007
l2007-2009 Earnings Guidance Drivers
nContinued growth in distribution and transmission rate base
nEarning the allowed rate of returns
nMaintaining our capital structure, 48% equity / 52% debt
(1) CAGR based on actual 2006 results, excluding the impact of IRS private letter ruling of $0.27 per share. Assumes UI earns the
distribution allowed rate of return. If unable to earn return, management will make the appropriate regulatory filings to seek regulatory
orders that provide the opportunity to earn the appropriate allowed return.
* Includes the impact of the IRS private letter ruling of $0.27 per share
** Expectations are not intended to be additive
| 2006 Actual | Nine Months Ended September 30, 2007 | 2007 EPS Guidance | 2007-2009 CAGR(1) | |
| United Illuminating Company | $2.12* | $1.58 | $1.85-$1.95 | |
| Corporate | (0.15) | (0.06) | (0.10)-(0.05) | |
Total Continuing Operations | $1.97* | $1.52 | $1.78-$1.88** | 5%-8% |

Financing Plan 2007-2009
lConsolidated cash on hand at UIL on 9/30/07, $52.7 million
nPrimarily proceeds from non-utility divestitures
nUsed to infuse equity into UI
lDPUC approved a 3-year debt financing plan of $375 million
nSuccessfully priced $175 million in July ‘07
nClosed on $100 million in September ‘07
nWill close on additional $75 million in December ‘07
lUIL Holdings to infuse equity into UI to maintain allowed capital structure of 48%
equity, 52% debt
equity, 52% debt
lNo equity issuance planned to support capital expenditure program through 2010,
excluding potential generation spending
excluding potential generation spending
Using cash effectively to increase shareowner value.

UIL is an Attractive Investment
Above average potential returns for our shareowners.
(1)As of October 31, 2007
* Assumes achieving distribution allowed rate of return

Why UIL?
UIL. A smart investment for smart investors.
lCompetitively positioned for continued success
nSolid enterprise foundation
nSeasoned management team with industry expertise
nAttractive investment opportunities in both distribution and transmission
businesses
businesses
nFuture investment opportunities in generation on the horizon
nTrusted by customers and stakeholders
lFocused on regulated utility
nPure-play utility with earnings growth
lContinued committment to the dividend
nConsistent dividend for more than 12 years, returning an annual dividend of
$1.728 per share
$1.728 per share

Appendix

10-Year Transmission Planning
Aging Infrastructure
Standards Compliance
Distribution Capacity
PROJECTS IN THREE CATEGORIES
Distribution capacity solutions exhausted
lDistribution load transfers
lExisting substation expansion
Majority of assets exceeding useful lives
lSubstation rebuilds
lLine/Cable replacements
lComponent replacement
program
program
North American Electric Reliability
Council Standards
Council Standards
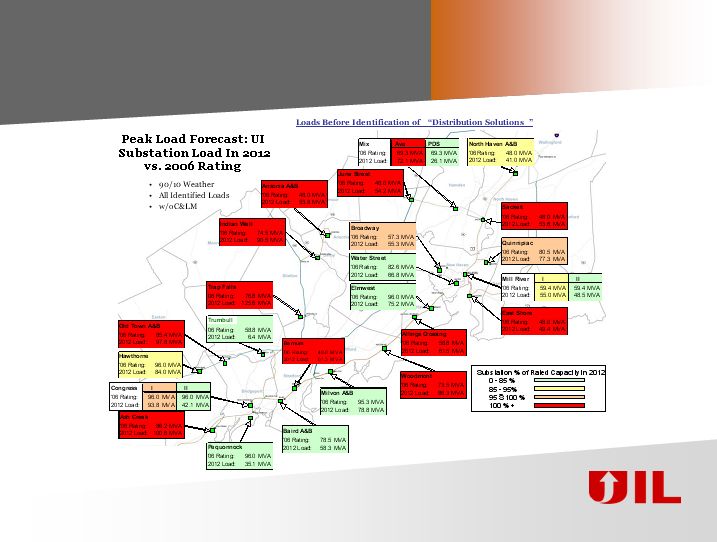
Distribution Capacity
Impact of Load Growth
2012

Aging Infrastructure
OVERVIEW OF AN AGING SYSTEM
lMajority of current assets installed in the
1960’s and 1970’s
1960’s and 1970’s
lCommon useful lives: 35 to 50+ years
n At end of life, risk of failure increases
nReliability diminishes
SUBSTATIONS

Standards Compliance
lNorth American Electric Reliability Council/Northeast Power Coordinating
Council/ISO-NE Reliability Standards:
Council/ISO-NE Reliability Standards:
nThermal
uStandards intended to ensure that equipment and components
remain within acceptable operating limits
remain within acceptable operating limits
nVoltage
uStandards intended to keep system voltage within acceptable limits
nShort Circuit
uStandards designed to prevent equipment from failing
nBulk Power System Protection Criteria
lPrioritization Criteria:
nProjected future date that condition creating violation could develop
nThe identified early-phase projects address concerns in all four areas above
$1.75B Capital Expenditure Details

Investments for the Customer Results in
Returns to our Shareowners
Returns to our Shareowners
Substantial, sustained growth in rate base.
Average Rate Base

EXPERIENCE & DEMONSTRATED CAPABILITIES
Middletown to Norwalk
Transmission Project
Transmission Project
lCap Ex: $255-$285
million
million
lIn service in 2009
lAll underground
lOne of, if not the largest
345-kV Gas Insulated
Switchgear substation in
North America
345-kV Gas Insulated
Switchgear substation in
North America
lRate base growth:
$260-$290 million
$260-$290 million
lFERC incentives
approved pending
requests for rehearing
approved pending
requests for rehearing
l100% CWIP, ROE adder
granted
granted
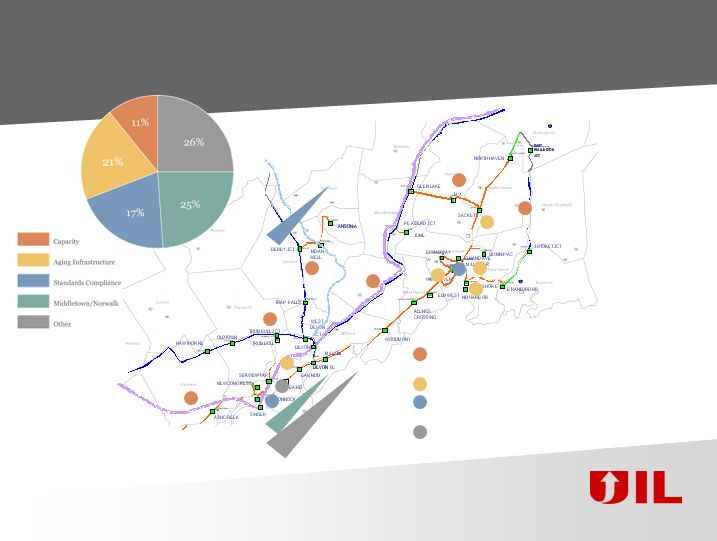
UI Transmission Project Locations
Sampling of Some of the Major Projects:
Capacity:Trumbull, Shelton, Fairfield, Orange,
Hamden, North Branford Substations
Hamden, North Branford Substations
Aging:Grand, Baird, Sackett Substation Rebuilds
Standards Compliance: Naugatuck Valley,
Pequonnock Fault Duty, Underground transmission
Pequonnock Fault Duty, Underground transmission
Other: e.g. customer driven needs, regional solutions, etc.

Top 7 (Immediate) Major Projects (1-4)
lMiddletown to Norwalk
nApproximate total T-CapEx: $255-$285 million
nNearly 50% complete
nExpected in service: 2009
lTrumbull Substation
nApproximate total T-CapEx: $12 million
nApproximately 50% complete
nExpected in service: 2008
lShelton Substation
nDriven by Distribution demand
nPreliminary T-CapEx estimate: $21 million
nExpected in service: 2010
lGrand Avenue Switching Station
nOperational limitations due to ring bus design, wiring and steel deterioration, no
expansion capability, breaker concerns, etc.
expansion capability, breaker concerns, etc.
nPreliminary T-CapEx estimate: $37 million
nExpected in service: 2012

Top 7 (Immediate) Major Projects (5-7)
lPequonnock Station
nShort circuit over-duty issues.
nSolution may allow for future generation connection
nPreliminary T-CapEx estimate: $45 million
nExpected in service: 2011
lNaugatuck Valley Reliability
nCurrent severe low voltage conditions at multiple substations. Single contingency causing
loss in excess of 100 MW. Future Thermal contingency issues.
loss in excess of 100 MW. Future Thermal contingency issues.
nPreliminary T-CapEx estimate: $54 million
nExpected in service: 2012
l115Kv High Pressure Fluid Filled (HPFF) under ground cable upgrade
nDriven by demand and generation placement.
nFuture Thermal contingency issues. Preliminary T-CapEx estimate: $45 million
nExpected in service: 2015
ALL THREE PROJECTS CURRENTLY UNDER IN-DEPTH STUDY WITH ISO-NE (SWCT WORKING GROUP)

Highlights
lDistribution rate case decision in January 2006
nAllows for an increase in rates annual on each January 1st to 1/1/09
nAllowed ROE 9.75%, achieved 9.88% after sharing in 2006
nCapital structure - 48% equity, 52% debt
nSales forecast 1% growth per year
n50/50 sharing on earnings in excess of allowed ROE
lTransmission
nApproved Middletown/Norwalk transmission project to be complete in 2009
u$255-$285 million commitment
nFERC incentives for M/N project - pending requests for rehearing
uIncrease of CWIP in rate base to 100%
uAdditional ROE incentive - 50 basis points for advanced transmission technologies
(estimated at approximately 50% of project costs)
(estimated at approximately 50% of project costs)
nRetail Transmission tracker
uTracks FERC-approved Transmission revenue requirements
uRates are looking forward
uAdjusted every six months
l10-year Distribution and Transmission capital expenditure plan
lFinancial flexibility - total 2006 proceeds from non-utility divestitures, $143 million
lLabor stability - collective bargaining agreement through 2011