EXHIBIT 99.1 UIL Holdings Corporation Transforming Investment into Future Value Second Quarter 2008 Results James P. Torgerson President and Chief Executive Officer Richard J. Nicholas Executive Vice President and Chief Financial Officer
Safe Harbor Provision Certain statements contained herein, regarding matters that are not historical facts, are forward-looking statements (as defined in the Private Securities Litigation Reform Act of 1995). These include statements regarding management’s intentions, plans, beliefs, expectations or forecasts for the future. Such forward-looking statements are based on the Corporation’s expectations and involve risks and uncertainties; consequently, actual results may differ materially from those expressed or implied in the statements. Such risks and uncertainties include, but are not limited to, general economic conditions, legislative and regulatory changes, changes in demand for electricity and other products and services, unanticipated weather conditions, changes in accounting principles, policies or guidelines, and other economic, competitive, governmental, and technological factors affecting the operations, timing, markets, products, services and prices of the Corporation’s subsidiaries. The foregoing and other factors are discussed and should be reviewed in the Corporation’s most recent Annual Report on Form 10-K and other subsequent periodic filings with the Securities and Exchange Commission. Forward-looking statements included herein speak only as of the date hereof and the Corporation undertakes no obligation to revise or update such statements to reflect events or circumstances after the date hereof or to reflect the occurrence of unanticipated events or circumstances. For more information, contact: Sue Allen – V.P. IR, 203.499.2409 Susan.Allen@uinet.com Michelle Hanson – Mgr. IR, 203.499.2481 Michelle.Hanson@uinet.com
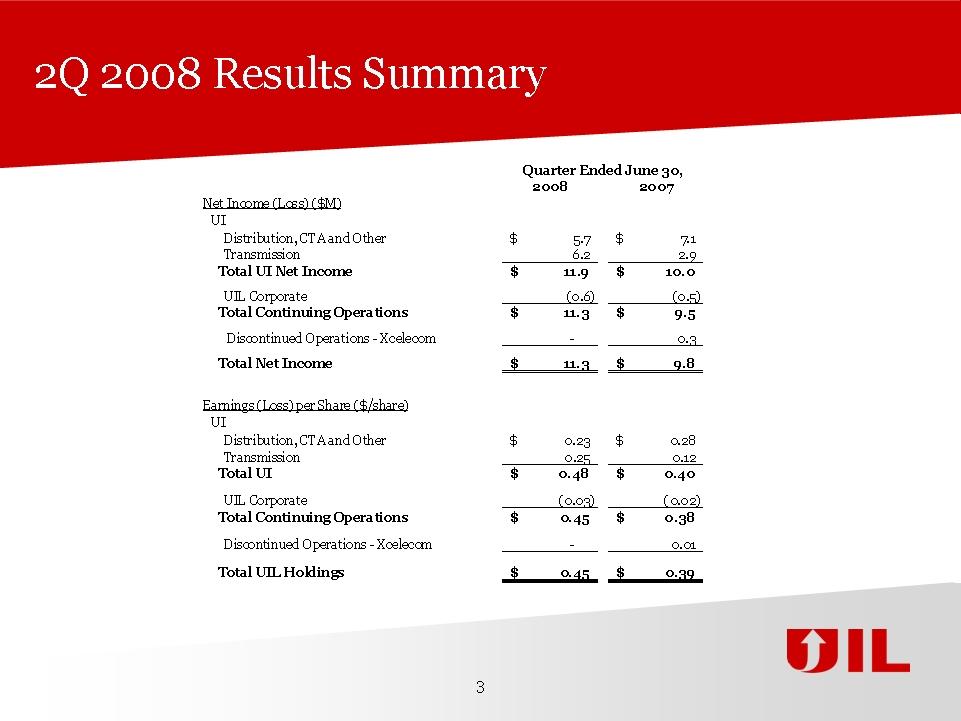
2Q 2008 Results Summary
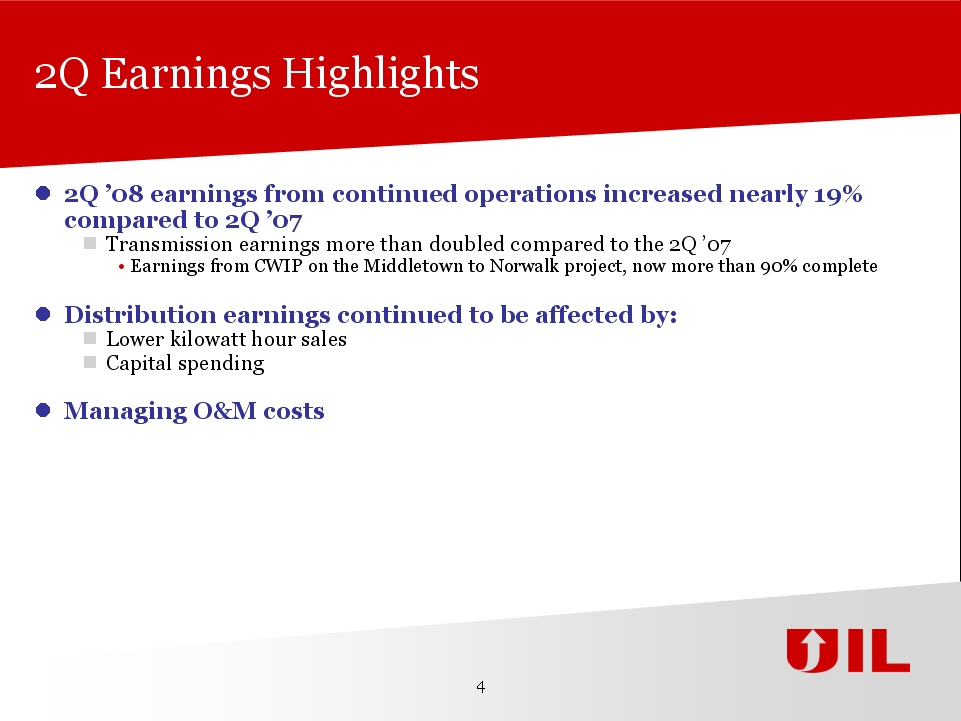
2Q Earnings Highlights 2Q ’08 earnings from continued operations increased nearly 19% compared to 2Q ’07 Transmission earnings more than doubled compared to the 2Q ’07 Earnings from CWIP on the Middletown to Norwalk project, now more than 90% complete Distribution earnings continued to be affected by: Lower kilowatt hour sales Capital spending Managing O&M costs
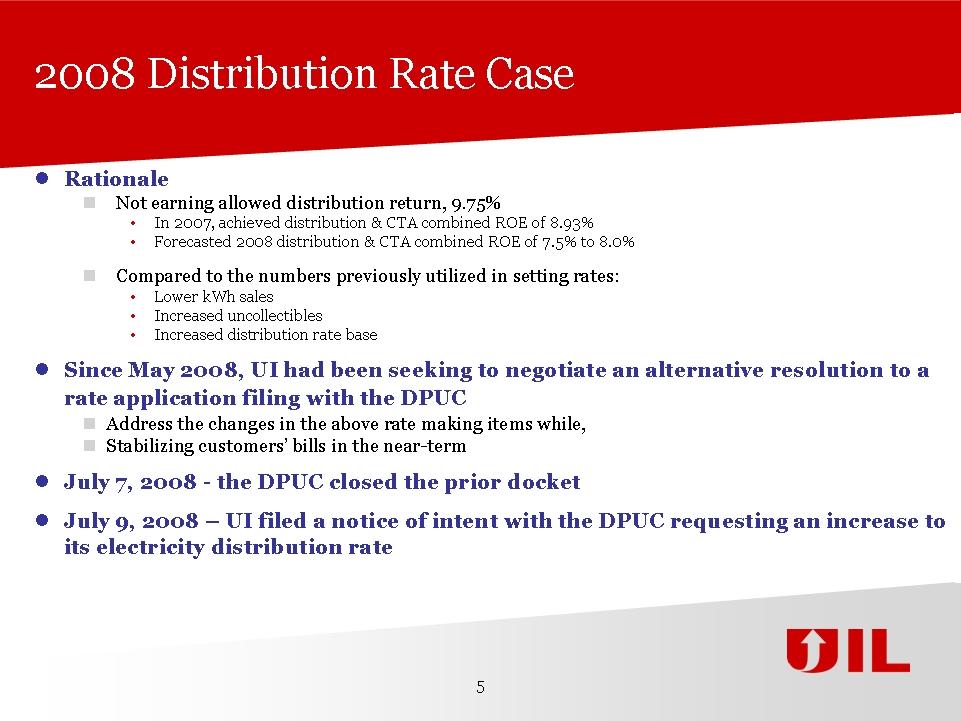
2008 Distribution Rate Case Rationale Not earning allowed distribution return, 9.75% In 2007, achieved distribution & CTA combined ROE of 8.93% Forecasted 2008 distribution & CTA combined ROE of 7.5% to 8.0% Compared to the numbers previously utilized in setting rates: Lower kWh sales Increased uncollectibles Increased distribution rate base Since May 2008, UI had been seeking to negotiate an alternative resolution to a rate application filing with the DPUC Address the changes in the above rate making items while, Stabilizing customers’ bills in the near-term July 7, 2008 - the DPUC closed the prior docket July 9, 2008 – UI filed a notice of intent with the DPUC requesting an increase to its electricity distribution rate
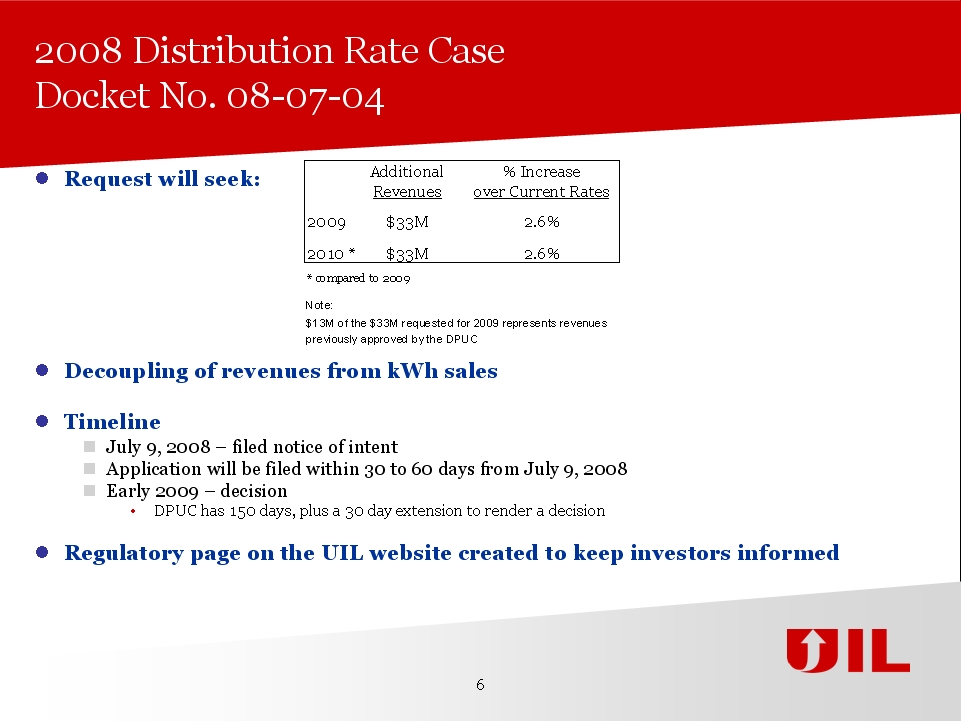
2008 Distribution Rate Case Docket No. 08-07-04 Request will seek: Decoupling of revenues from kWh sales Timeline July 9, 2008 – filed notice of intent Application will be filed within 30 to 60 days from July 9, 2008 Early 2009 – decision DPUC has 150 days, plus a 30 day extension to render a decision Regulatory page on the UIL website created to keep investors informed
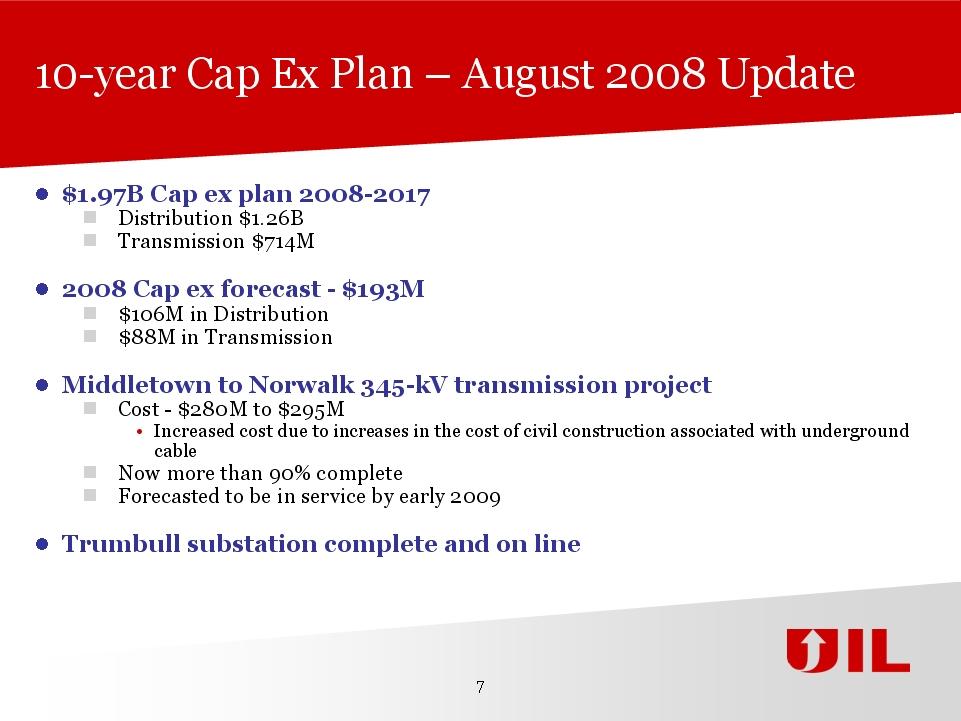
10-year Cap Ex Plan – August 2008 Update $1.97B Cap ex plan 2008-2017 Distribution $1.26B Transmission $714M 2008 Cap ex forecast - $193M $106M in Distribution $88M in Transmission Middletown to Norwalk 345-kV transmission project Cost - $280M to $295M Increased cost due to increases in the cost of civil construction associated with underground cable Now more than 90% complete Forecasted to be in service by early 2009 Trumbull substation complete and on line
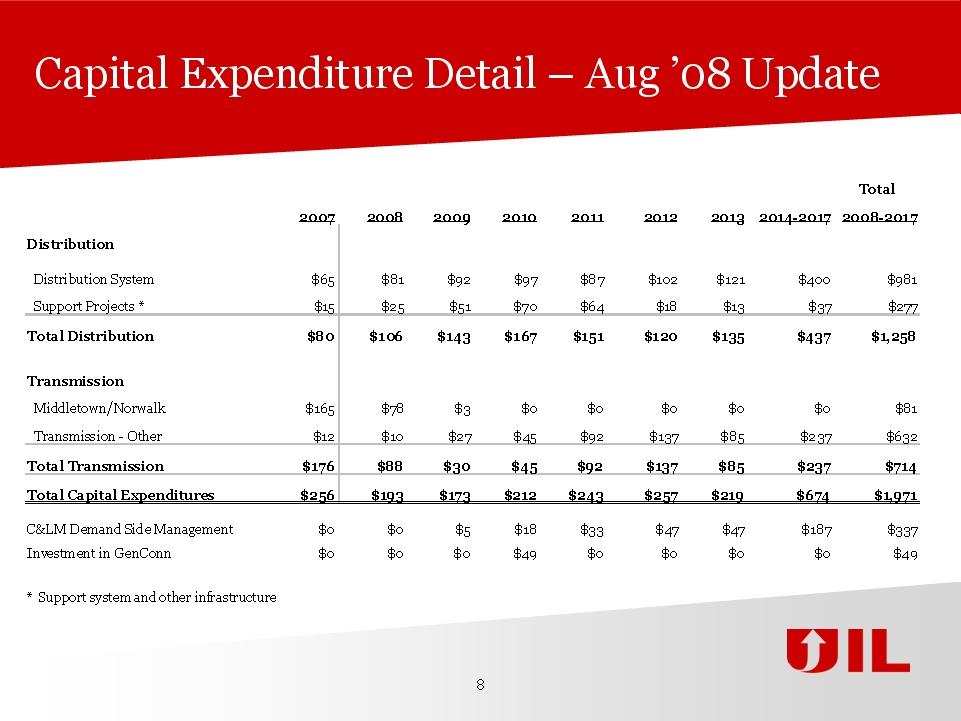
Capital Expenditure Detail – Aug ’08 Update
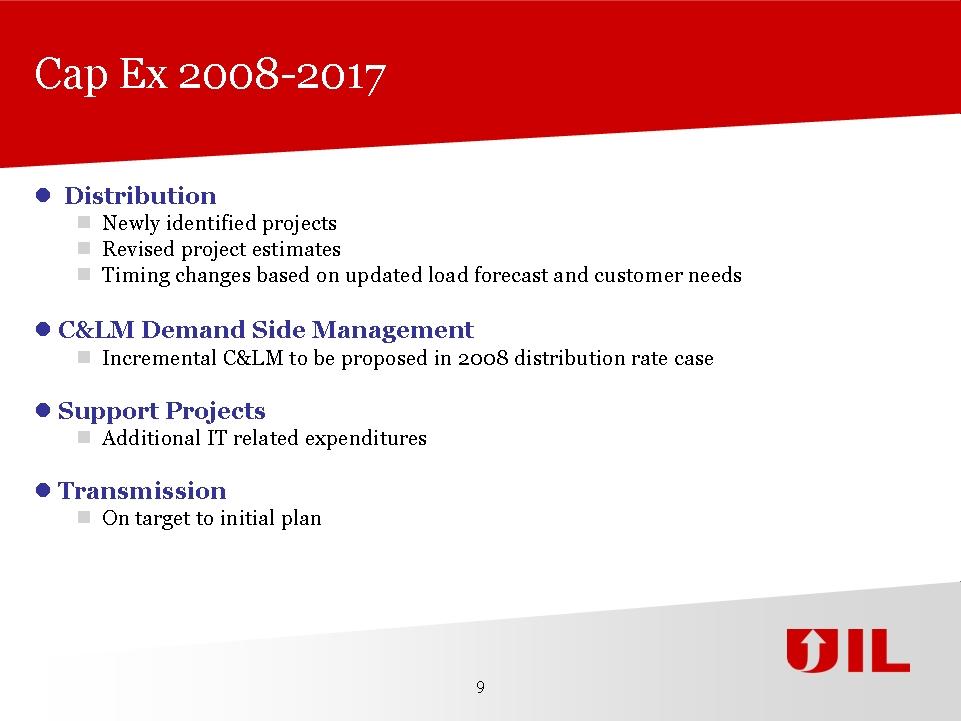
Cap Ex 2008-2017 Distribution Newly identified projects Revised project estimates Timing changes based on updated load forecast and customer needs C&LM Demand Side Management Incremental C&LM to be proposed in 2008 distribution rate case Support Projects Additional IT related expenditures Transmission On target to initial plan
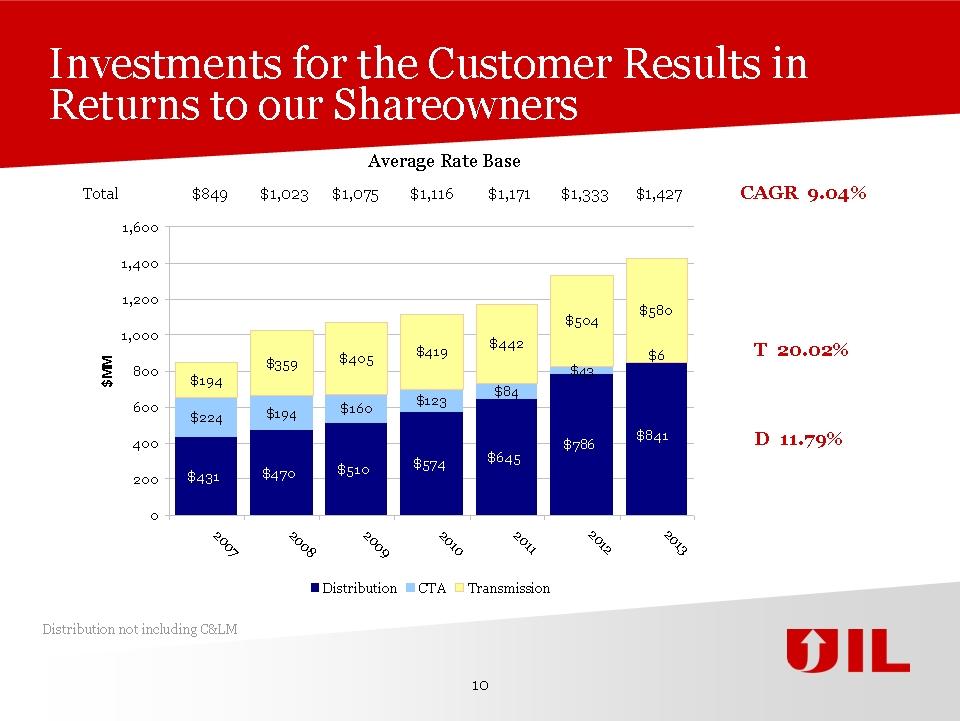
Investments for the Customer Results in Returns to our Shareowners Average Rate Base Total $849 $1,023 $1,075 $1,116 $1,171 $1,333 $1,427 CAGR 9.04% T 20.02% D 11.79% Distribution not including C&LM
Peaking Generation On June 25, 2008, the DPUC awarded GenConn Energy a contract to build 200 MW of new peaking generation
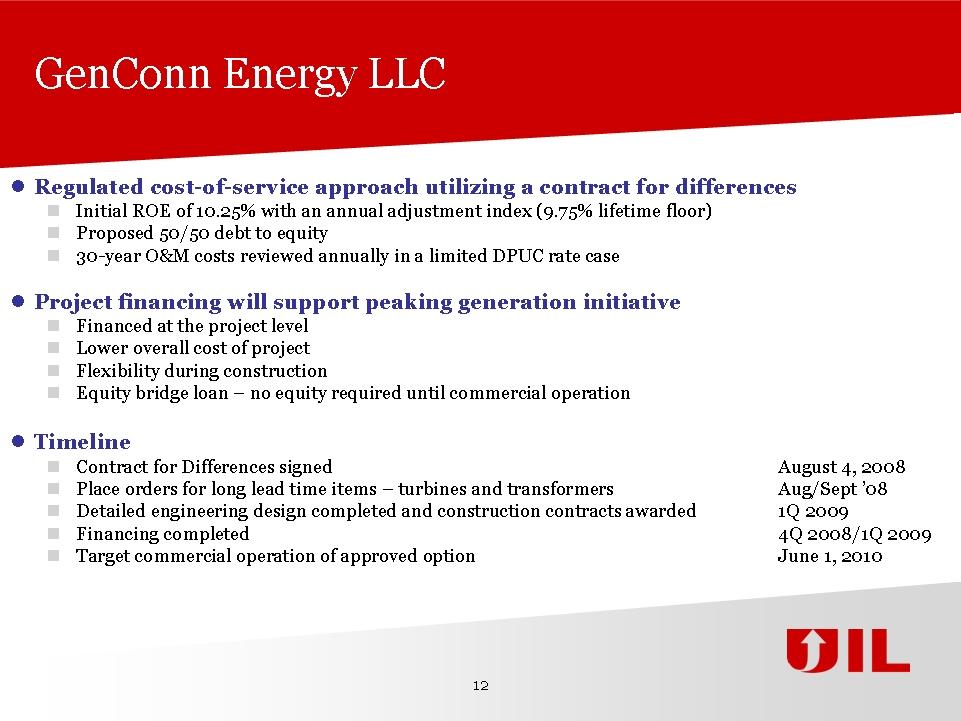
GenConn Energy LLC Regulated cost-of-service approach utilizing a contract for differences Initial ROE of 10.25% with an annual adjustment index (9.75% lifetime floor) Proposed 50/50 debt to equity 30-year O&M costs reviewed annually in a limited DPUC rate case Project financing will support peaking generation initiative Financed at the project level Lower overall cost of project Flexibility during construction Equity bridge loan – no equity required until commercial operation Timeline Contract for Differences signedAugust 4, 2008 Place orders for long lead time items – turbines and transformersAug/Sept ’08 Detailed engineering design completed and construction contracts awarded1Q 2009 Financing completed 4Q 2008/1Q 2009 Target commercial operation of approved optionJune 1, 2010
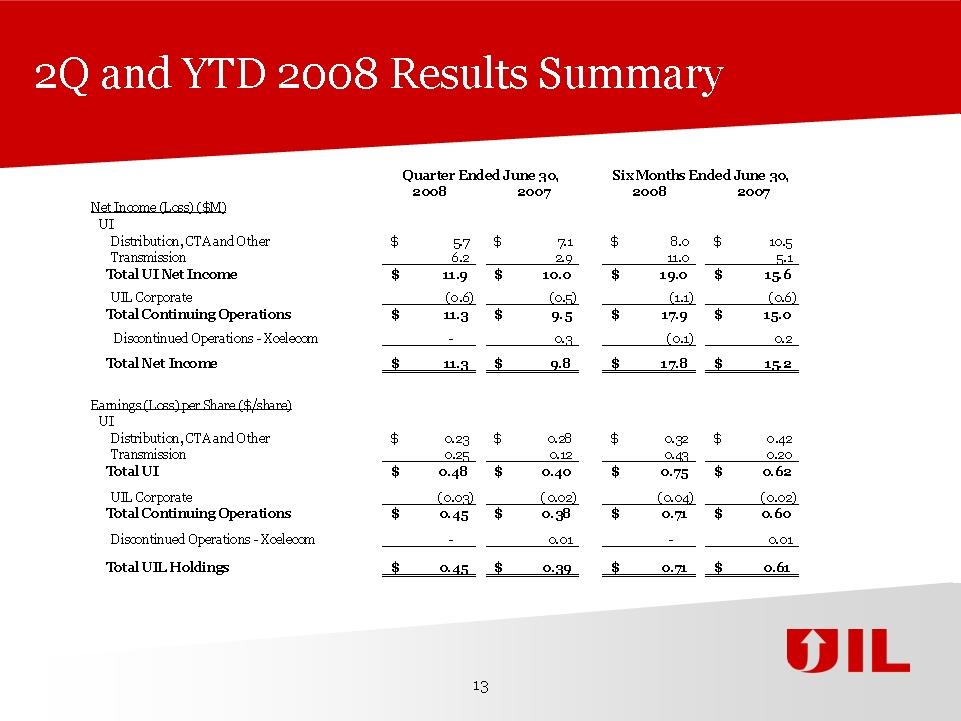
2Q and YTD 2008 Results Summary
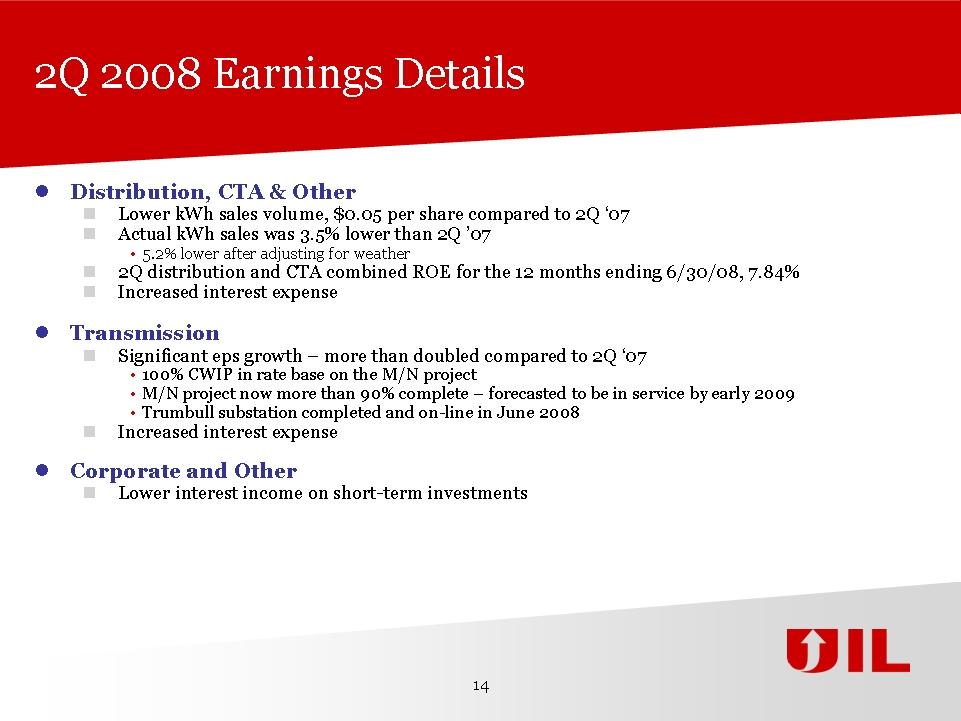
2Q 2008 Earnings Details Distribution, CTA & Other Lower kWh sales volume, $0.05 per share compared to 2Q ‘07 Actual kWh sales was 3.5% lower than 2Q ’07 5.2% lower after adjusting for weather 2Q distribution and CTA combined ROE for the 12 months ending 6/30/08, 7.84% Increased interest expense Transmission Significant eps growth – more than doubled compared to 2Q ‘07 100% CWIP in rate base on the M/N project M/N project now more than 90% complete – forecasted to be in service by early 2009 Trumbull substation completed and on-line in June 2008 Increased interest expense Corporate and Other Lower interest income on short-term investments
Reaffirming Consolidated 2008 Earnings Guidance CAGR based on actual 2007 results and earnings projection for 2008. Assumes UI earns its distribution allowed return on equity in 2010. Includes 6 months of peaking generation earnings and an equity issuance in 2010. ** Assumes UI earns a distribution and CTA combined return on equity of 7.5% to 8.0% and a transmission weighted average return on equity of 12.49% in 2008. Expectations are not intended to be additive.
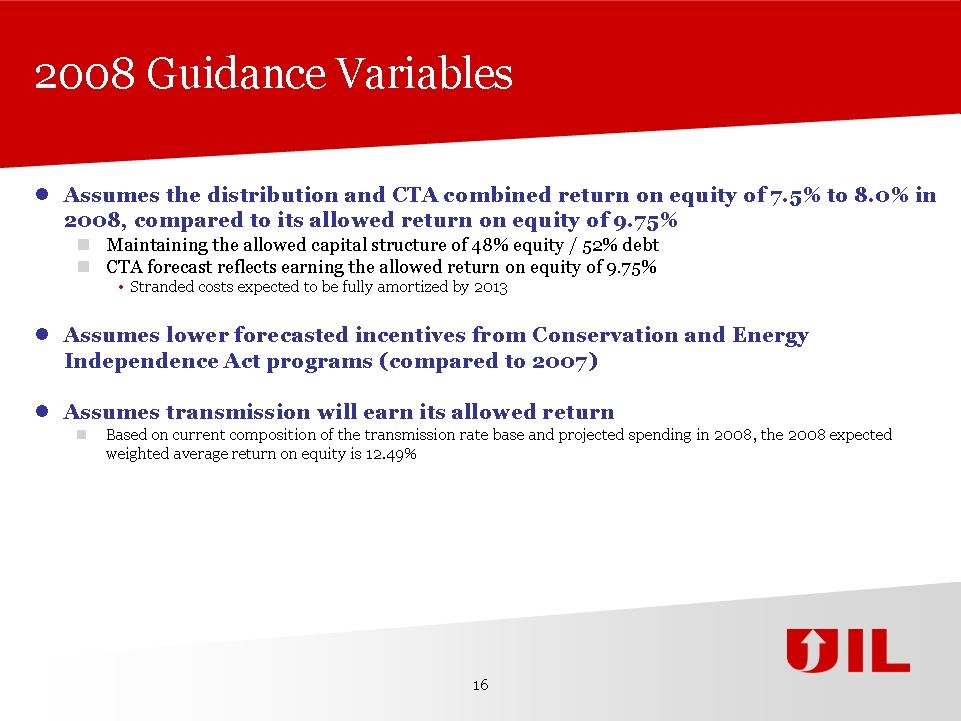
2008 Guidance Variables Assumes the distribution and CTA combined return on equity of 7.5% to 8.0% in 2008, compared to its allowed return on equity of 9.75% Maintaining the allowed capital structure of 48% equity / 52% debt CTA forecast reflects earning the allowed return on equity of 9.75% Stranded costs expected to be fully amortized by 2013 Assumes lower forecasted incentives from Conservation and Energy Independence Act programs (compared to 2007) Assumes transmission will earn its allowed return Based on current composition of the transmission rate base and projected spending in 2008, the 2008 expected weighted average return on equity is 12.49%
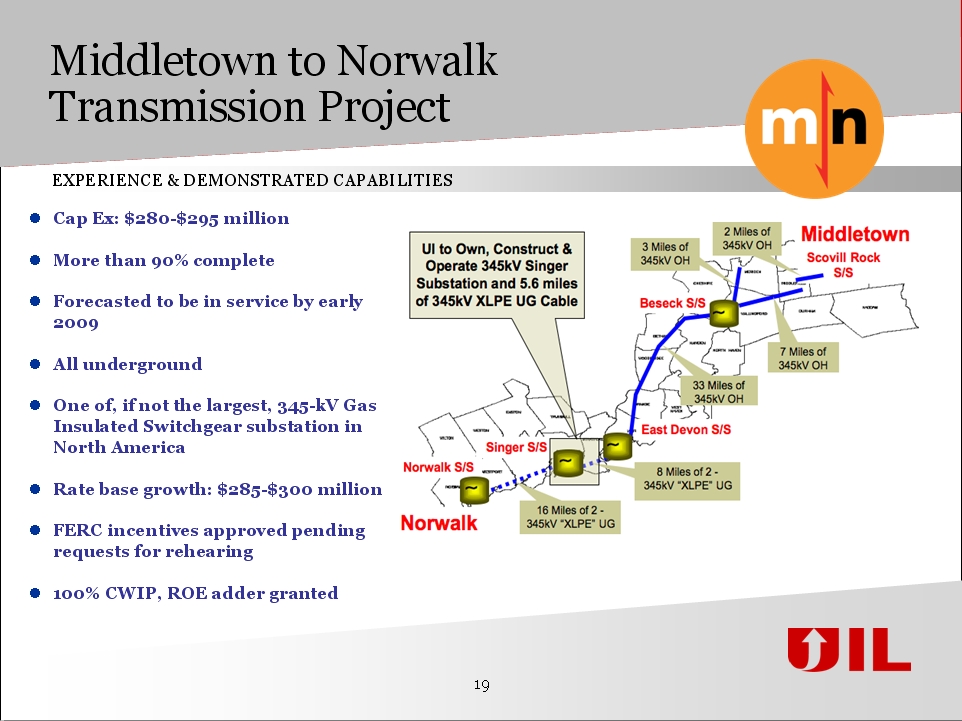
Middletown to Norwalk Transmission Project EXPERIENCE & DEMONSTRATED CAPABILITIES Cap Ex: $280-$295 million More than 90% complete Forecasted to be in service by early 2009 All underground One of, if not the largest, 345-kV Gas Insulated Switchgear substation in North America Rate base growth: $285-$300 million FERC incentives approved pending requests for rehearing 100% CWIP, ROE adder granted
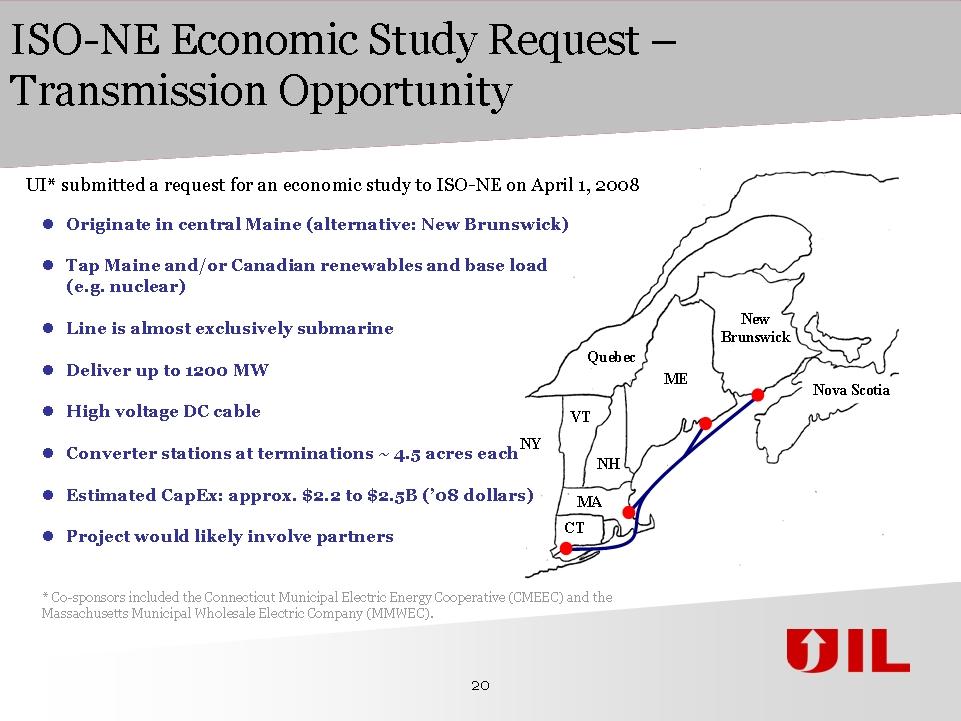
ISO-NE Economic Study Request – Transmission Opportunity UI* submitted a request for an economic study to ISO-NE on April 1, 2008 Originate in central Maine (alternative: New Brunswick) Tap Maine and/or Canadian renewables and base load (e.g. nuclear) Line is almost exclusively submarine Deliver up to 1200 MW High voltage DC cable Converter stations at terminations ~ 4.5 acres each Estimated CapEx: approx. $2.2 to $2.5B (’08 dollars) Project would likely involve partners
Peaking Generation THE HYBRID GENERATION MODEL CAN PROVIDE THE “BEST OF BOTH WORLDS” 2007 legislation recognized the need for more peaking generation in Connecticut UI/NRG Partnership UI’s cost-of-service expertise and record of delivering customer benefits NRG’s expertise in developing, building and operating generation assets NRG Owns 23000 MW of generation nationwide 1500 MW in CT at 5 sites Potential project benefits include Increased system reliability Competitive cost of construction and operation Price stability of cost-of-service investment The Hybrid model provides a template to potentially expand into “base-load” generation investments that can provide additional consumer and business value
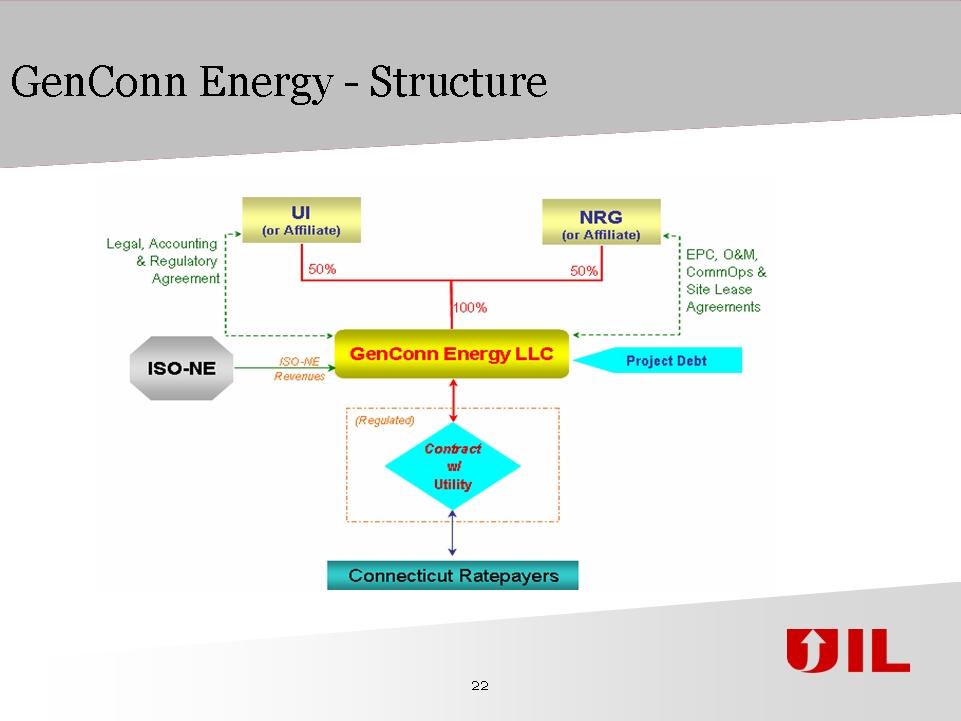
GenConn Energy - Structure