
46th Annual EEI Financial Conference
November 2011
Exhibit 99.1
Exhibit 99.1
2
2011 Fall EEI
2
Safe Harbor Provision
Certain statements contained herein, regarding matters that are not historical facts, are forward-looking statements (as defined in the
Private Securities Litigation Reform Act of 1995). These include statements regarding management’s intentions, plans, beliefs,
expectations or forecasts for the future. Such forward-looking statements are based on UIL Holdings’ expectations and involve risks and
uncertainties; consequently, actual results may differ materially from those expressed or implied in the statements. Such risks and
uncertainties include, but are not limited to, general economic conditions, legislative and regulatory changes, changes in demand for
electricity, gas and other products and services, unanticipated weather conditions, changes in accounting principles, policies or
guidelines, and other economic, competitive, governmental, and technological factors affecting the operations, markets, products and
services of UIL Holdings’ subsidiaries, The United Illuminating Company, The Southern Connecticut Gas Company, Connecticut
Natural Gas Corporation and The Berkshire Gas Company. Such risks and uncertainties with respect to UIL Holdings’ recent
acquisition of The Southern Connecticut Gas Company, Connecticut Natural Gas Corporation and The Berkshire Gas Company
include, but are not limited to, the possibility that the expected benefits will not be realized, or will not be realized within the expected
time period. The foregoing and other factors are discussed and should be reviewed in UIL Holdings’ most recent Annual Report on
Form 10-K and other subsequent periodic filings with the Securities and Exchange Commission. Forward-looking statements included
herein speak only as of the date hereof and UIL Holdings undertakes no obligation to revise or update such statements to reflect events
or circumstances after the date hereof or to reflect the occurrence of unanticipated events or circumstances.
James P. Torgerson
President and Chief Executive Officer

3
2011 Fall EEI
Contents
q Overview
ú Corporate Structure
ú Investment Highlights
ú YTD 3Q ’11 Financial Results
ú Debt Maturities & Credit Ratings
ú ’11 Earnings Guidance
ú UIL Integration
q UIL Forecasts
ú Capital Expenditure
ú Average Rate Base
q Business Operations & Services
ú Gas distribution
ú Electric transmission
ú Electric distribution
ú Generation
ú Smart Systems
q Governmental and Regulatory Updates
q Conclusion
3
4
2011 Fall EEI
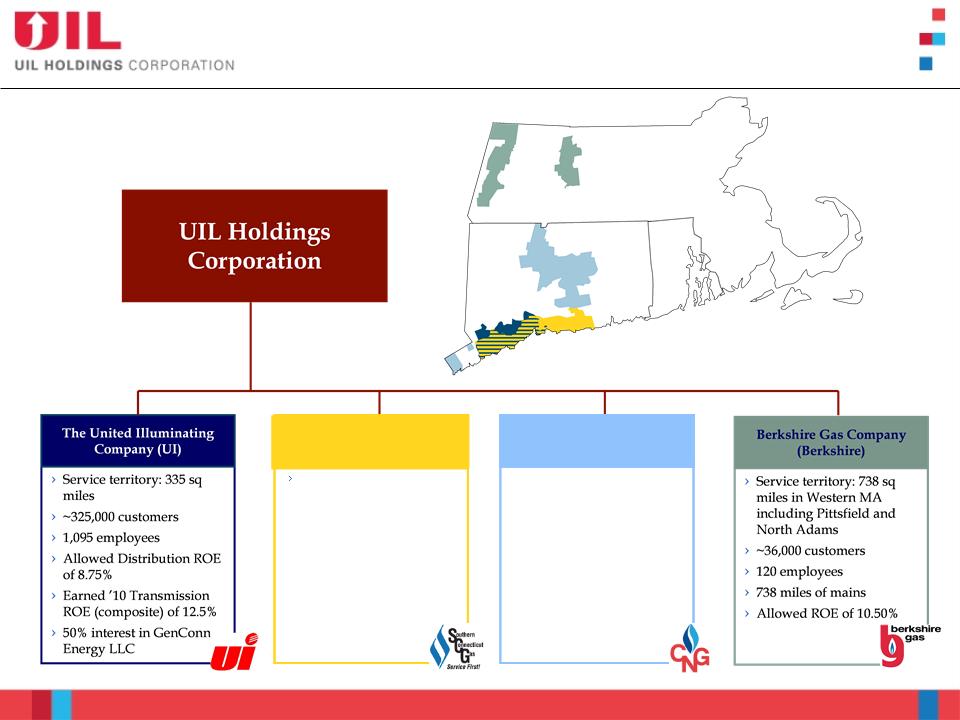
UIL - Corporate Structure
4
›
Service territory: 716 sq
miles
-
Greater Hartford
-
New Britain & Greenwich
›
~160,000 customers
›
319 employees
›
2,011 miles of mains with
~124,000 services
›
Allowed ROE of 9.41%
going forward
Service territory: 512 sq
miles from Westport, CT
to Old Saybrook, CT
›
~178,000 customers
›
290 employees
›
2,273 miles of mains with
~131,000 services
›
Allowed ROE of 9.36%
going forward
›
Service territory: 716 sq
miles
-
Greater Hartford
-
New Britain & Greenwich
›
~160,000 customers
›
319 employees
›
2,011 miles of mains with
~124,000 services
›
Connecticut Natural Gas
(CNG)
Service territory: 512 sq
miles from Westport, CT
to Old Saybrook, CT
›
~178,000 customers
›
290 employees
›
2,273 miles of mains with
~131,000 services
›
Southern Connecticut Gas
(SCG)

5
2011 Fall EEI
Investment Highlights
5
q Electric distribution & transmission and gas distribution utilities -
complementary earnings patterns
complementary earnings patterns
q Growth opportunities
q Disciplined capital investment program
q Commitment to investment grade credit profile
q Consistent history of dividend payments (5.1% yield as of 11/2/11)
Gas Operations
Electric Operations
ú Identified capital expenditure projects
with clear need
with clear need
ú Growth opportunities - converting
residentials and businesses to gas heat
residentials and businesses to gas heat
ú Winter peaking
ú Objective is to achieve allowed ROEs
ú Identified capital expenditure projects
with clear need
with clear need
ú Growth opportunities in transmission
ú Summer peaking
ú 50% owner in peaking generation
plants
plants
ú Opportunity to invest in regulated
renewables generation
renewables generation
ú Objective is to achieve allowed ROE
6
2011 Fall EEI
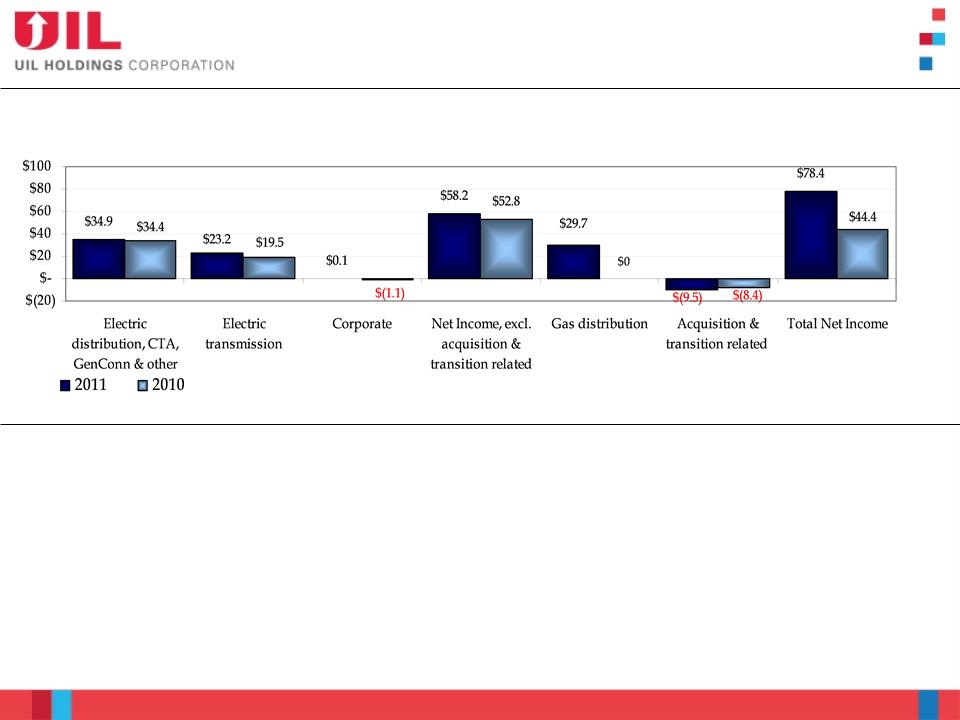
q $34M or 76% increase in net income compared to YTD 3Q ’10
ú Gas distribution net income of $29.7M YTD ’11, no comparable income in ‘10
ú Both GenConn peaking generation plants are now operating in the ISO-NE markets and YTD
contributed to UIL pre-tax income of $8.2M, compared to a pre-tax loss of $0.5M YTD 3Q ‘10
contributed to UIL pre-tax income of $8.2M, compared to a pre-tax loss of $0.5M YTD 3Q ‘10
ú YTD net income for electric transmission was $23.2M, an increase of $3.7M compared to YTD 3Q ’10,
primarily attributable to an increase in the allowance for funds used during construction due to
increased CWIP
primarily attributable to an increase in the allowance for funds used during construction due to
increased CWIP
q Average D & CTA ROE as of 9/30/11: 9.63%
q Preliminary average ROE as of 9/30/11: SCG 8.30-8.40%, CNG 8.90-9.00%
Net Income ($M)
6
YTD ’11 vs. YTD ‘10 Financial Results
by Business
by Business
7
2011 Fall EEI
** To be remarketed
Amounts may not add due to rounding
Based on current plans - expect no need for external equity at least through 2013
UI Pollution Control Revenue Bonds
UI Equity Bridge Loan repaid in July
UIL Debt retired in Feb
SCG, CNG & Berkshire
Near-Term Debt Maturities
($M)
$5
Berkshire note repaid in May
SCG notes refinanced
Issuer | S&P | Moody’s |
UIL Holdings | BBB (Stable) | Baa3 (Stable) |
United Illuminating | BBB (Stable) | Baa2 (Stable) |
SCG | BBB (Stable) | Baa2 (Stable) |
CNG | BBB (Stable) | Baa1 (Stable) |
Berkshire | BBB (Stable) | Baa2 (Stable) |
Issuer
Credit Ratings
7
**
Debt Maturities & Credit Ratings
8
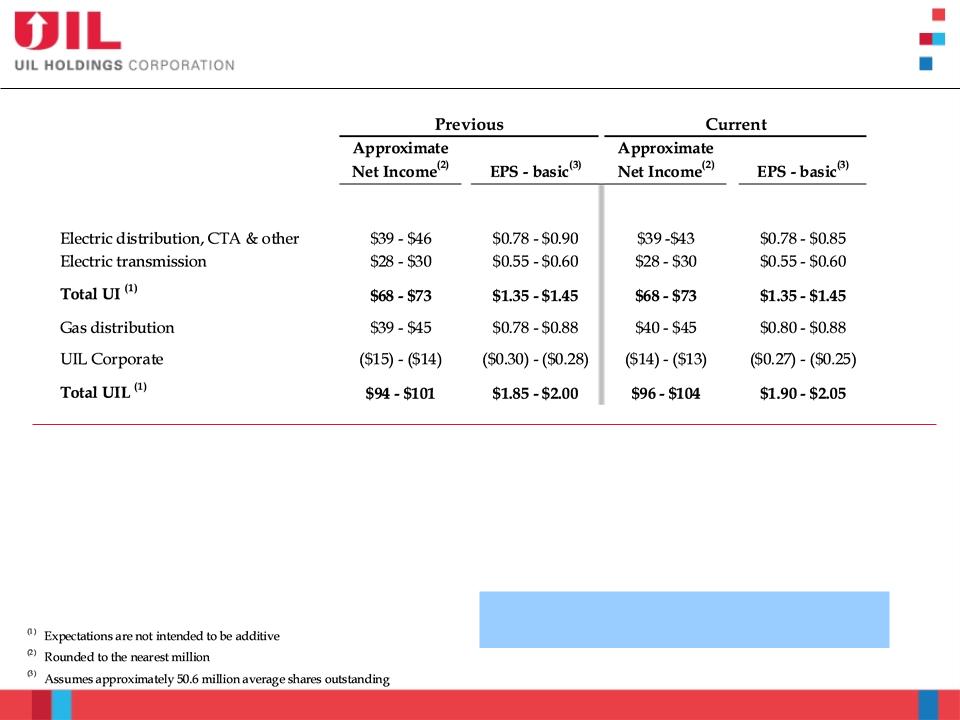
2011 Fall EEI
Current Assumptions
ú Electric distribution, CTA & other and Gas distribution ranges were narrowed reflecting year-to-date performance
ú GenConn expected to earn $0.12-$0.14 per share
ú UIL Corporate was reduced to reflect tax savings resulting from the deductibility of certain gas company acquisition costs
‘12 earnings expectations will be discussed on the
4Q ‘11 earnings call
4Q ‘11 earnings call
8
Increased ‘11 Earnings Expectations
as of 11/4/11
as of 11/4/11

9
2011 Fall EEI
Expected On-going Savings of $11.6M
9
$M
UIL Integration
q Integration progressing on schedule
q Successfully completed a major SAP system cutover from Iberdrola USA (IUSA) at the
beginning of August
beginning of August
q Substantially exited Transition Services Agreement as of the end of September ‘11

2011 Fall EEI
UIL Forecasts

11
2011 Fall EEI
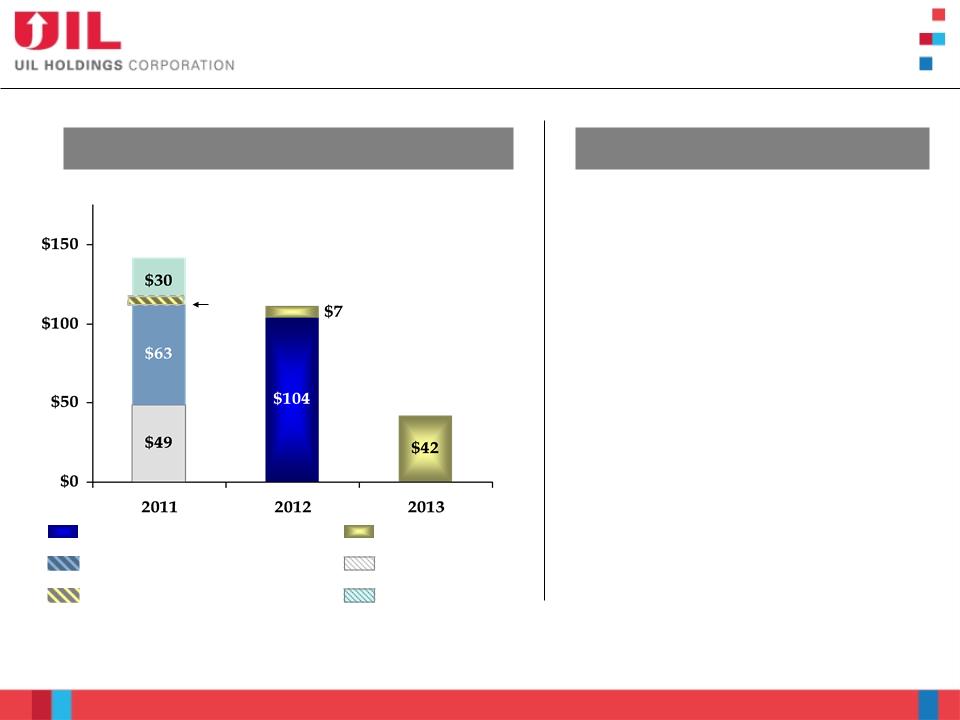
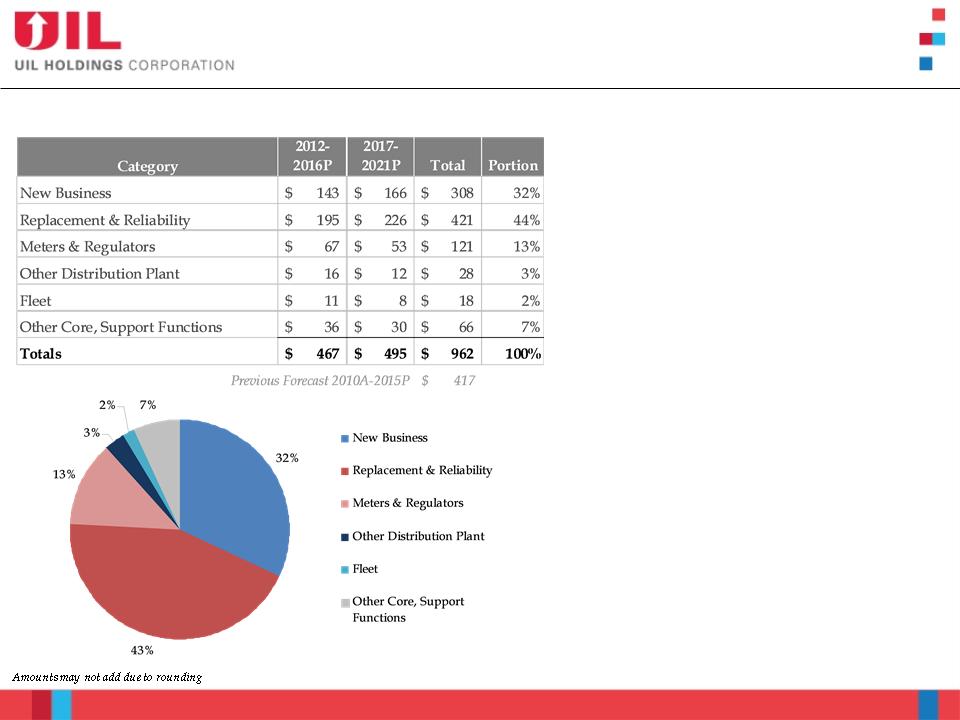
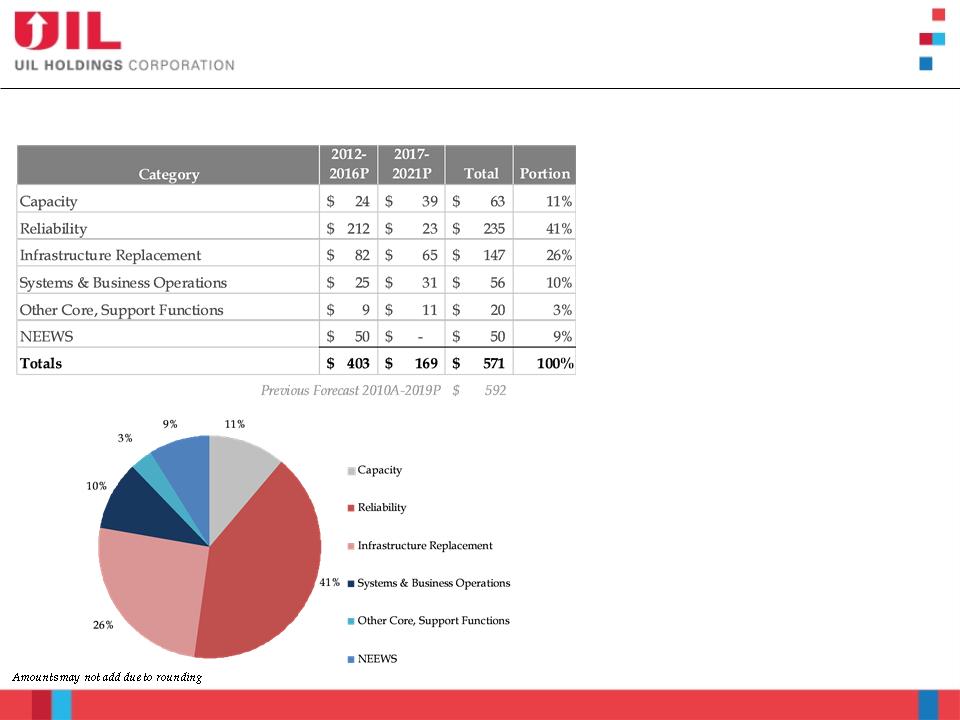
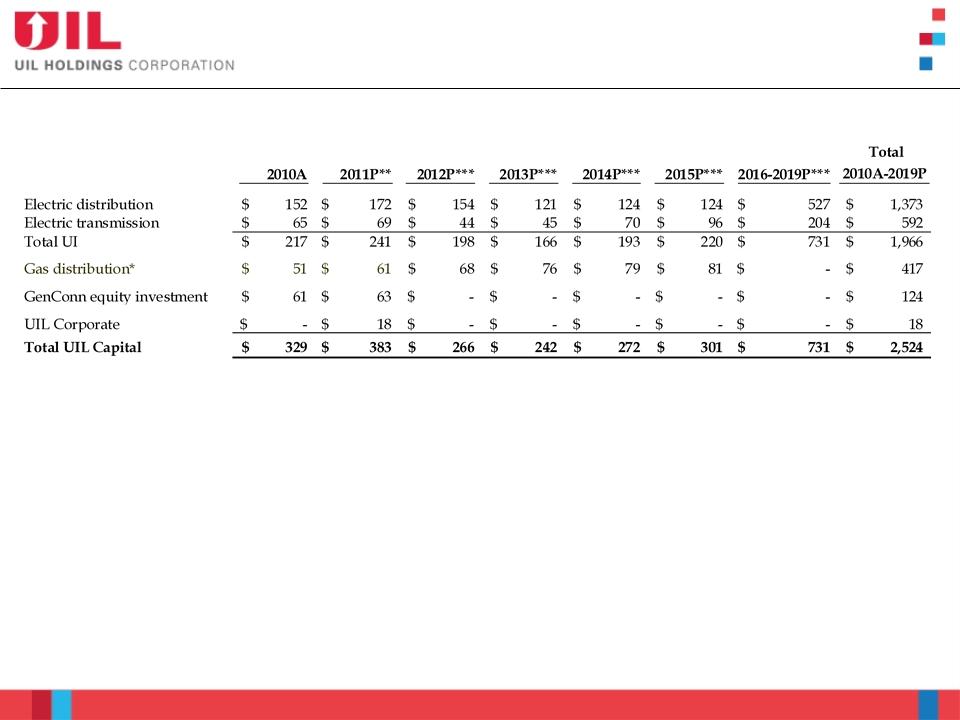
UIL 2012-2021 Capital Expenditure Forecast
11
* 2011 capex details can be found in the appendix
** Includes GenConn equity investment & 6-yr forecast (2010A-2015P) for Gas distribution
Does not include potential to construct, own and operate up to 10MW of Class I renewable generation
Amounts may not add due to rounding
Presentation format for 10-yr CapEx has
changed (and will be the format going
forward). Includes future 10 years (2012-
2021). Previous format included present
year and future 9 years.
changed (and will be the format going
forward). Includes future 10 years (2012-
2021). Previous format included present
year and future 9 years.
q Previous 2011 capex forecast, $383M*
q Identified projects with clear need
q Full 10-yr forecast for Gas distribution capex
ú Previous 6-yr forecast (2010A-2015P), $417
q Increased IT-related projects in UIL Corporate
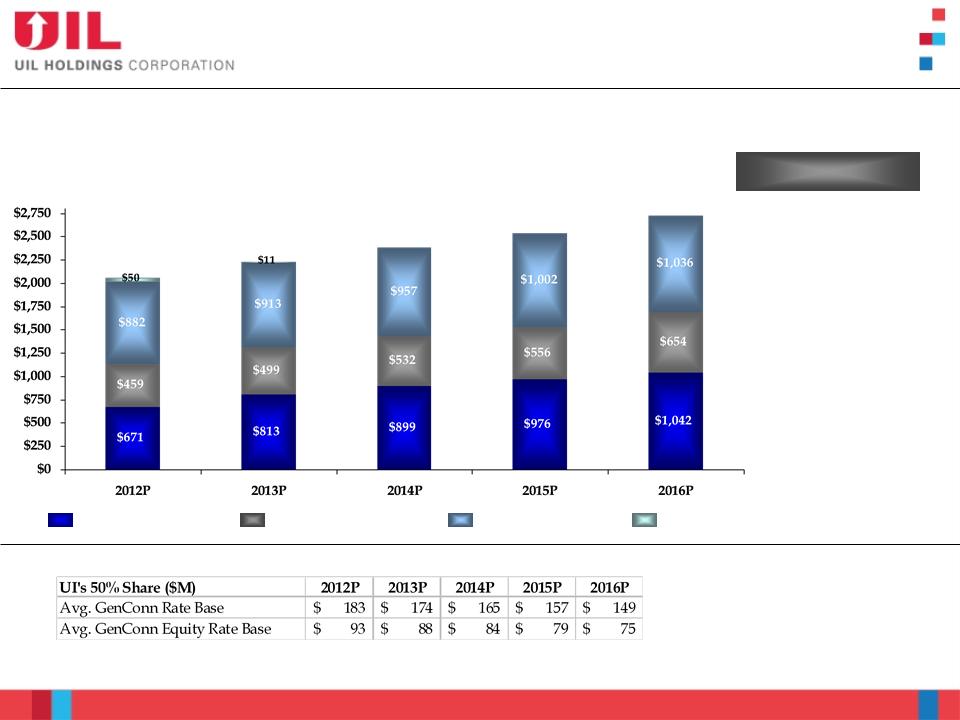
12
2011 Fall EEI
GenConn Equity Investments:
Rate Base $M (Excluding GenConn Equity Investments):
$2,062
$2,235
$2,388
$2,535
$2,731
2%
43%
22%
33%
1%
41%
22%
36%
40%
22%
38%
40%
22%
38%
38%
24%
38%
Electric distribution
CTA
Gas distribution*
Electric transmission
Amounts may not add due to rounding
* Gas distribution rate base by company can be found in the appendix
12
CAGR 7.3%
Gas distribution
4.1%
4.1%
Electric transmission
9.2%
9.2%
Electric distribution
11.6%
11.6%
2012-2016 Average Rate Base Forecast

Gas distribution
14
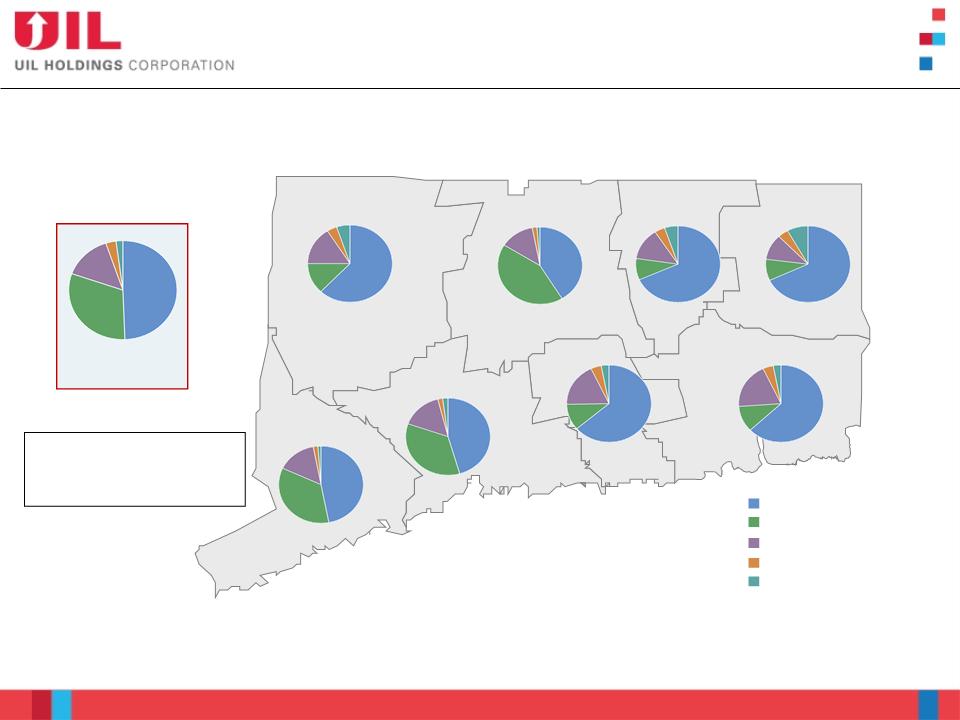
2011 Fall EEI
American Community Survey’s selected housing characteristics estimates show a large percentage of
households in Connecticut do not use natural gas for heating
households in Connecticut do not use natural gas for heating
Litchfield
62%
13%
16%
4%
5%
Fairfield
47%
35%
15%
2%
1%
Connecticut
50%
31%
15%
2%
1%
New Haven
46%
35%
16%
2%
2%
Middlesex
63%
11%
18%
4%
3%
New London
63%
11%
19%
3%
4%
Windham
68%
9%
11%
8%
4%
Tolland
67%
9%
13%
5%
4%
Hartford
41%
42%
13%
1%
2%
Fuel oil, kerosene
Electricity
Utility gas
Bottled, tank or LP gas
Other¹
Source: U.S. Census Bureau; Average data for 2005-2009
1 Other includes coal or coke, wood, solar, no fuel used and other
# Occupied
housing units:
1,327,482
housing units:
1,327,482
73,704
339,516
52,993
42,653
104,468
65,476
322,752
325,920
(0)
(17)
(2)
(12)
(0)
(0)
(4)
(9)
The # in parentheses represents
the number of cities or towns in
that county that are served by a
UIL gas company.
UIL gas company.
Approximately 37% of businesses & households on UIL gas mains are not currently natural gas customers
14
Gas Distribution
Potential for Heating in CT
Potential for Heating in CT

15
2011 Fall EEI
(1) Residential and commercial
15
Gas Distribution
Heating Conversions
Heating Conversions
q Interest in conversions increasing as heating season begins
ú Direct mail marketing deployed in October to increase customers’ awareness of conversion
benefits
benefits
ú Financing options are being expanded to assist customers with up-front conversion costs
ú Natural gas supply prices are low and expected to remain low for the foreseeable future
q Approximately 6,800 customer(1) additions in 2010
ú Targeting 30,000-35,000 additional gas heating customers over the next 3 years
▪ ’11 - approximately 25% increase over ‘10 levels
▪ ’12 - approximately 50% increase over ’10 levels
q Through September, residential conversions are 13% ahead of ‘10 levels
ú YTD 9/30/11, there were 4,129 conversions, compared to 3,654 conversions for YTD
9/30/10
9/30/10
q New residential customers are anticipated to generate approximately $280-$315 of
distribution net operating income per customer
distribution net operating income per customer

16
2011 Fall EEI
q New main is required to serve the new construction
q New main will pass 79 homes that are mostly heated with oil
q 18 homes already signed up for conversion
q Opportunity - 61 homes that will be on the new main
16
Gas Distribution
Example of Neighborhood Expansion
Example of Neighborhood Expansion
17
2011 Fall EEI
17
Gas Distribution
CapEx Forecast
CapEx Forecast
Gas Distribution CapEx Forecast $M
q Previous 2011 capex forecast, $61M
q Revised UIL Gas distribution
forecast
forecast
ú Previous 5-yr forecast was provided
by IUSA
by IUSA
q Forecast addresses replacement of
cast iron & bare steel
cast iron & bare steel
ú Base spend of approx. $26M annually
ú Accelerated infrastructure spending
of approx. $121M over 10 years
of approx. $121M over 10 years
q New Business
ú Heating conversions
ú Main extensions
18
2011 Fall EEI
18
Gas Distribution
Examples of Projects
Examples of Projects
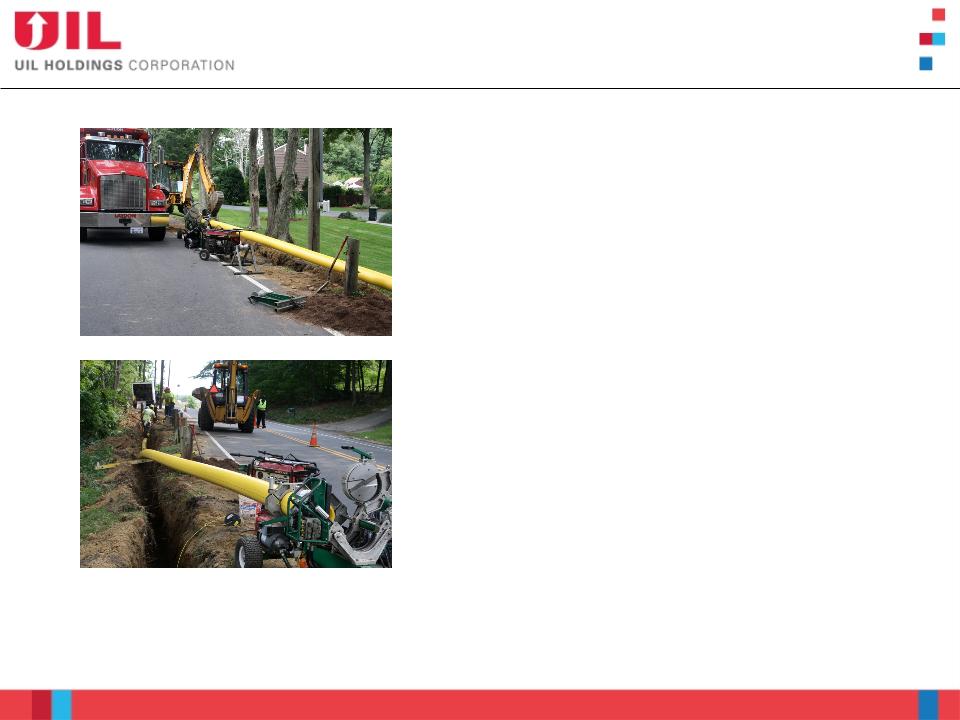
Replacement Services & Mains
ú Replacement of cast iron & bare steel
ú Enhances system performance
ú Program: on-going
~ $381M (2012-2021)

Electric transmission
20
2011 Fall EEI
20
Electric Transmission
CapEx Forecast
CapEx Forecast
q Previous 2011 capex forecast,
$69M
$69M
q CapEx is well-diversified in
scale and category
scale and category
ú Not highly dependent on a few
major projects or load growth
major projects or load growth
ú See next slide for examples
q Only includes high probability
projects …
projects …
ú Although UI is working on other
growth opportunities, they are not
included until highly likely
growth opportunities, they are not
included until highly likely
Transmission CapEx Forecast $M
21
2011 Fall EEI
21
Electric Transmission
Examples of Projects
Examples of Projects
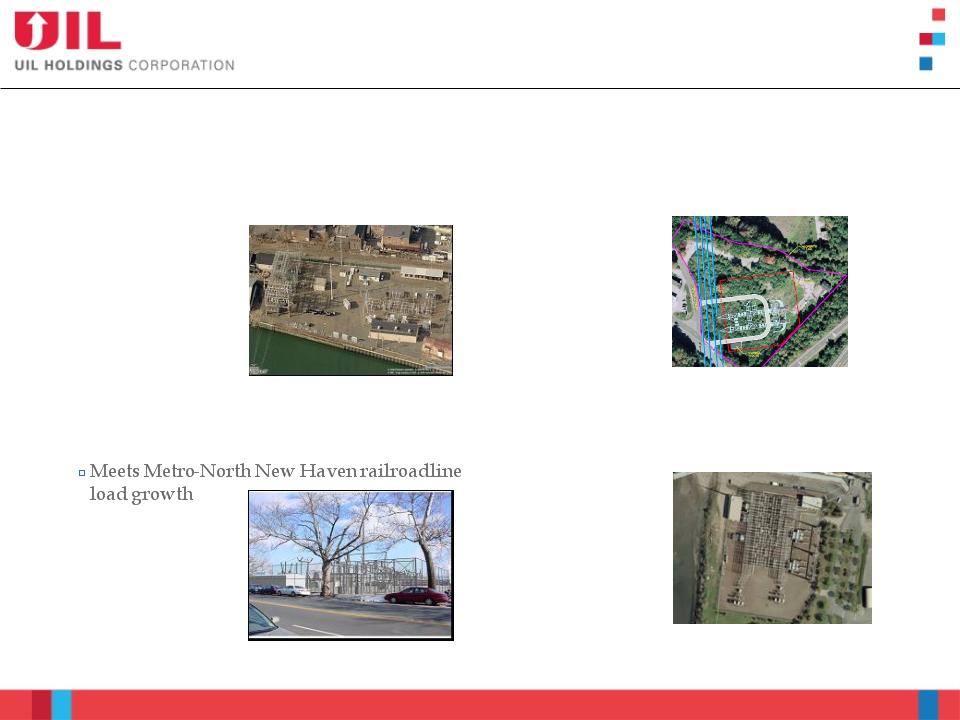
Grand Avenue 115 kV Switching
Station Rebuild
Station Rebuild
Shelton 115/ 13.8 kV Substation
Union Avenue 115/ 26.4 kV
Substation
Substation
ú Addresses short circuit capability issues and
aged/obsolete infrastructure
aged/obsolete infrastructure
ú Under
construction
construction
ú Planned in-service
2012
2012
~ $60M*
ú Meets Greater Shelton area load growth
ú In Planning
ú Planned in-
service 2014
service 2014
~ $25M*
ú Under
construction
construction
ú Planned in-service
2012
2012
~ $15M*
ú Addresses infrastructure condition,
maintenance short circuit capability concerns
maintenance short circuit capability concerns
ú Phased
upgrades in
engineering and
construction
upgrades in
engineering and
construction
ú Planned in-
service 2011-
2013
service 2011-
2013
~ $22M*
East Shore 115 kV Substation Upgrades
* Dollars shown are rounded/approximate expected total project Transmission CapEx (generally including both spend to date and future expected spend); excluding AFUDC.

22
2011 Fall EEI
Electric Transmission
Growth Outside Service Territory
Growth Outside Service Territory
Region-wide RPS Satisfaction
22
New England East-West Solution (NEEWS)
ú 2020 gap is
significant
significant
ú Unlikely to be
satisfied by
current queue
satisfied by
current queue
ú Significant
transmission
will be needed
transmission
will be needed
ú Together with
NU, NStar,
NGrid, UI is
cooperatively
researching
economical
delivery
NU, NStar,
NGrid, UI is
cooperatively
researching
economical
delivery
UI Participation in CL&P Project:
ú UI’s portion of investment: greater of $60M* or 8.4%
of CL&P’s costs for the CT portions of:
of CL&P’s costs for the CT portions of:
▪ Greater Springfield Reliability, Interstate
Reliability, Central CT Reliability Projects
Reliability, Central CT Reliability Projects
ú UI deposits thru end Nov. ‘11: $9.6M
▪ Remaining investments expected to be made over a
period of 3 to 5 years
period of 3 to 5 years
ú On 8/29/11, FERC approved UI’s request for a 125
basis point ROE adder resulting in a total project
ROE of 12.89% once assets are in service
basis point ROE adder resulting in a total project
ROE of 12.89% once assets are in service
*Based on most recent information/estimate from NU

23
2011 Fall EEI
Electric Transmission
Developments
Developments
FERC Order 1000
q Issued by FERC on July 21, 2011. Includes
provisions related to:
provisions related to:
ú Incorporating public policy into transmission
planning
planning
ú Transmission cost allocation
ú Limitation on right of first refusal
ú Inter-regional transmission coordination
q Potentially enhances UIL’s ability to participate in
renewable transmission
renewable transmission
q Initial review indicates that New England is
already compliant with many of the
requirements …
already compliant with many of the
requirements …
ú But, stakeholders will need to reach consensus on
some, e.g. incorporation of public policy
some, e.g. incorporation of public policy
ú Initial stakeholder discussions have begun
23
Challenge to Regional Base
ROE
ROE
q “206” Complaint filed by multiple
state governmental parties on
September 30, 2011
state governmental parties on
September 30, 2011
ú Claims that New England TO’s base
ROE is too high …
ROE is too high …
q Multiple New England TOs
(including UI) filed a response on
October 20, 2011
(including UI) filed a response on
October 20, 2011
ú Demonstrates that ROE is at an
appropriate level
appropriate level
q FERC will decide, but date of
decision uncertain
decision uncertain

Electric distribution
25
2011 Fall EEI
25
Electric Distribution
CapEx Forecast
CapEx Forecast
Electric Distribution CapEx Forecast $M
q Previous 2011 capex forecast,
$172M
$172M
q CapEx is well-diversified in
scale and category
scale and category
ú Forecast is not highly
dependent on a few major
projects or load growth
dependent on a few major
projects or load growth
26
2011 Fall EEI
26
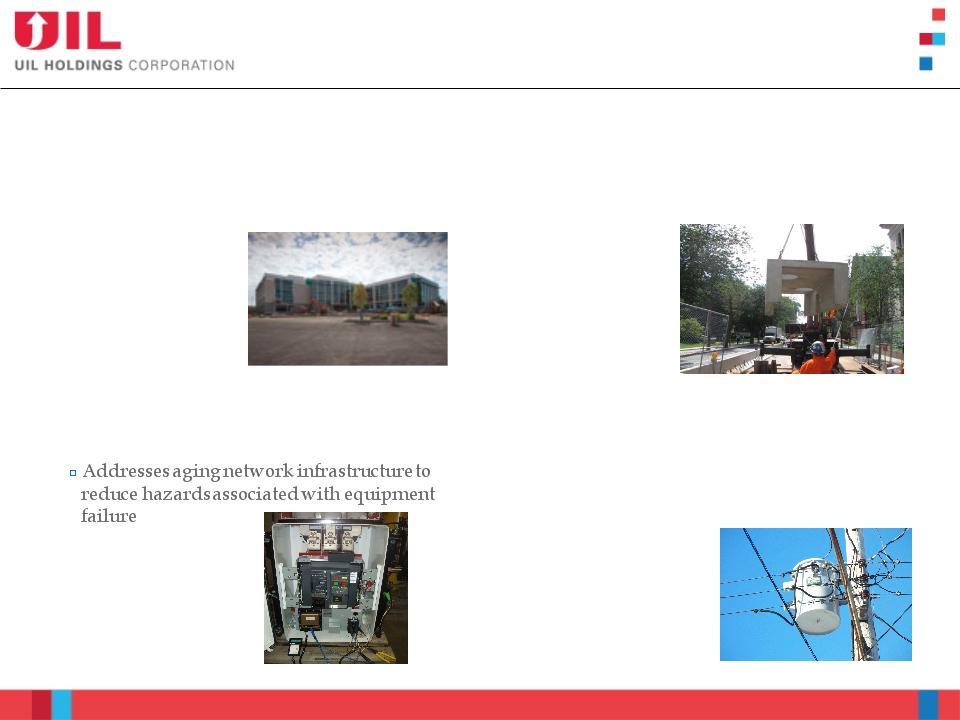
Electric Distribution
Examples of Projects
Central Facility - UI Office &
Operations Building
Operations Building
Splice Chamber Remediation
Network Infrastructure Replacement
Distribution Transformer
Replacement Program
Replacement Program
ú Consolidate all UI “Work Centers” onto a
single site referred to as the Central Facility
single site referred to as the Central Facility
ú Under
construction
construction
ú Planned in-service
2012
2012
~ $128M*
ú Rebuild deteriorated underground splicing
chambers
chambers
ú In progress
ú Annual program
over 10 years
over 10 years
~ $8M per year
ú In progress
ú Annual program
over 10 years
over 10 years
~ $5M per year
ú Infrastructure program to replace transformers due
to poor physical condition, inadequate capacity, that
could potentially contain levels of PCBs
to poor physical condition, inadequate capacity, that
could potentially contain levels of PCBs
ú In progress
ú Annual program
over 10 years
over 10 years
~ $7M per year
* Dollars shown are rounded/approximate expected total project Distribution CapEx (generally including both spend to date and future expected spend).
27
2011 Fall EEI
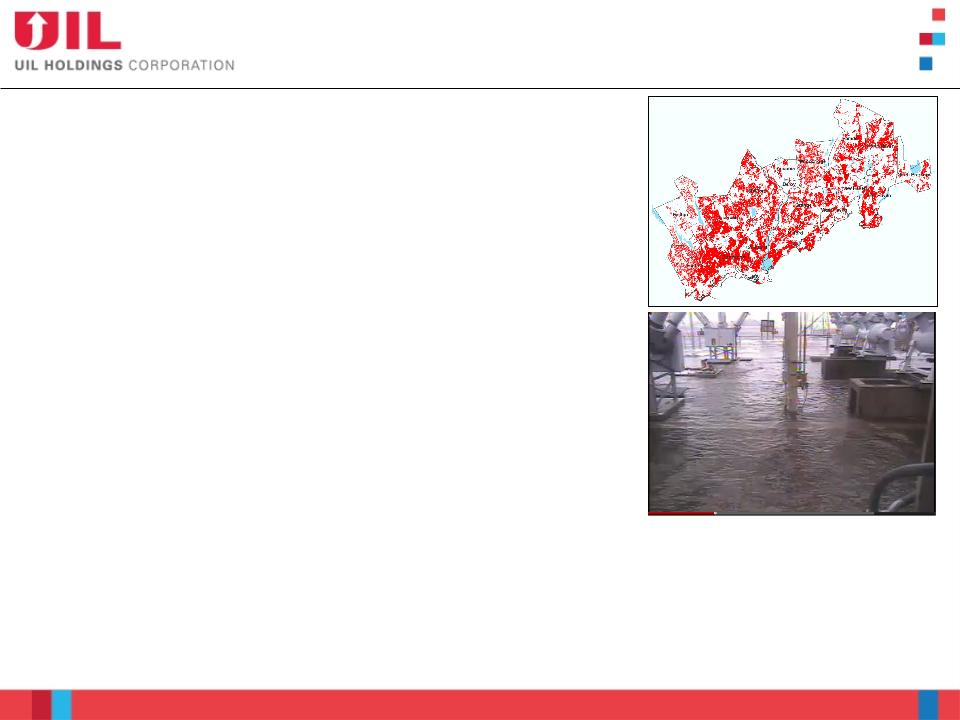
Electric Distribution
Recent Storm Update
Recent Storm Update
Tropical Storm Irene
q 59% of electrical circuits experienced outages
q More than 10,000 locations worked on by crews
q Nearly 50% of UI’s customers were without power at
the peak
the peak
ú 99.8% restored within 7 days
q Participated in post-Irene legislative hearings
q As of 9/30/11, the cost estimate was approximately
$20M, of which approximately $4M has been
capitalized
$20M, of which approximately $4M has been
capitalized
ú In accordance with PURA regulatory decision and past
storm guidance, a regulatory asset has been established
for storm-related O&M costs
storm guidance, a regulatory asset has been established
for storm-related O&M costs
ú Expect to seek recovery of these costs in a future rate
proceeding
proceeding
Autumnal Storm Alfred
q Approximately 16% of UI’s customers experienced
power outages
power outages
ú 99.9% of all customers had power within 3 days
27
Tropical Storm Irene
Impact across UI service territory
Peak of Tropical Storm Irene coincidental with
high tide - extensive flooding at two UI
substation properties
high tide - extensive flooding at two UI
substation properties

Generation
29
2011 Fall EEI
q Regulated COS approach
ú ROE, lifetime floor - 9.75%
ú 50/50 - debt/equity
ú Annual PURA rate case
q Both GenConn Devon & Middletown are now operating in the ISO-New England (ISO-NE)
markets
markets
ú UIL reported pre-tax income of $3.5M and $8.2M in the 3Q and first nine months of ’11, respectively
29
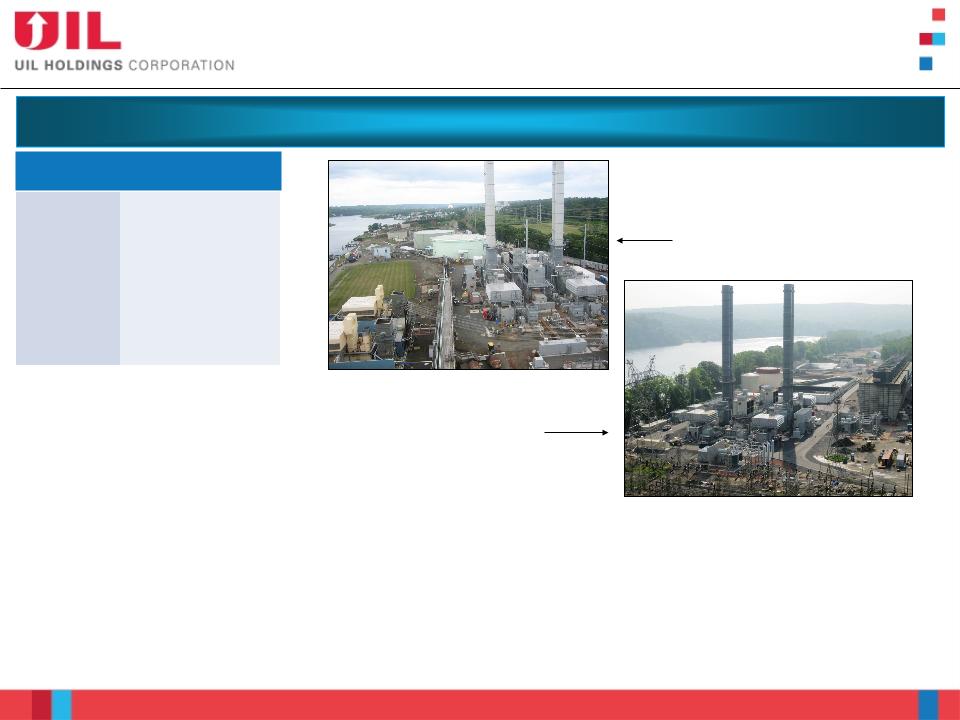
Generation
GenConn Energy - Peaking Generation
GenConn Energy - Peaking Generation
Project Highlights
Locations | Devon & Middletown |
Technology | GE LM6000 |
Capacity | 400 MW (188MW each at Devon and Middletown) |
Off Taker | CL&P |
50/50 Joint Venture between UI and NRG
Devon
Middletown
30
2011 Fall EEI
30
Generation
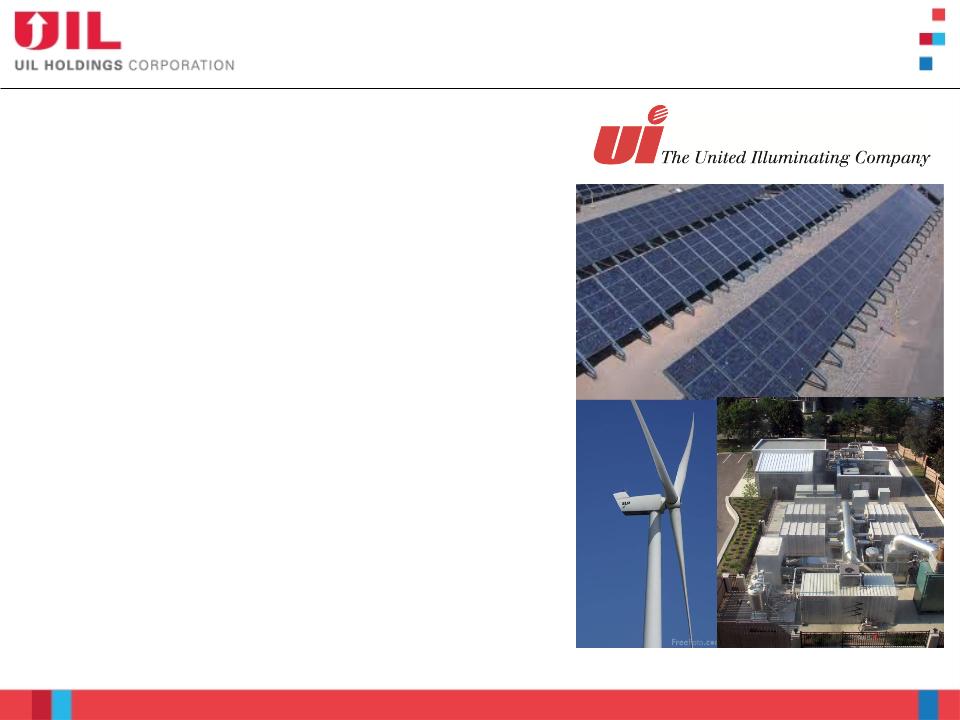
Regulated Renewables Development Opportunity
Regulated Renewables Development Opportunity
q CT Public Act 11-80 / Section 127 (effective July 1,
2011) authorizes UI to construct, own, operate and
rate base Class I renewable generation up to 10MW
2011) authorizes UI to construct, own, operate and
rate base Class I renewable generation up to 10MW
ú Solar Photovoltaics
ú Fuel Cells
ú Wind Turbines
q Expected investment up to $40-$50M over the next
two - three years
two - three years
q PURA filing expected by the first quarter 2012
q Entry into renewable generation
q Supports public policy objectives
q Aligns with sustainable business strategy

Smart Systems
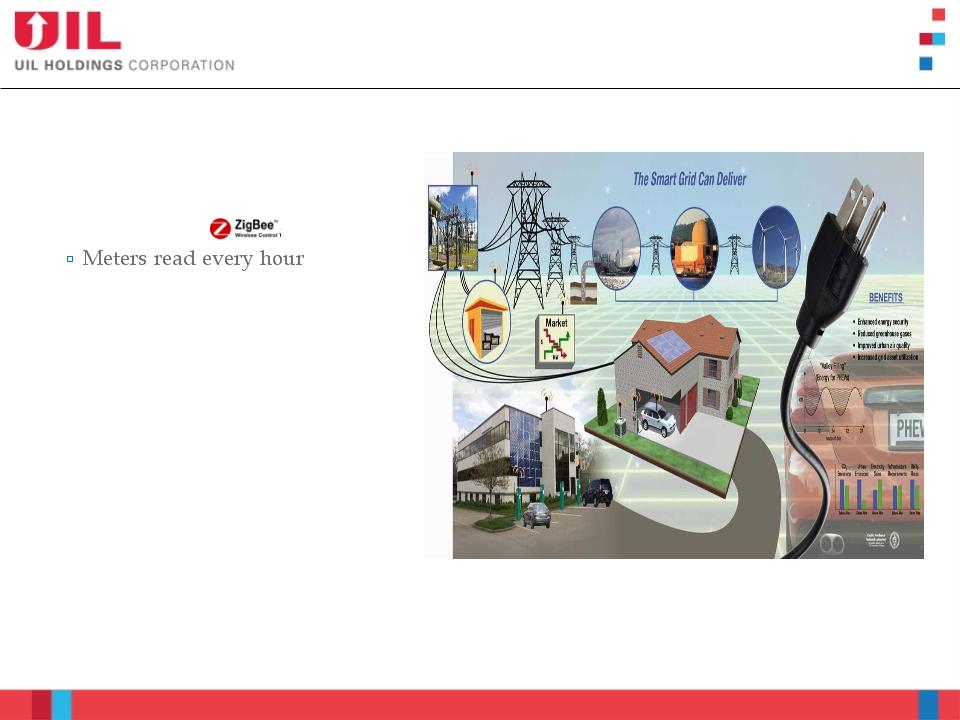
32
2011 Fall EEI
32
Smart Systems
UI’s Mesh Network
UI’s Mesh Network
Modernization of UI’s Electric System
q Over 337,000 meters -
ú 80,000 two-way w/remote
disconnect capability
disconnect capability
ú Meters have
q Mesh Network
q Master Data is stored in Meter
Data Management - interface
with SAP
Data Management - interface
with SAP
q Outage Mgt System uses meter
intelligence for restoration and
communication
intelligence for restoration and
communication
q Over 33% of our customers
have Time-of-Day rates
have Time-of-Day rates

Governmental and Regulatory
Updates
Updates

34
2011 Fall EEI
q Annual revenue requirement filed with CT PURA on 7/29/11 (DN 11-07-
12)
12)
ú Requesting approximately $78M for the period commencing 1/1/12 -
12/31/12
12/31/12
ú Draft decision expected 12/7/11
ú Final decision expected 12/21/11
q Final decision by CT PURA approving CNG & SCG settlement of rate
case appeals was issued on 8/3/11 (DN 08-12-06RE02 & DN 08-12-07RE02)
case appeals was issued on 8/3/11 (DN 08-12-06RE02 & DN 08-12-07RE02)
ú Resolves all pending issues related to the rate case appeals
ú Removes the 10 basis point ROE penalty for monitoring
ú Authorized ROEs going forward: CNG - 9.41%, SCG - 9.36%
ú Terminates the SCG potential overearnings investigation
ú Companies are allowed to recover carrying charges on the interim rate
decrease amounts over-credited to customers during the stay of the rate case
decisions (since 2009)
decrease amounts over-credited to customers during the stay of the rate case
decisions (since 2009)
▪ Approximately $3.7M to be recovered and collected over the next two non-winter
periods, $2.2M booked to earnings in 3Q ‘11
periods, $2.2M booked to earnings in 3Q ‘11
q BGC - regulated by the Massachusetts Department of Public Utilities (DPU)
ú 10-yr rate plan expiring 1/31/12
34
Regulatory Update

35
2011 Fall EEI
q Electric Decoupling final decision (DN 08-07-04 RE03)
ú Issued on 8/31/11
ú Approved decoupling credit of $1.4M for ’10 rate year
ú Allows decoupling mechanism to continue until next general rate case proceeding
q Utility Company Storm Response Docket (DN 11-09-09)
ú Investigation of the service response and communications of utilities in CT
following Tropical Storm Irene
following Tropical Storm Irene
q Transmission ROE
ú Several New England governmental entities have filed a complaint with FERC
regarding the base return on equity for transmission investments
regarding the base return on equity for transmission investments
▪ Claim that the current approved base ROE on transmission investments of 11.14% is not
just and reasonable and are seeking a reduction of the base ROE to 9.20%
just and reasonable and are seeking a reduction of the base ROE to 9.20%
q Electric Distribution Rate Case
ú Evaluating timing of distribution rate case to reflect significant investments in
distribution infrastructure
distribution infrastructure
q Generic ROE Proceeding (DN 09-10-06)
ú PURA schedule has not been updated
35
Regulatory Update - continued

36
2011 Fall EEI
36
Governmental Update
q Implementation of Public Act 11-80
ú Department of Energy & Environmental Protection (DEEP) was created
ú Former DPUC has become the Public Utilities Regulatory Authority (PURA)
▪ Change from 5 DPUC commissioners to three PURA directors
§ Kevin DelGobbo (former DPUC chair), John Betkoski and Anna Ficeto
ú Allows each electric distribution company to develop and own up to 10 MW renewable
source generation
source generation
q Post-Storm Irene Investigations
ú Participated in two legislative hearings
ú Governor Malloy established a State Team Organized for the Review of Management of
Irene (S.T.O.R.M. Irene) assessment team
Irene (S.T.O.R.M. Irene) assessment team
q Low Income Home Energy Assistance Program (LIHEAP)
ú Anticipate significant reductions in funds available for home energy assistance
programs
programs
q Next Legislative Session February-May ‘12

Conclusion
38
2011 Fall EEI
Investment Highlights
38
q Electric distribution & transmission and gas distribution utilities -
complementary earnings patterns
complementary earnings patterns
q Growth opportunities
q Disciplined capital investment program
q Commitment to investment grade credit profile
q Consistent history of dividend payments (5.1% yield as of 11/2/11)
Gas Operations
Electric Operations
ú Identified capital expenditure projects
with clear need
with clear need
ú Growth opportunities - converting
residentials and businesses to gas heat
residentials and businesses to gas heat
ú Winter peaking
ú Objective is to achieve allowed ROEs
ú Identified capital expenditure projects
with clear need
with clear need
ú Growth opportunities in transmission
ú Summer peaking
ú 50% owner in peaking generation
plants
plants
ú Opportunity to invest in regulated
renewables generation
renewables generation
ú Objective is to achieve allowed ROE

Q & A
Appendices

41
2011 Fall EEI
41
3Q & YTD 2011 Financial Results - Details
q Electric distribution, CTA, GenConn & Other
ú 1% increase in net income YTD, 3Q was lower primarily due to mark to market & effective tax
rate adjustments, offset by GenConn earnings
rate adjustments, offset by GenConn earnings
▪ The mark to market & effective tax rate adjustments reduced net income by $2.3M & $3.4M for the
3Q & first nine months of ’11, respectively
3Q & first nine months of ’11, respectively
▪ GenConn contributed to UIL pre-tax income of $3.5M & $8.2M for the 3Q & first nine months of ’11,
respectively
respectively
ú Average D & CTA ROE as of 9/30/11: 9.63%
q Electric transmission
ú 19% increase in net income for the quarter & YTD
▪ Increase attributable to an increase in the allowance for funds used during construction due to
increased CWIP
increased CWIP
q Gas Distribution
ú YTD income of $29.7M , 3Q loss of $6.2M due to seasonality of earnings
ú YTD - colder than normal winter season in New England in ’11
ú Recovered approximately $2.2M pre-tax of carrying charges in the 3Q ’11 on interim rate
decrease amounts over-credited to customers during stay of rate case decisions
decrease amounts over-credited to customers during stay of rate case decisions
▪ Recovery of carrying charges will continue until the outstanding surcharge balance is exhausted
ú Preliminary average ROE as of 9/30/11: SCG 8.30-8.40%, CNG 8.90-9.00%
q Corporate
ú YTD after-tax costs of $9.4M, a decrease of $0.1M compared to ’10
ú After-tax costs of $2.3M in the 3Q, a decrease of $2M compared to 3Q ’10
ú The decrease for the quarter & YTD was primarily attributable to the absence in ’11 of after-tax
acquistion related costs that occurred in the 3Q ’10, partially offset by the interest expense related
to the October ‘10 issuance of $450M of public debt
ú Interest expense on the $450M of public debt was $3.2M & $9.5M for the 3Q and first nine
months of ’11, respectively
months of ’11, respectively
42
2011 Fall EEI
SCG
BGC
CNG
$882
$913
$957
$1,002
$1,036
8%
42%
50%
8%
42%
50%
8%
42%
50%
8%
41%
51%
8%
41%
51%
$M
Amounts may not add due to rounding
42
Gas Distribution
2012-2016 Average Rate Base Forecast by Company
2012-2016 Average Rate Base Forecast by Company
43
2011 Fall EEI
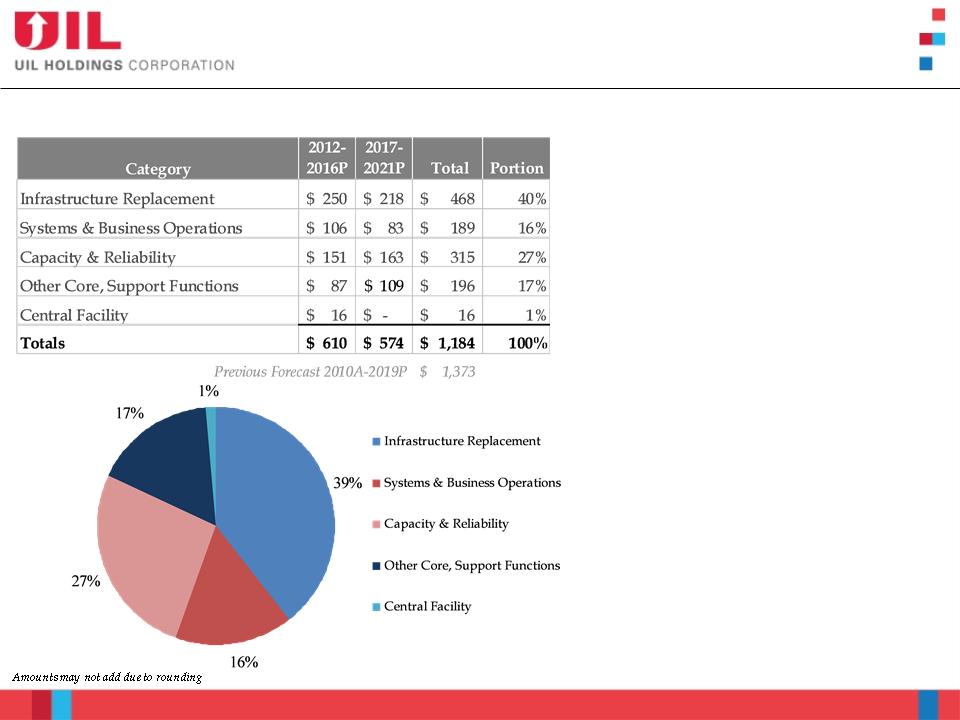
Previous 10-yr Capital Expenditure Forecast
43
*2010 Gas distribution CapEx reflects the full year amount; UIL ownership was for 6 weeks effective with the closing on the acquisition.
** Updated - February 23, 2011
*** Information as of November 2010, except for Gas distribution
Amounts may not add due to rounding
$M
44
2011 Fall EEI
44
Previous 5-yr Rate Base Forecast
45
2011 Fall EEI
CT RPS
45
Connecticut RPS Requirements
(Percentage of Retail Load)
Class 1 resources include energy derived from solar, wind, fuel cell, methane gas from landfills, ocean thermal, wave,
tidal, run-of-river hydropower (<5MW, began operation after July 1, 2003), sustainable biomass (NOx emission <0.075
lbs/MMBtu of heat input)
tidal, run-of-river hydropower (<5MW, began operation after July 1, 2003), sustainable biomass (NOx emission <0.075
lbs/MMBtu of heat input)
Class 2 resources include other biomass (NOx emission <0.2 lbs/MMBtu of heat input, began operation before July 1,
1998), small run-of-river hydroelectric (<5MW, began operation before July 1, 2003) and municipal solid waste trash-to-
energy facilities.
1998), small run-of-river hydroelectric (<5MW, began operation before July 1, 2003) and municipal solid waste trash-to-
energy facilities.
Class 3 include customer-sited combined heat and power (with operating efficiency >50% of facilities installed after
January 1, 2006), waste heat recovery systems (installed on or after April 1, 2007), electricity savings from conservation
and load management programs (began on or after January 1, 2006)
January 1, 2006), waste heat recovery systems (installed on or after April 1, 2007), electricity savings from conservation
and load management programs (began on or after January 1, 2006)