Filed by: UIL Holdings Corporation
Pursuant to Rule 425 under the Securities Act of 1933
and deemed filed pursuant to Rule 14a-12
of the Securities Exchange Act of 1934
Subject Company: UIL Holdings Corporation
Commission File No.: 001-15052
The following Current Report on Form 8-K was filed by UIL Holdings Corporation with the Securities and Exchange Commission on April 30, 2015.
UNITED STATES
SECURITIES AND EXCHANGE COMMISSION
Washington, D.C. 20549
FORM 8-K
CURRENT REPORT
PURSUANT TO SECTION 13 or 15(d)
OF THE SECURITIES EXCHANGE ACT OF 1934
Date of Report (Date of earliest event reported): April 30, 2015

(Exact name of registrant as specified in its charter)
Connecticut | 1-15052 | 06-1541045 |
| (State or other jurisdiction of Incorporation) | (Commission File Number) | (IRS Employer Identification No.) |
157 Church Street, New Haven, Connecticut | 06506 | |
| (Address of principal executive offices) | (Zip Code) |
| Registrant’s Telephone Number, | ||
Including Area Code | (203) 499-2000 |
| Not Applicable |
| (Former name or former address, if changed since last report) |
Check the appropriate box below if the Form 8-K filing is intended to simultaneously satisfy the filing obligation of the registrant under any of the following provisions (see General Instruction A.2. below):
| ☐ | Written communications pursuant to Rule 425 under the Securities Act (17 CFR 230.425) |
| ☐ | Soliciting material pursuant to Rule 14a-12 under the Exchange Act (17 CFR 240.14a-12) |
| ☐ | Pre-commencement communications pursuant to Rule 14d-2(b) under the Exchange Act (17CFR 240.14d-2(b)) |
| ☐ | Pre-commencement communications pursuant to Rule 13e-4(c) under the Exchange Act(17 CFR 240.13e-4(c)) |
| Item 2.02 | Results of Operations and Financial Condition |
On April 30, 2015, UIL Holdings Corporation (the Registrant or UIL Holdings) issued a press release announcing its financial results for the three-month period ended March 31, 2015. A copy of the Registrant's press release is attached hereto as Exhibit 99.1.
| Item 7.01 | Regulation FD Disclosure |
UIL Holdings will conduct a webcast conference call with financial analysts on Friday, May 1, 2015, beginning at 1:00 p.m. eastern time. UIL Holdings' executive management will present an overview of the financial results followed by a question and answer session. Interested parties, including analysts, investors and the media, may listen live via the internet by logging onto the Investors section of UIL Holdings' website at http://www.uil.com. Institutional investors can access the call via Thomson Street Events (www.streetevents.com), a password-protected event management site. A copy of the Registrant's presentation is attached hereto and incorporated by reference herein as Exhibit 99.2.
The Registrant is furnishing the information in this Item 7.01 and in Exhibit 99.2 to comply with Regulation FD.
The information contained in Item 2.02 and 7.01 of this Form 8-K, including Exhibits 99.1 and 99.2, shall not be deemed “filed” for any purpose, including for the purposes of Section 18 of the Securities Exchange Act of 1934, as amended (the “Exchange Act”), or otherwise subject to the liabilities of that Section, nor shall such information be deemed incorporated by reference into any filing under the Securities Act of 1933 as amended, or the Exchange Act, regardless of any general incorporation language in such filings.
| Item 9.01 | Financial Statements and Exhibits |
| (d) | Exhibits: The following exhibits are furnished as part of this report: |
Exhibit Description
| 99.1 | Press release issued by UIL Holdings Corporation on April 30, 2015. |
| 99.2 | 1Q ‘15 Earnings Presentation. |
SIGNATURES
Pursuant to the requirements of the Securities Exchange Act of 1934, the Registrant has duly caused this report to be signed on its behalf by the undersigned hereunto duly authorized.
UIL HOLDINGS CORPORATION Registrant | ||
| Date: April 30, 2015 | By | /s/ Richard J. Nicholas |
| Richard J. Nicholas | ||
| Executive Vice President and Chief Financial Officer | ||
Exhibit Index
| Exhibit | Description | |
| 99.1 | Press release issued by UIL Holdings Corporation on April 30, 2015. | |
| 99.2 | 1Q ‘15 Earnings Presentation. |
Exhibit 99.1
UIL Holdings Corporation
157 Church Street
P.O. Box 1564
New Haven, CT 06506-0901

NEWS RELEASE
| April 30, 2015 | Analyst Contact: | Susan Allen | 203-499-2409 | |
| Media Contact: | Michael West Jr. | 203-499-3858 |
UIL Reports First Quarter 2015 Earnings and Updates 2015 Earnings Guidance
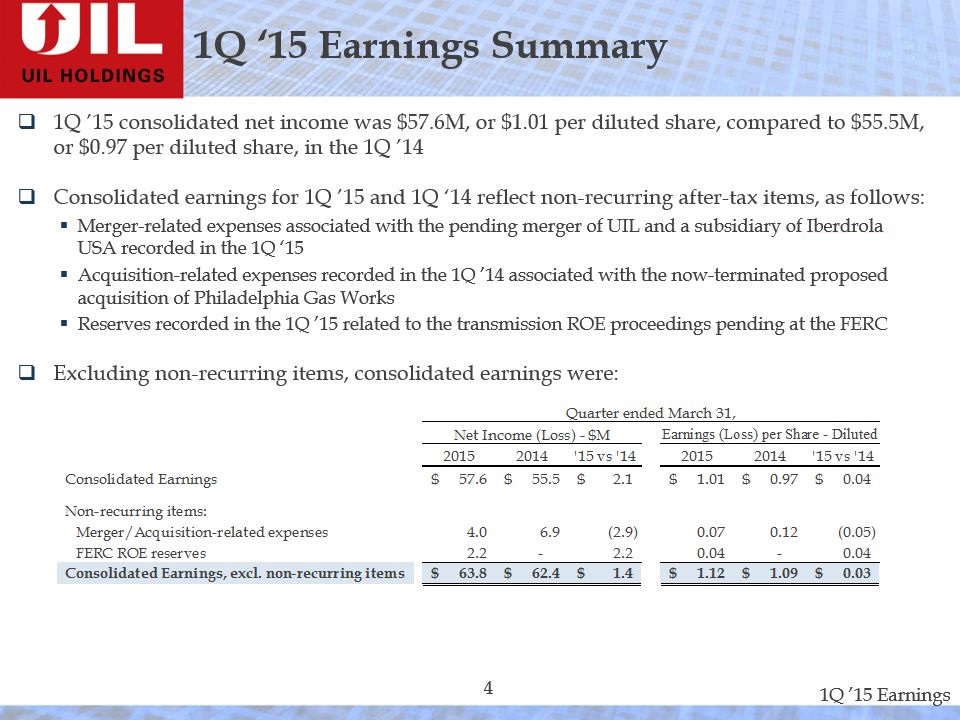
Today, UIL Holdings Corporation (NYSE: UIL) reported consolidated net income of $57.6 million, or $1.01 per diluted share, in the first quarter 2015, compared to $55.5 million, or $0.97 per diluted share, in the first quarter 2014.
Consolidated earnings for the first quarter 2015 and first quarter 2014 reflect certain non-recurring after-tax items, which are explained below.
| · | Merger-related expenses associated with the pending merger of UIL and a subsidiary of Iberdrola USA recorded in the first quarter 2015 |
| · | Acquisition-related expenses recorded in the first quarter 2014 associated with the now-terminated proposed acquisition of Philadelphia Gas Works |
| · | Reserves recorded in the first quarter 2015 related to the transmission return on equity (ROE) proceedings pending at the Federal Energy Regulatory Commission (FERC) |
Consolidated earnings, excluding the non-recurring items, for the quarter ended March 31 were:
| Quarter ended March 31, | ||||||||||||||||||||||||
| Net Income (Loss) - $M | Earnings (Loss) per Share - Diluted | |||||||||||||||||||||||
| 2015 | 2014 | '15 vs '14 | 2015 | 2014 | '15 vs '14 | |||||||||||||||||||
| Consolidated Earnings | $ | 57.6 | $ | 55.5 | $ | 2.1 | $ | 1.01 | $ | 0.97 | $ | 0.04 | ||||||||||||
| Non-recurring items: | ||||||||||||||||||||||||
| Merger/Acquisition-related expenses | 4.0 | 6.9 | (2.9 | ) | $ | 0.07 | 0.12 | (0.05 | ) | |||||||||||||||
| FERC ROE reserves | 2.2 | - | 2.2 | 0.04 | - | 0.04 | ||||||||||||||||||
| Consolidated Earnings, excl. non-recurring items | $ | 63.8 | $ | 62.4 | $ | 1.4 | $ | 1.12 | $ | 1.09 | $ | 0.03 | ||||||||||||
“Earnings per share, excluding non-recurring items related to M&A expenses and FERC ROE reserves, were up 2.75%. The increase in earnings was led by our gas companies as their earnings increased in the first quarter 2015 by almost 6% when compared to the same period in 2014,” commented James P. Torgerson, UIL’s president and chief executive officer. “Although colder weather played a large role, we saw increased earnings due to customer growth resulting from our strategic initiative of converting households and businesses to natural gas heat. We added another 2,002 customers in the first quarter 2015 and are on target to meet our 2015 goal of 12,000 conversions,” added Torgerson.
“Consistent with our long term strategy, in late February, we announced an agreement under which UIL will merge with a subsidiary of Iberdrola USA, with Iberdrola USA becoming a newly listed U.S. publicly-traded company, subject to
- more -
regulatory and UIL shareholder approvals and other customary closing conditions,” added Torgerson. “The proposed transaction brings together two premier companies to create a large, diversified power and utility company with seven highly regarded regulated electric and gas utilities in complementary geographies. Iberdrola USA is an ideal long-term partner for our customers, our employees and the communities we serve. We are excited for what the future holds and expect the transaction to close by year-end 2015.”
Electric Distribution
The electric distribution business earned $11.3 million, or $0.20 per diluted share, in the first quarter 2015, compared to $14.0 million, or $0.25 per diluted share, in the first quarter 2014. The decrease in earnings for the first quarter 2015 was mainly due to higher employee expenses, outside services and depreciation and amortization expenses.
Electric Transmission
The electric transmission business earned $6.5 million, or $0.11 per diluted share, in first quarter 2015, compared to $8.6 million, or $0.15 per diluted share, in the first quarter 2014.
Excluding the non-recurring FERC ROE reserves discussed above, the electric transmission earnings were:
| Quarter ended March 31, | ||||||||||||||||||||||||
| Net Income (Loss) - $M | Earnings (Loss) per Share - Diluted | |||||||||||||||||||||||
| 2015 | 2014 | '15 vs '14 | 2015 | 2014 | '15 vs '14 | |||||||||||||||||||
| Electric Transmission | $ | 6.5 | $ | 8.6 | $ | (2.1 | ) | $ | 0.11 | $ | 0.15 | $ | (0.04 | ) | ||||||||||
| FERC ROE reserves | 2.2 | - | 2.2 | 0.04 | - | 0.04 | ||||||||||||||||||
| Electric Transmission, excl. non-recurring item | $ | 8.7 | $ | 8.6 | $ | 0.1 | $ | 0.15 | $ | 0.15 | $ | - | ||||||||||||
Gas Distribution
The gas distribution businesses earned $41.2 million, or $0.72 per diluted share, in the first quarter 2015, compared to $39.0 million, or $0.68 per diluted share, in the first quarter 2014. The increase in earnings for the first quarter 2015 was primarily due to colder weather and customer growth.
The gross margin impacts from weather, normalized usage per customer and customer growth are presented in the table below:
| Impact of Weather, NUPC and Customer Growth | ||||
| (In Thousands) | ||||
1Q '15 vs. 1Q '14 Gross Margin | ||||
Weather(1) | $ | 6,665 | ||
| Normalized usage per customer | (881 | ) | ||
| Decoupling adjustment | (2,317 | ) | ||
| Subtotal | $ | 3,467 | ||
| Customer Growth | 2,032 | |||
| Total | $ | 5,499 | ||
| (1) | Excluding weather insurance payout of $1.7M, pre-tax, recorded in 1Q '14; including the weather insurance payout, impact would be $8,365 |
- more -
2
Corporate
Corporate costs were $1.4 million, after-tax, or $0.02 per diluted share, in the first quarter 2015, compared to costs of $6.1 million, after-tax, or $0.11 per diluted share, in the first quarter 2014. Corporate costs for the first quarter 2015 included after-tax merger-related expenses of $4.0 million, or $0.07 per diluted share, and Corporate costs for the first quarter 2014 included acquisition-related expenses of $6.9 million, or $0.12 per diluted share.
Excluding the non-recurring expenses discussed above, Corporate earnings were:
| Quarter ended March 31, | ||||||||||||||||||||||||
| Net Income (Loss) - $M | Earnings (Loss) per Share - Diluted | |||||||||||||||||||||||
| 2015 | 2014 | '15 vs '14 | 2015 | 2014 | '15 vs '14 | |||||||||||||||||||
| Corporate | $ | (1.4 | ) | $ | (6.1 | ) | $ | 4.7 | $ | (0.02 | ) | $ | (0.11 | ) | $ | 0.09 | ||||||||
| Merger/Acquisition-related expenses | 4.0 | 6.9 | (2.9 | ) | 0.07 | 0.12 | (0.05 | ) | ||||||||||||||||
| Corporate, excl. non-recurring item | $ | 2.6 | $ | 0.8 | $ | 1.8 | $ | 0.05 | $ | 0.01 | $ | 0.04 | ||||||||||||
The first quarter of each year reflect interim tax benefits recognized at the UIL corporate level, which will reverse over the year as each segment reflects its seasonal activity. The increase in earnings shown above reflect these interim tax benefits and an increase in earnings primarily due to increased returns on shared capital assets.
Segment details for UIL Holdings Corporation’s results for the first quarter 2015, compared to the same period in 2014, are presented in the table below:
| Net Income (Loss) - $M | ||||||||||||
| Quarter ended March 31, | ||||||||||||
| 2015 | 2014 | '15 vs '14 | ||||||||||
| Electric Distribution | $ | 11.3 | $ | 14.0 | $ | (2.7 | ) | |||||
| Electric Transmission | 8.7 | 8.6 | 0.1 | |||||||||
| Gas Distribution | 41.2 | 39.0 | 2.2 | |||||||||
| Operating Companies | 61.2 | 61.6 | (0.4 | ) | ||||||||
| Corporate | 2.6 | 0.8 | 1.8 | |||||||||
| Subtotal | $ | 63.8 | $ | 62.4 | $ | 1.4 | ||||||
| Merger and acquisition-related expenses | (4.0 | ) | (6.9 | ) | 2.9 | |||||||
| FERC ROE reserves | (2.2 | ) | - | (2.2 | ) | |||||||
| Consolidated Earnings | $ | 57.6 | $ | 55.5 | $ | 2.1 | ||||||
| Earnings (Loss) Per Share - Diluted | ||||||||||||
| Quarter ended March 31, | ||||||||||||
| 2015 | 2014 | '15 vs '14 | ||||||||||
| Electric Distribution | $ | 0.20 | $ | 0.25 | $ | (0.05 | ) | |||||
| Electric Transmission | 0.15 | 0.15 | - | |||||||||
| Gas Distribution | 0.72 | 0.68 | 0.04 | |||||||||
| Operating Companies | 1.07 | 1.08 | (0.01 | ) | ||||||||
| Corporate | 0.05 | 0.01 | 0.04 | |||||||||
| Subtotal | $ | 1.12 | $ | 1.09 | $ | 0.03 | ||||||
| Merger and acquisition-related expenses | (0.07 | ) | (0.12 | ) | 0.05 | |||||||
| FERC ROE reserves | (0.04 | ) | - | (0.04 | ) | |||||||
| Consolidated Earnings | $ | 1.01 | $ | 0.97 | $ | 0.04 | ||||||
| Avg. Shares - diluted (M) | 57.2 | 57.0 | ||||||||||
| Amounts may not add due to rounding |
- more -
3
Looking Forward
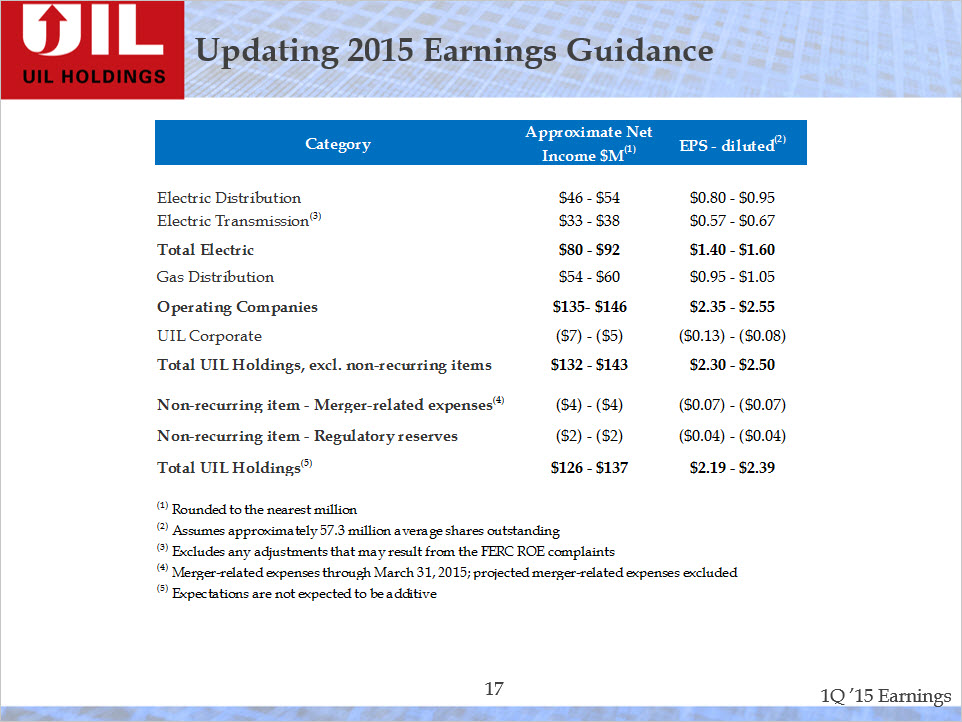
UIL’s consolidated earnings for 2015 are expected to be in the range of $126-$137 million, or $2.19-$2.39 per diluted share. Excluding the non-recurring items, 2015 consolidated earnings are expected to be in the range of $132-$143 million, or $2.30-$2.50 per diluted share. While consolidated earnings guidance excluding non-recurring items is unchanged, UIL has updated earnings guidance for the following business segments:
| · | Earnings for the electric distribution business have been revised to $0.80-$0.95 per diluted share, compared to the previously reported estimate of $0.85-$1.00 per diluted share. Earnings for total electric have been revised to $1.40-$1.60 per diluted share, compared to the previously reported estimate of $1.45-$1.65 per diluted share. The revision is primarily due to increased depreciation expense resulting from the timing of when UI distribution capital projects were closed to plant in service in 2014. |
| · | Earnings for the gas distribution business have been revised to $0.95-$1.05 per diluted share, compared to the previously reported estimate of $0.90-$1.00 per diluted share. The revision is primarily due to the earnings impact related to the increased margin from customer growth and from the colder weather. |
Guidance for all other business segments remains unchanged.
| Category | Approximate Net Income(1) | EPS - diluted(2) |
| Electric Distribution | $46 - $54 | $0.80 - $0.95 |
Electric Transmission(3) | $33 - $38 | $0.57 - $0.67 |
| Total Electric | $80 - $92 | $1.40 - $1.60 |
| Gas Distribution | $54 - $60 | $0.95 - $1.05 |
| Operating Companies | $135- $146 | $2.35 - $2.55 |
| UIL Corporate | ($7) - ($5) | ($0.13) - ($0.08) |
| Total UIL Holdings, excl. non-recurring items | $132 - $143 | $2.30 - $2.50 |
Non-recurring item - Merger-related expenses(4) | ($4) - ($4) | ($0.07) - ($0.07) |
| Non-recurring item - Regulatory reserves | ($2) - ($2) | ($0.04) - ($0.04) |
Total UIL Holdings(5) | $126 - $137 | $2.19 - $2.39 |
| (1) | Rounded to the nearest million |
| (2) | Assumes approximately 57.3 million average shares outstanding |
| (3) | Excludes any adjustments that may result from the FERC ROE complaints |
| (4) | Merger-related expenses through March 31, 2015; projected merger-related expenses excluded |
| (5) | Expectations are not expected to be additive |
First quarter 2015 earnings conference call
UIL Holdings will conduct a webcast conference call with financial analysts on Friday, May 1, 2015, beginning at 1:00 p.m. eastern time. UIL Holdings’ executive management will present an overview of the financial results followed by a question and answer session. Interested parties, including analysts, investors and the media, may listen
- more -
4
live via the internet by logging onto the Investors section of UIL Holdings’ website at http://www.uil.com. Institutional investors can access the call via Thomson Street Events (www.streetevents.com), a password-protected event management site.
Headquartered in New Haven, Connecticut, UIL Holdings Corporation (NYSE:UIL) is a diversified energy delivery company serving a total of approximately 727,000 electric and natural gas utility customers in 67 communities across two states, with combined total assets of over $5 billion.
UIL Holdings is the parent company for The United Illuminating Company (UI), Connecticut Natural Gas Corporation (CNG), The Southern Connecticut Gas Company (SCG), and The Berkshire Gas Company (Berkshire), each more than 100 years old. UI provides for the transmission and delivery of electricity and other energy related services for Connecticut’s Greater New Haven and Bridgeport areas. SCG and CNG are natural gas distribution companies that serve customers in Connecticut, while Berkshire serves natural gas customers in western Massachusetts. UIL Holdings employs more than 1,900 people in the New England region. For more information on UIL Holdings, visit http://www.uil.com.
Use of Non-GAAP Measures
UIL Holdings believes that a breakdown presented on a net income and per share basis is useful in understanding the change in the consolidated results of operations for UIL Holdings from one reporting period to another. UIL Holdings presents such per share amounts by taking the net income determined in accordance with generally accepted accounting principles (GAAP), and then dividing the results by the average number of diluted shares of UIL Holdings common stock outstanding for the periods presented. Any such amounts provided are provided for informational purposes only and are not intended to be used to calculate "Pro-forma" amounts.
UIL Holdings also believes presenting earnings excluding certain non-recurring items, as well as earnings per share (EPS) information by line of business, including as presented above
5
in the net income discussion and in the earnings guidance section, are useful in understanding and evaluating actual and projected financial performance and contribution of UIL’s businesses. EPS by business is calculated by taking the pre-tax amounts determined in accordance with GAAP of each line of business, and applying the effective statutory federal and state tax rate and then dividing the results by the average number of diluted shares of UIL common stock outstanding for the periods presented. Total consolidated EPS is a GAAP-basis presentation.
Forward-Looking Statements
Certain statements contained in this communication regarding matters that are not historical facts, are forward-looking statements (as defined in the Private Securities Litigation Reform Act of 1995). These include statements regarding management’s intentions, plans, beliefs, expectations or forecasts for the future. Such forward-looking statements are based on our expectations and involve risks and uncertainties; consequently, actual results may differ materially from those expressed or implied in the statements. In addition, risks and uncertainties related to the proposed merger with a subsidiary of Iberdrola USA include, but are not limited to, the expected timing and likelihood of completion of the pending merger, including the timing, receipt and terms and conditions of any required governmental and regulatory approvals of the pending merger that could reduce anticipated benefits or cause the parties to abandon the transaction, the ability to successfully integrate the businesses, the occurrence of any event, change or other circumstances that could give rise to the termination of the merger agreement, the possibility that UIL’s shareowners may not approve the merger agreement, the risk that the parties may not be able to satisfy the conditions to the proposed merger in a timely manner or at all, risks related to disruption of management time from ongoing business operations due to the proposed merger, the risk that any announcements relating to the proposed merger could have adverse effects on the market price of UIL’s common stock, and the risk that the proposed transaction and its announcement could have an adverse effect on the ability of UIL to retain and hire key personnel and maintain relationships with its suppliers, and on its operating results and businesses generally.
New factors emerge from time to time and it is not possible for us to predict all such factors, nor can we assess the impact of each such factor on the business or the extent to which any factor, or combination of factors, may cause actual results to differ materially from those contained in any forward-looking statements. These risks, as well as other risks associated with the merger, will be more fully discussed in the joint proxy statement/prospectus that will be included in the Registration Statement on Form S-4 that will be filed with the Securities and Exchange Commission (SEC) in connection with the merger. Additional risks and uncertainties are identified and discussed in UIL’s reports filed with the SEC and available at the SEC’s website at www.sec.gov. Forward-looking statements included in this release speak only as of the date of this release. UIL does not undertake any obligation to update its forward-looking statements to reflect events or circumstances after the date of this release.
The following are summaries of UIL Holdings’ unaudited consolidated financial information for the first quarter 2015:
6
UIL HOLDINGS CORPORATION
CONSOLIDATED STATEMENT OF INCOME
(In Thousands except per share amounts)
(Unaudited)
Three Months Ended March 31, | ||||||||
| 2015 | 2014 | |||||||
| Operating Revenues | $ | 584,053 | $ | 571,162 | ||||
| Operating Expenses | ||||||||
| Operation | ||||||||
| Purchased power | 97,102 | 53,130 | ||||||
| Natural gas purchased | 174,520 | 214,925 | ||||||
| Operation and maintenance | 101,347 | 92,877 | ||||||
| Transmission wholesale | 19,709 | 20,911 | ||||||
| Depreciation and amortization | 43,284 | 40,318 | ||||||
| Taxes - other than income taxes | 41,315 | 39,536 | ||||||
| Merger and acquisition-related expenses | 6,702 | 5,051 | ||||||
| Total Operating Expenses | 483,979 | 466,748 | ||||||
| Operating Income | 100,074 | 104,414 | ||||||
| Other Income and (Deductions), net | ||||||||
| Acquisition-related bridge facility fees | - | (6,413 | ) | |||||
| Other income and (deductions) | 4,368 | 3,862 | ||||||
| Total Other Income and (Deductions), net | 4,368 | (2,551 | ) | |||||
| Interest Charges, net | ||||||||
| Interest on long-term debt | 22,225 | 22,452 | ||||||
| Other interest, net | 1,232 | 175 | ||||||
| 23,457 | 22,627 | |||||||
| Amortization of debt expense and redemption premiums | 607 | 607 | ||||||
| Total Interest Charges, net | 24,064 | 23,234 | ||||||
| Income from Equity Investments | 2,936 | 3,386 | ||||||
| Income Before Income Taxes | 83,314 | 82,015 | ||||||
| Income Taxes | 25,705 | 26,550 | ||||||
| Net Income | 57,609 | 55,465 | ||||||
| Less: | ||||||||
| Preferred Stock Dividends of | ||||||||
| Subsidiary, Noncontrolling Interests | 7 | 13 | ||||||
| Net Income attributable to UIL Holdings | $ | 57,602 | $ | 55,452 | ||||
| Average Number of Common Shares Outstanding - Basic | 56,881 | 56,779 | ||||||
| Average Number of Common Shares Outstanding - Diluted | 57,184 | 57,043 | ||||||
| Earnings Per Share of Common Stock - Basic: | $ | 1.01 | $ | 0.98 | ||||
| Earnings Per Share of Common Stock - Diluted: | $ | 1.01 | $ | 0.97 | ||||
| Cash Dividends Declared per share of Common Stock | $ | 0.432 | $ | 0.432 | ||||
UIL HOLDINGS CORPORATION
CONSOLIDATED STATEMENT OF COMPREHENSIVE INCOME
(Thousands of Dollars)
(Unaudited)
Three Months Ended March 31, | ||||||||
| 2015 | 2014 | |||||||
| Net Income | $ | 57,609 | $ | 55,465 | ||||
| Other Comprehensive Income (Loss), net of deferred income taxes | ||||||||
| Changes in unrealized gains (losses) related to pension and other post-retirement benefit plans | 273 | 61 | ||||||
| Other | 7 | 12 | ||||||
| Total Other Comprehensive Income (Loss), net of deferred income taxes | 280 | 73 | ||||||
| Comprehensive Income | 57,889 | 55,538 | ||||||
| Less: | ||||||||
| Preferred Stock Dividends of Subsidiary, Noncontrolling Interests | 7 | 13 | ||||||
| Comprehensive Income Attributable to UIL Holdings | $ | 57,882 | $ | 55,525 | ||||
7
UIL HOLDINGS CORPORATION
CONDENSED CONSOLIDATED BALANCE SHEET
(Unaudited)
| (thousands of dollars) | March 31, 2015 | December 31, 2014 | ||||||
| ASSETS | ||||||||
| Current assets | $ | 647,714 | $ | 670,096 | ||||
| Other investments | 140,127 | 139,972 | ||||||
| Net property, plant and equipment | 3,316,841 | 3,292,690 | ||||||
| Regulatory assets | 700,321 | 687,198 | ||||||
| Goodwill | 266,205 | 266,205 | ||||||
| Deferred charges and other assets | 57,140 | 55,774 | ||||||
| Total Assets | $ | 5,128,348 | $ | 5,111,935 | ||||
| LIABILITIES AND CAPITALIZATION | ||||||||
| Current liabilities | $ | 444,650 | $ | 495,558 | ||||
| Deferred income taxes | 604,160 | 585,335 | ||||||
| Regulatory liabilities | 491,155 | 491,896 | ||||||
| Other noncurrent liabilities | 474,574 | 459,476 | ||||||
| Total Liabilities | 2,014,539 | 2,032,265 | ||||||
| Long-term debt, net of unamortized discount and premium | 1,710,168 | 1,711,349 | ||||||
| Preferred stock of subsidiary | 119 | 119 | ||||||
| Net common stock equity | 1,403,522 | 1,368,202 | ||||||
| Total Capitalization | 3,113,809 | 3,079,670 | ||||||
| Total Liabilities and Capitalization | $ | 5,128,348 | $ | 5,111,935 | ||||
8
Exhibit 99.2

1Q ‘15 Earnings PresentationMay 1, 2015 Exhibit 99.2

Forward Looking Statements Certain statements contained in this communication regarding matters that are not historical facts, are forward-looking statements (as defined in the Private Securities Litigation Reform Act of 1995). These include statements regarding management’s intentions, plans, beliefs, expectations or forecasts for the future. Such forward-looking statements are based on our expectations and involve risks and uncertainties; consequently, actual results may differ materially from those expressed or implied in the statements. In addition, risks and uncertainties related to the proposed merger with Iberdrola USA include, but are not limited to, the expected timing and likelihood of completion of the pending merger, including the timing, receipt and terms and conditions of any required governmental and regulatory approvals of the pending merger that could reduce anticipated benefits or cause the parties to abandon the transaction, the ability to successfully integrate the businesses, the occurrence of any event, change or other circumstances that could give rise to the termination of the merger agreement, the possibility that UIL’s shareowners may not approve the merger agreement, the risk that the parties may not be able to satisfy the conditions to the proposed merger in a timely manner or at all, risks related to disruption of management time from ongoing business operations due to the proposed merger, the risk that any announcements relating to the proposed merger could have adverse effects on the market price of UIL’s common stock, and the risk that the proposed transaction and its announcement could have an adverse effect on the ability of UIL to retain and hire key personnel and maintain relationships with its suppliers, and on its operating results and businesses generally. New factors emerge from time to time and it is not possible for us to predict all such factors, nor can we assess the impact of each such factor on the business or the extent to which any factor, or combination of factors, may cause actual results to differ materially from those contained in any forward-looking statements. These risks, as well as other risks associated with the merger, will be more fully discussed in the joint proxy statement/prospectus that will be included in the Registration Statement on Form S-4 that will be filed with the Securities and Exchange Commission (“SEC”) in connection with the merger. Additional risks and uncertainties are identified and discussed in UIL’s reports filed with the SEC and available at the SEC’s website at www.sec.gov. Forward-looking statements included in this release speak only as of the date of this release. Neither UIL nor Iberdrola USA undertakes any obligation to update its forward-looking statements to reflect events or circumstances after the date of this release. UIL Holdings believes that a breakdown presented on a net income and per share basis is useful in understanding the change in the consolidated results of operations for UIL Holdings from one reporting period to another. UIL Holdings presents such per share amounts by taking the net income determined in accordance with generally accepted accounting principles (GAAP), and then dividing the results by the average number of diluted shares of UIL Holdings common stock outstanding for the periods presented. Any such amounts provided are provided for informational purposes only and are not intended to be used to calculate "Pro-forma" amounts.UIL Holdings also believes presenting earnings excluding certain non-recurring items, as well as earnings per share (EPS) information by line of business, including as presented above in the net income discussion and in the earnings guidance section, are useful in understanding and evaluating actual and projected financial performance and contribution of UIL’s businesses. EPS by business is calculated by taking the pre-tax amounts determined in accordance with GAAP of each line of business, and applying the effective statutory federal and state tax rate and then dividing the results by the average number of diluted shares of UIL common stock outstanding for the periods presented. Total consolidated EPS is a GAAP-basis presentation. James TorgersonPresident and Chief Executive OfficerRichard NicholasExecutive Vice President and Chief Financial Officer Visit our website at www.UIL.com

Important Information For Investors &Shareholders Important Information For Investors And ShareholdersThis communication does not constitute an offer to sell or the solicitation of an offer to buy any securities or a solicitation of any vote or approval. This communication may be deemed to be solicitation material in respect of the proposed transaction between UIL Holdings Corporation (“UIL”) and Iberdrola USA, Inc. (“Iberdrola USA”). In connection with the proposed transaction between UIL and Iberdrola USA, Iberdrola USA intends to file with the SEC a registration statement on Form S-4, containing a proxy statement of UIL, that will also constitute a prospectus of Iberdrola USA. UIL will mail the proxy statement/prospectus to UIL’s shareholders. UIL AND IBERDROLA USA URGE INVESTORS AND SHAREHOLDERS TO READ THE JOINT PROXY STATEMENT/PROSPECTUS REGARDING THE PROPOSED MERGER WHEN IT BECOMES AVAILABLE, AS WELL AS OTHER DOCUMENTS FILED OR THAT WILL BE FILED WITH THE SEC, BECAUSE THEY CONTAIN OR WILL CONTAIN IMPORTANT INFORMATION ABOUT THE PROPOSED TRANSACTION. This communication is not a substitute for the registration statement, definitive proxy statement/prospectus or any other documents that Iberdrola USA or UIL may file with the SEC or send to shareholders in connection with the proposed transaction. You may obtain copies of all documents filed with the SEC regarding this proposed transaction (when available), free of charge, at the SEC’s website (www.sec.gov). Copies of the documents filed with the SEC by UIL are available free of charge on UIL’s website at www.uil.com or by contacting UIL’s Investor Relations Department at 203-499-2409. Copies of the documents filed with the SEC by Iberdrola USA are available free of charge on Iberdrola USA’s website at www.iberdrolausa.com or by contacting Iberdrola’s Investor Relations department at +34-91-784-2743. Participants in Solicitation UIL and its directors and executive officers, and Iberdrola USA and its directors and executive officers, may be deemed to be participants in the solicitation of proxies from the holders of UIL common stock in respect of the proposed transaction. Information about UIL’s executive officers and directors is set forth in UIL’s definitive proxy statement for its 2014 Annual Meeting of Shareholders, which was filed with the SEC on April 3, 2014. Other information regarding the interests of such individuals, as well as information regarding Iberdrola USA’s directors and executive officers, will be set forth in the joint proxy statement/prospectus, which will be included in Iberdrola USA’s registration on Form S-4 when it is filed with the SEC. You may obtain free copies of these documents as described in the preceding paragraph. 3 1Q ’15 Earnings
1Q ’15 consolidated net income was $57.6M, or $1.01 per diluted share, compared to $55.5M, or $0.97 per diluted share, in the 1Q ’14Consolidated earnings for 1Q ’15 and 1Q ‘14 reflect non-recurring after-tax items, as follows:Merger-related expenses associated with the pending merger of UIL and a subsidiary of Iberdrola USA recorded in the 1Q ‘15Acquisition-related expenses recorded in the 1Q ’14 associated with the now-terminated proposed acquisition of Philadelphia Gas WorksReserves recorded in the 1Q ’15 related to the transmission ROE proceedings pending at the FERCExcluding non-recurring items, consolidated earnings were: 1Q ‘15 Earnings Summary

Iberdrola USA/UIL Merger
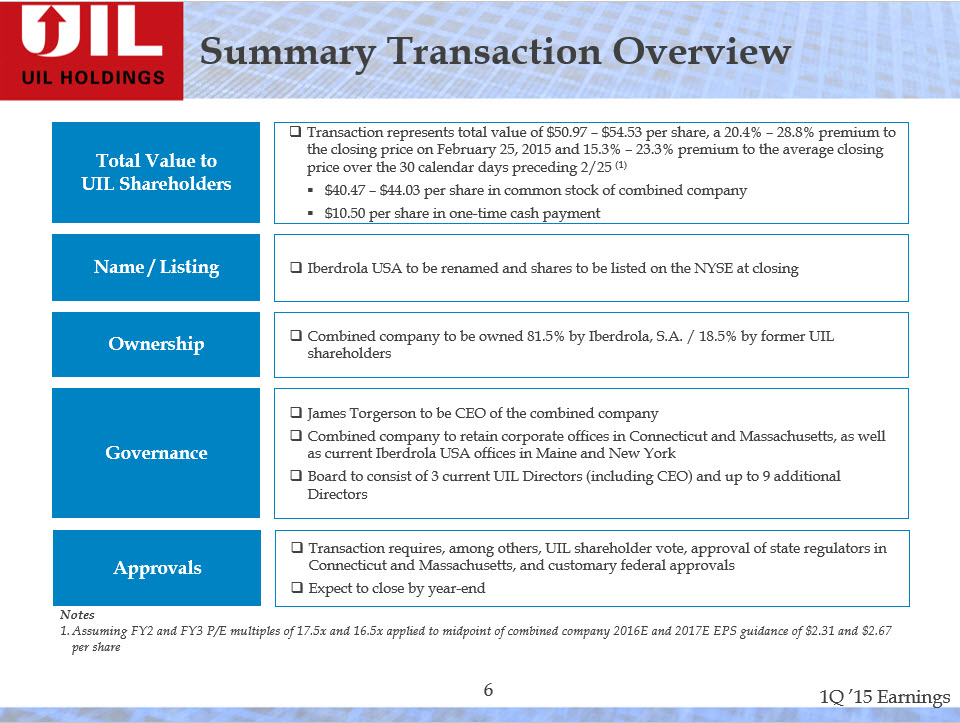
Summary Transaction OverviewTotal Value to UIL Shareholdersq Transaction represents total value of $50.97 – $54.53 per share, a 20.4% – 28.8% premium to the closing price on February 25, 2015 and 15.3% – 23.3% premium to the average closing price over the 30 calendar days preceding 2/25 (1)§$40.47 – $44.03 per share in common stock of combined company§$10.50 per share in one-time cash paymentqName / ListingqIberdrola USA to be renamed and shares to be listed on the NYSE at closingqOwnershipqCombined company to be owned 81.5% by Iberdrola, S.A. / 18.5% by former UIL shareholdersqGovernanceqJames Torgerson to be CEO of the combined companyqCombined company to retain corporate offices in Connecticut and Massachusetts, as well as current Iberdrola USA offices in Maine and New YorkqBoard to consist of 3 current UIL Directors (including CEO) and up to 9 additional DirectorsqApprovalsqTransaction requires, among others, UIL shareholder vote, approval of state regulators in Connecticut and Massachusetts, and customary federal approvals qExpect to close by year-endNotes1.Assuming FY2 and FY3 P/E multiples of 17.5x and 16.5x applied to midpoint of combined company 2016E and 2017E EPS guidance of $2.31 and $2.67 per share

State of Connecticut application – filed 3/25/15120 day statutory deadline with option to extend an additional 30 daysRegulatory time schedule establishedProposed final decision expected end of JuneFinal decision expected mid-JulyState of Massachusetts application – filed 3/25/15No statutory deadlinePublic comment hearing scheduled for 5/6/15Hart-Scott Rodino – filed 3/25/15Early termination granted on 4/7/15FERC filing – filed on 3/25/15 SEC S-4/Proxy – expected to be filed in 2Q ‘15UIL shareholder vote – date TBD Regulatory Timeline - expect to close by y
Regulatory Timeline - expect to close by year-end ‘15 State of Connecticut PURA application – filed 3/25/15120 day statutory deadline with option to extend an additional 30 daysRegulatory time schedule establishedProposed final decision expected end of JuneFinal decision expected mid-JulyState of Massachusetts DPU application – filed 3/25/15No statutory deadlinePublic comment hearing scheduled for 5/6/15Hart-Scott Rodino – filed 3/25/15Early termination granted on 4/7/15FERC filing – filed on 3/25/15SEC S-4/Proxy – expected to be filed in 2Q ‘15UIL shareholder vote – date TBD

UIL Holdings Stand-alone

$4.2B 10-yr Capital Expenditure Plan Amounts may not add due to rounding 2015P-2024P
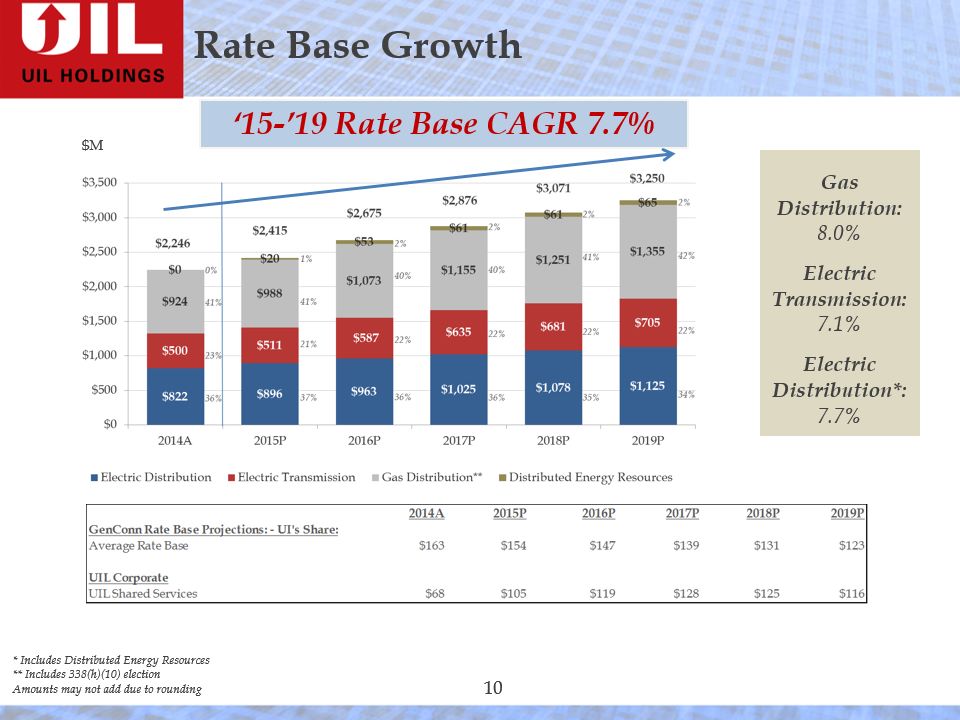
Rate Base Growth * Includes Distributed Energy Resources** Includes 338(h)(10) electionAmounts may not add due to rounding ‘15-’19 Rate Base CAGR 7.7% Gas Distribution:8.0%Electric Transmission:7.1%Electric Distribution*:7.7% $M

Successfully converted 16,266 households & businesses in ’14: Met our ’14 goal‘15 target is to convert at least 12,000 households & businessesConverted 2,002 households & businesses as of 3/31/15Natural gas is more cost effective than home heating oil and the benefits of natural gas remain advantageous for our customersCurrent home heating oil prices will make it more challenging to get customers to switch to natural gasComprehensive Energy Strategy goals were set when the price advantage of natural gas was higher. Heating oil prices have declined since then. * Acquisition Nov. ‘10 Gas Heating Customers # of Conversions
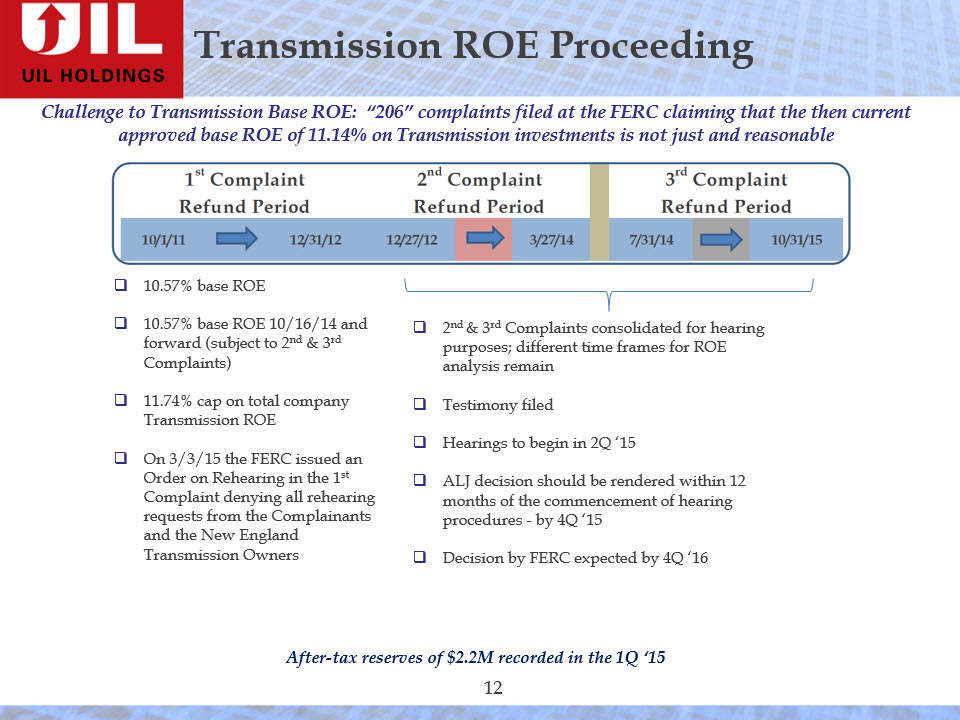
Transmission ROE Proceeding Challenge to Transmission Base ROE: “206” complaints filed at the FERC claiming that the then current approved base ROE of 11.14% on Transmission investments is not just and reasonable 10.57% base ROE10.57% base ROE 10/16/14 and forward (subject to 2nd & 3rd Complaints)11.74% cap on total company Transmission ROEOn 3/3/15 the FERC issued an Order on Rehearing in the 1st Complaint denying all rehearing requests from the Complainants and the New England Transmission Owners 2nd & 3rd Complaints consolidated for hearing purposes; different time frames for ROE analysis remainTestimony filedHearings to begin in 2Q ‘15ALJ decision should be rendered within 12 months of the commencement of hearing procedures - by 4Q ‘15Decision by FERC expected by 4Q ‘16 After-tax reserves of $2.2M recorded in the 1Q ‘15

1Q ‘15 Financial Results by Segment ~6% increase in Gas Distribution net income mainly from weather and customer growthOverall ~2% increase in net income, excluding non-recurring items

1Q ‘15 Financial Results - Details Electric Distribution1Q ’15 earnings of $11.3M, or $0.20 per diluted share, compared to earnings of $14.0M, or $0.25 per diluted share, in the 1Q ’14Decrease in earnings primarily due to –- Increased employee expenses, outside services and depreciation and amortization expensesGenConn contributed pre-tax earnings of $2.9M in 1Q ’15, compared to $3.4M in the 1Q ’1412-month average D ROE as of 3/31/15: 8.75%Electric TransmissionExcluding non-recurring FERC ROE reserves, 1Q ’15 earnings were flat compared to the 1Q ’14Overall weighted-average T ROE* as of 3/31/15: 11.36% (excl. reserve recorded in 1Q ‘15); 10.92% (incl. reserve recorded in 1Q ’15)* Weighted-average ROEs as of 3/31/15 based on projected year-end rate base and allowed ROEs
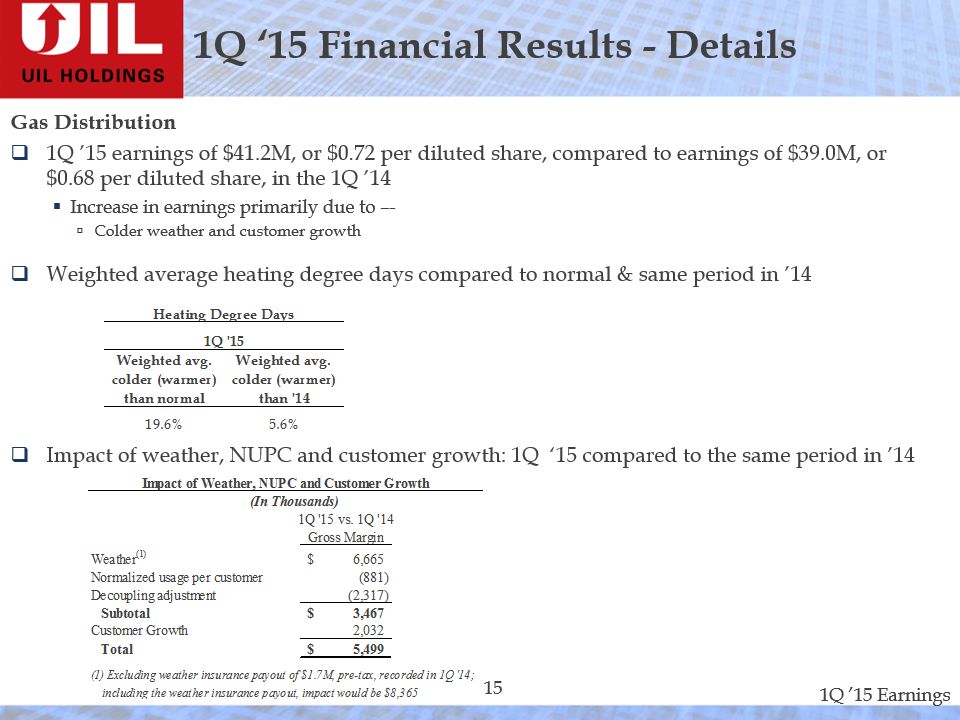
Gas Distribution1Q ’15 earnings of $41.2M, or $0.72 per diluted share, compared to earnings of $39.0M, or $0.68 per diluted share, in the 1Q ’14Increase in earnings primarily due to –-Colder weather and customer growthWeighted average heating degree days compared to normal & same period in ’14Impact of weather, NUPC and customer growth: 1Q ‘15 compared to the same period in ’14 1Q ‘15 Financial Results - Details

1Q ‘15 Financial Results - Details Gas Distribution – cont.Preliminary 12-month avg. ROEs* as of 3/31/15: SCG 9.50-9.70%, CNG 8.67-8.87%Preliminary 12-month avg. weather normalized ROEs* as of 3/31/15: SCG 8.53-8.73%, CNG 8.67-8.87%Corporate1Q ‘15 & 1Q ‘14 include interim tax benefits recognized at the UIL corporate level, which will reverse over the year as each segment reflects its seasonal activity1Q ’15 increase in earnings, excluding non-recurring merger/acquisition-related expenses, was primarily due to these interim tax benefits and increased returns on shared capital assets * Including impact of 338(h)(10)
Updating 2015 Earnings Guidance

Guidance Assumptions – Business Segments Electric Distribution - revised to $0.80-$0.95 per diluted share, compared to the previously reported estimate of $0.85-$1.00 per diluted share The revision is primarily due to increased depreciation expense resulting from when the timing of UI distribution capital projects were closed to plant in service in 2014Total Electric - revised to $1.40-$1.60 per diluted share, compared to the previously reported estimate of $1.45-$1.65 per diluted share Gas Distribution - revised to $0.95-$1.05 per diluted share, compared to the previously reported estimate of $0.90-$1.00 per diluted share The revision is primarily due to the earnings impact related to the increased margin from customer growth and from the colder weather

Questions