SECURITIES AND EXCHANGE COMMISSION
Washington, D.C. 20549
FORM 10-K
Annual Report Pursuant to Section 13 or 15(d)
of the Securities Exchange Act of 1934
For the Fiscal Year Ended December 31, 2007
Commission File Number 000- 50357
FIRST COMMUNITY BANK CORPORATION OF AMERICA
A Florida Corporation
IRS Employer Identification No. 65-0623023
9001 Belcher Road
Pinellas Park, Florida 33782
(727) 520-0987
Securities Registered Pursuant to Section 12(b)
of the Securities Exchange Act of 1934: NONE
Securities Registered Pursuant to Section 12(g) of the Securities Exchange
Act of 1934: Common Stock, $0.05 par value
Indicate by check mark if the registrant is a well-known seasoned issuer, as defined in Rule 405 of the Securities Act. Yes ¨ No x
Indicate by check mark if the registrant is not required to file reports pursuant to Section 13 or 15(d) of the Exchange Act. Yes ¨ No x
Note – Checking the box above will not review any registrant required to file reports pursuant to Section 13 or 15(d) of the Exchange Act.
Indicate by check mark whether the Registrant (1) has filed all reports required to be filed by Section 13 or 15(d) of the Securities Exchange Act of 1934 during the preceding 12 months (or for such shorter period that the Registrant was required to file such reports), and (2) has been subject to such filing requirements for the past 90 days. Yes x No ¨
Indicate by check mark if disclosure of delinquent filers pursuant to Item 405 of Regulation S-K (§229.405 of this chapter) is not contained herein, and will not be contained, to the best of registrant’s knowledge, in definitive proxy or information statements incorporated by reference in Part III of this Form 10-K x
Indicate by check mark whether the registrant is a large accelerated filer, an accelerated filer, or a non-accelerated filer. See definition of “accelerated filer and large accelerated filer” in Rule 12b-2 of the Exchange Act. (Check one):
Large accelerated filer ¨ Accelerated filer ¨ Non-accelerated filer x
Indicate by check mark whether the registrant is a shell company (as defined in Rule 12b-2 of the Act). Yes ¨ No x
The aggregate market value of the Registrant’s common stock held by non-affiliates of the Registrant, based upon the closing price of $10.15, as quoted on the NASDAQ Capital Market, on March 3, 2008 was approximately $22,738,832. For the purposes of this response, directors and officers of the Registrant’s common stock are considered the affiliates of the Registrant at that date.
The number of shares outstanding of the Registrant’s common stock, as of March 3, 2008: 4,111,121 shares of $.05 par value common stock.
Portions of the Proxy Statement of the Registrant for the Annual Meeting of Shareholders to be held on May 12, 2008, are incorporated by reference into Part III of this report.
TABLE OF CONTENTS
PART I
| Item 1. | Description of Business. |
Forward Looking Statements
This document contains forward-looking statements as defined by Section 27A of the Securities Act of 1933 and Section 21E of the Securities Exchange Act of 1934. These forward-looking statements involve substantial risks and uncertainties. When used in this document, or in the documents incorporated by reference, the words “anticipate”, “believe”, “estimate”, “may”, “intend” and “expect” and similar expressions are some of the forward-looking statements used in these documents. Actual results, performance, or achievements could differ materially from those contemplated, expressed or implied by the forward-looking statements. Factors which may cause results to change materially include competition, inflation, general economic conditions, changes in interest rates, and changes in the value of collateral securing loans First Community Bank has made, among other things. First Community Bank Corporation of America is referred to herein as “First Community. “We” and “our” refers to First Community and its wholly-owned subsidiaries First Community Bank of America and First Community Lender Services, Inc.
General
First Community is a Florida-based unitary savings and loan holding company with one bank subsidiary, First Community Bank of America (“First Community Bank”) and one non-bank subsidiary First Community Lenders Services, Inc.
First Community Bank
First Community owns all of the outstanding common stock of First Community Bank and First Community Lender Services, Inc. Our primary business activity, however, is the operation of our wholly-owned subsidiary First Community Bank, which was established in February 1985. First Community Bank has nine branch locations in Pinellas, Hillsborough, Pasco and Charlotte Counties. It is a federally-chartered stock savings bank that provides a variety of banking services to small and middle market businesses and individuals through its three banking offices located in Pinellas County, two banking offices located in Hillsborough County, one banking office in Pasco County, and three banking offices located in Charlotte County, Florida. During 2008, we anticipate opening one additional office in Pasco County.
As of December 31, 2007, First Community Bank had assets of approximately $436 million, net loans of $383 million and deposits of $335 million. Due to its strong focus on commercial lending, approximately 52% of First Community Bank’s total loans are commercial and 9% of its total deposits are comprised of non-interest bearing checking accounts.
First Community Lender Services, Inc.
First Community Lender Services, Inc. was incorporated in 2001 as a wholly-owned subsidiary of First Community. First Community Lender Services was originally established to network with title insurance vendors. In November 2004, 1031 Exchange services were added. A 1031 Exchange allows customers to sell investment property/properties and defer any capital gains taxes by purchasing a “like-kind” replacement property/properties within a certain time frame under Section 1031 of the Internal Revenue Code. First Community Lender Services, Inc. had nominal operations in 2007.
Strategy
We have experienced tremendous success in growing our Company, and attribute this success to two key business values: Safety and soundness first, coupled with a relentless commitment to serve our customers.
We believe that building relationships is a crucial factor in differentiating between the national and regional financial institutions and First Community. Even though, typically, the national and regional financial institutions have more products and more locations, they lose that personal service touch that we offer. The most frequent customer complaints we hear about the national and regional institutions are the lack of personalized service and the turnover in personnel, which limits the customer’s ability to develop a relationship with his or her banker. Customers are willing to make a change in order to have that personalized service, and we believe a significant opportunity exists to attract and retain these customers who are dissatisfied with their current banking relationship.
We believe we are unique in the sense that we offer a Regional President and local Regional Board of Directors in each of the counties we serve, all under the same charter. Each Region is operated as a community bank, emphasizing local leadership and local decision-making with Regional Presidents making most major decisions. Our Regional Presidents have
1
loan approval authority, and deposit and loan pricing authority enabling them to provide quicker service and to respond appropriately to their respective markets. Each county’s Regional Board and Regional President are drawn mainly from members of the local business community. We place emphasis on relationship banking so that each customer can identify and establish a comfort level with our bank officers and staff. While a significant portion of our lending effort is concentrated on commercial and professional businesses, we also focus on cross-marketing our deposit products to these borrowers. Many of our retail customers are the principals and employees of our small-and medium-sized business customers.
Market Focus
Our marketing efforts are focused on attracting small and medium-sized businesses and individuals, including service companies, light manufacturing companies, commercial real estate developers, entrepreneurs and professionals, such as engineers, physicians, attorneys, certified public accountants, and architects.
We have been successful in penetrating this market through our ability to deliver:
| | • | | Tailored and flexible loan products; |
| | • | | Comprehensive online banking and cash management services; and |
| | • | | Competitive investment SWEEP products. |
We distinguish ourselves from our competitors by providing a high level of personal service to customers who want quick, local decision making, and who appreciate and are looking for a long-term banking relationship. We believe banking is a business that requires public trust. Our senior management team has over 100 years of combined experience endeavoring to build a reputation worthy of our customers’ trust.
Future Growth
In the next few years, we plan to have sufficient capital on hand to take advantage of growth opportunities either through the acquisition of small banks in identified strategic markets, or through the acquisition of branch sites that may come available in markets we are trying to penetrate. Currently, we have no specific acquisition candidates targeted.During 2008, we anticipate opening one new office in our Pasco County Region. The acquisition or formation of banks, the purchase of branch facilities, and the establishment of new branch facilities are subject to regulatory approvals and other requirements. See the “Supervision and Regulation” section for more details regarding the requirements surrounding the acquisition or formation of banks.
Products and Services
General. Through First Community Bank we offer a broad array of traditional banking products and services to our customers, including the products and services described below. These services are offered at each of our banking locations, as well as through our online banking program atwww.efirstcommbank.com.
Deposits.We offer a full range of interest bearing and non-interest bearing accounts, including commercial and retail checking accounts, money market accounts, sweep accounts, cash management accounts, individual retirement accounts, savings accounts, and other time deposits, ranging from daily money market accounts to longer term certificates of deposit. We have tailored the rates and terms of our accounts and time deposits to compete with the rates and terms in our principal markets. We seek deposits from residents, businesses, professionals and employees of businesses in our primary markets. The FDIC insures all of our accounts up to the maximum amount permitted by law. In addition, we receive service charges that are competitive with other financial institutions in our principal markets, covering such matters as maintenance fees on checking accounts, per item processing fees on checking accounts, returned check charges and other similar fees.
Loan Activities. We rely on deposits, borrowings and other sources of funds to originate loans. We offer a full range of short- and medium-term commercial, consumer and real estate loans. We generally seek to allocate our loan portfolio as follows: 60% to real estate loans; 20% to consumer loans; and 20% to commercial and industrial loans. Our loan approval process provides for various levels of officer lending authority. When a loan amount exceeds officer lending authority levels, it is reviewed by the loan committee of our Board of Directors, which has ultimate lending authority. The loan committee meets as needed.
The risk of non-payment of loans is inherent in all loans. However, we carefully evaluate all loan applicants and attempt to minimize our credit risk by using thorough loan application and approval procedures that we have established for each category of loan. In determining whether to make a loan, we consider the borrower’s credit history, analyze the borrower’s income and ability to repay the loan, and evaluate the need for collateral to secure recovery in the event of default. We have established an allowance for loan losses based upon assumptions and judgments regarding the ultimate collectability of loans in our portfolio and a percentage of the outstanding balances of specific loans when their ultimate collectability is considered questionable.
2
Our loan activities are primarily directed to individuals, businesses and professionals in our principal markets whose demand for funds generally fall within our bank’s respective legal lending limits and who are also likely deposit customers. We have the ability to make loans in excess of our individual loan limits when we are able to secure a commitment from another lending institution to purchase a participation in the loan. The following is a description of each of the major categories of loans which we make.
Commercial Loans. This category includes loans made to business entities for a variety of business purposes. We place particular emphasis on loans to small- to medium-sized professional firms, retail and wholesale businesses, and light industry and manufacturing concerns operating in our principal markets. We consider “small businesses” to include those with generally less than $10 million in sales. Our commercial loans include term loans with variable interest rates secured by equipment, inventory, receivables and real estate, as well as secured and unsecured working capital lines of credit. The risks of these types of loans depend on the general business conditions in the local economy and the borrowers’ ability to sell its products and services in order to generate sufficient business profits to repay their loans under the agreed upon terms and conditions. Personal guarantees are obtained from the principals of business borrowers, and sometimes third parties, to further support the borrowers’ ability to service the debt and reduce the risk of non-payment.
Commercial Real Estate Loans. Commercial real estate loans are offered to developers of both commercial and residential properties. Interest rates may be fixed or adjustable. We manage credit risk associated with these loans by actively monitoring such measures as advance rate, cash flow, collateral value and other appropriate credit factors. Risks associated with commercial real estate loans include the general risk of the failure of the commercial borrower, which is different for each type of business and commercial entity. We evaluate each business on an individual basis. We attempt to reduce credit risks in the commercial real estate loan portfolio by emphasizing loans on owner-occupied office and retail buildings where the loan-to-value ratio established by independent appraisals does not exceed 80%. In addition, we typically require personal guarantees of the principal owners.
Construction and Development Loans.Construction and development loans are made on both a pre-sold and speculative basis, and generally have a fixed interest rate. If the borrower has entered into an arrangement to sell the property prior to beginning construction, we consider the loan to be on a pre-sold basis. If the borrower has not entered into an agreement to sell the property prior to beginning construction, we consider the loan to be on a speculative basis. We make residential and commercial construction loans to builders and developers as well as consumers who are contracting with a builder to build their own residence. As of December 31, 2007, our construction real estate portfolio consisted of 56% residential and 44% commercial for a total of $22,214,000 in construction loans. The terms of most construction and development loans range from twelve to twenty four months. Speculative loans are based on the borrower’s financial strength and cash flow position. Loan proceeds are disbursed based on a percentage of completion basis under a set budget and only after a third party inspector inspects the project. These loans generally command higher rates and fees commensurate with the risks warranted in the construction loan field. The risk in construction lending depends upon the performance of the builder in building the project to the plans and specifications of the borrower and our ability to administer and control all phases of construction disbursements. The primary source of repayment for most construction loans is the sale of the property. If the property is to be occupied by the borrower or leased to a third party, then upon completion of construction, we typically convert the loan to a permanent loan on a monthly amortization with a longer maturity.
Residential Real Estate Loans. Adjustable or fixed-interest rate residential real estate loans are made to qualified individuals for the purchase of existing single-family residences in our principal markets. We make these loans in accordance with our appraisal policy and real estate lending policy which detail maximum loan-to-value ratios and maturities. We believe that these loan-to-value ratios are sufficient to compensate us for fluctuations in real estate market values and minimize losses that could result from a downturn in the residential real estate market. We sell mortgage loans that do not conform to our policies in the secondary markets. The risk of these loans depends on our ability to sell the loans to national investors and on the frequency of interest rate changes. Our residential real estate loans are primarily in Florida.
We limit interest rate risk and credit risk on these loans by locking in the interest rate for each loan with a secondary market investor and receiving a forward sales agreement from the secondary market investor. Loans are retained for our portfolio when there is sufficient liquidity to fund the needs of the established customers and when rates are favorable to retain the loans. The loan underwriting standards and policies are generally the same for both loans sold in the secondary market and those retained in our portfolio.
Consumer and Installment Loans. Consumer loans include lines of credit and term loans secured by second mortgages on the residences of borrowers for a variety of purposes, including home improvements, education and other
3
personal expenditures. Consumer loans also include installment loans to individuals for personal, family and household purposes, including automobile and boat loans and pre-approved lines of credit. Consumer loans generally involve more risk than mortgage loans because the collateral for a defaulted loan may not provide an adequate source of repayment of the principal. This risk is due to the potential for damage to the collateral or other loss of value, and the fact that any remaining deficiency often does not warrant further collection efforts. In addition, consumer loan performance depends on the borrower’s continued financial stability and is, therefore, more likely to be adversely affected by job loss, divorce, illness or personal bankruptcy.
In addition, we have been approved for participation in the Office of Thrift Supervision pilot program, which allows us to lend up to 25% of our capital and surplus on certain types of loans.
Other Services and Products.In addition to the deposit and loan products discussed above, we also provide:
| | |
• Cash management services | | • Sweep accounts |
| |
• Telephone banking | | • Safe deposit boxes |
| |
• Traveler’s checks | | • eStatements |
| |
• Deposit pick-up for commercial customers | | • Wire transfers and ACH services |
| |
• Online banking/bill payment services | | • 1031 Exchange Services |
| |
• Automatic drafts for various accounts | | • Debit cards |
| |
• Certificate of Deposit Account Registry Service (CDARS) | | • Direct deposit of payroll and social security checks |
| |
• VISA® and MasterCard® credit card services through our correspondent banks. | | • Health Saving Accounts (HSA) |
We offer extended banking hours (both drive-in and lobby) and an after-hours depository and are associated with a shared network of automated teller machines that customers may use throughout our market areas and other regions. We are also associated with third party Internet banking service providers that enable us to provide customers with cost effective, secure and reliable Internet banking services.
Asset and Liability Management
Our main assets are cash and cash equivalents, our loan portfolio and our investment portfolio. Our liabilities consist primarily of deposits. Our objective is to support asset growth through the growth of core deposits, which include deposits of all categories made by individuals, partnerships, corporations and other entities. Consistent with the requirements of prudent banking necessary to maintain liquidity, we seek to match maturities and rates of loans and the investment portfolio with those of deposits, although exact matching is not always possible. The largest portion of our assets is invested in real estate, commercial and consumer loans. Our investment portfolio consists primarily of marketable securities of the United States government and federal agencies, generally with varied maturities.
Our asset/liability mix is monitored on a regular basis with a quarterly report detailing interest-sensitive assets and interest-sensitive liabilities. The objective of this policy is to control interest-sensitive assets and liabilities in order to minimize the impact of substantial movements in interest rates on our earnings.
Customers
The consolidation of the Florida banking industry over the last several years has created significant opportunities for community-oriented banks such as ours to build a successful, locally managed bank. We believe that many of the larger financial institutions do not provide the high level of personalized services desired by many small and medium-sized businesses and their principals. Our marketing efforts are focused on attracting small and medium-sized businesses and individuals, including service companies, manufacturing companies, commercial real estate developers, entrepreneurs and professionals, such as engineers, physicians, CPAs, architects and attorneys.
While a significant portion of our lending effort is concentrated on commercial and professional businesses, emphasis is also placed on generating a significant amount of consumer business. Many of our consumer customers are the principals and employees of our small and medium-sized business customers. We believe in old-fashioned “relationship banking,” where each customer can identify and establish a comfort level with our bank officers. We intend to continue to develop our consumer business with individuals who appreciate a high level of personal service, contact with their loan officer and
4
responsive decision-making. Most of our business is developed through our loan officers and members of our board of directors and by pursuing an aggressive strategy of calling on customers and potential customers throughout our principal market areas.
Information About Our Primary Markets
Pinellas, Hillsborough, Pasco and Charlotte Counties are considered to be our primary market areas. Pinellas County, located on Florida’s Gulf Coast, is a peninsula bordered by the Gulf of Mexico on the west and by Tampa Bay on the east. Pinellas County estimated its population in 2007 to be almost one million. Two of the top five beaches in the United States are located along the 588 miles of Pinellas County coastline, according to America’s Best Beaches’ List. Nicknamed the “Sunshine City,” St. Petersburg averages 361 sunny days every year, and is located in southeast Pinellas County. St. Petersburg is also home to the Tampa Bay Devil Rays. Top key business segments in Pinellas County are services industries, light manufacturing and financial services. Pinellas County has received the “Successful Community Award” for creating a special metropolitan region by improving housing, expanding recreational opportunities and protecting the environment. Hillsborough County is located midway along the west coast of Florida and is contiguous with Pinellas County. As of 2007, Hillsborough County estimated its population at 1,172,427. The City of Tampa is the largest city in Hillsborough County and is the third most populous city in Florida. It is approximately 20 miles northeast of St. Petersburg. Hillsborough’s key business segments include tourism, agriculture, construction, finance, health care, government, technology, and the port of Tampa, which is the seventh largest in the Nation. Tampa is home to both the NFL Tampa Bay Buccaneers and the NHL Tampa Bay Lightning. Pasco County, located on the Gulf of Mexico in the Tampa Bay area, is part of a nine-county region referred to as the “Nature Coast.” Pasco County estimated its population to be approximately 440,648 in 2007. Located in the rolling hills of eastern Pasco County, Dade City is the county seat. Pasco County’s economy has historically been tied to agriculture, however, over time it has shifted more to service, government and retail. Pasco County has a total of 745 square miles with more than 100 square miles of managed recreational facilities, including parks, four artificial reefs (one made up of surplus military tanks), more than 25 golf courses, and three State-designated canoe trails. Charlotte County is located between Lee County (Fort Myers) and Sarasota County in Southwest Florida on the Gulf of Mexico. Charlotte County estimated its population in 2007 at 170,461. Port Charlotte, the county’s geographical center, is approximately 100 miles south of St. Petersburg. Charlotte County features over 70 parks and recreational areas, including Charlotte Harbor, which is the 17th largest estuary in the Nation and the 2nd largest estuary in the State encompassing 270 square miles. The top two business segments of the County are service industries and construction. Charlotte County has been designated one of the top ten sailing destinations by SAIL magazine, and ranked 3rd “Best in America” place to live and golf by Golf Digest.
Competition
We are subject to intense competition from a variety of different competitors in our primary market areas in all phases of our operations. These competitors include:
| | • | | Large national and super-regional financial institutions that have well-established branches and significant market share in the communities we serve; |
| | • | | Finance companies, investment banking and brokerage firms, and insurance companies that offer bank-like products; |
| | • | | Credit unions, which can offer highly competitive rates on loans and deposits because they receive tax advantages not available to commercial banks; |
| | • | | Other community banks, including start-up banks, that can compete with us for customers who desire a high degree of personal service; |
| | • | | Technology-based financial institutions including large national and super-regional banks offering on-line deposit, bill payment, and mortgage loan application services; and |
| | • | | Both local and out-of-state trust companies and trust service offices. |
Other existing community banks with whom we compete, and many new community bank start-ups, have marketing strategies similar to ours. These other community banks may open new branches in the communities we serve and compete directly for customers who want the level of service offered by community banks. Other community banks also compete for the same management personnel in Florida.
Various legislative actions in recent years have led to increased competition among financial institutions. With the enactment of the Riegle-Neal Interstate Banking and Branching Efficiency Act of 1994 and other laws and regulations affecting interstate bank expansion, it is easier for financial institutions located outside of the State of Florida to enter the Florida market, including our targeted markets. In addition, recent legislative and regulatory changes and technological advances have enabled customers to conduct banking activities without regard to geographic barriers, through computer and telephone-based banking and similar services. There can be no assurance that the United States Congress, the Florida Legislature, or the applicable bank regulatory agencies will not enact legislation or promulgate rules that may further increase competitive pressures on us.
5
Personnel
At December 31, 2007, First Community had four officers and no other employees and First Community Bank had 102 full-time employees and 7 part-time persons. First Community Lender Services, Inc. has no employees of its own and operates using employees of First Community Bank.
SUPERVISION AND REGULATION
General
First Community is a registered unitary savings and loan holding company within the meaning of the Home Owners’ Loan Act (“HOLA”). First Community and First Community Bank, operate in a highly regulated environment. Our business activities, which are governed by statute, regulation and administrative policies, are supervised by a number of federal bank regulatory agencies, including the Office of Thrift Supervision, the Federal Deposit Insurance Corporation (“FDIC”) and, to a limited extent, the Federal Reserve Board. The following is a brief summary of the more recent legislation that affects our company and our subsidiaries.
Regulation of the Holding Company
Restrictions on the Acquisition of Savings Institutions. Under the change in Bank Control Act, no person may acquire control of a federal savings bank or its parent holding company, directly or indirectly, unless the Office of Thrift Supervision has been given 60 days prior written notice and has issued a notice discussing the proposed acquisition. In addition, regulations provide that no company may acquire control of a federal savings bank without the prior approval of the Office of Thrift Supervision. Any company that acquires such control becomes a “savings and loan holding company” subject to registration, examination and regulation by the Office of Thrift Supervision. Control in this context means ownership, control of, or holding proxies representing more than 25% of the voting shares of, an insured institution, the power to control in any manner the election of a majority of the directors of such institution or the power to exercise a controlling influence over the management or policies of the institution.
The Office of Thrift Supervision also has established certain rebuttable control determinations. An acquiror must file for approval of control with the Office of Thrift Supervision, or file to rebut the presumptions before surpassing a rebuttable control level of ownership. To rebut the presumption, the acquirer must file a submission with the Office of Thrift Supervision setting forth the reasons for rebuttal. The submission must be filed when the acquirer acquires more than 25% of any class of voting stock of the savings bank and when they have any of the control factors enumerated in 12 C.F.R. Section 574.4(c) which include, but are not limited to:
| | • | | The acquirer would be one of the two largest stockholders of any class of voting stock; |
| | • | | The acquirer and/or the acquirer’s representative or nominees would constitute more than one member of the savings bank’s board of directors; and |
| | • | | The acquirer or nominee or management official of the acquirer would serve as the chairman of the board of directors, chairman of the executive committee, chief executive officer, chief operating officer, chief financial officer, or in any similar policy making authority in the savings bank. |
Transactions with Affiliates. Our authority to engage in transactions with related parties or “affiliates” or to make loans to certain insiders is limited by Sections 23A and 23B of the Federal Reserve Act (“FRA”) and Regulation “W” adopted by the Federal Reserve. Section 23A limits the aggregate amount of transactions with any individual affiliate to 10% of the capital and surplus of the savings institution and also limits the aggregate amount of transactions with all affiliates to 20% of the savings institution’s capital and surplus.
Certain transactions with affiliates are required to be secured by collateral in an amount and of a type described in the FRA and the purchase of low quality assets from affiliates is generally prohibited. Section 23B provides that certain transactions with affiliates, including loans and asset purchases, must be on terms and circumstances, including credit standards, that are substantially the same or at least as favorable to the savings institution as those prevailing at the time for comparable transactions with a non-related party or non-affiliated holding company. In the absence of comparable transactions, such transactions may only occur under terms and circumstances, including credit standards that in good faith would be offered to or would apply to non-related parties or non-affiliated companies. Notwithstanding Sections 23A and 23B, savings institutions are prohibited from lending to any affiliate that is engaged in activities that are not permissible for bank holding companies under Section 4(c) of the Bank Holding Company Act of 1956. Further, no savings institution may purchase the securities of any affiliate other than a subsidiary.
6
In addition, Sections 22(g) and 22(h) of the FRA and Regulation O (which set limits on extensions of credit to executive officers, directors and 10% stockholders, as well as companies which such persons control) apply to savings institutions. Among other things, such loans must be made on terms, including interest rates, substantially the same as loans to unaffiliated individuals and which involve no more than the normal risk of collectability. These regulations also place limits on the amount of loans we may make to such persons. These restrictions apply in addition to certain restrictions on transactions with affiliates contained in the Office of Thrift Supervision regulations.
Support of Subsidiary Depository Institutions. Under Office of Thrift Supervision policy, First Community is expected to act as a source of financial strength to and to commit resources to support First Community Bank. This support may be required at times when, in the absence of such Office of Thrift Supervision policy, First Community might not be inclined to provide such support. In addition, any capital loans by First Community to First Community Bank must be subordinate in right of payment to deposits and to certain other indebtedness of First Community Bank. In the event of bankruptcy, any commitment by a holding company to a federal bank regulatory agency to maintain the capital of a subsidiary depository institution will be assumed by the bankruptcy trustee and will be entitled to a priority of payment.
Under the Federal Deposit Insurance Act, a depository institution of a holding company can be held liable for any loss incurred by, or reasonably expected to be incurred by, the FDIC, in connection with:
| | • | | The default of a commonly controlled FDIC-insured depository institution; or |
| | • | | Any assistance provided by the FDIC to any commonly controlled FDIC-insured depository institution in danger of default. |
Default is defined generally as the appointment of a conservator or a receiver and “in danger of default” is defined generally as the existence of certain conditions indicating that a default is likely to occur in the absence of regulatory assistance.
Payment of Dividends. There are statutory and regulatory limitations on the payment of dividends by First Community Bank as proscribed by the Office of Thrift Supervision’s capital distribution regulation. Under the regulation, First Community Bank may make a capital distribution without the approval of the Office of Thrift Supervision, provided the Office of Thrift Supervision is notified 30 days before declaration of the capital distribution. First Community Bank must also meet the following requirements:
| | • | | It is not of supervisory concern, and will remain adequately or well-capitalized, as defined in the Office of Thrift Supervision prompt corrective action regulations, following the proposed distribution; and |
| | • | | The distribution does not exceed First Community Bank’s net income for the calendar year-to-date, plus retained net income for the previous two calendar years (less any dividends previously paid). |
If First Community Bank does not meet the above-stated requirements, it must obtain the prior approval of the Office of Thrift Supervision before declaring any proposed distributions. The Office of Thrift Supervision can prohibit a proposed capital distribution by a savings institution, which would otherwise be permitted by the regulation, if the Office of Thrift Supervision determines that such distribution would constitute an unsafe or unsound practice. First Community Bank has never paid a dividend; instead earnings are reinvested in First Community Bank to support our current growth rate.
Regulation of First Community Bank
Capital Requirements. Both the Office of Thrift Supervision and the FDIC have promulgated regulations setting forth capital requirements applicable to depository institutions. The Office of Thrift Supervision capital regulations require savings institutions to meet three capital standards:
| | • | | A 1.5% tangible capital ratio (defined as the ratio of tangible capital to adjusted total assets); |
| | • | | A 4% leverage (core capital) ratio (defined as the ratio of core capital to adjusted total assets); and |
| | • | | An 8% risk-based capital standard as defined below. |
First Community Bank’s tangible capital, core capital, and risk-based capital ratios at December 31, 2007, were 7.71%, 10.02%, and 11.23%, respectively.
Core capital is defined as common stockholder’s equity (including retained earnings), certain non-cumulative perpetual preferred stock and related surplus, minority interests in equity accounts of consolidated subsidiaries, certain
7
goodwill and certain mortgage servicing rights less certain intangible assets, mortgage servicing rights less certain intangible assets, mortgage servicing rights and investments in non-includable subsidiaries. Tangible capital is defined in the same manner as core capital, except that all intangible assets (excluding certain mortgage servicing rights) must be deducted. Adjusted total assets is defined as GAAP total assets, minus intangible assets (except those included in core capital). The Office of Thrift Supervision regulations also require that in calculating the leverage ratio, tangible and risk-based capital standards, savings institutions must deduct investments in and loans to subsidiaries engaged in activities not permissible for a national bank.
The Office of Thrift Supervision risk-based capital standard for savings institutions requires that total capital (comprised of core capital and supplementary capital) be at least 8% of risk-weighted assets. In determining risk-weighted assets, all assets, including certain off-balance sheet assets, are multiplied by a risk-weight of 0% to 100%, as assigned by the Office of Thrift Supervision capital regulation based on the risks Office of Thrift Supervision believes are inherent in the type of asset. Generally, zero weight is assigned to risk-free assets, such as cash and unconditionally guaranteed United States Government securities. A weight of 20% is assigned to, among other things, certain obligations of United States Government-sponsored agencies (such as the FNMA and the FHLMC) and certain high quality mortgage-related securities. A weight of 50% is assigned to qualifying mortgage loans and certain other mortgaged-related securities, repossessed assets and assets that are 90 days or more past due.
The components of core capital are equivalent to those discussed above. The components of supplementary capital include permanent capital instruments (such as cumulative perpetual preferred stock, mandatory convertible subordinated debt and perpetual subordinated debt), maturing capital instruments (such as mandatory convertible subordinated debt and intermediate-term preferred stock) and the allowance for loan and lease losses. Allowance for loan and lease losses includable in supplementary capital is limited to a maximum of 1.25% of risk-weighted assets. Overall, the amount of capital counted toward supplementary capital cannot exceed 100% of core capital.
At December 31, 2007, First Community Bank exceeded each of its capital requirements. See Note 12 to the consolidated financial statements for a summary of the regulatory capital levels and percentages.
Standards for Safety and Soundness. The FDICIA, as amended by the Reigle Community Development and Regulatory Improvement Act of 1994, requires each federal banking agency to prescribe standards relating to internal controls, information systems and audit systems, loan documentation, credit underwriting, interest rate risk exposure, asset growth, and compensation, fees and benefits and such other operational and managerial standards as the agency deems appropriate for all insured depository institutions and their holding companies. The Office of Thrift Supervision and the other federal banking agencies adopted a rule establishing deadlines for the agencies to submit and review safety and soundness compliance plans and Interagency Guidelines Establishing Standards for Safety and Soundness. The guidelines require depository institutions to maintain internal controls and information systems and internal audit systems that are appropriate for the size, nature and scope of the institution’s business.
The guidelines also establish certain basic standards for loan documentation, credit underwriting, interest rate-risk exposure, and asset growth. The guidelines further provide that savings institutions should maintain safeguards to prevent the payment of compensation, fees and benefits that are excessive or that could lead to material financial loss, and that they should take into account factors such as compensation practices at comparable institutions. The Interagency Guidelines also include asset quality and earnings standards.
If the Office of Thrift Supervision determines that a savings institution is not in compliance with the safety and soundness guidelines, it may require the institution to submit an acceptable plan to achieve compliance with the guidelines. A savings institution is required to submit an acceptable compliance plan to the Office of Thrift Supervision within 30 days after receipt of a request for such a plan. Failure to submit or implement a compliance plan may subject the institution to regulatory sanctions.
Insurance of Deposit Accounts. The FDIC currently maintains the Deposit Insurance Fund (“DIF”), which was created in 2006 in the merger of the Bank Insurance Fund and Savings Association Insurance Fund. The deposit accounts of the Bank are insured by the DIF to the maximum amount provided by law. This insurance is backed by the full faith and credit of the United States Government.
As insurer, the FDIC is authorized to conduct examinations of and to require reporting by DIF-insured institutions. It also may prohibit any DIF-insured institution from engaging in any activity the FDIC determines by regulation or order to pose a serious threat to the DIF. The FDIC also has the authority to take enforcement actions against insured institutions.
The FDIC’s regulations for risk-based deposit insurance assessments establish four Risk Categories. Risk Category I is for well-capitalized institutions that are financially sound with only a few minor weaknesses. Risk Categories II, III and
8
IV present progressively greater risks to the DIF. Effective January 1, 2007, Risk Category I institutions pay quarterly assessments for deposit insurance at annual rates of 5 to 7 basis points. The rates for Risk Categories II, III and IV are 7, 28 and 43 basis points, respectively. With advance notice to insured institutions, rates are subject to change. Within Risk Category I, the precise rate for an individual institution with less than $10 billion in assets is generally determined by a formula using CAMELS ratings, which are assigned in examinations, and financial ratios. A different method applies for larger institutions. The rate for an individual institution is applied to it is assessment base, consisting generally of its deposit liabilities subject to certain adjustments. An institution insured by the FDIC on December 31, 1996, which had previously paid assessments (or its successor) is eligible for certain credit against deposit insurance assessments.
The FDIC also collects assessments against the assessable deposits of insured institutions to service the debt on bonds issued during the 1980’s to resolve the thrift bailout. During the year ended December 31, 2007, the quarterly assessments averaged approximately .00285% of assessable deposits, and First Community Bank paid approximately $38,500 in assessments.
Business Activities.
Qualified Thrift Lender Test (“QTL”). The HOLA requires savings institutions to meet a QTL test. The QTL test, as amended by the FDICIA, requires a savings institution to maintain at least 65% of its “portfolio assets” (as defined by regulation) in qualified thrift investments, primarily residential mortgages and related investments on a monthly basis in nine out of every 12 months. The definition of portfolio assets has recently been amended to include the small business loans upon which we focus. As of December 31, 2007, we exceeded the QTL test, maintaining approximately 84.81% of our portfolio assets in qualified thrift investments.
Interstate Banking. Federally-chartered savings institutions are allowed to branch nationwide to the extent allowed by federal statute. This ability permits savings institutions with interstate networks to diversify their loan portfolios and lines of business. The Office of Thrift Supervision authority preempts any state law purporting to regulate branching by federal savings institutions. Prior approval of the Office of Thrift Supervision is required for a savings institution to branch interstate or intrastate. To obtain supervisory clearance for branching, an applicant’s regulatory capital must meet or exceed the minimum requirements established by law and by the Office of Thrift Supervision regulations. In addition, the savings institution must have a satisfactory record under the Community Reinvestment Act (“CRA”). First Community Bank does not conduct interstate branching operations and does not plan to do so in the foreseeable future.
The Reigle-Neal Interstate Banking and Branching Efficiency Act of 1994 (“Interstate Act”) eliminated many existing restrictions on interstate banking by authorizing interstate acquisitions of financial institutions by bank holding companies without geographic limitations. Under the Interstate Act, existing restrictions on interstate acquisitions of banks by bank holding companies were repealed. Bank holding companies located in Florida are able to acquire any Florida-based bank, subject to certain deposit percentage and other restrictions. The legislation also provides thatde novo branching by an out-of-state bank is permitted only if it is expressly permitted by the laws of the host state. The authority of a bank to establish and operate branches within a state is subject to applicable state branching laws. Florida law permits interstate branching through the acquisition of a bank in existence for more than three years, but prohibits de novo branching by out of state banks.
Office of Thrift Supervision Assessments. Savings institutions are required by Office of Thrift Supervision regulation to pay assessments to the Office of Thrift Supervision to fund the operations of the Office of Thrift Supervision. The general assessment, to be paid on a semiannually basis, is computed upon the savings institution’s total assets, including consolidated subsidiaries, as reported in the institution’s latest quarterly thrift financial report.
The Office of Thrift Supervision also assesses fees to savings and loan holding companies such as First Community. The semi-annual assessment for savings and loan holding companies includes a $3,000 base assessment with an additional assessment based on the savings and loan holding company’s risk or complexity, organizational form and condition.
Federal Home Loan Bank System.First Community Bank is a member of the Federal Home Loan Bank (“FHLB”) system, which consists of 12 regional FHLBs. The FHLB provides a central credit facility primarily for member institutions. As a member of the FHLB-Atlanta, First Community Bank is required to acquire and hold shares of capital stock in that FHLB in an amount at least equal to 4.5% of our advances (borrowings) from the FHLB-Atlanta plus 8% of certain assets sold to the FHLB-Atlanta. We are in compliance with this requirement. FHLB advances must be secured by specified types of collateral and may be obtained only for the purpose of providing funds for residential housing finance.
The FHLBs are required to provide funds for the resolution of insolvent savings institutions and to contribute funds for affordable housing programs. These requirements could reduce the amount of dividends that the FHLBs pay to their members and could also result in the FHLBs imposing a higher rate of interest on advances to members. For the year ended
9
December 31, 2007, dividends paid by the FHLB-Atlanta to First Community Bank amounted to approximately $101,000, at a yield of 5.94% on our investment. Should dividends be reduced, or interest on FHLB advances increased, our consolidated net interest income might also be reduced. Furthermore, there can be no assurance that the value of the FHLB-Atlanta stock we hold will not decrease as a result of any new legislation.
Federal Reserve System. Federal Reserve regulations require depository institutions to maintain non-interest-earning reserves against their transaction accounts (primarily NOW and regular checking accounts). The Federal Reserve regulations generally require that reserves of 3% must be maintained against aggregate transaction accounts of $40.6 million or less (subject to adjustment by the Federal Reserve) and an initial reserve of $1,218,000 plus 10% of accounts in excess of $40.6 million. The first $6.6 million of otherwise reversible balances (subject to adjustments by the Federal Reserve) are exempted from the reserve requirements. We are in compliance with the foregoing requirements. The balances maintained to meet the reserve requirements imposed by the Federal Reserve may be used to satisfy liquidity requirements imposed by the Office of Thrift Supervision.
Because required reserves must be maintained in the form of either vault cash, a non-interest-bearing account at a Federal Reserve or a pass-through account as defined by the Federal Reserve, the effect of this reserve requirement is to reduce our interest-earning assets. FHLB System members are also authorized to borrow from the Federal Reserve discount window, however, Federal Reserve regulations require institutions to exhaust all FHLB sources before borrowing from a Federal Reserve discount window.
Other Laws. State usury and credit laws limit the amount of interest and various other charges collected or contracted by a bank on loans. Our loans are also subject to federal laws applicable to credit transactions, such as the:
| | • | | Federal Truth-In-Lending Act, which governs disclosures of credit terms to consumer borrowers; |
| | • | | Community Reinvestment Act, which requires financial institutions to meet their obligations to provide for the total credit needs of the communities they serve, including investing their assets in loans to low- and moderate-income borrowers; |
| | • | | Home Mortgage Disclosure Act requiring financial institutions to provide information to enable public officials to determine whether a financial institution is fulfilling its obligations to meet the housing needs of the community it serves; |
| | • | | Equal Credit Opportunity Act prohibiting discrimination on the basis of race, creed or other prohibitive factors in extending credit; |
| | • | | Real Estate Settlement Procedures Act, which requires lenders to disclose certain information regarding the nature and cost of real estate settlements, and prohibits certain lending practices, as well as limits escrow account amounts in real estate transactions; |
| | • | | Fair Credit Reporting Act governing the manner in which consumer debts may be collected by collection agencies; and |
| | • | | Rules and regulations of various federal agencies charged with the responsibility of implementing such federal laws. Our operations are also subject to the: |
| | • | | Privacy provisions of the Gramm-Leach-Bliley Act of 1999, which require us to maintain privacy policies intended to safeguard consumer financial information, to disclose these policies to our customers, and to allow customers to “opt out” of having their financial service providers disclose their confidential financial information to non-affiliated third parties, subject to certain exceptions; |
| | • | | Right to Financial Privacy Act, which imposes a duty to maintain confidentiality of consumer financial records and prescribes procedures for complying with administrative subpoenas of financial records; and |
| | • | | Electronic Funds Transfer Act and Regulation E, which govern automatic deposits to, and withdrawals from, deposit accounts and customers’ rights and liabilities arising from the use of debit cards, automated teller machines and other electronic banking services. |
Financial Modernization. The Gramm-Leach-Bliley Act of 1999 sought to achieve significant modernization of the federal bank regulatory framework by allowing the consolidation of banking institutions with other types of financial services firms, subject to various restrictions and requirements. In general, the Gramm-Leach-Bliley Act repealed most of the federal statutory barriers which separated commercial banking firms from insurance and securities firms and authorized the consolidation of such firms in a “financial services holding company”. We have no immediate plans to utilize the structural options created by the Gramm-Leach-Bliley Act, but we may develop such plans in the future.
10
After the September 11, 2001 terrorist attacks in New York and Washington, D.C., the United States government acted in several ways to tighten control on activities perceived to be connected to money laundering and terrorist funding. A series of orders were issued which identified terrorists and terrorist organizations and required the blocking of property and assets of, as well as prohibiting all transactions or dealings with, such terrorists, terrorist organizations and those that assist or sponsor them. The USA Patriot Act:
| | • | | Substantially broadens existing anti-money laundering legislation and the extraterritorial jurisdiction of the United States; |
| | • | | Imposes new compliance and due diligence obligations; |
| | • | | Creates new crimes and penalties; |
| | • | | Compels the production of documents located both inside and outside the United States; including those of foreign institutions that have a correspondent relationship in the United States; and |
| | • | | Clarifies the safe harbor from civil liability to customers. |
In addition, the United States Treasury Department issued regulations in cooperation with the federal banking agencies, the Securities and Exchange Commission, the Commodity Futures Trading Commission and the Department of Justice to:
| | • | | Require customer identification and verification; |
| | • | | Expand the money-laundering program requirement to the major financial services sectors; including insurance and unregistered investment companies, such as hedge funds; and |
| | • | | Facilitate and permit the sharing of information between law enforcement and financial institutions, as well as among financial institutions themselves. |
The United States Treasury Department also has created the Treasury USA Patriot Act Task Force to work with other financial regulators, the regulated community, law enforcement and consumers to continually improve the regulations.
On July 30, 2002, President Bush signed into law the Sarbanes-Oxley Act of 2002 (“Act”). The Securities and Exchange Commission (“SEC”) has promulgated certain regulations pursuant to the Act and will continue to propose additional implementing or clarifying regulations as necessary in furtherance of the Act. The passage of the Act and the regulations implemented by the SEC subject publicly traded companies to additional and more cumbersome reporting regulations and disclosure. Compliance with the Act and corresponding regulations may increase our operating expenses. The effective date of the application of the provision of Section 404 of the Act concerning independent auditor attestation of internal control compliance reporting for non-accelerated filers such as First Community has been extended to the first fiscal year ending on or after July 15, 2008.
Investing in our common stock involves risk. In addition to the other information set forth elsewhere in this Report, the following factors relating to us and our common stock should be carefully considered in deciding whether to invest in our common stock.
Our growth strategy may not be successful
As a strategy, we have sought to increase the size of our franchise through branch expansion and rapid growth, aggressively pursuing business development opportunities. No assurance can be provided that we will continue to be successful in increasing the volume of loans and deposits at acceptable risk levels and upon acceptable terms and expanding our asset base, while managing the costs and implementation risks associated with this growth strategy. There also can be no assurance that any further expansion will be profitable or that we will continue to be able to sustain our rate of growth, either through internal growth or through other successful expansions of our banking markets, or that we will be able to maintain capital sufficient to support our continued growth.
Losses from loan defaults may exceed the allowance we establish for that purpose, which will have an adverse effect on our business
If a significant number of loans are not repaid, it would have an adverse effect on our earnings and overall financial condition. Like all financial institutions, we maintain an allowance for loan losses to provide for losses inherent in the loan portfolio. The allowance for loan losses reflects our management’s best estimate of probable losses in the loan portfolio at the relevant balance sheet date. This evaluation is primarily based upon a review of our and the banking industry’s historical loan loss experience, known risks contained in the loan portfolio, composition and growth of the loan portfolio,
11
and economic factors. However, the determination of an appropriate level of loan loss allowance is an inherently difficult process and is based on numerous assumptions. As a result, our allowance for loan losses may not be adequate to cover actual losses, and future provisions for loan losses may adversely affect our earnings.
Our loan portfolio would be impaired if real estate values in our target markets decline
A significant portion of our loan portfolio consists of mortgages secured by real estate located in our primary market areas of Hillsborough and Pinellas Counties. Real estate values and real estate markets are generally affected by, among other things, changes in national, regional or local economic conditions; fluctuations in interest rates and the availability of loans to potential purchasers; changes in the tax laws and other governmental statutes, regulations and policies; and acts of nature. Over the past year, real estate prices in each of our markets have declined and if real estate prices continue to decline in any of these markets, the value of the real estate collateral securing our loans could be reduced. Such a reduction in the value of our collateral could increase the number of non-performing loans and adversely affect our financial performance.
Weakness in the economy and in the real estate market within our geographic footprint may adversely affect us
If the strength of the local economies in which we conduct operations declines, or continues to decline, this could result in, among other things, a deterioration of credit quality or a reduced demand for credit, including a resultant effect on our loan portfolio and allowance for loan and lease losses. The vast majority of our loan portfolio is secured by real estate or other commercial assets in our Florida markets. Certain markets have been particularly adversely affected by declines in real estate value, declines in home sale volumes, and declines in new home building. In 2007, the inventory of houses for sale in some of our markets has increased to a two-year supply. These declines may also adversely affect the general economy in our markets. These factors could result in higher delinquencies and greater charge-offs in future periods, which would materially adversely affect our financial condition and results of operations.
Changes in interest rates can have an adverse effect on our profitability
Our earnings and cash flows are largely dependent upon our net interest income. Net interest income is the difference between interest income earned on interest earning assets such as loans and investment securities and interest expense paid on interest bearing liabilities such as deposits and borrowed funds. Interest rates are highly sensitive to many factors that are beyond our control, including general economic conditions, competition, and policies of various governmental and regulatory agencies and, in particular, the Board of Governors of the Federal Reserve System. Changes in monetary policy, including changes in interest rates, could influence not only the interest we receive on loans and investment securities and the amount of interest it pays on deposits and borrowings, but such changes could also affect (i) our ability to originate loans and obtain deposits, (ii) the fair value of our financial assets and liabilities, and (iii) the average duration of our assets and liabilities. If the interest rates paid on deposits and other borrowings increase at a faster rate than the interest rates received on loans and other investments, our net interest income, and therefore earnings, could be adversely affected. Earnings could also be adversely affected if the interest rates received on loans and other investments fall more quickly than the interest rates paid on deposits and other borrowings.
Since January 1, 2008, the Federal Reserve Bank has dropped the prime rate 200 basis points from 7.25% to 5.25%. Although management believes it has implemented effective asset and liability management strategies to reduce the potential effects of changes in interest rates on our results of operations, any substantial unexpected, prolonged change in market interest rates could have a material adverse effect on our financial condition and results of operations.
Our business may suffer if we lose key employees
Our success is largely dependent on the personal contacts of our officers and employees in our market areas. If we lose key employees, temporarily or permanently, our business could be negatively impacted. We could be particularly hurt if our key employees went to work for our competitors. Our future success depends on the continued contributions of our existing senior management personnel, including our Chief Executive Officer and President Kenneth P. Cherven. We have entered into an employment agreement with Chief Executive Officer and President Cherven which contains standard non-competition provisions to help alleviate some of this risk.
Our subsidiaries face strong competition, which may limit their asset growth and profitability
Our primary market area is the urban areas in Hillsborough and Pinellas Counties, and to a lesser extent Pasco and Charlotte Counties. The banking business in these areas is extremely competitive, and the level of competition facing us following our expansion plans may increase further, which may limit our asset growth and profitability. Our subsidiary bank and service company experience competition in both lending and attracting funds from other banks, savings
12
institutions, and non-bank financial institutions located within its market area, many of which are significantly larger institutions. Non-bank competitors competing for deposits and deposit type accounts include mortgage bankers and brokers, finance companies, credit unions, securities firms, money market funds, life insurance companies and the mutual funds industry. For loans, we encounter competition from other banks, savings associations, finance companies, mortgage bankers and brokers, insurance companies, small loan and credit card companies, credit unions, pension trusts and securities firms.
Our financial results could be adversely affected if adverse economic conditions in our target markets exist for a prolonged period
Our success will depend in large part on economic conditions in West Central Florida. A prolonged economic downturn or recession in these markets could increase our nonperforming assets, which would result in operating losses, impaired liquidity and the erosion of capital. A variety of factors could cause such an economic dislocation or recession, including adverse developments in the industries in these areas such as tourism, or natural disasters such as hurricanes, floods or tornadoes, or additional terrorist activities such as those our country experienced in September 2001.
First Community and its subsidiaries operate in an environment highly regulated by state and federal government; changes in banking laws and regulations could have a negative impact on our business
As a unitary holding company, First Community is regulated primarily by the OTS. Our current Subsidiaries are regulated primarily by the Office of Thrift Supervision, the Federal Deposit Insurance Corporation and the Florida Office of Finance Regulation. Federal and various state laws and regulations govern numerous aspects of our operations and the operations of our Subsidiaries, including:
| | • | | Adequate capital and financial condition; |
| | • | | Permissible types and amounts of extensions of credit and investments; |
| | • | | Permissible non-banking activities; and |
| | • | | Restrictions on dividend payments. |
Federal and state regulatory agencies have extensive discretion and power to prevent or remedy unsafe or unsound practices or violations of law by our holding company, our subsidiary bank and service company. Following such examinations, we may be required, among other things, to change its asset valuations or the amounts of required loan loss allowances or to restrict its operations, based on information available to them at the time of their respective examination.
Regulatory action could severely limit future expansion plans
To carry out some of our expansion plans, we are required to obtain permission from the Office of Thrift Supervision. Application for the acquisition of existing thrifts and banks are submitted to the federal and state bank regulatory agencies for their approval. The future climate for regulatory approval is impossible to predict. Regulatory agencies could prohibit or otherwise significantly restrict our expansion plans, as well as those of our Subsidiaries, which could limit our ability to increase revenue.
Investors may face dilution resulting from the issuance of common stock in the future
We have the power to issue common stock without shareholder approval, up to the number of authorized shares set forth in our Articles of Incorporation. Our Board of Directors may determine from time to time a need to obtain additional capital through the issuance of additional shares of common stock or other securities, subject to limitations imposed by the NASDAQ Capital Market and the Office of Thrift Supervision. There can be no assurance that such shares can be issued at prices or on terms better than or equal to the terms obtained by our current shareholders. The issuance of any additional shares of common stock by us in the future may result in a reduction of the book value or market price, if any, of the then-outstanding common stock. Issuance of additional shares of common stock will reduce the proportionate ownership and voting power of our existing shareholders.
Shares of our preferred stock may be issued in the future which could materially adversely affect the rights of the holders of our common stock
Pursuant to our Articles of Incorporation, we have the authority to issue additional series of preferred stock and to determine the designations, preferences, rights and qualifications or restrictions of those shares without any further vote or action of the shareholders. The rights of the holders of our common stock will be subject to, and may be materially adversely affected by, the rights of the holders of any preferred stock that may be issued by us in the future.
13
We may need additional capital in the future and this capital may not be available when needed or at all
We may need to incur additional debt or equity financing in the near future to fund future growth and meet our capital needs. We cannot assure you that such financing will be available to us on acceptable terms or at all. If we are unable to obtain future financing, we may not have the resources available to fund our planned growth.
Future sales of our common stock could depress the price of the common stock
Sales of a substantial number of shares of our common stock in the public market by our shareholders, or the perception that such sales are likely to occur, could cause the market price of our common stock to decline.
There are substantial regulatory limitations on ownership of our common stock and changes of control
With certain limited exceptions, federal regulations prohibit a person or company or a group of persons deemed to be “acting in concert” from, directly or indirectly, acquiring 10% or more (5% if the acquirer is a bank holding company) of any class of our voting stock or obtaining the ability to control in any manner the election of a majority of our directors or otherwise direct our management or our policies without prior notice or application to and the approval of the Office of Thrift Supervision.
Although publicly traded, our common stock has substantially less liquidity than the average trading market for a stock quoted on the NASDAQ Capital Market, and our price may fluctuate in the future
Although our common stock is listed for trading on the NASDAQ Capital Market, the trading market in our common stock has substantially less liquidity than the average trading market for companies quoted on the NASDAQ Capital Market. A public trading market having the desired characteristics of depth, liquidity and orderliness depends on the presence in the marketplace of willing buyers and sellers of our common stock at any given time. This presence depends on the individual decisions of investors and general economic and market conditions over which we have no control.
The market price of our common stock may fluctuate in the future, and these fluctuations may be unrelated to our performance. General market price declines or overall market volatility in the future could adversely affect the price of our common stock, and the current market price may not be indicative of future market prices.
| Item 1B. | Unresolved Staff Comments. |
Not applicable.
| Item 2. | Description of Property. |
We lease our corporate headquarters, which also serves as our Mid-County office. Our headquarters is located at 9001 Belcher Road, Pinellas Park, Florida 33782 and consists of a 7,200 square foot, two-story stand alone building. The facility has three drive-through lanes and an ATM machine.
In addition to our headquarters, we currently have eight branch offices: St. Petersburg, Largo, South Shore, West Shore, Dade City, Port Charlotte, Punta Gorda and Veterans. We own our West Shore, Port Charlotte, Punta Gorda and Veterans offices. Our West Shore office in Hillsborough County is a two-story, 6,200 square foot building, with four drive-through lanes and an ATM machine. The Port Charlotte office is located in a stand-alone building consisting of approximately 4,000 square feet, with one drive-through lane. We renovated a 1,509 square foot vacant commercial building for our Punta Gorda office, which has two drive-through lanes, plus a drive-up ATM. The Veterans office is a two-story, 7,400 square foot building with four drive-through lanes and an ATM machine. We lease the St. Petersburg, Largo, South Shore, and Dade City offices. The St. Petersburg office consists of a 7,400 square foot, single story facility, with three drive-through lanes and an ATM machine. The Largo office consists of a 2,000 square foot, single story, stand alone facility with one drive-through lane. Our South Shore office, located in Apollo Beach in Hillsborough County, is a 3,227 square feet facility with one drive-through lane. The Dade City office consists of 1,400 square feet and is located in a retail center. During 2008, we will open one office in Pasco County. The Zephyrhills office will be a 3,200 square foot building of “Systems Built” construction located on an out parcel of the Merchant Square Plaza on U.S. 301. It will have two drive through lanes, and a drive-up ATM.
We operate a 400 square foot loan production facility in Bradenton, Florida and a 5,749 square foot operations center in Largo, Florida. Both facilities are leased.
| Item 3. | Legal Proceedings. |
There are no pending legal proceedings to which we are a party or to which any of our properties are subject.
14
| Item 4. | Submission of Matters to a Vote of Security Holders. |
No matters were submitted to a vote of security holders, through the solicitation of proxies or otherwise, during the fourth quarter of 2007.
PART II
| Item 5. | Market for Common Equity and Related Stockholder Matters. |
On September 4, 2003, our stock began trading on The NASDAQ SmallCap Market (currently the NASDAQ Capital Market) under the symbol “FCFL.” As of March 3, 2008, there were 153 registered holders of common stock of First Community and approximately 518 street name holders. On March 15, 2005, we paid a stock dividend in common stock equal to 5% of the outstanding shares to shareholders of record as of the close of business on March 1, 2005. On January 20, 2006, a three-for-two stock split was issued to shareholders of record as of the close of business on January 10, 2006. On February 28, 2007 we paid a common stock dividend equal to 5% of our common shares outstanding to record holders as of the close of business on February 12, 2007.
On March 3, 2008, the closing sales price of our common stock was $10.15 compared to $11.00 at December 31, 2007.
| | | | | | | | | | | | |
| | | Calendar Years |
| | | 2007 | | 2006 |
| | | Low | | High | | Low | | High |
| | | (Per share) | | (Per share) |
First Quarter* | | $ | 18.05 | | $ | 22.00 | | $ | 17.00 | | $ | 28.24 |
Second Quarter* | | | 14.05 | | | 19.00 | | | 19.75 | | | 21.75 |
Third Quarter* | | | 13.57 | | | 17.24 | | | 18.77 | | | 21.75 |
Fourth Quarter* | | | 10.98 | | | 14.60 | | | 18.51 | | | 20.58 |
| * | Reflects the 5% stock dividends paid on March 15, 2005 and February 28, 2007, and three-for-stock split issued on January 20, 2006. |
Equity Compensation Plan Information
| | | | | | | |
Plan Category | | Number of Securities to be
Issued Upon Exercise of
Outstanding Options | | Weighted-Average
Exercise Price of
Outstanding Options(1)) | | Number of Securities
Remaining Available
for Future Issuance
Under Equity
Compensation Plans(2)) |
Equity compensation plans approved by security holders | | 685,721 | | $ | 10.71 | | 55,790 |
Equity compensation plans not approved by security holders | | | | | | | |
| | | | | | | |
Total | | 685,721 | | $ | 10.71 | | 55,790 |
| | | | | | | |
(1) | Reflects the 5% stock dividends paid on March 15, 2005 and February 28, 2007, and the three-for-two stock split issued on January 20, 2006. |
(2) | Excludes securities reflected in first column. |
(Remainder of this page intentionally left blank)
15
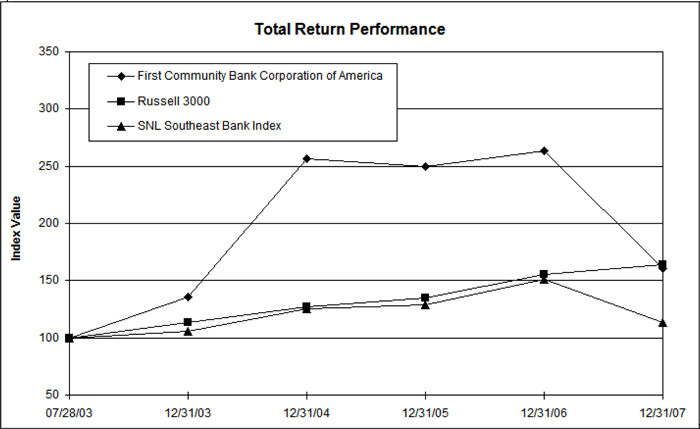
Stock Performance Graph
The following graph compares the cumulative stockholder’s return on First Community’s common stock with: (i) SNL Financial LC’s index for southeastern banks and bank holding companies; and (ii) the Russell 3000 Index, which pertains to listed companies representing 98% of the U.S. market for the period from July 28, 2003 to December 31, 2007, inclusive.
First Community Bank Corporation of America
| | | | | | | | | | |
| | | Period Ending |
Index | | 12/31/03 | | 12/31/04 | | 12/31/05 | | 12/31/06 | | 12/31/07 |
First Community Bank Corporation of America | | 135.40 | | 256.65 | | 249.35 | | 263.29 | | 160.98 |
Russell 3000 | | 113.22 | | 126.74 | | 134.50 | | 155.64 | | 163.64 |
SNL Southeast Bank Index | | 106.02 | | 125.72 | | 128.69 | | 150.90 | | 113.68 |
16
| Item 6. | Selected Consolidated Financial Data |
The following selected consolidated financial data, is derived from our financial statements and other data. The selected consolidated financial data should be read in conjunction with our financial statements, including the financial statement notes included elsewhere herein. Net loans are stated net of unearned income. Earnings per share is computed using the weighted-average number of shares of common stock and dilutive common stock equivalents from stock options as required. Book value per share excludes the effect of any outstanding stock options.
| | | | | | | | | | | | | | | | | | | | |
| | | At or for the year ended December 31, | |
| | | 2007 | | | 2006 | | | 2005 | | | 2004 | | | 2003 | |
| | | (Dollars in thousands, except per share data) | |
Total assets | | $ | 436,481 | | | $ | 390,899 | | | $ | 324,754 | | | $ | 241,806 | | | $ | 180,437 | |
Cash and cash equivalents | | | 9,100 | | | | 11,527 | | | | 21,698 | | | | 9,738 | | | | 3,197 | |
Securities available for sale | | | 6,847 | | | | 4,188 | | | | 8,918 | | | | 13,032 | | | | 3,949 | |
Securities held to maturity | | | 10,330 | | | | 11,151 | | | | 5,278 | | | | 1,775 | | | | 3,477 | |
Loans, net | | | 382,551 | | | | 346,788 | | | | 272,534 | | | | 205,789 | | | | 160,236 | |
Deposit accounts | | | 334,620 | | | | 299,710 | | | | 272,629 | | | | 200,718 | | | | 134,529 | |
Stockholders’ equity | | | 36,968 | | | | 33,682 | | | | 29,147 | | | | 23,618 | | | | 20,184 | |
Selected Operating Data: | | | | | | | | | | | | | | | | | | | | |
Total interest income | | $ | 28,830 | | | $ | 24,462 | | | $ | 16,765 | | | $ | 11,562 | | | $ | 9,211 | |
Total interest expense | | | 13,843 | | | | 9,627 | | | | 4,795 | | | | 3,212 | | | | 2,792 | |
Net interest income | | | 14,987 | | | | 14,835 | | | | 11,970 | | | | 8,350 | | | | 6,419 | |
Provision for loan losses | | | 1,165 | | | | 230 | | | | 795 | | | | 605 | | | | 668 | |
Net interest income after provision for loan losses | | | 13,822 | | | | 14,605 | | | | 11,175 | | | | 7,745 | | | | 5,751 | |
Non-interest income | | | 1,814 | | | | 1,583 | | | | 1,165 | | | | 1,081 | | | | 1,248 | |
Non-interest expenses | | | 11,219 | | | | 10,434 | | | | 7,805 | | | | 5,620 | | | | 4,700 | |
Net earnings | | | 2,865 | | | | 3,652 | | | | 2,863 | | | | 2,023 | | | | 1,468 | |
Per Share Data(*): | | | | | | | | | | | | | | | | | | | | |
Basic earnings per share | | $ | .70 | | | $ | .91 | | | $ | .82 | | | $ | .59 | | | $ | .52 | |
Diluted earnings per share | | $ | .67 | | | | .85 | | | | .75 | | | | .53 | | | | .48 | |
Book value per share | | $ | 9.06 | | | | 8.35 | | | | 7.78 | | | | 6.75 | | | | 6.13 | |
Performance Ratios: | | | | | | | | | | | | | | | | | | | | |
Return on average assets (R.O.A.) | | | .69 | % | | | 1.03 | % | | | 1.02 | % | | | 0.94 | % | | | 0.89 | % |
Return on average equity (R.O.E.) | | | 8.05 | % | | | 11.59 | % | | | 11.34 | % | | | 9.15 | % | | | 8.98 | % |
Dividend payout ratio | | | — | | | | — | | | | — | | | | — | | | | — | |
Equity to Assets | | | 8.47 | % | | | 8.62 | % | | | 8.98 | % | | | 9.77 | % | | | 11.19 | % |
Interest-rate spread during the period | | | 3.36 | % | | | 3.72 | % | | | 4.08 | % | | | 3.64 | % | | | 3.90 | % |
Net interest margin | | | 3.88 | % | | | 4.39 | % | | | 4.57 | % | | | 4.13 | % | | | 4.21 | % |
Non-interest expense to average assets | | | 3.60 | % | | | 2.95 | % | | | 2.79 | % | | | 2.62 | % | | | 2.86 | % |
Other Ratios and Data: | | | | | | | | | | | | | | | | | | | | |
Average equity to average assets | | | 8.57 | % | | | 8.90 | % | | | 9.03 | % | | | 10.32 | % | | | 9.96 | % |
Allowance for loan losses to total loans | | | 1.16 | % | | | 1.00 | % | | | 1.24 | % | | | 1.27 | % | | | 1.26 | % |
Net charge-offs to average loans | | | .03 | % | | | .05 | % | | | (0.01 | )% | | | (0.00 | )% | | | (0.04 | )% |
Non-performing loans to total loans | | | .14 | % | | | .04 | % | | | — | | | | 0.04 | % | | | 0.30 | % |
Allowance for loan losses to non-performing loans | | | 1.89 | % | | | 23.38 | % | | | — | | | | 33.00 | % | | | 4.25 | % |
Non-performing loans and foreclosed real estate as a percentage of total assets | | | .67 | % | | | 0.13 | % | | | — | | | | 0.05 | % | | | 0.29 | % |
Total number of full-service banking offices | | | 9 | | | | 7 | | | | 6 | | | | 4 | | | | 4 | |
(1) | All per share amounts have been adjusted to reflect the 5% stock dividends paid March 15, 2005 and February 28, 2007, and the three-for-two stock split issued on January 20, 2006. |
17
| Item 7. | Management’s Discussion and Analysis or Plan of Operation |
General
First Community Bank and First Community Lender Services, Inc. are wholly-owned subsidiaries. Our primary business activity is the operations of First Community Bank, a federally-chartered stock savings bank. First Community provides a variety of banking services to small and middle market businesses and individuals through its three banking offices located in Pinellas County, two banking offices located in Hillsborough County, one banking office in Pasco County and three banking offices located in Charlotte County, Florida. First Community Lender Services, Inc. provides tax deferred 1031 exchange services for eligible transactions. The following is a description of the significant accounting policies that we follow in preparing and presenting our consolidated financial statements.
Critical Accounting Policies
We believe that the determination of the allowance for loan losses represents a critical accounting policy. The allowance for loan losses is maintained at a level management considers to be adequate to absorb loan losses inherent in the portfolio, based on evaluations of the collectability and historical loss experience of loans. Credit losses are charged and recoveries are credited to the allowance. Provisions for loan losses are based on our review of the historical loan loss experience and such factors which, in management’s judgment, deserve consideration under existing economic conditions in estimating probable credit losses. The allowance is based on ongoing assessments of the estimated losses inherent in the loan portfolio. Our methodology for assessing the appropriate allowance level consists of several key elements described below.
Larger commercial loans that exhibit probable or observed credit weaknesses are subject to individual review. Where appropriate, reserves are allocated to individual loans based on our estimate of the borrower’s ability to repay the loan given the availability of collateral, other sources of cash flows and available legal options. Included in the review of individual loans are those that are impaired as provided in Statement of Financial Accounting Standards No. 114, “Accounting by Creditors for Impairment of a Loan”, as amended. Any specific reserves for impaired loans are measured based on the fair value of the underlying collateral. The collectability of both principal and interest is evaluated when assessing the need for a specific reserve. Historical loss rates are applied to other commercial loans not subject to specific reserve allocations.
Homogenous loans, such as installment and residential mortgage loans, are not individually reviewed by management. Reserves are established for each pool of loans based on the expected net charge-offs. Loss rates are based on the average net charge-off history by loan category.
Historical loss rates for commercial and consumer loans may be adjusted for significant factors that, in management’s judgment, reflect the impact of any current conditions on loss recognition. Factors which management considers in the analysis include the effects of the local economy, trends in the nature and volume of loans (delinquencies, charge-offs, non-accrual and problem loans), changes in the internal lending policies and credit standards, collection practices, and examination results from bank regulatory agencies and our internal credit review function.
Specific reserves on individual loans and historical loss rates are reviewed throughout the year and adjusted as necessary based on changing borrower and collateral conditions and actual collection and charge-off experience.
During 2007, we changed our overall approach in the determination of the allowances for loan losses. A new methodology was created to be in compliance with the guidance issued by the federal agencies in December of 2006. This methodology incorporated the calculation of loans considered impaired under FAS 114 and allocations for performing portfolio categories based on applying historical charge off data for loans categorized by similar risk characteristics based on the banks experience as per FAS 5. The methodology includes an unallocated portion (qualitative factors) justified by current general market conditions, trends in performance (delinquency), economic and political trends.
Loans
We believe that general economic conditions in our primary service areas, including the real estate market, continue to be healthy due to the growth in the areas’ population and demand for real estate property and personal services. Accordingly, we have experienced continued demand for consumer and commercial loans in 2007 as net loans increased $35.8 million, or 10.3%, to $382.6 million at December 31, 2007. Commercial loan activity is focused on seasonal working capital loans and commercial real estate term loans. At December 31, 2007, 2006 and 2005, our non accrual loans had balances of $2,364,000, $150,000, and $0, respectively.
18
Through First Community Bank, we engage in a full complement of lending activities, including commercial, consumer/installment and real estate loans.
Commercial lending activities are directed principally towards businesses whose demands for funds fall within our bank subsidiary’s legal lending limits and who are potential deposit customers. Particular emphasis is placed on loans to small- and medium-sized businesses. Commercial loans consist primarily of loans made to individual, partnership or corporate borrowers, and who obtained those loans for a variety of business purposes.
Real estate loans consist of residential and commercial first mortgage loans, second mortgage financing and construction loans.
Lines of credit include home equity, commercial, and consumer lines of credit.
Consumer loans consist primarily of installment loans to individuals for personal, family and household purposes.
We have correspondent relationships with several banks, whereby we can engage in the sale and purchase of loan participations. Participations purchased, if any, are entered into using the same underwriting criteria that would be applied if we had originated the loan. This includes credit and collateral analyses and maintenance of a complete credit file on each purchased participation that is consistent with the credit files that we maintain on our customers.
Nonperforming Loans and Real Estate Owned Policy. When a borrower fails to make a required payment on a loan, our loan officers attempt to collect the payment by contacting the borrower. If a payment on a loan has not been received by the end of a grace period (usually 10 days from the payment due date), notices are sent at that time, with follow-up contacts made thereafter. In most cases, delinquencies are cured promptly. If the delinquency exceeds 29 days and is not cured through normal collection procedures, more formal measures are instituted to remedy the default, including the commencement of foreclosure proceedings. We will then attempt to negotiate with the delinquent borrower to establish a satisfactory payment schedule.
A loan is generally placed on non accrual status and ceases accruing interest when loan payment performance is deemed unsatisfactory. All loans past due 90 days, however, are placed on non-accrual status and all prior accrued interest is reversed against income. Cash payments received while a loan is in non-accrual status are recorded as a reduction of principal as long as doubt exists as to collection. If a loan is brought current it will be taken off non-accrual status.
If foreclosure is required, when completed, the property would be sold at a public auction in which we will generally participate as a bidder. If we are the successful bidder, the acquired real estate property is then included in the foreclosed real estate account until it is sold. Under federal regulations we are permitted to finance sales of foreclosed real estate by “loans to facilitate,” which may involve more favorable interest rates and terms than generally would be granted under normal underwriting guidelines.
Charge-Offs Policy. All loans deemed uncollectible by management will be charged-off or written down as per the following guidelines:
19
| | | | | | | | | | | | | | | | | | | | | | | | | | | | | | | | | | | |
| | | December 31, | |
Type of Loan | | Amount
2007 | | | Percent of
Loans in
Each
Category
to Total
Loans
2007 | | | Amount
2006 | | | Percent of
Loans in
Each
Category
to Total
Loans
2006 | | | Amount
2005 | | | Percent of
Loans in
Each
Category
to Total
Loans
2005 | | | Amount
2004 | | | Percent of
Loans in
Each
Category
to Total
Loans
2004 | | | Amount
2003 | | | Percent of
Loans in
Each
Category
to Total
Loans
2003 | |
| | | (Dollars in thousands) | |
Residential mortgage loans | | $ | 128,426 | | | 33 | % | | $ | 114,311 | | | 32.6 | % | | $ | 75,585 | | | 27.3 | % | | $ | 44,147 | | | 21. | % | | $ | 39,783 | | | 24.5 | % |
Commercial real estate loans | | | 180,304 | | | 46.5 | | | | 162,973 | | | 46.5 | | | | 109,995 | | | 39.8 | | | | 97,849 | | | 46.9 | | | | 69,507 | | | 42.8 | |
Commercial loans | | | 22,343 | | | 5.8 | | | | 21,572 | | | 6.1 | | | | 31,916 | | | 11.6 | | | | 24,322 | | | 11.6 | | | | 21,502 | | | 13.2 | |
Installment loans | | | 56,496 | | | 14.6 | | | | 51,784 | | | 14.8 | | | | 58,708 | | | 21.3 | | | | 42,335 | | | 20.3 | | | | 31,578 | | | 19.5 | |
| | | | | | | | | | | | | | | | | | | | | | | | | | | | | | | | | | | |
Subtotal | | | 387,569 | | | 100.0 | % | | $ | 350,640 | | | 100.0 | % | | | 276,204 | | | 100.0 | % | | | 208,653 | | | 100.0 | % | | | 162,370 | | | 100.0 | % |
| | | | | | | | | | | | | | | | | | | | | | | | | | | | | | | | | | | |
Deduct: | | | | | | | | | | | | | | | | | | | | | | | | | | | | | | | | | | | |
Allowance for loan losses | | | (4,479 | ) | | | | | | (3,499 | ) | | | | | | (3,416 | ) | | | | | | (2,640 | ) | | | | | | (2,041 | ) | | | |
Net deferred loan fees | | | (539 | ) | | | | | | (353 | ) | | | | | | (254 | ) | | | | | | (224 | ) | | | | | | (93 | ) | | | |
| | | | | | | | | | | | | | | | | | | | | | | | | | | | | | | | | | | |
Net loans | | $ | 382,551 | | | | | | $ | 346,788 | | | | | | $ | 272,534 | | | | | | $ | 205,789 | | | | | | $ | 160,236 | | | | |
| | | | | | | | | | | | | | | | | | | | | | | | | | | | | | | | | | | |
| | • | | All open-end credits past due for more than 90 days and all unsecured closed-end credits past due for 90 days must be charged-off. |
| | • | | Secured non real estate loans when deemed uncollectible by management will be charged-off or written down to no more than 100% of the net liquidated collateral value of the loan as determined by management. |
| | • | | Unsecured loans past due 90 days or more will be charged-off in full or written down to an amount deemed collectible by management. |
| | • | | Management has the authority to charge-off loan losses and/or overdrafts up to $10,000, when deemed uncollectible. |
The following table presents various categories of loans contained in our loan portfolio and the total amount of all loans at December 31 for the years indicated.
The following is an analysis of maturities of our loans as of December 31, 2007 (in thousands):
| | | | | | | | | | | | |
Type of Loan | | Due in 1 Year
or Less | | Due in 1 to 5
Years | | Due After 5
Years | | Total |
Residential mortgage loans | | $ | 26,696 | | $ | 10,356 | | $ | 91,374 | | $ | 128,426 |
Commercial real estate loans | | | 53,308 | | | 57,423 | | | 69,573 | | | 180,304 |
Commercial loans | | | 13,621 | | | 7,944 | | | 778 | | | 22,343 |
Installment loans | | | 8,559 | | | 23,075 | | | 24,862 | | | 56,496 |
| | | | | | | | | | | | |
Total | | $ | 102,184 | | $ | 98,798 | | $ | 186,587 | | $ | 387,569 |
| | | | | | | | | | | | |
All loans are recorded according to original terms and demand loans, overdrafts and loans having no stated repayment terms or maturity are reported as due in one year or less.
20
At December 31, 2007, the amount of loans due after one year with fixed interest rates totaled approximately $95.6 million, while the amount of loans due after one year with floating interest rates totaled approximately $189.8 million. We generally do not make fixed-rate loans with maturities longer than five years.
At December 31, 2007, 2006, 2005, 2004 and 2003 non accrual loans were as follows for the years indicated (dollars in thousands):
| | | | | | | | | | | | | | | |
| | | At December 31, |
| | | 2007 | | 2006 | | 2005 | | 2004 | | 2003 |
Residential mortgage loans | | $ | 1,042 | | $ | — | | $ | — | | $ | 57 | | $ | 480 |
Commercial real estate loans | | | 1,289 | | | 150 | | | — | | | — | | | — |
Commercial loans | | | | | | — | | | — | | | — | | | — |
Installment loans | | | 33 | | | — | | | — | | | 23 | | | — |
| | | | | | | | | | | | | | | |
Total non-accrual loans | | $ | 2,364 | | $ | 150 | | $ | — | | $ | 80 | | $ | 480 |
| | | | | | | | | | | | | | | |
At December 31, 2007, 2006, 2005, 2004, and 2003 there were no loans which would be defined as troubled debt restructurings or past due ninety days or more and still accruing.
An analysis of our allowance for loan losses and loan loss experience (charge-offs and recoveries) is furnished in the following table (dollars in thousands):
| | | | | | | | | | | | | | | | | | | | |
| | | Year Ended December 31, | |
| | | 2007 | | | 2006 | | | 2005 | | | 2004 | | | 2003 | |
Balance at beginning of period | | $ | 3,499 | | | $ | 3,416 | | | $ | 2,640 | | | $ | 2,041 | | | $ | 1,434 | |
| | | | | | | | | | | | | | | | | | | | |
Charge-offs: | | | | | | | | | | | | | | | | | | | | |
Consumer | | | (85 | ) | | | (19 | ) | | | (20 | ) | | | (54 | ) | | | (6 | ) |
Commercial | | | (96 | ) | | | (134 | ) | | | (2 | ) | | | (2 | ) | | | (25 | ) |
Residential | | | (7 | ) | | | — | | | | — | | | | — | | | | (30 | ) |
Recoveries: | | | | | | | | | | | | | | | | | | | | |
Consumer | | | 3 | | | | 6 | | | | 2 | | | | 14 | | | | — | |
Commercial | | | — | | | | — | | | | 1 | | | | — | | | | — | |
Residential | | | — | | | | — | | | | — | | | | 36 | | | | — | |
| | | | | | | | | | | | | | | | | | | | |
Net charge-offs | | | (185 | ) | | | (147 | ) | | | (19 | ) | | | (6 | ) | | | (61 | ) |
Provision for losses charged to operations | | | 1,165 | | | | 230 | | | | 795 | | | | 605 | | | | 668 | |
| | | | | | | | | | | | | | | | | | | | |
Balance at end of period | | $ | 4,479 | | | $ | 3,499 | | | $ | 3,416 | | | $ | 2,640 | | | $ | 2,041 | |
| | | | | | | | | | | | | | | | | | | | |
Asset Quality Ratios | | | | | | | | | | | | | | | | | | | | |
Net charge-offs to average loans | | | .03 | % | | | .05 | % | | | (0.01 | )% | | | (0.00 | )% | | | (0.04 | )% |
Allowance for loan losses to total loans | | | 1.16 | | | | 1.00 | | | | 1.24 | | | | 1.27 | | | | 1.26 | |
Allowance for loan losses to non performing loans | | | 1.89 | | | | 23.38 | | | | — | | | | 33.0 | | | | 4.25 | |
Non performing loans to total loans | | | .14 | | | | .04 | | | | — | | | | 0.04 | | | | 0.30 | |
Non performing loans to total assets | | | .12 | | | | .04 | | | | — | | | | 0.03 | | | | 0.27 | |
21
At December 31 the allowance for possible credit losses were generally allocated as follows for the years indicated (dollars in thousands):
| | | | | | | | | | | | | | | | | | | | | | | | | | | | | | |
| | | 2007 | | | 2006 | | | 2005 | | | 2004 | | | 2003 | |
| | | Amount | | Percent of
Loans in
Each
Category
to Total
Loans | | | Amount | | Percent of
Loans in
Each
Category
to Total
Loans | | | Amount | | Percent of
Loans in
Each
Category
to Total
Loans | | | Amount | | Percent of
Loans in
Each
Category
to Total
Loans | | | Amount | | Percent of
Loans in
Each
Category
to Total
Loans | |
Residential mortgage loans | | $ | 901 | | 33.2 | % | | $ | 317 | | 32.6 | % | | $ | 417 | | 27.3 | % | | $ | 238 | | 21.2 | % | | $ | 196 | | 24.5 | % |
Commercial real estate loans | | | 2,094 | | 46.6 | | | $ | 1,400 | | 46.5 | | | | 1,447 | | 39.8 | | | | 1,251 | | 46.9 | | | | 907 | | 42.8 | |
Commercial loans | | | 244 | | 5.8 | | | | 945 | | 6.1 | | | | 819 | | 11.6 | | | | 699 | | 11.6 | | | | 426 | | 13.2 | |
Installment loans | | | 1,240 | | 14.4 | | | | 837 | | 14.8 | | | | 733 | | 21.3 | | | | 452 | | 20.3 | | | | 512 | | 19.5 | |
| | | | | | | | | | | | | | | | | | | | | | | | | | | | | | |
Total | | $ | 4,479 | | 100.0 | % | | $ | 3,499 | | 100.0 | % | | $ | 3,416 | | 100.0 | % | | $ | 2,640 | | 100.0 | % | | $ | 2,041 | | 100.0 | % |
| | | | | | | | | | | | | | | | | | | | | | | | | | | | | | |
Although the allowance for loan losses was determined by category of loans, the entire allowance is available to absorb losses from any category.
The allowance for loan losses is established based upon management’s evaluation of the potential losses in our total loan portfolio. In analyzing the adequacy of the allowance for loan losses, management considers its own internal review, as well as the results of independent external credit reviews, changes in the composition and volume of the loan portfolio, levels of non-performing and charged-off loans, local and national economic conditions, and other factors.
Investment Securities. We primarily invest in obligations of the United States or obligations guaranteed as to principal and interest by the United States and other taxable securities or mortgage backed obligations. The following table presents, at December 31, 2007, 2006 and 2005 the carrying value of our investments:
| | | | | | | | | |
| | | December 31, |
Investment Category | | 2007 | | 2006 | | 2005 |
| | | (dollars in thousands) |
Available for sale: | | | | | | | | | |
U.S. Treasury securities | | $ | — | | $ | 498 | | $ | 1,971 |
U.S. Government agency securities | | | 4,273 | | | 2,993 | | | 6,104 |
Mortgage-backed securities | | | 2,574 | | | 697 | | | 843 |
| | | | | | | | | |
Total | | $ | 6,847 | | $ | 4,188 | | $ | 8,918 |
| | | | | | | | | |
Held to maturity: | | | | | | | | | |
U.S. Government agency securities | | $ | 2,156 | | $ | 2,646 | | $ | 1,366 |
Mortgage-backed securities | | | 1,156 | | | 1,487 | | | 1,897 |
Municipal securities | | | 7,018 | | | 7,018 | | | 2,015 |
| | | | | | | | | |
Total | | $ | 10,330 | | $ | 11,151 | | $ | 5,278 |
| | | | | | | | | |
22
The following table sets forth, by maturity distribution, certain information pertaining to the securities portfolio (dollars in thousands):
| | | | | | | | | | | | | | | | | | | | | | | | | | | | | | |
| | | One Year or Less | | | After One Year
to Five Years | | | After Five Years
to Ten Years | | | After Ten Years | | | Total | |
| | | Carrying
Value | | Average
Yield | | | Carrying
Value | | Average
Yield | | | Carrying
Value | | Average
Yield | | | Carrying
Value | | Average
Yield | | | Carrying
Value | | Average
Yield | |
Available for Sale: | | | | | | | | | | | | | | | | | | | | | | | | | | | | | | |
U.S. Treasury securities | | $ | — | | — | % | | $ | — | | — | % | | $ | — | | — | % | | $ | — | | — | % | | $ | 0 | | — | % |
U.S. Government agency securities | | | 500 | | 5.00 | % | | $ | 1,196 | | 5.36 | % | | | 2,500 | | 5.85 | % | | | — | | — | | | $ | 4196 | | 5.61 | % |
| | | | | | | | | | | | | | | | | | | | | | | | | | | | | | |
Total | | $ | 500 | | 5.00 | % | | $ | 1,196 | | 5.36 | % | | $ | 2,500 | | 5.85 | % | | $ | — | | — | % | | $ | — | | — | % |
| | | | | | | | | | | | | | | | | | | | | | | | | | | | | | |
Mortgage-backed securities | | | | | | | | | | | | | | | | | | | | | | | | | | | 2,539 | | 5.58 | % |
| | | | | | | | | | | | | | | | | | | | | | | | | | | | | | |
Total | | | | | | | | | | | | | | | | | | | | | | | | | | $ | 6,735 | | 5.60 | % |
| | | | | | | | | | | | | | | | | | | | | | | | | | | | | | |
Held to Maturity: | | | | | | | | | | | | | | | | | | | | | | | | | | | | | | |
U.S. Government agency and municipal securities | | $ | 1,159 | | 4.91 | % | | $ | 497 | | 4.96 | % | | $ | 1,249 | | 4.56 | % | | $ | 6,269 | | 4.08 | % | | $ | 9,174 | | 4.16 | % |
| | | | | | | | | | | | | | | | | | | | | | | | | | | | | | |
Mortgage-backed securities | | | | | | | | | | | | | | | | | | | | | | | | | | | 1,156 | | 4.01 | % |
| | | | | | | | | | | | | | | | | | | | | | | | | | | | | | |
Total | | | | | | | | | | | | | | | | | | | | | | | | | | $ | 10,330 | | 4.27 | % |
| | | | | | | | | | | | | | | | | | | | | | | | | | | | | | |
Liquidity and Capital Resources
Liquidity Management. Liquidity management involves monitoring our sources and uses of funds in order to meet our day-to-day cash flow requirements while attempting to maximize profits. Liquidity represents the ability of a company to convert assets into cash or cash equivalents without significant loss and to raise additional funds by increasing liabilities. Liquidity management is made more complicated because different balance sheet components are subject to varying degrees of management control. For example, the timing of maturities of the investment portfolio is very predictable and subject to a high degree of control at the time investment decisions are made. However, net deposit inflows and outflows are far less predictable and are not subject to the same degree of control. Asset liquidity is provided by cash and assets which are readily marketable, can be pledged, or which will mature in the near future. Liability liquidity is provided by access to core funding sources, principally the ability to generate customer deposits in our primary markets. In addition, liability liquidity is provided through the ability to borrow against approved lines of credit including federal funds purchased from correspondent banks and from the FHLB.
Dividends. There are statutory and regulatory limitations on the payment of dividends by this subsidiary. The ability of First Community Bank to pay a dividend to us is governed by the Office of Thrift Supervision’s capital distribution regulation. This regulation and First Community Bank’s ability to pay dividends to us, is addressed in the sections entitled “Regulation and Supervision” and “Dividends.”
Management regularly reviews our liquidity position and has implemented internal policies that establish guidelines for sources of asset-based liquidity and limit the total amount of purchased funds used to support the balance sheet and funding from non-core sources.
Deposits and Other Sources of Funds. In addition to deposits, the sources of funds available for lending and other business purposes include loan repayments, loan sales, and borrowings from the FHLB. Loan repayments are a relatively stable source of funds, while deposit inflows and outflows are influenced significantly by general interest rates and money market conditions. We maintain lines of credit at Silverton Bank upon which we can draw up to $12 million. The line of credit at Silverton Bank is secured by our common stock. There was no balance drawn on that line of credit as of December 31, 2007. The line of credit at the Bankers Bank is unsecured and had no funds drawn at year end. Borrowings may be used on a short-term basis to compensate for reductions in other sources, such as deposits at less than projected levels.
A full range of interest bearing and non-interest bearing accounts, are offered, including business and consumer checking accounts, negotiable order of withdrawal (“NOW”) accounts, money market accounts with limited transactions, individual retirement accounts, regular interest bearing statement savings accounts and certificates of deposit with a range of maturity date options. The sources of deposits are individuals, businesses and employees of businesses within our market areas. Deposits are generally obtained through the personal solicitation of our officers and directors, direct mail solicitation and advertisements published in the local media. We pay competitive interest rates on time and savings deposits. In addition, we have implemented a service charge fee schedule competitive with other financial institutions in our market areas, covering such matters as maintenance fees on checking accounts, per item processing fees on checking accounts, returned check charges and the like.
23
Deposits from our primary market provide a relatively stable funding source for our loan portfolio and other earning assets. Our total deposits were $ 334.5, $299.7, and $272.6, million at December 31, 2007, 2006, and 2005, respectively. Most of the $34.8 million increase in deposits since December 31, 2006, was attributable to growth in time deposits reflecting the impact of the interest rate environment. The funding requirements for loans have continued to increase in 2007, from 2006 levels. Net loans have increased $35.8 million during the period from December 31, 2006, to December 31, 2007. Management anticipates that a stable base of deposits combined with favorably priced advances from the Federal Home Loan Bank will be our primary source of funding to meet both our short-term and long-term liquidity needs in the future.
The following table presents, for the years ended December 31 2007, 2006, and 2005 the average amount of, and average rate paid on, each of the following deposit categories (dollars in thousands):
| | | | | | | | | | | | | | | | | | |
| | | Average Amount | | Average Rate Paid | |
Deposit Category | | 2007 | | 2006 | | 2005 | | 2007 | | | 2006 | | | 2005 | |
Non interest bearing demand | | $ | 31,454 | | $ | 49,143 | | $ | 35,933 | | — | % | | — | % | | — | % |
Savings, NOW and money market deposits | | | 115,938 | | | 103,239 | | | 88,654 | | 2.31 | | | 2.04 | | | 1.31 | |
Time deposits | | | 187,228 | | | 140,104 | | | 101,681 | | 5.09 | | | 4.41 | | | 3.04 | |
| | | | | | | | | | | | | | | | | | |
Total | | $ | 334,620 | | $ | 292,486 | | $ | 226,268 | | 3.70 | % | | 2.83 | % | | 1.81 | % |
| | | | | | | | | | | | | | | | | | |
The following table indicates the amount of outstanding time certificates of deposit of $100,000 or more and their respective maturities as of December 31 (in thousands):
| | | |
| | | 2007 |
3 months or less | | $ | 21,210 |
3-12 months | | | 38,100 |
1-3 years | | | 12,635 |
Over 3 years | | | 2,216 |
| | | |
Total | | $ | 74,161 |
| | | |
Borrowings.To date, we have relied on deposits, proceeds from sales of loans and securities, repurchase agreements, and the purchase of overnight funds from correspondent banks as our major sources of funding. As of December 31, 2007, we held repurchase agreements, which are used as sweep account for commercial customers, of approximately $9.6 million. We will continue to rely on loan repayments, loan sales, and the sale of investment securities as additional sources of funding. In addition, in the future if there are periods when the supply of funds from deposits or other sources cannot meet our demand for loans, we have the ability to seek a portion of the needed funds through loans (advances) from the FHLB where it currently has the ability to borrow up to $97 million. The amounts advanced under FHLB advances, the maturity date, and the weighted-average interest rate as of December 31, 2007, 2006 and 2005, are set forth in the table below ($ in thousands):
24
| | | | | | | | | | | | |
Maturing in Year Ending December 31, | | Interest
Rate | | | At December 31, |
| | | 2007 | | 2006 | | 2005 |
2006 | | 2.48 | | | $ | | | $ | — | | $ | 2,000 |
2007 | | 5.50 | | | | | | | 17,500 | | | — |
2007 | | 5.36 | | | | | | | 7,000 | | | — |
2007 | | 3.34 | | | | | | | 2,000 | | | 2,000 |
2008 | | 4.64 | | | | 8,000 | | | — | | | 2,000 |
2008 | | 4.45 | | | | 3,000 | | | 3,000 | | | 3,000 |
2008 | | 4.14 | | | | 2,000 | | | 2,000 | | | 1,000 |
2009 | | 3.71 | | | | 1,000 | | | 1,000 | | | 1,000 |
2010 | | 3.75 | (1) | | | 5,000 | | | | | | — |
2011 | | 5.40 | | | | 5,000 | | | 5,000 | | | |
2012 | | 4.06 | (2) | | | 5,000 | | | — | | | 1,000 |
2016 | | 4.62 | (3) | | | 5,000 | | | 5,000 | | | — |
2017 | | 2.92 | (4) | | | 6,000 | | | — | | | |
| | | | | | | | | | | | |
| | | | | $ | 40,000 | | $ | 42,500 | | $ | 12,000 |
| | | | | | | | | | | | |
(1) | FHLB has a call option in December 2009 |
(2) | FHLB has a call option in September 2008 |
(3) | FHLB has a call option in October 2009 |
(4) | FHLB has a call option in December 2008 |
Average Contractual Obligations
Contractual obligations for payments under long-term debt and lease obligations are shown as follows, stratified by remaining term to contractual maturity (in thousands):
| | | | | | | | | | | | | | | |
| | | Less than
1 Year | | 1-3
Years | | 3-5
Years | | More than
5 Years | | Total |
Real estate operating leases | | $ | 625 | | $ | 1,088 | | $ | 914 | | $ | 1,531 | | $ | 4,158 |
Certificates of Deposit | | | 161,329 | | | 23,354 | | | 2,545 | | | — | | | 187,228 |
Federal home loan bank advances* | | | 13,000 | | | 6,000 | | | 10,000 | | | 11,000 | | | 40,000 |
| | | | | | | | | | | | | | | |
Total | | $ | 174,954 | | $ | 30,442 | | $ | 13,459 | | $ | 12,531 | | $ | 231,386 |
| | | | | | | | | | | | | | | |
| * | $17,500 in overnight FHLB advances not included since they are not long-term obligations |
Further discussion of the nature of each obligation is included in “Note 4-Premises and Equipment, Net”, “Note 5-Deposits”, and “Note 6-Federal Home Loan Bank Advances”.
Average Balance, Interest and Average Yields and Costs
The following is an analysis of the net interest earnings for the years ended December 31, 2007, 2006, and 2005, with respect to each major category of interest-earning assets and each major category of interest-bearing liabilities.
(Table on following page)
25
For purposes of these analyses, non-accruing loans, if any, are included in the average balances.
| | | | | | | | | | | | | | | | | | | | | | | | | | | |
| | | For the Year Ended December 31, | |
| | | 2007 | | | 2006 | | | 2005 | |
| | | Average
Balance | | Interest
and
Dividends | | Average
Yield/
Rate | | | Average
Balance | | Interest
and
Dividends | | Average
Yield/
Rate | | | Average
Balance | | Interest
and
Dividends | | Average
Yield/
Rate | |
| | | (Dollars in thousands) | |
ASSETS: | | | | | | | | | | | | | | | | | | | | | | | | | | | |
Earning assets: | | | | | | | | | | | | | | | | | | | | | | | | | | | |
Loans(1) | | $ | 361,881 | | $ | 27,481 | | 7.59 | % | | $ | 313,688 | | $ | 23,656 | | 7.54 | % | | $ | 233,888 | | $ | 16,093 | | 6.88 | % |
Securities(2) | | | 17,595 | | | 819 | | 4.65 | % | | | 15,181 | | | 592 | | 3.90 | % | | | 16,352 | | | 455 | | 2.78 | |
Other interest earnings assets | | | 6,751 | | | 530 | | 7.85 | % | | | 8,928 | | | 214 | | 2.40 | % | | | 11,787 | | | 217 | | 1.84 | |
| | | | | | | | | | | | | | | | | | | | | | | | | | | |
Total earning assets | | | 386,227 | | | 28,830 | | 7.46 | % | | | 337,797 | | | 24,462 | | 7.24 | % | | | 262,027 | | | 16,765 | | 6.40 | % |
| | | | | | | | | | | | | | | | | | | | | | | | | | | |
Non-earning assets | | | 29,171 | | | | | | | | | 16,057 | | | | | | | | | 17,542 | | | | | | |
| | | | | | | | | | | | | | | | | | | | | | | | | | | |
Total Assets | | $ | 415,398 | | | | | | | | $ | 353,854 | | | | | | | | $ | 279,569 | | | | | | |
| | | | | | | | | | | | | | | | | | | | | | | | | | | |
LIABILITIES: | | | | | | | | | | | | | | | | | | | | | | | | | | | |
Interest-bearing liabilities: | | | | | | | | | | | | | | | | | | | | | | | | | | | |
Savings NOW and money market | | $ | 113,196 | | | 2,612 | | 2.31 | % | | $ | 103,239 | | | 2,105 | | 2.04 | % | | $ | 88,654 | | | 1,161 | | 1.31 | % |
Time Deposits | | | 191,858 | | | 9,763 | | 5.09 | % | | | 140,104 | | | 6,175 | | 4.41 | % | | | 101,681 | | | 3,092 | | 3.04 | % |
| | | | | | | | | | | | | | | | | | | | | | | | | | | |
Total Interest Bearing Deposits | | | 305,054 | | | 12,375 | | 4.06 | % | | | 243,343 | | | 8,280 | | 3.40 | % | | | 190,335 | | | 4,253 | | 2.23 | % |
Other borrowings(3) | | | 32,089 | | | 1,468 | | 4.57 | % | | | 29,869 | | | 1,347 | | 4.51 | % | | | 16,017 | | | 542 | | 3.38 | % |
| | | | | | | | | | | | | | | | | | | | | | | | | | | |
Total interest-bearing liabilities | | | 337,143 | | | 13,843 | | 4.11 | % | | | 273,212 | | | 9,627 | | 3.52 | % | | | 206,352 | | | 4,795 | | 2.32 | % |
| | | | | | | | | | | | | | | | | | | | | | | | | | | |
Non interest-bearing liabilities | | | 42,655 | | | | | | | | | 49,143 | | | | | | | | | 47,967 | | | | | | |
Stockholders’ equity | | | 35,600 | | | | | | | | | 31,499 | | | | | | | | | 25,250 | | | | | | |
| | | | | | | | | | | | | | | | | | | | | | | | | | | |
Total liabilities and equity | | $ | 415,398 | | | | | | | | $ | 353,854 | | | | | | | | $ | 279,569 | | | | | | |
| | | | | | | | | | | | | | | | | | | | | | | | | | | |
Net interest income | | | | | $ | 14,987 | | | | | | | | $ | 14,835 | | | | | | | | $ | 11,970 | | | |
| | | | | | | | | | | | | | | | | | | | | | | | | | | |
Interest-rate spread(4) | | | | | | | | 3.36 | % | | | | | | | | 3.72 | % | | | | | | | | 4.08 | % |
| | | | | | | | | | | | | | | | | | | | | | | | | | | |
Net interest margin(5) | | | | | | | | 3.88 | % | | | | | | | | 4.39 | % | | | | | | | | 4.57 | % |
| | | | | | | | | | | | | | | | | | | | | | | | | | | |
Ratio of average interest-earning assets to average interest-bearing liabilities | | | | | | | | .93 | | | | | | | | | 1.24 | | | | | | | | | 1.27 | |
| | | | | | | | | | | | | | | | | | | | | | | | | | | |
(1) | Balances are net of deferred loan origination costs, undisbursed proceeds of construction loans in process, and include non-performing loans. |
(2) | Yields on securities available for sale are based on average amortized cost. |
(3) | Other borrowings include Federal Home Loan Bank Advances, repurchase agreements with customers and First Community’s line of credit. |
(4) | Interest-rate spread represents the difference between the weighted-average yield on interest-earnings assets and the weighted-average cost of interest bearing liabilities. |
(5) | Net interest margin represents net interest income as a percentage of average interest-earning assets. |
Rate/Volume Analysis
The following tables set forth certain information regarding changes in interest income and interest expense for the periods indicated. For each category of interest-earning assets and interest-bearing liabilities, information is provided on changes attributable to:
| | • | | Changes in rate (change in rate multiplied by prior volume); |
| | • | | Changes in volume (change in volume multiplied by prior rate); and |
| | • | | Changes in rate-volume (change in rate multiplied by change in volume). |
26
| | | | | | | | | | | | | | | |
| | | Year Ended December 31, 2007
Compared to 2006
Increase (Decrease) Due to
(dollars in thousands) |
| | | Rate | | | Volume | | | Rate/Volume | | | Total |
Interest Income: | | | | | | | | | | | | | | | |
Loans | | $ | 157 | | | $ | 3,634 | | | $ | 34 | | | $ | 3,825 |
Securities | | | 199 | | | | 97 | | | | 32 | | | | 328 |
Other interest-earning assets | | | 360 | | | | (54 | ) | | | (91 | ) | | | 215 |
| | | | | | | | | | | | | | | |
Total increase in interest income | | $ | 716 | | | | 3,677 | | | | (25 | ) | | | 4,368 |
| | | | | | | | | | | | | | | |
Interest Expense: | | | | | | | | | | | | | | | |
Deposits: | | | | | | | | | | | | | | | |
Savings, NOW and money-market deposits | | | 227 | | | | 208 | | | | 17 | | | | 452 |
Time deposits | | | 1,009 | | | | 2,262 | | | | 373 | | | | 3,644 |
Other borrowings | | | 18 | | | | 100 | | | | 2 | | | | 120 |
| | | | | | | | | | | | | | | |
Total increase in interest expense | | | 1,254 | | | | 2,570 | | | | 392 | | | | 4,216 |
| | | | | | | | | | | | | | | |
Net change in net interest income | | $ | (538 | ) | | $ | 1,107 | | | $ | (417 | ) | | $ | 152 |
| | | | | | | | | | | | | | | |
| | | | | | | | | | | | | | | | |
| | | Year Ended December 31, 2006
Compared to 2005
Increase (Decrease) Due to
(In thousands) | |
| | | Rate | | | Volume | | | Rate/Volume | | | Total | |
Interest Income: | | | | | | | | | | | | | | | | |
Loans | | $ | 1,544 | | | $ | 5,490 | | | $ | 529 | | | $ | 7,563 | |
Securities | | | 183 | | | | (33 | ) | | | (13 | ) | | | 137 | |
Other interest-earning assets | | | 66 | | | | (53 | ) | | | (16 | ) | | | (3 | ) |
| | | | | | | | | | | | | | | | |
Total increase (decrease) in interest income | | | 1,793 | | | | 5,404 | | | | 500 | | | | 7,697 | |
| | | | | | | | | | | | | | | | |
Interest Expense: | | | | | | | | | | | | | | | | |
Deposits: | | | | | | | | | | | | | | | | |
Savings, NOW and money-market deposits | | | 647 | | | | 191 | | | | 106 | | | | 944 | |
Time deposits | | | 1,393 | | | | 1,168 | | | | 522 | | | | 3,083 | |
Other borrowings | | | 181 | | | | 468 | | | | 156 | | | | 805 | |
| | | | | | | | | | | | | | | | |
Total increase (decrease) in interest expense | | | 2,221 | | | | 1,827 | | | | 784 | | | | 4,832 | |
| | | | | | | | | | | | | | | | |
Net change in net interest income | | $ | (428 | ) | | $ | 3,577 | | | $ | (284 | ) | | $ | 2,865 | |
| | | | | | | | | | | | | | | | |
Comparison of the Years Ended December 31, 2007 and 2006
General. Our net earnings for the year ended December 31, 2007, decreased to $2.9 Million or $0.70 earnings per basic share and $0.67 earnings per diluted share, compared to $3.7 million or $0.91 earnings per basic share and $0.85 earnings per diluted share for the year ended December 31, 2006. Net earnings decreased due to a $935,000 increases in provision for loan losses and a $785,000 increase in non-interest expense, which was partially offset by an increase in non-interest income and a decrease in the income tax provision due to a higher percentage of nontaxable income.
Net Interest Income. Interest income increased to $28.8 million during the year ended December 31, 2007, from $24.5 million in 2006. Interest on loans for the year ended December 31, 2006 increased to $27.5 million from $23.7 million for the year ended December 31, 2006. The increase in interest on loans was primarily due to an increase in the average balance of loans during the year ended December 31, 2007, when compared the year ended December 31, 2006. This yield on the loan portfolio of 7.59% in 2007 was only slightly higher than the 7.54% yield in 2006 reflecting a very competitive market given the overall upward trend in market interest rates for a good part of the year. Interest on securities increased to $819,000 during the year ended December 31, 2007, from $592,000 for the year ended December 31, 2006. The increase in interest income on securities was due primarily to an improvement in the average yield to 4.65%, from 3.90% in 2006. In addition, the average balance of securities in 2007 increased to $17.6 million in 2007, from $15.2 million in 2006.
27
Interest expense on interest bearing deposit accounts increased to $12.4 million during the year ended December 31, 2007, compared to $8.3 million during the year ended December 31, 2006. The increase was due to an increase in the average balance of interest bearing deposits in 2007 combined with higher rates paid on deposits due to rising interest rate environment for most of the year.
Interest expense on other interest bearing liabilities increased to $1.5 million during the year ended December 31, 2007, compared to $1.3 million in 2006. The increase was primarily due to an increase in the average balance of such liability accounts combined with a slight increase in rates paid on borrowings.
Provision for loan losses.During 2007, we changed our over all approach in the determination of allowance for loan losses. A new methodology was created to be in compliance with guidance issued by the federal agencies in December 2006. This methodology incorporated the calculation of loans considered impaired under FAS 114 and allocations of performing portfolio categories based on applying historical charge off data for loans categorized by similar risk characteristics based on our experience as per FAS 5.
The provision for loan losses was $1,165,000 for the year ended December 31, 2007, compared to $230,000 for the year ended December 31, 2006. The increase in provision for loan losses reflected concerns over the declining real estate market values in Florida.
The allowance for loan losses was $4.5 million at December 31, 2007, which was up from $3.5 million at December 31, 2006 and is believed to be adequate. Future adjustments to the allowance for loan losses may be necessary if there is prolonged economic weakness in our markets. We believe that our conservative underwriting policies somewhat mitigates our exposure in the troubled Florida real estate market.
Non interest Income. Non interest income increased to $1.8 million in 2007 from $1.6 million for the year ended December 31, 2006. The increase is primarily due to a $131,000 increase in deposit fees combined with a $117,000 increase in income from bank owned life insurance.
Non interest Expense. Total non interest expense increased to $11.2 million for the year ended December 31, 2007, from $10.4 million for the comparable period ended December 31, 2006. the increase in expenses reflect the full year impact of opening the operations center and the Pasco County office in 2006 combined with the opening of two new banking offices in 2007 to position the company for growth.
Income Taxes. Income taxes for the year ended December 31, 2007, was $1.6 million or 35.1% compared to $2.1 million or 36.5% for the year ended December 31, 2006. The decline in the effective tax rate reflects increased tax exempt income from the municipal securities and from bank owned life insurance.
Comparison of the Years Ended December 31, 2006 and 2005
General. Our net earnings for the year ended December 31, 2006, increased to $3.7 million or $0.91 earnings per basic share and $0.85 earnings per diluted share, compared to $2.9 million or $0.82 earnings per basic share and $0.74 earnings per diluted share for the year ended December 31, 2005. Net earnings increased due to increases in net interest income and non-interest income, which was partially offset by increases in non-interest expenses and the provision for income taxes.
Net Interest Income. Interest income increased to $24.5 million during the year ended December 31, 2006, from $16.8 million in 2005. Interest on loans for the year ended December 31, 2006 increased to $23.7 million from $16.1 million for the year ended December 31, 2005. The increase in interest on loans was primarily due to an increase in the average balance of loans during the year ended December 31, 2006, when compared the year ended December 31, 2005. This increase was partially offset by a decrease in the average yield earned for the year ended December 31, 2006 when compared to 2005. Interest on securities increased to $592,000 during the year ended December 31, 2006, from $455,000 for the year ended December 31, 2005. The increase in interest income on securities was due to an increase in the average balance of securities in 2006 when compared to 2005 partially offset by a decrease in the average yield earned in 2006 when compared to 2005.
Interest expense on interest bearing deposit accounts increased to $8.3 million during the year ended December 31, 2006, compared to $4.3 million during the year ended December 31, 2005. The increase was due to an increase in the average balance of interest bearing deposits in 2006, combined with higher rates paid on deposits due to rising interest rate environment.
Interest expense on other interest bearing liabilities increased to $1.4 million during the year ended December 31, 2006, compared to $0.5 million in 2005. The increase was primarily due to an increase in the average balance of such liability accounts, combined with increasing rates paid on borrowings.
28
Provision for Loan Losses.Calculating the allowance for loan losses is divided into two primary allocation groups: (1) specific allocation loans and (2) all other passing grade loans. For specific allocation loans, management determines an allowance amount to set aside which it believes is sufficient to cover any potential collateral shortfall. Problem loans are identified by the loan officer, loan review, loan committee, external auditors, or by the banking examiners. Those loans identified as problem loans are assigned a risk grade. Loans graded Special Mention are multiplied by an inherent loss factor of 3%-5% to determine the amount to be included in the allowance. Loans graded Substandard are generally multiplied by a loss factor of 5%-15%, loans graded Doubtful are generally multiplied by a loss factor of 50% and loans graded Loss are multiplied by a loss factor of 100%. In addition to the 15% and 50% on Substandard and Doubtful loans, respectively, the loans are individually reviewed for any additional reserve that may be necessary. All other loans, graded pass are multiplied by an historical experience factor to determine the appropriate level of the allowance for loan losses. In addition to historical experience factors, losses due to economic factors, concentration of credit risk and portfolio composition changes are also considered allowance for loan loss.
The provision for loan losses was $230,000 for the year ended December 31, 2006 compared to $795,000 for the year ended December 31, 2005. Provision for loan losses was reduced based on our planned exit strategies for various classified assets and to more accurately match the reserve to historically low loan loss trends. In 2006 we began the year with classified assets of $2.6 million or .94% of net loans and reduced the level to $1.3 million or .36% of net loans as of December 31, 2006. During the year as the exit strategy for problem loans was met, management was encouraged to reduce the loan loss provision.
The allowance for loan losses was $3.5 million at December 31, 2006, which was believed to be adequate. Future adjustments to the allowance for loan losses may be necessary if unforeseen economic weakness is caused by rising interest rates thus stressing the already slow residential real estate market.
Non interest Income. Non interest income increased to $1.6 million in 2006, from $1.2 million for the year ended December 31, 2005. The increase is primarily due to increases in deposit fees, other service charges and gains recognized on the sale of loans held for sale. Non-interest income included an immediate a $225,000 gain on the sale of two banking offices in a sale-leaseback transaction. In addition, $107,000 in deferred gain amortization was recognized in 2006.
Non interest Expense. Total non interest expense increased to $10.4 million for the year ended December 31, 2006, from $7.8 million for the comparable period ended December 31, 2005, primarily due to an increase in employee compensation and benefits of $1.9 million due to the opening of new banking offices and operations staff to support the growth.
Income Taxes. Income taxes for the year ended December 31, 2006, was $2.1 million or 36.5% compared to $1.7 million or 36.9% for the year ended December 31, 2005.
Selected Quarterly Results
Selected quarterly results of operations for the four quarters ended December 31, 2007 and 2006, are as follows. All per share amounts reflect the 5% stock dividends paid in March 15, 2005 and February 28, 2007, and the three-for-two stock split issued on January 20, 2006 (in thousands, except share amounts):
| | | | | | | | | | | | |
| | | 2007 |
| | | Fourth
Quarter | | Third
Quarter | | Second
Quarter | | First
Quarter |
Interest income | | $ | 7,308 | | $ | 7,337 | | $ | 7,258 | | $ | 6,927 |
Interest expense | | | 3,595 | | | 3,586 | | | 3,477 | | | 3,185 |
| | | | | | | | | | | | |
Net interest income | | | 3,713 | | | 3,751 | | | 3,781 | | | 3,742 |
Provision for loan losses | | | 676 | | | 176 | | | 176 | | | 137 |
| | | | | | | | | | | | |
Net interest income after provision for loan losses | | | 3,037 | | | 3,575 | | | 3,605 | | | 3,605 |
Noninterest income | | | 619 | | | 446 | | | 408 | | | 341 |
Noninterest expense | | | 2,878 | | | 2,758 | | | 2,818 | | | 2,765 |
| | | | | | | | | | | | |
Earnings before income taxes | | | 778 | | | 1,263 | | | 1,195 | | | 1,181 |
Income taxes | | | 257 | | | 429 | | | 435 | | | 431 |
| | | | | | | | | | | | |
29
| | | | | | | | | | | | |
| | | 2007 |
| | | Fourth
Quarter | | Third
Quarter | | Second
Quarter | | First
Quarter |
Net earnings | | $ | 521 | | $ | 834 | | $ | 760 | | $ | 750 |
| | | | | | | | | | | | |
Basic earnings per share | | $ | .13 | | $ | .20 | | $ | .19 | | $ | .18 |
Diluted earnings per share | | | .13 | | | .19 | | | .18 | | | .17 |
| | | | | | | | | | | | |
| | | 2006 |
| | | Fourth
Quarter | | Third
Quarter | | Second
Quarter | | First
Quarter |
Interest income | | $ | 6,768 | | $ | 6,437 | | $ | 5,933 | | $ | 5,324 |
Interest expense | | | 2,915 | | | 2,613 | | | 2,240 | | | 1,859 |
| | | | | | | | | | | | |
Net interest income | | | 3,853 | | | 3,824 | | | 3,693 | | | 3,465 |
Provision for loan losses | | | 170 | | | — | | | — | | | 60 |
| | | | | | | | | | | | |
Net interest income after provision for loan losses | | | 3,683 | | | 3,824 | | | 3,693 | | | 3,405 |
Noninterest income | | | 404 | | | 335 | | | 545 | | | 299 |
Noninterest expense | | | 2,812 | | | 2,720 | | | 2,535 | | | 2,367 |
| | | | | | | | | | | | |
Earnings before income taxes | | | 1,275 | | | 1,439 | | | 1,703 | | | 1,337 |
Income taxes | | | 454 | | | 526 | | | 632 | | | 490 |
| | | | | | | | | | | | |
Net earnings | | $ | 821 | | $ | 913 | | $ | 1,071 | | $ | 847 |
| | | | | | | | | | | | |
Basic earnings per share | | | .20 | | | .23 | | | .27 | | | .21 |
Diluted earnings per share | | | .19 | | | .21 | | | .25 | | | .20 |
| | | | | | | | | | | | |
Asset/Liability Management
Our objective is to manage assets and liabilities to provide a satisfactory, consistent level of profitability within the framework of established cash, loan, investment, borrowing and capital policies. Certain officers are responsible for monitoring policies and procedures that are designed to ensure acceptable composition of the asset/liability mix, stability and leverage of all sources of funds, while adhering to prudent banking practices. It is the overall philosophy of management to support asset growth primarily through growth of core deposits, which include deposits of all categories made by individuals, partnerships and corporations. The largest portion of our assets are invested in commercial, consumer and real estate loans.
The asset/liability mix is monitored on a quarterly basis and a quarterly report reflecting interest-sensitive assets and interest-sensitive liabilities is prepared and presented to the Board of Directors. The objective of this policy is to control interest-sensitive assets and liabilities to minimize the impact of substantial movements in interest rates on our earnings.
Interest Sensitivity
The objective of interest sensitivity management is to minimize the risk associated with the effect of interest rate changes on net interest margins while maintaining net interest income at acceptable levels. Managing this risk involves monthly monitoring of interest sensitive assets relative to interest sensitive liabilities over specific time intervals. All assets and liabilities are evaluated as maturing at the earlier of the re-pricing date or the contractual maturity date. While liabilities without specific terms such as money market, NOW and savings accounts are generally considered core deposits for liquidity purposes, they are deemed to re-price for purposes of interest rate sensitivity analysis. Management subjectively sets rates on all accounts.
At December 31, 2007, we had $219.8 million in interest sensitive assets, compared to $228.7 million in interest sensitive liabilities that will mature or re-price within a year.
A negative gap position is when there are a greater amount of interest sensitive liabilities re-pricing (or maturing) than there are interest sensitive assets in a given time interval. In this instance, the impact on net interest income would be positive in a declining rate environment and negative if rates were rising. Conversely, a positive gap position represents a greater amount of interest sensitive assets re-pricing (or maturing). Thus, an increase in rates would positively impact net interest income, as the yield on earning assets would increase prior to the increase in the cost of interest bearing liabilities.
30
The impact on net interest income described above is general, as other factors would additionally maximize or minimize the effect. For example, a change in the prime interest rate could effect an immediate change to rates on prime related assets, whereas a liability which re-prices according to changes in Treasury rates might (1) lag in the timing of the change and (2) change rates in an amount less than the change in the prime interest rate.
Management believes that the current balance sheet structure of interest sensitive assets and liabilities does not represent a material risk to earnings or liquidity in the event of a change in market rates.
The following is a combined maturity and re-pricing analysis of rate sensitive assets and liabilities as of December 31, 2007.
| | | | | | | | | | | | | | | | | | | | |
| | | 0-90
Days | | 91-365
Days | | | Over
1 Year to
5 Years | | Over
5 Years to
Ten Years | | | Over
Ten
Years | | Total |
| | | (dollars in thousands) |
Interest earning assets: | | | | | | | | | | | | | | | | | | | | |
Investment securities* | | $ | 819 | | $ | 2,140 | | | $ | 2,968 | | $ | 4,869 | | | $ | 6,269 | | $ | 17,065 |
Loans | | | 131,699 | | | 81,416 | | | | 150,005 | | | 19,213 | | | | 4,697 | | | 387,030 |
Other | | | 3,690 | | | — | | | | — | | | — | | | | — | | | 3,690 |
Total rate-sensitive assets | | $ | 136,208 | | $ | 83,556 | | | $ | 152,973 | | $ | 24,082 | | | $ | 10,966 | | $ | 407,785 |
| | | | | | | | | | | | | | | | | | | | |
Total rate sensitive liabilities | | $ | 102,510 | | $ | 126,151 | | | $ | 74,343 | | $ | 58,675 | | | $ | — | | $ | 361,679 |
| | | | | | | | | | | | | | | | | | | | |
Interest sensitivity gap: | | | | | | | | | | | | | | | | | | | | |
Sensitive assets less rate sensitive liabilities | | $ | 33,698 | | $ | (42,595 | ) | | $ | 78,630 | | $ | (34,593 | ) | | $ | 10,966 | | $ | 46,106 |
| | | | | | | | | | | | | | | | | | | | |
Cumulative Gap | | $ | 33,698 | | $ | (8,897 | ) | | $ | 69,733 | | $ | 35,140 | | | $ | 46,106 | | | |
| | | | | | | | | | | | | | | | | | | | |
| * | Investments and Federal Home Loan Bank Advances are scheduled through call dates. |
Market Risk Management
Our market risk is the risk of loss that may result from changes in market prices and rates. A simple interest rate “gap” analysis by itself may not be an accurate indicator of how net interest income will be affected by changes in interest rates. The measurement of market risk associated with financial instruments is meaningful only when related offsetting on- and off-balance sheet transactions are aggregated, and the resulting net positions are identified. Accordingly, while our Asset and Liability Committee (“ALCO”) relies primarily on its asset liability structure to control interest rate risk, a sudden and substantial change in interest rates may adversely impact our earnings to the extent that the interest rates of our assets and liabilities do not change at the same speed, to the same extent, or on the same basis. Our ALCO also evaluates how the repayment of particular assets and liabilities is impacted by changes in interest rates. Income associated with interest-earning assets and liabilities is impacted by changes in interest rates. Income associated with interest-earning assets and costs associated with interest-bearing liabilities may not be affected uniformly by changes in interest rates. In addition, the magnitude and duration of changes in interest rates may have a significant impact on net interest income. For example, although certain assets and liabilities may have similar maturities or periods of repricing, they may react in different degrees to changes in market interest rates. Interest rates on certain types of assets and liabilities fluctuate in advance of changes in general market interest rates. Interest rates on certain types of assets and liabilities fluctuate in advance of changes in general market interest rates, while interest rates on other types may lag behind changes in general market rates. In addition, certain assets, such as adjustable rate mortgage loans, have features (generally referred to as “interest rate caps”) that limit changes in interest rates on a short-term basis and over the life of the asset. In the event of a change in interest rates, prepayment and early withdrawal levels also could deviate significantly from those assumed in calculating the interest rate gap. The ability of many borrowers to service their debts also may decrease in the event of an interest rate increase.
Because gap analysis may not adequately address the interest rate risk, we also use simulation models to analyze net income sensitivity to movements in interest rates.
Economic Value of Equity. We measure the impact of market interest rate changes on the net present value of estimated cash flows from our assets, liabilities and off-balance sheet items, defined as economic value of equity, using the Office of Thrift Supervision model. This model assesses the changes in the market value of interest rate sensitive financial instruments that would occur in response to an instantaneous and sustained increase or decrease (shock) in market interest rates.
31
At December 31, 2007, our economic value of equity exposure related to those hypothetical changes in market interest rates was within the current guidelines established by us. The following table shows our projected change in economic value of equity for this set of rate shock at December 31, 2007.
| | | | | | | | | | | | |
Interest Rate Scenario | | Economic
Value | | Percentage
Change
From Base | | | Percentage
of Total
Assets | | | Percentage of
Equity Book
Value | |
| | | (Dollars in thousands) | |
Up 200 basis points | | $ | 40,455 | | 1.63 | % | | 1.73 | % | | 109.43 | % |
BASE | | | 39,808 | | — | | | — | | | 107.68 | % |
Down 200 basis points | | | 37,188 | | (6.58 | )% | | (.62 | )% | | 100.60 | % |
The computation of prospective effects of hypothetical interest rate changes are based on numerous assumptions, including relative levels of market interest rates, asset prepayments and deposit decay, and should not be relied upon as indicative of actual results. Further, the computations do not contemplate any actions we may undertake in response to changes in interest rates. Actual amounts may differ from the projections set forth above should market conditions vary from the underlying assumptions.
Net Interest Income Simulation. In order to measure interest rate risk at December 31, 2007, we used a simulation model to project changes in net interest income that result from forecasted changes in interest rates.
This analysis calculates the difference between net income forecasted using a rising and a falling interest rate scenario and net interest income using a base market interest rate derived from the current treasury yield curve. The income simulation model includes various assumptions regarding the repricing relationship for each of our products. Many of our assets are floating rate loans, which are assumed to re-price immediately in proportion to a change in market rates as specified in the underlying contractual agreements. Accordingly, the simulation model uses indexes to estimate these prepayments and reinvest the proceeds at current yields. Our non-term deposit products re-price more slowly, usually changing less than the change in market rates and at our discretion.
This analysis indicates the impact of changes in net interest income for the given set of rate changes and assumptions. It assumes the balance sheet remains static and that its structure does not change over the course of the year. It does not account for all factors that impact this analysis, including changes by management to mitigate the impact of interest rate changes or secondary impacts such as changes to our credit risk profile as interest rates change.
Furthermore, loan prepayment rate estimates and spread relationships change regularly. Interest rate changes create changes in actual loan prepayment rates that will differ from the market estimates incorporated in this analysis. Changes that vary significantly from the assumptions may have significant effects on our net interest income.
For the rising and falling interest rate scenarios, the base market interest rate forecast was increased and decreased over 12 months by 200 basis points. At December 31, 2007, our net interest margin exposure related to these hypothetical changes in market interest rates was within the current guidelines.
| | | | | | |
Interest Rate Scenario | | Adjusted Net
Interest Income | | Percentage
Change
From Base | |
| | | (In thousands) | | | |
Up 200 basis points | | $ | 17,301 | | 1.93 | % |
BASE | | | 16,974 | | — | |
Down 200 basis points | | | 16,432 | | (3.19 | )% |
32
| Item 8. | Financial Statements |
FIRST COMMUNITY BANK CORPORATION OF AMERICA AND SUBSIDIARIES
Index to Consolidated Financial Statements
| | |
| | | Page |
| |
Report of Independent Registered Public Accounting Firm | | F-2 |
| |
Consolidated Balance Sheets, December 31, 2007 and 2006 | | F-3 |
| |
Consolidated Statements of Earnings for the Years Ended December 31, 2007, 2006 and 2005 | | F-4 |
| |
Consolidated Statements of Stockholders’ Equity for the Years Ended December 31, 2007, 2006 and 2005 | | F-5-F-6 |
| |
Consolidated Statements of Cash Flows for the Years Ended December 31, 2007, 2006 and 2005 | | F-7-F-8 |
| |
Notes to Consolidated Financial Statements for the Years Ended December 31, 2007, 2006 and 2005 | | F-9-F-35 |
All schedules are omitted because of the absence of the conditions under which they are required or because the required information is included in the Consolidated Financial Statements and related Notes.
F-1
Report of Independent Registered Public Accounting Firm
The Board of Directors and Stockholders
First Community Bank Corporation of America
Pinellas Park, Florida:
We have audited the accompanying consolidated balance sheets of First Community Bank Corporation of America and Subsidiaries (the “Company”) as of December 31, 2007 and 2006, and the related consolidated statements of earnings, stockholders’ equity and cash flows for each of the years in the three-year period ended December 31, 2007. These financial statements are the responsibility of the Company’s management. Our responsibility is to express an opinion on these financial statements based on our audits.
We conducted our audits in accordance with the standards of the Public Company Accounting Oversight Board (United States). Those standards require that we plan and perform the audit to obtain reasonable assurance about whether the financial statements are free of material misstatement. An audit includes examining, on a test basis, evidence supporting the amounts and disclosures in the financial statements. An audit also includes assessing the accounting principles used and significant estimates made by management, as well as evaluating the overall financial statement presentation. We believe that our audits provide a reasonable basis for our opinion.
In our opinion, the consolidated financial statements referred to above present fairly, in all material respects, the financial position of the Company as of December 31, 2007 and 2006, and the results of its operations and its cash flows for each of the years in the three-year period ended December 31, 2007, in conformity with U.S. generally accepted accounting principles.
|
| HACKER, JOHNSON & SMITH PA |
| Tampa, Florida |
| March 24, 2008 |
F-2
FIRST COMMUNITY BANK CORPORATION OF AMERICA AND SUBSIDIARIES
Consolidated Balance Sheets
($ in thousands, except per share amounts)
| | | | | | |
| | | December 31, | |
| | | 2007 | | 2006 | |
Assets | | | | | | |
Cash and due from banks | | $ | 8,412 | | 2,219 | |
Interest-bearing deposits with banks | | | 688 | | 9,308 | |
| | | | | | |
Cash and cash equivalents | | | 9,100 | | 11,527 | |
Other interest-bearing deposits with banks | | | 498 | | 431 | |
Securities available for sale | | | 6,847 | | 4,188 | |
Securities held to maturity (market value of $10,178 and $11,039) | | | 10,330 | | 11,151 | |
Loans, net of allowance for loan losses of $4,479 in 2007 and $3,499 in 2006 | | | 382,551 | | 346,788 | |
Federal Home Loan Bank stock, at cost | | | 2,504 | | 2,553 | |
Premises and equipment, net | | | 11,486 | | 7,094 | |
Foreclosed real estate | | | 538 | | 368 | |
Accrued interest receivable | | | 1,855 | | 1,720 | |
Deferred income taxes | | | 2,294 | | 1,673 | |
Bank owned life insurance | | | 7,597 | | 2,395 | |
Other assets | | | 881 | | 1,011 | |
| | | | | | |
| | $ | 436,481 | | 390,899 | |
| | | | | | |
Liabilities and Stockholders' Equity | | | | | | |
Liabilities: | | | | | | |
Noninterest-bearing demand deposits | | | 31,454 | | 38,884 | |
Savings, NOW and money-market deposits | | | 115,938 | | 103,020 | |
Time deposits | | | 187,228 | | 157,806 | |
| | | | | | |
Total deposits | | | 334,620 | | 299,710 | |
Federal Home Loan Bank advances | | | 40,000 | | 42,500 | |
Federal funds purchased | | | 8,900 | | — | |
Other borrowings | | | 9,613 | | 6,289 | |
Accrued expenses and other liabilities | | | 6,380 | | 8,718 | |
| | | | | | |
Total liabilities | | | 399,513 | | 357,217 | |
| | | | | | |
Commitments (Notes 4, 14 and 18) | | | | | | |
Stockholders' equity: | | | | | | |
Preferred stock, $0.01 par value, 2,000,000 shares authorized, no shares issued or outstanding | | | — | | — | |
Common stock, $0.05 par value, 20,000,000 shares authorized, 4,082,002 and 3,840,687 shares issued and outstanding in 2007 and 2006 | | | 204 | | 192 | |
Additional paid-in capital | | | 30,216 | | 25,642 | |
Retained earnings | | | 6,478 | | 7,852 | |
Accumulated other comprehensive income (loss) | | | 70 | | (4 | ) |
| | | | | | |
Total stockholders' equity | | | 36,968 | | 33,682 | |
| | | | | | |
| | $ | 436,481 | | 390,899 | |
| | | | | | |
See Accompanying Notes to Consolidated Financial Statements.
F-3
FIRST COMMUNITY BANK CORPORATION OF AMERICA AND SUBSIDIARIES
Consolidated Statements of Earnings
(In thousands, except per share amounts)
| | | | | | | |
| | | Year Ended December 31, |
| | | 2007 | | 2006 | | 2005 |
Interest income: | | | | | | | |
Loans | | $ | 27,481 | | 23,656 | | 16,093 |
Securities | | | 819 | | 592 | | 455 |
Other interest earning assets | | | 530 | | 214 | | 217 |
| | | | | | | |
Total interest income | | | 28,830 | | 24,462 | | 16,765 |
| | | | | | | |
Interest expense: | | | | | | | |
Deposits | | | 12,375 | | 8,280 | | 4,253 |
Other borrowings | | | 1,468 | | 1,347 | | 542 |
| | | | | | | |
Total interest expense | | | 13,843 | | 9,627 | | 4,795 |
| | | | | | | |
Net interest income | | | 14,987 | | 14,835 | | 11,970 |
Provision for loan losses | | | 1,165 | | 230 | | 795 |
| | | | | | | |
Net interest income after provision for loan losses | | | 13,822 | | 14,605 | | 11,175 |
| | | | | | | |
Noninterest income: | | | | | | | |
Service charges on deposit accounts | | | 834 | | 703 | | 521 |
Other service charges and fees | | | 239 | | 242 | | 127 |
Income from bank owned life insurance | | | 202 | | 85 | | 86 |
Gain on sale of loans held for sale | | | 147 | | 237 | | 140 |
Other | | | 392 | | 316 | | 291 |
| | | | | | | |
Total noninterest income | | | 1,814 | | 1,583 | | 1,165 |
| | | | | | | |
Noninterest expenses: | | | | | | | |
Employee compensation and benefits | | | 7,069 | | 6,897 | | 4,976 |
Occupancy and equipment | | | 1,466 | | 1,214 | | 852 |
Data processing | | | 950 | | 883 | | 749 |
Professional fees | | | 276 | | 155 | | 197 |
Office supplies | | | 224 | | 305 | | 203 |
Insurance | | | 248 | | 186 | | 165 |
Advertising | | | 37 | | 38 | | 31 |
Other | | | 949 | | 756 | | 632 |
| | | | | | | |
Total noninterest expenses | | | 11,219 | | 10,434 | | 7,805 |
| | | | | | | |
Earnings before income taxes | | | 4,417 | | 5,754 | | 4,535 |
Income taxes | | | 1,552 | | 2,102 | | 1,672 |
| | | | | | | |
Net earnings | | $ | 2,865 | | 3,652 | | 2,863 |
| | | | | | | |
Earnings per share: | | | | | | | |
Basic earnings per share | | $ | .70 | | .91 | | .82 |
| | | | | | | |
Diluted earnings per share | | $ | .67 | | .85 | | .74 |
| | | | | | | |
See Accompanying Notes to Consolidated Financial Statements.
F-4
FIRST COMMUNITY BANK CORPORATION OF AMERICA AND SUBSIDIARIES
Consolidated Statements of Stockholders’ Equity
Years Ended December 31, 2007, 2006 and 2005
(In thousands, except share amounts)
| | | | | | | | | | | | | | | | | | | |
| | | Shares | | | Common
Stock | | | Additional
Paid-In
Capital | | | Retained
Earnings | | | Accumulated
Other
Comprehensive
Income (Loss) | | | Total | |
Balance at December 31, 2004 | | 2,115,497 | | | $ | 169 | | | 19,374 | | | 4,136 | | | (61 | ) | | 23,618 | |
Comprehensive income: | | | | | | | | | | | | | | | | | | | |
Net earnings | | — | | | | — | | | — | | | 2,863 | | | — | | | 2,863 | |
Net change in unrealized loss on securities available for sale, net of taxes of $3 | | — | | | | — | | | — | | | — | | | (5 | ) | | (5 | ) |
| | | | | | | | | | | | | | | | | | | |
Comprehensive income | | | | | | | | | | | | | | | | | | 2,858 | |
| | | | | | | | | | | | | | | | | | | |
Exercise of stock options | | 288,750 | | | | 23 | | | 2,643 | | | — | | | — | | | 2,666 | |
Tax benefit from stock options exercised | | — | | | | — | | | 298 | | | — | | | — | | | 298 | |
Repurchase of common stock | | (11,500 | ) | | | (1 | ) | | (287 | ) | | — | | | — | | | (288 | ) |
5% stock dividend, fractional shares paid-in cash | | 105,641 | | | | 9 | | | 2,785 | | | (2,798 | ) | | — | | | (4 | ) |
Three-for-two stock split, fractional shares paid-in cash | | 1,249,194 | | | | (13 | ) | | 13 | | | (1 | ) | | — | | | (1 | ) |
| | | | | | | | | | | | | | | | | | | |
Balance at December 31, 2005 | | 3,747,582 | | | | 187 | | | 24,826 | | | 4,200 | | | (66 | ) | | 29,147 | |
| | | | | | | | | | | | | | | | | | | |
Comprehensive income: | | | | | | | | | | | | | | | | | | | |
Net earnings | | — | | | | — | | | — | | | 3,652 | | | — | | | 3,652 | |
Net change in unrealized loss on securities available for sale, net of taxes of $37 | | — | | | | — | | | — | | | — | | | 62 | | | 62 | |
| | | | | | | | | | | | | | | | | | | |
Comprehensive income | | | | | | | | | | | | | | | | | | 3,714 | |
| | | | | | | | | | | | | | | | | | | |
Exercise of stock options | | 93,158 | | | | 5 | | | 606 | | | — | | | — | | | 611 | |
Tax benefit from stock options exercised | | — | | | | — | | | 188 | | | — | | | — | | | 188 | |
Share-based compensation | | — | | | | — | | | 22 | | | — | | | — | | | 22 | |
Three-for-two stock split, fractional shares paid-in cash | | (53 | ) | | | — | | | — | | | — | | | — | | | — | |
| | | | | | | | | | | | | | | | | | | |
Balance at December 31, 2006 | | 3,840,687 | | | $ | 192 | | | 25,642 | | | 7,852 | | | (4 | ) | | 33,682 | |
| | | | | | | | | | | | | | | | | | | |
(continued)
F-5
FIRST COMMUNITY BANK CORPORATION OF AMERICA AND SUBSIDIARIES
Consolidated Statements of Stockholders’ Equity, Continued
Years Ended December 31, 2007, 2006 and 2005
(In thousands, except share amounts)
| | | | | | | | | | | | | | | | |
| | | Shares | | Common
Stock | | Additional
Paid-In
Capital | | Retained
Earnings | | | Accumulated
Other
Comprehensive
Income (Loss) | | | Total | |
Balance at December 31, 2006 | | 3,840,687 | | $ | 192 | | 25,642 | | 7,852 | | | (4 | ) | | 33,682 | |
| | | | | | | | | | | | | | | | |
Comprehensive income: | | | | | | | | | | | | | | | | |
Net earnings | | — | | | — | | — | | 2,865 | | | — | | | 2,865 | |
Net change in unrealized loss on securities available for sale, net of taxes of $44 | | — | | | — | | — | | — | | | 74 | | | 74 | |
| | | | | | | | | | | | | | | | |
Comprehensive income | | | | | | | | | | | | | | | 2,939 | |
| | | | | | | | | | | | | | | | |
Exercise of stock options before 5% stock dividend | | 22,811 | | | 1 | | 146 | | — | | | — | | | 147 | |
5% stock dividend, net of fractional shares paid-in cash | | 193,047 | | | 10 | | 4,227 | | (4,239 | ) | | — | | | (2 | ) |
Exercise of stock options after 5% stock dividend | | 25,457 | | | 1 | | 144 | | — | | | — | | | 145 | |
Share based compensation expense | | — | | | — | | 57 | | — | | | — | | | 57 | |
| | | | | | | | | | | | | | | | |
Balance at December 31, 2007 | | 4,082,002 | | $ | 204 | | 30,216 | | 6,478 | | | 70 | | | 36,968 | |
| | | | | | | | | | | | | | | | |
See Accompanying Notes to Consolidated Financial Statements.
F-6
FIRST COMMUNITY BANK CORPORATION OF AMERICA AND SUBSIDIARIES
Consolidated Statements of Cash Flows
(In thousands)
| | | | | | | | | | |
| | | Year Ended December 31, | |
| | | 2007 | | | 2006 | | | 2005 | |
Cash flows from operating activities: | | | | | | | | | | |
Net earnings | | $ | 2,865 | | | 3,652 | | | 2,863 | |
Adjustments to reconcile net earnings to net cash provided by operating activities: | | | | | | | | | | |
Provision for loan losses | | | 1,165 | | | 230 | | | 795 | |
Depreciation and amortization | | | 520 | | | 462 | | | 311 | |
Net amortization of deferred loan fees and costs | | | (310 | ) | | 99 | | | 30 | |
Net amortization of premium, discounts on securities | | | (28 | ) | | — | | | — | |
Income from bank owned life insurance | | | (202 | ) | | (85 | ) | | (86 | ) |
(Gain) loss on sale of foreclosed real estate | | | — | | | — | | | (1 | ) |
Origination of loans held for sale | | | (15,252 | ) | | (15,088 | ) | | (11,339 | ) |
Proceeds from sale of loans held for sale | | | 15,432 | | | 16,250 | | | 10,256 | |
Gain on sale of loans held for sale | | | (147 | ) | | (237 | ) | | (140 | ) |
Increase in accrued interest receivable | | | (135 | ) | | (475 | ) | | (434 | ) |
Decrease (increase) in other assets | | | 130 | | | (137 | ) | | (189 | ) |
Deferred income tax benefit | | | (621 | ) | | (202 | ) | | (622 | ) |
Decrease (increase) in accrued expenses and other liabilities | | | (2,382 | ) | | 1,412 | | | 2,923 | |
Tax benefit from options exercised | | | — | | | — | | | 298 | |
Share-based compensation | | | 57 | | | 22 | | | — | |
| | | | | | | | | | |
Net cash provided by operating activities | | | 1,092 | | | 5,903 | | | 4,665 | |
| | | | | | | | | | |
Cash flows from investing activities: | | | | | | | | | | |
Net change in other interest-bearing deposits with banks | | | (67 | ) | | 96 | | | 188 | |
Purchase of securities available for sale | | | (5,807 | ) | | (2,487 | ) | | (487 | ) |
Principal payments on securities available for sale | | | 281 | | | 316 | | | 593 | |
Proceeds from calls and maturities of securities available for sale | | | 3,000 | | | 7,000 | | | 4,000 | |
Principal payments on securities held to maturity | | | 334 | | | 385 | | | 377 | |
Purchase of securities held to maturity | | | (1,000 | ) | | (7,138 | ) | | (12,422 | ) |
Proceeds from calls and maturities of securities held to maturity | | | 1,500 | | | 880 | | | 8,542 | |
Net increase in loans | | | (36,821 | ) | | (75,876 | ) | | (66,347 | ) |
(Purchase) sale of premises and equipment, net | | | (4,912 | ) | | 1,234 | | | (3,860 | ) |
Proceeds from sale of foreclosed real estate | | | — | | | — | | | 50 | |
Redemption (purchase) of Federal Home Loan Bank stock | | | 49 | | | (1,444 | ) | | (211 | ) |
Purchase of bank-owned life insurance | | | (5,000 | ) | | — | | | — | |
| | | | | | | | | | |
Net cash used in investing activities | | | (48,443 | ) | | (77,034 | ) | | (69,577 | ) |
| | | | | | | | | | |
Cash flows from financing activities: | | | | | | | | | | |
Increase in deposits | | | 34,910 | | | 27,081 | | | 71,911 | |
Proceeds from Federal Home Loan Bank advances | | | 54,200 | | | 59,700 | | | 33,800 | |
Repayments of Federal Home Loan Bank advances | | | (56,700 | ) | | (29,200 | ) | | (33,800 | ) |
Net increase in other borrowings | | | 3,324 | | | 2,580 | | | 2,587 | |
Proceeds from federal funds purchased | | | 8,900 | | | — | | | — | |
Proceeds from exercise of stock options and warrants | | | 292 | | | 611 | | | 2,666 | |
Repurchase of common stock | | | — | | | — | | | (288 | ) |
Fractional shares of stock dividend paid in cash | | | (2 | ) | | — | | | (4 | ) |
Tax benefit from options exercised | | | — | | | 188 | | | — | |
| | | | | | | | | | |
Net cash provided by financing activities | | | 44,924 | | | 60,960 | | | 76,872 | |
| | | | | | | | | | |
Net (decrease) increase in cash and cash equivalents | | | (2,427 | ) | | (10,171 | ) | | 11,960 | |
Cash and cash equivalents at beginning of year | | | 11,527 | | | 21,698 | | | 9,738 | |
| | | | | | | | | | |
Cash and cash equivalents at end of year | | $ | 9,100 | | | 11,527 | | | 21,698 | |
| | | | | | | | | | |
(continued)
F-7
FIRST COMMUNITY BANK CORPORATION OF AMERICA AND SUBSIDIARIES
Consolidated Statements of Cash Flows, Continued
(In thousands)
| | | | | | | | |
| | | Year Ended December 31, | |
| | | 2007 | | 2006 | | 2005 | |
Supplemental disclosure of cash flow information: | | | | | | | | |
Cash paid during the year for: | | | | | | | | |
Interest | | $ | 13,803 | | 9,199 | | 4,741 | |
| | | | | | | | |
Income taxes | | $ | 1,709 | | 2,193 | | 2,041 | |
| | | | | | | | |
Noncash transactions: | | | | | | | | |
Transfer from loans to foreclosed real estate | | $ | 329 | | 368 | | — | |
| | | | | | | | |
Accumulated other comprehensive income, net change in unrealized loss on securities available for sale, net of income taxes | | $ | 74 | | 62 | | (5 | ) |
| | | | | | | | |
Fractional shares of stock split accrued | | $ | — | | — | | (1 | ) |
| | | | | | | | |
See Accompanying Notes to Consolidated Financial Statements.
F-8
FIRST COMMUNITY BANK CORPORATION OF AMERICA AND SUBSIDIARIES
Notes to Consolidated Financial Statements
At December 31, 2007 and 2006 and For Each of the Three Years
in the Period Ended December 31, 2007
| (1) | Description of Business and Summary of Significant Accounting Policies |
Organization. First Community Bank Corporation of America (the “Holding Company”) owns all of the outstanding common stock of First Community Bank of America (the “Bank”) and First Community Lender Services, Inc. (“FCLS”) (collectively, the “Company”). The Holding Company’s primary business activity is the operations of the Bank. The Bank is a federally-chartered stock savings bank that provides a variety of banking services to small and middle market businesses and individuals through its three banking offices located in Pinellas County, two banking offices located in Hillsborough County, one banking office in Pasco County and three banking offices located in Charlotte County, Florida. FCLS provides tax deferred 1031 exchange services for eligible transactions. The following is a description of the significant accounting policies which the Company follows in preparing and presenting its consolidated financial statements.
Principles of Consolidation. The consolidated financial statements include the accounts of the Holding Company, the Bank and FCLS. All significant intercompany accounts and transactions have been eliminated in consolidation.
Use of Estimates. In preparing consolidated financial statements in conformity with accounting principles generally accepted in the United States of America, management is required to make estimates and assumptions that affect the reported amounts of assets and liabilities as of the date of the consolidated balance sheet and reported amounts of revenues and expenses during the reporting period. Actual results could differ from those estimates. The material estimate that is particularly susceptible to significant change in the near term relate to the determination of the allowance for loan losses.
Cash and Cash Equivalents. For purposes of the consolidated statements of cash flows, cash and cash equivalents include cash and balances due from banks and interest-bearing deposits with banks.
Banks are required to maintain cash reserves in the form of vault cash or in a noninterest-earning account with the Federal Reserve Bank or in noninterest-earning accounts with other qualified banks based on the balances of their transaction deposit accounts. The Bank’s reserve requirements at December 31, 2007 and 2006 was approximately $200,000 and $702,000, respectively.
(continued)
F-9
FIRST COMMUNITY BANK CORPORATION OF AMERICA AND SUBSIDIARIES
Notes to Consolidated Financial Statements, Continued
| (1) | Description of Business and Summary of Significant Accounting Policies, Continued |
Securities. The Company may classify its securities as either trading, held to maturity or available for sale. Trading securities are held principally for resale and recorded at their fair values. Unrealized gains and losses on trading securities are included immediately in earnings. Held-to-maturity securities are those which the Company has the positive intent and ability to hold to maturity and are reported at amortized cost. Available-for-sale securities consist of securities not classified as trading securities nor as held-to-maturity securities. Unrealized holding gains and losses, net of tax, on available-for-sale securities are excluded from earnings and reported in accumulated other comprehensive income. Gains and losses on the sale of available-for-sale securities are reported on the trade date and are determined using the specific-identification method. Premiums and discounts on securities available for sale and held to maturity are recognized in interest income using the interest method over the period to maturity.
Derivatives.The Company for the convenience of its customers enters into fixed rate loan commitments for loans which will be sold to a secondary market investor. Simultaneously with the commitment the Company enters into a forward sales agreement with a secondary market investor. Any holding gains or losses associated with the loan commitments are offset by the holding gains or losses on the forward sales agreement.
Loans. Loans that management has the intent and ability to hold for the foreseeable future or until maturity or pay-off are reported at their outstanding principal adjusted for any charge-offs, the allowance for loan losses, and any deferred fees or costs on originated loans and unamortized premiums or discounts on purchased loans.
Loan origination fees are deferred and certain direct origination costs are capitalized. Both are recognized as an adjustment of the yield of the related loan.
The accrual of interest on loans is discontinued at the time the loan is ninety days delinquent unless the loan is well collateralized and in process of collection. In all cases, loans are placed on nonaccrual or charged-off at an earlier date if collection of principal or interest is considered doubtful.
All interest accrued but not collected for loans that are placed on nonaccrual or charged-off is reversed against interest income. The interest on these loans is accounted for on the cash-basis or cost-recovery method, until qualifying for return to accrual. Loans are returned to accrual status when all the principal and interest amounts contractually due are brought current and future payments are reasonably assured.
(continued)
F-10
FIRST COMMUNITY BANK CORPORATION OF AMERICA AND SUBSIDIARIES
Notes to Consolidated Financial Statements, Continued
| (1) | Description of Business and Summary of Significant Accounting Policies, Continued |
Loans Held for Sale.Loans originated that are intended to be sold in the secondary market are carried at the lower of cost or estimated fair value in the aggregate. Net unrealized losses are recognized through a valuation allowance by charges to earnings. The Company had approximately $428,000 and $461,000 of loans held for sale at December 31, 2007 and 2006, respectively, which are included in loans on the accompanying consolidated balance sheets and the fair value of these loans exceeded book value in the aggregate.
Loan origination fees are deferred and direct loan origination costs are capitalized until the related loan is sold, at which time the net fees are included in the gain on the sale of loans in the consolidated statements of earnings.
Allowance for Loan Losses. The allowance for loan losses is established as losses are estimated to have occurred through a provision for loan losses charged to earnings. Loan losses are charged against the allowance when management believes the uncollectibility of a loan balance is confirmed. Subsequent recoveries, if any, are credited to the allowance.
The allowance for loan losses is divided into two groups: (1) impaired loans, (2) all other loans. For impaired loans, the Company has determined an allowance amount to set aside which it believes is sufficient to cover any losses. Impaired loans are identified by the Loan Officer, Loan Review, Loan Committee or by the Examiners. All other loans are multiplied by an historical loss factor adjusted for economic factors, concentration of credit and portfolio composition changes.
A loan is considered impaired when, based on current information and events, it is probable that the Company will be unable to collect the scheduled payments of principal or interest when due according to the contractual terms of the loan agreement. Factors considered by management in determining impairment include payment status, collateral value, and the probability of collecting scheduled principal and interest payments when due. Loans that experience insignificant payment delays and payment shortfalls generally are not classified as impaired. Management determines the significance of payment delays and payment shortfalls on a case-by-case basis, taking into consideration all of the circumstances surrounding the loan and the borrower, including the length of the delay, the reasons for the delay, the borrower’s prior payment record, and the amount of the shortfall in relation to the principal and interest owed. Impairment is measured on a loan by loan basis for commercial, commercial real estate and land, development and construction loans by either the present value of expected future cash flows discounted at the loan’s effective interest rate, the loan’s obtainable market price, or the fair value of the collateral if the loan is collateral dependent.
Large groups of smaller balance homogeneous loans are collectively evaluated for impairment. Accordingly, the Company does not separately identify individual installment and residential loans for impairment disclosures.
(continued)
F-11
FIRST COMMUNITY BANK CORPORATION OF AMERICA AND SUBSIDIARIES
Notes to Consolidated Financial Statements, Continued
| (1) | Description of Business and Summary of Significant Accounting Policies, Continued |
Foreclosed Real Estate. Real estate acquired through, or in lieu of, foreclosure, is initially recorded at the lower of fair value or the loan balance plus acquisition costs at the date of foreclosure. After foreclosure, valuations are periodically performed by management and the real estate is carried at the lower of carrying amount or fair value, less cost to sell. Revenue and expenses from operations and changes in the valuation allowance are included in earnings.
Premises and Equipment. Land is stated at cost. Buildings, furniture, fixtures, equipment and leasehold improvements are carried at cost, less accumulated depreciation and amortization. Depreciation and amortization are computed using the straight-line method over the estimated useful life of each type of asset or lease term, if shorter.
Off-Balance-Sheet Financial Instruments. In the ordinary course of business, the Company has entered into off-balance-sheet financial instruments consisting of commitments to extend credit, unused lines of credit and standby letters of credit. Such financial instruments are recorded in the consolidated financial statements when they are funded.
Transfer of Financial Assets. Transfers of financial assets are accounted for as sales, when control over the assets has been surrendered. Control over transferred assets is deemed to be surrendered when (1) the assets have been isolated from the Company, (2) the transferee obtains the right (free of conditions that constrain it from taking advantage of that right) to pledge or exchange the transferred assets, and (3) the Company does not maintain effective control over the transferred assets through an agreement to repurchase them before their maturity.
Income Taxes. Deferred income tax assets and liabilities are recorded to reflect the tax consequences on future years of temporary differences between revenues and expenses reported for financial statement and those reported for income tax purposes. Deferred tax assets and liabilities are measured using the enacted tax rates expected to apply to taxable income in the years in which those temporary differences are expected to be realized or settled. Valuation allowances are provided against assets which are not likely to be realized.
(continued)
F-12
FIRST COMMUNITY BANK CORPORATION OF AMERICA AND SUBSIDIARIES
Notes to Consolidated Financial Statements, Continued
| (1) | Description of Business and Summary of Significant Accounting Policies, Continued |
Stock Compensation Plans. Prior to January 1, 2006, the Company’s employees and directors stock option plans were accounted for under the recognition and measurement provisions of Accounting Principles Board Opinion No. 25 (Opinion 25),Accounting for Stock Issued to Employees, and related Interpretations, as permitted by Statement of Financial Accounting Standards (SFAS) No. 123,Accounting for Stock-Based Compensation (as amended by SFAS No. 148,Accounting for Stock-Based Compensation Transition and Disclosure) (collectively SFAS 123). No stock-based employee compensation cost was recognized in the Company’s consolidated statements of operations through December 31, 2005, as all options granted under the plans had an exercise price equal to the market value of the underlying common stock on the date of grant. Effective January 1, 2006, the Company adopted the fair value recognition provisions of Financial Accounting Standards Board (“FASB”) Statement No. 123(R),Share-Based Payment(SFAS 123(R)), using the modified-prospective-transition method. Under that transition method, compensation cost recognized in 2006 includes: (a) compensation cost for all share-based payments granted prior to, but not yet vested as of January 1, 2006, based on the grant date fair value calculated in accordance with the original provisions of SFAS 123, and (b) compensation cost for all share-based payments granted subsequent to December 31, 2005, based on the grant-date fair value estimated in accordance with the provisions of SFAS 123(R).
In addition, prior to the adoption of SFAS 123(R), the tax benefits of stock options exercised were classified as operating cash flows. Since the adoption of SFAS 123(R), tax benefits resulting from tax deductions in excess of the compensation cost recognized for options are classified as financing cash flows.
(continued)
F-13
FIRST COMMUNITY BANK CORPORATION OF AMERICA AND SUBSIDIARIES
Notes to Consolidated Financial Statements, Continued
| (1) | Description of Business and Summary of Significant Accounting Policies, Continued |
Fair Values of Financial Instruments. The fair value of a financial instrument is the current amount that would be exchanged between willing parties, other than in a forced liquidation. Fair value is best determined based upon quoted market prices. However, in many instances, there are no quoted market prices for the Company’s various financial instruments. In cases where quoted market prices are not available, fair values are based on estimates using present value or other valuation techniques. Those techniques are significantly affected by the assumptions used, including the discount rate and estimates of future cash flows. Accordingly, the fair value estimates may not be realized in an immediate settlement of the instrument. Certain financial instruments and all nonfinancial instruments are excluded from fair value disclosure requirements. Accordingly, the aggregate fair value amounts presented may not necessarily represent the underlying fair value of the Company. The following methods and assumptions were used by the Company in estimating fair values of financial instruments:
Cash and Cash Equivalents. The carrying amounts of cash and cash equivalents approximate their fair value.
Other Interest-Bearing Deposits with Banks.The carrying value of other interest-bearing deposits with bank approximates their fair value.
Securities. Fair values for securities available for sale and held to maturity are based on quoted market prices, where available. If quoted market prices are not available, fair values are based on quoted market prices of comparable instruments.
Loans. For variable-rate loans that reprice frequently and have no significant change in credit risk, fair values are based on carrying values. Fair values for certain fixed-rate mortgage (e.g. one-to-four family residential), commercial real estate and commercial loans are estimated using discounted cash flow analysis, using interest rates currently being offered for loans with similar terms to borrowers of similar credit quality.
Federal Home Loan Bank Stock.The carrying amount of the Federal Home Loan Bank stock approximates its fair value.
Accrued Interest Receivable. The carrying amount of accrued interest receivable approximates its fair value.
Deposits. The fair values disclosed for demand deposits, savings, money-market and NOW accounts are, by definition, equal to the amount payable on demand at the reporting date (that is, their carrying amounts). Fair values for fixed-rate certificates of deposit are estimated using a discounted cash flow calculation that applies interest rates currently being offered on certificates to a schedule of aggregated expected monthly maturities of time deposits.
(continued)
F-14
FIRST COMMUNITY BANK CORPORATION OF AMERICA AND SUBSIDIARIES
Notes to Consolidated Financial Statements, Continued
| (1) | Description of Business and Summary of Significant Accounting Policies, Continued |
Fair Values of Financial Instruments, Continued.
Federal Funds Purchased.The carrying amount of federal funds purchased approximates fair value.
Borrowed Funds.The carrying amounts of other borrowings approximate their fair values. Fair values of advances from the Federal Home Loan Bank are estimated using discounted cash flow analysis based on the Company’s current incremental borrowing rates for similar types of borrowings.
Off-Balance-Sheet Instruments. Fair values for off-balance-sheet lending commitments are based on fees currently charged to enter into similar agreements, taking into account the remaining terms of the agreements and the counterparties’ credit standing.
Comprehensive Income. Accounting principles generally require that recognized revenue, expenses, gains and losses be included in net earnings. Although certain changes in assets and liabilities, such as unrealized gains and losses on available-for-sale securities, are reported as a separate component of the equity section of the consolidated balance sheet, such items along with net earnings, are components of comprehensive income.
Earnings Per Share. Basic earnings per share is computed on the basis of the weighted-average number of common shares outstanding. Diluted earnings per share is computed based on the weighted-average number of shares outstanding plus the effect of outstanding stock options and warrants, computed using the treasury stock method. All per share information has been restated to reflect the 5% stock dividend paid in March, 2005, the three-for-two stock split declared in December, 2005 and the 5% stock dividend declared in January, 2007 and paid in February, 2007.
Recent Accounting Pronouncements. In September 2006, the FASB issued SFAS No. 157,Fair Value Measurements (SFAS 157). SFAS 157 defines fair value, establishes a framework for measuring fair value under generally accepted accounting principles and enhances disclosures about fair value measurements. SFAS 157 retains the exchange price notion and clarifies that the exchange price is the price that would be received for an asset or paid to transfer a liability (an exit price) in an orderly transaction between market participants on the measurement date. SFAS 157 is effective for the Company’s financial statements for the year beginning on January 1, 2008, with earlier adoption permitted. The adoption of SFAS 157 is not expected to have a material impact on the Company.
In February 2007, the FASB issued SFAS No. 159,The Fair Value Option for Financial Assets and Financial Liabilities (“SFAS 159”). SFAS 159 provides the Company with an option to report selected financial assets and liabilities at fair value. This statement is effective as of the beginning of a Company’s first fiscal year beginning after November 15, 2007. Management has evaluated the impact of SFAS 159 and it did not have a material effect on the Company’s consolidated financial condition or results of operations.
(continued)
F-15
FIRST COMMUNITY BANK CORPORATION OF AMERICA AND SUBSIDIARIES
Notes to Consolidated Financial Statements, Continued
| (1) | Description of Business and Summary of Significant Accounting Policies, Continued |
Recent Accounting Pronouncements, Continued.In September 2006, the Securities and Exchange Commission (SEC) issued Staff Accounting Bulletin No. 108 (SAB 108). SAB 108 expresses the SEC Staff’s views regarding the process of quantifying financial statement misstatements. SAB 108 states that in evaluating the materiality of financial statement misstatements a corporation must quantify the impact of correcting misstatements, including both the carryover and reversing effects of prior year misstatements, on the current year financial statements. SAB 108 was effective for the fiscal years ended after November 15, 2006. The adoption of SAB 108 had no effect on the Company’s results of operations or financial condition.
In July 2006, the FASB released FASB Interpretation No. 48,Accounting for Uncertainty in Income Taxes, an interpretation of FASB Statement No. 109 (FIN 48). FIN 48 clarifies the accounting and reporting for income taxes where interpretation of the tax law may be uncertain. FIN 48 prescribes a comprehensive model for the financial statement recognition, measurement, presentation and disclosure of income tax uncertainties with respect to positions taken or expected to be taken in income tax returns. The Company adopted FIN 48 on January 1, 2007. The adoption of FIN 48 had no effect on the Company.
In March 2006, the FASB issued SFAS No. 156,Accounting for Servicing of Financial Assets, an amendment of FASB Statement No. 133 and 140 (SFAS 156), which permits, but does not require, an entity to account for one or more classes of servicing rights (i.e., mortgage servicing rights) at fair value, with the changes in fair value recorded in the consolidated statement of earnings. This Statement was effective as of January 1, 2007. The adoption of SFAS 156 had no effect on the Company.
In December 2007, the FASB issued SFAS No. 141(R),Business Combinations (“SFAS 141(R)”). SFAS 141(R) is effective for fiscal years beginning after December 15, 2008 and early implementation is not permitted. SFAS 141(R) requires the acquiring entity in a business combination to recognize all (and only) the assets acquired and liabilities assumed in the transaction; establishes the acquisition date fair value as the measurement objective for all assets acquired and liabilities assumed; and requires the acquirer to disclose to investors and other users all of the information they need to evaluate and understand the nature and financial effect of the business combination. Acquisition related costs including finder’s fees, advisory, legal, accounting valuation and other professional and consulting fees are required to be expensed as incurred. Management is in the process of evaluating the impact of SFAS 141(R) and does not anticipate it will have a material impact on the Company’s financial condition or results of operations.
Reclassifications.Certain amounts in the 2006 consolidated financial statements have been reclassified to conform to the 2007 presentation.
(continued)
F-16
FIRST COMMUNITY BANK CORPORATION OF AMERICA AND SUBSIDIARIES
Notes to Consolidated Financial Statements, Continued
Securities have been classified according to management’s intent. The carrying amounts of securities and their fair value were as follows (in thousands):
| | | | | | | | | | |
| | | Amortized
Cost | | Gross
Unrealized
Gains | | Gross
Unrealized
Losses | | | Fair
Value |
Available for Sale: | | | | | | | | | | |
At December 31, 2007: | | | | | | | | | | |
U.S. government agency securities | | $ | 4,197 | | 76 | | — | | | 4,273 |
Mortgage-backed securities | | | 2,539 | | 36 | | (1 | ) | | 2,574 |
| | | | | | | | | | |
| | $ | 6,736 | | 112 | | (1 | ) | | 6,847 |
| | | | | | | | | | |
| | | | |
At December 31, 2006: | | | | | | | | | | |
U.S. Treasury securities | | | 499 | | — | | (1 | ) | | 498 |
U.S. government agency securities | | | 2,992 | | 1 | | — | | | 2,993 |
Mortgage-backed securities | | | 704 | | — | | (7 | ) | | 697 |
| | | | | | | | | | |
| | $ | 4,195 | | 1 | | (8 | ) | | 4,188 |
| | | | | | | | | | |
| | | | |
Held to Maturity: | | | | | | | | | | |
At December 31, 2007: | | | | | | | | | | |
U.S. government agency securities | | | 2,156 | | 11 | | — | | | 2,167 |
Mortgage-backed securities | | | 1,156 | | — | | (6 | ) | | 1,150 |
Municipal securities | | | 7,018 | | — | | (157 | ) | | 6,861 |
| | | | | | | | | | |
| | $ | 10,330 | | 11 | | (163 | ) | | 10,178 |
| | | | | | | | | | |
| | | | |
At December 31, 2006: | | | | | | | | | | |
U.S. government agency securities | | | 2,646 | | — | | (6 | ) | | 2,640 |
Mortgage-backed securities | | | 1,487 | | — | | (35 | ) | | 1,452 |
Municipal securities | | | 7,018 | | — | | (71 | ) | | 6,947 |
| | | | | | | | | | |
| | $ | 11,151 | | — | | (112 | ) | | 11,039 |
| | | | | | | | | | |
(continued)
F-17
FIRST COMMUNITY BANK CORPORATION OF AMERICA AND SUBSIDIARIES
Notes to Consolidated Financial Statements, Continued
The scheduled maturities of securities at December 31, 2007 were as follows (in thousands):
| | | | | | | | | |
| | | Available for Sale | | Held to Maturity |
| | | Amortized
Cost | | Fair
Value | | Amortized
Cost | | Fair
Value |
Less than one year | | $ | 500 | | 500 | | 1,159 | | 1,161 |
One to five years | | | 1,196 | | 1,216 | | 497 | | 500 |
Five to ten years | | | 2,500 | | 2,557 | | 1,249 | | 1,211 |
After ten years | | | — | | — | | 6,269 | | 6,156 |
Mortgage-backed securities | | | 2,539 | | 2,574 | | 1,156 | | 1,150 |
| | | | | | | | | |
| | $ | 6,735 | | 6,847 | | 10,330 | | 10,178 |
| | | | | | | | | |
There were no sales of securities in 2007, 2006 or 2005.
Securities with gross unrealized losses at December 31, 2007, aggregated by investment category and length of time that individual securities have been in a continuous loss position, is as follows (in thousands):
| | | | | | | | | | |
| | | Less Than Twelve Months | | Over Twelve Months |
| | | Gross
Unrealized
Losses | | Fair
Value | | Gross
Unrealized
Losses | | | Fair
Value |
Securities available for sale: | | | | | | | | | | |
U.S. treasury securities | | $ | — | | — | | — | | | — |
Mortgage-backed securities | | | — | | — | | (1 | ) | | 319 |
| | | | | | | | | | |
Total securities available for sale | | $ | — | | — | | (1 | ) | | 319 |
| | | | | | | | | | |
Securities held to maturity: | | | | | | | | | | |
U.S. government agency securities | | | — | | — | | — | | | — |
Mortgage-backed securities | | | — | | — | | (7 | ) | | 1,150 |
Municipal securities | | | — | | — | | (156 | ) | | 6,861 |
| | | | | | | | | | |
Total securities held to maturity | | $ | — | | — | | (163 | ) | | 8,011 |
| | | | | | | | | | |
Management evaluates securities for other-than-temporary impairment at least on a quarterly basis, and more frequently when economic or market concerns warrant such evaluation. Consideration is given to (1) the length of time and the extent to which the fair value has been less than cost, (2) the financial condition and near-term prospects of the issuer, and (3) the intent and ability of the Company to retain its investment in the issuer for a period of time sufficient to allow for any anticipated recovery in fair value.
(continued)
F-18
FIRST COMMUNITY BANK CORPORATION OF AMERICA AND SUBSIDIARIES
Notes to Consolidated Financial Statements, Continued
The unrealized losses on twenty-four investment securities were caused by interest rate changes. It is expected that the securities would not be settled at a price less than the par value of the investments. Because the decline in fair value is attributable to changes in interest rates and not credit quality, and because the Company has the ability and intent to hold these investments until a market price recovery or maturity, these investments are not considered other-than-temporarily impaired.
As of December 31, 2007 and 2006, securities with a carrying value of $13,574,000 and $9,603,000, respectively, were pledged for repurchase agreements with customers and for various purposes required or permitted by law.
The components of loans are summarized as follows (in thousands):
| | | | | | | |
| | | At December 31, | |
| | | 2007 | | | 2006 | |
Residential mortgage loans | | $ | 113,887 | | | 101,800 | |
Commercial real estate loans | | | 123,206 | | | 105,557 | |
Land loans | | | 23,344 | | | 25,660 | |
Developed lot loans | | | 23,495 | | | 22,053 | |
Construction loans | | | 24,798 | | | 22,214 | |
Commercial loans | | | 22,343 | | | 21,572 | |
Installment loans | | | 56,496 | | | 51,784 | |
| | | | | | | |
Total loans | | | 387,569 | | | 350,640 | |
Deduct: | | | | | | | |
Allowance for loan losses | | | (4,479 | ) | | (3,499 | ) |
Net deferred loan fees | | | (539 | ) | | (353 | ) |
| | | | | | | |
Loans, net | | $ | 382,551 | | | 346,788 | |
| | | | | | | |
An analysis of the change in the allowance for loan losses follows (in thousands):
| | | | | | | | | | |
| | | Year Ended December 31, | |
| | | 2007 | | | 2006 | | | 2005 | |
Balance at beginning of year | | $ | 3,499 | | | 3,416 | | | 2,640 | |
Provision for loan losses | | | 1,165 | | | 230 | | | 795 | |
(Charge-offs) net of recoveries | | | (185 | ) | | (147 | ) | | (19 | ) |
| | | | | | | | | | |
Balance at end of year | | $ | 4,479 | | | 3,499 | | | 3,416 | |
| | | | | | | | | | |
(continued)
F-19
FIRST COMMUNITY BANK CORPORATION OF AMERICA AND SUBSIDIARIES
Notes to Consolidated Financial Statements, Continued
The following summarizes the amount of collateral dependent impaired loans (in thousands):
| | | | |
| | | Year Ended
December 31, 2007 | |
Gross loans with no related allowance for loan losses | | $ | 4,357 | |
Gross loans with related allowance for loan losses | | | 2,106 | |
Total related allowance for loan losses | | | (306 | ) |
| | | | |
| |
Net investment in impaired loans | | $ | 6,157 | |
| | | | |
| |
| | | Year Ended
December 31, 2007 | |
Average net investment in impaired loans | | $ | 2,855 | |
| | | | |
Interest income recognized on impaired loans | | $ | 210 | |
| | | | |
Interest income received on impaired loans | | $ | 210 | |
| | | | |
There were no impaired loans at December 31, 2006.
Nonaccrual and past due loans were as follows (in thousands):
| | | | | |
| | | At December 31, |
| | | 2007 | | 2006 |
Nonaccrual loans | | $ | 2,364 | | 150 |
Past due ninety days or more, still accruing | | | — | | — |
| | | | | |
| | $ | 2,364 | | 150 |
| | | | | |
Credit Risk and Credit Losses.A credit risk concentration results when the Bank has a significant credit exposure to an individual or a group engaged in similar activities or having similar economic characteristics that would cause their ability to meet contractual obligations to be similarly affected by changes in economic or other conditions.
Most of the Company’s lending activity is with borrowers located within Charlotte, Pinellas, Pasco and Hillsborough Counties, Florida. Therefore, the Company’s exposure to credit risk is significantly affected by changes in the economy and real estate markets in those counties.
(continued)
F-20
FIRST COMMUNITY BANK CORPORATION OF AMERICA AND SUBSIDIARIES
Notes to Consolidated Financial Statements, Continued
At December 31, 2007, the construction loans included $12.5 million to individuals. The remaining construction loans included $8.3 million in commercial properties and $4.0 million in residential builder lines. The Bank believes that it has no significant exposure to any individual builder.
A majority of the Bank’s loan activity is with customers located in our four markets, St. Petersburg/Clearwater, Tampa, Dade City and Port Charlotte/Punta Gorda. The customer base is comprised of individuals, professionals and small to middle market sized companies. Loans are underwritten primarily on the borrower’s ability to repay the loan through personal cash flow, cash flow generated from the business, income producing real estate or the specific sale of an asset. Collateral and the amount to be obtained are determined through an analysis of the specific transaction and the source of repayment and related risk assessment. Collateral types are accounts receivable, inventory, equipment, commercial and residential real estate. The real estate utilized in commercial transactions is predominantly owner occupied industrial or income producing properties such as apartments, office, warehouse and some retail. The Bank’s exposure in commercial real estate is over 65% owner occupied and the source of repayment is cash flow from the Company’s operations. The remaining 35% of commercial real estate is income producing properties dependent on tenants. The Bank’s residential mortgage loans are comprised of 1-4 family homes and condominiums, 84% of which are primary residences and 16% are for investment.
The Bank has no major concentration in acquisition and development or builder lines. The Bank currently has two acquisition and development loans with 35 lots totaling $1.7million, two primary builder relationships totaling $3.2 million. The builders are located in the St. Petersburg/Clearwater area and the inventory is six speculative lots and fourteen model homes/townhouse units and the source of repayment is sale of the asset. The Banks raw land (commercial and residential) and developed commercial land loans totals $23.3 million to eighty-seven borrowers a majority of which was underwritten based on the cash flow of the borrower or guarantors to support the loan. The Bank has $23.5 million in developed residential lots to 139 borrowers mostly underwritten with the borrower’s personal cash flow as the primary source of repayment. Within this number are several small builders who maintain minimal lot inventory. The bank has minimal exposure in speculative single family homes as most loans are underwritten based on the borrowers ability to cash flow the loan in the event it must be termed out on a permanent basis.
The Bank also has over $15 million in manufactured housing loans in numerous parks through out the four market areas. These loans would be in rental parks, cooperative owned parks and subdivision parks. The Bank perfects its interest in the title and the cooperative share or real estate if applicable.
(continued)
F-21
FIRST COMMUNITY BANK CORPORATION OF AMERICA AND SUBSIDIARIES
Notes to Consolidated Financial Statements, Continued
| (4) | Premises and Equipment, Net |
Premises and equipment are summarized as follows (in thousands):
| | | | | | | |
| | | At December 31, | |
| | | 2007 | | | 2006 | |
Land | | $ | 5,323 | | | 2,289 | |
Buildings | | | 4,875 | | | 3,634 | |
Furniture, fixtures and equipment | | | 2,764 | | | 2,313 | |
Leasehold improvements | | | 546 | | | 349 | |
| | | | | | | |
Total, at cost | | | 13,508 | | | 8,585 | |
| | |
Less accumulated depreciation and amortization | | | (2,022 | ) | | (1,491 | ) |
| | | | | | | |
| | $ | 11,486 | | | 7,094 | |
| | | | | | | |
The Company leases four branch offices, an operations center and a loan production office. The leases have initial terms ranging from two to ten years. Three of the leases contain escalation clauses and renewal options.
The Bank sold its office properties in St. Petersburg and Pinellas Park, Florida on May 17, 2006, and simultaneously leased both properties with favorable long-term leases. An immediate gain of approximately $225,000 was recognized on one of the properties because of the excess gain over the present value of the lease payments. The remaining gain of approximately $2.6 million was deferred and is being amortized using the straight-line method over the ten year lease term. The lease expense is being straight-lined over the ten year lease life due to yearly 2% annual increases.
(continued)
F-22
FIRST COMMUNITY BANK CORPORATION OF AMERICA AND SUBSIDIARIES
Notes to Consolidated Financial Statements, Continued
| (4) | Premises and Equipment, Net, Continued |
Rent expense under the operating leases, net of related deferred gain amortization, was approximately $412,000, $278,000 and $128,000 for the years ended December 31, 2007, 2006 and 2005, respectively. Future minimum rental commitments at December 31, 2007 under these operating leases are as follows (in thousands):
| | | |
Year Ending December 31, | | Amount |
2008 | | $ | 625 |
2009 | | | 586 |
2010 | | | 502 |
2011 | | | 474 |
2012 | | | 440 |
Thereafter | | | 1,531 |
| | | |
Total | | $ | 4,158 |
| | | |
During 2007, the Company opened two new banking offices in Charlotte County, Florida. The Veterans Boulevard office is a two-story, 7,400 square foot building and the Punta Gorda office is a renovated 1,509 square foot former commercial building. There is no more than $30,000 in remaining payments on the completion of the Punta Gorda office.
The aggregate amount of time deposits of $100,000 or more was $74.2 million and $93.2 million at December 31, 2007 and 2006, respectively.
At December 31, 2007, scheduled maturities of time deposits are as follows (in thousands):
| | | |
Year Ending December 31, | | Amount |
2008 | | $ | 161,329 |
2009 | | | 18,121 |
2010 | | | 5,233 |
2011 | | | 244 |
2012 | | | 2,301 |
| | | |
Total | | $ | 187,228 |
| | | |
(continued)
F-23
FIRST COMMUNITY BANK CORPORATION OF AMERICA AND SUBSIDIARIES
Notes to Consolidated Financial Statements, Continued
| (6) | Federal Home Loan Bank Advances |
A summary of the Company’s Federal Home Loan Bank of Atlanta (“FHLB”) advances by maturity follows ($ in thousands):
| | | | | | | | |
| | | Interest
Rate | | | At December 31, |
Maturing in Year Ending December 31, | | | 2007 | | 2006 |
2007 | | 5.50 | | | $ | — | | 17,500 |
2007 | | 5.36 | | | | — | | 7,000 |
2007 | | 3.34 | | | | — | | 2,000 |
2008 | | 4.64 | | | | 8,000 | | — |
2008 | | 4.45 | | | | 3,000 | | 3,000 |
2008 | | 4.14 | | | | 2,000 | | 2,000 |
2009 | | 3.71 | | | | 1,000 | | 1,000 |
2010 | | 3.75 | (1) | | | 5,000 | | — |
2011 | | 5.40 | | | | 5,000 | | 5,000 |
2012 | | 4.06 | (2) | | | 5,000 | | — |
2016 | | 4.62 | (3) | | | 5,000 | | 5,000 |
2017 | | 2.92 | (4) | | | 6,000 | | — |
| | | | | | | | |
| | | | | $ | 40,000 | | 42,500 |
| | | | | | | | |
| | (1) | FHLB has a call option in December 2009 |
| | (2) | FHLB has a call option in September 2008 |
| | (3) | FHLB has a call option in October 2009 |
| | (4) | FHLB has a call option in December 2008 |
The Company has entered into a collateral agreement with the FHLB. These advances are collateralized by all of the Company’s FHLB stock and a blanket floating lien on all qualified 1-4 family mortgage loans.
(continued)
F-24
FIRST COMMUNITY BANK CORPORATION OF AMERICA AND SUBSIDIARIES
Notes to Consolidated Financial Statements, Continued
The Company enters into repurchase agreements with customers. These agreements require the Company to pledge securities as collateral for borrowings under these agreements. At December 31, 2007 and 2006, the outstanding balance of such borrowings totaled $9,613,000 and $6,289,000, respectively and the Company pledged securities with a carrying value of $13,574,000 and $9,105,000, respectively as collateral for these agreements.
Income taxes consisted of the following (in thousands):
| | | | | | | | | | |
| | | Year Ended December 31, | |
| | | 2007 | | | 2006 | | | 2005 | |
Current: | | | | | | | | | | |
Federal | | $ | 1,844 | | | 1,963 | | | 1,958 | |
State | | | 329 | | | 341 | | | 336 | |
| | | | | | | | | | |
Total current | | | 2,173 | | | 2,304 | | | 2,294 | |
| | | | | | | | | | |
| | | |
Deferred: | | | | | | | | | | |
Federal | | | (530 | ) | | (173 | ) | | (531 | ) |
State | | | (91 | ) | | (29 | ) | | (91 | ) |
| | | | | | | | | | |
Total deferred benefit | | | (621 | ) | | (202 | ) | | (622 | ) |
| | | | | | | | | | |
Total income taxes | | $ | 1,552 | | | 2,102 | | | 1,672 | |
| | | | | | | | | | |
(continued)
F-25
FIRST COMMUNITY BANK CORPORATION OF AMERICA AND SUBSIDIARIES
Notes to Consolidated Financial Statements, Continued
| (8) | Income Taxes, Continued |
The reasons for the differences between the statutory Federal income tax rate and the effective tax rate are summarized as follows ($ in thousands):
| | | | | | | | | | | | | | | | | | | | | |
| | | Year Ended December 31, | |
| | | 2007 | | | 2006 | | | 2005 | |
| | | Amount | | | % of
Earnings | | | Amount | | | % of
Earnings | | | Amount | | | % of
Earnings | |
Income taxes at statutory rate | | $ | 1,502 | | | 34.0 | % | | $ | 1,956 | | | 34.0 | % | | $ | 1,542 | | | 34.0 | % |
Increase (decrease) in taxes resulting from: | | | | | | | | | | | | | | | | | | | | | |
State taxes, net of Federal benefit | | | 157 | | | 3.6 | | | | 206 | | | 3.6 | | | | 162 | | | 3.6 | |
Tax exempt interest | | | (96 | ) | | (2.2 | ) | | | (38 | ) | | (.7 | ) | | | — | | | — | |
Other | | | (11 | ) | | (.3 | ) | | | (22 | ) | | (.4 | ) | | | (32 | ) | | (.7 | ) |
| | | | | | | | | | | | | | | | | | | | | |
Income taxes | | $ | 1,552 | | | 35.1 | % | | $ | 2,102 | | | 36.5 | % | | $ | 1,672 | | | 36.9 | % |
| | | | | | | | | | | | | | | | | | | | | |
The tax effects of temporary differences that give rise to significant portions of the deferred tax assets and liabilities are presented below (in thousands):
| | | | | | | |
| | | At December 31, | |
| | | 2007 | | | 2006 | |
Deferred tax assets: | | | | | | | |
Allowance for loan losses | | $ | 1,598 | | | 1,231 | |
Deferred loan fees | | | 407 | | | 376 | |
Deferred compensation | | | 421 | | | 339 | |
Premises and equipment | | | 16 | | | — | |
Other | | | 59 | | | 10 | |
| | | | | | | |
Total deferred tax assets | | | 2,501 | | | 1,956 | |
| | | | | | | |
| | |
Deferred tax liabilities: | | | | | | | |
Deferred loan costs | | | (207 | ) | | (244 | ) |
Premises and equipment | | | — | | | (39 | ) |
| | | | | | | |
Total deferred tax liabilities | | | (207 | ) | | (283 | ) |
| | |
Net deferred tax asset | | $ | 2,294 | | | 1,673 | |
The Company sponsors a 401(k) profit sharing plan which is available to all employees electing to participate after meeting certain length-of-service requirements. The Company contributed $162,000, $118,000 and $88,000 to the plan during the years ended December 31, 2007, 2006 and 2005, respectively.
(continued)
F-26
FIRST COMMUNITY BANK CORPORATION OF AMERICA AND SUBSIDIARIES
Notes to Consolidated Financial Statements, Continued
| (10) | Salary Continuation Agreement |
During the year ended December 31, 2005, the Company entered into a Salary Continuation Agreement (the “Agreement”) with the President and Chief Executive Officer of the Company which requires the Company to provide salary continuation benefits to him upon retirement. The Agreement requires the Company to pay monthly benefits following normal retirement age. The Agreement also provides for salary continuation in the event of a change in control of the Company and for early voluntary termination. The Company is accruing the present value of the future benefits over the term of the Agreement. The Company expensed $152,000, $148,000 and $83,000 under the Agreement in 2007, 2006 and 2005, respectively.
In February, 2005, the Company declared a 5% stock dividend to shareholders of record on March 1, 2005 which was paid on March 15, 2005.
On December 19, 2005, a three-for-two stock split was declared by the Company for shareholders of record as of January 10, 2006, which was paid on January 20, 2006. Also, the par value of the common stock was decreased from $.08 per share to $.05 per share.
In January, 2007, the Company declared a 5% stock dividend to shareholders of record on January 22, 2007 which was paid on February 28, 2007.
Banking regulations place certain restrictions on dividends and loans or advances made by the Bank to the Holding Company.
The Bank is subject to various regulatory capital requirements administered by the regulatory banking agencies. Failure to meet minimum capital requirements can initiate certain mandatory and possibly additional discretionary actions by regulators that, if undertaken, could have a direct material effect on the Company’s and the Bank’s financial statements. Under capital adequacy guidelines and the regulatory framework for prompt corrective action, the Bank must meet specific capital guidelines that involve quantitative measures of their assets, liabilities, and certain off-balance-sheet items as calculated under regulatory accounting practices. The capital amounts and classification are also subject to qualitative judgments by the regulators about components, risk weightings, and other factors.
(continued)
F-27
FIRST COMMUNITY BANK CORPORATION OF AMERICA AND SUBSIDIARIES
Notes to Consolidated Financial Statements, Continued
| (12) | Regulatory Matters, Continued |
Quantitative measures established by regulation to ensure capital adequacy require the Bank to maintain minimum amounts and percentages (set forth in the following table) of total and Tier 1 capital (as defined in the regulations) to risk-weighted assets (as defined) and of Tier 1 capital (as defined) to average assets (as defined). Management believes, as of December 31, 2007, the Bank met all capital adequacy requirements to which they are subject.
As of December 31, 2007, the most recent notification from the regulatory authorities categorized the Bank as well capitalized under the regulatory framework for prompt corrective action. To be categorized as well capitalized, an institution must maintain minimum total risk-based, Tier I risk-based, and Tier I leverage percentages as set forth in the following tables. There are no conditions or events since that notification that management believes have changed the Bank’s category. The Bank’s actual capital amounts and percentages are also presented in the table (dollars in thousands).
| | | | | | | | | | | | | | | | | | |
| | | Actual | | | For Capital
Adequacy Purposes | | | Minimum To Be
Well Capitalized
Under Prompt
Corrective Action
Provisions | |
| | | Amount | | % | | | Amount | | % | | | Amount | | % | |
As of December 31, 2007: | | | | | | | | | | | | | | | | | | |
Total Capital to Risk-Weighted Assets | | $ | 37,684 | | 11.23 | % | | $ | 26,849 | | 8.00 | % | | $ | 33,561 | | 10.00 | % |
Tier I Capital to Risk-Weighted Assets | | | 33,625 | | 10.02 | | | | 13,424 | | 4.00 | | | | 20,136 | | 6.00 | |
Tier I Capital (to Total Assets) | | | 33,625 | | 7.71 | | | | 17,449 | | 4.00 | | | | 21,811 | | 5.00 | |
| | | | | | |
As of December 31, 2006: | | | | | | | | | | | | | | | | | | |
Total Capital to Risk-Weighted Assets | | | 34,135 | | 11.19 | | | | 24,410 | | 8.00 | | | | 30,513 | | 10.00 | |
Tier I Capital to Risk-Weighted Assets | | | 30,636 | | 10.04 | | | | 12,206 | | 4.00 | | | | 18,307 | | 6.00 | |
Tier I Capital (to Total Assets) | | | 30,636 | | 7.85 | | | | 15,616 | | 4.00 | | | | 19,519 | | 5.00 | |
The aggregate amount of loans owed to the Company by its officers and directors at December 31, 2007 and 2006 was $623,000 and $618,000, respectively. During 2007, total principal additions were $160,000 and total principal payments were $155,000.
(continued)
F-28
FIRST COMMUNITY BANK CORPORATION OF AMERICA AND SUBSIDIARIES
Notes to Consolidated Financial Statements, Continued
| (14) | Off-Balance-Sheet Financial Instruments |
The Company is a party to financial instruments with off-balance-sheet risk in the normal course of business to meet the financing needs of its customers. These financial instruments are commitments to extend credit, unused lines of credit and standby letters of credit. These instruments involve, to varying degrees, elements of credit and interest-rate risk in excess of the amount recognized in the consolidated balance sheet. The contract amounts of these instruments reflect the extent of involvement the Company has in these financial instruments.
The Company’s exposure to credit loss in the event of nonperformance by the other party to the financial instrument for commitments to extend credit, unused lines of credit and standby letters of credit is represented by the contractual amount of those instruments. The Company uses the same credit policies in making commitments as it does for on-balance-sheet instruments.
Commitments to extend credit are agreements to lend to a customer as long as there is no violation of any condition established in the contract. Commitments generally have fixed expiration dates or other termination clauses and may require payment of a fee. Since some of the commitments are expected to expire without being drawn upon, the total commitment amounts do not necessarily represent future cash requirements. The Company evaluates each customer’s credit worthiness on a case-by-case basis. The amount of collateral obtained if deemed necessary by the Company upon extension of credit is based on management’s credit evaluation of the counterparty.
Standby letters of credit are conditional lending commitments issued by the Company to guarantee the performance of a customer to a third party and to support public and private borrowing arrangements. Essentially all letters of credit issued have expiration dates within one year. The credit risk involved in issuing letters-of-credit is essentially the same as that involved in extending loan facilities to customers. The Company may hold collateral supporting these commitments, and at December 31, 2007 such collateral amounted to $14,614,000.
A summary of the notional amounts of the Company’s financial instruments, with off-balance sheet risk at December 31, 2007, follows (in thousands):
| | | |
| | | Contract
Amount |
Commitments to extend credit | | $ | 12,334 |
| | | |
Unused lines of credit | | $ | 39,882 |
| | | |
Standby letters of credit | | $ | 2,812 |
| | | |
(continued)
F-29
FIRST COMMUNITY BANK CORPORATION OF AMERICA AND SUBSIDIARIES
Notes to Consolidated Financial Statements, Continued
| (15) | Fair Value of Financial Instruments |
The estimated fair values of the Company’s financial instruments were as follows (in thousands):
| | | | | | | | | | | |
| | | At December 31, 2007 | | | | At December 31, 2006 |
| | | Carrying
Amount | | Fair
Value | | | | Carrying
Amount | | Fair
Value |
Financial assets: | | | | | | | | | | | |
Cash and cash equivalents | | $ | 9,100 | | 9,100 | | | | 11,527 | | 11,527 |
Other interest-bearing deposits with banks | | | 498 | | 498 | | | | 431 | | 431 |
Securities | | | 17,177 | | 17,025 | | | | 15,339 | | 15,227 |
Loans | | | 382,551 | | 382,407 | | | | 346,788 | | 343,581 |
Federal Home Loan Bank stock | | | 2,504 | | 2,504 | | | | 2,533 | | 2,533 |
Accrued interest receivable | | | 1,855 | | 1,855 | | | | 1,720 | | 1,720 |
| | | | | |
Financial liabilities: | | | | | | | | | | | |
Deposits | | | 334,620 | | 335,166 | | | | 299,710 | | 295,411 |
Federal Home Loan Bank advances | | | 40,000 | | 39,877 | | | | 42,500 | | 42,484 |
Federal funds purchased | | | 8,900 | | 8,900 | | | | — | | — |
Other borrowings | | | 9,613 | | 9,613 | | | | 6,289 | | 6,289 |
Off-Balance Sheet Financial Instruments | | | — | | — | | | | — | | — |
(continued)
F-30
FIRST COMMUNITY BANK CORPORATION OF AMERICA AND SUBSIDIARIES
Notes to Consolidated Financial Statements, Continued
| (16) | Share-Based Compensation |
The Company has three stock option plans for directors and employees of the Company. Under the first two plans, the total number of options which may be granted to purchase common stock is 620,156 (amended) for directors and 516,797 (amended) for employees. At December 31, 2007, no options remain available for grant under the directors’ plan and 39,253 options remain available for grant under the employees’ plan. The third plan has 236,250 (amended) options available to either employees or directors and 15,750 remain available for grant as of December 31, 2007. The directors’ options vest immediately and have a life of five years. The employees’ options vest over periods up to four years and have terms up to ten years. All options and share prices have been adjusted to reflect the 5% stock dividend paid in March 2005, the three-for-two stock split declared in December 2005 and the 5% stock dividend declared in January 2007 and paid in February 2007:
| | | | | | | | | | | |
| | | Number
of Shares | | | Weighted
Average
Per Share
Price | | Weighted
Average
Remaining
Contractual
Term | | Aggregate
Intrinsic
Value |
Options outstanding at December 31, 2005 | | 781,981 | | | $ | 9.63 | | | | | |
Options granted | | 32,550 | | | | 19.51 | | | | | |
Options exercised | | (97,816 | ) | | | 6.25 | | | | | |
Options forfeited | | (1,574 | ) | | | 16.31 | | | | | |
| | | | | | | | | | | |
Options outstanding at December 31, 2006 | | 715,141 | | | | 10.28 | | | | | |
Options granted | | 22,350 | | | | 17.78 | | | | | |
Options exercised | | (49,409 | ) | | | 5.92 | | | | | |
Options forfeited | | (2,361 | ) | | | 16.31 | | | | | |
| | | | | | | | | | | |
Options outstanding at December 31, 2007 | | 685,721 | | | $ | 10.71 | | 3.7 years | | $ | 2,065 |
| | | | | | | | | | | |
| | | | | | | | | | | |
Options exercisable at December 31, 2007 | | 648,311 | | | $ | 10.34 | | 4.0 years | | $ | 2,007 |
| | | | | | | | | | | |
| | | | | | | | | | | |
The Company accelerated the vesting of all unvested options in 2005, primarily to reduce noncash compensation expense that would have been recorded in its consolidated statements of earnings in future years due to the adoption of SFAS No. 123(R) in January 2006. In accordance with SFAS 123, in 2005 the Company expensed the remaining unrecognized compensation cost associated with these options in the proforma disclosure.
(continued)
F-31
FIRST COMMUNITY BANK CORPORATION OF AMERICA AND SUBSIDIARIES
Notes to Consolidated Financial Statements, Continued
| (16) | Share-Based Compensation, Continued |
The following table illustrates the effect on net earnings and earnings per share if the Company had applied the fair value recognition provisions of SFAS No. 123 to stock-based employee compensation for the year ended December 31, 2005. All per share information has been restated to reflect the 5% stock dividend paid in March, 2005, the three-for-two stock split declared in December, 2005 and the 5% stock dividend declared in January, 2007 and paid in February, 2007 (in thousands, except per share amounts).
| | | | |
| | | Year Ended
December 31, | |
| | | 2005 | |
Net earnings, as reported | | $ | 2,863 | |
Deduct: Total stock-based employee compensation determined under the fair value based method for all awards, net of related tax effect | | | (133 | ) |
| | | | |
Proforma net earnings | | $ | 2,730 | |
| | | | |
Earnings per share: | | | | |
Basic, as reported | | $ | .82 | |
| | | | |
Basic, proforma | | $ | .78 | |
| | | | |
Diluted, as reported | | $ | .74 | |
| | | | |
Diluted, proforma | | $ | .71 | |
| | | | |
The total intrinsic value of options exercised during the years ended December 31, 2007 and 2006 was $645,000 and $1,064,000, respectively, and the tax benefit relating to the stock options exercised was $0 and $188,000, respectively. At December 31, 2007, there was $109,000 of total unrecognized compensation expense related to nonvested share-based compensation arrangements granted under the plans. The cost is expected to be recognized over a weighted-average period of thirty-three months. The total fair value of shares vesting and recognized as compensation expense was $57,000 and $22,000 for the years ended December 31, 2007 and 2006, respectively.
(continued)
F-32
FIRST COMMUNITY BANK CORPORATION OF AMERICA AND SUBSIDIARIES
Notes to Consolidated Financial Statements, Continued
| (16) | Share-Based Compensation, Continued |
The fair value of each option granted is estimated on the date of grant using the Black-Scholes option-pricing model with the following assumptions:
| | | | | | | | | | |
| | | Year Ended December 31, | |
| | | 2007 | | | 2006 | | | 2005 | |
Risk-free interest rate | | | 4.28 | % | | 4.94 | % | | 3.79 | % |
Expected dividend yield | | | — | | | — | | | — | |
Expected volatility | | | 4.00 | % | | 8.00 | % | | 9.27 | % |
Expected life in years | | | 6 | | | 6 | | | 3 | |
Per share grant-date fair value of options issued during the year | | $ | 3.28 | | | 4.79 | | | 3.82 | |
| | | | | | | | | | |
As part of its adoption of SFAS 123(R), the Company examined its historical pattern of option exercises in an effort to determine if there were any pattern based on certain employee populations. From this analysis, the Company could not identify any patterns in the exercise of options. As such, the Company used the guidance in Staff Accounting Bulletin No. 107 to determine the estimated life of options issued subsequent to the adoption of SFAS 123(R). Expected volatility is based on historical volatility of the Company’s stock. The risk-free rate for periods within the contractual life of the option is based on the U.S. Treasury yield curve in effect at the time of grant. The dividend yield assumption is based on the Company’s history and expectation of dividend payments.
(continued)
F-33
FIRST COMMUNITY BANK CORPORATION OF AMERICA AND SUBSIDIARIES
Notes to Consolidated Financial Statements, Continued
Earnings per share (“EPS”) of common stock has been computed on the basis of the weighted-average number of shares of common stock outstanding. Outstanding stock options are considered dilutive securities for purposes of calculating diluted EPS which is computed using the treasury stock method. All per share amounts have been adjusted to reflect the 5% stock dividend paid in March, 2005, the three-for-two stock split declared in December 2005 and the 5% stock dividend declared in January 2007 and paid in February 2007. The following tables present the calculations of EPS (dollars in thousands, except per share amounts).
| | | | | | | | |
| | | Earnings | | Weighted-
Average
Shares | | Per
Share
Amount |
Year Ended December 31, 2007: | | | | | | | | |
Basic EPS: | | | | | | | | |
Net earnings available to common stockholders | | $ | 2,865 | | 4,073,207 | | $ | .70 |
| | | | | | | | |
Effect of dilutive securities- | | | | | | | | |
Incremental shares from assumed conversion of options | | | | | 214,236 | | | |
| | | | | | | | |
Diluted EPS: | | | | | | | | |
Net earnings available to common stockholders and assumed conversions | | $ | 2,865 | | 4,287,443 | | $ | .67 |
| | | | | | | | |
Year Ended December 31, 2006: | | | | | | | | |
Basic EPS: | | | | | | | | |
Net earnings available to common stockholders | | | 3,652 | | 4,002,822 | | $ | .91 |
Effect of dilutive securities- | | | | | | | | |
Incremental shares from assumed conversion of options | | | | | 291,019 | | | |
| | | | | | | | |
Diluted EPS: | | | | | | | | |
Net earnings available to common stockholders and assumed conversions | | $ | 3,652 | | 4,293,841 | | $ | .85 |
| | | | | | | | |
Year Ended December 31, 2005: | | | | | | | | |
Basic EPS: | | | | | | | | |
Net earnings available to common stockholders | | | 2,863 | | 3,511,292 | | $ | .82 |
Effect of dilutive securities- | | | | | | | | |
Incremental shares from assumed conversion of options | | | | | 358,368 | | | |
| | | | | | | | |
Diluted EPS: | | | | | | | | |
Net earnings available to common stockholders and assumed conversions | | $ | 2,863 | | 3,869,660 | | $ | .74 |
| | | | | | | | |
(continued)
F-34
FIRST COMMUNITY BANK CORPORATION OF AMERICA AND SUBSIDIARIES
Notes to Consolidated Financial Statements, Continued
| (17) | Earnings Per Share, Continued |
At December 31, 2007 and 2006, the following options were excluded from the calculation of EPS due to the exercise price being above the average market price:
| | | | | | | |
| | | Number of
Outstanding
Options | | Exercise
Price | | Expire |
| | | |
2007 | | | | | | | |
Options | | 220,500 | | $ | 16.31 | | 2011 |
| | 12,602 | | | 16.31 | | 2011 |
| | 788 | | | 16.80 | | 2011 |
| | 6,300 | | | 19.23 | | 2012-2016 |
| | 5,250 | | | 19.52 | | 2012-2016 |
| | 10,500 | | | 20.00 | | 2012-2016 |
| | 10,500 | | | 19.19 | | 2016 |
| | 10,500 | | | 18.71 | | 2017 |
| | 6,850 | | | 18.57 | | 2017 |
2006 | | | | | | | |
Options | | 6,300 | | | 19.23 | | 2016 |
| | 5,250 | | | 19.52 | | 2016 |
| | 10,500 | | | 20.00 | | 2016 |
| | 10,500 | | | 19.19 | | 2016 |
Various legal claims arise from time to time in the normal course of business which, in the opinion of management, will not have a material effect on the Bank’s financial statements.
(continued)
F-35
FIRST COMMUNITY BANK CORPORATION OF AMERICA AND SUBSIDIARIES
Notes to Consolidated Financial Statements, Continued
| (19) | Holding Company Financial Information |
The Holding Company’s unconsolidated financial information is as follows (in thousands):
Condensed Balance Sheets
| | | | | |
| | | At December 31, |
| | | 2007 | | 2006 |
Assets | | | | | |
Cash | | $ | 2,314 | | 2,114 |
Investment in subsidiaries | | | 34,158 | | 31,094 |
Other assets | | | 555 | | 511 |
| | | | | |
Total assets | | $ | 37,027 | | 33,719 |
| | | | | |
| | |
Liabilities and Stockholders’ Equity | | | | | |
Liabilities | | | 59 | | 37 |
Stockholders’ equity | | | 36,968 | | 33,682 |
| | | | | |
Total liabilities and stockholders’ equity | | $ | 37,027 | | 33,719 |
| | | | | |
Condensed Statements of Earnings
| | | | | | | | | | |
| | | Year Ended December 31, | |
| | | 2007 | | | 2006 | | | 2005 | |
Revenues | | $ | 76 | | | 145 | | | 79 | |
Expenses | | | (144 | ) | | (174 | ) | | (84 | ) |
| | | | | | | | | | |
Loss before earnings of subsidiaries | | | (68 | ) | | (29 | ) | | (5 | ) |
Earnings of subsidiaries | | | 2,933 | | | 3,681 | | | 2,868 | |
| | | | | | | | | | |
Net earnings | | $ | 2,865 | | | 3,652 | | | 2,863 | |
| | | | | | | | | | |
(continued)
F-36
FIRST COMMUNITY BANK CORPORATION OF AMERICA AND SUBSIDIARIES
Notes to Consolidated Financial Statements, Continued
| (19) | Holding Company Financial Information, Continued |
Condensed Statements of Cash Flows
| | | | | | | | | | |
| | | Year Ended December 31, | |
| | | 2007 | | | 2006 | | | 2005 | |
Cash flows from operating activities: | | | | | | | | | | |
Net earnings | | $ | 2,865 | | | 3,652 | | | 2,863 | |
Adjustments to reconcile net earnings to net cash used in operating activities: | | | | | | | | | | |
Equity in undistributed earnings of subsidiaries | | | (2,933 | ) | | (3,681 | ) | | (2,868 | ) |
Increase in other assets | | | (44 | ) | | (205 | ) | | (529 | ) |
Increase in liabilities | | | 22 | | | 28 | | | 2 | |
Tax benefit from options exercised | | | — | | | — | | | 298 | |
| | | | | | | | | | |
Net cash used in operating activities | | | (90 | ) | | (206 | ) | | (234 | ) |
| | | | | | | | | | |
Cash flows used in investing activity- | | | | | | | | | | |
Investment in subsidiaries | | | — | | | (3,526 | ) | | (1,652 | ) |
| | | | | | | | | | |
Cash flows from financing activities: | | | | | | | | | | |
Proceeds from exercise of stock options and warrants | | | 292 | | | 611 | | | 2,666 | |
Repurchase of common stock | | | — | | | — | | | (288 | ) |
Fractional shares of stock dividend paid in cash | | | (2 | ) | | — | | | (4 | ) |
Tax benefit from options exercised | | | — | | | 188 | | | — | |
| | | | | | | | | | |
Net cash provided by financing activities | | | 290 | | | 799 | | | 2,374 | |
| | | | | | | | | | |
Net (decrease) increase in cash | | | 200 | | | (2,933 | ) | | 488 | |
Cash at beginning of year | | | 2,114 | | | 5,047 | | | 4,559 | |
| | | | | | | | | | |
Cash at end of year | | $ | 2,314 | | | 2,114 | | | 5,047 | |
| | | | | | | | | | |
Supplemental disclosure of cash flow information- | | | | | | | | | | |
Noncash transactions: | | | | | | | | | | |
Net change in unrealized gain (loss) on securities available for sale of the Bank | | $ | 74 | | | 62 | | | (5 | ) |
| | | | | | | | | | |
Share-based compensation of the Bank | | $ | 57 | | | 22 | | | — | |
| | | | | | | | | | |
Fractional shares of stock split accrued | | $ | — | | | — | | | (1 | ) |
| | | | | | | | | | |
F-37
| Item 9. | Changes In and Disagreements With Accountants on Accounting and Financial Disclosure. |
Neither First Community nor its subsidiaries has had any disagreements with its accountants.
| Item 9a. | Controls and Procedures. |
(a) Evaluation of Disclosure Controls and Procedures
First Community maintains controls and procedures designed to ensure that information required to be disclosed in the reports that we file or submit under the Securities Exchange Act of 1934 is recorded, processed, summarized and reported within the time periods specified in the rules and forms of the Securities and Exchange Commission. Based upon management’s evaluation of those controls and procedures performed within the 90 days preceding the filing of this Report, our Chief Executive Officer and Chief Financial Officer concluded that, subject to the limitations noted below, First Community’s disclosure controls and procedures (as defined in Rules 13a-15(e) under the Securities Exchange Act of 1934) are effective to ensure that the information required to be disclosed by the Company in the reports that it files or submits under the Securities Exchange Act of 1934 is recorded, processed, summarized and reported within the time periods specified in the U.S. Securities and Exchange Commission’s rules and forms.
(b) Management’s Report on Internal Control Over Financial Reporting
Our management is responsible for establishing and maintaining adequate internal control over financial reporting, as such term is defined in Exchange Act Rule 13a-15(f). Such internal controls over financial reporting were designed to provide reasonable assurance regarding the reliability of financial reporting and the preparation of financial statements for external purposes in accordance with generally accepted accounting principles.
The Company’s management assessed the effectiveness of the Company’s internal control over financial reporting as of December 31, 2006. In making this assessment, the Company used the criteria set forth inInternal Control-Integrated Frameworkissued by the Committee of Sponsoring Organizations of the Treadway Commission (“COSO”). Based upon our evaluation under the framework in Internal Control-Integrated Framework, our management concluded that our internal control over financial reporting was effective as of December 31, 2007.
This annual report does not include an attestation report of the Company’s registered public accounting firm regarding internal control over financial reporting. Management’s report was not subject to attestation by the Company’s registered public accounting firm pursuant to temporary rules of the Securities and Exchange Commission that permit the Company to provide only management’s report in this annual report.
(c) Changes in Internal Controls
We have made no significant changes in its internal controls over financial reporting during the quarter ended December 31, 2007 that have materially affected or are reasonably likely to materially affect our internal control over financial reporting.
(d) Limitations on the Effectiveness of Controls
Our management, including our Chief Executive Officer and Chief Financial Officer, does not expect that our disclosure controls and internal controls will prevent all error and all fraud. A control system, no matter how well conceived and operated, can provide only reasonable, not absolute, assurance that the objectives of the control system are met. Further, the design of a control system must reflect the fact that there are resource constraints, and the benefits of controls must be considered relative to their costs. Because of the inherent limitations in all control systems, no evaluation of controls can provide absolute assurance that all control issues and instances of fraud, if any, within First Community have been detected. These inherent limitations include the realities that judgments in decision-making can be faulty, and that breakdowns can occur because of simple error or mistake. Additionally, controls can be circumvented by the individual acts of some persons, by collusion of two or more people, or by management override of the control.
The design of any system of controls also is based in part upon certain assumptions about the likelihood of future events, and there can be no assurance that any design will succeed in achieving its stated goals under all potential future conditions; over time, controls may become inadequate because of changes in conditions, or the degree of compliance with the policies or procedures may deteriorate. Because of the inherent limitations in a cost-effective control system, misstatements due to error or fraud may occur and not be detected.
33
PART III
| Item 10. | Directors, Executive Officers, Promoters and Control Persons; Compliance With Section 16(a) of the Exchange Act. |
Information required by this Item appears in First Community’s Proxy Statement for the 2008 Annual Meeting of Shareholders under the caption, “Election of Directors”, “Non-Director Executive Officers”, “Report of the Audit Committee” and “Compliance with Section 16(a) of the Securities and Exchange Act of 1934”, and is hereby incorporated by reference. We have adopted a Code of Ethics that applies to our executive officers, a copy of which has been filed with our report on Form 10-K for the year ended December 31, 2005 as Exhibit 14. Persons who would like a copy of such Code of Ethics may receive one without charge upon request made to Kay M. McAleer, Vice President/Corporate Secretary, First Community Bank Corporation of America, 9001 Belcher Road, Pinellas Park, Florida 33782.
| Item 11. | Executive Compensation. |
Information required by this Item appears in First Community’s Proxy Statement for the 2008 Annual Meeting of Shareholders under the caption, “Executive Compensation”, Compensation Discussion and Analysis” and “Compensation Committee Report”, and is hereby incorporated by reference.
| Item 12. | Security Ownership of Certain Beneficial Owners and Management and Related Stockholder Matters. |
Information required by this Item appears in First Community’s Proxy Statement for the 2008 Annual Meeting of Shareholders under the caption, “Beneficial Stock Ownership of Directors and Executive Officers”, and is hereby incorporated by reference.
| Item 13. | Certain Relationships and Related Transactions. |
Information required by this Item appears in First Community’s Proxy Statement for the 2008 Annual Meeting of Shareholders under the caption, “Certain Transactions”, and is hereby incorporated by reference.
| Item 14. | Principal Accountant Fees and Services. |
Information required by this Item appears in First Community’s Proxy Statement for the 2008 Annual Meeting of Shareholders under the caption, “Audit Fees” and “All Other Fees” and is hereby incorporated by reference.
34
| Item 15. | Exhibits and Financial Statement Schedules. |
The following documents are filed as part of this report at pages F-1 through F-35.
Consolidated Financial Statements of First Community Bank Corporation of America, Inc. (including all required schedules):
| | 1. | Independent Auditor’s Report; |
| | 2. | Consolidated Balance Sheets at December 31, 2007 and 2006; |
| | 3. | Consolidated Statements of Earnings, Stockholders’ Equity, and Statements of Cash Flows for years ended December 31, 2007, 2006 and 2005. |
| | 4. | Notes to Consolidated Financial Statements |
35
Exhibits.
The following exhibits are filed with or incorporated by reference into this report. Certain of the exhibits were previously filed as a part of First Community’s Registration Statement on Form SB-2, Form 10-K, Form 10K-SB, Form 10-Q and Form 10-QSB as indicated and are hereby incorporated by reference.
| | |
Exhibit No. | | Description of Exhibit |
| *3.1 | | Amended and Restated Articles of Incorporation |
| |
| *3.2 | | Bylaws |
| |
| ***3.3 | | Amendment to Amended and Restated Articles of Incorporation |
| |
| *4.1 | | Specimen Common Stock Certificate |
| |
| *4.3 | | Warrant Certificate |
| |
| **10.1 | | Employment Agreement of Kenneth P. Cherven |
| |
| *10.2 | | First Amended and Restated Non-Employee Director Stock Option Plan |
| |
| *10.3 | | Long-Term Incentive Plan |
| |
| ****10.4 | | Deferred Compensation Plan |
| |
| ****10.5 | | 2005 Stock Option Plan |
| |
| ***14. | | Code of Ethics |
| |
| 21. | | Subsidiaries of the Registrant |
| |
| 31.1 | | Certification of Chief Executive Officer required by Rule 13a-14(a)/15-14(a) under the Exchange Act |
| |
| 31.2 | | Certification of Chief Financial Officer required by Rule 13a-14(a)/15-14(a) under the Exchange Act |
| |
| 32.1 | | Certification of Chief Executive Officer pursuant to 18 U.S.C. Section 1350, as adopted pursuant to Section 906 of Sarbanes-Oxley Act of 2002 |
| |
| 32.2 | | Certification of Chief Financial Officer pursuant to 18 U.S.C. Section 1350, as adopted pursuant to Section 906 of Sarbanes-Oxley Act of 2002 |
| * | Exhibits marked with an asterisk were submitted with First Community’s original filing of Form SB-2 on April 7, 2003. |
| ** | Exhibits marked with a double asterisk were submitted with the First Community’s filing of its Amendment One to Form SB-2 on May 8, 2003. |
| *** | Exhibits marked with a triple asterisk were submitted with the First Community’s filing of its Form 10-K on March 15, 2006. |
| **** | Exhibits marked with a quadruple asterisk were submitted with the First Community’s filing of its Form 10-K on March 8, 2007. |
36
SIGNATURES
In accordance with Section 13 or 15(d) of the Securities Exchange Act, the registrant caused this report to be signed on its behalf by the undersigned, thereunto duly authorized.
| | |
| FIRST COMMUNITY BANK CORPORATION OF AMERICA |
| |
| By | | /s/ Kenneth P. Cherven |
| | Kenneth P. Cherven, Chief Executive Officer and President |
| |
| Date: | | March 24, 2008 |
| |
| By: | | /s/ Stan B. McClelland |
| | Stan B. McClelland., Chief Financial Officer |
| |
| Date: | | March 24, 2008 |
In accordance with the Securities Exchange Act, this report has been signed below by the following persons on behalf of the registrant and in the capacities and on the dates indicated.
| | | | |
/s/ Brad Bishop | | | | March 24, 2008 |
| Brad Bishop, Director | | | | |
| | |
/s/ Kenneth P. Cherven | | | | March 24, 2008 |
| Kenneth P. Cherven, Director, Chief Executive Officer and President | | | | |
| | |
/s/ Kenneth Delarbre | | | | March 24, 2008 |
| Kenneth Delarbre, Director | | | | |
| | |
/s/ Kenneth F. Faliero | | | | March 24, 2008 |
| Kenneth F. Faliero, Director | | | | |
| | |
/s/ Edwin C. Hussemann | | | | March 24, 2008 |
| Edwin C. Hussemann, Director | | | | |
| | |
/s/ James Macaluso | | | | March 24, 2008 |
| James Macaluso, Director | | | | |
| | |
/s/ David K. Meehan | | | | March 24, 2008 |
| David K. Meehan, Director | | | | |
| | |
/s/ Robert G. Menke | | | | March 24, 2008 |
| Robert G. Menke, Director | | | | |
| | |
/s/ Robert M. Menke | | | | March 24, 2008 |
| Robert M. Menke, Director | | | | |
37