N-CSRS
UNITED STATES
SECURITIES AND EXCHANGE COMMISSION
Washington, D.C. 20549
FORM N-CSR
CERTIFIED SHAREHOLDER REPORT OF REGISTERED
MANAGEMENT INVESTMENT COMPANIES
Investment Company Act file number: 811-09277
VIKING MUTUAL FUNDS
(Exact name of registrant as specified in charter)
1 Main Street North, Minot, ND | | 58703 |
(Address of principal offices) | | (Zip code) |
Brent Wheeler and/or Kevin Flagstad, PO Box 500, Minot, ND 58702
(Name and address of agent for service)
Registrant’s telephone number, including area code: 701-852-5292
Date of fiscal year end: December 31st
Date of reporting period: June 30, 2017
Item 1. REPORT TO SHAREHOLDERS

VIKING MUTUAL FUNDS
Viking Tax-Free Fund for Montana
Viking Tax-Free Fund for North Dakota
Semi-Annual Report
June 30, 2017
| |
Investment Adviser
Viking Fund Management, LLC
PO Box 500
Minot, ND 58702 | Principal Underwriter
Integrity Funds Distributor, LLC*
PO Box 500
Minot, ND 58702 |
Transfer Agent
Integrity Fund Services, LLC
PO Box 759
Minot, ND 58702 | Custodian
Wells Fargo Bank, N.A.
Trust & Custody Solutions
801 Nicollet Mall, Suite 700
Minneapolis, MN 55479 |
|
|
*The Funds are distributed through Integrity Funds Distributor, LLC. Member FINRA |
|
VIKING TAX-FREE FUND FOR MONTANA
VIKING TAX-FREE FUND FOR NORTH DAKOTA
Enclosed is the report of the operations for the Viking Tax-Free Fund for Montana (“Tax-Free Fund for MT”) and Viking Tax-Free Fund for North Dakota (“Tax-Free Fund for ND”) (each a “Fund”) for the six months ended June 30, 2017. Each Fund’s portfolio and related financial statements are presented within for your review.
Economic Recap
The Federal Open Market Committee’s (“FOMC” or “Committee”) statement in mid-March noted that the labor market has continued to strengthen and that economic activity has continued to expand at a moderate pace. The Committee also noted that job gains remained solid and the unemployment rate was little changed. Household spending continued to rise moderately while business fixed investment appeared to have firmed somewhat. The Committee decided to raise the target range for the federal funds rate to 3/4 to 1 percent. From an economic perspective, the second quarter was more of the same, as the Committee’s statement in mid-June again noted that the labor market continued to strengthen and that economic activity had been rising moderately so far this year. The Committee also noted that job gains have moderated but have been solid, on average, since the beginning of the year, and the unemployment rate has declined. Household spending picked up in recent months, and business fixed investment continued to expand. The Committee continues to expect that, with gradual adjustments in the stance of monetary policy, economic activity will expand at a moderate pace and labor market conditions will strengthen somewhat further. In view of realized and expected labor market conditions and inflation, the Committee decided to raise the target range for the federal funds rate to 1 to 1-1/4 percent. The Committee expects that economic conditions will evolve in a manner that will warrant only gradual increases in the federal funds rate; the federal funds rate is likely to remain, for some time, below levels that are expected to prevail in the longer run. However, the actual path of the federal funds rate will depend on the economic outlook as informed by incoming data.
Municipal Bond Market Recap
Returns were positive for the municipal market in the first quarter of 2017, after two consecutive quarters of negative returns to finish 2016. The Fed's increase in the funds rate in mid-March had no net impact on bond market performance in the first quarter as it was highly anticipated. Municipal market yields rose and then declined in the first quarter, ending the period marginally lower than on December 30. The municipal market had doubts about the Trump Administration's ability to pass its growth initiatives in the near term. Favorable factors remained at the end of the first quarter with light supply and a muni/Treasury ratio that was attractive. Returns were again positive for the municipal market in the second quarter. The municipal bond market continued to perform well as the Trump agenda continued to lose momentum. The municipal market’s strength came as investors see it ever more unlikely that the current administration can accomplish meaningful tax reform this year. The lack of tax reform, as well as limited municipal supply and pent-up-demand have propelled municipals in the first half of the year. Issuance YTD came in at $171.9 billion nationally, a 15.9% decrease over the same period last year. State issuance in Montana was up 45.6% YTD, while North Dakota issuance decreased by 23.4% YTD, versus the first half of last year. The 10-year muni/Treasury yield ratio was 86.5% on June 30, 2017, down from 93.9% on March 31, 2017, and down from 94.6% on December 30, 2016.
Over the course of the first six months of 2017, the Portfolio Team continued to maintain a shorter maturity structure than in past years and also made a concerted effort to purchase bonds with higher coupons when possible. The shorter maturity structure and higher coupons will be more defensive, should a rise in rates occur.
Fund Performance and Outlook
Tax-Free Fund for MT and Tax-Free Fund for ND provided a total return for Class A Shares of 2.54%* and 2.27%*, respectively (at net asset value with distributions reinvested) and a total return for Class I Shares of 2.67%* and 2.50%* for the six months ended June 30, 2017 compared to the Funds’ benchmark, the Barclays Capital Municipal Bond Index which returned 3.57% and the Morningstar Muni Single State Intermediate Category which returned 2.49%.
Despite the continued relative scarcity of Montana and North Dakota municipal bonds throughout the period, each Fund was able to obtain an adequate supply of investment grade bonds of various maturities. Each Fund may also invest in non-rated bonds should we deem they are of investment grade equivalent. Although we refrain from making large bets on the direction of rates, we have taken the opportunity to shorten the Funds’ maturity structures over the last few years in anticipation of an eventual rise in rates. A shorter maturity structure should provide a somewhat greater degree of stability of each Fund’s share price should muni prices become volatile. The highest level of current income that is exempt from federal and each Fund’s state income taxes and is consistent with preservation of capital remains the investment objective of each Fund.
The current 3.8% Medicare surtax on investment income established by the Patient Protection and Affordable Care Act (municipals are exempt) combined with higher marginal tax rates at the federal and state levels boost the appeal of tax-exempt income. The federal marginal tax rate for taxpayers with adjusted gross incomes of $418,400 ($470,700 for married filing jointly) is 39.6%. The after-tax yield of a 10-year U.S. Treasury Note yielding 2.30% falls to approximately 1.30% at the 39.6% federal tax rate plus the 3.8% Medicare surtax.
Finally, we recommend that shareholders view their investment as long-term. As difficult as they may be, periods of panic (and euphoria) tend to be transitory in nature and it’s the long-term investors that may be rewarded with the long-term benefits of tax-free income and relatively low volatility that muni bonds have provided for decades.
If you would like more frequent updates, please visit the Fund’s website at www.integrityvikingfunds.com for daily prices along with pertinent Fund information.
Sincerely,
The Portfolio Management Team
The views expressed are those of The Portfolio Management Team of Viking Fund Management, LLC (“Viking Fund Management”, “VFM”, or the “Adviser”). The views are subject to change at any time in response to changing circumstances in the market and are not intended to predict or guarantee the future performance of any individual security, market sector, the markets generally, or any of the funds in the Integrity Viking family of funds.
*Performance does not include applicable front-end or contingent deferred sales charges, which would have reduced the performance. For Tax-Free Fund for MT Class A and I and Tax-Free Fund for ND Class A and I, the total annual fund operating expense ratio (before expense waivers and reimbursements and including acquired fund fees and expenses) as of the most recent fiscal year-end was 1.16%, 0.92%, 1.27% and 1.05%, respectively. The net annual fund operating expense ratio (after expense waivers and reimbursements and excluding acquired fund fees and expenses) as of the most recent fiscal year-end was 0.98%, 0.73%, 0.98% and 0.73%, respectively. The Funds’ investment adviser has contractually agreed to waive fees and reimburse expenses through April 29, 2018 so that total annual fund operating expenses after fee waivers and expense reimbursements (excluding taxes, brokerage fees, commissions, extraordinary and non-recurring expenses, and acquired fund fees and expenses) do not exceed 0.98%, 0.73%, 0.98% and 0.73%, respectively, of average daily net assets. This expense limitation agreement may only be terminated or modified prior to April 29, 2018 with the approval of the Fund’s Board of Trustees.
Performance data quoted above is historical. Past performance is no guarantee of future results. Current performance may be higher or lower than the performance data quoted. The principal value and investment return of an investment will fluctuate so that your shares, when redeemed, may be worth more or less than the original cost. You can obtain performance data current to the most recent month end (available within seven business days of the most recent month end) by calling 800-276-1262.
You should consider the Fund’s investment objectives, risks, charges, and expenses carefully before investing. For this and other important information, please obtain a Fund prospectus at no cost from your financial adviser and read it carefully before investing.
Bond prices and therefore the value of bond funds decline as interest rates rise. Because the Fund invests in securities of a single state, the Fund is more susceptible to factors adversely impacting the respective state than a municipal bond fund that does not concentrate its securities in a single state.
For investors subject to the alternative minimum tax, a portion of the Fund’s dividends may be taxable. Distributions of capital gains are generally taxable.
VIKING TAX-FREE FUND FOR MONTANA
Comparison of change in value of a $10,000 investment
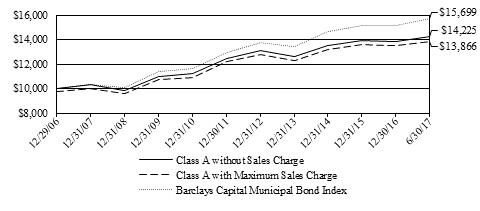
Average Annual Total Returns for the periods ending June 30, 2017
| 1 year | 3 year | 5 year | 10 year | Since Inception* |
Class A Without sales charge | -0.93% | 2.65% | 2.18% | 3.57% | 3.91% |
Class A With sales charge (2.50%) | -3.43% | 1.78% | 1.66% | 3.31% | 3.76% |
Class I Without sales charge | NA | N/A | N/A | N/A | -0.73% |
* August 3, 1999 for Class A; August 1, 2016 Class I |
The total annual fund operating expense ratio for Class A and I (before expense waivers and reimbursements and including acquired fund fees and expenses) as of the most recent fiscal year-end was 1.16% and 0.92%, respectively. The net annual fund operating expense ratio (after expense waivers and reimbursements and excluding acquired fund fees and expenses) as of the most recent fiscal year-end was 0.98% and 0.73%, respectively. The Fund’s investment adviser has contractually agreed to waive fees and reimburse expenses through April 29, 2018 so that total annual fund operating expenses after fee waivers and expense reimbursements (excluding taxes, brokerage fees, commissions, extraordinary and non-recurring expenses, and acquired fund fees and expenses) do not exceed 0.98% and 0.73%, respectively, of average daily net assets. This expense limitation agreement may only be terminated or modified prior to April 29, 2018 with the approval of the Fund’s Board of Trustees.
Performance data quoted above is historical. Past performance is no guarantee of future results. Current performance may be higher or lower than the performance data quoted. The principal value and investment return of an investment will fluctuate so that your shares, when redeemed, may be worth more or less than the original cost. You can obtain performance data current to the most recent month end (available within seven business days of the most recent month end) by calling 800-276-1262.
The table and graph above do not reflect the deduction of taxes that a shareholder would pay on Fund distributions and redemptions of Fund shares.
The graph comparing the Fund’s performance to a benchmark index provides you with a general sense of how the Fund performed. To put this information in context, it may be helpful to understand the special differences between the two. The Fund’s total return for the period shown appears with and without sales charges and includes Fund expenses and management fees. A securities index measures the performance of a theoretical portfolio. Unlike a fund, the index is unmanaged; there are no expenses that affect the results. In addition, few investors could purchase all of the securities to match the index. If they could, transaction costs and other expenses would be incurred. All Fund and benchmark returns include reinvested dividends.
VIKING TAX-FREE FUND FOR NORTH DAKOTA
Comparison of change in value of a $10,000 investment
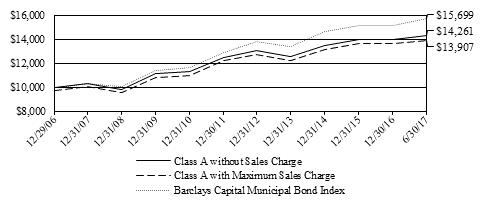
Average Annual Total Returns for the periods ending June 30, 2017
| 1 year | 3 year | 5 year | 10 year | Since Inception* |
Class A Without sales charge | -1.08% | 2.71% | 2.24% | 3.65% | 4.01% |
Class A With sales charge (2.50%) | -3.51% | 1.86% | 1.72% | 3.38% | 3.87% |
Class I Without sales charge | NA | N/A | N/A | N/A | -0.69% |
* August 3, 1999 for Class A; August 1, 2016 Class I |
The total annual fund operating expense ratio for class A and I (before expense waivers and reimbursements and including acquired fund fees and expenses) as of the most recent fiscal year-end was 1.27% and 1.05%, respectively. The net annual fund operating expense ratio (after expense waivers and reimbursements and excluding acquired fund fees and expenses) as of the most recent fiscal year-end was 0.98% and 0.73%, respectively. The Fund’s investment adviser has contractually agreed to waive fees and reimburse expenses through April 29, 2018 so that total annual fund operating expenses after fee waivers and expense reimbursements (excluding taxes, brokerage fees, commissions, extraordinary and non-recurring expenses, and acquired fund fees and expenses) do not exceed 0.98% and 0.73%, respectively, of average daily net assets. This expense limitation agreement may only be terminated or modified prior to April 29, 2018 with the approval of the Fund’s Board of Trustees.
Performance data quoted above is historical. Past performance is no guarantee of future results. Current performance may be higher or lower than the performance data quoted. The principal value and investment return of an investment will fluctuate so that your shares, when redeemed, may be worth more or less than the original cost. You can obtain performance data current to the most recent month end (available within seven business days of the most recent month end) by calling 800-276-1262.
The table and graph above do not reflect the deduction of taxes that a shareholder would pay on Fund distributions and redemptions of Fund shares.
The graph comparing the Fund’s performance to a benchmark index provides you with a general sense of how the Fund performed. To put this information in context, it may be helpful to understand the special differences between the two. The Fund’s total return for the period shown appears with and without sales charges and includes Fund expenses and management fees. A securities index measures the performance of a theoretical portfolio. Unlike a fund, the index is unmanaged; there are no expenses that affect the results. In addition, few investors could purchase all of the securities to match the index. If they could, transaction costs and other expenses would be incurred. All Fund and benchmark returns include reinvested dividends.
VIKING TAX-FREE FUND FOR MONTANA
PORTFOLIO MARKET SECTORS June 30, 2017 (unaudited)
General Obligation | 38.5% |
Health Care | 20.2% |
Other Revenue | 9.8% |
Education | 9.0% |
Transportation | 7.3% |
Housing | 6.7% |
Cash Equivalents and Other | 4.3% |
Utilities | 4.2% |
| | 100.0% |
Market sectors are breakdowns of the Fund’s portfolio holdings into specific investment classes.
These percentages are based on net assets.
SCHEDULE OF INVESTMENTS June 30, 2017 (unaudited)
| | | Principal | | Fair |
| | Amount | | Value |
MUNICIPAL BONDS (95.7%) | | | | |
| | | | |
Education (9.0%) | | | | |
Gallatin Sd #44-B 3.500% 06/15/2028 | $ | 575,000 | $ | 608,683 |
Mt Brd Regents Ref-K 4.500% 11/15/2025 | | 770,000 | | 771,455 |
Mt Hgr Ed-M 5.000% 11/15/2023 | | 250,000 | | 288,922 |
*Mt Brd Of Regents-Ref 4.000% 05/15/2025 | | 2,000,000 | | 2,214,300 |
Mt Brd Of Regents-Ref 4.000% 05/15/2026 | | 1,145,000 | | 1,249,309 |
Montana Hgr Ed-N-Ref 4.000% 11/15/2025 | | 500,000 | | 553,740 |
Mt Brd Regents Hgr Ed 5.000% 11/15/2025 | | 500,000 | | 595,035 |
Mt Brd Regents Hgr Ed 5.000% 11/15/2030 | | 240,000 | | 279,199 |
Univ Mt Facs/Impt-C 5.000% 11/15/2017 | | 35,000 | | 35,186 |
Univ Mt Hgr Ed Impt-D 5.375% 05/15/2019 | | 180,000 | | 187,895 |
| | | | | 6,783,724 |
General Obligation (38.5%) | | | | |
Bozeman 4.000% 07/01/2028 | | 540,000 | | 611,523 |
Butte Silver Bow-Ref 3.250% 07/01/2022 | | 765,000 | | 769,376 |
Butte Silver Bow 4.000% 07/01/2026 | | 115,000 | | 131,819 |
Butte Silver Bow 4.000% 07/01/2028 | | 215,000 | | 241,587 |
Butte Silver Bow 4.000% 07/01/2030 | | 225,000 | | 246,726 |
Butte Silver Bow 4.000% 07/01/2032 | | 240,000 | | 258,809 |
Butte Silver Bow 4.500% 07/01/2034 | | 850,000 | | 952,068 |
Cascade Co Sd #1-Bldg 5.000% 07/01/2027 | | 1,120,000 | | 1,397,872 |
Cascade Co Sd #1-Bldg 4.000% 07/01/2029 | | 925,000 | | 1,044,482 |
Cascade Co Sd #1-Bldg 4.000% 07/01/2030 | | 935,000 | | 1,046,125 |
Cascade Co Sd #1-Bldg 4.000% 07/01/2031 | | 700,000 | | 776,055 |
Cascade Cnty Mt High 4.000% 07/01/2028 | | 610,000 | | 696,901 |
Cascade Cnty Mt High 5.000% 07/01/2026 | | 940,000 | | 1,162,516 |
Cascade Cnty Mt High 5.000% 07/01/2027 | | 1,110,000 | | 1,385,391 |
Cascade Cnty Mt High 4.000% 07/01/2030 | | 670,000 | | 749,629 |
Flathead Cnty Hs Dist 5.000% 01/01/2023 | | 540,000 | | 634,927 |
Gallatin Sd 72-Bldg 3.500% 07/01/2023 | | 555,000 | | 598,451 |
Gallatin Sd 72-Bldg 3.750% 07/01/2024 | | 645,000 | | 695,478 |
Gallatin Sd 72-Bldg 4.000% 07/01/2025 | | 420,000 | | 454,944 |
Gallatin Co Sd #7 4.000% 12/01/2032 | | 915,000 | | 1,009,849 |
Gallatin Co Sd #7 4.000% 12/01/2033 | | 515,000 | | 565,809 |
Gallatin Co Sd #27 4.250% 06/15/2026 | | 415,000 | | 474,416 |
Meagher K-12 Sd #8 4.000% 07/01/2028 | | 475,000 | | 541,557 |
Missoula Cnty Mt 5.000% 07/01/2031 | | 445,000 | | 534,578 |
Missoula Sd #1-Bldg 4.000% 07/01/2032 | | 275,000 | | 299,954 |
Missoula Sd #4-Bldg 5.000% 06/15/2028 | | 500,000 | | 600,570 |
Missoula Sd #4-Bldg 5.000% 06/15/2029 | | 500,000 | | 594,275 |
Missoula Sd #4-Bldg 5.000% 06/15/2030 | | 500,000 | | 590,900 |
Missoula-Ref-A 4.000% 07/01/2026 | | 350,000 | | 404,600 |
Missoula-Ref-A 4.000% 07/01/2031 | | 250,000 | | 273,435 |
*Missoula Sd #1-Bldg 4.000% 07/01/2032 | | 1,200,000 | | 1,313,868 |
Missoula Sd #1-Bldg 4.000% 07/01/2033 | | 750,000 | | 813,090 |
Montana-C-Ref 4.000% 08/01/2023 | | 385,000 | | 448,075 |
Montana St-Ref 4.000% 08/01/2026 | | 855,000 | | 978,308 |
Montana St-Ref 4.000% 08/01/2027 | | 480,000 | | 541,056 |
Montana St-C-Wtr-Poll 5.000% 07/15/2025 | | 200,000 | | 221,444 |
Ravalli-Open Space 4.250% 07/01/2027 | | 150,000 | | 155,274 |
Ravalli-Open Space 4.350% 07/01/2028 | | 155,000 | | 161,431 |
Ravalli-Open Space 4.400% 07/01/2029 | | 165,000 | | 171,513 |
Ravalli Co-Open Space 4.250% 07/01/2030 | | 755,000 | | 827,186 |
Valley Co K-12 Sd #1a 4.250% 07/01/2031 | | 450,000 | | 504,563 |
Yellowstone Sd#2-Sch 5.000% 06/15/2024 | | 500,000 | | 614,290 |
Yellowstone Sd#2-Sch 5.000% 06/15/2026 | | 515,000 | | 623,356 |
Yellowstone Sd#2-Sch 5.000% 06/15/2027 | | 1,000,000 | | 1,200,100 |
Yellowstone Co Sd #2 5.000% 06/15/2031 | | 350,000 | | 412,038 |
Yellowstone Co Sd #2 5.000% 06/15/2032 | | 435,000 | | 510,051 |
| | | | | 29,240,265 |
Health Care (20.2%) | | | | |
Mt Fac Fin-A-Master 4.500% 07/01/2023 | | 250,000 | | 257,208 |
Mt Fac-Kalispell Regl 4.500% 07/01/2023 | | 1,025,000 | | 1,117,435 |
*Mt Fac-Kalispell Regl 4.650% 07/01/2024 | | 1,365,000 | | 1,484,819 |
Mt Fac-Kalispell Regl 4.750% 07/01/2025 | | 380,000 | | 412,490 |
Mt Hlth-D-Cmnty Med C 5.250% 06/01/2030 | | 660,000 | | 735,577 |
Mt Hlth-D-Cmnty Med C 5.125% 06/01/2026 | | 1,000,000 | | 1,122,590 |
Mt Fac 4.750% 01/01/2040 | | 705,000 | | 742,196 |
Mt Facs Fin Auth 4.500% 01/01/2024 | | 1,000,000 | | 1,061,230 |
Mt Facs Fin Auth 5.000% 01/01/2024 | | 400,000 | | 432,000 |
Mt Fac Fin Auth Rev 5.500% 01/01/2025 | | 575,000 | | 657,961 |
Mt Fac Fin Auth Rev 5.750% 01/01/2031 | | 815,000 | | 939,540 |
Mt Fac Fin Auth-A-Ref 5.000% 06/01/2028 | | 1,015,000 | | 1,177,684 |
Mt Fac Fin Auth-C 5.000% 06/01/2029 | | 915,000 | | 1,058,399 |
*Mt Hlth-Mt St Hosp Pj 5.000% 06/01/2022 | | 1,100,000 | | 1,101,056 |
Mt Hlth Master Ln-A 6.000% 08/01/2020 | | 790,000 | | 792,370 |
Yellowstone Hlth-A 5.000% 09/01/2029 | | 1,250,000 | | 1,258,613 |
Yellowstone Hlth-A 5.250% 09/01/2034 | | 245,000 | | 246,793 |
Yellowstone Cnty Rev 4.000% 10/01/2029 | | 710,000 | | 775,526 |
| | | | | 15,373,487 |
Housing (6.7%) | | | | |
Mt Brd Hsg-A-2-Amt 2.650% 06/01/2021 | | 135,000 | | 136,579 |
Mt Brd Hsg-A-2-Amt 2.650% 12/01/2021 | | 290,000 | | 294,495 |
Mt Brd Hsg-A-2-Amt 3.000% 06/01/2023 | | 165,000 | | 169,031 |
Mt Brd Hsg-A-2-Amt 3.000% 12/01/2023 | | 85,000 | | 87,151 |
Mt Brd Hsg-A-2-Amt 3.150% 06/01/2024 | | 340,000 | | 347,704 |
Mt Brd Hsg-A-2-Amt 3.150% 12/01/2024 | | 120,000 | | 122,448 |
Mt Brd Hsg-A-2-Amt 3.350% 06/01/2025 | | 150,000 | | 152,678 |
Mt Hrd Of Hsg-B2 3.875% 12/01/2023 | | 200,000 | | 217,136 |
Mt Hrd Of Hsg-B2 4.050% 06/01/2024 | | 175,000 | | 190,869 |
Mt Hrd Of Hsg-B2 4.050% 12/01/2024 | | 495,000 | | 537,808 |
Mt Hrd Of Hsg-B2 4.650% 12/01/2028 | | 280,000 | | 301,073 |
Mt Brd Hsg-Sf Prog-A 5.050% 12/01/2024 | | 25,000 | | 25,617 |
Mt Brd Hsg-Sf Prog-A 5.300% 12/01/2029 | | 120,000 | | 122,856 |
*Mt Brd Hsg-Sf-A-Home 4.700% 12/01/2026 | | 780,000 | | 816,512 |
Mt Brd Hsg-Sf-A-Home 4.850% 06/01/2028 | | 365,000 | | 378,333 |
Mt Brd Hsg-Sf-Amt-B2 3.850% 06/01/2019 | | 495,000 | | 506,974 |
Mt St Brd Of Hsg-A-2 2.650% 06/01/2019 | | 160,000 | | 161,949 |
Mt St Brd Of Hsg-A-2 2.900% 06/01/2020 | | 155,000 | | 157,948 |
Mt St Brd Of Hsg-A-2 3.100% 06/01/2021 | | 395,000 | | 405,491 |
| | | | | 5,132,652 |
Other Revenue (9.8%) | | | | |
Billings Impt Dists 5.500% 07/01/2026 | | 300,000 | | 318,195 |
Billings Pooled Spl 4.550% 07/01/2020 | | 65,000 | | 65,211 |
Billings Pooled Spl 4.700% 07/01/2021 | | 70,000 | | 70,245 |
Billings Pooled Spl 4.800% 07/01/2022 | | 70,000 | | 70,151 |
Billings Impt#1360-Rf 4.000% 07/01/2017 | | 130,000 | | 130,006 |
Billings Impt#1360-Rf 4.000% 07/01/2018 | | 405,000 | | 410,091 |
Billings Tax Incr-A 4.375% 07/01/2029 | | 490,000 | | 505,587 |
*Billings Tax Incr-A 5.000% 07/01/2033 | | 900,000 | | 934,146 |
Bozeman Tax Dwntwn 4.950% 07/01/2028 | | 200,000 | | 209,236 |
Butte Silver Bow Tax 5.000% 07/01/2021 | | 600,000 | | 644,934 |
Gallatin Impt-396 5.500% 07/01/2025 | | 600,000 | | 600,048 |
*Gallatin Impt-396 6.000% 07/01/2030 | | 1,000,000 | | 1,000,070 |
Grt Falls Tax-A-West 5.550% 07/01/2029 | | 275,000 | | 292,306 |
Helena Cops 4.625% 01/01/2024 | | 270,000 | | 284,623 |
Helena Cops 5.000% 01/01/2029 | | 175,000 | | 185,455 |
Missoula Pkg Commsn 4.000% 10/01/2026 | | 835,000 | | 920,245 |
Missoula Tax Dist Ii 5.125% 07/01/2026 | | 125,000 | | 129,187 |
Mt Hlth Fac-Boyd Andr 6.300% 10/01/2020 | | 655,000 | | 655,956 |
| | | | | 7,425,692 |
Transportation (7.3%) | | | | |
Billings Arpt-Ref 4.500% 07/01/2018 | | 800,000 | | 818,783 |
Billings Arpt-Ref 4.750% 07/01/2019 | | 350,000 | | 368,659 |
Billings Arpt-Ref 5.000% 07/01/2020 | | 235,000 | | 252,952 |
Madison Rut Impt-09-1 5.500% 07/01/2025 | | 770,000 | | 770,061 |
*Madison Rut Impt-09-1 6.000% 07/01/2030 | | 1,000,000 | | 1,000,070 |
Missoula Spl Assmt-C 4.750% 07/01/2027 | | 200,000 | | 200,010 |
Missoula Spl Asm-Pool 6.000% 07/01/2030 | | 200,000 | | 212,900 |
Missoula Spl Impt-540 4.600% 07/01/2024 | | 100,000 | | 100,073 |
Missoula Spl Impt-540 4.600% 07/01/2025 | | 105,000 | | 105,098 |
Missouls Spl Impt-541 5.400% 07/01/2029 | | 370,000 | | 388,681 |
Missoula Spl Impt#548 4.000% 07/01/2019 | | 190,000 | | 195,533 |
Missoula Spl Impt#548 4.625% 07/01/2023 | | 240,000 | | 251,258 |
Missoula Spl Impt#548 5.250% 07/01/2027 | | 240,000 | | 252,571 |
Missoula Spl Impt#548 5.500% 07/01/2031 | | 235,000 | | 246,167 |
Mt Trn Hwy 93 Constr 5.000% 06/01/2022 | | 350,000 | | 363,075 |
| | | | | 5,525,891 |
Utilities (4.2%) | | | | |
Billings Mont Swr 5.000% 07/01/2028 | | 400,000 | | 491,984 |
Billings Mont Swr 5.000% 07/01/2031 | | 260,000 | | 313,373 |
Billings Storm Swr 4.000% 07/01/2025 | | 215,000 | | 240,882 |
Billings Storm Swr 4.000% 07/01/2026 | | 225,000 | | 248,855 |
Billings Storm Swr 4.000% 07/01/2028 | | 250,000 | | 278,383 |
Billings Storm Swr 4.000% 07/01/2029 | | 250,000 | | 274,000 |
Dillon Wtr & Swr-Ref 4.000% 07/01/2033 | | 250,000 | | 273,435 |
*Forsyth Pcr 5.000% 05/01/2033 | | 1,000,000 | | 1,095,340 |
| | | | | 3,216,252 |
| | | | |
TOTAL MUNICPAL BONDS (COST: $70,006,627) | | | $ | 72,697,963 |
| | | | |
OTHER ASSETS LESS LIABILITIES (4.3%) | | | | 3,260,352 |
| | | | |
NET ASSETS (100.0%) | | | $ | 75,958,315 |
|
*Indicates all or a portion of bonds are segregated by the custodian to cover when-issued purchases. |
| |
|
The accompanying notes are an integral part of these financial statements. |
VIKING TAX-FREE FUND FOR NORTH DAKOTA
PORTFOLIO MARKET SECTORS June 30, 2017 (unaudited)
General Obligation | 22.0% |
Other Revenue | 17.8% |
Health Care | 17.1% |
Education | 14.5% |
Housing | 11.0% |
Utilities | 8.5% |
Transportation | 5.8% |
Cash Equivalents and Other | 3.3% |
| | 100.0% |
Market sectors are breakdowns of the Fund’s portfolio holdings into specific investment classes.
These percentages are based on net assets.
SCHEDULE OF INVESTMENTS June 30, 2017 (unaudited)
| | | Principal | | Fair |
| | Amount | | Value |
MUNICIPAL BONDS (96.7%) | | | | |
| | | | |
Education (14.5%) | | | | |
Barnes N Sd Bldg Auth 4.000% 05/01/2022 | $ | 250,000 | $ | 264,128 |
Nd Brd Hgr Ed-A-Ref 4.000% 04/01/2025 | | 415,000 | | 474,203 |
Nd Brd Hgr Ed 4.000% 04/01/2028 | | 365,000 | | 400,292 |
Nd Brd Hgr Ed-Ref 4.000% 04/01/2026 | | 435,000 | | 483,455 |
Nd Brd Hgr Ed-Ref 4.000% 04/01/2033 | | 500,000 | | 526,015 |
Nd Hgr Ed-Ref-Minot 4.000% 08/01/2023 | | 150,000 | | 167,196 |
Nd Hgr Ed-Ref-Minot 3.000% 08/01/2026 | | 265,000 | | 278,989 |
Nd Hgr Ed-Ref-Minot 3.000% 08/01/2027 | | 275,000 | | 282,948 |
Nd Hgr Ed-Ref-Minot 3.250% 08/01/2028 | | 280,000 | | 291,729 |
Nd Hgr Ed-Ref-Minot 3.250% 08/01/2029 | | 290,000 | | 296,453 |
N Dakota St Univ Bhe 5.000% 04/01/2025 | | 160,000 | | 169,790 |
Univ Of North Dakota 5.000% 04/01/2024 | | 250,000 | | 286,520 |
| | | | | 3,921,718 |
General Obligation (22.0%) | | | | |
Bismarck-H-Ref 3.000% 05/01/2023 | | 500,000 | | 523,940 |
Bismarck Pub Sd #1 4.000% 05/01/2026 | | 750,000 | | 823,868 |
Dickinson Sd #1 4.000% 08/01/2034 | | 400,000 | | 423,996 |
Fargo-B-Ref & Impt 5.000% 05/01/2026 | | 400,000 | | 484,672 |
Fargo-A-Ref & Impt 4.000% 05/01/2023 | | 300,000 | | 328,611 |
Grand Forks Bldg-A 4.625% 12/01/2026 | | 350,000 | | 355,369 |
Mandan Sd 1-Red 3.125% 08/01/2024 | | 200,000 | | 214,092 |
Maple-Steele Jt Wtr-B 4.000% 05/01/2030 | | 250,000 | | 250,580 |
Minot Arpt-D-Amt 3.500% 10/01/2025 | | 570,000 | | 609,609 |
Minot Arpt-D-Amt 4.000% 10/01/2028 | | 355,000 | | 376,371 |
Minot Wtr-D 5.250% 10/01/2022 | | 200,000 | | 202,288 |
Minot Wtr-D 5.375% 10/01/2023 | | 250,000 | | 252,840 |
*W Fargo Sd #6 4.000% 05/01/2023 | | 500,000 | | 549,260 |
W Fargo Sd #6-Bldg 3.000% 08/01/2022 | | 500,000 | | 533,480 |
| | | | | 5,928,976 |
Health Care (17.1%) | | | | |
Burleigh Hlthcr-A-Ref 5.000% 07/01/2022 | | 300,000 | | 353,907 |
Burleigh Hlthcr-A-Ref 4.500% 07/01/2032 | | 250,000 | | 287,575 |
Burleigh Hlthcr-A 5.000% 07/01/2035 | | 500,000 | | 572,765 |
Burleigh Indl-Rf-Mo S 5.050% 11/01/2018 | | 125,000 | | 125,079 |
Fargo Hlth Sys-Sanfrd 5.500% 11/01/2020 | | 500,000 | | 571,205 |
Fargo Hlth Sys-Sanfrd 6.000% 11/01/2028 | | 500,000 | | 585,450 |
Grand Forks Hlth Care 5.000% 12/01/2022 | | 500,000 | | 561,470 |
Grand Forks Hlth Care 4.000% 12/01/2027 | | 400,000 | | 414,944 |
Grand Forks Hlth Care 5.000% 12/01/2032 | | 250,000 | | 266,225 |
Grand Forks Nursing 7.250% 11/01/2029 | | 300,000 | | 306,300 |
Grand Forks Sr Hsg-A 5.125% 12/01/2025 | | 250,000 | | 270,305 |
Grand Forks Sr Hsg 3.000% 12/01/2020 | | 135,000 | | 135,090 |
Langdon Hlth-Cavalier 6.200% 01/01/2025 | | 155,000 | | 155,789 |
| | | | | 4,606,104 |
Housing (11.0%) | | | | |
Nd Hsg Fin-B 3.650% 01/01/2020 | | 95,000 | | 98,855 |
Nd Fin-A-Cap Fing Prg 4.500% 06/01/2026 | | 400,000 | | 439,024 |
North Dakota Hsg-B 2.900% 07/01/2020 | | 300,000 | | 308,436 |
North Dakota Hsg-B 3.050% 07/01/2021 | | 150,000 | | 153,528 |
*Nd Hsg Fin-A 3.350% 07/01/2021 | | 785,000 | | 785,079 |
*North Dakota Hfa 3.100% 01/01/2026 | | 1,165,000 | | 1,184,059 |
| | | | | 2,968,981 |
Other Revenue (17.8%) | | | | |
Bismark Pk Dist 3.500% 04/01/2025 | | 280,000 | | 289,400 |
Bismark Pk Dist 3.650% 04/01/2027 | | 295,000 | | 303,307 |
Burleigh Sales Tax-A 4.000% 11/01/2032 | | 400,000 | | 415,764 |
Grand Forks-D-Ref 5.000% 12/15/2027 | | 500,000 | | 597,725 |
Grand Forks-D-Ref 5.000% 12/15/2028 | | 250,000 | | 295,395 |
Jamestown Park Dist 4.000% 07/01/2033 | | 345,000 | | 358,455 |
Mandan-A 4.000% 09/01/2034 | | 500,000 | | 515,230 |
Nd Fin-Amt-A-Indl Dev 5.000% 06/01/2020 | | 115,000 | | 115,095 |
Nd Fin-Amt-A-Indl Dev 5.000% 06/01/2031 | | 240,000 | | 240,283 |
Nd Pub Fin Revolv-A 5.500% 10/01/2027 | | 250,000 | | 264,168 |
Nd Fin-A-Indl Dev Prg 6.000% 06/01/2034 | | 200,000 | | 216,308 |
Nd St Pub Fin-A 4.000% 06/01/2030 | | 400,000 | | 426,396 |
Nd Pub Fin Auth-A 4.000% 06/01/2028 | | 265,000 | | 290,294 |
Nd Pub Fin Auth-C 5.000% 06/01/2028 | | 130,000 | | 153,323 |
*Ward Co-Sales Tax Rev 3.000% 04/01/2022 | | 300,000 | | 311,940 |
| | | | | 4,793,083 |
Transportation (5.8%) | | | | |
Grand Forks Arpt-A 4.600% 06/01/2024 | | 350,000 | | 369,901 |
Grand Forks Arpt-A 5.000% 06/01/2029 | | 500,000 | | 530,335 |
Grand Fork Arpt-Prerf 4.500% 06/01/2028 | | 230,000 | | 256,234 |
Grand Fork Arpt-Unref 4.500% 06/01/2028 | | 370,000 | | 397,609 |
| | | | | 1,554,079 |
Utilities (8.5%) | | | | |
Bismarck Wtr Rev 3.000% 04/01/2021 | | 495,000 | | 512,305 |
*Bismarck Wtr Rev 3.625% 04/01/2025 | | 675,000 | | 696,735 |
Bismarck Wtr Rev 3.750% 04/01/2026 | | 265,000 | | 273,104 |
*Mclean Sldwst-A-Great 4.875% 07/01/2026 | | 750,000 | | 800,318 |
| | | | | 2,282,462 |
| | | | |
TOTAL MUNICIPAL BONDS (COST: $24,891,885) | | | $ | 26,055,403 |
| | | | |
OTHER ASSETS LESS LIABILITIES (3.3%) | | | | 885,770 |
| | | | |
NET ASSETS (100.0%) | | | $ | 26,941,173 |
|
*Indicates all or a portion of bonds are segregated by the custodian to cover when-issued purchases. |
|
|
The accompanying notes are an integral part of these financial statements. |
Statements of Assets and Liabilities June 30, 2017 (unaudited)
| | | Tax-Free | | Tax-Free |
| | | Fund for MT | | Fund for ND |
ASSETS | | | | |
Investments in securities, at value
(cost: $70,006,627 and $24,891,885, respectively) | $ | 72,697,963 | $ | 26,055,403 |
Cash | | 2,352,511 | | 648,751 |
Receivable for Fund shares sold | | 4,539 | | 22,144 |
Accrued dividends receivable | | 1,022,698 | | 246,928 |
Prepaid expenses | | 6,665 | | 2,569 |
Total assets | $ | 76,084,376 | $ | 26,975,795 |
| | | | |
LIABILITIES | | | | |
Payable for Fund shares redeemed | $ | 60,805 | $ | 15,494 |
Dividends payable | | 51,522 | | 12,898 |
Trustees’ fees payable | | 1,910 | | 907 |
Payable to affiliates | | 738 | | 1,042 |
Accrued expenses | | 11,086 | | 4,281 |
Total liabilities | $ | 126,061 | $ | 34,622 |
| | | | |
NET ASSETS | $ | 75,958,315 | $ | 26,941,173 |
| | | | |
NET ASSETS ARE REPRESENTED BY: | | | | |
Capital stock outstanding, $.001 par value, unlimited shares authorized | $ | 76,102,511 | $ | 26,679,483 |
Accumulated undistributed net realized gain (loss) on investments | | (2,839,706) | | (908,595) |
Accumulated undistributed net investment income (loss) | | 4,174 | | 6,767 |
Unrealized appreciation (depreciation) on investments | | 2,691,336 | | 1,163,518 |
| | | | |
NET ASSETS | $ | 75,958,315 | $ | 26,941,173 |
| | | | |
Net Assets - Class A | $ | 71,707,296 | $ | 26,558,565 |
Net Assets - Class I | $ | 4,251,019 | $ | 382,608 |
Shares outstanding - Class A | | 7,112,987 | | 2,577,327 |
Shares outstanding - Class I | | 421,688 | | 37,128 |
Net asset value per share - Class A* | | $10.08 | | $10.30 |
Net asset value per share - Class I | | $10.08 | | $10.31 |
Public offering price - Class A (sales charge of 2.50%) | | $10.34 | | $10.56 |
| | | | |
*Redemption price per share is equal to net asset value less any applicable contingent deferred sales charge. |
|
|
The accompanying notes are an integral part of these financial statements. |
Statements of Operations For the six months ended June 30, 2017 (unaudited)
| | | Tax-Free | | Tax-Free |
| | | Fund for MT | | Fund for ND |
INVESTMENT INCOME | | | | |
Interest | $ | 1,319,469 | $ | 463,385 |
Total investment income | $ | 1,319,469 | $ | 463,385 |
| | | | |
EXPENSES | | | | |
Investment advisory fees | $ | 193,472 | $ | 65,777 |
Distribution (12b-1) fees - Class A | | 93,697 | | 32,390 |
Transfer agent fees | | 49,439 | | 18,792 |
Administrative service fees | | 72,205 | | 36,451 |
Professional fees | | 9,179 | | 4,093 |
Reports to shareholders | | 1,651 | | 888 |
License, fees, and registrations | | 2,158 | | 2,861 |
Audit fees | | 6,670 | | 2,261 |
Trustees’ fees | | 2,674 | | 907 |
Transfer agent out-of-pockets | | 2,238 | | 1,649 |
Custodian fees | | 4,032 | | 1,469 |
Legal fees | | 3,061 | | 1,036 |
Insurance expense | | 1,192 | | 415 |
Total expenses | $ | 441,668 | $ | 168,989 |
Less expenses waived or reimbursed (See Note 7) | | (65,552) | | (40,562) |
Total net expenses | $ | 376,116 | $ | 128,427 |
| | | | |
NET INVESTMENT INCOME (LOSS) | $ | 943,353 | $ | 334,958 |
| | | | |
REALIZED AND UNREALIZED GAIN (LOSS) ON INVESTMENTS | | | | |
Net realized gain (loss) from investment transactions | $ | (392,580) | $ | 739 |
Net change in unrealized appreciation (depreciation) of investments | | 1,426,024 | | 268,006 |
Net realized and unrealized gain (loss) on investments | $ | 1,033,444 | $ | 268,745 |
| | | | |
NET INCREASE (DECREASE) IN NET ASSETS RESULTING FROM OPERATIONS | $ | 1,976,797 | $ | 603,703 |
| | | | |
| | | | |
The accompanying notes are an integral part of these financial statements. |
Statements of Changes in Net Assets For the six months ended June 30, 2017 (unaudited)
| | | Tax-Free | | Tax-Free |
| | | Fund for MT | | Fund for ND |
INCREASE (DECREASE) IN NET ASSETS FROM OPERATIONS | | | | |
Net investment income (loss) | $ | 943,353 | $ | 334,958 |
Net realized gain (loss) from investment transactions | | (392,580) | | 739 |
Net change in unrealized appreciation (depreciation) on investments | | 1,426,024 | | 268,006 |
Net increase (decrease) in net assets resulting from operations | $ | 1,976,797 | $ | 603,703 |
| | | | |
DISTRIBUTIONS TO SHAREHOLDERS FROM | | | | |
Net investment income - Class A | $ | (910,201) | $ | (328,822) |
Net investment income - Class I* | | (32,521) | | (5,530) |
Total distributions | $ | (942,722) | $ | (334,352) |
| | | | |
CAPITAL SHARE TRANSACTIONS | | | | |
Proceeds from sale of shares - Class A | $ | 3,309,749 | $ | 1,789,815 |
Proceeds from sale of shares - Class I* | | 3,476,431 | | 36,321 |
Proceeds from reinvested dividends - Class A | | 608,589 | | 253,761 |
Proceeds from reinvested dividends - Class I* | | 15,434 | | 3,634 |
Cost of shares redeemed - Class A | | (9,075,005) | | (1,134,966) |
Cost of shares redeemed - Class I* | | (101,820) | | (48,000) |
Net increase (decrease) in net assets resulting from capital share transactions | $ | (1,766,622) | $ | 900,565 |
| | | | |
TOTAL INCREASE (DECREASE) IN NET ASSETS | $ | (732,547) | $ | 1,169,916 |
NET ASSETS, BEGINNING OF PERIOD | $ | 76,690,862 | $ | 25,771,257 |
NET ASSETS, END OF PERIOD | $ | 75,958,315 | $ | 26,941,173 |
| | | | |
Accumulated undistributed net investment income | $ | 4,174 | $ | 6,767 |
| | | | |
* | Class I operations commenced on August 1, 2016. |
| |
The accompanying notes are an integral part of these financial statements. |
| | | | | | |
Statements of Changes in Net Assets For the year ended December 30, 2016
| | | Tax-Free | | Tax-Free |
| | | Fund for MT | | Fund for ND |
INCREASE (DECREASE) IN NET ASSETS FROM OPERATIONS | | | | |
Net investment income (loss) | $ | 1,995,856 | $ | 675,057 |
Net realized gain (loss) from investment transactions | | (551,409) | | (127,251) |
Net change in unrealized appreciation (depreciation) on investments | | (2,002,888) | | (578,191) |
Net increase (decrease) in net assets resulting from operations | $ | (558,441) | $ | (30,385) |
| | | | |
DISTRIBUTIONS TO SHAREHOLDERS FROM | | | | |
Net investment income - Class A | $ | (1,990,381) | $ | (670,541) |
Net investment income - Class I* | | (4,734) | | (3,295) |
Total distributions | $ | (1,995,115) | $ | (673,836) |
| | | | |
CAPITAL SHARE TRANSACTIONS | | | | |
Proceeds from sale of shares - Class A | $ | 18,045,397 | $ | 3,944,247 |
Proceeds from sale of shares - Class I* | | 848,581 | | 409,022 |
Proceeds from reinvested dividends - Class A | | 1,327,137 | | 524,042 |
Proceeds from reinvested dividends - Class I* | | 4,633 | | 2,349 |
Cost of shares redeemed - Class A | | (10,782,950) | | (4,439,248) |
Cost of shares redeemed - Class I* | | (9,529) | | (9,559) |
Net increase (decrease) in net assets resulting from capital share transactions | $ | 9,433,269 | $ | 430,853 |
| | | | |
TOTAL INCREASE (DECREASE) IN NET ASSETS | $ | 6,879,713 | $ | (273,368) |
NET ASSETS, BEGINNING OF PERIOD | $ | 69,811,149 | $ | 26,044,625 |
NET ASSETS, END OF PERIOD | $ | 76,690,862 | $ | 25,771,257 |
| | | | |
Accumulated undistributed net investment income | $ | 3,543 | $ | 6,161 |
| | | | |
* | Class I operations commenced on August 1, 2016. |
| |
|
The accompanying notes are an integral part of these financial statements. |
| | | | | | |
NOTES TO FINANCIAL STATEMENTS (unaudited)
NOTE 1: Organization
Viking Mutual Funds (the “Trust”) was organized as a Delaware business trust on March 30, 1999 and commenced operations on August 3, 1999. The Trust is registered under the Investment Company Act of 1940 as an open-end management investment company and consists of two series (the “Funds”).
The Viking Tax-Free Fund for Montana (“Tax-Free Fund for MT”) and Viking Tax-Free Fund for North Dakota (“Tax-Free Fund for ND”), each a non-diversified Fund, seek the highest level of current income that is exempt from both federal and state income taxes and is consistent with preservation of capital.
Each Fund in the Trust currently offers both Class A and Class I shares. Tax-Free Fund for MT Class A and Tax-Free Fund for North Dakota Class A are sold with an initial sales charge of 2.50% and a distribution fee of up to 0.25% on an annual basis. Class I shares are sold without sales charge or distribution fee. The two classes of shares represent interest in each Fund’s same portfolio of investments, have the same rights, and are generally identical in all respects except that each class bears its separate distribution and certain other class expenses and has exclusive voting rights with respect to any matter on which a separate vote of any class is required.
Each Fund is an investment company and, accordingly, follows the investment company accounting and reporting guidance of the Financial Accounting Standards Board (FASB) Accounting Standard Codification Topic 946 Financial Services – Investment Companies.
NOTE 2: Summary of Significant Accounting Policies
Investment security valuation—Securities for which quotations are not readily available are valued at fair value using a matrix system as determined by the Funds’ administrative services agent, Integrity Fund Services, LLC (“Integrity Fund Services” or “IFS”). The matrix system has been developed based on procedures approved by the Board of Trustees and includes consideration of the following: yields or prices of municipal bonds of comparable quality; type of issue, coupon, maturity, and rating; indications as to value from dealers; and general market conditions. Because the market value of securities can only be established by agreement between parties in a sales transaction, and because of the uncertainty inherent in the valuation process, the fair values as determined may differ from the values that would have been used had a readily available market for the securities existed. Shares of a registered investment company, including money market funds, that are not traded on an exchange are valued at the investment company’s net asset value per share. Refer to Note 3 for further disclosures related to the inputs used to value the Funds’ investments.
When-issued securities—The Funds may purchase securities on a when-issued basis. Payment and delivery may take place after the customary settlement period for that security. The price of the underlying securities and the date when the securities will be delivered and paid for are fixed at the time the transaction is negotiated. The value of the securities purchased on a when-issued basis are identified as such in each Fund’s Schedule of Investments. With respect to purchase commitments, the Funds identify securities to be segregated by the custodian in its records with a value at least equal to the amount of the commitment. Losses may arise due to changes in the value of the underlying securities, if the counterparty does not perform under the contract terms, or if the issuer does not issue the securities due to political, economic, or other factors.
Contingent deferred sales charge—Investments in Class A shares of $1 million or more may be subject to a 1.00% contingent deferred sales charge (“CDSC”) if redeemed within 24 months of purchase (excluding shares purchased with reinvested dividends and/or distributions).
Federal and state income taxes—Each Fund is a separate taxpayer for federal income tax purposes. Each Fund’s policy is to comply with the requirements of the Internal Revenue Code that are applicable to regulated investment companies and to distribute substantially all of its net investment income and any net realized gain on investments to its shareholders; therefore, no provision for income taxes is required.
As of and during the year ended December 30, 2016, the Funds did not have a liability for any unrecognized tax benefits. The Funds recognize interest and penalties, if any, related to unrecognized tax benefits as income tax expense in the Statements of Operations. During the year, the Funds did not incur any interest or penalties.
For all open tax years and all major taxing jurisdictions, management of the Funds has concluded that there are no significant uncertain tax positions that would require recognition in the financial statements. Open tax years are those that are open for examination by taxing authorities. Furthermore, management of the Funds is also not aware of any tax positions for which it is reasonably possible that the total amounts of unrecognized tax benefits will significantly change in the next twelve months.
Premiums and discounts—Premiums and discounts on municipal securities are accreted and amortized using the effective yield method over the lives of the respective securities for financial reporting purposes.
Security transactions, investment income, expenses and distributions—Income and expenses are recorded on the accrual basis. Investment transactions are accounted for on the trade date. Realized gains and losses are reported on the specific identification basis. Interest income and estimated expenses are accrued daily. The Funds declare dividends from net investment income daily and pay such dividends monthly. Capital gains, when available, are distributed at least annually. Dividends are reinvested in additional shares of the Funds at net asset value or paid in cash. Distributions to shareholders are recorded on the ex-dividend date. Income and capital gain distributions are determined in accordance with federal income tax regulations and may differ from net investment income and realized gains determined in accordance with accounting principles generally accepted in the United States of America. These differences are primarily due to differing treatment of market discount. In addition, other amounts have been reclassified within the composition of net assets to more appropriately conform financial accounting to tax basis treatment.
Use of estimates—The financial statements have been prepared in accordance with accounting principles generally accepted in the United States of America (“GAAP”), which requires management to make estimates and assumptions that affect the reported amounts of assets and liabilities and disclosure of contingent assets and liabilities at the date of the financial statements and the reported amounts of revenues and expenses during the reporting period. Actual results could differ from those estimates.
Common expenses—Common expenses of the Trust are allocated among the Funds within the Trust based on relative net assets of each Fund or the nature of the services performed and the relative applicability to each Fund.
Organizational expenses—All organizational and offering expenses of the Trust were borne by the Investment Advisor and are not subject to future recoupment. As a result, organizational and offering expenses are not reflected in the Statements of Assets and Liabilities.
NOTE 3: Fair Value Measurements
Various inputs are used in determining the value of the Funds' investments. These inputs are summarized in three broad levels: Level 1 inputs are based on quoted prices in active markets for identical securities. Level 2 inputs are based on significant observable inputs (including quoted prices for similar securities, interest rates, prepayment speeds, credit risk, etc.). Level 3 inputs are based on significant unobservable inputs (including each Fund's own assumptions in determining the fair value of investments). The following is a summary of the inputs used to value the Funds’ investments as of June 30, 2017:
| | | | | Level 1 | | | Level 2 | | | Level 3 | | | Total |
Tax-Free Fund for MT | Municipal Bonds | | $ | 0 | | $ | 72,697,963 | | $ | 0 | | $ | 72,697,963 |
| | Total | | $ | 0 | | $ | 72,697,963 | | $ | 0 | | $ | 72,697,963 |
| | | | | | | | | | | | | |
Tax-Free Fund for ND | Municipal Bonds | | $ | 0 | | $ | 26,055,403 | | $ | 0 | | $ | 26,055,403 |
| | Total | | $ | 0 | | $ | 26,055,403 | | $ | 0 | | $ | 26,055,403 |
Please refer to the Schedule of Investments for sector classification. The Funds did not hold any Level 3 assets during the six months ended June 30, 2017. There were no transfers into or out of Level 1 or Level 2 during the six months ended June 30, 2017. The Funds consider transfers into or out of Level 1 and Level 2 as of the end of the reporting period. The Funds did not hold any derivative instruments at any time during the six months ended June 30, 2017.
NOTE 4: Investment Transactions
Purchases and sales of investment securities (excluding short-term securities) for the six months ended June 30, 2017, were as follows:
| | Tax-Free Fund for MT | | Tax-Free Fund for ND |
Purchases | $11,233,469 | | $893,479 |
Sales | $14,375,448 | | $1,032,520 |
NOTE 5: Capital Share Transactions
Six Months Ended 6/30/17: | | Tax-Free | | Tax-Free |
Class A | | Fund for MT | | Fund for ND |
Shares sold | | 330,610 | | 173,878 |
Shares issued from reinvestments | | 60,726 | | 24,709 |
Shares redeemed | | (904,999) | | (110,592) |
Net increase (decrease) | | (513,663) | | 87,995 |
Class I | | | | |
Shares sold | | 347,826 | | 3,543 |
Shares issued from reinvestments | | 1,537 | | 354 |
Shares redeemed | | (10,139) | | (4,660) |
Net increase (decrease) | | 339,224 | | (763) |
| | | | |
Year Ended 12/30/16: | | Tax-Free | | Tax-Free |
Class A | | Fund for MT | | Fund for ND |
Shares sold | | 1,749,393 | | 374,263 |
Shares issued from reinvestments | | 129,262 | | 49,843 |
Shares redeemed | | (1,058,209) | | (422,651) |
Net increase (decrease) | | 820,446 | | 1,455 |
Class I | | | | |
Shares sold | | 82,963 | | 38,603 |
Shares issued from reinvestments | | 462 | | 227 |
Shares redeemed | | (961) | | (939) |
Net increase (decrease) | | 82,464 | | 37,891 |
NOTE 6: Income Tax Information
At December 30, 2016, the net unrealized appreciation (depreciation) based on the cost of investments for federal income tax purposes was as follows:
| Tax-Free Fund for MT | | Tax-Free Fund for ND |
Investments at cost | $73,758,641 | | $24,531,462 |
Unrealized appreciation | $1,991,152 | | $969,531 |
Unrealized depreciation | (722,297) | | (67,858) |
Net unrealized appreciation (depreciation) | $1,268,855* | | $901,673* |
| | | |
* | Differences between financial reporting-basis and tax-basis unrealized appreciation/(depreciation) are due to differing treatment of market discount. |
| | | | | |
The tax character of distributions paid was as follows:
| Tax-Free Fund for MT | | Tax-Free Fund for ND |
| Year | | Year | | Year | | Year |
| Ended 12/30/16 | | Ended 12/31/15 | | Ended 12/30/16 | | Ended 12/31/15 |
Tax-exempt income | $1,995,115 | | $1,953,771 | | $673,836 | | $663,307 |
As of December 30, 2016, the components of accumulated earnings/(deficit) on a tax basis were as follows:
| Tax-Free Fund for MT | | Tax-Free Fund for ND |
Accumulated capital and other (losses) | ($2,447,126) | | ($909,334) |
Unrealized appreciation/(depreciation)* | 1,268,855 | | 901,673 |
Total accumulated earnings/(deficit) | ($1,178,271) | | ($7,661) |
| | | |
* | Differences between financial reporting-basis and tax-basis unrealized appreciation/(depreciation) are due to differing treatment of market discount. |
| | | | | |
The tax components of distributable earnings are determined in accordance with income tax regulations which may differ from the composition of net assets reported under GAAP. Accordingly, for the year ended December 30, 2016, certain differences were reclassified in the Tax-Free Fund for MT and Tax-Free Fund for ND as follows: accumulated realized losses to paid in capital of $72,824 and 44,995 for capital loss carryforward expiration; and accumulated net investment income to accumulated realized gains (losses) of $173 due to market discount on the sale of bonds.
Under the Regulated Investment Company Modernization Act of 2010 (“Act”), funds are permitted to carry forward capital losses incurred in taxable years beginning after December 22, 2010 for an unlimited period of time. The short-term and long-term character of such losses are retained rather than being treated as short-term as under previous law. Pre-enactment losses are eligible to be carried forward for a maximum period of eight years. Pursuant to the Act, post-enactment capital losses must be utilized before pre-enactment capital losses. As a result, pre-enactment capital loss carryforwards may be more likely to expire unused. The Funds’ capital loss carryforward amounts as of December 30, 2016 are as follows:
| Tax-Free Fund for MT | | Tax-Free Fund for ND |
Expires in 2018 | $106,551 | | $75,200 |
Non-expiring short-term losses | $1,277,153 | | $541,942 |
Non-expiring long-term losses | $1,063,422 | | $292,192 |
Total Capital Loss Carryforwards | $2,447,126 | | $909,334 |
NOTE 7: Investment Advisory Fees and Other Transactions with Affiliates
Viking Fund Management (“VFM”), the Funds’ investment adviser; Integrity Funds Distributor, LLC (“Integrity Funds Distributor” or “IFD”), the Funds’ underwriter and distributor; and Integrity Fund Services, the Funds’ transfer, accounting, and administrative services agent; are subsidiaries of Corridor Investors, LLC (“Corridor Investors” or “Corridor”), the Funds’ sponsor. A Trustee of the Funds is also a Governor of Corridor.
VFM provides investment advisory and management services to the Funds. The Investment Advisory Agreement (the “Advisory Agreement”) provides for fees to be computed at an annual rate of 0.50% of each Fund’s average daily net assets. VFM has contractually agreed to pay all the expenses of the Funds (other than extraordinary or non-recurring expenses, taxes, brokerage fees, commissions, and acquired fund fees and expenses) until April 29, 2018 so that the net annual operating expenses do not exceed 0.98%. After this date, the expense limitations may be terminated or revised. There are no recoupment provisions in place for waived/reimbursed fees. VFM and affiliated service providers may also voluntarily waive fees or reimburse expenses not required under the advisory or other contracts from time to time. VFM and the affiliated service providers have agreed to voluntarily waive the affiliated service provider’s fees before voluntarily or contractually waiving VFM’s management fee. An expense limitation lowers expense ratios and increases returns to investors. Certain Officers of the Funds are also Officers and Governors of VFM.
| | Six Months Ended 06/30/17 | | Payable 06/30/17 |
| | Advisory Fees* | Advisory Fees Waived | | Advisory Fees* |
Tax-Free Fund for MT | $ | 144,619 | $ | 48,853 | | $ | 0 |
Tax-Free Fund for ND | $ | 37,278 | $ | 28,499 | | $ | 0 |
| | | | | | | |
* | After waivers. |
| | | | | | | | | |
IFD serves as the principal underwriter and distributor for the Funds and receives sales charges deducted from Fund share sales proceeds and CDSC from applicable Fund share redemptions. Also, the Funds have adopted a distribution plan for each class of shares as allowed by Rule 12b-1 of the 1940 Act. Distribution plans permit the Funds to reimburse its principal underwriter for costs related to selling shares of the Funds and for various other services. These costs, which consist primarily of commissions and service fees to broker-dealers who sell shares of the Funds, are paid by shareholders through expenses called “Distribution Plan expenses.” The Class A shares currently pay an annual distribution fee of up to 0.25% of the average daily net assets. Certain Officers of the Funds are also Officers and Governors of IFD.
| | Six Months Ended 06/30/17 | | Payable 06/30/17 |
| | Sales | | Distribution | Distribution | | Sales | | Distribution |
| | Charges | CDSC | Fees* | Fees Waived | | Charges | CDSC | Fees* |
Tax-Free Fund for MT - A | $ | 47,976 | $ | 0 | $ | 93,697 | $ | 0 | | $ | 0 | $ | 0 | $ | 0 |
Tax-Free Fund for ND - A | $ | 26,164 | $ | 0 | $ | 32,390 | $ | 0 | | $ | 0 | $ | 0 | $ | 0 |
| | | | | | | |
* | After waivers. |
| | | | | | | | | | | | | | | | | | | | | | | | |
IFS acts as the Funds’ transfer agent for a monthly variable fee equal to 0.12% of the average daily net assets on an annual basis for the first $0 to $200 million and at a lower rate in excess of $200 million and an additional fee of $500 per month for each additional share class plus reimbursement of out-of-pocket expenses and sub-transfer agent out-of-pocket expenses. Sub-transfer agent out-of-pocket expenses are included in the transfer agent fees below and in the transfer agent out-of-pocket balance on the Statements of Operations. IFS also acts as the Funds’ administrative services agent for a monthly fee equal to the sum of a fixed fee of $2,000 and a variable fee equal to 0.14% of the Funds’ average daily net assets on an annual basis for the first $0 to $200 million and at a lower rate in excess of $200 million plus reimbursement of out-of-pocket expenses. Certain Officers of the Funds are also Officers and Governors of IFS.
| | Six Months Ended 06/30/17 | | Payable 06/30/17 |
| | Transfer | Transfer | Admin. | Admin. | | Transfer | Admin. |
| | Agency | Agency | Service | Service | | Agency | Service |
| | Fees* | Fees Waived | Fees* | Fees Waived | | Fees* | Fees* |
Tax-Free Fund for MT | $ | 44,890 | $ | 6,787 | $ | 62,293 | $ | 9,912 | | $ | 738 | $ | 0 |
Tax-Free Fund for ND | $ | 16,345 | $ | 4,096 | $ | 28,484 | $ | 7,967 | | $ | 1,042 | $ | 0 |
* After waivers. |
NOTE 8: Principal Risks
The Funds invest primarily in municipal securities from a specific state. The Funds may also invest in municipal securities of U.S. territories and possessions (such as Puerto Rico, the U.S. Virgin Islands, and Guam). Each Fund is therefore more susceptible to political, economic, legislative, or regulatory factors adversely affecting issuers of municipal securities in its specific state or U.S. territories and possessions.
Interest rate risk is the risk that bond prices will decline in value because of changes in interest rates. There is normally an inverse relationship between the fair value of securities sensitive to prevailing interest rates and actual changes in interest rates. The longer the average maturity of each Fund’s portfolio, the greater its interest rate risk.
NOTE 9: Subsequent Events
The Funds are required to recognize in the financial statements the effects of all subsequent events that provide additional evidence about conditions that existed at the date of the Statements of Assets and Liabilities. For non-recognized subsequent events that must be disclosed to keep the financial statements from being misleading, the Funds are required to disclose the nature of the event as well as an estimate of its financial effect, or a statement that such an estimate cannot be made. Management has evaluated the impact of all subsequent events on the Funds through the issuance date of these financial statements and has noted no such events requiring accounting or disclosure.
VIKING TAX-FREE FUND FOR MONTANA CLASS A
Selected per share data and ratios for the periods indicated
| | Six | | | | | | | | | | |
| | Months | | Year | | Year | | Year | | Year | | Year |
| | Ended | | Ended | | Ended | | Ended | | Ended | | Ended |
| | 6/30/17# | | 12/30/16 | | 12/31/15 | | 12/31/14 | | 12/31/13 | | 12/31/12 |
NET ASSET VALUE, BEGINNING OF PERIOD | $ | 9.95 | | $ | 10.26 | | $ | 10.23 | | $ | 9.83 | | $ | 10.50 | | $ | 10.32 |
| | | | | | | | | | | | | | | | | |
Income (loss) from investment operations: | | | | | | | | | | | | | | | | | |
Net investment income (loss) | $ | 0.12 | | $ | 0.27 | | $ | 0.29 | | $ | 0.29 | | $ | 0.28 | | $ | 0.32 |
Net realized and unrealized gain (loss) on investments 3 | | 0.13 | | | (0.31) | | | 0.03 | | | 0.40 | | | (0.67) | | | 0.18 |
Total from investment operations | $ | 0.25 | | $ | (0.04) | | $ | 0.32 | | $ | 0.69 | | $ | (0.39) | | $ | 0.50 |
| | | | | | | | | | | | | | | | | |
Less Distributions: | | | | | | | | | | | | | | | | | |
Dividends from net investment income | $ | (0.12) | | $ | (0.27) | | $ | (0.29) | | $ | (0.29) | | $ | (0.28) | | $ | (0.32) |
Total distributions | $ | (0.12) | | $ | (0.27) | | $ | (0.29) | | $ | (0.29) | | $ | (0.28) | | $ | (0.32) |
| | | | | | | | | | | | | | | | | |
NET ASSET VALUE, END OF PERIOD | $ | 10.08 | | $ | 9.95 | | $ | 10.26 | | $ | 10.23 | | $ | 9.83 | | $ | 10.50 |
| | | | | | | | | | | | | | | | | |
Total Return
(excludes any applicable sales charge) | 2.54%^ | | (0.43%) | | 3.21% | | 7.08% | | (3.80%) | | 4.93% |
| | | | | | | | | | | | | | | | | |
RATIOS/SUPPLEMENTAL DATA | | | | | | | | | | | | | | | | | |
Net assets, end of period (in thousands) | $71,707 | | $75,870 | | $69,811 | | $68,064 | | $69,452 | | $78,934 |
Ratio of expenses to average net assets after waivers 1,2 | 0.98%* | | 0.98% | | 0.98% | | 0.98% | | 0.98% | | 0.97% |
Ratio of expenses to average net assets before waivers 2 | 1.15%* | | 1.16% | | 1.15% | | 1.14% | | 1.15% | | 1.15% |
Ratio of net investment income to average net assets 1,2 | 2.46%* | | 2.63% | | 2.87% | | 2.86% | | 2.71% | | 3.07% |
Portfolio turnover rate | 15.13% | | 16.58% | | 11.91% | | 13.20% | | 32.66% | | 5.79% |
1 | This row reflects the impact, if any, of fee waivers or reimbursements by the Adviser and/or affiliated service providers. |
2 | Average net assets was calculated using a 360-day period. |
3 | Realized and unrealized gains and loss per share in this caption are balancing amounts necessary to reconcile the change in net asset value per share for the period, and may not reconcile with the aggregate gains and losses in the Statement of Operations due to share transactions for the period. |
* Annualized.
# Unaudited.
^ Not annualized.
Total return represents the rate that an investor would have earned or lost on an investment in the Fund assuming reinvestment of all dividends and distributions.
The accompanying notes are an integral part of these financial statements.
VIKING TAX-FREE FUND FOR MONTANA CLASS I
Selected per share data and ratios for the periods indicated
| | Six | | Period |
| | Months | | From |
| | Ended | | 8/1/16+ to |
| | 6/30/17# | | 12/30/16 |
NET ASSET VALUE, BEGINNING OF PERIOD | $ | 9.95 | | $ | 10.41 |
| | | | | |
Income (loss) from investment operations: | | | | | |
Net investment income (loss) | $ | 0.13 | | $ | 0.12 |
Net realized and unrealized gain (loss) on investments 3 | | 0.13 | | | (0.46) |
Total from investment operations | $ | 0.26 | | $ | (0.34) |
| | | | | |
Less Distributions: | | | | | |
Dividends from net investment income | $ | (0.13) | | $ | (0.12) |
Total distributions | $ | (0.13) | | $ | (0.12) |
| | | | | |
NET ASSET VALUE, END OF PERIOD | $ | 10.08 | | $ | 9.95 |
| | | | | |
Total Return (excludes any applicable sales charge) | 2.67%^ | | (3.32%)^ |
| | | | | |
RATIOS/SUPPLEMENTAL DATA | | | | | |
Net assets, end of period (in thousands) | $4,251 | | $821 |
Ratio of expenses to average net assets after waivers 1,2 | 0.73%* | | 0.73%* |
Ratio of expenses to average net assets before waivers 2 | 0.90%* | | 0.92%* |
Ratio of net investment income to average net assets 1,2 | 2.70%* | | 2.74%* |
Portfolio turnover rate | 15.13% | | 16.58%^ |
1 | This row reflects the impact, if any, of fee waivers or reimbursements by the Adviser and/or affiliated service providers. |
2 | Average net assets was calculated using a 360-day period. |
3 | Realized and unrealized gains and loss per share in this caption are balancing amounts necessary to reconcile the change in net asset value per share for the period, and may not reconcile with the aggregate gains and losses in the Statement of Operations due to share transactions for the period. |
* Annualized.
# Unaudited.
^ Not annualized.
+ Commenced operations.
Total return represents the rate that an investor would have earned or lost on an investment in the Fund assuming reinvestment of all dividends and distributions.
The accompanying notes are an integral part of these financial statements.
VIKING TAX-FREE FUND FOR NORTH DAKOTA CLASS A
Selected per share data and ratios for the periods indicated
| | Six | | | | | | | | | | |
| | Months | | Year | | Year | | Year | | Year | | Year |
| | Ended | | Ended | | Ended | | Ended | | Ended | | Ended |
| | 6/30/17# | | 12/30/16 | | 12/31/15 | | 12/31/14 | | 12/31/13 | | 12/31/12 |
NET ASSET VALUE, BEGINNING OF PERIOD | $ | 10.20 | | $ | 10.47 | | $ | 10.39 | | $ | 9.94 | | $ | 10.62 | | $ | 10.49 |
| | | | | | | | | | | | | | | | | |
Income (loss) from investment operations: | | | | | | | | | | | | | | | | | |
Net investment income (loss) | $ | 0.13 | | $ | 0.27 | | $ | 0.27 | | $ | 0.28 | | $ | 0.28 | | $ | 0.34 |
Net realized and unrealized gain (loss) on investments 3 | | 0.10 | | | (0.27) | | | 0.08 | | | 0.45 | | | (0.68) | | | 0.13 |
Total from investment operations | $ | 0.23 | | $ | 0.00 | | $ | 0.35 | | $ | 0.73 | | $ | (0.40) | | $ | 0.47 |
| | | | | | | | | | | | | | | | | |
Less Distributions: | | | | | | | | | | | | | | | | | |
Dividends from net investment income | $ | (0.13) | | $ | (0.27) | | $ | (0.27) | | $ | (0.28) | | $ | (0.28) | | $ | (0.34) |
Total distributions | $ | (0.13) | | $ | (0.27) | | $ | (0.27) | | $ | (0.28) | | $ | (0.28) | | $ | (0.34) |
| | | | | | | | | | | | | | | | | |
NET ASSET VALUE, END OF PERIOD | $ | 10.30 | | $ | 10.20 | | $ | 10.47 | | $ | 10.39 | | $ | 9.94 | | $ | 10.62 |
| | | | | | | | | | | | | | | | | |
Total Return
(excludes any applicable sales charge) | 2.27%^ | | (0.08%) | | 3.43% | | 7.43% | | (3.80%) | | 4.48% |
| | | | | | | | | | | | | | | | | |
RATIOS/SUPPLEMENTAL DATA | | | | | | | | | | | | | | | | | |
Net assets, end of period (in thousands) | $26,559 | | $25,385 | | $26,045 | | $25,449 | | $24,140 | | $27,869 |
Ratio of expenses to average net assets after waivers 1,2 | 0.98%* | | 0.98% | | 0.98% | | 0.98% | | 0.98% | | 0.97% |
Ratio of expenses to average net assets before waivers 2 | 1.29%* | | 1.27% | | 1.24% | | 1.23% | | 1.24% | | 1.24% |
Ratio of net investment income to average net assets 1,2 | 2.57%* | | 2.53% | | 2.62% | | 2.75% | | 2.73% | | 3.15% |
Portfolio turnover rate | 3.48% | | 13.28% | | 19.05% | | 18.46% | | 37.28% | | 17.26% |
1 | This row reflects the impact, if any, of fee waivers or reimbursements by the Adviser and/or affiliated service providers. |
2 | Average net assets was calculated using a 360-day period. |
3 | Realized and unrealized gains and loss per share in this caption are balancing amounts necessary to reconcile the change in net asset value per share for the period, and may not reconcile with the aggregate gains and losses in the Statement of Operations due to share transactions for the period. |
* Annualized.
# Unaudited.
^ Not annualized.
Total return represents the rate that an investor would have earned or lost on an investment in the Fund assuming reinvestment of all dividends and distributions.
The accompanying notes are an integral part of these financial statements.
VIKING TAX-FREE FUND FOR NORTH DAKOTA CLASS I
Selected per share data and ratios for the periods indicated
| | Six | | Period |
| | Months | | From |
| | Ended | | 8/1/16+ to |
| | 6/30/17# | | 12/30/16 |
NET ASSET VALUE, BEGINNING OF PERIOD | $ | 10.20 | | $ | 10.65 |
| | | | | |
Income (loss) from investment operations: | | | | | |
Net investment income (loss) | $ | 0.14 | | $ | 0.12 |
Net realized and unrealized gain (loss) on investments 3 | | 0.11 | | | (0.45) |
Total from investment operations | $ | 0.25 | | $ | (0.33) |
| | | | | |
Less Distributions: | | | | | |
Dividends from net investment income | $ | (0.14) | | $ | (0.12) |
Total distributions | $ | (0.14) | | $ | (0.12) |
| | | | | |
NET ASSET VALUE, END OF PERIOD | $ | 10.31 | | $ | 10.20 |
| | | | | |
Total Return (excludes any applicable sales charge) | 2.50% | | (3.11%)^ |
| | | | | |
RATIOS/SUPPLEMENTAL DATA | | | | | |
Net assets, end of period (in thousands) | $383 | | $386 |
Ratio of expenses to average net assets after waivers 1,2 | 0.73%* | | 0.73%* |
Ratio of expenses to average net assets before waivers 2 | 1.04%* | | 1.05%* |
Ratio of net investment income to average net assets 1,2 | 2.82%* | | 2.82%* |
Portfolio turnover rate | 3.48% | | 13.28%^ |
1 | This row reflects the impact, if any, of fee waivers or reimbursements by the Adviser and/or affiliated service providers. |
2 | Average net assets was calculated using a 360-day period. |
3 | Realized and unrealized gains and loss per share in this caption are balancing amounts necessary to reconcile the change in net asset value per share for the period, and may not reconcile with the aggregate gains and losses in the Statement of Operations due to share transactions for the period. |
* Annualized.
# Unaudited.
^ Not annualized.
+ Commenced operations.
Total return represents the rate that an investor would have earned or lost on an investment in the Fund assuming reinvestment of all dividends and distributions.
The accompanying notes are an integral part of these financial statements.
EXPENSE EXAMPLE (unaudited)
As a shareholder of the Funds, you incur two types of costs: (1) transaction costs, including sales charges (loads), redemption fees and exchange fees; and (2) ongoing costs, including management fees, distribution (12b-1) fees and other Fund expenses. This example is intended to help you understand your ongoing costs (in dollars) of investing in the Funds and to compare these costs with the ongoing costs of investing in other mutual funds. The example is based on an investment of $1,000 invested at the beginning of the one-half year period shown below and held for the entire one-half year period.
Actual expenses
The section in the table under the heading “Actual” provides information about actual account values and actual expenses. You may use the information in these columns together with the amount you invested to estimate the expenses that you paid over the period. Simply divide your account value by $1,000 (for example, an account value of $8,600 divided by $1,000 equals 8.6), then multiply the result by the number in the appropriate column for your share class in the column entitled “Expenses Paid During Period” to estimate the expenses you paid on your account during this period.
Hypothetical example for comparison purposes
The section in the table under the heading “Hypothetical (5% return before expenses)” provides information about hypothetical account values and hypothetical expenses based on the Funds’ actual expense ratios and an assumed rate of return of 5% per year before expenses, which is not the Funds’ actual return. The hypothetical account values and expenses may not be used to estimate the actual ending account balance or expenses you paid for the period. You may use this information to compare the ongoing costs of investing in the Funds and other funds. To do so, compare this 5% hypothetical example with the 5% hypothetical examples that appear in the shareholder reports of the other funds.
Please note that the expenses shown in the table are meant to highlight your ongoing costs only and do not reflect any transactional costs, such as sales charges (loads), redemption fees, or exchange fees. Therefore, the section in the table under the heading “Hypothetical (5% return before expenses)” is useful in comparing ongoing costs only, and will not help you determine the relative total costs of owning different funds. In addition, if these transactional costs were included, your costs would have been higher.
| | Beginning | Ending | Expenses | |
| | Account | Account | Paid | Annualized |
| | Value | Value | During | Expense |
| 12/30/16 | 6/30/17 | Period* | Ratio |
Tax-Free Fund for MT | | | | |
Actual - Class A | $1,000.00 | $1,025.44 | $4.98 | 0.98% |
Actual - Class I | $1,000.00 | $1,026.72 | $3.70 | 0.73% |
Hypothetical - Class A (5% return before expenses) | $1,000.00 | $1,020.09 | $4.96 | 0.98% |
Hypothetical - Class I (5% return before expenses) | $1,000.00 | $1,021.34 | $3.70 | 0.73% |
Tax-Free Fund for ND | | | | |
Actual - Class A | $1,000.00 | $1,022.71 | $4.97 | 0.98% |
Actual - Class I | $1,000.00 | $1,024.98 | $3.71 | 0.73% |
Hypothetical - Class A (5% return before expenses) | $1,000.00 | $1,020.09 | $4.96 | 0.98% |
Hypothetical - Class I (5% return before expenses) | $1,000.00 | $1,021.34 | $3.70 | 0.73% |
| | | | |
* | Expenses are equal to the annualized expense ratio, multiplied by the average account value over the period, multiplied by 181 days in the one-half year period, and divided by 365 days in the fiscal year (to reflect the one-half year period). |
| | | | | | |
PROXY VOTING OF FUND PORTFOLIO SECURITIES
A description of the policies and procedures that the Funds use to determine how to vote proxies relating to securities held in the Funds’ portfolios is available, without charge and upon request, by calling 800-276-1262. A report on Form N-PX of how the Funds voted any such proxies during the most recent 12-month period ended June 30 is available through the Funds’ website at www.integrityvikingfunds.com. The information is also available from the Electronic Data Gathering Analysis and Retrieval (“EDGAR”) database on the website of the Securities and Exchange Commission (“SEC”) at www.sec.gov.
QUARTERLY PORTFOLIO SCHEDULE
Within 60 days of the end of their second and fourth fiscal quarters, the Funds provide a complete schedule of portfolio holdings in their semi-annual and annual reports on the Form N-CSR(S). These reports are filed electronically with the SEC and are delivered to the shareholders of the Funds. The Funds also file their complete schedule of portfolio holdings with the SEC for the first and third quarters of each fiscal year on Form N-Q. The Funds’ Forms N-Q and N-CSR(S) are available on the SEC’s website at www.sec.gov. The Funds’ Forms N-Q and N-CSR(S) may be reviewed and copied at the SEC’s Public Reference Room in Washington, D.C. Information on the operation of the Public Reference Room may be obtained by calling 202-551-8090. You may also access this information from the Funds’ website at www.integrityvikingfunds.com.
SHAREHOLDER INQUIRIES AND MAILINGS
Direct inquiries regarding the Funds to: Integrity Funds Distributor, LLC PO Box 500 Minot, ND 58702 Phone: 800-276-1262 | Direct inquiries regarding account information to: Integrity Fund Services, LLC PO Box 759 Minot, ND 58702 Phone: 800-601-5593 |
To reduce their expenses, the Funds may mail only one copy of its prospectus and each annual and semi-annual report to those addresses shared by two or more accounts. If you wish to receive additional copies of these documents, please call Integrity Funds Distributor at 800-276-1262 or contact your financial institution. Integrity Funds Distributor will begin sending you individual copies 30 days after receiving your request.
Integrity Viking Funds are sold by prospectus only. An investor should consider the investment objectives, risks, and charges and expenses of the investment company carefully before investing. The prospectus contains this and other information about the investment company. You may obtain a prospectus at no cost from your financial adviser or at www.integrityvikingfunds.com. Please read the prospectus carefully before investing.

Equity Funds
Integrity Dividend Harvest Fund
Integrity Energized Dividend Fund
Integrity Growth & Income Fund
Williston Basin/Mid-North America Stock Fund
Corporate Bond Fund
Integrity High Income Fund
State-Specific Tax-Exempt Bond Funds
Viking Tax-Free Fund for Montana
Viking Tax-Free Fund for North Dakota
Kansas Municipal Fund
Maine Municipal Fund
Nebraska Municipal Fund
New Hampshire Municipal Fund
Oklahoma Municipal Fund
Item 2. CODE OF ETHICS.
The information required in this Item is only required in an annual report on Form N-CSR.
Item 3. AUDIT COMMITTEE FINANCIAL EXPERT.
The information required in this Item is only required in an annual report on Form N-CSR.
Item 4. PRINCIPAL ACCOUNTANT FEES AND SERVICES.
The information required by this Item is only required in an annual report on Form N-CSR.
Item 5. AUDIT COMMITTEE OF LISTED REGISTRANTS.
Not applicable
Item 6. INVESTMENTS.
The Schedule of Investments is included as part of the report to shareholders filed under Item 1 of this Form.
Item 7. DISCLOSURE OF PROXY VOTING POLICIES AND PROCEDURES FOR CLOSED-END MANAGEMENT INVESTMENT COMPANIES.
Not applicable
Item 8. PORTFOLIO MANAGERS OF CLOSED-END MANAGEMENT INVESTMENT COMPANIES.
Not applicable
Item 9. PURCHASES OF EQUITY SECURITIES BY CLOSED-END MANAGEMENT INVESTMENT COMPANY AND AFFILIATED PURCHASERS.
Not applicable
Item 10. SUBMISSION OF MATTERS TO A VOTE OF SECURITY HOLDERS.
There have been no material changes to the procedures by which shareholders may recommend nominees to the registrant’s board of trustees in the last fiscal half-year.
Item 11. CONTROLS AND PROCEDURES.
| (a) | Based on their evaluation of the registrant’s disclosure controls and procedures as of a date within 90 days of the filing date of this Form N-CSR (the “Report”), the registrant’s principal executive officer and principal financial officer believe that the disclosure controls and procedures (as defined in Rule 30a-3(c) under the Investment Company Act of 1940, as amended) are effectively designed to ensure that information required to be disclosed by the registrant in the Report is recorded, processed, summarized and reported by the filing date, including ensuring that information required to be disclosed in the Report is accumulated and communicated to the registrant’s principal executive officer and principal financial officer who are making certifications in the Report, as appropriate, to allow timely decisions regarding required disclosure. |
| | |
| (b) | There were no changes in the registrant’s internal control over financial reporting (as defined in Rule 30a-3(d) under the Investment Company Act of 1940) that occurred during the registrant’s most recent fiscal half-year that have materially affected, or are reasonably likely to materially affect, the registrant's internal control over financial reporting. |
Item 12. EXHIBITS
| (a) | (1) | The registrant’s code of ethics filed pursuant to Item 2 of the N-CSR is filed with the registrant’s annual N-CSR. |
| | | |
| | (2) | Certification pursuant to Section 302 of the Sarbanes-Oxley Act of 2002 is filed and attached hereto. |
| | | |
| | (3) | Not applicable. |
| | |
| (b) | Certifications pursuant to Section 906 of the Sarbanes-Oxley Act of 2002 is filed and attached hereto. |
Pursuant to the requirements of the Securities Exchange Act of 1934 and the Investment Company Act of 1940, the registrant has duly caused this report to be signed on its behalf by the undersigned, thereunto duly authorized.
Viking Mutual Funds
By: /s/ Shannon D. Radke
Shannon D. Radke
President
September 5, 2017
Pursuant to the requirements of the Securities Exchange Act of 1934 and the Investment Company Act of 1940, this report has been signed below by the following persons on behalf of the registrant and in the capacities and on the dates indicated.
By: /s/ Shannon D. Radke
Shannon D. Radke
President
September 5, 2017
By: /s/ Adam Forthun
Adam Forthun
Treasurer
September 5, 2017