U.S. Bancorp Fund Services, LLC
615 E. Michigan Street
| | |
| KINETICS MUTUAL FUNDS, INC. | |
Table of Contents | |
| June 30, 2019 (Unaudited) | |
| |
| | Page |
| Shareholders’ Letter | 2 |
| Year 2019 Semi-Annual Investment Commentary | 7 |
| KINETICS MUTUAL FUNDS, INC. — FEEDER FUNDS AND | |
| THE KINETICS SPIN-OFF AND CORPORATE RESTRUCTURING FUND | |
| Expense Example | 12 |
| Allocation of Assets — The Kinetics Spin-off and Corporate | |
| Restructuring Fund | 19 |
| Schedule of Investments — The Kinetics Spin-off and Corporate | |
| Restructuring Fund | 20 |
| Statements of Assets & Liabilities | 23 |
| Statements of Operations | 28 |
| Statements of Changes in Net Assets | 33 |
| Notes to Financial Statements | 46 |
| Financial Highlights | 72 |
| KINETICS PORTFOLIOS TRUST — MASTER INVESTMENT PORTFOLIOS | |
| Allocation of Consolidated Portfolio Assets | 105 |
| Consolidated Portfolio of Investments —The Internet Portfolio | 113 |
| Consolidated Portfolio of Investments — The Global Portfolio | 116 |
| Consolidated Portfolio of Investments — The Paradigm Portfolio | 120 |
| Portfolio of Investments — The Medical Portfolio | 125 |
| Consolidated Portfolio of Investments — The Small Cap | |
| Opportunities Portfolio | 127 |
| Consolidated Portfolio of Investments — The Market | |
| Opportunities Portfolio | 130 |
| Portfolio of Investments — The Alternative Income Portfolio | 133 |
| Portfolio of Investments — The Multi-Disciplinary Income Portfolio | 134 |
| Consolidated Statements of Assets & Liabilities | 138 |
| Consolidated Statements of Operations | 142 |
| Consolidated Statements of Changes in Net Assets | 146 |
| Consolidated Notes to Financial Statements | 150 |
1
KINETICS MUTUAL FUNDS, INC.
Shareholders’ Letter
Dear Fellow Shareholders:
We are pleased to present the Kinetics Mutual Funds (“Funds”) Semi-Annual Report for the six-month period ended June 30, 2019. The Funds continue to be positioned in companies that we believe are valued attractively, based on our assessment of the prospective asset values and cash flows over the next five years. This long-term focus has been especially challenging recently, but it has become even more crucial due to factors relating to market structure and central bank policies, which have emphasized short-term results. While stimulative measures from the federal government and central bank have inflated corporate results over the past 18 months, the outlook beyond the next 18 months is far more challenging. The Funds benefitted from the sharp recovery from the market declines experienced late last year, but much as we believed that the declines indiscriminately impacted high quality, attractively valued assets, the subsequent recovery has been indiscriminate in inflating most assets back to levels consistent with prior highs. A performance summary for the half year ended June 30, 2019 follows (No-Load Class):
The Internet Fund 38.47%; The Global Fund 28.02%; The Paradigm Fund 28.92%; The Medical Fund 4.35%; The Small Cap Opportunities Fund 22.37%; The Market Opportunities Fund 25.70%; The Alternative Income Fund 1.64%; The Multi-Disciplinary Income Fund 6.94%; and the Kinetics Spin-Off and Corporate Restructuring Fund 26.51%. This compares to returns of: 18.54% for the S&P 500® Index; 13.69% for the S&P 600 Small Cap Index; 16.23% for the MSCI All Country World (ACWI) Index; 6.11% for the Bloomberg Barclays U.S. Aggregate Bond Index; 9.94% for the Bloomberg Barclays U.S. Corporate High Yield Index; 3.24% for the Bloomberg Barclays 1-3 Year U.S. Credit Bond Index; 21.33% for the Nasdaq Index; and 14.03% for the MSCI EAFE Index.
While we continue to provide equity and fixed income reference benchmark numbers (to aid in your understanding of how the broad asset classes have performed throughout the first half of 2019), we do not manage our Funds against any specific benchmark, nor have we ever done so in the history of the Funds. We believe that such benchmark adherence is highly detrimental to the long-term returns of a sound investment strategy, particularly in recent years, as the benchmarks themselves have undergone distortions that make them inconsistent with their original objectives.
2
The equity market declines experienced in the 4th quarter of 2018 are now a distant memory for most, as the S&P 500 Index (“S&P 500”) is now marginally higher than the peak closing level achieved in September of 2018. Investors have been rewarded repeatedly during the past decade for remaining fully invested, or, better yet, for increasing investment exposure to equities during any market declines. To wit, the trailing ten-year total return for the S&P 500 Index is 14.7% annually, which amounts to a near quadrupling of the initial investment. There have been six notable “corrections” during this period, where the market declined in excess of 10% (2010: -16%; 2011: -20%; 2015 (2): -12%, -13%; 2018 (2): -10%, -20%), but none of these declines were sustained, and, in each case, prior highs were recouped within months.
The comfort that investors generally seem to draw from these returns simply confirms the manner in which short-term memory can create serious risk exposure. Equity performance, and continued resilience to downturns, has been assisted materially by the sustained low interest rate policies maintained by central banks across the world. It may come as a surprise that an investment in the S&P 500 at the pre-financial crisis peak in 2007 would have earned a total return through the first half of this year (nearly 12 years) of 141%, or approximately 7.8% annually. It might be even more surprising that the near-20-year annual return for the S&P 500, from the peak of the prior Internet Bubble peak at year-end 1999, is only 5.9%. These returns are paltry compared to the nearly 15% annual return of the past decade, but we expect that most investors would be immensely fortunate to compound at a 5.9%, let alone a 7.8% rate over the next 12 years.
The role of central banks and artificially suppressed interest rates on trailing equity returns cannot be overstated. The focus of this analysis will be on the United States, but in general, policies have been more accommodative, but less impactful, internationally. In 2006, the Federal Reserve raised short-term interest rates by 100 basis points (1.00%) to 5.25% in four 0.25% movements during the first half of the year. By September of 2007, rates were reduced by 50 basis points to 4.75%; not coincidentally, this was just prior to the market peak in October 2007. By the end of 2008, rates had been reduced to a “target level1” of 0.00% – 0.25% and remained at this level until December of 2015;
| 1 | The FOMC adopted a target range policy for rates at this meeting, which has been maintained ever since. |
3
for nearly 7 full years, interest rates had been held at zero. It should be noted that by December 2015, when rates were finally raised, the S&P 500 Index had already eclipsed the previous 2007 peak level by a considerable margin. Rates were subsequently increased at a measured pace through December of 2018, ultimately peaking at the range of 2.25% - 2.50%, which rate prevails today. The S&P 500 Index is currently trading at approximately double the 2007 peak level, and real GDP is over 20% higher than in 2007; yet, short-term interest rates are at approximately half the level that they were at in 2007.
The impact of interest rates is circular in nature, as it impacts both the economy and asset (equity) prices. The economy is impacted primarily by rates influencing consumers’ and businesses’ willingness to spend versus to save –consider that U.S. GDP is approximately 69% personal consumption and 18% business investment. Lower rates enable consumers and businesses to borrow more inexpensively, in order to consume. However, the second derivative of low rates is that they disincentivize savings and safe investments by depressing the yields, thereby inflating the prices of risk assets. Ultimately, consumers and businesses would be compelled to consume more, as they can borrow more inexpensively, and incremental investments of their savings are increasingly less attractive given low yields/high prices. A tax cut to corporations and higher income families is intended to further the consumption persuasion, boosting GDP in turn. Logically, there are limits to the benefits of lower rates and other stimuli, with increasingly diminishing returns from each subsequent action. Alas, at the midpoint of this year, the market is pricing in approximately a 70% chance that rates will be lowered 25bps and a 30% chance that rates will be lowered 50bps at the July 2019 Federal Reserve Meeting2 – while the S&P 500 reaches new record levels daily.
Despite these facts, and the obvious implications for the future, optimism for U.S. equities now remains at very high levels. The most common argument for maintaining full equity exposure today is that the earnings yield on the S&P 500 is quite high relative to the 10-Year U.S. Treasury yield. As an example, a price to earnings ratio on the Index of 20x (historically very high) would represent a 5% earnings yield (1 / 20x = 0.05, or 5%), which, relative to a 2% 10-Year U.S. Treasury, would offer an incremental 3% in yield. At the midpoint of this year, the earnings yield was 5.2%, compared to a 10-Year yield of 2.0%, netting a
| 2 | Probabilities provided by the CME FedWatch Tool. |
4
3.2% spread. Comparatively, based on the past 30 years, the S&P 500 earnings yield has averaged only 0.68% higher than the 10-Year yield, and the median difference has been 0.96%. However, the attraction of the earnings yield today is simply a derivative of low interest rates, as the U.S. 10-Year Treasury yield is highly dependent on short-term interest rates set by the Federal Reserve. Over this 30-year period, the average and median yields on the U.S. 10-Year Treasury were 4.73% and 4.55%, respectively – both more than double the current level. If interest rates were currently consistent with the 30-year average, the current incremental earnings yield would be merely 0.47%.
This mid-year review of historical interest rates and equity market returns provides explication for our caution regarding equity markets over the past several years. There are obvious parallels to the 2005-2006 rate hikes, which needed to be reversed in 2007, although this ultimately only delayed the inevitable market decline in 2008/2009. The primary distinction that we identify today is the explicit willingness of central banks to inflate asset prices (equities) during inevitable market declines, which now includes policy tools beyond interest rates (i.e., quantitative easing). The finite nature of future rate cuts is even now in question – of course, a starting level of 2.5% leaves far less room to cut than did the 5.25% starting point in 2006, but various developed nations across Europe have shown a willingness to drop rates below zero. Thus, the markets ascend, and confidence in future equity returns remains inflated, based on the expectations of unlimited government support of asset prices.
Global central banks have been able to engage in such rate policies, hence, inflating the value of all financial assets, largely because consumer prices (which do not include financial assets) have remained subdued. It is generally politically unpalatable (for democracies) to promote/accept high consumer price inflation, not to mention being destructive to globally oriented businesses. Global inflation has remained muted largely due to technological shifts in the economy, as well as due to a profound demographic shift. Recall that 69% of U.S. GDP is driven by personal consumption; yet, the largest concentration of wealth (baby boomers) in the country is held by those who are past their highest consumption years. This concentration of wealth in aging demographics is standard across developed nations (it is far more pronounced in Japan, for instance), although it is less prominent in developing economies. We believe
5
that, eventually, inflation will pose a great risk to the wealth of future generations, as financial asset inflation has enriched those with considerable wealth, but it has not materially benefitted those without capital to invest (i.e., wage growth has annualized at 2.28%3 annually since the end of 2008). Equity markets may continue to rise, although the future rate of growth will need to be far lower, and perhaps to be negative in real terms (adjusted for inflation), should central banks support equities through rate cuts and easing. To this end, the Funds continue to maintain large cash balances and are generally concentrated in companies that we believe are not artificially profitable due to the current rate/inflation structure, and thus, can withstand or even benefit from a marked shift in the prevailing rate/inflation structure. We maintain this allocation despite the distinct risk of not fully participating in further speculative equity market advances driven by technology and cyclical companies that rely on the continuation of the status quo, and expect far more attractive levels to allocate capital in due course.
| 3 | U.S. Bureau of Labor Statistics, Employed full time: Median usual weekly nominal earnings (second quartile): Wage and salary workers: 25 years and over. |
6
KINETICS MUTUAL FUNDS, INC.
Investment Commentary
A multitude of factors drive investment decisions for individuals and institutions, which impact stock prices over the short and long-term. These range from the obvious (a desire to grow capital) to the more esoteric (a desire to limit return variability). As ardent value investors, we accept these behavioral factors as part of the balancing mechanism that generates market prices for securities, although we recognize that it can often result in distortions between asset prices and fundamental values. Our investment methodology is based upon the historical observation that, over extended periods of time, fundamental asset values and cash flows are what ultimately determine security prices. Hence, we rely upon the differences between stock prices and underlying asset values to generate attractive, long-term returns that are largely driven by different, specific variables than the broader market.
The current market advance, which is currently in its 10th year, has been unique given its duration, magnitude and concentration. It has largely been an accommodative market for the generation of strong absolute returns (as all asset prices have risen), but has also been a challenging environment in which to generate attractive returns on a relative basis (to the S&P 500 Index). The strong trailing performance of the S&P 500 Index has driven more asset flows into the top companies within the index regardless of prices, bolstering returns further. As a result, active managers with price discipline, who are seeking differentiated (uncorrelated) returns, have found this environment challenging.
As an example, the S&P 500 Index has returned 14.7% annually over the 10-year period ended June 30, 2019, which compares to 15.0% and 5.8%, respectively, for the S&P 600 (Small Cap) and MSCI Emerging Market indexes. Furthermore, the S&P 900 Growth Index has returned 16.1% annually over this period compared to 13.2% for the S&P 900 Value Index. In summary, over this extended 10-year observation period, large capitalization U.S. domiciled companies have performed similarly to smaller capitalization companies, and have outperformed emerging market issues, while growth companies have trounced the performance of their peer value companies. These observations are at odds with the historical observations that small and emerging market companies tend to outperform during strong markets. Additionally, value stocks often outperform growth stocks over a full cycle; however, this cycle has yet to end, and the outperformance of growth stocks has thus far been striking.
It can be argued that there are logical drivers for this return dispersion, ranging from the mounting global dominance of U.S. corporations (technology skewed), the current technological growth cycle, sustained low interest rates, global trade dynamics, and the strength of the U.S. Dollar. However, the
7
byproduct of all of these factors is a tremendous and growing concentration of asset liquidity in the largest U.S. equities, which are almost exclusively growth and technology-oriented companies. The companies happen to be the core holdings, and primary performance contributors, of the S&P 500 Index and, as such, of the passive index funds that track it.
Historically, equity investments were considered higher risk and far less liquid compared to the “safest” and “most liquid” asset class (excluding cash): U.S. treasuries. Logically, investors allocated smaller portions of their total net worth into higher risk and less liquid stocks, but intended to hold those investments for an extended period of time. Fixed income investments were frequently used for short-term and safer return requirements, and, until very recently, offered a reasonable rate of return. However, as fixed income markets have experienced a severe compression of yields over the past decade, capital allocators have sought alternative, more productive outlets for their capital. Generally, these funds require greater liquidity than does longer-term, committed equity capital. Hence, these fund flows have been concentrated in the largest, most liquid equities in the market, supporting their share prices in turn. Computerized trading strategies and indexation fund flows have furthered this liquidity-oriented allocation trend, although such pools of capital cannot be relied upon during market disruptions. This has resulted in lower observed variability in the largest stocks, which only creates more demand for these equities.
In aggregate, investors appear to accept this new liquidity concentration and “excess” return stream in large capitalization, technology (growth) dominated companies to be an enduring, if not permanent feature of capital markets. We believe that it is worth considering what the fundamental fair value of equities would be if the liquidity, low volatility and/or suppressed interest rate harmony were to be disrupted in any way. At the very least, it warrants exploring equity allocations that are not overly sensitive to these factors, and better yet, those that could benefit from any disruption. To this end, we believe there are incredibly compelling equity investments that meet these criteria today; however, most are distinctly out of favor.
These “contrarian” types of investment ideas have long been the source of our best return drivers and have served our investors very well through full investment cycles. This strategy is confronting its most disruptive and enduring headwind since we began investing: the current liquidity trend towards the largest, growing mega-capitalization (index) companies. We’ll conclude our thoughts on the current market backdrop with a reminder of Hyman Minsky’s “financial-instability hypothesis,” summarized as “stability leads to instability.”
8
The broader mandate equity Funds (The Paradigm Fund, The Small Cap Opportunities Fund, The Market Opportunities Fund, The Internet Fund and The Global Fund) continue to express a defensive outlook through elevated cash positions, which detracted from performance through the first half of the year given the appreciation of the portfolio investments. However, these Funds all benefitted materially from overweight positions in Texas Pacific Land Trust, which appreciated more than twice the level of the S&P 500® Index. The Internet Fund, The Global Fund and The Market Opportunities Fund were the most impacted by cash balances during the period, however each of these funds have outsized exposure to cryptocurrency, which benefitted the funds considerably given an approximate 3.5x increase in the market value of these underlying investments. The Spin-off and Corporate Restructuring Fund also had a high concentration and exposure to Texas Pacific Land Trust, which benefitted performance. The Medical Fund also has a high concentration where the top positions constitute a substantial portion of the fund’s assets. The income-oriented funds (The Multi-Disciplinary Income Fund and The Alternative Income Fund) also maintain defensive positioning, largely expressed through reduced option exposure, which detracted from performance relative to a full exposure. The income generation potential from options is not sufficient relative to the risks that we identify, but we are eager to reinitiate this exposure as conditions permit. We believe the positioning for all of the funds is currently optimal, and we continue to assess any developments that would warrant a modification.
9
Disclosure
This material is intended to be reviewed in conjunction with a current prospectus, which includes all fees and expenses that apply to a continued investment, as well as information regarding the risk factors, policies and objectives of the Funds. Read it carefully before investing.
Mutual fund investing involves risk. Principal loss is possible. Because The Internet Fund, The Medical Fund and The Market Opportunities Fund invest in a single industry or geographic region, their shares are subject to a higher degree of risk than funds with a higher level of diversification. Internet, biotechnology and certain capital markets or gaming stocks are subject to a rate of change in technology, obsolescence and competition that is generally higher than that of other industries, hence they may experience extreme price and volume fluctuations.
International investing [for all Funds] presents special risks including currency exchange fluctuation, government regulations, and the potential for political and economic instability. Accordingly, the share prices for these Funds are expected to be more volatile than that of U.S.-only funds. Past performance is no guarantee of future performance.
Because smaller companies [for The Small Cap Opportunities Fund] often have narrower markets and limited financial resources, they present more risk than larger, more well established, companies.
Non-investment grade debt securities [for all Funds], i.e., junk bonds, are subject to greater credit risk, price volatility and risk of loss than investment grade securities.
Further, options contain special risks including the imperfect correlation between the value of the option and the value of the underlying asset. Investments [for The Multi- Disciplinary Income Fund and The Alternative Income Fund] in futures, swaps and other derivative instruments may result in loss as derivative instruments may be illiquid, difficult to price and leveraged so that small changes may produce disproportionate losses to the Funds. To the extent the Funds segregate assets to cover derivative positions, they may impair their ability to meet current obligations, to honor requests for redemption and to manage the investments in a manner consistent with their
10
respective investment objectives. Purchasing and writing put and call options and, in particular, writing “uncovered” options are highly specialized activities that entail greater than ordinary investment risk.
As non-diversified Funds, except The Global Fund, The Alternative Income Fund and The Multi-Disciplinary Income Fund, the value of Fund shares may fluctuate more than shares invested in a broader range of industries and companies. Unlike other investment companies that directly acquire and manage their own portfolios of securities, The Kinetics Mutual Funds, except Kinetics Spin-Off and Corporate Restructuring Fund, pursue their investment objectives by investing all of their investable assets in a corresponding portfolio series of the Kinetics Portfolios Trust.
The information concerning the Funds included in the shareholder report contains certain forward-looking statements about the factors that may affect the performance of the Funds in the future. These statements are based on Fund management’s predictions and expectations concerning certain future events and their expected impact on the Funds, such as performance of the economy as a whole and of specific industry sectors, changes in the levels of interest rates, the impact of developing world events, and other factors that may influence the future performance of the Funds. Management believes these forward-looking statements to be reasonable, although they are inherently uncertain and difficult to predict. Actual events may cause adjustments in portfolio management strategies from those currently expected to be employed.
The MSCI All Country World Index, the S&P 500® Index, NASDAQ Composite®, S&P 600® Small Cap Index, MSCI EAFE® Index, Bloomberg Barclays U.S. 1-3 Year Credit Index, Bloomberg Barclays U.S. Aggregate Bond Index and Bloomberg Barclays U.S. Corporate High Yield Bond Index each represent an unmanaged, broad-basket of stocks or bonds. They are typically used as a proxy for overall market performance.
Distributor: Kinetics Funds Distributor LLC is not an affiliate of Kinetics Mutual Funds, Inc. Kinetics Funds Distributor LLC is an affiliate of Horizon Kinetics Asset Management LLC, Investment Adviser to Kinetics Mutual Funds, Inc.
For more information, log onto www.kineticsfunds.com. July 1, 2019 — Horizon Kinetics Asset Management, LLC®
11
KINETICS MUTUAL FUNDS, INC. — THE FUNDS
Expense Example
June 30, 2019 (Unaudited)
Shareholders incur two types of costs: (1) transaction costs, including sales charges (loads) on purchase payments, reinvestments of dividends or other distributions made by a Fund, redemption fees, and exchange fees, and (2), ongoing costs, including management fees, distribution and/or service (12b-1) fees, and other Fund expenses. This example is intended to help investors understand the ongoing costs (in dollars) of investing in a series of Kinetics Mutual Funds, Inc. (except the Spin-off Fund, each a “Feeder Fund” and including the Spin-off Fund, collectively the “Funds”), and to compare these costs with the ongoing costs of investing in other mutual funds. The example is based on an investment of $1,000 invested on January 1, 2019 and held for the entire period from January 1, 2019 to June 30, 2019.
Actual Expenses
The Actual Expenses comparison provides information about actual account values and actual expenses. Unlike other mutual funds that directly acquire and manage their own portfolio securities, each Feeder Fund invests all or generally all of its investable assets in a corresponding series of The Kinetics Portfolios Trust (each, a “Master Portfolio”, and together the “Master Portfolios”), a separately registered investment company. The Master Portfolio, in turn, invests in securities. With this type of organization, expenses can accrue specifically to the Master Portfolio or the Feeder Fund or both. Each Feeder Fund records its proportionate share of the Master Portfolio’s expenses, including directed brokerage credits, on a daily basis. Any expense reductions include Fund-specific expenses as well as the expenses allocated from the Master Portfolio. Note, the Spin-off Fund is not a Feeder Fund.
The Funds will charge shareholder fees for outgoing wire transfers, returned checks, and exchanges executed by telephone between a Fund and any other Fund. The Funds’ transfer agent charges a $5.00 transaction fee to shareholder accounts for telephone exchanges between any two Funds. The Funds’ transfer agent does not charge a transaction fee for written exchange requests. IRA accounts are assessed a $15.00 annual fee. Finally, as a disincentive to market-timing transactions, the Funds will assess a 2.00% fee on the redemption or exchange of Fund shares held for less than 30 days. These fees will be paid to the Funds to help offset transaction costs. The Funds reserve the right to waive
12
KINETICS MUTUAL FUNDS, INC. — THE FUNDS
Expense Example — (Continued)
June 30, 2019 (Unaudited)
the redemption fee, subject to their sole discretion, in instances deemed not to be disadvantageous to the Funds or shareholders as described in the Funds’ prospectus.
A shareholder may use the information provided in the first line, together with the amounts invested, to estimate the expenses paid over the period. A shareholder may divide his/her account value by $1,000 (e.g., an $8,600 account value divided by $1,000 = 8.6), then multiply the result by the number in the first line under the heading entitled “Expenses Paid During Period” to estimate the expenses paid on his/her account during this period.
Hypothetical Example for Comparison Purposes
The Hypothetical Example for Comparison Purposes provides information about hypothetical account values and hypothetical expenses based on the Funds’ actual expense ratios and an assumed rate of return of 5% per year before expenses, which are not the Funds’ actual returns. The hypothetical account values and expenses may not be used to estimate the actual ending account balance or expenses paid for the period. A shareholder may use this information to compare the ongoing costs of investing in the Funds and other funds. To do so, a shareholder would compare this 5% hypothetical example with the 5% hypothetical examples that appear in the shareholder reports of other funds. The expenses shown in the table are meant to highlight ongoing costs only and do not reflect any transactional costs, such as sales charges (loads), redemption fees, or exchange fees. Therefore, the Hypothetical Example for Comparison Purposes is useful in comparing ongoing costs only, and will not help determine the relative total costs of owning different funds. In addition, if these transactional costs were included, shareholders costs would have been higher.
13
| |
| KINETICS MUTUAL FUNDS, INC. — THE FUNDS |
Expense Example — (Continued) |
| June 30, 2019 (Unaudited) |
| |
| | | | | | | | | | | | Expenses Paid | |
| | | Beginning | | | Ending | | | | | | During | |
| | | Account | | | Account | | | Annualized | | | Period* | |
| | | Value | | | Value | | | Expense | | | (1/1/19 to | |
| | | (1/1/19) | | | (6/30/19) | | | Ratio | | | 6/30/19) | |
| | |
The Internet Fund | | | | | | | | | | | | |
| No Load Class Actual | | $ | 1,000.00 | | | $ | 1,384.70 | | | | 1.88 | % | | $ | 11.12 | |
| No Load Class Hypothetical (5% return | | | | | | | | | | | | | | | | |
| before expenses) | | $ | 1,000.00 | | | $ | 1,015.50 | | | | 1.88 | % | | $ | 9.39 | |
| Advisor Class A Actual | | $ | 1,000.00 | | | $ | 1,382.80 | | | | 2.13 | % | | $ | 12.58 | |
| Advisor Class A Hypothetical (5% return | | | | | | | | | | | | | | | | |
| before expenses) | | $ | 1,000.00 | | | $ | 1,014.26 | | | | 2.13 | % | | $ | 10.64 | |
| Advisor Class C Actual | | $ | 1,000.00 | | | $ | 1,379.60 | | | | 2.63 | % | | $ | 15.52 | |
| Advisor Class C Hypothetical (5% return | | | | | | | | | | | | | | | | |
| before expenses) | | $ | 1,000.00 | | | $ | 1,011.76 | | | | 2.63 | % | | $ | 13.12 | |
| | |
The Global Fund | | | | | | | | | | | | | | | | |
| No Load Class Actual – after expense | | | | | | | | | | | | | | | | |
| reimbursement | | $ | 1,000.00 | | | $ | 1,280.20 | | | | 1.39 | % | | $ | 7.86 | |
| No Load Class Hypothetical (5% return | | | | | | | | | | | | | | | | |
| before expenses) – after expense | | | | | | | | | | | | | | | | |
| reimbursement | | $ | 1,000.00 | | | $ | 1,017.90 | | | | 1.39 | % | | $ | 6.95 | |
| Advisor Class A Actual – after expense | | | | | | | | | | | | | | | | |
| reimbursement | | $ | 1,000.00 | | | $ | 1,277.10 | | | | 1.64 | % | | $ | 9.26 | |
| Advisor Class A Hypothetical (5% return | | | | | | | | | | | | | | | | |
| before expenses) – after expense | | | | | | | | | | | | | | | | |
| reimbursement | | $ | 1,000.00 | | | $ | 1,016.66 | | | | 1.64 | % | | $ | 8.20 | |
| Advisor Class C Actual – after expense | | | | | | | | | | | | | | | | |
| reimbursement | | $ | 1,000.00 | | | $ | 1,275.40 | | | | 2.14 | % | | $ | 12.07 | |
| Advisor Class C Hypothetical (5% return | | | | | | | | | | | | | | | | |
| before expenses) – after expense | | | | | | | | | | | | | | | | |
| reimbursement | | $ | 1,000.00 | | | $ | 1,014.18 | | | | 2.14 | % | | $ | 10.69 | |
14
| |
| KINETICS MUTUAL FUNDS, INC. — THE FUNDS |
Expense Example — (Continued) |
| June 30, 2019 (Unaudited) |
| |
| | | | | | | | | | | | Expenses Paid | |
| | | Beginning | | | Ending | | | | | | During | |
| | | Account | | | Account | | | Annualized | | | Period* | |
| | | Value | | | Value | | | Expense | | | (1/1/19 to | |
| | | (1/1/19) | | | (6/30/19) | | | Ratio | | | 6/30/19) | |
| | |
The Paradigm Fund | | | | | | | | | | | | |
| No Load Class Actual – after expense | | | | | | | | | | | | |
| reimbursement | | $ | 1,000.00 | | | $ | 1,289.20 | | | | 1.64 | % | | $ | 9.31 | |
| No Load Class Hypothetical (5% return | | | | | | | | | | | | | | | | |
| before expenses) – after expense | | | | | | | | | | | | | | | | |
| reimbursement | | $ | 1,000.00 | | | $ | 1,016.66 | | | | 1.64 | % | | $ | 8.20 | |
| Advisor Class A Actual – after expense | | | | | | | | | | | | | | | | |
| reimbursement | | $ | 1,000.00 | | | $ | 1,287.60 | | | | 1.89 | % | | $ | 10.72 | |
| Advisor Class A Hypothetical (5% return | | | | | | | | | | | | | | | | |
| before expenses) – after expense | | | | | | | | | | | | | | | | |
| reimbursement | | $ | 1,000.00 | | | $ | 1,015.42 | | | | 1.89 | % | | $ | 9.44 | |
| Advisor Class C Actual – after expense | | | | | | | | | | | | | | | | |
| reimbursement | | $ | 1,000.00 | | | $ | 1,284.50 | | | | 2.39 | % | | $ | 13.54 | |
| Advisor Class C Hypothetical (5% return | | | | | | | | | | | | | | | | |
| before expenses) – after expense | | | | | | | | | | | | | | | | |
| reimbursement | | $ | 1,000.00 | | | $ | 1,012.94 | | | | 2.39 | % | | $ | 11.93 | |
| Institutional Class Actual – after expense | | | | | | | | | | | | | | | | |
| reimbursement | | $ | 1,000.00 | | | $ | 1,290.70 | | | | 1.44 | % | | $ | 8.18 | |
| Institutional Class Hypothetical (5% return | | | | | | | | | | | | | | | | |
| before expenses) – after expense | | | | | | | | | | | | | | | | |
| reimbursement | | $ | 1,000.00 | | | $ | 1,017.65 | | | | 1.44 | % | | $ | 7.20 | |
| | |
The Medical Fund | | | | | | | | | | | | | | | | |
| No Load Class Actual – after expense | | | | | | | | | | | | | | | | |
| reimbursement | | $ | 1,000.00 | | | $ | 1,043.50 | | | | 1.39 | % | | $ | 7.04 | |
| No Load Class Hypothetical (5% return | | | | | | | | | | | | | | | | |
| before expenses) – after expense | | | | | | | | | | | | | | | | |
| reimbursement | | $ | 1,000.00 | | | $ | 1,017.90 | | | | 1.39 | % | | $ | 6.95 | |
| Advisor Class A Actual – after expense | | | | | | | | | | | | | | | | |
| reimbursement | | $ | 1,000.00 | | | $ | 1,042.20 | | | | 1.64 | % | | $ | 8.30 | |
| Advisor Class A Hypothetical (5% return | | | | | | | | | | | | | | | | |
| before expenses) – after expense | | | | | | | | | | | | | | | | |
| reimbursement | | $ | 1,000.00 | | | $ | 1,016.66 | | | | 1.64 | % | | $ | 8.20 | |
| Advisor Class C Actual – after expense | | | | | | | | | | | | | | | | |
| reimbursement | | $ | 1,000.00 | | | $ | 1,039.60 | | | | 2.14 | % | | $ | 10.82 | |
| Advisor Class C Hypothetical (5% return | | | | | | | | | | | | | | | | |
| before expenses) – after expense | | | | | | | | | | | | | | | | |
| reimbursement | | $ | 1,000.00 | | | $ | 1,014.18 | | | | 2.14 | % | | $ | 10.69 | |
15
| |
| KINETICS MUTUAL FUNDS, INC. — THE FUNDS |
Expense Example — (Continued) |
| June 30, 2019 (Unaudited) |
| |
| | | | | | | | | | | | Expenses Paid | |
| | | Beginning | | | Ending | | | | | | During | |
| | | Account | | | Account | | | Annualized | | | Period* | |
| | | Value | | | Value | | | Expense | | | (1/1/19 to | |
| | | (1/1/19) | | | (6/30/19) | | | Ratio | | | 6/30/19) | |
| | |
The Small Cap Opportunities Fund | | | | | | | | | | | | |
| No Load Class Actual – after expense | | | | | | | | | | | | |
| reimbursement | | $ | 1,000.00 | | | $ | 1,223.70 | | | | 1.64 | % | | $ | 9.04 | |
| No Load Class Hypothetical (5% return | | | | | | | | | | | | | | | | |
| before expenses) – after expense | | | | | | | | | | | | | | | | |
| reimbursement | | $ | 1,000.00 | | | $ | 1,016.66 | | | | 1.64 | % | | $ | 8.20 | |
| Advisor Class A Actual – after expense | | | | | | | | | | | | | | | | |
| reimbursement | | $ | 1,000.00 | | | $ | 1,222.00 | | | | 1.89 | % | | $ | 10.41 | |
| Advisor Class A Hypothetical (5% return | | | | | | | | | | | | | | | | |
| before expenses) – after expense | | | | | | | | | | | | | | | | |
| reimbursement | | $ | 1,000.00 | | | $ | 1,015.42 | | | | 1.89 | % | | $ | 9.44 | |
| Advisor Class C Actual – after expense | | | | | | | | | | | | | | | | |
| reimbursement | | $ | 1,000.00 | | | $ | 1,219.00 | | | | 2.39 | % | | $ | 13.15 | |
| Advisor Class C Hypothetical (5% return | | | | | | | | | | | | | | | | |
| before expenses) – after expense | | | | | | | | | | | | | | | | |
| reimbursement | | $ | 1,000.00 | | | $ | 1,012.94 | | | | 2.39 | % | | $ | 11.93 | |
| Institutional Class Actual – after expense | | | | | | | | | | | | | | | | |
| reimbursement | | $ | 1,000.00 | | | $ | 1,224.90 | | | | 1.44 | % | | $ | 7.94 | |
| Institutional Class Hypothetical (5% return | | | | | | | | | | | | | | | | |
| before expenses) – after expense | | | | | | | | | | | | | | | | |
| reimbursement | | $ | 1,000.00 | | | $ | 1,017.65 | | | | 1.44 | % | | $ | 7.20 | |
| | |
The Market Opportunities Fund | | | | | | | | | | | | | | | | |
| No Load Class Actual – after expense | | | | | | | | | | | | | | | | |
| reimbursement | | $ | 1,000.00 | | | $ | 1,257.00 | | | | 1.40 | % | | $ | 7.83 | |
| No Load Class Hypothetical (5% return | | | | | | | | | | | | | | | | |
| before expenses) – after expense | | | | | | | | | | | | | | | | |
| reimbursement | | $ | 1,000.00 | | | $ | 1,017.85 | | | | 1.40 | % | | $ | 7.00 | |
| Advisor Class A Actual – after expense | | | | | | | | | | | | | | | | |
| reimbursement | | $ | 1,000.00 | | | $ | 1,255.50 | | | | 1.65 | % | | $ | 9.23 | |
| Advisor Class A Hypothetical (5% return | | | | | | | | | | | | | | | | |
| before expenses) – after expense | | | | | | | | | | | | | | | | |
| reimbursement | | $ | 1,000.00 | | | $ | 1,016.61 | | | | 1.65 | % | | $ | 8.25 | |
| Advisor Class C Actual – after expense | | | | | | | | | | | | | | | | |
| reimbursement | | $ | 1,000.00 | | | $ | 1,251.80 | | | | 2.15 | % | | $ | 12.00 | |
| Advisor Class C Hypothetical (5% return | | | | | | | | | | | | | | | | |
| before expenses) – after expense | | | | | | | | | | | | | | | | |
| reimbursement | | $ | 1,000.00 | | | $ | 1,014.13 | | | | 2.15 | % | | $ | 10.74 | |
| Institutional Class Actual – after expense | | | | | | | | | | | | | | | | |
| reimbursement | | $ | 1,000.00 | | | $ | 1,258.10 | | | | 1.20 | % | | $ | 6.72 | |
| Institutional Class Hypothetical (5% return | | | | | | | | | | | | | | | | |
| before expenses) – after expense | | | | | | | | | | | | | | | | |
| reimbursement | | $ | 1,000.00 | | | $ | 1,018.84 | | | | 1.20 | % | | $ | 6.01 | |
16
| |
| KINETICS MUTUAL FUNDS, INC. — THE FUNDS |
Expense Example — (Continued) |
| June 30, 2019 (Unaudited) |
| |
| | | | | | | | | | | | Expenses Paid | |
| | | Beginning | | | Ending | | | | | | During | |
| | | Account | | | Account | | | Annualized | | | Period* | |
| | | Value | | | Value | | | Expense | | | (1/1/19 to | |
| | | (1/1/19) | | | (6/30/19) | | | Ratio | | | 6/30/19) | |
| | |
The Alternative Income Fund | | | | | | | | | | | | |
| No Load Class Actual – after expense | | | | | | | | | | | | |
| reimbursement | | $ | 1,000.00 | | | $ | 1,016.40 | | | | 0.95 | % | | $ | 4.75 | |
| No Load Class Hypothetical (5% return | | | | | | | | | | | | | | | | |
| before expenses) – after expense | | | | | | | | | | | | | | | | |
| reimbursement | | $ | 1,000.00 | | | $ | 1,020.08 | | | | 0.95 | % | | $ | 4.76 | |
| Advisor Class A Actual – after expense | | | | | | | | | | | | | | | | |
| reimbursement | | $ | 1,000.00 | | | $ | 1,015.30 | | | | 1.20 | % | | $ | 6.00 | |
| Advisor Class A Hypothetical (5% return | | | | | | | | | | | | | | | | |
| before expenses) – after expense | | | | | | | | | | | | | | | | |
| reimbursement | | $ | 1,000.00 | | | $ | 1,018.84 | | | | 1.20 | % | | $ | 6.01 | |
| Advisor Class C Actual – after expense | | | | | | | | | | | | | | | | |
| reimbursement | | $ | 1,000.00 | | | $ | 1,012.70 | | | | 1.70 | % | | $ | 8.48 | |
| Advisor Class C Hypothetical (5% return | | | | | | | | | | | | | | | | |
| before expenses) – after expense | | | | | | | | | | | | | | | | |
| reimbursement | | $ | 1,000.00 | | | $ | 1,016.36 | | | | 1.70 | % | | $ | 8.50 | |
| Institutional Class Actual – after expense | | | | | | | | | | | | | | | | |
| reimbursement | | $ | 1,000.00 | | | $ | 1,017.60 | | | | 0.75 | % | | $ | 3.75 | |
| Institutional Class Hypothetical (5% return | | | | | | | | | | | | | | | | |
| before expenses) – after expense | | | | | | | | | | | | | | | | |
| reimbursement | | $ | 1,000.00 | | | $ | 1,021.08 | | | | 0.75 | % | | $ | 3.76 | |
| | |
The Multi-Disciplinary Income Fund | | | | | | | | | | | | | | | | |
| No Load Class Actual – after expense | | | | | | | | | | | | | | | | |
| reimbursement | | $ | 1,000.00 | | | $ | 1,069.40 | | | | 1.49 | % | | $ | 7.65 | |
| No Load Class Hypothetical (5% return | | | | | | | | | | | | | | | | |
| before expenses) – after expense | | | | | | | | | | | | | | | | |
| reimbursement | | $ | 1,000.00 | | | $ | 1,017.41 | | | | 1.49 | % | | $ | 7.45 | |
| Advisor Class A Actual – after expense | | | | | | | | | | | | | | | | |
| reimbursement | | $ | 1,000.00 | | | $ | 1,068.50 | | | | 1.74 | % | | $ | 8.92 | |
| Advisor Class A Hypothetical (5% return | | | | | | | | | | | | | | | | |
| before expenses) – after expense | | | | | | | | | | | | | | | | |
| reimbursement | | $ | 1,000.00 | | | $ | 1,016.17 | | | | 1.74 | % | | $ | 8.70 | |
| Advisor Class C Actual – after expense | | | | | | | | | | | | | | | | |
| reimbursement | | $ | 1,000.00 | | | $ | 1,066.70 | | | | 2.24 | % | | $ | 11.48 | |
| Advisor Class C Hypothetical (5% return | | | | | | | | | | | | | | | | |
| before expenses) – after expense | | | | | | | | | | | | | | | | |
| reimbursement | | $ | 1,000.00 | | | $ | 1,013.69 | | | | 2.24 | % | | $ | 11.18 | |
| Institutional Class Actual – after expense | | | | | | | | | | | | | | | | |
| reimbursement | | $ | 1,000.00 | | | $ | 1,071.30 | | | | 1.29 | % | | $ | 6.63 | |
| Institutional Class Hypothetical (5% return | | | | | | | | | | | | | | | | |
| before expenses) – after expense | | | | | | | | | | | | | | | | |
| reimbursement | | $ | 1,000.00 | | | $ | 1,018.40 | | | | 1.29 | % | | $ | 6.46 | |
17
KINETICS MUTUAL FUNDS, INC. — THE FUNDS
Expense Example — (Continued)
June 30, 2019 (Unaudited)
| | | | | | | | | | | | Expenses Paid | |
| | | Beginning | | | Ending | | | | | | During | |
| | | Account | | | Account | | | Annualized | | | Period* | |
| | | Value | | | Value | | | Expense | | | (1/1/19 to | |
| | | (1/1/19) | | | (6/30/19) | | | Ratio | | | 6/30/19) | |
| | |
The Kinetics Spin-off and Corporate | | | | | | | | | | | | |
Restructuring Fund | | | | | | | | | | | | |
| No Load Class Actual – after expense | | | | | | | | | | | | |
| reimbursement | | $ | 1,000.00 | | | $ | 1,265.10 | | | | 1.45 | % | | $ | 8.14 | |
| No Load Class Hypothetical (5% return | | | | | | | | | | | | | | | | |
| before expenses) – after expense | | | | | | | | | | | | | | | | |
| reimbursement | | $ | 1,000.00 | | | $ | 1,017.61 | | | | 1.45 | % | | $ | 7.25 | |
| Advisor Class A Actual – after expense | | | | | | | | | | | | | | | | |
| reimbursement | | $ | 1,000.00 | | | $ | 1,264.70 | | | | 1.50 | % | | $ | 8.42 | |
| Advisor Class A Hypothetical (5% return | | | | | | | | | | | | | | | | |
| before expenses) – after expense | | | | | | | | | | | | | | | | |
| reimbursement | | $ | 1,000.00 | | | $ | 1,017.36 | | | | 1.50 | % | | $ | 7.50 | |
| Advisor Class C Actual – after expense | | | | | | | | | | | | | | | | |
| reimbursement | | $ | 1,000.00 | | | $ | 1,260.20 | | | | 2.25 | % | | $ | 12.61 | |
| Advisor Class C Hypothetical (5% return | | | | | | | | | | | | | | | | |
| before expenses) – after expense | | | | | | | | | | | | | | | | |
| reimbursement | | $ | 1,000.00 | | | $ | 1,013.64 | | | | 2.25 | % | | $ | 11.23 | |
| Institutional Class Actual – after expense | | | | | | | | | | | | | | | | |
| reimbursement | | $ | 1,000.00 | | | $ | 1,267.10 | | | | 1.25 | % | | $ | 7.03 | |
| Institutional Class Hypothetical (5% return | | | | | | | | | | | | | | | | |
| before expenses) – after expense | | | | | | | | | | | | | | | | |
| reimbursement | | $ | 1,000.00 | | | $ | 1,018.60 | | | | 1.25 | % | | $ | 6.26 | |
| Note: Each Feeder Fund records its proportionate share of the respective Master Portfolio’s expenses on a daily basis. Any expense reductions include Feeder Fund-specific expenses as well as the expenses allocated from the Master Portfolio. |
| * Expenses are equal to the Fund’s annualized expense ratio after expense reimbursement multiplied by the average account value over the period, multiplied by 181/365. |
18
KINETICS MUTUAL FUNDS, INC. — THE FUND
Allocation of Portfolio Assets
June 30, 2019 (Unaudited)
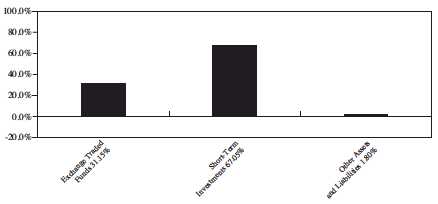
The Kinetics Spin-off and Corporate Restructuring Fund
| | | | | | | |
| | | | | | Percentage | |
| | | Market | | | of Total | |
Sector Allocation* | | Value | | | Net Assets | |
| Mining, Quarrying, and Oil and Gas Extraction | | $ | 8,444,403 | | | | 38.1 | % |
| Manufacturing | | | 3,091,756 | | | | 13.9 | % |
| Real Estate and Rental and Leasing | | | 2,431,901 | | | | 11.0 | % |
| Information | | | 1,986,850 | | | | 9.0 | % |
| Management of Companies and Enterprises | | | 1,554,124 | | | | 7.0 | % |
| Administrative and Support and Waste Management and | | | | | | | | |
| Remediation Services | | | 1,270,506 | | | | 5.7 | % |
| Educational Services | | | 897,039 | | | | 4.1 | % |
| Finance and Insurance | | | 521,546 | | | | 2.4 | % |
| Accommodation and Food Services | | | 495,360 | | | | 2.2 | % |
| Transportation and Warehousing | | | 430,500 | | | | 1.9 | % |
| Arts, Entertainment, and Recreation | | | 218,393 | | | | 1.0 | % |
| Professional, Scientific, and Technical Services | | | 28,750 | | | | 0.1 | % |
| Retail Trade | | | 28,416 | | | | 0.1 | % |
| * | Excludes Short-Term Investments |
19
| |
| KINETICS MUTUAL FUNDS, INC. — THE FUND |
The Kinetics Spin-off and Corporate |
Restructuring Fund |
| Schedule of Investments — June 30, 2019 (Unaudited) |
| |
COMMON STOCKS — 96.45% | | Shares | | | Value | |
| Accommodation – 2.23% | | | | | | |
| Civeo Corporation* | | | 288,000 | | | $ | 495,360 | |
| Administrative and Support Services – 5.73% | | | | | | | | |
PayPal Holdings, Inc.*c | | | 11,100 | | | | 1,270,506 | |
| Beverage and Tobacco Product Manufacturing – 0.36% | | | | | | | | |
| Crimson Wine Group Limited* | | | 10,000 | | | | 80,000 | |
| Broadcasting (except Internet) – 6.75% | | | | | | | | |
| Cable One, Inc. | | | 750 | | | | 878,243 | |
| The E.W. Scripps Company – Class A | | | 20,000 | | | | 305,800 | |
| TEGNA, Inc. | | | 11,600 | | | | 175,740 | |
| Tribune Media Company – Class A | | | 3,000 | | | | 138,660 | |
| | | | | | | | 1,498,443 | |
| Chemical Manufacturing – 0.28% | | | | | | | | |
| Prestige Consumer Healthcare, Inc.* | | | 797 | | | | 25,249 | |
| Rayonier Advanced Materials, Inc. | | | 5,800 | | | | 37,642 | |
| | | | | | | | 62,891 | |
| Educational Services – 4.04% | | | | | | | | |
| Graham Holdings Company – Class B | | | 1,300 | | | | 897,039 | |
| Fabricated Metal Product Manufacturing – 0.88% | | | | | | | | |
| Masco Corporation | | | 5,000 | | | | 196,200 | |
| Funds, Trusts, and Other Financial Vehicles – 1.63% | | | | | | | | |
| Capital Southwest Corporation | | | 17,300 | | | | 362,435 | |
| Lessors of Nonfinancial Intangible Assets (except Copyrighted Works) – 0.03% | | | | | | | | |
| PrairieSky Royalty Limited | | | 500 | | | | 7,025 | |
| Machinery Manufacturing – 2.90% | | | | | | | | |
| The Manitowoc Company, Inc.* | | | 8,025 | | | | 142,845 | |
| Welbilt, Inc.* | | | 30,000 | | | | 501,000 | |
| | | | | | | | 643,845 | |
| Management of Companies and Enterprises – 7.01% | | | | | | | | |
Associated Capital Group, Inc. – Class Ac | | | 33,600 | | | | 1,256,640 | |
| Dundee Corporation – Class A* | | | 48,400 | | | | 37,186 | |
| Galaxy Digital Holdings Ltd.* | | | 24,000 | | | | 43,068 | |
| Icahn Enterprises LP | | | 3,000 | | | | 217,230 | |
| | | | | | | | 1,554,124 | |
The accompanying notes are an integral part of these financial statements.
20
KINETICS MUTUAL FUNDS, INC. — THE FUND
The Kinetics Spin-off and Corporate
Restructuring Fund
Schedule of Investments — June 30, 2019 (Unaudited) — (Continued)
| | | | | | | |
| | | Shares | | | Value | |
| | |
| Medical Equipment and Supplies Manufacturing – 1.18% | | | | | | |
| Avanos Medical, Inc.* | | | 6,000 | | | $ | 261,660 | |
| Miscellaneous Manufacturing – 4.61% | | | | | | | | |
| CSW Industrials, Inc. | | | 15,000 | | | | 1,022,250 | |
| Oil and Gas Extraction – 38.06% | | | | | | | | |
Texas Pacific Land Trustc | | | 10,730 | | | | 8,444,402 | |
| Other Financial Investment Activities – 0.72% | | | | | | | | |
| GAMCO Investors, Inc. – Class A | | | 8,300 | | | | 159,111 | |
| Other Telecommunications – 1.39% | | | | | | | | |
| Liberty Broadband Corporation – Series A* | | | 3,000 | | | | 308,520 | |
| Publishing Industries (except Internet) – 0.81% | | | | | | | | |
| Gannett Company, Inc. | | | 7,700 | | | | 62,832 | |
| New Media Investment Group, Inc. | | | 12,400 | | | | 117,056 | |
| | | | | | | | 179,888 | |
| Real Estate – 10.93% | | | | | | | | |
Dream Unlimited Corp. – Class Ac | | | 203,200 | | | | 1,124,556 | |
The Howard Hughes Corporation*c | | | 10,500 | | | | 1,300,320 | |
| | | | | | | | 2,424,876 | |
| Scientific Research and Development Services – 0.13% | | | | | | | | |
| Rafael Holdings, Inc. – Class B* | | | 1,000 | | | | 28,750 | |
| Spectator Sports – 0.99% | | | | | | | | |
| Liberty Media Corp.-Liberty Braves – Class C* | | | 1,590 | | | | 44,472 | |
| Liberty Media Corp.-Liberty Formula One – Class A* | | | 4,850 | | | | 173,921 | |
| | | | | | | | 218,393 | |
| Sporting Goods, Hobby, Musical Instrument, and Book Stores – 0.13% | | | | | | | | |
| Vista Outdoor, Inc.* | | | 3,200 | | | | 28,416 | |
| Transportation Equipment Manufacturing – 3.72% | | | | | | | | |
| General Electric Company | | | 76,000 | | | | 798,000 | |
| Wabtec Corp. | | | 375 | | | | 26,910 | |
| | | | | | | | 824,910 | |
| Water Transportation – 1.94% | | | | | | | | |
| A.P. Moeller-Maersk A/S – Class B – ADR | | | 70,000 | | | | 430,500 | |
The accompanying notes are an integral part of these financial statements.
21
KINETICS MUTUAL FUNDS, INC. — THE FUND
The Kinetics Spin-off and Corporate
Restructuring Fund
Schedule of Investments — June 30, 2019 (Unaudited) — (Continued)
| | | | | |
| | Shares | | Value | |
| | |
| TOTAL COMMON STOCKS | | | | | |
| (cost $13,075,421) | | | | $ | 21,399,544 | |
| | |
| | |
SHORT-TERM INVESTMENTS – 3.68% | | | | | | |
| Money Market Funds – 0.00% | | | | | | |
Fidelity Institutional Government Portfolio – Class I, 2.26%b | | 362 | | | | 362 | |
| | |
| | | Principal | | | | |
| | | Amount | | | | |
| U.S. Treasury Obligations – 3.68% | | | | | | |
United States Treasury Billsf | | | | | | |
| Maturity Date: 08/06/2019, Yield to Maturity 2.20% | | $ | 819,000 | | | | 817,295 | |
| TOTAL SHORT-TERM INVESTMENTS | | | | | | | | |
| (cost $817,569) | | | | | | | 817,657 | |
TOTAL INVESTMENTS – 100.13% | | | | | | | | |
(cost $13,892,990) | | | | | | $ | 22,217,201 | |
| Percentages are stated as a percent of net assets. |
| * — Non-income producing security. |
b — The rate quoted is the annualized seven-day yield as of June 30, 2019. |
c — Significant Investment. See note 6. |
f — Level 2 Investment. See note 7. |
| ADR — American Depository Receipt. |
The accompanying notes are an integral part of these financial statements.
22
KINETICS MUTUAL FUNDS, INC. — THE FEEDER FUNDS
Statements of Assets & Liabilities
June 30, 2019 (Unaudited)
| | | | | | | |
| | | The Internet | | | The Global | |
| | | Fund | | | Fund | |
ASSETS: | | | | | | |
| Investments in the Master Portfolio, at value* | | $ | 138,780,513 | | | $ | 14,807,580 | |
| Receivable from Adviser | | | — | | | | 11,790 | |
| Receivable for Fund shares sold | | | 338,036 | | | | 670,185 | |
| Prepaid expenses and other assets | | | 27,275 | | | | 27,538 | |
| Total Assets | | | 139,145,824 | | | | 15,517,093 | |
LIABILITIES: | | | | | | | | |
| Payable for Master Portfolio interest purchased | | | 272,494 | | | | 665,939 | |
| Payable to Adviser | | | 3,630 | | | | — | |
| Payable to Directors | | | 2,736 | | | | 284 | |
| Payable to Chief Compliance Officer | | | 181 | | | | 19 | |
| Payable for Fund shares repurchased | | | 65,543 | | | | 4,245 | |
| Payable for shareholder servicing fees | | | 26,672 | | | | 2,739 | |
| Payable for distribution fees | | | 9,099 | | | | 25,732 | |
| Accrued expenses and other liabilities | | | 56,082 | | | | 17,963 | |
| Total Liabilities | | | 436,437 | | | | 716,921 | |
| Net Assets | | $ | 138,709,387 | | | $ | 14,800,172 | |
NET ASSETS CONSIST OF: | | | | | | | | |
| Paid in capital | | $ | 102,277,636 | | | $ | 11,283,898 | |
| Accumulated earnings | | | 36,431,751 | | | | 3,516,274 | |
| Net Assets | | $ | 138,709,387 | | | $ | 14,800,172 | |
CALCULATION OF NET ASSET VALUE PER SHARE – NO LOAD CLASS: | | | | | | | | |
| Net Assets | | $ | 134,356,533 | | | $ | 7,927,672 | |
| Shares outstanding | | | 3,568,263 | | | | 1,133,566 | |
| Net asset value per share (offering price and redemption price) | | $ | 37.65 | | | $ | 6.99 | |
CALCULATION OF NET ASSET VALUE PER SHARE – ADVISOR CLASS A: | | | | | | | | |
| Net Assets | | $ | 3,146,740 | | | $ | 1,461,809 | |
| Shares outstanding | | | 91,029 | | | | 209,899 | |
| Net asset value per share (redemption price) | | $ | 34.57 | | | $ | 6.96 | |
| Offering price per share ($34.57 divided by .9425 and $6.96 | | | | | | | | |
| divided by .9425) | | $ | 36.68 | | | $ | 7.38 | |
CALCULATION OF NET ASSET VALUE PER SHARE – ADVISOR CLASS C: | | | | | | | | |
| Net Assets | | $ | 1,206,114 | | | $ | 5,410,691 | |
| Shares outstanding | | | 41,283 | | | | 828,138 | |
| Net asset value per share (offering price and redemption price) | | $ | 29.22 | | | $ | 6.53 | |
| * Each Feeder Fund invests all or generally all its assets directly in the corresponding Master Portfolio. The financial statements for the Master Portfolios, along with the portfolio of investments in securities, are contained elsewhere in this report and should be read in conjunction with the Feeder Funds’ financial statements. |
The accompanying notes are an integral part of these financial statements.
23
KINETICS MUTUAL FUNDS, INC. — THE FEEDER FUNDS
Statements of Assets & Liabilities — (Continued)
June 30, 2019 (Unaudited)
| | | | | | | |
| | | The Paradigm | | | The Medical | |
| | | Fund | | | Fund | |
ASSETS: | | | | | | |
| Investments in the Master Portfolio, at value* | | $ | 812,193,045 | | | $ | 16,350,802 | |
| Receivable from Adviser | | | 60,745 | | | | 14,015 | |
| Receivable for Master Portfolio interest sold | | | 41,705 | | | | 6,614 | |
| Receivable for Fund shares sold | | | 730,278 | | | | 47 | |
| Prepaid expenses and other assets | | | 69,606 | | | | 23,225 | |
| Total Assets | | | 813,095,379 | | | | 16,394,703 | |
LIABILITIES: | | | | | | | | |
| Payable to Directors | | | 17,914 | | | | 377 | |
| Payable to Chief Compliance Officer | | | 1,234 | | | | 27 | |
| Payable for Fund shares repurchased | | | 771,983 | | | | 6,661 | |
| Payable for shareholder servicing fees | | | 127,907 | | | | 3,344 | |
| Payable for distribution fees | | | 167,896 | | | | 754 | |
| Accrued expenses and other liabilities | | | 198,180 | | | | 19,010 | |
| Total Liabilities | | | 1,285,114 | | | | 30,173 | |
| Net Assets | | $ | 811,810,265 | | | $ | 16,364,530 | |
NET ASSETS CONSIST OF: | | | | | | | | |
| Paid in capital | | $ | 457,185,882 | | | $ | 11,256,319 | |
| Accumulated earnings | | | 354,624,383 | | | | 5,108,211 | |
| Net Assets | | $ | 811,810,265 | | | $ | 16,364,530 | |
CALCULATION OF NET ASSET VALUE PER SHARE – NO LOAD CLASS: | | | | | | | | |
| Net Assets | | $ | 366,468,773 | | | $ | 15,005,228 | |
| Shares outstanding | | | 6,878,961 | | | | 612,679 | |
| Net asset value per share (offering price and redemption price) | | $ | 53.27 | | | $ | 24.49 | |
CALCULATION OF NET ASSET VALUE PER SHARE – ADVISOR CLASS A: | | | | | | | | |
| Net Assets | | $ | 114,414,245 | | | $ | 1,184,822 | |
| Shares outstanding | | | 2,224,275 | | | | 50,517 | |
| Net asset value per share (redemption price) | | $ | 51.44 | | | $ | 23.45 | |
| Offering price per share ($51.44 divided by .9425 and $23.45 | | | | | | | | |
| divided by .9425) | | $ | 54.58 | | | $ | 24.88 | |
CALCULATION OF NET ASSET VALUE PER SHARE – ADVISOR CLASS C: | | | | | | | | |
| Net Assets | | $ | 125,128,259 | | | $ | 174,480 | |
| Shares outstanding | | | 2,624,600 | | | | 7,737 | |
| Net asset value per share (offering price and redemption price) | | $ | 47.68 | | | $ | 22.55 | |
CALCULATION OF NET ASSET VALUE PER SHARE – INSTITUTIONAL CLASS: | | | | | | | | |
| Net Assets | | $ | 205,798,988 | | | | N/A | |
| Shares outstanding | | | 3,824,552 | | | | N/A | |
| Net asset value per share (offering price and redemption price) | | $ | 53.81 | | | | N/A | |
| * Each Feeder Fund invests all or generally all its assets directly in the corresponding Master Portfolio. The financial statements for the Master Portfolios, along with the portfolio of investments in securities, are contained elsewhere in this report and should be read in conjunction with the Feeder Funds’ financial statements. |
The accompanying notes are an integral part of these financial statements.
24
KINETICS MUTUAL FUNDS, INC. — THE FEEDER FUNDS
Statements of Assets & Liabilities — (Continued)
June 30, 2019 (Unaudited)
| | | | | | | |
| | | The Small Cap | | | The Market | |
| | | Opportunities | | | Opportunities | |
| | | Fund | | | Fund | |
| | |
ASSETS: | | | | | | |
| Investments in the Master Portfolio, at value* | | $ | 313,189,159 | | | $ | 89,706,107 | |
| Receivable from Adviser | | | 51,193 | | | | 29,567 | |
| Receivable for Fund shares sold | | | 466,063 | | | | 608,998 | |
| Prepaid expenses and other assets | | | 56,427 | | | | 27,413 | |
| Total Assets | | | 313,762,842 | | | | 90,372,085 | |
LIABILITIES: | | | | | | | | |
| Payable for Master Portfolio interest purchased | | | 102,554 | | | | 604,639 | |
| Payable to Directors | | | 7,314 | | | | 1,892 | |
| Payable to Chief Compliance Officer | | | 442 | | | | 131 | |
| Payable for Fund shares repurchased | | | 363,509 | | | | 4,359 | |
| Payable for shareholder servicing fees | | | 55,285 | | | | 15,738 | |
| Payable for distribution fees | | | 32,995 | | | | 30,829 | |
| Accrued expenses and other liabilities | | | 84,274 | | | | 33,547 | |
| Total Liabilities | | | 646,373 | | | | 691,135 | |
| Net Assets | | $ | 313,116,469 | | | $ | 89,680,950 | |
NET ASSETS CONSIST OF: | | | | | | | | |
| Paid in capital | | $ | 247,228,529 | | | $ | 60,576,791 | |
| Accumulated earnings | | | 65,887,940 | | | | 29,104,159 | |
| Net Assets | | $ | 313,116,469 | | | $ | 89,680,950 | |
CALCULATION OF NET ASSET VALUE PER SHARE – NO LOAD CLASS: | | | | | | | | |
| Net Assets | | $ | 206,433,372 | | | $ | 59,683,555 | |
| Shares outstanding | | | 3,281,848 | | | | 2,175,126 | |
| Net asset value per share (offering price and redemption price) | | $ | 62.90 | | | $ | 27.44 | |
CALCULATION OF NET ASSET VALUE PER SHARE – ADVISOR CLASS A: | | | | | | | | |
| Net Assets | | $ | 32,103,850 | | | $ | 7,592,067 | |
| Shares outstanding | | | 527,398 | | | | 281,429 | |
| Net asset value per share (redemption price) | | $ | 60.87 | | | $ | 26.98 | |
| Offering price per share ($60.87 divided by .9425 and $26.98 | | | | | | | | |
| divided by .9425) | | $ | 64.58 | | | $ | 28.63 | |
CALCULATION OF NET ASSET VALUE PER SHARE – ADVISOR CLASS C: | | | | | | | | |
| Net Assets | | $ | 10,770,027 | | | $ | 10,926,597 | |
| Shares outstanding | | | 185,873 | | | | 423,533 | |
| Net asset value per share (offering price and redemption price) | | $ | 57.94 | | | $ | 25.80 | |
CALCULATION OF NET ASSET VALUE PER SHARE – INSTITUTIONAL CLASS: | | | | | | | | |
| Net Assets | | $ | 63,809,220 | | | $ | 11,478,731 | |
| Shares outstanding | | | 996,034 | | | | 411,724 | |
| Net asset value per share (offering price and redemption price) | | $ | 64.06 | | | $ | 27.88 | |
| * Each Feeder Fund invests all or generally all its assets directly in the corresponding Master Portfolio. The financial statements for the Master Portfolios, along with the portfolio of investments in securities, are contained elsewhere in this report and should be read in conjunction with the Feeder Funds’ financial statements. |
The accompanying notes are an integral part of these financial statements.
25
KINETICS MUTUAL FUNDS, INC. — THE FEEDER FUNDS
Statements of Assets & Liabilities — (Continued)
June 30, 2019 (Unaudited)
| | | | | | | |
| | | | | | The Multi- | |
| | | The Alternative | | | Disciplinary | |
| | | Income | | | Income | |
| | | Fund | | | Fund | |
| | |
ASSETS: | | | | | | |
| Investments in the Master Portfolio, at value* | | $ | 18,663,077 | | | $ | 36,368,434 | |
| Receivable from Adviser | | | 17,847 | | | | 12,040 | |
| Receivable for Master Portfolio interest sold | | | — | | | | 33,178 | |
| Receivable for Fund shares sold | | | 10,995 | | | | 10,928 | |
| Prepaid expenses and other assets | | | 42,630 | | | | 20,152 | |
| Total Assets | | | 18,734,549 | | | | 36,444,732 | |
LIABILITIES: | | | | | | | | |
| Payable for Master Portfolio interest purchased | | | 6,767 | | | | — | |
| Payable to Directors | | | 434 | | | | 840 | |
| Payable to Chief Compliance Officer | | | 28 | | | | 69 | |
| Payable for Fund shares repurchased | | | 4,228 | | | | 44,106 | |
| Payable for shareholder servicing fees | | | 1,768 | | | | 4,192 | |
| Payable for distribution fees | | | 5,160 | | | | 44,192 | |
| Accrued expenses and other liabilities | | | 20,135 | | | | 24,327 | |
| Total Liabilities | | | 38,520 | | | | 117,726 | |
| Net Assets | | $ | 18,696,029 | | | $ | 36,327,006 | |
NET ASSETS CONSIST OF: | | | | | | | | |
| Paid in capital | | $ | 18,640,493 | | | $ | 38,873,941 | |
| Accumulated earnings (deficit) | | | 55,536 | | | | (2,546,935 | ) |
| Net Assets | | $ | 18,696,029 | | | $ | 36,327,006 | |
CALCULATION OF NET ASSET VALUE PER SHARE – NO LOAD CLASS: | | | | | | | | |
| Net Assets | | $ | 4,025,929 | | | $ | 5,907,344 | |
| Shares outstanding | | | 40,966 | | | | 539,297 | |
| Net asset value per share (offering price and redemption price) | | $ | 98.27 | | | $ | 10.95 | |
CALCULATION OF NET ASSET VALUE PER SHARE – ADVISOR CLASS A: | | | | | | | | |
| Net Assets | | $ | 972,809 | | | $ | 2,536,033 | |
| Shares outstanding | | | 10,026 | | | | 232,663 | |
| Net asset value per share (redemption price) | | $ | 97.03 | | | $ | 10.90 | |
| Offering price per share ($97.03 divided by .9425 and $10.90 | | | | | | | | |
| divided by .9425) | | $ | 102.95 | | | $ | 11.56 | |
CALCULATION OF NET ASSET VALUE PER SHARE – ADVISOR CLASS C: | | | | | | | | |
| Net Assets | | $ | 1,014,687 | | | $ | 7,787,453 | |
| Shares outstanding | | | 10,866 | | | | 722,504 | |
| Net asset value per share (offering price and redemption price) | | $ | 93.38 | | | $ | 10.78 | |
CALCULATION OF NET ASSET VALUE PER SHARE – INSTITUTIONAL CLASS: | | | | | | | | |
| Net Assets | | $ | 12,682,604 | | | $ | 20,096,176 | |
| Shares outstanding | | | 127,365 | | | | 1,830,897 | |
| Net asset value per share (offering price and redemption price) | | $ | 99.58 | | | $ | 10.98 | |
| * Each Feeder Fund invests all or generally all its assets directly in the corresponding Master Portfolio. The financial statements for the Master Portfolios, along with the portfolio of investments in securities, are contained elsewhere in this report and should be read in conjunction with the Feeder Funds’ financial statements. |
The accompanying notes are an integral part of these financial statements.
26
KINETICS MUTUAL FUNDS, INC. — THE FUND
Statement of Assets & Liabilities — (Continued)
June 30, 2019 (Unaudited)
| | | | |
| | | The Kinetics | |
| | | Spin-off and | |
| | | Corporate | |
| | | Restructuring | |
| | | Fund | |
| | |
ASSETS: | | | |
Investments, at value(1) | | $ | 22,217,201 | |
| Cash | | | 3,297 | |
| Dividends and interest receivable | | | 8,127 | |
| Prepaid expenses and other assets | | | 27,108 | |
| Total Assets | | | 22,255,733 | |
LIABILITIES: | | | | |
| Payable to Adviser | | | 4,743 | |
| Payable to Directors | | | 511 | |
| Payable to Chief Compliance Officer | | | 40 | |
| Payable to custodian | | | 1,021 | |
| Payable for Fund shares repurchased | | | 13,597 | |
| Payable for shareholder servicing fees | | | 2,198 | |
| Payable for distribution fees | | | 5,446 | |
| Accrued expenses and other liabilities | | | 40,436 | |
| Total Liabilities | | | 67,992 | |
| Net Assets | | $ | 22,187,741 | |
(1) Cost of investments | | $ | 13,892,990 | |
NET ASSETS CONSIST OF: | | | | |
| Paid in capital | | $ | 14,947,278 | |
| Accumulated earnings | | | 7,240,463 | |
| Net Assets | | $ | 22,187,741 | |
CALCULATION OF NET ASSET VALUE PER SHARE – NO LOAD CLASS: | | | | |
| Net Assets | | $ | 14,481 | |
| Shares outstanding | | | 1,172 | |
| Net asset value per share (offering price and redemption price) | | $ | 12.36 | |
CALCULATION OF NET ASSET VALUE PER SHARE – ADVISOR CLASS A: | | | | |
| Net Assets | | $ | 3,933,726 | |
| Shares outstanding | | | 333,498 | |
| Net asset value per share (redemption price) | | $ | 11.80 | |
| Offering price per share ($11.80 divided by .9425) | | $ | 12.52 | |
CALCULATION OF NET ASSET VALUE PER SHARE – ADVISOR CLASS C: | | | | |
| Net Assets | | $ | 4,274,179 | |
| Shares outstanding | | | 385,291 | |
| Net asset value per share (offering price and redemption price) | | $ | 11.09 | |
CALCULATION OF NET ASSET VALUE PER SHARE – INSTITUTIONAL CLASS: | | | | |
| Net Assets | | $ | 13,965,355 | |
| Shares outstanding | | | 1,177,676 | |
| Net asset value per share (offering price and redemption price) | | $ | 11.86 | |
The accompanying notes are an integral part of these financial statements.
27
KINETICS MUTUAL FUNDS, INC. — THE FEEDER FUNDS
Statements of Operations
For the Six Months Ended June 30, 2019 (Unaudited)
| | | | | | | |
| | | The Internet | | | The Global | |
| | | Fund | | | Fund | |
INVESTMENT INCOME (LOSS) ALLOCATED FROM MASTER PORTFOLIOS: | | | | | | |
| Dividends† | | $ | 216,803 | | | $ | 34,684 | |
| Interest | | | 445,567 | | | | 67,092 | |
| Income from securities lending | | | 69,726 | | | | 2,972 | |
| Expenses allocated from Master Portfolio | | | (819,019 | ) | | | (100,152 | ) |
| Net investment income (loss) from Master Portfolio | | | (86,923 | ) | | | 4,596 | |
EXPENSES: | | | | | | | | |
| Distribution fees – Advisor Class A | | | 3,433 | | | | 1,500 | |
| Distribution fees – Advisor Class C | | | 4,312 | | | | 17,809 | |
| Shareholder servicing fees – Advisor Class A | | | 3,433 | | | | 1,500 | |
| Shareholder servicing fees – Advisor Class C | | | 1,437 | | | | 5,936 | |
| Shareholder servicing fees – No Load Class | | | 143,284 | | | | 7,884 | |
| Transfer agent fees and expenses | | | 49,931 | | | | 8,892 | |
| Reports to shareholders | | | 18,346 | | | | 1,641 | |
| Administration fees | | | 25,556 | | | | 4,801 | |
| Professional fees | | | 9,844 | | | | 4,621 | |
| Directors’ fees | | | 5,137 | | | | 542 | |
| Chief Compliance Officer fees | | | 1,040 | | | | 113 | |
| Registration fees | | | 28,916 | | | | 25,457 | |
| Fund accounting fees | | | 2,707 | | | | 283 | |
| Other expenses | | | 2,582 | | | | 253 | |
| Total expenses | | | 299,958 | | | | 81,232 | |
| Less, expense reimbursement | | | — | | | | (76,894 | ) |
| Net expenses | | | 299,958 | | | | 4,338 | |
| Net investment income (loss) | | | (386,881 | ) | | | 258 | |
REALIZED AND UNREALIZED GAIN (LOSS) ON INVESTMENTS | | | | | | | | |
ALLOCATED FROM MASTER PORTFOLIOS: | | | | | | | | |
| Net realized gain (loss) on: | | | | | | | | |
| Investments and foreign currency | | | (83,368 | ) | | | 1,491 | |
| Net change in unrealized appreciation of: | | | | | | | | |
| Investments and foreign currency | | | 39,601,372 | | | | 3,020,967 | |
| Net gain on investments | | | 39,518,004 | | | | 3,022,458 | |
| Net increase in net assets resulting from operations | | $ | 39,131,123 | | | $ | 3,022,716 | |
| † Net of foreign taxes withheld of: | | $ | 733 | | | $ | 1,263 | |
The accompanying notes are an integral part of these financial statements.
28
KINETICS MUTUAL FUNDS, INC. — THE FEEDER FUNDS
Statements of Operations — (Continued)
For the Six Months Ended June 30, 2019 (Unaudited)
| | | | | | | |
| | | The Paradigm | | | The Medical | |
| | | Fund | | | Fund | |
INVESTMENT INCOME (LOSS) ALLOCATED FROM MASTER PORTFOLIOS: | | | | | | |
| Dividends† | | $ | 3,428,893 | | | $ | 263,383 | |
| Interest | | | 1,218,874 | | | | 1,119 | |
| Income from securities lending | | | 101,259 | | | | 8,289 | |
| Expenses allocated from Master Portfolio | | | (5,199,318 | ) | | | (125,866 | ) |
| Net investment income (loss) from Master Portfolio | | | (450,292 | ) | | | 146,925 | |
EXPENSES: | | | | | | | | |
| Distribution fees – Advisor Class A | | | 140,505 | | | | 1,633 | |
| Distribution fees – Advisor Class C | | | 444,144 | | | | 1,015 | |
| Shareholder servicing fees – Advisor Class A | | | 140,505 | | | | 1,633 | |
| Shareholder servicing fees – Advisor Class C | | | 148,048 | | | | 338 | |
| Shareholder servicing fees – No Load Class | | | 436,050 | | | | 18,832 | |
| Shareholder servicing fees – Institutional Class | | | 185,986 | | | | — | |
| Transfer agent fees and expenses | | | 98,857 | | | | 10,628 | |
| Reports to shareholders | | | 41,583 | | | | 2,210 | |
| Administration fees | | | 159,990 | | | | 4,671 | |
| Professional fees | | | 43,699 | | | | 4,893 | |
| Directors’ fees | | | 34,581 | | | | 767 | |
| Chief Compliance Officer fees | | | 7,262 | | | | 163 | |
| Registration fees | | | 47,606 | | | | 25,982 | |
| Fund accounting fees | | | 17,853 | | | | 420 | |
| Other expenses | | | 14,549 | | | | 344 | |
| Total expenses | | | 1,961,218 | | | | 73,529 | |
| Less, expense waiver for Institutional Class shareholder | | | | | | | | |
| servicing fees | | | (139,490 | ) | | | — | |
| Less, expense reimbursement | | | (343,898 | ) | | | (81,083 | ) |
| Net expenses | | | 1,477,830 | | | | (7,554 | ) |
| Net investment income (loss) | | | (1,928,122 | ) | | | 154,479 | |
REALIZED AND UNREALIZED GAIN ON INVESTMENTS ALLOCATED | | | | | | | | |
FROM MASTER PORTFOLIOS: | | | | | | | | |
| Net realized gain on: | | | | | | | | |
| Investments and foreign currency | | | 3,536,182 | | | | 514,085 | |
| Net change in unrealized appreciation of: | | | | | | | | |
| Investments and foreign currency | | | 183,510,953 | | | | 49,441 | |
| Net gain on investments | | | 187,047,135 | | | | 563,526 | |
| Net increase in net assets resulting from operations | | $ | 185,119,013 | | | $ | 718,005 | |
| † Net of foreign taxes withheld of: | | $ | 59,417 | | | $ | 16,187 | |
The accompanying notes are an integral part of these financial statements.
29
KINETICS MUTUAL FUNDS, INC. — THE FEEDER FUNDS
Statements of Operations — (Continued)
For the Six Months Ended June 30, 2019 (Unaudited)
| | | | | | | |
| | | The Small Cap | | | The Market | |
| | | Opportunities | | | Opportunities | |
| | | Fund | | | Fund | |
INVESTMENT INCOME (LOSS) ALLOCATED FROM MASTER PORTFOLIOS: | | | | | | |
| Dividends† | | $ | 1,194,517 | | | $ | 292,949 | |
| Interest | | | 1,152,476 | | | | 405,967 | |
| Income from securities lending | | | 16,260 | | | | 14,338 | |
| Expenses allocated from Master Portfolio | | | (2,078,578 | ) | | | (574,092 | ) |
| Net investment income from Master Portfolio | | | 284,675 | | | | 139,162 | |
EXPENSES: | | | | | | | | |
| Distribution fees – Advisor Class A | | | 28,645 | | | | 8,830 | |
| Distribution fees – Advisor Class C | | | 38,730 | | | | 36,711 | |
| Shareholder servicing fees – Advisor Class A | | | 28,645 | | | | 8,830 | |
| Shareholder servicing fees – Advisor Class C | | | 12,910 | | | | 12,237 | |
| Shareholder servicing fees – No Load Class | | | 272,922 | | | | 67,852 | |
| Shareholder servicing fees – Institutional Class | | | 53,331 | | | | 10,507 | |
| Transfer agent fees and expenses | | | 35,782 | | | | 17,065 | |
| Reports to shareholders | | | 24,668 | | | | 4,596 | |
| Administration fees | | | 63,598 | | | | 19,078 | |
| Professional fees | | | 19,894 | | | | 8,600 | |
| Directors’ fees | | | 13,765 | | | | 3,682 | |
| Chief Compliance Officer fees | | | 2,899 | | | | 773 | |
| Registration fees | | | 43,386 | | | | 40,125 | |
| Fund accounting fees | | | 6,977 | | | | 1,926 | |
| Other expenses | | | 5,095 | | | | 1,545 | |
| Total expenses | | | 651,247 | | | | 242,357 | |
| Less, expense waiver for Institutional Class shareholder | | | | | | | | |
| servicing fees | | | (39,998 | ) | | | (7,880 | ) |
| Less, expense reimbursement | | | (175,503 | ) | | | (202,037 | ) |
| Net expenses | | | 435,746 | | | | 32,440 | |
| Net investment income (loss) | | | (151,071 | ) | | | 106,722 | |
REALIZED AND UNREALIZED GAIN (LOSS) ON INVESTMENTS | | | | | | | | |
ALLOCATED FROM MASTER PORTFOLIOS: | | | | | | | | |
| Net realized loss on: | | | | | | | | |
| Investments and foreign currency | | | (743,608 | ) | | | (101,238 | ) |
| Net change in unrealized appreciation of: | | | | | | | | |
| Investments and foreign currency | | | 52,360,079 | | | | 18,374,679 | |
| Net gain on investments | | | 51,616,471 | | | | 18,273,441 | |
| Net increase in net assets resulting from operations | | $ | 51,465,400 | | | $ | 18,380,163 | |
| † Net of foreign taxes withheld of: | | $ | 43,365 | | | $ | 4,763 | |
The accompanying notes are an integral part of these financial statements.
30
KINETICS MUTUAL FUNDS, INC. — THE FEEDER FUNDS
Statements of Operations — (Continued)
For the Six Months Ended June 30, 2019 (Unaudited)
| | | | | | | |
| | | | | | The Multi- | |
| | | The Alternative | | | Disciplinary | |
| | | Income | | | Income | |
| | | Fund | | | Fund | |
INVESTMENT INCOME ALLOCATED FROM MASTER PORTFOLIOS: | | | | | | |
| Dividends | | $ | 72,118 | | | $ | 120,059 | |
| Interest | | | 150,187 | | | | 915,297 | |
| Income from securities lending | | | — | | | | 12,373 | |
| Expenses allocated from Master Portfolio | | | (108,438 | ) | | | (268,667 | ) |
| Net investment income from Master Portfolio | | | 113,867 | | | | 779,062 | |
EXPENSES: | | | | | | | | |
| Distribution fees – Advisor Class A | | | 1,224 | | | | 3,399 | |
| Distribution fees – Advisor Class C | | | 3,847 | | | | 29,238 | |
| Shareholder servicing fees – Advisor Class A | | | 1,224 | | | | 3,399 | |
| Shareholder servicing fees – Advisor Class C | | | 1,282 | | | | 9,746 | |
| Shareholder servicing fees – No Load Class | | | 5,204 | | | | 7,299 | |
| Shareholder servicing fees – Institutional Class | | | 12,767 | | | | 20,842 | |
| Transfer agent fees and expenses | | | 11,746 | | | | 13,432 | |
| Reports to shareholders | | | 2,189 | | | | 2,827 | |
| Administration fees | | | 6,121 | | | | 9,893 | |
| Professional fees | | | 4,992 | | | | 5,931 | |
| Directors’ fees | | | 872 | | | | 1,691 | |
| Chief Compliance Officer fees | | | 180 | | | | 362 | |
| Registration fees | | | 32,280 | | | | 45,558 | |
| Fund accounting fees | | | 466 | | | | 930 | |
| Other expenses | | | 405 | | | | 820 | |
| Total expenses | | | 84,799 | | | | 155,367 | |
| Less, expense waiver for Institutional Class shareholder | | | | | | | | |
| servicing fees | | | (9,575 | ) | | | (15,632 | ) |
| Less, expense reimbursement | | | (101,416 | ) | | | (119,487 | ) |
| Net expenses | | | (26,192 | ) | | | 20,248 | |
| Net investment income | | | 140,059 | | | | 758,814 | |
REALIZED AND UNREALIZED GAIN (LOSS) ON INVESTMENTS | | | | | | | | |
ALLOCATED FROM MASTER PORTFOLIOS: | | | | | | | | |
| Net realized gain (loss) on: | | | | | | | | |
| Investments and foreign currency | | | (20 | ) | | | (17,612 | ) |
| Written option contracts expired or closed | | | 31,375 | | | | — | |
| Net change in unrealized appreciation (depreciation) of: | | | | | | | | |
| Investments and foreign currency | | | 175,373 | | | | 1,787,479 | |
| Written option contracts | | | (26,725 | ) | | | — | |
| Net gain on investments | | | 180,003 | | | | 1,769,867 | |
| Net increase in net assets resulting from operations | | $ | 320,062 | | | $ | 2,528,681 | |
The accompanying notes are an integral part of these financial statements.
31
KINETICS MUTUAL FUNDS, INC. — THE FUND
Statement of Operations — (Continued)
For the Six Months Ended June 30, 2019 (Unaudited)
| | | | |
| | | The Kinetics | |
| | | Spin-off and | |
| | | Corporate | |
| | | Restructuring | |
| | | Fund | |
INVESTMENT INCOME: | | | |
| Dividends† | | $ | 208,223 | |
| Interest | | | 12,616 | |
| Total investment income | | | 220,839 | |
EXPENSES: | | | | |
| Distribution fees – Advisor Class A | | | 4,845 | |
| Distribution fees – Advisor Class C | | | 16,441 | |
| Shareholder servicing fees – Advisor Class A | | | 4,845 | |
| Shareholder servicing fees – Advisor Class C | | | 5,480 | |
| Shareholder servicing fees – No Load Class | | | 17 | |
| Shareholder servicing fees – Institutional Class | | | 13,447 | |
| Investment advisory fees | | | 108,608 | |
| Transfer agent fees and expenses | | | 11,886 | |
| Reports to shareholders | | | 1,681 | |
| Administration fees | | | 11,852 | |
| Professional fees | | | 10,332 | |
| Directors’ fees | | | 1,126 | |
| Chief Compliance Officer fees | | | 212 | |
| Registration fees | | | 37,675 | |
| Fund accounting fees | | | 2,477 | |
| Custodian fees and expenses | | | 2,674 | |
| Other expenses | | | 437 | |
| Total expenses | | | 234,035 | |
| Less, expense waiver for Institutional Class shareholder servicing fees | | | (10,085 | ) |
| Less, expense reimbursement | | | (61,410 | ) |
| Net expenses | | | 162,540 | |
| Net investment income | | | 58,299 | |
REALIZED AND UNREALIZED GAIN ON INVESTMENTS AND FOREIGN CURRENCY: | | | | |
| Net realized gain on: | | | | |
| Investments and foreign currency | | | 222,060 | |
| Net change in unrealized appreciation of: | | | | |
| Investments and foreign currency | | | 4,588,172 | |
| Net gain on investments | | | 4,810,232 | |
| Net increase in net assets resulting from operations | | $ | 4,868,531 | |
| † Net of foreign taxes withheld of: | | $ | 2,350 | |
The accompanying notes are an integral part of these financial statements.
32
KINETICS MUTUAL FUNDS, INC. — THE FEEDER FUNDS
Statements of Changes in Net Assets
| | | | | | | | | | | | | |
| | | The Internet Fund | | | The Global Fund | |
| | | For the | | | | | | For the | | | | |
| | | Period Ended | | | For the | | | Period Ended | | | For the | |
| | | June 30, | | | Year Ended | | | June 30, | | | Year Ended | |
| | | 2019 | | | December 31, | | | 2019 | | | December 31, | |
| | | (Unaudited) | | | 2018 | | | (Unaudited) | | | 2018 | |
| | |
OPERATIONS: | | | | | | | | | | | | |
| Net investment income (loss) | | $ | (386,881 | ) | | $ | (1,528,279 | ) | | $ | 258 | | | $ | (85,713 | ) |
| Net realized gain (loss) on sale of | | | | | | | | | | | | | | | | |
| investments and foreign currency | | | (83,368 | ) | | | 32,297,461 | | | | 1,491 | | | | (275,998 | ) |
| Net change in unrealized appreciation | | | | | | | | | | | | | | | | |
| (depreciation) of investments and | | | | | | | | | | | | | | | | |
| foreign currency | | | 39,601,372 | | | | (74,911,350 | ) | | | 3,020,967 | | | | (3,290,792 | ) |
| Net increase (decrease) in net assets | | | | | | | | | | | | | | | | |
| resulting from operations | | | 39,131,123 | | | | (44,142,168 | ) | | | 3,022,716 | | | | (3,652,503 | ) |
DISTRIBUTIONS TO SHAREHOLDERS: | | | | | | | | | | | | | | | | |
| No Load Class (See Note 5) | | | — | | | | (29,829,211 | ) | | | — | | | | (4,521 | ) |
| Advisor Class A (See Note 5) | | | — | | | | (761,641 | ) | | | — | | | | (802 | ) |
| Advisor Class C (See Note 5) | | | — | | | | (385,282 | ) | | | — | | | | (3,643 | ) |
| Total distributions to shareholders | | | — | | | | (30,976,134 | ) | | | — | | | | (8,966 | ) |
CAPITAL SHARE TRANSACTIONS – | | | | | | | | | | | | | | | | |
NO LOAD CLASS: | | | | | | | | | | | | | | | | |
| Proceeds from shares sold | | | 2,472,540 | | | | 15,506,662 | | | | 1,197,309 | | | | 1,114,685 | |
| Redemption fees | | | 1,086 | | | | 71,771 | | | | 275 | | | | 5,543 | |
| Proceeds from shares issued to holders | | | | | | | | | | | | | | | | |
| in reinvestment of dividends | | | — | | | | 29,208,393 | | | | — | | | | 4,459 | |
| Cost of shares redeemed | | | (8,237,807 | ) | | | (32,343,565 | ) | | | (505,571 | ) | | | (2,135,351 | ) |
| Net increase (decrease) in net assets | | | | | | | | | | | | | | | | |
| resulting from capital | | | | | | | | | | | | | | | | |
| share transactions | | | (5,764,181 | ) | | | 12,443,261 | | | | 692,013 | | | | (1,010,664 | ) |
CAPITAL SHARE TRANSACTIONS – | | | | | | | | | | | | | | | | |
ADVISOR CLASS A: | | | | | | | | | | | | | | | | |
| Proceeds from shares sold | | | 143,583 | | | | 1,208,292 | | | | 228,097 | | | | 160,717 | |
| Redemption fees | | | — | | | | 2,647 | | | | 194 | | | | 75 | |
| Proceeds from shares issued to holders | | | | | | | | | | | | | | | | |
| in reinvestment of dividends | | | — | | | | 701,010 | | | | — | | | | 733 | |
| Cost of shares redeemed | | | (381,949 | ) | | | (1,754,869 | ) | | | (73,923 | ) | | | (336,656 | ) |
| Net increase (decrease) in net assets | | | | | | | | | | | | | | | | |
| resulting from capital | | | | | | | | | | | | | | | | |
| share transactions | | | (238,366 | ) | | | 157,080 | | | | 154,368 | | | | (175,131 | ) |
CAPITAL SHARE TRANSACTIONS – | | | | | | | | | | | | | | | | |
ADVISOR CLASS C: | | | | | | | | | | | | | | | | |
| Proceeds from shares sold | | | 47,452 | | | | 617,031 | | | | 161,303 | | | | 542,381 | |
| Redemption fees | | | — | | | | 673 | | | | — | | | | — | |
| Proceeds from shares issued to holders | | | | | | | | | | | | | | | | |
| in reinvestment of dividends | | | — | | | | 378,088 | | | | — | | | | 3,544 | |
| Cost of shares redeemed | | | (280,327 | ) | | | (816,194 | ) | | | (191,580 | ) | | | (380,036 | ) |
| Net increase (decrease) in net assets | | | | | | | | | | | | | | | | |
| resulting from capital | | | | | | | | | | | | | | | | |
| share transactions | | | (232,875 | ) | | | 179,598 | | | | (30,277 | ) | | | 165,889 | |
The accompanying notes are an integral part of these financial statements.
33
KINETICS MUTUAL FUNDS, INC. — THE FEEDER FUNDS
Statements of Changes in Net Assets — (Continued)
| | | | | | | | | | | | | |
| | | The Internet Fund | | | The Global Fund | |
| | | For the | | | | | | For the | | | | |
| | | Period Ended | | | For the | | | Period Ended | | | For the | |
| | | June 30, | | | Year Ended | | | June 30, | | | Year Ended | |
| | | 2019 | | | December 31, | | | 2019 | | | December 31, | |
| | | (Unaudited) | | | 2018 | | | (Unaudited) | | | 2018 | |
TOTAL INCREASE (DECREASE) IN | | | | | | | | | | | | |
NET ASSETS: | | $ | 32,895,701 | | | $ | (62,338,363 | ) | | $ | 3,838,820 | | | $ | (4,681,375 | ) |
NET ASSETS: | | | | | | | | | | | | | | | | |
| Beginning of period | | | 105,813,686 | | | | 168,152,049 | | | | 10,961,352 | | | | 15,642,727 | |
| End of period | | $ | 138,709,387 | | | $ | 105,813,686 | | | $ | 14,800,172 | | | $ | 10,961,352 | |
CHANGES IN SHARES OUTSTANDING – | | | | | | | | | | | | | | | | |
NO LOAD CLASS: | | | | | | | | | | | | | | | | |
| Shares sold | | | 70,605 | | | | 312,559 | | | | 178,486 | | | | 160,540 | |
| Shares issued in reinvestments of | | | | | | | | | | | | | | | | |
| dividends and distributions | | | — | | | | 1,071,144 | | | | — | | | | 815 | |
| Shares redeemed | | | (263,120 | ) | | | (730,044 | ) | | | (81,677 | ) | | | (323,558 | ) |
| Net increase (decrease) in | | | | | | | | | | | | | | | | |
| shares outstanding | | | (192,515 | ) | | | 653,659 | | | | 96,809 | | | | (162,203 | ) |
CHANGES IN SHARES OUTSTANDING – | | | | | | | | | | | | | | | | |
ADVISOR CLASS A: | | | | | | | | | | | | | | | | |
| Shares sold | | | 4,642 | | | | 26,425 | | | | 36,127 | | | | 23,309 | |
| Shares issued in reinvestments of | | | | | | | | | | | | | | | | |
| dividends and distributions | | | — | | | | 27,962 | | | | — | | | | 134 | |
| Shares redeemed | | | (12,857 | ) | | | (40,084 | ) | | | (12,053 | ) | | | (50,489 | ) |
| Net increase (decrease) in | | | | | | | | | | | | | | | | |
| shares outstanding | | | (8,215 | ) | | | 14,303 | | | | 24,074 | | | | (27,046 | ) |
CHANGES IN SHARES OUTSTANDING – | | | | | | | | | | | | | | | | |
ADVISOR CLASS C: | | | | | | | | | | | | | | | | |
| Shares sold | | | 1,784 | | | | 14,737 | | | | 25,514 | | | | 84,067 | |
| Shares issued in reinvestments of | | | | | | | | | | | | | | | | |
| dividends and distributions | | | — | | | | 17,801 | | | | — | | | | 691 | |
| Shares redeemed | | | (10,782 | ) | | | (24,012 | ) | | | (33,469 | ) | | | (68,137 | ) |
| Net increase (decrease) in | | | | | | | | | | | | | | | | |
| shares outstanding | | | (8,998 | ) | | | 8,526 | | | | (7,955 | ) | | | 16,621 | |
The accompanying notes are an integral part of these financial statements.
34
KINETICS MUTUAL FUNDS, INC. — THE FEEDER FUNDS
Statements of Changes in Net Assets — (Continued)
| | | | | | | | | | | | | |
| | | The Paradigm Fund | | | The Medical Fund | |
| | | For the | | | | | | For the | | | | |
| | | Period Ended | | | For the | | | Period Ended | | | For the | |
| | | June 30, | | | Year Ended | | | June 30, | | | Year Ended | |
| | | 2019 | | | December 31, | | | 2019 | | | December 31, | |
| | | (Unaudited) | | | 2018 | | | (Unaudited) | | | 2018 | |
| | |
OPERATIONS: | | | | | | | | | | | | |
| Net investment income (loss) | | $ | (1,928,122 | ) | | $ | (8,440,870 | ) | | $ | 154,479 | | | $ | 176,963 | |
| Net realized gain on sale of investments | | | | | | | | | | | | | | | | |
| and foreign currency | | | 3,536,182 | | | | 126,256,576 | | | | 514,085 | | | | 1,558,346 | |
| Net change in unrealized appreciation | | | | | | | | | | | | | | | | |
| (depreciation) of investments and | | | | | | | | | | | | | | | | |
| foreign currency | | | 183,510,953 | | | | (161,220,219 | ) | | | 49,441 | | | | (1,464,481 | ) |
| Net increase (decrease) in net assets | | | | | | | | | | | | | | | | |
| resulting from operations | | | 185,119,013 | | | | (43,404,513 | ) | | | 718,005 | | | | 270,828 | |
DISTRIBUTIONS TO SHAREHOLDERS: | | | | | | | | | | | | | | | | |
| No Load Class (See Note 5) | | | — | | | | (28,537,272 | ) | | | — | | | | (1,297,367 | ) |
| Advisor Class A (See Note 5) | | | — | | | | (9,460,887 | ) | | | — | | | | (114,972 | ) |
| Advisor Class C (See Note 5) | | | — | | | | (10,598,549 | ) | | | — | | | | (28,691 | ) |
| Institutional Class (See Note 5) | | | — | | | | (14,412,154 | ) | | | N/A | | | | N/A | |
| Total distributions to shareholders | | | — | | | | (63,008,862 | ) | | | — | | | | (1,441,030 | ) |
CAPITAL SHARE TRANSACTIONS – | | | | | | | | | | | | | | | | |
NO LOAD CLASS: | | | | | | | | | | | | | | | | |
| Proceeds from shares sold | | | 13,170,005 | | | | 82,815,246 | | | | 120,481 | | | | 275,511 | |
| Redemption fees | | | 5,457 | | | | 36,638 | | | | 4 | | | | 600 | |
| Proceeds from shares issued to holders | | | | | | | | | | | | | | | | |
| in reinvestment of dividends | | | — | | | | 27,524,795 | | | | — | | | | 1,275,339 | |
| Cost of shares redeemed | | | (29,444,400 | ) | | | (101,236,433 | ) | | | (578,677 | ) | | | (1,751,133 | ) |
| Net increase (decrease) in net assets | | | | | | | | | | | | | | | | |
| resulting from capital | | | | | | | | | | | | | | | | |
| share transactions | | | (16,268,938 | ) | | | 9,140,246 | | | | (458,192 | ) | | | (199,683 | ) |
CAPITAL SHARE TRANSACTIONS – | | | | | | | | | | | | | | | | |
ADVISOR CLASS A: | | | | | | | | | | | | | | | | |
| Proceeds from shares sold | | | 9,032,075 | | | | 21,835,533 | | | | 2,720 | | | | 43,479 | |
| Redemption fees | | | — | | | | 435 | | | | — | | | | — | |
| Proceeds from shares issued to holders | | | | | | | | | | | | | | | | |
| in reinvestment of dividends | | | — | | | | 8,391,508 | | | | — | | | | 106,203 | |
| Cost of shares redeemed | | | (17,605,898 | ) | | | (26,515,410 | ) | | | (192,629 | ) | | | (1,718,121 | ) |
| Net increase (decrease) in net assets | | | | | | | | | | | | | | | | |
| resulting from capital | | | | | | | | | | | | | | | | |
| share transactions | | | (8,573,823 | ) | | | 3,712,066 | | | | (189,909 | ) | | | (1,568,439 | ) |
CAPITAL SHARE TRANSACTIONS – | | | | | | | | | | | | | | | | |
ADVISOR CLASS C: | | | | | | | | | | | | | | | | |
| Proceeds from shares sold | | | 2,339,619 | | | | 4,108,371 | | | | — | | | | 6,203 | |
| Redemption fees | | | 419 | | | | 233 | | | | — | | | | — | |
| Proceeds from shares issued to holders | | | | | | | | | | | | | | | | |
| in reinvestment of dividends | | | — | | | | 9,940,055 | | | | — | | | | 17,314 | |
| Cost of shares redeemed | | | (6,266,486 | ) | | | (15,531,853 | ) | | | (158,873 | ) | | | (60,909 | ) |
| Net decrease in net assets resulting | | | | | | | | | | | | | | | | |
| from capital share transactions | | | (3,926,448 | ) | | | (1,483,194 | ) | | | (158,873 | ) | | | (37,392 | ) |
The accompanying notes are an integral part of these financial statements.
35
KINETICS MUTUAL FUNDS, INC. — THE FEEDER FUNDS
Statements of Changes in Net Assets — (Continued)
| | | | | | | | | | | | | |
| | | The Paradigm Fund | | | The Medical Fund | |
| | | For the | | | | | | For the | | | | |
| | | Period Ended | | | For the | | | Period Ended | | | For the | |
| | | June 30, | | | Year Ended | | | June 30, | | | Year Ended | |
| | | 2019 | | | December 31, | | | 2019 | | | December 31, | |
| | | (Unaudited) | | | 2018 | | | (Unaudited) | | | 2018 | |
| | |
CAPITAL SHARE TRANSACTIONS – | | | | | | | | | | | | |
INSTITUTIONAL CLASS: | | | | | | | | | | | | |
| Proceeds from shares sold | | $ | 29,813,835 | | | $ | 55,326,340 | | | $ | N/A | | | $ | N/A | |
| Redemption fees | | | 17,338 | | | | 667 | | | | N/A | | | | N/A | |
| Proceeds from shares issued to holders | | | | | | | | | | | | | | | | |
| in reinvestment of dividends | | | — | | | | 12,639,473 | | | | N/A | | | | N/A | |
| Cost of shares redeemed | | | (17,549,379 | ) | | | (104,577,445 | ) | | | N/A | | | | N/A | |
| Net increase (decrease) in net assets | | | | | | | | | | | | | | | | |
| resulting from capital | | | | | | | | | | | | | | | | |
| share transactions | | | 12,281,794 | | | | (36,610,965 | ) | | | N/A | | | | N/A | |
TOTAL INCREASE (DECREASE) IN | | | | | | | | | | | | | | | | |
NET ASSETS: | | | 168,631,598 | | | | (131,655,222 | ) | | | (88,969 | ) | | | (2,975,716 | ) |
NET ASSETS: | | | | | | | | | | | | | | | | |
| Beginning of period | | | 643,178,667 | | | | 774,833,889 | | | | 16,453,499 | | | | 19,429,215 | |
| End of period | | $ | 811,810,265 | | | $ | 643,178,667 | | | $ | 16,364,530 | | | $ | 16,453,499 | |
CHANGES IN SHARES OUTSTANDING – | | | | | | | | | | | | | | | | |
NO LOAD CLASS: | | | | | | | | | | | | | | | | |
| Shares sold | | | 264,550 | | | | 1,519,083 | | | | 4,922 | | | | 10,660 | |
| Shares issued in reinvestments of | | | | | | | | | | | | | | | | |
| dividends and distributions | | | — | | | | 666,945 | | | | — | | | | 55,235 | |
| Shares redeemed | | | (597,177 | ) | | | (1,993,617 | ) | | | (23,576 | ) | | | (68,554 | ) |
| Net increase (decrease) in | | | | | | | | | | | | | | | | |
| shares outstanding | | | (332,627 | ) | | | 192,411 | | | | (18,654 | ) | | | (2,659 | ) |
CHANGES IN SHARES OUTSTANDING – | | | | | | | | | | | | | | | | |
ADVISOR CLASS A: | | | | | | | | | | | | | | | | |
| Shares sold | | | 191,096 | | | | 412,429 | | | | 119 | | | | 1,803 | |
| Shares issued in reinvestments of | | | | | | | | | | | | | | | | |
| dividends and distributions | | | — | | | | 210,314 | | | | — | | | | 4,797 | |
| Shares redeemed | | | (357,512 | ) | | | (530,967 | ) | | | (8,241 | ) | | | (70,696 | ) |
| Net increase (decrease) in | | | | | | | | | | | | | | | | |
| shares outstanding | | | (166,416 | ) | | | 91,776 | | | | (8,122 | ) | | | (64,096 | ) |
The accompanying notes are an integral part of these financial statements.
36
KINETICS MUTUAL FUNDS, INC. — THE FEEDER FUNDS
Statements of Changes in Net Assets — (Continued)
| | | | | | | | | | | | | |
| | | The Paradigm Fund | | | The Medical Fund | |
| | | For the | | | | | | For the | | | | |
| | | Period Ended | | | For the | | | Period Ended | | | For the | |
| | | June 30, | | | Year Ended | | | June 30, | | | Year Ended | |
| | | 2019 | | | December 31, | | | 2019 | | | December 31, | |
| | | (Unaudited) | | | 2018 | | | (Unaudited) | | | 2018 | |
| | |
CHANGES IN SHARES OUTSTANDING – | | | | | | | | | | | | |
ADVISOR CLASS C: | | | | | | | | | | | | |
| Shares sold | | | 50,571 | | | | 83,476 | | | | — | | | | 261 | |
| Shares issued in reinvestments of | | | | | | | | | | | | | | | | |
| dividends and distributions | | | — | | | | 268,071 | | | | — | | | | 811 | |
| Shares redeemed | | | (139,520 | ) | | | (328,265 | ) | | | (7,024 | ) | | | (2,576 | ) |
| Net increase (decrease) in | | | | | | | | | | | | | | | | |
| shares outstanding | | | (88,949 | ) | | | 23,282 | | | | (7,024 | ) | | | (1,504 | ) |
CHANGES IN SHARES OUTSTANDING – | | | | | | | | | | | | | | | | |
INSTITUTIONAL CLASS: | | | | | | | | | | | | | | | | |
| Shares sold | | | 600,611 | | | | 1,056,356 | | | | N/A | | | | N/A | |
| Shares issued in reinvestments of | | | | | | | | | | | | | | | | |
| dividends and distributions | | | — | | | | 303,541 | | | | N/A | | | | N/A | |
| Shares redeemed | | | (349,070 | ) | | | (2,078,833 | ) | | | N/A | | | | N/A | |
| Net increase (decrease) in | | | | | | | | | | | | | | | | |
| shares outstanding | | | 251,541 | | | | (718,936 | ) | | | N/A | | | | N/A | |
The accompanying notes are an integral part of these financial statements.
37
KINETICS MUTUAL FUNDS, INC. — THE FEEDER FUNDS
Statements of Changes in Net Assets — (Continued)
| | | | | | | | | | | | | |
| | | The Small Cap | | | The Market | |
| | | Opportunities Fund | | | Opportunities Fund | |
| | | For the | | | | | | For the | | | | |
| | | Period Ended | | | For the | | | Period Ended | | | For the | |
| | | June 30, | | | Year Ended | | | June 30, | | | Year Ended | |
| | | 2019 | | | December 31, | | | 2019 | | | December 31, | |
| | | (Unaudited) | | | 2018 | | | (Unaudited) | | | 2018 | |
OPERATIONS: | | | | | | | | | | | | |
| Net investment income (loss) | | $ | (151,071 | ) | | $ | (1,690,146 | ) | | $ | 106,722 | | | $ | (515,996 | ) |
| Net realized gain (loss) on sale of | | | | | | | | | | | | | | | | |
| investments and foreign currency | | | (743,608 | ) | | | 1,459,768 | | | | (101,238 | ) | | | 3,265,471 | |
| Net change in unrealized appreciation | | | | | | | | | | | | | | | | |
| (depreciation) of investments and | | | | | | | | | | | | | | | | |
| foreign currency | | | 52,360,079 | | | | (7,770,718 | ) | | | 18,374,679 | | | | (12,163,458 | ) |
| Net increase (decrease) in net assets | | | | | | | | | | | | | | | | |
| resulting from operations | | | 51,465,400 | | | | (8,001,096 | ) | | | 18,380,163 | | | | (9,413,983 | ) |
DISTRIBUTIONS TO SHAREHOLDERS: | | | | | | | | | | | | | | | | |
| No Load Class (See Note 5) | | | — | | | | — | | | | — | | | | (4,071,130 | ) |
| Advisor Class A (See Note 5) | | | — | | | | — | | | | — | | | | (550,627 | ) |
| Advisor Class C (See Note 5) | | | — | | | | — | | | | — | | | | (756,822 | ) |
| Institutional Class (See Note 5) | | | — | | | | — | | | | — | | | | (797,447 | ) |
| Total distributions to shareholders | | | — | | | | — | | | | — | | | | (6,176,026 | ) |
CAPITAL SHARE TRANSACTIONS – | | | | | | | | | | | | | | | | |
NO LOAD CLASS: | | | | | | | | | | | | | | | | |
| Proceeds from shares sold | | | 80,161,987 | | | | 143,962,162 | | | | 1,849,540 | | | | 11,158,690 | |
| Redemption fees | | | 10,673 | | | | 105,311 | | | | 5,730 | | | | 22,294 | |
| Proceeds from shares issued to holders | | | | | | | | | | | | | | | | |
| in reinvestment of dividends | | | — | | | | — | | | | — | | | | 4,049,701 | |
| Cost of shares redeemed | | | (75,197,176 | ) | | | (107,174,264 | ) | | | (2,890,837 | ) | | | (7,907,108 | ) |
| Net increase (decrease) in net assets | | | | | | | | | | | | | | | | |
| resulting from capital | | | | | | | | | | | | | | | | |
| share transactions | | | 4,975,484 | | | | 36,893,209 | | | | (1,035,567 | ) | | | 7,323,577 | |
CAPITAL SHARE TRANSACTIONS – | | | | | | | | | | | | | | | | |
ADVISOR CLASS A: | | | | | | | | | | | | | | | | |
| Proceeds from shares sold | | | 21,856,703 | | | | 10,894,936 | | | | 489,278 | | | | 2,608,472 | |
| Redemption fees | | | 260 | | | | 42 | | | | — | | | | 1,069 | |
| Proceeds from shares issued to holders | | | | | | | | | | | | | | | | |
| in reinvestment of dividends | | | — | | | | — | | | | — | | | | 488,996 | |
| Cost of shares redeemed | | | (3,376,109 | ) | | | (11,614,360 | ) | | | (915,188 | ) | | | (2,750,126 | ) |
| Net increase (decrease) in net assets | | | | | | | | | | | | | | | | |
| resulting from capital | | | | | | | | | | | | | | | | |
| share transactions | | | 18,480,854 | | | | (719,382 | ) | | | (425,910 | ) | | | 348,411 | |
The accompanying notes are an integral part of these financial statements.
38
KINETICS MUTUAL FUNDS, INC. — THE FEEDER FUNDS
Statements of Changes in Net Assets — (Continued)
| | | | | | | | | | | | | |
| | | The Small Cap | | | The Market | |
| | | Opportunities Fund | | | Opportunities Fund | |
| | | For the | | | | | | For the | | | | |
| | | Period Ended | | | For the | | | Period Ended | | | For the | |
| | | June 30, | | | Year Ended | | | June 30, | | | Year Ended | |
| | | 2019 | | | December 31, | | | 2019 | | | December 31, | |
| | | (Unaudited) | | | 2018 | | | (Unaudited) | | | 2018 | |
CAPITAL SHARE TRANSACTIONS – | | | | | | | | | | | | |
ADVISOR CLASS C: | | | | | | | | | | | | |
| Proceeds from shares sold | | $ | 1,736,716 | | | $ | 2,267,642 | | | $ | 660,858 | | | $ | 2,488,206 | |
| Redemption fees | | | — | | | | 61 | | | | — | | | | — | |
| Proceeds from shares issued to holders | | | | | | | | | | | | | | | | |
| in reinvestment of dividends | | | — | | | | — | | | | — | | | | 710,825 | |
| Cost of shares redeemed | | | (1,235,078 | ) | | | (1,950,729 | ) | | | (419,538 | ) | | | (898,991 | ) |
| Net increase in net assets resulting | | | | | | | | | | | | | | | | |
| from capital share transactions | | | 501,638 | | | | 316,974 | | | | 241,320 | | | | 2,300,040 | |
CAPITAL SHARE TRANSACTIONS – | | | | | | | | | | | | | | | | |
INSTITUTIONAL CLASS: | | | | | | | | | | | | | | | | |
| Proceeds from shares sold | | | 20,655,316 | | | | 59,836,127 | | | | 760,160 | | | | 4,583,098 | |
| Redemption fees | | | 281 | | | | 194 | | | | — | | | | 3,077 | |
| Proceeds from shares issued to holders | | | | | | | | | | | | | | | | |
| in reinvestment of dividends | | | — | | | | — | | | | — | | | | 772,205 | |
| Cost of shares redeemed | | | (6,245,393 | ) | | | (46,387,833 | ) | | | (1,140,478 | ) | | | (4,061,116 | ) |
| Net increase (decrease) in net assets | | | | | | | | | | | | | | | | |
| resulting from capital | | | | | | | | | | | | | | | | |
| share transactions | | | 14,410,204 | | | | 13,448,488 | | | | (380,318 | ) | | | 1,297,264 | |
TOTAL INCREASE (DECREASE) IN | | | | | | | | | | | | | | | | |
NET ASSETS: | | | 89,833,580 | | | | 41,938,193 | | | | 16,779,688 | | | | (4,320,717 | ) |
NET ASSETS: | | | | | | | | | | | | | | | | |
| Beginning of period | | | 223,282,889 | | | | 181,344,696 | | | | 72,901,262 | | | | 77,221,979 | |
| End of period | | $ | 313,116,469 | | | $ | 223,282,889 | | | $ | 89,680,950 | | | $ | 72,901,262 | |
CHANGES IN SHARES OUTSTANDING – | | | | | | | | | | | | | | | | |
NO LOAD CLASS: | | | | | | | | | | | | | | | | |
| Shares sold | | | 1,323,534 | | | | 2,475,834 | | | | 72,712 | | | | 409,732 | |
| Shares issued in reinvestments of | | | | | | | | | | | | | | | | |
| dividends and distributions | | | — | | | | — | | | | — | | | | 184,918 | |
| Shares redeemed | | | (1,238,543 | ) | | | (1,892,831 | ) | | | (118,491 | ) | | | (293,818 | ) |
| Net increase (decrease) in | | | | | | | | | | | | | | | | |
| shares outstanding | | | 84,991 | | | | 583,003 | | | | (45,779 | ) | | | 300,832 | |
The accompanying notes are an integral part of these financial statements.
39
KINETICS MUTUAL FUNDS, INC. — THE FEEDER FUNDS
Statements of Changes in Net Assets — (Continued)
| | | | | | | | | | | | | |
| | | The Small Cap | | | The Market | |
| | | Opportunities Fund | | | Opportunities Fund | |
| | | For the | | | | | | For the | | | | |
| | | Period Ended | | | For the | | | Period Ended | | | For the | |
| | | June 30, | | | Year Ended | | | June 30, | | | Year Ended | |
| | | 2019 | | | December 31, | | | 2019 | | | December 31, | |
| | | (Unaudited) | | | 2018 | | | (Unaudited) | | | 2018 | |
CHANGES IN SHARES OUTSTANDING – | | | | | | | | | | | | |
ADVISOR CLASS A: | | | | | | | | | | | | |
| Shares sold | | | 373,002 | | | | 181,646 | | | | 19,817 | | | | 96,994 | |
| Shares issued in reinvestments of | | | | | | | | | | | | | | | | |
| dividends and distributions | | | — | | | | — | | | | — | | | | 22,681 | |
| Shares redeemed | | | (56,519 | ) | | | (206,344 | ) | | | (37,359 | ) | | | (106,854 | ) |
| Net increase (decrease) in | | | | | | | | | | | | | | | | |
| shares outstanding | | | 316,483 | | | | (24,698 | ) | | | (17,542 | ) | | | 12,821 | |
CHANGES IN SHARES OUTSTANDING – | | | | | | | | | | | | | | | | |
ADVISOR CLASS C: | | | | | | | | | | | | | | | | |
| Shares sold | | | 31,208 | | | | 42,783 | | | | 27,642 | | | | 95,868 | |
| Shares issued in reinvestments of | | | | | | | | | | | | | | | | |
| dividends and distributions | | | — | | | | — | | | | — | | | | 34,389 | |
| Shares redeemed | | | (21,496 | ) | | | (36,924 | ) | | | (17,467 | ) | | | (35,654 | ) |
| Net increase in shares outstanding | | | 9,712 | | | | 5,859 | | | | 10,175 | | | | 94,603 | |
CHANGES IN SHARES OUTSTANDING – | | | | | | | | | | | | | | | | |
INSTITUTIONAL CLASS: | | | | | | | | | | | | | | | | |
| Shares sold | | | 332,808 | | | | 1,013,611 | | | | 29,978 | | | | 164,990 | |
| Shares issued in reinvestments of | | | | | | | | | | | | | | | | |
| dividends and distributions | | | — | | | | — | | | | — | | | | 34,737 | |
| Shares redeemed | | | (102,969 | ) | | | (775,830 | ) | | | (45,605 | ) | | | (150,570 | ) |
| Net increase (decrease) in | | | | | | | | | | | | | | | | |
| shares outstanding | | | 229,839 | | | | 237,781 | | | | (15,627 | ) | | | 49,157 | |
The accompanying notes are an integral part of these financial statements.
40
KINETICS MUTUAL FUNDS, INC. — THE FEEDER FUNDS
Statements of Changes in Net Assets — (Continued)
| | | | | | | | | | | | | |
| | | The Alternative | | | The Multi- | |
| | | Income Fund | | | Disciplinary Income Fund | |
| | | For the | | | | | | For the | | | | |
| | | Period Ended | | | For the | | | Period Ended | | | For the | |
| | | June 30, | | | Year Ended | | | June 30, | | | Year Ended | |
| | | 2019 | | | December 31, | | | 2019 | | | December 31, | |
| | | (Unaudited) | | | 2018 | | | (Unaudited) | | | 2018 | |
| | |
OPERATIONS: | | | | | | | | | | | | |
| Net investment income | | $ | 140,059 | | | $ | 212,204 | | | $ | 758,814 | | | $ | 1,740,685 | |
| Net realized gain (loss) on sale of | | | | | | | | | | | | | | | | |
| investments, foreign currency and | | | | | | | | | | | | | | | | |
| written options | | | 31,355 | | | | 12,211 | | | | (17,612 | ) | | | (106,042 | ) |
| Net change in unrealized appreciation | | | | | | | | | | | | | | | | |
| (depreciation) of investments, foreign | | | | | | | | | | | | | | | | |
| currency and written options | | | 148,648 | | | | (52,473 | ) | | | 1,787,479 | | | | (2,045,258 | ) |
| Net increase (decrease) in net assets | | | | | | | | | | | | | | | | |
| resulting from operations | | | 320,062 | | | | 171,942 | | | | 2,528,681 | | | | (410,615 | ) |
DISTRIBUTIONS TO SHAREHOLDERS: | | | | | | | | | | | | | | | | |
| No Load Class (See Note 5) | | | (33,323 | ) | | | (43,839 | ) | | | (126,497 | ) | | | (279,550 | ) |
| Advisor Class A (See Note 5) | | | (6,915 | ) | | | (7,366 | ) | | | (54,636 | ) | | | (135,583 | ) |
| Advisor Class C (See Note 5) | | | (5,010 | ) | | | (2,517 | ) | | | (141,080 | ) | | | (274,465 | ) |
| Institutional Class (See Note 5) | | | (114,042 | ) | | | (157,514 | ) | | | (464,434 | ) | | | (1,052,523 | ) |
| Total distributions to shareholders | | | (159,290 | ) | | | (211,236 | ) | | | (786,647 | ) | | | (1,742,121 | ) |
CAPITAL SHARE TRANSACTIONS – | | | | | | | | | | | | | | | | |
NO LOAD CLASS: | | | | | | | | | | | | | | | | |
| Proceeds from shares sold | | | 276,602 | | | | 1,775,799 | | | | 545,480 | | | | 1,580,972 | |
| Redemption fees | | | — | | | | 693 | | | | — | | | | — | |
| Proceeds from shares issued to holders | | | | | | | | | | | | | | | | |
| in reinvestment of dividends | | | 29,248 | | | | 38,990 | | | | 122,822 | | | | 269,844 | |
| Cost of shares redeemed | | | (580,323 | ) | | | (2,508,132 | ) | | | (1,168,891 | ) | | | (2,346,967 | ) |
| Net decrease in net assets resulting | | | | | | | | | | | | | | | | |
| from capital share transactions | | | (274,473 | ) | | | (692,650 | ) | | | (500,589 | ) | | | (496,151 | ) |
CAPITAL SHARE TRANSACTIONS – | | | | | | | | | | | | | | | | |
ADVISOR CLASS A: | | | | | | | | | | | | | | | | |
| Proceeds from shares sold | | | 129,033 | | | | 200,164 | | | | 45,226 | | | | 740,005 | |
| Proceeds from shares issued to holders | | | | | | | | | | | | | | | | |
| in reinvestment of dividends | | | 6,610 | | | | 7,098 | | | | 47,547 | | | | 120,015 | |
| Cost of shares redeemed | | | (103,345 | ) | | | (769,557 | ) | | | (498,509 | ) | | | (2,516,680 | ) |
| Net increase (decrease) in net assets | | | | | | | | | | | | | | | | |
| resulting from capital | | | | | | | | | | | | | | | | |
| share transactions | | | 32,298 | | | | (562,295 | ) | | | (405,736 | ) | | | (1,656,660 | ) |
The accompanying notes are an integral part of these financial statements.
41
KINETICS MUTUAL FUNDS, INC. — THE FEEDER FUNDS
Statements of Changes in Net Assets — (Continued)
| | | | | | | | | | | | | |
| | | The Alternative | | | The Multi- | |
| | | Income Fund | | | Disciplinary Income Fund | |
| | | For the | | | | | | For the | | | | |
| | | Period Ended | | | For the | | | Period Ended | | | For the | |
| | | June 30, | | | Year Ended | | | June 30, | | | Year Ended | |
| | | 2019 | | | December 31, | | | 2019 | | | December 31, | |
| | | (Unaudited) | | | 2018 | | | (Unaudited) | | | 2018 | |
| | |
CAPITAL SHARE TRANSACTIONS – | | | | | | | | | | | | |
ADVISOR CLASS C: | | | | | | | | | | | | |
| Proceeds from shares sold | | $ | — | | | $ | 100,725 | | | $ | 250,451 | | | $ | 2,550,446 | |
| Proceeds from shares issued to holders | | | | | | | | | | | | | | | | |
| in reinvestment of dividends | | | 4,673 | | | | 2,361 | | | | 121,618 | | | | 240,821 | |
| Cost of shares redeemed | | | (105,110 | ) | | | (506,070 | ) | | | (674,206 | ) | | | (1,640,422 | ) |
| Net increase (decrease) in net assets | | | | | | | | | | | | | | | | |
| resulting from capital | | | | | | | | | | | | | | | | |
| share transactions | | | (100,437 | ) | | | (402,984 | ) | | | (302,137 | ) | | | 1,150,845 | |
CAPITAL SHARE TRANSACTIONS – | | | | | | | | | | | | | | | | |
INSTITUTIONAL CLASS: | | | | | | | | | | | | | | | | |
| Proceeds from shares sold | | | 1,320,103 | | | | 2,595,166 | | | | 863,716 | | | | 4,284,382 | |
| Redemption fees | | | — | | | | 21 | | | | — | | | | — | |
| Proceeds from shares issued to holders | | | | | | | | | | | | | | | | |
| in reinvestment of dividends | | | 114,001 | | | | 157,456 | | | | 459,890 | | | | 1,044,349 | |
| Cost of shares redeemed | | | (1,578,824 | ) | | | (5,023,911 | ) | | | (2,769,293 | ) | | | (13,935,784 | ) |
| Net increase (decrease) in net assets | | | | | | | | | | | | | | | | |
| resulting from capital | | | | | | | | | | | | | | | | |
| share transactions | | | (144,720 | ) | | | 2,271,268 | | | | (1,445,687 | ) | | | (8,607,053 | ) |
TOTAL DECREASE IN NET ASSETS: | | | (326,560 | ) | | | (3,968,491 | ) | | | (912,115 | ) | | | (11,761,755 | ) |
NET ASSETS: | | | | | | | | | | | | | | | | |
| Beginning of period | | | 19,022,589 | | | | 22,991,080 | | | | 37,239,121 | | | | 49,000,876 | |
| End of period | | $ | 18,696,029 | | | $ | 19,022,589 | | | $ | 36,327,006 | | | $ | 37,239,121 | |
CHANGES IN SHARES OUTSTANDING – | | | | | | | | | | | | | | | | |
NO LOAD CLASS: | | | | | | | | | | | | | | | | |
| Shares sold | | | 2,825 | | | | 18,217 | | | | 50,167 | | | | 144,240 | |
| Shares issued in reinvestments of | | | | | | | | | | | | | | | | |
| dividends and distributions | | | 298 | | | | 401 | | | | 11,291 | | | | 25,153 | |
| Shares redeemed | | | (5,920 | ) | | | (25,771 | ) | | | (108,823 | ) | | | (215,707 | ) |
| Net decrease in shares outstanding | | | (2,797 | ) | | | (7,153 | ) | | | (47,365 | ) | | | (46,314 | ) |
CHANGES IN SHARES OUTSTANDING – | | | | | | | | | | | | | | | | |
ADVISOR CLASS A: | | | | | | | | | | | | | | | | |
| Shares sold | | | 1,337 | | | | 2,079 | | | | 4,133 | | | | 67,860 | |
| Shares issued in reinvestments of | | | | | | | | | | | | | | | | |
| dividends and distributions | | | 68 | | | | 74 | | | | 4,394 | | | | 11,231 | |
| Shares redeemed | | | (1,068 | ) | | | (8,043 | ) | | | (46,016 | ) | | | (232,124 | ) |
| Net increase (decrease) in | | | | | | | | | | | | | | | | |
| shares outstanding | | | 337 | | | | 5,890 | | | | (37,489 | ) | | | (153,033 | ) |
The accompanying notes are an integral part of these financial statements.
42
KINETICS MUTUAL FUNDS, INC. — THE FEEDER FUNDS
Statements of Changes in Net Assets — (Continued)
| | | | | | | | | | | | | |
| | | The Alternative | | | The Multi- | |
| | | Income Fund | | | Disciplinary Income Fund | |
| | | For the | | | | | | For the | | | | |
| | | Period Ended | | | For the | | | Period Ended | | | For the | |
| | | June 30, | | | Year Ended | | | June 30, | | | Year Ended | |
| | | 2019 | | | December 31, | | | 2019 | | | December 31, | |
| | | (Unaudited) | | | 2018 | | | (Unaudited) | | | 2018 | |
| | |
CHANGES IN SHARES OUTSTANDING – | | | | | | | | | | | | |
ADVISOR CLASS C: | | | | | | | | | | | | |
| Shares sold | | | — | | | | 1,088 | | | | 23,366 | | | | 237,920 | |
| Shares issued in reinvestments of | | | | | | | | | | | | | | | | |
| dividends and distributions | | | 50 | | | | 25 | | | | 11,363 | | | | 22,803 | |
| Shares redeemed | | | (1,132 | ) | | | (5,485 | ) | | | (62,890 | ) | | | (153,690 | ) |
| Net increase (decrease) in | | | | | | | | | | | | | | | | |
| shares outstanding | | | (1,082 | ) | | | (4,372 | ) | | | (28,161 | ) | | | 107,033 | |
CHANGES IN SHARES OUTSTANDING – | | | | | | | | | | | | | | | | |
INSTITUTIONAL CLASS: | | | | | | | | | | | | | | | | |
| Shares sold | | | 13,293 | | | | 26,221 | | | | 79,109 | | | | 391,889 | |
| Shares issued in reinvestments of | | | | | | | | | | | | | | | | |
| dividends and distributions | | | 1,147 | | | | 1,595 | | | | 42,180 | | | | 97,116 | |
| Shares redeemed | | | (15,886 | ) | | | (50,795 | ) | | | (253,477 | ) | | | (1,279,794 | ) |
| Net increase (decrease) in | | | | | | | | | | | | | | | | |
| shares outstanding | | | (1,446 | ) | | | 22,979 | | | | (132,188 | ) | | | (790,789 | ) |
The accompanying notes are an integral part of these financial statements.
43
KINETICS MUTUAL FUNDS, INC. — THE FUND
Statements of Changes in Net Assets — (Continued)
| | | | | | | |
| | | The Kinetics Spin-off and | |
| | | Corporate Restructuring Fund | |
| | | For the | | | | |
| | | Period Ended | | | For the | |
| | | June 30, | | | Year Ended | |
| | | 2019 | | | December 31, | |
| | | (Unaudited) | | | 2018 | |
OPERATIONS: | | | | | | |
| Net investment income (loss) | | $ | 58,299 | | | $ | (166,846 | ) |
| Net realized gain (loss) on sale of investments and foreign currency | | | 222,060 | | | | (117,499 | ) |
| Net change in unrealized appreciation (depreciation) of investments and foreign currency | | | 4,588,172 | | | | (1,246,793 | ) |
| Net increase (decrease) in net assets resulting from operations | | | 4,868,531 | | | | (1,531,138 | ) |
DISTRIBUTIONS TO SHAREHOLDERS: | | | | | | | | |
| No Load Class (See Note 5) | | | — | | | | (506 | ) |
| Advisor Class A (See Note 5) | | | — | | | | (153,489 | ) |
| Advisor Class C (See Note 5) | | | — | | | | (201,832 | ) |
| Institutional Class (See Note 5) | | | — | | | | (525,309 | ) |
| Total distributions to shareholders | | | — | | | | (881,136 | ) |
CAPITAL SHARE TRANSACTIONS – NO LOAD CLASS: | | | | | | | | |
| Proceeds from shares sold | | | — | | | | 2,600 | |
| Proceeds from shares issued to holders in reinvestment of dividends | | | — | | | | 506 | |
| Cost of shares redeemed | | | — | | | | — | |
| Net increase in net assets resulting from capital share transactions | | | — | | | | 3,106 | |
CAPITAL SHARE TRANSACTIONS – ADVISOR CLASS A: | | | | | | | | |
| Proceeds from shares sold | | | 261,907 | | | | 83,577 | |
| Proceeds from shares issued to holders in reinvestment of dividends | | | — | | | | 149,160 | |
| Cost of shares redeemed | | | (500,430 | ) | | | (823,693 | ) |
| Net decrease in net assets resulting from capital share transactions | | | (238,523 | ) | | | (590,956 | ) |
CAPITAL SHARE TRANSACTIONS – ADVISOR CLASS C: | | | | | | | | |
| Proceeds from shares sold | | | 21,995 | | | | 40,259 | |
| Proceeds from shares issued to holders in reinvestment of dividends | | | — | | | | 201,572 | |
| Cost of shares redeemed | | | (880,877 | ) | | | (1,087,034 | ) |
| Net decrease in net assets resulting from capital share transactions | | | (858,882 | ) | | | (845,203 | ) |
The accompanying notes are an integral part of these financial statements.
44
KINETICS MUTUAL FUNDS, INC. — THE FUND
Statement of Changes in Net Assets — (Continued)
| | | | | | | |
| | | The Kinetics Spin-off and | |
| | | Corporate Restructuring Fund | |
| | | For the | | | | |
| | | Period Ended | | | For the | |
| | | June 30, | | | Year Ended | |
| | | 2019 | | | December 31, | |
| | | (Unaudited) | | | 2018 | |
CAPITAL SHARE TRANSACTIONS – INSTITUTIONAL CLASS | | | | | | |
| Proceeds from shares sold | | $ | 236,671 | | | $ | 300,943 | |
| Proceeds from shares issued to holders in reinvestment of dividends | | | — | | | | 442,957 | |
| Cost of shares redeemed | | | (538,519 | ) | | | (2,088,988 | ) |
| Net decrease in net assets resulting from capital share transactions | | | (301,848 | ) | | | (1,345,088 | ) |
TOTAL INCREASE (DECREASE) IN NET ASSETS: | | | 3,469,278 | | | | (5,190,415 | ) |
NET ASSETS: | | | | | | | | |
| Beginning of period | | | 18,718,463 | | | | 23,908,878 | |
| End of period | | $ | 22,187,741 | | | $ | 18,718,463 | |
CHANGES IN SHARES OUTSTANDING – NO LOAD CLASS: | | | | | | | | |
| Shares sold | | | — | | | | 195 | |
| Shares issued in reinvestments of dividends and distributions | | | — | | | | 52 | |
| Shares redeemed | | | — | | | | — | |
| Net increase in shares outstanding | | | — | | | | 247 | |
CHANGES IN SHARES OUTSTANDING – ADVISOR CLASS A: | | | | | | | | |
| Shares sold | | | 24,171 | | | | 6,872 | |
| Shares issued in reinvestments of dividends and distributions | | | — | | | | 16,073 | |
| Shares redeemed | | | (44,882 | ) | | | (73,949 | ) |
| Net decrease in shares outstanding | | | (20,711 | ) | | | (51,004 | ) |
CHANGES IN SHARES OUTSTANDING – ADVISOR CLASS C: | | | | | | | | |
| Shares sold | | | 2,038 | | | | 3,328 | |
| Shares issued in reinvestments of dividends and distributions | | | — | | | | 23,010 | |
| Shares redeemed | | | (84,024 | ) | | | (102,216 | ) |
| Net decrease in shares outstanding | | | (81,986 | ) | | | (75,878 | ) |
CHANGES IN SHARES OUTSTANDING – INSTITUTIONAL CLASS: | | | | | | | | |
| Shares sold | | | 20,061 | | | | 25,225 | |
| Shares issued in reinvestments of dividends and distributions | | | — | | | | 47,528 | |
| Shares redeemed | | | (48,097 | ) | | | (182,315 | ) |
| Net decrease in shares outstanding | | | (28,036 | ) | | | (109,562 | ) |
The accompanying notes are an integral part of these financial statements.
45
KINETICS MUTUAL FUNDS, INC. — THE FEEDER FUNDS
Notes to Financial Statements
June 30, 2019 (Unaudited)
1. Organization
Kinetics Mutual Funds, Inc. (the “Company”) is registered under the Investment Company Act of 1940, as amended (the “1940 Act”), and is incorporated in the State of Maryland. The Company is an open-end management investment company issuing its shares in series. One billion shares are authorized for the Company with a par value of $0.001 per share. The series of the Company presently authorized are The Internet Fund (“Internet”), The Global Fund (“Global”), The Paradigm Fund (“Paradigm”), The Medical Fund (“Medical”), The Small Cap Opportunities Fund (“Small Cap”), The Market Opportunities Fund (“Market Opportunities”), The Alternative Income Fund (“Alternative Income”), The Multi-Disciplinary Income Fund (“Multi-Disciplinary Income”) and The Kinetics Spin-off and Corporate Restructuring Fund (“Spin-off Fund”). Investment operations of the Company began on October 21, 1996 (Internet), September 30, 1999 (Medical), December 31, 1999 (Global and Paradigm), March 20, 2000 (Small Cap), January 31, 2006 (Market Opportunities), June 29, 2007 (Alternative Income), February 11, 2008 (Multi-Disciplinary Income) and May 4, 2007 (Spin-off Fund). The Spin-off Fund completed a plan of reorganization at the close of business on December 8, 2017 to begin operations under the Company. Prior to December 8, 2017, the Spin-off Fund, was known as Horizon Spin-off and Corporate Restructuring a series of Investment Managers Series Trust. Each series, except the Spin-off Fund, unlike many other investment companies which directly acquire and manage their own portfolios of securities, seeks to achieve its investment objective by investing all of its investable assets in a corresponding portfolio series (each a “Master Portfolio” and collectively the “Master Portfolios”) of Kinetics Portfolios Trust (the “Trust”). The Spin-off Fund does not invest all of its investable assets in a Master Portfolio and will directly acquire and manage its own portfolio of securities.
On April 28, 2000 (January 31, 2006, with respect to Market Opportunities, June 29, 2007, with respect to Alternative Income, and February 11, 2008, with respect to Multi-Disciplinary Income), each series in the Company, except for the Spin-off Fund, entered into a master-feeder fund structure. By entering into this structure, each series, except for the Spin-off Fund, (each a “Feeder Fund” and collectively, the “Feeder Funds”) invested all of its assets in a corresponding Master Portfolio which had the same investment objective as the Feeder Fund. Each Master Portfolio has multiple feeder funds. Each Feeder Fund receives a proportionate amount of interest in the Master Portfolio equal to its relative contribution of capital. Thus, each Feeder Fund is allocated its portion of income, gains (losses) and expenses from the Master Portfolio.
46
KINETICS MUTUAL FUNDS, INC. — THE FEEDER FUNDS
Notes to Financial Statements — (Continued)
June 30, 2019 (Unaudited)
Each Feeder Fund’s respective interest in the corresponding Master Portfolio as of June 30, 2019, is as follows:
| | |
| | Interest in |
| | Master Portfolio |
| The Internet Fund | 99.978% |
| The Global Fund | 99.930% |
| The Paradigm Fund | 97.702% |
| The Medical Fund | 99.772% |
| The Small Cap Opportunities Fund | 99.978% |
| The Market Opportunities Fund | 99.968% |
| The Alternative Income Fund | 99.317% |
| The Multi-Disciplinary Income Fund | 99.484% |
Prior to the conversion to a master-feeder fund structure on April 28, 2000, each then existing series conducted its own investment operations.
As of June 30, 2019, each of the Funds offers Advisor Class A shares. Advisor Class A shares are subject to an annual Rule 12b-1 fee of 0.25% of average daily net assets and a shareholder servicing fee of 0.25% of average daily net assets. The Advisor Class A shares are also subject to a front-end sales charge of 5.75%.
As of June 30, 2019, each of the Funds offers Advisor Class C shares. Advisor Class C shares are subject to an annual Rule 12b-1 fee of 0.75% of average daily net assets and a shareholder servicing fee of 0.25% of average daily net assets. If you sell your Advisor Class C shares within 12 months of purchase, you will have to pay a contingent deferred sales charge of 1.00%, which is applied to the NAV of the shares on the date of original purchase or on the date of redemption, whichever is less.
As of June 30, 2019, each of the Funds offers No Load Class shares. No Load Class shares are subject to a shareholder servicing fee of 0.25% of average daily net assets but do not have 12b-1 fees or a sales charge.
As of June 30, 2019, the Paradigm, Small Cap, Market Opportunities, Alternative Income, Multi-Disciplinary Income and Spin-off funds offer Institutional Class shares. Institutional Class shares are subject to a shareholder servicing fee of 0.20% of average daily net assets but do not have 12b-1 fees or a sales charge. The Adviser has contractually agreed to waive the portion of the Institutional Class shareholder servicing fee in excess of 0.05%.
47
KINETICS MUTUAL FUNDS, INC. — THE FEEDER FUNDS
Notes to Financial Statements — (Continued)
June 30, 2019 (Unaudited)
Each class of shares for each Feeder Fund and the Spin-off Fund has identical rights and privileges except with respect to the Rule 12b-1 fees paid by the Advisor Class A and Advisor Class C shares, the front-end sales charge on the Advisor Class A shares, the contingent deferred sales charge on Class C, the shareholder servicing fees paid by the Advisor Class A, Advisor Class C, No Load Class and Institutional Class shares, voting rights on matters pertaining to a single class of shares and the exchange privileges of each class of shares. Shares of each Feeder Fund and the Spin-off Fund will assess a 2.00% redemption fee (with exceptions) on shares redeemed or exchanged within 30 days of purchase. Income, expenses (other than expenses attributable to a specific class), and realized and unrealized gains or losses on investments are allocated to each class based on its relative net assets.
Refer to the Master Portfolios’ financial statements to obtain information about the investment objective of the corresponding Feeder Fund. The financial statements of the Master Portfolios, including the portfolios of investments, are contained elsewhere in this report and should be read in conjunction with the Feeder Funds’ financial statements.
2. Significant Accounting Policies
Security Valuation
Master Portfolios and Spin-off Fund equity securities that are listed on a securities exchange for which market quotations are readily available are valued at the last quoted sale price on the day the valuation is made. Price information on listed securities is taken from the exchange where the security is primarily traded. All equity securities, including exchange-traded funds, that are traded using the National Association of Securities Dealers’ Automated Quotation System (“NASDAQ”) are valued using the NASDAQ Official Closing Price (“NOCP”). In the event market quotations are not readily available or if events occur that may materially affect the value of a particular security between the time trading ends on a particular security and the close of regular trading on the New York Stock Exchange (“NYSE”), “fair value” will be determined. Unlisted equity securities and listed equity securities not traded on the valuation date for which market quotations are readily available are valued at the last bid price. Futures, options on futures and swap contracts that are listed or traded on a national securities exchange, commodities exchange,
48
KINETICS MUTUAL FUNDS, INC. — THE FEEDER FUNDS
Notes to Financial Statements — (Continued)
June 30, 2019 (Unaudited)
contract market or over-the-counter markets and are freely transferable will be valued at the composite price, using the National Best Bid and Offer quotes (“NBBO”). NBBO consists of the highest bid price and lowest ask price across any of the exchanges on which an option is quoted, thus providing a view across the entire U.S. options marketplace. Composite option pricing calculates the mean of the highest bid price and lowest ask price across the exchanges where the option is traded. If a composite option price is not available, then a quote provided by one of the authorized pricing vendors will be used. If neither a composite price nor a quote from an authorized pricing provider is available, and it is the day of expiration or post-expiration, expiring options will be priced at intrinsic value. Non-exchange-traded options for which over-the-counter quotations are not readily available are valued at the mean between the last bid and asked quotations. Debt obligations (including convertible securities) that are either investment grade or below investment grade and irrespective of days to maturity are valued at evaluated mean by one of the authorized third party pricing agents which rely on various valuation methodologies such as matrix pricing and other analytical pricing models as well as market transactions and dealer quotations. Certain instruments, such as repurchase agreements and demand notes, do not have values from third parties and are valued at amortized cost. Investments in registered open-end investment companies (including money market funds), other than exchange-traded funds, are valued at their reported net asset value (“NAV”).
Other assets and securities for which no quotations are readily available (including restricted securities) will be valued in good faith at fair value using methods determined by the Board of Trustees of the Master Portfolios and Spin-off Fund. In determining the fair value of a security, the Board of Trustees shall take into account the relevant factors and surrounding circumstances, which may include: (i) the nature and pricing history (if any) of the security; (ii) whether any dealer quotations for the security are available; (iii) possible valuation methodologies that could be used to determine the fair value of the security; (iv) the recommendation of the portfolio manager of the Portfolios with respect to the valuation of the security; (v) whether the same or similar securities are held by other funds managed by the Adviser or other funds and the method used to price the security in those funds; (vi) the extent to which the fair value to be determined for the security will result from the use of data
49
KINETICS MUTUAL FUNDS, INC. — THE FEEDER FUNDS
Notes to Financial Statements — (Continued)
June 30, 2019 (Unaudited)
or formula produced by third parties independent of the Adviser; (vii) the liquidity or illiquidity of the market for the security; and (viii) the value of a foreign security traded on other foreign markets. At June 30, 2019, 0.00% and 0.00% of the net assets of The Internet Portfolio and The Paradigm Portfolio, respectively, were fair valued securities. The other Master Portfolios and Spin-off Fund did not hold any fair valued securities at June 30, 2019.
Bitcoin
The Master Portfolios and Spin-off Fund may invest in Grayscale Bitcoin Trust, a Delaware statutory trust (“Bitcoin Trust”) that invests in bitcoins. From time to time, the Bitcoin Trust issues creation units in exchange for bitcoins and distributes bitcoins in exchange for redemption units. The performance of the Bitcoin Trust is intended to reflect changes in the value of the Trust’s bitcoin investments. At June 30, 2019, 23.4%, 16.0%, 3.6%, 1.5%, and 10.1% of the net assets of The Internet Portfolio, The Global Portfolio, The Paradigm Portfolio, The Small Cap Opportunities Portfolio and The Market Opportunities Portfolio, respectively, were invested in the Bitcoin Trust. Investments in bitcoins produce non qualifying income under subchapter M of the Internal Revenue Code.
Bitcoin is a decentralized digital currency that enables instant transfers to anyone, anywhere in the world. Managing transactions in bitcoins occurs via an open source, cryptographic protocol central authority. The Bitcoin Network is an online, end-user-to-end-user network that hosts the public transaction ledger, known as the Blockchain, and the source code that comprises the basis for the cryptographic and algorithmic protocols governing the Bitcoin Network. No single entity owns or operates the Bitcoin Network, the infrastructure of which is collectively maintained by a decentralized user base. Since the Bitcoin Network is decentralized, it does not rely on either governmental authorities or financial institutions to create, transmit or determine the value of bitcoins. Rather, the value of bitcoins is determined by the supply of and demand for bitcoins in the global bitcoin exchange market for the trading of bitcoins, which consists of transactions on electronic bitcoin exchanges (“Bitcoin Exchanges”). Pricing on Bitcoin Exchanges and other venues can be volatile and can adversely affect the value of the Bitcoin Trust. Currently, there is relatively small use of bitcoins in the retail and commercial marketplace in comparison to the relatively large use of bitcoins by speculators, thus contributing to price volatility that could adversely affect a Master Portfolio’s direct or indirect
50
KINETICS MUTUAL FUNDS, INC. — THE FEEDER FUNDS
Notes to Financial Statements — (Continued)
June 30, 2019 (Unaudited)
investment in the Bitcoin Trust. Bitcoin transactions are irrevocable, and stolen or incorrectly transferred bitcoins may be irretrievable. As a result, any incorrectly executed bitcoin transactions could adversely affect the value of a Master Portfolio’s direct or indirect investment in the Bitcoin Trust. Shares of the Bitcoin Trust may trade at a premium or discount to the net asset value of the Bitcoin Trust. The price of bitcoins is set in transfers by mutual agreement or barter as well as the number of merchants that accept bitcoins. Because bitcoins are digital files that can be transferred without the involvement of intermediaries or third parties, there are little or no transaction costs in direct end-user-to-end-user transactions. Bitcoins can be used to pay for goods and services or can be converted to fiat currencies, such as the U.S. dollar, at rates determined by the Bitcoin Exchanges. Additionally, third party service providers such as Bitcoin Exchanges are also used for transfers but they may charge significant fees for processing transactions.
As bitcoins have grown in popularity, the U.S. Congress and a number of federal and state agencies (including the Financial Crimes Enforcement Network (FinCEN), the U.S. Securities and Exchange Commission, the Commodity Futures Trading Commission, the Financial Industry Regulatory Authority, the Consumer Financial Protection Bureau, the Department of Justice, the Department of Homeland Security, the Federal Bureau of Investigation, the IRS, and state financial institution regulators) have begun to examine the operations of the network that facilitates bitcoins, bitcoin users and the Bitcoin Exchanges, with particular focus on (1) the extent to which bitcoins can be used to launder the proceeds of illegal activities or fund criminal or terrorist enterprises, (2) the safety and soundness of the Bitcoin Exchange or other service-providers that hold bitcoins for users and (3) other risks to investors and consumers who hold and use bitcoins. Ongoing and future regulatory actions may alter, perhaps to a materially adverse extent, the value of a Master Portfolio’s and it’s Subsidiary’s investment in the Bitcoin Trust or the ability of the Bitcoin Trust to continue to operate.
Repurchase Agreements
Each Master Portfolio and the Spin-off Fund may enter into repurchase agreements with banks that are members of the Federal Reserve System or securities dealers who are members of a national securities exchange or are primary dealers in U.S. Government Securities. In connection with transactions
51
KINETICS MUTUAL FUNDS, INC. — THE FEEDER FUNDS
Notes to Financial Statements — (Continued)
June 30, 2019 (Unaudited)
in repurchase agreements, it is the Trust’s policy that the Master Portfolios and Spin-off Fund receive, as collateral, securities whose market value, including accrued interest, at all times will be at least equal to 102% of the amount invested by the Master Portfolio and Spin-off Fund in each repurchase agreement. If the seller defaults and the value of the collateral declines, realization of the collateral by the Master Portfolio and Spin-off Fund may be delayed or limited.
Written Options
The Master Portfolios and Spin-off Fund may write (sell) call or put options for trading or hedging purposes. When a Master Portfolio or Spin-off Fund writes an option, an amount equal to the premium received by the Master Portfolio or Spin-off Fund is included in the Statement of Assets and Liabilities as an asset and an equivalent liability. The amount of the liability is subsequently marked-to-market to reflect the current value of the option written. By writing the option, the Master Portfolio or Spin-off Fund may become obligated during the term of the option to deliver or purchase the securities underlying the option at the exercise price if the option is exercised. When an option expires on its stipulated expiration date or the Master Portfolio or Spin-off Fund enters into a closing purchase transaction, the Master Portfolio or Spin-off Fund realizes a gain or loss if the cost of the closing transaction differs from the premium received when the option was sold, without regard to any unrealized gain or loss on the underlying security, and the liability related to such option is eliminated. When an option is exercised, the premium originally received decreases the cost basis of the underlying security (or increases the proceeds on the security sold short) and the Master Portfolio or Spin-off Fund realizes a gain or loss from the sale of the security (or closing of the short sale). As collateral for uncovered written options, each of the Master Portfolios and Spin-off Fund are required under the 1940 Act to maintain assets consisting of cash, cash equivalents or unencumbered, liquid securities. This collateral is required to be adjusted daily to reflect the exercise price of the purchase obligation for put options or the market value of the instrument underlying the contract for call options.
52
KINETICS MUTUAL FUNDS, INC. — THE FEEDER FUNDS
Notes to Financial Statements — (Continued)
June 30, 2019 (Unaudited)
Foreign Currency Translations
The books and records of the Master Portfolios and Spin-off Fund are maintained in U.S. dollars. For the Master Portfolios and Spin-off Fund, foreign currency transactions are translated into U.S. dollars on the following basis: (i) market values of investment securities and other assets and liabilities are translated at the exchange rate of such currencies against the U.S. dollar, as provided by an approved pricing service, and (ii) purchases and sales of investment securities, dividend and interest income and certain expenses at the rates of exchange prevailing on the respective dates of such transactions. The Master Portfolios and Spin-off Fund do not isolate and treat as ordinary income that portion of the results of operations arising as a result of changes in the exchange rate from the fluctuations arising from changes in the market prices of securities held during the period. Such fluctuations are included with the net realized and unrealized gain or loss from investments. However, for federal income tax purposes, the Master Portfolios and Spin-off Fund do isolate and treat as ordinary income the effect of changes in foreign exchange rates arising from actual foreign currency transactions and the effect of changes in foreign exchange rates arising between trade date and settlement date.
Restricted and Illiquid Securities
The Master Portfolios and Spin-off Fund may invest in restricted securities. These securities are valued by the Master Portfolios and Spin-off Fund after giving due consideration to pertinent factors including recent private sales, market conditions and the issuer’s financial performance. The Master Portfolios and Spin-off Fund have no right to require registration of unregistered securities. The 144A securities have been deemed to be liquid by the Master Portfolio and Spin-off Fund’s Adviser under the supervision of the Board of Trustees/Directors. At June 30, 2019, the following Master Portfolios and Spin-off Fund held securities restricted to institutional investors (144A securities):
| | | |
| | | Percentage of |
| | Market Value | Net Assets |
| The Multi-Disciplinary Income Portfolio | $9,062,233 | 24.79% |
53
KINETICS MUTUAL FUNDS, INC. — THE FEEDER FUNDS
Notes to Financial Statements — (Continued)
June 30, 2019 (Unaudited)
An illiquid asset is any asset which may not be sold or disposed of in current market conditions within seven days without the sale or disposition significantly changing the market value of the investment. At June 30, 2019, the following Master Portfolios and Spin-off Fund held illiquid securities:
| | | | | | | |
| | | | | | Percentage of | |
| | | Market Value | | | Net Assets | |
| The Internet Portfolio | | $ | — | * | | | 0.00 | % |
| The Paradigm Portfolio | | | — | * | | | 0.00 | % |
| The Multi-Disciplinary Income Portfolio | | | 160,760 | | | | 0.44 | % |
| * Amount is less than $0.50 |
When-Issued Securities
The Master Portfolios and Spin-off Fund may purchase securities on a when-issued or delayed delivery basis. Although the purchase amounts of these securities are established at the time the purchaser enters into the agreement, these securities may be delivered and paid for at a future date. The Master Portfolios and Spin-off Fund record purchases of when-issued securities and reflect the values of such securities in determining net asset value in the same manner as other portfolio securities. The Master Portfolios and Spin-off Fund maintain at all times cash or other liquid assets in an amount at least equal to the amount of outstanding commitments for when-issued securities.
Securities Lending
Each Master Portfolio and Spin-off Fund may lend its portfolio securities to broker-dealers by entering directly into lending arrangements with such broker-dealers or indirectly through repurchase agreements with respect to no more than 33 1 / 3 % of the total assets of each Master Portfolio and Spin-off Fund (including any collateral posted) or 50% of the total assets of each Master Portfolio and Spin-off Fund (excluding any collateral posted). Securities lending and repurchase transactions will be fully collateralized at all times with cash and/or short-term debt obligations. The Master Portfolios and Spin-off Fund receive interest on the collateral received as well as a fee for the securities loaned.
54
KINETICS MUTUAL FUNDS, INC. — THE FEEDER FUNDS
Notes to Financial Statements — (Continued)
June 30, 2019 (Unaudited)
Expense Allocation
Common expenses incurred by the Funds are allocated among the Funds (i) based upon relative average net assets, (ii) as incurred on a specific identification basis, or (iii) equally among the Funds, depending on the nature of the expenditure.
Each Feeder Fund records its proportionate share of the corresponding Master Portfolio’s expenses on a daily basis. In addition, each Feeder Fund accrues its own separate expenses. Any cap on expenses includes Feeder Fund-specific expenses as well as the expenses allocated from the Master Portfolio.
Federal Income Taxes
Each Master Portfolio will be treated as a partnership for federal income tax purposes. As such, each investor in a Master Portfolio via its investment in a Feeder Fund will be subject to taxation on its share of the Master Portfolio’s ordinary income and capital gains. It is intended that the Master Portfolio’s assets will be managed so an investor in the Master Portfolio via its investment in a Feeder Fund can satisfy the requirements of subchapter M of the Internal Revenue Code. It is intended that the Spin-off Fund will be managed to satisfy the requirements of subchapter M of the Internal Revenue Code.
The consolidated financial statements include the accounts of Cayman, Ltd., Cayman wholly-owned Controlled Foreign Corporations (“CFCs”) and the accounts of Delaware Corporations (“Cayman” or “Delaware”, respectively, or “Subsidiaries” for both). The respective Master Portfolios hold a CFC: Internet Portfolio, Global Portfolio, Paradigm Portfolio, Small Cap Opportunities Portfolio and Market Opportunities Portfolio. The respective Master Portfolios hold a Delaware subsidiary: Internet Portfolio, Global Portfolio and Market Opportunities Portfolio. The investment of up to 25% of a Master Portfolio’s assets in the Subsidiaries is a structure that has been used by a number of Registered Investment Companies (“RICs”), avoiding bad income generation by indirectly making commodities-related investments. These investments would not generate qualifying income if they were made directly by the RIC. Section 851(b) of the Internal Revenue Code provides that income earned by a CFC or controlled subsidiary, such as the Subsidiaries, will be treated as qualifying income for a RIC provided the Subsidiaries distribute those earnings out to the RIC each year. If the IRS were to determine that income derived from a Master Portfolio’s investment in its Subsidiaries do not constitute qualifying income
55
KINETICS MUTUAL FUNDS, INC. — THE FEEDER FUNDS
Notes to Financial Statements — (Continued)
June 30, 2019 (Unaudited)
and if such positions were upheld by a court, or if future legislation or Treasury regulations were to adversely affect the tax treatment of such investments, then the corresponding Feeder Fund might cease to qualify as a RIC and could be required to reduce its exposure to such investments. In that event, a Feeder Fund’s taxable income would be subject to tax at the Feeder Fund level at regular corporate tax rates (without reduction for distributions to shareholders) and to a further tax at the shareholder level when such income is distributed. In such an event, in order to re-qualify for taxation as a regulated investment company, the Feeder Fund may be required to recognize unrealized gains, pay substantial taxes and interest and make certain distributions.
It is the Funds’ policy to meet the requirements of the Internal Revenue Code applicable to regulated investment companies and the Funds intend to distribute investment company net taxable income and net capital gains to shareholders.
Dividends from net investment income and distributions of net realized capital gains, if any, will be declared and paid at least annually. The character of distributions made during the year from net investment income or net realized gains may differ from the characterization for federal income tax purposes due to differences in the recognition of income, expenses and realized gain items for financial statement and tax purposes. Additionally, the Funds may utilize earnings and profits distributed to shareholders on redemption of shares as part of the dividends paid deduction for income tax purposes. Where appropriate, reclassifications between capital accounts are made for such differences that are permanent in nature.
There is no tax liability resulting from unrecognized tax benefits relating to uncertain income tax positions taken or expected to be taken in future tax returns. As of June 30, 2019, open tax years include the tax years ended December 31, 2015 through December 31, 2018. The Funds are also not aware of any tax positions for which it is reasonably possible that the total amounts of unrecognized tax benefits will significantly change in the next six months.
56
KINETICS MUTUAL FUNDS, INC. — THE FEEDER FUNDS
Notes to Financial Statements — (Continued)
June 30, 2019 (Unaudited)
Use of Estimates
The preparation of financial statements in conformity with U.S. generally accepted accounting principles (”GAAP”) requires management to make estimates and assumptions that affect the reported amounts in the financial statements. Actual results could differ from those estimates.
Other
Realized gains and losses on the sale of investments are calculated on the identified cost basis. Dividend income is recorded on the ex-dividend date. Interest income is accounted for on the accrual basis and includes amortization of premiums and accretion of discounts on the effective interest method. Other noncash dividends are recognized as investment income at the fair value of the property received. Withholding taxes on foreign dividends have been incorporated in accordance with the Company’s understanding of the applicable country’s tax rules and rates.
3. Investment Adviser
The Trust has entered into Investment Advisory Agreements (the “Agreements”) with Horizon Kinetics Asset Management LLC (the “Adviser”), with whom certain officers and trustees of the Trust are affiliated, to furnish investment advisory services to the Master Portfolios and Spin-off Fund. The Adviser is a wholly-owned subsidiary of Horizon Kinetics LLC. Under the terms of the Agreements, the Master Portfolios, except the Alternative Income Portfolio, compensate the Adviser for its management services at the annual rate of 1.25% of each Master Portfolio’s average daily net assets. The Alternative Income Portfolio compensates the Adviser for its management services at the annual rate of 0.90% of the Master Portfolio’s average daily net assets. The Spinoff Fund compensates the Adviser for its management services at the annual rate of 1.00% of the Fund’s average daily net assets.
The Adviser has agreed to waive a portion of its advisory fee and/or reimburse certain operating expenses as deemed appropriate through at least May 1, 2020. The Adviser may discontinue the waiver/reimbursement at any time after May 1, 2020; these waivers/reimbursements are not subject to recapture. Operating expenses exclude brokerage commissions, borrowing costs on
57
KINETICS MUTUAL FUNDS, INC. — THE FEEDER FUNDS
Notes to Financial Statements — (Continued)
June 30, 2019 (Unaudited)
securities sold short, short dividends, interest expense, taxes, acquired fund fees and expenses and extraordinary expenses. Below are operating expense limitations by each share class of each of the funds:
| | | | | | | |
| | | The Internet | | | The Global | |
| | | Fund | | | Fund | |
| No Load Class | | | 1.89 | % | | | 1.39 | % |
| Class A | | | 2.14 | % | | | 1.64 | % |
| Class C | | | 2.64 | % | | | 2.14 | % |
| | |
| | | The Paradigm | | | The Medical | |
| | | Fund | | | Fund | |
| No Load Class | | | 1.64 | % | | | 1.39 | % |
| Class A | | | 1.89 | % | | | 1.64 | % |
| Class C | | | 2.39 | % | | | 2.14 | % |
| Institutional Class | | | 1.44 | % | | | N/A | |
| | |
| | | The Small Cap | | | The Market | |
| | | Opportunities | | | Opportunities | |
| | | Fund | | | Fund | |
| No Load Class | | | 1.64 | % | | | 1.40 | % |
| Class A | | | 1.89 | % | | | 1.65 | % |
| Class C | | | 2.39 | % | | | 2.15 | % |
| Institutional Class | | | 1.44 | % | | | 1.20 | % |
| | |
| | | The | | | The Multi- | |
| | | Alternative | | | Disciplinary | |
| | | Income | | | Income | |
| | | Fund | | | Fund | |
| No Load Class | | | 0.95 | % | | | 1.49 | % |
| Class A | | | 1.20 | % | | | 1.74 | % |
| Class C | | | 1.70 | % | | | 2.24 | % |
| Institutional Class | | | 0.75 | % | | | 1.29 | % |
| | |
| | | The | | | | | |
| | | Spin-off | | | | | |
| | | Fund | | | | | |
| No Load Class | | | 1.45 | % | | | | |
| Class A | | | 1.50 | % | | | | |
| Class C | | | 2.25 | % | | | | |
| Institutional Class | | | 1.25 | % | | | | |
58
KINETICS MUTUAL FUNDS, INC. — THE FEEDER FUNDS
Notes to Financial Statements — (Continued)
June 30, 2019 (Unaudited)
For the period ended June 30, 2019, the rate earned by the Adviser from the Master Portfolios and Spin-off Fund and the waived fees/reimbursed expenses for the Funds are as follows:
| | | | | | | |
| | | The Internet | | | The Global | |
| | | Fund | | | Fund | |
| Annual Advisory Rate | | | 1.25 | % | | | 1.25 | % |
| Expenses Reimbursed by Adviser through | | | | | | | | |
| voluntary waiver | | $ | — | | | $ | 76,894 | |
| | |
| | | The Paradigm | | | The Medical | |
| | | Fund | | | Fund | |
| | |
| Annual Advisory Rate | | | 1.25 | % | | | 1.25 | % |
| Expenses Reimbursed by Adviser through | | | | | | | | |
| voluntary waiver | | $ | 343,898 | | | $ | 81,083 | |
| Expenses Reimbursed by Adviser through | | | | | | | | |
| institutional class shareholder servicing | | | | | | | | |
| fee waiver | | $ | 139,490 | | | | N/A | |
| | |
| | | The Small Cap | | | The Market | |
| | | Opportunities | | | Opportunities | |
| | | Fund | | | Fund | |
| Annual Advisory Rate | | | 1.25 | % | | | 1.25 | % |
| Expenses Reimbursed by Adviser through | | | | | | | | |
| voluntary waiver | | $ | 175,503 | | | $ | 202,037 | |
| Expenses Reimbursed by Adviser through | | | | | | | | |
| institutional class shareholder servicing | | | | | | | | |
| fee waiver | | $ | 39,998 | | | $ | 7,880 | |
| | |
| | | The | | | The Multi- | |
| | | Alternative | | | Disciplinary | |
| | | Income | | | Income | |
| | | Fund | | | Fund | |
| Annual Advisory Rate | | | 0.90 | % | | | 1.25 | % |
| Expenses Reimbursed by Adviser through | | | | | | | | |
| voluntary waiver | | $ | 101,416 | | | $ | 119,487 | |
| Expenses Reimbursed by Adviser through | | | | | | | | |
| institutional class shareholder | | | | | | | | |
| servicing fee waiver | | $ | 9,575 | | | $ | 15,632 | |
59
KINETICS MUTUAL FUNDS, INC. — THE FEEDER FUNDS
Notes to Financial Statements — (Continued)
June 30, 2019 (Unaudited)
| | |
| | The |
| | Spin-off |
| | Fund |
| Annual Advisory Rate | 1.00% |
| |
| Expenses Reimbursed by Adviser through | |
| voluntary waiver | $61,410 |
| |
| Expenses Reimbursed by Adviser through | |
| institutional class shareholder servicing | |
| fee waiver | $10,085 |
The Adviser receives the shareholder servicing fees from the No Load Class, Advisor Class A and Advisor Class C shares of a Fund pursuant to a Shareholder Servicing Agreement in the amount equal to 0.25% of the Funds’ average daily net assets attributable to No Load Class, Advisor Class A and Advisor Class C shares, respectively. For the Institutional Class, the Adviser receives a shareholder servicing fee pursuant to a shareholder servicing agreement in the amount equal to 0.20% of a Funds’ average daily net assets attributable to Institutional Class shares. At this time, the Adviser has contractually agreed to waive and/or reimburse the portion of the Institutional Class shareholder servicing fee in excess of 0.05% of a Funds’ average daily net assets attributable to Institutional Class shares until at least May 1, 2020. For the period ended June 30, 2019, the Adviser waived amounts depicted in the above table in shareholder servicing fees for the Institutional Class of the Paradigm, Small Cap, Market Opportunities, Alternative Income, Multi-Disciplinary Income and Spinoff Funds.
| | | | |
| | | Shareholder Servicing | |
| | | Expenses for the | |
| | | period ended | |
| | | June 30, 2019 | |
| The Internet Fund | | $ | 148,154 | |
| The Global Fund | | | 15,320 | |
| The Paradigm Fund | | | 910,589 | |
| The Medical Fund | | | 20,803 | |
| The Small Cap Opportunities Fund | | | 367,808 | |
| The Market Opportunities Fund | | | 99,426 | |
| The Alternative Income Fund | | | 20,477 | |
| The Multi-Disciplinary Income Fund | | | 41,286 | |
| The Spin-off Fund | | | 23,789 | |
60
KINETICS MUTUAL FUNDS, INC. — THE FEEDER FUNDS
Notes to Financial Statements — (Continued)
June 30, 2019 (Unaudited)
The Adviser is responsible for paying a portion of these shareholder servicing fees to various agents that have a written shareholder servicing agreement with the Adviser and that perform shareholder servicing functions and maintenance of shareholder accounts on behalf of their clients who own shares of the Funds.
For the period ended June 30, 2019, the Funds were allocated approximately $13,000 for the services of the Chief Compliance Officer employed by the Adviser.
The Company, on behalf of the Funds, has adopted two Retail Distribution Plans pursuant to Rule 12b-1 under the 1940 Act (each a “12b-1 Plan”). One 12b-1 Plan is for Advisor Class A shares, while the other 12b-1 Plan is for Advisor Class C shares. Under the 12b-1 Plan for Advisor Class A shares, Advisor Class A shares may pay up to an annual rate of 0.50% of the average daily net asset value of Advisor Class A shares to the Distributor or other qualified recipients under the 12b-1 Plan. During the period ended June 30, 2019, payments under the 12b-1 Plan for the Advisor Class A shares of the Internet, Global, Paradigm, Medical, Small Cap, Market Opportunities, Alternative Income, Multi-Disciplinary Income and Spin-off Funds were limited to 0.25% of the average daily net asset value of such shares of such Funds. Under the second 12b-1 Plan, Advisor Class C shares pay an annual rate of 0.75% of the average daily net asset value of such shares.
| | | | | | | |
| | | 12b-1 Expenses for | |
| | | the period ended | |
| | | June 30, 2019 | |
| | | Advisor Class A | | | Advisor Class C | |
| The Internet Fund | | $ | 3,433 | | | $ | 4,312 | |
| The Global Fund | | | 1,500 | | | | 17,809 | |
| The Paradigm Fund | | | 140,505 | | | | 444,144 | |
| The Medical Fund | | | 1,633 | | | | 1,015 | |
| The Small Cap Opportunities Fund | | | 28,645 | | | | 38,730 | |
| The Market Opportunities Fund | | | 8,830 | | | | 36,711 | |
| The Alternative Income Fund | | | 1,224 | | | | 3,847 | |
| The Multi-Disciplinary Income Fund | | | 3,399 | | | | 29,238 | |
| The Spin-off Fund | | | 4,845 | | | | 16,441 | |
61
KINETICS MUTUAL FUNDS, INC. — THE FEEDER FUNDS
Notes to Financial Statements — (Continued)
June 30, 2019 (Unaudited)
Kinetics Funds Distributor, LLC (the “Distributor”) acts as the Funds’ principal underwriter in a continuous public offering of the Funds’ shares. The Distributor is an affiliate of the Adviser.
| | | | |
| | | Distributor Sales | |
| | | Load Fees for the | |
| | | period ended | |
| | | June 30, 2019 | |
| The Internet Fund | | $ | — | |
| The Global Fund | | | 69 | |
| The Paradigm Fund | | | 9,298 | |
| The Medical Fund | | | — | |
| The Small Cap Opportunities Fund | | | 2,233 | |
| The Market Opportunities Fund | | | 751 | |
| The Alternative Income Fund | | | 537 | |
| The Multi-Disciplinary Income Fund | | | 122 | |
| The Spin-off Fund | | | 3 | |
4. Reclassification of Capital Accounts
GAAP requires that certain components of net assets relating to permanent differences be reclassified between financial and tax reporting. These reclassifications have no effect on net assets or net asset value per share. For the year ended December 31, 2018, each Fund recorded the following reclassifications to the accounts listed below:
| | | | | | | |
| | | INCREASE/(DECREASE) | |
| | | Accumulated | | | | |
| | | Earnings | | | | |
| | | (Deficit) | | | Paid In Capital | |
| The Internet Fund | | $ | (3,671,159 | ) | | $ | 3,671,159 | |
| The Global Fund | | | 96,636 | | | | (96,636 | ) |
| The Paradigm Fund | | | 63,983,762 | | | | (63,983,762 | ) |
| The Medical Fund | | | (135,633 | ) | | | 135,633 | |
| The Small Cap Opportunities Fund | | | 8,444,103 | | | | (8,444,103 | ) |
| The Market Opportunities Fund | | | 5,499,335 | | | | (5,499,335 | ) |
| The Alternative Income Fund | | | 2,172,468 | | | | (2,172,468 | ) |
| The Multi-Disciplinary Income Fund | | | — | | | | — | |
| The Spin-off Fund | | | 305,339 | | | | (305,339 | ) |
62
KINETICS MUTUAL FUNDS, INC. — THE FEEDER FUNDS
Notes to Financial Statements — (Continued)
June 30, 2019 (Unaudited)
5. Income Taxes
At December 31, 2018, the components of accumulated earnings (losses) on a tax basis were as follows:
| | | | | | | | | | | | | |
| | | Internet | | | Global | | | Paradigm | | | Medical | |
| Net Unrealized Appreciation | | | | | | | | | | | | |
| (Depreciation) | | $ | (4,479,838 | ) | | $ | 821,657 | | | $ | 171,515,040 | | | $ | 4,211,630 | |
| Undistributed Ordinary Income | | | 584,678 | | | | — | | | | — | | | | 33,026 | |
| Undistributed Long-Term | | | | | | | | | | | | | | | | |
| Capital Gains | | | 1,370,903 | | | | — | | | | — | | | | 145,550 | |
| Total Distributable Earnings | | $ | 1,955,581 | | | $ | — | | | $ | — | | | $ | 178,576 | |
| Other Accumulated Loss | | | (175,115 | ) | | | (328,099 | ) | | | (2,009,670 | ) | | | — | |
| Total Accumulated Gain (Loss) | | $ | (2,699,372 | ) | | $ | 493,558 | | | $ | 169,505,370 | | | $ | 4,390,206 | |
| | | | | | | | | | | | | | | | |
| | | | | | | | | | | | | | | Multi- | |
| | | Small Cap | | | Market | | | Alternative | | | Disciplinary | |
| | | Opportunities | | | Opportunities | | | Income | | | Income | |
| Net Unrealized Appreciation | | | | | | | | | | | | | | | | |
| (Depreciation) | | $ | 18,831,624 | | | $ | 11,178,621 | | | $ | (99,324 | ) | | $ | (2,723,858 | ) |
| Undistributed Ordinary Income | | | — | | | | — | | | | 20,837 | | | | 46,024 | |
| Undistributed Long-Term | | | | | | | | | | | | | | | | |
| Capital Gains | | | — | | | | — | | | | — | | | | — | |
| Total Distributable Earnings | | $ | — | | | $ | — | | | $ | 20,837 | | | $ | 46,024 | |
| Other Accumulated Loss | | | (4,409,084 | ) | | | (454,625 | ) | | | (26,749 | ) | | | (1,611,135 | ) |
| Total Accumulated Gain (Loss) | | $ | 14,422,540 | | | $ | 10,723,996 | | | $ | (105,236 | ) | | $ | (4,288,969 | ) |
| | | | | | | | | | | | | | | | | |
| | | Spin-off | | | | | | | | | | | | | |
| | | Fund | | | | | | | | | | | | | |
| Net Unrealized Appreciation | | $ | 3,971,944 | | | | | | | | | | | | | |
| Undistributed Ordinary Income | | | — | | | | | | | | | | | | | |
| Undistributed Long-Term | | | | | | | | | | | | | | | | |
| Capital Gains | | | — | | | | | | | | | | | | | |
| Total Distributable Earnings | | $ | — | | | | | | | | | | | | | |
| Other Accumulated Loss | | | (1,600,012 | ) | | | | | | | | | | | | |
| Total Accumulated Gain | | $ | 2,371,932 | | | | | | | | | | | | | |
At December 31, 2018, the Funds had no accumulated net realized capital loss carryforwards that will expire in 2019.
63
KINETICS MUTUAL FUNDS, INC. — THE FEEDER FUNDS
Notes to Financial Statements — (Continued)
June 30, 2019 (Unaudited)
At December 31, 2018, the Global Fund had $137,054 in short-term capital loss carryforwards without expiration and $190,565 in long-term capital loss carryforwards without expiration. The Multi-Disciplinary Income Fund had $6,135 in short-term capital loss carryforwards without expiration and $1,605,000 in long-term capital loss carryforwards without expiration.
For the year ended December 31, 2018, the following Funds utilized capital loss carryforwards:
| | | | |
| | | Capital Loss | |
| | | Carryforward | |
| The Internet Fund | | $ | — | |
| The Global Fund | | | — | |
| The Paradigm Fund | | | 60,551,088 | |
| The Medical Fund | | | — | |
| The Small Cap Opportunities Fund | | | 1,512,633 | |
| The Market Opportunities Fund | | | — | |
| The Alternative Income Fund | | | 31,179 | |
| The Multi-Disciplinary Income Fund | | | — | |
| The Spin-off Fund | | | — | |
For the year ended December 31, 2018, the Paradigm Fund, the Small Cap Opportunities Fund, the Market Opportunities Fund and the Alternative Income Fund had $55,234,994, $6,712,069, $906,590 and $2,172,468 of capital loss carryforwards expire without being utilized.
At December 31, 2018, the following Funds deferred, on a tax basis, post-October losses:
| | | | | | | |
| | | Late Year | | | Post-October | |
| | | Ordinary | | | Capital Loss | |
| | | Loss Deferral | | | Deferral | |
| The Internet Fund | | $ | — | | | $ | — | |
| The Global Fund | | | (480 | ) | | | — | |
| The Paradigm Fund | | | (1,768,802 | ) | | | — | |
| The Medical Fund | | | — | | | | — | |
| The Small Cap Opportunities Fund | | | (3,865,853 | ) | | | (40,662 | ) |
| The Market Opportunities Fund | | | (275,163 | ) | | | (164,377 | ) |
| The Alternative Income Fund | | | — | | | | — | |
| The Multi-Disciplinary Income Fund | | | — | | | | — | |
| The Spin-off Fund | | | (102,987 | ) | | | (1,003,864 | ) |
64
KINETICS MUTUAL FUNDS, INC. — THE FEEDER FUNDS
Notes to Financial Statements — (Continued)
June 30, 2019 (Unaudited)
The tax components of dividends paid during the six month period ended June 30, 2019 and the year ended December 31, 2018, are:
| | | | | | | | | | | | | |
| | | The Internet Fund | | | The Global Fund | |
| | | Ordinary | | | Long-Term | | | Ordinary | | | Long-Term | |
| | | Income | | | Capital Gains | | | Income | | | Capital Gains | |
| | | Distribution | | | Distribution | | | Distribution | | | Distribution | |
| 2019 | | $ | — | | | $ | — | | | $ | — | | | $ | — | |
| 2018 | | $ | 777,455 | | | $ | 30,198,679 | | | $ | — | | | $ | 8,966 | |
| | |
| | | The Paradigm Fund | | | The Medical Fund | |
| | | Ordinary | | | Long-Term | | | Ordinary | | | Long-Term | |
| | | Income | | | Capital Gains | | | Income | | | Capital Gains | |
| | | Distribution | | | Distribution | | | Distribution | | | Distribution | |
| 2019 | | $ | — | | | $ | — | | | $ | — | | | $ | — | |
| 2018 | | $ | — | | | $ | 63,008,862 | | | $ | 176,000 | | | $ | 1,265,030 | |
| |
| | | The Small Cap | | | The Market | |
| | | Opportunities Fund | | | Opportunities Fund | |
| | | Ordinary | | | Long-Term | | | Ordinary | | | Long-Term | |
| | | Income | | | Capital Gains | | | Income | | | Capital Gains | |
| | | Distribution | | | Distribution | | | Distribution | | | Distribution | |
| 2019 | | $ | — | | | $ | — | | | $ | — | | | $ | — | |
| 2018 | | $ | — | | | $ | — | | | $ | 4,281,585 | | | $ | 1,894,441 | |
| | |
| | | The Alternative | | | The Multi-Disciplinary | |
| | | Income Fund | | | Income Fund | |
| | | Ordinary | | | Long-Term | | | Ordinary | | | Long-Term | |
| | | Income | | | Capital Gains | | | Income | | | Capital Gains | |
| | | Distribution | | | Distribution | | | Distribution | | | Distribution | |
| 2019 | | $ | 159,290 | | | $ | — | | | $ | 786,647 | | | $ | — | |
| 2018 | | $ | 211,236 | | | $ | — | | | $ | 1,742,121 | | | $ | — | |
| | |
| | | The Spin-off | | | | | | | | | |
| | | Fund | | | | | | | | | |
| | | Ordinary | | | Long-Term | | | | | | | | | |
| | | Income | | | Capital Gains | | | | | | | | | |
| | | Distribution | | | Distribution | | | | | | | | | |
| 2019 | | $ | — | | | $ | — | | | | | | | | | |
| 2018 | | $ | 71,090 | | | $ | 810,046 | | | | | | | | | |
65
KINETICS MUTUAL FUNDS, INC. — THE FEEDER FUNDS
Notes to Financial Statements — (Continued)
June 30, 2019 (Unaudited)
Each Feeder Fund and the Spin-off Fund designated as long-term capital gain dividend, pursuant to Internal Revenue Code Section 852(b)(3), the amount necessary to reduce the earnings and profits of the Feeder Funds and the Spin-off Fund related to net capital gain to zero for the tax year ended December 31, 2018.
6. Securities Transactions, Tax Cost and Significant Investments – The Spin-off Fund
Purchases and sales of investment securities, other than short-term investments and short-term options, for the six month period ended June 30, 2019, were as follows for the Spin-off Fund:
| | | | | | | | | | | | | |
| | | Purchases | | | Sales | |
| | | U.S. Government | | | Other | | | U.S. Government | | | Other | |
| The Spin-off Fund | | $ | — | | | $ | 425,023 | | | $ | — | | | $ | 844,516 | |
As of December 31, 2018, the cost of investments and unrealized appreciation (depreciation) on investment securities for federal income tax purposes was as follows for the Spin-off Fund:
| | | | |
| | | The Spin-off | |
| | | Fund | |
| Tax Cost of Investments | | $ | 14,739,313 | |
| Unrealized Appreciation | | | 7,799,439 | |
| Unrealized Depreciation | | | (3,827,495 | ) |
| Net Unrealized Appreciation | | $ | 3,971,944 | |
Significant Investments
The Spin-off Fund may invest a greater percentage of its assets in one or more individual securities at any time. The greater percentage of assets in individual securities (not including short-term investments or other funds) exposes the portfolio to the risk of unanticipated industry conditions, the risks particular to a single company or security, and the risk of potentially lower liquidity. At June 30, 2019, Spin-off Fund invested approximately 60% of its net assets in individual securities greater than 5% of net assets. Please see the Schedule of Investments for further details.
66
KINETICS MUTUAL FUNDS, INC. — THE FEEDER FUNDS
Notes to Financial Statements — (Continued)
June 30, 2019 (Unaudited)
7. Summary of Fair Value Exposure – Spin-off Fund
Various inputs are used in determining the value of the Spin-off Fund’s investments. These inputs are summarized in the three broad levels listed below:
Level 1 — Unadjusted quoted prices in active markets for identical assets or liabilities that the Spin-off Fund has the ability to access.
Level 2 — Observable inputs other than quoted prices included in Level 1 that are observable for the asset or liability, either directly or indirectly. These inputs may include quoted prices for the identical instrument on an inactive market, prices for similar instruments, interest rates, prepayment speeds, credit risk, yield curves, default rates and similar data.
Level 3 — Unobservable inputs for the asset or liability, to the extent relevant observable inputs are not available, representing the Spin-off Fund’s own assumptions about the assumptions a market participant would use in valuing the asset or liability, and would be based on the best information available.
The availability of observable inputs can vary from security to security and is affected by a wide variety of factors, including, for example, the type of security, whether the security is new and not yet established in the marketplace, the liquidity of markets, and other characteristics particular to the security. To the extent that valuation is based on models or inputs that are less observable or unobservable in the market, the determination of fair value requires more judgment. Accordingly, the degree of judgment exercised in determining fair value is greatest for instruments categorized in Level 3.
The inputs used to measure fair value may fall into different levels of the fair value hierarchy. In such cases, for disclosure purposes, the level in the fair value hierarchy within which the fair value measurement falls in its entirety, is determined based on the lowest level input that is significant to the fair value measurement in its entirety.
67
KINETICS MUTUAL FUNDS, INC. — THE FEEDER FUNDS
Notes to Financial Statements — (Continued)
June 30, 2019 (Unaudited)
The following is a summary of the inputs used to value The Spin-off Fund’s net assets as of June 30, 2019:
| | | | | | | | | | | | | |
Assets^ | | Level 1 | | | Level 2 | | | Level 3 | | | Total | |
| Common Stocks | | $ | 21,399,544 | | | $ | — | | | $ | — | | | $ | 21,399,544 | |
| Short-Term Investments | | | 362 | | | | 817,295 | | | | — | | | | 817,657 | |
| Total Investments in Securities | | $ | 21,399,906 | | | $ | 817,295 | | | $ | — | | | $ | 22,217,201 | |
As of June 30, 2019, there were no investments in Level 3 securities. During the six-month period ended June 30, 2019, there were no transfers into or out of Level 3.
| ^ See Schedule of Investments for breakout of investments by industry classification. |
8. Investment Adviser
The Spin-off Fund entered into Investment Advisory Agreements (the “Agreement”) with Horizon Kinetics Asset Management LLC (the “Adviser”), with whom certain officers and trustees of the Trust are affiliated, to furnish investment advisory services to the Spin-off Fund. The Adviser is a wholly-owned subsidiary of Horizon Kinetics LLC. Under the terms of the Agreements, the Spin-off Fund compensates the Adviser for its management services at the annual rate of 1.00% of the Spin-off Fund’s average daily net assets. For the period ended June 30, 2019, Spin-off Fund incurred $108,608 in expenses pursuant to the Agreement.
9. Subsequent Events
In preparing these financial statements, management has evaluated Fund related events and transactions for potential recognition or disclosure through the date the financial statements were issued. There were no events or translations that occurred during the period that materially impacted the amounts or disclosures in the Funds’ financial statements.
10. Tax Information (Unaudited)
The Internet, Medical, Market Opportunities, and Spin-off Funds designated 18%, 100%, 8% and 100%, respectively, of dividends declared after December 31, 2018, from net investment income as qualified dividend income under the Jobs and Growth Tax Relief Reconciliation Act of 2003.
The Internet, Medical, Market Opportunities, Alternative Income, Multi-Disciplinary Income and Spin-off Funds designated 3%, 12%, 76%, 100%, 100% and 8%, respectively, as ordinary income distributions and 97%, 100%,
68
KINETICS MUTUAL FUNDS, INC. — THE FEEDER FUNDS
Notes to Financial Statements — (Continued)
June 30, 2019 (Unaudited)
100%, 88%, 24% and 92%, respectively, for the Internet, Global, Paradigm, Medical, Market Opportunities and Spin-off Funds as long-term capital gain distribution for the purposes of the dividends paid deduction, which include earnings and profits distributed to shareholders on redemptions of Fund shares.
For corporate shareholders in the Internet, Medical, Market Opportunities and Spin-off Funds, the percentage of ordinary dividend income distributed for the year ended December 31, 2018, which was designated as qualifying for the dividends-received deduction, is 15%, 100%, 4% and 100%, respectively. The Internet, Medical, Market Opportunities, Alternative Income, Multi-Disciplinary Income and Spin-off Funds designated 14%, 1%, 11%, 58%, 72% and 9%, respectively, of their ordinary income distributions for the fiscal year ended December 31, 2018, as interest-related dividends under Internal Revenue Code Section 871(k)(l)(C).
The Internet, Market Opportunities and Spin-off Funds designated 100%, 100% and 100%, respectively, of their ordinary income distributions as short-term capital gain distributions under Internal Revenue Code Section 871(k)(2)(C).
11. Recent Accounting Pronouncements
In March 2017, the FASB issued ASU 2017‐08, Receivables—Nonrefundable Fees and Other Costs (Subtopic 310‐20): Premium Amortization on Purchased Callable Debt Securities (“ASU 2017‐08”). The amendments in the ASU 2017‐08 shorten the amortization period for certain callable debt securities, held at a premium, to be amortized to the earliest call date. The ASU 2017‐08 does not require an accounting change for securities held at a discount; which continues to be amortized to maturity. The ASU 2017‐08 is effective for fiscal years and interim periods within those fiscal years beginning after December 15, 2018. Management has assessed these changes and concluded these changes do not have a material impact on the Funds’ financial statements.
12. Information about Proxy Voting (Unaudited)
Information regarding how the Spin-off Fund, the Feeder Funds and the Master Portfolios vote proxies relating to portfolio securities is available without charge, upon request by calling toll-free at 1-800-930-3828 or by accessing the Company’s website at www.kineticsfunds.com and by accessing the SEC’s website at www.sec.gov. Information regarding how the Spin-off Fund, the Feeder Funds and the Master Portfolios voted proxies relating to portfolio
69
KINETICS MUTUAL FUNDS, INC. — THE FEEDER FUNDS
Notes to Financial Statements — (Continued)
June 30, 2019 (Unaudited)
securities during the most recent twelve month period ended June 30, is available without charge, upon request, by calling toll-free at 1-800-930-3828 or by accessing the SEC’s website at www.sec.gov.
13. Information about the Portfolio Holdings (Unaudited)
The Spin-off Fund and Feeder Funds file their complete schedule of portfolio holdings for their first and third fiscal quarters with the SEC on Part F of Form N-PORT. The Spin-off Fund’s and Feeder Funds’ Part F of Form N-PORT is available without charge, upon request, by calling toll-free at 1-800-930-3828. Furthermore, you can obtain the Part F of Form N-PORT on the SEC’s website at www.sec.gov.
14. Approval of Investment Advisory Contract by Directors of Kinetics Mutual Funds, Inc.
At a meeting of the Board of Directors of the Company held on March 15, 2019, the Board, including all of the Directors who are not interested persons under the 1940 Act (the “Independent Directors”), approved the Advisory Agreement between Horizon Kinetics Asset Management LLC (the “Adviser”) and Kinetics Spin-off and Corporate Restructuring Fund (“Spin-off Fund”). The Board noted that the Adviser has served as the sub-adviser to the Spin-off Fund since its inception. In reaching a decision to approve the Advisory Agreement (the “Agreement”), the Board of Directors, including all of the Independent Directors, considered, among; (1) the nature, extent and quality of the services provided by the Adviser including, but not limited to, a review of the complexity of the services provided and whether the services are provided in a satisfactory and efficient manner; (2) the experience and qualifications of the personnel providing such services; (3) the investment performance of the Spinoff Fund and the Adviser as compared with industry competitors; (4) an evaluation of the fee structure, any fee waivers, and the Spin-off Fund’s expense ratios, and a comparison of them in relation to those of other investment companies having comparable investment policies and limitations; (5) possible alternative fee structures or bases for determining fees; (6) the extent to which economies of scale would be realized as the Spin-off Fund grows and whether fee levels reflect these economies of scale for the benefit of the Spin-off Fund’s investors; (7) the direct and indirect costs of the services to be provided (and the basis of determining and allocating these costs) and profits to be realized by the Adviser and its affiliates from their relationship with the Spin-off Fund;
70
KINETICS MUTUAL FUNDS, INC. — THE FEEDER FUNDS
Notes to Financial Statements — (Continued)
June 30, 2019 (Unaudited)
(8) other compensation or possible benefits to the Adviser and its affiliates arising from their advisory and other relationships with the Spin-off Fund, including, if applicable, any benefits derived or to be derived by the Adviser from its relationship with the Spin-off Fund such as soft dollar arrangements by which brokers provide research to the Spin-off Fund or the Adviser in return for allocating the Spin-off Fund’s brokerage; (9) the entrepreneurial risks borne by the Adviser, if any (e.g., because a fund is in a start-up mode or for other reasons, its revenues may be less or its expenses greater than anticipated); (10) a comparison of the fees charged by the Adviser with fees charged by the Adviser to similar clients; and (11) the policies and procedures that are in place to address, among other things, informational and cyber-related security.
The Board of Directors, including all of the Independent Directors, concluded that: they were satisfied with the quality of services provided by the Adviser in advising the Spin-off Fund, the profits earned by the Adviser would be reasonable in light of the nature, extent and quality of the services provided to the Spin-off Fund; and that the Spin-off Fund was not large enough to attain significant economies of scale. Based on the factors considered, the Board of Directors, including all of the Independent Directors, concluded that it was appropriate to approve the Agreement.
71
KINETICS MUTUAL FUNDS, INC. — THE FEEDER FUNDS
Financial Highlights
| | | | | | | | | | | | | | | | | | | |
| | | The Internet Fund | |
| | | No Load Class | |
| | | For the | | | | | | | | | | | | | | | | |
| | | Period | | | For the | | | For the | | | For the | | | For the | | | For the | |
| | | Ended | | | Year Ended | | | Year Ended | | | Year Ended | | | Year Ended | | | Year Ended | |
| | | June 30, 2019 | | | December 31, | | | December 31, | | | December 31, | | | December 31, | | | December 31, | |
| | | (Unaudited) | | | 2018 | | | 2017 | | | 2016 | | | 2015 | | | 2014 | |
| | |
PER SHARE DATA:(1) | | | | | | | | | | | | | | | | | | |
| Net Asset Value, | | | | | | | | | | | | | | | | | | |
| Beginning of Period | | $ | 27.19 | | | $ | 52.18 | | | $ | 39.33 | | | $ | 41.68 | | | $ | 56.08 | | | $ | 59.27 | |
| Income from Investment Operations: | | | | | | | | | | | | | | | | | | | | | | | | |
Net investment income (loss)(2) | | | (0.10 | ) | | | (0.48 | ) | | | 0.36 | | | | (0.68 | ) | | | (0.84 | ) | | | (0.77 | ) |
| Net realized and unrealized gain | | | | | | | | | | | | | | | | | | | | | | | | |
| (loss) on investments | | | 10.56 | | | | (13.77 | ) | | | 22.13 | | | | 1.76 | | | | (2.21 | ) | | | 0.69 | |
| Total from Investment | | | | | | | | | | | | | | | | | | | | | | | | |
| Operations | | | 10.46 | | | | (14.25 | ) | | | 22.49 | | | | 1.08 | | | | (3.05 | ) | | | (0.08 | ) |
| Redemption Fees | | | 0.00 | (3) | | | 0.02 | | | | 0.00 | (3) | | | 0.00 | (3) | | | 0.00 | (3) | | | 0.01 | |
| Less Distributions: | | | | | | | | | | | | | | | | | | | | | | | | |
| From net realized gains | | | — | | | | (10.76 | ) | | | (9.64 | ) | | | (3.43 | ) | | | (11.35 | ) | | | (3.12 | ) |
| Total Distributions | | | — | | | | (10.76 | ) | | | (9.64 | ) | | | (3.43 | ) | | | (11.35 | ) | | | (3.12 | ) |
| Net Asset Value, End of Period | | $ | 37.65 | | | $ | 27.19 | | | $ | 52.18 | | | $ | 39.33 | | | $ | 41.68 | | | $ | 56.08 | |
| Total return | | | 38.47 | %(4) | | | (27.32 | )% | | | 57.43 | % | | | 2.59 | % | | | (5.42 | )% | | | (0.16 | )% |
| | |
SUPPLEMENTAL DATA AND RATIOS | | | | | | | | | | | | | | | | | | | | | | | | |
| Net assets, end of period (000’s) | | $ | 134,357 | | | $ | 102,268 | | | $ | 162,120 | | | $ | 109,930 | | | $ | 122,332 | | | $ | 151,200 | |
| Ratio of operating expenses to | | | | | | | | | | | | | | | | | | | | | | | | |
average net assets:(6) | | | 1.88 | %(5) | | | 1.84 | % | | | 1.84 | % | | | 1.87 | % | | | 1.82 | % | | | 1.78 | % |
| Ratio of net investment income | | | | | | | | | | | | | | | | | | | | | | | | |
| (loss) to average net assets: | | | (0.64 | )%(5) | | | (1.05 | )% | | | 0.79 | % | | | (1.68 | )% | | | (1.51 | )% | | | (1.34 | )% |
Portfolio turnover rate(7) | | | 1 | % | | | 15 | % | | | 44 | % | | | 2 | % | | | 1 | % | | | 1 | % |
| (1) | Information presented relates to a share of capital stock outstanding for each period. |
| (2) | Net investment income per share represents net investment income divided by the average shares outstanding throughout the period. |
| (3) | Amount calculated is less than $0.005. |
| (4) | Not annualized. |
| (5) | Annualized. |
| (6) | See Note #3, Investment Adviser, for the waiver and expense reimbursement discussion. |
| (7) | Portfolio turnover of The Internet Portfolio. |
The accompanying notes are an integral part of these financial statements.
72
KINETICS MUTUAL FUNDS, INC. — THE FEEDER FUNDS
Financial Highlights — (Continued)
| | | | | | | | | | | | | | | | | | | |
| | | The Internet Fund | |
| | | Advisor Class A | |
| | | For the | | | | | | | | | | | | | | | | |
| | | Period | | | For the | | | For the | | | For the | | | For the | | | For the | |
| | | Ended | | | Year Ended | | | Year Ended | | | Year Ended | | | Year Ended | | | Year Ended | |
| | | June 30, 2019 | | | December 31, | | | December 31, | | | December 31, | | | December 31, | | | December 31, | |
| | | (Unaudited) | | | 2018 | | | 2017 | | | 2016 | | | 2015 | | | 2014 | |
| | |
PER SHARE DATA:(1) | | | | | | | | | | | | | | | | | | |
| Net Asset Value, | | | | | | | | | | | | | | | | | | |
| Beginning of Period | | $ | 25.00 | | | $ | 49.27 | | | $ | 37.57 | | | $ | 40.07 | | | $ | 54.51 | | | $ | 57.84 | |
| Income from Investment Operations: | | | | | | | | | | | | | | | | | | | | | | | | |
Net investment income (loss)(2) | | | (0.13 | ) | | | (0.57 | ) | | | 0.24 | | | | (0.75 | ) | | | (0.95 | ) | | | (0.89 | ) |
| Net realized and unrealized gain | | | | | | | | | | | | | | | | | | | | | | | | |
| (loss) on investments | | | 9.70 | | | | (12.97 | ) | | | 21.09 | | | | 1.68 | | | | (2.14 | ) | | | 0.68 | |
| Total from Investment | | | | | | | | | | | | | | | | | | | | | | | | |
| Operations | | | 9.57 | | | | (13.54 | ) | | | 21.33 | | | | 0.93 | | | | (3.09 | ) | | | (0.21 | ) |
| Redemption Fees | | | — | | | | 0.03 | | | | 0.01 | | | | — | | | | — | | | | 0.00 | (3) |
| Less Distributions: | | | | | | | | | | | | | | | | | | | | | | | | |
| From net realized gains | | | — | | | | (10.76 | ) | | | (9.64 | ) | | | (3.43 | ) | | | (11.35 | ) | | | (3.12 | ) |
| Total Distributions | | | — | | | | (10.76 | ) | | | (9.64 | ) | | | (3.43 | ) | | | (11.35 | ) | | | (3.12 | ) |
| | |
| Net Asset Value, End of Period | | $ | 34.57 | | | $ | 25.00 | | | $ | 49.27 | | | $ | 37.57 | | | $ | 40.07 | | | $ | 54.51 | |
Total return(4) | | | 38.28 | %(5) | | | (27.47 | )% | | | 57.06 | % | | | 2.32 | % | | | (5.65 | )% | | | (0.41 | )% |
| | |
SUPPLEMENTAL DATA AND RATIOS | | | | | | | | | | | | | | | | | | | | | | | | |
| Net assets, end of period (000’s) | | $ | 3,147 | | | $ | 2,481 | | | $ | 4,185 | | | $ | 1,923 | | | $ | 2,978 | | | $ | 5,143 | |
| Ratio of operating expenses to | | | | | | | | | | | | | | | | | | | | | | | | |
average net assets:(7) | | | 2.13 | %(6) | | | 2.09 | % | | | 2.09 | % | | | 2.12 | % | | | 2.07 | % | | | 2.03 | % |
| Ratio of net investment income (loss) | | | | | | | | | | | | | | | | | | | | | | | | |
| to average net assets: | | | (0.89 | )%(6) | | | (1.30 | )% | | | 0.54 | % | | | (1.93 | )% | | | (1.76 | )% | | | (1.59 | )% |
Portfolio turnover rate(8) | | | 1 | % | | | 15 | % | | | 44 | % | | | 2 | % | | | 1 | % | | | 1 | % |
| (1) | Information presented relates to a share of capital stock outstanding for each period. |
| (2) | Net investment income per share represents net investment income divided by the average shares outstanding throughout the period. |
| (3) | Amount calculated is less than $0.005. |
| (4) | The total return calculation does not reflect the 5.75% front end sales charge on Advisor Class A shares. |
| (5) | Not annualized. |
| (6) | Annualized. |
| (7) | See Note #3, Investment Adviser, for the waiver and expense reimbursement discussion. |
| (8) | Portfolio turnover of The Internet Portfolio. |
The accompanying notes are an integral part of these financial statements.
73
KINETICS MUTUAL FUNDS, INC. — THE FEEDER FUNDS
Financial Highlights — (Continued)
| | | | | | | | | | | | | | | | | | | |
| | | The Internet Fund | |
| | | Advisor Class C | |
| | | For the | | | | | | | | | | | | | | | | |
| | | Period | | | For the | | | For the | | | For the | | | For the | | | For the | |
| | | Ended | | | Year Ended | | | Year Ended | | | Year Ended | | | Year Ended | | | Year Ended | |
| | | June 30, 2019 | | | December 31, | | | December 31, | | | December 31, | | | December 31, | | | December 31, | |
| | | (Unaudited) | | | 2018 | | | 2017 | | | 2016 | | | 2015 | | | 2014 | |
| | |
PER SHARE DATA:(1) | | | | | | | | | | | | | | | | | | |
| Net Asset Value, | | | | | | | | | | | | | | | | | | |
| Beginning of Period | | $ | 21.18 | | | $ | 44.24 | | | $ | 34.52 | | | $ | 37.27 | | | $ | 51.81 | | | $ | 55.38 | |
| Income from Investment Operations: | | | | | | | | | | | | | | | | | | | | | | | | |
Net investment income (loss)(2) | | | (0.17 | ) | | | (0.70 | ) | | | 0.02 | | | | (0.88 | ) | | | (1.15 | ) | | | (1.11 | ) |
| Net realized and unrealized gain | | | | | | | | | | | | | | | | | | | | | | | | |
| (loss) on investments | | | 8.21 | | | | (11.61 | ) | | | 19.30 | | | | 1.56 | | | | (2.04 | ) | | | 0.64 | |
| Total from Investment | | | | | | | | | | | | | | | | | | | | | | | | |
| Operations | | | 8.04 | | | | (12.31 | ) | | | 19.32 | | | | 0.68 | | | | (3.19 | ) | | | (0.47 | ) |
| Redemption Fees | | | — | | | | 0.01 | | | | 0.04 | | | | — | | | | — | | | | 0.02 | |
| Less Distributions: | | | | | | | | | | | | | | | | | | | | | | | | |
| From net realized gains | | | — | | | | (10.76 | ) | | | (9.64 | ) | | | (3.43 | ) | | | (11.35 | ) | | | (3.12 | ) |
| Total Distributions | | | — | | | | (10.76 | ) | | | (9.64 | ) | | | (3.43 | ) | | | (11.35 | ) | | | (3.12 | ) |
| Net Asset Value, End of Period | | $ | 29.22 | | | $ | 21.18 | | | $ | 44.24 | | | $ | 34.52 | | | $ | 37.27 | | | $ | 51.81 | |
| Total return | | | 37.96 | %(3) | | | (27.86 | )% | | | 56.36 | % | | | 1.83 | % | | | (6.14 | )% | | | (0.86 | )% |
| | |
SUPPLEMENTAL DATA AND RATIOS | | | | | | | | | | | | | | | | | | | | | | | | |
| Net assets, end of period (000’s) | | $ | 1,206 | | | $ | 1,065 | | | $ | 1,847 | | | $ | 704 | | | $ | 848 | | | $ | 1,105 | |
| Ratio of operating expenses to | | | | | | | | | | | | | | | | | | | | | | | | |
average net assets:(5) | | | 2.63 | %(4) | | | 2.59 | % | | | 2.59 | % | | | 2.62 | % | | | 2.57 | % | | | 2.53 | % |
| Ratio of net investment income | | | | | | | | | | | | | | | | | | | | | | | | |
| (loss) to average net assets: | | | (1.39 | )%(4) | | | (1.80 | )% | | | 0.04 | % | | | (2.43 | )% | | | (2.26 | )% | | | (2.09 | )% |
Portfolio turnover rate(6) | | | 1 | % | | | 15 | % | | | 44 | % | | | 2 | % | | | 1 | % | | | 1 | % |
| (1) | Information presented relates to a share of capital stock outstanding for each period. |
| (2) | Net investment income per share represents net investment income divided by the average shares outstanding throughout the period. |
| (3) | Not annualized. |
| (4) | Annualized. |
| (5) | See Note #3, Investment Adviser, for the waiver and expense reimbursement discussion. |
| (6) | Portfolio turnover of The Internet Portfolio. |
The accompanying notes are an integral part of these financial statements.
74
KINETICS MUTUAL FUNDS, INC. — THE FEEDER FUNDS
Financial Highlights — (Continued)
| | | | | | | | | | | | | | | | | | | |
| | | The Global Fund | |
| | | No Load Class | |
| | | For the | | | | | | | | | | | | | | | | |
| | | Period | | | For the | | | For the | | | For the | | | For the | | | For the | |
| | | Ended | | | Year Ended | | | Year Ended | | | Year Ended | | | Year Ended | | | Year Ended | |
| | | June 30, 2019 | | | December 31, | | | December 31, | | | December 31, | | | December 31, | | | December 31, | |
| | | (Unaudited) | | | 2018 | | | 2017 | | | 2016 | | | 2015 | | | 2014 | |
| | |
PER SHARE DATA:(1) | | | | | | | | | | | | | | | | | | |
| Net Asset Value, | | | | | | | | | | | | | | | | | | |
| Beginning of Period | | $ | 5.46 | | | $ | 7.15 | | | $ | 5.23 | | | $ | 4.59 | | | $ | 5.33 | | | $ | 6.05 | |
| Income from Investment Operations: | | | | | | | | | | | | | | | | | | | | | | | | |
Net investment income (loss)(2) | | | 0.01 | | | | (0.02 | ) | | | 0.10 | | | | (0.01 | ) | | | (0.02 | ) | | | (0.02 | ) |
| Net realized and unrealized gain | | | | | | | | | | | | | | | | | | | | | | | | |
| (loss) on investments | | | 1.52 | | | | (1.67 | ) | | | 2.47 | | | | 0.67 | | | | (0.72 | ) | | | (0.70 | ) |
| Total from Investment | | | | | | | | | | | | | | | | | | | | | | | | |
| Operations | | | 1.53 | | | | (1.69 | ) | | | 2.57 | | | | 0.66 | | | | (0.74 | ) | | | (0.72 | ) |
Redemption Fees(3) | | | 0.00 | | | | 0.00 | | | | 0.00 | | | | 0.00 | | | | 0.00 | | | | 0.00 | |
| Less Distributions: | | | | | | | | | | | | | | | | | | | | | | | | |
| From net investment income | | | — | | | | — | | | | (0.10 | ) | | | — | | | | — | | | | — | |
| From net realized gains | | | — | | | | (0.00 | )(3) | | | (0.55 | ) | | | (0.02 | ) | | | (0.00 | )(3) | | | (0.00 | )(3) |
| Total Distributions | | | — | | | | (0.00 | )(3) | | | (0.65 | ) | | | (0.02 | ) | | | (0.00 | )(3) | | | (0.00 | )(3) |
| Net Asset Value, End of Period | | $ | 6.99 | | | $ | 5.46 | | | $ | 7.15 | | | $ | 5.23 | | | $ | 4.59 | | | $ | 5.33 | |
| Total return | | | 28.02 | %(4) | | | (23.58 | )% | | | 49.20 | % | | | 14.40 | % | | | (13.83 | )% | | | (11.89 | )% |
| | |
SUPPLEMENTAL DATA AND RATIOS | | | | | | | | | | | | | | | | | | | | | | | | |
| Net assets, end of period (000’s) | | $ | 7,928 | | | $ | 5,665 | | | $ | 8,577 | | | $ | 5,316 | | | $ | 4,745 | | | $ | 6,771 | |
| Ratio of operating expenses to | | | | | | | | | | | | | | | | | | | | | | | | |
| average net assets: | | | | | | | | | | | | | | | | | | | | | | | | |
| Before expense reimbursement | | | 2.64 | %(5) | | | 2.53 | % | | | 3.07 | %(8) | | | 3.04 | % | | | 2.87 | % | | | 2.61 | % |
After expense reimbursement(6) | | | 1.39 | %(5) | | | 1.39 | % | | | 1.76 | %(8) | | | 1.39 | % | | | 1.39 | % | | | 1.39 | % |
| Ratio of net investment income (loss) | | | | | | | | | | | | | | | | | | | | | | | | |
| to average net assets: | | | 0.32 | %(5) | | | (0.30 | )% | | | 1.69 | % | | | (0.17 | )% | | | (0.29 | )% | | | (0.32 | )% |
Portfolio turnover rate(7) | | | 1 | % | | | 28 | % | | | 169 | % | | | 11 | % | | | 16 | % | | | 14 | % |
| (1) | Information presented relates to a share of capital stock outstanding for each period. |
| (2) | Net investment income per share represents net investment income divided by the average shares outstanding throughout the period. |
| (3) | Amount calculated is less than $0.005. |
| (4) | Not annualized. |
| (5) | Annualized. |
| (6) | See Note #3, Investment Adviser, for the waiver and expense reimbursement discussion. |
| (7) | Portfolio turnover of The Global Portfolio. |
| (8) | The ratio of expenses includes a tax expense. The expense ratio excluding the tax expense was 2.69% before expense reimbursement and 1.39% after expense reimbursement. |
The accompanying notes are an integral part of these financial statements.
75
KINETICS MUTUAL FUNDS, INC. — THE FEEDER FUNDS
Financial Highlights — (Continued)
| | | | | | | | | | | | | | | | | | | |
| | | The Global Fund | |
| | | Advisor Class A | |
| | | For the | | | | | | | | | | | | | | | | |
| | | Period | | | For the | | | For the | | | For the | | | For the | | | For the | |
| | | Ended | | | Year Ended | | | Year Ended | | | Year Ended | | | Year Ended | | | Year Ended | |
| | | June 30, 2019 | | | December 31, | | | December 31, | | | December 31, | | | December 31, | | | December 31, | |
| | | (Unaudited) | | | 2018 | | | 2017 | | | 2016 | | | 2015 | | | 2014 | |
| | |
PER SHARE DATA:(1) | | | | | | | | | | | | | | | | | | |
| Net Asset Value, | | | | | | | | | | | | | | | | | | |
| Beginning of Period | | $ | 5.45 | | | $ | 7.15 | | | $ | 5.19 | | | $ | 4.57 | | | $ | 5.31 | | | $ | 6.03 | |
| Income from Investment Operations: | | | | | | | | | | | | | | | | | | | | | | | | |
Net investment income (loss)(2) | | | 0.00 | (3) | | | (0.04 | ) | | | 0.09 | | | | (0.02 | ) | | | (0.03 | ) | | | (0.03 | ) |
| Net realized and unrealized | | | | | | | | | | | | | | | | | | | | | | | | |
| gain (loss) on investments | | | 1.51 | | | | (1.66 | ) | | | 2.45 | | | | 0.66 | | | | (0.71 | ) | | | (0.70 | ) |
| Total from Investment | | | | | | | | | | | | | | | | | | | | | | | | |
| Operations | | | 1.51 | | | | (1.70 | ) | | | 2.54 | | | | 0.64 | | | | (0.74 | ) | | | (0.73 | ) |
| Redemption Fees | | | 0.00 | (3) | | | 0.00 | (3) | | | 0.06 | | | | 0.00 | (3) | | | — | | | | 0.01 | |
| Less Distributions: | | | | | | | | | | | | | | | | | | | | | | | | |
| From net investment income | | | — | | | | — | | | | (0.09 | ) | | | — | | | | — | | | | — | |
| From net realized gains | | | — | | | | (0.00 | )(3) | | | (0.55 | ) | | | (0.02 | ) | | | (0.00 | )(3) | | | (0.00 | )(3) |
| Total Distributions | | | — | | | | (0.00 | )(3) | | | (0.64 | ) | | | (0.02 | ) | | | (0.00 | )(3) | | | (0.00 | )(3) |
| Net Asset Value, End of Period | | $ | 6.96 | | | $ | 5.45 | | | $ | 7.15 | | | $ | 5.19 | | | $ | 4.57 | | | $ | 5.31 | |
Total return(4) | | | 27.71 | %(5) | | | (23.72 | )% | | | 50.29 | % | | | 14.03 | % | | | (13.89 | )% | | | (11.93 | )% |
| | |
SUPPLEMENTAL DATA AND RATIOS | | | | | | | | | | | | | | | | | | | | | | | | |
| Net assets, end of period (000’s) | | $ | 1,462 | | | $ | 1,012 | | | $ | 1,523 | | | $ | 309 | | | $ | 376 | | | $ | 497 | |
| Ratio of operating expenses to | | | | | | | | | | | | | | | | | | | | | | | | |
| average net assets: | | | | | | | | | | | | | | | | | | | | | | | | |
| Before expense reimbursement | | | 2.89 | %(6) | | | 2.78 | % | | | 3.32 | %(9) | | | 3.29 | % | | | 3.12 | % | | | 2.86 | % |
After expense reimbursement(7) | | | 1.64 | %(6) | | | 1.64 | % | | | 2.01 | %(9) | | | 1.64 | % | | | 1.64 | % | | | 1.64 | % |
| Ratio of net investment income (loss) | | | | | | | | | | | | | | | | | | | | | | | | |
| to average net assets: | | | 0.07 | %(6) | | | (0.55 | )% | | | 1.44 | % | | | (0.42 | )% | | | (0.54 | )% | | | (0.57 | )% |
Portfolio turnover rate(8) | | | 1 | % | | | 28 | % | | | 169 | % | | | 11 | % | | | 16 | % | | | 14 | % |
| (1) | Information presented relates to a share of capital stock outstanding for each period. |
| (2) | Net investment income per share represents net investment income divided by the average shares outstanding throughout the period. |
| (3) | Amount calculated is less than $0.005. |
| (4) | The total return calculation does not reflect the 5.75% front end sales charge on Advisor Class A shares. |
| (5) | Not annualized. |
| (6) | Annualized. |
| (7) | See Note #3, Investment Adviser, for the waiver and expense reimbursement discussion. |
| (8) | Portfolio turnover of The Global Portfolio. |
| (9) | The ratio of expenses includes a tax expense. The expense ratio excluding the tax expense was 2.94% before expense reimbursement and 1.64% after expense reimbursement. |
The accompanying notes are an integral part of these financial statements.
76
KINETICS MUTUAL FUNDS, INC. — THE FEEDER FUNDS
Financial Highlights — (Continued)
| | | | | | | | | | | | | | | | | | | |
| | | The Global Fund | |
| | | Advisor Class C | |
| | | For the | | | | | | | | | | | | | | | | |
| | | Period | | | For the | | | For the | | | For the | | | For the | | | For the | |
| | | Ended | | | Year Ended | | | Year Ended | | | Year Ended | | | Year Ended | | | Year Ended | |
| | | June 30, 2019 | | | December 31, | | | December 31, | | | December 31, | | | December 31, | | | December 31, | |
| | | (Unaudited) | | | 2018 | | | 2017 | | | 2016 | | | 2015 | | | 2014 | |
| | |
PER SHARE DATA:(1) | | | | | | | | | | | | | | | | | | |
| Net Asset Value, | | | | | | | | | | | | | | | | | | |
| Beginning of Period | | $ | 5.12 | | | $ | 6.76 | | | $ | 4.99 | | | $ | 4.41 | | | $ | 5.16 | | | $ | 5.90 | |
| Income from Investment Operations: | | | | | | | | | | | | | | | | | | | | | | | | |
Net investment income (loss)(2) | | | (0.01 | ) | | | (0.07 | ) | | | 0.05 | | | | (0.04 | ) | | | (0.05 | ) | | | (0.06 | ) |
| Net realized and unrealized | | | | | | | | | | | | | | | | | | | | | | | | |
| gain (loss) on investments | | | 1.42 | | | | (1.57 | ) | | | 2.34 | | | | 0.64 | | | | (0.70 | ) | | | (0.68 | ) |
| Total from Investment | | | | | | | | | | | | | | | | | | | | | | | | |
| Operations | | | 1.41 | | | | (1.64 | ) | | | 2.39 | | | | 0.60 | | | | (0.75 | ) | | | (0.74 | ) |
| Redemption Fees | | | — | | | | — | | | | — | | | | — | | | | — | | | | 0.00 | (3) |
| Less Distributions: | | | | | | | | | | | | | | | | | | | | | | | | |
| From net investment income | | | — | | | | — | | | | (0.07 | ) | | | — | | | | — | | | | — | |
| From net realized gains | | | — | | | | (0.00 | )(3) | | | (0.55 | ) | | | (0.02 | ) | | | (0.00 | )(3) | | | (0.00 | )(3) |
| Total Distributions | | | — | | | | (0.00 | )(3) | | | (0.62 | ) | | | (0.02 | ) | | | (0.00 | )(3) | | | (0.00 | )(3) |
| Net Asset Value, End of Period | | $ | 6.53 | | | $ | 5.12 | | | $ | 6.76 | | | $ | 4.99 | | | $ | 4.41 | | | $ | 5.16 | |
| Total return | | | 27.54 | %(4) | | | (24.20 | )% | | | 48.02 | % | | | 13.63 | % | | | (14.48 | )% | | | (12.53 | )% |
| | |
SUPPLEMENTAL DATA AND RATIOS | | | | | | | | | | | | | | | | | | | | | | | | |
| Net assets, end of period (000’s) | | $ | 5,411 | | | $ | 4,284 | | | $ | 5,542 | | | $ | 1,920 | | | $ | 1,614 | | | $ | 1,608 | |
| Ratio of operating expenses to | | | | | | | | | | | | | | | | | | | | | | | | |
| average net assets: | | | | | | | | | | | | | | | | | | | | | | | | |
| Before expense reimbursement | | | 3.39 | %(5) | | | 3.28 | % | | | 3.82 | %(8) | | | 3.79 | % | | | 3.62 | % | | | 3.36 | % |
After expense reimbursement(6) | | | 2.14 | %(5) | | | 2.14 | % | | | 2.51 | %(8) | | | 2.14 | % | | | 2.14 | % | | | 2.14 | % |
| Ratio of net investment income (loss) | | | | | | | | | | | | | | | | | | | | | | | | |
| to average net assets: | | | (0.43 | )%(5) | | | (1.05 | )% | | | 0.94 | % | | | (0.92 | )% | | | (1.04 | )% | | | (1.07 | )% |
Portfolio turnover rate(7) | | | 1 | % | | | 28 | % | | | 169 | % | | | 11 | % | | | 16 | % | | | 14 | % |
| (1) | Information presented relates to a share of capital stock outstanding for each period. |
| (2) | Net investment income per share represents net investment income divided by the average shares outstanding throughout the period. |
| (3) | Amount calculated is less than $0.005. |
| (4) | Not annualized. |
| (5) | Annualized. |
| (6) | See Note #3, Investment Adviser, for the waiver and expense reimbursement discussion. |
| (7) | Portfolio turnover of The Global Portfolio. |
| (8) | The ratio of expenses includes a tax expense. The expense ratio excluding the tax expense was 3.44% before expense reimbursement and 2.14% after expense reimbursement. |
The accompanying notes are an integral part of these financial statements.
77
KINETICS MUTUAL FUNDS, INC. — THE FEEDER FUNDS
Financial Highlights — (Continued)
| | | | | | | | | | | | | | | | | | | |
| | | The Paradigm Fund | |
| | | No Load Class | |
| | | For the | | | | | | | | | | | | | | | | |
| | | Period | | | For the | | | For the | | | For the | | | For the | | | For the | |
| | | Ended | | | Year Ended | | | Year Ended | | | Year Ended | | | Year Ended | | | Year Ended | |
| | | June 30, 2019 | | | December 31, | | | December 31, | | | December 31, | | | December 31, | | | December 31, | |
| | | (Unaudited) | | | 2018 | | | 2017 | | | 2016 | | | 2015 | | | 2014 | |
| | |
PER SHARE DATA:(1) | | | | | | | | | | | | | | | | | | |
| Net Asset Value, | | | | | | | | | | | | | | | | | | |
| Beginning of Period | | $ | 41.32 | | | $ | 48.32 | | | $ | 37.63 | | | $ | 31.24 | | | $ | 34.08 | | | $ | 34.35 | |
| Income from Investment Operations: | | | | | | | | | | | | | | | | | | | | | | | | |
Net investment loss(2) | | | (0.10 | ) | | | (0.50 | ) | | | (0.34 | ) | | | (0.36 | ) | | | (0.32 | ) | | | (0.36 | ) |
| Net realized and unrealized gain | | | | | | | | | | | | | | | | | | | | | | | | |
| (loss) on investments | | | 12.05 | | | | (2.20 | ) | | | 11.03 | | | | 6.75 | | | | (2.52 | ) | | | 0.09 | |
| Total from Investment | | | | | | | | | | | | | | | | | | | | | | | | |
| Operations | | | 11.95 | | | | (2.70 | ) | | | 10.69 | | | | 6.39 | | | | (2.84 | ) | | | (0.27 | ) |
| Redemption Fees | | | 0.00 | (3) | | | 0.01 | | | | 0.00 | (3) | | | 0.00 | (3) | | | 0.00 | (3) | | | 0.00 | (3) |
| Less Distributions: | | | | | | | | | | | | | | | | | | | | | | | | |
| From net realized gains | | | — | | | | (4.31 | ) | | | — | | | | — | | | | — | | | | — | |
| Total Distributions | | | — | | | | (4.31 | ) | | | — | | | | — | | | | — | | | | — | |
| Net Asset Value, End of Period | | $ | 53.27 | | | $ | 41.32 | | | $ | 48.32 | | | $ | 37.63 | | | $ | 31.24 | | | $ | 34.08 | |
| Total return | | | 28.92 | %(4) | | | (5.55 | )% | | | 28.41 | % | | | 20.45 | % | | | (8.33 | )% | | | (0.79 | )% |
| | |
SUPPLEMENTAL DATA AND RATIOS | | | | | | | | | | | | | | | | | | | | | | | | |
| Net assets, end of period (000’s) | | $ | 366,469 | | | $ | 297,990 | | | $ | 339,189 | | | $ | 336,837 | | | $ | 292,014 | | | $ | 521,738 | |
| Ratio of operating expenses to | | | | | | | | | | | | | | | | | | | | | | | | |
| average net assets: | | | | | | | | | | | | | | | | | | | | | | | | |
| Before expense reimbursement | | | 1.73 | %(5) | | | 1.73 | % | | | 1.74 | % | | | 1.75 | % | | | 1.71 | % | | | 1.68 | % |
After expense reimbursement(6) | | | 1.64 | %(5) | | | 1.64 | % | | | 1.64 | % | | | 1.64 | % | | | 1.64 | % | | | 1.64 | % |
| Ratio of net investment loss | | | | | | | | | | | | | | | | | | | | | | | | |
| to average net assets: | | | (0.40 | )%(5) | | | (0.93 | )% | | | (0.82 | )% | | | (1.11 | )% | | | (0.92 | )% | | | (1.02 | )% |
Portfolio turnover rate(7) | | | 0 | % | | | 3 | % | | | 14 | % | | | 2 | % | | | 2 | % | | | 7 | % |
| (1) | Information presented relates to a share of capital stock outstanding for each period. |
| (2) | Net investment income per share represents net investment income divided by the average shares outstanding throughout the period. |
| (3) | Amount calculated is less than $0.005. |
| (4) | Not annualized. |
| (5) | Annualized. |
| (6) | See Note #3, Investment Adviser, for the waiver and expense reimbursement discussion. |
| (7) | Portfolio turnover of The Paradigm Portfolio. |
The accompanying notes are an integral part of these financial statements.
78
KINETICS MUTUAL FUNDS, INC. — THE FEEDER FUNDS
Financial Highlights — (Continued)
| | | | | | | | | | | | | | | | | | | |
| | | The Paradigm Fund | |
| | | Advisor Class A | |
| | | For the | | | | | | | | | | | | | | | | |
| | | Period | | | For the | | | For the | | | For the | | | For the | | | For the | |
| | | Ended | | | Year Ended | | | Year Ended | | | Year Ended | | | Year Ended | | | Year Ended | |
| | | June 30, 2019 | | | December 31, | | | December 31, | | | December 31, | | | December 31, | | | December 31, | |
| | | (Unaudited) | | | 2018 | | | 2017 | | | 2016 | | | 2015 | | | 2014 | |
| | |
PER SHARE DATA:(1) | | | | | | | | | | | | | | | | | | |
| Net Asset Value, | | | | | | | | | | | | | | | | | | |
| Beginning of Period | | $ | 39.95 | | | $ | 46.99 | | | $ | 36.69 | | | $ | 30.53 | | | $ | 33.39 | | | $ | 33.74 | |
| Income from Investment Operations: | | | | | | | | | | | | | | | | | | | | | | | | |
Net investment loss(2) | | | (0.16 | ) | | | (0.61 | ) | | | (0.43 | ) | | | (0.43 | ) | | | (0.39 | ) | | | (0.43 | ) |
| Net realized and unrealized gain | | | | | | | | | | | | | | | | | | | | | | | | |
| (loss) on investments | | | 11.65 | | | | (2.12 | ) | | | 10.73 | | | | 6.59 | | | | (2.47 | ) | | | 0.08 | |
| Total from Investment | | | | | | | | | | | | | | | | | | | | | | | | |
| Operations | | | 11.49 | | | | (2.73 | ) | | | 10.30 | | | | 6.16 | | | | (2.86 | ) | | | (0.35 | ) |
| Redemption Fees | | | — | | | | 0.00 | (3) | | | 0.00 | (3) | | | 0.00 | (3) | | | 0.00 | (3) | | | 0.00 | (3) |
| Less Distributions: | | | | | | | | | | | | | | | | | | | | | | | | |
| From net realized gains | | | — | | | | (4.31 | ) | | | — | | | | — | | | | — | | | | — | |
| Total Distributions | | | — | | | | (4.31 | ) | | | — | | | | — | | | | — | | | | — | |
| Net Asset Value, End of Period | | $ | 51.44 | | | $ | 39.95 | | | $ | 46.99 | | | $ | 36.69 | | | $ | 30.53 | | | $ | 33.39 | |
Total return(4) | | | 28.76 | %(5) | | | (5.79 | )% | | | 28.07 | % | | | 20.18 | % | | | (8.57 | )% | | | (1.04 | )% |
| | |
SUPPLEMENTAL DATA AND RATIOS | | | | | | | | | | | | | | | | | | | | | | | | |
| Net assets, end of period (000’s) | | $ | 114,414 | | | $ | 95,503 | | | $ | 108,029 | | | $ | 103,921 | | | $ | 129,707 | | | $ | 171,958 | |
| Ratio of operating expenses to | | | | | | | | | | | | | | | | | | | | | | | | |
| average net assets: | | | | | | | | | | | | | | | | | | | | | | | | |
| Before expense reimbursement | | | 1.98 | %(6) | | | 1.98 | % | | | 1.99 | % | | | 2.00 | % | | | 1.96 | % | | | 1.93 | % |
After expense reimbursement(7) | | | 1.89 | %(6) | | | 1.89 | % | | | 1.89 | % | | | 1.89 | % | | | 1.89 | % | | | 1.89 | % |
| Ratio of net investment loss | | | | | | | | | | | | | | | | | | | | | | | | |
| to average net assets: | | | (0.65 | )%(6) | | | (1.18 | )% | | | (1.07 | )% | | | (1.36 | )% | | | (1.17 | )% | | | (1.27 | )% |
Portfolio turnover rate(8) | | | 0 | % | | | 3 | % | | | 14 | % | | | 2 | % | | | 2 | % | | | 7 | % |
| (1) | Information presented relates to a share of capital stock outstanding for each period. |
| (2) | Net investment income per share represents net investment income divided by the average shares outstanding throughout the period. |
| (3) | Amount calculated is less than $0.005. |
| (4) | The total return calculation does not reflect the 5.75% front end sales charge on Advisor Class A shares. |
| (5) | Not annualized. |
| (6) | Annualized. |
| (7) | See Note #3, Investment Adviser, for the waiver and expense reimbursement discussion. |
| (8) | Portfolio turnover of The Paradigm Portfolio. |
The accompanying notes are an integral part of these financial statements.
79
KINETICS MUTUAL FUNDS, INC. — THE FEEDER FUNDS
Financial Highlights — (Continued)
| | | | | | | | | | | | | | | | | | | |
| | | The Paradigm Fund | |
| | | Advisor Class C | |
| | | For the | | | | | | | | | | | | | | | | |
| | | Period | | | For the | | | For the | | | For the | | | For the | | | For the | |
| | | Ended | | | Year Ended | | | Year Ended | | | Year Ended | | | Year Ended | | | Year Ended | |
| | | June 30, 2019 | | | December 31, | | | December 31, | | | December 31, | | | December 31, | | | December 31, | |
| | | (Unaudited) | | | 2018 | | | 2017 | | | 2016 | | | 2015 | | | 2014 | |
| | |
PER SHARE DATA:(1) | | | | | | | | | | | | | | | | | | |
| Net Asset Value, | | | | | | | | | | | | | | | | | | |
| Beginning of Period | | $ | 37.12 | | | $ | 44.21 | | | $ | 34.68 | | | $ | 29.01 | | | $ | 31.88 | | | $ | 32.38 | |
| Income from Investment Operations: | | | | | | | | | | | | | | | | | | | | | | | | |
Net investment loss(2) | | | (0.26 | ) | | | (0.81 | ) | | | (0.60 | ) | | | (0.56 | ) | | | (0.53 | ) | | | (0.58 | ) |
| Net realized and unrealized gain | | | | | | | | | | | | | | | | | | | | | | | | |
| (loss) on investments | | | 10.82 | | | | (1.97 | ) | | | 10.13 | | | | 6.23 | | | | (2.34 | ) | | | 0.08 | |
| Total from Investment | | | | | | | | | | | | | | | | | | | | | | | | |
| Operations | | | 10.56 | | | | (2.78 | ) | | | 9.53 | | | | 5.67 | | | | (2.87 | ) | | | (0.50 | ) |
Redemption Fees(3) | | | 0.00 | | | | 0.00 | | | | 0.00 | | | | 0.00 | | | | 0.00 | | | | 0.00 | |
| Less Distributions: | | | | | | | | | | | | | | | | | | | | | | | | |
| From net realized gains | | | — | | | | (4.31 | ) | | | — | | | | — | | | | — | | | | — | |
| Total Distributions | | | — | | | | (4.31 | ) | | | — | | | | — | | | | — | | | | — | |
| Net Asset Value, End of Period | | $ | 47.68 | | | $ | 37.12 | | | $ | 44.21 | | | $ | 34.68 | | | $ | 29.01 | | | $ | 31.88 | |
| Total return | | | 28.45 | %(4) | | | (6.27 | )% | | | 27.48 | % | | | 19.55 | % | | | (9.00 | )% | | | (1.54 | )% |
| | |
SUPPLEMENTAL DATA AND RATIOS | | | | | | | | | | | | | | | | | | | | | | | | |
| Net assets, end of period (000’s) | | $ | 125,128 | | | $ | 100,718 | | | $ | 118,924 | | | $ | 111,973 | | | $ | 114,008 | | | $ | 135,333 | |
| Ratio of operating expenses to | | | | | | | | | | | | | | | | | | | | | | | | |
| average net assets: | | | | | | | | | | | | | | | | | | | | | | | | |
| Before expense reimbursement | | | 2.48 | %(5) | | | 2.48 | % | | | 2.49 | % | | | 2.50 | % | | | 2.46 | % | | | 2.43 | % |
After expense reimbursement(6) | | | 2.39 | %(5) | | | 2.39 | % | | | 2.39 | % | | | 2.39 | % | | | 2.39 | % | | | 2.39 | % |
| Ratio of net investment loss | | | | | | | | | | | | | | | | | | | | | | | | |
| to average net assets: | | | (1.15 | )%(5) | | | (1.68 | )% | | | (1.57 | )% | | | (1.86 | )% | | | (1.67 | )% | | | (1.77 | )% |
Portfolio turnover rate(7) | | | 0 | % | | | 3 | % | | | 14 | % | | | 2 | % | | | 2 | % | | | 7 | % |
| (1) | Information presented relates to a share of capital stock outstanding for each period. |
| (2) | Net investment income per share represents net investment income divided by the average shares outstanding throughout the period. |
| (3) | Amount calculated is less than $0.005. |
| (4) | Not annualized. |
| (5) | Annualized. |
| (6) | See Note #3, Investment Adviser, for the waiver and expense reimbursement discussion. |
| (7) | Portfolio turnover of The Paradigm Portfolio. |
The accompanying notes are an integral part of these financial statements.
80
KINETICS MUTUAL FUNDS, INC. — THE FEEDER FUNDS
Financial Highlights — (Continued)
| | | | | | | | | | | | | | | | | | | |
| | | The Paradigm Fund | |
| | | Institutional Class | |
| | | For the | | | | | | | | | | | | | | | | |
| | | Period | | | For the | | | For the | | | For the | | | For the | | | For the | |
| | | Ended | | | Year Ended | | | Year Ended | | | Year Ended | | | Year Ended | | | Year Ended | |
| | | June 30, 2019 | | | December 31, | | | December 31, | | | December 31, | | | December 31, | | | December 31, | |
| | | (Unaudited) | | | 2018 | | | 2017 | | | 2016 | | | 2015 | | | 2014 | |
| | |
PER SHARE DATA:(1) | | | | | | | | | | | | | | | | | | |
| Net Asset Value, | | | | | | | | | | | | | | | | | | |
| Beginning of Period | | $ | 41.69 | | | $ | 48.62 | | | $ | 37.79 | | | $ | 31.30 | | | $ | 34.08 | | | $ | 34.28 | |
| Income from Investment Operations: | | | | | | | | | | | | | | | | | | | | | | | | |
Net investment loss(2) | | | (0.05 | ) | | | (0.39 | ) | | | (0.26 | ) | | | (0.30 | ) | | | (0.25 | ) | | | (0.29 | ) |
| Net realized and unrealized gain | | | | | | | | | | | | | | | | | | | | | | | | |
| (loss) on investments | | | 12.17 | | | | (2.23 | ) | | | 11.09 | | | | 6.79 | | | | (2.53 | ) | | | 0.09 | |
| Total from Investment | | | | | | | | | | | | | | | | | | | | | | | | |
| Operations | | | 12.12 | | | | (2.62 | ) | | | 10.83 | | | | 6.49 | | | | (2.78 | ) | | | (0.20 | ) |
Redemption Fees(3) | | | 0.00 | | | | 0.00 | | | | 0.00 | | | | 0.00 | | | | 0.00 | | | | 0.00 | |
| Less Distributions: | | | | | | | | | | | | | | | | | | | | | | | | |
| From net realized gains | | | — | | | | (4.31 | ) | | | — | | | | — | | | | — | | | | — | |
| Total Distributions | | | — | | | | (4.31 | ) | | | — | | | | — | | | | — | | | | — | |
| Net Asset Value, End of Period | | $ | 53.81 | | | $ | 41.69 | | | $ | 48.62 | | | $ | 37.79 | | | $ | 31.30 | | | $ | 34.08 | |
| Total return | | | 29.07 | %(4) | | | (5.37 | )% | | | 28.66 | % | | | 20.73 | % | | | (8.16 | )% | | | (0.61 | )% |
| | |
SUPPLEMENTAL DATA AND RATIOS | | | | | | | | | | | | | | | | | | | | | | | | |
| Net assets, end of period (000’s) | | $ | 205,799 | | | $ | 148,968 | | | $ | 208,692 | | | $ | 270,880 | | | $ | 302,130 | | | $ | 346,273 | |
| Ratio of operating expenses to | | | | | | | | | | | | | | | | | | | | | | | | |
| average net assets: | | | | | | | | | | | | | | | | | | | | | | | | |
| Before expense reimbursement | | | 1.68 | %(5) | | | 1.68 | % | | | 1.69 | % | | | 1.70 | % | | | 1.66 | % | | | 1.63 | % |
After expense reimbursement(6) | | | 1.44 | %(5) | | | 1.44 | % | | | 1.44 | % | | | 1.44 | % | | | 1.44 | % | | | 1.44 | % |
| Ratio of net investment income | | | | | | | | | | | | | | | | | | | | | | | | |
| (loss) to average net assets: | | | (0.20 | )%(5) | | | (0.73 | )% | | | (0.62 | )% | | | (0.91 | )% | | | (0.72 | )% | | | (0.82 | )% |
Portfolio turnover rate(7) | | | 0 | % | | | 3 | % | | | 14 | % | | | 2 | % | | | 2 | % | | | 7 | % |
| (1) | Information presented relates to a share of capital stock outstanding for each period. |
| (2) | Net investment income per share represents net investment income divided by the average shares outstanding throughout the period. |
| (3) | Amount calculated is less than $0.005. |
| (4) | Not annualized. |
| (5) | Annualized. |
| (6) | See Note #3, Investment Adviser, for the waiver and expense reimbursement discussion. |
| (7) | Portfolio turnover of The Paradigm Portfolio. |
The accompanying notes are an integral part of these financial statements.
81
KINETICS MUTUAL FUNDS, INC. — THE FEEDER FUNDS
Financial Highlights — (Continued)
| | | | | | | | | | | | | | | | | | | |
| | | The Medical Fund | |
| | | No Load Class | |
| | | For the | | | | | | | | | | | | | | | | |
| | | Period | | | For the | | | For the | | | For the | | | For the | | | For the | |
| | | Ended | | | Year Ended | | | Year Ended | | | Year Ended | | | Year Ended | | | Year Ended | |
| | | June 30, 2019 | | | December 31, | | | December 31, | | | December 31, | | | December 31, | | | December 31, | |
| | | (Unaudited) | | | 2018 | | | 2017 | | | 2016 | | | 2015 | | | 2014 | |
| | |
PER SHARE DATA:(1) | | | | | | | | | | | | | | | | | | |
| Net Asset Value, | | | | | | | | | | | | | | | | | | |
| Beginning of Period | | $ | 23.47 | | | $ | 25.33 | | | $ | 26.62 | | | $ | 30.62 | | | $ | 30.67 | | | $ | 26.38 | |
| Income from Investment Operations: | | | | | | | | | | | | | | | | | | | | | | | | |
Net investment income(2) | | | 0.23 | | | | 0.27 | | | | 0.24 | | | | 0.19 | | | | 0.08 | | | | 0.13 | |
| Net realized and unrealized gain | | | | | | | | | | | | | | | | | | | | | | | | |
| (loss) on investments | | | 0.79 | | | | 0.12 | | | | 2.63 | | | | (2.64 | ) | | | 1.96 | | | | 4.21 | |
| Total from Investment | | | | | | | | | | | | | | | | | | | | | | | | |
| Operations | | | 1.02 | | | | 0.39 | | | | 2.87 | | | | (2.45 | ) | | | 2.04 | | | | 4.34 | |
Redemption Fees(3) | | | 0.00 | | | | 0.00 | | | | 0.00 | | | | 0.00 | | | | 0.00 | | | | 0.00 | |
| Less Distributions: | | | | | | | | | | | | | | | | | | | | | | | | |
| From net investment income | | | — | | | | (0.29 | ) | | | (0.26 | ) | | | (0.22 | ) | | | (0.12 | ) | | | — | |
| From net realized gains | | | — | | | | (1.96 | ) | | | (3.90 | ) | | | (1.33 | ) | | | (1.97 | ) | | | (0.05 | ) |
| Total Distributions | | | — | | | | (2.25 | ) | | | (4.16 | ) | | | (1.55 | ) | | | (2.09 | ) | | | (0.05 | ) |
| Net Asset Value, End of Period | | $ | 24.49 | | | $ | 23.47 | | | $ | 25.33 | | | $ | 26.62 | | | $ | 30.62 | | | $ | 30.67 | |
| Total return | | | 4.35 | %(4) | | | 1.67 | % | | | 10.71 | % | | | (8.01 | )% | | | 6.59 | % | | | 16.44 | % |
| | |
SUPPLEMENTAL DATA AND RATIOS | | | | | | | | | | | | | | | | | | | | | | | | |
| Net assets, end of period (000’s) | | $ | 15,005 | | | $ | 14,814 | | | $ | 16,060 | | | $ | 17,560 | | | $ | 22,257 | | | $ | 21,876 | |
| Ratio of operating expenses to | | | | | | | | | | | | | | | | | | | | | | | | |
| average net assets: | | | | | | | | | | | | | | | | | | | | | | | | |
| Before expense reimbursement | | | 2.36 | %(5) | | | 2.23 | % | | | 2.15 | % | | | 2.08 | % | | | 1.99 | % | | | 2.02 | % |
After expense reimbursement(6) | | | 1.39 | %(5) | | | 1.39 | % | | | 1.39 | % | | | 1.39 | % | | | 1.39 | % | | | 1.39 | % |
| Ratio of net investment income | | | | | | | | | | | | | | | | | | | | | | | | |
| to average net assets: | | | 1.89 | %(5) | | | 1.03 | % | | | 0.86 | % | | | 0.69 | % | | | 0.25 | % | | | 0.46 | % |
Portfolio turnover rate(7) | | | 6 | % | | | 0 | % | | | 0 | % | | | 0 | % | | | 12 | % | | | 3 | % |
| (1) | Information presented relates to a share of capital stock outstanding for each period. |
| (2) | Net investment income per share represents net investment income divided by the average shares outstanding throughout the period. |
| (3) | Amount calculated is less than $0.005. |
| (4) | Not annualized. |
| (5) | Annualized. |
| (6) | See Note #3, Investment Adviser, for the waiver and expense reimbursement discussion. |
| (7) | Portfolio turnover of The Medical Portfolio. |
The accompanying notes are an integral part of these financial statements.
82
KINETICS MUTUAL FUNDS, INC. — THE FEEDER FUNDS
Financial Highlights — (Continued)
| | | | | | | | | | | | | | | | | | | |
| | | The Medical Fund | |
| | | Advisor Class A | |
| | | For the | | | | | | | | | | | | | | | | |
| | | Period | | | For the | | | For the | | | For the | | | For the | | | For the | |
| | | Ended | | | Year Ended | | | Year Ended | | | Year Ended | | | Year Ended | | | Year Ended | |
| | | June 30, 2019 | | | December 31, | | | December 31, | | | December 31, | | | December 31, | | | December 31, | |
| | | (Unaudited) | | | 2018 | | | 2017 | | | 2016 | | | 2015 | | | 2014 | |
| | |
PER SHARE DATA:(1) | | | | | | | | | | | | | | | | | | |
| Net Asset Value, | | | | | | | | | | | | | | | | | | |
| Beginning of Period | | $ | 22.50 | | | $ | 24.33 | | | $ | 25.71 | | | $ | 29.57 | | | $ | 29.71 | | | $ | 25.62 | |
| Income from Investment Operations: | | | | | | | | | | | | | | | | | | | | | | | | |
Net investment income(2) | | | 0.19 | | | | 0.19 | | | | 0.17 | | | | 0.12 | | | | 0.00 | (3) | | | 0.06 | |
| Net realized and unrealized gain | | | | | | | | | | | | | | | | | | | | | | | | |
| (loss) on investments | | | 0.76 | | | | 0.11 | | | | 2.53 | | | | (2.55 | ) | | | 1.90 | | | | 4.08 | |
| Total from Investment | | | | | | | | | | | | | | | | | | | | | | | | |
| Operations | | | 0.95 | | | | 0.30 | | | | 2.70 | | | | (2.43 | ) | | | 1.90 | | | | 4.14 | |
| Redemption Fees | | | — | | | | — | | | | 0.00 | (3) | | | 0.00 | (3) | | | 0.00 | (3) | | | 0.00 | (3) |
| Less Distributions: | | | | | | | | | | | | | | | | | | | | | | | | |
| From net investment income | | | — | | | | (0.17 | ) | | | (0.18 | ) | | | (0.10 | ) | | | (0.07 | ) | | | — | |
| From net realized gains | | | — | | | | (1.96 | ) | | | (3.90 | ) | | | (1.33 | ) | | | (1.97 | ) | | | (0.05 | ) |
| Total Distributions | | | — | | | | (2.13 | ) | | | (4.08 | ) | | | (1.43 | ) | | | (2.04 | ) | | | (0.05 | ) |
| Net Asset Value, End of Period | | $ | 23.45 | | | $ | 22.50 | | | $ | 24.33 | | | $ | 25.71 | | | $ | 29.57 | | | $ | 29.71 | |
Total return(4) | | | 4.22 | %(5) | | | 1.36 | % | | | 10.43 | % | | | (8.24 | )% | | | 6.34 | % | | | 16.15 | % |
| | |
SUPPLEMENTAL DATA AND RATIOS | | | | | | | | | | | | | | | | | | | | | | | | |
| Net assets, end of period (000’s) | | $ | 1,185 | | | $ | 1,319 | | | $ | 2,986 | | | $ | 3,687 | | | $ | 6,241 | | | $ | 4,578 | |
| Ratio of operating expenses to | | | | | | | | | | | | | | | | | | | | | | | | |
| average net assets: | | | | | | | | | | | | | | | | | | | | | | | | |
| Before expense reimbursement | | | 2.61 | %(6) | | | 2.48 | % | | | 2.40 | % | | | 2.33 | % | | | 2.24 | % | | | 2.27 | % |
After expense reimbursement(7) | | | 1.64 | %(6) | | | 1.64 | % | | | 1.64 | % | | | 1.64 | % | | | 1.64 | % | | | 1.64 | % |
| Ratio of net investment income | | | | | | | | | | | | | | | | | | | | | | | | |
| to average net assets: | | | 1.64 | %(6) | | | 0.78 | % | | | 0.61 | % | | | 0.44 | % | | | 0.00 | % | | | 0.21 | % |
Portfolio turnover rate(8) | | | 6 | % | | | 0 | % | | | 0 | % | | | 0 | % | | | 12 | % | | | 3 | % |
| (1) | Information presented relates to a share of capital stock outstanding for each period. |
| (2) | Net investment income per share represents net investment income divided by the average shares outstanding throughout the period. |
| (3) | Amount calculated is less than $0.005. |
| (4) | The total return calculation does not reflect the 5.75% front end sales charge on Advisor Class A shares. |
| (5) | Not annualized. |
| (6) | Annualized. |
| (7) | See Note #3, Investment Adviser, for the waiver and expense reimbursement discussion. |
| (8) | Portfolio turnover of The Medical Portfolio. |
The accompanying notes are an integral part of these financial statements.
83
KINETICS MUTUAL FUNDS, INC. — THE FEEDER FUNDS
Financial Highlights — (Continued)
| | | | | | | | | | | | | | | | | | | |
| | | The Medical Fund | |
| | | Advisor Class C | |
| | | For the | | | | | | | | | | | | | | | | |
| | | Period | | | For the | | | For the | | | For the | | | For the | | | For the | |
| | | Ended | | | Year Ended | | | Year Ended | | | Year Ended | | | Year Ended | | | Year Ended | |
| | | June 30, 2019 | | | December 31, | | | December 31, | | | December 31, | | | December 31, | | | December 31, | |
| | | (Unaudited) | | | 2018 | | | 2017 | | | 2016 | | | 2015 | | | 2014 | |
| | |
PER SHARE DATA:(1) | | | | | | | | | | | | | | | | | | |
| Net Asset Value, | | | | | | | | | | | | | | | | | | |
| Beginning of Period | | $ | 21.69 | | | $ | 23.57 | | | $ | 24.99 | | | $ | 28.82 | | | $ | 29.15 | | | $ | 25.27 | |
| Income from Investment Operations: | | | | | | | | | | | | | | | | | | | | | | | | |
Net investment income (loss)(2) | | | 0.13 | | | | 0.07 | | | | 0.03 | | | | (0.02 | ) | | | (0.16 | ) | | | (0.08 | ) |
| Net realized and unrealized gain | | | | | | | | | | | | | | | | | | | | | | | | |
| (loss) on investments | | | 0.73 | | | | 0.11 | | | | 2.45 | | | | (2.48 | ) | | | 1.87 | | | | 4.01 | |
| Total from Investment | | | | | | | | | | | | | | | | | | | | | | | | |
| Operations | | | 0.86 | | | | 0.18 | | | | 2.48 | | | | (2.50 | ) | | | 1.71 | | | | 3.93 | |
| Redemption Fees | | | — | | | | — | | | | — | | | | — | | | | — | | | | — | |
| Less Distributions: | | | | | | | | | | | | | | | | | | | | | | | | |
| From net investment income | | | — | | | | (0.10 | ) | | | — | | | | — | | | | (0.07 | ) | | | — | |
| From net realized gains | | | — | | | | (1.96 | ) | | | (3.90 | ) | | | (1.33 | ) | | | (1.97 | ) | | | (0.05 | ) |
| Total Distributions | | | — | | | | (2.06 | ) | | | (3.90 | ) | | | (1.33 | ) | | | (2.04 | ) | | | (0.05 | ) |
| Net Asset Value, End of Period | | $ | 22.55 | | | $ | 21.69 | | | $ | 23.57 | | | $ | 24.99 | | | $ | 28.82 | | | $ | 29.15 | |
| Total return | | | 3.96 | %(3) | | | 0.90 | % | | | 9.86 | % | | | (8.69 | )% | | | 5.81 | % | | | 15.54 | % |
| | |
SUPPLEMENTAL DATA AND RATIOS | | | | | | | | | | | | | | | | | | | | | | | | |
| Net assets, end of period (000’s) | | $ | 174 | | | $ | 320 | | | $ | 383 | | | $ | 422 | | | $ | 608 | | | $ | 631 | |
| Ratio of operating expenses to | | | | | | | | | | | | | | | | | | | | | | | | |
| average net assets: | | | | | | | | | | | | | | | | | | | | | | | | |
| Before expense reimbursement | | | 3.11 | %(4) | | | 2.98 | % | | | 2.90 | % | | | 2.83 | % | | | 2.74 | % | | | 2.77 | % |
After expense reimbursement(5) | | | 2.14 | %(4) | | | 2.14 | % | | | 2.14 | % | | | 2.14 | % | | | 2.14 | % | | | 2.14 | % |
| Ratio of net investment income (loss) | | | | | | | | | | | | | | | | | | | | | | | | |
| to average net assets: | | | 1.14 | %(4) | | | 0.28 | % | | | 0.11 | % | | | (0.06 | )% | | | (0.50 | )% | | | (0.29 | )% |
Portfolio turnover rate(6) | | | 6 | % | | | 0 | % | | | 0 | % | | | 0 | % | | | 12 | % | | | 3 | % |
| (1) | Information presented relates to a share of capital stock outstanding for each period. |
| (2) | Net investment income per share represents net investment income divided by the average shares outstanding throughout the period. |
| (3) | Not annualized. |
| (4) | Annualized. |
| (5) | See Note #3, Investment Adviser, for the waiver and expense reimbursement discussion. |
| (6) | Portfolio turnover of The Medical Portfolio. |
The accompanying notes are an integral part of these financial statements.
84
KINETICS MUTUAL FUNDS, INC. — THE FEEDER FUNDS
Financial Highlights — (Continued)
| | | | | | | | | | | | | | | | | | | |
| | | The Small Cap Opportunities Fund | |
| | | No Load Class | |
| | | For the | | | | | | | | | | | | | | | | |
| | | Period | | | For the | | | For the | | | For the | | | For the | | | For the | |
| | | Ended | | | Year Ended | | | Year Ended | | | Year Ended | | | Year Ended | | | Year Ended | |
| | | June 30, 2019 | | | December 31, | | | December 31, | | | December 31, | | | December 31, | | | December 31, | |
| | | (Unaudited) | | | 2018 | | | 2017 | | | 2016 | | | 2015 | | | 2014 | |
| | |
PER SHARE DATA:(1) | | | | | | | | | | | | | | | | | | |
| Net Asset Value, | | | | | | | | | | | | | | | | | | |
| Beginning of Period | | $ | 51.40 | | | $ | 51.25 | | | $ | 40.60 | | | $ | 32.64 | | | $ | 37.21 | | | $ | 40.12 | |
| Income from Investment Operations: | | | | | | | | | | | | | | | | | | | | | | | | |
Net investment loss(2) | | | (0.03 | ) | | | (0.35 | ) | | | (0.33 | ) | | | (0.36 | ) | | | (0.35 | ) | | | (0.36 | ) |
| Net realized and unrealized gain | | | | | | | | | | | | | | | | | | | | | | | | |
| (loss) on investments | | | 11.53 | | | | 0.47 | | | | 10.98 | | | | 8.32 | | | | (4.22 | ) | | | (2.56 | ) |
| Total from Investment | | | | | | | | | | | | | | | | | | | | | | | | |
| Operations | | | 11.50 | | | | 0.12 | | | | 10.65 | | | | 7.96 | | | | (4.57 | ) | | | (2.92 | ) |
| Redemption Fees | | | 0.00 | (3) | | | 0.03 | | | | 0.00 | (3) | | | 0.00 | (3) | | | 0.00 | (3) | | | 0.01 | |
| Less Distributions: | | | | | | | | | | | | | | | | | | | | | | | | |
| From net investment income | | | — | | | | — | | | | — | | | | — | | | | — | | | | — | |
| Total Distributions | | | — | | | | — | | | | — | | | | — | | | | — | | | | — | |
| Net Asset Value, End of Period | | $ | 62.90 | | | $ | 51.40 | | | $ | 51.25 | | | $ | 40.60 | | | $ | 32.64 | | | $ | 37.21 | |
| Total return | | | 22.37 | %(4) | | | 0.29 | % | | | 26.23 | % | | | 24.39 | % | | | (12.26 | )% | | | (7.28 | )% |
| | |
SUPPLEMENTAL DATA AND RATIOS | | | | | | | | | | | | | | | | | | | | | | | | |
| Net assets, end of period (000’s) | | $ | 206,433 | | | $ | 164,330 | | | $ | 133,960 | | | $ | 132,443 | | | $ | 145,032 | | | $ | 251,110 | |
| Ratio of operating expenses to | | | | | | | | | | | | | | | | | | | | | | | | |
| average net assets: | | | | | | | | | | | | | | | | | | | | | | | | |
| Before expense reimbursement | | | 1.76 | %(5) | | | 1.74 | % | | | 1.78 | % | | | 1.76 | % | | | 1.73 | % | | | 1.71 | % |
After expense reimbursement(6) | | | 1.64 | %(5) | | | 1.64 | % | | | 1.64 | % | | | 1.64 | % | | | 1.64 | % | | | 1.64 | % |
| Ratio of net investment loss | | | | | | | | | | | | | | | | | | | | | | | | |
| to average net assets: | | | (0.09 | )%(5) | | | (0.60 | )% | | | (0.74 | )% | | | (1.03 | )% | | | (0.94 | )% | | | (0.89 | )% |
Portfolio turnover rate(7) | | | 2 | % | | | 3 | % | | | 9 | % | | | 4 | % | | | 2 | % | | | 19 | % |
| (1) | Information presented relates to a share of capital stock outstanding for each period. |
| (2) | Net investment income per share represents net investment income divided by the average shares outstanding throughout the period. |
| (3) | Amount calculated is less than $0.005. |
| (4) | Not annualized. |
| (5) | Annualized. |
| (6) | See Note #3, Investment Adviser, for the waiver and expense reimbursement discussion. |
| (7) | Portfolio turnover of The Small Cap Opportunities Portfolio. |
The accompanying notes are an integral part of these financial statements.
85
KINETICS MUTUAL FUNDS, INC. — THE FEEDER FUNDS
Financial Highlights — (Continued)
| | | | | | | | | | | | | | | | | | | |
| | | The Small Cap Opportunities Fund |
| | | Advisor Class A | |
| | | For the | | | | | | | | | | | | | | | | |
| | | Period | | | For the | | | For the | | | For the | | | For the | | | For the | |
| | | Ended | | | Year Ended | | | Year Ended | | | Year Ended | | | Year Ended | | | Year Ended | |
| | | June 30, 2019 | | | December 31, | | | December 31, | | | December 31, | | | December 31, | | | December 31, | |
| | | (Unaudited) | | | 2018 | | | 2017 | | | 2016 | | | 2015 | | | 2014 | |
| | |
PER SHARE DATA:(1) | | | | | | | | | | | | | | | | | | |
| Net Asset Value, | | | | | | | | | | | | | | | | | | |
| Beginning of Period | | $ | 49.81 | | | $ | 49.81 | | | $ | 39.55 | | | $ | 31.88 | | | $ | 36.43 | | | $ | 39.39 | |
| Income from Investment Operations: | | | | | | | | | | | | | | | | | | | | | | | | |
Net investment loss(2) | | | (0.10 | ) | | | (0.48 | ) | | | (0.42 | ) | | | (0.43 | ) | | | (0.43 | ) | | | (0.45 | ) |
| Net realized and unrealized | | | | | | | | | | | | | | | | | | | | | | | | |
| gain (loss) on investments | | | 11.16 | | | | 0.48 | | | | 10.68 | | | | 8.10 | | | | (4.12 | ) | | | (2.51 | ) |
| Total from Investment | | | | | | | | | | | | | | | | | | | | | | | | |
| Operations | | | 11.06 | | | | — | | | | 10.26 | | | | 7.67 | | | | (4.55 | ) | | | (2.96 | ) |
Redemption Fees(3) | | | 0.00 | | | | 0.00 | | | | 0.00 | | | | 0.00 | | | | 0.00 | | | | 0.00 | |
| Less Distributions: | | | | | | | | | | | | | | | | | | | | | | | | |
| From net investment income | | | — | | | | — | | | | — | | | | — | | | | — | | | | — | |
| Total Distributions | | | — | | | | — | | | | — | | | | — | | | | — | | | | — | |
| Net Asset Value, End of Period | | $ | 60.87 | | | $ | 49.81 | | | $ | 49.81 | | | $ | 39.55 | | | $ | 31.88 | | | $ | 36.43 | |
Total return(4) | | | 22.20 | %(5) | | | 0.00 | % | | | 25.94 | % | | | 24.06 | % | | | (12.47 | )% | | | (7.54 | )% |
| | |
SUPPLEMENTAL DATA AND RATIOS | | | | | | | | | | | | | | | | | | | | | | | | |
| Net assets, end of period (000’s) | | $ | 32,104 | | | $ | 10,505 | | | $ | 11,735 | | | $ | 13,694 | | | $ | 14,857 | | | $ | 25,591 | |
| Ratio of operating expenses to | | | | | | | | | | | | | | | | | | | | | | | | |
| average net assets: | | | | | | | | | | | | | | | | | | | | | | | | |
| Before expense reimbursement | | | 2.01 | %(6) | | | 1.99 | % | | | 2.03 | % | | | 2.01 | % | | | 1.98 | % | | | 1.96 | % |
After expense reimbursement(7) | | | 1.89 | %(6) | | | 1.89 | % | | | 1.89 | % | | | 1.89 | % | | | 1.89 | % | | | 1.89 | % |
| Ratio of net investment loss | | | | | | | | | | | | | | | | | | | | | | | | |
| to average net assets: | | | (0.34 | )%(6) | | | (0.85 | )% | | | (0.99 | )% | | | (1.28 | )% | | | (1.19 | )% | | | (1.14 | )% |
Portfolio turnover rate(8) | | | 2 | % | | | 3 | % | | | 9 | % | | | 4 | % | | | 2 | % | | | 19 | % |
| (1) | Information presented relates to a share of capital stock outstanding for each period. |
| (2) | Net investment income per share represents net investment income divided by the average shares outstanding throughout the period. |
| (3) | Amount calculated is less than $0.005. |
| (4) | The total return calculation does not reflect the 5.75% front end sales charge on Advisor Class A shares. |
| (5) | Not annualized. |
| (6) | Annualized. |
| (7) | See Note #3, Investment Adviser, for the waiver and expense reimbursement discussion. |
| (8) | Portfolio turnover of The Small Cap Opportunities Portfolio. |
The accompanying notes are an integral part of these financial statements.
86
KINETICS MUTUAL FUNDS, INC. — THE FEEDER FUNDS
Financial Highlights — (Continued)
| | | | | | | | | | | | | | | | | | | |
| | | The Small Cap Opportunities Fund | |
| | | Advisor Class C | |
| | | For the | | | | | | | | | | | | | | | | |
| | | Period | | | For the | | | For the | | | For the | | | For the | | | For the | |
| | | Ended | | | Year Ended | | | Year Ended | | | Year Ended | | | Year Ended | | | Year Ended | |
| | | June 30, 2019 | | | December 31, | | | December 31, | | | December 31, | | | December 31, | | | December 31, | |
| | | (Unaudited) | | | 2018 | | | 2017 | | | 2016 | | | 2015 | | | 2014 | |
| | |
PER SHARE DATA:(1) | | | | | | | | | | | | | | | | | | |
| Net Asset Value, | | | | | | | | | | | | | | | | | | |
| Beginning of Period | | $ | 47.53 | | | $ | 47.77 | | | $ | 38.12 | | | $ | 30.88 | | | $ | 35.47 | | | $ | 38.53 | |
| Income from Investment Operations: | | | | | | | | | | | | | | | | | | | | | | | | |
Net investment loss(2) | | | (0.23 | ) | | | (0.73 | ) | | | (0.61 | ) | | | (0.58 | ) | | | (0.59 | ) | | | (0.63 | ) |
| Net realized and unrealized gain | | | | | | | | | | | | | | | | | | | | | | | | |
| (loss) on investments | | | 10.64 | | | | 0.49 | | | | 10.26 | | | | 7.82 | | | | (4.00 | ) | | | (2.44 | ) |
| Total from Investment | | | | | | | | | | | | | | | | | | | | | | | | |
| Operations | | | 10.41 | | | | (0.24 | ) | | | 9.65 | | | | 7.24 | | | | (4.59 | ) | | | (3.07 | ) |
| Redemption Fees | | | — | | | | 0.00 | (3) | | | — | | | | 0.00 | (3) | | | — | | | | 0.01 | |
| Less Distributions: | | | | | | | | | | | | | | | | | | | | | | | | |
| From net investment income | | | — | | | | — | | | | — | | | | — | | | | — | | | | — | |
| Total Distributions | | | — | | | | — | | | | — | | | | — | | | | — | | | | — | |
| Net Asset Value, End of Period | | $ | 57.94 | | | $ | 47.53 | | | $ | 47.77 | | | $ | 38.12 | | | $ | 30.88 | | | $ | 35.47 | |
| Total return | | | 21.90 | %(4) | | | (0.50 | )% | | | 25.31 | % | | | 23.45 | % | | | (12.92 | )% | | | (7.97 | )% |
| | |
SUPPLEMENTAL DATA AND RATIOS | | | | | | | | | | | | | | | | | | | | | | | | |
| Net assets, end of period (000’s) | | $ | 10,770 | | | $ | 8,373 | | | $ | 8,135 | | | $ | 8,426 | | | $ | 8,840 | | | $ | 12,928 | |
| Ratio of operating expenses to | | | | | | | | | | | | | | | | | | | | | | | | |
| average net assets: | | | | | | | | | | | | | | | | | | | | | | | | |
| Before expense reimbursement | | | 2.51 | %(5) | | | 2.49 | % | | | 2.53 | % | | | 2.51 | % | | | 2.48 | % | | | 2.46 | % |
After expense reimbursement(6) | | | 2.39 | %(5) | | | 2.39 | % | | | 2.39 | % | | | 2.39 | % | | | 2.39 | % | | | 2.39 | % |
| Ratio of net investment loss | | | | | | | | | | | | | | | | | | | | | | | | |
| to average net assets: | | | (0.84 | )%(5) | | | (1.35 | )% | | | (1.49 | )% | | | (1.78 | )% | | | (1.69 | )% | | | (1.64 | )% |
Portfolio turnover rate(7) | | | 2 | % | | | 3 | % | | | 9 | % | | | 4 | % | | | 2 | % | | | 19 | % |
| (1) | Information presented relates to a share of capital stock outstanding for each period. |
| (2) | Net investment income per share represents net investment income divided by the average shares outstanding throughout the period. |
| (3) | Amount calculated is less than $0.005. |
| (4) | Not annualized. |
| (5) | Annualized. |
| (6) | See Note #3, Investment Adviser, for the waiver and expense reimbursement discussion. |
| (7) | Portfolio turnover of The Small Cap Opportunities Portfolio. |
The accompanying notes are an integral part of these financial statements.
87
KINETICS MUTUAL FUNDS, INC. — THE FEEDER FUNDS
Financial Highlights — (Continued)
| | | | | | | | | | | | | | | | | | | |
| | | The Small Cap Opportunities Fund | |
| | | Institutional Class | |
| | | For the | | | | | | | | | | | | | | | | |
| | | Period | | | For the | | | For the | | | For the | | | For the | | | For the | |
| | | Ended | | | Year Ended | | | Year Ended | | | Year Ended | | | Year Ended | | | Year Ended | |
| | | June 30, 2019 | | | December 31, | | | December 31, | | | December 31, | | | December 31, | | | December 31, | |
| | | (Unaudited) | | | 2018 | | | 2017 | | | 2016 | | | 2015 | | | 2014 | |
| | |
PER SHARE DATA:(1) | | | | | | | | | | | | | | | | | | |
| Net Asset Value, | | | | | | | | | | | | | | | | | | |
| Beginning of Period | | $ | 52.30 | | | $ | 52.07 | | | $ | 41.16 | | | $ | 33.03 | | | $ | 37.57 | | | $ | 40.44 | |
| Income from Investment Operations: | | | | | | | | | | | | | | | | | | | | | | | | |
Net investment income (loss)(2) | | | 0.03 | | | | (0.24 | ) | | | (0.24 | ) | | | (0.29 | ) | | | (0.28 | ) | | | (0.28 | ) |
| Net realized and unrealized gain | | | | | | | | | | | | | | | | | | | | | | | | |
| (loss) on investments | | | 11.73 | | | | 0.47 | | | | 11.15 | | | | 8.42 | | | | (4.26 | ) | | | (2.59 | ) |
| Total from Investment | | | | | | | | | | | | | | | | | | | | | | | | |
| Operations | | | 11.76 | | | | 0.23 | | | | 10.91 | | | | 8.13 | | | | (4.54 | ) | | | (2.87 | ) |
Redemption Fees(3) | | | 0.00 | | | | 0.00 | | | | 0.00 | | | | 0.00 | | | | 0.00 | | | | 0.00 | |
| Less Distributions: | | | | | | | | | | | | | | | | | | | | | | | | |
| From net investment income | | | — | | | | — | | | | — | | | | — | | | | — | | | | — | |
| Total Distributions | | | — | | | | — | | | | — | | | | — | | | | — | | | | — | |
| Net Asset Value, End of Period | | $ | 64.06 | | | $ | 52.30 | | | $ | 52.07 | | | $ | 41.16 | | | $ | 33.03 | | | $ | 37.57 | |
| Total return | | | 22.49 | %(4) | | | 0.44 | % | | | 26.51 | % | | | 24.61 | % | | | (12.06 | )% | | | (7.12 | )% |
| | |
SUPPLEMENTAL DATA AND RATIOS | | | | | | | | | | | | | | | | | | | | | | | | |
| Net assets, end of period (000’s) | | $ | 63,809 | | | $ | 40,075 | | | $ | 27,514 | | | $ | 50,517 | | | $ | 51,258 | | | $ | 63,392 | |
| Ratio of operating expenses to | | | | | | | | | | | | | | | | | | | | | | | | |
| average net assets: | | | | | | | | | | | | | | | | | | | | | | | | |
| Before expense reimbursement | | | 1.71 | %(5) | | | 1.69 | % | | | 1.73 | % | | | 1.71 | % | | | 1.68 | % | | | 1.66 | % |
After expense reimbursement(6) | | | 1.44 | %(5) | | | 1.44 | % | | | 1.44 | % | | | 1.44 | % | | | 1.44 | % | | | 1.44 | % |
| Ratio of net investment income (loss) | | | | | | | | | | | | | | | | | | | | | | | | |
| to average net assets: | | | 0.11 | %(5) | | | (0.40 | )% | | | (0.54 | )% | | | (0.83 | )% | | | (0.74 | )% | | | (0.69 | )% |
Portfolio turnover rate(7) | | | 2 | % | | | 3 | % | | | 9 | % | | | 4 | % | | | 2 | % | | | 19 | % |
| (1) | Information presented relates to a share of capital stock outstanding for each period. |
| (2) | Net investment income per share represents net investment income divided by the average shares outstanding throughout the period. |
| (3) | Amount calculated is less than $0.005. |
| (4) | Not annualized. |
| (5) | Annualized. |
| (6) | See Note #3, Investment Adviser, for the waiver and expense reimbursement discussion. |
| (7) | Portfolio turnover of The Small Cap Opportunities Portfolio. |
The accompanying notes are an integral part of these financial statements.
88
KINETICS MUTUAL FUNDS, INC. — THE FEEDER FUNDS
Financial Highlights — (Continued)
| | | | | | | | | | | | | | | | | | | |
| | | The Market Opportunities Fund | |
| | | No Load Class | |
| | | For the | | | | | | | | | | | | | | | | |
| | | Period | | | For the | | | For the | | | For the | | | For the | | | For the | |
| | | Ended | | | Year Ended | | | Year Ended | | | Year Ended | | | Year Ended | | | Year Ended | |
| | | June 30, 2019 | | | December 31, | | | December 31, | | | December 31, | | | December 31, | | | December 31, | |
| | | (Unaudited) | | | 2018 | | | 2017 | | | 2016 | | | 2015 | | | 2014 | |
| | |
PER SHARE DATA:(1) | | | | | | | | | | | | | | | | | | |
| Net Asset Value, | | | | | | | | | | | | | | | | | | |
| Beginning of Period | | $ | 21.83 | | | $ | 26.72 | | | $ | 18.26 | | | $ | 15.16 | | | $ | 16.68 | | | $ | 17.66 | |
| Income from Investment Operations: | | | | | | | | | | | | | | | | | | | | | | | | |
Net investment income (loss)(2) | | | 0.04 | | | | (0.14 | ) | | | 0.17 | | | | (0.15 | ) | | | (0.15 | ) | | | (0.10 | ) |
| Net realized and unrealized gain | | | | | | | | | | | | | | | | | | | | | | | | |
| (loss) on investments | | | 5.57 | | | | (2.77 | ) | | | 8.46 | | | | 3.25 | | | | (1.37 | ) | | | (0.88 | ) |
| Total from Investment | | | | | | | | | | | | | | | | | | | | | | | | |
| Operations | | | 5.61 | | | | (2.91 | ) | | | 8.63 | | | | 3.10 | | | | (1.52 | ) | | | (0.98 | ) |
| Redemption Fees | | | 0.00 | (3) | | | 0.01 | | | | 0.00 | (3) | | | 0.00 | (3) | | | — | | | | 0.00 | (3) |
| Less Distributions: | | | | | | | | | | | | | | | | | | | | | | | | |
| From net investment income | | | — | | | | — | | | | (0.17 | ) | | | — | | | | — | | | | — | |
| From net realized gains | | | — | | | | (1.99 | ) | | | — | | | | — | | | | — | | | | — | |
| Total Distributions | | | — | | | | (1.99 | ) | | | (0.17 | ) | | | — | | | | — | | | | — | |
| Net Asset Value, End of Period | | $ | 27.44 | | | $ | 21.83 | | | $ | 26.72 | | | $ | 18.26 | | | $ | 15.16 | | | $ | 16.68 | |
| Total return | | | 25.70 | %(4) | | | (10.86 | )% | | | 47.28 | % | | | 20.45 | % | | | (9.11 | )% | | | (5.55 | )% |
| | |
SUPPLEMENTAL DATA AND RATIOS | | | | | | | | | | | | | | | | | | | | | | | | |
| Net assets, end of period (000’s) | | $ | 59,684 | | | $ | 48,487 | | | $ | 51,298 | | | $ | 32,178 | | | $ | 31,230 | | | $ | 37,318 | |
| Ratio of operating expenses to | | | | | | | | | | | | | | | | | | | | | | | | |
| average net assets: | | | | | | | | | | | | | | | | | | | | | | | | |
| Before expense reimbursement | | | 1.89 | %(5) | | | 1.86 | % | | | 1.92 | % | | | 1.97 | % | | | 1.90 | % | | | 1.86 | % |
After expense reimbursement(6) | | | 1.40 | %(5) | | | 1.64 | % | | | 1.64 | % | | | 1.64 | % | | | 1.64 | % | | | 1.64 | % |
| Ratio of net investment income (loss) | | | | | | | | | | | | | | | | | | | | | | | | |
| to average net assets: | | | 0.35 | %(5) | | | (0.53 | )% | | | 0.81 | % | | | (0.96 | )% | | | (0.91 | )% | | | (0.55 | )% |
Portfolio turnover rate(7) | | | 1 | % | | | 8 | % | | | 35 | % | | | 5 | % | | | 2 | % | | | 18 | % |
| (1) | Information presented relates to a share of capital stock outstanding for each period. |
| (2) | Net investment income per share represents net investment income divided by the average shares outstanding throughout the period. |
| (3) | Amount calculated is less than $0.005. |
| (4) | Not annualized. |
| (5) | Annualized. |
| (6) | See Note #3, Investment Adviser, for the waiver and expense reimbursement discussion. |
| (7) | Portfolio turnover of The Market Opportunities Portfolio. |
The accompanying notes are an integral part of these financial statements.
89
KINETICS MUTUAL FUNDS, INC. — THE FEEDER FUNDS
Financial Highlights — (Continued)
| | | | | | | | | | | | | | | | | | | |
| | | The Market Opportunities Fund | |
| | | Advisor Class A | |
| | | For the | | | | | | | | | | | | | | | | |
| | | Period | | | For the | | | For the | | | For the | | | For the | | | For the | |
| | | Ended | | | Year Ended | | | Year Ended | | | Year Ended | | | Year Ended | | | Year Ended | |
| | | June 30, 2019 | | | December 31, | | | December 31, | | | December 31, | | | December 31, | | | December 31, | |
| | | (Unaudited) | | | 2018 | | | 2017 | | | 2016 | | | 2015 | | | 2014 | |
| | |
PER SHARE DATA:(1) | | | | | | | | | | | | | | | | | | |
| Net Asset Value, | | | | | | | | | | | | | | | | | | |
| Beginning of Period | | $ | 21.49 | | | $ | 26.41 | | | $ | 18.07 | | | $ | 15.04 | | | $ | 16.59 | | | $ | 17.60 | |
| Income from Investment Operations: | | | | | | | | | | | | | | | | | | | | | | | | |
Net investment income (loss)(2) | | | 0.01 | | | | (0.21 | ) | | | 0.11 | | | | (0.19 | ) | | | (0.19 | ) | | | (0.14 | ) |
| Net realized and unrealized gain | | | | | | | | | | | | | | | | | | | | | | | | |
| (loss) on investments | | | 5.48 | | | | (2.72 | ) | | | 8.37 | | | | 3.22 | | | | (1.36 | ) | | | (0.87 | ) |
| Total from Investment | | | | | | | | | | | | | | | | | | | | | | | | |
| Operations | | | 5.49 | | | | (2.93 | ) | | | 8.48 | | | | 3.03 | | | | (1.55 | ) | | | (1.01 | ) |
| Redemption Fees | | | — | | | | 0.00 | (3) | | | 0.00 | (3) | | | — | | | | 0.00 | (3) | | | — | |
| Less Distributions: | | | | | | | | | | | | | | | | | | | | | | | | |
| From net investment income | | | — | | | | — | | | | (0.14 | ) | | | — | | | | — | | | | — | |
| From net realized gains | | | — | | | | (1.99 | ) | | | — | | | | — | | | | — | | | | — | |
| Total Distributions | | | — | | | | (1.99 | ) | | | (0.14 | ) | | | — | | | | — | | | | — | |
| | |
| Net Asset Value, End of Period | | $ | 26.98 | | | $ | 21.49 | | | $ | 26.41 | | | $ | 18.07 | | | $ | 15.04 | | | $ | 16.59 | |
Total return(4) | | | 25.55 | %(5) | | | (11.10 | )% | | | 46.91 | % | | | 20.15 | % | | | (9.34 | )% | | | (5.74 | )% |
| | |
SUPPLEMENTAL DATA AND RATIOS | | | | | | | | | | | | | | | | | | | | | | | | |
| Net assets, end of period (000’s) | | $ | 7,592 | | | $ | 6,426 | | | $ | 7,557 | | | $ | 4,537 | | | $ | 4,502 | | | $ | 8,817 | |
| Ratio of operating expenses to | | | | | | | | | | | | | | | | | | | | | | | | |
| average net assets: | | | | | | | | | | | | | | | | | | | | | | | | |
| Before expense reimbursement | | | 2.14 | %(6) | | | 2.11 | % | | | 2.17 | % | | | 2.22 | % | | | 2.15 | % | | | 2.11 | % |
After expense reimbursement(7) | | | 1.65 | %(6) | | | 1.89 | % | | | 1.89 | % | | | 1.89 | % | | | 1.89 | % | | | 1.89 | % |
| Ratio of net investment income (loss) | | | | | | | | | | | | | | | | | | | | | | | | |
| to average net assets: | | | 0.10 | %(6) | | | (0.78 | )% | | | 0.56 | % | | | (1.21 | )% | | | (1.16 | )% | | | (0.80 | )% |
Portfolio turnover rate(8) | | | 1 | % | | | 8 | % | | | 35 | % | | | 5 | % | | | 2 | % | | | 18 | % |
| (1) | Information presented relates to a share of capital stock outstanding for each period. |
| (2) | Net investment income per share represents net investment income divided by the average shares outstanding throughout the period. |
| (3) | Amount calculated is less than $0.005. |
| (4) | The total return calculation does not reflect the 5.75% front end sales charge on Advisor Class A shares. |
| (5) | Not annualized. |
| (6) | Annualized. |
| (7) | See Note #3, Investment Adviser, for the waiver and expense reimbursement discussion. |
| (8) | Portfolio turnover of The Market Opportunities Portfolio. |
The accompanying notes are an integral part of these financial statements.
90
KINETICS MUTUAL FUNDS, INC. — THE FEEDER FUNDS
Financial Highlights — (Continued)
| | | | | | | | | | | | | | | | | | | |
| | | The Market Opportunities Fund | |
| | | Advisor Class C | |
| | | For the | | | | | | | | | | | | | | | | |
| | | Period | | | For the | | | For the | | | For the | | | For the | | | For the | |
| | | Ended | | | Year Ended | | | Year Ended | | | Year Ended | | | Year Ended | | | Year Ended | |
| | | June 30, 2019 | | | December 31, | | | December 31, | | | December 31, | | | December 31, | | | December 31, | |
| | | (Unaudited) | | | 2018 | | | 2017 | | | 2016 | | | 2015 | | | 2014 | |
| | |
PER SHARE DATA:(1) | | | | | | | | | | | | | | | | | | |
| Net Asset Value, | | | | | | | | | | | | | | | | | | |
| Beginning of Period | | $ | 20.61 | | | $ | 25.53 | | | $ | 17.51 | | | $ | 14.65 | | | $ | 16.24 | | | $ | 17.32 | |
| Income from Investment Operations: | | | | | | | | | | | | | | | | | | | | | | | | |
Net investment income (loss)(2) | | | (0.05 | ) | | | (0.33 | ) | | | 0.01 | | | | (0.26 | ) | | | (0.27 | ) | | | (0.22 | ) |
| Net realized and unrealized gain | | | | | | | | | | | | | | | | | | | | | | | | |
| (loss) on investments | | | 5.24 | | | | (2.60 | ) | | | 8.07 | | | | 3.12 | | | | (1.32 | ) | | | (0.86 | ) |
| Total from Investment | | | | | | | | | | | | | | | | | | | | | | | | |
| Operations | | | 5.19 | | | | (2.93 | ) | | | 8.08 | | | | 2.86 | | | | (1.59 | ) | | | (1.08 | ) |
| Redemption Fees | | | — | | | | — | | | | — | | | | — | | | | — | | | | 0.00 | (3) |
| Less Distributions: | | | | | | | | | | | | | | | | | | | | | | | | |
| From net investment income | | | — | | | | — | | | | (0.06 | ) | | | — | | | | — | | | | — | |
| From net realized gains | | | — | | | | (1.99 | ) | | | — | | | | — | | | | — | | | | — | |
| Total Distributions | | | — | | | | (1.99 | ) | | | (0.06 | ) | | | — | | | | — | | | | — | |
| | |
| Net Asset Value, End of Period | | $ | 25.80 | | | $ | 20.61 | | | $ | 25.53 | | | $ | 17.51 | | | $ | 14.65 | | | $ | 16.24 | |
| Total return | | | 25.18 | %(4) | | | (11.48 | )% | | | 46.12 | % | | | 19.52 | % | | | (9.79 | )% | | | (6.24 | )% |
| | |
SUPPLEMENTAL DATA AND RATIOS | | | | | | | | | | | | | | | | | | | | | | | | |
| Net assets, end of period (000’s) | | $ | 10,927 | | | $ | 8,517 | | | $ | 8,139 | | | $ | 4,428 | | | $ | 4,079 | | | $ | 5,109 | |
| Ratio of operating expenses to | | | | | | | | | | | | | | | | | | | | | | | | |
| average net assets: | | | | | | | | | | | | | | | | | | | | | | | | |
| Before expense reimbursement | | | 2.64 | %(5) | | | 2.61 | % | | | 2.67 | % | | | 2.72 | % | | | 2.65 | % | | | 2.61 | % |
After expense reimbursement(6) | | | 2.15 | %(5) | | | 2.39 | % | | | 2.39 | % | | | 2.39 | % | | | 2.39 | % | | | 2.39 | % |
| Ratio of net investment income (loss) | | | | | | | | | | | | | | | | | | | | | | | | |
| to average net assets: | | | (0.40 | )%(5) | | | (1.28 | )% | | | 0.06 | % | | | (1.71 | )% | | | (1.66 | )% | | | (1.30 | )% |
Portfolio turnover rate(7) | | | 1 | % | | | 8 | % | | | 35 | % | | | 5 | % | | | 2 | % | | | 18 | % |
| (1) | Information presented relates to a share of capital stock outstanding for each period. |
| (2) | Net investment income per share represents net investment income divided by the average shares outstanding throughout the period]. |
| (3) | Amount calculated is less than $0.005. |
| (4) | Not annualized. |
| (5) | Annualized. |
| (6) | See Note #3, Investment Adviser, for the waiver and expense reimbursement discussion. |
| (7) | Portfolio turnover of The Market Opportunities Portfolio. |
The accompanying notes are an integral part of these financial statements.
91
KINETICS MUTUAL FUNDS, INC. — THE FEEDER FUNDS
Financial Highlights — (Continued)
| | | | | | | | | | | | | | | | | | | |
| | | The Market Opportunities Fund | |
| | | Institutional Class | |
| | | For the | | | | | | | | | | | | | | | | |
| | | Period | | | For the | | | For the | | | For the | | | For the | | | For the | |
| | | Ended | | | Year Ended | | | Year Ended | | | Year Ended | | | Year Ended | | | Year Ended | |
| | | June 30, 2019 | | | December 31, | | | December 31, | | | December 31, | | | December 31, | | | December 31, | |
| | | (Unaudited) | | | 2018 | | | 2017 | | | 2016 | | | 2015 | | | 2014 | |
| | |
PER SHARE DATA:(1) | | | | | | | | | | | | | | | | | | |
| Net Asset Value, | | | | | | | | | | | | | | | | | | |
| Beginning of Period | | $ | 22.16 | | | $ | 27.04 | | | $ | 18.46 | | | $ | 15.29 | | | $ | 16.80 | | | $ | 17.74 | |
| Income from Investment Operations: | | | | | | | | | | | | | | | | | | | | | | | | |
Net investment income (loss)(2) | | | 0.07 | | | | (0.09 | ) | | | 0.22 | | | | (0.12 | ) | | | (0.12 | ) | | | (0.06 | ) |
| Net realized and unrealized gain | | | | | | | | | | | | | | | | | | | | | | | | |
| (loss) on investments | | | 5.65 | | | | (2.81 | ) | | | 8.55 | | | | 3.29 | | | | (1.39 | ) | | | (0.88 | ) |
| Total from Investment | | | | | | | | | | | | | | | | | | | | | | | | |
| Operations | | | 5.72 | | | | (2.90 | ) | | | 8.77 | | | | 3.17 | | | | (1.51 | ) | | | (0.94 | ) |
| Redemption Fees | | | — | | | | 0.01 | | | | 0.02 | | | | — | | | | — | | | | — | |
| Less Distributions: | | | | | | | | | | | | | | | | | | | | | | | | |
| From net investment income | | | — | | | | — | | | | (0.21 | ) | | | — | | | | — | | | | — | |
| From net realized gains | | | — | | | | (1.99 | ) | | | — | | | | — | | | | — | | | | — | |
| Total Distributions | | | — | | | | (1.99 | ) | | | (0.21 | ) | | | — | | | | — | | | | — | |
| | |
| Net Asset Value, End of Period | | $ | 27.88 | | | $ | 22.16 | | | $ | 27.04 | | | $ | 18.46 | | | $ | 15.29 | | | $ | 16.80 | |
| Total return | | | 25.81 | %(3) | | | (10.70 | )% | | | 47.65 | % | | | 20.73 | % | | | (8.93 | )% | | | (5.36 | )% |
| | |
SUPPLEMENTAL DATA AND RATIOS | | | | | | | | | | | | | | | | | | | | | | | | |
| Net assets, end of period (000’s) | | $ | 11,479 | | | $ | 9,471 | | | $ | 10,228 | | | $ | 2,426 | | | $ | 2,355 | | | $ | 3,108 | |
| Ratio of operating expenses to | | | | | | | | | | | | | | | | | | | | | | | | |
| average net assets: | | | | | | | | | | | | | | | | | | | | | | | | |
| Before expense reimbursement | | | 1.84 | %(4) | | | 1.81 | % | | | 1.87 | % | | | 1.92 | % | | | 1.85 | % | | | 1.81 | % |
After expense reimbursement(5) | | | 1.20 | %(4) | | | 1.44 | % | | | 1.44 | % | | | 1.44 | % | | | 1.44 | % | | | 1.44 | % |
| Ratio of net investment income (loss) | | | | | | | | | | | | | | | | | | | | | | | | |
| to average net assets: | | | 0.55 | %(4) | | | (0.33 | )% | | | 1.01 | % | | | (0.76 | )% | | | (0.71 | )% | | | (0.35 | )% |
Portfolio turnover rate(6) | | | 1 | % | | | 8 | % | | | 35 | % | | | 5 | % | | | 2 | % | | | 18 | % |
| (1) | Information presented relates to a share of capital stock outstanding for each period. |
| (2) | Net investment income per share represents net investment income divided by the average shares outstanding throughout the period. |
| (3) | Not annualized. |
| (4) | Annualized. |
| (5) | See Note #3, Investment Adviser, for the waiver and expense reimbursement discussion. |
| (6) | Portfolio turnover of The Market Opportunities Portfolio. |
The accompanying notes are an integral part of these financial statements.
92
KINETICS MUTUAL FUNDS, INC. — THE FEEDER FUNDS
Financial Highlights — (Continued)
| | | | | | | | | | | | | | | | | | | |
| | | The Alternative Income Fund | |
| | | No Load Class | |
| | | For the | | | | | | | | | | | | | | | | |
| | | Period | | | For the | | | For the | | | For the | | | For the | | | For the | |
| | | Ended | | | Year Ended | | | Year Ended | | | Year Ended | | | Year Ended | | | Year Ended | |
| | | June 30, 2019 | | | December 31, | | | December 31, | | | December 31, | | | December 31, | | | December 31, | |
| | | (Unaudited) | | | 2018 | | | 2017 | | | 2016 | | | 2015 | | | 2014 | |
| | |
PER SHARE DATA:(1) | | | | | | | | | | | | | | | | | | |
| Net Asset Value, | | | | | | | | | | | | | | | | | | |
| Beginning of Period | | $ | 97.46 | | | $ | 97.57 | | | $ | 95.36 | | | $ | 91.68 | | | $ | 89.06 | | | $ | 87.88 | |
| Income from Investment Operations: | | | | | | | | | | | | | | | | | | | | | | | | |
Net investment income (loss)(2) | | | 0.68 | | | | 0.92 | | | | 0.08 | | | | (0.01 | ) | | | 0.01 | | | | (0.12 | ) |
| Net realized and unrealized gain | | | | | | | | | | | | | | | | | | | | | | | | |
| (loss) on investments | | | 0.92 | | | | (0.03 | ) | | | 2.12 | | | | 3.69 | | | | 2.56 | | | | 1.30 | |
| Total from Investment | | | | | | | | | | | | | | | | | | | | | | | | |
| Operations | | | 1.60 | | | | 0.89 | | | | 2.20 | | | | 3.68 | | | | 2.57 | | | | 1.18 | |
| Redemption Fees | | | — | | | | 0.01 | | | | 0.01 | | | | 0.00 | (3) | | | 0.05 | | | | 0.00 | (3) |
| Less Distributions: | | | | | | | | | | | | | | | | | | | | | | | | |
| From net investment income | | | (0.79 | ) | | | (1.01 | ) | | | — | | | | — | | | | — | | | | — | |
| Total Distributions | | | (0.79 | ) | | | (1.01 | ) | | | — | | | | — | | | | — | | | | — | |
| | |
| Net Asset Value, End of Period | | $ | 98.27 | | | $ | 97.46 | | | $ | 97.57 | | | $ | 95.36 | | | $ | 91.68 | | | $ | 89.06 | |
| Total return | | | 1.64 | %(4) | | | 0.92 | % | | | 2.32 | % | | | 4.00 | % | | | 2.94 | % | | | 1.50 | % |
| | |
SUPPLEMENTAL DATA AND RATIOS | | | | | | | | | | | | | | | | | | | | | | | | |
| Net assets, end of period (000’s) | | $ | 4,026 | | | $ | 4,265 | | | $ | 4,968 | | | $ | 5,664 | | | $ | 4,570 | | | $ | 8,202 | |
| Ratio of operating expenses to | | | | | | | | | | | | | | | | | | | | | | | | |
| average net assets: | | | | | | | | | | | | | | | | | | | | | | | | |
| Before expense reimbursement | | | 2.02 | %(5) | | | 1.88 | % | | | 1.75 | % | | | 1.78 | % | | | 1.74 | % | | | 1.80 | % |
After expense reimbursement(6) | | | 0.95 | %(5) | | | 0.95 | % | | | 0.95 | % | | | 0.95 | % | | | 0.95 | % | | | 0.95 | % |
| Ratio of net investment income | | | | | | | | | | | | | | | | | | | | | | | | |
| (loss) to average net assets: | | | 1.40 | %(5) | | | 0.94 | % | | | 0.08 | % | | | (0.01 | )% | | | 0.01 | % | | | (0.14 | )% |
Portfolio turnover rate(7) | | | 0 | % | | | 0 | % | | | 0 | % | | | 1 | % | | | 6 | % | | | 17 | % |
| (1) | Information presented relates to a share of capital stock outstanding for each period. |
| (2) | Net investment income per share represents net investment income divided by the average shares outstanding throughout the period. |
| (3) | Amount calculated is less than $0.005. |
| (4) | Not annualized. |
| (5) | Annualized. |
| (6) | See Note #3, Investment Adviser, for the waiver and expense reimbursement discussion. |
| (7) | Portfolio turnover of The Alternative Income Portfolio. |
The accompanying notes are an integral part of these financial statements.
93
KINETICS MUTUAL FUNDS, INC. — THE FEEDER FUNDS
Financial Highlights — (Continued)
| | | | | | | | | | | | | | | | | | | |
| | | The Alternative Income Fund | |
| | | Advisor Class A | |
| | | For the | | | | | | | | | | | | | | | | |
| | | Period | | | For the | | | For the | | | For the | | | For the | | | For the | |
| | | Ended | | | Year Ended | | | Year Ended | | | Year Ended | | | Year Ended | | | Year Ended | |
| | | June 30, 2019 | | | December 31, | | | December 31, | | | December 31, | | | December 31, | | | December 31, | |
| | | (Unaudited) | | | 2018 | | | 2017 | | | 2016 | | | 2015 | | | 2014 | |
| | |
PER SHARE DATA:(1) | | | | | | | | | | | | | | | | | | |
| Net Asset Value, | | | | | | | | | | | | | | | | | | |
| Beginning of Period | | $ | 96.24 | | | $ | 96.38 | | | $ | 94.44 | | | $ | 91.02 | | | $ | 88.69 | | | $ | 87.73 | |
| Income from Investment Operations: | | | | | | | | | | | | | | | | | | | | | | | | |
Net investment income (loss)(2) | | | 0.55 | | | | 0.66 | | | | (0.16 | ) | | | (0.24 | ) | | | (0.22 | ) | | | (0.34 | ) |
| Net realized and unrealized gain | | | | | | | | | | | | | | | | | | | | | | | | |
| (loss) on investments | | | 0.92 | | | | (0.03 | ) | | | 2.10 | | | | 3.65 | | | | 2.55 | | | | 1.30 | |
| Total from Investment | | | | | | | | | | | | | | | | | | | | | | | | |
| Operations | | | 1.47 | | | | 0.63 | | | | 1.94 | | | | 3.41 | | | | 2.33 | | | | 0.96 | |
| Redemption Fees | | | — | | | | — | | | | 0.00 | (3) | | | 0.01 | | | | — | | | | 0.00 | (3) |
| Less Distributions: | | | | | | | | | | | | | | | | | | | | | | | | |
| From net investment income | | | (0.68 | ) | | | (0.77 | ) | | | — | | | | — | | | | — | | | | — | |
| Total Distributions | | | (0.68 | ) | | | (0.77 | ) | | | — | | | | — | | | | — | | | | — | |
| | |
| Net Asset Value, End of Period | | $ | 97.03 | | | $ | 96.24 | | | $ | 96.38 | | | $ | 94.44 | | | $ | 91.02 | | | $ | 88.69 | |
Total return(4) | | | 1.53 | %(5) | | | 0.65 | % | | | 2.05 | % | | | 3.76 | % | | | 2.63 | % | | | 1.24 | % |
| | |
SUPPLEMENTAL DATA AND RATIOS | | | | | | | | | | | | | | | | | | | | | | | | |
| Net assets, end of period (000’s) | | $ | 973 | | | $ | 932 | | | $ | 1,501 | | | $ | 2,458 | | | $ | 1,565 | | | $ | 1,554 | |
| Ratio of operating expenses to | | | | | | | | | | | | | | | | | | | | | | | | |
| average net assets: | | | | | | | | | | | | | | | | | | | | | | | | |
| Before expense reimbursement | | | 2.27 | %(6) | | | 2.13 | % | | | 2.00 | % | | | 2.03 | % | | | 1.99 | % | | | 2.05 | % |
After expense reimbursement(7) | | | 1.20 | %(6) | | | 1.20 | % | | | 1.20 | % | | | 1.20 | % | | | 1.20 | % | | | 1.20 | % |
| Ratio of net investment income | | | | | | | | | | | | | | | | | | | | | | | | |
| (loss) to average net assets: | | | 1.15 | %(6) | | | 0.69 | % | | | (0.17 | )% | | | (0.26 | )% | | | (0.24 | )% | | | (0.39 | )% |
Portfolio turnover rate(8) | | | 0 | % | | | 0 | % | | | 0 | % | | | 1 | % | | | 6 | % | | | 17 | % |
| (1) | Information presented relates to a share of capital stock outstanding for each period. |
| (2) | Net investment income per share represents net investment income divided by the average shares outstanding throughout the period. |
| (3) | Amount calculated is less than $0.005. |
| (4) | The total return calculation does not reflect the 5.75% front end sales charge on Advisor Class A shares. |
| (5) | Not annualized. |
| (6) | Annualized. |
| (7) | See Note #3, Investment Adviser, for the waiver and expense reimbursement discussion. |
| (8) | Portfolio turnover of The Alternative Income Portfolio. |
The accompanying notes are an integral part of these financial statements.
94
KINETICS MUTUAL FUNDS, INC. — THE FEEDER FUNDS
Financial Highlights — (Continued)
| | | | | | | | | | | | | | | | | | | |
| | | The Alternative Income Fund | |
| | | Advisor Class C | |
| | | For the | | | | | | | | | | | | | | | | |
| | | Period | | | For the | | | For the | | | For the | | | For the | | | For the | |
| | | Ended | | | Year Ended | | | Year Ended | | | Year Ended | | | Year Ended | | | Year Ended | |
| | | June 30, 2019 | | | December 31, | | | December 31, | | | December 31, | | | December 31, | | | December 31, | |
| | | (Unaudited) | | | 2018 | | | 2017 | | | 2016 | | | 2015 | | | 2014 | |
| | |
PER SHARE DATA:(1) | | | | | | | | | | | | | | | | | | |
| Net Asset Value, | | | | | | | | | | | | | | | | | | |
| Beginning of Period | | $ | 92.65 | | | $ | 92.73 | | | $ | 91.33 | | | $ | 88.46 | | | $ | 86.60 | | | $ | 86.10 | |
| Income from Investment Operations: | | | | | | | | | | | | | | | | | | | | | | | | |
Net investment income (loss)(2) | | | 0.30 | | | | 0.17 | | | | (0.62 | ) | | | (0.68 | ) | | | (0.65 | ) | | | (0.77 | ) |
| Net realized and unrealized gain | | | | | | | | | | | | | | | | | | | | | | | | |
| (loss) on investments | | | 0.89 | | | | (0.04 | ) | | | 2.02 | | | | 3.55 | | | | 2.48 | | | | 1.27 | |
| Total from Investment | | | | | | | | | | | | | | | | | | | | | | | | |
| Operations | | | 1.19 | | | | 0.13 | | | | 1.40 | | | | 2.87 | | | | 1.83 | | | | 0.50 | |
| Redemption Fees | | | — | | | | — | | | | — | | | | — | | | | 0.03 | | | | — | |
| Less Distributions: | | | | | | | | | | | | | | | | | | | | | | | | |
| From net investment income | | | (0.46 | ) | | | (0.21 | ) | | | — | | | | — | | | | — | | | | — | |
| Total Distributions | | | (0.46 | ) | | | (0.21 | ) | | | — | | | | — | | | | — | | | | — | |
| | |
| Net Asset Value, End of Period | | $ | 93.38 | | | $ | 92.65 | | | $ | 92.73 | | | $ | 91.33 | | | $ | 88.46 | | | $ | 86.60 | |
| Total return | | | 1.27 | %(3) | | | 0.15 | % | | | 1.53 | % | | | 3.23 | % | | | 2.15 | % | | | 0.74 | % |
| | |
SUPPLEMENTAL DATA AND RATIOS | | | | | | | | | | | | | | | | | | | | | | | | |
| Net assets, end of period (000’s) | | $ | 1,015 | | | $ | 1,107 | | | $ | 1,513 | | | $ | 1,640 | | | $ | 1,356 | | | $ | 1,506 | |
| Ratio of operating expenses to | | | | | | | | | | | | | | | | | | | | | | | | |
| average net assets: | | | | | | | | | | | | | | | | | | | | | | | | |
| Before expense reimbursement | | | 2.77 | %(4) | | | 2.63 | % | | | 2.50 | % | | | 2.53 | % | | | 2.49 | % | | | 2.55 | % |
After expense reimbursement(5) | | | 1.70 | %(4) | | | 1.70 | % | | | 1.70 | % | | | 1.70 | % | | | 1.70 | % | | | 1.70 | % |
| Ratio of net investment income | | | | | | | | | | | | | | | | | | | | | | | | |
| (loss) to average net assets: | | | 0.65 | %(4) | | | 0.19 | % | | | (0.67 | )% | | | (0.76 | )% | | | (0.74 | )% | | | (0.89 | )% |
Portfolio turnover rate(6) | | | 0 | % | | | 0 | % | | | 0 | % | | | 1 | % | | | 6 | % | | | 17 | % |
| (1) | Information presented relates to a share of capital stock outstanding for each period. |
| (2) | Net investment income per share represents net investment income divided by the average��shares outstanding throughout the period. |
| (3) | Not annualized. |
| (4) | Annualized. |
| (5) | See Note #3, Investment Adviser, for the waiver and expense reimbursement discussion. |
| (6) | Portfolio turnover of The Alternative Income Portfolio. |
The accompanying notes are an integral part of these financial statements.
95
KINETICS MUTUAL FUNDS, INC. — THE FEEDER FUNDS
Financial Highlights — (Continued)
| | | | | | | | | | | | | | | | | | | |
| | | The Alternative Income Fund | |
| | | Institutional Class | |
| | | For the | | | | | | | | | | | | | | | | |
| | | Period | | | For the | | | For the | | | For the | | | For the | | | For the | |
| | | Ended | | | Year Ended | | | Year Ended | | | Year Ended | | | Year Ended | | | Year Ended | |
| | | June 30, 2019 | | | December 31, | | | December 31, | | | December 31, | | | December 31, | | | December 31, | |
| | | (Unaudited) | | | 2018 | | | 2017 | | | 2016 | | | 2015 | | | 2014 | |
| | |
PER SHARE DATA:(1) | | | | | | | | | | | | | | | | | | |
| Net Asset Value, | | | | | | | | | | | | | | | | | | |
| Beginning of Period | | $ | 98.73 | | | $ | 98.88 | | | $ | 96.66 | | | $ | 92.84 | | | $ | 90.14 | | | $ | 88.76 | |
| Income from Investment Operations: | | | | | | | | | | | | | | | | | | | | | | | | |
Net investment income(2) | | | 0.79 | | | | 1.13 | | | | 0.27 | | | | 0.18 | | | | 0.19 | | | | 0.06 | |
| Net realized and unrealized gain | | | | | | | | | | | | | | | | | | | | | | | | |
| (loss) on investments | | | 0.95 | | | | (0.05 | ) | | | 2.16 | | | | 3.75 | | | | 2.60 | | | | 1.32 | |
| Total from Investment | | | | | | | | | | | | | | | | | | | | | | | | |
| Operations | | | 1.74 | | | | 1.08 | | | | 2.43 | | | | 3.93 | | | | 2.79 | | | | 1.38 | |
| Redemption Fees | | | — | | | | 0.00 | (3) | | | 0.00 | (3) | | | 0.00 | (3) | | | 0.00 | (3) | | | 0.00 | (3) |
| Less Distributions: | | | | | | | | | | | | | | | | | | | | | | | | |
| From net investment income | | | (0.89 | ) | | | (1.23 | ) | | | (0.21 | ) | | | (0.11 | ) | | | (0.09 | ) | | | — | |
| Total Distributions | | | (0.89 | ) | | | (1.23 | ) | | | (0.21 | ) | | | (0.11 | ) | | | (0.09 | ) | | | — | |
| | |
| Net Asset Value, End of Period | | $ | 99.58 | | | $ | 98.73 | | | $ | 98.88 | | | $ | 96.66 | | | $ | 92.84 | | | $ | 90.14 | |
| Total return | | | 1.76 | %(4) | | | 1.10 | % | | | 2.51 | % | | | 4.22 | % | | | 3.09 | % | | | 1.72 | % |
| | |
SUPPLEMENTAL DATA AND RATIOS | | | | | | | | | | | | | | | | | | | | | | | | |
| Net assets, end of period (000’s) | | $ | 12,683 | | | $ | 12,718 | | | $ | 15,008 | | | $ | 18,165 | | | $ | 20,255 | | | $ | 26,874 | |
| Ratio of operating expenses to | | | | | | | | | | | | | | | | | | | | | | | | |
| average net assets: | | | | | | | | | | | | | | | | | | | | | | | | |
| Before expense reimbursement | | | 1.97 | %(5) | | | 1.83 | % | | | 1.70 | % | | | 1.73 | % | | | 1.69 | % | | | 1.75 | % |
After expense reimbursement(6) | | | 0.75 | %(5) | | | 0.75 | % | | | 0.75 | % | | | 0.75 | % | | | 0.75 | % | | | 0.75 | % |
| Ratio of net investment income | | | | | | | | | | | | | | | | | | | | | | | | |
| to average net assets: | | | 1.60 | %(5) | | | 1.14 | % | | | 0.28 | % | | | 0.19 | % | | | 0.21 | % | | | 0.06 | % |
Portfolio turnover rate(7) | | | 0 | % | | | 0 | % | | | 0 | % | | | 1 | % | | | 6 | % | | | 17 | % |
| (1) | Information presented relates to a share of capital stock outstanding for each period. |
| (2) | Net investment income per share represents net investment income divided by the average shares outstanding throughout the period. |
| (3) | Amount calculated is less than $0.005. |
| (4) | Not annualized. |
| (5) | Annualized. |
| (6) | See Note #3, Investment Adviser, for the waiver and expense reimbursement discussion. |
| (7) | Portfolio turnover of The Alternative Income Portfolio. |
The accompanying notes are an integral part of these financial statements.
96
KINETICS MUTUAL FUNDS, INC. — THE FEEDER FUNDS
Financial Highlights — (Continued)
| | | | | | | | | | | | | | | | | | | |
| | | The Multi-Disciplinary Income Fund | |
| | | No Load Class | |
| | | For the | | | | | | | | | | | | | | | | |
| | | Period | | | For the | | | For the | | | For the | | | For the | | | For the | |
| | | Ended | | | Year Ended | | | Year Ended | | | Year Ended | | | Year Ended | | | Year Ended | |
| | | June 30, 2019 | | | December 31, | | | December 31, | | | December 31, | | | December 31, | | | December 31, | |
| | | (Unaudited) | | | 2018 | | | 2017 | | | 2016 | | | 2015 | | | 2014 | |
| | |
PER SHARE DATA:(1) | | | | | | | | | | | | | | | | | | |
| Net Asset Value, | | | | | | | | | | | | | | | | | | |
| Beginning of Period | | $ | 10.46 | | | $ | 11.02 | | | $ | 10.95 | | | $ | 10.32 | | | $ | 10.79 | | | $ | 11.02 | |
| Income from Investment Operations: | | | | | | | | | | | | | | | | | | | | | | | | |
Net investment income(2) | | | 0.22 | | | | 0.44 | | | | 0.37 | | | | 0.43 | | | | 0.37 | | | | 0.33 | |
| Net realized and unrealized gain | | | | | | | | | | | | | | | | | | | | | | | | |
| (loss) on investments | | | 0.50 | | | | (0.55 | ) | | | 0.14 | | | | 0.63 | | | | (0.60 | ) | | | (0.06 | ) |
| Total from Investment | | | | | | | | | | | | | | | | | | | | | | | | |
| Operations | | | 0.72 | | | | (0.11 | ) | | | 0.51 | | | | 1.06 | | | | (0.23 | ) | | | 0.27 | |
| Redemption Fees | | | — | | | | — | | | | 0.00 | (3) | | | — | | | | 0.00 | (3) | | | 0.00 | (3) |
| Less Distributions: | | | | | | | | | | | | | | | | | | | | | | | | |
| From net investment income | | | (0.23 | ) | | | (0.45 | ) | | | (0.44 | ) | | | (0.43 | ) | | | (0.23 | ) | | | (0.29 | ) |
| From net realized gains | | | — | | | | — | | | | — | | | | — | | | | (0.01 | ) | | | (0.21 | ) |
| Total Distributions | | | (0.23 | ) | | | (0.45 | ) | | | (0.44 | ) | | | (0.43 | ) | | | (0.24 | ) | | | (0.50 | ) |
| | |
| Net Asset Value, End of Period | | $ | 10.95 | | | $ | 10.46 | | | $ | 11.02 | | | $ | 10.95 | | | $ | 10.32 | | | $ | 10.79 | |
| Total return | | | 6.94 | %(4) | | | (1.00 | )% | | | 4.75 | % | | | 10.41 | % | | | (2.17 | )% | | | 2.46 | % |
| | |
SUPPLEMENTAL DATA AND RATIOS | | | | | | | | | | | | | | | | | | | | | | | | |
| Net assets, end of period (000’s) | | $ | 5,907 | | | $ | 6,134 | | | $ | 6,974 | | | $ | 6,809 | | | $ | 6,108 | | | $ | 10,105 | |
| Ratio of operating expenses to | | | | | | | | | | | | | | | | | | | | | | | | |
| average net assets: | | | | | | | | | | | | | | | | | | | | | | | | |
| Before expense reimbursement | | | 2.13 | %(5) | | | 1.97 | % | | | 1.91 | % | | | 1.85 | % | | | 1.79 | % | | | 1.79 | % |
After expense reimbursement(6) | | | 1.49 | %(5) | | | 1.49 | % | | | 1.49 | % | | | 1.49 | % | | | 1.49 | % | | | 1.49 | % |
| Ratio of net investment income | | | | | | | | | | | | | | | | | | | | | | | | |
| to average net assets: | | | 4.14 | %(5) | | | 4.06 | % | | | 3.37 | % | | | 4.02 | % | | | 3.38 | % | | | 2.93 | % |
Portfolio turnover rate(7) | | | 0 | % | | | 2 | % | | | 16 | % | | | 9 | % | | | 10 | % | | | 35 | % |
| (1) | Information presented relates to a share of capital stock outstanding for each period. |
| (2) | Net investment income per share represents net investment income divided by the average shares outstanding throughout the period. |
| (3) | Amount calculated is less than $0.005. |
| (4) | Not annualized. |
| (5) | Annualized. |
| (6) | See Note #3, Investment Adviser, for the waiver and expense reimbursement discussion. |
| (7) | Portfolio turnover of The Multi-Disciplinary Income Portfolio. |
The accompanying notes are an integral part of these financial statements.
97
KINETICS MUTUAL FUNDS, INC. — THE FEEDER FUNDS
Financial Highlights — (Continued)
| | | | | | | | | | | | | | | | | | | |
| | | The Multi-Disciplinary Income Fund | |
| | | Advisor Class A | |
| | | For the | | | | | | | | | | | | | | | | |
| | | Period | | | For the | | | For the | | | For the | | | For the | | | For the | |
| | | Ended | | | Year Ended | | | Year Ended | | | Year Ended | | | Year Ended | | | Year Ended | |
| | | June 30, 2019 | | | December 31, | | | December 31, | | | December 31, | | | December 31, | | | December 31, | |
| | | (Unaudited) | | | 2018 | | | 2017 | | | 2016 | | | 2015 | | | 2014 | |
| | |
PER SHARE DATA:(1) | | | | | | | | | | | | | | | | | | |
| Net Asset Value, | | | | | | | | | | | | | | | | | | |
| Beginning of Period | | $ | 10.41 | | | $ | 10.96 | | | $ | 10.90 | | | $ | 10.27 | | | $ | 10.75 | | | $ | 10.98 | |
| Income from Investment Operations: | | | | | | | | | | | | | | | | | | | | | | | | |
Net investment income(2) | | | 0.21 | | | | 0.41 | | | | 0.34 | | | | 0.40 | | | | 0.34 | | | | 0.30 | |
| Net realized and unrealized gain | | | | | | | | | | | | | | | | | | | | | | | | |
| (loss) on investments | | | 0.50 | | | | (0.54 | ) | | | 0.13 | | | | 0.63 | | | | (0.60 | ) | | | (0.06 | ) |
| Total from Investment | | | | | | | | | | | | | | | | | | | | | | | | |
| Operations | | | 0.71 | | | | (0.13 | ) | | | 0.47 | | | | 1.03 | | | | (0.26 | ) | | | 0.24 | |
| Redemption Fees | | | — | | | | — | | | | 0.00 | (3) | | | — | | | | 0.00 | (3) | | | 0.00 | (3) |
| Less Distributions: | | | | | | | | | | | | | | | | | | | | | | | | |
| From net investment income | | | (0.22 | ) | | | (0.42 | ) | | | (0.41 | ) | | | (0.40 | ) | | | (0.21 | ) | | | (0.26 | ) |
| From net realized gains | | | — | | | | — | | | | — | | | | — | | | | (0.01 | ) | | | (0.21 | ) |
| Total Distributions | | | (0.22 | ) | | | (0.42 | ) | | | (0.41 | ) | | | (0.40 | ) | | | (0.22 | ) | | | (0.47 | ) |
| | |
| Net Asset Value, End of Period | | $ | 10.90 | | | $ | 10.41 | | | $ | 10.96 | | | $ | 10.90 | | | $ | 10.27 | | | $ | 10.75 | |
Total return(4) | | | 6.85 | %(5) | | | (1.18 | )% | | | 4.40 | % | | | 10.17 | % | | | (2.46 | )% | | | 2.17 | % |
| | |
SUPPLEMENTAL DATA AND RATIOS | | | | | | | | | | | | | | | | | | | | | | | | |
| Net assets, end of period (000’s) | | $ | 2,536 | | | $ | 2,811 | | | $ | 4,640 | | | $ | 6,935 | | | $ | 8,754 | | | $ | 12,281 | |
| Ratio of operating expenses to | | | | | | | | | | | | | | | | | | | | | | | | |
| average net assets: | | | | | | | | | | | | | | | | | | | | | | | | |
| Before expense reimbursement | | | 2.38 | %(6) | | | 2.22 | % | | | 2.16 | % | | | 2.10 | % | | | 2.04 | % | | | 2.04 | % |
After expense reimbursement(7) | | | 1.74 | %(6) | | | 1.74 | % | | | 1.74 | % | | | 1.74 | % | | | 1.74 | % | | | 1.74 | % |
| Ratio of net investment income | | | | | | | | | | | | | | | | | | | | | | | | |
| to average net assets: | | | 3.89 | %(6) | | | 3.81 | % | | | 3.12 | % | | | 3.77 | % | | | 3.13 | % | | | 2.68 | % |
Portfolio turnover rate(8) | | | 0 | % | | | 2 | % | | | 16 | % | | | 9 | % | | | 10 | % | | | 35 | % |
| (1) | Information presented relates to a share of capital stock outstanding for each period. |
| (2) | Net investment income per share represents net investment income divided by the average shares outstanding throughout the period. |
| (3) | Amount calculated is less than $0.005. |
| (4) | The total return calculation does not reflect the 5.75% front end sales charge on Advisor Class A shares. |
| (5) | Not annualized. |
| (6) | Annualized. |
| (7) | See Note #3, Investment Adviser, for the waiver and expense reimbursement discussion. |
| (8) | Portfolio turnover of The Multi-Disciplinary Income Portfolio. |
The accompanying notes are an integral part of these financial statements.
98
KINETICS MUTUAL FUNDS, INC. — THE FEEDER FUNDS
Financial Highlights — (Continued)
| | | | | | | | | | | | | | | | | | | |
| | | The Multi-Disciplinary Income Fund | |
| | | Advisor Class C | |
| | | For the | | | | | | | | | | | | | | | | |
| | | Period | | | For the | | | For the | | | For the | | | For the | | | For the | |
| | | Ended | | | Year Ended | | | Year Ended | | | Year Ended | | | Year Ended | | | Year Ended | |
| | | June 30, 2019 | | | December 31, | | | December 31, | | | December 31, | | | December 31, | | | December 31, | |
| | | (Unaudited) | | | 2018 | | | 2017 | | | 2016 | | | 2015 | | | 2014 | |
| | |
PER SHARE DATA:(1) | | | | | | | | | | | | | | | | | | |
| Net Asset Value, | | | | | | | | | | | | | | | | | | |
| Beginning of Period | | $ | 10.29 | | | $ | 10.86 | | | $ | 10.79 | | | $ | 10.18 | | | $ | 10.65 | | | $ | 10.90 | |
| Income from Investment Operations: | | | | | | | | | | | | | | | | | | | | | | | | |
Net investment income(2) | | | 0.18 | | | | 0.35 | | | | 0.29 | | | | 0.34 | | | | 0.28 | | | | 0.24 | |
| Net realized and unrealized | | | | | | | | | | | | | | | | | | | | | | | | |
| gain (loss) on investments | | | 0.50 | | | | (0.54 | ) | | | 0.14 | | | | 0.62 | | | | (0.58 | ) | | | (0.06 | ) |
| Total from Investment | | | | | | | | | | | | | | | | | | | | | | | | |
| Operations | | | 0.68 | | | | (0.19 | ) | | | 0.43 | | | | 0.96 | | | | (0.30 | ) | | | 0.18 | |
| Redemption Fees | | | — | | | | — | | | | — | | | | — | | | | — | | | | 0.00 | (3) |
| Less Distributions: | | | | | | | | | | | | | | | | | | | | | | | | |
| From net investment income | | | (0.19 | ) | | | (0.38 | ) | | | (0.36 | ) | | | (0.35 | ) | | | (0.16 | ) | | | (0.22 | ) |
| From net realized gains | | | — | | | | — | | | | — | | | | — | | | | (0.01 | ) | | | (0.21 | ) |
| Total Distributions | | | (0.19 | ) | | | (0.38 | ) | | | (0.36 | ) | | | (0.35 | ) | | | (0.17 | ) | | | (0.43 | ) |
| | |
| Net Asset Value, End of Period | | $ | 10.78 | | | $ | 10.29 | | | $ | 10.86 | | | $ | 10.79 | | | $ | 10.18 | | | $ | 10.65 | |
| Total return | | | 6.67 | %(4) | | | (1.83 | )% | | | 4.00 | % | | | 9.51 | % | | | (2.84 | )% | | | 1.61 | % |
| | |
SUPPLEMENTAL DATA AND RATIOS | | | | | | | | | | | | | | | | | | | | | | | | |
| Net assets, end of period (000’s) | | $ | 7,787 | | | $ | 7,727 | | | $ | 6,987 | | | $ | 7,790 | | | $ | 9,266 | | | $ | 10,403 | |
| Ratio of operating expenses to | | | | | | | | | | | | | | | | | | | | | | | | |
| average net assets: | | | | | | | | | | | | | | | | | | | | | | | | |
| Before expense reimbursement | | | 2.88 | %(5) | | | 2.72 | % | | | 2.66 | % | | | 2.60 | % | | | 2.54 | % | | | 2.54 | % |
After expense reimbursement(6) | | | 2.24 | %(5) | | | 2.24 | % | | | 2.24 | % | | | 2.24 | % | | | 2.24 | % | | | 2.24 | % |
| Ratio of net investment income | | | | | | | | | | | | | | | | | | | | | | | | |
| to average net assets: | | | 3.39 | %(5) | | | 3.31 | % | | | 2.62 | % | | | 3.27 | % | | | 2.63 | % | | | 2.18 | % |
Portfolio turnover rate(7) | | | 0 | % | | | 2 | % | | | 16 | % | | | 9 | % | | | 10 | % | | | 35 | % |
| (1) | Information presented relates to a share of capital stock outstanding for each period. |
| (2) | Net investment income per share represents net investment income divided by the average shares outstanding throughout the period. |
| (3) | Amount calculated is less than $0.005. |
| (4) | Not annualized. |
| (5) | Annualized. |
| (6) | See Note #3, Investment Adviser, for the waiver and expense reimbursement discussion. |
| (7) | Portfolio turnover of The Multi-Disciplinary Income Portfolio. |
The accompanying notes are an integral part of these financial statements.
99
KINETICS MUTUAL FUNDS, INC. — THE FEEDER FUNDS
Financial Highlights — (Continued)
| | | | | | | | | | | | | | | | | | | |
| | | The Multi-Disciplinary Income Fund | |
| | | Institutional Class | |
| | | For the | | | | | | | | | | | | | | | | |
| | | Period | | | For the | | | For the | | | For the | | | For the | | | For the | |
| | | Ended | | | Year Ended | | | Year Ended | | | Year Ended | | | Year Ended | | | Year Ended | |
| | | June 30, 2019 | | | December 31, | | | December 31 | | | December 31, | | | December 31, | | | December 31, | |
| | | (Unaudited) | | | 2018 | | | 2017 | | | 2016 | | | 2015 | | | 2014 | |
| | |
PER SHARE DATA:(1) | | | | | | | | | | | | | | | | | | |
| Net Asset Value, | | | | | | | | | | | | | | | | | | |
| Beginning of Period | | $ | 10.48 | | | $ | 11.04 | | | $ | 10.97 | | | $ | 10.34 | | | $ | 10.82 | | | $ | 11.06 | |
| Income from Investment Operations: | | | | | | | | | | | | | | | | | | | | | | | | |
Net investment income(2) | | | 0.23 | | | | 0.46 | | | | 0.40 | | | | 0.45 | | | | 0.39 | | | | 0.35 | |
| Net realized and unrealized gain | | | | | | | | | | | | | | | | | | | | | | | | |
| (loss) on investments | | | 0.51 | | | | (0.54 | ) | | | 0.13 | | | | 0.63 | | | | (0.59 | ) | | | (0.06 | ) |
| Total from Investment | | | | | | | | | | | | | | | | | | | | | | | | |
| Operations | | | 0.74 | | | | (0.08 | ) | | | 0.53 | | | | 1.08 | | | | (0.20 | ) | | | 0.29 | |
| Redemption Fees | | | — | | | | — | | | | — | | | | 0.00 | (3) | | | 0.00 | (3) | | | — | |
| Less Distributions: | | | | | | | | | | | | | | | | | | | | | | | | |
| From net investment income | | | (0.24 | ) | | | (0.48 | ) | | | (0.46 | ) | | | (0.45 | ) | | | (0.27 | ) | | | (0.32 | ) |
| From net realized gains | | | — | | | | — | | | | — | | | | — | | | | (0.01 | ) | | | (0.21 | ) |
| Total Distributions | | | (0.24 | ) | | | (0.48 | ) | | | (0.46 | ) | | | (0.45 | ) | | | (0.28 | ) | | | (0.53 | ) |
| | |
| Net Asset Value, End of Period | | $ | 10.98 | | | $ | 10.48 | | | $ | 11.04 | | | $ | 10.97 | | | $ | 10.34 | | | $ | 10.82 | |
| Total return | | | 7.13 | %(4) | | | (0.80 | )% | | | 4.93 | % | | | 10.61 | % | | | (1.96 | )% | | | 2.61 | % |
| | |
SUPPLEMENTAL DATA AND RATIOS | | | | | | | | | | | | | | | | | | | | | | | | |
| Net assets, end of period (000’s) | | $ | 20,096 | | | $ | 20,567 | | | $ | 30,399 | | | $ | 78,084 | | | $ | 66,199 | | | $ | 102,590 | |
| Ratio of operating expenses to | | | | | | | | | | | | | | | | | | | | | | | | |
| average net assets: | | | | | | | | | | | | | | | | | | | | | | | | |
| Before expense reimbursement | | | 2.08 | %(5) | | | 1.92 | % | | | 1.86 | % | | | 1.80 | % | | | 1.74 | % | | | 1.74 | % |
After expense reimbursement(6) | | | 1.29 | %(5) | | | 1.29 | % | | | 1.29 | % | | | 1.29 | % | | | 1.29 | % | | | 1.29 | % |
| Ratio of net investment income | | | | | | | | | | | | | | | | | | | | | | | | |
| to average net assets: | | | 4.34 | %(5) | | | 4.26 | % | | | 3.57 | % | | | 4.22 | % | | | 3.58 | % | | | 3.13 | % |
Portfolio turnover rate(7) | | | 0 | % | | | 2 | % | | | 16 | % | | | 9 | % | | | 10 | % | | | 35 | % |
| (1) | Information presented relates to a share of capital stock outstanding for each period. |
| (2) | Net investment income per share represents net investment income divided by the average shares outstanding throughout the period. |
| (3) | Amount calculated is less than $0.005. |
| (4) | Not annualized. |
| (5) | Annualized. |
| (6) | See Note #3, Investment Adviser, for the waiver and expense reimbursement discussion. |
| (7) | Portfolio turnover of The Multi-Disciplinary Income Portfolio. |
The accompanying notes are an integral part of these financial statements.
100
| |
| KINETICS MUTUAL FUNDS, INC. — THE FUND |
Financial Highlights — (Continued) |
| |
| |
| | | The Spin-off Fund |
| | | No Load Class |
| | | For the | | | | | | December 11, | |
| | | Period Ended | | | For the | | | 2017^ | |
| | | June 30, | | | Year Ended | | | through | |
| | | 2019 | | | December 31, | | | December 31, | |
| | | (Unaudited) | | | 2018 | | | 2017 | |
| | |
PER SHARE DATA:(1) | | | | | | | | | |
| Net Asset Value, Beginning of Period | | $ | 9.77 | | | $ | 11.14 | | | $ | 10.81 | |
| Income from Investment Operations: | | | | | | | | | | | | |
Net investment income (loss)(2) | | | 0.03 | | | | (0.08 | ) | | | 0.00 | (3) |
| Net realized and unrealized gain (loss) on investments | | | 2.56 | | | | (0.84 | ) | | | 0.33 | |
| Total from Investment Operations | | | 2.59 | | | | (0.92 | ) | | | 0.33 | |
| Redemption fees | | | — | | | | — | | | | — | |
| Less Distributions: | | | | | | | | | | | | |
| From net realized gains | | | — | | | | (0.45 | ) | | | — | |
| Total Distributions | | | — | | | | (0.45 | ) | | | — | |
| Net Asset Value, End of Period | | $ | 12.36 | | | $ | 9.77 | | | $ | 11.14 | |
| Total return | | | 26.51 | %(4) | | | (8.22 | )% | | | 3.05 | %(4) |
| | |
SUPPLEMENTAL DATA AND RATIOS | | | | | | | | | | | | |
| Net assets, end of period (000’S) | | $ | 14 | | | $ | 11 | | | $ | 10 | |
| Ratio of operating expenses to average net assets: | | | | | | | | | | | | |
| Before expense reimbursement | | | 1.99 | %(5) | | | 1.84 | % | | | 1.70 | %(5) |
After expense reimbursement(6) | | | 1.45 | %(5) | | | 1.45 | % | | | 1.45 | %(5) |
| Ratio of net investment income to average net assets: | | | 0.58 | %(5) | | | (0.63 | )% | | | (0.61 | )%(5) |
Portfolio turnover rate(4) | | | 2 | % | | | 9 | % | | | 0 | % |
| ^ | Commencement of operations. |
| (1) | Information presented relates to a share of capital stock outstanding for each period. |
| (2) | Net investment income per share represents net investment income divided by the average shares outstanding throughout the period. |
| (3) | Amount calculated is less than $0.005. |
| (4) | Not annualized. |
| (5) | Annualized. |
| (6) | See Note #3, Investment Adviser, for the waiver and expense reimbursement discussion. |
The accompanying notes are an integral part of these financial statements.
101
KINETICS MUTUAL FUNDS, INC. — THE FUND
Financial Highlights — (Continued)
| | | | | | | | | | | | | | | | | | | | | | |
| | | The Spin-off Fund | |
| | | Advisor Class A | |
| | | For the | | | | | | | | | | | | | | | | | | | |
| | | Period | | | For the | | | For the | | | For the | | | For the | | | For the | | | For the | |
| | | Ended | | | Year | | | Period | | | Year | | | Year | | | Year | | | Year | |
| | | June 30, | | | Ended | | | Ended | | | Ended | | | Ended | | | Ended | | | Ended | |
| | | 2019 | | | December 31, | | | December 31, | | | April 30, | | | April 30, | | | April 30, | | | April 30, | |
| | | (Unaudited) | | | 2018 | | | 2017^ | | | 2017 | | | 2016 | | | 2015 | | | 2014 | |
| | |
PER SHARE DATA:(1) | | | | | | | | | | | | | | | | | | | | | |
| Net Asset Value, Beginning | | | | | | | | | | | | | | | | | | | | | |
| of Period | | $ | 9.33 | | | $ | 10.67 | | | $ | 9.82 | | | $ | 8.52 | | | $ | 10.22 | | | $ | 10.32 | | | $ | 8.74 | |
| Income from Investment Operations: | | | | | | | | | | | | | | | | | | | | | | | | | | | | |
Net investment income (loss)(2) | | | 0.03 | | | | (0.08 | ) | | | (0.02 | ) | | | 0.03 | | | | 0.00 | (3) | | | (0.03 | ) | | | (0.03 | ) |
| Net realized and unrealized gain | | | | | | | | | | | | | | | | | | | | | | | | | | | | |
| (loss) on investments | | | 2.44 | | | | (0.81 | ) | | | 1.29 | | | | 1.45 | | | | (1.70 | ) | | | (0.07 | ) | | | 1.60 | |
| Net Increase from payment by | | | | | | | | | | | | | | | | | | | | | | | | | | | | |
| affiliates | | | — | | | | — | | | | — | | | | — | | | | — | | | | — | | | | 0.01 | |
| Total from Investment | | | | | | | | | | | | | | | | | | | | | | | | | | | | |
| Operations | | | 2.47 | | | | (0.89 | ) | | | 1.27 | | | | 1.48 | | | | (1.70 | ) | | | (0.10 | ) | | | 1.58 | |
| Redemption fees | | | — | | | | — | | | | — | | | | — | | | | — | | | | — | | | | — | |
| Less Distributions: | | | | | | | | | | | | | | | | | | | | | | | | | | | | |
| From net investment income | | | — | | | | — | | | | 0.00 | (3) | | | — | | | | — | | | | — | | | | — | |
| From net realized gains | | | — | | | | (0.45 | ) | | | (0.42 | ) | | | (0.18 | ) | | | — | | | | — | | | | — | |
| Total Distributions | | | — | | | | (0.45 | ) | | | (0.42 | ) | | | (0.18 | ) | | | — | | | | — | | | | — | |
| | |
| Net Asset Value, End of Period | | $ | 11.80 | | | $ | 9.33 | | | $ | 10.67 | | | $ | 9.82 | | | $ | 8.52 | | | $ | 10.22 | | | $ | 10.32 | |
Total return(4) | | | 26.47 | %(5) | | | (8.30 | )% | | | 12.95 | %(5) | | | 17.36 | % | | | (16.63 | )% | | | (0.97 | )% | | | 18.08 | %(8) |
| | |
SUPPLEMENTAL DATA AND RATIOS | | | | | | | | | | | | | | | | | | | | | | | | | | | | |
| Net assets, end of period (000’S) | | $ | 3,934 | | | $ | 3,303 | | | $ | 4,322 | | | $ | 4,583 | | | $ | 6,067 | | | $ | 14,604 | | | $ | 12,536 | |
| Ratio of operating expenses to | | | | | | | | | | | | | | | | | | | | | | | | | | | | |
| average net assets: | | | | | | | | | | | | | | | | | | | | | | | | | | | | |
| Before expense reimbursement | | | 2.24 | %(6) | | | 2.06 | % | | | 2.07 | %(6) | | | 2.45 | % | | | 1.74 | % | | | 1.77 | % | | | 1.94 | % |
After expense reimbursement(7) | | | 1.50 | %(6) | | | 1.50 | % | | | 1.50 | %(6) | | | 1.50 | % | | | 1.50 | % | | | 1.50 | % | | | 1.50 | % |
| Ratio of net investment income to | | | | | | | | | | | | | | | | | | | | | | | | | | | | |
| average net assets: | | | 0.53 | %(6) | | | (0.68 | )% | | | (0.27 | )%(6) | | | 0.31 | % | | | 0.05 | % | | | (0.30 | )% | | | (0.32 | )% |
| Portfolio turnover rate | | | 2 | %(5) | | | 9 | % | | | 0 | %(5) | | | 11 | % | | | 2 | % | | | 40 | % | | | 18 | % |
| ^ | For the period May 1, 2017 through December 31, 2017. The Fund changed its fiscal year end from April 30 to December 31. |
| (1) | Information presented relates to a share of capital stock outstanding for each period. |
| (2) | Net investment income per share represents net investment income divided by the average shares outstanding throughout the period. |
| (3) | Amount calculated is less than $0.005. |
| (4) | The total return calculation does not reflect the 5.75% front end sales charge on Advisor Class A shares. |
| (5) | Not annualized. |
| (6) | Annualized. |
| (7) | See Note #3, Investment Adviser, for the waiver and expense reimbursement discussion. |
| (8) | Total return would have been 17.96% had the Advisor not reimbursed the Fund for the loss on a portfolio investment. |
The accompanying notes are an integral part of these financial statements.
102
KINETICS MUTUAL FUNDS, INC. — THE FUND
Financial Highlights — (Continued)
| | | | | | | | | | | | | | | | | | | | | | |
| | | The Spin-off Fund | |
| | | Advisor Class C | |
| | | For the | | | | | | | | | | | | | | | | | | | |
| | | Period | | | For the | | | For the | | | For the | | | For the | | | For the | | | For the | |
| | | Ended | | | Year | | | Period | | | Year | | | Year | | | Year | | | Year | |
| | | June 30, | | | Ended | | | Ended | | | Ended | | | Ended | | | Ended | | | Ended | |
| | | 2019 | | | December 31, | | | December 31, | | | April 30, | | | April 30, | | | April 30, | | | April 30, | |
| | | (Unaudited) | | | 2018 | | | 2017^ | | | 2017 | | | 2016 | | | 2015 | | | 2014 | |
| | |
PER SHARE DATA:(1) | | | | | | | | | | | | | | | | | | | | | |
| Net Asset Value, Beginning | | | | | | | | | | | | | | | | | | | | | |
| of Period | | $ | 8.80 | | | $ | 10.17 | | | $ | 9.43 | | | $ | 8.25 | | | $ | 9.97 | | | $ | 10.14 | | | $ | 8.64 | |
| Income from Investment Operations: | | | | | | | | | | | | | | | | | | | | | | | | | | | | |
Net investment income (loss)(2) | | | (0.01 | ) | | | (0.16 | ) | | | (0.07 | ) | | | (0.04 | ) | | | (0.06 | ) | | | (0.11 | ) | | | (0.09 | ) |
| Net realized and unrealized gain | | | | | | | | | | | | | | | | | | | | | | | | | | | | |
| (loss) on investments | | | 2.30 | | | | (0.76 | ) | | | 1.23 | | | | 1.40 | | | | (1.66 | ) | | | (0.06 | ) | | | 1.58 | |
| Net Increase from payment by | | | | | | | | | | | | | | | | | | | | | | | | | | | | |
| affiliates | | | — | | | | — | | | | — | | | | — | | | | — | | | | — | | | | 0.01 | |
| Total from Investment | | | | | | | | | | | | | | | | | | | | | | | | | | | | |
| Operations | | | 2.29 | | | | (0.92 | ) | | | 1.16 | | | | 1.36 | | | | (1.72 | ) | | | (0.17 | ) | | | 1.50 | |
| Redemption fees | | | — | | | | — | | | | — | | | | — | | | | — | | | | — | | | | — | |
| Less Distributions: | | | | | | | | | | | | | | | | | | | | | | | | | | | | |
| From net investment income | | | — | | | | — | | | | — | | | | — | | | | — | | | | — | | | | — | |
| From net realized gains | | | — | | | | (0.45 | ) | | | (0.42 | ) | | | (0.18 | ) | | | — | | | | — | | | | — | |
| Total Distributions | | | — | | | | (0.45 | ) | | | (0.42 | ) | | | (0.18 | ) | | | — | | | | — | | | | — | |
| | |
| Net Asset Value, End of Period | | $ | 11.09 | | | $ | 8.80 | | | $ | 10.17 | | | $ | 9.43 | | | $ | 8.25 | | | $ | 9.97 | | | $ | 10.14 | |
| Total return | | | 26.02 | %(3) | | | (9.00 | )% | | | 12.31 | %(3) | | | 16.46 | % | | | (17.25 | )% | | | (1.68 | )% | | | 17.36 | %(6) |
| | |
SUPPLEMENTAL DATA AND RATIOS | | | | | | | | | | | | | | | | | | | | | | | | | | | | |
| Net assets, end of period (000’S) | | $ | 4,274 | | | $ | 4,114 | | | $ | 5,526 | | | $ | 5,678 | | | $ | 6,290 | | | $ | 12,057 | | | $ | 10,701 | |
| Ratio of operating expenses to | | | | | | | | | | | | | | | | | | | | | | | | | | | | |
| average net assets: | | | | | | | | | | | | | | | | | | | | | | | | | | | | |
| Before expense reimbursement | | | 2.74 | %(4) | | | 2.56 | % | | | 2.82 | %(4) | | | 3.20 | % | | | 2.49 | % | | | 2.52 | % | | | 2.53 | % |
After expense reimbursement(5) | | | 2.25 | %(4) | | | 2.25 | % | | | 2.25 | %(4) | | | 2.25 | % | | | 2.25 | % | | | 2.25 | % | | | 2.09 | % |
| Ratio of net investment income to | | | | | | | | | | | | | | | | | | | | | | | | | | | | |
| average net assets: | | | (0.22 | )%(4) | | | (1.43 | )% | | | (1.02 | )%(4) | | | (0.44 | )% | | | (0.70 | )% | | | (1.05 | )% | | | (0.91 | )% |
| Portfolio turnover rate | | | 2 | %(3) | | | 9 | % | | | 0 | %(3) | | | 11 | % | | | 2 | % | | | 40 | % | | | 18 | % |
| ^ | For the period May 1, 2017 through December 31, 2017. The Fund changed its fiscal year end from April 30 to December 31. |
| (1) | Information presented relates to a share of capital stock outstanding for each period. |
| (2) | Net investment income per share represents net investment income divided by the average shares outstanding throughout the period. |
| (3) | Not annualized. |
| (4) | Annualized. |
| (5) | See Note #3, Investment Adviser, for the waiver and expense reimbursement discussion. |
| (6) | Total return would have been 17.25% had the Advisor not reimbursed the Fund for the loss on a portfolio investment. |
The accompanying notes are an integral part of these financial statements.
103
KINETICS MUTUAL FUNDS, INC. — THE FUND
Financial Highlights — (Continued)
| | | | | | | | | | | | | | | | | | | | | | |
| | | The Spin-off Fund | |
| | | Institutional Class | |
| | | For the | | | | | | | | | | | | | | | | | | | |
| | | Period | | | For the | | | For the | | | For the | | | For the | | | For the | | | For the | |
| | | Ended | | | Year | | | Period | | | Year | | | Year | | | Year | | | Year | |
| | | June 30, | | | Ended | | | Ended | | | Ended | | | Ended | | | Ended | | | Ended | |
| | | 2019 | | | December 31, | | | December 31, | | | April 30, | | | April 30, | | | April 30, | | | April 30, | |
| | | (Unaudited) | | | 2018 | | | 2017^ | | | 2017 | | | 2016 | | | 2015 | | | 2014 | |
| | |
PER SHARE DATA:(1) | | | | | | | | | | | | | | | | | | | | | |
| Net Asset Value, Beginning | | | | | | | | | | | | | | | | | | | | | |
| of Period | | $ | 9.36 | | | $ | 10.68 | | | $ | 9.85 | | | $ | 8.53 | | | $ | 10.20 | | | $ | 10.27 | | | $ | 8.67 | |
| Income from Investment Operations: | | | | | | | | | | | | | | | | | | | | | | | | | | | | |
Net investment income (loss)(2) | | | 0.04 | | | | (0.05 | ) | | | 0.00 | (3) | | | 0.05 | | | | 0.03 | | | | (0.01 | ) | | | (0.01 | ) |
| Net realized and unrealized gain | | | | | | | | | | | | | | | | | | | | | | | | | | | | |
| (loss) on investments | | | 2.46 | | | | (0.82 | ) | | | 1.29 | | | | 1.45 | | | | (1.70 | ) | | | (0.06 | ) | | | 1.60 | |
| Net Increase from payment by | | | | | | | | | | | | | | | | | | | | | | | | | | | | |
| affiliates | | | — | | | | — | | | | — | | | | — | | | | — | | | | — | | | | 0.01 | |
| Total from Investment | | | | | | | | | | | | | | | | | | | | | | | | | | | | |
| Operations | | | 2.50 | | | | (0.87 | ) | | | 1.29 | | | | 1.50 | | | | (1.67 | ) | | | (0.07 | ) | | | 1.60 | |
| Redemption fees | | | — | | | | — | | | | 0.00 | (3) | | | — | | | | — | | | | — | | | | — | |
| Less Distributions: | | | | | | | | | | | | | | | | | | | | | | | | | | | | |
| From net investment income | | | — | | | | — | | | | (0.04 | ) | | | — | | | | — | | | | — | | | | — | |
| From net realized gains | | | — | | | | (0.45 | ) | | | (0.42 | ) | | | (0.18 | ) | | | — | | | | — | | | | — | |
| Total Distributions | | | — | | | | (0.45 | ) | | | (0.46 | ) | | | (0.18 | ) | | | — | | | | — | | | | — | |
| | |
| Net Asset Value, End of Period | | $ | 11.86 | | | $ | 9.36 | | | $ | 10.68 | | | $ | 9.85 | | | $ | 8.53 | | | $ | 10.20 | | | $ | 10.27 | |
| Total return | | | 26.71 | %(4) | | | (8.11 | )% | | | 13.07 | %(4) | | | 17.57 | % | | | (16.37 | )% | | | (0.68 | )% | | | 18.45 | %(6) |
| | |
SUPPLEMENTAL DATA AND RATIOS | | | | | | | | | | | | | | | | | | | | | | | | | | | | |
| Net assets, end of period (000’S) | | $ | 13,965 | | | $ | 11,290 | | | $ | 14,050 | | | $ | 12,022 | | | $ | 24,185 | | | $ | 52,312 | | | $ | 52,635 | |
| Ratio of operating expenses to | | | | | | | | | | | | | | | | | | | | | | | | | | | | |
| average net assets: | | | | | | | | | | | | | | | | | | | | | | | | | | | | |
| Before expense reimbursement | | | 1.94 | %(5) | | | 1.76 | % | | | 1.83 | %(5) | | | 2.20 | % | | | 1.49 | % | | | 1.52 | % | | | 1.69 | % |
After expense reimbursement(7) | | | 1.25 | %(5) | | | 1.25 | % | | | 1.25 | %(5) | | | 1.25 | % | | | 1.25 | % | | | 1.25 | % | | | 1.25 | % |
| Ratio of net investment income | | | | | | | | | | | | | | | | | | | | | | | | | | | | |
| to average net assets: | | | 0.78 | %(5) | | | (0.43 | )% | | | (0.02 | )%(5) | | | 0.56 | % | | | 0.30 | % | | | (0.05 | )% | | | (0.07 | )% |
| Portfolio turnover rate | | | 2 | %(4) | | | 9 | % | | | 0 | %(4) | | | 11 | % | | | 2 | % | | | 40 | % | | | 18 | % |
| ^ | For the period May 1, 2017 through December 31, 2017. The Fund changed its fiscal year end from April 30 to December 31. |
| (1) | Information presented relates to a share of capital stock outstanding for each period. |
| (2) | Net investment income per share represents net investment income divided by the average shares outstanding throughout the period. |
| (3) | Amount calculated is less than $0.005. |
| (4) | Not annualized. |
| (5) | Annualized. |
| (6) | Total return would have been 18.34% had the Advisor not reimbursed the Fund for the loss on a portfolio investment. |
| (7) | See Note #3, Investment Adviser, for the waiver and expense reimbursement discussion. |
The accompanying notes are an integral part of these financial statements.
104
KINETICS PORTFOLIOS TRUST — MASTER INVESTMENT PORTFOLIOS
Allocation of Consolidated Portfolio Assets
June 30, 2019 (Unaudited)
The Internet Portfolio
| | | | | | | |
| | | | | | Percentage | |
| | | Market | | | of Total | |
Sector Allocation* | | Value | | | Net Assets | |
Finance and Insurance# | | $ | 42,752,171 | | | | 30.8 | % |
| Information | | | 24,833,960 | | | | 17.9 | % |
| Mining, Quarrying, and Oil and Gas Extraction | | | 16,547,252 | | | | 11.9 | % |
| Professional, Scientific, and Technical Services | | | 8,897,584 | | | | 6.4 | % |
| Administrative and Support and Waste Management and | | | | | | | | |
| Remediation Services | | | 7,212,228 | | | | 5.2 | % |
| Arts, Entertainment, and Recreation | | | 1,163,360 | | | | 0.8 | % |
| Management of Companies and Enterprises | | | 888,880 | | | | 0.7 | % |
| Retail Trade | | | 93,496 | | | | 0.1 | % |
| * | Excludes Short-Term Investments |
| # | In the Finance and Insurance Sector, $32,478,042 represents a cryptocurrency investment of 23.4% of total net assets as of June 30, 2019. |
105
KINETICS PORTFOLIOS TRUST — MASTER INVESTMENT PORTFOLIOS
Allocation of Portfolio Assets
June 30, 2019 (Unaudited) — (Continued)
The Global Portfolio
| | | | | | | |
| | | | | | Percentage | |
| | | Market | | | of Total | |
Country Allocation* | | Value | | | Net Assets | |
United States# | | $ | 5,669,398 | | | | 38.3 | % |
| Canada | | | 1,481,869 | | | | 10.0 | % |
| United Kingdom | | | 355,460 | | | | 2.4 | % |
| France | | | 311,275 | | | | 2.1 | % |
| Cayman Islands | | | 242,000 | | | | 1.6 | % |
| Brazil | | | 97,736 | | | | 0.7 | % |
| Australia | | | 30,750 | | | | 0.2 | % |
| New Zealand | | | 7,021 | | | | 0.1 | % |
| Guernsey | | | 5,905 | | | | 0.0 | % |
| Bermuda | | | 533 | | | | 0.0 | % |
| * | Excludes Short-Term Investments |
| # | In the United States Sector, $2,368,149 represents a cryptocurrency investment of 16.0% of total net assets as of June 30, 2019. |
106
KINETICS PORTFOLIOS TRUST — MASTER INVESTMENT PORTFOLIOS
Allocation of Consolidated Portfolio Assets
June 30, 2019 (Unaudited) — (Continued)
The Paradigm Portfolio
| | | | | | | |
| | | | | | Percentage | |
| | | Market | | | of Total | |
Sector Allocation* | | Value | | | Net Assets | |
| Mining, Quarrying, and Oil and Gas Extraction | | $ | 346,663,251 | | | | 41.7 | % |
Finance and Insurance# | | | 110,154,330 | | | | 13.3 | % |
| Information | | | 73,287,710 | | | | 8.8 | % |
| Real Estate and Rental and Leasing | | | 70,901,693 | | | | 8.5 | % |
| Management of Companies and Enterprises | | | 45,344,303 | | | | 5.5 | % |
| Arts, Entertainment, and Recreation | | | 39,044,382 | | | | 4.7 | % |
| Accommodation and Food Services | | | 15,150,308 | | | | 1.8 | % |
| Professional, Scientific, and Technical Services | | | 7,520,247 | | | | 0.9 | % |
| Manufacturing | | | 4,368,375 | | | | 0.5 | % |
| Retail Trade | | | 3,501,768 | | | | 0.4 | % |
| Transportation and Warehousing | | | 3,232,211 | | | | 0.4 | % |
| Utilities | | | 2,859,804 | | | | 0.4 | % |
| * | Excludes Short-Term Investments |
| # | In the Finance and Insurance Sector, $29,739,528 represents a cryptocurrency investment of 3.6% of total net assets as of June 30, 2019. |
107
KINETICS PORTFOLIOS TRUST — MASTER INVESTMENT PORTFOLIOS
Allocation of Portfolio Assets
June 30, 2019 (Unaudited) — (Continued)
The Medical Portfolio
| | | | | | | |
| | | | | | Percentage | |
| | | Market | | | of Total | |
Sector Allocation* | | Value | | | Net Assets | |
| Manufacturing | | $ | 15,585,217 | | | | 95.1 | % |
| Professional, Scientific, and Technical Services | | | 750,670 | | | | 4.6 | % |
| * | Excludes Short-Term Investments |
108
KINETICS PORTFOLIOS TRUST — MASTER INVESTMENT PORTFOLIOS
Allocation of Consolidated Portfolio Assets
June 30, 2019 (Unaudited) — (Continued)
The Small Cap Opportunities Portfolio
| | | | | | | |
| | | | | | Percentage | |
| | | Market | | | of Total | |
Sector Allocation* | | Value | | | Net Assets | |
| Mining, Quarrying, and Oil and Gas Extraction | | $ | 94,916,290 | | | | 30.3 | % |
| Management of Companies and Enterprises | | | 32,454,912 | | | | 10.4 | % |
| Real Estate and Rental and Leasing | | | 24,049,982 | | | | 7.7 | % |
Finance and Insurance# | | | 18,029,094 | | | | 5.7 | % |
| Accommodation and Food Services | | | 12,576,880 | | | | 4.0 | % |
| Professional, Scientific, and Technical Services | | | 12,506,209 | | | | 4.0 | % |
| Arts, Entertainment, and Recreation | | | 10,931,250 | | | | 3.5 | % |
| Manufacturing | | | 6,755,240 | | | | 2.1 | % |
| Transportation and Warehousing | | | 6,497,902 | | | | 2.1 | % |
| Wholesale Trade | | | 871,400 | | | | 0.3 | % |
| Information | | | 304,196 | | | | 0.1 | % |
| * | Excludes Short-Term Investments |
| # | In the Finance and Insurance Sector, $4,646,800 represents a cryptocurrency investment of 1.5% of total net assets as of June 30, 2019. |
109
KINETICS PORTFOLIOS TRUST — MASTER INVESTMENT PORTFOLIOS
Allocation of Consolidated Portfolio Assets
June 30, 2019 (Unaudited) — (Continued)
The Market Opportunities Portfolio
| | | | | | | |
| | | | | | Percentage | |
| | | Market | | | of Total | |
Sector Allocation* | | Value | | | Net Assets | |
| Mining, Quarrying, and Oil and Gas Extraction | | $ | 29,147,113 | | | | 32.5 | % |
Finance and Insurance# | | | 16,131,387 | | | | 18.0 | % |
| Management of Companies and Enterprises | | | 3,145,651 | | | | 3.5 | % |
| Real Estate and Rental and Leasing | | | 2,765,240 | | | | 3.1 | % |
| Information | | | 2,459,264 | | | | 2.7 | % |
| Transportation and Warehousing | | | 417,574 | | | | 0.5 | % |
| Manufacturing | | | 22,400 | | | | 0.0 | % |
| Wholesale Trade | | | 20,880 | | | | 0.0 | % |
| Professional, Scientific, and Technical Services | | | 5,695 | | | | 0.0 | % |
| Retail Trade | | | 200 | | | | 0.0 | % |
| * | Excludes Short-Term Investments |
| # | In the Finance and Insurance Sector, $9,106,354 represents a cryptocurrency investment of 10.1% of total net assets as of June 30, 2019. |
110
KINETICS PORTFOLIOS TRUST — MASTER INVESTMENT PORTFOLIOS
Allocation of Portfolio Assets
June 30, 2019 (Unaudited) — (Continued)
The Alternative Income Portfolio
| | | | | | | |
| | | | | | Percentage | |
| | | Market | | | of Total | |
Sector Allocation* | | Value | | | Net Assets | |
| Finance and Insurance | | $ | 5,853,461 | | | | 31.2 | % |
| * | Excludes Short-Term Investments |
111
KINETICS PORTFOLIOS TRUST — MASTER INVESTMENT PORTFOLIOS
Allocation of Portfolio Assets
June 30, 2019 (Unaudited) — (Continued)
The Multi-Disciplinary Income Portfolio
| | | | | | | |
| | | | | | Percentage | |
| | | Market | | | of Total | |
Sector Allocation* | | Value | | | Net Assets | |
| Manufacturing | | $ | 6,113,399 | | | | 16.7 | % |
| Construction | | | 6,078,890 | | | | 16.6 | % |
| Information | | | 4,226,077 | | | | 11.6 | % |
| Mining, Quarrying, and Oil and Gas Extraction | | | 3,694,980 | | | | 10.1 | % |
| Retail Trade | | | 3,607,687 | | | | 9.9 | % |
| Finance and Insurance | | | 3,148,148 | | | | 8.6 | % |
| Management of Companies and Enterprises | | | 3,041,250 | | | | 8.3 | % |
| Transportation and Warehousing | | | 2,773,073 | | | | 7.6 | % |
| Real Estate and Rental and Leasing | | | 1,713,030 | | | | 4.7 | % |
| Professional, Scientific, and Technical Services | | | 511,250 | | | | 1.4 | % |
| * | Excludes Short-Term Investments |
112
KINETICS PORTFOLIOS TRUST — MASTER INVESTMENT PORTFOLIOS
The Internet Portfolio
Consolidated Portfolio of Investments — June 30, 2019 (Unaudited)
| | | | | | | |
COMMON STOCKS — 73.76% | | Shares | | | Value | |
| Administrative and Support Services — 5.20% | | | | | | |
CreditRiskMonitor.com, Inc.f | | | 780 | | | $ | 1,248 | |
PayPal Holdings, Inc.*c | | | 63,000 | | | | 7,210,980 | |
| | | | | | | | 7,212,228 | |
| Broadcasting (except Internet) — 4.47% | | | | | | | | |
| The E.W. Scripps Company — Class A | | | 40,000 | | | | 611,600 | |
| The Madison Square Garden Company — Class A* | | | 16,366 | | | | 4,581,498 | |
| MSG Networks, Inc. — Class A* | | | 49,100 | | | | 1,018,334 | |
| | | | | | | | 6,211,432 | |
| Credit Intermediation and Related Activities — 2.49% | | | | | | | | |
| LendingTree, Inc.*^ | | | 8,233 | | | | 3,458,107 | |
| Data Processing, Hosting, and Related Services — 4.71% | | | | | | | | |
| IHS Markit Limited* | | | 200 | | | | 12,744 | |
| MasterCard, Inc. — Class A | | | 7,000 | | | | 1,851,710 | |
| Verisk Analytics, Inc. | | | 7,000 | | | | 1,025,220 | |
| Visa, Inc. — Class A | | | 21,000 | | | | 3,644,550 | |
| | | | | | | | 6,534,224 | |
| Electronic Shopping and Mail-Order Houses — 0.06% | | | | | | | | |
| Liberty Expedia Holdings, Inc. — Class A* | | | 1,800 | | | | 86,022 | |
| Management of Companies and Enterprises — 0.64% | | | | | | | | |
| Galaxy Digital Holdings Ltd* | | | 112,000 | | | | 200,985 | |
| Icahn Enterprises LP | | | 9,500 | | | | 687,895 | |
| | | | | | | | 888,880 | |
| Oil and Gas Extraction — 11.92% | | | | | | | | |
Texas Pacific Land Trustc | | | 21,026 | | | | 16,547,252 | |
| Other Information Services — 4.99% | | | | | | | | |
| Alphabet, Inc. — Class A* | | | 3,200 | | | | 3,464,960 | |
| Alphabet, Inc. — Class C* | | | 3,200 | | | | 3,458,912 | |
| | | | | | | | 6,923,872 | |
| Other Motor Vehicle Dealers — 0.00% | | | | | | | | |
| Copart, Inc.* | | | 100 | | | | 7,474 | |
| Other Professional, Scientific, and Technical Services — 0.37% | | | | | | | | |
| GMO Internet, Inc. | | | 28,400 | | | | 514,185 | |
The accompanying notes are an integral part of these financial statements.
113
KINETICS PORTFOLIOS TRUST — MASTER INVESTMENT PORTFOLIOS
The Internet Portfolio
Consolidated Portfolio of Investments — June 30, 2019 (Unaudited) — (Continued)
| | | | | | | |
| | | Shares | | | Value | |
| Other Telecommunications — 3.03% | | | | | | |
| Liberty Broadband Corporation — Series A* | | | 8,000 | | | $ | 822,720 | |
| Liberty Broadband Corporation — Series C* | | | 8,000 | | | | 833,760 | |
| Liberty Global plc — Series C* | | | 59,800 | | | | 1,586,494 | |
| Liberty Latin America Limited — Class C* | | | 16,496 | | | | 283,566 | |
| Liberty Media Corp.—Liberty SiriusXM — Class A* | | | 18,000 | | | | 680,580 | |
| | | | | | | | 4,207,120 | |
| Professional, Scientific, and Technical Services — 6.04% | | | | | | | | |
| CACI International, Inc. — Class A* | | | 29,200 | | | | 5,974,028 | |
| Cookpad, Inc.* | | | 268,000 | | | | 763,122 | |
| ManTech International Corporation — Class A | | | 25,000 | | | | 1,646,250 | |
| | | | | | | | 8,383,400 | |
| Satellite Telecommunications — 0.69% | | | | | | | | |
| EchoStar Corporation — Class A* | | | 21,600 | | | | 957,312 | |
| Securities and Commodity Exchanges — 0.48% | | | | | | | | |
| Cboe Global Markets, Inc. | | | 6,424 | | | | 665,719 | |
| Securities, Commodity Contracts, and Other Financial Investments | | | | | | | | |
| and Related Activities — 27.83% | | | | | | | | |
| CME Group, Inc. | | | 4,180 | | | | 811,380 | |
Grayscale Bitcoin Trust*^c | | | 2,146,599 | | | | 32,478,042 | |
| MarketAxess Holdings, Inc. | | | 5,000 | | | | 1,607,100 | |
| OTC Markets Group, Inc. — Class A | | | 116,985 | | | | 3,731,822 | |
| | | | | | | | 38,628,344 | |
| Spectator Sports — 0.84% | | | | | | | | |
| Liberty Media Corp.—Liberty Braves — Class A* | | | 8,000 | | | | 222,400 | |
| Liberty Media Corp.—Liberty Braves — Class C* | | | 8,000 | | | | 223,760 | |
| Liberty Media Corp.—Liberty Formula One — Class A* | | | 20,000 | | | | 717,200 | |
| | | | | | | | 1,163,360 | |
| TOTAL COMMON STOCKS | | | | | | | | |
| (cost $67,299,488) | | | | | | | 102,388,931 | |
The accompanying notes are an integral part of these financial statements.
114
KINETICS PORTFOLIOS TRUST — MASTER INVESTMENT PORTFOLIOS
The Internet Portfolio
Consolidated Portfolio of Investments — June 30, 2019 (Unaudited) — (Continued)
| | | | | | | |
| | | Principal | | | | |
ESCROW NOTES — 0.00% | | Amount | | | Value | |
| Other Telecommunications — 0.00% | | | | | | |
Adelphia Communications Corp. Preferred*+a | | $ | 190,000 | | | $ | — | |
| TOTAL ESCROW NOTES | | | | | | | | |
| (cost $0) | | | | | | | — | |
SHORT-TERM INVESTMENTS — 26.14% | | Shares | | | | | |
| Money Market Funds — 0.00% | | | | | | | | |
Fidelity Institutional Government Portfolio — Class I, 2.26%b | | | 1,802 | | | | 1,802 | |
| | |
| | | Principal | | | | | |
| | | Amount | | | | | |
| U.S. Treasury Obligations — 26.14% | | | | | | | | |
United States Treasury Billsf | | | | | | | | |
| Maturity Date: 08/06/2019, Yield to Maturity 2.20% | | $ | 35,478,000 | | | | 35,404,117 | |
| Maturity Date: 08/13/2019, Yield to Maturity 2.02% | | | 429,000 | | | | 427,947 | |
| Maturity Date: 08/20/2019, Yield to Maturity 2.03% | | | 453,000 | | | | 451,688 | |
| | | | | | | | 36,283,752 | |
| TOTAL SHORT-TERM INVESTMENTS | | | | | | | | |
| (cost $36,281,801) | | | | | | | 36,285,554 | |
INVESTMENTS PURCHASED WITH THE CASH | | | | | | | | |
PROCEEDS FROM SECURITIES LENDING — 4.84% | | Shares | | | | | |
| Money Market Funds — 4.84% | | | | | | | | |
First American Government Obligations Fund — Class X, 2.30%b | | | 6,714,974 | | | | 6,714,974 | |
| TOTAL INVESTMENTS PURCHASED WITH THE CASH PROCEEDS | | | | | | | | |
| FROM SECURITIES LENDING | | | | | | | | |
| (cost $6,714,974) | | | | | | | 6,714,974 | |
TOTAL INVESTMENTS — 104.74% | | | | | | | | |
(cost $110,296,263) | | | | | | $ | 145,389,459 | |
| Percentages are stated as a percent of net assets. |
| * – Non-income producing security. |
| ^ — This security or a portion of this security was out on loan at June 30, 2019. Total loaned securities had a market value of $7,102,950 at June 30, 2019. The remaining contractual maturities of all of the securities lending transactions were overnight and continuous. |
| + — Security is considered illiquid and was fair valued. The aggregate value of such securities is $0 or 0.00% of net assets. |
| a — Value determined using significant unobservable inputs. |
| b — The rate quoted is the annualized seven-day yield as of June 30, 2019. |
| c — Significant Investment. See note 2. |
| f — Level 2 Investment. See note 8. |
The accompanying notes are an integral part of these financial statements.
115
KINETICS PORTFOLIOS TRUST — MASTER INVESTMENT PORTFOLIOS
The Global Portfolio
Consolidated Portfolio of Investments — June 30, 2019 (Unaudited) — (Continued)
| | | | | | | |
COMMON STOCKS — 55.22% | | Shares | | | Value | |
| Accommodation — 2.34% | | | | | | |
| Civeo Corporation* | | | 201,600 | | | $ | 346,752 | |
| Lessors of Nonfinancial Intangible Assets (except Copyrighted Works) — 0.02% | | | | | | | | |
| PrairieSky Royalty Limited | | | 200 | | | | 2,810 | |
| Management of Companies and Enterprises — 4.22% | | | | | | | | |
| Bollore SA | | | 68,000 | | | | 300,013 | |
Clarke, Inc.*f | | | 24,800 | | | | 246,191 | |
| Galaxy Digital Holdings Ltd.* | | | 44,000 | | | | 78,958 | |
| | | | | | | | 625,162 | |
| Mining (except Oil and Gas) — 3.56% | | | | | | | | |
| Franco-Nevada Corporation | | | 3,600 | | | | 305,568 | |
| NovaGold Resources, Inc.* | | | 4,000 | | | | 23,640 | |
| Wheaton Precious Metals Corporation | | | 8,200 | | | | 198,276 | |
| | | | | | | | 527,484 | |
| Oil and Gas Extraction — 15.35% | | | | | | | | |
Texas Pacific Land Trustc | | | 2,890 | | | | 2,274,401 | |
| Other Financial Investment Activities — 1.54% | | | | | | | | |
| Brookfield Asset Management, Inc. — Class A | | | 4,000 | | | | 191,120 | |
| Burford Capital Limited | | | 300 | | | | 5,905 | |
| IMF Bentham Limited* | | | 15,000 | | | | 30,750 | |
| | | | | | | | 227,775 | |
| Other Investment Pools and Funds — 0.47% | | | | | | | | |
Partners Value Investments LP*f | | | 2,193 | | | | 70,250 | |
| Other Pipeline Transportation — 0.08% | | | | | | | | |
| Rubis SCA | | | 200 | | | | 11,262 | |
| Other Telecommunications — 0.05% | | | | | | | | |
| Liberty Latin America Limited — Class A* | | | 9 | | | | 155 | |
| Liberty Latin America Limited — Class C* | | | 22 | | | | 378 | |
| NZME Limited | | | 20,000 | | | | 7,021 | |
| | | | | | | | 7,554 | |
| Professional, Scientific, and Technical Services — 5.11% | | | | | | | | |
CACI International, Inc. — Class A*c | | | 3,700 | | | | 756,983 | |
The accompanying notes are an integral part of these financial statements.
116
KINETICS PORTFOLIOS TRUST — MASTER INVESTMENT PORTFOLIOS
The Global Portfolio
Consolidated Portfolio of Investments — June 30, 2019 (Unaudited) — (Continued)
| | | | | | | |
| | | Shares | | | Value | |
| Securities and Commodity Exchanges — 1.44% | | | | | | |
| B3 SA - Brasil Bolsa Balcao | | | 10,000 | | | $ | 97,736 | |
| Cboe Global Markets, Inc. | | | 1,118 | | | | 115,858 | |
| | | | | | | | 213,594 | |
| Securities, Commodity Contracts, and Other Financial Investments | | | | | | | | |
| and Related Activities — 17.01% | | | | | | | | |
| CME Group, Inc. | | | 786 | | | | 152,571 | |
Grayscale Bitcoin Trust*^c | | | 156,520 | | | | 2,368,149 | |
| | | | | | | | 2,520,720 | |
| Support Activities for Mining — 1.63% | | | | | | | | |
Siem Industries, Inc.*f | | | 5,500 | | | | 242,000 | |
| Support Activities for Water Transportation — 2.40% | | | | | | | | |
| Braemar Shipping Services plc | | | 2,000 | | | | 4,826 | |
| Clarkson plc | | | 11,000 | | | | 350,634 | |
| | | | | | | | 355,460 | |
| TOTAL COMMON STOCKS | | | | | | | | |
| (cost $4,303,574) | | | | | | | 8,182,207 | |
| | |
PREFERRED STOCKS — 0.08% | | | | | | | | |
| Other Investment Pools and Funds — 0.08% | | | | | | | | |
| Partners Value Investments LP — Class A | | | 515 | | | | 12,231 | |
| TOTAL PREFERRED STOCKS | | | | | | | | |
| (cost $9,785) | | | | | | | 12,231 | |
| | |
| | | Principal | | | | | |
CONVERTIBLE BONDS — 0.01% | | Amount | | | | | |
| Department Stores — 0.01% | | | | | | | | |
Sears Holdings Corporation, 8.000%, 12/15/2019ef | | $ | 41,080 | | | | 1,438 | |
| TOTAL CONVERTIBLE BONDS | | | | | | | | |
| (cost $41,080) | | | | | | | 1,438 | |
The accompanying notes are an integral part of these financial statements.
117
KINETICS PORTFOLIOS TRUST — MASTER INVESTMENT PORTFOLIOS
The Global Portfolio
Consolidated Portfolio of Investments — June 30, 2019 (Unaudited) — (Continued)
| | | | | | | |
WARRANTS — 0.04% | | Shares | | | Value | |
| Other Investment Pools and Funds — 0.04% | | | | | | |
Partners Value Investments LP*f | | | | | | |
| Expiration: 06/30/2026, Exercise Price: 32.45 CAD | | | 1,893 | | | $ | 6,071 | |
| TOTAL WARRANTS | | | | | | | | |
| (cost $7,160) | | | | | | | 6,071 | |
SHORT-TERM INVESTMENTS — 40.27% | | | | | | | | |
| Money Market Funds — 0.00% | | | | | | | | |
Fidelity Institutional Government Portfolio — Class I, 2.26%b | | | 493 | | | | 493 | |
| | | Principal | | | | | |
| | | Amount | | | | | |
| U.S. Treasury Obligations — 40.27% | | | | | | | | |
United States Treasury Billsf | | | | | | | | |
| Maturity Date: 07/02/2019, Yield to Maturity 2.24% | | $ | 16,000 | | | | 15,999 | |
| Maturity Date: 07/09/2019, Yield to Maturity 2.31% | | | 15,000 | | | | 14,993 | |
| Maturity Date: 07/30/2019, Yield to Maturity 2.26% | | | 4,778,000 | | | | 4,769,773 | |
| Maturity Date: 08/06/2019, Yield to Maturity 2.20% | | | 1,016,000 | | | | 1,013,884 | |
| Maturity Date: 08/13/2019, Yield to Maturity 2.02% | | | 77,000 | | | | 76,811 | |
| Maturity Date: 08/20/2019, Yield to Maturity 2.02% | | | 75,000 | | | | 74,783 | |
| | | | | | | | 5,966,243 | |
| TOTAL SHORT-TERM INVESTMENTS | | | | | | | | |
| (cost $5,966,204) | | | | | | | 5,966,736 | |
| | |
INVESTMENTS PURCHASED WITH THE CASH | | | | | | | | |
PROCEEDS FROM SECURITIES LENDING — 0.98% | | Shares | | | | | |
| Money Market Funds — 0.98% | | | | | | | | |
First American Government Obligations Fund — Class X, 2.30%b | | | 145,578 | | | | 145,578 | |
| TOTAL INVESTMENTS PURCHASED WITH THE CASH PROCEEDS | | | | | | | | |
| FROM SECURITIES LENDING | | | | | | | | |
| (cost $145,578) | | | | | | | 145,578 | |
TOTAL INVESTMENTS — 96.60% | | | | | | | | |
(cost $10,473,381) | | | | | | $ | 14,314,261 | |
The accompanying notes are an integral part of these financial statements.
118
KINETICS PORTFOLIOS TRUST — MASTER INVESTMENT PORTFOLIOS
The Global Portfolio
Consolidated Portfolio of Investments — June 30, 2019 (Unaudited) — (Continued)
| Percentages are stated as a percent of net assets. |
| * — Non-income producing security. |
| ^ — This security or a portion of this security was out on loan at June 30, 2019. Total loaned securities had a market value of $154,568 at June 30, 2019. The remaining contractual maturities of all of the securities lending transactions were overnight and continuous. |
| b — The rate quoted is the annualized seven-day yield as of June 30, 2019. |
| c — Significant Investment. See note 2. |
| e — Default or other conditions exist and the security is not presently accruing income. |
| f — Level 2 Investment. See note 8. |
| CAD — Canadian Dollars. |
The accompanying notes are an integral part of these financial statements.
119
KINETICS PORTFOLIOS TRUST — MASTER INVESTMENT PORTFOLIOS
The Paradigm Portfolio
Consolidated Portfolio of Investments — June 30, 2019 (Unaudited) — (Continued)
| | | | | | | |
COMMON STOCKS — 86.85% | | Shares | | | Value | |
| Accommodation — 0.47% | | | | | | |
| Civeo Corporation* | | | 2,290,000 | | | $ | 3,938,800 | |
| Amusement, Gambling, and Recreation Industries — 0.41% | | | | | | | | |
| Las Vegas Sands Corp. | | | 38,900 | | | | 2,298,601 | |
| MGM Resorts International | | | 39,900 | | | | 1,139,943 | |
| | | | | | | | 3,438,544 | |
| Beverage and Tobacco Product Manufacturing — 0.06% | | | | | | | | |
| Crimson Wine Group Limited* | | | 65,600 | | | | 524,800 | |
| Broadcasting (except Internet) — 0.22% | | | | | | | | |
| CBS Corporation — Class B | | | 36,000 | | | | 1,796,400 | |
| Cable and Other Subscription Programming — 0.81% | | | | | | | | |
| Discovery Communications, Inc. — Class A* | | | 148,600 | | | | 4,562,020 | |
| Discovery Communications, Inc. — Class C* | | | 75,800 | | | | 2,156,510 | |
| | | | | | | | 6,718,530 | |
| Chemical Manufacturing — 0.02% | | | | | | | | |
| Element Solutions, Inc.* | | | 18,000 | | | | 186,120 | |
| Data Processing, Hosting, and Related Services — 0.01% | | | | | | | | |
| IHS Markit Limited* | | | 800 | | | | 50,976 | |
| Electronic Shopping and Mail-Order Houses — 0.42% | | | | | | | | |
| Liberty Expedia Holdings, Inc. — Class A* | | | 25,000 | | | | 1,194,750 | |
| Qurate Retail, Inc.* | | | 186,200 | | | | 2,307,018 | |
| | | | | | | | 3,501,768 | |
| Food Services and Drinking Places — 1.35% | | | | | | | | |
| The Wendy’s Company | | | 572,600 | | | | 11,211,508 | |
| Insurance Carriers and Related Activities — 1.89% | | | | | | | | |
| Markel Corporation* | | | 14,400 | | | | 15,690,240 | |
| Management of Companies and Enterprises — 5.45% | | | | | | | | |
| Associated Capital Group, Inc. — Class A | | | 261,200 | | | | 9,768,880 | |
| Bollore SA | | | 336,000 | | | | 1,482,415 | |
| Icahn Enterprises LP | | | 468,200 | | | | 33,902,362 | |
| RIT Capital Partners plc | | | 7,200 | | | | 190,645 | |
| | | | | | | | 45,344,302 | |
| Mining (except Oil and Gas) — 2.21% | | | | | | | | |
| Franco-Nevada Corporation | | | 216,600 | | | | 18,385,008 | |
The accompanying notes are an integral part of these financial statements.
120
KINETICS PORTFOLIOS TRUST — MASTER INVESTMENT PORTFOLIOS
The Paradigm Portfolio
Consolidated Portfolio of Investments — June 30, 2019 (Unaudited) — (Continued)
| | | | | | | |
| | | Shares | | | Value | |
| Motion Picture and Sound Recording Industries — 0.28% | | | | | | |
| Lions Gate Entertainment Corporation — Class B | | | 167,800 | | | $ | 1,948,158 | |
| Viacom, Inc. — Class B | | | 12,000 | | | | 358,440 | |
| | | | | | | | 2,306,598 | |
| Oil and Gas Extraction — 39.34% | | | | | | | | |
| Continental Resources, Inc.* | | | 47,200 | | | | 1,986,648 | |
Texas Pacific Land Trustcd | | | 411,203 | | | | 323,612,649 | |
Tourmaline Oil Corp.f | | | 113,600 | | | | 1,446,946 | |
| | | | | | | | 327,046,243 | |
| Other Financial Investment Activities — 5.18% | | | | | | | | |
| Brookfield Asset Management, Inc. — Class A | | | 703,000 | | | | 33,589,340 | |
| Brookfield Business Partners LP | | | 5,000 | | | | 191,550 | |
| GAMCO Investors, Inc. — Class A | | | 1,800 | | | | 34,506 | |
| Onex Corp. | | | 152,600 | | | | 9,223,861 | |
| | | | | | | | 43,039,257 | |
| Other Investment Pools and Funds — 0.00% | | | | | | | | |
Partners Value Investments LP*f | | | 800 | | | | 25,627 | |
| Other Professional, Scientific, and Technical Services — 0.07% | | | | | | | | |
| GMO Internet, Inc. | | | 32,000 | | | | 579,363 | |
| Other Telecommunications — 5.93% | | | | | | | | |
| GCI Liberty, Inc. — Class A* | | | 72,000 | | | | 4,425,120 | |
| Liberty Broadband Corporation — Series A* | | | 42,000 | | | | 4,319,280 | |
| Liberty Broadband Corporation — Series C* | | | 140,000 | | | | 14,590,800 | |
| Liberty Media Corp.—Liberty SiriusXM — Class A* | | | 284,000 | | | | 10,738,040 | |
| Liberty Media Corp.—Liberty SiriusXM — Class C* | | | 400,000 | | | | 15,192,000 | |
| | | | | | | | 49,265,240 | |
| Performing Arts, Spectator Sports, and Related Industries — 3.35% | | | | | | | | |
| Live Nation Entertainment, Inc.* | | | 420,000 | | | | 27,825,000 | |
| Professional, Scientific, and Technical Services — 0.83% | | | | | | | | |
| CACI International, Inc. — Class A* | | | 32,200 | | | | 6,587,798 | |
| Cookpad, Inc.* | | | 124,000 | | | | 353,087 | |
| | | | | | | | 6,940,885 | |
| Real Estate — 8.53% | | | | | | | | |
Dream Unlimited Corp. — Class Af | | | 272,000 | | | | 1,510,015 | |
| Equity Lifestyle Properties, Inc. — REIT | | | 67,700 | | | | 8,214,718 | |
The Howard Hughes Corporation*c | | | 494,000 | | | | 61,176,960 | |
| | | | | | | | 70,901,693 | |
The accompanying notes are an integral part of these financial statements.
121
KINETICS PORTFOLIOS TRUST — MASTER INVESTMENT PORTFOLIOS
The Paradigm Portfolio
Consolidated Portfolio of Investments — June 30, 2019 (Unaudited) — (Continued)
| | | | | | | |
| | | Shares | | | Value | |
| Satellite Telecommunications — 1.58% | | | | | | |
| DISH Network Corporation — Class A* | | | 110,200 | | | $ | 4,232,782 | |
| EchoStar Corporation — Class A* | | | 201,200 | | | | 8,917,184 | |
| | | | | | | | 13,149,966 | |
| Securities and Commodity Exchanges — 2.11% | | | | | | | | |
| Cboe Global Markets, Inc. | | | 169,600 | | | | 17,575,648 | |
| Securities, Commodity Contracts, and Other Financial Investments | | | | | | | | |
| and Related Activities — 4.07% | | | | | | | | |
| CME Group, Inc. | | | 21,000 | | | | 4,076,310 | |
| Grayscale Bitcoin Trust*^ | | | 1,965,600 | | | | 29,739,528 | |
| | | | | | | | 33,815,838 | |
| Spectator Sports — 0.94% | | | | | | | | |
| Liberty Media Corp.—Liberty Formula One — Class A* | | | 92,000 | | | | 3,299,120 | |
| Liberty Media Corp.—Liberty Formula One — Class C* | | | 119,800 | | | | 4,481,718 | |
| | | | | | | | 7,780,838 | |
| Support Activities for Mining — 0.15% | | | | | | | | |
Siem Industries, Inc.*f | | | 28,000 | | | | 1,232,000 | |
| Support Activities for Water Transportation — 0.39% | | | | | | | | |
| Clarkson plc | | | 101,400 | | | | 3,232,211 | |
| Transportation Equipment Manufacturing — 0.44% | | | | | | | | |
| General Electric Company | | | 336,000 | | | | 3,528,000 | |
| Wabtec Corp. | | | 1,804 | | | | 129,455 | |
| | | | | | | | 3,657,455 | |
| Utilities — 0.34% | | | | | | | | |
| Brookfield Infrastructure Partners LP | | | 66,600 | | | | 2,859,804 | |
| TOTAL COMMON STOCKS | | | | | | | | |
| (cost $352,563,837) | | | | | | | 722,020,662 | |
| | |
PREFERRED STOCKS — 0.00% | | | | | | | | |
| Other Investment Pools and Funds — 0.00% | | | | | | | | |
| Partners Value Investments LP — Class A | | | 217 | | | | 5,154 | |
| TOTAL PREFERRED STOCKS | | | | | | | | |
| (cost $1,764) | | | | | | | 5,154 | |
The accompanying notes are an integral part of these financial statements.
122
KINETICS PORTFOLIOS TRUST — MASTER INVESTMENT PORTFOLIOS
The Paradigm Portfolio
Consolidated Portfolio of Investments — June 30, 2019 (Unaudited) — (Continued)
| | | | | | | |
| | | Principal | | | | |
ESCROW NOTES — 0.00% | | Amount | | | Value | |
| Other Telecommunications 0.00% | | | | | | |
Adelphia Communications Corp.*+a | | $ | 200,000 | | | $ | — | |
| TOTAL ESCROW NOTES | | | | | | | | |
| (cost $0) | | | | | | | — | |
| | |
WARRANTS — 0.00% | | Shares | | | | | |
| Other Investment Pools and Funds — 0.00% | | | | | | | | |
Partners Value Investments LP*f | | | | | | | | |
| Expiration: 06/30/2026, Exercise Price: 32.45 CAD | | | 800 | | | | 2,566 | |
| TOTAL WARRANTS | | | | | | | | |
| (cost $2,367) | | | | | | | 2,566 | |
| | |
SHORT-TERM INVESTMENTS — 13.21% | | | | | | | | |
| Money Market Funds — 0.02% | | | | | | | | |
Fidelity Institutional Government Portfolio — Class I, 2.26%b | | | 129,884 | | | | 129,884 | |
| | |
| | | Principal | | | | | |
| | | Amount | | | | | |
| U.S. Treasury Obligations — 13.19% | | | | | | | | |
United States Treasury Billsf | | | | | | | | |
| Maturity Date: 07/02/2019, Yield to Maturity 2.24% | | $ | 826,000 | | | | 825,955 | |
| Maturity Date: 07/16/2019, Yield to Maturity 2.27% | | | 190,000 | | | | 189,838 | |
| Maturity Date: 07/30/2019, Yield to Maturity 2.26% | | | 16,529,000 | | | | 16,500,539 | |
| Maturity Date: 08/06/2019, Yield to Maturity 2.20% | | | 91,545,000 | | | | 91,354,357 | |
| Maturity Date: 08/13/2019, Yield to Maturity 2.02% | | | 715,000 | | | | 713,246 | |
| Maturity Date: 08/20/2019, Yield to Maturity 2.03% | | | 64,000 | | | | 63,815 | |
| | | | | | | | 109,647,750 | |
| TOTAL SHORT-TERM INVESTMENTS | | | | | | | | |
| (cost $109,766,364) | | | | | | | 109,777,634 | |
The accompanying notes are an integral part of these financial statements.
123
KINETICS PORTFOLIOS TRUST — MASTER INVESTMENT PORTFOLIOS
The Paradigm Portfolio
Consolidated Portfolio of Investments — June 30, 2019 (Unaudited) — (Continued)
| | | | | | | |
INVESTMENTS PURCHASED WITH THE CASH | | | | | | |
PROCEEDS FROM SECURITIES LENDING — 3.34% | | Shares | | | Value | |
| | |
| Money Market Funds — 3.34% | | | | | | |
First American Government Obligations Fund — Class X, 2.30%b | | | 27,724,643 | | | $ | 27,724,643 | |
| TOTAL INVESTMENTS PURCHASED WITH THE CASH PROCEEDS | | | | | | | | |
| FROM SECURITIES LENDING | | | | | | | | |
| (cost $27,724,643) | | | | | | | 27,724,643 | |
TOTAL INVESTMENTS — 103.40% | | | | | | | | |
(cost $490,058,975) | | | | | | $ | 859,530,659 | |
| Percentages are stated as a percent of net assets. |
| * — Non-income producing security. |
| ^ — This security or a portion of this security was out on loan at June 30, 2019. Total loaned securities had a market value of $29,436,762 at June 30, 2019. The remaining contractual maturities of all of the securities lending transactions were overnight and continuous. |
| + — Security is considered illiquid and was fair valued. The aggregate value of such securities is $0.00 or 0.00% of net assets. |
| a — Value determined using significant unobservable inputs. |
| b — The rate quoted is the annualized seven-day yield as of June 30, 2019. |
| c — Significant Investment. See note 2. |
| d — Affiliated issuer. See note 10. |
| f — Level 2 Investment. See note 8. |
| CAD — Canadian Dollars. |
| REIT — Real Estate Investment Trust. |
The accompanying notes are an integral part of these financial statements.
124
KINETICS PORTFOLIOS TRUST — MASTER INVESTMENT PORTFOLIOS
The Medical Portfolio
Portfolio of Investments — June 30, 2019 (Unaudited) — (Continued)
| | | | | | | |
COMMON STOCKS — 99.55% | | Shares | | | Value | |
| Chemical Manufacturing — 0.03% | | | | | | |
| Celldex Therapeutics, Inc.* | | | 1,752 | | | $ | $4,696 | |
| Pharmaceutical and Medicine Manufacturing — 95.02% | | | | | | | | |
| AbbVie, Inc. | | | 10,000 | | | | 727,200 | |
| Agenus, Inc.* | | | 148 | | | | 444 | |
| Alkermes plc* | | | 21,000 | | | | 473,340 | |
| Arena Pharmaceuticals, Inc.* | | | 4,500 | | | | 263,835 | |
AstraZeneca plc — ADRc | | | 24,000 | | | | 990,720 | |
Biogen, Inc.*c | | | 3,750 | | | | 877,013 | |
Bristol-Myers Squibb Companyc | | | 20,500 | | | | 929,675 | |
| Celgene Corporation* | | | 7,000 | | | | 647,080 | |
Eli Lilly & Companyc | | | 8,500 | | | | 941,715 | |
| Gilead Sciences, Inc. | | | 11,000 | | | | 743,160 | |
GlaxoSmithKline plc — ADRc | | | 22,673 | | | | 907,373 | |
| Immune Pharmaceuticals, Inc.* | | | 1 | | | | — | |
| Ionis Pharmaceuticals, Inc.* | | | 12,000 | | | | 771,240 | |
Johnson & Johnsonc | | | 9,000 | | | | 1,253,520 | |
| Madrigal Pharmaceuticals, Inc.* | | | 514 | | | | 53,872 | |
Merck & Co., Inc.c | | | 15,000 | | | | 1,257,750 | |
| Merrimack Pharmaceuticals, Inc.* | | | 7,500 | | | | 45,375 | |
Novartis AG — ADRc | | | 14,000 | | | | 1,278,340 | |
| Onconova Therapeutics, Inc.* | | | 160 | | | | 456 | |
| Pacific Biosciences of California, Inc.* | | | 12,000 | | | | 72,600 | |
Pfizer, Inc.c | | | 32,000 | | | | 1,386,240 | |
| Progenics Pharmaceuticals, Inc.* | | | 67,200 | | | | 414,624 | |
| Roche Holding AG Limited — ADR | | | 11,000 | | | | 386,100 | |
Sanofi — ADRc | | | 25,000 | | | | 1,081,750 | |
| Xenon Pharmaceuticals, Inc.* | | | 7,000 | | | | 69,020 | |
| | | | | | | | 15,572,442 | |
| Professional, Scientific, and Technical Services — 4.50% | | | | | | | | |
| Amgen, Inc. | | | 4,000 | | | | 737,120 | |
| TOTAL COMMON STOCKS | | | | | | | | |
| (cost $12,004,329) | | | | | | | 16,314,258 | |
The accompanying notes are an integral part of these financial statements.
125
KINETICS PORTFOLIOS TRUST — MASTER INVESTMENT PORTFOLIOS
The Medical Portfolio
Portfolio of Investments — June 30, 2019 (Unaudited) — (Continued)
| | | | | | | |
RIGHTS — 0.13% | | Shares | | | Value | |
| Pharmaceutical and Medicine Manufacturing — 0.05% | | | | | | |
| Sanofi* | | | 15,538 | | | $ | 8,079 | |
| Scientific Research and Development Services — 0.08% | | | | | | | | |
Ligand Pharmaceuticals, Inc.*f | | | 44,000 | | | | 10,560 | |
| Ligand Pharmaceuticals, Inc. | | | 44,000 | | | | 2,200 | |
| Ligand Pharmaceuticals, Inc.* | | | 44,000 | | | | 570 | |
Ligand Pharmaceuticals, Inc.*#f | | | 44,000 | | | | 220 | |
| | | | | | | | 13,550 | |
| TOTAL RIGHTS | | | | | | | | |
| (cost $0) | | | | | | | 21,629 | |
| | |
SHORT-TERM INVESTMENTS — 0.26% | | | | | | | | |
| Money Market Funds — 0.04% | | | | | | | | |
Fidelity Institutional Government Portfolio — Class I, 2.26%b | | | 6,911 | | | | 6,911 | |
| | |
| | | Principal | | | | | |
| | | Amount | | | | | |
| U.S. Treasury Obligations — 0.22% | | | | | | | | |
United States Treasury Billsf | | | | | | | | |
| Maturity Date: 07/16/2019, Yield to Maturity 2.25% | | $ | 10,000 | | | | 9,992 | |
| Maturity Date: 08/06/2019, Yield to Maturity 2.20% | | | 26,000 | | | | 25,946 | |
| | | | | | | | 35,938 | |
| TOTAL SHORT-TERM INVESTMENTS | | | | | | | | |
| (cost $42,845) | | | | | | | 42,849 | |
TOTAL INVESTMENTS — 99.94% | | | | | | | | |
(cost $12,047,174) | | | | | | $ | 16,378,736 | |
| Percentages are stated as a percent of net assets. |
| * — Non-income producing security. |
| # — Contingent value right (contingent upon profitability of company). |
| b — The rate quoted is the annualized seven-day yield as of June 30, 2019. |
| c — Significant Investment. See note 2. |
| f — Level 2 Investment. See note 8. |
| ADR — American Depository Receipt. |
The accompanying notes are an integral part of these financial statements.
126
KINETICS PORTFOLIOS TRUST — MASTER INVESTMENT PORTFOLIOS
The Small Cap Opportunities Portfolio
Consolidated Portfolio of Investments — June 30, 2019 (Unaudited) — (Continued)
| | | | | | | |
COMMON STOCKS — 69.61% | | Shares | | | Value | |
| Accommodation — 1.77% | | | | | | |
| Civeo Corporation* | | | 3,214,000 | | | $ | 5,528,080 | |
| Beverage and Tobacco Product Manufacturing — 0.26% | | | | | | | | |
| Crimson Wine Group Limited* | | | 101,200 | | | | 809,600 | |
| Chemical Manufacturing — 1.68% | | | | | | | | |
| Element Solutions, Inc.* | | | 62,400 | | | | 645,216 | |
| Inter Parfums, Inc. | | | 69,600 | | | | 4,627,704 | |
| | | | | | | | 5,272,920 | |
| Food Services and Drinking Places — 2.25% | | | | | | | | |
| The Wendy’s Company | | | 360,000 | | | | 7,048,800 | |
| Funds, Trusts, and Other Financial Vehicles — 0.00% | | | | | | | | |
| Equity Commonwealth REIT | | | 400 | | | | 13,008 | |
| Machinery Manufacturing — 0.22% | | | | | | | | |
| Colfax Corporation* | | | 24,000 | | | | 672,720 | |
| Management of Companies and Enterprises — 10.36% | | | | | | | | |
| Associated Capital Group, Inc. — Class A | | | 164,750 | | | | 6,161,650 | |
| Dundee Corporation — Class A* | | | 2,012,400 | | | | 1,546,127 | |
| Galaxy Digital Holdings Ltd.* | | | 448,000 | | | | 803,940 | |
Icahn Enterprises LPc | | | 306,100 | | | | 22,164,701 | |
| RIT Capital Partners plc | | | 67,000 | | | | 1,774,063 | |
| Sandstorm Gold Ltd.* | | | 800 | | | | 4,432 | |
| | | | | | | | 32,454,913 | |
| Merchant Wholesalers, Durable Goods — 0.28% | | | | | | | | |
| Dorman Products, Inc.* | | | 10,000 | | | | 871,400 | |
| Mining (except Oil and Gas) — 0.03% | | | | | | | | |
| Wheaton Precious Metals Corporation | | | 4,400 | | | | 106,392 | |
| Motion Picture and Sound Recording Industries — 0.01% | | | | | | | | |
| Lions Gate Entertainment Corporation — Class B | | | 3,600 | | | | 41,796 | |
| Oil and Gas Extraction — 30.27% | | | | | | | | |
| Permian Basin Royalty Trust | | | 163,800 | | | | 997,542 | |
Texas Pacific Land Trustc | | | 119,204 | | | | 93,812,356 | |
| | | | | | | | 94,809,898 | |
| Other Financial Investment Activities — 1.28% | | | | | | | | |
| GAMCO Investors, Inc. — Class A | | | 22,000 | | | | 421,740 | |
Onex Corporationf | | | 59,400 | | | | 3,582,915 | |
| | | | | | | | 4,004,655 | |
The accompanying notes are an integral part of these financial statements.
127
KINETICS PORTFOLIOS TRUST — MASTER INVESTMENT PORTFOLIOS
The Small Cap Opportunities Portfolio
Consolidated Portfolio of Investments — June 30, 2019 (Unaudited) — (Continued)
| | | | | | | |
| | | Shares | | | Value | |
| Other Investment Pools and Funds — 2.40% | | | | | | |
| JZ Capital Partners Limited* | | | 25,800 | | | $ | 159,237 | |
Partners Value Investments LP*f | | | 191,000 | | | | 6,118,476 | |
| Urbana Corporation — Class A | | | 694,471 | | | | 1,240,931 | |
| | | | | | | | 7,518,644 | |
| Other Pipeline Transportation — 1.73% | | | | | | | | |
| Rubis SCA | | | 96,100 | | | | 5,411,314 | |
| Performing Arts, Spectator Sports, and Related Industries — 3.49% | | | | | | | | |
| Live Nation Entertainment, Inc.* | | | 165,000 | | | | 10,931,250 | |
| Professional, Scientific, and Technical Services — 3.99% | | | | | | | | |
| CACI International, Inc. — Class A* | | | 50,300 | | | | 10,290,877 | |
| Cookpad, Inc.* | | | 778,000 | | | | 2,215,332 | |
| | | | | | | | 12,506,209 | |
| Real Estate — 7.68% | | | | | | | | |
Dream Unlimited Corp. — Class Af | | | 2,188,400 | | | | 12,148,958 | |
| The Howard Hughes Corporation* | | | 96,100 | | | | 11,901,024 | |
| | | | | | | | 24,049,982 | |
| Securities, Commodity Contracts, and Other Financial Investments | | | | | | | | |
| and Related Activities — 1.48% | | | | | | | | |
| Grayscale Bitcoin Trust*^ | | | 307,125 | | | | 4,646,800 | |
| Support Activities for Water Transportation — 0.35% | | | | | | | | |
| Braemar Shipping Services plc | | | 450,322 | | | | 1,086,588 | |
| Telecommunications — 0.08% | | | | | | | | |
| LICT Corporation* | | | 16 | | | | 262,400 | |
| TOTAL COMMON STOCKS | | | | | | | | |
| (cost $142,877,608) | | | | | | | 218,047,369 | |
| | |
PREFERRED STOCKS — 0.39% | | | | | | | | |
| Other Investment Pools and Funds — 0.39% | | | | | | | | |
| Partners Value Investments LP — Class A | | | 51,933 | | | | 1,233,409 | |
| TOTAL PREFERRED STOCKS | | | | | | | | |
| (cost $420,822) | | | | | | | 1,233,409 | |
The accompanying notes are an integral part of these financial statements.
128
KINETICS PORTFOLIOS TRUST — MASTER INVESTMENT PORTFOLIOS
The Small Cap Opportunities Portfolio
Consolidated Portfolio of Investments — June 30, 2019 (Unaudited) — (Continued)
| | | | | | | |
WARRANTS — 0.20% | | Shares | | | Value | |
| Other Investment Pools and Funds — 0.20% | | | | | | |
Partners Value Investments LP*f | | | | | | |
| Expiration: 06/30/2026, Exercise Price: 32.45 CAD | | | 191,000 | | | $ | 612,577 | |
| TOTAL WARRANTS | | | | | | | | |
| (cost $564,856) | | | | | | | 612,577 | |
| | |
SHORT-TERM INVESTMENTS — 29.78% | | | | | | | | |
| Money Market Funds — 0.00% | | | | | | | | |
Fidelity Institutional Government Portfolio — Class I, 2.26%b | | | 33 | | | | 33 | |
| | |
| | | Principal | | | | | |
| | | Amount | | | | | |
| U.S. Treasury Obligations — 29.78% | | | | | | | | |
United States Treasury Billsf | | | | | | | | |
| Maturity Date: 07/30/2019, Yield to Maturity 2.26% | | $ | 16,690,000 | | | | 16,661,262 | |
| Maturity Date: 08/06/2019, Yield to Maturity 2.20% | | | 76,800,000 | | | | 76,640,064 | |
| | | | | | | | 93,301,326 | |
| TOTAL SHORT-TERM INVESTMENTS | | | | | | | | |
| (cost $93,291,591) | | | | | | | 93,301,359 | |
| | |
INVESTMENTS PURCHASED WITH THE CASH | | | | | | | | |
PROCEEDS FROM SECURITIES LENDING — 1.38% | | Shares | | | | | |
| Money Market Funds — 1.38% | | | | | | | | |
First American Government Obligations Fund — Class X, 2.30%b | | | 4,332,755 | | | | 4,332,755 | |
| TOTAL INVESTMENTS PURCHASED WITH THE CASH PROCEEDS | | | | | | | | |
| FROM SECURITIES LENDING | | | | | | | | |
| (cost $4,332,755) | | | | | | | 4,332,755 | |
TOTAL INVESTMENTS — 101.36% | | | | | | | | |
(cost $241,487,632) | | | | | | $ | 317,527,469 | |
| Percentages are stated as a percent of net assets. |
| * — Non-income producing security. |
| ^ — This security or a portion of this security was out on loan at June 30, 2019. Total loaned securities had a market value of $4,600,322 at June 30, 2019. The remaining contractual maturities of all of the securities lending transactions were overnight and continuous. |
| b — The rate quoted is the annualized seven-day yield as of June 30, 2019. |
| c — Significant Investment. See note 2. |
| f — Level 2 Investment. See note 8. |
| CAD— Canadian Dollars. |
| REIT — Real Estate Investment Trust. |
The accompanying notes are an integral part of these financial statements.
129
KINETICS PORTFOLIOS TRUST — MASTER INVESTMENT PORTFOLIOS
The Market Opportunities Portfolio
Consolidated Portfolio of Investments — June 30, 2019 (Unaudited) — (Continued)
| | | | | | | |
COMMON STOCKS — 59.84% | | Shares | | | Value | |
| Beverage and Tobacco Product Manufacturing — 0.02% | | | | | | |
| Crimson Wine Group Limited* | | | 2,800 | | | $ | 22,400 | |
| Data Processing, Hosting, and Related Services — 2.74% | | | | | | | | |
| IHS Markit Limited* | | | 200 | | | | 12,744 | |
| MasterCard, Inc. — Class A | | | 4,000 | | | | 1,058,120 | |
| Visa, Inc. — Class A | | | 8,000 | | | | 1,388,400 | |
| | | | | | | | 2,459,264 | |
| Insurance Carriers and Related Activities — 0.77% | | | | | | | | |
| Arthur J. Gallagher & Co. | | | 400 | | | | 35,036 | |
| Markel Corporation* | | | 600 | | | | 653,760 | |
| | | | | | | | 688,796 | |
| Management of Companies and Enterprises — 3.51% | | | | | | | | |
| Associated Capital Group, Inc. — Class A | | | 33,800 | | | | 1,264,120 | |
Clarke, Inc.*f | | | 1,000 | | | | 9,927 | |
| Dundee Corporation — Class A* | | | 2,000 | | | | 1,537 | |
| Galaxy Digital Holdings Ltd.* | | | 110,000 | | | | 197,396 | |
| Icahn Enterprises LP | | | 23,100 | | | | 1,672,671 | |
| | | | | | | | 3,145,651 | |
| Merchant Wholesalers, Durable Goods — 0.02% | | | | | | | | |
| A-Mark Precious Metals, Inc.* | | | 1,600 | | | | 20,880 | |
| Mining (except Oil and Gas) — 0.62% | | | | | | | | |
| Franco-Nevada Corporation | | | 4,800 | | | | 407,424 | |
| Wheaton Precious Metals Corporation | | | 6,200 | | | | 149,916 | |
| | | | | | | | 557,340 | |
| Oil and Gas Extraction — 31.86% | | | | | | | | |
Texas Pacific Land Trustc | | | 36,328 | | | | 28,589,773 | |
| Other Financial Investment Activities — 0.70% | | | | | | | | |
| GAMCO Investors, Inc. — Class A | | | 3,800 | | | | 72,846 | |
| Oaktree Capital Group LLC | | | 9,000 | | | | 445,860 | |
| Sprott, Inc. | | | 41,155 | | | | 105,908 | |
| | | | | | | | 624,614 | |
| Other Investment Pools and Funds — 2.27% | | | | | | | | |
Partners Value Investments LP*f | | | 43,516 | | | | 1,393,987 | |
Urbana Corporationf | | | 3,200 | | | | 5,865 | |
| Urbana Corporation — Class A | | | 356,004 | | | | 636,134 | |
| | | | | | | | 2,035,986 | |
The accompanying notes are an integral part of these financial statements.
130
KINETICS PORTFOLIOS TRUST — MASTER INVESTMENT PORTFOLIOS
The Market Opportunities Portfolio
Consolidated Portfolio of Investments — June 30, 2019 (Unaudited) — (Continued)
| | | | | | | |
| | | Shares | | | Value | |
| Professional, Scientific, and Technical Services — 0.01% | | | | | | |
| Cookpad, Inc.* | | | 2,000 | | | $ | 5,695 | |
| Real Estate — 3.08% | | | | | | | | |
Dream Unlimited Corp. — Class Af | | | 272,800 | | | | 1,514,456 | |
| The Howard Hughes Corporation* | | | 10,100 | | | | 1,250,784 | |
| | | | | | | | 2,765,240 | |
| Securities and Commodity Exchanges — 1.40% | | | | | | | | |
| Cboe Global Markets, Inc. | | | 7,806 | | | | 808,936 | |
| NASDAQ, Inc. | | | 1,800 | | | | 173,106 | |
| NZX Limited | | | 359,002 | | | | 270,118 | |
| | | | | | | | 1,252,160 | |
| Securities, Commodity Contracts, and Other Financial Investments | | | | | | | | |
| and Related Activities — 12.38% | | | | | | | | |
| CME Group, Inc. | | | 5,891 | | | | 1,143,502 | |
Grayscale Bitcoin Trust*^c | | | 601,874 | | | | 9,106,354 | |
| IntercontinentalExchange Group, Inc. | | | 10,000 | | | | 859,400 | |
| | | | | | | | 11,109,256 | |
| Support Activities for Water Transportation — 0.46% | | | | | | | | |
| Clarkson plc | | | 13,100 | | | | 417,574 | |
| TOTAL COMMON STOCKS | | | | | | | | |
| (cost $24,131,501) | | | | | | | 53,694,629 | |
| | |
PREFERRED STOCKS — 0.31% | | | | | | | | |
| Other Investment Pools and Funds — 0.31% | | | | | | | | |
| Partners Value Investments LP — Class A | | | 11,832 | | | | 281,010 | |
| TOTAL PREFERRED STOCKS | | | | | | | | |
| (cost $219,010) | | | | | | | 281,010 | |
| | |
| | | Principal | | | | | |
CONVERTIBLE BONDS — 0.00% | | Amount | | | | | |
| Department Stores — 0.00% | | | | | | | | |
Sears Holdings Corporation, 8.000%, 12/15/2019ef | | $ | 5,720 | | | | 200 | |
| TOTAL CONVERTIBLE BONDS | | | | | | | | |
| (cost $5,720) | | | | | | | 200 | |
The accompanying notes are an integral part of these financial statements.
131
KINETICS PORTFOLIOS TRUST — MASTER INVESTMENT PORTFOLIOS
The Market Opportunities Portfolio
Consolidated Portfolio of Investments — June 30, 2019 (Unaudited) — (Continued)
| | | | | | | |
WARRANTS — 0.16% | | Shares | | | Value | |
| | |
| Other Investment Pools and Funds — 0.16% | | | | | | |
Partners Value Investments LP*f | | | | | | |
| Expiration: 06/30/2026, Exercise Price: 32.45 CAD | | | 43,516 | | | $ | 139,565 | |
| TOTAL WARRANTS | | | | | | | | |
| (cost $130,104) | | | | | | | 139,565 | |
| | |
SHORT-TERM INVESTMENTS — 39.14% | | | | | | | | |
| Money Market Funds — 0.00% | | | | | | | | |
Fidelity Institutional Government Portfolio — Class I, 2.26%b | | | 1,150 | | | | 1,150 | |
| | |
| | | Principal | | | | | |
| | | Amount | | | | | |
| U.S. Treasury Obligations — 39.14% | | | | | | | | |
United States Treasury Billsf | | | | | | | | |
| Maturity Date: 07/02/2019, Yield to Maturity 2.24% | | $ | 7,000 | | | | 7,000 | |
| Maturity Date: 07/30/2019, Yield to Maturity 2.26% | | | 8,861,000 | | | | 8,845,742 | |
| Maturity Date: 08/06/2019, Yield to Maturity 2.20% | | | 26,012,000 | | | | 25,957,830 | |
| Maturity Date: 08/13/2019, Yield to Maturity 2.05% | | | 80,000 | | | | 79,804 | |
| Maturity Date: 08/20/2019, Yield to Maturity 2.02% | | | 230,000 | | | | 229,334 | |
| | | | | | | | 35,119,710 | |
| TOTAL SHORT-TERM INVESTMENTS | | | | | | | | |
| (cost $35,117,303) | | | | | | | 35,120,860 | |
| | |
INVESTMENTS PURCHASED WITH THE CASH | | | | | | | | |
PROCEEDS FROM SECURITIES LENDING — 1.38% | | Shares | | | | | |
| Money Market Funds — 1.38% | | | | | | | | |
First American Government Obligations Fund — Class X, 2.30%b | | | 1,241,317 | | | | 1,241,317 | |
| TOTAL INVESTMENTS PURCHASED WITH THE CASH PROCEEDS | | | | | | | | |
| FROM SECURITIES LENDING | | | | | | | | |
| (cost $1,241,317) | | | | | | | 1,241,317 | |
TOTAL INVESTMENTS — 100.83% | | | | | | | | |
(cost $60,844,955) | | | | | | $ | 90,477,581 | |
| Percentages are stated as a percent of net assets. |
| * — Non-income producing security. |
| ^ — This security or a portion of this security was out on loan at June 30, 2019. Total loaned securities had a market value of $1,317,974 at June 30, 2019. The remaining contractual maturities of all of the securities lending transactions were overnight and continuous. |
| b — The rate quoted is the annualized seven-day yield as of June 30, 2019. |
| c — Significant Investment. See note 2. |
| e — Default or other conditions exist and the security is not presently accruing income. |
| f — Level 2 Investment. See note 8. |
| CAD— Canadian Dollars. |
The accompanying notes are an integral part of these financial statements.
132
KINETICS PORTFOLIOS TRUST — MASTER INVESTMENT PORTFOLIOS
The Alternative Income Portfolio
Portfolio of Investments — June 30, 2019 (Unaudited) — (Continued)
| | | | | | | |
EXCHANGE TRADED FUNDS — 31.15% | | Shares | | | Value | |
| Funds, Trusts, and Other Financial Vehicles — 31.15% | | | | | | |
| iShares 1-3 Year Credit Bond ETF | | | 54,000 | | | $ | 2,885,760 | |
| PIMCO Enhanced Short Maturity Active ETF | | | 4,700 | | | | 478,225 | |
SPDR Barclays Short Term Corporate Bond ETF# | | | 24,000 | | | | 738,720 | |
| Vanguard Short-Term Corporate Bond ETF | | | 21,700 | | | | 1,750,756 | |
| TOTAL EXCHANGE TRADED FUNDS | | | | | | | | |
| (cost $5,804,792) | | | | | | | 5,853,461 | |
| | |
SHORT-TERM INVESTMENTS — 67.05% | | | | | | | | |
| Money Market Funds — 12.50% | | | | | | | | |
Fidelity Institutional Government Portfolio — Class I, 2.26%#b | | | 2,348,988 | | | | 2,348,988 | |
| | |
| | | Principal | | | | | |
| | | Amount | | | | | |
| U.S. Treasury Obligations — 54.55% | | | | | | | | |
United States Treasury Billsf | | | | | | | | |
| Maturity Date: 08/06/2019, Yield to Maturity 2.20% | | $ | 10,272,000 | | | | 10,250,609 | |
| TOTAL SHORT-TERM INVESTMENTS | | | | | | | | |
| (cost $12,598,493) | | | | | | | 12,599,597 | |
TOTAL INVESTMENTS — 98.20% | | | | | | | | |
(cost $18,403,285) | | | | | | $ | 18,453,058 | |
| Percentages are stated as a percent of net assets. |
| # — All or a portion of the securities have been committed as collateral for written option contracts, totaling $3,087,056. |
| b — The rate quoted is the annualized seven-day yield as of June 30, 2019. |
| f — Level 2 Investment. See note 8. |
| ETF — Exchange Traded Fund. |
The accompanying notes are an integral part of these financial statements.
133
KINETICS PORTFOLIOS TRUST — MASTER INVESTMENT PORTFOLIOS
The Multi-Disciplinary Income Portfolio
Portfolio of Investments — June 30, 2019 (Unaudited) — (Continued)
| | | | | | | |
| | | Principal | | | | |
CONVERTIBLE BONDS — 1.72% | | Amount | | | Value | |
| Pipeline Transportation of Natural Gas — 1.72% | | | | | | |
Cheniere Energy, Inc., 4.250%, 03/15/2045f | | $ | 800,000 | | | $ | 630,480 | |
| TOTAL CONVERTIBLE BONDS | | | | | | | | |
| (cost $638,274) | | | | | | | 630,480 | |
| | |
CORPORATE BONDS — 84.71% | | | | | | | | |
| Advertising, Public Relations, and Related Services — 1.40% | | | | | | | | |
Lamar Media Corp., 5.000%, 05/01/2023f | | | 500,000 | | | | 511,250 | |
| Broadcasting (except Internet) — 5.92% | | | | | | | | |
Altice Luxembourg SA, 7.750%, 05/15/2022◾f | | | 250,000 | | | | 254,688 | |
Cablevision Systems Corporation, 5.875%, 09/15/2022f | | | 200,000 | | | | 210,500 | |
Sinclair Television Group, Inc., 5.375%, 04/01/2021f | | | 250,000 | | | | 250,781 | |
Sirius XM Radio, Inc., 4.625%, 05/15/2023◾f | | | 1,050,000 | | | | 1,065,750 | |
TEGNA, Inc.f | | | | | | | | |
| 5.125%, 10/15/2019 | | | 133,000 | | | | 133,333 | |
| 5.125%, 07/15/2020 | | | 250,000 | | | | 250,937 | |
| | | | | | | | 2,165,989 | |
| Chemical Manufacturing — 10.56% | | | | | | | | |
Ashland, Inc., 4.750%, 08/15/2022cf | | | 3,000,000 | | | | 3,146,250 | |
The Chemours Companyf | | | | | | | | |
| 6.625%, 05/15/2023 | | | 474,000 | | | | 492,069 | |
| 7.000%, 05/15/2025 | | | 214,000 | | | | 224,165 | |
| | | | | | | | 3,862,484 | |
| Construction of Buildings — 16.63% | | | | | | | | |
Brookfield Residential Propertiescf | | | | | | | | |
| 6.500%, 12/15/2020◾ | | | 3,250,000 | | | | 3,258,125 | |
| 6.125%, 07/01/2022◾ | | | 100,000 | | | | 102,000 | |
| 6.375%, 05/15/2025◾ | | | 651,000 | | | | 660,765 | |
Lennar Corporation, 4.750%, 11/15/2022cf | | | 1,960,000 | | | | 2,058,000 | |
| | | | | | | | 6,078,890 | |
| Deep Sea, Coastal, and Great Lakes Water Transportation — 5.42% | | | | | | | | |
Stolt-Nielsen Limited, 6.375%, 09/21/2022cf | | | 2,000,000 | | | | 1,981,833 | |
| Fabricated Metal Product Manufacturing — 0.66% | | | | | | | | |
Ball Corporation, 5.250%, 07/01/2025f | | | 224,000 | | | | 243,040 | |
The accompanying notes are an integral part of these financial statements.
134
KINETICS PORTFOLIOS TRUST — MASTER INVESTMENT PORTFOLIOS
The Multi-Disciplinary Income Portfolio
Portfolio of Investments — June 30, 2019 (Unaudited) — (Continued)
| | | | | | | |
| | | Principal | | | | |
| | | Amount | | | Value | |
| Food Manufacturing — 5.49% | | | | | | |
Lamb Weston Holdings, Inc.cf | | | | | | |
| 4.625%, 11/01/2024◾ | | $ | 1,000,000 | | | $ | 1,041,250 | |
| 4.875%, 11/01/2026◾ | | | 925,000 | | | | 966,625 | |
| | | | | | | | 2,007,875 | |
| Management of Companies and Enterprises — 8.32% | | | | | | | | |
Icahn Enterprises, 5.875%, 02/01/2022cf | | | 3,000,000 | | | | 3,041,250 | |
| Metal Ore Mining — 0.75% | | | | | | | | |
Teck Resources Limited, 4.750%, 01/15/2022f | | | 264,000 | | | | 273,581 | |
| Motor Vehicle and Parts Dealers — 9.87% | | | | | | | | |
Penske Automotive Group, Inc., 5.750%, 10/01/2022cf | | | 3,550,000 | | | | 3,607,687 | |
| Oil and Gas Extraction — 6.31% | | | | | | | | |
Continental Resources, Inc., 5.000%, 09/15/2022f | | | 479,000 | | | | 483,427 | |
Murphy Oil Corp., 4.450%, 12/01/2022f | | | 1,208,000 | | | | 1,224,610 | |
QEP Resources, Inc.f | | | | | | | | |
| 6.875%, 03/01/2021 | | | 250,000 | | | | 258,125 | |
| 5.375%, 10/01/2022 | | | 120,000 | | | | 117,150 | |
| 5.250%, 05/01/2023 | | | 230,000 | | | | 222,525 | |
| | | | | | | | 2,305,837 | |
| Publishing Industries (except Internet) — 0.70% | | | | | | | | |
Tribune Media Company, 5.875%, 07/15/2022f | | | 250,000 | | | | 255,600 | |
| Real Estate — 4.69% | | | | | | | | |
The Howard Hughes Corporation, 5.375%, 03/15/2025◾f | | | 1,650,000 | | | | 1,713,030 | |
| Support Activities for Mining — 3.05% | | | | | | | | |
Ensco plc, 4.700%, 03/15/2021f | | | 600,000 | | | | 560,562 | |
Rowan Companies, Inc., 4.875%, 06/01/2022f | | | 600,000 | | | | 555,000 | |
| | | | | | | | 1,115,562 | |
| Telecommunications — 4.94% | | | | | | | | |
CenturyLink, Inc., 5.800%, 03/15/2022f | | | 500,000 | | | | 523,750 | |
Crown Castle International Corp., 4.875%, 04/15/2022f | | | 700,000 | | | | 744,488 | |
Hughes Satellite Systems Corp., 7.625%, 06/15/2021f | | | 500,000 | | | | 536,250 | |
| | | | | | | | 1,804,488 | |
| TOTAL CORPORATE BONDS | | | | | | | | |
| (cost $30,283,874) | | | | | | | 30,968,396 | |
The accompanying notes are an integral part of these financial statements.
135
KINETICS PORTFOLIOS TRUST — MASTER INVESTMENT PORTFOLIOS
The Multi-Disciplinary Income Portfolio
Portfolio of Investments — June 30, 2019 (Unaudited) — (Continued)
| | | | | | | |
| | | Principal | | | | |
MUNICIPAL BONDS — 0.44% | | Amount | | | Value | |
| Support Activities for Air Transportation — 0.44% | | | | | | |
| Branson Missouri Regional Airport Transportation Development District, | | | | | | |
5.000%, 04/01/2043+ef | | $ | 1,045,935 | | | $ | 160,760 | |
| TOTAL MUNICIPAL BONDS | | | | | | | | |
| (cost $2,253,382) | | | | | | | 160,760 | |
CLOSED-END FUNDS — 8.61% | | Shares | | | | | |
| Funds, Trusts, and Other Financial Vehicles — 8.61% | | | | | | | | |
| DoubleLine Opportunistic Credit Fund | | | 50,900 | | | | 1,064,828 | |
| PIMCO Dynamic Income Fund^ | | | 64,800 | | | | 2,083,320 | |
| TOTAL CLOSED-END FUNDS | | | | | | | | |
| (cost $3,353,432) | | | | | | | 3,148,148 | |
SHORT-TERM INVESTMENTS — 3.62% | | | | | | | | |
| Money Market Funds — 0.02% | | | | | | | | |
Fidelity Institutional Government Portfolio — Class I, 2.26%b | | | 5,809 | | | | 5,809 | |
| | |
| | | Principal | | | | | |
| | | Amount | | | | | |
| U.S. Treasury Obligations — 3.60% | | | | | | | | |
United States Treasury Billsf | | | | | | | | |
| Maturity Date: 07/30/2019, Yield to Maturity 2.10% | | $ | 1,318,000 | | | | 1,315,731 | |
| TOTAL SHORT-TERM INVESTMENTS | | | | | | | | |
| (cost $1,321,590) | | | | | | | 1,321,540 | |
| | |
INVESTMENTS PURCHASED WITH THE CASH | | | | | | | | |
PROCEEDS FROM SECURITIES LENDING — 5.46% | | Shares | | | | | |
| Money Market Funds — 5.46% | | | | | | | | |
First American Government Obligations Fund — Class X, 2.30%b | | | 1,995,000 | | | | 1,995,000 | |
| TOTAL INVESTMENTS PURCHASED WITH THE CASH PROCEEDS | | | | | | | | |
| FROM SECURITIES LENDING | | | | | | | | |
| (cost $1,995,000) | | | | | | | 1,995,000 | |
TOTAL INVESTMENTS — 104.56% | | | | | | | | |
(cost $39,845,552) | | | | | | $ | 38,224,324 | |
The accompanying notes are an integral part of these financial statements.
136
KINETICS PORTFOLIOS TRUST — MASTER INVESTMENT PORTFOLIOS
The Multi-Disciplinary Income Portfolio
Portfolio of Investments — June 30, 2019 (Unaudited) — (Continued)
| Percentages are stated as a percent of net assets. |
◾— The percentage of net assets comprised of 144a securities was 24.79%. |
| ^ — This security or a portion of this security was out on loan at June 30, 2019. Total loaned securities had a market value of $1,929,000 at June 30, 2019. The remaining contractual maturities of all of the securities lending transactions were overnight and continuous. |
| + — Security is considered illiquid. The aggregate value of such securities is $160,760 or 0.44% of net assets. |
| b — The rate quoted is the annualized seven-day yield as of June 30, 2019. |
| c — Significant Investment. See note 2. |
| e — Default or other conditions exist and the security is not presently accruing income. |
| f — Level 2 Investment. See note 8. |
The accompanying notes are an integral part of these financial statements.
137
KINETICS PORTFOLIOS TRUST — MASTER INVESTMENT PORTFOLIOS
Statements of Assets & Liabilities
June 30, 2019 (Unaudited)
| | | | | | | |
| | | The Internet | | | The Global | |
| | | Portfolio | | | Portfolio | |
| | | (Consolidated) | | | (Consolidated) | |
ASSETS: | | | | | | |
Investments, at value(1)(2) | | $ | 145,389,459 | | | $ | 14,314,261 | |
| Cash | | | 603 | | | | 1,207 | |
| Receivable for contributed capital | | | 338,036 | | | | 670,185 | |
| Receivable for investments sold | | | 31,685 | | | | — | |
| Dividends and interest receivable | | | 2,362 | | | | 16,331 | |
| Prepaid expenses and other assets | | | 12,770 | | | | 559 | |
| Total Assets | | | 145,774,915 | | | | 15,002,543 | |
LIABILITIES: | | | | | | | | |
| Payable to Adviser | | | 133,378 | | | | 13,665 | |
| Payable to Trustees | | | 2,810 | | | | 288 | |
| Payable to Chief Compliance Officer | | | 185 | | | | 20 | |
| Payable for collateral received for securities loaned | | | 6,714,974 | | | | 145,578 | |
| Payable for withdrawn capital | | | 65,543 | | | | 4,245 | |
| Accrued expenses and other liabilities | | | 47,240 | | | | 20,837 | |
| Total Liabilities | | | 6,964,130 | | | | 184,633 | |
| Net Assets | | $ | 138,810,785 | | | $ | 14,817,910 | |
(1) Cost of investments | | $ | 110,296,263 | | | $ | 10,473,381 | |
(2) Includes loaned securities with a market value of | | $ | 7,102,950 | | | $ | 154,568 | |
The accompanying notes are an integral part of these financial statements.
138
KINETICS PORTFOLIOS TRUST — MASTER INVESTMENT PORTFOLIOS
Statements of Assets & Liabilities — (Continued)
June 30, 2019 (Unaudited)
| | | | | | | |
| | | The Paradigm | | | | |
| | | Portfolio | | | The Medical | |
| | | (Consolidated) | | | Portfolio | |
ASSETS: | | | | | | |
| Investments, at value | | | | | | |
Unaffiliated issuers(1) | | $ | 535,918,010 | | | $ | 16,378,736 | |
Affiliated issuers(2) | | | 323,612,649 | | | | — | |
Total investments, at value(3)(4) | | $ | 859,530,659 | | | $ | 16,378,736 | |
| Cash | | | 13,469 | | | | — | |
| Receivable for contributed capital | | | 730,278 | | | | 47 | |
| Receivable for investments sold | | | 381,434 | | | | — | |
| Dividends and interest receivable | | | 105,035 | | | | 50,749 | |
| Prepaid expenses and other assets | | | 66,772 | | | | 1,207 | |
| Total Assets | | | 860,827,647 | | | | 16,430,739 | |
LIABILITIES: | | | | | | | | |
| Payable to Adviser | | | 821,306 | | | | 16,746 | |
| Payable to Trustees | | | 18,792 | | | | 381 | |
| Payable to Chief Compliance Officer | | | 1,268 | | | | 27 | |
| Payable for collateral received for securities loaned | | | 27,724,643 | | | | — | |
| Payable for withdrawn capital | | | 771,983 | | | | 6,661 | |
| Accrued expenses and other liabilities | | | 189,824 | | | | 18,761 | |
| Total Liabilities | | | 29,527,816 | | | | 42,576 | |
| Net Assets | | $ | 831,299,831 | | | $ | 16,388,163 | |
(1) Unaffiliated issuers cost | | $ | 445,598,895 | | | $ | 12,047,174 | |
(2) Affiliated issuers cost | | $ | 44,460,080 | | | $ | — | |
(3) Total issuers cost | | $ | 490,058,975 | | | $ | 12,047,174 | |
(4) Includes loaned securities with a market value of | | $ | 29,436,762 | | | $ | — | |
The accompanying notes are an integral part of these financial statements.
139
KINETICS PORTFOLIOS TRUST — MASTER INVESTMENT PORTFOLIOS
Statements of Assets & Liabilities — (Continued)
June 30, 2019 (Unaudited)
| | | | | | | |
| | | The Small Cap | | | The Market | |
| | | Opportunities | | | Opportunities | |
| | | Portfolio | | | Portfolio | |
| | | (Consolidated) | | | (Consolidated) | |
ASSETS: | | | | | | |
Investments, at value(1)(2) | | $ | 317,527,469 | | | $ | 90,477,581 | |
| Cash | | | 36,314 | | | | 5,372 | |
| Receivable for contributed capital | | | 466,063 | | | | 608,998 | |
| Receivable for investments sold | | | 47,993 | | | | 14,451 | |
| Dividends and interest receivable | | | 325,186 | | | | 8,237 | |
| Prepaid expenses and other assets | | | 14,612 | | | | 4,048 | |
| Total Assets | | | 318,417,637 | | | | 91,118,687 | |
LIABILITIES: | | | | | | | | |
| Payable to Adviser | | | 326,547 | | | | 87,715 | |
| Payable to Trustees | | | 7,555 | | | | 1,943 | |
| Payable to Chief Compliance Officer | | | 442 | | | | 133 | |
| Payable for securities purchased | | | 41,066 | | | | 9,584 | |
| Payable for collateral received for securities loaned | | | 4,332,755 | | | | 1,241,317 | |
| Payable for withdrawn capital | | | 363,509 | | | | 4,359 | |
| Accrued expenses and other liabilities | | | 87,425 | | | | 38,873 | |
| Total Liabilities | | | 5,159,299 | | | | 1,383,924 | |
| Net Assets | | $ | 313,258,338 | | | $ | 89,734,763 | |
(1) Cost of investments | | $ | 241,487,632 | | | $ | 60,844,955 | |
(2) Includes loaned securities with a market value of | | $ | 4,600,322 | | | $ | 1,317,974 | |
The accompanying notes are an integral part of these financial statements.
140
KINETICS PORTFOLIOS TRUST — MASTER INVESTMENT PORTFOLIOS
Statements of Assets & Liabilities — (Continued)
June 30, 2019 (Unaudited)
| | | | | | | |
| | | | | | The Multi- | |
| | | The Alternative | | | Disciplinary | |
| | | Income | | | Income | |
| | | Portfolio | | | Portfolio | |
ASSETS: | | | | | | |
Investments, at value(1)(2) | | $ | 18,453,058 | | | $ | 38,224,324 | |
| Cash at broker | | | 360,482 | | | | — | |
| Receivable for contributed capital | | | 10,995 | | | | 10,928 | |
| Dividends and interest receivable | | | 4,362 | | | | 414,298 | |
| Prepaid expenses and other assets | | | 584 | | | | 10,329 | |
| Total Assets | | | 18,829,481 | | | | 38,659,879 | |
LIABILITIES: | | | | | | | | |
| Payable to Adviser | | | 13,996 | | | | 38,392 | |
| Payable to Trustees | | | 437 | | | | 855 | |
| Payable to Chief Compliance Officer | | | 34 | | | | 60 | |
| Payable for collateral received for securities loaned | | | — | | | | 1,995,000 | |
| Payable for withdrawn capital | | | 4,228 | | | | 44,106 | |
| Accrued expenses and other liabilities | | | 19,318 | | | | 24,325 | |
| Total Liabilities | | | 38,013 | | | | 2,102,738 | |
| Net Assets | | $ | 18,791,468 | | | $ | 36,557,141 | |
(1) Cost of investments | | $ | 18,403,285 | | | $ | 39,845,552 | |
(2) Includes loaned securities with a market value of | | $ | — | | | $ | 1,929,000 | |
The accompanying notes are an integral part of these financial statements.
141
KINETICS PORTFOLIOS TRUST — MASTER INVESTMENT PORTFOLIOS
Statements of Operations
For the Six Months Ended June 30, 2019 (Unaudited)
| | | | | | | |
| | | The Internet | | | The Global | |
| | | Portfolio | | | Portfolio | |
| | | (Consolidated) | | | (Consolidated) | |
INVESTMENT INCOME: | | | | | | |
| Dividends† | | $ | 216,849 | | | $ | 34,710 | |
| Interest | | | 445,649 | | | | 67,137 | |
| Income from securities lending | | | 69,735 | | | | 2,974 | |
| Total investment income | | | 732,233 | | | | 104,821 | |
EXPENSES: | | | | | | | | |
| Investment advisory fees | | | 741,184 | | | | 76,449 | |
| Administration fees | | | 34,672 | | | | 9,554 | |
| Professional fees | | | 14,839 | | | | 7,293 | |
| Fund accounting fees | | | 12,152 | | | | 2,514 | |
| Trustees’ fees | | | 6,107 | | | | 629 | |
| Chief Compliance Officer fees | | | 1,059 | | | | 114 | |
| Custodian fees and expenses | | | 6,063 | | | | 2,897 | |
| Registration fees | | | 523 | | | | 522 | |
| Other expenses | | | 2,595 | | | | 253 | |
| Total expenses | | | 819,194 | | | | 100,225 | |
| Net investment income (loss) | | | (86,961 | ) | | | 4,596 | |
REALIZED AND UNREALIZED GAIN (LOSS) ON INVESTMENTS: | | | | | | | | |
| Net realized gain (loss) on: | | | | | | | | |
| Investments and foreign currency | | | (83,490 | ) | | | 1,495 | |
| Net change in unrealized appreciation of: | | | | | | | | |
| Investments and foreign currency | | | 39,609,993 | | | | 3,023,218 | |
| Net realized and unrealized gain on investments | | | 39,526,503 | | | | 3,024,713 | |
| Net increase in net assets resulting from operations | | $ | 39,439,542 | | | $ | 3,029,309 | |
| † Net of foreign taxes withheld of: | | $ | 733 | | | $ | 1,264 | |
The accompanying notes are an integral part of these financial statements.
142
KINETICS PORTFOLIOS TRUST — MASTER INVESTMENT PORTFOLIOS
Statements of Operations — (Continued)
For the Six Months Ended June 30, 2019 (Unaudited)
| | | | | | | |
| | | The Paradigm | | | | |
| | | Portfolio | | | The Medical | |
| | | (Consolidated) | | | Portfolio | |
INVESTMENT INCOME: | | | | | | |
| Dividends† | | $ | 1,013,385 | | | $ | 263,966 | |
| Interest | | | 1,245,298 | | | | 1,121 | |
| Income from securities lending | | | 101,261 | | | | 8,307 | |
| Dividends from affiliated issuer | | | 2,494,818 | | | | — | |
| Total investment income | | | 4,854,762 | | | | 273,394 | |
EXPENSES: | | | | | | | | |
| Investment advisory fees | | | 4,896,977 | | | | 104,158 | |
| Administration fees | | | 195,413 | | | | 10,504 | |
| Professional fees | | | 42,627 | | | | 4,825 | |
| Fund accounting fees | | | 76,704 | | | | 2,543 | |
| Trustees’ fees | | | 40,173 | | | | 896 | |
| Chief Compliance Officer fees | | | 7,461 | | | | 164 | |
| Custodian fees and expenses | | | 45,627 | | | | 2,684 | |
| Registration fees | | | 24 | | | | 24 | |
| Other expenses | | | 14,943 | | | | 346 | |
| Total expenses | | | 5,319,949 | | | | 126,144 | |
| Net investment income (loss) | | | (465,187 | ) | | | 147,250 | |
REALIZED AND UNREALIZED GAIN (LOSS) ON INVESTMENTS: | | | | | | | | |
| Net realized gain (loss) on: | | | | | | | | |
| Investments and foreign currency | | | (2,740,267 | ) | | | 514,789 | |
| Affiliated issuer | | | 6,373,889 | | | | — | |
| Net change in unrealized appreciation of: | | | | | | | | |
| Investments and foreign currency | | | 91,069,133 | | | | 49,960 | |
| Affiliated Issuer | | | 96,664,965 | | | | — | |
| Net realized and unrealized gain on investments | | | 191,367,720 | | | | 564,749 | |
| Net increase in net assets resulting from operations | | $ | 190,902,533 | | | $ | 711,999 | |
| † Net of foreign taxes withheld of: | | $ | 60,798 | | | $ | 16,223 | |
The accompanying notes are an integral part of these financial statements.
143
KINETICS PORTFOLIOS TRUST — MASTER INVESTMENT PORTFOLIOS
Statements of Operations — (Continued)
For the Six Months Ended June 30, 2019 (Unaudited)
| | | | | | | |
| | | The Small Cap | | | The Market | |
| | | Opportunities | | | Opportunities | |
| | | Portfolio | | | Portfolio | |
| | | (Consolidated) | | | (Consolidated) | |
INVESTMENT INCOME: | | | | | | |
| Dividends† | | $ | 1,194,773 | | | $ | 293,042 | |
| Interest | | | 1,152,714 | | | | 406,093 | |
| Income from securities lending | | | 16,437 | | | | 14,388 | |
| Total investment income | | | 2,363,924 | | | | 713,523 | |
EXPENSES: | | | | | | | | |
| Investment advisory fees | | | 1,900,837 | | | | 510,411 | |
| Administration fees | | | 78,985 | | | | 26,096 | |
| Professional fees | | | 24,824 | | | | 14,331 | |
| Fund accounting fees | | | 30,138 | | | | 9,182 | |
| Trustees’ fees | | | 15,274 | | | | 4,224 | |
| Chief Compliance Officer fees | | | 2,887 | | | | 777 | |
| Custodian fees and expenses | | | 20,952 | | | | 7,179 | |
| Registration fees | | | 26 | | | | 524 | |
| Other expenses | | | 5,105 | | | | 1,552 | |
| Total expenses | | | 2,079,028 | | | | 574,276 | |
| Net investment income | | | 284,896 | | | | 139,247 | |
REALIZED AND UNREALIZED GAIN (LOSS) ON INVESTMENTS: | | | | | | | | |
| Net realized loss on: | | | | | | | | |
| Investments and foreign currency | | | (743,747 | ) | | | (101,265 | ) |
| Net change in unrealized appreciation of: | | | | | | | | |
| Investments and foreign currency | | | 52,372,737 | | | | 18,380,470 | |
| Net realized and unrealized gain on investments | | | 51,628,990 | | | | 18,279,205 | |
| Net increase in net assets resulting from operations | | $ | 51,913,886 | | | $ | 18,418,452 | |
| † Net of foreign taxes withheld of: | | $ | 43,374 | | | $ | 4,764 | |
The accompanying notes are an integral part of these financial statements.
144
KINETICS PORTFOLIOS TRUST — MASTER INVESTMENT PORTFOLIOS
Statements of Operations — (Continued)
For the Six Months Ended June 30, 2019 (Unaudited)
| | | | | | | |
| | | | | | The Multi- | |
| | | The Alternative | | | Disciplinary | |
| | | Income | | | Income | |
| | | Portfolio | | | Portfolio | |
INVESTMENT INCOME: | | | | | | |
| Dividends | | $ | 72,599 | | | $ | 120,648 | |
| Interest | | | 151,191 | | | | 919,792 | |
| Income from securities lending | | | — | | | | 12,435 | |
| Total investment income | | | 223,790 | | | | 1,052,875 | |
EXPENSES: | | | | | | | | |
| Investment advisory fees | | | 85,647 | | | | 233,768 | |
| Administration fees | | | 11,802 | | | | 16,409 | |
| Professional fees | | | 4,919 | | | | 5,773 | |
| Fund accounting fees | | | 2,274 | | | | 7,417 | |
| Trustees’ fees | | | 1,018 | | | | 1,999 | |
| Chief Compliance Officer fees | | | 188 | | | | 355 | |
| Custodian fees and expenses | | | 2,881 | | | | 3,410 | |
| Registration fees | | | 25 | | | | 27 | |
| Other expenses | | | 409 | | | | 828 | |
| Total expenses | | | 109,163 | | | | 269,986 | |
| Net investment income | | | 114,627 | | | | 782,889 | |
REALIZED AND UNREALIZED GAIN (LOSS) ON INVESTMENTS: | | | | | | | | |
| Net realized gain (loss) on: | | | | | | | | |
| Investments and foreign currency | | | (97 | ) | | | (17,633 | ) |
| Written option contracts expired or closed | | | 31,663 | | | | — | |
| Net change in unrealized appreciation (depreciation) of: | | | | | | | | |
| Investments and foreign currency | | | 176,550 | | | | 1,796,085 | |
| Written option contracts | | | (26,903 | ) | | | — | |
| Net realized and unrealized gain on investments | | | 181,213 | | | | 1,778,452 | |
| Net increase in net assets resulting from operations | | $ | 295,840 | | | $ | 2,561,341 | |
The accompanying notes are an integral part of these financial statements.
145
KINETICS PORTFOLIOS TRUST — MASTER INVESTMENT PORTFOLIOS
Statements of Changes in Net Assets
| | | | | | | | | | | | | |
| | | The Internet Portfolio | | | The Global Portfolio | |
| | | (Consolidated) | | | (Consolidated) | |
| | | For the | | | For the | | | For the | | | For the | |
| | | Period Ended | | | Year Ended | | | Period Ended | | | Year Ended | |
| | | June 30, 2019 | | | December 31, | | | June 30, 2019 | | | December 31, | |
| | | (Unaudited) | | | 2018 | | | (Unaudited) | | | 2018 | |
| | |
OPERATIONS: | | | | | | | | | | | | |
| Net investment income (loss) | | $ | (86,961 | ) | | $ | (852,933 | ) | | $ | 4,596 | | | $ | (79,686 | ) |
| Net realized gain (loss) on sale of | | | | | | | | | | | | | | | | |
| investments and foreign currency | | | (83,490 | ) | | | 32,301,030 | | | | 1,495 | | | | (276,114 | ) |
| Net change in unrealized appreciation | | | | | | | | | | | | | | | | |
| (depreciation) of investments and | | | | | | | | | | | | | | | | |
| foreign currency | | | 39,609,993 | | | | (74,922,835 | ) | | | 3,023,218 | | | | (3,293,146 | ) |
| Net increase (decrease) in net assets | | | | | | | | | | | | | | | | |
| resulting from operations | | | 39,439,542 | | | | (43,474,738 | ) | | | 3,029,309 | | | | (3,648,946 | ) |
NET INCREASE (DECREASE) IN NET | | | | | | | | | | | | | | | | |
ASSETS RESULTING FROM | | | | | | | | | | | | | | | | |
BENEFICIAL INTEREST | | | | | | | | | | | | | | | | |
TRANSACTIONS: | | | | | | | | | | | | | | | | |
| Contributions | | | 1,344,150 | | | | 6,470,678 | | | | 1,413,922 | | | | 1,307,577 | |
| Withdrawals | | | (7,867,500 | ) | | | (25,363,999 | ) | | | (597,317 | ) | | | (2,373,818 | ) |
| Net increase (decrease) in net assets | | | | | | | | | | | | | | | | |
| resulting from beneficial | | | | | | | | | | | | | | | | |
| interest transactions | | | (6,523,350 | ) | | | (18,893,321 | ) | | | 816,605 | | | | (1,066,241 | ) |
| Total increase (decrease) in | | | | | | | | | | | | | | | | |
| net assets | | | 32,916,192 | | | | (62,368,059 | ) | | | 3,845,914 | | | | (4,715,187 | ) |
NET ASSETS: | | | | | | | | | | | | | | | | |
| Beginning of period | | | 105,894,593 | | | | 168,262,652 | | | | 10,971,996 | | | | 15,687,183 | |
| End of period | | $ | 138,810,785 | | | $ | 105,894,593 | | | $ | 14,817,910 | | | $ | 10,971,996 | |
The accompanying notes are an integral part of these financial statements.
146
KINETICS PORTFOLIOS TRUST — MASTER INVESTMENT PORTFOLIOS
Statements of Changes in Net Assets — (Continued)
| | | | | | | | | | | | | |
| | | The Paradigm Portfolio | | | | | | | |
| | | (Consolidated) | | | The Medical Portfolio | |
| | | For the | | | For the | | | For the | | | For the | |
| | | Period Ended | | | Year Ended | | | Period Ended | | | Year Ended | |
| | | June 30, 2019 | | | December 31, | | | June 30, 2019 | | | December 31, | |
| | | (Unaudited) | | | 2018 | | | (Unaudited) | | | 2018 | |
OPERATIONS: | | | | | | | | | | | | |
| Net investment income (loss) | | $ | (465,187 | ) | | $ | (5,456,085 | ) | | $ | 147,250 | | | $ | 171,494 | |
| Net realized gain on sale of | | | | | | | | | | | | | | | | |
| investments and foreign currency | | | 3,633,622 | | | | 129,576,341 | | | | 514,789 | | | | 1,560,378 | |
| Net change in unrealized appreciation | | | | | | | | | | | | | | | | |
| (depreciation) of investments and | | | | | | | | | | | | | | | | |
| foreign currency | | | 187,734,098 | | | | (165,251,075 | ) | | | 49,960 | | | | (1,466,285 | ) |
| Net increase (decrease) in net assets | | | | | | | | | | | | | | | | |
| resulting from operations | | | 190,902,533 | | | | (41,130,819 | ) | | | 711,999 | | | | 265,587 | |
NET DECREASE IN NET ASSETS | | | | | | | | | | | | | | | | |
RESULTING FROM BENEFICIAL | | | | | | | | | | | | | | | | |
INTEREST TRANSACTIONS: | | | | | | | | | | | | | | | | |
| Contributions | | | 12,314,598 | | | | 77,369,100 | | | | 107,412 | | | | 206,115 | |
| Withdrawals | | | (30,196,966 | ) | | | (168,838,467 | ) | | | (900,940 | ) | | | (3,464,345 | ) |
| Net decrease in net assets resulting | | | | | | | | | | | | | | | | |
| from beneficial interest | | | | | | | | | | | | | | | | |
| transactions | | | (17,882,368 | ) | | | (91,469,367 | ) | | | (793,528 | ) | | | (3,258,230 | ) |
| Total increase (decrease) in net assets | | | 173,020,165 | | | | (132,600,186 | ) | | | (81,529 | ) | | | (2,992,643 | ) |
NET ASSETS: | | | | | | | | | | | | | | | | |
| Beginning of period | | | 658,279,666 | | | | 790,879,852 | | | | 16,469,692 | | | | 19,462,335 | |
| End of period | | $ | 831,299,831 | | | $ | 658,279,666 | | | $ | 16,388,163 | | | $ | 16,469,692 | |
The accompanying notes are an integral part of these financial statements.
147
KINETICS PORTFOLIOS TRUST — MASTER INVESTMENT PORTFOLIOS
Statements of Changes in Net Assets — (Continued)
| | | | | | | | | | | | | |
| | | The Small Cap | | | The Market | |
| | | Opportunities Portfolio | | | Opportunities Portfolio | |
| | | (Consolidated) | | | (Consolidated) | |
| | | For the | | | For the | | | For the | | | For the | |
| | | Period Ended | | | Year Ended | | | Period Ended | | | Year Ended | |
| | | June 30, 2019 | | | December 31, | | | June 30, 2019 | | | December 31, | |
| | | (Unaudited) | | | 2018 | | | (Unaudited) | | | 2018 | |
| | |
OPERATIONS: | | | | | | | | | | | | |
| Net investment income (loss) | | $ | 284,896 | | | $ | (909,931 | ) | | $ | 139,247 | | | $ | (250,527 | ) |
| Net realized gain (loss) on sale of | | | | | | | | | | | | | | | | |
| investments and foreign currency | | | (743,747 | ) | | | 1,460,421 | | | | (101,265 | ) | | | 3,266,854 | |
| Net change in unrealized appreciation | | | | | | | | | | | | | | | | |
| (depreciation) of investments and | | | | | | | | | | | | | | | | |
| foreign currency | | | 52,372,737 | | | | (7,770,750 | ) | | | 18,380,470 | | | | (12,167,425 | ) |
| Net increase (decrease) in net assets | | | | | | | | | | | | | | | | |
| resulting from operations | | | 51,913,886 | | | | (7,220,260 | ) | | | 18,418,452 | | | | (9,151,098 | ) |
NET INCREASE (DECREASE) IN NET | | | | | | | | | | | | | | | | |
ASSETS RESULTING FROM | | | | | | | | | | | | | | | | |
BENEFICIAL INTEREST | | | | | | | | | | | | | | | | |
TRANSACTIONS: | | | | | | | | | | | | | | | | |
| Contributions | | | 81,589,788 | | | | 153,048,372 | | | | 2,273,853 | | | | 12,968,925 | |
| Withdrawals | | | (43,638,951 | ) | | | (103,903,461 | ) | | | (3,896,070 | ) | | | (8,159,216 | ) |
| Net increase (decrease) in net assets | | | | | | | | | | | | | | | | |
| resulting from beneficial | | | | | | | | | | | | | | | | |
| interest transactions | | | 37,950,837 | | | | 49,144,911 | | | | (1,622,217 | ) | | | 4,809,709 | |
| Total increase (decrease) in net assets | | | 89,864,723 | | | | 41,924,651 | | | | 16,796,235 | | | | (4,341,389 | ) |
NET ASSETS: | | | | | | | | | | | | | | | | |
| Beginning of period | | | 223,393,615 | | | | 181,468,964 | | | | 72,938,528 | | | | 77,279,917 | |
| End of period | | $ | 313,258,338 | | | $ | 223,393,615 | | | $ | 89,734,763 | | | $ | 72,938,528 | |
The accompanying notes are an integral part of these financial statements.
148
KINETICS PORTFOLIOS TRUST — MASTER INVESTMENT PORTFOLIOS
Statements of Changes in Net Assets — (Continued)
| | | | | | | | | | | | | |
| | | The Alternative | | | The Multi-Disciplinary | |
| | | Income Portfolio | | | Income Portfolio | |
| | | For the | | | For the | | | For the | | | For the | |
| | | Period Ended | | | Year Ended | | | Period Ended | | | Year Ended | |
| | | June 30, 2019 | | | December 31, | | | June 30, 2019 | | | December 31, | |
| | | (Unaudited) | | | 2018 | | | (Unaudited) | | | 2018 | |
OPERATIONS: | | | | | | | | | | | | |
| Net investment income | | $ | 114,627 | | | $ | 167,001 | | | $ | 782,889 | | | $ | 1,794,418 | |
| Net realized gain (loss) on sale of | | | | | | | | | | | | | | | | |
| investments, foreign currency and | | | | | | | | | | | | | | | | |
| written options | | | 31,566 | | | | 12,409 | | | | (17,633 | ) | | | (106,210 | ) |
| Net change in unrealized appreciation | | | | | | | | | | | | | | | | |
| (depreciation) of investments, foreign | | | | | | | | | | | | | | | | |
| currency and written options | | | 149,647 | | | | (52,766 | ) | | | 1,796,085 | | | | (2,054,163 | ) |
| Net increase (decrease) in net assets | | | | | | | | | | | | | | | | |
| resulting from operations | | | 295,840 | | | | 126,644 | | | | 2,561,341 | | | | (365,955 | ) |
NET DECREASE IN NET ASSETS | | | | | | | | | | | | | | | | |
RESULTING FROM BENEFICIAL | | | | | | | | | | | | | | | | |
INTEREST TRANSACTIONS: | | | | | | | | | | | | | | | | |
| Contributions | | | 1,124,330 | | | | 2,933,892 | | | | 880,319 | | | | 5,144,814 | |
| Withdrawals | | | (1,760,794 | ) | | | (7,035,790 | ) | | | (4,300,976 | ) | | | (16,568,073 | ) |
| Net decrease in net assets resulting | | | | | | | | | | | | | | | | |
| from beneficial interest | | | | | | | | | | | | | | | | |
| transactions | | | (636,464 | ) | | | (4,101,898 | ) | | | (3,420,657 | ) | | | (11,423,259 | ) |
| Total decrease in net assets | | | (340,624 | ) | | | (3,975,254 | ) | | | (859,316 | ) | | | (11,789,214 | ) |
NET ASSETS: | | | | | | | | | | | | | | | | |
| Beginning of period | | | 19,132,092 | | | | 23,107,346 | | | | 37,416,457 | | | | 49,205,671 | |
| End of period | | $ | 18,791,468 | | | $ | 19,132,092 | | | $ | 36,557,141 | | | $ | 37,416,457 | |
The accompanying notes are an integral part of these financial statements.
149
KINETICS PORTFOLIOS TRUST — MASTER INVESTMENT PORTFOLIOS
Notes to Consolidated Financial Statements
June 30, 2019 (Unaudited)
1. Organization
The Kinetics Portfolios Trust (the “Trust”) was organized as a Delaware Statutory Trust on March 14, 2000 and is registered under the Investment Company Act of 1940, as amended (the “1940 Act”), as an open-end management investment company issuing its beneficial interests in series, each series representing a distinct portfolio with its own investment objective and policies. The series currently authorized are: The Internet Portfolio, The Global Portfolio, The Paradigm Portfolio, The Medical Portfolio, The Small Cap Opportunities Portfolio, The Market Opportunities Portfolio, The Alternative Income Portfolio and The Multi-Disciplinary Income Portfolio (collectively, the “Master Portfolios”). Pursuant to the 1940 Act, the Master Portfolios, are “non-diversified” series of the Trust, except The Global Portfolio, The Alternative Income Portfolio and The Multi-Disciplinary Income Portfolio. The Market Opportunities Portfolio commenced operations on January 31, 2006, The Alternative Income Portfolio commenced operations on June 29, 2007 and The Multi-Disciplinary Income Portfolio commenced operations on February 11, 2008. Each of the remaining Master Portfolios commenced operations on April 28, 2000.
Each Master Portfolio is a Master Investment Portfolio in a master-feeder fund structure. Each Master Portfolio has multiple feeder funds invested in the Master Portfolio. By contributing assets to the Master Portfolio, the feeder funds receive a beneficial interest in the Master Portfolio. The Master Portfolio then invests the contributed assets in portfolio securities and allocates income, gains (losses) and expenses to the feeder funds based on the feeder funds’ proportionate interests in the Master Portfolio.
Each of the Master Portfolios, except for The Alternative Income Portfolio and The Multi-Disciplinary Income Portfolio, seeks to provide investors with long-term capital growth. The Alternative Income Portfolio seeks to provide current income and gains. The Multi-Disciplinary Income Portfolio seeks to provide investors with total return. The Internet Portfolio invests primarily in the equity securities of U.S. and foreign companies engaged in the Internet and Internet-related activities. The Global Portfolio generally invests in the equity securities of foreign companies that have the ability to facilitate an increase in the growth of their traditional business lines and in U.S. companies benefiting from international economic growth. The Paradigm Portfolio invests primarily in the equity securities of U.S. and foreign companies that the investment adviser believes are undervalued and that have high returns on equity and are well
150
KINETICS PORTFOLIOS TRUST — MASTER INVESTMENT PORTFOLIOS
Notes to Consolidated Financial Statements —
(Continued) June 30, 2019 (Unaudited)
positioned to reduce their costs, extend the reach of their distribution channels and experience significant growth in their assets or revenues. The Medical Portfolio invests primarily in the equity securities of U.S. and foreign companies engaged in medical research, pharmaceutical treatments and related medical technology industries and related technology industries, generally, with a focus on companies engaged in cancer research and drug development. The Small Cap Opportunities Portfolio invests primarily in the equity securities of U.S. and foreign small capitalized companies that provide attractive valuation opportunities due to special situations such as lack of institutional ownership, lack of significant analyst coverage or companies with sound fundamentals that have experienced a short-term earnings shortfall. The Market Opportunities Portfolio invests primarily in the equity securities of U.S. and foreign companies engaged in capital markets or related to capital markets, as well as companies involved in the gaming industry. The Alternative Income and Multi-Disciplinary Income Portfolios utilize a two-part investment strategy, which includes fixed income and derivatives components. The Internet Portfolio, Global Portfolio, Paradigm Portfolio, Small Cap Opportunities Portfolio and Market Opportunities Portfolio utilize wholly-owned subsidiaries to achieve their investment objectives. Please see Note 2 for further details.
2. Significant Accounting Policies
Security Valuation
Master Portfolios equity securities that are listed on a securities exchange for which market quotations are readily available are valued at the last quoted sale price on the day the valuation is made. Price information on listed securities is taken from the exchange where the security is primarily traded. All equity securities, including exchange-traded funds, that are traded using the National Association of Securities Dealers’ Automated Quotation System (“NASDAQ”) are valued using the NASDAQ Official Closing Price (“NOCP”). In the event market quotations are not readily available or if events occur that may materially affect the value of a particular security between the time trading ends on a particular security and the close of regular trading on the New York Stock Exchange (“NYSE”), “fair value” will be determined. Unlisted equity securities and listed equity securities not traded on the valuation date for which market quotations are readily available are valued at the last bid price. Futures, options on futures and swap contracts that are listed or traded on a national securities exchange, commodities exchange, contract market or over-the-counter markets and are freely transferable will be valued at the composite price, using the
151
KINETICS PORTFOLIOS TRUST — MASTER INVESTMENT PORTFOLIOS
Notes to Consolidated Financial Statements —
(Continued) June 30, 2019 (Unaudited)
National Best Bid and Offer quotes (“NBBO”). NBBO consists of the highest bid price and lowest ask price across any of the exchanges on which an option is quoted, thus providing a view across the entire U.S. options marketplace.
Composite option pricing calculates the mean of the highest bid price and lowest asked price across the exchanges where the option is traded. If a composite option price is not available, then a quote provided by one of the authorized pricing vendors will be used. If neither a composite price nor a quote from an authorized pricing provider is available, and it is the day of expiration or post-expiration, expiring options will be priced at intrinsic value. Non-exchange-traded options for which over-the-counter quotations are not readily available are valued at the mean between the last bid and asked quotations. Debt obligations (including convertible securities) that are either investment grade or below investment grade and irrespective of days to maturity are valued at evaluated mean by one of the authorized third party pricing agents which rely on various valuation methodologies such as matrix pricing and other analytical pricing models as well as market transactions and dealer quotations. Certain instruments, such as repurchase agreements and demand notes, do not have values from third parties and are valued at amortized cost. Investments in registered open-end investment companies (including money market funds), other than exchange-traded funds, are valued at their reported net asset value (“NAV”).
Other assets and securities for which no quotations are readily available (including restricted securities) will be valued in good faith at fair value using methods determined by the Board of Trustees of the Master Portfolios. In determining the fair value of a security, the Board of Trustees shall take into account the relevant factors and surrounding circumstances, which may include: (i) the nature and pricing history (if any) of the security; (ii) whether any dealer quotations for the security are available; (iii) possible valuation methodologies that could be used to determine the fair value of the security; (iv) the recommendation of the portfolio manager of the Portfolios with respect to the valuation of the security; (v) whether the same or similar securities are held by other funds managed by the Adviser or other funds and the method used to price the security in those funds; (vi) the extent to which the fair value to be determined for the security will result from the use of data or formula produced by third parties independent of the Adviser; (vii) the liquidity or illiquidity of the market for the security; and (viii) the value of a foreign security
152
KINETICS PORTFOLIOS TRUST — MASTER INVESTMENT PORTFOLIOS
Notes to Consolidated Financial Statements —
(Continued) June 30, 2019 (Unaudited)
traded on other foreign markets. At June 30, 2019, 0.00% and 0.00% of the net assets of The Internet Portfolio and The Paradigm Portfolio, respectively, were fair valued securities. The other Master Portfolios did not hold any fair valued securities at June 30, 2019.
Bitcoin
The Master Portfolios may invest in Grayscale Bitcoin Trust, a Delaware statutory trust (“Bitcoin Trust”) that invests in bitcoins. From time to time, the Bitcoin Trust issues creation units in exchange for bitcoins and distributes bitcoins in exchange for redemption units. The performance of the Bitcoin Trust is intended to reflect changes in the value of the Trust’s bitcoin investments. At June 30, 2019, 23.4%, 16.0%, 3.6%, 1.5%, and 10.1% of the net assets of The Internet Portfolio, The Global Portfolio, The Paradigm Portfolio, The Small Cap Opportunities Portfolio and The Market Opportunities Portfolio, respectively, were invested in the Bitcoin Trust. Investments in bitcoins produce non qualifying income under Subchapter M of the Internal Revenue Code.
Bitcoin is a decentralized digital currency that enables instant transfers to anyone, anywhere in the world. Managing transactions in bitcoins occurs via an open source, cryptographic protocol central authority. The Bitcoin Network is an online, end-user-to-end-user network that hosts the public transaction ledger, known as the Blockchain, and the source code that comprises the basis for the cryptographic and algorithmic protocols governing the Bitcoin Network. No single entity owns or operates the Bitcoin Network, the infrastructure of which is collectively maintained by a decentralized user base. Since the Bitcoin Network is decentralized, it does not rely on either governmental authorities or financial institutions to create, transmit or determine the value of bitcoins. Rather, the value of bitcoins is determined by the supply of and demand for bitcoins in the global bitcoin exchange market for the trading of bitcoins, which consists of transactions on electronic bitcoin exchanges (“Bitcoin Exchanges”). Pricing on Bitcoin Exchanges and other venues can be volatile and can adversely affect the value of the Bitcoin Trust. Currently, there is relatively small use of bitcoins in the retail and commercial marketplace in comparison to the relatively large use of bitcoins by speculators, thus contributing to price volatility that could adversely affect a Master Portfolio’s direct or indirect investment in the Bitcoin Trust. Bitcoin transactions are irrevocable, and stolen or incorrectly transferred bitcoins may be irretrievable. As a result, any incorrectly executed bitcoin transactions could adversely affect the value of a Master Portfolio’s direct or indirect investment in the Bitcoin Trust. Shares of the
153
KINETICS PORTFOLIOS TRUST — MASTER INVESTMENT PORTFOLIOS
Notes to Consolidated Financial Statements —
(Continued) June 30, 2019 (Unaudited)
Bitcoin Trust may trade at a premium or discount to the net asset value of the Bitcoin Trust. The price of bitcoins is set in transfers by mutual agreement or barter as well as the number of merchants that accept bitcoins. Because bitcoins are digital files that can be transferred without the involvement of intermediaries or third parties, there are little or no transaction costs in direct end-user-to-end-user transactions. Bitcoins can be used to pay for goods and services or can be converted to fiat currencies, such as the U.S. dollar, at rates determined by the Bitcoin Exchanges. Additionally, third party service providers such as Bitcoin Exchanges are also used for transfers but they may charge significant fees for processing transactions.
As bitcoins have grown in popularity, the U.S. Congress and a number of federal and state agencies (including the Financial Crimes Enforcement Network (FinCEN), the U.S. Securities and Exchange Commission, the Commodity Futures Trading Commission, the Financial Industry Regulatory Authority, the Consumer Financial Protection Bureau, the Department of Justice, the Department of Homeland Security, the Federal Bureau of Investigation, the IRS, and state financial institution regulators) have begun to examine the operations of the network that facilitates bitcoins, bitcoin users and the Bitcoin Exchanges, with particular focus on (1) the extent to which bitcoins can be used to launder the proceeds of illegal activities or fund criminal or terrorist enterprises, (2) the safety and soundness of the Bitcoin Exchange or other service-providers that hold bitcoins for users and (3) other risks to investors and consumers who hold and use bitcoins. Ongoing and future regulatory actions may alter, perhaps to a materially adverse extent, the value of a Master Portfolio’s and its Subsidiary’s investment in the Bitcoin Trust or the ability of the Bitcoin Trust to continue to operate.
Consolidation of Subsidiaries
The consolidated financial statements include the accounts of Cayman, Ltd., Cayman wholly-owned Controlled Foreign Corporations (“CFCs”) and the accounts of Delaware Corporations (the “Cayman” or “Delaware”, respectively, or “Subsidiaries” for both). The respective Master Portfolios hold a CFC: Internet Portfolio, Global Portfolio, Paradigm Portfolio, Small Cap Opportunities Portfolio and Market Opportunities Portfolio. The respective Master Portfolios hold a Delaware subsidiary: Internet Portfolio, Global Portfolio and Market Opportunities Portfolio. Each Master Portfolio can invest up to 25% of its total assets in the Subsidiaries. The Subsidiaries act as an investment vehicle in order to invest in commodity-linked and bitcoin-linked instruments consistent with
154
KINETICS PORTFOLIOS TRUST — MASTER INVESTMENT PORTFOLIOS
Notes to Consolidated Financial Statements —
(Continued) June 30, 2019 (Unaudited)
the Portfolio’s investment objectives and policies. By investing in its Subsidiaries, a Master Portfolio is indirectly exposed to the risks associated with the Subsidiary’s investments. The investments held by a Subsidiary are generally similar to those that are permitted to be held by the Master Portfolio and are subject to the same risks that apply to similar investments if held directly by the Master Portfolio. Each Subsidiary is not registered under the 1940 Act and is not subject to all the investor protections of the 1940 Act. However, each Master Portfolio wholly-owns and controls its Subsidiaries, making it unlikely that the Subsidiaries will take action contrary to the interests of the Master Portfolio. Each Subsidiary will be subject to the same investment restrictions and limitations and follow the same compliance policies and procedures as its Master Portfolio.
The Cayman Subsidiary is an exempted Cayman investment company and is not subject to Cayman Islands taxes at the present time. For U.S. income tax purposes, each Cayman Subsidiary is a CFC not subject to U.S. income taxes. As a wholly-owned CFC, however, each Cayman Subsidiary’s net income and capital gain will be included each year in the respective Portfolio’s investment company taxable income.
As of June 30, 2019, the respective Cayman Subsidiary’s market value and percent of the respective Portfolio’s net assets were:
| | | | | | | |
| Internet Portfolio | | $ | 12,342,321 | | | | 8.89 | % |
| Global Portfolio | | $ | 671,714 | | | | 4.53 | % |
| Paradigm Portfolio | | $ | 36,779,288 | | | | 4.42 | % |
| Small Cap Opportunities Portfolio | | $ | 8,469,788 | | | | 2.70 | % |
| Market Opportunities Portfolio | | $ | 2,803,101 | | | | 3.12 | % |
The Delaware Subsidiary is organized under Delaware law. Any net gains that the Delaware Subsidiary recognizes on future sales of the contributed Bitcoin Trust shares will be subject to federal and state corporate income tax, but the dividends that the Delaware Subsidiary pays to its respective Master Portfolio (i.e., those gains, net of the tax paid and any other expenses of the Delaware Subsidiary) will be eligible to be treated as “qualified dividend income” under the Internal Revenue Code.
155
KINETICS PORTFOLIOS TRUST — MASTER INVESTMENT PORTFOLIOS
Notes to Consolidated Financial Statements —
(Continued) June 30, 2019 (Unaudited)
As of June 30, 2019, the respective Delaware Subsidiary’s net assets and percent of the respective Portfolio’s net assets were:
| | | | | | | |
| Internet Portfolio | | $ | 1,278 | | | | 0.00 | % |
| Global Portfolio | | $ | 1,068 | | | | 0.01 | % |
| Market Opportunities Portfolio | | $ | 1,712 | | | | 0.00 | % |
Repurchase Agreements
Each Master Portfolio may enter into repurchase agreements with banks that are members of the Federal Reserve System or securities dealers who are members of a national securities exchange or are primary dealers in U.S. Government Securities. In connection with transactions in repurchase agreements, it is the Trust’s policy that the Master Portfolio receive, as collateral, securities whose market value, including accrued interest, at all times will be at least equal to 102% of the amount invested by the Master Portfolio in each repurchase agreement. If the seller defaults, and the value of the collateral declines, realization of the collateral by the Master Portfolio may be delayed or limited.
Written Options
The Master Portfolios may write (sell) call or put options for trading or hedging purposes. When a Master Portfolio writes an option, an amount equal to the premium received by the Master Portfolio is included in the Statement of Assets and Liabilities as an asset and an equivalent liability. The amount of the liability is subsequently marked-to-market to reflect the current value of the option written. By writing the option, the Master Portfolio may become obligated during the term of the option to deliver or purchase the securities underlying the option at the exercise price if the option is exercised. When an option expires on its stipulated expiration date or the Master Portfolio enters into a closing purchase transaction, the Master Portfolio realizes a gain or loss if the cost of the closing transaction differs from the premium received when the option was sold, without regard to any unrealized gain or loss on the underlying security, and the liability related to such option is eliminated. When an option is exercised, the premium originally received decreases the cost basis of the underlying security (or increases the proceeds on the security sold short) and the Master Portfolio realizes a gain or loss from the sale of the security (or closing of the short sale). As collateral for uncovered written options, the Master Portfolio is required under the 1940 Act to maintain assets consisting of cash, cash equivalents or unencumbered, liquid securities. This collateral is required to be adjusted daily to reflect the exercise price of the purchase obligation for
156
KINETICS PORTFOLIOS TRUST — MASTER INVESTMENT PORTFOLIOS
Notes to Consolidated Financial Statements —
(Continued) June 30, 2019 (Unaudited)
put options or the market value of the instrument underlying the contract for call options.
Foreign Currency Translations
The books and records of the Master Portfolios are maintained in U.S. dollars. For the Master Portfolios, foreign currency transactions are translated into U.S. dollars on the following basis: (i) market values of investment securities and other assets and liabilities are translated at the exchange rate of such currencies against the U.S. dollar, as provided by an approved pricing service, and (ii) purchases and sales of investment securities, dividend and interest income and certain expenses at the rates of exchange prevailing on the respective dates of such transactions. The Master Portfolios do not isolate and treat as ordinary income that portion of the results of operations arising as a result of changes in the exchange rate from the fluctuations arising from changes in the market prices of securities held during the period. Such fluctuations are included with the net realized and unrealized gain or loss from investments. However, for federal income tax purposes, the Master Portfolios do isolate and treat as ordinary income the effect of changes in foreign exchange rates arising from actual foreign currency transactions and the effect of changes in foreign exchange rates arising between trade date and settlement date.
Restricted and Illiquid Securities
The Master Portfolios may invest in restricted securities. These securities are valued by the Master Portfolios after giving due consideration to pertinent factors including recent private sales, market conditions and the issuer’s financial performance. The Master Portfolios have no right to require registration of unregistered securities. The 144A securities have been deemed to be liquid by the Master Portfolios Adviser under the supervision of the Board of Trustees. At June 30, 2019, the following Master Portfolios held securities restricted to institutional investors (144A Securities):
| | | |
| | | Percentage of |
| | Market Value | Net Assets |
| The Multi-Disciplinary Income Portfolio | $9,062,233 | 24.79% |
An illiquid asset is any asset which may not be sold or disposed of in current market conditions within seven days without the sale or disposition
157
KINETICS PORTFOLIOS TRUST — MASTER INVESTMENT PORTFOLIOS
Notes to Consolidated Financial Statements —
(Continued) June 30, 2019 (Unaudited)
significantly changing the market value of the investment. At June 30, 2019, the following Master Portfolios held illiquid securities:
| | | | | | | |
| | | | | | Percentage of | |
| | | Market Value | | | Net Assets | |
| The Internet Portfolio | | $ | — | * | | | 0.00 | % |
| The Paradigm Portfolio | | | — | * | | | 0.00 | % |
| The Multi-Disciplinary Income Portfolio | | | 160,760 | | | | 0.44 | % |
| * Amount is less than $0.50. |
When-Issued Securities
The Master Portfolios may purchase securities on a when-issued or delayed delivery basis. Although the purchase amounts of these securities are established at the time the purchaser enters into the agreement, these securities may be delivered and paid for at a future date. The Master Portfolios record purchases of when-issued securities and reflect the values of such securities in determining net asset value in the same manner as other portfolio securities. The Master Portfolios maintain at all times cash or other liquid assets in an amount at least equal to the amount of outstanding commitments for when-issued securities.
Securities Lending
Each Master Portfolio may lend its portfolio securities to broker-dealers by entering directly into lending arrangements with such broker dealers or indirectly through repurchase agreements with respect to no more than 33 1 / 3 % of the total assets of each Master Portfolio (including any collateral posted) or 50% of the total assets of each Master Portfolio (excluding any collateral posted). Securities lending and repurchase transactions will be fully collateralized at all times with cash and/or short-term debt obligations. The Master Portfolios receive interest on the collateral received as well as a fee for the securities loaned.
Significant Investments
The Portfolios may invest a greater percentage of their assets in one or more individual securities at any time. The greater percentage of assets in individual securities (not including short-term investments or other funds) expose the Portfolios to the risk of unanticipated industry conditions, the risks particular to a single company or security, and the risk of potentially lower liquidity. At
158
KINETICS PORTFOLIOS TRUST — MASTER INVESTMENT PORTFOLIOS
Notes to Consolidated Financial Statements —
(Continued) June 30, 2019 (Unaudited)
June 30, 2019, The Internet Portfolio, The Global Portfolio, The Paradigm Portfolio, The Medical Portfolio, The Small Cap Opportunities Portfolio, The Market Opportunities Portfolio and The Multi-Disciplinary Income Portfolio invested approximately 41%, 36%, 46%, 67%, 37%, 42% and 58% of their respective net assets in individual securities greater than 5% of net assets. Please see the respective Schedule of Investments for further details.
Short-Term Investments
The Portfolios may invest in money market funds and short-term high quality debt securities such as commercial paper, repurchase agreements and certificates of deposit. Money market funds typically invest in short-term instruments and attempt to maintain a stable net asset value. While the risk is low, these funds may lose value.
Expense Allocation
Common expenses incurred by the Master Portfolios are allocated among the Master Portfolios (i) based upon relative average net assets, (ii) as incurred on a specific identification basis, or (iii) equally among the Master Portfolios, depending on the nature of the expenditure. All expenses incurred by the Master Portfolios are allocated to the Feeder Funds daily based on their proportionate interests in the respective Master Portfolios.
Federal Income Taxes
Each Master Portfolio will be treated as a partnership for federal income tax purposes. As such, each investor in a Master Portfolio will be subject to taxation on its share of the Master Portfolio’s ordinary income and capital gains. It is intended that each Master Portfolio’s assets will be managed so an investor in the Master Portfolio can satisfy the requirements of subchapter M of the Internal Revenue Code.
There is no tax liability resulting from unrecognized tax benefits relating to uncertain income tax positions taken or expected to be taken in future tax returns. As of June 30, 2019, open tax years include the tax years ended December 31, 2015 through December 31, 2018. The Master Portfolios are also not aware of any tax positions for which it is reasonably possible that the total amounts of unrecognized tax benefits will significantly change in the next six months.
159
KINETICS PORTFOLIOS TRUST — MASTER INVESTMENT PORTFOLIOS
Notes to Consolidated Financial Statements —
(Continued) June 30, 2019 (Unaudited)
Use of Estimates
The preparation of financial statements in conformity with U.S. generally accepted accounting principles (“GAAP”) requires management to make estimates and assumptions that affect the reported amounts in the financial statements. Actual results could differ from those estimates.
Other
Realized gains and losses on the sale of investments are calculated on the identified cost basis. Dividend income is recorded on the ex-dividend date. Interest income is accounted for on the accrual basis and includes amortization of premiums and accretion of discounts on the effective interest method. Other noncash dividends are recognized as investment income at the fair value of the property received. Withholding taxes on foreign dividends have been incorporated in accordance with the Trust’s understanding of the applicable country’s tax rules and rates.
3. Investment Adviser
The Trust has entered into Investment Advisory Agreements (the “Agreements”) with Horizon Kinetics Asset Management LLC (the “Adviser”), with whom certain officers and trustees of the Trust are affiliated, to furnish investment advisory services to the Master Portfolios. The Adviser is a wholly-owned subsidiary of Horizon Kinetics LLC. Under the terms of the Agreements, the Master Portfolios, except the Alternative Income Portfolio, compensate the Adviser for its management services at the annual rate of 1.25% of each Master Portfolio’s average daily net assets. The Alternative Income Portfolio compensates the Adviser for its management services at the annual rate of 0.90% of the Master Portfolio’s average daily net assets.
For the six-month period ended June 30, 2019, Master Portfolios incurred the following expenses pursuant to the Agreements:
| | | | |
| | | Investment Advisory Fees | |
| The Internet Portfolio | | $ | 741,184 | |
| The Global Portfolio | | | 76,449 | |
| The Paradigm Portfolio | | | 4,896,977 | |
| The Medical Portfolio | | | 104,158 | |
| The Small Cap Opportunities Portfolio | | | 1,900,837 | |
| The Market Opportunities Portfolio | | | 510,411 | |
| The Alternative Income Portfolio | | | 85,647 | |
| The Multi-Disciplinary Income Portfolio | | | 233,768 | |
160
KINETICS PORTFOLIOS TRUST — MASTER INVESTMENT PORTFOLIOS
Notes to Consolidated Financial Statements —
(Continued) June 30, 2019 (Unaudited)
For the six-month period ended June 30, 2019, the Trust was allocated approximately $13,000 for the services of the Chief Compliance Officer employed by the Adviser.
4. Approval of Investment Advisory Contract by Trustees of Kinetics Portfolios Trust (Unaudited)
At a meeting of the Board of Trustees of the Trust held on March 15, 2019, the Board, including a majority of the Trustees who are not interested persons under the 1940 Act (the “Independent Trustees”), approved the Advisory Agreements with respect to each Master Portfolio. In reaching a decision to approve the Advisory Agreements (the “Agreements”), the Board of Trustees, including a majority of the Independent Trustees, considered, among; (1) the nature, extent and quality of the services provided by the Adviser including, but not limited to, a review of the complexity of the services provided and whether the services are provided in a satisfactory and efficient manner; (2) the experience and qualifications of the personnel providing such services; (3) the investment performance of the Funds over time, along with that of the Adviser as compared with industry competitors; (4) an evaluation of the fee structure, any fee waivers, and the Funds’ expense ratios, and a comparison of them in relation to those of other investment companies having comparable investment policies and limitations; (5) possible alternative fee structures or bases for determining fees; (6) the extent to which economies of scale would be realized as the Funds grows and whether fee levels reflect these economies of scale for the benefit of the Fund’s investors; (7) the direct and indirect costs of the services to be provided (and the basis of determining and allocating these costs) and profits to be realized by the Adviser and its affiliates from their relationship with the Funds; (8) other compensation or possible benefits to the Adviser and its affiliates arising from their advisory and other relationships with the Funds, including, if applicable, any benefits derived or to be derived by the Adviser from its relationship with the Funds such as soft dollar arrangements by which brokers provide research to the Funds or the Adviser in return for allocating the Funds’ brokerage; (9) the entrepreneurial risks borne by the Adviser, if any (e.g., because a fund is in a start-up mode or for other reasons, its revenues may be less or its expenses greater than anticipated); (10) a comparison of the fees charged by the Adviser with fees charged by the Adviser to similar clients; and (11) the policies and procedures that are in place to address, among other things, informational and cyber-related security.
161
KINETICS PORTFOLIOS TRUST — MASTER INVESTMENT PORTFOLIOS
Notes to Consolidated Financial Statements —
(Continued) June 30, 2019 (Unaudited)
The Board of Trustees, including a majority of the Independent Trustees, concluded that: they were satisfied with the quality of services provided by the Adviser in advising the Master Portfolios, the profits earned by the Adviser would be reasonable in light of the nature, extent and quality of the services provided to each Master Portfolio; and that each Master Portfolio was not large enough to attain significant economies of scale. Based on the factors considered, the Board of Trustees, including a majority of the Independent Trustees, concluded that it was appropriate to approve the Agreements.
5. Securities Transactions
Purchases and sales of investment securities, other than short-term investments and short-term options, for the six-month period ended June 30, 2019, were as follows:
| | | | | | | | | | | | | |
| | | Purchases | | | Sales | |
| | | U.S. | | | | | | U.S. | | | | |
| | | Government | | | Other | | | Government | | | Other | |
| The Internet Portfolio | | $ | — | | | $ | 913,439 | | | $ | — | | | $ | 1,297,715 | |
| The Global Portfolio | | | — | | | | 186,373 | | | | — | | | | 44,665 | |
| The Paradigm Portfolio | | | — | | | | 1,565,824 | | | | — | | | | 28,125,282 | |
| The Medical Portfolio | | | — | | | | 968,335 | | | | — | | | | 1,619,181 | |
| The Small Cap Opportunities | | | | | | | | | | | | | | | | |
| Portfolio | | | — | | | | 10,153,135 | | | | — | | | | 3,536,882 | |
| The Market Opportunities | | | | | | | | | | | | | | | | |
| Portfolio | | | — | | | | 592,571 | | | | — | | | | 1,267,305 | |
| The Alternative Income Portfolio | | | — | | | | — | | | | — | | | | — | |
| The Multi-Disciplinary | | | | | | | | | | | | | | | | |
| Income Portfolio | | | — | | | | 3,902 | | | | — | | | | 3,914,304 | |
As of December 31, 2018, the cost of investments and unrealized appreciation (depreciation) on investment securities for federal income tax purposes was as follows:
| | | | | | | | | | | | | |
| | | Internet | | | Global | | | Paradigm | | | Medical | |
| Tax Cost of Investments | | $ | 111,845,606 | | | $ | 10,122,935 | | | $ | 485,771,770 | | | $ | 12,204,701 | |
| Unrealized Appreciation | | | 5,961,464 | | | | 1,794,922 | | | | 246,828,639 | | | | 6,492,815 | |
| Unrealized Depreciation | | | (10,442,344 | ) | | | (973,551 | ) | | | (69,641,788 | ) | | | (2,275,586 | ) |
| Net Unrealized Appreciation | | | | | | | | | | | | | | | | |
| (Depreciation) | | $ | (4,480,880 | ) | | $ | 821,371 | | | $ | 177,186,851 | | | $ | 4,217,229 | |
162
KINETICS PORTFOLIOS TRUST — MASTER INVESTMENT PORTFOLIOS
Notes to Consolidated Financial Statements —
(Continued) June 30, 2019 (Unaudited)
| | | | | | | | | | | | | |
| | | | | | | | | | | | Multi- | |
| | | Small Cap | | | Market | | | Alternative | | | Disciplinary | |
| | | Opportunities | | | Opportunities | | | Income | | | Income | |
| Tax Cost of Investments | | $ | 205,050,760 | | | $ | 61,972,397 | | | $ | 18,920,465 $ | | | | 39,845,695 | |
| Unrealized Appreciation | | | 72,325,091 | | | | 16,645,203 | | | | 27,086 | | | | 721,261 | |
| Unrealized Depreciation | | | (53,482,975 | ) | | | (5,458,999 | ) | | | (153,863 | ) | | | (3,455,438 | ) |
| Net Unrealized Appreciation | | | | | | | | | | | | | | | | |
| (Depreciation) | | $ | 18,842,116 | | | $ | 11,186,204 | | | $ | (126,777 | )$ | | | (2,734,177 | ) |
6. Portfolio Securities Loaned
As of June 30, 2019, the Master Portfolios had loaned securities that were collateralized by cash. The majority of the cash collateral is invested by the custodian in a money market pooled account approved by the Adviser. Although risk is mitigated by the collateral, a Master Portfolio could experience a delay in recovering its securities and possible loss of income or value if the borrower fails to return them. The Master Portfolio receives interest on the collateral received as well as a fee for the securities loaned. The Master Portfolios will continue to receive dividends and interest on all securities loaned. Gain or loss in the fair value of the securities loaned that may occur during the term of the loan will be accounted for by the Master Portfolios. Loans of securities are terminable at any time and the borrower, after notice, is required to return borrowed securities within the standard time period for settlement of securities transactions. As the securities loans are subject to termination by the Funds or the borrower at any time, the remaining maturities of the outstanding securities lending transactions are considered to be overnight and continuous. The value of the securities on loan and the value of the related collateral at June 30, 2019, were as follows:
| | | | | | | |
| | | Securities | | | Collateral | |
| The Internet Portfolio | | $ | 7,102,950 | | | $ | 6,714,974 | |
| The Global Portfolio | | | 154,568 | | | | 145,578 | |
| The Paradigm Portfolio | | | 29,436,762 | | | | 27,724,643 | |
| The Medical Portfolio | | | — | | | | — | |
| The Small Cap Opportunities Portfolio | | | 4,600,322 | | | | 4,332,755 | |
| The Market Opportunities Portfolio | | | 1,317,974 | | | | 1,241,317 | |
| The Alternative Income Portfolio | | | — | | | | — | |
| The Multi-Disciplinary Income Portfolio | | | 1,929,000 | | | | 1,995,000 | |
163
KINETICS PORTFOLIOS TRUST — MASTER INVESTMENT PORTFOLIOS
Notes to Consolidated Financial Statements —
(Continued) June 30, 2019 (Unaudited)
7. Selected Financial Highlights
Financial highlights for the Master Portfolios were as follows:
| | | | | | | | | | | | | | | | | | | |
| | | The Internet Portfolio |
| | | For the | | | For the | | | For the | | | For the | | | For the | | | For the | |
| | | Period Ended | | | Year Ended | | | Year Ended | | | Year Ended | | | Year Ended | | | Year Ended | |
| | | June 30, 2019 | | | December 31, | | | December 31, | | | December 31, | | | December 31, | | | December 31, | |
| | | (Unaudited) | | | 2018 | | | 2017 | | | 2016 | | | 2015 | | | 2014 | |
| Total Return* | | | 38.97 | %(2) | | | (26.86 | )% | | | 57.90 | % | | | 3.09 | % | | | (4.95 | )% | | | 0.28 | % |
| Ratio of expenses | | | | | | | | | | | | | | | | | | | | | | | | |
| to average | | | | | | | | | | | | | | | | | | | | | | | | |
| net assets: | | | 1.38 | %(1) | | | 1.38 | % | | | 1.37 | % | | | 1.37 | % | | | 1.35 | % | | | 1.34 | % |
| Ratio of net investment | | | | | | | | | | | | | | | | | | | | | | | | |
| income (loss) | | | | | | | | | | | | | | | | | | | | | | | | |
| to average | | | | | | | | | | | | | | | | | | | | | | | | |
| net assets: | | | (0.15 | )%(1) | | | (0.60 | )% | | | 1.27 | % | | | (1.18 | )% | | | (1.05 | )% | | | (0.90 | )% |
| Portfolio turnover | | | | | | | | | | | | | | | | | | | | | | | | |
| rate | | | 1 | % | | | 15 | % | | | 44 | % | | | 2 | % | | | 1 | % | | | 1 | % |
| | |
| | | The Global Portfolio |
| | | For the | | | For the | | | For the | | | For the | | | For the | | | For the | |
| | | Period Ended | | | Year Ended | | | Year Ended | | | Year Ended | | | Year Ended | | | Year Ended | |
| | | June 30, 2019 | | | December 31, | | | December 31, | | | December 31, | | | December 31, | | | December 31, | |
| | | (Unaudited) | | | | 2018 | | | | 2017 | | | | 2016 | | | | 2015 | | | | 2014 | |
| Total Return* | | | 27.77 | %(2) | | | (23.85 | )% | | | 49.37 | % | | | 14.13 | % | | | (14.13 | )% | | | (12.10 | )% |
| Ratio of expenses | | | | | | | | | | | | | | | | | | | | | | | | |
| to average | | | | | | | | | | | | | | | | | | | | | | | | |
| net assets: | | | 1.64 | %(1) | | | 1.66 | % | | | 1.59 | % | | | 1.66 | % | | | 1.69 | % | | | 1.60 | % |
| Ratio of net investment | | | | | | | | | | | | | | | | | | | | | | | | |
| income (loss) | | | | | | | | | | | | | | | | | | | | | | | | |
| to average | | | | | | | | | | | | | | | | | | | | | | | | |
| net assets: | | | 0.08 | %(1) | | | (0.57 | )% | | | 1.88 | % | | | (0.44 | )% | | | (0.59 | )% | | | (0.52 | )% |
| Portfolio turnover rate | | | 1 | % | | | 28 | % | | | 169 | % | | | 11 | % | | | 16 | % | | | 14 | % |
| | |
| | | The Paradigm Portfolio |
| | | For the | | | For the | | | For the | | | For the | | | For the | | | For the | |
| | | Period Ended | | | Year Ended | | | Year Ended | | | Year Ended | | | Year Ended | | | Year Ended | |
| | | June 30, 2019 | | | December 31, | | | December 31, | | | December 31, | | | December 31, | | | December 31, | |
| | | (Unaudited) | | | | 2018 | | | | 2017 | | | | 2016 | | | | 2015 | | | | 2014 | |
| Total Return* | | | 29.20 | %(2) | | | (5.27 | )% | | | 28.69 | % | | | 20.72 | % | | | (8.04 | )% | | | (0.48 | )% |
| Ratio of expenses | | | | | | | | | | | | | | | | | | | | | | | | |
| to average | | | | | | | | | | | | | | | | | | | | | | | | |
| net assets: | | | 1.36 | %(1) | | | 1.36 | % | | | 1.36 | % | | | 1.37 | % | | | 1.35 | % | | | 1.33 | % |
| Ratio of net investment | | | | | | | | | | | | | | | | | | | | | | | | |
| loss to average | | | | | | | | | | | | | | | | | | | | | | | | |
| net assets: | | | (0.12 | )%(1) | | | (0.65 | )% | | | (0.53 | )% | | | (0.84 | )% | | | (0.63 | )% | | | (0.72 | )% |
| Portfolio turnover rate | | | 0 | % | | | 3 | % | | | 14 | % | | | 2 | % | | | 2 | % | | | 7 | % |
164
KINETICS PORTFOLIOS TRUST — MASTER INVESTMENT PORTFOLIOS
Notes to Consolidated Financial Statements —
(Continued) June 30, 2019 (Unaudited)
| | | | | | | | | | | | | | | | | | | |
| | | The Medical Portfolio | |
| | | For the | | | For the | | | For the | | | For the | | | For the | | | For the | |
| | | Period Ended | | | Year Ended | | | Year Ended | | | Year Ended | | | Year Ended | | | Year Ended | |
| | | June 30, 2019 | | | December 31, | | | December 31, | | | December 31, | | | December 31, | | | December 31, | |
| | | (Unaudited) | | | 2018 | | | 2017 | | | 2016 | | | 2015 | | | 2014 | |
| Total Return* | | | 4.23 | %(2) | | | 1.59 | % | | | 10.67 | % | | | (8.04 | )% | | | 6.58 | % | | | 16.42 | % |
| Ratio of expenses | | | | | | | | | | | | | | | | | | | | | | | | |
| to average | | | | | | | | | | | | | | | | | | | | | | | | |
| net assets: | | | 1.51 | %(1) | | | 1.47 | % | | | 1.43 | % | | | 1.42 | % | | | 1.40 | % | | | 1.41 | % |
| Ratio of net investment | | | | | | | | | | | | | | | | | | | | | | | | |
| income to average | | | | | | | | | | | | | | | | | | | | | | | | |
| net assets: | | | 1.77 | %(1) | | | 0.96 | % | | | 0.82 | % | | | 0.66 | % | | | 0.24 | % | | | 0.44 | % |
| Portfolio turnover rate | | | 6 | % | | | 0 | % | | | 0 | % | | | 0 | % | | | 12 | % | | | 3 | % |
| | |
| | | The Small Cap Opportunities Portfolio | |
| | | For the | | | For the | | | For the | | | For the | | | For the | | | For the | |
| | | Period Ended | | | Year Ended | | | Year Ended | | | Year Ended | | | Year Ended | | | Year Ended | |
| | | June 30, 2019 | | | December 31, | | | December 31, | | | December 31, | | | December 31, | | | December 31, | |
| | | (Unaudited) | | | | 2018 | | | | 2017 | | | | 2016 | | | | 2015 | | | | 2014 | |
| Total Return* | | | 22.64 | %(2) | | | 0.56 | % | | | 26.50 | % | | | 24.67 | % | | | (11.97 | )% | | | (6.98 | )% |
| Ratio of expenses | | | | | | | | | | | | | | | | | | | | | | | | |
| to average | | | | | | | | | | | | | | | | | | | | | | | | |
| net assets: | | | 1.37 | %(1) | | | 1.37 | % | | | 1.37 | % | | | 1.36 | % | | | 1.35 | % | | | 1.34 | % |
| Ratio of net investment | | | | | | | | | | | | | | | | | | | | | | | | |
| income (loss) | | | | | | | | | | | | | | | | | | | | | | | | |
| to average | | | | | | | | | | | | | | | | | | | | | | | | |
| net assets: | | | 0.19 | %(1) | | | (0.33 | )% | | | (0.47 | )% | | | (0.75 | )% | | | (0.65 | )% | | | (0.59 | )% |
| Portfolio turnover rate | | | 2 | % | | | 3 | % | | | 9 | % | | | 4 | % | | | 2 | % | | | 19 | % |
| | |
| | | The Market Opportunities Portfolio | |
| | | For the | | | For the | | | For the | | | For the | | | For the | | | For the | |
| | | Period Ended | | | Year Ended | | | Year Ended | | | Year Ended | | | Year Ended | | | Year Ended | |
| | | June 30, 2019 | | | December 31, | | | December 31, | | | December 31, | | | December 31, | | | December 31, | |
| | | (Unaudited) | | | | 2018 | | | | 2017 | | | | 2016 | | | | 2015 | | | | 2014 | |
| Total Return* | | | 25.69 | %(2) | | | (10.62 | )% | | | 47.53 | % | | | 20.68 | % | | | (8.87 | )% | | | (5.30 | )% |
| Ratio of expenses | | | | | | | | | | | | | | | | | | | | | | | | |
| to average | | | | | | | | | | | | | | | | | | | | | | | | |
| net assets: | | | 1.41 | %(1) | | | 1.40 | % | | | 1.39 | % | | | 1.41 | % | | | 1.40 | % | | | 1.39 | % |
| Ratio of net investment | | | | | | | | | | | | | | | | | | | | | | | | |
| income (loss) | | | | | | | | | | | | | | | | | | | | | | | | |
| to average | | | | | | | | | | | | | | | | | | | | | | | | |
| net assets: | | | 0.34 | %(1) | | | (0.30 | )% | | | 1.05 | % | | | (0.73 | )% | | | (0.66 | )% | | | (0.30 | )% |
| Portfolio turnover rate | | | 1 | % | | | 8 | % | | | 35 | % | | | 5 | % | | | 2 | % | | | 18 | % |
165
KINETICS PORTFOLIOS TRUST — MASTER INVESTMENT PORTFOLIOS
Notes to Consolidated Financial Statements —
(Continued) June 30, 2019 (Unaudited)
| | | | | | | | | | | | | | | | | | | |
| | | The Alternative Income Portfolio | |
| | | For the | | | For the | | | For the | | | For the | | | For the | | | For the | |
| | | Period Ended | | | Year Ended | | | Year Ended | | | Year Ended | | | Year Ended | | | Year Ended | |
| | | June 30, 2019 | | | December 31, | | | December 31, | | | December 31, | | | December 31, | | | December 31, | |
| | | (Unaudited) | | | 2018 | | | 2017 | | | 2016 | | | 2015 | | | 2014 | |
| Total Return* | | | 1.44 | %(2) | | | 0.77 | % | | | 2.20 | % | | | 3.85 | % | | | 2.73 | % | | | 1.23 | % |
| Ratio of expenses | | | | | | | | | | | | | | | | | | | | | | | | |
| to average | | | | | | | | | | | | | | | | | | | | | | | | |
| net assets: | | | 1.15 | %(1) | | | 1.10 | % | | | 1.07 | % | | | 1.10 | % | | | 1.16 | % | | | 1.22 | % |
| Ratio of net investment | | | | | | | | | | | | | | | | | | | | | | | | |
| income (loss) | | | | | | | | | | | | | | | | | | | | | | | | |
| to average | | | | | | | | | | | | | | | | | | | | | | | | |
| net assets: | | | 1.20 | %(1) | | | 0.79 | % | | | (0.04 | )% | | | (0.16 | )% | | | (0.20 | )% | | | (0.40 | )% |
| Portfolio turnover rate | | | 0 | % | | | 0 | % | | | 0 | % | | | 1 | % | | | 6 | % | | | 17 | % |
| | |
| | | The Multi-Disciplinary Income Portfolio | |
| | | For the | | | For the | | | For the | | | For the | | | For the | | | For the | |
| | | Period Ended | | | Year Ended | | | Year Ended | | | Year Ended | | | Year Ended | | | Year Ended | |
| | | June 30, 2019 | | | December 31, | | | December 31, | | | December 31, | | | December 31, | | | December 31, | |
| | | (Unaudited) | | | | 2018 | | | | 2017 | | | | 2016 | | | | 2015 | | | | 2014 | |
| Total Return* | | | 6.99 | %(2) | | | (0.93 | )% | | | 4.84 | % | | | 10.52 | % | | | (2.05 | )% | | | 2.58 | % |
| Ratio of expenses | | | | | | | | | | | | | | | | | | | | | | | | |
| to average | | | | | | | | | | | | | | | | | | | | | | | | |
| net assets: | | | 1.44 | %(1) | | | 1.42 | % | | | 1.40 | % | | | 1.38 | % | | | 1.37 | % | | | 1.37 | % |
| Ratio of net investment | | | | | | | | | | | | | | | | | | | | | | | | |
| income to average | | | | | | | | | | | | | | | | | | | | | | | | |
| net assets: | | | 4.19 | %(1) | | | 4.13 | % | | | 3.47 | % | | | 4.13 | % | | | 3.50 | % | | | 3.06 | % |
| Portfolio turnover rate | | | 0 | % | | | 2 | % | | | 16 | % | | | 9 | % | | | 10 | % | | | 35 | % |
| * | The returns are calculated by adjusting the corresponding No Load Feeder returns by Feeder expenses and reimbursements. |
| (1) | Annualized. |
| (2) | Not annualized. |
8. Summary of Fair Value Exposure
Various inputs are used in determining the value of a Master Portfolio’s investments. These inputs are summarized in the three broad levels listed below:
Level 1 — Unadjusted quoted prices in active markets for identical assets or liabilities that a Master Portfolio has the ability to access.
Level 2 — Observable inputs other than quoted prices included in Level 1 that are observable for the asset or liability, either directly or indirectly. These inputs may include quoted prices for the identical instrument on an inactive market,
166
KINETICS PORTFOLIOS TRUST — MASTER INVESTMENT PORTFOLIOS
Notes to Consolidated Financial Statements —
(Continued) June 30, 2019 (Unaudited)
prices for similar instruments, interest rates, prepayment speeds, credit risk, yield curves, default rates and similar data.
Level 3 — Unobservable inputs for the asset or liability, to the extent relevant observable inputs are not available, representing a Master Portfolio’s own assumptions about the assumptions a market participant would use in valuing the asset or liability, and would be based on the best information available.
The availability of observable inputs can vary from security to security and is affected by a wide variety of factors, including, for example, the type of security, whether the security is new and not yet established in the marketplace, the liquidity of markets, and other characteristics particular to the security. To the extent that valuation is based on models or inputs that are less observable or unobservable in the market, the determination of fair value requires more judgment. Accordingly, the degree of judgment exercised in determining fair value is greatest for instruments categorized in Level 3.
The inputs used to measure fair value may fall into different levels of the fair value hierarchy. In such cases, for disclosure purposes, the level in the fair value hierarchy within which the fair value measurement falls in its entirety, is determined based on the lowest level input that is significant to the fair value measurement in its entirety.
The Internet Portfolio
The following is a summary of the inputs used to value The Internet Portfolio’s net assets as of June 30, 2019:
| | | | | | | | | | | | | |
Assets^ | | Level 1 | | | Level 2 | | | Level 3 | | | Total | |
| Common Stocks | | $ | 102,387,683 | | | $ | 1,248 | | | $ | — | | | $ | 102,388,931 | |
| Escrow Notes | | | — | | | | — | | | | — | * | | | — | * |
| Short-Term Investments | | | 1,802 | | | | 36,283,752 | | | | — | | | | 36,285,554 | |
| Investments Purchased with the Cash | | | | | | | | | | | | | | | | |
| Proceeds from Securities Lending | | | 6,714,974 | | | | — | | | | — | | | | 6,714,974 | |
| Total Investments in Securities | | $ | 109,104,459 | | | $ | 36,285,000 | | | $ | — | * | | $ | 145,389,459 | |
During the six-month period ended June 30, 2019, there were no transfers into or out of Level 3.
167
KINETICS PORTFOLIOS TRUST — MASTER INVESTMENT PORTFOLIOS
Notes to Consolidated Financial Statements —
(Continued) June 30, 2019 (Unaudited)
Following is a reconciliation of Level 3 assets for which significant unobservable inputs were used to determine fair value:
| | | | |
Description | | Investments in Securities | |
| Balance as of December 31, 2018 | | $ | — | * |
| Accrued discounts/premiums | | | — | |
| Realized gain (loss) | | | — | |
| Change in unrealized appreciation (depreciation) | | | — | ** |
| Net purchases and/or acquisitions | | | — | |
| Net sales and/or write-offs | | | — | |
| Transfer in and/or out of Level 3 | | | — | |
| Balance as of June 30, 2019 | | $ | — | * |
| | | | | |
| | Fair Value at | Valuation | Unobservable | |
Description | 6/30/2019 | Techniques | Input | Range |
| Escrow Notes | $—* | Conservative Value | No active | $0.00-$0.00 |
| | | Assigned Pending | market | |
| | | Bankruptcy Litigation | | |
| | | Proceedings/Market | | |
| | | Comparables | | |
There is no active market for the Level 3 securities, so a conservative value is being assigned until such time as a market exists.
| ^ | See Consolidated Portfolio of Investments for breakout of investments by industry classification. |
| * | Amount is less than $0.50. |
| ** | Total change in unrealized appreciation/depreciation included in the statement of operations attributable to Level 3 securities held on June 30, 2019 is zero. |
The Global Portfolio
The following is a summary of the inputs used to value The Global Portfolio’s net assets as of June 30, 2019:
| | | | | | | | | | | | | |
Assets^ | | Level 1 | | | Level 2 | | | Level 3 | | | Total | |
| Common Stocks | | $ | 7,623,766 | | | $ | 558,441 | | | $ | — | | | $ | 8,182,207 | |
| Preferred Stocks | | | 12,231 | | | | — | | | | — | | | | 12,231 | |
| Convertible Bonds | | | — | | | | 1,438 | | | | — | | | | 1,438 | |
| Warrants | | | — | | | | 6,071 | | | | — | | | | 6,071 | |
| Short-Term Investments | | | 493 | | | | 5,966,243 | | | | — | | | | 5,966,736 | |
| Investments Purchased with the Cash | | | | | | | | | | | | | | | | |
| Proceeds from Securities Lending | | | 145,578 | | | | — | | | | — | | | | 145,578 | |
| Total Investments in Securities | | $ | 7,782,068 | | | $ | 6,532,193 | | | $ | — | | | $ | 14,314,261 | |
168
KINETICS PORTFOLIOS TRUST — MASTER INVESTMENT PORTFOLIOS
Notes to Consolidated Financial Statements —
(Continued) June 30, 2019 (Unaudited)
As of June 30, 2019, there were no investments in Level 3 securities.
During the six-month period ended June 30, 2019, there were no transfers into or out of Level 3.
^ See Consolidated Portfolio of Investments for breakout of investments by industry classification.The Paradigm Portfolio
The following is a summary of the inputs used to value The Paradigm Portfolio’s net assets as of June 30, 2019:
| | | | | | | | | | | | | |
Assets^ | | Level 1 | | | Level 2 | | | Level 3 | | | Total | |
| Common Stocks | | $ | 717,806,074 | | | $ | 4,214,588 | | | $ | — | | | $ | 722,020,662 | |
| Preferred Stocks | | | 5,154 | | | | — | | | | — | | | | 5,154 | |
| Escrow Notes | | | — | | | | — | | | | — | * | | | — | * |
| Warrants | | | — | | | | 2,566 | | | | — | | | | 2,566 | |
| Short-Term Investments | | | 129,884 | | | | 109,647,750 | | | | — | | | | 109,777,634 | |
| Investments Purchased with the Cash | | | | | | | | | | | | | | | | |
| Proceeds from Securities Lending | | | 27,724,643 | | | | — | | | | — | | | | 27,724,643 | |
| Total Investments in Securities | | $ | 745,665,755 | | | $ | 113,864,904 | | | $ | — | * | | $ | 859,530,659 | |
During the six-month period ended June 30, 2019, there were no transfers into or out of Level 3.
Following is a reconciliation of Level 3 assets for which significant unobservable inputs were used to determine fair value:
| | | | |
Description | | Investments in Securities | |
| Balance as of December 31, 2018 | | $ | — | * |
| Accrued discounts/premiums | | | — | |
| Realized gain (loss) | | | — | |
| Change in unrealized appreciation (depreciation) | | | — | ** |
| Net purchases and/or acquisitions | | | — | |
| Net sales and/or write-offs | | | — | |
| Transfer in and/or out of Level 3 | | | — | |
| Balance as of June 30, 2019 | | $ | — | * |
169
KINETICS PORTFOLIOS TRUST — MASTER INVESTMENT PORTFOLIOS
Notes to Consolidated Financial Statements —
(Continued) June 30, 2019 (Unaudited)
| | | | | |
| | Fair Value at | Valuation | Unobservable | |
Description | 6/30/2019 | Techniques | Input | Range |
| Escrow Notes | $—* | Conservative Value | No active | $0.00-$0.00 |
| | | Assigned Pending | market | |
| | | Bankruptcy Litigation | | |
| | | Proceedings/Market | | |
| | | Comparables | | |
There is no active market for the Level 3 securities, so a conservative value is being assigned until such time as a market exists.
| ^ | See Consolidated Portfolio of Investments for breakout of investments by industry classification. |
| * | Amount is less than $0.50. |
| ** | Total change in unrealized appreciation/depreciation included in the statement of operations attributable to Level 3 securities held on June 30, 2019 is zero. |
The Medical Portfolio
The following is a summary of the inputs used to value The Medical Portfolio’s net assets as of June 30, 2019:
| | | | | | | | | | | | | |
Assets^ | | Level 1 | | | Level 2 | | | Level 3 | | | Total | |
| Common Stocks | | $ | 16,314,258 | | | $ | — | | | $ | — | | | $ | 16,314,258 | |
| Rights | | | 10,849 | | | | 10,780 | | | | — | | | | 21,629 | |
| Short-Term Investments | | | 6,911 | | | | 35,938 | | | | — | | | | 42,849 | |
| Total Investments in Securities | | $ | 16,332,018 | | | $ | 46,718 | | | $ | — | | | $ | 16,378,736 | |
As of June 30, 2019, there were no investments in Level 3 securities.
During the six-month period ended June 30, 2019, there were no transfers into or out of Level 3.
^ See Portfolio of Investments for breakout of investments by industry classification.The Small Cap Opportunities Portfolio
The following is a summary of the inputs used to value The Small Cap Opportunities Portfolio’s net assets as of June 30, 2019:
| | | | | | | | | | | | | |
Assets^ | | Level 1 | | | Level 2 | | | Level 3 | | | Total | |
| Common Stocks | | $ | 196,197,020 | | | $ | 21,850,349 | | | $ | — | | | $ | 218,047,369 | |
| Preferred Stocks | | | 1,233,409 | | | | — | | | | — | | | | 1,233,409 | |
| Warrants | | | — | | | | 612,577 | | | | — | | | | 612,577 | |
| Short-Term Investments | | | 33 | | | | 93,301,326 | | | | — | | | | 93,301,359 | |
| Investments Purchased with the Cash | | | | | | | | | | | | | | | | |
| Proceeds from Securities Lending | | | 4,332,755 | | | | — | | | | — | | | | 4,332,755 | |
| Total Investments in Securities | | $ | 201,763,217 | | | $ | 115,764,252 | | | $ | — | | | $ | 317,527,469 | |
170
KINETICS PORTFOLIOS TRUST — MASTER INVESTMENT PORTFOLIOS
Notes to Consolidated Financial Statements —
(Continued) June 30, 2019 (Unaudited)
As of June 30, 2019, there were no investments in Level 3 securities.
During the six-month period ended June 30, 2019, there were no transfers into or out of Level 3.
^ See Consolidated Portfolio of Investments for breakout of investments by industry classification.The Market Opportunities Portfolio
The following is a summary of the inputs used to value The Market Opportunities Portfolio’s net assets as of June 30, 2019:
| | | | | | | | | | | | | |
Assets^ | | Level 1 | | | Level 2 | | | Level 3 | | | Total | |
| Common Stocks | | $ | 50,770,394 | | | $ | 2,924,235 | | | $ | — | | | $ | 53,694,629 | |
| Preferred Stocks | | | 281,010 | | | | — | | | | — | | | | 281,010 | |
| Convertible Bonds | | | — | | | | 200 | | | | — | | | | 200 | |
| Warrants | | | — | | | | 139,565 | | | | — | | | | 139,565 | |
| Short-Term Investments | | | 1,150 | | | | 35,119,710 | | | | — | | | | 35,120,860 | |
| Investments Purchased with the Cash | | | | | | | | | | | | | | | | |
| Proceeds from Securities Lending | | | 1,241,317 | | | | — | | | | — | | | | 1,241,317 | |
| Total Investments in Securities | | $ | 52,293,871 | | | $ | 38,183,710 | | | $ | — | | | $ | 90,477,581 | |
As of June 30, 2019, there were no investments in Level 3 securities.
During the six-month period ended June 30, 2019, there were no transfers into or out of Level 3.
^ See Consolidated Portfolio of Investments for breakout of investments by industry classification.The Alternative Income Portfolio
The following is a summary of the inputs used to value The Alternative Income Portfolio’s net assets as of June 30, 2019:
| | | | | | | | | | | | | |
Assets^ | | Level 1 | | | Level 2 | | | Level 3 | | | Total | |
| Exchange Traded Funds | | $ | 5,853,461 | | | $ | – | | | $ | – | | | $ | 5,853,461 | |
| Short-Term Investments | | | 2,348,988 | | | | 10,250,609 | | | | – | | | | 12,599,597 | |
| Total Investments in Securities | | $ | 8,202,449 | | | $ | 10,250,609 | | | $ | – | | | $ | 18,453,058 | |
As of June 30, 2019, there were no investments in Level 3 securities.
During the six-month period ended June 30, 2019, there were no transfers into or out of Level 3.
^ See Portfolio of Investments for breakout of investments by industry classification.171
KINETICS PORTFOLIOS TRUST — MASTER INVESTMENT PORTFOLIOS
Notes to Consolidated Financial Statements —
(Continued) June 30, 2019 (Unaudited)
The Multi-Disciplinary Income Portfolio
The following is a summary of the inputs used to value The Multi-Disciplinary Income Portfolio’s net assets as of June 30, 2019:
| | | | | | | | | | | | | |
Assets^ | | Level 1 | | | Level 2 | | | Level 3 | | | Total | |
| Convertible Bonds | | $ | – | | | $ | 630,480 | | | $ | – | | | $ | 630,480 | |
| Corporate Bonds | | | – | | | | 30,968,396 | | | | – | | | | 30,968,396 | |
| Municipal Bonds | | | – | | | | 160,760 | | | | – | | | | 160,760 | |
| Closed-End Funds | | | 3,148,148 | | | | �� | | | | – | | | | 3,148,148 | |
| Short-Term Investments | | | 5,809 | | | | 1,315,731 | | | | – | | | | 1,321,540 | |
| Investments Purchased with the Cash | | | | | | | | | | | | | | | | |
| Proceeds from Securities Lending | | | 1,995,000 | | | | – | | | | – | | | | 1,995,000 | |
| Total Investments in Securities | | $ | 5,148,957 | | | $ | 33,075,367 | | | $ | – | | | $ | 38,224,324 | |
As of June 30, 2019, there were no investments in Level 3 securities.
During the six-month period ended June 30, 2019, there were no transfers into or out of Level 3.
^ See Portfolio of Investments for breakout of investments by industry classification.9. Disclosures about Derivative Instruments and Hedging Activities
The Master Portfolios have adopted authoritative standards regarding disclosure of derivatives and hedging activity intended to improve financial reporting of derivative instruments by enabling investors to understand how and why a Master Portfolio uses derivatives, how derivatives are accounted for by the Master Portfolios, and how derivative instruments affect a Master Portfolio’s results of operations and financial position. The Master Portfolios utilized options to implement or to gain further exposure to their respective investment strategies. As of June 30, 2019, none of the Portfolios held any derivative instruments.
10. Offsetting Assets and Liabilities
The Master Portfolios are subject to various Master Netting Arrangements, which govern the terms of certain transactions with select counterparties. The Master Netting Arrangements allow a Portfolio to close out and net its total exposure to a counterparty in the event of a default with respect to all the transactions governed under a single agreement with a counterparty. The Master
172
KINETICS PORTFOLIOS TRUST — MASTER INVESTMENT PORTFOLIOS
Notes to Consolidated Financial Statements —
(Continued) June 30, 2019 (Unaudited)
Netting Arrangements also specify collateral posting arrangements at prearranged exposure levels. Under the Master Netting Arrangements, collateral is routinely transferred if the total net exposure to certain transactions (net of existing collateral already in place) governed under the relevant Master Netting Arrangement with a counterparty in a given account exceeds a specific threshold depending on the counterparty and the type of Master Netting Arrangement.
The following is a summary of the Assets and Liabilities subject to offsetting in the Master Portfolios as of June 30, 2019:
| | | | | | | | | | | | | | | | | | | |
| | | | | | | | | Net | | | | | | | | | | |
| | | | | | Gross | | | Amounts | | | Gross Amounts not Offset | | | | |
| | | | | | Amounts | | | Presented | | | in the Statement of | | | | |
| | | Gross | | | Offset in the | | | in the | | | Assets & Liabilities | | | | |
| | | Amounts of | | | Statement | | | Statement | | | | | | Collateral | | | | |
| | | Recognized | | | of Assets & | | | of Assets & | | | Financial | | | Pledged | | | Net | |
| | | Liabilities | | | Liabilities | | | Liabilities | | | Instruments | | | (Received) | | | Amount | |
The Internet Portfolio | | | | | | | | | | | | | | | | | | |
| Securities Lending | | $ | 6,714,974 | | | $ | — | | | $ | 6,714,974 | | | $ | 6,714,974 | | | $ | — | | | $ | — | |
| | | $ | 6,714,974 | | | $ | — | | | $ | 6,714,974 | | | $ | 6,714,974 | | | $ | — | | | $ | — | |
| | |
The Global Portfolio | | | | | | | | | | | | | | | | | | | | | | | | |
| Securities Lending | | $ | 145,578 | | | $ | — | | | $ | 145,578 | | | $ | 145,578 | | | $ | — | | | $ | — | |
| | | $ | 145,578 | | | $ | — | | | $ | 145,578 | | | $ | 145,578 | | | $ | — | | | $ | — | |
| | |
The Paradigm Portfolio | | | | | | | | | | | | | | | | | | | | | | | | |
| Securities Lending | | $ | 27,724,643 | | | $ | — | | | $ | 27,724,643 | | | $ | 27,724,643 | | | $ | — | | | $ | — | |
| | | $ | 27,724,643 | | | $ | — | | �� | $ | 27,724,643 | | | $ | 27,724,643 | | | $ | — | | | $ | — | |
| | |
The Small Cap | | | | | | | | | | | | | | | | | | | | | | | | |
Opportunities Portfolio | | | | | | | | | | | | | | | | | | | | | | | | |
| Securities Lending | | $ | 4,332,755 | | | $ | — | | | $ | 4,332,755 | | | $ | 4,332,755 | | | $ | — | | | $ | — | |
| | | $ | 4,332,755 | | | $ | — | | | $ | 4,332,755 | | | $ | 4,332,755 | | | $ | — | | | $ | — | |
| | |
The Market | | | | | | | | | | | | | | | | | | | | | | | | |
Opportunities Portfolio | | | | | | | | | | | | | | | | | | | | | | | | |
| Securities Lending | | $ | 1,241,317 | | | $ | — | | | $ | 1,241,317 | | | $ | 1,241,317 | | | $ | — | | | $ | — | |
| | | $ | 1,241,317 | | | $ | — | | | $ | 1,241,317 | | | $ | 1,241,317 | | | $ | — | | | $ | — | |
| | |
The Multi-Disciplinary | | | | | | | | | | | | | | | | | | | | | | | | |
Income Portfolio | | | | | | | | | | | | | | | | | | | | | | | | |
| Securities Lending | | $ | 1,995,000 | | | $ | — | | | $ | 1,995,000 | | | $ | 1,995,000 | | | $ | — | | | $ | — | |
| | | $ | 1,995,000 | | | $ | — | | | $ | 1,995,000 | | | $ | 1,995,000 | | | $ | — | | | $ | — | |
173
KINETICS PORTFOLIOS TRUST — MASTER INVESTMENT PORTFOLIOS
Notes to Consolidated Financial Statements —
(Continued) June 30, 2019 (Unaudited)
11. Affiliated Issuers
Under section 2(a)(3) of the 1940 Act, an investment company is defined as being an affiliated person of a company if it owns five percent or more of a company’s outstanding voting stock.
Investments in affiliated companies for The Paradigm Portfolio as of June 30, 2019, are shown below:
| | | | | | | | |
| | Fair value at | | | Net | Change in | Fair value at | |
Name | December 31, | | Sales | Realized | Unrealized | June 30, | Dividend |
of Issuer | 2018 | Purchases | Proceeds | Gain | Appreciation | 2019 | Income |
| Texas Pacific | | | | | | | |
| Land Trust | $229,200,484 | $— | $8,626,689 | $6,373,889 | $96,664,965 | $323,612,649 | $2,494,818 |
| | | | | |
| | Number of | | | Number of |
| | shares held at | | | shares held at |
| | December 31, | | | June 30, |
Name of Issuer | 2018 | Purchases | Sales | 2019 |
| Texas Pacific Land Trust | 423,168 | — | (11,965) | 411,203 |
12. Subsequent Events
In preparing these financial statements, management has evaluated Portfolio related events and transactions for potential recognition or disclosure through the date the financial statements were issued. There were no events or translations that occurred during the period that materially impacted the amounts or disclosures in the Master Portfolios’ financial statements.
13. Recent Accounting Pronouncements
In March 2017, the FASB issued ASU 2017‐08, Receivables—Nonrefundable Fees and Other Costs (Subtopic 310‐20): Premium Amortization on Purchased Callable Debt Securities (“ASU 2017‐08”). The amendments in the ASU 2017‐08 shorten the amortization period for certain callable debt securities, held at a premium, to be amortized to the earliest call date. The ASU 2017‐08 does not require an accounting change for securities held at a discount; which continues to be amortized to maturity. The ASU 2017‐08 is effective for fiscal years and interim periods within those fiscal years beginning after December 15, 2018. Management has assessed these changes and concluded these changes do not have a material impact on the Master Portfolios’ financial statements.
174
KINETICS PORTFOLIOS TRUST — MASTER INVESTMENT PORTFOLIOS
Notes to Consolidated Financial Statements —
(Continued) June 30, 2019 (Unaudited)
14. Information about Proxy Voting
Information regarding how the Feeder Funds and the Master Portfolios vote proxies relating to portfolio securities is available without charge upon request by calling toll-free at 1-800-930-3828 or by accessing the Funds’ website at www.kineticsfunds.com and by accessing the SEC’s website at www.sec.gov. Information regarding how the Feeder Funds and the Master Portfolios voted proxies relating to portfolio securities during the most recent twelve month period ended June 30, is available without charge, upon request, by calling toll-free at 1-800-930-3828 or by accessing the SEC’s website at www.sec.gov.
15. Information about the Portfolio Holdings
The Master Portfolios file their complete schedule of portfolio holdings for their first and third fiscal quarters with the SEC on Part F of Form N-PORT. The Master Portfolios’ Part F of Form N-PORT is available without charge, upon request, by calling toll-free at 1-800-930-3828. Furthermore, you can obtain the Part F of Form N-PORT on the SEC’s website at www.sec.gov.
175
Not applicable to registrants who are not listed issuers (as defined in Rule 10A-3 under the Securities Exchange Act of 1934).
The Schedule of Investments is included as part of the report to shareholders filed under Item 1 of this Form.
Not applicable to open-end investment companies.
Not applicable to open-end investment companies.
Not applicable to open-end investment companies.
There have been no material changes to the procedures by which shareholders may recommend nominees to the registrant's board of trustees.
Not applicable to open-end investment companies.
Filed herewith.
(3) Not applicable to open-end investment companies.
Furnished herewith.