0001083387 tsr:C000192498Member tsr:bench2025020493749_3301Member 2024-12-31
UNITED STATES
SECURITIES AND EXCHANGE COMMISSION
Washington, D.C. 20549
FORM N-CSR
CERTIFIED SHAREHOLDER REPORT OF REGISTERED
MANAGEMENT INVESTMENT COMPANIES
Investment Company Act file number 811-09303 & 811-09923
Kinetics Mutual Funds, Inc. & Kinetics Portfolios Trust
(Exact name of registrant as specified in charter)
470 Park Avenue South
New York, NY 10016
(Address of principal executive offices) (Zip code)
U.S. Bancorp Fund Services, LLC
615 E. Michigan Street
Milwaukee, WI 53202
(Name and address of agent for service)
1-646-495-7333
Registrant's telephone number, including area code
Date of fiscal year end: December 31
Date of reporting period: December 31, 2024
Item 1. Reports to Stockholders.
| | |
| The Internet Fund | |
| Advisor Class A | KINAX |
| Annual Shareholder Report | December 31, 2024 |
This annual shareholder report contains important information about the The Internet Fund for the period of January 1, 2024, to December 31, 2024. You can find additional information about the Fund at https://kineticsfunds.com/resources/. You can also request this information by contacting us at 1-800-930-3828.
WHAT WERE THE FUND COSTS FOR THE PAST YEAR? (based on a hypothetical $10,000 investment)
| | |
Class Name | Costs of a $10,000 investment | Costs paid as a percentage of a $10,000 investment |
| Advisor Class A | $231 | 1.64% |
HOW DID THE FUND PERFORM LAST YEAR AND WHAT AFFECTED ITS PERFORMANCE?
For the 12-month period ended December 31, 2024, the Fund’s No-Load class posted 76.44% outperforming benchmarks S&P 500 Index and the NASDAQ Composite Index which posted 25.02% and 28.64%, respectively.
WHAT FACTORS INFLUENCED PERFORMANCE
The Fund’s performance was largely driven by its exposure to blockchain and cryptocurrency, with Bitcoin prices more than doubling for the second consecutive year. Bitcoin continues to distinguish itself from other cryptocurrencies, which is supported by an increasingly supportive regulatory environment. Additionally, the Fund benefited from strong gains in “hard asset” companies, which we believe stand to benefit from rising price levels as well as technological innovations, particularly in the energy sector. Energy prices were mixed for the year, as strong supply growth negated resilient demand. However, our investments in energy-related royalties and land/infrastructure were less impacted by commodity market fluctuations due to distinct growth drivers.
The portfolio remains focused on undervalued companies participating in the growth of the internet as well as companies that provide new services or products made possible by internet-related technologies. Guided by our long-term value investment philosophy, the Fund may experience periods of outperformance or underperformance relative to the benchmark, but we believe the Fund is well-positioned to generate above-market returns over the long term.
The Fund’s top contributor: Security selection collectively contributed positively to performance particularly with the Fund’s overweight exposure to blockchain and cryptocurrency. Grayscale Bitcoin Trust ETF (“GBTC”) was the largest contributor to returns.
The Fund’s top detractor: Bakkt Holdings, Inc (“BKKT”) detracted marginally from returns.
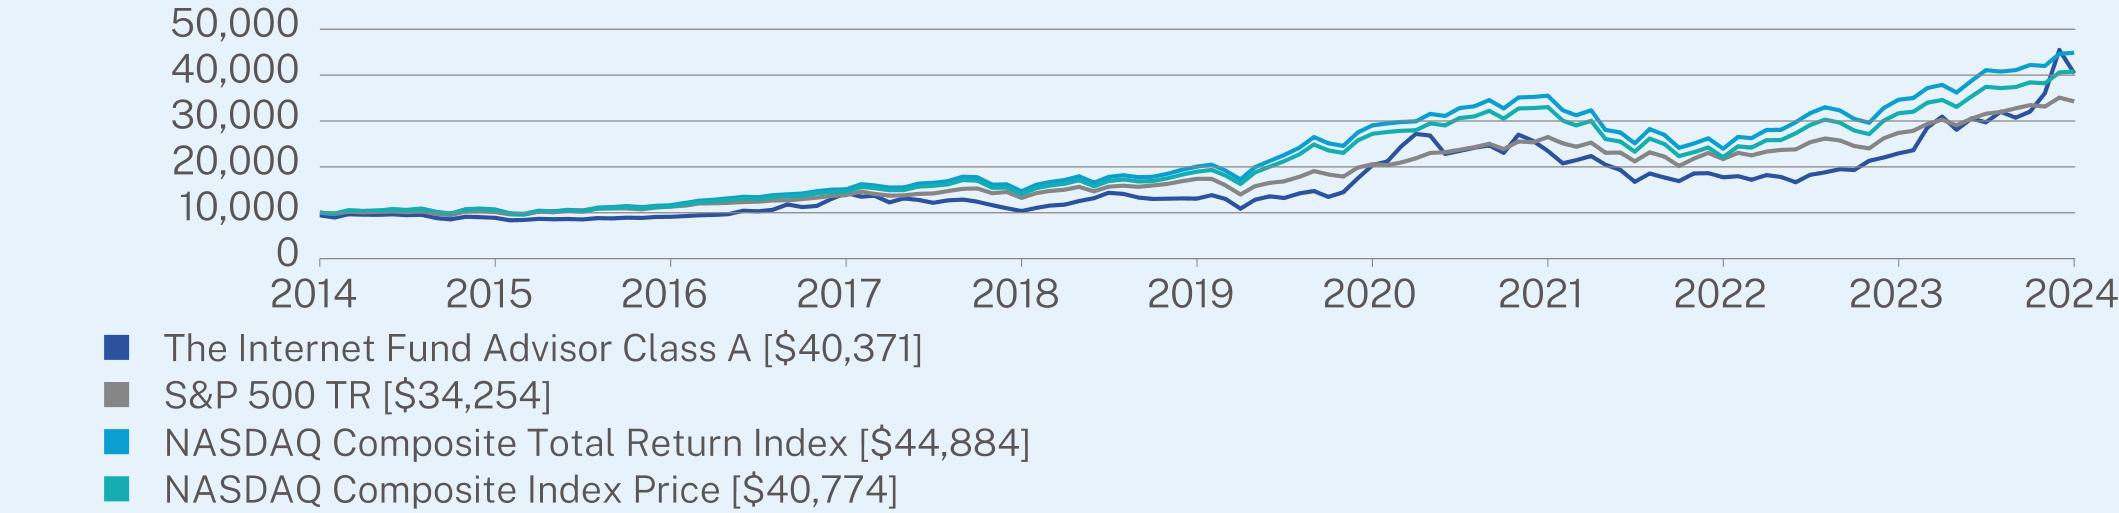
HOW DID THE FUND PERFORM OVER THE PAST 10 YEARS?*
The $10,000 chart reflects a hypothetical $10,000 investment in the class of shares noted and assumes the maximum sales charge. The chart uses total return NAV performance and assumes reinvestment of dividends and capital gains. Fund expenses, including 12b-1 fees, management fees and other expenses were deducted.
| The Internet Fund | PAGE 1 | TSR-AR-494613862 |
CUMULATIVE PERFORMANCE (Initial Investment of $10,000)
ANNUAL AVERAGE TOTAL RETURN (%)
| | | |
| | 1 Year | 5 Year | 10 Year |
Advisor Class A (without sales charge) | 76.00 | 25.31 | 15.66 |
Advisor Class A (with sales charge) | 65.87 | 23.83 | 14.98 |
S&P 500 TR | 25.02 | 14.53 | 13.10 |
NASDAQ Composite Total Return Index | 29.57 | 17.49 | 16.20 |
NASDAQ Composite Index Price | 28.64 | 16.57 | 15.09 |
Visit https://kineticsfunds.com/resources/ for more recent performance information.
| * | The Fund’s past performance is not a good predictor of how the Fund will perform in the future. The graph and table do not reflect the deduction of taxes that a shareholder would pay on Fund distributions or redemption of Fund shares. |
KEY FUND STATISTICS (as of December 31, 2024)
| |
Net Assets | $331,557,134 |
Number of Holdings | 30 |
Net Advisory Fee | $3,259,047 |
Portfolio Turnover | 43% |
Visit https://kineticsfunds.com/resources/ for more recent performance information.
WHAT DID THE FUND INVEST IN? (as of December 31, 2024)
| |
Top Sectors | (% of Net Assets) |
Finance and Insurance | 57.3% |
Mining, Quarrying, and Oil and Gas Extraction | 22.1% |
Professional, Scientific, and Technical Services | 4.9% |
Information | 1.6% |
Management of Companies and Enterprises | 0.7% |
Real Estate | 0.3% |
Entertainment | 0.1% |
Arts, Entertainment, and Recreation | 0.1% |
Media | 0.0% |
Retail Trade | 0.0% |
| |
Top 10 Issuers | (% of Net Assets) |
Grayscale Bitcoin Trust ETF | 47.8% |
Texas Pacific Land Corp. | 21.0% |
Grayscale Bitcoin Mini Trust ETF | 5.4% |
CACI International, Inc. | 4.9% |
OTC Markets Group, Inc. - Class A | 1.9% |
Landbridge Co. LLC | 1.0% |
Miami International Holdings Inc. | 0.9% |
Mastercard, Inc. | 0.8% |
Galaxy Digital Holdings Ltd. | 0.7% |
Bakkt Holdings, Inc. | 0.6% |
For additional information about the Fund; including its prospectus, financial information, holdings and proxy information, scan the QR code or visit https://kineticsfunds.com/resources/.
| The Internet Fund | PAGE 2 | TSR-AR-494613862 |
HOUSEHOLDING
To reduce Fund expenses, only one copy of most shareholder documents may be mailed to shareholders with multiple accounts at the same address (Householding). If you would prefer that your Horizon Kinetics Asset Management LLC documents not be householded, please contact Horizon Kinetics Asset Management LLC at 1-800-930-3828, or contact your financial intermediary. Your instructions will typically be effective within 30 days of receipt by Horizon Kinetics Asset Management LLC or your financial intermediary.
| The Internet Fund | PAGE 3 | TSR-AR-494613862 |
9424889290991429010365130682039123461177222293840371100001013811351138291322317386205852649421696273993425410000106961164515096146672004929055354992394934640448841000010573113661457614010189452721333034221003169640774
| | |
| The Internet Fund | |
| Advisor Class C | KINCX |
| Annual Shareholder Report | December 31, 2024 |
This annual shareholder report contains important information about the The Internet Fund for the period of January 1, 2024, to December 31, 2024. You can find additional information about the Fund at https://kineticsfunds.com/resources/. You can also request this information by contacting us at 1-800-930-3828.
WHAT WERE THE FUND COSTS FOR THE PAST YEAR? (based on a hypothetical $10,000 investment)
| | |
Class Name | Costs of a $10,000 investment | Costs paid as a percentage of a $10,000 investment |
| Advisor Class C | $290 | 2.14% |
HOW DID THE FUND PERFORM LAST YEAR AND WHAT AFFECTED ITS PERFORMANCE?
For the 12-month period ended December 31, 2024, the Fund’s No-Load class posted 76.44% outperforming benchmarks S&P 500 Index and the NASDAQ Composite Index which posted 25.02% and 28.64%, respectively.
WHAT FACTORS INFLUENCED PERFORMANCE
The Fund’s performance was largely driven by its exposure to blockchain and cryptocurrency, with Bitcoin prices more than doubling for the second consecutive year. Bitcoin continues to distinguish itself from other cryptocurrencies, which is supported by an increasingly supportive regulatory environment. Additionally, the Fund benefited from strong gains in “hard asset” companies, which we believe stand to benefit from rising price levels as well as technological innovations, particularly in the energy sector. Energy prices were mixed for the year, as strong supply growth negated resilient demand. However, our investments in energy-related royalties and land/infrastructure were less impacted by commodity market fluctuations due to distinct growth drivers.
The portfolio remains focused on undervalued companies participating in the growth of the internet as well as companies that provide new services or products made possible by internet-related technologies. Guided by our long-term value investment philosophy, the Fund may experience periods of outperformance or underperformance relative to the benchmark, but we believe the Fund is well-positioned to generate above-market returns over the long term.
The Fund’s top contributor: Security selection collectively contributed positively to performance particularly with the Fund’s overweight exposure to blockchain and cryptocurrency. Grayscale Bitcoin Trust ETF (“GBTC”) was the largest contributor to returns.
The Fund’s top detractor: Bakkt Holdings, Inc (“BKKT”) detracted marginally from returns.
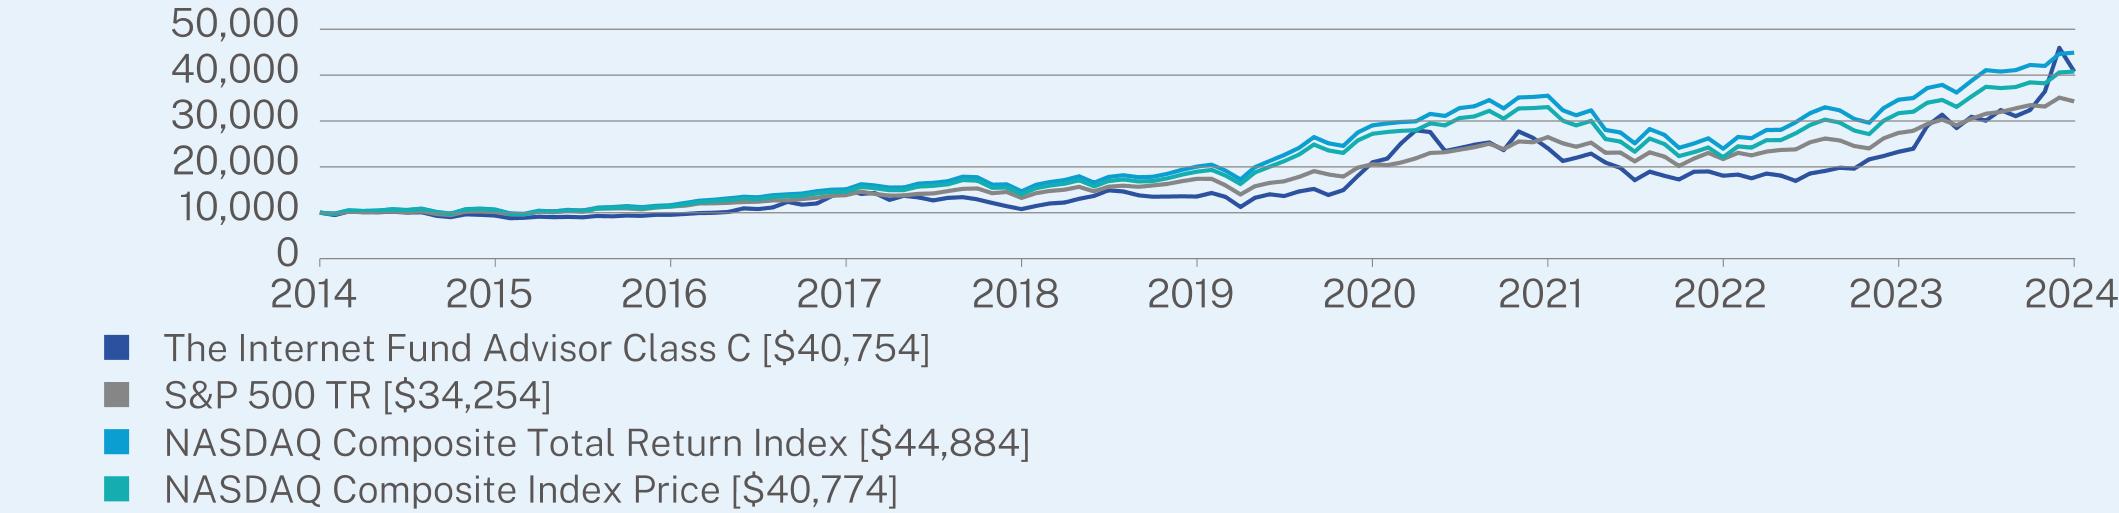
HOW DID THE FUND PERFORM OVER THE PAST 10 YEARS?*
The $10,000 chart reflects a hypothetical $10,000 investment in the class of shares noted and assumes the maximum sales charge. The chart uses total return NAV performance and assumes reinvestment of dividends and capital gains. Fund expenses, including 12b-1 fees, management fees and other expenses were deducted.
| The Internet Fund | PAGE 1 | TSR-AR-494613763 |
CUMULATIVE PERFORMANCE (Initial Investment of $10,000)
ANNUAL AVERAGE TOTAL RETURN (%)
| | | |
| | 1 Year | 5 Year | 10 Year |
Advisor Class C (without sales charge) | 75.11 | 24.68 | 15.08 |
Advisor Class C (with sales charge) | 74.11 | 24.68 | 15.08 |
S&P 500 TR | 25.02 | 14.53 | 13.10 |
NASDAQ Composite Total Return Index | 29.57 | 17.49 | 16.20 |
NASDAQ Composite Index Price | 28.64 | 16.57 | 15.09 |
Visit https://kineticsfunds.com/resources/ for more recent performance information.
| * | The Fund’s past performance is not a good predictor of how the Fund will perform in the future. The graph and table do not reflect the deduction of taxes that a shareholder would pay on Fund distributions or redemption of Fund shares. |
KEY FUND STATISTICS (as of December 31, 2024)
| |
Net Assets | $331,557,134 |
Number of Holdings | 30 |
Net Advisory Fee | $3,259,047 |
Portfolio Turnover | 43% |
Visit https://kineticsfunds.com/resources/ for more recent performance information.
WHAT DID THE FUND INVEST IN? (as of December 31, 2024)
| |
Top Sectors | (% of Net Assets) |
Finance and Insurance | 57.3% |
Mining, Quarrying, and Oil and Gas Extraction | 22.1% |
Professional, Scientific, and Technical Services | 4.9% |
Information | 1.6% |
Management of Companies and Enterprises | 0.7% |
Real Estate | 0.3% |
Entertainment | 0.1% |
Arts, Entertainment, and Recreation | 0.1% |
Media | 0.0% |
Retail Trade | 0.0% |
| |
Top 10 Issuers | (% of Net Assets) |
Grayscale Bitcoin Trust ETF | 47.8% |
Texas Pacific Land Corp. | 21.0% |
Grayscale Bitcoin Mini Trust ETF | 5.4% |
CACI International, Inc. | 4.9% |
OTC Markets Group, Inc. - Class A | 1.9% |
Landbridge Co. LLC | 1.0% |
Miami International Holdings Inc. | 0.9% |
Mastercard, Inc. | 0.8% |
Galaxy Digital Holdings Ltd. | 0.7% |
Bakkt Holdings, Inc. | 0.6% |
For additional information about the Fund; including its prospectus, financial information, holdings and proxy information, scan the QR code or visit https://kineticsfunds.com/resources/.
| The Internet Fund | PAGE 2 | TSR-AR-494613763 |
HOUSEHOLDING
To reduce Fund expenses, only one copy of most shareholder documents may be mailed to shareholders with multiple accounts at the same address (Householding). If you would prefer that your Horizon Kinetics Asset Management LLC documents not be householded, please contact Horizon Kinetics Asset Management LLC at 1-800-930-3828, or contact your financial intermediary. Your instructions will typically be effective within 30 days of receipt by Horizon Kinetics Asset Management LLC or your financial intermediary.
| The Internet Fund | PAGE 3 | TSR-AR-494613763 |
10000938695581494510781135252099824047180672327340754100001013811351138291322317386205852649421696273993425410000106961164515096146672004929055354992394934640448841000010573113661457614010189452721333034221003169640774
| | |
| The Internet Fund | |
| No Load Class | WWWFX |
| Annual Shareholder Report | December 31, 2024 |
This annual shareholder report contains important information about the The Internet Fund for the period of January 1, 2024, to December 31, 2024. You can find additional information about the Fund at https://kineticsfunds.com/resources/. You can also request this information by contacting us at 1-800-930-3828.
WHAT WERE THE FUND COSTS FOR THE PAST YEAR? (based on a hypothetical $10,000 investment)
| | |
Class Name | Costs of a $10,000 investment | Costs paid as a percentage of a $10,000 investment |
| No Load Class | $202 | 1.39% |
HOW DID THE FUND PERFORM LAST YEAR AND WHAT AFFECTED ITS PERFORMANCE?
For the 12-month period ended December 31, 2024, the Fund’s No-Load class posted 76.44% outperforming benchmarks S&P 500 Index and the NASDAQ Composite Index which posted 25.02% and 28.64%, respectively.
WHAT FACTORS INFLUENCED PERFORMANCE
The Fund’s performance was largely driven by its exposure to blockchain and cryptocurrency, with Bitcoin prices more than doubling for the second consecutive year. Bitcoin continues to distinguish itself from other cryptocurrencies, which is supported by an increasingly supportive regulatory environment. Additionally, the Fund benefited from strong gains in “hard asset” companies, which we believe stand to benefit from rising price levels as well as technological innovations, particularly in the energy sector. Energy prices were mixed for the year, as strong supply growth negated resilient demand. However, our investments in energy-related royalties and land/infrastructure were less impacted by commodity market fluctuations due to distinct growth drivers.
The portfolio remains focused on undervalued companies participating in the growth of the internet as well as companies that provide new services or products made possible by internet-related technologies. Guided by our long-term value investment philosophy, the Fund may experience periods of outperformance or underperformance relative to the benchmark, but we believe the Fund is well-positioned to generate above-market returns over the long term.
The Fund’s top contributor: Security selection collectively contributed positively to performance particularly with the Fund’s overweight exposure to blockchain and cryptocurrency. Grayscale Bitcoin Trust ETF (“GBTC”) was the largest contributor to returns.
The Fund’s top detractor: Bakkt Holdings, Inc (“BKKT”) detracted marginally from returns.
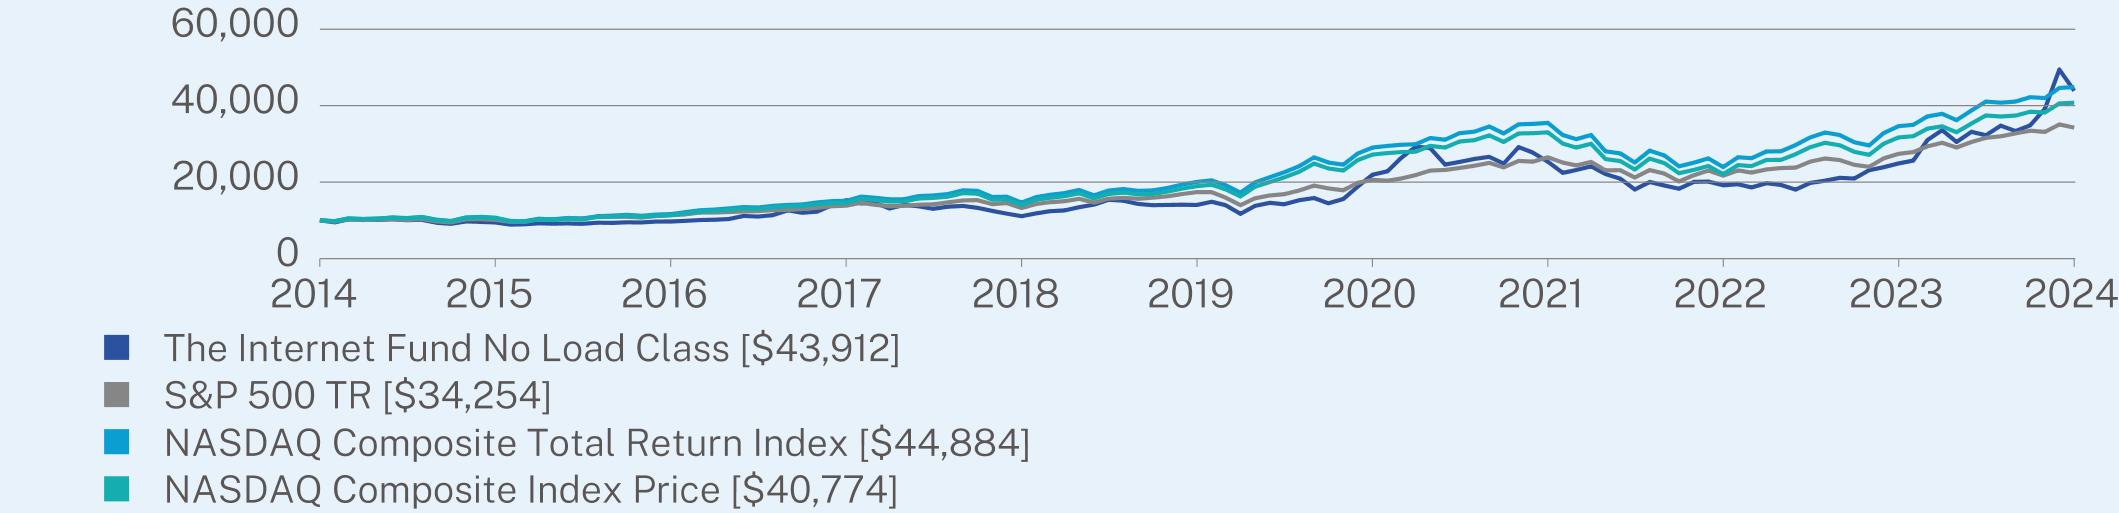
HOW DID THE FUND PERFORM OVER THE PAST 10 YEARS?*
The $10,000 chart reflects a hypothetical $10,000 investment in the class of shares noted and assumes the maximum sales charge. The chart uses total return NAV performance and assumes reinvestment of dividends and capital gains. Fund expenses, including 12b-1 fees, management fees and other expenses were deducted.
| The Internet Fund | PAGE 1 | TSR-AR-460953102 |
CUMULATIVE PERFORMANCE (Initial Investment of $10,000)
ANNUAL AVERAGE TOTAL RETURN (%)
| | | |
| | 1 Year | 5 Year | 10 Year |
No Load Class (without sales charge) | 76.44 | 25.62 | 15.95 |
S&P 500 TR | 25.02 | 14.53 | 13.10 |
NASDAQ Composite Total Return Index | 29.57 | 17.49 | 16.20 |
NASDAQ Composite Index Price | 28.64 | 16.57 | 15.09 |
Visit https://kineticsfunds.com/resources/ for more recent performance information.
| * | The Fund’s past performance is not a good predictor of how the Fund will perform in the future. The graph and table do not reflect the deduction of taxes that a shareholder would pay on Fund distributions or redemption of Fund shares. |
KEY FUND STATISTICS (as of December 31, 2024)
| |
Net Assets | $331,557,134 |
Number of Holdings | 30 |
Net Advisory Fee | $3,259,047 |
Portfolio Turnover | 43% |
Visit https://kineticsfunds.com/resources/ for more recent performance information.
WHAT DID THE FUND INVEST IN? (as of December 31, 2024)
| |
Top Sectors | (% of Net Assets) |
Finance and Insurance | 57.3% |
Mining, Quarrying, and Oil and Gas Extraction | 22.1% |
Professional, Scientific, and Technical Services | 4.9% |
Information | 1.6% |
Management of Companies and Enterprises | 0.7% |
Real Estate | 0.3% |
Entertainment | 0.1% |
Arts, Entertainment, and Recreation | 0.1% |
Media | 0.0% |
Retail Trade | 0.0% |
| |
Top 10 Issuers | (% of Net Assets) |
Grayscale Bitcoin Trust ETF | 47.8% |
Texas Pacific Land Corp. | 21.0% |
Grayscale Bitcoin Mini Trust ETF | 5.4% |
CACI International, Inc. | 4.9% |
OTC Markets Group, Inc. - Class A | 1.9% |
Landbridge Co. LLC | 1.0% |
Miami International Holdings Inc. | 0.9% |
Mastercard, Inc. | 0.8% |
Galaxy Digital Holdings Ltd. | 0.7% |
Bakkt Holdings, Inc. | 0.6% |
For additional information about the Fund; including its prospectus, financial information, holdings and proxy information, scan the QR code or visit https://kineticsfunds.com/resources/.
| The Internet Fund | PAGE 2 | TSR-AR-460953102 |
HOUSEHOLDING
To reduce Fund expenses, only one copy of most shareholder documents may be mailed to shareholders with multiple accounts at the same address (Householding). If you would prefer that your Horizon Kinetics Asset Management LLC documents not be householded, please contact Horizon Kinetics Asset Management LLC at 1-800-930-3828, or contact your financial intermediary. Your instructions will typically be effective within 30 days of receipt by Horizon Kinetics Asset Management LLC or your financial intermediary.
| The Internet Fund | PAGE 3 | TSR-AR-460953102 |
10000945897041527611102140392195925331191802488743912100001013811351138291322317386205852649421696273993425410000106961164515096146672004929055354992394934640448841000010573113661457614010189452721333034221003169640774
| | |
| The Global Fund | |
| Advisor Class A | KGLAX |
| Annual Shareholder Report | December 31, 2024 |
This annual shareholder report contains important information about the The Global Fund for the period of January 1, 2024, to December 31, 2024. You can find additional information about the Fund at https://kineticsfunds.com/resources/. You can also request this information by contacting us at 1-800-930-3828.
WHAT WERE THE FUND COSTS FOR THE PAST YEAR? (based on a hypothetical $10,000 investment)
| | |
Class Name | Costs of a $10,000 investment | Costs paid as a percentage of a $10,000 investment |
| Advisor Class A | $192 | 1.64% |
HOW DID THE FUND PERFORM LAST YEAR AND WHAT AFFECTED ITS PERFORMANCE?
For the 12-month period ended December 31, 2024, the Fund posted 72.16%, significantly outperforming the S&P 500 Index and MSCI All Country World Index which posted 25.02% and 17.49%, respectively.
WHAT FACTORS INFLUENCED PERFORMANCE
Blockchain and cryptocurrency contributed positively, with Bitcoin prices more than doubling for the second consecutive year. Bitcoin continues to set itself apart from other cryptocurrencies, supported by a more favorable regulatory landscape. The Fund’s performance was driven by strong positive returns in “hard asset” companies, which we believe are well-positioned to benefit from rising prices, particularly in the energy sector. Energy prices were mixed for the year, as strong supply growth negated resilient demand. Our energy exposure to royalties and land/infrastructure decoupled from commodity markets due to unique growth drivers.
The portfolio remains focused on global companies with unique business models exhibiting market mispricing and dislocation. Guided by our long-term value investment philosophy, the Fund may experience periods of outperformance or underperformance relative to the benchmark, but we believe the Fund is well-positioned to generate above-market returns over the long term.
The Fund’s top contributor: Security selection collectively contributed positively to performance particularly with the Fund’s overweight exposure to Energy and Blockchain/Cryptocurrency. Grayscale Bitcoin Trust ETF (“GBTC”) was the largest contributor to returns.
The Fund’s top detractor: Permian Basin Royalty Trust (“PBT”) detracted marginally from returns.
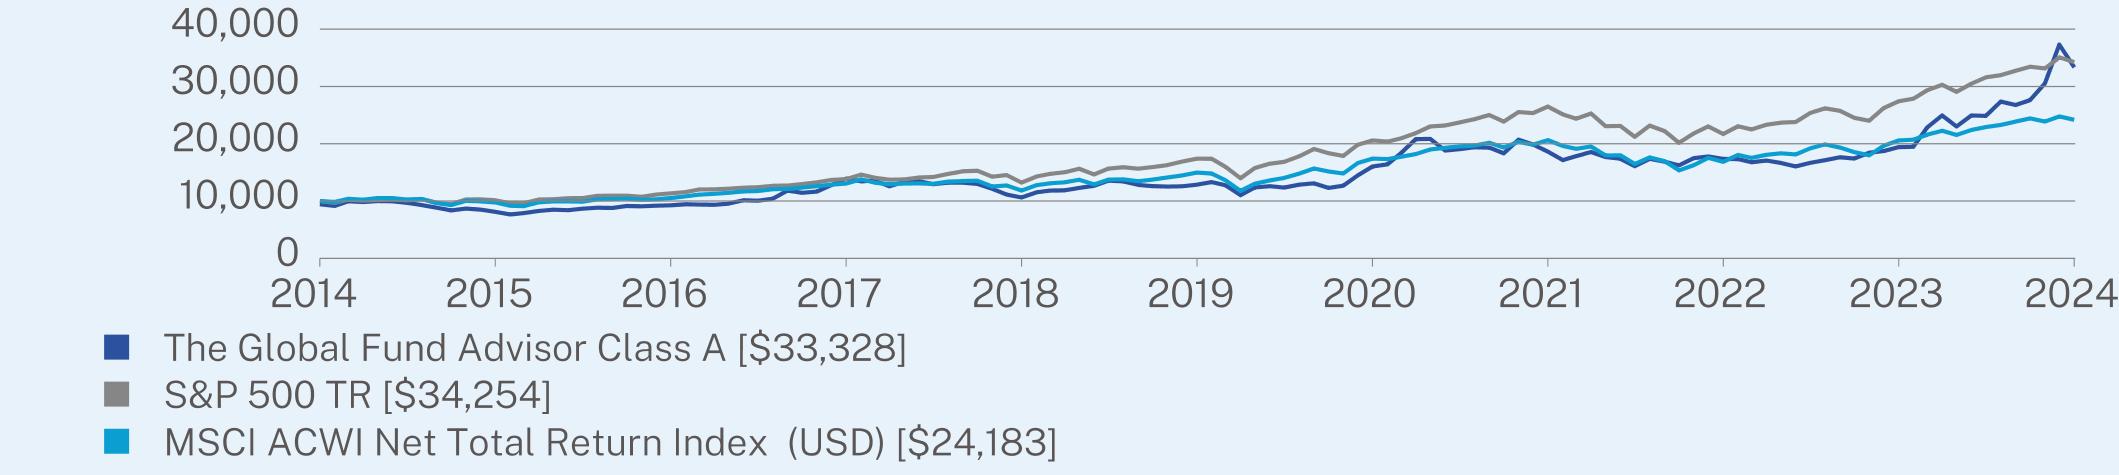
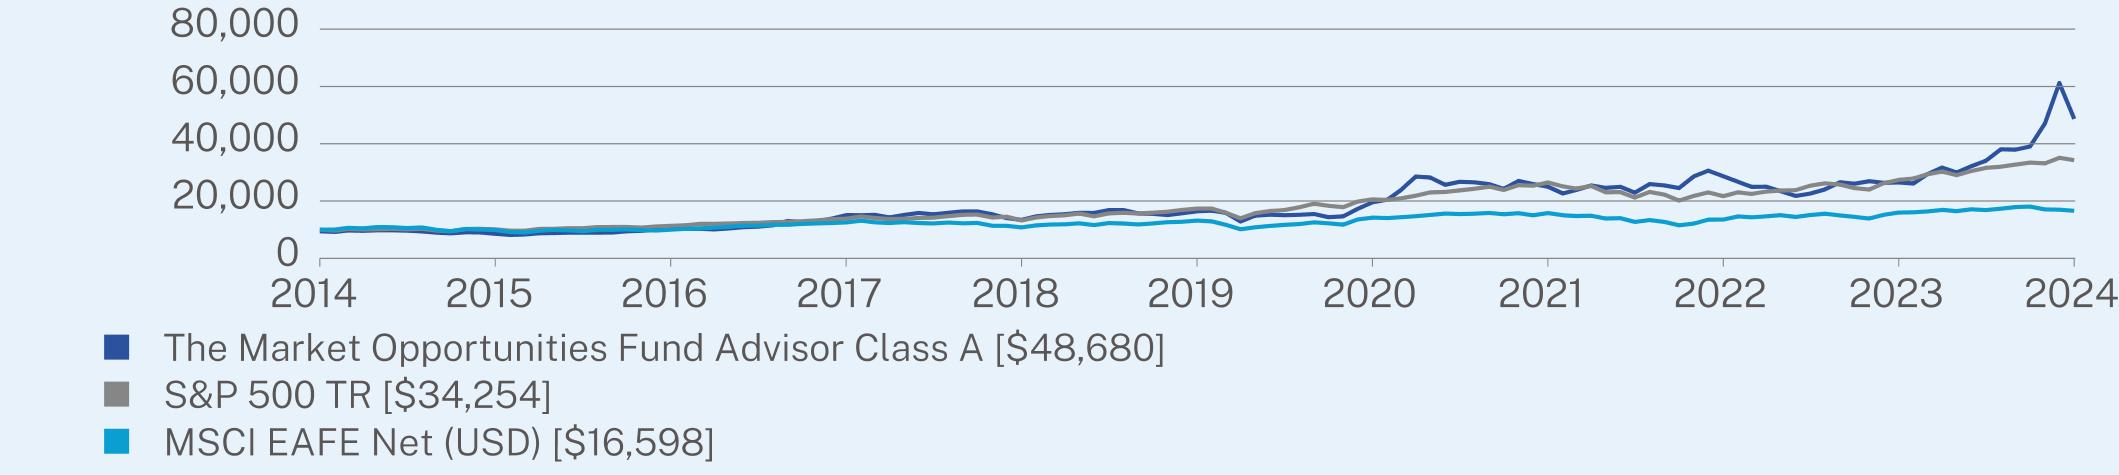
HOW DID THE FUND PERFORM OVER THE PAST 10 YEARS?*
The $10,000 chart reflects a hypothetical $10,000 investment in the class of shares noted and assumes the maximum sales charge. The chart uses total return NAV performance and assumes reinvestment of dividends and capital gains. Fund expenses, including 12b-1 fees, management fees and other expenses were deducted.
| The Global Fund | PAGE 1 | TSR-AR-494613631 |
CUMULATIVE PERFORMANCE (Initial Investment of $10,000)
ANNUAL AVERAGE TOTAL RETURN (%)
| | | |
| | 1 Year | 5 Year | 10 Year |
Advisor Class A (without sales charge) | 71.69 | 20.98 | 13.45 |
Advisor Class A (with sales charge) | 61.80 | 19.57 | 12.79 |
S&P 500 TR | 25.02 | 14.53 | 13.10 |
MSCI ACWI Net Total Return Index (USD) | 17.49 | 10.06 | 9.23 |
Visit https://kineticsfunds.com/resources/ for more recent performance information.
| * | The Fund’s past performance is not a good predictor of how the Fund will perform in the future. The graph and table do not reflect the deduction of taxes that a shareholder would pay on Fund distributions or redemption of Fund shares. |
KEY FUND STATISTICS (as of December 31, 2024)
| |
Net Assets | $49,640,955 |
Number of Holdings | 67 |
Net Advisory Fee | $181,178 |
Portfolio Turnover | 34% |
Visit https://kineticsfunds.com/resources/ for more recent performance information.
WHAT DID THE FUND INVEST IN? (as of December 31, 2024)
| |
Top Sectors(% of Net Assets) |
Finance and Insurance | 31.7% |
Mining, Quarrying, and Oil and Gas Extraction | 26.6% |
Management of Companies and Enterprises | 7.0% |
Entertainment | 1.9% |
Real Estate and Rental and Leasing | 1.2% |
Transportation and Warehousing | 1.2% |
Professional, Scientific and Technical Services | 0.6% |
Media | 0.5% |
Real Estate | 0.3% |
Accommodation and Food Services | 0.2% |
| |
Top 10 Issuers(% of Net Assets) |
Grayscale Bitcoin Trust ETF | 22.9% |
Texas Pacific Land Corp. | 19.2% |
White Mountains Insurance Group Ltd. | 4.1% |
Landbridge Co. LLC | 4.0% |
Grayscale Bitcoin Mini Trust ETF | 2.6% |
IG Port, Inc. | 1.9% |
Galaxy Digital Holdings Ltd. | 1.5% |
GAMCO Investors, Inc. | 1.3% |
Wheaton Precious Metals Corp. | 1.2% |
Mesabi Trust | 1.2% |
| |
Top Ten Countries(% of Net Assets) |
United States | 61.7% |
Canada | 5.7% |
Japan | 2.5% |
United Kingdom | 1.0% |
Sweden | 0.5% |
Germany | 0.3% |
Cayman Islands | 0.3% |
Netherlands | 0.3% |
Brazil | 0.1% |
Greece | 0.1% |
For additional information about the Fund; including its prospectus, financial information, holdings and proxy information, scan the QR code or visit https://kineticsfunds.com/resources/.
| The Global Fund | PAGE 2 | TSR-AR-494613631 |
HOUSEHOLDING
To reduce Fund expenses, only one copy of most shareholder documents may be mailed to shareholders with multiple accounts at the same address (Householding). If you would prefer that your Horizon Kinetics Asset Management LLC documents not be householded, please contact Horizon Kinetics Asset Management LLC at 1-800-930-3828, or contact your financial intermediary. Your instructions will typically be effective within 30 days of receipt by Horizon Kinetics Asset Management LLC or your financial intermediary.
| The Global Fund | PAGE 3 | TSR-AR-494613631 |
94328122926113918106181285816034186251736019412333281000010138113511382913223173862058526494216962739934254100009764105311305611827149731740620633168442058424183
| | |
| The Global Fund | |
| Advisor Class C | KGLCX |
| Annual Shareholder Report | December 31, 2024 |
This annual shareholder report contains important information about the The Global Fund for the period of January 1, 2024, to December 31, 2024. You can find additional information about the Fund at https://kineticsfunds.com/resources/. You can also request this information by contacting us at 1-800-930-3828.
WHAT WERE THE FUND COSTS FOR THE PAST YEAR? (based on a hypothetical $10,000 investment)
| | |
Class Name | Costs of a $10,000 investment | Costs paid as a percentage of a $10,000 investment |
| Advisor Class C | $250 | 2.14% |
HOW DID THE FUND PERFORM LAST YEAR AND WHAT AFFECTED ITS PERFORMANCE?
For the 12-month period ended December 31, 2024, the Fund posted 72.16%, significantly outperforming the S&P 500 Index and MSCI All Country World Index which posted 25.02% and 17.49%, respectively.
WHAT FACTORS INFLUENCED PERFORMANCE
Blockchain and cryptocurrency contributed positively, with Bitcoin prices more than doubling for the second consecutive year. Bitcoin continues to set itself apart from other cryptocurrencies, supported by a more favorable regulatory landscape. The Fund’s performance was driven by strong positive returns in “hard asset” companies, which we believe are well-positioned to benefit from rising prices, particularly in the energy sector. Energy prices were mixed for the year, as strong supply growth negated resilient demand. Our energy exposure to royalties and land/infrastructure decoupled from commodity markets due to unique growth drivers.
The portfolio remains focused on global companies with unique business models exhibiting market mispricing and dislocation. Guided by our long-term value investment philosophy, the Fund may experience periods of outperformance or underperformance relative to the benchmark, but we believe the Fund is well-positioned to generate above-market returns over the long term.
The Fund’s top contributor: Security selection collectively contributed positively to performance particularly with the Fund’s overweight exposure to Energy and Blockchain/Cryptocurrency. Grayscale Bitcoin Trust ETF (“GBTC”) was the largest contributor to returns.
The Fund’s top detractor: Permian Basin Royalty Trust (“PBT”) detracted marginally from returns.
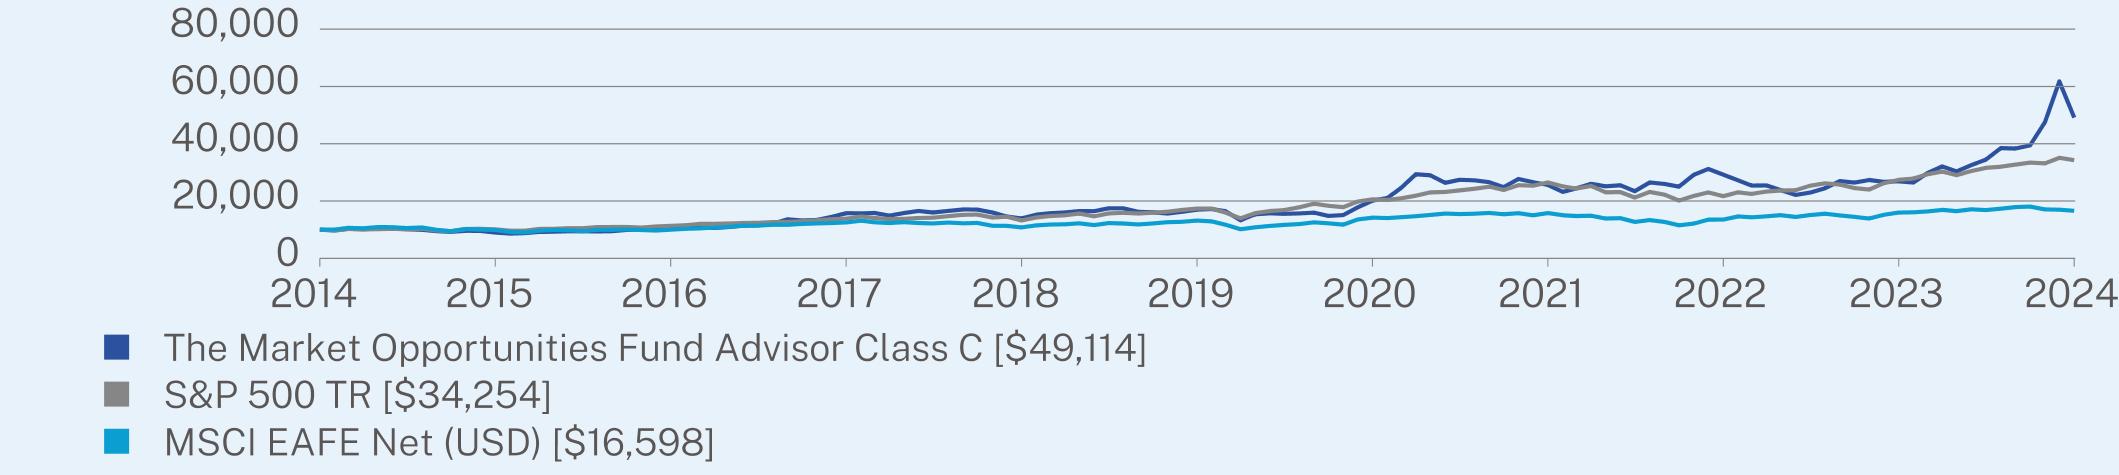
HOW DID THE FUND PERFORM OVER THE PAST 10 YEARS?*
The $10,000 chart reflects a hypothetical $10,000 investment in the class of shares noted and assumes the maximum sales charge. The chart uses total return NAV performance and assumes reinvestment of dividends and capital gains. Fund expenses, including 12b-1 fees, management fees and other expenses were deducted.
| The Global Fund | PAGE 1 | TSR-AR-494613623 |
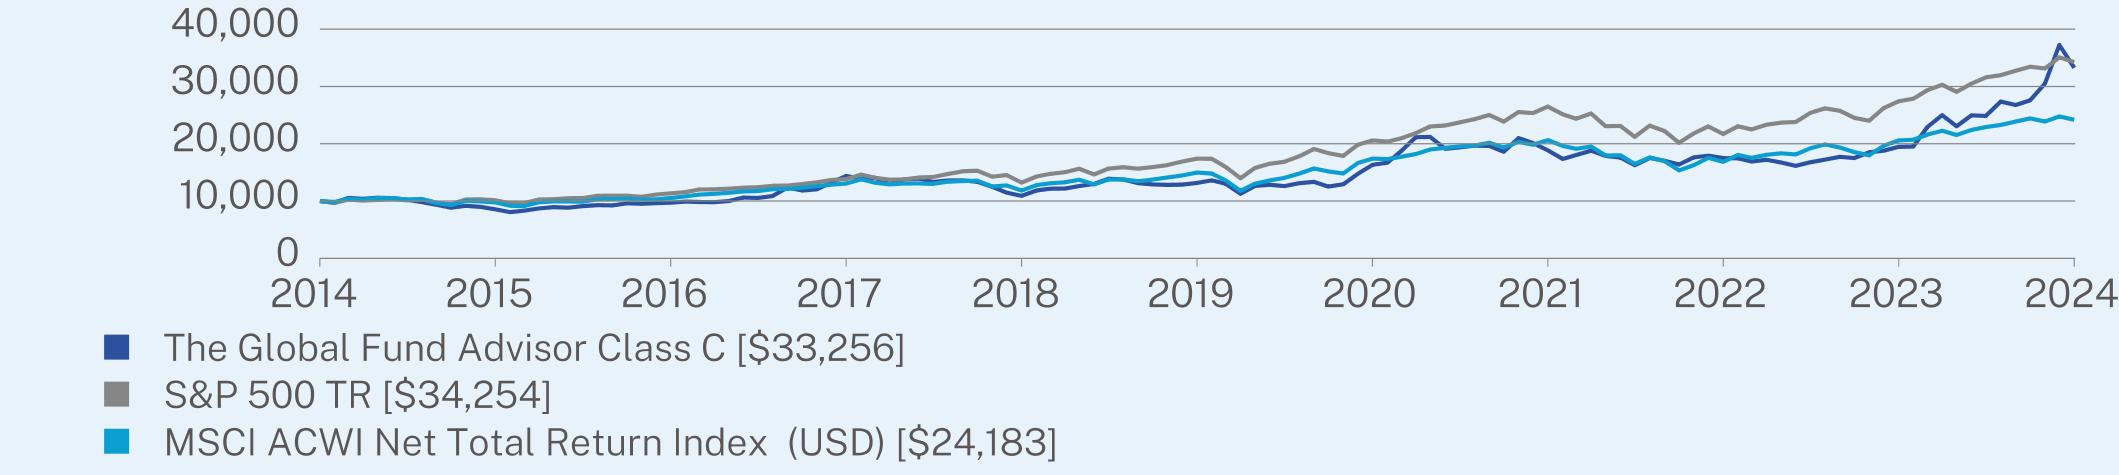
CUMULATIVE PERFORMANCE (Initial Investment of $10,000)
ANNUAL AVERAGE TOTAL RETURN (%)
| | | |
| | 1 Year | 5 Year | 10 Year |
Advisor Class C (without sales charge) | 70.97 | 20.37 | 12.77 |
Advisor Class C (with sales charge) | 69.97 | 20.37 | 12.77 |
S&P 500 TR | 25.02 | 14.53 | 13.10 |
MSCI ACWI Net Total Return Index (USD) | 17.49 | 10.06 | 9.23 |
Visit https://kineticsfunds.com/resources/ for more recent performance information.
| * | The Fund’s past performance is not a good predictor of how the Fund will perform in the future. The graph and table do not reflect the deduction of taxes that a shareholder would pay on Fund distributions or redemption of Fund shares. |
KEY FUND STATISTICS (as of December 31, 2024)
| |
Net Assets | $49,640,955 |
Number of Holdings | 67 |
Net Advisory Fee | $181,178 |
Portfolio Turnover | 34% |
Visit https://kineticsfunds.com/resources/ for more recent performance information.
WHAT DID THE FUND INVEST IN? (as of December 31, 2024)
| |
Top Sectors(% of Net Assets) |
Finance and Insurance | 31.7% |
Mining, Quarrying, and Oil and Gas Extraction | 26.6% |
Management of Companies and Enterprises | 7.0% |
Entertainment | 1.9% |
Real Estate and Rental and Leasing | 1.2% |
Transportation and Warehousing | 1.2% |
Professional, Scientific and Technical Services | 0.6% |
Media | 0.5% |
Real Estate | 0.3% |
Accommodation and Food Services | 0.2% |
| |
Top 10 Issuers(% of Net Assets) |
Grayscale Bitcoin Trust ETF | 22.9% |
Texas Pacific Land Corp. | 19.2% |
White Mountains Insurance Group Ltd. | 4.1% |
Landbridge Co. LLC | 4.0% |
Grayscale Bitcoin Mini Trust ETF | 2.6% |
IG Port, Inc. | 1.9% |
Galaxy Digital Holdings Ltd. | 1.5% |
GAMCO Investors, Inc. | 1.3% |
Wheaton Precious Metals Corp. | 1.2% |
Mesabi Trust | 1.2% |
| |
Top Ten Countries(% of Net Assets) |
United States | 61.7% |
Canada | 5.7% |
Japan | 2.5% |
United Kingdom | 1.0% |
Sweden | 0.5% |
Germany | 0.3% |
Cayman Islands | 0.3% |
Netherlands | 0.3% |
Brazil | 0.1% |
Greece | 0.1% |
For additional information about the Fund; including its prospectus, financial information, holdings and proxy information, scan the QR code or visit https://kineticsfunds.com/resources/.
| The Global Fund | PAGE 2 | TSR-AR-494613623 |
HOUSEHOLDING
To reduce Fund expenses, only one copy of most shareholder documents may be mailed to shareholders with multiple accounts at the same address (Householding). If you would prefer that your Horizon Kinetics Asset Management LLC documents not be householded, please contact Horizon Kinetics Asset Management LLC at 1-800-930-3828, or contact your financial intermediary. Your instructions will typically be effective within 30 days of receipt by Horizon Kinetics Asset Management LLC or your financial intermediary.
| The Global Fund | PAGE 3 | TSR-AR-494613623 |
100008552971714383109031316016333188541749619452332561000010138113511382913223173862058526494216962739934254100009764105311305611827149731740620633168442058424183
| | |
| The Global Fund | |
| No Load Class | WWWEX |
| Annual Shareholder Report | December 31, 2024 |
This annual shareholder report contains important information about the The Global Fund for the period of January 1, 2024, to December 31, 2024. You can find additional information about the Fund at https://kineticsfunds.com/resources/. You can also request this information by contacting us at 1-800-930-3828.
WHAT WERE THE FUND COSTS FOR THE PAST YEAR? (based on a hypothetical $10,000 investment)
| | |
Class Name | Costs of a $10,000 investment | Costs paid as a percentage of a $10,000 investment |
| No Load Class | $163 | 1.39% |
HOW DID THE FUND PERFORM LAST YEAR AND WHAT AFFECTED ITS PERFORMANCE?
For the 12-month period ended December 31, 2024, the Fund posted 72.16%, significantly outperforming the S&P 500 Index and MSCI All Country World Index which posted 25.02% and 17.49%, respectively.
WHAT FACTORS INFLUENCED PERFORMANCE
Blockchain and cryptocurrency contributed positively, with Bitcoin prices more than doubling for the second consecutive year. Bitcoin continues to set itself apart from other cryptocurrencies, supported by a more favorable regulatory landscape. The Fund’s performance was driven by strong positive returns in “hard asset” companies, which we believe are well-positioned to benefit from rising prices, particularly in the energy sector. Energy prices were mixed for the year, as strong supply growth negated resilient demand. Our energy exposure to royalties and land/infrastructure decoupled from commodity markets due to unique growth drivers.
The portfolio remains focused on global companies with unique business models exhibiting market mispricing and dislocation. Guided by our long-term value investment philosophy, the Fund may experience periods of outperformance or underperformance relative to the benchmark, but we believe the Fund is well-positioned to generate above-market returns over the long term.
The Fund’s top contributor: Security selection collectively contributed positively to performance particularly with the Fund’s overweight exposure to Energy and Blockchain/Cryptocurrency. Grayscale Bitcoin Trust ETF (“GBTC”) was the largest contributor to returns.
The Fund’s top detractor: Permian Basin Royalty Trust (“PBT”) detracted marginally from returns.
HOW DID THE FUND PERFORM OVER THE PAST 10 YEARS?*
The $10,000 chart reflects a hypothetical $10,000 investment in the class of shares noted and assumes the maximum sales charge. The chart uses total return NAV performance and assumes reinvestment of dividends and capital gains. Fund expenses, including 12b-1 fees, management fees and other expenses were deducted.
| The Global Fund | PAGE 1 | TSR-AR-494613805 |
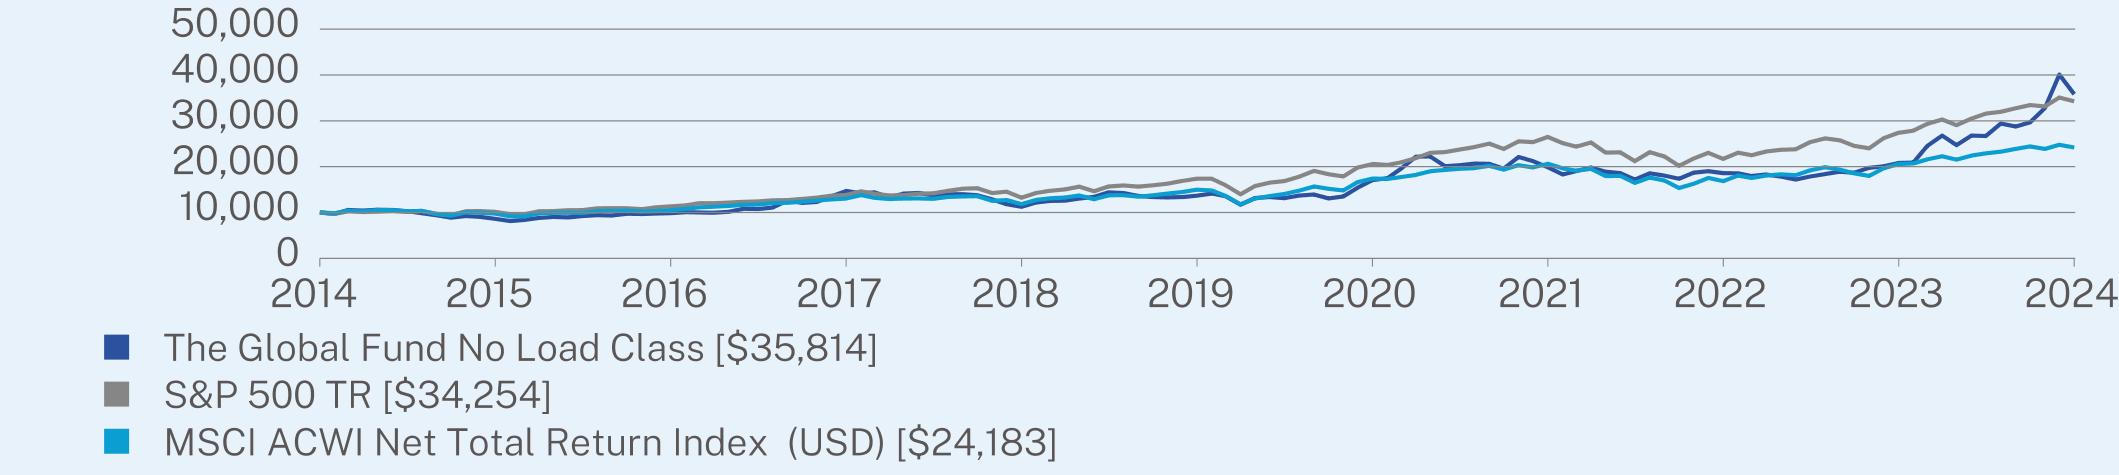
CUMULATIVE PERFORMANCE (Initial Investment of $10,000)
ANNUAL AVERAGE TOTAL RETURN (%)
| | | |
| | 1 Year | 5 Year | 10 Year |
No Load Class (without sales charge) | 72.16 | 21.25 | 13.61 |
S&P 500 TR | 25.02 | 14.53 | 13.10 |
MSCI ACWI Net Total Return Index (USD) | 17.49 | 10.06 | 9.23 |
Visit https://kineticsfunds.com/resources/ for more recent performance information.
| * | The Fund’s past performance is not a good predictor of how the Fund will perform in the future. The graph and table do not reflect the deduction of taxes that a shareholder would pay on Fund distributions or redemption of Fund shares. |
KEY FUND STATISTICS (as of December 31, 2024)
| |
Net Assets | $49,640,955 |
Number of Holdings | 67 |
Net Advisory Fee | $181,178 |
Portfolio Turnover | 34% |
Visit https://kineticsfunds.com/resources/ for more recent performance information.
WHAT DID THE FUND INVEST IN? (as of December 31, 2024)
| |
Top Sectors(% of Net Assets) |
Finance and Insurance | 31.7% |
Mining, Quarrying, and Oil and Gas Extraction | 26.6% |
Management of Companies and Enterprises | 7.0% |
Entertainment | 1.9% |
Real Estate and Rental and Leasing | 1.2% |
Transportation and Warehousing | 1.2% |
Professional, Scientific and Technical Services | 0.6% |
Media | 0.5% |
Real Estate | 0.3% |
Accommodation and Food Services | 0.2% |
| |
Top 10 Issuers(% of Net Assets) |
Grayscale Bitcoin Trust ETF | 22.9% |
Texas Pacific Land Corp. | 19.2% |
White Mountains Insurance Group Ltd. | 4.1% |
Landbridge Co. LLC | 4.0% |
Grayscale Bitcoin Mini Trust ETF | 2.6% |
IG Port, Inc. | 1.9% |
Galaxy Digital Holdings Ltd. | 1.5% |
GAMCO Investors, Inc. | 1.3% |
Wheaton Precious Metals Corp. | 1.2% |
Mesabi Trust | 1.2% |
| |
Top Ten Countries(% of Net Assets) |
United States | 61.7% |
Canada | 5.7% |
Japan | 2.5% |
United Kingdom | 1.0% |
Sweden | 0.5% |
Germany | 0.3% |
Cayman Islands | 0.3% |
Netherlands | 0.3% |
Brazil | 0.1% |
Greece | 0.1% |
For additional information about the Fund; including its prospectus, financial information, holdings and proxy information, scan the QR code or visit https://kineticsfunds.com/resources/.
| The Global Fund | PAGE 2 | TSR-AR-494613805 |
HOUSEHOLDING
To reduce Fund expenses, only one copy of most shareholder documents may be mailed to shareholders with multiple accounts at the same address (Householding). If you would prefer that your Horizon Kinetics Asset Management LLC documents not be householded, please contact Horizon Kinetics Asset Management LLC at 1-800-930-3828, or contact your financial intermediary. Your instructions will typically be effective within 30 days of receipt by Horizon Kinetics Asset Management LLC or your financial intermediary.
| The Global Fund | PAGE 3 | TSR-AR-494613805 |
100008617985714707112401366917086198741859120802358141000010138113511382913223173862058526494216962739934254100009764105311305611827149731740620633168442058424183
| | |
| The Paradigm Fund | |
| Advisor Class A | KNPAX |
| Annual Shareholder Report | December 31, 2024 |
This annual shareholder report contains important information about the The Paradigm Fund for the period of January 1, 2024, to December 31, 2024. You can find additional information about the Fund at https://kineticsfunds.com/resources/. You can also request this information by contacting us at 1-800-930-3828.
WHAT WERE THE FUND COSTS FOR THE PAST YEAR? (based on a hypothetical $10,000 investment)
| | |
Class Name | Costs of a $10,000 investment | Costs paid as a percentage of a $10,000 investment |
| Advisor Class A | $234 | 1.89% |
HOW DID THE FUND PERFORM LAST YEAR AND WHAT AFFECTED ITS PERFORMANCE?
For the 12-month period ended December 31, 2024, the Fund’s No-Load share class posted 88.47% and significantly outperformed the S&P 500 Index and MSCI All Country World Index which posted 25.02% and 17.49%, respectively.
WHAT FACTORS INFLUENCED PERFORMANCE
The Fund’s performance was driven by strong positive returns in “hard asset” companies, which we believe are well-positioned to benefit from rising prices, particularly in the energy sector. Energy prices were mixed for the year, as strong supply growth negated resilient demand. Our energy exposure to royalties and land/infrastructure decoupled from commodity markets due to unique growth drivers. Blockchain and cryptocurrency also contributed positively, with Bitcoin prices more than doubling for the second consecutive year. Bitcoin continues to set itself apart from other cryptocurrencies, supported by a more favorable regulatory landscape.
The portfolio remains focused on high-quality, durable businesses with exposure to hard assets, which we believe are well-positioned to perform across various macroeconomic conditions, particularly in a sustained inflationary environment. Guided by our long-term value investment philosophy, the Fund may experience periods of outperformance or underperformance relative to the benchmark, but we believe the Fund is well-positioned to generate above-market returns over the long term.
The Fund’s top contributor: Security selection collectively contributed positively to performance particularly within the Energy Sector. Texas Pacific Land Corporation (Ticker: TPL) was the largest contributor to returns.
The Fund’s top detractor: Howard Hughes Holdings Inc (Ticker: HHH) detracted marginally from returns.
HOW DID THE FUND PERFORM OVER THE PAST 10 YEARS?*
The $10,000 chart reflects a hypothetical $10,000 investment in the class of shares noted and assumes the maximum sales charge. The chart uses total return NAV performance and assumes reinvestment of dividends and capital gains. Fund expenses, including 12b-1 fees, management fees and other expenses were deducted.
| The Paradigm Fund | PAGE 1 | TSR-AR-494613854 |
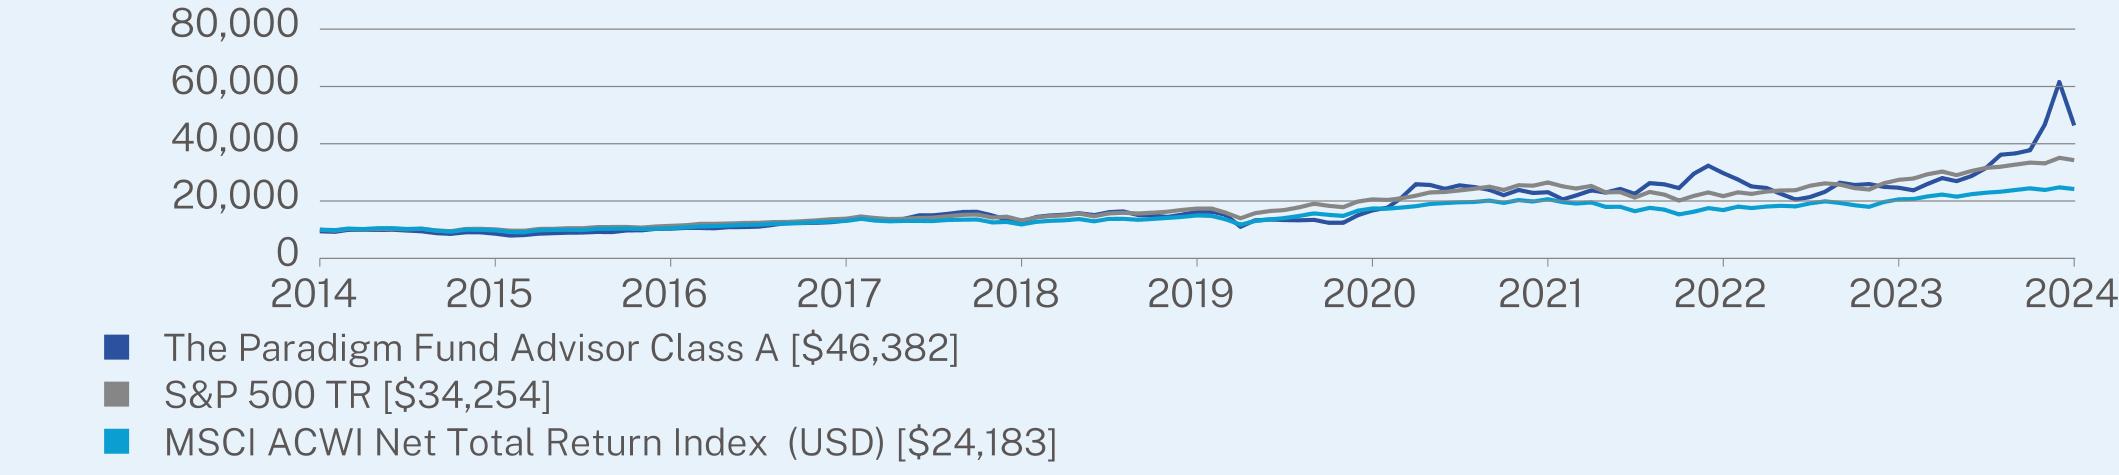
CUMULATIVE PERFORMANCE (Initial Investment of $10,000)
ANNUAL AVERAGE TOTAL RETURN (%)
| | | |
| | 1 Year | 5 Year | 10 Year |
Advisor Class A (without sales charge) | 88.00 | 23.32 | 17.28 |
Advisor Class A (with sales charge) | 77.18 | 21.87 | 16.58 |
S&P 500 TR | 25.02 | 14.53 | 13.10 |
MSCI ACWI Net Total Return Index (USD) | 17.49 | 10.06 | 9.23 |
Visit https://kineticsfunds.com/resources/ for more recent performance information.
| * | The Fund’s past performance is not a good predictor of how the Fund will perform in the future. The graph and table do not reflect the deduction of taxes that a shareholder would pay on Fund distributions or redemption of Fund shares. |
KEY FUND STATISTICS (as of December 31, 2024)
| |
Net Assets | $1,331,836,958 |
Number of Holdings | 53 |
Net Advisory Fee | $12,443,785 |
Portfolio Turnover | 2% |
Visit https://kineticsfunds.com/resources/ for more recent performance information.
WHAT DID THE FUND INVEST IN? (as of December 31, 2024)
| |
Top Sectors | (% of Net Assets) |
Mining, Quarrying, and Oil and Gas Extraction | 73.6% |
Finance and Insurance | 16.2% |
Arts, Entertainment, and Recreation | 2.1% |
Real Estate and Rental and Leasing | 1.8% |
Information | 1.3% |
Professional, Scientific and Technical Services | 0.9% |
Management of Companies and Enterprises | 0.8% |
Food Services and Drinking Places | 0.4% |
Management, Scientific, and Technical Consulting | 0.4% |
Accommodation and Food Services | 0.4% |
| |
Top 10 Issuers | (% of Net Assets) |
Texas Pacific Land Corp. | 67.7% |
Grayscale Bitcoin Trust ETF | 10.8% |
Landbridge Co. LLC | 4.4% |
Brookfield Corp. | 2.8% |
Live Nation Entertainment, Inc. | 2.1% |
Howard Hughes Holdings, Inc. | 1.4% |
Franco-Nevada Corp. | 1.3% |
Grayscale Bitcoin Mini Trust ETF | 1.2% |
CACI International, Inc. | 0.9% |
Cboe Global Markets, Inc. | 0.9% |
For additional information about the Fund; including its prospectus, financial information, holdings and proxy information, scan the QR code or visit https://kineticsfunds.com/resources/.
| The Paradigm Fund | PAGE 2 | TSR-AR-494613854 |
HOUSEHOLDING
To reduce Fund expenses, only one copy of most shareholder documents may be mailed to shareholders with multiple accounts at the same address (Householding). If you would prefer that your Horizon Kinetics Asset Management LLC documents not be householded, please contact Horizon Kinetics Asset Management LLC at 1-800-930-3828, or contact your financial intermediary. Your instructions will typically be effective within 30 days of receipt by Horizon Kinetics Asset Management LLC or your financial intermediary.
| The Paradigm Fund | PAGE 3 | TSR-AR-494613854 |
942486171035613263124951626316759230962976224672463821000010138113511382913223173862058526494216962739934254100009764105311305611827149731740620633168442058424183
| | |
| The Paradigm Fund | |
| Advisor Class C | KNPCX |
| Annual Shareholder Report | December 31, 2024 |
This annual shareholder report contains important information about the The Paradigm Fund for the period of January 1, 2024, to December 31, 2024. You can find additional information about the Fund at https://kineticsfunds.com/resources/. You can also request this information by contacting us at 1-800-930-3828.
WHAT WERE THE FUND COSTS FOR THE PAST YEAR? (based on a hypothetical $10,000 investment)
| | |
Class Name | Costs of a $10,000 investment | Costs paid as a percentage of a $10,000 investment |
| Advisor Class C | $295 | 2.39% |
HOW DID THE FUND PERFORM LAST YEAR AND WHAT AFFECTED ITS PERFORMANCE?
For the 12-month period ended December 31, 2024, the Fund’s No-Load share class posted 88.47% and significantly outperformed the S&P 500 Index and MSCI All Country World Index which posted 25.02% and 17.49%, respectively.
WHAT FACTORS INFLUENCED PERFORMANCE
The Fund’s performance was driven by strong positive returns in “hard asset” companies, which we believe are well-positioned to benefit from rising prices, particularly in the energy sector. Energy prices were mixed for the year, as strong supply growth negated resilient demand. Our energy exposure to royalties and land/infrastructure decoupled from commodity markets due to unique growth drivers. Blockchain and cryptocurrency also contributed positively, with Bitcoin prices more than doubling for the second consecutive year. Bitcoin continues to set itself apart from other cryptocurrencies, supported by a more favorable regulatory landscape.
The portfolio remains focused on high-quality, durable businesses with exposure to hard assets, which we believe are well-positioned to perform across various macroeconomic conditions, particularly in a sustained inflationary environment. Guided by our long-term value investment philosophy, the Fund may experience periods of outperformance or underperformance relative to the benchmark, but we believe the Fund is well-positioned to generate above-market returns over the long term.
The Fund’s top contributor: Security selection collectively contributed positively to performance particularly within the Energy Sector. Texas Pacific Land Corporation (Ticker: TPL) was the largest contributor to returns.
The Fund’s top detractor: Howard Hughes Holdings Inc (Ticker: HHH) detracted marginally from returns.
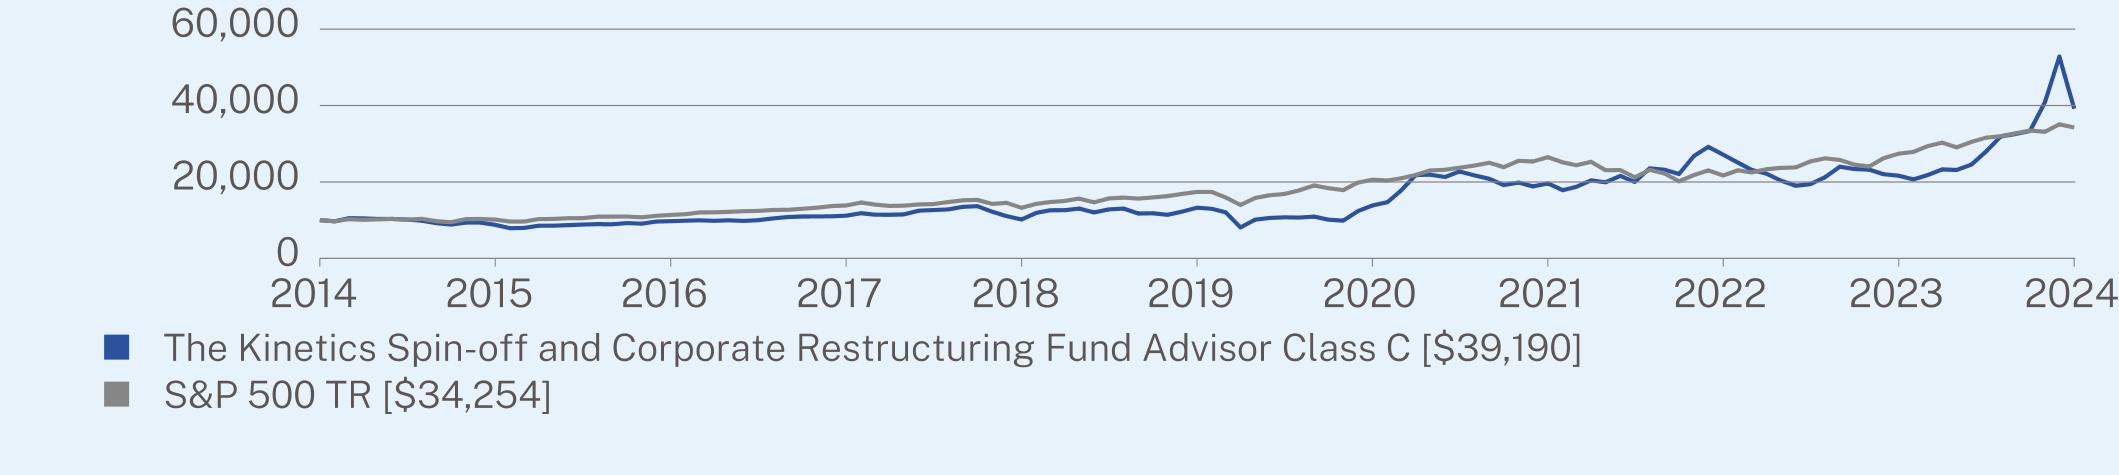
HOW DID THE FUND PERFORM OVER THE PAST 10 YEARS?*
The $10,000 chart reflects a hypothetical $10,000 investment in the class of shares noted and assumes the maximum sales charge. The chart uses total return NAV performance and assumes reinvestment of dividends and capital gains. Fund expenses, including 12b-1 fees, management fees and other expenses were deducted.
| The Paradigm Fund | PAGE 1 | TSR-AR-494613821 |
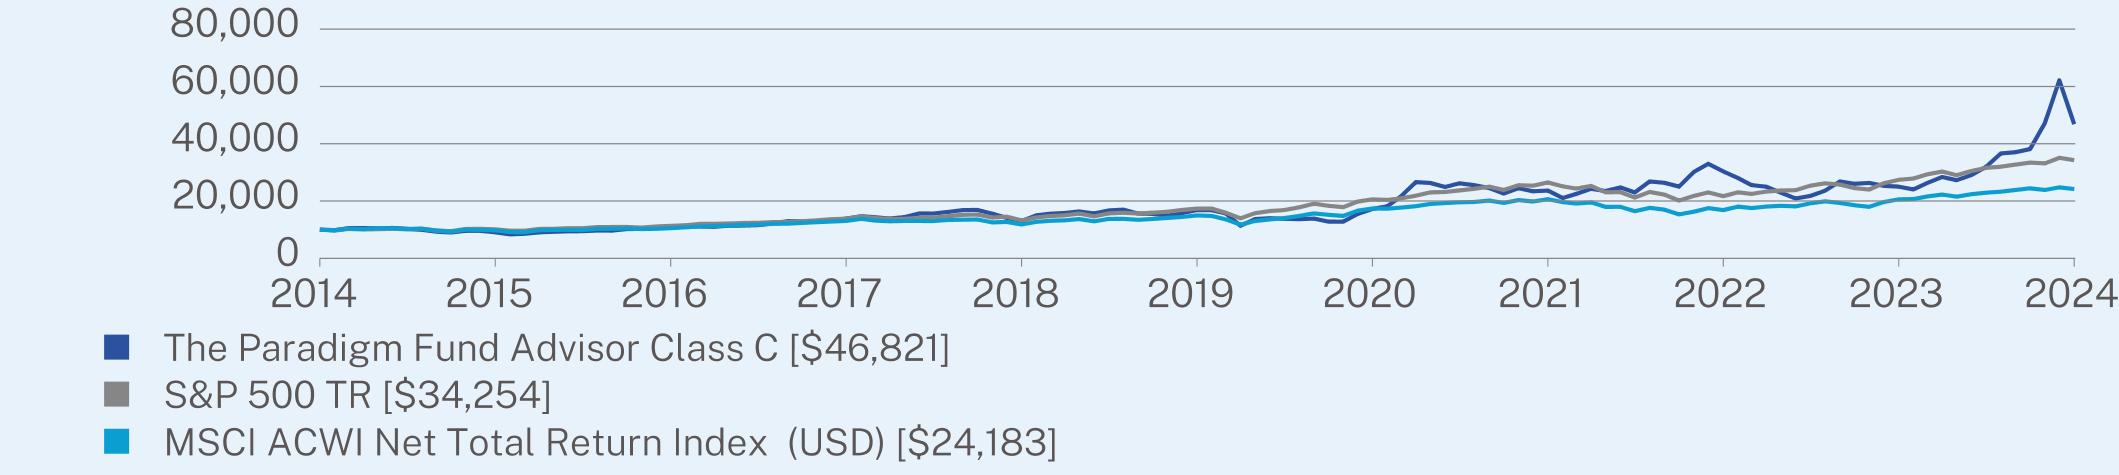
CUMULATIVE PERFORMANCE (Initial Investment of $10,000)
ANNUAL AVERAGE TOTAL RETURN (%)
| | | |
| | 1 Year | 5 Year | 10 Year |
Advisor Class C (without sales charge) | 87.06 | 22.71 | 16.69 |
Advisor Class C (with sales charge) | 86.06 | 22.71 | 16.69 |
S&P 500 TR | 25.02 | 14.53 | 13.10 |
MSCI ACWI Net Total Return Index (USD) | 17.49 | 10.06 | 9.23 |
Visit https://kineticsfunds.com/resources/ for more recent performance information.
| * | The Fund’s past performance is not a good predictor of how the Fund will perform in the future. The graph and table do not reflect the deduction of taxes that a shareholder would pay on Fund distributions or redemption of Fund shares. |
KEY FUND STATISTICS (as of December 31, 2024)
| |
Net Assets | $1,331,836,958 |
Number of Holdings | 53 |
Net Advisory Fee | $12,443,785 |
Portfolio Turnover | 2% |
Visit https://kineticsfunds.com/resources/ for more recent performance information.
WHAT DID THE FUND INVEST IN? (as of December 31, 2024)
| |
Top Sectors | (% of Net Assets) |
Mining, Quarrying, and Oil and Gas Extraction | 73.6% |
Finance and Insurance | 16.2% |
Arts, Entertainment, and Recreation | 2.1% |
Real Estate and Rental and Leasing | 1.8% |
Information | 1.3% |
Professional, Scientific and Technical Services | 0.9% |
Management of Companies and Enterprises | 0.8% |
Food Services and Drinking Places | 0.4% |
Management, Scientific, and Technical Consulting | 0.4% |
Accommodation and Food Services | 0.4% |
| |
Top 10 Issuers | (% of Net Assets) |
Texas Pacific Land Corp. | 67.7% |
Grayscale Bitcoin Trust ETF | 10.8% |
Landbridge Co. LLC | 4.4% |
Brookfield Corp. | 2.8% |
Live Nation Entertainment, Inc. | 2.1% |
Howard Hughes Holdings, Inc. | 1.4% |
Franco-Nevada Corp. | 1.3% |
Grayscale Bitcoin Mini Trust ETF | 1.2% |
CACI International, Inc. | 0.9% |
Cboe Global Markets, Inc. | 0.9% |
For additional information about the Fund; including its prospectus, financial information, holdings and proxy information, scan the QR code or visit https://kineticsfunds.com/resources/.
| The Paradigm Fund | PAGE 2 | TSR-AR-494613821 |
HOUSEHOLDING
To reduce Fund expenses, only one copy of most shareholder documents may be mailed to shareholders with multiple accounts at the same address (Householding). If you would prefer that your Horizon Kinetics Asset Management LLC documents not be householded, please contact Horizon Kinetics Asset Management LLC at 1-800-930-3828, or contact your financial intermediary. Your instructions will typically be effective within 30 days of receipt by Horizon Kinetics Asset Management LLC or your financial intermediary.
| The Paradigm Fund | PAGE 3 | TSR-AR-494613821 |
1000091001087813868129981683117262236683034625029468211000010138113511382913223173862058526494216962739934254100009764105311305611827149731740620633168442058424183
| | |
| The Paradigm Fund | |
| Institutional Class | KNPYX |
| Annual Shareholder Report | December 31, 2024 |
This annual shareholder report contains important information about the The Paradigm Fund for the period of January 1, 2024, to December 31, 2024. You can find additional information about the Fund at https://kineticsfunds.com/resources/. You can also request this information by contacting us at 1-800-930-3828.
WHAT WERE THE FUND COSTS FOR THE PAST YEAR? (based on a hypothetical $10,000 investment)
| | |
Class Name | Costs of a $10,000 investment | Costs paid as a percentage of a $10,000 investment |
| Institutional Class | $178 | 1.44% |
HOW DID THE FUND PERFORM LAST YEAR AND WHAT AFFECTED ITS PERFORMANCE?
For the 12-month period ended December 31, 2024, the Fund’s No-Load share class posted 88.47% and significantly outperformed the S&P 500 Index and MSCI All Country World Index which posted 25.02% and 17.49%, respectively.
WHAT FACTORS INFLUENCED PERFORMANCE
The Fund’s performance was driven by strong positive returns in “hard asset” companies, which we believe are well-positioned to benefit from rising prices, particularly in the energy sector. Energy prices were mixed for the year, as strong supply growth negated resilient demand. Our energy exposure to royalties and land/infrastructure decoupled from commodity markets due to unique growth drivers. Blockchain and cryptocurrency also contributed positively, with Bitcoin prices more than doubling for the second consecutive year. Bitcoin continues to set itself apart from other cryptocurrencies, supported by a more favorable regulatory landscape.
The portfolio remains focused on high-quality, durable businesses with exposure to hard assets, which we believe are well-positioned to perform across various macroeconomic conditions, particularly in a sustained inflationary environment. Guided by our long-term value investment philosophy, the Fund may experience periods of outperformance or underperformance relative to the benchmark, but we believe the Fund is well-positioned to generate above-market returns over the long term.
The Fund’s top contributor: Security selection collectively contributed positively to performance particularly within the Energy Sector. Texas Pacific Land Corporation (Ticker: TPL) was the largest contributor to returns.
The Fund’s top detractor: Howard Hughes Holdings Inc (Ticker: HHH) detracted marginally from returns.
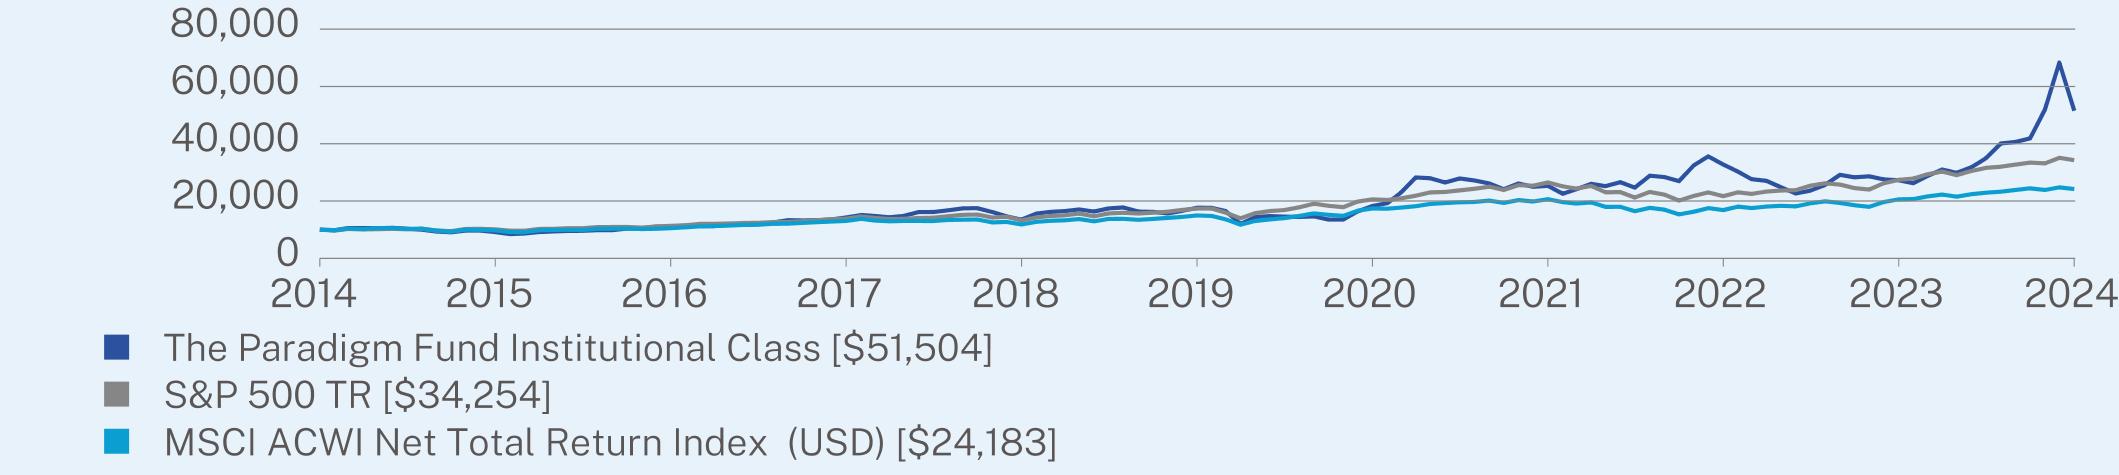
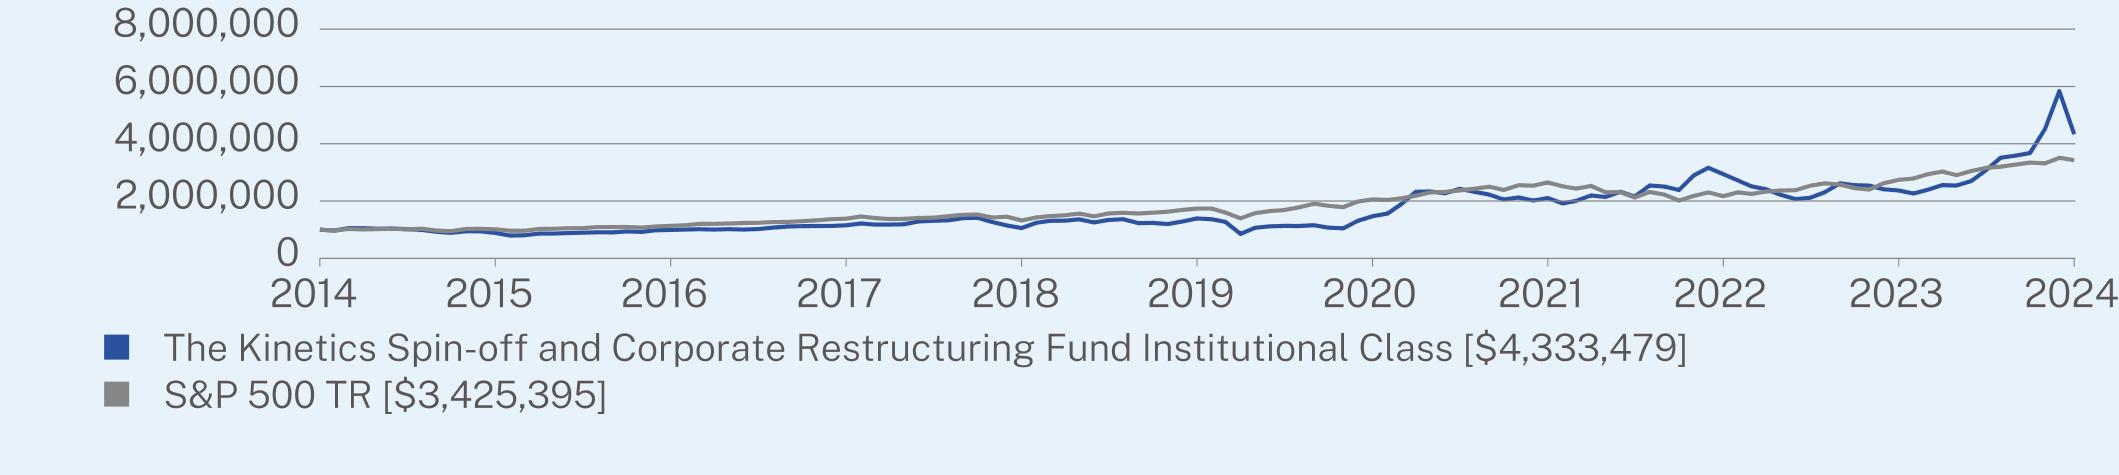
HOW DID THE FUND PERFORM OVER THE PAST 10 YEARS?*
The $10,000 chart reflects a hypothetical $10,000 investment in the class of shares noted and assumes the maximum sales charge. The chart uses total return NAV performance and assumes reinvestment of dividends and capital gains. Fund expenses, including 12b-1 fees, management fees and other expenses were deducted.
| The Paradigm Fund | PAGE 1 | TSR-AR-494613797 |
CUMULATIVE PERFORMANCE (Initial Investment of $10,000)
ANNUAL AVERAGE TOTAL RETURN (%)
| | | |
| | 1 Year | 5 Year | 10 Year |
Institutional Class (without sales charge) | 88.83 | 23.88 | 17.81 |
S&P 500 TR | 25.02 | 14.53 | 13.10 |
MSCI ACWI Net Total Return Index (USD) | 17.49 | 10.06 | 9.23 |
Visit https://kineticsfunds.com/resources/ for more recent performance information.
| * | The Fund’s past performance is not a good predictor of how the Fund will perform in the future. The graph and table do not reflect the deduction of taxes that a shareholder would pay on Fund distributions or redemption of Fund shares. |
KEY FUND STATISTICS (as of December 31, 2024)
| |
Net Assets | $1,331,836,958 |
Number of Holdings | 53 |
Net Advisory Fee | $12,443,785 |
Portfolio Turnover | 2% |
Visit https://kineticsfunds.com/resources/ for more recent performance information.
WHAT DID THE FUND INVEST IN? (as of December 31, 2024)
| |
Top Sectors | (% of Net Assets) |
Mining, Quarrying, and Oil and Gas Extraction | 73.6% |
Finance and Insurance | 16.2% |
Arts, Entertainment, and Recreation | 2.1% |
Real Estate and Rental and Leasing | 1.8% |
Information | 1.3% |
Professional, Scientific and Technical Services | 0.9% |
Management of Companies and Enterprises | 0.8% |
Food Services and Drinking Places | 0.4% |
Management, Scientific, and Technical Consulting | 0.4% |
Accommodation and Food Services | 0.4% |
| |
Top 10 Issuers | (% of Net Assets) |
Texas Pacific Land Corp. | 67.7% |
Grayscale Bitcoin Trust ETF | 10.8% |
Landbridge Co. LLC | 4.4% |
Brookfield Corp. | 2.8% |
Live Nation Entertainment, Inc. | 2.1% |
Howard Hughes Holdings, Inc. | 1.4% |
Franco-Nevada Corp. | 1.3% |
Grayscale Bitcoin Mini Trust ETF | 1.2% |
CACI International, Inc. | 0.9% |
Cboe Global Markets, Inc. | 0.9% |
For additional information about the Fund; including its prospectus, financial information, holdings and proxy information, scan the QR code or visit https://kineticsfunds.com/resources/.
| The Paradigm Fund | PAGE 2 | TSR-AR-494613797 |
HOUSEHOLDING
To reduce Fund expenses, only one copy of most shareholder documents may be mailed to shareholders with multiple accounts at the same address (Householding). If you would prefer that your Horizon Kinetics Asset Management LLC documents not be householded, please contact Horizon Kinetics Asset Management LLC at 1-800-930-3828, or contact your financial intermediary. Your instructions will typically be effective within 30 days of receipt by Horizon Kinetics Asset Management LLC or your financial intermediary.
| The Paradigm Fund | PAGE 3 | TSR-AR-494613797 |
1000091841108914266135001765218278253053275427275515041000010138113511382913223173862058526494216962739934254100009764105311305611827149731740620633168442058424183
| | |
| The Paradigm Fund | |
| No Load Class | WWNPX |
| Annual Shareholder Report | December 31, 2024 |
This annual shareholder report contains important information about the The Paradigm Fund for the period of January 1, 2024, to December 31, 2024. You can find additional information about the Fund at https://kineticsfunds.com/resources/. You can also request this information by contacting us at 1-800-930-3828.
WHAT WERE THE FUND COSTS FOR THE PAST YEAR? (based on a hypothetical $10,000 investment)
| | |
Class Name | Costs of a $10,000 investment | Costs paid as a percentage of a $10,000 investment |
| No Load Class | $203 | 1.64% |
HOW DID THE FUND PERFORM LAST YEAR AND WHAT AFFECTED ITS PERFORMANCE?
For the 12-month period ended December 31, 2024, the Fund’s No-Load share class posted 88.47% and significantly outperformed the S&P 500 Index and MSCI All Country World Index which posted 25.02% and 17.49%, respectively.
WHAT FACTORS INFLUENCED PERFORMANCE
The Fund’s performance was driven by strong positive returns in “hard asset” companies, which we believe are well-positioned to benefit from rising prices, particularly in the energy sector. Energy prices were mixed for the year, as strong supply growth negated resilient demand. Our energy exposure to royalties and land/infrastructure decoupled from commodity markets due to unique growth drivers. Blockchain and cryptocurrency also contributed positively, with Bitcoin prices more than doubling for the second consecutive year. Bitcoin continues to set itself apart from other cryptocurrencies, supported by a more favorable regulatory landscape.
The portfolio remains focused on high-quality, durable businesses with exposure to hard assets, which we believe are well-positioned to perform across various macroeconomic conditions, particularly in a sustained inflationary environment. Guided by our long-term value investment philosophy, the Fund may experience periods of outperformance or underperformance relative to the benchmark, but we believe the Fund is well-positioned to generate above-market returns over the long term.
The Fund’s top contributor: Security selection collectively contributed positively to performance particularly within the Energy Sector. Texas Pacific Land Corporation (Ticker: TPL) was the largest contributor to returns.
The Fund’s top detractor: Howard Hughes Holdings Inc (Ticker: HHH) detracted marginally from returns.
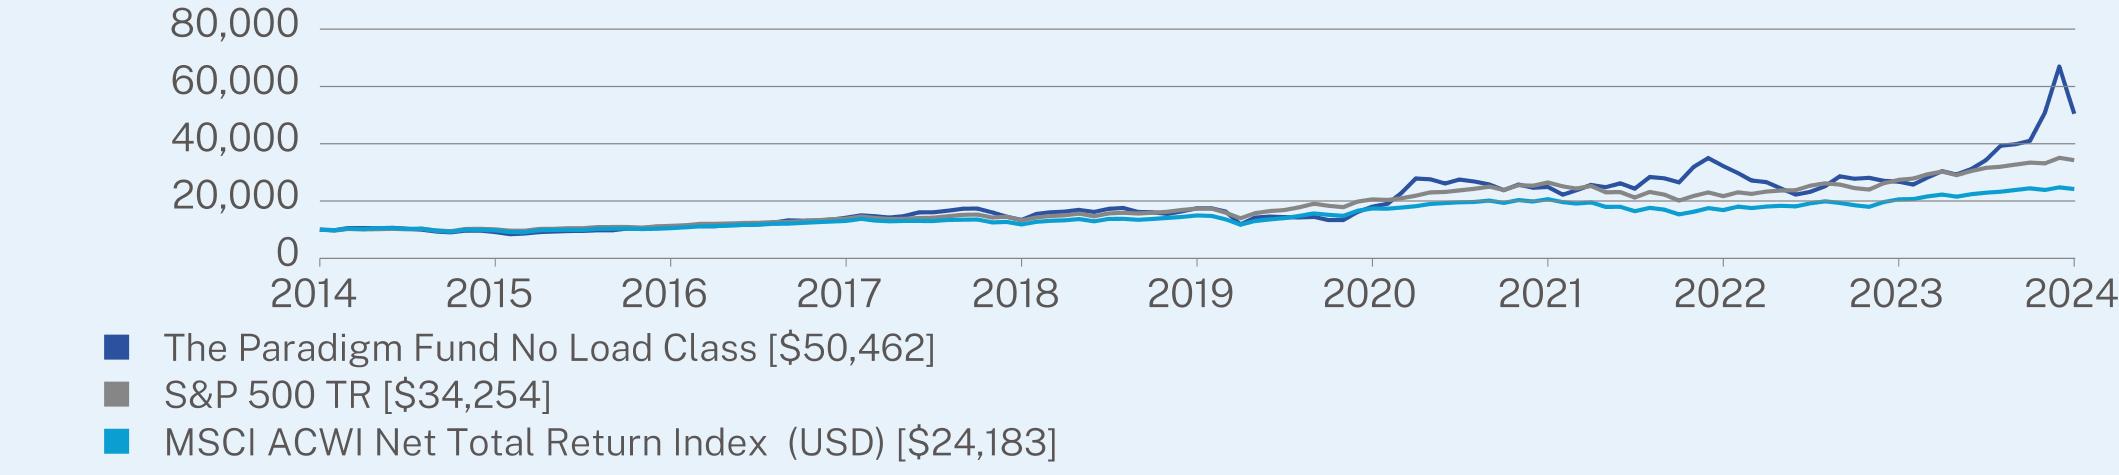
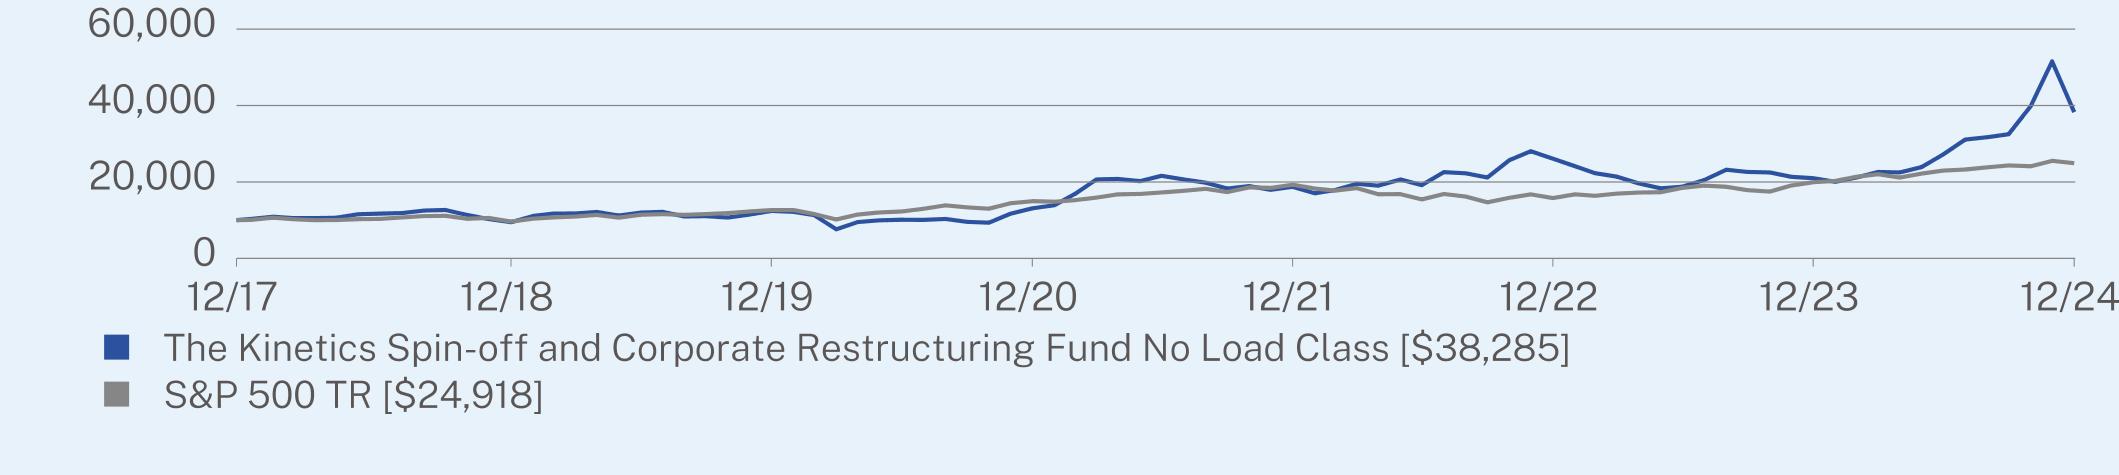
HOW DID THE FUND PERFORM OVER THE PAST 10 YEARS?*
The $10,000 chart reflects a hypothetical $10,000 investment in the class of shares noted and assumes the maximum sales charge. The chart uses total return NAV performance and assumes reinvestment of dividends and capital gains. Fund expenses, including 12b-1 fees, management fees and other expenses were deducted.
CUMULATIVE PERFORMANCE (Initial Investment of $10,000)
ANNUAL AVERAGE TOTAL RETURN (%)
| | | |
| | 1 Year | 5 Year | 10 Year |
No Load Class (without sales charge) | 88.47 | 23.63 | 17.57 |
S&P 500 TR | 25.02 | 14.53 | 13.10 |
MSCI ACWI Net Total Return Index (USD) | 17.49 | 10.06 | 9.23 |
Visit https://kineticsfunds.com/resources/ for more recent performance information.
| * | The Fund’s past performance is not a good predictor of how the Fund will perform in the future. The graph and table do not reflect the deduction of taxes that a shareholder would pay on Fund distributions or redemption of Fund shares. |
KEY FUND STATISTICS (as of December 31, 2024)
| |
Net Assets | $1,331,836,958 |
Number of Holdings | 53 |
Net Advisory Fee | $12,443,785 |
Portfolio Turnover | 2% |
Visit https://kineticsfunds.com/resources/ for more recent performance information.
WHAT DID THE FUND INVEST IN? (as of December 31, 2024)
| |
Top Sectors | (% of Net Assets) |
Mining, Quarrying, and Oil and Gas Extraction | 73.6% |
Finance and Insurance | 16.2% |
Arts, Entertainment, and Recreation | 2.1% |
Real Estate and Rental and Leasing | 1.8% |
Information | 1.3% |
Professional, Scientific and Technical Services | 0.9% |
Management of Companies and Enterprises | 0.8% |
Food Services and Drinking Places | 0.4% |
Management, Scientific, and Technical Consulting | 0.4% |
Accommodation and Food Services | 0.4% |
| |
Top 10 Issuers | (% of Net Assets) |
Texas Pacific Land Corp. | 67.7% |
Grayscale Bitcoin Trust ETF | 10.8% |
Landbridge Co. LLC | 4.4% |
Brookfield Corp. | 2.8% |
Live Nation Entertainment, Inc. | 2.1% |
Howard Hughes Holdings, Inc. | 1.4% |
Franco-Nevada Corp. | 1.3% |
Grayscale Bitcoin Mini Trust ETF | 1.2% |
CACI International, Inc. | 0.9% |
Cboe Global Markets, Inc. | 0.9% |
For additional information about the Fund; including its prospectus, financial information, holdings and proxy information, scan the QR code or visit https://kineticsfunds.com/resources/.
HOUSEHOLDING
To reduce Fund expenses, only one copy of most shareholder documents may be mailed to shareholders with multiple accounts at the same address (Householding). If you would prefer that your Horizon Kinetics Asset Management LLC documents not be householded, please contact Horizon Kinetics Asset Management LLC at 1-800-930-3828, or contact your financial intermediary. Your instructions will typically be effective within 30 days of receipt by Horizon Kinetics Asset Management LLC or your financial intermediary.
1000091671104214178133921747318053249413221826775504621000010138113511382913223173862058526494216962739934254100009764105311305611827149731740620633168442058424183
| | |
| The Small Cap Opportunities Fund | |
| Advisor Class A | KSOAX |
| Annual Shareholder Report | December 31, 2024 |
This annual shareholder report contains important information about the The Small Cap Opportunities Fund for the period of January 1, 2024, to December 31, 2024. You can find additional information about the Fund at https://kineticsfunds.com/resources/. You can also request this information by contacting us at 1-800-930-3828.
WHAT WERE THE FUND COSTS FOR THE PAST YEAR? (based on a hypothetical $10,000 investment)
| | |
Class Name | Costs of a $10,000 investment | Costs paid as a percentage of a $10,000 investment |
| Advisor Class A | $225 | 1.89% |
HOW DID THE FUND PERFORM LAST YEAR AND WHAT AFFECTED ITS PERFORMANCE?
For the 12-month period ended December 31, 2024, the Fund’s No-Load class posted 68.52% and significantly outperformed benchmarks S&P 600 Small Cap Index and S&P 500 Index which posted 8.70% and 25.02%, respectively.
WHAT FACTORS INFLUENCED PERFORMANCE
The Fund’s performance was driven by strong positive returns in “hard asset” companies, which we believe are well-positioned to benefit from rising prices, particularly in the energy sector. Energy prices were mixed for the year, as strong supply growth negated resilient demand. Our energy exposure to royalties and land/infrastructure decoupled from commodity markets due to unique growth drivers. The Fund also benefitted from exposure to a “Defense Technology” company that provides essential surveillance, communications and encryption/security for the federal government.
The portfolio remains focused on companies within the broader universe of value companies in the hard asset realm and seeks opportunities in small capitalization issuers with the potential to expand to higher valuations either through revaluation, growth or a combination thereof. Guided by long-term our value investment philosophy, the Fund may experience periods of outperformance or underperformance relative to the benchmark, but we believe the Fund is well-positioned to generate above-market returns over the long term.
The Fund’s top contributor: Security selection collectively contributed positively to performance particularly within the Energy Sector. Texas Pacific Land Corporation (“TPL”) was the largest contributor to returns.
The Fund’s top detractor: Inter Parfums, Inc (“IPAR”) detracted marginally from returns.
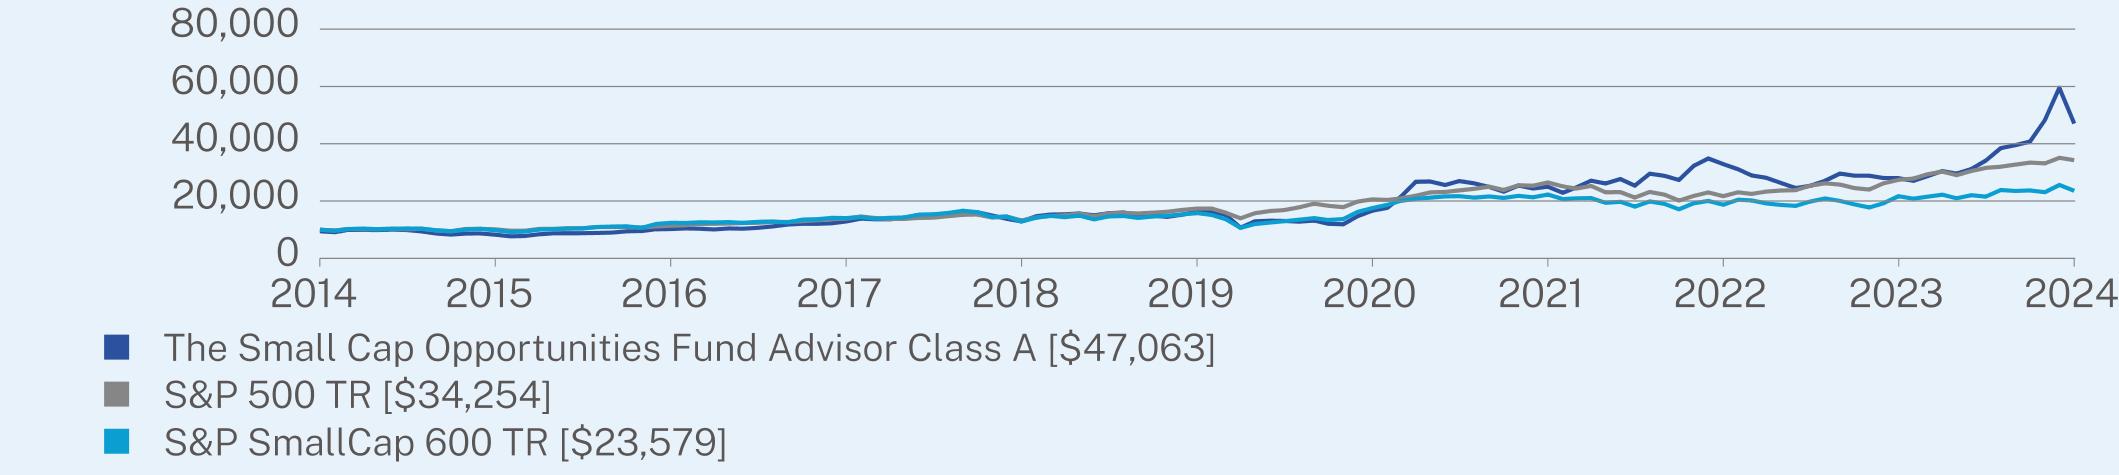
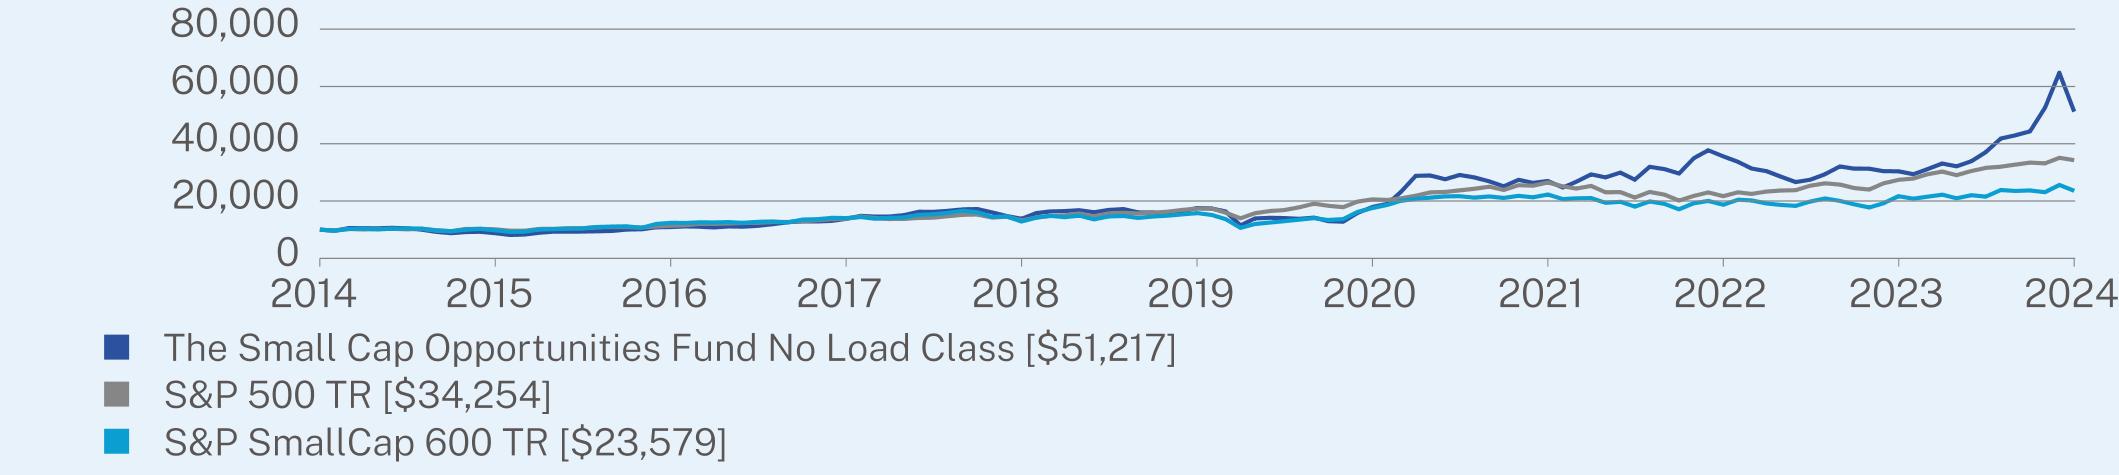
HOW DID THE FUND PERFORM OVER THE PAST 10 YEARS?*
The $10,000 chart reflects a hypothetical $10,000 investment in the class of shares noted and assumes the maximum sales charge. The chart uses total return NAV performance and assumes reinvestment of dividends and capital gains. Fund expenses, including 12b-1 fees, management fees and other expenses were deducted.
| The Small Cap Opportunities Fund | PAGE 1 | TSR-AR-494613839 |
CUMULATIVE PERFORMANCE (Initial Investment of $10,000)
ANNUAL AVERAGE TOTAL RETURN (%)
| | | |
| | 1 Year | 5 Year | 10 Year |
Advisor Class A (without sales charge) | 68.10 | 23.57 | 17.45 |
Advisor Class A (with sales charge) | 58.44 | 22.11 | 16.75 |
S&P 500 TR | 25.02 | 14.53 | 13.10 |
S&P SmallCap 600 TR | 8.70 | 8.36 | 8.96 |
Visit https://kineticsfunds.com/resources/ for more recent performance information.
| * | The Fund’s past performance is not a good predictor of how the Fund will perform in the future. The graph and table do not reflect the deduction of taxes that a shareholder would pay on Fund distributions or redemption of Fund shares. |
KEY FUND STATISTICS (as of December 31, 2024)
| |
Net Assets | $465,795,726 |
Number of Holdings | 56 |
Net Advisory Fee | $4,073,747 |
Portfolio Turnover | 6% |
Visit https://kineticsfunds.com/resources/ for more recent performance information.
WHAT DID THE FUND INVEST IN? (as of December 31, 2024)
| |
Top Sectors | (% of Net Assets) |
Mining, Quarrying, and Oil and Gas Extraction | 59.1% |
Finance and Insurance | 7.2% |
Professional, Scientific and Technical Services | 4.9% |
Management of Companies and Enterprises | 3.2% |
Accommodation and Food Services | 2.7% |
Real Estate | 2.6% |
Manufacturing | 1.6% |
Management, Scientific, and Technical Consulting | 1.6% |
Real Estate and Rental and Leasing | 0.8% |
Arts, Entertainment, and Recreation | 0.7% |
| |
Top 10 Issuers | (% of Net Assets) |
Texas Pacific Land Corp. | 53.2% |
Landbridge Co. LLC | 5.5% |
Grayscale Bitcoin Trust ETF | 4.8% |
CACI International, Inc. | 4.3% |
Civeo Corp. | 2.7% |
DREAM Unlimited Corp. | 2.3% |
Carnival Corp. | 1.6% |
Interparfums, Inc. | 1.5% |
Associated Capital Group, Inc. | 1.4% |
Urbana Corp. | 1.0% |
For additional information about the Fund; including its prospectus, financial information, holdings and proxy information, scan the QR code or visit https://kineticsfunds.com/resources/.
| The Small Cap Opportunities Fund | PAGE 2 | TSR-AR-494613839 |
HOUSEHOLDING
To reduce Fund expenses, only one copy of most shareholder documents may be mailed to shareholders with multiple accounts at the same address (Householding). If you would prefer that your Horizon Kinetics Asset Management LLC documents not be householded, please contact Horizon Kinetics Asset Management LLC at 1-800-930-3828, or contact your financial intermediary. Your instructions will typically be effective within 30 days of receipt by Horizon Kinetics Asset Management LLC or your financial intermediary.
| The Small Cap Opportunities Fund | PAGE 3 | TSR-AR-494613839 |
942582511023612891128911633516669249943290227997470631000010138113511382913223173862058526494216962739934254100009803124061404812856157851756722278186922169223579
| | |
| The Small Cap Opportunities Fund | |
| Advisor Class C | KSOCX |
| Annual Shareholder Report | December 31, 2024 |
This annual shareholder report contains important information about the The Small Cap Opportunities Fund for the period of January 1, 2024, to December 31, 2024. You can find additional information about the Fund at https://kineticsfunds.com/resources/. You can also request this information by contacting us at 1-800-930-3828.
WHAT WERE THE FUND COSTS FOR THE PAST YEAR? (based on a hypothetical $10,000 investment)
| | |
Class Name | Costs of a $10,000 investment | Costs paid as a percentage of a $10,000 investment |
| Advisor Class C | $284 | 2.39% |
HOW DID THE FUND PERFORM LAST YEAR AND WHAT AFFECTED ITS PERFORMANCE?
For the 12-month period ended December 31, 2024, the Fund’s No-Load class posted 68.52% and significantly outperformed benchmarks S&P 600 Small Cap Index and S&P 500 Index which posted 8.70% and 25.02%, respectively.
WHAT FACTORS INFLUENCED PERFORMANCE
The Fund’s performance was driven by strong positive returns in “hard asset” companies, which we believe are well-positioned to benefit from rising prices, particularly in the energy sector. Energy prices were mixed for the year, as strong supply growth negated resilient demand. Our energy exposure to royalties and land/infrastructure decoupled from commodity markets due to unique growth drivers. The Fund also benefitted from exposure to a “Defense Technology” company that provides essential surveillance, communications and encryption/security for the federal government.
The portfolio remains focused on companies within the broader universe of value companies in the hard asset realm and seeks opportunities in small capitalization issuers with the potential to expand to higher valuations either through revaluation, growth or a combination thereof. Guided by long-term our value investment philosophy, the Fund may experience periods of outperformance or underperformance relative to the benchmark, but we believe the Fund is well-positioned to generate above-market returns over the long term.
The Fund’s top contributor: Security selection collectively contributed positively to performance particularly within the Energy Sector. Texas Pacific Land Corporation (“TPL”) was the largest contributor to returns.
The Fund’s top detractor: Inter Parfums, Inc (“IPAR”) detracted marginally from returns.
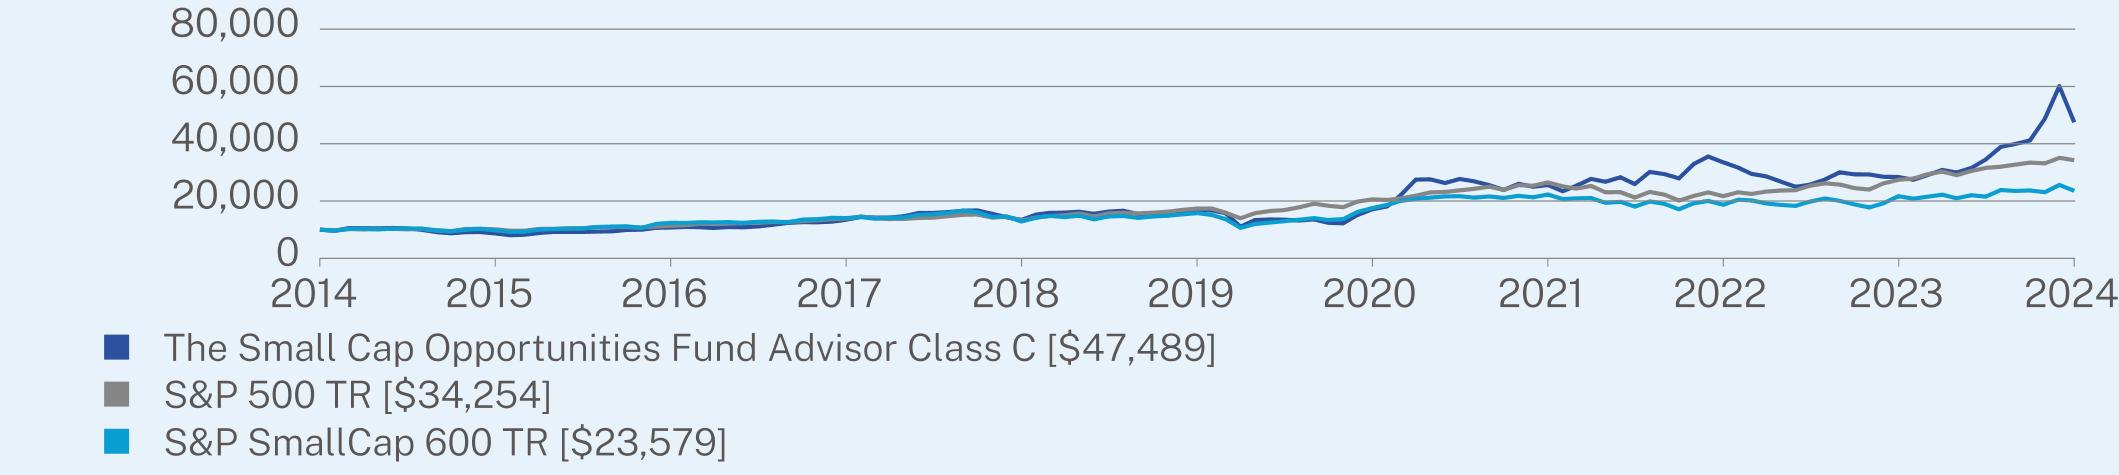
HOW DID THE FUND PERFORM OVER THE PAST 10 YEARS?*
The $10,000 chart reflects a hypothetical $10,000 investment in the class of shares noted and assumes the maximum sales charge. The chart uses total return NAV performance and assumes reinvestment of dividends and capital gains. Fund expenses, including 12b-1 fees, management fees and other expenses were deducted.
| The Small Cap Opportunities Fund | PAGE 1 | TSR-AR-494613748 |
CUMULATIVE PERFORMANCE (Initial Investment of $10,000)
ANNUAL AVERAGE TOTAL RETURN (%)
| | | |
| | 1 Year | 5 Year | 10 Year |
Advisor Class C (without sales charge) | 67.25 | 22.95 | 16.86 |
Advisor Class C (with sales charge) | 66.25 | 22.95 | 16.86 |
S&P 500 TR | 25.02 | 14.53 | 13.10 |
S&P SmallCap 600 TR | 8.70 | 8.36 | 8.96 |
Visit https://kineticsfunds.com/resources/ for more recent performance information.
| * | The Fund’s past performance is not a good predictor of how the Fund will perform in the future. The graph and table do not reflect the deduction of taxes that a shareholder would pay on Fund distributions or redemption of Fund shares. |
KEY FUND STATISTICS (as of December 31, 2024)
| |
Net Assets | $465,795,726 |
Number of Holdings | 56 |
Net Advisory Fee | $4,073,747 |
Portfolio Turnover | 6% |
Visit https://kineticsfunds.com/resources/ for more recent performance information.
WHAT DID THE FUND INVEST IN? (as of December 31, 2024)
| |
Top Sectors | (% of Net Assets) |
Mining, Quarrying, and Oil and Gas Extraction | 59.1% |
Finance and Insurance | 7.2% |
Professional, Scientific and Technical Services | 4.9% |
Management of Companies and Enterprises | 3.2% |
Accommodation and Food Services | 2.7% |
Real Estate | 2.6% |
Manufacturing | 1.6% |
Management, Scientific, and Technical Consulting | 1.6% |
Real Estate and Rental and Leasing | 0.8% |
Arts, Entertainment, and Recreation | 0.7% |
| |
Top 10 Issuers | (% of Net Assets) |
Texas Pacific Land Corp. | 53.2% |
Landbridge Co. LLC | 5.5% |
Grayscale Bitcoin Trust ETF | 4.8% |
CACI International, Inc. | 4.3% |
Civeo Corp. | 2.7% |
DREAM Unlimited Corp. | 2.3% |
Carnival Corp. | 1.6% |
Interparfums, Inc. | 1.5% |
Associated Capital Group, Inc. | 1.4% |
Urbana Corp. | 1.0% |
For additional information about the Fund; including its prospectus, financial information, holdings and proxy information, scan the QR code or visit https://kineticsfunds.com/resources/.
| The Small Cap Opportunities Fund | PAGE 2 | TSR-AR-494613748 |
HOUSEHOLDING
To reduce Fund expenses, only one copy of most shareholder documents may be mailed to shareholders with multiple accounts at the same address (Householding). If you would prefer that your Horizon Kinetics Asset Management LLC documents not be householded, please contact Horizon Kinetics Asset Management LLC at 1-800-930-3828, or contact your financial intermediary. Your instructions will typically be effective within 30 days of receipt by Horizon Kinetics Asset Management LLC or your financial intermediary.
| The Small Cap Opportunities Fund | PAGE 3 | TSR-AR-494613748 |
1000087081075013472134041690117160256023353328394474891000010138113511382913223173862058526494216962739934254100009803124061404812856157851756722278186922169223579
| | |
| The Small Cap Opportunities Fund | |
| Institutional Class | KSCYX |
| Annual Shareholder Report | December 31, 2024 |
This annual shareholder report contains important information about the The Small Cap Opportunities Fund for the period of January 1, 2024, to December 31, 2024. You can find additional information about the Fund at https://kineticsfunds.com/resources/. You can also request this information by contacting us at 1-800-930-3828.
WHAT WERE THE FUND COSTS FOR THE PAST YEAR? (based on a hypothetical $10,000 investment)
| | |
Class Name | Costs of a $10,000 investment | Costs paid as a percentage of a $10,000 investment |
| Institutional Class | $172 | 1.44% |
HOW DID THE FUND PERFORM LAST YEAR AND WHAT AFFECTED ITS PERFORMANCE?
For the 12-month period ended December 31, 2024, the Fund’s No-Load class posted 68.52% and significantly outperformed benchmarks S&P 600 Small Cap Index and S&P 500 Index which posted 8.70% and 25.02%, respectively.
WHAT FACTORS INFLUENCED PERFORMANCE
The Fund’s performance was driven by strong positive returns in “hard asset” companies, which we believe are well-positioned to benefit from rising prices, particularly in the energy sector. Energy prices were mixed for the year, as strong supply growth negated resilient demand. Our energy exposure to royalties and land/infrastructure decoupled from commodity markets due to unique growth drivers. The Fund also benefitted from exposure to a “Defense Technology” company that provides essential surveillance, communications and encryption/security for the federal government.
The portfolio remains focused on companies within the broader universe of value companies in the hard asset realm and seeks opportunities in small capitalization issuers with the potential to expand to higher valuations either through revaluation, growth or a combination thereof. Guided by long-term our value investment philosophy, the Fund may experience periods of outperformance or underperformance relative to the benchmark, but we believe the Fund is well-positioned to generate above-market returns over the long term.
The Fund’s top contributor: Security selection collectively contributed positively to performance particularly within the Energy Sector. Texas Pacific Land Corporation (“TPL”) was the largest contributor to returns.
The Fund’s top detractor: Inter Parfums, Inc (“IPAR”) detracted marginally from returns.
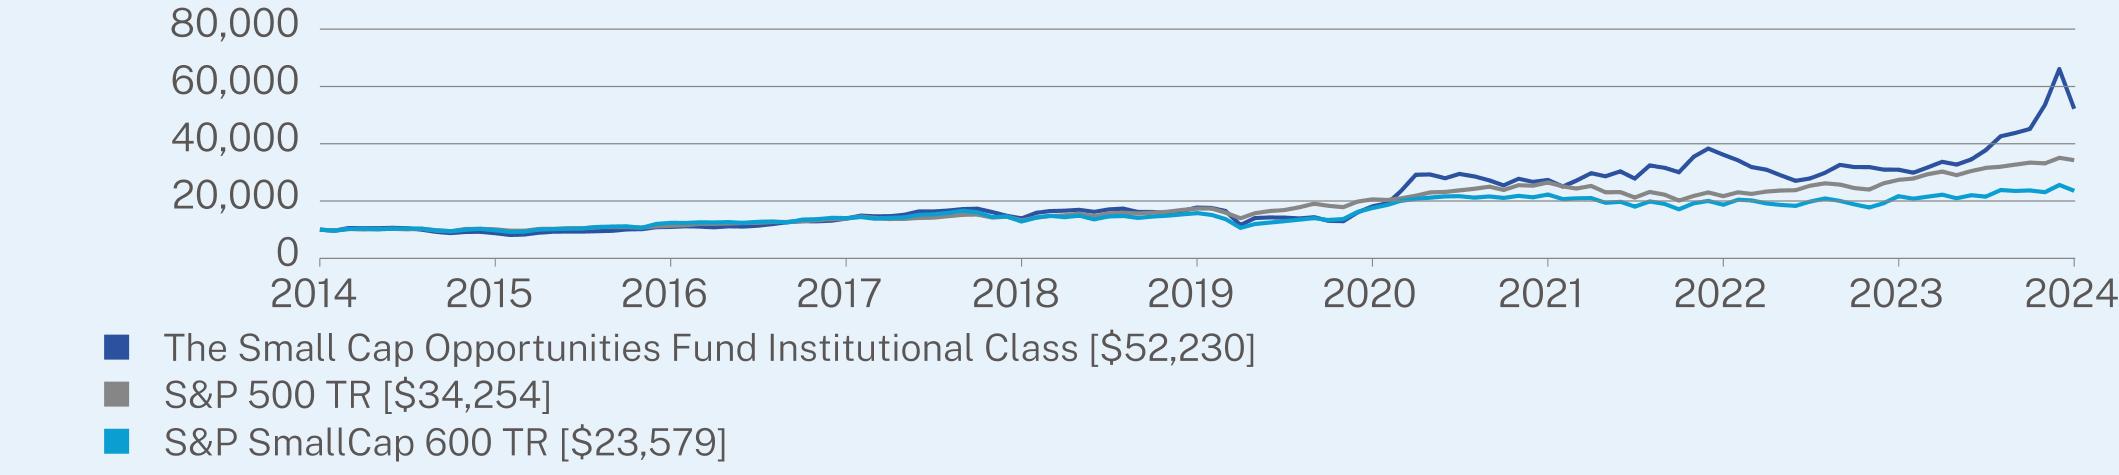
HOW DID THE FUND PERFORM OVER THE PAST 10 YEARS?*
The $10,000 chart reflects a hypothetical $10,000 investment in the class of shares noted and assumes the maximum sales charge. The chart uses total return NAV performance and assumes reinvestment of dividends and capital gains. Fund expenses, including 12b-1 fees, management fees and other expenses were deducted.
| The Small Cap Opportunities Fund | PAGE 1 | TSR-AR-494613813 |
CUMULATIVE PERFORMANCE (Initial Investment of $10,000)
ANNUAL AVERAGE TOTAL RETURN (%)
| | | |
| | 1 Year | 5 Year | 10 Year |
Institutional Class (without sales charge) | 68.85 | 24.13 | 17.98 |
S&P 500 TR | 25.02 | 14.53 | 13.10 |
S&P SmallCap 600 TR | 8.70 | 8.36 | 8.96 |
Visit https://kineticsfunds.com/resources/ for more recent performance information.
| * | The Fund’s past performance is not a good predictor of how the Fund will perform in the future. The graph and table do not reflect the deduction of taxes that a shareholder would pay on Fund distributions or redemption of Fund shares. |
KEY FUND STATISTICS (as of December 31, 2024)
| |
Net Assets | $465,795,726 |
Number of Holdings | 56 |
Net Advisory Fee | $4,073,747 |
Portfolio Turnover | 6% |
Visit https://kineticsfunds.com/resources/ for more recent performance information.
WHAT DID THE FUND INVEST IN? (as of December 31, 2024)
| |
Top Sectors | (% of Net Assets) |
Mining, Quarrying, and Oil and Gas Extraction | 59.1% |
Finance and Insurance | 7.2% |
Professional, Scientific and Technical Services | 4.9% |
Management of Companies and Enterprises | 3.2% |
Accommodation and Food Services | 2.7% |
Real Estate | 2.6% |
Manufacturing | 1.6% |
Management, Scientific, and Technical Consulting | 1.6% |
Real Estate and Rental and Leasing | 0.8% |
Arts, Entertainment, and Recreation | 0.7% |
| |
Top 10 Issuers | (% of Net Assets) |
Texas Pacific Land Corp. | 53.2% |
Landbridge Co. LLC | 5.5% |
Grayscale Bitcoin Trust ETF | 4.8% |
CACI International, Inc. | 4.3% |
Civeo Corp. | 2.7% |
DREAM Unlimited Corp. | 2.3% |
Carnival Corp. | 1.6% |
Interparfums, Inc. | 1.5% |
Associated Capital Group, Inc. | 1.4% |
Urbana Corp. | 1.0% |
For additional information about the Fund; including its prospectus, financial information, holdings and proxy information, scan the QR code or visit https://kineticsfunds.com/resources/.
| The Small Cap Opportunities Fund | PAGE 2 | TSR-AR-494613813 |
HOUSEHOLDING
To reduce Fund expenses, only one copy of most shareholder documents may be mailed to shareholders with multiple accounts at the same address (Householding). If you would prefer that your Horizon Kinetics Asset Management LLC documents not be householded, please contact Horizon Kinetics Asset Management LLC at 1-800-930-3828, or contact your financial intermediary. Your instructions will typically be effective within 30 days of receipt by Horizon Kinetics Asset Management LLC or your financial intermediary.
| The Small Cap Opportunities Fund | PAGE 3 | TSR-AR-494613813 |
1000087941095813863139241772618171273693618730933522301000010138113511382913223173862058526494216962739934254100009803124061404812856157851756722278186922169223579
| | |
| The Small Cap Opportunities Fund | |
| No Load Class | KSCOX |
| Annual Shareholder Report | December 31, 2024 |
This annual shareholder report contains important information about the The Small Cap Opportunities Fund for the period of January 1, 2024, to December 31, 2024. You can find additional information about the Fund at https://kineticsfunds.com/resources/. You can also request this information by contacting us at 1-800-930-3828.
WHAT WERE THE FUND COSTS FOR THE PAST YEAR? (based on a hypothetical $10,000 investment)
| | |
Class Name | Costs of a $10,000 investment | Costs paid as a percentage of a $10,000 investment |
| No Load Class | $195 | 1.64% |
HOW DID THE FUND PERFORM LAST YEAR AND WHAT AFFECTED ITS PERFORMANCE?
For the 12-month period ended December 31, 2024, the Fund’s No-Load class posted 68.52% and significantly outperformed benchmarks S&P 600 Small Cap Index and S&P 500 Index which posted 8.70% and 25.02%, respectively.
WHAT FACTORS INFLUENCED PERFORMANCE
The Fund’s performance was driven by strong positive returns in “hard asset” companies, which we believe are well-positioned to benefit from rising prices, particularly in the energy sector. Energy prices were mixed for the year, as strong supply growth negated resilient demand. Our energy exposure to royalties and land/infrastructure decoupled from commodity markets due to unique growth drivers. The Fund also benefitted from exposure to a “Defense Technology” company that provides essential surveillance, communications and encryption/security for the federal government.
The portfolio remains focused on companies within the broader universe of value companies in the hard asset realm and seeks opportunities in small capitalization issuers with the potential to expand to higher valuations either through revaluation, growth or a combination thereof. Guided by long-term our value investment philosophy, the Fund may experience periods of outperformance or underperformance relative to the benchmark, but we believe the Fund is well-positioned to generate above-market returns over the long term.
The Fund’s top contributor: Security selection collectively contributed positively to performance particularly within the Energy Sector. Texas Pacific Land Corporation (“TPL”) was the largest contributor to returns.
The Fund’s top detractor: Inter Parfums, Inc (“IPAR”) detracted marginally from returns.
HOW DID THE FUND PERFORM OVER THE PAST 10 YEARS?*
The $10,000 chart reflects a hypothetical $10,000 investment in the class of shares noted and assumes the maximum sales charge. The chart uses total return NAV performance and assumes reinvestment of dividends and capital gains. Fund expenses, including 12b-1 fees, management fees and other expenses were deducted.
| The Small Cap Opportunities Fund | PAGE 1 | TSR-AR-494613706 |
CUMULATIVE PERFORMANCE (Initial Investment of $10,000)
ANNUAL AVERAGE TOTAL RETURN (%)
| | | |
| | 1 Year | 5 Year | 10 Year |
No Load Class (without sales charge) | 68.52 | 23.88 | 17.74 |
S&P 500 TR | 25.02 | 14.53 | 13.10 |
S&P SmallCap 600 TR | 8.70 | 8.36 | 8.96 |
Visit https://kineticsfunds.com/resources/ for more recent performance information.
| * | The Fund’s past performance is not a good predictor of how the Fund will perform in the future. The graph and table do not reflect the deduction of taxes that a shareholder would pay on Fund distributions or redemption of Fund shares. |
KEY FUND STATISTICS (as of December 31, 2024)
| |
Net Assets | $465,795,726 |
Number of Holdings | 56 |
Net Advisory Fee | $4,073,747 |
Portfolio Turnover | 6% |
Visit https://kineticsfunds.com/resources/ for more recent performance information.
WHAT DID THE FUND INVEST IN? (as of December 31, 2024)
| |
Top Sectors | (% of Net Assets) |
Mining, Quarrying, and Oil and Gas Extraction | 59.1% |
Finance and Insurance | 7.2% |
Professional, Scientific and Technical Services | 4.9% |
Management of Companies and Enterprises | 3.2% |
Accommodation and Food Services | 2.7% |
Real Estate | 2.6% |
Manufacturing | 1.6% |
Management, Scientific, and Technical Consulting | 1.6% |
Real Estate and Rental and Leasing | 0.8% |
Arts, Entertainment, and Recreation | 0.7% |
| |
Top 10 Issuers | (% of Net Assets) |
Texas Pacific Land Corp. | 53.2% |
Landbridge Co. LLC | 5.5% |
Grayscale Bitcoin Trust ETF | 4.8% |
CACI International, Inc. | 4.3% |
Civeo Corp. | 2.7% |
DREAM Unlimited Corp. | 2.3% |
Carnival Corp. | 1.6% |
Interparfums, Inc. | 1.5% |
Associated Capital Group, Inc. | 1.4% |
Urbana Corp. | 1.0% |
For additional information about the Fund; including its prospectus, financial information, holdings and proxy information, scan the QR code or visit https://kineticsfunds.com/resources/.
| The Small Cap Opportunities Fund | PAGE 2 | TSR-AR-494613706 |
HOUSEHOLDING
To reduce Fund expenses, only one copy of most shareholder documents may be mailed to shareholders with multiple accounts at the same address (Householding). If you would prefer that your Horizon Kinetics Asset Management LLC documents not be householded, please contact Horizon Kinetics Asset Management LLC at 1-800-930-3828, or contact your financial intermediary. Your instructions will typically be effective within 30 days of receipt by Horizon Kinetics Asset Management LLC or your financial intermediary.
| The Small Cap Opportunities Fund | PAGE 3 | TSR-AR-494613706 |
1000087741091413777138171755617960269983562630392512171000010138113511382913223173862058526494216962739934254100009803124061404812856157851756722278186922169223579
| | |
| The Market Opportunities Fund | |
| Advisor Class A | KMKAX |
| Annual Shareholder Report | December 31, 2024 |
This annual shareholder report contains important information about the The Market Opportunities Fund for the period of January 1, 2024, to December 31, 2024. You can find additional information about the Fund at https://kineticsfunds.com/resources/. You can also request this information by contacting us at 1-800-930-3828.
WHAT WERE THE FUND COSTS FOR THE PAST YEAR? (based on a hypothetical $10,000 investment)
| | |
Class Name | Costs of a $10,000 investment | Costs paid as a percentage of a $10,000 investment |
| Advisor Class A | $200 | 1.65% |
HOW DID THE FUND PERFORM LAST YEAR AND WHAT AFFECTED ITS PERFORMANCE?
For the 12-month period ended December 31, 2024, the Fund’s No-Load class posted 84.08%, significantly outperforming benchmarks S&P 500 Index and MSCI EAFE Index which posted 25.02% and 3.82%, respectively.
WHAT FACTORS INFLUENCED PERFORMANCE
The Fund’s performance was driven by strong positive returns in “hard asset” companies, which we believe are well-positioned to benefit from rising prices, particularly in the energy sector. Energy prices were mixed for the year, as strong supply growth negated resilient demand. Our energy exposure to royalties and land/infrastructure decoupled from commodity markets due to unique growth drivers. Blockchain and cryptocurrency also contributed positively, with Bitcoin prices more than doubling for the second consecutive year. Bitcoin continues to set itself apart from other cryptocurrencies, supported by a more favorable regulatory landscape.
The portfolio remains focused on high-quality, durable businesses with exposure to hard assets, which we believe are well-positioned to perform across various macroeconomic conditions, particularly in a sustained inflationary environment. Guided by our long-term value investment philosophy, the Fund may experience periods of outperformance or underperformance relative to the benchmark, but we believe the Fund is well-positioned to generate above-market returns over the long term.
The Fund’s top contributor: Security selection collectively contributed positively to performance particularly with the Fund’s overweight exposure to Energy and Blockchain/Cryptocurrency. Texas Pacific Land Corporation (“TPL”) was the largest contributor to returns.
The Fund’s top detractor: Permian Basin Royalty Trust (“PBT”) detracted marginally from returns.
HOW DID THE FUND PERFORM OVER THE PAST 10 YEARS?*
The $10,000 chart reflects a hypothetical $10,000 investment in the class of shares noted and assumes the maximum sales charge. The chart uses total return NAV performance and assumes reinvestment of dividends and capital gains. Fund expenses, including 12b-1 fees, management fees and other expenses were deducted.
| The Market Opportunities Fund | PAGE 1 | TSR-AR-494613771 |
CUMULATIVE PERFORMANCE (Initial Investment of $10,000)
ANNUAL AVERAGE TOTAL RETURN (%)
| | | |
| | 1 Year | 5 Year | 10 Year |
Advisor Class A (without sales charge) | 83.60 | 24.29 | 17.84 |
Advisor Class A (with sales charge) | 73.04 | 22.83 | 17.15 |
S&P 500 TR | 25.02 | 14.53 | 13.10 |
MSCI EAFE Net (USD) | 3.82 | 4.73 | 5.20 |
Visit https://kineticsfunds.com/resources/ for more recent performance information.
| * | The Fund’s past performance is not a good predictor of how the Fund will perform in the future. The graph and table do not reflect the deduction of taxes that a shareholder would pay on Fund distributions or redemption of Fund shares. |
KEY FUND STATISTICS (as of December 31, 2024)
| |
Net Assets | $223,495,159 |
Number of Holdings | 69 |
Net Advisory Fee | $1,535,281 |
Portfolio Turnover | 7% |
Visit https://kineticsfunds.com/resources/ for more recent performance information.
WHAT DID THE FUND INVEST IN? (as of December 31, 2024)
| |
Top Sectors | (% of Net Assets) |
Mining, Quarrying, and Oil and Gas Extraction | 58.2% |
Finance and Insurance | 30.2% |
Management of Companies and Enterprises | 3.3% |
Information | 1.5% |
Transportation and Warehousing | 0.6% |
Real Estate | 0.3% |
Global Exchanges | 0.1% |
Professional, Scientific and Technical Services | 0.1% |
Live Sports (Spectator Sports) | 0.1% |
Industrial | 0.1% |
| |
Top 10 Issuers | (% of Net Assets) |
Texas Pacific Land Corp. | 53.9% |
Grayscale Bitcoin Trust ETF | 19.8% |
Partners Value Investments LP | 2.6% |
Grayscale Bitcoin Mini Trust ETF | 2.2% |
Landbridge Co. LLC | 2.0% |
White Mountains Insurance Group Ltd. | 1.2% |
Associated Capital Group, Inc. | 1.2% |
Intercontinental Exchange, Inc. | 0.9% |
Urbana Corp. | 0.8% |
Wheaton Precious Metals Corp. | 0.8% |
For additional information about the Fund; including its prospectus, financial information, holdings and proxy information, scan the QR code or visit https://kineticsfunds.com/resources/.
| The Market Opportunities Fund | PAGE 2 | TSR-AR-494613771 |
HOUSEHOLDING
To reduce Fund expenses, only one copy of most shareholder documents may be mailed to shareholders with multiple accounts at the same address (Householding). If you would prefer that your Horizon Kinetics Asset Management LLC documents not be householded, please contact Horizon Kinetics Asset Management LLC at 1-800-930-3828, or contact your financial intermediary. Your instructions will typically be effective within 30 days of receipt by Horizon Kinetics Asset Management LLC or your financial intermediary.
| The Market Opportunities Fund | PAGE 3 | TSR-AR-494613771 |
942685451026715083134081641419584250082868226514486801000010138113511382913223173862058526494216962739934254100009919100181252610798131761420515805135211598716598
| | |
| The Market Opportunities Fund | |
| Advisor Class C | KMKCX |
| Annual Shareholder Report | December 31, 2024 |
This annual shareholder report contains important information about the The Market Opportunities Fund for the period of January 1, 2024, to December 31, 2024. You can find additional information about the Fund at https://kineticsfunds.com/resources/. You can also request this information by contacting us at 1-800-930-3828.
WHAT WERE THE FUND COSTS FOR THE PAST YEAR? (based on a hypothetical $10,000 investment)
| | |
Class Name | Costs of a $10,000 investment | Costs paid as a percentage of a $10,000 investment |
| Advisor Class C | $261 | 2.15% |
HOW DID THE FUND PERFORM LAST YEAR AND WHAT AFFECTED ITS PERFORMANCE?
For the 12-month period ended December 31, 2024, the Fund’s No-Load class posted 84.08%, significantly outperforming benchmarks S&P 500 Index and MSCI EAFE Index which posted 25.02% and 3.82%, respectively.
WHAT FACTORS INFLUENCED PERFORMANCE
The Fund’s performance was driven by strong positive returns in “hard asset” companies, which we believe are well-positioned to benefit from rising prices, particularly in the energy sector. Energy prices were mixed for the year, as strong supply growth negated resilient demand. Our energy exposure to royalties and land/infrastructure decoupled from commodity markets due to unique growth drivers. Blockchain and cryptocurrency also contributed positively, with Bitcoin prices more than doubling for the second consecutive year. Bitcoin continues to set itself apart from other cryptocurrencies, supported by a more favorable regulatory landscape.
The portfolio remains focused on high-quality, durable businesses with exposure to hard assets, which we believe are well-positioned to perform across various macroeconomic conditions, particularly in a sustained inflationary environment. Guided by our long-term value investment philosophy, the Fund may experience periods of outperformance or underperformance relative to the benchmark, but we believe the Fund is well-positioned to generate above-market returns over the long term.
The Fund’s top contributor: Security selection collectively contributed positively to performance particularly with the Fund’s overweight exposure to Energy and Blockchain/Cryptocurrency. Texas Pacific Land Corporation (“TPL”) was the largest contributor to returns.
The Fund’s top detractor: Permian Basin Royalty Trust (“PBT”) detracted marginally from returns.
HOW DID THE FUND PERFORM OVER THE PAST 10 YEARS?*
The $10,000 chart reflects a hypothetical $10,000 investment in the class of shares noted and assumes the maximum sales charge. The chart uses total return NAV performance and assumes reinvestment of dividends and capital gains. Fund expenses, including 12b-1 fees, management fees and other expenses were deducted.
| The Market Opportunities Fund | PAGE 1 | TSR-AR-494613730 |
CUMULATIVE PERFORMANCE (Initial Investment of $10,000)
ANNUAL AVERAGE TOTAL RETURN (%)
| | | |
| | 1 Year | 5 Year | 10 Year |
Advisor Class C (without sales charge) | 82.65 | 23.66 | 17.25 |
Advisor Class C (with sales charge) | 81.65 | 23.66 | 17.25 |
S&P 500 TR | 25.02 | 14.53 | 13.10 |
MSCI EAFE Net (USD) | 3.82 | 4.73 | 5.20 |
Visit https://kineticsfunds.com/resources/ for more recent performance information.
| * | The Fund’s past performance is not a good predictor of how the Fund will perform in the future. The graph and table do not reflect the deduction of taxes that a shareholder would pay on Fund distributions or redemption of Fund shares. |
KEY FUND STATISTICS (as of December 31, 2024)
| |
Net Assets | $223,495,159 |
Number of Holdings | 69 |
Net Advisory Fee | $1,535,281 |
Portfolio Turnover | 7% |
Visit https://kineticsfunds.com/resources/ for more recent performance information.
WHAT DID THE FUND INVEST IN? (as of December 31, 2024)
| |
Top Sectors | (% of Net Assets) |
Mining, Quarrying, and Oil and Gas Extraction | 58.2% |
Finance and Insurance | 30.2% |
Management of Companies and Enterprises | 3.3% |
Information | 1.5% |
Transportation and Warehousing | 0.6% |
Real Estate | 0.3% |
Global Exchanges | 0.1% |
Professional, Scientific and Technical Services | 0.1% |
Live Sports (Spectator Sports) | 0.1% |
Industrial | 0.1% |
| |
Top 10 Issuers | (% of Net Assets) |
Texas Pacific Land Corp. | 53.9% |
Grayscale Bitcoin Trust ETF | 19.8% |
Partners Value Investments LP | 2.6% |
Grayscale Bitcoin Mini Trust ETF | 2.2% |
Landbridge Co. LLC | 2.0% |
White Mountains Insurance Group Ltd. | 1.2% |
Associated Capital Group, Inc. | 1.2% |
Intercontinental Exchange, Inc. | 0.9% |
Urbana Corp. | 0.8% |
Wheaton Precious Metals Corp. | 0.8% |
For additional information about the Fund; including its prospectus, financial information, holdings and proxy information, scan the QR code or visit https://kineticsfunds.com/resources/.
| The Market Opportunities Fund | PAGE 2 | TSR-AR-494613730 |
HOUSEHOLDING
To reduce Fund expenses, only one copy of most shareholder documents may be mailed to shareholders with multiple accounts at the same address (Householding). If you would prefer that your Horizon Kinetics Asset Management LLC documents not be householded, please contact Horizon Kinetics Asset Management LLC at 1-800-930-3828, or contact your financial intermediary. Your instructions will typically be effective within 30 days of receipt by Horizon Kinetics Asset Management LLC or your financial intermediary.
| The Market Opportunities Fund | PAGE 3 | TSR-AR-494613730 |
1000090211078215755139451698420157256122923026890491141000010138113511382913223173862058526494216962739934254100009919100181252610798131761420515805135211598716598
| | |
| The Market Opportunities Fund | |
| Institutional Class | KMKYX |
| Annual Shareholder Report | December 31, 2024 |
This annual shareholder report contains important information about the The Market Opportunities Fund for the period of January 1, 2024, to December 31, 2024. You can find additional information about the Fund at https://kineticsfunds.com/resources/. You can also request this information by contacting us at 1-800-930-3828.
WHAT WERE THE FUND COSTS FOR THE PAST YEAR? (based on a hypothetical $10,000 investment)
| | |
Class Name | Costs of a $10,000 investment | Costs paid as a percentage of a $10,000 investment |
| Institutional Class | $146 | 1.20% |
HOW DID THE FUND PERFORM LAST YEAR AND WHAT AFFECTED ITS PERFORMANCE?
For the 12-month period ended December 31, 2024, the Fund’s No-Load class posted 84.08%, significantly outperforming benchmarks S&P 500 Index and MSCI EAFE Index which posted 25.02% and 3.82%, respectively.
WHAT FACTORS INFLUENCED PERFORMANCE
The Fund’s performance was driven by strong positive returns in “hard asset” companies, which we believe are well-positioned to benefit from rising prices, particularly in the energy sector. Energy prices were mixed for the year, as strong supply growth negated resilient demand. Our energy exposure to royalties and land/infrastructure decoupled from commodity markets due to unique growth drivers. Blockchain and cryptocurrency also contributed positively, with Bitcoin prices more than doubling for the second consecutive year. Bitcoin continues to set itself apart from other cryptocurrencies, supported by a more favorable regulatory landscape.
The portfolio remains focused on high-quality, durable businesses with exposure to hard assets, which we believe are well-positioned to perform across various macroeconomic conditions, particularly in a sustained inflationary environment. Guided by our long-term value investment philosophy, the Fund may experience periods of outperformance or underperformance relative to the benchmark, but we believe the Fund is well-positioned to generate above-market returns over the long term.
The Fund’s top contributor: Security selection collectively contributed positively to performance particularly with the Fund’s overweight exposure to Energy and Blockchain/Cryptocurrency. Texas Pacific Land Corporation (“TPL”) was the largest contributor to returns.
The Fund’s top detractor: Permian Basin Royalty Trust (“PBT”) detracted marginally from returns.
HOW DID THE FUND PERFORM OVER THE PAST 10 YEARS?*
The $10,000 chart reflects a hypothetical $10,000 investment in the class of shares noted and assumes the maximum sales charge. The chart uses total return NAV performance and assumes reinvestment of dividends and capital gains. Fund expenses, including 12b-1 fees, management fees and other expenses were deducted.
| The Market Opportunities Fund | PAGE 1 | TSR-AR-494613615 |
CUMULATIVE PERFORMANCE (Initial Investment of $10,000)
ANNUAL AVERAGE TOTAL RETURN (%)
| | | |
| | 1 Year | 5 Year | 10 Year |
Institutional Class (without sales charge) | 84.40 | 24.84 | 18.38 |
S&P 500 TR | 25.02 | 14.53 | 13.10 |
MSCI EAFE Net (USD) | 3.82 | 4.73 | 5.20 |
Visit https://kineticsfunds.com/resources/ for more recent performance information.
| * | The Fund’s past performance is not a good predictor of how the Fund will perform in the future. The graph and table do not reflect the deduction of taxes that a shareholder would pay on Fund distributions or redemption of Fund shares. |
KEY FUND STATISTICS (as of December 31, 2024)
| |
Net Assets | $223,495,159 |
Number of Holdings | 69 |
Net Advisory Fee | $1,535,281 |
Portfolio Turnover | 7% |
Visit https://kineticsfunds.com/resources/ for more recent performance information.
WHAT DID THE FUND INVEST IN? (as of December 31, 2024)
| |
Top Sectors | (% of Net Assets) |
Mining, Quarrying, and Oil and Gas Extraction | 58.2% |
Finance and Insurance | 30.2% |
Management of Companies and Enterprises | 3.3% |
Information | 1.5% |
Transportation and Warehousing | 0.6% |
Real Estate | 0.3% |
Global Exchanges | 0.1% |
Professional, Scientific and Technical Services | 0.1% |
Live Sports (Spectator Sports) | 0.1% |
Industrial | 0.1% |
| |
Top 10 Issuers | (% of Net Assets) |
Texas Pacific Land Corp. | 53.9% |
Grayscale Bitcoin Trust ETF | 19.8% |
Partners Value Investments LP | 2.6% |
Grayscale Bitcoin Mini Trust ETF | 2.2% |
Landbridge Co. LLC | 2.0% |
White Mountains Insurance Group Ltd. | 1.2% |
Associated Capital Group, Inc. | 1.2% |
Intercontinental Exchange, Inc. | 0.9% |
Urbana Corp. | 0.8% |
Wheaton Precious Metals Corp. | 0.8% |
For additional information about the Fund; including its prospectus, financial information, holdings and proxy information, scan the QR code or visit https://kineticsfunds.com/resources/.
| The Market Opportunities Fund | PAGE 2 | TSR-AR-494613615 |
HOUSEHOLDING
To reduce Fund expenses, only one copy of most shareholder documents may be mailed to shareholders with multiple accounts at the same address (Householding). If you would prefer that your Horizon Kinetics Asset Management LLC documents not be householded, please contact Horizon Kinetics Asset Management LLC at 1-800-930-3828, or contact your financial intermediary. Your instructions will typically be effective within 30 days of receipt by Horizon Kinetics Asset Management LLC or your financial intermediary.
| The Market Opportunities Fund | PAGE 3 | TSR-AR-494613615 |
1000091071099516233144971782821355274013156929314540561000010138113511382913223173862058526494216962739934254100009919100181252610798131761420515805135211598716598
| | |
| The Market Opportunities Fund | |
| No Load Class | KMKNX |
| Annual Shareholder Report | December 31, 2024 |
This annual shareholder report contains important information about the The Market Opportunities Fund for the period of January 1, 2024, to December 31, 2024. You can find additional information about the Fund at https://kineticsfunds.com/resources/. You can also request this information by contacting us at 1-800-930-3828.
WHAT WERE THE FUND COSTS FOR THE PAST YEAR? (based on a hypothetical $10,000 investment)
| | |
Class Name | Costs of a $10,000 investment | Costs paid as a percentage of a $10,000 investment |
| No Load Class | $170 | 1.40% |
HOW DID THE FUND PERFORM LAST YEAR AND WHAT AFFECTED ITS PERFORMANCE?
For the 12-month period ended December 31, 2024, the Fund’s No-Load class posted 84.08%, significantly outperforming benchmarks S&P 500 Index and MSCI EAFE Index which posted 25.02% and 3.82%, respectively.
WHAT FACTORS INFLUENCED PERFORMANCE
The Fund’s performance was driven by strong positive returns in “hard asset” companies, which we believe are well-positioned to benefit from rising prices, particularly in the energy sector. Energy prices were mixed for the year, as strong supply growth negated resilient demand. Our energy exposure to royalties and land/infrastructure decoupled from commodity markets due to unique growth drivers. Blockchain and cryptocurrency also contributed positively, with Bitcoin prices more than doubling for the second consecutive year. Bitcoin continues to set itself apart from other cryptocurrencies, supported by a more favorable regulatory landscape.
The portfolio remains focused on high-quality, durable businesses with exposure to hard assets, which we believe are well-positioned to perform across various macroeconomic conditions, particularly in a sustained inflationary environment. Guided by our long-term value investment philosophy, the Fund may experience periods of outperformance or underperformance relative to the benchmark, but we believe the Fund is well-positioned to generate above-market returns over the long term.
The Fund’s top contributor: Security selection collectively contributed positively to performance particularly with the Fund’s overweight exposure to Energy and Blockchain/Cryptocurrency. Texas Pacific Land Corporation (“TPL”) was the largest contributor to returns.
The Fund’s top detractor: Permian Basin Royalty Trust (“PBT”) detracted marginally from returns.
HOW DID THE FUND PERFORM OVER THE PAST 10 YEARS?*
The $10,000 chart reflects a hypothetical $10,000 investment in the class of shares noted and assumes the maximum sales charge. The chart uses total return NAV performance and assumes reinvestment of dividends and capital gains. Fund expenses, including 12b-1 fees, management fees and other expenses were deducted.
| The Market Opportunities Fund | PAGE 1 | TSR-AR-494613789 |
CUMULATIVE PERFORMANCE (Initial Investment of $10,000)
ANNUAL AVERAGE TOTAL RETURN (%)
| | | |
| | 1 Year | 5 Year | 10 Year |
No Load Class (without sales charge) | 84.08 | 24.59 | 18.14 |
S&P 500 TR | 25.02 | 14.53 | 13.10 |
MSCI EAFE Net (USD) | 3.82 | 4.73 | 5.20 |
Visit https://kineticsfunds.com/resources/ for more recent performance information.
| * | The Fund’s past performance is not a good predictor of how the Fund will perform in the future. The graph and table do not reflect the deduction of taxes that a shareholder would pay on Fund distributions or redemption of Fund shares. |
KEY FUND STATISTICS (as of December 31, 2024)
| |
Net Assets | $223,495,159 |
Number of Holdings | 69 |
Net Advisory Fee | $1,535,281 |
Portfolio Turnover | 7% |
Visit https://kineticsfunds.com/resources/ for more recent performance information.
WHAT DID THE FUND INVEST IN? (as of December 31, 2024)
| |
Top Sectors | (% of Net Assets) |
Mining, Quarrying, and Oil and Gas Extraction | 58.2% |
Finance and Insurance | 30.2% |
Management of Companies and Enterprises | 3.3% |
Information | 1.5% |
Transportation and Warehousing | 0.6% |
Real Estate | 0.3% |
Global Exchanges | 0.1% |
Professional, Scientific and Technical Services | 0.1% |
Live Sports (Spectator Sports) | 0.1% |
Industrial | 0.1% |
| |
Top 10 Issuers | (% of Net Assets) |
Texas Pacific Land Corp. | 53.9% |
Grayscale Bitcoin Trust ETF | 19.8% |
Partners Value Investments LP | 2.6% |
Grayscale Bitcoin Mini Trust ETF | 2.2% |
Landbridge Co. LLC | 2.0% |
White Mountains Insurance Group Ltd. | 1.2% |
Associated Capital Group, Inc. | 1.2% |
Intercontinental Exchange, Inc. | 0.9% |
Urbana Corp. | 0.8% |
Wheaton Precious Metals Corp. | 0.8% |
For additional information about the Fund; including its prospectus, financial information, holdings and proxy information, scan the QR code or visit https://kineticsfunds.com/resources/.
| The Market Opportunities Fund | PAGE 2 | TSR-AR-494613789 |
HOUSEHOLDING
To reduce Fund expenses, only one copy of most shareholder documents may be mailed to shareholders with multiple accounts at the same address (Householding). If you would prefer that your Horizon Kinetics Asset Management LLC documents not be householded, please contact Horizon Kinetics Asset Management LLC at 1-800-930-3828, or contact your financial intermediary. Your instructions will typically be effective within 30 days of receipt by Horizon Kinetics Asset Management LLC or your financial intermediary.
| The Market Opportunities Fund | PAGE 3 | TSR-AR-494613789 |
1000090891094716123143711764221091270063105128776529711000010138113511382913223173862058526494216962739934254100009919100181252610798131761420515805135211598716598
| | |
| The Multi-Disciplinary Income Fund | |
| No Load Class | KMDNX |
| Annual Shareholder Report | December 31, 2024 |
This annual shareholder report contains important information about the The Multi-Disciplinary Income Fund for the period of January 1, 2024, to December 31, 2024. You can find additional information about the Fund at https://kineticsfunds.com/resources/. You can also request this information by contacting us at 1-800-930-3828.
WHAT WERE THE FUND COSTS FOR THE PAST YEAR? (based on a hypothetical $10,000 investment)
| | |
Class Name | Costs of a $10,000 investment | Costs paid as a percentage of a $10,000 investment |
| No Load Class | $75 | 0.74% |
HOW DID THE FUND PERFORM LAST YEAR AND WHAT AFFECTED ITS PERFORMANCE?
For the 12-month period ended December 31, 2024, the Fund’s No-Load class posted 7.05%, driven by its re-positioning of its portfolio investment mix (during 2023) to include only high-quality collateralized loan obligation (“CLO”) debt tranche investments.
WHAT FACTORS INFLUENCED PERFORMANCE
The CLO debt tranches held by the Fund generated current cash income and avoided significant interest rate risks inherent in more traditional fixed income investment strategies. The Fund also benefited from fewer than anticipated interest rate cuts by the Federal Reserve in 2024.
The Fund’s investments include only AAA and AA rated CLO debt tranches. During 2024, the Fund increased its portfolio weighing of AA rated CLO debt given the higher yields and the minimal incremental credit risk relative to AAA rated CLO debt.
The Fund’s top contributor: Security selection collectively contributed positively to performance, specifically due to the increase in the Funds weighing of AA debt investments during 2024 and the overall credit performance of the Fund’s investments. The Fund also benefited from the floating rate structure of its CLO investments.
The Fund’s top detractor: The Fund suffered no impairment related losses in any investment during the year due to any credit event.
HOW DID THE FUND PERFORM OVER THE PAST 10 YEARS?*
The $10,000 chart reflects a hypothetical $10,000 investment in the class of shares noted and assumes the maximum sales charge. The chart uses total return NAV performance and assumes reinvestment of dividends and capital gains. Fund expenses, including 12b-1 fees, management fees and other expenses were deducted.
| The Multi-Disciplinary Income Fund | PAGE 1 | TSR-AR-494613672 |
CUMULATIVE PERFORMANCE (Initial Investment of $10,000)
ANNUAL AVERAGE TOTAL RETURN (%)
| | | |
| | 1 Year | 5 Year | 10 Year |
No Load Class (without sales charge) | 7.05 | 1.88 | 2.98 |
Bloomberg US Aggregate Bond Index | 1.25 | -0.33 | 1.35 |
Bloomberg U.S. High Yield Corporate Bond Index | 8.19 | 4.21 | 5.17 |
CBOE S&P 500 PutWrite Index (PUT) | 17.84 | 9.12 | 7.70 |
Cboe S&P 500 BuyWrite Monthly Index | 20.12 | 6.88 | 6.94 |
Visit https://kineticsfunds.com/resources/ for more recent performance information.
| * | The Fund’s past performance is not a good predictor of how the Fund will perform in the future. The graph and table do not reflect the deduction of taxes that a shareholder would pay on Fund distributions or redemption of Fund shares. |
KEY FUND STATISTICS (as of December 31, 2024)
| |
Net Assets | $13,628,238 |
Number of Holdings | 27 |
Net Advisory Fee | $0 |
Portfolio Turnover | 37% |
Average Credit Quality | AAA |
Effective Duration | 2 Yrs |
30-Day SEC Yield | 6.20% |
30-Day SEC Yield Unsubsidized | 5.62% |
Visit https://kineticsfunds.com/resources/ for more recent performance information.
WHAT DID THE FUND INVEST IN? (as of December 31, 2024)
| |
Top Sectors | (% of Net Assets) |
Asset Backed Securities | 91.1% |
| |
Top 10 Issuers | (% of Net Assets) |
Sound Point CLO Ltd. 2024-39A, AA tranche | 7.5% |
Babson CLO Ltd./Cayman Islands 2023-1A, AAA tranche | 4.1% |
Sound Point CLO Ltd. 2017-3A, AAA tranche | 3.9% |
Venture CDO Ltd. 2023-48A, AA tranche | 3.8% |
Fort Washington CLO 2019-1A, AA tranche | 3.8% |
Magnetite CLO Ltd. 2023-37A, AA tranche | 3.8% |
ICG US CLO Ltd. 2023-1A, AA tranche | 3.8% |
37 Capital CLO 2023-1A, AAA tranche | 3.8% |
Rad CLO 2023-20A, AA tranche | 3.8% |
Battery Park CLO 2022-1A, AAA tranche | 3.8% |
| The Multi-Disciplinary Income Fund | PAGE 2 | TSR-AR-494613672 |
For additional information about the Fund; including its prospectus, financial information, holdings and proxy information, scan the QR code or visit https://kineticsfunds.com/resources/.
HOUSEHOLDING
To reduce Fund expenses, only one copy of most shareholder documents may be mailed to shareholders with multiple accounts at the same address (Householding). If you would prefer that your Horizon Kinetics Asset Management LLC documents not be householded, please contact Horizon Kinetics Asset Management LLC at 1-800-930-3828, or contact your financial intermediary. Your instructions will typically be effective within 30 days of receipt by Horizon Kinetics Asset Management LLC or your financial intermediary.
| The Multi-Disciplinary Income Fund | PAGE 3 | TSR-AR-494613672 |
100009783108021131511202122191205012193119121252613409100001005510321106871068811620124921229910699112911143210000955311190120291177913466144231518513486152991655210000106401146712710119561357113860168801558717820209991000010524112681273312126140281364116434145661628819566
| | |
| The Kinetics Spin-off and Corporate Restructuring Fund | |
| Advisor Class A | LSHAX |
| Annual Shareholder Report | December 31, 2024 |
This annual shareholder report contains important information about the The Kinetics Spin-off and Corporate Restructuring Fund for the period of January 1, 2024, to December 31, 2024. You can find additional information about the Fund at https://kineticsfunds.com/resources/. You can also request this information by contacting us at 1-800-930-3828.
WHAT WERE THE FUND COSTS FOR THE PAST YEAR? (based on a hypothetical $10,000 investment)
| | |
Class Name | Costs of a $10,000 investment | Costs paid as a percentage of a $10,000 investment |
| Advisor Class A | $181 | 1.50% |
HOW DID THE FUND PERFORM LAST YEAR AND WHAT AFFECTED ITS PERFORMANCE?
For the 12-month period ended December 31, 2024, the Fund’s No-Load class posted 82.86%, significantly outperforming its benchmark S&P 500 Index, which posted 25.02% for the same period.
WHAT FACTORS INFLUENCED PERFORMANCE
The Fund’s performance was driven by strong positive returns in “hard asset” companies, which we believe stand to benefit from rising price levels, particularly in the energy sector. Energy prices were mixed for the year, as strong supply growth negated resilient demand. However, our investments in energy-related royalties and land/infrastructure were less impacted by commodity market fluctuations due to distinct growth drivers. The Fund also benefited from exposure to a niche Industrial supplier to the HVAC/R (heating, ventilation, air conditioning and refrigeration) market. These end markets have sustained secular growth trends which arose during the pandemic recovery.
The portfolio remains focused on companies that are actively seeking to maximize shareholder value through spin-offs and subject to restructuring activity. Guided by our long-term value investment philosophy, the Fund may experience periods of outperformance or underperformance relative to the benchmark, but we believe the Fund is well-positioned to generate above-market returns over the long term.
The Fund’s top contributor: Security selection collectively contributed positively to performance particularly within the Energy Sector. Texas Pacific Land Corporation (“TPL”) was the largest contributor to returns.
The Fund’s top detractor: Bakkt Holdings, Inc (“BKKT”) detracted marginally from returns.
HOW DID THE FUND PERFORM OVER THE PAST 10 YEARS?*
The $10,000 chart reflects a hypothetical $10,000 investment in the class of shares noted and assumes the maximum sales charge. The chart uses total return NAV performance and assumes reinvestment of dividends and capital gains. Fund expenses, including 12b-1 fees, management fees and other expenses were deducted.
| The Kinetics Spin-off and Corporate Restructuring Fund | PAGE 1 | TSR-AR-494613557 |
CUMULATIVE PERFORMANCE (Initial Investment of $10,000)
ANNUAL AVERAGE TOTAL RETURN (%)
| | | |
| | 1 Year | 5 Year | 10 Year |
Advisor Class A (without sales charge) | 82.36 | 25.14 | 15.50 |
Advisor Class A (with sales charge) | 71.91 | 23.67 | 14.82 |
S&P 500 TR | 25.02 | 14.53 | 13.10 |
Visit https://kineticsfunds.com/resources/ for more recent performance information.
| * | The Fund’s past performance is not a good predictor of how the Fund will perform in the future. The graph and table do not reflect the deduction of taxes that a shareholder would pay on Fund distributions or redemption of Fund shares. |
KEY FUND STATISTICS (as of December 31, 2024)
| |
Net Assets | $36,632,373 |
Number of Holdings | 36 |
Net Advisory Fee | $150,643 |
Portfolio Turnover | 6% |
Visit https://kineticsfunds.com/resources/ for more recent performance information.
WHAT DID THE FUND INVEST IN? (as of December 31, 2024)
| |
Top Sectors | (% of Net Assets) |
Mining, Quarrying, and Oil and Gas Extraction | 79.9% |
Manufacturing | 5.6% |
Management of Companies and Enterprises | 3.9% |
Finance and Insurance | 3.6% |
Accommodation and Food Services | 1.2% |
Real Estate and Rental and Leasing | 1.0% |
Information | 0.9% |
Real Estate | 0.2% |
Utilities | 0.0% |
Media | 0.0% |
| |
Top 10 Issuers | (% of Net Assets) |
Texas Pacific Land Corp. | 74.8% |
CSW Industrials, Inc. | 5.2% |
Landbridge Co. LLC | 5.0% |
Associated Capital Group, Inc. | 3.2% |
GAMCO Investors, Inc. | 2.6% |
Civeo Corp. | 1.2% |
Liberty Media Corp.-Liberty Formula One | 0.7% |
PrairieSky Royalty Ltd. | 0.6% |
Grayscale Bitcoin Mini Trust ETF | 0.4% |
Bakkt Holdings, Inc. | 0.4% |
For additional information about the Fund; including its prospectus, financial information, holdings and proxy information, scan the QR code or visit https://kineticsfunds.com/resources/.
| The Kinetics Spin-off and Corporate Restructuring Fund | PAGE 2 | TSR-AR-494613557 |
HOUSEHOLDING
To reduce Fund expenses, only one copy of most shareholder documents may be mailed to shareholders with multiple accounts at the same address (Householding). If you would prefer that your Horizon Kinetics Asset Management LLC documents not be householded, please contact Horizon Kinetics Asset Management LLC at 1-800-930-3828, or contact your financial intermediary. Your instructions will typically be effective within 30 days of receipt by Horizon Kinetics Asset Management LLC or your financial intermediary.
| The Kinetics Spin-off and Corporate Restructuring Fund | PAGE 3 | TSR-AR-494613557 |
9427833093171077798821297513652194882717621840398271000010138113511382913223173862058526494216962739934254
| | |
| The Kinetics Spin-off and Corporate Restructuring Fund | |
| Advisor Class C | LSHCX |
| Annual Shareholder Report | December 31, 2024 |
This annual shareholder report contains important information about the The Kinetics Spin-off and Corporate Restructuring Fund for the period of January 1, 2024, to December 31, 2024. You can find additional information about the Fund at https://kineticsfunds.com/resources/. You can also request this information by contacting us at 1-800-930-3828.
WHAT WERE THE FUND COSTS FOR THE PAST YEAR? (based on a hypothetical $10,000 investment)
| | |
Class Name | Costs of a $10,000 investment | Costs paid as a percentage of a $10,000 investment |
| Advisor Class C | $271 | 2.25% |
HOW DID THE FUND PERFORM LAST YEAR AND WHAT AFFECTED ITS PERFORMANCE?
For the 12-month period ended December 31, 2024, the Fund’s No-Load class posted 82.86%, significantly outperforming its benchmark S&P 500 Index, which posted 25.02% for the same period.
WHAT FACTORS INFLUENCED PERFORMANCE
The Fund’s performance was driven by strong positive returns in “hard asset” companies, which we believe stand to benefit from rising price levels, particularly in the energy sector. Energy prices were mixed for the year, as strong supply growth negated resilient demand. However, our investments in energy-related royalties and land/infrastructure were less impacted by commodity market fluctuations due to distinct growth drivers. The Fund also benefited from exposure to a niche Industrial supplier to the HVAC/R (heating, ventilation, air conditioning and refrigeration) market. These end markets have sustained secular growth trends which arose during the pandemic recovery.
The portfolio remains focused on companies that are actively seeking to maximize shareholder value through spin-offs and subject to restructuring activity. Guided by our long-term value investment philosophy, the Fund may experience periods of outperformance or underperformance relative to the benchmark, but we believe the Fund is well-positioned to generate above-market returns over the long term.
The Fund’s top contributor: Security selection collectively contributed positively to performance particularly within the Energy Sector. Texas Pacific Land Corporation (“TPL”) was the largest contributor to returns.
The Fund’s top detractor: Bakkt Holdings, Inc (“BKKT”) detracted marginally from returns.
HOW DID THE FUND PERFORM OVER THE PAST 10 YEARS?*
The $10,000 chart reflects a hypothetical $10,000 investment in the class of shares noted and assumes the maximum sales charge. The chart uses total return NAV performance and assumes reinvestment of dividends and capital gains. Fund expenses, including 12b-1 fees, management fees and other expenses were deducted.
| The Kinetics Spin-off and Corporate Restructuring Fund | PAGE 1 | TSR-AR-494613540 |
CUMULATIVE PERFORMANCE (Initial Investment of $10,000)
ANNUAL AVERAGE TOTAL RETURN (%)
| | | |
| | 1 Year | 5 Year | 10 Year |
Advisor Class C (without sales charge) | 81.04 | 24.22 | 14.64 |
Advisor Class C (with sales charge) | 80.04 | 24.22 | 14.64 |
S&P 500 TR | 25.02 | 14.53 | 13.10 |
Visit https://kineticsfunds.com/resources/ for more recent performance information.
| * | The Fund’s past performance is not a good predictor of how the Fund will perform in the future. The graph and table do not reflect the deduction of taxes that a shareholder would pay on Fund distributions or redemption of Fund shares. |
KEY FUND STATISTICS (as of December 31, 2024)
| |
Net Assets | $36,632,373 |
Number of Holdings | 36 |
Net Advisory Fee | $150,643 |
Portfolio Turnover | 6% |
Visit https://kineticsfunds.com/resources/ for more recent performance information.
WHAT DID THE FUND INVEST IN? (as of December 31, 2024)
| |
Top Sectors | (% of Net Assets) |
Mining, Quarrying, and Oil and Gas Extraction | 79.9% |
Manufacturing | 5.6% |
Management of Companies and Enterprises | 3.9% |
Finance and Insurance | 3.6% |
Accommodation and Food Services | 1.2% |
Real Estate and Rental and Leasing | 1.0% |
Information | 0.9% |
Real Estate | 0.2% |
Utilities | 0.0% |
Media | 0.0% |
| |
Top 10 Issuers | (% of Net Assets) |
Texas Pacific Land Corp. | 74.8% |
CSW Industrials, Inc. | 5.2% |
Landbridge Co. LLC | 5.0% |
Associated Capital Group, Inc. | 3.2% |
GAMCO Investors, Inc. | 2.6% |
Civeo Corp. | 1.2% |
Liberty Media Corp.-Liberty Formula One | 0.7% |
PrairieSky Royalty Ltd. | 0.6% |
Grayscale Bitcoin Mini Trust ETF | 0.4% |
Bakkt Holdings, Inc. | 0.4% |
For additional information about the Fund; including its prospectus, financial information, holdings and proxy information, scan the QR code or visit https://kineticsfunds.com/resources/.
| The Kinetics Spin-off and Corporate Restructuring Fund | PAGE 2 | TSR-AR-494613540 |
HOUSEHOLDING
To reduce Fund expenses, only one copy of most shareholder documents may be mailed to shareholders with multiple accounts at the same address (Householding). If you would prefer that your Horizon Kinetics Asset Management LLC documents not be householded, please contact Horizon Kinetics Asset Management LLC at 1-800-930-3828, or contact your financial intermediary. Your instructions will typically be effective within 30 days of receipt by Horizon Kinetics Asset Management LLC or your financial intermediary.
| The Kinetics Spin-off and Corporate Restructuring Fund | PAGE 3 | TSR-AR-494613540 |
100008778973511171101651324913842196172714221647391901000010138113511382913223173862058526494216962739934254
| | |
| The Kinetics Spin-off and Corporate Restructuring Fund | |
| Institutional Class | LSHUX |
| Annual Shareholder Report | December 31, 2024 |
This annual shareholder report contains important information about the The Kinetics Spin-off and Corporate Restructuring Fund for the period of January 1, 2024, to December 31, 2024. You can find additional information about the Fund at https://kineticsfunds.com/resources/. You can also request this information by contacting us at 1-800-930-3828.
WHAT WERE THE FUND COSTS FOR THE PAST YEAR? (based on a hypothetical $10,000 investment)
| | |
Class Name | Costs of a $10,000 investment | Costs paid as a percentage of a $10,000 investment |
| Institutional Class | $151 | 1.25% |
HOW DID THE FUND PERFORM LAST YEAR AND WHAT AFFECTED ITS PERFORMANCE?
For the 12-month period ended December 31, 2024, the Fund’s No-Load class posted 82.86%, significantly outperforming its benchmark S&P 500 Index, which posted 25.02% for the same period.
WHAT FACTORS INFLUENCED PERFORMANCE
The Fund’s performance was driven by strong positive returns in “hard asset” companies, which we believe stand to benefit from rising price levels, particularly in the energy sector. Energy prices were mixed for the year, as strong supply growth negated resilient demand. However, our investments in energy-related royalties and land/infrastructure were less impacted by commodity market fluctuations due to distinct growth drivers. The Fund also benefited from exposure to a niche Industrial supplier to the HVAC/R (heating, ventilation, air conditioning and refrigeration) market. These end markets have sustained secular growth trends which arose during the pandemic recovery.
The portfolio remains focused on companies that are actively seeking to maximize shareholder value through spin-offs and subject to restructuring activity. Guided by our long-term value investment philosophy, the Fund may experience periods of outperformance or underperformance relative to the benchmark, but we believe the Fund is well-positioned to generate above-market returns over the long term.
The Fund’s top contributor: Security selection collectively contributed positively to performance particularly within the Energy Sector. Texas Pacific Land Corporation (“TPL”) was the largest contributor to returns.
The Fund’s top detractor: Bakkt Holdings, Inc (“BKKT”) detracted marginally from returns.
HOW DID THE FUND PERFORM OVER THE PAST 10 YEARS?*
The $1,000,000 chart reflects a hypothetical $1,000,000 investment in the class of shares noted and assumes the maximum sales charge. The chart uses total return NAV performance and assumes reinvestment of dividends and capital gains. Fund expenses, including 12b-1 fees, management fees and other expenses were deducted.
| The Kinetics Spin-off and Corporate Restructuring Fund | PAGE 1 | TSR-AR-494613532 |
CUMULATIVE PERFORMANCE (Initial Investment of $1,000,000)
ANNUAL AVERAGE TOTAL RETURN (%)
| | | |
| | 1 Year | 5 Year | 10 Year |
Institutional Class (without sales charge) | 82.86 | 25.47 | 15.79 |
S&P 500 TR | 25.02 | 14.53 | 13.10 |
Visit https://kineticsfunds.com/resources/ for more recent performance information.
| * | The Fund’s past performance is not a good predictor of how the Fund will perform in the future. The graph and table do not reflect the deduction of taxes that a shareholder would pay on Fund distributions or redemption of Fund shares. |
KEY FUND STATISTICS (as of December 31, 2024)
| |
Net Assets | $36,632,373 |
Number of Holdings | 36 |
Net Advisory Fee | $150,643 |
Portfolio Turnover | 6% |
Visit https://kineticsfunds.com/resources/ for more recent performance information.
WHAT DID THE FUND INVEST IN? (as of December 31, 2024)
| |
Top Sectors | (% of Net Assets) |
Mining, Quarrying, and Oil and Gas Extraction | 79.9% |
Manufacturing | 5.6% |
Management of Companies and Enterprises | 3.9% |
Finance and Insurance | 3.6% |
Accommodation and Food Services | 1.2% |
Real Estate and Rental and Leasing | 1.0% |
Information | 0.9% |
Real Estate | 0.2% |
Utilities | 0.0% |
Media | 0.0% |
| |
Top 10 Issuers | (% of Net Assets) |
Texas Pacific Land Corp. | 74.8% |
CSW Industrials, Inc. | 5.2% |
Landbridge Co. LLC | 5.0% |
Associated Capital Group, Inc. | 3.2% |
GAMCO Investors, Inc. | 2.6% |
Civeo Corp. | 1.2% |
Liberty Media Corp.-Liberty Formula One | 0.7% |
PrairieSky Royalty Ltd. | 0.6% |
Grayscale Bitcoin Mini Trust ETF | 0.4% |
Bakkt Holdings, Inc. | 0.4% |
For additional information about the Fund; including its prospectus, financial information, holdings and proxy information, scan the QR code or visit https://kineticsfunds.com/resources/.
HOUSEHOLDING
To reduce Fund expenses, only one copy of most shareholder documents may be mailed to shareholders with multiple accounts at the same address (Householding). If you would prefer that your Horizon Kinetics Asset Management LLC documents not be householded, please contact Horizon Kinetics Asset Management LLC at 1-800-930-3828, or contact your financial intermediary. Your instructions will typically be effective within 30 days of receipt by Horizon Kinetics Asset Management LLC or your financial intermediary.
| The Kinetics Spin-off and Corporate Restructuring Fund | PAGE 2 | TSR-AR-494613532 |
10000008862949933481151264105793613937211469864210370029413952369885433347910000001013838113509313829011322270173860520584872649385216955827398843425395
| | |
| The Kinetics Spin-off and Corporate Restructuring Fund | |
| No Load Class | LSHEX |
| Annual Shareholder Report | December 31, 2024 |
This annual shareholder report contains important information about the The Kinetics Spin-off and Corporate Restructuring Fund for the period of January 1, 2024, to December 31, 2024. You can find additional information about the Fund at https://kineticsfunds.com/resources/. You can also request this information by contacting us at 1-800-930-3828.
WHAT WERE THE FUND COSTS FOR THE PAST YEAR? (based on a hypothetical $10,000 investment)
| | |
Class Name | Costs of a $10,000 investment | Costs paid as a percentage of a $10,000 investment |
| No Load Class | $175 | 1.45% |
HOW DID THE FUND PERFORM LAST YEAR AND WHAT AFFECTED ITS PERFORMANCE?
For the 12-month period ended December 31, 2024, the Fund’s No-Load class posted 82.86%, significantly outperforming its benchmark S&P 500 Index, which posted 25.02% for the same period.
WHAT FACTORS INFLUENCED PERFORMANCE
The Fund’s performance was driven by strong positive returns in “hard asset” companies, which we believe stand to benefit from rising price levels, particularly in the energy sector. Energy prices were mixed for the year, as strong supply growth negated resilient demand. However, our investments in energy-related royalties and land/infrastructure were less impacted by commodity market fluctuations due to distinct growth drivers. The Fund also benefited from exposure to a niche Industrial supplier to the HVAC/R (heating, ventilation, air conditioning and refrigeration) market. These end markets have sustained secular growth trends which arose during the pandemic recovery.
The portfolio remains focused on companies that are actively seeking to maximize shareholder value through spin-offs and subject to restructuring activity. Guided by our long-term value investment philosophy, the Fund may experience periods of outperformance or underperformance relative to the benchmark, but we believe the Fund is well-positioned to generate above-market returns over the long term.
The Fund’s top contributor: Security selection collectively contributed positively to performance particularly within the Energy Sector. Texas Pacific Land Corporation (“TPL”) was the largest contributor to returns.
The Fund’s top detractor: Bakkt Holdings, Inc (“BKKT”) detracted marginally from returns.
HOW DID THE FUND PERFORM SINCE INCEPTION?*
The $10,000 chart reflects a hypothetical $10,000 investment in the class of shares noted and assumes the maximum sales charge. The chart uses total return NAV performance and assumes reinvestment of dividends and capital gains. Fund expenses, including 12b-1 fees, management fees and other expenses were deducted.
| The Kinetics Spin-off and Corporate Restructuring Fund | PAGE 1 | TSR-AR-494613524 |
CUMULATIVE PERFORMANCE (Initial Investment of $10,000)
ANNUAL AVERAGE TOTAL RETURN (%)
| | | |
| | 1 Year | 5 Year | Since Inception
(12/11/2017) |
No Load Class (without sales charge) | 82.47 | 25.25 | 20.96 |
S&P 500 TR | 25.02 | 14.53 | 13.82 |
Visit https://kineticsfunds.com/resources/ for more recent performance information.
| * | The Fund’s past performance is not a good predictor of how the Fund will perform in the future. The graph and table do not reflect the deduction of taxes that a shareholder would pay on Fund distributions or redemption of Fund shares. |
KEY FUND STATISTICS (as of December 31, 2024)
| |
Net Assets | $36,632,373 |
Number of Holdings | 36 |
Net Advisory Fee | $150,643 |
Portfolio Turnover | 6% |
Visit https://kineticsfunds.com/resources/ for more recent performance information.
WHAT DID THE FUND INVEST IN? (as of December 31, 2024)
| |
Top Sectors | (% of Net Assets) |
Mining, Quarrying, and Oil and Gas Extraction | 79.9% |
Manufacturing | 5.6% |
Management of Companies and Enterprises | 3.9% |
Finance and Insurance | 3.6% |
Accommodation and Food Services | 1.2% |
Real Estate and Rental and Leasing | 1.0% |
Information | 0.9% |
Real Estate | 0.2% |
Utilities | 0.0% |
Media | 0.0% |
| |
Top 10 Issuers | (% of Net Assets) |
Texas Pacific Land Corp. | 74.8% |
CSW Industrials, Inc. | 5.2% |
Landbridge Co. LLC | 5.0% |
Associated Capital Group, Inc. | 3.2% |
GAMCO Investors, Inc. | 2.6% |
Civeo Corp. | 1.2% |
Liberty Media Corp.-Liberty Formula One | 0.7% |
PrairieSky Royalty Ltd. | 0.6% |
Grayscale Bitcoin Mini Trust ETF | 0.4% |
Bakkt Holdings, Inc. | 0.4% |
For additional information about the Fund; including its prospectus, financial information, holdings and proxy information, scan the QR code or visit https://kineticsfunds.com/resources/.
| The Kinetics Spin-off and Corporate Restructuring Fund | PAGE 2 | TSR-AR-494613524 |
HOUSEHOLDING
To reduce Fund expenses, only one copy of most shareholder documents may be mailed to shareholders with multiple accounts at the same address (Householding). If you would prefer that your Horizon Kinetics Asset Management LLC documents not be householded, please contact Horizon Kinetics Asset Management LLC at 1-800-930-3828, or contact your financial intermediary. Your instructions will typically be effective within 30 days of receipt by Horizon Kinetics Asset Management LLC or your financial intermediary.
| The Kinetics Spin-off and Corporate Restructuring Fund | PAGE 3 | TSR-AR-494613524 |
1000010305945812421130961871426094209823828510000100609619126471497419273157821993124918
Item 2. Code of Ethics.
The registrant has adopted a code of ethics that applies to the registrant’s principal executive officer and principal financial officer. The registrant has not made any substantive amendments to its code of ethics during the period covered by this report. The registrant has not granted any waivers from any provisions of the code of ethics during the period covered by this report. A copy of the registrant’s Code of Ethics is filed herewith.
Item 3. Audit Committee Financial Expert.
The registrant’s board of trustees/directors has determined that there is at least two audit committee financial experts serving on its audit committee. Mr. Douglas Cohen and Mr. Joseph Breslin are the “audit committee financial experts” and are considered to be “independent” as each term is defined in Item 3 of Form N-CSR.
Item 4. Principal Accountant Fees and Services.
The registrant has engaged its principal accountant to perform audit services, audit-related services, tax services and other services during the past two fiscal years. “Audit services” refer to performing an audit of the registrant's annual financial statements or services that are normally provided by the accountant in connection with statutory and regulatory filings or engagements for those fiscal years. “Audit-related services” refer to the assurance and related services by the principal accountant that are reasonably related to the performance of the audit. “Tax services” refer to professional services rendered by the principal accountant for tax compliance, tax advice, and tax planning. There were no “Other services” provided by the principal accountant. The following table details the aggregate fees billed or expected to be billed for each of the last two fiscal years for audit fees, audit-related fees, tax fees and other fees by the principal accountant.
| | FYE 12/31/2024 Kinetics Portfolios Trust | FYE 12/31/2024 Kinetics Mutual Funds | FYE 12/31/2023 Kinetics Portfolios Trust | FYE 12/31/2023 Kinetics Mutual Funds |
| Audit Fees | $ 67,500 | $ 84,500 | $ 67,500 | $ 83,700 |
| Audit-Related Fees | 0 | 0 | 0 | 0 |
| Tax Fees | $ 21,500 | $ 24,300 | $ 21,500 | $ 24,300 |
| All Other Fees | 0 | 0 | 0 | 0 |
The audit committee has adopted pre-approval policies and procedures that require the audit committee to pre-approve all audit and non-audit services of the registrant, including services provided to any entity affiliated with the registrant.
The percentage of fees billed by Tait, Weller & Baker LLP applicable to non-audit services pursuant to waiver of pre-approval requirement were as follows:
| | FYE 12/31/2024 | FYE 12/31/2023 |
| Audit-Related Fees | 0% | 0% |
| Tax Fees | 0% | 0% |
| All Other Fees | 0% | 0% |
All of the principal accountant’s hours spent on auditing the registrant’s financial statements were attributed to work performed by full-time permanent employees of the principal accountant.
The following table indicates the non-audit fees billed or expected to be billed by the registrant’s accountant for services to the registrant and to the registrant’s investment adviser (and any other controlling entity, etc.—not sub-adviser) for the last two years. The audit committee of the board of trustees/directors has considered whether the provision of non-audit services that were rendered to the registrant's investment adviser is compatible with maintaining the principal accountant's independence and has concluded that the provision of such non-audit services by the accountant has not compromised the accountant’s independence.
| Non-Audit Related Fees | FYE 12/31/2024 | FYE 12/31/2023 |
| Registrant | 0 | 0 |
| Registrant’s Investment Adviser | 0 | 0 |
The registrant has not been identified by the U.S. Securities and Exchange Commission as having filed an annual report issued by a registered public accounting firm branch or office that is located in a foreign jurisdiction where the Public Company Accounting Oversight Board is unable to inspect or completely investigate because of a position taken by an authority in that jurisdiction.
The registrant is not a foreign issuer.
Item 5. Audit Committee of Listed Registrants.
Not applicable to registrants who are not listed issuers (as defined in Rule 10A-3 under the Securities Exchange Act of 1934).
Item 6. Investments.
| (a) | Schedule of Investments is included within the financial statements filed under Item 7 of this Form. |
Item 7. Financial Statements and Financial Highlights for Open-End Investment Companies.
KINETICS MUTUAL FUNDS, INC
The Internet Fund
The Global Fund
The Paradigm Fund
The Small Cap Opportunities Fund
The Market Opportunities Fund
The Multi-Disciplinary Income Fund
The Kinetics Spin-Off and Corporate Restructuring Fund
Core Financial Statements
December 31, 2024
TABLE OF CONTENTS
| | | | |
KINETICS MUTUAL FUNDS, INC. – FEEDER FUNDS AND THE KINETICS SPIN-OFF AND CORPORATE RESTRUCTURING FUND
| | | |
| | | |
| | | |
| | | |
| | | |
| | | |
| | | |
| | | |
KINETICS PORTFOLIOS TRUST – MASTER INVESTMENT PORTFOLIOS
| | | |
| | | |
| | | |
| | | |
| | | |
| | | |
| | | |
| | | |
| | | |
| | | |
| | | |
| | | |
| | | |
| | | |
| | | | |
Directory of Funds’ Service Providers | | | Back Cover |
| | | | |
TABLE OF CONTENTS
KINETICS MUTUAL FUNDS, INC. – The Funds
The Kinetics Spin-Off and Corporate Restructuring Fund
Schedule of Investments
December 31, 2024
| | | | | | | |
COMMON STOCKS - 95.8%
| | | | | | |
Accommodation - 1.2%
| | | | | | |
Civeo Corp. | | | 20,000 | | | $454,400 |
Broadcasting (except Internet) - 0.2%
| | | | | | |
Atlanta Braves Holdings, Inc. - Class C(a) | | | 1,694 | | | 64,812 |
Chemical Manufacturing - 0.2%
| | | | | | |
Prestige Consumer Healthcare, Inc.(a) | | | 797 | | | 62,238 |
Diversified Real Estate Activities - 0.6%
| | | | | | |
PrairieSky Royalty Ltd. | | | 12,000 | | | 233,998 |
Electric Power Generation, Transmission and Distribution - 0.0%(b)
| | | | | | |
GE Vernova, Inc. | | | 25 | | | 8,223 |
Funds, Trusts, and Other Financial Vehicles - 0.0%(b)
| | | | | | |
Mesabi Trust | | | 550 | | | 15,461 |
Insurance Carriers - 0.0%(b)
| | | | | | |
Fairfax Financial Holdings Limited | | | 2 | | | 2,780 |
Machinery Manufacturing - 0.1%
| | | | | | |
General Electric Co. | | | 100 | | | 16,679 |
Management of Companies and Enterprises - 3.9%
| | | | | | |
Associated Capital Group, Inc. - Class A | | | 34,300 | | | 1,175,101 |
Fairfax India Holdings Corp.(a)(c) | | | 1,600 | | | 25,606 |
Galaxy Digital Holdings Ltd.(a) | | | 3,600 | | | 62,586 |
Hawaiian Electric Industries, Inc.(a) | | | 3,800 | | | 36,974 |
White Mountains Insurance Group Ltd. | | | 58 | | | 112,814 |
| | | | | | 1,413,081 |
Media - 0.0%(b)
| | | | | | |
Toei Animation Co. Ltd. | | | 200 | | | 4,493 |
Media Streaming Distribution Services, Social Networks, and Other Media Networks and Content Providers - 0.7%
| | | | | | |
Liberty Media Corp.-Liberty Formula One - Class A(a) | | | 3,000 | | | 252,120 |
Mining (except Oil and Gas) - 0.0%(b)
| | | | | | |
Knife River Corp.(a) | | | 100 | | | 10,164 |
Miscellaneous Manufacturing - 5.2%
| | | | | | |
CSW Industrials, Inc. | | | 5,400 | | | 1,905,120 |
Nonmetallic Mineral Mining and Quarrying - 0.0%(b)
| | | | | | |
Anglo American PLC - ADR | | | 72 | | | 1,062 |
Nonmetallic Mineral Product Manufacturing - 0.2%
| | | | | | |
Eagle Materials, Inc. | | | 324 | | | 79,950 |
| | | | | | | |
| | | | | | | |
Office Administrative Services - 0.2%
| | | | | | |
DigitalBridge Group, Inc. | | | 6,300 | | | $71,064 |
Offices of Real Estate Agents and Brokers - 5.0%
|
Landbridge Co. LLC(a) | | | 1,666 | | | 96,861 |
Landbridge Co. LLC - Class A | | | 27,000 | | | 1,744,200 |
| | | | | | 1,841,061 |
Oil and Gas Extraction - 74.8%(d)
| | | | | | |
Texas Pacific Land Corp.(e) | | | 24,777 | | | 27,402,371 |
Other Financial Investment Activities - 3.0%
|
Bakkt Holdings, Inc.(a) | | | 5,180 | | | 128,308 |
GAMCO Investors, Inc. - Class A | | | 39,300 | | | 950,274 |
Seaport Entertainment Group, Inc.(a) | | | 188 | | | 5,255 |
| | | | | | 1,083,837 |
Other Investment Pools and Funds - 0.1%
| | | | | | |
Urbana Corp. | | | 6,234 | | | 24,416 |
Urbana Corp. - Class A | | | 1,600 | | | 6,434 |
| | | | | | 30,850 |
Real Estate - 0.3%
| | | | | | |
Howard Hughes Holdings, Inc.(a) | | | 1,600 | | | 123,072 |
Securities, Commodity Contracts, and Other Financial Investments and Related Activities - 0.0%(b)
| | | | | | |
Brookfield Corp. | | | 36 | | | 2,068 |
Support Activities for Mining - 0.1%
| | | | | | |
Aris Water Solutions, Inc. - Class A | | | 106 | | | 2,539 |
Liberty Energy, Inc. | | | 972 | | | 19,333 |
| | | | | | 21,872 |
TOTAL COMMON STOCKS
(Cost $4,582,206) | | | | | | 35,100,776 |
UNIT INVESTMENT TRUSTS - 0.6%
| | | | | | |
Grayscale Bitcoin Cash Trust(a) | | | 6,073 | | | 31,883 |
Grayscale Bitcoin Mini Trust ETF(a) | | | 3,736 | | | 156,427 |
Grayscale Bitcoin Trust ETF(a) | | | 60 | | | 4,441 |
| | | | | | 192,751 |
TOTAL UNIT INVESTMENT TRUSTS
(Cost $159,587) | | | | | | 192,751 |
EXCHANGE TRADED FUNDS - 0.0%(b)
|
iShares Bitcoin Trust ETF(a) | | | 146 | | | 7,745 |
TOTAL EXCHANGE TRADED FUNDS
(Cost $5,256) | | | | | | 7,745 |
TOTAL INVESTMENTS - 96.4%
(Cost $4,747,049) | | | | | | $35,301,272 |
Money Market Deposit Account - 3.7%(f) | | | | | | 1,368,829 |
Liabilities in Excess of Other
Assets - (0.1)% | | | | | | (37,728) |
TOTAL NET ASSETS - 100.0% | | | | | | $36,632,373 |
| | | | | | | |
The accompanying notes are an integral part of these financial statements.
TABLE OF CONTENTS
KINETICS MUTUAL FUNDS, INC. – The Funds
The Kinetics Spin-Off and Corporate Restructuring Fund
Schedule of Investments
December 31, 2024(Continued)
Percentages are stated as a percent of net assets.
ADR - American Depositary Receipt
PLC - Public Limited Company
(a)
| Non-income producing security.
|
(b)
| Represents less than 0.05% of net assets.
|
(c)
| Security is exempt from registration pursuant to Rule 144A under the Securities Act of 1933, as amended. These securities may only be resold in transactions exempt from registration to qualified institutional investors. As of December 31, 2024, the value of these securities total $25,606 or 0.1% of the Fund’s net assets.
|
(d)
| To the extent that the Fund invests more heavily in a particular industry or sector of the economy, its performance will be especially sensitive to developments that significantly affect those industries or sectors.
|
(e)
| Fair value of this security exceeds 25% of the Fund’s net assets. Additional information for this security, including the financial statements, is available from the SEC’s EDGAR database at www.sec.gov.
|
(f)
| The U.S. Bank Money Market Deposit Account (the “MMDA”) is a short-term vehicle in which the Fund holds cash balances. The MMDA will bear interest at a variable rate that is determined based on market conditions and is subject to change daily. The rate as of December 31, 2024 was 4.24%. |
The accompanying notes are an integral part of these financial statements.
TABLE OF CONTENTS
KINETICS MUTUAL FUNDS, INC. – THE FEEDER FUNDS
STATEMENTS OF ASSETS & LIABILITIES
December 31, 2024
| | | | | | | |
ASSETS:
| | | | | | |
Investments in the Master Portfolio, at value* | | | $331,468,729 | | | $49,615,481 |
Receivable from Adviser | | | — | | | 18,610 |
Receivable for Master Portfolio interest sold | | | — | | | 318,956 |
Receivable for Fund shares sold | | | 559,388 | | | 200,093 |
Prepaid expenses and other assets | | | 27,577 | | | 25,825 |
Total assets | | | 332,055,694 | | | 50,178,965 |
LIABILITIES:
| | | | | | |
Payable for Master Portfolio interest purchased | | | 370,021 | | | — |
Payable to Directors | | | 4,768 | | | 672 |
Payable to Chief Compliance Officer | | | 347 | | | 36 |
Payable for Fund shares repurchased | | | 189,366 | | | 519,049 |
Payable for shareholder servicing fees | | | 74,525 | | | 10,904 |
Payable for distribution fees | | | 18,811 | | | 17,567 |
Accrued expenses and other liabilities | | | 46,611 | | | 15,002 |
Total liabilities | | | 704,449 | | | 563,230 |
NET ASSETS | | | $ 331,351,245 | | | $49,615,735 |
Net Assets Consist of:
| | | | | | |
Paid in capital | | | $97,487,231 | | | $26,310,801 |
Accumulated earnings | | | 233,864,014 | | | 23,304,934 |
Net assets | | | $331,351,245 | | | $49,615,735 |
Calculation of Net Asset Value Per Share - No Load Class:
| | | | | | |
Net Assets | | | $323,379,778 | | | $40,018,423 |
Shares outstanding | | | 3,154,593 | | | 2,499,169 |
Net asset value per share (offering price and redemption price) | | | $102.51 | | | $16.01 |
Calculation of Net Asset Value Per Share - Advisor Class A:
| | | | | | |
Net Assets | | | $3,927,101 | | | $2,753,183 |
Shares outstanding | | | 42,512 | | | 173,205 |
Net asset value per share (redemption price) | | | $92.38 | | | $15.90 |
Offering price per share ($92.38 divided by .9425 and $15.90 divided by .9425) | | | $98.02 | | | $16.87 |
Calculation of Net Asset Value Per Share - Advisor Class C:
| | | | | | |
Net Assets | | | $4,044,366 | | | $6,844,129 |
Shares outstanding | | | 53,829 | | | 467,296 |
Net asset value per share (offering price and redemption price) | | | $75.13 | | | $14.65 |
| | | | | | | |
*
| Each Feeder Fund invests all or generally all its assets directly in the corresponding Master Portfolio. The financial statements for the Master Portfolios, along with the portfolio of investments in securities, are contained elsewhere in this report and should be read in conjunction with the Feeder Funds’ financial statements. |
The accompanying notes are an integral part of these financial statements.
TABLE OF CONTENTS
KINETICS MUTUAL FUNDS, INC. – THE FEEDER FUNDS
STATEMENTS OF ASSETS & LIABILITIES
December 31, 2024(Continued)
| | | | | | | |
ASSETS:
| | | | | | |
Investments in the Master Portfolio, at value* | | | $1,274,814,113 | | | $465,583,146 |
Receivable for Fund shares sold | | | 6,587,509 | | | 770,389 |
Prepaid expenses and other assets | | | 55,480 | | | 37,981 |
Total assets | | | 1,281,457,102 | | | 466,391,516 |
LIABILITIES:
| | | | | | |
Payable for Master Portfolio interest purchased | | | 772,932 | | | 340,886 |
Payable to Adviser | | | 23,902 | | | 487 |
Payable to Directors | | | 21,497 | | | 7,411 |
Payable to Chief Compliance Officer | | | 1,129 | | | 396 |
Payable for Fund shares repurchased | | | 5,814,577 | | | 429,479 |
Payable for shareholder servicing fees | | | 240,110 | | | 89,995 |
Payable for distribution fees | | | 257,447 | | | 49,127 |
Fund distribution payable | | | — | | | 23 |
Accrued expenses and other liabilities | | | 120,771 | | | 52,245 |
Total liabilities | | | 7,252,365 | | | 970,049 |
NET ASSETS | | | $ 1,274,204,737 | | | $465,421,467 |
Net Assets Consist of:
| | | | | | |
Paid in capital | | | $139,003,516 | | | $168,776,030 |
Accumulated earnings | | | 1,135,201,221 | | | 296,645,437 |
Net assets | | | $ 1,274,204,737 | | | $465,421,467 |
Calculation of Net Asset Value Per Share - No Load Class:
| | | | | | |
Net Assets | | | $607,750,395 | | | $336,526,372 |
Shares outstanding | | | 4,539,355 | | | 1,983,587 |
Net asset value per share (offering price and redemption price) | | | $133.88 | | | $169.66 |
Calculation of Net Asset Value Per Share - Advisor Class A:
| | | | | | |
Net Assets | | | $254,588,581 | | | $24,368,073 |
Shares outstanding | | | 2,004,399 | | | 150,004 |
Net asset value per share (redemption price) | | | $127.01 | | | $162.45 |
Offering price per share ($127.01 divided by .9425 and $162.45 divided by .9425) | | | $134.76 | | | $172.36 |
Calculation of Net Asset Value Per Share - Advisor Class C:
| | | | | | |
Net Assets | | | $89,897,239 | | | $12,482,408 |
Shares outstanding | | | 796,938 | | | 82,136 |
Net asset value per share (offering price and redemption price) | | | $112.80 | | | $151.97 |
Calculation of Net Asset Value Per Share - Institutional Class:
| | | | | | |
Net Assets | | | $321,968,522 | | | $92,044,614 |
Shares outstanding | | | 2,371,211 | | | 529,043 |
Net asset value per share (offering price and redemption price) | | | $135.78 | | | $173.98 |
| | | | | | | |
*
| Each Feeder Fund invests all or generally all its assets directly in the corresponding Master Portfolio. The financial statements for the Master Portfolios, along with the portfolio of investments in securities, are contained elsewhere in this report and should be read in conjunction with the Feeder Funds’ financial statements. |
The accompanying notes are an integral part of these financial statements.
TABLE OF CONTENTS
KINETICS MUTUAL FUNDS, INC. – THE FEEDER FUNDS
STATEMENTS OF ASSETS & LIABILITIES
December 31, 2024(Continued)
| | | | | | | |
ASSETS:
| | | | | | |
Investments in the Master Portfolio, at value* | | | $223,411,083 | | | $13,416,320 |
Receivable from Adviser | | | 49,775 | | | 682 |
Receivable for Master Portfolio interest sold | | | 499,689 | | | — |
Prepaid expenses and other assets | | | 37,181 | | | 14,806 |
Total assets | | | 223,997,728 | | | 13,431,808 |
LIABILITIES:
| | | | | | |
Payable for Master Portfolio interest purchased | | | 442,762 | | | — |
Payable to Directors | | | 3,515 | | | 215 |
Payable to Chief Compliance Officer | | | 202 | | | 26 |
Payable for Fund shares repurchased | | | 56,928 | | | — |
Payable for shareholder servicing fees | | | 46,517 | | | 2,856 |
Payable for distribution fees | | | 33,034 | | | 11,983 |
Accrued expenses and other liabilities | | | 30,359 | | | 10,739 |
Total liabilities | | | 613,317 | | | 25,819 |
NET ASSETS | | | $223,384,411 | | | $13,405,989 |
Net Assets Consist of:
| | | | | | |
Paid in capital | | | $52,430,801 | | | $18,748,920 |
Accumulated earnings | | | 170,953,610 | | | (5,342,931) |
Net assets | | | $223,384,411 | | | $13,405,989 |
Calculation of Net Asset Value Per Share - No Load Class:
| | | | | | |
Net Assets | | | $161,183,226 | | | $13,405,989 |
Shares outstanding | | | 2,109,304 | | | 1,343,118 |
Net asset value per share (offering price and redemption price) | | | $76.42 | | | $9.98 |
Calculation of Net Asset Value Per Share - Advisor Class A:
| | | | | | |
Net Assets | | | $18,805,891 | | | N/A |
Shares outstanding | | | 250,601 | | | N/A |
Net asset value per share (redemption price) | | | $75.04 | | | N/A |
Offering price per share ($75.04 divided by .9425) | | | $79.62 | | | N/A |
Calculation of Net Asset Value Per Share - Advisor Class C:
| | | | | | |
Net Assets | | | $15,057,203 | | | N/A |
Shares outstanding | | | 211,591 | | | N/A |
Net asset value per share (offering price and redemption price) | | | $71.16 | | | N/A |
Calculation of Net Asset Value Per Share - Institutional Class:
| | | | | | |
Net Assets | | | $28,338,091 | | | N/A |
Shares outstanding | | | 364,614 | | | N/A |
Net asset value per share (offering price and redemption price) | | | $77.72 | | | N/A |
| | | | | | | |
*
| Each Feeder Fund invests all or generally all its assets directly in the corresponding Master Portfolio. The financial statements for the Master Portfolios, along with the portfolio of investments in securities, are contained elsewhere in this report and should be read in conjunction with the Feeder Funds’ financial statements. |
The accompanying notes are an integral part of these financial statements.
TABLE OF CONTENTS
KINETICS MUTUAL FUNDS, INC. – THE FEEDER FUNDS
STATEMENTS OF ASSETS & LIABILITIES
December 31, 2024(Continued)
| | | | |
ASSETS:
| | | |
Investments, at value(1) | | | $35,301,272 |
Foreign currencies, at value(3) | | | 4,320 |
Cash | | | 1,368,829 |
Receivable for investments sold | | | 2,264 |
Receivable for Fund shares sold | | | 16,085 |
Dividends and interest receivable | | | 14,924 |
Prepaid expenses and other assets | | | 26,603 |
Total assets | | | 36,734,297 |
LIABILITIES:
| | | |
Payable to Adviser | | | 21,898 |
Payable to Directors | | | 738 |
Payable to Chief Compliance Officer | | | 36 |
Payable for securities purchased | | | 2,177 |
Payable to custodian | | | 1,577 |
Payable for Fund shares repurchased | | | 26,591 |
Payable for shareholder servicing fees | | | 3,928 |
Payable for distribution fees | | | 15,307 |
Accrued expenses and other liabilities | | | 29,672 |
Total liabilities | | | 101,924 |
NET ASSETS | | | $36,632,373 |
(1) Cost of investments | | | 4,747,049 |
(3) Cost of foreign currencies | | | $4,327 |
Net Assets Consist of:
| | | |
Paid in capital | | | $6,043,059 |
Accumulated earnings | | | 30,589,314 |
Net assets | | | $36,632,373 |
Calculation of Net Asset Value Per Share - No Load Class:
| | | |
Net Assets | | | $222,284 |
Shares outstanding | | | 6,553 |
Net asset value per share (offering price and redemption price) | | | $33.92 |
Calculation of Net Asset Value Per Share - Advisor Class A:
| | | |
Net Assets | | | $10,684,435 |
Shares outstanding | | | 332,814 |
Net asset value per share (redemption price) | | | $32.10 |
Offering price per share ($32.10 divided by .9425) | | | $34.06 |
Calculation of Net Asset Value Per Share - Advisor Class C:
| | | |
Net Assets | | | $264,165 |
Shares outstanding | | | 9,153 |
Net asset value per share (offering price and redemption price) | | | $28.86 |
Calculation of Net Asset Value Per Share - Institutional Class:
| | | |
Net Assets | | | $25,461,489 |
Shares outstanding | | | 787,404 |
Net asset value per share (offering price and redemption price) | | | $32.34 |
| | | | |
The accompanying notes are an integral part of these financial statements.
TABLE OF CONTENTS
KINETICS MUTUAL FUNDS, INC. – The Feeder Funds
Statements of Operations
For the Year Ended December 31, 2024
| | | | | | | |
INVESTMENT GAIN ALLOCATED FROM MASTER PORTFOLIOS:
| | | | | | |
Dividends† | | | $1,485,835 | | | $348,004 |
Interest | | | 2,410,472 | | | 288,587 |
Income from securities lending | | | 237,740 | | | 18,051 |
Expenses allocated from Master Portfolio | | | (3,487,599) | | | (439,231) |
Net investment income from Master Portfolio | | | 646,448 | | | 215,411 |
EXPENSES:
| | | | | | |
Distribution fees - Advisor Class A (See Note 3) | | | 8,298 | | | 5,162 |
Distribution fees - Advisor Class C (See Note 3) | | | 22,996 | | | 43,908 |
Shareholder servicing fees - Advisor Class A (See Note 3) | | | 8,298 | | | 5,162 |
Shareholder servicing fees - Advisor Class C (See Note 3) | | | 7,665 | | | 14,636 |
Shareholder servicing fees - No Load Class (See Note 3) | | | 635,693 | | | 56,125 |
Transfer agent fees and expenses | | | 96,296 | | | 20,510 |
Reports to shareholders | | | 17,525 | | | 2,922 |
Administration fees | | | 62,045 | | | 9,754 |
Professional fees | | | 38,623 | | | 11,964 |
Directors’ fees | | | 22,740 | | | 2,462 |
Chief Compliance Officer fees | | | 3,888 | | | 392 |
Registration fees | | | 57,544 | | | 55,545 |
Fund accounting fees | | | 9,608 | | | 985 |
Other expenses | | | 7,638 | | | 795 |
Total expenses | | | 998,857 | | | 230,322 |
Less, expense reimbursement | | | — | | | (198,353) |
Net expenses | | | 998,857 | | | 31,969 |
Net investment income (loss) from Master Portfolio | | | (352,409) | | | 183,442 |
REALIZED AND UNREALIZED GAIN ON INVESTMENTS ALLOCATED FROM MASTER PORTFOLIOS:
| | | | | | |
Net realized gain on:
| | | | | | |
Investments and foreign currency | | | 2,252,945 | | | 411,112 |
Net change in unrealized appreciation (depreciation) of:
| | | | | | |
Investments and foreign currency | | | 141,485,777 | | | 14,608,888 |
Net gain on investments | | | 143,738,722 | | | 15,020,000 |
Net increase in net assets resulting from operations | | | $143,386,313 | | | $15,203,442 |
† Net of foreign taxes withheld of: | | | $16,450 | | | $16,912 |
| | | | | | | |
The accompanying notes are an integral part of these financial statements.
TABLE OF CONTENTS
KINETICS MUTUAL FUNDS, INC. – The Feeder Funds
Statements of Operations
For the Year Ended December 31, 2024(Continued)
| | | | | | | |
INVESTMENT GAIN ALLOCATED FROM MASTER PORTFOLIOS:
| | | | | | |
Dividends† | | | $14,507,164 | | | $5,749,101 |
Interest | | | 1,579,006 | | | 2,158,680 |
Income from securities lending | | | 375,137 | | | 38,597 |
Expenses allocated from Master Portfolio | | | (13,237,378) | | | (4,623,238) |
Net investment income from Master Portfolio | | | 3,223,929 | | | 3,323,140 |
EXPENSES:
| | | | | | |
Distribution fees - Advisor Class A (See Note 3) | | | 498,868 | | | 49,898 |
Distribution fees - Advisor Class C (See Note 3) | | | 528,207 | | | 75,365 |
Shareholder servicing fees - Advisor Class A (See Note 3) | | | 498,868 | | | 49,898 |
Shareholder servicing fees - Advisor Class C (See Note 3) | | | 176,069 | | | 25,122 |
Shareholder servicing fees - No Load Class (See Note 3) | | | 1,148,092 | | | 626,859 |
Shareholder servicing fees - Institutional Class (See Note 3) | | | 539,016 | | | 132,012 |
Transfer agent fees and expenses | | | 219,181 | | | 84,596 |
Reports to shareholders | | | 25,439 | | | 15,453 |
Administration fees | | | 221,933 | | | 77,598 |
Professional fees | | | 111,957 | | | 44,123 |
Directors’ fees | | | 85,824 | | | 29,608 |
Chief Compliance Officer fees | | | 13,929 | | | 4,745 |
Registration fees | | | 78,189 | | | 79,350 |
Fund accounting fees | | | 33,046 | | | 11,426 |
Other expenses | | | 29,627 | | | 11,392 |
Total expenses | | | 4,208,245 | | | 1,317,445 |
Less, expense waiver for Institutional Class shareholder servicing fees | | | (404,262) | | | (99,009) |
Less, expense reimbursement | | | (174,303) | | | (164,624) |
Net expenses | | | 3,629,680 | | | 1,053,812 |
Net investment income (loss) from Master Portfolio | | | (405,751) | | | 2,269,328 |
REALIZED AND UNREALIZED GAIN ON INVESTMENTS ALLOCATED FROM MASTER PORTFOLIOS:
| | | | | | |
Net realized gain on:
| | | | | | |
Investments and foreign currency | | | 63,393,324 | | | 12,283,641 |
Net change in unrealized appreciation (depreciation) of:
| | | | | | |
Investments and foreign currency | | | 564,567,500 | | | 157,237,452 |
Net gain on investments | | | 627,960,824 | | | 169,521,093 |
Net increase in net assets resulting from operations | | | $627,555,073 | | | $171,790,421 |
† Net of foreign taxes withheld of: | | | $173,897 | | | $241,134 |
| | | | | | |
| | | | | | | |
The accompanying notes are an integral part of these financial statements.
TABLE OF CONTENTS
KINETICS MUTUAL FUNDS, INC. – The Feeder Funds
Statements of Operations
For the Year Ended December 31, 2024(Continued)
| | | | | | | |
INVESTMENT GAIN ALLOCATED FROM MASTER PORTFOLIOS:
| | | | | | |
Dividends† | | | $2,363,240 | | | $— |
Interest | | | 813,639 | | | 944,130 |
Income from securities lending | | | 97,676 | | | (112) |
Realized gain on paydown | | | — | | | 4,118 |
Expenses allocated from Master Portfolio | | | (2,279,357) | | | (66,263) |
Net investment income from Master Portfolio | | | 995,198 | | | 881,873 |
EXPENSES:
| | | | | | |
Distribution fees - Advisor Class A (See Note 3) | | | 33,326 | | | — |
Distribution fees - Advisor Class C (See Note 3) | | | 91,614 | | | — |
Shareholder servicing fees - Advisor Class A (See Note 3) | | | 33,326 | | | — |
Shareholder servicing fees - Advisor Class C (See Note 3) | | | 30,538 | | | — |
Shareholder servicing fees - No Load Class (See Note 3) | | | 297,813 | | | 32,540 |
Shareholder servicing fees - Institutional Class (See Note 3) | | | 50,068 | | | — |
Transfer agent fees and expenses | | | 51,962 | | | 7,645 |
Reports to shareholders | | | 5,816 | | | 1,503 |
Administration fees | | | 40,856 | | | 4,635 |
Professional fees | | | 26,886 | | | 10,514 |
Directors’ fees | | | 14,666 | | | 1,145 |
Chief Compliance Officer fees | | | 2,415 | | | 201 |
Registration fees | | | 68,009 | | | 26,625 |
Fund accounting fees | | | 5,905 | | | 463 |
Other expenses | | | 4,876 | | | 505 |
Total expenses | | | 758,076 | | | 85,776 |
Less, expense waiver for Institutional Class shareholder servicing fees | | | (37,551) | | | — |
Less, expense reimbursement | | | (549,141) | | | (52,698) |
Net expenses | | | 171,384 | | | 33,078 |
Net investment income | | | 823,814 | | | 848,795 |
REALIZED AND UNREALIZED GAIN ON INVESTMENTS ALLOCATED FROM MASTER PORTFOLIOS:
| | | | | | |
Net realized gain on:
| | | | | | |
Investments and foreign currency | | | 1,152,184 | | | 212 |
Net change in unrealized appreciation (depreciation) of:
| | | | | | |
Investments and foreign currency | | | 99,556,362 | | | 33,159 |
Net gain on investments | | | 100,708,546 | | | 33,371 |
Net increase in net assets resulting from operations | | | $101,532,360 | | | $882,166 |
† Net of foreign taxes withheld of: | | | $42,079 | | | $— |
| | | | | | | |
The accompanying notes are an integral part of these financial statements.
TABLE OF CONTENTS
KINETICS MUTUAL FUNDS, INC. – The Feeder Funds
Statements of Operations
For the Year Ended December 31, 2024(Continued)
| | | | |
INVESTMENT INCOME:
| | | |
Dividends† | | | $597,371 |
Interest | | | 133,753 |
Total investment income | | | 731,124 |
EXPENSES:
| | | |
Distribution fees - Advisor Class A (See Note 3) | | | 19,380 |
Distribution fees - Advisor Class C (See Note 3) | | | 2,285 |
Shareholder servicing fees - Advisor Class A (See Note 3) | | | 19,380 |
Shareholder servicing fees - Advisor Class C (See Note 3) | | | 762 |
Shareholder servicing fees - No Load Class (See Note 3) | | | 150 |
Shareholder servicing fees - Institutional Class (See Note 3) | | | 42,170 |
Transfer agent fees and expenses | | | 24,891 |
Reports to shareholders | | | 895 |
Administration fees | | | 21,004 |
Professional fees | | | 21,512 |
Directors’ fees | | | 2,817 |
Chief Compliance Officer fees | | | 403 |
Registration fees | | | 65,920 |
Fund accounting fees | | | 4,595 |
Investment advisory fees | | | 292,017 |
Custodian fees and expenses | | | 9,893 |
Other expenses | | | 862 |
Total expenses | | | 528,936 |
Less, expense waiver for Institutional Class shareholder servicing fees | | | (31,628) |
Less, expense reimbursement | | | (109,746) |
Net expenses | | | 387,562 |
Net investment income | | | 343,562 |
REALIZED AND UNREALIZED GAN ON INVESTMENTS AND FOREIGN CURRENCY:
|
Net realized gain on:
| | | |
Investments and foreign currency | | | 1,640,709 |
Net change in unrealized appreciation (depreciation) of:
| | | |
Investments and foreign currency | | | 15,192,766 |
Net gain on investments | | | 16,833,475 |
Net increase in net assets resulting from operations | | | $17,177,037 |
† Net of foreign taxes withheld of: | | | $5,720 |
| | | |
| | | | |
The accompanying notes are an integral part of these financial statements.
TABLE OF CONTENTS
KINETICS MUTUAL FUNDS, INC. – The Feeder Funds
Statements of Changes in Net Assets
December 31, 2024
| | | | | | | |
OPERATIONS:
| | | | | | | | | | | | |
Net investment income (loss) | | | $(352,409) | | | $1,328,402 | | | $183,442 | | | $396,197 |
Net realized gain (loss) on sale of investments and foreign currency | | | 2,252,945 | | | 2,270,772 | | | 411,112 | | | (225,114) |
Net change in unrealized appreciation (depreciation) of investments and foreign currency | | | 141,485,777 | | | 40,793,916 | | | 14,608,888 | | | 1,884,327 |
Net increase in net assets resulting from operations | | | 143,386,313 | | | 44,393,090 | | | 15,203,442 | | | 2,055,410 |
DISTRIBUTIONS TO SHAREHOLDERS:
| | | | | | | | | | | | |
No Load Class (See Note 5) | | | (2,995,678) | | | (1,389,302) | | | (390,102) | | | (288,013) |
Advisor Class A (See Note 5) | | | (39,960) | | | (19,295) | | | (20,472) | | | (32,510) |
Advisor Class C (See Note 5) | | | (50,656) | | | (19,149) | | | (24,781) | | | (93,545) |
Total distributions to shareholders | | | (3,086,294) | | | (1,427,746) | | | (435,355) | | | (414,068) |
CAPITAL SHARE TRANSACTIONS - NO LOAD CLASS:
| | | | | | | | | | | | |
Proceeds from shares sold | | | 46,528,670 | | | 22,530,500 | | | 26,193,230 | | | 5,166,095 |
Redemption fees | | | 73,966 | | | 18,241 | | | 24,137 | | | 1,604 |
Proceeds from shares issued to holders in reinvestment of dividends | | | 2,857,824 | | | 1,355,174 | | | 375,413 | | | 264,030 |
Cost of shares redeemed | | | (48,713,578) | | | (24,605,463) | | | (9,068,243) | | | (15,798,617) |
Net increase (decrease) in net assets resulting from capital share transactions | | | 746,882 | | | (701,548) | | | 17,524,537 | | | (10,366,888) |
CAPITAL SHARE TRANSACTIONS - ADVISOR CLASS A:
| | | | | | | | | | | | |
Proceeds from shares sold | | | 876,102 | | | 155,760 | | | 501,806 | | | 641,746 |
Redemption fees | | | 953 | | | 275 | | | 2,143 | | | 165 |
Proceeds from shares issued to holders in reinvestment of dividends | | | 37,549 | | | 18,197 | | | 18,689 | | | 29,860 |
Cost of shares redeemed | | | (1,180,960) | | | (656,118) | | | (166,019) | | | (283,684) |
Net increase (decrease) in net assets resulting from capital share transactions | | | (266,356) | | | (481,886) | | | 356,619 | | | 388,087 |
CAPITAL SHARE TRANSACTIONS - ADVISOR CLASS C:
| | | | | | | | | | | | |
Proceeds from shares sold | | | 1,262,584 | | | 489,700 | | | 241,729 | | | 63,890 |
Redemption fees | | | 890 | | | 155 | | | 5,954 | | | 620 |
Proceeds from shares issued to holders in reinvestment of dividends | | | 43,306 | | | 15,552 | | | 21,486 | | | 80,873 |
Cost of shares redeemed | | | (759,591) | | | (208,805) | | | (1,226,667) | | | (2,349,373) |
Net increase (decrease) in net assets resulting from capital share transactions | | | 547,189 | | | 296,602 | | | (957,498) | | | (2,203,990) |
Total increase (decrease) in net assets: | | | 141,327,734 | | | 42,078,512 | | | 31,691,745 | | | (10,541,449) |
| | | | | | | | | | | | | |
The accompanying notes are an integral part of these financial statements.
TABLE OF CONTENTS
KINETICS MUTUAL FUNDS, INC. – The Feeder Funds
Statements of Changes in Net Assets
December 31, 2024(Continued)
| | | | | | | |
NET ASSETS:
| | | | | | | | | | | | |
Beginning of period | | | 190,023,511 | | | 147,944,999 | | | 17,923,990 | | | 28,465,439 |
End of period | | | $331,351,245 | | | $190,023,511 | | | $49,615,735 | | | $17,923,990 |
CHANGES IN SHARES OUTSTANDING - NO LOAD CLASS:
| | | | | | | | | | | | |
Shares sold | | | 552,482 | | | 469,358 | | | 1,885,199 | | | 613,349 |
Shares issued in reinvestments of dividends and distributions | | | 27,757 | | | 22,973 | | | 23,390 | | | 27,939 |
Shares redeemed | | | (593,838) | | | (495,814) | | | (671,518) | | | (1,827,851) |
Net increase (decrease) in shares outstanding | | | (13,599) | | | (3,483) | | | 1,237,071 | | | (1,186,563) |
CHANGES IN SHARES OUTSTANDING - ADVISOR CLASS A:
| | | | | | | | | | | | |
Shares sold | | | 11,392 | | | 3,354 | | | 40,860 | | | 76,187 |
Shares issued in reinvestments of dividends and distributions | | | 405 | | | 341 | | | 1,173 | | | 3,183 |
Shares redeemed | | | (13,362) | | | (15,340) | | | (11,950) | | | (34,476) |
Net increase (decrease) in shares outstanding | | | (1,565) | | | (11,645) | | | 30,083 | | | 44,894 |
CHANGES IN SHARES OUTSTANDING - ADVISOR CLASS C:
| | | | | | | | | | | | |
Shares sold | | | 22,017 | | | 12,578 | | | 21,188 | | | 7,613 |
Shares issued in reinvestments of dividends and distributions | | | 574 | | | 356 | | | 1,463 | | | 9,350 |
Shares redeemed | | | (12,406) | | | (5,881) | | | (105,233) | | | (299,977) |
Net increase (decrease) in shares outstanding | | | 10,185 | | | 7,053 | | | (82,582) | | | (283,014) |
| | | | | | | | | | | | | |
The accompanying notes are an integral part of these financial statements.
TABLE OF CONTENTS
KINETICS MUTUAL FUNDS, INC. – The Feeder Funds
Statements of Changes in Net Assets
December 31, 2024(Continued)
| | | | | | | |
OPERATIONS:
| | | | | | | | | | | | |
Net investment income (loss) | | | $(405,751) | | | $(4,563,069) | | | $2,269,328 | | | $810,391 |
Net realized gain on sale of investments and foreign currency | | | 63,393,324 | | | 44,517,267 | | | 12,283,641 | | | 25,853,591 |
Net change in unrealized appreciation (depreciation) of investments and foreign currency | | | 564,567,500 | | | (222,967,205) | | | 157,237,452 | | | (96,790,127) |
Net increase (decrease) in net assets resulting from operations | | | 627,555,073 | | | (183,013,007) | | | 171,790,421 | | | (70,126,145) |
DISTRIBUTIONS TO SHAREHOLDERS:
| | | | | | | | | | | | |
No Load Class (See Note 5) | | | (17,505,444) | | | (18,426,906) | | | (11,698,430) | | | (13,093,946) |
Advisor Class A (See Note 5) | | | (7,561,107) | | | (8,220,489) | | | (834,147) | | | (996,007) |
Advisor Class C (See Note 5) | | | (2,991,483) | | | (3,589,123) | | | (411,553) | | | (517,585) |
Institutional Class (See Note 5) | | | (9,634,516) | | | (11,939,043) | | | (3,243,686) | | | (4,154,384) |
Total distributions to shareholders | | | (37,692,550) | | | (42,175,561) | | | (16,187,816) | | | (18,761,922) |
CAPITAL SHARE TRANSACTIONS - NO LOAD CLASS:
| | | | | | | | | | | | |
Proceeds from shares sold | | | 146,481,009 | | | 34,835,326 | | | 86,914,477 | | | 50,835,416 |
Redemption fees | | | 176,250 | | | 22,525 | | | 105,506 | | | 42,028 |
Proceeds from shares issued to holders in reinvestment of dividends | | | 16,903,620 | | | 16,215,633 | | | 11,358,942 | | | 12,713,540 |
Cost of shares redeemed | | | (163,192,540) | | | (124,544,750) | | | (78,238,146) | | | (122,340,004) |
Net increase (decrease) in net assets resulting from capital share transactions | | | 368,339 | | | (73,471,266) | | | 20,140,779 | | | (58,749,020) |
CAPITAL SHARE TRANSACTIONS - ADVISOR CLASS A:
| | | | | | | | | | | | |
Proceeds from shares sold | | | 16,263,157 | | | 10,075,104 | | | 1,486,866 | | | 1,947,225 |
Redemption fees | | | 74,617 | | | 8,755 | | | 7,951 | | | 3,090 |
Proceeds from shares issued to holders in reinvestment of dividends | | | 6,507,268 | | | 7,086,025 | | | 766,852 | | | 924,495 |
Cost of shares redeemed | | | (30,338,385) | | | (20,919,604) | | | (3,248,446) | | | (6,353,628) |
Net decrease in net assets resulting from capital share transactions | | | (7,493,343) | | | (3,749,720) | | | (986,777) | | | (3,478,818) |
CAPITAL SHARE TRANSACTIONS - ADVISOR CLASS C:
| | | | | | | | | | | | |
Proceeds from shares sold | | | 3,033,051 | | | 820,174 | | | 684,542 | | | 461,432 |
Redemption fees | | | 25,939 | | | 3,733 | | | 4,002 | | | 1,628 |
Proceeds from shares issued to holders in reinvestment of dividends | | | 2,648,384 | | | 3,308,818 | | | 391,218 | | | 494,780 |
Cost of shares redeemed | | | (12,993,781) | | | (12,483,355) | | | (1,667,589) | | | (2,343,328) |
Net decrease in net assets resulting from capital share transactions | | | (7,286,407) | | | (8,350,630) | | | (587,827) | | | (1,385,488) |
| | | | | | | | | | | | | |
The accompanying notes are an integral part of these financial statements.
TABLE OF CONTENTS
KINETICS MUTUAL FUNDS, INC. – The Feeder Funds
Statements of Changes in Net Assets
December 31, 2024(Continued)
| | | | | | | |
CAPITAL SHARE TRANSACTIONS - INSTITUTIONAL CLASS:
| | | | | | | | | | | | |
Proceeds from shares sold | | | 32,839,071 | | | 17,506,065 | | | 26,568,127 | | | 25,651,547 |
Redemption fees | | | 93,986 | | | 13,553 | | | 27,723 | | | 13,010 |
Proceeds from shares issued to holders in reinvestment of dividends | | | 9,227,333 | | | 11,504,845 | | | 3,158,502 | | | 4,081,341 |
Cost of shares redeemed | | | (105,011,272) | | | (34,482,229) | | | (22,966,384) | | | (51,989,074) |
Net increase (decrease) in net assets resulting from capital share transactions | | | (62,850,882) | | | (5,457,766) | | | 6,787,968 | | | (22,243,176) |
Total increase (decrease) in net assets: | | | 512,600,230 | | | (316,217,950) | | | 180,956,748 | | | (174,744,569) |
NET ASSETS:
| | | | | | | | | | | | |
Beginning of period | | | 761,604,507 | | | 1,077,822,457 | | | 284,464,719 | | | 459,209,288 |
End of period | | | $1,274,204,737 | | | $761,604,507 | | | $465,421,467 | | | $284,464,719 |
CHANGES IN SHARES OUTSTANDING - NO LOAD CLASS:
| | | | | | | | | | | | |
Shares sold | | | 1,085,072 | | | 434,064 | | | 512,083 | | | 437,326 |
Shares issued in reinvestments of dividends and distributions | | | 125,949 | | | 219,278 | | | 66,802 | | | 120,736 |
Shares redeemed | | | (1,297,185) | | | (1,595,065) | | | (560,275) | | | (1,102,436) |
Net increase (decrease) in shares outstanding | | | (86,164) | | | (941,723) | | | 18,610 | | | (544,374) |
CHANGES IN SHARES OUTSTANDING - ADVISOR CLASS A:
| | | | | | | | | | | | |
Shares sold | | | 173,507 | | | 135,767 | | | 11,066 | | | 18,033 |
Shares issued in reinvestments of dividends and distributions | | | 51,105 | | | 100,668 | | | 4,710 | | | 9,152 |
Shares redeemed | | | (284,223) | | | (287,548) | | | (22,575) | | | (61,176) |
Net decrease in shares outstanding | | | (59,611) | | | (51,113) | | | (6,799) | | | (33,991) |
CHANGES IN SHARES OUTSTANDING - ADVISOR CLASS C:
| | | | | | | | | | | | |
Shares sold | | | 25,145 | | | 11,467 | | | 4,473 | | | 4,345 |
Shares issued in reinvestments of dividends and distributions | | | 23,421 | | | 52,471 | | | 2,568 | | | 5,216 |
Shares redeemed | | | (171,592) | | | (188,372) | | | (14,297) | | | (23,721) |
Net decrease in shares outstanding | | | (123,026) | | | (124,434) | | | (7,256) | | | (14,160) |
CHANGES IN SHARES OUTSTANDING - INSTITUTIONAL CLASS:
| | | | | | | | | | | | |
Shares sold | | | 266,348 | | | 222,256 | | | 167,661 | | | 226,213 |
Shares issued in reinvestments of dividends and distributions | | | 67,788 | | | 153,562 | | | 18,114 | | | 37,850 |
Shares redeemed | | | (963,052) | | | (447,341) | | | (176,421) | | | (464,148) |
Net increase (decrease) in shares
outstanding | | | (628,916) | | | (71,523) | | | 9,354 | | | (200,085) |
| | | | | | | | | | | | | |
The accompanying notes are an integral part of these financial statements.
TABLE OF CONTENTS
KINETICS MUTUAL FUNDS, INC. – The Feeder Funds
Statements of Changes in Net Assets
December 31, 2024(Continued)
| | | | | | | |
OPERATIONS:
| | | | | | | | | | | | |
Net investment income | | | $823,814 | | | $1,082,839 | | | $848,795 | | | $664,441 |
Net realized gain (loss) on sale of investments and foreign currency | | | 1,152,184 | | | (726,318) | | | 212 | | | (1,798,834) |
Net change in unrealized appreciation (depreciation) of investments and foreign currency | | | 99,556,362 | | | (10,472,164) | | | 33,159 | | | 1,781,637 |
Net increase (decrease) in net assets resulting from operations | | | 101,532,360 | | | (10,115,643) | | | 882,166 | | | 647,244 |
DISTRIBUTIONS TO SHAREHOLDERS:
| | | | | | | | | | | | |
No Load Class (See Note 5) | | | (1,298,731) | | | (797,934) | | | (831,330) | | | (670,836) |
Advisor Class A (See Note 5) | | | (123,250) | | | (63,485) | | | N/A | | | N/A |
Advisor Class C (See Note 5) | | | (38,806) | | | (11,691) | | | N/A | | | N/A |
Institutional Class (See Note 5) | | | (263,024) | | | (205,505) | | | N/A | | | N/A |
Total distributions to shareholders | | | (1,723,811) | | | (1,078,615) | | | (831,330) | | | (670,836) |
CAPITAL SHARE TRANSACTIONS - NO LOAD CLASS:
| | | | | | | | | | | | |
Proceeds from shares sold | | | 46,031,959 | | | 18,354,213 | | | 3,467,955 | | | 748,769 |
Redemption fees | | | 53,472 | | | 3,406 | | | — | | | 136 |
Proceeds from shares issued to holders in reinvestment of dividends | | | 1,293,531 | | | 794,718 | | | 359,382 | | | 363,091 |
Cost of shares redeemed | | | (48,192,222) | | | (15,662,286) | | | (2,593,080) | | | (5,292,588) |
Net increase (decrease) in net assets resulting from capital share transactions | | | (813,260) | | | 3,490,051 | | | 1,234,257 | | | (4,180,592) |
CAPITAL SHARE TRANSACTIONS - ADVISOR CLASS A:
| | | | | | | | | | | | |
Proceeds from shares sold | | | 3,213,198 | | | 1,602,408 | | | N/A | | | N/A |
Redemption fees | | | 6,056 | | | 311 | | | N/A | | | N/A |
Proceeds from shares issued to holders in reinvestment of dividends | | | 111,117 | | | 56,701 | | | N/A | | | N/A |
Cost of shares redeemed | | | (1,724,261) | | | (1,354,213) | | | N/A | | | N/A |
Net increase in net assets resulting from capital share transactions | | | 1,606,110 | | | 305,207 | | | N/A | | | N/A |
CAPITAL SHARE TRANSACTIONS - ADVISOR CLASS C:
| | | | | | | | | | | | |
Proceeds from shares sold | | | 155,821 | | | 235,261 | | | N/A | | | N/A |
Redemption fees | | | 5,095 | | | 416 | | | N/A | | | N/A |
Proceeds from shares issued to holders in reinvestment of dividends | | | 29,634 | | | 8,965 | | | N/A | | | N/A |
Cost of shares redeemed | | | (2,239,709) | | | (1,900,355) | | | N/A | | | N/A |
Net increase (decrease) in net assets resulting from capital share transactions | | | (2,049,159) | | | (1,655,713) | | | N/A | | | N/A |
| | | | | | | | | | | | | |
The accompanying notes are an integral part of these financial statements.
TABLE OF CONTENTS
KINETICS MUTUAL FUNDS, INC. – The Feeder Funds
Statements of Changes in Net Assets
December 31, 2024(Continued)
| | | | | | | |
CAPITAL SHARE TRANSACTIONS - INSTITUTIONAL CLASS:
| | | | | | | | | | | | |
Proceeds from shares sold | | | 7,572,863 | | | 2,098,017 | | | N/A | | | N/A |
Redemption fees | | | 9,672 | | | 723 | | | N/A | | | N/A |
Proceeds from shares issued to holders in reinvestment of dividends | | | 243,680 | | | 172,816 | | | N/A | | | N/A |
Cost of shares redeemed | | | (14,184,723) | | | (2,197,198) | | | N/A | | | N/A |
Net increase (decrease) in net assets resulting from capital share transactions | | | (6,358,508) | | | 74,358 | | | N/A | | | N/A |
Total increase (decrease) in net assets: | | | 92,193,732 | | | (8,980,355) | | | 1,285,093 | | | (4,204,184) |
NET ASSETS:
| | | | | | | | | | | | |
Beginning of period | | | 131,190,679 | | | 140,171,034 | | | 12,120,896 | | | 16,325,080 |
End of period | | | $223,384,411 | | | $131,190,679 | | | $13,405,989 | | | $12,120,896 |
CHANGES IN SHARES OUTSTANDING - NO LOAD CLASS:
| | | | | | | | | | | | |
Shares sold | | | 658,930 | | | 461,402 | | | 344,908 | | | 75,446 |
Shares issued in reinvestments of dividends and distributions | | | 16,869 | | | 18,918 | | | 36,149 | | | 36,771 |
Shares redeemed | | | (767,370) | | | (390,959) | | | (259,566) | | | (532,766) |
Net increase (decrease) in shares outstanding | | | (91,571) | | | 89,361 | | | 121,491 | | | (420,549) |
CHANGES IN SHARES OUTSTANDING - ADVISOR CLASS A:
| | | | | | | | | | | | |
Shares sold | | | 55,945 | | | 38,915 | | | N/A | | | N/A |
Shares issued in reinvestments of dividends and distributions | | | 1,476 | | | 1,373 | | | N/A | | | N/A |
Shares redeemed | | | (31,353) | | | (34,303) | | | N/A | | | N/A |
Net increase in shares outstanding | | | 26,068 | | | 5,985 | | | N/A | | | N/A |
CHANGES IN SHARES OUTSTANDING - ADVISOR CLASS C:
| | | | | | | | | | | | |
Shares sold | | | 2,738 | | | 6,010 | | | N/A | | | N/A |
Shares issued in reinvestments of dividends and distributions | | | 415 | | | 229 | | | N/A | | | N/A |
Shares redeemed | | | (44,310) | | | (50,121) | | | N/A | | | N/A |
Net increase (decrease) in shares outstanding | | | (41,157) | | | (43,882) | | | N/A | | | N/A |
CHANGES IN SHARES OUTSTANDING - INSTITUTIONAL CLASS:
| | | | | | | | | | | | |
Shares sold | | | 121,491 | | | 51,749 | | | N/A | | | N/A |
Shares issued in reinvestments of dividends and distributions | | | 3,125 | | | 4,048 | | | N/A | | | N/A |
Shares redeemed | | | (229,314) | | | (52,636) | | | N/A | | | N/A |
Net increase (decrease) in shares outstanding | | | (104,698) | | | 3,161 | | | N/A | | | N/A |
| | | | | | | | | | | | | |
The accompanying notes are an integral part of these financial statements.
TABLE OF CONTENTS
KINETICS MUTUAL FUNDS, INC. – The Feeder Funds
Statements of Changes in Net Assets
December 31, 2024(Continued)
| | | | |
OPERATIONS:
| | | | | | |
Net investment income | | | $343,562 | | | $66,127 |
Net realized gain on sale of investments and foreign currency | | | 1,640,709 | | | 840,254 |
Net change in unrealized appreciation (depreciation) of investments and
foreign currency | | | 15,192,766 | | | (7,529,872) |
Net increase (decrease) in net assets resulting from operations | | | 17,177,037 | | | (6,623,491) |
DISTRIBUTIONS TO SHAREHOLDERS:
| | | | | | |
No Load Class (See Note 5) | | | (9,975) | | | (2,351) |
Advisor Class A (See Note 5) | | | (478,493) | | | (502,430) |
Advisor Class C (See Note 5) | | | (11,130) | | | (28,807) |
Institutional Class (See Note 5) | | | (1,210,270) | | | (1,496,121) |
Total distributions to shareholders | | | (1,709,868) | | | (2,029,709) |
CAPITAL SHARE TRANSACTIONS - NO LOAD CLASS:
| | | | | | |
Proceeds from shares sold | | | 198,304 | | | 16,543 |
Redemption fees | | | 11 | | | 20 |
Proceeds from shares issued to holders in reinvestment of dividends | | | 9,848 | | | 2,350 |
Cost of shares redeemed | | | (17,500) | | | (98,343) |
Net increase (decrease) in net assets resulting from capital share transactions | | | 190,663 | | | (79,430) |
CAPITAL SHARE TRANSACTIONS - ADVISOR CLASS A:
| | | | | | |
Proceeds from shares sold | | | 3,241,621 | | | 666,170 |
Redemption fees | | | 2,717 | | | 1,352 |
Proceeds from shares issued to holders in reinvestment of dividends | | | 476,428 | | | 501,499 |
Cost of shares redeemed | | | (2,497,363) | | | (3,661,523) |
Net increase (decrease) in net assets resulting from capital share transactions | | | 1,223,403 | | | (2,492,502) |
CAPITAL SHARE TRANSACTIONS - ADVISOR CLASS C:
| | | | | | |
Proceeds from shares sold | | | 159,120 | | | 30 |
Redemption fees | | | 119 | | | 100 |
Proceeds from shares issued to holders in reinvestment of dividends | | | 11,130 | | | 24,509 |
Cost of shares redeemed | | | (431,340) | | | (383,518) |
Net decrease in net assets resulting from capital share transactions | | | (260,971) | | | (358,879) |
CAPITAL SHARE TRANSACTIONS - INSTITUTIONAL CLASS:
| | | | | | |
Proceeds from shares sold | | | 2,184,900 | | | 766,829 |
Redemption fees | | | 7,835 | | | 3,496 |
Proceeds from shares issued to holders in reinvestment of dividends | | | 1,201,335 | | | 1,189,746 |
Cost of shares redeemed | | | (5,859,392) | | | (2,995,966) |
Net decrease in net assets resulting from capital share transactions | | | (2,465,322) | | | (1,035,895) |
Total increase (decrease) in net assets: | | | 14,154,942 | | | (12,619,906) |
| | | | | | | |
The accompanying notes are an integral part of these financial statements.
TABLE OF CONTENTS
KINETICS MUTUAL FUNDS, INC. – The Feeder Funds
Statements of Changes in Net Assets
December 31, 2024(Continued)
| | | | |
NET ASSETS:
| | | | | | |
Beginning of period | | | 22,477,431 | | | 35,097,337 |
End of period | | | $ 36,632,373 | | | $22,477,431 |
CHANGES IN SHARES OUTSTANDING - NO LOAD CLASS:
| | | | | | |
Shares sold | | | 5,472 | | | 807 |
Shares issued in reinvestments of dividends and distributions | | | 289 | | | 119 |
Shares redeemed | | | (684) | | | (5,100) |
Net increase (decrease) in shares outstanding | | | 5,077 | | | (4,174) |
CHANGES IN SHARES OUTSTANDING - ADVISOR CLASS A:
| | | | | | |
Shares sold | | | 88,676 | | | 30,875 |
Shares issued in reinvestments of dividends and distributions | | | 14,796 | | | 26,905 |
Shares redeemed | | | (83,319) | | | (170,293) |
Net increase (decrease) in shares outstanding | | | 20,153 | | | (112,513) |
CHANGES IN SHARES OUTSTANDING - ADVISOR CLASS C:
| | | | | | |
Shares sold | | | 5,965 | | | 2 |
Shares issued in reinvestments of dividends and distributions | | | 385 | | | 1,455 |
Shares redeemed | | | (15,282) | | | (19,975) |
Net decrease in shares outstanding | | | (8,932) | | | (18,518) |
CHANGES IN SHARES OUTSTANDING - INSTITUTIONAL CLASS:
| | | | | | |
Shares sold | | | 79,065 | | | 34,136 |
Shares issued in reinvestments of dividends and distributions | | | 37,044 | | | 63,352 |
Shares redeemed | | | (211,895) | | | (143,469) |
Net decrease in shares outstanding | | | (95,786) | | | (45,981) |
| | | | | | | |
| |
The accompanying notes are an integral part of these financial statements.
|
| |
The accompanying notes are an integral part of these financial statements.
TABLE OF CONTENTS
THE INTERNET FUND
FINANCIAL HIGHLIGHTS
No Load Class
| | | | |
PER SHARE DATA:(1)
| | | | | | | | | | | | | | | |
Net asset value, beginning of year | | | $58.64 | | | $45.53 | | | $60.64 | | | $53.01 | | | $33.89 |
INCOME FROM INVESTMENT OPERATIONS:
| | | | | | | | | | | | |
Net investment income (loss)(2) | | | (0.10) | | | 0.40 | | | (0.30) | | | (0.83) | | | (0.29) |
Net realized and unrealized gain (loss) on investments | | | 44.91 | | | 13.14 | | | (14.44) | | | 8.93 | | | 19.41 |
Total from investment operations | | | 44.81 | | | 13.54 | | | (14.74) | | | 8.10 | | | 19.12 |
Redemption fees | | | 0.02 | | | 0.01 | | | 0.01 | | | 0.05 | | | 0.00(3) |
LESS DISTRIBUTIONS:
| | | | | | | | | | | | | | | |
From net investment income | | | (0.21) | | | — | | | — | | | — | | | — |
From net realized gains | | | (0.75) | | | (0.44) | | | (0.38) | | | (0.52) | | | — |
Total distributions | | | (0.96) | | | (0.44) | | | (0.38) | | | (0.52) | | | — |
Net asset value, end of year | | | $102.51 | | | $58.64 | | | $45.53 | | | $60.64 | | | $53.01 |
Total return | | | 76.44% | | | 29.76% | | | (24.28)% | | | 15.35% | | | 56.42% |
SUPPLEMENTAL DATA AND RATIOS
| | | | | | | | | | | | | | | |
Net assets, end of Year (000’s) | | | $323,380 | | | $185,790 | | | $144,397 | | | $226,228 | | | $169,374 |
Ratio of operating expenses to average net assets:(4) | | | 1.71% | | | 1.75% | | | 1.77% | | | 1.71% | | | 1.82% |
Ratio of net investment income (loss) to average net assets: | | | (0.12)% | | | 0.83% | | | (0.60)% | | | (1.29)% | | | (0.80)% |
Portfolio turnover rate(5) | | | 43% | | | 19% | | | 19% | | | 4% | | | 1% |
| | | | | | | | | | | | | | | | |
(1)
| Information presented relates to a share of capital stock outstanding for each year. |
(2)
| Net investment income per share represents net investment income divided by the average shares outstanding throughout the year. |
(3)
| Amount calculated is less than $0.005. |
(4)
| See Note #3, Investment Adviser, for the waiver and expense reimbursement discussion. |
(5)
| Portfolio turnover of The Internet Portfolio. |
The accompanying notes are an integral part of these financial statements.
TABLE OF CONTENTS
THE INTERNET FUND
FINANCIAL HIGHLIGHTS
Advisor Class A
| | | | |
PER SHARE DATA:(1)
| | | | | | | | | | | | | | | |
Net asset value, beginning of year | | | $53.03 | | | $41.31 | | | $55.20 | | | $48.42 | | | $31.03 |
INCOME FROM INVESTMENT OPERATIONS:
| | | | | | | | | | | | |
Net investment income (loss)(2) | | | (0.27) | | | 0.26 | | | (0.39) | | | (0.91) | | | (0.35) |
Net realized and unrealized gain (loss) on investments | | | 40.56 | | | 11.89 | | | (13.13) | | | 8.17 | | | 17.74 |
Total from investment operations | | | 40.29 | | | 12.15 | | | (13.52) | | | 7.26 | | | 17.39 |
Redemption fees | | | 0.02 | | | 0.01 | | | 0.01 | | | 0.04 | | | 0.00(6) |
LESS DISTRIBUTIONS:
| | | | | | | | | | | | | | | |
From net investment income | | | (0.21) | | | — | | | — | | | — | | | — |
From net realized gains | | | (0.75) | | | (0.44) | | | (0.38) | | | (0.52) | | | — |
Total distributions | | | (0.96) | | | (0.44) | | | (0.38) | | | (0.52) | | | — |
Net asset value, end of year | | | $92.38 | | | $53.03 | | | $41.31 | | | $55.20 | | | $48.42 |
Total return | | | 76.00% | | | 29.43% | | | (24.47)% | | | 15.06% | | | 56.04% |
SUPPLEMENTAL DATA AND RATIOS
| | | | | | | | | | | | | | | |
Net assets, end of Year (000’s) | | | $3,927 | | | $2,337 | | | $2,302 | | | $5,620 | | | $2,864 |
Ratio of operating expenses to average net assets:(4) | | | 1.96% | | | 2.00% | | | 2.02% | | | 1.96% | | | 2.07% |
Ratio of net investment income (loss) to average net assets: | | | (0.37)% | | | 0.58% | | | (0.85)% | | | (1.54)% | | | (1.05)% |
Portfolio turnover rate(5) | | | 43% | | | 19% | | | 19% | | | 4% | | | 1% |
| | | | | | | | | | | | | | | | |
(1)
| Information presented relates to a share of capital stock outstanding for each year. |
(2)
| Net investment income per share represents net investment income divided by the average shares outstanding throughout the year. |
(3)
| The total return calculation does not reflect the 5.75% front end sales charge on Advisor Class A shares. |
(4)
| See Note #3, Investment Adviser, for the waiver and expense reimbursement discussion. |
(5)
| Portfolio turnover of The Internet Portfolio. |
(6)
| Amount calculated is less than $0.005. |
The accompanying notes are an integral part of these financial statements.
TABLE OF CONTENTS
THE INTERNET FUND
FINANCIAL HIGHLIGHTS
Advisor Class C
| | | | |
PER SHARE DATA:(1)
| | | | | | | | | | | | | | | |
Net asset value, beginning of year | | | $43.45 | | | $34.07 | | | $45.86 | | | $40.49 | | | $26.08 |
INCOME FROM INVESTMENT OPERATIONS:
| | | | | | | | | | | | |
Net investment income (loss)(2) | | | (0.53) | | | 0.03 | | | (0.51) | | | (1.00) | | | (0.43) |
Net realized and unrealized gain (loss) on investments | | | 33.15 | | | 9.79 | | | (10.90) | | | 6.85 | | | 14.84 |
Total from investment operations | | | 32.62 | | | 9.82 | | | (11.41) | | | 5.85 | | | 14.41 |
Redemption fees | | | 0.02 | | | 0.00(5) | | | 0.00(5) | | | 0.04 | | | 0.00(5) |
LESS DISTRIBUTIONS:
| | | | | | | | | | | | | | | |
From net investment income | | | (0.21) | | | — | | | — | | | — | | | — |
From net realized gains | | | (0.75) | | | (0.44) | | | (0.38) | | | (0.52) | | | — |
Total distributions | | | (0.96) | | | (0.44) | | | (0.38) | | | (0.52) | | | — |
Net asset value, end of year | | | $75.13 | | | $43.45 | | | $34.07 | | | $45.86 | | | $40.49 |
Total return | | | 75.11% | | | 28.82% | | | (24.87)% | | | 14.52% | | | 55.25% |
SUPPLEMENTAL DATA AND RATIOS
| | | | | | | | | | | | | | | |
Net assets, end of Year (000’s) | | | $4,044 | | | $1,896 | | | $1,247 | | | $1,893 | | | $1,560 |
Ratio of operating expenses to average net assets:(3) | | | 2.46% | | | 2.50% | | | 2.52% | | | 2.46% | | | 2.57% |
Ratio of net investment income (loss) to average net assets: | | | (0.87)% | | | 0.08% | | | (1.35)% | | | (2.04)% | | | (1.55)% |
Portfolio turnover rate(4) | | | 43% | | | 19% | | | 19% | | | 4% | | | 1% |
| | | | | | | | | | | | | | | | |
(1)
| Information presented relates to a share of capital stock outstanding for each year. |
(2)
| Net investment income per share represents net investment income divided by the average shares outstanding throughout the year. |
(3)
| See Note #3, Investment Adviser, for the waiver and expense reimbursement discussion. |
(4)
| Portfolio turnover of The Internet Portfolio. |
(5)
| Amount calculated is less than $0.005. |
The accompanying notes are an integral part of these financial statements.
TABLE OF CONTENTS
THE GLOBAL FUND
FINANCIAL HIGHLIGHTS
No Load Class
| | | | |
PER SHARE DATA:(1)
| | | | | | | | | | | | | | | |
Net asset value, beginning of year | | | $9.39 | | | $8.60 | | | $9.33 | | | $8.30 | | | $6.64 |
INCOME FROM INVESTMENT OPERATIONS:
| | | | | | | | | | | | |
Net investment income (loss)(2) | | | 0.10 | | | 0.15 | | | 0.02 | | | (0.09) | | | (0.03) |
Net realized and unrealized gain (loss) on investments | | | 6.67 | | | 0.87 | | | (0.62) | | | 1.43 | | | 1.69 |
Total from investment operations | | | 6.77 | | | 1.02 | | | (0.60) | | | 1.34 | | | 1.66 |
Redemption fees | | | 0.01 | | | 0.00(3) | | | 0.00(3) | | | 0.01 | | | 0.00(3) |
LESS DISTRIBUTIONS:
| | | | | | | | | | | | | | | |
From net investment income | | | (0.16) | | | (0.23) | | | — | | | (0.29) | | | — |
From net realized gains | | | — | | | — | | | (0.13) | | | (0.03) | | | — |
Total distributions | | | (0.16) | | | (0.23) | | | (0.13) | | | (0.32) | | | — |
Net asset value, end of year | | | $16.01 | | | $9.39 | | | $8.60 | | | $9.33 | | | $8.30 |
Total return | | | 72.16% | | | 11.89% | | | (6.46)% | | | 16.32% | | | 25.00% |
SUPPLEMENTAL DATA AND RATIOS
| | | | | | | | | | | | | | | |
Net assets, end of Year (000’s) | | | $40,018 | | | $11,857 | | | $21,052 | | | $19,128 | | | $13,904 |
Ratio of operating expenses to average net assets:
| | | | | | | | | | | | | | | |
Before expense reimbursement | | | 2.04% | | | 2.13% | | | 2.07% | | | 2.08% | | | 2.45% |
After expense reimbursement(4) | | | 1.39% | | | 1.39% | | | 1.39% | | | 1.39% | | | 1.39% |
Ratio of net investment income (loss) to average net assets: | | | 0.78% | | | 1.81% | | | 0.25% | | | (0.90)% | | | (0.46)% |
Portfolio turnover rate(5) | | | 34% | | | 16% | | | 57% | | | 7% | | | 8% |
| | | | | | | | | | | | | | | | |
(1)
| Information presented relates to a share of capital stock outstanding for each year. |
(2)
| Net investment income per share represents net investment income divided by the average shares outstanding throughout the year. |
(3)
| Amount calculated is less than $0.005. |
(4)
| See Note #3, Investment Adviser, for the waiver and expense reimbursement discussion. |
(5)
| Portfolio turnover of The Global Portfolio. |
The accompanying notes are an integral part of these financial statements.
TABLE OF CONTENTS
THE GLOBAL FUND
FINANCIAL HIGHLIGHTS
Advisor Class A
| | | | |
PER SHARE DATA:(1)
| | | | | | | | | | | | | | | |
Net asset value, beginning of year | | | $9.33 | | | $8.55 | | | $9.31 | | | $8.23 | | | $6.60 |
INCOME FROM INVESTMENT OPERATIONS:
| | | | | | | | | | | | |
Net investment income (loss)(2) | | | 0.07 | | | 0.13 | | | 0.00 | | | (0.11) | | | (0.05) |
Net realized and unrealized gain (loss) on investments | | | 6.61 | | | 0.88 | | | (0.63) | | | 1.44 | | | 1.68 |
Total from investment operations | | | 6.68 | | | 1.01 | | | (0.63) | | | 1.33 | | | 1.63 |
Redemption fees | | | 0.01 | | | 0.00(3) | | | 0.00(3) | | | 0.00(3) | | | 0.00(3) |
LESS DISTRIBUTIONS:
| | | | | | | | | | | | | | | |
From net investment income | | | (0.12) | | | (0.23) | | | — | | | (0.22) | | | — |
From net realized gains | | | — | | | — | | | (0.13) | | | (0.03) | | | — |
Total distributions | | | (0.12) | | | (0.23) | | | (0.13) | | | (0.25) | | | — |
Net asset value, end of year | | | $ 15.90 | | | $9.33 | | | $8.55 | | | $9.31 | | | $8.23 |
Total return | | | 71.69% | | | 11.82% | | | (6.79)% | | | 16.16% | | | 24.70% |
SUPPLEMENTAL DATA AND RATIOS
| | | | | | | | | | | | | | | |
Net assets, end of Year (000’s) | | | $2,753 | | | $1,335 | | | $840 | | | $595 | | | $574 |
Ratio of operating expenses to average net assets:
| | | | | | | | | | | | | | | |
Before expense reimbursement | | | 2.29% | | | 2.38% | | | 2.32% | | | 2.33% | | | 2.70% |
After expense reimbursement(5) | | | 1.64% | | | 1.64% | | | 1.64% | | | 1.64% | | | 1.64% |
Ratio of net investment income (loss) to average net assets: | | | 0.52% | | | 1.56% | | | 0% | | | (1.15)% | | | (0.71)% |
Portfolio turnover rate(6) | | | 34% | | | 16% | | | 57% | | | 7% | | | 8% |
| | | | | | | | | | | | | | | | |
(1)
| Information presented relates to a share of capital stock outstanding for each year. |
(2)
| Net investment income per share represents net investment income divided by the average shares outstanding throughout the year. |
(3)
| Amount calculated is less than $0.005. |
(4)
| The total return calculation does not reflect the 5.75% front end sales charge on Advisor Class A shares. |
(5)
| See Note #3, Investment Adviser, for the waiver and expense reimbursement discussion. |
(6)
| Portfolio turnover of The Global Portfolio. |
The accompanying notes are an integral part of these financial statements.
TABLE OF CONTENTS
THE GLOBAL FUND
FINANCIAL HIGHLIGHTS
Advisor Class C
| | | | |
PER SHARE DATA:(1)
| | | | | | | | | | | | | | | |
Net asset value, beginning of year | | | $8.60 | | | $7.89 | | | $8.64 | | | $7.67 | | | $6.18 |
INCOME FROM INVESTMENT OPERATIONS:
| | | | | | | | | | | | |
Net investment income (loss)(2) | | | — | | | 0.08 | | | (0.04) | | | (0.15) | | | (0.07) |
Net realized and unrealized gain (loss) on investments | | | 6.09 | | | 0.80 | | | (0.58) | | | 1.33 | | | 1.56 |
Total from investment operations | | | 6.09 | | | 0.88 | | | (0.62) | | | 1.18 | | | 1.49 |
Redemption fees | | | 0.01 | | | 0.00(3) | | | 0.00(3) | | | 0.00(3) | | | 0.00(3) |
LESS DISTRIBUTIONS:
| | | | | | | | | | | | | | | |
From net investment income | | | (0.05) | | | (0.17) | | | — | | | (0.18) | | | — |
From net realized gains | | | — | | | — | | | (0.13) | | | (0.03) | | | — |
Total distributions | | | (0.05) | | | (0.17) | | | (0.13) | | | (0.21) | | | — |
Net asset value, end of year | | | $ 14.65 | | | $8.60 | | | $7.89 | | | $8.64 | | | $7.67 |
Total return | | | 70.97% | | | 11.18% | | | (7.21)% | | | 15.44% | | | 24.11% |
SUPPLEMENTAL DATA AND RATIOS
| | | | | | | | | | | | | | | |
Net assets, end of Year (000’s) | | | $6,844 | | | $4,732 | | | $6,574 | | | $7,439 | | | $5,982 |
Ratio of operating expenses to average net assets:
| | | | | | | | | | | | | | | |
Before expense reimbursement | | | 2.79% | | | 2.88% | | | 2.82% | | | 2.83% | | | 3.20% |
After expense reimbursement(4) | | | 2.14% | | | 2.14% | | | 2.14% | | | 2.14% | | | 2.14% |
Ratio of net investment income (loss) to average net assets: | | | 0.03% | | | 1.06% | | | (0.50)% | | | (1.65)% | | | (1.21)% |
Portfolio turnover rate(5) | | | 34% | | | 16% | | | 57% | | | 7% | | | 8% |
| | | | | | | | | | | | | | | | |
(1)
| Information presented relates to a share of capital stock outstanding for each year. |
(2)
| Net investment income per share represents net investment income divided by the average shares outstanding throughout the year. |
(3)
| Amount calculated is less than $0.005. |
(4)
| See Note #3, Investment Adviser, for the waiver and expense reimbursement discussion. |
(5)
| Portfolio turnover of The Global Portfolio. |
The accompanying notes are an integral part of these financial statements.
TABLE OF CONTENTS
THE PARADIGM FUND
FINANCIAL HIGHLIGHTS
No Load Class
| | | | |
PER SHARE DATA:(1)
| | | | | | | | | | | | | | | |
Net asset value, beginning of year | | | $73.13 | | | $92.91 | | | $73.37 | | | $53.99 | | | $53.38 |
INCOME FROM INVESTMENT OPERATIONS:
| | | | | | | | | | | | |
Net investment income (loss)(2) | | | 0.01 | | | (0.39) | | | (0.13) | | | (0.67) | | | 0.19 |
Net realized and unrealized gain (loss) on investments | | | 64.65 | | | (15.26) | | | 21.52 | | | 21.26 | | | 1.59 |
Total from investment operations | | | 64.66 | | | (15.65) | | | 21.39 | | | 20.59 | | | 1.78 |
Redemption fees | | | 0.04 | | | 0.00(3) | | | 0.01 | | | 0.01 | | | 0.00(3) |
LESS DISTRIBUTIONS:
| | | | | | | | | | | | | | | |
From net investment income | | | (0.09) | | | — | | | (0.01) | | | — | | | (0.18) |
From net realized gains | | | (3.86) | | | (4.13) | | | (1.85) | | | (1.22) | | | (0.99) |
Total distributions | | | (3.95) | | | (4.13) | | | (1.86) | | | (1.22) | | | (1.17) |
Net asset value, end of year | | | $133.88 | | | $73.13 | | | $92.91 | | | $73.37 | | | $53.99 |
Total return | | | 88.47% | | | (16.89)% | | | 29.17% | | | 38.15% | | | 3.32% |
SUPPLEMENTAL DATA AND RATIOS
| | | | | | | | | | | | | | | |
Net assets, end of Year (000’s) | | | $607,750 | | | $338,263 | | | $517,268 | | | $368,383 | | | $274,876 |
Ratio of operating expenses to average net assets:
| | | | | | | | | | | | | | | |
Before expense reimbursement | | | 1.66% | | | 1.68% | | | 1.67% | | | 1.68% | | | 1.72% |
After expense reimbursement(4) | | | 1.64% | | | 1.64% | | | 1.64% | | | 1.64% | | | 1.64% |
Ratio of net investment income (loss) to average net assets: | | | 0.01% | | | (0.51)% | | | (0.16)% | | | (0.88)% | | | 0.42% |
Portfolio turnover rate(5) | | | 2% | | | 0% | | | 0% | | | 1% | | | 1% |
| | | | | | | | | | | | | | | | |
(1)
| Information presented relates to a share of capital stock outstanding for each year. |
(2)
| Net investment income per share represents net investment income divided by the average shares outstanding throughout the year. |
(3)
| Amount calculated is less than $0.005. |
(4)
| See Note #3, Investment Adviser, for the waiver and expense reimbursement discussion. |
(5)
| Portfolio turnover of The Paradigm Portfolio. |
The accompanying notes are an integral part of these financial statements.
TABLE OF CONTENTS
THE PARADIGM FUND
FINANCIAL HIGHLIGHTS
Advisor Class A
| | | | |
PER SHARE DATA:(1)
| | | | | | | | | | | | | | | |
Net asset value, beginning of year | | | $69.61 | | | $88.90 | | | $70.44 | | | $51.99 | | | $51.47 |
INCOME FROM INVESTMENT OPERATIONS:
| | | | | | | | | | | | |
Net investment income (loss)(2) | | | (0.24) | | | (0.56) | | | (0.31) | | | (0.83) | | | 0.07 |
Net realized and unrealized gain (loss) on investments | | | 61.46 | | | (14.60) | | | 20.62 | | | 20.49 | | | 1.51 |
Total from investment operations | | | 61.22 | | | (15.16) | | | 20.31 | | | 19.66 | | | 1.58 |
Redemption fees | | | 0.04 | | | 0.00(3) | | | 0.00(3) | | | 0.01 | | | 0.00 (3) |
LESS DISTRIBUTIONS:
| | | | | | | | | | | | | | | |
From net investment income | | | — | | | — | | | — | | | — | | | (0.07) |
From net realized gains | | | (3.86) | | | (4.13) | | | (1.85) | | | (1.22) | | | (0.99) |
Total distributions | | | (3.86) | | | (4.13) | | | (1.85) | | | (1.22) | | | (1.06) |
Net asset value, end of year | | | $127.01 | | | $69.61 | | | $88.90 | | | $70.44 | | | $51.99 |
Total return | | | 88.00% | | | (17.10)% | | | 28.86% | | | 37.81% | | | 3.05% |
SUPPLEMENTAL DATA AND RATIOS
| | | | | | | | | | | | | | | |
Net assets, end of Year (000’s) | | | $254,589 | | | $143,676 | | | $188,033 | | | $155,850 | | | $94,179 |
Ratio of operating expenses to average net assets:
| | | | | | | | | | | | | | | |
Before expense reimbursement | | | 1.91% | | | 1.93% | | | 1.92% | | | 1.93% | | | 1.97% |
After expense reimbursement(5) | | | 1.89% | | | 1.89% | | | 1.89% | | | 1.89% | | | 1.89% |
Ratio of net investment income (loss) to average net assets: | | | (0.24)% | | | (0.76)% | | | (0.41)% | | | (1.13)% | | | 0.17% |
Portfolio turnover rate(6) | | | 2% | | | 0% | | | 0% | | | 1% | | | 1% |
| | | | | | | | | | | | | | | | |
(1)
| Information presented relates to a share of capital stock outstanding for each year. |
(2)
| Net investment income per share represents net investment income divided by the average shares outstanding throughout the year. |
(3)
| Amount calculated is less than $0.005. |
(4)
| The total return calculation does not reflect the 5.75% front end sales charge on Advisor Class A shares. |
(5)
| See Note #3, Investment Adviser, for the waiver and expense reimbursement discussion. |
(6)
| Portfolio turnover of The Paradigm Portfolio. |
The accompanying notes are an integral part of these financial statements.
TABLE OF CONTENTS
THE PARADIGM FUND
FINANCIAL HIGHLIGHTS
Advisor Class C
| | | | |
PER SHARE DATA:(1)
| | | | | | | | | | | | | | | |
Net asset value, beginning of year | | | $62.36 | | | $80.56 | | | $64.28 | | | $47.77 | | | $47.54 |
INCOME FROM INVESTMENT OPERATIONS:
| | | | | | | | | | | | |
Net investment loss(2) | | | (0.64) | | | (0.83) | | | (0.63) | | | (1.08) | | | (0.14) |
Net realized and unrealized gain (loss) on investments | | | 54.91 | | | (13.24) | | | 18.76 | | | 18.80 | | | 1.36 |
Total from investment operations | | | 54.27 | | | (14.07) | | | 18.13 | | | 17.72 | | | 1.22 |
Redemption fees | | | 0.03 | | | 0.00(3) | | | 0.00(3) | | | 0.01 | | | 0.00(3) |
LESS DISTRIBUTIONS:
| | | | | | | | | | | | | | | |
From net realized gains | | | (3.86) | | | (4.13) | | | (1.85) | | | (1.22) | | | (0.99) |
Total distributions | | | (3.86) | | | (4.13) | | | (1.85) | | | (1.22) | | | (0.99) |
Net asset value, end of year | | | $112.80 | | | $62.36 | | | $80.56 | | | $64.28 | | | $47.77 |
Total return | | | 87.06% | | | (17.52)% | | | 28.22% | | | 37.11% | | | 2.56% |
SUPPLEMENTAL DATA AND RATIOS
| | | | | | | | | | | | | | | |
Net assets, end of Year (000’s) | | | $89,897 | | | $57,370 | | | $84,135 | | | $71,947 | | | $84,597 |
Ratio of operating expenses to average net assets:
| | | | | | | | | | | | | | | |
Before expense reimbursement | | | 2.41% | | | 2.43% | | | 2.42% | | | 2.43% | | | 2.47% |
After expense reimbursement(4) | | | 2.39% | | | 2.39% | | | 2.39% | | | 2.39% | | | 2.39% |
Ratio of net investment loss to average net assets: | | | (0.74)% | | | (1.26)% | | | (0.91)% | | | (1.63)% | | | (0.33)% |
Portfolio turnover rate(5) | | | 2% | | | 0% | | | 0% | | | 1% | | | 1% |
| | | | | | | | | | | | | | | | |
(1)
| Information presented relates to a share of capital stock outstanding for each year. |
(2)
| Net investment income per share represents net investment income divided by the average shares outstanding throughout the year. |
(3)
| Amount calculated is less than $0.005. |
(4)
| See Note #3, Investment Adviser, for the waiver and expense reimbursement discussion. |
(5)
| Portfolio turnover of The Paradigm Portfolio. |
The accompanying notes are an integral part of these financial statements.
TABLE OF CONTENTS
THE PARADIGM FUND
FINANCIAL HIGHLIGHTS
Institutional Class
| | | | |
PER SHARE DATA:(1)
| | | | | | | | | | | | | | | |
Net asset value, beginning of year | | | $74.10 | | | $93.89 | | | $74.09 | | | $54.51 | | | $53.87 |
INCOME FROM INVESTMENT OPERATIONS:
| | | | | | | | | | | | |
Net investment income (loss)(2) | | | 0.22 | | | (0.24) | | | 0.03 | | | (0.52) | | | 0.28 |
Net realized and unrealized gain (loss) on investments | | | 65.57 | | | (15.42) | | | 21.77 | | | 21.47 | | | 1.64 |
Total from investment operations | | | 65.79 | | | (15.66) | | | 21.80 | | | 20.95 | | | 1.92 |
Redemption fees | | | 0.04 | | | 0.00(3) | | | 0.00 (3) | | | 0.01 | | | 0.00 |
LESS DISTRIBUTIONS:
| | | | | | | | | | | | | | | |
From net investment income | | | (0.29) | | | — | | | (0.15) | | | (0.16) | | | (0.29) |
From net realized gains | | | (3.86) | | | (4.13) | | | (1.85) | | | (1.22) | | | (0.99) |
Total distributions | | | (4.15) | | | (4.13) | | | (2.00) | | | (1.38) | | | (1.28) |
Net asset value, end of year | | | $135.78 | | | $74.10 | | | $93.89 | | | $74.09 | | | $54.51 |
Total return | | | 88.83% | | | (16.73)% | | | 29.43% | | | 38.44% | | | 3.55% |
SUPPLEMENTAL DATA AND RATIOS
| | | | | | | | | | | | | | | |
Net assets, end of Year (000’s) | | | $321,969 | | | $222,295 | | | $288,387 | | | $229,996 | | | $184,693 |
Ratio of operating expenses to average net assets:
| | | | | | | | | | | | | | | |
Before expense reimbursement | | | 1.61% | | | 1.63% | | | 1.62% | | | 1.63% | | | 1.67% |
After expense reimbursement(4) | | | 1.44% | | | 1.44% | | | 1.44% | | | 1.44% | | | 1.44% |
Ratio of net investment income (loss) to average net assets: | | | 0.21% | | | (0.31)% | | | 0.04% | | | (0.68)% | | | 0.62% |
Portfolio turnover rate(5) | | | 2% | | | 0% | | | 0% | | | 1% | | | 1% |
| | | | | | | | | | | | | | | | |
(1)
| Information presented relates to a share of capital stock outstanding for each year. |
(2)
| Net investment income per share represents net investment income divided by the average shares outstanding throughout the year. |
(3)
| Amount calculated is less than $0.005. |
(4)
| See Note #3, Investment Adviser, for the waiver and expense reimbursement discussion. |
(5)
| Portfolio turnover of The Paradigm Portfolio. |
The accompanying notes are an integral part of these financial statements.
TABLE OF CONTENTS
THE SMALL CAP OPPORTUNITIES FUND
FINANCIAL HIGHLIGHTS
No Load Class
| | | | |
PER SHARE DATA:(1)
| | | | | | | | | | | | | | | |
Net asset value, beginning of year | | | $104.27 | | | $130.35 | | | $98.78 | | | $66.81 | | | $65.31 |
INCOME FROM INVESTMENT OPERATIONS:
| | | | | | | | | | | | |
Net investment income (loss)(2) | | | 0.90 | | | 0.25 | | | 0.07 | | | (0.91) | | | 0.43 |
Net realized and unrealized gain (loss) on investments | | | 70.50 | | | (19.35) | | | 31.47 | | | 34.48 | | | 1.07 |
Total from investment operations | | | 71.40 | | | (19.10) | | | 31.54 | | | 33.57 | | | 1.50 |
Redemption fees | | | 0.06 | | | 0.02 | | | 0.03 | | | 0.05 | | | 0.00(3) |
LESS DISTRIBUTIONS:
| | | | | | | | | | | | | | | |
From net investment income | | | (2.94) | | | (1.30) | | | — | | | (1.65) | | | — |
From net realized gains | | | (3.13) | | | (5.70) | | | — | | | — | | | — |
Total distributions | | | (6.07) | | | (7.00) | | | — | | | (1.65) | | | — |
Net asset value, end of year | | | $169.66 | | | $104.27 | | | $130.35 | | | $98.78 | | | $66.81 |
Total return | | | 68.52% | | | (14.69)% | | | 31.96% | | | 50.33% | | | 2.30% |
SUPPLEMENTAL DATA AND RATIOS
| | | | | | | | | | | | | | | |
Net assets, end of Year (000’s) | | | $336,526 | | | $204,889 | | | $327,093 | | | $195,631 | | | $126,350 |
Ratio of operating expenses to average net assets:
| | | | | | | | | | | | | | | |
Before expense reimbursement | | | 1.69% | | | 1.72% | | | 1.69% | | | 1.70% | | | 1.78% |
After expense reimbursement(4) | | | 1.64% | | | 1.64% | | | 1.64% | | | 1.64% | | | 1.64% |
Ratio of net investment income (loss) to average net assets: | | | 0.65% | | | 0.22% | | | 0.07% | | | (0.93)% | | | 0.78% |
Portfolio turnover rate(5) | | | 6% | | | 2% | | | 6% | | | 3% | | | 0% |
| | | | | | | | | | | | | | | | |
(1)
| Information presented relates to a share of capital stock outstanding for each year. |
(2)
| Net investment income per share represents net investment income divided by the average shares outstanding throughout the year. |
(3)
| Amount calculated is less than $0.005. |
(4)
| See Note #3, Investment Adviser, for the waiver and expense reimbursement discussion. |
(5)
| Portfolio turnover of The Small Cap Opportunities Portfolio. |
The accompanying notes are an integral part of these financial statements.
TABLE OF CONTENTS
THE SMALL CAP OPPORTUNITIES FUND
FINANCIAL HIGHLIGHTS
Advisor Class A
| | | | |
PER SHARE DATA:(1)
| | | | | | | | | | | | | | | |
Net asset value, beginning of year | | | $ 100.03 | | | $125.37 | | | $95.24 | | | $64.41 | | | $63.12 |
INCOME FROM INVESTMENT OPERATIONS:
| | | | | | | | | | | | |
Net investment income (loss)(2) | | | 0.53 | | | (0.03) | | | (0.20) | | | (1.12) | | | 0.28 |
Net realized and unrealized gain (loss) on investments | | | 67.55 | | | (18.61) | | | 30.30 | | | 33.24 | | | 1.01 |
Total from investment operations | | | 68.08 | | | (18.64) | | | 30.10 | | | 32.12 | | | 1.29 |
Redemption fees | | | 0.05 | | | 0.02 | | | 0.03 | | | 0.05 | | | 0.00(3) |
LESS DISTRIBUTIONS:
| | | | | | | | | | | | | | | |
From net investment income | | | (2.58) | | | (1.02) | | | — | | | (1.34) | | | — |
From net realized gains | | | (3.13) | | | (5.70) | | | — | | | — | | | — |
Total distributions | | | (5.71) | | | (6.72) | | | — | | | (1.34) | | | — |
Net asset value, end of year | | | $ 162.45 | | | $100.03 | | | $125.37 | | | $95.24 | | | $64.41 |
Total return | | | 68.10% | | | (14.91)% | | | 31.64% | | | 49.94% | | | 2.04% |
SUPPLEMENTAL DATA AND RATIOS
| | | | | | | | | | | | | | | |
Net assets, end of Year (000’s) | | | $24,368 | | | $15,685 | | | $23,920 | | | $14,755 | | | $8,172 |
Ratio of operating expenses to average net assets:
| | | | | | | | | | | | | | | |
Before expense reimbursement | | | 1.94% | | | 1.97% | | | 1.94% | | | 1.95% | | | 2.03% |
After expense reimbursement(5) | | | 1.89% | | | 1.89% | | | 1.89% | | | 1.89% | | | 1.89% |
Ratio of net investment income (loss) to average net assets: | | | 0.40% | | | (0.03)% | | | (0.18)% | | | (1.18)% | | | 0.53% |
Portfolio turnover rate(6) | | | 6% | | | 2% | | | 6% | | | 3% | | | 0% |
| | | | | | | | | | | | | | | | |
(1)
| Information presented relates to a share of capital stock outstanding for each year. |
(2)
| Net investment income per share represents net investment income divided by the average shares outstanding throughout the year. |
(3)
| Amount calculated is less than $0.005. |
(4)
| The total return calculation does not reflect the 5.75% front end sales charge on Advisor Class A shares. |
(5)
| See Note #3, Investment Adviser, for the waiver and expense reimbursement discussion. |
(6)
| Portfolio turnover of The Small Cap Opportunities Portfolio. |
The accompanying notes are an integral part of these financial statements.
TABLE OF CONTENTS
THE SMALL CAP OPPORTUNITIES FUND
FINANCIAL HIGHLIGHTS
Advisor Class C
| | | | |
PER SHARE DATA:(1)
| | | | | | | | | | | | | | | |
Net asset value, beginning of year | | | $93.93 | | | $118.14 | | | $90.20 | | | $60.85 | | | $59.93 |
INCOME FROM INVESTMENT OPERATIONS:
| | | | | | | | | | | | |
Net investment income (loss)(2) | | | (0.12) | | | (0.53) | | | (0.69) | | | (1.49) | | | 0.02 |
Net realized and unrealized gain (loss) on investments | | | 63.25 | | | (17.53) | | | 28.60 | | | 31.38 | | | 0.90 |
Total from investment operations | | | 63.13 | | | (18.06) | | | 27.91 | | | 29.89 | | | 0.92 |
Redemption fees | | | 0.05 | | | 0.02 | | | 0.03 | | | 0.05 | | | 0.00(3) |
LESS DISTRIBUTIONS:
| | | | | | | | | | | | | | | |
From net investment income | | | (2.01) | | | (0.47) | | | — | | | (0.59) | | | — |
From net realized gains | | | (3.13) | | | (5.70) | | | — | | | — | | | — |
Total distributions | | | (5.14) | | | (6.17) | | | — | | | (0.59) | | | — |
Net asset value, end of year | | | $151.97 | | | $93.93 | | | $118.14 | | | $90.20 | | | $60.85 |
Total return | | | 67.25% | | | (15.32)% | | | 30.98% | | | 49.20% | | | 1.53% |
SUPPLEMENTAL DATA AND RATIOS
| | | | | | | | | | | | | | | |
Net assets, end of Year (000’s) | | | $12,482 | | | $8,396 | | | $12,234 | | | $9,219 | | | $8,684 |
Ratio of operating expenses to average net assets:
| | | | | | | | | | | | | | | |
Before expense reimbursement | | | 2.44% | | | 2.46% | | | 2.44% | | | 2.45% | | | 2.53% |
After expense reimbursement(4) | | | 2.39% | | | 2.39% | | | 2.39% | | | 2.39% | | | 2.39% |
Ratio of net investment income (loss) to average net assets: | | | (0.10)% | | | (0.53)% | | | (0.68)% | | | (1.68)% | | | 0.03% |
Portfolio turnover rate(5) | | | 6% | | | 2% | | | 6% | | | 3% | | | 0% |
| | | | | | | | | | | | | | | | |
(1)
| Information presented relates to a share of capital stock outstanding for each year. |
(2)
| Net investment income per share represents net investment income divided by the average shares outstanding throughout the year. |
(3)
| Amount calculated is less than $0.005. |
(4)
| See Note #3, Investment Adviser, for the waiver and expense reimbursement discussion. |
(5)
| Portfolio turnover of The Small Cap Opportunities Portfolio. |
The accompanying notes are an integral part of these financial statements.
TABLE OF CONTENTS
THE SMALL CAP OPPORTUNITIES FUND
FINANCIAL HIGHLIGHTS
Institutional Class
| | | | |
PER SHARE DATA:(1)
| | | | | | | | | | | | | | | |
Net asset value, beginning of year | | | $ 106.78 | | | $133.32 | | | $100.83 | | | $68.25 | | | $66.58 |
INCOME FROM INVESTMENT OPERATIONS:
| | | | | | | | | | | | |
Net investment income (loss)(2) | | | 1.21 | | | 0.48 | | | 0.31 | | | (0.73) | | | 0.55 |
Net realized and unrealized gain (loss) on investments | | | 72.26 | | | (19.78) | | | 32.14 | | | 35.22 | | | 1.12 |
Total from investment operations | | | 73.47 | | | (19.30) | | | 32.45 | | | 34.49 | | | 1.67 |
Redemption fees | | | 0.06 | | | 0.02 | | | 0.04 | | | 0.06 | | | 0.00(3) |
LESS DISTRIBUTIONS:
| | | | | | | | | | | | | | | |
From net investment income | | | (3.20) | | | (1.56) | | | — | | | (1.97) | | | — |
From net realized gains | | | (3.13) | | | (5.70) | | | — | | | — | | | — |
Total distributions | | | (6.33) | | | (7.26) | | | — | | | (1.97) | | | — |
Net asset value, end of year | | | $ 173.98 | | | $106.78 | | | $133.32 | | | $100.83 | | | $68.25 |
Total return | | | 68.85% | | | (14.52)% | | | 32.22% | | | 50.62% | | | 2.51% |
SUPPLEMENTAL DATA AND RATIOS
| | | | | | | | | | | | | | | |
Net assets, end of Year (000’s) | | | $92,045 | | | $55,494 | | | $95,963 | | | $49,484 | | | $35,118 |
Ratio of operating expenses to average net assets:
| | | | | | | | | | | | | | | |
Before expense reimbursement | | | 1.64% | | | 1.67% | | | 1.64% | | | 1.65% | | | 1.73% |
After expense reimbursement(4) | | | 1.44% | | | 1.44% | | | 1.44% | | | 1.44% | | | 1.44% |
Ratio of net investment income (loss) to average net assets: | | | 0.85% | | | 0.42% | | | 0.27% | | | (0.73)% | | | 0.98% |
Portfolio turnover rate(5) | | | 6% | | | 2% | | | 6% | | | 3% | | | 0% |
| | | | | | | | | | | | | | | | |
(1)
| Information presented relates to a share of capital stock outstanding for each year. |
(2)
| Net investment income per share represents net investment income divided by the average shares outstanding throughout the year. |
(3)
| Amount calculated is less than $0.005. |
(4)
| See Note #3, Investment Adviser, for the waiver and expense reimbursement discussion. |
(5)
| Portfolio turnover of The Small Cap Opportunities Portfolio. |
The accompanying notes are an integral part of these financial statements.
TABLE OF CONTENTS
THE MARKET OPPORTUNITIES FUND
FINANCIAL HIGHLIGHTS
No Load Class
| | | | |
PER SHARE DATA:(1)
| | | | | | | | | | | | | | | |
Net asset value, beginning of year | | | $41.85 | | | $45.55 | | | $40.16 | | | $31.85 | | | $26.71 |
INCOME FROM INVESTMENT OPERATIONS:
| | | | | | | | | | | | |
Net investment income (loss)(2) | | | 0.31 | | | 0.36 | | | 0.07 | | | (0.33) | | | 0.10 |
Net realized and unrealized gain (loss) on investments | | | 34.85 | | | (3.70) | | | 5.94 | | | 9.25 | | | 5.12 |
Total from investment operations | | | 35.16 | | | (3.34) | | | 6.01 | | | 8.92 | | | 5.22 |
Redemption fees | | | 0.03 | | | 0.00(3) | | | 0.00(3) | | | 0.02 | | | 0.00(3) |
LESS DISTRIBUTIONS:
| | | | | | | | | | | | | | | |
From net investment income | | | (0.53) | | | (0.36) | | | (0.02) | | | (0.59) | | | (0.08) |
From net realized gains | | | (0.09) | | | — | | | (0.60) | | | (0.04) | | | — |
Total distributions | | | (0.62) | | | (0.36) | | | (0.62) | | | (0.63) | | | (0.08) |
Net asset value, end of year | | | $76.42 | | | $41.85 | | | $45.55 | | | $40.16 | | | $31.85 |
Total return | | | 84.08% | | | (7.33)% | | | 14.98% | | | 28.04% | | | 19.55% |
SUPPLEMENTAL DATA AND RATIOS
| | | | | | | | | | | | | | | |
Net assets, end of Year (000’s) | | | $161,183 | | | $92,117 | | | $96,190 | | | $86,943 | | | $66,570 |
Ratio of operating expenses to average net assets:
| | | | | | | | | | | | | | | |
Before expense reimbursement | | | 1.72% | | | 1.76% | | | 1.76% | | | 1.75% | | | 1.85% |
After expense reimbursement(4) | | | 1.40% | | | 1.40% | | | 1.40% | | | 1.40% | | | 1.40% |
Ratio of net investment income (loss) to average net assets: | | | 0.53% | | | 0.90% | | | 0.18% | | | (0.79)% | | | 0.40% |
Portfolio turnover rate(5) | | | 7% | | | 5% | | | 13% | | | 2% | | | 2% |
| | | | | | | | | | | | | | | | |
(1)
| Information presented relates to a share of capital stock outstanding for each year. |
(2)
| Net investment income per share represents net investment income divided by the average shares outstanding throughout the year. |
(3)
| Amount calculated is less than $0.005. |
(4)
| See Note #3, Investment Adviser, for the waiver and expense reimbursement discussion. |
(5)
| Portfolio turnover of The Market Opportunities Portfolio. |
The accompanying notes are an integral part of these financial statements.
TABLE OF CONTENTS
THE MARKET OPPORTUNITIES FUND
FINANCIAL HIGHLIGHTS
Advisor Class A
| | | | |
PER SHARE DATA:(1)
| | | | | | | | | | | | | | | |
Net asset value, beginning of year | | | $41.14 | | | $44.81 | | | $39.54 | | | $31.36 | | | $26.29 |
INCOME FROM INVESTMENT OPERATIONS:
| | | | | | | | | | | | |
Net investment income (loss)(2) | | | 0.16 | | | 0.26 | | | (0.03) | | | (0.43) | | | 0.04 |
Net realized and unrealized gain (loss) on investments | | | 34.20 | | | (3.65) | | | 5.83 | | | 9.10 | | | 5.04 |
Total from investment operations | | | 34.36 | | | (3.39) | | | 5.80 | | | 8.67 | | | 5.08 |
Redemption fees | | | 0.03 | | | 0.00(3) | | | 0.00(3) | | | 0.02 | | | 0.00(3) |
LESS DISTRIBUTIONS:
| | | | | | | | | | | | | | | |
From net investment income | | | (0.40) | | | (0.28) | | | — | | | (0.47) | | | (0.01) |
From net realized gains | | | (0.09) | | | — | | | (0.53) | | | (0.04) | | | — |
Total distributions | | | (0.49) | | | (0.28) | | | (0.53) | | | (0.51) | | | (0.01) |
Net asset value, end of year | | | $75.04 | | | $41.14 | | | $44.81 | | | $39.54 | | | $31.36 |
Total return | | | 83.60% | | | (7.56)% | | | 14.69% | | | 27.70% | | | 19.31% |
SUPPLEMENTAL DATA AND RATIOS
| | | | | | | | | | | | | | | |
Net assets, end of Year (000’s) | | | $18,806 | | | $9,238 | | | $9,794 | | | $8,786 | | | $6,442 |
Ratio of operating expenses to average net assets:
| | | | | | | | | | | | | | | |
Before expense reimbursement | | | 1.97% | | | 2.01% | | | 2.01% | | | 2.00% | | | 2.10% |
After expense reimbursement(5) | | | 1.65% | | | 1.65% | | | 1.65% | | | 1.65% | | | 1.65% |
Ratio of net investment income (loss) to average net assets: | | | 0.28% | | | 0.65% | | | (0.07)% | | | (1.04)% | | | 0.15% |
Portfolio turnover rate(6) | | | 7% | | | 5% | | | 13% | | | 2% | | | 2% |
| | | | | | | | | | | | | | | | |
(1)
| Information presented relates to a share of capital stock outstanding for each year. |
(2)
| Net investment income per share represents net investment income divided by the average shares outstanding throughout the year. |
(3)
| Amount calculated is less than $0.005. |
(4)
| The total return calculation does not reflect the 5.75% front end sales charge on Advisor Class A shares. |
(5)
| See Note #3, Investment Adviser, for the waiver and expense reimbursement discussion. |
(6)
| Portfolio turnover of The Market Opportunities Portfolio. |
The accompanying notes are an integral part of these financial statements.
TABLE OF CONTENTS
THE MARKET OPPORTUNITIES FUND
FINANCIAL HIGHLIGHTS
Advisor Class C
| | | | |
PER SHARE DATA:(1)
| | | | | | | | | | | | | | | |
Net asset value, beginning of year | | | $39.06 | | | $42.51 | | | $37.72 | | | $29.79 | | | $25.10 |
INCOME FROM INVESTMENT OPERATIONS:
| | | | | | | | | | | | |
Net investment income (loss)(2) | | | (0.12) | | | 0.06 | | | (0.22) | | | (0.60) | | | (0.08) |
Net realized and unrealized gain (loss) on investments | | | 32.38 | | | (3.46) | | | 5.54 | | | 8.65 | | | 4.77 |
Total from investment operations | | | 32.26 | | | (3.40) | | | 5.32 | | | 8.05 | | | 4.69 |
Redemption fees | | | 0.02 | | | 0.00(5) | | | 0.00(5) | | | 0.02 | | | 0.00(5) |
LESS DISTRIBUTIONS:
| | | | | | | | | | | | | | | |
From net investment income | | | (0.09) | | | (0.05) | | | — | | | (0.10) | | | — |
From net realized gains | | | (0.09) | | | — | | | (0.53) | | | (0.04) | | | — |
Total distributions | | | (0.18) | | | (0.05) | | | (0.53) | | | (0.14) | | | — |
Net asset value, end of year | | | $71.16 | | | $39.06 | | | $42.51 | | | $37.72 | | | $29.79 |
Total return | | | 82.65% | | | (8.01)% | | | 14.12% | | | 27.06% | | | 18.69% |
SUPPLEMENTAL DATA AND RATIOS
| | | | | | | | | | | | | | | |
Net assets, end of Year (000’s) | | | $15,057 | | | $9,871 | | | $12,610 | | | $11,087 | | | $9,392 |
Ratio of operating expenses to average net assets:
| | | | | | | | | | | | | | | |
Before expense reimbursement | | | 2.47% | | | 2.51% | | | 2.51% | | | 2.50% | | | 2.60% |
After expense reimbursement(3) | | | 2.15% | | | 2.15% | | | 2.15% | | | 2.15% | | | 2.15% |
Ratio of net investment income (loss) to average net assets: | | | (0.22)% | | | 0.15% | | | (0.57)% | | | (1.54)% | | | (0.35)% |
Portfolio turnover rate(4) | | | 7% | | | 5% | | | 13% | | | 2% | | | 2% |
| | | | | | | | | | | | | | | | |
(1)
| Information presented relates to a share of capital stock outstanding for each year. |
(2)
| Net investment income per share represents net investment income divided by the average shares outstanding throughout the year. |
(3)
| See Note #3, Investment Adviser, for the waiver and expense reimbursement discussion. |
(4)
| Portfolio turnover of The Market Opportunities Portfolio. |
(5)
| Amount calculated is less than $0.005. |
The accompanying notes are an integral part of these financial statements.
TABLE OF CONTENTS
THE MARKET OPPORTUNITIES FUND
FINANCIAL HIGHLIGHTS
Institutional Class
| | | | |
PER SHARE DATA:(1)
| | | | | | | | | | | | | | | |
Net asset value, beginning of year | | | $42.54 | | | $46.29 | | | $40.79 | | | $32.34 | | | $27.11 |
INCOME FROM INVESTMENT OPERATIONS:
| | | | | | | | | | | | |
Net investment income (loss)(2) | | | 0.42 | | | 0.45 | | | 0.16 | | | (0.25) | | | 0.15 |
Net realized and unrealized gain (loss) on investments | | | 35.46 | | | (3.76) | | | 6.04 | | | 9.39 | | | 5.22 |
Total from investment operations | | | 35.88 | | | (3.31) | | | 6.20 | | | 9.14 | | | 5.37 |
Redemption fees | | | 0.02 | | | 0.00(3) | | | 0.00(3) | | | 0.02 | | | — |
LESS DISTRIBUTIONS:
| | | | | | | | | | | | | | | |
From net investment income | | | (0.63) | | | (0.44) | | | (0.03) | | | (0.67) | | | (0.14) |
From net realized gains | | | (0.09) | | | — | | | (0.67) | | | (0.04) | | | — |
Total distributions | | | (0.72) | | | (0.44) | | | (0.70) | | | (0.71) | | | (0.14) |
Net asset value, end of year | | | $77.72 | | | $42.54 | | | $46.29 | | | $40.79 | | | $32.34 |
Total return | | | 84.40% | | | (7.14)% | | | 15.21% | | | 28.31% | | | 19.79% |
SUPPLEMENTAL DATA AND RATIOS
| | | | | | | | | | | | | | | |
Net assets, end of Year (000’s) | | | $28,338 | | | $19,964 | | | $21,577 | | | $22,655 | | | $14,260 |
Ratio of operating expenses to average net assets:
| | | | | | | | | | | | | | | |
Before expense reimbursement | | | 1.67% | | | 1.71% | | | 1.71% | | | 1.70% | | | 1.80% |
After expense reimbursement(3) | | | 1.20% | | | 1.20% | | | 1.20% | | | 1.20% | | | 1.20% |
Ratio of net investment income (loss) to average net assets: | | | 0.73% | | | 1.10% | | | 0.38% | | | (0.59)% | | | 0.60% |
Portfolio turnover rate(4) | | | 7% | | | 5% | | | 13% | | | 2% | | | 2% |
| | | | | | | | | | | | | | | | |
(1)
| Information presented relates to a share of capital stock outstanding for each year. |
(2)
| Net investment income per share represents net investment income divided by the average shares outstanding throughout the year. |
(3)
| Amount calculated is less than $0.005. |
(4)
| See Note #3, Investment Adviser, for the waiver and expense reimbursement discussion. |
(5)
| Portfolio turnover of The Market Opportunities Portfolio. |
The accompanying notes are an integral part of these financial statements.
TABLE OF CONTENTS
THE MULTI-DISCIPLINARY INCOME FUND
FINANCIAL HIGHLIGHTS
No Load Class
| | | | |
PER SHARE DATA:(1)
| | | | | | | | | | | | | | | |
Net asset value, beginning of year | | | $9.92 | | | $9.94 | | | $10.40 | | | $10.45 | | | $10.95 |
INCOME FROM INVESTMENT OPERATIONS:
| | | | | | | | | | | | |
Net investment income(2) | | | 0.65 | | | 0.49 | | | 0.21 | | | 0.18 | | | 0.33 |
Net realized and unrealized gain (loss) on investments | | | 0.03 | | | 0.01 | | | (0.45) | | | (0.07) | | | (0.50) |
Total from investment operations | | | 0.68 | | | 0.50 | | | (0.24) | | | 0.11 | | | (0.17) |
Redemption fees | | | 0.00 | | | 0.00(3) | | | 0.00(3) | | | 0.01 | | | 0.00(3) |
LESS DISTRIBUTIONS:
| | | | | | | | | | | | | | | |
From net investment income | | | (0.62) | | | (0.52) | | | (0.22) | | | (0.17) | | | (0.33) |
Total distributions | | | (0.62) | | | (0.52) | | | (0.22) | | | (0.17) | | | (0.33) |
Net asset value, end of year | | | $9.98 | | | $9.92 | | | $9.94 | | | $10.40 | | | $10.45 |
Total return | | | 7.05% | | | 5.15% | | | (2.30)% | | | 1.18% | | | (1.38)% |
SUPPLEMENTAL DATA AND RATIOS
| | | | | | | | | | | | | | | |
Net assets, end of Year (000’s) | | | $13,406 | | | $12,121 | | | $16,325 | | | $3,202 | | | $3,698 |
Ratio of operating expenses to average net assets:
| | | | | | | | | | | | | | | |
Before expense reimbursement | | | 1.17% | | | 1.64% | | | 2.30% | | | 2.10% | | | 2.13% |
After expense reimbursement(4) | | | 0.76% | | | 1.03% (6) | | | 1.49% | | | 1.49% | | | 1.49% |
Ratio of net investment income to average net assets: | | | 6.52% | | | 4.94% | | | 2.06% | | | 1.72% | | | 3.14% |
Portfolio turnover rate(5) | | | 37% | | | 37% | | | 0% | | | 0% | | | 0% |
| | | | | | | | | | | | | | | | |
(1)
| Information presented relates to a share of capital stock outstanding for each year. |
(2)
| Net investment income per share represents net investment income divided by the average shares outstanding throughout the year. |
(3)
| Amount calculated is less than $0.005. |
(4)
| See Note #3, Investment Adviser, for the waiver and expense reimbursement discussion. |
(5)
| Portfolio turnover of The Multi-Disciplinary Income Portfolio. |
(6)
| Effective as of April 30, 2023, the Adviser has agreed to reduce the expense limitation for the Multi-Disciplinary Income Fund from 1.49% to 0.74%. |
The accompanying notes are an integral part of these financial statements.
TABLE OF CONTENTS
THE SPIN-OFF FUND
FINANCIAL HIGHLIGHTS
No Load Class
| | | | |
PER SHARE DATA:(1)
| | | | | | | | | | | | | | | |
Net asset value, beginning of year | | | $ 19.46 | | | $26.33 | | | $19.20 | | | $13.45 | | | $12.83 |
INCOME FROM INVESTMENT OPERATIONS:
| | | | | | | | | | | | |
Net investment income (loss)(2) | | | 0.32 | | | 0.03 | | | 0.08 | | | (0.11) | | | 0.10 |
Net realized and unrealized gain (loss) on investments | | | 15.73 | | | (5.17) | | | 7.49 | | | 5.88 | | | 0.60 |
Total from investment operations | | | 16.05 | | | (5.14) | | | 7.57 | | | 5.77 | | | 0.70 |
Redemption fees | | | 0.01 | | | 0.01 | | | 0.00(3) | | | 0.00(3) | | | — |
LESS DISTRIBUTIONS:
| | | | | | | | | | | | | | | |
From net investment income | | | (0.40) | | | (0.03) | | | — | | | (0.02) | | | (0.08) |
From net realized gains | | | (1.20) | | | (1.71) | | | (0.44) | | | — | | | — |
Total distributions | | | (1.60) | | | (1.74) | | | (0.44) | | | (0.02) | | | (0.08) |
Net asset value, end of year | | | $33.92 | | | $19.46 | | | $26.33 | | | $19.20 | | | $13.45 |
Total return | | | 82.47% | | | (19.59)% | | | 39.43% | | | 42.90% | | | 5.44% |
SUPPLEMENTAL DATA AND RATIOS
| | | | | | | | | | | | | | | |
Net assets, end of Year (000’s) | | | $222 | | | $29 | | | $149 | | | $125 | | | $18 |
Ratio of operating expenses to average net assets:
| | | | | | | | | | | | | | | |
Before expense reimbursement | | | 1.77% | | | 1.83% | | | 1.79% | | | 1.84% | | | 2.17% |
After expense reimbursement(4) | | | 1.45% | | | 1.45% | | | 1.45% | | | 1.45% | | | 1.45% |
Ratio of net investment income (loss) to average net assets: | | | 1.06% | | | 0.15% | | | 0.36% | | | (0.57)% | | | 0.92% |
Portfolio turnover rate | | | 6% | | | 1% | | | 4% | | | 1% | | | 0% |
| | | | | | | | | | | | | | | | |
(1)
| Information presented relates to a share of capital stock outstanding for each Year. |
(2)
| Net investment income per share represents net investment income divided by the average shares outstanding throughout the Year. |
(3)
| Amount calculated is less than $0.005. |
(4)
| See Note #3, Investment Adviser, for the waiver and expense reimbursement discussion. |
The accompanying notes are an integral part of these financial statements.
TABLE OF CONTENTS
THE SPIN-OFF FUND
FINANCIAL HIGHLIGHTS
Advisor Class A
| | | | |
PER SHARE DATA:(1)
| | | | | | | | | | | | | | | |
Net asset value, beginning of year | | | $18.42 | | | $25.05 | | | $18.28 | | | $12.82 | | | $12.25 |
INCOME FROM INVESTMENT OPERATIONS:
| | | | | | | | | | | | |
Net investment income (loss)(2) | | | 0.26 | | | 0.02 | | | 0.06 | | | (0.12) | | | 0.09 |
Net realized and unrealized gain (loss) on investments | | | 14.91 | | | (4.91) | | | 7.15 | | | 5.60 | | | 0.55 |
Total from investment operations | | | 15.17 | | | (4.89) | | | 7.21 | | | 5.48 | | | 0.64 |
Redemption fees | | | 0.01 | | | 0.00(3) | | | 0.00(3) | | | 0.00(3) | | | — |
LESS DISTRIBUTIONS:
| | | | | | | | | | | | | | | |
From net investment income | | | (0.30) | | | (0.03) | | | — | | | (0.02) | | | (0.07) |
From net realized gains | | | (1.20) | | | (1.71) | | | (0.44) | | | — | | | — |
Total distributions | | | (1.50) | | | (1.74) | | | (0.44) | | | (0.02) | | | (0.07) |
Net asset value, end of year | | | $32.10 | | | $18.42 | | | $25.05 | | | $18.28 | | | $12.82 |
Total return | | | 82.36% | | | (19.63)% | | | 39.45% | | | 42.75% | | | 5.21% |
SUPPLEMENTAL DATA AND RATIOS
| | | | | | | | | | | | | | | |
Net assets, end of Year (000’s) | | | $10,684 | | | $5,758 | | | $10,649 | | | $5,869 | | | $2,521 |
Ratio of operating expenses to average net assets:
| | | | | | | | | | | | | | | |
Before expense reimbursement | | | 2.02% | | | 2.08% | | | 2.04% | | | 2.09% | | | 2.41% |
After expense reimbursement(5) | | | 1.50% | | | 1.50% | | | 1.50% | | | 1.50% | | | 1.50% |
Ratio of net investment income (loss) to average net assets: | | | 1.00% | | | 0.09% | | | 0.30% | | | (0.62)% | | | 0.87% |
Portfolio turnover rate | | | 6% | | | 1% | | | 4% | | | 1% | | | 0% |
| | | | | | | | | | | | | | | | |
(1)
| Information presented relates to a share of capital stock outstanding for each Year. |
(2)
| Net investment income per share represents net investment income divided by the average shares outstanding throughout the Year. |
(3)
| Amount calculated is less than $0.005. |
(4)
| The total return calculation does not reflect the 5.75% front end sales charge on Advisor Class A shares. |
(5)
| See Note #3, Investment Adviser, for the waiver and expense reimbursement discussion. |
The accompanying notes are an integral part of these financial statements.
TABLE OF CONTENTS
THE SPIN-OFF FUND
FINANCIAL HIGHLIGHTS
Advisor Class C
| | | | |
PER SHARE DATA:(1)
| | | | | | | | | | | | | | | |
Net asset value, beginning of year | | | $ 16.64 | | | $23.01 | | | $16.95 | | | $11.98 | | | $11.47 |
INCOME FROM INVESTMENT OPERATIONS:
| | | | | | | | | | | | |
Net investment income (loss)(2) | | | 0.06 | | | (0.13) | | | (0.08) | | | (0.23) | | | 0.01 |
Net realized and unrealized gain (loss) on investments | | | 13.42 | | | (4.50) | | | 6.58 | | | 5.23 | | | 0.50 |
Total from investment operations | | | 13.48 | | | (4.63) | | | 6.50 | | | 5.00 | | | 0.51 |
Redemption fees | | | 0.01 | | | 0.00(4) | | | 0.00(4) | | | 0.00(4) | | | — |
LESS DISTRIBUTIONS:
| | | | | | | | | | | | | | | |
From net investment income | | | (0.07) | | | (0.03) | | | — | | | (0.03) | | | (0.00)(6) |
From net realized gains | | | (1.20) | | | (1.71) | | | (0.44) | | | — | | | — |
Total distributions | | | (1.27) | | | (1.74) | | | (0.44) | | | (0.03) | | | (0.00)(6) |
Net asset value, end of year | | | $28.86 | | | $16.64 | | | $23.01 | | | $16.95 | | | $11.98 |
Total return | | | 81.04% | | | (20.24)% | | | 38.36% | | | 41.73% | | | 4.47% |
SUPPLEMENTAL DATA AND RATIOS
| | | | | | | | | | | | | | | |
Net assets, end of Year (000’s) | | | $264 | | | $301 | | | $842 | | | $940 | | | $2,611 |
Ratio of operating expenses to average net assets:
| | | | | | | | | | | | | | | |
Before expense reimbursement | | | 2.52% | | | 2.58% | | | 2.54% | | | 2.59% | | | 2.91% |
After expense reimbursement(3) | | | 2.25% | | | 2.25% | | | 2.25% | | | 2.25% | | | 2.25% |
Ratio of net investment income (loss) to average net assets: | | | 0.25% | | | (0.66)% | | | (0.43)% | | | (1.37)% | | | 0.12% |
Portfolio turnover rate | | | 6% | | | 1% | | | 4% | | | 1% | | | 0% |
| | | | | | | | | | | | | | | | |
(1)
| Information presented relates to a share of capital stock outstanding for each Year. |
(2)
| Net investment income per share represents net investment income divided by the average shares outstanding throughout the Year. |
(3)
| See Note #3, Investment Adviser, for the waiver and expense reimbursement discussion. |
(4)
| Amount calculated is less than $0.005. |
The accompanying notes are an integral part of these financial statements.
TABLE OF CONTENTS
THE SPIN-OFF FUND
FINANCIAL HIGHLIGHTS
Institutional Class
| | | | |
PER SHARE DATA:(1)
| | | | | | | | | | | | | | | |
Net asset value, beginning of year | | | $18.56 | | | $25.25 | | | $18.40 | | | $12.87 | | | $12.32 |
INCOME FROM INVESTMENT OPERATIONS:
| | | | | | | | | | | | |
Net investment income (loss)(2) | | | 0.32 | | | 0.07 | | | 0.12 | | | (0.07) | | | 0.12 |
Net realized and unrealized gain (loss) on investments | | | 15.06 | | | (4.95) | | | 7.21 | | | 5.62 | | | 0.55 |
Total from investment operations | | | 15.38 | | | (4.88) | | | 7.33 | | | 5.55 | | | 0.67 |
Redemption fees | | | 0.01 | | | 0.00(3) | | | 0.00(3) | | | 0.00(3) | | | 0.00(3) |
LESS DISTRIBUTIONS:
| | | | | | | | | | | | | | | |
From net investment income | | | (0.41) | | | (0.10) | | | (0.04) | | | (0.02) | | | (0.12) |
From net realized gains | | | (1.20) | | | (1.71) | | | (0.44) | | | — | | | — |
Total distributions | | | (1.61) | | | (1.81) | | | (0.48) | | | (0.02) | | | (0.12) |
Net asset value, end of year | | | $32.34 | | | $18.56 | | | $25.25 | | | $18.40 | | | $12.87 |
Total return | | | 82.86% | | | (19.43)% | | | 39.82% | | | 43.12% | | | 5.46% |
SUPPLEMENTAL DATA AND RATIOS
| | | | | | | | | | | | | | | |
Net assets, end of Year (000’s) | | | $25,461 | | | $16,389 | | | $23,458 | | | $17,377 | | | $12,387 |
Ratio of operating expenses to average net assets:
| | | | | | | | | | | | | | | |
Before expense reimbursement | | | 1.72% | | | 1.78% | | | 1.74% | | | 1.79% | | | 2.11% |
After expense reimbursement(4) | | | 1.25% | | | 1.25% | | | 1.25% | | | 1.25% | | | 1.25% |
Ratio of net investment income (loss) to average net assets: | | | 1.25% | | | 0.35% | | | 0.56% | | | (0.37)% | | | 1.12% |
Portfolio turnover rate | | | 6% | | | 1% | | | 4% | | | 1% | | | 0% |
| | | | | | | | | | | | | | | | |
(1)
| Information presented relates to a share of capital stock outstanding for each Year. |
(2)
| Net investment income per share represents net investment income divided by the average shares outstanding throughout the Year. |
(3)
| Amount calculated is less than $0.005. |
(4)
| See Note #3, Investment Adviser, for the waiver and expense reimbursement discussion. |
The accompanying notes are an integral part of these financial statements.
TABLE OF CONTENTS
KINETICS MUTUAL FUNDS, INC. – The Feeder Funds
Notes to Financial Statements
December 31, 2024 (Unaudited)
1. Organization
Kinetics Mutual Funds, Inc. (the “Company”) is registered under the Investment Company Act of 1940, as amended (the “1940 Act”), and is incorporated in the State of Maryland. The Company is an open-end management investment company issuing its shares in series. One billion shares are authorized for the Company with a par value of $0.001 per share. The series of the Company presently authorized are The Internet Fund (“Internet”), The Global Fund (“Global”), The Paradigm Fund (“Paradigm”), The Small Cap Opportunities Fund (“Small Cap”), The Market Opportunities Fund (“Market Opportunities”), The Multi-Disciplinary Income Fund (“Multi-Disciplinary Income”) and The Kinetics Spin-Off and Corporate Restructuring Fund (“Spin-Off Fund”) (each, a “Fund” and collectively, the “Funds”). Investment operations of the Company began on October 21, 1996 (Internet), December 31, 1999 (Global and Paradigm), March 20, 2000 (Small Cap), January 31, 2006 (Market Opportunities), February 11, 2008 (Multi-Disciplinary Income) and May 4, 2007 (Spin-Off Fund). The Spin-Off Fund completed a plan of reorganization at the close of business on December 8, 2017 to begin operations under the Company. Prior to December 8, 2017, the Spin-Off Fund was known as Horizon Spin-Off and Corporate Restructuring Fund, a series of Investment Managers Series Trust. Each series, except the Spin-Off Fund, unlike many other investment companies which directly acquire and manage their own portfolios of securities, seeks to achieve its investment objective by investing all of its investable assets in a corresponding portfolio series, The Internet Portfolio (“Internet Portfolio”), The Global Portfolio (“Global Portfolio”), The Paradigm Portfolio (“Paradigm Portfolio”), The Small Cap Opportunities Portfolio (“Small Cap Opportunities Portfolio”), The Market Opportunities Portfolio (“Market Opportunities Portfolio”) and The Multi-Disciplinary Income Portfolio (“Multi-Disciplinary Income Portfolio”) (each a “Master Portfolio” and collectively the “Master Portfolios”) of Kinetics Portfolios Trust (the “Trust”). The Spin-Off Fund does not invest all of its investable assets in a Master Portfolio and will directly acquire and manage its own portfolio of securities.
On April 28, 2000 (January 31, 2006, with respect to Market Opportunities, and February 11, 2008, with respect to Multi-Disciplinary Income), each series in the Company, except for the Spin-Off Fund, entered into a master-feeder fund structure. By entering into this structure, each series, except for the Spin-Off Fund, (each a “Feeder Fund” and collectively, the “Feeder Funds”) invested all of its assets in a corresponding Master Portfolio which had the same investment objective as the Feeder Fund. Each Master Portfolio may have multiple feeder funds. Each Feeder Fund receives a proportionate amount of interest in the Master Portfolio equal to its relative contribution of capital. Thus, each Feeder Fund is allocated its portion of income, gains (losses) and expenses from the Master Portfolio.
Each Feeder Fund’s respective interest in the corresponding Master Portfolio as of December 31, 2024, is as follows:
| | | | |
The Internet Fund | | | 99.973% |
The Global Fund | | | 99.949% |
The Paradigm Fund | | | 95.718% |
The Small Cap Opportunities Fund | | | 99.954% |
The Market Opportunities Fund | | | 99.962% |
The Multi-Disciplinary Income Fund | | | 98.445% |
| | | | |
Prior to the conversion to a master-feeder fund structure on April 28, 2000, each then existing series conducted its own investment operations.
As of December 31, 2024, each of the Funds (other than the Multi-Disciplinary Income Fund) offers Advisor Class A shares. Advisor Class A shares are subject to an annual Rule 12b-1 fee of 0.25% of average daily net assets and a shareholder servicing fee of 0.25% of average daily net assets. The Advisor Class A shares are also subject to a front-end sales charge of 5.75%.
As of December 31, 2024, each of the Funds (other than the Multi-Disciplinary Income Fund) offers Advisor Class C shares. Advisor Class C shares are subject to an annual Rule 12b-1 fee of 0.75% of average daily net assets and a shareholder servicing fee of 0.25% of average daily net assets. If you sell your Advisor Class C shares within 12 months
TABLE OF CONTENTS
KINETICS MUTUAL FUNDS, INC. – The Feeder Funds
Notes to Financial Statements
December 31, 2024 (Unaudited)(Continued)
of purchase, you will have to pay a contingent deferred sales charge of 1.00%, which is applied to the NAV of the shares on the date of original purchase or on the date of redemption, whichever is less.
As of December 31, 2024, each of the Funds offers No Load Class shares. No Load Class shares are subject to a shareholder servicing fee of 0.25% of average daily net assets but do not have 12b-1 fees or a sales charge.
As of December 31, 2024, the Paradigm, Small Cap, Market Opportunities and Spin-Off Funds offer Institutional Class shares. Institutional Class shares are subject to a shareholder servicing fee of 0.20% of average daily net assets but do not have 12b-1 fees or a sales charge. The Adviser has contractually agreed to waive the portion of the Institutional Class shareholder servicing fee in excess of 0.05%.
Each class of shares for each Feeder Fund and the Spin-Off Fund has identical rights and privileges except with respect to the Rule 12b-1 fees paid by the Advisor Class A and Advisor Class C shares, the front-end sales charge on the Advisor Class A shares, the contingent deferred sales charge on Class C, the shareholder servicing fees paid by the Advisor Class A, Advisor Class C, No Load Class and Institutional Class shares, voting rights on matters pertaining to a single class of shares and the exchange privileges of each class of shares. Shares of each Feeder Fund and the Spin-Off Fund will assess a 2.00% redemption fee (with exceptions) on shares redeemed or exchanged within 30 days of purchase. Income, expenses (other than expenses attributable to a specific class), and realized and unrealized gains or losses on investments are allocated to each class based on its relative net assets.
Refer to the Master Portfolios’ financial statements to obtain information about the investment objective of the corresponding Feeder Fund. The financial statements of the Master Portfolios, including the portfolios of investments, are contained elsewhere in this report, and should be read in conjunction with the Feeder Funds’ financial statements.
2. Significant Accounting Policies
Security Valuation – Master Portfolios and Spin-Off Fund equity securities that are listed on a securities exchange for which market quotations are readily available are valued at the last quoted sale price on the day the valuation is made. Price information on listed securities is taken from the exchange where the security is primarily traded. All equity securities, including exchange-traded funds, that are traded using the National Association of Securities Dealers’ Automated Quotation System (“NASDAQ”) are valued using the NASDAQ Official Closing Price (“NOCP”). In the event market quotations are not readily available or if events occur that may materially affect the value of a particular security between the time trading ends on a particular security and the close of regular trading on the New York Stock Exchange (“NYSE”), “fair value” will be determined. Unlisted equity securities and listed equity securities not traded on the valuation date for which market quotations are readily available are valued at the last bid price. Futures, options on futures and swap contracts that are listed or traded on a national securities exchange, commodities exchange, contract market or over-the-counter markets and are freely transferable will be valued at the composite price, using the National Best Bid and Offer quotes (“NBBO”). NBBO consists of the highest bid price and lowest ask price across any of the exchanges on which an option is quoted, thus providing a view across the entire U.S. options marketplace. Composite option pricing calculates the mean of the highest bid price and lowest ask price across the exchanges where the option is traded. If a composite option price is not available, then a quote provided by one of the authorized pricing vendors will be used. If neither a composite price nor a quote from an authorized pricing provider is available, and it is the day of expiration or post-expiration, expiring options will be priced at intrinsic value. Non-exchange-traded options for which over-the-counter quotations are not readily available are valued at the mean between the last bid and asked quotations. Debt obligations (including convertible securities) that are either investment grade or below investment grade and irrespective of days to maturity are valued at evaluated mean by one of the authorized third party pricing agents which rely on various valuation methodologies such as matrix pricing and other analytical pricing models as well as market transactions and dealer quotations. Certain instruments, such as repurchase agreements and demand notes, do not have values from third parties and are valued at amortized cost. Investments in registered open-end investment companies (including money market funds), other than exchange-traded funds, are valued at their reported net asset value (“NAV”).
Other assets and securities for which no quotations are readily available (including restricted securities) will be valued in good faith at fair value by the Adviser, as the Master Portfolios’ and Spin-Off Fund’s Valuation Designee. In determining the fair value of a security, the Adviser, as Valuation Designee, shall take into account the relevant factors and surrounding circumstances, which may include: (i) the nature and pricing history (if any) of the security; (ii)
TABLE OF CONTENTS
KINETICS MUTUAL FUNDS, INC. – The Feeder Funds
Notes to Financial Statements
December 31, 2024 (Unaudited)(Continued)
whether any dealer quotations for the security are available; (iii) possible valuation methodologies that could be used to determine the fair value of the security; (iv) the recommendation of the portfolio manager of the Portfolios with respect to the valuation of the security; (v) whether the same or similar securities are held by other funds managed by the Adviser or other funds and the method used to price the security in those funds; (vi) the extent to which the fair value to be determined for the security will result from the use of data or formula produced by third parties independent of the Adviser; (vii) the liquidity or illiquidity of the market for the security; and (viii) the value of a foreign security traded on other foreign markets. At December 31, 2024, 0.92%, 0.20%, 0.00% and 0.54% of the net assets of The Internet Portfolio, The Global Portfolio, The Paradigm Portfolio and The Market Opportunities Portfolio, respectively, were fair valued securities. The Small Cap Opportunities Portfolio, The Multi-Disciplinary Income Portfolio and Spin-Off Fund Portfolio did not hold any fair valued securities at December 31, 2024.
Bitcoin – The Master Portfolios and Spin-Off Fund may invest in Grayscale Bitcoin Trust, a Delaware statutory trust (“Bitcoin Trust”) that invests in bitcoins. From time to time, the Bitcoin Trust issues creation units in exchange for bitcoins and distributes bitcoins in exchange for redemption units. The performance of the Bitcoin Trust is intended to reflect changes in the value of the Bitcoin Trust’s bitcoin investments. At December 31, 2024, 53.23%, 25.48%, 12.04%, 5.31%, 22.08% and 0.55% of the net assets of The Internet Portfolio, The Global Portfolio, The Paradigm Portfolio, The Small Cap Opportunities Portfolio, The Market Opportunities Portfolio and The Spin-Off Fund, respectively, were invested in the Bitcoin Trust. Investments in bitcoins produce non-qualifying income under Subchapter M of the Internal Revenue Code.
Bitcoin is a decentralized digital currency that enables instant transfers to anyone, anywhere in the world. Managing transactions in bitcoins occurs via an open source, cryptographic protocol central authority. The Bitcoin Network is an online, end-user-to-end-user network that hosts the public transaction ledger, known as the Blockchain, and the source code that comprises the basis for the cryptographic and algorithmic protocols governing the Bitcoin Network. No single entity owns or operates the Bitcoin Network, the infrastructure of which is collectively maintained by a decentralized user base. Since the Bitcoin Network is decentralized, it does not rely on either governmental authorities or financial institutions to create, transmit or determine the value of bitcoins. Rather, the value of bitcoins is determined by the supply of and demand for bitcoins in the global bitcoin exchange market for the trading of bitcoins, which consists of transactions on electronic bitcoin exchanges (“Bitcoin Exchanges”). Pricing on Bitcoin Exchanges and other venues can be volatile and can adversely affect the value of the Bitcoin Trust. Currently, there is relatively small use of bitcoins in the retail and commercial marketplace in comparison to the relatively large use of bitcoins by speculators, thus contributing to price volatility that could adversely affect a Master Portfolio’s direct or indirect investment in the Bitcoin Trust. Bitcoin transactions are irrevocable and stolen or incorrectly transferred bitcoins may be irretrievable. As a result, any incorrectly executed bitcoin transactions could adversely affect the value of a Master Portfolio’s direct or indirect investment in the Bitcoin Trust. Shares of the Bitcoin Trust may trade at a premium or discount to the net asset value of the Bitcoin Trust. The price of bitcoins is set in transfers by mutual agreement or barter as well as the number of merchants that accept bitcoins. Because bitcoins are digital files that can be transferred without the involvement of intermediaries or third parties, there are little or no transaction costs in direct end-user-to-end-user transactions. Bitcoins can be used to pay for goods and services or can be converted to fiat currencies, such as the U.S. dollar, at rates determined by the Bitcoin Exchanges. Additionally, third party service providers such as Bitcoin Exchanges are also used for transfers, but they may charge significant fees for processing transactions.
As bitcoins have grown in popularity, the U.S. Congress and a number of federal and state agencies (including the Financial Crimes Enforcement Network (FinCEN), the U.S. Securities and Exchange Commission, the Commodity Futures Trading Commission, the Financial Industry Regulatory Authority, the Consumer Financial Protection Bureau, the Department of Justice, the Department of Homeland Security, the Federal Bureau of Investigation, the IRS, and state financial institution regulators) have begun to examine the operations of the network that facilitates bitcoins, bitcoin users and the Bitcoin Exchanges, with particular focus on (1) the extent to which bitcoins can be used to launder the proceeds of illegal activities or fund criminal or terrorist enterprises, (2) the safety and soundness of the Bitcoin Exchange or other service-providers that hold bitcoins for users and (3) other risks to investors and consumers who hold and use bitcoins. Ongoing and future regulatory actions may alter, perhaps to a materially adverse extent, the value of a Master Portfolio’s and it’s Subsidiary’s investment in the Bitcoin Trust or the ability of the Bitcoin Trust to continue to operate.
TABLE OF CONTENTS
KINETICS MUTUAL FUNDS, INC. – The Feeder Funds
Notes to Financial Statements
December 31, 2024 (Unaudited)(Continued)
Repurchase Agreements – Each Master Portfolio and the Spin-Off Fund may enter into repurchase agreements with banks that are members of the Federal Reserve System or securities dealers who are members of a national securities exchange or are primary dealers in U.S. Government Securities. In connection with transactions in repurchase agreements, it is the Trust’s policy that the Master Portfolios and Spin-Off Fund receive, as collateral, securities whose market value, including accrued interest, at all times will be at least equal to 102% of the amount invested by the Master Portfolio and Spin-Off Fund in each repurchase agreement. If the seller defaults and the value of the collateral declines, realization of the collateral by the Master Portfolio and Spin-Off Fund may be delayed or limited.
Foreign Currency Translations – The books and records of the Master Portfolios and Spin-Off Fund are maintained in U.S. dollars. For the Master Portfolios and Spin-Off Fund, foreign currency transactions are translated into U.S. dollars on the following basis: (i) market values of investment securities and other assets and liabilities are translated at the exchange rate of such currencies against the U.S. dollar, as provided by an approved pricing service, and (ii) purchases and sales of investment securities, dividend and interest income and certain expenses at the rates of exchange prevailing on the respective dates of such transactions. The Master Portfolios and Spin-Off Fund do not isolate and treat as ordinary income that portion of the results of operations arising as a result of changes in the exchange rate from the fluctuations arising from changes in the market prices of securities held during the year. Such fluctuations are included with the net realized and unrealized gain or loss from investments. However, for federal income tax purposes, the Master Portfolios and Spin-Off Fund do isolate and treat as ordinary income the effect of changes in foreign exchange rates arising from actual foreign currency transactions and the effect of changes in foreign exchange rates arising between trade date and settlement date.
Restricted and Illiquid Securities – The Master Portfolios and Spin-Off Fund may invest in restricted securities. These securities are valued by the Master Portfolios and Spin-Off Fund after giving due consideration to pertinent factors including recent private sales, market conditions and the issuer’s financial performance. The Master Portfolios and Spin-Off Fund have no right to require registration of unregistered securities. The 144A securities have been deemed to be liquid by the Master Portfolio and Spin-Off Fund’s Adviser under the oversight of the Board of Trustees/Directors. At December 31, 2024, market value and percentage of 144A securities held by the Master Portfolios and Spin-Off Fund are disclosed under the respective schedule of investments.
An illiquid asset is any asset which may not be sold or disposed of in current market conditions within seven days without the sale or disposition significantly changing the market value of the investment. At December 31, 2024, market value and percentage of illiquid securities held by the Master Portfolios and Spin-Off Fund are disclosed under the respective schedule of investments.
When-Issued Securities – The Master Portfolios and Spin-Off Fund may purchase securities on a when- issued or delayed delivery basis. Although the purchase amounts of these securities are established at the time the purchaser enters into the agreement, these securities may be delivered and paid for at a future date. The Master Portfolios and Spin-Off Fund record purchases of when-issued securities and reflect the values of such securities in determining net asset value in the same manner as other portfolio securities.
Securities Lending – Each Master Portfolio and Spin-Off Fund may lend its portfolio securities to broker-dealers by entering directly into lending arrangements with such broker- dealers or indirectly through repurchase agreements with respect to no more than 33 1∕3% of the total assets of each Master Portfolio and Spin-Off Fund (including any collateral posted) or 50% of the total assets of each Master Portfolio and Spin-Off Fund (excluding any collateral posted).Securities lending and repurchase transactions will be fully collateralized at all times with cash and/or short-term debt obligations. The Master Portfolios and Spin-Off Fund receive interest on the collateral received as well as a fee for the securities loaned.
Expense Allocation – Common expenses incurred by the Funds are allocated among the Funds (i) based upon relative average net assets, (ii) as incurred on a specific identification basis, or (iii) equally among the Funds, depending on the nature of the expenditure.
Each Feeder Fund records its proportionate share of the corresponding Master Portfolio’s expenses on a daily basis. In addition, each Feeder Fund accrues its own separate expenses. Any cap on expenses includes Feeder Fund-specific expenses as well as the expenses allocated from the Master Portfolio.
TABLE OF CONTENTS
KINETICS MUTUAL FUNDS, INC. – The Feeder Funds
Notes to Financial Statements
December 31, 2024 (Unaudited)(Continued)
Federal Income Taxes – Each Master Portfolio will be treated as a partnership for federal income tax purposes. As such, each investor in a Master Portfolio via its investment in a Feeder Fund will be subject to taxation on its share of the Master Portfolio’s ordinary income and capital gains. It is intended that the Master Portfolio’s assets will be managed so an investor in the Master Portfolio via its investment in a Feeder Fund can satisfy the requirements of subchapter M of the Internal Revenue Code. It is intended that the Spin-Off Fund will be managed to satisfy the requirements of subchapter M of the Internal Revenue Code.
The consolidated financial statements include the accounts of Cayman wholly-owned Controlled Foreign Corporations (“CFCs”) and the accounts of Delaware Corporations (“Cayman” or “Delaware,” respectively, or “Subsidiaries” for both).The respective Master Portfolios hold a CFC: Internet Portfolio, Global Portfolio, Paradigm Portfolio, Small Cap Opportunities Portfolio and Market Opportunities Portfolio. The respective Master Portfolios hold a Delaware subsidiary: Internet Portfolio, Global Portfolio and Market Opportunities Portfolio. The investment of up to 25% of a Master Portfolio’s assets in the Subsidiaries is a structure that has been used by a number of Registered Investment Companies (“RICs”) to avoid earning non-qualified income by indirectly making commodities-related investments which would not generate qualifying income if they were made directly by the RIC. Under Treasury Regulations, income from a foreign subsidiary that is a CFC, such as the Subsidiaries, is qualifying income for a RIC for U.S. federal income tax purposes (1) to the extent the income is actually distributed by the CFC to the RIC each year and (2) even if not distributed currently, to the extent the income is derived with respect to the RIC’s business of investing in stock, securities or currencies. If the IRS were to determine that income derived from a Master Portfolio’s investment in its Subsidiaries do not constitute qualifying income and if such positions were upheld by a court, or if future legislation or Treasury regulations were to adversely affect the tax treatment of such investments, then the corresponding Feeder Fund might cease to qualify as a RIC and could be required to reduce its exposure to such investments. In that event, a Feeder Fund’s taxable income would be subject to tax at the Feeder Fund level at regular corporate tax rates (without reduction for distributions to shareholders) and to a further tax at the shareholder level when such income is distributed. In such an event, in order to re-qualify for taxation as a regulated investment company, the Feeder Fund may be required to recognize unrealized gains, pay substantial taxes, and interest and make certain distributions.
It is the Funds’ policy to meet the requirements of the Internal Revenue Code applicable to regulated investment companies and the Funds intend to distribute investment company net taxable income and net capital gains to shareholders.
Dividends from net investment income and distributions of net realized capital gains, if any, will be declared and paid at least annually. The character of distributions made during the year from net investment income or net realized gains may differ from the characterization for federal income tax purposes due to differences in the recognition of income, expenses and realized gain items for financial statement and tax purposes. Additionally, the Funds may utilize earnings and profits distributed to shareholders on redemption of shares as part of the dividends paid deduction for income tax purposes. Where appropriate, reclassifications between capital accounts are made for such differences that are permanent in nature.
There is no tax liability resulting from unrecognized tax benefits relating to uncertain income tax positions taken or expected to be taken in future tax returns. As of December 31, 2024, open tax years include the tax years ended December 31, 2021 through December 31, 2024.The Funds are also not aware of any tax positions for which it is reasonably possible that the total amounts of unrecognized tax benefits will significantly change in the next twelve months.
Use of Estimates – The preparation of financial statements in conformity with U.S. generally accepted accounting principles (”GAAP”) requires management to make estimates and assumptions that affect the reported amounts in the financial statements. Actual results could differ from those estimates.
Other – Realized gains and losses on the sale of investments are calculated on the identified cost basis. Dividend income is recorded on the ex-dividend date. Interest income is accounted for on the accrual basis and includes amortization of premiums and accretion of discounts on the effective interest method. Other noncash dividends are recognized as investment income at the fair value of the property received. Withholding taxes on foreign dividends have been incorporated in accordance with the Company’s understanding of the applicable country’s tax rules and rates.
TABLE OF CONTENTS
KINETICS MUTUAL FUNDS, INC. – The Feeder Funds
Notes to Financial Statements
December 31, 2024 (Unaudited)(Continued)
3. Investment Adviser
The Trust has entered into Investment Advisory Agreements (the “Agreements”) with Horizon Kinetics Asset Management LLC (the “Adviser”), with whom certain officers and trustees of the Trust are affiliated, to furnish investment advisory services to the Master Portfolios and Spin-Off Fund. The Adviser is a wholly-owned subsidiary of Horizon Kinetics Holding Corporation (OTC: HKHC). Under the terms of the Agreements, the Master Portfolios, except the Multi-Disciplinary Income Portfolio, compensate the Adviser for its management services at the annual rate of 1.25% of each Master Portfolio’s average daily net assets. Effective as of April 30, 2023, the Adviser has agreed to reduce the management fee for the Multi-Disciplinary Income Portfolio from 1.25% to 1.00% Additionally, effective as of April 30, 2023, the Adviser has agreed to waive 0.75% of the 1.00% management fee for the Multi-Disciplinary Income Portfolio through April 30, 2025. The Spin-Off Fund compensates the Adviser for its management services at the annual rate of 1.00% of the Fund’s average daily net assets.
The Adviser has agreed to waive a portion of its advisory fee and/or reimburse certain operating expenses as deemed appropriate through at least April 30, 2025. The Adviser may discontinue the waiver/reimbursement at any time after April 30, 2025; these waivers/reimbursements are not subject to recapture. Operating expenses exclude brokerage commissions, borrowing costs on securities sold short, short dividends, interest expense, taxes, acquired fund fees and expenses and extraordinary expenses. Below are operating expense limitations by each share class of each of the funds:
| | | | | | | |
No Load Class | | | 1.75% | | | 1.39% |
Class A | | | 2.00% | | | 1.64% |
Class C | | | 2.50% | | | 2.14% |
| | | | | | | |
| | | | | | | |
No Load Class | | | 1.64% | | | 1.64% |
Class A | | | 1.89% | | | 1.89% |
Class C | | | 2.39% | | | 2.39% |
Institutional Class | | | 1.44% | | | 1.44% |
| | | | | | | |
| | | | | | | |
No Load Class | | | 1.40% | | | 0.74% |
Class A | | | 1.65% | | | N/A |
Class C | | | 2.15% | | | N/A |
Institutional Class | | | 1.20% | | | N/A |
| | | | | | | |
| | | | | | | |
No Load Class | | | 1.45% | | | |
Class A | | | 1.50% | | | |
Class C | | | 2.25% | | | |
Institutional Class | | | 1.25% | | | |
| | | | | | | |
For the Year ended December 31, 2024, the rate earned by the Adviser from the Master Portfolios and Spin-Off Fund and the waived fees/reimbursed expenses for the Funds are as follows:
| | | | | | | |
Annual Advisory Rate | | | 1.25% | | | 1.25% |
Expenses Reimbursed by Adviser through voluntary waiver | | | $— | | | $198,353 |
| | | | | | | |
TABLE OF CONTENTS
KINETICS MUTUAL FUNDS, INC. – The Feeder Funds
Notes to Financial Statements
December 31, 2024 (Unaudited)(Continued)
| | | | | | | |
Annual Advisory Rate | | | 1.25% | | | 1.25% |
Expenses Reimbursed by Adviser through voluntary waiver | | | $174,303 | | | $164,624 |
Expenses Reimbursed by Adviser through institutional class shareholder servicing fee waiver | | | $404,262 | | | $99,009 |
| | | | | | | |
| | | | | | | |
Annual Advisory Rate | | | 1.25% | | | 1.00% |
Expenses Reimbursed by Adviser through voluntary waiver | | | $549,141 | | | $52,698 |
Expenses Reimbursed by Adviser through institutional class shareholder servicing fee waiver | | | $37,551 | | | N/A |
| | | | | | | |
| | | | | | | |
Annual Advisory Rate | | | 1.00% | | | |
Expenses Reimbursed by Adviser through voluntary waiver | | | $109,746 | | | |
Expenses Reimbursed by Adviser through institutional class shareholder servicing fee waiver | | | $31,628 | | | |
| | | | | | | |
The Adviser receives the shareholder servicing fees from the No Load Class, Advisor Class A and Advisor Class C shares of a Fund pursuant to a Shareholder Servicing Agreement in the amount equal to 0.25% of the Funds’ average daily net assets attributable to No Load Class, Advisor Class A and Advisor Class C shares, respectively. For the Institutional Class, the Adviser receives a shareholder servicing fee pursuant to a shareholder servicing agreement in the amount equal to 0.20% of a Funds’ average daily net assets attributable to Institutional Class shares. At this time, the Adviser has contractually agreed to waive and/or reimburse the portion of the Institutional Class shareholder servicing fee in excess of 0.05% of a Fund’s average daily net assets attributable to Institutional Class shares until at least April 30, 2025. For the Year ended December 31, 2024, the Adviser waived amounts depicted in the above table in shareholder servicing fees for the Institutional Class of the Paradigm, Small Cap, Market Opportunities, Multi-Disciplinary Income and Spin-Off Funds.
| | | | |
The Internet Fund | | | $651,656 |
The Global Fund | | | 75,923 |
The Paradigm Fund | | | 2,362,045 |
The Small Cap Opportunities Fund | | | 833,891 |
The Market Opportunities Fund | | | 411,745 |
The Multi-Disciplinary Income Fund | | | 32,540 |
The Spin-off Fund | | | 62,462 |
| | | | |
The Adviser is responsible for paying a portion of these shareholder servicing fees to various agents that have a written shareholder servicing agreement with the Adviser and that perform shareholder servicing functions and maintenance of shareholder accounts on behalf of their clients who own shares of the Funds.
For the Year ended December 31, 2024, the Funds were allocated approximately $26,000 for the services of the Chief Compliance Officer employed by the Adviser.
The Company, on behalf of the Funds, has adopted two Retail Distribution Plans pursuant to Rule 12b-1 under the 1940 Act (each a “12b-1 Plan”).One 12b-1 Plan is for Advisor Class A shares, while the other 12b-1 Plan is for Advisor Class C shares. Under the 12b-1 Plan for Advisor Class A shares, Advisor Class A shares may pay up to an annual rate of 0.50% of the average daily net asset value of Advisor Class A shares to the Distributor or other qualified recipients under the 12b-1 Plan. During the Year ended December 31, 2024, payments under the 12b-1 Plan for the Advisor
TABLE OF CONTENTS
KINETICS MUTUAL FUNDS, INC. – The Feeder Funds
Notes to Financial Statements
December 31, 2024 (Unaudited)(Continued)
Class A shares of the Internet, Global, Paradigm, Small Cap, Market Opportunities, Multi-Disciplinary Income and Spin-Off Funds were limited to 0.25% of the average daily net asset value of such shares of such Funds. Under the second 12b-1 Plan, Advisor Class C shares pay an annual rate of 0.75% of the average daily net asset value of such shares.
| | | | |
The Internet Fund | | | $8,298 | | | $22,996 |
The Global Fund | | | 5,162 | | | 43,908 |
The Paradigm Fund | | | 498,868 | | | 528,207 |
The Small Cap Opportunities Fund | | | 49,898 | | | 75,365 |
The Market Opportunities Fund | | | 33,326 | | | 91,614 |
The Spin-off Fund | | | 19,380 | | | 2,285 |
| | | | | | | |
Kinetics Funds Distributor, LLC (the “Distributor”) acts as the Funds’ principal underwriter in a continuous public offering of the Funds’ shares. The Distributor is an affiliate of the Adviser.
| | | | |
The Internet Fund | | | $1,022 |
The Global Fund | | | 407 |
The Paradigm Fund | | | 31,517 |
The Small Cap Opportunities Fund | | | 1,075 |
The Market Opportunities Fund | | | 1,417 |
The Multi-Disciplinary Income Fund | | | — |
The Spin-off Fund | | | 664 |
| | | | |
4. Reclassification of Capital Accounts
GAAP requires that certain components of net assets relating to permanent differences be reclassified between financial and tax reporting. These reclassifications have no effect on net assets or net asset value per share. For the year ended December 31, 2024, each Fund recorded the following reclassifications to the accounts listed below:
| | | | |
The Internet Fund | | | $(887,066) | | | $887,066 |
The Global Fund | | | $(12,179) | | | $12,179 |
The Paradigm Fund | | | $(7,339,539) | | | $7,339,539 |
The Small Cap Opportunities Fund | | | $(471,411) | | | $471,411 |
The Market Opportunities Fund | | | $(481,113) | | | $481,113 |
The Multi-Disciplinary Income Fund | | | $— | | | $— |
The Spin-Off Fund | | | $(249,519) | | | $249,519 |
| | | | | | | |
TABLE OF CONTENTS
KINETICS MUTUAL FUNDS, INC. – The Feeder Funds
Notes to Financial Statements
December 31, 2024 (Unaudited)(Continued)
5. Income Taxes
At December 31, 2024, the components of accumulated earnings (losses) on a tax basis were as follows:
| | | | | | | | | | | | | |
Net Unrealized Appreciation | | | $ 232,573,044 | | | $23,195,307 | | | $1,112,925,602 | | | $298,250,979 |
Undistributed Ordinary Income | | | 93,433 | | | 171,360 | | | — | | | — |
Undistributed Long-Term Capital Gains | | | 1,197,537 | | | — | | | 23,818,116 | | | — |
Total Distributable Earnings | | | $1,290,970 | | | $171,360 | | | $23,818,116 | | | $— |
Other Accumulated Loss | | | — | | | (61,733) | | | (1,542,497) | | | (1,605,542) |
Total Accumulated Gain | | | $ 233,864,014 | | | $23,304,934 | | | $1,135,201,221 | | | $296,645,437 |
| | | | | | | | | | | | | |
| | | | | | | | | | |
Net Unrealized Appreciation | | | $ 170,705,757 | | | $70,197 | | | $30,375,317 |
Undistributed Ordinary Income | | | 277,412 | | | 50,965 | | | 43,075 |
Undistributed Long-Term Capital Gains | | | 37,923 | | | — | | | 170,922 |
Total Distributable Earnings | | | $315,335 | | | $50,965 | | | $213,997 |
Other Accumulated Loss | | | (67,482) | | | (5,464,093) | | | — |
Total Accumulated Gain (Loss) | | | $ 170,953,610 | | | $(5,342,931) | | | $30,589,314 |
| | | | | | | | | | |
At December 31, 2024, the Funds had no accumulated net realized capital loss carryforwards that will expire in 2024.
At December 31, 2024, the Funds had the following short-term and long-term capital loss carryforwards without expiration.
| | | | |
The Internet Fund | | | $— | | | $— | | | $— |
The Global Fund | | | 11,749 | | | — | | | 11,749 |
The Paradigm Fund | | | — | | | — | | | — |
The Small Cap Opportunities Fund | | | — | | | — | | | — |
The Market Opportunities Fund | | | — | | | — | | | — |
The Multi-Disciplinary Income Fund | | | 13,004 | | | 5,451,089 | | | 5,464,093 |
The Spin-Off Fund | | | — | | | — | | | — |
| | | | | | | | | | |
For the year ended December 31, 2024, the following Funds utilized capital losses.
| | | | |
The Internet Fund | | | $— |
The Global Fund | | | 215,150 |
The Paradigm Fund | | | — |
The Small Cap Opportunities Fund | | | — |
The Market Opportunities Fund | | | 494,017 |
The Multi-Disciplinary Income Fund | | | — |
The Spin-Off Fund | | | — |
| | | | |
TABLE OF CONTENTS
KINETICS MUTUAL FUNDS, INC. – The Feeder Funds
Notes to Financial Statements
December 31, 2024 (Unaudited)(Continued)
At December 31, 2024, the following Funds deferred, on a tax basis, post- October losses:
| | | | |
The Internet Fund | | | $— |
The Global Fund | | | — |
The Paradigm Fund | | | 1,542,497 |
The Small Cap Opportunities Fund | | | 1,605,542 |
The Market Opportunities Fund | | | — |
The Multi-Disciplinary Income Fund | | | — |
The Spin-Off Fund | | | — |
| | | | |
The tax components of dividends paid during the Year ended December 31, 2023 and the year ended December 31, 2024, are:
| | | | | | | |
2024 | | | $672,765 | | | $2,413,529 | | | $435,355 | | | $ — |
2023 | | | $— | | | $1,427,746 | | | $414,068 | | | $ — |
| |
| | |
| | | | | | | |
2024 | | | $1,084,208 | | | $36,608,342 | | | $4,384,242 | | | $11,803,574 |
2023 | | | $— | | | $42,175,561 | | | $3,518,981 | | | $15,242,941 |
| | | | | | | | | | | | | |
| | | | | | | |
2024 | | | $1,449,269 | | | $274,542 | | | $831,330 | | | $— |
2023 | | | $1,078,615 | | | $ — | | | $670,836 | | | $ — |
| |
| | |
| | | | |
2024 | | | $406,111 | | | $1,303,757 |
2023 | | | $89,721 | | | $1,939,988 |
| | | | | | | |
Each Feeder Fund and the Spin-Off Fund designated as long-term capital gain dividend, pursuant to Internal Revenue Code Section 852(b)(3), the amount necessary to reduce the earnings and profits of the Feeder Funds and the Spin-Off Fund related to net capital gain to zero for the tax year ended December 31, 2024.
TABLE OF CONTENTS
KINETICS MUTUAL FUNDS, INC. – The Feeder Funds
Notes to Financial Statements
December 31, 2024 (Unaudited)(Continued)
6. Securities Transactions, Tax Cost and Significant Investments – The Spin-Off Fund
Purchases and sales of investment securities, other than short-term investments and short-term options, for the Year ended December 31, 2024, were as follows for the Spin-Off Fund:
| | | | | | | |
The Spin-off Fund | | | $ — | | | $1,527,525 | | | $ — | | | $2,480,682 |
| | | | | | | | | | | | | |
As of December 31, 2024, the cost of investments and unrealized appreciation (depreciation) on investment securities for federal income tax purposes was as follows for the Spin-Off Fund:
| | | | |
Tax Cost of Investments | | | $4,925,951 |
Unrealized Appreciation | | | 30,780,701 |
Unrealized Depreciation | | | (405,380) |
Net Unrealized Appreciation | | | $30,375,321 |
| | | | |
Significant Investments – The Spin-Off Fund may invest a greater percentage of its assets in one or more individual securities at any time. The greater percentage of assets in individual securities (not including short-term investments or other funds) exposes the fund to the risk of unanticipated industry conditions, the risks particular to a single company or security, and the risk of potentially lower liquidity. At December 31, 2024, Spin-Off Fund invested approximately 85% of its net assets in individual securities greater than 5% of net assets. See the Schedule of Investments for further details.
Holding a large concentration in a single security or issuer may expose the fund to the market volatility of that specific security or issuer if the security or issuer performs worse than the market as a whole, which could adversely affect the Fund’s performance. At December 31, 2024, the Spin-Off Fund holds 74.8% of its net assets in Texas Pacific Land Corp. Because a large portion of its revenue is derived from oil and gas royalties, the performance of the Spin-Off Fund could be adversely affected if the underlying markets for oil or gas were to decline, thereby having a more significant impact on the Spin-Off Fund given the concentration in this holding.
7. Summary of Fair Value Exposure – Spin-Off Fund
Various inputs are used in determining the value of the Spin-Off Fund’s investments. These inputs are summarized in the three broad levels listed below:
Level 1 –
| Unadjusted quoted prices in active markets for identical assets or liabilities that the Spin-Off Fund has the ability to access.
|
Level 2 –
| Observable inputs other than quoted prices included in Level 1 that are observable for the asset or liability, either directly or indirectly. These inputs may include quoted prices for the identical instrument on an inactive market, prices for similar instruments, interest rates, prepayment speeds, credit risk, yield curves, default rates and similar data.
|
Level 3 –
| Unobservable inputs for the asset or liability, to the extent relevant observable inputs are not available, representing the Spin-Off Fund’s own assumptions about the assumptions a market participant would use in valuing the asset or liability, and would be based on the best information available.
|
The availability of observable inputs can vary from security to security and is affected by a wide variety of factors, including, for example, the type of security, whether the security is new and not yet established in the marketplace, the liquidity of markets, and other characteristics particular to the security. To the extent that valuation is based on models or inputs that are less observable or unobservable in the market, the determination of fair value requires more judgment. Accordingly, the degree of judgment exercised in determining fair value is greatest for instruments categorized in Level 3.
TABLE OF CONTENTS
KINETICS MUTUAL FUNDS, INC. – The Feeder Funds
Notes to Financial Statements
December 31, 2024 (Unaudited)(Continued)
The inputs used to measure fair value may fall into different levels of the fair value hierarchy. In such cases, for disclosure purposes, the level in the fair value hierarchy within which the fair value measurement falls in its entirety, is determined based on the lowest level input that is significant to the fair value measurement in its entirety. The following is a summary of the inputs used to value The Spin-Off Fund’s net assets as of December 31, 2024:
The Kinetics Spin-Off and Corporate Restructuring Fund
The following is a summary of the inputs used to value The Kinetics Spin-Off and Corporate Restructuring Fund’s net assets as of December 31, 2024:
| | | | | | | | | | | | | |
Common Stocks | | | $34,979,498 | | | $121,278 | | | $ — | | | $35,100,776 |
Closed-End Funds | | | — | | | — | | | — | | | — |
Unit Investment Trust | | | 192,751 | | | — | | | — | | | 192,751 |
Exchange Traded Funds | | | 7,745 | | | — | | | — | | | 7,745 |
Total Investments in Securities | | | $ 35,179,994 | | | $121,278 | | | $— | | | $35,301,272 |
| | | | | | | | | | | | | |
As of December 31, 2024, there were no investments in Level 3 securities.
During the period ended December 31, 2024, there were no transfers into or out of Level 3.
^
| See Consolidated Portfolio of Investments for breakout of investments by industry classification. |
8. Investment Adviser
The Spin-Off Fund entered into Investment Advisory Agreements (the “Agreement”) with the Adviser, with whom certain officers and trustees of the Trust are affiliated, to furnish investment advisory services to the Spin-Off Fund. The Adviser is a wholly-owned subsidiary of Horizon Kinetics Holding Corporation. Under the terms of the Agreement, the Spin-Off Fund compensates the Adviser for its management services at the annual rate of 1.00% of the Spin-Off Fund’s average daily net assets. For the Year ended December 31, 2024, Spin-Off Fund incurred $292,017 in expenses pursuant to the Agreement.
9. Subsequent Events
In preparing these financial statements, management has evaluated Fund related events and transactions for potential recognition or disclosure through the date the financial statements were issued. There were no other events or translations that occurred during the year that materially impacted the amounts or disclosures in the Funds’ financial statements.
10. Tax Information (Unaudited)
For the fiscal year ended December 31, 2024, certain dividends paid by the Funds may be subject to a maximum tax rate of 15%, as provided for by the Jobs and Growth Tax Relief Reconciliation Act of 2003.The percentage of dividends declared from ordinary income designated as qualified dividend income was as follows:
| | | | |
The Internet Fund | | | 83.03% |
The Global Fund | | | 82.17% |
The Paradigm Fund | | | 100.00% |
The Small Cap Opportunities Fund | | | 100.00% |
The Market Opportunities Fund | | | 100.00% |
The Multi-Disciplinary Income Fund | | | 0.00% |
The Spin-Off Fund | | | 100.00% |
| | | | |
TABLE OF CONTENTS
KINETICS MUTUAL FUNDS, INC. – The Feeder Funds
Notes to Financial Statements
December 31, 2024 (Unaudited)(Continued)
For corporate shareholders, the percent of ordinary income distributions qualifying for the corporate dividends received deduction for the fiscal year ended December 31, 2024 was as follows:
| | | | |
The Internet Fund | | | 83.35% |
The Global Fund | | | 34.59% |
The Paradigm Fund | | | 100.00% |
The Small Cap Opportunities Fund | | | 96.09% |
The Market Opportunities Fund | | | 97.80% |
The Multi-Disciplinary Income Fund | | | 0.00% |
The Spin-Off Fund | | | 100.00% |
| | | | |
The percentage of ordinary income distributions that are designated as interest-related dividends under Internal Revenue Code Section 871(k)(1)(C) for the year ended December 31, 2024 was as follows:
| | | | |
The Internet Fund | | | 16.97% |
The Global Fund | | | 17.83% |
The Paradigm Fund | | | 0.00% |
The Small Cap Opportunities Fund | | | 0.00% |
The Market Opportunities Fund | | | 0.00% |
The Multi-Disciplinary Income Fund | | | 98.42% |
The Spin-Off Fund | | | 0.00% |
| | | | |
The percentage of taxable ordinary income distributions that are designated as short-term capital gain distributions under Internal Revenue Section 871(k)(2)(C) for the year ended December 31, 2024 was as follows:
| | | | |
The Internet Fund | | | 0.00% |
The Global Fund | | | 0.00% |
The Paradigm Fund | | | 0.00% |
The Small Cap Opportunities Fund | | | 0.00% |
The Market Opportunities Fund | | | 0.00% |
The Multi-Disciplinary Income Fund | | | 0.00% |
The Spin-Off Fund | | | 0.00% |
| | | | |
The percentage of taxable income distributions that are designated as ordinary and long-term capital gain distributions under Internal Revenue Section 871(k)(2)(C) for the year ended December 31, 2024 was as follows:
| | | | | | | |
The Internet Fund | | | 21.80% | | | 78.20% |
The Global Fund | | | 100.00% | | | 0.00% |
The Paradigm Fund | | | 2.88% | | | 97.12% |
The Small Cap Opportunities Fund | | | 27.08% | | | 72.92% |
The Market Opportunities Fund | | | 84.07% | | | 15.93% |
The Multi-Disciplinary Income Fund | | | 100.00% | | | 0.00% |
The Spin-Off Fund | | | 23.75% | | | 76.25% |
| | | | | | | |
11. Recent Accounting Pronouncements
Segment Reporting (Topic 280)
In November 2023, the FASB issued ASU 2023-07, Segment Reporting (Topic 280): Improvements to Reportable Segment Disclosures (“ASU 2023-07”). This change is intended to improve reportable segment disclosure requirements, primarily through enhanced disclosures about significant segment expenses, allowing financial statement users to better understand the components of a segment’s profit or loss and assess potential future cash flows for each
TABLE OF CONTENTS
KINETICS MUTUAL FUNDS, INC. – The Feeder Funds
Notes to Financial Statements
December 31, 2024 (Unaudited)(Continued)
reportable segment and the entity as a whole. The amendments expand a public entity’s segment disclosures by requiring disclosure of significant segment expenses that are regularly provided to the chief operating decision maker (“CODM”), clarifying when an entity may report one or more additional measures to assess segment performance, requiring enhanced interim disclosures and providing new disclosure requirements for entities with a single reportable segment, among other new disclosure requirements. The amendments are effective for fiscal years beginning after December 15, 2023 and interim periods within fiscal years beginning after December 15, 2024, and early adoption is permitted. Management has evaluated the impact of adopting this guidance with respect to the financial statements and disclosures and determined there is no impact for the Funds.
12. Information about Proxy Voting (Unaudited)
Information regarding how the Spin-Off Fund, the Feeder Funds and the Master Portfolios vote proxies relating to portfolio securities is available without charge, upon request by calling toll-free at 1-800-930-3828 or by accessing the Company’s website at www.kineticsfunds.com and by accessing the SEC’s website at www.sec.gov.Information regarding how the Spin-Off Fund, the Feeder Funds and the Master Portfolios voted proxies relating to portfolio securities during the most recent twelve month period ended June 30, is available without charge, upon request, by calling toll-free at 1-800-930-3828 or by accessing the SEC’s website at www.sec.gov.
13. Information about the Portfolio Holdings (Unaudited)
The Spin-Off Fund and Feeder Funds file their complete schedule of portfolio holdings for their first and third fiscal quarters with the SEC on Part F of Form N-PORT. The Spin-Off Fund’s and Feeder Funds’ Part F of Form N-PORT is available without charge, upon request, by calling toll-free at 1-800-930-3828.Furthermore, you can obtain the Part F of Form N-PORT on the SEC’s website at www.sec.gov.
TABLE OF CONTENTS
KINETICS MUTUAL FUNDS, INC. – The Feeder Funds
REPORT OF INDEPENDENT REGISTERED PUBLIC ACCOUNTING FIRM
To the Shareholders and Board of Directors of Kinetics Mutual Funds, Inc.
Opinion on the Financial Statements
We have audited the accompanying statements of assets and liabilities of The Internet Fund, The Global Fund, The Paradigm Fund, The Small Cap Opportunities Fund, The Market Opportunities Fund, The Multi-Disciplinary Income Fund, and the Kinetics Spin-off and Corporate Restructuring Fund (the “Funds”), each a series of Kinetics Mutual Funds, Inc. (the “Trust”), including the portfolios of investments, as of December 31, 2024, the related statements of operations for the year then ended, the statements of changes in net assets for each of the two years in the period then ended, financial highlights for each of the five years in the period then ended, and the related notes (collectively referred to as the “financial statements”). In our opinion, the financial statements present fairly, in all material respects, the financial position of the Funds as of December 31, 2024, the results of their operations for the year then ended, the changes in their net assets for each of the two years in the period then ended, and their financial highlights for each of the five years in the period then ended, in conformity with accounting principles generally accepted in the United States of America.
Basis for Opinion
These financial statements are the responsibility of the Funds’ management. Our responsibility is to express an opinion on the Funds’ financial statements based on our audits. We are a public accounting firm registered with the Public Company Accounting Oversight Board (United States) (“PCAOB”) and are required to be independent with respect to the Funds in accordance with the U.S. federal securities laws and the applicable rules and regulations of the Securities and Exchange Commission and the PCAOB. We have served as the auditor of one or more of the funds in the Trust since 2004.
We conducted our audits in accordance with the standards of the PCAOB. Those standards require that we plan and perform the audits to obtain reasonable assurance about whether the financial statements are free of material misstatement, whether due to error or fraud. The Funds are not required to have, nor were we engaged to perform, an audit of the Funds’ internal control over financial reporting. As part of our audits we are required to obtain an understanding of internal control over financial reporting, but not for the purpose of expressing an opinion on the effectiveness of the Funds’ internal control over financial reporting. Accordingly, we express no such opinion.
Our audits included performing procedures to assess the risks of material misstatement of the financial statements, whether due to error or fraud, and performing procedures that respond to those risks. Such procedures included examining, on a test basis, evidence regarding the amounts and disclosures in the financial statements. Our audits also included evaluating the accounting principles used and significant estimates made by management, as well as evaluating the overall presentation of the financial statements. With respect to Kinetics Spin-off and Corporate Restructuring Fund, our procedures included confirmation of securities owned as of December 31, 2024 by correspondence with the custodian and brokers or through other appropriate auditing procedures when replies from brokers were unable to be obtained. We believe that our audits provide a reasonable basis for our opinion.
TAIT, WELLER & BAKER LLP
Philadelphia, Pennsylvania
February 28, 2025
TABLE OF CONTENTS
KINETICS PORTFOLIO TRUST – MASTER INVESTMENTS PORTFOLIO
The Internet Portfolio
Consolidated Portfolio of Investments - December 31, 2024
| | | | | | | |
UNIT INVESTMENT TRUSTS - 53.2%
|
Grayscale Bitcoin Mini Trust ETF(a) | | | 428,419 | | | $17,937,903 |
Grayscale Bitcoin Trust ETF(a)(b)(c) | | | 2,142,099 | | | 158,558,168 |
| | | | | | 176,496,071 |
TOTAL UNIT INVESTMENT TRUSTS
(Cost $6,613,988) | | | | | | 176,496,071 |
COMMON STOCKS - 33.9%
|
Administrative and Support
Services - 0.0%(d)
| | | | | | |
CreditRiskMonitor.com, Inc.(a) | | | 780 | | | 2,359 |
Aerospace and Defense - 4.9%
| | | | | | |
CACI International, Inc. - Class A(a) | | | 40,000 | | | 16,162,400 |
Broadcasting (except Internet) - 0.2%
| | | | | | |
Atlanta Braves Holdings, Inc. - Class A(a) | | | 8,000 | | | 326,400 |
Atlanta Braves Holdings, Inc. - Class C(a) | | | 8,000 | | | 306,080 |
| | | | | | 632,480 |
Data Processing, Hosting, and Related Services - 1.4%
| | | | | | |
Mastercard, Inc. - Class A | | | 5,000 | | | 2,632,850 |
Verisk Analytics, Inc. | | | 7,000 | | | 1,928,010 |
| | | | | | 4,560,860 |
Entertainment - 0.2%
| | | | | | |
IG Port, Inc. | | | 32,000 | | | 490,540 |
Financial Services - 0.0%(d)
| | | | | | |
Hellenic Exchanges - Athens Stock Exchange SA | | | 16,400 | | | 76,616 |
Funds, Trusts, and Other Financial Vehicles - 0.3%
| | | | | | |
Mesabi Trust(b) | | | 37,900 | | | 1,065,369 |
Global Exchanges - 0.0%(d)
| | | | | | |
Japan Exchange Group, Inc. - ADR | | | 6,200 | | | 69,068 |
Management of Companies and Enterprises - 0.7%
| | | | | | |
Galaxy Digital Holdings Ltd.(a) | | | 140,000 | | | 2,433,893 |
Management, Scientific, and Technical
Consulting Services - 0.0%(d)
|
Booz Allen Hamilton Holding Corp. | | | 638 | | | 82,111 |
Media - 0.0%(d)
| | | | | | |
Toei Animation Co. Ltd. | | | 7,000 | | | 157,266 |
Office Administrative Services - 0.3%
|
DigitalBridge Group, Inc. | | | 80,400 | | | 906,912 |
Offices of Real Estate Agents and Brokers - 1.0%
| | | | | | |
Landbridge Co. LLC(a) | | | 49,975 | | | 2,905,546 |
| | | | | | | |
| | | | | | | |
Landbridge Co. LLC - Class A | | | 5,400 | | | $348,840 |
| | | | | | 3,254,386 |
Oil and Gas Extraction - 21.1%
| | | | | | |
Permian Basin Royalty Trust | | | 12,550 | | | 139,054 |
Texas Pacific Land Corp. | | | 63,078 | | | 69,761,745 |
| | | | | | 69,900,799 |
Other Financial Investment
Activities - 0.6%
| | | | | | |
Bakkt Holdings, Inc.(a)(b) | | | 80,000 | | | 1,981,600 |
Other Motor Vehicle Dealers - 0.0%(d)
|
Copart, Inc.(a) | | | 400 | | | 22,956 |
Performing Arts, Spectator Sports, and Related Industries - 0.1%
| | | | | | |
Madison Square Garden Entertainment Corp.(a) | | | 4,000 | | | 142,400 |
Sphere Entertainment Co.(a) | | | 4,000 | | | 161,280 |
| | | | | | 303,680 |
Securities and Commodities Exchanges - 1.2%
| | | | | | |
CME Group, Inc. | | | 4,000 | | | 928,920 |
Miami International Holdings
Inc.(a)(e) | | | 268,000 | | | 2,913,160 |
Nasdaq, Inc. | | | 2,100 | | | 162,351 |
| | | | | | 4,004,431 |
Securities, Commodity Contracts, and Other Financial Investments and Related Activities - 1.9%
| | | | | | |
OTC Markets Group, Inc. - Class A | | | 121,000 | | | 6,196,713 |
S&P Global, Inc. | | | 113 | | | 56,277 |
| | | | | | 6,252,990 |
TOTAL COMMON STOCKS
(Cost $49,268,192) | | | | | | 112,360,716 |
| | | Contracts | | | |
WARRANTS - 0.0%(d)
|
Securities and Commodities Exchanges - 0.0%(d)
| | | | | | |
Miami International Holdings Warrant, Expires 04/01/2026, Exercise Price $7.50(a)(e) | | | 40,819 | | | 138,785 |
TOTAL WARRANTS
(Cost $0) | | | | | | 138,785 |
TOTAL INVESTMENTS - 87.1%
(Cost $55,882,180) | | | | | | $288,995,572 |
Money Market Deposit
Account - 13.8%(f)(g) | | | | | | 45,619,310 |
Liabilities in Excess of Other
Assets - (0.9)% | | | | | | (3,057,748) |
TOTAL NET ASSETS - 100.0% | | | | | | $331,557,134 |
| | | | | | | |
The accompanying notes are an integral part of these financial statements.
TABLE OF CONTENTS
KINETICS PORTFOLIO TRUST – MASTER INVESTMENTS PORTFOLIO
The Internet Portfolio
Consolidated Portfolio of Investments - December 31, 2024(Continued)
Percentages are stated as a percent of net assets.
ADR - American Depositary Receipt
SA - Sociedad Anónima
(a)
| Non-income producing security. |
(b)
| All or a portion of this security is on loan as of December 31, 2024. The total market value of these securities was $3,102,245 which represented 0.9% of net assets. |
(c)
| Fair value of this security exceeds 25% of the Fund’s net assets. Additional information for this security, including the financial statements, is available from the SEC’s EDGAR database at www.sec.gov. |
(d)
| Represents less than 0.05% of net assets. |
(e)
| Fair value determined using significant unobservable inputs in accordance with procedures established by and under the supervision of the Adviser, acting as Valuation Designee. These securities represented $3,051,945 or 0.9% of net assets as of December 31, 2024. |
(f)
| The U.S. Bank Money Market Deposit Account (the “MMDA”) is a short-term vehicle in which the Fund holds cash balances. The MMDA will bear interest at a variable rate that is determined based on market conditions and is subject to change daily. The rate as of December 31, 2024 was 4.24%. |
(g)
| All or a portion of security has been pledged as collateral. The total value of assets committed as collateral as of December 31, 2024 is $3,252,116 which represented 1.0% of net assets. |
The accompanying notes are an integral part of these financial statements.
TABLE OF CONTENTS
KINETICS PORTFOLIO TRUST – MASTER INVESTMENTS PORTFOLIO
THE GLOBAL PORTFOLIO
Consolidated Portfolio of Investments - December 31, 2024
The accompanying notes are an integral part of these financial statements.
TABLE OF CONTENTS
KINETICS PORTFOLIO TRUST – MASTER INVESTMENTS PORTFOLIO
THE GLOBAL PORTFOLIO
Consolidated Portfolio of Investments - December 31, 2024
Percentages are stated as a percent of net assets.
AB - Aktiebolag
ADR - American Depositary Receipt
AG - Aktiengesellschaft
NV - Naamloze Vennootschap
PLC - Public Limited Company
SA - Sociedad Anónima
(a)
| Represents less than 0.05% of net assets.
|
(b)
| Non-income producing security.
|
(c)
| Security is exempt from registration pursuant to Rule 144A under the Securities Act of 1933, as amended. These securities may only be resold in transactions exempt from registration to qualified institutional investors. As of December 31, 2024, the value of these securities total $260,078 or 0.5% of the Fund’s net assets.
|
(d)
| Fair value determined using significant unobservable inputs in accordance with procedures established by and under the supervision of the Adviser, acting as Valuation Designee. These securities represented $99,990 or 0.2% of net assets as of December 31, 2024.
|
(e)
| All or a portion of this security is on loan as of December 31, 2024. The total market value of these securities was $139,480 which represented 0.3% of net assets.
|
(f)
| Issuer is currently in default.
|
(g)
| The U.S. Bank Money Market Deposit Account (the “MMDA”) is a short-term vehicle in which the Fund holds cash balances. The MMDA will bear interest at a variable rate that is determined based on market conditions and is subject to change daily. The rate as of December 31, 2024 was 4.24%.
|
(h)
| All or a portion of security has been pledged as collateral. The total value of assets committed as collateral as of December 31, 2024 is $149,222 which represented 0.3% of net assets. |
The accompanying notes are an integral part of these financial statements.
TABLE OF CONTENTS
KINETICS PORTFOLIO TRUST – MASTER INVESTMENTS PORTFOLIO
The Paradigm Portfolio
Consolidated Portfolio of Investments - December 31, 2024
| | | | | | | |
COMMON STOCKS - 86.2%
|
Accommodation - 0.4%
|
Civeo Corp. | | | 217,600 | | | $4,943,872 |
Aerospace and Defense - 0.9%
| | | | | | |
CACI International, Inc. - Class A(a) | | | 30,000 | | | 12,121,800 |
Beverage and Tobacco Product Manufacturing - 0.0%(b)
| | | | | | |
Crimson Wine Group Ltd.(a) | | | 22,000 | | | 139,700 |
Broadcasting (except Internet) - 0.0%(b)
|
Atlanta Braves Holdings, Inc. - Class C(a) | | | 4,842 | | | 185,255 |
Diversified Real Estate Activities - 0.1%
|
PrairieSky Royalty Ltd. | | | 60,000 | | | 1,169,988 |
Entertainment - 0.0%(b)
| | | | | | |
IG Port, Inc. | | | 20,400 | | | 312,719 |
Financial Services - 0.0%(b)
| | | | | | |
Hellenic Exchanges - Athens Stock Exchange SA | | | 200 | | | 934 |
Food Services and Drinking
Places - 0.4%
| | | | | | |
Wendy’s Co. | | | 339,600 | | | 5,535,480 |
Funds, Trusts, and Other Financial Vehicles - 0.1%
| | | | | | |
Mesabi Trust(c) | | | 40,800 | | | 1,146,888 |
Hospitality and Tourism - 0.6%
| | | | | | |
Carnival Corp.(a) | | | 215,000 | | | 5,357,800 |
Royal Caribbean Cruises Ltd. | | | 10,200 | | | 2,353,038 |
| | | | | | 7,710,838 |
Insurance Carriers - 0.0%(b)
| | | | | | |
Fairfax Financial Holdings Limited | | | 2 | | | 2,779 |
Insurance Carriers and Related Activities - 0.0%(b)
| | | | | | |
Markel Group, Inc.(a) | | | 100 | | | 172,623 |
Legal Services - 0.0%(b)
| | | | | | |
CRA International, Inc. | | | 124 | | | 23,213 |
Management of Companies and Enterprises - 0.8%
| | | | | | |
Associated Capital Group, Inc. - Class A | | | 260,290 | | | 8,917,405 |
Fairfax India Holdings Corp.(a)(d) | | | 400 | | | 6,402 |
Hawaiian Electric Industries, Inc.(a) | | | 6,000 | | | 58,380 |
White Mountains Insurance Group Ltd. | | | 702 | | | 1,365,432 |
| | | | | | 10,347,619 |
| | | | | | | |
| | | | | | | |
Management, Scientific, and Technical
Consulting Services - 0.0%(b)
|
Booz Allen Hamilton Holding Corp. | | | 800 | | | $102,960 |
Media - 0.0%(b)
| | | | | | |
Toei Animation Co. Ltd. | | | 15,400 | | | 345,985 |
Mining (except Oil and Gas) - 1.5%
| | | | | | |
Franco-Nevada Corp. | | | 148,000 | | | 17,403,320 |
Wheaton Precious Metals Corp. | | | 48,200 | | | 2,710,768 |
| | | | | | 20,114,088 |
Motor Vehicle and Parts
Dealers - 0.0%(b)
| | | | | | |
AutoNation, Inc.(a) | | | 30 | | | 5,095 |
Nonmetallic Mineral Product Manufacturing - 0.0%(b)
| | | | | | |
Eagle Materials, Inc. | | | 572 | | | 141,147 |
Office Administrative Services - 0.0%(b)
|
DigitalBridge Group, Inc. | | | 1,200 | | | 13,536 |
Offices of Real Estate Agents and Brokers - 4.4%
| | | | | | |
Landbridge Co. LLC(a) | | | 3,332 | | | 193,722 |
Landbridge Co. LLC - Class A(c) | | | 900,000 | | | 58,140,000 |
| | | | | | 58,333,722 |
Oil and Gas Extraction - 67.7%(f)
| | | | | | |
Texas Pacific Land Corp.(g) | | | 815,210 | | | 901,589,652 |
Other Financial Investment Activities - 0.4%
| | | | | | |
GAMCO Investors, Inc. - Class A | | | 7,400 | | | 178,932 |
Onex Corp. | | | 60,300 | | | 4,741,992 |
Seaport Entertainment Group, Inc.(a) | | | 30,000 | | | 838,500 |
| | | | | | 5,759,424 |
Other Investment Pools and
Funds - 0.0%(b)
| | | | | | |
Partners Value Investments LP(a) | | | 800 | | | 89,047 |
Urbana Corp. | | | 6,902 | | | 27,033 |
Urbana Corp. - Class A | | | 1,978 | | | 7,953 |
| | | | | | 124,033 |
Other Telecommunications - 0.5%
| | | | | | |
Liberty Broadband Corp. - Class C(a) | | | 81,000 | | | 6,055,560 |
Performing Arts, Spectator Sports, and Related Industries - 2.1%
| | | | | | |
Live Nation Entertainment, Inc.(a) | | | 220,000 | | | 28,490,000 |
Real Estate - 1.4%
| | | | | | |
DREAM Unlimited Corp.(a) | | | 12,400 | | | 190,816 |
Howard Hughes Holdings, Inc.(a) | | | 239,800 | | | 18,445,416 |
| | | | | | 18,636,232 |
| | | | | | | |
The accompanying notes are an integral part of these financial statements.
TABLE OF CONTENTS
KINETICS PORTFOLIO TRUST – MASTER INVESTMENTS PORTFOLIO
The Paradigm Portfolio
Consolidated Portfolio of Investments - December 31, 2024(Continued)
| | | | | | | |
COMMON STOCKS - (Continued)
|
Securities and Commodities Exchanges - 0.9%
| | | | | | |
Cboe Global Markets, Inc. | | | 60,000 | | | $11,724,000 |
Securities, Commodity Contracts, and Other Financial Investments and Related Activities - 3.6%
| | | | | | |
Brookfield Asset Management Ltd. | | | 176,887 | | | 9,585,507 |
Brookfield Corp. | | | 660,000 | | | 37,917,000 |
S&P Global, Inc. | | | 340 | | | 169,330 |
| | | | | | 47,671,837 |
Support Activities for Mining - 0.0%(b)
|
Aris Water Solutions, Inc. - Class A | | | 800 | | | 19,160 |
Support Activities for Water Transportation - 0.3%
| | | | | | |
Clarkson PLC | | | 87,000 | | | 4,307,578 |
Siem Industries, Inc.(a)(e) | | | 13,200 | | | 302,280 |
| | | | | | 4,609,858 |
Telecommunications - 0.0%(b)
| | | | | | |
GCI LIBERTY INC SR ESCROW(a)(e) | | | 72,000 | | | 0 |
Utilities - 0.1%
| | | | | | |
Brookfield Infrastructure Partners LP | | | 28,000 | | | 890,120 |
TOTAL COMMON STOCKS
(Cost $124,806,866) | | | | | | 1,148,440,117 |
UNIT INVESTMENT TRUSTS - 12.1%
|
Grayscale Bitcoin Mini Trust ETF(a) | | | 389,280 | | | 16,299,154 |
Grayscale Bitcoin Trust ETF(a) | | | 1,946,400 | | | 144,072,528 |
Grayscale Ethereum Classic Trust(a) | | | 12 | | | 129 |
| | | | | | 160,371,811 |
TOTAL UNIT INVESTMENT TRUSTS
(Cost $25,987,742) | | | | | | 160,371,811 |
REAL ESTATE INVESTMENT TRUSTS - 0.4%
|
Real Estate - 0.4%
| | | | | | |
Equity LifeStyle Properties, Inc. | | | 68,800 | | | 4,582,080 |
TOTAL REAL ESTATE INVESTMENT TRUSTS
(Cost $3,110,124) | | | | | | 4,582,080 |
| | | Contracts | | | |
WARRANTS - 0.0%(b)
|
Other Investment Pools and Funds - 0.0%(b)
|
Partners Value Investments LP, Expires 06/30/2026, Exercise Price $11.50(a) | | | 800 | | | 11,832 |
TOTAL WARRANTS
(Cost $2,368) | | | | | | 11,832 |
| | | | | | | |
| | | | | | | |
PREFERRED STOCKS - 0.0%(b)
|
Other Investment Pools and Funds - 0.0%(b)
|
Partners Value Investments LP Series 1*, 0.16%, 11/27/2030 | | | 800 | | | $600 |
TOTAL PREFERRED STOCKS
(Cost $239) | | | | | | 600 |
TOTAL INVESTMENTS - 98.7%
(Cost $153,907,339) | | | | | | $1,313,406,440 |
Money Market Deposit
Account - 2.8%(h)(i) | | | | | | 37,848,826 |
Liabilities in Excess of Other
Assets - (1.5)% | | | | | | (19,418,308) |
TOTAL NET ASSETS - 100.0% | | | | | | $1,331,836,958 |
| | | | | | | |
Percentages are stated as a percent of net assets.
PLC - Public Limited Company
SA - Sociedad Anónima
(a)
| Non-income producing security. |
(b)
| Represents less than 0.05% of net assets. |
(c)
| All or a portion of this security is on loan as of December 31, 2024. The total market value of these securities was $18,089,439 which represented 1.4% of net assets. |
(d)
| Security is exempt from registration pursuant to Rule 144A under the Securities Act of 1933, as amended. These securities may only be resold in transactions exempt from registration to qualified institutional investors. As of December 31, 2024, the value of these securities total $6,402 or 0.0% of the Fund’s net assets. |
(e)
| Fair value determined using significant unobservable inputs in accordance with procedures established by and under the supervision of the Adviser, acting as Valuation Designee. These securities represented $0 or 0.0% of net assets as of December 31, 2024. |
(f)
| To the extent that the Fund invests more heavily in a particular industry or sector of the economy, its performance will be especially sensitive to developments that significantly affect those industries or sectors. |
(g)
| Fair value of this security exceeds 25% of the Fund’s net assets. Additional information for this security, including the financial statements, is available from the SEC’s EDGAR database at www.sec.gov. |
(h)
| The U.S. Bank Money Market Deposit Account (the “MMDA”) is a short-term vehicle in which the Fund holds cash balances. The MMDA will bear interest at a variable rate that is determined based on market conditions and is subject to change daily. The rate as of December 31, 2024 was 4.24%. |
(i)
| All or a portion of security has been pledged as collateral. The total value of assets committed as collateral as of December 31, 2024 is $18,686,718 which represented 1.4% of net assets. |
The accompanying notes are an integral part of these financial statements.
TABLE OF CONTENTS
KINETICS PORTFOLIO TRUST – MASTER INVESTMENTS PORTFOLIO
The Small Cap Opportunities Portfolio
Consolidated Portfolio of Investments - December 31, 2024
| | | | | | | |
COMMON STOCKS - 79.5%
|
Accommodation - 2.7%
|
Civeo Corp. | | | 558,032 | | | $12,678,487 |
Administrative and Support
Services - 0.0%(a)
| | | | | | |
RB Global, Inc. | | | 400 | | | 36,084 |
Aerospace and Defense - 4.3%
| | | | | | |
CACI International, Inc. - Class A(b) | | | 50,000 | | | 20,203,000 |
Beverage and Tobacco Product Manufacturing - 0.1%
| | | | | | |
Crimson Wine Group Ltd.(b) | | | 49,300 | | | 313,055 |
Chemical Manufacturing - 1.5%
| | | | | | |
Interparfums, Inc. | | | 53,200 | | | 6,996,332 |
Oil-Dri Corp. of America | | | 200 | | | 17,528 |
| | | | | | 7,013,860 |
Diversified Real Estate Activities - 0.3%
|
PrairieSky Royalty Ltd. | | | 72,000 | | | 1,403,986 |
Entertainment - 0.1%
| | | | | | |
IG Port, Inc. | | | 32,000 | | | 490,540 |
Food Services and Drinking
Places - 0.6%
| | | | | | |
Wendy’s Co. | | | 162,600 | | | 2,650,380 |
Funds, Trusts, and Other Financial Vehicles - 0.3%
| | | | | | |
Mesabi Trust(c) | | | 44,200 | | | 1,242,462 |
Hospitality and Tourism - 1.6%
| | | | | | |
Carnival Corp.(b) | | | 296,000 | | | 7,376,320 |
Royal Caribbean Cruises Ltd. | | | 200 | | | 46,138 |
| | | | | | 7,422,458 |
Industrial Services - 0.1%
| | | | | | |
BRAEMAR PLC | | | 189,800 | | | 556,006 |
Insurance Carriers - 0.0%(a)
| | | | | | |
Fairfax Financial Holdings Limited | | | 4 | | | 5,559 |
Legal Services - 0.0%(a)
| | | | | | |
CRA International, Inc. | | | 1,024 | | | 191,693 |
Machinery Manufacturing - 0.0%(a)
| | | | | | |
Oshkosh Corp. | | | 400 | | | 38,028 |
Management of Companies and Enterprises - 3.2%
| | | | | | |
Associated Capital Group, Inc. - Class A | | | 190,500 | | | 6,526,435 |
Dundee Corp. - Class A(b) | | | 99,000 | | | 98,010 |
Fairfax India Holdings Corp.(b)(d) | | | 8,400 | | | 134,434 |
Galaxy Digital Holdings Ltd.(b) | | | 119,200 | | | 2,072,286 |
| | | | | | | |
| | | | | | | |
Hawaiian Electric Industries, Inc.(b) | | | 154,000 | | | $1,498,420 |
White Mountains Insurance Group
Ltd. | | | 2,306 | | | 4,485,308 |
| | | | | | 14,814,893 |
Management, Scientific, and Technical
Consulting Services - 0.1%
|
Booz Allen Hamilton Holding Corp. | | | 3,400 | | | 437,580 |
Media - 0.1%
| | | | | | |
Toei Animation Co. Ltd. | | | 14,000 | | | 314,532 |
Mining (except Oil and Gas) - 0.1%
| | | | | | |
Triple Flag Precious Metals Corp. | | | 720 | | | 10,829 |
Wheaton Precious Metals Corp. | | | 5,000 | | | 281,200 |
| | | | | | 292,029 |
Motor Vehicle and Parts
Dealers - 0.0%(a)
| | | | | | |
AutoNation, Inc.(b) | | | 520 | | | 88,317 |
Penske Automotive Group, Inc. | | | 500 | | | 76,220 |
| | | | | | 164,537 |
Nonmetallic Mineral Product Manufacturing - 0.0%(a)
| | | | | | |
Eagle Materials, Inc. | | | 804 | | | 198,395 |
Office Administrative Services - 0.3%
| | | | | | |
DigitalBridge Group, Inc. | | | 124,000 | | | 1,398,720 |
Offices of Real Estate Agents and Brokers - 5.5%
| | | | | | |
Landbridge Co. LLC - Class A | | | 395,000 | | | 25,517,000 |
Oil and Gas Extraction - 53.5%(e)
| | | | | | |
Permian Basin Royalty Trust | | | 99,600 | | | 1,103,568 |
Texas Pacific Land Corp.(f) | | | 224,232 | | | 247,991,623 |
| | | | | | 249,095,191 |
Other Financial Investment
Activities - 0.1%
| | | | | | |
GAMCO Investors, Inc. - Class A | | | 13,800 | | | 333,684 |
Seaport Entertainment Group, Inc.(b) | | | 2,166 | | | 60,539 |
| | | | | | 394,223 |
Other Investment Pools and
Funds - 1.0%
| | | | | | |
Urbana Corp. | | | 29,200 | | | 114,367 |
Urbana Corp. - Class A | | | 1,104,900 | | | 4,442,813 |
| | | | | | 4,557,180 |
Other Pipeline Transportation - 0.1%
| | | | | | |
Rubis SCA | | | 14,200 | | | 351,253 |
Performing Arts, Spectator Sports, and Related Industries - 0.7%
| | | | | | |
Live Nation Entertainment, Inc.(b) | | | 23,300 | | | 3,017,350 |
Madison Square Garden Entertainment Corp.(b) | | | 772 | | | 27,483 |
| | | | | | | |
The accompanying notes are an integral part of these financial statements.
TABLE OF CONTENTS
KINETICS PORTFOLIO TRUST – MASTER INVESTMENTS PORTFOLIO
The Small Cap Opportunities Portfolio
Consolidated Portfolio of Investments - December 31, 2024(Continued)
| | | | | | | |
COMMON STOCKS - (Continued)
|
Performing Arts, Spectator Sports, and
Related Industries - (Continued)
|
Sphere Entertainment Co.(b) | | | 772 | | | $31,127 |
| | | | | | 3,075,960 |
Professional, Scientific, and Technical Services - 0.5%
| | | | | | |
Science Applications International Corp. | | | 19,600 | | | 2,190,888 |
Promoters of Performing Arts, Sports,
and Similar Events - 0.0%(a)
|
Madison Square Garden Sports Corp.(b) | | | 240 | | | 54,163 |
Real Estate - 2.7%
| | | | | | |
DREAM Unlimited Corp.(b) | | | 681,200 | | | 10,482,552 |
Howard Hughes Holdings, Inc.(b) | | | 19,000 | | | 1,461,480 |
Tejon Ranch Co.(b) | | | 41,117 | | | 653,760 |
| | | | | | 12,597,792 |
Securities and Commodity Contracts
Intermediation and
Brokerage - 0.0%(a)
| | | | | | |
Affiliated Managers Group, Inc. | | | 234 | | | 43,271 |
Support Activities for Mining - 0.0%(a)
|
Aris Water Solutions, Inc. - Class A | | | 2,000 | | | 47,900 |
Liberty Energy, Inc. | | | 400 | | | 7,956 |
Pason Systems, Inc. | | | 8,000 | | | 75,745 |
| | | | | | 131,601 |
Support Activities for Water Transportation - 0.0%(a)
| | | | | | |
Clarkson PLC | | | 2,400 | | | 118,830 |
Telecommunications - 0.0%(a)
| | | | | | |
LICT Corp.(b) | | | 16 | | | 225,680 |
TOTAL COMMON STOCKS
(Cost $91,972,137) | | | | | | 370,219,316 |
UNIT INVESTMENT TRUSTS - 5.3%
|
Grayscale Bitcoin Mini Trust ETF(b) | | | 60,000 | | | 2,512,200 |
Grayscale Bitcoin Trust ETF(b) | | | 300,000 | | | 22,206,000 |
Grayscale Ethereum Classic Trust(b) | | | 60 | | | 646 |
| | | | | | 24,718,846 |
TOTAL UNIT INVESTMENT TRUSTS
(Cost $3,168,943) | | | | | | 24,718,846 |
| | | | | | | |
| | | | | | | |
WARRANTS - 0.5%
|
Other Investment Pools and
Funds - 0.5%
|
Partners Value Investments LP, Expires 06/30/2026, Exercise Price $11.50(b) | | | 160,000 | | | $2,366,413 |
TOTAL WARRANTS
(Cost $433,365) | | | | | | 2,366,413 |
TOTAL INVESTMENTS - 85.3%
(Cost $95,574,445) | | | | | | 397,304,575 |
Money Market Deposit
Account - 14.7%(g)(h) | | | | | | 68,670,849 |
Liabilities in Excess of Other
Assets - (0.0)%(i) | | | | | | (179,698) |
TOTAL NET ASSETS - 100.0% | | | | | | $465,795,726 |
| | | | | | | |
Percentages are stated as a percent of net assets.
PLC - Public Limited Company
(a)
| Represents less than 0.05% of net assets. |
(b)
| Non-income producing security. |
(c)
| All or a portion of this security is on loan as of December 31, 2024. The total market value of these securities was $554,891 which represented 0.1% of net assets. |
(d)
| Security is exempt from registration pursuant to Rule 144A under the Securities Act of 1933, as amended. These securities may only be resold in transactions exempt from registration to qualified institutional investors. As of December 31, 2024, the value of these securities total $134,434 or 0.0% of the Fund’s net assets. |
(e)
| To the extent that the Fund invests more heavily in a particular industry or sector of the economy, its performance will be especially sensitive to developments that significantly affect those industries or sectors. |
(f)
| Fair value of this security exceeds 25% of the Fund’s net assets. Additional information for this security, including the financial statements, is available from the SEC’s EDGAR database at www.sec.gov. |
(g)
| The U.S. Bank Money Market Deposit Account (the “MMDA”) is a short-term vehicle in which the Fund holds cash balances. The MMDA will bear interest at a variable rate that is determined based on market conditions and is subject to change daily. The rate as of December 31, 2024 was 4.24%. |
(h)
| All or a portion of security has been pledged as collateral. The total value of assets committed as collateral as of December 31, 2024 is $567,525 which represented 0.1% of net assets. |
(i)
| Represents less than 0.05% of net assets. |
The accompanying notes are an integral part of these financial statements.
TABLE OF CONTENTS
KINETICS PORTFOLIO TRUST – MASTER INVESTMENTS PORTFOLIO
The Market Opportunities Portfolio
Consolidated Portfolio of Investments - December 31, 2024
| | | | | | | |
COMMON STOCKS - 72.0%
|
Administrative and Support
Services - 0.1%
|
RB Global, Inc. | | | 1,400 | | | $126,294 |
Aerospace and Defense - 0.1%
| | | | | | |
CACI International, Inc. - Class A(a) | | | 300 | | | 121,218 |
Agencies, Brokerages, and Other
Insurance Related Activities - 0.1%
|
Brookfield Wealth Solutions Ltd. | | | 4,617 | | | 265,200 |
Asset Management - 0.0%(b)
| | | | | | |
Investor AB(a) | | | 400 | | | 10,582 |
Coal Mining - 0.0%(b)
| | | | | | |
CONSOL Energy, Inc. | | | 2 | | | 213 |
Data Processing, Hosting, and Related Services - 0.8%
| | | | | | |
Mastercard, Inc. - Class A | | | 1,000 | | | 526,570 |
Visa, Inc. - Class A | | | 4,000 | | | 1,264,160 |
| | | | | | 1,790,730 |
Diversified Real Estate
Activities - 0.0%(b)
| | | | | | |
PrairieSky Royalty Ltd. | | | 200 | | | 3,900 |
Entertainment - 0.0%(b)
| | | | | | |
IG Port, Inc. | | | 1,200 | | | 18,395 |
Financial Services - 0.0%(b)
| | | | | | |
Hellenic Exchanges - Athens Stock Exchange SA | | | 11,200 | | | 52,323 |
Hong Kong Exchanges & Clearing Ltd. | | | 100 | | | 3,796 |
Value Partners Group Ltd.(a) | | | 2,000 | | | 394 |
| | | | | | 56,513 |
Funds, Trusts, and Other Financial Vehicles - 0.5%
| | | | | | |
Mesabi Trust(c) | | | 37,142 | | | 1,044,062 |
Global Exchanges - 0.6%
| | | | | | |
ASX Ltd. | | | 4,400 | | | 177,238 |
Deutsche Boerse AG | | | 1,800 | | | 414,672 |
Euronext NV(d) | | | 2,520 | | | 282,700 |
Japan Exchange Group, Inc. - ADR | | | 8,200 | | | 91,348 |
London Stock Exchange Group PLC | | | 600 | | | 84,766 |
NZX Ltd. | | | 364,202 | | | 297,506 |
| | | | | | 1,348,230 |
Insurance Carriers - 0.0%(b)
| | | | | | |
Fairfax Financial Holdings Limited | | | 2 | | | 2,779 |
Insurance Carriers and Related Activities - 0.1%
| | | | | | |
Arthur J. Gallagher & Co. | | | 400 | | | 113,540 |
| | | | | | | |
| | | | | | | |
Legal Services - 0.0%(b)
| | | | | | |
CRA International, Inc. | | | 36 | | | $6,739 |
Live Sports (Spectator Sports) - 0.1%
| | | | | | |
BIGLEAGUE(a)(e) | | | 2,455 | | | 135,025 |
Management of Companies and Enterprises - 3.3%
| | | | | | |
Associated Capital Group, Inc. - Class A | | | 77,000 | | | 2,637,982 |
Fairfax India Holdings Corp.(a)(d) | | | 4,000 | | | 64,016 |
Galaxy Digital Holdings Ltd.(a) | | | 96,800 | | | 1,682,863 |
Hawaiian Electric Industries, Inc.(a) | | | 32,400 | | | 315,252 |
White Mountains Insurance
Group Ltd. | | | 1,406 | | | 2,734,754 |
| | | | | | 7,434,867 |
Management, Scientific, and Technical
Consulting Services - 0.0%(b)
|
Booz Allen Hamilton Holding Corp. | | | 144 | | | 18,533 |
Media - 0.0%(b)
| | | | | | |
Toei Animation Co. Ltd. | | | 400 | | | 8,987 |
Mining (except Oil and Gas) - 1.5%
| | | | | | |
Franco-Nevada Corp. | | | 14,600 | | | 1,716,814 |
Wheaton Precious Metals Corp. | | | 30,800 | | | 1,732,192 |
| | | | | | 3,449,006 |
Miscellaneous Durable Goods Merchant Wholesalers - 0.0%(b)
| | | | | | |
A-Mark Precious Metals, Inc. | | | 3,200 | | | 87,680 |
Motor Vehicle and Parts
Dealers - 0.0%(b)
| | | | | | |
AutoNation, Inc.(a) | | | 10 | | | 1,698 |
Nonmetallic Mineral Mining and Quarrying - 0.1%
| | | | | | |
Anglo American PLC - ADR | | | 8,000 | | | 118,000 |
Nonmetallic Mineral Product Manufacturing - 0.0%(b)
| | | | | | |
Eagle Materials, Inc. | | | 2 | | | 493 |
Office Administrative Services - 0.3%
| | | | | | |
DigitalBridge Group, Inc. | | | 50,200 | | | 566,256 |
Offices of Real Estate Agents and Brokers - 2.0%
| | | | | | |
Landbridge Co. LLC(a) | | | 4,998 | | | 290,584 |
Landbridge Co. LLC - Class A | | | 66,400 | | | 4,289,440 |
| | | | | | 4,580,024 |
Oil and Gas Extraction - 54.6%(f)
| | | | | | |
Permian Basin Royalty Trust | | | 127,450 | | | 1,412,146 |
Texas Pacific Land Corp.(g) | | | 108,984 | | | 120,531,945 |
| | | | | | 121,944,091 |
| | | | | | | |
The accompanying notes are an integral part of these financial statements.
TABLE OF CONTENTS
KINETICS PORTFOLIO TRUST – MASTER INVESTMENTS PORTFOLIO
The Market Opportunities Portfolio
Consolidated Portfolio of Investments - December 31, 2024(Continued)
| | | | | | | |
COMMON STOCKS - (Continued)
|
Other Financial Investment
Activities - 1.0%
| | | | | | |
Bakkt Holdings, Inc.(a)(c) | | | 32,000 | | | $792,640 |
GAMCO Investors, Inc. - Class A | | | 58,600 | | | 1,416,948 |
| | | | | | 2,209,588 |
Other Investment Pools and
Funds - 3.0%
| | | | | | |
Partners Value Investments LP(a) | | | 43,516 | | | 4,843,688 |
Urbana Corp. | | | 43,700 | | | 171,158 |
Urbana Corp. - Class A | | | 419,300 | | | 1,686,009 |
| | | | | | 6,700,855 |
Professional, Scientific, and Technical Services - 0.0%(b)
| | | | | | |
Science Applications International Corp. | | | 200 | | | 22,356 |
Real Estate - 0.0%(b)
| | | | | | |
Tejon Ranch Co.(a) | | | 3,000 | | | 47,700 |
Securities and Commodities Exchanges - 3.1%
| | | | | | |
Cboe Global Markets, Inc. | | | 8,000 | | | 1,563,200 |
CME Group, Inc. | | | 5,800 | | | 1,346,934 |
Intercontinental Exchange, Inc. | | | 12,900 | | | 1,922,229 |
Miami International Holdings
Inc.(a)(e) | | | 95,000 | | | 1,032,650 |
Nasdaq, Inc. | | | 7,200 | | | 556,632 |
TMX Group Ltd. | | | 18,000 | | | 554,482 |
| | | | | | 6,976,127 |
Securities and Commodity Contracts Intermediation and
Brokerage - 0.0%(b)
| | | | | | |
Affiliated Managers Group, Inc. | | | 190 | | | 35,135 |
MarketAxess Holdings, Inc. | | | 48 | | | 10,850 |
| | | | | | 45,985 |
Securities, Commodity Contracts, and Other Financial Investments and Related Activities - 0.1%
| | | | | | |
Brookfield Asset Management Ltd. | | | 806 | | | 43,677 |
OTC Markets Group, Inc. - Class A | | | 800 | | | 40,970 |
S&P Global, Inc. | | | 113 | | | 56,278 |
| | | | | | 140,925 |
Support Activities for Mining - 0.0%(b)
|
Aris Water Solutions, Inc. - Class A | | | 800 | | | 19,160 |
Support Activities for Water Transportation - 0.6%
| | | | | | |
Clarkson PLC | | | 29,000 | | | 1,435,859 |
TOTAL COMMON STOCKS
(Cost $36,489,440) | | | | | | 160,851,610 |
| | | | | | | |
| | | | | | | |
UNIT INVESTMENT TRUSTS - 22.1%
|
Grayscale Bitcoin Mini Trust ETF(a) | | | 119,774 | | | $5,014,937 |
Grayscale Bitcoin Trust ETF(a) | | | 598,874 | | | 44,328,654 |
Grayscale Ethereum Classic Trust(a) | | | 12 | | | 129 |
| | | | | | 49,343,720 |
TOTAL UNIT INVESTMENT TRUSTS
(Cost $1,794,088) | | | | | | 49,343,720 |
| | | Contracts | | | |
WARRANTS - 0.3%
|
Other Investment Pools and
Funds - 0.3%
| | | | | | |
Partners Value Investments LP, Expires 06/30/2026, Exercise
Price $11.50(a) | | | 43,516 | | | 643,605 |
Securities and Commodities Exchanges - 0.0%(b)
| | | | | | |
Miami International Holdings Warrant, Expires 04/01/2026, Exercise Price $7.50(a)(e) | | | 14,469 | | | 49,195 |
TOTAL WARRANTS
(Cost $130,105) | | | | | | 692,800 |
| | | Shares | | | |
PREFERRED STOCKS - 0.1%
| | | | | | |
Financial Services - 0.1%
| | | | | | |
Partners Value Investments LP Series 1*, 4.50%, Perpetual | | | 11,832 | | | 213,094 |
Other Investment Pools and
Funds - 0.0%(b)
| | | | | | |
Partners Value Investments LP Series 1*, 0.16%, 11/27/2030 | | | 43,516 | | | 32,637 |
TOTAL PREFERRED STOCKS
(Cost $259,342) | | | | | | 245,731 |
| | | Par | | | |
CONVERTIBLE BONDS - 0.0%(b)
|
Department Stores - 0.0%(b)
| | | | | | |
Sears Holdings Corp., 8.00%, 12/15/2019(e)(h) | | | $5,720 | | | 0 |
TOTAL CONVERTIBLE BONDS
(Cost $5,720) | | | | | | 0 |
TOTAL INVESTMENTS - 94.5%
(Cost $38,678,695) | | | | | | $211,133,861 |
Money Market Deposit
Account - 5.8%(i)(j) | | | | | | 13,068,640 |
Liabilities in Excess of Other
Assets - (0.3)% | | | | | | (707,342) |
TOTAL NET ASSETS - 100.0% | | | | | | $223,495,159 |
| | | | | | | |
The accompanying notes are an integral part of these financial statements.
TABLE OF CONTENTS
KINETICS PORTFOLIO TRUST – MASTER INVESTMENTS PORTFOLIO
The Market Opportunities Portfolio
Consolidated Portfolio of Investments - December 31, 2024(Continued)
Percentages are stated as a percent of net assets.
AB - Aktiebolag
ADR - American Depositary Receipt
AG - Aktiengesellschaft
NV - Naamloze Vennootschap
PLC - Public Limited Company
SA - Sociedad Anónima
(a)
| Non-income producing security. |
(b)
| Represents less than 0.05% of net assets. |
(c)
| All or a portion of this security is on loan as of December 31, 2024. The total market value of these securities was $940,497 which represented 0.4% of net assets. |
(d)
| Security is exempt from registration pursuant to Rule 144A under the Securities Act of 1933, as amended. These securities may only be resold in transactions exempt from registration to qualified institutional investors. As of December 31, 2024, the value of these securities total $346,716 or 0.2% of the Fund’s net assets. |
(e)
| Fair value determined using significant unobservable inputs in accordance with procedures established by and under the supervision of the Adviser, acting as Valuation Designee. These securities represented $1,216,870 or 0.5% of net assets as of December 31, 2024. |
(f)
| To the extent that the Fund invests more heavily in a particular industry or sector of the economy, its performance will be especially sensitive to developments that significantly affect those industries or sectors. |
(g)
| Fair value of this security exceeds 25% of the Fund’s net assets. Additional information for this security, including the financial statements, is available from the SEC’s EDGAR database at www.sec.gov. |
(h)
| Issuer is currently in default. |
(i)
| The U.S. Bank Money Market Deposit Account (the “MMDA”) is a short-term vehicle in which the Fund holds cash balances. The MMDA will bear interest at a variable rate that is determined based on market conditions and is subject to change daily. The rate as of December 31, 2024 was 4.24%. |
(j)
| All or a portion of security has been pledged as collateral. The total value of assets committed as collateral as of December 31, 2024 is $966,221 which represented 0.4% of net assets. |
The accompanying notes are an integral part of these financial statements.
TABLE OF CONTENTS
KINETICS PORTFOLIO TRUST – MASTER INVESTMENTS PORTFOLIO
The Multi-Disciplinary Income Portfolio
Consolidated Portfolio of Investments - December 31, 2024
| | | | | | | |
COLLATERALIZED LOAN OBLIGATIONS - 91.0%
|
37 Capital CLO, Series 2023-1A, Class A1, 6.71% (3 mo. Term SOFR + 2.05%), 04/15/2036(a) | | | $500,000 | | | $502,956 |
Apidos CLO, Series 2023-43A, Class A2, 6.68% (3 mo. Term SOFR + 2.05%), 04/25/2035(a) | | | 500,000 | | | 501,587 |
Atlas Senior Loan Fund Ltd.
| | | | | | |
Series 2019-14A, Class BR, 6.83% (3 mo. Term SOFR + 2.21%), 07/20/2032(a) | | | 500,000 | | | 500,152 |
Series 2021-18A, Class B, 6.74% (3 mo. Term SOFR + 2.11%), 01/18/2035(a) | | | 500,000 | | | 500,481 |
Babson CLO Ltd./Cayman Islands, Series 2023-1A, Class A, 6.37% (3 mo. Term SOFR + 1.75%), 04/20/2036(a) | | | 550,000 | | | 551,413 |
Battery Park CLO, Series 2022-1A, Class AR, 6.12% (3 mo. Term SOFR + 1.50%), 10/20/2037(a) | | | 500,000 | | | 502,622 |
BlueMountain CLO Ltd., Series 2022-35A, Class BR, 6.48% (3 mo. Term SOFR + 1.85%), 10/22/2037(a) | | | 500,000 | | | 500,297 |
Bryant Park Funding Ltd., Series 2023-21A, Class B, 7.38% (3 mo. Term SOFR + 2.75%), 10/18/2036(a) | | | 250,000 | | | 252,196 |
Carlyle Global Market Strategies, Series 2023-3A, Class B, 7.26% (3 mo. Term SOFR + 2.60%), 10/15/2036(a) | | | 450,000 | | | 454,418 |
Fort Washington CLO, Series 2019-1A, Class BR2, 6.52% (3 mo. Term SOFR + 1.90%), 10/20/2037(a) | | | 500,000 | | | 504,367 |
Fortress Credit BSL Ltd., Series 2023-1A, Class AT, 6.88% (3 mo. Term SOFR + 2.25%), 04/23/2036(a) | | | 500,000 | | | 502,423 |
Golub Capital Partners CLO Ltd., Series 2023-70A, Class B, 7.13% (3 mo. Term SOFR + 2.50%), 10/25/2036(a) | | | 250,000 | | | 251,525 |
ICG US CLO Ltd., Series 2023-1A, Class B, 7.63% (3 mo. Term SOFR + 3.00%), 07/18/2036(a) | | | 500,000 | | | 503,300 |
Katayma CLO Ltd., Series 2023-1A, Class B, 7.27% (3 mo. Term SOFR + 2.65%), 10/20/2036(a) | | | 250,000 | | | 251,647 |
Magnetite CLO Ltd., Series 2023-37A, Class B, 6.92% (3 mo. Term SOFR + 2.30%), 10/20/2036(a) | | | 500,000 | | | 503,697 |
Man GLG US CLO, Series 2023-1A, Class A, 6.92% (3 mo. Term SOFR + 2.30%), 07/20/2035(a) | | | 500,000 | | | 501,342 |
Mountain View CLO Ltd., Series 2019-2A, Class B1R, 6.81% (3 mo. Term SOFR + 2.15%), 07/15/2037(a) | | | 450,000 | | | 453,632 |
| | | | | | | |
| | | | | | | |
Octagon 67 Ltd., Series 2023-1A, Class A1, 6.43% (3 mo. Term SOFR + 1.80%), 04/25/2036(a) | | | $500,000 | | | $501,420 |
Orion CLO Ltd., Series 2023-2A, Class B, 7.38% (3 mo. Term SOFR + 2.75%), 01/25/2037(a) | | | 250,000 | | | 252,838 |
Post CLO, Series 2023-1A, Class A, 6.57% (3 mo. Term SOFR + 1.95%), 04/20/2036(a) | | | 500,000 | | | 501,446 |
Rad CLO, Series 2023-20A, Class B, 7.27% (3 mo. Term SOFR + 2.65%), 07/20/2036(a) | | | 500,000 | | | 502,786 |
Sculptor CLO Ltd., Series 27A, Class B1, 6.63% (3 mo. Term SOFR + 2.01%), 07/20/2034(a) | | | 250,000 | | | 250,223 |
Sound Point CLO Ltd.
| | | | | | |
Series 2017-3A, Class A2, 6.48% (3 mo. Term SOFR + 1.86%), 10/20/2030(a) | | | 520,000 | | | 520,484 |
Series 2024-39A, Class B, 7.26% (3 mo. Term SOFR + 1.95%), 07/20/2037(a) | | | 1,000,000 | | | 1,002,000 |
Venture CDO Ltd.
| | | | | | |
Series 2013-15A, Class BR3, 6.79% (3 mo. Term SOFR + 2.13%), 07/15/2032(a) | | | 250,000 | | | 250,658 |
Series 2023-48A, Class B1, 7.37% (3 mo. Term SOFR + 2.75%), 10/20/2036(a) | | | 500,000 | | | 505,614 |
Wind River CLO Ltd., Series 2021-2A, Class B, 6.53% (3 mo. Term SOFR + 1.91%), 07/20/2034(a) | | | 375,000 | | | 376,007 |
TOTAL COLLATERALIZED LOAN OBLIGATIONS
(Cost $12,330,174) | | | | | | 12,401,531 |
TOTAL INVESTMENTS - 91.0%
(Cost $12,330,174) | | | | | | $12,401,531 |
Money Market Deposit
Account - 2.5%(b) | | | | | | 334,495 |
Other Assets in Excess of
Liabilities - 6.5% | | | | | | 892,212 |
TOTAL NET ASSETS - 100.0% | | | | | | $13,628,238 |
| | | | | | | |
Percentages are stated as a percent of net assets.
SOFR - Secured Overnight Financing Rate
(a)
| Security is exempt from registration pursuant to Rule 144A under the Securities Act of 1933, as amended. These securities may only be resold in transactions exempt from registration to qualified institutional investors. As of December 31, 2024, the value of these securities total $12,401,531 or 91.0% of the Fund’s net assets. |
(b)
| The U.S. Bank Money Market Deposit Account (the “MMDA”) is a short-term vehicle in which the Fund holds cash balances. The MMDA will bear interest at a variable rate that is determined based on market conditions and is subject to change daily. The rate as of December 31, 2024 was 4.24%. |
The accompanying notes are an integral part of these financial statements.
TABLE OF CONTENTS
KINETICS PORTFOLIO TRUST – MASTER INVESTMENTS PORTFOLIO
Statements of Assets & Liabilities
December 31, 2024
| | | | | | | |
ASSETS:
| | | | | | |
Investments, at value(1)(2) | | | $288,995,572 | | | $35,931,518 |
Cash | | | 42,367,194 | | | 14,054,749 |
Cash proceeds from securities lending | | | 3,252,116 | | | 149,222 |
Receivable for contributed capital | | | 559,386 | | | 200,093 |
Dividends and interest receivable | | | 191,534 | | | 56,675 |
Securities lending receivable | | | 48,962 | | | 4,206 |
Prepaid expenses and other assets | | | 3,526 | | | 3,657 |
Total Assets | | | 335,418,290 | | | 50,400,120 |
LIABILITIES:
| | | | | | |
Payable to Adviser | | | 372,923 | | | 54,563 |
Payable to Trustees | | | 4,886 | | | 744 |
Payable to Chief Compliance Officer | | | 373 | | | 35 |
Payable for securities purchased | | | — | | | 15,481 |
Payable for collateral received for securities loaned | | | 3,252,116 | | | 149,222 |
Payable for withdrawn capital | | | 189,366 | | | 519,049 |
Accrued expenses and other liabilities | | | 41,492 | | | 20,071 |
Total Liabilities | | | 3,861,156 | | | 759,165 |
Net Assets | | | $331,557,134 | | | $49,640,955 |
(1) Cost of investments | | | $55,882,180 | | | $12,552,358 |
(2) Includes loaned securities with a market value of | | | $3,102,245 | | | $139,480 |
| | | | | | | |
The accompanying notes are an integral part of these financial statements.
TABLE OF CONTENTS
KINETICS PORTFOLIO TRUST – MASTER INVESTMENTS PORTFOLIO
Statements of Assets & Liabilities
December 31, 2024(Continued)
| | | | | | | |
ASSETS:
| | | | | | |
Investments, at value(1)(2) | | | $1,313,406,440 | | | $397,304,575 |
Foreign currencies, at value(3) | | | 9,520 | | | 409,214 |
Cash | | | 19,162,109 | | | 68,103,324 |
Cash proceeds from securities lending | | | 18,686,717 | | | 567,525 |
Receivable for contributed capital | | | 6,587,509 | | | 770,364 |
Receivable for investments sold | | | 4,527 | | | — |
Dividends and interest receivable | | | 97,275 | | | 341,367 |
Securities lending receivable | | | 97,904 | | | 304 |
Prepaid expenses and other assets | | | 7,551 | | | 3,327 |
Total Assets | | | 1,358,059,552 | | | 467,500,000 |
LIABILITIES:
| | | | | | |
Payable to Adviser | | | 1,569,127 | | | 531,946 |
Payable to Trustees | | | 24,316 | | | 8,009 |
Payable to Chief Compliance Officer | | | 1,156 | | | 389 |
Payable for securities purchased | | | 3,964 | | | 116,655 |
Payable for collateral received for securities loaned | | | 18,686,717 | | | 567,525 |
Payable for withdrawn capital | | | 5,814,577 | | | 429,479 |
Accrued expenses and other liabilities | | | 122,737 | | | 50,271 |
Total Liabilities | | | 26,222,594 | | | 1,704,274 |
Net Assets | | | $1,331,836,958 | | | $465,795,726 |
(1) Cost of investments | | | $153,907,339 | | | $95,574,445 |
(2) Includes loaned securities with a market value of | | | $18,089,439 | | | $554,891 |
(3) Cost of foreign currencies | | | $9,535 | | | $409,841 |
| | | | | | | |
The accompanying notes are an integral part of these financial statements.
TABLE OF CONTENTS
KINETICS PORTFOLIO TRUST – MASTER INVESTMENTS PORTFOLIO
Statements of Assets & Liabilities
December 31, 2024(Continued)
| | | | | | | |
ASSETS:
| | | | | | |
Investments, at value(1)(2) | | | $211,133,861 | | | $12,401,531 |
Cash | | | 12,102,419 | | | 334,495 |
Cash proceeds from securities lending | | | 966,221 | | | — |
Receivable for contributed capital | | | 499,690 | | | — |
Receivable for investments sold | | | — | | | 709,132 |
Dividends and interest receivable | | | 96,051 | | | 197,716 |
Securities lending receivable | | | 18,448 | | | — |
Prepaid expenses and other assets | | | 6,646 | | | 583 |
Total Assets | | | 224,823,336 | | | 13,643,457 |
LIABILITIES:
| | | | | | |
Payable to Adviser | | | 258,421 | | | 3,069 |
Payable to Trustees | | | 3,784 | | | 222 |
Payable to Chief Compliance Officer | | | 194 | | | 20 |
Payable for securities purchased | | | 9,810 | | | — |
Payable for collateral received for securities loaned | | | 966,221 | | | — |
Payable for withdrawn capital | | | 56,928 | | | — |
Accrued expenses and other liabilities | | | 32,819 | | | 11,908 |
Total Liabilities | | | 1,328,177 | | | 15,219 |
Net Assets | | | $223,495,159 | | | $13,628,238 |
(1) Cost of investments | | | $38,678,695 | | | $12,330,174 |
(2) Includes loaned securities with a market value of | | | $940,497 | | | $— |
| | | | | | | |
The accompanying notes are an integral part of these financial statements.
TABLE OF CONTENTS
KINETICS PORTFOLIO TRUST – MASTER INVESTMENTS PORTFOLIO
Statements of Operations
For the Year Ended December 31, 2024
| | | | | | | |
INVESTMENT INCOME:
| | | | | | |
Dividends† | | | $1,486,216 | | | $348,216 |
Interest | | | 2,411,124 | | | 288,771 |
Income from securities lending | | | 237,540 | | | 18,060 |
Total investment income | | | 4,134,880 | | | 655,047 |
EXPENSES:
| | | | | | |
Investment advisory fees | | | 3,259,047 | | | 379,531 |
Administration fees | | | 93,943 | | | 22,121 |
Professional fees | | | 38,950 | | | 12,543 |
Fund accounting fees | | | 35,333 | | | 5,743 |
Trustees’ fees | | | 25,444 | | | 2,799 |
Chief Compliance Officer fees | | | 3,894 | | | 388 |
Custodian fees and expenses | | | 23,406 | | | 14,734 |
Registration fees | | | 913 | | | 873 |
Other expenses | | | 7,593 | | | 790 |
Total expenses | | | 3,488,523 | | | 439,522 |
Net investment income | | | 646,357 | | | 215,525 |
REALIZED AND UNREALIZED GAIN ON INVESTMENTS:
| | | | | | |
Net realized gain on:
| | | | | | |
Investments and foreign currency | | | 2,223,955 | | | 408,403 |
Net change in unrealized appreciation (depreciation) of:
| | | | | | |
Investments and foreign currency | | | 141,553,335 | | | 14,622,178 |
Net realized and unrealized gain on investments | | | 143,777,290 | | | 15,030,581 |
Net increase in net assets resulting from operations | | | $ 144,423,647 | | | $15,246,106 |
† Net of foreign taxes withheld of: | | | $16,450 | | | $16,917 |
| | | | | | | |
The accompanying notes are an integral part of these financial statements.
TABLE OF CONTENTS
KINETICS PORTFOLIO TRUST – MASTER INVESTMENTS PORTFOLIO
Statements of Operations
For the Year Ended December 31, 2024(Continued)
| | | | | | | |
INVESTMENT INCOME:
| | | | | | |
Dividends† | | | $15,128,825 | | | $5,751,901 |
Interest | | | 1,646,316 | | | 2,159,309 |
Income from securities lending | | | 389,553 | | | 38,959 |
Total investment income | | | 17,164,694 | | | 7,950,169 |
EXPENSES:
| | | | | | |
Investment advisory fees | | | 13,022,350 | | | 4,337,380 |
Administration fees | | | 320,288 | | | 115,656 |
Professional fees | | | 116,825 | | | 45,331 |
Fund accounting fees | | | 132,596 | | | 45,227 |
Trustees’ fees | | | 100,191 | | | 33,285 |
Chief Compliance Officer fees | | | 14,426 | | | 4,715 |
Custodian fees and expenses | | | 61,676 | | | 32,191 |
Registration fees | | | 1,109 | | | 341 |
Other expenses | | | 30,630 | | | 11,332 |
Total expenses | | | 13,800,091 | | | 4,625,458 |
Net investment income | | | 3,364,603 | | | 3,324,711 |
REALIZED AND UNREALIZED GAIN ON INVESTMENTS:
| | | | | | |
Net realized gain on:
| | | | | | |
Investments and foreign currency | | | 65,584,015 | | | 12,288,989 |
Net change in unrealized appreciation (depreciation) of:
| | | | | | |
Investments and foreign currency | | | 589,073,494 | | | 157,317,304 |
Net realized and unrealized gain on investments | | | 654,657,509 | | | 169,606,293 |
Net increase in net assets resulting from operations | | | $658,022,112 | | | $172,931,004 |
† Net of foreign taxes withheld of: | | | $180,729 | | | $241,245 |
| | | | | | | |
The accompanying notes are an integral part of these financial statements.
TABLE OF CONTENTS
KINETICS PORTFOLIO TRUST – MASTER INVESTMENTS PORTFOLIO
Statements of Operations
For the Year Ended December 31, 2024(Continued)
| | | | | | | |
INVESTMENT INCOME:
| | | | | | |
Dividends† | | | $2,364,095 | | | $— |
Interest | | | 814,089 | | | 956,732 |
Income from securities lending | | | 97,695 | | | — |
Realized gain on paydown | | | — | | | 6,397 |
Total investment income | | | 3,275,879 | | | 963,129 |
EXPENSES:
| | | | | | |
Investment advisory fees | | | 2,121,973 | | | 33,081 |
Administration fees | | | 63,974 | | | 17,096 |
Professional fees | | | 27,325 | | | 10,530 |
Fund accounting fees | | | 23,640 | | | 2,492 |
Trustees’ fees | | | 16,391 | | | 1,316 |
Chief Compliance Officer fees | | | 2,390 | | | 196 |
Custodian fees and expenses | | | 18,611 | | | 1,839 |
Registration fees | | | 1,058 | | | 250 |
Other expenses | | | 4,852 | | | 509 |
Total expenses | | | 2,280,214 | | | 67,309 |
Net investment income | | | 995,665 | | | 895,820 |
REALIZED AND UNREALIZED GAIN ON INVESTMENTS:
| | | | | | |
Net realized gain on:
| | | | | | |
Investments and foreign currency | | | 1,152,608 | | | 212 |
Net change in unrealized appreciation (depreciation) of:
| | | | | | |
Investments and foreign currency | | | 99,593,891 | | | 33,694 |
Net realized and unrealized gain on investments | | | 100,746,499 | | | 33,906 |
Net increase in net assets resulting from operations | | | $ 101,742,164 | | | $929,726 |
† Net of foreign taxes withheld of: | | | $42,086 | | | $— |
| | | | | | | |
The accompanying notes are an integral part of these financial statements.
TABLE OF CONTENTS
KINETICS PORTFOLIO TRUST – MASTER INVESTMENTS PORTFOLIO
Statements of Changes in Net Assets
December 31, 2024
| | | | | | | |
OPERATIONS:
| | | | | | | | | | | | |
Net investment income | | | $646,357 | | | $1,991,233 | | | $215,525 | | | $419,909 |
Net realized gain (loss) on sale of investments and foreign currency | | | 2,223,955 | | | 2,271,422 | | | 408,403 | | | (222,953) |
Net change in unrealized appreciation (depreciation) of investments and foreign currency | | | 141,553,335 | | | 40,804,932 | | | 14,622,178 | | | 1,877,441 |
Net increase in net assets resulting from operations | | | 144,423,647 | | | 45,067,587 | | | 15,246,106 | | | 2,074,397 |
NET INCREASE (DECREASE) IN NET ASSETS RESULTING FROM BENEFICIAL INTEREST TRANSACTIONS:
| | | | | | | | | | | | |
Contributions | | | 24,430,090 | | | 17,091,150 | | | 21,279,236 | | | 3,644,721 |
Withdrawals | | | (27,437,765) | | | (20,061,591) | | | (4,821,431) | | | (16,259,972) |
Net increase (decrease) in net assets resulting from capital share transactions | | | (3,007,675) | | | (2,970,441) | | | 16,457,805 | | | (12,615,251) |
Total increase (decrease) in net assets | | | 141,415,972 | | | 42,097,146 | | | 31,703,911 | | | (10,540,854) |
NET ASSETS:
| | | | | | | | | | | | |
Beginning of period | | | 190,141,162 | | | 148,044,016 | | | 17,937,044 | | | 28,477,898 |
End of period | | | $ 331,557,134 | | | $190,141,162 | | | $49,640,955 | | | $17,937,044 |
| | | | | | | | | | | | | |
The accompanying notes are an integral part of these financial statements.
TABLE OF CONTENTS
KINETICS PORTFOLIO TRUST – MASTER INVESTMENTS PORTFOLIO
Statements of Changes in Net Assets
December 31, 2024(Continued)
| | | | | | | |
OPERATIONS:
| | | | | | | | | | | | |
Net investment income (loss) | | | $3,364,603 | | | $(1,747,915) | | | $3,324,711 | | | $1,793,096 |
Net realized gain on sale of investments and foreign currency | | | 65,584,015 | | | 45,826,388 | | | 12,288,989 | | | 25,865,311 |
Net change in unrealized appreciation (depreciation) of investments and foreign currency | | | 589,073,494 | | | (230,225,379) | | | 157,317,304 | | | (96,823,072) |
Net increase (decrease) in net assets resulting from operations | | | 658,022,112 | | | (186,146,906) | | | 172,931,004 | | | (69,164,665) |
NET INCREASE (DECREASE) IN NET ASSETS RESULTING FROM BENEFICIAL INTEREST TRANSACTIONS:
| | | | | | | | | | | | |
Contributions | | | 63,780,544 | | | 11,582,819 | | | 58,007,184 | | | 21,051,746 |
Withdrawals | | | (182,039,049) | | | (147,816,245) | | | (49,824,266) | | | (126,689,296) |
Net increase (decrease) in net assets resulting from capital share transactions | | | (118,258,505) | | | (136,233,426) | | | 8,182,918 | | | (105,637,550) |
Total increase (decrease) in net assets | | | 539,763,607 | | | (322,380,332) | | | 181,113,922 | | | (174,802,215) |
NET ASSETS:
| | | | | | | | | | | | |
Beginning of period | | | 792,073,351 | | | 1,114,453,683 | | | 284,681,804 | | | 459,484,019 |
End of period | | | $ 1,331,836,958 | | | $792,073,351 | | | $465,795,726 | | | $284,681,804 |
| | | | | | | | | | | | | |
The accompanying notes are an integral part of these financial statements.
TABLE OF CONTENTS
KINETICS PORTFOLIO TRUST – MASTER INVESTMENTS PORTFOLIO
Statements of Changes in Net Assets
December 31, 2024(Continued)
| | | | | | | |
OPERATIONS:
| | | | | | | | | | | | |
Net investment income | | | $995,665 | | | $1,195,140 | | | $895,820 | | | $686,502 |
Net realized gain (loss) on sale of investments and foreign currency | | | 1,152,608 | | | (726,565) | | | 212 | | | (1,808,280) |
Net change in unrealized appreciation (depreciation) of investments and foreign currency | | | 99,593,891 | | | (10,475,455) | | | 33,694 | | | 1,791,042 |
Net increase (decrease) in net assets resulting from operations | | | 101,742,164 | | | (10,006,880) | | | 929,726 | | | 669,264 |
NET INCREASE (DECREASE) IN NET ASSETS RESULTING FROM BENEFICIAL INTEREST TRANSACTIONS:
| | | | | | | | | | | | |
Contributions | | | 33,719,079 | | | 12,998,060 | | | 3,448,353 | | | 669,442 |
Withdrawals | | | (43,200,796) | | | (11,988,686) | | | (3,075,477) | | | (5,520,347) |
Net increase (decrease) in net assets resulting from capital share transactions | | | (9,481,717) | | | 1,009,374 | | | 372,876 | | | (4,850,905) |
Total increase (decrease) in net assets | | | 92,260,447 | | | (8,997,506) | | | 1,302,602 | | | (4,181,641) |
NET ASSETS:
| | | | | | | | | | | | |
Beginning of period | | | 131,234,712 | | | 140,232,218 | | | 12,325,636 | | | 16,507,277 |
End of period | | | $ 223,495,159 | | | $131,234,712 | | | $13,628,238 | | | $12,325,636 |
| | | | | | | | | | | | | |
The accompanying notes are an integral part of these financial statements.
TABLE OF CONTENTS
KINETICS PORTFOLIO TRUST – MASTER INVESTMENTS PORTFOLIO
Notes to Consolidated Financial Statements
December 31, 2024
1. Organization
The Kinetics Portfolios Trust (the “Trust”) was organized as a Delaware Statutory Trust on March 14, 2000 and is registered under the Investment Company Act of 1940, as amended (the “1940 Act”), as an open-end management investment company issuing its beneficial interests in series, each series representing a distinct portfolio with its own investment objective and policies. The series currently authorized are: The Internet Portfolio, The Global Portfolio, The Paradigm Portfolio, The Small Cap Opportunities Portfolio, The Market Opportunities Portfolio and The Multi-Disciplinary Income Portfolio (collectively, the “Master Portfolios”). Pursuant to the 1940 Act, the Master Portfolios, are “non- diversified” series of the Trust, except The Global Portfolio and The Multi-Disciplinary Income Portfolio. The Market Opportunities Portfolio commenced operations on January 31, 2006 and The Multi-Disciplinary Income Portfolio commenced operations on February 11, 2008. Each of the remaining Master Portfolios commenced operations on April 28, 2000.
Each Master Portfolio is a Master Investment Portfolio in a master-feeder fund structure. Each Master Portfolio may have multiple feeder funds invested in the Master Portfolio. By contributing assets to the Master Portfolio, the feeder funds receive a beneficial interest in the Master Portfolio. The Master Portfolio then invests the contributed assets in portfolio securities and allocates income, gains (losses) and expenses to the feeder funds based on the feeder funds’ proportionate interests in the Master Portfolio.
Each of the Master Portfolios, except for The Multi-Disciplinary Income Portfolio, seeks to provide investors with long- term capital growth. The Multi-Disciplinary Income Portfolio seeks to provide investors with total return. The Internet Portfolio invests primarily in the equity securities of U.S. and foreign companies engaged in the Internet and Internet- related activities. The Global Portfolio generally invests in the equity securities of foreign companies that have the ability to facilitate an increase in the growth of their traditional business lines and in U.S. companies benefiting from international economic growth. The Paradigm Portfolio invests primarily in the equity securities of U.S. and foreign companies that the investment adviser believes are undervalued and that have high returns on equity and are well positioned to reduce their costs, extend the reach of their distribution channels and experience significant growth in their assets or revenues. The Small Cap Opportunities Portfolio invests primarily in the equity securities of U.S. and foreign small capitalized companies that provide attractive valuation opportunities due to special situations such as lack of institutional ownership, lack of significant analyst coverage or companies with sound fundamentals that have experienced a short-term earnings shortfall. The Market Opportunities Portfolio invests primarily in the equity securities of U.S. and foreign companies engaged in capital markets or related to capital markets, as well as companies involved in the gaming industry. The Multi-Disciplinary Income Portfolios utilize a two-part investment strategy, which includes fixed income and derivatives components. The Internet Portfolio, Global Portfolio, Paradigm Portfolio, Small Cap Opportunities Portfolio and Market Opportunities Portfolio utilize wholly-owned subsidiaries to achieve their investment objectives. Please see Note 2 for further details.
2. Significant Accounting Policies
Security Valuation – Master Portfolios equity securities that are listed on a securities exchange for which market quotations are readily available are valued at the last quoted sale price on the day the valuation is made. Price information on listed securities is taken from the exchange where the security is primarily traded. All equity securities, including exchange-traded funds, that are traded using the National Association of Securities Dealers’ Automated Quotation System (“NASDAQ”) are valued using the NASDAQ Official Closing Price (“NOCP”). In the event market quotations are not readily available or if events occur that may materially affect the value of a particular security between the time trading ends on a particular security and the close of regular trading on the New York Stock Exchange (“NYSE”), “fair value” will be determined. Unlisted equity securities and listed equity securities not traded on the valuation date for which market quotations are readily available are valued at the last bid price. Futures, options on futures and swap contracts that are listed or traded on a national securities exchange, commodities exchange, contract market or over-the-counter markets and are freely transferable will be valued at the composite price, using the National Best Bid and Offer quotes (“NBBO”). NBBO consists of the highest bid price and lowest ask price across any of the exchanges on which an option is quoted, thus providing a view across the entire U.S. options marketplace.
Composite option pricing calculates the mean of the highest bid price and lowest asked price across the exchanges where the option is traded. If a composite option price is not available, then a quote provided by one of the authorized
TABLE OF CONTENTS
KINETICS PORTFOLIO TRUST – MASTER INVESTMENTS PORTFOLIO
Notes to Consolidated Financial Statements
December 31, 2024(Continued)
pricing vendors will be used. If neither a composite price nor a quote from an authorized pricing provider is available, and it is the day of expiration or post-expiration, expiring options will be priced at intrinsic value. Non-exchange-traded options for which over-the-counter quotations are not readily available are valued at the mean between the last bid and asked quotations. Debt obligations (including convertible securities) that are either investment grade or below investment grade and irrespective of days to maturity are valued at evaluated mean by one of the authorized third party pricing agents which rely on various valuation methodologies such as matrix pricing and other analytical pricing models as well as market transactions and dealer quotations. Certain instruments, such as repurchase agreements and demand notes, do not have values from third parties and are valued at amortized cost. Investments in registered open-end investment companies (including money market funds), other than exchange-traded funds, are valued at their reported net asset value (“NAV”).
Other assets and securities for which no quotations are readily available (including restricted securities) will be valued in good faith at fair value by the Adviser, as the Portfolios’ Valuation Designee. In determining the fair value of a security, the Adviser, as Valuation Designee, shall take into account the relevant factors and surrounding circumstances, which may include: (i) the nature and pricing history (if any) of the security; (ii) whether any dealer quotations for the security are available; (iii) possible valuation methodologies that could be used to determine the fair value of the security; (iv) the recommendation of the portfolio manager of the Portfolios with respect to the valuation of the security; (v) whether the same or similar securities are held by other funds managed by the Adviser or other funds and the method used to price the security in those funds; (vi) the extent to which the fair value to be determined for the security will result from the use of data or formula produced by third parties independent of the Adviser; (vii) the liquidity or illiquidity of the market for the security; and (viii) the value of a foreign security traded on other foreign markets. At December 31, 2024, 0.92%, 0.20%, 0.02% and 0.54% of the net assets of The Internet Portfolio, The Global Portfolio, The Paradigm Portfolio and The Market Opportunities Portfolio, respectively, were fair valued securities. The Small Cap Opportunities Portfolio and The Multi-Disciplinary Income Portfolio did not hold any fair valued securities at December 31, 2024.
Bitcoin – The Master Portfolios may invest in Grayscale Bitcoin Trust, a Delaware statutory trust (“Bitcoin Trust”) that invests in bitcoins. From time to time, the Bitcoin Trust issues creation units in exchange for bitcoins and distributes bitcoins in exchange for redemption units. The performance of the Bitcoin Trust is intended to reflect changes in the value of the Bitcoin Trust’s bitcoin investments. At December 31, 2024, 53.23%, 25.48%, 12.04%, 5.31% and 22.08% of the net assets of The Internet Portfolio, The Global Portfolio, The Paradigm Portfolio, The Small Cap Opportunities Portfolio and The Market Opportunities Portfolio, respectively, were invested in the Bitcoin Trust. Investments in bitcoins produce non-qualifying income under Subchapter M of the Internal Revenue Code.
Bitcoin is a decentralized digital currency that enables instant transfers to anyone, anywhere in the world. Managing transactions in bitcoins occurs via an open source, cryptographic protocol central authority. The Bitcoin Network is an online, end-user-to-end-user network that hosts the public transaction ledger, known as the Blockchain, and the source code that comprises the basis for the cryptographic and algorithmic protocols governing the Bitcoin Network. No single entity owns or operates the Bitcoin Network, the infrastructure of which is collectively maintained by a decentralized user base. Since the Bitcoin Network is decentralized, it does not rely on either governmental authorities or financial institutions to create, transmit or determine the value of bitcoins. Rather, the value of bitcoins is determined by the supply of and demand for bitcoins in the global bitcoin exchange market for the trading of bitcoins, which consists of transactions on electronic bitcoin exchanges (“Bitcoin Exchanges”). Pricing on Bitcoin Exchanges and other venues can be volatile and can adversely affect the value of the Bitcoin Trust. Currently, there is relatively small use of bitcoins in the retail and commercial marketplace in comparison to the relatively large use of bitcoins by speculators, thus contributing to price volatility that could adversely affect a Master Portfolio’s direct or indirect investment in the Bitcoin Trust. Bitcoin transactions are irrevocable and stolen or incorrectly transferred bitcoins may be irretrievable. As a result, any incorrectly executed bitcoin transactions could adversely affect the value of a Master Portfolio’s direct or indirect investment in the Bitcoin Trust. Shares of the Bitcoin Trust may trade at a premium or discount to the net asset value of the Bitcoin Trust. The price of bitcoins is set in transfers by mutual agreement or barter as well as the number of merchants that accept bitcoins. Because bitcoins are digital files that can be transferred without the involvement of intermediaries or third parties, there are little or no transaction costs in direct end-user-to-end-user transactions. Bitcoins can be used to pay for goods and services or can be converted to fiat currencies, such as the U.S.
TABLE OF CONTENTS
KINETICS PORTFOLIO TRUST – MASTER INVESTMENTS PORTFOLIO
Notes to Consolidated Financial Statements
December 31, 2024(Continued)
dollar, at rates determined by the Bitcoin Exchanges. Additionally, third party service providers such as Bitcoin Exchanges are also used for transfers, but they may charge significant fees for processing transactions.
As bitcoins have grown in popularity, the U.S. Congress and a number of federal and state agencies (including the Financial Crimes Enforcement Network (FinCEN), the U.S. Securities and Exchange Commission, the Commodity Futures Trading Commission, the Financial Industry Regulatory Authority, the Consumer Financial Protection Bureau, the Department of Justice, the Department of Homeland Security, the Federal Bureau of Investigation, the IRS, and state financial institution regulators) have begun to examine the operations of the network that facilitates bitcoins, bitcoin users and the Bitcoin Exchanges, with particular focus on (1) the extent to which bitcoins can be used to launder the proceeds of illegal activities or fund criminal or terrorist enterprises, (2) the safety and soundness of the Bitcoin Exchange or other service-providers that hold bitcoins for users and (3) other risks to investors and consumers who hold and use bitcoins. Ongoing and future regulatory actions may alter, perhaps to a materially adverse extent, the value of a Master Portfolio’s and its Subsidiary’s investment in the Bitcoin Trust or the ability of the Bitcoin Trust to continue to operate.
Consolidation of Subsidiaries – The consolidated financial statements include the accounts of Cayman wholly-owned Controlled Foreign Corporations (“CFCs”) and the accounts of Delaware Corporations (the “Cayman” or “Delaware,” respectively, or “Subsidiaries” for both). The respective Master Portfolios hold a CFC: Internet Portfolio, Global Portfolio, Paradigm Portfolio, Small Cap Opportunities Portfolio and Market Opportunities Portfolio. The respective Master Portfolios hold a Delaware subsidiary: Internet Portfolio, Global Portfolio and Market Opportunities Portfolio. Each Master Portfolio can invest up to 25% of its total assets in the Subsidiaries. The Subsidiaries act as an investment vehicle in order to invest in commodity-linked and bitcoin-linked instruments consistent with the Portfolio’s investment objectives and policies. By investing in its Subsidiaries, a Master Portfolio is indirectly exposed to the risks associated with the Subsidiary’s investments. The investments held by a Subsidiary are generally similar to those that are permitted to be held by the Master Portfolio and are subject to the same risks that apply to similar investments if held directly by the Master Portfolio. Each Subsidiary is not registered under the 1940 Act and is not subject to all the investor protections of the 1940 Act. However, each Master Portfolio wholly-owns and controls its Subsidiaries, making it unlikely that the Subsidiaries will take action contrary to the interests of the Master Portfolio. Each Subsidiary will be subject to the same investment restrictions and limitations and follow the same compliance policies and procedures as its Master Portfolio.
The Cayman Subsidiary is an exempted Cayman investment company and is not subject to Cayman Islands taxes at the present time. For U.S. income tax purposes, each Cayman Subsidiary is a CFC not subject to U.S. income taxes. As a wholly-owned CFC, however, each Cayman Subsidiary’s net income and capital gain will be included each year in the respective Portfolio’s investment company taxable income.
As of December 31, 2024, the respective Cayman Subsidiary’s net assets and percent of the respective Portfolio’s net assets were:
| | | | | | | | |
Internet Portfolio | | | $45,213,972 | | | 13.64% | |
Global Portfolio | | | 2,344,742 | | | 4.72% | |
Paradigm Portfolio | | | 162,866,529 | | | 12.23% | |
Small Cap Opportunities Portfolio | | | 27,252,250 | | | 5.85% | |
Market Opportunities Portfolio | | | 13,416,759 | | | 6.00% | |
The Spin-off Fund | | | 536,433 | | | 1.46% | |
| | | | | | | | |
The Delaware Subsidiary is organized under Delaware law. Any net gains that the Delaware Subsidiary recognizes on future sales of the contributed Bitcoin Trust shares will be subject to federal and state corporate income tax, but the dividends that the Delaware Subsidiary pays to its respective Master Portfolio (i.e., those gains, net of the tax paid and any other expenses of the Delaware Subsidiary) will be eligible to be treated as “qualified dividend income” under the Internal Revenue Code.
TABLE OF CONTENTS
KINETICS PORTFOLIO TRUST – MASTER INVESTMENTS PORTFOLIO
Notes to Consolidated Financial Statements
December 31, 2024(Continued)
As of December 31, 2024, the respective Delaware Subsidiary’s net assets and percent of the respective Portfolio’s net assets were:
| | | | | | | | |
Internet Portfolio | | | $1,419 | | | 0.00% | |
Global Portfolio | | | 1,405 | | | 0.00% | |
Market Opportunities Portfolio | | | 1,461 | | | 0.00% | |
| | | | | | | | |
Repurchase Agreements – Each Master Portfolio may enter into repurchase agreements with banks that are members of the Federal Reserve System or securities dealers who are members of a national securities exchange or are primary dealers in U.S. Government Securities. In connection with transactions in repurchase agreements, it is the Trust’s policy that the Master Portfolio receive, as collateral, securities whose market value, including accrued interest, at all times will be at least equal to 102% of the amount invested by the Master Portfolio in each repurchase agreement. If the seller defaults, and the value of the collateral declines, realization of the collateral by the Master Portfolio may be delayed or limited.
Foreign Currency Translations – The books and records of the Master Portfolios are maintained in U.S. dollars. For the Master Portfolios, foreign currency transactions are translated into U.S. dollars on the following basis: (i) market values of investment securities and other assets and liabilities are translated at the exchange rate of such currencies against the U.S. dollar, as provided by an approved pricing service, and (ii) purchases and sales of investment securities, dividend and interest income and certain expenses at the rates of exchange prevailing on the respective dates of such transactions. The Master Portfolios do not isolate and treat as ordinary income that portion of the results of operations arising as a result of changes in the exchange rate from the fluctuations arising from changes in the market prices of securities held during the period. Such fluctuations are included with the net realized and unrealized gain or loss from investments. However, for federal income tax purposes, the Master Portfolios do isolate and treat as ordinary income the effect of changes in foreign exchange rates arising from actual foreign currency transactions and the effect of changes in foreign exchange rates arising between trade date and settlement date.
Restricted and Illiquid Securities – The Master Portfolios may invest in restricted securities. These securities are valued by the Master Portfolios after giving due consideration to pertinent factors including recent private sales, market conditions and the issuer’s financial performance. The Master Portfolios have no right to require registration of unregistered securities. The 144A securities have been deemed to be liquid by the Master Portfolios’ Adviser under the oversight of the Board of Trustees. At December 31, 2024, market value and percentage of 144A securities held by the Master Portfolios are disclosed under the respective schedule of investments.
An illiquid asset is any asset which may not be sold or disposed of in current market conditions within seven days without the sale or disposition significantly changing the market value of the investment. At December 31, 2024, market value and percentage of illiquid securities held by the Master Portfolios are disclosed under the respective schedule of investments.
When-Issued Securities – The Master Portfolios may purchase securities on a when-issued or delayed delivery basis. Although the purchase amounts of these securities are established at the time the purchaser enters into the agreement, these securities may be delivered and paid for at a future date. The Master Portfolios record purchases of when-issued securities and reflect the values of such securities in determining net asset value in the same manner as other portfolio securities.
Securities Lending – Each Master Portfolio may lend its portfolio securities to broker-dealers by entering directly into lending arrangements with such broker dealers or indirectly through repurchase agreements with respect to no more than 331⁄3% of the total assets of each Master Portfolio (including any collateral posted) or 50% of the total assets of each Master Portfolio (excluding any collateral posted). Securities lending and repurchase transactions will be fully collateralized at all times with cash and/or short-term debt obligations. The Master Portfolios receive interest on the collateral received as well as a fee for the securities loaned.
Significant Investments – The Portfolios may invest a greater percentage of their assets in one or more individual securities at any time. The greater percentage of assets in individual securities (not including short-term investments or other funds) expose the portfolios to the risk of unanticipated industry conditions, the risks particular to a single company or security, and the risk of potentially lower liquidity. At December 31, 2024, The Internet Portfolio, The
TABLE OF CONTENTS
KINETICS PORTFOLIO TRUST – MASTER INVESTMENTS PORTFOLIO
Notes to Consolidated Financial Statements
December 31, 2024(Continued)
Global Portfolio, The Paradigm Portfolio, The Small Cap Opportunities Portfolio, The Market Opportunities Portfolio and The Multi-Disciplinary Income Portfolio invested approximately 79%, 40%, 79%, 59%, 74% and 7% of their respective net assets in individual securities greater than 5% of net assets. See the respective Schedule of Investments for further details.
Holding a large concentration in a single security or issuer may expose the portfolios to the market volatility of that specific security or issuer if the security or issuer performs worse than the market as a whole, which could adversely affect the portfolios’ performance. At December 31, 2024, The Internet Portfolio, The Global Portfolio, The Paradigm Portfolio, The Small Cap Opportunities Portfolio and The Market Opportunities Portfolio held 21.0%, 19.2%, 67.7%, 53.2% and 53.9% of their respective net assets in Texas Pacific Land Corp. Because a large portion of its revenue is derived from oil and gas royalties, the performance of the portfolios could be adversely affected if the underlying markets for oil and gas were to decline, thereby having a more significant impact on the portfolios given the concentration in this holding.
Short-Term Investments – The Portfolios may invest in money market funds and short-term high quality debt securities such as commercial paper, repurchase agreements and certificates of deposit. Money market funds typically invest in short-term instruments and attempt to maintain a stable net asset value. While the risk is low, these funds may lose value.
Expense Allocation – Common expenses incurred by the Master Portfolios are allocated among the Master Portfolios (i) based upon relative average net assets, (ii) as incurred on a specific identification basis, or (iii) equally among the Master Portfolios, depending on the nature of the expenditure. All expenses incurred by the Master Portfolios are allocated to the Feeder Funds daily based on their proportionate interests in the respective Master Portfolios.
Federal Income Taxes – Each Master Portfolio will be treated as a partnership for federal income tax purposes. As such, each investor in a Master Portfolio will be subject to taxation on its share of the Master Portfolio’s ordinary income and capital gains. It is intended that each Master Portfolio’s assets will be managed so an investor in the Master Portfolio can satisfy the requirements of subchapter M of the Internal Revenue Code.
There is no tax liability resulting from unrecognized tax benefits relating to uncertain income tax positions taken or expected to be taken in future tax returns. As of December 31, 2024, open tax years include the tax years ended December 31, 2021 through December 31, 2024. The Master Portfolios are also not aware of any tax positions for which it is reasonably possible that the total amounts of unrecognized tax benefits will significantly change in the next twelve months.
Use of Estimates – The preparation of financial statements in conformity with U.S. generally accepted accounting principles (“GAAP”) requires management to make estimates and assumptions that affect the reported amounts in the financial statements. Actual results could differ from those estimates.
Other – Realized gains and losses on the sale of investments are calculated on the identified cost basis. Dividend income is recorded on the ex-dividend date. Interest income is accounted for on the accrual basis and includes amortization of premiums and accretion of discounts on the effective interest method. Other noncash dividends are recognized as investment income at the fair value of the property received. Withholding taxes on foreign dividends have been incorporated in accordance with the Trust’s understanding of the applicable country’s tax rules and rates.
3. Investment Adviser
The Trust has entered into Investment Advisory Agreements (the “Agreements”) with Horizon Kinetics Asset Management LLC (the “Adviser”), with whom certain officers and trustees of the Trust are affiliated, to furnish investment advisory services to the Master Portfolios. The Adviser is a wholly-owned subsidiary of Horizon Kinetics Holding Corporation. Under the terms of the Agreements, the Master Portfolios, Multi-Disciplinary Income Portfolio, compensate the Adviser for its management services at the annual rate of 1.25% of each Master Portfolio’s average daily net assets. Effective as of April 30, 2023, the Adviser has agreed to reduce the management fee for the Multi-Disciplinary Income Portfolio from 1.25% to 1.00% Additionally, effective as of April 30, 2023, the Adviser has agreed to waive 0.75% of the 1.00% management fee for the Multi-Disciplinary Income Portfolio through April 30, 2025.
TABLE OF CONTENTS
KINETICS PORTFOLIO TRUST – MASTER INVESTMENTS PORTFOLIO
Notes to Consolidated Financial Statements
December 31, 2024(Continued)
For the Year ended December 31, 2024, Master Portfolios incurred the following expenses pursuant to the Agreements:
| | | | |
The Internet Portfolio | | | $3,259,047 |
The Global Portfolio | | | 379,531 |
The Paradigm Portfolio | | | 13,022,350 |
The Small Cap Opportunities Portfolio | | | 4,337,380 |
The Market Opportunities Portfolio | | | 2,121,973 |
The Multi-Disciplinary Income Portfolio | | | 33,081 |
| | | | |
For the Year ended December 31, 2024, the Trust was allocated approximately $26,000 for the services of the Chief Compliance Officer employed by the Adviser.
4. Securities Transactions
Purchases and sales of investment securities, other than short-term investments and short-term options, for the Year ended December 31, 2024, were as follows:
| | | | | | | | | |
| | The Internet Portfolio | | | $— | | | $97,476,945 | | | $— | | | $91,024,225 | |
| | The Global Portfolio | | | — | | | 13,247,683 | | | — | | | 8,319,631 | |
| | The Paradigm Portfolio | | | — | | | 18,846,797 | | | — | | | 97,209,832 | |
| | The Small Cap Opportunities Portfolio | | | — | | | 18,154,234 | | | — | | | 27,560,962 | |
| | The Market Opportunities Portfolio | | | — | | | 16,102,146 | | | — | | | 10,916,337 | |
| | The Multi-Disciplinary Income Portfolio | | | — | | | 5,298,454 | | | — | | | 4,410,300 | |
| | | | | | | | | | | | | | | |
As of December 31, 2024, the cost of investments and unrealized appreciation (depreciation) on investment securities for federal income tax purposes was as follows:
| | | | | | | | | | |
Tax Cost of Investments | | | $56,351,961 | | | $12,849,685 | | | $158,247,197 |
Unrealized Appreciation | | | 235,670,252 | | | 24,326,736 | | | 1,166,659,210 |
Unrealized Depreciation | | | (3,026,641) | | | (1,244,903) | | | (11,499,967) |
Net Unrealized Appreciation | | | $232,643,611 | | | $23,081,833 | | | $1,155,159,243 |
| | | | | | | | | | |
| | | | | | | | | | |
Tax Cost of Investments | | | $99,075,807 | | | $40,396,374 | | | $12,330,174 |
Unrealized Appreciation | | | 313,207,605 | | | 174,143,475 | | | 71,809 |
Unrealized Depreciation | | | (14,978,837) | | | (3,405,988) | | | (452) |
Net Unrealized Appreciation | | | $298,228,768 | | | $170,737,487 | | | $71,357 |
| | | | | | | | | | |
5. Portfolio Securities Loaned
As of December 31, 2024, the Master Portfolios had loaned securities that were collateralized by cash. The majority of the cash collateral is invested by the custodian in a money market pooled account approved by the Adviser. Although risk is mitigated by the collateral, a Master Portfolio could experience a delay in recovering its securities and possible loss of income or value if the borrower fails to return them. The Master Portfolio receives interest on the collateral received as well as a fee for the securities loaned. The Master Portfolios will continue to receive dividends and
TABLE OF CONTENTS
KINETICS PORTFOLIO TRUST – MASTER INVESTMENTS PORTFOLIO
Notes to Consolidated Financial Statements
December 31, 2024(Continued)
interest on all securities loaned. Gain or loss in the fair value of the securities loaned that may occur during the term of the loan will be accounted for by the Master Portfolios. Loans of securities are terminable at any time and the borrower, after notice, is required to return borrowed securities within the standard time period for settlement of securities transactions. As the securities loans are subject to termination by the Funds or the borrower at any time, the remaining maturities of the outstanding securities lending transactions are considered to be overnight and continuous. The value of the securities on loan and the value of the related collateral at December 31, 2024, were as follows:
| | | | | | | |
The Internet Portfolio | | | $3,102,245 | | | $3,252,116 |
The Global Portfolio | | | 139,480 | | | 149,222 |
The Paradigm Portfolio | | | 18,089,439 | | | 18,686,717 |
The Small Cap Opportunities Portfolio | | | 554,891 | | | 567,525 |
The Market Opportunities Portfolio | | | 940,497 | | | 966,221 |
The Multi-Disciplinary Income Portfolio | | | — | | | — |
| | | | | | | |
6. Selected Financial Highlights
Financial highlights for the Master Portfolios were as follows
| | | | |
Total Return | | | 76.81% | | | 30.16% | | | (23.86)% | | | 15.72% | | | 56.87% |
Ratio of expenses to average net assets: | | | 1.34% | | | 1.35% | | | 1.35% | | | 1.34% | | | 1.37% |
Ratio of net investment income (loss) to average net assets: | | | 0.25% | | | 1.23% | | | (0.18)% | | | (0.92)% | | | (0.36)% |
Portfolio turnover rate | | | 43% | | | 19% | | | 19% | | | 4% | | | 1% |
| | | | | | | | | | | | | | | | |
| | | | |
Total Return | | | 72.10% | | | 11.79% | | | (6.53)% | | | 16.23% | | | 24.80% |
Ratio of expenses to average net assets: | | | 1.45% | | | 1.49% | | | 1.46% | | | 1.48% | | | 1.59% |
Ratio of net investment income (loss) to average net assets: | | | 0.71% | | | 1.71% | | | 0.18% | | | (1.00)% | | | (0.66)% |
Portfolio turnover rate | | | 34% | | | 16% | | | 57% | | | 7% | | | 8% |
| | | | | | | | | | | | | | | | |
| | | | |
Total Return | | | 88.79% | | | (16.59)% | | | 29.48% | | | 38.46% | | | 3.61% |
Ratio of expenses to average net assets: | | | 1.32% | | | 1.34% | | | 1.33% | | | 1.33% | | | 1.35% |
Ratio of net investment income (loss) to average net assets: | | | 0.32% | | | (0.20)% | | | 0.15% | | | (0.58)% | | | 0.70% |
Portfolio turnover rate | | | 2% | | | 0% | | | 0% | | | 1% | | | 1% |
| | | | | | | | | | | | | | | | |
| | | | |
Total Return | | | 68.83% | | | (14.40)% | | | 32.26% | | | 50.63% | | | 2.57% |
Ratio of expenses to average net assets: | | | 1.33% | | | 1.35% | | | 1.34% | | | 1.34% | | | 1.37% |
Ratio of net investment income (loss) to average net assets: | | | 0.96% | | | 0.52% | | | 0.37% | | | (0.62)% | | | 1.05% |
Portfolio turnover rate | | | 6% | | | 2% | | | 6% | | | 3% | | | 0% |
| | | | | | | | | | | | | | | | |
TABLE OF CONTENTS
KINETICS PORTFOLIO TRUST – MASTER INVESTMENTS PORTFOLIO
Notes to Consolidated Financial Statements
December 31, 2024(Continued)
| | | | |
Total Return | | | 84.14% | | | (7.29)% | | | 15.02% | | | 28.08% | | | 19.57% |
Ratio of expenses to average net assets: | | | 1.34% | | | 1.36% | | | 1.36% | | | 1.36% | | | 1.38% |
Ratio of net investment income (loss) to average net assets: | | | 0.59% | | | 0.94% | | | 0.22% | | | (0.74)% | | | 0.42% |
Portfolio turnover rate | | | 7% | | | 5% | | | 13% | | | 2% | | | 2% |
| | | | | | | | | | | | | | | | |
| | | | |
Total Return | | | 7.30% | | | 5.24% | | | (2.29)% | | | 1.23% | | | (1.35)% |
Ratio of expenses to average net assets: | | | 0.51% | | | 0.94% | | | 1.48% | | | 1.44% | | | 1.46% |
Ratio of net investment income to average net assets: | | | 6.77% | | | 5.16% | | | 2.14% | | | 1.74% | | | 3.17% |
Portfolio turnover rate | | | 37% | | | 37% | | | 0% | | | 0% | | | 0% |
| | | | | | | | | | | | | | | | |
7. Summary of Fair Value Exposure
Various inputs are used in determining the value of Master Portfolio’s and Spin-Off Fund’s investments. These inputs are summarized in the three broad levels listed below:
Level 1 –
Unadjusted quoted prices in active markets for identical assets or liabilities that Master Portfolio’s and Spin-Off Fund has the ability to access.
Level 2 –
Observable inputs other than quoted prices included in Level 1 that are observable for the asset or liability, either directly or indirectly. These inputs may include quoted prices for the identical instrument on an inactive market, prices for similar instruments, interest rates, prepayment speeds, credit risk, yield curves, default rates and similar data.
Level 3 –
Unobservable inputs for the asset or liability, to the extent relevant observable inputs are not available, representing the Spin-Off Fund’s own assumptions about the assumptions a market participant would use in valuing the asset or liability, and would be based on the best information available.
The availability of observable inputs can vary from security to security and is affected by a wide variety of factors, including, for example, the type of security, whether the security is new and not yet established in the marketplace, the liquidity of markets, and other characteristics particular to the security. To the extent that valuation is based on models or inputs that are less observable or unobservable in the market, the determination of fair value requires more judgment. Accordingly, the degree of judgment exercised in determining fair value is greatest for instruments categorized in Level 3.
The inputs used to measure fair value may fall into different levels of the fair value hierarchy. In such cases, for disclosure purposes, the level in the fair value hierarchy within which the fair value measurement falls in its entirety, is determined based on the lowest level input that is significant to the fair value measurement in its entirety.
The Internet Portfolio
The following is a summary of the inputs used to value The Internet Portfolio’s net assets as of December 31, 2024:
| | | | | | | | | | | | | |
Common Stocks | | | $106,542,009 | | | $2,905,547 | | | $2,913,160 | | | $112,360,716 |
Unit Investment Trust | | | 176,496,071 | | | — | | | — | | | 176,496,071 |
Exchange Traded Funds | | | — | | | — | | | — | | | — |
Warrants | | | — | | | — | | | 138,785 | | | 138,785 |
Total Investments in Securities | | | $ 283,038,080 | | | $2,905,547 | | | $3,051,945 | | | $288,995,572 |
| | | | | | | | | | | | | |
TABLE OF CONTENTS
KINETICS PORTFOLIO TRUST – MASTER INVESTMENTS PORTFOLIO
Notes to Consolidated Financial Statements
December 31, 2024(Continued)
Following is a reconciliation of Level 3 assets for which significant unobservable inputs were used to determine fair value:
| | | | |
Balance as of December 31, 2023 | | | $2,896,327 |
Accrued discounts/premiums | | | — |
Realized gain (loss) | | | — |
Change in unrealized appreciation (depreciation) | | | 155,618*** |
Net purchases and/or acquisitions | | | — |
Net sales and/or write-offs | | | — |
Transfer in and/or out of Level 3 | | | — |
Balance as of December 31, 2024 | | | $3,051,945 |
| | | | |
| | | | | | | | | | | | | |
Common Stocks | | | $2,913,160 | | | Discounted Cash Flow | | | Volatility | | | 16.8% |
| | | | | | Option Pricing Model | | | Discount for Lack of Marketability | | | 5.0% |
| | | | | | | | | Weighted Average Cost of Capital | | | 13.5% |
| | | | | | | | | Years to Maturity | | | 9.5 |
| | | | | | | | | Risk-Free Rate | | | 4.9% |
Warrants | | | $138,785 | | | Discounted Cash Flow | | | Volatility | | | 16.8% |
| | | | | | Option Pricing Model | | | Discount for Lack of Marketability | | | 10.0% |
| | | | | | | | | Weighted Average Cost of Capital | | | 13.5% |
| | | | | | | | | Years to Maturity | | | 9.5 |
| | | | | | | | | Risk-Free Rate | | | 4.9% |
| | | | | | | | | | | | | |
^
| See Consolidated Portfolio of Investments for breakout of investments by industry classification.
|
**
| Represents the expected directional change in the fair value of the Level 3 investments that would result from an increase in the corresponding input. A decrease to the unobservable input would have the opposite effect except for discount for lack of marketability where a decrease would result in an increase to the value of the investment. Significant changes in these inputs could result in significantly higher or lower fair value measurements.
|
***
| Total change in unrealized appreciation/(depreciation) relating to Level 3 investment assets and investment liabilities still held by the Fund at December 31, 2024 is $155,618. |
The Global Portfolio
The following is a summary of the inputs used to value The Global Portfolio’s net assets as of December 31, 2024:
| | | | | | | | | | | | | |
Common Stocks | | | $22,506,288 | | | $613,273 | | | $99,990 | | | $23,219,551 |
Unit Investment Trust | | | 12,649,385 | | | — | | | — | | | 12,649,385 |
Warrants | | | — | | | 51,662 | | | — | | | 51,662 |
Preferred Stocks | | | — | | | 10,920 | | | — | | | 10,920 |
Convertible Bonds | | | — | | | — | | | — * | | | — |
Total Investments in Securities | | | $ 35,155,673 | | | $675,855 | | | $99,990 | | | $35,931,518 |
| | | | | | | | | | | | | |
TABLE OF CONTENTS
KINETICS PORTFOLIO TRUST – MASTER INVESTMENTS PORTFOLIO
Notes to Consolidated Financial Statements
December 31, 2024(Continued)
Following is a reconciliation of Level 3 assets for which significant unobservable inputs were used to determine fair value:
| | | | |
Balance as of December 31, 2023 | | | $259,490 |
Accrued discounts/premiums | | | — |
Realized gain (loss) | | | — |
Change in unrealized appreciation (depreciation) | | | (33,550)*** |
Net purchases and/or acquisitions | | | — |
Net sales and/or write-offs | | | — |
Transfer in and/or out of Level 3 | | | (125,950) |
Balance as of December 31, 2024 | | | $99,990 |
| | | | |
| | | | | | | | | | | | | |
Common Stocks | | | $ 99,990 | | | Cost Approach | | | Precedent
Transaction | | | $55.00-$55.00 |
Convertible Bonds | | | $—* | | | Asset Liquidation
Analysis | | | Liquidation
Proceeds | | | $0.00-$0.00 |
| | | | | | | | | | | | | |
^
| See Consolidated Portfolio of Investments for breakout of investments by industry classification.
|
*
| Amount is less than $0.50.
|
**
| Represents the expected directional change in the fair value of the Level 3 investments that would result from an increase in the corresponding input. A decrease to the unobservable input would have the opposite effect. Significant changes in these inputs could result in significantly higher or lower fair value measurements.
|
***
| Total change in unrealized appreciation/(depreciation) relating to Level 3 investment assets and investment liabilities still held by the Fund at December 31, 2024 is $(33,550). |
The Paradigm Portfolio
The following is a summary of the inputs used to value The Paradigm Portfolio’s net assets as of December 31, 2024:
| | | | | | | | | | | | | |
Common Stocks | | | $1,147,828,035 | | | $612,082 | | | $—* | | | $1,148,440,117 |
Unit Investment Trust | | | 160,371,811 | | | — | | | — | | | 160,371,811 |
Real Estate Investment Trusts | | | 4,582,080 | | | — | | | — | | | 4,582,080 |
Warrants | | | — | | | 11,832 | | | — | | | 11,832 |
Preferred Stocks | | | — | | | 600 | | | — | | | 600 |
Total Investments in Securities | | | $ 1,312,781,926 | | | $624,514 | | | $— | | | $1,313,406,440 |
| | | | | | | | | | | | | |
Following is a reconciliation of Level 3 assets for which significant unobservable inputs were used to determine fair value:
| | | | |
Balance as of December 31, 2023 | | | $762,700 |
Accrued discounts/premiums | | | — |
Realized gain (loss) | | | (845,018) |
Change in unrealized appreciation (depreciation) | | | 773,969*** |
Net purchases and/or acquisitions | | | — |
Net sales and/or write-offs | | | (389,371) |
Transfer in and/or out of Level 3 | | | (302,280) |
Balance as of December 31, 2024 | | | $ — |
| | | | |
TABLE OF CONTENTS
KINETICS PORTFOLIO TRUST – MASTER INVESTMENTS PORTFOLIO
Notes to Consolidated Financial Statements
December 31, 2024(Continued)
| | | | | | | | | | | | | |
Common Stocks | | | $ —* | | | Asset Liquidation
Analysis | | | Precedent
Transaction | | | $0.00 - $0.00 |
| | | | | | | | | | | | | |
^
| See Consolidated Portfolio of Investments for breakout of investments by industry classification.
|
*
| Amount is less than $0.50.
|
**
| Represents the expected directional change in the fair value of the Level 3 investments that would result from an increase in the corresponding input. A decrease to the unobservable input would have the opposite effect. Significant changes in these inputs could result in significantly higher or lower fair value measurements.
|
***
| Total change in unrealized appreciation/(depreciation) relating to Level 3 investment assets and investment liabilities still held by the Fund at December 31, 2024 is $773,969. |
The Small Cap Opportunities Portfolio
The following is a summary of the inputs used to value The Small Cap Opportunities Portfolio’s net assets as of December 31, 2024:
Following is a reconciliation of Level 3 assets for which significant unobservable inputs were used to determine fair value:
| | | | | | | | | | | | | |
Common Stocks | | | $369,879,270 | | | $340,046 | | | $— | | | $370,219,316 |
Unit Investment Trust | | | 24,718,846 | | | — | | | — | | | 24,718,846 |
Warrants | | | — | | | 2,366,413 | | | — | | | 2,366,413 |
Total Investments in Securities | | | $394,598,116 | | | $2,706,459 | | | $— | | | $397,304,575 |
| | | | | | | | | | | | | |
As of December 31, 2024, there were no investments in Level 3 securities.
During the period ended December 31, 2024, there were no transfers into or out of Level 3.
^
| See Consolidated Portfolio of Investments for breakout of investments by industry classification. |
The Market Opportunities Portfolio
The following is a summary of the inputs used to value The Market Opportunities Portfolio’s net assets as of December 31, 2024:
| | | | | | | | | | | | | |
Common Stocks | | | $154,378,505 | | | $5,305,430 | | | $1,167,675 | | | $160,851,610 |
Unit Investment Trust | | | 49,343,720 | | | — | | | — | | | 49,343,720 |
Warrants | | | — | | | 643,605 | | | 49,195 | | | 692,800 |
Preferred Stocks | | | — | | | 245,731 | | | — | | | 245,731 |
Convertible Bonds | | | — | | | — | | | — * | | | — |
Total Investments in Securities | | | $203,722,225 | | | $6,194,766 | | | $1,216,870 | | | $211,133,861 |
| | | | | | | | | | | | | |
TABLE OF CONTENTS
KINETICS PORTFOLIO TRUST – MASTER INVESTMENTS PORTFOLIO
Notes to Consolidated Financial Statements
December 31, 2024(Continued)
Following is a reconciliation of Level 3 assets for which significant unobservable inputs were used to determine fair value:
| | | | |
Balance as of December 31, 2023 | | | $1,161,707 |
Accrued discounts/premiums | | | — |
Realized gain (loss) | | | — |
Change in unrealized appreciation (depreciation) | | | 55,163*** |
Net purchases and/or acquisitions | | | — |
Net sales and/or write-offs | | | — |
Transfer in and/or out of Level 3 | | | — |
Balance as of December 31, 2024 | | | $1,216,870 |
| | | | |
| | | | | | | | | | | | | |
Common Stocks | | | $1,032,650 | | | Discounted Cash Flow | | | Volatility | | | 16.8% |
| | | | | | Option Pricing Model | | | Discount for Lack of Marketability | | | 5.0% |
| | | | | | | | | Weighted Average Cost of Capital | | | 13.5% |
| | | | | | | | | Years to Maturity | | | 9.5 |
| | | | | | | | | Risk-Free Rate | | | 4.9% |
Common Stocks | | | $135,025 | | | Cost Approach | | | Precedent Transaction | | | $55.00-$55.00 |
Convertible Bonds | | | $—* | | | Asset Liquidation Analysis | | | Liquidation Proceeds | | | $0.00-$0.00 |
Warrants | | | $49,195 | | | Discounted Cash Flow | | | Volatility | | | 16.8% |
| | | | | | Option Pricing Model | | | Discount for Lack of Marketability | | | 10.0% |
| | | | | | | | | Weighted Average Cost of Capital | | | 13.5% |
| | | | | | | | | Years to Maturity | | | 9.5 |
| | | | | | | | | Risk-Free Rate | | | 4.9% |
| | | | | | | | | | | | | |
^
| See Consolidated Portfolio of Investments for breakout of investments by industry classification.
|
*
| Amount is less than $0.50.
|
**
| Represents the expected directional change in the fair value of the Level 3 investments that would result from an increase in the corresponding input. A decrease to the unobservable input would have the opposite effect. Significant changes in these inputs could result in significantly higher or lower fair value measurements.
|
***
| Total change in unrealized appreciation/(depreciation) relating to Level 3 investment assets and investment liabilities still held by the Fund at December 31, 2024 is $55,163. |
The Multi-Disciplinary Income Portfolio
The following is a summary of the inputs used to value The Multi-Disciplinary Income Portfolio’s net assets as of December 31, 2024:
| | | | | | | | | | | | | |
Collateralized Loan Obligation | | | $— | | | $12,401,531 | | | $— | | | $12,401,531 |
Total Investments in Securities | | | $— | | | $12,401,531 | | | $— | | | $12,401,531 |
| | | | | | | | | | | | | |
As of December 31, 2024, there were no investments in Level 3 securities.
During the period ended December 31, 2024, there were no transfers into or out of Level 3.
^
| See Consolidated Portfolio of Investments for breakout of investments by industry classification. |
TABLE OF CONTENTS
KINETICS PORTFOLIO TRUST – MASTER INVESTMENTS PORTFOLIO
Notes to Consolidated Financial Statements
December 31, 2024(Continued)
8. Disclosures about Derivative Instruments and Hedging Activities
The Master Portfolios have adopted authoritative standards regarding disclosure of derivatives and hedging activity intended to improve financial reporting of derivative instruments by enabling investors to understand how and why a Master Portfolio uses derivatives, how derivatives are accounted for by the Master Portfolios, and how derivative instruments affect a Master Portfolio’s results of operations and financial position. At December 31, 2024, none of the Portfolios held any derivative instruments and there were no transactions during the Year ended December 31, 2024.
9. Offsetting Assets and Liabilities
The Master Portfolios are subject to various Master Netting Arrangements, which govern the terms of certain transactions with select counterparties. The Master Netting Arrangements allow a Portfolio to close out and net its total exposure to a counterparty in the event of a default with respect to all the transactions governed under a single agreement with a counterparty. The Master Netting Arrangements also specify collateral posting arrangements at pre- arranged exposure levels. Under the Master Netting Arrangements, collateral is routinely transferred if the total net exposure to certain transactions (net of existing collateral already in place) governed under the relevant Master Netting Arrangement with a counterparty in a given account exceeds a specific threshold depending on the counterparty and the type of Master Netting Arrangement.
The following is a summary of the Assets and Liabilities subject to offsetting in the Master Portfolios as of December 31, 2024:
| | | | | | | | | | | | | | | | | | | |
The Internet Portfolio | | | Securities Lending | | | $3,252,116 | | | $— | | | $3,252,116 | | | $3,252,116 | | | $— | | | $— |
| | | | | | $3,252,116 | | | $— | | | $3,252,116 | | | $3,252,116 | | | $— | | | $— |
The Global Portfolio | | | Securities Lending | | | $149,222 | | | $— | | | $149,222 | | | $149,222 | | | $— | | | $— |
| | | | | | $149,222 | | | $— | | | $149,222 | | | $149,222 | | | $— | | | $— |
The Paradigm Portfolio | | | Securities Lending | | | $ 18,686,717 | | | $— | | | $18,686,717 | | | $18,686,717 | | | $— | | | $— |
| | | | | | $ 18,686,717 | | | $— | | | $18,686,717 | | | $18,686,717 | | | $— | | | $— |
The Small Cap Opportunities Portfolio | | | Securities Lending | | | $567,525 | | | $— | | | $567,525 | | | $567,525 | | | $— | | | $— |
| | | | | | $567,525 | | | $— | | | $567,525 | | | $567,525 | | | $— | | | $— |
The Market Opportunities Portfolio | | | Securities Lending | | | $966,221 | | | $— | | | $966,221 | | | $966,221 | | | $— | | | $— |
| | | | | | $966,221 | | | $— | | | $966,221 | | | $966,221 | | | $— | | | $— |
| | | | | | | | | | | | | | | | | | | | | | |
TABLE OF CONTENTS
KINETICS PORTFOLIO TRUST – MASTER INVESTMENTS PORTFOLIO
Notes to Consolidated Financial Statements
December 31, 2024(Continued)
10. Subsequent Events
In preparing these financial statements, management has evaluated Portfolio related events and transactions for potential recognition or disclosure through the date the financial statements were issued. There were no other events or translations that occurred during the year that materially impacted the amounts or disclosures in the Master Portfolios’ financial statements.
11. Recent Accounting Pronouncements
Segment Reporting (Topic 280) – In November 2023, the FASB issued ASU 2023-07, Segment Reporting (Topic 280): Improvements to Reportable Segment Disclosures (“ASU 2023-07”). This change is intended to improve reportable segment disclosure requirements, primarily through enhanced disclosures about significant segment expenses, allowing financial statement users to better understand the components of a segment’s profit or loss and assess potential future cash flows for each reportable segment and the entity as a whole. The amendments expand a public entity’s segment disclosures by requiring disclosure of significant segment expenses that are regularly provided to the chief operating decision maker (“CODM”), clarifying when an entity may report one or more additional measures to assess segment performance, requiring enhanced interim disclosures and providing new disclosure requirements for entities with a single reportable segment, among other new disclosure requirements. The amendments are effective for fiscal years beginning after December 15, 2023 and interim periods within fiscal years beginning after December 15, 2024, and early adoption is permitted. Management has evaluated the impact of adopting this guidance with respect to the financial statements and disclosures and determined there is no impact for the Funds.
12. Information about Proxy Voting (Unaudited)
Information regarding how the Feeder Funds and the Master Portfolios vote proxies relating to portfolio securities is available without charge upon request by calling toll-free at 1-800-930-3828 or by accessing the Funds’ website at www.kineticsfunds.com and by accessing the SEC’s website at www.sec.gov. Information regarding how the Feeder Funds and the Master Portfolios voted proxies relating to portfolio securities during the most recent twelve month period ended June 30, is available without charge, upon request, by calling toll-free at 1-800-930-3828 or by accessing the SEC’s website at www.sec.gov.
13. Information about the Portfolio Holdings (Unaudited)
The Master Portfolios file their complete schedule of portfolio holdings for their first and third fiscal quarters with the SEC on Part F of Form N-PORT. The Master Portfolios’ Part F of Form N-PORT is available without charge, upon request, by calling toll-free at 1-800-930-3828. Furthermore, you can obtain the Part F of Form N-PORT on the SEC’s website at www.sec.gov.
TABLE OF CONTENTS
KINETICS PORTFOLIO TRUST – MASTER INVESTMENTS PORTFOLIO
REPORT OF INDEPENDENT REGISTERED PUBLIC ACCOUNTING FIRM
To the Shareholders and Board of Trustees of Kinetics Portfolios Trust
Opinion on the Financial Statements
We have audited the accompanying statements [consolidated where noted as such] of assets and liabilities of The Internet Portfolio, The Global Portfolio, The Paradigm Portfolio, The Small Cap Opportunities Portfolio, The Market Opportunities Portfolio, and The Multi-Disciplinary Income Portfolio (the “Funds”), each a series of Kinetics Portfolios Trust (the “Trust”), including the schedules of investments, as of December 31, 2024, the related statements of operations for the year then ended, the statements of changes in net assets for each of the two years in the period then ended, and financial highlights for each of the five years in the period then ended, and the related notes (collectively referred to as the “financial statements”). In our opinion, the financial statements present fairly, in all material respects, the [consolidated where noted as such] financial position of the Funds as of December 31, 2024, the results of their operations for the year then ended, the changes in their net assets for each of the two years in the period then ended, and their financial highlights for each of the five years in the period then ended, in conformity with accounting principles generally accepted in the United States of America.
Basis for Opinion
These financial statements are the responsibility of the Funds’ management. Our responsibility is to express an opinion on the Funds’ financial statements based on our audits. We are a public accounting firm registered with the Public Company Accounting Oversight Board (United States) (“PCAOB”) and are required to be independent with respect to the Funds in accordance with the U.S. federal securities laws and the applicable rules and regulations of the Securities and Exchange Commission and the PCAOB. We have served as the auditor of one or more of the funds in the Trust since 2004.
We conducted our audits in accordance with the standards of the PCAOB. Those standards require that we plan and perform the audits to obtain reasonable assurance about whether the financial statements are free of material misstatement, whether due to error or fraud. The Funds are not required to have, nor were we engaged to perform, an audit of the Funds’ internal control over financial reporting. As part of our audits we are required to obtain an understanding of internal control over financial reporting, but not for the purpose of expressing an opinion on the effectiveness of the Funds’ internal control over financial reporting. Accordingly, we express no such opinion.
Our audits included performing procedures to assess the risks of material misstatement of the financial statements, whether due to error or fraud, and performing procedures that respond to those risks. Such procedures included examining, on a test basis, evidence regarding the amounts and disclosures in the financial statements. Our audits also included evaluating the accounting principles used and significant estimates made by management, as well as evaluating the overall presentation of the financial statements. Our procedures included confirmation of securities owned as of December 31, 2024 by correspondence with the custodian and brokers or through other appropriate auditing procedures when replies from brokers were unable to be obtained. We believe that our audits provide a reasonable basis for our opinion.
TAIT, WELLER & BAKER LLP
Philadelphia, Pennsylvania
February 28, 2025
TABLE OF CONTENTS
KINETICS PORTFOLIO TRUST – MASTER INVESTMENTS PORTFOLIO
Additional Information
The below information is required disclosure from Form N-CSR
Item 8. Changes in and Disagreements with Accountants for Open-End Investment Companies.
There were no changes in or disagreements with accountants during the period covered by this report.
Item 9. Proxy Disclosure for Open-End Investment Companies.
There were no matters submitted to a vote of shareholders during the period covered by this report.
Item 10. Remuneration Paid to Directors, Officers, and Others of Open-End Investment Companies.
Refer to information provided within financial statements.
Item 11. Statement Regarding Basis for Approval of Investment Advisory Contract.
Not applicable.
TABLE OF CONTENTS
KINETICS PORTFOLIO TRUST – MASTER INVESTMENTS PORTFOLIO
Management of the Funds and the Portfolios (Unaudited)
The management and affairs of the Funds and the Portfolios are under the oversight of the Board of Directors of the Company and the Board of Trustees of the Trust, respectively. Each Board consists of the same eight individuals, five of whom are not “interested persons” of the Company or the Trust as that term is defined in the Investment Company Act of 1940, as amended (the “1940 Act”). The Directors are fiduciaries for the Funds’ shareholders and are governed by the laws of the State of Maryland in this regard. The Trustees are fiduciaries for the Portfolios’ shareholders and are governed by the laws of the State of Delaware in this regard.
Each Board establishes policies for the operation of the Funds and the Portfolios and appoints the officers who conduct the daily business of the Funds and the Portfolios. Directors/Trustees of the Company and the Trust are listed below with their addresses, present positions with the Company and Trust, length of time served, principal occupations over at least the last five years, number of Funds and Portfolios overseen and any other Directorships held. The SAI includes additional information about the Funds’ officers and directors and is available, without charge, upon request by calling 1-800-930-3828.
Board of Directors/Board of Trustees
Independent Directors/Trustees
| | | | | | | | | | | | | | | | |
Steven T . Russell
Year Born: 1963
c/o Horizon Kinetics Asset
Management LLC
470 Park Avenue South
New York, New York 10016 | | | Independent Director/ Independent Trustee | | | Indefinite/ 23 years | | | Professor of Business Law, Suffolk County Community College (1997 to Present); Lawyer, Private Practice (2010 to present). | | | 13 | | | N/A |
Douglas Cohen, CPA
Year Born: 1961
c/o Horizon Kinetics Asset
Management LLC
470 Park Avenue South
New York, New York 10016 | | | Independent Director/ Independent Trustee | | | Indefinite/ 23 years | | | Chief Financial Officer, Sunrise Credit Services, Inc. (2005 to 2021). | | | 13 | | | N/A |
William J. Graham
Year Born: 1961
c/o Horizon Kinetics
Asset Management LLC
470 Park Avenue South
New York, New York 10016 | | | Independent Director/ Independent Trustee | | | Indefinite/ 23 years | | | Attorney, William J. Graham, PC (2001 to present); Assistant Town Attorney, Town of Islip, NY (2016 to 2021). | | | 13 | | | N/A |
Joseph E. Breslin
Year Born: 1953
c/o Horizon Kinetics
Asset Management LLC
470 Park Avenue South
New York, New York 10016 | | | Independent Director/ Independent Trustee | | | Indefinite/ 23 years | | | Counsel, White Oak Global Advisors, LLC (2016 to present). | | | 13 | | | Trustee, Forethought Variable Insurance Trust (23 portfolios); Trustee, BluArc MultiStrategy Fund (2014-2017); Chairman and Trustee, Northern Lights Fund Trust IV (21 portfolios); Trustee, Hatteras Alternative Mutual Funds Trust (5 portfolios) (2004-2016); Trustee, Underlying Funds Trust (5 portfolios) (2004-2016); Trustee, Director, Hatteras Master Fund, L.P. (2013-2016); Director, Hatteras Core Alternatives TEI Fund, L.P. (2013-2016); Director, Hatteras Core Alternatives Fund, L.P. (2013-2016); Director, Hatteras Core Alternatives Institutional Fund, L.P. (2013-2016); and Director, Hatteras Core Alternatives TEI Institutional Fund, L.P. (2013-2016). |
| | | | | | | | | | | | | | | | |
TABLE OF CONTENTS
KINETICS PORTFOLIO TRUST – MASTER INVESTMENTS PORTFOLIO
Management of the Funds and the Portfolios (Unaudited)(Continued)
| | | | | | | | | | | | | | | | |
James M. Breen
Year Born: 1959
c/o Horizon Kinetics
Asset Management LLC
470 Park Avenue South
New York, New York 10016 | | | Independent Director/ Independent Trustee | | | Indefinite/ 23 years | | | Security Consultant and Licensed Florida Private Investigator (2019 to present); Special Agent, Florida Department of Law Enforcement (FDLE) (2015 to 2019); Vice President, HBES Consulting, Inc. (2014 to present); Citibank, Senior AML Analyst ((2014-2015); Senior Special Agent, Homeland Security Investigations, Miami, FL (2011 to 2014); Assistant Attaché Immigration & Customs Enforcement, Pretoria, South Africa (2008 to 2011). | | | 13 | | | N/A |
Murray Stahl(3)(4)
Year Born: 1953
c/o Horizon Kinetics
Asset Management LLC
470 Park Avenue South
New York, New York 10016 | | | Director/
Trustee & Secretary | | | Indefinite/ 23 years | | | Chairman, FRMO Corp. (2001 to present) (provides consulting services to private investment funds and research services with respect to marketable securities); Chairman and Chief Investment Officer, Horizon Kinetics Holding Corporation, (including Horizon Kinetics Asset Management LLC (investment adviser) (1994 to present); Kinetics Asset Management LLC and Kinetics Advisers, LLC (2000 to 2019); CEO, Horizon Kinetics Holding Corporation (2015 to present). | | | 13 | | | Director and Officer of RENN Fund, Inc. (closed end investment company) (2017-present). Director of
Texas Pacific Land Corp.
(2021 to present). Director and Officer of FRMO Corp. (since 2001). |
Peter B. Doyle(3)
Year Born: 1962
c/o Horizon Kinetics
Asset Management LLC
470 Park Avenue South
New York, New York 10016 | | | Director/
Trustee & President & Chairman of the Board | | | Indefinite/ 21 years | | | Vice President, FMRO Corp. (2001 to present) (provides consulting services to private investment funds and research services with respect to marketable securities); Managing Director, Horizon Kinetics Holding Corporation (including Horizon Kinetics Asset Management LLC (an SEC-registered investment adviser) (1994 to present); Kinetics Asset Management LLC and Kinetics Advisers LLC (2000 to 2019); and President of Kinetics Mutual Funds, Inc. (1998 to present). Co-Portfolio Manager of the RENN Fund, Inc. (2021 to present) | | | 13 | | | Director and Officer of FRMO Corp. |
| | | | | | | | | | | | | | | | |
TABLE OF CONTENTS
KINETICS PORTFOLIO TRUST – MASTER INVESTMENTS PORTFOLIO
Management of the Funds and the Portfolios (Unaudited)(Continued)
| | | | | | | | | | | | | | | | |
Steven Bregman
Year Born: 1958
c/o Horizon Kinetics
Asset Management LLC
470 Park Avenue South
New York, New York 10016 | | | Co-Portfolio Manager and Investment Team Member | | | Indefinite/ 8 years | | | President, Horizon Kinetics Holding Corporation, (including Horizon Kinetics Asset Management LLC (investment adviser) (1994 to present); Kinetics Asset Management LLC and Kinetics Advisers, LLC (2000 to 2019; President and CFO of FRMO Corp. (2001 to present) (provides consulting services to private investment funds and research services with respect to marketable securities); Co-Portfolio Manager of RENN Fund, Inc. (closed end investment company) (since 2021); | | | 13 | | | Director of Winland Electronics, Inc (electronics) (since 2020). Director and Officer of FRMO Corp. (since 2001). |
| | | | | | | | | | | | | | | | |
(1)
| The term “fund complex” refers to the Company and the Trust, which hold themselves out as related for investment purposes. |
(2)
| “Other Directorships Held” includes only directorships of companies required to register or file reports with the SEC under the Securities Exchange Act of 1934, as amended, (that is, “public companies”) or investment companies registered under the 1940 Act. |
(3)
| Directors/Trustees who are considered “interested persons” as defined in Section 2(a)(19) of the 1940 Act because of their association with the Adviser and its affiliates. |
(4)
| Murray Stahl is a member of the Board of Directors (the “Board”) of Texas Pacific Land Corporation (“TPL”), a large holding in certain client accounts and funds, including Kinetics Mutual Funds, which are managed by Horizon Kinetics Asset Management LLC (“HKAM”). Officers, directors, and employees of HKAM may also hold substantial amounts of TPL, both directly and indirectly, in their personal accounts. HKAM seeks to address potential conflicts of interest through the adoption of various policies and procedures, which include both electronic and physical safeguards. All personal and proprietary trading is also subject to HKAM’s Code of Ethics and is monitored by the firm’s Legal and Compliance Department. As a result of Murray Stahl being on the Board of TPL, he does not have any trading authority over shares of TPL. All trading decisions for TPL in Murray Stahl’s personal accounts and in client accounts and funds where he remains a portfolio manager hasbeen delegated to another portfolio manager. |
| | | | | | | | | | | | | |
Russell W. Grimaldi
Year Born: 1980
c/o Horizon Kinetics
Asset Management LLC
470 Park Avenue South
New York, New York 10016 | | | Chief Compliance Officer | | | Indefinite/ 1 month | | | Chief Compliance Officer, Horizon Kinetics
Holding Corporation (including Horizon
Kinetics Asset Management (2011 to present),
Chief Compliance Officer, Renn Fund, Inc.
(2024 to present). | | | N/A |
Jay H. Kesslen
Year Born: 1973
c/o Horizon Kinetics
Asset Management LLC
470 Park Avenue South
New York, New York 10016 | | | Vice President and Assistant Secretary | | | Indefinite/ 18 years | | | General Counsel, Horizon Kinetics Holding Corporation (including Horizon Kinetics Asset Management LLC (an SEC registered investment adviser) (2011 to present), Chief Compliance Officer, Horizon Kinetics Holding Corporation (2015-2016), Kinetics Asset Management LLC (2000 to present), Kinetics Advisers LLC (2000 to 2019), Kinetics Funds Distributor LLC (2000 to present), KBD Securities LLC (2000 to present)); FRMO Corp. (2014 to present); Chief Compliance Officer, RENN Fund, Inc. (2017 to present). | | | N/A |
| | | | | | | | | | | | | |
TABLE OF CONTENTS
Kinetics Mutual Funds, Inc.
615 East Michigan Street
Milwaukee, WI 53202
INVESTMENT ADVISER AND SHAREHOLDER SERVICING AGENT
Horizon Kinetics Asset Management LLC
470 Park Avenue South
New York, NY 10016
INDEPENDENT REGISTERED PUBLIC ACCOUNTING FIRM
Tait, Weller & Baker LLP
50 South 16th Street, Suite 2900
Philadelphia, PA 19102
DISTRIBUTOR
Kinetics Funds Distributor LLC
470 Park Avenue South
New York, NY 10016
ADMINISTRATOR FUND ACCOUNTANT AND TRANSFER AGENT
U.S. Bancorp Fund Services, LLC
615 East Michigan Street
Milwaukee, WI 53202
CUSTODIAN
U.S. Bank, N.A.
Custody Operations
1555 River Center Drive, Suite 302
Milwaukee, WI 53212
THIS MATERIAL MUST BE PRECEDED OR ACCOMPANIED BY A PROSPECTUS
| (b) | [Insert financial highlights here] |
Item 8. Changes in and Disagreements with Accountants for Open-End Investment Companies.
There were no changes in or disagreements with accountants during the period covered by this report.
Item 9. Proxy Disclosure for Open-End Investment Companies.
There were no matters submitted to a vote of shareholders during the period covered by this report.
Item 10. Remuneration Paid to Directors, Officers, and Others of Open-End Investment Companies.
See Item 7(a).
Item 11. Statement Regarding Basis for Approval of Investment Advisory Contract.
Not applicable
Item 12. Disclosure of Proxy Voting Policies and Procedures for Closed-End Management Investment Companies.
Not applicable to open-end investment companies.
Item 13. Portfolio Managers of Closed-End Management Investment Companies.
Not applicable to open-end investment companies.
Item 14. Purchases of Equity Securities by Closed-End Management Investment Company and Affiliated Purchasers.
Not applicable to open-end investment companies.
Item 15. Submission of Matters to a Vote of Security Holders.
There have been no material changes to the procedures by which shareholders may recommend nominees to the registrant’s board of directors/trustees.
Item 16. Controls and Procedures.
| (a) | The Registrant’s Principal Executive Officer and Principal Financial Officer have reviewed the Registrant's disclosure controls and procedures (as defined in Rule 30a-3(c) under the Investment Company Act of 1940 (the “Act”)) as of a date within 90 days of the filing of this report, as required by Rule 30a-3(b) under the Act and Rules 13a-15(b) or 15d-15(b) under the Securities Exchange Act of 1934. Based on their review, such officers have concluded that the disclosure controls and procedures are effective in ensuring that information required to be disclosed in this report is appropriately recorded, processed, summarized and reported and made known to them by others within the Registrant and by the Registrant’s service provider. |
| (b) | There were no changes in the Registrant's internal control over financial reporting (as defined in Rule 30a-3(d) under the Act) that occurred during the period covered by this report that have materially affected, or are reasonably likely to materially affect, the Registrant's internal control over financial reporting. |
Item 17. Disclosure of Securities Lending Activities for Closed-End Management Investment Companies
Not applicable to open-end investment companies.
Item 18. Recovery of Erroneously Awarded Compensation.
Not applicable
Item 19. Exhibits.
(2) Any policy required by the listing standards adopted pursuant to Rule 10D-1 under the Exchange Act (17 CFR 240.10D-1) by the registered national securities exchange or registered national securities association upon which the registrant’s securities are listed. Not Applicable.
(3) A separate certification for each principal executive officer and principal financial officer of the registrant as required by Rule 30a-2(a) under the Investment Company Act of 1940 (17 CFR 270.30a-2(a)). Filed herewith.
(4) Any written solicitation to purchase securities under Rule 23c-1 under the Act sent or given during the period covered by the report by or on behalf of the registrant to 10 or more persons. Not applicable to open-end investment companies.
| (5) | Change in the registrant’s independent public accountant. Provide the information called for by Item 4 of Form 8-K under the Exchange Act (17 CFR 249.308). Unless otherwise specified by Item 4 or related to and necessary for a complete understanding of information not previously disclosed, the information should relate to events occurring during the reporting period. Not applicable to open-end investment companies. |
SIGNATURES
Pursuant to the requirements of the Securities Exchange Act of 1934 and the Investment Company Act of 1940, the registrant has duly caused this report to be signed on its behalf by the undersigned, thereunto duly authorized.
Kinetics Mutual Funds, Inc. & Kinetics Portfolios Trust
| By: | /s/ Jay Kesslen | |
| | Jay Kesslen, | |
| | Vice President for the President and Treasurer | |
| | | |
| Date: | March 1, 2025 | |
Pursuant to the requirements of the Securities Exchange Act of 1934 and the Investment Company Act of 1940, this report has been signed below by the following persons on behalf of the registrant and in the capacities and on the dates indicated.
| By: | /s/ Jay Kesslen | |
| | Jay Kesslen, | |
| | Vice President for the President and Treasurer | |
| | | |
| Date: | March 1, 2025 | |