UNITED STATES
SECURITIES AND EXCHANGE COMMISSION
Washington, D.C. 20549
FORM N-CSR
CERTIFIED SHAREHOLDER REPORT OF
REGISTERED MANAGEMENT INVESTMENT COMPANIES
Investment Company Act file number 811-09297
Nuveen Quality Municipal Income Fund
(Exact name of registrant as specified in charter)
Nuveen Investments
333 West Wacker Drive
Chicago, IL 60606
(Address of principal executive offices) (Zip code)
Mark L. Winget
Nuveen Investments
333 West Wacker Drive
Chicago, IL 60606
(Name and address of agent for service)
Registrant’s telephone number, including area code: (312) 917-7700
Date of fiscal year end: Date: October 31
Date of reporting period: October 31, 2021
Form N-CSR is to be used by management investment companies to file reports with the Commission not later than 10 days after the transmission to stockholders of any report that is required to be transmitted to stockholders under Rule 30e-1 under the Investment Company Act of 1940 (17 CFR 270.30e-1). The Commission may use the information provided on Form N-CSR in its regulatory, disclosure review, inspection, and policymaking roles.
A registrant is required to disclose the information specified by Form N-CSR, and the Commission will make this information public. A registrant is not required to respond to the collection of information contained in Form N-CSR unless the Form displays a currently valid Office of Management and Budget (“OMB”) control number. Please direct comments concerning the accuracy of the information collection burden estimate and any suggestions for reducing the burden to Secretary, Securities and Exchange Commission, 450 Fifth Street, NW, Washington, DC 20549-0609. The OMB has reviewed this collection of information under the clearance requirements of 44 U.S.C. ss. 3507.
ITEM 1. REPORTS TO STOCKHOLDERS.
Life is
Complex.
Nuveen makes things e-simple.
It only takes a minute to sign up for e-Reports. Once enrolled, you’ll receive an e-mail as soon as your Nuveen Fund information is ready—no more waiting for delivery by regular mail. Just click on the link within the e-mail to see the report and save it on your computer if you wish.
Free e-Reports
right to your e-mail!
www.investordelivery.com
If you receive your Nuveen Fund
dividends and statements from your
financial professional or brokerage account.
or
www.nuveen.com/client-access
If you receive your Nuveen Fund
dividends and statements directly from
Nuveen.
NOT FDIC INSURED MAY LOSE
VALUE NO BANK GUARANTEE

Table of Contents
3
Chair’s Letter
to Shareholders

Dear Shareholders,
In 2021, we have seen a nearly full recovery in the economy and began to approach more normalcy in our daily lives, enabled by unprecedented help from governments and central banks and the development of effective COVID-19 vaccines and therapies. However, the newly discovered omicron variant is a reminder that pandemic risks are still with us, which has created uncertainty about the economic outlook in the coming year and contributed to recent short-term volatility in the markets.
As some factors that drove 2021’s rebound fade and the pandemic continues to pose some downside risk, global economic growth is expected to be slower but remain expansionary. In the U.S., the Federal Reserve has begun winding down its pandemic bond buying program and could begin raising short-term interest rates in 2022. The crisis-related fiscal stimulus totaling $5.3 trillion to support individuals and families, small and large businesses, state and local governments, education, public health and vaccinations will also phase out. Government spending will be lower from here but should continue to aid the global recovery in the coming year. In the U.S., the $1.2 trillion Infrastructure Investment and Jobs Act recently went into effect on November 15, 2021, funding upgrades to road, rail and air transportation, broadband internet, and power and water systems. Europe, Japan and China are also expected to roll out additional fiscal support in 2022.
Investors will continue to closely monitor inflation. The spread of the COVID-19 delta variant in 2021 exacerbated shortages of raw materials and labor and disrupted transportation and logistics, which contributed to inflation staying elevated for longer than expected. This prompted some central banks to begin withdrawing monetary stimulus measures and others to raise interest rates. The timing of monetary policy normalization will be a key focus in the markets, as will the progression of the virus, which can be difficult to predict given uneven vaccination rates around the world and the potential for new variants.
We anticipate periodic volatility as markets digest incoming data on economic activity levels, inflation, interest rates and COVID-19, as well as their impacts to consumer behavior and corporate profits. Short-term market fluctuations can provide your Fund opportunities to invest in new ideas as well as upgrade existing positioning while providing long-term value for shareholders. For more than 120 years, the careful consideration of risk and reward has guided Nuveen’s focus on delivering long-term results to our shareholders.
As the global economy shifts from the fast recovery phase to a new phase of expansion potentially impacted by inflations and new COVID strains, it may be an opportune time to assess your portfolio. We encourage you to review your time horizon, risk tolerance and investment goals with your financial professional.
On behalf of the other members of the Nuveen Fund Board, I look forward to continuing to earn your trust in the months and years ahead.

Terence J. Toth
Chair of the Board
December 22, 2021
4
Important Notices
For Shareholders of
Nuveen Quality Municipal Income Fund (NAD)
Nuveen AMT-Free Quality Municipal Income Fund (NEA)
Fund Reorganizations
Effective prior to the opening of business on April 12, 2021, Nuveen Maryland Quality Municipal Income Fund (NMY) was reorganized into NAD, and effective prior to the opening of business on February 8, 2021, Nuveen Michigan Quality Municipal Income Fund (NUM) was merged into NEA (each a “Reorganization” and collectively, the “Reorganizations”). Refer to Note 1 and Note 10 of the Notes to Financial Statements within this report for further details on the Reorganizations.
5
Portfolio Manager’s Comments
Nuveen Quality Municipal Income Fund (NAD)
Nuveen AMT-Free Quality Municipal Income Fund (NEA)
These Funds feature portfolio management by Nuveen Asset Management, LLC (NAM), an affiliate of Nuveen Fund Advisors, LLC, the Funds’ investment adviser. Portfolio manager Christopher L. Drahn, CFA, has managed NAD and NEA since 2016.
Here he discusses U.S. economic and municipal market conditions, key investment strategies and the twelve-month performance of these two national Funds. For more information on the Funds’ investment objectives and policies, please refer to the Shareholder Update section at the end of the report.
What factors affected the U.S. economy and financial markets during the twelve-month reporting period ended October 31, 2021?
Supported by massive fiscal and monetary stimulus and economic reopening, the U.S. economy rebounded more quickly than expected from the deep downturn caused by the COVID-19 crisis and containment measures. The federal government’s relief measures have totaled approximately $5.3 trillion across six aid packages, which included direct payments to individuals and families, expanded unemployment insurance, loans to large and small businesses, funding for hospitals and health agencies, state and local governments, education and public health/vaccinations. Additionally, while not technically a pandemic spending measure, the $1.2 trillion Infrastructure Investment and Jobs Act that funds improvements to roads/bridges, broadband internet, airports and ports, and water and power systems was signed into law after the close of this reporting period on November 15, 2021. The U.S. Federal Reserve (Fed) has maintained short-term interest rates near zero and enacted credit facilities to help keep the financial system stable, lowering borrowing costs for businesses and individuals.
By the start of this reporting period, markets had largely stabilized from the initial shock of the health crisis. To recap, in March 2020, equity and commodity markets sold off and safe-haven assets rallied as countries initiated quarantines, restricted travel and shuttered factories and businesses, while an ill-timed oil price war between the Organization of the Petroleum Exporting Countries (OPEC) and non-OPEC member Russia further amplified oil price volatility. In late 2020, the announcement of high efficacy rates in several COVID 19 vaccine trials, followed by regulatory authorizations and public vaccination drives across Western countries,
This material is not intended to be a recommendation or investment advice, does not constitute a solicitation to buy, sell or hold a security or an investment strategy and is not provided in a fiduciary capacity. The information provided does not take into account the specific objectives or circumstances of any particular investor, or suggest any specific course of action. Investment decisions should be made based on an investor’s objectives and circumstances and in consultation with his or her advisors.
Certain statements in this report are forward-looking statements. Discussions of specific investments are for illustration only and are not intended as recommendations of individual investments. The forward-looking statements and other views expressed herein are those of the portfolio manager as of the date of this report. Actual future results or occurrences may differ significantly from those anticipated in any forward-looking statements, and the views expressed herein are subject to change at any time, due to numerous market and other factors. The Funds disclaim any obligation to update publicly or revise any forward-looking statements or views expressed herein.
The ratings disclosed are the lowest rating given by one of the following national rating agencies: Standard & Poor’s Group (S&P), Moody’s Investors Service, Inc. (Moody’s) or Fitch, Inc. (Fitch). Credit ratings are subject to change. AAA, AA, A and BBB are investment grade ratings, while BB, B, CCC, CC, C and D are below investment grade ratings. Holdings designated N/R are not rated by these national rating agencies.
Bond insurance guarantees only the payment of principal and interest on the bond when due, and not the value of the bonds themselves, which will fluctuate with the bond market and the financial success of the issuer and the insurer. Insurance relates specifically to the bonds in the portfolio and not to the share prices of a Fund. No representation is made as to the insurers’ ability to meet their commitments.
Refer to the Glossary of Terms Used in this Report for further definition of the terms used within this section.
6
improved the outlook for 2021, which contributed to risk-on sentiment in the markets. The positive sentiment was realized during the first half of 2021 as U.S. gross domestic product (GDP) expanded at an annualized rate of 6.3% in the first quarter of 2021 and 6.7% in the second quarter of 2021. However, economic growth slowed considerably in the third quarter of 2021 to a 2.1% annualized rate, dampened by the spread of the COVID-19 delta variant and constricted supply chains, according to the “second” estimate released by the Bureau of Economic Analysis.
Although supply bottlenecks, labor shortages and higher inflation have weighed on economic growth in the short term, consumer demand remains strong. Given the U.S. economy’s progress, the Fed began signaling a timeline for tapering pandemic monetary support by reducing its monthly bond purchases (which was initially announced at the November 2021 policy meeting, after the close of this reporting period), as well as suggested interest rate normalization that could start later in 2022. In addition to monetary policy, markets remained concerned about the political gridlock over raising the debt ceiling – the amount the U.S. government is allowed to borrow. (After the close of this reporting period, the government approved a $2.5 trillion increase to the debt limit, averting a default at the end of 2021.)
Although U.S. Treasury yields moved higher in the twelve-month reporting period, most notably in 10-year maturities, municipal yields at the long end of the yield curve were broadly unchanged. While a rising rate environment would typically signal a more challenging environment for municipal bonds, the improving fundamental credit backdrop and favorable supply-demand dynamics helped the municipal market stay resilient. Economic reopening and vaccine distribution bolstered investor confidence while the revenue recovery for many municipal issuers was V-shaped and strong. Additionally, the American Rescue Plan Act signed into law in March 2021 provided federal aid to the already improving financial positions of state and local governments. Credit ratings agencies upgraded their outlooks for most municipal sectors from negative to stable, and individual credit upgrades exceeded downgrades by a 2-to-1 margin in this reporting period. Overall, default risk stayed notably moderate. Supply issuance in 2021 year-to-date remained on pace with 2020’s record volume, with a significant, albeit moderating, proportion of issuance in taxable municipals and refunding deals. Demand also stayed strong, with consistently positive inflows that further supported credit spread narrowing and municipal bond performance.
Municipal bonds generally performed well in the twelve-month reporting period. Municipal yields increased across the short to intermediate maturity range while remaining nearly unchanged at the long end, leading to the outperformance of longer maturity municipal bonds. Credit spreads tightened significantly as the economic recovery progressed and demand remained strong for credits offering higher yields.
What key strategies were used to manage the Funds during the twelve-month reporting period ended October 31, 2021?
Each Fund’s investment objective is to provide current income exempt from regular federal income tax, and in the case of NEA the alternative minimum tax (“AMT”) applicable to individuals. Both Funds invest primarily in a portfolio of municipal obligations issued by state and local government authorities or certain U.S. territories. The Funds continued to take a bottom-up approach to discov-
7
Portfolio Manager’s Comments (continued)
ering sectors that appeared undervalued as well as individual credits that the portfolio management team believed had the potential to perform well over the long term.
Trading activity continued to focus on pursuing the Funds’ investment objectives. The Funds’ overall sector weightings were generally maintained and did not change significantly in this reporting period. In both NAD and NEA, pre-refunded sector weightings increased slightly as additional older holdings were advance refunded, while tobacco weightings dropped slightly due to continued calls of older issues in that sector. The Funds’ overall credit profiles also did not materially change over the course of the reporting period, although NAD and NEA did add very slightly to higher ratings categories as credit spreads generally continued to compress.
The opportunities for tax loss swapping greatly dissipated after the market’s rebound in the summer and fall of 2020, although there were a few tax loss swaps that did take place in NAD and NEA during the brief back-up in yields in March 2021 and again in October 2021. This strategy entailed selling depreciated bonds with lower embedded book yields and buying similarly structured but now higher yielding bonds. This approach was implemented to enhance the Funds’ income earning capability and to seek to make the Funds more tax efficient.
As of October 31, 2021, the Funds continued to use inverse floating rate securities. The Funds employ inverse floaters for a variety of reasons, including duration management and income and total return enhancement.
How did the Funds perform during the twelve-month reporting period ended October 31, 2021?
For the twelve months ended October 31, 2021, the Funds outperformed the NAD and NEA Blended Benchmark, which is composed of 80% S&P Municipal Bond Investment Grade Index and 20% S&P Municipal Bond High Yield Index (the “Blended Benchmark”). For the purposes of this Performance Commentary, references to relative performance are in comparison to the NAD and NEA Blended Benchmark.
The main factors contributing to the outperformance of the portfolios during the reporting period were yield curve and duration positioning, along with credit quality allocation. During the reporting period, longer maturity ranges consistently outperformed shorter ranges. As a result, longer duration bonds generally outperformed, which benefitted the relative performance of both portfolios since they were both overweight to longer duration bonds. From a credit quality standpoint, lower rated bonds outperformed high grade bonds as credit spreads tightened during the reporting period. With the AAA and AA rating categories underperforming, NAD’s portfolio benefited from an underweight and favorable security selection in both categories while NEA’s portfolio was aided by an underweight to the AAA rated category and favorable security selection in both AAA and AA rated paper. Both portfolios were overweight to the A rated category, which generally performed in-line with the Blended Benchmark,
8
but benefited from positive security selection. BBB rated bonds outperformed, and the overweights to these lower rated investment grade bonds contributed positively to relative performance in both portfolios.
The outperformance was partially offset by sector allocations, particularly within the pre-refunded sector. Both portfolios held an overweight allocation to the pre-refunded sector, which detracted from relative performance. Pre-refunded bonds are typically vintage holdings retained for their higher book yields, resulting in more favorable distributable income characteristics for the Funds. Other detractors included the portfolios’ underweight in the “other/miscellaneous” transportation category, which includes various passenger and commuter rail projects. However, NAD’s portfolio held a smaller underweight in the category, resulting in a smaller negative impact compared to NEA’s portfolio. Both portfolios were underweight to the industrial development revenue (IDR) sector, which also detracted from relative performance.
9
Fund Leverage
IMPACT OF THE FUNDS’ LEVERAGE STRATEGIES ON PERFORMANCE
One important factor impacting the returns of the Funds’ common shares relative to their comparative benchmarks was the Funds’ use of leverage through their issuance of preferred shares, reverse repurchase agreements for NEA and/or investments in inverse floating rate securities, which represent leveraged investments in underlying bonds. The Funds use leverage because our research has shown that, over time, leveraging provides opportunities for additional income. The opportunity arises when short-term rates that the Fund pays on its leveraging instruments are lower than the interest the Fund earns on its portfolio of long-term bonds that it has bought with the proceeds of that leverage. This has been particularly true in the recent market environment where short-term rates have been low by historical standards.
However, use of leverage can expose Fund common shares to additional price volatility. When a Fund uses leverage, the Fund’s common shares will experience a greater increase in their net asset value if the municipal bonds acquired through the use of leverage increase in value, but will also experience a correspondingly larger decline in their net asset value if the bonds acquired through leverage decline in value. All this will make the shares’ total return performance more variable, over time.
In addition, common share income in levered funds will typically decrease in comparison to unlevered funds when short-term interest rates increase and increase when short-term interest rates decrease. In recent quarters, fund leverage expenses have generally tracked the overall movement of short-term tax-exempt interest rates. While fund leverage expenses are somewhat higher than their recent lows, leverage nevertheless continues to provide the opportunity for incremental common share income, particularly over longer-term periods.
| | | |
Leverage had a positive impact on the performance of NAD and NEA over this reporting period. | | |
| As of October 31, 2021, the Funds’ percentages of leverage are as shown in the accompanying table. | | |
| | NAD | NEA |
| Effective Leverage* | 36.91% | 37.35% |
| Regulatory Leverage* | 35.16% | 35.32% |
| * | | Effective leverage is a Fund’s effective economic leverage, and includes both regulatory leverage and the leverage effects of certain derivative and other investments in a Fund’s portfolio that increase the Fund’s investment exposure. Currently, the leverage effects of Tender Option Bond (TOB) inverse floater holdings and reverse repurchase agreements are included in effective leverage values, in addition to any regulatory leverage. Regulatory leverage consists of preferred shares issued or borrowings of a Fund. Both of these are part of a Fund’s capital structure. A Fund, however, may from time to time borrow on a typically transient basis in connection with its day-to-day operations, primarily in connection with the need to settle portfolio trades. Such incidental borrowings are excluded from the calculation of a Fund’s effective leverage ratio. Regulatory leverage is subject to asset coverage limits set forth in the Investment Company Act of 1940. |
10
THE FUNDS’ REGULATORY LEVERAGE
As of October 31, 2021, the Funds have issued and outstanding preferred shares as shown in the accompanying table.
| | | | |
| | Variable Rate | Variable Rate | |
| | Preferred* | Remarketed Preferred** | |
| | Shares | Shares | |
| | Issued at | Issued at | |
| | Liquidation | Liquidation | |
| | Preference | Preference | Total |
| NAD | $1,406,500,000 | $ 632,000,000 | $2,038,500,000 |
| NEA | $ 836,500,000 | $1,728,300,000 | $2,564,800,000 |
| * | | Preferred shares of the Fund featuring a floating rate dividend based on a predetermined formula or spread to an index rate. Includes the following preferred shares AMTP, iMTP, MFP-VRM and VRDP in Special Rate Mode, where applicable. See Notes to Financial Statements, Note 5 – Fund Shares for further details. |
| ** | | Preferred shares of the Fund featuring floating rate dividends set by a remarketing agent via a regular remarketing. Includes the following preferred shares VRDP not in Special Rate Mode, MFP-VRRM and MFP-VRDM, where applicable. See Notes to Financial Statements, Note 5 – Fund Shares for further details. |
Refer to Notes to Financial Statements, Note 5 — Fund Shares for further details on preferred shares and each Fund’s respective transactions.
Reverse Repurchase Agreements
As noted previously, NEA used reverse repurchase agreements, in which the Fund sells to a counterparty a security that it holds with a contemporaneous agreement to repurchase the same security at an agreed upon price and date. During the current reporting period, NEA temporarily used reverse repurchase agreements while awaiting the settlement of newly issued preferred shares. The Fund’s transactions in reverse repurchase agreements are as shown in the accompanying table.
| | | | | | | | | |
| | | | | | | | Subsequent to the Close of |
| | Current Reporting Period | | | | the Reporting Period |
| |
| Outstanding | | | Outstanding | Average | | | | Outstanding |
| Balance as of | | | Balance as of | Balance | | | | Balance as of |
| November 1, 2020 | Sales | Purchases | October 31, 2021 | Outstanding* | | Sales | Purchases | December 28, 2021 |
| $ — | $130,900,000 | $(130,900,000) | $ — | $130,900,000 | | $ — | $ — | $ — |
| * | | For the period February 1, 2021 through February 18, 2021. |
Refer to Notes to Financial Statements, Note 9 - Fund Leverage for further details.
11
Common Share Information
COMMON SHARE DISTRIBUTION INFORMATION
The following information regarding the Funds’ distributions is current as of October 31, 2021. Each Fund’s distribution levels may vary over time based on each Fund’s investment activity and portfolio investment value changes.
During the current reporting period, each Fund’s distributions to common shareholders were as shown in the accompanying table.
| | Per Common |
| | Share Amounts |
| Monthly Distributions (Ex-Dividend Date) | NAD | NEA |
| November 2020 | $0.0595 | $0.0585 |
| December | 0.0595 | 0.0585 |
| January | 0.0595 | 0.0585 |
| February* | 0.0595 | 0.0586 |
| March | 0.0595 | 0.0585 |
| April | 0.0595 | 0.0585 |
| May | 0.0595 | 0.0585 |
| June | 0.0595 | 0.0585 |
| July | 0.0595 | 0.0585 |
| August | 0.0595 | 0.0585 |
| September | 0.0595 | 0.0585 |
| October 2021 | 0.0595 | 0.0585 |
| Total Distributions from Net Investment Income | $0.7140 | $0.7021 |
| Yields | | |
| Market Yield** | 4.57% | 4.62% |
| Taxable-Equivalent Yield** | 7.69% | 7.78% |
| * | | Total of distributions declared by NEA before and after the Reorganization as further described in the Notes to Financial Statements. |
| ** | | Market Yield is based on the Fund’s current annualized monthly dividend divided by the Fund’s current market price as of the end of the reporting period. Taxable-Equivalent Yield represents the yield that must be earned on a fully taxable investment in order to equal the yield of the Fund on an after-tax basis. It is based on a federal income tax rate of 40.8%. Your actual federal income tax rate may differ from the assumed rate. The Taxable-Equivalent Yield also takes into account the percentage of the Fund’s income generated and paid by the Fund (based on payments made during the previous calendar year) that was not exempt from federal income tax. Separately, if the comparison were instead to investments that generate qualified dividend income, which is taxable at a rate lower than an individual’s ordinary graduated tax rate, the fund’s Taxable-Equivalent Yield would be lower. |
Each Fund seeks to pay regular monthly dividends out of its net investment income at a rate that reflects its past and projected net income performance. To permit each Fund to maintain a more stable monthly dividend, the Fund may pay dividends at a rate that may be more or less than the amount of net income actually earned by the Fund during the period. Distributions to common shareholders are determined on a tax basis, which may differ from amounts recorded in the accounting records. In instances where the monthly dividend exceeds the earned net investment income, the Fund would report a negative undistributed net ordinary income. Refer to Note 6 – Income Tax Information for additional information regarding the amounts of undistributed net ordinary income and undistributed net long-term capital gains and the character of the actual distributions paid by the Fund during the period.
All monthly dividends paid by each Fund during the current reporting period were paid from net investment income. If a portion of the Fund’s monthly distributions is sourced or comprised of elements other than net investment income, including capital gains and/or a return of capital, shareholders will be notified of those sources. For financial reporting purposes, the per share amounts
12
of each Fund’s distributions for the reporting period are presented in this report’s Financial Highlights. For income tax purposes, distribution information for each Fund as of its most recent tax year end is presented in Note 6 – Income Tax Information within the Notes to Financial Statements of this report.
NUVEEN CLOSED-END FUND DISTRIBUTION AMOUNTS
The Nuveen Closed-End Funds’ monthly and quarterly periodic distributions to shareholders are posted on www.nuveen.com and can be found on Nuveen’s enhanced closed-end fund resource page, which is at https://www.nuveen.com/resource-center-closed-endfunds, along with other Nuveen closed-end fund product updates. To ensure timely access to the latest information, shareholders may use a subscribe function, which can be activated at this web page (https://www.nuveen.com/subscriptions).
COMMON SHARE REPURCHASES
During August 2021, the Funds’ Board of Trustees reauthorized an open-market share repurchase program, allowing each Fund to repurchase an aggregate of up to approximately 10% of its outstanding common shares.
As of October 31, 2021, and since the inception of the Funds’ repurchase programs, the Funds have cumulatively repurchased and retired their outstanding common shares as shown in the accompanying table.
| | | |
| | NAD | NEA |
| Common shares cumulatively repurchased and retired | 17,900 | 75,000 |
| Common shares authorized for repurchase | 23,340,000 | 29,900,000 |
During the current reporting period, the Funds did not repurchase any of their outstanding common shares.
OTHER COMMON SHARE INFORMATION
As of October 31, 2021, the Funds’ common share prices were trading at a premium/(discount) to their common share NAVs and trading at an average premium/(discount) to NAV during the current reporting period, as follows:
| | | |
| | NAD | NEA |
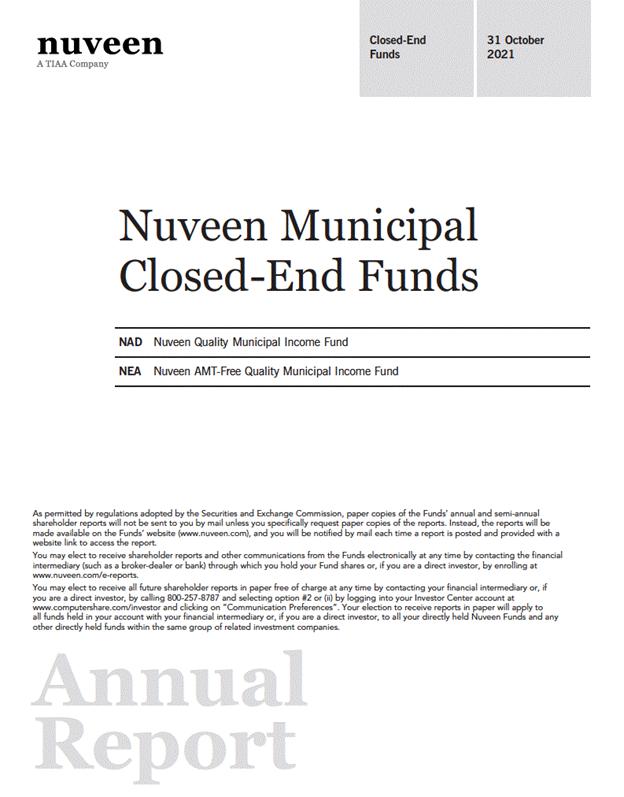
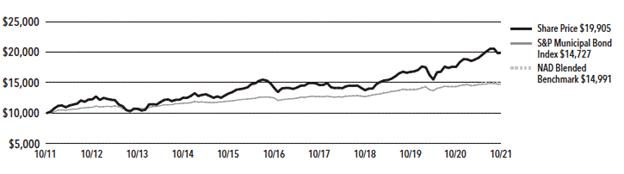
| Common share NAV | $16.11 | $15.71 |
| Common share price | $15.63 | $15.18 |
| Premium/(Discount) to NAV | (2.98)% | (3.37)% |
| Average premium/(discount) to NAV | (5.16)% | (5.00)% |
13
| | |
| NAD | Nuveen Quality Municipal Income Fund |
| | Performance Overview and Holding Summaries as of October 31, 2021 |
Refer to the Glossary of Terms Used in this Report for further definition of the terms used within this section.
Average Annual Total Returns as of October 31, 2021
| | Average Annual |
| | 1-Year | 5-Year | 10-Year |
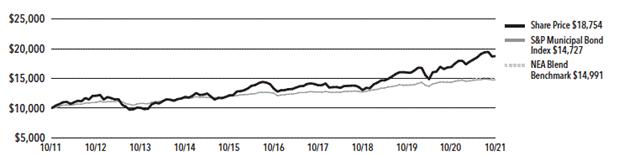
| NAD at Common Share NAV | 6.85% | 5.08% | 6.46% |
| NAD at Common Share Price | 13.31% | 7.11% | 7.13% |
| S&P Municipal Bond Index | 2.76% | 3.33% | 3.95% |
| NAD Blended Benchmark1,2 | 3.66% | 3.67% | 4.12% |
Past performance is not predictive of future results. Current performance may be higher or lower than the data shown. Returns do not reflect the deduction of taxes that shareholders may have to pay on Fund distributions or upon the sale of Fund shares. Returns at NAV are net of Fund expenses, and assume reinvestment of distributions. Comparative index return information is provided for the Fund’s shares at NAV only. Indexes are not available for direct investment.
Daily Common Share NAV and Share Price
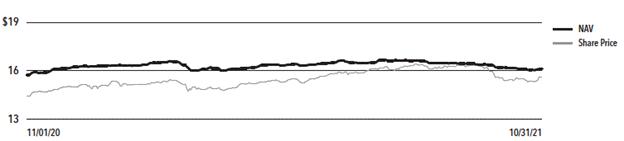
Growth of an Assumed $10,000 Investment as of October 31, 2021 — Common Share Price
| 1 | | For purposes of Fund performance, relative results are measured against this benchmark/index. |
| 2 | | NAD Blended Benchmark consists of the returns of the S&P Municipal Bond Index prior to 9/12/16 and thereafter: 1) 80% of the return of the S&P Municipal Bond Investment Grade Index and 2) 20% of the return of the S&P Municipal Bond High Yield Index. |
14
This data relates to the securities held in the Fund’s portfolio of investments as of the end of the reporting period. It should not be construed as a measure of performance for the Fund itself. Holdings are subject to change.
The ratings disclosed are the lowest rating given by one of the following national rating agencies: Standard & Poor’s Group, Moody’s Investors Service, Inc. or Fitch, Inc. Credit ratings are subject to change. AAA, AA, A and BBB are investment grade ratings; BB, B, CCC, CC, C and D are below-investment grade ratings. Holdings designated N/R are not rated by these national rating agencies.
| | |
| Fund Allocation | |
| (% of net assets) | |
| Long-Term Municipal Bonds | 154.5% |
| Investment Companies | 0.0% |
| Corporate Bonds | 0.0% |
| Short-Term Municipal Bonds | 0.2% |
| Other Assets Less Liabilities | 2.4% |
| Net Assets Plus Floating Rate Obligations, | |
| AMTP Shares, net of deferred offering costs, |
| MFP Shares, net of deferred offering | |
| costs & VRDP Shares, net of deferred | |
| offering costs | 157.1% |
| Floating Rate Obligations | (3.0)% |
| AMTP Shares, net of deferred | |
| offering costs | (19.3)% |
| MFP Shares, net of deferred | |
| offering costs | (18.0)% |
| VRDP Shares, net of deferred | |
| offering costs | (16.8)% |
| Net Assets | 100% |
| |
| Portfolio Credit Quality | |
| (% of total investment exposure) | |
| U.S. Guaranteed | 11.3% |
| AAA | 2.0% |
| AA | 18.5% |
| A | 39.5% |
| BBB | 17.1% |
| BB or Lower | 6.2% |
| N/R (not rated) | 5.4% |
| N/A (not applicable) | 0.0% |
| Total | 100% |
| | |
| Portfolio Composition | |
| (% of total investments) | |
| Transportation | 26.8% |
| Health Care | 17.0% |
| Tax Obligation/Limited | 15.2% |
| U.S. Guaranteed | 11.1% |
| Utilities | 9.9% |
| Tax Obligation/General | 9.2% |
| Other | 10.8% |
| Total | 100% |
| States and Territories | |
| (% of total municipal bonds) | |
| Texas | 11.5% |
| Illinois | 9.4% |
| Maryland | 7.4% |
| California | 7.4% |
| Colorado | 6.7% |
| New York | 6.1% |
| Florida | 5.6% |
| Ohio | 3.8% |
| Pennsylvania | 3.3% |
| New Jersey | 3.0% |
| Missouri | 2.8% |
| South Carolina | 2.7% |
| Washington | 2.1% |
| Michigan | 2.0% |
| Louisiana | 2.0% |
| Arizona | 2.0% |
| Georgia | 1.4% |
| Oregon | 1.4% |
| District of Columbia | 1.4% |
| Other1 | 18.0% |
| Total | 100% |
| 1 | | See Portfolio of Investments for details on “other” States and Territories. |
15
| | |
| NEA | Nuveen AMT-Free Quality Municipal |
| | Income Fund |
| | Performance Overview and Holding Summaries as of October 31, 2021 |
Refer to the Glossary of Terms Used in this Report for further definition of the terms used within this section.
Average Annual Total Returns as of October 31, 2021
| | | | |
| | | Average Annual | |
| | 1-Year | 5-Year | 10-Year |
| NEA at Common Share NAV | 5.91% | 5.08% | 5.78% |
| NEA at Common Share Price | 10.92% | 7.16% | 6.49% |
| S&P Municipal Bond Index | 2.76% | 3.33% | 3.95% |
| NEA Blended Benchmark1,2 | 3.66% | 3.67% | 4.12% |
Past performance is not predictive of future results. Current performance may be higher or lower than the data shown. Returns do not reflect the deduction of taxes that shareholders may have to pay on Fund distributions or upon the sale of Fund shares. Returns at NAV are net of Fund expenses, and assume reinvestment of distributions. Comparative index return information is provided for the Fund’s shares at NAV only. Indexes are not available for direct investment.
Daily Common Share NAV and Share Price
Growth of an Assumed $10,000 Investment as of October 31, 2021 — Common Share Price
| 1 | | For purposes of Fund performance, relative results are measured against this benchmark/index. |
| 2 | | NEA Blended Benchmark consists of the returns of the S&P Municipal Bond Index prior to 9/12/16 and thereafter: 1) 80% of the return of the S&P Municipal Bond Investment Grade Index and 2) 20% of the return of the S&P Municipal Bond High Yield Index. |
16
This data relates to the securities held in the Fund’s portfolio of investments as of the end of the reporting period. It should not be construed as a measure of performance for the Fund itself. Holdings are subject to change.
The ratings disclosed are the lowest rating given by one of the following national rating agencies: Standard & Poor’s Group, Moody’s Investors Service, Inc. or Fitch, Inc. Credit ratings are subject to change. AAA, AA, A and BBB are investment grade ratings; BB, B, CCC, CC, C and D are below-investment grade ratings. Holdings designated N/R are not rated by these national rating agencies.
| | |
| Fund Allocation | |
| (% of net assets) | |
| Long-Term Municipal Bonds | 154.8% |
| Short-Term Municipal Bonds | 0.1% |
| Other Assets Less Liabilities | 2.3% |
| Net Assets Plus Floating Rate Obligations, | |
| AMTP Shares, net of deferred offering costs, |
| MFP Shares, net of deferred offering | |
| costs & VRDP Shares, net of deferred | |
| offering costs | 157.2% |
| Floating Rate Obligations | (2.8)% |
| AMTP Shares, net of deferred | |
| offering costs | (6.7)% |
| MFP Shares, net of deferred | |
| offering costs | (23.1)% |
| VRDP Shares, net of deferred | |
| offering costs | (24.6)% |
| Net Assets | 100% |
| Portfolio Credit Quality | |
| (% of total investment exposure) | |
| U.S. Guaranteed | 12.5% |
| AAA | 3.1% |
| AA | 23.7% |
| A | 35.2% |
| BBB | 15.3% |
| BB or Lower | 5.6% |
| N/R (not rated) | 4.6% |
| Total | 100% |
| Portfolio Composition | |
| (% of total investments) | |
| Health Care | 20.7% |
| Tax Obligation/Limited | 16.4% |
| Transportation | 15.4% |
| U.S. Guaranteed | 12.5% |
| Tax Obligation/General | 11.5% |
| Utilities | 10.7% |
| Education and Civic Organizations | 7.1% |
| Other | 5.7% |
| Total | 100% |
| States and Territories | |
| (% of total municipal bonds) | |
| Illinois | 10.1% |
| Michigan | 9.7% |
| Colorado | 7.2% |
| Texas | 6.8% |
| New York | 5.8% |
| California | 4.9% |
| North Carolina | 4.7% |
| Florida | 4.3% |
| Ohio | 4.1% |
| New Jersey | 4.0% |
| Pennsylvania | 3.6% |
| Missouri | 2.9% |
| South Carolina | 2.5% |
| Georgia | 2.4% |
| Wisconsin | 2.2% |
| District of Columbia | 2.1% |
| Washington | 2.0% |
| Louisiana | 1.9% |
| Other1 | 18.8% |
| Total | 100% |
| 1 | | See Portfolio of Investments for details on “other” States and Territories. |
17
Shareholder Meeting Report
The annual meeting of shareholders was held on August 4, 2021 for NAD and NEA. The meeting was held virtually due to public health concerns regarding the ongoing COVID-19 pandemic; at this meeting the shareholders were asked to elect Board members.
| | | | | |
| | NAD | NEA |
| | Common and | Preferred | Common and | Preferred |
| | Preferred | shares | Preferred | shares |
| | shares voting | voting | shares voting | voting |
| | together | together | together | together |
| | as a class | as a class | as a class | as a class |
| Approval of the Board Members was reached as follows: | | | | |
| Jack B. Evans | | | | |
| For | 131,201,873 | — | 177,963,388 | — |
| Withhold | 58,701,191 | — | 68,180,947 | — |
| Total | 189,903,064 | — | 246,144,335 | — |
| Joanne T. Medero | | | | |
| For | 184,486,096 | — | 239,973,683 | — |
| Withhold | 5,416,968 | — | 6,170,652 | — |
| Total | 189,903,064 | — | 246,144,335 | — |
| Matthew Thornton III | | | | |
| For | 184,565,873 | — | 240,030,046 | — |
| Withhold | 5,337,191 | — | 6,114,289 | — |
| Total | 189,903,064 | — | 246,144,335 | — |
| William C. Hunter | | | | |
| For | — | 3,773 | — | 227,364 |
| Withhold | — | 16,612 | — | 124,910 |
| Total | — | 20,385 | — | 352,274 |
| Albin F. Moschner | | | | |
| For | — | 3,773 | — | 227,364 |
| Withhold | — | 16,612 | — | 124,910 |
| Total | — | 20,385 | — | 352,274 |
18
Report of Independent Registered Public Accounting Firm
To the Shareholders and Board of Trustees
Nuveen Quality Municipal Income Fund
Nuveen AMT-Free Quality Municipal Income Fund:
Opinion on the Financial Statements
We have audited the accompanying statements of assets and liabilities of Nuveen Quality Municipal Income Fund and Nuveen AMT-Free Quality Municipal Income Fund (the Funds), including the portfolios of investments, as of October 31, 2021, the related statements of operations and cash flows for the year then ended, the statements of changes in net assets for each of the years in the two-year period then ended, and the related notes (collectively, the financial statements) and the financial highlights for each of the years in the five-year period then ended. In our opinion, the financial statements and financial highlights present fairly, in all material respects, the financial position of the Funds as of October 31, 2021, the results of their operations and cash flows for the year then ended, the changes in their net assets for each of the years in the two-year period then ended, and the financial highlights for each of the years in the five-year period then ended, in conformity with U.S. generally accepted accounting principles.
Basis for Opinion
These financial statements and financial highlights are the responsibility of the Funds’ management. Our responsibility is to express an opinion on these financial statements and financial highlights based on our audits. We are a public accounting firm registered with the Public Company Accounting Oversight Board (United States) (PCAOB) and are required to be independent with respect to the Funds in accordance with the U.S. federal securities laws and the applicable rules and regulations of the Securities and Exchange Commission and the PCAOB.
We conducted our audits in accordance with the standards of the PCAOB. Those standards require that we plan and perform the audit to obtain reasonable assurance about whether the financial statements and financial highlights are free of material misstatement, whether due to error or fraud. Our audits included performing procedures to assess the risks of material misstatement of the financial statements and financial highlights, whether due to error or fraud, and performing procedures that respond to those risks. Such procedures included examining, on a test basis, evidence regarding the amounts and disclosures in the financial statements and financial highlights. Such procedures also included confirmation of securities owned as of October 31, 2021, by correspondence with custodians and brokers or other appropriate auditing procedures. Our audits also included evaluating the accounting principles used and significant estimates made by management, as well as evaluating the overall presentation of the financial statements and financial highlights. We believe that our audits provide a reasonable basis for our opinion.
/s/ KPMG LLP
We have served as the auditor of one or more Nuveen investment companies since 2014.
Chicago, Illinois
December 28, 2021
19
| | |
| NAD | Nuveen Quality Municipal Income Fund |
| | Portfolio of Investments |
| | October 31, 2021 |
| | | | | |
| Principal | | Optional Call | | |
| Amount (000) | Description (1) | Provisions (2) | Ratings (3) | Value |
| | LONG-TERM INVESTMENTS – 154.5% (99.8% of Total Investments) | | | |
| | MUNICIPAL BONDS – 154.5% (99.8% of Total Investments) | | | |
| | Alabama – 1.4% (0.9% of Total Investments) | | | |
| | Alabama State Port Authority, Docks Facilities Revenue Bonds, Refunding Series 2017A: | | | |
| $ 5,000 | 5.000%, 10/01/33 – AGM Insured (AMT) | 10/27 at 100.00 | BBB+ | $ 5,958,350 |
| 5,455 | 5.000%, 10/01/34 – AGM Insured (AMT) | 10/27 at 100.00 | BBB+ | 6,487,468 |
| 5,550 | 5.000%, 10/01/35 – AGM Insured (AMT) | 10/27 at 100.00 | BBB+ | 6,593,622 |
| 4,430 | Gardendale, Alabama, General Obligation Warrants, Series 2021B, 4.000%, 5/01/46 | 5/31 at 100.00 | AA– | 5,195,460 |
| 17,500 | Lower Alabama Gas District, Alabama, Gas Project Revenue Bonds, Series 2016A, | No Opt. Call | A2 | 24,891,300 |
| | 5.000%, 9/01/46 | | | |
| 4,165 | Tuscaloosa County Industrial Development Authority, Alabama, Gulf Opportunity Zone | 5/29 at 100.00 | N/R | 4,795,997 |
| | Bonds, Hunt Refining Project, Refunding Series 2019A, 5.250%, 5/01/44, 144A | | | |
| 42,100 | Total Alabama | | | 53,922,197 |
| | Alaska – 0.2% (0.1% of Total Investments) | | | |
| | Alaska Industrial Development and Export Authority, Power Revenue Bonds, Snettisham | | | |
| | Hydroelectric Project, Refunding Series 2015: | | | |
| 1,580 | 5.000%, 1/01/24 (AMT) | No Opt. Call | Baa2 | 1,708,170 |
| 3,400 | 5.000%, 1/01/25 (AMT) | No Opt. Call | Baa2 | 3,776,584 |
| 1,000 | 5.000%, 1/01/28 (AMT) | 7/25 at 100.00 | Baa2 | 1,103,760 |
| 1,075 | 5.000%, 1/01/29 (AMT) | 7/25 at 100.00 | Baa2 | 1,181,145 |
| 300 | 5.000%, 1/01/31 (AMT) | 7/25 at 100.00 | Baa2 | 327,447 |
| 395 | Northern Tobacco Securitization Corporation, Alaska, Tobacco Settlement Asset-Backed | 6/31 at 100.00 | BBB+ | 438,790 |
| | Bonds, Senior Series 2021A Class 1, 4.000%, 6/01/50 | | | |
| 7,750 | Total Alaska | | | 8,535,896 |
| | Arizona – 3.1% (2.0% of Total Investments) | | | |
| 980 | Apache County Industrial Development Authority, Arizona, Pollution Control Revenue | 3/22 at 100.00 | A– | 992,377 |
| | Bonds, Tucson Electric Power Company, Series 20102A, 4.500%, 3/01/30 | | | |
| 2,500 | Arizona Health Facilities Authority, Revenue Bonds, Scottsdale Lincoln Hospitals | 12/24 at 100.00 | A2 | 2,817,700 |
| | Project, Refunding Series 2014A, 5.000%, 12/01/39 | | | |
| 2,000 | Arizona Industrial Development Authority, Arizona, Education Revenue Bonds, Academies of | 1/28 at 100.00 | AA– | 2,311,420 |
| | Math & Science Projects, Series 2018A, 5.000%, 7/01/48 | | | |
| | Arizona Sports and Tourism Authority, Tax Revenue Bonds, Multipurpose Stadium Facility | | | |
| | Project, Refunding Senior Series 2012A: | | | |
| 1,490 | 5.000%, 7/01/30 | 7/22 at 100.00 | A | 1,528,531 |
| 2,500 | 5.000%, 7/01/32 | 7/22 at 100.00 | A | 2,563,450 |
| 2,335 | 5.000%, 7/01/36 | 7/22 at 100.00 | A | 2,392,371 |
| 3,345 | Maricopa County Industrial Development Authority, Arizona, Hospital Revenue Bonds, | 3/31 at 100.00 | A2 | 3,807,346 |
| | HonorHealth, Series 2021A, 4.000%, 9/01/51 | | | |
| 11,795 | Maricopa County Industrial Development Authority, Arizona, Revenue Bonds, Banner Health, | 1/27 at 100.00 | AA– | 13,239,652 |
| | Refunding Series 2016A, 4.000%, 1/01/36 | | | |
| | Phoenix Civic Improvement Corporation, Arizona, Airport Revenue Bonds, Junior Lien | | | |
| | Series 2019A: | | | |
| 5,500 | 4.000%, 7/01/44 | 7/29 at 100.00 | A | 6,306,190 |
| 2,000 | 4.000%, 7/01/49 | 7/29 at 100.00 | A | 2,272,120 |
| 3,165 | Phoenix Civic Improvement Corporation, Arizona, Airport Revenue Bonds, Junior Lien | 7/29 at 100.00 | A | 3,828,289 |
| | Series 2019B, 5.000%, 7/01/44 (AMT) | | | |
| 12,935 | Phoenix Civic Improvement Corporation, Arizona, Airport Revenue Bonds, Senior Lien | 7/27 at 100.00 | A+ | 15,355,009 |
| | Series 2017A, 5.000%, 7/01/47 (AMT) | | | |
| 6,000 | Phoenix Civic Improvement Corporation, Arizona, Airport Revenue Bonds, Senior Lien | 7/28 at 100.00 | A+ | 7,218,240 |
| | Series 2018, 5.000%, 7/01/48 (AMT) | | | |
20
| | | | | |
| Principal | | Optional Call | | |
| Amount (000) | Description (1) | Provisions (2) | Ratings (3) | Value |
| | Arizona (continued) | | | |
| $ 7,000 | Phoenix Civic Improvement Corporation, Arizona, Revenue Bonds, Civic Plaza Expansion | No Opt. Call | AA | $ 10,523,170 |
| | Project, Series 2005B, 5.500%, 7/01/39 – FGIC Insured | | | |
| 2,475 | Pima County Industrial Development Authority, Arizona, Revenue Bonds, Tucson Medical | 4/31 at 100.00 | A | 2,841,968 |
| | Center, Series 2021A, 4.000%, 4/01/46 | | | |
| 1,000 | Pinal County Electrical District 4, Arizona, Electric System Revenue Bonds, Refunding | 12/25 at 100.00 | AA | 1,096,350 |
| | Series 2015, 4.000%, 12/01/38 – AGM Insured | | | |
| | Salt Verde Financial Corporation, Arizona, Senior Gas Revenue Bonds, Citigroup Energy | | | |
| | Inc Prepay Contract Obligations, Series 2007: | | | |
| 500 | 5.500%, 12/01/29 | No Opt. Call | BBB+ | 645,525 |
| 24,765 | 5.000%, 12/01/37 | No Opt. Call | BBB+ | 33,991,944 |
| 1,100 | Student and Academic Services LLC, Arizona, Lease Revenue Bonds, Northern Arizona | 6/24 at 100.00 | A2 | 1,214,169 |
| | University Project, Series 2014, 5.000%, 6/01/34 – BAM Insured | | | |
| 93,385 | Total Arizona | | | 114,945,821 |
| | Arkansas – 0.2% (0.1% of Total Investments) | | | |
| 4,000 | Arkansas Development Finance Authority, Industrial Development Revenue Bonds, Big River | 9/26 at 103.00 | B | 4,358,560 |
| | Steel Project, Series 2019, 4.500%, 9/01/49 (AMT), 144A | | | |
| 2,055 | Arkansas State University, Student Fee Revenue Bonds, Jonesboro Campus, Series 2013, | 12/23 at 100.00 | A1 | 2,220,612 |
| | 4.875%, 12/01/43 | | | |
| 6,055 | Total Arkansas | | | 6,579,172 |
| | California – 11.5% (7.4% of Total Investments) | | | |
| 1,535 | Alameda Corridor Transportation Authority, California, Revenue Bonds, Senior Lien Series | No Opt. Call | A– | 1,092,229 |
| | 1999A, 0.000%, 10/01/37 – NPFG Insured | | | |
| | Anaheim Public Financing Authority, California, Lease Revenue Bonds, Public Improvement | | | |
| | Project, Series 1997C: | | | |
| 2,945 | 0.000%, 9/01/27 – AGM Insured | No Opt. Call | A2 | 2,729,131 |
| 7,150 | 0.010%, 9/01/28 – AGM Insured | No Opt. Call | A2 | 6,473,109 |
| 2,455 | 0.000%, 9/01/32 – AGM Insured | No Opt. Call | A2 | 1,993,705 |
| 95 | 0.000%, 9/01/35 – AGM Insured | No Opt. Call | AA | 70,794 |
| 105 | 0.000%, 9/01/35 – AGM Insured (ETM) | No Opt. Call | AA (4) | 82,880 |
| | Bay Area Toll Authority, California, Revenue Bonds, San Francisco Bay Area Toll Bridge, | | | |
| | Series 2013S-4: | | | |
| 10,000 | 5.000%, 4/01/38 (Pre-refunded 4/01/23) | 4/23 at 100.00 | A1 (4) | 10,680,000 |
| 3,500 | 5.250%, 4/01/53 (Pre-refunded 4/01/23) | 4/23 at 100.00 | A1 (4) | 3,750,285 |
| 1,055 | Brisbane School District, San Mateo County, California, General Obligation Bonds, | No Opt. Call | A2 | 796,799 |
| | Election 2003 Series 2005, 0.000%, 7/01/35 – AGM Insured | | | |
| | Byron Unified School District, Contra Costa County, California, General Obligation | | | |
| | Bonds, Series 2007B: | | | |
| 60 | 0.000%, 8/01/32 (ETM) | No Opt. Call | A2 (4) | 50,244 |
| 235 | 0.000%, 8/01/32 – SYNCORA GTY Insured (ETM) | No Opt. Call | N/R (4) | 198,897 |
| 1,405 | 0.000%, 8/01/32 – SYNCORA GTY Insured | No Opt. Call | A+ | 1,125,082 |
| | Calexico Unified School District, Imperial County, California, General Obligation Bonds, | | | |
| | Series 2005B: | | | |
| 3,685 | 0.000%, 8/01/31 – FGIC Insured | No Opt. Call | A | 3,062,382 |
| 4,505 | 0.000%, 8/01/33 – FGIC Insured | No Opt. Call | A | 3,550,706 |
| | California Health Facilities Financing Authority, California, Revenue Bonds, Sutter | | | |
| | Health, Refunding Series 2016B: | | | |
| 2,855 | 5.000%, 11/15/46 (Pre-refunded 11/15/26) | 11/26 at 100.00 | N/R (4) | 3,478,047 |
| 4,145 | 5.000%, 11/15/46 | 11/26 at 100.00 | A | 4,911,659 |
| 22,520 | California Health Facilities Financing Authority, California, Revenue Bonds, Sutter | 11/27 at 100.00 | A | 27,301,897 |
| | Health, Refunding Series 2017A, 5.000%, 11/15/48 | | | |
| 2,275 | California Health Facilities Financing Authority, California, Revenue Bonds, Sutter | 11/27 at 100.00 | A | 2,591,293 |
| | Health, Series 2018A, 4.000%, 11/15/42 | | | |
| 710 | California Health Facilities Financing Authority, Revenue Bonds, Saint Joseph Health | 7/23 at 100.00 | AA– | 764,471 |
| | System, Series 2013A, 5.000%, 7/01/37 | | | |
21
| NAD | Nuveen Quality Municipal Income Fund |
| | Portfolio of Investments (continued) |
| | October 31, 2021 |
| | | | | |
| Principal | | Optional Call | | |
| Amount (000) | Description (1) | Provisions (2) | Ratings (3) | Value |
| | California (continued) | | | |
| | California Health Facilities Financing Authority, Revenue Bonds, Stanford Hospitals and | | | |
| | Clinics, Tender Option Bond Trust 2016-XG0049: | | | |
| $ 790 | 9.434%, 8/15/51 (Pre-refunded 8/15/22), 144A (IF) (5) | 8/22 at 100.00 | AA– (4) | $ 849,843 |
| 825 | 9.442%, 8/15/51 (Pre-refunded 8/15/22), 144A (IF) (5) | 8/22 at 100.00 | AA– (4) | 887,551 |
| 2,140 | 9.442%, 8/15/51 (Pre-refunded 8/15/22), 144A (IF) (5) | 8/22 at 100.00 | AA– (4) | 2,302,255 |
| 5,000 | California Municipal Finance Authority, Revenue Bonds, Linxs APM Project, Senior Lien | 6/28 at 100.00 | BBB– | 5,921,450 |
| | Series 2018A, 5.000%, 12/31/47 (AMT) | | | |
| 3,250 | California Municipal Finance Authority, Revenue Bonds, Community Medical Centers, Series | 2/27 at 100.00 | A– | 3,864,087 |
| | 2017A, 5.000%, 2/01/42 | | | |
| 815 | California State Public Works Board, Lease Revenue Bonds, Various Capital Projects, | 11/23 at 100.00 | A+ | 887,364 |
| | Series 2013I, 5.000%, 11/01/38 | | | |
| 500 | California Statewide Communities Development Authority, California, Revenue Bonds, Loma | 12/24 at 100.00 | BB– | 562,470 |
| | Linda University Medical Center, Series 2014A, 5.250%, 12/01/44 | | | |
| | California Statewide Communities Development Authority, California, Revenue Bonds, Loma | | | |
| | Linda University Medical Center, Series 2016A: | | | |
| 6,000 | 5.000%, 12/01/46, 144A | 6/26 at 100.00 | BB– | 6,830,880 |
| 3,070 | 5.250%, 12/01/56, 144A | 6/26 at 100.00 | BB– | 3,513,001 |
| 5,480 | California Statewide Communities Development Authority, California, Revenue Bonds, Loma | 6/28 at 100.00 | BB– | 6,652,556 |
| | Linda University Medical Center, Series 2018A, 5.500%, 12/01/58, 144A | | | |
| | California Statewide Community Development Authority, Revenue Bonds, Daughters of | | | |
| | Charity Health System, Series 2005A: | | | |
| 481 | 5.750%, 7/01/30 (6), (7) | 11/21 at 100.00 | N/R | 421,196 |
| 1,318 | 5.500%, 7/01/39 (6), (7) | 11/21 at 100.00 | N/R | 1,153,502 |
| 4,890 | Clovis Unified School District, Fresno County, California, General Obligation Bonds, | No Opt. Call | Baa2 | 4,676,356 |
| | Series 2006B, 0.000%, 8/01/26 – NPFG Insured | | | |
| 1,000 | Coachella Valley Unified School District, Riverside County, California, General | No Opt. Call | A– | 847,260 |
| | Obligation Bonds, Series 2005A, 0.000%, 8/01/30 – FGIC Insured | | | |
| 1,260 | Davis Redevelopment Agency, California, Tax Allocation Bonds, Davis Redevelopment | 12/21 at 100.00 | N/R (4) | 1,266,842 |
| | Project, Subordinate Series 2011A, 7.000%, 12/01/36 (Pre-refunded 12/01/21) | | | |
| 4,000 | East Bay Municipal Utility District, Alameda and Contra Costa Counties, California, | 6/24 at 100.00 | Aa1 | 4,441,200 |
| | Water System Revenue Bonds, Series 2014C, 5.000%, 6/01/44 | | | |
| 3,010 | El Camino Community College District, California, General Obligation Bonds, Election of | No Opt. Call | AA+ | 2,934,148 |
| | 2002 Series 2012C, 0.000%, 8/01/25 | | | |
| 3,500 | Foothill/Eastern Transportation Corridor Agency, California, Toll Road Revenue Bonds, | No Opt. Call | BBB | 2,689,085 |
| | Refunding Senior Lien Series 2015A, 0.000%, 1/15/34 – AGM Insured | | | |
| | Foothill/Eastern Transportation Corridor Agency, California, Toll Road Revenue Bonds, | | | |
| | Refunding Series 2013A: | | | |
| 1,480 | 5.750%, 1/15/46 (Pre-refunded 1/15/24) | 1/24 at 100.00 | Baa2 (4) | 1,656,579 |
| 6,480 | 6.000%, 1/15/49 (Pre-refunded 1/15/24) | 1/24 at 100.00 | Baa2 (4) | 7,284,038 |
| 9,930 | Golden State Tobacco Securitization Corporation, California, Enhanced Tobacco Settlement | 6/25 at 100.00 | A+ (4) | 11,554,051 |
| | Asset-Backed Revenue Bonds, Refunding Series 2015A, 5.000%, 6/01/45 (Pre-refunded 6/01/25) | | | |
| | Golden State Tobacco Securitization Corporation, California, Enhanced Tobacco Settlement | | | |
| | Asset-Backed Revenue Bonds, Series 2005A: | | | |
| 1,455 | 0.000%, 6/01/24 – AMBAC Insured (ETM) | No Opt. Call | A+ (4) | 1,438,573 |
| 3,500 | 0.000%, 6/01/26 – AGM Insured (ETM) | No Opt. Call | Aa3 (4) | 3,378,795 |
| 3,000 | Golden State Tobacco Securitization Corporation, California, Tobacco Settlement | 6/22 at 100.00 | N/R | 3,072,030 |
| | Asset-Backed Bonds, Series 2018A-1, 5.000%, 6/01/47 | | | |
| 5,945 | Golden State Tobacco Securitization Corporation, California, Tobacco Settlement | 6/22 at 100.00 | N/R | 6,087,739 |
| | Asset-Backed Bonds, Series 2018A-2, 5.000%, 6/01/47 | | | |
| 1,260 | Huntington Beach Union High School District, Orange County, California, Certificates of | No Opt. Call | A1 | 935,096 |
| | Participation, Capital Project, Series 2007, 0.000%, 9/01/35 – AGM Insured | | | |
| 5,240 | Huntington Beach Union High School District, Orange County, California, General | No Opt. Call | AA | 4,529,037 |
| | Obligation Bonds, Series 2005, 0.000%, 8/01/30 – AGM Insured | | | |
22
| Principal | | Optional Call | | |
| Amount (000) | Description (1) | Provisions (2) | Ratings (3) | Value |
| | California (continued) | | | |
| $ 2,500 | Huntington Beach Union High School District, Orange County, California, General | No Opt. Call | AA– | $ 2,042,825 |
| | Obligation Bonds, Series 2007, 0.000%, 8/01/32 – FGIC Insured | | | |
| 5,000 | Kern Community College District, California, General Obligation Bonds, Safety, Repair & | No Opt. Call | AA | 4,925,600 |
| | Improvement, Election 2002 Series 2006, 0.000%, 11/01/24 – AGM Insured | | | |
| 1,045 | Lake Tahoe Unified School District, El Dorado County, California, General Obligation | No Opt. Call | A– | 865,929 |
| | Bonds, Series 2001B, 0.000%, 8/01/31 – NPFG Insured | | | |
| | Los Angeles Department of Airports, California, Revenue Bonds, Los Angeles International | | | |
| | Airport, Subordinate Lien Series 2016B: | | | |
| 2,000 | 5.000%, 5/15/41 (AMT) | 5/26 at 100.00 | A+ | 2,334,500 |
| 20,015 | 5.000%, 5/15/46 (AMT) | 5/26 at 100.00 | A+ | 23,291,856 |
| 4,615 | Los Angeles Department of Airports, California, Revenue Bonds, Los Angeles International | 5/28 at 100.00 | A+ | 5,571,459 |
| | Airport, Subordinate Lien Series 2018A, 5.000%, 5/15/44 (AMT) | | | |
| 2,665 | Los Angeles Department of Water and Power, California, Power System Revenue Bonds, | 1/24 at 100.00 | AA– | 2,912,419 |
| | Series 2014B, 5.000%, 7/01/43 | | | |
| 250 | Lynwood Redevelopment Agency, California, Tax Allocation Revenue Bonds, Project Area A, | 11/21 at 100.00 | A | 251,068 |
| | Subordinate Lien Series 2011A, 7.000%, 9/01/31 | | | |
| 6,215 | Martinez Unified School District, Contra Costa County, California, General Obligation | 8/24 at 100.00 | AA (4) | 7,164,714 |
| | Bonds, Series 2011, 5.875%, 8/01/31 (Pre-refunded 8/01/24) | | | |
| 5,955 | Mount San Antonio Community College District, Los Angeles County, California, General | 8/35 at 100.00 | AA | 6,684,845 |
| | Obligation Bonds, Election of 2008, Series 2013A, 0.000%, 8/01/43 (8) | | | |
| 2,700 | M-S-R Energy Authority, California, Gas Revenue Bonds, Citigroup Prepay Contracts, | No Opt. Call | BBB+ | 4,051,647 |
| | Series 2009A, 7.000%, 11/01/34 | | | |
| 2,200 | M-S-R Energy Authority, California, Gas Revenue Bonds, Citigroup Prepay Contracts, | No Opt. Call | BBB+ | 3,439,436 |
| | Series 2009C, 6.500%, 11/01/39 | | | |
| 8,150 | Ontario Redevelopment Financing Authority, San Bernardino County, California, Revenue | No Opt. Call | Baa2 | 9,122,784 |
| | Bonds, Redevelopment Project 1, Refunding Series 1995, 7.400%, 8/01/25 – NPFG Insured | | | |
| 4,930 | Patterson Joint Unified School District, Stanislaus County, California, General | No Opt. Call | A2 | 2,928,519 |
| | Obligation Bonds, 2008 Election Series 2009B, 0.000%, 8/01/42 – AGM Insured | | | |
| 13,145 | Perris, California, GNMA Mortgage-Backed Securities Program Single Family Mortgage | No Opt. Call | AA+ (4) | 14,920,627 |
| | Revenue Bonds, Series 1988B, 8.200%, 9/01/23 (ETM) | | | |
| 6,000 | Placentia-Yorba Linda Unified School District, Orange County, California, Certificates | No Opt. Call | A1 (4) | 4,808,520 |
| | of Participation, Series 2006, 0.010%, 10/01/34 – FGIC Insured (ETM) | | | |
| 2,905 | Pomona, California, GNMA/FNMA Collateralized Securities Program Single Family Mortgage | No Opt. Call | AA+ (4) | 3,061,318 |
| | Revenue Bonds, Series 1990A, 7.600%, 5/01/23 (ETM) | | | |
| 2,000 | Poway Unified School District, San Diego County, California, General Obligation Bonds, | No Opt. Call | AA– | 1,241,220 |
| | School Facilities Improvement District 2007-1, Series 2011A, 0.000%, 8/01/41 | | | |
| 5,000 | Rialto Unified School District, San Bernardino County, California, General Obligation | 8/36 at 100.00 | Aa3 | 6,669,950 |
| | Bonds, Series 2011A, 0.000%, 8/01/41 – AGM Insured (8) | | | |
| 5,000 | Riverside County Asset Leasing Corporation, California, Leasehold Revenue Bonds, | No Opt. Call | A1 | 4,820,250 |
| | Riverside County Hospital Project, Series 1997, 0.000%, 6/01/25 – NPFG Insured | | | |
| 4,615 | Riverside County Redevelopment Agency, California, Tax Allocation Bonds, Jurupa Valley | No Opt. Call | A | 3,067,729 |
| | Project Area, Series 2011B, 0.000%, 10/01/38 | | | |
| 625 | Riverside County Transportation Commission, California, Toll Revenue Senior Lien Bonds, | 6/31 at 100.00 | BBB+ | 719,719 |
| | RCTC 91 Express Lanes, Refunding Series 2021B-1, 4.000%, 6/01/46 | | | |
| 330 | Riverside County Transportation Commission, California, Toll Revenue Senior Lien Bonds, | 6/23 at 100.00 | BBB+ | 358,093 |
| | Series 2013A, 5.750%, 6/01/48 | | | |
| 14,900 | San Francisco Airports Commission, California, Revenue Bonds, San Francisco | 5/26 at 100.00 | A | 17,354,626 |
| | International Airport, Second Series 2016B, 5.000%, 5/01/46 (AMT) | | | |
| | San Francisco Airports Commission, California, Revenue Bonds, San Francisco | | | |
| | International Airport, Second Series 2018D: | | | |
| 11,615 | 5.000%, 5/01/43 (AMT) | 5/28 at 100.00 | A | 13,976,678 |
| 12,285 | 5.000%, 5/01/48 (AMT) | 5/28 at 100.00 | A | 14,729,101 |
23
| NAD | Nuveen Quality Municipal Income Fund |
| | Portfolio of Investments (continued) |
| | October 31, 2021 |
| | | | | |
| Principal | | Optional Call | | |
| Amount (000) | Description (1) | Provisions (2) | Ratings (3) | Value |
| | California (continued) | | | |
| $ 11,025 | San Francisco Airports Commission, California, Revenue Bonds, San Francisco | 5/29 at 100.00 | A | $ 13,273,990 |
| | International Airport, Second Series 2019A, 5.000%, 5/01/49 (AMT) | | | |
| 2,000 | San Francisco City and County Redevelopment Agency Successor Agency, California, Special | 8/22 at 29.31 | N/R | 581,500 |
| | Tax Bonds, Community Facilities District 6 Mission Bay South Public Improvements, Series | | | |
| | 2013C, 0.000%, 8/01/43 | | | |
| 2,000 | San Joaquin Hills Transportation Corridor Agency, Orange County, California, Toll Road | 1/25 at 100.00 | BBB– | 2,220,820 |
| | Revenue Bonds, Refunding Junior Lien Series 2014B, 5.250%, 1/15/44 | | | |
| | San Joaquin Hills Transportation Corridor Agency, Orange County, California, Toll Road | | | |
| | Revenue Bonds, Refunding Senior Lien Series 2014A: | | | |
| 15,350 | 5.000%, 1/15/44 | 1/25 at 100.00 | BBB | 17,108,956 |
| 25,840 | 5.000%, 1/15/50 | 1/25 at 100.00 | BBB | 28,750,359 |
| | San Jose, California, Airport Revenue Bonds, Refunding Series 2017A: | | | |
| 5,000 | 5.000%, 3/01/41 (AMT) | 3/27 at 100.00 | A– | 5,873,450 |
| 5,000 | 5.000%, 3/01/47 (AMT) | 3/27 at 100.00 | A– | 5,882,600 |
| 14,985 | San Ysidro School District, San Diego County, California, General Obligation Bonds, 1997 | No Opt. Call | AA | 9,586,804 |
| | Election Series 2012G, 0.000%, 8/01/40 – AGM Insured | | | |
| 6,660 | San Ysidro School District, San Diego County, California, General Obligation Bonds, | 8/25 at 38.93 | A3 | 2,437,826 |
| | Refunding Series 2015, 0.000%, 8/01/43 | | | |
| 2,460 | Santee School District, San Diego County, California, General Obligation Bonds, Capital | No Opt. Call | AA | 1,973,018 |
| | Appreciation, Election 2006, Series 2008D, 0.000%, 8/01/33 – AGC Insured | | | |
| 5,000 | Solano Community College District, Solano and Yolo Counties, California, General | 8/23 at 100.00 | AA (4) | 5,417,750 |
| | Obligation Bonds, Election 2012 Series 2013A, 5.000%, 8/01/43 (Pre-refunded 8/01/23) | | | |
| 1,145 | Southern Kern Unified School District, Kern County, California, General Obligation | No Opt. Call | A2 | 968,624 |
| | Bonds, Series 2006C, 0.000%, 11/01/30 – AGM Insured | | | |
| 1,175 | Southern Kern Unified School District, Kern County, California, General Obligation | No Opt. Call | A2 | 863,719 |
| | Bonds, Series 2010B, 0.000%, 11/01/35 – AGM Insured | | | |
| | Union City Community Redevelopment Agency, California, Tax Allocation Revenue Bonds, | | | |
| | Redevelopment Project, Subordinate Lien Series 2011: | | | |
| 1,000 | 6.375%, 12/01/23 (Pre-refunded 12/01/21) | 12/21 at 100.00 | N/R (4) | 1,004,950 |
| 1,000 | 6.500%, 12/01/24 (Pre-refunded 12/01/21) | 12/21 at 100.00 | N/R (4) | 1,005,040 |
| 1,000 | 6.625%, 12/01/25 (Pre-refunded 12/01/21) | 12/21 at 100.00 | N/R (4) | 1,005,140 |
| 1,325 | 6.750%, 12/01/26 (Pre-refunded 12/01/21) | 12/21 at 100.00 | N/R (4) | 1,331,943 |
| 2,410 | Victor Elementary School District, San Bernardino County, California, General Obligation | No Opt. Call | A+ | 2,288,440 |
| | Bonds, Series 2002A, 0.010%, 8/01/26 – FGIC Insured | | | |
| 3,750 | Wiseburn School District, Los Angeles County, California, General Obligation Bonds, | 8/31 at 100.00 | AA | 4,239,862 |
| | Series 2011B, 0.000%, 8/01/36 – AGM Insured (8) | | | |
| 411,639 | Total California | | | 432,470,817 |
| | Colorado – 10.4% (6.7% of Total Investments) | | | |
| 4,350 | Aerotropolis Regional Transportation Authority, Colorado, Special Revenue Bonds, Series | 12/26 at 103.00 | N/R | 4,313,286 |
| | 2021, 4.375%, 12/01/52 | | | |
| 3,000 | Anthem West Metropolitan District, Colorado, General Obligation Bonds, Refunding Series | 12/25 at 100.00 | A1 | 3,495,120 |
| | 2015, 5.000%, 12/01/35 – BAM Insured | | | |
| 4,195 | Boulder Larimer & Weld Counties School District RE-1J Saint Vrain Valley, Colorado, | 12/26 at 100.00 | AA+ | 4,781,713 |
| | General Obligation Bonds, Series 2016C, 4.000%, 12/15/34 | | | |
| 10,000 | Boulder Valley School District RE2, Boulder County, Colorado, General Obligation Bonds, | 6/29 at 100.00 | AA+ | 11,508,300 |
| | Series 2019A, 4.000%, 12/01/48 | | | |
| 4,000 | Centennial Water and Sanitation District, Douglas County, Colorado, Water and Wastewater | 12/28 at 100.00 | AA+ | 4,906,000 |
| | Revenue Bonds, Series 2019, 5.000%, 12/01/43 | | | |
| 1,775 | Centerra Metropolitan District 1, Loveland, Colorado, Special Revenue Bonds, Refunding & | 12/22 at 103.00 | N/R | 1,871,560 |
| | Improvement Series 2017, 5.000%, 12/01/29, 144A | | | |
| 1,605 | Cherokee Metropolitan District, Colorado, Water and Wastewater Revenue Bonds, Series | 8/30 at 100.00 | AA | 1,901,460 |
| | 2020, 4.000%, 8/01/45 – BAM Insured | | | |
| 2,945 | Colorado Educational and Cultural Facilities Authority, Charter School Revenue Bonds, | 8/23 at 100.00 | BB+ | 3,191,231 |
| | Community Leadership Academy, Inc. Second Campus Project, Series 2013, 7.350%, 8/01/43 | | | |
24
| Principal | | Optional Call | | |
| Amount (000) | Description (1) | Provisions (2) | Ratings (3) | Value |
| | Colorado (continued) | | | |
| $ 1,715 | Colorado Educational and Cultural Facilities Authority, Charter School Revenue Bonds, | 8/26 at 100.00 | A+ | $ 1,791,112 |
| | Flagstaff Academy Project, Refunding Series 2016, 3.625%, 8/01/46 | | | |
| 500 | Colorado Educational and Cultural Facilities Authority, Charter School Revenue Bonds, | 1/24 at 100.00 | A+ | 527,570 |
| | Liberty Common Charter School, Series 2014A, 5.000%, 1/15/44 | | | |
| 1,000 | Colorado Educational and Cultural Facilities Authority, Charter School Revenue Bonds, | 8/24 at 100.00 | A+ | 1,096,920 |
| | Peak-to-Peak Charter School, Refunding Series 2014, 5.000%, 8/15/30 | | | |
| 3,915 | Colorado Educational and Cultural Facilities Authority, Charter School Revenue Bonds, | 6/26 at 100.00 | A+ | 4,026,930 |
| | Weld County School District 6 – Frontier Academy, Refunding & Improvement Series 2016, | | | |
| | 3.250%, 6/01/46 | | | |
| 1,250 | Colorado Educational and Cultural Facilities Authority, Revenue Bonds, University | No Opt. Call | A+ | 1,291,850 |
| | Corporation for Atmospheric Research Project, Refunding Series 2012A, 4.500%, 9/01/22 | | | |
| 545 | Colorado Educational and Cultural Facilities Authority, Revenue Bonds, University | 9/27 at 100.00 | A2 | 600,056 |
| | Corporation for Atmospheric Research Project, Refunding Series 2017, 3.625%, 9/01/31 | | | |
| | Colorado Educational and Cultural Facilities Authority, Revenue Bonds, University of | | | |
| | Denver, Series 2017A: | | | |
| 1,200 | 4.000%, 3/01/36 | 3/27 at 100.00 | A1 | 1,353,504 |
| 1,600 | 4.000%, 3/01/37 | 3/27 at 100.00 | A1 | 1,801,536 |
| | Colorado Health Facilities Authority, Colorado, Revenue Bonds, AdventHealth Obligated | | | |
| | Group, Series 2021A: | | | |
| 9,595 | 4.000%, 11/15/46 | 11/31 at 100.00 | AA | 11,204,849 |
| 3,000 | 4.000%, 11/15/50 | 11/31 at 100.00 | AA | 3,486,420 |
| 1,930 | Colorado Health Facilities Authority, Colorado, Revenue Bonds, Adventist Health | 5/26 at 100.00 | AA | 2,138,073 |
| | System/Sunbelt Obligated Group, Series 2016A, 4.000%, 11/15/41 | | | |
| | Colorado Health Facilities Authority, Colorado, Revenue Bonds, Catholic Health | | | |
| | Initiatives, Series 2013A: | | | |
| 3,020 | 5.250%, 1/01/40 (Pre-refunded 1/01/23) | 1/23 at 100.00 | BBB+ (4) | 3,194,043 |
| 4,890 | 5.250%, 1/01/45 (Pre-refunded 1/01/23) | 1/23 at 100.00 | BBB+ (4) | 5,171,371 |
| 4,600 | Colorado Health Facilities Authority, Colorado, Revenue Bonds, Christian Living | 1/24 at 102.00 | N/R | 4,918,688 |
| | Neighborhoods Project, Refunding Series 2016, 5.000%, 1/01/37 | | | |
| 15,395 | Colorado Health Facilities Authority, Colorado, Revenue Bonds, CommonSpirit Health, | 8/29 at 100.00 | BBB+ | 17,102,767 |
| | Series 2019A-2, 4.000%, 8/01/49 | | | |
| 270 | Colorado Health Facilities Authority, Colorado, Revenue Bonds, Evangelical Lutheran Good | 6/23 at 100.00 | N/R (4) | 292,993 |
| | Samaritan Society Project, Series 2013, 5.625%, 6/01/43 (Pre-refunded 6/01/23) | | | |
| | Colorado Health Facilities Authority, Colorado, Revenue Bonds, Evangelical Lutheran Good | | | |
| | Samaritan Society Project, Series 2013A: | | | |
| 2,670 | 5.000%, 6/01/28 (Pre-refunded 6/01/25) | 6/25 at 100.00 | N/R (4) | 3,101,499 |
| 6,425 | 5.000%, 6/01/40 (Pre-refunded 6/01/25) | 6/25 at 100.00 | N/R (4) | 7,463,344 |
| 665 | Colorado Health Facilities Authority, Colorado, Revenue Bonds, Frasier Meadows Project, | 5/27 at 100.00 | BB+ | 758,253 |
| | Refunding & Improvement Series 2017A, 5.250%, 5/15/47 | | | |
| 3,830 | Colorado Health Facilities Authority, Colorado, Revenue Bonds, Parkview Medical Center, | 9/30 at 100.00 | Baa1 | 4,388,222 |
| | Series 2020A, 4.000%, 9/01/45 | | | |
| 5,000 | Colorado Health Facilities Authority, Colorado, Revenue Bonds, Sanford Health, Series | 11/29 at 100.00 | A+ | 6,202,400 |
| | 2019A, 5.000%, 11/01/44 | | | |
| 3,300 | Colorado Health Facilities Authority, Colorado, Revenue Bonds, SCL Health System, | 1/30 at 100.00 | AA– | 3,857,271 |
| | Refunding Series 2019A, 4.000%, 1/01/38 | | | |
| 2,620 | Colorado Health Facilities Authority, Colorado, Revenue Bonds, SCL Health System, | 1/30 at 100.00 | AA– | 3,049,968 |
| | Refunding Series 2019B, 4.000%, 1/01/40 | | | |
| 1,100 | Colorado High Performance Transportation Enterprise, C-470 Express Lanes Revenue Bonds, | 12/24 at 100.00 | BBB | 1,235,465 |
| | Senior Lien Series 2017, 5.000%, 12/31/56 | | | |
| 1,250 | Colorado Mesa University, Colorado, Enterprise Revenue Bonds, Series 2012B, | 11/21 at 100.00 | Aa2 | 1,253,313 |
| | 4.250%, 5/15/37 | | | |
25
| | |
| NAD | Nuveen Quality Municipal Income Fund |
| | Portfolio of Investments (continued) |
| | October 31, 2021 |
| | | | | |
| Principal | | Optional Call | | |
| Amount (000) | Description (1) | Provisions (2) | Ratings (3) | Value |
| | Colorado (continued) | | | |
| | Colorado State Board of Governors, Colorado State University Auxiliary Enterprise System | | | |
| | Revenue Bonds, Refunding Series 2017C: | | | |
| $ 1,115 | 5.000%, 3/01/43 (Pre-refunded 3/01/28) | 3/28 at 100.00 | N/R (4) | $ 1,391,464 |
| 1,660 | 5.000%, 3/01/43 | 3/28 at 100.00 | AA | 1,991,485 |
| 2,360 | Colorado State Board of Governors, Colorado State University Auxiliary Enterprise System | 3/28 at 100.00 | AA | 2,667,319 |
| | Revenue Bonds, Refunding Series 2017E, 4.000%, 3/01/43 | | | |
| 3,555 | Colorado State, Certificates of Participation, Rural Series 2020A, 4.000%, 12/15/38 | 12/30 at 100.00 | AA– | 4,210,293 |
| 3,000 | Commerce City, Colorado, Sales and Use Tax Revenue Bonds, Series 2014, 5.000%, 8/01/44 ý | 8/24 at 100.00 | A1 | 3,319,470 |
| | AGM Insured | | | |
| 7,250 | Commerce City, Colorado, Sales and Use Tax Revenue Bonds, Series 2016, 5.000%, 8/01/46 | 8/26 at 100.00 | A1 | 8,439,725 |
| 2,000 | Denver City and County, Colorado, Airport System Revenue Bonds, Series 2012B, 5.000%, | 11/22 at 100.00 | A+ (4) | 2,098,620 |
| | 11/15/32 (Pre-refunded 11/15/22) | | | |
| 1,100 | Denver City and County, Colorado, Airport System Revenue Bonds, Subordinate Lien Series | 11/23 at 100.00 | A | 1,200,089 |
| | 2013A, 5.250%, 11/15/43 (AMT) | | | |
| 4,515 | Denver City and County, Colorado, Airport System Revenue Bonds, Subordinate Lien Series | 11/23 at 100.00 | A | 4,911,733 |
| | 2013B, 5.000%, 11/15/43 | | | |
| | Denver City and County, Colorado, Airport System Revenue Bonds, Subordinate Lien Series 2018A: | | | |
| 20,460 | 5.000%, 12/01/43 (AMT) | 12/28 at 100.00 | A | 24,713,634 |
| 30,435 | 5.000%, 12/01/48 (AMT) | 12/28 at 100.00 | A | 36,551,522 |
| 1,820 | Denver City and County, Colorado, Dedicated Tax Revenue Bonds, Refunding & Improvement | 8/26 at 100.00 | AA– | 2,011,555 |
| | Series 2016A, 4.000%, 8/01/46 | | | |
| 2,005 | Denver City and County, Colorado, Special Facilities Airport Revenue Bonds, United | 10/23 at 100.00 | B | 2,116,759 |
| | Airlines, Inc. Project, Refunding Series 2017, 5.000%, 10/01/32 (AMT) | | | |
| | Denver Convention Center Hotel Authority, Colorado, Revenue Bonds, Convention Center | | | |
| | Hotel, Refunding Senior Lien Series 2016: | | | |
| 2,955 | 5.000%, 12/01/28 | 12/26 at 100.00 | BBB– | 3,470,086 |
| 2,000 | 5.000%, 12/01/29 | 12/26 at 100.00 | BBB– | 2,335,900 |
| 2,400 | 5.000%, 12/01/36 | 12/26 at 100.00 | BBB– | 2,740,632 |
| 1,605 | 5.000%, 12/01/40 | 12/26 at 100.00 | BBB– | 1,823,441 |
| | E-470 Public Highway Authority, Colorado, Senior Revenue Bonds, Capital Appreciation | | | |
| | Series 2010A: | | | |
| 385 | 0.000%, 9/01/35 | No Opt. Call | A | 286,509 |
| 150 | 0.000%, 9/01/37 | No Opt. Call | A | 104,933 |
| 75 | 0.000%, 9/01/38 | No Opt. Call | A | 50,877 |
| 20 | 0.000%, 9/01/39 | No Opt. Call | A | 13,139 |
| 110 | 0.000%, 9/01/41 | No Opt. Call | A | 67,597 |
| | E-470 Public Highway Authority, Colorado, Senior Revenue Bonds, Series 1997B: | | | |
| 1,520 | 0.000%, 9/01/23 – NPFG Insured | No Opt. Call | A | 1,507,475 |
| 18,380 | 0.000%, 9/01/25 – NPFG Insured | No Opt. Call | A | 17,788,532 |
| | E-470 Public Highway Authority, Colorado, Senior Revenue Bonds, Series 2000B: | | | |
| 1,045 | 0.000%, 9/01/29 – NPFG Insured | No Opt. Call | A | 923,028 |
| 2,175 | 0.010%, 9/01/30 – NPFG Insured | No Opt. Call | A | 1,866,128 |
| 25,050 | 0.000%, 9/01/31 – NPFG Insured | No Opt. Call | A | 20,897,461 |
| 23,305 | 0.000%, 9/01/32 – NPFG Insured | No Opt. Call | A | 18,946,266 |
| 100 | 0.010%, 9/01/33 – NPFG Insured | No Opt. Call | A | 79,219 |
| 12,500 | E-470 Public Highway Authority, Colorado, Senior Revenue Bonds, Series 2006A, 0.010%, | 9/26 at 54.77 | A | 6,304,500 |
| | 9/01/38 – NPFG Insured | | | |
| | E-470 Public Highway Authority, Colorado, Toll Revenue Bonds, Series 2004A: | | | |
| 385 | 0.000%, 9/01/28 – NPFG Insured | No Opt. Call | A | 349,499 |
| 60,000 | 0.000%, 3/01/36 – NPFG Insured | No Opt. Call | A | 44,074,800 |
| 180 | Eagle County Air Terminal Corporation, Colorado, Airport Terminal Project Revenue Bonds, | 11/21 at 100.00 | Baa2 | 180,059 |
| | Refunding Series 2011A, 5.500%, 5/01/22 (AMT) | | | |
| 1,250 | Eagle River Water and Sanitation District, Eagle County, Colorado, Enterprise Wastewater | 12/29 at 100.00 | AA | 1,454,238 |
| | Revenue Bonds, Improvement Series 2020A, 4.000%, 12/01/45 – AGM Insured | | | |
| 4,000 | Ebert Metropolitan District, Denver Colorado, Limited Tax General Obligation Bonds, | 12/28 at 100.00 | A1 | 4,861,200 |
| | Refunding Series 2018A-1, 5.000%, 12/01/43 – BAM Insured | | | |
26
| | | | | |
| Principal | | Optional Call | | |
| Amount (000) | Description (1) | Provisions (2) | Ratings (3) | Value |
| | Colorado (continued) | | | |
| $ 2,450 | Firestone, Colorado, Water Enterprise Revenue Bones, Series 2020, 4.000%, 12/01/49 – | 12/30 at 100.00 | AA | $ 2,839,428 |
| | BAM Insured | | | |
| 520 | Flying Horse Metropolitan District 2, El Paso County, Colorado, General Obligation | 12/30 at 100.00 | A2 | 604,427 |
| | Limited Tax Bonds, Refunding & Improvement Series 2020A, 4.000%, 12/01/44 – AGM Insured | | | |
| 1,860 | Metropolitan State University of Denver, Colorado, Institutional Enterprise Revenue | 12/25 at 100.00 | Aa2 | 2,054,500 |
| | Bonds, Aerospace and Engineering Sciences Building Project, Series 2016, 4.000%, 12/01/40 | | | |
| 1,500 | North Pine Vistas Metropolitan District 3, Castle Pines, Douglas County, Colorado, | 12/31 at 100.00 | A2 | 1,694,820 |
| | Limited Tax General Obligation Bonds, Refunding & Improvement Senior Series 2021A, 4.000%, | | | |
| | 12/01/51 – AGM Insured | | | |
| 4,000 | Northern Colorado Water Conservancy District Building Corporation, Certificates of | 7/31 at 100.00 | AA+ | 4,667,640 |
| | Participation, Refunding Series 2021, 4.000%, 7/01/46 | | | |
| | Park 70 Metropolitan District, Aurora, Colorado, General Obligation Bonds, Limited Tax | | | |
| | Refunding & Improvement Series 2016: | | | |
| 1,565 | 5.000%, 12/01/36 | 12/26 at 100.00 | Baa3 | 1,788,748 |
| 2,100 | 5.000%, 12/01/46 | 12/26 at 100.00 | Baa3 | 2,366,721 |
| 6,705 | Park Creek Metropolitan District, Colorado, Senior Limited Property Tax Supported | 12/25 at 100.00 | A | 7,561,228 |
| | Revenue Bonds, Refunding Series 2015A, 5.000%, 12/01/45 | | | |
| 2,395 | Park Creek Metropolitan District, Colorado, Senior Limited Property Tax Supported | 12/29 at 100.00 | A | 2,842,194 |
| | Revenue Bonds, Series 2019A, 4.000%, 12/01/36 – AGM Insured | | | |
| 500 | Peak Metropolitan District 1, Colorado Springs, El Paso County, Colorado, Limited Tax | 3/26 at 103.00 | N/R | 541,510 |
| | General Obligation Bonds, Series 2021A, 5.000%, 12/01/51, 144A | | | |
| 700 | Public Authority for Colorado Energy, Natural Gas Purchase Revenue Bonds, Colorado | No Opt. Call | A– | 1,063,909 |
| | Springs Utilities, Series 2008, 6.500%, 11/15/38 | | | |
| 1,500 | Sierra Ridge Metropolitan District 2, Douglas County, Colorado, General Obligation | 12/21 at 103.00 | N/R | 1,547,310 |
| | Bonds, Limited Tax Series 2016A, 5.500%, 12/01/46 | | | |
| 750 | Thompson Crossing Metropolitan District 2, Johnstown, Larimer County, Colorado, General | 12/26 at 100.00 | AA | 882,345 |
| | Obligation Bonds, Limited Tax Convertible to Unlimited Tax, Series 2016B, 5.000%, 12/01/36 – | | | |
| | AGM Insured | | | |
| | Traditions Metropolitan District 2, Colorado, Limited Tax General Obligation Bonds, | | | |
| | Refunding Series 2016: | | | |
| 1,050 | 5.000%, 12/01/32 – BAM Insured | 12/26 at 100.00 | A3 | 1,250,057 |
| 1,000 | 4.125%, 12/01/37 – BAM Insured | 12/26 at 100.00 | A3 | 1,124,290 |
| 500 | Transport Metropolitan District 3, In the City of Aurora, Adams County, Colorado, | 3/26 at 103.00 | N/R | 556,970 |
| | General Obligation Limited Bonds, Series 2021A-1, 5.000%, 12/01/41 | | | |
| 2,000 | Upper Eagle Regional Water Authority, Eagle County, Colorado, Water Revenue Bonds, | 12/30 at 100.00 | AA | 2,352,160 |
| | Refunding & Improvement Series 2020, 4.000%, 12/01/50 – AGM Insured | | | |
| 2,000 | Vista Ridge Metropolitan District, In the Town of Erie, Weld County, Colorado, General | 12/26 at 100.00 | A2 | 2,214,320 |
| | Obligation Refunding Bonds, Series 2016A, 4.000%, 12/01/36 – BAM Insured | | | |
| 387,115 | Total Colorado | | | 390,978,851 |
| | Connecticut – 1.3% (0.8% of Total Investments) | | | |
| 850 | Connecticut Health and Educational Facilities Authority, Revenue Bonds, McLean | 1/26 at 102.00 | BB+ | 939,539 |
| | Affiliates, Series 2020A, 5.000%, 1/01/45, 144A | | | |
| 3,430 | Connecticut Health and Educational Facilities Authority, Revenue Bonds, Sacred Heart | 7/22 at 100.00 | A2 (4) | 3,540,515 |
| | University, Series 2012H, 5.000%, 7/01/24 (Pre-refunded 7/01/22) – AGM Insured | | | |
| | Connecticut Municipal Electric Energy Cooperative, Power Supply System Revenue Bonds, | | | |
| | Tender Option Bond Trust 2016-XG0059: | | | |
| 1,295 | 17.876%, 1/01/32, 144A (IF) (5) | 1/23 at 100.00 | Aa3 | 1,560,410 |
| 190 | 17.709%, 1/01/38, 144A (IF) (5) | 1/23 at 100.00 | Aa3 | 226,852 |
| | Connecticut State, Special Tax Obligation Bonds, Transportation Infrastructure Purposes | | | |
| | Series 2018A: | | | |
| 14,775 | 5.000%, 1/01/34 | 1/28 at 100.00 | AA– | 18,081,350 |
| 6,410 | 5.000%, 1/01/37 | 1/28 at 100.00 | AA– | 7,806,162 |
| 6,000 | 5.000%, 1/01/38 | 1/28 at 100.00 | AA– | 7,303,200 |
| 3,565 | Hartford County Metropolitan District, Connecticut, Clean Water Project Revenue Bonds, | 4/22 at 100.00 | AA– (4) | 3,621,648 |
| | Series 2013A, 4.000%, 4/01/39 (Pre-refunded 4/01/22) | | | |
27
| NAD | Nuveen Quality Municipal Income Fund |
| | Portfolio of Investments (continued) |
| | October 31, 2021 |
| Principal | | Optional Call | | |
| Amount (000) | Description (1) | Provisions (2) | Ratings (3) | Value |
| | Connecticut (continued) | | | |
| $ 5,077 | Mashantucket Western Pequot Tribe, Connecticut, Special Revenue Bonds, Subordinate | No Opt. Call | N/R | $ 761,496 |
| | Series 2013A, 6.050%, 7/01/31 (cash 4.000%, PIK 2.050%) (7) | | | |
| 4,000 | University of Connecticut, General Obligation Bonds, Series 2020A, 5.000%, 2/15/39 | 2/30 at 100.00 | A+ | 5,019,520 |
| 45,592 | Total Connecticut | | | 48,860,692 |
| | Delaware – 0.2% (0.2% of Total Investments) | | | |
| 800 | Delaware Health Facilities Authority, Revenue Bonds, Beebe Medical Center Project, | 12/28 at 100.00 | BBB | 945,104 |
| | Series 2018, 5.000%, 6/01/48 | | | |
| 7,255 | Delaware Transportation Authority, Revenue Bonds, US 301 Project, Series 2015, 5.000%, 6/01/55 | 6/25 at 100.00 | AA– | 8,241,462 |
| 8,055 | Total Delaware | | | 9,186,566 |
| | District of Columbia – 2.1% (1.4% of Total Investments) | | | |
| 680 | District of Columbia Housing Finance Agency, GNMA Collateralized Single Family Mortgage | 11/21 at 100.00 | AA+ | 682,604 |
| | Revenue Bonds, Series 1988E-4, 6.375%, 6/01/26 (AMT) | | | |
| 1,805 | District of Columbia Tobacco Settlement Corporation, Tobacco Settlement Asset-Backed | No Opt. Call | BBB | 1,977,883 |
| | Bonds, Series 2001, 6.500%, 5/15/33 | | | |
| 34,000 | District of Columbia Tobacco Settlement Corporation, Tobacco Settlement Asset-Backed | 11/21 at 22.08 | N/R | 7,472,520 |
| | Bonds, Series 2006A, 0.000%, 6/15/46 | | | |
| 10,265 | District of Columbia Water and Sewer Authority, Public Utility Revenue Bonds, Series | No Opt. Call | Aa1 | 11,034,259 |
| | 1998, 5.500%, 10/01/23 – AGM Insured (UB) | | | |
| | Metropolitan Washington Airports Authority, Virginia, Dulles Toll Road Revenue Bonds, | | | |
| | Dulles Metrorail & Capital improvement Projects, Refunding & Subordinate Lien Series 2019B: | | | |
| 2,000 | 4.000%, 10/01/44 | 10/29 at 100.00 | Baa2 | 2,248,880 |
| 4,750 | 5.000%, 10/01/47 | 10/29 at 100.00 | Baa2 | 5,746,455 |
| 6,000 | 4.000%, 10/01/49 | 10/29 at 100.00 | Baa2 | 6,706,140 |
| 1,810 | 4.000%, 10/01/53 – AGM Insured | 10/29 at 100.00 | A2 | 2,059,255 |
| 5,625 | Metropolitan Washington Airports Authority, Virginia, Dulles Toll Road Revenue Bonds, | 4/22 at 100.00 | Baa1 | 5,732,775 |
| | Dulles Metrorail & Capital Improvement Projects, Refunding Second Senior Lien Series 2014A, | | | |
| | 5.000%, 10/01/53 | | | |
| 2,000 | Metropolitan Washington Airports Authority, Virginia, Dulles Toll Road Revenue Bonds, | No Opt. Call | A3 | 1,408,660 |
| | Dulles Metrorail & Capital improvement Projects, Second Senior Lien Series 2009B, 0.000%, | | | |
| | 10/01/36 – AGC Insured | | | |
| 5,000 | Metropolitan Washington Airports Authority, Virginia, Dulles Toll Road Revenue Bonds, | 10/26 at 100.00 | A3 | 6,294,650 |
| | Dulles Metrorail & Capital improvement Projects, Second Senior Lien Series 2009C, 6.500%, | | | |
| | 10/01/41 – AGC Insured | | | |
| 4,500 | Metropolitan Washington D.C. Airports Authority, Airport System Revenue Bonds, Refunding | 10/23 at 100.00 | A+ | 4,872,690 |
| | Series 2013A, 5.000%, 10/01/30 (AMT) | | | |
| 12,550 | Metropolitan Washington D.C. Airports Authority, Airport System Revenue Bonds, Refunding | 10/31 at 100.00 | A+ | 15,659,514 |
| | Series 2021A, 5.000%, 10/01/46 (AMT) | | | |
| 1,000 | Washington Metropolitan Area Transit Authority, District of Columbia, Gross Revenue | 7/27 at 100.00 | AA– | 1,210,230 |
| | Bonds, Refunding Crossover Series 2017A-2, 5.000%, 7/01/33 | | | |
| | Washington Metropolitan Area Transit Authority, District of Columbia, Gross Revenue | | | |
| | Bonds, Series 2017B: | | | |
| 1,500 | 5.000%, 7/01/29 | 7/27 at 100.00 | AA– | 1,829,475 |
| 3,000 | 5.000%, 7/01/42 | 7/27 at 100.00 | AA– | 3,581,310 |
| 1,000 | Washington Metropolitan Area Transit Authority, District of Columbia, Gross Revenue | 7/27 at 100.00 | AA– | 1,201,440 |
| | Bonds, Series 2018, 5.000%, 7/01/38 | | | |
| 97,485 | Total District of Columbia | | | 79,718,740 |
| | Florida – 8.6% (5.6% of Total Investments) | | | |
| 1,480 | Atlantic Beach, Florida, Healthcare Facilities Revenue Refunding Bonds, Fleet Landing | 11/23 at 100.00 | BBB | 1,567,216 |
| | Project, Series 2013A, 5.000%, 11/15/37 | | | |
| | Bay County, Florida, Educational Facilities Revenue Refunding Bonds, Bay Haven Charter | | | |
| | Academy, Inc. Project, Series 2013A: | | | |
| 450 | 5.000%, 9/01/45 | 9/23 at 100.00 | BBB | 472,333 |
| 2,260 | 5.000%, 9/01/48 | 9/23 at 100.00 | BBB | 2,369,633 |
28
| Principal | | Optional Call | | |
| Amount (000) | Description (1) | Provisions (2) | Ratings (3) | Value |
| | Florida (continued) | | | |
| $ 7,500 | Broward County, Florida, Airport System Revenue Bonds, Series 2015A, 5.000%, 10/01/45 (AMT) | 10/25 at 100.00 | A | $ 8,617,650 |
| 1,000 | Central Florida Expressway Authority, Revenue Bonds, Refunding Senior Lien Series 2021, | 7/31 at 100.00 | AA | 1,194,290 |
| | 4.000%, 7/01/39 – AGM Insured | | | |
| 100 | Florida Development Finance Corporation, Educational Facilities Revenue Bonds, | 6/22 at 100.00 | N/R | 101,862 |
| | Renaissance Charter School, Inc. Projects, Series 2012A, 6.125%, 6/15/43, 144A | | | |
| 175 | Florida Development Finance Corporation, Educational Facilities Revenue Bonds, | 9/27 at 100.00 | N/R | 194,098 |
| | Renaissance Charter School, Inc. Projects, Series 2020C, 5.000%, 9/15/40, 144A | | | |
| 14,000 | Florida Development Finance Corporation, Florida, Surface Transportation Facility Revenue | 1/24 at 107.00 | N/R | 15,119,720 |
| | Bonds, Brightline Passenger Rail Project, Green Series 2019B, 7.375%, 1/01/49 (AMT), 144A | | | |
| | Florida Development Finance Corporation, Florida, Surface Transportation Facility | | | |
| | Revenue Bonds, Virgin Trains USA Passenger Rail Project , Series 2019A: | | | |
| 12,000 | 6.375%, 1/01/49 (AMT) (Mandatory Put 1/01/26), 144A | 11/21 at 104.00 | N/R | 12,181,800 |
| 15,985 | 6.500%, 1/01/49 (AMT) (Mandatory Put 1/01/29), 144A | 11/21 at 104.00 | N/R | 16,201,277 |
| 4,165 | Florida Higher Educational Facilities Financing Authority, Revenue Bonds, Nova | 4/22 at 100.00 | Baa1 (4) | 4,247,550 |
| | Southeastern University Project, Refunding Series 2012A, 5.000%, 4/01/32 (Pre-refunded 4/01/22) | | | |
| | Greater Orlando Aviation Authority, Florida, Orlando Airport Facilities Revenue Bonds, | | | |
| | Priority Subordinated Series 2017A: | | | |
| 31,985 | 5.000%, 10/01/47 (AMT) | 10/27 at 100.00 | A | 38,141,793 |
| 9,065 | 5.000%, 10/01/52 (AMT) | 10/27 at 100.00 | A | 10,790,704 |
| 3,890 | Greater Orlando Aviation Authority, Florida, Orlando Airport Facilities Revenue Bonds, | 10/26 at 100.00 | A+ | 4,577,635 |
| | Series 2016A, 5.000%, 10/01/40 (AMT) | | | |
| 6,020 | Hillsborough County Aviation Authority, Florida, Revenue Bonds, Tampa International | 10/24 at 100.00 | A+ | 6,731,504 |
| | Airport, Senior Lien Series 2015A, 5.000%, 10/01/44 (AMT) | | | |
| 5,000 | Hillsborough County Aviation Authority, Florida, Revenue Bonds, Tampa International | 10/28 at 100.00 | AA– | 6,051,050 |
| | Airport, Series 2018E, 5.000%, 10/01/48 (AMT) | | | |
| 2,290 | Hillsborough County Aviation Authority, Florida, Revenue Bonds, Tampa International | 10/24 at 100.00 | A+ | 2,571,235 |
| | Airport, Subordinate Lien Series 2015B, 5.000%, 10/01/40 | | | |
| 10,305 | Hillsborough County Aviation Authority, Florida, Tampa International Airport Customer | 10/24 at 100.00 | A– | 11,538,818 |
| | Facility Charge Revenue Bonds, Series 2015A, 5.000%, 10/01/44 | | | |
| 10,200 | Hillsborough County Industrial Development Authority, Florida, Hospital Revenue Bonds, | 2/31 at 100.00 | Baa1 | 11,571,798 |
| | Florida Health Sciences Center Inc D/B/A Tampa General Hospital, Series 2020A, 4.000%, 8/01/50 | | | |
| 5,000 | Hillsborough County Port District, Florida, Revenue Bonds, Tampa Port Authority Project, | 6/28 at 100.00 | A | 5,868,700 |
| | Series 2018B, 5.000%, 6/01/46 (AMT) | | | |
| 5,075 | Lakeland, Florida, Hospital System Revenue Bonds, Lakeland Regional Health, Series 2015, | 11/24 at 100.00 | A2 (4) | 5,778,699 |
| | 5.000%, 11/15/35 (Pre-refunded 11/15/24) | | | |
| 9,820 | Miami Beach Redevelopment Agency, Florida, Tax Increment Revenue Bonds, City | 2/24 at 100.00 | A1 | 10,713,816 |
| | Center/Historic Convention Village, Series 2015A, 5.000%, 2/01/44 – AGM Insured | | | |
| 2,000 | Miami Health Facilities Authority, Florida, Health Facilities Revenue Bonds, Miami | 7/27 at 100.00 | BB+ | 2,020,900 |
| | Jewish Health System Inc. Project, Series 2017, 5.125%, 7/01/46 | | | |
| 2,930 | Miami-Dade County Educational Facilities Authority, Florida, Revenue Bonds, University | 4/23 at 100.00 | A– | 3,083,620 |
| | of Miami, Series 2012A, 5.000%, 4/01/42 | | | |
| 8,070 | Miami-Dade County Educational Facilities Authority, Florida, Revenue Bonds, University | 4/25 at 100.00 | A– | 9,047,519 |
| | of Miami, Series 2015A, 5.000%, 4/01/45 | | | |
| 12,545 | Miami-Dade County Educational Facilities Authority, Florida, Revenue Bonds, University | 4/28 at 100.00 | A– | 14,765,089 |
| | of Miami, Series 2018A, 5.000%, 4/01/53 | | | |
| 1,110 | Miami-Dade County Health Facilities Authority, 4.000%, 8/01/51 (WI/DD, Settling 11/10/21) | 8/31 at 100.00 | A | 1,263,002 |
| 1,500 | Miami-Dade County Health Facility Authority, Florida, Hospital Revenue Bonds, Nicklaus | 8/27 at 100.00 | A | 1,782,900 |
| | Children’s Hospital, Refunding Series 2017, 5.000%, 8/01/42 | | | |
| 1,000 | Miami-Dade County, Florida, Aviation Revenue Bonds, Miami International Airport, | 10/22 at 100.00 | A– (4) | 1,043,070 |
| | Refunding Series 2012A, 5.000%, 10/01/29 (Pre-refunded 10/01/22) (AMT) | | | |
| 1,000 | Miami-Dade County, Florida, Aviation Revenue Bonds, Miami International Airport, | 10/24 at 100.00 | A– | 1,124,350 |
| | Refunding Series 2014B, 5.000%, 10/01/37 | | | |
29
| NAD | Nuveen Quality Municipal Income Fund |
| | Portfolio of Investments (continued) |
| | October 31, 2021 |
| Principal | | Optional Call | | |
| Amount (000) | Description (1) | Provisions (2) | Ratings (3) | Value |
| | Florida (continued) | | | |
| $ 5,000 | Miami-Dade County, Florida, Aviation Revenue Bonds, Refunding Series 2014A, 5.000%, | 10/24 at 100.00 | A– | $ 5,598,650 |
| | 10/01/35 (AMT) | | | |
| 6,025 | Miami-Dade County, Florida, Aviation Revenue Bonds, Refunding Series 2015A, 5.000%, | 10/25 at 100.00 | A– | 6,920,375 |
| | 10/01/38 (AMT) | | | |
| 2,865 | Miami-Dade County, Florida, Special Obligation Bonds, Refunding Subordinate Series | 10/22 at 100.00 | A2 (4) | 2,991,089 |
| | 2012B, 5.000%, 10/01/37 (Pre-refunded 10/01/22) | | | |
| 3,000 | Miami-Dade County, Florida, Transit System Sales Surtax Revenue Bonds, Refunding Series | 7/22 at 100.00 | A1 (4) | 3,096,660 |
| | 2012, 5.000%, 7/01/42 (Pre-refunded 7/01/22) | | | |
| 12,370 | Miami-Dade County, Florida, Water and Sewer System Revenue Bonds, Series 2013A, 5.000%, | 10/22 at 100.00 | A+ (4) | 12,914,404 |
| | 10/01/42 (Pre-refunded 10/01/22) | | | |
| 6,035 | Miami-Dade County, Florida, Water and Sewer System Revenue Bonds, Series 2019B, | 10/29 at 100.00 | A+ | 6,900,057 |
| | 4.000%, 10/01/49 | | | |
| 3,375 | Miami-Dade County, Florida, Water and Sewer System Revenue Bonds, Series 2021, | 4/31 at 100.00 | A+ | 3,946,016 |
| | 4.000%, 10/01/48 | | | |
| 2,360 | Osceola County, Florida, Transportation Revenue Bonds, Osceola Parkway, Refunding & | 10/29 at 100.00 | BBB– | 2,904,830 |
| | Improvement Series 2019A-1, 5.000%, 10/01/44 | | | |
| 2,000 | Palm Beach County Health Facilities Authority, Florida, Retirement Communities Revenue | 11/26 at 100.00 | A– | 2,353,180 |
| | Bonds, ACTS Retirement – Life Communities, Inc Obligated Group, Series 2016, 5.000%, 11/15/32 | | | |
| 115 | Palm Beach County Health Facilities Authority, Florida, Revenue Bonds, Sinai Residences | 6/22 at 102.00 | N/R | 120,613 |
| | of Boca Raton Project, Series 2014A, 7.250%, 6/01/34 | | | |
| 4,635 | Port Saint Lucie, Florida, Public Service Tax Revenue Bonds, Recovery Zone Facility Bond | 9/24 at 100.00 | AA– | 5,197,550 |
| | Series 2014B, 5.000%, 9/01/43 | | | |
| 10,095 | Putnam County Development Authority, Florida, Pollution Control Revenue Bonds, Seminole | 5/28 at 100.00 | A– | 11,988,216 |
| | Electric Cooperatice, Inc. Project, Refunding Series 2018B, 5.000%, 3/15/42 | | | |
| | South Miami Health Facilities Authority, Florida, Hospital Revenue Bonds, Baptist Health | | | |
| | Systems of South Florida Obligated Group, Series 2017: | | | |
| 5,770 | 5.000%, 8/15/42 | 8/27 at 100.00 | A1 | 6,989,720 |
| 6,040 | 5.000%, 8/15/47 | 8/27 at 100.00 | A1 | 7,297,468 |
| 705 | Southeast Overtown/Park West Community Redevelopment Agency, Florida, Tax Increment | 3/24 at 100.00 | BBB+ | 764,276 |
| | Revenue Bonds, Series 2014A-1, 5.000%, 3/01/30, 144A | | | |
| 1,500 | Sumter County Industrial Development Authority, Florida, Hospital Revenue Bonds, Central | 1/24 at 100.00 | A– | 1,634,055 |
| | Florida Health Alliance Projects, Series 2014A, 5.250%, 7/01/44 | | | |
| 700 | Tampa, Florida, Cigarette Tax Allocation Bonds, H. Lee Moffitt Cancer Center Project, | 9/22 at 100.00 | A+ | 725,977 |
| | Refunding & Capital Improvement Series 2012A, 5.000%, 9/01/29 | | | |
| 2,405 | Tampa, Florida, Health System Revenue Bonds, Baycare Health System, Series 2016A, | 5/26 at 100.00 | Aa2 | 2,668,372 |
| | 4.000%, 11/15/46 | | | |
| | Tampa, Florida, Revenue Bonds, H. Lee Moffitt Cancer Center and Research Institute, | | | |
| | Series 2020B: | | | |
| 1,000 | 5.000%, 7/01/40 | 7/30 at 100.00 | A– | 1,248,640 |
| 1,845 | 4.000%, 7/01/45 | 7/30 at 100.00 | A– | 2,096,806 |
| 14,610 | Tampa-Hillsborough County Expressway Authority, Florida, Revenue Bonds, Refunding Series | 7/22 at 100.00 | A2 (4) | 15,075,767 |
| | 2012B, 5.000%, 7/01/42 (Pre-refunded 7/01/22) | | | |
| 85 | Tolomato Community Development District, Florida, Special Assessment Bonds, Convertible, | 5/22 at 100.00 | N/R | 75,757 |
| | Capital Appreciation, Series 2012A-4, 0.000%, 5/01/40 (8) | | | |
| 120 | Tolomato Community Development District, Florida, Special Assessment Bonds, Hope Note, | 11/21 at 100.00 | N/R | 1 |
| | Series 2007-3, 6.650%, 5/01/40 (7) | | | |
| 290 | Tolomato Community Development District, Florida, Special Assessment Bonds, Refunding | 11/21 at 100.00 | N/R | 290,824 |
| | Series 2015-1, 0.000%, 5/01/40 (8) | | | |
| 180 | Tolomato Community Development District, Florida, Special Assessment Bonds, Refunding | 11/21 at 100.00 | N/R | 140,020 |
| | Series 2015-2, 0.000%, 5/01/40 (8) | | | |
| 195 | Tolomato Community Development District, Florida, Special Assessment Bonds, Refunding | 11/21 at 100.00 | N/R | 2 |
| | Series 2015-3, 6.610%, 5/01/40 (7) | | | |
| 750 | Volusia County Educational Facilities Authority, Florida, Revenue Bonds, Embry-Riddle | 10/29 at 100.00 | A2 | 858,645 |
| | Aeronautical University, Series 2020A, 4.000%, 10/15/38 | | | |
30
| Principal | | Optional Call | | |
| Amount (000) | Description (1) | Provisions (2) | Ratings (3) | Value |
| | Florida (continued) | | | |
| $ 6,510 | Volusia County Educational Facilities Authority, Florida, Revenue Bonds, Stetson | 6/25 at 100.00 | A– | $ 7,229,941 |
| | University Inc. Project, Series 2015, 5.000%, 6/01/45 | | | |
| 288,500 | Total Florida | | | 322,761,542 |
| | Georgia – 2.2% (1.5% of Total Investments) | | | |
| 1,820 | Atlanta Development Authority, Georgia, Revenue Bonds, New Downtown Atlanta Stadium | 7/25 at 100.00 | A | 2,082,917 |
| | Project, Senior Lien Series 2015A-1, 5.250%, 7/01/40 | | | |
| 5,000 | Atlanta, Georgia, Water and Wastewater Revenue Bonds, Refunding Series 2015, | 5/25 at 100.00 | AA– | 5,749,550 |
| | 5.000%, 11/01/32 | | | |
| 8,875 | Crisp County Hospital Authority, Georgia, Revenue Anticipation Certificates, Crisp | 7/31 at 100.00 | A1 | 10,197,197 |
| | County Hospital Project, Series 2021, 4.000%, 7/01/46 | | | |
| 1,040 | Dalton Development Authority, Georgia, Revenue Certificates, Hamilton Health Care System | No Opt. Call | Baa2 | 1,159,153 |
| | Inc., Series 1996, 5.500%, 8/15/26 – NPFG Insured | | | |
| | Fulton County Development Authority, Georgia, Hospital Revenue Bonds, Wellstar Health | | | |
| | System, Inc Project, Series 2017A: | | | |
| 2,000 | 5.000%, 4/01/47 | 4/27 at 100.00 | A | 2,362,900 |
| 13,710 | 4.000%, 4/01/50 | 4/30 at 100.00 | A | 15,493,123 |
| 3,180 | Georgia Municipal Electric Authority, Plant Vogtle Units 3 & 4 Project M Bonds, Series | 7/28 at 100.00 | BBB+ | 3,800,386 |
| | 2019A, 5.000%, 1/01/63 | | | |
| 2,935 | Georgia Ports Authority, Revenue Bonds, Series 2021, 4.000%, 7/01/51 (WI/DD, Settling 11/04/21) | 7/31 at 100.00 | AA | 3,447,627 |
| | Main Street Natural Gas Inc., Georgia, Gas Supply Revenue Bonds, Series 2019A: | | | |
| 1,460 | 5.000%, 5/15/43 | 5/29 at 100.00 | A3 | 1,739,867 |
| 5,000 | 5.000%, 5/15/49 | No Opt. Call | A3 | 7,229,500 |
| 3,265 | Metropolitan Atlanta Rapid Transit Authority, Georgia, Sales Tax Revenue Bonds, Third | 7/26 at 100.00 | AA– | 3,868,372 |
| | Indenture, Series 2015B, 5.000%, 7/01/41 | | | |
| 10,260 | Municipal Electric Authority of Georgia, Plant Vogtle Units 3 & 4 Project J Bonds, | 7/25 at 100.00 | Baa1 | 11,577,692 |
| | Series 2015A, 5.000%, 7/01/60 | | | |
| 5,000 | Private Colleges and Universities Authority, Georgia, Revenue Bonds, Emory University, | 10/26 at 100.00 | AA | 5,923,450 |
| | Refunding Series 2016A, 5.000%, 10/01/46 | | | |
| 3,040 | Private Colleges and Universities Authority, Georgia, Revenue Bonds, Mercer University, | 10/31 at 100.00 | Baa1 | 3,477,973 |
| | Series 2021, 4.000%, 10/01/50 | | | |
| 5,370 | Rockdale County Development Authority, Georgia, Revenue Bonds, Piedmont Healthcare, Inc. | 7/29 at 100.00 | A1 | 6,173,621 |
| | Project, Series 2019A, 4.000%, 7/01/44 | | | |
| 71,955 | Total Georgia | | | 84,283,328 |
| |
| | Guam – 0.7% (0.5% of Total Investments) | | | |
| 2,000 | Government of Guam, Business Privilege Tax Bonds, Refunding Series 2015D, 5.000%, 11/15/34 | 11/25 at 100.00 | BB | 2,259,420 |
| | Government of Guam, Business Privilege Tax Bonds, Series 2011A: | | | |
| 1,265 | 5.000%, 1/01/31 (Pre-refunded 1/01/22) | 1/22 at 100.00 | BB (4) | 1,274,842 |
| 1,000 | 5.250%, 1/01/36 | 1/22 at 100.00 | BB | 1,008,190 |
| | Guam A.B. Won Pat International Airport Authority, Revenue Bonds, Series 2013C: | | | |
| 60 | 6.375%, 10/01/43 (AMT) | 10/23 at 100.00 | Baa2 | 65,018 |
| 65 | 6.375%, 10/01/43 (Pre-refunded 10/01/23) (AMT) | 10/23 at 100.00 | Baa2 (4) | 72,322 |
| | Guam Economic Development & Commerce Authority, Tobacco Settlement Asset-Backed Bonds, | | | |
| | Series 2007A: | | | |
| 1,875 | 5.250%, 6/01/32 | 11/21 at 100.00 | N/R | 1,875,769 |
| 2,915 | 5.625%, 6/01/47 | 11/21 at 100.00 | N/R | 2,916,020 |
| 1,300 | Guam Government Waterworks Authority, Water and Wastewater System Revenue Bonds, | 7/24 at 100.00 | Baa2 | 1,402,583 |
| | Refunding Series 2014A, 5.000%, 7/01/35 | | | |
| 3,250 | Guam Government Waterworks Authority, Water and Wastewater System Revenue Bonds, Series | 7/23 at 100.00 | Baa2 (4) | 3,523,422 |
| | 2013, 5.500%, 7/01/43 (Pre-refunded 7/01/23) | | | |
| | Guam Government Waterworks Authority, Water and Wastewater System Revenue Bonds, | | | |
| | Series 2016: | | | |
| 245 | 5.000%, 7/01/27 | 7/26 at 100.00 | Baa2 | 284,161 |
| 1,240 | 5.000%, 1/01/46 | 7/26 at 100.00 | Baa2 | 1,385,254 |
31
| NAD | Nuveen Quality Municipal Income Fund |
| | Portfolio of Investments (continued) |
| | October 31, 2021 |
| Principal | | Optional Call | | |
| Amount (000) | Description (1) | Provisions (2) | Ratings (3) | Value |
| | Guam (continued) | | | |
| $ 1,000 | Guam Government Waterworks Authority, Water and Wastewater System Revenue Bonds, Series | 7/30 at 100.00 | Baa2 | $ 1,205,620 |
| | 2020A, 5.000%, 1/01/50 | | | |
| | Guam Government, Limited Obligation Section 30 Revenue Bonds, Series 2016A: | | | |
| 1,000 | 5.000%, 12/01/23 | No Opt. Call | BB | 1,090,990 |
| 2,000 | 5.000%, 12/01/33 | 12/26 at 100.00 | BB | 2,317,100 |
| 2,260 | 5.000%, 12/01/34 | 12/26 at 100.00 | BB | 2,613,825 |
| 1,175 | 5.000%, 12/01/46 | 12/26 at 100.00 | BB | 1,337,526 |
| | Guam Port Authority, Port Revenue Bonds, Private Activity Series 2018B: | | | |
| 510 | 5.000%, 7/01/32 (AMT) | 7/28 at 100.00 | Baa2 | 599,602 |
| 355 | 5.000%, 7/01/33 (AMT) | 7/28 at 100.00 | Baa2 | 415,943 |
| 1,250 | Guam Power Authority, Revenue Bonds, Series 2012A, 5.000%, 10/01/30 – AGM Insured | 10/22 at 100.00 | BBB | 1,296,875 |
| | Guam Power Authority, Revenue Bonds, Series 2014A: | | | |
| 600 | 5.000%, 10/01/39 | 10/24 at 100.00 | BBB | 658,200 |
| 575 | 5.000%, 10/01/44 | 10/24 at 100.00 | BBB | 628,147 |
| 25,940 | Total Guam | | | 28,230,829 |
| | Hawaii – 1.4% (0.9% of Total Investments) | | | |
| 13,000 | Hawaii Department of Budget and Finance, Special Purpose Revenue Bonds, Hawaii Pacific | 7/23 at 100.00 | A1 | 14,003,080 |
| | Health Obligated Group, Series 2013A, 5.500%, 7/01/43 | | | |
| 6,000 | Hawaii Department of Budget and Finance, Special Purpose Revenue Bonds, Hawaiian | 3/27 at 100.00 | Baa1 | 6,606,960 |
| | Electric Company, Inc. and Subsidiary Projects, Refunding Series 2017B, 4.000%, 3/01/37 (AMT) | | | |
| 11,205 | Hawaii State, Airport System Revenue Bonds, Series 2015A, 5.000%, 7/01/45 (AMT) | 7/25 at 100.00 | A+ | 12,770,451 |
| 10,000 | Hawaii State, Airport System Revenue Bonds, Series 2018A, 5.000%, 7/01/43 (AMT) | 7/28 at 100.00 | A+ | 12,033,500 |
| 5,000 | Hawaii State, General Obligation Bonds, Series 2017FK, 4.000%, 5/01/35 | 5/27 at 100.00 | Aa2 | 5,716,300 |
| 45,205 | Total Hawaii | | | 51,130,291 |
| | Idaho – 0.6% (0.4% of Total Investments) | | | |
| 5,000 | Idaho Health Facilities Authority, Hospital Revenue Bonds, CHE Trinity Health Group, | 12/27 at 100.00 | AA– | 6,046,350 |
| | Series 2017A, 5.000%, 12/01/47 | | | |
| 11,205 | Idaho Health Facilities Authority, Hospital Revenue Bonds, CHE Trinity Health Group, | 6/27 at 100.00 | AA– | 13,413,617 |
| | Series 2017ID, 5.000%, 12/01/46 | | | |
| 1,700 | Idaho Health Facilities Authority, Revenue Bonds, Madison Memorial Hospital Project, | 9/26 at 100.00 | BB+ | 1,957,261 |
| | Refunding Series 2016, 5.000%, 9/01/29 | | | |
| | Idaho Water Resource Board, Water Resource Loan Program Revenue, Ground Water Rights | | | |
| | Mitigation Series 2012A: | | | |
| 1,155 | 4.750%, 9/01/26 | 9/22 at 100.00 | A3 | 1,196,961 |
| 310 | 5.000%, 9/01/32 | 9/22 at 100.00 | A3 | 321,427 |
| 19,370 | Total Idaho | | | 22,935,616 |
| | Illinois – 14.6% (9.4% of Total Investments) | | | |
| | Bensenville, Illinois, General Obligation Bonds, Series 2011A: | | | |
| 1,055 | 5.000%, 12/15/30 (Pre-refunded 12/15/21) – AGM Insured | 12/21 at 100.00 | AA (4) | 1,061,119 |
| 1,945 | 5.000%, 12/15/30 (Pre-refunded 12/15/21) – AGM Insured | 12/21 at 100.00 | AA (4) | 1,956,087 |
| 6,000 | Chicago Board of Education, Illinois, Dedicated Capital Improvement Tax Revenue Bonds, | 4/27 at 100.00 | A– | 7,221,540 |
| | Series 2016, 6.000%, 4/01/46 | | | |
| 1,470 | Chicago Board of Education, Illinois, General Obligation Bonds, Dedicated Revenues | 12/21 at 100.00 | Ba3 | 1,474,513 |
| | Series 2011A, 5.000%, 12/01/41 | | | |
| 9,250 | Chicago Board of Education, Illinois, General Obligation Bonds, Dedicated Revenues, | 12/25 at 100.00 | BB | 11,075,858 |
| | Series 2016A, 7.000%, 12/01/44 | | | |
| 2,400 | Chicago Board of Education, Illinois, General Obligation Bonds, Dedicated Revenues, | 12/26 at 100.00 | BB | 2,919,720 |
| | Series 2016B, 6.500%, 12/01/46 | | | |
| 11,295 | Chicago Board of Education, Illinois, General Obligation Bonds, Dedicated Revenues, | 12/27 at 100.00 | BB | 14,478,609 |
| | Series 2017A, 7.000%, 12/01/46, 144A | | | |
32
| | | | | |
| Principal | | Optional Call | | |
| Amount (000) | Description (1) | Provisions (2) | Ratings (3) | Value |
| | Illinois (continued) | | | |
| | Chicago Board of Education, Illinois, Unlimited Tax General Obligation Bonds, Dedicated | | | |
| | Tax Revenues, Series 1998B-1: | | | |
| $ 10,130 | 0.000%, 12/01/24 – FGIC Insured | No Opt. Call | BB | $ 9,846,259 |
| 7,140 | 0.010%, 12/01/25 – FGIC Insured | No Opt. Call | BB | 6,809,775 |
| 4,325 | 0.010%, 12/01/29 – FGIC Insured | No Opt. Call | BB | 3,727,199 |
| 4,235 | 0.000%, 12/01/31 – FGIC Insured | No Opt. Call | BB | 3,439,709 |
| | Chicago Board of Education, Illinois, Unlimited Tax General Obligation Bonds, Dedicated | | | |
| | Tax Revenues, Series 1999A: | | | |
| 15,000 | 0.000%, 12/01/21 – FGIC Insured | No Opt. Call | BB | 14,994,300 |
| 10,000 | 0.000%, 12/01/23 – FGIC Insured | No Opt. Call | BB | 9,846,900 |
| 8,845 | 5.500%, 12/01/26 – NPFG Insured | No Opt. Call | BB | 10,186,963 |
| 7,900 | Chicago Transit Authority, Illinois, Sales Tax Receipts Revenue Bonds, Series 2011, | 12/21 at 100.00 | A2 (4) | 7,932,469 |
| | 5.250%, 12/01/40 (Pre-refunded 12/01/21) | | | |
| | Chicago, Illinois, General Airport Revenue Bonds, O’Hare International Airport, | | | |
| | Refunding Senior Lien Series 2018A: | | | |
| 5,450 | 5.000%, 1/01/48 (AMT) | 1/29 at 100.00 | A | 6,476,998 |
| 10,285 | 5.000%, 1/01/53 (AMT) | 1/29 at 100.00 | A | 12,197,290 |
| 2,245 | Chicago, Illinois, General Airport Revenue Bonds, O’Hare International Airport, Senior | 1/25 at 100.00 | A | 2,514,422 |
| | Lien Series 2015C, 5.000%, 1/01/46 (AMT) | | | |
| | Chicago, Illinois, General Airport Revenue Bonds, O’Hare International Airport, Senior | | | |
| | Lien Series 2017D: | | | |
| 11,250 | 5.000%, 1/01/42 (AMT) | 1/27 at 100.00 | A | 13,158,787 |
| 3,000 | 5.000%, 1/01/47 (AMT) | 1/27 at 100.00 | A | 3,510,390 |
| | Chicago, Illinois, General Obligation Bonds, City Colleges, Series 1999: | | | |
| 4,115 | 0.000%, 1/01/33 – FGIC Insured | No Opt. Call | BBB– | 3,208,507 |
| 29,600 | 0.000%, 1/01/38 – FGIC Insured | No Opt. Call | BBB– | 19,499,000 |
| 11,675 | Chicago, Illinois, General Obligation Bonds, Project & Refunding Series 2017A, 6.000%, 1/01/38 | 1/27 at 100.00 | BBB– | 14,179,754 |
| | Chicago, Illinois, General Obligation Bonds, Series 2019A: | | | |
| 4,000 | 5.000%, 1/01/40 | 1/29 at 100.00 | BBB– | 4,727,320 |
| 7,445 | 5.500%, 1/01/49 | 1/29 at 100.00 | BBB– | 8,943,604 |
| 15,570 | Chicago, Illinois, General Obligation Refunding Bonds, Emergency Telephone System, | No Opt. Call | BBB– | 16,065,126 |
| | Series 1999, 5.500%, 1/01/23 – FGIC Insured | | | |
| 6,280 | Chicago, Illinois, Sales Tax Revenue Bonds, Series 2011A, 5.000%, 1/01/41 (Pre-refunded 1/01/22) | 1/22 at 100.00 | N/R (4) | 6,329,926 |
| 6,375 | Chicago, Illinois, Wastewater Transmission Revenue Bonds, Second Lien Series 2001A, | No Opt. Call | Baa2 | 7,722,611 |
| | 5.500%, 1/01/30 – NPFG Insured | | | |
| 1,500 | Chicago, Illinois, Water Revenue Bonds, Senior Lien Series 2001, 5.750%, 11/01/30 ý | No Opt. Call | Baa2 | 1,799,520 |
| | AMBAC Insured | | | |
| 4,500 | Cook County Community College District 508, Illinois, General Obligation Bonds, Chicago | 12/27 at 100.00 | A+ | 5,191,830 |
| | City Colleges, Series 2017, 5.000%, 12/01/47 | | | |
| 3,000 | Cook County, Illinois, General Obligation Bonds, Refunding Series 2016A, 5.000%, 11/15/31 | 11/26 at 100.00 | A2 | 3,547,020 |
| | Cook County, Illinois, General Obligation Bonds, Refunding Series 2018: | | | |
| 500 | 5.000%, 11/15/34 | 11/26 at 100.00 | A2 | 589,535 |
| 4,550 | 5.000%, 11/15/35 | 11/26 at 100.00 | A2 | 5,360,219 |
| | Illinois Educational Facilities Authority, Revenue Bonds, Field Museum of Natural | | | |
| | History, Series 2002.RMKT: | | | |
| 5,000 | 4.450%, 11/01/36 | 11/25 at 102.00 | A2 | 5,752,350 |
| 815 | 4.500%, 11/01/36 | 11/24 at 100.00 | A | 900,697 |
| 2,785 | 5.500%, 11/01/36 | 11/23 at 100.00 | A | 3,062,275 |
| 410 | Illinois Finance Authority, Charter School Revenue Bonds, Intrinsic Charter Schools | 12/25 at 100.00 | N/R | 461,426 |
| | Belmont School Project, Series 2015A, 6.000%, 12/01/45, 144A | | | |
| | Illinois Finance Authority, Revenue Bonds, Advocate Health Care Network, Refunding | | | |
| | Series 2015: | | | |
| 1,930 | 5.000%, 5/01/45 (UB) (5) | 5/25 at 100.00 | N/R | 2,224,788 |
| 12,025 | 5.000%, 5/01/45 (Pre-refunded 5/01/25) (UB) | 5/25 at 100.00 | Aa3 (4) | 13,906,912 |
33
| NAD | Nuveen Quality Municipal Income Fund |
| | Portfolio of Investments (continued) |
| | October 31, 2021 |
| Principal | | Optional Call | | |
| Amount (000) | Description (1) | Provisions (2) | Ratings (3) | Value |
| | Illinois (continued) | | | |
| $ 2,000 | Illinois Finance Authority, Revenue Bonds, Art Institute of Chicago, Series 2016, | 3/26 at 100.00 | AA– | $ 2,211,580 |
| | 4.000%, 3/01/38 | | | |
| 2,500 | Illinois Finance Authority, Revenue Bonds, Ascension Health/fkaPresence Health Network, | 2/27 at 100.00 | Aa2 | 2,995,800 |
| | Series 2016C, 5.000%, 2/15/33 | | | |
| 3,000 | Illinois Finance Authority, Revenue Bonds, Bradley University, Refunding Series 2021A, | 8/31 at 100.00 | BBB+ | 3,350,730 |
| | 4.000%, 8/01/51 | | | |
| 4,985 | Illinois Finance Authority, Revenue Bonds, Centegra Health System, Series 2012, 5.000%, | 9/22 at 100.00 | AA+ (4) | 5,183,752 |
| | 9/01/32 (Pre-refunded 9/01/22) | | | |
| | Illinois Finance Authority, Revenue Bonds, Centegra Health System, Series 2014A: | | | |
| 4,750 | 5.000%, 9/01/39 (Pre-refunded 9/01/24) | 9/24 at 100.00 | AA+ (4) | 5,366,598 |
| 6,000 | 5.000%, 9/01/42 (Pre-refunded 9/01/24) | 9/24 at 100.00 | AA+ (4) | 6,778,860 |
| 10,745 | Illinois Finance Authority, Revenue Bonds, OSF Healthcare System, Series 2015A, | 11/25 at 100.00 | A3 | 12,372,653 |
| | 5.000%, 11/15/45 | | | |
| | Illinois Finance Authority, Revenue Bonds, Rehabilitation Institute of Chicago, Series 2013A: | | | |
| 415 | 5.500%, 7/01/28 | 7/23 at 100.00 | A– | 439,680 |
| 390 | 6.000%, 7/01/43 | 7/23 at 100.00 | A– | 415,701 |
| 4,250 | Illinois Finance Authority, Revenue Bonds, Rush University Medical Center Obligated | 5/25 at 100.00 | A+ | 4,831,485 |
| | Group, Series 2015B, 5.000%, 11/15/39 | | | |
| | Illinois Finance Authority, Revenue Bonds, Silver Cross Hospital and Medical Centers, | | | |
| | Refunding Series 2015C: | | | |
| 560 | 5.000%, 8/15/35 | 8/25 at 100.00 | A3 | 642,365 |
| 3,745 | 5.000%, 8/15/44 | 8/25 at 100.00 | A3 | 4,282,295 |
| 7,850 | Illinois Finance Authority, Revenue Bonds, The Carle Foundation, Fixed Period Series | 8/31 at 100.00 | AA– | 8,260,241 |
| | 2021A, 3.000%, 8/15/48 | | | |
| | Illinois Finance Authority, Revenue Bonds, University of Chicago, Refunding Series 2015A: | | | |
| 330 | 5.000%, 10/01/46 | 10/25 at 100.00 | AA– | 379,998 |
| 2,670 | 5.000%, 10/01/46 (Pre-refunded 10/01/25) | 10/25 at 100.00 | N/R (4) | 3,129,374 |
| 2,000 | Illinois Health Facilities Authority, Revenue Bonds, Midwest Care Center I Inc., Series | 11/21 at 100.00 | Aa3 | 2,003,920 |
| | 2001, 5.950%, 2/20/36 | | | |
| 1,830 | Illinois Sports Facility Authority, State Tax Supported Bonds, Refunding Series 2014, | 6/24 at 100.00 | BB+ | 2,002,898 |
| | 5.250%, 6/15/32 – AGM Insured | | | |
| 450 | Illinois State, General Obligation Bonds, December Series 2017A, 5.000%, 12/01/39 | 12/27 at 100.00 | BBB– | 521,397 |
| | Illinois State, General Obligation Bonds, February Series 2014: | | | |
| 5,705 | 5.250%, 2/01/33 | 2/24 at 100.00 | BBB– | 6,254,392 |
| 5,815 | 5.250%, 2/01/34 | 2/24 at 100.00 | BBB– | 6,372,251 |
| 2,000 | 5.000%, 2/01/39 | 2/24 at 100.00 | BBB– | 2,172,160 |
| | Illinois State, General Obligation Bonds, January Series 2016: | | | |
| 3,500 | 5.000%, 1/01/29 | 1/26 at 100.00 | BBB– | 4,057,095 |
| 8,250 | 5.000%, 1/01/32 | 1/26 at 100.00 | BBB– | 9,519,428 |
| 4,200 | Illinois State, General Obligation Bonds, June Series 2016, 5.000%, 6/01/27 | 6/26 at 100.00 | BBB– | 4,888,800 |
| 1,025 | Illinois State, General Obligation Bonds, March Series 2012, 5.000%, 3/01/34 | 3/22 at 100.00 | BBB– | 1,038,961 |
| | Illinois State, General Obligation Bonds, May Series 2020: | | | |
| 1,635 | 5.500%, 5/01/30 | No Opt. Call | BBB– | 2,091,884 |
| 5,305 | 5.500%, 5/01/39 | 5/30 at 100.00 | BBB– | 6,585,998 |
| 3,000 | 5.750%, 5/01/45 | 5/30 at 100.00 | BBB– | 3,727,080 |
| 1,500 | Illinois State, General Obligation Bonds, November Series 2016, 5.000%, 11/01/37 | 11/26 at 100.00 | BBB– | 1,735,395 |
| 3,510 | Illinois State, General Obligation Bonds, October Series 2016, 5.000%, 2/01/27 | No Opt. Call | BBB– | 4,161,386 |
| 2,375 | Illinois State, General Obligation Bonds, Refunding Series 2012, 5.000%, 8/01/25 | 8/22 at 100.00 | BBB– | 2,454,634 |
| | Illinois State, General Obligation Bonds, Series 2013: | | | |
| 2,500 | 5.250%, 7/01/31 | 7/23 at 100.00 | BBB– | 2,685,000 |
| 1,520 | 5.500%, 7/01/38 | 7/23 at 100.00 | BBB– | 1,634,927 |
| 1,395 | Illinois Toll Highway Authority, Toll Highway Revenue Bonds, Senior Lien Series 2013A, | 1/23 at 100.00 | A1 | 1,468,349 |
| | 5.000%, 1/01/38 | | | |
34
| Principal | | Optional Call | | |
| Amount (000) | Description (1) | Provisions (2) | Ratings (3) | Value |
| | Illinois (continued) | | | |
| $ 4,685 | Illinois Toll Highway Authority, Toll Highway Revenue Bonds, Senior Lien Series 2015A, | 7/25 at 100.00 | A1 | $ 5,357,719 |
| | 5.000%, 1/01/40 | | | |
| 4,435 | Illinois Toll Highway Authority, Toll Highway Revenue Bonds, Senior Lien Series 2015B, | 1/26 at 100.00 | A1 | 5,132,093 |
| | 5.000%, 1/01/40 | | | |
| | Illinois Toll Highway Authority, Toll Highway Revenue Bonds, Senior Lien Series 2020A: | | | |
| 1,600 | 5.000%, 1/01/41 | 1/31 at 100.00 | A1 | 2,019,840 |
| 10,000 | 5.000%, 1/01/45 | 1/31 at 100.00 | A1 | 12,503,500 |
| | Illinois Toll Highway Authority, Toll Highway Revenue Bonds, Tender Option Bond Trust | | | |
| | 2015-XF0052: | | | |
| 1,875 | 17.670%, 1/01/38, 144A (IF) | 1/23 at 100.00 | A1 | 2,269,406 |
| 1,815 | 17.687%, 1/01/38, 144A (IF) | 1/23 at 100.00 | A1 | 2,197,185 |
| 2,000 | Kane & DeKalb Counties Community Unit School District 301, Illinois, General Obligation | No Opt. Call | Aa2 | 1,999,400 |
| | Bonds, Series 2006, 0.000%, 12/01/21 – NPFG Insured | | | |
| 2,500 | Macon County School District 61 Decatur, Illinois, General Obligation Bonds, Alternate | 1/27 at 100.00 | A3 | 2,770,425 |
| | Revenue Source Refunding School Series 2020C, 4.000%, 1/01/40 – AGM Insured | | | |
| 9,000 | McHenry County Community Unit School District 200, Woodstock, Illinois, General | No Opt. Call | Aa2 | 8,921,790 |
| | Obligation Bonds, Series 2006B, 0.000%, 1/15/23 – FGIC Insured | | | |
| 1,890 | Metropolitan Pier and Exposition Authority, Illinois, McCormick Place Expansion Project | 12/25 at 100.00 | BB+ | 2,118,142 |
| | Bonds, Refunding Series 2015B, 5.000%, 6/15/52 | | | |
| 1,000 | Metropolitan Pier and Exposition Authority, Illinois, McCormick Place Expansion Project | 12/25 at 100.00 | BB+ | 1,140,420 |
| | Bonds, Series 2015A, 5.500%, 6/15/53 | | | |
| 4,780 | Metropolitan Pier and Exposition Authority, Illinois, McCormick Place Expansion Project | 12/27 at 100.00 | BB+ | 5,524,485 |
| | Bonds, Series 2017A, 5.000%, 6/15/57 | | | |
| | Metropolitan Pier and Exposition Authority, Illinois, Revenue Bonds, McCormick Place | | | |
| | Expansion Project, Refunding Series 1996A: | | | |
| 6,015 | 0.000%, 12/15/21 – NPFG Insured (ETM) | No Opt. Call | BB+ (4) | 6,012,654 |
| 12,250 | 0.000%, 12/15/22 – NPFG Insured | No Opt. Call | BB+ | 12,157,145 |
| 23,575 | 0.010%, 12/15/23 – NPFG Insured | No Opt. Call | BB+ | 23,161,494 |
| 10,775 | 0.000%, 12/15/24 – NPFG Insured | No Opt. Call | BB+ | 10,441,406 |
| | Metropolitan Pier and Exposition Authority, Illinois, Revenue Bonds, McCormick Place | | | |
| | Expansion Project, Series 2002A: | | | |
| 155 | 0.000%, 12/15/23 (ETM) | No Opt. Call | N/R (4) | 153,183 |
| 6,610 | 0.000%, 12/15/23 | No Opt. Call | Baa2 | 6,494,061 |
| 5,000 | 0.010%, 12/15/34 – NPFG Insured | No Opt. Call | BB+ | 3,668,150 |
| 1,100 | 0.000%, 12/15/35 – NPFG Insured | No Opt. Call | BB+ | 782,672 |
| 3,805 | 0.000%, 6/15/41 – NPFG Insured | No Opt. Call | BB+ | 2,234,981 |
| 1,890 | Metropolitan Pier and Exposition Authority, Illinois, Revenue Bonds, McCormick Place | No Opt. Call | AA+ (4) | 2,223,509 |
| | Hospitality Facility, Series 1996A, 7.000%, 7/01/26 (ETM) | | | |
| 2,130 | Northern Illinois University, Auxiliary Facilities System Revenue Bonds, Series 2021, | 4/31 at 100.00 | Ba2 | 2,480,598 |
| | 4.000%, 10/01/40 – BAM Insured | | | |
| 3,500 | Regional Transportation Authority, Cook, DuPage, Kane, Lake, McHenry and Will Counties, | No Opt. Call | A1 | 3,679,375 |
| | Illinois, General Obligation Bonds, Series 1999, 5.750%, 6/01/23 – AGM Insured | | | |
| 2,395 | Southwestern Illinois Development Authority, Local Government Revenue Bonds, Edwardsville | No Opt. Call | AA | 2,375,505 |
| | Community Unit School District 7 Project, Series 2007, 0.000%, 12/01/22 – AGM Insured | | | |
| | Springfield, Illinois, Electric Revenue Bonds, Refunding Senior Lien Series 2015: | | | |
| 2,250 | 5.000%, 3/01/29 | 3/25 at 100.00 | A3 | 2,562,750 |
| 3,505 | 5.000%, 3/01/40 – AGM Insured | 3/25 at 100.00 | A2 | 3,971,130 |
| | University of Illinois, Health Services Facilities System Revenue Bonds, Series 2013: | | | |
| 1,580 | 6.000%, 10/01/32 | 10/23 at 100.00 | Baa1 | 1,724,175 |
| 9,625 | 6.250%, 10/01/38 | 10/23 at 100.00 | Baa1 | 10,565,074 |
| 2,845 | 6.000%, 10/01/42 | 10/23 at 100.00 | Baa1 | 3,104,492 |
| 4,930 | Will County Community High School District 210 Lincoln-Way, Illinois, General Obligation | No Opt. Call | A2 | 4,885,285 |
| | Bonds, Series 2006, 0.000%, 1/01/23 – AGM Insured | | | |
| 516,515 | Total Illinois | | | 548,950,438 |
35
| NAD | Nuveen Quality Municipal Income Fund |
| | Portfolio of Investments (continued) |
| | October 31, 2021 |
| Principal | | Optional Call | | |
| Amount (000) | Description (1) | Provisions (2) | Ratings (3) | Value |
| | Indiana – 1.6% (1.0% of Total Investments) | | | |
| $ 6,180 | Crown Point Multi-School Building Corporation, Indiana, First Mortgage Bonds, Crown | No Opt. Call | Baa2 | $ 6,141,746 |
| | Point Community School Corporation, Series 2000, 0.000%, 1/15/23 – NPFG Insured | | | |
| 1,480 | Gary Local Public Improvement Bond Bank, Indiana, Economic Development Revenue Bonds, | 6/30 at 100.00 | N/R | 1,598,844 |
| | Drexel Foundation for Educational Excellence Project, Refunding Series 2020A, 5.875%, | | | |
| | 6/01/55, 144A | | | |
| 1,555 | Indiana Finance Authority, Educational Facilities Revenue Bonds, Butler University | 2/22 at 100.00 | A– | 1,570,892 |
| | Project, Refunding Series 2012B, 5.000%, 2/01/28 | | | |
| 2,865 | Indiana Finance Authority, Hospital Revenue Bonds, Community Health Network Project, | 5/23 at 100.00 | A (4) | 3,067,412 |
| | Series 2012A, 5.000%, 5/01/42 (Pre-refunded 5/01/23) | | | |
| 10,000 | Indiana Finance Authority, Hospital Revenue Bonds, Indiana University Health Obligation | 12/29 at 100.00 | AA | 11,428,700 |
| | Group, Fixed Rate Series 2019A, 4.000%, 12/01/49 | | | |
| 7,480 | Indiana Finance Authority, Hospital Revenue Bonds, Indiana University Health Obligation | 6/25 at 100.00 | AA | 8,531,090 |
| | Group, Refunding 2015A, 5.000%, 12/01/40 | | | |
| | Indiana Finance Authority, Provate Activity Bonds, Ohio River Bridges East End Crossing | | | |
| | Project, Series 2013A: | | | |
| 3,015 | 5.000%, 7/01/44 (Pre-refunded 7/01/23) (AMT) | 7/23 at 100.00 | BBB+ (4) | 3,240,522 |
| 1,420 | 5.000%, 7/01/48 (Pre-refunded 7/01/23) (AMT) | 7/23 at 100.00 | BBB+ (4) | 1,526,216 |
| 1,500 | Indiana Finance Authority, Provate Activity Bonds, Ohio River Bridges East End Crossing | 7/23 at 100.00 | BBB+ (4) | 1,612,200 |
| | Project, Series 2013B, 5.000%, 7/01/40 (Pre-refunded 7/01/23) (AMT) | | | |
| 5,115 | Indiana Finance Authority, Wastewater Utility Revenue Bonds, CWA Authority Project, | 10/26 at 100.00 | A+ | 6,050,329 |
| | First Lien Green Series 2016A, 5.000%, 10/01/41 | | | |
| 1,650 | Indiana Finance Authority, Wastewater Utility Revenue Bonds, CWA Authority Project, | 10/31 at 100.00 | A1 | 1,973,416 |
| | Refunding First Lien Series 2021-1, 4.000%, 10/01/38 | | | |
| 4,500 | Indiana Finance Authority, Wastewater Utility Revenue Bonds, CWA Authority Project, | 10/22 at 100.00 | Aa3 | 4,621,770 |
| | Series 2012A, 4.000%, 10/01/42 | | | |
| 4,375 | Indiana Municipal Power Agency Power Supply System Revenue Bonds, Refunding Series | 7/26 at 100.00 | A+ | 5,175,625 |
| | 2016A, 5.000%, 1/01/42 | | | |
| 3,985 | Valparaiso, Indiana, Exempt Facilities Revenue Bonds, Pratt Paper LLC Project, Series | 1/24 at 100.00 | N/R | 4,459,813 |
| | 2013, 7.000%, 1/01/44 (AMT) | | | |
| 55,120 | Total Indiana | | | 60,998,575 |
| | Iowa – 0.2% (0.1% of Total Investments) | | | |
| 850 | Iowa Finance Authority Senior Living Facilities Revenue Bonds, Sunrise Retirement | 9/28 at 102.00 | N/R | 908,097 |
| | Community Project, Refunding Series 2021, 5.000%, 9/01/41 | | | |
| 1,505 | Iowa Finance Authority, Iowa, Midwestern Disaster Area Revenue Bonds, Alcoa Inc. | 8/22 at 100.00 | Ba2 | 1,537,312 |
| | Project, Series 2012, 4.750%, 8/01/42 | | | |
| 1,335 | Iowa Finance Authority, Iowa, Midwestern Disaster Area Revenue Bonds, Iowa Fertilizer | 12/23 at 100.00 | B+ | 1,438,863 |
| | Company Project, Series 2013, 5.250%, 12/01/25 | | | |
| 1,990 | Iowa Finance Authority, Iowa, Midwestern Disaster Area Revenue Bonds, Iowa Fertilizer | 12/22 at 105.00 | BB– | 2,165,498 |
| | Company Project, Series 2018B, 5.250%, 12/01/50 (Mandatory Put 12/01/37) | | | |
| 5,290 | Iowa Tobacco Settlement Authority, Tobacco Settlement Asset-Backed Bonds, Class 2 | 6/31 at 25.58 | N/R | 898,348 |
| | Capital Appreciation Senior Lien Series 2021B-2, 0.000%, 6/01/65 | | | |
| 790 | Iowa Tobacco Settlement Authority, Tobacco Settlement Asset-Backed Bonds, Senior Class 1 | 6/31 at 100.00 | BBB+ | 878,283 |
| | Series 2021A-2, 4.000%, 6/01/49 | | | |
| 11,760 | Total Iowa | | | 7,826,401 |
| | Kansas – 0.1% (0.1% of Total Investments) | | | |
| 3,965 | Lawrence, Kansas, Hospital Revenue Bonds, Lawrence Memorial Hospital, Series 2018A, | 7/28 at 100.00 | A | 4,739,761 |
| | 5.000%, 7/01/48 | | | |
| 340 | Overland Park Transportation Development District, Kansas, Sales Tax Revenue Bonds, Oak | 11/21 at 100.00 | BBB | 340,116 |
| | Park Mall Project, Series 2010, 5.900%, 4/01/32 | | | |
| 4,305 | Total Kansas | | | 5,079,877 |
36
| Principal | | Optional Call | | |
| Amount (000) | Description (1) | Provisions (2) | Ratings (3) | Value |
| | Kentucky – 0.6% (0.4% of Total Investments) | | | |
| $ 2,730 | Kentucky Economic Development Finance Authority, Revenue Bonds, Next Generation Kentucky | 7/25 at 100.00 | Baa2 | $ 3,046,598 |
| | Information Highway Project, Senior Series 2015A, 5.000%, 1/01/45 | | | |
| | Kentucky Public Transportation Infrastructure Authority, Toll Revenue Bonds, Downtown | | | |
| | Crossing Project, Convertible Capital Appreciation First Tier Series 2013C: | | | |
| 4,790 | 0.000%, 7/01/43 (8) | 7/31 at 100.00 | Baa2 | 5,868,708 |
| 3,655 | 0.000%, 7/01/46 (8) | 7/31 at 100.00 | Baa2 | 4,487,426 |
| | Kentucky Public Transportation Infrastructure Authority, Toll Revenue Bonds, Downtown | | | |
| | Crossing Project, First Tier Series 2013A: | | | |
| 8,360 | 5.750%, 7/01/49 (Pre-refunded 7/01/23) | 7/23 at 100.00 | Baa2 (4) | 9,125,860 |
| 585 | 6.000%, 7/01/53 (Pre-refunded 7/01/23) | 7/23 at 100.00 | Baa2 (4) | 640,710 |
| 20,120 | Total Kentucky | | | 23,169,302 |
| | Louisiana – 3.1% (2.0% of Total Investments) | | | |
| 4,405 | Ascension Parish Industrial development Board, Louisiana, Revenue Bonds, Impala | 7/23 at 100.00 | N/R | 4,619,171 |
| | Warehousing (US) LLC Project, Series 2013, 6.000%, 7/01/36 | | | |
| 2,665 | East Baton Rouge Sewerage Commission, Louisiana, Revenue Bonds, Refunding Series 2014B, | 2/25 at 100.00 | AA– (4) | 3,060,912 |
| | 5.000%, 2/01/39 (Pre-refunded 2/01/25) | | | |
| 3,130 | Jefferson Sales Tax District, Jefferson Parish, Louisiana, Special Sales Tax Revenue | 12/27 at 100.00 | A1 | 3,813,874 |
| | Bonds, Series 2017B, 5.000%, 12/01/42 – AGM Insured | | | |
| | Lafayette Parish School Board, Louisiana, Sales Tax Revenue Bonds, Series 2018: | | | |
| 1,500 | 4.000%, 4/01/40 | 4/27 at 100.00 | AA+ | 1,694,550 |
| 4,685 | 4.000%, 4/01/43 | 4/27 at 100.00 | AA+ | 5,267,626 |
| 5,200 | Louisiana Local Government Environmental Facilities and Community Development Authority, | 2/24 at 100.00 | A+ (4) | 5,749,588 |
| | Revenue Bonds, East Baton Rouge Sewerage Commission Projects, Subordinate Lien Series 2014A, | | | |
| | 5.000%, 2/01/44 (Pre-refunded 2/01/24) | | | |
| | Louisiana Public Facilities Authority, Louisiana, Revenue Bonds, Ochsner Clinic Foundation | | | |
| | Project, Refunding Series 2017: | | | |
| 5,000 | 5.000%, 5/15/42 | 5/27 at 100.00 | A3 | 5,880,850 |
| 1,090 | 5.000%, 5/15/46 | 5/27 at 100.00 | A3 | 1,280,924 |
| 11,700 | Louisiana Public Facilities Authority, Louisiana, Revenue Bonds, Ochsner Clinic Foundation | 5/30 at 100.00 | A3 | 13,320,333 |
| | Project, Series 2020A, 4.000%, 5/15/49 | | | |
| 7,445 | Louisiana Public Facilities Authority, Dock and Wharf Revenue Bonds, Impala Warehousing | 7/23 at 100.00 | N/R | 7,879,416 |
| | (US) LLC Project, Series 2013, 6.500%, 7/01/36 (AMT), 144A | | | |
| 1,265 | Louisiana Public Facilities Authority, Hospital Revenue and Refunding Bonds, Lafayette | 11/25 at 100.00 | N/R (4) | 1,489,310 |
| | General Medical Center Project, Series 2016A, 5.000%, 11/01/45 (Pre-refunded 11/01/25) | | | |
| 3,570 | Louisiana Public Facilities Authority, Hospital Revenue Bonds, Louisiana Children’s | 6/30 at 100.00 | A+ | 4,057,555 |
| | Medical Center Hospital, Series 2020A, 4.000%, 6/01/50 | | | |
| 1,830 | Louisiana Public Facilities Authority, Revenue Bonds, Ochsner Clinic Foundation Project, | 5/26 at 100.00 | A3 | 2,026,286 |
| | Refunding Series 2016, 4.000%, 5/15/35 | | | |
| 330 | Louisiana Stadium and Exposition District, Revenue Refunding Bonds, Senior Lien Series | 7/23 at 100.00 | A2 | 353,691 |
| | 2013A, 5.000%, 7/01/36 | | | |
| 14,000 | Louisiana State, Gasoline and Fuels Tax Revenue Bonds, Refunding Series 2015A, | 5/25 at 100.00 | AA– | 15,222,760 |
| | 4.000%, 5/01/41 | | | |
| | New Orleans Aviation Board, Louisiana, General Airport Revenue Bonds, North Terminal | | | |
| | Project, Series 2015B: | | | |
| 6,235 | 5.000%, 1/01/40 (AMT) | 1/25 at 100.00 | A– | 6,995,670 |
| 6,895 | 5.000%, 1/01/45 (AMT) | 1/25 at 100.00 | A– | 7,708,748 |
| 7,800 | New Orleans Aviation Board, Louisiana, General Airport Revenue Bonds, North Terminal | 1/27 at 100.00 | A– | 9,144,096 |
| | Project, Series 2017B, 5.000%, 1/01/48 (AMT) | | | |
| 1,000 | New Orleans, Louisiana, General Obligation Bonds, Refunding Series 2012, 5.000%, | 12/22 at 100.00 | A2 | 1,048,980 |
| | 12/01/28 – AGM Insured | | | |
| 5,350 | New Orleans, Louisiana, Sewerage Service Revenue Bonds, Refunding Series 2014, 5.000%, | 6/24 at 100.00 | A (4) | 5,979,588 |
| | 6/01/44 (Pre-refunded 6/01/24) | | | |
37
| NAD | Nuveen Quality Municipal Income Fund |
| | Portfolio of Investments (continued) |
| | October 31, 2021 |
| Principal | | Optional Call | | |
| Amount (000) | Description (1) | Provisions (2) | Ratings (3) | Value |
| | Louisiana (continued) | | | |
| $ 1,200 | New Orleans, Louisiana, Water Revenue Bonds, Refunding Series 2014, 5.000%, 12/01/44 | 12/24 at 100.00 | A– (4) | $ 1,367,592 |
| | (Pre-refunded 12/01/24) | | | |
| 485 | Saint Charles Parish, Louisiana, Gulf Opportunity Zone Revenue Bonds, Valero Project, | No Opt. Call | BBB | 495,098 |
| | Series 2010, 4.000%, 12/01/40 (Mandatory Put 6/01/22) | | | |
| 5,655 | Shreveport, Louisiana, Water and Sewer Revenue Bonds, Refunding Series 2015, | 12/25 at 100.00 | A– | 6,526,039 |
| | 5.000%, 12/01/40 | | | |
| 102,435 | Total Louisiana | | | 114,982,657 |
| | Maine – 0.5% (0.3% of Total Investments) | | | |
| 2,775 | Maine Health and Higher Educational Facilities Authority Revenue Bonds, Eastern Maine | 7/23 at 100.00 | Ba1 (4) | 2,992,255 |
| | Medical Center Obligated Group Issue, Series 2013, 5.000%, 7/01/33 (Pre-refunded 7/01/23) | | | |
| | Maine Health and Higher Educational Facilities Authority Revenue Bonds, Eastern Maine | | | |
| | Medical Center Obligated Group Issue, Series 2016A: | | | |
| 3,820 | 4.000%, 7/01/41 | 7/26 at 100.00 | Ba1 | 4,169,110 |
| 2,800 | 4.000%, 7/01/46 | 7/26 at 100.00 | Ba1 | 3,037,216 |
| 3,245 | Maine Health and Higher Educational Facilities Authority Revenue Bonds, MaineHealth | 7/28 at 100.00 | A+ | 3,902,599 |
| | Issue, Series 2018A, 5.000%, 7/01/43 | | | |
| 2,000 | Maine Health and Higher Educational Facilities Authority, Revenue Bonds, Bates College, | 7/23 at 100.00 | A+ | 2,137,840 |
| | Series 2013, 5.000%, 7/01/43 | | | |
| 800 | Maine Health and Higher Educational Facilities Authority, Revenue Bonds, Series 2021A, | 7/31 at 100.00 | A1 | 924,624 |
| | 4.000%, 7/01/50 – AGM Insured | | | |
| | Maine Turnpike Authority, Special Obligation Bonds, Series 2014: | | | |
| 1,290 | 5.000%, 7/01/33 | 7/24 at 100.00 | A– | 1,435,821 |
| 1,020 | 5.000%, 7/01/34 | 7/24 at 100.00 | A– | 1,134,444 |
| 17,750 | Total Maine | | | 19,733,909 |
| | Maryland – 11.5% (7.4% of Total Investments) | | | |
| 1,870 | Anne Arundel County, Maryland, FNMA Multifamily Housing Revenue Bonds, Glenview Gardens | 11/21 at 101.00 | AA+ | 1,881,164 |
| | Apartments Project, Series 2009, 5.000%, 1/01/28 (Mandatory Put 1/01/27) | | | |
| 1,000 | Anne Arundel County, Maryland, General Obligation Bonds, Consolidated General | 10/29 at 100.00 | Aa1 | 1,260,860 |
| | Improvement, Series 2019, 5.000%, 10/01/44 | | | |
| 1,200 | Anne Arundel County, Maryland, Special Tax District Revenue Bonds, Villages of | 7/23 at 100.00 | AA | 1,286,856 |
| | Dorchester & Farmington Village Projects, Series 2013, 5.000%, 7/01/32 | | | |
| | Baltimore County, Maryland, Revenue Bonds, Oak Crest Village, Series 2016: | | | |
| 1,000 | 3.625%, 1/01/37 | 1/26 at 100.00 | A | 1,087,140 |
| 2,220 | 5.000%, 1/01/37 | 1/26 at 100.00 | A | 2,542,122 |
| 2,500 | Baltimore County, Maryland, Revenue Bonds, Oak Crest Village, Series 2020, 4.000%, 1/01/50 | 1/27 at 103.00 | A | 2,840,875 |
| 635 | Baltimore County, Maryland, Revenue Bonds, Riderwood Village Inc Facility, Series 2020, | 1/27 at 103.00 | A | 723,964 |
| | 4.000%, 1/01/50 | | | |
| 9,215 | Baltimore, Maryland, Convention Center Hotel Revenue Bonds, Refunding Series 2017, | 9/27 at 100.00 | CCC | 9,720,719 |
| | 5.000%, 9/01/42 | | | |
| 2,480 | Baltimore, Maryland, Project and Revenue Refunding Bonds, Water Projects, Series 2013B, | 1/24 at 100.00 | AA– (4) | 2,730,034 |
| | 5.000%, 7/01/38 (Pre-refunded 1/01/24) | | | |
| 1,000 | Baltimore, Maryland, Revenue Bonds, Storm Water Projects, Series 2019A, 5.000%, 7/01/49 | 7/29 at 100.00 | AA– | 1,236,110 |
| 2,000 | Baltimore, Maryland, Revenue Bonds, Wastewater Projects, Series 2019A, 5.000%, 7/01/49 | 7/29 at 100.00 | AA | 2,472,220 |
| 5,000 | Baltimore, Maryland, Revenue Bonds, Wastewater Projects, Subordinate Series 2014C, | 1/25 at 100.00 | AA– | 5,642,500 |
| | 5.000%, 7/01/44 | | | |
| | Baltimore, Maryland, Revenue Bonds, Wastewater Projects, Subordinate Series 2017A: | | | |
| 2,000 | 5.000%, 7/01/46 | 1/27 at 100.00 | AA– | 2,393,380 |
| 2,000 | 5.000%, 7/01/46 (UB) | 1/27 at 100.00 | AA– | 2,393,380 |
| | Baltimore, Maryland, Revenue Bonds, Water Projects, Refunding Series 1994A: | | | |
| 175 | 5.000%, 7/01/24 – FGIC Insured | No Opt. Call | AA– | 180,392 |
| 1,620 | 5.000%, 7/01/24 – FGIC Insured (ETM) | No Opt. Call | AA– (4) | 1,754,201 |
38
| Principal | | Optional Call | | |
| Amount (000) | Description (1) | Provisions (2) | Ratings (3) | Value |
| | Maryland (continued) | | | |
| $ 2,340 | Baltimore, Maryland, Revenue Bonds, Water Projects, Refunding Series 1998A, 5.000%, | 8/21 at 100.00 | AA (4) | $ 2,709,673 |
| | 7/01/28 – FGIC Insured (ETM) | | | |
| 3,000 | Baltimore, Maryland, Revenue Bonds, Water Projects, Series 2020A, 4.000%, 7/01/45 | 7/30 at 100.00 | AA– | 3,501,900 |
| 2,500 | Baltimore, Maryland, Revenue Bonds, Water Projects, Subordinate Series 2014A, | 1/25 at 100.00 | A+ | 2,821,250 |
| | 5.000%, 7/01/44 | | | |
| 6,000 | Baltimore, Maryland, Revenue Bonds, Water Projects, Subordinate Series 2017A, 5.000%, | 1/27 at 100.00 | AA– | 7,194,660 |
| | 7/01/41 (UB) | | | |
| 1,450 | Baltimore, Maryland, Special Obligation Bonds, Center/West Development Project, Series | 6/26 at 100.00 | N/R | 1,566,609 |
| | 2017A, 5.500%, 6/01/43 | | | |
| | Baltimore, Maryland, Special Obligation Bonds, Consolidated Tax Increment Financing, | | | |
| | Series 2015: | | | |
| 525 | 5.000%, 6/15/30 | 6/24 at 100.00 | BBB+ | 573,410 |
| 425 | 5.000%, 6/15/33 | 6/24 at 100.00 | BBB+ | 462,447 |
| | Baltimore, Maryland, Special Obligation Bonds, East Baltimore Research Park Project, | | | |
| | Series 2017A: | | | |
| 1,270 | 4.500%, 9/01/33 | 9/27 at 100.00 | N/R | 1,397,559 |
| 240 | 5.000%, 9/01/38 | 9/27 at 100.00 | N/R | 269,172 |
| | Baltimore, Maryland, Special Obligation Bonds, Harbor Point Project, Refunding Series 2016: | | | |
| 1,895 | 5.000%, 6/01/36 | 6/26 at 100.00 | N/R | 2,078,986 |
| 250 | 5.125%, 6/01/43 | 6/26 at 100.00 | N/R | 272,013 |
| 2,000 | Baltimore, Maryland, Special Obligation Bonds, Harbor Point Project, Refunding Series | 6/29 at 100.00 | N/R | 2,062,200 |
| | 2019A, 3.625%, 6/01/46, 144A | | | |
| 350 | Baltimore, Maryland, Special Obligation Bonds, Harbor Point Project, Refunding Series | 6/23 at 100.00 | N/R | 352,744 |
| | 2019B, 3.875%, 6/01/46, 144A | | | |
| | Brunswick, Frederick County, Maryland, Special Obligation Bonds, Brunswick Crossing | | | |
| | Special Taxing District, Refunding Series 2019: | | | |
| 450 | 4.000%, 7/01/29 | 1/29 at 100.00 | N/R | 512,033 |
| 739 | 5.000%, 7/01/36 | 1/29 at 100.00 | N/R | 864,164 |
| | Frederick County, Maryland, Educational Facilities Revenue Bonds, Mount Saint Mary’s | | | |
| | University Inc., Series 2017A: | | | |
| 3,000 | 5.000%, 9/01/37, 144A | 9/27 at 100.00 | BB+ | 3,339,000 |
| 1,750 | 5.000%, 9/01/45, 144A | 9/27 at 100.00 | BB+ | 1,919,172 |
| 414 | Frederick County, Maryland, Special Obligation Bonds, Lake Linganore Village Community | 11/21 at 100.00 | AA | 415,726 |
| | Development Series 2001A, 5.700%, 7/01/29 – RAAI Insured | | | |
| | Frederick County, Maryland, Special Obligation Bonds, Urbana Community Development | | | |
| | Authority, Refunding Series 2020A: | | | |
| 1,020 | 4.000%, 7/01/38 | 7/30 at 100.00 | A– | 1,186,005 |
| 500 | 4.000%, 7/01/39 | 7/30 at 100.00 | A– | 580,025 |
| 370 | Frederick County, Maryland, Tax Increment and Special Tax B Limited Obligation Bonds, | 7/29 at 100.00 | N/R | 388,086 |
| | Oakdale-Lake Linganore Project, Series 2019, 3.750%, 7/01/39 | | | |
| 120 | Frederick County, Maryland, Tax Increment and Special Tax Limited Obligation Bonds, | 7/30 at 102.00 | N/R | 140,861 |
| | Jefferson Technology Park Project, Refunding Series 2020B, 4.625%, 7/01/43, 144A | | | |
| 3,000 | Gaithersburg, Maryland, Economic Development Revenue Bonds, Asbury Methodist Obligated | 1/24 at 104.00 | BBB | 3,316,140 |
| | Group Project, Refunding Series 2018A, 5.000%, 1/01/36 | | | |
| | Howard County Housing Commission, Maryland, Revenue Bonds, Columbia Commons Apartments, | | | |
| | Series 2014A: | | | |
| 1,500 | 4.000%, 6/01/34 | 6/24 at 100.00 | A+ | 1,591,950 |
| 1,550 | 5.000%, 6/01/44 | 6/24 at 100.00 | A+ | 1,671,117 |
| 1,860 | Howard County Housing Commission, Maryland, Revenue Bonds, Gateway Village Apartments, | 6/26 at 100.00 | A+ | 1,997,212 |
| | Series 2016, 4.000%, 6/01/46 | | | |
| | Howard County Housing Commission, Maryland, Revenue Bonds, The Verona at Oakland Mills | | | |
| | Project, Series 2013: | | | |
| 2,000 | 4.625%, 10/01/28 | 10/23 at 100.00 | A+ | 2,116,640 |
| 3,000 | 5.000%, 10/01/28 | 10/23 at 100.00 | A+ | 3,199,050 |
39
| NAD | Nuveen Quality Municipal Income Fund |
| | Portfolio of Investments (continued) |
| | October 31, 2021 |
| Principal | | Optional Call | | |
| Amount (000) | Description (1) | Provisions (2) | Ratings (3) | Value |
| | Maryland (continued) | | | |
| $ 1,000 | Howard County Housing Commission, Maryland, Revenue Bonds, Woodfield Oxford Square | 12/27 at 100.00 | A+ | $ 1,147,710 |
| | Apartments, Series 2017, 5.000%, 12/01/42 | | | |
| 1,290 | Howard County, Maryland, Retirement Community Revenue Bonds, Vantage House, Refunding | 4/27 at 100.00 | N/R | 1,341,987 |
| | Series 2016, 5.000%, 4/01/46 | | | |
| 1,710 | Howard County, Maryland, Retirement Community Revenue Bonds, Vantage House, Refunding | 4/27 at 100.00 | N/R | 1,802,648 |
| | Series 2017, 5.000%, 4/01/36 | | | |
| 1,420 | Howard County, Maryland, Special Obligation Bonds, Annapolis Junction Town Center | 2/24 at 100.00 | N/R | 1,490,759 |
| | Project, Series 2014, 6.100%, 2/15/44 | | | |
| | Howard County, Maryland, Special Obligation Bonds, Downtown Columbia Project, Series 2017A: | | | |
| 1,500 | 4.125%, 2/15/34, 144A | 2/26 at 100.00 | N/R | 1,573,500 |
| 1,550 | 4.375%, 2/15/39, 144A | 2/26 at 100.00 | N/R | 1,630,584 |
| 850 | 4.500%, 2/15/47, 144A | 2/26 at 100.00 | N/R | 890,078 |
| | Hyattsville, Maryland, Special Obligation Bonds, University Town Center Project, Series 2016: | | | |
| 2,125 | 5.000%, 7/01/31 | 7/25 at 100.00 | N/R | 2,239,601 |
| 1,640 | 5.000%, 7/01/34 | 7/25 at 100.00 | N/R | 1,713,488 |
| 1,220 | Maryland Community Development Administration Department of Housing and Community | 7/29 at 100.00 | Aa2 | 1,234,579 |
| | Development, Housing Revenue Bonds, Series 2000A, 2.800%, 7/01/45 | | | |
| 1,195 | Maryland Community Development Administration Department of Housing and Community | 1/24 at 100.00 | Aa2 | 1,243,421 |
| | Development, Housing Revenue Bonds, Series 2014D, 3.900%, 7/01/40 | | | |
| 680 | Maryland Community Development Administration Department of Housing and Community | 1/27 at 100.00 | Aa2 | 719,576 |
| | Development, Housing Revenue Bonds, Series 2017C, 3.550%, 7/01/42 | | | |
| 700 | Maryland Community Development Administration Department of Housing and Community | 1/30 at 100.00 | Aa2 | 685,426 |
| | Development, Housing Revenue Bonds, Series 2020E, 2.350%, 7/01/45 | | | |
| 2,080 | Maryland Community Development Administration Department of Housing and Community | 3/26 at 100.00 | AA | 2,148,432 |
| | Development, Residential Revenue Bonds, Series 2011B, 3.250%, 3/01/36 | | | |
| | Maryland Community Development Administration Department of Housing and Community | | | |
| | Development, Residential Revenue Bonds, Series 2014C: | | | |
| 3,000 | 3.400%, 3/01/31 | 3/24 at 100.00 | AA | 3,107,220 |
| 890 | 3.750%, 3/01/39 | 3/24 at 100.00 | Aa1 | 919,913 |
| 1,500 | Maryland Community Development Administration Department of Housing and Community | 9/25 at 100.00 | AA | 1,569,210 |
| | Development, Residential Revenue Bonds, Series 2015A, 3.800%, 9/01/35 | | | |
| 680 | Maryland Community Development Administration Department of Housing and Community | 3/28 at 100.00 | AA | 722,493 |
| | Development, Residential Revenue Bonds, Series 2019A, 3.750%, 9/01/39 | | | |
| 925 | Maryland Community Development Administration Department of Housing and Community | 9/28 at 100.00 | AA | 984,468 |
| | Development, Residential Revenue Bonds, Series 2019B, 3.350%, 9/01/42 | | | |
| 1,445 | Maryland Community Development Administration Department of Housing and Community | 3/29 at 100.00 | AA | 1,500,343 |
| | Development, Residential Revenue Bonds, Series 2019C, 3.000%, 3/01/42 | | | |
| 2,000 | Maryland Community Development Administration Department of Housing and Community | 9/29 at 100.00 | AA | 1,919,280 |
| | Development, Residential Revenue Bonds, Series 2020D, 2.100%, 9/01/40 | | | |
| 2,570 | Maryland Community Development Administration Department of Housing and Community | 3/30 at 100.00 | AA | 2,415,749 |
| | Development, Residential Revenue Bonds, Series 2021A, 2.000%, 9/01/43 | | | |
| 2,000 | Maryland Community Development Administration Department of Housing and Community | 7/29 at 100.00 | Aa2 | 2,114,900 |
| | Development, Residential Revenue Bonds, Taxable Series 2019D, 3.350%, 7/01/49 | | | |
| 1,000 | Maryland Community Development Administration, Department of Housing and Community | 12/24 at 100.00 | Aaa | 1,055,890 |
| | Development, Multifamily Development Revenue Bonds, Marlborough Apartments, Series 2014I, | | | |
| | 3.450%, 12/15/31 | | | |
| 1,150 | Maryland Community Development Administration, Local Government Infrastructure Bonds, | 6/30 at 100.00 | Aa2 | 1,349,629 |
| | Senior Obligation Series 2020A-1, 4.000%, 6/01/40 | | | |
| 720 | Maryland Community Development Administration, Local Government Infrastructure Bonds, | 6/29 at 100.00 | Aa3 | 819,691 |
| | Subordinate Obligation Series 2019B-2, 4.000%, 6/01/49 | | | |
| 600 | Maryland Economic Development Corporation Economic Development Revenue Bonds, Terminal | 6/29 at 100.00 | Baa3 | 708,408 |
| | Project, Series 2019A, 5.000%, 6/01/49 (AMT) | | | |
40
| | | | | |
| Principal | | Optional Call | | |
| Amount (000) | Description (1) | Provisions (2) | Ratings (3) | Value |
| | Maryland (continued) | | | |
| | Maryland Economic Development Corporation Economic Development Revenue Bonds, | | | |
| | Transportation Facilities Project, Refunding Series 2017A: | | | |
| $ 1,000 | 5.000%, 6/01/31 | 6/28 at 100.00 | Baa3 | $ 1,209,540 |
| 1,125 | 5.000%, 6/01/32 | 6/28 at 100.00 | Baa3 | 1,356,593 |
| 3,360 | 5.000%, 6/01/35 | 6/28 at 100.00 | Baa3 | 4,030,522 |
| 1,500 | Maryland Economic Development Corporation, Air Cargo Obligated Group Revenue Bonds, AFCO | 7/29 at 100.00 | BBB | 1,701,570 |
| | Airport Real Estate Group, Series 2019, 4.000%, 7/01/44 (AMT) | | | |
| | Maryland Economic Development Corporation, Parking Facilities Revenue Bonds Baltimore | | | |
| | City Project, Subordinate Parking Facilities Revenue Bonds, Series 2018C: | | | |
| 1,250 | 4.000%, 6/01/48 | 6/28 at 100.00 | BB– | 1,137,375 |
| 1,080 | 4.000%, 6/01/58 | 6/28 at 100.00 | BB– | 950,216 |
| 3,725 | Maryland Economic Development Corporation, Parking Facilities Revenue Bonds, Baltimore | 6/28 at 100.00 | BB | 3,980,721 |
| | City Project, Senior Parking Facilities Revenue Bonds, Series 2018A, 5.000%, 6/01/58 | | | |
| 5,810 | Maryland Economic Development Corporation, Port Facilities Revenue Bonds, CNX Marine | 11/21 at 100.00 | BB– | 5,869,959 |
| | Terminals Inc. Port of Baltimore Facility, Refunding Series 2010, 5.750%, 9/01/25 | | | |
| | Maryland Economic Development Corporation, Private Activity Revenue Bonds AP, Purple | | | |
| | Line Light Rail Project, Green Bonds, Series 2016D: | | | |
| 2,000 | 5.000%, 9/30/28 (AMT) | 9/26 at 100.00 | B– | 2,369,240 |
| 1,000 | 5.000%, 9/30/31 (AMT) | 9/26 at 100.00 | B– | 1,170,620 |
| 5,825 | 5.000%, 3/31/46 (AMT) | 9/26 at 100.00 | B– | 6,778,086 |
| 2,200 | 5.000%, 3/31/51 (AMT) | 9/26 at 100.00 | B– | 2,555,564 |
| 2,000 | Maryland Economic Development Corporation, Revenue Bonds, Chesapeake Bay Hyatt | 11/21 at 100.00 | N/R | 1,200,000 |
| | Conference Center, Series 2006A, 2.500%, 12/01/31 (7) | | | |
| | Maryland Economic Development Corporation, Senior Student Housing Revenue Bonds, Towson | | | |
| | University Project, Refunding Series 2017: | | | |
| 1,100 | 5.000%, 7/01/36 | 7/27 at 100.00 | BB+ | 1,225,279 |
| 470 | 5.000%, 7/01/37 | 11/21 at 100.00 | BB+ | 470,874 |
| | Maryland Economic Development Corporation, Special Obligation Bonds, Metro Centre Owings | | | |
| | Mills Project, Series 2017: | | | |
| 585 | 4.375%, 7/01/36 | 1/27 at 100.00 | N/R | 644,366 |
| 355 | 4.500%, 7/01/44 | 1/27 at 100.00 | N/R | 390,993 |
| | Maryland Economic Development Corporation, Student Housing Revenue Bonds, Salisbury | | | |
| | University Project, Refunding Series 2013: | | | |
| 500 | 5.000%, 6/01/27 | 6/23 at 100.00 | Baa3 | 526,985 |
| 500 | 5.000%, 6/01/34 | 6/23 at 100.00 | Baa3 | 522,015 |
| 1,510 | Maryland Economic Development Corporation, Student Housing Revenue Bonds, Sheppard Pratt | 7/22 at 100.00 | BBB– | 1,540,306 |
| | University Village, Series 2012, 5.000%, 7/01/33 | | | |
| 495 | Maryland Economic Development Corporation, Student Housing Revenue Bonds, University of | 7/25 at 100.00 | BB+ | 536,783 |
| | Maryland – Baltimore Project, Refunding Senior Lien Series 2015, 5.000%, 7/01/39 | | | |
| 1,110 | Maryland Economic Development Corporation, Student Housing Revenue Bonds, University of | 11/21 at 100.00 | A2 | 1,111,798 |
| | Maryland, Baltimore County Project, Refunding Series 2016, 3.600%, 7/01/35 – AGM Insured | | | |
| | Maryland Economic Development Corporation, Student Housing Revenue Bonds, University of | | | |
| | Maryland, College Park Project, Refunding Series 2016: | | | |
| 875 | 5.000%, 6/01/30 – AGM Insured | 6/26 at 100.00 | A2 | 1,016,899 |
| 240 | 5.000%, 6/01/31 – AGM Insured | 6/26 at 100.00 | A2 | 278,676 |
| 2,405 | 5.000%, 6/01/35 – AGM Insured | 6/26 at 100.00 | A2 | 2,782,777 |
| 780 | 5.000%, 6/01/43 – AGM Insured | 6/26 at 100.00 | A2 | 901,033 |
| 865 | Maryland Health and Higher Educational Facilities Authority, Revenue Bonds, Stevenson | 6/31 at 100.00 | BBB– | 983,566 |
| | University, Series 2021A, 4.000%, 6/01/41 | | | |
| 360 | Maryland Health and Higher Educational Facilities Authority, Revenue Bonds, University | 1/27 at 100.00 | A | 431,215 |
| | of Maryland Medical Systems, Series 2020B-2, 5.000%, 7/01/45 (Mandatory Put 7/01/27) | | | |
41
| NAD | Nuveen Quality Municipal Income Fund |
| | Portfolio of Investments (continued) |
| | October 31, 2021 |
| Principal | | Optional Call | | |
| Amount (000) | Description (1) | Provisions (2) | Ratings (3) | Value |
| | Maryland (continued) | | | |
| | Maryland Health and Higher Educational Facilities Authority, Maryland, Hospital Revenue | | | |
| | Bonds, Meritus Medical Center, Series 2015: | | | |
| $ 990 | 4.000%, 7/01/32 | 7/25 at 100.00 | BBB+ | $ 1,078,823 |
| 2,470 | 4.250%, 7/01/35 | 7/25 at 100.00 | BBB+ | 2,716,333 |
| 1,740 | 5.000%, 7/01/45 | 7/25 at 100.00 | BBB+ | 1,940,030 |
| | Maryland Health and Higher Educational Facilities Authority, Parking Facilities Revenue | | | |
| | Bonds, Johns Hopkins Hospital, Series 2001: | | | |
| 1,300 | 5.000%, 7/01/27 – AMBAC Insured | 11/21 at 100.00 | N/R | 1,311,596 |
| 1,000 | 5.000%, 7/01/34 – AMBAC Insured | 11/21 at 100.00 | N/R | 1,008,920 |
| 330 | Maryland Health and Higher Educational Facilities Authority, Parking Facilities Revenue | 11/21 at 100.00 | N/R | 332,944 |
| | Bonds, Johns Hopkins Medical Institutions, Series 1996, 5.500%, 7/01/26 – AMBAC Insured | | | |
| | Maryland Health and Higher Educational Facilities Authority, Revenue Bonds Doctors | | | |
| | Community Hospital, Series 2017B: | | | |
| 250 | 5.000%, 7/01/34 | 7/27 at 100.00 | Baa3 | 283,803 |
| 4,820 | 5.000%, 7/01/38 | 7/27 at 100.00 | Baa3 | 5,414,836 |
| | Maryland Health and Higher Educational Facilities Authority, Revenue Bonds, Mercy | | | |
| | Medical Center, Series 2016A: | | | |
| 90 | 5.000%, 7/01/36 | 7/26 at 100.00 | BBB+ | 104,470 |
| 1,450 | 5.000%, 7/01/38 | 7/26 at 100.00 | BBB+ | 1,677,099 |
| 600 | 4.000%, 7/01/42 | 7/26 at 100.00 | BBB+ | 650,760 |
| 1,540 | Maryland Health and Higher Educational Facilities Authority, Revenue Bonds, Adventist | 1/32 at 100.00 | Baa3 | 1,957,432 |
| | Healthcare Inc., Series 2021, 5.000%, 1/01/36 | | | |
| | Maryland Health and Higher Educational Facilities Authority, Revenue Bonds, Adventist | | | |
| | Healthcare, Series 2011A: | | | |
| 1,350 | 6.250%, 1/01/31 | 1/22 at 100.00 | Baa3 | 1,363,406 |
| 375 | 6.125%, 1/01/36 | 1/22 at 100.00 | Baa3 | 378,645 |
| 4,020 | Maryland Health and Higher Educational Facilities Authority, Revenue Bonds, Adventist | 1/27 at 100.00 | Baa3 | 4,758,072 |
| | Healthcare, Series 2016A, 5.500%, 1/01/46 | | | |
| 1,355 | Maryland Health and Higher Educational Facilities Authority, Revenue Bonds, Anne Arundel | 7/22 at 100.00 | A3 | 1,396,571 |
| | Health System Issue, Series 2012, 5.000%, 7/01/24 | | | |
| 2,000 | Maryland Health and Higher Educational Facilities Authority, Revenue Bonds, Calvert | 7/23 at 100.00 | A3 (4) | 2,156,920 |
| | Health System Issue, Refunding Series 2013, 5.000%, 7/01/38 (Pre-refunded 7/01/23) | | | |
| | Maryland Health and Higher Educational Facilities Authority, Revenue Bonds, Carroll | | | |
| | Hospital Center, Series 2012A: | | | |
| 1,000 | 4.000%, 7/01/30 (Pre-refunded 7/01/22) | 7/22 at 100.00 | A1 (4) | 1,025,250 |
| 1,775 | 5.000%, 7/01/37 (Pre-refunded 7/01/22) | 7/22 at 100.00 | A1 (4) | 1,831,587 |
| | Maryland Health and Higher Educational Facilities Authority, Revenue Bonds, Charlestown | | | |
| | Community Issue, Series 2016A: | | | |
| 2,125 | 5.000%, 1/01/36 | 7/26 at 100.00 | A– | 2,462,492 |
| 4,090 | 5.000%, 1/01/45 | 7/26 at 100.00 | A– | 4,681,414 |
| | Maryland Health and Higher Educational Facilities Authority, Revenue Bonds, Frederick | | | |
| | Health System Issue; Series 2020: | | | |
| 1,000 | 3.250%, 7/01/39 | 7/30 at 100.00 | Baa1 | 1,084,010 |
| 100 | 4.000%, 7/01/40 | 7/30 at 100.00 | Baa1 | 116,208 |
| 280 | 4.000%, 7/01/45 | 7/30 at 100.00 | Baa1 | 321,062 |
| 1,240 | 4.000%, 7/01/50 | 7/30 at 100.00 | Baa1 | 1,409,781 |
| 4,335 | Maryland Health and Higher Educational Facilities Authority, Revenue Bonds, Frederick | 7/22 at 100.00 | Baa1 (4) | 4,447,190 |
| | Memorial Hospital Issue, Series 2012A, 4.250%, 7/01/32 (Pre-refunded 7/01/22) | | | |
| 700 | Maryland Health and Higher Educational Facilities Authority, Revenue Bonds, Goucher | 7/22 at 100.00 | BBB+ | 719,418 |
| | College, Series 2012A, 5.000%, 7/01/34 | | | |
| | Maryland Health and Higher Educational Facilities Authority, Revenue Bonds, Goucher | | | |
| | College, Series 2017A: | | | |
| 1,100 | 5.000%, 7/01/37 | 7/27 at 100.00 | BBB+ | 1,279,696 |
| 1,200 | 5.000%, 7/01/44 | 7/27 at 100.00 | BBB+ | 1,381,236 |
42
| | | | | |
| Principal | | Optional Call | | |
| Amount (000) | Description (1) | Provisions (2) | Ratings (3) | Value |
| | Maryland (continued) | | | |
| | Maryland Health and Higher Educational Facilities Authority, Revenue Bonds, Green Street | | | |
| | Academy, Series 2017A: | | | |
| $ 265 | 5.125%, 7/01/37, 144A | 7/27 at 100.00 | N/R | $ 289,642 |
| 500 | 5.250%, 7/01/47, 144A | 7/27 at 100.00 | N/R | 541,105 |
| 2,405 | Maryland Health and Higher Educational Facilities Authority, Revenue Bonds, Helix | 8/21 at 100.00 | N/R (4) | 2,753,797 |
| | Health, Series 1997, 5.000%, 7/01/27 – AMBAC Insured (ETM) | | | |
| 2,500 | Maryland Health and Higher Educational Facilities Authority, Revenue Bonds, Johns | 5/25 at 100.00 | AA– | 2,731,000 |
| | Hopkins Health System Issue, Series 2015A, 4.000%, 5/15/40 | | | |
| | Maryland Health and Higher Educational Facilities Authority, Revenue Bonds, Johns | | | |
| | Hopkins University, Series 2012A: | | | |
| 1,145 | 5.000%, 7/01/30 (Pre-refunded 7/01/22) | 7/22 at 100.00 | AA (4) | 1,181,892 |
| 1,050 | 5.000%, 7/01/37 (Pre-refunded 7/01/22) | 7/22 at 100.00 | AA (4) | 1,083,831 |
| | Maryland Health and Higher Educational Facilities Authority, Revenue Bonds, Johns | | | |
| | Hopkins University, Series 2013B: | | | |
| 500 | 5.000%, 7/01/38 | 7/23 at 100.00 | AA | 535,325 |
| 4,375 | 4.250%, 7/01/41 | 7/23 at 100.00 | AA | 4,608,931 |
| 2,000 | Maryland Health and Higher Educational Facilities Authority, Revenue Bonds, LifeBridge | 7/26 at 100.00 | A+ | 2,331,600 |
| | Health Issue, Series 2016, 5.000%, 7/01/47 | | | |
| | Maryland Health and Higher Educational Facilities Authority, Revenue Bonds, LifeBridge | | | |
| | Health Issue, Series 2017: | | | |
| 1,000 | 5.000%, 7/01/33 | 7/27 at 100.00 | A+ | 1,188,480 |
| 2,500 | 4.000%, 7/01/42 | 7/27 at 100.00 | A+ | 2,782,550 |
| 1,000 | 5.000%, 7/01/44 | 7/27 at 100.00 | A+ | 1,179,060 |
| | Maryland Health and Higher Educational Facilities Authority, Revenue Bonds, LifeBridge | | | |
| | Health System, Series 2015: | | | |
| 1,500 | 4.000%, 7/01/35 (Pre-refunded 7/01/25) | 7/25 at 100.00 | A+ (4) | 1,687,635 |
| 1,125 | 5.000%, 7/01/40 (Pre-refunded 7/01/25) | 7/25 at 100.00 | A+ (4) | 1,306,474 |
| 2,975 | 4.125%, 7/01/47 | 7/25 at 100.00 | A+ | 3,227,072 |
| 1,250 | Maryland Health and Higher Educational Facilities Authority, Revenue Bonds, Loyola | 10/22 at 100.00 | A (4) | 1,305,338 |
| | University Maryland, Series 2012A, 5.000%, 10/01/39 (Pre-refunded 10/01/22) | | | |
| | Maryland Health and Higher Educational Facilities Authority, Revenue Bonds, Loyola | | | |
| | University Maryland, Series 2014: | | | |
| 1,000 | 4.000%, 10/01/45 | 10/24 at 100.00 | A | 1,078,840 |
| 1,250 | 5.000%, 10/01/45 | 10/24 at 100.00 | A | 1,393,737 |
| 1,210 | Maryland Health and Higher Educational Facilities Authority, Revenue Bonds, Loyola | 10/29 at 100.00 | A | 1,486,316 |
| | University Maryland, Series 2019A, 5.000%, 10/01/49 | | | |
| | Maryland Health and Higher Educational Facilities Authority, Revenue Bonds, Maryland | | | |
| | Institute College of Art, Series 2012: | | | |
| 1,500 | 5.000%, 6/01/34 | 6/22 at 100.00 | Baa1 | 1,535,280 |
| 3,000 | 5.000%, 6/01/47 | 6/22 at 100.00 | Baa1 | 3,065,400 |
| | Maryland Health and Higher Educational Facilities Authority, Revenue Bonds, Maryland | | | |
| | Institute College of Art, Series 2016: | | | |
| 175 | 5.000%, 6/01/36 | 6/26 at 100.00 | Baa1 | 199,812 |
| 2,500 | 4.000%, 6/01/42 | 6/26 at 100.00 | Baa1 | 2,704,525 |
| | Maryland Health and Higher Educational Facilities Authority, Revenue Bonds, Maryland | | | |
| | Institute College of Art, Series 2017: | | | |
| 525 | 5.000%, 6/01/35 | 6/26 at 100.00 | Baa1 | 600,448 |
| 1,000 | 5.000%, 6/01/42 | 6/26 at 100.00 | Baa1 | 1,131,780 |
| 2,500 | Maryland Health and Higher Educational Facilities Authority, Revenue Bonds, MedStar | 2/25 at 100.00 | A | 2,836,500 |
| | Health Issue, Series 2015, 5.000%, 8/15/38 | | | |
| 6,000 | Maryland Health and Higher Educational Facilities Authority, Revenue Bonds, MedStar | 5/27 at 100.00 | A | 7,208,280 |
| | Health Issue, Series 2017A, 5.000%, 5/15/42 | | | |
| 2,850 | Maryland Health and Higher Educational Facilities Authority, Revenue Bonds, Mercy | 7/22 at 100.00 | BBB+ | 2,930,541 |
| | Medical Cente, Series 2011, 5.000%, 7/01/31 | | | |
43
| NAD | Nuveen Quality Municipal Income Fund |
| | Portfolio of Investments (continued) |
| | October 31, 2021 |
| Principal | | Optional Call | | |
| Amount (000) | Description (1) | Provisions (2) | Ratings (3) | Value |
| | Maryland (continued) | | | |
| | Maryland Health and Higher Educational Facilities Authority, Revenue Bonds, Peninsula | | | |
| | Regional Medical Center Issue, Refunding Series 2015: | | | |
| $ 2,790 | 5.000%, 7/01/39 (Pre-refunded 7/01/24) | 7/24 at 100.00 | A3 (4) | $ 3,132,221 |
| 5,500 | 5.000%, 7/01/45 (Pre-refunded 7/01/24) | 7/24 at 100.00 | A3 (4) | 6,174,630 |
| | Maryland Health and Higher Educational Facilities Authority, Revenue Bonds, Trinity | | | |
| | Health Credit Group, Series 2017MD: | | | |
| 1,000 | 5.000%, 12/01/46 | 6/27 at 100.00 | AA– | 1,204,880 |
| 3,260 | 5.000%, 12/01/46 (UB) (5) | 6/27 at 100.00 | AA– | 3,927,909 |
| | Maryland Health and Higher Educational Facilities Authority, Revenue Bonds, University | | | |
| | of Maryland Medical System Issue, Series 2013A: | | | |
| 4,665 | 4.000%, 7/01/43 (Pre-refunded 7/01/22) | 7/22 at 100.00 | A (4) | 4,784,377 |
| 11,500 | 5.000%, 7/01/43 (Pre-refunded 7/01/22) | 7/22 at 100.00 | A (4) | 11,870,530 |
| 1,000 | Maryland Health and Higher Educational Facilities Authority, Revenue Bonds, University | 7/25 at 100.00 | A | 1,138,550 |
| | of Maryland Medical System Issue, Series 2015, 5.000%, 7/01/35 | | | |
| 5,500 | Maryland Health and Higher Educational Facilities Authority, Revenue Bonds, University | 7/27 at 100.00 | A | 6,574,315 |
| | of Maryland Medical System Issue, Series 2017B, 5.000%, 7/01/39 | | | |
| 2,000 | Maryland Health and Higher Educational Facilities Authority, Revenue Bonds, University | 1/28 at 100.00 | A | 2,238,540 |
| | of Maryland Medical System Issue, Taxable Series 2017D, 4.000%, 7/01/48 | | | |
| 2,500 | Maryland Health and Higher Educational Facilities Authority, Revenue Bonds, University | 4/30 at 100.00 | A | 2,859,575 |
| | of Pittsburgh Medical Center, Series 2020B, 4.000%, 4/15/50 | | | |
| 12,250 | Maryland Health and Higher Educational Facilities Authority, Revenue Bonds, Western | 7/24 at 100.00 | N/R (4) | 13,816,162 |
| | Maryland Health, Series 2014, 5.250%, 7/01/34 (Pre-refunded 7/01/24) | | | |
| | Maryland Stadium Authority, Revenue Bonds, Baltimore City Public Schools Construction & | | | |
| | Revitalization Program, Series 2016: | | | |
| 4,395 | 5.000%, 5/01/33 | 5/26 at 100.00 | AA– | 5,178,892 |
| 3,650 | 5.000%, 5/01/35 (Pre-refunded 5/01/26) | 5/26 at 100.00 | AA– (4) | 4,365,181 |
| 5,100 | 5.000%, 5/01/46 (Pre-refunded 5/01/26) (UB) (5) | 5/26 at 100.00 | AA– (4) | 6,099,294 |
| | Maryland Stadium Authority, Revenue Bonds, Baltimore City Public Schools Construction & | | | |
| | Revitalization Program, Series 2018A: | | | |
| 2,000 | 5.000%, 5/01/35 | 5/28 at 100.00 | AA– | 2,444,020 |
| 2,000 | 5.000%, 5/01/36 (UB) (5) | 5/28 at 100.00 | AA– | 2,438,160 |
| 6,250 | 5.000%, 5/01/42 (UB) (5) | 5/28 at 100.00 | AA– | 7,579,437 |
| 1,500 | Maryland Transportation Authority, Passenger Facility Charge Revenue Bonds, | 6/29 at 100.00 | A– | 1,858,830 |
| | Baltimore/Washington International Thurgood Marshall Airport Project, Series 2019, 5.000%, | | | |
| | 6/01/32 (AMT) | | | |
| 3,000 | Maryland Transportation Authority, Revenue Bonds, Transportation Facilities Projects, | 7/30 at 100.00 | AA– | 3,535,020 |
| | Series 2020, 4.000%, 7/01/39 | | | |
| 1,095 | Maryland Transportation Authority, Revenue Bonds, Transportation Facilities Projects, | 7/31 at 100.00 | Aa2 | 1,402,060 |
| | Series 2021A, 5.000%, 7/01/51 | | | |
| 1,500 | Montgomery County Housing Opportunities Commission, Maryland, Multifamily Housing | 7/24 at 100.00 | Aaa | 1,564,605 |
| | Development Bonds, Series 2014A, 3.875%, 7/01/39 | | | |
| 180 | Montgomery County Housing Opportunities Commission, Maryland, Single Family Mortgage | 7/26 at 100.00 | Aa2 | 190,521 |
| | Revenue Bonds, Series 2017A, 3.650%, 7/01/37 | | | |
| 8,000 | Montgomery County, Maryland, Revenue Bonds, Trinity Health Credit Group, Refunding | 12/21 at 100.00 | AA– (4) | 8,031,280 |
| | Series 2011MD, 5.000%, 12/01/40 (Pre-refunded 12/01/21) | | | |
| | Montgomery County, Maryland, Revenue Bonds, Trinity Health Credit Group, Series 2015: | | | |
| 6,000 | 4.000%, 12/01/44 | 6/25 at 100.00 | AA– | 6,544,440 |
| 2,000 | 5.000%, 12/01/44 (UB) (5) | 6/25 at 100.00 | AA– | 2,300,100 |
| 625 | Morgan State University, Maryland, Student Tuition and Fee Revenue Bonds, Academic Fees | 7/22 at 100.00 | A+ (4) | 644,925 |
| | and Auxiliary Facilities, Refunding Series 2012, 5.000%, 7/01/29 (Pre-refunded 7/01/22) | | | |
| 320 | Prince George’s County Revenue Authority, Maryland, Special Obligation Bonds, | 1/26 at 100.00 | N/R | 353,440 |
| | Suitland-Naylor Road Project, Series 2016, 5.000%, 7/01/46, 144A | | | |
| 4,500 | Prince George’s County, Maryland, Certificates of Participation, University of Maryland | 10/28 at 100.00 | AA+ | 5,542,920 |
| | Capital Region Medical Center, Series 2018, 5.000%, 10/01/43 (UB) (5) | | | |
44
| Principal | | Optional Call | | |
| Amount (000) | Description (1) | Provisions (2) | Ratings (3) | Value |
| | Maryland (continued) | | | |
| | Prince George’s County, Maryland, General Obligation Consolidated Public Improvement | | | |
| | Bonds, Series 2014A: | | | |
| $ 3,000 | 4.000%, 9/01/30 | 9/24 at 100.00 | AAA | $ 3,285,660 |
| 3,000 | 4.000%, 9/01/31 | 9/24 at 100.00 | AAA | 3,285,630 |
| 1,050 | Prince George’s County, Maryland, Revenue Bonds, Collington Episcopal Life Care | 4/27 at 100.00 | N/R | 1,120,119 |
| | Community Inc., Series 2017, 5.250%, 4/01/37 | | | |
| 5,147 | Prince George’s County, Maryland, Special Obligation Bonds, National Harbor Project, | 11/21 at 100.00 | N/R | 5,187,610 |
| | Series 2005, 5.200%, 7/01/34 | | | |
| | Prince George’s County, Maryland, Special Obligation Bonds, Westphalia Town Center | | | |
| | Project, Series 2018: | | | |
| 1,300 | 5.125%, 7/01/39, 144A | 7/28 at 100.00 | N/R | 1,450,709 |
| 2,200 | 5.250%, 7/01/48, 144A | 7/28 at 100.00 | N/R | 2,452,274 |
| 2,099 | Prince George’s County, Maryland, Special Tax District Bonds, Victoria Falls Project, | 11/21 at 100.00 | N/R | 2,109,327 |
| | Series 2005, 5.250%, 7/01/35 | | | |
| 1,340 | Rockville Mayor and Council, Maryland, Economic Development Revenue Bonds, Ingleside | 11/24 at 103.00 | B– | 1,453,029 |
| | King Farm Project, Refunding Series 2017, 5.000%, 11/01/35 | | | |
| 795 | Rockville Mayor and Council, Maryland, Economic Development Revenue Bonds, Ingleside | 11/24 at 103.00 | B– | 866,160 |
| | King Farm Project, Refunding Series 2017A-2, 5.000%, 11/01/31 | | | |
| | Rockville Mayor and Council, Maryland, Economic Development Revenue Bonds, Ingleside | | | |
| | King Farm Project, Series 2017A-1: | | | |
| 1,070 | 5.000%, 11/01/28 | 11/24 at 103.00 | B– | 1,174,935 |
| 1,000 | 5.000%, 11/01/37 | 11/24 at 103.00 | B– | 1,082,540 |
| | Rockville Mayor and Council, Maryland, Economic Development Revenue Bonds, Series 2017B: | | | |
| 500 | 5.000%, 11/01/42 | 11/24 at 103.00 | B– | 538,715 |
| 1,000 | 5.000%, 11/01/47 | 11/24 at 103.00 | B– | 1,074,130 |
| | Washington County County Commissioners, Maryland, Revenue Bonds, Diakon Lutheran Social | | | |
| | Ministries Project, Series 2019B: | | | |
| 1,000 | 5.000%, 1/01/29 | No Opt. Call | BBB+ | 1,243,010 |
| 500 | 5.000%, 1/01/32 | 1/29 at 100.00 | BBB+ | 611,965 |
| 2,000 | Washington Suburban Sanitary District, Montgomery and Prince George’s Counties, | 6/26 at 100.00 | AAA | 2,375,720 |
| | Maryland, General Obligation Bonds, Consolidated Public Improvement, Second Series 2016, | | | |
| | 5.000%, 6/01/35 | | | |
| 2,500 | Washington Suburban Sanitary District, Montgomery and Prince George’s Counties, Maryland, | No Opt. Call | AAA | 2,907,700 |
| | General Obligation Bonds, Consolidated Public Improvement, Series 2017, 5.000%, 6/15/25 | | | |
| 2,500 | Washington Suburban Sanitary District, Montgomery and Prince George’s Counties, Maryland, | 6/28 at 100.00 | AAA | 2,919,175 |
| | General Obligation Bonds, Consolidated Public Improvement, Series 2018, 4.000%, 6/01/39 | | | |
| 391,204 | Total Maryland | | | 432,496,692 |
| |
| | Massachusetts – 1.0% (0.6% of Total Investments) | | | |
| 7,860 | Massachusetts Bay Transportation Authority, Sales Tax Revenue Bonds, Subordinated Series | 7/31 at 100.00 | Aa3 | 9,241,081 |
| | 2021A-1, 4.000%, 7/01/51 | | | |
| 650 | Massachusetts Development Finance Agency, Health Care Facility Revenue Bonds, Adventcare | 11/21 at 100.00 | N/R | 292,500 |
| | Project, Series 2007A, 0.000%, 10/15/37 (7) | | | |
| 815 | Massachusetts Development Finance Agency, Health Care Facility Revenue Bonds, Adventcare | 11/21 at 100.00 | N/R | 366,750 |
| | Project, Series 2010, 0.000%, 10/15/37 (7) | | | |
| | Massachusetts Development Finance Agency, Revenue Bonds, Atrius Health Issue, Series 2019A: | | | |
| 275 | 5.000%, 6/01/39 | 6/29 at 100.00 | BBB | 334,045 |
| 270 | 4.000%, 6/01/49 | 6/29 at 100.00 | BBB | 300,753 |
| 825 | Massachusetts Development Finance Agency, Revenue Bonds, Boston Medical Center Issue, | 7/25 at 100.00 | BBB | 929,981 |
| | Green Bonds, Series 2015D, 5.000%, 7/01/44 | | | |
| 3,500 | Massachusetts Development Finance Agency, Revenue Bonds, Boston University, Series | 10/26 at 100.00 | AA– | 4,161,535 |
| | 2016BB-1, 5.000%, 10/01/46 | | | |
45
| NAD | Nuveen Quality Municipal Income Fund |
| | Portfolio of Investments (continued) |
| | October 31, 2021 |
| Principal | | Optional Call | | |
| Amount (000) | Description (1) | Provisions (2) | Ratings (3) | Value |
| | Massachusetts (continued) | | | |
| | Massachusetts Development Finance Agency, Revenue Bonds, Boston University, Tender | | | |
| | Option Bond Trust 2016-XG0070: | | | |
| $ 930 | 17.874%, 10/01/48, 144A (IF) (5) | 10/23 at 100.00 | AA– | $ 1,234,873 |
| 505 | 17.979%, 10/01/48, 144A (IF) (5) | 10/23 at 100.00 | AA– | 670,751 |
| 3,200 | Massachusetts Development Finance Agency, Revenue Bonds, Emerson College, Series 2015, | 1/25 at 100.00 | Baa2 | 3,429,088 |
| | 4.500%, 1/01/45 | | | |
| 1,220 | Massachusetts Development Finance Agency, Revenue Bonds, Loomis Communities, Series | 1/23 at 100.00 | BBB | 1,298,836 |
| | 2013A, 5.125%, 1/01/25 | | | |
| 2,300 | Massachusetts Development Finance Agency, Revenue Bonds, Olin College, Series 2013E, | 11/23 at 100.00 | A | 2,485,610 |
| | 5.000%, 11/01/43 | | | |
| 1,500 | Massachusetts Development Finance Agency, Revenue Bonds, UMass Memorial Health Care, | 7/26 at 100.00 | BBB+ | 1,646,220 |
| | Series 2016I, 4.000%, 7/01/41 | | | |
| | Massachusetts Development Finance Agency, Revenue Bonds, Western New England University, | | | |
| | Series 2015: | | | |
| 1,145 | 5.000%, 9/01/40 | 9/25 at 100.00 | BBB | 1,282,858 |
| 1,280 | 5.000%, 9/01/45 | 9/25 at 100.00 | BBB | 1,426,061 |
| 5,930 | Massachusetts School Building Authority, Dedicated Sales Tax Revenue Bonds, Senior | 5/23 at 100.00 | Aa2 (4) | 6,364,610 |
| | Series 2013A, 5.000%, 5/15/43 (Pre-refunded 5/15/23) | | | |
| 1,100 | Massachusetts Turnpike Authority, Metropolitan Highway System Revenue Bonds, Senior | No Opt. Call | A2 | 1,085,810 |
| | Series 1997A, 0.010%, 1/01/24 – NPFG Insured | | | |
| 33,305 | Total Massachusetts | | | 36,551,362 |
| | Michigan – 3.1% (2.0% of Total Investments) | | | |
| 3,535 | Detroit Water and Sewerage Department, Michigan, Sewage Disposal System Revenue Bonds, | 7/22 at 100.00 | A1 (4) | 3,654,766 |
| | Refunding Senior Lien Series 2012A, 5.250%, 7/01/39 (Pre-refunded 7/01/22) | | | |
| 1,000 | Eastern Michigan University, General Revenue Bonds, Series 2018A, 4.000%, 3/01/44 – | 3/28 at 100.00 | A2 | 1,115,020 |
| | AGM Insured | | | |
| 6,910 | Hudsonville Public Schools, Ottawa and Allegan Counties, Michigan, General Obligation | 5/30 at 100.00 | AA | 8,044,968 |
| | Bonds, School Building & Site Series 2020-I, 4.000%, 5/01/47 | | | |
| | Michigan Finance Authority, Distributable State Aid Revenue Bonds, Charter County of | | | |
| | Wayne, Second Lien Refunding Series 2020: | | | |
| 11,000 | 4.000%, 11/01/50 | 11/30 at 100.00 | Aa3 | 12,635,920 |
| 5,375 | 4.000%, 11/01/55 | 11/30 at 100.00 | Aa3 | 6,183,615 |
| 10,005 | 4.000%, 11/01/55 | 11/30 at 100.00 | Aa3 | 11,404,699 |
| 5,000 | Michigan Finance Authority, Hospital Revenue Bonds, McLaren Health Care, Refunding | 8/29 at 100.00 | A1 | 5,763,250 |
| | Series 2019A, 4.000%, 2/15/44 | | | |
| 1,500 | Michigan Finance Authority, Hospital Revenue Bonds, Sparrow Obligated Group, Series | 11/22 at 100.00 | A | 1,564,470 |
| | 2012, 5.000%, 11/15/42 | | | |
| 405 | Michigan Finance Authority, Local Government Loan Program Revenue Bonds, Detroit Water & | 7/24 at 100.00 | A1 | 450,328 |
| | Sewerage Department Water Supply System Local Project, Refunding Senior Loan Series 2014D-1, | | | |
| | 5.000%, 7/01/37 – AGM Insured | | | |
| 2,690 | Michigan Finance Authority, Local Government Loan Program Revenue Bonds, Detroit | 7/24 at 100.00 | A1 | 3,003,170 |
| | Water & Sewerage Department Water Supply System Local Project, Series 2014C-3, | | | |
| | 5.000%, 7/01/32 – AGM Insured | | | |
| 1,000 | Michigan Finance Authority, Local Government Loan Program Revenue Bonds, Detroit Water & | 7/24 at 100.00 | A2 | 1,111,630 |
| | Sewerage Department Water Supply System Local Project, Series 2014D-6, 5.000%, 7/01/36 – | | | |
| | NPFG Insured | | | |
| 1,405 | Michigan Finance Authority, Michigan, Revenue Bonds, Trinity Health Credit Group, | 12/29 at 100.00 | AA– | 1,605,732 |
| | Refunding Series 2019A-MI, 4.000%, 12/01/49 | | | |
| | Michigan Finance Authority, Revenue Bonds, Trinity Health Credit Group, Refunding Series 2015MI: | | | |
| 2,500 | 5.000%, 12/01/31 (Pre-refunded 6/01/22) | 6/22 at 100.00 | AA– (4) | 2,570,100 |
| 3,670 | 5.000%, 12/01/32 (Pre-refunded 6/01/22) | 6/22 at 100.00 | AA– (4) | 3,772,907 |
| 2,000 | Michigan Finance Authority, State Revolving Fund Revenue Bonds, Clean Water Series 2012, | 10/22 at 100.00 | AAA | 2,088,020 |
| | 5.000%, 10/01/31 (Pre-refunded 10/01/22) | | | |
46
| Principal | | Optional Call | | |
| Amount (000) | Description (1) | Provisions (2) | Ratings (3) | Value |
| | Michigan (continued) | | | |
| $ 4,435 | Michigan Finance Authority, Tobacco Settlement Asset- Backed Bonds, 2006 Sold Tobacco | 12/30 at 100.00 | BBB+ | $ 5,532,263 |
| | Receipts Senior Current Interest Series 2020A-2, 5.000%, 6/01/40 | | | |
| 5,000 | Michigan Hospital Finance Authority, Revenue Bonds, Ascension Health Senior Credit | 11/26 at 100.00 | Aa2 | 5,630,550 |
| | Group, Refunding & Project Series 2010F-6, 4.000%, 11/15/47 | | | |
| 10,000 | Michigan State Building Authority, Revenue Bonds, Facilities Program, Refunding Series | 10/25 at 100.00 | AA– | 11,615,800 |
| | 2015-I, 5.000%, 4/15/34 | | | |
| 5,200 | Michigan State Hospital Finance Authority, Revenue Bonds, Trinity Health Care Group, | 6/22 at 100.00 | AA– (4) | 5,344,924 |
| | Series 2009C, 5.000%, 12/01/48 (Pre-refunded 6/01/22) | | | |
| 10,000 | Michigan State, Trunk Line Fund Bonds, Rebuilding Michigan Program, Series 2021A, | 11/31 at 100.00 | Aa2 | 11,797,700 |
| | 4.000%, 11/15/44 | | | |
| 3,000 | Wayne County Airport Authority, Michigan, Revenue Bonds, Detroit Metropolitan Wayne | 12/22 at 100.00 | A– | 3,151,050 |
| | County Airport, Series 2012A, 5.000%, 12/01/37 | | | |
| | Wayne County Airport Authority, Michigan, Revenue Bonds, Detroit Metropolitan Wayne | | | |
| | County Airport, Series 2015D: | | | |
| 1,325 | 5.000%, 12/01/40 | 12/25 at 100.00 | A– | 1,537,318 |
| 1,200 | 5.000%, 12/01/45 | 12/25 at 100.00 | A– | 1,390,728 |
| | Wayne County Airport Authority, Michigan, Revenue Bonds, Detroit Metropolitan Wayne | | | |
| | County Airport, Series 2017B: | | | |
| 1,350 | 5.000%, 12/01/42 (AMT) | 12/27 at 100.00 | A– | 1,616,112 |
| 3,140 | 5.000%, 12/01/47 (AMT) | 12/27 at 100.00 | A– | 3,756,633 |
| 1,120 | Wayne State University, Michigan, General Revenue Bonds, Series 2018A, 5.000%, 11/15/36 | 11/25 at 100.00 | A+ | 1,296,579 |
| 103,765 | Total Michigan | | | 117,638,252 |
| | Minnesota – 1.6% (1.0% of Total Investments) | | | |
| 310 | Baytown Township, Minnesota Charter School Lease Revenue Bonds, Saint Croix Preparatory | 8/26 at 100.00 | BB+ | 328,684 |
| | Academy, Refunding Series 2016A, 4.000%, 8/01/36 | | | |
| 2,000 | Brainerd Independent School District 181, Crow Wing County, Minnesota, General | 2/27 at 100.00 | AAA | 2,245,300 |
| | Obligation Bonds, School Building Series 2018A, 4.000%, 2/01/42 | | | |
| 150 | Central Minnesota Municipal Power Agency, Revenue Bonds, Brookings – Southeast Twin | 1/30 at 100.00 | A1 | 160,294 |
| | Cities Transmission Project, Refunding Series 2021, 3.000%, 1/01/38 – AGM Insured (WI/DD, | | | |
| | Settling 11/10/21) | | | |
| 500 | Deephaven, Minnesota, Charter School Lease Revenue Bonds, Eagle Ridge Academy Project, | 7/25 at 100.00 | BB+ | 521,090 |
| | Series 2016A, 4.000%, 7/01/37 | | | |
| 5,625 | Duluth Economic Development Authority, Minnesota, Health Care Facilities Revenue Bonds, | 2/28 at 100.00 | A– | 6,601,781 |
| | Essentia Health Obligated Group, Series 2018A, 5.000%, 2/15/53 | | | |
| 3,010 | Independent School District 621, Mounds View, Minnesota, General Obligation Bonds, | 2/27 at 100.00 | AAA | 3,367,889 |
| | School Building Series 2018A, 4.000%, 2/01/42 | | | |
| | Minneapolis-St. Paul Metropolitan Airports Commission, Minnesota, Airport Revenue Bonds, | | | |
| | Refunding Subordinate Lien Series 2019B: | | | |
| 1,235 | 5.000%, 1/01/37 (AMT) | 7/29 at 100.00 | A | 1,514,727 |
| 3,500 | 5.000%, 1/01/44 (AMT) | 7/29 at 100.00 | A | 4,233,495 |
| 2,500 | 5.000%, 1/01/49 (AMT) | 7/29 at 100.00 | A | 2,998,800 |
| 2,295 | Minneapolis-St. Paul Metropolitan Airports Commission, Minnesota, Airport Revenue Bonds, | 1/27 at 100.00 | A+ | 2,719,759 |
| | Senior Lien Series 2016C, 5.000%, 1/01/46 | | | |
| | Minneapolis-St. Paul Metropolitan Airports Commission, Minnesota, Airport Revenue Bonds, | | | |
| | Subordinate Lien Series 2016D: | | | |
| 470 | 5.000%, 1/01/32 (AMT) | 1/27 at 100.00 | A | 555,615 |
| 450 | 5.000%, 1/01/35 (AMT) | 1/27 at 100.00 | A | 530,770 |
| 580 | 5.000%, 1/01/37 (AMT) | 1/27 at 100.00 | A | 681,442 |
| 750 | 5.000%, 1/01/41 (AMT) | 1/27 at 100.00 | A | 877,080 |
| | Minnesota Higher Education Facilities Authority, Revenue Bonds, Carleton College, | | | |
| | Refunding Series 2017: | | | |
| 1,460 | 4.000%, 3/01/41 | 3/27 at 100.00 | Aa2 | 1,631,944 |
| 1,700 | 4.000%, 3/01/47 | 3/27 at 100.00 | Aa2 | 1,900,464 |
47
| NAD | Nuveen Quality Municipal Income Fund |
| | Portfolio of Investments (continued) |
| | October 31, 2021 |
| Principal | | Optional Call | | |
| Amount (000) | Description (1) | Provisions (2) | Ratings (3) | Value |
| | Minnesota (continued) | | | |
| $ 2,150 | Minnesota Higher Education Facilities Authority, Revenue Bonds, Macalester College, | 3/27 at 100.00 | Aa3 | $ 2,403,571 |
| | Refunding Series 2017, 4.000%, 3/01/48 | | | |
| 270 | Minnesota Housing Finance Agency, Housing Infrastructure State Appropriation Bonds, | 8/31 at 100.00 | Aa2 | 292,202 |
| | Series 2021A, 3.000%, 8/01/36 | | | |
| 770 | Minnesota Housing Finance Agency, Housing Infrastructure State Appropriation Bonds, | 8/31 at 100.00 | Aa2 | 838,291 |
| | Series 2021B, 3.000%, 8/01/36 | | | |
| 910 | Rochester, Minnesota, Health Care Facilities Revenue Bonds, Mayo Clinic, Series 2018A, | 5/28 at 100.00 | AA | 1,034,270 |
| | 4.000%, 11/15/48 | | | |
| 1,520 | Saint Paul Housing & Redevelopment Authority, Minnesota, Charter School Lease Revenue | 12/24 at 100.00 | BBB– | 1,649,778 |
| | Bonds, Community of Peace Academy Project, Refunding Series 2015A, 5.000%, 12/01/50 | | | |
| | Saint Paul Housing & Redevelopment Authority, Minnesota, Charter School Lease Revenue | | | |
| | Bonds, Hmong College Prep Academy Project, Series 2016A: | | | |
| 2,205 | 5.500%, 9/01/36 | 9/26 at 100.00 | BB+ | 2,517,096 |
| 5,000 | 5.750%, 9/01/46 | 9/26 at 100.00 | BB+ | 5,681,200 |
| | Saint Paul Housing and Redevelopment Authority Minnesota, Senior Housing and Health Care | | | |
| | Revenue Bonds, Episcopal Homes Project, Series 2013: | | | |
| 500 | 5.000%, 5/01/33 | 5/23 at 100.00 | N/R | 514,460 |
| 1,000 | 5.125%, 5/01/48 | 5/23 at 100.00 | N/R | 1,024,090 |
| 2,245 | Saint Paul Housing and Redevelopment Authority, Minnesota, Health Care Revenue Bonds, | 11/27 at 100.00 | A3 | 2,678,532 |
| | Fairview Health Services, Series 2017A, 5.000%, 11/15/47 | | | |
| 750 | St. Paul Housing and Redevelopment Authority, Minnesota, Hospital Revenue Bonds, | 11/25 at 100.00 | N/R (4) | 880,980 |
| | HealthEast Inc., Series 2015A, 5.000%, 11/15/29 (Pre-refunded 11/15/25) | | | |
| 2,000 | Wayzata, Minnesota Senior Housing Revenue Bonds, Folkestone Senior Living Community, | 8/24 at 102.00 | N/R | 2,131,060 |
| | Refunding Series 2019, 5.000%, 8/01/54 | | | |
| 3,855 | West Saint Paul-Mendota Heights-Eagan Independent School District 197, Dakota County, | 2/27 at 100.00 | AAA | 4,370,645 |
| | Minnesota, General Obligation Bonds, School Building Series 2018A, 4.000%, 2/01/41 | | | |
| 2,000 | Western Minnesota Municipal Power Agency, Minnesota, Power Supply Revenue Bonds, Series | 1/24 at 100.00 | Aa3 (4) | 2,203,920 |
| | 2014A, 5.000%, 1/01/46 (Pre-refunded 1/01/24) | | | |
| 51,710 | Total Minnesota | | | 59,089,229 |
| | Mississippi – 0.7% (0.5% of Total Investments) | | | |
| | Mississippi Hospital Equipment and Facilities Authority, Revenue Bonds, Baptist Memorial | | | |
| | Healthcare, Series 2016A: | | | |
| 7,500 | 5.000%, 9/01/36 | 9/26 at 100.00 | BBB+ | 8,766,600 |
| 15,500 | 5.000%, 9/01/46 | 9/26 at 100.00 | BBB+ | 17,921,410 |
| 23,000 | Total Mississippi | | | 26,688,010 |
| | Missouri – 4.2% (2.7% of Total Investments) | | | |
| 1,000 | Boone County, Missouri, Hospital Revenue Bonds, Boone Hospital Center, Refunding Series | 8/26 at 100.00 | Ba1 | 1,155,210 |
| | 2016, 5.000%, 8/01/28 | | | |
| 2,010 | Bridgeton Industrial Development Authority, Missouri, Senior Housing Revenue Bonds, The | 5/25 at 100.00 | N/R | 2,001,980 |
| | Sarah Community Project, Refunding Series 2016, 3.625%, 5/01/30 | | | |
| 500 | Curators of the University of Missouri, System Facilities Revenue Bonds, Series 2014A, | 11/24 at 100.00 | AA+ | 548,330 |
| | 4.000%, 11/01/33 | | | |
| | Kansas City Industrial Development Authority, Missouri, Airport Special Obligation | | | |
| | Bonds, Kansas City International Airport Terminal Modernization Project, Series 2019B: | | | |
| 3,425 | 5.000%, 3/01/35 (AMT) | 3/29 at 100.00 | A– | 4,185,282 |
| 6,600 | 5.000%, 3/01/46 (AMT) | 3/29 at 100.00 | A– | 7,877,166 |
| 7,000 | 5.000%, 3/01/54 (AMT) | 3/29 at 100.00 | A– | 8,298,220 |
| 4,000 | Kansas City Industrial Development Authority, Missouri, Airport Special Obligation | 3/30 at 100.00 | A2 | 4,790,280 |
| | Bonds, Kansas City International Airport Terminal Modernization Project, Series 2020A, | | | |
| | 5.000%, 3/01/57 – AGM Insured (AMT) | | | |
48
| Principal | | Optional Call | | |
| Amount (000) | Description (1) | Provisions (2) | Ratings (3) | Value |
| | Missouri (continued) | | | |
| $ 400 | Kansas City Industrial Development Authority, Missouri, Sales Tax Revenue Bonds, Ward | 4/26 at 100.00 | N/R | $ 413,892 |
| | Parkway Center Community Improvement District, Senior Refunding & Improvement Series 2016, | | | |
| | 5.000%, 4/01/46, 144A | | | |
| | Kansas City Municipal Assistance Corporation, Missouri, Leasehold Revenue Bonds, | | | |
| | Improvement Series 2004B-1: | | | |
| 7,000 | 0.000%, 4/15/27 – AMBAC Insured | No Opt. Call | A2 | 6,561,450 |
| 5,000 | 0.000%, 4/15/28 – AMBAC Insured | No Opt. Call | A2 | 4,575,850 |
| 5,000 | 0.000%, 4/15/29 – AMBAC Insured | No Opt. Call | A2 | 4,457,900 |
| 4,470 | Kansas City, Missouri, Sanitary Sewer System Revenue Bonds, Improvement Series 2018A, | 1/28 at 100.00 | AA | 5,172,192 |
| | 4.000%, 1/01/42 | | | |
| 1,000 | Missouri Environmental Improvement and Energy Resources Authority, Revenue Bonds, Union | 6/27 at 102.00 | A | 1,058,580 |
| | Electric Company Project, Series 1998C, 2.750%, 9/01/33 | | | |
| 1,000 | Missouri Health and Education Facilities Authority, Health Facilities Revenue Bonds, | 5/26 at 100.00 | A+ | 1,171,370 |
| | Saint Luke’s Health System, Inc., Series 2016, 5.000%, 11/15/34 | | | |
| 4,000 | Missouri Health and Education Facilities Authority, Health Facilities Revenue Bonds, | 11/30 at 100.00 | A+ | 4,572,480 |
| | Saint Luke’s Health System, Inc., Series 2020, 4.000%, 11/15/50 | | | |
| 3,080 | Missouri Health and Educational Facilities Authority, Educational Facilities Revenue | 5/23 at 100.00 | BBB | 3,259,194 |
| | Bonds, Saint Louis College of Pharmacy, Series 2013, 5.500%, 5/01/43 | | | |
| 1,260 | Missouri Health and Educational Facilities Authority, Educational Facilities Revenue | 10/23 at 100.00 | A+ | 1,366,344 |
| | Bonds, University of Central Missouri, Series 2013C-2, 5.000%, 10/01/34 | | | |
| | Missouri Health and Educational Facilities Authority, Health Facilities Revenue Bonds, | | | |
| | CoxHealth, Series 2013A: | | | |
| 1,045 | 5.000%, 11/15/44 | 11/23 at 100.00 | A2 | 1,131,275 |
| 11,090 | 5.000%, 11/15/48 | 11/23 at 100.00 | A2 | 12,005,590 |
| | Missouri Health and Educational Facilities Authority, Health Facilities Revenue Bonds, | | | |
| | Mercy Health, Series 2017C: | | | |
| 5,000 | 5.000%, 11/15/42 | 11/27 at 100.00 | A+ | 5,956,550 |
| 10,000 | 4.000%, 11/15/47 | 11/27 at 100.00 | A+ | 11,163,300 |
| 3,000 | 5.000%, 11/15/47 | 11/27 at 100.00 | A+ | 3,562,260 |
| 8,750 | Missouri Health and Educational Facilities Authority, Health Facilities Revenue Bonds, | 6/30 at 100.00 | A+ | 9,981,213 |
| | Mercy Health, Series 2020, 4.000%, 6/01/53 | | | |
| 2,125 | Missouri Health and Educational Facilities Authority, Health Facilities Revenue Bonds, | 2/29 at 100.00 | A1 | 2,394,578 |
| | Mosaic Health System, Series 2019A, 4.000%, 2/15/54 | | | |
| | Missouri Health and Educational Facilities Authority, Health Facilities Revenue Bonds, | | | |
| | SSM Health Care, Series 2018A: | | | |
| 2,000 | 4.000%, 6/01/48 | 6/28 at 100.00 | A+ | 2,237,940 |
| 3,500 | 5.000%, 6/01/48 | 6/28 at 100.00 | A+ | 4,175,885 |
| | Missouri Health and Educational Facilities Authority, Revenue Bonds, Children’s Mercy | | | |
| | Hospital, Series 2017A: | | | |
| 1,250 | 4.000%, 5/15/42 | 5/25 at 102.00 | A+ | 1,374,700 |
| 16,750 | 4.000%, 5/15/48 | 5/25 at 102.00 | A+ | 18,377,597 |
| 7,925 | Missouri Health and Educational Facilities Authority, Revenue Bonds, Lutheran Senior | 2/26 at 100.00 | BBB | 8,792,550 |
| | Services Projects, Series 2016A, 5.000%, 2/01/46 | | | |
| 3,370 | Missouri Health and Educational Facilities Authority, Revenue Bonds, Lutheran Senior | 2/26 at 100.00 | BBB | 3,738,914 |
| | Services Projects, Series 2016B, 5.000%, 2/01/46 | | | |
| 400 | Missouri Health and Educational Facilities Authority, Revenue Bonds, Maryville | 6/22 at 100.00 | Baa2 | 404,628 |
| | University of St. Louis Project, Series 2015, 3.500%, 6/15/30 | | | |
| | Missouri Health and Educational Facilities Authority, Revenue Bonds, Saint Louis | | | |
| | University, Series 2017A: | | | |
| 725 | 4.000%, 10/01/36 | 4/27 at 100.00 | A1 | 809,136 |
| 3,510 | 5.000%, 10/01/42 | 4/27 at 100.00 | A1 | 4,151,207 |
| 2,000 | Missouri Joint Municipal Electric Utility Commission, Power Supply System Revenue Bonds, | 6/27 at 100.00 | A2 | 2,370,640 |
| | MoPEP Facilities, Series 2018, 5.000%, 12/01/43 | | | |
49
| NAD | Nuveen Quality Municipal Income Fund |
| | Portfolio of Investments (continued) |
| | October 31, 2021 |
| Principal | | Optional Call | | |
| Amount (000) | Description (1) | Provisions (2) | Ratings (3) | Value |
| | Missouri (continued) | | | |
| $ 1,000 | North Central Missouri Regional Water Commission, Waterworks System Revenue Bonds, | 11/21 at 100.00 | N/R | $ 1,001,310 |
| | Series 2006, 5.000%, 1/01/37 | | | |
| 2,000 | Saint Charles County Public Water Supply District 2, Missouri, Certificates of | 12/21 at 100.00 | AA+ | 2,006,320 |
| | Participation, Series 2015, 4.125%, 12/01/38 | | | |
| 575 | Saint Louis County Industrial Development Authority, Missouri, Revenue Bonds, Friendship | 9/22 at 100.00 | N/R (4) | 597,925 |
| | Village of Chesterfield, Series 2012, 5.000%, 9/01/42 (Pre-refunded 9/01/22) | | | |
| 375 | Saint Louis County Industrial Development Authority, Missouri, Revenue Bonds, Friendship | 9/23 at 100.00 | BB+ | 399,578 |
| | Village of Sunset Hills, Series 2013A, 5.875%, 9/01/43 | | | |
| 1,000 | Saint Louis County Industrial Development Authority, Missouri, Revenue Bonds, Friendship | 9/25 at 103.00 | BB+ | 1,115,110 |
| | Village Saint Louis Obligated Group, Series 2018A, 5.125%, 9/01/48 | | | |
| 490 | Saint Louis, Missouri, Airport Revenue Bonds, Lambert-St. Louis International Airport, | 7/22 at 100.00 | A– | 501,667 |
| | Refunding Series 2012, 4.250%, 7/01/29 – FGIC Insured (AMT) | | | |
| 144,625 | Total Missouri | | | 159,715,593 |
| | Montana – 0.2% (0.1% of Total Investments) | | | |
| 2,090 | Montana Facility Finance Authority, Healthcare Facility Revenue Bonds, Kalispell | 7/28 at 100.00 | BBB | 2,427,890 |
| | Regional Medical Center, Series 2018B, 5.000%, 7/01/43 | | | |
| 3,315 | Montana Facility Finance Authority, Montana, Health Facilities Revenue Bonds, Bozeman | 6/28 at 100.00 | A | 3,943,856 |
| | Deaconess Health Services Obligated Group, Series 2018, 5.000%, 6/01/48 | | | |
| 5,405 | Total Montana | | | 6,371,746 |
| | Nebraska – 0.3% (0.2% of Total Investments) | | | |
| 2,300 | Central Plains Energy Project, Nebraska, Gas Project 3 Revenue Bonds, Series 2012, | 9/22 at 100.00 | BBB+ | 2,388,688 |
| | 5.000%, 9/01/32 | | | |
| 2,045 | District Energy Corporation, Nebraska, Facility Revenue Bonds, NSP System Series 2021, | 7/31 at 100.00 | AA | 2,385,799 |
| | 4.000%, 7/01/45 | | | |
| | Douglas County Hospital Authority 2, Nebraska, Health Facilities Revenue Bonds, | | | |
| | Children’s Hospital Obligated Group, Refunding Series 2020A: | | | |
| 1,450 | 4.000%, 11/15/39 | 11/30 at 100.00 | A1 | 1,700,372 |
| 1,000 | 4.000%, 11/15/50 | 11/30 at 100.00 | A1 | 1,146,650 |
| | Douglas County Hospital Authority 3, Nebraska, Health Facilities Revenue Bonds, Nebraska | | | |
| | Methodist Health System, Refunding Series 2015: | | | |
| 1,635 | 4.125%, 11/01/36 | 11/25 at 100.00 | A | 1,798,631 |
| 1,000 | 5.000%, 11/01/45 | 11/25 at 100.00 | A | 1,143,130 |
| 9,430 | Total Nebraska | | | 10,563,270 |
| | Nevada – 0.6% (0.4% of Total Investments) | | | |
| | Las Vegas Valley Water District, Nevada, General Obligation Bonds, Refunding Series 2015: | | | |
| 9,000 | 5.000%, 6/01/32 | 12/24 at 100.00 | AA | 10,208,610 |
| 5,000 | 5.000%, 6/01/39 | 12/24 at 100.00 | AA | 5,627,250 |
| 2,600 | Las Vegas Valley Water District, Nevada, General Obligation Bonds, Water Series 2012B, | 6/22 at 100.00 | AA | 2,669,030 |
| | 5.000%, 6/01/42 | | | |
| | Nevada System of Higher Education, Community College Revenue Bonds, Series 2017: | | | |
| 2,400 | 4.000%, 7/01/41 | 7/27 at 100.00 | AA– | 2,709,216 |
| 2,000 | 4.000%, 7/01/47 | 7/27 at 100.00 | AA– | 2,246,460 |
| 21,000 | Total Nevada | | | 23,460,566 |
| | New Hampshire – 0.7% (0.5% of Total Investments) | | | |
| 10,000 | National Finance Authority, New Hampshire, Hospital Facilities Revenue Bonds, Saint | 5/31 at 100.00 | AA | 11,377,200 |
| | Elizabeth Medical Center, Inc., Series 2021A, 4.000%, 5/01/51 | | | |
| 3,500 | New Hampshire Health and Education Facilities Authority, Revenue Bonds, Catholic Medical | 7/22 at 100.00 | Baa3 | 3,549,700 |
| | Center, Series 2012, 4.000%, 7/01/32 | | | |
| 4,000 | New Hampshire Health and Education Facilities Authority, Revenue Bonds, | 2/28 at 100.00 | A | 4,870,080 |
| | Dartmouth-Hitchcock Obligated Group, Series 2018A, 5.000%, 8/01/35 | | | |
| 5,000 | New Hampshire Health and Education Facilities Authority, Revenue Bonds, | No Opt. Call | A | 7,724,500 |
| | Dartmouth-Hitchcock Obligated Group, Series 2020A, 5.000%, 8/01/59 | | | |
| 22,500 | Total New Hampshire | | | 27,521,480 |
50
| Principal | | Optional Call | | |
| Amount (000) | Description (1) | Provisions (2) | Ratings (3) | Value |
| | New Jersey – 4.7% (3.0% of Total Investments) | | | |
| $ 905 | Camden County Improvement Authority, New Jersey, Health Care Redevelopment Revenue | 2/23 at 100.00 | BBB+ | $ 954,549 |
| | Bonds, Cooper Health System Obligated Group Issue, Series 2013A, 5.750%, 2/15/42 | | | |
| 5,000 | New Jersey Economic Development Authority, New Jersey, Transit Transportation Project | 11/29 at 100.00 | BBB | 6,093,200 |
| | Revenue Bonds, Series 2020A, 5.000%, 11/01/40 | | | |
| | New Jersey Economic Development Authority, Private Activity Bonds, The Goethals Bridge | | | |
| | Replacement Project, Series 2013: | | | |
| 1,965 | 5.000%, 1/01/31 – AGM Insured (AMT) | 1/24 at 100.00 | BBB+ | 2,159,987 |
| 1,865 | 5.125%, 1/01/39 – AGM Insured (AMT) | 1/24 at 100.00 | BBB+ | 2,047,845 |
| 1,585 | 5.125%, 7/01/42 – AGM Insured (AMT) | 1/24 at 100.00 | BBB+ | 1,738,586 |
| 6,030 | New Jersey Economic Development Authority, Revenue Bonds, New Jersey Transit Corporation | No Opt. Call | BBB | 7,035,804 |
| | Projects Sublease, Refunding Series 2017B, 5.000%, 11/01/25 | | | |
| 2,000 | New Jersey Economic Development Authority, School Facilities Construction Bonds, | 12/26 at 100.00 | BBB | 2,431,500 |
| | Refunding Series 2016BBB, 5.500%, 6/15/31 | | | |
| 6,770 | New Jersey Economic Development Authority, School Facilities Construction Bonds, Series | No Opt. Call | BBB | 8,501,224 |
| | 2005N-1, 5.500%, 9/01/27 – NPFG Insured | | | |
| 2,825 | New Jersey Economic Development Authority, School Facilities Construction Bonds, Series | 6/24 at 100.00 | BBB | 3,132,642 |
| | 2014UU, 5.000%, 6/15/30 | | | |
| 2,550 | New Jersey Economic Development Authority, School Facilities Construction Bonds, Social | 12/30 at 100.00 | BBB | 2,860,896 |
| | Series 2021QQQ, 4.000%, 6/15/50 | | | |
| 1,480 | New Jersey Health Care Facilities Financing Authority, New Jersey, Revenue Bonds, Saint | 11/21 at 100.00 | Ba1 | 1,484,470 |
| | Peters University Hospital, Series 2007, 5.750%, 7/01/37 | | | |
| 8,415 | New Jersey Health Care Facilities Financing Authority, Revenue Bonds, RWJ Barnabas | 7/26 at 100.00 | AA– | 9,923,052 |
| | Health Obligated Group, Refunding Series 2016A, 5.000%, 7/01/43 | | | |
| 1,235 | New Jersey Health Care Facilities Financing Authority, Revenue Bonds, University | 7/25 at 100.00 | BB– | 1,402,713 |
| | Hospital Issue, Refunding Series 2015A, 5.000%, 7/01/46 – AGM Insured | | | |
| | New Jersey Transportation Trust Fund Authority, Federal Highway Reimbursement Revenue | | | |
| | Notes, Series 2016A-1: | | | |
| 2,020 | 5.000%, 6/15/28 | 6/26 at 100.00 | Baa1 | 2,377,096 |
| 3,340 | 5.000%, 6/15/29 | 6/26 at 100.00 | Baa1 | 3,920,793 |
| 1,000 | New Jersey Transportation Trust Fund Authority, Transportation System Bonds, Capital | No Opt. Call | BBB | 930,280 |
| | Appreciation Series 2010A, 0.000%, 12/15/26 | | | |
| | New Jersey Transportation Trust Fund Authority, Transportation System Bonds, Refunding | | | |
| | Series 2006C: | | | |
| 21,120 | 0.010%, 12/15/28 – AMBAC Insured | No Opt. Call | BBB | 18,767,866 |
| 10,000 | 0.000%, 12/15/32 – AGM Insured | No Opt. Call | BBB+ | 8,014,700 |
| 20,000 | 0.000%, 12/15/33 – AGM Insured | No Opt. Call | BBB+ | 15,604,600 |
| 25,000 | 0.000%, 12/15/35 – AMBAC Insured | No Opt. Call | BBB | 18,164,250 |
| 30,000 | 0.000%, 12/15/36 – AMBAC Insured | No Opt. Call | BBB | 21,122,400 |
| 2,000 | New Jersey Transportation Trust Fund Authority, Transportation System Bonds, Series | No Opt. Call | BBB | 1,568,040 |
| | 2009A, 0.000%, 12/15/32 | | | |
| 1,000 | New Jersey Transportation Trust Fund Authority, Transportation System Bonds, Series | 6/22 at 100.00 | BBB (4) | 1,029,420 |
| | 2012A, 5.000%, 6/15/42 (Pre-refunded 6/15/22) | | | |
| | New Jersey Transportation Trust Fund Authority, Transportation System Bonds, Series 2015AA: | | | |
| 1,690 | 5.250%, 6/15/33 | 6/25 at 100.00 | BBB | 1,948,553 |
| 2,840 | 5.000%, 6/15/45 | 6/25 at 100.00 | BBB | 3,202,924 |
| 2,800 | New Jersey Transportation Trust Fund Authority, Transportation System Bonds, Series | 12/28 at 100.00 | BBB | 3,407,656 |
| | 2018A, 5.000%, 12/15/36 | | | |
| 665 | New Jersey Transportation Trust Fund Authority, Transportation System Bonds, Series | 12/29 at 100.00 | BBB | 754,296 |
| | 2019A, 4.000%, 12/15/39 | | | |
| 8,375 | New Jersey Transportation Trust Fund Authority, Transportation System Bonds, Series | 12/30 at 100.00 | BBB | 9,396,415 |
| | 2020AA, 4.000%, 6/15/50 | | | |
| 2,460 | New Jersey Turnpike Authority, Revenue Bonds, Series 2017B, 4.000%, 1/01/34 | 1/28 at 100.00 | A2 | 2,847,450 |
51
| NAD | Nuveen Quality Municipal Income Fund |
| | Portfolio of Investments (continued) |
| | October 31, 2021 |
| Principal | | Optional Call | | |
| Amount (000) | Description (1) | Provisions (2) | Ratings (3) | Value |
| | New Jersey (continued) | | | |
| | New Jersey Turnpike Authority, Revenue Bonds, Tender Option Bond Trust 2016-XF1057: | | | |
| $ 489 | 17.437%, 1/01/43 (Pre-refunded 7/01/22), 144A (IF) (5) | 7/22 at 100.00 | A2 (4) | $ 551,772 |
| 826 | 17.437%, 1/01/43 (Pre-refunded 7/01/22), 144A (IF) (5) | 7/22 at 100.00 | N/R (4) | 932,336 |
| 570 | Rutgers State University, New Jersey, Revenue Bonds, Refunding Series 2013L, 5.000%, | 5/23 at 100.00 | A+ (4) | 610,721 |
| | 5/01/43 (Pre-refunded 5/01/23) | | | |
| 3,905 | South Jersey Transportation Authority, New Jersey, Transportation System Revenue Bonds, | 11/30 at 100.00 | Baa2 | 4,758,711 |
| | Series 2020A, 5.000%, 11/01/45 | | | |
| | Tobacco Settlement Financing Corporation, New Jersey, Tobacco Settlement Asset-Backed | | | |
| | Bonds, Series 2018A: | | | |
| 3,215 | 5.000%, 6/01/36 | 6/28 at 100.00 | A– | 3,845,815 |
| 1,405 | 5.000%, 6/01/46 | 6/28 at 100.00 | BBB+ | 1,634,465 |
| 380 | Tobacco Settlement Financing Corporation, New Jersey, Tobacco Settlement Asset-Backed | 6/28 at 100.00 | BB+ | 437,429 |
| | Bonds, Series 2018B, 5.000%, 6/01/46 | | | |
| 187,725 | Total New Jersey | | | 175,594,456 |
| | New Mexico – 0.4% (0.3% of Total Investments) | | | |
| 3,370 | New Mexico Hospital Equipment Loan Council, Hospital Revenue Bonds, Presbyterian | 11/27 at 100.00 | Aa3 | 4,036,822 |
| | Healthcare Services, Series 2017A, 5.000%, 8/01/46 | | | |
| | New Mexico Hospital Equipment Loan Council, Hospital Revenue Bonds, Presbyterian | | | |
| | Healthcare Services, Series 2019A: | | | |
| 1,575 | 5.000%, 8/01/44 | 8/29 at 100.00 | Aa3 | 1,951,677 |
| 4,760 | 4.000%, 8/01/48 | 8/29 at 100.00 | Aa3 | 5,418,927 |
| 4,035 | Santa Fe County, New Mexico, Correctional System Gross Receipts Tax Revenue Bonds, | No Opt. Call | A2 | 4,591,305 |
| | Series 1997, 6.000%, 2/01/27 – AGM Insured | | | |
| 13,740 | Total New Mexico | | | 15,998,731 |
| | New York – 9.5% (6.1% of Total Investments) | | | |
| 6,600 | Brooklyn Arena Local Development Corporation, New York, Payment in Lieu of Taxes Revenue | No Opt. Call | Ba1 | 3,479,322 |
| | Bonds, Barclays Center Project, Series 2009, 0.000%, 7/15/44 | | | |
| 490 | Buffalo and Erie County Industrial Land Development Corporation, New York, Revenue | 7/25 at 100.00 | Ba2 | 546,071 |
| | Bonds, Catholic Health System, Inc. Project, Series 2015, 5.250%, 7/01/35 | | | |
| 3,125 | Dormitory Authority of the State of New York, General Revenue Bonds, Saint Johns | 7/23 at 100.00 | A– | 3,300,656 |
| | University, Series 2013A, 5.000%, 7/01/44 | | | |
| | Dormitory Authority of the State of New York, Revenue Bonds, North Shore Long Island | | | |
| | Jewish Obligated Group, Series 2015A: | | | |
| 1,680 | 4.125%, 5/01/42 | 5/25 at 100.00 | A– | 1,837,735 |
| 3,195 | 5.000%, 5/01/43 | 5/25 at 100.00 | A– | 3,617,603 |
| 600 | Dormitory Authority of the State of New York, Revenue Bonds, Orange Regional Medical | 6/27 at 100.00 | BBB– | 713,274 |
| | Center Obligated Group, Series 2017, 5.000%, 12/01/34, 144A | | | |
| | Dormitory Authority of the State of New York, State Personal Income Tax Revenue Bonds, | | | |
| | General Purpose, Series 2019D: | | | |
| 14,185 | 5.000%, 2/15/41 | 2/30 at 100.00 | Aa2 | 17,639,047 |
| 5,815 | 5.000%, 2/15/48 | 2/30 at 100.00 | Aa2 | 7,152,043 |
| 9,420 | Dormitory Authority of the State of New York, State Personal Income Tax Revenue Bonds, | 9/30 at 100.00 | Aa2 | 10,896,114 |
| | General Purpose, Series 2020A. Bidding Group 1 thru 5, 4.000%, 3/15/47 | | | |
| 7,500 | Liberty Development Corporation, New York, Goldman Sachs Headquarter Revenue Bonds, | No Opt. Call | BBB+ | 10,437,225 |
| | Series 2005, 5.250%, 10/01/35 | | | |
| | Long Island Power Authority, New York, Electric System General Revenue Bonds, Series 2014A: | | | |
| 1,155 | 4.000%, 9/01/39 – AGM Insured | 9/24 at 100.00 | A2 | 1,240,689 |
| 3,000 | 5.000%, 9/01/39 | 9/24 at 100.00 | A | 3,352,410 |
| 860 | 5.000%, 9/01/44 | 9/24 at 100.00 | A | 957,180 |
| 5,000 | Long Island Power Authority, New York, Electric System General Revenue Bonds, Series | 9/28 at 100.00 | A | 6,242,400 |
| | 2018, 5.000%, 9/01/37 | | | |
52
| Principal | | Optional Call | | |
| Amount (000) | Description (1) | Provisions (2) | Ratings (3) | Value |
| | New York (continued) | | | |
| $ 10,000 | Metropolitan Transportation Authority, New York, Dedicated Tax Fund Bonds, Refunding | No Opt. Call | AA | $ 7,986,100 |
| | Series 2012A, 0.000%, 11/15/32 | | | |
| | Metropolitan Transportation Authority, New York, Transportation Revenue Bonds, Series 2011A: | | | |
| 5,000 | Metropolitan Transportation Authority, New York, Transportation Revenue Bonds, Series | 5/23 at 100.00 | BBB+ | 5,284,900 |
| | 2013A, 5.000%, 11/15/38 | | | |
| | New York City Industrial Development Agency, New York, Civic Facility Revenue Bonds, | | | |
| | Bronx Parking Development Company, LLC Project, Series 2007: | | | |
| 500 | 0.000%, 10/01/37 (7) | 11/21 at 100.00 | N/R | 400,000 |
| 1,000 | 0.000%, 10/01/46 (7) | 11/21 at 100.00 | N/R | 800,000 |
| 5,900 | New York City Municipal Water Finance Authority, New York, Water and Sewer System Second | 6/23 at 100.00 | AA+ | 6,313,000 |
| | General Resolution Revenue Bonds, Fiscal 2014 Series BB, 5.000%, 6/15/46 | | | |
| 5,105 | New York City Municipal Water Finance Authority, New York, Water and Sewer System Second | 12/30 at 100.00 | AA+ | 5,882,594 |
| | General Resolution Revenue Bonds, Fiscal 2021 Series AA-1, 4.000%, 6/15/50 | | | |
| 5,000 | New York City Transitional Finance Authority, New York, Future Tax Secured Bonds, | 5/23 at 100.00 | Aa1 | 5,343,900 |
| | Subordinate Fiscal 2013 Series I, 5.000%, 5/01/38 | | | |
| 2,000 | New York City Transitional Finance Authority, New York, Future Tax Secured Bonds, | 5/26 at 100.00 | Aa1 | 2,331,780 |
| | Subordinate Fiscal 2017 Series A-1, 5.000%, 5/01/40 | | | |
| 3,760 | New York City Transitional Finance Authority, New York, Future Tax Secured Bonds, | 2/27 at 100.00 | Aa1 | 4,469,023 |
| | Subordinate Fiscal 2017 Series E-1, 5.000%, 2/01/43 | | | |
| 5,000 | New York City Transitional Finance Authority, New York, Future Tax Secured Bonds, | 5/28 at 100.00 | Aa1 | 6,125,700 |
| | Subordinate Fiscal 2018 Series C-3, 5.000%, 5/01/40 | | | |
| | New York City Transitional Finance Authority, New York, Future Tax Secured Bonds, | | | |
| | Subordinate Fiscal 2020 Subseries B-1: | | | |
| 14,405 | 4.000%, 11/01/41 | 11/29 at 100.00 | Aa1 | 16,836,852 |
| 5,875 | 4.000%, 11/01/47 | 11/29 at 100.00 | Aa1 | 6,792,087 |
| 5,000 | New York City Transitional Finance Authority, New York, Future Tax Secured Bonds, | 11/30 at 100.00 | Aa1 | 5,769,500 |
| | Subordinate Fiscal 2021 Subseries C-1, 4.000%, 5/01/44 | | | |
| 3,925 | New York City Transitional Finance Authority, New York, Future Tax Secured Bonds, | 8/31 at 100.00 | Aa1 | 4,546,328 |
| | Subordinate Fiscal 2022 Subseries B-1, 4.000%, 8/01/48 | | | |
| 2,060 | New York City, New York, General Obligation Bonds, Fiscal 2017 Series B-1, 5.000%, 12/01/41 | 12/26 at 100.00 | AA– | 2,456,983 |
| 11,000 | New York City, New York, General Obligation Bonds, Fiscal 2020 Series A-1, 4.000%, 8/01/40 | 8/29 at 100.00 | AA– | 12,736,570 |
| 2,040 | New York City, New York, General Obligation Bonds, Fiscal 2021 Series C, 4.000%, 8/01/40 | 8/30 at 100.00 | AA– | 2,369,990 |
| 6,000 | New York City, New York, General Obligation Bonds, Fiscal 2021 Series F-1, 5.000%, 3/01/43 | 3/31 at 100.00 | AA– | 7,581,540 |
| 5 | New York City, New York, General Obligation Bonds, Fiscal Series 2005M, 5.000%, 4/01/24 | 11/21 at 100.00 | AA– | 5,018 |
| 2,000 | New York Convention Center Development Corporation, New York, Revenue Bonds, Hotel Unit | 11/25 at 100.00 | A2 | 2,275,820 |
| | Fee Secured, Refunding Series 2015, 5.000%, 11/15/45 | | | |
| 350 | New York Counties Tobacco Trust I, Tobacco Settlement Pass-Through Bonds, Series 2000B, | 11/21 at 100.00 | Baa1 | 350,378 |
| | 6.500%, 6/01/35 | | | |
| 1,460 | New York Counties Tobacco Trust VI, New York, Tobacco Settlement Pass-Through Bonds, | No Opt. Call | A– | 1,585,239 |
| | Series Series 2016A-1, 5.625%, 6/01/35 | | | |
| 25,170 | New York Liberty Development Corporation, New York, Liberty Revenue Bonds, 3 World Trade | 11/24 at 100.00 | N/R | 27,460,973 |
| | Center Project, Class 1 Series 2014, 5.000%, 11/15/44, 144A | | | |
| | New York Liberty Development Corporation, New York, Liberty Revenue Bonds, 4 World Trade | | | |
| | Center Project, Series 2011: | | | |
| 10,000 | New York State Thruway Authority, State Personal Income Tax Revenue Bonds, Series | 3/31 at 100.00 | AA+ | 11,469,000 |
| | 2021A-1, 4.000%, 3/15/54 | | | |
| 10,000 | New York State Urban Development Corporation, State Personal Income Tax Revenue Bonds, | 9/30 at 100.00 | Aa2 | 11,594,500 |
| | General Purpose, Series 2020A, 4.000%, 3/15/45 | | | |
| | New York State Urban Development Corporation, State Personal Income Tax Revenue Bonds, | | | |
| | General Purpose, Series 2020C: | | | |
| 3,500 | 4.000%, 3/15/45 | 9/30 at 100.00 | Aa2 | 4,058,075 |
| 10,500 | 4.000%, 3/15/49 | 9/30 at 100.00 | Aa2 | 12,124,350 |
53
| NAD | Nuveen Quality Municipal Income Fund |
| | Portfolio of Investments (continued) |
| | October 31, 2021 |
| Principal | | Optional Call | | |
| Amount (000) | Description (1) | Provisions (2) | Ratings (3) | Value |
| | New York (continued) | | | |
| | New York Transportation Development Corporation, New York, Special Facilities Bonds, | | | |
| | LaGuardia Airport Terminal B Redevelopment Project, Series 2016A: | | | |
| $ 2,000 | 4.000%, 7/01/35 – AGM Insured (AMT) | 7/24 at 100.00 | BBB | $ 2,160,880 |
| 10,800 | 5.000%, 7/01/41 (AMT) | 7/24 at 100.00 | Baa3 | 11,977,740 |
| 32,390 | 5.000%, 7/01/46 (AMT) | 7/24 at 100.00 | Baa3 | 35,901,076 |
| | New York Transportation Development Corporation, New York, Special Facility Revenue Bonds, | | | |
| | American Airlines, Inc. John F Kennedy International Airport Project, Refunding Series 2016: | | | |
| 175 | 5.000%, 8/01/26 (AMT) | 11/21 at 100.00 | B– | 175,348 |
| 5,940 | 5.000%, 8/01/31 (AMT) | 11/21 at 100.00 | B– | 5,951,583 |
| 4,130 | New York Transportation Development Corporation, New York, Special Facility Revenue | 8/30 at 100.00 | B– | 4,867,907 |
| | Bonds, American Airlines, Inc. John F Kennedy International Airport Project, Series 2020, | | | |
| | 5.250%, 8/01/31 (AMT) | | | |
| 3,050 | New York Transportation Development Corporation, Special Facility Revenue Bonds, Delta | 1/28 at 100.00 | BB+ | 3,631,788 |
| | Air Lines, Inc. – LaGuardia Airport Terminals C&D Redevelopment Project, Series 2018, 5.000%, | | | |
| | 1/01/33 (AMT) | | | |
| 1,310 | Port Authority of New York and New Jersey, Consolidated Revenue Bonds, One Hundred | 12/23 at 100.00 | A+ | 1,416,975 |
| | Seventy Eighth Series 2013, 5.000%, 12/01/43 (AMT) | | | |
| 4,320 | Port Authority of New York and New Jersey, Consolidated Revenue Bonds, One Hundred | 12/23 at 100.00 | A+ | 4,724,395 |
| | Seventy Ninth Series 2013, 5.000%, 12/01/38 | | | |
| 2,000 | Port Authority of New York and New Jersey, Consolidated Revenue Bonds, Two Hundred | 7/30 at 100.00 | A+ | 2,282,540 |
| | Twenty-One Series 2020, 4.000%, 7/15/45 (AMT) | | | |
| | Syracuse Industrial Development Authority, New York, PILOT Revenue Bonds, Carousel | | | |
| | Center Project, Refunding Series 2016A: | | | |
| 2,835 | 5.000%, 1/01/29 (AMT) | 1/26 at 100.00 | CC | 2,814,588 |
| 2,700 | 5.000%, 1/01/34 (AMT) | 1/26 at 100.00 | CC | 2,555,928 |
| 2,855 | Triborough Bridge and Tunnel Authority, New York, General Revenue Bonds, MTA Bridges & | 5/31 at 100.00 | AA– | 3,586,223 |
| | Tunnels, Series 2021A, 5.000%, 11/15/56 | | | |
| 17,975 | Triborough Bridge and Tunnel Authority, New York, Payroll Mobility Tax Bonds, Senior | 5/31 at 100.00 | AA+ | 22,614,347 |
| | Lien Subseries 2021A-1, 5.000%, 5/15/51 | | | |
| | TSASC Inc., New York, Tobacco Asset-Backed Bonds, Series 2006: | | | |
| 1,250 | 5.000%, 6/01/45 | 6/27 at 100.00 | CCC+ | 1,364,450 |
| 2,850 | 5.000%, 6/01/48 | 6/27 at 100.00 | N/R | 3,073,925 |
| 315,760 | Total New York | | | 355,461,662 |
| | North Carolina – 1.4% (0.9% of Total Investments) | | | |
| 12,250 | Fayetteville State University, North Carolina, General Revenue Bonds, Series 2013A, | 4/23 at 100.00 | BBB+ | 13,053,967 |
| | 5.125%, 4/01/43 | | | |
| 3,480 | North Carolina Department of Transportation, Private Activity Revenue Bonds, I-77 Hot | 6/25 at 100.00 | BBB– | 3,778,375 |
| | Lanes Project, Series 2015, 5.000%, 6/30/54 (AMT) | | | |
| 10,300 | North Carolina Eastern Municipal Power Agency, Power System Revenue Bonds, Refunding | No Opt. Call | Baa2 (4) | 10,398,777 |
| | Series 1993B, 6.000%, 1/01/22 – CAPMAC Insured (ETM) (UB) (5) | | | |
| 1,570 | North Carolina Medical Care Commission, Retirement Facilities First Mortgage Revenue | 10/24 at 102.00 | N/R | 1,703,701 |
| | Bonds, Southminster Project, Refunding Series 2016, 5.000%, 10/01/31 | | | |
| | North Carolina Medical Care Commission, Health Care Facilities Revenue Bonds, Novant | | | |
| | Health Obligated Group, Series 2019A: | | | |
| 8,275 | 4.000%, 11/01/49 | 11/29 at 100.00 | AA– | 9,393,863 |
| 4,650 | 4.000%, 11/01/52 | 11/29 at 100.00 | AA– | 5,256,407 |
| | North Carolina Medical Care Commission, Health Care Facilities Revenue Bonds, WakeMed, | | | |
| | Refunding Series 2012A: | | | |
| 5,000 | 5.000%, 10/01/27 | 10/22 at 100.00 | A2 | 5,199,350 |
| 3,400 | 5.000%, 10/01/31 | 10/22 at 100.00 | A2 | 3,537,156 |
| 500 | North Carolina Municipal Power Agency 1, Catawba Electric Revenue Bonds, Refunding | 1/26 at 100.00 | A | 575,460 |
| | Series 2015A, 5.000%, 1/01/32 | | | |
| 49,425 | Total North Carolina | | | 52,897,056 |
54
| Principal | | Optional Call | | |
| Amount (000) | Description (1) | Provisions (2) | Ratings (3) | Value |
| | North Dakota – 0.5% (0.3% of Total Investments) | | | |
| $ 675 | Burleigh County, North Dakota, Health Care Revenue Bonds, Saint Alexius Medical Center | 7/22 at 100.00 | N/R (4) | $ 695,709 |
| | Project, Refunding Series 2012A, 5.000%, 7/01/38 (Pre-refunded 7/01/22) | | | |
| 7,625 | Grand Forks, North Dakota, Health Care System Revenue Bonds, Altru Health System | 12/21 at 100.00 | BBB– | 7,654,509 |
| | Obligated Group, Series 2012, 5.000%, 12/01/32 | | | |
| 5,000 | Grand Forks, North Dakota, Health Care System Revenue Bonds, Altru Health System | 12/27 at 100.00 | BBB– | 5,477,350 |
| | Obligated Group, Series 2017A, 4.000%, 12/01/47 | | | |
| 700 | Grand Forks, North Dakota, Senior Housing & Nursing Facilities Revenue Bonds, Valley | 12/26 at 100.00 | N/R | 729,253 |
| | Homes and Services Obligated Group, Series 2017, 5.000%, 12/01/36 | | | |
| 2,700 | University of North Dakota, Certificates of Participation, Housing Infrastructure | 6/30 at 100.00 | A1 | 3,073,140 |
| | Project, Series 2021A, 4.000%, 6/01/51 – AGM Insured | | | |
| 16,700 | Total North Dakota | | | 17,629,961 |
| | Ohio – 5.8% (3.8% of Total Investments) | | | |
| 6,250 | Akron, Bath and Copley Joint Township Hospital District, Ohio, Hospital Facilities | 11/26 at 100.00 | BBB+ | 7,344,937 |
| | Revenue Bonds, Summa Health System, Refunding & Improvement Series 2016, 5.250%, 11/15/46 | | | |
| 6,000 | Allen County, Ohio, Hospital Facilities Revenue Bonds, Mercy Health, Series 2017A, | 2/28 at 100.00 | A+ | 6,858,840 |
| | 4.000%, 8/01/36 | | | |
| 1,340 | Bowling Green State University, Ohio, General Receipts Bonds, Series 2017B, 5.000%, 6/01/45 | 6/27 at 100.00 | A+ | 1,585,689 |
| 24,740 | Buckeye Tobacco Settlement Financing Authority, Ohio, Tobacco Settlement Asset-Backed | 6/30 at 22.36 | N/R | 3,866,120 |
| | Revenue Bonds, Refunding Senior Lien Capital Appreciation Series 2020B-3 Class 2, | | | |
| | 0.000%, 6/01/57 | | | |
| 790 | Buckeye Tobacco Settlement Financing Authority, Ohio, Tobacco Settlement Asset-Backed | 6/30 at 100.00 | BBB+ | 874,554 |
| | Revenue Bonds, Refunding Senior Lien Series 2020A-2 Class 1, 4.000%, 6/01/48 | | | |
| 41,060 | Buckeye Tobacco Settlement Financing Authority, Ohio, Tobacco Settlement Asset-Backed | 6/30 at 100.00 | N/R | 46,107,506 |
| | Revenue Bonds, Refunding Senior Lien Series 2020B-2 Class 2, 5.000%, 6/01/55 | | | |
| 24,910 | Buckeye Tobacco Settlement Financing Authority, Ohio, Tobacco Settlement Asset-Backed | 6/22 at 100.00 | N/R (4) | 25,789,323 |
| | Revenue Bonds, Senior Lien Series 2007A-3, 6.250%, 6/01/37 (Pre-refunded 6/01/22) | | | |
| | Butler County, Ohio, Hospital Facilities Revenue Bonds, UC Health, Refunding Series 2017: | | | |
| 3,960 | 4.000%, 11/15/34 | 11/27 at 100.00 | A3 | 4,479,512 |
| 3,000 | 4.000%, 11/15/35 | 11/27 at 100.00 | A3 | 3,390,120 |
| | Cleveland-Cuyahoga County Port Authority, Ohio, Cultural Facility Revenue Bonds, The | | | |
| | Cleveland Museum of Natural History Project, Series 2021: | | | |
| 205 | 4.000%, 7/01/40 | 7/31 at 100.00 | A3 | 240,139 |
| 300 | 4.000%, 7/01/41 | 7/31 at 100.00 | A3 | 350,457 |
| 2,000 | Columbus-Franklin County Finance Authority, Ohio, Tax Increment Financing Revenue Bonds, | 6/29 at 100.00 | N/R | 2,181,480 |
| | Bridge Park D Block Project, Series 2019A-1, 5.000%, 12/01/51 | | | |
| 4,795 | Fairfield County, Ohio, Hospital Facilities Revenue Bonds, Fairfield Medical Center | 6/23 at 100.00 | Ba2 | 4,915,211 |
| | Project, Series 2013, 5.000%, 6/15/43 | | | |
| 8,000 | Hamilton County, Ohio, Hospital Facilities Revenue Bonds, TriHealth, Inc. Obligated | 8/27 at 100.00 | A+ | 9,455,360 |
| | Group Project, Series 2017A, 5.000%, 8/15/42 | | | |
| | JobsOhio Beverage System, Ohio, Statewide Liquor Profits Revenue Bonds, Senior Lien | | | |
| | Series 2013A: | | | |
| 1,000 | 5.000%, 1/01/38 (Pre-refunded 1/01/23) | 1/23 at 100.00 | Aa3 (4) | 1,055,240 |
| 16,820 | 5.000%, 1/01/38 (Pre-refunded 1/01/23) (UB) (5) | 1/23 at 100.00 | Aa3 (4) | 17,749,137 |
| | JobsOhio Beverage System, Ohio, Statewide Senior Lien Liquor Profits Revenue Bonds, | | | |
| | Tender Option Bond Trust 2016-XG0052: | | | |
| 265 | 17.852%, 1/01/38 (Pre-refunded 1/01/23), 144A (IF) | 1/23 at 100.00 | Aa3 (4) | 323,112 |
| 625 | 17.985%, 1/01/38 (Pre-refunded 1/01/23), 144A (IF) | 1/23 at 100.00 | Aa3 (4) | 763,106 |
| 975 | 17.985%, 1/01/38 (Pre-refunded 1/01/23), 144A (IF) | 1/23 at 100.00 | Aa3 (4) | 1,190,446 |
| 1,315 | 17.985%, 1/01/38 (Pre-refunded 1/01/23), 144A (IF) | 1/23 at 100.00 | Aa3 (4) | 1,605,576 |
| 8,360 | Lake County, Ohio, Hospital Facilities Revenue Bonds, Lake Hospital System, Inc., | 8/25 at 100.00 | Baa1 (4) | 9,727,278 |
| | Refunding Series 2015, 5.000%, 8/15/45 (Pre-refunded 8/15/25) | | | |
| 2,045 | Middleburg Heights, Ohio, Hospital Facilities Improvement Revenue Bonds, Southwest | 8/30 at 100.00 | A2 | 2,307,271 |
| | General Health Center Project, Refunding Series 2020A, 4.000%, 8/01/47 | | | |
55
| NAD | Nuveen Quality Municipal Income Fund |
| | Portfolio of Investments (continued) |
| | October 31, 2021 |
| Principal | | Optional Call | | |
| Amount (000) | Description (1) | Provisions (2) | Ratings (3) | Value |
| | Ohio (continued) | | | |
| $ 2,000 | Muskingum County, Ohio, Hospital Facilities Revenue Bonds, Genesis HealthCare System | 2/23 at 100.00 | Ba2 | $ 2,086,560 |
| | Obligated Group Project, Series 2013, 5.000%, 2/15/33 | | | |
| 3,000 | Ohio Air Quality Development Authority, Ohio, Pollution Control Revenue Bonds, | No Opt. Call | N/R | 2,980,650 |
| | FirstEnergy Generation Corporation Project, Refunding Series 2009D, 3.375%, 8/01/29 | | | |
| | (Mandatory Put 9/15/21) | | | |
| 4,350 | Ohio Higher Educational Facility Commission, Revenue Bonds, University of Dayton, Series | 6/25 at 100.00 | A2 | 4,905,887 |
| | 2015A, 5.000%, 12/01/44 | | | |
| 8,330 | Ohio State, Hospital Revenue Bonds, University Hospitals Health System, Inc., Series | 1/30 at 100.00 | A | 10,168,431 |
| | 2020A, 5.000%, 1/15/50 | | | |
| 3,710 | Ohio State, Turnpike Revenue Bonds, Ohio Turnpike and Infrastructure Commission | 2/31 at 100.00 | A+ | 4,615,017 |
| | Infrastructure Projects, Junior Lien, Capital Appreciation Series 2013A-3, 0.000%, 2/15/36 (8) | | | |
| | Ohio State, Turnpike Revenue Bonds, Ohio Turnpike and Infrastructure Commission | | | |
| | Infrastructure Projects, Junior Lien, Current Interest Series 2013A-1: | | | |
| 1,500 | 5.250%, 2/15/39 | 2/23 at 100.00 | A+ | 1,591,755 |
| 10,530 | 5.000%, 2/15/48 (Pre-refunded 2/15/23) | 2/23 at 100.00 | A+ (4) | 11,171,803 |
| | Ohio State, Turnpike Revenue Bonds, Ohio Turnpike and Infrastructure Commission, | | | |
| | Infrastructure Projects, Junior Lien Series 2018A: | | | |
| 3,375 | 4.000%, 2/15/38 | 2/28 at 100.00 | A+ | 3,857,693 |
| 16,325 | 5.000%, 2/15/43 | 2/28 at 100.00 | A+ | 19,574,001 |
| 4,255 | Ross County, Ohio, Hospital Facilities Revenue Bonds, Adena Health System Obligated | 12/29 at 100.00 | A– | 5,156,847 |
| | Group Project, Refunding & Improvement Series 2019, 5.000%, 12/01/49 | | | |
| 725 | Warren County, Ohio, Healthcare Facilities Revenue Bonds, Otterbein Homes Obligated | 7/29 at 100.00 | A | 821,113 |
| | Group, Refunding Series 2019A, 4.000%, 7/01/45 | | | |
| 216,855 | Total Ohio | | | 219,090,171 |
| | Oklahoma – 0.3% (0.2% of Total Investments) | | | |
| 3,000 | Tulsa Airports Improvement Trust, Oklahoma, General Airport Revenue Bonds, Series 2013A, | 6/23 at 100.00 | Baa1 (4) | 3,245,490 |
| | 5.625%, 6/01/43 (Pre-refunded 6/01/23) (AMT) | | | |
| 4,985 | Tulsa Airports Improvement Trust, Oklahoma, General Airport Revenue Bonds, Series 2015A, | 6/24 at 100.00 | Baa1 (4) | 5,557,976 |
| | 5.000%, 6/01/45 (Pre-refunded 6/01/24) – BAM Insured (AMT) | | | |
| 1,000 | Tulsa County Industrial Authority, Oklahoma, Senior Living Community Revenue Bonds, | 11/25 at 102.00 | BBB– | 1,145,550 |
| | Montereau, Inc Project, Refunding Series 2017, 5.250%, 11/15/37 | | | |
| 8,985 | Total Oklahoma | | | 9,949,016 |
| | Oregon – 2.2% (1.4% of Total Investments) | | | |
| 2,435 | Beaverton School District 48J, Washington and Multnomah Counties, Oregon, General | 6/27 at 100.00 | AA+ | 2,938,680 |
| | Obligation Bonds, Convertible Deferred Interest Series 2017D, 5.000%, 6/15/36 | | | |
| 725 | Clackamas County Hospital Facility Authority, Oregon, Revenue Bonds, Rose Villa Inc., | 11/25 at 102.00 | N/R | 794,470 |
| | Series 2020A, 5.250%, 11/15/50 | | | |
| 4,875 | Deschutes County Hospital Facility Authority, Oregon, Hospital Revenue Bonds, Saint | 1/26 at 100.00 | A2 | 5,555,306 |
| | Charles Health System, Inc., Series 2016A, 5.000%, 1/01/48 | | | |
| 15,440 | Oregon Facilities Authority, Revenue Bonds, Legacy Health Project, Series 2016A, | 6/26 at 100.00 | A+ | 17,800,467 |
| | 5.000%, 6/01/46 | | | |
| 3,085 | Oregon Facilities Authority, Revenue Bonds, Samaritan Health Services Project, Refunding | 10/30 at 100.00 | BBB+ | 3,792,792 |
| | Series 2020A, 5.000%, 10/01/40 | | | |
| 1,500 | Oregon Health and Science University, Revenue Bonds, Refunding Series 2016B, | 7/26 at 100.00 | AA– | 1,765,200 |
| | 5.000%, 7/01/39 | | | |
| | Port of Portland, Oregon, International Airport Revenue Bonds, Series 2017-24B: | | | |
| 4,000 | 5.000%, 7/01/36 (AMT) | 1/27 at 100.00 | A+ | 4,707,400 |
| 1,000 | 5.000%, 7/01/37 (AMT) | 1/27 at 100.00 | A+ | 1,174,900 |
| 7,645 | 5.000%, 7/01/42 (AMT) | 1/27 at 100.00 | A+ | 8,946,255 |
| 19,000 | 5.000%, 7/01/47 (AMT) | 1/27 at 100.00 | A+ | 22,232,470 |
56
| Principal | | Optional Call | | |
| Amount (000) | Description (1) | Provisions (2) | Ratings (3) | Value |
| | Oregon (continued) | | | |
| | Salem Hospital Facility Authority, Oregon, Revenue Bonds, Salem Health Projects, Series 2019A: | | | |
| $ 5,855 | 5.000%, 5/15/44 | 5/29 at 100.00 | A+ | $ 7,187,071 |
| 3,000 | 4.000%, 5/15/49 | 5/29 at 100.00 | A+ | 3,408,660 |
| 2,000 | University of Oregon, General Revenue Bonds, Series 2018A, 5.000%, 4/01/48 | 4/28 at 100.00 | AA– | 2,429,560 |
| 70,560 | Total Oregon | | | 82,733,231 |
| | Pennsylvania – 5.1% (3.3% of Total Investments) | | | |
| 7,500 | Allegheny County Hospital Development Authority, Pennsylvania, Revenue Bonds, Allegheny | 4/28 at 100.00 | A | 8,903,625 |
| | Health Network Obligated Group Issue, Series 2018A, 5.000%, 4/01/47 | | | |
| 3,670 | Allegheny County Sanitary Authority, Pennsylvania, Sewer Revenue Bonds, Series 2020B, | 12/30 at 100.00 | A+ | 4,304,433 |
| | 4.000%, 6/01/45 | | | |
| 2,000 | Beaver County Industrial Development Authority, Pennsylvania, Pollution Control Revenue | No Opt. Call | N/R | 2,032,860 |
| | Bonds, FirstEnergy Generation Project, Refunding Series 2006A, 4.375%, 1/01/35 (Mandatory | | | |
| | Put 7/01/22) | | | |
| 345 | Commonwealth Financing Authority, Pennsylvania, State Appropriation Lease Bonds, Master | 6/28 at 100.00 | A | 417,591 |
| | Settlement, Series 2018, 5.000%, 6/01/34 | | | |
| | Delaware River Joint Toll Bridge Commission, New Jersey and Pennsylvania, Bridge System | | | |
| | Revenue Bonds, Series 2017: | | | |
| 3,500 | 5.000%, 7/01/37 | 7/27 at 100.00 | A | 4,200,630 |
| 8,385 | 5.000%, 7/01/42 | 7/27 at 100.00 | A | 9,989,638 |
| 8,000 | Lancaster County Hospital Authority/PA, 5.000%, 11/01/51 (WI/DD, Settling 11/10/21) | 11/29 at 100.00 | A2 | 9,700,640 |
| | Lehigh County Authority, Pennsylvania, Water and Sewer Revenue Bonds, Allentown | | | |
| | Concession, Capital Appreciation Series 2013B: | | | |
| 5,400 | 0.000%, 12/01/33 | No Opt. Call | A | 4,088,394 |
| 11,000 | 0.000%, 12/01/38 | No Opt. Call | A | 7,076,740 |
| | Lehigh County Authority, Pennsylvania, Water and Sewer Revenue Bonds, Allentown | | | |
| | Concession, Series 2013A: | | | |
| 2,500 | 5.125%, 12/01/47 | 12/23 at 100.00 | A | 2,714,875 |
| 2,875 | 5.125%, 12/01/47 (Pre-refunded 12/01/23) | 12/23 at 100.00 | N/R (4) | 3,159,510 |
| | Montgomery County Higher Education and Health Authority, Pennsylvania, Revenue Bonds, | | | |
| | Thomas Jefferson University, Series 2018A: | | | |
| 2,400 | 5.000%, 9/01/35 | 9/28 at 100.00 | A | 2,941,992 |
| 5,210 | 5.000%, 9/01/43 | 9/28 at 100.00 | A | 6,290,658 |
| | Montgomery County Higher Education and Health Authority, Pennsylvania, Revenue Bonds, | | | |
| | Thomas Jefferson University, Series 2019: | | | |
| 500 | 4.000%, 9/01/44 | 9/29 at 100.00 | A | 567,375 |
| 165 | 4.000%, 9/01/49 | 9/29 at 100.00 | A | 186,118 |
| 3,430 | Montgomery County Industrial Development Authority, Pennsylvania, Health System Revenue | 1/25 at 100.00 | Ba1 | 3,866,673 |
| | Bonds, Albert Einstein Healthcare Network Issue, Series 2015A, 5.250%, 1/15/45 | | | |
| 1,900 | Montgomery County Industrial Development Authority, Pennsylvania, Revenue Bonds, ACTS | 11/27 at 103.00 | A– | 2,170,294 |
| | Retirement-Life Communities, Inc. Obligated Group, Series 2020, 4.000%, 11/15/43 | | | |
| 235 | Pennsylvania Economic Development Financing Authority, Exempt Facilities Revenue Bonds, | 11/24 at 100.00 | N/R | 247,920 |
| | National Gypsum Company, Refunding Series 2014, 5.500%, 11/01/44 (AMT) | | | |
| 9,575 | Pennsylvania Higher Educational Facilities Authority, Revenue Bonds, University of | 8/29 at 100.00 | Aa3 | 11,059,125 |
| | Pennsylvania Health System, Series 2019, 4.000%, 8/15/44 | | | |
| 16,750 | Pennsylvania Turnpike Commission, Turnpike Revenue Bonds, Capital Appreciation Series | 12/27 at 100.00 | A3 | 21,796,273 |
| | 2009E, 6.375%, 12/01/38 | | | |
| 4,305 | Pennsylvania Turnpike Commission, Turnpike Revenue Bonds, Series 2015A-1, 5.000%, 12/01/45 | 6/25 at 100.00 | A+ | 4,869,084 |
| 4,600 | Pennsylvania Turnpike Commission, Turnpike Revenue Bonds, Series 2021B, 5.000%, 12/01/51 | 6/31 at 100.00 | A+ | 5,751,288 |
| 2,000 | Pennsylvania Turnpike Commission, Turnpike Revenue Bonds, Subordinate Lien Series | 12/24 at 100.00 | A3 | 2,247,320 |
| | 2014A-1, 5.000%, 12/01/38 | | | |
| 14,500 | Pennsylvania Turnpike Commission, Turnpike Revenue Bonds, Subordinate Series 2009C, | 6/26 at 100.00 | A2 | 17,861,535 |
| | 6.250%, 6/01/33 – AGM Insured | | | |
57
| NAD | Nuveen Quality Municipal Income Fund |
| | Portfolio of Investments (continued) |
| | October 31, 2021 |
| Principal | | Optional Call | | |
| Amount (000) | Description (1) | Provisions (2) | Ratings (3) | Value |
| | Pennsylvania (continued) | | | |
| $ 6,250 | Pennsylvania Turnpike Commission, Turnpike Revenue Bonds, Subordinate Series 2015B-1, | 12/25 at 100.00 | A3 | $ 7,164,313 |
| | 5.000%, 12/01/45 | | | |
| 5,000 | Pennsylvania Turnpike Commission, Turnpike Revenue Bonds, Subordinate Series 2016A-1, | 12/25 at 100.00 | A3 | 5,706,350 |
| | 5.000%, 12/01/46 | | | |
| | Pennsylvania Turnpike Commission, Turnpike Revenue Bonds, Subordinate Series 2021A: | | | |
| 3,740 | 4.000%, 12/01/45 | 12/30 at 100.00 | A3 | 4,282,524 |
| 4,620 | 4.000%, 12/01/50 | 12/30 at 100.00 | A3 | 5,179,251 |
| 5,965 | Philadelphia School District, Pennsylvania, General Obligation Bonds, Series 2021A, | 9/31 at 100.00 | A2 | 6,804,812 |
| | 4.000%, 9/01/46 (WI/DD, Settling 11/04/21) | | | |
| 8,650 | Philadelphia, Pennsylvania, Airport Revenue Bonds, Refunding Series 2017B, 5.000%, | 7/27 at 100.00 | A– | 10,248,434 |
| | 7/01/42 (AMT) | | | |
| 2,150 | Pittsburgh Water and Sewer Authority, Pennsylvania, Water and Sewer System Revenue | 9/30 at 100.00 | A2 | 2,505,653 |
| | Bonds, First Lien Series 2020B, 4.000%, 9/01/50 – AGM Insured | | | |
| 1,000 | Upper Darby School District, Delaware County, Pennsylvania, General Obligation Bonds, | 10/29 at 100.00 | A1 | 1,158,080 |
| | Series 2021A, 4.000%, 4/01/46 – BAM Insured | | | |
| 10,000 | Westmoreland County Municipal Authority, Pennsylvania, Municipal Service Revenue Bonds, | 8/25 at 100.00 | AA | 11,503,000 |
| | Series 2016, 5.000%, 8/15/38 – BAM Insured | | | |
| 168,120 | Total Pennsylvania | | | 190,997,008 |
| | Puerto Rico – 1.6% (1.1% of Total Investments) | | | |
| 3,270 | Children’s Trust Fund, Puerto Rico, Tobacco Settlement Asset-Backed Bonds, Refunding | 11/21 at 100.00 | BB | 3,350,769 |
| | Series 2002, 5.500%, 5/15/39 | | | |
| 500 | Puerto Rico Aqueduct and Sewerage Authority, Revenue Bonds, Senior Lien Series 2012A, | 7/22 at 100.00 | CCC | 518,545 |
| | 6.000%, 7/01/47 | | | |
| 1,100 | Puerto Rico Highway and Transportation Authority, Highway Revenue Bonds, Series 2007N, | No Opt. Call | N/R | 1,163,943 |
| | 5.500%, 7/01/29 – AMBAC Insured | | | |
| 800 | Puerto Rico Public Buildings Authority, Guaranteed Government Facilities Revenue Bonds, | 11/21 at 100.00 | N/R | 812,464 |
| | Refunding Series 2002D, 5.450%, 7/01/31 – AMBAC Insured | | | |
| 755 | Puerto Rico Public Finance Corporation, Commonwealth Appropriation Bonds, Series 1998A, | No Opt. Call | AA+ | 801,840 |
| | 5.125%, 6/01/24 – AMBAC Insured | | | |
| | Puerto Rico Sales Tax Financing Corporation, Sales Tax Revenue Bonds, Restructured 2018A-1: | | | |
| 47 | 0.000%, 7/01/24 | No Opt. Call | N/R | 44,984 |
| 90 | 0.000%, 7/01/27 | No Opt. Call | N/R | 81,450 |
| 88 | 0.000%, 7/01/29 | 7/28 at 98.64 | N/R | 75,421 |
| 114 | 0.000%, 7/01/31 | 7/28 at 91.88 | N/R | 90,684 |
| 128 | 0.000%, 7/01/33 | 7/28 at 86.06 | N/R | 94,851 |
| 1,093 | 4.500%, 7/01/34 | 7/25 at 100.00 | N/R | 1,194,769 |
| 3,291 | 4.550%, 7/01/40 | 7/28 at 100.00 | N/R | 3,664,166 |
| 12,927 | 0.010%, 7/01/46 | 7/28 at 41.38 | N/R | 4,214,073 |
| 3,495 | 0.000%, 7/01/51 | 7/28 at 30.01 | N/R | 827,511 |
| 5,099 | 4.750%, 7/01/53 | 7/28 at 100.00 | N/R | 5,695,685 |
| 24,836 | 5.000%, 7/01/58 | 7/28 at 100.00 | N/R | 28,100,444 |
| | Puerto Rico Sales Tax Financing Corporation, Sales Tax Revenue Bonds, Taxable | | | |
| | Restructured Cofina Project Series 2019A-2: | | | |
| 3,875 | 4.329%, 7/01/40 | 7/28 at 100.00 | N/R | 4,262,384 |
| 20 | 4.536%, 7/01/53 | 7/28 at 100.00 | N/R | 22,057 |
| 2,484 | 4.784%, 7/01/58 | 7/28 at 100.00 | N/R | 2,771,796 |
| | Puerto Rico, Highway Revenue Bonds, Highway and Transportation Authority, Refunding | | | |
| | Series 2007CC: | | | |
| 765 | 5.500%, 7/01/28 – NPFG Insured | No Opt. Call | Baa2 | 842,158 |
| 2,300 | 5.500%, 7/01/30 – AGM Insured | No Opt. Call | A2 | 2,586,925 |
| 67,077 | Total Puerto Rico | | | 61,216,919 |
58
| Principal | | Optional Call | | |
| Amount (000) | Description (1) | Provisions (2) | Ratings (3) | Value |
| | Rhode Island – 0.4% (0.3% of Total Investments) | | | |
| $ 7,230 | Rhode Island Health and Educational Building Corporation, Higher Education Facility | 9/23 at 100.00 | AA+ | $ 7,789,891 |
| | Revenue Bonds, Brown University, Series 2013, 5.000%, 9/01/43 | | | |
| 3,320 | Rhode Island Health and Educational Building Corporation, Hospital Financing Revenue | 5/26 at 100.00 | BBB+ | 3,742,105 |
| | Bonds, Lifespan Obligated Group, Refunding Series 2016, 5.000%, 5/15/39 | | | |
| 30,175 | Rhode Island Tobacco Settlement Financing Corporation, Tobacco Settlement Asset-Backed | 11/21 at 16.44 | CCC– | 5,039,829 |
| | Bonds, Series 2007A, 0.010%, 6/01/52 | | | |
| 40,725 | Total Rhode Island | | | 16,571,825 |
| | South Carolina – 4.2% (2.7% of Total Investments) | | | |
| | Lexington County Health Services District, Inc., South Carolina, Hospital Revenue Bonds, | | | |
| | Lexington Medical Center, Series 2016: | | | |
| 7,500 | 5.000%, 11/01/41 | 5/26 at 100.00 | A | 8,626,725 |
| 3,180 | 5.000%, 11/01/46 | 5/26 at 100.00 | A | 3,657,223 |
| | Piedmont Municipal Power Agency, South Carolina, Electric Revenue Bonds, Series 2004A-2: | | | |
| 21,565 | 0.000%, 1/01/30 – AMBAC Insured | No Opt. Call | A– | 18,498,888 |
| 1,250 | 0.000%, 1/01/31 – AGC Insured | No Opt. Call | A3 | 1,050,475 |
| 4,610 | Rock Hill, South Carolina, Combined Utility System Revenue Bonds, Series 2016, | 1/26 at 100.00 | A | 5,213,403 |
| | 5.000%, 1/01/47 | | | |
| | South Carolina Jobs-Economic Development Authority, Economic Development Revenue Bonds, | | | |
| | Bishop Gadsden Episcopal Retirement Community, Series 2019A: | | | |
| 645 | 5.000%, 4/01/44 | 4/26 at 103.00 | BBB– | 731,101 |
| 625 | 5.000%, 4/01/49 | 4/26 at 103.00 | BBB– | 705,781 |
| 1,640 | South Carolina Jobs-Economic Development Authority, Economic Development Revenue Bonds, | 10/25 at 100.00 | A1 | 1,877,111 |
| | Furman University, Refunding Series 2015, 5.000%, 10/01/45 | | | |
| 13,475 | South Carolina Jobs-Economic Development Authority, Hospital Revenue Bonds, Bon Secours | 6/30 at 100.00 | A+ | 15,415,535 |
| | Mercy Health, Inc, Series 2020A, 4.000%, 12/01/44 | | | |
| 1,000 | South Carolina Jobs-Economic Development Authority, Hospital Revenue Bonds, McLeod | 5/28 at 100.00 | AA– | 1,197,890 |
| | Health Projects, Refunding & Improvement Series 2018, 5.000%, 11/01/43 | | | |
| 14,765 | South Carolina Public Service Authority, Santee Cooper Revenue Obligations, Refunding & | 6/25 at 100.00 | A– | 16,791,496 |
| | Improvement Series 2015A, 5.000%, 12/01/50 | | | |
| | South Carolina Public Service Authority, Santee Cooper Revenue Obligations, Refunding | | | |
| | Series 2014C: | | | |
| 8,900 | 5.000%, 12/01/39 | 12/24 at 100.00 | A– | 10,011,788 |
| 12,760 | 5.000%, 12/01/46 | 12/24 at 100.00 | A– | 14,356,659 |
| 9,000 | South Carolina Public Service Authority, Santee Cooper Revenue Obligations, Refunding | 12/26 at 100.00 | A– | 10,563,210 |
| | Series 2016B, 5.000%, 12/01/56 | | | |
| 5,500 | South Carolina Public Service Authority, Santee Cooper Revenue Obligations, Series | 12/23 at 100.00 | A– | 5,996,595 |
| | 2013A, 5.125%, 12/01/43 | | | |
| 3,455 | South Carolina Public Service Authority, Santee Cooper Revenue Obligations, Series | 6/24 at 100.00 | A– | 3,864,936 |
| | 2014A, 5.500%, 12/01/54 | | | |
| | South Carolina State Ports Authority, Revenue Bonds, Series 2015: | | | |
| 860 | 5.250%, 7/01/55 (Pre-refunded 7/01/25) (AMT) | 7/25 at 100.00 | A1 (4) | 1,006,518 |
| 4,140 | 5.250%, 7/01/55 (Pre-refunded 7/01/25) (AMT) | 7/25 at 100.00 | A+ (4) | 4,845,332 |
| | South Carolina State Ports Authority, Revenue Bonds, Series 2018: | | | |
| 15,350 | 5.000%, 7/01/48 (AMT) | 7/28 at 100.00 | A+ | 18,466,664 |
| 8,000 | 5.000%, 7/01/55 (AMT) | 7/28 at 100.00 | A+ | 9,582,880 |
| 5,000 | South Carolina State Ports Authority, Revenue Bonds, Series 2019A, 5.000%, 7/01/54 | 7/29 at 100.00 | A+ | 6,083,800 |
| 143,220 | Total South Carolina | | | 158,544,010 |
| | South Dakota – 0.9% (0.6% of Total Investments) | | | |
| 11,320 | South Dakota Board of Regents, Housing and Auxiliary Facilities System Revenue Bonds, | 10/27 at 100.00 | A1 | 12,747,452 |
| | Series 2017, 4.000%, 4/01/42 | | | |
| 6,000 | South Dakota Health and Educational Facilities Authority, Revenue Bonds, Monument | 9/30 at 100.00 | A1 | 6,830,640 |
| | Health, Inc., Series 2020A, 4.000%, 9/01/50 | | | |
59
| NAD | Nuveen Quality Municipal Income Fund |
| | Portfolio of Investments (continued) |
| | October 31, 2021 |
| Principal | | Optional Call | | |
| Amount (000) | Description (1) | Provisions (2) | Ratings (3) | Value |
| | South Dakota (continued) | | | |
| $ 2,685 | South Dakota Health and Educational Facilities Authority, Revenue Bonds, Regional | 9/27 at 100.00 | A1 | $ 3,011,442 |
| | Health, Refunding Series 2017, 4.000%, 9/01/36 | | | |
| 1,460 | South Dakota Health and Educational Facilities Authority, Revenue Bonds, Sanford Health, | 11/24 at 100.00 | A+ | 1,635,215 |
| | Series 2014B, 5.000%, 11/01/44 | | | |
| 7,185 | South Dakota Health and Educational Facilities Authority, Revenue Bonds, Sanford Health, | 11/25 at 100.00 | A+ | 8,222,442 |
| | Series 2015, 5.000%, 11/01/45 | | | |
| 28,650 | Total South Dakota | | | 32,447,191 |
| | Tennessee – 1.4% (0.9% of Total Investments) | | | |
| 9,460 | Chattanooga Health, Educational and Housing Facility Board, Tennessee, Revenue Bonds, | 1/23 at 100.00 | BBB+ (4) | 9,998,558 |
| | Catholic Health Initiatives, Series 2013A, 5.250%, 1/01/45 (Pre-refunded 1/01/23) | | | |
| | Greeneville Health and Educational Facilities Board, Tennessee, Hospital Revenue Bonds, | | | |
| | Ballad Health, Series 2018A: | | | |
| 2,000 | 5.000%, 7/01/36 | 7/28 at 100.00 | A– | 2,428,980 |
| 7,000 | 5.000%, 7/01/37 | 7/28 at 100.00 | A– | 8,483,790 |
| 17,000 | Knox County Health, Educational and Housing Facility Board, Tennessee, Hospital Revenue | 1/27 at 100.00 | A | 19,947,630 |
| | Bonds, Covenant Health, Refunding Series 2016A, 5.000%, 1/01/47 | | | |
| | Metropolitan Government of Nashville-Davidson County Health and Educational Facilities | | | |
| | Board, Tennessee, Revenue Bonds, Belmont University Project, Series 2012: | | | |
| 535 | Metropolitan Government of Nashville-Davidson County Health and Educational Facilities | 7/26 at 100.00 | A3 | 624,714 |
| | Board, Tennessee, Revenue Bonds, Vanderbilt University Medical Center, Series 2016A, | | | |
| | 5.000%, 7/01/46 | | | |
| 6,000 | Metropolitan Nashville Airport Authority, Tennessee, Airport Revenue Bonds, Subordinate | 7/30 at 100.00 | A2 | 7,392,840 |
| | Series 2019B, 5.000%, 7/01/39 (AMT) | | | |
| 4,000 | The Tennessee Energy Acquisition Corporation, Gas Revenue Bonds, Series 2006A, | No Opt. Call | BBB+ | 4,728,200 |
| | 5.250%, 9/01/26 | | | |
| 45,995 | Total Tennessee | | | 53,604,712 |
| | Texas – 17.8% (11.5% of Total Investments) | | | |
| 1,975 | Allen Independent School District, Collin County, Texas, General Obligation Bonds, | 2/26 at 100.00 | AAA | 2,298,189 |
| | School Building Series 2016, 5.000%, 2/15/39 | | | |
| 8,835 | Arlington, Texas, Special Tax Revenue Bonds, Senior Lien Series 2018A, 5.000%, 2/15/43 ý | 2/28 at 100.00 | A1 | 10,570,017 |
| | AGM Insured | | | |
| 500 | Austin Community College District, Texas, General Obligation Bonds, Refunding Limited | No Opt. Call | AA+ | 541,320 |
| | Tax Series 2016, 5.000%, 8/01/23 | | | |
| | Austin, Texas, Airport System Revenue Bonds, Series 2015: | | | |
| 3,000 | 5.000%, 11/15/39 (AMT) | 11/24 at 100.00 | A | 3,367,800 |
| 3,040 | 5.000%, 11/15/44 (AMT) | 11/24 at 100.00 | A | 3,412,704 |
| 4,500 | Austin, Texas, Airport System Revenue Bonds, Series 2017B, 5.000%, 11/15/46 (AMT) | 11/26 at 100.00 | A | 5,303,340 |
| 2,000 | Austin, Texas, Electric Utility System Revenue Bonds, Refunding Series 2012A, 5.000%, 11/15/40 | 11/22 at 100.00 | Aa3 | 2,093,640 |
| | Austin, Texas, Electric Utility System Revenue Bonds, Refunding Series 2015A: | | | |
| 3,000 | 5.000%, 11/15/38 | 11/25 at 100.00 | Aa3 | 3,469,860 |
| 13,705 | 5.000%, 11/15/45 (UB) (5) | 11/25 at 100.00 | Aa3 | 15,693,595 |
| 5,000 | Austin, Texas, Water and Wastewater System Revenue Bonds, Refunding Series 2013A, | 5/23 at 100.00 | AA– | 5,335,800 |
| | 5.000%, 11/15/43 | | | |
| 1,450 | Austin, Texas, Water and Wastewater System Revenue Bonds, Refunding Series 2016, | 11/26 at 100.00 | AA– | 1,729,937 |
| | 5.000%, 11/15/41 | | | |
| | Bell County Water Control Improvement District 1, Texas, Water Revenue Bonds, Series 2014: | | | |
| 1,000 | 5.000%, 7/10/37 – BAM Insured | 7/23 at 100.00 | A1 | 1,072,190 |
| 1,575 | 5.000%, 7/10/38 – BAM Insured | 7/23 at 100.00 | A1 | 1,687,880 |
| | Bexar County, Texas, Venue Project Revenue Bonds, Refunding Combined Venue Tax Series 2015: | | | |
| 1,060 | 5.000%, 8/15/34 (Pre-refunded 8/15/24) – AGM Insured | 8/24 at 100.00 | A– (4) | 1,194,249 |
| 1,160 | 5.000%, 8/15/35 (Pre-refunded 8/15/24) – AGM Insured | 8/24 at 100.00 | A– (4) | 1,306,914 |
60
| Principal | | Optional Call | | |
| Amount (000) | Description (1) | Provisions (2) | Ratings (3) | Value |
| | Texas (continued) | | | |
| $ 1,500 | Board of Regents of the University of Texas, Permanent University Fund Bonds, Refunding | 7/24 at 100.00 | AAA | $ 1,678,875 |
| | Series 2015A, 5.000%, 7/01/28 | | | |
| 2,000 | Brownsville, Texas, Utility System Revenue Bonds, Refunding Series 2015, 5.000%, 9/01/31 | 9/25 at 100.00 | A– | 2,310,020 |
| | Bryan, Brazos County, Texas, Electric System Revenue Bonds, Refunding Series 2012: | | | |
| 1,000 | 5.000%, 7/01/28 | 7/22 at 100.00 | A+ | 1,030,540 |
| 1,000 | 5.000%, 7/01/29 | 7/22 at 100.00 | A+ | 1,030,540 |
| 1,620 | Cameron County, Texas, Revenue and Tax Bonds, State Highway 550 Project, Series 2012, | 2/22 at 100.00 | Aa3 (4) | 1,642,469 |
| | 5.000%, 2/15/32 (Pre-refunded 2/15/22) – AGM Insured | | | |
| | Central Texas Regional Mobility Authority, Revenue Bonds, Refunding Senior Lien Series 2013A: | | | |
| 765 | 5.000%, 1/01/43 (Pre-refunded 1/01/23) | 1/23 at 100.00 | A– (4) | 806,983 |
| 1,100 | 5.000%, 1/01/43 (Pre-refunded 1/01/23) – AGM Insured | 1/23 at 100.00 | A2 (4) | 1,160,368 |
| 665 | Central Texas Regional Mobility Authority, Revenue Bonds, Refunding Subordinate Lien | 1/23 at 100.00 | BBB+ (4) | 700,930 |
| | Series 2013, 5.000%, 1/01/42 (Pre-refunded 1/01/23) | | | |
| | Central Texas Regional Mobility Authority, Revenue Bonds, Senior Lien Series 2010: | | | |
| 2,945 | 0.000%, 1/01/36 | No Opt. Call | A– | 2,081,791 |
| 2,205 | 0.000%, 1/01/37 | No Opt. Call | A– | 1,508,308 |
| 2,160 | 0.000%, 1/01/38 | No Opt. Call | A– | 1,429,726 |
| 1,000 | 0.000%, 1/01/40 | No Opt. Call | A– | 620,270 |
| 2,000 | Central Texas Regional Mobility Authority, Revenue Bonds, Senior Lien Series 2021B, | 1/31 at 100.00 | A– | 2,476,660 |
| | 5.000%, 1/01/46 | | | |
| | Central Texas Regional Mobility Authority, Revenue Bonds, Senior Lien, Series 2015A: | | | |
| 2,600 | 5.000%, 1/01/35 (Pre-refunded 7/01/25) | 7/25 at 100.00 | A– (4) | 3,020,238 |
| 3,035 | 5.000%, 1/01/45 (Pre-refunded 7/01/25) | 7/25 at 100.00 | A– (4) | 3,525,547 |
| 3,000 | City of Austin TX Water & Wastewater System Revenue, 4.000%, 11/15/51 (WI/DD, | 11/31 at 100.00 | AA– | 3,528,510 |
| | Settling 11/18/21) | | | |
| 1,000 | Clifton Higher Education Finance Corporation, Texas, Education Revenue Bonds, Idea | 8/23 at 100.00 | A– | 1,078,930 |
| | Public Schools, Series 2013, 6.000%, 8/15/43 | | | |
| | Clifton Higher Education Finance Corporation, Texas, Education Revenue Bonds, Uplift | | | |
| | Education Charter School, Series 2013A: | | | |
| 1,000 | 4.350%, 12/01/42 | 12/22 at 100.00 | BBB– | 1,021,450 |
| 1,000 | 4.400%, 12/01/47 | 12/22 at 100.00 | BBB– | 1,020,670 |
| 2,000 | Corpus Christi, Texas, Utility System Revenue Bonds, Improvement Junior Lien Series | 7/23 at 100.00 | AA– (4) | 2,160,580 |
| | 2013, 5.000%, 7/15/43 (Pre-refunded 7/15/23) | | | |
| 1,175 | Dallas Area Rapid Transit, Texas, Sales Tax Revenue Bonds, Refunding Senior Lien Series | 12/24 at 100.00 | Aa2 (4) | 1,341,051 |
| | 2014A, 5.000%, 12/01/36 (Pre-refunded 12/01/24) | | | |
| 1,680 | Dallas Area Rapid Transit, Texas, Sales Tax Revenue Bonds, Refunding Series 2016A, | 12/25 at 100.00 | Aa2 | 1,943,357 |
| | 5.000%, 12/01/48 | | | |
| 8,100 | Dallas-Fort Worth International Airport, Texas, Joint Revenue Bonds, Improvement Series | 11/22 at 100.00 | A | 8,486,208 |
| | 2013C, 5.125%, 11/01/43 (AMT) | | | |
| 16,980 | Dallas-Fort Worth International Airport, Texas, Joint Revenue Bonds, Improvement Series | 11/22 at 100.00 | A | 17,683,991 |
| | 2014B, 4.500%, 11/01/45 (AMT) | | | |
| 1,230 | Danbury Higher Education Authority, Texas, Charter School Revenue Bonds, John H. Wood | 8/23 at 100.00 | N/R (4) | 1,350,073 |
| | Jr. Public Charter District, Inspire Academies, Series 2013A, 6.000%, 8/15/28 | | | |
| | (Pre-refunded 8/15/23) | | | |
| 200 | Decatur Hospital Authority, Texas, Revenue Bonds, Wise Regional Health System, Series | 9/24 at 100.00 | BBB– | 219,694 |
| | 2014A, 5.250%, 9/01/44 | | | |
| 1,000 | El Paso County Hospital District, Texas, General Obligation Bonds, Refunding Series 2013, | 8/23 at 100.00 | BBB+ | 1,071,400 |
| | 5.000%, 8/15/33 | | | |
| 7,760 | Grand Parkway Transportation Corporation, Texas, System Toll Revenue Bonds, Frst Tier | 10/23 at 100.00 | BBB | 8,347,820 |
| | Series 2013A, 5.125%, 10/01/43 | | | |
61
| NAD | Nuveen Quality Municipal Income Fund |
| | Portfolio of Investments (continued) |
| | October 31, 2021 |
| Principal | | Optional Call | | |
| Amount (000) | Description (1) | Provisions (2) | Ratings (3) | Value |
| | Texas (continued) | | | |
| | Grand Parkway Transportation Corporation, Texas, System Toll Revenue Bonds, Refunding | | | |
| | First Tier Series 2020C: | | | |
| $ 3,500 | 4.000%, 10/01/40 | 4/30 at 100.00 | A2 | $ 4,078,795 |
| 4,550 | 4.000%, 10/01/49 | 4/30 at 100.00 | A2 | 5,190,640 |
| | Grand Parkway Transportation Corporation, Texas, System Toll Revenue Bonds, Subordinate | | | |
| | Lien Series 2013B: | | | |
| 10,760 | 5.000%, 4/01/53 (Pre-refunded 10/01/23) | 10/23 at 100.00 | AA (4) | 11,724,634 |
| 5,295 | Grand Parkway Transportation Corporation, Texas, System Toll Revenue Bonds, Subordinate | 4/28 at 100.00 | AA | 6,450,369 |
| | Lien Series 2018A. Tela Supported, 5.000%, 10/01/48 | | | |
| 4,105 | Grand Parkway Transportation Corporation, Texas, System Toll Revenue Bonds, Tender | 10/23 at 100.00 | AA (4) | 5,577,546 |
| | Option Bond Trust 2015-XF0228, 18.108%, 11/01/44 (Pre-refunded 10/01/23), 144A (IF) | | | |
| 4,960 | Gulf Coast Industrial Development Authority, Texas, Solid Waste Disposal Revenue Bonds, | 10/22 at 100.00 | B3 | 5,037,227 |
| | Citgo Petroleum Corporation Project, Series 1995, 4.875%, 5/01/25 (AMT) | | | |
| 1,000 | Hale Center Education Facilities Corporation, Texas, Revenue Bonds, Wayland Baptist | 11/21 at 100.00 | BBB– | 1,009,840 |
| | University Project, Improvement and Refunding Series 2010, 5.000%, 3/01/35 | | | |
| 1,000 | Harris County Cultural Education Facilities Finance Corporation, Texas, Hospital Revenue | 12/22 at 100.00 | A+ (4) | 1,051,070 |
| | Bonds, Memorial Hermann Healthcare System, Refunding Series 2013A, 5.000%, 12/01/35 | | | |
| | (Pre-refunded 12/01/22) | | | |
| 1,000 | Harris County Cultural Education Facilities Finance Corporation, Texas, Medical | 11/22 at 100.00 | A (4) | 1,050,180 |
| | Facilities Revenue Bonds, Baylor College of Medicine, Refunding Series 2012A, 5.000%, | | | |
| | 11/15/26 (Pre-refunded 11/15/22) | | | |
| | Harris County Cultural Education Facilities Finance Corporation, Texas, Revenue Bonds, | | | |
| | Houston Methodist Hospital System, Series 2015: | | | |
| 1,895 | 4.000%, 12/01/45 | 6/25 at 100.00 | AA | 2,058,387 |
| 4,480 | 5.000%, 12/01/45 | 6/25 at 100.00 | AA | 5,055,456 |
| | Harris County Cultural Education Facilities Finance Corporation, Texas, Revenue | | | |
| | Refunding Bonds, Young Men’s Christian Association of the Greater Houston Area, Series 2013A: | | | |
| 1,615 | 5.000%, 6/01/28 | 6/23 at 100.00 | Baa2 | 1,670,023 |
| 3,000 | 5.000%, 6/01/38 | 6/23 at 100.00 | Baa2 | 3,068,970 |
| 10,725 | Harris County, Texas, Toll Road Revenue Bonds, Refunding First Lien Series 2021A, | 8/30 at 100.00 | Aa2 | 12,406,465 |
| | 4.000%, 8/15/50 | | | |
| 1,165 | Harris County, Texas, Toll Road Revenue Bonds, Refunding Senior Lien Series 2012C, | 8/22 at 100.00 | AA– | 1,208,198 |
| | 5.000%, 8/15/31 | | | |
| 5,150 | Harris County, Texas, Toll Road Revenue Bonds, Refunding Senior Lien Series 2016A, | 8/26 at 100.00 | AA | 6,076,279 |
| | 5.000%, 8/15/41 | | | |
| | Harris County-Houston Sports Authority, Texas, Revenue Bonds, Capital Appreciation | | | |
| | Refunding Senior Lien Series 2014A: | | | |
| 510 | 0.010%, 11/15/41 – AGM Insured | 11/31 at 62.66 | A2 | 236,288 |
| 1,020 | 0.010%, 11/15/42 – AGM Insured | 11/31 at 59.73 | A2 | 448,912 |
| 1,255 | 0.010%, 11/15/43 – AGM Insured | 11/31 at 56.93 | A2 | 525,054 |
| 3,305 | 0.010%, 11/15/44 – AGM Insured | 11/31 at 54.25 | A2 | 1,313,771 |
| 4,460 | 0.010%, 11/15/45 – AGM Insured | 11/31 at 51.48 | A2 | 1,676,559 |
| 6,500 | 0.000%, 11/15/47 – AGM Insured | 11/31 at 46.45 | A2 | 2,196,025 |
| | Harris County-Houston Sports Authority, Texas, Revenue Bonds, Junior Lien Series 2001H: | | | |
| 105 | 0.000%, 11/15/24 – NPFG Insured (ETM) | No Opt. Call | Baa2 (4) | 102,953 |
| 495 | 0.000%, 11/15/24 – NPFG Insured | No Opt. Call | BB+ | 466,295 |
| 50 | 0.000%, 11/15/29 – NPFG Insured (ETM) | No Opt. Call | Baa2 (4) | 44,501 |
| 4,390 | 0.000%, 11/15/29 – NPFG Insured | No Opt. Call | BB+ | 3,470,734 |
| 105 | 0.000%, 11/15/30 – NPFG Insured (ETM) | No Opt. Call | Baa2 (4) | 91,499 |
| 625 | 0.000%, 11/15/30 – NPFG Insured | No Opt. Call | BB+ | 473,744 |
| 7,570 | 0.010%, 11/15/31 – NPFG Insured | No Opt. Call | BB+ | 5,508,613 |
| 210 | 0.000%, 11/15/32 – NPFG Insured | 11/31 at 94.05 | BB+ | 143,218 |
| 260 | 0.000%, 11/15/33 | 11/31 at 88.44 | BB+ | 166,621 |
| 2,045 | 0.010%, 11/15/34 – NPFG Insured | 11/31 at 83.17 | BB+ | 1,228,963 |
| 1,130 | 0.010%, 11/15/36 – NPFG Insured | 11/31 at 73.51 | BB+ | 599,047 |
| 4,370 | 0.010%, 11/15/38 – NPFG Insured | 11/31 at 64.91 | BB+ | 2,034,497 |
| 2,260 | 0.010%, 11/15/39 – NPFG Insured | 11/31 at 60.98 | BB+ | 985,360 |
62
| Principal | | Optional Call | | |
| Amount (000) | Description (1) | Provisions (2) | Ratings (3) | Value |
| | Texas (continued) | | | |
| | Harris County-Houston Sports Authority, Texas, Revenue Bonds, Refunding Second Lien | | | |
| | Series 2014C: | | | |
| $ 600 | 5.000%, 11/15/33 | 11/24 at 100.00 | BBB– | $ 662,754 |
| 400 | 5.000%, 11/15/34 | 11/24 at 100.00 | BBB– | 441,728 |
| | Harris County-Houston Sports Authority, Texas, Revenue Bonds, Refunding Senior Lien | | | |
| | Series 2014A: | | | |
| 1,000 | 5.000%, 11/15/28 | 11/24 at 100.00 | BBB | 1,104,890 |
| 1,000 | 5.000%, 11/15/30 | 11/24 at 100.00 | BBB | 1,104,120 |
| 3,440 | Harris County-Houston Sports Authority, Texas, Revenue Bonds, Senior Lien Series 2001G, | 11/31 at 53.78 | BBB | 1,330,626 |
| | 0.000%, 11/15/41 – NPFG Insured | | | |
| 1,000 | Harris County-Houston Sports Authority, Texas, Revenue Bonds, Third Lien Series 2004A-3, | 11/24 at 59.10 | BB | 544,010 |
| | 0.000%, 11/15/33 – NPFG Insured | | | |
| 7,570 | Houston, Texas, Airport System Revenue Bonds, Refunding & Subordinate Lien Series 2018A, | 7/28 at 100.00 | A | 9,142,440 |
| | 5.000%, 7/01/41 (AMT) | | | |
| 2,000 | Houston, Texas, Airport System Revenue Bonds, Refunding Subordinate Lien Series Series | 7/22 at 100.00 | A (4) | 2,062,720 |
| | 2012A, 5.000%, 7/01/31 (Pre-refunded 7/01/22) (AMT) | | | |
| 5,000 | Houston, Texas, Airport System Special Facilities Revenue Bonds, United Airlines, Inc. | No Opt. Call | B | 5,900,450 |
| | Technical Operations Center Project, Series 2018, 5.000%, 7/15/28 (AMT) | | | |
| 380 | Houston, Texas, Airport System Special Facilities Revenue Bonds, United Airlines, Inc. | 7/24 at 100.00 | B | 411,969 |
| | Terminal E Project, Refunding Series 2014, 5.000%, 7/01/29 (AMT) | | | |
| 1,885 | Houston, Texas, Airport System Special Facilities Revenue Bonds, United Airlines, Inc. | No Opt. Call | B– | 2,190,747 |
| | Terminal E Project, Refunding Series 2020A, 5.000%, 7/01/27 (AMT) | | | |
| 1,000 | Houston, Texas, Airport System Special Facilities Revenue Bonds, United Airlines, Inc. | No Opt. Call | B– | 1,162,870 |
| | Terminal Improvements Project, Refunding Series 2020B-2, 5.000%, 7/15/27 (AMT) | | | |
| 2,000 | Houston, Texas, Combined Utility System Revenue Bonds, Refunding First Lien Series | 11/22 at 100.00 | AA (4) | 2,099,700 |
| | 2012D, 5.000%, 11/15/42 (Pre-refunded 11/15/22) | | | |
| 3,000 | Houston, Texas, Combined Utility System Revenue Bonds, Refunding First Lien Series | 11/28 at 100.00 | Aa2 | 3,754,530 |
| | 2018D, 5.000%, 11/15/36 | | | |
| 2,000 | Houston, Texas, General Obligation Bonds, Refunding Public Improvement Series 2017A, | 3/27 at 100.00 | Aa3 | 2,399,780 |
| | 5.000%, 3/01/31 | | | |
| 1,015 | Houston, Texas, Hotel Occupancy Tax and Special Revenue Bonds, Convention and | 9/24 at 100.00 | A | 1,121,819 |
| | Entertainment Facilities Department, Refunding Series 2014, 5.000%, 9/01/34 | | | |
| | Houston, Texas, Hotel Occupancy Tax and Special Revenue Bonds, Convention and | | | |
| | Entertainment Project, Series 2001B: | | | |
| 3,250 | 0.000%, 9/01/25 – AMBAC Insured | No Opt. Call | A2 | 3,104,920 |
| 4,130 | 0.000%, 9/01/26 – AMBAC Insured | No Opt. Call | A2 | 3,863,698 |
| 3,130 | 0.000%, 9/01/30 – AMBAC Insured | No Opt. Call | A | 2,593,174 |
| 12,030 | 0.000%, 9/01/31 – AMBAC Insured | No Opt. Call | A | 9,671,398 |
| 1,470 | 0.000%, 9/01/32 – AMBAC Insured | No Opt. Call | A | 1,147,364 |
| | Houston, Texas, Water and Sewerage System Revenue Bonds, Refunding Junior Lien | | | |
| | Series 1998A: | | | |
| 4,680 | 0.000%, 12/01/22 – AGM Insured | No Opt. Call | AA+ | 4,667,504 |
| 12,030 | 0.000%, 12/01/22 – AGM Insured (ETM) | No Opt. Call | AA+ (4) | 11,998,361 |
| 1,360 | Jacksonville Independent School District, Cherokee County, Texas, General Obligation | 2/24 at 100.00 | Aaa | 1,487,405 |
| | Bonds, School Building Series 2014, 5.000%, 2/15/39 | | | |
| 2,675 | Laredo Community College District, Webb County, Texas, General Obligation Bonds, Series | 8/24 at 100.00 | AA– (4) | 3,016,624 |
| | 2014, 5.000%, 8/01/34 (Pre-refunded 8/01/24) | | | |
| | Leander Independent School District, Williamson and Travis Counties, Texas, General | | | |
| | Obligation Bonds, Refunding Series 2015A: | | | |
| 8,000 | 4.000%, 8/15/37 | 8/25 at 100.00 | AAA | 8,855,120 |
| 2,275 | 5.000%, 8/15/40 | 8/25 at 100.00 | AAA | 2,611,427 |
| 1,750 | Love Field Airport Modernization Corporation, Texas, General Airport Revenue Bonds | 11/25 at 100.00 | A– | 2,018,205 |
| | Series 2015, 5.000%, 11/01/35 (AMT) | | | |
63
| NAD | Nuveen Quality Municipal Income Fund |
| | Portfolio of Investments (continued) |
| | October 31, 2021 |
| Principal | | Optional Call | | |
| Amount (000) | Description (1) | Provisions (2) | Ratings (3) | Value |
| | Texas (continued) | | | |
| $ 1,150 | Lower Colorado River Authority, Texas, Revenue Bonds, Refunding Series 2012A, | 5/22 at 100.00 | A | $ 1,179,176 |
| | 5.000%, 5/15/36 | | | |
| | Lower Colorado River Authority, Texas, Revenue Bonds, Refunding Series 2012B: | | | |
| 25 | 5.000%, 5/15/29 (Pre-refunded 5/15/22) | 5/22 at 100.00 | N/R (4) | 25,628 |
| 1,975 | 5.000%, 5/15/29 | 5/22 at 100.00 | A | 2,025,106 |
| 6,500 | Lower Colorado River Authority, Texas, Transmission Contract Revenue Bonds, LCRA | 5/26 at 100.00 | A | 7,520,240 |
| | Transmission Services Corporation Project, Refunding Series 2016, 5.000%, 5/15/46 | | | |
| 1,350 | Lubbock Independent School District, Lubbock County, Texas, General Obligation Bonds, | 2/23 at 100.00 | AAA | 1,433,187 |
| | School Building Series 2013A, 5.000%, 2/15/43 (Pre-refunded 2/15/23) | | | |
| 9,180 | Matagorda County Navigation District 1, Texas, Collateralized Revenue Refunding Bonds, | No Opt. Call | A | 11,354,926 |
| | Houston Light and Power Company, Series 1997, 5.125%, 11/01/28 – AMBAC Insured (AMT) | | | |
| | McCamey County Hospital District, Texas, General Obligation Bonds, Series 2013: | | | |
| 1,000 | 5.750%, 12/01/33 | 12/25 at 100.00 | B1 | 1,081,410 |
| 3,000 | 6.125%, 12/01/38 | 12/25 at 100.00 | B1 | 3,257,790 |
| 2,835 | Mission Economic Development Corporation, Texas, Revenue Bonds, Natgasoline Project, | 11/21 at 105.00 | BB– | 2,981,371 |
| | Senior Lien Series 2018, 4.625%, 10/01/31 (AMT), 144A | | | |
| 4,735 | New Hope Cultural Education Facilities Finance Corporation, Texas, Student Housing | 4/24 at 100.00 | A2 | 5,164,891 |
| | Revenue Bonds, CHF-Collegiate Housing Foundation – College Station I LLC – Texas A&M | | | |
| | University Project, Series 2014A, 5.000%, 4/01/46 – AGM Insured | | | |
| 565 | North Central Texas Health Facilities Development Corporation, Hospital Revenue Bonds, | 7/21 at 100.00 | N/R (4) | 640,993 |
| | Presbyterian Healthcare System, Series 1996A, 5.750%, 6/01/26 – NPFG Insured (ETM) | | | |
| 885 | North Central Texas Health Facilities Development Corporation, Texas, Revenue Bonds, | 8/22 at 100.00 | Aa3 (4) | 918,409 |
| | Children’s Medical Center Dallas Project, Series 2012, 5.000%, 8/15/32 (Pre-refunded 8/15/22) | | | |
| 710 | North Fort Bend Water Authority, Texas, Water System Revenue Bonds, Series 2011, 5.000%, | 12/21 at 100.00 | A2 (4) | 714,068 |
| | 12/15/36 (Pre-refunded 12/15/21) – AGM Insured | | | |
| 3,860 | North Harris County Regional Water Authority, Texas, Water Revenue Bonds, Refunding | 12/22 at 100.00 | A1 | 4,056,744 |
| | Senior Lien Series 2013, 5.000%, 12/15/33 | | | |
| | North Texas Tollway Authority, Special Projects System Revenue Bonds, Convertible | | | |
| | Capital Appreciation Series 2011C: | | | |
| 4,030 | 0.000%, 9/01/43 (Pre-refunded 9/01/31) (8) | 9/31 at 100.00 | N/R (4) | 5,591,464 |
| 8,470 | 6.750%, 9/01/45 (Pre-refunded 9/01/31) | 9/31 at 100.00 | N/R (4) | 12,714,571 |
| 7,000 | North Texas Tollway Authority, System Revenue Bonds, Refunding First Tier Capital | 1/25 at 100.00 | A+ (4) | 8,321,110 |
| | Appreciation Series 2008I, 6.500%, 1/01/43 (Pre-refunded 1/01/25) | | | |
| 2,500 | North Texas Tollway Authority, System Revenue Bonds, Refunding First Tier, Series 2008D, | No Opt. Call | A1 | 1,830,175 |
| | 0.000%, 1/01/36 – AGC Insured | | | |
| 10,260 | North Texas Tollway Authority, System Revenue Bonds, Refunding First Tier, Series 2015B, | 1/23 at 100.00 | A+ | 10,802,036 |
| | 5.000%, 1/01/40 | | | |
| 4,555 | North Texas Tollway Authority, System Revenue Bonds, Refunding First Tier, Series 2019A, | 1/29 at 100.00 | A+ | 5,224,722 |
| | 4.000%, 1/01/44 | | | |
| | North Texas Tollway Authority, System Revenue Bonds, Refunding Second Tier, Series 2015A: | | | |
| 13,355 | 5.000%, 1/01/33 | 1/25 at 100.00 | A | 15,131,749 |
| 1,000 | 5.000%, 1/01/34 | 1/25 at 100.00 | A | 1,132,370 |
| 1,000 | Nueces River Authority, Texas, Water Supply Revenue Bonds, Corpus Christi Lake Texana | 7/25 at 100.00 | AA– | 1,162,260 |
| | Project, Refunding Series 2015, 5.000%, 7/15/26 | | | |
| 1,425 | Port of Houston Authority, Harris County, Texas, General Obligation Bonds, Series 2010E, | No Opt. Call | AA | 1,093,916 |
| | 0.000%, 10/01/35 | | | |
| 4,000 | Prosper Independent School District, Collin County, Texas, General Obligation Bonds, | 2/25 at 100.00 | AAA | 4,507,800 |
| | Refunding Series 2015, 5.000%, 2/15/40 | | | |
| 205 | Reagan Hospital District of Reagan County, Texas, Limited Tax Revenue Bonds, Series | 2/24 at 100.00 | Ba1 | 217,929 |
| | 2014A, 5.125%, 2/01/39 | | | |
| 4,060 | San Antonio Convention Center Hotel Finance Corporation, Texas, Contract Revenue | 11/21 at 100.00 | BBB+ | 4,068,120 |
| | Empowerment Zone Bonds, Series 2005A, 5.000%, 7/15/39 – AMBAC Insured (AMT) | | | |
64
| Principal | | Optional Call | | |
| Amount (000) | Description (1) | Provisions (2) | Ratings (3) | Value |
| | Texas (continued) | | | |
| $ 2,500 | San Antonio, Texas, Airport System Revenue Bonds, Refunding Series 2012, 5.000%, | 7/22 at 100.00 | A | $ 2,576,850 |
| | 7/01/27 (AMT) | | | |
| 2,640 | San Antonio, Texas, Water System Revenue Bonds, Refunding Junior Lien Series 2015B, | 5/25 at 100.00 | AA | 3,032,964 |
| | 5.000%, 5/15/34 | | | |
| 1,000 | San Antonio, Texas, Water System Revenue Bonds, Refunding Junior Lien Series 2018A, | 5/28 at 100.00 | AA | 1,202,800 |
| | 5.000%, 5/15/48 | | | |
| 1,925 | Stephen F. Austin State University, Texas, Revenue Bonds, Refunding & Improvement Series | 10/28 at 100.00 | A1 | 2,341,820 |
| | 2016, 5.000%, 10/15/42 | | | |
| 515 | Tarrant County Cultural Education Facilities Finance Corporation, Texas, Hospital | 9/23 at 100.00 | A3 (4) | 560,083 |
| | Revenue Bonds, Hendrick Medical Center, Refunding Series 2013, 5.125%, 9/01/33 | | | |
| | (Pre-refunded 9/01/23) | | | |
| 1,250 | Tarrant County Cultural Education Facilities Finance Corporation, Texas, Hospital | 5/26 at 100.00 | AA– | 1,478,812 |
| | Revenue Bonds, Scott & White Healthcare Project, Series 2016A, 5.000%, 11/15/32 | | | |
| 2,000 | Tarrant County Cultural Education Facilities Finance Corporation, Texas, Revenue Bonds, | 8/26 at 100.00 | AA | 2,356,640 |
| | Texas Health Resources System, Series 2016A, 5.000%, 2/15/41 | | | |
| 2,775 | Texas Municipal Gas Acquisition and Supply Corporation I, Gas Supply Revenue Bonds, | No Opt. Call | A– | 3,210,231 |
| | Senior Lien Series 2008D, 6.250%, 12/15/26 | | | |
| 530 | Texas Private Activity Bond Surface Transportation Corporation, Revenue Bonds, NTE | 12/29 at 100.00 | Baa2 | 605,165 |
| | Mobility Partners LLC North Tarrant Express Managed Lanes Project, Refunding Senior Lien | | | |
| | Series 2019A, 4.000%, 12/31/39 | | | |
| 19,735 | Texas Private Activity Bond Surface Transportation Corporation, Senior Lien Revenue | 12/25 at 100.00 | Baa3 | 21,870,130 |
| | Bonds, Blueridge Transportation Group, LLC SH 288 Toll Lanes Project, Series 2016, 5.000%, | | | |
| | 12/31/55 (AMT) | | | |
| | Texas Private Activity Bond Surface Transportation Corporation, Senior Lien Revenue | | | |
| | Bonds, NTE Mobility Partners Segments 3 LLC Segments 3A & 3B Facility, Series 2013: | | | |
| 1,335 | 7.000%, 12/31/38 (AMT) | 9/23 at 100.00 | Baa3 | 1,487,684 |
| 4,040 | 6.750%, 6/30/43 (AMT) | 9/23 at 100.00 | Baa3 | 4,481,370 |
| 25,000 | Texas Private Activity Bond Surface Transportation Corporation, Senior Lien Revenue | 6/29 at 100.00 | Baa3 | 29,754,250 |
| | Bonds, NTE Mobility Partners Segments 3 LLC Segments 3C Project, Series 2019, 5.000%, | | | |
| | 6/30/58 (AMT) | | | |
| | Texas State, General Obligation Bonds, Texas Transportation Commission, Highway | | | |
| | Improvement Series 2014: | | | |
| 800 | 5.000%, 4/01/44 (Pre-refunded 4/01/24) | 4/24 at 100.00 | N/R (4) | 888,424 |
| 1,200 | 5.000%, 4/01/44 (Pre-refunded 4/01/24) | 4/24 at 100.00 | AAA | 1,334,172 |
| 2,000 | Texas State, General Obligation Bonds, Transportation Commission Highway Improvement | 4/22 at 100.00 | AAA | 2,040,060 |
| | Series 2012A, 5.000%, 4/01/42 (Pre-refunded 4/01/22) | | | |
| 2,000 | Texas State, General Obligation Bonds, Transportation Commission Mobility Fund, | 4/24 at 100.00 | AAA | 2,223,620 |
| | Refunding Series 2014, 5.000%, 10/01/34 (Pre-refunded 4/01/24) | | | |
| 9,430 | Texas Transportation Commission, Central Texas Turnpike System Revenue Bonds, Refunding | 8/22 at 100.00 | A3 (4) | 9,789,754 |
| | First Tier Series 2012A, 5.000%, 8/15/41 (Pre-refunded 8/15/22) | | | |
| | Texas Transportation Commission, Central Texas Turnpike System Revenue Bonds, Refunding | | | |
| | First Tier Series 2015B: | | | |
| 8,335 | 0.000%, 8/15/36 | 8/24 at 59.60 | A3 | 4,796,459 |
| 10,960 | 5.000%, 8/15/37 | 8/24 at 100.00 | A3 | 12,183,794 |
| | Texas Transportation Commission, Central Texas Turnpike System Revenue Bonds, Refunding | | | |
| | Second Tier Series 2015C: | | | |
| 2,100 | 5.000%, 8/15/33 | 8/24 at 100.00 | Baa1 | 2,348,829 |
| 15,750 | 5.000%, 8/15/42 | 8/24 at 100.00 | Baa1 | 17,579,835 |
| 10,000 | Texas Transportation Commission, Highway Fund Revenue Bonds, First Tier Series 2016A, | 10/26 at 100.00 | AAA | 12,016,700 |
| | 5.000%, 10/01/30 (UB) (5) | | | |
| 1,875 | Texas Transportation Commission, State Highway 249 System Revenue Bonds, First Tier Toll | 2/29 at 100.00 | Baa3 | 2,159,475 |
| | Series 2019A, 5.000%, 8/01/57 | | | |
65
| NAD | Nuveen Quality Municipal Income Fund |
| | Portfolio of Investments (continued) |
| | October 31, 2021 |
| Principal | | Optional Call | | |
| Amount (000) | Description (1) | Provisions (2) | Ratings (3) | Value |
| | Texas (continued) | | | |
| | Texas Turnpike Authority, Central Texas Turnpike System Revenue Bonds, First Tier Series 2002A: | | | |
| $ 2,020 | 0.000%, 8/15/23 – AMBAC Insured (ETM) | No Opt. Call | A3 (4) | $ 2,008,042 |
| 9,980 | 0.000%, 8/15/23 – AMBAC Insured | No Opt. Call | A3 | 9,893,274 |
| 3,830 | 0.000%, 8/15/24 – AMBAC Insured (ETM) | No Opt. Call | A3 (4) | 3,782,699 |
| 21,170 | 0.000%, 8/15/24 – AMBAC Insured | No Opt. Call | A3 | 20,784,706 |
| | Texas Water Development Board, State Water Implementation Revenue Fund Bonds, Master | | | |
| | Trust Series 2017A: | | | |
| 10,000 | 4.000%, 10/15/42 (UB) (5) | 10/27 at 100.00 | AAA | 11,506,900 |
| 5,000 | 5.000%, 10/15/42 | 10/27 at 100.00 | AAA | 6,118,550 |
| 16,600 | 5.000%, 10/15/42 (UB) (5) | 10/27 at 100.00 | AAA | 20,313,586 |
| 5,000 | Texas Water Development Board, State Water Implementation Revenue Fund Bonds, Master | 10/28 at 100.00 | AAA | 6,169,650 |
| | Trust Series 2018B, 5.000%, 4/15/49 | | | |
| 2,490 | Uptown Development Authority, Houston, Texas, Tax Increment Contract Revenue Bonds, | 9/25 at 100.00 | Baa2 | 2,756,604 |
| | Infrastructure Improvement Facilities, Series 2018, 5.000%, 9/01/40 | | | |
| 1,735 | Via Metropolitan Transit Advanced Transportation District, Texas, Sales Tax Revenue | 8/24 at 100.00 | AA+ (4) | 1,956,577 |
| | Bonds, Refunding & Improvement Series 2014, 5.000%, 8/01/38 (Pre-refunded 8/01/24) | | | |
| 1,150 | Waco Education Finance Corporation, Texas, Revenue Bonds, Baylor University, Series | 3/31 at 100.00 | A+ | 1,349,479 |
| | 2021, 4.000%, 3/01/40 | | | |
| 220 | Winter Garden Housing Finance Corporation, Texas, GNMA/FNMA Mortgage-Backed Securities | 11/21 at 100.00 | CC | 220,849 |
| | Program Single Family Mortgage Revenue Bonds, Series 1994, 6.950%, 10/01/27 (AMT) | | | |
| | Wylie Independent School District, Collin County, Texas, General Obligation Bonds, | | | |
| | Capital Appreciation Series 2015: | | | |
| 780 | 0.000%, 8/15/50 (Pre-refunded 8/15/25) | 8/25 at 35.55 | Aaa | 271,190 |
| 6,220 | 0.000%, 8/15/50 | 8/25 at 35.55 | Aaa | 2,082,580 |
| | Wylie Independent School District, Collin County, Texas, General Obligation Bonds, | | | |
| | School Building Series 2015B: | | | |
| 1,000 | 0.000%, 8/15/45 (Pre-refunded 8/15/25) | 8/25 at 44.15 | Aaa | 431,780 |
| 8,000 | 0.000%, 8/15/45 | 8/25 at 44.15 | Aaa | 3,345,360 |
| 642,975 | Total Texas | | | 667,715,428 |
| | Utah – 1.3% (0.8% of Total Investments) | | | |
| 27,055 | Salt Lake City, Utah, Airport Revenue Bonds, International Airport Series 2017A, 5.000%, | 7/27 at 100.00 | A | 32,068,292 |
| | 7/01/47 (AMT) | | | |
| 4,500 | Salt Lake City, Utah, Airport Revenue Bonds, International Airport Series 2018A, 5.000%, | 7/28 at 100.00 | A | 5,357,520 |
| | 7/01/48 (AMT) | | | |
| 5,795 | Utah Charter School Finance Authority, Charter School Revenue Bonds, Hawthorn Academy | 4/26 at 100.00 | AA | 6,528,357 |
| | Project, Series 2016, 5.000%, 10/15/46 | | | |
| | Utah Transit Authority, Sales Tax Revenue Bonds, Refunding Series 2012: | | | |
| 1,665 | 5.000%, 6/15/42 (Pre-refunded 6/15/22) | 6/22 at 100.00 | N/R (4) | 1,715,050 |
| 2,445 | 5.000%, 6/15/42 (Pre-refunded 6/15/22) | 6/22 at 100.00 | AA– (4) | 2,518,154 |
| 41,460 | Total Utah | | | 48,187,373 |
| | Virgin Islands – 0.3% (0.2% of Total Investments) | | | |
| 235 | Tobacco Settlement Financing Corporation, Virgin Islands, Tobacco Settlement | 11/21 at 100.00 | A1 | 235,583 |
| | Asset-Backed Bonds, Series 2001, 5.000%, 5/15/31 | | | |
| 1,800 | Virgin Islands Public Finance Authority, Federal Highway Grant Anticipation Loan Note | 9/25 at 100.00 | A | 2,027,268 |
| | Revenue Bonds, Series 2015, 5.000%, 9/01/33, 144A | | | |
| 2,000 | Virgin Islands Public Finance Authority, Gross Receipts Taxes Loan Note, Refunding | 11/21 at 100.00 | Baa2 | 2,031,160 |
| | Series 2006, 5.000%, 10/01/27 – FGIC Insured | | | |
| 2,240 | Virgin Islands Public Finance Authority, Gross Receipts Taxes Loan Note, Working Capital | 10/24 at 100.00 | A2 | 2,435,910 |
| | Series 2014A, 5.000%, 10/01/34 – AGM Insured, 144A | | | |
| 1,035 | Virgin Islands Public Finance Authority, Matching Fund Loan Notes Revenue Bonds, Senior | 11/21 at 100.00 | A2 | 1,071,753 |
| | Lien Series 2009A-1, 5.000%, 10/01/29 – AGM Insured | | | |
66
| Principal | | Optional Call | | |
| Amount (000) | Description (1) | Provisions (2) | Ratings (3) | Value |
| | Virgin Islands (continued) | | | |
| $ 1,110 | Virgin Islands Public Finance Authority, Matching Fund Loan Notes Revenue Bonds, Senior | No Opt. Call | A2 | $ 1,167,775 |
| | Lien, Refunding Series 2013B, 5.000%, 10/01/24 – AGM Insured | | | |
| 730 | Virgin Islands Water and Power Authority, Electric System Revenue Bonds, Refunding | 11/21 at 100.00 | Caa3 | 726,533 |
| | Series 2007A, 5.000%, 7/01/24 | | | |
| 9,150 | Total Virgin Islands | | | 9,695,982 |
| | Virginia – 2.1% (1.3% of Total Investments) | | | |
| 670 | Amherst Industrial Development Authority, Virginia, Revenue Bonds, Sweet Briar College, | 11/21 at 100.00 | BB | 665,136 |
| | Series 2006, 5.000%, 9/01/26 | | | |
| 560 | Arlington County Industrial Development Authority, Virginia, Hospital Facility Revenue | 7/30 at 100.00 | A+ | 645,473 |
| | Bonds, Virginia Hospital Center, Series 2020, 4.000%, 7/01/45 | | | |
| 515 | Chesapeake, Virginia, Transportation System Senior Toll Road Revenue Bonds, Capital | 7/28 at 100.00 | BBB+ | 561,556 |
| | Appreciation Series 2012B, 0.000%, 7/15/40 (8) | | | |
| 1,000 | Fairfax County Industrial Development Authority, Virginia, Healthcare Revenue Bonds, | 5/28 at 100.00 | Aa2 | 1,128,010 |
| | Inova Health System, Series 2018A, 4.000%, 5/15/48 (UB) (5) | | | |
| 1,000 | Fairfax County Redevelopment and Housing Authority, Virginia, Multifamily Housing | 11/21 at 100.00 | AA+ | 1,004,690 |
| | Revenue Bonds, FHA-Insured Mortgage – Cedar Ridge Project, Series 2007, 4.850%, 10/01/48 (AMT) | | | |
| 12,000 | Hampton Roads Transportation Accountability Commission, Virginia, Hampton Roads | 1/28 at 100.00 | AA | 14,259,960 |
| | Transportation Fund Revenue Bonds, Senior Lien Series 2018A, 5.000%, 7/01/52 | | | |
| 2,400 | Henrico County Economic Development Authority, Virginia, Revenue Bonds, Bon Secours | 11/22 at 100.00 | N/R (4) | 2,514,696 |
| | Health System Obligated Group, Series 2013, 5.000%, 11/01/30 (Pre-refunded 11/01/22) | | | |
| | Prince William County Industrial Development Authority, Virginia, Health Care Facilities | | | |
| | Revenue Bonds, Novant Health Obligated Group-Prince William Hospital, Refunding Series 2013B: | | | |
| 2,000 | 4.000%, 11/01/33 (Pre-refunded 11/01/22) | 11/22 at 100.00 | AA– (4) | 2,075,020 |
| 3,000 | 5.000%, 11/01/46 (Pre-refunded 11/01/22) | 11/22 at 100.00 | AA– (4) | 3,142,410 |
| 6,115 | Tobacco Settlement Financing Corporation of Virginia, Tobacco Settlement Asset Backed | 11/21 at 100.00 | B– | 6,148,999 |
| | Bonds, Series 2007B1, 5.000%, 6/01/47 | | | |
| 15,605 | Virginia Small Business Financing Authority, Private Activity Revenue Bonds, Transform | 6/27 at 100.00 | Baa3 | 18,370,362 |
| | 66 P3 Project, Senior Lien Series 2017, 5.000%, 12/31/56 (AMT) | | | |
| 8,135 | Virginia Small Business Financing Authority, Senior Lien Revenue Bonds, 95 Express Lanes | 1/22 at 100.00 | BBB– | 8,190,969 |
| | LLC Project, Series 2019, 5.000%, 7/01/49 (AMT) | | | |
| | Virginia Small Business Financing Authority, Senior Lien Revenue Bonds, Elizabeth River | | | |
| | Crossing, Opco LLC Project, Series 2012: | | | |
| 4,225 | 6.000%, 1/01/37 (AMT) | 7/22 at 100.00 | BBB– | 4,374,438 |
| 14,375 | 5.500%, 1/01/42 (AMT) | 7/22 at 100.00 | BBB– | 14,821,200 |
| 71,600 | Total Virginia | | | 77,902,919 |
| | Washington – 3.2% (2.1% of Total Investments) | | | |
| 2,000 | Energy Northwest, Washington, Electric Revenue Bonds, Columbia Generating Station, | 7/24 at 100.00 | AA– | 2,219,340 |
| | Refunding Series 2014A, 5.000%, 7/01/40 | | | |
| 2,375 | Grant County Public Utility District 2, Washington, Revenue Bonds, Priest Rapids | 1/26 at 100.00 | Aa3 (4) | 2,811,074 |
| | Hydroelectric Project, Refunding Series 2015A, 5.000%, 1/01/41 (Pre-refunded 1/01/26) | | | |
| 14,380 | King County Public Hospital District 2, Washington, General Obligation Bonds, | 12/29 at 100.00 | Aa3 | 16,381,696 |
| | EvergreenHealth, Limited Tax 2020A, 4.000%, 12/01/45 | | | |
| 2,270 | Port Everett, Washington, Revenue Bonds, Refunding Series 2016, 5.000%, 12/01/46 | 6/26 at 100.00 | A2 | 2,577,176 |
| 14,955 | Port of Seattle, Washington, Revenue Bonds, Intermediate Lien Series 2017C, 5.000%, | 5/27 at 100.00 | A+ | 17,512,006 |
| | 5/01/42 (AMT) | | | |
| | Port of Seattle, Washington, Revenue Bonds, Intermediate Lien Series 2018A: | | | |
| 6,000 | 5.000%, 5/01/36 (AMT) | 5/27 at 100.00 | A+ | 7,057,620 |
| 4,515 | 5.000%, 5/01/43 (AMT) | 5/27 at 100.00 | A+ | 5,254,331 |
| 1,145 | Port of Seattle, Washington, Revenue Bonds, Intermediate Lien Series 2019, 5.000%, | 4/29 at 100.00 | A+ | 1,373,347 |
| | 4/01/44 (AMT) | | | |
| 15,000 | Seattle, Washington, Municipal Light and Power Revenue Bonds, Refunding & Improvement | 7/31 at 100.00 | AA | 17,563,800 |
| | Series 2021A, 4.000%, 7/01/51 | | | |
67
| NAD | Nuveen Quality Municipal Income Fund |
| | Portfolio of Investments (continued) |
| | October 31, 2021 |
| Principal | | Optional Call | | |
| Amount (000) | Description (1) | Provisions (2) | Ratings (3) | Value |
| | Washington (continued) | | | |
| $ 10,000 | Spokane Public Facilities District, Washington, Hotel, Motel, and Sales Use Tax Revenue | 6/23 at 100.00 | BBB+ (4) | $ 10,753,000 |
| | Bonds, Series 2013A, 5.000%, 5/01/43 (Pre-refunded 6/01/23) | | | |
| 1,590 | Washington Health Care Facilities Authority, Revenue Bonds, Kadlec Regional Medical | 12/21 at 100.00 | N/R (4) | 1,596,153 |
| | Center, Series 2012, 5.000%, 12/01/42 (Pre-refunded 12/01/21) | | | |
| 4,000 | Washington Health Care Facilities Authority, Revenue Bonds, Providence Health & | 10/22 at 100.00 | AA– | 4,171,920 |
| | Services, Refunding Series 2012A, 5.000%, 10/01/32 | | | |
| 1,000 | Washington Health Care Facilities Authority, Revenue Bonds, Seattle Children’s Hospital, | 10/22 at 100.00 | Aa2 (4) | 1,043,540 |
| | Series 2012A, 5.000%, 10/01/42 (Pre-refunded 10/01/22) | | | |
| 11,500 | Washington Health Care Facilities Authority, Revenue Bonds, Seattle Children’s Hospital, | 4/25 at 100.00 | Aa2 | 12,970,390 |
| | Series 2015A, 5.000%, 10/01/45 (UB) | | | |
| 6,200 | Washington State Convention Center Public Facilities District, Lodging Tax Revenue | 7/31 at 100.00 | BBB– | 6,340,182 |
| | Bonds, Refunding Series 2021B. Exchange Purchase, 3.000%, 7/01/58 | | | |
| 2,525 | Washington State Higher Education Facilities Authority, Revenue Bonds, Seattle | 5/30 at 100.00 | A | 2,859,487 |
| | University, Series 2020, 4.000%, 5/01/45 | | | |
| 320 | Washington State Housing Finance Commission, Revenue Bonds, Riverview Retirement | 1/23 at 100.00 | BBB– | 328,477 |
| | Community, Refunding Series 2012, 5.000%, 1/01/48 | | | |
| 6,480 | Washington State, Motor Vehicle Fuel Tax General Obligation Bonds, Series 2002-03C, | No Opt. Call | AA+ | 6,392,002 |
| | 0.000%, 6/01/24 – NPFG Insured | | | |
| 106,255 | Total Washington | | | 119,205,541 |
| | West Virginia – 1.0% (0.6% of Total Investments) | | | |
| 7,000 | West Virginia Hospital Finance Authority, Hospital Revenue Bonds, West Virginia United | 6/23 at 100.00 | A (4) | 7,576,520 |
| | Health System Obligated Group, Refunding & Improvement Series 2013A, 5.500%, 6/01/44 | | | |
| | (Pre-refunded 6/01/23) | | | |
| 15,000 | West Virginia Hospital Finance Authority, Hospital Revenue Bonds, West Virginia United | 6/28 at 100.00 | A | 17,851,200 |
| | Health System Obligated Group, Series 2018A, 5.000%, 6/01/52 | | | |
| 2,000 | West Virginia Hospital Finance Authority, Revenue Bonds, West Virginia University Health | 6/27 at 100.00 | A | 2,355,040 |
| | System Obligated Group, Improvement Series 2017A, 5.000%, 6/01/42 | | | |
| 7,000 | West Virginia Parkways Authority, Turnpike Toll Revenue Bonds, Senior Lien Series 2021, | 6/31 at 100.00 | AA– | 8,134,210 |
| | 4.000%, 6/01/51 | | | |
| 31,000 | Total West Virginia | | | 35,916,970 |
| | Wisconsin – 1.9% (1.2% of Total Investments) | | | |
| | Public Finance Authority of Wisconsin, Conference Center and Hotel Revenue Bonds, | | | |
| | Lombard Public Facilities Corporation, First Tier Series 2018A-1: | | | |
| 34 | 0.000%, 1/01/47, 144A (7) | No Opt. Call | N/R | 1,054 |
| 30 | 0.000%, 1/01/48, 144A (7) | No Opt. Call | N/R | 905 |
| 29 | 0.000%, 1/01/49, 144A (7) | No Opt. Call | N/R | 870 |
| 29 | 0.000%, 1/01/50, 144A (7) | No Opt. Call | N/R | 807 |
| 28 | 0.000%, 1/01/51, 144A (7) | No Opt. Call | N/R | 778 |
| 36 | 0.000%, 1/01/52, 144A (7) | No Opt. Call | N/R | 971 |
| 36 | 0.000%, 1/01/53, 144A (7) | No Opt. Call | N/R | 939 |
| 35 | 0.000%, 1/01/54, 144A (7) | No Opt. Call | N/R | 882 |
| 34 | 0.000%, 1/01/55, 144A (7) | No Opt. Call | N/R | 844 |
| 33 | 0.000%, 1/01/56, 144A (7) | No Opt. Call | N/R | 812 |
| 1,715 | 0.000%, 7/01/56, 144A (7) | 3/28 at 100.00 | N/R | 1,295,413 |
| 37 | 0.000%, 1/01/57, 144A (7) | No Opt. Call | N/R | 874 |
| 36 | 0.000%, 1/01/58, 144A (7) | No Opt. Call | N/R | 831 |
| 35 | 0.000%, 1/01/59, 144A (7) | No Opt. Call | N/R | 793 |
| 34 | 0.000%, 1/01/60, 144A (7) | No Opt. Call | N/R | 752 |
| 34 | 0.000%, 1/01/61, 144A (7) | No Opt. Call | N/R | 720 |
| 33 | 0.000%, 1/01/62, 144A (7) | No Opt. Call | N/R | 682 |
| 32 | 0.000%, 1/01/63, 144A (7) | No Opt. Call | N/R | 652 |
| 31 | 0.000%, 1/01/64, 144A (7) | No Opt. Call | N/R | 626 |
| 31 | 0.000%, 1/01/65, 144A (7) | No Opt. Call | N/R | 596 |
| 33 | 0.000%, 1/01/66, 144A (7) | No Opt. Call | N/R | 611 |
| 401 | 0.000%, 1/01/67, 144A (7) | No Opt. Call | N/R | 6,843 |
68
| Principal | | Optional Call | | |
| Amount (000) | Description (1) | Provisions (2) | Ratings (3) | Value |
| | Wisconsin (continued) | | | |
| | Public Finance Authority of Wisconsin, Conference Center and Hotel Revenue Bonds, | | | |
| | Lombard Public Facilities Corporation, Second Tier Series 2018B: | | | |
| $ 59 | 0.000%, 1/01/46, 144A (7) | No Opt. Call | N/R | $ 1,908 |
| 59 | 0.000%, 1/01/47, 144A (7) | No Opt. Call | N/R | 1,806 |
| 58 | 0.000%, 1/01/48, 144A (7) | No Opt. Call | N/R | 1,761 |
| 58 | 0.000%, 1/01/49, 144A (7) | No Opt. Call | N/R | 1,707 |
| 57 | 0.000%, 1/01/50, 144A (7) | No Opt. Call | N/R | 1,615 |
| 62 | 0.000%, 1/01/51, 144A (7) | No Opt. Call | N/R | 1,735 |
| 1,607 | 0.000%, 7/01/51, 144A (7) | 3/28 at 100.00 | N/R | 1,070,723 |
| 62 | 0.000%, 1/01/52, 144A (7) | No Opt. Call | N/R | 1,654 |
| 61 | 0.000%, 1/01/53, 144A (7) | No Opt. Call | N/R | 1,600 |
| 61 | 0.000%, 1/01/54, 144A (7) | No Opt. Call | N/R | 1,543 |
| 60 | 0.000%, 1/01/55, 144A (7) | No Opt. Call | N/R | 1,487 |
| 59 | 0.000%, 1/01/56, 144A (7) | No Opt. Call | N/R | 1,441 |
| 59 | 0.000%, 1/01/57, 144A (7) | No Opt. Call | N/R | 1,390 |
| 58 | 0.000%, 1/01/58, 144A (7) | No Opt. Call | N/R | 1,337 |
| 57 | 0.000%, 1/01/59, 144A (7) | No Opt. Call | N/R | 1,303 |
| 57 | 0.000%, 1/01/60, 144A (7) | No Opt. Call | N/R | 1,251 |
| 56 | 0.000%, 1/01/61, 144A (7) | No Opt. Call | N/R | 1,197 |
| 56 | 0.000%, 1/01/62, 144A (7) | No Opt. Call | N/R | 1,158 |
| 55 | 0.000%, 1/01/63, 144A (7) | No Opt. Call | N/R | 1,116 |
| 54 | 0.000%, 1/01/64, 144A (7) | No Opt. Call | N/R | 1,087 |
| 54 | 0.000%, 1/01/65, 144A (7) | No Opt. Call | N/R | 1,043 |
| 53 | 0.000%, 1/01/66, 144A (7) | No Opt. Call | N/R | 978 |
| 693 | 0.000%, 1/01/67, 144A (7) | No Opt. Call | N/R | 11,832 |
| 10,000 | Public Finance Authority of Wisconsin, Hospital Revenue Bonds, Renown Regional Medical | 6/30 at 100.00 | A+ | 11,479,000 |
| | Center Project, Refunding Series 2020A, 4.000%, 6/01/45 | | | |
| 5,000 | Wisconsin Health and Educational Facilities Authority, Revenue Bonds, Agnesian | 7/23 at 100.00 | N/R (4) | 5,392,300 |
| | HealthCare, Inc., Series 2013B, 5.000%, 7/01/36 (Pre-refunded 7/01/23) | | | |
| 3,000 | Wisconsin Health and Educational Facilities Authority, Revenue Bonds, Aspirus, Inc. | 8/31 at 100.00 | A1 | 3,412,170 |
| | Obligated Group, Inc. Project, Series 2021, 4.000%, 8/15/51 (WI/DD, Settling 11/10/21) | | | |
| 1,250 | Wisconsin Health and Educational Facilities Authority, Revenue Bonds, Marshfield Clinic, | 2/22 at 100.00 | A– | 1,266,413 |
| | Series 2012B, 5.000%, 2/15/32 | | | |
| | Wisconsin Health and Educational Facilities Authority, Revenue Bonds, PHW Muskego, Inc. | | | |
| | Project, Series 2021: | | | |
| 1,690 | 4.000%, 10/01/41 | 10/28 at 102.00 | N/R | 1,766,033 |
| 2,000 | 4.000%, 10/01/61 | 10/28 at 102.00 | N/R | 2,020,880 |
| 2,500 | Wisconsin Health and Educational Facilities Authority, Wisconsin, Revenue Bonds, | 7/27 at 100.00 | A+ | 2,783,750 |
| | Agnesian HealthCare, Inc., Series 2017, 4.000%, 7/01/47 | | | |
| 10,225 | Wisconsin Health and Educational Facilities Authority, Wisconsin, Revenue Bonds, | 5/26 at 100.00 | Aa2 | 11,737,073 |
| | Ascension Health Alliance Senior Credit Group, Series 2016A, 4.500%, 11/15/39 | | | |
| 1,870 | Wisconsin Health and Educational Facilities Authority, Wisconsin, Revenue Bonds, Beloit | 7/26 at 100.00 | A | 2,043,218 |
| | Health System, Inc., Series 2016, 4.000%, 7/01/46 | | | |
| 4,220 | Wisconsin Health and Educational Facilities Authority, Wisconsin, Revenue Bonds, | 8/27 at 100.00 | Aa3 | 4,780,922 |
| | Children’s Hospital of Wisconsin, Inc., Series 2017, 4.000%, 8/15/42 | | | |
| | Wisconsin Health and Educational Facilities Authority, Wisconsin, Revenue Bonds, | | | |
| | Marshfield Clinic, Series 2016A: | | | |
| 12,440 | 5.000%, 2/15/42 | 2/26 at 100.00 | A– | 14,226,011 |
| 6,000 | 5.000%, 2/15/46 | 2/26 at 100.00 | A– | 6,856,680 |
| 66,486 | Total Wisconsin | | | 70,195,377 |
| $ 5,426,558 | Total Municipal Bonds (cost $5,239,336,003) | | | 5,806,933,256 |
69
| NAD | Nuveen Quality Municipal Income Fund |
| | Portfolio of Investments (continued) |
| | October 31, 2021 |
| Shares | Description (1) | | | | Value |
| | INVESTMENT COMPANIES – 0.0% (0.0% of Total Investments) | | | | |
| 8,812 | BlackRock MuniHoldings Fund Inc | | | | $ 143,548 |
| 32,524 | Invesco Quality Municipal Income Trust | | | | 423,137 |
| | Total Investment Companies (cost $530,611) | | | | 566,685 |
| |
| Principal | | | | | |
| Amount (000) | Description (1) | Coupon | Maturity | Ratings (3) | Value |
| | CORPORATE BONDS – 0.0% (0.0% of Total Investments) | | | | |
| | Consumer Discretionary – 0.0% (0.0% of Total Investments) | | | | |
| $ 146 | Lombard Starwood Westin Hotel Conference Center and Hotel Project Revenue | 7.500% | 12/31/23 | N/R | $ 145,519 |
| | Bonds (cash 7.500%, PIK 7.500%) | | | | |
| $ 146 | Total Corporate Bonds (cost $145,519) | | | | 145,519 |
| | Total Long-Term Investments (cost $5,240,012,133) | | | | 5,807,645,460 |
| Principal | | Optional Call | | |
| Amount (000) | Description (1) | Provisions (2) | Ratings (3) | Value |
| | SHORT-TERM INVESTMENTS – 0.2% (0.2% of Total Investments) | | | |
| | MUNICIPAL BONDS – 0.2% (0.2% of Total Investments) | | | |
| | National – 0.2% (0.2% of Total Investments) | | | |
| $ 9,100 | JPMorgan Chase Putters/Drivers Trust Various States, Variable Rate Demand Obligations, Series 5029, | No Opt. Call | AA | $ 9,100,000 |
| | 0.220%, 12/01/24 (AMT) (9) | | | |
| $ 9,100 | Total Short-Term Investments (cost $9,100,000) | | | 9,100,000 |
| | Total Investments (cost $5,249,112,133) – 154.7% | | | 5,816,745,460 |
| | Floating Rate Obligations – (3.0)% | | | (111,960,000) |
| | Adjustable Rate MuniFund Term Preferred Shares, net of deferred offering costs – (19.3)% (10) | | | (727,169,346) |
| | MuniFund Preferred Shares, net of deferred offering costs – (18.0)% (11) | | | (678,419,684) |
| | Variable Rate Demand Preferred Shares, net of deferred offering costs – (16.8)% (12) | | | (630,487,336) |
| | Other Assets Less Liabilities – 2.4% | | | 90,664,887 |
| | Net Assets Applicable to Common Shares – 100% | | | $ 3,759,373,981 |
70
| (1) | | All percentages shown in the Portfolio of Investments are based on net assets applicable to common shares unless otherwise noted. |
| (2) | | Optional Call Provisions: Dates (month and year) and prices of the earliest optional call or redemption. There may be other call provisions at varying prices at later dates. Certain mortgage-backed securities may be subject to periodic principal paydowns. Optional Call Provisions are not covered by the report of independent registered public accounting firm. |
| (3) | | The ratings disclosed are the lowest of Standard & Poor’s Group (“Standard & Poor’s”), Moody’s Investors Service, Inc. (“Moody’s”) or Fitch, Inc. (“Fitch”) rating. Ratings below BBB by Standard & Poor’s, Baa by Moody’s or BBB by Fitch are considered to be below investment grade. Holdings designated N/R are not rated by any of these national rating agencies. Ratings are not covered by the report of independent registered public accounting firm. |
| (4) | | Backed by an escrow or trust containing sufficient U.S. Government or U.S. Government agency securities, which ensure the timely payment of principal and interest. |
| (5) | | Investment, or portion of investment, has been pledged to collateralize the net payment obligations for investments in inverse floating rate transactions. |
| (6) | | Investment valued at fair value using methods determined in good faith by, or at the discretion of, the Board. For fair value measurement disclosure purposes, investment classified as Level 3. |
| (7) | | Defaulted security. A security whose issuer has failed to fully pay principal and/or interest when due, or is under the protection of bankruptcy. |
| (8) | | Step-up coupon bond, a bond with a coupon that increases ("steps up"), usually at regular intervals, while the bond is outstanding. The rate shown is the coupon as of the end of the reporting period. |
| (9) | | Investment has a maturity of greater than one year, but has variable rate and/or demand features which qualify it as a short-term investment. The rate disclosed, as well as the reference rate and spread, where applicable, is that in effect as of the end of the reporting period. This rate changes periodically based on market conditions or a specified market index. |
| (10) | | Adjustable Rate MuniFund Term Preferred Shares, net of deferred offering cost as a percentage of Total Investments is 12.5%. |
| (11) | | MuniFund Preferred Shares, net of deferred offering costs as a percentage of Total Investments is 11.7%. |
| (12) | | Variable Rate Demand Preferred Shares, net of deferred offering costs as a percentage of Total Investments is 10.8%. |
| 144A | | Investment is exempt from registration under Rule 144A of the Securities Act of 1933, as amended. These investments may only be resold in transactions exempt from registration, which are normally those transactions with qualified institutional buyers. |
| AMT | | Alternative Minimum Tax |
| IF | | Inverse floating rate security issued by a tender option bond (“TOB”) trust, the interest rate on which varies inversely with the Securities Industry Financial Markets Association (SIFMA) short-term rate, which resets weekly, or a similar short-term rate, and is reduced by the expenses related to the TOB trust. |
| PIK | | Payment-in-kind (“PIK”) security. Depending on the terms of the security, income may be received in the form of cash, securities, or a combination of both. The PIK rate shown, where applicable, represents the annualized rate of the last PIK payment made by the issuer as of the end of the reporting period. |
| UB | | Underlying bond of an inverse floating rate trust reflected as a financing transaction. See Notes to Financial Statements, Note 4 – Portfolio Securities and Investments in Derivatives, for more information. |
| WI/DD | | Investment, or portion of investment, purchased on a when-issued or delayed delivery basis. |
See accompanying notes to financial statements.
71
| NEA | Nuveen AMT-Free Quality Municipal |
| | Income Fund |
| | Portfolio of Investments |
| | October 31, 2021 |
| Principal | | Optional Call | | |
| Amount (000) | Description (1) | Provisions (2) | Ratings (3) | Value |
| | LONG-TERM INVESTMENTS – 154.8% (99.9% of Total Investments) | | | |
| | MUNICIPAL BONDS – 154.8% (99.9% of Total Investments) | | | |
| | Alabama – 1.3% (0.9% of Total Investments) | | | |
| | Birmingham Airport Authority, Alabama, Airport Revenue Bonds, Series 2020: | | | |
| $ 875 | 4.000%, 7/01/35 – BAM Insured | 7/30 at 100.00 | A3 | $ 1,030,706 |
| 1,000 | 4.000%, 7/01/37 – BAM Insured | 7/30 at 100.00 | A3 | 1,165,270 |
| 975 | 4.000%, 7/01/40 – BAM Insured | 7/30 at 100.00 | A3 | 1,128,816 |
| 1,535 | Gardendale, Alabama, General Obligation Warrants, Series 2021B, 4.000%, 5/01/51 | 5/31 at 100.00 | AA– | 1,791,852 |
| 6,945 | Huntsville Healthcare Authority, Alabama, Revenue Bonds, Series 2020B, 4.000%, 6/01/45 | 6/30 at 100.00 | A1 | 7,978,069 |
| 4,250 | Infirmary Health System Special Care Facilities Financing Authority of Mobile, Alabama, | 2/26 at 100.00 | A– | 4,837,095 |
| | Revenue Bonds, Infirmary Health System, Inc., Series 2016A, 5.000%, 2/01/41 | | | |
| 23,175 | Lower Alabama Gas District, Alabama, Gas Project Revenue Bonds, Series 2016A, | No Opt. Call | A2 | 32,963,193 |
| | 5.000%, 9/01/46 | | | |
| 4,900 | Mobile Spring Hill College Educational Building Authority, Alabama, Revenue Bonds, | 4/25 at 100.00 | N/R | 5,327,084 |
| | Spring Hill College Project, Series 2015, 5.875%, 4/15/45 | | | |
| 5,310 | Tuscaloosa County Industrial Development Authority, Alabama, Gulf Opportunity Zone | 5/29 at 100.00 | N/R | 6,114,465 |
| | Bonds, Hunt Refining Project, Refunding Series 2019A, 5.250%, 5/01/44, 144A | | | |
| 48,965 | Total Alabama | | | 62,336,550 |
| | Alaska – 0.0% (0.0% of Total Investments) | | | |
| 495 | Northern Tobacco Securitization Corporation, Alaska, Tobacco Settlement Asset-Backed | 6/31 at 100.00 | BBB+ | 549,876 |
| | Bonds, Senior Series 2021A Class 1, 4.000%, 6/01/50 | | | |
| | Arizona – 1.6% (1.0% of Total Investments) | | | |
| 1,460 | Apache County Industrial Development Authority, Arizona, Pollution Control Revenue | 3/22 at 100.00 | A– | 1,478,440 |
| | Bonds, Tucson Electric Power Company, Series 20102A, 4.500%, 3/01/30 | | | |
| 3,815 | Arizona Board of Regents, University of Arizona, SPEED Revenue Bonds, Stimulus Plan for | 8/30 at 100.00 | A+ | 4,440,126 |
| | Economic and Educational Development, Refunding Series 2020A, 4.000%, 8/01/44 | | | |
| 1,025 | Arizona Industrial Development Authority, Arizona, Education Revenue Bonds, Academies of | 7/27 at 100.00 | AA– | 1,170,447 |
| | Math & Science Projects, Series 2017A, 5.000%, 7/01/51 | | | |
| 7,115 | Lake Havasu City, Arizona, Wastewater System Revenue Bonds, Refunding Senior Lien Series | 7/25 at 100.00 | A2 | 8,073,319 |
| | 2015B, 5.000%, 7/01/43 – AGM Insured | | | |
| 1,315 | Maricopa County Industrial Development Authority, Arizona, Hospital Revenue Bonds, | 9/28 at 100.00 | A2 | 1,601,631 |
| | HonorHealth, Series 2019A, 5.000%, 9/01/42 | | | |
| 5,135 | Maricopa County Industrial Development Authority, Arizona, Revenue Bonds, Banner Health, | 1/27 at 100.00 | AA– | 5,763,935 |
| | Refunding Series 2016A, 4.000%, 1/01/36 | | | |
| 6,355 | Phoenix Civic Improvement Corporation, Arizona, Airport Revenue Bonds, Junior Lien | 7/29 at 100.00 | A | 7,286,516 |
| | Series 2019A, 4.000%, 7/01/44 | | | |
| | Phoenix Civic Improvement Corporation, Arizona, Revenue Bonds, Civic Plaza Expansion | | | |
| | Project, Series 2005B: | | | |
| 6,545 | 5.500%, 7/01/37 – FGIC Insured | No Opt. Call | AA | 9,590,192 |
| 10,000 | 5.500%, 7/01/40 – FGIC Insured | No Opt. Call | AA | 15,213,600 |
| 3,000 | Queen Creek, Arizona, Excise Tax & State Shared Revenue Obligation Bonds, Series 2018A, | 8/28 at 100.00 | AA | 3,628,950 |
| | 5.000%, 8/01/47 | | | |
| 11,080 | Salt Verde Financial Corporation, Arizona, Senior Gas Revenue Bonds, Citigroup Energy | No Opt. Call | BBB+ | 15,208,186 |
| | Inc Prepay Contract Obligations, Series 2007, 5.000%, 12/01/37 | | | |
| 56,845 | Total Arizona | | | 73,455,342 |
| | Arkansas – 0.1% (0.1% of Total Investments) | | | |
| 5,080 | Independence County, Arkansas, Hydroelectric Power Revenue Bonds, Series 2003, 5.350%, | 11/21 at 100.00 | N/R | 5,093,716 |
| | 5/01/28 – ACA Insured | | | |
72
| Principal | | Optional Call | | |
| Amount (000) | Description (1) | Provisions (2) | Ratings (3) | Value |
| | California – 7.5% (4.9% of Total Investments) | | | |
| $ 22,880 | Alameda Corridor Transportation Authority, California, Revenue Bonds, Senior Lien Series | No Opt. Call | A– | $ 18,706,002 |
| | 1999A, 0.000%, 10/01/32 – NPFG Insured | | | |
| 4,225 | Alameda Unified School District, Alameda County, California, General Obligation Bonds, | No Opt. Call | AA | 3,855,312 |
| | Series 2005B, 0.000%, 8/01/28 – AGM Insured | | | |
| 3,450 | Antelope Valley Joint Union High School District, Los Angeles and Kern Counties, | No Opt. Call | Aa3 | 3,032,653 |
| | California, General Obligation Bonds, Series 2004B, 0.000%, 8/01/29 – NPFG Insured | | | |
| | Bay Area Toll Authority, California, Revenue Bonds, San Francisco Bay Area Toll Bridge, | | | |
| | Series 2013S-4: | | | |
| 5,000 | 5.000%, 4/01/38 (Pre-refunded 4/01/23) | 4/23 at 100.00 | A1 (4) | 5,340,000 |
| 6,500 | 5.250%, 4/01/53 (Pre-refunded 4/01/23) | 4/23 at 100.00 | A1 (4) | 6,964,815 |
| 10,000 | Bay Area Toll Authority, California, Revenue Bonds, San Francisco Bay Area Toll Bridge, | 4/24 at 100.00 | Aa3 (4) | 11,137,300 |
| | Series 2014F-1, 5.000%, 4/01/54 (Pre-refunded 4/01/24) | | | |
| 8,000 | Beverly Hills Unified School District, Los Angeles County, California, General | No Opt. Call | AA+ | 6,552,240 |
| | Obligation Bonds, Series 2009, 0.000%, 8/01/33 | | | |
| | Burbank Unified School District, Los Angeles County, California, General Obligation | | | |
| | Bonds, Election 2013, Series 2015A: | | | |
| 2,250 | 0.000%, 8/01/32 (Pre-refunded 2/01/25) (5) | 2/25 at 100.00 | A+ (4) | 2,380,770 |
| 1,350 | 0.000%, 8/01/33 (Pre-refunded 2/01/25) (5) | 2/25 at 100.00 | A+ (4) | 1,428,462 |
| 160 | California County Tobacco Securitization Agency, Tobacco Settlement Asset-Backed Bonds, | 6/30 at 100.00 | BBB– | 190,987 |
| | Los Angeles County Securitization Corporation, Series 2020B-1, 5.000%, 6/01/49 | | | |
| | California Educational Facilities Authority, Revenue Refunding Bonds, Loyola Marymount | | | |
| | University, Series 2001A: | | | |
| 3,255 | 0.000%, 10/01/23 – NPFG Insured | No Opt. Call | A2 | 3,226,584 |
| 5,890 | 0.000%, 10/01/24 – NPFG Insured | No Opt. Call | A2 | 5,782,625 |
| 7,615 | 0.000%, 10/01/25 – NPFG Insured | No Opt. Call | A2 | 7,360,811 |
| 1,350 | 0.000%, 10/01/39 – NPFG Insured | No Opt. Call | A2 | 902,556 |
| 1,330 | California Health Facilities Financing Authority, Revenue Bonds, CommonSpirit Health, | 4/30 at 100.00 | BBB+ | 1,513,979 |
| | Series 2020A, 4.000%, 4/01/49 | | | |
| | California Health Facilities Financing Authority, Revenue Bonds, Lucile Salter Packard | | | |
| | Children’s Hospital, Series 2012A: | | | |
| 3,000 | 5.000%, 8/15/51 (UB) (6) | 8/22 at 100.00 | A+ | 3,113,730 |
| 10,000 | 5.000%, 8/15/51 | 8/22 at 100.00 | A+ | 10,379,100 |
| 530 | California Health Facilities Financing Authority, Revenue Bonds, Saint Joseph Health | 7/23 at 100.00 | AA– | 570,662 |
| | System, Series 2013A, 5.000%, 7/01/37 | | | |
| | California Health Facilities Financing Authority, Revenue Bonds, Stanford Hospitals and | | | |
| | Clinics, Tender Option Bond Trust 2016-XG0049: | | | |
| 485 | 9.434%, 8/15/51 (Pre-refunded 8/15/22), 144A (IF) (6) | 8/22 at 100.00 | AA– (4) | 521,739 |
| 525 | 9.442%, 8/15/51 (Pre-refunded 8/15/22), 144A (IF) (6) | 8/22 at 100.00 | AA– (4) | 564,806 |
| 1,285 | 9.442%, 8/15/51 (Pre-refunded 8/15/22), 144A (IF) (6) | 8/22 at 100.00 | AA– (4) | 1,382,429 |
| 1,500 | California Municipal Finance Authority, Revenue Bonds, Eisenhower Medical Center, | 7/27 at 100.00 | BBB– | 1,778,085 |
| | Refunding Series 2017A, 5.000%, 7/01/42 | | | |
| 965 | California Public Finance Authority, Revenue Bonds, Henry Mayo Newhall Hospital, Series | 10/26 at 100.00 | BBB– | 1,116,746 |
| | 2017, 5.000%, 10/15/47 | | | |
| 2,930 | California State Public Works Board, Lease Revenue Bonds, Various Capital Projects, | 11/23 at 100.00 | A+ | 3,190,155 |
| | Series 2013I, 5.000%, 11/01/38 | | | |
| 5,000 | California State, General Obligation Bonds, Refunding Various Purpose Series 2017, | 8/26 at 100.00 | AA– | 5,690,150 |
| | 4.000%, 8/01/36 | | | |
| 5 | California State, General Obligation Bonds, Series 2004, 5.000%, 4/01/31 – AMBAC Insured | 11/21 at 100.00 | AA– | 5,018 |
| 9,130 | California Statewide Communities Development Authority, California, Revenue Bonds, Loma | 6/28 at 100.00 | BB– | 11,083,546 |
| | Linda University Medical Center, Series 2018A, 5.500%, 12/01/58, 144A | | | |
| | California Statewide Community Development Authority, Revenue Bonds, Daughters of | | | |
| | Charity Health System, Series 2005A: | | | |
| 710 | 5.750%, 7/01/30 (7), (8) | 11/21 at 100.00 | N/R | 621,423 |
| 912 | 5.750%, 7/01/35 (7), (8) | 11/21 at 100.00 | N/R | 797,719 |
| 1,094 | 5.500%, 7/01/39 (7), (8) | 11/21 at 100.00 | N/R | 957,263 |
73
| NEA | Nuveen AMT-Free Quality Municipal Income Fund |
| | Portfolio of Investments (continued) |
| | October 31, 2021 |
| Principal | | Optional Call | | |
| Amount (000) | Description (1) | Provisions (2) | Ratings (3) | Value |
| | California (continued) | | | |
| $ 10,445 | Castaic Lake Water Agency, California, Certificates of Participation, Water System | No Opt. Call | AA | $ 9,238,185 |
| | Improvement Project, Series 1999a, 0.000%, 8/01/29 – AMBAC Insured | | | |
| 4,775 | Clovis Unified School District, Fresno County, California, General Obligation Bonds, | No Opt. Call | Baa2 (4) | 4,678,020 |
| | Series 2001A, 0.000%, 8/01/25 – FGIC Insured (ETM) | | | |
| 3,330 | Contra Costa Community College District, Contra Costa County, California, General | 8/23 at 100.00 | AA+ (4) | 3,608,221 |
| | Obligation Bonds, Election of 2006, Series 2013, 5.000%, 8/01/38 (Pre-refunded 8/01/23) | | | |
| 7,775 | Foothill/Eastern Transportation Corridor Agency, California, Toll Road Revenue Bonds, | No Opt. Call | BBB | 5,973,610 |
| | Refunding Senior Lien Series 2015A, 0.000%, 1/15/34 – AGM Insured | | | |
| | Foothill/Eastern Transportation Corridor Agency, California, Toll Road Revenue Bonds, | | | |
| | Refunding Series 2013A: | | | |
| 910 | 0.000%, 1/15/42 (5) | 1/31 at 100.00 | Baa2 | 1,145,963 |
| 3,350 | 5.750%, 1/15/46 (Pre-refunded 1/15/24) | 1/24 at 100.00 | Baa2 (4) | 3,749,688 |
| 8,350 | 6.000%, 1/15/49 (Pre-refunded 1/15/24) | 1/24 at 100.00 | Baa2 (4) | 9,386,068 |
| 10,000 | Golden State Tobacco Securitization Corporation, California, Tobacco Settlement | 6/22 at 100.00 | B– | 10,245,100 |
| | Asset-Backed Bonds, Senior Convertible Series 2007A-2, 5.300%, 6/01/37 | | | |
| 8,150 | Golden State Tobacco Securitization Corporation, California, Tobacco Settlement | 6/22 at 100.00 | N/R | 8,345,681 |
| | Asset-Backed Bonds, Series 2018A-1, 5.000%, 6/01/47 | | | |
| 10,170 | Golden State Tobacco Securitization Corporation, California, Tobacco Settlement | 6/22 at 100.00 | N/R | 10,414,182 |
| | Asset-Backed Bonds, Series 2018A-2, 5.000%, 6/01/47 | | | |
| 5,000 | Huntington Beach Union High School District, Orange County, California, General | No Opt. Call | AA– | 4,085,650 |
| | Obligation Bonds, Series 2007, 0.000%, 8/01/32 – FGIC Insured | | | |
| 3,040 | Kern Community College District, California, General Obligation Bonds, Safety, Repair & | No Opt. Call | AA | 3,020,362 |
| | Improvement, Election 2002 Series 2006, 0.000%, 11/01/23 – AGM Insured | | | |
| 1,500 | Lincoln Unified School District, Placer County, California, Special Tax Bonds, Community | No Opt. Call | N/R | 1,386,570 |
| | Facilities District 1, Series 2005, 0.000%, 9/01/26 – AMBAC Insured | | | |
| 995 | Los Angeles Department of Water and Power, California, Electric Plant Revenue Bonds, | 11/21 at 100.00 | N/R (4) | 998,980 |
| | Series 1994, 5.375%, 2/15/34 (ETM) | | | |
| 2,490 | Madera Unified School District, Madera County, California, General Obligation Bonds, | No Opt. Call | Baa2 | 2,317,020 |
| | Election 2002 Series 2005, 0.000%, 8/01/27 – NPFG Insured | | | |
| 10,335 | Mount San Antonio Community College District, Los Angeles County, California, General | 8/35 at 100.00 | AA | 11,601,658 |
| | Obligation Bonds, Election of 2008, Series 2013A, 0.000%, 8/01/43 (5) | | | |
| 5,500 | M-S-R Energy Authority, California, Gas Revenue Bonds, Citigroup Prepay Contracts, | No Opt. Call | BBB+ | 8,598,590 |
| | Series 2009B, 6.500%, 11/01/39 | | | |
| 240 | Mt. Diablo Hospital District, California, Insured Hospital Revenue Bonds, Series 1993A, | 10/21 at 100.00 | N/R (4) | 252,643 |
| | 5.125%, 12/01/23 – AMBAC Insured (ETM) | | | |
| 14,100 | New Haven Unified School District, California, General Obligation Bonds, Refunding | No Opt. Call | Aa3 | 10,691,043 |
| | Series 2009, 0.000%, 8/01/34 – AGC Insured | | | |
| 3,515 | Newport Beach, California, Revenue Bonds, Hoag Memorial Hospital Presybterian, Series | 12/21 at 100.00 | N/R (4) | 3,531,345 |
| | 2011A, 5.875%, 12/01/30 (Pre-refunded 12/01/21) | | | |
| 2,500 | Norwalk La Mirada Unified School District, Los Angeles County, California, General | No Opt. Call | Aa3 | 2,217,950 |
| | Obligation Bonds, Election 2002 Series 2005B, 0.000%, 8/01/29 | | | |
| 2,585 | Ontario Redevelopment Financing Authority, San Bernardino County, California, Revenue | No Opt. Call | Baa2 | 2,893,546 |
| | Bonds, Redevelopment Project 1, Refunding Series 1995, 7.400%, 8/01/25 – NPFG Insured | | | |
| | Orange County Water District, California, Revenue Certificates of Participation, Series 2003B: | | | |
| 1,490 | 5.000%, 8/15/34 – NPFG Insured (ETM) | No Opt. Call | Aa1 (4) | 1,965,087 |
| 1,745 | 5.000%, 8/15/34 (Pre-refunded 8/15/32) – NPFG Insured | 8/32 at 100.00 | N/R (4) | 2,384,804 |
| 1,000 | Pajaro Valley Unified School District, Santa Cruz County, California, General Obligation | No Opt. Call | Aa3 | 892,650 |
| | Bonds, Series 2005B, 0.000%, 8/01/29 – AGM Insured | | | |
| 2,000 | Palomar Pomerado Health, California, General Obligation Bonds, Capital Appreciation, | No Opt. Call | BBB– | 1,954,120 |
| | Election of 2004, Series 2007A, 0.000%, 8/01/24 – NPFG Insured | | | |
| 9,320 | Palomar Pomerado Health, California, General Obligation Bonds, Series 2009A, 0.000%, | No Opt. Call | BBB– | 7,337,170 |
| | 8/01/33 – AGC Insured | | | |
74
| Principal | | Optional Call | | |
| Amount (000) | Description (1) | Provisions (2) | Ratings (3) | Value |
| | California (continued) | | | |
| $ 1,970 | Pomona, California, GNMA/FHLMC Collateralized Single Family Mortgage Revenue Refunding | No Opt. Call | AA+ (4) | $ 2,107,802 |
| | Bonds, Series 1990B, 7.500%, 8/01/23 (ETM) | | | |
| 1,800 | Rialto Unified School District, San Bernardino County, California, General Obligation | No Opt. Call | Aa3 | 1,640,286 |
| | Bonds, Series 2011A, 0.000%, 8/01/28 | | | |
| 625 | Riverside County Transportation Commission, California, Toll Revenue Senior Lien Bonds, | 6/31 at 100.00 | BBB+ | 719,719 |
| | RCTC 91 Express Lanes, Refunding Series 2021B-1, 4.000%, 6/01/46 | | | |
| 760 | Riverside County Transportation Commission, California, Toll Revenue Senior Lien Bonds, | 6/23 at 100.00 | BBB+ | 824,699 |
| | Series 2013A, 5.750%, 6/01/44 | | | |
| 1,490 | San Bernardino, California, GNMA Mortgage-Backed Securities Program Single Family | No Opt. Call | AA+ (4) | 1,568,910 |
| | Mortgage Revenue Refunding Bonds, Series 1990A, 7.500%, 5/01/23 (ETM) | | | |
| 2,250 | San Buenaventura, California, Revenue Bonds, Community Memorial Health System, Series | 12/21 at 100.00 | BB (4) | 2,263,117 |
| | 2011, 7.500%, 12/01/41 (Pre-refunded 12/01/21) | | | |
| 4,000 | San Francisco Airports Commission, California, Revenue Bonds, San Francisco | 5/23 at 100.00 | A | 4,264,520 |
| | International Airport, Governmental Purpose, Second Series 2013B, 5.000%, 5/01/43 | | | |
| 8,075 | San Francisco City and County Public Utilities Commission, California, Water Revenue | 11/30 at 100.00 | AA– | 9,470,360 |
| | Bonds, Local Water Series 2020C, 4.000%, 11/01/50 | | | |
| | San Joaquin Hills Transportation Corridor Agency, Orange County, California, Toll Road | | | |
| | Revenue Bonds, Refunding Senior Lien Series 2014A: | | | |
| 10,595 | 5.000%, 1/15/44 | 1/25 at 100.00 | BBB | 11,809,081 |
| 32,725 | 5.000%, 1/15/50 | 1/25 at 100.00 | BBB | 36,410,817 |
| 7,210 | San Joaquin Hills Transportation Corridor Agency, Orange County, California, Toll Road | No Opt. Call | Baa2 | 7,061,546 |
| | Revenue Bonds, Refunding Series 1997A, 0.000%, 1/15/23 – NPFG Insured | | | |
| 2,965 | San Juan Unified School District, Sacramento County, California, General Obligation | No Opt. Call | A+ | 2,721,929 |
| | Bonds, Series 2004A, 0.000%, 8/01/28 – NPFG Insured | | | |
| 4,005 | San Mateo Union High School District, San Mateo County, California, General Obligation | No Opt. Call | AA+ | 3,834,147 |
| | Bonds, Election of 2000, Series 2002B, 0.000%, 9/01/26 – FGIC Insured | | | |
| 15,750 | San Ysidro School District, San Diego County, California, General Obligation Bonds, 1997 | No Opt. Call | AA | 10,403,662 |
| | Election Series 2012G, 0.000%, 8/01/39 – AGM Insured | | | |
| | San Ysidro School District, San Diego County, California, General Obligation Bonds, | | | |
| | Refunding Series 2015: | | | |
| 5,000 | 0.000%, 8/01/46 | 8/25 at 32.80 | A3 | 1,536,550 |
| 6,570 | 0.000%, 8/01/47 | 8/25 at 30.90 | A3 | 1,900,964 |
| 2,630 | Union Elementary School District, Santa Clara County, California, General Obligation | No Opt. Call | Baa2 | 2,543,420 |
| | Bonds, Series 2001B, 0.000%, 9/01/25 – FGIC Insured | | | |
| 364,356 | Total California | | | 354,143,102 |
| | Colorado – 11.1% (7.2% of Total Investments) | | | |
| 1,365 | Aerotropolis Regional Transportation Authority, Colorado, Special Revenue Bonds, Series | 12/24 at 102.00 | N/R | 1,465,259 |
| | 2019, 5.000%, 12/01/51 | | | |
| 6,600 | Aerotropolis Regional Transportation Authority, Colorado, Special Revenue Bonds, Series | 12/26 at 103.00 | N/R | 6,544,296 |
| | 2021, 4.375%, 12/01/52 | | | |
| 500 | Blue Lake Metropolitan District 2 , Lochbuie, Colorado, Limited Tax General Obligation | 12/21 at 103.00 | N/R | 515,810 |
| | Bonds, Series 2016A, 5.750%, 12/01/46 | | | |
| 500 | Brighton Crossing Metropolitan District 6, Brighton, Colorado, Limited Tax General | 12/25 at 103.00 | N/R | 542,095 |
| | Obligation Bonds, Series 2020A-3, 5.000%, 12/01/50 | | | |
| 1,140 | Castle Oaks Metropolitan District 3, Castle Rock, Douglas County, Colorado, General Obligation | 12/30 at 100.00 | A2 | 1,317,532 |
| | Limited Tax Bonds, Refunding & Improvement Series 2020, 4.000%, 12/01/45 – AGM Insured | | | |
| 1,060 | Centerra Metropolitan District 1, Loveland, Colorado, Special Revenue Bonds, Improvement | 12/23 at 103.00 | N/R | 1,129,292 |
| | Series 2018, 5.250%, 12/01/48 | | | |
| | Centerra Metropolitan District 1, Loveland, Colorado, Special Revenue Bonds, Refunding & | | | |
| | Improvement Series 2017: | | | |
| 1,575 | 5.000%, 12/01/37, 144A | 12/22 at 103.00 | N/R | 1,653,782 |
| 3,620 | 5.000%, 12/01/47, 144A | 12/22 at 103.00 | N/R | 3,790,357 |
75
| NEA | Nuveen AMT-Free Quality Municipal Income Fund |
| | Portfolio of Investments (continued) |
| | October 31, 2021 |
| Principal | | Optional Call | | |
| Amount (000) | Description (1) | Provisions (2) | Ratings (3) | Value |
| | Colorado (continued) | | | |
| $ 1,250 | Central Platte Valley Metropolitan District, Colorado, General Obligation Bonds, | 12/23 at 100.00 | BBB– | $ 1,335,613 |
| | Refunding Series 2013A, 5.375%, 12/01/33 | | | |
| 115 | Central Platte Valley Metropolitan District, Colorado, General Obligation Bonds, | 12/23 at 100.00 | BB | 120,375 |
| | Refunding Series 2014, 5.000%, 12/01/43 | | | |
| 3,500 | Cherokee Metropolitan District, Colorado, Water and Wastewater Revenue Bonds, Series | 8/30 at 100.00 | AA | 4,080,055 |
| | 2020, 4.000%, 8/01/50 – BAM Insured | | | |
| 1,700 | Colorado Educational and Cultural Facilities Authority, Charter School Revenue Bonds, | 7/24 at 100.00 | BB | 1,804,788 |
| | Skyview Academy Project, Series 2014, 5.375%, 7/01/44, 144A | | | |
| | Colorado Health Facilities Authority, Colorado, Health Facilities Revenue Bonds, The | | | |
| | Evangelical Lutheran Good Samaritan Society Project, Refunding Series 2017: | | | |
| 2,005 | 5.000%, 6/01/34 (Pre-refunded 6/01/27) | 6/27 at 100.00 | N/R (4) | 2,446,541 |
| 4,615 | 5.000%, 6/01/35 (Pre-refunded 6/01/27) | 6/27 at 100.00 | N/R (4) | 5,631,315 |
| 7,205 | 5.000%, 6/01/36 (Pre-refunded 6/01/27) | 6/27 at 100.00 | N/R (4) | 8,791,685 |
| 8,715 | 5.000%, 6/01/37 (Pre-refunded 6/01/27) | 6/27 at 100.00 | N/R (4) | 10,634,217 |
| 4,105 | 5.000%, 6/01/42 (Pre-refunded 6/01/27) | 6/27 at 100.00 | N/R (4) | 5,009,003 |
| 8,545 | 5.000%, 6/01/47 (Pre-refunded 6/01/27) | 6/27 at 100.00 | N/R (4) | 10,426,780 |
| 14,180 | Colorado Health Facilities Authority, Colorado, Revenue Bonds, AdventHealth Obligated | 11/29 at 100.00 | AA | 16,443,270 |
| | Group, Series 2019A, 4.000%, 11/15/43 | | | |
| 7,000 | Colorado Health Facilities Authority, Colorado, Revenue Bonds, AdventHealth Obligated | 11/31 at 100.00 | AA | 8,134,980 |
| | Group, Series 2021A, 4.000%, 11/15/50 | | | |
| 5,000 | Colorado Health Facilities Authority, Colorado, Revenue Bonds, Catholic Health | 1/23 at 100.00 | BBB+ (4) | 5,287,700 |
| | Initiatives, Series 2013A, 5.250%, 1/01/45 (Pre-refunded 1/01/23) | | | |
| 5,000 | Colorado Health Facilities Authority, Colorado, Revenue Bonds, Children’s Hospital | 12/23 at 100.00 | A+ | 5,437,500 |
| | Colorado Project, Series 2013A, 5.000%, 12/01/36 | | | |
| 3,050 | Colorado Health Facilities Authority, Colorado, Revenue Bonds, Christian Living | 1/24 at 102.00 | N/R | 3,261,304 |
| | Neighborhoods Project, Refunding Series 2016, 5.000%, 1/01/37 | | | |
| 8,550 | Colorado Health Facilities Authority, Colorado, Revenue Bonds, CommonSpirit Health, | 8/29 at 100.00 | BBB+ | 9,567,621 |
| | Series 2019A-1, 4.000%, 8/01/44 | | | |
| 26,025 | Colorado Health Facilities Authority, Colorado, Revenue Bonds, CommonSpirit Health, | 8/29 at 100.00 | BBB+ | 28,911,953 |
| | Series 2019A-2, 4.000%, 8/01/49 | | | |
| 4,600 | Colorado Health Facilities Authority, Colorado, Revenue Bonds, Covenant Living | 12/27 at 103.00 | A– | 5,203,336 |
| | Communities & Services, Series 2020A, 4.000%, 12/01/50 | | | |
| 2,375 | Colorado Health Facilities Authority, Colorado, Revenue Bonds, Evangelical Lutheran Good | 6/22 at 100.00 | N/R (4) | 2,441,595 |
| | Samaritan Society Project, Refunding Series 2012, 5.000%, 12/01/42 (Pre-refunded 6/01/22) | | | |
| 1,000 | Colorado Health Facilities Authority, Colorado, Revenue Bonds, Evangelical Lutheran Good | 6/23 at 100.00 | N/R (4) | 1,085,160 |
| | Samaritan Society Project, Series 2013, 5.625%, 6/01/43 (Pre-refunded 6/01/23) | | | |
| 750 | Colorado Health Facilities Authority, Colorado, Revenue Bonds, Frasier Meadows Project, | 5/27 at 100.00 | BB+ | 863,543 |
| | Refunding & Improvement Series 2017A, 5.250%, 5/15/37 | | | |
| 1,500 | Colorado Health Facilities Authority, Colorado, Revenue Bonds, Parkview Medical Center, | 9/25 at 100.00 | Baa1 | 1,631,100 |
| | Refunding Series 2015B, 4.000%, 9/01/34 | | | |
| 10,035 | Colorado Health Facilities Authority, Colorado, Revenue Bonds, Parkview Medical Center, | 9/30 at 100.00 | Baa1 | 11,458,766 |
| | Series 2020A, 4.000%, 9/01/50 | | | |
| 1,000 | Colorado Health Facilities Authority, Colorado, Revenue Bonds, Sanford Health, Series | 11/29 at 100.00 | A+ | 1,173,730 |
| | 2019A, 4.000%, 11/01/39 | | | |
| 3,300 | Colorado Health Facilities Authority, Colorado, Revenue Bonds, SCL Health System, | 1/30 at 100.00 | AA– | 3,873,474 |
| | Refunding Series 2019A, 4.000%, 1/01/37 | | | |
| 4,880 | Colorado Health Facilities Authority, Colorado, Revenue Bonds, SCL Health System, | 1/30 at 100.00 | AA– | 5,680,857 |
| | Refunding Series 2019B, 4.000%, 1/01/40 | | | |
| 4,150 | Colorado High Performance Transportation Enterprise, C-470 Express Lanes Revenue Bonds, | 12/24 at 100.00 | BBB | 4,661,073 |
| | Senior Lien Series 2017, 5.000%, 12/31/56 | | | |
| | Colorado International Center Metropolitan District 14, Denver, Colorado, Limited Tax | | | |
| | General Obligation Bonds, Refunding & Improvement Series 2018: | | | |
| 1,895 | 5.625%, 12/01/32 | 12/23 at 103.00 | N/R | 2,044,724 |
| 2,660 | 5.875%, 12/01/46 | 12/23 at 103.00 | N/R | 2,856,760 |
76
| Principal | | Optional Call | | |
| Amount (000) | Description (1) | Provisions (2) | Ratings (3) | Value |
| | Colorado (continued) | | | |
| | Colorado School of Mines Board of Trustees, Golden, Colorado, Institutional Enterprise | | | |
| | Revenue Bonds, Series 2017B: | | | |
| $ 2,000 | 5.000%, 12/01/42 | 12/27 at 100.00 | A+ | $ 2,435,680 |
| 1,225 | 5.000%, 12/01/47 | 12/27 at 100.00 | A+ | 1,488,522 |
| 1,500 | Colorado State Board of Governors, Colorado State University Auxiliary Enterprise System | 3/27 at 100.00 | A+ | 1,832,475 |
| | Revenue Bonds, Refunding Series 2016B, 5.000%, 3/01/41 | | | |
| 2,000 | Colorado State Board of Governors, Colorado State University Auxiliary Enterprise System | 9/27 at 100.00 | AA | 2,264,160 |
| | Revenue Bonds, Refunding Series 2017A, 4.000%, 3/01/40 | | | |
| 6,500 | Colorado State Board of Governors, Colorado State University Auxiliary Enterprise System | 3/28 at 100.00 | AA | 7,346,430 |
| | Revenue Bonds, Refunding Series 2017E, 4.000%, 3/01/43 | | | |
| 5,000 | Colorado State, Certificates of Participation, Rural Series 2018A, 4.000%, 12/15/35 | 12/28 at 100.00 | AA– | 5,839,150 |
| 2,505 | Colorado State, Certificates of Participation, Rural Series 2020A, 4.000%, 12/15/39 | 12/30 at 100.00 | AA– | 2,959,532 |
| | Commerce City, Colorado, Sales and Use Tax Revenue Bonds, Series 2016: | | | |
| 7,115 | 5.000%, 8/01/41 | 8/26 at 100.00 | A1 | 8,339,705 |
| 1,000 | 5.000%, 8/01/46 | 8/26 at 100.00 | A1 | 1,164,100 |
| 1,000 | Copper Ridge Metropolitan District, Colorado Springs, Colorado, Tax Increment and Sales | 12/24 at 103.00 | N/R | 1,067,930 |
| | Tax Supported Revenue Bonds, Series 2019, 5.000%, 12/01/39 | | | |
| 11,140 | Denver City and County, Colorado, Airport System Revenue Bonds, Series 2012B, 5.000%, | 11/22 at 100.00 | A+ (4) | 11,689,313 |
| | 11/15/37 (Pre-refunded 11/15/22) | | | |
| 12,900 | Denver City and County, Colorado, Airport System Revenue Bonds, Subordinate Lien Series | 11/23 at 100.00 | A | 14,033,523 |
| | 2013B, 5.000%, 11/15/43 | | | |
| 2,500 | Denver City and County, Colorado, Airport System Revenue Bonds, Subordinate Lien Series | 12/28 at 100.00 | A | 3,046,725 |
| | 2018B, 5.000%, 12/01/48 | | | |
| 11,750 | Denver City and County, Colorado, Dedicated Tax Revenue Bonds, Series 2021A, | 8/31 at 100.00 | AA– | 13,694,860 |
| | 4.000%, 8/01/51 | | | |
| | Denver Convention Center Hotel Authority, Colorado, Revenue Bonds, Convention Center | | | |
| | Hotel, Refunding Senior Lien Series 2016: | | | |
| 5,120 | 5.000%, 12/01/32 | 12/26 at 100.00 | BBB– | 5,922,970 |
| 2,935 | 5.000%, 12/01/35 | 12/26 at 100.00 | BBB– | 3,366,915 |
| 1,800 | 5.000%, 12/01/40 | 12/26 at 100.00 | BBB– | 2,044,980 |
| 365 | Denver Urban Renewal Authority, Colorado, Tax Increment Revenue Bonds, 9th and Colorado | 12/23 at 103.00 | N/R | 396,087 |
| | Urban Redevelopment Area, Series 2018A, 5.250%, 12/01/39, 144A | | | |
| | E-470 Public Highway Authority, Colorado, Senior Revenue Bonds, Series 2000B: | | | |
| 6,200 | 0.000%, 9/01/22 – NPFG Insured | No Opt. Call | A | 6,183,756 |
| 45,540 | 0.010%, 9/01/30 – NPFG Insured | No Opt. Call | A | 39,072,865 |
| 16,635 | 0.000%, 9/01/32 – NPFG Insured | No Opt. Call | A | 13,523,756 |
| 49,250 | 0.010%, 9/01/33 – NPFG Insured | No Opt. Call | A | 39,015,357 |
| | E-470 Public Highway Authority, Colorado, Toll Revenue Bonds, Series 2004A: | | | |
| 9,310 | 0.000%, 9/01/28 – NPFG Insured | No Opt. Call | A | 8,451,525 |
| 2,900 | 0.000%, 9/01/34 – NPFG Insured | No Opt. Call | A | 2,233,319 |
| 18,500 | 0.000%, 3/01/36 – NPFG Insured | No Opt. Call | A | 13,589,730 |
| 2,200 | Eagle River Water and Sanitation District, Eagle County, Colorado, Enterprise Wastewater | 12/29 at 100.00 | AA | 2,549,778 |
| | Revenue Bonds, Improvement Series 2020A, 4.000%, 12/01/49 – AGM Insured | | | |
| 1,200 | El Paso County School District 3, Widefield, Colorado, Certificates of Participation, | 12/31 at 100.00 | AA | 1,387,992 |
| | Recreation Facility Project, Series 2021, 4.000%, 12/01/46 – AGM Insured | | | |
| 2,000 | Firestone, Colorado, Water Enterprise Revenue Bones, Series 2020, 4.000%, 12/01/45 – | 12/30 at 100.00 | AA | 2,327,620 |
| | BAM Insured | | | |
| 1,755 | Flying Horse Metropolitan District 2, El Paso County, Colorado, General Obligation | 12/30 at 100.00 | A2 | 2,032,272 |
| | Limited Tax Bonds, Refunding & Improvement Series 2020A, 4.000%, 12/01/50 – AGM Insured | | | |
| 2,750 | Foothills Park and Recreation District, Jefferson County, Colorado, Lease Revenue Bonds, | 12/31 at 100.00 | AA– | 3,252,453 |
| | Certificates of Participation, Series 2021, 4.000%, 12/01/41 | | | |
| 2,875 | Johnstown, Colorado, Wastewater Revenue Bonds, Series 2021, 4.000%, 12/01/51 – | 12/31 at 100.00 | AA | 3,385,514 |
| | AGM Insured | | | |
77
| NEA | Nuveen AMT-Free Quality Municipal Income Fund |
| | Portfolio of Investments (continued) |
| | October 31, 2021 |
| Principal | | Optional Call | | |
| Amount (000) | Description (1) | Provisions (2) | Ratings (3) | Value |
| | Colorado (continued) | | | |
| $ 5,000 | Leyden Rock Metropolitan District, Arvada, Jefferson County, Colorado, General | 12/31 at 100.00 | A3 | $ 5,848,150 |
| | Obligation Limited Tax Bonds, Convertible to Unlimited Tax, Refunding & Improvement Series | | | |
| | 2021, 4.000%, 12/01/51 – AGM Insured | | | |
| 1,000 | Little Thompson Water District, Colorado, Water Revenue Bonds, Series 2020, 4.000%, 12/01/50 | 12/30 at 100.00 | AA– | 1,169,710 |
| 1,000 | Lorson Ranch Metropolitan District 2, El Paso County, Colorado, Limited Tax General | 12/26 at 100.00 | BBB+ | 1,154,990 |
| | Obligation Bonds, Series 2016, 5.000%, 12/01/36 | | | |
| 1,000 | Louisville, Boulder County, Colorado, General Obligation Bonds, Limited Tax, Series | 12/26 at 100.00 | AA+ | 1,129,150 |
| | 2017, 4.000%, 12/01/36 | | | |
| 1,200 | Morgan County Quality Water District, Morgan and Washington Counties, Colorado, Water | 12/30 at 100.00 | AA | 1,378,884 |
| | Revenue Bonds, Series 2020, 4.000%, 12/01/50 – AGM Insured | | | |
| 1,000 | North Pine Vistas Metropolitan District 3, Castle Pines, Douglas County, Colorado, | 12/31 at 100.00 | A2 | 1,135,410 |
| | Limited Tax General Obligation Bonds, Refunding & Improvement Senior Series 2021A, 4.000%, | | | |
| | 12/01/46 – AGM Insured | | | |
| 1,085 | North Range Metropolitan District 2, Adams County, Colorado , Limited Tax General | 12/22 at 103.00 | N/R | 1,144,230 |
| | Obligation Bonds, Refunding Special Revenue & Improvement Series 2017A, 5.750%, 12/01/47 | | | |
| 7,750 | Northern Colorado Water Conservancy District Building Corporation, Certificates of | 7/31 at 100.00 | AA+ | 9,000,850 |
| | Participation, Refunding Series 2021, 4.000%, 7/01/51 | | | |
| 1,220 | Overlook Metropolitan District, Parker, Douglas County, Colorado, General Obligation | 12/31 at 100.00 | Baa3 | 1,418,531 |
| | Limited Tax Bonds, Convertible to Unlimted Tax Refunding Series 2021A, 4.000%, 12/01/51 – | | | |
| | BAM Insured | | | |
| 1,224 | Palisade Metropolitan District 2, Broomfield County, Colorado, General Obligation | 12/21 at 103.00 | N/R | 1,262,017 |
| | Limited Tax Bonds, Series 2016, 4.375%, 12/01/31 | | | |
| 17,735 | Park Creek Metropolitan District, Colorado, Senior Limited Property Tax Supported | 12/25 at 100.00 | A | 19,999,759 |
| | Revenue Bonds, Refunding Series 2015A, 5.000%, 12/01/45 | | | |
| | Park Creek Metropolitan District, Colorado, Senior Limited Property Tax Supported | | | |
| | Revenue Bonds, Series 2019A: | | | |
| 3,040 | 4.000%, 12/01/37 – AGM Insured | 12/29 at 100.00 | A | 3,598,539 |
| 3,255 | 4.000%, 12/01/46 – AGM Insured | 12/29 at 100.00 | A | 3,782,245 |
| 600 | Pueblo Urban Renewal Authority, Colorado, Tax Increment Revenue Bonds, EVRAZ Project, | 12/30 at 100.00 | N/R | 670,764 |
| | Series 2021A, 4.750%, 12/01/45, 144A | | | |
| | Rampart Range Metropolitan District 1, Lone Tree, Colorado, Limited Tax Supported and | | | |
| | Special Revenue Bonds, Refunding & Improvement Series 2017: | | | |
| 8,765 | 5.000%, 12/01/42 | 12/27 at 100.00 | A2 | 10,498,366 |
| 3,600 | 5.000%, 12/01/47 | 12/27 at 100.00 | A2 | 4,284,000 |
| 3,250 | Thompson Crossing Metropolitan District 2, Johnstown, Larimer County, Colorado, General | 12/26 at 100.00 | AA | 3,787,030 |
| | Obligation Bonds, Limited Tax Convertible to Unlimited Tax, Series 2016B, 5.000%, 12/01/46 – | | | |
| | AGM Insured | | | |
| | Thompson Crossing Metropolitan District 6, Larimer County, Colorado, General Obligation | | | |
| | Limited Tax Bonds, Refunding & Improvement Convertible to Unlimited Tax Series 2020: | | | |
| 895 | 3.000%, 12/01/30, 144A | No Opt. Call | Ba2 | 923,130 |
| 1,300 | 5.000%, 12/01/44, 144A | 12/30 at 100.00 | Ba2 | 1,505,296 |
| 995 | Transport Metropolitan District 3, In the City of Aurora, Adams County, Colorado, | 3/26 at 103.00 | N/R | 1,096,878 |
| | General Obligation Limited Bonds, Series 2021A-1, 5.000%, 12/01/51 | | | |
| 1,000 | Triview Metropolitan District, El Paso County, Colorado, Water and Wastewater Enterprise | 12/28 at 100.00 | A3 | 1,067,360 |
| | Revenue Bonds, Green Series 2020, 3.250%, 12/01/45 – BAM Insured | | | |
| 4,000 | University of Colorado Hospital Authority, Colorado, Revenue Bonds, Series 2012A, | 11/22 at 100.00 | Aa3 | 4,186,840 |
| | 5.000%, 11/15/42 | | | |
| 14,500 | University of Colorado, Enterprise System Revenue Bonds, Series 2014A, 5.000%, 6/01/46 | 6/24 at 100.00 | Aa1 (4) | 16,246,235 |
| | (Pre-refunded 6/01/24) | | | |
| 2,500 | Vista Ridge Metropolitan District, In the Town of Erie, Weld County, Colorado, General | 12/26 at 100.00 | A2 | 2,767,900 |
| | Obligation Refunding Bonds, Series 2016A, 4.000%, 12/01/36 – BAM Insured | | | |
| 5,000 | Weld County School District 6, Greeley, Colorado, General Obligation Bonds, Series 2020, | 12/29 at 100.00 | AA | 6,291,150 |
| | 5.000%, 12/01/44 | | | |
78
| Principal | | Optional Call | | |
| Amount (000) | Description (1) | Provisions (2) | Ratings (3) | Value |
| | Colorado (continued) | | | |
| $ 2,175 | Weld County School District RE1, Colorado, General Obligation Bonds, Series 2017, | 12/26 at 100.00 | AA | $ 2,603,693 |
| | 5.000%, 12/15/30 | | | |
| 500 | Westerly Metropolitan District 4, Weld County, Colorado, General Obligation Limited Tax | 3/26 at 103.00 | N/R | 540,460 |
| | Bonds, Series 2021A-1, 5.000%, 12/01/50 | | | |
| 499,124 | Total Colorado | | | 521,687,802 |
| | Connecticut – 0.6% (0.4% of Total Investments) | | | |
| 1,650 | Connecticut Health and Educational Facilities Authority, Revenue Bonds, Fairfield | 7/26 at 100.00 | A– | 1,920,171 |
| | University, Series 2016Q-1, 5.000%, 7/01/46 | | | |
| 2,800 | Connecticut Health and Educational Facilities Authority, Revenue Bonds, McLean | 1/26 at 102.00 | BB+ | 3,077,452 |
| | Affiliates, Series 2020A, 5.000%, 1/01/55, 144A | | | |
| 7,165 | Connecticut Health and Educational Facilities Authority, Revenue Bonds, Quinnipiac | 7/25 at 100.00 | A– | 7,977,869 |
| | University, Refunding Series 2015L, 5.000%, 7/01/45 | | | |
| | Connecticut Health and Educational Facilities Authority, Revenue Bonds, Sacred Heart | | | |
| | University, Series 2017I-1: | | | |
| 500 | 5.000%, 7/01/34 | 7/27 at 100.00 | A3 | 593,485 |
| 2,425 | 5.000%, 7/01/42 | 7/27 at 100.00 | A3 | 2,841,542 |
| 7,075 | Connecticut State, Special Tax Obligation Bonds, Transportation Infrastructure Purposes, | 5/30 at 100.00 | AA– | 8,942,588 |
| | Series 2020A, 5.000%, 5/01/40 | | | |
| 3,285 | University of Connecticut, General Obligation Bonds, Series 2020A, 5.000%, 2/15/40 | 2/30 at 100.00 | A+ | 4,114,627 |
| 24,900 | Total Connecticut | | | 29,467,734 |
| | Delaware – 0.3% (0.2% of Total Investments) | | | |
| 3,350 | Delaware Health Facilities Authority, Revenue Bonds, Nanticoke Memorial Hospital, Series | 7/23 at 100.00 | AA– (4) | 3,604,097 |
| | 2013, 5.000%, 7/01/32 (Pre-refunded 7/01/23) | | | |
| 1,000 | Delaware Health Facilities Authority, Revenue Bonds, Beebe Medical Center Project, | 12/28 at 100.00 | BBB | 1,181,380 |
| | Series 2018, 5.000%, 6/01/48 | | | |
| 9,070 | Delaware Transportation Authority, Revenue Bonds, US 301 Project, Series 2015, | 6/25 at 100.00 | AA– | 10,303,248 |
| | 5.000%, 6/01/55 | | | |
| 13,420 | Total Delaware | | | 15,088,725 |
| | District of Columbia – 3.2% (2.1% of Total Investments) | | | |
| 1,250 | District of Columbia Student Dormitory Revenue Bonds, Provident Group – Howard | 10/22 at 100.00 | BB– | 1,289,187 |
| | Properties LLC Issue, Series 2013, 5.000%, 10/01/45 | | | |
| 107,000 | District of Columbia Tobacco Settlement Corporation, Tobacco Settlement Asset-Backed | 11/21 at 22.08 | N/R | 23,516,460 |
| | Bonds, Series 2006A, 0.000%, 6/15/46 | | | |
| | District of Columbia, Revenue Bonds, Georgetown University, Refunding Series 2017: | | | |
| 3,500 | 5.000%, 4/01/35 | 4/27 at 100.00 | A– | 4,136,580 |
| 60 | 5.000%, 4/01/36 (Pre-refunded 4/01/27) | 4/27 at 100.00 | N/R (4) | 73,174 |
| 3,440 | 5.000%, 4/01/36 | 4/27 at 100.00 | A– | 4,057,102 |
| | Metropolitan Washington Airports Authority, Virginia, Dulles Toll Road Revenue Bonds, | | | |
| | Dulles Metrorail & Capital improvement Projects, Refunding & Subordinate Lien Series 2019B: | | | |
| 12,455 | 4.000%, 10/01/44 | 10/29 at 100.00 | Baa2 | 14,004,900 |
| 5,000 | 5.000%, 10/01/47 | 10/29 at 100.00 | Baa2 | 6,048,900 |
| 13,710 | 4.000%, 10/01/49 | 10/29 at 100.00 | Baa2 | 15,323,530 |
| 11,960 | Metropolitan Washington Airports Authority, Virginia, Dulles Toll Road Revenue Bonds, | 4/22 at 100.00 | Baa1 | 12,189,154 |
| | Dulles Metrorail & Capital Improvement Projects, Refunding Second Senior Lien Series 2014A, | | | |
| | 5.000%, 10/01/53 | | | |
| 7,000 | Metropolitan Washington Airports Authority, Virginia, Dulles Toll Road Revenue Bonds, | No Opt. Call | A3 | 4,930,310 |
| | Dulles Metrorail & Capital improvement Projects, Second Senior Lien Series 2009B, 0.000%, | | | |
| | 10/01/36 – AGC Insured | | | |
| 32,000 | Metropolitan Washington Airports Authority, Virginia, Dulles Toll Road Revenue Bonds, | 10/26 at 100.00 | A3 | 40,285,760 |
| | Dulles Metrorail & Capital improvement Projects, Second Senior Lien Series 2009C, 6.500%, | | | |
| | 10/01/41 – AGC Insured | | | |
79
| NEA | Nuveen AMT-Free Quality Municipal Income Fund |
| | Portfolio of Investments (continued) |
| | October 31, 2021 |
| Principal | | Optional Call | | |
| Amount (000) | Description (1) | Provisions (2) | Ratings (3) | Value |
| | District of Columbia (continued) | | | |
| $ 18,000 | Metropolitan Washington Airports Authority, Virginia, Dulles Toll Road Revenue Bonds, | 10/28 at 100.00 | Baa1 | $ 23,705,640 |
| | Dulles Metrorail Capital Appreciation, Second Senior Lien Series 2010B, 6.500%, 10/01/44 | | | |
| 1,195 | Washington Metropolitan Area Transit Authority, District of Columbia, Dedicated Revenue | 7/30 at 100.00 | AA | 1,385,351 |
| | Bonds, Series 2020A, 4.000%, 7/15/45 | | | |
| 216,570 | Total District of Columbia | | | 150,946,048 |
| | Florida – 6.7% (4.3% of Total Investments) | | | |
| 2,800 | Bay County, Florida, Educational Facilities Revenue Refunding Bonds, Bay Haven Charter | 9/23 at 100.00 | BBB | 2,937,032 |
| | Academy, Inc. Project, Series 2016, 5.000%, 9/01/46 | | | |
| 1,425 | Central Florida Expressway Authority, Revenue Bonds, Refunding Senior Lien Series 2021, | 7/31 at 100.00 | AA | 1,703,431 |
| | 4.000%, 7/01/38 – AGM Insured | | | |
| 2,830 | City of Miami Beach, Florida, Stormwater Revenue Bonds, Series 2015, 5.000%, 9/01/41 | 9/25 at 100.00 | AA– | 3,246,774 |
| 1,585 | Cocoa, Florida, Water and Sewer System Revenue Bonds, Refunding Series 2003, 5.500%, | No Opt. Call | AA | 1,695,506 |
| | 10/01/23 – AMBAC Insured | | | |
| 3,570 | Collier County Educational Facilities Authority, Florida, Revenue Bonds, Hodges | 11/23 at 100.00 | N/R (4) | 3,971,089 |
| | University, Refunding Series 2013, 6.125%, 11/01/43 (Pre-refunded 11/01/23) | | | |
| 5,810 | Collier County, Florida, Tourist Development Tax Revenue Bonds, Series 2018, 4.000%, 10/01/43 | 10/28 at 100.00 | Aa3 | 6,428,881 |
| | Davie, Florida, Educational Facilities Revenue Bonds, Nova Southeastern University | | | |
| | Project, Series 2013A: | | | |
| 8,555 | 6.000%, 4/01/42 (Pre-refunded 4/01/23) | 4/23 at 100.00 | Baa1 (4) | 9,243,421 |
| 4,280 | 5.625%, 4/01/43 (Pre-refunded 4/01/23) | 4/23 at 100.00 | Baa1 (4) | 4,603,696 |
| 530 | Florida Development Finance Corporation, Educational Facilities Revenue Bonds, | 9/27 at 100.00 | N/R | 580,960 |
| | Renaissance Charter School, Inc. Projects, Series 2020C, 5.000%, 9/15/50, 144A | | | |
| | Florida Municipal Loan Council, Revenue Bonds, Series 2000B: | | | |
| 1,040 | 0.000%, 11/01/25 – NPFG Insured | No Opt. Call | Baa2 | 971,849 |
| 1,590 | 0.000%, 11/01/26 – NPFG Insured | No Opt. Call | Baa2 | 1,447,552 |
| 1,690 | Fort Myers, Florida, Utility System Revenue Bonds, Refunding Series 2019A, 4.000%, 10/01/44 | 10/28 at 100.00 | A+ | 1,929,169 |
| 15,000 | Hillsborough County Aviation Authority, Florida, Revenue Bonds, Tampa International | 10/28 at 100.00 | A+ | 18,383,100 |
| | Airport, Series 2018F, 5.000%, 10/01/48 (UB) (6) | | | |
| | Hillsborough County Aviation Authority, Florida, Revenue Bonds, Tampa International | | | |
| | Airport, Subordinate Lien Series 2015B: | | | |
| 5,730 | 5.000%, 10/01/40 | 10/24 at 100.00 | A+ | 6,433,701 |
| 12,885 | 5.000%, 10/01/44 | 10/24 at 100.00 | A+ | 14,467,407 |
| 13,145 | Hillsborough County Industrial Development Authority, Florida, Hospital Revenue Bonds, | 2/31 at 100.00 | Baa1 | 14,784,444 |
| | Florida Health Sciences Center Inc D/B/A Tampa General Hospital, Series 2020A, 4.000%, 8/01/55 | | | |
| 400 | Jacksonville, Florida, Better Jacksonville Sales Tax Revenue Bonds, Refunding Series | 10/22 at 100.00 | A+ | 417,228 |
| | 2012, 5.000%, 10/01/30 | | | |
| 2,500 | Lakeland, Florida, Hospital System Revenue Bonds, Lakeland Regional Health, Series 2015, | 11/24 at 100.00 | A2 | 2,802,500 |
| | 5.000%, 11/15/45 | | | |
| | Miami Beach Redevelopment Agency, Florida, Tax Increment Revenue Bonds, City | | | |
| | Center/Historic Convention Village, Series 2015A: | | | |
| 3,810 | 5.000%, 2/01/40 – AGM Insured | 2/24 at 100.00 | A1 | 4,161,282 |
| 19,145 | 5.000%, 2/01/44 – AGM Insured | 2/24 at 100.00 | A1 | 20,887,578 |
| | Miami Health Facilities Authority, Florida, Health Facilities Revenue Bonds, Miami | | | |
| | Jewish Health System Inc. Project, Series 2017: | | | |
| 205 | 5.000%, 7/01/32 | 7/27 at 100.00 | BB+ | 208,219 |
| 2,000 | 5.125%, 7/01/38 | 7/27 at 100.00 | BB+ | 2,035,920 |
| 5,035 | 5.125%, 7/01/46 | 7/27 at 100.00 | BB+ | 5,087,616 |
| 7,390 | Miami-Dade County Educational Facilities Authority, Florida, Revenue Bonds, University | 4/25 at 100.00 | A– | 8,285,151 |
| | of Miami, Series 2015A, 5.000%, 4/01/45 | | | |
| 17,925 | Miami-Dade County Educational Facilities Authority, Florida, Revenue Bonds, University | 4/28 at 100.00 | A– | 21,097,187 |
| | of Miami, Series 2018A, 5.000%, 4/01/53 | | | |
| 10,000 | Miami-Dade County Expressway Authority, Florida, Toll System Revenue Bonds, Series | 11/21 at 100.00 | BBB+ | 10,192,600 |
| | 2010A, 5.000%, 7/01/35 | | | |
80
| Principal | | Optional Call | | |
| Amount (000) | Description (1) | Provisions (2) | Ratings (3) | Value |
| | Florida (continued) | | | |
| $ 3,000 | Miami-Dade County Health Facilities Authority, 4.000%, 8/01/46 (WI/DD, Settling 11/10/21) | 8/31 at 100.00 | A | $ 3,426,930 |
| 1,210 | Miami-Dade County Industrial Development Authority, Florida, Revenue Bonds, Doral | 1/28 at 100.00 | BBB– | 1,370,131 |
| | Academy, Seres 2018, 5.000%, 1/15/37 | | | |
| 1,000 | Miami-Dade County, Florida, Aviation Revenue Bonds, Miami International Airport, | 10/24 at 100.00 | A– | 1,124,350 |
| | Refunding Series 2014B, 5.000%, 10/01/37 | | | |
| 1,500 | Miami-Dade County, Florida, Aviation Revenue Bonds, Refunding Series 2016A, 5.000%, 10/01/41 | 10/26 at 100.00 | A– | 1,773,510 |
| 4,715 | Miami-Dade County, Florida, Public Facilities Revenue Bonds, Jackson Health System, | 6/27 at 100.00 | Aa3 | 5,682,377 |
| | Series 2017, 5.000%, 6/01/38 | | | |
| 1,850 | Miami-Dade County, Florida, Special Obligation Bonds, Refunding Subordinate Series | 10/22 at 100.00 | A2 (4) | 1,931,418 |
| | 2012B, 5.000%, 10/01/37 (Pre-refunded 10/01/22) | | | |
| | Miami-Dade County, Florida, Transit System Sales Surtax Revenue Bonds, Refunding Series 2012: | | | |
| 5,500 | 5.000%, 7/01/31 (Pre-refunded 7/01/22) | 7/22 at 100.00 | A1 (4) | 5,677,210 |
| 3,000 | 5.000%, 7/01/42 (Pre-refunded 7/01/22) | 7/22 at 100.00 | A1 (4) | 3,096,660 |
| 7,000 | Miami-Dade County, Florida, Transit System Sales Surtax Revenue Bonds, Series 2018, | 7/28 at 100.00 | AA | 7,921,760 |
| | 4.000%, 7/01/48 | | | |
| 5,770 | Miami-Dade County, Florida, Water and Sewer System Revenue Bonds, Series 2013A, 5.000%, | 10/22 at 100.00 | A+ (4) | 6,023,938 |
| | 10/01/42 (Pre-refunded 10/01/22) | | | |
| 9,965 | Miami-Dade County, Florida, Water and Sewer System Revenue Bonds, Series 2019B, | 10/29 at 100.00 | A+ | 11,393,383 |
| | 4.000%, 10/01/49 | | | |
| 2,400 | New Smyrna Beach Utilities Commission, Florida, Utility System Revenue Certificates, | 4/30 at 100.00 | Aa2 | 2,790,024 |
| | Refunding Series 2020, 4.000%, 10/01/49 | | | |
| 750 | Orange County Health Facilities Authority, Florida, Hospital Revenue Bonds, Orlando | 4/22 at 100.00 | A2 (4) | 764,865 |
| | Health, Inc., Series 2012A, 5.000%, 10/01/42 (Pre-refunded 4/01/22) | | | |
| 1,095 | Osceola County, Florida, Transportation Revenue Bonds, Osceola Parkway, Refunding & | 10/29 at 91.18 | BBB– | 838,715 |
| | Improvement Capital Appreciation Series 2019A-2, 0.000%, 10/01/32 | | | |
| 5,045 | Osceola County, Florida, Transportation Revenue Bonds, Osceola Parkway, Refunding & | 10/29 at 100.00 | BBB– | 6,172,860 |
| | Improvement Series 2019A-1, 5.000%, 10/01/49 | | | |
| 10,120 | Palm Beach County Health Facilities Authority, Florida, Hospital Revenue Bonds, Baptist | 8/29 at 100.00 | A1 | 11,478,205 |
| | Health Systems of South Florida Obligated Group, Series 2019, 4.000%, 8/15/49 | | | |
| 5,680 | Palm Beach County Health Facilities Authority, Florida, Retirement Communities Revenue | 11/26 at 100.00 | A– | 6,683,031 |
| | Bonds, ACTS Retirement – Life Communities, Inc Obligated Group, Series 2016, 5.000%, 11/15/32 | | | |
| 255 | Palm Beach County Health Facilities Authority, Florida, Revenue Bonds, Sinai Residences | 6/22 at 102.00 | N/R | 267,447 |
| | of Boca Raton Project, Series 2014A, 7.250%, 6/01/34 | | | |
| 1,385 | Rivercrest Community Development District, Florida, Special Assessment Bonds, Series | 11/21 at 100.00 | A3 | 1,388,449 |
| | 2007, 5.000%, 5/01/30 – RAAI Insured | | | |
| 6,625 | South Broward Hospital District, Florida, Hospital Revenue Bonds, Refunding Series 2015, | 5/25 at 100.00 | Aa3 | 7,253,646 |
| | 4.000%, 5/01/33 | | | |
| | South Miami Health Facilities Authority, Florida, Hospital Revenue Bonds, Baptist Health | | | |
| | Systems of South Florida Obligated Group, Series 2017: | | | |
| 4,595 | 5.000%, 8/15/42 | 8/27 at 100.00 | A1 | 5,566,337 |
| 12,325 | 5.000%, 8/15/47 | 8/27 at 100.00 | A1 | 14,890,942 |
| 2,290 | Tampa Sports Authority, Hillsborough County, Florida, Sales Tax Payments Special Purpose | No Opt. Call | Baa2 | 2,528,618 |
| | Bonds, Stadium Project, Series 1995, 5.750%, 10/01/25 – NPFG Insured | | | |
| 3,300 | Tampa, Florida, Health System Revenue Bonds, Baycare Health System, Series 2012A, | 5/22 at 100.00 | Aa2 | 3,379,332 |
| | 5.000%, 11/15/33 | | | |
| 4,000 | Tampa, Florida, Health System Revenue Bonds, Baycare Health System, Series 2016A, | 5/26 at 100.00 | Aa2 | 4,438,040 |
| | 4.000%, 11/15/46 | | | |
| | Tampa, Florida, Revenue Bonds, H. Lee Moffitt Cancer Center and Research Institute, | | | |
| | Series 2020B: | | | |
| 345 | 4.000%, 7/01/39 | 7/30 at 100.00 | A– | 399,324 |
| 5,545 | 5.000%, 7/01/50 | 7/30 at 100.00 | A– | 6,802,051 |
| 9,720 | Tampa-Hillsborough County Expressway Authority, Florida, Revenue Bonds, Refunding Series | 7/22 at 100.00 | A2 (4) | 10,029,874 |
| | 2012B, 5.000%, 7/01/42 (Pre-refunded 7/01/22) | | | |
81
| NEA | Nuveen AMT-Free Quality Municipal Income Fund |
| | Portfolio of Investments (continued) |
| | October 31, 2021 |
| Principal | | Optional Call | | |
| Amount (000) | Description (1) | Provisions (2) | Ratings (3) | Value |
| | Florida (continued) | | | |
| $ 2,000 | Volusia County Educational Facilities Authority, Florida, Revenue Bonds, Embry-Riddle | 4/25 at 100.00 | A2 (4) | $ 2,302,620 |
| | Aeronautical University, Series 2015B, 5.000%, 10/15/45 (Pre-refunded 4/15/25) | | | |
| 1,000 | Volusia County Educational Facilities Authority, Florida, Revenue Bonds, Embry-Riddle | 10/29 at 100.00 | A2 | 1,142,390 |
| | Aeronautical University, Series 2020A, 4.000%, 10/15/39 | | | |
| 7,400 | Volusia County Educational Facilities Authority, Florida, Revenue Bonds, Stetson | 6/25 at 100.00 | A– | 8,218,366 |
| | University Inc. Project, Series 2015, 5.000%, 6/01/45 | | | |
| 281,260 | Total Florida | | | 314,760,096 |
| | Georgia – 3.7% (2.4% of Total Investments) | | | |
| 7,230 | Atlanta, Georgia, Airport General Revenue Bonds, Refunding Series 2012B, 5.000%, 1/01/42 | 1/22 at 100.00 | A+ | 7,286,828 |
| | Atlanta, Georgia, Water and Wastewater Revenue Bonds, Refunding Series 2015: | | | |
| 3,400 | 5.000%, 11/01/33 (Pre-refunded 5/01/25) | 5/25 at 100.00 | AA– (4) | 3,938,526 |
| 2,040 | 5.000%, 11/01/35 (Pre-refunded 5/01/25) | 5/25 at 100.00 | AA– (4) | 2,363,116 |
| 1,755 | Atlanta, Georgia, Water and Wastewater Revenue Bonds, Series 1999A, 5.500%, 11/01/22 – | No Opt. Call | AA– | 1,797,699 |
| | FGIC Insured | | | |
| 2,000 | Cobb County Kennestone Hospital Authority, Georgia, Revenue Anticipation Certificates, | 4/27 at 100.00 | A | 2,374,540 |
| | Wellstar Health System, Series 2017A, 5.000%, 4/01/42 | | | |
| 5,725 | Fayette County Hospital Authority, Georgia, Revenue Anticipation Certificates, Piedmont | 7/26 at 100.00 | A1 | 6,617,528 |
| | Healthcare, Inc. Project, Series 2016A, 5.000%, 7/01/46 | | | |
| | Fulton County Development Authority, Georgia, Hospital Revenue Bonds, Wellstar Health | | | |
| | System, Inc Project, Series 2017A: | | | |
| 4,330 | 5.000%, 4/01/42 | 4/27 at 100.00 | A | 5,140,879 |
| 13,670 | 5.000%, 4/01/47 | 4/27 at 100.00 | A | 16,150,421 |
| 5,485 | 4.000%, 4/01/50 | 4/30 at 100.00 | A | 6,198,379 |
| 29,000 | Fulton County Development Authority, Georgia, Revenue Bonds, Piedmont Healthcare, Inc. | 7/29 at 100.00 | A1 | 33,011,860 |
| | Project, Series 2019A, 4.000%, 7/01/49 | | | |
| 12,590 | Gainesville and Hall County Hospital Authority, Georgia, Revenue Anticipation | 2/25 at 100.00 | AA (4) | 14,643,051 |
| | Certificates, Northeast Georgia Health Services Inc., Series 2014A, 5.500%, 8/15/54 | | | |
| | (Pre-refunded 2/15/25) | | | |
| 7,500 | Gainesville and Hall County Hospital Authority, Georgia, Revenue Anticipation | 2/27 at 100.00 | AA | 8,866,800 |
| | Certificates, Northeast Georgia Health Services Inc., Series 2017B, 5.250%, 2/15/45 | | | |
| 3,565 | Georgia Municipal Electric Authority, Plant Vogtle Units 3 & 4 Project M Bonds, Series | 7/28 at 100.00 | BBB+ | 4,260,496 |
| | 2019A, 5.000%, 1/01/63 | | | |
| 3,500 | Georgia Ports Authority, Revenue Bonds, Series 2021, 4.000%, 7/01/46 (WI/DD, Settling 11/04/21) | 7/31 at 100.00 | AA | 4,130,840 |
| 11,000 | Griffin-Spalding County Hospital Authority, Georgia, Revenue Anticipation Certificates, | 4/27 at 100.00 | A | 12,251,140 |
| | Wellstar Health System Inc., Series 2017A, 4.000%, 4/01/42 | | | |
| 1,350 | Henry County Water and Sewerage Authority, Georgia, Revenue Bonds, Refunding Series | No Opt. Call | AA+ | 1,661,445 |
| | 2005, 5.250%, 2/01/27 – BHAC Insured | | | |
| | Main Street Natural Gas Inc., Georgia, Gas Supply Revenue Bonds, Series 2019A: | | | |
| 1,860 | 5.000%, 5/15/43 | 5/29 at 100.00 | A3 | 2,216,543 |
| 8,000 | 5.000%, 5/15/49 | No Opt. Call | A3 | 11,567,200 |
| 7,905 | Municipal Electric Authority of Georgia, Plant Vogtle Units 3 & 4 Project J Bonds, | 7/25 at 100.00 | Baa1 | 8,920,239 |
| | Series 2015A, 5.000%, 7/01/60 | | | |
| | Municipal Electric Authority of Georgia, Plant Vogtle Units 3 & 4 Project M Bonds, | | | |
| | Series 2021A: | | | |
| 1,000 | 5.000%, 1/01/56 | 1/30 at 100.00 | BBB+ | 1,204,690 |
| 1,675 | 5.000%, 1/01/62 – AGM Insured | 1/30 at 100.00 | BBB+ | 2,030,368 |
| 8,230 | Private Colleges and Universities Authority, Georgia, Revenue Bonds, Mercer University, | 10/25 at 100.00 | Baa1 | 9,275,045 |
| | Series 2015, 5.000%, 10/01/40 | | | |
| 7,000 | Rockdale County Development Authority, Georgia, Revenue Bonds, Piedmont Healthcare, Inc. | 7/29 at 100.00 | A1 | 8,047,550 |
| | Project, Series 2019A, 4.000%, 7/01/44 | | | |
| 675 | Valdosta and Lowndes County Hospital Authority, Georgia, Revenue Anticipation | 10/29 at 100.00 | AA– | 792,275 |
| | Certificates, Refunding Series 2019A, 4.000%, 10/01/38 | | | |
| 150,485 | Total Georgia | | | 174,747,458 |
82
| Principal | | Optional Call | | |
| Amount (000) | Description (1) | Provisions (2) | Ratings (3) | Value |
| | Guam – 0.1% (0.1% of Total Investments) | | | |
| $ 4,060 | Guam Government Waterworks Authority, Water and Wastewater System Revenue Bonds, Series | 7/23 at 100.00 | Baa2 (4) | $ 4,401,568 |
| | 2013, 5.500%, 7/01/43 (Pre-refunded 7/01/23) | | | |
| | Hawaii – 0.0% (0.0% of Total Investments) | | | |
| 275 | Hawaii Department of Budget and Finance, Special Purpose Revenue Bonds, Hawaii Pacific | 7/23 at 100.00 | BB | 294,616 |
| | University, Series 2013A, 6.875%, 7/01/43 | | | |
| | Idaho – 0.1% (0.1% of Total Investments) | | | |
| 2,110 | Idaho Health Facilities Authority, Revenue Bonds, Saint Luke’s Health System Project, | 3/22 at 100.00 | A3 | 2,138,084 |
| | Series 2012A, 5.000%, 3/01/47 | | | |
| 2,420 | Idaho Housing and Finance Association, GNMA Housing Revenue Refunding Bonds, Wedgewood | 11/21 at 101.00 | Aaa | 2,455,574 |
| | Terrace Project, Series 2002A-1, 7.250%, 3/20/37 | | | |
| 4,530 | Total Idaho | | | 4,593,658 |
| | Illinois – 15.7% (10.1% of Total Investments) | | | |
| | Board of Regents of Illinois State University, Auxiliary Facilities System Revenue | | | |
| | Bonds, Series 2018A: | | | |
| 1,000 | 5.000%, 4/01/34 – AGM Insured | 4/28 at 100.00 | A2 | 1,216,680 |
| 285 | 5.000%, 4/01/37 – AGM Insured | 4/28 at 100.00 | A2 | 343,647 |
| 1,370 | 5.000%, 4/01/38 – AGM Insured | 4/28 at 100.00 | A2 | 1,649,220 |
| | Bolingbrook, Will and DuPage Counties, Illinois, General Obligation Bonds, Refunding | | | |
| | Series 2002B: | | | |
| 4,595 | 0.000%, 1/01/32 – FGIC Insured | No Opt. Call | A2 | 3,646,730 |
| 4,000 | 0.010%, 1/01/34 – FGIC Insured | No Opt. Call | A2 | 2,988,920 |
| 11,000 | Chicago Board of Education, Illinois, Dedicated Capital Improvement Tax Revenue Bonds, | 4/27 at 100.00 | A– | 13,239,490 |
| | Series 2016, 6.000%, 4/01/46 | | | |
| 2,940 | Chicago Board of Education, Illinois, General Obligation Bonds, Dedicated Revenues | 12/21 at 100.00 | Ba3 | 2,949,026 |
| | Series 2011A, 5.000%, 12/01/41 | | | |
| 5,000 | Chicago Board of Education, Illinois, General Obligation Bonds, Dedicated Revenues, | 12/27 at 100.00 | BB | 5,914,750 |
| | Refunding Series 2017G, 5.000%, 12/01/34 | | | |
| 6,920 | Chicago Board of Education, Illinois, General Obligation Bonds, Dedicated Revenues, | 12/28 at 100.00 | BB | 8,200,823 |
| | Refunding Series 2018D, 5.000%, 12/01/46 | | | |
| 11,450 | Chicago Board of Education, Illinois, General Obligation Bonds, Dedicated Revenues, | 12/25 at 100.00 | BB | 13,710,115 |
| | Series 2016A, 7.000%, 12/01/44 | | | |
| 1,785 | Chicago Board of Education, Illinois, General Obligation Bonds, Dedicated Revenues, | 12/26 at 100.00 | BB | 2,171,542 |
| | Series 2016B, 6.500%, 12/01/46 | | | |
| 23,535 | Chicago Board of Education, Illinois, General Obligation Bonds, Dedicated Revenues, | 12/27 at 100.00 | BB | 30,168,575 |
| | Series 2017A, 7.000%, 12/01/46, 144A | | | |
| | Chicago Board of Education, Illinois, General Obligation Bonds, Dedicated Revenues, | | | |
| | Series 2021A: | | | |
| 1,500 | 5.000%, 12/01/38 | 12/30 at 100.00 | BB | 1,835,865 |
| 1,750 | 5.000%, 12/01/40 | 12/30 at 100.00 | BB | 2,131,973 |
| 1,000 | Chicago Board of Education, Illinois, Unlimited Tax General Obligation Bonds, Dedicated | No Opt. Call | BB | 1,151,720 |
| | Tax Revenues, Series 1999A, 5.500%, 12/01/26 – NPFG Insured | | | |
| 3,225 | Chicago Transit Authority, Illinois, Sales Tax Receipts Revenue Bonds, Second Lien | 12/29 at 100.00 | A+ | 3,614,032 |
| | Series 2020A, 4.000%, 12/01/55 | | | |
| 5,785 | Chicago Transit Authority, Illinois, Sales Tax Receipts Revenue Bonds, Series 2011, | 12/21 at 100.00 | A2 (4) | 5,808,776 |
| | 5.250%, 12/01/40 (Pre-refunded 12/01/21) | | | |
| 9,285 | Chicago Transit Authority, Illinois, Sales Tax Receipts Revenue Bonds, Series 2014, | 12/24 at 100.00 | AA | 10,535,411 |
| | 5.250%, 12/01/49 | | | |
| | Chicago, Illinois, General Obligation Bonds, City Colleges, Series 1999: | | | |
| 32,670 | 0.000%, 1/01/22 – FGIC Insured | No Opt. Call | BBB– | 32,637,003 |
| 22,670 | 0.000%, 1/01/25 – FGIC Insured | No Opt. Call | BBB– | 21,905,114 |
| 10,565 | Chicago, Illinois, General Obligation Bonds, Project & Refunding Series 2017A, 6.000%, 1/01/38 | 1/27 at 100.00 | BBB– | 12,831,615 |
| 4,000 | Chicago, Illinois, General Obligation Bonds, Series 2019A, 5.000%, 1/01/40 | 1/29 at 100.00 | BBB– | 4,727,320 |
83
| NEA | Nuveen AMT-Free Quality Municipal Income Fund |
| | Portfolio of Investments (continued) |
| | October 31, 2021 |
| Principal | | Optional Call | | |
| Amount (000) | Description (1) | Provisions (2) | Ratings (3) | Value |
| | Illinois (continued) | | | |
| $ 5,000 | Chicago, Illinois, Sales Tax Revenue Bonds, Series 2011A, 5.000%, 1/01/41 (Pre-refunded 1/01/22) | 1/22 at 100.00 | N/R (4) | $ 5,039,750 |
| 5,000 | Cook County Community College District 508, Illinois, General Obligation Bonds, Chicago | 12/23 at 100.00 | BBB | 5,331,550 |
| | City Colleges, Series 2013, 5.250%, 12/01/43 | | | |
| 4,500 | Cook County Community College District 508, Illinois, General Obligation Bonds, Chicago | 12/27 at 100.00 | A+ | 5,191,830 |
| | City Colleges, Series 2017, 5.000%, 12/01/47 | | | |
| 3,500 | Evanston, Cook County, Illinois, General Obligation Bonds, Corporate Purpose Series | 6/28 at 100.00 | Aa2 | 3,940,335 |
| | 2018A, 4.000%, 12/01/43 | | | |
| | Illinois Educational Facilities Authority, Revenue Bonds, Field Museum of Natural | | | |
| | History, Series 2002.RMKT: | | | |
| 2,750 | 3.900%, 11/01/36 | 11/27 at 102.00 | A | 3,135,770 |
| 5,265 | 5.500%, 11/01/36 | 11/23 at 100.00 | A | 5,789,183 |
| 3,215 | Illinois Finance Authority, Health Services Facility Lease Revenue Bonds, Provident | 10/30 at 100.00 | BBB+ | 3,562,381 |
| | Group – UIC Surgery Center, LLC – University of Illinois Health Services Facility Project, | | | |
| | Series 2020, 4.000%, 10/01/55 | | | |
| 5,020 | Illinois Finance Authority, Revenue Bonds, Advocate Health Care Network, Series 2012, | 6/22 at 100.00 | Aa3 (4) | 5,160,761 |
| | 5.000%, 6/01/42 (Pre-refunded 6/01/22) | | | |
| | Illinois Finance Authority, Revenue Bonds, Ascension Health/fkaPresence Health Network, | | | |
| | Series 2016C: | | | |
| 3,500 | 5.000%, 2/15/32 | 2/27 at 100.00 | Aa2 | 4,198,740 |
| 55 | 4.000%, 2/15/41 (Pre-refunded 2/15/27) | 2/27 at 100.00 | N/R (4) | 63,823 |
| 1,200 | 4.000%, 2/15/41 (Pre-refunded 2/15/27) | 2/27 at 100.00 | N/R (4) | 1,392,492 |
| 25,880 | 4.000%, 2/15/41 | 2/27 at 100.00 | Aa2 | 28,987,153 |
| 1,000 | 5.000%, 2/15/41 | 2/27 at 100.00 | Aa2 | 1,187,810 |
| 2,000 | Illinois Finance Authority, Revenue Bonds, Bradley University, Refunding Series 2021A, | 8/31 at 100.00 | BBB+ | 2,242,600 |
| | 4.000%, 8/01/46 | | | |
| 4,200 | Illinois Finance Authority, Revenue Bonds, Centegra Health System, Series 2012, 5.000%, | 9/22 at 100.00 | AA+ (4) | 4,367,454 |
| | 9/01/38 (Pre-refunded 9/01/22) | | | |
| | Illinois Finance Authority, Revenue Bonds, Centegra Health System, Series 2014A: | | | |
| 8,750 | 5.000%, 9/01/39 (Pre-refunded 9/01/24) | 9/24 at 100.00 | AA+ (4) | 9,885,837 |
| 11,030 | 5.000%, 9/01/42 (Pre-refunded 9/01/24) | 9/24 at 100.00 | AA+ (4) | 12,461,804 |
| 2,910 | Illinois Finance Authority, Revenue Bonds, Ingalls Health System, Series 2013, 5.000%, | 5/22 at 100.00 | A1 (4) | 2,983,332 |
| | 5/15/43 (Pre-refunded 5/15/22) | | | |
| 16,165 | Illinois Finance Authority, Revenue Bonds, Mercy Health Corporation, Series 2016, | 6/26 at 100.00 | A3 | 18,904,967 |
| | 5.000%, 12/01/40 | | | |
| 1,100 | Illinois Finance Authority, Revenue Bonds, Northwestern Memorial Healthcare, Tender | 8/22 at 100.00 | Aa2 | 1,266,815 |
| | Option Bond Trust 2015-XF0076, 17.967%, 8/15/37, 144A (IF) | | | |
| 13,540 | Illinois Finance Authority, Revenue Bonds, OSF Healthcare System, Series 2015A, | 11/25 at 100.00 | A3 | 15,591,039 |
| | 5.000%, 11/15/45 | | | |
| 2,215 | Illinois Finance Authority, Revenue Bonds, Rehabilitation Institute of Chicago, Series | 7/23 at 100.00 | A– | 2,360,969 |
| | 2013A, 6.000%, 7/01/43 | | | |
| 4,135 | Illinois Finance Authority, Revenue Bonds, Silver Cross Hospital and Medical Centers, | 8/25 at 100.00 | A3 | 4,728,248 |
| | Refunding Series 2015C, 5.000%, 8/15/44 | | | |
| 5,410 | Illinois Finance Authority, Revenue Bonds, Southern Illinois Healthcare Enterprises, | 3/27 at 100.00 | A+ | 6,331,702 |
| | Inc., Series 2017A, 5.000%, 3/01/47 | | | |
| 8,760 | Illinois Finance Authority, Revenue Bonds, The Carle Foundation, Fixed Period Series | 8/31 at 100.00 | AA– | 10,193,574 |
| | 2021A, 4.000%, 8/15/48 | | | |
| | Illinois State, General Obligation Bonds, April Series 2014: | | | |
| 2,500 | 5.000%, 4/01/31 | 4/24 at 100.00 | BBB– | 2,741,650 |
| 3,000 | 5.000%, 4/01/38 | 4/24 at 100.00 | BBB– | 3,277,170 |
| | Illinois State, General Obligation Bonds, December Series 2017A: | | | |
| 5,000 | 5.000%, 12/01/34 | 12/27 at 100.00 | BBB– | 5,851,300 |
| 1,175 | 5.000%, 12/01/35 | 12/27 at 100.00 | BBB– | 1,372,882 |
| 5,420 | 5.000%, 12/01/39 | 12/27 at 100.00 | BBB– | 6,279,937 |
84
| Principal | | Optional Call | | |
| Amount (000) | Description (1) | Provisions (2) | Ratings (3) | Value |
| | Illinois (continued) | | | |
| $ 1,600 | Illinois State, General Obligation Bonds, February Series 2014, 5.250%, 2/01/32 | 2/24 at 100.00 | BBB– | $ 1,754,832 |
| 1,750 | Illinois State, General Obligation Bonds, January Series 2016, 5.000%, 1/01/32 | 1/26 at 100.00 | BBB– | 2,019,273 |
| 3,565 | Illinois State, General Obligation Bonds, June Series 2016, 5.000%, 6/01/26 | No Opt. Call | BBB– | 4,170,943 |
| | Illinois State, General Obligation Bonds, May Series 2018A: | | | |
| 17,000 | 6.000%, 5/01/26 | No Opt. Call | BBB– | 20,598,900 |
| 4,485 | 6.000%, 5/01/27 | No Opt. Call | BBB– | 5,570,998 |
| | Illinois State, General Obligation Bonds, May Series 2020: | | | |
| 1,115 | 5.500%, 5/01/30 | No Opt. Call | BBB– | 1,426,576 |
| 5,305 | 5.500%, 5/01/39 | 5/30 at 100.00 | BBB– | 6,585,998 |
| 2,515 | Illinois State, General Obligation Bonds, November Series 2016, 5.000%, 11/01/23 | No Opt. Call | BBB– | 2,736,898 |
| 9,710 | Illinois State, General Obligation Bonds, October Series 2016, 5.000%, 2/01/27 | No Opt. Call | BBB– | 11,511,982 |
| 2,500 | Illinois State, General Obligation Bonds, Series 2012A, 5.000%, 3/01/25 | 3/22 at 100.00 | BBB– | 2,537,900 |
| 2,035 | Illinois State, General Obligation Bonds, Series 2013, 5.500%, 7/01/38 | 7/23 at 100.00 | BBB– | 2,188,866 |
| 5,030 | Illinois Toll Highway Authority, Toll Highway Revenue Bonds, Senior Lien Series 2013A, | 1/23 at 100.00 | A1 | 5,294,477 |
| | 5.000%, 1/01/38 | | | |
| | Illinois Toll Highway Authority, Toll Highway Revenue Bonds, Senior Lien Series 2014B: | | | |
| 8,000 | 5.000%, 1/01/38 | 1/24 at 100.00 | A1 | 8,762,720 |
| 6,500 | 5.000%, 1/01/39 | 1/24 at 100.00 | A1 | 7,115,225 |
| 10,040 | Illinois Toll Highway Authority, Toll Highway Revenue Bonds, Senior Lien Series 2015A, | 7/25 at 100.00 | A1 | 11,481,644 |
| | 5.000%, 1/01/40 | | | |
| 8,890 | Illinois Toll Highway Authority, Toll Highway Revenue Bonds, Senior Lien Series 2015B, | 1/26 at 100.00 | A1 | 10,287,330 |
| | 5.000%, 1/01/40 | | | |
| 10,000 | Illinois Toll Highway Authority, Toll Highway Revenue Bonds, Senior Lien Series 2017A, | 1/28 at 100.00 | A1 | 11,951,400 |
| | 5.000%, 1/01/42 | | | |
| 13,185 | Illinois Toll Highway Authority, Toll Highway Revenue Bonds, Senior Lien Series 2020A, | 1/31 at 100.00 | A1 | 16,485,865 |
| | 5.000%, 1/01/45 | | | |
| 1,115 | Illinois Toll Highway Authority, Toll Highway Revenue Bonds, Tender Option Bond Trust | 1/23 at 100.00 | A1 | 1,349,786 |
| | 2015-XF0052, 17.687%, 1/01/38, 144A (IF) | | | |
| 11,050 | Illinois, General Obligation Bonds, Illinois FIRST Program, Series 2001, 6.000%, | No Opt. Call | BBB– | 13,146,074 |
| | 11/01/26 – FGIC Insured | | | |
| 1,740 | Lake County Community Unit School District 60, Waukegan, Illinois, General Obligation | No Opt. Call | A2 | 1,740,000 |
| | Refunding Bonds, Series 2001B, 0.000%, 11/01/21 – AGM Insured | | | |
| 3,125 | Macon County School District 61 Decatur, Illinois, General Obligation Bonds, Alternate | 1/27 at 100.00 | A3 | 3,437,125 |
| | Revenue Source Refunding School Series 2020C, 4.000%, 1/01/45 – AGM Insured | | | |
| 17,945 | McHenry and Kane Counties Community Consolidated School District 158, Huntley, Illinois, | No Opt. Call | Baa2 | 17,925,081 |
| | General Obligation Bonds, Series 2003, 0.000%, 1/01/22 – FGIC Insured | | | |
| 5,000 | Metropolitan Pier and Exposition Authority, Illinois, McCormick Place Expansion Project | 6/22 at 100.00 | BB+ | 5,145,500 |
| | Bonds, Refunding Series 2012B, 5.000%, 6/15/52 | | | |
| 2,350 | Metropolitan Pier and Exposition Authority, Illinois, McCormick Place Expansion Project | 12/29 at 100.00 | BB+ | 2,777,324 |
| | Bonds, Refunding Series 2020A, 5.000%, 6/15/50 | | | |
| 8,800 | Metropolitan Pier and Exposition Authority, Illinois, McCormick Place Expansion Project | 12/25 at 100.00 | BB+ | 10,035,696 |
| | Bonds, Series 2015A, 5.500%, 6/15/53 | | | |
| 4,750 | Metropolitan Pier and Exposition Authority, Illinois, McCormick Place Expansion Project | 12/27 at 100.00 | BB+ | 5,489,813 |
| | Bonds, Series 2017A, 5.000%, 6/15/57 | | | |
| | Metropolitan Pier and Exposition Authority, Illinois, Revenue Bonds, McCormick Place | | | |
| | Expansion Project, Capital Appreciation Refunding Series 2010B-1: | | | |
| 33,000 | 0.000%, 6/15/45 – AGM Insured | No Opt. Call | BB+ | 17,164,950 |
| 5,355 | 0.010%, 6/15/46 – AGM Insured | No Opt. Call | BB+ | 2,698,063 |
| | Metropolitan Pier and Exposition Authority, Illinois, Revenue Bonds, McCormick Place | | | |
| | Expansion Project, Refunding Series 1996A: | | | |
| 5,010 | 0.000%, 12/15/21 – NPFG Insured (ETM) | No Opt. Call | BB+ (4) | 5,008,046 |
| 23,920 | 0.000%, 12/15/22 – NPFG Insured | No Opt. Call | BB+ | 23,738,686 |
| 13,350 | 0.000%, 12/15/24 – NPFG Insured | No Opt. Call | BB+ | 12,936,684 |
85
| NEA | Nuveen AMT-Free Quality Municipal Income Fund |
| | Portfolio of Investments (continued) |
| | October 31, 2021 |
| Principal | | Optional Call | | |
| Amount (000) | Description (1) | Provisions (2) | Ratings (3) | Value |
| | Illinois (continued) | | | |
| | Metropolitan Pier and Exposition Authority, Illinois, Revenue Bonds, McCormick Place | | | |
| | Expansion Project, Refunding Series 1998A: | | | |
| $ 410 | 5.500%, 12/15/23 – NPFG Insured (ETM) | No Opt. Call | N/R (4) | $ 417,880 |
| 2,025 | 5.500%, 12/15/23 – FGIC Insured (ETM) | No Opt. Call | BB+ (4) | 2,127,951 |
| 2,170 | 5.500%, 12/15/23 – NPFG Insured | No Opt. Call | BB+ | 2,355,730 |
| | Metropolitan Pier and Exposition Authority, Illinois, Revenue Bonds, McCormick Place | | | |
| | Expansion Project, Series 2002A: | | | |
| 1,420 | 5.700%, 6/15/25 (Pre-refunded 6/15/22) | 6/22 at 101.00 | N/R (4) | 1,481,642 |
| 5,080 | 5.700%, 6/15/25 | 6/22 at 101.00 | BB+ | 5,300,523 |
| 8,000 | 5.750%, 6/15/26 – NPFG Insured | 6/22 at 101.00 | BB+ | 8,349,760 |
| 1,115 | 5.750%, 6/15/27 | 6/22 at 101.00 | BB+ | 1,163,748 |
| 4,610 | 5.750%, 6/15/27 (Pre-refunded 6/15/22) | 6/22 at 101.00 | N/R (4) | 4,811,549 |
| 195 | 0.000%, 6/15/30 (ETM) | No Opt. Call | N/R (4) | 170,996 |
| 3,505 | 0.000%, 6/15/30 | No Opt. Call | BBB+ | 2,941,992 |
| 28,000 | 0.000%, 12/15/35 – AGM Insured | No Opt. Call | BB+ | 20,202,560 |
| 3,280 | 0.000%, 6/15/37 – NPFG Insured | No Opt. Call | BB+ | 2,214,787 |
| 11,715 | 0.000%, 12/15/38 – NPFG Insured | No Opt. Call | BB+ | 7,541,883 |
| 6,700 | Metropolitan Pier and Exposition Authority, Illinois, Revenue Bonds, McCormick Place | No Opt. Call | AA+ (4) | 7,882,282 |
| | Hospitality Facility, Series 1996A, 7.000%, 7/01/26 (ETM) | | | |
| 17,865 | Regional Transportation Authority, Cook, DuPage, Kane, Lake, McHenry and Will Counties, | No Opt. Call | A1 | 18,780,581 |
| | Illinois, General Obligation Bonds, Series 1999, 5.750%, 6/01/23 – AGM Insured | | | |
| 2,300 | Regional Transportation Authority, Cook, DuPage, Kane, Lake, McHenry and Will Counties, | No Opt. Call | A1 | 3,042,555 |
| | Illinois, General Obligation Bonds, Series 2000A, 6.500%, 7/01/30 – NPFG Insured | | | |
| 4,125 | Southwestern Illinois Development Authority, Health Facility Revenue Bonds, Memorial | 11/23 at 100.00 | N/R (4) | 4,715,948 |
| | Group, Inc., Series 2013, 7.625%, 11/01/48 (Pre-refunded 11/01/23) | | | |
| | Springfield, Illinois, Electric Revenue Bonds, Refunding Senior Lien Series 2015: | | | |
| 2,250 | 5.000%, 3/01/29 | 3/25 at 100.00 | A3 | 2,562,750 |
| 7,000 | 5.000%, 3/01/31 | 3/25 at 100.00 | A3 | 7,970,550 |
| 2,000 | University of Illinois, Health Services Facilities System Revenue Bonds, Series 2013, | 10/23 at 100.00 | Baa1 | 2,195,340 |
| | 6.250%, 10/01/38 | | | |
| 4,810 | Will County Community High School District 210 Lincoln-Way, Illinois, General Obligation | No Opt. Call | A2 | 4,766,373 |
| | Bonds, Series 2006, 0.000%, 1/01/23 – AGM Insured | | | |
| | Will County Community Unit School District 201-U Crete-Monee, Illinois, General | | | |
| | Obligation Bonds, Capital Appreciation Series 2004: | | | |
| 165 | 0.000%, 11/01/22 – NPFG Insured (ETM) | No Opt. Call | N/R (4) | 164,457 |
| 780 | 0.000%, 11/01/22 – NPFG Insured (ETM) | No Opt. Call | Baa2 (4) | 776,662 |
| 2,385 | 0.000%, 11/01/22 – NPFG Insured | No Opt. Call | A | 2,369,092 |
| 701,165 | Total Illinois | | | 736,583,451 |
| | Indiana – 2.8% (1.8% of Total Investments) | | | |
| 6,000 | Indiana Finance Authority, Educational Facilities Revenue Bonds, Valparaiso University | 10/24 at 100.00 | Baa1 | 6,581,520 |
| | Project, Series 2014, 5.000%, 10/01/44 | | | |
| | Indiana Finance Authority, Hospital Revenue Bonds, Community Health Network Project, | | | |
| | Series 2012A: | | | |
| 5,000 | 4.000%, 5/01/35 (Pre-refunded 5/01/23) | 5/23 at 100.00 | A (4) | 5,278,600 |
| 5,420 | 5.000%, 5/01/42 (Pre-refunded 5/01/23) | 5/23 at 100.00 | A (4) | 5,802,923 |
| 10,000 | Indiana Finance Authority, Hospital Revenue Bonds, Indiana University Health Obligation | 12/29 at 100.00 | AA | 11,428,700 |
| | Group, Fixed Rate Series 2019A, 4.000%, 12/01/49 | | | |
| | Indiana Finance Authority, Hospital Revenue Bonds, Indiana University Health Obligation | | | |
| | Group, Refunding 2015A: | | | |
| 1,875 | 4.000%, 12/01/40 | 6/25 at 100.00 | AA | 2,069,775 |
| 3,400 | 5.000%, 12/01/40 | 6/25 at 100.00 | AA | 3,877,768 |
| 1,150 | Indiana Finance Authority, Hospital Revenue Bonds, Marion General Hospital Project, | 7/30 at 100.00 | A | 1,303,583 |
| | Series 2020A, 4.000%, 7/01/50 | | | |
86
| Principal | | Optional Call | | |
| Amount (000) | Description (1) | Provisions (2) | Ratings (3) | Value |
| | Indiana (continued) | | | |
| $ 8,630 | Indiana Finance Authority, Revenue Bonds, Community Foundation of Northwest Indiana | 3/22 at 100.00 | AA– (4) | $ 8,766,699 |
| | Obligated Group, Series 2012, 5.000%, 3/01/41 (Pre-refunded 3/01/22) | | | |
| 11,000 | Indiana Finance Authority, Wastewater Utility Revenue Bonds, CWA Authority Project, | 10/26 at 100.00 | A+ | 12,923,240 |
| | First Lien Green Series 2016A, 5.000%, 10/01/46 | | | |
| 4,200 | Indiana Finance Authority, Wastewater Utility Revenue Bonds, CWA Authority Project, | 10/30 at 100.00 | Aa3 | 4,913,832 |
| | First Lien Green Series 2020A, 4.000%, 10/01/45 | | | |
| 3,000 | Indiana Finance Authority, Wastewater Utility Revenue Bonds, CWA Authority Project, | 10/31 at 100.00 | A1 | 3,603,780 |
| | Refunding First Lien Series 2021-1, 4.000%, 10/01/40 | | | |
| 5,000 | Indiana Finance Authority, Wastewater Utility Revenue Bonds, CWA Authority Project, | 10/22 at 100.00 | Aa3 | 5,206,250 |
| | Series 2012A, 5.000%, 10/01/37 | | | |
| 13,215 | Indiana Finance Authority, Wastewater Utility Revenue Bonds, CWA Authority Project, | 10/24 at 100.00 | A+ | 14,740,143 |
| | Series 2014A, 5.000%, 10/01/44 | | | |
| 5,130 | Indiana Finance Authority, Water Utility Revenue Bonds, Citizens Energy Group Project, | 10/26 at 100.00 | A+ | 6,026,929 |
| | First Lien Series 2016A, 5.000%, 10/01/46 | | | |
| 1,255 | Indiana Health Facility Financing Authority, Revenue Bonds, Ancilla Systems Inc. | 11/21 at 100.00 | N/R (4) | 1,259,895 |
| | Obligated Group, Series 1997, 5.250%, 7/01/22 – NPFG Insured (ETM) | | | |
| 14,100 | Indiana Municipal Power Agency Power Supply System Revenue Bonds, Refunding Series | 7/26 at 100.00 | A+ | 16,680,300 |
| | 2016A, 5.000%, 1/01/42 | | | |
| | Indianapolis Local Public Improvement Bond Bank, Indiana, Series 1999E: | | | |
| 9,255 | 0.000%, 2/01/25 – AMBAC Insured | No Opt. Call | AA– | 9,052,871 |
| 9,560 | 0.000%, 2/01/26 – AMBAC Insured | No Opt. Call | AA– | 9,207,618 |
| 1,580 | Zionsville Community Schools Building Corporation, Boone County, Indiana, First Mortgage | No Opt. Call | A2 | 1,450,819 |
| | Bonds, Series 2005Z, 0.000%, 1/15/28 – AGM Insured | | | |
| 118,770 | Total Indiana | | | 130,175,245 |
| | Iowa – 0.9% (0.6% of Total Investments) | | | |
| 3,275 | Iowa Finance Authority Senior Living Facilities Revenue Bonds, Sunrise Retirement | 9/28 at 102.00 | N/R | 3,451,621 |
| | Community Project, Refunding Series 2021, 5.000%, 9/01/51 | | | |
| 16,130 | Iowa Finance Authority, Iowa, Midwestern Disaster Area Revenue Bonds, Iowa Fertilizer | 12/23 at 100.00 | B+ | 17,384,914 |
| | Company Project, Series 2013, 5.250%, 12/01/25 | | | |
| 2,690 | Iowa Finance Authority, Iowa, Midwestern Disaster Area Revenue Bonds, Iowa Fertilizer | 12/22 at 105.00 | BB– | 2,927,231 |
| | Company Project, Series 2018B, 5.250%, 12/01/50 (Mandatory Put 12/01/37) | | | |
| 3,085 | Iowa Finance Authority, Senior Housing Revenue Bonds, Northcrest Inc. Project, Series | 3/24 at 103.00 | BB+ | 3,314,925 |
| | 2018A, 5.000%, 3/01/48 | | | |
| 8,265 | Iowa Tobacco Settlement Authority, Tobacco Settlement Asset-Backed Bonds, Class 2 | 6/31 at 25.58 | N/R | 1,403,562 |
| | Capital Appreciation Senior Lien Series 2021B-2, 0.000%, 6/01/65 | | | |
| 1,095 | Iowa Tobacco Settlement Authority, Tobacco Settlement Asset-Backed Bonds, Senior Class 1 | 6/31 at 100.00 | BBB+ | 1,217,366 |
| | Series 2021A-2, 4.000%, 6/01/49 | | | |
| | Xenia Rural Water District, Iowa, Water Revenue Bonds, Refunding Capital Loan Note | | | |
| | Series 2016: | | | |
| 4,700 | 5.000%, 12/01/36 | 12/26 at 100.00 | A– | 5,394,002 |
| 5,990 | 5.000%, 12/01/41 | 12/26 at 100.00 | A– | 6,822,670 |
| 45,230 | Total Iowa | | | 41,916,291 |
| | Kansas – 0.3% (0.2% of Total Investments) | | | |
| 2,000 | Kansas Development Finance Authority, Health Facilities Revenue Bonds, Stormont-Vail | 11/22 at 100.00 | A2 | 2,098,620 |
| | Health Care Inc., Series 2013J, 5.000%, 11/15/38 | | | |
| 3,000 | Kansas Development Finance Authority, Hospital Revenue Bonds, Adventist Health | 5/22 at 100.00 | AA | 3,076,410 |
| | System/Sunbelt Obligated Group, Series 2012A, 5.000%, 11/15/28 | | | |
| 3,700 | Kansas Municipal Energy Agency, Power Project Revenue Bonds, Dogwood Project, Series | 4/26 at 100.00 | AA | 4,325,374 |
| | 2018A, 5.000%, 4/01/38 – BAM Insured | | | |
| 5,270 | Lawrence, Kansas, Hospital Revenue Bonds, Lawrence Memorial Hospital, Series 2018A, | 7/28 at 100.00 | A | 6,337,965 |
| | 5.000%, 7/01/43 | | | |
| 13,970 | Total Kansas | | | 15,838,369 |
87
| NEA | Nuveen AMT-Free Quality Municipal Income Fund |
| | Portfolio of Investments (continued) |
| | October 31, 2021 |
| Principal | | Optional Call | | |
| Amount (000) | Description (1) | Provisions (2) | Ratings (3) | Value |
| | Kentucky – 0.9% (0.5% of Total Investments) | | | |
| $ 6,010 | Kentucky Economic Development Finance Authority, Health System Revenue Bonds, Norton | No Opt. Call | Baa2 | $ 5,219,264 |
| | Healthcare Inc., Series 2000B, 0.000%, 10/01/28 – NPFG Insured | | | |
| 1,300 | Kentucky Economic Development Finance Authority, Hospital Revenue Bonds, Owensboro | 6/27 at 100.00 | BBB– | 1,514,656 |
| | Health, Refunding Series 2017A, 5.000%, 6/01/37 | | | |
| 4,625 | Kentucky Economic Development Finance Authority, Revenue Bonds, CommonSpirit Health, | 8/29 at 100.00 | BBB+ | 5,524,239 |
| | Series 2019A-2, 5.000%, 8/01/49 | | | |
| | Kentucky Public Transportation Infrastructure Authority, Toll Revenue Bonds, Downtown | | | |
| | Crossing Project, Convertible Capital Appreciation First Tier Series 2013C: | | | |
| 5,000 | 0.000%, 7/01/43 (5) | 7/31 at 100.00 | Baa2 | 6,126,000 |
| 8,610 | 0.000%, 7/01/46 (5) | 7/31 at 100.00 | Baa2 | 10,570,927 |
| | Kentucky Public Transportation Infrastructure Authority, Toll Revenue Bonds, Downtown | | | |
| | Crossing Project, First Tier Series 2013A: | | | |
| 2,655 | 5.750%, 7/01/49 (Pre-refunded 7/01/23) | 7/23 at 100.00 | Baa2 (4) | 2,898,225 |
| 430 | 6.000%, 7/01/53 (Pre-refunded 7/01/23) | 7/23 at 100.00 | Baa2 (4) | 470,949 |
| | Louisville/Jefferson County Metro Government, Kentucky, Revenue Bonds, Catholic Health | | | |
| | Initiatives, Series 2012A: | | | |
| 2,980 | 5.000%, 12/01/35 (Pre-refunded 6/01/22) | 6/22 at 100.00 | BBB+ (4) | 3,062,159 |
| 3,000 | 5.000%, 12/01/35 (Pre-refunded 6/01/22) | 6/22 at 100.00 | N/R (4) | 3,082,710 |
| 1,380 | University of Kentucky, General Receipts Bonds, University of Kentucky Mixed-Use Parking | 5/29 at 100.00 | AA– | 1,561,746 |
| | Project, Series 2019A, 4.000%, 5/01/44 | | | |
| 35,990 | Total Kentucky | | | 40,030,875 |
| | Louisiana – 3.0% (1.9% of Total Investments) | | | |
| 6,860 | Ascension Parish Industrial development Board, Louisiana, Revenue Bonds, Impala | 7/23 at 100.00 | N/R | 7,193,533 |
| | Warehousing (US) LLC Project, Series 2013, 6.000%, 7/01/36 | | | |
| 5,500 | East Baton Rouge Sewerage Commission, Louisiana, Revenue Bonds, Refunding Series 2019A, | 2/29 at 100.00 | AA– | 6,332,040 |
| | 4.000%, 2/01/45 | | | |
| 1,870 | Jefferson Sales Tax District, Jefferson Parish, Louisiana, Special Sales Tax Revenue | 12/27 at 100.00 | A1 | 2,278,576 |
| | Bonds, Series 2017B, 5.000%, 12/01/42 – AGM Insured | | | |
| | Louisiana Public Facilities Authority, Louisiana, Revenue Bonds, Ochsner Clinic Foundation | | | |
| | Project, Refunding Series 2017: | | | |
| 4,000 | 5.000%, 5/15/42 | 5/27 at 100.00 | A3 | 4,704,680 |
| 22,625 | 5.000%, 5/15/46 | 5/27 at 100.00 | A3 | 26,587,995 |
| 22,975 | Louisiana Public Facilities Authority, Louisiana, Revenue Bonds, Ochsner Clinic Foundation | 5/30 at 100.00 | A3 | 26,156,808 |
| | Project, Series 2020A, 4.000%, 5/15/49 | | | |
| 4,000 | Louisiana Public Facilities Authority, Hospital Revenue Bonds, Louisiana Children’s | 6/30 at 100.00 | A+ | 4,546,280 |
| | Medical Center Hospital, Series 2020A, 4.000%, 6/01/50 | | | |
| 1,695 | Louisiana Public Facilities Authority, Lease Revenue Bonds, Provident Group-Flagship Properties | 7/26 at 100.00 | A3 | 1,904,214 |
| | LLC – Louisiana State University Nicolson Gateway Project, Series 2016A, 5.000%, 7/01/46 | | | |
| | Louisiana Public Facilities Authority, Revenue Bonds, Ochsner Clinic Foundation Project, | | | |
| | Refunding Series 2016: | | | |
| 20 | 4.000%, 5/15/35 (Pre-refunded 5/15/26) | 5/26 at 100.00 | N/R (4) | 22,817 |
| 2,345 | 4.000%, 5/15/36 | 5/26 at 100.00 | A3 | 2,591,999 |
| 20 | 5.000%, 5/15/47 (Pre-refunded 5/15/26) | 5/26 at 100.00 | N/R (4) | 23,705 |
| 1,975 | Louisiana Public Facilities Authority, Revenue Bonds, Ochsner Clinic Foundation Project, | 5/25 at 100.00 | A3 | 2,214,488 |
| | Series 2015, 5.000%, 5/15/47 | | | |
| 13,590 | Louisiana Stadium and Exposition District, Revenue Refunding Bonds, Senior Lien Series | 7/23 at 100.00 | A2 | 14,565,626 |
| | 2013A, 5.000%, 7/01/36 | | | |
| 1,015 | Louisiana State, Gasoline and Fuels Tax Revenue Bonds, Refunding Second Lien Series | 11/27 at 100.00 | AA– | 1,224,060 |
| | 2017C, 5.000%, 5/01/45 | | | |
| 12,000 | New Orleans Aviation Board, Louisiana, General Airport Revenue Bonds, North Terminal | 1/25 at 100.00 | A– | 13,564,200 |
| | Project, Series 2015A, 5.000%, 1/01/45 | | | |
| 5,000 | New Orleans Aviation Board, Louisiana, General Airport Revenue Bonds, North Terminal | 1/27 at 100.00 | A– | 5,918,900 |
| | Project, Series 2017A, 5.000%, 1/01/48 | | | |
88
| Principal | | Optional Call | | |
| Amount (000) | Description (1) | Provisions (2) | Ratings (3) | Value |
| | Louisiana (continued) | | | |
| $ 6,280 | New Orleans, Louisiana, Sewerage Service Revenue Bonds, Refunding Series 2014, 5.000%, | 6/24 at 100.00 | A (4) | $ 7,019,030 |
| | 6/01/44 (Pre-refunded 6/01/24) | | | |
| 4,000 | Port New Orleans Board of Commissioners, Louisiana, Revenue Bonds, Port Facilities, | 4/28 at 100.00 | A2 | 4,701,120 |
| | Refunding Series 2018A, 5.000%, 4/01/48 – AGM Insured | | | |
| 5,000 | Saint Tammany Parish Hospital Service District 1, Louisiana, Hospital Revenue Bonds, St. | 7/28 at 100.00 | AA– | 5,994,300 |
| | Tammany Parish Hospital Project, Refunding Series 2018A, 5.000%, 7/01/48 | | | |
| 1,355 | Shreveport, Louisiana, Water and Sewer Revenue Bonds, Refunding Series 2015, 5.000%, 12/01/40 | 12/25 at 100.00 | A– | 1,563,711 |
| 122,125 | Total Louisiana | | | 139,108,082 |
| | Maine – 0.6% (0.4% of Total Investments) | | | |
| 7,000 | Maine Health and Higher Educational Facilities Authority Revenue Bonds, Eastern Maine | 7/23 at 100.00 | Ba1 (4) | 7,548,030 |
| | Medical Center Obligated Group Issue, Series 2013, 5.000%, 7/01/43 (Pre-refunded 7/01/23) | | | |
| 6,300 | Maine Health and Higher Educational Facilities Authority Revenue Bonds, Eastern Maine | 7/26 at 100.00 | Ba1 | 7,215,894 |
| | Medical Center Obligated Group Issue, Series 2016A, 5.000%, 7/01/41 | | | |
| | Maine Health and Higher Educational Facilities Authority Revenue Bonds, MaineHealth | | | |
| | Issue, Series 2018A: | | | |
| 3,440 | 5.000%, 7/01/43 | 7/28 at 100.00 | A+ | 4,137,116 |
| 2,935 | 5.000%, 7/01/48 | 7/28 at 100.00 | A+ | 3,508,499 |
| 750 | Maine Health and Higher Educational Facilities Authority, Revenue Bonds, Series 2021A, | 7/31 at 100.00 | A1 | 871,620 |
| | 4.000%, 7/01/46 – AGM Insured | | | |
| 2,430 | Maine Turnpike Authority, Turnpike Revenue Bonds, Series 2020, 4.000%, 7/01/45 | 7/30 at 100.00 | AA– | 2,819,699 |
| 22,855 | Total Maine | | | 26,100,858 |
| | Maryland – 1.1% (0.7% of Total Investments) | | | |
| | Baltimore, Maryland, Convention Center Hotel Revenue Bonds, Refunding Series 2017: | | | |
| 3,260 | 5.000%, 9/01/35 | 9/27 at 100.00 | CCC | 3,468,347 |
| 1,000 | 5.000%, 9/01/39 | 9/27 at 100.00 | CCC | 1,057,340 |
| 1,645 | 5.000%, 9/01/46 | 9/27 at 100.00 | CCC | 1,729,372 |
| 8,610 | Baltimore, Maryland, Revenue Bonds, Water Projects, Subordinate Series 2017A, 5.000%, 7/01/41 | 1/27 at 100.00 | A+ | 10,324,337 |
| 275 | Maryland Health and Higher Educational Facilities Authority, Revenue Bonds, Frederick | 7/30 at 100.00 | Baa1 | 312,653 |
| | Health System Issue; Series 2020, 4.000%, 7/01/50 | | | |
| 3,500 | Maryland Health and Higher Educational Facilities Authority, Revenue Bonds, University | 7/22 at 100.00 | A (4) | 3,612,770 |
| | of Maryland Medical System Issue, Series 2013A, 5.000%, 7/01/43 (Pre-refunded 7/01/22) | | | |
| 4,000 | Maryland Health and Higher Educational Facilities Authority, Revenue Bonds, University | 1/28 at 100.00 | A | 4,477,080 |
| | of Maryland Medical System Issue, Taxable Series 2017D, 4.000%, 7/01/48 | | | |
| 17,000 | Maryland Stadium Authority, Revenue Bonds, Baltimore City Public Schools Construction & | 5/28 at 100.00 | AA– | 20,616,070 |
| | Revitalization Program, Series 2018A, 5.000%, 5/01/42 | | | |
| 1,250 | Maryland Transportation Authority, Revenue Bonds, Transportation Facilities Projects, | 7/31 at 100.00 | Aa2 | 1,609,225 |
| | Series 2021A, 5.000%, 7/01/46 | | | |
| 2,000 | Montgomery County, Maryland, Revenue Bonds, Trinity Health Credit Group, Series 2015, | 6/25 at 100.00 | AA– | 2,300,100 |
| | 5.000%, 12/01/44 | | | |
| 1,150 | Rockville Mayor and Council, Maryland, Economic Development Revenue Bonds, Ingleside | 11/24 at 103.00 | B– | 1,244,921 |
| | King Farm Project, Series 2017A-1, 5.000%, 11/01/37 | | | |
| 2,250 | Rockville Mayor and Council, Maryland, Economic Development Revenue Bonds, Series 2017B, | 11/24 at 103.00 | B– | 2,416,792 |
| | 5.000%, 11/01/47 | | | |
| 45,940 | Total Maryland | | | 53,169,007 |
| | Massachusetts – 1.4% (0.9% of Total Investments) | | | |
| 1,250 | Massachusetts Development Finance Agency, Hospital Revenue Bonds, Cape Cod Healthcare | 11/23 at 100.00 | A (4) | 1,375,375 |
| | Obligated Group, Series 2013, 5.250%, 11/15/41 (Pre-refunded 11/15/23) | | | |
| 435 | Massachusetts Development Finance Agency, Revenue Bonds, Atrius Health Issue, Series | 6/29 at 100.00 | BBB | 528,399 |
| | 2019A, 5.000%, 6/01/39 | | | |
| 930 | Massachusetts Development Finance Agency, Revenue Bonds, Boston Medical Center Issue, | 7/25 at 100.00 | BBB | 1,048,342 |
| | Green Bonds, Series 2015D, 5.000%, 7/01/44 | | | |
89
| NEA | Nuveen AMT-Free Quality Municipal Income Fund |
| | Portfolio of Investments (continued) |
| | October 31, 2021 |
| Principal | | Optional Call | | |
| Amount (000) | Description (1) | Provisions (2) | Ratings (3) | Value |
| | Massachusetts (continued) | | | |
| $ 11,370 | Massachusetts Development Finance Agency, Revenue Bonds, Boston University, Series | 10/26 at 100.00 | AA– | $ 13,519,044 |
| | 2016BB-1, 5.000%, 10/01/46 | | | |
| 3,630 | Massachusetts Development Finance Agency, Revenue Bonds, CareGroup Issue, Series | 7/28 at 100.00 | A3 | 4,338,177 |
| | 2018J-2, 5.000%, 7/01/53 | | | |
| 1,100 | Massachusetts Development Finance Agency, Revenue Bonds, Dana-Farber Cancer Institute | 12/26 at 100.00 | A | 1,295,888 |
| | Issue, Series 2016N, 5.000%, 12/01/46 | | | |
| | Massachusetts Development Finance Agency, Revenue Bonds, Emerson College, Series 2015: | | | |
| 2,070 | 4.500%, 1/01/45 | 1/25 at 100.00 | Baa2 | 2,218,191 |
| 8,800 | 5.000%, 1/01/45 | 1/25 at 100.00 | Baa2 | 9,645,944 |
| 2,700 | Massachusetts Development Finance Agency, Revenue Bonds, Olin College, Series 2013E, | 11/23 at 100.00 | A | 2,917,890 |
| | 5.000%, 11/01/43 | | | |
| 4,000 | Massachusetts Development Finance Agency, Revenue Bonds, Partners HealthCare System | 1/28 at 100.00 | AA– | 4,598,080 |
| | Issue, Series 2017S-1, 4.000%, 7/01/35 | | | |
| 805 | Massachusetts Development Finance Agency, Revenue Bonds, Southcoast Health System | 7/31 at 100.00 | BBB+ | 1,009,695 |
| | Obligated Group Issue, Series 2021G, 5.000%, 7/01/50 | | | |
| 1,725 | Massachusetts Development Finance Agency, Revenue Bonds, Wellforce Issue, Series 2019A, | 1/29 at 100.00 | BBB+ | 2,058,235 |
| | 5.000%, 7/01/44 | | | |
| | Massachusetts Development Finance Agency, Revenue Bonds, Western New England University, | | | |
| | Series 2015: | | | |
| 1,380 | 5.000%, 9/01/40 | 9/25 at 100.00 | BBB | 1,546,152 |
| 1,545 | 5.000%, 9/01/45 | 9/25 at 100.00 | BBB | 1,721,300 |
| 3,000 | Massachusetts Development Finance Authority, Revenue Bonds, WGBH Educational Foundation, | No Opt. Call | AA– | 4,549,200 |
| | Series 2002A, 5.750%, 1/01/42 – AMBAC Insured | | | |
| 6,840 | Massachusetts School Building Authority, Dedicated Sales Tax Revenue Bonds, Senior | 5/23 at 100.00 | Aa2 (4) | 7,341,304 |
| | Series 2013A, 5.000%, 5/15/43 (Pre-refunded 5/15/23) | | | |
| | Massachusetts School Building Authority, Dedicated Sales Tax Revenue Bonds, Tender | | | |
| | Option Bond Trust 2016-XF2223, | | | |
| 1,323 | 9.396%, 8/15/24 (Pre-refunded 8/15/22), 144A (IF) | 8/22 at 100.00 | N/R (4) | 1,421,185 |
| 6,177 | 9.396%, 8/15/24, 144A (IF) | 8/22 at 100.00 | Aa2 | 6,638,465 |
| 59,080 | Total Massachusetts | | | 67,770,866 |
| | Michigan – 15.1% (9.7% of Total Investments) | | | |
| 315 | Advanced Technology Academy, Michigan, Public School Academy Revenue Bonds, Refunding | 11/27 at 102.00 | BB | 351,657 |
| | Series 2019, 5.000%, 11/01/34 | | | |
| 840 | Ann Arbor Public School District, Washtenaw County, Michigan, General Obligation Bonds, | No Opt. Call | Aa3 | 936,751 |
| | School Building & Site Series 2015, 5.000%, 5/01/24 | | | |
| 4,150 | Bloomfield Hills Schools, Oakland County, Michigan, General Obligation Bonds, School | 5/30 at 100.00 | Aa1 | 4,876,623 |
| | Building & Site Series 2020, 4.000%, 5/01/50 | | | |
| 895 | Bloomfield Township, Michigan, General Obligation Bonds, Refunding Series 2016, | 5/26 at 100.00 | AAA | 1,070,805 |
| | 5.000%, 5/01/28 | | | |
| 1,000 | Boyne City Public School District, Charlevoix and Antrim Counties, Michigan, General | 5/30 at 100.00 | AA | 1,179,500 |
| | Obligation Bonds, School Building & Site Series 2020I, 4.000%, 5/01/39 – AGM Insured | | | |
| 4,445 | Byron Center Public Schools, Kent County, Michigan, General Obligation Bonds, School | 5/27 at 100.00 | AA | 5,227,587 |
| | Building & Site Series 2017I, 5.000%, 5/01/47 | | | |
| 1,135 | Caledonia Community Schools, Kent, Allegan and Barry Counties, Michigan, General | 5/24 at 100.00 | AA | 1,252,552 |
| | Obligation Bonds, School Building & Site Series 2014, 5.000%, 5/01/39 | | | |
| 6,525 | Caledonia Community Schools, Kent, Allegan and Barry Counties, Michigan, General | 5/30 at 100.00 | AA | 7,578,070 |
| | Obligation Bonds, School Building & Site Series 2020I, 4.000%, 5/01/50 | | | |
| 1,220 | Central Michigan University Board of Trustees, General Revenue Bonds, Refunding Series | 10/24 at 100.00 | A+ | 1,355,676 |
| | 2014, 5.000%, 10/01/39 | | | |
| 1,000 | Conner Creek Academy East, Michigan, Public School Revenue Bonds, Series 2007, | 11/21 at 100.00 | B | 932,120 |
| | 5.250%, 11/01/36 | | | |
90
| Principal | | Optional Call | | |
| Amount (000) | Description (1) | Provisions (2) | Ratings (3) | Value |
| | Michigan (continued) | | | |
| $ 2,000 | County of Calhoun Hospital Finance Authority, Michigan, Hospital Revenue Bonds, Oaklawn | 2/27 at 100.00 | Ba1 | $ 2,255,820 |
| | Hospital, Refunding Series 2016, 5.000%, 2/15/47 | | | |
| 4,400 | Detroit Downtown Development Authority, Michigan, Tax Increment Revenue Bonds, Catalyst | 7/24 at 100.00 | AA | 4,851,836 |
| | Development Project, Series 2018A, 5.000%, 7/01/48 – AGM Insured | | | |
| 5,335 | Detroit Water and Sewerage Department, Michigan, Sewage Disposal System Revenue Bonds, | 7/22 at 100.00 | A1 (4) | 5,515,750 |
| | Refunding Senior Lien Series 2012A, 5.250%, 7/01/39 (Pre-refunded 7/01/22) | | | |
| 2,830 | Detroit, Michigan, Senior Lien Sewerage Disposal System Revenue Bonds, Series 2001B, | No Opt. Call | A2 | 3,412,810 |
| | 5.500%, 7/01/29 – NPFG Insured | | | |
| 15 | Detroit, Michigan, Water Supply System Revenue Bonds, Refunding Second Lien Series | 11/21 at 100.00 | A+ | 15,056 |
| | 2004A, 5.000%, 7/01/34 – AGM Insured | | | |
| 1,700 | Downriver Utility Wastewater Authority, Michigan, Sewer System Revenue Bonds, Series | 4/28 at 100.00 | AA | 2,038,011 |
| | 2018, 5.000%, 4/01/43 – AGM Insured | | | |
| | Eastern Michigan University, General Revenue Bonds, Refunding Series 2017A: | | | |
| 1,100 | 5.000%, 3/01/33 – BAM Insured | 3/27 at 100.00 | A2 | 1,299,859 |
| 2,270 | 5.000%, 3/01/36 – BAM Insured | 3/27 at 100.00 | A2 | 2,668,635 |
| 11,165 | Eastern Michigan University, General Revenue Bonds, Series 2018A, 4.000%, 3/01/44 – | 3/28 at 100.00 | A2 | 12,449,198 |
| | AGM Insured | | | |
| 1,045 | Ferndale Public School District, Oakland County, Michigan, General Obligation Bonds, | 5/31 at 100.00 | AA | 1,246,257 |
| | Refunding Series 2021A, 4.000%, 5/01/42 | | | |
| | Ferris State University, Michigan, General Revenue Bonds, Series 2020A: | | | |
| 1,000 | 4.000%, 10/01/39 | 10/29 at 100.00 | A+ | 1,158,360 |
| 350 | 4.000%, 10/01/40 | 10/29 at 100.00 | A+ | 404,687 |
| | Genesee County, Michigan, Sewage Disposal System Revenue Bonds, Interceptors & Treatment | | | |
| | Facilties, Series 2020A: | | | |
| 200 | 4.000%, 6/01/36 – BAM Insured | 6/29 at 100.00 | AA | 229,000 |
| 200 | 4.000%, 6/01/37 – BAM Insured | 6/29 at 100.00 | AA | 228,458 |
| 200 | 4.000%, 6/01/38 – BAM Insured | 6/29 at 100.00 | AA | 228,016 |
| 200 | 4.000%, 6/01/39 – BAM Insured | 6/29 at 100.00 | AA | 227,546 |
| 220 | 4.000%, 6/01/40 – BAM Insured | 6/29 at 100.00 | AA | 249,863 |
| | Grand Rapids and Kent County Joint Building Authority, Michigan, Limited Tax General | | | |
| | Obligation Bonds, Devos Place Project, Series 2001: | | | |
| 7,660 | 0.000%, 12/01/21 | No Opt. Call | AAA | 7,659,004 |
| 7,955 | 0.000%, 12/01/22 | No Opt. Call | AAA | 7,933,760 |
| 8,260 | 0.000%, 12/01/23 | No Opt. Call | AAA | 8,196,233 |
| 8,575 | 0.000%, 12/01/24 | No Opt. Call | AAA | 8,437,800 |
| 8,900 | 0.000%, 12/01/25 | No Opt. Call | AAA | 8,637,895 |
| 3,000 | 0.000%, 12/01/26 | No Opt. Call | AAA | 2,863,260 |
| 100 | 0.000%, 12/01/27 | No Opt. Call | AAA | 93,458 |
| 4,305 | 0.000%, 12/01/29 | No Opt. Call | AAA | 3,855,515 |
| | Grand Rapids Public Schools, Kent County, Michigan, General Obligation Bonds, Refunding | | | |
| | School Building & Site Series 2016: | | | |
| 4,205 | 5.000%, 5/01/28 – AGM Insured | 5/26 at 100.00 | A3 | 4,969,343 |
| 1,000 | 5.000%, 5/01/38 – AGM Insured | 5/26 at 100.00 | A3 | 1,163,030 |
| | Grand Rapids Public Schools, Kent County, Michigan, General Obligation Bonds, School | | | |
| | Building & Site Series 2019: | | | |
| 1,000 | 5.000%, 11/01/36 – AGM Insured | 5/29 at 100.00 | A3 | 1,240,580 |
| 1,100 | 5.000%, 11/01/41 – AGM Insured | 5/29 at 100.00 | A3 | 1,350,987 |
| 1,850 | 5.000%, 11/01/43 – AGM Insured | 5/29 at 100.00 | A3 | 2,254,317 |
| | Grand Rapids, Kent County, Michigan, Santiary Sewer System Revenue Bonds, Improvement & | | | |
| | Refunding Series 2020: | | | |
| 2,000 | 5.000%, 1/01/45 | 1/30 at 100.00 | AA | 2,491,300 |
| 1,000 | 4.000%, 1/01/50 | 1/30 at 100.00 | AA | 1,148,200 |
| | Grand Rapids, Michigan, Sanitary Sewer System Revenue Bonds, Improvement & Refunding | | | |
| | Series 2014: | | | |
| 1,000 | 5.000%, 1/01/32 (Pre-refunded 1/01/24) | 1/24 at 100.00 | AA (4) | 1,101,960 |
| 1,000 | 5.000%, 1/01/33 (Pre-refunded 1/01/24) | 1/24 at 100.00 | AA (4) | 1,101,960 |
| 1,000 | 5.000%, 1/01/34 (Pre-refunded 1/01/24) | 1/24 at 100.00 | AA (4) | 1,101,960 |
| 1,855 | 5.000%, 1/01/44 (Pre-refunded 1/01/24) | 1/24 at 100.00 | AA (4) | 2,044,136 |
91
| NEA | Nuveen AMT-Free Quality Municipal Income Fund |
| | Portfolio of Investments (continued) |
| | October 31, 2021 |
| Principal | | Optional Call | | |
| Amount (000) | Description (1) | Provisions (2) | Ratings (3) | Value |
| | Michigan (continued) | | | |
| | Grand Rapids, Michigan, Sanitary Sewer System Revenue Bonds, Series 2018: | | | |
| $ 2,500 | 5.000%, 1/01/43 | 1/28 at 100.00 | AA | $ 2,983,525 |
| 1,055 | 5.000%, 1/01/48 | 1/28 at 100.00 | AA | 1,251,947 |
| | Grand Rapids, Michigan, Water Supply System Revenue Bonds, Series 2020: | | | |
| 2,400 | 5.000%, 1/01/40 (UB) (6) | 1/30 at 100.00 | AA | 3,022,800 |
| 1,870 | 5.000%, 1/01/45 (UB) (6) | 1/30 at 100.00 | AA | 2,329,365 |
| 3,000 | 5.000%, 1/01/50 (UB) (6) | 1/30 at 100.00 | AA | 3,720,270 |
| | Grand Traverse County Hospital Finance Authority, Michigan, Revenue Bonds, Munson | | | |
| | Healthcare, Series 2019A: | | | |
| 1,720 | 5.000%, 7/01/36 | 7/28 at 100.00 | A1 | 2,101,100 |
| 1,995 | 5.000%, 7/01/39 | 7/28 at 100.00 | A1 | 2,423,446 |
| 500 | Grand Valley State University, Michigan, General Revenue Bonds, Refunding Series 2014B, | 12/24 at 100.00 | A+ | 562,950 |
| | 5.000%, 12/01/28 | | | |
| 1,005 | Great Lakes Water Authority, Michigan, Sewer Disposal System Revenue Bonds, Refunding | 7/26 at 100.00 | A2 | 1,192,664 |
| | Second Lien Series 2016C, 5.000%, 7/01/32 | | | |
| | Great Lakes Water Authority, Michigan, Water Supply Revenue Bonds, Refunding Senior Lien | | | |
| | Series 2016C: | | | |
| 6,245 | 5.000%, 7/01/32 | 7/26 at 100.00 | A1 | 7,430,051 |
| 10,000 | 5.000%, 7/01/35 | 7/26 at 100.00 | A1 | 11,882,400 |
| 27,960 | Great Lakes Water Authority, Michigan, Water Supply Revenue Bonds, Senior Lien Series | 7/26 at 100.00 | A1 | 32,568,367 |
| | 2016A, 5.000%, 7/01/46 | | | |
| | Hudsonville Public Schools, Ottawa and Allegan Counties, Michigan, General Obligation | | | |
| | Bonds, School Building & Site Series 2020-I: | | | |
| 2,040 | 4.000%, 5/01/45 | 5/30 at 100.00 | AA | 2,380,517 |
| 7,615 | 4.000%, 5/01/49 | 5/30 at 100.00 | AA | 8,850,991 |
| 1,265 | Jenison Public Schools, Ottawa County, Michigan, General Obligation Bonds, Series 2017, | 5/27 at 100.00 | Aa3 | 1,532,750 |
| | 5.000%, 5/01/30 | | | |
| 1,675 | Kalamazoo County, Michigan, General Obligation Bonds, Juvenile Home Facilities Series | 4/27 at 100.00 | AA+ | 2,028,040 |
| | 2017, 5.000%, 4/01/30 | | | |
| | Kent County, Michigan, General Obligation Bonds, Limited Tax Capital Improvement Series 2016: | | | |
| 1,000 | 5.000%, 6/01/31 | 6/26 at 100.00 | AAA | 1,193,950 |
| 1,445 | 5.000%, 6/01/34 | 6/26 at 100.00 | AAA | 1,719,507 |
| | Kent County, Michigan, General Obligation Bonds, Limited Tax Capital Improvement Series 2017A: | | | |
| 1,570 | 5.000%, 6/01/36 | 6/27 at 100.00 | AAA | 1,905,823 |
| 1,650 | 5.000%, 6/01/37 | 6/27 at 100.00 | AAA | 1,999,354 |
| 1,025 | Kent County, Michigan, General Obligation Bonds, Limited Tax Series 2015, 5.000%, 1/01/34 | 1/25 at 100.00 | AAA | 1,163,785 |
| 3,440 | Kent County, Michigan, General Obligation Bonds, Refunding Limited Tax Series 2015, | 1/25 at 100.00 | AAA | 3,911,590 |
| | 5.000%, 1/01/31 | | | |
| | Kent Hospital Finance Authority, Michigan, Revenue Bonds, Spectrum Health System, | | | |
| | Refunding Series 2011C: | | | |
| 5,500 | 5.000%, 1/15/31 (Pre-refunded 1/15/22) | 1/22 at 100.00 | Aa3 (4) | 5,554,065 |
| 2,000 | 5.000%, 1/15/42 (Pre-refunded 1/15/22) | 1/22 at 100.00 | Aa3 (4) | 2,019,660 |
| | Lake Saint Claire Clean Water Drain Drainage District, Macomb County, Michigan, General | | | |
| | Obligation Bonds, Series 2013: | | | |
| 1,000 | 5.000%, 10/01/25 (Pre-refunded 10/01/23) | 10/23 at 100.00 | AA+ (4) | 1,090,660 |
| 1,020 | 5.000%, 10/01/26 (Pre-refunded 10/01/23) | 10/23 at 100.00 | AA+ (4) | 1,112,473 |
| | Lake Superior State University Board of Trustees, Michigan, General Revenue Bonds, | | | |
| | Series 2018: | | | |
| 2,395 | 5.000%, 1/15/38 – AGM Insured | 1/28 at 100.00 | AA | 2,855,367 |
| 4,000 | 5.000%, 1/15/43 – AGM Insured | 1/28 at 100.00 | AA | 4,729,120 |
| 7,100 | Lansing Board of Water and Light, Michigan, Utility System Revenue Bonds, Series 2019A, | 7/29 at 100.00 | AA– | 8,755,223 |
| | 5.000%, 7/01/48 | | | |
| 9,600 | Lansing Board of Water and Light, Michigan, Utility System Revenue Bonds, Series 2021A, | 7/31 at 100.00 | AA– | 12,321,408 |
| | 5.000%, 7/01/51 | | | |
92
| Principal | | Optional Call | | |
| Amount (000) | Description (1) | Provisions (2) | Ratings (3) | Value |
| | Michigan (continued) | | | |
| | Lansing School District, Ingham County, Michigan, General Obligation Bonds, Series 2016I: | | | |
| $ 2,085 | 5.000%, 5/01/38 | 5/26 at 100.00 | AA | $ 2,441,869 |
| 2,200 | 5.000%, 5/01/41 | 5/26 at 100.00 | AA | 2,561,812 |
| | Lansing School District, Ingham County, Michigan, General Obligation Bonds, Unlimited | | | |
| | Tax, Series 2019: | | | |
| 1,325 | 5.000%, 5/01/40 | 5/29 at 100.00 | AA | 1,634,003 |
| 1,000 | 5.000%, 5/01/41 | 5/29 at 100.00 | AA | 1,230,540 |
| 2,200 | Lansing Township Downtown Development Authority, Ingham County, Michigan, Tax Increment | 2/24 at 103.00 | N/R | 2,333,342 |
| | Bonds, Series 2013A, 5.950%, 2/01/42 | | | |
| | Marquette, Michigan, Electric Utility System Revenue Bonds, Refunding Series 2016A: | | | |
| 75 | 5.000%, 7/01/32 | 7/26 at 100.00 | AA– | 88,919 |
| 500 | 5.000%, 7/01/33 | 7/26 at 100.00 | AA– | 592,800 |
| 1,500 | Michigan Finance Authority, Distributable State Aid Revenue Bonds, Charter County of | 11/28 at 100.00 | Aa3 | 1,819,395 |
| | Wayne Criminal Justice Center Project, Senior Lien Series 2018, 5.000%, 11/01/43 | | | |
| | Michigan Finance Authority, Distributable State Aid Revenue Bonds, Charter County of | | | |
| | Wayne, Second Lien Refunding Series 2020: | | | |
| 12,980 | 4.000%, 11/01/50 | 11/30 at 100.00 | Aa3 | 14,910,386 |
| 10,000 | 4.000%, 11/01/55 | 11/30 at 100.00 | Aa3 | 11,399,000 |
| 18,875 | 4.000%, 11/01/55 | 11/30 at 100.00 | Aa3 | 21,714,555 |
| 3,500 | Michigan Finance Authority, Higher Education Limited Obligation Revenue Bonds, Kalamazoo | 12/28 at 100.00 | A3 | 4,261,355 |
| | College Project, Refunding Series 2018, 5.000%, 12/01/43 | | | |
| 1,780 | Michigan Finance Authority, Hospital Revenue Bonds, Beaumont Health Credit Group, | 8/24 at 100.00 | A+ | 1,991,695 |
| | Refunding Series 2015A, 5.000%, 8/01/32 | | | |
| 5,505 | Michigan Finance Authority, Hospital Revenue Bonds, Crittenton Hospital Medical Center, | 6/22 at 100.00 | N/R (4) | 5,657,709 |
| | Refunding Series 2012A, 5.000%, 6/01/39 (Pre-refunded 6/01/22) | | | |
| 9,195 | Michigan Finance Authority, Hospital Revenue Bonds, Henry Ford Health System, Series | 11/29 at 100.00 | A | 10,308,882 |
| | 2019A, 4.000%, 11/15/50 | | | |
| 4,850 | Michigan Finance Authority, Hospital Revenue Bonds, MidMichigan Health Credit Group, | 6/24 at 100.00 | A+ (4) | 5,434,085 |
| | Refunding Series 2014, 5.000%, 6/01/39 (Pre-refunded 6/01/24) | | | |
| 3,930 | Michigan Finance Authority, Hospital Revenue Bonds, Oakwood Obligated Group, Refunding | 8/23 at 100.00 | A+ | 4,252,889 |
| | Series 2013, 5.000%, 8/15/31 | | | |
| 6,060 | Michigan Finance Authority, Hospital Revenue Bonds, Sparrow Obligated Group, Refunding | 5/25 at 100.00 | A | 6,857,557 |
| | Series 2015, 5.000%, 11/15/45 | | | |
| 3,000 | Michigan Finance Authority, Hospital Revenue Bonds, Sparrow Obligated Group, Series | 11/22 at 100.00 | A | 3,128,940 |
| | 2012, 5.000%, 11/15/42 | | | |
| | Michigan Finance Authority, Local Government Loan Program Revenue Bonds, Detroit | | | |
| | Regional Convention Facility Authority Local Project, Series 2014H-1: | | | |
| 2,000 | 5.000%, 10/01/24 | 10/23 at 100.00 | AA– | 2,178,740 |
| 2,000 | 5.000%, 10/01/25 | 10/24 at 100.00 | AA– | 2,261,920 |
| 11,025 | 5.000%, 10/01/39 | 10/24 at 100.00 | AA– | 12,332,124 |
| | Michigan Finance Authority, Local Government Loan Program Revenue Bonds, Detroit Water & | | | |
| | Sewerage Department Sewage Disposal System Local Project, Second Lien Series 2015C: | | | |
| 4,665 | 5.000%, 7/01/34 | 7/25 at 100.00 | A2 | 5,354,814 |
| 1,070 | 5.000%, 7/01/35 | 7/25 at 100.00 | A2 | 1,227,804 |
| | Michigan Finance Authority, Local Government Loan Program Revenue Bonds, Detroit Water & | | | |
| | Sewerage Department Water Supply System Local Project, Refunding Senior Loan Series 2014D-1: | | | |
| 1,500 | 5.000%, 7/01/35 – AGM Insured | 7/24 at 100.00 | A1 | 1,670,820 |
| 1,625 | 5.000%, 7/01/37 – AGM Insured | 7/24 at 100.00 | A1 | 1,806,870 |
| 1,300 | Michigan Finance Authority, Local Government Loan Program Revenue Bonds, Detroit Water & | 7/22 at 100.00 | N/R (4) | 1,341,652 |
| | Sewerage Department Water Supply System Local Project, Series 2014C-1, 5.000%, 7/01/44 | | | |
| | (Pre-refunded 7/01/22) | | | |
| | Michigan Finance Authority, Michigan, Revenue Bonds, Trinity Health Credit Group, | | | |
| | Refunding Series 2016MI: | | | |
| 175 | 5.000%, 12/01/45 (Pre-refunded 6/01/26) | 6/26 at 100.00 | N/R (4) | 208,506 |
| 11,825 | 5.000%, 12/01/45 | 6/26 at 100.00 | AA– | 13,896,267 |
93
| NEA | Nuveen AMT-Free Quality Municipal Income Fund |
| | Portfolio of Investments (continued) |
| | October 31, 2021 |
| Principal | | Optional Call | | |
| Amount (000) | Description (1) | Provisions (2) | Ratings (3) | Value |
| | Michigan (continued) | | | |
| $ 12,520 | Michigan Finance Authority, Michigan, Revenue Bonds, Trinity Health Credit Group, | 12/27 at 100.00 | AA– | $ 14,376,215 |
| | Refunding Series 2017A-MI, 4.000%, 12/01/36 | | | |
| 1,900 | Michigan Finance Authority, Michigan, Revenue Bonds, Trinity Health Credit Group, | 6/27 at 100.00 | AA– | 2,307,759 |
| | Refunding Series 2017MI, 5.000%, 12/01/30 | | | |
| 6,835 | Michigan Finance Authority, Michigan, Revenue Bonds, Trinity Health Credit Group, | 12/29 at 100.00 | AA– | 7,811,516 |
| | Refunding Series 2019A-MI, 4.000%, 12/01/49 | | | |
| | Michigan Finance Authority, Revenue Bonds, Oakwood Obligated Group, Refunding Series 2012: | | | |
| 1,000 | 5.000%, 11/01/25 | 11/22 at 100.00 | A+ | 1,047,670 |
| 1,000 | 5.000%, 11/01/26 | 11/22 at 100.00 | A+ | 1,047,570 |
| 3,750 | 5.000%, 11/01/42 | 11/22 at 100.00 | A+ | 3,914,887 |
| | Michigan Finance Authority, Revenue Bonds, Trinity Health Credit Group, Refunding Series 2011MI: | | | |
| 70 | 5.000%, 12/01/39 (Pre-refunded 12/01/21) | 12/21 at 100.00 | N/R (4) | 70,265 |
| 9,965 | 5.000%, 12/01/39 (Pre-refunded 12/01/21) | 12/21 at 100.00 | AA– (4) | 10,003,963 |
| 3,000 | Michigan Finance Authority, Revenue Bonds, Trinity Health Credit Group, Refunding Series | 6/22 at 100.00 | AA– (4) | 3,084,120 |
| | 2015MI, 5.000%, 12/01/31 (Pre-refunded 6/01/22) | | | |
| 1,135 | Michigan Finance Authority, State Revolving Fund Revenue Bonds, Clean Water Series 2012, | 10/22 at 100.00 | AAA | 1,184,951 |
| | 5.000%, 10/01/32 (Pre-refunded 10/01/22) | | | |
| | Michigan Finance Authority, State Revolving Fund Revenue Bonds, Clean Water Subordinate | | | |
| | Refunding Series 2013: | | | |
| 1,955 | 5.000%, 10/01/22 | No Opt. Call | AAA | 2,041,235 |
| 3,200 | 5.000%, 10/01/25 (Pre-refunded 10/01/22) | 10/22 at 100.00 | AAA | 3,340,832 |
| 11,730 | Michigan Finance Authority, Tobacco Settlement Asset- Backed Bonds, 2006 Sold Tobacco | 12/30 at 100.00 | BBB+ | 14,632,119 |
| | Receipts Senior Current Interest Series 2020A-2, 5.000%, 6/01/40 | | | |
| 10,330 | Michigan Hospital Finance Authority, Revenue Bonds, Ascension Health Senior Credit | 11/26 at 100.00 | Aa2 | 11,632,716 |
| | Group, Refunding & Project Series 2010F-6, 4.000%, 11/15/47 | | | |
| 1,725 | Michigan Housing Development Authority, Rental Housing Revenue Bonds, Series 2012A-2, | 4/22 at 100.00 | AA (4) | 1,756,516 |
| | 4.625%, 10/01/41 (Pre-refunded 4/01/22) | | | |
| 1,000 | Michigan Housing Development Authority, Rental Housing Revenue Bonds, Series 2012D, | 4/22 at 100.00 | AA (4) | 1,015,680 |
| | 4.000%, 10/01/42 (Pre-refunded 4/01/22) | | | |
| 220 | Michigan Public Educational Facilities Authority, Charter School Revenue Bonds, American | 11/21 at 100.00 | N/R | 220,330 |
| | Montessori Academy, Series 2007, 6.500%, 12/01/37 | | | |
| | Michigan Public Power Agency, AFEC Project Revenue Bonds, Series 2012A: | | | |
| 1,900 | 5.000%, 1/01/27 | 1/22 at 100.00 | BBB+ | 1,913,148 |
| 5,845 | 5.000%, 1/01/43 | 1/22 at 100.00 | BBB+ | 5,882,174 |
| 1,845 | Michigan State Building Authority, Revenue Bonds, Facilities Program, Refunding Series | 10/23 at 100.00 | AA– | 2,006,068 |
| | 2013-I-A, 5.000%, 10/15/29 | | | |
| | Michigan State Building Authority, Revenue Bonds, Facilities Program, Refunding Series 2015-I: | | | |
| 2,085 | 5.000%, 4/15/31 (Pre-refunded 10/15/25) | 10/25 at 100.00 | N/R (4) | 2,451,751 |
| 14,915 | 5.000%, 4/15/31 | 10/25 at 100.00 | AA– | 17,375,528 |
| 5,615 | 5.000%, 4/15/38 | 10/25 at 100.00 | AA– | 6,508,010 |
| 2,500 | Michigan State Building Authority, Revenue Bonds, Facilities Program, Refunding Series | 10/26 at 100.00 | AA– | 2,905,600 |
| | 2016-I, 5.000%, 10/15/46 | | | |
| 1,505 | Michigan State Hospital Finance Authority, Hospital Revenue Refunding Bonds, St. John’s | 11/21 at 100.00 | N/R (4) | 1,627,703 |
| | Health System, Series 1998A, 5.000%, 5/15/28 – AMBAC Insured (ETM) | | | |
| 3,000 | Michigan State Hospital Finance Authority, Revenue Bonds, Trinity Health Care Group, | 6/22 at 100.00 | AA– (4) | 3,083,610 |
| | Series 2009C, 5.000%, 12/01/48 (Pre-refunded 6/01/22) | | | |
| 7,790 | Michigan State University, General Revenue Bonds, Series 2013A, 5.000%, 8/15/41 | 8/23 at 100.00 | AA | 8,379,158 |
| 4,165 | Michigan State University, General Revenue Bonds, Taxable Series 2019A, 5.000%, 2/15/48 | 2/29 at 100.00 | AA | 5,075,136 |
| 1,950 | Michigan State, Comprehensive Transportation Revenue Bonds, Refunding Series 2015, | 11/24 at 100.00 | Aa2 | 2,213,601 |
| | 5.000%, 11/15/29 | | | |
| 4,000 | Michigan State, General Obligation Bonds, Environmental Program, Refunding Series 2011A, | 12/21 at 100.00 | AA | 4,015,400 |
| | 5.000%, 12/01/22 | | | |
| 15,330 | Michigan State, Trunk Line Fund Bonds, Rebuilding Michigan Program Series 2020B, 4.000%, | 11/30 at 100.00 | Aa2 | 17,885,204 |
| | 11/15/45 (UB) (6) | | | |
94
| Principal | | Optional Call | | |
| Amount (000) | Description (1) | Provisions (2) | Ratings (3) | Value |
| | Michigan (continued) | | | |
| | Michigan State, Trunk Line Fund Bonds, Series 2011: | | | |
| $ 4,790 | Mona Shores Public Schools, Muskegon County, Michigan, General Obligation Bonds, School | 5/29 at 100.00 | Aa1 | $ 5,831,442 |
| | Building & Site Series 2019I, 5.000%, 5/01/48 | | | |
| 7,500 | Monroe Public Schools, Monroe County, Michigan, General Obligation Bonds, School | 5/30 at 100.00 | AA | 9,315,525 |
| | Building & Site Series 2020I, 5.000%, 5/01/50 (UB) (6) | | | |
| 500 | Montrose School District, Michigan, School Building and Site Bonds, Series 1997, 6.000%, | No Opt. Call | Aa2 | 514,455 |
| | 5/01/22 – NPFG Insured | | | |
| 2,945 | Muskegon Community College District, Michigan, General Obligation Bonds, Community | 5/24 at 100.00 | AA | 3,246,156 |
| | Facility Series 2013I, 5.000%, 5/01/38 | | | |
| | Muskegon County, Michigan, General Obligation Wastewater Bonds, Management System 1, | | | |
| | Refunding Series 2015: | | | |
| 1,350 | 5.000%, 11/01/33 | 11/25 at 100.00 | AA | 1,578,852 |
| 1,730 | 5.000%, 11/01/36 | 11/25 at 100.00 | AA | 2,012,855 |
| | Northern Michigan University, General Revenue Bonds, Series 2018A: | | | |
| 400 | 5.000%, 12/01/33 | 6/28 at 100.00 | A | 488,908 |
| 650 | 5.000%, 12/01/35 | 6/28 at 100.00 | A | 791,869 |
| 5,780 | Oakland University, Michigan, General Revenue Bonds, Series 2012, 5.000%, 3/01/42 | 3/22 at 100.00 | A1 | 5,861,036 |
| 5,400 | Oakland University, Michigan, General Revenue Bonds, Series 2016, 5.000%, 3/01/47 | 3/26 at 100.00 | A1 | 6,239,106 |
| | Port Huron, Michigan, Water Supply System Revenue Bonds, Series 2011: | | | |
| 500 | 5.250%, 10/01/31 | 11/21 at 100.00 | A– | 501,845 |
| 1,500 | 5.625%, 10/01/40 | 11/21 at 100.00 | A– | 1,505,925 |
| 5,380 | Royal Oak Hospital Finance Authority, Michigan, Hospital Revenue Bonds, William Beaumont | 3/24 at 100.00 | A+ | 5,916,870 |
| | Hospital Obligated Group, Refunding Series 2014D, 5.000%, 9/01/39 | | | |
| 1,510 | Royal Oak, Oakland County, Michigan, General Obligation Bonds, Taxable Limited Tax | 4/28 at 100.00 | AA | 1,826,556 |
| | Series 2018, 5.000%, 4/01/43 | | | |
| 810 | Saginaw Valley State University, Michigan, General Revenue Bonds, Refunding Series | 7/26 at 100.00 | A | 955,565 |
| | 2016A, 5.000%, 7/01/35 | | | |
| 1,435 | South Haven Public Schools, Van Buren County, Michigan, General Obligation Bonds, School | 5/24 at 100.00 | AA | 1,584,369 |
| | Building & Site, Series 2014A, 5.000%, 5/01/41 – BAM Insured | | | |
| 550 | Troy School District, Oakland County, Michigan, General Obligation Bonds, Refunding | 5/25 at 100.00 | AA | 637,323 |
| | Series 2015, 5.000%, 5/01/26 | | | |
| | University of Michigan, General Revenue Bonds, Refunding Series 2017A: | | | |
| 2,000 | 5.000%, 4/01/34 | 4/27 at 100.00 | AAA | 2,427,640 |
| 2,000 | 5.000%, 4/01/35 | 4/27 at 100.00 | AAA | 2,424,040 |
| 1,065 | 5.000%, 4/01/36 | 4/27 at 100.00 | AAA | 1,288,064 |
| 2,000 | 5.000%, 4/01/42 | 4/27 at 100.00 | AAA | 2,399,960 |
| 5,000 | 5.000%, 4/01/47 | 4/27 at 100.00 | AAA | 5,976,250 |
| 7,200 | 5.000%, 4/01/47 (UB) (6) | 4/27 at 100.00 | AAA | 8,605,800 |
| 4,000 | University of Michigan, General Revenue Bonds, Series 2014A, 5.000%, 4/01/44 | 4/24 at 100.00 | AAA | 4,427,800 |
| | University of Michigan, General Revenue Bonds, Series 2015: | | | |
| 5,735 | 5.000%, 4/01/40 (UB) (6) | 4/26 at 100.00 | AAA | 6,707,656 |
| 2,400 | 5.000%, 4/01/46 (UB) (6) | 4/26 at 100.00 | AAA | 2,802,864 |
| 2,150 | University of Michigan, General Revenue Bonds, Series 2020A, 4.000%, 4/01/45 | 4/30 at 100.00 | AAA | 2,518,381 |
| 1,600 | Walled Lake Consolidated School District, Oakland County, Michigan, General Obligation | 11/23 at 100.00 | Aa1 (4) | 1,750,064 |
| | Bonds, School Building & Site Series 2014, 5.000%, 5/01/40 (Pre-refunded 11/01/23) | | | |
| 2,000 | Walled Lake Consolidated School District, Oakland County, Michigan, General Obligation | 5/29 at 100.00 | Aa1 | 2,486,500 |
| | Bonds, School Building & Site Series 2019, 5.000%, 5/01/49 | | | |
| 2,500 | Walled Lake Consolidated School District, Oakland County, Michigan, General Obligation | 5/30 at 100.00 | Aa1 | 3,169,050 |
| | Bonds, School Building & Site Series 2020, 5.000%, 5/01/45 | | | |
| 1,000 | Wayne County Airport Authority, Michigan, Revenue Bonds, Detroit Metropolitan Wayne | 12/27 at 100.00 | A– | 1,212,620 |
| | County Airport, Senior Series 2017A, 5.000%, 12/01/42 | | | |
| 4,000 | Wayne County Airport Authority, Michigan, Revenue Bonds, Detroit Metropolitan Wayne | 12/22 at 100.00 | A | 4,194,720 |
| | County Airport, Series 2012A, 5.000%, 12/01/42 – AGM Insured | | | |
| 2,200 | Wayne County Airport Authority, Michigan, Revenue Bonds, Detroit Metropolitan Wayne | 12/25 at 100.00 | A– | 2,549,668 |
| | County Airport, Series 2015D, 5.000%, 12/01/45 | | | |
95
| NEA | Nuveen AMT-Free Quality Municipal Income Fund |
| | Portfolio of Investments (continued) |
| | October 31, 2021 |
| Principal | | Optional Call | | |
| Amount (000) | Description (1) | Provisions (2) | Ratings (3) | Value |
| | Michigan (continued) | | | |
| $ 3,700 | Wayne State University, Michigan, General Revenue Bonds, Series 2013A, 5.000%, 11/15/40 | 11/23 at 100.00 | A+ | $ 4,025,896 |
| 5,000 | Wayne State University, Michigan, General Revenue Bonds, Series 2018A, 5.000%, 11/15/43 | 11/28 at 100.00 | A+ | 6,022,450 |
| 2,810 | Wayne State University, Michigan, General Revenue Bonds, Series 2019A, 5.000%, 11/15/35 | 11/29 at 100.00 | A+ | 3,524,780 |
| 2,590 | West Bloomfield School District, Oakland County, Michigan, General Obligation Bonds, | 5/27 at 100.00 | A1 | 3,109,917 |
| | School Building & Site Series 2017, 5.000%, 5/01/36 – AGM Insured | | | |
| | Western Michigan University, General Revenue Bonds, Refunding Series 2013: | | | |
| 750 | 5.250%, 11/15/33 (Pre-refunded 11/15/23) – AGM Insured | 11/23 at 100.00 | Aa3 (4) | 826,035 |
| 4,250 | 5.000%, 11/15/39 (Pre-refunded 11/15/23) – AGM Insured | 11/23 at 100.00 | Aa3 (4) | 4,659,275 |
| | Western Michigan University, General Revenue Bonds, Refunding Series 2015A: | | | |
| 1,500 | 5.000%, 11/15/40 | 5/25 at 100.00 | A | 1,706,355 |
| 850 | 5.000%, 11/15/45 | 5/25 at 100.00 | A | 966,934 |
| 3,335 | Western Michigan University, General Revenue Bonds, Refunding Series 2019A, 5.000%, 11/15/49 | 11/29 at 100.00 | A | 4,065,832 |
| 700 | Williamston Community School District, Michigan, Unlimited Tax General Obligation QSBLF | No Opt. Call | Aa2 | 767,970 |
| | Bonds, Series 1996, 5.500%, 5/01/25 – NPFG Insured | | | |
| 2,700 | Wyandotte, Michigan, Electric Revenue Bonds, Refunding Series 2015A, 5.000%, 10/01/44 – | 10/25 at 100.00 | AA | 3,094,524 |
| | BAM Insured | | | |
| 626,400 | Total Michigan | | | 709,707,756 |
| | Minnesota – 2.5% (1.6% of Total Investments) | | | |
| 285 | Baytown Township, Minnesota Charter School Lease Revenue Bonds, Saint Croix Preparatory | 8/26 at 100.00 | BB+ | 302,177 |
| | Academy, Refunding Series 2016A, 4.000%, 8/01/36 | | | |
| 3,565 | Brooklyn Center, Minnesota, Charter School Lease Revenue Bonds, Tesfa International dba | 6/29 at 100.00 | N/R | 3,514,377 |
| | Twin Lakes STEM Academy Project, Series 2021A, 5.250%, 6/15/56 | | | |
| 730 | Brooklyn Center, Minnesota, Charter School Lease Revenue Bonds, Tesfa International dba | 6/29 at 100.00 | N/R | 753,791 |
| | Twin Lakes STEM Academy Project, Taxable Series 2021B, 6.000%, 6/15/31 | | | |
| 350 | Chatfield, Minnesota, Healthcare and Housing Facilities Revenue Bonds, Chosen Valley | 9/26 at 102.00 | N/R | 346,024 |
| | Care Center Project, Refunding Series 2019, 4.000%, 9/01/39 | | | |
| 4,005 | City of Milaca, Minnesota Refunding Revenue Bonds, Grandview Christian Home Project, | 10/24 at 102.00 | N/R | 4,221,711 |
| | Series 2016, 5.000%, 10/01/41 | | | |
| | Dakota County Community Development Agency, Minnesota, Senior Housing Revenue Bonds, | | | |
| | Walker Highview Hills LLC Project, Refunding Series 2016A: | | | |
| 2,130 | 3.500%, 8/01/25, 144A | 8/22 at 100.00 | N/R | 2,154,325 |
| 1,000 | 5.000%, 8/01/46, 144A | 8/22 at 100.00 | N/R | 1,015,360 |
| | Duluth Economic Development Authority, Minnesota, Health Care Facilities Revenue Bonds, | | | |
| | Essentia Health Obligated Group, Series 2018A: | | | |
| 3,750 | 5.000%, 2/15/48 | 2/28 at 100.00 | A– | 4,409,512 |
| 8,250 | 5.000%, 2/15/53 | 2/28 at 100.00 | A– | 9,682,612 |
| 5,240 | 5.250%, 2/15/53 | 2/28 at 100.00 | A– | 6,302,200 |
| 5,500 | 5.000%, 2/15/58 | 2/28 at 100.00 | A– | 6,455,075 |
| 9,840 | Independent School District 621, Mounds View, Minnesota, General Obligation Bonds, | 2/27 at 100.00 | AAA | 11,028,869 |
| | School Building Series 2018A, 4.000%, 2/01/41 | | | |
| 2,800 | Itasca County Independent School District 318, Minnesota, General Obligation Bonds, | 2/27 at 100.00 | AAA | 3,133,872 |
| | Series 2018A, 4.000%, 2/01/37 | | | |
| | Minneapolis, Minnesota, Health Care System Revenue Bonds, Fairview Health Services, | | | |
| | Series 2018A: | | | |
| 2,530 | 4.000%, 11/15/48 | 11/28 at 100.00 | A3 | 2,831,019 |
| 3,395 | 5.000%, 11/15/49 | 11/28 at 100.00 | A3 | 4,077,463 |
| | Minneapolis-St. Paul Metropolitan Airports Commission, Minnesota, Airport Revenue Bonds, | | | |
| | Senior Lien Series 2016C: | | | |
| 3,500 | 5.000%, 1/01/41 | 1/27 at 100.00 | A+ | 4,150,370 |
| 5,000 | 5.000%, 1/01/46 | 1/27 at 100.00 | A+ | 5,925,400 |
| | Minnesota Housing Finance Agency, Housing Infrastructure State Appropriation Bonds, | | | |
| | Series 2021A: | | | |
| 265 | 3.000%, 8/01/35 | 8/31 at 100.00 | Aa2 | 289,677 |
| 280 | 3.000%, 8/01/37 | 8/31 at 100.00 | Aa2 | 303,646 |
96
| Principal | | Optional Call | | |
| Amount (000) | Description (1) | Provisions (2) | Ratings (3) | Value |
| | Minnesota (continued) | | | |
| $ 650 | Minnesota Housing Finance Agency, Housing Infrastructure State Appropriation Bonds, | 8/31 at 100.00 | Aa2 | $ 710,528 |
| | Series 2021B, 3.000%, 8/01/35 | | | |
| | Minnesota Housing Finance Agency, Housing Infrastructure State Appropriation Bonds, | | | |
| | Series 2021C: | | | |
| 1,000 | 4.000%, 8/01/38 | 8/31 at 100.00 | Aa2 | 1,205,860 |
| 1,500 | 4.000%, 8/01/43 | 8/31 at 100.00 | Aa2 | 1,771,275 |
| 2,855 | Rochester, Minnesota, Electric Utility Revenue Bonds, Refunding Series 2017A, 5.000%, 12/01/47 | 12/26 at 100.00 | Aa3 | 3,338,922 |
| 4,000 | Saint Cloud, Minnesota, Health Care Revenue Bonds, CentraCare Health System, Series | 5/29 at 100.00 | A2 | 4,515,600 |
| | 2019, 4.000%, 5/01/49 | | | |
| 1,000 | Saint Paul Housing & Redevelopment Authority, Minnesota, Charter School Lease Revenue | 9/30 at 100.00 | BB+ | 1,169,320 |
| | Bonds, Hmong College Prep Academy Project, Refunding Series 2020A, 5.000%, 9/01/40 | | | |
| 5,850 | Saint Paul Housing & Redevelopment Authority, Minnesota, Charter School Lease Revenue | 9/26 at 100.00 | BB+ | 6,698,542 |
| | Bonds, Hmong College Prep Academy Project, Series 2016A, 6.000%, 9/01/51 | | | |
| 4,170 | Saint Paul Housing & Redevelopment Authority, Minnesota, Charter School Lease Revenue | 9/24 at 102.00 | BB+ | 4,363,571 |
| | Bonds, Nova Classical Academy, Series 2016A, 4.125%, 9/01/47 | | | |
| 3,000 | Saint Paul Housing and Redevelopment Authority, Minnesota, Health Care Facility Revenue | 7/25 at 100.00 | A | 3,450,630 |
| | Bonds, HealthPartners Obligated Group, Refunding Series 2015A, 5.000%, 7/01/30 | | | |
| | Saint Paul Housing and Redevelopment Authority, Minnesota, Health Care Revenue Bonds, | | | |
| | Fairview Health Services, Series 2017A: | | | |
| 595 | 4.000%, 11/15/35 | 11/27 at 100.00 | A3 | 676,765 |
| 1,470 | 4.000%, 11/15/43 | 11/27 at 100.00 | A3 | 1,659,292 |
| 850 | Sartell, Minnesota, Health Care Facilities Revenue Bonds, Country Manor Campus LLC | 9/27 at 100.00 | N/R | 884,791 |
| | Project, Refunding Series 2017, 5.000%, 9/01/42 | | | |
| | St. Paul Housing and Redevelopment Authority, Minnesota, Hospital Revenue Bonds, | | | |
| | HealthEast Inc., Series 2015A: | | | |
| 3,595 | 5.000%, 11/15/40 (Pre-refunded 11/15/25) | 11/25 at 100.00 | N/R (4) | 4,222,831 |
| 5,315 | 5.000%, 11/15/44 (Pre-refunded 11/15/25) | 11/25 at 100.00 | N/R (4) | 6,243,212 |
| | Wayzata, Minnesota Senior Housing Revenue Bonds, Folkestone Senior Living Community, | | | |
| | Refunding Series 2019: | | | |
| 300 | 5.000%, 8/01/32 | 8/24 at 102.00 | N/R | 324,381 |
| 150 | 5.000%, 8/01/33 | 8/24 at 102.00 | N/R | 162,023 |
| 250 | 5.000%, 8/01/35 | 8/24 at 102.00 | N/R | 269,620 |
| 600 | 4.000%, 8/01/39 | 8/24 at 102.00 | N/R | 627,720 |
| 2,000 | 5.000%, 8/01/49 | 8/24 at 102.00 | N/R | 2,136,540 |
| 101,565 | Total Minnesota | | | 115,328,903 |
| | Mississippi – 0.3% (0.2% of Total Investments) | | | |
| 11,465 | Medical Center Educational Building Corporation, Mississippi, Revenue Bonds, University of | 6/27 at 100.00 | Aa2 | 12,639,475 |
| | Mississippi Medical Center New Facilities & Refinancing Project, Series 2017A, 4.000%, 6/01/47 | | | |
| | Missouri – 4.5% (2.9% of Total Investments) | | | |
| 2,585 | Bi-State Development Agency of the Missouri-Illinois Metropolitan District, Mass Transit | 10/22 at 100.00 | Aa2 (4) | 2,698,766 |
| | Sales Tax Appropriation Bonds, Refunding Combined Lien Series 2013A, 5.000%, 10/01/44 | | | |
| | (Pre-refunded 10/01/22) | | | |
| | Boone County, Missouri, Hospital Revenue Bonds, Boone Hospital Center, Refunding Series 2016: | | | |
| 2,470 | 4.000%, 8/01/33 | 8/26 at 100.00 | Ba1 | 2,671,997 |
| 4,590 | 5.000%, 8/01/35 | 8/26 at 100.00 | Ba1 | 5,209,099 |
| 640 | 4.000%, 8/01/38 | 8/26 at 100.00 | Ba1 | 687,482 |
| | Hannibal Industrial Development Authority, Missouri, Health Facilities Revenue Bonds, | | | |
| | Hannibal Regional Healthcare System, Series 2017: | | | |
| 2,860 | 5.000%, 10/01/42 | 10/27 at 100.00 | BBB+ | 3,357,812 |
| 1,000 | 5.000%, 10/01/47 | 10/27 at 100.00 | BBB+ | 1,166,660 |
| | Kansas City Municipal Assistance Corporation, Missouri, Leasehold Revenue Bonds, | | | |
| | Improvement Series 2004B-1: | | | |
| 8,150 | 0.000%, 4/15/27 – AMBAC Insured | No Opt. Call | A2 | 7,639,403 |
| 5,000 | 0.000%, 4/15/31 – AMBAC Insured | No Opt. Call | A2 | 4,208,150 |
97
| NEA | Nuveen AMT-Free Quality Municipal Income Fund |
| | Portfolio of Investments (continued) |
| | October 31, 2021 |
| Principal | | Optional Call | | |
| Amount (000) | Description (1) | Provisions (2) | Ratings (3) | Value |
| | Missouri (continued) | | | |
| | Kansas City, Missouri, Sanitary Sewer System Revenue Bonds, Improvement Series 2018A: | | | |
| $ 2,475 | 4.000%, 1/01/38 | 1/28 at 100.00 | AA | $ 2,871,297 |
| 4,470 | 4.000%, 1/01/42 | 1/28 at 100.00 | AA | 5,172,192 |
| 1,585 | Kansas City, Missouri, Special Obligation Bonds, Kansas City Missouri Projects, Series | 4/31 at 100.00 | A2 | 2,012,902 |
| | 2021A, 5.000%, 4/01/39 | | | |
| 2,700 | Maryland Heights, Missouri, Tax Increment and Special District Revenue Bonds, Westport | 11/29 at 100.00 | N/R | 2,855,439 |
| | Plaza Redevelopment Area, Series 2020, 4.125%, 11/01/38 | | | |
| 5,385 | Metropolitan St. Louis Sewerage District, Missouri, Wastewater System Revenue Bonds, | 5/30 at 100.00 | AA+ | 6,756,129 |
| | Series 2020B, 5.000%, 5/01/49 | | | |
| 3,000 | Missouri Environmental Improvement and Energy Resources Authority, Revenue Bonds, Union | 7/27 at 102.00 | A | 3,208,950 |
| | Electric Company Project, Refunding Series 1998A, 2.900%, 9/01/33 | | | |
| 1,350 | Missouri Health and Education Facilities Authority, Health Facilities Revenue Bonds, | 5/26 at 100.00 | A+ | 1,579,392 |
| | Saint Luke’s Health System, Inc., Series 2016, 5.000%, 11/15/35 | | | |
| 5,000 | Missouri Health and Education Facilities Authority, Health Facilities Revenue Bonds, | 11/30 at 100.00 | A+ | 5,715,600 |
| | Saint Luke’s Health System, Inc., Series 2020, 4.000%, 11/15/50 | | | |
| 1,400 | Missouri Health and Educational Facilities Authority, Educational Facilities Revenue | 6/27 at 100.00 | A1 | 1,668,282 |
| | Bonds, Kansas City University of Medicine and Biosciences, Series 2017A, 5.000%, 6/01/42 | | | |
| 11,985 | Missouri Health and Educational Facilities Authority, Educational Facilities Revenue | 5/23 at 100.00 | BBB | 12,682,287 |
| | Bonds, Saint Louis College of Pharmacy, Series 2013, 5.500%, 5/01/43 | | | |
| 3,665 | Missouri Health and Educational Facilities Authority, Health Facilities Revenue Bonds, | 1/25 at 100.00 | AA | 3,956,881 |
| | BJC Health System, Series 2015A, 4.000%, 1/01/45 | | | |
| 2,305 | Missouri Health and Educational Facilities Authority, Health Facilities Revenue Bonds, | 7/31 at 100.00 | AA | 2,674,422 |
| | BJC Health System, Series 2021A, 4.000%, 7/01/46 | | | |
| 1,500 | Missouri Health and Educational Facilities Authority, Health Facilities Revenue Bonds, | 7/26 at 100.00 | AA | 1,636,275 |
| | BJC Health System, Variable Rate Demand Obligation Series 2013C, 4.000%, 1/01/50 (Mandatory | | | |
| | Put 1/01/46) | | | |
| 14,000 | Missouri Health and Educational Facilities Authority, Health Facilities Revenue Bonds, | 1/28 at 100.00 | AA | 15,674,540 |
| | BJC Health System, Variable Rate Demand Obligation Series 2017D, 4.000%, 1/01/58 (Mandatory | | | |
| | Put 1/01/48) (UB) (6) | | | |
| 17,300 | Missouri Health and Educational Facilities Authority, Health Facilities Revenue Bonds, | 11/23 at 100.00 | A2 | 18,728,288 |
| | CoxHealth, Series 2013A, 5.000%, 11/15/48 | | | |
| | Missouri Health and Educational Facilities Authority, Health Facilities Revenue Bonds, | | | |
| | CoxHealth, Series 2019A: | | | |
| 4,165 | 4.000%, 11/15/44 | 5/29 at 100.00 | A2 | 4,725,442 |
| 4,220 | 4.000%, 11/15/49 | 5/29 at 100.00 | A2 | 4,744,630 |
| | Missouri Health and Educational Facilities Authority, Health Facilities Revenue Bonds, | | | |
| | Mercy Health, Series 2017C: | | | |
| 2,220 | 5.000%, 11/15/42 | 11/27 at 100.00 | A+ | 2,644,708 |
| 3,000 | 5.000%, 11/15/47 | 11/27 at 100.00 | A+ | 3,562,260 |
| 25,150 | Missouri Health and Educational Facilities Authority, Health Facilities Revenue Bonds, | 6/30 at 100.00 | A+ | 28,688,856 |
| | Mercy Health, Series 2020, 4.000%, 6/01/53 | | | |
| 3,000 | Missouri Health and Educational Facilities Authority, Health Facilities Revenue Bonds, | 6/24 at 100.00 | A+ | 3,239,700 |
| | SSM Health Care, Series 2014A, 4.000%, 6/01/33 | | | |
| 10,000 | Missouri Health and Educational Facilities Authority, Revenue Bonds, Children’s Mercy | 5/25 at 102.00 | A+ | 10,997,600 |
| | Hospital, Series 2017A, 4.000%, 5/15/42 | | | |
| | Missouri Health and Educational Facilities Authority, Revenue Bonds, Lutheran Senior | | | |
| | Services Projects, Series 2014A: | | | |
| 1,540 | 5.000%, 2/01/35 | 2/24 at 100.00 | BBB | 1,647,661 |
| 2,000 | 5.000%, 2/01/44 | 2/24 at 100.00 | BBB | 2,130,220 |
| 1,150 | Missouri Health and Educational Facilities Authority, Revenue Bonds, Lutheran Senior | 2/26 at 100.00 | BBB | 1,275,891 |
| | Services Projects, Series 2016A, 5.000%, 2/01/46 | | | |
| 700 | Missouri Health and Educational Facilities Authority, Revenue Bonds, Lutheran Senior | 2/26 at 100.00 | BBB | 791,791 |
| | Services Projects, Series 2016B, 5.000%, 2/01/34 | | | |
98
| Principal | | Optional Call | | |
| Amount (000) | Description (1) | Provisions (2) | Ratings (3) | Value |
| | Missouri (continued) | | | |
| $ 1,700 | Missouri Health and Educational Facilities Authority, Revenue Bonds, Lutheran Senior | 2/24 at 104.00 | BBB | $ 1,876,885 |
| | Services Projects, Series 2019A, 5.000%, 2/01/42 | | | |
| | Missouri Health and Educational Facilities Authority, Revenue Bonds, Lutheran Senior | | | |
| | Services Projects, Series 2019C: | | | |
| 1,500 | 5.000%, 2/01/42 | 2/29 at 102.00 | BBB | 1,812,240 |
| 1,000 | 4.000%, 2/01/48 | 2/29 at 100.00 | BBB | 1,107,920 |
| 500 | Missouri Health and Educational Facilities Authority, Revenue Bonds, Saint Louis | 4/29 at 100.00 | A1 | 563,895 |
| | University, Series 2019A, 4.000%, 10/01/48 | | | |
| 7,085 | Missouri Joint Municipal Electric Utility Commission, Power Project Revenue Bonds, | 6/26 at 100.00 | A2 | 8,349,177 |
| | Pairie State Power Project, Refunding Series 2016A, 5.000%, 12/01/34 | | | |
| 2,415 | Saint Charles County Public Water Supply District 2, Missouri, Certificates of | 12/25 at 100.00 | AA+ | 2,630,007 |
| | Participation, Missouri Project Series 2019, 4.000%, 12/01/41 | | | |
| | Saint Charles County Public Water Supply District 2, Missouri, Certificates of | | | |
| | Participation, Refunding Series 2016C: | | | |
| 1,675 | 4.000%, 12/01/31 | 12/25 at 100.00 | AA+ | 1,879,417 |
| 2,535 | 5.000%, 12/01/32 | 12/25 at 100.00 | AA+ | 2,966,127 |
| 220 | Saint Louis County Industrial Development Authority, Missouri, Revenue Bonds, Friendship | 9/23 at 100.00 | BB+ | 234,419 |
| | Village of Sunset Hills, Series 2013A, 5.875%, 9/01/43 | | | |
| 7,250 | Saint Louis County Industrial Development Authority, Missouri, Revenue Bonds, Friendship | 9/25 at 103.00 | BB+ | 8,103,108 |
| | Village Saint Louis Obligated Group, Series 2018A, 5.250%, 9/01/53 | | | |
| 725 | The Industrial Development Authority of the City of Saint Louis, Missouri, Development | 11/26 at 100.00 | N/R | 715,967 |
| | Financing Revenue Bonds, Ballpark Village Development Project, Series 2017A, 3.875%, 11/15/29 | | | |
| 189,165 | Total Missouri | | | 209,520,166 |
| | Montana – 0.4% (0.2% of Total Investments) | | | |
| 1,475 | Kalispell, Montana, Housing and Healthcare Facilities Revenue Bonds, Immanuel Lutheran | 5/25 at 102.00 | N/R | 1,590,832 |
| | Corporation, Series 2017A, 5.250%, 5/15/47 | | | |
| 4,965 | Montana Facility Finance Authority, Healthcare Facility Revenue Bonds, Kalispell | 7/28 at 100.00 | BBB | 5,733,135 |
| | Regional Medical Center, Series 2018B, 5.000%, 7/01/48 | | | |
| 2,580 | Montana Facility Finance Authority, Hospital Revenue Bonds, Benefis Health System | 2/27 at 100.00 | A+ | 3,031,371 |
| | Obligated Group, Refunding Series 2016, 5.000%, 2/15/41 | | | |
| 3,310 | Montana Facility Finance Authority, Montana, Health Facilities Revenue Bonds, Bozeman | 6/28 at 100.00 | A | 3,937,907 |
| | Deaconess Health Services Obligated Group, Series 2018, 5.000%, 6/01/48 | | | |
| 1,825 | Montana Facility Finance Authority, Revenue Bonds, Billings Clinic Obligated Group, | 8/28 at 100.00 | AA– | 2,205,841 |
| | Series 2018A, 5.000%, 8/15/48 | | | |
| 14,155 | Total Montana | | | 16,499,086 |
| | Nebraska – 1.0% (0.7% of Total Investments) | | | |
| 2,620 | Central Plains Energy Project, Nebraska, Gas Project 3 Revenue Bonds, Series 2012, | 9/22 at 100.00 | BBB+ | 2,721,027 |
| | 5.000%, 9/01/42 | | | |
| | Douglas County Hospital Authority 2, Nebraska, Health Facilities Revenue Bonds, | | | |
| | Children’s Hospital Obligated Group, Refunding Series 2020A: | | | |
| 1,200 | 4.000%, 11/15/39 | 11/30 at 100.00 | A1 | 1,407,204 |
| 1,625 | 4.000%, 11/15/40 | 11/30 at 100.00 | A1 | 1,900,227 |
| 3,000 | Douglas County Hospital Authority 2, Nebraska, Health Facilities Revenue Bonds, | 5/27 at 100.00 | A1 | 3,528,270 |
| | Children’s Hospital Obligated Group, Series 2017, 5.000%, 11/15/47 | | | |
| | Douglas County Hospital Authority 3, Nebraska, Health Facilities Revenue Bonds, Nebraska | | | |
| | Methodist Health System, Refunding Series 2015: | | | |
| 3,500 | 5.000%, 11/01/45 | 11/25 at 100.00 | A | 4,000,955 |
| 1,400 | 5.000%, 11/01/48 | 11/25 at 100.00 | A | 1,581,706 |
| 4,000 | Lincoln, Nebraska, Electric System Revenue Bonds, Refunding Series 2012, 5.000%, 9/01/37 | 9/22 at 100.00 | AA (4) | 4,160,080 |
| | (Pre-refunded 9/01/22) | | | |
| | Madison County Hospital Authority 1, Nebraska, Hospital Revenue Bonds, Faith Regional | | | |
| | Health Services Project, Refunding Series 2017A: | | | |
| 2,150 | 5.000%, 7/01/29 | 7/27 at 100.00 | BBB | 2,528,830 |
| 2,000 | 5.000%, 7/01/30 | 7/27 at 100.00 | BBB | 2,340,060 |
99
| NEA | Nuveen AMT-Free Quality Municipal Income Fund |
| | Portfolio of Investments (continued) |
| | October 31, 2021 |
| Principal | | Optional Call | | |
| Amount (000) | Description (1) | Provisions (2) | Ratings (3) | Value |
| | Nebraska (continued) | | | |
| | Madison County Hospital Authority 1, Nebraska, Hospital Revenue Bonds, Faith Regional | | | |
| | Health Services Project, Series 2018: | | | |
| $ 1,000 | 5.000%, 7/01/32 | 7/25 at 100.00 | BBB | $ 1,124,870 |
| 820 | 5.000%, 7/01/33 | 7/25 at 100.00 | BBB | 921,475 |
| 2,000 | 5.000%, 7/01/34 | 7/25 at 100.00 | BBB | 2,244,820 |
| 5,110 | Municipal Energy Agency of Nebraska, Power Supply System Revenue Bonds, Refunding Series | 10/26 at 100.00 | A | 6,042,115 |
| | 2016A, 5.000%, 4/01/38 | | | |
| 12,500 | University of Nebraska Facilities Corporation, Nebraska, Facilities Program Bonds, | 7/31 at 100.00 | AA | 14,489,125 |
| | Series 2021A, 4.000%, 7/15/59 | | | |
| 42,925 | Total Nebraska | | | 48,990,764 |
| | Nevada – 1.9% (1.2% of Total Investments) | | | |
| 6,030 | Carson City, Nevada, Hospital Revenue Bonds, Carson Tahoe Regional Healthcare Project, | 9/27 at 100.00 | A– | 7,127,098 |
| | Series 2017A, 5.000%, 9/01/47 | | | |
| 4,000 | Clark County School District, Nevada, General Obligation Bonds, Limited Tax Building | 6/28 at 100.00 | A+ | 4,568,240 |
| | Series 2018A, 4.000%, 6/15/37 | | | |
| 7,525 | Clark County, Nevada, General Obligation Bonds, Stadium Improvement, Limited Tax | 6/28 at 100.00 | AA+ | 9,009,080 |
| | Additionally Secured by Pledged Revenues, Series 2018A, 5.000%, 5/01/48 | | | |
| 365 | Director of the State of Nevada Department of Business and Industry, Charter School | 12/25 at 100.00 | BB | 401,398 |
| | Lease Revenue Bonds, Somerset Academy, Series 2018A, 5.000%, 12/15/38, 144A | | | |
| | Henderson, Nevada, Limited Obligation Bonds, Local Improvement District T-18 Inspirada, | | | |
| | Refunding Series 2016: | | | |
| 2,300 | 4.000%, 9/01/26 | No Opt. Call | N/R | 2,511,324 |
| 1,525 | 4.000%, 9/01/27 | 9/26 at 100.00 | N/R | 1,657,934 |
| 2,660 | 4.000%, 9/01/29 | 9/26 at 100.00 | N/R | 2,863,091 |
| 2,920 | 4.000%, 9/01/30 | 9/26 at 100.00 | N/R | 3,126,035 |
| | Las Vegas Valley Water District, Nevada, General Obligation Bonds, Refunding Series 2015: | | | |
| 5,000 | 5.000%, 6/01/32 | 12/24 at 100.00 | AA | 5,671,450 |
| 10,000 | 5.000%, 6/01/33 | 12/24 at 100.00 | AA | 11,336,300 |
| 6,620 | 5.000%, 6/01/39 | 12/24 at 100.00 | AA | 7,450,479 |
| 11,915 | 5.000%, 6/01/39 (UB) (6) | 12/24 at 100.00 | AA | 13,409,737 |
| | Las Vegas Valley Water District, Nevada, General Obligation Bonds, Tender Option Bond | | | |
| | Trust 2015-XF0233: | | | |
| 1,000 | 18.198%, 12/01/22, 144A (IF) | No Opt. Call | AA | 1,501,820 |
| 3,995 | 18.288%, 12/01/22, 144A (IF) | No Opt. Call | AA | 5,998,493 |
| 1,250 | 18.299%, 6/01/39, 144A (IF) | 12/24 at 100.00 | AA | 1,877,275 |
| 1,250 | 18.299%, 6/01/39, 144A (IF) | 12/24 at 100.00 | AA | 1,877,275 |
| 2,500 | 18.299%, 6/01/39, 144A (IF) | 12/24 at 100.00 | AA | 3,754,550 |
| 4,100 | Las Vegas Valley Water District, Nevada, General Obligation Bonds, Water Series 2012B, | 6/22 at 100.00 | AA | 4,208,855 |
| | 5.000%, 6/01/42 | | | |
| 74,955 | Total Nevada | | | 88,350,434 |
| | New Hampshire – 0.2% (0.1% of Total Investments) | | | |
| 1,335 | National Finance Authority, New Hampshire, Hospital Facilities Revenue Bonds, Saint | 5/31 at 100.00 | AA | 1,528,054 |
| | Elizabeth Medical Center, Inc., Series 2021A, 4.000%, 5/01/45 | | | |
| 1,500 | New Hampshire Health and Education Facilities Authority, Revenue Bonds, Concord | 10/27 at 100.00 | A2 | 1,775,715 |
| | Hospital, Series 2017, 5.000%, 10/01/47 | | | |
| | New Hampshire Health and Education Facilities Authority, Revenue Bonds, | | | |
| | Dartmouth-Hitchcock Obligated Group, Series 2018A: | | | |
| 1,115 | 5.000%, 8/01/36 | 2/28 at 100.00 | A | 1,356,208 |
| 2,935 | 5.000%, 8/01/37 | 2/28 at 100.00 | A | 3,564,881 |
| 1,110 | New Hampshire Health and Education Facilities Authority, Revenue Bonds, | No Opt. Call | A | 1,714,839 |
| | Dartmouth-Hitchcock Obligated Group, Series 2020A, 5.000%, 8/01/59 | | | |
| 7,995 | Total New Hampshire | | | 9,939,697 |
100
| Principal | | Optional Call | | |
| Amount (000) | Description (1) | Provisions (2) | Ratings (3) | Value |
| | New Jersey – 6.2% (4.0% of Total Investments) | | | |
| $ 10,600 | New Jersey Economic Development Authority, Revenue Bonds, New Jersey Transit Corporation | No Opt. Call | BBB | $ 12,368,080 |
| | Projects Sublease, Refunding Series 2017B, 5.000%, 11/01/25 | | | |
| 6,000 | New Jersey Economic Development Authority, Revenue Bonds, Provident Group – Montclair | 6/27 at 100.00 | A2 | 7,082,640 |
| | Properties LLC, Montclair State University Student Housing Project, Refunding Series 2017, | | | |
| | 5.000%, 6/01/42 – AGM Insured | | | |
| 20,890 | New Jersey Economic Development Authority, School Facilities Construction Bonds, | 12/26 at 100.00 | BBB | 25,464,701 |
| | Refunding Series 2016BBB, 5.500%, 6/15/30 | | | |
| | New Jersey Economic Development Authority, School Facilities Construction Bonds, Series 2014UU: | | | |
| 5,515 | 5.000%, 6/15/30 | 6/24 at 100.00 | BBB | 6,115,584 |
| 935 | 5.000%, 6/15/40 (Pre-refunded 6/15/24) | 6/24 at 100.00 | N/R (4) | 1,049,294 |
| 4,065 | 5.000%, 6/15/40 | 6/24 at 100.00 | BBB | 4,465,890 |
| 1,000 | New Jersey Economic Development Authority, School Facilities Construction Bonds, Series | 12/28 at 100.00 | BBB | 1,199,980 |
| | 2018EEE, 5.000%, 6/15/43 | | | |
| 2,550 | New Jersey Economic Development Authority, School Facilities Construction Bonds, Social | 12/30 at 100.00 | BBB | 2,860,896 |
| | Series 2021QQQ, 4.000%, 6/15/50 | | | |
| 2,020 | New Jersey Health Care Facilities Financing Authority, New Jersey, Revenue Bonds, Saint | 11/21 at 100.00 | Ba1 | 2,026,100 |
| | Peters University Hospital, Series 2007, 5.750%, 7/01/37 | | | |
| 2,500 | New Jersey Health Care Facilities Financing Authority, Revenue Bonds, Hackensack | 7/27 at 100.00 | AA– | 2,991,375 |
| | Meridian Health Obligated Group, Refunding Series 2017A, 5.000%, 7/01/37 | | | |
| 720 | New Jersey Health Care Facilities Financing Authority, Revenue Bonds, Robert Wood | 7/23 at 100.00 | AA– | 778,435 |
| | Johnson University Hospital, Series 2013A, 5.500%, 7/01/43 | | | |
| 10,970 | New Jersey Health Care Facilities Financing Authority, Revenue Bonds, RWJ Barnabas | 7/26 at 100.00 | AA– | 12,935,934 |
| | Health Obligated Group, Refunding Series 2016A, 5.000%, 7/01/43 | | | |
| 5,000 | New Jersey Health Care Facilities Financing Authority, Revenue Bonds, RWJ Barnabas | 7/31 at 100.00 | AA– | 5,807,000 |
| | Health Obligated Group, Series 2021A, 4.000%, 7/01/51 | | | |
| 695 | New Jersey Health Care Facilities Financing Authority, Revenue Bonds, University | 7/25 at 100.00 | BB– | 789,381 |
| | Hospital Issue, Refunding Series 2015A, 5.000%, 7/01/46 – AGM Insured | | | |
| | New Jersey Transportation Trust Fund Authority, Federal Highway Reimbursement Revenue | | | |
| | Notes, Series 2016A-1: | | | |
| 3,050 | 5.000%, 6/15/28 | 6/26 at 100.00 | Baa1 | 3,589,179 |
| 7,795 | 5.000%, 6/15/29 | 6/26 at 100.00 | Baa1 | 9,150,473 |
| | New Jersey Transportation Trust Fund Authority, Transportation System Bonds, Capital | | | |
| | Appreciation Series 2010A: | | | |
| 5,000 | 0.000%, 12/15/26 | No Opt. Call | BBB | 4,651,400 |
| 16,495 | 0.000%, 12/15/33 | No Opt. Call | BBB | 12,549,891 |
| | New Jersey Transportation Trust Fund Authority, Transportation System Bonds, Refunding | | | |
| | Series 2006C: | | | |
| 1,815 | 0.000%, 12/15/26 – BHAC Insured | No Opt. Call | AA+ | 1,717,916 |
| 10,000 | 0.000%, 12/15/30 – FGIC Insured | No Opt. Call | BBB | 8,389,800 |
| 38,000 | 0.000%, 12/15/33 – AGM Insured | No Opt. Call | BBB+ | 29,648,740 |
| 45,000 | 0.000%, 12/15/35 – AMBAC Insured | No Opt. Call | BBB | 32,695,650 |
| 10,000 | 0.000%, 12/15/36 – AMBAC Insured | No Opt. Call | BBB | 7,040,800 |
| 5,000 | New Jersey Transportation Trust Fund Authority, Transportation System Bonds, Series | No Opt. Call | BBB | 5,485,850 |
| | 2010D, 5.000%, 12/15/23 | | | |
| 1,000 | New Jersey Transportation Trust Fund Authority, Transportation System Bonds, Series | 6/22 at 100.00 | BBB (4) | 1,029,420 |
| | 2012A, 5.000%, 6/15/42 (Pre-refunded 6/15/22) | | | |
| 7,500 | New Jersey Transportation Trust Fund Authority, Transportation System Bonds, Series | 6/23 at 100.00 | BBB | 8,038,125 |
| | 2013AA, 5.500%, 6/15/39 | | | |
| 5,000 | New Jersey Transportation Trust Fund Authority, Transportation System Bonds, Series | 12/29 at 100.00 | BBB | 6,253,700 |
| | 2019A, 5.000%, 12/15/32 | | | |
| 5,000 | New Jersey Transportation Trust Fund Authority, Transportation System Bonds, Series | 12/28 at 100.00 | BBB | 5,569,000 |
| | 2019BB, 4.000%, 6/15/44 | | | |
| 15,450 | New Jersey Transportation Trust Fund Authority, Transportation System Bonds, Series | 12/30 at 100.00 | BBB | 17,450,311 |
| | 2020AA, 4.000%, 6/15/45 | | | |
101
| NEA | Nuveen AMT-Free Quality Municipal Income Fund |
| | Portfolio of Investments (continued) |
| | October 31, 2021 |
| Principal | | Optional Call | | |
| Amount (000) | Description (1) | Provisions (2) | Ratings (3) | Value |
| | New Jersey (continued) | | | |
| $ 14,000 | New Jersey Turnpike Authority, Revenue Bonds, Refunding Series 2005D-1, 5.250%, 1/01/26 – | No Opt. Call | A2 | $ 16,614,500 |
| | AGM Insured | | | |
| 1,160 | New Jersey Turnpike Authority, Revenue Bonds, Series 2017B, 4.000%, 1/01/34 | 1/28 at 100.00 | A2 | 1,342,700 |
| | New Jersey Turnpike Authority, Revenue Bonds, Tender Option Bond Trust 2016-XF1057: | | | |
| 489 | 17.437%, 1/01/43 (Pre-refunded 7/01/22), 144A (IF) (6) | 7/22 at 100.00 | A2 (4) | 552,337 |
| 826 | 17.437%, 1/01/43 (Pre-refunded 7/01/22), 144A (IF) (6) | 7/22 at 100.00 | N/R (4) | 931,772 |
| 1,500 | New Jersey Turnpike Authority, Turnpike Revenue Bonds, Series 2017G, 4.000%, 1/01/33 | 1/28 at 100.00 | A2 | 1,738,995 |
| 3,000 | Rahway Valley Sewerage Authority, New Jersey, Sewer Revenue Bonds, Series 2005A, 0.000%, | No Opt. Call | Aa3 | 2,910,090 |
| | 9/01/25 – NPFG Insured | | | |
| | Rutgers State University, New Jersey, Revenue Bonds, Refunding Series 2013L: | | | |
| 2,000 | 5.000%, 5/01/38 (Pre-refunded 5/01/23) | 5/23 at 100.00 | A+ (4) | 2,142,880 |
| 910 | 5.000%, 5/01/43 (Pre-refunded 5/01/23) | 5/23 at 100.00 | A+ (4) | 975,010 |
| 3,905 | South Jersey Transportation Authority, New Jersey, Transportation System Revenue Bonds, | 11/30 at 100.00 | Baa2 | 4,758,711 |
| | Series 2020A, 5.000%, 11/01/45 | | | |
| | Tobacco Settlement Financing Corporation, New Jersey, Tobacco Settlement Asset-Backed | | | |
| | Bonds, Series 2018A: | | | |
| 10,355 | 5.000%, 6/01/46 | 6/28 at 100.00 | BBB+ | 12,046,179 |
| 4,710 | 5.250%, 6/01/46 | 6/28 at 100.00 | BBB+ | 5,582,339 |
| 2,615 | Tobacco Settlement Financing Corporation, New Jersey, Tobacco Settlement Asset-Backed | 6/28 at 100.00 | BB+ | 3,010,205 |
| | Bonds, Series 2018B, 5.000%, 6/01/46 | | | |
| 295,035 | Total New Jersey | | | 291,801,263 |
| | New Mexico – 0.2% (0.1% of Total Investments) | | | |
| 7,600 | New Mexico Hospital Equipment Loan Council, Hospital Revenue Bonds, Presbyterian | 8/29 at 100.00 | Aa3 | 8,652,068 |
| | Healthcare Services, Series 2019A, 4.000%, 8/01/48 | | | |
| | New York – 9.0% (5.8% of Total Investments) | | | |
| 7,000 | Brooklyn Arena Local Development Corporation, New York, Payment in Lieu of Taxes Revenue | No Opt. Call | Ba1 | 3,545,920 |
| | Bonds, Barclays Center Project, Series 2009, 0.000%, 7/15/45 | | | |
| | Dormitory Authority of the State of New York, Revenue Bonds, New School University, | | | |
| | Series 2015A: | | | |
| 900 | 5.000%, 7/01/50 (Pre-refunded 7/01/25) | 7/25 at 100.00 | N/R (4) | 1,045,107 |
| 11,930 | 5.000%, 7/01/50 | 7/25 at 100.00 | BBB+ | 13,531,006 |
| 3,200 | Dormitory Authority of the State of New York, Revenue Bonds, New York University, Series | 7/22 at 100.00 | AA– (4) | 3,302,752 |
| | 2012A, 5.000%, 7/01/42 (Pre-refunded 7/01/22) | | | |
| 4,000 | Dormitory Authority of the State of New York, Revenue Bonds, New York University, Series | 7/23 at 100.00 | AA– (4) | 4,317,320 |
| | 2013A, 5.000%, 7/01/43 (Pre-refunded 7/01/23) | | | |
| 1,000 | Dormitory Authority of the State of New York, Revenue Bonds, Orange Regional Medical | 6/27 at 100.00 | BBB– | 1,191,020 |
| | Center Obligated Group, Series 2017, 5.000%, 12/01/33, 144A | | | |
| | Dormitory Authority of the State of New York, State Personal Income Tax Revenue Bonds, | | | |
| | General Purpose Series 2015B Group C: | | | |
| 5 | 5.000%, 2/15/36 (Pre-refunded 2/15/25) | 2/25 at 100.00 | N/R (4) | 5,742 |
| 14,070 | 5.000%, 2/15/36 | 2/25 at 100.00 | Aa2 | 15,953,973 |
| 12,500 | Dormitory Authority of the State of New York, State Personal Income Tax Revenue Bonds, | 3/29 at 100.00 | Aa2 | 15,407,375 |
| | General Purpose, Series 2019A. Bidding Group 1,2,3,4, 5.000%, 3/15/45 | | | |
| | Dormitory Authority of the State of New York, State Personal Income Tax Revenue Bonds, | | | |
| | General Purpose, Series 2019D: | | | |
| 9,000 | 4.000%, 2/15/47 | 2/30 at 100.00 | Aa2 | 10,347,390 |
| 10,915 | 5.000%, 2/15/48 | 2/30 at 100.00 | Aa2 | 13,424,686 |
| 17,000 | 4.000%, 2/15/49 | 2/30 at 100.00 | Aa2 | 19,485,230 |
| 10,000 | Dormitory Authority of the State of New York, State Personal Income Tax Revenue Bonds, | 9/30 at 100.00 | Aa2 | 11,558,500 |
| | General Purpose, Series 2020A. Bidding Group 1 thru 5, 4.000%, 3/15/48 | | | |
| 10,000 | Liberty Development Corporation, New York, Goldman Sachs Headquarter Revenue Bonds, | No Opt. Call | BBB+ | 13,916,300 |
| | Series 2005, 5.250%, 10/01/35 | | | |
102
| Principal | | Optional Call | | |
| Amount (000) | Description (1) | Provisions (2) | Ratings (3) | Value |
| | New York (continued) | | | |
| | Long Island Power Authority, New York, Electric System General Revenue Bonds, Series 2014A: | | | |
| $ 1,045 | 4.000%, 9/01/39 – AGM Insured | 9/24 at 100.00 | A2 | $ 1,122,529 |
| 780 | 5.000%, 9/01/44 | 9/24 at 100.00 | A | 868,140 |
| 5,000 | Long Island Power Authority, New York, Electric System General Revenue Bonds, Series | 9/28 at 100.00 | A | 6,242,400 |
| | 2018, 5.000%, 9/01/37 | | | |
| | Long Island Power Authority, New York, Electric System Revenue Bonds, Series 2012A: | | | |
| 345 | 5.000%, 9/01/42 | 9/22 at 100.00 | A | 358,158 |
| 5,010 | 5.000%, 9/01/42 (Pre-refunded 9/01/22) | 9/22 at 100.00 | N/R (4) | 5,211,452 |
| 9,745 | 5.000%, 9/01/42 (Pre-refunded 9/01/22) | 9/22 at 100.00 | N/R (4) | 10,134,118 |
| 1,000 | Monroe County Industrial Development Corporation, New York, Revenue Bonds, University | 7/23 at 100.00 | AA– (4) | 1,079,330 |
| | of Rochester Project, Series 2013A, 5.000%, 7/01/43 (Pre-refunded 7/01/23) | | | |
| 7,225 | New York City Municipal Water Finance Authority, New York, Water and Sewer System Second | 6/23 at 100.00 | AA+ | 7,730,750 |
| | General Resolution Revenue Bonds, Fiscal 2014 Series BB, 5.000%, 6/15/46 | | | |
| 5,000 | New York City Municipal Water Finance Authority, New York, Water and Sewer System Second | 6/27 at 100.00 | AA+ | 6,032,450 |
| | General Resolution Revenue Bonds, Fiscal 2017 Series EE, 5.000%, 6/15/37 | | | |
| 12,000 | New York City Municipal Water Finance Authority, New York, Water and Sewer System Second | 12/30 at 100.00 | AA+ | 13,827,840 |
| | General Resolution Revenue Bonds, Fiscal 2021 Series BB-1, 4.000%, 6/15/50 | | | |
| 3,500 | New York City Transitional Finance Authority, New York, Building Aid Revenue Bonds, | 7/27 at 100.00 | Aa3 | 4,004,455 |
| | Fiscal 2018, Series 2017S-1, 4.000%, 7/15/36 | | | |
| 5,000 | New York City Transitional Finance Authority, New York, Future Tax Secured Bonds, | 5/23 at 100.00 | Aa1 | 5,343,900 |
| | Subordinate Fiscal 2013 Series I, 5.000%, 5/01/38 | | | |
| 5,000 | New York City Transitional Finance Authority, New York, Future Tax Secured Bonds, | 5/28 at 100.00 | Aa1 | 6,114,000 |
| | Subordinate Fiscal 2018 Series C-3, 5.000%, 5/01/41 | | | |
| 10,000 | New York City Transitional Finance Authority, New York, Future Tax Secured Bonds, | 8/28 at 100.00 | Aa1 | 12,333,900 |
| | Subordinate Fiscal 2019 Series A-1, 5.000%, 8/01/40 | | | |
| 5,000 | New York City Transitional Finance Authority, New York, Future Tax Secured Bonds, | 11/30 at 100.00 | Aa1 | 5,782,650 |
| | Subordinate Fiscal 2021 Subseries C-1, 4.000%, 5/01/43 | | | |
| 4,570 | New York City Transitional Finance Authority, New York, Future Tax Secured Bonds, | 8/31 at 100.00 | Aa1 | 5,315,641 |
| | Subordinate Fiscal 2022 Subseries B-1, 4.000%, 8/01/45 | | | |
| 2,060 | New York City, New York, General Obligation Bonds, Fiscal 2017 Series B-1, 5.000%, 12/01/41 | 12/26 at 100.00 | AA– | 2,456,983 |
| 10,370 | New York City, New York, General Obligation Bonds, Fiscal 2020 Series A-1, 4.000%, 8/01/40 | 8/29 at 100.00 | AA– | 12,007,112 |
| 3,500 | New York City, New York, General Obligation Bonds, Fiscal 2020 SeriesD-1, 4.000%, 3/01/44 | 3/30 at 100.00 | AA– | 4,004,945 |
| 1,910 | New York City, New York, General Obligation Bonds, Fiscal 2021 Series C, 4.000%, 8/01/41 | 8/30 at 100.00 | AA– | 2,213,365 |
| 11,000 | New York City, New York, General Obligation Bonds, Fiscal 2021 Series F-1, 5.000%, 3/01/50 | 3/31 at 100.00 | AA– | 13,762,540 |
| 12,000 | New York City, New York, General Obligation Bonds, Fiscal 2022 Series A-1, 4.000%, 8/01/50 | 8/31 at 100.00 | AA– | 13,861,080 |
| 10 | New York City, New York, General Obligation Bonds, Fiscal Series 1996J, 5.500%, 2/15/26 | 11/21 at 100.00 | AA– | 10,040 |
| 5 | New York City, New York, General Obligation Bonds, Fiscal Series 1997H, 6.125%, 8/01/25 | 11/21 at 100.00 | AA– | 5,022 |
| 23,920 | New York Liberty Development Corporation, New York, Liberty Revenue Bonds, 3 World Trade | 11/24 at 100.00 | N/R | 26,097,198 |
| | Center Project, Class 1 Series 2014, 5.000%, 11/15/44, 144A | | | |
| 4,045 | New York State Environmental Facilities Corporation, State Clean Water and Drinking | 6/22 at 100.00 | AAA | 4,404,398 |
| | Water Revolving Funds Revenue Bonds, New York City Municipal Water Finance Authority | | | |
| | Projects, Tender Option Bond Trust, 13.658%, 6/15/26, 144A (IF) (6) | | | |
| 10,000 | New York State Thruway Authority, General Revenue Junior Indebtedness Obligations, | 1/26 at 100.00 | A– | 11,617,000 |
| | Series 2016A, 5.250%, 1/01/56 | | | |
| 10,000 | New York State Thruway Authority, State Personal Income Tax Revenue Bonds, Series | 3/31 at 100.00 | AA+ | 11,487,200 |
| | 2021A-1, 4.000%, 3/15/52 | | | |
| | New York State Urban Development Corporation, State Personal Income Tax Revenue Bonds, | | | |
| | General Purpose, Series 2020A: | | | |
| 15,440 | 4.000%, 3/15/45 | 9/30 at 100.00 | Aa2 | 17,901,908 |
| 13,595 | 4.000%, 3/15/49 | 9/30 at 100.00 | Aa2 | 15,698,147 |
| 5,000 | New York State Urban Development Corporation, State Personal Income Tax Revenue Bonds, | 9/30 at 100.00 | Aa2 | 5,773,500 |
| | General Purpose, Series 2020C, 4.000%, 3/15/49 | | | |
103
| NEA | Nuveen AMT-Free Quality Municipal Income Fund |
| | Portfolio of Investments (continued) |
| | October 31, 2021 |
| Principal | | Optional Call | | |
| Amount (000) | Description (1) | Provisions (2) | Ratings (3) | Value |
| | New York (continued) | | | |
| $ 2,105 | Onondaga Civic Development Corporation, New York, Revenue Bonds, Saint Joseph’s Hospital | 7/22 at 100.00 | N/R (4) | $ 2,172,234 |
| | Health Center Project, Series 2012, 5.000%, 7/01/42 (Pre-refunded 7/01/22) | | | |
| 3,925 | Port Authority of New York and New Jersey, Consolidated Revenue Bonds, One Hundred | 12/23 at 100.00 | A+ | 4,292,419 |
| | Seventy Ninth Series 2013, 5.000%, 12/01/38 | | | |
| 9,950 | Triborough Bridge and Tunnel Authority, New York, General Purpose Revenue Bonds, | No Opt. Call | AA– | 9,977,860 |
| | Refunding Bonds, Tender Option Bond Trust 2016-XL0003, 7.264%, 11/15/21, 144A (IF) (6) | | | |
| 5,000 | Triborough Bridge and Tunnel Authority, New York, General Purpose Revenue Bonds, | 5/25 at 100.00 | AA– | 5,680,400 |
| | Refunding Series 2015A, 5.000%, 11/15/50 | | | |
| | Triborough Bridge and Tunnel Authority, New York, General Purpose Revenue Bonds, | | | |
| | Refunding Subordinate Lien Series 2013A: | | | |
| 10,725 | 0.010%, 11/15/31 | No Opt. Call | A+ | 8,702,909 |
| 1,105 | 0.010%, 11/15/32 | No Opt. Call | A+ | 871,933 |
| 6,800 | Triborough Bridge and Tunnel Authority, New York, General Revenue Bonds, MTA Bridges & | 5/31 at 100.00 | AA– | 8,541,616 |
| | Tunnels, Series 2021A, 5.000%, 11/15/51 | | | |
| 12,195 | Triborough Bridge and Tunnel Authority, New York, Payroll Mobility Tax Bonds, Senior | 5/31 at 100.00 | AA+ | 15,342,530 |
| | Lien Subseries 2021A-1, 5.000%, 5/15/51 | | | |
| 5,000 | TSASC Inc., New York, Tobacco Asset-Backed Bonds, Series 2006, 5.000%, 6/01/45 | 6/27 at 100.00 | CCC+ | 5,457,800 |
| 371,400 | Total New York | | | 420,874,173 |
| | North Carolina – 7.2% (4.7% of Total Investments) | | | |
| | Board of Governors of the University of North Carolina, Winston-Salem State University | | | |
| | General Revenue Bonds, Series 2013: | | | |
| 2,950 | 5.000%, 4/01/33 | 4/22 at 100.00 | BBB+ | 3,007,230 |
| 1,000 | 5.125%, 4/01/43 | 4/22 at 100.00 | BBB+ | 1,019,910 |
| 1,145 | Brunswick County, North Carolina, Enterprise System Revenue Bonds, Refunding Series | 4/22 at 100.00 | AA– (4) | 1,167,934 |
| | 2012A, 5.000%, 4/01/25 (Pre-refunded 4/01/22) | | | |
| | Buncombe County, North Carolina, Limited Obligation Bonds, Refunding Series 2014A: | | | |
| 1,085 | 5.000%, 6/01/33 | 6/24 at 100.00 | AA+ | 1,210,014 |
| 1,600 | 5.000%, 6/01/34 | 6/24 at 100.00 | AA+ | 1,784,352 |
| 4,645 | Cape Fear Public Utility Authority, North Carolina, Water and Sewer System Revenue | 8/29 at 100.00 | AA+ | 5,416,302 |
| | Bonds, Refunding Series 2019A, 4.000%, 8/01/44 | | | |
| | Catawba County, North Carolina, General Obligation Bonds, Limited Obligation Series 2014A: | | | |
| 1,000 | 5.000%, 6/01/30 | 6/24 at 100.00 | AA | 1,112,750 |
| 730 | 5.000%, 6/01/31 | 6/24 at 100.00 | AA | 812,110 |
| | Charlotte, North Carolina, Airport Revenue Bonds, Charlotte Douglas International, | | | |
| | Refunding Series 2014A: | | | |
| 2,865 | 5.000%, 7/01/27 | 7/24 at 100.00 | Aa3 | 3,217,223 |
| 3,000 | 5.000%, 7/01/28 | 7/24 at 100.00 | Aa3 | 3,368,820 |
| | Charlotte, North Carolina, Airport Revenue Bonds, Charlotte Douglas International, | | | |
| | Refunding Series 2017A: | | | |
| 1,365 | 5.000%, 7/01/42 (UB) (6) | 7/27 at 100.00 | Aa3 | 1,658,502 |
| 5,390 | 5.000%, 7/01/47 (UB) (6) | 7/27 at 100.00 | Aa3 | 6,528,637 |
| 2,045 | Charlotte, North Carolina, Storm Water Fee Revenue Bonds, Refunding Series 2014, | 12/24 at 100.00 | AAA | 2,318,948 |
| | 5.000%, 12/01/39 | | | |
| | Charlotte, North Carolina, Water and Sewer System Revenue Bonds, Refunding Series 2015: | | | |
| 940 | 5.000%, 7/01/32 | 7/25 at 100.00 | AAA | 1,086,875 |
| 2,325 | 5.000%, 7/01/40 | 7/25 at 100.00 | AAA | 2,678,981 |
| | Charlotte, North Carolina, Water and Sewer System Revenue Bonds, Refunding Series 2018: | | | |
| 2,055 | 5.000%, 7/01/44 | 7/28 at 100.00 | AAA | 2,544,337 |
| 16,865 | 5.000%, 7/01/44 (UB) (6) | 7/28 at 100.00 | AAA | 20,880,894 |
| 5,250 | Charlotte-Mecklenburg Hospital Authority, North Carolina, Health Care Revenue Bonds, DBA | 1/22 at 100.00 | AA– | 5,298,352 |
| | Carolinas HealthCare System, Refunding Series 2012A, 5.000%, 1/15/43 | | | |
| 4,000 | Charlotte-Mecklenburg Hospital Authority, North Carolina, Health Care Revenue Bonds, | 1/29 at 100.00 | AA– | 4,969,600 |
| | Doing Business as Atrium Health, Refunding Series 2018A, 5.000%, 1/15/36 | | | |
104
| Principal | | Optional Call | | |
| Amount (000) | Description (1) | Provisions (2) | Ratings (3) | Value |
| | North Carolina (continued) | | | |
| $ 2,085 | Dare County, North Carolina, Installment Purchase Contract, Limited Obligation Series | 6/22 at 100.00 | AA (4) | $ 2,143,463 |
| | 2012B, 5.000%, 6/01/28 (Pre-refunded 6/01/22) | | | |
| 835 | Durham, North Carolina, General Obligation Bonds, Refunding Series 2015, 5.000%, 10/01/26 | No Opt. Call | AAA | 1,011,477 |
| 5,000 | East Carolina University, North Carolina, General Revenue Bonds, Series 2014A, 5.000%, | 10/23 at 100.00 | AA– (4) | 5,448,250 |
| | 10/01/41 (Pre-refunded 10/01/23) | | | |
| 2,310 | East Carolina University, North Carolina, General Revenue Bonds, Series 2016A, 5.000%, 10/01/29 | 4/26 at 100.00 | AA– | 2,708,914 |
| 4,750 | Greensboro, North Carolina, Combined Enterprise System Revenue Bonds, Series 2017A, | 6/27 at 100.00 | Aa1 | 5,397,615 |
| | 4.000%, 6/01/47 | | | |
| 2,000 | Greensboro, North Carolina, Limited Obligation Bonds, Coliseum Complex Project, Series | 4/28 at 100.00 | Aa2 (4) | 2,507,960 |
| | 2018A, 5.000%, 4/01/42 (Pre-refunded 4/01/28) | | | |
| 500 | Henderson County, North Carolina, Limited Obligation Bonds, Series 2015, 5.000%, 10/01/31 | 10/25 at 100.00 | AA | 579,775 |
| 339 | Hillsborough, North Carolina, Special Assessment Revenue Bonds, Series 2013, 7.750%, 2/01/24 | 2/23 at 100.00 | N/R | 347,821 |
| | Jacksonville Public Facilities Corporation, North Carolina, Limited Obligation Bonds, | | | |
| | Series 2012: | | | |
| 1,065 | 5.000%, 4/01/29 (Pre-refunded 4/01/22) | 4/22 at 100.00 | A+ (4) | 1,086,108 |
| 1,165 | 5.000%, 4/01/30 (Pre-refunded 4/01/22) | 4/22 at 100.00 | A+ (4) | 1,188,090 |
| 1,000 | 5.000%, 4/01/31 (Pre-refunded 4/01/22) | 4/22 at 100.00 | A+ (4) | 1,019,820 |
| 200 | 5.000%, 4/01/32 (Pre-refunded 4/01/22) | 4/22 at 100.00 | A+ (4) | 203,964 |
| 1,535 | Mooresville, North Carolina, Enterprise System Revenue Bonds, Refunding Series 2012, | 5/22 at 100.00 | Aa2 (4) | 1,571,656 |
| | 5.000%, 5/01/28 (Pre-refunded 5/01/22) | | | |
| 4,295 | Nash Health Care Systems, North Carolina, Health Care Facilities Revenue Bonds, Series | 5/22 at 100.00 | BBB | 4,344,478 |
| | 2012, 5.000%, 11/01/41 | | | |
| 500 | New Hanover County, North Carolina, Hospital Revenue Bonds, New Hanover Regional Medical | 10/23 at 100.00 | N/R (4) | 543,535 |
| | Center, Refunding Series 2013, 5.000%, 10/01/26 (Pre-refunded 10/01/23) | | | |
| 6,140 | New Hanover County, North Carolina, Hospital Revenue Bonds, New Hanover Regional Medical | 10/27 at 100.00 | N/R (4) | 7,549,560 |
| | Center, Series 2017, 5.000%, 10/01/47 (Pre-refunded 10/01/27) | | | |
| 1,800 | North Carolina Agricultural & Technical State University, General Revenue Bonds, | 10/25 at 100.00 | A1 | 2,081,916 |
| | Refunding Series 2015A, 5.000%, 10/01/40 | | | |
| | North Carolina Capital Facilities Finance Agency, Revenue Bonds, Davidson College, | | | |
| | Series 2014: | | | |
| 500 | 5.000%, 3/01/26 | 3/22 at 100.00 | AA+ | 507,885 |
| 250 | 5.000%, 3/01/28 | 3/22 at 100.00 | AA+ | 253,893 |
| 500 | 5.000%, 3/01/29 | 3/22 at 100.00 | AA+ | 507,665 |
| 500 | 5.000%, 3/01/32 | 3/22 at 100.00 | AA+ | 507,450 |
| 1,230 | 5.000%, 3/01/45 | 3/22 at 100.00 | AA+ | 1,247,663 |
| 3,900 | North Carolina Capital Facilities Finance Agency, Revenue Bonds, Duke University | 10/26 at 100.00 | AA+ | 4,620,291 |
| | Project, Refunding Series 2016B, 5.000%, 7/01/42 | | | |
| | North Carolina Capital Facilities Finance Agency, Revenue Bonds, Duke University | | | |
| | Project, Series 2015 A: | | | |
| 1,605 | 5.000%, 10/01/55 (Pre-refunded 10/01/25) | 10/25 at 100.00 | AA+ (4) | 1,884,623 |
| 9,485 | 5.000%, 10/01/55 (Pre-refunded 10/01/25) (UB) (6) | 10/25 at 100.00 | AA+ (4) | 11,137,477 |
| | North Carolina Capital Facilities Finance Agency, Revenue Bonds, Johnson & Wales | | | |
| | University, Series 2013A: | | | |
| 1,560 | 5.000%, 4/01/32 | 4/23 at 100.00 | Baa2 | 1,639,544 |
| 1,000 | 5.000%, 4/01/33 | 4/23 at 100.00 | Baa2 | 1,050,960 |
| 5,000 | North Carolina Capital Facilities Financing Agency, Educational Facility Revenue Bonds, | 7/26 at 100.00 | Aa3 | 5,568,100 |
| | Wake Forest University, Refunding Series 2016, 4.000%, 1/01/37 | | | |
| 2,500 | North Carolina Capital Facilities Financing Agency, Educational Facility Revenue Bonds, | 1/28 at 100.00 | Aa3 | 2,994,125 |
| | Wake Forest University, Series 2018, 5.000%, 1/01/48 | | | |
| 4,440 | North Carolina Capital Facilities Finance Agency, Revenue Bonds, The Methodist | 3/22 at 100.00 | BB | 4,465,264 |
| | University, Series 2012, 5.000%, 3/01/34 | | | |
| | North Carolina Eastern Municipal Power Agency, Power System Revenue Bonds, Refunding | | | |
| | Series 1993B: | | | |
| 100 | 6.000%, 1/01/22 (ETM) | No Opt. Call | BBB+ (4) | 100,959 |
| 180 | 6.000%, 1/01/22 – FGIC Insured (ETM) | No Opt. Call | Baa2 (4) | 181,726 |
105
| NEA | Nuveen AMT-Free Quality Municipal Income Fund |
| | Portfolio of Investments (continued) |
| | October 31, 2021 |
| Principal | | Optional Call | | |
| Amount (000) | Description (1) | Provisions (2) | Ratings (3) | Value |
| | North Carolina (continued) | | | |
| $ 3,500 | North Carolina Eastern Municipal Power Agency, Power System Revenue Bonds, Series 2012A, | 7/22 at 100.00 | N/R (4) | $ 3,612,770 |
| | 5.000%, 1/01/25 (Pre-refunded 7/01/22) | | | |
| 22,210 | North Carolina Medial Care Commission, Health Care Facilities Revenue Bonds, Rex | 1/30 at 100.00 | A2 | 25,004,018 |
| | Healthcare, Series 2020A, 4.000%, 7/01/49 | | | |
| 2,720 | North Carolina Medical Care Commission, Retirement Facilities First Mortgage Revenue | 10/24 at 102.00 | N/R | 2,928,434 |
| | Bonds, Southminster Project, Refunding Series 2016, 5.000%, 10/01/37 | | | |
| 2,375 | North Carolina Medical Care Commission, Health Care Facilities Revenue Bonds, Cape Fear | 10/22 at 100.00 | A3 (4) | 2,479,524 |
| | Valley Health System, Refunding Series 2012A, 5.000%, 10/01/27 (Pre-refunded 10/01/22) | | | |
| 2,690 | North Carolina Medical Care Commission, Health Care Facilities Revenue Bonds, Deerfield | 11/26 at 100.00 | A | 3,101,005 |
| | Episcopal Retirement Community, Refunding First Mortgage Series 2016, 5.000%, 11/01/37 | | | |
| 1,250 | North Carolina Medical Care Commission, Health Care Facilities Revenue Bonds, Duke | 6/26 at 100.00 | AA | 1,468,338 |
| | University Health System, Refunding Series 2016D, 5.000%, 6/01/29 | | | |
| 7,000 | North Carolina Medical Care Commission, Health Care Facilities Revenue Bonds, Duke | 6/22 at 100.00 | Aa2 (4) | 7,196,280 |
| | University Health System, Series 2012A, 5.000%, 6/01/42 (Pre-refunded 6/01/22) | | | |
| 12,775 | North Carolina Medical Care Commission, Health Care Facilities Revenue Bonds, Novant | 11/29 at 100.00 | AA– | 14,502,308 |
| | Health Obligated Group, Series 2019A, 4.000%, 11/01/49 | | | |
| 2,000 | North Carolina Medical Care Commission, Health Care Facilities Revenue Bonds, Rex | 7/25 at 100.00 | A2 | 2,280,960 |
| | Healthcare, Series 2015A, 5.000%, 7/01/44 | | | |
| 3,000 | North Carolina Medical Care Commission, Health Care Facilities Revenue Bonds, Wake | 12/22 at 100.00 | A2 | 3,134,340 |
| | Forest Baptist Obligated Group, Series 2012A, 5.000%, 12/01/45 | | | |
| | North Carolina Medical Care Commission, Health Care Facilities Revenue Bonds, WakeMed, | | | |
| | Refunding Series 2012A: | | | |
| 2,000 | 5.000%, 10/01/27 | 10/22 at 100.00 | A2 | 2,079,740 |
| 6,800 | 5.000%, 10/01/31 | 10/22 at 100.00 | A2 | 7,074,312 |
| 1,500 | 5.000%, 10/01/38 | 10/22 at 100.00 | A2 | 1,558,395 |
| 2,930 | North Carolina Medical Care Commission, Hospital Revenue Bonds, Southeastern Regional | 6/22 at 100.00 | BBB+ | 3,002,811 |
| | Medical Center, Refunding Series 2012, 5.000%, 6/01/32 | | | |
| 450 | North Carolina Medical Care Commission, Retirement Facilities First Mortgage Revenue | 10/23 at 100.00 | N/R | 475,479 |
| | Bonds, United Methodist Retirement Homes, Refunding Series 2013A, 5.000%, 10/01/33 | | | |
| 500 | North Carolina Medical Care Commission, Revenue Bonds, First Mortgage Galloway Ridge | 1/27 at 103.00 | N/R | 558,550 |
| | Project, Refunding Series 2019A, 5.000%, 1/01/39 | | | |
| | North Carolina Municipal Power Agency 1, Catawba Electric Revenue Bonds, Refunding | | | |
| | Series 2015A: | | | |
| 1,545 | 5.000%, 1/01/28 | 1/26 at 100.00 | A | 1,795,352 |
| 1,500 | 5.000%, 1/01/32 | 1/26 at 100.00 | A | 1,726,380 |
| 760 | North Carolina Municipal Power Agency 1, Catawba Electric Revenue Bonds, Refunding | 7/26 at 100.00 | A | 892,582 |
| | Series 2016A, 5.000%, 1/01/30 | | | |
| 2,020 | North Carolina State University at Raleigh, General Revenue Bonds, Series 2013A, 5.000%, | 10/23 at 100.00 | AA (4) | 2,203,133 |
| | 10/01/42 (Pre-refunded 10/01/23) | | | |
| 5,000 | North Carolina State, Limited Obligation Bonds, Refunding Series 2014C, 5.000%, 5/01/25 | 5/24 at 100.00 | AA+ | 5,576,000 |
| | North Carolina State, Limited Obligation Bonds, Refunding Series 2017B: | | | |
| 2,000 | 5.000%, 5/01/29 (UB) (6) | 5/27 at 100.00 | AA+ | 2,441,140 |
| 4,000 | 5.000%, 5/01/30 (UB) (6) | 5/27 at 100.00 | AA+ | 4,868,160 |
| | North Carolina Turnpike Authority, Monroe Expressway Toll Revenue Bonds, Capital | | | |
| | Appreciation Series 2017C: | | | |
| 835 | 0.000%, 7/01/28 | 7/26 at 91.99 | Baa3 | 698,319 |
| 800 | 0.000%, 7/01/30 | 7/26 at 83.69 | Baa3 | 603,320 |
| 850 | 0.000%, 7/01/31 | 7/26 at 79.58 | Baa3 | 607,359 |
| 2,400 | 0.000%, 7/01/33 | 7/26 at 71.99 | Baa3 | 1,546,248 |
| 3,160 | 0.000%, 7/01/36 | 7/26 at 61.63 | Baa3 | 1,731,554 |
| 3,100 | 0.000%, 7/01/37 | 7/26 at 58.52 | Baa3 | 1,606,854 |
| 1,900 | 0.000%, 7/01/40 | 7/26 at 50.36 | Baa3 | 843,714 |
| 400 | North Carolina Turnpike Authority, Monroe Expressway Toll Revenue Bonds, Series 2017A, | 7/26 at 100.00 | Baa3 | 450,360 |
| | 5.000%, 7/01/47 | | | |
106
| Principal | | Optional Call | | |
| Amount (000) | Description (1) | Provisions (2) | Ratings (3) | Value |
| | North Carolina (continued) | | | |
| $ 1,000 | North Carolina Turnpike Authority, Triangle Expressway System Revenue Bonds, Refunding | 1/29 at 100.00 | BBB | $ 1,199,510 |
| | Series 2018, 5.000%, 1/01/40 | | | |
| 2,200 | North Carolina Turnpike Authority, Triangle Expressway System Revenue Bonds, Refunding | 1/27 at 100.00 | BBB | 2,606,406 |
| | Senior Lien Series 2017, 5.000%, 1/01/39 – AGM Insured | | | |
| | North Carolina Turnpike Authority, Triangle Expressway System Revenue Bonds, Senior Lien | | | |
| | Series 2009B: | | | |
| 150 | 0.000%, 1/01/31 – AGC Insured | No Opt. Call | BBB | 129,539 |
| 4,375 | 0.000%, 1/01/33 – AGC Insured | No Opt. Call | BBB | 3,601,106 |
| 2,300 | 0.000%, 1/01/34 – AGC Insured | No Opt. Call | BBB | 1,847,337 |
| 2,380 | 0.000%, 1/01/35 – AGC Insured | No Opt. Call | BBB | 1,858,970 |
| 7,575 | 0.000%, 1/01/37 – AGC Insured | No Opt. Call | BBB | 5,576,639 |
| 1,470 | 0.000%, 1/01/38 – AGC Insured | No Opt. Call | BBB | 1,050,565 |
| 3,040 | Oak Island, North Carolina, Enterprise System Revenue Bonds, Refunding Series 2015, | 6/25 at 100.00 | A2 | 3,464,050 |
| | 5.000%, 6/01/33 | | | |
| | Orange County Public Facilities Company, North Carolina, Limited Obligation Bonds, | | | |
| | Refunding Series 2017: | | | |
| 200 | 5.000%, 10/01/27 | No Opt. Call | AA+ | 247,600 |
| 150 | 5.000%, 10/01/28 | 10/27 at 100.00 | AA+ | 185,139 |
| 400 | 5.000%, 10/01/30 | 10/27 at 100.00 | AA+ | 491,908 |
| | Raleigh, North Carolina, Combined Enterprise System Revenue Bonds, Refunding Series 2012A: | | | |
| 550 | 5.000%, 3/01/30 (Pre-refunded 3/01/22) | 3/22 at 100.00 | AAA | 558,806 |
| 1,600 | 5.000%, 3/01/31 (Pre-refunded 3/01/22) | 3/22 at 100.00 | AAA | 1,625,616 |
| | Raleigh, North Carolina, Combined Enterprise System Revenue Bonds, Refunding Series 2013A: | | | |
| 5,000 | 5.000%, 3/01/28 (Pre-refunded 3/01/23) | 3/23 at 100.00 | AAA | 5,318,300 |
| 3,785 | 5.000%, 3/01/43 (Pre-refunded 3/01/23) | 3/23 at 100.00 | AAA | 4,025,953 |
| 5,000 | Raleigh, North Carolina, Combined Enterprise System Revenue Bonds, Refunding Series | 3/27 at 100.00 | AAA | 5,658,850 |
| | 2016A, 4.000%, 3/01/46 | | | |
| 1,000 | Raleigh, North Carolina, General Obligation Bonds, Refunding Series 2016A, 5.000%, 9/01/26 | No Opt. Call | AAA | 1,208,410 |
| 1,000 | Raleigh, North Carolina, Limited Obligation Bonds, Series 2013, 5.000%, 10/01/33 | 10/23 at 100.00 | AA+ (4) | 1,090,660 |
| | (Pre-refunded 10/01/23) | | | |
| | Raleigh, North Carolina, Limited Obligation Bonds, Series 2014A: | | | |
| 1,195 | 5.000%, 10/01/25 | 10/24 at 100.00 | AA+ | 1,351,497 |
| 1,305 | 5.000%, 10/01/26 | 10/24 at 100.00 | AA+ | 1,479,035 |
| 650 | Rocky Mount, North Carolina, Special Obligation Bonds, Series 2016, 5.000%, 5/01/30 | 5/26 at 100.00 | AA– | 762,814 |
| | Sampson County, North Carolina, Limited Obligation Bonds, Refunding Series 2017: | | | |
| 300 | 5.000%, 9/01/32 | 9/27 at 100.00 | A | 361,920 |
| 1,250 | 4.000%, 9/01/35 | 9/27 at 100.00 | A | 1,424,725 |
| 1,265 | 4.000%, 9/01/36 | 9/27 at 100.00 | A | 1,442,113 |
| 1,000 | 4.000%, 9/01/37 | 9/27 at 100.00 | A | 1,140,260 |
| 1,100 | Union County, North Carolina, Enterprise System Revenue Bonds, Series 2019A, 4.000%, 6/01/44 | 6/29 at 100.00 | Aa2 | 1,280,686 |
| | University of North Carolina, Chapel Hill, Revenue Bonds, Hospital System, Series 2019: | | | |
| 1,360 | 5.000%, 2/01/45 | No Opt. Call | Aa3 | 1,985,138 |
| 840 | 5.000%, 2/01/49 | No Opt. Call | Aa3 | 1,268,198 |
| 800 | University of North Carolina, Charlotte, General Revenue Bonds, Refunding Series 2015, | 4/25 at 100.00 | A+ | 905,208 |
| | 5.000%, 4/01/45 | | | |
| 170 | University of North Carolina, Charlotte, General Revenue Bonds, Refunding Series 2017A, | 10/27 at 100.00 | A+ | 207,024 |
| | 5.000%, 10/01/31 | | | |
| | University of North Carolina, Charlotte, General Revenue Bonds, Series 2014: | | | |
| 2,070 | 5.000%, 4/01/32 (Pre-refunded 4/01/24) | 4/24 at 100.00 | A+ (4) | 2,304,096 |
| 1,175 | 5.000%, 4/01/33 (Pre-refunded 4/01/24) | 4/24 at 100.00 | A+ (4) | 1,307,881 |
| 1,385 | 5.000%, 4/01/35 (Pre-refunded 4/01/24) | 4/24 at 100.00 | A+ (4) | 1,541,630 |
| 4,735 | University of North Carolina, Charlotte, General Revenue Bonds, Series 2017, 5.000%, 10/01/42 | 10/27 at 100.00 | A+ | 5,709,226 |
| 1,415 | University of North Carolina, Greensboro, General Revenue Bonds, Refunding Series 2017, | 4/28 at 100.00 | A+ | 1,732,257 |
| | 5.000%, 4/01/31 | | | |
107
| NEA | Nuveen AMT-Free Quality Municipal Income Fund |
| | Portfolio of Investments (continued) |
| | October 31, 2021 |
| Principal | | Optional Call | | |
| Amount (000) | Description (1) | Provisions (2) | Ratings (3) | Value |
| | North Carolina (continued) | | | |
| | University of North Carolina, Greensboro, General Revenue Bonds, Series 2014: | | | |
| $ 1,000 | 5.000%, 4/01/32 | 4/24 at 100.00 | A+ | $ 1,111,420 |
| 3,065 | 5.000%, 4/01/39 | 4/24 at 100.00 | A+ | 3,406,502 |
| 4,765 | University of North Carolina, Greensboro, General Revenue Bonds, Series 2018, 5.000%, 4/01/43 | 4/28 at 100.00 | A+ | 5,709,232 |
| | University of North Carolina, Wilmington, General Revenue Bonds, Refunding Series 2019B: | | | |
| 1,000 | 4.000%, 10/01/39 | 10/29 at 100.00 | Aa3 | 1,163,160 |
| 1,500 | 4.000%, 10/01/44 | 10/29 at 100.00 | Aa3 | 1,726,515 |
| 1,845 | 4.000%, 10/01/49 | 10/29 at 100.00 | Aa3 | 2,110,828 |
| 1,250 | Western Carolina University, North Carolina, General Revenue Bonds, Refunding Series | 10/25 at 100.00 | Aa3 | 1,430,725 |
| | 2015A, 5.000%, 10/01/45 | | | |
| 312,109 | Total North Carolina | | | 339,138,991 |
| | North Dakota – 1.0% (0.6% of Total Investments) | | | |
| 5,080 | Burleigh County, North Dakota, Health Care Revenue Bonds, Saint Alexius Medical Center | 7/22 at 100.00 | N/R (4) | 5,218,989 |
| | Project, Refunding Series 2012A, 4.500%, 7/01/32 (Pre-refunded 7/01/22) | | | |
| 1,015 | Grand Forks, North Dakota, Health Care System Revenue Bonds, Altru Health System | 12/21 at 100.00 | BBB– | 1,018,928 |
| | Obligated Group, Series 2012, 5.000%, 12/01/35 | | | |
| | Grand Forks, North Dakota, Health Care System Revenue Bonds, Altru Health System | | | |
| | Obligated Group, Series 2017A: | | | |
| 1,000 | 5.000%, 12/01/37 | 12/27 at 100.00 | BBB– | 1,175,950 |
| 8,525 | 5.000%, 12/01/42 | 12/27 at 100.00 | BBB– | 9,968,282 |
| 7,070 | 4.000%, 12/01/47 | 12/27 at 100.00 | BBB– | 7,744,973 |
| 1,800 | Grand Forks, North Dakota, Health Care System Revenue Bonds, Altru Health System | 12/31 at 100.00 | BBB– | 2,021,850 |
| | Obligated Group, Series 2021, 4.000%, 12/01/51 | | | |
| 900 | Grand Forks, North Dakota, Senior Housing & Nursing Facilities Revenue Bonds, Valley | 12/26 at 100.00 | N/R | 937,611 |
| | Homes and Services Obligated Group, Series 2017, 5.000%, 12/01/36 | | | |
| 500 | Grand Forks, North Dakota, Senior Housing and Nursing Facilities Revenue Bonds, Valley | No Opt. Call | N/R | 531,635 |
| | Homes Obligated Group, Series 2016A, 5.125%, 12/01/24 | | | |
| 2,000 | University of North Dakota, Certificates of Participation, Housing Infrastructure | 6/30 at 100.00 | A1 | 2,286,140 |
| | Project, Series 2021A, 4.000%, 6/01/46 – AGM Insured | | | |
| | Ward County Health Care, North Dakota, Revenue Bonds, Trinity Obligated Group, Series 2017C: | | | |
| 11,065 | 5.000%, 6/01/43 | 6/28 at 100.00 | BBB– | 12,840,601 |
| 2,610 | 5.000%, 6/01/48 | 6/28 at 100.00 | BBB– | 3,010,870 |
| 1,420 | Williston, North Dakota, Multifamily Housing Revenue Bonds, Eagle Crest Apartments LLC | 9/23 at 100.00 | N/R | 795,200 |
| | Project, Series 2013, 7.750%, 9/01/38 (8) | | | |
| 42,985 | Total North Dakota | | | 47,551,029 |
| | Ohio – 6.4% (4.1% of Total Investments) | | | |
| | Akron, Bath and Copley Joint Township Hospital District, Ohio, Hospital Facilities | | | |
| | Revenue Bonds, Summa Health System, Refunding & Improvement Series 2016: | | | |
| 3,020 | 5.250%, 11/15/41 | 11/26 at 100.00 | BBB+ | 3,551,218 |
| 8,255 | 5.250%, 11/15/46 | 11/26 at 100.00 | BBB+ | 9,701,193 |
| 320 | Akron, Bath and Copley Joint Township Hospital District, Ohio, Hospital Revenue Bonds, | 5/22 at 100.00 | A1 | 327,587 |
| | Children’s Hospital Medical Center, Improvement & Refunding Series 2012, 5.000%, 11/15/42 | | | |
| | Allen County, Ohio, Hospital Facilities Revenue Bonds, Catholic Health Partners, | | | |
| | Refunding and Improvement Series 2012A: | | | |
| 860 | 4.000%, 5/01/33 (Pre-refunded 5/01/22) | 5/22 at 100.00 | A+ (4) | 876,400 |
| 650 | 5.000%, 5/01/33 (Pre-refunded 5/01/22) | 5/22 at 100.00 | A+ (4) | 665,626 |
| 800 | 5.000%, 5/01/42 (Pre-refunded 5/01/22) | 5/22 at 100.00 | A+ (4) | 819,232 |
| 11,940 | Allen County, Ohio, Hospital Facilities Revenue Bonds, Mercy Health, Refunding & | 11/24 at 100.00 | A+ | 13,418,172 |
| | Improvement Series 2015A, 5.000%, 11/01/43 | | | |
| 8,655 | Allen County, Ohio, Hospital Facilities Revenue Bonds, Mercy Health, Series 2017A, | 2/28 at 100.00 | A+ | 9,835,888 |
| | 4.000%, 8/01/38 | | | |
| 2,750 | Bowling Green State University, Ohio, General Receipts Bonds, Series 2017B, 5.000%, 6/01/42 | 6/27 at 100.00 | A+ | 3,260,730 |
108
| Principal | | Optional Call | | |
| Amount (000) | Description (1) | Provisions (2) | Ratings (3) | Value |
| | Ohio (continued) | | | |
| $ 25,315 | Buckeye Tobacco Settlement Financing Authority, Ohio, Tobacco Settlement Asset-Backed | 6/30 at 22.36 | N/R | $ 3,955,975 |
| | Revenue Bonds, Refunding Senior Lien Capital Appreciation Series 2020B-3 Class 2, | | | |
| | 0.000%, 6/01/57 | | | |
| 990 | Buckeye Tobacco Settlement Financing Authority, Ohio, Tobacco Settlement Asset-Backed | 6/30 at 100.00 | BBB+ | 1,095,960 |
| | Revenue Bonds, Refunding Senior Lien Series 2020A-2 Class 1, 4.000%, 6/01/48 | | | |
| 41,930 | Buckeye Tobacco Settlement Financing Authority, Ohio, Tobacco Settlement Asset-Backed | 6/30 at 100.00 | N/R | 47,084,455 |
| | Revenue Bonds, Refunding Senior Lien Series 2020B-2 Class 2, 5.000%, 6/01/55 | | | |
| 14,570 | Buckeye Tobacco Settlement Financing Authority, Ohio, Tobacco Settlement Asset-Backed | 6/22 at 100.00 | N/R (4) | 15,084,321 |
| | Revenue Bonds, Senior Lien Series 2007A-3, 6.250%, 6/01/37 (Pre-refunded 6/01/22) | | | |
| 5,000 | Cleveland Clinic Health System Obligated Group, Ohio, Martin County Health Facilities | 1/29 at 100.00 | AA | 5,745,600 |
| | Authority, Hospital Revenue Bonds, Series 2019B, 4.000%, 1/01/46 | | | |
| | Cleveland Heights-University Heights City School District, Ohio, General Obligation | | | |
| | Bonds, School Improvement Series 2014: | | | |
| 7,060 | 5.000%, 12/01/51 (Pre-refunded 6/01/23) | 6/23 at 100.00 | A1 (4) | 7,585,829 |
| 10,480 | 5.000%, 12/01/51 (Pre-refunded 6/01/23) | 6/23 at 100.00 | N/R (4) | 11,269,144 |
| | Cleveland-Cuyahoga County Port Authority, Ohio, Cultural Facility Revenue Bonds, The | | | |
| | Cleveland Museum of Natural History Project, Series 2021: | | | |
| 300 | 4.000%, 7/01/37 | 7/31 at 100.00 | A3 | 353,925 |
| 300 | 4.000%, 7/01/38 | 7/31 at 100.00 | A3 | 353,082 |
| 350 | 4.000%, 7/01/39 | 7/31 at 100.00 | A3 | 410,879 |
| 1,000 | 4.000%, 7/01/51 | 7/31 at 100.00 | A3 | 1,149,160 |
| 5,165 | Cuyahoga Community College District, Ohio, General Obligation Bonds, Facilities | 6/26 at 100.00 | AA | 5,700,507 |
| | Construction & Improvement Series 2018, 4.000%, 12/01/38 | | | |
| 5,975 | Fairfield County, Ohio, Hospital Facilities Revenue Bonds, Fairfield Medical Center | 6/23 at 100.00 | Ba2 | 6,124,793 |
| | Project, Series 2013, 5.000%, 6/15/43 | | | |
| 1,465 | Franklin County, Ohio, Hospital Revenue Bonds, Nationwide Children’s Hospital Project, | 5/22 at 100.00 | Aa2 | 1,499,398 |
| | Improvement Series 2012A, 5.000%, 11/01/42 | | | |
| | Hamilton County, Ohio, Healthcare Revenue Bonds, Life Enriching Communities Project, | | | |
| | Series 2017A: | | | |
| 1,500 | 5.000%, 1/01/47 | 1/27 at 100.00 | BBB– | 1,653,015 |
| 1,120 | 5.000%, 1/01/52 | 1/27 at 100.00 | BBB– | 1,231,429 |
| | Hamilton County, Ohio, Healthcare Revenue Bonds, Life Enriching Communities, Refunding & | | | |
| | Improvement Series 2016: | | | |
| 3,425 | 5.000%, 1/01/46 | 1/26 at 100.00 | BBB– | 3,719,071 |
| 6,000 | 5.000%, 1/01/51 | 1/26 at 100.00 | BBB– | 6,502,860 |
| | JobsOhio Beverage System, Ohio, Statewide Liquor Profits Revenue Bonds, Senior Lien | | | |
| | Series 2013A: | | | |
| 6,920 | 5.000%, 1/01/38 (Pre-refunded 1/01/23) | 1/23 at 100.00 | Aa3 (4) | 7,302,261 |
| 14,850 | 5.000%, 1/01/38 (Pre-refunded 1/01/23) (UB) (6) | 1/23 at 100.00 | Aa3 (4) | 15,670,314 |
| | JobsOhio Beverage System, Ohio, Statewide Senior Lien Liquor Profits Revenue Bonds, | | | |
| | Tender Option Bond Trust 2016-XG0052: | | | |
| 875 | 17.985%, 1/01/38 (Pre-refunded 1/01/23), 144A (IF) | 1/23 at 100.00 | Aa3 (4) | 1,068,349 |
| 1,050 | 17.985%, 1/01/38 (Pre-refunded 1/01/23), 144A (IF) | 1/23 at 100.00 | Aa3 (4) | 1,282,019 |
| 5,000 | Miami County, Ohio, Hospital Facilities Revenue Bonds, Kettering Health Network | 8/28 at 100.00 | A2 | 6,062,900 |
| | Obligated Group Project, Refunding Improvement Series 2019, 5.000%, 8/01/45 | | | |
| 6,000 | Middletown City School District, Butler County, Ohio, General Obligation Bonds, | No Opt. Call | A2 | 7,835,760 |
| | Refunding Series 2007, 5.250%, 12/01/31 – AGM Insured | | | |
| 6,840 | Montgomery County, Ohio, Hospital Facilities Revenue Bonds, Kettering Health Network | 2/31 at 100.00 | A2 | 7,839,119 |
| | Obligated Group Project, Refunding & Improvement Series 2021, 4.000%, 8/01/51 | | | |
| 21,000 | Northeast Ohio Regional Sewer District, Wastewater Improvement Revenue Bonds, Refunding | 11/24 at 100.00 | AA+ (4) | 23,946,090 |
| | & Improvement Series 2014, 5.000%, 11/15/49 (Pre-refunded 11/15/24) | | | |
| 9,365 | Ohio Higher Educational Facility Commission, Revenue Bonds, University of Dayton, Series | 6/28 at 100.00 | A2 | 11,199,135 |
| | 2018A, 5.000%, 12/01/48 | | | |
| 7,550 | Ohio State, Turnpike Revenue Bonds, Ohio Turnpike and Infrastructure Commission | 2/31 at 100.00 | A+ | 9,391,747 |
| | Infrastructure Projects, Junior Lien, Capital Appreciation Series 2013A-3, 0.000%, 2/15/36 (5) | | | |
109
| NEA | Nuveen AMT-Free Quality Municipal Income Fund |
| | Portfolio of Investments (continued) |
| | October 31, 2021 |
| Principal | | Optional Call | | |
| Amount (000) | Description (1) | Provisions (2) | Ratings (3) | Value |
| | Ohio (continued) | | | |
| $ 19,515 | Ohio State, Turnpike Revenue Bonds, Ohio Turnpike and Infrastructure Commission | 2/23 at 100.00 | A+ (4) | $ 20,704,439 |
| | Infrastructure Projects, Junior Lien, Current Interest Series 2013A-1, 5.000%, 2/15/48 | | | |
| | (Pre-refunded 2/15/23) | | | |
| 9,000 | Ohio State, Turnpike Revenue Bonds, Ohio Turnpike and Infrastructure Commission, | 2/28 at 100.00 | A+ | 10,152,270 |
| | Infrastructure Projects, Junior Lien Series 2018A, 4.000%, 2/15/46 | | | |
| 4,255 | Ross County, Ohio, Hospital Facilities Revenue Bonds, Adena Health System Obligated | 12/29 at 100.00 | A– | 5,156,847 |
| | Group Project, Refunding & Improvement Series 2019, 5.000%, 12/01/49 | | | |
| | Southeastern Ohio Port Authority, Hospital Facilities Revenue Bonds, Memorial Health | | | |
| | System Obligated Group Project, Refunding and Improvement Series 2012: | | | |
| 135 | 5.750%, 12/01/32 | 12/22 at 100.00 | BB– | 139,984 |
| 130 | 6.000%, 12/01/42 | 12/22 at 100.00 | BB– | 134,554 |
| 4,190 | Springboro Community City School District, Warren County, Ohio, General Obligation | No Opt. Call | Aa3 | 5,069,858 |
| | Bonds, Refunding Series 2007, 5.250%, 12/01/26 – AGM Insured | | | |
| 3,670 | Tuscarawas County Economic Development and Finance Alliance, Ohio, Higher Education | 3/25 at 100.00 | N/R | 3,960,664 |
| | Facilities Revenue Bonds, Ashland University, Refunding & Improvement Series 2015, | | | |
| | 6.000%, 3/01/45 | | | |
| 289,540 | Total Ohio | | | 299,891,759 |
| | Oklahoma – 0.3% (0.2% of Total Investments) | | | |
| 1,165 | Norman Regional Hospital Authority, Oklahoma, Hospital Revenue Bonds, Series 2019, | 9/29 at 100.00 | Baa1 | 1,413,681 |
| | 5.000%, 9/01/45 | | | |
| | Oklahoma Development Finance Authority, Health System Revenue Bonds, OU Medicine | | | |
| | Project, Series 2018B: | | | |
| 2,205 | 5.250%, 8/15/48 | 8/28 at 100.00 | BB+ | 2,671,975 |
| 2,700 | 5.500%, 8/15/52 | 8/28 at 100.00 | BB+ | 3,307,959 |
| 4,570 | 5.500%, 8/15/57 | 8/28 at 100.00 | BB+ | 5,582,757 |
| 1,125 | Tulsa County Industrial Authority, Oklahoma, Senior Living Community Revenue Bonds, | 11/25 at 102.00 | BBB– | 1,288,744 |
| | Montereau, Inc Project, Refunding Series 2017, 5.250%, 11/15/37 | | | |
| 11,765 | Total Oklahoma | | | 14,265,116 |
| | Oregon – 1.7% (1.1% of Total Investments) | | | |
| | Clackamas Community College District, Oregon, General Obligation Bonds, Deferred | | | |
| | Interest Series 2017A: | | | |
| 760 | 5.000%, 6/15/38 | 6/27 at 100.00 | Aa1 | 914,219 |
| 2,750 | 5.000%, 6/15/39 | 6/27 at 100.00 | Aa1 | 3,302,888 |
| 1,185 | Clackamas County Hospital Facility Authority, Oregon, Revenue Bonds, Rose Villa Inc., | 11/25 at 102.00 | N/R | 1,301,746 |
| | Series 2020A, 5.375%, 11/15/55 | | | |
| | Columbia County School District 502 Saint Helens, Oregon, General Obligation Bonds, | | | |
| | Series 2017: | | | |
| 1,310 | 5.000%, 6/15/38 | 6/27 at 100.00 | Aa1 | 1,575,825 |
| 1,705 | 5.000%, 6/15/39 | 6/27 at 100.00 | Aa1 | 2,047,790 |
| 2,000 | Eugene, Oregon, Electric Utility Revenue Bonds, Series 2020A, 4.000%, 8/01/49 | 8/30 at 100.00 | AA– | 2,333,340 |
| 7,955 | Oregon Facilities Authority, Revenue Bonds, Legacy Health Project, Series 2016A, 5.000%, 6/01/46 | 6/26 at 100.00 | A+ | 9,171,160 |
| | Oregon Facilities Authority, Revenue Bonds, Samaritan Health Services, Refunding Series 2016A: | | | |
| 6,275 | 5.000%, 10/01/35 | 10/26 at 100.00 | BBB+ | 7,315,019 |
| 140 | 5.000%, 10/01/46 (Pre-refunded 10/01/26) | 10/26 at 100.00 | N/R (4) | 168,309 |
| 2,120 | 5.000%, 10/01/46 | 10/26 at 100.00 | BBB+ | 2,428,630 |
| 8,890 | Oregon State Department of Transportation, Highway User Tax Revenue Bonds, Senior Lien | 11/23 at 100.00 | Aa1 (4) | 9,746,107 |
| | Series 2013A, 5.000%, 11/15/38 (Pre-refunded 11/15/23) | | | |
| 30,870 | Salem Hospital Facility Authority, Oregon, Revenue Bonds, Salem Health Projects, Series | 5/29 at 100.00 | A+ | 35,075,111 |
| | 2019A, 4.000%, 5/15/49 | | | |
| 5,265 | Salem Hospital Facility Authority, Oregon, Revenue Bonds, Salem Health Project, | 5/26 at 100.00 | A+ | 6,054,171 |
| | Refunding Series 2016A, 5.000%, 5/15/46 | | | |
| 500 | Warm Springs Reservation Confederated Tribes, Oregon, Hydroelectric Revenue Bonds, | 5/29 at 100.00 | A3 | 600,710 |
| | Tribal Economic Development Bond Pelton Round Butte Project, Taxable Refunding Green Series | | | |
| | 2019B, 5.000%, 11/01/36, 144A | | | |
| 71,725 | Total Oregon | | | 82,035,025 |
110
| Principal | | Optional Call | | |
| Amount (000) | Description (1) | Provisions (2) | Ratings (3) | Value |
| | Pennsylvania – 5.5% (3.6% of Total Investments) | | | |
| $ 15,000 | Allegheny County Hospital Development Authority, Pennsylvania, Revenue Bonds, Allegheny | 4/28 at 100.00 | A | $ 17,807,250 |
| | Health Network Obligated Group Issue, Series 2018A, 5.000%, 4/01/47 | | | |
| 2,765 | Allegheny County Sanitary Authority, Pennsylvania, Sewer Revenue Bonds, Series 2020B, | 12/30 at 100.00 | A+ | 3,239,280 |
| | 4.000%, 6/01/50 | | | |
| | Bethlehem Authority, Northampton and Lehigh Counties, Pennsylvania, Guaranteed Water | | | |
| | Revenue Bonds, Series 1998: | | | |
| 3,125 | 0.000%, 5/15/22 – AGM Insured | No Opt. Call | A2 | 3,115,750 |
| 3,125 | 0.000%, 5/15/23 – AGM Insured | No Opt. Call | A2 | 3,091,562 |
| 3,135 | 0.000%, 5/15/24 – AGM Insured | No Opt. Call | A2 | 3,067,786 |
| 3,155 | 0.000%, 5/15/26 – AGM Insured | No Opt. Call | A2 | 2,983,589 |
| 4,145 | 0.000%, 11/15/26 – AGM Insured | No Opt. Call | A2 | 3,874,663 |
| 2,800 | 0.000%, 5/15/28 – AGM Insured | No Opt. Call | A2 | 2,520,112 |
| 3,000 | 0.000%, 11/15/28 – AGM Insured | No Opt. Call | A2 | 2,664,000 |
| 1,200 | Centre County Hospital Authority, Pennsylvania, Hospital Revenue Bonds, Mount Nittany | 11/27 at 100.00 | A+ | 1,440,252 |
| | Medical Center Project, Series 2018A, 5.000%, 11/15/42 | | | |
| 895 | Commonwealth Financing Authority, Pennsylvania, State Appropriation Lease Bonds, Master | 6/28 at 100.00 | A | 1,083,317 |
| | Settlement, Series 2018, 5.000%, 6/01/34 | | | |
| 2,150 | Dauphin County General Authority, Pennsylvania, Health System Revenue Bonds, Pinnacle | 6/22 at 100.00 | A | 2,206,072 |
| | Health System Project, Series 2012A, 5.000%, 6/01/42 | | | |
| 26,595 | Delaware River Joint Toll Bridge Commission, New Jersey and Pennsylvania, Bridge System | 7/27 at 100.00 | A | 31,684,485 |
| | Revenue Bonds, Series 2017, 5.000%, 7/01/42 | | | |
| 1,050 | Delaware Valley Regional Finance Authority, Pennsylvania, Local Government Revenue | No Opt. Call | A1 | 1,316,249 |
| | Bonds, Series 1997B, 5.700%, 7/01/27 – AMBAC Insured | | | |
| | Erie Water Authority, Erie County, Pennsylvania, Water Revenue Bonds, Series 2011A: | | | |
| 1,315 | 4.625%, 12/01/44 (Pre-refunded 12/01/21) | 12/21 at 100.00 | A2 (4) | 1,319,655 |
| 2,685 | 4.625%, 12/01/44 (Pre-refunded 12/01/21) | 12/21 at 100.00 | A2 (4) | 2,694,505 |
| 4,915 | Lancaster County Hospital Authority, Pennsylvania, Revenue Bonds, United Zion Retirement | 6/27 at 100.00 | N/R | 5,203,855 |
| | Community, Series 2017A, 5.000%, 12/01/47 | | | |
| 3,500 | Lancaster County Hospital Authority/PA, 5.000%, 11/01/46 (WI/DD, Settling 11/10/21) | 11/29 at 100.00 | A2 | 4,263,560 |
| | Lehigh County Authority, Pennsylvania, Water and Sewer Revenue Bonds, Allentown | | | |
| | Concession, Capital Appreciation Series 2013B: | | | |
| 4,480 | 0.000%, 12/01/31 | No Opt. Call | A | 3,595,424 |
| 5,180 | 0.000%, 12/01/32 | No Opt. Call | A | 4,038,535 |
| | Lehigh County Authority, Pennsylvania, Water and Sewer Revenue Bonds, Allentown | | | |
| | Concession, Series 2013A: | | | |
| 4,310 | 5.125%, 12/01/47 | 12/23 at 100.00 | A | 4,680,444 |
| 4,960 | 5.125%, 12/01/47 (Pre-refunded 12/01/23) | 12/23 at 100.00 | N/R (4) | 5,450,842 |
| 5,410 | Montgomery County Higher Education and Health Authority, Pennsylvania, Revenue Bonds, | 9/28 at 100.00 | A | 6,491,892 |
| | Thomas Jefferson University, Series 2018A, 5.000%, 9/01/48 | | | |
| 1,000 | Montgomery County Higher Education and Health Authority, Pennsylvania, Revenue Bonds, | 9/29 at 100.00 | A | 1,134,750 |
| | Thomas Jefferson University, Series 2019, 4.000%, 9/01/44 | | | |
| 5,000 | Montgomery County Industrial Development Authority, Pennsylvania, Health System Revenue | 1/25 at 100.00 | Ba1 | 5,636,550 |
| | Bonds, Albert Einstein Healthcare Network Issue, Series 2015A, 5.250%, 1/15/45 | | | |
| 630 | Northampton County Industrial Development Authority, Pennsylvania, Recovery Revenue | 11/21 at 100.00 | N/R | 157,552 |
| | Bonds, Northampton Generating Project, Senior Lien Series 2013A0 & AE2, 1.250%, 12/31/23 | | | |
| 234 | Northampton County Industrial Development Authority, Pennsylvania, Recovery Revenue | No Opt. Call | N/R | 58,405 |
| | Bonds, Northampton Generating Project, Senior Lien Taxable Series 2013B, 5.000%, 12/31/23 | | | |
| | (cash 5.000%, PIK 5.000%) | | | |
| 1,700 | Pennsylvania Higher Educational Facilities Authority, Revenue Bonds, AICUP Financing | 11/22 at 100.00 | Ba1 | 1,715,232 |
| | Program-Delaware Valley College of Science and Agriculture Project, Series 2012 LL1, | | | |
| | 4.000%, 11/01/32 | | | |
| 3,570 | Pennsylvania Higher Educational Facilities Authority, Revenue Bonds, University of | 8/31 at 100.00 | Aa3 | 4,217,991 |
| | Pennsylvania Health System, Refunding Series 2021A, 4.000%, 8/15/43 | | | |
| 5,910 | Pennsylvania Higher Educational Facilities Authority, Revenue Bonds, University of | 8/29 at 100.00 | Aa3 | 6,826,050 |
| | Pennsylvania Health System, Series 2019, 4.000%, 8/15/44 | | | |
111
| NEA | Nuveen AMT-Free Quality Municipal Income Fund |
| | Portfolio of Investments (continued) |
| | October 31, 2021 |
| Principal | | Optional Call | | |
| Amount (000) | Description (1) | Provisions (2) | Ratings (3) | Value |
| | Pennsylvania (continued) | | | |
| | Pennsylvania Turnpike Commission, Motor License Fund-Enhanced Turnpike Special Revenue | | | |
| | Bonds, Subordinate Series 2011B: | | | |
| $ 965 | 5.000%, 12/01/41 (Pre-refunded 12/01/21) | 12/21 at 100.00 | A2 (4) | $ 968,735 |
| 1,035 | 5.000%, 12/01/41 (Pre-refunded 12/01/21) | 12/21 at 100.00 | A2 (4) | 1,039,047 |
| | Pennsylvania Turnpike Commission, Motor License Fund-Enhanced Turnpike Special Revenue | | | |
| | Bonds, Subordinate Series 2013A: | | | |
| 1,105 | 5.000%, 12/01/36 (Pre-refunded 12/01/22) | 12/22 at 100.00 | N/R (4) | 1,161,753 |
| 2,010 | 5.000%, 12/01/36 (Pre-refunded 12/01/22) | 12/22 at 100.00 | A2 (4) | 2,113,234 |
| 16,805 | Pennsylvania Turnpike Commission, Turnpike Revenue Bonds, Capital Appreciation Series | 12/27 at 100.00 | A3 | 21,867,842 |
| | 2009E, 6.375%, 12/01/38 | | | |
| 5,575 | Pennsylvania Turnpike Commission, Turnpike Revenue Bonds, Series 2015B, 5.000%, 12/01/45 | 12/25 at 100.00 | A1 | 6,402,497 |
| 6,340 | Pennsylvania Turnpike Commission, Turnpike Revenue Bonds, Series 2016A-1, 5.000%, 12/01/41 | 6/26 at 100.00 | A1 | 7,472,451 |
| 15,000 | Pennsylvania Turnpike Commission, Turnpike Revenue Bonds, Series 2021A, 4.000%, 12/01/51 | 6/31 at 100.00 | A+ | 17,192,400 |
| 6,500 | Pennsylvania Turnpike Commission, Turnpike Revenue Bonds, Series 2021B, 5.000%, 12/01/46 | 6/31 at 100.00 | A+ | 8,222,240 |
| 19,250 | Pennsylvania Turnpike Commission, Turnpike Revenue Bonds, Subordinate Series 2009C, | 6/26 at 100.00 | A2 | 23,712,727 |
| | 6.250%, 6/01/33 – AGM Insured | | | |
| | Pennsylvania Turnpike Commission, Turnpike Revenue Bonds, Subordinate Series 2021A: | | | |
| 3,735 | 4.000%, 12/01/45 | 12/30 at 100.00 | A3 | 4,276,799 |
| 4,620 | 4.000%, 12/01/50 | 12/30 at 100.00 | A3 | 5,179,251 |
| 1,445 | Philadelphia Authority for Industrial Development Senior Living Facilities, Philadelphia, | 7/27 at 100.00 | BB | 1,610,380 |
| | Pennsylvania, Revenue Bonds, Wesley Enhanced Living Obligated Group, Series 2017A, | | | |
| | 5.000%, 7/01/37 | | | |
| 505 | Philadelphia Hospitals and Higher Education Facilities Authority, Pennsylvania, Hospital | 7/22 at 100.00 | Ba1 | 519,322 |
| | Revenue Bonds, Temple University Health System Obligated Group, Series 2012A, | | | |
| | 5.625%, 7/01/42 | | | |
| 5,965 | Philadelphia School District, Pennsylvania, General Obligation Bonds, Series 2021A, | 9/31 at 100.00 | A2 | 6,804,812 |
| | 4.000%, 9/01/46 (WI/DD, Settling 11/04/21) | | | |
| 3,410 | Philadelphia, Pennsylvania, Water and Wastewater Revenue Bonds, Series 1997A, 5.125%, | No Opt. Call | A1 (4) | 4,200,813 |
| | 8/01/27 – AMBAC Insured (ETM) | | | |
| 2,020 | Pittsburgh Water and Sewer Authority, Pennsylvania, Water and Sewer System Revenue | 9/30 at 100.00 | A2 | 2,365,723 |
| | Bonds, First Lien Series 2020B, 4.000%, 9/01/45 – AGM Insured | | | |
| 1,125 | Scranton, Pennsylvania, Sewer Authority Revenue Bonds, Series 2011A, 5.250%, 12/01/31 | 12/21 at 100.00 | AA (4) | 1,129,646 |
| | (Pre-refunded 12/01/21) – AGM Insured | | | |
| 1,930 | Susquehanna Area Regional Airport Authority, Pennsylvania, Airport System Revenue Bonds, | 1/23 at 100.00 | Baa3 | 1,973,888 |
| | Series 2012B, 4.000%, 1/01/33 | | | |
| 2,800 | Upper Darby School District, Delaware County, Pennsylvania, General Obligation Bonds, | 10/29 at 100.00 | A1 | 3,247,524 |
| | Series 2021A, 4.000%, 4/01/51 – BAM Insured | | | |
| 229,079 | Total Pennsylvania | | | 259,040,693 |
| | Puerto Rico – 1.9% (1.2% of Total Investments) | | | |
| 3,996 | Cofina Class 2 Trust Tax-Exempt Class 2054, Puerto Rico. Unit Exchanged From Cusip | No Opt. Call | N/R | 937,617 |
| | 74529JAP0, 0.010%, 8/01/54 | | | |
| 625 | Puerto Rico Electric Power Authority, Power Revenue Bonds, Refunding Series 2005SS, | 11/21 at 100.00 | D | 633,650 |
| | 5.000%, 7/01/25 – NPFG Insured | | | |
| 1,000 | Puerto Rico Electric Power Authority, Power Revenue Bonds, Series 2007VV, 5.250%, | No Opt. Call | D | 1,052,920 |
| | 7/01/24 – NPFG Insured | | | |
| 1,305 | Puerto Rico Highway and Transportation Authority, Highway Revenue Bonds, Series 2005L, | No Opt. Call | Baa2 | 1,358,740 |
| | 5.250%, 7/01/23 – NPFG Insured | | | |
| 1,000 | Puerto Rico Highway and Transportation Authority, Highway Revenue Bonds, Series 2007N, | No Opt. Call | AAA | 1,037,200 |
| | 5.250%, 7/01/31 – AMBAC Insured | | | |
112
| Principal | | Optional Call | | |
| Amount (000) | Description (1) | Provisions (2) | Ratings (3) | Value |
| | Puerto Rico (continued) | | | |
| | Puerto Rico Sales Tax Financing Corporation, Sales Tax Revenue Bonds, Restructured 2018A-1: | | | |
| $ 5,281 | 4.500%, 7/01/34 | 7/25 at 100.00 | N/R | $ 5,772,714 |
| 9,399 | 4.550%, 7/01/40 | 7/28 at 100.00 | N/R | 10,464,753 |
| 25,000 | 0.000%, 7/01/51 | 7/28 at 30.01 | N/R | 5,919,250 |
| 33,017 | 5.000%, 7/01/58 | 7/28 at 100.00 | N/R | 37,356,754 |
| 1,370 | Puerto Rico Sales Tax Financing Corporation, Sales Tax Revenue Bonds, Restructured | 7/28 at 100.00 | N/R | 1,525,344 |
| | Cofina Project Series 2019A-2A, 4.550%, 7/01/40 | | | |
| | Puerto Rico Sales Tax Financing Corporation, Sales Tax Revenue Bonds, Taxable | | | |
| | Restructured Cofina Project Series 2019A-2: | | | |
| 5,399 | 4.329%, 7/01/40 | 7/28 at 100.00 | N/R | 5,938,738 |
| 5,580 | 4.329%, 7/01/40 | 7/28 at 100.00 | N/R | 6,137,833 |
| 9,000 | 4.784%, 7/01/58 | 7/28 at 100.00 | N/R | 10,042,740 |
| 101,972 | Total Puerto Rico | | | 88,178,253 |
| | Rhode Island – 0.7% (0.5% of Total Investments) | | | |
| 1,315 | Rhode Island Health and Educational Building Corporation, Hospital Financing Revenue | 5/26 at 100.00 | BBB+ | 1,482,189 |
| | Bonds, Lifespan Obligated Group, Refunding Series 2016, 5.000%, 5/15/39 | | | |
| 174,390 | Rhode Island Tobacco Settlement Financing Corporation, Tobacco Settlement Asset-Backed | 11/21 at 16.44 | CCC– | 29,126,618 |
| | Bonds, Series 2007A, 0.010%, 6/01/52 | | | |
| 2,235 | Rhode Island Turnpike and Bridge Authority, Motor Fuel Tax Revenue Bonds, Series 2016A, | 4/26 at 100.00 | A | 2,599,350 |
| | 5.000%, 10/01/40 | | | |
| 177,940 | Total Rhode Island | | | 33,208,157 |
| | South Carolina – 3.8% (2.5% of Total Investments) | | | |
| 3,050 | Charleston County Airport District, South Carolina, Airport Revenue Bonds, Series 2019, | 7/29 at 100.00 | A | 3,757,203 |
| | 5.000%, 7/01/43 | | | |
| | Lexington County Health Services District, Inc., South Carolina, Hospital Revenue Bonds, | | | |
| | Lexington Medical Center, Series 2016: | | | |
| 1,290 | 5.000%, 11/01/41 | 5/26 at 100.00 | A | 1,483,797 |
| 6,820 | 5.000%, 11/01/46 | 5/26 at 100.00 | A | 7,843,477 |
| | Piedmont Municipal Power Agency, South Carolina, Electric Revenue Bonds, Series 2004A-2: | | | |
| 26,955 | 0.000%, 1/01/31 – AMBAC Insured | No Opt. Call | A– | 22,447,585 |
| 15,420 | 0.000%, 1/01/32 – AMBAC Insured | No Opt. Call | A– | 12,486,345 |
| 1,370 | South Carolina Jobs-Economic Development Authority, Economic Development Revenue Bonds, | 4/26 at 103.00 | BBB– | 1,543,456 |
| | Bishop Gadsden Episcopal Retirement Community, Series 2019A, 5.000%, 4/01/54 | | | |
| | South Carolina Jobs-Economic Development Authority, Hospital Revenue Bonds, McLeod | | | |
| | Health Projects, Refunding & Improvement Series 2018: | | | |
| 19,130 | 5.000%, 11/01/43 | 5/28 at 100.00 | AA– | 22,915,636 |
| 7,580 | 5.000%, 11/01/48 | 5/28 at 100.00 | AA– | 9,026,415 |
| 20,035 | South Carolina Public Service Authority, Santee Cooper Revenue Obligations, Refunding & | 6/25 at 100.00 | A– | 22,784,804 |
| | Improvement Series 2015A, 5.000%, 12/01/50 | | | |
| | South Carolina Public Service Authority, Santee Cooper Revenue Obligations, Refunding | | | |
| | Series 2014C: | | | |
| 3,850 | 5.000%, 12/01/39 | 12/24 at 100.00 | A– | 4,330,942 |
| 4,000 | 5.000%, 12/01/46 | 12/24 at 100.00 | A– | 4,500,520 |
| 10,000 | South Carolina Public Service Authority, Santee Cooper Revenue Obligations, Refunding | 12/26 at 100.00 | A– | 11,736,900 |
| | Series 2016B, 5.000%, 12/01/56 | | | |
| 6,790 | South Carolina Public Service Authority, Santee Cooper Revenue Obligations, Series | 12/23 at 100.00 | A– | 7,403,069 |
| | 2013A, 5.125%, 12/01/43 | | | |
| | South Carolina Public Service Authority, Santee Cooper Revenue Obligations, Series 2014A: | | | |
| 2,000 | 5.000%, 12/01/49 | 6/24 at 100.00 | A– | 2,212,980 |
| 17,240 | 5.500%, 12/01/54 | 6/24 at 100.00 | A– | 19,285,526 |
| 17,170 | South Carolina State Ports Authority, Revenue Bonds, Series 2019A, 5.000%, 7/01/54 | 7/29 at 100.00 | A+ | 20,891,769 |
| 4,500 | Spartanburg Regional Health Services District, Inc., South Carolina, Hospital Revenue | 4/22 at 100.00 | A3 | 4,588,155 |
| | Bonds, Refunding Series 2012A, 5.000%, 4/15/32 | | | |
| 167,200 | Total South Carolina | | | 179,238,579 |
113
| NEA | Nuveen AMT-Free Quality Municipal Income Fund |
| | Portfolio of Investments (continued) |
| | October 31, 2021 |
| Principal | | Optional Call | | |
| Amount (000) | Description (1) | Provisions (2) | Ratings (3) | Value |
| | South Dakota – 1.0% (0.7% of Total Investments) | | | |
| | Sioux Falls, South Dakota, Health Facilities Revenue Bonds, Dow Rummel Village Project, | | | |
| | Series 2017: | | | |
| $ 3,000 | 5.000%, 11/01/42 | 11/26 at 100.00 | BB | $ 3,266,340 |
| 3,150 | 5.125%, 11/01/47 | 11/26 at 100.00 | BB | 3,429,500 |
| 8,800 | South Dakota Health and Educational Facilities Authority, Revenue Bonds, Avera Health | 7/24 at 100.00 | A1 | 9,770,024 |
| | System, Series 2014, 5.000%, 7/01/44 | | | |
| 5,205 | South Dakota Health and Educational Facilities Authority, Revenue Bonds, Avera Health, | 7/27 at 100.00 | A1 | 6,136,695 |
| | Refunding Series 2017, 5.000%, 7/01/46 | | | |
| 11,200 | South Dakota Health and Educational Facilities Authority, Revenue Bonds, Monument | 9/30 at 100.00 | A1 | 12,750,528 |
| | Health, Inc., Series 2020A, 4.000%, 9/01/50 | | | |
| 3,565 | South Dakota Health and Educational Facilities Authority, Revenue Bonds, Sanford Health, | 11/24 at 100.00 | A+ | 3,992,836 |
| | Series 2014B, 5.000%, 11/01/44 | | | |
| 8,260 | South Dakota Health and Educational Facilities Authority, Revenue Bonds, Sanford Health, | 11/25 at 100.00 | A+ | 9,452,661 |
| | Series 2015, 5.000%, 11/01/45 | | | |
| 43,180 | Total South Dakota | | | 48,798,584 |
| | Tennessee – 1.3% (0.8% of Total Investments) | | | |
| 10,670 | Chattanooga Health, Educational and Housing Facility Board, Tennessee, Revenue Bonds, | 1/23 at 100.00 | BBB+ (4) | 11,277,443 |
| | Catholic Health Initiatives, Series 2013A, 5.250%, 1/01/45 (Pre-refunded 1/01/23) | | | |
| 3,090 | Chattanooga Health, Educational and Housing Facility Board, Tennessee, Revenue Bonds, | 8/29 at 100.00 | BBB+ | 3,712,171 |
| | CommonSpirit Health, Series 2019A-2, 5.000%, 8/01/44 | | | |
| 12,000 | Clarksville, Tennessee, Water, Sewer, and Gas Revenue Bonds, Series 2021A, 4.000%, 2/01/51 | 2/31 at 100.00 | Aa2 | 14,003,640 |
| 2,180 | Greeneville Health and Educational Facilities Board, Tennessee, Hospital Revenue Bonds, | 7/28 at 100.00 | A– | 2,653,627 |
| | Ballad Health, Series 2018A, 5.000%, 7/01/35 | | | |
| 2,065 | Johnson City Health and Educational Facilities Board, Tennessee, Hospital Revenue Bonds, | 8/22 at 100.00 | A– | 2,130,915 |
| | Mountain States Health Alliance, Series 2012A, 5.000%, 8/15/42 | | | |
| | Knox County Health, Educational and Housing Facilities Board, Tennessee, Revenue Bonds, | | | |
| | University Health System, Inc., Series 2016: | | | |
| 5,000 | 5.000%, 9/01/36 | 9/26 at 100.00 | BBB | 5,676,400 |
| 1,000 | 5.000%, 9/01/47 | 9/26 at 100.00 | BBB | 1,119,930 |
| | Knox County Health, Educational and Housing Facilities Board, Tennessee, Revenue Bonds, | | | |
| | University Health System, Inc., Series 2017: | | | |
| 445 | 5.000%, 4/01/31 | 4/27 at 100.00 | BBB | 516,391 |
| 1,755 | 5.000%, 4/01/36 | 4/27 at 100.00 | BBB | 2,014,705 |
| | Metropolitan Government of Nashville-Davidson County Health and Educational Facilities | | | |
| | Board, Tennessee, Revenue Bonds, Lipscomb University, Refunding & Improvement Series 2016A: | | | |
| 2,225 | 5.000%, 10/01/41 | 10/26 at 100.00 | BBB | 2,542,552 |
| 1,000 | 5.000%, 10/01/45 | 10/26 at 100.00 | BBB | 1,136,380 |
| 11,000 | Metropolitan Government of Nashville-Davidson County Health and Educational Facilities | 7/26 at 100.00 | A3 | 12,844,590 |
| | Board, Tennessee, Revenue Bonds, Vanderbilt University Medical Center, Series 2016A, | | | |
| | 5.000%, 7/01/46 | | | |
| 52,430 | Total Tennessee | | | 59,628,744 |
| | Texas – 10.6% (6.8% of Total Investments) | | | |
| 18,000 | Arlington, Texas, Special Tax Revenue Bonds, Senior Lien Series 2018A, 5.000%, 2/15/48 – | 2/28 at 100.00 | A1 | 21,387,780 |
| | AGM Insured | | | |
| 4,000 | Austin, Texas, Airport System Revenue Bonds, Series 2019A, 5.000%, 11/15/49 | 11/29 at 100.00 | A | 4,929,920 |
| 14,615 | Austin, Texas, Electric Utility System Revenue Bonds, Refunding Series 2015A, 5.000%, | 11/25 at 100.00 | Aa3 | 16,735,636 |
| | 11/15/45 (UB) (6) | | | |
| 1,000 | Cedar Hill Independent School District, Dallas County, Texas, General Obligation Bonds, | No Opt. Call | Baa2 | 810,320 |
| | Refunding Series 2002, 0.000%, 8/15/32 – FGIC Insured | | | |
| 1,330 | Central Texas Regional Mobility Authority, Revenue Bonds, Refunding Senior Lien Series | 1/23 at 100.00 | A– (4) | 1,402,990 |
| | 2013A, 5.000%, 1/01/43 (Pre-refunded 1/01/23) | | | |
114
| Principal | | Optional Call | | |
| Amount (000) | Description (1) | Provisions (2) | Ratings (3) | Value |
| | Texas (continued) | | | |
| $ 3,100 | Central Texas Regional Mobility Authority, Revenue Bonds, Senior Lien Series 2021B, | 1/31 at 100.00 | A– | $ 3,838,823 |
| | 5.000%, 1/01/46 | | | |
| 7,750 | Central Texas Regional Mobility Authority, Revenue Bonds, Senior Lien, Series 2015A, | 7/25 at 100.00 | A– (4) | 9,002,632 |
| | 5.000%, 1/01/45 (Pre-refunded 7/01/25) | | | |
| | Clifton Higher Education Finance Corporation, Texas, Education Revenue Bonds, Uplift | | | |
| | Education Charter School, Series 2013A: | | | |
| 1,925 | 4.350%, 12/01/42 | 12/22 at 100.00 | BBB– | 1,966,291 |
| 1,000 | 4.400%, 12/01/47 | 12/22 at 100.00 | BBB– | 1,020,670 |
| 2,500 | Comal Independent School District, Comal, Bexar, Guadalupe, Hays, and Kendall Counties, | No Opt. Call | Aaa | 2,490,350 |
| | Texas, General Obligation Bonds, Series 2005A, 0.000%, 2/01/23 | | | |
| 9,000 | Dallas Fort Worth International Airport, 4.000%, 11/01/45 (WI/DD, Settling 11/10/21) | 11/30 at 100.00 | N/R | 10,331,377 |
| 160 | Decatur Hospital Authority, Texas, Revenue Bonds, Wise Regional Health System, Series | 9/24 at 100.00 | BBB– | 175,755 |
| | 2014A, 5.250%, 9/01/44 | | | |
| 3,700 | El Paso Independent School District, El Paso County, Texas, General Obligation Bonds, | 8/26 at 100.00 | Aaa | 4,324,042 |
| | School Building Series 2017, 5.000%, 8/15/42 | | | |
| | Grand Parkway Transportation Corporation, Texas, System Toll Revenue Bonds, Refunding | | | |
| | First Tier Series 2020C: | | | |
| 6,545 | 4.000%, 10/01/39 | 4/30 at 100.00 | A2 | 7,647,636 |
| 10,600 | 4.000%, 10/01/45 | 4/30 at 100.00 | A2 | 12,175,160 |
| 2,500 | 4.000%, 10/01/49 | 4/30 at 100.00 | A2 | 2,852,000 |
| | Grand Parkway Transportation Corporation, Texas, System Toll Revenue Bonds, Subordinate | | | |
| | Lien Series 2013B: | | | |
| 15,000 | 5.000%, 4/01/53 (Pre-refunded 10/01/23) (UB) (6) | 10/23 at 100.00 | AA (4) | 16,344,750 |
| 16,920 | 5.000%, 4/01/53 (Pre-refunded 10/01/23) | 10/23 at 100.00 | AA (4) | 18,436,878 |
| 5,295 | Grand Parkway Transportation Corporation, Texas, System Toll Revenue Bonds, Subordinate | 4/28 at 100.00 | AA | 6,450,369 |
| | Lien Series 2018A. Tela Supported, 5.000%, 10/01/48 | | | |
| 6,610 | Grand Parkway Transportation Corporation, Texas, System Toll Revenue Bonds, Tender | 10/23 at 100.00 | AA (4) | 8,981,139 |
| | Option Bond Trust 2015-XF0228, 18.108%, 11/01/44 (Pre-refunded 10/01/23), 144A (IF) | | | |
| | Harris County Cultural Education Facilities Finance Corporation, Texas, Revenue Bonds, | | | |
| | Houston Methodist Hospital System, Series 2015: | | | |
| 2,845 | 4.000%, 12/01/45 | 6/25 at 100.00 | AA | 3,090,296 |
| 2,320 | 5.000%, 12/01/45 | 6/25 at 100.00 | AA | 2,618,004 |
| 9,500 | Harris County, Texas, Toll Road Revenue Bonds, Refunding First Lien Series 2021A, | 8/30 at 100.00 | Aa2 | 11,084,885 |
| | 4.000%, 8/15/45 | | | |
| | Harris County, Texas, Toll Road Revenue Bonds, Refunding Senior Lien Series 2018A: | | | |
| 13,890 | 5.000%, 8/15/43 | 2/28 at 100.00 | AA | 16,885,795 |
| 2,000 | 4.000%, 8/15/48 | 2/28 at 100.00 | AA | 2,268,320 |
| 4,040 | Harris County, Texas, Toll Road Revenue Bonds, Tender Options Bond Trust 2015-XF2184, | No Opt. Call | AAA | 7,466,728 |
| | 14.454%, 8/15/28 – AGM Insured, 144A (IF) (6) | | | |
| | Harris County-Houston Sports Authority, Texas, Revenue Bonds, Capital Appreciation | | | |
| | Refunding Senior Lien Series 2014A: | | | |
| 1,195 | 0.010%, 11/15/41 – AGM Insured | 11/31 at 62.66 | A2 | 553,655 |
| 2,390 | 0.010%, 11/15/42 – AGM Insured | 11/31 at 59.73 | A2 | 1,051,863 |
| 2,660 | 0.010%, 11/15/43 – AGM Insured | 11/31 at 56.93 | A2 | 1,112,864 |
| 7,260 | 0.010%, 11/15/44 – AGM Insured | 11/31 at 54.25 | A2 | 2,885,923 |
| 10,440 | 0.010%, 11/15/45 – AGM Insured | 11/31 at 51.48 | A2 | 3,924,500 |
| 7,165 | 0.000%, 11/15/49 – AGM Insured | 11/31 at 41.91 | A2 | 2,179,163 |
| 3,000 | 0.000%, 11/15/52 – AGM Insured | 11/31 at 35.81 | A2 | 775,710 |
| | Houston, Texas, Airport System Revenue Bonds, Refunding & Subordinate Lien Series 2018B: | | | |
| 2,000 | 5.000%, 7/01/43 | 7/28 at 100.00 | A | 2,427,720 |
| 2,710 | 5.000%, 7/01/48 | 7/28 at 100.00 | A | 3,269,696 |
| 4,550 | Houston, Texas, Airport System Revenue Bonds, Refunding Subordinate Lien Series 2012B, | 7/22 at 100.00 | A (4) | 4,695,782 |
| | 5.000%, 7/01/31 (Pre-refunded 7/01/22) | | | |
115
| NEA | Nuveen AMT-Free Quality Municipal Income Fund |
| | Portfolio of Investments (continued) |
| | October 31, 2021 |
| Principal | | Optional Call | | |
| Amount (000) | Description (1) | Provisions (2) | Ratings (3) | Value |
| | Texas (continued) | | | |
| $ 855 | Houston, Texas, Airport System Revenue Bonds, Subordinate Lien Series 2000B, 5.450%, | No Opt. Call | A | $ 937,431 |
| | 7/01/24 – AGM Insured | | | |
| | Houston, Texas, Hotel Occupancy Tax and Special Revenue Bonds, Convention and | | | |
| | Entertainment Project, Series 2001B: | | | |
| 1,495 | 0.000%, 9/01/23 – AGM Insured | No Opt. Call | A2 | 1,473,502 |
| 10,850 | 0.000%, 9/01/25 – AMBAC Insured | No Opt. Call | A | 10,326,270 |
| 1,715 | 0.000%, 9/01/32 – AMBAC Insured | No Opt. Call | A | 1,338,592 |
| | Leander Independent School District, Williamson and Travis Counties, Texas, General | | | |
| | Obligation Bonds, Refunding Series 2015A: | | | |
| 2,725 | 5.000%, 8/15/40 | 8/25 at 100.00 | AAA | 3,127,973 |
| 4,000 | 4.000%, 8/15/41 | 8/25 at 100.00 | AAA | 4,359,120 |
| 8,305 | Lower Colorado River Authority, Texas, Transmission Contract Revenue Bonds, LCRA | 5/25 at 100.00 | A | 9,401,094 |
| | Transmission Services Corporation Project, Refunding Series 2015, 5.000%, 5/15/45 | | | |
| | McCamey County Hospital District, Texas, General Obligation Bonds, Series 2013: | | | |
| 1,780 | 5.750%, 12/01/33 | 12/25 at 100.00 | B1 | 1,924,910 |
| 1,800 | 6.125%, 12/01/38 | 12/25 at 100.00 | B1 | 1,954,674 |
| | Midtown Redevelopment Authority, Texas, Tax Increment Contract Revenue, Refunding Series 2017: | | | |
| 16,285 | 5.000%, 1/01/36 | 1/27 at 100.00 | A3 | 18,900,860 |
| 10,040 | 5.000%, 1/01/38 – AGM Insured | 1/27 at 100.00 | A2 | 11,698,608 |
| | Montgomery County Toll Road Authority, Texas, Toll Road Revenue Bonds, Senior Lien | | | |
| | Series 2018: | | | |
| 2,100 | 5.000%, 9/15/43 | 9/25 at 100.00 | BBB– | 2,340,618 |
| 1,815 | 5.000%, 9/15/48 | 9/25 at 100.00 | BBB– | 2,016,193 |
| 850 | New Hope Cultural Education Facilities Finance Corporation, Texas, Retirement Facility | 11/24 at 102.00 | BB+ | 923,058 |
| | Revenue Bonds, Methodist Retirement Communities Crestview Project, Series 2016, 5.000%, 11/15/31 | | | |
| 4,290 | North Fort Bend Water Authority, Texas, Water System Revenue Bonds, Series 2011, 5.000%, | 12/21 at 100.00 | A2 (4) | 4,314,582 |
| | 12/15/36 (Pre-refunded 12/15/21) – AGM Insured | | | |
| | North Texas Tollway Authority, Special Projects System Revenue Bonds, Convertible | | | |
| | Capital Appreciation Series 2011C: | | | |
| 1,880 | 0.000%, 9/01/43 (Pre-refunded 9/01/31) (5) | 9/31 at 100.00 | N/R (4) | 2,608,425 |
| 7,990 | 6.750%, 9/01/45 (Pre-refunded 9/01/31) | 9/31 at 100.00 | N/R (4) | 11,994,029 |
| 4,000 | North Texas Tollway Authority, System Revenue Bonds, Refunding First Tier Capital | 1/25 at 100.00 | A+ (4) | 4,754,920 |
| | Appreciation Series 2008I, 6.500%, 1/01/43 (Pre-refunded 1/01/25) | | | |
| 2,125 | North Texas Tollway Authority, System Revenue Bonds, Refunding First Tier, Series 2008D, | No Opt. Call | A1 | 1,948,073 |
| | 0.000%, 1/01/28 – AGC Insured | | | |
| | North Texas Tollway Authority, System Revenue Bonds, Refunding First Tier, Series 2015B: | | | |
| 10,260 | 5.000%, 1/01/40 | 1/23 at 100.00 | A+ | 10,802,036 |
| 12,205 | 5.000%, 1/01/45 | 1/25 at 100.00 | A+ | 13,726,597 |
| 5,110 | North Texas Tollway Authority, System Revenue Bonds, Refunding First Tier, Series 2019A, | 1/29 at 100.00 | A+ | 5,861,323 |
| | 4.000%, 1/01/44 | | | |
| 5,000 | North Texas Tollway Authority, System Revenue Bonds, Refunding Second Tier Series 2018, | 1/28 at 100.00 | A | 5,936,600 |
| | 5.000%, 1/01/48 | | | |
| | North Texas Tollway Authority, System Revenue Bonds, Refunding Second Tier, Series 2015A: | | | |
| 6,285 | 5.000%, 1/01/33 | 1/25 at 100.00 | A | 7,121,156 |
| 4,000 | 5.000%, 1/01/34 | 1/25 at 100.00 | A | 4,529,480 |
| 4,000 | 5.000%, 1/01/35 | 1/25 at 100.00 | A | 4,524,080 |
| 2,250 | Red River Education Finance Corporation, Texas, Higher Education Revenue Bonds, Saint | 6/26 at 100.00 | BBB | 2,454,863 |
| | Edward's University Project, Series 2016, 4.000%, 6/01/36 | | | |
| 3,480 | Tarrant County Cultural Education Facilities Finance Corporation, Texas, Hospital Revenue Bonds, | 9/23 at 100.00 | A3 (4) | 3,808,442 |
| | Hendrick Medical Center, Refunding Series 2013, 5.500%, 9/01/43 (Pre-refunded 9/01/23) | | | |
| 4,000 | Tarrant County Cultural Education Facilities Finance Corporation, Texas, Hospital Revenue | 8/23 at 100.00 | AA– (4) | 4,335,640 |
| | Bonds, Scott & White Healthcare Project, Series 2013A, 5.000%, 8/15/43 (Pre-refunded 8/15/23) | | | |
| 2,500 | Tarrant County Cultural Education Facilities Finance Corporation, Texas, Revenue Bonds, | 8/26 at 100.00 | AA | 2,945,800 |
| | Texas Health Resources System, Series 2016A, 5.000%, 2/15/41 | | | |
116
| Principal | | Optional Call | | |
| Amount (000) | Description (1) | Provisions (2) | Ratings (3) | Value |
| | Texas (continued) | | | |
| | Texas Private Activity Bond Surface Transportation Corporation, Senior Lien Revenue | | | |
| | Bonds, LBJ Infrastructure Group LLC IH-635 Managed Lanes Project, Refunding Series 2020A: | | | |
| $ 1,805 | 4.000%, 12/31/37 | 12/30 at 100.00 | BBB– | $ 2,109,161 |
| 2,500 | 4.000%, 6/30/38 | 12/30 at 100.00 | BBB– | 2,914,625 |
| 2,500 | Texas State, General Obligation Bonds, Transportation Commission Highway Improvement | 4/22 at 100.00 | AAA | 2,550,075 |
| | Series 2012A, 5.000%, 4/01/31 (Pre-refunded 4/01/22) | | | |
| 17,760 | Texas Transportation Commission, Central Texas Turnpike System Revenue Bonds, Refunding | 8/22 at 100.00 | A3 (4) | 18,437,544 |
| | First Tier Series 2012A, 5.000%, 8/15/41 (Pre-refunded 8/15/22) | | | |
| 7,345 | Texas Transportation Commission, Central Texas Turnpike System Revenue Bonds, Refunding | 8/24 at 100.00 | A3 | 8,165,143 |
| | First Tier Series 2015B, 5.000%, 8/15/37 | | | |
| | Texas Transportation Commission, Central Texas Turnpike System Revenue Bonds, Refunding | | | |
| | Second Tier Series 2015C: | | | |
| 3,650 | 5.000%, 8/15/33 | 8/24 at 100.00 | Baa1 | 4,082,488 |
| 6,385 | 5.000%, 8/15/37 | 8/24 at 100.00 | Baa1 | 7,137,345 |
| 44,120 | 5.000%, 8/15/42 | 8/24 at 100.00 | Baa1 | 49,245,862 |
| 4,000 | Texas Turnpike Authority, Central Texas Turnpike System Revenue Bonds, First Tier Series | No Opt. Call | A3 | 3,867,920 |
| | 2002A, 0.000%, 8/15/25 – AMBAC Insured | | | |
| 8,000 | Texas Water Development Board, State Water Implementation Revenue Fund Bonds, Master | 10/29 at 100.00 | AAA | 9,239,680 |
| | Trust Series 2019A, 4.000%, 10/15/54 | | | |
| 1,000 | Waco Education Finance Corporation, Texas, Revenue Bonds, Baylor University, Series | 3/31 at 100.00 | A+ | 1,170,320 |
| | 2021, 4.000%, 3/01/41 | | | |
| 6,500 | West Harris County Regional Water Authority, Texas, Water System Revenue Bonds, | 12/31 at 100.00 | A1 | 7,554,950 |
| | Refunding Series 2021, 4.000%, 12/15/60 – BAM Insured | | | |
| 459,070 | Total Texas | | | 496,459,484 |
| | Utah – 0.4% (0.3% of Total Investments) | | | |
| | Salt Lake City, Utah, Airport Revenue Bonds, International Airport Series 2017B: | | | |
| 3,560 | 5.000%, 7/01/42 | 7/27 at 100.00 | A | 4,254,093 |
| 1,975 | 5.000%, 7/01/47 | 7/27 at 100.00 | A | 2,353,963 |
| 4,000 | Salt Lake City, Utah, Airport Revenue Bonds, International Airport Series 2018B, | 7/28 at 100.00 | A | 4,826,120 |
| | 5.000%, 7/01/48 | | | |
| | Utah Charter School Finance Authority, Charter School Revenue Bonds, Utah Charter | | | |
| | Academies Project, Series 2018: | | | |
| 1,000 | 5.000%, 10/15/38 | 10/27 at 100.00 | AA | 1,176,830 |
| 2,320 | 5.000%, 10/15/43 | 10/27 at 100.00 | AA | 2,708,299 |
| 2,040 | 5.000%, 10/15/48 | 10/27 at 100.00 | AA | 2,368,460 |
| 3,000 | Utah County, Utah, Hospital Revenue Bonds, IHC Health Services Inc., Series 2020A, | 5/30 at 100.00 | AA+ | 3,485,760 |
| | 4.000%, 5/15/43 | | | |
| 17,895 | Total Utah | | | 21,173,525 |
| | Vermont – 0.3% (0.2% of Total Investments) | | | |
| | University of Vermont and State Agricultural College, Revenue Bonds, Refunding Series 2015: | | | |
| 1,000 | 4.000%, 10/01/40 | 10/25 at 100.00 | A+ | 1,100,810 |
| 10,000 | 5.000%, 10/01/45 | 10/25 at 100.00 | A+ | 11,445,800 |
| 11,000 | Total Vermont | | | 12,546,610 |
| | Virginia – 0.2% (0.1% of Total Investments) | | | |
| | Arlington County Industrial Development Authority, Virginia, Hospital Facility Revenue | | | |
| | Bonds, Virginia Hospital Center, Series 2020: | | | |
| 1,385 | 4.000%, 7/01/39 | 7/30 at 100.00 | A+ | 1,618,677 |
| 670 | 4.000%, 7/01/40 | 7/30 at 100.00 | A+ | 781,495 |
| 430 | Chesapeake, Virginia, Transportation System Senior Toll Road Revenue Bonds, Capital | 7/28 at 100.00 | BBB+ | 468,872 |
| | Appreciation Series 2012B, 0.000%, 7/15/40 (5) | | | |
| 4,000 | Fairfax County Industrial Development Authority, Virginia, Healthcare Revenue Bonds, | 5/28 at 100.00 | Aa2 | 4,512,040 |
| | Inova Health System, Series 2018A, 4.000%, 5/15/48 (UB) (6) | | | |
117
| NEA | Nuveen AMT-Free Quality Municipal Income Fund |
| | Portfolio of Investments (continued) |
| | October 31, 2021 |
| Principal | | Optional Call | | |
| Amount (000) | Description (1) | Provisions (2) | Ratings (3) | Value |
| | Virginia (continued) | | | |
| $ 1,800 | Henrico County Economic Development Authority, Virginia, Revenue Bonds, Bon Secours | 11/22 at 100.00 | N/R (4) | $ 1,886,022 |
| | Health System Obligated Group, Series 2013, 5.000%, 11/01/30 (Pre-refunded 11/01/22) | | | |
| 2,000 | Prince William County Industrial Development Authority, Virginia, Health Care Facilities | 11/22 at 100.00 | AA– (4) | 2,075,020 |
| | Revenue Bonds, Novant Health Obligated Group-Prince William Hospital, Refunding Series 2013B, | | | |
| | 4.000%, 11/01/33 (Pre-refunded 11/01/22) | | | |
| 10,285 | Total Virginia | | | 11,342,126 |
| | Washington – 3.2% (2.0% of Total Investments) | | | |
| 7,000 | Central Puget Sound Regional Transit Authority, Washington, Sales Tax and Motor Vehicle | 11/26 at 100.00 | Aa1 | 8,340,010 |
| | Excise Tax Bonds, Green Series 2016S-1, 5.000%, 11/01/41 | | | |
| 12,235 | Chelan County Public Utility District 1, Washington, Columbia River-Rock Island | No Opt. Call | Aa3 | 11,714,645 |
| | Hydro-Electric System Revenue Refunding Bonds, Series 1997A, 0.000%, 6/01/26 – NPFG Insured | | | |
| 4,000 | Energy Northwest, Washington, Electric Revenue Bonds, Columbia Generating Station, | 7/30 at 100.00 | AA– | 4,745,160 |
| | Refunding Series 2020A, 4.000%, 7/01/39 | | | |
| 8,075 | King County Public Hospital District 1, Washington, Limited Tax General Obligation | 12/28 at 100.00 | A2 | 9,843,587 |
| | Bonds, Refunding Series 2018, 5.000%, 12/01/43 | | | |
| 4,200 | King County Public Hospital District 1, Washington, Limited Tax General Obligation | 12/26 at 100.00 | A– | 4,953,858 |
| | Bonds, Valley Medical Center, Refunding Series 2016, 5.000%, 12/01/36 | | | |
| 4,000 | King County Public Hospital District 2, Washington, General Obligation Bonds, | 12/29 at 100.00 | Aa3 | 4,556,800 |
| | EvergreenHealth, Limited Tax 2020A, 4.000%, 12/01/45 | | | |
| 15,000 | King County, Washington, Sewer Revenue Bonds, Refunding Series 2012, 5.000%, 1/01/52 | 1/22 at 100.00 | AA+ (4) | 15,119,250 |
| | (Pre-refunded 1/01/22) | | | |
| 3,000 | Port of Seattle, Washington, Revenue Bonds, Intermediate Lien Series 2015A, 5.000%, 4/01/40 | 10/24 at 100.00 | A+ | 3,351,810 |
| 1,250 | Seattle Housing Authority, Washington, Pooled Housing Revenue Bonds, Refunding Series | 12/23 at 100.00 | AA (4) | 1,372,775 |
| | 2014, 5.000%, 12/01/44 (Pre-refunded 12/01/23) | | | |
| 15,000 | Seattle, Washington, Municipal Light and Power Revenue Bonds, Refunding & Improvement | 7/31 at 100.00 | AA | 17,627,250 |
| | Series 2021A, 4.000%, 7/01/47 | | | |
| 12,515 | Spokane Public Facilities District, Washington, Hotel, Motel, and Sales Use Tax Revenue | 6/23 at 100.00 | BBB+ (4) | 13,457,379 |
| | Bonds, Series 2013A, 5.000%, 12/01/38 (Pre-refunded 6/01/23) | | | |
| 5,250 | Tacoma, Washington, Sewer Revenue Bonds, Series 2018, 4.000%, 12/01/48 | 12/28 at 100.00 | Aa2 | 6,030,518 |
| 555 | Washington Health Care Facilities Authority, Revenue Bonds, CommonSpirit Health, Series | 8/29 at 100.00 | BBB+ | 621,056 |
| | 2019A-1, 4.000%, 8/01/44 | | | |
| | Washington Health Care Facilities Authority, Revenue Bonds, Providence Health & | | | |
| | Services, Refunding Series 2012A: | | | |
| 4,000 | 5.000%, 10/01/32 | 10/22 at 100.00 | AA– | 4,171,920 |
| 10,000 | 4.250%, 10/01/40 | 10/22 at 100.00 | AA– | 10,340,800 |
| 3,135 | Washington Health Care Facilities Authority, Revenue Bonds, Seattle Children’s Hospital, | 10/22 at 100.00 | Aa2 (4) | 3,271,498 |
| | Refunding Series 2012B, 5.000%, 10/01/30 (Pre-refunded 10/01/22) | | | |
| 8,230 | Washington Health Care Facilities Authority, Revenue Bonds, Seattle Children’s Hospital, | 10/22 at 100.00 | Aa2 (4) | 8,588,334 |
| | Series 2012A, 5.000%, 10/01/42 (Pre-refunded 10/01/22) | | | |
| 2,600 | Washington State Convention Center Public Facilities District, Lodging Tax Revenue | 7/31 at 100.00 | BB+ | 2,519,972 |
| | Bonds, Refunding Subordinate Series 2021B. Exchange Purchase, 3.000%, 7/01/58 | | | |
| 2,410 | Washington State Higher Education Facilities Authority, Revenue Bonds, Seattle | 5/30 at 100.00 | A | 2,714,407 |
| | University, Series 2020, 4.000%, 5/01/50 | | | |
| 500 | Washington State Housing Finance Commission, Non-profit Housing Revenue Bonds, | 1/25 at 102.00 | BB | 540,475 |
| | Presbyterian Retirement Communities Northwest Project, Refunding Series 2016A, 5.000%, | | | |
| | 1/01/46, 144A | | | |
| 5,650 | Washington State, General Obligation Bonds, Various Purpose Series 2021A, 5.000%, 8/01/42 | 8/30 at 100.00 | AA+ | 7,198,213 |
| 9,000 | Washington State, Motor Vehicle Fuel Tax General Obligation Bonds, Series 2003C, 0.000%, | No Opt. Call | AA+ | 8,279,100 |
| | 6/01/28 – FGIC Insured | | | |
| 137,605 | Total Washington | | | 149,358,817 |
118
| Principal | | Optional Call | | |
| Amount (000) | Description (1) | Provisions (2) | Ratings (3) | Value |
| | West Virginia – 1.3% (0.8% of Total Investments) | | | |
| | West Virginia Hospital Finance Authority, Hospital Revenue Bonds, West Virginia United | | | |
| | Health System Obligated Group, Refunding & Improvement Series 2013A: | | | |
| $ 3,000 | 5.375%, 6/01/38 (Pre-refunded 6/01/23) | 6/23 at 100.00 | A (4) | $ 3,241,170 |
| 16,845 | 5.500%, 6/01/44 (Pre-refunded 6/01/23) | 6/23 at 100.00 | A (4) | 18,232,354 |
| 9,000 | West Virginia Hospital Finance Authority, Hospital Revenue Bonds, West Virginia United | 6/28 at 100.00 | A | 10,710,720 |
| | Health System Obligated Group, Series 2018A, 5.000%, 6/01/52 | | | |
| 3,500 | West Virginia Hospital Finance Authority, Revenue Bonds, West Virginia University Health | 6/27 at 100.00 | A | 4,121,320 |
| | System Obligated Group, Improvement Series 2017A, 5.000%, 6/01/42 | | | |
| | West Virginia Parkways Authority, Turnpike Toll Revenue Bonds, Senior Lien Series 2021: | | | |
| 6,750 | 4.000%, 6/01/43 | 6/31 at 100.00 | AA– | 7,938,945 |
| 8,845 | 4.000%, 6/01/51 | 6/31 at 100.00 | AA– | 10,278,156 |
| 5,750 | West Virginia State, General Obligation Bonds, State Road Competitive Series 2018B, | 6/28 at 100.00 | AA– | 6,641,135 |
| | 4.000%, 6/01/42 | | | |
| 53,690 | Total West Virginia | | | 61,163,800 |
| | Wisconsin – 3.4% (2.2% of Total Investments) | | | |
| | Public Finance Authority of Wisconsin, Conference Center and Hotel Revenue Bonds, | | | |
| | Lombard Public Facilities Corporation, Second Tier Series 2018B: | | | |
| 43 | 0.000%, 1/01/46, 144A (8) | No Opt. Call | N/R | 1,381 |
| 42 | 0.000%, 1/01/47, 144A (8) | No Opt. Call | N/R | 1,307 |
| 42 | 0.000%, 1/01/48, 144A (8) | No Opt. Call | N/R | 1,274 |
| 42 | 0.000%, 1/01/49, 144A (8) | No Opt. Call | N/R | 1,235 |
| 41 | 0.000%, 1/01/50, 144A (8) | No Opt. Call | N/R | 1,168 |
| 45 | 0.000%, 1/01/51, 144A (8) | No Opt. Call | N/R | 1,255 |
| 1,163 | 0.000%, 7/01/51, 144A (8) | 3/28 at 100.00 | N/R | 774,787 |
| 45 | 0.000%, 1/01/52, 144A (8) | No Opt. Call | N/R | 1,197 |
| 44 | 0.000%, 1/01/53, 144A (8) | No Opt. Call | N/R | 1,158 |
| 44 | 0.000%, 1/01/54, 144A (8) | No Opt. Call | N/R | 1,117 |
| 43 | 0.000%, 1/01/55, 144A (8) | No Opt. Call | N/R | 1,076 |
| 43 | 0.000%, 1/01/56, 144A (8) | No Opt. Call | N/R | 1,043 |
| 42 | 0.000%, 1/01/57, 144A (8) | No Opt. Call | N/R | 1,006 |
| 42 | 0.000%, 1/01/58, 144A (8) | No Opt. Call | N/R | 968 |
| 42 | 0.000%, 1/01/59, 144A (8) | No Opt. Call | N/R | 942 |
| 41 | 0.000%, 1/01/60, 144A (8) | No Opt. Call | N/R | 905 |
| 41 | 0.000%, 1/01/61, 144A (8) | No Opt. Call | N/R | 866 |
| 40 | 0.000%, 1/01/62, 144A (8) | No Opt. Call | N/R | 838 |
| 40 | 0.000%, 1/01/63, 144A (8) | No Opt. Call | N/R | 808 |
| 39 | 0.000%, 1/01/64, 144A (8) | No Opt. Call | N/R | 787 |
| 39 | 0.000%, 1/01/65, 144A (8) | No Opt. Call | N/R | 755 |
| 39 | 0.000%, 1/01/66, 144A (8) | No Opt. Call | N/R | 707 |
| 501 | 0.000%, 1/01/67, 144A (8) | No Opt. Call | N/R | 8,562 |
| 2,250 | Public Finance Authority of Wisconsin, Health Care Facilities Revenue Bonds, Appalachian | 1/31 at 100.00 | BBB | 2,534,265 |
| | Regional Healthcare System Obligated Group, Series 2021A, 4.000%, 7/01/56 | | | |
| 2,000 | Public Finance Authority of Wisconsin, Retirement Communities Revenue Bonds, ACTS | 11/27 at 103.00 | A– | 2,411,920 |
| | Retirement – Life Communities, Inc Obligated Group, Series 2020A, 5.000%, 11/15/41 | | | |
| | Public Finance Authority, Wisconsin, Educational Revenue Bonds, Lake Norman Charter | | | |
| | School, Series 2018A: | | | |
| 6,000 | 5.000%, 6/15/38, 144A | 6/26 at 100.00 | BBB– | 6,587,400 |
| 2,335 | 5.000%, 6/15/48, 144A | 6/26 at 100.00 | BBB– | 2,534,175 |
| 4,100 | University of Wisconsin Hospitals and Clinics Authority, Revenue Bonds, Refunding Series | 4/23 at 100.00 | AA– (4) | 4,373,962 |
| | 2013A, 5.000%, 4/01/38 (Pre-refunded 4/01/23) | | | |
| 4,000 | Wisconsin Health and Educational Facilities Authority, Revenue Bonds, Aspirus, Inc. | 8/31 at 100.00 | A1 | 4,578,800 |
| | Obligated Group, Inc. Project, Series 2021, 4.000%, 8/15/46 (WI/DD, Settling 11/10/21) | | | |
| 1,015 | Wisconsin Health and Educational Facilities Authority, Revenue Bonds, Froedtert Health | 10/22 at 100.00 | AA | 1,048,637 |
| | Inc. Obligated Group, Series 2012A, 5.000%, 4/01/42 | | | |
119
| NEA | Nuveen AMT-Free Quality Municipal Income Fund |
| | Portfolio of Investments (continued) |
| | October 31, 2021 |
| Principal | | Optional Call | | |
| Amount (000) | Description (1) | Provisions (2) | Ratings (3) | Value |
| | Wisconsin (continued) | | | |
| $ 18,410 | Wisconsin Health and Educational Facilities Authority, Revenue Bonds, Marshfield Clinic | 2/27 at 100.00 | A– | $ 21,521,474 |
| | Health System, Inc., Series 2017C, 5.000%, 2/15/47 | | | |
| | Wisconsin Health and Educational Facilities Authority, Revenue Bonds, Marshfield Clinic, | | | |
| | Series 2012B: | | | |
| 1,000 | 5.000%, 2/15/27 | 2/22 at 100.00 | A– | 1,013,310 |
| 1,000 | 5.000%, 2/15/28 | 2/22 at 100.00 | A– | 1,013,250 |
| 4,735 | 5.000%, 2/15/40 | 2/22 at 100.00 | A– | 4,796,081 |
| 2,000 | Wisconsin Health and Educational Facilities Authority, Revenue Bonds, Marshfield Clinic, | 2/26 at 100.00 | A– | 2,289,660 |
| | Series 2016B, 5.000%, 2/15/35 | | | |
| 7,625 | Wisconsin Health and Educational Facilities Authority, Revenue Bonds, Mercy Alliance, | 6/22 at 100.00 | A3 | 7,812,499 |
| | Inc., Series 2012, 5.000%, 6/01/39 | | | |
| 315 | Wisconsin Health and Educational Facilities Authority, Revenue Bonds, Meriter Hospital | No Opt. Call | A1 | 325,748 |
| | Inc., Series 1992A, 6.000%, 12/01/22 – FGIC Insured | | | |
| 2,650 | Wisconsin Health and Educational Facilities Authority, Revenue Bonds, Ministry Health | 8/22 at 100.00 | N/R (4) | 2,750,037 |
| | Care, Inc., Refunding 2012C, 5.000%, 8/15/32 (Pre-refunded 8/15/22) | | | |
| | Wisconsin Health and Educational Facilities Authority, Revenue Bonds, PHW Muskego, Inc. | | | |
| | Project, Series 2021: | | | |
| 2,415 | 4.000%, 10/01/51 | 10/28 at 102.00 | N/R | 2,467,671 |
| 2,470 | 4.000%, 10/01/61 | 10/28 at 102.00 | N/R | 2,495,787 |
| 5,155 | Wisconsin Health and Educational Facilities Authority, Wisconsin, Revenue Bonds, | 5/26 at 100.00 | Aa2 | 5,840,718 |
| | Ascension Health Alliance Senior Credit Group, Series 2016A, 4.000%, 11/15/34 | | | |
| 2,000 | Wisconsin Health and Educational Facilities Authority, Wisconsin, Revenue Bonds, | 8/27 at 100.00 | A1 | 2,364,380 |
| | Aspirus, Inc. Obligated Group, Series 2017, 5.000%, 8/15/52 | | | |
| 2,500 | Wisconsin Health and Educational Facilities Authority, Wisconsin, Revenue Bonds, Aurora | 4/23 at 100.00 | Aa3 (4) | 2,675,025 |
| | Health Care, Inc., Series 2013A, 5.125%, 4/15/31 (Pre-refunded 4/15/23) | | | |
| | Wisconsin Health and Educational Facilities Authority, Wisconsin, Revenue Bonds, | | | |
| | Benevolent Corporation Cedar Community, Series 2017: | | | |
| 1,110 | 5.000%, 6/01/37 | 6/25 at 103.00 | N/R | 1,215,139 |
| 955 | 5.000%, 6/01/41 | 6/25 at 103.00 | N/R | 1,039,966 |
| 3,620 | Wisconsin Health and Educational Facilities Authority, Wisconsin, Revenue Bonds, | 8/30 at 100.00 | Aa3 | 4,178,132 |
| | Children’s Hospital of Wisconsin, Inc., Series 2020, 4.000%, 8/15/50 | | | |
| | Wisconsin Health and Educational Facilities Authority, Wisconsin, Revenue Bonds, | | | |
| | Franciscan Sisters of Christian Charity Sponsored Ministry, Series 2017A: | | | |
| 1,000 | 5.000%, 9/01/30 (Pre-refunded 9/01/27) | 9/27 at 100.00 | N/R (4) | 1,225,360 |
| 1,110 | 5.000%, 9/01/31 (Pre-refunded 9/01/27) | 9/27 at 100.00 | N/R (4) | 1,360,150 |
| 1,100 | 5.000%, 9/01/32 (Pre-refunded 9/01/27) | 9/27 at 100.00 | N/R (4) | 1,347,896 |
| 1,725 | 5.000%, 9/01/33 (Pre-refunded 9/01/27) | 9/27 at 100.00 | N/R (4) | 2,113,746 |
| 1,775 | 5.000%, 9/01/34 (Pre-refunded 9/01/27) | 9/27 at 100.00 | N/R (4) | 2,175,014 |
| 1,910 | 5.000%, 9/01/35 (Pre-refunded 9/01/27) | 9/27 at 100.00 | N/R (4) | 2,340,438 |
| 2,065 | 5.000%, 9/01/36 (Pre-refunded 9/01/27) | 9/27 at 100.00 | N/R (4) | 2,530,368 |
| 8,500 | Wisconsin Health and Educational Facilities Authority, Wisconsin, Revenue Bonds, | 2/26 at 100.00 | A– | 9,713,630 |
| | Marshfield Clinic, Series 2016A, 5.000%, 2/15/46 | | | |
| 5,000 | Wisconsin Health and Educational Facilities Authority, Wisconsin, Revenue Bonds, Medical | 11/26 at 100.00 | AA– | 5,924,100 |
| | College of Wisconsin, Inc., Series 2016, 5.000%, 12/01/41 | | | |
| | Wisconsin Health and Educational Facilities Authority, Wisconsin, Revenue Bonds, Saint | | | |
| | John’s Communities Inc., Series 2018A: | | | |
| 1,240 | 5.000%, 9/15/31 (Pre-refunded 9/15/23) | 9/23 at 100.00 | BBB– (4) | 1,347,520 |
| 7,955 | 5.000%, 9/15/50 (Pre-refunded 9/15/23) | 9/23 at 100.00 | BBB– (4) | 8,644,778 |
| 10,230 | Wisconsin Health and Educational Facilities Authority, Wisconsin, Revenue Bonds, | 12/24 at 100.00 | A1 | 11,530,438 |
| | ThedaCare Inc, Series 2015, 5.000%, 12/15/44 | | | |
| 18,165 | Wisconsin Health and Educational Facilities Authority, Wisconsin, Revenue Bonds, | 12/29 at 100.00 | A1 | 20,424,726 |
| | ThedaCare Inc, Series 2019, 4.000%, 12/15/49 | | | |
| 143,978 | Total Wisconsin | | | 159,351,342 |
120
| Principal | | Optional Call | | |
| Amount (000) | Description (1) | Provisions (2) | Ratings (3) | Value |
| | Wyoming – 0.3% (0.2% of Total Investments) | | | |
| $ 9,625 | Sweetwater County, Wyoming, Hospital Revenue Bonds, Memorial Hospital Project, Refunding | 9/23 at 100.00 | BB+ | $ 10,180,459 |
| | Series 2013A, 5.000%, 9/01/37 | | | |
| | Teton County Hospital District, Wyoming, Hospital Revenue Bonds, St. John’s Medical | | | |
| | Center Project, Series 2011B: | | | |
| 2,000 | 5.500%, 12/01/27 (Pre-refunded 12/01/21) | 12/21 at 100.00 | N/R (4) | 2,008,400 |
| 1,000 | 6.000%, 12/01/36 (Pre-refunded 12/01/21) | 12/21 at 100.00 | N/R (4) | 1,004,592 |
| 12,625 | Total Wyoming | | | 13,193,451 |
| $ 6,924,223 | Total Long-Term Investments (cost $6,555,399,890) | | | 7,270,127,205 |
| Principal | | Optional Call | | |
| Amount (000) | Description (1) | Provisions (2) | Ratings (3) | Value |
| | SHORT-TERM INVESTMENTS – 0.1% (0.1% of Total Investments) | | | |
| | MUNICIPAL BONDS – 0.1% (0.1% of Total Investments) | | | |
| | Minnesota – 0.1% (0.1% of Total Investments) | | | |
| $ 6,500 | Bloomington, Minnesota, Housing Revenue Bonds, Presbyterian Homes Projects, | 10/21 at 100.00 | AA+ | $ 6,500,000 |
| | Refunding Series 2008, 0.050%, 7/01/38 (9) | | | |
| $ 6,500 | Total Short-Term Investments (cost $6,500,000) | | | 6,500,000 |
| | Total Investments (cost $6,561,899,890) – 154.9% | | | 7,276,627,205 |
| | Floating Rate Obligations – (2.8)% | | | (133,490,000) |
| | Adjustable Rate MuniFund Term Preferred Shares, net of deferred offering costs – (6.7)% (10) | | | (316,321,358) |
| | MuniFund Preferred Shares, net of deferred offering costs – (23.1)% (11) | | | (1,086,408,687) |
| | Variable Rate Demand Preferred Shares, net of deferred offering costs – (24.6)% (12) | | | (1,153,832,843) |
| | Other Assets Less Liabilities – 2.3% | | | 110,739,765 |
| | Net Assets Applicable to Common Shares – 100% | | | $ 4,697,314,082 |
121
| | |
| NEA | Nuveen AMT-Free Quality Municipal Income Fund |
| | Portfolio of Investments (continued) |
| | October 31, 2021 |
| (1) | | All percentages shown in the Portfolio of Investments are based on net assets applicable to common shares unless otherwise noted. |
| (2) | | Optional Call Provisions: Dates (month and year) and prices of the earliest optional call or redemption. There may be other call provisions at varying prices at later dates. Certain mortgage-backed securities may be subject to periodic principal paydowns. Optional Call Provisions are not covered by the report of independent registered public accounting firm. |
| (3) | | The ratings disclosed are the lowest of Standard & Poor’s Group (“Standard & Poor’s”), Moody’s Investors Service, Inc. (“Moody’s”) or Fitch, Inc. (“Fitch”) rating. Ratings below BBB by Standard & Poor’s, Baa by Moody’s or BBB by Fitch are considered to be below investment grade. Holdings designated N/R are not rated by any of these national rating agencies. Ratings are not covered by the report of independent registered public accounting firm. |
| (4) | | Backed by an escrow or trust containing sufficient U.S. Government or U.S. Government agency securities, which ensure the timely payment of principal and interest. |
| (5) | | Step-up coupon bond, a bond with a coupon that increases (“steps up”), usually at regular intervals, while the bond is outstanding. The rate shown is the coupon as of the end of the reporting period. |
| (6) | | Investment, or portion of investment, has been pledged to collateralize the net payment obligations for investments in inverse floating rate transactions. |
| (7) | | Investment valued at fair value using methods determined in good faith by, or at the discretion of, the Board. For fair value measurement disclosure purposes, investment classified as Level 3. |
| (8) | | Defaulted security. A security whose issuer has failed to fully pay principal and/or interest when due, or is under the protection of bankruptcy. |
| (9) | | Investment has a maturity of greater than one year, but has variable rate and/or demand features which qualify it as a short-term investment. The rate disclosed, as well as the reference rate and spread, where applicable, is that in effect as of the end of the reporting period. This rate changes periodically based on market conditions or a specified market index. |
| (10) | | Adjustable Rate MuniFund Term Preferred Shares, net of deferred offering cost as a percentage of Total Investments is 4.3%. |
| (11) | | MuniFund Preferred Shares, net of deferred offering costs as a percentage of Total Investments is 14.9%. |
| (12) | | Variable Rate Demand Preferred Shares, net of deferred offering costs as a percentage of Total Investments is 15.9%. |
| 144A | | Investment is exempt from registration under Rule 144A of the Securities Act of 1933, as amended. These investments may only be resold in transactions exempt from registration, which are normally those transactions with qualified institutional buyers. |
| IF | | Inverse floating rate security issued by a tender option bond (“TOB”) trust, the interest rate on which varies inversely with the Securities Industry Financial Markets Association (SIFMA) short-term rate, which resets weekly, or a similar short-term rate, and is reduced by the expenses related to the TOB trust. |
| PIK | | Payment-in-kind (“PIK”) security. Depending on the terms of the security, income may be received in the form of cash, securities, or a combination of both. The PIK rate shown, where applicable, represents the annualized rate of the last PIK payment made by the issuer as of the end of the reporting period. |
| UB | | Underlying bond of an inverse floating rate trust reflected as a financing transaction. See Notes to Financial Statements, Note 4 – Portfolio Securities and Investments in Derivatives, for more information. |
| WI/DD | | Investment, or portion of investment, purchased on a when-issued or delayed delivery basis. |
See accompanying notes to financial statements.
122
Statement of Assets and Liabilities
October 31, 2021
| | | |
| | NAD | NEA |
| Assets | | |
| Long-term investments, at value (cost $5,240,012,133 and $6,555,399,890, respectively) | $5,807,645,460 | $7,270,127,205 |
| Short-term investments, at value (cost approximates value) | 9,100,000 | 6,500,000 |
| Cash | — | 15,894,199 |
| Receivable for: | | |
| Dividends | 533 | — |
| Interest | 71,158,715 | 87,175,391 |
| Investments sold | 78,217,638 | 74,357,243 |
| Other assets | 1,606,623 | 2,523,316 |
| Total assets | 5,967,728,969 | 7,456,577,354 |
| Liabilities | | |
| Cash overdraft | 5,949,481 | — |
| Floating rate obligations | 111,960,000 | 133,490,000 |
| Payable for: | | |
| Dividends | 13,134,363 | 16,743,496 |
| Investments purchased – regular settlement | 8,215,200 | 12,697,057 |
| Investments purchased – when-issued/delayed-delivery settlement | 28,148,939 | 33,383,192 |
| Offering costs | — | 251,705 |
| Adjustable Rate MuniFund Term Preferred (“AMTP”) Shares, net of deferred offering | | |
| costs (liquidation preference $727,500,000 and $316,500,000, respectively) | 727,169,346 | 316,321,358 |
| MuniFund Preferred (“MFP”) Shares, net of deferred offering | | |
| costs (liquidation preference $679,000,000 and $1,088,900,000, respectively) | 678,419,684 | 1,086,408,687 |
| Variable Rate Demand Preferred (“VRDP”) Shares, net of deferred offering costs | | |
| (liquidation preference $632,000,000 and $1,159,400,000, respectively) | 630,487,336 | 1,153,832,843 |
| Accrued expenses: | | |
| Management fees | 2,727,768 | 3,405,178 |
| Trustees fees | 1,215,979 | 1,646,146 |
| Other | 926,892 | 1,083,610 |
| Total liabilities | 2,208,354,988 | 2,759,263,272 |
| Commitments and contingencies (as disclosed in Note 8) | | |
| Net assets applicable to common shares | $3,759,373,981 | $4,697,314,082 |
| Common shares outstanding | 233,404,656 | 299,037,392 |
| Net asset value (“NAV”) per common share outstanding | $ 16.11 | $ 15.71 |
| Net assets applicable to common shares consist of: | | |
| Common shares, $0.01 par value per share | $ 2,334,047 | $ 2,990,374 |
| Paid-in-surplus | 3,240,550,330 | 4,014,252,974 |
| Total distributable earnings | 516,489,604 | 680,070,734 |
| Net assets applicable to common shares | $3,759,373,981 | $4,697,314,082 |
| Authorized shares: | | |
| Common | Unlimited | Unlimited |
| Preferred | Unlimited | Unlimited |
See accompanying notes to financial statements.
123
Statement of Operations
Year Ended October 31, 2021
| | | |
| | NAD | NEA |
| Investment Income | $214,422,356 | $269,316,812 |
| Expenses | | |
| Management fees | 31,171,336 | 39,777,925 |
| Interest expense and amortization of offering costs | 13,862,021 | 11,999,378 |
| Liquidity fees | 4,737,394 | 10,896,109 |
| Remarketing fees | 640,779 | 1,975,890 |
| Custodian fees | 436,555 | 516,937 |
| Trustees fees | 173,181 | 219,476 |
| Professional fees | 423,607 | 889,252 |
| Shareholder reporting expenses | 212,377 | 255,638 |
| Shareholder servicing agent fees | 118,283 | 135,004 |
| Stock exchange listing fees | 89,230 | 75,758 |
| Investor relations expenses | 165,134 | 219,415 |
| Reorganization expenses | 364,332 | 275,501 |
| Other | 135,648 | 162,586 |
| Net expenses | 52,529,877 | 67,398,869 |
| Net investment income (loss) | 161,892,479 | 201,917,943 |
| Realized and Unrealized Gain (Loss) | | |
| Net realized gain (loss) from Investments | 5,976,132 | 13,219,775 |
| Change in net unrealized appreciation (depreciation) of Investments | 63,470,598 | 39,506,288 |
| Net realized and unrealized gain (loss) | 69,446,730 | 52,726,063 |
| Net increase (decrease) in net assets applicable to common shares from operations | $231,339,209 | $254,644,006 |
See accompanying notes to financial statements.
124
Statement of Changes in Net Assets
| | | | | | |
| | NAD | | NEA |
| | Year Ended | Year Ended | | Year Ended | Year Ended |
| | 10/31/21 | 10/31/20 | | 10/31/21 | 10/31/20 |
| Operations | | | | | |
| Net investment income (loss) | $ 161,892,479 | $ 146,764,330 | | $ 201,917,943 | $ 191,357,878 |
| Net realized gain (loss) from investments | 5,976,132 | (11,900,124) | | 13,219,775 | (3,608,635) |
| Change in net unrealized appreciation (depreciation) of investments | 63,470,598 | (32,006,896) | | 39,506,288 | (24,512,170) |
| Net increase (decrease) in net assets applicable to common shares | | | | | |
| from operations | 231,339,209 | 102,857,310 | | 254,644,006 | 163,237,073 |
| Distributions to Common Shareholders | | | | | |
| Dividends | (158,884,170) | (138,980,629) | | (205,660,254) | (183,762,876) |
| Decrease in net assets applicable to common shares from distributions | | | | | |
| to common shareholders | (158,884,170) | (138,980,629) | | (205,660,254) | (183,762,876) |
| Capital Share Transactions | | | | | |
| Common Shares: | | | | | |
| Issued in the Reorganization | 352,666,794 | 159,102,613 | | 329,945,848 | 245,521,737 |
| Net increase (decrease) in net assets applicable to common shares from | | | | | |
| capital share transactions | 352,666,794 | 159,102,613 | | 329,945,848 | 245,521,737 |
| Net increase (decrease) in net assets applicable to common shares | 425,121,833 | 122,979,294 | | 378,929,600 | 224,995,934 |
| Net assets applicable to common shares at the beginning of period | $3,334,252,148 | $3,211,272,854 | | $4,318,384,482 | $4,093,388,548 |
| Net assets applicable to common shares at the end of period | $3,759,373,981 | $3,334,252,148 | | $4,697,314,082 | $4,318,384,482 |
See accompanying notes to financial statements.
125
Statement of Cash Flows
Year Ended October 31, 2021
| | | |
| | NAD | NEA |
| |
| Cash Flows from Operating Activities: | | |
| Net Increase (Decrease) in Net Assets Applicable to Common Shares from Operations | $ 231,339,209 | $ 254,644,006 |
| Adjustments to reconcile the net increase (decrease) in net assets applicable to | | |
| common shares from operations to net cash provided by (used in) operating activities: | | |
| Purchases of investments | (576,808,718) | (833,111,401) |
| Proceeds from sales and maturities of investments | 604,051,225 | 857,101,456 |
| Proceeds from (Purchases of) short-term investments, net | (9,100,000) | (1,500,000) |
| Payment-in-kind distributions | (1,366) | (10,453) |
| Proceeds from litigation settlement | — | 125 |
| Taxes paid | (44,077) | (52,937) |
| Amortization (Accretion) of premium and discounts, net | 2,972,113 | 4,546,606 |
| Amortization of deferred offering costs | 313,055 | 1,141,720 |
| (Increase) Decrease in: | | |
| Receivable for interest | 819,429 | (1,233,360) |
| Receivable for investments sold | (60,897,638) | (47,657,243) |
| Other assets | (216,600) | (216,507) |
| Increase (Decrease) in: | | |
| Payable for interest | (123,345) | (127,039) |
| Payable for investments purchased - regular settlement | 8,215,200 | 12,697,057 |
| Payable for investments purchased - when-issued/delayed-delivery settlement | 24,815,672 | 33,383,192 |
| Payable for offering costs | — | 251,705 |
| Accrued management fees | 262,470 | 244,356 |
| Accrued Trustees fees | 359,087 | 500,640 |
| Accrued other expenses | (37,833) | (54,342) |
| Net realized (gain) loss from: | | |
| Investments | (5,976,132) | (13,219,775) |
| Paydowns | (833,242) | (318,376) |
| Change in net unrealized appreciation (depreciation) of Investments | (63,470,598) | (39,506,288) |
| Net cash provided by (used in) operating activities | 155,637,911 | 227,503,142 |
| Cash Flow from Financing Activities: | | |
| Increase (Decrease) in cash overdraft | 5,949,481 | (3,916,633) |
| (Repayments of) floating rate obligations | (5,425,000) | (4,890,000) |
| Proceeds from MFP Shares issued, at liquidation preference | — | 130,900,000 |
| (Payments for) VRDP Shares redeemed, at liquidation preference | — | (130,900,000) |
| Proceeds from borrowings | 4,149,160 | 85,413,202 |
| (Repayments of) borrowings | (4,149,160) | (85,413,202) |
| Proceeds from reverse repurchase agreements | — | 130,900,000 |
| (Repayments of) reverse repurchase agreements | — | (130,900,000) |
| (Payments for) deferred offering costs | — | (961,800) |
| Cash distributions paid to common shareholders | (157,674,125) | (204,461,812) |
| Net cash provided by (used in) financing activities | (157,149,644) | (214,230,245) |
| Net Increase (Decrease) in Cash | (1,511,733) | 13,272,897 |
| Cash at the beginning of period | 263,532 | — |
| Cash acquired in connection with the Reorganizations | 1,248,201 | 2,621,302 |
| Cash at the end of period | $ — | $ 15,894,199 |
| Supplemental Disclosure of Cash Flow Information(1) | NAD | NEA |
| Cash paid for interest (excluding amortization of offering costs) | $ 13,579,678 | $ 10,822,008 |
| (1) | | See Notes to Financial Statements, Note 1 – General Information for more information of the non-cash activities related to the Funds’ Reorganizations. |
See accompanying notes to financial statements.
126
THIS PAGE INTENTIONALLY LEFT BLANK
127
Financial Highlights
Selected data for a common share outstanding throughout each period:
| | | | | | | | | | | | | |
| | | | | | | Less Distributions | | | | | |
| | | Investment Operations | | to Common Shareholders | | | | Common Share | |
| | | | | | | | From | | | Discount | | |
| | Beginning | Net | Net | | | From | Accumu- | | | per | | |
| | Common | Investment | Realized/ | | | Net | lated Net | | | Share | | Ending |
| | Share | Income | Unrealized | | | Investment | Realized | | | Repurchased | Ending | Share |
| | NAV | (Loss) | Gain (Loss) | Total | | Income | Gains | Total | | and Retired | NAV | Price |
| NAD | | | | | | | | | | | | |
| Year Ended 10/31: | | | | | | | | | | |
| 2021 | $15.75 | $0.72 | $ 0.35 | $ 1.07 | | $(0.71) | $ — | $(0.71) | | — | $16.11 | $15.63 |
| 2020 | 15.91 | 0.70 | (0.19) | 0.51 | | (0.67) | — | (0.67) | | — | 15.75 | 14.44 |
| 2019 | 14.42 | 0.67 | 1.46 | 2.13 | | (0.64) | — | (0.64) | | — | 15.91 | 14.42 |
| 2018 | 15.41 | 0.69 | (0.99) | (0.30) | | (0.69) | — | (0.69) | | —* | 14.42 | 12.41 |
| 2017 | 15.75 | 0.73 | (0.29) | 0.44 | | (0.78) | — | (0.78) | | — | 15.41 | 13.86 |
| NEA | | | | | | | | | | | | |
| Year Ended 10/31: | | | | | | | | | | |
| 2021 | 15.50 | 0.69 | 0.22 | 0.91 | | (0.70) | — | (0.70) | | — | 15.71 | 15.18 |
| 2020 | 15.58 | 0.69 | (0.11) | 0.58 | | (0.66) | — | (0.66) | | — | 15.50 | 14.33 |
| 2019 | 14.16 | 0.66 | 1.40 | 2.06 | | (0.64) | — | (0.64) | | — | 15.58 | 14.20 |
| 2018 | 15.07 | 0.68 | (0.91) | (0.23) | | (0.68) | — | (0.68) | | —* | 14.16 | 12.13 |
| 2017 | 15.36 | 0.71 | (0.26) | 0.45 | | (0.74) | — | (0.74) | | — | 15.07 | 13.57 |
| (a) | | Total Return Based on Common Share NAV is the combination of changes in common share NAV, reinvested dividend income at NAV and reinvested capital gains distributions at NAV, if any. The last dividend declared in the period, which is typically paid on the first business day of the following month, is assumed to be reinvested at the ending NAV. The actual reinvest price for the last dividend declared in the period may often be based on the Fund’s market price (and not its NAV), and therefore may be different from the price used in the calculation. Total returns are not annualized. |
Total Return Based on Common Share Price is the combination of changes in the market price per share and the effect of reinvested dividend income and reinvested capital gains distributions, if any, at the average price paid per share at the time of reinvestment. The last dividend declared in the period, which is typically paid on the first business day of the following month, is assumed to be reinvested at the ending market price. The actual reinvestment for the last dividend declared in the period may take place over several days, and in some instances may not be based on the market price, so the actual reinvestment price may be different from the price used in the calculation. Total returns are not annualized.
128
| | | | | Common Share Supplemental Data/ | |
| | | | | Ratios Applicable to Common Shares | |
| Common Share | | | | | |
| Total Returns | | | Ratios to Average Net Assets(b) | |
| |
| | Based | | Ending | | | |
| Based | on | | Net | | Net | Portfolio |
| on | Share | | Assets | | Investment | Turnover |
| NAV(a) | Price(a) | | (000) | Expenses | Income (Loss) | Rate(c) |
| |
| |
| 6.85% | 13.31% | | $3,759,374 | 1.44% | 4.43% | 10% |
| 3.27 | 4.89 | | 3,334,252 | 1.87 | 4.47 | 15 |
| 15.03 | 21.78 | | 3,211,273 | 2.45 | 4.35 | 8 |
| (2.03) | (5.69) | | 2,910,735 | 2.34 | 4.57 | 20 |
| 3.01 | 3.26 | | 3,110,034 | 1.95 | 4.84 | 18 |
| |
| |
| 5.91 | 10.92 | | 4,697,314 | 1.44 | 4.31 | 12 |
| 3.84 | 5.74 | | 4,318,384 | 1.85 | 4.46 | 16 |
| 14.81 | 22.78 | | 4,093,389 | 2.40 | 4.41 | 8 |
| (1.62) | (5.84) | | 3,719,774 | 2.29 | 4.63 | 11 |
| 3.16 | 4.21 | | 3,959,861 | 1.94 | 4.80 | 15 |
| (b) | • | Net Investment Income (Loss) ratios reflect income earned and expenses incurred on assets attributable to preferred shares issued by the Fund, where applicable. |
| • | The expense ratios reflect, among other things, all interest expense and other costs related to preferred shares (as described in Note 5 – Fund Shares) and/or the interest expense deemed to have been paid by the Fund on the floating rate certificates issued by the special purpose trusts for the self-deposited inverse floaters held by the Fund (as described in Note 4 – Portfolio Securities and Investments in Derivatives), where applicable, as follows: |
| | | | | |
| NAD | | | NEA | |
| Year Ended 10/31: | | | Year Ended 10/31: | |
| 2021 | 0.53% | | 2021 | 0.53% |
| 2020 | 0.94 | | 2020 | 0.94 |
| 2019 | 1.50 | | 2019 | 1.47 |
| 2018 | 1.39 | | 2018 | 1.35 |
| 2017 | 1.00 | | 2017 | 1.00 |
| (c) | | Portfolio Turnover Rate is calculated based on the lesser of long-term purchases or sales (as disclosed in Note 4 – Portfolio Securities and Investments in Derivatives) divided by the average long-term market value during the period. |
| * | | Rounds to less than $0.01 per share. |
See accompanying notes to financial statements.
129
Financial Highlights (continued)
| | | | | | | | | | | | | | |
| | | | | | | | | | | | | | AMTP, MFP, |
| | | | | | | | | | | | | | VMTP and/or |
| | | | | | | | | | | | | | VRDP Shares |
| | AMTP Shares | | MFP Shares | | VMTP Shares | | VRDP Shares | | at the End |
| | at the End of Period | | at the End of Period | | at the End of Period | | at the End of Period | | of Period |
| | | Asset | | | Asset | | | Asset | | | Asset | | Asset |
| | Aggregate | Coverage | | Aggregate | Coverage | | Aggregate | Coverage | | Aggregate | Coverage | | Coverage |
| | Amount | Per | | Amount | Per | | Amount | Per | | Amount | Per | | Per $1 |
| | Outstanding | $100,000 | | Outstanding | $100,000 | | Outstanding | $100,000 | | Outstanding | $100,000 | | Liquidation |
| | (000) | Share | | (000) | Share(a) | | (000) | Share | | (000) | Share | | Preference |
| |
| NAD | | | | | | | | | | | | | |
| Year Ended 10/31: | | | | | | | | | | | | | |
| 2021 | $727,500 | $284,419 | | $679,000 | $284,419 | | $ — | $ — | | $632,000 | $284,419 | | $2.84 |
| 2020 | 545,500 | 279,599 | | 679,000 | 279,599 | | — | — | | 632,000 | 279,599 | | 2.80 |
| 2019 | 545,500 | 279,954 | | 607,000 | 279,954 | | — | — | | 632,000 | 279,954 | | 2.80 |
| 2018 | — | — | | 607,000 | 263,112 | | 545,500 | 263,112 | | 632,000 | 263,112 | | 2.63 |
| 2017 | — | — | | — | — | | 952,500 | 296,279 | | 632,000 | 296,279 | | 2.96 |
| |
| NEA | | | | | | | | | | | | | |
| Year Ended 10/31: | | | | | | | | | | | | | |
| 2021 | 316,500 | 283,145 | | 1,088,900 | 283,145 | | — | — | | 1,159,400 | 283,145 | | 2.83 |
| 2020 | 143,500 | 280,550 | | 958,000 | 280,550 | | — | — | | 1,290,300 | 280,550 | | 2.81 |
| 2019 | — | — | | 958,000 | 282,066 | | — | — | | 1,290,300 | 282,066 | | 2.82 |
| 2018 | — | — | | 958,000 | 265,448 | | — | — | | 1,290,300 | 265,448 | | 2.65 |
| 2017 | — | — | | — | — | | 773,000 | 291,919 | | 1,290,300 | 291,919 | | 2.92 |
| (a) | | NEA’s Series D MFP Shares have a $1,000 liquidation preference per share, while all other MFP Shares have a $100,000 liquidation preference per share. The asset coverage per $1,000 share for NEA’s Series D MFP Shares were as follows: |
| | |
| | Asset |
| | Coverage |
| | Per |
| | $1,000 |
| NEA | Share |
| Series D | |
| Year Ended 10/31: | |
| 2021 | $2,831 |
| 2020 | 2,805 |
| 2019 | 2,800 |
| 2018 | — |
| 2017 | — |
See accompanying notes to financial statements.
130
Notes to
Financial Statements
1. General Information
Fund Information
The funds covered in this report and their corresponding New York Stock Exchange (“NYSE”) symbols are as follows (each a “Fund” and collectively, the “Funds”):
• Nuveen Quality Municipal Income Fund (NAD)
• Nuveen AMT-Free Quality Municipal Income Fund (NEA)
The Funds are registered under the Investment Company Act of 1940 (the “1940 Act”), as amended, as diversified closed-end management investment companies. NAD and NEA were organized as Massachusetts business trusts on January 15, 1999 and July 29, 2002, respectively.
The end of the reporting period for the Funds is October 31, 2021, and the period covered by these Notes to Financial Statements is the fiscal year ended October 31, 2021 (the ”current fiscal period”).
Investment Adviser and Sub-Adviser
The Funds’ investment adviser is Nuveen Fund Advisors, LLC (the “Adviser”), a subsidiary of Nuveen, LLC (“Nuveen”). Nuveen is the investment management arm of Teachers Insurance and Annuity Association of America (TIAA). The Adviser has overall responsibility for management of the Funds, oversees the management of the Funds’ portfolios, manages the Funds’ business affairs and provides certain clerical, bookkeeping and other administrative services, and, if necessary, asset allocation decisions. The Adviser has entered into sub-advisory agreements with Nuveen Asset Management, LLC (the “Sub-Adviser”), a subsidiary of the Adviser, under which the Sub-Adviser manages the investment portfolios of the Funds.
Fund Reorganizations
Effective prior to the opening of business on April 12, 2021, Nuveen Maryland Quality Municipal Income Fund (NMY) (a “Target Fund”) was reorganized into NAD (an “Acquiring Fund”) and effective prior to the opening of business on February 8, 2021, Nuveen Michigan Quality Municipal Income Fund (NUM) (a “Target Fund”) was reorganized into NEA (an “Acquiring Fund”) (each a “Reorganization” and collectively the “Reorganizations”).
For accounting and performance reporting purposes, the Acquiring Fund is the survivor.
Upon the closing of each Reorganization, each Target Fund transferred its assets to its respective Acquiring Fund in exchange for common and preferred shares of the Acquiring Funds and the assumption by the Acquiring Funds of the liabilities of each Target Fund. Each Target Fund was then liquidated, dissolved and terminated in accordance with its Declaration of Trust. Shareholders of each Target Fund became shareholders of their respective Acquiring Fund. Holders of common shares of each Target Fund received newly issued common shares of their respective Acquiring Fund, the aggregate net asset value (“NAV”) of which was equal to the aggregate NAV of the common shares of each Target Fund held immediately prior to each Reorganization (including for this purpose fractional Acquiring Fund shares to which shareholders were entitled). Holders of preferred shares of each Target Fund received on a one-for-one basis newly issued preferred shares of their respective Acquiring Fund, in exchange for preferred shares of each Target Fund held immediately prior to each Reorganization. Details of each Reorganization are further described in Note 10 – Fund Reorganizations.
Other Matters
The outbreak of the novel coronavirus (“COVID-19”) and subsequent global pandemic began significantly impacting the U.S. and global financial markets and economies during the calendar quarter ended March 31, 2020. The worldwide spread of COVID-19 has created significant uncertainty in the global economy. The duration and extent of COVID-19 over the long term cannot be reasonably estimated at this time. The ultimate impact of COVID-19 and the extent to which COVID-19 impacts the Funds’ normal course of business, results of operations, investments, and cash flows will depend on future developments, which are highly uncertain and difficult to predict. Management continues to monitor and evaluate this situation.
2. Significant Accounting Policies
The accompanying financial statements were prepared in accordance with accounting principles generally accepted in the United States of America (“U.S. GAAP”), which may require the use of estimates made by management and the evaluation of subsequent events. Actual results may differ from those estimates. Each Fund is an investment company and follows the accounting guidance in the Financial Accounting Standards Board (“FASB”) Accounting Standards Codification 946, Financial Services—Investment Companies. The NAV for financial reporting purposes may differ from the NAV
131
Notes to Financial Statements (continued)
for processing security and common share transactions. The NAV for financial reporting purposes includes security and common share transactions through the date of the report. Total return is computed based on the NAV used for processing security and common share transactions. The following is a summary of the significant accounting policies consistently followed by the Funds.
Compensation
The Funds pay no compensation directly to those of its trustees who are affiliated with the Adviser or to its officers, all of whom receive remuneration for their services to the Funds from the Adviser or its affiliates. The Funds’ Board of the Trustees (the “Board”) has adopted a deferred compensation plan for independent trustees that enables trustees to elect to defer receipt of all or a portion of the annual compensation they are entitled to receive from certain Nuveen-advised funds. Under the plan, deferred amounts are treated as though equal dollar amounts had been invested in shares of select Nuveen-advised funds.
Distributions to Common Shareholders
Distributions to common shareholders are recorded on the ex-dividend date. The amount, character and timing of distributions are determined in accordance with federal income tax regulations, which may differ from U.S. GAAP.
Indemnifications
Under the Funds’ organizational documents, their officers and trustees are indemnified against certain liabilities arising out of the performance of their duties to the Funds. In addition, in the normal course of business, the Funds enter into contracts that provide general indemnifications to other parties. The Funds’ maximum exposure under these arrangements is unknown as this would involve future claims that may be made against the Funds that have not yet occurred. However, the Funds have not had prior claims or losses pursuant to these contracts and expect the risk of loss to be remote.
Investments and Investment Income
Securities transactions are accounted for as of the trade date for financial reporting purposes. Realized gains and losses on securities transactions are based upon the specific identification method. Investment income is comprised of interest income, which is recorded on an accrual basis and includes accretion of discounts and amortization of premiums for financial reporting purposes. Investment income also reflects payment-in-kind (“PIK”) interest and paydown gains and losses, if any. PIK interest represents income received in the form of securities in lieu of cash. Investment income also reflects dividend income, which is recorded on the ex-dividend date.
Netting Agreements
In the ordinary course of business, the Funds may enter into transactions subject to enforceable International Swaps and Derivatives Association, Inc. (ISDA) master agreements or other similar arrangements (“netting agreements”). Generally, the right to offset in netting agreements allows each Fund to offset certain securities and derivatives with a specific counterparty, when applicable, as well as any collateral received or delivered to that counterparty based on the terms of the agreements. Generally, each Fund manages its cash collateral and securities collateral on a counterparty basis.
The Funds’ investments subject to netting agreements as of the end of the reporting period, if any, are further described in Note 4 – Portfolio Securities and Investments in Derivatives.
New Accounting Pronouncements and Rule Issuances
Reference Rate Reform
In March 2020, FASB issued Accounting Standards Update (“ASU”) 2020-04, Reference Rate Reform: Facilitation of the Effects of Reference Rate Reform on Financial Reporting. The main objective of the new guidance is to provide relief to companies that will be impacted by the expected change in benchmark interest rates, when participating banks will no longer be required to submit London Interbank Offered Rate (LIBOR) quotes by the UK Financial Conduct Authority (FCA). The new guidance allows companies to, provided the only change to existing contracts are a change to an approved benchmark interest rate, account for modifications as a continuance of the existing contract without additional analysis. For new and existing contracts, the Funds may elect to apply the amendments as of March 12, 2020 through December 31, 2022. Management has not yet elected to apply the amendments, is continuously evaluating the potential effect a discontinuation of LIBOR could have on the Funds’ investments and has currently determined that it is unlikely the ASU’s adoption will have a significant impact on the Funds’ financial statements and various filings.
Securities and Exchange Commission (“SEC”) Adopts New Rules to Modernize Fund Valuation Framework
In December 2020, the SEC voted to adopt a new rule governing fund valuation practices. New Rule 2a-5 under the 1940 Act establishes requirements for determining fair value in good faith for purposes of the 1940 Act. Rule 2a-5 will permit fund boards to designate certain parties to perform fair value determinations, subject to board oversight and certain other conditions. Rule 2a-5 also defines when market quotations are “readily available” for purposes of Section 2(a)(41) of the 1940 Act, which requires a fund to fair value a security when market quotations are not readily available. The SEC also adopted new Rule 31a-4 under the 1940 Act, which sets forth the recordkeeping requirements associated with fair value
132
determinations. Finally, the SEC is rescinding previously issued guidance on related issues, including the role of a board in determining fair value and the accounting and auditing of fund investments. Rule 2a-5 and Rule 31a-4 became effective on March 8, 2021, with a compliance date of September 8, 2022. A fund may voluntarily comply with the rules after the effective date, and in advance of the compliance date, under certain conditions. Management is currently assessing the impact of these provisions on the Funds’ financial statements.
3. Investment Valuation and Fair Value Measurements
The Funds’ investments in securities are recorded at their estimated fair value utilizing valuation methods approved by the Board. Fair value is defined as the price that would be received upon selling an investment or transferring a liability in an orderly transaction to an independent buyer in the principal or most advantageous market for the investment. U.S. GAAP establishes the three-tier hierarchy which is used to maximize the use of observable market data and minimize the use of unobservable inputs and to establish classification of fair value measurements for disclosure purposes. Observable inputs reflect the assumptions market participants would use in pricing the asset or liability. Observable inputs are based on market data obtained from sources independent of the reporting entity. Unobservable inputs reflect management’s assumptions about the assumptions market participants would use in pricing the asset or liability. Unobservable inputs are based on the best information available in the circumstances. The following is a summary of the three-tiered hierarchy of valuation input levels.
Level 1 – Inputs are unadjusted and prices are determined using quoted prices in active markets for identical securities.
Level 2 – Prices are determined using other significant observable inputs (including quoted prices for similar securities, interest rates, credit spreads, etc.).
Level 3 – Prices are determined using significant unobservable inputs (including management’s assumptions in determining the fair value of investments).
A description of the valuation techniques applied to the Funds’ major classifications of assets and liabilities measured at fair value follows:
Prices of fixed-income securities are generally provided by an independent pricing service (“pricing service”) approved by the Board. The pricing service establishes a security’s fair value using methods that may include consideration of the following: yields or prices of investments of comparable quality, type of issue, coupon, maturity and rating, market quotes or indications of value from security dealers, evaluations of anticipated cash flows or collateral, general market conditions and other information and analysis, including the obligor’s credit characteristics considered relevant. In pricing certain securities, particularly less liquid and lower quality securities, the pricing service may consider information about a security, its issuer or market activity provided by the Adviser. These securities are generally classified as Level 2.
Investments in investment companies are valued at their respective NAVs on the valuation date and are generally classified as Level 1.
Any portfolio security or derivative for which market quotations are not readily available or for which the above valuation procedures are deemed not to reflect fair value are valued at fair value, as determined in good faith using procedures approved by the Board. As a general principle, the fair value of a security would appear to be the amount that the owner might reasonably expect to receive for it in a current sale. A variety of factors may be considered in determining the fair value of such securities, which may include consideration of the following: yields or prices of investments of comparable quality, type of issue, coupon, maturity and rating, market quotes or indications of value from security dealers, evaluations of anticipated cash flows or collateral, general market conditions and other information and analysis, including the obligor’s credit characteristics considered relevant. To the extent the inputs are observable and timely, the values would be classified as Level 2 of the fair value hierarchy; otherwise they would be classified as Level 3.
The following table summarizes the market value of the Funds’ investments as of the end of the reporting period, based on the inputs used to value them:
| | | | | |
| NAD | Level 1 | Level 2 | Level 3 | Total |
| Long-Term Investments*: | | | | |
| Municipal Bonds | $ — | $5,805,358,558 | $ 1,574,698** | $5,806,933,256 |
| Investment Companies | 566,685 | — | — | 566,685 |
| Corporate Bonds | — | 145,519 | — | 145,519 |
| Short-Term Investments*: | | | | |
| Municipal Bonds | — | 9,100,000 | — | 9,100,000 |
| Total | $566,685 | $5,814,604,077 | $ 1,574,698 | $5,816,745,460 |
| |
| NEA | | | | |
| Long-Term Investments*: | | | | |
| Municipal Bonds | $ — | $7,267,750,800 | $2,376,405** | $7,270,127,205 |
| Short-Term Investments*: | | | | |
| Municipal Bonds | — | 6,500,000 | — | 6,500,000 |
| |
| Total | $ — | $7,274,250,800 | $2,376,405 | $7,276,627,205 |
| * | | Refer to the Fund’s Portfolio of Investments for state classifications. |
| ** | | Refer to the Fund’s Portfolio of Investments for securities classified as Level 3. |
133
Notes to Financial Statements (continued)
The Funds hold liabilities in floating rate obligations and preferred shares, where applicable, which are not reflected in the tables above. The fair values of the Funds’ liabilities for floating rate obligations approximate their liquidation values. Floating rate obligations are generally classified as Level 2 and further described in Note 4 - Portfolio Securities and Investments in Derivatives. The fair values of the Funds’ liabilities for preferred shares approximate their liquidation preference. Preferred shares are generally classified as Level 2 and further described in Note 5 - Fund Shares.
4. Portfolio Securities and Investments in Derivatives
Portfolio Securities
Inverse Floating Rate Securities
Each Fund is authorized to invest in inverse floating rate securities. An inverse floating rate security is created by depositing a municipal bond (referred to as an “Underlying Bond”), typically with a fixed interest rate, into a special purpose tender option bond (“TOB”) trust (referred to as the “TOB Trust”) created by or at the direction of one or more Funds. In turn, the TOB Trust issues (a) floating rate certificates (referred to as “Floaters”), in face amounts equal to some fraction of the Underlying Bond’s par amount or market value, and (b) an inverse floating rate certificate (referred to as an “Inverse Floater”) that represents all remaining or residual interest in the TOB Trust. Floaters typically pay short-term tax-exempt interest rates to third parties who are also provided a right to tender their certificate and receive its par value, which may be paid from the proceeds of a remarketing of the Floaters, by a loan to the TOB Trust from a third party liquidity provider (“Liquidity Provider”), or by the sale of assets from the TOB Trust. The Inverse Floater is issued to a long term investor, such as one or more of the Funds. The income received by the Inverse Floater holder varies inversely with the short-term rate paid to holders of the Floaters, and in most circumstances the Inverse Floater holder bears substantially all of the Underlying Bond’s downside investment risk and also benefits disproportionately from any potential appreciation of the Underlying Bond’s value. The value of an Inverse Floater will be more volatile than that of the Underlying Bond because the interest rate is dependent on not only the fixed coupon rate of the Underlying Bond but also on the short-term interest paid on the Floaters, and because the Inverse Floater essentially bears the risk of loss (and possible gain) of the greater face value of the Underlying Bond.
The Inverse Floater held by a Fund gives the Fund the right to (a) cause the holders of the Floaters to tender their certificates at par (or slightly more than par in certain circumstances), and (b) have the trustee of the TOB Trust (the “Trustee”) transfer the Underlying Bond held by the TOB Trust to the Fund, thereby collapsing the TOB Trust.
The Fund may acquire an Inverse Floater in a transaction where it (a) transfers an Underlying Bond that it owns to a TOB Trust created by a third party or (b) transfers an Underlying Bond that it owns, or that it has purchased in a secondary market transaction for the purpose of creating an Inverse Floater, to a TOB Trust created at its direction, and in return receives the Inverse Floater of the TOB Trust (referred to as a “self-deposited Inverse Floater”). A Fund may also purchase an Inverse Floater in a secondary market transaction from a third party creator of the TOB Trust without first owning the Underlying Bond (referred to as an “externally-deposited Inverse Floater”).
An investment in a self-deposited Inverse Floater is accounted for as a “financing” transaction (i.e., a secured borrowing). For a self-deposited Inverse Floater, the Underlying Bond deposited into the TOB Trust is identified in the Fund’s Portfolio of Investments as “(UB) – Underlying bond of an inverse floating rate trust reflected as a financing transaction,” with the Fund recognizing as liabilities, labeled “Floating rate obligations” on the Statement of Assets and Liabilities, (a) the liquidation value of Floaters issued by the TOB Trust, and (b) the amount of any borrowings by the TOB Trust from a Liquidity Provider to enable the TOB Trust to purchase outstanding Floaters in lieu of a remarketing. In addition, the Fund recognizes in “Investment Income” the entire earnings of the Underlying Bond, and recognizes (a) the interest paid to the holders of the Floaters or on the TOB Trust’s borrowings, and (b) other expenses related to remarketing, administration, trustee, liquidity and other services to a TOB Trust, as a component of “Interest expense and amortization of offering costs” on the Statement of Operations. Earnings due from the Underlying Bond and interest due to the holders of the Floaters as of the end of the reporting period are recognized as components of “Receivable for interest” and “Payable for interest” on the Statement of Assets and Liabilities, respectively.
In contrast, an investment in an externally-deposited Inverse Floater is accounted for as a purchase of the Inverse Floater and is identified in the Fund’s Portfolio of Investments as “(IF) – Inverse floating rate investment.” For an externally-deposited Inverse Floater, a Fund’s Statement of Assets and Liabilities recognizes the Inverse Floater and not the Underlying Bond as an asset, and the Fund does not recognize the Floaters, or any related borrowings from a Liquidity Provider, as a liability. Additionally, the Fund reflects in “Investment Income” only the net amount of earnings on the Inverse Floater (net of the interest paid to the holders of the Floaters or the Liquidity Provider as lender, and the expenses of the Trust), and does not show the amount of that interest paid or the expenses of the TOB Trust as described above as interest expense on the Statement of Operations.
Fees paid upon the creation of a TOB Trust for self-deposited Inverse Floaters and externally-deposited Inverse Floaters are recognized as part of the cost basis of the Inverse Floater and are capitalized over the term of the TOB Trust.
As of the end of the reporting period, the aggregate value of Floaters issued by each Fund’s TOB Trust for self-deposited Inverse Floaters and externally-deposited Inverse Floaters was as follows:
| | | |
| Floating Rate Obligations Outstanding | NAD | NEA |
| Floating rate obligations: self-deposited Inverse Floaters | $111,960,000 | $133,490,000 |
| Floating rate obligations: externally-deposited Inverse Floaters | 49,340,000 | 102,085,000 |
| Total | $161,300,000 | $235,575,000 |
134
During the current fiscal period, the average amount of Floaters (including any borrowings from a Liquidity Provider) outstanding, and the average annual interest rate and fees related to self-deposited Inverse Floaters, were as follows:
| | | |
| Self-Deposited Inverse Floaters | NAD | NEA |
| Average floating rate obligations outstanding | $115,758,151 | $134,295,726 |
| Average annual interest rate and fees | 0.60% | 0.56% |
TOB Trusts are supported by a liquidity facility provided by a Liquidity Provider pursuant to which the Liquidity Provider agrees, in the event that Floaters are (a) tendered to the Trustee for remarketing and the remarketing does not occur, or (b) subject to mandatory tender pursuant to the terms of the TOB Trust agreement, to either purchase Floaters or to provide the Trustee with an advance from a loan facility to fund the purchase of Floaters by the TOB Trust. In certain circumstances, the Liquidity Provider may otherwise elect to have the Trustee sell the Underlying Bond to retire the Floaters that were tendered and not remarketed prior to providing such a loan. In these circumstances, the Liquidity Provider remains obligated to provide a loan to the extent that the proceeds of the sale of the Underlying Bond is not sufficient to pay the purchase price of the Floaters.
The size of the commitment under the loan facility for a given TOB Trust is at least equal to the balance of that TOB Trust’s outstanding Floaters plus any accrued interest. In consideration of the loan facility, fee schedules are in place and are charged by the Liquidity Provider(s). Any loans made by the Liquidity Provider will be secured by the purchased Floaters held by the TOB Trust. Interest paid on any outstanding loan balances will be effectively borne by the Fund that owns the Inverse Floaters of the TOB Trust that has incurred the borrowing and may be at a rate that is greater than the rate that would have been paid had the Floaters been successfully remarketed.
As described above, any amounts outstanding under a liquidity facility are recognized as a component of “Floating rate obligations” on the Statement of Assets and Liabilities by the Fund holding the corresponding Inverse Floaters issued by the borrowing TOB Trust. As of the end of the reporting period, NAD had outstanding borrowings under such liquidity facilities in the amount of $2,903,000, which are recognized as a component of “Floating rate obligations” on the Statement of Assets and Liabilities. There were no loans outstanding under such facilities for NEA as of the end of the reporting period.
Each Fund may also enter into shortfall and forbearance agreements (sometimes referred to as a “recourse arrangement”) (TOB Trusts involving such agreements are referred to herein as “Recourse Trusts”), under which a Fund agrees to reimburse the Liquidity Provider for the Trust’s Floaters, in certain circumstances, for the amount (if any) by which the liquidation value of the Underlying Bond held by the TOB Trust may fall short of the sum of the liquidation value of the Floaters issued by the TOB Trust plus any amounts borrowed by the TOB Trust from the Liquidity Provider, plus any shortfalls in interest cash flows. Under these agreements, a Fund’s potential exposure to losses related to or on an Inverse Floater may increase beyond the value of the Inverse Floater as a Fund may potentially be liable to fulfill all amounts owed to holders of the Floaters or the Liquidity Provider. Any such shortfall amount in the aggregate is recognized as “Unrealized depreciation on Recourse Trusts” on the Statement of Assets and Liabilities.
As of the end of the reporting period, each Fund’s maximum exposure to the Floaters issued by Recourse Trusts for self-deposited Inverse Floaters and externally-deposited Inverse Floaters was as follows:
| | | |
| Floating Rate Obligations — Recourse Trusts | NAD | NEA |
| Maximum exposure to Recourse Trusts: self-deposited Inverse Floaters | $ 95,645,000 | $133,490,000 |
| Maximum exposure to Recourse Trusts: externally-deposited Inverse Floaters | 38,265,000 | 95,430,000 |
| Total | $133,910,000 | $228,920,000 |
Zero Coupon Securities
A zero coupon security does not pay a regular interest coupon to its holders during the life of the security. Income to the holder of the security comes from accretion of the difference between the original purchase price of the security at issuance and the par value of the security at maturity and is effectively paid at maturity. The market prices of zero coupon securities generally are more volatile than the market prices of securities that pay interest periodically.
Investment Transactions
Long-term purchases and sales (including maturities) during the current fiscal period were as follows:
| | | |
| | NAD | NEA |
| Purchases | $576,808,718 | $833,111,401 |
| Sales and Maturities | 604,051,225 | 857,101,456 |
The Funds may purchase securities on a when-issued or delayed-delivery basis. Securities purchased on a when-issued or delayed-delivery basis may have extended settlement periods; interest income is not accrued until settlement date. Any securities so purchased are subject to market fluctuation during this period. The Funds have earmarked securities in their portfolios with a current value at least equal to the amount of the when-issued/delayed
135
Notes to Financial Statements (continued)
delivery purchase commitments. If a Fund has outstanding when-issued/delayed-delivery purchases commitments as of the end of the reporting period, such amounts are recognized on the Statement of Assets and Liabilities.
Investments in Derivatives
In addition to the inverse floating rate securities in which each Fund may invest, which are considered portfolio securities for financial reporting purposes, each Fund is authorized to invest in certain other derivative instruments such as futures, options and swap contracts. Each Fund limits its investments in futures, options on futures and swap contracts to the extent necessary for the Adviser to claim the exclusion from registration by the Commodity Futures Trading Commission as a commodity pool operator with respect to the Fund. The Funds record derivative instruments at fair value, with changes in fair value recognized on the Statement of Operations, when applicable. Even though the Funds’ investments in derivatives may represent economic hedges, they are not considered to be hedge transactions for financial reporting purposes.
Although the Funds are authorized to invest in derivative instruments and may do so in the future, they did not make any such investments during the current fiscal period.
Market and Counterparty Credit Risk
In the normal course of business each Fund may invest in financial instruments and enter into financial transactions where risk of potential loss exists due to changes in the market (market risk) or failure of the other party to the transaction to perform (counterparty credit risk). The potential loss could exceed the value of the financial assets recorded on the financial statements. Financial assets, which potentially expose each Fund to counterparty credit risk, consist principally of cash due from counterparties on forward, option and swap transactions, when applicable. The extent of each Fund’s exposure to counterparty credit risk in respect to these financial assets approximates their carrying value as recorded on the Statement of Assets and Liabilities.
Each Fund helps manage counterparty credit risk by entering into agreements only with counterparties the Adviser believes have the financial resources to honor their obligations and by having the Adviser monitor the financial stability of the counterparties. Additionally, counterparties may be required to pledge collateral daily (based on the daily valuation of the financial asset) on behalf of each Fund with a value approximately equal to the amount of any unrealized gain above a pre-determined threshold. Reciprocally, when each Fund has an unrealized loss, the Funds have instructed the custodian to pledge assets of the Funds as collateral with a value approximately equal to the amount of the unrealized loss above a pre-determined threshold. Collateral pledges are monitored and subsequently adjusted if and when the valuations fluctuate, either up or down, by at least the pre-determined threshold amount.
5. Fund Shares
Common Share Transactions
Transactions in common shares for the Funds during the Funds’ current and prior fiscal period, where applicable, were as follows:
| | | | | | | | |
| | | NAD | | | | NEA | |
| | Year | | Year | | Year | | Year |
| | Ended | | Ended | | Ended | | Ended |
| | 10/31/21 | | 10/31/20 | | 10/31/21 | | 10/31/20 |
| Common shares: | | | | | | | |
| Issued in the Reorganization | 21,755,613 | | 9,784,676 | | 20,447,125 | | 15,869,620 |
Preferred Shares
Adjustable Rate MuniFund Term Preferred Shares
The Funds have issued and have outstanding Adjustable Rate MuniFund Term Preferred (“AMTP”) Shares, with a $100,000 liquidation preference per share. AMTP Shares are issued via private placement and are not publically available.
As of the end of the reporting period, NAD and NEA had $727,169,346 and $316,321,358 of AMTP Shares at liquidation preference, net of deferred offering costs, respectively. Further details of each Fund’s AMTP Shares outstanding as of the end of the reporting period, were as follows:
| | | | |
| | | Shares | Liquidation |
| Fund | Series | Outstanding | Preference |
| NAD | 2028 | 3,370 | $337,000,000 |
| | 2028-1 | 2,085 | 208,500,000 |
| | 2028-2* | 1,820 | 182,000,000 |
| NEA | 2028 | 1,435 | $143,500,000 |
| | 2028-1* | 1,730 | 173,000,000 |
* AMTP Shares issued in connection with the Reorganization.
136
Each Fund is obligated to redeem its AMTP Shares by the date as specified in its offering document (“Term Redemption Date”), unless earlier redeemed by the Fund. AMTP Shares are subject to optional and mandatory redemption in certain circumstances. The AMTP Shares may be redeemed at the option of the Fund, subject to payment of premium for approximately six months following the date of issuance (“Premium Expiration Date”), and at the redemption price per share thereafter. The redemption price per share is equal to the sum of the liquidation preference per share plus any accumulated but unpaid dividends.
AMTP Shares are short-term or short/intermediate-term instruments that pay a variable dividend rate tied to a short-term index, plus an additional fixed “spread” amount which is initially established at the time of issuance and may be adjusted in the future based upon a mutual agreement between the majority owner and the Fund. From time-to-time the majority owner may propose to the Fund an adjustment to the dividend rate. Should the majority owner and the Fund fail to agree upon an adjusted dividend rate, and such proposed dividend rate adjustment is not withdrawn, the Fund will be required to redeem all outstanding shares upon the end of a notice period.
In addition, the Funds may be obligated to redeem a certain amount of the AMTP Shares if the Funds fails to maintain certain asset coverage and leverage ratio requirements and such failures are not cured by the applicable cure date. The Term Redemption Date and Premium Expiration Date for each Fund’s AMTP Shares are as follows:
| | | | | |
| | Notice | | Term | Premium |
| Fund | Period | Series | Redemption Date | Expiration Date |
| NAD | 360-day | 2028 | December 1, 2028** | November 30, 2019 |
| | 360-day | 2028-1 | December 1, 2028** | November 30, 2019 |
| | 360-day | 2028-2 | December 1, 2028** | November 30, 2019 |
| NEA | 360-day | 2028 | December 1, 2028** | November 30, 2019 |
| | 360-day | 2028-1 | December 1, 2028** | December 13, 2019 |
** Subject to early termination by either the Fund or the holder.
The average liquidation preference of AMTP Shares outstanding and annualized dividend rate for each Fund during the current fiscal period were as follows:
| | | |
| | NAD | NEA |
| Average liquidation preference of AMTP Shares outstanding | $646,721,918 | $269,576,712 |
| Annualized dividend rate | 0.95% | 0.92% |
AMTP Shares are subject to restrictions on transfer, generally do not trade, and market quotations are generally not available. The fair value of AMTP Shares is expected to be approximately their liquidation preference so long as the fixed “spread” on the AMTP Shares remains roughly in line with the “spread” being demanded by investors on instruments having similar terms in the current market environment. In present market conditions, the Funds’ Adviser has determined that the fair value of AMTP Shares is approximately their liquidation preference, but their fair value could vary if market conditions change materially. For financial reporting purposes, the liquidation preference of AMTP Shares is a liability and is recognized as a component of “Adjustable Rate MuniFund Term Preferred (“AMTP”) Shares, net of deferred offering costs” on the Statement of Assets and Liabilities.
AMTP Share dividends are treated as interest payments for financial reporting purposes. Unpaid dividends on AMTP Shares are recognized as a component of “Interest payable” on the Statement of Assets and Liabilities. Dividends accrued on AMTP Shares are recognized as a component of “Interest expense and amortization of offering costs” on the Statement of Operations.
Costs incurred in connection with each Fund’s offering of AMTP Shares were recorded as deferred charges, which are amortized over the life of the shares and are recognized as components of “Adjustable Rate MuniFund Term Preferred (“AMTP”) Shares, net of deferred offering costs” on the Statement of Assets and Liabilities and “Interest expense and amortization of offering costs” on the Statement of Operations.
MuniFund Preferred Shares
The Funds have issued and have outstanding MuniFund Preferred (“MFP”) Shares, with a $100,000 ($1,000 for NEA’s Series D) liquidation preference per share. These MFP Shares were issued via private placement and are not publically available.
The Funds are obligated to redeem their MFP Shares by the date as specified in its offering documents (“Term Redemption Date”), unless earlier redeemed by the Funds. MFP Shares are initially issued in a pre-specified mode, however, MFP Shares can be subsequently designated as an alternative mode at a later date at the discretion of the Funds. The modes within MFP Shares detail the dividend mechanics and are described as follows. At a subsequent date, the Funds may establish additional mode structures with the MFP Share.
| • | | Variable Rate Remarketed Mode (“VRRM”) – Dividends for MFP Shares within this mode will be established by a remarketing agent; therefore, market value of the MFP Shares is expected to approximate its liquidation preference. Shareholders have the ability to request a best-efforts tender of their shares upon seven days notice. If the remarketing agent is unable to identify an alternative purchaser, the shares will be retained by the shareholder requesting tender and the subsequent dividend rate will increase to its step-up dividend rate. If after one consecutive year of unsuccessful remarketing attempts, the Fund will be required to designate an alternative mode or redeem the shares. |
Each Fund will pay a remarketing fee on the aggregate principal amount of all MFP Shares while designated in VRRM. Payments made by the Fund to the remarketing agent are recognized as “Remarketing fees” on the Statement of Operations.
137
Notes to Financial Statements (continued)
| • | | Variable Rate Mode (“VRM”) – Dividends for MFP Shares designated in this mode are based upon a short-term index plus an additional fixed “spread” amount established at the time of issuance or renewal / conversion of its mode. At the end of the period of the mode, the Fund will be required to either extend the term of the mode, designate an alternative mode or redeem the MFP Shares. |
The fair value of MFP Shares while in VRM are expected to approximate their liquidation preference so long as the fixed “spread” on the shares remains roughly in line with the “spread” being demanded by investors on instruments having similar terms in the current market. In current market conditions, the Adviser has determined that the fair value of the shares are approximately their liquidation preference, but their fair value could vary if market conditions change materially.
| • | | Variable Rate Demand Mode (“VRDM”) – Dividends for MFP Shares designated in this mode will be established by a remarketing agent; therefore, the market value of the MFP Shares is expected to approximate its liquidation preference. While in this mode, Shares will have an unconditional liquidity feature that enables its shareholders to require a liquidity provider with, which the Fund has entered into a contractual agreement, to purchase shares in the event that the shares are not able to be successfully remarketed. In the event that shares within this mode are unable to be successfully remarketed and are purchased by the liquidity provider, the dividend rate will be the maximum rate which is designed to escalate according to a specified schedule in order to enhance the remarketing agent’s ability to successfully remarket the shares. Each Fund is required redeem any shares that are still owned by a liquidity provider after six months of continuous, unsuccessful remarketing. |
The Fund will pay a liquidity and remarketing fee on the aggregate principal amount of all MFP shares while within VRDM. Payments made by the Fund to the liquidity provider and remarketing agent are recognized as “Liquidity fees” and “Remarketing fees”, respectively, on the Statement Operations.
For financial reporting purposes, the liquidation preference of MFP Shares is recorded as a liability and is recognized as a component of “MuniFund Preferred (“MFP”) Shares, net of deferred offering costs” on the Statement of Assets and Liabilities. Dividends on the MFP shares are treated as interest payments for financial reporting purposes. Unpaid dividends on MFP shares are recognized as a component on “Interest payable” on the Statement of Assets and Liabilities. Dividends accrued on MFP Shares are recognized as a component of “Interest expense and amortization of offering costs” on the Statement of Operations.
Subject to certain conditions, MFP Shares may be redeemed, in whole or in part, at any time at the option of the Fund. The Fund may also be required to redeem certain MFP shares if the Fund fails to maintain certain asset coverage requirements and such failures are not cured by the applicable cure date. The redemption price per share in all circumstances is equal to the liquidation preference per share plus any accumulated but unpaid dividends.
NEA incurred offering costs of $961,800 in connection with its offering of MFP Shares, which were recorded as a deferred charge and are being amortized over the life of the shares. These offering costs are recognized as a component of “MuniFund Preferred (“MFP”) Shares, net of deferred offering costs” on the Statement of Assets and Liabilities and “Interest expense and amortization of offering costs” on the Statement of Operations.
As of the end of the reporting period, NAD and NEA had $678,419,684 and $1,086,408,687 of MFP Shares at liquidation preference, net of deferred offering costs, respectively. Further details of each Fund’s MFP Shares outstanding as of the end of the reporting period, were as follows:
| | | | | | | |
| | | Shares | Liquidation | Term | | Mode |
| Fund | Series | Outstanding | Preference | Redemption Date | Mode | Termination Date |
| NAD | A | 6,070 | $607,000,000 | January 3, 2028 | VRM | January 3, 2028* |
| | B | 720 | 72,000,000 | September 1, 2047 | VRM | September 28, 2022 |
| NEA | A | 1,850 | $185,000,000 | February 3, 2048 | VRM | February 3, 2048* |
| | B | 3,350 | 335,000,000 | March 2, 2028 | VRM | March 2, 2028* |
| | C | 2,380 | 238,000,000 | March 2, 2028 | VRDM | March 2, 2028* |
| | D | 330,900 | 330,900,000 | March 1, 2029 | VRRM | N/A |
* Subject to earlier termination by either the Fund or the shareholder.
The average liquidation preference of MFP Shares outstanding and annualized dividend rate for the Funds during the current fiscal period were as follows:
| | | |
| | NAD | NEA |
| Average liquidation preference of MFP Shares outstanding | $679,000,000 | $1,049,450,685 |
| Annualized dividend rate | 0.85% | 0.58% |
Variable Rate Demand Preferred Shares
The Funds have issued and have outstanding Variable Rate Demand Preferred (“VRDP”) Shares, with a $100,000 liquidation preference per share. VRDP
Shares are issued via private placement and are not publicly available.
138
As of the end of the reporting period, NAD and NEA had $630,487,336 and $1,153,832,843 of VRDP Shares at liquidation preference, net of deferred offering costs, respectively. Further details of each Fund’s VRDP Shares outstanding as of the end of the reporting period, were as follows:
| | | | | | |
| | | Shares | Remarketing | Liquidation | |
| Fund | Series | Outstanding | Fee* | Preference | Maturity |
| NAD | 1 | 2,368 | 0.10% | $236,800,000 | September 11, 2026 |
| | 2 | 2,675 | 0.10 | 267,500,000 | September 11, 2026 |
| | 3 | 1,277 | 0.10 | 127,700,000 | September 11, 2026 |
| NEA | 1 | 2,190 | 0.10% | $219,000,000 | June 1, 2040 |
| | 3 | 3,509 | 0.05 | 350,900,000 | March 1, 2040 |
| | 4 | 4,895 | 0.10 | 489,500,000 | September 11, 2026 |
| | 5 | 1,000 | 0.10 | 100,000,000 | October 1, 2046 |
* Remarketing fees as a percentage of aggregate principal amount of all VRDP Shares outstanding of each series.
VRDP Shares include a liquidity feature that allows VRDP shareholders to have their shares purchased by a liquidity provider with whom each Fund has contracted in the event that VRDP Shares are not able to be successfully remarketed. Each Fund is required to redeem any VRDP Shares that are still owned by the liquidity provider after six months of continuous, unsuccessful remarketing. Each Fund pays an annual remarketing fee on the aggregate principal amount of all VRDP Shares outstanding. Each Fund’s VRDP Shares have successfully remarketed since issuance.
Dividends on the VRDP Shares (which are treated as interest payments for financial reporting purposes) are set at a rate established by a remarketing agent; therefore, the market value of the VRDP Shares is expected to approximate its liquidation preference. In the event that VRDP shares are unable to be successfully remarketed, the dividend rate will be the maximum rate which is designed to escalate according to a specified schedule in order to enhance the remarketing agent’s ability to successfully remarket the VRDP Shares.
Subject to certain conditions, VRDP Shares may be redeemed, in whole or in part, at any time at the option of each Fund. Each Fund may also redeem certain of the VRDP Shares if the Fund fails to maintain certain asset coverage requirements and such failures are not cured by the applicable cure date. The redemption price per share is equal to the sum of the liquidation preference per share plus any accumulated but unpaid dividends.
The average liquidation preference of VRDP Shares outstanding and annualized dividend rate for each Fund during the current fiscal period were as follows:
| | | |
| | NAD | NEA |
| Average liquidation preference of VRDP Shares outstanding | $632,000,000 | $1,194,904,384 |
| Annualized dividend rate | 0.15% | 0.12% |
For financial reporting purposes, the liquidation preference of VRDP Shares is a liability and is recognized as a component of “Variable Rate Demand Preferred (“VRDP”) Shares, net of deferred offering costs” on the Statement of Assets and Liabilities. Unpaid dividends on VRDP Shares are recognized as a component of “Interest payable” on the Statement of Assets and Liabilities, when applicable. Dividends accrued on VRDP Shares are recognized as a component of “Interest expense and amortization of offering costs” on the Statement of Operations. Costs incurred by the Funds in connection with their offerings of VRDP Shares were recorded as a deferred charge, which are amortized over the life of the shares and are recognized as a component of “Variable Rate Demand Preferred (“VRDP”) Shares, net of deferred offering costs” on the Statement of Assets and Liabilities and “Interest expense and amortization of offerings costs” on the Statement of Operations. In addition to interest expense, each Fund also pays a per annum liquidity fee to the liquidity provider, as well as a remarketing fee, which are recognized as “Liquidity fees” and “Remarketing fees,” respectively, on the Statement of Operations.
Preferred Share Transactions
Transactions in preferred shares for the Funds during the Funds’ current and prior fiscal period, where applicable, are noted in the following tables.
Transactions in AMTP Shares for the Funds, where applicable, were as follows:
| | | | |
| | Year Ended |
| | October 31, 2021 |
| NAD | Series | Shares | Amount |
| AMTP Shares issued in connection with the Reorganization | 2028-2 | 1,820 | $182,000,000 |
| | Year Ended |
| | October 31, 2021 |
| NEA | Series | Shares | Amount |
| AMTP Shares issued in connection with the Reorganization | 2028-1 | 1,730 | $173,000,000 |
139
Notes to Financial Statements (continued)
| | | | |
| | Year Ended |
| | October 31, 2020 |
| NEA | Series | Shares | Amount |
| AMTP Shares issued in connection with the Reorganization | 2028 | 1,435 | $143,500,000 |
| Transactions in MFP Shares for the Funds, where applicable, were as follows: | | | |
| | Year Ended |
| | October 31, 2021 |
| NEA | Series | Shares | Amount |
| MFP Shares issued | D | 130,900 | $130,900,000 |
| | Year Ended |
| | October 31, 2020 |
| NAD | Series | Shares | Amount |
| MFP Shares issued in connection with the Reorganization | B | 720 | $72,000,000 |
| Transactions VRDP Shares for the Funds, where applicable, were as follows: | | | |
| | Year Ended |
| | October 31, 2021 |
| NEA | Series | Shares | Amount |
| VRDP Shares redeemed | 2 | (1,309) | $(130,900,000) |
6. Income Tax Information
Each Fund is a separate taxpayer for federal income tax purposes. Each Fund intends to distribute substantially all of its net investment income and net capital gains to shareholders and to otherwise comply with the requirements of Subchapter M of the Internal Revenue Code applicable to regulated investment companies. Therefore, no federal income tax provision is required. Furthermore, each Fund intends to satisfy conditions that will enable interest from municipal securities, which is exempt from regular federal income tax, and in the case of NEA the alternative minimum tax applicable to individuals, to retain such tax-exempt status when distributed to shareholders of the Funds. Net realized capital gains and ordinary income distributions paid by the Funds are subject to federal taxation.
For all open tax years and all major taxing jurisdictions, management of the Funds has concluded that there are no significant uncertain tax positions that would require recognition in the financial statements. Open tax years are those that are open for examination by taxing authorities (i.e., generally the last four tax year ends and the interim tax period since then). Furthermore, management of the Funds is also not aware of any tax positions for which it is reasonably possible that the total amounts of unrecognized tax benefits will significantly change in the next twelve months.
The following information is presented on an income tax basis. Differences between amounts for financial statement and federal income tax purposes are primarily due to timing differences in recognizing taxable market discount, timing differences in recognizing certain gains and losses on investment transactions and the treatment of investments in inverse floating rate securities reflected as financing transactions, if any. To the extent that differences arise that are permanent in nature, such amounts are reclassified within the capital accounts as detailed below. Temporary differences do not require reclassification. Temporary and permanent differences do not impact the NAVs of the Funds.
The table below presents the cost and unrealized appreciation (depreciation) of each Fund’s investment portfolio, as determined on a federal income tax basis, as of October 31, 2021.
| | | |
| | NAD | NEA |
| Tax cost of investments | $5,133,161,146 | $6,421,802,478 |
| Gross unrealized: | | |
| Appreciation | $ 583,323,196 | $ 728,074,264 |
| Depreciation | (11,696,861) | (6,739,046) |
| Net unrealized appreciation (depreciation) of investments | $ 571,626,335 | $ 721,335,218 |
Permanent differences, primarily due to federal taxes paid, paydowns, nondeductible offering costs, nondeductible reorganization expenses, reorganization adjustments and taxable market discount resulted in reclassifications among the Funds’ components of common share net assets as of October 31, 2021, the Funds’ tax year end.
140
The tax components of undistributed net tax-exempt income, net ordinary income and net long-term capital gains as of October 31, 2021, the Funds’ tax year end, were as follows:
| | | |
| | NAD | NEA |
| Undistributed net tax-exempt income1 | $20,828,737 | $19,400,869 |
| Undistributed net ordinary income2 | 276,521 | 1,242,086 |
| Undistributed net long-term capital gains | — | — |
| 1 | | Undistributed net tax-exempt income (on a tax basis) has not been reduced for the dividend declared on October 1, 2021, and paid on November 1, 2021. |
| 2 | | Net ordinary income consists of taxable market discount income and net short-term capital gains, if any. |
The tax character of distributions paid during the Funds’ tax years ended October 31, 2021 and October 31, 2020 was designated for purposes of the dividends paid deduction as follows:
| | | |
| 2021 | NAD | NEA |
| Distributions from net tax-exempt income3 | $157,536,985 | $204,081,456 |
| Distributions from net ordinary income2 | 1,347,185 | 1,578,798 |
| Distributions from net long-term capital gains | — | — |
| 2020 | NAD | NEA |
| Distributions from net tax-exempt income | $163,888,867 | $210,634,570 |
| Distributions from net ordinary income2 | 385 | 246 |
| Distributions from net long-term capital gains | — | — |
| 2 | | Net ordinary income consists of taxable market discount income and net short-term capital gains, if any. |
| 3 | | The Funds hereby designate these amounts paid during the fiscal year ended October 31, 2021, as Exempt Interest Dividends. |
As of October 31, 2021, the Funds’ tax year end, the Funds had unused capital losses carrying forward available for federal income tax purposes to be applied against future capital gains, if any. The capital losses are not subject to expiration.
| | | |
| | NAD4 | NEA4 |
| Not subject to expiration: | | |
| Short-term | $53,565,163 | $43,431,672 |
| Long-term | 8,789,249 | 982,080 |
| Total | $62,354,412 | $44,413,752 |
| 4 | | A portion of NAD’s and NEA’s capital loss carryforwards are subject to an annual limitation under the Internal Revenue Code and related regulations. |
During the Funds’ tax year ended October 31, 2021, the Funds utilized capital loss carryforwards as follows:
| | | |
| | NAD | NEA |
| Utilized capital loss carryforwards | $6,990,777 | $13,774,119 |
7. Management Fees and Other Transactions with Affiliates
Management Fees
Each Fund’s management fee compensates the Adviser for overall investment advisory and administrative services and general office facilities. The Sub-Adviser is compensated for its services to the Funds from the management fees paid to the Adviser.
Each Fund’s management fee consists of two components – a fund-level fee, based only on the amount of assets within each individual Fund, and a complex-level fee, based on the aggregate amount of all eligible fund assets managed by the Adviser. This pricing structure enables Fund shareholders to benefit from growth in the assets within their respective Fund as well as from growth in the amount of complex-wide assets managed by the Adviser.
The annual fund-level fee, payable monthly, for each Fund is calculated according to the following schedule:
| | |
| Averaged Daily Managed Assets* | Fund-Level Fee Rate |
| For the first $125 million | 0.4500% |
| For the next $125 million | 0.4375 |
| For the next $250 million | 0.4250 |
| For the next $500 million | 0.4125 |
| For the next $1 billion | 0.4000 |
| For the next $3 billion | 0.3750 |
| For managed assets over $5 billion | 0.3625 |
141
Notes to Financial Statements (continued)
The annual complex-level fee, payable monthly, for each Fund is calculated by multiplying the current complex-wide fee rate, determined according to the following schedule by the Fund’s daily managed assets:
| | |
| Complex-Level Eligible Asset Breakpoint Level* | Effective Complex-Level Fee Rate at Breakpoint Level |
| $55 billion | 0.2000% |
| $56 billion | 0.1996 |
| $57 billion | 0.1989 |
| $60 billion | 0.1961 |
| $63 billion | 0.1931 |
| $66 billion | 0.1900 |
| $71 billion | 0.1851 |
| $76 billion | 0.1806 |
| $80 billion | 0.1773 |
| $91 billion | 0.1691 |
| $125 billion | 0.1599 |
| $200 billion | 0.1505 |
| $250 billion | 0.1469 |
| $300 billion | 0.1445 |
| * | | For the complex-level fees, managed assets include closed-end fund assets managed by the Adviser that are attributable to certain types of leverage. For these purposes, leverage includes the funds’ use of preferred stock and borrowings and certain investments in the residual interest certificates (also called inverse floating rate securities) in tender option bond (TOB) trusts, including the portion of assets held by a TOB trust that has been effectively financed by the trust’s issuance of floating rate securities, subject to an agreement by the Adviser as to certain funds to limit the amount of such assets for determining managed assets in certain circumstances. The complex-level fee is calculated based upon the aggregate daily managed assets of all Nuveen open-end and closed-end funds that constitute “eligible assets.” Eligible assets do not include assets attributable to investments in other Nuveen funds or assets in excess of a determined amount (originally $2 billion) added to the Nuveen fund complex in connection with the Adviser’s assumption of the management of the former First American Funds effective January 1, 2011, but do not include certain Nuveen Funds that were reorganized into funds advised by an affiliate of the Adviser during the 2019 calendar year. As of October 31, 2021, the complex-level fee for each Fund was 0.1534%. |
Other Transactions with Affiliates
Each Fund is permitted to purchase or sell securities from or to certain other funds or accounts managed by the Sub-Adviser (“Affiliated Entity”) under specified conditions outlined in procedures adopted by the Board (“cross-trade”). These procedures have been designed to ensure that any cross-trade of securities by the Fund from or to an Affiliated Entity by virtue of having a common investment adviser (or affiliated investment adviser), common officer and/or common trustee complies with Rule 17a-7 under the 1940 Act. These transactions are effected at the current market price (as provided by an independent pricing service) without incurring broker commissions.
During the current fiscal period, the Funds engaged in cross-trades pursuant to these procedures as follows:
| Cross-Trades | NAD | NEA |
| Purchases | $70,665,643 | $50,045,386 |
| Sales | 58,417,150 | 50,193,173 |
| Realized gain (loss) | (1,017,108) | (1,260,671) |
8. Commitments and Contingencies
In the normal course of business, each Fund enters into a variety of agreements that may expose the Fund to some risk of loss. These could include recourse arrangements for certain TOB Trusts and certain agreements related to preferred shares, which are described elsewhere in these Notes to Financial Statements. The risk of future loss arising from such agreements, while not quantifiable, is expected to be remote. As of the end of the reporting period, the Funds did not have any unfunded commitments.
From time to time, the Funds may be a party to certain legal proceedings in the ordinary course of business, including proceedings relating to the enforcement of the Funds’ rights under contracts. As of the end of the reporting period, the Funds are not subject to any material legal proceedings.
9. Fund Leverage
Reverse Repurchase Agreements
During the current fiscal period, NEA utilized reverse repurchase agreements as means of temporary borrowings awaiting the settlement of newly issued preferred shares.
The Fund may enter into a reverse repurchase agreement with brokers, dealers, banks or other financial institutions that have been determined by the Adviser to be creditworthy and permissible with its investment policy. In a reverse repurchase agreement, a Fund sells to the counterparty a security that it holds with a contemporaneous agreement to repurchase the same security at an agreed-upon price and date, reflecting the interest rate effective for the term of the agreement. It may also be viewed as the borrowing of money by the Fund. Cash received in exchange for securities delivered, plus
142
accrued interest payments to be made by the Fund to a counterparty, are reflected as a liability on the Statement of Assets and Liabilities. Interest payments made by the Fund to counterparties are recognized as a component of “Interest expense and amortization of offering costs” on the Statement of Operations.
In a reverse repurchase agreement, the Fund retains the risk of loss associated with the sold security. In order to minimize risk, the Fund pledges and/or segregates securities and cash as collateral with a fair value at least equal to its purchase obligations under these agreements (including accrued interest). Reverse repurchase agreements also involve the risk that the purchaser fails to return the securities as agreed upon, files for bankruptcy or becomes insolvent. Upon a bankruptcy or insolvency of a counterparty, the Fund is considered to be an unsecured creditor with respect to excess collateral and as such the return of excess collateral may be delayed. A Fund will pledge assets determined to be liquid by the Adviser to cover its obligations under reverse repurchase agreements.
As of the end of the reporting period, the Fund did not have any outstanding reverse repurchase agreements.
During the current fiscal period, the average daily balance outstanding and average interest rate on the Fund’s reverse repurchase agreements were as follows:
| Utilization period (days outstanding) | 18 |
| Average daily balance outstanding | $ 130,900,000* |
| Average interest rate | 0.81% |
| * For the period February 1, 2021 through February 18, 2021. | |
Committed Line of Credit
The Funds, along with certain other funds managed by the Adviser (“Participating Funds”), have established a 364-day, $2.635 billion standby credit facility with a group of lenders, under which the Participating Funds may borrow for temporary purposes (other than on-going leveraging for investment purposes). Each Participating Fund is allocated a designated proportion of the facility’s capacity (and its associated costs, as described below) based upon a multifactor assessment of the likelihood and frequency of its need to draw on the facility, the size of the Fund and its anticipated draws, and the potential importance of such draws to the operations and well-being of the Fund, relative to those of the other Funds. A Fund may effect draws on the facility in excess of its designated capacity if and to the extent that other Participating Funds have undrawn capacity. The credit facility expires in June 2022 unless extended or renewed.
The credit facility has the following terms: 0.15% per annum on unused commitment amounts and a drawn interest rate equal to the higher of (a) OBFR (Overnight Bank Funding Rate) plus 1.20% per annum or (b) the Fed Funds Effective Rate plus 1.20% per annum on amounts borrowed. Prior to June 23, 2021, the drawn interest rate was equal to the higher of (a) one-month LIBOR (London Inter-Bank Offered Rate) plus 1.25% per annum or (b) the Fed Funds rate plus 1.25% per annum on amounts borrowed. The Participating Funds also incurred a 0.05% upfront fee on the increase of the $230 million commitment amount during the reporting period. Interest expense incurred by the Participating Funds, when applicable, is recognized as a component of “Interest expense and amortization of offering costs” on the Statement of Operations. Participating Funds paid administration, legal and arrangement fees, which are recognized as a component of “Interest expense and amortization of offering costs” on the Statement of Operations, and along with commitment fees, have been allocated among such Participating Funds based upon the relative proportions of the facility’s aggregate capacity reserved for them and other factors deemed relevant by the Adviser and the Board of each Participating Fund.
During the current fiscal period, the Funds utilized this facility. The Funds’ maximum outstanding balance during the utilization period was as follows:
| | | |
| | NAD | NEA |
| Maximum outstanding balance | $4,149,160 | $84,900,000 |
During the Funds’ utilization period(s), during the current fiscal period, the average daily balance outstanding and average annual interest rate on the Borrowings were as follows:
| | | |
| | NAD | NEA |
| Utilization period (days outstanding) | 4 | 7 |
| Average daily balance outstanding | $4,149,160 | $36,678,973 |
| Average annual interest rate | 1.39% | 1.38% |
Borrowings outstanding as of the end of the reporting period are recognized as “Borrowings” on the Statement of Assets and Liabilities, where applicable.
Inter-Fund Borrowing and Lending
The SEC has granted an exemptive order permitting registered open-end and closed-end Nuveen funds to participate in an inter-fund lending facility whereby the Nuveen funds may directly lend to and borrow money from each other for temporary purposes (e.g., to satisfy redemption requests or when
143
Notes to Financial Statements (continued)
a sale of securities “fails,” resulting in an unanticipated cash shortfall) (the “Inter-Fund Program”). The closed-end Nuveen funds, including the Funds covered by this shareholder report, will participate only as lenders, and not as borrowers, in the Inter-Fund Program because such closed-end funds rarely, if ever, need to borrow cash to meet redemptions. The Inter-Fund Program is subject to a number of conditions, including, among other things, the requirements that (1) no fund may borrow or lend money through the Inter-Fund Program unless it receives a more favorable interest rate than is typically available from a bank or other financial institution for a comparable transaction; (2) no fund may borrow on an unsecured basis through the Inter-Fund Program unless the fund’s outstanding borrowings from all sources immediately after the inter-fund borrowing total 10% or less of its total assets; provided that if the borrowing fund has a secured borrowing outstanding from any other lender, including but not limited to another fund, the inter-fund loan must be secured on at least an equal priority basis with at least an equivalent percentage of collateral to loan value; (3) if a fund’s total outstanding borrowings immediately after an inter-fund borrowing would be greater than 10% of its total assets, the fund may borrow through the inter-fund loan on a secured basis only; (4) no fund may lend money if the loan would cause its aggregate outstanding loans through the Inter-Fund Program to exceed 15% of its net assets at the time of the loan; (5) a fund’s inter-fund loans to any one fund shall not exceed 5% of the lending fund’s net assets; (6) the duration of inter-fund loans will be limited to the time required to receive payment for securities sold, but in no event more than seven days; and (7) each inter-fund loan may be called on one business day’s notice by a lending fund and may be repaid on any day by a borrowing fund. In addition, a Nuveen fund may participate in the Inter-Fund Program only if and to the extent that such participation is consistent with the fund’s investment objective and investment policies. The Board is responsible for overseeing the Inter-Fund Program.
The limitations detailed above and the other conditions of the SEC exemptive order permitting the Inter-Fund Program are designed to minimize the risks associated with Inter-Fund Program for both the lending fund and the borrowing fund. However, no borrowing or lending activity is without risk. When a fund borrows money from another fund, there is a risk that the loan could be called on one day’s notice or not renewed, in which case the fund may have to borrow from a bank at a higher rate or take other actions to payoff such loan if an inter-fund loan is not available from another fund. Any delay in repayment to a lending fund could result in a lost investment opportunity or additional borrowing costs.
During the current reporting period, none of the Funds covered by this shareholder report have entered into any inter-fund loan activity.
10. Fund Reorganizations
The Reorganizations as previously described in Note 1 — General Information were structured to qualify as tax-free reorganizations under the Internal Revenue Code for federal income tax purposes, and the Target Funds’ shareholders recognized no gain or loss for federal income tax purposes as a result. Prior to the closing of the Reorganizations, the Target Funds distributed all of its net investment income and capital gains, if any. Such a distribution may be taxable to the Target Funds’ shareholders for federal income tax purposes.
Investments
The cost, fair value and net unrealized appreciation (depreciation) of the investments (including investments in derivatives) of the Target Funds as of the date of the Reorganizations, were as follows:
| | |
| | NMY |
| Cost of investments | $486,183,039 |
| Fair value of investments | 529,460,773 |
| Net unrealized appreciation (depreciation) of investments | 43,277,734 |
| | NUM |
| Cost of investments | $452,413,776 |
| Fair value of investments | 495,438,757 |
| Net unrealized appreciation (depreciation) of investments | 43,024,981 |
For financial reporting purposes, assets received and shares issued by the Acquiring Funds were recorded at fair value; however, the cost basis of the investments received from the Target Funds were carried forward to align ongoing reporting of the Acquiring Funds’ realized and unrealized gains and losses with amounts distributable to shareholders for tax purposes.
Common Shares
The common shares outstanding, net assets applicable to common shares and NAV per common share outstanding immediately before and after the Reorganizations were as follows:
| | |
| Target Fund – Prior to Reorganization into NAD | NMY |
| Common shares outstanding | 23,099,664 |
| Net assets applicable to common shares | $352,666,794 |
| NAV per common share outstanding | $ 15.27 |
144
| | |
| Target Fund – Prior to Reorganization into NEA | NUM |
| Common shares outstanding | 20,226,887 |
| Net assets applicable to common shares | $ 329,945,848 |
| NAV per common share outstanding | $ 16.31 |
| Acquiring Fund – Prior to Reorganization | NAD |
| Common shares outstanding | 211,649,043 |
| Net assets applicable to common shares | $3,430,907,503 |
| NAV per common share outstanding | $ 16.21 |
| Acquiring Fund – Prior to Reorganization | NEA |
| Common shares outstanding | 278,590,267 |
| Net assets applicable to common shares | $4,495,465,583 |
| NAV per common share outstanding | $ 16.14 |
| Acquiring Fund – Post Reorganization | NAD |
| Common shares outstanding | 233,404,656 |
| Net assets applicable to common shares | $3,783,574,297 |
| NAV per common share outstanding | $ 16.21 |
| Acquiring Fund – Post Reorganization | NEA |
| Common shares outstanding | 299,037,392 |
| Net assets applicable to common shares | $4,825,411,431 |
| NAV per common share outstanding | $ 16.14 |
Pro Forma Results of Operations (Unaudited)
The beginning of the Target Funds’ current fiscal periods were June 1, 2020 for NMY and March 1, 2020 for NUM. Assuming the Reorganizations had been completed on November 1, 2020, the beginning of the Acquiring Funds’ current fiscal period, the pro forma results of operations for each Fund’s current fiscal period, are as follows:
| | |
| Acquiring Fund – Pro Forma Results from Operations | NAD |
| Net investment income (loss) | $168,209,612 |
| Net realized and unrealized gains (losses) | 79,922,769 |
| Change in net assets resulting from operations | 248,132,381 |
| Acquiring Fund – Pro Forma Results from Operations | NEA |
| Net investment income (loss) | $205,280,241 |
| Net realized and unrealized gains (losses) | 61,832,265 |
| Change in net assets resulting from operations | 267,112,506 |
Because the combined investment portfolios of each Reorganization have been managed as a single integrated portfolio since each Reorganization was completed, it is not practicable to separate the amounts of revenue and earnings of the Target Funds that have been included in the Statement of Operations of their respective Acquiring Funds since the Reorganizations were consummated.
Cost and Expenses
In connection with the Reorganizations, the Acquiring Fund incurred certain associated costs and expenses. Such amounts were included as components of “Accrued other expenses” on the Statement of Assets and Liabilities and “Reorganization expenses” on the Statement of Operations.
145
Shareholder Update (Unaudited)
CURRENT INVESTMENT OBJECTIVES, INVESTMENT POLICIES AND PRINCIPAL RISKS OF THE FUNDS
NUVEEN QUALITY MUNICIPAL INCOME FUND (NAD)
Investment Objectives
The Fund’s investment objectives are to provide current income exempt from regular federal income tax and to enhance portfolio value relative to the municipal bond market by investing in tax-exempt municipal securities that the Fund’s investment adviser believes are underrated or undervalued or that represent municipal market sectors that are undervalued.
Investment Policies
Under normal circumstances, the Fund will invest at least 80% of its Assets (as defined below) in municipal securities and other related investments, the income from which is exempt from regular federal income taxes.
The Fund generally invests in municipal securities with long-term maturities in order to maintain an average effective maturity of 15 to 30 years, including the effects of leverage, but the average effective maturity of obligations held by the Fund may be lengthened or shortened as a result of portfolio transactions effected by the Fund’s investment adviser and/or the Fund’s sub-adviser, depending on market conditions and on an assessment by the portfolio manager of which segments of the municipal securities markets offer the most favorable relative investment values and opportunities for tax-exempt income and total return.
“Assets” mean the net assets of the Fund plus the amount of any borrowings for investment purposes. “Managed Assets” mean the total assets of the Fund, minus the sum of its accrued liabilities (other than Fund liabilities incurred for the express purpose of creating leverage). Total assets for this purpose shall include assets attributable to the Fund’s use of leverage (whether or not those assets are reflected in the Fund’s financial statements for purposes of generally accepted accounting principles), and derivatives will be valued at their market value.
Under normal circumstances:
| • | | The Fund may invest up to 20% of its Managed Assets in municipal securities that pay interest that is taxable under the federal alternative minimum tax. |
| • | | The Fund may invest up to 35% of its Managed Assets in securities that, at the time of investment, are rated below the three highest grades (Baa or BBB or lower) by at least one nationally recognized statistical rating organization (“NRSRO”) or are unrated but judged to be of comparable quality by the Fund’s sub-adviser. |
| • | | The Fund may invest up to 15% of its Managed Assets in inverse floating rate securities. |
| • | | The Fund may not enter into a futures contract or related options or forward contracts if more than 30% of the Fund’s Managed Assets would be represented by futures contracts or more than 5% of the Fund’s Managed Assets would be committed to initial margin deposits and premiums on futures contracts or related options. |
The foregoing policies apply only at the time of any new investment.
Approving Changes in Investment Policies
The Board of Trustees of the Fund may change the policies described above without a shareholder vote. However, with respect to the Fund’s policy of investing at least 80% of its Assets in municipal securities and other related investments, the income from which is exempt from regular federal income taxes, such policy may not be changed without 60 days’ prior written notice and the approval of the holders of a majority of the outstanding common shares and preferred shares voting together as a single class, and the approval of the holders of a majority of the outstanding preferred shares, voting separately as a single class. A “majority of the outstanding” shares means (i) 67% or more of the shares present at a meeting, if the holders of more than 50% of the shares are present or represented by proxy or (ii) more than 50% of the shares, whichever is less.
Portfolio Contents
The Fund generally invests in municipal securities. Municipal securities include municipal bonds, notes, securities issued to finance and refinance public projects, certificates of participation, variable rate demand obligations, lease obligations, municipal notes, pre-refunded municipal bonds, private activity bonds, securities issued by tender option bond trusts (“TOB Trusts”), including inverse floating rate securities, and other forms of municipal bonds and securities, and other related instruments that create exposure to municipal bonds, notes and securities that provide for the payment of interest income that is exempt from regular U.S. federal income tax.
146
Municipal securities are debt obligations generally issued by states, cities and local authorities and certain possessions and territories of the United States (such as Puerto Rico and Guam) to finance or refinance public purpose projects such as roads, schools, and water supply systems.
The Fund may also invest in municipal securities that pay interest that is taxable under the federal alternative minimum tax applicable to noncorporate taxpayers (“AMT Bonds”). AMT Bonds may trigger adverse tax consequences for Fund shareholders who are subject to the federal alternative minimum tax.
The Fund may invest in municipal securities that represent lease obligations and certificates of participation in such leases. A municipal lease is an obligation in the form of a lease or installment purchase that is issued by a state or local government to acquire equipment and facilities. Income from such obligations generally is exempt from state and local taxes in the state of issuance. A certificate of participation represents an undivided interest in an unmanaged pool of municipal leases, an installment purchase agreement or other instruments. The certificates typically are issued by a municipal agency, a trust or other entity that has received an assignment of the payments to be made by the state or political subdivision under such leases or installment purchase agreements. Such certificates provide the Fund with the right to a pro rata undivided interest in the underlying municipal securities. In addition, such participations generally provide the Fund with the right to demand payment, on not more than seven days’ notice, of all or any part of the Fund’s participation interest in the underlying municipal securities, plus accrued interest.
The Fund may invest in municipal notes. Municipal securities in the form of notes generally are used to provide for short-term capital needs, in anticipation of an issuer’s receipt of other revenues or financing, and typically have maturities of up to three years. Such instruments may include tax anticipation notes, revenue anticipation notes, bond anticipation notes, tax and revenue anticipation notes and construction loan notes. Tax anticipation notes are issued to finance the working capital needs of governments. Generally, they are issued in anticipation of various tax revenues, such as income, sales, property, use and business taxes, and are payable from these specific future taxes. Revenue anticipation notes are issued in expectation of receipt of other kinds of revenue, such as federal revenues available under federal revenue sharing programs. Bond anticipation notes are issued to provide interim financing until long-term bond financing can be arranged. In most cases, the long-term bonds then provide the funds needed for repayment of the bond anticipation notes. Tax and revenue anticipation notes combine the funding sources of both tax anticipation notes and revenue anticipation notes. Construction loan notes are sold to provide construction financing. Mortgage notes insured by the Federal Housing Authority secure these notes; however, the proceeds from the insurance may be less than the economic equivalent of the payment of principal and interest on the mortgage note if there has been a default. The anticipated revenues from taxes, grants or bond financing generally secure the obligations of an issuer of municipal notes.
The Fund may invest in “tobacco settlement bonds.” Tobacco settlement bonds are municipal securities that are secured or payable solely from the collateralization of the proceeds from class action or other litigation against the tobacco industry.
The Fund may invest in pre-refunded municipal securities. The principal of and interest on pre-refunded municipal securities are no longer paid from the original revenue source for the securities. Instead, the source of such payments is typically an escrow fund consisting of U.S. government securities. The assets in the escrow fund are derived from the proceeds of refunding bonds issued by the same issuer as the pre-refunded municipal securities. Issuers of municipal securities use this advance refunding technique to obtain more favorable terms with respect to securities that are not yet subject to call or redemption by the issuer. For example, advance refunding enables an issuer to refinance debt at lower market interest rates, restructure debt to improve cash flow or eliminate restrictive covenants in the indenture or other governing instrument for the pre-refunded municipal securities. However, except for a change in the revenue source from which principal and interest payments are made, the pre-refunded municipal securities remain outstanding on their original terms until they mature or are redeemed by the issuer.
The Fund may invest in private activity bonds. Private activity bonds are issued by or on behalf of public authorities to obtain funds to provide privately operated housing facilities, airport, mass transit or port facilities, sewage disposal, solid waste disposal or hazardous waste treatment or disposal facilities and certain local facilities for water supply, gas or electricity. Other types of private activity bonds, the proceeds of which are used for the construction, equipment, repair or improvement of privately operated industrial or commercial facilities, may constitute municipal securities, although the current federal tax laws place substantial limitations on the size of such issues.
The Fund may invest in municipal securities issued by special taxing districts. Special taxing districts are organized to plan and finance infrastructure developments to induce residential, commercial and industrial growth and redevelopment. The bond financing methods such as tax increment finance, tax assessment, special services district and Mello-Roos bonds, are generally payable solely from taxes or other revenues attributable to the specific projects financed by the bonds without recourse to the credit or taxing power of related or overlapping municipalities.
The Fund may invest in inverse floating rate securities issued by a TOB trust, the interest rate on which varies inversely with the Securities Industry Financial Markets Association short-term rate, which resets weekly, or a similar short-term rate, and is reduced by the expenses related to the TOB trust. Typically, inverse floating rate securities represent beneficial interests in a special purpose trust (sometimes called a TOB trust) formed by a third party sponsor for the purpose of holding municipal bonds. Inverse floating rate securities may increase or decrease in value at a greater rate than the underlying interest rate on the municipal bond held by the TOB trust, which effectively leverages the Fund’s investment.
147
Shareholder Update (Unaudited) (continued)
The Fund may invest in floating rate securities issued by special purpose trusts. Floating rate securities may take the form of short-term floating rate securities or the option period may be substantially longer. Generally, the interest rate earned will be based upon the market rates for municipal securities with maturities or remarketing provisions that are comparable in duration to the periodic interval of the tender option, which may vary from weekly, to monthly, to extended periods of one year or multiple years. Since the option feature has a shorter term than the final maturity or first call date of the underlying bond deposited in the trust, the Fund as the holder of the floating rate security relies upon the terms of the agreement with the financial institution furnishing the option as well as the credit strength of that institution. As further assurance of liquidity, the terms of the trust provide for a liquidation of the municipal security deposited in the trust and the application of the proceeds to pay off the floating rate security. The trusts that are organized to issue both short-term floating rate securities and inverse floaters generally include liquidation triggers to protect the investor in the floating rate security.
The Fund may invest in zero coupon bonds. A zero coupon bond is a bond that typically does not pay interest for the entire life of the obligation or for an initial period after the issuance of the obligation.
The Fund may buy and sell securities on a when-issued or delayed delivery basis, making payment or taking delivery at a later date, normally within 15 to 45 days of the trade date.
The Fund may invest in illiquid securities (i.e., securities that are not readily marketable), including, but not limited to, restricted securities (securities the disposition of which is restricted under the federal securities laws), securities that may be resold only pursuant to Rule 144A under the Securities Act of 1933, as amended (the “1933 Act”), and repurchase agreements with maturities in excess of seven days.
The Fund may enter into certain derivative instruments in pursuit of its investment objectives, including to seek to enhance return, to hedge certain risks of its investments in municipal securities or as a substitute for a position in the underlying asset. Such instruments include financial futures contracts, swap contracts (including interest rate swaps, credit default swaps and municipal market data rate locks (“MMD Rate Locks”)), options on financial futures, options on swap contracts or other derivative instruments.
The Fund may purchase and sell MMD Rate Locks. An MMD Rate Lock permits the Fund to lock in a specified municipal interest rate for a portion of its portfolio to preserve a return on a particular investment or a portion of its portfolio as a duration management technique or to protect against any increase in the price of securities to be purchased at a later date. By using an MMD Rate Lock, the Fund can create a synthetic long or short position, allowing the Fund to select what the manager believes is an attractive part of the yield curve. The Fund will ordinarily use these transactions as a hedge or for duration or risk management although it is permitted to enter into them to enhance income or gain or to increase the Fund’s yield, for example, during periods of steep interest rate yield curves (i.e., wide differences between short term and long term interest rates).
The Fund may also invest in securities of other open- or closed-end investment companies (including exchange-traded funds (“ETFs”)) that invest primarily in municipal securities of the types in which the Fund may invest directly, to the extent permitted by the Investment Company Act of 1940, as amended (the “1940 Act”), the rules and regulations issued thereunder and applicable exemptive orders issued by the Securities and Exchange Commission (“SEC”).
Use of Leverage
The Fund uses leverage to pursue its investment objectives. The Fund may use leverage to the extent permitted by the 1940 Act. The Fund may source leverage through a number of methods including the issuance of preferred shares of beneficial interest (“Preferred Shares”), investments in inverse floating rate securities, entering into reverse repurchase agreements (effectively a secured borrowing) and borrowings (subject to certain investment restrictions). In addition, the Fund may also use certain derivatives that have the economic effect of leverage by creating additional investment exposure. The amount and sources of leverage will vary depending on market conditions.
Temporary Defensive Periods
During temporary defensive periods (e.g., times when, in the Fund’s investment adviser’s and/or the Fund’s sub-adviser’s opinion, temporary imbalances of supply and demand or other temporary dislocations in the tax-exempt bond market adversely affect the price at which long-term or intermediate-term municipal securities are available), and in order to keep the Fund’s cash fully invested, the Fund may invest any percentage of its Managed Assets in short-term investments including high quality, short-term debt securities that may be either tax-exempt or taxable. The Fund may not achieve its investment objectives during such periods.
148
NUVEEN AMT-FREE QUALITY MUNICIPAL INCOME FUND (NEA)
Investment Objectives
The Fund’s investment objectives are to provide current income exempt from regular federal income tax and federal alternative minimum tax applicable to individuals, and to enhance portfolio value relative to the municipal bond market by investing in tax-exempt municipal securities that the Fund’s investment adviser believes are underrated or undervalued or that represent municipal market sectors that are undervalued.
Investment Policies
As a fundamental investment policy, under normal circumstances, the Fund will invest at least 80% of its Assets (as defined below) in municipal securities and other related investments that pay interest exempt from regular federal income tax. Additionally, as a fundamental investment policy, under normal circumstances, the Fund will invest at least 80% of its Assets in a portfolio of securities, the income from which is exempt from the federal alternative minimum tax applicable to individuals. As a non-fundamental investment policy, under normal circumstances, the Fund will invest 100% of its Managed Assets (as defined below) in municipal securities and other related investments the income from which is exempt from the federal alternative minimum tax applicable to individuals at the time of purchase.
The Fund generally invests in municipal securities with long-term maturities in order to maintain an average effective maturity of 15 to 30 years, including the effects of leverage, but the average effective maturity of obligations held by the Fund may be lengthened or shortened as a result of portfolio transactions effected by the Fund’s investment adviser and/or the Fund’s sub-adviser, depending on market conditions and on an assessment by the portfolio manager of which segments of the municipal securities markets offer the most favorable relative investment values and opportunities for tax-exempt income and total return.
“Assets” means net assets of the Fund plus the amount of any borrowings for investment purposes. “Managed Assets” means the total assets of the Fund, minus the sum of its accrued liabilities (other than Fund liabilities incurred for the express purpose of creating leverage). Total assets for this purpose shall include assets attributable to the Fund’s use of leverage (whether or not those assets are reflected in the Fund’s financial statements for purposes of generally accepted accounting principles), and derivatives will be valued at their market value.
Additionally, as a non-fundamental policy, the Fund:
| • | | May invest up to 35% of its Managed Assets in securities rated, at the time of investment, below the three highest grades (Baa or BBB or lower) by at least one NRSRO which includes below-investment-grade securities, or unrated securities judged to be of comparable quality by the Fund’s sub-adviser. |
| • | | May invest in distressed securities but may not invest in the securities of an issuer which, at the time of investment, is in default on its obligations to pay principal or interest thereon when due or that is involved in a bankruptcy proceeding (i.e., rated below C-, at the time of investment); provided, however, that the Fund’s sub-adviser may determine that it is in the best interest of shareholders in pursuing a workout arrangement with issuers of defaulted securities to make loans to the defaulted issuer or another party, or purchase a debt, equity or other interest from the defaulted issuer or another party, or take other related or similar steps involving the investment of additional monies, but only if that issuer’s securities are already held by the Fund. |
| • | | May invest up to 15% of its Managed Assets in inverse floating rate securities. |
| • | | The Fund may not enter into a futures contract or related options or forward contracts if more than 30% of the Fund’s Managed Assets would be represented by futures contracts or more than 5% of the Fund’s Managed Assets would be committed to initial margin deposits and premiums on futures contracts or related options. |
The foregoing policies apply only at the time of any new investment.
Approving Changes in Investment Policies
The Board of Trustees of the Fund may change the policies described above without a shareholder vote. However, with respect to the Fund’s fundamental policy of investing at least 80% of its Assets in municipal securities and other related investments that pay interest exempt from both regular federal income tax and the federal alternative minimum tax applicable to individuals such policy may not be changed without 60 days’ prior written notice and the approval of the holders of a majority of the outstanding common shares and preferred shares voting together as a single class, and the approval of the holders of a majority of the outstanding preferred shares, voting separately as a single class. A “majority of the outstanding” shares means (i) 67% or more of the shares present at a meeting, if the holders of more than 50% of the shares are present or represented by proxy or (ii) more than 50% of the shares, whichever is less.
149
Shareholder Update (Unaudited) (continued)
Portfolio Contents
The Fund generally invests its assets in a portfolio of municipal securities. Municipal securities include municipal bonds, notes, securities issued to finance and refinance public projects, certificates of participation, variable rate demand obligations, lease obligations, municipal notes, pre-refunded municipal bonds, private activity bonds, securities issued by TOB Trusts, including inverse floating rate securities, and other forms of municipal bonds and securities, and other related instruments that create exposure to municipal bonds, notes and securities that provide for the payment of interest income that is exempt from regular U.S. federal income tax.
Municipal securities are debt obligations generally issued by states, cities and local authorities and certain possessions and territories of the United States (such as Puerto Rico and Guam) to finance or refinance public purpose projects such as roads, schools, and water supply systems.
The Fund may invest in municipal securities that are additionally secured by insurance, bank credit agreements or escrow accounts.
The Fund may invest in municipal securities that represent lease obligations and certificates of participation in such leases. A municipal lease is an obligation in the form of a lease or installment purchase that is issued by a state or local government to acquire equipment and facilities. Income from such obligations generally is exempt from state and local taxes in the state of issuance. A certificate of participation represents an undivided interest in an unmanaged pool of municipal leases, an installment purchase agreement or other instruments. The certificates typically are issued by a municipal agency, a trust or other entity that has received an assignment of the payments to be made by the state or political subdivision under such leases or installment purchase agreements. Such certificates provide the Fund with the right to a pro rata undivided interest in the underlying municipal securities. In addition, such participations generally provide the Fund with the right to demand payment, on not more than seven days’ notice, of all or any part of the Fund’s participation interest in the underlying municipal securities, plus accrued interest.
The Fund may invest in municipal notes. Municipal securities in the form of notes generally are used to provide for short-term capital needs, in anticipation of an issuer’s receipt of other revenues or financing, and typically have maturities of up to three years. Such instruments may include tax anticipation notes, revenue anticipation notes, bond anticipation notes, tax and revenue anticipation notes and construction loan notes. Tax anticipation notes are issued to finance the working capital needs of governments. Generally, they are issued in anticipation of various tax revenues, such as income, sales, property, use and business taxes, and are payable from these specific future taxes. Revenue anticipation notes are issued in expectation of receipt of other kinds of revenue, such as federal revenues available under federal revenue sharing programs. Bond anticipation notes are issued to provide interim financing until long-term bond financing can be arranged. In most cases, the long-term bonds then provide the funds needed for repayment of the bond anticipation notes. Tax and revenue anticipation notes combine the funding sources of both tax anticipation notes and revenue anticipation notes. Construction loan notes are sold to provide construction financing. Mortgage notes insured by the Federal Housing Authority secure these notes; however, the proceeds from the insurance may be less than the economic equivalent of the payment of principal and interest on the mortgage note if there has been a default. The anticipated revenues from taxes, grants or bond financing generally secure the obligations of an issuer of municipal notes.
The Fund may invest in “tobacco settlement bonds.” Tobacco settlement bonds are municipal securities that are secured or payable solely from the collateralization of the proceeds from class action or other litigation against the tobacco industry.
The Fund may invest in pre-refunded municipal securities. The principal of and interest on pre-refunded municipal securities are no longer paid from the original revenue source for the securities. Instead, the source of such payments is typically an escrow fund consisting of U.S. government securities. The assets in the escrow fund are derived from the proceeds of refunding bonds issued by the same issuer as the pre-refunded municipal securities. Issuers of municipal securities use this advance refunding technique to obtain more favorable terms with respect to securities that are not yet subject to call or redemption by the issuer. For example, advance refunding enables an issuer to refinance debt at lower market interest rates, restructure debt to improve cash flow or eliminate restrictive covenants in the indenture or other governing instrument for the pre-refunded municipal securities. However, except for a change in the revenue source from which principal and interest payments are made, the pre-refunded municipal securities remain outstanding on their original terms until they mature or are redeemed by the issuer.
The Fund may invest in private activity bonds. Private activity bonds are issued by or on behalf of public authorities to obtain funds to provide privately operated housing facilities, airport, mass transit or port facilities, sewage disposal, solid waste disposal or hazardous waste treatment or disposal facilities and certain local facilities for water supply, gas or electricity. Other types of private activity bonds, the proceeds of which are used for the construction, equipment, repair or improvement of privately operated industrial or commercial facilities, may constitute municipal securities, although the current federal tax laws place substantial limitations on the size of such issues.
The Fund may invest in municipal securities issued by special taxing districts. Special taxing districts are organized to plan and finance infrastructure developments to induce residential, commercial and industrial growth and redevelopment. The bond financing methods such as tax increment finance, tax assessment, special services district and Mello-Roos bonds, are generally payable solely from taxes or other revenues attributable to the specific projects financed by the bonds without recourse to the credit or taxing power of related or overlapping municipalities.
150
The Fund may invest in inverse floating rate securities issued by a TOB trust, the interest rate on which varies inversely with the Securities Industry Financial Markets Association short-term rate, which resets weekly, or a similar short-term rate, and is reduced by the expenses related to the TOB trust. Typically, inverse floating rate securities represent beneficial interests in a special purpose trust (sometimes called a TOB trust) formed by a third party sponsor for the purpose of holding municipal bonds. Inverse floating rate securities may increase or decrease in value at a greater rate than the underlying interest rate on the municipal bond held by the TOB trust, which effectively leverages the Fund’s investment.
The Fund may invest in floating rate securities issued by special purpose trusts. Floating rate securities may take the form of short-term floating rate securities or the option period may be substantially longer. Generally, the interest rate earned will be based upon the market rates for municipal securities with maturities or remarketing provisions that are comparable in duration to the periodic interval of the tender option, which may vary from weekly, to monthly, to extended periods of one year or multiple years. Since the option feature has a shorter term than the final maturity or first call date of the underlying bond deposited in the trust, the Fund as the holder of the floating rate security relies upon the terms of the agreement with the financial institution furnishing the option as well as the credit strength of that institution. As further assurance of liquidity, the terms of the trust provide for a liquidation of the municipal security deposited in the trust and the application of the proceeds to pay off the floating rate security. The trusts that are organized to issue both short-term floating rate securities and inverse floaters generally include liquidation triggers to protect the investor in the floating rate security.
The Fund may invest in zero coupon bonds. A zero coupon bond is a bond that typically does not pay interest for the entire life of the obligation or for an initial period after the issuance of the obligation.
The Fund may buy and sell securities on a when-issued or delayed delivery basis, making payment or taking delivery at a later date, normally within 15 to 45 days of the trade date.
The Fund may invest in illiquid securities (i.e., securities that are not readily marketable), including, but not limited to, restricted securities (securities the disposition of which is restricted under the federal securities laws), securities that may be resold only pursuant to Rule 144A under the 1933 Act, and repurchase agreements with maturities in excess of seven days.
The Fund may enter into certain derivative instruments in pursuit of its investment objectives, including to seek to enhance return, to hedge certain risks of its investments in municipal securities or as a substitute for a position in the underlying asset. Such instruments include financial futures contracts, swap contracts (including interest rate swaps, credit default swaps and MMD Rate Locks), options on financial futures, options on swap contracts or other derivative instruments.
The Fund may purchase and sell MMD Rate Locks. An MMD Rate Lock permits the Fund to lock in a specified municipal interest rate for a portion of its portfolio to preserve a return on a particular investment or a portion of its portfolio as a duration management technique or to protect against any increase in the price of securities to be purchased at a later date. By using an MMD Rate Lock, the Fund can create a synthetic long or short position, allowing the Fund to select what the manager believes is an attractive part of the yield curve. The Fund will ordinarily use these transactions as a hedge or for duration or risk management although it is permitted to enter into them to enhance income or gain or to increase the Fund’s yield, for example, during periods of steep interest rate yield curves (i.e., wide differences between short term and long term interest rates).
The Fund may also invest in securities of other open- or closed-end investment companies (including ETFs) that invest primarily in municipal securities of the types in which the Fund may invest directly, to the extent permitted by the 1940 Act, the rules and regulations issued thereunder and applicable exemptive orders issued by the SEC.
Use of Leverage
The Fund uses leverage to pursue its investment objectives. The Fund may use leverage to the extent permitted by the 1940 Act. The Fund may source leverage through a number of methods including the issuance of Preferred Shares, investments in inverse floating rate securities, entering into reverse repurchase agreements (effectively a secured borrowing) and borrowings (subject to certain investment restrictions). In addition, the Fund may also use certain derivatives that have the economic effect of leverage by creating additional investment exposure. The amount and sources of leverage will vary depending on market conditions.
Temporary Defensive Periods
During temporary defensive periods or in order to help keep the Fund’s assets fully invested, including during the period within which the net proceeds of an offering of Securities are first being invested, the Fund may deviate from its investment policies and objectives. During such periods, the Fund may invest any percentage of its Managed Assets in short-term investments, including high quality, short-term debt securities that may be either tax-exempt or taxable. The Fund may not achieve its investment objectives during such periods.
151
Shareholder Update (Unaudited) (continued)
PRINCIPAL RISKS OF THE FUNDS
The factors that are most likely to have a material effect on a particular Fund’s portfolio as a whole are called “principal risks.” Each Fund is subject to the principal risks indicated below, whether through direct investment or derivative positions. Each Fund may be subject to additional risks other than those identified and described below because the types of investments made by a Fund can change over time.
| | | |
| | Nuveen Quality Municipal | Nuveen AMT-Free Quality |
| Risk | Income Fund (NAD) | Municipal Income Fund (NEA) |
| Portfolio Level Risks | | |
| Alternative Minimum Tax Risk | X | — |
| Below Investment Grade Risk | X | X |
| Call Risk | X | X |
| Credit Risk | X | X |
| Credit Spread Risk | X | X |
| Deflation Risk | X | X |
| Derivatives Risk | X | X |
| Distressed Securities Risk | X | X |
| Duration Risk | X | X |
| Economic Sector Risk | X | X |
| Financial Futures and Options Risk | X | X |
| Hedging Risk | X | X |
| Illiquid Investments Risk | X | X |
| Income Risk | X | X |
| Inflation Risk | X | X |
| Insurance Risk | X | X |
| Interest Rate Risk | X | X |
| Inverse Floating Rate Securities Risk | X | X |
| LIBOR Replacement Risk | X | X |
| Municipal Securities Market Liquidity Risk | X | X |
| Municipal Securities Market Risk | X | X |
| Other Investment Companies Risk | X | X |
| Puerto Rico Municipal Securities Market Risk | X | X |
| Reinvestment Risk | X | X |
| Sector and Industry Risk | X | X |
| Sector Focus Risk | X | X |
| Special Risks Related to Certain Municipal Obligations | X | X |
| Swap Transactions Risk | X | X |
| Tax Risk | X | X |
| Taxability Risk | X | X |
| Tobacco Settlement Bond Risk | X | X |
| Unrated Securities Risk | X | X |
| Valuation Risk | X | X |
| Zero Coupon Bonds Risk | X | X |
152
| | | |
| | Nuveen Quality Municipal | Nuveen AMT-Free Quality |
| Risk | Income Fund (NAD) | Municipal Income Fund (NEA) |
| Fund Level and Other Risks | | |
| Anti-Takeover Provisions | X | X |
| Counterparty Risk | X | X |
| Cybersecurity Risk | X | X |
| Economic and Political Events Risk | X | X |
| Global Economic Risk | X | X |
| Investment and Market Risk | X | X |
| Legislation and Regulatory Risk | X | X |
| Leverage Risk | X | X |
| Market Discount from Net Asset Value | X | X |
| Recent Market Conditions | X | X |
| Reverse Repurchase Agreement Risk | X | X |
Portfolio Level Risks:
Alternative Minimum Tax Risk. The Fund may invest in AMT Bonds. Therefore, a portion of the Fund’s otherwise exempt-interest dividends may be taxable to those shareholders subject to the federal alternative minimum tax.
Below Investment Grade Risk. Municipal securities of below investment grade quality are regarded as having speculative characteristics with respect to the issuer’s capacity to pay interest and repay principal, and may be subject to higher price volatility and default risk than investment grade municipal securities of comparable terms and duration. Issuers of lower grade municipal securities may be highly leveraged and may not have available to them more traditional methods of financing. The prices of these lower grade securities are typically more sensitive to negative developments, such as a decline in the issuer’s revenues or a general economic downturn. The secondary market for lower rated municipal securities may not be as liquid as the secondary market for more highly rated municipal securities, a factor which may have an adverse effect on the Fund’s ability to dispose of a particular municipal security. If a below investment grade municipal security goes into default, or its issuer enters bankruptcy, it might be difficult to sell that security in a timely manner at a reasonable price.
Call Risk. The Fund may invest in municipal securities that are subject to call risk. Such municipal securities may be redeemed at the option of the issuer, or “called,” before their stated maturity or redemption date. In general, an issuer will call its instruments if they can be refinanced by issuing new instruments that bear a lower interest rate. The Fund is subject to the possibility that during periods of falling interest rates, an issuer will call its high yielding municipal securities. The Fund would then be forced to invest the unanticipated proceeds at lower interest rates, resulting in a decline in the Fund’s income.
Credit Risk. Issuers of municipal securities in which the Fund may invest may default on their obligations to pay principal or interest when due. This non-payment would result in a reduction of income to the Fund, a reduction in the value of a municipal security experiencing non-payment and potentially a decrease in the net asset value (“NAV”) of the Fund. To the extent that the credit rating assigned to a municipal security in the Fund’s portfolio is downgraded, the market price and liquidity of such security may be adversely affected.
Credit Spread Risk. Credit spread risk is the risk that credit spreads (i.e., the difference in yield between securities that is due to differences in their credit quality) may increase when the market believes that municipal securities generally have a greater risk of default. Increasing credit spreads may reduce the market values of the Fund’s securities. Credit spreads often increase more for lower rated and unrated securities than for investment grade securities. In addition, when credit spreads increase, reductions in market value will generally be greater for longer-maturity securities.
Deflation Risk. Deflation risk is the risk that prices throughout the economy decline over time. Deflation may have an adverse effect on the creditworthiness of issuers and may make issuer default more likely, which may result in a decline in the value of the Fund’s portfolio.
Derivatives Risk. The use of derivatives involves additional risks and transaction costs which could leave the Fund in a worse position than if it had not used these instruments. Derivative instruments can be used to acquire or to transfer the risk and returns of a municipal security or other asset without buying or selling the municipal security or asset. These instruments may entail investment exposures that are greater than their cost would suggest. As a result, a small investment in derivatives can result in losses that greatly exceed the original investment. Derivatives can be highly volatile, illiquid and difficult to value. An over-the-counter derivative transaction between the Fund and a counterparty that is not cleared through a central counterparty also involves the risk that a loss may be sustained as a result of the failure of the counterparty to the contract to make required payments. The payment
153
Shareholder Update (Unaudited) (continued)
obligation for a cleared derivative transaction is guaranteed by a central counterparty, which exposes the Fund to the creditworthiness of the central counterparty.
It is possible that developments in the derivatives market, including changes in government regulation, could adversely impact the Fund’s ability to invest in certain derivatives.
Distressed Securities Risk. The Fund may invest in low-rated securities or securities unrated but judged by the sub-adviser to be of comparable quality. Some or many of these low-rated securities, although not in default, may be “distressed,” meaning that the issuer is experiencing financial difficulties or distress at the time of acquisition. Such securities would present a substantial risk of future default which may cause the Fund to incur losses, including additional expenses, to the extent it is required to seek recovery upon a default in the payment of principal or interest on those securities. In any reorganization or liquidation proceeding relating to a portfolio security, the Fund may lose its entire investment or may be required to accept cash or securities with a value less than its original investment. Distressed securities may be subject to restrictions on resale.
Duration Risk. Duration is the sensitivity, expressed in years, of the price of a fixed-income security to changes in the general level of interest rates (or yields). Securities with longer durations tend to be more sensitive to interest rate (or yield) changes, which typically corresponds to increased volatility and risk, than securities with shorter durations. For example, if a security or portfolio has a duration of three years and interest rates increase by 1%, then the security or portfolio would decline in value by approximately 3%. Duration differs from maturity in that it considers potential changes to interest rates, and a security’s coupon payments, yield, price and par value and call features, in addition to the amount of time until the security matures. The duration of a security will be expected to change over time with changes in market factors and time to maturity.
Economic Sector Risk. The Fund may invest a significant amount of its total assets in municipal securities in the same economic sector. This may make the Fund more susceptible to adverse economic, political or regulatory occurrences affecting an economic sector. As concentration increases, so does the potential for fluctuation in the value of the Fund’s assets. In addition, the Fund may invest a significant portion of its assets in certain sectors of the municipal securities market, such as health care facilities, private educational facilities, special taxing districts and start-up utility districts, and private activity bonds including industrial development bonds on behalf of transportation companies, whose credit quality and performance may be more susceptible to economic, business, political, regulatory and other developments than other sectors of municipal issuers. If the Fund invests a significant portion of its assets in the sectors noted above, the Fund’s performance may be subject to additional risk and variability.
Financial Futures and Options Transactions Risk. The Fund may use certain transactions for hedging the portfolio’s exposure to credit risk and the risk of increases in interest rates, which could result in poorer overall performance for the Fund. There may be an imperfect correlation between price movements of the futures and options and price movements of the portfolio securities being hedged.
If the Fund engages in futures transactions or in the writing of options on futures, it will be required to maintain initial margin and maintenance margin and may be required to make daily variation margin payments in accordance with applicable rules of the exchanges and the Commodity Futures Trading Commission (“CFTC”). If the Fund purchases a financial futures contract or a call option or writes a put option in order to hedge the anticipated purchase of municipal securities, and if the Fund fails to complete the anticipated purchase transaction, the Fund may have a loss or a gain on the futures or options transaction that will not be offset by price movements in the municipal securities that were the subject of the anticipatory hedge. There can be no assurance that a liquid market will exist at a time when the Fund seeks to close out a derivatives or futures or a futures option position, and the Fund would remain obligated to meet margin requirements until the position is closed.
Hedging Risk. The Fund’s use of derivatives or other transactions to reduce risk involves costs and will be subject to the investment adviser’s and/or the sub-adviser’s ability to predict correctly changes in the relationships of such hedge instruments to the Fund’s portfolio holdings or other factors. No assurance can be given that the investment adviser’s and/or the sub-adviser’s judgment in this respect will be correct, and no assurance can be given that the Fund will enter into hedging or other transactions at times or under circumstances in which it may be advisable to do so. Hedging activities may reduce the Fund’s opportunities for gain by offsetting the positive effects of favorable price movements and may result in net losses.
Illiquid Investments Risk. Illiquid investments are investments that are not readily marketable and may include restricted securities, which are securities that may not be resold unless they have been registered under the 1933 Act or that can be sold in a private transaction pursuant to an available exemption from such registration. Illiquid investments involve the risk that the investments will not be able to be sold at the time desired by the Fund or at prices approximating the value at which the Fund is carrying the investments on its books from time to time.
Income Risk. The Fund’s income could decline due to falling market interest rates. This is because, in a falling interest rate environment, the Fund generally will have to invest the proceeds from maturing portfolio securities in lower-yielding securities.
Inflation Risk. Inflation risk is the risk that the value of assets or income from investments will be worth less in the future as inflation decreases the value of money. As inflation increases, the real value of the common shares and distributions can decline.
Insurance Risk. The Fund may purchase municipal securities that are secured by insurance, bank credit agreements or escrow accounts. The credit quality of the companies that provide such credit enhancements will affect the value of those securities. Certain significant providers of insurance for municipal securities have incurred significant losses as a result of exposure to sub-prime mortgages and other lower credit quality investments. As a result, such losses reduced the insurers’ capital and called into question their continued ability to perform their obligations under such insurance if they
154
are called upon to do so in the future. While an insured municipal security will typically be deemed to have the rating of its insurer, if the insurer of a municipal security suffers a downgrade in its credit rating or the market discounts the value of the insurance provided by the insurer, the value of the municipal security would more closely, if not entirely, reflect such rating. In such a case, the value of insurance associated with a municipal security may not add any value. The insurance feature of a municipal security does not guarantee the full payment of principal and interest through the life of an insured obligation, the market value of the insured obligation or the NAV of the common shares represented by such insured obligation.
Interest Rate Risk. Interest rate risk is the risk that municipal securities in the Fund’s portfolio will decline in value because of changes in market interest rates. Generally, when market interest rates rise, the market value of such securities will fall, and vice versa. As interest rates decline, issuers of municipal securities may prepay principal earlier than scheduled, forcing the Fund to reinvest in lower-yielding securities and potentially reducing the Fund’s income. As interest rates increase, slower than expected principal payments may extend the average life of municipal securities, potentially locking in a below-market interest rate and reducing the Fund’s value. In typical market interest rate environments, the prices of longer-term municipal securities generally fluctuate more than prices of shorter-term municipal securities as interest rates change.
Inverse Floating Rate Securities Risk. The Fund may invest in inverse floating rate securities. In general, income on inverse floating rate securities will decrease when short-term interest rates increase and increase when short-term interest rates decrease. Investments in inverse floating rate securities may subject the Fund to the risks of reduced or eliminated interest payments and losses of principal. In addition, inverse floating rate securities may increase or decrease in value at a greater rate than the underlying interest rate, which effectively leverages the Fund’s investment. As a result, the market value of such securities generally will be more volatile than that of fixed rate securities.
The Fund may invest in inverse floating rate securities issued by special purpose trusts that have recourse to the Fund. In such instances, the Fund may be at risk of loss that exceeds its investment in the inverse floating rate securities.
The Fund may be required to sell its inverse floating rate securities at less than favorable prices, or liquidate other Fund portfolio holdings in certain circumstances, including, but not limited to, the following:
| • | | If the Fund has a need for cash and the securities in a special purpose trust are not actively trading due to adverse market conditions; |
| • | | If special purpose trust sponsors (as a collective group or individually) experience financial hardship and consequently seek to terminate their respective outstanding special purpose trusts; and |
| • | | If the value of an underlying security declines significantly and if additional collateral has not been posted by the Fund. |
LIBOR Replacement Risk. The use of the London Inter-Bank Offered Rate (“LIBOR”) will begin to be phased out in the near future, which may adversely affect the Fund’s investments whose value is tied to LIBOR. There remains uncertainty regarding the future use of LIBOR and the nature of any replacement reference rate. Actions by regulators have resulted in the establishment of alternative reference rates to LIBOR in most major currencies and markets are slowly developing in response to these new rates. The transition process away from LIBOR may involve, among other things, increased volatility in markets for instruments that currently rely on LIBOR. The potential effect of a discontinuation of LIBOR on the Fund’s investments will vary depending on, among other things: (1) existing fallback provisions that provide a replacement reference rate if LIBOR is no longer available; (2) termination provisions in individual contracts; and (3) whether, how, and when industry participants develop and adopt new reference rates and fallbacks for both legacy and new products and instruments held by the Fund. Accordingly, it is difficult to predict the full impact of the transition away from LIBOR until it is clearer how the Fund’s products an instruments will be impacted by this transition.
Municipal Securities Market Liquidity Risk. Inventories of municipal securities held by brokers and dealers have decreased in recent years, lessening their ability to make a market in these securities. This reduction in market making capacity has the potential to decrease the Fund’s ability to buy or sell municipal securities at attractive prices, and increase municipal security price volatility and trading costs, particularly during periods of economic or market stress. In addition, recent federal banking regulations may cause certain dealers to reduce their inventories of municipal securities, which may further decrease the Fund’s ability to buy or sell municipal securities. As a result, the Fund may be forced to accept a lower price to sell a security, to sell other securities to raise cash, or to give up an investment opportunity, any of which could have a negative effect on performance. If the Fund needed to sell large blocks of municipal securities to raise cash to meet its obligations, those sales could further reduce the municipal securities’ prices and hurt performance.
Municipal Securities Market Risk. The amount of public information available about the municipal securities in the Fund’s portfolio is generally less than that for corporate equities or bonds, and the investment performance of the Fund may therefore be more dependent on the analytical abilities of the sub-adviser than if the Fund were a stock fund or taxable bond fund. The secondary market for municipal securities, particularly below investment grade municipal securities, also tends to be less well-developed or liquid than many other securities markets, which may adversely affect the Fund’s ability to sell its municipal securities at attractive prices.
Other Investment Companies Risk. The Fund may invest in the securities of other investment companies, including ETFs. Investing in an investment company exposes the Fund to all of the risks of that investment company’s investments. The Fund, as a holder of the securities of other investment companies, will bear its pro rata portion of the other investment companies’ expenses, including advisory fees. These expenses are in addition to the direct expenses of the Fund’s own operations. As a result, the cost of investing in investment company shares may exceed the costs of investing directly
155
Shareholder Update (Unaudited) (continued)
in its underlying investments. In addition, securities of other investment companies may be leveraged. As a result, the Fund may be indirectly exposed to leverage through an investment in such securities and therefore magnify the Fund’s leverage risk.
With respect to ETF’s, an ETF that is based on a specific index may not be able to replicate and maintain exactly the composition and relative weighting of securities in the index. The value of an ETF based on a specific index is subject to change as the values of its respective component assets fluctuate according to market volatility. ETFs typically rely on a limited pool of authorized participants to create and redeem shares, and an active trading market for ETF shares may not develop or be maintained. The market value of shares of ETFs and closed-end funds may differ from their NAV.
Puerto Rico Municipal Securities Market Risk. To the extent that the Fund invests a significant portion of its assets in the securities issued by the Commonwealth of Puerto Rico or its political subdivisions, agencies, instrumentalities, or public corporations (collectively referred to as “Puerto Rico” or the “Commonwealth”), it will be disproportionally affected by political, social and economic conditions and developments in the Commonwealth. In addition, economic, political or regulatory changes in that territory could adversely affect the value of the Fund’s investment portfolio.
Puerto Rico currently is experiencing significant fiscal and economic challenges, including substantial debt service obligations, high levels of unemployment, underfunded public retirement systems, and persistent government budget deficits. These challenges may negatively affect the value of the Fund’s investments in Puerto Rican municipal securities. Several major ratings agencies have downgraded the general obligation debt of Puerto Rico to below investment grade and continue to maintain a negative outlook for this debt, which increases the likelihood that the rating will be lowered further. Puerto Rico recently defaulted on its debt by failing to make full payment due on its outstanding bonds, and there can be no assurance that Puerto Rico will be able to satisfy its future debt obligations. Further downgrades or defaults may place additional strain on the Puerto Rico economy and may negatively affect the value, liquidity, and volatility of the Fund’s investments in Puerto Rican municipal securities. Additionally, numerous issuers have entered Title III of the Puerto Rico Oversite, Management and Economic Stability Act (“PROMESA”), which is similar to bankruptcy protection, through which the Commonwealth of Puerto Rico can restructure its debt. However, Puerto Rico’s case is the first ever heard under PROMESA and there is no existing case precedent to guide the proceedings. Accordingly, Puerto Rico’s debt restructuring process could take significantly longer than traditional municipal bankruptcy proceedings. Further, it is not clear whether a debt restructuring process will ultimately be approved or, if so, the extent to which it will apply to Puerto Rico municipal securities sold by an issuer other than the territory. A debt restructuring could reduce the principal amount due, the interest rate, the maturity, and other terms of Puerto Rico municipal securities, which could adversely affect the value of Puerto Rican municipal securities. Legislation that would allow Puerto Rico to restructure its municipal debt obligations, thus increasing the risk that Puerto Rico may never pay off municipal indebtedness, or may pay only a small fraction of the amount owed, could also impact the value of the Fund’s investments in Puerto Rican municipal securities.
These challenges and uncertainties have been exacerbated by multiple hurricanes and the resulting natural disasters that have stuck Puerto Rico since 2017. The full extent of the natural disasters’ impact on Puerto Rico’s economy and foreign investment in Puerto Rico is difficult to estimate.
Reinvestment Risk. Reinvestment risk is the risk that income from the Fund’s portfolio will decline if and when the Fund invests the proceeds from matured, traded or called municipal securities at market interest rates that are below the portfolio’s current earnings rate. A decline in income could affect the common shares’ market price, NAV and/or a common shareholder’s overall returns.
Sector and Industry Risk. Subject to the concentration limits of the Fund’s investment policies and guidelines, a Fund may invest a significant portion of its net assets in certain sectors of the municipal securities market, such as hospitals and other health care facilities, charter schools and other private educational facilities, special taxing districts and start-up utility districts, and private activity bonds including industrial development bonds on behalf of transportation companies such as airline companies, whose credit quality and performance may be more susceptible to economic, business, political, regulatory and other developments than other sectors of municipal issuers. If the Fund invests a significant portion of its net assets in the sectors noted above, the Fund’s performance may be subject to additional risk and variability.
Sector Focus Risk. At times, the Fund may focus its investments (i.e., overweight its investments relative to the overall municipal securities market) in one or more particular sectors, which may subject the Fund to additional risk and variability. Securities issued in the same sector may be similarly affected by economic or market events, making the Fund more vulnerable to unfavorable developments in that sector than funds that invest more broadly. As the percentage of the Fund’s Managed Assets invested in a particular sector increases, so does the potential for fluctuation in the NAV of the Fund’s common shares.
Special Risks Related to Certain Municipal Obligations. Municipal leases and certificates of participation involve special risks not normally associated with general obligations or revenue bonds. Leases and installment purchase or conditional sale contracts (which normally provide for title to the leased asset to pass eventually to the governmental issuer) have evolved as a means for governmental issuers to acquire property and equipment without meeting the constitutional and statutory requirements for the issuance of debt. The debt issuance limitations are deemed to be inapplicable because of the inclusion in many leases or contracts of “non-appropriation” clauses that relieve the governmental issuer of any obligation to make future payments under the lease or contract unless money is appropriated for such purpose by the appropriate legislative body. In addition, such leases or contracts may be subject to the temporary abatement of payments in the event that the governmental issuer is prevented from maintaining occupancy of the leased premises or utilizing the leased equipment. Although the obligations may be secured by the leased equipment or facilities, the disposition of the
156
property in the event of non-appropriation or foreclosure might prove difficult, time consuming and costly, and may result in a delay in recovering or the failure to fully recover the Fund’s original investment. In the event of non-appropriation, the issuer would be in default and taking ownership of the assets may be a remedy available to the Fund, although the Fund does not anticipate that such a remedy would normally be pursued.
Certificates of participation involve the same risks as the underlying municipal leases. In addition, the Fund may be dependent upon the municipal authority issuing the certificates of participation to exercise remedies with respect to the underlying securities. Certificates of participation also entail a risk of default or bankruptcy, both of the issuer of the municipal lease and also the municipal agency issuing the certificate of participation.
Swap Transactions Risk. The Fund may enter into debt-related derivative instruments such as credit default swap contracts and interest rate swaps. Like most derivative instruments, the use of swaps is a highly specialized activity that involves investment techniques and risks different from those associated with ordinary portfolio securities transactions. In addition, the use of swaps requires an understanding by the adviser and/or the sub-adviser of not only the referenced asset, rate or index, but also of the swap itself. If the investment adviser and/or the sub-adviser is incorrect in its forecasts of default risks, market spreads or other applicable factors or events, the investment performance of the Fund would diminish compared with what it would have been if these techniques were not used.
Tax Risk. The value of the Fund’s investments and its NAV may be adversely affected by changes in tax rates, rules and policies. Because interest income from municipal securities is normally not subject to regular federal income taxation, the attractiveness of municipal securities in relation to other investment alternatives is affected by changes in federal income tax rates or changes in the tax exempt status of interest income from municipal securities. Additionally, the Fund is not a suitable investment for individual retirement accounts, for other tax exempt or tax-deferred accounts, for investors who are not sensitive to the federal income tax consequences of their investments.
Taxability Risk. The Fund will invest in municipal securities in reliance at the time of purchase on an opinion of bond counsel to the issuer that the interest paid on those securities will be excludable from gross income for regular federal income tax purposes, and the sub-adviser will not independently verify that opinion. Subsequent to the Fund’s acquisition of such a municipal security, however, the security may be determined to pay, or to have paid, taxable income. As a result, the treatment of dividends previously paid or to be paid by the Fund as “exempt-interest dividends” could be adversely affected, subjecting the Fund’s shareholders to increased federal income tax liabilities. Certain other investments made by the Fund, including derivatives transactions, may result in the receipt of taxable income or gains by the Fund.
Tobacco Settlement Bond Risk. The Fund may invest in tobacco settlement bonds. Tobacco settlement bonds are municipal securities that are backed solely by expected revenues to be derived from lawsuits involving tobacco related deaths and illnesses which were settled between certain states and American tobacco companies. Tobacco settlement bonds are secured by an issuing state’s proportionate share in the Master Settlement Agreement, an agreement between 46 states and nearly all of the U.S. tobacco manufacturers (the “MSA”). Under the terms of the MSA, the actual amount of future settlement payments by tobacco-manufacturers is dependent on many factors, including, among other things, reduced cigarette consumption. Payments made by tobacco manufacturers could be negatively impacted if the decrease in tobacco consumption is significantly greater than the forecasted decline.
Unrated Securities Risk. The Fund may purchase securities that are not rated by any rating organization. The investment adviser may, after assessing such securities’ credit quality, internally assign ratings to certain of those securities in categories similar to those of rating organizations. Some unrated securities may not have an active trading market or may be difficult to value, which means the Fund might have difficulty selling them promptly at an acceptable price. To the extent that the Fund invests in unrated securities, the Fund’s ability to achieve its investment objectives will be more dependent on the investment adviser’s credit analysis than would be the case when the Fund invests in rated securities.
Valuation Risk. The municipal securities in which the Fund invests typically are valued by a pricing service utilizing a range of market-based inputs and assumptions, including readily available market quotations obtained from broker-dealers making markets in such instruments, cash flows and transactions for comparable instruments. There is no assurance that the Fund will be able to sell a portfolio security at the price established by the pricing service, which could result in a loss to the Fund. Pricing services generally price municipal securities assuming orderly transactions of an institutional “round lot” size, but some trades may occur in smaller, “odd lot” sizes, often at lower prices than institutional round lot trades. Different pricing services may incorporate different assumptions and inputs into their valuation methodologies, potentially resulting in different values for the same securities. As a result, if the Fund were to change pricing services, or if the Fund’s pricing service were to change its valuation methodology, there could be a material impact, either positive or negative, on the Fund’s NAV.
Zero Coupon Bonds Risk. Because interest on zero coupon bonds is not paid on a current basis, the values of zero coupon bonds will be more volatile in response to interest rate changes than the values of bonds that distribute income regularly. Although zero coupon bonds generate income for accounting purposes, they do not produce cash flow, and thus the Fund could be forced to liquidate securities at an inopportune time in order to generate cash to distribute to shareholders as required by tax laws.
157
Shareholder Update (Unaudited) (continued)
Fund Level and Other Risks:
Anti-Takeover Provisions. The Fund’s organizational documents include provisions that could limit the ability of other entities or persons to acquire control of the Fund or convert the Fund to open-end status. These provisions could have the effect of depriving the common shareholders of opportunities to sell their common shares at a premium over the then-current market price of the common shares.
Counterparty Risk. Changes in the credit quality of the companies that serve as the Fund’s counterparties with respect to derivatives or other transactions supported by another party’s credit will affect the value of those instruments. Certain entities that have served as counterparties in the markets for these transactions have incurred or may incur in the future significant financial hardships including bankruptcy and losses as a result of exposure to sub-prime mortgages and other lower-quality credit investments. As a result, such hardships have reduced these entities’ capital and called into question their continued ability to perform their obligations under such transactions. By using such derivatives or other transactions, the Fund assumes the risk that its counterparties could experience similar financial hardships. In the event of the insolvency of a counterparty, the Fund may sustain losses or be unable to liquidate a derivatives position.
Cybersecurity Risk. The Fund and its service providers are susceptible to operational and information security risk resulting from cyber incidents. Cyber incidents refer to both intentional attacks and unintentional events including: processing errors, human errors, technical errors including computer glitches and system malfunctions, inadequate or failed internal or external processes, market-wide technical-related disruptions, unauthorized access to digital systems (through “hacking” or malicious software coding), computer viruses, and cyber-attacks which shut down, disable, slow or otherwise disrupt operations, business processes or website access or functionality (including denial of service attacks). Cyber incidents could adversely impact the Fund and cause the Fund to incur financial loss and expense, as well as face exposure to regulatory penalties, reputational damage, and additional compliance costs associated with corrective measures. In addition, substantial costs may be incurred in order to prevent any cyber incidents in the future. Furthermore, the Fund cannot control the cybersecurity plans and systems put in place by its service providers or any other third parties whose operations may affect the Fund.
Economic and Political Events Risk. The Fund may be more sensitive to adverse economic, business or political developments if it invests a substantial portion of its assets in the municipal securities of similar projects (such as those relating to the education, health care, housing, transportation, or utilities industries), industrial development bonds, or in particular types of municipal securities (such as general obligation bonds, private activity bonds or moral obligation bonds). Such developments may adversely affect a specific industry or local political and economic conditions, and thus may lead to declines in the creditworthiness and value of such municipal securities.
Global Economic Risk. National and regional economies and financial markets are becoming increasingly interconnected, which increases the possibilities that conditions in one country, region or market might adversely impact issuers in a different country, region or market. Changes in legal, political, regulatory, tax and economic conditions may cause fluctuations in markets and securities prices around the world, which could negatively impact the value of the Fund’s investments. Major economic or political disruptions, particularly in large economies like China’s, may have global negative economic and market repercussions. Additionally, events such as war, terrorism, natural and environmental disasters and the spread of infectious illnesses or other public health emergencies may adversely affect the global economy and the markets and issuers in which the Fund invests. Recent examples of such events include the outbreak of a novel coronavirus known as COVID-19 that was first detected in China in December 2019 and heightened concerns regarding North Korea’s nuclear weapons and long-range ballistic missile programs. These events could reduce consumer demand or economic output, result in market closure, travel restrictions or quarantines, and generally have a significant impact on the economy. These events could also impair the information technology and other operational systems upon which the Fund’s service providers, including the investment adviser and sub-adviser, rely, and could otherwise disrupt the ability of employees of the Fund’s service providers to perform essential tasks on behalf of the Fund. Governmental and quasi-governmental authorities and regulators throughout the world have in the past responded to major economic disruptions with a variety of significant fiscal and monetary policy changes, including but not limited to, direct capital infusions into companies, new monetary programs and dramatically lower interest rates. An unexpected or quick reversal of these policies, or the ineffectiveness of these policies, could increase volatility in securities markets, which could adversely affect the Fund’s investments.
Investment and Market Risk. An investment in common shares is subject to investment risk, including the possible loss of the entire principal amount that you invest. Common shares frequently trade at a discount to their NAV. An investment in common shares represents an indirect investment in the securities owned by the Fund. Common shares at any point in time may be worth less than your original investment, even after taking into account the reinvestment of Fund dividends and distributions.
Legislation and Regulatory Risk. At any time after the date of this report, legislation or additional regulations may be enacted that could negatively affect the assets of the Fund, securities held by the Fund or the issuers of such securities. Fund shareholders may incur increased costs resulting from such legislation or additional regulation. There can be no assurance that future legislation, regulation or deregulation will not have a material adverse effect on the Fund or will not impair the ability of the Fund to achieve its investment objectives.
The SEC’s recently adopted new Rule 18f-4 under the 1940 Act governing the use of derivatives by registered investment companies, which could affect the nature and extent of derivatives used by the Fund. It is possible that the recently adopted Rule 18f-4 could limit the implementation of the Fund’s use of derivatives, which could have an adverse impact on the Fund.
158
Leverage Risk. The use of leverage creates special risks for common shareholders, including potential interest rate risks and the likelihood of greater volatility of NAV and market price of, and distributions on, the common shares. The use of leverage in a declining market will likely cause a greater decline in the Fund’s NAV, which may result at a greater decline of the common share price, than if the Fund were not to have used leverage.
The Fund will pay (and common shareholders will bear) any costs and expenses relating to the Fund’s use of leverage, which will result in a reduction in the Fund’s NAV. The investment adviser may, based on its assessment of market conditions and composition of the Fund’s holdings, increase or decrease the amount of leverage. Such changes may impact the Fund’s distributions and the price of the common shares in the secondary market.
The Fund may seek to refinance its leverage over time, in the ordinary course, as current forms of leverage mature or it is otherwise desirable to refinance; however, the form that such leverage will take cannot be predicted at this time. If the Fund is unable to replace existing leverage on comparable terms, its costs of leverage will increase. Accordingly, there is no assurance that the use of leverage may result in a higher yield or return to common shareholders.
The amount of fees paid to the investment adviser and the sub-advisor for investment advisory services will be higher if the Fund uses leverage because the fees will be calculated based on the Fund’s Managed Assets - this may create an incentive for the investment adviser and the sub-advisor to leverage the Fund or increase the Fund’s leverage.
Market Discount from Net Asset Value. Shares of closed-end investment companies like the Fund frequently trade at prices lower than their NAV. This characteristic is a risk separate and distinct from the risk that the Fund’s NAV could decrease as a result of investment activities. Whether investors will realize gains or losses upon the sale of the common shares will depend not upon the Fund’s NAV but entirely upon whether the market price of the common shares at the time of sale is above or below the investor’s purchase price for the common shares. Furthermore, management may have difficulty meeting the Fund’s investment objectives and managing its portfolio when the underlying securities are redeemed or sold during periods of market turmoil and as investors’ perceptions regarding closed-end funds or their underlying investments change. Because the market price of the common shares will be determined by factors such as relative supply of and demand for the common shares in the market, general market and economic circumstances, and other factors beyond the control of the Fund, the Fund cannot predict whether the common shares will trade at, below or above NAV. The common shares are designed primarily for long-term investors, and you should not view the Fund as a vehicle for short-term trading purposes.
Recent Market Conditions. In response to the financial crisis and recent market events, policy and legislative changes by the United States government and the Federal Reserve to assist in the ongoing support of financial markets, both domestically and in other countries, are changing many aspects of financial regulation. The impact of these changes on the markets, and the practical implications for market participants, may not be fully known for some time. Withdrawal of government support, failure of efforts in response to the crisis, or investor perception that such efforts are not succeeding, could adversely impact the value and liquidity of certain securities. The severity or duration of adverse economic conditions may also be affected by policy changes made by governments or quasi-governmental organizations, including changes in tax laws and the imposition of trade barriers. The impact of new financial regulation legislation on the markets and the practical implications for market participants may not be fully known for some time. Changes to the Federal Reserve policy may affect the value, volatility and liquidity of dividend and interest paying securities. In addition, the contentious domestic political environment, as well as political and diplomatic events within the United States and abroad, such as the U.S. government’s inability at times to agree on a long-term budget and deficit reduction plan, the threat of a federal government shutdown and threats not to increase the federal government’s debt limit, may affect investor and consumer confidence and may adversely impact financial markets and the broader economy, perhaps suddenly and to a significant degree.
Interest rates have been unusually low in recent years in the United States and abroad but there is consensus that interest rates will increase during the life of the Fund, which could negatively impact the price of debt securities. Because there is little precedent for this situation, it is difficult to predict the impact of a significant rate increase on various markets.
The current political climate has intensified concerns about a potential trade war between China and the United States, as each country has recently imposed tariffs on the other country’s products. These actions may trigger a significant reduction in international trade, the oversupply of certain manufactured goods, substantial price reductions of goods and possible failure of individual companies and/or large segments of China’s export industry, which could have a negative impact on the Fund’s performance.
The impact of these developments in the near- and long-term is unknown and could have additional adverse effects on economies, financial markets and asset valuations around the world.
Reverse Repurchase Agreement Risk. A reverse repurchase agreement, in economic essence, constitutes a securitized borrowing by the Fund from the security purchaser. The Fund may enter into reverse repurchase agreements for the purpose of creating a leveraged investment exposure and, as such, their usage involves essentially the same risks associated with a leveraging strategy generally since the proceeds from these agreements may be invested in additional portfolio securities. Reverse repurchase agreements tend to be short-term in tenor, and there can be no assurances that the purchaser (lender) will commit to extend or “roll” a given agreement upon its agreed-upon repurchase date or an alternative purchaser can be identified on similar terms. Reverse repurchase agreements also involve the risk that the purchaser fails to return the securities as agreed upon, files for
159
Shareholder Update (Unaudited) (continued)
bankruptcy or becomes insolvent. The Fund may be restricted from taking normal portfolio actions during such time, could be subject to loss to the extent that the proceeds of the agreement are less than the value of securities subject to the agreement and may experience adverse tax consequences.
EFFECTS OF LEVERAGE
The following table is furnished in response to requirements of the SEC. It is designed to illustrate the effects of leverage through the use of senior securities, as that term is defined under Section 18 of the 1940 Act, as well as certain other forms of leverage, such as reverse repurchase agreements and investments in inverse floating rate securities, on common share total return, assuming investment portfolio total returns (consisting of income and changes in the value of investments held in a Fund’s portfolio) of -10%, -5%, 0%, 5% and 10%. The table below reflects each Fund’s (i) continued use of leverage as of October 31, 2021 as a percentage of Managed Assets (including assets attributable to such leverage), (ii) the estimated annual effective interest expense rate payable by the Funds on such instruments (based on actual leverage costs incurred during the fiscal year ended October 31, 2021) as set forth in the table, and (iii) the annual return that the Fund’s portfolio must experience (net of expenses) in order to cover such costs of leverage based on such estimated annual effective interest expense rate. The information below does not reflect any Fund’s use of certain derivative instruments.
The numbers are merely estimates, used for illustration. The costs of leverage may vary frequently and may be significantly higher or lower than the estimated rate. The assumed investment portfolio returns in the table below are hypothetical figures and are not necessarily indicative of the investment portfolio returns experienced or expected to be experienced by the Funds. Your actual returns may be greater or less than those appearing below.
| | | |
| | Nuveen Quality Municipal | Nuveen AMT-Free Quality |
| | Income Fund (NAD) | Municipal Income Fund (NEA) |
| Estimated Leverage as a Percentage of Managed Assets (Including Assets Attributable to Leverage) | 36.91% | 37.35% |
| Estimated Annual Effective Leverage Expense Rate Payable by Fund on Leverage | 0.93% | 0.94% |
| Annual Return Fund Portfolio Must Experience (net of expenses) to Cover Estimated Annual | | |
| Effective Interest Expense Rate on Leverage | 0.34% | 0.35% |
| Common Share Total Return for (10.00)% Assumed Portfolio Total Return | -16.39% | -16.52% |
| Common Share Total Return for (5.00)% Assumed Portfolio Total Return | -8.47% | -8.54% |
| Common Share Total Return for 0.00% Assumed Portfolio Total Return | -0.54% | -0.56% |
| Common Share Total Return for 5.00% Assumed Portfolio Total Return | 7.38% | 7.42% |
| Common Share Total Return for 10.00% Assumed Portfolio Total Return | 15.31% | 15.40% |
Common Share total return is composed of two elements — the distributions paid by the Fund to holders of common shares (the amount of which is largely determined by the net investment income of the Fund after paying dividend payments on any preferred shares issued by the Fund and expenses on any forms of leverage outstanding) and gains or losses on the value of the securities and other instruments the Fund owns. As required by SEC rules, the table assumes that the Funds are more likely to suffer capital losses than to enjoy capital appreciation. For example, to assume a total return of 0%, the Fund must assume that the income it receives on its investments is entirely offset by losses in the value of those investments. This table reflects hypothetical performance of the Fund’s portfolio and not the actual performance of the Fund’s common shares, the value of which is determined by market forces and other factors. Should the Fund elect to add additional leverage to its portfolio, any benefits of such additional leverage cannot be fully achieved until the proceeds resulting from the use of such leverage have been received by the Fund and invested in accordance with the Fund’s investment objectives and policies. As noted above, the Fund’s willingness to use additional leverage, and the extent to which leverage is used at any time, will depend on many factors.
160
DIVIDEND REINVESTMENT PLAN
Nuveen Closed-End Funds Automatic Reinvestment Plan
Your Nuveen Closed-End Fund allows you to conveniently reinvest distributions in additional Fund shares. By choosing to reinvest, you’ll be able to invest money regularly and automatically, and watch your investment grow through the power of compounding. Just like distributions in cash, there may be times when income or capital gains taxes may be payable on distributions that are reinvested. It is important to note that an automatic reinvestment plan does not ensure a profit, nor does it protect you against loss in a declining market.
Easy and convenient
To make recordkeeping easy and convenient, each month you’ll receive a statement showing your total distributions, the date of investment, the shares acquired and the price per share, and the total number of shares you own.
How shares are purchased
The shares you acquire by reinvesting will either be purchased on the open market or newly issued by the Fund. If the shares are trading at or above NAV at the time of valuation, the Fund will issue new shares at the greater of the NAV or 95% of the then-current market price. If the shares are trading at less than NAV, shares for your account will be purchased on the open market. If Computershare Trust Company, N.A. (the “Plan Agent”) begins purchasing Fund shares on the open market while shares are trading below NAV, but the Fund’s shares subsequently trade at or above their NAV before the Plan Agent is able to complete its purchases, the Plan Agent may cease open-market purchases and may invest the uninvested portion of the distribution in newly-issued Fund shares at a price equal to the greater of the shares’ NAV or 95% of the shares’ market value on the last business day immediately prior to the purchase date. Distributions received to purchase shares in the open market will normally be invested shortly after the distribution payment date. No interest will be paid on distributions awaiting reinvestment. Because the market price of the shares may increase before purchases are completed, the average purchase price per share may exceed the market price at the time of valuation, resulting in the acquisition of fewer shares than if the distribution had been paid in shares issued by the Fund. A pro rata portion of any applicable brokerage commissions on open market purchases will be paid by Dividend Reinvestment Plan (the “Plan”) participants. These commissions usually will be lower than those charged on individual transactions.
Flexible
You may change your distribution option or withdraw from the Plan at any time, should your needs or situation change. You can reinvest whether your shares are registered in your name, or in the name of a brokerage firm, bank, or other nominee. Ask your investment advisor if his or her firm will participate on your behalf. Participants whose shares are registered in the name of one firm may not be able to transfer the shares to another firm and continue to participate in the Plan. The Fund reserves the right to amend or terminate the Plan at any time. Although the Fund reserves the right to amend the Plan to include a service charge payable by the participants, there is no direct service charge to participants in the Plan at this time.
Call today to start reinvesting distributions
For more information on the Nuveen Automatic Reinvestment Plan or to enroll in or withdraw from the Plan, speak with your financial professional or call us at (800) 257-8787.
CHANGES OCCURRING DURING THE FISCAL YEAR
The following information in this annual report is a summary of certain changes during the most recent fiscal year. This information may not reflect all of the changes that have occurred since you purchased shares of a Fund.
During the most recent fiscal year, there have been no changes to: (i) the Funds’ investment objectives and principal investment policies that have not been approved by shareholders, (ii) the principal risks of the Fund, (iii) the portfolio managers of the Funds; (iv) a Fund’s charter or by-laws that would delay or prevent a change of control of the Fund that have not been approved by shareholders.
161
Shareholder Update (Unaudited) (continued)
UPDATED DISCLOSURES FOR THE FUND WITH AN EFFECTIVE SHELF OFFERING REGISTRATION STATEMENT
The following includes additional disclosures for the Fund in this annual report with an effective shelf offering registration statement as of the fiscal year ended October 31, 2021.
NUVEEN AMT-FREE QUALITY MUNICIPAL INCOME FUND (NEA)
SENIOR SECURITIES
The following table sets forth information regarding the Fund’s outstanding senior securities as of the end of each of the Fund’s last ten fiscal periods, as applicable. The Fund’s senior securities during this time period are comprised of borrowings that constitute “senior securities” as defined in the Investment Company Act of 1940, as amended (1940 Act). The information in this table for the fiscal years ended 2021, 2020, 2019, 2018 and 2017 has been audited by KPMG LLP, independent registered public accounting firm. The Fund’s audited financial statements, including the report of KPMG LLP thereon, and accompanying notes thereto, are included in this Annual Report.
| | | | | | | | | | | | |
| | | | | | | | Variable Rate | | | AMPT, MFP, |
| | Adjustable Rate | | | MuniFund Term | MuniFund Term | Variable Rate | MTP, VMTP |
| | MuniFund Term | MuniFund Preferred | Preferred (MTP) | Preferred (VMTP) | Demand Preferred | and/or VRDP |
| | Preferred (AMTP) Shares | (MFP) Shares | Shares at the | Shares at the | (VRDP) Shares at | Shares at the |
| | at the End of Period | at the End of Period | End of Period | End of Period | the End of Period | End of Period |
| | | Asset | | Asset | | | | Asset | | Asset | Asset |
| | Aggregate | Coverage | Aggregate | Coverage | Aggregate | Asset | Aggregate | Coverage | Aggregate | Coverage Coverage |
| | Amount | Per | Amount | Per | Amount | Coverage | Amount | Per | Amount | Per | Per $1 |
| Fiscal Year | Outstanding | $100,000 | Outstanding | $100,000 | Outstanding | Per $10 | Outstanding | $100,000 | Outstanding | $100,000 Liquidation |
| Ended | (000) (1) | Share (2) | (000) (1) | Share (2)(3) | (000) (1) | Share (4) | (000) (1) | Share (2) | (000) (1) | Share (2) | Preference |
| October 31 | | | | | | | | | | | |
| 2021 | $316,500 | $283,145 | $1,088,900 | $283,145 | $0 | $0 | $0 | $0 | $1,159,400 | $283,145 | $2.83 |
| 2020 | $143,500 | $280,550 | $958,000 | $280,550 | $0 | $0 | $0 | $0 | $1,290,300 | $280,550 | $2.81 |
| 2019 | $0 | $0 | $958,000 | $282,066 | $0 | $0 | $0 | $0 | $1,290,300 | $282,066 | $2.82 |
| 2018 | $0 | $0 | $958,000 | $265,448 | $0 | $0 | $0 | $0 | $1,290,300 | $265,448 | $2.65 |
| 2017 | $0 | $0 | $0 | $0 | $0 | $0 | $773,000 | $291,919 | $1,290,300 | $291,919 | $2.92 |
| 2016 | $0 | $0 | $0 | $0 | $0 | $0 | $773,000 | $295,667 | $1,290,300 | $295,667 | $2.96 |
| 2015 | $0 | $0 | $0 | $0 | $0 | $0 | $151,000 | $333,349 | $349,900 | $333,349 | $3.33 |
| 2014 | $0 | $0 | $0 | $0 | $0 | $0 | $151,000 | $338,193 | $349,900 | $338,193 | $3.38 |
| 2013 | $0 | $0 | $0 | $0 | $83,000 | $31.65 | $67,600 | $316,451 | $349,900 | $316,451 | $3.16 |
| 2012 | $0 | $0 | $0 | $0 | $83,000 | $32.87 | $67,600 | $328,743 | $0 | $0 | $3.29 |
| (1) | | Aggregate amount outstanding represents the liquidation preference multiplied by the number of outstanding preferred shares as of the end of the relevant fiscal year. |
| (2) | | Asset coverage per $100,000 share is calculated by subtracting the Fund’s liabilities and indebtedness not represented by senior securities from the Fund’s total assets, dividing the result by the aggregate amount of the Fund’s senior securities representing indebtedness then outstanding, and multiplying the result by 100,000. |
| (3) | | The Fund’s Series D MFP Shares have a $1,000 liquidation preference per share, while all other MFP Shares have a $100,000 liquidation preference per share. The asset coverage per $1,000 share for the Fund’s Series D MFP Shares were as follows: |
| | | | | |
| | Fiscal Year Ended October 31 |
| Series D MFP Shares | 2021 | 2020 | 2019 | 2018 |
| Asset Coverage Per $1,000 Share* | $2,831 | $2,805 | $2,800 | $0 |
| * | | Asset coverage per $1,000 share is calculated by subtracting the Fund’s liabilities and indebtedness not represented by senior securities from the Fund’s total assets, dividing the result by the aggregate amount of the Fund’s senior securities representing indebtedness then outstanding, and multiplying the result by 1,000. |
| (4) | | Asset coverage per $10 share is calculated by subtracting the Fund’s liabilities and indebtedness not represented by senior securities from the Fund’s total assets, dividing the result by the aggregate amount of the Fund’s senior securities representing indebtedness then outstanding, and multiplying the result by 10. The Ending and Average Market Value Per Share for each Series of the Fund’s MTP Shares outstanding were as follows: |
| | | | |
| | Fiscal Year Ended October 31 |
| Series 2015 (NEA PRCCL) | 2014 | 2013 | 2012 |
| Ending Market Value per Share | $0 | $10.07 | $10.16 |
| Average Market Value per Share | $10.05** | $10.10 | $10.14 |
| ** | | For the period November 1, 2013 through December 20, 2013. |
UNRESOLVED STAFF COMMENTS
The Fund believes that there are no material unresolved written comments, received 180 days or more before October 31, 2021, from the Staff of the SEC regarding any of its periodic or current reports under the Securities Exchange Act or the 1940 Act, or its registration statement.
162
Additional Fund Information (Unaudited)
| Board of Trustees | | | | | |
| Jack B. Evans | William C. Hunter | Amy B. R. Lancellotta | Joanne T. Medero | Albin F. Moschner | John K. Nelson |
| Judith M. Stockdale | Carole E. Stone | Matthew Thornton III | Terence J. Toth | Margaret L. Wolff | Robert L. Young |
| Investment Adviser | Custodian | Legal Counsel | Independent Registered | Transfer Agent and |
| Nuveen Fund Advisors, LLC | State Street Bank | Chapman and Cutler LLP | Public Accounting Firm | Shareholder Services |
| 333 West Wacker Drive | & Trust Company | Chicago, IL 60603 | KPMG LLP | Computershare Trust |
| Chicago, IL 60606 | One Lincoln Street | | 200 East Randolph Street | Company, N.A. |
| | Boston, MA 02111 | | Chicago, IL 60601 | 150 Royall Street |
| | | | | Canton, MA 02021 |
| | | | | (800) 257-8787 |
Portfolio of Investments Information
Each Fund is required to file its complete schedule of portfolio holdings with the Securities and Exchange Commission (SEC) for the first and third quarters of each fiscal year as an exhibit to its report on Form N-PORT. You may obtain this information on the SEC’s website at http://www.sec.gov.
Nuveen Funds’ Proxy Voting Information
You may obtain (i) information regarding how each fund voted proxies relating to portfolio securities held during the most recent twelve-month period ended June 30, without charge, upon request, by calling Nuveen toll-free at (800) 257-8787 or on Nuveen’s website at www.nuveen.com and (ii) a description of the policies and procedures that each fund used to determine how to vote proxies relating to portfolio securities without charge, upon request, by calling Nuveen toll free at (800) 257-8787. You may also obtain this information directly from the SEC. Visit the SEC on-line at http://www.sec.gov.
CEO Certification Disclosure
Each Fund’s Chief Executive Officer (CEO) has submitted to the New York Stock Exchange (NYSE) the annual CEO certification as required by Section 303A.12(a) of the NYSE Listed Company Manual. Each Fund has filed with the SEC the certification of its CEO and Chief Financial Officer required by Section 302 of the Sarbanes-Oxley Act.
Common Share Repurchases
Each Fund intends to repurchase, through its open-market share repurchase program, shares of its own common stock at such times and in such amounts as is deemed advisable. During the period covered by this report, each Fund repurchased shares of its common stock as shown in the accompanying table. Any future repurchases will be reported to shareholders in the next annual or semi-annual report.
| | | |
| | NAD | NEA |
| Common shares repurchased | 0 | 0 |
FINRA BrokerCheck
The Financial Industry Regulatory Authority (FINRA) provides information regarding the disciplinary history of FINRA member firms and associated investment professionals. This information as well as an investor brochure describing FINRA BrokerCheck is available to the public by calling the FINRA BrokerCheck Hotline number at (800) 289-9999 or by visiting www.FINRA.org.
163
Glossary of Terms Used in this Report (Unaudited)
| • | | Average Annual Total Return: This is a commonly used method to express an investment’s performance over a particular, usually multi-year time period. It expresses the return that would have been necessary each year to equal the investment’s actual cumulative performance (including change in NAV or market price and reinvested dividends and capital gains distributions, if any) over the time period being considered. |
| • | | Duration: Duration is a measure of the expected period over which a bond’s principal and interest will be paid, and consequently is a measure of the sensitivity of a bond’s or bond fund’s value to changes when market interest rates change. Generally, the longer a bond’s or fund’s duration, the more the price of the bond or fund will change as interest rates change. |
| • | | Effective Leverage: Effective leverage is a fund’s effective economic leverage, and includes both regulatory leverage (see leverage) and the leverage effects of certain derivative investments in the fund’s portfolio. Currently, the leverage effects of Tender Option Bond (TOB) inverse floater holdings are included in effective leverage values, in addition to any regulatory leverage. |
| • | | Gross Domestic Product (GDP): The total market value of all final goods and services produced in a country/region in a given year, equal to total consumer, investment and government spending, plus the value of exports, minus the value of imports. |
| • | | Inverse Floating Rate Securities: Inverse floating rate securities, also known as inverse floaters or tender option bonds (TOBs), are created by depositing a municipal bond, typically with a fixed interest rate, into a special purpose trust. This trust, in turn, (a) issues floating rate certificates typically paying short-term tax-exempt interest rates to third parties in amounts equal to some fraction of the deposited bond’s par amount or market value, and (b) issues an inverse floating rate certificate (sometimes referred to as an “inverse floater”) to an investor (such as a fund) interested in gaining investment exposure to a long-term municipal bond. The income received by the holder of the inverse floater varies inversely with the short-term rate paid to the floating rate certificates’ holders, and in most circumstances the holder of the inverse floater bears substantially all of the underlying bond’s downside investment risk. The holder of the inverse floater typically also benefits disproportionately from any potential appreciation of the underlying bond’s value. Hence, an inverse floater essentially represents an investment in the underlying bond on a leveraged basis. |
| • | | Leverage: Leverage is created whenever a fund has investment exposure (both reward and/or risk) equivalent to more than 100% of the investment capital. |
| • | | NAD and NEA Blended Benchmark: A blended benchmark consisting of the returns of the S&P Municipal Bond Index prior to 9/12/16 and thereafter: 1) 80% of the return of the S&P Municipal Bond Investment Grade Index and 2) 20% of the return of the S&P Municipal Bond High Yield Index. The S&P Municipal Bond Index is a market value-weighted index designed to measure the performance of the tax-exempt U.S. municipal bond market. The S&P Municipal Bond Investment Grade Index is a market value-weighted index designed to measure the performance of tax-exempt investment grade municipal bonds. The S&P Municipal Bond High Yield Index is a market value-weighted index designed to measure the performance of tax-exempt high yield municipal bonds. Index returns assume compounding and do not include the effects of any fees or expenses. |
| • | | Net Asset Value (NAV) Per Share: A fund’s Net Assets is equal to its total assets (securities, cash, accrued earnings and receivables) less its total liabilities. NAV per share is equal to the fund’s Net Assets divided by its number of shares outstanding. |
164
| • | | Pre-Refunded Bond/Pre-Refunding: Pre-Refunded Bond/Pre-Refunding, also known as advanced refundings or refinancings, is a procedure used by state and local governments to refinance municipal bonds to lower interest expenses. The issuer sells new bonds with a lower yield and uses the proceeds to buy U.S. Treasury securities, the interest from which is used to make payments on the higher-yielding bonds. Because of this collateral, pre-refunding generally raises a bond’s credit rating and thus its value. |
| • | | Regulatory Leverage: Regulatory leverage consists of preferred shares issued by or borrowings of a fund. Both of these are part of a fund’s capital structure. Regulatory leverage is subject to asset coverage limits set in the Investment Company Act of 1940. |
| • | | S&P Municipal Bond Index: A market value-weighted index designed to measure the performance of the tax-exempt, U.S. municipal bond market. Index returns assume reinvestment of distributions, but do not reflect any applicable sales charges or management fees. |
| • | | Total Investment Exposure: Total investment exposure is a fund’s assets managed by the Adviser that are attributable to financial leverage. For these purposes, financial leverage includes a fund’s use of preferred stock and borrowings and investments in the residual interest certificates (also called inverse floating rate securities) in tender option bond (TOB) trusts, including the portion of assets held by a TOB trust that has been effectively financed by the trust’s issuance of floating rate securities. |
| • | | Zero Coupon Bond: A zero coupon bond does not pay a regular interest coupon to its holders during the life of the bond. Income to the holder of the bond comes from accretion of the difference between the original purchase price of the bond at issuance and the par value of the bond at maturity and is effectively paid at maturity. The market prices of zero coupon bonds generally are more volatile than the market prices of bonds that pay interest periodically. |
165
Annual Investment Management Agreement Approval Process
At a meeting held on May 25-27, 2021 (the “May Meeting”), the Boards of Trustees (collectively, the “Board” and each Trustee, a “Board Member”), of the Funds, which are comprised entirely of Board Members who are not “interested persons” (as defined under the Investment Company Act of 1940 (the “1940 Act”)) (the “Independent Board Members”), approved, for their respective Fund, the renewal of the management agreement (each, an “Investment Management Agreement”) with Nuveen Fund Advisors, LLC (the “Adviser”), pursuant to which the Adviser serves as the investment adviser to such Fund and the sub-advisory agreement (each, a “Sub-Advisory Agreement”) with Nuveen Asset Management, LLC (the “Sub-Adviser”), pursuant to which the Sub-Adviser serves as the investment sub-adviser to such Fund. Although the 1940 Act requires that continuances of the Advisory Agreements (as defined below) be approved by the in-person vote of a majority of the Independent Board Members, the May Meeting was held virtually through the internet in view of the health risks associated with holding an in-person meeting during the COVID-19 pandemic and governmental restrictions on gatherings. The May Meeting was held virtually in reliance on certain exemptive relief the Securities and Exchange Commission provided to registered investment companies providing temporary relief from the in-person voting requirements of the 1940 Act with respect to the approval of a fund’s advisory agreement in light of these challenges.
Following up to an initial two-year period, the Board considers the renewal of each Investment Management Agreement and Sub-Advisory Agreement on behalf of the applicable Fund on an annual basis. The Investment Management Agreements and Sub-Advisory Agreements are collectively referred to as the “Advisory Agreements” and the Adviser and the Sub-Adviser are collectively, the “Fund Advisers” and each, a “Fund Adviser.” Throughout the year, the Board and its committees meet regularly and, at these meetings, receive regular and/or special reports that cover an extensive array of topics and information that are relevant to its annual consideration of the renewal of the advisory agreements for the Nuveen funds. Such information may address, among other things, fund performance and risk information; the Adviser’s strategic plans; product initiatives for various funds; the review of the funds and investment teams; compliance, regulatory and risk management matters; the trading practices of the various sub-advisers to the funds; valuation of securities; fund expenses; securities lending; liquidity management; overall market and regulatory developments; and with respect to closed-end funds, capital management initiatives, institutional ownership, management of leverage financing and the secondary market trading of the closed-end funds and any actions to address discounts. The Board also seeks to meet periodically with the Nuveen funds’ sub-advisers and portfolio teams, when feasible.
In addition, in connection with the annual consideration of the advisory agreements for the Nuveen funds, the Board, through its independent legal counsel, requested and received extensive materials and information prepared specifically for its annual consideration of the renewal of such advisory agreements by the Adviser and by Broadridge Financial Solutions, Inc. (“Broadridge”), an independent provider of investment company data. The materials cover a wide range of topics including, but not limited to, a description of the nature, extent and quality of services provided by the Fund Advisers; a review of product actions taken during 2020 (such as mergers, liquidations, fund launches, changes to investment teams, and changes to investment policies); a review of each sub-adviser to the Nuveen funds and the applicable investment teams; an analysis of fund performance in absolute terms and as compared to the performance of certain peer funds and benchmarks with a focus on any performance outliers; an analysis of the fees and expense ratios of the Nuveen funds in absolute terms and as compared to those of certain peer funds with a focus on any expense outliers; a review of management fee schedules; a description of portfolio manager compensation; an overview of the secondary market trading of shares of the Nuveen closed-end funds (including, among other things, an analysis of performance, distribution and valuation and capital-raising trends in the broader closed-end fund market and with respect to Nuveen closed-end funds and a review of the leverage management actions taken on behalf of the closed-end funds particularly during the periods of market volatility generally caused by the COVID-19 pandemic); a review of the performance of various service providers; a description of various initiatives Nuveen had undertaken or continued during the year for the benefit of particular fund(s) and/or the
166
complex; a description of the profitability or financial data of Nuveen and the sub-advisers to the Nuveen funds; and a description of indirect benefits received by the Adviser and the sub-advisers as a result of their relationships with the Nuveen funds. The information prepared specifically for the annual review supplemented the information provided to the Board and its committees and the evaluations of the Nuveen funds by the Board and its committees during the year.
In continuing its practice, the Board met prior to the May Meeting to begin its considerations of the renewal of the Advisory Agreements. Accordingly, on April 21-22, 2021 (the “April Meeting”), the Board met to review and discuss, in part, the performance of the Nuveen funds and the Adviser’s evaluation of each sub-adviser to the Nuveen funds. At the April Meeting, the Board Members asked questions and requested additional information that was provided for the May Meeting. The Board reviewed fund performance throughout the year and in its review, the Board recognized the volatile market conditions that occurred in early 2020 arising, in part, from the public health crisis caused by the novel coronavirus known as COVID-19 and the resulting impact on a fund’s performance for 2020 and thereafter. Accordingly, the Board considered performance data measured over various periods of time as summarized in more detail below.
The Independent Board Members considered the review of the advisory agreements for the Nuveen funds to be an ongoing process and employed the accumulated information, knowledge and experience the Board Members had gained during their tenure on the boards governing the Nuveen funds and working with the Adviser and sub-advisers in their review of the advisory agreements. The contractual arrangements are a result of multiple years of review, negotiation and information provided in connection with the boards’ annual review of the Nuveen funds’ advisory arrangements and oversight of the Nuveen funds.
The Independent Board Members were advised by independent legal counsel during the annual review process as well as throughout the year, including meeting in executive sessions with such counsel at which no representatives from the Adviser or the Sub-Adviser were present. In connection with their annual review, the Independent Board Members also received a memorandum from independent legal counsel outlining their fiduciary duties and legal standards in reviewing the Advisory Agreements.
The Board’s decision to renew the Advisory Agreements was not based on a single identified factor, but rather the decision reflected the comprehensive consideration of all the information provided throughout the year and at the April and May Meetings, and each Board Member may have attributed different levels of importance to the various factors and information considered in connection with the approval process. The following summarizes the principal factors and information, but not all the factors, the Board considered in deciding to renew the Advisory Agreements as well as the Board’s conclusions.
A. Nature, Extent and Quality of Services
In evaluating the renewal of the Advisory Agreements, the Independent Board Members received and considered information regarding the nature, extent and quality of the applicable Fund Adviser’s services provided to the respective Fund with particular focus on the services and enhancements to such services provided during the last year. The Independent Board Members considered the Investment Management Agreements and the Sub-Advisory Agreements separately in the course of their review. With this approach, they considered the respective roles of the Adviser and the Sub-Adviser in providing services to the Funds.
The Board recognized that the Nuveen funds operate in a highly regulated industry and, therefore, the Adviser has provided a wide array of management, oversight and administrative services to manage and operate the funds, and the scope and complexity of these services have expanded over time as a result of, among other things, regulatory and other developments. The Board accordingly considered the extensive resources, tools and capabilities available to the Adviser to operate and manage the Nuveen funds. With respect to the Adviser, as a general matter, some of these services it and its affiliates provide to the Nuveen funds include, but are not limited to: product management (such as setting dividends, analyzing fund expenses, providing competitive analysis, and providing due diligence support); investment oversight, risk management and securities valuation services (such as overseeing and reviewing the various sub-advisers to the Nuveen funds and their investment teams; analyzing fund performance and risk data; overseeing operational and risk management; participating in financial statement,
167
Annual Investment Management Agreement Approval Process (continued)
marketing and risk disclosures; providing daily valuation services and developing related valuation policies, procedures and methodologies; periodic testing of audit and regulatory requirements; participating in product development and management processes; participating in leverage management, liquidity monitoring and counterparty credit oversight; providing due diligence and overseeing fund accounting and custody providers; overseeing third party pricing services and periodically assessing investment and liquidity risks); fund administration (such as preparing fund tax returns and other tax compliance services; preparing regulatory filings; overseeing the funds’ independent public accountants and other service providers; analyzing products and enhancements; and managing fund budgets and expenses); oversight of shareholder services and transfer agency functions (such as overseeing transfer agent service providers which include registered shareholder customer service and transaction processing; overseeing proxy solicitation and tabulation services; and overseeing the production and distribution of financial reports by service providers); Board relations services (such as organizing and administering Board and committee meetings, preparing various reports to the Board and committees and providing other support services); compliance and regulatory oversight services (such as managing compliance policies; monitoring compliance with applicable fund policies and laws and regulations; devising internal compliance programs and a framework to review and assess compliance programs; evaluating the compliance programs of the various sub-advisers to the Nuveen funds and certain other service providers; responding to regulatory requests; and preparing compliance training materials); legal support and oversight of outside law firms (such as helping to prepare and file registration statements and proxy statements; overseeing fund activities and providing legal interpretations regarding such activities; maintaining regulatory registrations and negotiating agreements with other fund service providers; and monitoring changes in regulatory requirements and commenting on rule proposals impacting investment companies); and with respect to closed-end funds, managing leverage, monitoring asset coverage and promoting an orderly secondary market.
In evaluating services, the Board reviewed various highlights of the initiatives the Adviser and its affiliates have undertaken or continued in 2020 to benefit the Nuveen complex and/or particular Nuveen funds and meet the requirements of an increasingly complex regulatory environment including, but not limited to:
| • | | Centralization of Functions – ongoing initiatives to centralize investment leadership, market approach and shared support functions within Nuveen and its affiliates in seeking to operate more effectively the business and enhance the services to the Nuveen funds; |
| • | | Fund Improvements and Product Management Initiatives – continuing to proactively manage the Nuveen fund complex as a whole and at the individual fund level with an aim to continually improve product platforms and investment strategies to better serve shareholders through, among other things, rationalizing the product line and gaining efficiencies through mergers, repositionings and liquidations; launching new funds; reviewing and updating investment policies and benchmarks; and modifying portfolio management teams for various funds; |
| • | | Investment Team Integrations – continuing to integrate and adjust the members of certain investment teams, in part, to allow greater access to tools and resources within the Nuveen organization and its affiliates; |
| • | | Capital Initiatives – continuing to invest capital to support new Nuveen funds with initial capital as well as to support existing funds and facilitate regulatory or logistical changes; |
| • | | Compliance Program Initiatives – continuing efforts to mitigate compliance risk, increase operating efficiencies, implement enhancements to strengthen key compliance program elements and support international business growth and other corporate objectives; |
| • | | Investment Oversight – preparing reports to the Board addressing, among other things, fund performance; market conditions; investment teams; new products; changes to mandates, policies and benchmarks; and other management proposals; |
168
| • | | Risk Management and Valuation Services - continuing to oversee and manage risk including, among other things, conducting daily calculations and monitoring of risk measures across the Nuveen funds, instituting appropriate investment risk controls, providing risk reporting throughout the firm, participating in internal oversight committees, and continuing to implement an operational risk framework that seeks to provide greater transparency of operational risk matters across the complex as well as provide multiple other risk programs that seek to provide a more disciplined and consistent approach to identifying and mitigating Nuveen’s operational risks. Further, the securities valuation team continues, among other things, to oversee the daily valuation process of the portfolio securities of the funds, maintains the valuation policies and procedures, facilitates valuation committee meetings, manages relationships with pricing vendors, and prepares relevant valuation reports and designs methods to simplify and enhance valuation workflow within the organization; |
| • | | Regulatory Matters – continuing efforts to monitor regulatory trends and advocate on behalf of Nuveen and/or the Nuveen funds, to implement and comply with new or revised rules and mandates and to respond to regulatory inquiries and exams; |
| • | | Government Relations – continuing efforts of various Nuveen teams and Nuveen’s affiliates to develop policy positions on a broad range of issues that may impact the Nuveen funds, advocate and communicate these positions to lawmakers and other regulatory authorities and work with trade associations to ensure these positions are represented; |
| • | | Business Continuity, Disaster Recovery and Information Security – continuing efforts of Nuveen to periodically test and update business continuity and disaster recovery plans and, together with its affiliates, to maintain an information security program designed to identify and manage information security risks, and provide reports to the Board, at least annually, addressing, among other things, management’s security risk assessment, cyber risk profile, potential impact of new or revised laws and regulations, incident tracking and other relevant information technology risk-related reports; |
| • | | Dividend Management Services – continuing to manage the dividends among the varying types of Nuveen funds within the Nuveen complex to be consistent with the respective fund’s product design and positioning in striving to deliver those earnings to shareholders in a relatively consistent manner over time as well as assisting in the development of new products or the restructuring of existing funds; and |
| • | | with respect specifically to closed-end funds, such continuing services also included: |
| • | | • Leverage Management Services – continuing to actively manage the various forms of leverage utilized across the complex, including through committing resources and focusing on sourcing/structure development and bank provider management, which was key to navigating the respective funds through the COVID-related market volatility in 2020; |
| • | | • Capital Management, Market Intelligence and Secondary Market Services – ongoing capital management efforts through shelf offerings, share repurchases, tender offers and capital return programs as well as providing market data analysis to help understand closed-end fund ownership cycles and their impact on secondary market trading as well as to improve proxy solicitation efforts; and |
| • | | • Closed-end Fund Investor Relations Program – maintaining the closed-end fund investor relations program which, among other things, raises awareness, provides educational materials and cultivates advocacy for closed-end funds and the Nuveen closed-end fund product line. |
In its review, the Board recognized that Nuveen’s risk management, compliance, technology and operations capabilities are all integral to providing its investment management services to the Nuveen funds. Further, the Board noted the benefits to shareholders of investing in a Nuveen fund, as each Nuveen fund is a part of a large fund complex with a variety of investment disciplines, capabilities, expertise and resources available to navigate and support the funds including during stressed times as occurred in the market in the first half of 2020. The Board recognized the impact of the COVID-19 pandemic during the year and the adaptations required by service providers to continue to deliver their services to the Nuveen funds, including working remotely. In this regard, the Board noted the ability of the Adviser and the various sub-advisers to the Nuveen funds to provide
169
Annual Investment Management Agreement Approval Process (continued)
continuously their services notwithstanding the significant disruptions caused by the pandemic. In addition to the services provided by the Adviser, the Board also considered the risks borne by the Adviser and its affiliates in managing the Nuveen funds, including entrepreneurial, operational, reputational, regulatory and litigation risks.
The Board further considered the division of responsibilities between the Adviser and the Sub-Adviser and recognized that the Sub-Adviser and its investment personnel generally are responsible for the management of each Fund’s portfolio under the oversight of the Adviser and the Board. The Board considered an analysis of the Sub-Adviser provided by the Adviser which included, among other things, the assets under management of the applicable investment team and changes thereto, a summary of the applicable investment team and changes thereto, the investment process and philosophy of the applicable investment team, the performance of the Nuveen funds sub-advised by the Sub-Adviser over various periods of time and a summary of any significant policy and/or other changes to the Nuveen funds sub-advised by the Sub-Adviser. The Board further considered at the May Meeting or prior meetings evaluations of the Sub-Advisers’ compliance programs and trade execution. The Board also considered the structure of investment personnel compensation programs and whether this structure provides appropriate incentives to act in the best interests of the respective Nuveen funds. The Board noted that the Adviser recommended the renewal of the Sub-Advisory Agreements.
Based on its review, the Board determined, in the exercise of its reasonable business judgment, that it was satisfied with the nature, extent and quality of services provided to the respective Funds under each applicable Advisory Agreement.
B. The Investment Performance of the Funds and Fund Advisers
In evaluating the quality of the services provided by the Fund Advisers, the Board also received and considered a variety of investment performance data of the Nuveen funds they advise. In evaluating performance, the Board recognized that performance data may differ significantly depending on the ending date selected, particularly during periods of market volatility, and therefore considered performance over a variety of time periods that may include full market cycles. In this regard, the Board reviewed, among other things, Fund performance over the quarter, one-, three- and five-year periods ending December 31, 2020 as well as performance data periods ending nearer to the May Meeting, including the quarter, one-, three- and five-year periods ending March 31, 2021 and May 14, 2021. The performance data prepared for the annual review of the advisory agreements for the Nuveen funds supplemented the fund performance data that the Board received throughout the year at its meetings representing differing time periods. In its review, the Board took into account the discussions with representatives of the Adviser; the Adviser’s analysis regarding fund performance that occurred at these Board meetings with particular focus on funds that were considered performance outliers (both overperformance and underperformance); the factors contributing to the performance; and any recommendations or steps taken to address performance concerns. Regardless of the time period reviewed by the Board, the Board recognized that shareholders may evaluate performance based on their own holding periods which may differ from the periods reviewed by the Board and lead to differing results.
In its review, the Board reviewed both absolute and relative fund performance during the annual review over the various time periods. With respect to the latter, the Board considered fund performance in comparison to the performance of peer funds (the “Performance Peer Group”) and recognized and/or customized benchmarks (i.e., generally benchmarks derived from multiple recognized benchmarks). For Nuveen funds that had changes in portfolio managers since 2018 or significant changes, among other things, to their investment strategies or policies since 2019, the Board reviewed certain performance data comparing the performance of such funds before and after such changes. In considering performance data, the Board is aware of certain inherent limitations with such data, including that differences between the objective(s), strategies and other characteristics of the Nuveen funds compared to the respective Performance Peer Group and/or benchmark(s) (such as differences in the use of leverage) as well as differences in the composition of the Performance Peer Group over time will necessarily contribute to differences in performance results and limit the value of the comparative information. To assist the Board in its review of the comparability of the relative performance, the Adviser has ranked the relevancy of the peer group to the funds as low, medium or high.
170
The Board also evaluated performance in light of various relevant factors, including, among other things, general market conditions, issuer-specific information, asset class information, leverage and fund cash flows. In relation to general market conditions, the Board recognized the significant market decline in the early part of 2020 in connection with, among other things, the impact of the COVID-19 pandemic and that such a period of underperformance and market volatility may significantly weigh on the longer term performance results. Accordingly, depending on the facts and circumstances including any differences between the respective Nuveen fund and its benchmark and/or Performance Peer Group, the Board may be satisfied with a fund’s performance notwithstanding that its performance may be below that of its benchmark or peer group for certain periods. However, with respect to any Nuveen funds for which the Board had identified performance issues, the Board monitors such funds closely until performance improves, discusses with the Adviser the reasons for such results, considers whether any steps are necessary or appropriate to address such issues, and reviews the results of any steps undertaken.
The secondary market trading of shares of the Nuveen closed-end funds continues to be a priority for the Board given its importance to shareholders, and therefore data reflecting the premiums and discounts at which the shares of the closed-end funds trade are reviewed by the Board during its annual review and by the Board and/or its Closed-end Fund committee during its respective quarterly meetings throughout the year. The Board continuously reviews all closed-end fund discounts and the fund’s performance relative to both primary and secondary benchmarks and peers. In its review, the Board considers, among other things, changes to investment mandates and guidelines, enhanced and attractive distribution policies, leverage levels and types, fund reorganizations, share repurchases and similar capital market actions and effective communications programs to build greater awareness and deepen understanding of closed-end funds.
The Board’s determinations with respect to each Fund are summarized below.
For Nuveen Quality Municipal Income Fund, the Board noted that the Fund outperformed its blended benchmark and ranked in the first quartile of its Performance Peer Group for the one-, three- and five-year periods ended December 31, 2020. The Fund outperformed its blended benchmark for the one-, three- and five-year periods ended March 31, 2021 and ranked in the third quartile of its Performance Peer Group for the one-year period ended March 31, 2021, the first quartile for the three-year period ended March 31, 2021 and the second quartile for the five-year period ended March 31, 2021. Similarly, for periods ended May 14, 2021, the Fund outperformed its blended benchmark for the one-, three- and five-year periods, and the Fund ranked in the third quartile of its Performance Peer Group for the one-year period, the first quartile for the three-year period and the second quartile for the five-year period. Based on its review, the Board was satisfied with the Fund’s overall performance.
For Nuveen AMT-Free Quality Municipal Income Fund, the Board noted that the Fund outperformed its blended benchmark and ranked in the first quartile of its Performance Peer Group for the one-, three- and five-year periods ended December 31, 2020. The Fund outperformed its blended benchmark for the one-, three- and five-year periods ended March 31, 2021 and although the Fund ranked in the fourth quartile of its Performance Peer Group for the one-year period ended March 31, 2021, the Fund ranked in the second quartile for the three-year period ended March 31, 2021 and the first quartile for the five-year period ended March 31, 2021. Similarly, for periods ended May 14, 2021, the Fund outperformed its blended benchmark for the one-, three- and five-year periods and although the Fund ranked in the fourth quartile of its Performance Peer Group for the one-year period, the Fund ranked in the second quartile for the three-year period and first quartile for the five-year period. Based on its review, the Board was satisfied with the Fund’s overall performance.
C. Fees, Expenses and Profitability
1. Fees and Expenses
As part of its annual review, the Board considered the contractual management fee and net management fee (the management fee after taking into consideration fee waivers and/or expense reimbursements, if any) paid by a Nuveen fund to the Adviser in light of the nature, extent and quality of the services provided. The Board also considered the total operating expense ratio of each fund before and after any fee waivers and/or expense reimbursements. More specifically, the Independent Board
171
Annual Investment Management Agreement Approval Process (continued)
Members reviewed, among other things, each fund’s gross and net management fee rates (i.e., before and after expense reimbursements and/or fee waivers, if any) and net total expense ratio in relation to those of a comparable universe of funds (the “Peer Universe”) established by Broadridge (subject to certain exceptions). The Independent Board Members reviewed the methodology Broadridge employed to establish its Peer Universe and recognized that differences between the applicable fund and its respective Peer Universe as well as changes to the composition of the Peer Universe from year to year may limit some of the value of the comparative data. The Independent Board Members also considered a fund’s operating expense ratio as it more directly reflected the shareholder’s costs in investing in the respective fund.
In their review, the Independent Board Members considered, in particular, each fund with a net expense ratio (excluding investment-related costs of leverage) of six basis points or higher compared to that of its peer average (each, an “Expense Outlier Fund”) and an analysis as to the factors contributing to each such fund’s higher relative net expense ratio. In addition, although the Board reviewed a fund’s total net expenses both including and excluding investment-related expenses (i.e., leverage costs) and taxes for certain of the closed-end funds, the Board recognized that leverage expenses will vary across funds and in comparison to peers because of differences in the forms and terms of leverage employed by the respective fund. Accordingly, in reviewing the comparative data between a fund and its peers, the Board generally considered the fund’s net expense ratio and fees (excluding leverage costs and leveraged assets) to be higher if they were over 10 basis points higher, slightly higher if they were 6 to 10 basis points higher, in line if they were within approximately 5 basis points higher than the peer average and below if they were below the peer average of the Peer Universe. The Independent Board Members also considered, in relevant part, a fund’s net management fee and net total expense ratio in light of its performance history.
In their review of the fee arrangements for the Nuveen funds, the Independent Board Members considered the management fee schedules, including the complex-wide and fund-level breakpoint schedules. The Board noted that across the Nuveen fund complex, the complex-wide fee breakpoints reduced fees by approximately $58.4 million and fund-level breakpoints reduced fees by approximately $69.6 million in 2020.
With respect to the Sub-Adviser, the Board also considered the sub-advisory fee schedule paid to the Sub-Adviser in light of the sub-advisory services provided to the respective Fund, the breakpoint schedule and comparative data of the fees the Sub-Adviser charges to other clients, if any. In its review, the Board recognized that the compensation paid to the Sub-Adviser is the responsibility of the Adviser, not the Funds.
The Independent Board Members noted that the Funds had net management fees and net expense ratios below their respective peer averages.
Based on its review of the information provided, the Board determined that each Fund’s management fees (as applicable) to a Fund Adviser were reasonable in light of the nature, extent and quality of services provided to the Fund.
2. Comparisons with the Fees of Other Clients
In determining the appropriateness of fees, the Board also considered information regarding the fee rates the respective Fund Advisers charged to certain other types of clients and the type of services provided to these other clients. With respect to the Adviser and/or the Sub-Adviser, such other clients may include retail and institutional managed accounts, passively managed exchange-traded funds (“ETFs”) sub-advised by the Sub-Adviser that are offered by another fund complex and municipal managed accounts offered by an unaffiliated adviser. With respect to the Sub-Adviser, the Board reviewed, among other things, the fee range and average fee of municipal retail advisory accounts and municipal institutional accounts as well as the sub-advisory fee the Sub-Adviser received for serving as sub-adviser to passive ETFs offered outside the Nuveen family.
In considering the fee data of other clients, the Board recognized, among other things, the differences in the amount, type and level of services provided to the Nuveen funds relative to other clients as well as the differences in portfolio investment policies, investor profiles, account sizes and regulatory requirements, all of which contribute to the variations in the fee schedules. The Board recognized the breadth of services the Adviser had provided to the Nuveen funds compared to the other types of clients
172
as the funds operate in a highly regulated industry with increasing regulatory requirements as well as the increased entrepreneurial, legal and regulatory risks that the Adviser incurs in sponsoring and managing the funds. Further, with respect to ETFs, the Board considered that Nuveen ETFs were passively managed compared to the active management of the other Nuveen funds which contributed to the differences in fee levels between the Nuveen ETFs and other Nuveen funds. In general, higher fee levels reflect higher levels of service provided by the Adviser, increased investment management complexity, greater product management requirements, and higher levels of business risk or some combination of these factors. The Board further considered that the Sub-Adviser’s fee is essentially for portfolio management services and therefore more comparable to the fees it receives for retail wrap accounts and other external sub-advisory mandates. The Board concluded the varying levels of fees were justified given, among other things, the inherent differences in the products and the level of services provided to the Nuveen funds versus other clients, the differing regulatory requirements and legal liabilities and the entrepreneurial, legal and regulatory risks incurred in sponsoring and advising a registered investment company.
3. Profitability of Fund Advisers
In their review, the Independent Board Members considered information regarding Nuveen’s level of profitability for its advisory services to the Nuveen funds for the calendar years 2020 and 2019. The Board reviewed, among other things, Nuveen’s net margins (pre-tax) (both including and excluding distribution expenses); gross and net revenue margins (pre- and post-tax and excluding distribution) from Nuveen funds only; revenues, expenses and net income (pre- and post-tax and before distribution expenses) of Nuveen for fund advisory services; and comparative profitability data comparing the operating margins of Nuveen compared to the adjusted operating margins of certain peers that had publicly available data and with the most comparable assets under management (based on asset size and asset composition) for each of the last two calendar years. In reviewing the peer comparison data, the Independent Board Members noted that Nuveen Investments, Inc.’s operating margins were on the low range compared to the total company adjusted operating margins of the peers. The Board also reviewed the revenues and expenses the Adviser derived from its ETF product line for the 2019 and 2020 calendar years.
In reviewing the profitability data, the Independent Board Members recognized the subjective nature of calculating profitability as the information is not audited and is dependent on cost allocation methodologies to allocate corporate-wide expenses to the Nuveen complex and its affiliates and to further allocate such Nuveen complex expenses between the Nuveen fund and non-fund businesses. Generally, fund-specific expenses are allocated to the Nuveen funds and partial fund-related expenses and/or corporate overhead and shared costs (such as legal and compliance, accounting and finance, information technology and human resources and office services) are partially attributed to the funds pursuant to cost allocation methodologies. The Independent Board Members reviewed a description of the cost allocation methodologies employed to develop the financial information, a summary of the history of changes to the methodology over the years from 2010 to 2020, and the net revenue margins derived from the Nuveen funds (pre-tax and including and excluding distribution) and total company margins from Nuveen Investments, Inc. compared to the firm-wide adjusted margins of the peers for each calendar year from 2010 to 2020. The Board had also appointed three Independent Board Members to serve as the Board’s liaisons, with the assistance of independent counsel, to review the development of the profitability data and any proposed changes to the cost allocation methodology prior to incorporating any such changes and to report to the full Board. The Board recognized that other reasonable and valid allocation methodologies could be employed and could lead to significantly different results. The Independent Board Members also considered the key drivers behind the revenue and expense changes that impacted Nuveen’s net margins between 2019 and 2020. The Board also noted the reinvestments Nuveen and/or its parent made into its business through, among other things, the investment of seed capital in certain Nuveen funds and continued investments in enhancements to information technology, portfolio accounting systems and the global trading platform.
In reviewing the comparative peer data noted above, the Board considered that the operating margins of Nuveen Investments, Inc. were in the lower half of the peer group range; however, the Independent Board Members also recognized the limitations of the comparative data given that peer data is not generally public and the calculation of profitability is subjective and affected
173
Annual Investment Management Agreement Approval Process (continued)
by numerous factors (such as types of funds a peer manages, its business mix, its cost of capital, the numerous assumptions underlying the methodology used to allocate expenses and other factors) that can have a significant impact on the results.
Aside from Nuveen’s profitability, the Board recognized that the Adviser is a subsidiary of Nuveen, LLC, the investment management arm of Teachers Insurance and Annuity Association of America (“TIAA”). Accordingly, the Board also reviewed a balance sheet for TIAA reflecting its assets, liabilities and capital and contingency reserves for the 2020 and 2019 calendar years to consider the financial strength of TIAA. The Board recognized the benefit of an investment adviser and its parent with significant resources, particularly during periods of market volatility as experienced with the COVID-19 pandemic.
In addition to Nuveen, the Independent Board Members considered the profitability of the Sub-Adviser from its relationships with the Nuveen funds. In this regard, the Independent Board Members reviewed, among other things, the Sub-Adviser’s revenues, expenses and net revenue margins (pre- and post-tax) for its advisory activities for the calendar year ended December 31, 2020 as well as its pre- and post-tax net revenue margins for 2020 compared to such margins for 2019. The Independent Board Members also reviewed a profitability analysis reflecting the revenues, expenses and revenue margin (pre-and post-tax) by asset type for the Sub-Adviser for the calendar year ending December 31, 2020 and the pre- and post-tax revenue margins from 2020 and 2019.
In evaluating the reasonableness of the compensation, the Independent Board Members also considered any other ancillary benefits derived by the respective Fund Adviser from its relationship with the Nuveen funds as discussed in further detail below.
Based on a consideration of all the information provided, the Board noted that Nuveen’s and the Sub-Adviser’s level of profitability was acceptable and not unreasonable in light of the services provided.
D. Economies of Scale and Whether Fee Levels Reflect These Economies of Scale
The Board considered whether there have been economies of scale with respect to the management of the Nuveen funds and whether these economies of scale have been appropriately shared with the funds. The Board recognized that although economies of scale are difficult to measure and certain expenses may not decline with a rise in assets, there are several methods to help share the benefits of economies of scale, including breakpoints in the management fee schedule, fee waivers and/or expense limitations, the pricing of Nuveen funds at scale at inception and investments in Nuveen’s business which can enhance the services provided to the funds for the fees paid. The Board noted that Nuveen generally has employed these various methods, and the Board considered the extent to which the Nuveen funds will benefit from economies of scale as their assets grow. In this regard, the Board noted that the management fee of the Adviser is generally comprised of a fund-level component and a complex-level component each with its own breakpoint schedule, subject to certain exceptions. The Board reviewed the fund-level and complex-level fee schedules. The Board considered that the fund-level breakpoint schedules are designed to share economies of scale with shareholders if the particular fund grows, and the complex-level breakpoint schedule is designed to deliver the benefits of economies of scale to shareholders when the eligible assets in the complex pass certain thresholds even if the assets of a particular fund are unchanged or have declined. With respect to the Nuveen closed-end funds, the Independent Board Members noted that, although such funds may from time to time make additional share offerings, the growth of their assets would occur primarily through the appreciation of such funds’ investment portfolios. Further, in the calculation of the complex-level component, the Board noted that it had approved the acquisition of several Nuveen funds by similar TIAA-CREF funds in 2019. However, to mitigate the loss of the assets of these Nuveen funds deemed eligible to be included in the calculation of the complex-wide fee when these Nuveen funds left the complex upon acquisition, Nuveen agreed to credit approximately $604.5 million to assets under management to the Nuveen complex in calculating the complex-wide component.
The Independent Board Members also recognized the Adviser’s continued reinvestment in its business through various initiatives including maintaining a seed account available for investments into Nuveen funds and investing in its internal infrastructure, information technology and other systems that will, among other things, consolidate and enhance accounting
174
systems, integrate technology platforms to support growth and efficient data processing, and further develop its global trading platform to enhance the investment process for the investment teams.
Based on its review, the Board concluded that the current fee arrangements together with the Adviser’s reinvestment in its business appropriately shared any economies of scale with shareholders.
E. Indirect Benefits
The Independent Board Members received and considered information regarding other benefits the respective Fund Adviser or its affiliates may receive as a result of their relationship with the Nuveen funds. The Board considered the compensation that an affiliate of the Adviser received for serving as co-manager in the initial public offerings of new closed-end funds and for serving as an underwriter on shelf offerings of existing closed-end funds. In addition, the Independent Board Members also noted that various sub-advisers (including the Sub-Adviser) may engage in soft dollar transactions pursuant to which they may receive the benefit of research products and other services provided by broker-dealers executing portfolio transactions on behalf of the applicable Nuveen funds. However, the Board noted that any benefits for the Sub-Adviser when transacting in fixed-income securities may be more limited as such securities generally trade on a principal basis and therefore do not generate brokerage commissions.
Based on its review, the Board concluded that any indirect benefits received by a Fund Adviser as a result of its relationship with the Funds were reasonable and within acceptable parameters.
F. Other Considerations
The Board Members did not identify any single factor discussed previously as all-important or controlling. The Board Members, including the Independent Board Members, concluded that the terms of each Advisory Agreement were fair and reasonable, that the respective Fund Adviser’s fees were reasonable in light of the services provided to each Fund and that the Advisory Agreements be renewed.
175
Board Members & Officers (Unaudited)
The management of the Funds, including general supervision of the duties performed for the Funds by the Adviser, is the responsibility of the Board of Trustees of the Funds. None of the trustees who are not “interested” persons of the Funds (referred to herein as “independent board members”) has ever been a director or employee of, or consultant to, Nuveen or its affiliates. The names and business addresses of the trustees and officers of the Funds, their principal occupations and other affiliations during the past five years, the number of portfolios each Trustee oversees and other directorships they hold are set forth below.
| | | | | |
| Name, | Position(s) Held | Year First | Principal | Number |
| Year of Birth | with the Funds | Elected or | Occupation(s) | of Portfolios |
| & Address | | Appointed | Including other | in Fund Complex |
| | | and Term(1) | Directorships | Overseen by |
| | | | During Past 5 Years | Board Member |
| |
| |
| Independent Board Members: | | | | |
| |
| • TERENCE J. TOTH | | | Formerly, a Co-Founding Partner, Promus Capital (investment advisory | |
| 1959 | | | firm) (2008-2017); Director, Quality Control Corporation (manufacturing) | |
| 333 W. Wacker Drive | Chairman and | 2008 | (since 2012); member: Catalyst Schools of Chicago Board (since 2008) | 142 |
| Chicago, IL 60606 | Board Member | Class II | and Mather Foundation Board (philanthropy) (since 2012), and chair of | |
| | | | its Investment Committee; formerly, Director, Fulcrum IT Services LLC | |
| | | | (information technology services firm to government entities) (2010-2019); | |
| | | | formerly, Director, LogicMark LLC (health services) (2012-2016); formerly, | |
| | | | Director, Legal & General Investment Management America, Inc. (asset | |
| | | | management) (2008-2013); formerly, CEO and President, Northern Trust | |
| | | | Global Investments (financial services) (2004-2007): Executive Vice | |
| | | | President, Quantitative Management & Securities Lending (2000-2004); | |
| | | | prior thereto, various positions with Northern Trust Company (financial | |
| | | | services) (since 1994); formerly, Member, Northern Trust Mutual Funds | |
| | | | Board (2005-2007), Northern Trust Global Investments Board (2004-2007), | |
| | | | Northern Trust Japan Board (2004-2007), Northern Trust Securities Inc. | |
| | | | Board (2003-2007) and Northern Trust Hong Kong Board (1997-2004). | |
| |
| • JACK B. EVANS | | | Chairman (since 2019), formerly, President (1996-2019), The Hall-Perrine | |
| 1948 | | | Foundation, (private philanthropic corporation); Life Trustee of Coe College; | |
| 333 W. Wacker Drive | Board Member | 1999 | formerly, Member and President Pro-Tem of the Board of Regents for the | 142 |
| Chicago, IL 60606 | | Class III | State of Iowa University System (2007- 2013); Director and Chairman | |
| | | | (2009-2021), United Fire Group, a publicly held company; Director, | |
| | | | Public Member, American Board of Orthopaedic Surgery (2015-2020); | |
| | | | Director (2000-2004), Alliant Energy; Director (1996-2015), The | |
| | | | Gazette Company (media and publishing); Director (1997- 2003), Federal | |
| | | | Reserve Bank of Chicago; President and Chief Operating Officer (1972-1995), | |
| | | | SCI Financial Group, Inc., (regional financial services firm). | |
| |
| • WILLIAM C. HUNTER | | | Dean Emeritus, formerly, Dean, Tippie College of Business, University of | |
| 1948 | | | (2006-2012); Director of Wellmark, Inc. (since 2009); past Director (2005- | |
| 333 W. Wacker Drive | Board Member | 2003 | 2015), and past President (2010-2014) Beta Gamma Sigma, Inc., The | 142 |
| Chicago, IL 60606 | | Class I | International Business Honor Society; formerly, Director (2004-2018) of | |
| | | | Xerox Corporation; formerly, Dean and Distinguished Professor of Finance, | |
| | | | School of Business at the University of Connecticut (2003-2006); previously, | |
| | | | Senior Vice President and Director of Research at the Federal Reserve Bank | |
| | | | of Chicago (1995-2003); formerly, Director (1997-2007), Credit Research | |
| | | | Center at Georgetown University. | |
| |
| • AMY B. R. LANCELLOTTA | | | Formerly, Managing Director, Independent Directors Council (IDC) (supports | |
| 1959 | | | the fund independent director community and is part of the Investment | |
| 333 W. Wacker Drive | Board Member | 2021 | Company Institute (ICI), which represents regulated investment companies) | 142 |
| Chicago, IL 60606 | | Class II | (2006-2019); formerly, various positions with ICI (1989-2006); Member of | |
| | | | the Board of Directors, Jewish Coalition Against Domestic Abuse (JCADA) | |
| | | | (since 2020). | |
176
| | | | | |
| Name, | Position(s) Held | Year First | Principal | Number |
| Year of Birth | with the Funds | Elected or | Occupation(s) | of Portfolios |
| & Address | | Appointed | Including other | in Fund Complex |
| | | and Term(1) | Directorships | Overseen by |
| | | | During Past 5 Years | Board Member |
| |
| |
| Independent Board Members (continued): | | | |
| |
| • JOANNE T. MEDERO | | | Formerly, Managing Director, Government Relations and Public Policy | |
| 1954 | | | (2009-2020) and Senior Advisor to the Vice Chairman (2018-2020), | |
| 333 W. Wacker Drive | Board Member | 2021 | BlackRock, Inc. (global investment management firm); formerly, Managing | 142 |
| Chicago, IL 60606 | | Class III | (Director, Global Head of Government Relations and Public Policy, Barclays | |
| | | | Group (IBIM) (investment banking, investment management and wealth | |
| | | | management businesses) (2006-2009); formerly, Managing Director, | |
| | | | Global General Counsel and Corporate Secretary, Barclays Global Investors | |
| | | | (global investment management firm) (1996-2006); formerly, Partner, Orrick, | |
| | | | Herrington & Sutcliffe LLP (law firm) (1993-1995); formerly, General Counsel, | |
| | | | Commodity Futures Trading Commission (government agency overseeing U.S. |
| | | | derivatives markets) (1989-1993); formerly, Deputy Associate Director/ Associate |
| | | | Director for Legal and Financial Affairs, Office of Presidential Personnel, The | |
| | | | White House (1986-1989); Member of the Board of Directors, Baltic-American | |
| | | | Freedom Foundation (seeks to provide opportunities for citizens of the Baltic | |
| | | | states to gain education and professional development through exchanges in | |
| | | | the U.S.) (since 2019). | |
| |
| • ALBIN F. MOSCHNER | | | Founder and Chief Executive Officer, Northcroft Partners, LLC, | |
| 1952 | | | (management consulting) (since 2012); formerly, Chairman (2019), and | |
| 333 W. Wacker Drive | Board Member | 2016 | Director (2012-2019), USA Technologies, Inc., (provider of solutions | 142 |
| Chicago, IL 60606 | | Class III | and services to facilitate electronic payment transactions); formerly, | |
| | | | Director, Wintrust Financial Corporation (1996-2016); previously, held | |
| | | | positions at Leap Wireless International, Inc., (consumer wireless services) | |
| | | | including Consultant (2011- 2012), Chief Operating Officer (2008-2011), and | |
| | | | Chief Marketing Officer (2004- 2008); formerly, President, Verizon Card | |
| | | | Services division of Verizon Communications, Inc. (2000-2003); formerly, | |
| | | | President, One Point Services at One Point Communications | |
| | | | (telecommunication services) (1999-2000); formerly, Vice Chairman of the | |
| | | | Board, Diba, Incorporated (internet technology provider) (1996-1997); | |
| | | | formerly, various executive positions (1991-1996) including Chief Executive | |
| | | | Officer (1995-1996) of Zenith Electronics Corporation (consumer electronics). | |
| |
| • JOHN K. NELSON | | | Member of Board of Directors of Core12 LLC. (private firm which | |
| 1962 | | | develops branding, marketing and communications strategies for | |
| 333 W. Wacker Drive | Board Member | 2013 | clients) (since 2008); served on The President’s Council of Fordham | 142 |
| Chicago, IL 60606 | | Class II | University (2010-2019) and previously a Director of the Curran Center | |
| | | | for Catholic American Studies (2009- 2018); formerly, senior external | |
| | | | advisor to the Financial Services practice of Deloitte Consulting LLP. | |
| | | | (2012-2014); former Chair of the Board of Trustees of Marian University | |
| | | | (2010-2014 as trustee, 2011-2014 as Chair); formerly Chief Executive | |
| | | | Officer of ABN AMRO Bank N.V., North America, and Global Head of the | |
| | | | Financial Markets Division (2007-2008), with various executive leadership | |
| | | | roles in ABN AMRO Bank N.V. between 1996 and 2007. | |
| |
| • JUDITH M. STOCKDALE | | | Board Member, Land Trust Alliance (national public charity addressing | |
| 1947 | | | natural land and water conservation in the U.S.) (since 2013); formerly, | |
| 333 W. Wacker Drive | Board Member | 1997 | Board Member, U.S. Endowment for Forestry and Communities (national | 142 |
| Chicago, IL 60606 | | Class I | endowment addressing forest health, sustainable forest production and | |
| | | | markets, and economic health of forest-reliant communities in the U.S.) | |
| | | | (2013-2019); formerly, Executive Director (1994-2012), Gaylord and Dorothy | |
| | | | Donnelley Foundation (private foundation endowed to support both natural | |
| | | | land conservation and artistic vitality); prior thereto, Executive Director, | |
| | | | Great Lakes Protection Fund (endowment created jointly by seven of the eight | |
| | | | Great Lake states’ Governors to take a regional approach to improving the | |
| | | | health of the Great Lakes) (1990-1994). | |
177
Board Members & Officers (Unaudited) (continued)
| | | | | |
| Name, | Position(s) Held | Year First | Principal | Number |
| Year of Birth | with the Funds | Elected or | Occupation(s) | of Portfolios |
| & Address | | Appointed | Including other | in Fund Complex |
| | | and Term(1) | Directorships | Overseen by |
| | | | During Past 5 Years | Board Member |
| |
| |
| Independent Board Members (continued): | | | |
| |
| • CAROLE E. STONE | | | Former Director, Chicago Board Options Exchange, Inc. (2006-2017); | |
| 1947 | | | and C2 Options Exchange, Incorporated (2009-2017); formerly Director, | |
| 333 W. Wacker Drive | Board Member | 2007 | Cboe, Global Markets, Inc., (2010-2020) formerly named CBOE Holdings, | 142 |
| Chicago, IL 60606 | | Class I | Inc.; formerly, Commissioner, New York State Commission on | |
| | | | Public Authority Reform (2005-2010). | |
| |
| • MATTHEW THORNTON III | | | Formerly, Executive Vice President and Chief Operating Officer | |
| 1958 | | | FedEx Freight Corporation, a subsidiary of FedEx Corporation (“FedEx”) | |
| 333 West Wacker Drive | Board Member | 2020 | (provider of transportation, e-commerce and business services through its | 142 |
| Chicago, IL 60606 | | Class III | portfolio of companies); formerly, Senior Vice President, U.S. Operations | |
| | | | (2006-2018), Federal Express Corporation, a subsidiary of FedEx; formerly, | |
| | | | Member of the Board of Directors (2012-2018), Safe Kids Worldwide® (a | |
| | | | non-profit organization dedicated to preventing childhood injuries). | |
| | | | Member of the Board of Directors (since 2014), The Sherwin-Williams | |
| | | | Company (develops, manufactures, distributes and sells paints, coatings | |
| | | | and related products); Director (since 2020), Crown Castle International | |
| | | | (provider of communications infrastructure) | |
| |
| • MARGARET L. WOLFF | | | Formerly, member of the Board of Directors (2013-2017) of Travelers | |
| 1955 | | | Insurance Company of Canada and The Dominion of Canada General | |
| 333 W. Wacker Drive | Board Member | 2016 | Insurance Company (each, a part of Travelers Canada, the Canadian | |
| Chicago, IL 60606 | | Class I | operation of The Travelers Companies, Inc.); formerly, Of Counsel, | 142 |
| | | | Skadden, Arps, Slate, Meagher & Flom LLP (legal services, Mergers & | |
| | | | Acquisitions Group) (2005-2014); Member of the Board of Trustees of | |
| | | | New York-Presbyterian Hospital (since 2005); Member (since 2004) and | |
| | | | Chair (since 2015) of the Board of Trustees of The John A. Hartford | |
| | | | Foundation (philanthropy dedicated to improving the care of older | |
| | | | adults); formerly, Member (2005-2015) and Vice Chair (2011-2015) of the | |
| | | | Board of Trustees of Mt. Holyoke College. | |
| |
| • ROBERT L. YOUNG | | | Formerly, Chief Operating Officer and Director, J.P.Morgan Investment | |
| 1963 | | | Management Inc. (financial services) (2010-2016); formerly, President | |
| 333 W. Wacker Drive | Board Member | 2017 | and Principal Executive Officer (2013-2016), and Senior Vice President | 142 |
| Chicago, IL 60606 | | Class II | and Chief Operating Officer (2005-2010), of J.P.Morgan Funds; formerly, | |
| | | | Director and various officer positions for J.P.Morgan Investment | |
| | | | Management Inc. (formerly, JPMorgan Funds Management, Inc. and | |
| | | | formerly, One Group Administrative Services) and JPMorgan Distribution | |
| | | | Services, Inc. (financial services) (formerly, One Group Dealer Services, | |
| | | | Inc.) (1999-2017). | |
178
| | | | |
| Name, | Position(s) Held | Year First | Principal |
| & Year Address of Birth | |with the Funds | Appointed Elected or (2) | During Occupation(s) Past 5 Years |
| |
| |
| Officers of the Funds: | | | |
| |
| • DAVID J. LAMB | | | Managing Director of Nuveen Fund Advisors, LLC (since 2019) Senior Managing Director |
| 1963 | Chief | | (since 2021), formerly, Managing Director (2020-2021) of Nuveen Securities, LLC; Senior |
| 333 W. Wacker Drive | Administrative | 2015 | Managing Director (since 2021), formerly, Managing Director (2017-2021), Senior Vice President |
| Chicago, IL 60606 | Officer | | of Nuveen (2006-2017), Vice President prior to 2006. |
| |
| • MARK J. CZARNIECKI | | | Vice President and Assistant Secretary of Nuveen Securities, LLC (since 2016) and Nuveen Fund |
| 1979 | Vice President | | Advisors (since 2017); Vice President and Associate General Counsel of Nuveen (since 2013) and |
| 901 Marquette Avenue | and Assistant | 2013 | Vice President, Assistant Secretary and Associate General Counsel of Nuveen Asset Management |
| Minneapolis, MN 55402 | Secretary | | LLC (since 2018). |
| |
| • DIANA R. GONZALEZ | | | Vice President and Assistant Secretary of Nuveen Fund Advisors, LLC (since 2017); Vice |
| 1978 | Vice President | | President and Associate General Counsel of Nuveen (since 2017); formerly, Associate General |
| 333 W. Wacker Drive | and Assistant | 2017 | Counsel of Jackson National Asset Management (2012-2017). |
| Chicago, IL 60606 | Secretary | | |
| |
| • NATHANIEL T. JONES | | | Senior Managing Director (since 2021), formerly, Managing Director (2017-2021), Senior Vice |
| 1979 | | | President (2016-2017), Vice President (2011-2016) of Nuveen; Managing Director |
| 333 W. Wacker Drive | Vice President | | (since 2015) of Nuveen Fund Advisors, LLC; Chartered Financial Analyst. |
| Chicago, IL 60606 | and Treasurer | 2016 | |
| |
| • TINA M. LAZAR | | | Managing Director (since 2017), formerly, Senior Vice President (2014-2017) of Nuveen |
| 1961 | | | Securities, LLC. |
| 333 W. Wacker Drive | Vice President | 2002 | |
| Chicago, IL 60606 | | | |
| |
| • BRIAN J. LOCKHART | | | Managing Director (since 2019) of Nuveen Fund Advisors, LLC; Senior Managing Director (since |
| 1974 | | | 2021), formerly, Managing Director (2017-2021), Vice President (2010-2017) of Nuveen; Head |
| 333 W. Wacker Drive | Vice President | 2019 | of Investment Oversight (since 2017), formerly, Team Leader of Manager Oversight (2015-2017); |
| Chicago, IL 60606 | | | Chartered Financial Analyst and Certified Financial Risk Manager. |
| |
| • JACQUES M. LONGERSTAEY | | | Senior Managing Director, Chief Risk Officer, Nuveen (since May 2019); Senior Managing |
| 1963 | | | Director (since May 2019) of Nuveen Fund Advisors, LLC; formerly, Chief Investment and Model |
| 8500 Andrew | Vice President | 2019 | Risk Officer, Wealth & Investment Management Division, Wells Fargo Bank (NA) (2013-2019). |
| Carnegie Blvd. | | | |
| Charlotte, NC 28262 | | | |
| |
| • KEVIN J. MCCARTHY | | | Senior Managing Director (since 2017) and Secretary and General Counsel (since 2016) of Nuveen |
| 1966 | Vice President | | Investments, Inc., formerly, Executive Vice President (2016-2017) and Managing Director and |
| 333 W. Wacker Drive | and Assistant | 2007 | Assistant Secretary (2008-2016); Senior Managing Director (since 2017) and Assistant Secretary |
| Chicago, IL 60606 | Secretary | | (since 2008) of Nuveen Securities, LLC, formerly Executive Vice President (2016-2017) and |
| | | | Managing Director (2008- 2016); Senior Managing Director (since 2017), and Secretary (since |
| | | | 2016) of Nuveen Fund Advisors, LLC, formerly, Co-General Counsel (2011-2020), Executive Vice |
| | | | President (2016-2017), Managing Director (2008-2016) and Assistant Secretary (2007-2016); Senior |
| | | | Managing Director (since 2017), Secretary (since 2016) of Nuveen Asset Management, LLC, |
| | | | formerly, Associate General Counsel (2011-2020), Executive Vice President (2016-2017) and |
| | | | Managing Director and Assistant Secretary (2011- 2016); Vice President (since 2007) and Secretary |
| | | | (since 2016), formerly, Assistant Secretary, of NWQ Investment Management Company, LLC, Santa |
| | | | Barbara Asset Management, LLC and Winslow Capital Management, LLC (since 2010). Senior |
| | | | Managing Director (since 2017) and Secretary (since 2016) of Nuveen Alternative Investments, LLC. |
| |
| • JON SCOTT MEISSNER | | | Managing Director of Mutual Fund Tax and Financial Reporting groups at Nuveen (since 2017); |
| 1973 | Vice President | | Managing Director of Nuveen Fund Advisors, LLC (since 2019); Senior Director of Teachers |
| 8500 Andrew | |and Assistant | 2019 | Advisors, LLC and TIAA-CREF Investment Management, LLC (since 2016); Senior Director (since |
| Carnegie Blvd. | Secretary | | 2015) Mutual Fund Taxation to the TIAA-CREF Funds, the TIAA-CREF Life Funds, the TIAA Separate |
| Charlotte, NC 28262 | | | Account VA-1 and the CREF Accounts; has held various positions with TIAA since 2004. |
179
Board Members & Officers (Unaudited) (continued)
| | | | |
| Name, | Position(s) Held | Year First | Principal |
| & Year Address of Birth | with the Funds | Appointed Elected or (2) | During Occupation(s) Past 5 Years |
| |
| Officers of the Funds (continued): | | |
| |
| • DEANN D. MORGAN | | | President, Nuveen Fund Advisors, LLC (since 2020); Executive Vice President, Global Head |
| 1969 | | | of Product at Nuveen (since 2019); Co-Chief Executive Officer of Nuveen Securities, LLC since |
| 730 Third Avenue | Vice President | 2020 | 2020); Managing Member of MDR Collaboratory LLC (since 2018); formerly,Managing Director, |
| New York, NY 10017 | | | (Head of Wealth Management Product Structuring & COO Multi Asset Investing. The Blackstone |
| | | | Group (2013-2017). |
| |
| • CHRISTOPHER M. ROHRBACHER | | Managing Director and Assistant Secretary (since 2017) of Nuveen Securities, LLC; Managing |
| 1971 | Vice President | | Director (since 2017) General Counsel (since 2020), and Assistant Secretary (since 2016), formerly, |
| 333 W. Wacker Drive | and Assistant | 2008 | Senior Vice President (2016-2017), of Nuveen Fund Advisors, LLC; Managing Director, Associate |
| Chicago, IL 60606 | Secretary | | General Counsel and Assistant Secretary of Nuveen Asset Management, LLC (since 2020); |
| | | | Managing Director (since 2017), and Associate General Counsel (since 2016), formerly, Senior Vice |
| | | | President (2012-2017) and Assistant General Counsel (2008-2016) of Nuveen. |
| |
| • WILLIAM A. SIFFERMANN | | | Managing Director (since 2017), formerly Senior Vice President (2016-2017) and Vice President |
| 1975 | | | (2011-2016) of Nuveen. |
| 333 W. Wacker Drive | Vice President | 2017 | |
| Chicago, IL 60606 | | | |
| |
| • E. SCOTT WICKERHAM | | | Senior Managing Director, Head of Public Investment Finance at Nuveen (since 2019), formerly, |
| 1973 | Vice President | | Managing Director; Senior Managing Director (since 2019) of Nuveen Fund Advisers, (LLC; |
| 8500 Andrew | and Controller | 2019 | Principal Financial Officer, Principal Accounting Officer and Treasurer (since 2017) of the TIAA- |
| Carnegie Blvd. | | | CREF Funds, the TIAA-CREF Life Funds, the TIAA Separate Account VA-1 and Principal Financial |
| Charlotte, NC 28262 | | | Officer, Principal Accounting Officer (since 2020) and Treasurer (since 2017) to the CREF Accounts; |
| | | | formerly, Senior Director, TIAA-CREF Fund Administration (2014-2015); has held various positions |
| | | | with TIAA since 2006. |
| |
| • MARK L. WINGET | | | Vice President and Assistant Secretary of Nuveen Securities, LLC (since 2008), and Nuveen Fund |
| 1968 | Vice President | | Advisors, LLC (since 2019); Vice President, Associate General Counsel and Assistant Secretary of |
| 333 W. Wacker Drive | and Secretary | 2008 | Nuveen Asset Management, LLC (since 2020); Vice President (since 2010) and Associate General |
| Chicago, IL 60606 | | | Counsel (since 2019), formerly, Assistant General Counsel (2008-2016) of Nuveen. |
| |
| • GIFFORD R. ZIMMERMAN | | | Formerly, Managing Director (2002-2020) and Assistant Secretary (2002-2020) of Nuveen |
| 1956 | Vice President | | Securities, LLC; formerly, Managing Director (2002-2020), Assistant Secretary (1997-2020) and |
| 333 W. Wacker Drive | and Chief | 1988 | Co-General Counsel (2011- 2020) of Nuveen Fund Advisors, LLC; formerly, Managing Director |
| Chicago, IL 60606 | Compliance Officer | | (2004-2020) and Assistant Secretary (1994-2020) of Nuveen Investments, Inc.; formerly, Managing |
| | | | Director, Assistant Secretary and Associate General Counsel of Nuveen Asset Management, LLC |
| | | | (2011-2020); formerly, Vice President and Assistant Secretary of NWQ Investment Management |
| | | | Company, LLC (2002-2020), Santa Barbara Asset Management, LLC (2006-2020) and Winslow |
| | | | Capital Management, LLC (2010-2020); Chartered Financial Analyst. |
| (1) | | The Board of Trustees is divided into three classes, Class I, Class II, and Class III, with each being elected to serve until the third succeeding annual shareholders’ meeting subsequent to its election or thereafter in each case when its respective successors are duly elected or appointed, except two board members are elected by the holders of Preferred Shares, when applicable, to serve until the next annual shareholders’ meeting subsequent to its election or thereafter in each case when its respective successors are duly elected or appointed. The year first elected or appointed represents the year in which the board member was first elected or appointed to any fund in the Nuveen complex. |
| (2) | | Officers serve indefinite terms until their successor has been duly elected and qualified, their death or their resignation or removal. The year first elected or appointed represents the year in which the Officer was first elected or appointed to any fund in the Nuveen complex. |
180
Notes
181
Notes
182
Notes
183

Nuveen:
Serving Investors for Generations
Since 1898, financial professionals and their clients have relied on Nuveen to provide dependable investment solutions through continued adherence to proven, long-term investing principles. Today, we offer a range of high quality solutions designed to be integral components of a well-diversified core portfolio.
Focused on meeting investor needs.
Nuveen is the investment manager of TIAA. We have grown into one of the world’s premier global asset managers, with specialist knowledge across all major asset classes and particular strength in solutions that provide income for investors and that draw on our expertise in alternatives and responsible investing. Nuveen is driven not only by the independent investment processes across the firm, but also the insights, risk management, analytics and other tools and resources that a truly world-class platform provides. As a global asset manager, our mission is to work in partnership with our clients to create solutions which help them secure their financial future.
Find out how we can help you.
To learn more about how the products and services of Nuveen may be able to help you meet your financial goals, talk to your financial professional, or call us at (800) 257-8787. Please read the information provided carefully before you invest. Investors should consider the investment objective and policies, risk considerations, charges and expenses of any investment carefully. Where applicable, be sure to obtain a prospectus, which contains this and other relevant information. To obtain a prospectus, please contact your securities representative or Nuveen, 333 W. Wacker Dr., Chicago, IL 60606. Please read the prospectus carefully before you invest or send money.
Learn more about Nuveen Funds at: www.nuveen.com/closed-end-funds
Nuveen Securities, LLC, member FINRA and SIPC | 333 West Wacker Drive Chicago, IL 60606 | www.nuveen.com

EAN-B-1021D 1936998-INV-Y-12/22
ITEM 2. CODE OF ETHICS.
As of the end of the period covered by this report, the registrant has adopted a code of ethics that applies to the registrant’s principal executive officer, principal financial officer, principal accounting officer or controller, or persons performing similar functions. There were no amendments to or waivers from the Code during the period covered by this report. The registrant has posted the code of ethics on its website at www.nuveen.com/fund-governance. (To view the code, click on Code of Conduct.)
ITEM 3. AUDIT COMMITTEE FINANCIAL EXPERT.
As of the end of the period covered by this report, the registrant’s Board of Directors or Trustees (“Board”) determined that the registrant has at least one “audit committee financial expert” (as defined in Item 3 of Form N-CSR) serving on its Audit Committee. The registrant’s audit committee financial experts are Carole E. Stone, Jack B. Evans, William C. Hunter and Albin F. Moschner, who are “independent” for purposes of Item 3 of Form N-CSR.
Ms. Stone served for five years as Director of the New York State Division of the Budget. As part of her role as Director, Ms. Stone was actively involved in overseeing the development of the State’s operating, local assistance and capital budgets, its financial plan and related documents; overseeing the development of the State’s bond-related disclosure documents and certifying that they fairly presented the State’s financial position; reviewing audits of various State and local agencies and programs; and coordinating the State’s system of internal audit and control. Prior to serving as Director, Ms. Stone worked as a budget analyst/examiner with increasing levels of responsibility over a 30 year period, including approximately five years as Deputy Budget Director. Ms. Stone has also served as Chair of the New York State Racing Association Oversight Board, as Chair of the Public Authorities Control Board, as a Commissioner on the New York State Commission on Public Authority Reform and as a member of the Boards of Directors of several New York State public authorities. These positions have involved overseeing operations and finances of certain entities and assessing the adequacy of project/entity financing and financial reporting. Currently, Ms. Stone is on the Board of Directors of CBOE Holdings, Inc., of the Chicago Board Options Exchange, and of C2 Options Exchange. Ms. Stone’s position on the boards of these entities and as a member of both CBOE Holdings’ Audit Committee and its Finance Committee has involved, among other things, the oversight of audits, audit plans and preparation of financial statements.
Mr. Evans was formerly President and Chief Operating Officer of SCI Financial Group, Inc., a full service registered broker-dealer and registered investment adviser (“SCI”). As part of his role as President and Chief Operating Officer, Mr. Evans actively supervised the Chief Financial Officer (the “CFO”) and actively supervised the CFO’s preparation of financial statements and other filings with various regulatory authorities. In such capacity, Mr. Evans was actively involved in the preparation of SCI’s financial statements and the resolution of issues raised in connection therewith. Mr. Evans has also served on the audit committee of various reporting companies. At such companies, Mr. Evans was involved in the oversight of audits, audit plans, and the preparation of financial statements. Mr. Evans also formerly chaired the audit committee of the Federal Reserve Bank of Chicago.
Mr. Hunter was formerly a Senior Vice President at the Federal Reserve Bank of Chicago. As part of his role as Senior Vice President, Mr. Hunter was the senior officer responsible for all operations of each of the Economic Research, Statistics, and Community and Consumer Affairs units at the Federal Reserve Bank of Chicago. In such capacity, Mr. Hunter oversaw the subunits of the Statistics and Community and Consumer Affairs divisions responsible for the analysis and evaluation of bank and bank holding company financial statements and financial filings. Prior to serving as Senior Vice President at the Federal Reserve Bank of Chicago, Mr. Hunter was the Vice President of the Financial Markets unit at the Federal Reserve Bank of Atlanta where he supervised financial staff and bank holding company analysts who analyzed and evaluated bank and bank holding company financial statements. Mr. Hunter also currently serves on the Boards of Directors of Xerox Corporation and Wellmark, Inc. as well as on the Audit Committees of such Boards. As an Audit Committee member, Mr. Hunter’s responsibilities include, among other things, reviewing financial statements, internal audits and internal controls over financial reporting. Mr. Hunter also formerly was a Professor of Finance at the University of Connecticut School of Business and has authored numerous scholarly articles on the topics of finance, accounting and economics.
Mr. Moschner, Founder and Chief Executive Officer, Northcroft Partners, LLC, (management consulting) (since 2012); formerly, Chairman (2019), and Director (2012-2019), USA Technologies, Inc., (provider of solutions and services to facilitate electronic payment transactions); formerly, Director, Wintrust Financial Corporation (1996-2016); previously, held positions at Leap Wireless International, Inc., (consumer wireless services) including Consultant (2011-2012), Chief Operating Officer (2008-2011), and Chief Marketing Officer (2004-2008); formerly, President, Verizon Card Services division of Verizon Communications, Inc. (2000-2003); formerly, President, One Point Services at One Point Communications (telecommunication services) (1999-2000); formerly, Vice Chairman of the Board, Diba, Incorporated (internet technology provider) (1996-1997); formerly, various executive positions (1991-1996), including Chief Executive Officer (1995-1996) of Zenith Electronics Corporation (consumer electronics).
ITEM 4. PRINCIPAL ACCOUNTANT FEES AND SERVICES.
Nuveen Quality Municipal Income Fund
The following tables show the amount of fees that KPMG LLP, the Fund’s auditor, billed to the Fund during the Fund’s last two full fiscal years. For engagements with KPMG LLP the Audit Committee approved in advance all audit services and non-audit services that KPMG LLP provided to the Fund, except for those non-audit services that were subject to the pre-approval exception under Rule 2-01 of Regulation S-X (the “pre-approval exception”). The pre-approval exception for services provided directly to the Fund waives the pre-approval requirement for services other than audit, review or attest services if: (A) the aggregate amount of all such services provided constitutes no more than 5% of the total amount of revenues paid by the Fund to its accountant during the fiscal year in which the services are provided; (B) the Fund did not recognize the services as non-audit services at the time of the engagement; and (C) the services are promptly brought to the Audit Committee’s attention, and the Committee (or its delegate) approves the services before the audit is completed.
The Audit Committee has delegated certain pre-approval responsibilities to its Chair (or, in her absence, any other member of the Audit Committee).
SERVICES THAT THE FUND’S AUDITOR BILLED TO THE FUND
| | | Audit Fees Billed | | Audit-Related Fees | | Tax Fees | | All Other Fees |
| Fiscal Year Ended | | to Fund 1 | | Billed to Fund 2 | | Billed to Fund 3 | | Billed to Fund 4 |
| October 31, 2021 | | $ | 29,125 | | | $ | 5,750 | | | $ | 0 | | | $ | 0 | |
| | | | | | | | | | | | | | | | | |
| Percentage approved | | | 0 | % | | | 0 | % | | | 0 | % | | | 0 | % |
| pursuant to | | | | | | | | | | | | | | | | |
| pre-approval | | | | | | | | | | | | | | | | |
| exception | | | | | | | | | | | | | | | | |
| | | | | | | | | | | | | | | | | |
| October 31, 2020 | | $ | 30,090 | | | $ | 3,500 | | | $ | 0 | | | $ | 0 | |
| | | | | | | | | | | | | | | | | |
| Percentage approved | | | 0 | % | | | 0 | % | | | 0 | % | | | 0 | % |
| pursuant to | | | | | | | | | | | | | | | | |
| pre-approval | | | | | | | | | | | | | | | | |
| exception | | | | | | | | | | | | | | | | |
| 1 "Audit Fees" are the aggregate fees billed for professional services for the audit of the Fund's annual financial statements and services provided in connection with statutory and regulatory filings or engagements. |
| |
| 2 "Audit Related Fees" are the aggregate fees billed for assurance and related services reasonably related to the performance of the audit or review of financial statements that are not reported under "Audit Fees". These fees include offerings related to the Fund's common shares and leverage. |
| |
| 3 "Tax Fees" are the aggregate fees billed for professional services for tax advice, tax compliance, and tax planning. These fees include: all global withholding tax services; excise and state tax reviews; capital gain, tax equalization and taxable basis calculation performed by the principal accountant. |
| |
| 4 "All Other Fees" are the aggregate fees billed for products and services other than "Audit Fees", "Audit-Related Fees" and "Tax Fees". These fees represent all "Agreed-Upon Procedures" engagements pertaining to the Fund's use of leverage. |
SERVICES THAT THE FUND’S AUDITOR BILLED TO THE ADVISER AND AFFILIATED FUND SERVICE PROVIDERS
The following tables show the amount of fees billed by KPMG LLP to Nuveen Fund Advisors, LLC (formerly Nuveen Fund Advisors, Inc.) (the “Adviser”), and any entity controlling, controlled by or under common control with the Adviser that provides ongoing services to the Fund (“Affiliated Fund Service Provider”), for engagements directly related to the Fund’s operations and financial reporting, during the Fund’s last two full fiscal years.
The tables also show the percentage of fees subject to the pre-approval exception. The pre-approval exception for services provided to the Adviser and any Affiliated Fund Service Provider (other than audit, review or attest services) waives the pre-approval requirement if: (A) the aggregate amount of all such services provided constitutes no more than 5% of the total amount of revenues paid to KPMG LLP by the Fund, the Adviser and Affiliated Fund Service Providers during the fiscal year in which the services are provided that would have to be pre-approved by the Audit Committee; (B) the Fund did not recognize the services as non-audit services at the time of the engagement; and (C) the services are promptly brought to the Audit Committee’s attention, and the Committee (or its delegate) approves the services before the Fund’s audit is completed.
| | | Audit-Related Fees | | Tax Fees Billed to | | All Other Fees |
| | | Billed to Adviser and | | Adviser and | | Billed to Adviser |
| | | Affiliated Fund | | Affiliated Fund | | and Affiliated Fund |
| Fiscal Year Ended | | Service Providers | | Service Providers | | Service Providers |
| October 31, 2021 | | $ | 0 | | | $ | 0 | | | $ | 0 | |
| | | | | | | | | | | | | |
| Percentage approved | | | 0 | % | | | 0 | % | | | 0 | % |
| pursuant to | | | | | | | | | | | | |
| pre-approval | | | | | | | | | | | | |
| exception | | | | | | | | | | | | |
| October 31, 2020 | | $ | 0 | | | $ | 0 | | | $ | 0 | |
| | | | | | | | | | | | | |
| Percentage approved | | | 0 | % | | | 0 | % | | | 0 | % |
| pursuant to | | | | | | | | | | | | |
| pre-approval | | | | | | | | | | | | |
| exception | | | | | | | | | | | | |
NON-AUDIT SERVICES
The following table shows the amount of fees that KPMG LLP billed during the Fund’s last two full fiscal years for non-audit services. The Audit Committee is required to pre-approve non- audit services that KPMG LLP provides to the Adviser and any Affiliated Fund Services Provider, if the engagement related directly to the Fund’s operations and financial reporting (except for those subject to the pre-approval exception described above). The Audit Committee requested and received information from KPMG LLP about any non-audit services that KPMG LLP rendered during the Fund’s last fiscal year to the Adviser and any Affiliated Fund Service Provider. The Committee considered this information in evaluating KPMG LLP’s independence.
| | | | | Total Non-Audit Fees | | | | |
| | | | | billed to Adviser and | | | | |
| | | | | Affiliated Fund Service | | Total Non-Audit Fees | | |
| | | | | Providers (engagements | | billed to Adviser and | | |
| | | | | related directly to the | | Affiliated Fund Service | | |
| | | Total Non-Audit Fees | | operations and financial | | Providers (all other | | |
| Fiscal Year Ended | | Billed to Fund | | reporting of the Fund) | | engagements) | | Total |
| | October 31, 2021 | | | $ | 0 | | | $0 | | $0 | | $ | 0 | |
| | October 31, 2020 | | | $ | 0 | | | $0 | | $0 | | $ | 0 | |
"Non-Audit Fees billed to Fund" for both fiscal year ends represent "Tax Fees" and "All Other Fees" billed to Fund in their respective
amounts from the previous table. |
| |
| Less than 50 percent of the hours expended on the principal accountant's engagement to audit the registrant's financial statements for the most recent fiscal year were attributed to work performed by persons other than the principal accountant's full-time, permanent employees. |
Audit Committee Pre-Approval Policies and Procedures. Generally, the Audit Committee must approve (i) all non-audit services to be performed for the Fund by the Fund’s independent accountants and (ii) all audit and non-audit services to be performed by the Fund’s independent accountants for the Affiliated Fund Service Providers with respect to operations and financial reporting of the Fund. Regarding tax and research projects conducted by the independent accountants for the Fund and Affiliated Fund Service Providers (with respect to operations and financial reports of the Fund) such engagements will be (i) pre-approved by the Audit Committee if they are expected to be for amounts greater than $10,000; (ii) reported to the Audit Committee chair for her verbal approval prior to engagement if they are expected to be for amounts under $10,000 but greater than $5,000; and (iii) reported to the Audit Committee at the next Audit Committee meeting if they are expected to be for an amount under $5,000.
ITEM 5. AUDIT COMMITTEE OF LISTED REGISTRANTS.
The registrant’s Board has a separately designated Audit Committee established in accordance with Section 3(a)(58)(A) of the Securities Exchange Act of 1934, as amended (15 U.S.C. 78c(a)(58)(A)). As of the end of the period covered by this report the members of the audit committee are Jack B. Evans, William C. Hunter, John K. Nelson, Albin F. Moschner, Judith M. Stockdale and Carole E. Stone, Chair.
ITEM 6. SCHEDULE OF INVESTMENTS.
a) See Portfolio of Investments in Item 1.
b) Not applicable.
ITEM 7. DISCLOSURE OF PROXY VOTING POLICIES AND PROCEDURES FOR CLOSED-END MANAGEMENT INVESTMENT COMPANIES.
Nuveen Fund Advisors, LLC is the registrant’s investment adviser (referred to herein as the “Adviser”). The Adviser is responsible for the on-going monitoring of the Fund’s investment portfolio, managing the Fund’s business affairs and providing certain clerical, bookkeeping and administrative services. The Adviser has engaged Nuveen Asset Management, LLC (“Sub-Adviser”) as Sub-Adviser to provide discretionary investment advisory services. As part of these services, the Adviser has delegated to the Sub-Adviser the full responsibility for proxy voting on securities held in the registrant’s portfolio and related duties in accordance with the Sub-Adviser’s policies and procedures. The Adviser periodically monitors the Sub-Adviser’s voting to ensure that it is carrying out its duties. The Sub-Adviser’s proxy voting policies and procedures are attached to this filing as an exhibit and incorporated herein by reference.
ITEM 8. PORTFOLIO MANAGER OF CLOSED-END MANAGEMENT INVESTMENT COMPANIES.
Nuveen Fund Advisors, LLC is the registrant's investment adviser (also referred to as the "Adviser"). The Adviser is responsible for the selection and on-going monitoring of the Fund's investment portfolio, managing the Fund's business affairs and providing certain clerical, bookkeeping and administrative services. The Adviser has engaged Nuveen Asset Management, LLC (“Nuveen Asset Management” or “Sub-Adviser”) as Sub-Adviser to provide discretionary investment advisory services. The following section provides information on the portfolio manager at the Sub-Adviser:
Item 8(a)(1). PORTFOLIO MANAGER BIOGRAPHY
As of the date of filing this report, the following individual at the Sub-Adviser (the “Portfolio Manager”) has primary responsibility for the day-to-day implementation of the Fund’s investment strategy:
Christopher L. Drahn, CFA, Managing Director at Nuveen Asset Management, manages tax-exempt fixed income portfolios as well as mutual funds and closed-end funds. He began working in the investment industry when he joined the firm in 1980. Chris became a portfolio manager in 1988. He received a B.A. from Wartburg College and an M.B.A. in finance from the University of Minnesota. Chris holds the Chartered Financial Analyst designation.
Item 8(a)(2). OTHER ACCOUNTS MANAGED BY PORTFOLIO MANAGER
Other Accounts Managed. In addition to managing the registrant, the portfolio manager is also primarily responsible for the day-to-day portfolio management of the following accounts:
Portfolio Manager | Type of Account
Managed | Number of
Accounts | Assets* |
| Christopher L. Drahn | Registered Investment Company | 10 | $20.11 billion |
| | Other Pooled Investment Vehicles | 0 | $0 |
| | Other Accounts | 2 | $136 million |
| * | Assets are as of October 31, 2021. None of the assets in these accounts are subject to an advisory fee based on performance. |
POTENTIAL MATERIAL CONFLICTS OF INTEREST
Actual or apparent conflicts of interest may arise when a portfolio manager has day-to-day management responsibilities with respect to more than one account. More specifically, portfolio managers who manage multiple accounts are presented a number of potential conflicts, including, among others, those discussed below.
The management of multiple accounts may result in a portfolio manager devoting unequal time and attention to the management of each account. Nuveen Asset Management seeks to manage such competing interests for the time and attention of portfolio managers by having portfolio managers focus on a particular investment discipline. Most accounts managed by a portfolio manager in a particular investment strategy are managed using the same investment models.
If a portfolio manager identifies a limited investment opportunity which may be suitable for more than one account, an account may not be able to take full advantage of that opportunity due to an allocation of filled purchase or sale orders across all eligible accounts. To deal with these situations, Nuveen Asset Management has adopted procedures for allocating limited opportunities across multiple accounts.
With respect to many of its clients’ accounts, Nuveen Asset Management determines which broker to use to execute transaction orders, consistent with its duty to seek best execution of the transaction. However, with respect to certain other accounts, Nuveen Asset Management may be limited by the client with respect to the selection of brokers or may be instructed to direct trades through a particular broker. In these cases, Nuveen Asset Management may place separate, non-simultaneous, transactions for a Fund and other accounts which may temporarily affect the market price of the security or the execution of the transaction, or both, to the detriment of the Fund or the other accounts.
Some clients are subject to different regulations. As a consequence of this difference in regulatory requirements, some clients may not be permitted to engage in all the investment techniques or transactions or to engage in these transactions to the same extent as the other accounts managed by the portfolio manager. Finally, the appearance of a conflict of interest may arise where Nuveen Asset Management has an incentive, such as a performance-based management fee, which relates to the management of some accounts, with respect to which a portfolio manager has day-to-day management responsibilities.
Conflicts of interest may also arise when the Sub-Adviser invests one or more of its client accounts in different or multiple parts of the same issuer’s capital structure, including investments in public versus private securities, debt versus equity, or senior versus junior/subordinated debt, or otherwise where there are different or inconsistent rights or benefits. Decisions or actions such as investing, trading, proxy voting, exercising, waiving or amending rights or covenants, workout activity, or serving on a board, committee or other involvement in governance may result in conflicts of interest between clients holding different securities or investments. Generally, individual portfolio managers will seek to act in a manner that they believe serves the best interest of the accounts they manage. In cases where a portfolio manager or team faces a conflict among its client accounts, it will seek to act in a manner that it believes best reflects its overall fiduciary duty, which may result in relative advantages or disadvantages for particular accounts.
Nuveen Asset Management has adopted certain compliance procedures which are designed to address these types of conflicts common among investment managers. However, there is no guarantee that such procedures will detect each and every situation in which a conflict arises.
Item 8(a)(3). FUND MANAGER COMPENSATION
As of the most recently completed fiscal year end, the primary Portfolio Manager’s compensation is as follows:
Portfolio managers are compensated through a combination of base salary and variable components consisting of (i) a cash bonus; (ii) a long-term performance award; and (iii) participation in a profits interest plan.
Base salary. A portfolio manager’s base salary is determined based upon an analysis of the portfolio manager’s general performance, experience and market levels of base pay for such position.
Cash bonus. A portfolio manager is eligible to receive an annual cash bonus that is based on three variables: risk-adjusted investment performance relative to benchmark generally measured over the most recent one, three and five year periods (unless the portfolio manager’s tenure is shorter), ranking versus Morningstar peer funds generally measured over the most recent one, three and five year periods (unless the portfolio manager’s tenure is shorter), and management and peer reviews.
Long-term performance award. A portfolio manager is eligible to receive a long-term performance award that vests after three years. The amount of the award when granted is based on the same factors used in determining the cash bonus. The value of the award at the completion of the three-year vesting period is adjusted based on the risk-adjusted investment performance of Fund(s) managed by the portfolio manager during the vesting period and the performance of the TIAA organization as a whole.
Profits interest plan. Portfolio managers are eligible to receive profits interests in Nuveen Asset Management and its affiliate, Teachers Advisors, LLC, which vest over time and entitle their holders to a percentage of the firms’ annual profits. Profits interests are allocated to each portfolio manager based on such person’s overall contribution to the firms.
There are generally no differences between the methods used to determine compensation with respect to the Fund and the Other Accounts shown in the table above.
Item 8(a)(4). OWNERSHIP OF NAD SECURITIES AS OF OCTOBER 31, 2021
| Name of Portfolio Manager | None | $1 - $10,000 | $10,001-$50,000 | $50,001-$100,000 | $100,001-$500,000 | $500,001-$1,000,000 | Over $1,000,000 |
| Christopher Drahn | X | | | | | | |
ITEM 9. PURCHASES OF EQUITY SECURITIES BY CLOSED-END MANAGEMENT INVESTMENT COMPANY AND AFFILIATED PURCHASERS.
Not applicable.
ITEM 10. SUBMISSION OF MATTERS TO A VOTE OF SECURITY HOLDERS.
There have been no material changes to the procedures by which shareholders may recommend nominees to the registrant’s Board implemented after the registrant last provided disclosure in response to this Item.
ITEM 11. CONTROLS AND PROCEDURES.
| (a) | The registrant’s principal executive and principal financial officers, or persons performing similar functions, have concluded that the registrant’s disclosure controls and procedures (as defined in Rule 30a-3(c) under the Investment Company Act of 1940, as amended (the “1940 Act”) (17 CFR 270.30a-3(c))) are effective, as of a date within 90 days of the filing date of this report that includes the disclosure required by this paragraph, based on their evaluation of the controls and procedures required by Rule 30a-3(b) under the 1940 Act (17 CFR 270.30a-3(b)) and Rules 13a-15(b) or 15d-15(b) under the Securities Exchange Act of 1934, as amended (the “Exchange Act”) (17 CFR 240.13a-15(b) or 240.15d-15(b)). |
| (b) | There were no changes in the registrant’s internal control over financial reporting (as defined in Rule 30a-3(d) under the 1940 Act (17 CFR 270.30a-3(d)) that occurred during the period covered by this report that has materially affected, or is reasonably likely to materially affect, the registrant’s internal control over financial reporting. |
ITEM 12. DISCLOSURE OF SECURITIES LENDING ACTIVITIES FOR CLOSED-END MANAGEMENT INVESTMENT COMPANIES.
Not applicable.
ITEM 13. EXHIBITS.
File the exhibits listed below as part of this Form.
| (a)(3) | | Any written solicitation to purchase securities under Rule 23c-1 under the 1940 Act (17 CFR 270.23c-1) sent or given during the period covered by the report by or on behalf of the registrant to 10 or more persons. Not applicable. |
| (a)(4) | | Change in the registrant’s independent public accountant. Not applicable. |
SIGNATURES
Pursuant to the requirements of the Securities Exchange Act of 1934 and the Investment Company Act of 1940, the registrant has duly caused this report to be signed on its behalf by the undersigned, thereunto duly authorized.
(Registrant) Nuveen Quality Municipal Income Fund
By (Signature and Title) /s/ Mark L. Winget
Mark L. Winget
Vice President and Secretary
Date: January 6, 2022
Pursuant to the requirements of the Securities Exchange Act of 1934 and the Investment Company Act of 1940, this report has been signed below by the following persons on behalf of the registrant and in the capacities and on the dates indicated.
By (Signature and Title) /s/ David J. Lamb
David J. Lamb
Chief Administrative Officer
(principal executive officer)
Date: January 6, 2022
By (Signature and Title) /s/ E. Scott Wickerham
E. Scott Wickerham
Vice President and Controller
(principal financial officer)
Date: January 6, 2022