Investor Presentation
(Based upon Second Quarter 2005 results)
July 25, 2005
www.j2global.com
1

Future operating results
Subscriber growth and retention
Earnings growth and expectations
New products, services and features
Corporate spending
Liquidity
Network capacity and coverage
Regulatory developments
Taxes
Certain statements in this presentation constitute “forward-looking statements” within the meaning of the Private Securities Litigation Reform Act of 1995, particularly those contained in the slide entitled “2005 Financial Guidance”. These forward-looking statements are based on management’s current expectations or beliefs as of July 25, 2005 and are subject to numerous assumptions, risks and uncertainties that could cause actual results to differ materially from those described in the forward-looking statements. We undertake no obligation to revise or publicly release the results of any revision to these forward-looking statements. Readers should carefully review the risk factors described in this presentation. Such statements address the following subjects:
Safe Harbor for Forward-Looking Statements
All information in this presentation speaks as of July 25, 2005 and any
distribution of this presentation after that date is not intended and will not be
construed as updating or confirming such information.
2
Risk Factors
Inability to sustain growth in our customer base, revenue or profitability
Competition in price, quality, features and geographic coverage
Inability to obtain telephone numbers in sufficient quantities on acceptable terms in desirable locations
Enactment of burdensome telecommunications or Internet regulations
Reduced use of fax services due to increased use of email or widespread adoption of digital signatures
Inadequate intellectual property protection or violations of third party intellectual property rights
System failures or breach of system or network security
Failure to expand and upgrade our systems and network infrastructure to accommodate increased traffic
Inability to adapt to technological change, or third party development of new technologies superior to ours
Economic downturns in industries which rely heavily on fax transmissions
Loss of services of executive officers and other key employees
Loss of third party suppliers and marketing relationships, and inability to enter into new such relationships
on acceptable terms
Other factors set forth in our Annual Report on Form 10-K filed on 3/28/05 and the other reports filed by
us from time to time with the Securities and Exchange Commission
The following factors, among others, could cause our business, prospects, financial condition, operating results
and cash flows to be materially adversely affected:
3

j2 Global deploys the power of the
Internet to deliver business critical
communication and messaging services to
individuals and corporations throughout
the world.
4
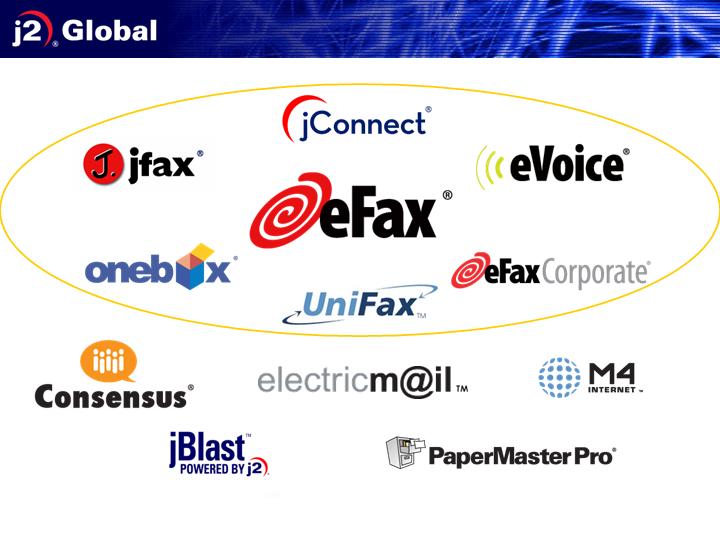
All brand names and logos are trademarks of j2 Global Communications, Inc. or its affiliates in the U.S. and/or internationally.
5

Unique Assets
9.3 million subscribed telephone numbers (DIDs)
Global advanced messaging network
1,500+ cities in 25 countries on 5 continents
13.6MM+ unique DIDs worldwide in inventory
Patented technology
A portfolio of 23 issued U.S. patents, and numerous pending U.S. patent
applications, issued foreign patents and pending foreign applications
Expertise
Effective customer acquisition strategies and Web marketing
Breadth, depth and management of a complex network & architecture
Strong financial position
33 consecutive quarters of Revenues growth
14 consecutive quarters of positive and growing Operating Earnings
35% year-over-year Revenues growth
$108.6MM of cash & investments to fund growth (as of 6/30/05)
Nominal amount of debt
6

Subscriber Profile
Vertical Markets
Financial institutions
Real estate
Law firms & corporate legal departments
Medical
Government
Hospitality
Remote workers & “road warriors”
Value Proposition
Digitization (paper reduction)
Security
Privacy
Regulatory Compliance
Efficiency
Cost
Infrastructure replacement
7

Subscriber Acquisition
Individuals
Targeted Web marketing
(e.g. AOL, Hotmail, Yahoo!, Google, AT&T, United Online, etc.)
Sold primarily through: www.eFax.com and www.j2.com
Use of proprietary Life Cycle Management (i.e. Free Paid conversions)
Advertising & Calling-Party-Pays revenue supports the Free base
Small to Mid-Sized Businesses
Sold through: www.eFaxCorporate.com, supported by Telesales
Self-service Web-based broadcast fax engine at www.jblast.com
Outsourced email, spam & virus protection through Electric Mail
Use of proprietary Life Cycle Management (i.e. usage stimulation)
Large Enterprise/Government
Direct sales force
Marketed through Web and traditional direct selling methods
Use of proprietary Life Cycle Management (i.e. usage stimulation)
8

Paid Subscription Drivers
Six drivers for Paid subscription additions:
Subscribers coming directly to the Company’s Websites
Brand awareness
Search engine discovery
Free-to-Paid subscriber upgrades
Life Cycle Management
eFax Corporate SME sales
Hybrid Website and human interaction (i.e. Telesales)
Direct enterprise & government sales
Through the outside Corporate Sales team
Direct marketing spend for Paid subscribers
Targeted marketing
CPA deals
International marketing programs in Western Europe
9

1,500+ cities
in 25 countries
on 5 continents
Everyone has a fax number
on their business cards…
but the smart ones get
their faxes delivered to
their email.
Current population of j2 Global-served
countries: 758 million
Representing 246+ million Internet users
j2 Global has >638,000 international
subscribers
137 million total US employees
j2 Global has 8.6 million U.S. subscribers
10

Initiative Updates
Enterprise Sales
14 Enterprise accounts with 1,000+ DIDs – all under annual or
multi-year contracts
Signed another 3,000 DID account during Q2
Pipeline: 42 qualified 1,000+ DID opportunities, of which 13
are international
International
54% increase in Paid net subscriber additions between Q1 and
Q2 2005
Signed marketing agreement with Lycos for 8 E.U. countries
Taipei, Taiwan service to be introduced in Q3
eVoice
Approximately 2,000 Paid subscribers – acquired with virtually
no external marketing (which starts this quarter)
International (Europe) eVoice launch in Q3 2005
11

Product Roadmap
Inbound Fax to Email
Outbound Fax via Email
Fax broadcasting
Secure fax
OCR
PDF delivery
Fax storage/archive
“Smart” Caller ID
New notification methods
Voice
Services
Inbound VM to Email
Voicemail management
Telephone access
Conference Calling
Enhanced voicemail
Call screening
Call forwarding
Voicemail interrupt
Collaboration
Unified
Messaging
& Comm.
Services
Integrated Email,
voicemail & fax services
Find me/Follow me
Wireless messaging and
notification
Virtual PBX
ProtoFax®
Messenger 4.0
HotSend®
PaperMaster Pro®
Currently offered
Future opportunities
Document
Management
Services
Permission-based
Email marketing
Outsourced Email
Spam control
Virus filtering
Message storage
Hosted ExchangeTM
IP
Fax
Exchange is a registered Trademark of the Microsoft Corporation
12

Financial Highlights
13

Historical Revenue & Operating Income Growth
33 consecutive quarters of Revenue growth
14 consecutive quarter of Operating Earnings growth
14

Cost Trends
*
*
* Reflects a reclassification of certain network operations and depreciation expenses
into Cost of Revenues, which was implemented in Q1 2005 (and is on-going),
versus their historical inclusion in General & Administrative expenses. See Slide
#19 for a reconciliation to previously reported numbers.
15

2005 Financial Guidance
(1) Assumes an effective annual tax rate of 27% and 25.5 million fully diluted shares outstanding
$0.48 – 0.49
$37.4 – 38.0
Q3
2005
$1.82 – 1.87
Net Earnings per Share (1)
$145 – 148
Revenues (millions)
Year-End
2005
16
Recent Events
j2 Global’s network expanded to 25 countries with the
introduction of local telephone numbers in Spain and
Portugal
Acquired the assets of Data On Call, a profitable fax-to-
email provider to businesses
Electric Mail launched PerimeterProtect™ services,
offering up-front email messaging protection and
continuity through SPAM and content filtering, as well as
virus blocking
OneBox Receptionist introduced, providing virtual PBX
functionality to small- and medium-sized businesses
Increased analyst coverage with the addition of Morgan
Keegan and First Albany
17
Metrics
18
Q1
Q2
Q3
Q4
Q1
Q2
Q3
Q4
Q1
Q2
Fixed Subscriber Revenues
$9,916
$11,177
$12,121
$13,976
$16,021
$17,750
$19,122
$20,823
$22,773
$23,756
Variable Subscriber Revenues
4,538
5,130
5,685
5,542
6,041
7,314
7,863
8,226
8,502
10,323
Subscriber Revenues
$14,454
$16,307
$17,806
$19,517
$22,062
$25,063
$26,985
$29,050
$31,275
$34,079
Other Revenues
754
730
1,097
957
880
768
786
749
949
806
Total Revenues
$15,208
$17,037
$18,903
$20,474
$22,942
$25,831
$27,771
$29,799
$32,224
$34,885
DID Based Revenues
$14,063
$15,835
$17,478
$19,216
$21,664
$24,057
$25,994
$27,937
$30,186
$33,009
Non-DID Revenues
1,145
1,202
1,424
1,258
1,278
1,774
1,777
1,862
2,038
1,876
Total Revenues
$15,208
$17,037
$18,903
$20,474
$22,942
$25,831
$27,771
$29,799
$32,224
$34,885
Subscriber Revenue/Total Revenues
95.0%
95.7%
94.2%
95.3%
96.2%
97.0%
97.2%
97.5%
97.1%
97.7%
DID Based/Total Revenues
92.5%
92.9%
92.5%
93.9%
94.4%
93.1%
93.6%
93.8%
93.7%
94.6%
%
Fixed
Subscriber Revenues
68.6%
68.5%
68.1%
71.6%
72.6%
70.8%
70.9%
71.7%
72.8%
69.7%
%
Variable
Subscriber Revenues
31.4%
31.5%
31.9%
28.4%
27.4%
29.2%
29.1%
28.3%
27.2%
30.3%
Paid DIDs
(4)
304,969
348,988
380,230
400,245
434,616
469,328
515,162
553,949
598,490
641,720
Average Monthly Revenue/DID
$15.59
$15.52
$15.36
$15.73
$16.68
$17.22
$16.95
$16.87
$16.85
$17.21
Cancel Rate
(1)
3.6%
3.0%
2.8%
3.3%
2.9%
2.4%
2.6%
2.7%
2.8%
2.5%
Free DIDs
4,320,975
4,825,991
5,146,838
5,150,388
5,843,167
6,873,083
7,106,249
8,180,452
8,448,517
8,653,386
Average Monthly Revenue/DID
$0.05
$0.04
$0.05
$0.05
$0.05
$0.04
$0.04
$0.04
$0.04
$0.04
Total DID Inventory (MM)
5.8
6.5
6.7
7.1
8.6
9.5
11.3
11.9
12.7
13.6
Cities Covered
1,000
1,000
1,100
1,100
1,300
1,350
1,400
1,500
1,500
1,500
Countries Covered
18
19
20
20
20
20
20
22
23
25
Gross Margin
(3)
80.2%
80.9%
81.5%
82.6%
84.1%
84.3%
84.3%
85.1%
79.8%
80.2%
Operating Margin
34.2%
36.1%
39.2%
41.4%
43.5%
42.6%
43.0%
44.0%
41.4%
44.0%
Cash/Funds Available for Growth
(millions)
$38.7
$46.5
$54.5
$63.8
$67.4
$74.2
$83.9
$93.8
$98.2
$108.6
Free Cash Flow
(2)
(millions)
$5.0
$7.1
$7.7
$9.5
$9.9
$11.6
$11.9
$10.9
$11.3
$13.8
(1)
Cancel Rate is defined as individual customer DIDs with greater than 4 months of continuous service (continuous service includes customer DIDs which are administratively cancelled and
reactivated within a calendar month), and DIDs realted to enterprise customers beginning with their first day of service. Calculated monthly and expressed here as an average over the three
months of the quarter.
(2)
Free Cash Flow is net cash provided by operating activities, less purchases of property and equipment. In Q4 2003, it excludes the benefit of $9.5 million to record the reversal of certain
valuation allowances of defered tax assets.
(3)
Reflects the inclusion of certain network operations and depreciation expense in Cost of Revenues in Q1 2005 versus its historical inclusion in General & Administrative expense.
(4)
For Q1 2005, reduced by 6,625 DIDs due to the discontinuance of a marketing trial.
2005
2003
2004

19
Reconciliation of previously reported
Cost of Revenues and General & Administrative Expenses for 2004
($ in thousands)
Q2-2004
% of Rev
Q3-2004
% of Rev
Q4-2004
% of Rev
Cost of Revenues
Previously reported
4,063
$
15.7%
4,363
$
15.7%
4,448
$
14.9%
Add: Certain network operations
and depreciation expenses
1,070
1,092
1,128
Adjusted Cost of Revenues
5,133
$
19.9%
5,455
$
19.6%
5,576
$
18.7%
Gross Margin
Previously reported
84.3%
84.3%
85.1%
Adjusted Gross Margin
80.1%
80.4%
81.3%
General and Administrative Expenses
Previously reported
4,734
$
18.3%
5,321
$
19.2%
5,506
$
18.5%
Less: Certain network operations
and depreciation expenses
1,070
1,092
1,128
Adjusted General
and Administrative Expenses
3,664
$
14.2%
4,229
$
15.2%
4,378
$
14.7%

(1) In Q4 2003, excludes benefit of $9.5 million to record the reversal of certain valuation allowances of our deferred tax assets.
(2) Prior to Q4 2003, the Company accrued tax expense at the rate of 5% or less.
(3) Net cash provided by operating activities, less purchases of property & equipment. Free Cash Flow amounts are not meant
as a substitute for GAAP, but are solely for informational purposes.
Computation of Free Cash Flow
($ in millions)
(1,2)
20
Q1 '03
Q2 '03
Q3 '03
Q4 '03
Q1 '04
Q2 '04
Q3 '04
Q4 '04
Q1 '05
Q2 '05
Net cash provided by operating activities
$5.308
$8.542
$8.623
$10.375
$10.252
$13.044
$13.240
$14.785
$13.762
$15.227
Purchases of property & equipment
(0.300)
(1.414)
(0.947)
(0.906)
(0.319)
(1.442)
(1.337)
(3.883)
(2.473)
(1.420)
Free Cash Flow
(3)
$5.008
$7.128
$7.676
$9.469
$9.933
$11.602
$11.903
$10.902
$11.289
$13.807
®
21