EXHIBIT 99.2
Investor Presentation
(Based upon Fourth Quarter 2007 results)
February 19, 2008
Future operating results
Subscriber growth, retention and usage levels
Fax and voice service growth
New products, services and features
Corporate spending
Liquidity
Network capacity, coverage and security
Regulatory developments
Taxes
Certain statements in this presentation constitute “forward-looking statements” within the meaning of the Private
Securities Litigation Reform Act of 1995, particularly those contained in the slides entitled “2008 Outlook – Fax
Services”, “2008 Outlook – Voice Services”, and “2008 Guidance.” These forward-looking statements are based on
management’s current expectations or beliefs as of February 19, 2008 and are subject to numerous assumptions, risks
and uncertainties that could cause actual results to differ materially from those described in the forward-looking
statements. We undertake no obligation to revise or publicly release the results of any revision to these forward-
looking statements. Readers should carefully review the risk factors described in this presentation. Such statements
address the following subjects:
Safe Harbor for Forward-Looking Statements
All information in this presentation speaks as of February 19, 2008 and any
distribution of this presentation after that date is not intended and will not be
construed as updating or confirming such information.
distribution of this presentation after that date is not intended and will not be
construed as updating or confirming such information.
2

Risk Factors
Inability to sustain growth in our customer base, revenue or profitability
Competition in price, quality, features and geographic coverage
Higher than expected tax rates or exposure to additional tax liability
Inability to obtain telephone numbers in sufficient quantities on acceptable terms in desired locations
Enactment of burdensome telecommunications or Internet regulations including increased taxes or fees
Reduced use of fax services due to increased use of email, scanning or widespread adoption of digital signatures
Inadequate intellectual property protection or violations of third party intellectual property rights
System failures or breach of system or network security and resulting harm to our reputation
Inability to adapt to technological change, or third party development of new technologies superior to ours
Economic downturns in industries which rely heavily on fax transmissions or general economic downturns
Loss of services of executive officers and other key employees
Inability to maintain existing or enter into new supplier and marketing relationships on acceptable terms
Other factors set forth in our Annual Report on Form 10-K filed on 03/12/2007 and the other reports filed by us from time to
time with the Securities and Exchange Commission
time with the Securities and Exchange Commission
The following factors, among others, could cause our business, prospects, financial condition, operating results and cash flows to
be materially adversely affected:
be materially adversely affected:
3

All brand names and logos are trademarks of j2 Global Communications, Inc. or its affiliates in the U.S. and/or internationally.
Messaging/Communications as a Service
4
Core j2 Global Assets
11.9 million Subscribed Telephone Numbers (DIDs)
1,064K Paid DIDs
Global Advanced Messaging Network
Over 3,000 cities in 42 countries on 5 continents
17.2MM + unique DIDs worldwide in inventory
Intellectual Property
56 issued patents and licensing programs designed to monetize the portfolio
Protection of brands and marks
Programs designed to effectively collect evidence to prosecute junk faxers
Expertise
Effective customer acquisition strategies and Web marketing
Breadth, depth and management of a complex network & architecture
Successful acquisition and integration of 16 businesses in 7 countries
Strong Financial Position
12 consecutive years of Revenue growth
6 consecutive years of positive and growing Operating Earnings
$84MM of Free Cash Flow (FY 2007)
$230MM of cash & investments to fund growth/ no debt (as of 12/31/07)
5
Individuals
Targeted marketing (search, online media and radio)
Sold through: eFax.com, eVoice.com, Onebox.com, fax.com, j2.com, and other brand
websites
websites
Use of proprietary Life Cycle Management
Advertising, Up-selling, and Calling-Party-Pays revenue supports the Free base
Small to Mid-Sized Businesses (SMBs)
Sold through: eFaxCorporate.com and Onebox Receptionist and eVoice Receptionist websites
Supported by Chat and Telesales groups in U.S. and Europe (in multiple languages)
Self-service Web-based broadcast fax engine at jblast.com
Outsourced email, spam & virus protection and archiving
Use of proprietary Life Cycle Management (i.e. feature up-sell)
Enterprise (SMEs)/Large Enterprise/Government
Direct sales force in U.S. and Europe
Marketed through Web and traditional direct selling methods
Designed for > 150 DID accounts
Subscriber Acquisition
6

Seven Drivers for Paid DID Additions
Subscribers coming directly to the Company’s Websites/Cross Sell/Telesales
Brand awareness driven by demand-generation programs and “word of mouth”
Search engine discovery
Accounts for 40% to 50% of monthly paid DID signups
Free-to-Paid subscriber upgrades
Life Cycle Management
eFax Corporate SMB sales
Hybrid Website and human interaction (i.e. Telesales)
Direct SME/Enterprise/Government
Through the outside Corporate Sales team
Direct domestic marketing spend for paid subscribers
Targeted marketing program across various media
International marketing programs
Cross sell
Offer additional services to existing customers
Paid Subscription Drivers
7

Financial Highlights
8

(1) Excludes SFAS 123(R) non-cash compensation expense. See slide 23 and 24 for a reconciliation to the nearest GAAP financial measure.
(2) Excludes SFAS 123(R) non-cash compensation expense, net of tax benefit. See slide 23 and 24 for a reconciliation to the nearest GAAP
financial measure.
financial measure.
(3) See slide 22 for a reconciliation to the nearest GAAP financial measure.
2007 Q4 and Annual Non-GAAP Results
9
$
Margin
$
Margin
GAAP Revenue
$56.8M
$220.7M
Gross Profit/Margin
(1)
$45.4M
79.9%
$177.4M
80.4%
Operating Profit/Margin
(1)
$23.3M
41.0%
$93.8M
42.5%
Non-GAAP EPS
(2)
$0.36
$1.45
Free Cash Flow
(3)
$21.4M
$83.9M
Cash & Investments
$229.8M
$229.8M
Q4 2007
FY 2007
2007 excludes SFAS 123(R) non-cash compensation, net of tax benefit. See slides 23 and 24 for reconciliations to the nearest GAAP financial measures.
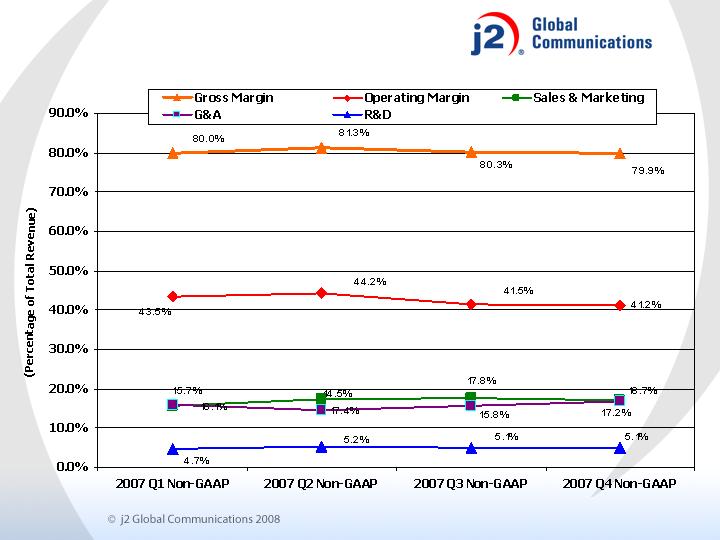
2007 Margin Trends by Quarter
10
Ending Paid DIDs (in 000s)
2007 DIDs Increased 160,000 or 18% over 2006
US DIDs Grew by 121,000 or 15% over 2006
Strong Growth in Voice services
International DIDs Increased by 49% or 38,000
Continuing Ramp Up in International Fax Services
11
2004
2005
2006
2007
US
Fax
496
666
794
870
75
9.5%
Voice
10
15
31
77
46
147.0%
Total US
506
681
826
947
121
14.7%
International
Fax
45
57
76
111
36
47.1%
Voice
3
2
3
5
3
100.6%
Total Int'l
47
59
78
116
38
48.9%
Total Ending DIDs
553
741
904
1,064
160
17.7%
'07 vs. '06
Annual Revenue Summary (in $000s)
2007 Revenues Increased $39.6M or 22% over 2006
US Revenues Increased $28.7M or 19.2% over 2006
International Revenues Increased 48% or $8.5M over 2006
Double Digit Growth Across All Sectors
12
2004
2005
2006
2007
US
Fax
$87,723
$117,576
$145,936
$171,241
$25,305
17.3%
Voice
1,394
2,418
3,266
6,618
3,352
102.6%
Total US Fax & Voice
89,117
119,994
149,202
177,859
28,657
19.2%
International
Fax
7,808
11,847
17,071
24,392
7,320
42.9%
Voice
-
728
771
1,957
1,185
153.7%
Total Int'l Fax & Voice
7,808
12,575
17,843
26,348
8,506
47.7%
Other
(1)
9,418
11,372
14,034
16,471
2,437
17.4%
Total Revenue
$106,343
$143,941
$181,079
$220,678
$39,600
21.9%
(1)
Other revenue includes Email, jBlast, Advertising and Patents
' 07 vs. '06

Accomplishments & Outlook
13
2007 Accomplishments – Fax Services
US
Fax DIDs increased to 870,000 – mostly eFax @ $16.95
Successful price increase of ~ 30% for eFax individual customers
Successfully launched fax.com/Fully integrated Send2Fax
Completed RapidFAX acquisition in December 2007
Increased Telesales staff for SMB sales
eFax Developer growth
Message center offered to corporate customers in Q4
Multi-brand approach for Fax services
International
FAX DIDs increased 47% to 111,000
Established Italian, Polish and Portuguese Web presence
Increased by 24 people presence in Europe (mostly in Ireland)
Acquired YAC
Expanded network to 42 countries
Completed multi-byte development
14

2008 Outlook – Fax Services
Global
Environment conducive to M&A
Strong cash position and cash flows
5 year low multiples for public companies
100+ candidates in fax to email delivery space
US
Double digit DID growth – Corporate faster than Individual
Stable price environment targeting multiple segments
Marketing of primary (eFax) and secondary brands
Fax indexing to create searchable faxes
Assumes light usage from credit sensitive customers
International
Increase market penetration in top European countries/Canada
Continued penetration leads to faster organic growth than US
Increase corporate European presence
Operational efficiencies due to consolidation of EU staff
Deploy multi-byte across network
15
2007 Accomplishments – Voice Services
US
Voice DIDs grew 147% to 77,000
New features introduced in Q4 2007 include click-to-call and tested
speech-to-text
speech-to-text
Increased Telesales staff and expanded CS support
Successful cross-selling to Fax customer base
International
Began focus in late 2007
Added DIDs in 14 European countries and Hong Kong
Acquired YAC in Q3
Simplified voice service proposal in Europe
16
2008 Outlook – Voice Services
Global
Early stage and evolving space with multiple competitors worldwide
Market readiness supports high growth
Several acquisition opportunities
US
Expect organic revenue to more than double
New websites and features for eVoice and Onebox
Continue cross selling to SMB fax customer base and upsell to eVoice
Rollout speech-to-text for voicemail and launch live Onebox
Receptionist
Receptionist
International
Expect organic revenue/DID growth > 50%
Launch new YAC website
Launch European-centric brand and simplified Receptionist service
Consolidate and upgrade two voice platforms/facilities
17

Annual Guidance
18

2008 Guidance
$1.45 - $1.65
GAAP EPS
$240 - $270
2008
Revenues (MM)
2008 EPS is based on GAAP which includes SFAS 123(R) non-cash
compensation expense.
compensation expense.
19
Supplemental Information
20
Metrics
21
2007
Q1
Q2
Q3
Q4
Total
Q1
Q2
Q3
Q4
Total
Fixed Subscriber Revenues
$28,537
$29,855
$32,179
$36,013
$126,586
$37,765
$39,653
$41,362
$43,347
$162,127
Variable Subscriber Revenues
12,025
12,816
12,312
11,433
48,585
12,528
12,961
12,667
12,046
50,201
Subscriber Revenues
$40,562
$42,671
$44,491
$47,447
175,171
$50,293
$52,613
$54,029
$55,394
212,328
Other Revenues
1,456
1,595
1,400
1,457
5,908
3,849
1,367
1,717
1,437
8,369
Total Revenues
$42,018
$44,266
$45,891
$48,904
181,079
$54,141
$53,980
$55,746
$56,830
220,697
DID - Based Revenues
$38,718
$40,683
$42,832
$45,650
$167,882
$48,130
$50,084
$51,209
$52,353
$201,776
Non-DID Revenues
3,300
3,583
3,059
3,254
13,197
6,011
3,895
4,537
4,478
18,921
Total Revenues
$42,018
$44,266
$45,891
$48,904
181,079
$54,141
$53,980
$55,746
$56,830
220,697
Subscriber Revenues/Total Revenues
96.5%
96.4%
96.9%
97.0%
96.7%
92.9%
97.5%
96.9%
97.5%
96.2%
DID - Based/Total Revenues
92.1%
91.9%
93.3%
93.3%
92.7%
88.9%
92.8%
91.9%
92.1%
91.4%
%
Fixed
Subscriber Revenues
70.4%
70.0%
72.3%
75.9%
72.3%
75.1%
75.4%
76.6%
78.3%
76.4%
%
Variable
Subscriber Revenues
29.6%
30.0%
27.7%
24.1%
27.7%
24.9%
24.6%
23.4%
21.7%
23.6%
Paid DIDs
(1) (2) (3) (4)
788,130
836,576
887,801
906,652
930,273
972,599
1,017,985
1,063,698
Average Monthly Revenue/DID
$16.39
$16.15
$15.98
$16.45
$16.96
$16.96
$16.47
$16.08
Cancel Rate
(5)
2.5%
2.6%
2.7%
2.9%
3.0%
2.8%
3.0%
2.7%
Free DIDs
10,225,974
10,537,817
10,619,571
10,322,922
10,355,815
10,671,519
10,706,503
10,874,104
Average Monthly Revenue/DID
$0.04
$0.04
$0.05
$0.04
$0.05
$0.05
$0.06
$0.07
Total DID Inventory (MM)
15.2
15.2
16.2
16.4
16.9
17.0
17.1
17.2
Cities Covered
1,814
1,814
2,330
2,727
2,884
2,933
2,950
3,024
Countries Covered
29
32
35
37
40
42
42
42
Cash & Investment
(millions)
$162.3
$174.9
$171.0
$191.6
$210.3
$233.1
$239.8
$229.8
Free Cash Flow
(6)
(millions)
$18.5
$11.0
$12.4
$23.9
$65.8
$26.1
$20.6
$15.7
$21.4
$83.9
(1)
For Q3 2006, DIDs reflect net changes related to anticipated unprovisioned Corporate DIDs.
(2)
For Q4 2006, DIDs reflect net changes related to anticipated unprovisioned Corporate DIDs and adjustments associated with a database upgrade.
(3)
For Q3 2006, Q4 2006 and Q1 to Q3 2007, the Send2Fax DIDs reflect a reserve for the net impact of product migration and a price increase.
(4)
For Q4 2007, the RapidFax DIDs reflect a reserve for the net impact of product migration and a price increase.
(5)
Cancel Rate is defined as individual customer DIDs with greater than 4 months of continuous service (continuous service includes customer DIDs which are administratively cancelled and reactivated within a
calendar month), and DIDs related to enterprise customers beginning with their first day of service. Calculated monthly and expressed here as an average over the three months of the quarter.
(6)
Free Cash Flow is net cash provided by operating activities, less purchases of property and equipment.��
2006
(1) Net cash provided by operating activities, less purchases of property & equipment. Free Cash Flow amounts are not meant as a substitute
for GAAP, but are solely for informational purposes.
for GAAP, but are solely for informational purposes.
22
Computation of Free Cash Flow
($ in millions)
Q1 '06
Q2 '06
Q3 '06
Q4 '06
Q1 '07
Q2 '07
Q3 '07
Q4 '07
Net cash from operating activities
$19.245
$14.250
$13.607
$25.903
$26.659
$23.113
$18.656
$25.779
Purch. of property & equipment
(0.757)
(3.288)
(1.181)
(1.973)
(0.529)
(2.506)
(2.940)
(4.340)
Free Cash Flow
(1)
$18.488
$10.962
$12.426
$23.930
$26.130
$20.607
$15.716
$21.439
GAAP Reconciliation
(1) Stock-based compensation is as follows: for Q4, Cost of revenues is $177K, Sales and Marketing is $342K, R&D is $228K, and G&A is $1,368K; for Q3, Cost of revenues is $169K, Sales and
Marketing is $304K, R&D is $186K, and G&A is $1,209K; for Q2, Cost of revenues is $140K, Sales and Marketing is $264K, R&D is $184K, and G&A is $1,114K; and for Q1, Cost of revenues is
$182K, Sales and Marketing is $278K, R&D is $173K, and G&A is $1,097K.
Marketing is $304K, R&D is $186K, and G&A is $1,209K; for Q2, Cost of revenues is $140K, Sales and Marketing is $264K, R&D is $184K, and G&A is $1,114K; and for Q1, Cost of revenues is
$182K, Sales and Marketing is $278K, R&D is $173K, and G&A is $1,097K.
(2) Income tax expense is adjusted for the net impact of item 1 above.
23
j2 GLOBAL COMMUNICATIONS, INC.
UNAUDITED CONDENSED CONSOLIDATED STATEMENTS OF OPERATIONS
(IN THOUSANDS, EXCEPT SHARE AND PER SHARE AMOUNTS)
Non-GAAP
Non-GAAP
Non-GAAP
Non-GAAP
Reported
Entries
Non-GAAP
Reported
Entries
Non-GAAP
Reported
Entries
Non-GAAP
Reported
Entries
Non-GAAP
Revenues
Subscriber
55,394
$
-
$
55,394
$
54,029
$
-
$
54,029
$
52,613
$
-
$
52,613
$
50,293
$
-
$
50,293
$
Other
1,436
0
1,436
1,717
-
1,717
1,367
-
1,367
3,848
-
3,848
Total revenues
56,830
0
56,830
55,746
-
55,746
53,980
-
53,980
54,141
-
54,141
Cost of revenues
(1)
11,597
(177)
11,420
11,168
(169)
10,999
10,232
(140)
10,092
10,990
(182)
10,808
Gross profit
45,233
177
45,410
44,578
169
44,747
43,748
140
43,888
43,151
182
43,333
Operating expenses:
Sales and marketing
(1)
10,098
(342)
9,756
10,218
(304)
9,914
9,672
(264)
9,408
8,780
(278)
8,502
Research, development and engineering
(1)
3,099
(228)
2,871
3,045
(186)
2,859
2,976
(184)
2,792
2,713
(173)
2,540
General and administrative
(1)
10,866
(1,368)
9,498
10,042
(1,209)
8,833
8,950
(1,114)
7,836
9,825
(1,097)
8,728
Total operating expenses
24,063
(1,938)
22,125
23,305
(1,699)
21,606
21,598
(1,562)
20,036
21,318
(1,548)
19,770
Operating earnings
21,170
2,115
23,285
21,273
1,868
23,141
22,150
1,702
23,852
21,833
1,730
23,563
Other income and expenses:
Interest and other income, net
2,314
126
2,440
2,598
-
2,598
2,398
-
2,398
1,725
-
1,725
Total other income and expenses:
2,314
126
2,440
2,598
-
2,598
2,398
-
2,398
1,725
-
1,725
Earnings before income taxes
23,484
2,241
25,725
23,871
1,868
25,739
24,548
1,702
26,250
23,558
1,730
25,288
Income tax expense
(2)
6,628
664
7,292
5,783
584
6,367
7,470
518
7,988
7,119
464
7,583
Net earnings
16,856
$
1,577
$
18,433
$
18,088
$
1,284
$
19,372
$
17,078
$
1,184
$
18,262
$
16,439
$
1,266
$
17,705
$
Diluted net earnings per share
0.34
$
0.36
$
0.35
$
0.38
$
0.33
$
0.36
$
0.32
$
0.35
$
Diluted weighted average shares outstanding
50,268,781
50,517,395
51,075,957
51,372,910
51,007,561
51,225,457
50,680,093
50,905,135
THREE MONTHS ENDED JUNE 30, 2007
THREE MONTHS ENDED MARCH 31, 2007
THREE MONTHS ENDED SEPTEMBER 30, 2007
THREE MONTHS ENDED DECEMBER 31, 2007
GAAP Reconciliation
(1) Stock-based compensation adjustments for 2007 are: Cost of revenue is $668K, Sales and Marketing is $1,187K, R&D is $771K, and G&A is $4,788K. 2006 adjustments are as follows: Cost of revenues is $316K, Sales and Marketing is $1,038K, R&D
is $556K, and G&A is $3,782K.
is $556K, and G&A is $3,782K.
(2) Income tax expense is adjusted for the net impact of items above.
24
j2 GLOBAL COMMUNICATIONS, INC.
UNAUDITED CONDENSED CONSOLIDATED STATEMENTS OF OPERATIONS
(IN THOUSANDS, EXCEPT SHARE AND PER SHARE AMOUNTS)
Non-GAAP
Non-GAAP
Reported
Entries
Modified
Reported
Entries
Modified
Revenues
Subscriber
212,329
$
-
$
212,329
$
175,171
$
-
$
175,171
$
Other
8,368
-
8,368
5,908
-
5,908
$
Total revenues
220,697
-
220,697
181,079
-
181,079
Cost of revenues
(1)
43,987
(668)
43,319
36,723
(316)
36,407
Gross profit
176,710
668
177,378
144,356
316
144,672
Operating expenses:
Sales and marketing
(1)
38,768
(1,187)
37,581
30,792
(1,038)
29,754
Research, development and engineering
(1)
11,833
(771)
11,062
8,773
(556)
8,217
General and administrative
(1)
39,683
(4,788)
34,895
38,754
(3,782)
34,972
Total operating expenses
90,284
(6,746)
83,538
78,319
(5,376)
72,943
Operating earnings
86,426
7,414
93,840
66,037
5,692
71,729
Other income and expenses:
Interest and other income, net
9,035
126
9,161
7,195
0
7,195
Total other income and expenses:
9,035
126
9,161
7,195
0
7,195
Earnings before income taxes
95,461
7,540
103,001
73,232
5,692
78,924
Income tax expense
(2)
Income tax expense
(2)
27,000
2,213
29,213
20,101
1,584
21,685
Net earnings
68,461
$
5,327
$
73,788
$
53,131
$
4,108
$
57,239
$
Diluted net earnings per share
1.35
$
1.45
$
1.04
$
1.12
$
Diluted weighted average shares outstanding
50,762,007
51,009,299
51,048,995
51,330,932
TWELVE MONTHS ENDED
DECEMBER 31, 2006
TWELVE MONTHS ENDED
DECEMBER 31, 2007
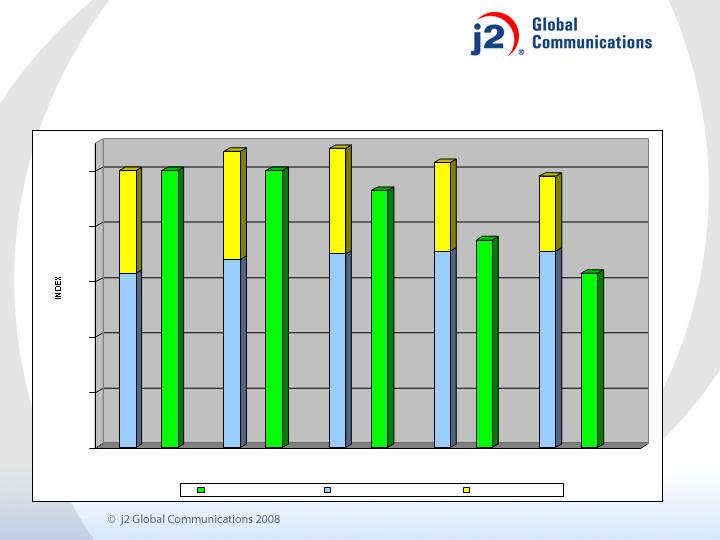
Usage Pattern of Corporate and Web High Volume
Users
Users
25
63
37
100
68
39
100
70
38
93
71
32
75
71
27
63
0
20
40
60
80
100
Q4
'06
Q1
'07
Q2
'07
Q3
'07
Q4
'07
Web Heavy Users
Non Credit Sensitive
Credit Sensitive
