Investor Presentation
(Based upon First Quarter 2009 Results)
May 5, 2009
1
Future operating results
Global economic conditions
Subscriber growth, retention and usage levels
Fax and voice service growth
New products, services and features
Corporate spending
Liquidity
Network capacity, coverage and security
Regulatory developments
Taxes
Certain statements in this presentation constitute “forward-looking statements” within the meaning of the Private
Securities Litigation Reform Act of 1995, particularly those contained in the slide “2009 Guidance.” These forward-
looking statements are based on management’s current expectations or beliefs as of May 5, 2009 and are subject to
numerous assumptions, risks and uncertainties that could cause actual results to differ materially from those described
in the forward-looking statements. We undertake no obligation to revise or publicly release the results of any revision
to these forward-looking statements. Readers should carefully review the risk factors described in this presentation.
Such statements address the following subjects:
Safe Harbor for Forward-Looking Statements
All information in this presentation speaks as of May 5, 2009 and any distribution of
this presentation after that date is not intended and will not be construed as updating
or confirming such information.
2
Risk Factors
Inability to sustain growth in our customer base, revenue or profitability, particularly in light of the uncertain U.S. or
worldwide economy and the related impact on customer acquisitions, cancelations and credit card payment declines
Competition in price, quality, features and geographic coverage
Higher than expected tax rates or exposure to additional tax liability
Inability to obtain telephone numbers in sufficient quantities on acceptable terms in desired locations
Enactment of burdensome telecommunications or Internet regulations including increased taxes or fees
Reduced use of fax services due to increased use of email, scanning or widespread adoption of digital signatures
Inadequate intellectual property protection or violations of third party intellectual property rights
System failures or breach of system or network security and resulting harm to our reputation
Inability to adapt to technological change, or third party development of new technologies superior to ours
Loss of services of executive officers and other key employees
Inability to maintain existing or enter into new supplier and marketing relationships on acceptable terms
Other factors set forth in our Annual Report on Form 10-K filed on 02/25/2009, as amended on 03/05/2009 and the other
reports filed by us from time to time with the Securities and Exchange Commission
The following factors, among others, could cause our business, prospects, financial condition, operating results and cash flows to
be materially adversely affected:
3
(1) Includes SFAS 123(R) non-cash compensation expense.
(2) Includes SFAS 123(R) non-cash compensation expense, net of tax benefit.
(3) See slide 11 for computation of free cash flow.
GAAP Results
GAAP Revenues
$60.4M
Gross Profit/Margin (1)
$49.0M
81.1%
Operating Profit/Margin (1)
$26.5M
43.8%
GAAP EPS (2)
$0.42/Share
Free Cash Flow (3)
$30.4M
Cash and Investments
$179M
$
Margin
Q1 2009
4

Operational Overview
5
Business Review
Fax
Continued success with multiple pricing programs
7 new large corporate deals including 3 upgrades
Integrated Mijanda fax customers and select brands
Acquired fax assets of CallWave
Usage and cancel rate affected by weak economy and higher unemployment
Voice
Approaching 200,000 DIDs
Strong roll out in Europe
Segmenting domestic market by three brands
Integrated Mijanda voice customers
6
Other Businesses/Operations
Successfully integrated Mailwise (hygiene provider)
Beginning to cross-sell Electric Mail services to Mailwise customers
Looking for additional M&A opportunities
Patent Licensing
Lower revenue due to acquisitions of Mijanda and Callwave fax assets
Three core patents out of reexam and related stays lifted
Advertising & Broadcast Fax
Impact of weakening economy continuing
< 2% of j2’s revenue
Operational
Gross margin improved 1 percentage point over Q1 2008
Operating margin improved more than 5 percentage points – record margin
Headcount remains stable at 400
Record free cash flow
7
2009 Guidance
Modest Increase in Revenues and Non-GAAP EPS
8

Supplemental Information
9

Metrics
10
2009
Q1
Q2
Q3
Q4
Total
Q1
Q2
Q3
Q4
Total
Q1
Fixed Subscriber Revenues
$37,757
$39,643
$41,362
$43,336
$162,098
$44,260
$46,593
$47,481
$48,125
$186,459
$48,799
Variable Subscriber Revenues
12,536
12,970
12,667
12,057
50,231
12,956
12,943
12,985
11,497
50,382
10,842
Subscriber Revenues
$50,293
$52,613
$54,029
$55,393
212,329
$57,216
$59,536
$60,466
$59,622
236,841
$59,640
Other Revenues
3,848
1,367
1,717
1,437
8,368
1,433
1,140
1,086
1,014
4,673
751
Total Revenues
$54,141
$53,980
$55,746
$56,830
220,697
$58,649
$60,676
$61,552
$60,636
241,513
$60,391
DID - Based Revenues
$48,684
$50,929
$52,204
$53,473
$205,290
$55,301
$57,551
$58,440
$57,691
$228,983
$57,449
Non-DID Revenues
5,457
3,051
3,542
3,357
15,407
3,348
3,125
3,112
2,944
12,529
2,942
Total Revenues
$54,141
$53,980
$55,746
$56,830
220,697
$58,649
$60,676
$61,552
$60,636
241,512
$60,391
Subscriber Revenues/Total Revenues
92.9%
97.5%
96.9%
97.5%
96.2%
97.6%
98.1%
98.2%
98.3%
98.1%
98.8%
DID - Based/Total Revenues
89.9%
94.3%
93.6%
94.1%
93.0%
94.3%
94.8%
94.9%
95.1%
94.8%
95.1%
%
Fixed
Subscriber Revenues
75.1%
75.3%
76.6%
78.2%
76.3%
77.4%
78.3%
78.5%
80.7%
78.7%
81.8%
%
Variable
Subscriber Revenues
24.9%
24.7%
23.4%
21.8%
23.7%
22.6%
21.7%
21.5%
19.3%
21.3%
18.2%
Paid DIDs
(1)
930,273
972,599
1,017,985
1,063,698
1,098,650
1,162,872
1,198,950
1,236,079
1,273,876
Average Monthly Revenue/DID
$17.16
$17.26
$16.80
$16.44
$16.30
$16.29
$15.87
$15.28
$14.85
Cancel Rate
(2)
3.0%
2.8%
3.0%
2.7%
2.8%
2.9%
3.0%
3.1%
3.5%
Free DIDs
10,355,815
10,671,519
10,706,503
10,874,104
10,098,143
10,233,875
10,357,506
10,362,771
10,137,651
Average Monthly Revenue/DID
$0.05
$0.05
$0.06
$0.07
$0.08
$0.07
$0.07
$0.06
$0.05
Total DID Inventory (MM)
16.9
17.0
17.1
17.2
17.4
17.5
17.3
19.8
19.4
Cities Covered
2,884
2,933
2,950
3,024
3,084
3,126
3,137
3,135
3,207
Countries Covered
40
42
42
42
44
45
46
46
46
Cash & Investment
(millions)
$210.3
$233.1
$239.8
$229.8
$181.3
$149.9
$151.8
$161.9
$179.3
Free Cash Flow
(3)
(millions)
$26.1
$20.6
$15.7
$21.4
$83.9
$26.9
$23.0
$14.7
$23.5
$88.2
$30.4
(1)
Paid DIDs reflect reserves for anticipated product migration and/or price increase.
(2)
Cancel Rate is defined as individual customer DIDs with greater than 4 months of continuous service (continuous service includes customer DIDs which are administratively cancelled and reactivated within calendar month),
and DIDs related to enterprise customers beginning with their first day of service. Calculated monthly and expressed here as an average over the three months of the quarter.
(3)
Free cash flow is net cash provided by operating activities, less purchases of property and equipment. See slide 11 for computation of free cash flow.
Note also that Q3 and Q4 2008 Free Cash Flow have been updated in the above schedule for an immaterial correction.
Quarterly revenues for Q1 2007 and Q1 2008 have been reclassed between fixed, variable and other revenue and between DID based and non-DID based revenue.
This reclass is related to revised revenue classification for a j2 subsidiary, it does not impact total revenues for the quarter.
2008
2007
(1)
Net cash provided by operating activities, less purchases of property & equipment. Free cash flow amounts are not meant as a
substitute for GAAP, but are solely for informational purposes.
(2)
Free cash flow schedule has been revised for an immaterial correction to Q3 and Q4 2008 free cash flow.
Computation of Free Cash Flow
($ in millions)
11
Q2 '07
Q3 '07
Q4 '07
Q1 '08
Q2 '08
Q3 '08
Q4 '08
Q1 '09
Net cash from operating activities
$23.113
$18.656
$25.779
$27.411
$23.840
$15.676
$23.789
$31.152
Purch. of property & equipment
(2.506)
(2.940)
(4.340)
(0.469)
(0.796)
(0.937)
(0.305)
(0.721)
Free Cash Flow
(1) (2)
$20.607
$15.716
$21.439
$26.942
$23.044
$14.739
$23.484
$30.431
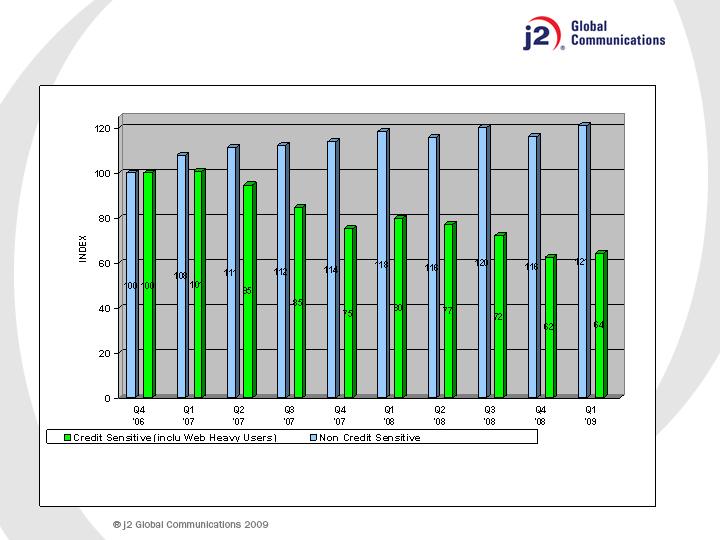
Usage of Corporate and Web High Volume Users
12