Investor Presentation
(Based upon Fourth Quarter 2009 Results)
February 18, 2010
Future operating results
Global economic conditions
Subscriber growth, retention and usage levels
Fax and voice service growth
New products, services and features
Corporate spending
Intellectual property
Liquidity
Network capacity, coverage and security
Regulatory developments
Taxes
Certain statements in this presentation constitute “forward-looking statements” within the meaning of the Private
Securities Litigation Reform Act of 1995, particularly those contained in the “2010 Guidance” slides. These forward-
looking statements are based on management’s current expectations or beliefs as of February 18, 2010 and are
subject to numerous assumptions, risks and uncertainties that could cause actual results to differ materially from those
described in the forward-looking statements. We undertake no obligation to revise or publicly release the results of
any revision to these forward-looking statements. Readers should carefully review the risk factors described in this
presentation. Such forward-looking statements address the following subjects, among others:
Safe Harbor for Forward-Looking Statements
All information in this presentation speaks as of February 18, 2010 and any
distribution of this presentation after that date is not intended and will not be
construed as updating or confirming such information.
Risk Factors
Inability to sustain growth in our customer base, revenue or profitability, particularly in light of the uncertain U.S. or
worldwide economy and the related impact on customer acquisitions, cancelations and credit card payment declines
Competition in price, quality, features and geographic coverage
Higher than expected tax rates or exposure to additional tax liability
Inability to obtain telephone numbers in sufficient quantities on acceptable terms in desired locations
Enactment of burdensome telecommunications or Internet regulations including increased taxes or fees
Reduced use of fax services due to increased use of email, scanning or widespread adoption of digital signatures
Inadequate intellectual property protection or violations of third party intellectual property rights
System failures or breach of system or network security and resulting harm to our reputation
Inability to adapt to technological change, or third party development of new technologies superior to ours
Loss of services of executive officers and other key employees
Inability to maintain existing or enter into new supplier and marketing relationships on acceptable terms
Other factors set forth in our Annual Report on Form 10-K, and the other reports filed by us from time to time with the
Securities and Exchange Commission
The following factors, among others, could cause our business, prospects, financial condition, operating results and cash flows to
be materially adversely affected:
Q4 ’09 GAAP & Non-GAAP Results
(1) Non-GAAP excludes share-based compensation, impairment of auction rate and related securities, gain on sale of investments and disposal of long lived asset, in each case, net of tax.
(2) Non-GAAP excludes share-based compensation, impairment of auction rate and related securities, gain on sale of investments and disposal of long lived asset, in each case, net of tax.
Q4’s GAAP tax rate is 31.4% and non-GAAP is 30.7%.
(3) See slide 15 for computation of free cash flow.
$
Margin
Q4 2009 GAAP
Revenues
$60.9M
$60.9M
Gross Profit/Margin (1)
$50.4M
82.8%
$50.8M
83.3%
Operating Profit/Margin (1)
$23.8M
39.0%
$29.1M
47.8%
EPS (2)
$0.39/Share
$0.45/Share
Free Cash Flow (3)
$22.2M
Cash and Investments
$243.7M
$
Margin
Q4 2009 Non-GAAP

FY ’09 GAAP & Non-GAAP Results
(1) Non-GAAP excludes share-based compensation, impairment of auction rate and related securities, gain on sale of investments and disposal of long lived asset, in each case, net of tax.
(2) Non-GAAP excludes share-based compensation, impairment of auction rate and related securities, gain on sale of investments and disposal of long lived asset, in each case, net of tax.
Full year GAAP tax rate is 31.7% and non-GAAP is 29.6%.
(3) See slide 15 for computation of free cash flow.
$
Margin
FY 2009 GAAP
Revenues
$245.6M
$245.6M
Gross Profit/Margin (1)
$200.8M
81.8%
$202.1M
82.3%
Operating Profit/Margin (1)
$104.5M
42.5%
$104.5M
48.0%
EPS (2)
$1.48/Share
$1.85/Share
Free Cash Flow (3)
$101.6M
Cash and Investments
$243.7M
$
Margin
FY 2009 Non-GAAP

2009 Recap and 2010 Outlook
Recap 2009 Guidance: Modest increase in Revenues and Non-GAAP EPS
Financial Results
1.7% Revenue Growth
8.8% Non-GAAP EPS Growth
11.4% EBITDA Growth
13.1% FCF Growth
Operational Results
Cancel rate peaked @ 3.7% in March 2009; highest level since Q1 2003 (3.6%)
- Rate declined to 3.0% by Q4
2009 Growth Drivers:
- Voice year-over-year revenue growth of 28%
- Corporate revenue growth of 4% with 22 wins, ending the year with 76 large
accounts
- International revenue growth ~ 5%, mostly in local currencies
2009 Recap
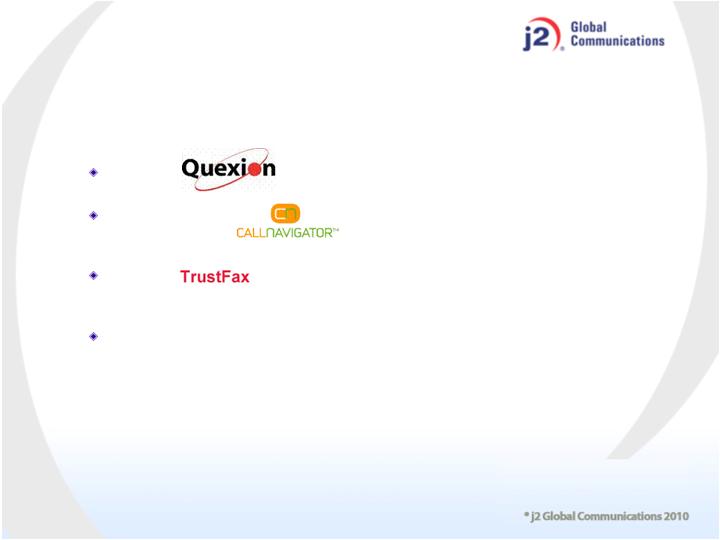
M&A
Quexion anti-spam/virus protection, hosted email and security
Reality Telecom UK based voice service, fully compatible with
eReceptionist
Trustfax U.S. based fax to email for individuals and SMB; top 5 in U.S.
market
M&A pipeline – solid pipeline with multiple targets in multiple countries;
predominantly international opportunities for fax and voice with email deals
available globally
2010 Outlook M&A
Fax
Geographic expansion – planning accelerated growth in telephone numbers around the
world: adding both countries and area codes outside of the U.S. and Europe
Organizational enhancements to permit focus on EMEA (Europe, Middle East and Africa)
and ROW (Rest of the World)
EMEA revenue run rate approx. $30M; headquarters in Dublin managed by recently
recruited in-country European VP
Expansion and penetration into ROW territories led by our International VP who built
EMEA from almost zero to a $30M business. Focus on Canada, Asia-Pacific, and Latin
America
Expect Fax DID growth to surpass total revenue growth of 5%
eFax Corporate: Increase our enterprise sales staff by 20% and increase sales in the
government sector
Voice
Crack the code for free-to-paid model a-la’ eFax free, provide high value free trial to
business users
Focus on branding strategy and market leadership, EU expected to be higher growth
Continue cross-selling efforts, improving retention, and rolling out new features
Advertising
Reinvest in our fax brands, focus on eFax U.S. via free offering and media spend
Additional marketing spend outside of search engines for Onebox and eVoice
Expand in Japan market, multi-year plan
2010 Outlook Organic Growth

2010 GUIDANCE

Economy
Assume economy is in recovery mode but pace will be slow and volatile
Expect minimal increase in new hiring
Slightly weaker USD relative to GBP and Euro for 2010
Operational View
Continue to leverage current infrastructure/efficiencies
Increased Investment in IP
Expect increase in cash outlay for cases based on patents that are out of re-exam
M&A/opportunistic investments for our cash
Other Assumptions
Interest Income flat with 2009
Tax rate (30.5%): assume no current R&D credits will be approved by Congress
Stock based compensation expense for 2010 will be ~ $0.20
2010 Assumptions/Guidance

2010 Guidance
2010 EPS is based on Non-GAAP which excludes SFAS 123(R) non-cash compensation
expense, net of tax benefit.
2010 Plan
Revenues (M) 3% - 7% increase vs. 2009
Non-GAAP EPS similar to 2009
Supplemental Information
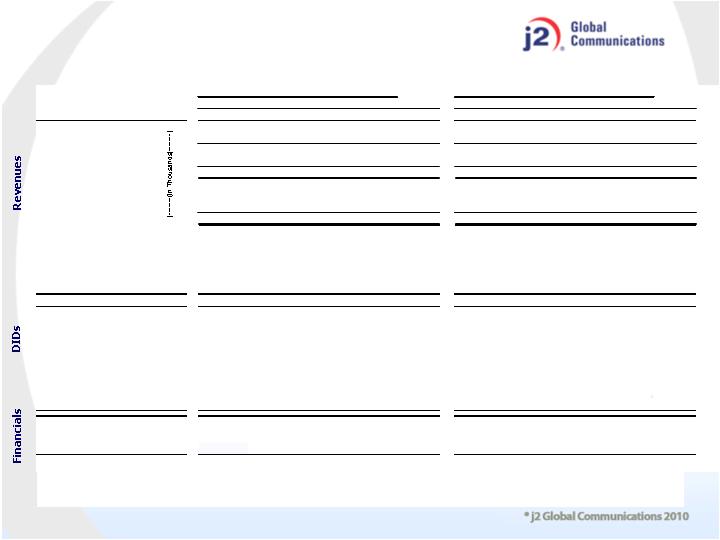
Metrics
Free cash flow is net cash provided by operating activities, plus excess tax benefits from share based compensation, less purchases of property and equipment. See slide 15 for computation of free cash flow.
(3)
within calendar month), and DIDs related to enterprise customers beginning with their first day of service. Calculated monthly and expressed here as an average over the three months of the quarter.
Cancel Rate is defined as individual customer DIDs with greater than 4 months of continuous service (continuous service includes customer DIDs which are administratively cancelled and reactivated
(2)
Paid DIDs reflect reserves for: anticipated product migration and/or price increase.
(1)
Q1
Q2
Q3
Q4
Total
Q1
Q2
Q3
Q4
Total
Fixed Subscriber Revenues
$44,260
$46,593
$47,481
$48,125
$186,459
$48,799
$49,726
$49,782
$49,612
$197,918
Variable Subscriber Revenues
12,956
12,943
12,985
11,503
50,388
10,842
11,322
11,264
10,576
44,004
Subscriber Revenues
$57,216
$59,536
$60,466
$59,628
236,847
$59,640
$61,049
$61,046
$60,188
241,923
Other Revenues
1,433
1,140
1,086
1,014
4,673
751
1,415
756
727
3,648
Total Revenues
$58,649
$60,676
$61,552
$60,642
241,520
$60,391
$62,464
$61,801
$60,915
245,571
DID - Based Revenues
$55,301
$57,551
$58,440
$57,698
$228,990
$57,449
$58,904
$58,969
$58,121
$233,443
Non-DID Revenues
3,348
3,125
3,112
2,944
12,529
2,942
3,560
2,832
2,793
12,128
Total Revenues
$58,649
$60,676
$61,552
$60,642
241,519
$60,391
$62,464
$61,801
$60,915
245,571
Subscriber Revenues/Total Revenues
97.6%
98.1%
98.2%
98.3%
98.1%
98.8%
97.7%
98.8%
98.8%
98.5%
DID - Based/Total Revenues
94.3%
94.8%
94.9%
95.1%
94.8%
95.1%
94.3%
95.4%
95.4%
95.1%
%
Fixed
Subscriber Revenues
77.4%
78.3%
78.5%
80.7%
78.7%
81.8%
81.5%
81.5%
82.4%
81.8%
%
Variable
Subscriber Revenues
22.6%
21.7%
21.5%
19.3%
21.3%
18.2%
18.5%
18.5%
17.6%
18.2%
Paid DIDs
(1)
1,098,650
1,162,872
1,198,950
1,236,079
1,273,876
1,274,145
1,274,240
1,275,486
Average Monthly Revenue/DID
$16.30
$16.29
$15.87
$15.29
$14.85
$14.96
$15.03
$14.85
Cancel Rate
(2)
2.8%
2.9%
3.0%
3.1%
3.5%
3.3%
3.1%
3.0%
Free DIDs (MM)
10.1
10.2
10.4
10.4
10.1
10.1
10.0
9.9
Average Monthly Revenue/DID
$0.08
$0.07
$0.07
$0.06
$0.05
$0.06
$0.05
$0.04
Cities Covered
3,084
3,126
3,137
3,135
3,207
3,327
3,500
3,539
Countries Covered
44
45
46
46
46
46
46
46
Cash & Investment
(millions)
$181.3
$149.9
$151.8
$161.9
$179.3
$194.8
$222.5
$243.7
Free Cash Flow
(3)
(millions)
$27.2
$23.2
$15.0
$24.4
$89.8
$30.4
$22.9
$26.1
$22.2
$101.6
2008
2009
(1)
Free cash flow is defined as net cash provided by operating activities, less purchases of property, plant and equipment, plus
excess tax benefit from share based compensation. Free cash flow amounts are not meant as a substitute for GAAP, but are
solely for informational purposes.
Computation of Free Cash Flow
($ in millions)
Q4 '07
Q1 '08
Q2 '08
Q3 '08
Q4 '08
Q1 '09
Q2 '09
Q3 '09
Q4 '09
Net cash provided by operating activities
$25.779
$27.411
$23.840
$15.676
$23.789
$31.152
$20.362
$26.469
$23.850
Purch. of property & equipment
($4.340)
($0.469)
($0.796)
($0.937)
($0.305)
($0.721)
($0.217)
($0.767)
($1.546)
Excess tax benefit from share based compensation
$1.271
$0.239
$0.204
$0.212
$0.910
$0.005
$2.718
$0.403
($0.063)
Free Cash Flow
(1)
$22.710
$27.181
$23.248
$14.951
$24.394
$30.436
$22.863
$26.105
$22.241
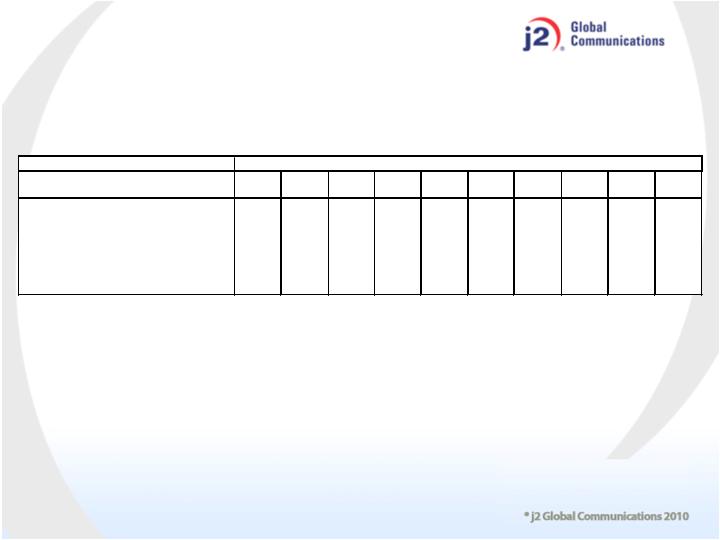
j2 Global Key Financial & Operating Metrics, 2000-2009
(1) EBITDA is defined as Operating Income adjusted to include depreciation and amortization and, for 2009, excludes loss on disposal of long lived asset
(2) FCF is defined as net cash provided by operating activities, less purchases of property, plant and equipment, plus excess tax benefit from share based
compensation. Free cash flow amounts are not meant as a substitute for GAAP, but are solely for informational purposes. See slide 15 for additional
information on the computation of free cash flow.
2000
2001
2002
2003
2004
2005
2006
2007
2008
2009
Total Revenue ($ in Millions)
$13.9
$33.3
$48.2
$71.6
$106.3
$143.9
$181.1
$220.7
$241.5
$245.6
Annual Growth
139%
45%
49%
48%
35%
26%
22%
9%
2%
Paid DIDs
(in thousands)
N/A
N/A
270
400
554
740
907
1,064
1,236
1,275
Avg. Revenue per User (Subscriber Rev)
N/A
N/A
$14.57
$15.88
$16.82
$16.75
$16.45
$16.75
$15.96
$15.09
EBITDA ($ in Millions)
(1)
($18.0)
$0.7
$17.4
$31.2
$50.3
$68.4
$80.0
$104.0
$119.1
$132.6
Margin (%)
-129%
2%
36%
44%
47%
47%
44%
47%
49%
54%
Free Cash Flow ($ in Millions)
(2)
($14.4)
$0.2
$13.5
$29.1
$43.8
$55.4
$67.3
$88.6
$89.8
$101.6
(1) Stock-based compensation is as follows: for Q4, Cost of revenues is $328K, Sales and Marketing is $480K, R&D is $219K, and G&A is $1,896K, for 12 months of 2009, Cost of revenue is
$1,263K, Sales and Marketing is $1,818K, R&D is $853K, and G&A is $7,084K.
(2) Loss on disposal of long-lived asset is $2,442 for Q4.
(3) Impairment charge for auction rate securities in Q4 is $150K, for 12 months of 2009 is $9,343K.
(4) Interest and other income is $1,812 for Q4
(5) Income tax expense adjusted for the net impact of item 3 above is $965K.
Non-GAAP Results & Reconciliation to GAAP
Reported
Non-GAAP
Reported
Non-GAAP
Revenues
Subscriber
60,188
$
-
$
60,188
$
241,922
$
-
$
241,922
$
Other
727
-
727
3,649
-
3,649
Total revenue
60,915
-
60,915
245,571
-
245,571
Cost of revenues
(1)
10,480
(328)
(1)
10,152
44,730
(1,263)
(1)
43,467
Gross profit
50,435
328
50,763
200,841
1,263
202,104
Operating expenses:
Sales and marketing
(1)
9,563
(480)
(1)
9,083
37,006
(1,818)
(1)
35,188
Research, development and engineering
(1)
2,972
(219)
(1)
2,753
11,657
(853)
(1)
10,804
General and administrative
(1)
11,693
(1,896)
(1)
9,797
45,275
(7,084)
(1)
38,191
Loss on disposal of long-lived asset
(2)
2,442
(2,442)
(2)
-
2,442
(2,442)
(2)
-
Total operating expenses
26,670
(5,037)
21,633
96,380
(12,197)
84,183
Operating earnings
23,765
5,365
29,130
104,461
13,460
117,921
Other-than-temporary impairment losses
(3)
(150)
150
(3)
-
(9,343)
9,343
(3)
-
Interest and other income, net
(4)
2,184
(1,812)
(4)
372
2,661
(1,812)
(4)
849
Earnings before income taxes
25,799
3,703
29,502
97,779
20,991
118,770
Income tax expense
(5)
8,095
965
(5)
9,060
30,952
4,204
(5)
35,156
Net earnings
17,704
$
2,738
$
20,442
$
66,827
$
16,787
$
83,614
$
Diluted net earnings per share
0.39
$
0.45
$
1.48
$
1.85
$
Diluted weighted average shares outstanding
45,244,333
45,244,333
45,138,001
45,138,001
TWELEVE MONTHS ENDED DECEMBER 31, 2009
Non-GAAP Entries
j2 GLOBAL COMMUNICATIONS, INC.
UNAUDITED RECONCILIATION OF NON-GAAP FINANCIAL RESULTS
(UNAUDITED, IN THOUSANDS, EXCEPT SHARE AND PER SHARE AMOUNTS)
Non-GAAP Entries
THREE MONTHS ENDED DECEMBER 31, 2009
THREE MONTHS AND TWELVE MONTHS ENDED DECEMBER 31, 2009
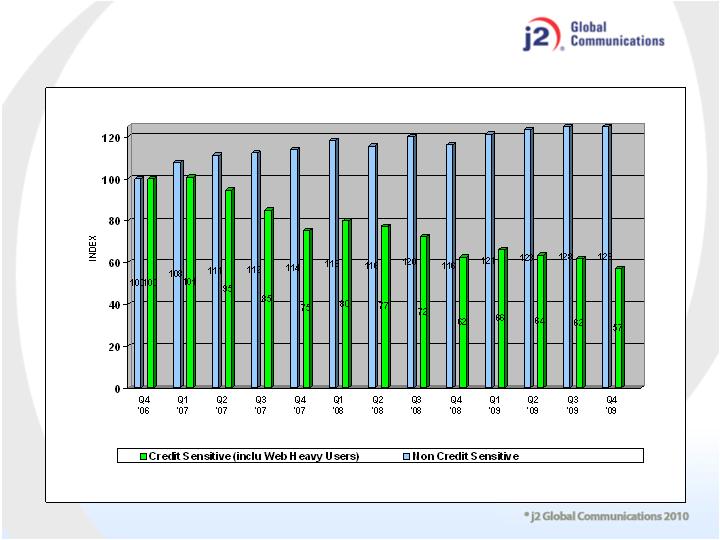
Usage of Corporate and Web High Volume Users