EXHIBIT 99.2

Investors Presentation ® Third Quarter 2017 Results November 2, 2017
Certain statements in this presentation are “forward-looking statements” within the meaning of the Private Securities Litigation Reform Act of 1995, particularly those regarding our 2017 Financial Guidance. Such forward-looking statements are subject to numerous assumptions, risks and uncertainties that could cause actual results to differ materially from those described in those statements. Readers should carefully review the Risk Factors slide of this presentation. These forward-looking statements are based on management’s expectations or beliefs as of November 2, 2017 and as well as those set forth in our Annual Report on Form 10-K filed by us on March 1, 2017 with the Securities and Exchange Commission (“SEC”) and the other reports we file from time-to-time with the SEC. We undertake no obligation to revise or publicly release any updates to such statements based on future information or actual results. Such forward-looking statements address the following subjects, among others: All information in this presentation speaks as of November 2, 2017 and any redistribution or rebroadcast of this presentation after that date is not intended and will not be construed as updating or confirming such information. Future operating resultsAbility to acquire businesses on acceptable terms and integrate and recognize synergies from acquired businessesDeployment of cash and investment balances to grow the companySubscriber growth, retention, usage levels and average revenue per accountCloud service and digital media growth and continued demand for fax servicesInternational growthNew products, services, features and technologiesCorporate spending including stock repurchasesIntellectual property and related licensing revenuesLiquidity and ability to repay or refinance indebtednessNetwork capacity, coverage, reliability and securityRegulatory developments and taxes 2 Safe Harbor for Forward-Looking Statements
Inability to sustain growth or profitability, particularly in light of an uncertain U.S. and worldwide economy and the related impact on customer acquisition, retention and usage levels, advertising spend and credit and debit card payment declinesReduced use of fax services due to increased use of email, scanning or widespread adoption of digital signatures or otherwiseInability to acquire businesses on acceptable terms or successfully integrate and realize anticipated synergies Failure to offer compelling digital media content causing reduced traffic and advertising levels; loss of advertisers or reduction in advertising spend; increased prevalence or effectiveness of advertising blocking technologies; inability to monetize handheld devices and handheld traffic supplanting monetized traffic; and changes by our vendors or partners that impact our traffic or publisher audience acquisition and/or monetization New or unanticipated costs or tax liabilities, including those relating to federal and state income tax and indirect taxes, such as sales, value-added and telecommunications taxesInability to manage certain risks inherent to our business, such as fraudulent activity, system failure or a security breachCompetition from others with regard to price, service, content and functionalityInadequate intellectual property (IP) protection, expiration or invalidity of key patents, violations of 3rd party IP rights or inability or significant delay in monetizing IPInability to continue to expand our business and operations internationallyInability to maintain required services on acceptable terms with financially stable telecom, co-location and other critical vendors; and inability to obtain telephone numbers in sufficient quantities on acceptable terms and in desired locationsLevel of debt limiting availability of cash flow to reinvest in the business; inability to repay or refinance debt when due; and restrictive covenants relating to debt imposing operating and financial restrictions on business activities or plansInability to maintain and increase our cloud services customer base or average revenue per userEnactment of burdensome telecommunications, Internet, advertising, health care or other regulations, or being subject to existing regulationsInability to adapt to technological change and diversify services & related revenues at acceptable levels of financial returnLoss of services of executive officers and other key employeesOther factors set forth in our Annual Report on Form 10-K filed by us on March 1, 2017 with the Securities and Exchange Commission (“SEC”) and the other reports we file from time-to-time with the SEC The following factors, among others, could cause our business, prospects, financial condition, operating results and cash flows to be materially adversely affected: 3 Risk Factors

Q3 2017 Results
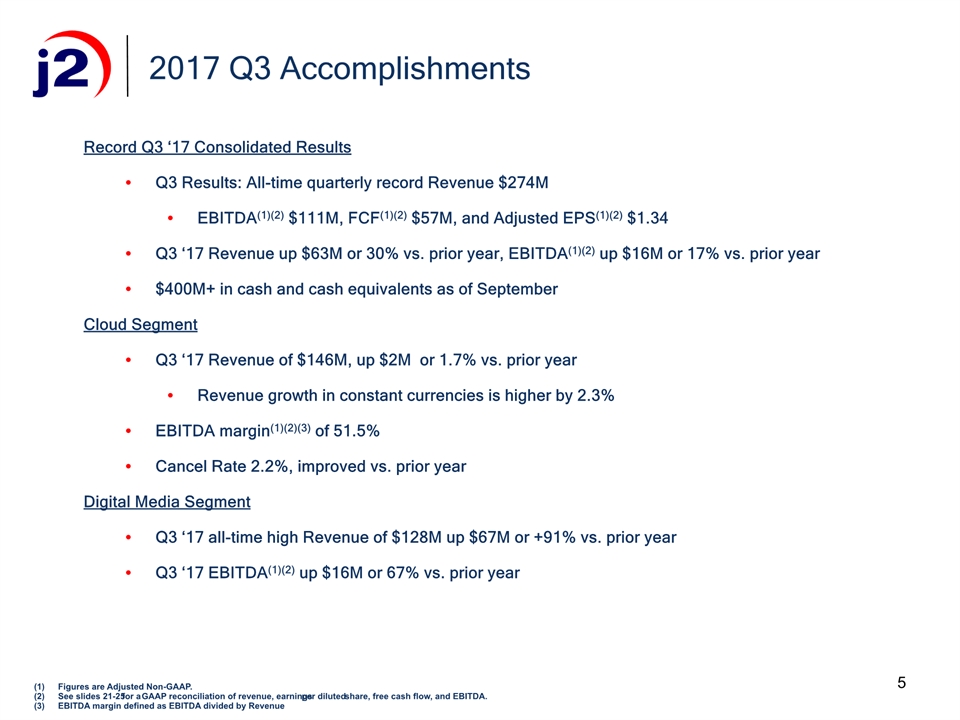
5 Record Q3 ‘17 Consolidated ResultsQ3 Results: All-time quarterly record Revenue $274MEBITDA(1)(2) $111M, FCF(1)(2) $57M, and Adjusted EPS(1)(2) $1.34Q3 ‘17 Revenue up $63M or 30% vs. prior year, EBITDA(1)(2) up $16M or 17% vs. prior year$400M+ in cash and cash equivalents as of September Cloud SegmentQ3 ‘17 Revenue of $146M, up $2M or 1.7% vs. prior yearRevenue growth in constant currencies is higher by 2.3%EBITDA margin(1)(2)(3) of 51.5%Cancel Rate 2.2%, improved vs. prior yearDigital Media SegmentQ3 ‘17 all-time high Revenue of $128M up $67M or +91% vs. prior yearQ3 ‘17 EBITDA(1)(2) up $16M or 67% vs. prior year 2017 Q3 Accomplishments Figures are Adjusted Non-GAAP. See slides 21-25 for a GAAP reconciliation of revenue, earnings per diluted share, free cash flow, and EBITDA.EBITDA margin defined as EBITDA divided by Revenue
j2 Global Consolidated
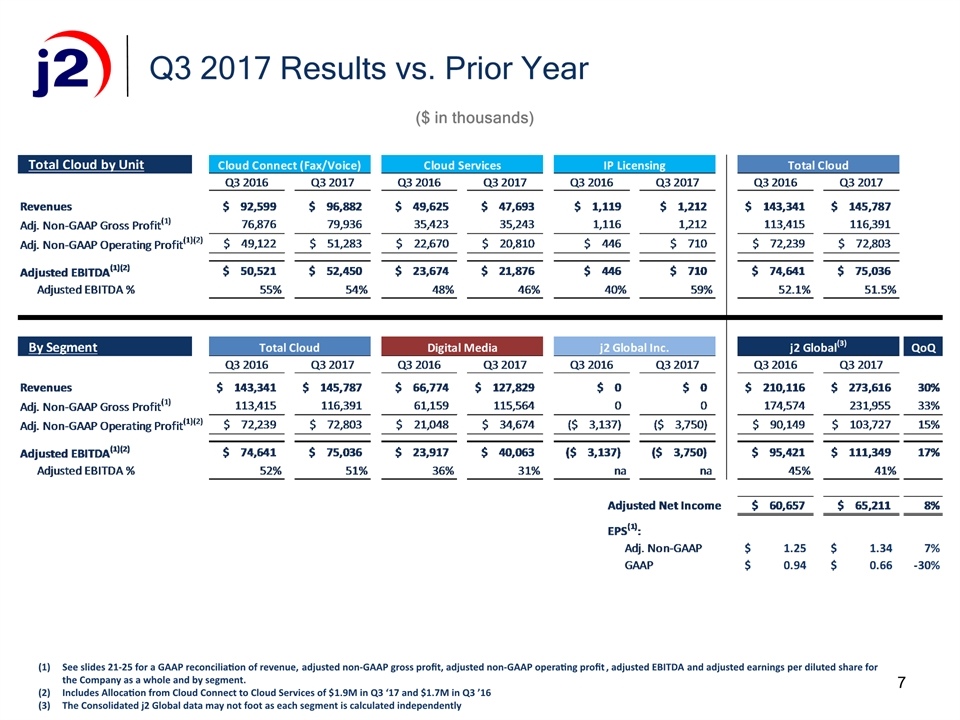
7 Q3 2017 Results vs. Prior Year See slides 21-25 for a GAAP reconciliation of revenue, adjusted non-GAAP gross profit, adjusted non-GAAP operating profit, adjusted EBITDA and adjusted earnings per diluted share for the Company as a whole and by segment.Includes Allocation from Cloud Connect to Cloud Services of $1.9M in Q3 ‘17 and $1.7M in Q3 ’16The Consolidated j2 Global data may not foot as each segment is calculated independently ($ in thousands)
Business Cloud Services
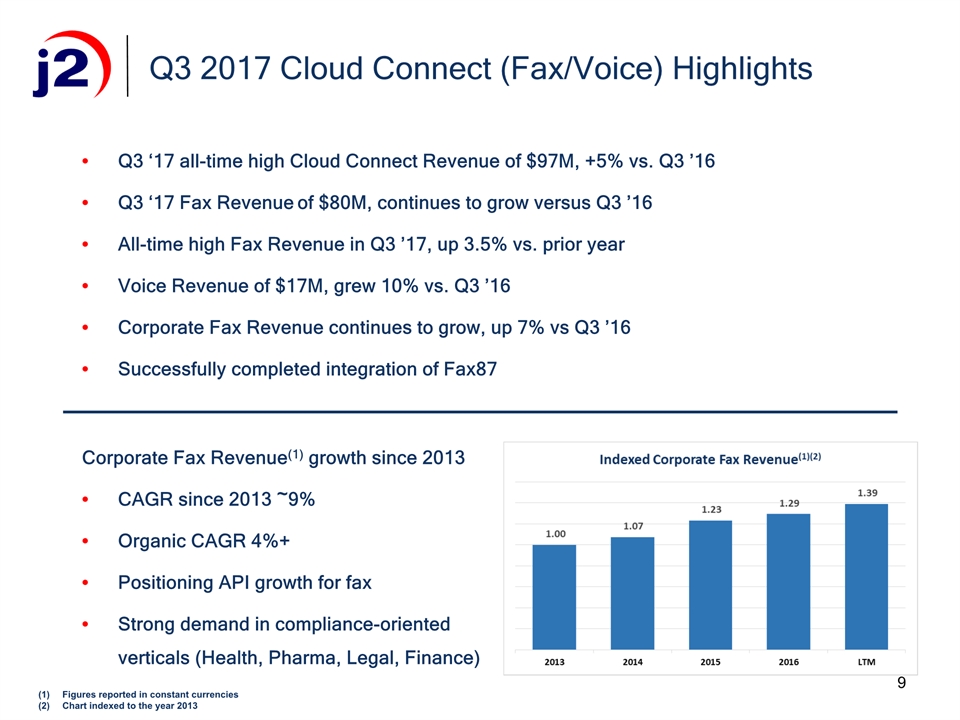
Q3 ‘17 all-time high Cloud Connect Revenue of $97M, +5% vs. Q3 ’16Q3 ‘17 Fax Revenue of $80M, continues to grow versus Q3 ’16All-time high Fax Revenue in Q3 ’17, up 3.5% vs. prior yearVoice Revenue of $17M, grew 10% vs. Q3 ’16Corporate Fax Revenue continues to grow, up 7% vs Q3 ’16Successfully completed integration of Fax87 Q3 2017 Cloud Connect (Fax/Voice) Highlights Corporate Fax Revenue(1) growth since 2013CAGR since 2013 ~9%Organic CAGR 4%+Positioning API growth for faxStrong demand in compliance-oriented verticals (Health, Pharma, Legal, Finance) 9 Figures reported in constant currenciesChart indexed to the year 2013
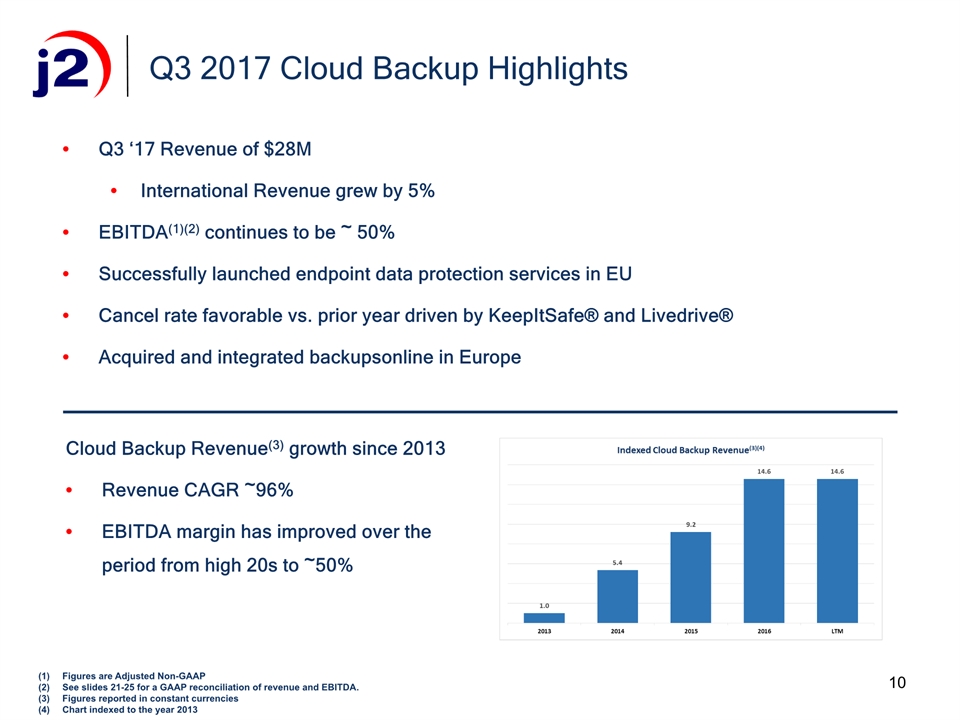
Q3 ‘17 Revenue of $28MInternational Revenue grew by 5%EBITDA(1)(2) continues to be ~ 50%Successfully launched endpoint data protection services in EUCancel rate favorable vs. prior year driven by KeepItSafe® and Livedrive® Acquired and integrated backupsonline in Europe Q3 2017 Cloud Backup Highlights Figures are Adjusted Non-GAAPSee slides 21-25 for a GAAP reconciliation of revenue and EBITDA.Figures reported in constant currenciesChart indexed to the year 2013 10 Cloud Backup Revenue(3) growth since 2013Revenue CAGR ~96%EBITDA margin has improved over the period from high 20s to ~50%
Email Security – FuseMail® Strong organic growth, sequential quarterly growth of ~7.2% topline, driven by EuropeQ3 ‘17 Revenue of $11.4M, EBITDA(1)(2) of ~$4MStrong new business sales in Excel Micro™ after McAfee migrationsOngoing investment in the FuseMail® product roadmap – features and packagesNordics acquisition WeCloud integration on trackEmail Marketing – Campaigner® Q3 ‘17 Revenue of $7.7M, YTD Revenue is up 17% vs. prior yearCampaigner continues to enhance it digital marketing product suiteLaunching new landing page functionality and enhancing dynamic content featuresARPA(2) up 17% vs Q3 ’16 Q3 2017 Email Security & Email Marketing Highlights Figures are Adjusted Non-GAAPARPA defined as Average Revenue per Account per month 11

Digital Media
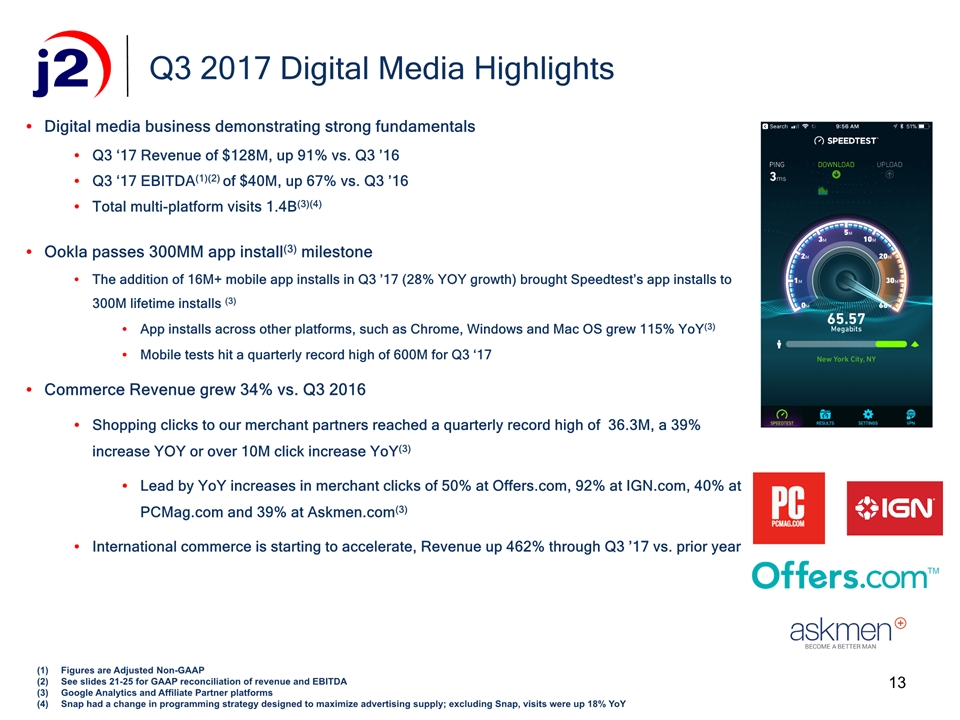
13 Digital media business demonstrating strong fundamentalsQ3 ‘17 Revenue of $128M, up 91% vs. Q3 ’16Q3 ‘17 EBITDA(1)(2) of $40M, up 67% vs. Q3 ’16Total multi-platform visits 1.4B(3)(4) Q3 2017 Digital Media Highlights Ookla passes 300MM app install(3) milestoneThe addition of 16M+ mobile app installs in Q3 ’17 (28% YOY growth) brought Speedtest’s app installs to 300M lifetime installs (3)App installs across other platforms, such as Chrome, Windows and Mac OS grew 115% YoY(3)Mobile tests hit a quarterly record high of 600M for Q3 ‘17Commerce Revenue grew 34% vs. Q3 2016Shopping clicks to our merchant partners reached a quarterly record high of 36.3M, a 39% increase YOY or over 10M click increase YoY(3)Lead by YoY increases in merchant clicks of 50% at Offers.com, 92% at IGN.com, 40% at PCMag.com and 39% at Askmen.com(3)International commerce is starting to accelerate, Revenue up 462% through Q3 ’17 vs. prior year Figures are Adjusted Non-GAAPSee slides 21-25 for GAAP reconciliation of revenue and EBITDAGoogle Analytics and Affiliate Partner platformsSnap had a change in programming strategy designed to maximize advertising supply; excluding Snap, visits were up 18% YoY
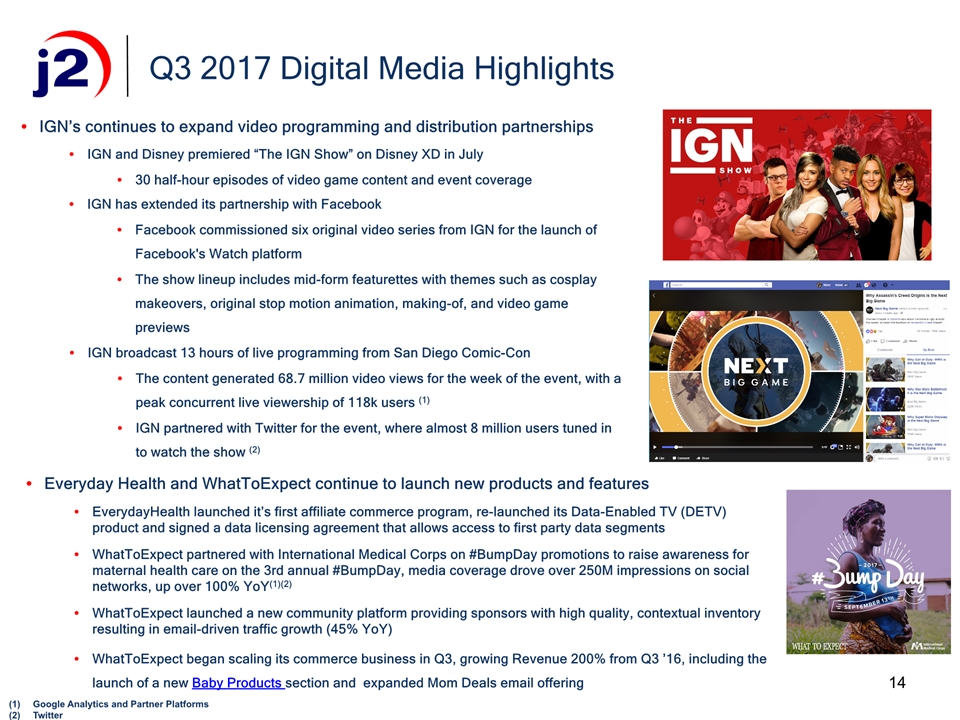
14 Q3 2017 Digital Media Highlights IGN’s continues to expand video programming and distribution partnershipsIGN and Disney premiered “The IGN Show” on Disney XD in July30 half-hour episodes of video game content and event coverage Google Analytics and Partner PlatformsTwitter IGN has extended its partnership with FacebookFacebook commissioned six original video series from IGN for the launch of Facebook's Watch platformThe show lineup includes mid-form featurettes with themes such as cosplay makeovers, original stop motion animation, making-of, and video game previews IGN broadcast 13 hours of live programming from San Diego Comic-ConThe content generated 68.7 million video views for the week of the event, with a peak concurrent live viewership of 118k users (1) IGN partnered with Twitter for the event, where almost 8 million users tuned in to watch the show (2) Everyday Health and WhatToExpect continue to launch new products and featuresEverydayHealth launched it’s first affiliate commerce program, re-launched its Data-Enabled TV (DETV) product and signed a data licensing agreement that allows access to first party data segmentsWhatToExpect partnered with International Medical Corps on #BumpDay promotions to raise awareness for maternal health care on the 3rd annual #BumpDay, media coverage drove over 250M impressions on social networks, up over 100% YoY(1)(2)WhatToExpect launched a new community platform providing sponsors with high quality, contextual inventory resulting in email-driven traffic growth (45% YoY)WhatToExpect began scaling its commerce business in Q3, growing Revenue 200% from Q3 ’16, including the launch of a new Baby Products section and expanded Mom Deals email offering

2017 Financial Guidance
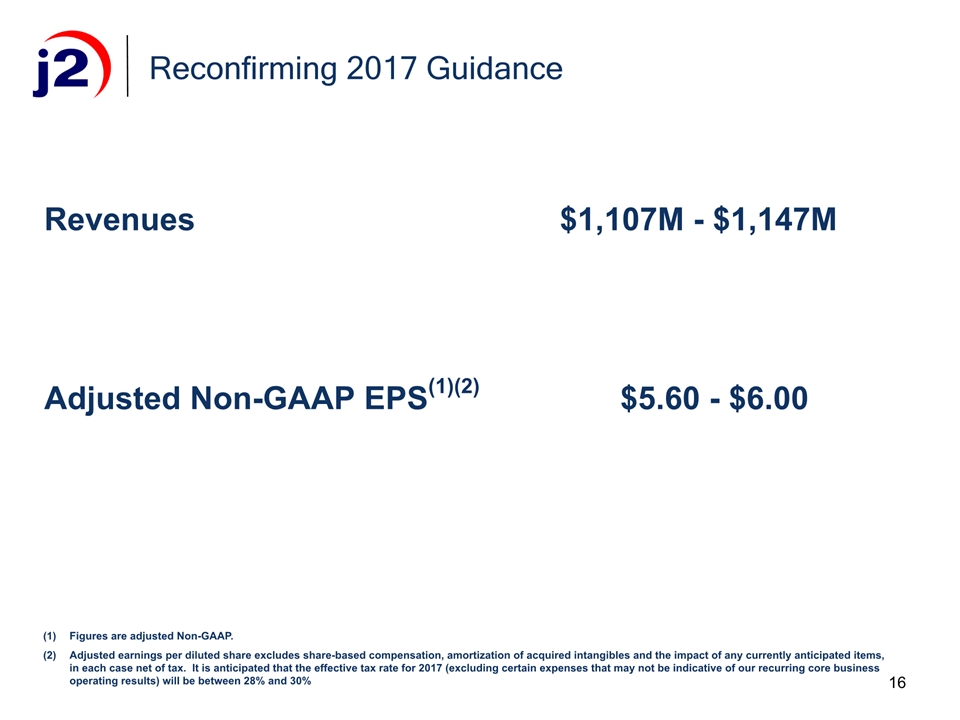
16 Reconfirming 2017 Guidance Figures are adjusted Non-GAAP.Adjusted earnings per diluted share excludes share-based compensation, amortization of acquired intangibles and the impact of any currently anticipated items, in each case net of tax. It is anticipated that the effective tax rate for 2017 (excluding certain expenses that may not be indicative of our recurring core business operating results) will be between 28% and 30% Revenues $1,107M - $1,147MAdjusted Non-GAAP EPS(1)(2) $5.60 - $6.00
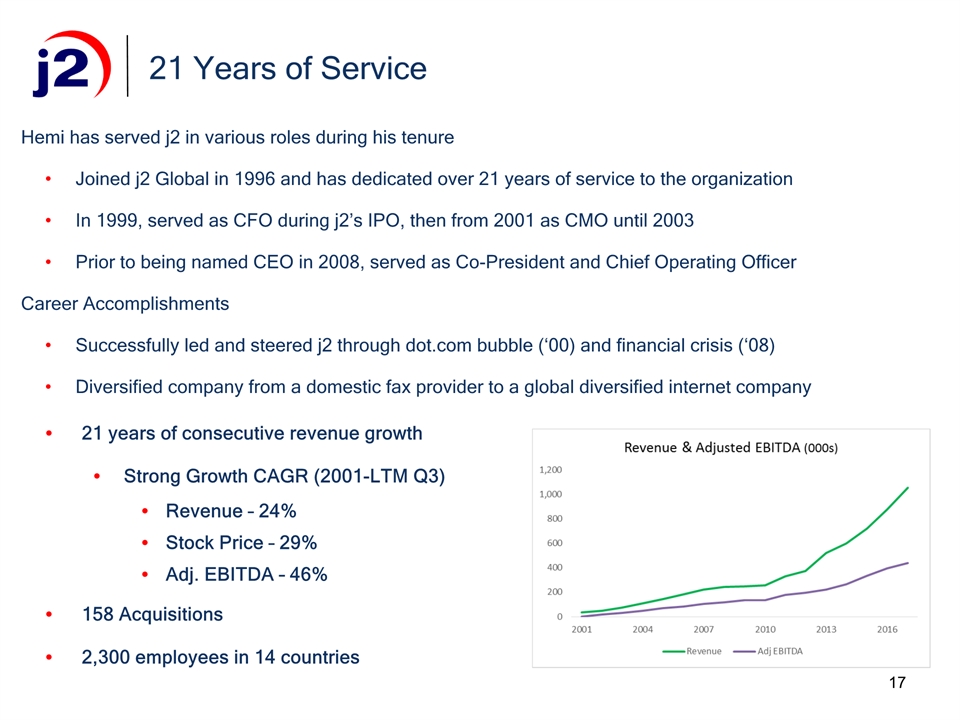
17 Hemi has served j2 in various roles during his tenureJoined j2 Global in 1996 and has dedicated over 21 years of service to the organizationIn 1999, served as CFO during j2’s IPO, then from 2001 as CMO until 2003Prior to being named CEO in 2008, served as Co-President and Chief Operating OfficerCareer AccomplishmentsSuccessfully led and steered j2 through dot.com bubble (‘00) and financial crisis (‘08)Diversified company from a domestic fax provider to a global diversified internet company 21 Years of Service 21 years of consecutive revenue growthStrong Growth CAGR (2001-LTM Q3)Revenue – 24%Stock Price – 29%Adj. EBITDA – 46% 158 Acquisitions2,300 employees in 14 countries
Supplemental Information
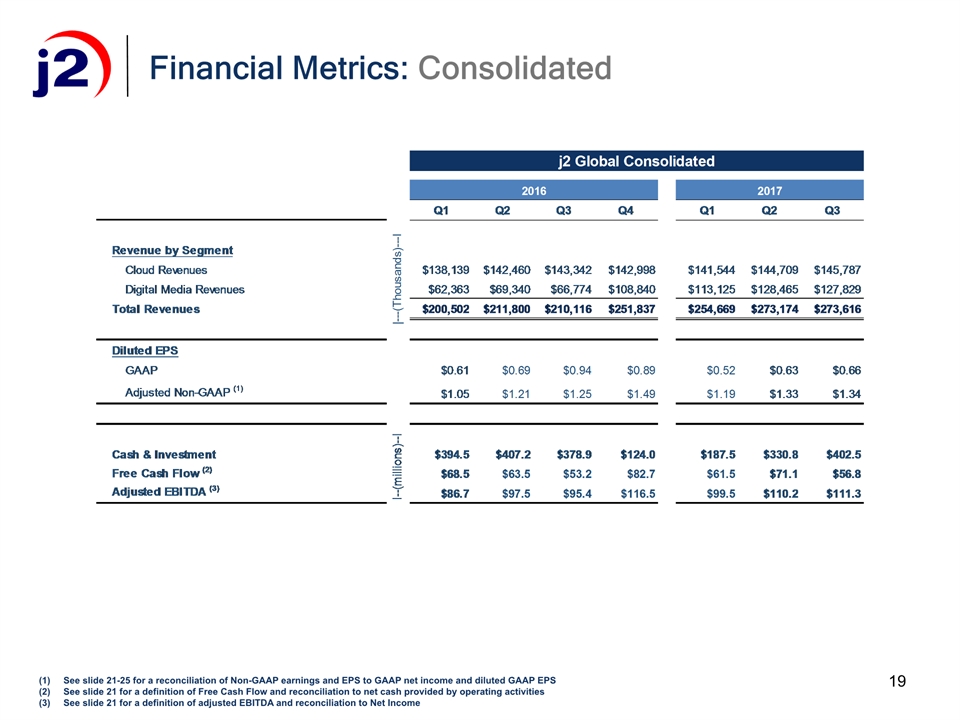
19 See slide 21-25 for a reconciliation of Non-GAAP earnings and EPS to GAAP net income and diluted GAAP EPSSee slide 21 for a definition of Free Cash Flow and reconciliation to net cash provided by operating activitiesSee slide 21 for a definition of adjusted EBITDA and reconciliation to Net Income Financial Metrics: Consolidated
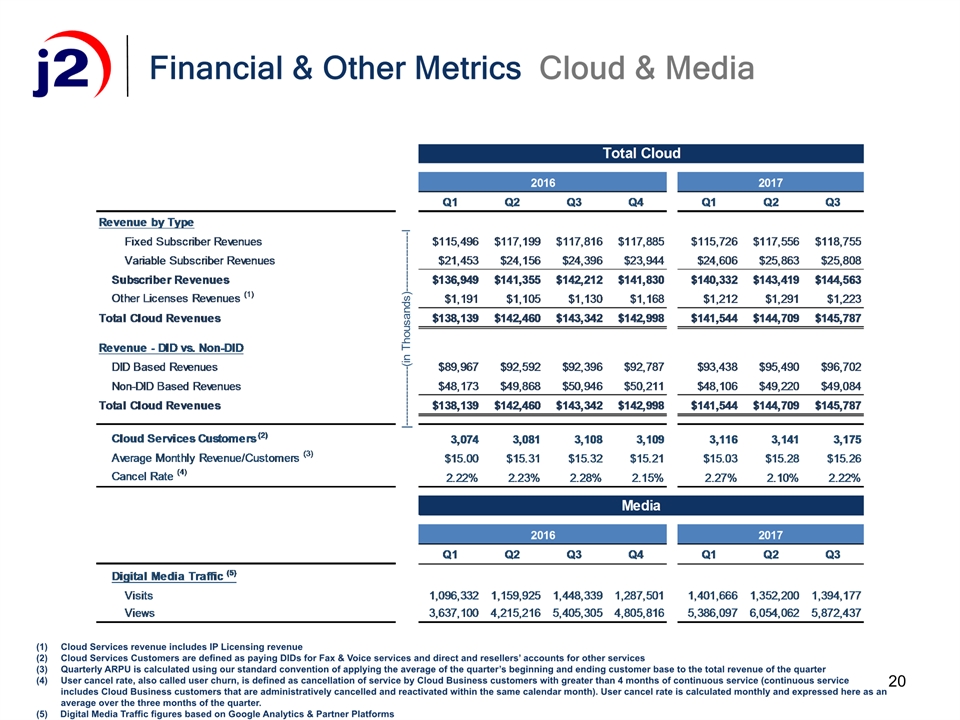
20 Financial & Other Metrics Cloud & Media Cloud Services revenue includes IP Licensing revenueCloud Services Customers are defined as paying DIDs for Fax & Voice services and direct and resellers’ accounts for other servicesQuarterly ARPU is calculated using our standard convention of applying the average of the quarter’s beginning and ending customer base to the total revenue of the quarterUser cancel rate, also called user churn, is defined as cancellation of service by Cloud Business customers with greater than 4 months of continuous service (continuous service includes Cloud Business customers that are administratively cancelled and reactivated within the same calendar month). User cancel rate is calculated monthly and expressed here as an average over the three months of the quarter. Digital Media Traffic figures based on Google Analytics & Partner Platforms
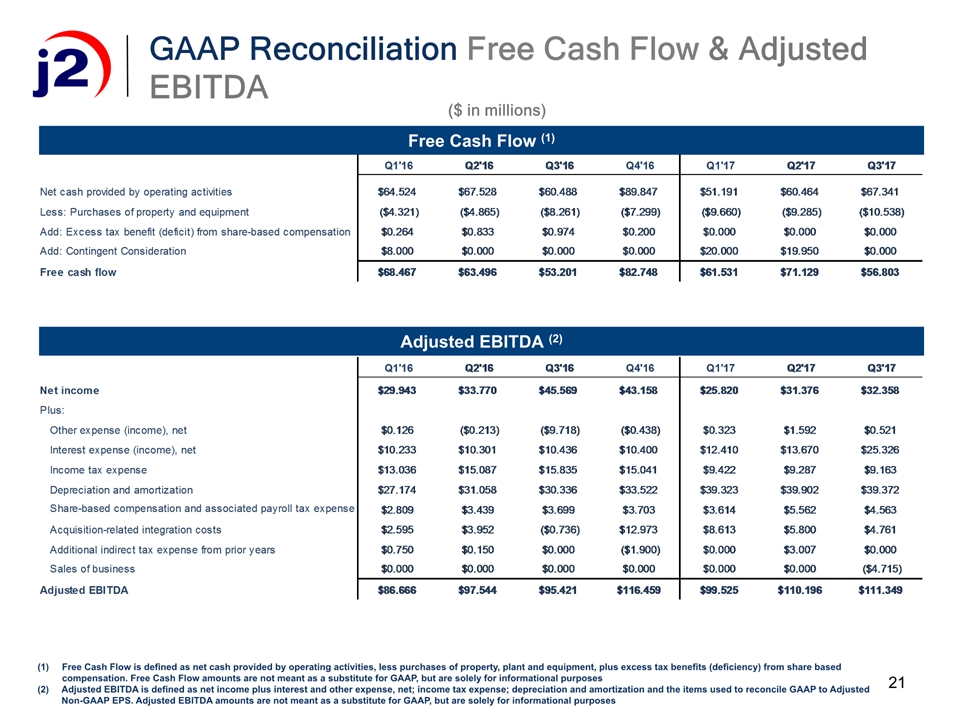
21 Free Cash Flow (1) Free Cash Flow is defined as net cash provided by operating activities, less purchases of property, plant and equipment, plus excess tax benefits (deficiency) from share based compensation. Free Cash Flow amounts are not meant as a substitute for GAAP, but are solely for informational purposesAdjusted EBITDA is defined as net income plus interest and other expense, net; income tax expense; depreciation and amortization and the items used to reconcile GAAP to Adjusted Non-GAAP EPS. Adjusted EBITDA amounts are not meant as a substitute for GAAP, but are solely for informational purposes GAAP Reconciliation Free Cash Flow & Adjusted EBITDA Adjusted EBITDA (2) ($ in millions)

22 GAAP Reconciliation Q3 Adjusted Non-GAAP Earnings & EPS Adjusted Non-GAAP net income is not meant as a substitute for GAAP, and is defined as GAAP net income with the following modifications: 1) Elimination of shared-based compensation expense and associated payroll taxes 2) Elimination of certain acquisition-related integration costs 3) Elimination of amortization of patents and intangible assets that we acquired ($ in thousands)
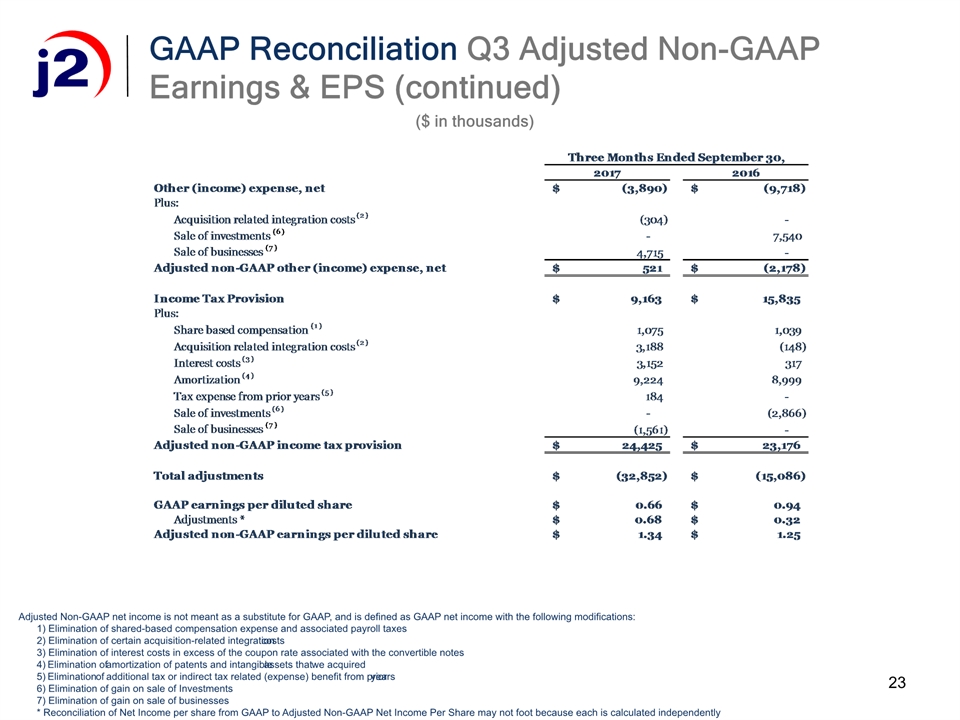
23 GAAP Reconciliation Q3 Adjusted Non-GAAP Earnings & EPS (continued) Adjusted Non-GAAP net income is not meant as a substitute for GAAP, and is defined as GAAP net income with the following modifications: 1) Elimination of shared-based compensation expense and associated payroll taxes 2) Elimination of certain acquisition-related integration costs 3) Elimination of interest costs in excess of the coupon rate associated with the convertible notes 4) Elimination of amortization of patents and intangible assets that we acquired 5) Elimination of additional tax or indirect tax related (expense) benefit from prior years 6) Elimination of gain on sale of Investments 7) Elimination of gain on sale of businesses * Reconciliation of Net Income per share from GAAP to Adjusted Non-GAAP Net Income Per Share may not foot because each is calculated independently ($ in thousands)
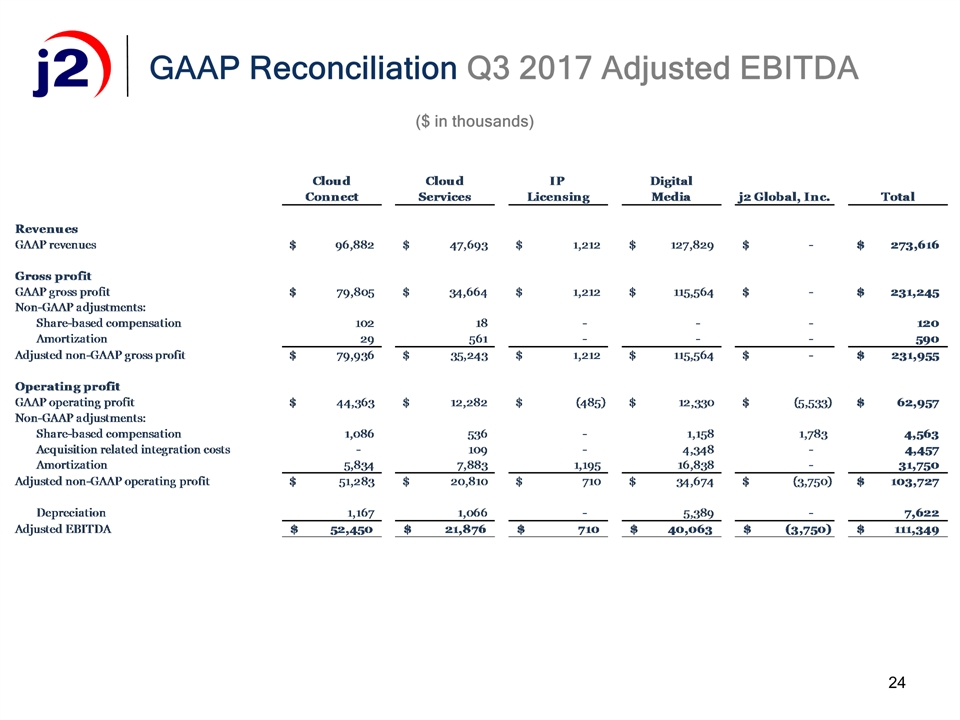
24 GAAP Reconciliation Q3 2017 Adjusted EBITDA ($ in thousands)
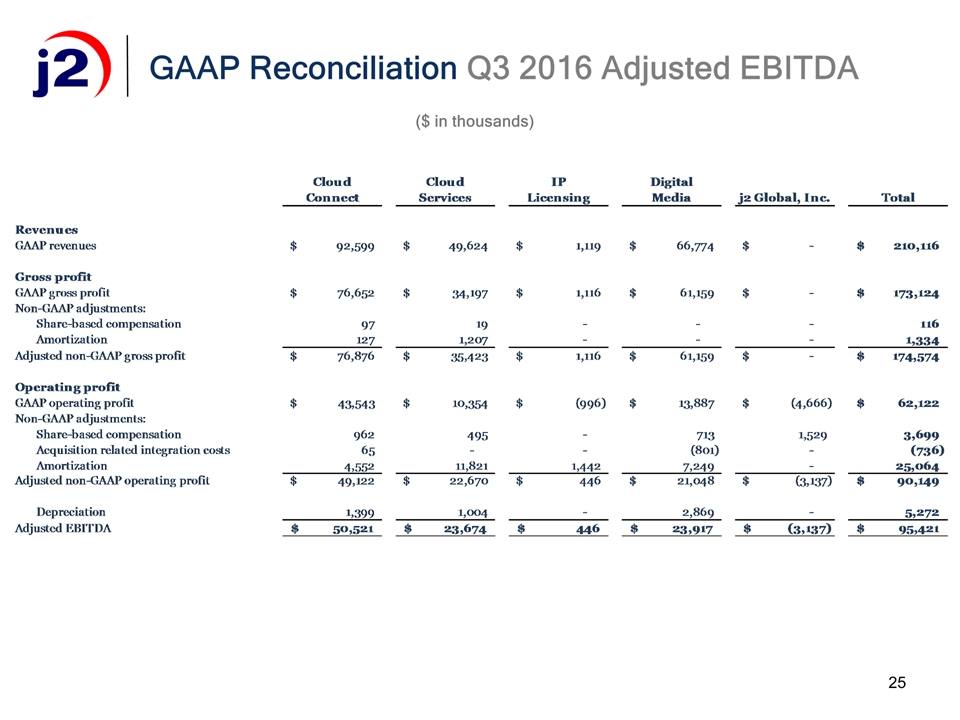
25 GAAP Reconciliation Q3 2016 Adjusted EBITDA ($ in thousands)

®