UNITED STATES
SECURITIES AND EXCHANGE COMMISSION
Washington, DC 20549
FORM N-CSR
CERTIFIED SHAREHOLDER REPORT OF REGISTERED MANAGEMENT INVESTMENT COMPANY
Investment Company Act file number 811-09293
DAVIS VARIABLE ACCOUNT FUND, INC.
(Exact name of registrant as specified in charter)
2949 East Elvira Road, Suite 101
Tucson, AZ 85756
(Address of principal executive offices)
Thomas D. Tays
Davis Selected Advisers, L.P.
2949 East Elvira Road, Suite 101
Tucson, AZ 85756
(Name and address of agent for service)
Registrant’s telephone number, including area code: 520-806-7600
Date of fiscal year end: December 31, 2010
Date of reporting period: June 30, 2010
____________________
ITEM 1. REPORT TO STOCKHOLDERS
| DAVIS VARIABLE ACCOUNT FUND, INC. | Table of Contents |
| Management’s Discussion of Fund Performance: | |
| Davis Value Portfolio | 2 |
| Davis Financial Portfolio | 4 |
| Davis Real Estate Portfolio | 6 |
| | |
| Fund Overview: | |
| Davis Value Portfolio | 8 |
| Davis Financial Portfolio | 9 |
| Davis Real Estate Portfolio | 10 |
| | |
| Expense Example | 11 |
| | |
| Schedule of Investments: | |
| Davis Value Portfolio | 12 |
| Davis Financial Portfolio | 17 |
| Davis Real Estate Portfolio | 19 |
| | |
| Statements of Assets and Liabilities | 22 |
| | |
| Statements of Operations | 23 |
| | |
| Statements of Changes in Net Assets | 24 |
| | |
| Notes to Financial Statements | 26 |
| | |
| Financial Highlights: | |
| Davis Value Portfolio | 32 |
| Davis Financial Portfolio | 33 |
| Davis Real Estate Portfolio | 34 |
| | |
| Director Approval of Advisory Agreements | 35 |
| | |
| Fund Information | 38 |
| | |
| Directors and Officers | 39 |
This Semi-Annual Report is authorized for use by existing shareholders. Prospective shareholders must receive a current Davis Variable Account Fund, Inc. prospectus, which contains more information about investment strategies, risks, charges, and expenses. Please read the prospectus carefully before investing or sending money.
Shares of the Davis Variable Account Funds are not deposits or obligations of any bank, are not guaranteed by any bank, are not insured by the FDIC or any other agency, and involve investment risks, including possible loss of the principal amount invested.
| DAVIS VARIABLE ACCOUNT FUND, INC. | Management’s Discussion of Fund Performance |
| DAVIS VALUE PORTFOLIO | |
Performance Overview
Davis Value Portfolio delivered a negative return on net asset value of 7.16% for the six-month period ended June 30, 2010. Over the same time period, the Standard & Poor’s 500® Index (“Index”) declined 6.65%. Every sector1 within the Index delivered negative returns over the period. The sectors within the Index that turned in the strongest (but still negative) performance over the six-month period were industrials, consumer discretionary, and consumer staples. The sectors within the Index that turned in the weakest performance over the six-month period were materials, energy, and information technology.
Factors Impacting the Portfolio’s Performance
The Portfolio had more invested in financials than any other sector over the six-month period. Financial companies were the most important contributor2 relative to the Index. The Portfolio’s financial companies out-performed the corresponding sector within the Index (down 2% versus down 4% for the Index) and had a higher relative average weighting (29% versus 16% for the Index). Berkshire Hathaway3, Progressive, and Hang Lung Group were among the most important contributors to performance. Bank of New York Mellon and Julius Baer Group were among the most important detractors from performance.
Energy companies were the most important detractors from performance. The Portfolio’s energy companies out-performed the corresponding sector within the Index (down 10% versus down 12% for the Index), but had a higher relative average weighting (16% versus 11% for the Index) in this weaker performing sector. EOG Resources was among the most important contributors to performance. Devon Energy, Transocean, and China Coal Energy were among the most important detractors from performance.
Information technology companies were the second most important detractors from performance. The Portfolio’s information technology companies under-performed the corresponding sector within the Index (down 16% versus down 10% for the Index) and had a lower relative average weighting (7% versus 19% for the Index). Microsoft and Google were among the most important detractors from performance.
The Portfolio’s consumer discretionary companies were significant detractors from performance relative to the Index. The Portfolio’s consumer discretionary companies under-performed the corresponding sector within the Index (down 11% versus down 2% for the Index) and had a lower relative average weighting (7% versus 10% for the Index) in this stronger performing sector.
Other important contributors to performance included Express Scripts and Hershey. Other important detractors from performance included Pfizer and Costco Wholesale.
The Portfolio ended the six-month period with approximately 15% of its net assets invested in foreign companies. As a whole these companies under-performed the domestic companies held by the Portfolio.
Davis Value Portfolio’s investment objective is long-term growth of capital. There can be no assurance that the Portfolio will achieve its objective. Davis Value Portfolio’s principal risks are: market risk, company risk, financial services risk, foreign country risk, small- and medium-capitalization risk, fees and expenses risk, and headline risk. See the prospectus for a full description of each risk.
1 The companies included in the Standard & Poor’s 500® Index are divided into ten sectors. One or more industry groups make up a sector.
2 A company’s or sector’s contribution to or detraction from the Portfolio’s performance is a product both of its appreciation or depreciation and its weighting within the portfolio. For example, a 5% holding that rises 20% has twice as much impact as a 1% holding that rises 50%.
3 This Management Discussion of Fund Performance discusses a number of individual companies. The information provided in this report does not provide information reasonably sufficient upon which to base an investment decision and should not be considered a recommendation to purchase or sell any particular security. The Schedule of Investments lists the Portfolio’s holdings of each company discussed.
| DAVIS VARIABLE ACCOUNT FUND, INC. | Management’s Discussion of Fund Performance |
| DAVIS VALUE PORTFOLIO - (CONTINUED) | |
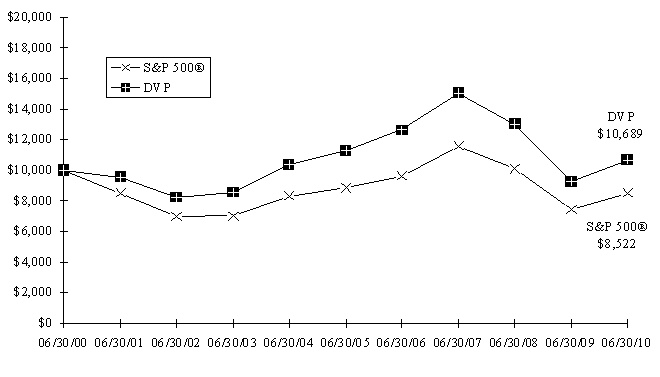
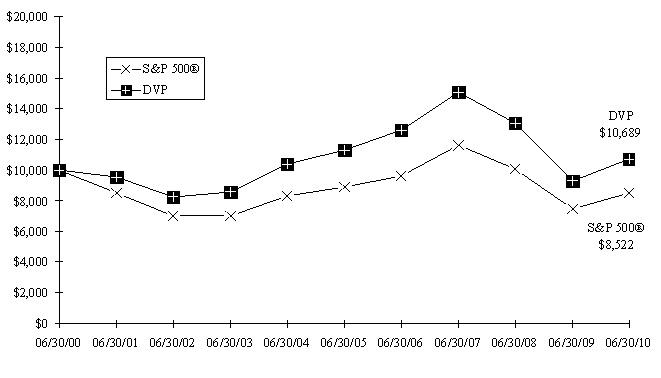
Comparison of a $10,000 investment in Davis Value Portfolio versus the Standard & Poor’s 500® Index over 10 years for an investment made on June 30, 2000
Average Annual Total Return for periods ended June 30, 2010
| Fund & Benchmark Index | 1-Year | 5-Year | 10-Year | Since Fund’s Inception (07/01/99) | Gross Expense Ratio | Net Expense Ratio |
| Davis Value Portfolio | 15.34% | (1.13)% | 0.67% | 1.47% | 0.62% | 0.62% |
Standard & Poor’s 500® Index | 14.43% | (0.79)% | (1.59)% | (0.87)% | | |
The Standard & Poor’s 500® Index is an unmanaged index of 500 selected common stocks, most of which are listed on the New York Stock Exchange. The Index is adjusted for dividends, weighted towards stocks with large market capitalizations, and represents approximately two-thirds of the total market value of all domestic common stocks. Investments cannot be made directly in the Index.
The performance data for Davis Value Portfolio contained in this report represents past performance and assumes that all distributions were reinvested, and should not be considered as an indication of future performance from an investment in the Portfolio today. The investment return and principal value will fluctuate so that shares may be worth more or less than their original cost when redeemed. Portfolio performance changes over time and current performance may be higher or lower than stated. The operating expense ratio may vary in future years. For more current information please call Davis Funds Investor Services at 1-800-279-0279.
Portfolio performance numbers are net of all Portfolio operating expenses, but do not include any insurance charges imposed by your insurance company’s separate account. If performance included the effect of these additional charges, the return would be lower.
| DAVIS VARIABLE ACCOUNT FUND, INC. | Management’s Discussion of Fund Performance |
| DAVIS FINANCIAL PORTFOLIO | |
Performance Overview
Davis Financial Portfolio delivered a negative return on net asset value of 7.01% for the six-month period ended June 30, 2010. Over the same time period, the Standard & Poor’s 500® Index (“Index”) declined 6.65%. The Index’s banking and insurance industry groups1 turned in positive performances, while the diversified financials industry group turned in a negative performance.
Factors Impacting the Portfolio’s Performance
The Portfolio’s financial sector holdings under-performed the corresponding sector within the Index (down 6% versus down 4% for the Index). The Portfolio had a limited amount of assets invested in other sectors. These non-financial holdings, mostly in energy and industrials, overall detracted2 from performance.
The Portfolio’s diversified financial companies were the largest detractors from performance. The Portfolio’s diversified financial companies out-performed the corresponding industry group within the Index (down 8% versus down 10% for the Index). Brookfield Asset Management3, First Marblehead, Oaktree, and JPMorgan Chase were among the most important contributors to performance. Moody’s, Visa, Goldman Sachs, Julius Baer Group, and Bank of New York Mellon were among the most important detractors from performance. The Portfolio no longer owns JPMorgan Chase.
The Portfolio’s insurance companies were the second largest detractors from performance. The Portfolio’s insurance companies under-performed the corresponding industry group within the Index (down 6% versus up 2% for the Index). Progressive, ACE, and FPIC Insurance Group were the most important contributors to performance. Transatlantic Holdings, Loews, and Everest Re Group were among the most important detractors from performance. The Portfolio no longer owns FPIC Insurance Group.
The Portfolio’s banking companies under-performed the corresponding industry group within the Index (down 1% versus up 3% for the Index). State Bank of India was among the most important contributors to performance.
The Portfolio ended the six-month period with approximately 27% of its net assets invested in foreign companies. As a whole these companies out-performed the domestic companies held by the Portfolio.
Davis Financial Portfolio’s investment objective is long-term growth of capital. There can be no assurance that the Portfolio will achieve its objective. Davis Financial Portfolio’s principal risks are: market risk, company risk, concentrated financial services portfolio risk, foreign country risk, small- and medium-capitalization risk, fees and expenses risk, focused portfolio risk, and headline risk. See the prospectus for a full description of each risk.
Davis Financial Portfolio concentrates its investments in the financial sector, and it may be subject to greater risks than a portfolio that does not concentrate its investments in a particular sector. The Portfolio’s investment performance, both good and bad, is expected to reflect the economic performance of the financial sector more than a portfolio that does not concentrate its portfolio.
1 The companies included in the Standard & Poor’s 500® Index are divided into ten sectors. One or more industry groups make up a sector.
2 A company’s or sector’s contribution to or detraction from the Portfolio’s performance is a product both of its appreciation or depreciation and its weighting within the portfolio. For example, a 5% holding that rises 20% has twice as much impact as a 1% holding that rises 50%.
3 This Management Discussion of Fund Performance discusses a number of individual companies. The information provided in this report does not provide information reasonably sufficient upon which to base an investment decision and should not be considered a recommendation to purchase or sell any particular security. The Schedule of Investments lists the Portfolio’s holdings of each company discussed.
| DAVIS VARIABLE ACCOUNT FUND, INC. | Management’s Discussion of Fund Performance |
| DAVIS FINANCIAL PORTFOLIO - (CONTINUED) | |
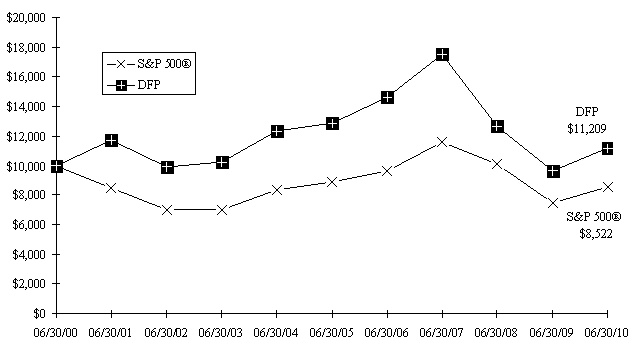
Comparison of a $10,000 investment in Davis Financial Portfolio versus the Standard & Poor’s 500® Index over 10 years for an investment made on June 30, 2000
Average Annual Total Return for periods ended June 30, 2010
| Fund & Benchmark Index | 1-Year | 5-Year | 10-Year | Since Fund’s Inception (07/01/99) | Gross Expense Ratio | Net Expense Ratio |
| Davis Financial Portfolio | 16.40% | (2.68)% | 1.15% | 1.06% | 0.68% | 0.68% |
Standard & Poor’s 500® Index | 14.43% | (0.79)% | (1.59)% | (0.87)% | | |
The Standard & Poor’s 500® Index is an unmanaged index of 500 selected common stocks, most of which are listed on the New York Stock Exchange. The Index is adjusted for dividends, weighted towards stocks with large market capitalizations, and represents approximately two-thirds of the total market value of all domestic common stocks. Investments cannot be made directly in the Index.
The performance data for Davis Financial Portfolio contained in this report represents past performance and assumes that all distributions were reinvested, and should not be considered as an indication of future performance from an investment in the Portfolio today. The investment return and principal value will fluctuate so that shares may be worth more or less than their original cost when redeemed. Portfolio performance changes over time and current performance may be higher or lower than stated. The operating expense ratio may vary in future years. For more current information please call Davis Funds Investor Services at 1-800-279-0279.
Portfolio performance numbers are net of all Portfolio operating expenses, but do not include any insurance charges imposed by your insurance company’s separate account. If performance included the effect of these additional charges, the return would be lower.
Davis Financial Portfolio received a favorable class action settlement from a company that it no longer owns. This settlement had a material impact on the investment performance of the Portfolio in 2009. This was a one-time event that is unlikely to be repeated.
| DAVIS VARIABLE ACCOUNT FUND, INC. | Management’s Discussion of Fund Performance |
| DAVIS REAL ESTATE PORTFOLIO | |
Performance Overview
Davis Real Estate Portfolio delivered a total return on net asset value of 4.03% for the six-month period ended June 30, 2010. Over the same time period, the Wilshire U.S. Real Estate Securities Index (“Index”) returned 5.40%. Industrial REITs was the only sub-industry1 within the Index to deliver a negative return, while specialized REITs, residential REITs, and real estate operating companies turned in the strongest performances.
Factors Impacting the Portfolio’s Performance
Residential REITs were the most important contributors2 to the Portfolio’s performance, but the most important detractors from performance relative to the Index. The Portfolio’s residential REITs under-performed the corresponding sub-industry within the Index (up 10% versus up 15% for the Index) and had a lower relative average weighting (11% versus 16% for the Index). Essex Property Trust3 and AvalonBay were among the most important contributors to performance. UDR was among the most important detractors from performance. The Portfolio no longer owns AvalonBay.
Specialized REITs were the second most important contributors to performance. The Portfolio’s specialized REITs out-performed the corresponding sub-industry within the Index (up 10% versus up 7% for the Index) and had a lower relative average weighting (11% versus 26% for the Index). Host Hotels & Resorts, Ventas, Cogdell Spencer, and Entertainment Properties were among the most important contributors to performance. The Portfolio no longer owns Host Hotels & Resorts.
The Portfolio had more invested in office REITs than in any other sub-industry and they were the third most important contributors to performance. The Portfolio’s office REITs out-performed the corresponding sector within the Index (up 6% versus up 3% for the Index) and had a higher relative average weighting (29% versus 17% for the Index). Digital Realty and Boston Properties were among the most important contributors to performance. Highwoods Properties and Alexandria Real Estate were among the most important detractors from performance.
Forest City Enterprises was the single most important detractor from the Portfolio’s performance. The Portfolio’s large investment in Forest City Enterprises (approximately 5%) together with its poor investment performance (down 4%) accounted for the majority of the Portfolio’s under-performance relative to the Index.
Industrial REITs were also important detractors from performance. The Portfolio’s industrial REITs out-performed the corresponding sub-industry within the Index (down 8% versus down 14% for the Index) and had approximately the same average weighting (both approximately 5%). DCT Industrial Trust and ProLogis were among the most important detractors from performance. The Portfolio no longer owns ProLogis.
Davis Real Estate Portfolio’s investment objective is total return through a combination of growth and income. There can be no assurance that the Portfolio will achieve its objective. Davis Real Estate Portfolio’s principal risks are: market risk, company risk, concentrated real estate services portfolio risk, focused portfolio risk, foreign country risk, small- and medium-capitalization risk, fees and expenses risk, and headline risk. See the prospectus for a full description of each risk.
Davis Real Estate Portfolio concentrates its investments in the real estate sector, and it may be subject to greater risks than a portfolio that does not concentrate its investments in a particular sector. The Portfolio’s investment performance, both good and bad, is expected to reflect the economic performance of the real estate sector much more than a portfolio that does not concentrate its portfolio.
Davis Real Estate Portfolio is allowed to focus its investments in fewer companies, and it may be subject to greater risks than a more diversified portfolio that is not allowed to focus its investments in a few companies. Should the portfolio manager determine that it is prudent to focus the Portfolio’s portfolio in a few companies, the Portfolio’s investment performance, both good and bad, is expected to reflect the economic performance of its more focused portfolio.
1 The companies included in the Wilshire U.S. Real Estate Securities Index are divided into eight sub-industries.
2 A company’s or sector’s contribution to or detraction from the Portfolio’s performance is a product both of its appreciation or depreciation and its weighting within the portfolio. For example, a 5% holding that rises 20% has twice as much impact as a 1% holding that rises 50%.
3 This Management Discussion of Fund Performance discusses a number of individual companies. The information provided in this report does not provide information reasonably sufficient upon which to base an investment decision and should not be considered a recommendation to purchase or sell any particular security. The Schedule of Investments lists the Portfolio’s holdings of each company discussed.
| DAVIS VARIABLE ACCOUNT FUND, INC. | Management’s Discussion of Fund Performance |
| DAVIS REAL ESTATE PORTFOLIO - (CONTINUED) | |
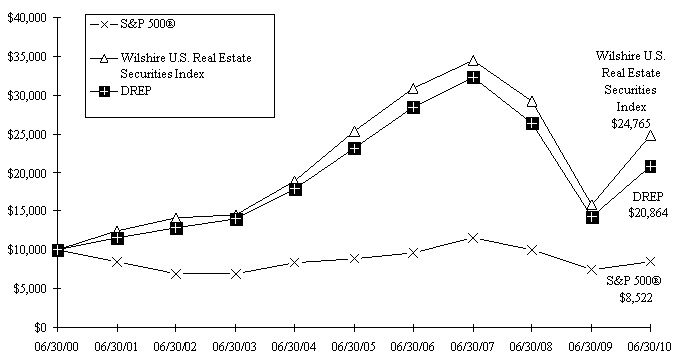
Comparison of a $10,000 investment in Davis Real Estate Portfolio versus the Standard & Poor’s 500® Index and the Wilshire U.S. Real Estate Securities Index over 10 years for an investment made on June 30, 2000
Average Annual Total Return for periods ended June 30, 2010
| Fund & Benchmark Indices | 1-Year | 5-Year | 10-Year | Since Fund’s Inception (07/01/99) | Gross Expense Ratio | Net Expense Ratio |
| Davis Real Estate Portfolio | 45.66% | (2.11)% | 7.63% | 6.96% | 0.84% | 0.84% |
Standard & Poor’s 500® Index | 14.43% | (0.79)% | (1.59)% | (0.87)% | | |
Wilshire U.S. Real Estate Securities Index | 56.07% | (0.47)% | 9.49% | 9.03% | | |
The Standard & Poor’s 500® Index is an unmanaged index of 500 selected common stocks, most of which are listed on the New York Stock Exchange. The Index is adjusted for dividends, weighted towards stocks with large market capitalizations, and represents approximately two-thirds of the total market value of all domestic common stocks. Investments cannot be made directly in the Index.
The Wilshire U.S. Real Estate Securities Index is a broad measure of the performance of publicly traded real estate securities. It reflects no deduction for fees or expenses. Investments cannot be made directly in the Index.
The performance data for Davis Real Estate Portfolio contained in this report represents past performance and assumes that all distributions were reinvested, and should not be considered as an indication of future performance from an investment in the Portfolio today. The investment return and principal value will fluctuate so that shares may be worth more or less than their original cost when redeemed. Portfolio performance changes over time and current performance may be higher or lower than stated. The operating expense ratio may vary in future years. For more current information please call Davis Funds Investor Services at 1-800-279-0279.
Portfolio performance numbers are net of all Portfolio operating expenses, but do not include any insurance charges imposed by your insurance company’s separate account. If performance included the effect of these additional charges, the return would be lower.
| DAVIS VARIABLE ACCOUNT FUND, INC. | Fund Overview |
| DAVIS VALUE PORTFOLIO | June 30, 2010 (Unaudited) |
| Portfolio Composition | | Industry Weightings |
| (% of Fund’s Net Assets) | | (% of Long Term Portfolio) |
| | | | | | |
| | | | | Fund | S&P 500® |
| Common Stock (U.S.) | 74.70% | | Energy | 17.19% | 10.75% |
| Common Stock (Foreign) | 15.25% | | Diversified Financials | 12.19% | 7.74% |
| Corporate Bonds | 0.55% | | Insurance | 11.58% | 3.98% |
| Convertible Bonds (Foreign) | 0.16% | | Health Care | 11.02% | 12.09% |
| Convertible Bonds (U.S.) | 0.09% | | Food & Staples Retailing | 8.05% | 2.53% |
| Short Term Investments | 3.90% | | Information Technology | 6.55% | 18.76% |
| Other Assets & Liabilities | 5.35% | | Food, Beverage & Tobacco | 6.19% | 6.18% |
| | 100.00% | | Materials | 6.12% | 3.44% |
| | | | Banks | 4.81% | 3.20% |
| | | | Commercial & Professional Services | 2.62% | 0.64% |
| | | | Retailing | 2.55% | 3.46% |
| | | | Transportation | 2.44% | 1.93% |
| | | | Media | 2.31% | 3.14% |
| | | | Household & Personal Products | 1.94% | 2.82% |
| | | | Automobiles & Components | 1.75% | 0.64% |
| | | | Other | 1.47% | 10.94% |
| | | | Capital Goods | 1.22% | 7.76% |
| | | | | 100.00% | 100.00% |
Top 10 Holdings
(% of Fund’s Net Assets)
| | | |
| Occidental Petroleum Corp. | Energy | 4.63% |
| Costco Wholesale Corp. | Food & Staples Retailing | 4.41% |
| Wells Fargo & Co. | Commercial Banks | 4.37% |
| American Express Co. | Consumer Finance | 4.23% |
| EOG Resources, Inc. | Energy | 3.97% |
| Berkshire Hathaway Inc., Class A | Property & Casualty Insurance | 3.73% |
| Devon Energy Corp. | Energy | 2.97% |
| CVS Caremark Corp. | Food & Staples Retailing | 2.90% |
| Merck & Co., Inc. | Pharmaceuticals, Biotechnology & Life Sciences | 2.87% |
| Loews Corp. | Multi-line Insurance | 2.63% |
| | | |
| DAVIS VARIABLE ACCOUNT FUND, INC. | Fund Overview |
| DAVIS FINANCIAL PORTFOLIO | June 30, 2010 (Unaudited) |
| Portfolio Composition | | Industry Weightings |
| (% of Fund’s Net Assets) | | (% of Stock Holdings) |
| | | | | | |
| | | | | Fund | S&P 500® |
| Common Stock (U.S.) | 72.31% | | Diversified Financials | 43.35% | 7.74% |
| Common Stock (Foreign) | 27.16% | | Insurance | 33.34% | 3.98% |
| Short Term Investments | 0.51% | | Banks | 14.90% | 3.20% |
| Other Assets & Liabilities | 0.02% | | Energy | 5.67% | 10.75% |
| | 100.00% | | Commercial & Professional Services | 2.74% | 0.64% |
| | | | Information Technology | – | 18.76% |
| | | | Health Care | – | 12.09% |
| | | | Capital Goods | – | 7.76% |
| | | | Food, Beverage & Tobacco | – | 6.18% |
| | | | Other | – | 28.90% |
| | | | | 100.00% | 100.00% |
| | | | | | |
| | | | | | |
Top 10 Holdings
(% of Fund’s Net Assets)
| | | |
| American Express Co. | Consumer Finance | 10.15% |
| Transatlantic Holdings, Inc. | Reinsurance | 9.16% |
| State Bank of India Ltd., GDR | Commercial Banks | 6.87% |
| Loews Corp. | Multi-line Insurance | 6.72% |
| Wells Fargo & Co. | Commercial Banks | 6.17% |
| Oaktree Capital Group LLC, Class A | Diversified Financial Services | 5.89% |
| Canadian Natural Resources Ltd. | Energy | 5.64% |
| Markel Corp. | Property & Casualty Insurance | 5.17% |
| Bank of New York Mellon Corp. | Capital Markets | 4.90% |
| Progressive Corp. | Property & Casualty Insurance | 3.92% |
| DAVIS VARIABLE ACCOUNT FUND, INC. | Fund Overview |
| DAVIS REAL ESTATE PORTFOLIO | June 30, 2010 (Unaudited) |
| Portfolio Composition | | Industry Weightings |
| (% of Fund’s Net Assets) | | (% of Long Term Portfolio) |
| | | | | | |
| | | | | | Wilshire U.S. Real Estate Securities Index |
| Common Stock | 83.66% | | | |
| Preferred Stock | 8.73% | | | Fund |
| Convertible Bonds | 2.89% | | Office REITs | 39.23% | 16.63% |
| Short Term Investments | 4.54% | | Retail REITs | 13.30% | 23.89% |
| Other Assets & Liabilities | 0.18% | | Residential REITs | 11.66% | 17.01% |
| | 100.00% | | Specialized REITs | 8.92% | 25.71% |
| | | | Telecommunication Services | 7.95% | – |
| | | | Real Estate Operating Companies | 5.58% | 2.06% |
| | | | Diversified REITs | 5.56% | 8.61% |
| | | | Industrial REITs | 4.92% | 5.42% |
| | | | Other | 2.88% | 0.67% |
| | | | | 100.00% | 100.00% |
| | | | | | |
Top 10 Holdings
(% of Fund’s Net Assets)
| | | |
| Corporate Office Properties Trust | Office REITs | 5.63% |
| Digital Realty Trust, Inc. | Office REITs | 5.44% |
| American Campus Communities, Inc. | Residential REITs | 5.29% |
| Alexandria Real Estate Equities, Inc. | Office REITs | 5.01% |
| Forest City Enterprises, Inc., Class A | Real Estate Operating Companies | 4.95% |
| Essex Property Trust, Inc. | Residential REITs | 4.10% |
| Federal Realty Investment Trust | Retail REITs | 3.72% |
| Douglas Emmett, Inc. | Office REITs | 3.66% |
| Vornado Realty Trust | Diversified REITs | 3.59% |
| DCT Industrial Trust Inc. | Industrial REITs | 3.55% |
| DAVIS VARIABLE ACCOUNT FUND, INC. | Expense Example (Unaudited) |
Example
As a shareholder of the Fund, you incur ongoing costs only, including advisory and administrative fees and other Fund expenses. The Expense Example is intended to help you understand your ongoing costs (in dollars) of investing in each Fund and to compare these costs with the ongoing costs of investing in other mutual funds. The Expense Example is based on an investment of $1,000 invested at the beginning of the period and held for the entire period indicated, which for each Fund is for the six-month period ended June 30, 2010. Please note that the Expense Example is general and does not reflect charges imposed by your insurance company’s separate account or account specific costs, which may increase your total costs of investing in the Funds. If these charges or account specific costs were included in the Expense Exam ple, the expenses would have been higher.
Actual Expenses
The information represented in the row entitled “Actual” provides information about actual account values and actual expenses. You may use the information in this row, together with the amount you invested, to estimate the expenses that you paid over the period. Simply divide your account value by $1,000 (for example, an $8,600 account value divided by $1,000 = 8.6), then, multiply the result by the number under the heading “Expenses Paid During Period” to estimate the expenses you paid on your account during this period.
Hypothetical Example for Comparison Purposes
The information represented in the row entitled “Hypothetical” provides information about hypothetical account values and hypothetical expenses based on each Fund’s actual expense ratio and an assumed rate of return of 5% per year before expenses, which is not the Fund’s actual return. The hypothetical account values and expenses may not be used to estimate the actual ending account balance or expenses you paid for the period. You may use this information to compare the ongoing costs of investing in the Fund and other funds. To do so, compare this 5% hypothetical example with the 5% hypothetical examples that appear in the shareholder reports of the other funds.
Please note that the expenses shown in the table are meant to highlight your ongoing costs only. Therefore, the information in the row entitled “Hypothetical” is useful in comparing ongoing costs only, and will not help you determine the relative total costs of owning different funds.
| | Beginning Account Value (01/01/10) | Ending Account Value (06/30/10) | Expenses Paid During Period* (01/01/10-06/30/10) | |
| Davis Value Portfolio | | | | |
| (annualized expense ratio 0.62%**) | | | | |
| Actual | $1,000.00 | $928.37 | $2.96 | |
| Hypothetical | $1,000.00 | $1,021.72 | $3.11 | |
| | | | | |
| Davis Financial Portfolio | | | | |
| (annualized expense ratio 0.68%**) | | | | |
| Actual | $1,000.00 | $929.86 | $3.25 | |
| Hypothetical | $1,000.00 | $1,021.42 | $3.41 | |
| | | | | |
| Davis Real Estate Portfolio | | | | |
| (annualized expense ratio 0.84%**) | | | | |
| Actual | $1,000.00 | $1,040.26 | $4.25 | |
| Hypothetical | $1,000.00 | $1,020.63 | $4.21 | |
| | | | | |
| Hypothetical assumes 5% annual return before expenses. |
| *Expenses are equal to each Fund’s annualized operating expense ratio, multiplied by the average account value over the period, multiplied by 181/365 (to reflect the one-half year period). |
| **The expense ratios reflect the impact, if any, of the reduction of expenses paid indirectly and of certain reimbursements from the Adviser. |
| DAVIS VARIABLE ACCOUNT FUND, INC. | Schedule of Investments |
| DAVIS VALUE PORTFOLIO | June 30, 2010 (Unaudited) |
| Shares | | Security | | Value (Note 1) | |
| |
| | CONSUMER DISCRETIONARY – (5.63%) | |
| | Automobiles & Components – (1.04%) | |
| | 225,000 | Harley-Davidson, Inc. | | $ | 5,001,750 | |
| |
| | Consumer Durables & Apparel – (0.15%) | |
| | 20,299 | Hunter Douglas NV (Netherlands) | | | 741,388 | |
| |
| | Consumer Services – (0.02%) | |
| | 6,963 | H&R Block, Inc. | | | 109,249 | |
| |
| | Media – (2.10%) | |
| | 117,070 | Grupo Televisa S.A., ADR (Mexico) | | | 2,038,189 | |
| | 8,506 | Liberty Media - Starz, Series A * | | | 440,441 | |
| | 296,325 | News Corp., Class A | | | 3,545,528 | |
| | 130,600 | Walt Disney Co. | | | 4,113,900 | |
| |
| | | 10,138,058 | |
| |
| | Retailing – (2.32%) | |
| | 3,260 | Amazon.com, Inc. * | | | 356,318 | |
| | 167,915 | Bed Bath & Beyond Inc. * | | | 6,225,449 | |
| | 175,000 | CarMax, Inc. * | | | 3,482,500 | |
| | 107,765 | Liberty Media Corp. - Interactive, Series A * | | | 1,132,071 | |
| |
| | | 11,196,338 | |
| |
| | Total Consumer Discretionary | | | 27,186,783 | |
| |
| | CONSUMER STAPLES – (14.69%) | |
| | Food & Staples Retailing – (7.31%) | |
| | 388,390 | Costco Wholesale Corp. | | | 21,293,482 | |
| | 477,398 | CVS Caremark Corp. | | | 13,997,309 | |
| |
| | | 35,290,791 | |
| |
| | Food, Beverage & Tobacco – (5.62%) | |
| | 111,940 | Coca-Cola Co. | | | 5,610,433 | |
| | 99,233 | Diageo PLC, ADR (United Kingdom) | | | 6,225,878 | |
| | 141,621 | Heineken Holding NV (Netherlands) | | | 5,173,724 | |
| | 33,060 | Hershey Co. | | | 1,584,566 | |
| | 39,065 | Mead Johnson Nutrition Co. | | | 1,957,938 | |
| | 15,100 | Nestle S.A. (Switzerland) | | | 728,104 | |
| | 92,290 | Philip Morris International Inc. | | | 4,230,574 | |
| | 60,000 | Unilever NV, NY Shares (Netherlands) | | | 1,639,200 | |
| |
| | | 27,150,417 | |
| |
| | Household & Personal Products – (1.76%) | |
| | 31,800 | Natura Cosmeticos S.A. (Brazil) | | | 704,709 | |
| | 130,040 | Procter & Gamble Co. | | | 7,799,799 | |
| |
| | | 8,504,508 | |
| |
| | Total Consumer Staples | | | 70,945,716 | |
| |
| | ENERGY – (15.60%) | |
| | 324,800 | Canadian Natural Resources Ltd. (Canada) | | | 10,793,104 | |
| | 2,659,900 | China Coal Energy Co. - H (China) | | | 3,309,571 | |
| | 2,632 | ConocoPhillips | | | 129,205 | |
| | 235,230 | Devon Energy Corp. | | | 14,330,212 | |
| | 194,830 | EOG Resources, Inc. | | | 19,165,427 | |
| | 289,560 | Occidental Petroleum Corp. | | | 22,339,554 | |
| | 290,000 | OGX Petroleo e Gas Participacoes S.A. (Brazil)* | | | 2,686,316 | |
| DAVIS VARIABLE ACCOUNT FUND, INC. | Schedule of Investments |
| DAVIS VALUE PORTFOLIO - (CONTINUED) | June 30, 2010 (Unaudited) |
| Shares | | Security | | Value (Note 1) | |
COMMON STOCK – (CONTINUED) | |
| | ENERGY – (CONTINUED) | |
| | 4,100 | Schlumberger Ltd. | | $ | 226,894 | |
| | 51,504 | Transocean Ltd. * | | | 2,386,180 | |
| |
| | Total Energy | | | 75,366,463 | |
| |
| | FINANCIALS – (26.63%) | |
| | Banks – (4.37%) | |
| | Commercial Banks – (4.37%) | |
| | 823,824 | Wells Fargo & Co. | | | 21,089,894 | |
| |
| | Diversified Financials – (11.06%) | |
| | Capital Markets – (5.85%) | |
| | 90,220 | Ameriprise Financial, Inc. | | | 3,259,649 | |
| | 454,000 | Bank of New York Mellon Corp. | | | 11,209,260 | |
| | 116,400 | Brookfield Asset Management Inc., Class A (Canada) | | | 2,632,968 | |
| | 221,460 | GAM Holding Ltd. (Switzerland)* | | | 2,393,212 | |
| | 18,660 | Goldman Sachs Group, Inc. | | | 2,449,498 | |
| | 221,460 | Julius Baer Group Ltd. (Switzerland) | | | 6,314,397 | |
| |
| | 28,258,984 | |
| |
| | Consumer Finance – (4.23%) | |
| | 515,119 | American Express Co. | | | 20,450,225 | |
| |
| | Diversified Financial Services – (0.98%) | |
| | 14,068 | JPMorgan Chase & Co. | | | 515,029 | |
| | 148,230 | Moody's Corp. | | | 2,952,742 | |
| | 17,900 | Visa Inc., Class A | | | 1,266,425 | |
| |
| | 4,734,196 | |
| |
| | | 53,443,405 | |
| |
| | Insurance – (10.51%) | |
| | Multi-line Insurance – (3.21%) | |
| | 5,130 | Fairfax Financial Holdings Ltd. (Canada) | | | 1,889,584 | |
| | 2,490 | Fairfax Financial Holdings Ltd., 144A (Canada)(a)(b) | | | 911,936 | |
| | 381,190 | Loews Corp. | | | 12,697,439 | |
| |
| | 15,498,959 | |
| |
| | Property & Casualty Insurance – (6.30%) | |
| | 150 | Berkshire Hathaway Inc., Class A * | | | 18,000,000 | |
| | 1,390 | Markel Corp. * | | | 472,600 | |
| | 638,720 | Progressive Corp. (Ohio) | | | 11,956,838 | |
| |
| | 30,429,438 | |
| |
| | Reinsurance – (1.00%) | |
| | 100,907 | Transatlantic Holdings, Inc. | | | 4,839,500 | |
| |
| | | 50,767,897 | |
| |
| | Real Estate – (0.69%) | |
| | 623,000 | Hang Lung Group Ltd. (Hong Kong) | | | 3,317,761 | |
| |
| | Total Financials | | | 128,618,957 | |
| |
| | HEALTH CARE – (10.00%) | |
| | Health Care Equipment & Services – (3.08%) | |
| | 57,900 | Baxter International Inc. | | | 2,353,056 | |
| | 63,800 | Becton, Dickinson and Co. | | | 4,314,156 | |
| | 7,350 | Cardinal Health, Inc. | | | 247,034 | |
| | 17,950 | CareFusion Corp. * | | | 407,465 | |
| DAVIS VARIABLE ACCOUNT FUND, INC. | Schedule of Investments |
| DAVIS VALUE PORTFOLIO - (CONTINUED) | June 30, 2010 (Unaudited) |
| Shares | | Security | | Value (Note 1) | |
COMMON STOCK – (CONTINUED) | |
| | HEALTH CARE – (CONTINUED) | |
| | Health Care Equipment & Services – (Continued) | |
| | 160,960 | Express Scripts, Inc. * | | $ | 7,569,144 | |
| |
| | | 14,890,855 | |
| |
| | Pharmaceuticals, Biotechnology & Life Sciences – (6.92%) | |
| | 197,680 | Johnson & Johnson | | | 11,674,981 | |
| | 395,855 | Merck & Co., Inc. | | | 13,843,049 | |
| | 553,600 | Pfizer Inc. | | | 7,894,336 | |
| |
| | | 33,412,366 | |
| |
| | Total Health Care | | | 48,303,221 | |
| |
| | INDUSTRIALS – (5.69%) | |
| | Capital Goods – (1.10%) | |
| | 111,180 | ABB Ltd., ADR (Switzerland) | | | 1,921,190 | |
| | 96,934 | Tyco International Ltd. | | | 3,414,985 | |
| |
| | | 5,336,175 | |
| |
| | Commercial & Professional Services – (2.38%) | |
| | 53,500 | D&B Corp. | | | 3,590,920 | |
| | 350,897 | Iron Mountain Inc. | | | 7,881,147 | |
| |
| | | 11,472,067 | |
| |
| | Transportation – (2.21%) | |
| | 1,482,352 | China Merchants Holdings International Co., Ltd. (China) | | | 4,874,758 | |
| | 1,097,000 | China Shipping Development Co. Ltd. - H (China) | | | 1,383,925 | |
| | 466,804 | Cosco Pacific Ltd. (China) | | | 553,296 | |
| | 26,355 | Kuehne & Nagel International AG (Switzerland) | | | 2,712,951 | |
| | 63,000 | LLX Logistica S.A. (Brazil)* | | | 256,886 | |
| | 15,710 | United Parcel Service, Inc., Class B | | | 893,742 | |
| |
| | | 10,675,558 | |
| |
| | Total Industrials | | | 27,483,800 | |
| |
| | INFORMATION TECHNOLOGY – (5.95%) | |
| | Semiconductors & Semiconductor Equipment – (1.49%) | |
| | 307,500 | Texas Instruments Inc. | | | 7,158,600 | |
| |
| | Software & Services – (2.19%) | |
| | 210,600 | Activision Blizzard, Inc. | | | 2,210,247 | |
| | 8,500 | Google Inc., Class A * | | | 3,781,650 | |
| | 199,410 | Microsoft Corp. | | | 4,587,427 | |
| |
| | | 10,579,324 | |
| |
| | Technology Hardware & Equipment – (2.27%) | |
| | 139,550 | Agilent Technologies, Inc. * | | | 3,967,406 | |
| | 161,870 | Hewlett-Packard Co. | | | 7,005,734 | |
| |
| | | 10,973,140 | |
| |
| | Total Information Technology | | | 28,711,064 | |
| |
| | MATERIALS – (5.39%) | |
| | 81,830 | BHP Billiton PLC (United Kingdom) | | | 2,121,733 | |
| | 42,380 | Martin Marietta Materials, Inc. | | | 3,594,248 | |
| | 36,900 | Monsanto Co. | | | 1,705,518 | |
| | 11,354 | Potash Corp. of Saskatchewan Inc. (Canada) | | | 979,169 | |
| | 10,800 | Praxair, Inc. | | | 820,692 | |
| | 41,205 | Rio Tinto PLC (United Kingdom) | | | 1,809,493 | |
| | 503,895 | Sealed Air Corp. | | | 9,936,809 | |
| DAVIS VARIABLE ACCOUNT FUND, INC. | Schedule of Investments |
| DAVIS VALUE PORTFOLIO - (CONTINUED) | June 30, 2010 (Unaudited) |
| Shares/Principal | | Security | | Value (Note 1) | |
COMMON STOCK – (CONTINUED) | |
| | MATERIALS – (CONTINUED) | |
| | 256,750 | Sino-Forest Corp. (Canada)* | | $ | 3,649,079 | |
| | 8,900 | Sino-Forest Corp., 144A (Canada)*(a)(b) | | | 126,492 | |
| | 29,790 | Vulcan Materials Co. | | | 1,305,696 | |
| |
| | Total Materials | | | 26,048,929 | |
| |
| | TELECOMMUNICATION SERVICES – (0.37%) | |
| | 37,700 | America Movil SAB de C.V., Series L, ADR (Mexico) | | | 1,790,750 | |
| |
| | Total Telecommunication Services | | | 1,790,750 | |
| |
| | TOTAL COMMON STOCK – (Identified cost $344,964,079) | | | 434,455,683 | |
| |
CONVERTIBLE BONDS – (0.25%) | |
| | MATERIALS – (0.16%) | |
| $ | 736,000 | Sino-Forest Corp., Conv. Sr. Notes, 5.00%, 08/01/13 (Canada) (c) | | | 754,860 | |
| |
| | Total Materials | | | 754,860 | |
| |
| | TELECOMMUNICATION SERVICES – (0.09%) | |
| | 400,000 | Level 3 Communications, Inc., Conv. Sr. Notes, 15.00%, 01/15/13 (c) | | | 453,000 | |
| |
| | Total Telecommunication Services | | | 453,000 | |
| |
| | TOTAL CONVERTIBLE BONDS – (Identified cost $1,136,000) | | | 1,207,860 | |
| |
CORPORATE BONDS – (0.55%) | |
| | CONSUMER DISCRETIONARY – (0.55%) | |
| | Automobiles & Components – (0.55%) | |
| | 2,000,000 | Harley-Davidson, Inc., Sr. Notes, 15.00%, 02/01/14 (c) | | | 2,651,690 | |
| |
| | TOTAL CORPORATE BONDS – (Identified cost $2,000,000) | | | 2,651,690 | |
| |
SHORT TERM INVESTMENTS – (3.90%) | |
| | 3,323,000 | Banc of America Securities LLC Joint Repurchase Agreement, | | | | | | |
| | 0.03%, 07/01/10, dated 06/30/10, repurchase value of $3,323,003 | | | | | | |
| | (collateralized by: U.S. Government agency obligations in a pooled cash account, 0.00%-5.00%, 12/08/10-07/15/20, total market value $3,389,460) | | | 3,323,000 | |
| | 4,848,000 | Goldman, Sachs & Co. Joint Repurchase Agreement, | | | | | | |
| | 0.01%, 07/01/10, dated 06/30/10, repurchase value of $4,848,001 | | | | | | |
| | (collateralized by: U.S. Government agency obligations in a pooled cash account, 0.00%-5.05%, 08/30/10-01/26/15, total market value $4,944,960) | | | 4,848,000 | |
| | 10,632,000 | Mizuho Securities USA Inc. Joint Repurchase Agreement, | | | | | | |
| | 0.14%, 07/01/10, dated 06/30/10, repurchase value of $10,632,041 | | | | | | |
| | (collateralized by: U.S. Government agency mortgages in a pooled cash account, 2.421%-6.229%, 09/01/19-07/01/40, total market value $10,844,640) | | | 10,632,000 | |
| |
| | TOTAL SHORT TERM INVESTMENTS – (Identified cost $18,803,000) | | | 18,803,000 | |
| |
| | Total Investments – (94.65%) – (Identified cost $366,903,079) – (d) | | | 457,118,233 | |
| | Other Assets Less Liabilities – (5.35%) | | | 25,863,305 | |
| |
| | Net Assets – (100.00%) | | $ | 482,981,538 | |
| |
| |
| | ADR: American Depositary Receipt | | |
| | * | | Non-Income producing security. | |
| DAVIS VARIABLE ACCOUNT FUND, INC. | Schedule of Investments |
| DAVIS VALUE PORTFOLIO - (CONTINUED) | June 30, 2010 (Unaudited) |
| | (a) | | These securities are subject to Rule 144A. The Board of Directors of the Fund has determined that there is sufficient liquidity in these securities to realize current valuations. These securities amounted to $1,038,428 or 0.22% of the Fund's net assets as of June 30, 2010. | |
| | (b) | | Restricted Security – See Note 7 of the Notes to Financial Statements. | |
| | (c) | | Illiquid Security – See Note 7 of the Notes to Financial Statements. | |
| | (d) | | Aggregate cost for federal income tax purposes is $368,524,063. At June 30, 2010 unrealized appreciation (depreciation) of securities for federal income tax purposes is as follows: | |
| | Unrealized appreciation | | $ | 104,121,499 | |
| | Unrealized depreciation | | | (15,527,329) | |
| |
| | Net unrealized appreciation | | $ | 88,594,170 | |
| |
| |
| See Notes to Financial Statements | |
| DAVIS VARIABLE ACCOUNT FUND, INC. | Schedule of Investments |
| DAVIS FINANCIAL PORTFOLIO | June 30, 2010 (Unaudited) |
| Shares | | Security | | Value (Note 1) | |
| |
| | ENERGY – (5.64%) | |
| | 125,000 | Canadian Natural Resources Ltd. (Canada) | | $ | 4,153,750 | |
| |
| | Total Energy | | | 4,153,750 | |
| |
| | FINANCIALS – (91.10%) | |
| | Banks – (14.82%) | |
| | Commercial Banks – (14.82%) | |
| | 20,000 | Banco Santander Brasil S.A., ADS (Brazil) | | | 206,600 | |
| | 21,600 | ICICI Bank Ltd., ADR (India) | | | 780,624 | |
| | 50,948 | State Bank of India Ltd., GDR (India) | | | 5,060,851 | |
| | 14,500 | U.S. Bancorp | | | 324,075 | |
| | 177,500 | Wells Fargo & Co. | | | 4,544,000 | |
| |
| | | 10,916,150 | |
| |
| | Diversified Financials – (43.12%) | |
| | Capital Markets – (19.28%) | |
| | 41,860 | Ameriprise Financial, Inc. | | | 1,512,402 | |
| | 146,200 | Bank of New York Mellon Corp. | | | 3,609,678 | |
| | 100,300 | Brookfield Asset Management Inc., Class A (Canada) | | | 2,268,786 | |
| | 20,100 | Charles Schwab Corp. | | | 285,018 | |
| | 93,910 | GAM Holding Ltd. (Switzerland)* | | | 1,014,840 | |
| | 19,520 | Goldman Sachs Group, Inc. | | | 2,562,390 | |
| | 93,910 | Julius Baer Group Ltd. (Switzerland) | | | 2,677,617 | |
| | 6,060 | T. Rowe Price Group Inc. | | | 269,034 | |
| |
| | 14,199,765 | |
| |
| | Consumer Finance – (10.77%) | |
| | 188,300 | American Express Co. | | | 7,475,510 | |
| | 194,994 | First Marblehead Corp. * | | | 458,236 | |
| |
| | 7,933,746 | |
| |
| | Diversified Financial Services – (13.07%) | |
| | 14,486 | Bank of America Corp. | | | 208,164 | |
| | 69,500 | Cielo S.A. (Brazil) | | | 585,263 | |
| | 122,000 | Moody's Corp. | | | 2,430,240 | |
| | 126,700 | Oaktree Capital Group LLC, Class A (a) | | | 4,339,475 | |
| | 62,000 | RHJ International (Belgium)* | | | 459,274 | |
| | 22,600 | Visa Inc., Class A | | | 1,598,950 | |
| |
| | 9,621,366 | |
| |
| | 31,754,877 | |
| |
| | Insurance – (33.16%) | |
| | Life & Health Insurance – (3.79%) | |
| | 42,833 | China Life Insurance Co., Ltd., ADR (China) | | | 2,792,712 | |
| |
| | Multi-line Insurance – (6.72%) | |
| | 148,600 | Loews Corp. | | | 4,949,866 | |
| |
| | Property & Casualty Insurance – (10.81%) | |
| | 24,600 | ACE Ltd. | | | 1,266,408 | |
| | 11,200 | Markel Corp. * | | | 3,808,000 | |
| | 154,100 | Progressive Corp. (Ohio) | | | 2,884,752 | |
| |
| | 7,959,160 | |
| |
| | | |
| | | | | | | |
| DAVIS VARIABLE ACCOUNT FUND, INC. | Schedule of Investments |
| DAVIS FINANCIAL PORTFOLIO - (CONTINUED) | June 30, 2010 (Unaudited) |
| Shares/Principal | | Security | | Value (Note 1) | |
COMMON STOCK – (CONTINUED) | |
| | FINANCIALS – (CONTINUED) | |
| | Insurance – (Continued) | |
| | Reinsurance – (11.84%) | |
| | 27,900 | Everest Re Group, Ltd. | | $ | 1,973,088 | |
| | 140,737 | Transatlantic Holdings, Inc. | | | 6,749,746 | |
| |
| | 8,722,834 | |
| |
| | | 24,424,572 | |
| |
| | Total Financials | | | 67,095,599 | |
| |
| | INDUSTRIALS – (2.73%) | |
| | Commercial & Professional Services – (2.73%) | |
| | 29,900 | D&B Corp. | | | 2,006,888 | |
| |
| | Total Industrials | | | 2,006,888 | |
| |
| | TOTAL COMMON STOCK – (Identified cost $64,591,482) | | | 73,256,237 | |
| |
SHORT TERM INVESTMENTS – (0.51%) | |
| $ | 67,000 | Banc of America Securities LLC Joint Repurchase Agreement, | | | | | | |
| �� | 0.03%, 07/01/10, dated 06/30/10, repurchase value of $67,000 | | | | | | |
| | (collateralized by: U.S. Government agency obligations in a pooled cash account, 0.00%-5.00%, 12/08/10-07/15/20, total market value $68,340) | | | 67,000 | |
| | 97,000 | Goldman, Sachs & Co. Joint Repurchase Agreement, | | | | | | |
| | 0.01%, 07/01/10, dated 06/30/10, repurchase value of $97,000 | | | | | | |
| | (collateralized by: U.S. Government agency obligations in a pooled cash account, 0.00%-5.05%, 08/30/10-01/26/15, total market value $98,940) | | | 97,000 | |
| | 214,000 | Mizuho Securities USA Inc. Joint Repurchase Agreement, | | | | | | |
| | 0.14%, 07/01/10, dated 06/30/10, repurchase value of $214,001 | | | | | | |
| | (collateralized by: U.S. Government agency mortgages in a pooled cash account, 2.421%-6.229%, 09/01/19-07/01/40, total market value $218,280) | | | 214,000 | |
| |
| | TOTAL SHORT TERM INVESTMENTS – (Identified cost $378,000) | | | 378,000 | |
| |
| | Total Investments – (99.98%) – (Identified cost $64,969,482) – (b) | | | 73,634,237 | |
| | Other Assets Less Liabilities – (0.02%) | | | 15,530 | |
| |
| | Net Assets – (100.00%) | | $ | 73,649,767 | |
| |
| |
| | ADR: American Depositary Receipt | | |
| | ADS: American Depositary Share | | |
| | GDR: Global Depositary Receipt | | |
| | * | | Non-Income producing security. | |
| | (a) | | Illiquid Security – See Note 7 of the Notes to Financial Statements. | |
| | (b) | | Aggregate cost for federal income tax purposes is $65,123,027. At June 30, 2010 unrealized appreciation (depreciation) of securities for federal income tax purposes is as follows: | |
| | Unrealized appreciation | | $ | 15,419,557 | |
| | Unrealized depreciation | | | (6,908,347) | |
| |
| | Net unrealized appreciation | | $ | 8,511,210 | |
| |
| |
| See Notes to Financial Statements | |
| DAVIS VARIABLE ACCOUNT FUND, INC. | Schedule of Investments |
| DAVIS REAL ESTATE PORTFOLIO | June 30, 2010 (Unaudited) |
| Shares | | Security | | Value (Note 1) | |
| |
| | FINANCIALS – (73.35%) | |
| | Real Estate – (73.35%) | |
| | Real Estate Investment Trusts (REITs) – (68.40%) | |
| | Diversified REITs – (5.30%) | |
| | 59,914 | Cousins Properties, Inc. | | $ | 403,821 | |
| | 11,570 | Vornado Realty Trust | | | 844,031 | |
| |
| | 1,247,852 | |
| |
| | Industrial REITs – (3.55%) | |
| | 184,900 | DCT Industrial Trust Inc. | | | 835,748 | |
| |
| | Office REITs – (28.41%) | |
| | 18,600 | Alexandria Real Estate Equities, Inc. | | | 1,178,682 | |
| | 10,900 | Boston Properties, Inc. | | | 777,606 | |
| | 35,090 | Corporate Office Properties Trust | | | 1,324,998 | |
| | 22,200 | Digital Realty Trust, Inc. | | | 1,280,496 | |
| | 60,500 | Douglas Emmett, Inc. | | | 860,310 | |
| | 33,200 | DuPont Fabros Technology Inc. | | | 815,392 | |
| | 16,200 | Highwoods Properties, Inc. | | | 449,712 | |
| |
| | 6,687,196 | |
| |
| | Residential REITs – (10.71%) | |
| | 45,600 | American Campus Communities, Inc. | | | 1,244,424 | |
| | 9,890 | Essex Property Trust, Inc. | | | 964,671 | |
| | 16,300 | UDR, Inc. | | | 311,819 | |
| |
| | 2,520,914 | |
| |
| | Retail REITs – (11.93%) | |
| | 21,460 | CBL & Associates Properties, Inc. | | | 266,962 | |
| | 12,450 | Federal Realty Investment Trust | | | 874,862 | |
| | 23,600 | Regency Centers Corp. | | | 811,840 | |
| | 6,292 | Simon Property Group, Inc. | | | 508,079 | |
| | 9,160 | Taubman Centers, Inc. | | | 344,691 | |
| |
| | 2,806,434 | |
| |
| | Specialized REITs – (8.50%) | |
| | 60,583 | Cogdell Spencer, Inc. | | | 409,541 | |
| | 13,400 | Entertainment Properties Trust | | | 510,138 | |
| | 16,400 | LaSalle Hotel Properties | | | 337,348 | |
| | 15,820 | Ventas, Inc. | | | 742,749 | |
| |
| | 1,999,776 | |
| |
| | 16,097,920 | |
| |
| | Real Estate Management & Development – (4.95%) | |
| | Real Estate Operating Companies – (4.95%) | |
| | 102,980 | Forest City Enterprises, Inc., Class A * | | | 1,165,734 | |
| |
| | 17,263,654 | |
| |
| | Total Financials | | | 17,263,654 | |
| |
| | INDUSTRIALS – (2.74%) | |
| | Transportation – (2.74%) | |
| | 21,700 | Alexander & Baldwin, Inc. | | | 646,226 | |
| |
| | Total Industrials | | | 646,226 | |
| |
| | TELECOMMUNICATION SERVICES – (7.57%) | |
| | 12,300 | American Tower Corp., Class A * | | | 547,350 | |
| | 17,350 | Crown Castle International Corp. * | | | 646,461 | |
| DAVIS VARIABLE ACCOUNT FUND, INC. | Schedule of Investments |
| DAVIS REAL ESTATE PORTFOLIO - (CONTINUED) | June 30, 2010 (Unaudited) |
| Shares/Principal | | Security | | Value (Note 1) | |
COMMON STOCK – (CONTINUED) | |
| | TELECOMMUNICATION SERVICES – (CONTINUED) | |
| | 17,300 | SBA Communications Corp., Class A * | | $ | 588,373 | |
| |
| | Total Telecommunication Services | | | 1,782,184 | |
| |
| | TOTAL COMMON STOCK – (Identified cost $19,867,470) | | | 19,692,064 | |
| |
PREFERRED STOCK – (8.73%) | |
| | FINANCIALS – (8.73%) | |
| | Real Estate – (8.73%) | |
| | Real Estate Investment Trusts (REITs) – (8.73%) | |
| | Industrial REITs – (1.14%) | |
| | 11,900 | AMB Property Corp., 6.75%, Series M | | | 267,809 | |
| |
| | Office REITs – (6.44%) | |
| | 33,272 | Alexandria Real Estate Equities, Inc., 7.00%, Series D, Conv. Pfd. | | | 716,386 | |
| | 5,700 | Digital Realty Trust, Inc., 5.50%, Series D, Cum. Conv. Pfd. | | | 197,363 | |
| | 5,014 | Digital Realty Trust, Inc., 8.50%, Series A | | | 126,917 | |
| | 19,930 | SL Green Realty Corp., 7.625%, Series C | | | 475,380 | |
| |
| | 1,516,046 | |
| |
| | Residential REITs – (0.40%) | |
| | 2,000 | Equity Residential, 7.00%, Series E, Cum. Conv. Pfd. | | | 93,312 | |
| |
| | Retail REITs – (0.75%) | |
| | 8,280 | CBL & Associates Properties, Inc., 7.375%, Series D | | | 176,799 | |
| |
| | Total Financials | | | 2,053,966 | |
| |
| | TOTAL PREFERRED STOCK – (Identified cost $1,072,511) | | | 2,053,966 | |
| |
CONVERTIBLE BONDS – (2.89%) | |
| | FINANCIALS – (2.89%) | |
| | Real Estate – (2.89%) | |
| | Real Estate Investment Trusts (REITs) – (2.52%) | |
| | Office REITs – (2.52%) | |
| $ | 344,000 | Digital Realty Trust, Inc., 144A Conv. Sr. Notes, 5.50%, 04/15/29 (a) | | | 492,995 | |
| | 104,000 | SL Green Realty Corp., 144A Conv. Sr. Notes, 3.00%, 03/30/27 (a) | | | 101,400 | |
| |
| | 594,395 | |
| |
| | Real Estate Management & Development – (0.37%) | |
| | Real Estate Operating Companies – (0.37%) | |
| | 80,000 | Forest City Enterprises, Inc., 144A Conv. Sr. Notes, 5.00%, 10/15/16 (a) | | | 86,000 | |
| |
| | Total Financials | | | 680,395 | |
| |
| | TOTAL CONVERTIBLE BONDS – (Identified cost $526,520) | | | 680,395 | |
| |
SHORT TERM INVESTMENTS – (4.54%) | |
| | 189,000 | Banc of America Securities LLC Joint Repurchase Agreement, | | | | | |
| | 0.03%, 07/01/10, dated 06/30/10, repurchase value of $189,000 | | | | | |
| | (collateralized by: U.S. Government agency obligations in a pooled cash account, 0.00%-5.00%, 12/08/10-07/15/20, total market value $192,780) | | | 189,000 | |
| | 275,000 | Goldman, Sachs & Co. Joint Repurchase Agreement, | | | | | |
| | 0.01%, 07/01/10, dated 06/30/10, repurchase value of $275,000 | | | | | |
| | (collateralized by: U.S. Government agency obligations in a pooled cash account, 0.00%-5.05%, 08/30/10-01/26/15, total market value $280,500) | | | 275,000 | |
| DAVIS VARIABLE ACCOUNT FUND, INC. | Schedule of Investments |
| DAVIS REAL ESTATE PORTFOLIO - (CONTINUED) | June 30, 2010 (Unaudited) |
| Principal | | Security | | Value (Note 1) | |
SHORT TERM INVESTMENTS – (CONTINUED) | |
| $ | 604,000 | Mizuho Securities USA Inc. Joint Repurchase Agreement, | | | | | |
| | 0.14%, 07/01/10, dated 06/30/10, repurchase value of $604,002 | | | | | |
| | (collateralized by: U.S. Government agency mortgages in a pooled cash account, 2.421%-6.229%, 09/01/19-07/01/40, total market value $616,080) | | $ | 604,000 | |
| |
| | TOTAL SHORT TERM INVESTMENTS – (Identified cost $1,068,000) | | | 1,068,000 | |
| |
| | Total Investments – (99.82%) – (Identified cost $22,534,501) – (b) | | | 23,494,425 | |
| | Other Assets Less Liabilities – (0.18%) | | | 42,028 | |
| |
| | Net Assets – (100.00%) | | $ | 23,536,453 | |
| |
| |
| | * | | Non-Income producing security. | |
| | (a) | | These securities are subject to Rule 144A. The Board of Directors of the Fund has determined that there is sufficient liquidity in these securities to realize current valuations. These securities amounted to $680,395 or 2.89% of the Fund's net assets as of June 30, 2010. | |
| | (b) | | Aggregate cost for federal income tax purposes is $23,958,696. At June 30, 2010 unrealized appreciation (depreciation) of securities for federal income tax purposes is as follows: | |
| | Unrealized appreciation | | $ | 3,160,262 | |
| | Unrealized depreciation | | | (3,624,533) | |
| |
| | Net unrealized depreciation | | $ | (464,271) | |
| |
| |
| See Notes to Financial Statements | |
| DAVIS VARIABLE ACCOUNT FUND, INC. | Statements of Assets and Liabilities |
| | At June 30, 2010 (Unaudited) |
| | | | Davis Value Portfolio | | | Davis Financial Portfolio | | | Davis Real Estate Portfolio | |
| | | | | | | | | | | |
| ASSETS: | | | | | | | | | | |
Investments in securities at value* (see accompanying Schedule of Investments) | | $ | 457,118,233 | | $ | 73,634,237 | | $ | 23,494,425 | |
Cash | | | 6,640 | | | 2,736 | | | 2,091 | |
Cash - foreign currencies** | | | 168,794 | | | – | | | – | |
| Receivables: | | | | | | | | | | |
| | Capital stock sold | | | 25,342,035 | | | 39,530 | | | 23 | |
| | Dividends and interest | | | 797,344 | | | 174,040 | | | 105,483 | |
| | Investment securities sold | | | 153,565 | | | – | | | 132,692 | |
Prepaid expenses | | | 2,683 | | | 469 | | | 211 | |
| | Total assets | | | 483,589,294 | | | 73,851,012 | | | 23,734,925 | |
| | | | | | | | | | | |
| LIABILITIES: | | | | | | | | | | |
| Payables: | | | | | | | | | | |
| | Investment securities purchased | | | – | | | – | | | 117,025 | |
| | Capital stock redeemed | | | 298,587 | | | 135,240 | | | 47,786 | |
Accrued management fees | | | 248,911 | | | 39,573 | | | 14,497 | |
Other accrued expenses | | | 60,258 | | | 26,432 | | | 19,164 | |
| | Total liabilities | | | 607,756 | | | 201,245 | | | 198,472 | |
| | | | | | | | | | | |
NET ASSETS | | $ | 482,981,538 | | $ | 73,649,767 | | $ | 23,536,453 | |
| | | | | | | | | | | |
SHARES OUTSTANDING | | | 48,379,052 | | | 7,938,202 | | | 3,077,925 | |
NET ASSET VALUE, offering, and redemption price per share (Net assets ÷ Shares outstanding) | | $ | 9.98 | | $ | 9.28 | | $ | 7.65 | |
| | | | | | | | | | | |
| NET ASSETS CONSIST OF: | | | | | | | | | | |
Par value of shares of capital stock | | $ | 48,379 | | $ | 7,938 | | $ | 3,078 | |
Additional paid-in capital | | | 420,135,917 | | | 76,172,454 | | | 37,261,446 | |
Undistributed net investment income | | | 2,674,377 | | | 974,606 | | | 166,647 | |
| Accumulated net realized losses from investments and foreign currency transactions | | | (30,093,599) | | | (12,170,192) | | | (14,854,174) | |
Net unrealized appreciation on investments and foreign currency transactions | | | 90,216,464 | | | 8,664,961 | | | 959,456 | |
| | Net Assets | | $ | 482,981,538 | | $ | 73,649,767 | | $ | 23,536,453 | |
| | | | | | | | | | | | |
| *Including: | | | | | | | | | | |
| | Cost of investments | | $ | 366,903,079 | | $ | 64,969,482 | | $ | 22,534,501 | |
| | | | | | | | | | | | |
**Cost of cash - foreign currencies | | | 169,401 | | | – | | | – | |
| | | | | | | | | | | | |
| See Notes to Financial Statements |
| | | | | | | | | | | | |
| DAVIS VARIABLE ACCOUNT FUND, INC. | Statements of Operations |
| | For the six months ended June 30, 2010 (Unaudited) |
| | | | Davis Value Portfolio | | | Davis Financial Portfolio | | | Davis Real Estate Portfolio | |
| | | | | | | | | | | |
| INVESTMENT INCOME: | | | | | | | | | | |
| Income: | | | | | | | | | | |
| | Dividends* | | $ | 3,842,380 | | $ | 775,586 | | $ | 397,403 | |
| | Interest | | | 279,830 | | | 2,100 | | | 19,307 | |
| | Total income | | | 4,122,210 | | | 777,686 | | | 416,710 | |
| | | | | | | | | | | | |
| Expenses: | | | | | | | | | | |
| | Management fees (Note 3) | | | 1,396,996 | | | 227,292 | | | 66,468 | |
| | Custodian fees | | | 47,566 | | | 14,122 | | | 9,893 | |
| | Transfer agent fees | | | 8,961 | | | 4,127 | | | 2,815 | |
| | Audit fees | | | 10,200 | | | 9,000 | | | 9,000 | |
| | Legal fees | | | 9,150 | | | 1,482 | | | 420 | |
| | Accounting fees (Note 3) | | | 3,252 | | | 1,002 | | | 1,002 | |
| | Reports to shareholders | | | 30,000 | | | 7,550 | | | 2,000 | |
| | Directors’ fees and expenses | | | 58,417 | | | 11,886 | | | 5,638 | |
| | Registration and filing fees | | | 150 | | | 27 | | | 7 | |
| | Miscellaneous | | | 9,815 | | | 4,675 | | | 4,490 | |
| | Total expenses | | | 1,574,507 | | | 281,163 | | | 101,733 | |
| | Expenses paid indirectly (Note 4) | | | (8) | | | (1) | | | (1) | |
| | Net expenses | | | 1,574,499 | | | 281,162 | | | 101,732 | |
| | Net investment income | | | 2,547,711 | | | 496,524 | | | 314,978 | |
| | | | | | | | | | | | |
REALIZED & UNREALIZED GAIN (LOSS) ON INVESTMENTS AND FOREIGN CURRENCY TRANSACTIONS: | | | | | | | | | | |
| Net realized gain (loss) from: | | | | | | | | | | |
| | Investment transactions | | | 11,261,274 | | | 1,241,185 | | | 816,833 | |
| | Foreign currency transactions | | | (293) | | | (12,061) | | | – | |
Net decrease in unrealized appreciation | | | (49,199,383) | | | (7,482,629) | | | (198,556) | |
| | Net realized and unrealized gain (loss) on investments and foreign currency transactions | | | (37,938,402) | | | (6,253,505) | | | 618,277 | |
| | Net increase (decrease) in net assets resulting from operations | | $ | (35,390,691) | | $ | (5,756,981) | | $ | 933,255 | |
| | | | | | | | | | | | |
*Net of foreign taxes withheld as follows | | $ | 64,686 | | $ | 18,596 | | $ | 395 | |
| | | | | | | | | | | | |
| See Notes to Financial Statements |
| DAVIS VARIABLE ACCOUNT FUND, INC. | Statements of Changes in Net Assets |
| | For the six months ended June 30, 2010 (Unaudited) |
| | | | Davis Value Portfolio | | | Davis Financial Portfolio | | | Davis Real Estate Portfolio | |
| | | | | | | | | | | | |
| OPERATIONS: | | | | | | | | | | |
| | Net investment income | | $ | 2,547,711 | | $ | 496,524 | | $ | 314,978 | |
| | Net realized gain from investments and foreign currency transactions | | | 11,260,981 | | | 1,229,124 | | | 816,833 | |
| | Net decrease in unrealized appreciation on investments and foreign currency transactions | | | (49,199,383) | | | (7,482,629) | | | (198,556) | |
| | Net increase (decrease) in net assets resulting from operations | | | (35,390,691) | | | (5,756,981) | | | 933,255 | |
| | | | | | | | | | | | |
DIVIDENDS AND DISTRIBUTIONS TO SHAREHOLDERS FROM: | | | | | | | | | | |
| | Net investment income | | | – | | | – | | | (155,619) | |
| | | | | | | | | | | | |
| CAPITAL SHARE TRANSACTIONS: | | | | | | | | | | |
| | Net decrease in net assets resulting from capital share transactions (Note 5) | | | (1,031,735) | | | (8,430,473) | | | (807,536) | |
| | Total decrease in net assets | | | (36,422,426) | | | (14,187,454) | | | (29,900) | |
| | | | | | | | | | | | |
| NET ASSETS: | | | | | | | | | | |
| | Beginning of period | | | 519,403,964 | | | 87,837,221 | | | 23,566,353 | |
| | End of period* | | $ | 482,981,538 | | $ | 73,649,767 | | $ | 23,536,453 | |
| | | | | | | | | | | | |
*Including undistributed net investment income of | | $ | 2,674,377 | | $ | 974,606 | | $ | 166,647 | |
| | | | | | | | | | | | |
| See Notes to Financial Statements |
| DAVIS VARIABLE ACCOUNT FUND, INC. | Statements of Changes in Net Assets |
| | For the year ended December 31, 2009 |
| | | | Davis Value Portfolio | | | Davis Financial Portfolio | | | Davis Real Estate Portfolio | |
| | | | | | | | | | | | |
| OPERATIONS: | | | | | | | | | | |
| | Net investment income | | $ | 3,837,745 | | $ | 489,320 | | $ | 523,044 | |
| | Net realized loss from investments and foreign currency transactions | | | (40,978,639) | | | (8,123,742) | | | (12,772,190) | |
| | Net change in unrealized appreciation (depreciation) on investments and foreign currency transactions | | | 155,373,588 | | | 34,312,747 | | | 17,711,950 | |
| | Net increase in net assets resulting from operations | | | 118,232,694 | | | 26,678,325 | | | 5,462,804 | |
| | | | | | | | | | | | |
DIVIDENDS AND DISTRIBUTIONS TO SHAREHOLDERS FROM: | | | | | | | | | | |
| | Net investment income | | | (3,982,003) | | | (629,608) | | | (513,936) | |
| | | | | | | | | | | | |
| CAPITAL SHARE TRANSACTIONS: | | | | | | | | | | |
| | Net increase (decrease) in net assets resulting from capital share transactions (Note 5) | | | 72,001,466 | | | 4,467,751 | | | (713,924) | |
| | Total increase in net assets | | | 186,252,157 | | | 30,516,468 | | | 4,234,944 | |
| | | | | | | | | | | | |
| NET ASSETS: | | | | | | | | | | |
| | Beginning of year | | | 333,151,807 | | | 57,320,753 | | | 19,331,409 | |
| | End of year* | | $ | 519,403,964 | | $ | 87,837,221 | | $ | 23,566,353 | |
| | | | | | | | | | | | |
*Including undistributed net investment income of | | $ | 126,666 | | $ | 478,082 | | $ | 7,288 | |
| | | | | | | | | | | | |
| See Notes to Financial Statements |
| DAVIS VARIABLE ACCOUNT FUND, INC. | Notes to Financial Statements |
| | June 30, 2010 (Unaudited) |
NOTE 1 - SUMMARY OF SIGNIFICANT ACCOUNTING POLICIES
The Davis Variable Account Fund, Inc. (a Maryland corporation), consists of three series of funds, Davis Value Portfolio, Davis Financial Portfolio, and Davis Real Estate Portfolio (collectively “Funds”). Davis Value Portfolio and Davis Financial Portfolio are registered under the Investment Company Act of 1940 (“40 Act”), as amended, as diversified, open-end management investment companies. Davis Real Estate Portfolio is registered under the 40 Act, as amended, as a non-diversified, open-end management investment company. Only insurance companies, for the purpose of funding variable annuity or variable life insurance contracts, may purchase shares of the Funds. The Funds account separately for the assets, liabilities, and operations of each series. The following is a summary of significant accounting policies followed by the Funds in the preparation of financial statements.
Security Valuation - The Funds calculate the net asset value of their shares as of the close of the New York Stock Exchange (“Exchange”), normally 4:00 P.M. Eastern time, on each day the Exchange is open for business. Securities listed on the Exchange (and other national exchanges) are valued at the last reported sales price on the day of valuation. Securities traded in the over-the-counter market (e.g. NASDAQ) and listed securities for which no sale was reported on that date are stated at the average of closing bid and asked prices. Securities traded on foreign exchanges are valued based upon the last sales price on the principal exchange on which the security is traded prior to the time when the Funds’ assets are valued. Securities (including restricted securities) for which market quotations are not readily available are valued at their fair value. Securities whose values have been materially affected by what Davis Selected Advisers, L.P. (“Davis Advisors” or “Adviser”), the Funds’ investment adviser, identifies as a significant event occurring before the Funds’ assets are valued but after the close of their respective exchanges will be fair valued. Fair value is determined in good faith using consistently applied procedures under the supervision of the Board of Directors. Short-term securities purchased within 60 days to maturity are valued at amortized cost, which approximates market value. These valuation procedures are reviewed and subject to approval by the Board of Directors.
Value Measurements - Fair value is defined as the price that the Funds would receive upon selling an investment in an orderly transaction to an independent buyer in the principal or most advantageous market for the investment. Various inputs are used to determine the fair value of the Funds’ investments. These inputs are summarized in the three broad levels listed below.
Level 1 – quoted prices in active markets for identical securities
Level 2 – other significant observable inputs (including quoted prices for similar investments, interest rates, prepayment
speeds, credit risk, etc.)
| Level 3 – significant unobservable inputs (including Fund’s own assumptions in determining the fair value of investments) |
The inputs or methodology used for valuing securities are not necessarily an indication of the risk associated with investing in those securities.
| DAVIS VARIABLE ACCOUNT FUND, INC. | Notes to Financial Statements – (Continued) |
| | June 30, 2010 (Unaudited) |
NOTE 1 - SUMMARY OF SIGNIFICANT ACCOUNTING POLICIES – (CONTINUED)
Value Measurements – (Continued)
The following is a summary of the inputs used as of June 30, 2010 in valuing each Fund’s investments carried at value:
| | Investments in Securities at Value |
| | | | | | |
| | Davis | | Davis | | Davis |
| | Value | | Financial | | Real Estate |
| | Portfolio | | Portfolio | | Portfolio |
| Valuation inputs | | | | | | | | |
| Level 1 – Quoted prices: | | | | | | | | |
Equity securities: | | | | | | | | |
| Consumer discretionary | $ | 26,445,395 | | $ | – | | $ | – |
| Consumer staples | | 65,043,888 | | | – | | | – |
| Energy | | 72,056,892 | | | 4,153,750 | | | – |
| Financials | | 116,593,587 | | | 53,543,542 | | | 19,120,257 |
| Health care | | 48,303,221 | | | – | | | – |
| Industrials | | 17,958,870 | | | 2,006,888 | | | 646,226 |
| Information technology | | 28,711,064 | | | – | | | – |
| Materials | | 22,117,703 | | | – | | | – |
| Telecommunication services | | 1,790,750 | | | – | | | 1,782,184 |
| Level 2 – Other Significant Observable Inputs: | | | | | | | | |
| Convertible debt securities | | 1,207,860 | | | – | | | 680,395 |
| Corporate debt securities | | 2,651,690 | | | – | | | – |
Equity securities*: | | | | | | | | |
| Consumer discretionary | | 741,388 | | | – | | | – |
| Consumer staples | | 5,901,828 | | | – | | | – |
| Energy | | 3,309,571 | | | – | | | – |
| Financials | | 12,025,370 | | | 13,552,057 | | | 197,363 |
| Industrials | | 9,524,930 | | | – | | | – |
| Materials | | 3,931,226 | | | – | | | – |
| Short-term securities | | 18,803,000 | | | 378,000 | | | 1,068,000 |
| Level 3 – Significant Unobservable Inputs: | | – | | | – | | | – |
| Total | $ | 457,118,233 | | $ | 73,634,237 | | $ | 23,494,425 |
| | | | | | | | | |
| Level 1 to Level 2 transfers** | $ | 6,314,397 | | $ | 2,677,617 | | $ | – |
| | | | | | | | | |
*Includes certain securities trading primarily outside the U.S. whose value the Fund adjusted as a result of significant market movements following the close of local trading.
**Application of standing Board valuation procedures related to non-U.S. securities triggered transfers between Level 1 and Level 2 assets during the six months ended June 30, 2010.
Master Repurchase Agreements - The Funds, along with other affiliated funds, may transfer uninvested cash balances into one or more master repurchase agreement accounts. These balances are invested in one or more repurchase agreements, secured by U.S. Government securities. A custodian bank holds securities pledged as collateral for repurchase agreements until the agreements mature. Each agreement requires that the market value of the collateral be sufficient to cover payments of interest and principal; however, in the event of default by the other party to the agreement, retention of the collateral may be subject to legal proceedings.
Currency Translation - The market values of all assets and liabilities denominated in foreign currencies are recorded in the financial statements after translation to the U.S. Dollar based upon the mean between the bid and offered quotations of the currencies against U.S. Dollars on the date of valuation. The cost basis of such assets and liabilities is determined based upon historical exchange rates. Income and expenses are translated at average exchange rates in effect as accrued or incurred.
| DAVIS VARIABLE ACCOUNT FUND, INC. | Notes to Financial Statements – (Continued) |
| | June 30, 2010 (Unaudited) |
NOTE 1 - SUMMARY OF SIGNIFICANT ACCOUNTING POLICIES – (CONTINUED)
Foreign Currency - The Funds may enter into forward purchases or sales of foreign currencies to hedge certain foreign currency denominated assets and liabilities against declines in market value relative to the U.S. Dollar. Forward currency contracts are marked-to-market daily and the change in market value is recorded by the Funds as an unrealized gain or loss. When the forward currency contract is closed, the Funds record a realized gain or loss equal to the difference between the value of the forward currency contract at the time it was opened and value at the time it was closed. Investments in forward currency contracts may expose the Funds to risks resulting from unanticipated movements in foreign currency exchange rates or failure of the counter-party to the agreement to perform in accordance with the terms of the contract.
Reported net realized foreign exchange gains or losses arise from the sales of foreign currencies, currency gains or losses realized between the trade and settlement dates on securities transactions, the difference between the amounts of dividends, interest, and foreign withholding taxes recorded on the Funds’ books, and the U.S. Dollar equivalent of the amounts actually received or paid. Net unrealized foreign exchange gains and losses arise from changes in the value of assets and liabilities other than investments in securities at fiscal year end, resulting from changes in the exchange rate. The Funds include foreign currency gains and losses realized on the sale of investments together with market gains and losses on such investments in the Statements of Operations.
Federal Income Taxes - It is each Fund’s policy to comply with the requirements of the Internal Revenue Code applicable to regulated investment companies, and to distribute substantially all of its taxable income, including any net realized gains on investments not offset by loss carryovers, to shareholders. Therefore, no provision for federal income or excise tax is required. The Adviser has analyzed the Funds’ tax positions taken on federal and state income tax returns for all open tax years and has concluded that as of June 30, 2010, no provision for income tax would be required in the Funds’ financial statements. The Funds’ federal and st ate (Arizona and Maryland) income and federal excise tax returns for tax years for which the applicable statutes of limitations have not expired are subject to examination by the Internal Revenue Service and state departments of revenue. The earliest tax year that remains subject to examination by these jurisdictions is 2006. At December 31, 2009, Davis Value Portfolio and Davis Financial Portfolio had post October 2009 losses available to offset future capital gains, if any, which expire in 2018. The Funds have available for federal income tax purposes unused capital loss carryforwards that expire in 2017. Details of post October 2009 capital losses and capital loss carryforwards are as follows:
| | Post October 2009 Capital Losses (expiring 12/31/2018) | | |
| Davis Value Portfolio | $ | 9,789,000 | | |
| Davis Financial Portfolio | | 239,000 | | |
| | Capital Loss Carryforwards |
| | | | | | |
| | Davis | | Davis | | Davis |
| | Value | | Financial | | Real Estate |
| | Portfolio | | Portfolio | | Portfolio |
Expiring | | | | | | | | |
| 12/31/2016 | $ | – | | $ | 4,739,000 | | $ | 2,585,000 |
| 12/31/2017 | | 30,445,000 | | | 8,267,000 | | | 11,662,000 |
| | $ | 30,445,000 | | $ | 13,006,000 | | $ | 14,247,000 |
Securities Transactions and Related Investment Income - Securities transactions are accounted for on the trade date (date the order to buy or sell is executed) with realized gain or loss on the sale of securities being determined based upon identified cost. Dividend income is recorded on the ex-dividend date. Dividend income from REIT securities may include return of capital. Upon notification from the issuer, the amount of the return of capital is reclassified to adjust dividend income, reduce the cost basis, and/or adjust realized gain/loss. Interest income, which includes accretion of discount and amortization of premium, is accrued as earned.
| DAVIS VARIABLE ACCOUNT FUND, INC. | Notes to Financial Statements – (Continued) |
| | June 30, 2010 (Unaudited) |
NOTE 1 - SUMMARY OF SIGNIFICANT ACCOUNTING POLICIES – (CONTINUED)
Dividends and Distributions to Shareholders - Dividends and distributions to shareholders are recorded on the ex-dividend date. Net investment income (loss), net realized gains (losses), and net unrealized appreciation (depreciation) on investments may differ for financial statement and tax purposes primarily due to differing treatments of wash sales, foreign currency transactions, passive foreign investment company shares, and partnership income. The character of dividends and distributions made during the fiscal year from net investment income and net realized securities gains may differ from their ultimate characterization for federal income tax purposes. Also, due to the timing of dividends and distributions, the fiscal year in which a mounts are distributed may differ from the fiscal year in which income or realized gain was recorded by the Funds. The Funds adjust certain components of capital to reflect permanent differences between financial statement amounts and net income and realized gains/losses determined in accordance with income tax rules.
Indemnification - Under the Funds’ organizational documents, their officers and directors are indemnified against certain liabilities arising out of the performance of their duties to the Funds. In addition, some of the Funds’ contracts with their service providers contain general indemnification clauses. The Funds’ maximum exposure under these arrangements is unknown since the amount of any future claims that may be made against the Funds cannot be determined and the Funds have no historical basis for predicting the likelihood of any such claims.
Use of Estimates in Financial Statements - In preparing financial statements in conformity with accounting principles generally accepted in the United States of America, management makes estimates and assumptions that affect the reported amounts of assets and liabilities and disclosure of contingent assets and liabilities at the date of the financial statements, as well as the reported amounts of income and expenses during the reporting period. Actual results may differ from these estimates.
Directors Fees and Expenses - The Funds set up a Rabbi Trust to provide for the deferred compensation plan for Independent Directors that enables them to elect to defer receipt of all or a portion of annual fees they are entitled to receive. The value of an eligible Director’s account is based upon years of service and fees paid to each Director during the years of service. The amount paid to the Director under the plan will be determined based upon the performance of the Davis Funds.
NOTE 2 - PURCHASES AND SALES OF SECURITIES
Purchases and sales of investment securities (excluding short-term securities) during the six months ended June 30, 2010 were as follows:
| | Davis | | Davis | | Davis | |
| | Value | | Financial | | Real Estate | |
| | Portfolio | | Portfolio | | Portfolio | |
| Cost of purchases | $ | 43,291,970 | | $ | 760,892 | | $ | 6,777,818 | |
| Proceeds of sales | | 65,205,561 | | | 8,284,312 | | | 6,023,100 | |
NOTE 3 - INVESTMENT ADVISORY FEES AND OTHER TRANSACTIONS WITH AFFILIATES
Advisory fees are paid monthly to the Adviser. The annual rate for each of the Davis Value Portfolio, Davis Financial Portfolio, and Davis Real Estate Portfolio is 0.55% of the respective Fund’s average net assets.
Boston Financial Data Services, Inc. (“BFDS”) is the Funds’ primary transfer agent. State Street Bank and Trust Company (“State Street Bank”) is the Funds’ primary accounting provider. Fees for such services are included in the custodian fee as State Street Bank also serves as the Funds’ custodian. The Adviser is also paid for certain accounting services. The fee paid to the Adviser for these services for the six months ended June 30, 2010 for Davis Value Portfolio, Davis Financial Portfolio, and Davis Real Estate Portfolio amounted to $3,252, $1,002, and $1,002, respectively. Certain directors and officers of the Funds are also directors and officers of the general partner of the Adviser.
Davis Selected Advisers-NY, Inc. (“DSA-NY”), a wholly-owned subsidiary of the Adviser, acts as sub-adviser to the Funds. DSA-NY performs research and portfolio management services for the Funds under a Sub-Advisory Agreement with the Adviser. The Funds pay no fees directly to DSA-NY.
| DAVIS VARIABLE ACCOUNT FUND, INC. | Notes to Financial Statements – (Continued) |
| | June 30, 2010 (Unaudited) |
NOTE 4 - EXPENSES PAID INDIRECTLY
Under an agreement with State Street Bank, custodian fees are reduced for earnings on cash balances maintained at the custodian by the Funds. Such reductions amounted to $8, $1, and $1 for Davis Value Portfolio, Davis Financial Portfolio, and Davis Real Estate Portfolio, respectively, during the six months ended June 30, 2010.
NOTE 5 - CAPITAL STOCK
At June 30, 2010, there were 5 billion shares of capital stock ($0.001 par value per share) authorized. Transactions in capital stock were as follows:
| | | Six months ended June 30, 2010 (Unaudited) |
| | | | Davis Value Portfolio | | | Davis Financial Portfolio | | | Davis Real Estate Portfolio |
| Shares sold | | | 4,127,801 | | | 870,632 | | | 183,797 |
| Shares issued in reinvestment of distributions | | | – | | | – | | | 19,501 |
| | | | 4,127,801 | | | 870,632 | | | 203,298 |
| Shares redeemed | | | (4,051,841) | | | (1,730,799) | | | (312,081) |
| | Net increase (decrease) | | | 75,960 | | | (860,167) | | | (108,783) |
| | | | | | | | | | | |
| Proceeds from shares sold | | $ | 42,592,134 | | $ | 8,789,085 | | $ | 1,459,862 |
| Proceeds from shares issued in reinvestment of distributions | | | – | | | – | | | 155,619 |
| | | | 42,592,134 | | | 8,789,085 | | | 1,615,481 |
| Cost of shares redeemed | | | (43,623,869) | | | (17,219,558) | | | (2,423,017) |
| | Net decrease | | $ | (1,031,735) | | $ | (8,430,473) | | $ | (807,536) |
| | | | | | | | | | | |
| | | Year ended December 31, 2009 |
| | | | Davis Value Portfolio | | | Davis Financial Portfolio | | | Davis Real Estate Portfolio |
| Shares sold | | | 16,029,614 | | | 3,303,661 | | | 708,612 |
| Shares issued in reinvestment of distributions | | | 368,022 | | | 63,087 | | | 102,105 |
| | | | 16,397,636 | | | 3,366,748 | | | 810,717 |
| Shares redeemed | | | (8,410,774) | | | (2,616,379) | | | (956,040) |
| | Net increase (decrease) | | | 7,986,862 | | | 750,369 | | | (145,323) |
| | | | | | | | | | | |
| Proceeds from shares sold | | $ | 142,471,775 | | $ | 26,457,753 | | $ | 4,050,873 |
| Proceeds from shares issued in reinvestment of distributions | | | 3,982,003 | | | 629,608 | | | 513,936 |
| | | | 146,453,778 | | | 27,087,361 | | | 4,564,809 |
| Cost of shares redeemed | | | (74,452,312) | | | (22,619,610) | | | (5,278,733) |
| | Net increase (decrease) | | $ | 72,001,466 | | $ | 4,467,751 | | $ | (713,924) |
NOTE 6 - BANK BORROWINGS
Each Fund may borrow up to 5% of its assets from a bank to purchase portfolio securities, or for temporary and emergency purposes. The purchase of securities with borrowed funds creates leverage in the Fund. Each Fund has entered into an agreement, which enables it to participate with certain other funds managed by the Adviser in an unsecured line of credit with a bank, which permits borrowings up to $50 million, collectively. Interest is charged based on its borrowings, at a rate equal to the higher of the Federal Funds Rate or the Overnight Libor Rate, plus 1.25%. The Funds had no borrowings during the six months ended June 30, 2010.
| DAVIS VARIABLE ACCOUNT FUND, INC. | Notes to Financial Statements – (Continued) |
| | June 30, 2010 (Unaudited) |
NOTE 7 - ILLIQUID AND RESTRICTED SECURITIES
Securities may be considered illiquid if they lack a readily available market or if valuation has not changed for a certain period of time. Restricted securities are not registered under the Securities Act of 1933 and may have contractual restrictions on resale. They are valued under methods approved by the Board of Directors as reflecting fair value. The aggregate value of illiquid securities in Davis Value Portfolio amounted to $3,859,550 or 0.80% of the Fund’s net assets as of June 30, 2010. The aggregate value of restricted securities in Davis Value Portfolio amounted to $1,038,428 or 0.22% of the Fund’s net assets as of June 30, 2010. The aggregate value of illiquid securities in Davis Financial Portfolio amounted to $4,339,475 or 5.8 9% of the Fund’s net assets as of June 30, 2010.
Information regarding illiquid and restricted securities is as follows:
| Fund | | Security | | Acquisition Date | | Principal | | Units/ Shares | | Cost per Unit/Share | | Valuation per Unit/Share as of June 30, 2010 |
| | | | | | | | | | | | | | | |
| Davis Value Portfolio | | Fairfax Financial Holdings Ltd., 144A | | 02/23/10 | | NA | | 2,490 | | $ | 355.00 | | $ | 366.24 |
| | | | | | | | | | | | | | | |
| Davis Value Portfolio | | Harley-Davidson, Inc., Sr. Notes, 15.00%, 02/01/14 | | 02/03/09 | | $ 2,000,000 | | 20,000 | | $ | 100.00 | | $ | 132.58 |
| | | | | | | | | | | | | | | |
| Davis Value Portfolio | | Level 3 Communications, Inc., Conv. Sr. Notes, 15.00%, 01/15/13 | | 12/23/08 | | $ 400,000 | | 4,000 | | $ | 100.00 | | $ | 113.25 |
| | | | | | | | | | | | | | | |
| Davis Value Portfolio | | Sino-Forest Corp., Conv. Sr. Notes, 5.00%, 08/01/13 | | 07/17/08 | | $ 736,000 | | 7,360 | | $ | 100.00 | | $ | 102.56 |
| | | | | | | | | | | | | | | |
| Davis Value Portfolio | | Sino-Forest Corp., 144A | | 12/11/09 | | NA | | 8,900 | | $ | 15.85 | | $ | 14.21 |
| | | | | | | | | | | | | | | |
| Davis Financial Portfolio | | Oaktree CapitalGroup LLC, Class A | | 05/21/07 | | NA | | 126,700 | | $ | 23.84 | | $ | 34.25 |
NOTE 8 - SUBSEQUENT EVENTS
Fund management has determined that no material events or transactions occurred subsequent to June 30, 2010 and through the issuance of the financial statements, which required adjustments and/or additional disclosure.
| DAVIS VARIABLE ACCOUNT FUND, INC. | Financial Highlights |
| DAVIS VALUE PORTFOLIO |
| The following financial information represents selected data for each share of capital stock outstanding throughout each period: |
| | | | | | | | | | | | | | | | | | | | | | | | | | | | | | | | | | |
| | Six months ended June 30, 2010 | | Year ended December 31, | |
| | (Unaudited) | | 2009 | | 2008 | | 2007 | | 2006 | | 2005 | |
| Net Asset Value, Beginning of Period | | $ | 10.75 | | $ | 8.26 | | $ | 14.48 | | $ | 14.58 | | $ | 12.77 | | $ | 11.78 | |
| | | | | | | | | | | | | | | | | | | | | | | | | | | | | | | | | | |
| Income (Loss) from Investment Operations: | | | | | | | | | | | | | | | | | | | | | | | | | | | | | | | | |
| | Net Investment Income | | 0.05 | | 0.08 | | 0.13 | | 0.17 | | 0.11 | | 0.12 | |
| | Net Realized and Unrealized Gains (Losses) | | (0.82) | | 2.49 | | (6.00) | | 0.51 | | 1.81 | | 0.99 | |
| | Total from Investment Operations | | (0.77) | | 2.57 | | (5.87) | | 0.68 | | 1.92 | | 1.11 | |
| | | | | | | | | | | | | | | | | | | | | | | | | | | | | | | | | | |
| Dividends and Distributions: | | | | | | | | | | | | | | | | | | | | | | | | | | | | | | | | |
| | Dividends from Net Investment Income | | – | | (0.08) | | (0.12) | | (0.17) | | (0.11) | | (0.11) | |
| | Distributions from Realized Gains | | – | | – | | (0.23) | | (0.61) | | – | | – | |
| | Distributions in Excess of Net Investment Income | | – | | – | | – | | – | | – | | (0.01) | |
| | Total Dividends and Distributions | | – | | (0.08) | | (0.35) | | (0.78) | | (0.11) | | (0.12) | |
Net Asset Value, End of Period | | $ | 9.98 | | $ | 10.75 | | $ | 8.26 | | $ | 14.48 | | $ | 14.58 | | $ | 12.77 | |
| | | | | | | | | | | | | | | | | | | | | | | | | | | | | | | | | | |
Total Returna | | (7.16) | % | | 31.16 | % | | (40.32) | % | | 4.64 | % | | 15.00 | % | | 9.44 | % | |
| | | | | | | | | | | | | | | | | | | | | | | | | | | | | | | | | | |
| Ratios/Supplemental Data: | | | | | | | | | | | | | | | | | | | | | | | | | | | | | | | | |
| | Net Assets, End of Period (in thousands) | | $ | 482,982 | | | $ | 519,404 | | | $ | 333,152 | | | $ | 658,699 | | | $ | 771,828 | | | $ | 620,369 | | |
| | Ratio of Expenses to Average Net Assets: | | | | | | | | | | | | | | | | | | | | | | | | | | | | | | | | |
| | Gross | | 0.62 | %b | | 0.71 | % | | 0.82 | % | | 0.81 | % | | 0.81 | % | | 0.81 | % | |
| | Netc | | 0.62 | %b | | 0.71 | % | | 0.82 | % | | 0.81 | % | | 0.81 | % | | 0.81 | % | |
| Ratio of Net Investment Income to Average Net Assets | | 1.00 | %b | | 0.97 | % | | 0.98 | % | | 1.11 | % | | 0.83 | % | | 0.87 | % | |
Portfolio Turnover Rated | | 9 | % | | 20 | % | | 17 | % | | 9 | % | | 19 | % | | 14 | % | |
| | | | | | | | | | | | | | | | | | | | | | | | | | | | | | | | | | |
| a | Assumes hypothetical initial investment on the business day before the first day of the fiscal period, with all dividends and distributions reinvested in additional shares on the reinvestment date, and redemption at the net asset value calculated on the last business day of the fiscal period. Total returns are not annualized for periods of less than one year and do not reflect charges attributable to your insurance company’s separate account. Inclusion of these charges would reduce the total returns shown. | | |
| | | | |
| b | Annualized. | | |
| | | | |
| c | The Net Ratio of Expenses to Average Net Assets reflects the impact, if any, of the reduction of expenses paid indirectly and of certain reimbursements from the Adviser. | | |
| | | | |
| d | The lesser of purchases or sales of portfolio securities for a period, divided by the monthly average of the market value of portfolio securities owned during the period. Securities with a maturity or expiration date at the time of acquisition of one year or less are excluded from the calculation. | | |
| See Notes to Financial Statements |
| DAVIS VARIABLE ACCOUNT FUND, INC. | Financial Highlights – (Continued) |
| DAVIS FINANCIAL PORTFOLIO |
| The following financial information represents selected data for each share of capital stock outstanding throughout each period: |
| | | | | | | | | | | | | | | | | | | | | | | | | | | | | | | | | | |
| | Six months ended June 30, 2010 | | Year ended December 31, | |
| | (Unaudited) | | 2009 | | 2008 | | 2007 | | 2006 | | 2005 | |
| Net Asset Value, Beginning of Period | | $ | 9.98 | | $ | 7.12 | | $ | 14.27 | | $ | 16.29 | | $ | 13.83 | | $ | 12.82 | |
| | | | | | | | | | | | | | | | | | | | | | | | | | | | | | | | | | |
| Income (Loss) from Investment Operations: | | | | | | | | | | | | | | | | | | | | | | | | | | | | | | | | |
| | Net Investment Income | | 0.07 | | 0.05 | | 0.08 | | 0.17 | | 0.09 | | 0.07 | |
| | Net Realized and Unrealized Gains (Losses) | | (0.77) | | 2.88 | | (6.76) | | (1.12) | | 2.47 | | 1.00 | |
| | Total from Investment Operations | | (0.70) | | 2.93 | | (6.68) | | (0.95) | | 2.56 | | 1.07 | |
| | | | | | | | | | | | | | | | | | | | | | | | | | | | | | | | | | |
| Dividends and Distributions: | | | | | | | | | | | | | | | | | | | | | | | | | | | | | | | | |
| | Dividends from Net Investment Income | | – | | (0.07) | | – | | (0.17) | | (0.09) | | (0.06) | |
| | Distributions from Realized Gains | | – | | – | | (0.47) | | (0.90) | | (0.01) | | – | |
| | Total Dividends and Distributions | | – | | (0.07) | | (0.47) | | (1.07) | | (0.10) | | (0.06) | |
Net Asset Value, End of Period | | $ | 9.28 | | $ | 9.98 | | $ | 7.12 | | $ | 14.27 | | $ | 16.29 | | $ | 13.83 | |
| | | | | | | | | | | | | | | | | | | | | | | | | | | | | | | | | | |
Total Returna | | (7.01) | % | | 41.18 | %b | | (46.36) | % | | (6.05) | % | | 18.50 | % | | 8.38 | % | |
| | | | | | | | | | | | | | | | | | | | | | | | | | | | | | | | | | |
| Ratios/Supplemental Data: | | | | | | | | | | | | | | | | | | | | | | | | | | | | | | | | |
| | Net Assets, End of Period (in thousands) | | $ | 73,650 | | | $ | 87,837 | | | $ | 57,321 | | | $ | 116,725 | | | $ | 155,807 | | | $ | 124,060 | | |
| | Ratio of Expenses to Average Net Assets: | | | | | | | | | | | | | | | | | | | | | | | | | | | | | | | | |
| | Gross | | 0.68 | %c | | 0.78 | % | | 0.88 | % | | 0.85 | % | | 0.84 | % | | 0.85 | % | |
| | Netd | | 0.68 | %c | | 0.78 | % | | 0.88 | % | | 0.85 | % | | 0.84 | % | | 0.85 | % | |
| Ratio of Net Investment Income to Average Net Assets | | 1.20 | %c | | 0.67 | % | | 0.73 | % | | 0.97 | % | | 0.66 | % | | 0.52 | % | |
Portfolio Turnover Ratee | | 1 | % | | 10 | % | | 16 | % | | 17 | % | | 9 | % | | 21 | % | |
| | | | | | | | | | | | | | | | | | | | | | | | | | | | | | | | | | |
| a | Assumes hypothetical initial investment on the business day before the first day of the fiscal period, with all dividends and distributions reinvested in additional shares on the reinvestment date, and redemption at the net asset value calculated on the last business day of the fiscal period. Total returns are not annualized for periods of less than one year and do not reflect charges attributable to your insurance company’s separate account. Inclusion of these charges would reduce the total returns shown. | | |
| | | | |
| b | Davis Financial Portfolio received a favorable class action settlement from a company that it no longer owns. This settlement had an approximate impact of 0.4% on the investment performance of the Fund in 2009. This was a one-time event that is unlikely to be repeated. | | |
| | | | |
| c | Annualized. | | |
| d | The Net Ratio of Expenses to Average Net Assets reflects the impact, if any, of the reduction of expenses paid indirectly and of certain reimbursements from the Adviser. | | |
| | | | |
| e | The lesser of purchases or sales of portfolio securities for a period, divided by the monthly average of the market value of portfolio securities owned during the period. Securities with a maturity or expiration date at the time of acquisition of one year or less are excluded from the calculation. | | |
| | | | |
| See Notes to Financial Statements |
| DAVIS VARIABLE ACCOUNT FUND, INC. | Financial Highlights – (Continued) |
| DAVIS REAL ESTATE PORTFOLIO |
| The following financial information represents selected data for each share of capital stock outstanding throughout each period: |
| | | | | | | | | | | | | | | | | | | | | | | | | | | | | | | | | | |
| | Six months ended June 30, 2010 | | Year ended December 31, | |
| | (Unaudited) | | 2009 | | 2008 | | 2007 | | 2006 | | 2005 | |
| Net Asset Value, Beginning of Period | | $ | 7.40 | | $ | 5.80 | | $ | 11.45 | | $ | 20.43 | | $ | 17.33 | | $ | 16.80 | |
| | | | | | | | | | | | | | | | | | | | | | | | | | | | | | | | | | |
| Income (Loss) from Investment Operations: | | | | | | | | | | | | | | | | | | | | | | | | | | | | | | | | |
| | Net Investment Income | | 0.10 | | 0.16 | | 0.19 | | 0.42 | | 0.34 | | 0.30 | |
| | Net Realized and Unrealized Gains (Losses) | | 0.20 | | 1.60 | | (5.50) | | (3.40) | | 5.58 | | 1.86 | |
| | Total from Investment Operations | | 0.30 | | 1.76 | | (5.31) | | (2.98) | | 5.92 | | 2.16 | |
| | | | | | | | | | | | | | | | | | | | | | | | | | | | | | | | | | |
| Dividends and Distributions: | | | | | | | | | | | | | | | | | | | | | | | | | | | | | | | | |
| | Dividends from Net Investment Income | | (0.05) | | (0.16) | | (0.22) | | (0.64) | | (0.60) | | (0.54) | |
| | Distributions from Realized Gains | | – | | – | | (0.11) | | (5.36) | | (2.22) | | (1.09) | |
| | Return of Capital | | – | | – | | (0.01) | | – | | – | | – | |
| | Total Dividends and Distributions | | (0.05) | | (0.16) | | (0.34) | | (6.00) | | (2.82) | | (1.63) | |
Net Asset Value, End of Period | | $ | 7.65 | | $ | 7.40 | | $ | 5.80 | | $ | 11.45 | | $ | 20.43 | | $ | 17.33 | |
| | | | | | | | | | | | | | | | | | | | | | | | | | | | | | | | | | |
Total Returna | | 4.03 | % | | 31.73 | % | | (46.91) | % | | (15.48) | % | | 34.37 | % | | 13.14 | % | |
| | | | | | | | | | | | | | | | | | | | | | | | | | | | | | | | | | |
| Ratios/Supplemental Data: | | | | | | | | | | | | | | | | | | | | | | | | | | | | | | | | |
| | Net Assets, End of Period (in thousands) | | $ | 23,536 | | | $ | 23,566 | | | $ | 19,331 | | | $ | 49,548 | | | $ | 89,738 | | | $ | 64,556 | | |
| | Ratio of Expenses to Average Net Assets: | | | | | | | | | | | | | | | | | | | | | | | | | | | | | | | | |
| | Gross | | 0.84 | %b | | 0.98 | % | | 0.98 | % | | 0.88 | % | | 0.86 | % | | 0.87 | % | |
| | Netc | | 0.84 | %b | | 0.98 | % | | 0.98 | % | | 0.87 | % | | 0.86 | % | | 0.87 | % | |
| Ratio of Net Investment Income to Average Net Assets | | 2.61 | %b | | 2.81 | % | | 1.84 | % | | 1.92 | % | | 1.63 | % | | 1.71 | % | |
Portfolio Turnover Rated | | 27 | % | | 70 | % | | 41 | % | | 49 | % | | 38 | % | | 28 | % | |
| | | | | | | | | | | | | | | | | | | | | | | | | | | | | | | | | | |
| a | Assumes hypothetical initial investment on the business day before the first day of the fiscal period, with all dividends and distributions reinvested in additional shares on the reinvestment date, and redemption at the net asset value calculated on the last business day of the fiscal period. Total returns are not annualized for periods of less than one year and do not reflect charges attributable to your insurance company’s separate account. Inclusion of these charges would reduce the total returns shown. | | |
| | | | |
| b | Annualized. | | |
| | | | |
| c | The Net Ratio of Expenses to Average Net Assets reflects the impact, if any, of the reduction of expenses paid indirectly and of certain reimbursements from the Adviser. | | |
| | | | |
| d | The lesser of purchases or sales of portfolio securities for a period, divided by the monthly average of the market value of portfolio securities owned during the period. Securities with a maturity or expiration date at the time of acquisition of one year or less are excluded from the calculation. | | |
| | | | |
| See Notes to Financial Statements |
| DAVIS VARIABLE ACCOUNT FUND, INC. | Director Approval of Advisory Agreements |
Process of Annual Review
The Board of Directors of the Davis Funds oversees the management of each Davis Fund and, as required by law, determines annually whether to approve the continuance of each Davis Fund’s advisory agreement with Davis Selected Advisers, L.P. and sub-advisory agreement with Davis Selected Advisers-NY, Inc. (jointly “Davis Advisors” and “Advisory Agreements”).
As a part of this process the Independent Directors, with the assistance of counsel for the Independent Directors, prepared questions submitted to Davis Advisors in anticipation of the annual contract review. The Independent Directors were provided with responsive background material (including recent investment performance data), and their counsel provided guidance, prior to a separate contract review meeting held in March 2010 where the Independent Directors reviewed and evaluated all information which they deemed reasonably necessary in the circumstances. Upon completion of this review, the Independent Directors found that the terms of the Advisory Agreements are fair and reasonable and that continuation of the Advisory Agreements was in the best interest of Davis Financial Portfolio and its shareholders.
Reasons the Independent Directors Approved Continuation of the Advisory Agreements
The Independent Directors’ determinations were based upon a comprehensive consideration of all information provided to the Independent Directors and were not the result of any single factor. The following facts and conclusions were important, but not exclusive, in the Independent Directors’ recommendation to renew the Advisory Agreements.
The Independent Directors considered not only the investment performance of each Fund, but also the full range and quality of services provided by Davis Advisors to each Fund and their shareholders, including whether it:
| 1. | Achieves satisfactory investment results over the long-term after all costs; |
| 2. | Handles shareholder transactions, inquiries, requests, and records efficiently and effectively, and provides quality accounting, legal, and compliance services, and oversight of third party service providers; and |
| 3. | Fosters healthy investor behavior. |
Davis Advisors is reimbursed a portion of its costs in providing some, but not all, of these services.
A shareholder’s ultimate return is the product of a fund’s results as well as the shareholder’s behavior, specifically in selecting when to invest or redeem. The Independent Directors concluded that, through its actions and communications, Davis Advisors has attempted to have a meaningful, positive impact on investor behavior.
The Independent Directors noted the importance of reviewing quantitative measures, but also recognized that qualitative factors are also important in assessing whether Davis Fund shareholders are likely to be well served by the renewal of the Advisory Agreements. They noted both the value and shortcomings of purely quantitative measures, including the data provided by independent service providers, and concluded that while such measures and data may be informative, the judgment of the Independent Directors must take many factors, including those listed below, into consideration in representing the shareholders of the Davis Funds. In connection with reviewing comparative performance information, the Independent Directors generally give weight to longer-term measurements.
The Independent Directors expect Davis Advisors to employ a disciplined, company-specific, research-driven, businesslike, long-term investment philosophy.
The Independent Directors recognized Davis Advisors’ (a) efforts to minimize transaction costs by generally having a long-term time horizon and low portfolio turnover; (b) record of generally producing satisfactory results over longer-term periods; (c) efforts towards fostering healthy investor behavior by, among other things, providing informative and substantial educational material; and (d) efforts to promote shareholder interests by actively speaking out on corporate governance issues.
| DAVIS VARIABLE ACCOUNT FUND, INC. | Director Approval of Advisory Agreements – (Continued) |
Reasons the Independent Directors Approved Continuation of the Advisory Agreements – (Continued)
The Independent Directors reviewed (a) comparative fee and expense information for other funds, as selected and analyzed by a nationally recognized independent service provider; (b) information regarding fees charged by Davis Advisors to other advisory clients, including funds which it sub-advises and private accounts, as well as the differences in the services provided to such other clients; and (c) the fee schedules of each of the Funds, including an assessment of competitive fee schedules.
Effective July 1, 2009, Davis Advisors voluntarily and permanently reduced all management fee breakpoints above 0.55% to 0.55%. The former fee schedule for each Fund was a flat 0.75%. Each Fund now has a flat fee of 0.55%, resulting in a fee which the Independent Directors noted was both lower than under its previous schedule and lower than the average fees of their peer groups as determined by an independent service provider.
The Independent Directors reviewed the fixed management fee for each Fund and the profitability of each Fund to Davis Advisors, the extent to which economies of scale might be realized if any of the Funds’ net assets increased, and whether the fixed fee reflected those potential economies of scale. The Independent Directors considered the nature, quality, and extent of the services being provided to each Fund and the costs incurred by Davis Advisors in providing such services. The Independent Directors considered various potential benefits that Davis Advisors may receive in connection with the services it provides under the Advisory Agreements with the Funds, including a review of portfolio brokerage practices. The Independent Directors noted that Davis Advisors does not use client commissions to pay for publications that are ava ilable to the general public or for third-party research services.
Davis Value Portfolio
The Independent Directors noted that Davis Value Portfolio had out-performed its benchmark, the Standard & Poor’s 500® Index, over the one- and ten-year time periods and under-performed over the three- and five-year time periods, all ended February 28, 2010. The Fund out-performed the average performance of its peer group as determined by an independent service provider over the one-, five-, and ten-year time periods and under-performed over the three-year time period, all ended December 31, 2009. The Independent Directors noted that the Fund out-performed the Standard & Poor’s 500® Index in 5 of the 6 rolling five calendar year time frames, and its p eer group in all of the 6 rolling five calendar year time frames ended December 31, 2009. The Fund out-performed both the Index and its peers in the 1 rolling ten calendar year time frame ended December 31, 2009.
The Independent Directors also considered the total expense ratio for Davis Value Portfolio, noting that the expenses were reasonable and below the average ratios of its peer group as determined by an independent service provider.
Davis Financial Portfolio
The Independent Directors noted that Davis Financial Portfolio had out-performed its benchmark, the Standard & Poor’s 500® Index, over the one- and ten-year time periods and under-performed over the three- and five-year time periods, all ended February 28, 2010. The Fund out-performed the average performance of its peer group as determined by an independent service provider over the one-, three-, five-, and ten-year time periods ended December 31, 2009. The Independent Directors noted that the Fund out-performed the Standard & Poor’s 500® Index in 3 of the 6 rolling five calendar year time frames, and its peer group in all of the 6 rolling five calend ar year time frames ended December 31, 2009. The Fund out-performed both the Index and its peers in the 1 rolling ten calendar year time frame ended December 31, 2009.
The Independent Directors also considered the total expense ratio for Davis Financial Portfolio, noting that the expenses were reasonable and below the average ratios of its peer group as determined by an independent service provider.
| DAVIS VARIABLE ACCOUNT FUND, INC. | Director Approval of Advisory Agreements – (Continued) |
Davis Real Estate Portfolio
The Independent Directors noted that Davis Real Estate Portfolio had under-performed its benchmark, the Wilshire U.S. Real Estate Securities Index, over the one-, three-, five-, and ten-year time periods ended February 28, 2010. The Independent Directors also noted that the Fund had taken on less risk, as measured by the standard deviation, than the Index over the one-, three-, and five-year time periods ended February 28, 2010. The Fund out-performed the average performance of its peer group as determined by an independent service provider over the one-year time period and under-performed over the three-, five-, and ten-year time periods, all ended December 31, 2009. The Independent Directors noted that the Fund out-performed the Wilshire U.S. Real Estate Securities Index in 1 of the 6 rolling five calendar year time frames, and its p eer group in 4 of the 6 rolling five calendar year time frames ended December 31, 2009. The Fund under-performed both the Index and its peers in the 1 rolling ten calendar year time frame ended December 31, 2009.
The Independent Directors also considered the total expense ratio for Davis Real Estate Portfolio, noting that the expenses were reasonable and within the range of the ratios of its peer group as determined by an independent service provider.
Approval of Advisory Agreements
The Independent Directors concluded that Davis Advisors had provided Davis Value Portfolio, Davis Financial Portfolio, and Davis Real Estate Portfolio and their shareholders a reasonable level of both investment and non-investment services. The Independent Directors further concluded that shareholders have received a significant benefit from Davis Advisors’ shareholder oriented approach, as well as the execution of its investment discipline.
The Independent Directors determined that the advisory fees for Davis Value Portfolio, Davis Financial Portfolio, and Davis Real Estate Portfolio were reasonable in light of the nature, quality and extent of the services being provided to the Funds, the costs incurred by Davis Advisors in providing such service, and in comparison to the range of the average advisory fees of their peer groups as determined by an independent service provider. The Independent Directors found that the terms of the Advisory Agreements are fair and reasonable and that continuation of the Advisory Agreements was in the best interest of each Fund and their shareholders. The Independent Directors and the full Board of Directors therefore voted to continue the Advisory Agreements.
| DAVIS VARIABLE ACCOUNT FUND, INC. | Fund Information |
Portfolio Proxy Voting Policies and Procedures
The Funds have adopted Portfolio Proxy Voting Policies and Procedures under which the Funds vote proxies relating to securities held by the Funds. A description of the Funds’ Portfolio Proxy Voting Policies and Procedures is available (i) without charge, upon request, by calling the Funds toll-free at 1-800-279-0279, (ii) on the Funds’ website at www.davisfunds.com, and (iii) on the SEC’s website at www.sec.gov.
In addition, the Funds are required to file Form N-PX, with their complete proxy voting record for the 12 months ended June 30th, no later than August 31st of each year. The Funds’ Form N-PX filing is available (i) without charge, upon request, by calling the Funds toll-free at 1-800-279-0279, (ii) on the Funds’ website at www.davisfunds.com, and (iii) on the SEC’s website at www.sec.gov.
Form N-Q
The Funds file their complete schedule of portfolio holdings with the SEC for the first and third quarters of each fiscal year on Form N-Q. The Funds’ Form N-Q is available without charge, upon request, by calling 1-800-279-0279 or on the Funds’ website at www.davisfunds.com or on the SEC’s website at www.sec.gov. The Funds’ Form N-Q may be reviewed and copied at the SEC’s Public Reference Room in Washington, DC, and information on the operation of the Public Reference Room may be obtained by calling 1-800-SEC-0330.
| DAVIS VARIABLE ACCOUNT FUND, INC. | Directors and Officers |
For the purposes of their service as directors to the Davis Funds, the business address for each of the directors is 2949 E. Elvira Road, Suite 101, Tucson, AZ 85756. Each Director serves until their retirement, resignation, death or removal. Subject to exceptions and exemptions, which may be granted by the Independent Directors, Directors must retire at the close of business on the last day of the calendar year in which the Director attains age seventy-four (74).
Name (birthdate) | Position(s) Held With Fund | Term of Office and Length of Time Served | Principal Occupation(s) During Past Five Years | Number of Portfolios in Fund Complex Overseen by Director | Other Directorships Held by Director |
| | | | | | |
Independent Directors
| | | | | | |
Marc P. Blum (09/09/42) | Director | Director since 1986 | Chief Executive Officer, World Total Return Fund, LLLP; of Counsel to Gordon, Feinblatt, Rothman, Hoffberger and Hollander, LLC (law firm). | 13 | Director, Legg Mason Investment Counsel & Trust Company N.A. (asset management company) and Rodney Trust Company (Delaware). |
| | | | | | |
John S. Gates, Jr. (08/02/53) | Director | Director since 2007 | Chairman and Chief Executive Officer of PortaeCo LLC, a private investment company (beginning in 2006); Co-founder of CenterPoint Properties Trust (REIT); Co-chairman and Chief Executive Officer for 22 years (until 2006). | 13 | Director, DCT Industrial Trust (REIT). |
| | | | | | |
Thomas S. Gayner (12/16/61) | Director/ Chairman | Director since 2004 | Executive Vice President and Chief Investment Officer, Markel Corporation (insurance company). | 13 | Director, Washington Post Co. (publishing company); Director, Colfax Corp. (engineering and manufacturer of pumps and fluid handling equipment). |
| | | | | | |
G. Bernard Hamilton (03/18/37) | Director | Director since 1978 | Managing General Partner, Avanti Partners, L.P. (investment partnership), retired 2005. | 13 | none |
| | | | | | |
Samuel H. Iapalucci (07/19/52) | Director | Director since 2006 | Former Executive Vice President and Chief Financial Officer, CH2M-HILL Companies, Ltd. (engineering). | 13 | Director, Trow Global Holdings Inc. (engineering & consulting). |
| | | | | | |
Robert P. Morgenthau (03/22/57) | Director | Director since 2002 | Chairman, NorthRoad Capital Management, LLC (investment management firm) since June 2002. | 13 | none |
| | | | | | |
Christian R. Sonne (05/06/36) | Director | Director since 1990 | General Partner, Tuxedo Park Associates (land holding and development firm). | 13 | none |
| | | | | | |
Marsha Williams (03/28/51) | Director | Director since 1999 | Senior Vice President and Chief Financial Officer, Orbitz Worldwide, Inc. (travel-services provider) since 2007; former Executive Vice President and Chief Financial Officer, Equity Office Properties Trust (REIT). | 13 | Director, Modine Manufacturing, Inc. (heat transfer technology); Director, Chicago Bridge & Iron Company, N.V. (industrial construction and engineering); Director, Fifth Third Bancorp (diversified financial services). |
| DAVIS VARIABLE ACCOUNT FUND, INC. | Directors and Officers – (Continued) |
Name (birthdate) | Position(s) Held With Fund | Term of Office and Length of Time Served | Principal Occupation(s) During Past Five Years | Number of Portfolios in Fund Complex Overseen by Director | Other Directorships Held by Director |
| | | | | | |
Inside Directors*
| | | | | | |
Christopher C. Davis (07/13/65) | Director | Director since 1997 | President or Vice President of each Davis Fund, Selected Fund, and Clipper Fund; Chairman, Davis Selected Advisers, L.P., and also serves as an executive officer in certain companies affiliated with the Adviser, including sole member of the Adviser’s general partner, Davis Investments, LLC; Employee of Shelby Cullom Davis & Co. (registered broker/dealer). | 10 | Director, Davis New York Venture Fund, Inc. (consisting of four portfolios); Director, the Selected Funds (consisting of three portfolios) since 1998; Director, Washington Post Co. (publishing company). |
* Christopher C. Davis owns partnership units (directly, indirectly, or both) of the Adviser and is considered to be an “interested person” of the Funds as defined in the Investment Company Act of 1940.
Officers
Christopher C. Davis (born 07/13/65, Davis Funds officer since 1997). See description in the section on Inside Directors.
Andrew A. Davis (born 06/25/63, Davis Funds officer since 1997). President or Vice President of each of the Davis Funds (consisting of 13 portfolios) and Selected Funds (consisting of three portfolios); President, Davis Selected Advisers, L.P., serves as an executive officer in certain companies affiliated with the Adviser; Director of Davis Series, Inc. (consisting of six portfolios) and the Selected Funds (consisting of three portfolios).
Kenneth C. Eich (born 08/14/53, Davis Funds officer since 1997). Executive Vice President and Principal Executive Officer of each of the Davis Funds (consisting of 13 portfolios), Selected Funds (consisting of three portfolios), and Clipper Fund, Inc. (consisting of one portfolio); Chief Operating Officer, Davis Selected Advisers, L.P., and also serves as an executive officer in certain companies affiliated with the Adviser.
Douglas A. Haines (born 03/04/71, Davis Funds officer since 2004). Vice President, Treasurer, Chief Financial Officer, Principal Financial Officer, and Principal Accounting Officer of each of the Davis Funds (consisting of 13 portfolios), Selected Funds (consisting of three portfolios), and Clipper Fund, Inc. (consisting of one portfolio); Vice President and Director of Fund Accounting, Davis Selected Advisers, L.P.
Sharra L. Haynes (born 09/25/66, Davis Funds officer since 1997). Vice President, Chief Compliance Officer of each of the Davis Funds (consisting of 13 portfolios), Selected Funds (consisting of three portfolios), and Clipper Fund, Inc. (consisting of one portfolio); Vice President and Chief Compliance Officer, Davis Selected Advisers, L.P., and also serves as an executive officer in certain companies affiliated with the Adviser.
Thomas D. Tays (born 03/07/57, Davis Funds officer since 1997). Vice President and Secretary of each of the Davis Funds (consisting of 13 portfolios), Selected Funds (consisting of three portfolios), and Clipper Fund, Inc. (consisting of one portfolio); Vice President, Chief Legal Officer and Secretary, Davis Selected Advisers, L.P., and also serves as an executive officer in certain companies affiliated with the Adviser.
Arthur Don (born 09/24/53, Davis Funds officer since 1991). Assistant Secretary (for clerical purposes only) of each of the Davis Funds and Selected Funds; Shareholder, Greenberg Traurig, LLP (law firm); counsel to the Independent Directors and the Davis Funds.
| DAVIS VARIABLE ACCOUNT FUND, INC. | |
| Investment Adviser | |
| Davis Selected Advisers, L.P. (Doing business as “Davis Advisors”) | |
| 2949 East Elvira Road, Suite 101 | |
| Tucson, Arizona 85756 | |
| (800) 279-0279 | |
| | |
| Distributor | |
| Davis Distributors, LLC | |
| 2949 East Elvira Road, Suite 101 | |
| Tucson, Arizona 85756 | |
| | |
| Transfer Agent | |
| Boston Financial Data Services, Inc. | |
| c/o The Davis Funds | |
| P.O. Box 8406 | |
| Boston, Massachusetts 02266-8406 | |
| | |
| Custodian | |
| State Street Bank and Trust Co. | |
| One Lincoln Street | |
| Boston, Massachusetts 02111 | |
| | |
| Counsel | |
| Greenberg Traurig, LLP | |
| 77 West Wacker Drive, Suite 3100 | |
| Chicago, Illinois 60601 | |
| | |
| Independent Registered Public Accounting Firm | |
| KPMG LLP | |
| 707 Seventeenth Street, Suite 2700 | |
| Denver, Colorado 80202 | |
For more information about Davis Variable Account Fund, Inc., including management fee, charges, and expenses, see the current prospectus, which must precede or accompany this report. The Funds’ Statement of Additional Information contains additional information about the Funds’ Directors and is available without charge upon request by calling 1-800-279-0279 and on the Funds’ website at www.davisfunds.com. Quarterly Fact sheets are available on the Funds’ website at www.davisfunds.com.
| DAVIS VALUE PORTFOLIO | Table of Contents |
| Management's Discussion of Fund Performance | 2 |
| | |
| Fund Overview | 4 |
| | |
| Expense Example | 5 |
| | |
| Schedule of Investments | 6 |
| | |
| Statement of Assets and Liabilities | 11 |
| | |
| Statement of Operations | 12 |
| | |
| Statements of Changes in Net Assets | 13 |
| | |
| Notes to Financial Statements | 14 |
| | |
| Financial Highlights | 19 |
| | |
| Director Approval of Advisory Agreements | 20 |
| | |
| Fund Information | 22 |
| | |
| Directors and Officers | 23 |
This Semi-Annual Report is authorized for use by existing shareholders. Prospective shareholders must receive a current Davis Value Portfolio prospectus, which contains more information about investment strategies, risks, charges, and expenses. Please read the prospectus carefully before investing or sending money.
Shares of the Davis Value Portfolio are not deposits or obligations of any bank, are not guaranteed by any bank, are not insured by the FDIC or any other agency, and involve investment risks, including possible loss of the principal amount invested.
| DAVIS VALUE PORTFOLIO | Management’s Discussion of Fund Performance |
Performance Overview
Davis Value Portfolio delivered a negative return on net asset value of 7.16% for the six-month period ended June 30, 2010. Over the same time period, the Standard & Poor’s 500® Index (“Index”) declined 6.65%. Every sector1 within the Index delivered negative returns over the period. The sectors within the Index that turned in the strongest (but still negative) performance over the six-month period were industrials, consumer discretionary, and consumer staples. The sectors within the Index that turned in the weakest performance over the six-month period were materials, energy, and information technology.
Factors Impacting the Portfolio’s Performance
The Portfolio had more invested in financials than any other sector over the six-month period. Financial companies were the most important contributor2 relative to the Index. The Portfolio’s financial companies out-performed the corresponding sector within the Index (down 2% versus down 4% for the Index) and had a higher relative average weighting (29% versus 16% for the Index). Berkshire Hathaway3, Progressive, and Hang Lung Group were among the most important contributors to performance. Bank of New York Mellon and Julius Baer Group were among the most important detractors from performance.
Energy companies were the most important detractors from performance. The Portfolio’s energy companies out-performed the corresponding sector within the Index (down 10% versus down 12% for the Index), but had a higher relative average weighting (16% versus 11% for the Index) in this weaker performing sector. EOG Resources was among the most important contributors to performance. Devon Energy, Transocean, and China Coal Energy were among the most important detractors from performance.
Information technology companies were the second most important detractors from performance. The Portfolio’s information technology companies under-performed the corresponding sector within the Index (down 16% versus down 10% for the Index) and had a lower relative average weighting (7% versus 19% for the Index). Microsoft and Google were among the most important detractors from performance.
The Portfolio’s consumer discretionary companies were significant detractors from performance relative to the Index. The Portfolio’s consumer discretionary companies under-performed the corresponding sector within the Index (down 11% versus down 2% for the Index) and had a lower relative average weighting (7% versus 10% for the Index) in this stronger performing sector.
Other important contributors to performance included Express Scripts and Hershey. Other important detractors from performance included Pfizer and Costco Wholesale.
The Portfolio ended the six-month period with approximately 15% of its net assets invested in foreign companies. As a whole these companies under-performed the domestic companies held by the Portfolio.
Davis Value Portfolio’s investment objective is long-term growth of capital. There can be no assurance that the Portfolio will achieve its objective. Davis Value Portfolio’s principal risks are: market risk, company risk, financial services risk, foreign country risk, small- and medium-capitalization risk, fees and expenses risk, and headline risk. See the prospectus for a full description of each risk.
1 The companies included in the Standard & Poor’s 500® Index are divided into ten sectors. One or more industry groups make up a sector.
2 A company’s or sector’s contribution to or detraction from the Portfolio’s performance is a product both of its appreciation or depreciation and its weighting within the portfolio. For example, a 5% holding that rises 20% has twice as much impact as a 1% holding that rises 50%.
3 This Management Discussion of Fund Performance discusses a number of individual companies. The information provided in this report does not provide information reasonably sufficient upon which to base an investment decision and should not be considered a recommendation to purchase or sell any particular security. The Schedule of Investments lists the Portfolio’s holdings of each company discussed.
| DAVIS VALUE PORTFOLIO | Management’s Discussion of Fund Performance – (Continued) |
Comparison of a $10,000 investment in Davis Value Portfolio versus the Standard & Poor’s 500® Index over 10 years for an investment made on June 30, 2000
Average Annual Total Return for periods ended June 30, 2010
| Fund & Benchmark Index | 1-Year | 5-Year | 10-Year | Since Fund’s Inception (07/01/99) | Gross Expense Ratio | Net Expense Ratio |
| Davis Value Portfolio | 15.34% | (1.13)% | 0.67% | 1.47% | 0.62% | 0.62% |
Standard & Poor’s 500® Index | 14.43% | (0.79)% | (1.59)% | (0.87)% | | |
The Standard & Poor’s 500® Index is an unmanaged index of 500 selected common stocks, most of which are listed on the New York Stock Exchange. The Index is adjusted for dividends, weighted towards stocks with large market capitalizations, and represents approximately two-thirds of the total market value of all domestic common stocks. Investments cannot be made directly in the Index.
The performance data for Davis Value Portfolio contained in this report represents past performance and assumes that all distributions were reinvested, and should not be considered as an indication of future performance from an investment in the Portfolio today. The investment return and principal value will fluctuate so that shares may be worth more or less than their original cost when redeemed. Portfolio performance changes over time and current performance may be higher or lower than stated. The operating expense ratio may vary in future years. For more current information please call Davis Funds Investor Services at 1-800-279-0279.
Portfolio performance numbers are net of all Portfolio operating expenses, but do not include any insurance charges imposed by your insurance company’s separate account. If performance included the effect of these additional charges, the return would be lower.
| DAVIS VALUE PORTFOLIO | Fund Overview |
| | June 30, 2010 (Unaudited) |
| Portfolio Composition | | Industry Weightings |
| (% of Fund’s Net Assets) | | (% of Long Term Portfolio) |
| | | | | | |
| | | | | Fund | S&P 500® |
| Common Stock (U.S.) | 74.70% | | Energy | 17.19% | 10.75% |
| Common Stock (Foreign) | 15.25% | | Diversified Financials | 12.19% | 7.74% |
| Corporate Bonds | 0.55% | | Insurance | 11.58% | 3.98% |
| Convertible Bonds (Foreign) | 0.16% | | Health Care | 11.02% | 12.09% |
| Convertible Bonds (U.S.) | 0.09% | | Food & Staples Retailing | 8.05% | 2.53% |
| Short Term Investments | 3.90% | | Information Technology | 6.55% | 18.76% |
| Other Assets & Liabilities | 5.35% | | Food, Beverage & Tobacco | 6.19% | 6.18% |
| | 100.00% | | Materials | 6.12% | 3.44% |
| | | | Banks | 4.81% | 3.20% |
| | | | Commercial & Professional Services | 2.62% | 0.64% |
| | | | Retailing | 2.55% | 3.46% |
| | | | Transportation | 2.44% | 1.93% |
| | | | Media | 2.31% | 3.14% |
| | | | Household & Personal Products | 1.94% | 2.82% |
| | | | Automobiles & Components | 1.75% | 0.64% |
| | | | Other | 1.47% | 10.94% |
| | | | Capital Goods | 1.22% | 7.76% |
| | | | | 100.00% | 100.00% |
Top 10 Holdings
(% of Fund’s Net Assets)
| | | |
| Occidental Petroleum Corp. | Energy | 4.63% |
| Costco Wholesale Corp. | Food & Staples Retailing | 4.41% |
| Wells Fargo & Co. | Commercial Banks | 4.37% |
| American Express Co. | Consumer Finance | 4.23% |
| EOG Resources, Inc. | Energy | 3.97% |
| Berkshire Hathaway Inc., Class A | Property & Casualty Insurance | 3.73% |
| Devon Energy Corp. | Energy | 2.97% |
| CVS Caremark Corp. | Food & Staples Retailing | 2.90% |
| Merck & Co., Inc. | Pharmaceuticals, Biotechnology & Life Sciences | 2.87% |
| Loews Corp. | Multi-line Insurance | 2.63% |
| | | |
| DAVIS VALUE PORTFOLIO | Expense Example (Unaudited) |
Example
As a shareholder of the Fund, you incur ongoing costs only, including advisory and administrative fees and other Fund expenses. The Expense Example is intended to help you understand your ongoing costs (in dollars) of investing in the Fund and to compare these costs with the ongoing costs of investing in other mutual funds. The Expense Example is based on an investment of $1,000 invested at the beginning of the period and held for the entire period indicated, which for the Fund is for the six-month period ended June 30, 2010. Please note that the Expense Example is general and does not reflect charges imposed by your insurance company’s separate account or account specific costs, which may increase your total costs of investing in the Fund. If these charges or account specific costs were included in the Expense Example , the expenses would have been higher.
Actual Expenses
The information represented in the row entitled “Actual” provides information about actual account values and actual expenses. You may use the information in this row, together with the amount you invested, to estimate the expenses that you paid over the period. Simply divide your account value by $1,000 (for example, an $8,600 account value divided by $1,000 = 8.6), then, multiply the result by the number under the heading “Expenses Paid During Period” to estimate the expenses you paid on your account during this period.
Hypothetical Example for Comparison Purposes
The information represented in the row entitled “Hypothetical” provides information about hypothetical account values and hypothetical expenses based on the Fund’s actual expense ratio and an assumed rate of return of 5% per year before expenses, which is not the Fund’s actual return. The hypothetical account values and expenses may not be used to estimate the actual ending account balance or expenses you paid for the period. You may use this information to compare the ongoing costs of investing in the Fund and other funds. To do so, compare this 5% hypothetical example with the 5% hypothetical examples that appear in the shareholder reports of the other funds.
Please note that the expenses shown in the table are meant to highlight your ongoing costs only. Therefore, the information in the row entitled “Hypothetical” is useful in comparing ongoing costs only, and will not help you determine the relative total costs of owning different funds.
| | Beginning | Ending | Expenses Paid |
| | Account Value | Account Value | During Period* |
| | (01/01/10) | (06/30/10) | (01/01/10-06/30/10) |
| | | | |
Actual | $1,000.00 | $928.37 | $2.96 |
Hypothetical | $1,000.00 | $1,021.72 | $3.11 |
Hypothetical assumes 5% annual return before expenses.
* Expenses are equal to the Fund’s annualized operating expense ratio (0.62%)**, multiplied by the average account value over the period, multiplied by 181/365 (to reflect the one-half year period).
** The expense ratio reflects the impact, if any, of the reduction of expenses paid indirectly and of certain reimbursements from the Adviser.
| DAVIS VALUE PORTFOLIO | Schedule of Investments |
| | June 30, 2010 (Unaudited) |
| Shares | | Security | | Value (Note 1) | |
| |
| | CONSUMER DISCRETIONARY – (5.63%) | |
| | Automobiles & Components – (1.04%) | |
| | 225,000 | Harley-Davidson, Inc. | | $ | 5,001,750 | |
| |
| | Consumer Durables & Apparel – (0.15%) | |
| | 20,299 | Hunter Douglas NV (Netherlands) | | | 741,388 | |
| |
| | Consumer Services – (0.02%) | |
| | 6,963 | H&R Block, Inc. | | | 109,249 | |
| |
| | Media – (2.10%) | |
| | 117,070 | Grupo Televisa S.A., ADR (Mexico) | | | 2,038,189 | |
| | 8,506 | Liberty Media - Starz, Series A * | | | 440,441 | |
| | 296,325 | News Corp., Class A | | | 3,545,528 | |
| | 130,600 | Walt Disney Co. | | | 4,113,900 | |
| |
| | | 10,138,058 | |
| |
| | Retailing – (2.32%) | |
| | 3,260 | Amazon.com, Inc. * | | | 356,318 | |
| | 167,915 | Bed Bath & Beyond Inc. * | | | 6,225,449 | |
| | 175,000 | CarMax, Inc. * | | | 3,482,500 | |
| | 107,765 | Liberty Media Corp. - Interactive, Series A * | | | 1,132,071 | |
| |
| | | 11,196,338 | |
| |
| | Total Consumer Discretionary | | | 27,186,783 | |
| |
| | CONSUMER STAPLES – (14.69%) | |
| | Food & Staples Retailing – (7.31%) | |
| | 388,390 | Costco Wholesale Corp. | | | 21,293,482 | |
| | 477,398 | CVS Caremark Corp. | | | 13,997,309 | |
| |
| | | 35,290,791 | |
| |
| | Food, Beverage & Tobacco – (5.62%) | |
| | 111,940 | Coca-Cola Co. | | | 5,610,433 | |
| | 99,233 | Diageo PLC, ADR (United Kingdom) | | | 6,225,878 | |
| | 141,621 | Heineken Holding NV (Netherlands) | | | 5,173,724 | |
| | 33,060 | Hershey Co. | | | 1,584,566 | |
| | 39,065 | Mead Johnson Nutrition Co. | | | 1,957,938 | |
| | 15,100 | Nestle S.A. (Switzerland) | | | 728,104 | |
| | 92,290 | Philip Morris International Inc. | | | 4,230,574 | |
| | 60,000 | Unilever NV, NY Shares (Netherlands) | | | 1,639,200 | |
| |
| | | 27,150,417 | |
| |
| | Household & Personal Products – (1.76%) | |
| | 31,800 | Natura Cosmeticos S.A. (Brazil) | | | 704,709 | |
| | 130,040 | Procter & Gamble Co. | | | 7,799,799 | |
| |
| | | 8,504,508 | |
| |
| | Total Consumer Staples | | | 70,945,716 | |
| |
| | ENERGY – (15.60%) | |
| | 324,800 | Canadian Natural Resources Ltd. (Canada) | | | 10,793,104 | |
| | 2,659,900 | China Coal Energy Co. - H (China) | | | 3,309,571 | |
| | 2,632 | ConocoPhillips | | | 129,205 | |
| | 235,230 | Devon Energy Corp. | | | 14,330,212 | |
| | 194,830 | EOG Resources, Inc. | | | 19,165,427 | |
| | 289,560 | Occidental Petroleum Corp. | | | 22,339,554 | |
| | 290,000 | OGX Petroleo e Gas Participacoes S.A. (Brazil)* | | | 2,686,316 | |
| DAVIS VALUE PORTFOLIO | Schedule of Investments – (Continued) |
| | June 30, 2010 (Unaudited) |
| Shares | | Security | | Value (Note 1) | |
COMMON STOCK – (CONTINUED) | |
| | ENERGY – (CONTINUED) | |
| | 4,100 | Schlumberger Ltd. | | $ | 226,894 | |
| | 51,504 | Transocean Ltd. * | | | 2,386,180 | |
| |
| | Total Energy | | | 75,366,463 | |
| |
| | FINANCIALS – (26.63%) | |
| | Banks – (4.37%) | |
| | Commercial Banks – (4.37%) | |
| | 823,824 | Wells Fargo & Co. | | | 21,089,894 | |
| |
| | Diversified Financials – (11.06%) | |
| | Capital Markets – (5.85%) | |
| | 90,220 | Ameriprise Financial, Inc. | | | 3,259,649 | |
| | 454,000 | Bank of New York Mellon Corp. | | | 11,209,260 | |
| | 116,400 | Brookfield Asset Management Inc., Class A (Canada) | | | 2,632,968 | |
| | 221,460 | GAM Holding Ltd. (Switzerland)* | | | 2,393,212 | |
| | 18,660 | Goldman Sachs Group, Inc. | | | 2,449,498 | |
| | 221,460 | Julius Baer Group Ltd. (Switzerland) | | | 6,314,397 | |
| |
| | 28,258,984 | |
| |
| | Consumer Finance – (4.23%) | |
| | 515,119 | American Express Co. | | | 20,450,225 | |
| |
| | Diversified Financial Services – (0.98%) | |
| | 14,068 | JPMorgan Chase & Co. | | | 515,029 | |
| | 148,230 | Moody's Corp. | | | 2,952,742 | |
| | 17,900 | Visa Inc., Class A | | | 1,266,425 | |
| |
| | 4,734,196 | |
| |
| | | 53,443,405 | |
| |
| | Insurance – (10.51%) | |
| | Multi-line Insurance – (3.21%) | |
| | 5,130 | Fairfax Financial Holdings Ltd. (Canada) | | | 1,889,584 | |
| | 2,490 | Fairfax Financial Holdings Ltd., 144A (Canada)(a)(b) | | | 911,936 | |
| | 381,190 | Loews Corp. | | | 12,697,439 | |
| |
| | 15,498,959 | |
| |
| | Property & Casualty Insurance – (6.30%) | |
| | 150 | Berkshire Hathaway Inc., Class A * | | | 18,000,000 | |
| | 1,390 | Markel Corp. * | | | 472,600 | |
| | 638,720 | Progressive Corp. (Ohio) | | | 11,956,838 | |
| |
| | 30,429,438 | |
| |
| | Reinsurance – (1.00%) | |
| | 100,907 | Transatlantic Holdings, Inc. | | | 4,839,500 | |
| |
| | | 50,767,897 | |
| |
| | Real Estate – (0.69%) | |
| | 623,000 | Hang Lung Group Ltd. (Hong Kong) | | | 3,317,761 | |
| |
| | Total Financials | | | 128,618,957 | |
| |
| | HEALTH CARE – (10.00%) | |
| | Health Care Equipment & Services – (3.08%) | |
| | 57,900 | Baxter International Inc. | | | 2,353,056 | |
| | 63,800 | Becton, Dickinson and Co. | | | 4,314,156 | |
| | 7,350 | Cardinal Health, Inc. | | | 247,034 | |
| | 17,950 | CareFusion Corp. * | | | 407,465 | |
| DAVIS VALUE PORTFOLIO | Schedule of Investments – (Continued) |
| | June 30, 2010 (Unaudited) |
| Shares | | Security | | Value (Note 1) | |
COMMON STOCK – (CONTINUED) | |
| | HEALTH CARE – (CONTINUED) | |
| | Health Care Equipment & Services – (Continued) | |
| | 160,960 | Express Scripts, Inc. * | | $ | 7,569,144 | |
| |
| | | 14,890,855 | |
| |
| | Pharmaceuticals, Biotechnology & Life Sciences – (6.92%) | |
| | 197,680 | Johnson & Johnson | | | 11,674,981 | |
| | 395,855 | Merck & Co., Inc. | | | 13,843,049 | |
| | 553,600 | Pfizer Inc. | | | 7,894,336 | |
| |
| | | 33,412,366 | |
| |
| | Total Health Care | | | 48,303,221 | |
| |
| | INDUSTRIALS – (5.69%) | |
| | Capital Goods – (1.10%) | |
| | 111,180 | ABB Ltd., ADR (Switzerland) | | | 1,921,190 | |
| | 96,934 | Tyco International Ltd. | | | 3,414,985 | |
| |
| | | 5,336,175 | |
| |
| | Commercial & Professional Services – (2.38%) | |
| | 53,500 | D&B Corp. | | | 3,590,920 | |
| | 350,897 | Iron Mountain Inc. | | | 7,881,147 | |
| |
| | | 11,472,067 | |
| |
| | Transportation – (2.21%) | |
| | 1,482,352 | China Merchants Holdings International Co., Ltd. (China) | | | 4,874,758 | |
| | 1,097,000 | China Shipping Development Co. Ltd. - H (China) | | | 1,383,925 | |
| | 466,804 | Cosco Pacific Ltd. (China) | | | 553,296 | |
| | 26,355 | Kuehne & Nagel International AG (Switzerland) | | | 2,712,951 | |
| | 63,000 | LLX Logistica S.A. (Brazil)* | | | 256,886 | |
| | 15,710 | United Parcel Service, Inc., Class B | | | 893,742 | |
| |
| | | 10,675,558 | |
| |
| | Total Industrials | | | 27,483,800 | |
| |
| | INFORMATION TECHNOLOGY – (5.95%) | |
| | Semiconductors & Semiconductor Equipment – (1.49%) | |
| | 307,500 | Texas Instruments Inc. | | | 7,158,600 | |
| |
| | Software & Services – (2.19%) | |
| | 210,600 | Activision Blizzard, Inc. | | | 2,210,247 | |
| | 8,500 | Google Inc., Class A * | | | 3,781,650 | |
| | 199,410 | Microsoft Corp. | | | 4,587,427 | |
| |
| | | 10,579,324 | |
| |
| | Technology Hardware & Equipment – (2.27%) | |
| | 139,550 | Agilent Technologies, Inc. * | | | 3,967,406 | |
| | 161,870 | Hewlett-Packard Co. | | | 7,005,734 | |
| |
| | | 10,973,140 | |
| |
| | Total Information Technology | | | 28,711,064 | |
| |
| | MATERIALS – (5.39%) | |
| | 81,830 | BHP Billiton PLC (United Kingdom) | | | 2,121,733 | |
| | 42,380 | Martin Marietta Materials, Inc. | | | 3,594,248 | |
| | 36,900 | Monsanto Co. | | | 1,705,518 | |
| | 11,354 | Potash Corp. of Saskatchewan Inc. (Canada) | | | 979,169 | |
| | 10,800 | Praxair, Inc. | | | 820,692 | |
| | 41,205 | Rio Tinto PLC (United Kingdom) | | | 1,809,493 | |
| | 503,895 | Sealed Air Corp. | | | 9,936,809 | |
| DAVIS VALUE PORTFOLIO | Schedule of Investments – (Continued) |
| | June 30, 2010 (Unaudited) |
| Shares/Principal | | Security | | Value (Note 1) | |
COMMON STOCK – (CONTINUED) | |
| | MATERIALS – (CONTINUED) | |
| | 256,750 | Sino-Forest Corp. (Canada)* | | $ | 3,649,079 | |
| | 8,900 | Sino-Forest Corp., 144A (Canada)*(a)(b) | | | 126,492 | |
| | 29,790 | Vulcan Materials Co. | | | 1,305,696 | |
| |
| | Total Materials | | | 26,048,929 | |
| |
| | TELECOMMUNICATION SERVICES – (0.37%) | |
| | 37,700 | America Movil SAB de C.V., Series L, ADR (Mexico) | | | 1,790,750 | |
| |
| | Total Telecommunication Services | | | 1,790,750 | |
| |
| | TOTAL COMMON STOCK – (Identified cost $344,964,079) | | | 434,455,683 | |
| |
CONVERTIBLE BONDS – (0.25%) | |
| | MATERIALS – (0.16%) | |
| $ | 736,000 | Sino-Forest Corp., Conv. Sr. Notes, 5.00%, 08/01/13 (Canada) (c) | | | 754,860 | |
| |
| | Total Materials | | | 754,860 | |
| |
| | TELECOMMUNICATION SERVICES – (0.09%) | |
| | 400,000 | Level 3 Communications, Inc., Conv. Sr. Notes, 15.00%, 01/15/13 (c) | | | 453,000 | |
| |
| | Total Telecommunication Services | | | 453,000 | |
| |
| | TOTAL CONVERTIBLE BONDS – (Identified cost $1,136,000) | | | 1,207,860 | |
| |
CORPORATE BONDS – (0.55%) | |
| | CONSUMER DISCRETIONARY – (0.55%) | |
| | Automobiles & Components – (0.55%) | |
| | 2,000,000 | Harley-Davidson, Inc., Sr. Notes, 15.00%, 02/01/14 (c) | | | 2,651,690 | |
| |
| | TOTAL CORPORATE BONDS – (Identified cost $2,000,000) | | | 2,651,690 | |
| |
SHORT TERM INVESTMENTS – (3.90%) | |
| | 3,323,000 | Banc of America Securities LLC Joint Repurchase Agreement, | | | | | | |
| | 0.03%, 07/01/10, dated 06/30/10, repurchase value of $3,323,003 | | | | | | |
| | (collateralized by: U.S. Government agency obligations in a pooled cash account, 0.00%-5.00%, 12/08/10-07/15/20, total market value $3,389,460) | | | 3,323,000 | |
| | 4,848,000 | Goldman, Sachs & Co. Joint Repurchase Agreement, | | | | | | |
| | 0.01%, 07/01/10, dated 06/30/10, repurchase value of $4,848,001 | | | | | | |
| | (collateralized by: U.S. Government agency obligations in a pooled cash account, 0.00%-5.05%, 08/30/10-01/26/15, total market value $4,944,960) | | | 4,848,000 | |
| | 10,632,000 | Mizuho Securities USA Inc. Joint Repurchase Agreement, | | | | | | |
| | 0.14%, 07/01/10, dated 06/30/10, repurchase value of $10,632,041 | | | | | | |
| | (collateralized by: U.S. Government agency mortgages in a pooled cash account, 2.421%-6.229%, 09/01/19-07/01/40, total market value $10,844,640) | | | 10,632,000 | |
| |
| | TOTAL SHORT TERM INVESTMENTS – (Identified cost $18,803,000) | | | 18,803,000 | |
| |
| | Total Investments – (94.65%) – (Identified cost $366,903,079) – (d) | | | 457,118,233 | |
| | Other Assets Less Liabilities – (5.35%) | | | 25,863,305 | |
| |
| | Net Assets – (100.00%) | | $ | 482,981,538 | |
| |
| |
| | ADR: American Depositary Receipt | | |
| | * | | Non-Income producing security. | |
| DAVIS VALUE PORTFOLIO | Schedule of Investments – (Continued) |
| | June 30, 2010 (Unaudited) |
| | (a) | | These securities are subject to Rule 144A. The Board of Directors of the Fund has determined that there is sufficient liquidity in these securities to realize current valuations. These securities amounted to $1,038,428 or 0.22% of the Fund's net assets as of June 30, 2010. | |
| | | | | |
| | (b) | | Restricted Security – See Note 7 of the Notes to Financial Statements. | |
| | | | | |
| | (c) | | Illiquid Security – See Note 7 of the Notes to Financial Statements. | |
| | | | | |
| | (d) | | Aggregate cost for federal income tax purposes is $368,524,063. At June 30, 2010 unrealized appreciation (depreciation) of securities for federal income tax purposes is as follows: | |
| | | | | |
| | Unrealized appreciation | | $ | 104,121,499 | |
| | Unrealized depreciation | | | (15,527,329) | |
| | Net unrealized appreciation | | $ | 88,594,170 | |
| |
| See Notes to Financial Statements | |
| DAVIS VALUE PORTFOLIO | Statement of Assets and Liabilities |
| | At June 30, 2010 (Unaudited) |
| ASSETS: | | | | |
Investments in securities at value* (see accompanying Schedule of Investments) | | $ | 457,118,233 | |
| Cash | | | 6,640 | |
Cash - foreign currencies** | | | 168,794 | |
| Receivables: | | | | |
| | Capital stock sold | | | 25,342,035 | |
| | Dividends and interest | | | 797,344 | |
| | Investment securities sold | | | 153,565 | |
Prepaid expenses | | | 2,683 | |
| | Total assets | | | 483,589,294 | |
| LIABILITIES: | | | | |
| Payables: | | | | |
| | Capital stock redeemed | | | 298,587 | |
Accrued management fee | | | 248,911 | |
Other accrued expenses | | | 60,258 | |
| | Total liabilities | | | 607,756 | |
NET ASSETS | | $ | 482,981,538 | |
SHARES OUTSTANDING | | | 48,379,052 | |
NET ASSET VALUE, offering, and redemption price per share (Net assets ÷ Shares outstanding) | | $ | 9.98 | |
| NET ASSETS CONSIST OF: | | | | |
Par value of shares of capital stock | | $ | 48,379 | |
Additional paid-in capital | | | 420,135,917 | |
Undistributed net investment income | | | 2,674,377 | |
| Accumulated net realized losses from investments and foreign currency transactions | | | (30,093,599) | |
Net unrealized appreciation on investments and foreign currency transactions | | | 90,216,464 | |
| | Net Assets | | $ | 482,981,538 | |
| | | | | | |
| *Including: | | | | |
| | Cost of Investments | | $ | 366,903,079 | |
| | | | | | |
**Cost of cash - foreign currencies | | | 169,401 | |
| | | | | | |
| See Notes to Financial Statements |
| | | | | | |
| DAVIS VALUE PORTFOLIO | Statement of Operations |
| | For the six months ended June 30, 2010 (Unaudited) |
| INVESTMENT INCOME: | | | | |
| Income: | | | | |
| | Dividends* | | $ | 3,842,380 | |
| | Interest | | | 279,830 | |
| | Total income | | | 4,122,210 | |
| | | | | | | | | |
| Expenses: | | | | |
| | Management fees (Note 3) | | $ | 1,396,996 | | | | |
| | Custodian fees | | | 47,566 | | | | |
| | Transfer agent fees | | | 8,961 | | | | |
| | Audit fees | | | 10,200 | | | | |
| | Legal fees | | | 9,150 | | | | |
| | Accounting fees (Note 3) | | | 3,252 | | | | |
| | Reports to shareholders | | | 30,000 | | | | |
| | Directors’ fees and expenses | | | 58,417 | | | | |
| | Registration and filing fees | | | 150 | | | | |
| | Miscellaneous | | | 9,815 | | | | |
| | Total expenses | | | 1,574,507 | |
| | Expenses paid indirectly (Note 4) | | | (8) | |
| | Net expenses | | | 1,574,499 | |
| | Net investment income | | | 2,547,711 | |
| | | | | | | | | |
| REALIZED & UNREALIZED GAIN (LOSS) ON INVESTMENTS AND FOREIGN CURRENCY TRANSACTIONS: | | | | |
| Net realized gain (loss) from: | | | | |
| | Investment transactions | | | 11,261,274 | |
| | Foreign currency transactions | | | (293) | |
Net decrease in unrealized appreciation | | | (49,199,383) | |
| | Net realized and unrealized loss on investments and foreign currency transactions | | | (37,938,402) | |
| | Net decrease in net assets resulting from operations | | $ | (35,390,691) | |
| | | | | | | | | |
*Net of foreign taxes withheld as follows | | $ | 64,686 | |
| | | | | | | | | |
| See Notes to Financial Statements |
| DAVIS VALUE PORTFOLIO | Statements of Changes in Net Assets |
| | | Six months ended June 30, 2010 (Unaudited) | | Year ended December 31, 2009 |
| | | | | | | | |
| OPERATIONS: | | | | | | |
| | Net investment income | | $ | 2,547,711 | | $ | 3,837,745 |
| | Net realized gain (loss) from investments and foreign currency transactions | | | 11,260,981 | | | (40,978,639) |
| | Net change in unrealized appreciation (depreciation) on investments and foreign currency transactions | | | (49,199,383) | | | 155,373,588 |
| | Net increase (decrease) in net assets resulting from operations | | | (35,390,691) | | | 118,232,694 |
| | | | | | | | |
| DIVIDENDS AND DISTRIBUTIONS TO SHAREHOLDERS FROM: | | | | | | |
| | Net investment income | | | – | | | (3,982,003) |
| | | | | | | | |
| CAPITAL SHARE TRANSACTIONS: | | | | | | |
| | Net increase (decrease) in net assets resulting from capital share transactions (Note 5) | | | (1,031,735) | | | 72,001,466 |
| | Total increase (decrease) in net assets | | | (36,422,426) | | | 186,252,157 |
| | | | | | | | |
| NET ASSETS: | | | | | | |
| | Beginning of period | | | 519,403,964 | | | 333,151,807 |
| | End of period* | | $ | 482,981,538 | | $ | 519,403,964 |
| | | | | | | | |
*Including undistributed net investment income of | | $ | 2,674,377 | | $ | 126,666 |
| | | | | | | | |
| See Notes to Financial Statements |
| DAVIS VALUE PORTFOLIO | Notes to Financial Statements |
| | June 30, 2010 (Unaudited) |
NOTE 1 - SUMMARY OF SIGNIFICANT ACCOUNTING POLICIES
The Fund is a separate series of Davis Variable Account Fund, Inc. (a Maryland corporation), which is registered under the Investment Company Act of 1940, as amended, as a diversified, open-end management investment company. Only insurance companies, for the purpose of funding variable annuity or variable life insurance contracts, may purchase shares of the Fund. The following is a summary of significant accounting policies followed by the Fund in the preparation of financial statements.
Security Valuation - The Fund calculates the net asset value of its shares as of the close of the New York Stock Exchange (“Exchange”), normally 4:00 P.M. Eastern time, on each day the Exchange is open for business. Securities listed on the Exchange (and other national exchanges) are valued at the last reported sales price on the day of valuation. Securities traded in the over-the-counter market (e.g. NASDAQ) and listed securities for which no sale was reported on that date are stated at the average of closing bid and asked prices. Securities traded on foreign exchanges are valued based upon the last sales price on the principal exchange on which the security is traded prior to the time when the Fund’s assets a re valued. Securities (including restricted securities) for which market quotations are not readily available are valued at their fair value. Securities whose values have been materially affected by what Davis Selected Advisers, L.P. (“Davis Advisors” or “Adviser”), the Fund’s investment adviser, identifies as a significant event occurring before the Fund’s assets are valued but after the close of their respective exchanges will be fair valued. Fair value is determined in good faith using consistently applied procedures under the supervision of the Board of Directors. Short-term securities purchased within 60 days to maturity are valued at amortized cost, which approximates market value. These valuation procedures are reviewed and subject to approval by the Board of Directors.
Value Measurements - Fair value is defined as the price that the Fund would receive upon selling an investment in an orderly transaction to an independent buyer in the principal or most advantageous market for the investment. Various inputs are used to determine the fair value of the Fund’s investments. These inputs are summarized in the three broad levels listed below.
Level 1 – quoted prices in active markets for identical securities
Level 2 – other significant observable inputs (including quoted prices for similar investments, interest rates, prepayment speeds, credit risk, etc.)
| Level 3 – significant unobservable inputs (including Fund’s own assumptions in determining the fair value of investments) |
The inputs or methodology used for valuing securities are not necessarily an indication of the risk associated with investing in those securities.
| DAVIS VALUE PORTFOLIO | Notes to Financial Statements – (Continued) |
| | June 30, 2010 (Unaudited) |
NOTE 1 - SUMMARY OF SIGNIFICANT ACCOUNTING POLICIES – (CONTINUED)
Value Measurements – (Continued)
The following is a summary of the inputs used as of June 30, 2010 in valuing the Fund’s investments carried at value:
| | Investments in Securities at Value |
| | Valuation Inputs |
| | | | Level 2: | | Level 3: | | |
| | | | Other Significant | | Significant | | |
| | Level 1: | | Observable | | Unobservable | | |
| | Quoted Prices | | Inputs* | | Inputs | | Total |
Equity securities: | | | | | | | | | | | |
| Consumer discretionary | $ | 26,445,395 | | $ | 741,388 | | $ | – | | $ | 27,186,783 |
| Consumer staples | | 65,043,888 | | | 5,901,828 | | | – | | | 70,945,716 |
| Energy | | 72,056,892 | | | 3,309,571 | | | – | | | 75,366,463 |
| Financials | | 116,593,587 | | | 12,025,370 | | | – | | | 128,618,957 |
| Health care | | 48,303,221 | | | – | | | – | | | 48,303,221 |
| Industrials | | 17,958,870 | | | 9,524,930 | | | – | | | 27,483,800 |
| Information technology | | 28,711,064 | | | – | | | – | | | 28,711,064 |
| Materials | | 22,117,703 | | | 3,931,226 | | | – | | | 26,048,929 |
| Telecommunication services | | 1,790,750 | | | – | | | – | | | 1,790,750 |
| Convertible debt securities | | – | | | 1,207,860 | | | – | | | 1,207,860 |
| Corporate debt securities | | – | | | 2,651,690 | | | – | | | 2,651,690 |
| Short-term securities | | – | | | 18,803,000 | | | – | | | 18,803,000 |
| Total | $ | 399,021,370 | | $ | 58,096,863 | | $ | – | | $ | 457,118,233 |
| | | | | | | | | | | | |
*Includes certain securities trading primarily outside the U.S. whose value the Fund adjusted as a result of significant market movements following the close of local trading.
Application of standing Board valuation procedures related to non-U.S. securities triggered transfers between Level 1 and Level 2 assets during the period. During the six months ended June 30, 2010, $6,314,397 transferred from Level 1 to Level 2.
Master Repurchase Agreements - The Fund, along with other affiliated funds, may transfer uninvested cash balances into one or more master repurchase agreement accounts. These balances are invested in one or more repurchase agreements, secured by U.S. Government securities. A custodian bank holds securities pledged as collateral for repurchase agreements until the agreements mature. Each agreement requires that the market value of the collateral be sufficient to cover payments of interest and principal; however, in the event of default by the other party to the agreement, retention of the collateral may be subject to legal proceedings.
Currency Translation - The market values of all assets and liabilities denominated in foreign currencies are recorded in the financial statements after translation to the U.S. Dollar based upon the mean between the bid and offered quotations of the currencies against U.S. Dollars on the date of valuation. The cost basis of such assets and liabilities is determined based upon historical exchange rates. Income and expenses are translated at average exchange rates in effect as accrued or incurred.
| DAVIS VALUE PORTFOLIO | Notes to Financial Statements – (Continued) |
| | June 30, 2010 (Unaudited) |
NOTE 1 - SUMMARY OF SIGNIFICANT ACCOUNTING POLICIES – (CONTINUED)
Foreign Currency - The Fund may enter into forward purchases or sales of foreign currencies to hedge certain foreign currency denominated assets and liabilities against declines in market value relative to the U.S. Dollar. Forward currency contracts are marked-to-market daily and the change in market value is recorded by the Fund as an unrealized gain or loss. When the forward currency contract is closed, the Fund records a realized gain or loss equal to the difference between the value of the forward currency contract at the time it was opened and value at the time it was closed. Investments in forward currency contracts may expose the Fund to risks resulting from una nticipated movements in foreign currency exchange rates or failure of the counter-party to the agreement to perform in accordance with the terms of the contract.
Reported net realized foreign exchange gains or losses arise from the sales of foreign currencies, currency gains or losses realized between the trade and settlement dates on securities transactions, the difference between the amounts of dividends, interest, and foreign withholding taxes recorded on the Fund’s books, and the U.S. Dollar equivalent of the amounts actually received or paid. Net unrealized foreign exchange gains and losses arise from changes in the value of assets and liabilities other than investments in securities at fiscal year end, resulting from changes in the exchange rate. The Fund includes foreign currency gains and losses realized on the sale of investments together with market gains and losses on such investments in the Statement of Operations.
Federal Income Taxes - It is the Fund’s policy to comply with the requirements of the Internal Revenue Code applicable to regulated investment companies, and to distribute substantially all of its taxable income, including any net realized gains on investments not offset by loss carryovers, to shareholders. Therefore, no provision for federal income or excise tax is required. The Adviser has analyzed the Fund’s tax positions taken on federal and state income tax returns for all open tax years and has concluded that as of June 30, 2010, no provision for income tax would be required in the Fund’s financial statements. The Fund’s federal and state (Arizona and Maryland) income and federal excise tax returns for tax years for which the applicable statutes of limitations have not expired are subject to examination by the Internal Revenue Service and state departments of revenue. The earliest tax year that remains subject to examination by these jurisdictions is 2006. At December 31, 2009, the Fund had available for federal income tax purposes unused capital loss carryforwards and post October 2009 capital losses as follows:
| | Capital Loss Carryforwards | | Post October 2009 Capital Losses |
| Expiring | | | | | |
| 12/31/2017 | $ | 30,445,000 | $ | – |
| 12/31/2018 | | – | | 9,789,000 |
| | $ | 30,445,000 | | $ | 9,789,000 |
Securities Transactions and Related Investment Income - Securities transactions are accounted for on the trade date (date the order to buy or sell is executed) with realized gain or loss on the sale of securities being determined based upon identified cost. Dividend income is recorded on the ex-dividend date. Interest income, which includes accretion of discount and amortization of premium, is accrued as earned.
Dividends and Distributions to Shareholders - Dividends and distributions to shareholders are recorded on the ex-dividend date. Net investment income (loss), net realized gains (losses), and net unrealized appreciation (depreciation) on investments may differ for financial statement and tax purposes primarily due to differing treatments of wash sales, passive foreign investment company shares, and foreign currency transactions. The character of dividends and distributions made during the fiscal year from net investment income and net realized securities gains may differ from their ultimate characterization for federal income tax purposes. Also, due to the timing of dividends and distributions, the fiscal year in which amounts ar e distributed may differ from the fiscal year in which income or realized gain was recorded by the Fund. The Fund adjusts certain components of capital to reflect permanent differences between financial statement amounts and net income and realized gains/losses determined in accordance with income tax rules.
Indemnification - Under the Fund’s organizational documents, its officers and directors are indemnified against certain liabilities arising out of the performance of their duties to the Fund. In addition, some of the Fund’s contracts with its service providers contain general indemnification clauses. The Fund’s maximum exposure under these arrangements is unknown since the amount of any future claims that may be made against the Fund cannot be determined and the Fund has no historical basis for predicting the likelihood of any such claims.
| DAVIS VALUE PORTFOLIO | Notes to Financial Statements – (Continued) |
| | June 30, 2010 (Unaudited) |
NOTE 1 - SUMMARY OF SIGNIFICANT ACCOUNTING POLICIES – (CONTINUED)
Use of Estimates in Financial Statements - In preparing financial statements in conformity with accounting principles generally accepted in the United States of America, management makes estimates and assumptions that affect the reported amounts of assets and liabilities and disclosure of contingent assets and liabilities at the date of the financial statements, as well as the reported amounts of income and expenses during the reporting period. Actual results may differ from these estimates.
Directors Fees and Expenses - The Fund set up a Rabbi Trust to provide for the deferred compensation plan for Independent Directors that enables them to elect to defer receipt of all or a portion of annual fees they are entitled to receive. The value of an eligible Director’s account is based upon years of service and fees paid to each Director during the years of service. The amount paid to the Director by the Trust under the plan will be determined based upon the performance of the Davis Funds.
NOTE 2 - PURCHASES AND SALES OF SECURITIES
Purchases and sales of investment securities (excluding short-term securities) during the six months ended June 30, 2010 were $43,291,970 and $65,205,561, respectively.
NOTE 3 - INVESTMENT ADVISORY FEES AND OTHER TRANSACTIONS WITH AFFILIATES
Advisory fees are paid monthly to the Adviser at an annual rate of 0.55% of the Fund’s average net assets.
Boston Financial Data Services, Inc. (“BFDS”) is the Fund’s primary transfer agent. State Street Bank and Trust Company (“State Street Bank”) is the Fund’s primary accounting provider. Fees for such services are included in the custodian fee as State Street Bank also serves as the Fund’s custodian. The Adviser is also paid for certain accounting services. The fee paid to the Adviser for these services for the six months ended June 30, 2010 amounted to $3,252. Certain directors and officers of the Fund are also directors and officers of the general partner of the Adviser.
Davis Selected Advisers-NY, Inc. (“DSA-NY”), a wholly-owned subsidiary of the Adviser, acts as sub-adviser to the Fund. DSA-NY performs research and portfolio management services for the Fund under a Sub-Advisory Agreement with the Adviser. The Fund pays no fees directly to DSA-NY.
NOTE 4 - EXPENSES PAID INDIRECTLY
Under an agreement with State Street Bank, custodian fees are reduced for earnings on cash balances maintained at the custodian by the Fund. Such reductions amounted to $8 during the six months ended June 30, 2010.
NOTE 5 - CAPITAL STOCK
At June 30, 2010, there were 500 million shares of capital stock ($0.001 par value per share) authorized. Transactions in capital stock were as follows:
| | | Six months ended | | Year ended |
| | | June 30, 2010 (Unaudited) | | December 31, 2009 |
| | | Shares | | Amount | | Shares | | Amount |
| Shares sold | | 4,127,801 | | $ | 42,592,134 | | 16,029,614 | | $ | 142,471,775 |
Shares issued in reinvestment of distributions | | – | | | – | | 368,022 | | | 3,982,003 |
| | | 4,127,801 | | | 42,592,134 | | 16,397,636 | | | 146,453,778 |
| Shares redeemed | | (4,051,841) | | | (43,623,869) | | (8,410,774) | | | (74,452,312) |
| Net increase (decrease) | | 75,960 | | $ | (1,031,735) | | 7,986,862 | | $ | 72,001,466 |
| | | | | | | | | | |
| DAVIS VALUE PORTFOLIO | Notes to Financial Statements – (Continued) |
| | June 30, 2010 (Unaudited) |
NOTE 6 - BANK BORROWINGS
The Fund may borrow up to 5% of its assets from a bank to purchase portfolio securities, or for temporary and emergency purposes. The purchase of securities with borrowed funds creates leverage in the Fund. The Fund has entered into an agreement, which enables it to participate with certain other funds managed by the Adviser in an unsecured line of credit with a bank, which permits borrowings up to $50 million, collectively. Interest is charged based on its borrowings, at a rate equal to the higher of the Federal Funds Rate or the Overnight Libor Rate, plus 1.25%. The Fund had no borrowings during the six months ended June 30, 2010.
NOTE 7 - ILLIQUID AND RESTRICTED SECURITIES
Securities may be considered illiquid if they lack a readily available market or if valuation has not changed for a certain period of time. Restricted securities are not registered under the Securities Act of 1933 and may have contractual restrictions on resale. They are valued under methods approved by the Board of Directors as reflecting fair value. The aggregate value of illiquid securities amounted to $3,859,550 or 0.80% of the Fund’s net assets as of June 30, 2010. The aggregate value of restricted securities amounted to $1,038,428 or 0.22% of the Fund’s net assets as of June 30, 2010.
Information regarding illiquid and restricted securities is as follows:
| Security | | Acquisition Date | | Principal | | Units/ Shares | | Cost per Unit/Share | | Valuation per Unit/Share as of June 30, 2010 |
| | | | | | | | | | | | | |
| Fairfax Financial Holdings Ltd., 144A | | 02/23/10 | | NA | | 2,490 | | $ | 355.00 | | $ | 366.24 |
| | | | | | | | | | | | | |
| Harley-Davidson, Inc., Sr. Notes, 15.00%, 02/01/14 | | 02/03/09 | | $ 2,000,000 | | 20,000 | | $ | 100.00 | | $ | 132.58 |
| | | | | | | | | | | | | |
| Level 3 Communications, Inc., Conv. Sr. Notes, 15.00%, 01/15/13 | | 12/23/08 | | $ 400,000 | | 4,000 | | $ | 100.00 | | $ | 113.25 |
| | | | | | | | | | | | | |
| Sino-Forest Corp., Conv. Sr. Notes, 5.00%, 08/01/13 | | 07/17/08 | | $ 736,000 | | 7,360 | | $ | 100.00 | | $ | 102.56 |
| | | | | | | | | | | | | |
| Sino-Forest Corp., 144A | | 12/11/09 | | NA | | 8,900 | | $ | 15.85 | | $ | 14.21 |
NOTE 8 - SUBSEQUENT EVENTS
Fund management has determined that no material events or transactions occurred subsequent to June 30, 2010 and through the issuance of the financial statements, which required adjustments and/or additional disclosure.
| DAVIS VALUE PORTFOLIO | Financial Highlights |
| The following financial information represents selected data for each share of capital stock outstanding throughout each period: |
| | | | | | | | | | | | | | | | | | | | | | | | | | | | | | | | | | |
| | Six months ended June 30, 2010 | | Year ended December 31, | |
| | (Unaudited) | | 2009 | | 2008 | | 2007 | | 2006 | | 2005 | |
| Net Asset Value, Beginning of Period | | $ | 10.75 | | $ | 8.26 | | $ | 14.48 | | $ | 14.58 | | $ | 12.77 | | $ | 11.78 | |
| | | | | | | | | | | | | | | | | | | | | | | | | | | | | | | | | | |
| Income (Loss) from Investment Operations: | | | | | | | | | | | | | | | | | | | | | | | | | | | | | | | | |
| | Net Investment Income | | 0.05 | | 0.08 | | 0.13 | | 0.17 | | 0.11 | | 0.12 | |
| | Net Realized and Unrealized Gains (Losses) | | (0.82) | | 2.49 | | (6.00) | | 0.51 | | 1.81 | | 0.99 | |
| | Total from Investment Operations | | (0.77) | | 2.57 | | (5.87) | | 0.68 | | 1.92 | | 1.11 | |
| | | | | | | | | | | | | | | | | | | | | | | | | | | | | | | | | | |
| Dividends and Distributions: | | | | | | | | | | | | | | | | | | | | | | | | | | | | | | | | |
| | Dividends from Net Investment Income | | – | | (0.08) | | (0.12) | | (0.17) | | (0.11) | | (0.11) | |
| | Distributions from Realized Gains | | – | | – | | (0.23) | | (0.61) | | – | | – | |
| | Distributions in Excess of Net Investment Income | | – | | – | | – | | – | | – | | (0.01) | |
| | Total Dividends and Distributions | | – | | (0.08) | | (0.35) | | (0.78) | | (0.11) | | (0.12) | |
Net Asset Value, End of Period | | $ | 9.98 | | $ | 10.75 | | $ | 8.26 | | $ | 14.48 | | $ | 14.58 | | $ | 12.77 | |
| | | | | | | | | | | | | | | | | | | | | | | | | | | | | | | | | | |
Total Returna | | (7.16) | % | | 31.16 | % | | (40.32) | % | | 4.64 | % | | 15.00 | % | | 9.44 | % | |
| | | | | | | | | | | | | | | | | | | | | | | | | | | | | | | | | | |
| Ratios/Supplemental Data: | | | | | | | | | | | | | | | | | | | | | | | | | | | | | | | | |
| | Net Assets, End of Period (in thousands) | | $ | 482,982 | | | $ | 519,404 | | | $ | 333,152 | | | $ | 658,699 | | | $ | 771,828 | | | $ | 620,369 | | |
| | Ratio of Expenses to Average Net Assets: | | | | | | | | | | | | | | | | | | | | | | | | | | | | | | | | |
| | Gross | | 0.62 | %b | | 0.71 | % | | 0.82 | % | | 0.81 | % | | 0.81 | % | | 0.81 | % | |
| | Netc | | 0.62 | %b | | 0.71 | % | | 0.82 | % | | 0.81 | % | | 0.81 | % | | 0.81 | % | |
| Ratio of Net Investment Income to Average Net Assets | | 1.00 | %b | | 0.97 | % | | 0.98 | % | | 1.11 | % | | 0.83 | % | | 0.87 | % | |
Portfolio Turnover Rated | | 9 | % | | 20 | % | | 17 | % | | 9 | % | | 19 | % | | 14 | % | |
| | | | | | | | | | | | | | | | | | | | | | | | | | | | | | | | | | |
| a | Assumes hypothetical initial investment on the business day before the first day of the fiscal period, with all dividends and distributions reinvested in additional shares on the reinvestment date, and redemption at the net asset value calculated on the last business day of the fiscal period. Total returns are not annualized for periods of less than one year and do not reflect charges attributable to your insurance company’s separate account. Inclusion of these charges would reduce the total returns shown. | | |
| | | | |
| b | Annualized. | | |
| | | | |
| c | The Net Ratio of Expenses to Average Net Assets reflects the impact, if any, of the reduction of expenses paid indirectly and of certain reimbursements from the Adviser. | | |
| | | | |
| d | The lesser of purchases or sales of portfolio securities for a period, divided by the monthly average of the market value of portfolio securities owned during the period. Securities with a maturity or expiration date at the time of acquisition of one year or less are excluded from the calculation. | | |
| | | | |
| See Notes to Financial Statements |
| DAVIS VALUE PORTFOLIO | Director Approval of Advisory Agreements |
Process of Annual Review
The Board of Directors of the Davis Funds oversees the management of each Davis Fund and, as required by law, determines annually whether to approve the continuance of each Davis Fund’s advisory agreement with Davis Selected Advisers, L.P. and sub-advisory agreement with Davis Selected Advisers-NY, Inc. (jointly “Davis Advisors” and “Advisory Agreements”).
As a part of this process the Independent Directors, with the assistance of counsel for the Independent Directors, prepared questions submitted to Davis Advisors in anticipation of the annual contract review. The Independent Directors were provided with responsive background material (including recent investment performance data), and their counsel provided guidance, prior to a separate contract review meeting held in March 2010 where the Independent Directors reviewed and evaluated all information which they deemed reasonably necessary in the circumstances. Upon completion of this review, the Independent Directors found that the terms of the Advisory Agreements are fair and reasonable and that continuation of the Advisory Agreements was in the best interest of Davis Value Portfolio and its shareholders.
Reasons the Independent Directors Approved Continuation of the Advisory Agreements
The Independent Directors’ determinations were based upon a comprehensive consideration of all information provided to the Independent Directors and were not the result of any single factor. The following facts and conclusions were important, but not exclusive, in the Independent Directors’ recommendation to renew the Advisory Agreements.
The Independent Directors considered not only the investment performance of the Fund, but also the full range and quality of services provided by Davis Advisors to the Fund and its shareholders, including whether it:
| 1. | Achieves satisfactory investment results over the long-term after all costs; |
| 2. | Handles shareholder transactions, inquiries, requests, and records efficiently and effectively, and provides quality accounting, legal, and compliance services, and oversight of third party service providers; and |
| 3. | Fosters healthy investor behavior. |
Davis Advisors is reimbursed a portion of its costs in providing some, but not all, of these services.
A shareholder’s ultimate return is the product of a fund’s results as well as the shareholder’s behavior, specifically in selecting when to invest or redeem. The Independent Directors concluded that, through its actions and communications, Davis Advisors has attempted to have a meaningful, positive impact on investor behavior.
The Independent Directors noted the importance of reviewing quantitative measures, but also recognized that qualitative factors are also important in assessing whether Davis Fund shareholders are likely to be well served by the renewal of the Advisory Agreements. They noted both the value and shortcomings of purely quantitative measures, including the data provided by independent service providers, and concluded that while such measures and data may be informative, the judgment of the Independent Directors must take many factors, including those listed below, into consideration in representing the shareholders of the Davis Funds. In connection with reviewing comparative performance information, the Independent Directors generally give weight to longer-term measurements.
The Independent Directors expect Davis Advisors to employ a disciplined, company-specific, research-driven, businesslike, long-term investment philosophy.
The Independent Directors recognized Davis Advisors’ (a) efforts to minimize transaction costs by generally having a long-term time horizon and low portfolio turnover; (b) record of generally producing satisfactory results over longer-term periods; (c) efforts towards fostering healthy investor behavior by, among other things, providing informative and substantial educational material; and (d) efforts to promote shareholder interests by actively speaking out on corporate governance issues.
| DAVIS VALUE PORTFOLIO | Director Approval of Advisory Agreements – (Continued) |
Reasons the Independent Directors Approved Continuation of the Advisory Agreements – (Continued)
The Independent Directors reviewed (a) comparative fee and expense information for other funds, as selected and analyzed by a nationally recognized independent service provider; (b) information regarding fees charged by Davis Advisors to other advisory clients, including funds which it sub-advises and private accounts, as well as the differences in the services provided to such other clients; and (c) the fee schedule of the Fund, including an assessment of competitive fee schedules.
Effective July 1, 2009, Davis Advisors voluntarily and permanently reduced all management fee breakpoints above 0.55% to 0.55%. The former fee schedule for the Fund was a flat 0.75%. The Fund now has a flat fee of 0.55%, resulting in a fee which the Independent Directors noted was both lower than under its previous schedule and lower than the average fees of its peer group as determined by an independent service provider.
The Independent Directors reviewed the fixed management fee for the Fund and the profitability of the Fund to Davis Advisors, the extent to which economies of scale might be realized if the Fund’s net assets increased, and whether the fixed fee reflected those potential economies of scale. The Independent Directors considered the nature, quality, and extent of the services being provided to the Fund and the costs incurred by Davis Advisors in providing such services. The Independent Directors considered various potential benefits that Davis Advisors may receive in connection with the services it provides under the Advisory Agreements with the Fund, including a review of portfolio brokerage practices. The Independent Directors noted that Davis Advisors does not use client commissions to pay for publications that are available to t he general public or for third-party research services.
The Independent Directors noted that Davis Value Portfolio had out-performed its benchmark, the Standard & Poor’s 500® Index, over the one- and ten-year time periods and under-performed over the three- and five-year time periods, all ended February 28, 2010. The Fund out-performed the average performance of its peer group as determined by an independent service provider over the one-, five-, and ten-year time periods and under-performed over the three-year time period, all ended December 31, 2009. The Independent Directors noted that the Fund out-performed the Standard & Poor’s 500® Index in 5 of the 6 rolling five calendar year time frames, and its p eer group in all of the 6 rolling five calendar year time frames ended December 31, 2009. The Fund out-performed both the Index and its peers in the 1 rolling ten calendar year time frame ended December 31, 2009.
The Independent Directors also considered the total expense ratio for Davis Value Portfolio, noting that the expenses were reasonable and below the average ratios of its peer group as determined by an independent service provider.
Approval of Advisory Agreements
The Independent Directors concluded that Davis Advisors had provided Davis Value Portfolio and its shareholders a reasonable level of both investment and non-investment services. The Independent Directors further concluded that shareholders have received a significant benefit from Davis Advisors’ shareholder oriented approach, as well as the execution of its investment discipline.
The Independent Directors determined that the advisory fee for Davis Value Portfolio was reasonable in light of the nature, quality, and extent of the services being provided to the Fund, the costs incurred by Davis Advisors in providing such service, and in comparison to the range of the average advisory fees of its peer group as determined by an independent service provider. The Independent Directors found that the terms of the Advisory Agreements are fair and reasonable and that continuation of the Advisory Agreements was in the best interest of the Fund and its shareholders. The Independent Directors and the full Board of Directors therefore voted to continue the Advisory Agreements.
| DAVIS VALUE PORTFOLIO | Fund Information |
Portfolio Proxy Voting Policies and Procedures
The Fund has adopted Portfolio Proxy Voting Policies and Procedures under which the Fund votes proxies relating to securities held by the Fund. A description of the Fund’s Portfolio Proxy Voting Policies and Procedures is available (i) without charge, upon request, by calling the Fund toll-free at 1-800-279-0279, (ii) on the Fund’s website at www.davisfunds.com, and (iii) on the SEC’s website at www.sec.gov.
In addition, the Fund is required to file Form N-PX, with its complete proxy voting record for the 12 months ended June 30th, no later than August 31st of each year. The Fund’s Form N-PX filing is available (i) without charge, upon request, by calling the Fund toll-free at 1-800-279-0279, (ii) on the Fund’s website at www.davisfunds.com, and (iii) on the SEC’s website at www.sec.gov.
Form N-Q
The Fund files its complete schedule of portfolio holdings with the SEC for the first and third quarters of each fiscal year on Form N-Q. The Fund’s Form N-Q is available without charge, upon request, by calling 1-800-279-0279 or on the Fund’s website at www.davisfunds.com or on the SEC’s website at www.sec.gov. The Fund’s Form N-Q may be reviewed and copied at the SEC’s Public Reference Room in Washington, DC, and information on the operation of the Public Reference Room may be obtained by calling 1-800-SEC-0330.
| DAVIS VALUE PORTFOLIO | Directors and Officers |
For the purposes of their service as directors to the Davis Funds, the business address for each of the directors is 2949 E. Elvira Road, Suite 101, Tucson, AZ 85756. Each Director serves until their retirement, resignation, death or removal. Subject to exceptions and exemptions, which may be granted by the Independent Directors, Directors must retire at the close of business on the last day of the calendar year in which the Director attains age seventy-four (74).
Name (birthdate) | Position(s) Held With Fund | Term of Office and Length of Time Served | Principal Occupation(s) During Past Five Years | Number of Portfolios in Fund Complex Overseen by Director | Other Directorships Held by Director |
| | | | | | |
Independent Directors
| | | | | | |
Marc P. Blum (09/09/42) | Director | Director since 1986 | Chief Executive Officer, World Total Return Fund, LLLP; of Counsel to Gordon, Feinblatt, Rothman, Hoffberger and Hollander, LLC (law firm). | 13 | Director, Legg Mason Investment Counsel & Trust Company N.A. (asset management company) and Rodney Trust Company (Delaware). |
| | | | | | |
John S. Gates, Jr. (08/02/53) | Director | Director since 2007 | Chairman and Chief Executive Officer of PortaeCo LLC, a private investment company (beginning in 2006); Co-founder of CenterPoint Properties Trust (REIT); Co-chairman and Chief Executive Officer for 22 years (until 2006). | 13 | Director, DCT Industrial Trust (REIT). |
| | | | | | |
Thomas S. Gayner (12/16/61) | Director/ Chairman | Director since 2004 | Executive Vice President and Chief Investment Officer, Markel Corporation (insurance company). | 13 | Director, Washington Post Co. (publishing company); Director, Colfax Corp. (engineering and manufacturer of pumps and fluid handling equipment). |
| | | | | | |
G. Bernard Hamilton (03/18/37) | Director | Director since 1978 | Managing General Partner, Avanti Partners, L.P. (investment partnership), retired 2005. | 13 | none |
| | | | | | |
Samuel H. Iapalucci (07/19/52) | Director | Director since 2006 | Former Executive Vice President and Chief Financial Officer, CH2M-HILL Companies, Ltd. (engineering). | 13 | Director, Trow Global Holdings Inc. (engineering & consulting). |
| | | | | | |
Robert P. Morgenthau (03/22/57) | Director | Director since 2002 | Chairman, NorthRoad Capital Management, LLC (investment management firm) since June 2002. | 13 | none |
| | | | | | |
Christian R. Sonne (05/06/36) | Director | Director since 1990 | General Partner, Tuxedo Park Associates (land holding and development firm). | 13 | none |
| | | | | | |
Marsha Williams (03/28/51) | Director | Director since 1999 | Senior Vice President and Chief Financial Officer, Orbitz Worldwide, Inc. (travel-services provider) since 2007; former Executive Vice President and Chief Financial Officer, Equity Office Properties Trust (REIT). | 13 | Director, Modine Manufacturing, Inc. (heat transfer technology); Director, Chicago Bridge & Iron Company, N.V. (industrial construction and engineering); Director, Fifth Third Bancorp (diversified financial services). |
| DAVIS VALUE PORTFOLIO | Directors and Officers – (Continued) |
Name (birthdate) | Position(s) Held With Fund | Term of Office and Length of Time Served | Principal Occupation(s) During Past Five Years | Number of Portfolios in Fund Complex Overseen by Director | Other Directorships Held by Director |
| | | | | | |
Inside Directors*
| | | | | | |
Christopher C. Davis (07/13/65) | Director | Director since 1997 | President or Vice President of each Davis Fund, Selected Fund, and Clipper Fund; Chairman, Davis Selected Advisers, L.P., and also serves as an executive officer in certain companies affiliated with the Adviser, including sole member of the Adviser’s general partner, Davis Investments, LLC; Employee of Shelby Cullom Davis & Co. (registered broker/dealer). | 10 | Director, Davis New York Venture Fund, Inc. (consisting of four portfolios); Director, the Selected Funds (consisting of three portfolios) since 1998; Director, Washington Post Co. (publishing company). |
* Christopher C. Davis owns partnership units (directly, indirectly, or both) of the Adviser and is considered to be an “interested person” of the Funds as defined in the Investment Company Act of 1940.
Officers
Christopher C. Davis (born 07/13/65, Davis Funds officer since 1997). See description in the section on Inside Directors.
Andrew A. Davis (born 06/25/63, Davis Funds officer since 1997). President or Vice President of each of the Davis Funds (consisting of 13 portfolios) and Selected Funds (consisting of three portfolios); President, Davis Selected Advisers, L.P., serves as an executive officer in certain companies affiliated with the Adviser; Director of Davis Series, Inc. (consisting of six portfolios) and the Selected Funds (consisting of three portfolios).
Kenneth C. Eich (born 08/14/53, Davis Funds officer since 1997). Executive Vice President and Principal Executive Officer of each of the Davis Funds (consisting of 13 portfolios), Selected Funds (consisting of three portfolios), and Clipper Fund, Inc. (consisting of one portfolio); Chief Operating Officer, Davis Selected Advisers, L.P., and also serves as an executive officer in certain companies affiliated with the Adviser.
Douglas A. Haines (born 03/04/71, Davis Funds officer since 2004). Vice President, Treasurer, Chief Financial Officer, Principal Financial Officer, and Principal Accounting Officer of each of the Davis Funds (consisting of 13 portfolios), Selected Funds (consisting of three portfolios), and Clipper Fund, Inc. (consisting of one portfolio); Vice President and Director of Fund Accounting, Davis Selected Advisers, L.P.
Sharra L. Haynes (born 09/25/66, Davis Funds officer since 1997). Vice President, Chief Compliance Officer of each of the Davis Funds (consisting of 13 portfolios), Selected Funds (consisting of three portfolios), and Clipper Fund, Inc. (consisting of one portfolio); Vice President and Chief Compliance Officer, Davis Selected Advisers, L.P., and also serves as an executive officer in certain companies affiliated with the Adviser.
Thomas D. Tays (born 03/07/57, Davis Funds officer since 1997). Vice President and Secretary of each of the Davis Funds (consisting of 13 portfolios), Selected Funds (consisting of three portfolios), and Clipper Fund, Inc. (consisting of one portfolio); Vice President, Chief Legal Officer and Secretary, Davis Selected Advisers, L.P., and also serves as an executive officer in certain companies affiliated with the Adviser.
Arthur Don (born 09/24/53, Davis Funds officer since 1991). Assistant Secretary (for clerical purposes only) of each of the Davis Funds and Selected Funds; Shareholder, Greenberg Traurig, LLP (law firm); counsel to the Independent Directors and the Davis Funds.
| Investment Adviser | |
| Davis Selected Advisers, L.P. (Doing business as “Davis Advisors”) | |
| 2949 East Elvira Road, Suite 101 | |
| Tucson, Arizona 85756 | |
| (800) 279-0279 | |
| | |
| Distributor | |
| Davis Distributors, LLC | |
| 2949 East Elvira Road, Suite 101 | |
| Tucson, Arizona 85756 | |
| | |
| Transfer Agent | |
| Boston Financial Data Services, Inc. | |
| c/o The Davis Funds | |
| P.O. Box 8406 | |
| Boston, Massachusetts 02266-8406 | |
| | |
| Custodian | |
| State Street Bank and Trust Co. | |
| One Lincoln Street | |
| Boston, Massachusetts 02111 | |
| | |
| Counsel | |
| Greenberg Traurig, LLP | |
| 77 West Wacker Drive, Suite 3100 | |
| Chicago, Illinois 60601 | |
| | |
| Independent Registered Public Accounting Firm | |
| KPMG LLP | |
| 707 Seventeenth Street, Suite 2700 | |
| Denver, Colorado 80202 | |
For more information about Davis Value Portfolio, including management fee, charges, and expenses, see the current prospectus, which must precede or accompany this report. The Fund’s Statement of Additional Information contains additional information about the Fund’s Directors and is available without charge upon request by calling 1-800-279-0279 and on the Fund’s website at www.davisfunds.com. Quarterly Fact sheets are available on the Fund’s website at www.davisfunds.com.
| DAVIS FINANCIAL PORTFOLIO | Table of Contents |
| Management’s Discussion of Fund Performance | 2 |
| | |
| Fund Overview | 4 |
| | |
| Expense Example | 5 |
| | |
| Schedule of Investments | 6 |
| | |
| Statement of Assets and Liabilities | 8 |
| | |
| Statement of Operations | 9 |
| | |
| Statements of Changes in Net Assets | 10 |
| | |
| Notes to Financial Statements | 11 |
| | |
| Financial Highlights | 15 |
| | |
| Director Approval of Advisory Agreements | 16 |
| | |
| Fund Information | 18 |
| | |
| Directors and Officers | 19 |
| | |
This Semi-Annual Report is authorized for use by existing shareholders. Prospective shareholders must receive a current Davis Financial Portfolio prospectus, which contains more information about investment strategies, risks, charges, and expenses. Please read the prospectus carefully before investing or sending money.
Shares of the Davis Financial Portfolio are not deposits or obligations of any bank, are not guaranteed by any bank, are not insured by the FDIC or any other agency, and involve investment risks, including possible loss of the principal amount invested.
| DAVIS FINANCIAL PORTFOLIO | Management’s Discussion of Fund Performance |
Performance Overview
Davis Financial Portfolio delivered a negative return on net asset value of 7.01% for the six-month period ended June 30, 2010. Over the same time period, the Standard & Poor’s 500® Index (“Index”) declined 6.65%. The Index’s banking and insurance industry groups1 turned in positive performances, while the diversified financials industry group turned in a negative performance.
Factors Impacting the Portfolio’s Performance
The Portfolio’s financial sector holdings under-performed the corresponding sector within the Index (down 6% versus down 4% for the Index). The Portfolio had a limited amount of assets invested in other sectors. These non-financial holdings, mostly in energy and industrials, overall detracted2 from performance.
The Portfolio’s diversified financial companies were the largest detractors from performance. The Portfolio’s diversified financial companies out-performed the corresponding industry group within the Index (down 8% versus down 10% for the Index). Brookfield Asset Management3, First Marblehead, Oaktree, and JPMorgan Chase were among the most important contributors to performance. Moody’s, Visa, Goldman Sachs, Julius Baer Group, and Bank of New York Mellon were among the most important detractors from performance. The Portfolio no longer owns JPMorgan Chase.
The Portfolio’s insurance companies were the second largest detractors from performance. The Portfolio’s insurance companies under-performed the corresponding industry group within the Index (down 6% versus up 2% for the Index). Progressive, ACE, and FPIC Insurance Group were the most important contributors to performance. Transatlantic Holdings, Loews, and Everest Re Group were among the most important detractors from performance. The Portfolio no longer owns FPIC Insurance Group.
The Portfolio’s banking companies under-performed the corresponding industry group within the Index (down 1% versus up 3% for the Index). State Bank of India was among the most important contributors to performance.
The Portfolio ended the six-month period with approximately 27% of its net assets invested in foreign companies. As a whole these companies out-performed the domestic companies held by the Portfolio.
Davis Financial Portfolio’s investment objective is long-term growth of capital. There can be no assurance that the Portfolio will achieve its objective. Davis Financial Portfolio’s principal risks are: market risk, company risk, concentrated financial services portfolio risk, foreign country risk, small- and medium-capitalization risk, fees and expenses risk, focused portfolio risk, and headline risk. See the prospectus for a full description of each risk.
Davis Financial Portfolio concentrates its investments in the financial sector, and it may be subject to greater risks than a portfolio that does not concentrate its investments in a particular sector. The Portfolio’s investment performance, both good and bad, is expected to reflect the economic performance of the financial sector more than a portfolio that does not concentrate its portfolio.
1 The companies included in the Standard & Poor’s 500® Index are divided into ten sectors. One or more industry groups make up a sector.
2 A company’s or sector’s contribution to or detraction from the Portfolio’s performance is a product both of its appreciation or depreciation and its weighting within the portfolio. For example, a 5% holding that rises 20% has twice as much impact as a 1% holding that rises 50%.
3 This Management Discussion of Fund Performance discusses a number of individual companies. The information provided in this report does not provide information reasonably sufficient upon which to base an investment decision and should not be considered a recommendation to purchase or sell any particular security. The Schedule of Investments lists the Portfolio’s holdings of each company discussed.
| DAVIS FINANCIAL PORTFOLIO | Management’s Discussion of Fund Performance - (Continued) |
| | |
Comparison of a $10,000 investment in Davis Financial Portfolio versus the Standard & Poor’s 500® Index over 10 years for an investment made on June 30, 2000
Average Annual Total Return for periods ended June 30, 2010
| Fund & Benchmark Index | 1-Year | 5-Year | 10-Year | Since Fund’s Inception (07/01/99) | Gross Expense Ratio | Net Expense Ratio |
| Davis Financial Portfolio | 16.40% | (2.68)% | 1.15% | 1.06% | 0.68% | 0.68% |
Standard & Poor’s 500® Index | 14.43% | (0.79)% | (1.59)% | (0.87)% | | |
The Standard & Poor’s 500® Index is an unmanaged index of 500 selected common stocks, most of which are listed on the New York Stock Exchange. The Index is adjusted for dividends, weighted towards stocks with large market capitalizations, and represents approximately two-thirds of the total market value of all domestic common stocks. Investments cannot be made directly in the Index.
The performance data for Davis Financial Portfolio contained in this report represents past performance and assumes that all distributions were reinvested, and should not be considered as an indication of future performance from an investment in the Portfolio today. The investment return and principal value will fluctuate so that shares may be worth more or less than their original cost when redeemed. Portfolio performance changes over time and current performance may be higher or lower than stated. The operating expense ratio may vary in future years. For more current information please call Davis Funds Investor Services at 1-800-279-0279.
Portfolio performance numbers are net of all Portfolio operating expenses, but do not include any insurance charges imposed by your insurance company’s separate account. If performance included the effect of these additional charges, the return would be lower.
Davis Financial Portfolio received a favorable class action settlement from a company that it no longer owns. This settlement had a material impact on the investment performance of the Portfolio in 2009. This was a one-time event that is unlikely to be repeated.
| DAVIS FINANCIAL PORTFOLIO | Fund Overview |
| | June 30, 2010 (Unaudited) |
| Portfolio Composition | | Industry Weightings |
| (% of Fund’s Net Assets) | | (% of Stock Holdings) |
| | | | | | |
| | | | | Fund | S&P 500® |
| Common Stock (U.S.) | 72.31% | | Diversified Financials | 43.35% | 7.74% |
| Common Stock (Foreign) | 27.16% | | Insurance | 33.34% | 3.98% |
| Short Term Investments | 0.51% | | Banks | 14.90% | 3.20% |
| Other Assets & Liabilities | 0.02% | | Energy | 5.67% | 10.75% |
| | 100.00% | | Commercial & Professional Services | 2.74% | 0.64% |
| | | | Information Technology | – | 18.76% |
| | | | Health Care | – | 12.09% |
| | | | Capital Goods | – | 7.76% |
| | | | Food, Beverage & Tobacco | – | 6.18% |
| | | | Other | – | 28.90% |
| | | | | 100.00% | 100.00% |
| | | | | | |
| | | | | | |
Top 10 Holdings
(% of Fund’s Net Assets)
| | | |
| American Express Co. | Consumer Finance | 10.15% |
| Transatlantic Holdings, Inc. | Reinsurance | 9.16% |
| State Bank of India Ltd., GDR | Commercial Banks | 6.87% |
| Loews Corp. | Multi-line Insurance | 6.72% |
| Wells Fargo & Co. | Commercial Banks | 6.17% |
| Oaktree Capital Group LLC, Class A | Diversified Financial Services | 5.89% |
| Canadian Natural Resources Ltd. | Energy | 5.64% |
| Markel Corp. | Property & Casualty Insurance | 5.17% |
| Bank of New York Mellon Corp. | Capital Markets | 4.90% |
| Progressive Corp. | Property & Casualty Insurance | 3.92% |
| DAVIS FINANCIAL PORTFOLIO | Expense Example (Unaudited) |
Example
As a shareholder of the Fund, you incur ongoing costs only, including advisory and administrative fees and other Fund expenses. The Expense Example is intended to help you understand your ongoing costs (in dollars) of investing in the Fund and to compare these costs with the ongoing costs of investing in other mutual funds. The Expense Example is based on an investment of $1,000 invested at the beginning of the period and held for the entire period indicated, which for the Fund is for the six-month period ended June 30, 2010. Please note that the Expense Example is general and does not reflect charges imposed by your insurance company’s separate account or account specific costs, which may increase your total costs of investing in the Fund. If these charges or account specific costs were included in the Expense Example , the expenses would have been higher.
Actual Expenses
The information represented in the row entitled “Actual” provides information about actual account values and actual expenses. You may use the information in this row, together with the amount you invested, to estimate the expenses that you paid over the period. Simply divide your account value by $1,000 (for example, an $8,600 account value divided by $1,000 = 8.6), then, multiply the result by the number under the heading “Expenses Paid During Period” to estimate the expenses you paid on your account during this period.
Hypothetical Example for Comparison Purposes
The information represented in the row entitled “Hypothetical” provides information about hypothetical account values and hypothetical expenses based on the Fund’s actual expense ratio and an assumed rate of return of 5% per year before expenses, which is not the Fund’s actual return. The hypothetical account values and expenses may not be used to estimate the actual ending account balance or expenses you paid for the period. You may use this information to compare the ongoing costs of investing in the Fund and other funds. To do so, compare this 5% hypothetical example with the 5% hypothetical examples that appear in the shareholder reports of the other funds.
Please note that the expenses shown in the table are meant to highlight your ongoing costs only. Therefore, the information in the row entitled “Hypothetical” is useful in comparing ongoing costs only, and will not help you determine the relative total costs of owning different funds.
| | Beginning | Ending | Expenses Paid |
| | Account Value | Account Value | During Period* |
| | (01/01/2010) | (06/30/2010) | (01/01/2010-06/30/2010) |
| | | | |
Actual | $1,000.00 | $929.86 | $3.25 |
Hypothetical | $1,000.00 | $1,021.42 | $3.41 |
Hypothetical assumes 5% annual return before expenses.
* Expenses are equal to the Fund’s annualized operating expense ratio (0.68%)**, multiplied by the average account value over the period, multiplied by 181/365 (to reflect the one-half year period).
** The expense ratio reflects the impact, if any, of the reduction of expenses paid indirectly and of certain reimbursements from the Adviser.
| DAVIS FINANCIAL PORTFOLIO | Schedule of Investments |
| | June 30, 2010 (Unaudited) |
| Shares | | Security | | Value (Note 1) | |
| |
| | ENERGY – (5.64%) | |
| | 125,000 | Canadian Natural Resources Ltd. (Canada) | | $ | 4,153,750 | |
| |
| | Total Energy | | | 4,153,750 | |
| |
| | FINANCIALS – (91.10%) | |
| | Banks – (14.82%) | |
| | Commercial Banks – (14.82%) | |
| | 20,000 | Banco Santander Brasil S.A., ADS (Brazil) | | | 206,600 | |
| | 21,600 | ICICI Bank Ltd., ADR (India) | | | 780,624 | |
| | 50,948 | State Bank of India Ltd., GDR (India) | | | 5,060,851 | |
| | 14,500 | U.S. Bancorp | | | 324,075 | |
| | 177,500 | Wells Fargo & Co. | | | 4,544,000 | |
| |
| | | 10,916,150 | |
| |
| | Diversified Financials – (43.12%) | |
| | Capital Markets – (19.28%) | |
| | 41,860 | Ameriprise Financial, Inc. | | | 1,512,402 | |
| | 146,200 | Bank of New York Mellon Corp. | | | 3,609,678 | |
| | 100,300 | Brookfield Asset Management Inc., Class A (Canada) | | | 2,268,786 | |
| | 20,100 | Charles Schwab Corp. | | | 285,018 | |
| | 93,910 | GAM Holding Ltd. (Switzerland)* | | | 1,014,840 | |
| | 19,520 | Goldman Sachs Group, Inc. | | | 2,562,390 | |
| | 93,910 | Julius Baer Group Ltd. (Switzerland) | | | 2,677,617 | |
| | 6,060 | T. Rowe Price Group Inc. | | | 269,034 | |
| |
| | 14,199,765 | |
| |
| | Consumer Finance – (10.77%) | |
| | 188,300 | American Express Co. | | | 7,475,510 | |
| | 194,994 | First Marblehead Corp. * | | | 458,236 | |
| |
| | 7,933,746 | |
| |
| | Diversified Financial Services – (13.07%) | |
| | 14,486 | Bank of America Corp. | | | 208,164 | |
| | 69,500 | Cielo S.A. (Brazil) | | | 585,263 | |
| | 122,000 | Moody's Corp. | | | 2,430,240 | |
| | 126,700 | Oaktree Capital Group LLC, Class A (a) | | | 4,339,475 | |
| | 62,000 | RHJ International (Belgium)* | | | 459,274 | |
| | 22,600 | Visa Inc., Class A | | | 1,598,950 | |
| |
| | 9,621,366 | |
| |
| | 31,754,877 | |
| |
| | Insurance – (33.16%) | |
| | Life & Health Insurance – (3.79%) | |
| | 42,833 | China Life Insurance Co., Ltd., ADR (China) | | | 2,792,712 | |
| |
| | Multi-line Insurance – (6.72%) | |
| | 148,600 | Loews Corp. | | | 4,949,866 | |
| |
| | Property & Casualty Insurance – (10.81%) | |
| | 24,600 | ACE Ltd. | | | 1,266,408 | |
| | 11,200 | Markel Corp. * | | | 3,808,000 | |
| | 154,100 | Progressive Corp. (Ohio) | | | 2,884,752 | |
| |
| | 7,959,160 | |
| |
| | | |
| | | | | | | |
| DAVIS FINANCIAL PORTFOLIO | Schedule of Investments – (Continued) |
| | June 30, 2010 (Unaudited) |
| Shares/Principal | | Security | | Value (Note 1) | |
COMMON STOCK – (CONTINUED) | |
| | FINANCIALS – (CONTINUED) | |
| | Insurance – (Continued) | |
| | Reinsurance – (11.84%) | |
| | 27,900 | Everest Re Group, Ltd. | | $ | 1,973,088 | |
| | 140,737 | Transatlantic Holdings, Inc. | | | 6,749,746 | |
| |
| | 8,722,834 | |
| |
| | | 24,424,572 | |
| |
| | Total Financials | | | 67,095,599 | |
| |
| | INDUSTRIALS – (2.73%) | |
| | Commercial & Professional Services – (2.73%) | |
| | 29,900 | D&B Corp. | | | 2,006,888 | |
| |
| | Total Industrials | | | 2,006,888 | |
| |
| | TOTAL COMMON STOCK – (Identified cost $64,591,482) | | | 73,256,237 | |
| |
SHORT TERM INVESTMENTS – (0.51%) | |
| $ | 67,000 | Banc of America Securities LLC Joint Repurchase Agreement, | | | | | | |
| | 0.03%, 07/01/10, dated 06/30/10, repurchase value of $67,000 | | | | | | |
| | (collateralized by: U.S. Government agency obligations in a pooled cash account, 0.00%-5.00%, 12/08/10-07/15/20, total market value $68,340) | | | 67,000 | |
| | 97,000 | Goldman, Sachs & Co. Joint Repurchase Agreement, | | | | | | |
| | 0.01%, 07/01/10, dated 06/30/10, repurchase value of $97,000 | | | | | | |
| | (collateralized by: U.S. Government agency obligations in a pooled cash account, 0.00%-5.05%, 08/30/10-01/26/15, total market value $98,940) | | | 97,000 | |
| | 214,000 | Mizuho Securities USA Inc. Joint Repurchase Agreement, | | | | | | |
| | 0.14%, 07/01/10, dated 06/30/10, repurchase value of $214,001 | | | | | | |
| | (collateralized by: U.S. Government agency mortgages in a pooled cash account, 2.421%-6.229%, 09/01/19-07/01/40, total market value $218,280) | | | 214,000 | |
| |
| | TOTAL SHORT TERM INVESTMENTS – (Identified cost $378,000) | | | 378,000 | |
| |
| | Total Investments – (99.98%) – (Identified cost $64,969,482) – (b) | | | 73,634,237 | |
| | Other Assets Less Liabilities – (0.02%) | | | 15,530 | |
| |
| | Net Assets – (100.00%) | | $ | 73,649,767 | |
| |
| |
| | ADR: American Depositary Receipt | | |
| | | | |
| | ADS: American Depositary Share | | |
| | | | |
| | GDR: Global Depositary Receipt | | |
| | | | |
| | * | | Non-Income producing security. | |
| | | | | |
| | (a) | | Illiquid Security – See Note 7 of the Notes to Financial Statements. | |
| | | | | |
| | (b) | | Aggregate cost for federal income tax purposes is $65,123,027. At June 30, 2010 unrealized appreciation (depreciation) of securities for federal income tax purposes is as follows: | |
| | | | | |
| | Unrealized appreciation | | $ | 15,419,557 | |
| | Unrealized depreciation | | | (6,908,347) | |
| | Net unrealized appreciation | | $ | 8,511,210 | |
| |
| See Notes to Financial Statements | |
| DAVIS FINANCIAL PORTFOLIO | Statement of Assets and Liabilities |
| | | | | | | | | | | At June 30, 2010 (Unaudited) |
| ASSETS: | | | | |
Investments in securities at value* (see accompanying Schedule of Investments) | | $ | 73,634,237 | |
Cash | | | 2,736 | |
| Receivables: | | | | |
| | Capital stock sold | | | 39,530 | |
| | Dividends and interest | | | 174,040 | |
Prepaid expenses | | | 469 | |
| | Total assets | | | 73,851,012 | |
| LIABILITIES: | | | | |
| Payables: | | | | |
| | Capital stock redeemed | | | 135,240 | |
Accrued management fee | | | 39,573 | |
Other accrued expenses | | | 26,432 | |
| | Total liabilities | | | 201,245 | |
NET ASSETS | | $ | 73,649,767 | |
SHARES OUTSTANDING | | | 7,938,202 | |
| | | | | | |
NET ASSET VALUE, offering, and redemption price per share (Net assets ÷ Shares outstanding) | | $ | 9.28 | |
| NET ASSETS CONSIST OF: | | | | |
Par value of shares of capital stock | | $ | 7,938 | |
Additional paid-in capital | | | 76,172,454 | |
Undistributed net investment income | | | 974,606 | |
| Accumulated net realized losses from investments and foreign currency transactions | | | (12,170,192) | |
Net unrealized appreciation on investments and foreign currency transactions | | | 8,664,961 | |
| | Net Assets | | $ | 73,649,767 | |
| | | | | | |
| *Including: | | | | |
| | Cost of Investments | | $ | 64,969,482 | |
| | | | | | |
| See Notes to Financial Statements |
| | | | | | |
| DAVIS FINANCIAL PORTFOLIO | Statement of Operations |
For the six months ended June 30, 2010 (Unaudited) |
| INVESTMENT INCOME: | | | | |
| Income: | | | | |
| | Dividends* | | $ | 775,586 | |
| | Interest | | | 2,100 | |
| | Total income | | | 777,686 | |
| | | | | | | | | |
| Expenses: | | | | |
| | Management fees (Note 3) | | $ | 227,292 | | | | |
| | Custodian fees | | | 14,122 | | | | |
| | Transfer agent fees | | | 4,127 | | | | |
| | Audit fees | | | 9,000 | | | | |
| | Legal fees | | | 1,482 | | | | |
| | Accounting fees (Note 3) | | | 1,002 | | | | |
| | Reports to shareholders | | | 7,550 | | | | |
| | Directors’ fees and expenses | | | 11,886 | | | | |
| | Registration and filing fees | | | 27 | | | | |
| | Miscellaneous | | | 4,675 | | | | |
| | Total expenses | | | 281,163 | |
| | Expenses paid indirectly (Note 4) | | | (1) | |
| | Net expenses | | | 281,162 | |
| | Net investment income | | | 496,524 | |
| | | | | | | | | |
| REALIZED & UNREALIZED GAIN (LOSS) ON INVESTMENTS AND FOREIGN CURRENCY TRANSACTIONS: | | | | |
| Net realized gain (loss) from: | | | | |
| | Investment transactions | | | 1,241,185 | |
| | Foreign currency transactions | | | (12,061) | |
Net decrease in unrealized appreciation | | | (7,482,629) | |
| | Net realized and unrealized loss on investments and foreign currency transactions | | | (6,253,505) | |
| | Net decrease in net assets resulting from operations | | $ | (5,756,981) | |
| | | | | | | | | |
*Net of foreign taxes withheld as follows | | $ | 18,596 | |
| | | | | | | | | |
| See Notes to Financial Statements |
| DAVIS FINANCIAL PORTFOLIO | Statements of Changes in Net Assets |
| | | Six months ended June 30, 2010 (Unaudited) | | Year ended December 31, 2009 |
| | | | | | | | |
| OPERATIONS: | | | | | | |
| | Net investment income | | $ | 496,524 | | $ | 489,320 |
| | Net realized gain (loss) from investments and foreign currency transactions | | | 1,229,124 | | | (8,123,742) |
| | Net change in unrealized appreciation (depreciation) on investments and foreign currency transactions | | | (7,482,629) | | | 34,312,747 |
| | Net increase (decrease) in net assets resulting from operations | | | (5,756,981) | | | 26,678,325 |
| | | | | | | | |
| DIVIDENDS AND DISTRIBUTIONS TO SHAREHOLDERS FROM: | | | | | | |
| | Net investment income | | | – | | | (629,608) |
| | | | | | | | |
| CAPITAL SHARE TRANSACTIONS: | | | | | | |
| | Net increase (decrease) in net assets resulting from capital share transactions (Note 5) | | | (8,430,473) | | | 4,467,751 |
| | Total increase (decrease) in net assets | | | (14,187,454) | | | 30,516,468 |
| | | | | | | | |
| NET ASSETS: | | | | | | |
| | Beginning of period | | | 87,837,221 | | | 57,320,753 |
| | End of period* | | $ | 73,649,767 | | $ | 87,837,221 |
| | | | | | | | |
*Including undistributed net investment income of | | $ | 974,606 | | $ | 478,082 |
| | | | | | | | |
| See Notes to Financial Statements |
| DAVIS FINANCIAL PORTFOLIO | Notes to Financial Statements |
| | June 30, 2010 (Unaudited) |
NOTE 1 - SUMMARY OF SIGNIFICANT ACCOUNTING POLICIES
The Fund is a separate series of Davis Variable Account Fund, Inc. (a Maryland corporation), which is registered under the Investment Company Act of 1940, as amended, as a diversified, open-end management investment company. Only insurance companies, for the purpose of funding variable annuity or variable life insurance contracts, may purchase shares of the Fund. The following is a summary of significant accounting policies followed by the Fund in the preparation of financial statements.
Security Valuation - The Fund calculates the net asset value of its shares as of the close of the New York Stock Exchange (“Exchange”), normally 4:00 P.M. Eastern time, on each day the Exchange is open for business. Securities listed on the Exchange (and other national exchanges) are valued at the last reported sales price on the day of valuation. Securities traded in the over-the-counter market (e.g. NASDAQ) and listed securities for which no sale was reported on that date are stated at the average of closing bid and asked prices. Securities traded on foreign exchanges are valued based upon the last sales price on the principal exchange on which the security is traded prior to the time when the Fund’s assets a re valued. Securities (including restricted securities) for which market quotations are not readily available are valued at their fair value. Securities whose values have been materially affected by what Davis Selected Advisers, L.P. (“Davis Advisors” or “Adviser”), the Fund’s investment adviser, identifies as a significant event occurring before the Fund’s assets are valued but after the close of their respective exchanges will be fair valued. Fair value is determined in good faith using consistently applied procedures under the supervision of the Board of Directors. Short-term securities purchased within 60 days to maturity are valued at amortized cost, which approximates market value. These valuation procedures are reviewed and subject to approval by the Board of Directors.
Value Measurements - Fair value is defined as the price that the Fund would receive upon selling an investment in an orderly transaction to an independent buyer in the principal or most advantageous market for the investment. Various inputs are used to determine the fair value of the Fund’s investments. These inputs are summarized in the three broad levels listed below.
Level 1 – quoted prices in active markets for identical securities
Level 2 – other significant observable inputs (including quoted prices for similar investments, interest rates, prepayment
speeds, credit risk, etc.)
| Level 3 – significant unobservable inputs (including Fund’s own assumptions in determining the fair value of investments) |
The inputs or methodology used for valuing securities are not necessarily an indication of the risk associated with investing in those securities.
The following is a summary of the inputs used as of June 30, 2010 in valuing the Fund’s investments carried at value:
| | Investments in Securities at Value |
| | Valuation Inputs |
| | | | Level 2: | | Level 3: | | |
| | | | Other Significant | | Significant | | |
| | Level 1: | | Observable | | Unobservable | | |
| | Quoted Prices | | Inputs* | | Inputs | | Total |
Equity securities: | | | | | | | | | | | |
| Energy | $ | 4,153,750 | | $ | – | | $ | – | | $ | 4,153,750 |
| Financials | | 53,543,542 | | | 13,552,057 | | | – | | | 67,095,599 |
| Industrials | | 2,006,888 | | | – | | | – | | | 2,006,888 |
| Short-term securities | | – | | | 378,000 | | | – | | | 378,000 |
| Total | $ | 59,704,180 | | $ | 13,930,057 | | $ | – | | $ | 73,634,237 |
| | | | | | | | | | | | |
*Includes certain securities trading primarily outside the U.S. whose value the Fund adjusted as a result of significant market movements following the close of local trading.
Application of standing Board valuation procedures related to non-U.S. securities triggered transfers between Level 1 and Level 2 assets during the period. During the six months ended June 30, 2010, $2,677,617 transferred from Level 1 to Level 2.
| DAVIS FINANCIAL PORTFOLIO | Notes to Financial Statements – (Continued) |
| | June 30, 2010 (Unaudited) |
NOTE 1 - SUMMARY OF SIGNIFICANT ACCOUNTING POLICIES – (CONTINUED)
Master Repurchase Agreements - The Fund, along with other affiliated funds, may transfer uninvested cash balances into one or more master repurchase agreement accounts. These balances are invested in one or more repurchase agreements, secured by U.S. Government securities. A custodian bank holds securities pledged as collateral for repurchase agreements until the agreements mature. Each agreement requires that the market value of the collateral be sufficient to cover payments of interest and principal; however, in the event of default by the other party to the agreement, retention of the collateral may be subject to legal proceedings.
Currency Translation - The market values of all assets and liabilities denominated in foreign currencies are recorded in the financial statements after translation to the U.S. Dollar based upon the mean between the bid and offered quotations of the currencies against U.S. Dollars on the date of valuation. The cost basis of such assets and liabilities is determined based upon historical exchange rates. Income and expenses are translated at average exchange rates in effect as accrued or incurred.
Foreign Currency - The Fund may enter into forward purchases or sales of foreign currencies to hedge certain foreign currency denominated assets and liabilities against declines in market value relative to the U.S. Dollar. Forward currency contracts are marked-to-market daily and the change in market value is recorded by the Fund as an unrealized gain or loss. When the forward currency contract is closed, the Fund records a realized gain or loss equal to the difference between the value of the forward currency contract at the time it was opened and value at the time it was closed. Investments in forward currency contracts may expose the Fund to risks resulting from una nticipated movements in foreign currency exchange rates or failure of the counter-party to the agreement to perform in accordance with the terms of the contract.
Reported net realized foreign exchange gains or losses arise from the sales of foreign currencies, currency gains or losses realized between the trade and settlement dates on securities transactions, the difference between the amounts of dividends interest, and foreign withholding taxes recorded on the Fund’s books, and the U.S. Dollar equivalent of the amounts actually received or paid. Net unrealized foreign exchange gains and losses arise from changes in the value of assets and liabilities other than investments in securities at fiscal year end, resulting from changes in the exchange rate. The Fund includes foreign currency gains and losses realized on the sale of investments together with market gains and losses on such investments in the Statement of Operations.
Federal Income Taxes - It is the Fund’s policy to comply with the requirements of the Internal Revenue Code applicable to regulated investment companies, and to distribute substantially all of its taxable income, including any net realized gains on investments not offset by loss carryovers, to shareholders. Therefore, no provision for federal income or excise tax is required. The Adviser has analyzed the Fund’s tax positions taken on federal and state income tax returns for all open tax years and has concluded that as of June 30, 2010, no provision for income tax would be required in the Fund’s financial statements. The Fund’s federal and state (Arizona and Maryland) income and federal excise tax returns for tax years for which the applicable statutes of limitations have not expired are subject to examination by the Internal Revenue Service and state departments of revenue. The earliest tax year that remains subject to examination by these jurisdictions is 2006. At December 31, 2009, the Fund had available for federal income tax purposes unused capital loss carryforwards and post October 2009 capital losses as follows:
| | Capital Loss Carryforwards | | Post October 2009 Capital Losses |
| Expiring | | | | | |
| 12/31/2016 | $ | 4,739,000 | | $ | – |
| 12/31/2017 | | 8,267,000 | | | – |
| 12/31/2018 | | – | | 239,000 |
| | $ | 13,006,000 | | $ | 239,000 |
Securities Transactions and Related Investment Income - Securities transactions are accounted for on the trade date (date the order to buy or sell is executed) with realized gain or loss on the sale of securities being determined based upon identified cost. Dividend income is recorded on the ex-dividend date. Interest income, which includes accretion of discount and amortization of premium, is accrued as earned.
| DAVIS FINANCIAL PORTFOLIO | Notes to Financial Statements – (Continued) |
| | June 30, 2010 (Unaudited) |
NOTE 1 - SUMMARY OF SIGNIFICANT ACCOUNTING POLICIES – (CONTINUED)
Dividends and Distributions to Shareholders - Dividends and distributions to shareholders are recorded on the ex-dividend date. Net investment income (loss), net realized gains (losses), and net unrealized appreciation (depreciation) on investments may differ for financial statement and tax purposes primarily due to differing treatments of wash sales, foreign currency transactions, and partnership income. The character of dividends and distributions made during the fiscal year from net investment income and net realized securities gains may differ from their ultimate characterization for federal income tax purposes. Also, due to the timing of dividends and distributions, the fiscal year in which amounts are distributed may diffe r from the fiscal year in which income or realized gain was recorded by the Fund. The Fund adjusts certain components of capital to reflect permanent differences between financial statement amounts and net income and realized gains/losses determined in accordance with income tax rules.
Indemnification - Under the Fund’s organizational documents, its officers and directors are indemnified against certain liabilities arising out of the performance of their duties to the Fund. In addition, some of the Fund’s contracts with its service providers contain general indemnification clauses. The Fund’s maximum exposure under these arrangements is unknown since the amount of any future claims that may be made against the Fund cannot be determined and the Fund has no historical basis for predicting the likelihood of any such claims.
Use of Estimates in Financial Statements - In preparing financial statements in conformity with accounting principles generally accepted in the United States of America, management makes estimates and assumptions that affect the reported amounts of assets and liabilities and disclosure of contingent assets and liabilities at the date of the financial statements, as well as the reported amounts of income and expenses during the reporting period. Actual results may differ from these estimates.
Directors Fees and Expenses - The Fund set up a Rabbi Trust to provide for the deferred compensation plan for Independent Directors that enables them to elect to defer receipt of all or a portion of annual fees they are entitled to receive. The value of an eligible Director’s account is based upon years of service and fees paid to each Director during the years of service. The amount paid to the Director under the plan will be determined based upon the performance of the Davis Funds
NOTE 2 - PURCHASES AND SALES OF SECURITIES
Purchases and sales of investment securities (excluding short-term securities) during the six months ended June 30, 2010 were $760,892 and $8,284,312, respectively.
NOTE 3 - INVESTMENT ADVISORY FEES AND OTHER TRANSACTIONS WITH AFFILIATES
Advisory fees are paid monthly to the Adviser at an annual rate of 0.55% of the Fund’s average net assets.
Boston Financial Data Services, Inc. (“BFDS”) is the Fund’s primary transfer agent. State Street Bank and Trust Company (“State Street Bank”) is the Fund’s primary accounting provider. Fees for such services are included in the custodian fee as State Street Bank also serves as the Fund’s custodian. The Adviser is also paid for certain accounting services. The fee paid to the Adviser for these services for the six months ended June 30, 2010 amounted to $1,002. Certain directors and officers of the Fund are also directors and officers of the general partner of the Adviser.
Davis Selected Advisers-NY, Inc. (“DSA-NY”), a wholly-owned subsidiary of the Adviser, acts as sub-adviser to the Fund. DSA-NY performs research and portfolio management services for the Fund under a Sub-Advisory Agreement with the Adviser. The Fund pays no fees directly to DSA-NY.
NOTE 4 - EXPENSES PAID INDIRECTLY
Under an agreement with State Street Bank, custodian fees are reduced for earnings on cash balances maintained at the custodian by the Fund. Such reductions amounted to $1 during the six months ended June 30, 2010.
| DAVIS FINANCIAL PORTFOLIO | Notes to Financial Statements – (Continued) |
| | June 30, 2010 (Unaudited) |
NOTE 5 - CAPITAL STOCK
At June 30, 2010, there were 500 million shares of capital stock ($0.001 par value per share) authorized. Transactions in capital stock were as follows:
| | | Six months ended | | Year ended |
| | | June 30, 2010 (Unaudited) | | December 31, 2009 |
| | | Shares | | Amount | | Shares | | Amount |
| Shares sold | | 870,632 | | $ | 8,789,085 | | 3,303,661 | | $ | 26,457,753 |
| Shares issued in reinvestment of distributions | | – | | | – | | 63,087 | | | 629,608 |
| | | 870,632 | | | 8,789,085 | | 3,366,748 | | | 27,087,361 |
| Shares redeemed | | (1,730,799) | | | (17,219,558) | | (2,616,379) | | | (22,619,610) |
| Net increase (decrease) | | (860,167) | | $ | (8,430,473) | | 750,369 | | $ | 4,467,751 |
NOTE 6 - BANK BORROWINGS
The Fund may borrow up to 5% of its assets from a bank to purchase portfolio securities, or for temporary and emergency purposes. The purchase of securities with borrowed funds creates leverage in the Fund. The Fund has entered into an agreement, which enables it to participate with certain other funds managed by the Adviser in an unsecured line of credit with a bank, which permits borrowings up to $50 million, collectively. Interest is charged based on its borrowings, at a rate equal to the higher of the Federal Funds Rate or the Overnight Libor Rate, plus 1.25%. The Fund had no borrowings during the six months ended June 30, 2010.
NOTE 7 - ILLIQUID SECURITIES
Securities may be considered illiquid if they lack a readily available market or if valuation has not changed for a certain period of time. The aggregate value of illiquid securities amounted to $4,339,475 or 5.89% of the Fund’s net assets as of June 30, 2010.
Information regarding illiquid securities is as follows:
| Security | | Acquisition Date | | Shares | | Cost per Share | | Valuation per Share as of June 30, 2010 |
| | | | | | | | | | | |
| Oaktree Capital Group LLC, Class A | | 05/21/07 | | 126,700 | | $ | 23.84 | | $ | 34.25 |
NOTE 8 - SUBSEQUENT EVENTS
Fund management has determined that no material events or transactions occurred subsequent to June 30, 2010 and through the issuance of the financial statements, which required adjustments and/or additional disclosure.
| DAVIS FINANCIAL PORTFOLIO | Financial Highlights |
| The following financial information represents selected data for each share of capital stock outstanding throughout each period: |
| | | | | | | | | | | | | | | | | | | | | | | | | | | | | | | | | | |
| | Six months ended June 30, 2010 | | Year ended December 31, | |
| | (Unaudited) | | 2009 | | 2008 | | 2007 | | 2006 | | 2005 | |
| Net Asset Value, Beginning of Period | | $ | 9.98 | | $ | 7.12 | | $ | 14.27 | | $ | 16.29 | | $ | 13.83 | | $ | 12.82 | |
| | | | | | | | | | | | | | | | | | | | | | | | | | | | | | | | | | |
| Income (Loss) from Investment Operations: | | | | | | | | | | | | | | | | | | | | | | | | | | | | | | | | |
| | Net Investment Income | | 0.07 | | 0.05 | | 0.08 | | 0.17 | | 0.09 | | 0.07 | |
| | Net Realized and Unrealized Gains (Losses) | | (0.77) | | 2.88 | | (6.76) | | (1.12) | | 2.47 | | 1.00 | |
| | Total from Investment Operations | | (0.70) | | 2.93 | | (6.68) | | (0.95) | | 2.56 | | 1.07 | |
| | | | | | | | | | | | | | | | | | | | | | | | | | | | | | | | | | |
| Dividends and Distributions: | | | | | | | | | | | | | | | | | | | | | | | | | | | | | | | | |
| | Dividends from Net Investment Income | | – | | (0.07) | | – | | (0.17) | | (0.09) | | (0.06) | |
| | Distributions from Realized Gains | | – | | – | | (0.47) | | (0.90) | | (0.01) | | – | |
| | Total Dividends and Distributions | | – | | (0.07) | | (0.47) | | (1.07) | | (0.10) | | (0.06) | |
Net Asset Value, End of Period | | $ | 9.28 | | $ | 9.98 | | $ | 7.12 | | $ | 14.27 | | $ | 16.29 | | $ | 13.83 | |
| | | | | | | | | | | | | | | | | | | | | | | | | | | | | | | | | | |
Total Returna | | (7.01) | % | | 41.18 | %b | | (46.36) | % | | (6.05) | % | | 18.50 | % | | 8.38 | % | |
| | | | | | | | | | | | | | | | | | | | | | | | | | | | | | | | | | |
| Ratios/Supplemental Data: | | | | | | | | | | | | | | | | | | | | | | | | | | | | | | | | |
| | Net Assets, End of Period (in thousands) | | $ | 73,650 | | | $ | 87,837 | | | $ | 57,321 | | | $ | 116,725 | | | $ | 155,807 | | | $ | 124,060 | | |
| | Ratio of Expenses to Average Net Assets: | | | | | | | | | | | | | | | | | | | | | | | | | | | | | | | | |
| | Gross | | 0.68 | %c | | 0.78 | % | | 0.88 | % | | 0.85 | % | | 0.84 | % | | 0.85 | % | |
| | Netd | | 0.68 | %c | | 0.78 | % | | 0.88 | % | | 0.85 | % | | 0.84 | % | | 0.85 | % | |
| Ratio of Net Investment Income to Average Net Assets | | 1.20 | %c | | 0.67 | % | | 0.73 | % | | 0.97 | % | | 0.66 | % | | 0.52 | % | |
Portfolio Turnover Ratee | | 1 | % | | 10 | % | | 16 | % | | 17 | % | | 9 | % | | 21 | % | |
| | | | | | | | | | | | | | | | | | | | | | | | | | | | | | | | | | |
| a | Assumes hypothetical initial investment on the business day before the first day of the fiscal period, with all dividends and distributions reinvested in additional shares on the reinvestment date, and redemption at the net asset value calculated on the last business day of the fiscal period. Total returns are not annualized for periods of less than one year and do not reflect charges attributable to your insurance company’s separate account. Inclusion of these charges would reduce the total returns shown. | | |
| | | | |
| b | Davis Financial Portfolio received a favorable class action settlement from a company that it no longer owns. This settlement had an approximate impact of 0.4% on the investment performance of the Fund in 2009. This was a one-time event that is unlikely to be repeated. | | |
| | | | |
| c | Annualized. | | |
| | | | |
| d | The Net Ratio of Expenses to Average Net Assets reflects the impact, if any, of the reduction of expenses paid indirectly and of certain reimbursements from the Adviser. | | |
| | | | |
| e | The lesser of purchases or sales of portfolio securities for a period, divided by the monthly average of the market value of portfolio securities owned during the period. Securities with a maturity or expiration date at the time of acquisition of one year or less are excluded from the calculation. | | |
| | | | |
| See Notes to Financial Statements |
| DAVIS FINANCIAL PORTFOLIO | Director Approval of Advisory Agreements |
Process of Annual Review
The Board of Directors of the Davis Funds oversees the management of each Davis Fund and, as required by law, determines annually whether to approve the continuance of each Davis Fund’s advisory agreement with Davis Selected Advisers, L.P. and sub-advisory agreement with Davis Selected Advisers-NY, Inc. (jointly “Davis Advisors” and “Advisory Agreements”).
As a part of this process the Independent Directors, with the assistance of counsel for the Independent Directors, prepared questions submitted to Davis Advisors in anticipation of the annual contract review. The Independent Directors were provided with responsive background material (including recent investment performance data), and their counsel provided guidance, prior to a separate contract review meeting held in March 2010 where the Independent Directors reviewed and evaluated all information which they deemed reasonably necessary in the circumstances. Upon completion of this review, the Independent Directors found that the terms of the Advisory Agreements are fair and reasonable and that continuation of the Advisory Agreements was in the best interest of Davis Financial Portfolio and its shareholders.
Reasons the Independent Directors Approved Continuation of the Advisory Agreements
The Independent Directors’ determinations were based upon a comprehensive consideration of all information provided to the Independent Directors and were not the result of any single factor. The following facts and conclusions were important, but not exclusive, in the Independent Directors’ recommendation to renew the Advisory Agreements.
The Independent Directors considered not only the investment performance of the Fund, but also the full range and quality of services provided by Davis Advisors to the Fund and its shareholders, including whether it:
| 1. | Achieves satisfactory investment results over the long-term after all costs; |
| 2. | Handles shareholder transactions, inquiries, requests, and records efficiently and effectively, and provides quality accounting, legal, and compliance services, and oversight of third party service providers; and |
| 3. | Fosters healthy investor behavior. |
Davis Advisors is reimbursed a portion of its costs in providing some, but not all, of these services.
A shareholder’s ultimate return is the product of a fund’s results as well as the shareholder’s behavior, specifically in selecting when to invest or redeem. The Independent Directors concluded that, through its actions and communications, Davis Advisors has attempted to have a meaningful, positive impact on investor behavior.
The Independent Directors noted the importance of reviewing quantitative measures, but also recognized that qualitative factors are also important in assessing whether Davis Fund shareholders are likely to be well served by the renewal of the Advisory Agreements. They noted both the value and shortcomings of purely quantitative measures, including the data provided by independent service providers, and concluded that while such measures and data may be informative, the judgment of the Independent Directors must take many factors, including those listed below, into consideration in representing the shareholders of the Davis Funds. In connection with reviewing comparative performance information, the Independent Directors generally give weight to longer-term measurements.
The Independent Directors expect Davis Advisors to employ a disciplined, company-specific, research-driven, businesslike, long-term investment philosophy.
The Independent Directors recognized Davis Advisors’ (a) efforts to minimize transaction costs by generally having a long-term time horizon and low portfolio turnover; (b) record of generally producing satisfactory results over longer-term periods; (c) efforts towards fostering healthy investor behavior by, among other things, providing informative and substantial educational material; and (d) efforts to promote shareholder interests by actively speaking out on corporate governance issues.
| DAVIS FINANCIAL PORTFOLIO | Director Approval of Advisory Agreements – (Continued) |
Reasons the Independent Directors Approved Continuation of the Advisory Agreements – (Continued)
The Independent Directors reviewed (a) comparative fee and expense information for other funds, as selected and analyzed by a nationally recognized independent service provider; (b) information regarding fees charged by Davis Advisors to other advisory clients, including funds which it sub-advises and private accounts, as well as the differences in the services provided to such other clients; and (c) the fee schedule of the Fund, including an assessment of competitive fee schedules.
Effective July 1, 2009, Davis Advisors voluntarily and permanently reduced all management fee breakpoints above 0.55% to 0.55%. The former fee schedule for the Fund was a flat 0.75%. The Fund now has a flat fee of 0.55%, resulting in a fee which the Independent Directors noted was both lower than under its previous schedule and lower than the average fees of its peer group as determined by an independent service provider.
The Independent Directors reviewed the fixed management fee for the Fund and the profitability of the Fund to Davis Advisors, the extent to which economies of scale might be realized if the Fund’s net assets increased, and whether the fixed fee reflected those potential economies of scale. The Independent Directors considered the nature, quality, and extent of the services being provided to the Fund and the costs incurred by Davis Advisors in providing such services. The Independent Directors considered various potential benefits that Davis Advisors may receive in connection with the services it provides under the Advisory Agreements with the Fund, including a review of portfolio brokerage practices. The Independent Directors noted that Davis Advisors does not use client commissions to pay for publications that are available to t he general public or for third-party research services.
The Independent Directors noted that Davis Financial Portfolio had out-performed its benchmark, the Standard & Poor’s 500® Index, over the one- and ten-year time periods and under-performed over the three- and five-year time periods, all ended February 28, 2010. The Fund out-performed the average performance of its peer group as determined by an independent service provider over the one-, three-, five-, and ten-year time periods ended December 31, 2009. The Independent Directors noted that the Fund out-performed the Standard & Poor’s 500® Index in 3 of the 6 rolling five calendar year time frames, and its peer group in all of the 6 rolling five calend ar year time frames ended December 31, 2009. The Fund out-performed both the Index and its peers in the 1 rolling ten calendar year time frame ended December 31, 2009.
The Independent Directors also considered the total expense ratio for Davis Financial Portfolio, noting that the expenses were reasonable and below the average ratios of its peer group as determined by an independent service provider
Approval of Advisory Agreements
The Independent Directors concluded that Davis Advisors had provided Davis Financial Portfolio and its shareholders a reasonable level of both investment and non-investment services. The Independent Directors further concluded that shareholders have received a significant benefit from Davis Advisors’ shareholder oriented approach, as well as the execution of its investment discipline.
The Independent Directors determined that the advisory fee for Davis Financial Portfolio was reasonable in light of the nature, quality and extent of the services being provided to the Fund, the costs incurred by Davis Advisors in providing such service, and in comparison to the range of the average advisory fees of its peer group as determined by an independent service provider. The Independent Directors found that the terms of the Advisory Agreements are fair and reasonable and that continuation of the Advisory Agreements was in the best interest of the Fund and its shareholders. The Independent Directors and the full Board of Directors therefore voted to continue the Advisory Agreements.
| DAVIS FINANCIAL PORTFOLIO | Fund Information |
Portfolio Proxy Voting Policies and Procedures
The Fund has adopted Portfolio Proxy Voting Policies and Procedures under which the Fund votes proxies relating to securities held by the Fund. A description of the Fund’s Portfolio Proxy Voting Policies and Procedures is available (i) without charge, upon request, by calling the Fund toll-free at 1-800-279-0279, (ii) on the Fund’s website at www.davisfunds.com, and (iii) on the SEC’s website at www.sec.gov.
In addition, the Fund is required to file Form N-PX, with its complete proxy voting record for the 12 months ended June 30th, no later than August 31st of each year. The Fund’s Form N-PX filing is available (i) without charge, upon request, by calling the Fund toll-free at 1-800-279-0279, (ii) on the Fund’s website at www.davisfunds.com, and (iii) on the SEC’s website at www.sec.gov.
Form N-Q
The Fund files its complete schedule of portfolio holdings with the SEC for the first and third quarters of each fiscal year on Form N-Q. The Fund’s Form N-Q is available without charge, upon request, by calling 1-800-279-0279 or on the Fund’s website at www.davisfunds.com or on the SEC’s website at www.sec.gov. The Fund’s Form N-Q may be reviewed and copied at the SEC’s Public Reference Room in Washington, DC, and information on the operation of the Public Reference Room may be obtained by calling 1-800-SEC-0330.
| DAVIS FINANCIAL PORTFOLIO | | | | | | Directors and Officers |
For the purposes of their service as directors to the Davis Funds, the business address for each of the directors is 2949 E. Elvira Road, Suite 101, Tucson, AZ 85756. Each Director serves until their retirement, resignation, death or removal. Subject to exceptions and exemptions, which may be granted by the Independent Directors, Directors must retire at the close of business on the last day of the calendar year in which the Director attains age seventy-four (74).
Name (birthdate) | Position(s) Held With Fund | Term of Office and Length of Time Served | Principal Occupation(s) During Past Five Years | Number of Portfolios in Fund Complex Overseen by Director | Other Directorships Held by Director |
| | | | | | |
Independent Directors
| | | | | | |
Marc P. Blum (09/09/42) | Director | Director since 1986 | Chief Executive Officer, World Total Return Fund, LLLP; of Counsel to Gordon, Feinblatt, Rothman, Hoffberger and Hollander, LLC (law firm). | 13 | Director, Legg Mason Investment Counsel & Trust Company N.A. (asset management company) and Rodney Trust Company (Delaware). |
| | | | | | |
John S. Gates, Jr. (08/02/53) | Director | Director since 2007 | Chairman and Chief Executive Officer of PortaeCo LLC, a private investment company (beginning in 2006); Co-founder of CenterPoint Properties Trust (REIT); Co-chairman and Chief Executive Officer for 22 years (until 2006). | 13 | Director, DCT Industrial Trust (REIT). |
| | | | | | |
Thomas S. Gayner (12/16/61) | Director/ Chairman | Director since 2004 | Executive Vice President and Chief Investment Officer, Markel Corporation (insurance company). | 13 | Director, Washington Post Co. (publishing company); Director, Colfax Corp. (engineering and manufacturer of pumps and fluid handling equipment). |
| | | | | | |
G. Bernard Hamilton (03/18/37) | Director | Director since 1978 | Managing General Partner, Avanti Partners, L.P. (investment partnership), retired 2005. | 13 | none |
| | | | | | |
Samuel H. Iapalucci (07/19/52) | Director | Director since 2006 | Former Executive Vice President and Chief Financial Officer, CH2M-HILL Companies, Ltd. (engineering). | 13 | Director, Trow Global Holdings Inc. (engineering & consulting). |
| | | | | | |
Robert P. Morgenthau (03/22/57) | Director | Director since 2002 | Chairman, NorthRoad Capital Management, LLC (investment management firm) since June 2002. | 13 | none |
| | | | | | |
Christian R. Sonne (05/06/36) | Director | Director since 1990 | General Partner, Tuxedo Park Associates (land holding and development firm). | 13 | none |
| | | | | | |
Marsha Williams (03/28/51) | Director | Director since 1999 | Senior Vice President and Chief Financial Officer, Orbitz Worldwide, Inc. (travel-services provider) since 2007; former Executive Vice President and Chief Financial Officer, Equity Office Properties Trust (REIT). | 13 | Director, Modine Manufacturing, Inc. (heat transfer technology); Director, Chicago Bridge & Iron Company, N.V. (industrial construction and engineering); Director, Fifth Third Bancorp (diversified financial services). |
| DAVIS FINANCIAL PORTFOLIO | Directors and Officers – (Continued) |
Name (birthdate) | Position(s) Held With Fund | Term of Office and Length of Time Served | Principal Occupation(s) During Past Five Years | Number of Portfolios in Fund Complex Overseen by Director | Other Directorships Held by Director |
| | | | | | |
Inside Directors*
| | | | | | |
Christopher C. Davis (07/13/65) | Director | Director since 1997 | President or Vice President of each Davis Fund, Selected Fund, and Clipper Fund; Chairman, Davis Selected Advisers, L.P., and also serves as an executive officer in certain companies affiliated with the Adviser, including sole member of the Adviser’s general partner, Davis Investments, LLC; Employee of Shelby Cullom Davis & Co. (registered broker/dealer). | 10 | Director, Davis New York Venture Fund, Inc. (consisting of four portfolios); Director, the Selected Funds (consisting of three portfolios) since 1998; Director, Washington Post Co. (publishing company). |
* Christopher C. Davis owns partnership units (directly, indirectly, or both) of the Adviser and is considered to be an “interested person” of the Funds as defined in the Investment Company Act of 1940.
Officers
Christopher C. Davis (born 07/13/65, Davis Funds officer since 1997). See description in the section on Inside Directors.
Andrew A. Davis (born 06/25/63, Davis Funds officer since 1997). President or Vice President of each of the Davis Funds (consisting of 13 portfolios) and Selected Funds (consisting of three portfolios); President, Davis Selected Advisers, L.P., serves as an executive officer in certain companies affiliated with the Adviser; Director of Davis Series, Inc. (consisting of six portfolios) and the Selected Funds (consisting of three portfolios).
Kenneth C. Eich (born 08/14/53, Davis Funds officer since 1997). Executive Vice President and Principal Executive Officer of each of the Davis Funds (consisting of 13 portfolios), Selected Funds (consisting of three portfolios), and Clipper Fund, Inc. (consisting of one portfolio); Chief Operating Officer, Davis Selected Advisers, L.P., and also serves as an executive officer in certain companies affiliated with the Adviser.
Douglas A. Haines (born 03/04/71, Davis Funds officer since 2004). Vice President, Treasurer, Chief Financial Officer, Principal Financial Officer, and Principal Accounting Officer of each of the Davis Funds (consisting of 13 portfolios), Selected Funds (consisting of three portfolios), and Clipper Fund, Inc. (consisting of one portfolio); Vice President and Director of Fund Accounting, Davis Selected Advisers, L.P.
Sharra L. Haynes (born 09/25/66, Davis Funds officer since 1997). Vice President, Chief Compliance Officer of each of the Davis Funds (consisting of 13 portfolios), Selected Funds (consisting of three portfolios), and Clipper Fund, Inc. (consisting of one portfolio); Vice President and Chief Compliance Officer, Davis Selected Advisers, L.P., and also serves as an executive officer in certain companies affiliated with the Adviser.
Thomas D. Tays (born 03/07/57, Davis Funds officer since 1997). Vice President and Secretary of each of the Davis Funds (consisting of 13 portfolios), Selected Funds (consisting of three portfolios), and Clipper Fund, Inc. (consisting of one portfolio); Vice President, Chief Legal Officer and Secretary, Davis Selected Advisers, L.P., and also serves as an executive officer in certain companies affiliated with the Adviser.
Arthur Don (born 09/24/53, Davis Funds officer since 1991). Assistant Secretary (for clerical purposes only) of each of the Davis Funds and Selected Funds; Shareholder, Greenberg Traurig, LLP (law firm); counsel to the Independent Directors and the Davis Funds.
| DAVIS FINANCIAL PORTFOLIO |
| Investment Adviser | |
| Davis Selected Advisers, L.P. (Doing business as “Davis Advisors”) | |
| 2949 East Elvira Road, Suite 101 | |
| Tucson, Arizona 85756 | |
| (800) 279-0279 | |
| | |
| Distributor | |
| Davis Distributors, LLC | |
| 2949 East Elvira Road, Suite 101 | |
| Tucson, Arizona 85756 | |
| | |
| Transfer Agent | |
| Boston Financial Data Services, Inc. | |
| c/o The Davis Funds | |
| P.O. Box 8406 | |
| Boston, Massachusetts 02266-8406 | |
| | |
| Custodian | |
| State Street Bank and Trust Co. | |
| One Lincoln Street | |
| Boston, Massachusetts 02111 | |
| | |
| Counsel | |
| Greenberg Traurig, LLP | |
| 77 West Wacker Drive, Suite 3100 | |
| Chicago, Illinois 60601 | |
| | |
| Independent Registered Public Accounting Firm | |
| KPMG LLP | |
| 707 Seventeenth Street, Suite 2700 | |
| Denver, Colorado 80202 | |
For more information about Davis Financial Portfolio, including management fee, charges, and expenses, see the current prospectus, which must precede or accompany this report. The Fund’s Statement of Additional Information contains additional information about the Fund’s Directors and is available without charge upon request by calling 1-800-279-0279 and on the Fund’s website at www.davisfunds.com. Quarterly Fact sheets are available on the Fund’s website at www.davisfunds.com.
| DAVIS REAL ESTATE PORTFOLIO | Table of Contents |
| Management’s Discussion of Fund Performance | 2 |
| | |
| Fund Overview | 4 |
| | |
| Expense Example | 5 |
| | |
| Schedule of Investments | 6 |
| | |
| Statement of Assets and Liabilities | 9 |
| | |
| Statement of Operations | 10 |
| | |
| Statements of Changes in Net Assets | 11 |
| | |
| Notes to Financial Statements | 12 |
| | |
| Financial Highlights | 16 |
| | |
| Director Approval of Advisory Agreements | 17 |
| | |
| Fund Information | 19 |
| | |
| Directors and Officers | 20 |
| | |
This Semi-Annual Report is authorized for use by existing shareholders. Prospective shareholders must receive a current Davis Real Estate Portfolio prospectus, which contains more information about investment strategies, risks, charges, and expenses. Please read the prospectus carefully before investing or sending money.
Shares of the Davis Real Estate Portfolio are not deposits or obligations of any bank, are not guaranteed by any bank, are not insured by the FDIC or any other agency, and involve investment risks, including possible loss of the principal amount invested.
| DAVIS REAL ESTATE PORTFOLIO | Management’s Discussion of Fund Performance |
Performance Overview
Davis Real Estate Portfolio delivered a total return on net asset value of 4.03% for the six-month period ended June 30, 2010. Over the same time period, the Wilshire U.S. Real Estate Securities Index (“Index”) returned 5.40%. Industrial REITs was the only sub-industry1 within the Index to deliver a negative return, while specialized REITs, residential REITs, and real estate operating companies turned in the strongest performances.
Factors Impacting the Portfolio’s Performance
Residential REITs were the most important contributors2 to the Portfolio’s performance, but the most important detractors from performance relative to the Index. The Portfolio’s residential REITs under-performed the corresponding sub-industry within the Index (up 10% versus up 15% for the Index) and had a lower relative average weighting (11% versus 16% for the Index). Essex Property Trust3 and AvalonBay were among the most important contributors to performance. UDR was among the most important detractors from performance. The Portfolio no longer owns AvalonBay.
Specialized REITs were the second most important contributors to performance. The Portfolio’s specialized REITs out-performed the corresponding sub-industry within the Index (up 10% versus up 7% for the Index) and had a lower relative average weighting (11% versus 26% for the Index). Host Hotels & Resorts, Ventas, Cogdell Spencer, and Entertainment Properties were among the most important contributors to performance. The Portfolio no longer owns Host Hotels & Resorts.
The Portfolio had more invested in office REITs than in any other sub-industry and they were the third most important contributors to performance. The Portfolio’s office REITs out-performed the corresponding sector within the Index (up 6% versus up 3% for the Index) and had a higher relative average weighting (29% versus 17% for the Index). Digital Realty and Boston Properties were among the most important contributors to performance. Highwoods Properties and Alexandria Real Estate were among the most important detractors from performance.
Forest City Enterprises was the single most important detractor from the Portfolio’s performance. The Portfolio’s large investment in Forest City Enterprises (approximately 5%) together with its poor investment performance (down 4%) accounted for the majority of the Portfolio’s under-performance relative to the Index.
Industrial REITs were also important detractors from performance. The Portfolio’s industrial REITs out-performed the corresponding sub-industry within the Index (down 8% versus down 14% for the Index) and had approximately the same average weighting (both approximately 5%). DCT Industrial Trust and ProLogis were among the most important detractors from performance. The Portfolio no longer owns ProLogis.
Davis Real Estate Portfolio’s investment objective is total return through a combination of growth and income. There can be no assurance that the Portfolio will achieve its objective. Davis Real Estate Portfolio’s principal risks are: market risk, company risk, concentrated real estate services portfolio risk, focused portfolio risk, foreign country risk, small- and medium-capitalization risk, fees and expenses risk, and headline risk. See the prospectus for a full description of each risk.
Davis Real Estate Portfolio concentrates its investments in the real estate sector, and it may be subject to greater risks than a portfolio that does not concentrate its investments in a particular sector. The Portfolio’s investment performance, both good and bad, is expected to reflect the economic performance of the real estate sector much more than a portfolio that does not concentrate its portfolio.
Davis Real Estate Portfolio is allowed to focus its investments in fewer companies, and it may be subject to greater risks than a more diversified portfolio that is not allowed to focus its investments in a few companies. Should the portfolio manager determine that it is prudent to focus the Portfolio’s portfolio in a few companies, the Portfolio’s investment performance, both good and bad, is expected to reflect the economic performance of its more focused portfolio.
1 The companies included in the Wilshire U.S. Real Estate Securities Index are divided into eight sub-industries.
2 A company’s or sector’s contribution to or detraction from the Portfolio’s performance is a product both of its appreciation or depreciation and its weighting within the portfolio. For example, a 5% holding that rises 20% has twice as much impact as a 1% holding that rises 50%.
3 This Management Discussion of Fund Performance discusses a number of individual companies. The information provided in this report does not provide information reasonably sufficient upon which to base an investment decision and should not be considered a recommendation to purchase or sell any particular security. The Schedule of Investments lists the Portfolio’s holdings of each company discussed.
| DAVIS REAL ESTATE PORTFOLIO | Management’s Discussion of Fund Performance – (Continued) |
Comparison of a $10,000 investment in Davis Real Estate Portfolio versus the Standard & Poor’s 500® Index and the Wilshire U.S. Real Estate Securities Index over 10 years for an investment made on June 30, 2000
Average Annual Total Return for periods ended June 30, 2010
| Fund & Benchmark Indices | 1-Year | 5-Year | 10-Year | Since Fund’s Inception (07/01/99) | Gross Expense Ratio | Net Expense Ratio |
| Davis Real Estate Portfolio | 45.66% | (2.11)% | 7.63% | 6.96% | 0.84% | 0.84% |
Standard & Poor’s 500® Index | 14.43% | (0.79)% | (1.59)% | (0.87)% | | |
| Wilshire U.S. Real Estate Securities Index | 56.07% | (0.47)% | 9.49% | 9.03% | | |
The Standard & Poor’s 500® Index is an unmanaged index of 500 selected common stocks, most of which are listed on the New York Stock Exchange. The Index is adjusted for dividends, weighted towards stocks with large market capitalizations, and represents approximately two-thirds of the total market value of all domestic common stocks. Investments cannot be made directly in the Index.
The Wilshire U.S. Real Estate Securities Index is a broad measure of the performance of publicly traded real estate securities. It reflects no deduction for fees or expenses. Investments cannot be made directly in the Index.
The performance data for Davis Real Estate Portfolio contained in this report represents past performance and assumes that all distributions were reinvested, and should not be considered as an indication of future performance from an investment in the Portfolio today. The investment return and principal value will fluctuate so that shares may be worth more or less than their original cost when redeemed. Portfolio performance changes over time and current performance may be higher or lower than stated. The operating expense ratio may vary in future years. For more current information please call Davis Funds Investor Services at 1-800-279-0279.
Portfolio performance numbers are net of all Portfolio operating expenses, but do not include any insurance charges imposed by your insurance company’s separate account. If performance included the effect of these additional charges, the return would be lower.
| DAVIS REAL ESTATE PORTFOLIO | Fund Overview |
| | June 30, 2010 (Unaudited) |
| Portfolio Composition | | Industry Weightings |
| (% of Fund’s Net Assets) | | (% of Long Term Portfolio) |
| | | | | | |
| | | | | | Wilshire U.S. Real Estate Securities Index |
| Common Stock | 83.66% | | | |
| Preferred Stock | 8.73% | | | Fund |
| Convertible Bonds | 2.89% | | Office REITs | 39.23% | 16.63% |
| Short Term Investments | 4.54% | | Retail REITs | 13.30% | 23.89% |
| Other Assets & Liabilities | 0.18% | | Residential REITs | 11.66% | 17.01% |
| | 100.00% | | Specialized REITs | 8.92% | 25.71% |
| | | | Telecommunication Services | 7.95% | – |
| | | | Real Estate Operating Companies | 5.58% | 2.06% |
| | | | Diversified REITs | 5.56% | 8.61% |
| | | | Industrial REITs | 4.92% | 5.42% |
| | | | Other | 2.88% | 0.67% |
| | | | | 100.00% | 100.00% |
| | | | | | |
Top 10 Holdings
(% of Fund’s Net Assets)
| | | |
| Corporate Office Properties Trust | Office REITs | 5.63% |
| Digital Realty Trust, Inc. | Office REITs | 5.44% |
| American Campus Communities, Inc. | Residential REITs | 5.29% |
| Alexandria Real Estate Equities, Inc. | Office REITs | 5.01% |
| Forest City Enterprises, Inc., Class A | Real Estate Operating Companies | 4.95% |
| Essex Property Trust, Inc. | Residential REITs | 4.10% |
| Federal Realty Investment Trust | Retail REITs | 3.72% |
| Douglas Emmett, Inc. | Office REITs | 3.66% |
| Vornado Realty Trust | Diversified REITs | 3.59% |
| DCT Industrial Trust Inc. | Industrial REITs | 3.55% |
| DAVIS REAL ESTATE PORTFOLIO | Expense Example (Unaudited) |
Example
As a shareholder of the Fund, you incur ongoing costs only, including advisory and administrative fees and other Fund expenses. The Expense Example is intended to help you understand your ongoing costs (in dollars) of investing in the Fund and to compare these costs with the ongoing costs of investing in other mutual funds. The Expense Example is based on an investment of $1,000 invested at the beginning of the period and held for the entire period indicated, which for the Fund is for the six-month period ended June 30, 2010. Please note that the Expense Example is general and does not reflect charges imposed by your insurance company’s separate account or account specific costs, which may increase your total costs of investing in the Fund. If these charges or account specific costs were included in the Expense Example , the expenses would have been higher.
Actual Expenses
The information represented in the row entitled “Actual” provides information about actual account values and actual expenses. You may use the information in this row, together with the amount you invested, to estimate the expenses that you paid over the period. Simply divide your account value by $1,000 (for example, an $8,600 account value divided by $1,000 = 8.6), then, multiply the result by the number under the heading “Expenses Paid During Period” to estimate the expenses you paid on your account during this period.
Hypothetical Example for Comparison Purposes
The information represented in the row entitled “Hypothetical” provides information about hypothetical account values and hypothetical expenses based on the Fund’s actual expense ratio and an assumed rate of return of 5% per year before expenses, which is not the Fund’s actual return. The hypothetical account values and expenses may not be used to estimate the actual ending account balance or expenses you paid for the period. You may use this information to compare the ongoing costs of investing in the Fund and other funds. To do so, compare this 5% hypothetical example with the 5% hypothetical examples that appear in the shareholder reports of the other funds.
Please note that the expenses shown in the table are meant to highlight your ongoing costs only. Therefore, the information in the row entitled “Hypothetical” is useful in comparing ongoing costs only, and will not help you determine the relative total costs of owning different funds.
| | Beginning | Ending | Expenses Paid |
| | Account Value | Account Value | During Period* |
| | (01/01/10) | (06/30/10) | (01/01/10-06/30/10) |
| | | | |
Actual | $1,000.00 | $1,040.26 | $4.25 |
Hypothetical | $1,000.00 | $1,020.63 | $4.21 |
Hypothetical assumes 5% annual return before expenses.
* Expenses are equal to the Fund’s annualized operating expense ratio (0.84%)**, multiplied by the average account value over the period, multiplied by 181/365 (to reflect the one-half year period).
** The expense ratio reflects the impact, if any, of the reduction of expenses paid indirectly and of certain reimbursements from the Adviser.
| DAVIS REAL ESTATE PORTFOLIO | Schedule of Investments |
| | June 30, 2010 (Unaudited) |
| Shares | | Security | | Value (Note 1) | |
| |
| | FINANCIALS – (73.35%) | |
| | Real Estate – (73.35%) | |
| | Real Estate Investment Trusts (REITs) – (68.40%) | |
| | Diversified REITs – (5.30%) | |
| | 59,914 | Cousins Properties, Inc. | | $ | 403,821 | |
| | 11,570 | Vornado Realty Trust | | | 844,031 | |
| |
| | 1,247,852 | |
| |
| | Industrial REITs – (3.55%) | |
| | 184,900 | DCT Industrial Trust Inc. | | | 835,748 | |
| |
| | Office REITs – (28.41%) | |
| | 18,600 | Alexandria Real Estate Equities, Inc. | | | 1,178,682 | |
| | 10,900 | Boston Properties, Inc. | | | 777,606 | |
| | 35,090 | Corporate Office Properties Trust | | | 1,324,998 | |
| | 22,200 | Digital Realty Trust, Inc. | | | 1,280,496 | |
| | 60,500 | Douglas Emmett, Inc. | | | 860,310 | |
| | 33,200 | DuPont Fabros Technology Inc. | | | 815,392 | |
| | 16,200 | Highwoods Properties, Inc. | | | 449,712 | |
| |
| | 6,687,196 | |
| |
| | Residential REITs – (10.71%) | |
| | 45,600 | American Campus Communities, Inc. | | | 1,244,424 | |
| | 9,890 | Essex Property Trust, Inc. | | | 964,671 | |
| | 16,300 | UDR, Inc. | | | 311,819 | |
| |
| | 2,520,914 | |
| |
| | Retail REITs – (11.93%) | |
| | 21,460 | CBL & Associates Properties, Inc. | | | 266,962 | |
| | 12,450 | Federal Realty Investment Trust | | | 874,862 | |
| | 23,600 | Regency Centers Corp. | | | 811,840 | |
| | 6,292 | Simon Property Group, Inc. | | | 508,079 | |
| | 9,160 | Taubman Centers, Inc. | | | 344,691 | |
| |
| | 2,806,434 | |
| |
| | Specialized REITs – (8.50%) | |
| | 60,583 | Cogdell Spencer, Inc. | | | 409,541 | |
| | 13,400 | Entertainment Properties Trust | | | 510,138 | |
| | 16,400 | LaSalle Hotel Properties | | | 337,348 | |
| | 15,820 | Ventas, Inc. | | | 742,749 | |
| |
| | 1,999,776 | |
| |
| | 16,097,920 | |
| |
| | Real Estate Management & Development – (4.95%) | |
| | Real Estate Operating Companies – (4.95%) | |
| | 102,980 | Forest City Enterprises, Inc., Class A * | | | 1,165,734 | |
| |
| | 17,263,654 | |
| |
| | Total Financials | | | 17,263,654 | |
| |
| | INDUSTRIALS – (2.74%) | |
| | Transportation – (2.74%) | |
| | 21,700 | Alexander & Baldwin, Inc. | | | 646,226 | |
| |
| | Total Industrials | | | 646,226 | |
| |
| | TELECOMMUNICATION SERVICES – (7.57%) | |
| | 12,300 | American Tower Corp., Class A * | | | 547,350 | |
| | 17,350 | Crown Castle International Corp. * | | | 646,461 | |
| DAVIS REAL ESTATE PORTFOLIO | Schedule of Investments – (Continued) |
| | June 30, 2010 (Unaudited) |
| Shares/Principal | | Security | | Value (Note 1) | |
COMMON STOCK – (CONTINUED) | |
| | TELECOMMUNICATION SERVICES – (CONTINUED) | |
| | 17,300 | SBA Communications Corp., Class A * | | $ | 588,373 | |
| |
| | Total Telecommunication Services | | | 1,782,184 | |
| |
| | TOTAL COMMON STOCK – (Identified cost $19,867,470) | | | 19,692,064 | |
| |
PREFERRED STOCK – (8.73%) | |
| | FINANCIALS – (8.73%) | |
| | Real Estate – (8.73%) | |
| | Real Estate Investment Trusts (REITs) – (8.73%) | |
| | Industrial REITs – (1.14%) | |
| | 11,900 | AMB Property Corp., 6.75%, Series M | | | 267,809 | |
| |
| | Office REITs – (6.44%) | |
| | 33,272 | Alexandria Real Estate Equities, Inc., 7.00%, Series D, Conv. Pfd. | | | 716,386 | |
| | 5,700 | Digital Realty Trust, Inc., 5.50%, Series D, Cum. Conv. Pfd. | | | 197,363 | |
| | 5,014 | Digital Realty Trust, Inc., 8.50%, Series A | | | 126,917 | |
| | 19,930 | SL Green Realty Corp., 7.625%, Series C | | | 475,380 | |
| |
| | 1,516,046 | |
| |
| | Residential REITs – (0.40%) | |
| | 2,000 | Equity Residential, 7.00%, Series E, Cum. Conv. Pfd. | | | 93,312 | |
| |
| | Retail REITs – (0.75%) | |
| | 8,280 | CBL & Associates Properties, Inc., 7.375%, Series D | | | 176,799 | |
| |
| | Total Financials | | | 2,053,966 | |
| |
| | TOTAL PREFERRED STOCK – (Identified cost $1,072,511) | | | 2,053,966 | |
| |
CONVERTIBLE BONDS – (2.89%) | |
| | FINANCIALS – (2.89%) | |
| | Real Estate – (2.89%) | |
| | Real Estate Investment Trusts (REITs) – (2.52%) | |
| | Office REITs – (2.52%) | |
| $ | 344,000 | Digital Realty Trust, Inc., 144A Conv. Sr. Notes, 5.50%, 04/15/29 (a) | | | 492,995 | |
| | 104,000 | SL Green Realty Corp., 144A Conv. Sr. Notes, 3.00%, 03/30/27 (a) | | | 101,400 | |
| |
| | 594,395 | |
| |
| | Real Estate Management & Development – (0.37%) | |
| | Real Estate Operating Companies – (0.37%) | |
| | 80,000 | Forest City Enterprises, Inc., 144A Conv. Sr. Notes, 5.00%, 10/15/16 (a) | | | 86,000 | |
| |
| | Total Financials | | | 680,395 | |
| |
| | TOTAL CONVERTIBLE BONDS – (Identified cost $526,520) | | | 680,395 | |
| |
SHORT TERM INVESTMENTS – (4.54%) | |
| | 189,000 | Banc of America Securities LLC Joint Repurchase Agreement, | | | | | |
| | 0.03%, 07/01/10, dated 06/30/10, repurchase value of $189,000 | | | | | |
| | (collateralized by: U.S. Government agency obligations in a pooled cash account, 0.00%-5.00%, 12/08/10-07/15/20, total market value $192,780) | | | 189,000 | |
| | 275,000 | Goldman, Sachs & Co. Joint Repurchase Agreement, | | | | | |
| | 0.01%, 07/01/10, dated 06/30/10, repurchase value of $275,000 | | | | | |
| | (collateralized by: U.S. Government agency obligations in a pooled cash account, 0.00%-5.05%, 08/30/10-01/26/15, total market value $280,500) | | | 275,000 | |
| DAVIS REAL ESTATE PORTFOLIO | Schedule of Investments – (Continued) |
| | June 30, 2010 (Unaudited) |
| Principal | | Security | | Value (Note 1) | |
SHORT TERM INVESTMENTS – (CONTINUED) | |
| $ | 604,000 | Mizuho Securities USA Inc. Joint Repurchase Agreement, | | | | | |
| | 0.14%, 07/01/10, dated 06/30/10, repurchase value of $604,002 | | | | | |
| | (collateralized by: U.S. Government agency mortgages in a pooled cash account, 2.421%-6.229%, 09/01/19-07/01/40, total market value $616,080) | | $ | 604,000 | |
| |
| | TOTAL SHORT TERM INVESTMENTS – (Identified cost $1,068,000) | | | 1,068,000 | |
| |
| | Total Investments – (99.82%) – (Identified cost $22,534,501) – (b) | | | 23,494,425 | |
| | Other Assets Less Liabilities – (0.18%) | | | 42,028 | |
| |
| | Net Assets – (100.00%) | | $ | 23,536,453 | |
| |
| | * | | Non-Income producing security. | |
| | | | | |
| | (a) | | These securities are subject to Rule 144A. The Board of Directors of the Fund has determined that there is sufficient liquidity in these securities to realize current valuations. These securities amounted to $680,395 or 2.89% of the Fund's net assets as of June 30, 2010. | |
| | | | | |
| | (b) | | Aggregate cost for federal income tax purposes is $23,958,696. At June 30, 2010 unrealized appreciation (depreciation) of securities for federal income tax purposes is as follows: | |
| | | | | |
| | Unrealized appreciation | | $ | 3,160,262 | |
| | Unrealized depreciation | | | (3,624,533) | |
| | Net unrealized depreciation | | $ | (464,271) | |
| |
| |
| See Notes to Financial Statements | |
| DAVIS REAL ESTATE PORTFOLIO | Statement of Assets and Liabilities |
| | At June 30, 2010 (Unaudited) |
| ASSETS: | | | | |
Investments in securities at value* (see accompanying Schedule of Investments) | | $ | 23,494,425 | |
| Cash | | | 2,091 | |
| Receivables: | | | | |
| | Capital stock sold | | | 23 | |
| | Dividends and interest | | | 105,483 | |
| | Investment securities sold | | | 132,692 | |
Prepaid expenses | | | 211 | |
| | Total assets | | | 23,734,925 | |
| LIABILITIES: | | | | |
| Payables: | | | | |
| | Capital stock redeemed | | | 47,786 | |
| | Investment securities purchased | | | 117,025 | |
Accrued management fee | | | 14,497 | |
Other accrued expenses | | | 19,164 | |
| | Total liabilities | | | 198,472 | |
NET ASSETS | | $ | 23,536,453 | |
SHARES OUTSTANDING | | | 3,077,925 | |
NET ASSET VALUE, offering, and redemption price per share (Net assets ÷ Shares outstanding) | | $ | 7.65 | |
| NET ASSETS CONSIST OF: | | | | |
Par value of shares of capital stock | | $ | 3,078 | |
Additional paid-in capital | | | 37,261,446 | |
Undistributed net investment income | | | 166,647 | |
Accumulated net realized losses from investments | | | (14,854,174) | |
Net unrealized appreciation on investments and foreign currency transactions | | | 959,456 | |
| | Net Assets | | $ | 23,536,453 | |
| | | | | | |
| *Including: | | | | |
| | Cost of Investments | | $ | 22,534,501 | |
| | | | | | |
| See Notes to Financial Statements |
| | | | | | |
| DAVIS REAL ESTATE PORTFOLIO | Statement of Operations |
| | For the six months ended June 30, 2010 (Unaudited) |
| INVESTMENT INCOME: | | | | |
| Income: | | | | |
| | Dividends* | | $ | 397,403 | |
| | Interest | | | 19,307 | |
| | Total income | | | 416,710 | |
| | | | | | | | | |
| Expenses: | | | | |
| | Management fees (Note 3) | | $ | 66,468 | | | | |
| | Custodian fees | | | 9,893 | | | | |
| | Transfer agent fees | | | 2,815 | | | | |
| | Audit fees | | | 9,000 | | | | |
| | Legal fees | | | 420 | | | | |
| | Accounting fees (Note 3) | | | 1,002 | | | | |
| | Reports to shareholders | | | 2,000 | | | | |
| | Directors’ fees and expenses | | | 5,638 | | | | |
| | Registration and filing fees | | | 7 | | | | |
| | Miscellaneous | | | 4,490 | | | | |
| | Total expenses | | | 101,733 | |
| | Expenses paid indirectly (Note 4) | | | (1) | |
| | Net expenses | | | 101,732 | |
| | Net investment income | | | 314,978 | |
| | | | | | | | | |
| REALIZED & UNREALIZED GAIN (LOSS) ON INVESTMENTS AND FOREIGN CURRENCY TRANSACTIONS: | | | | |
Net realized gain from investment transactions | | | 816,833 | |
Net decrease in unrealized appreciation | | | (198,556) | |
| | Net realized and unrealized gain on investments and foreign currency transactions | | | 618,277 | |
| | Net increase in net assets resulting from operations | | $ | 933,255 | |
| | | | | | | | | |
*Net of foreign taxes withheld as follows | | $ | 395 | |
| | | | | | | | | |
| See Notes to Financial Statements |
| DAVIS REAL ESTATE PORTFOLIO | Statements of Changes in Net Assets |
| | | Six months ended June 30, 2010 (Unaudited) | | Year ended December 31, 2009 |
| | | | | | | | |
| OPERATIONS: | | | | | | |
| | Net investment income | | $ | 314,978 | | $ | 523,044 |
| | Net realized gain (loss) from investments and foreign currency transactions | | | 816,833 | | | (12,772,190) |
| | Net change in unrealized appreciation (depreciation) on investments and foreign currency transactions | | | (198,556) | | | 17,711,950 |
| | Net increase in net assets resulting from operations | | | 933,255 | | | 5,462,804 |
| | | | | | | | |
| DIVIDENDS AND DISTRIBUTIONS TO SHAREHOLDERS FROM: | | | | | | |
| | Net investment income | | | (155,619) | | | (513,936) |
| | | | | | | | |
| CAPITAL SHARE TRANSACTIONS: | | | | | | |
| | Net decrease in net assets resulting from capital share transactions (Note 5) | | | (807,536) | | | (713,924) |
| | Total increase (decrease) in net assets | | | (29,900) | | | 4,234,944 |
| | | | | | | | |
| NET ASSETS: | | | | | | |
| | Beginning of period | | | 23,566,353 | | | 19,331,409 |
| | End of period* | | $ | 23,536,453 | | $ | 23,566,353 |
| | | | | | | | |
*Including undistributed net investment income of | | $ | 166,647 | | $ | 7,288 |
| | | | | | | | |
| See Notes to Financial Statements |
| DAVIS REAL ESTATE PORTFOLIO | Notes to Financial Statements |
| | June 30, 2010 (Unaudited) |
NOTE 1 - SUMMARY OF SIGNIFICANT ACCOUNTING POLICIES
The Fund is a separate series of Davis Variable Account Fund, Inc. (a Maryland corporation), which is registered under the Investment Company Act of 1940, as amended, as a non-diversified, open-end management investment company. Only insurance companies, for the purpose of funding variable annuity or variable life insurance contracts, may purchase shares of the Fund. The following is a summary of significant accounting policies followed by the Fund in the preparation of financial statements.
Security Valuation - The Fund calculates the net asset value of its shares as of the close of the New York Stock Exchange (“Exchange”), normally 4:00 P.M. Eastern time, on each day the Exchange is open for business. Securities listed on the Exchange (and other national exchanges) are valued at the last reported sales price on the day of valuation. Securities traded in the over-the-counter market (e.g. NASDAQ) and listed securities for which no sale was reported on that date are stated at the average of closing bid and asked prices. Securities traded on foreign exchanges are valued based upon the last sales price on the principal exchange on which the security is traded prior to the time when the Fund’s assets a re valued. Securities (including restricted securities) for which market quotations are not readily available are valued at their fair value. Securities whose values have been materially affected by what Davis Selected Advisers, L.P. (“Davis Advisors” or “Adviser”), the Fund’s investment adviser, identifies as a significant event occurring before the Fund’s assets are valued but after the close of their respective exchanges will be fair valued. Fair value is determined in good faith using consistently applied procedures under the supervision of the Board of Directors. Short-term securities purchased within 60 days to maturity are valued at amortized cost, which approximates market value. These valuation procedures are reviewed and subject to approval by the Board of Directors.
Value Measurements - Fair value is defined as the price that the Fund would receive upon selling an investment in an orderly transaction to an independent buyer in the principal or most advantageous market for the investment. Various inputs are used to determine the fair value of the Fund’s investments. These inputs are summarized in the three broad levels listed below.
Level 1 – quoted prices in active markets for identical securities
Level 2 – other significant observable inputs (including quoted prices for similar investments, interest rates, prepayment
speeds, credit risk, etc.)
| | Level 3 – significant unobservable inputs (including Fund’s own assumptions in determining the fair value of investments) |
The inputs or methodology used for valuing securities are not necessarily an indication of the risk associated with investing in those securities.
The following is a summary of the inputs used as of June 30, 2010 in valuing the Fund’s investments carried at value:
| | Investments in Securities at Value |
| | Valuation Inputs |
| | | | Level 2: | | Level 3: | | |
| | | | Other Significant | | Significant | | |
| | Level 1: | | Observable | | Unobservable | | |
| | Quoted Prices | | Inputs | | Inputs | | Total |
Equity securities: | | | | | | | | | | | |
| Financials | $ | 19,120,257 | | $ | 197,363 | | $ | – | | $ | 19,317,620 |
| Industrials | | 646,226 | | | – | | | – | | | 646,226 |
| Telecommunication services | | 1,782,184 | | | – | | | – | | | 1,782,184 |
| Convertible debt securities | | – | | | 680,395 | | | – | | | 680,395 |
| Short-term securities | | – | | | 1,068,000 | | | – | | | 1,068,000 |
| Total | $ | 21,548,667 | | $ | 1,945,758 | | $ | – | | $ | 23,494,425 |
| | | | | | | | | | | | |
| DAVIS REAL ESTATE PORTFOLIO | Notes to Financial Statements – (Continued) |
| | June 30, 2010 (Unaudited) |
NOTE 1 - SUMMARY OF SIGNIFICANT ACCOUNTING POLICIES – (CONTINUED)
Master Repurchase Agreements - The Fund, along with other affiliated funds, may transfer uninvested cash balances into one or more master repurchase agreement accounts. These balances are invested in one or more repurchase agreements, secured by U.S. Government securities. A custodian bank holds securities pledged as collateral for repurchase agreements until the agreements mature. Each agreement requires that the market value of the collateral be sufficient to cover payments of interest and principal; however, in the event of default by the other party to the agreement, retention of the collateral may be subject to legal proceedings.
Currency Translation - The market values of all assets and liabilities denominated in foreign currencies are recorded in the financial statements after translation to the U.S. Dollar based upon the mean between the bid and offered quotations of the currencies against U.S. Dollars on the date of valuation. The cost basis of such assets and liabilities is determined based upon historical exchange rates. Income and expenses are translated at average exchange rates in effect as accrued or incurred.
Foreign Currency - The Fund may enter into forward purchases or sales of foreign currencies to hedge certain foreign currency denominated assets and liabilities against declines in market value relative to the U.S. Dollar. Forward currency contracts are marked-to-market daily and the change in market value is recorded by the Fund as an unrealized gain or loss. When the forward currency contract is closed, the Fund records a realized gain or loss equal to the difference between the value of the forward currency contract at the time it was opened and value at the time it was closed. Investments in forward currency contracts may expose the Fund to risks resulting from una nticipated movements in foreign currency exchange rates or failure of the counter-party to the agreement to perform in accordance with the terms of the contract.
Reported net realized foreign exchange gains or losses arise from the sales of foreign currencies, currency gains or losses realized between the trade and settlement dates on securities transactions, the difference between the amounts of dividends, interest, and foreign withholding taxes recorded on the Fund’s books, and the U.S. Dollar equivalent of the amounts actually received or paid. Net unrealized foreign exchange gains and losses arise from changes in the value of assets and liabilities other than investments in securities at fiscal year end, resulting from changes in the exchange rate. The Fund includes foreign currency gains and losses realized on the sale of investments together with market gains and losses on such investments in the Statement of Operations.
Federal Income Taxes - It is the Fund’s policy to comply with the requirements of the Internal Revenue Code applicable to regulated investment companies, and to distribute substantially all of its taxable income, including any net realized gains on investments not offset by loss carryovers, to shareholders. Therefore, no provision for federal income or excise tax is required. The Adviser has analyzed the Fund’s tax positions taken on federal and state income tax returns for all open tax years and has concluded that as of June 30, 2010, no provision for income tax would be required in the Fund’s financial statements. The Fund’s federal and state (Arizona and Maryland) income and federal excise tax returns for tax years for which the applicable statutes of limitations have not expired are subject to examination by the Internal Revenue Service and state departments of revenue. The earliest tax year that remains subject to examination by these jurisdictions is 2006. At December 31, 2009, the Fund had available for federal income tax purposes unused capital loss carryforwards as follows:
| | | Capital Loss Carryforwards |
| Expiring | | | |
| 12/31/2016 | $ | 2,585,000 |
| 12/31/2017 | | 11,662,000 |
| | | $ | 14,247,000 |
Securities Transactions and Related Investment Income - Securities transactions are accounted for on the trade date (date the order to buy or sell is executed) with realized gain or loss on the sale of securities being determined based upon identified cost. Dividend income is recorded on the ex-dividend date. Dividend income from REIT securities may include return of capital. Upon notification from the issuer, the amount of the return of capital is reclassified to adjust dividend income, reduce the cost basis, and/or adjust realized gain/loss. Interest income, which includes accretion of discount and amortization of premium, is accrued as earned.
| DAVIS REAL ESTATE PORTFOLIO | Notes to Financial Statements – (Continued) |
| | June 30, 2010 (Unaudited) |
NOTE 1 - SUMMARY OF SIGNIFICANT ACCOUNTING POLICIES – (CONTINUED)
Dividends and Distributions to Shareholders - Dividends and distributions to shareholders are recorded on the ex-dividend date. Net investment income (loss), net realized gains (losses), and net unrealized appreciation (depreciation) on investments may differ for financial statement and tax purposes primarily due to differing treatments of wash sales and foreign currency transactions. The character of dividends and distributions made during the fiscal year from net investment income and net realized securities gains may differ from their ultimate characterization for federal income tax purposes. Also, due to the timing of dividends and distributions, the fiscal year in which amounts are distributed may differ from the fiscal yea r in which income or realized gain was recorded by the Fund. The Fund adjusts certain components of capital to reflect permanent differences between financial statement amounts and net income and realized gains/losses determined in accordance with income tax rules.
Indemnification - Under the Fund’s organizational documents, its officers and directors are indemnified against certain liabilities arising out of the performance of their duties to the Fund. In addition, some of the Fund’s contracts with its service providers contain general indemnification clauses. The Fund’s maximum exposure under these arrangements is unknown since the amount of any future claims that may be made against the Fund cannot be determined and the Fund has no historical basis for predicting the likelihood of any such claims.
Use of Estimates in Financial Statements - In preparing financial statements in conformity with accounting principles generally accepted in the United States of America, management makes estimates and assumptions that affect the reported amounts of assets and liabilities and disclosure of contingent assets and liabilities at the date of the financial statements, as well as the reported amounts of income and expenses during the reporting period. Actual results may differ from these estimates.
Directors Fees and Expenses - The Fund set up a Rabbi Trust to provide for the deferred compensation plan for Independent Directors that enables them to elect to defer receipt of all or a portion of annual fees they are entitled to receive. The value of an eligible Director’s account is based upon years of service and fees paid to each Director during the years of service. The amount paid to the Director by the Trust under the plan will be determined based upon the performance of the Davis Funds.
NOTE 2 - PURCHASES AND SALES OF SECURITIES
Purchases and sales of investment securities (excluding short-term securities) during the six months ended June 30, 2010 were $6,777,818 and $6,023,100, respectively.
NOTE 3 - INVESTMENT ADVISORY FEES AND OTHER TRANSACTIONS WITH AFFILIATES
Advisory fees are paid monthly to the Adviser at an annual rate of 0.55% of the Fund’s average net assets.
Boston Financial Data Services, Inc. (“BFDS”) is the Fund’s primary transfer agent. State Street Bank and Trust Company (“State Street Bank”) is the Fund’s primary accounting provider. Fees for such services are included in the custodian fee as State Street Bank also serves as the Fund’s custodian. The Adviser is also paid for certain accounting services. The fee paid to the Adviser for these services for the six months ended June 30, 2010 amounted to $1,002. Certain directors and officers of the Fund are also directors and officers of the general partner of the Adviser.
Davis Selected Advisers-NY, Inc. (“DSA-NY”), a wholly-owned subsidiary of the Adviser, acts as sub-adviser to the Fund. DSA-NY performs research and portfolio management services for the Fund under a Sub-Advisory Agreement with the Adviser. The Fund pays no fees directly to DSA-NY.
NOTE 4 - EXPENSES PAID INDIRECTLY
Under an agreement with State Street Bank, custodian fees are reduced for earnings on cash balances maintained at the custodian by the Fund. Such reductions amounted to $1 during the six months ended June 30, 2010.
| DAVIS REAL ESTATE PORTFOLIO | Notes to Financial Statements – (Continued) |
| | June 30, 2010 (Unaudited) |
NOTE 5 - CAPITAL STOCK
At June 30, 2010, there were 500 million shares of capital stock ($0.001 par value per share) authorized. Transactions in capital stock were as follows:
| | | Six months ended | | Year ended |
| | | June 30, 2010 (Unaudited) | | December 31, 2009 |
| | | Shares | | Amount | | Shares | | Amount |
| Shares sold | | 183,797 | | $ | 1,459,862 | | 708,612 | | $ | 4,050,873 |
Shares issued in reinvestment of distributions | | 19,501 | | | 155,619 | | 102,105 | | | 513,936 |
| | | 203,298 | | | 1,615,481 | | 810,717 | | | 4,564,809 |
| Shares redeemed | | (312,081) | | | (2,423,017) | | (956,040) | | | (5,278,733) |
| Net decrease | | (108,783) | | $ | (807,536) | | (145,323) | | $ | (713,924) |
| | | | | | | | | | |
NOTE 6 - BANK BORROWINGS
The Fund may borrow up to 5% of its assets from a bank to purchase portfolio securities, or for temporary and emergency purposes. The purchase of securities with borrowed funds creates leverage in the Fund. The Fund has entered into an agreement, which enables it to participate with certain other funds managed by the Adviser in an unsecured line of credit with a bank, which permits borrowings up to $50 million, collectively. Interest is charged based on its borrowings, at a rate equal to the higher of the Federal Funds Rate or the Overnight Libor Rate, plus 1.25%. The Fund had no borrowings during the six months ended June 30, 2010.
NOTE 7 - SUBSEQUENT EVENTS
Fund management has determined that no material events or transactions occurred subsequent to June 30, 2010 and through the issuance of the financial statements, which required adjustments and/or additional disclosure.
| DAVIS REAL ESTATE PORTFOLIO | Financial Highlights |
| The following financial information represents selected data for each share of capital stock outstanding throughout each period: |
| | | | | | | | | | | | | | | | | | | | | | | | | | | | | | | | | | |
| | Six months ended June 30, 2010 | | Year ended December 31, | |
| | (Unaudited) | | 2009 | | 2008 | | 2007 | | 2006 | | 2005 | |
| Net Asset Value, Beginning of Period | | $ | 7.40 | | $ | 5.80 | | $ | 11.45 | | $ | 20.43 | | $ | 17.33 | | $ | 16.80 | |
| | | | | | | | | | | | | | | | | | | | | | | | | | | | | | | | | | |
| Income (Loss) from Investment Operations: | | | | | | | | | | | | | | | | | | | | | | | | | | | | | | | | |
| | Net Investment Income | | 0.10 | | 0.16 | | 0.19 | | 0.42 | | 0.34 | | 0.30 | |
| | Net Realized and Unrealized Gains (Losses) | | 0.20 | | 1.60 | | (5.50) | | (3.40) | | 5.58 | | 1.86 | |
| | Total from Investment Operations | | 0.30 | | 1.76 | | (5.31) | | (2.98) | | 5.92 | | 2.16 | |
| | | | | | | | | | | | | | | | | | | | | | | | | | | | | | | | | | |
| Dividends and Distributions: | | | | | | | | | | | | | | | | | | | | | | | | | | | | | | | | |
| | Dividends from Net Investment Income | | (0.05) | | (0.16) | | (0.22) | | (0.64) | | (0.60) | | (0.54) | |
| | Distributions from Realized Gains | | – | | – | | (0.11) | | (5.36) | | (2.22) | | (1.09) | |
| | Return of Capital | | – | | – | | (0.01) | | – | | – | | – | |
| | Total Dividends and Distributions | | (0.05) | | (0.16) | | (0.34) | | (6.00) | | (2.82) | | (1.63) | |
Net Asset Value, End of Period | | $ | 7.65 | | $ | 7.40 | | $ | 5.80 | | $ | 11.45 | | $ | 20.43 | | $ | 17.33 | |
| | | | | | | | | | | | | | | | | | | | | | | | | | | | | | | | | | |
Total Returna | | 4.03 | % | | 31.73 | % | | (46.91) | % | | (15.48) | % | | 34.37 | % | | 13.14 | % | |
| | | | | | | | | | | | | | | | | | | | | | | | | | | | | | | | | | |
| Ratios/Supplemental Data: | | | | | | | | | | | | | | | | | | | | | | | | | | | | | | | | |
| | Net Assets, End of Period (in thousands) | | $ | 23,536 | | | $ | 23,566 | | | $ | 19,331 | | | $ | 49,548 | | | $ | 89,738 | | | $ | 64,556 | | |
| | Ratio of Expenses to Average Net Assets: | | | | | | | | | | | | | | | | | | | | | | | | | | | | | | | | |
| | Gross | | 0.84 | %b | | 0.98 | % | | 0.98 | % | | 0.88 | % | | 0.86 | % | | 0.87 | % | |
| | Netc | | 0.84 | %b | | 0.98 | % | | 0.98 | % | | 0.87 | % | | 0.86 | % | | 0.87 | % | |
| Ratio of Net Investment Income to Average Net Assets | | 2.61 | %b | | 2.81 | % | | 1.84 | % | | 1.92 | % | | 1.63 | % | | 1.71 | % | |
Portfolio Turnover Rated | | 27 | % | | 70 | % | | 41 | % | | 49 | % | | 38 | % | | 28 | % | |
| | | | | | | | | | | | | | | | | | | | | | | | | | | | | | | | | | |
| a | Assumes hypothetical initial investment on the business day before the first day of the fiscal period, with all dividends and distributions reinvested in additional shares on the reinvestment date, and redemption at the net asset value calculated on the last business day of the fiscal period. Total returns are not annualized for periods of less than one year and do not reflect charges attributable to your insurance company’s separate account. Inclusion of these charges would reduce the total returns shown. | | |
| | | | |
| b | Annualized. | | |
| | | | |
| c | The Net Ratio of Expenses to Average Net Assets reflects the impact, if any, of the reduction of expenses paid indirectly and of certain reimbursements from the Adviser. | | |
| | | | |
| d | The lesser of purchases or sales of portfolio securities for a period, divided by the monthly average of the market value of portfolio securities owned during the period. Securities with a maturity or expiration date at the time of acquisition of one year or less are excluded from the calculation. | | |
| | | | |
| See Notes to Financial Statements |
| DAVIS REAL ESTATE PORTFOLIO | Director Approval of Advisory Agreements |
Process of Annual Review
The Board of Directors of the Davis Funds oversees the management of each Davis Fund and, as required by law, determines annually whether to approve the continuance of each Davis Fund’s advisory agreement with Davis Selected Advisers, L.P. and sub-advisory agreement with Davis Selected Advisers-NY, Inc. (jointly “Davis Advisors” and “Advisory Agreements”).
As a part of this process the Independent Directors, with the assistance of counsel for the Independent Directors, prepared questions submitted to Davis Advisors in anticipation of the annual contract review. The Independent Directors were provided with responsive background material (including recent investment performance data), and their counsel provided guidance, prior to a separate contract review meeting held in March 2010 where the Independent Directors reviewed and evaluated all information which they deemed reasonably necessary in the circumstances. Upon completion of this review, the Independent Directors found that the terms of the Advisory Agreements are fair and reasonable and that continuation of the Advisory Agreements was in the best interest of Davis Real Estate Portfolio and its shareholders.
Reasons the Independent Directors Approved Continuation of the Advisory Agreements
The Independent Directors’ determinations were based upon a comprehensive consideration of all information provided to the Independent Directors and were not the result of any single factor. The following facts and conclusions were important, but not exclusive, in the Independent Directors’ recommendation to renew the Advisory Agreements.
The Independent Directors considered not only the investment performance of the Fund, but also the full range and quality of services provided by Davis Advisors to the Fund and its shareholders, including whether it:
| 1. | Achieves satisfactory investment results over the long-term after all costs; |
| 2. | Handles shareholder transactions, inquiries, requests, and records efficiently and effectively, and provides quality accounting, legal, and compliance services, and oversight of third party service providers; and |
| 3. | Fosters healthy investor behavior. |
Davis Advisors is reimbursed a portion of its costs in providing some, but not all, of these services.
A shareholder’s ultimate return is the product of a fund’s results as well as the shareholder’s behavior, specifically in selecting when to invest or redeem. The Independent Directors concluded that, through its actions and communications, Davis Advisors has attempted to have a meaningful, positive impact on investor behavior.
The Independent Directors noted the importance of reviewing quantitative measures, but also recognized that qualitative factors are also important in assessing whether Davis Fund shareholders are likely to be well served by the renewal of the Advisory Agreements. They noted both the value and shortcomings of purely quantitative measures, including the data provided by independent service providers, and concluded that while such measures and data may be informative, the judgment of the Independent Directors must take many factors, including those listed below, into consideration in representing the shareholders of the Davis Funds. In connection with reviewing comparative performance information, the Independent Directors generally give weight to longer-term measurements.
The Independent Directors expect Davis Advisors to employ a disciplined, company-specific, research-driven, businesslike, long-term investment philosophy.
The Independent Directors recognized Davis Advisors’ (a) efforts to minimize transaction costs by generally having a long-term time horizon and low portfolio turnover; (b) record of generally producing satisfactory results over longer-term periods; (c) efforts towards fostering healthy investor behavior by, among other things, providing informative and substantial educational material; and (d) efforts to promote shareholder interests by actively speaking out on corporate governance issues.
| DAVIS REAL ESTATE PORTFOLIO | Director Approval of Advisory Agreements – (Continued) |
Reasons the Independent Directors Approved Continuation of the Advisory Agreements – (Continued)
The Independent Directors reviewed (a) comparative fee and expense information for other funds, as selected and analyzed by a nationally recognized independent service provider; (b) information regarding fees charged by Davis Advisors to other advisory clients, including funds which it sub-advises and private accounts, as well as the differences in the services provided to such other clients; and (c) the fee schedule of the Fund, including an assessment of competitive fee schedules.
Effective July 1, 2009, Davis Advisors voluntarily and permanently reduced all management fee breakpoints above 0.55% to 0.55%. The former fee schedule for the Fund was a flat 0.75%. The Fund now has a flat fee of 0.55%, resulting in a fee which the Independent Directors noted was both lower than under its previous schedule and lower than the average fees of its peer group as determined by an independent service provider.
The Independent Directors reviewed the fixed management fee for the Fund and the profitability of the Fund to Davis Advisors, the extent to which economies of scale might be realized if the Fund’s net assets increased, and whether the fixed fee reflected those potential economies of scale. The Independent Directors considered the nature, quality, and extent of the services being provided to the Fund and the costs incurred by Davis Advisors in providing such services. The Independent Directors considered various potential benefits that Davis Advisors may receive in connection with the services it provides under the Advisory Agreements with the Fund, including a review of portfolio brokerage practices. The Independent Directors noted that Davis Advisors does not use client commissions to pay for publications that are available to t he general public or for third-party research services.
The Independent Directors noted that Davis Real Estate Portfolio had under-performed its benchmark, the Wilshire U.S. Real Estate Securities Index, over the one-, three-, five-, and ten-year time periods ended February 28, 2010. The Independent Directors also noted that the Fund had taken on less risk, as measured by the standard deviation, than the Index over the one-, three-, and five-year time periods ended February 28, 2010. The Fund out-performed the average performance of its peer group as determined by an independent service provider over the one-year time period and under-performed over the three-, five-, and ten-year time periods, all ended December 31, 2009. The Independent Directors noted that the Fund out-performed the Wilshire U.S. Real Estate Securities Index in 1 of the 6 rolling five calendar year time frames, and its p eer group in 4 of the 6 rolling five calendar year time frames ended December 31, 2009. The Fund under-performed both the Index and its peers in the 1 rolling ten calendar year time frame ended December 31, 2009.
The Independent Directors also considered the total expense ratio for Davis Real Estate Portfolio, noting that the expenses were reasonable and within the range of the ratios of its peer group as determined by an independent service provider
Approval of Advisory Agreements
The Independent Directors concluded that Davis Advisors had provided Davis Real Estate Portfolio and its shareholders a reasonable level of both investment and non-investment services. The Independent Directors further concluded that shareholders have received a significant benefit from Davis Advisors’ shareholder oriented approach, as well as the execution of its investment discipline.
The Independent Directors determined that the advisory fee for Davis Real Estate Portfolio was reasonable in light of the nature, quality, and extent of the services being provided to the Fund, the costs incurred by Davis Advisors in providing such service, and in comparison to the range of the average advisory fees of its peer group as determined by an independent service provider. The Independent Directors found that the terms of the Advisory Agreements are fair and reasonable and that continuation of the Advisory Agreements was in the best interest of the Fund and its shareholders. The Independent Directors and the full Board of Directors therefore voted to continue the Advisory Agreements.
| DAVIS REAL ESTATE PORTFOLIO | Fund Information |
Portfolio Proxy Voting Policies and Procedures
The Fund has adopted Portfolio Proxy Voting Policies and Procedures under which the Fund votes proxies relating to securities held by the Fund. A description of the Fund’s Portfolio Proxy Voting Policies and Procedures is available (i) without charge, upon request, by calling the Fund toll-free at 1-800-279-0279, (ii) on the Fund’s website at www.davisfunds.com, and (iii) on the SEC’s website at www.sec.gov.
In addition, the Fund is required to file Form N-PX, with its complete proxy voting record for the 12 months ended June 30th, no later than August 31st of each year. The Fund’s Form N-PX filing is available (i) without charge, upon request, by calling the Fund toll-free at 1-800-279-0279, (ii) on the Fund’s website at www.davisfunds.com, and (iii) on the SEC’s website at www.sec.gov.
Form N-Q
The Fund files its complete schedule of portfolio holdings with the SEC for the first and third quarters of each fiscal year on Form N-Q. The Fund’s Form N-Q is available without charge, upon request, by calling 1-800-279-0279 or on the Fund’s website at www.davisfunds.com or on the SEC’s website at www.sec.gov. The Fund’s Form N-Q may be reviewed and copied at the SEC’s Public Reference Room in Washington, DC, and information on the operation of the Public Reference Room may be obtained by calling 1-800-SEC-0330.
| DAVIS REAL ESTATE PORTFOLIO | Directors and Officers |
For the purposes of their service as directors to the Davis Funds, the business address for each of the directors is 2949 E. Elvira Road, Suite 101, Tucson, AZ 85756. Each Director serves until their retirement, resignation, death or removal. Subject to exceptions and exemptions, which may be granted by the Independent Directors, Directors must retire at the close of business on the last day of the calendar year in which the Director attains age seventy-four (74).
Name (birthdate) | Position(s) Held With Fund | Term of Office and Length of Time Served | Principal Occupation(s) During Past Five Years | Number of Portfolios in Fund Complex Overseen by Director | Other Directorships Held by Director |
| | | | | | |
Independent Directors
| | | | | | |
Marc P. Blum (09/09/42) | Director | Director since 1986 | Chief Executive Officer, World Total Return Fund, LLLP; of Counsel to Gordon, Feinblatt, Rothman, Hoffberger and Hollander, LLC (law firm). | 13 | Director, Legg Mason Investment Counsel & Trust Company N.A. (asset management company) and Rodney Trust Company (Delaware). |
| | | | | | |
John S. Gates, Jr. (08/02/53) | Director | Director since 2007 | Chairman and Chief Executive Officer of PortaeCo LLC, a private investment company (beginning in 2006); Co-founder of CenterPoint Properties Trust (REIT); Co-chairman and Chief Executive Officer for 22 years (until 2006). | 13 | Director, DCT Industrial Trust (REIT). |
| | | | | | |
Thomas S. Gayner (12/16/61) | Director/ Chairman | Director since 2004 | Executive Vice President and Chief Investment Officer, Markel Corporation (insurance company). | 13 | Director, Washington Post Co. (publishing company); Director, Colfax Corp. (engineering and manufacturer of pumps and fluid handling equipment). |
| | | | | | |
G. Bernard Hamilton (03/18/37) | Director | Director since 1978 | Managing General Partner, Avanti Partners, L.P. (investment partnership), retired 2005. | 13 | none |
| | | | | | |
Samuel H. Iapalucci (07/19/52) | Director | Director since 2006 | Former Executive Vice President and Chief Financial Officer, CH2M-HILL Companies, Ltd. (engineering). | 13 | Director, Trow Global Holdings Inc. (engineering & consulting). |
| | | | | | |
Robert P. Morgenthau (03/22/57) | Director | Director since 2002 | Chairman, NorthRoad Capital Management, LLC (investment management firm) since June 2002. | 13 | none |
| | | | | | |
Christian R. Sonne (05/06/36) | Director | Director since 1990 | General Partner, Tuxedo Park Associates (land holding and development firm). | 13 | none |
| | | | | | |
Marsha Williams (03/28/51) | Director | Director since 1999 | Senior Vice President and Chief Financial Officer, Orbitz Worldwide, Inc. (travel-services provider) since 2007; former Executive Vice President and Chief Financial Officer, Equity Office Properties Trust (REIT). | 13 | Director, Modine Manufacturing, Inc. (heat transfer technology); Director, Chicago Bridge & Iron Company, N.V. (industrial construction and engineering); Director, Fifth Third Bancorp (diversified financial services). |
| DAVIS REAL ESTATE PORTFOLIO | Directors and Officers – (Continued) |
Name (birthdate) | Position(s) Held With Fund | Term of Office and Length of Time Served | Principal Occupation(s) During Past Five Years | Number of Portfolios in Fund Complex Overseen by Director | Other Directorships Held by Director |
| | | | | | |
Inside Directors*
| | | | | | |
Christopher C. Davis (07/13/65) | Director | Director since 1997 | President or Vice President of each Davis Fund, Selected Fund, and Clipper Fund; Chairman, Davis Selected Advisers, L.P., and also serves as an executive officer in certain companies affiliated with the Adviser, including sole member of the Adviser’s general partner, Davis Investments, LLC; Employee of Shelby Cullom Davis & Co. (registered broker/dealer). | 10 | Director, Davis New York Venture Fund, Inc. (consisting of four portfolios); Director, the Selected Funds (consisting of three portfolios) since 1998; Director, Washington Post Co. (publishing company). |
* Christopher C. Davis owns partnership units (directly, indirectly, or both) of the Adviser and is considered to be an “interested person” of the Funds as defined in the Investment Company Act of 1940.
Officers
Christopher C. Davis (born 07/13/65, Davis Funds officer since 1997). See description in the section on Inside Directors.
Andrew A. Davis (born 06/25/63, Davis Funds officer since 1997). President or Vice President of each of the Davis Funds (consisting of 13 portfolios) and Selected Funds (consisting of three portfolios); President, Davis Selected Advisers, L.P., serves as an executive officer in certain companies affiliated with the Adviser; Director of Davis Series, Inc. (consisting of six portfolios) and the Selected Funds (consisting of three portfolios).
Kenneth C. Eich (born 08/14/53, Davis Funds officer since 1997). Executive Vice President and Principal Executive Officer of each of the Davis Funds (consisting of 13 portfolios), Selected Funds (consisting of three portfolios), and Clipper Fund, Inc. (consisting of one portfolio); Chief Operating Officer, Davis Selected Advisers, L.P., and also serves as an executive officer in certain companies affiliated with the Adviser.
Douglas A. Haines (born 03/04/71, Davis Funds officer since 2004). Vice President, Treasurer, Chief Financial Officer, Principal Financial Officer, and Principal Accounting Officer of each of the Davis Funds (consisting of 13 portfolios), Selected Funds (consisting of three portfolios), and Clipper Fund, Inc. (consisting of one portfolio); Vice President and Director of Fund Accounting, Davis Selected Advisers, L.P.
Sharra L. Haynes (born 09/25/66, Davis Funds officer since 1997). Vice President, Chief Compliance Officer of each of the Davis Funds (consisting of 13 portfolios), Selected Funds (consisting of three portfolios), and Clipper Fund, Inc. (consisting of one portfolio); Vice President and Chief Compliance Officer, Davis Selected Advisers, L.P., and also serves as an executive officer in certain companies affiliated with the Adviser.
Thomas D. Tays (born 03/07/57, Davis Funds officer since 1997). Vice President and Secretary of each of the Davis Funds (consisting of 13 portfolios), Selected Funds (consisting of three portfolios), and Clipper Fund, Inc. (consisting of one portfolio); Vice President, Chief Legal Officer and Secretary, Davis Selected Advisers, L.P., and also serves as an executive officer in certain companies affiliated with the Adviser.
Arthur Don (born 09/24/53, Davis Funds officer since 1991). Assistant Secretary (for clerical purposes only) of each of the Davis Funds and Selected Funds; Shareholder, Greenberg Traurig, LLP (law firm); counsel to the Independent Directors and the Davis Funds.
| DAVIS REAL ESTATE PORTFOLIO |
| Investment Adviser | |
| Davis Selected Advisers, L.P. (Doing business as “Davis Advisors”) | |
| 2949 East Elvira Road, Suite 101 | |
| Tucson, Arizona 85756 | |
| (800) 279-0279 | |
| | |
| Distributor | |
| Davis Distributors, LLC | |
| 2949 East Elvira Road, Suite 101 | |
| Tucson, Arizona 85756 | |
| | |
| Transfer Agent | |
| Boston Financial Data Services, Inc. | |
| c/o The Davis Funds | |
| P.O. Box 8406 | |
| Boston, Massachusetts 02266-8406 | |
| | |
| Custodian | |
| State Street Bank and Trust Co. | |
| One Lincoln Street | |
| Boston, Massachusetts 02111 | |
| | |
| Counsel | |
| Greenberg Traurig, LLP | |
| 77 West Wacker Drive, Suite 3100 | |
| Chicago, Illinois 60601 | |
| | |
| Independent Registered Public Accounting Firm | |
| KPMG LLP | |
| 707 Seventeenth Street, Suite 2700 | |
| Denver, Colorado 80202 | |
For more information about Davis Real Estate Portfolio, including management fee, charges, and expenses, see the current prospectus, which must precede or accompany this report. The Fund’s Statement of Additional Information contains additional information about the Fund’s Directors and is available without charge upon request by calling 1-800-279-0279 and on the Fund’s website at www.davisfunds.com. Quarterly Fact sheets are available on the Fund’s website at www.davisfunds.com.
ITEM 2. CODE OF ETHICS
Not Applicable
ITEM 3. AUDIT COMMITTEE FINANCIAL EXPERT
The registrant’s board of directors has determined that independent trustee Marsha Williams qualifies as the “audit committee financial expert”, as defined in Item 3 of form N-CSR.
ITEM 4. PRINCIPAL ACCOUNTANT FEES AND SERVICES
Not Applicable
ITEM 5. AUDIT COMMITTEE OF LISTED REGISTRANTS
Not Applicable
ITEM 6. SCHEDULE OF INVESTMENTS
Not Applicable. The complete Schedule of Investments is included in Item 1 of this for N-CSR
ITEM 7. DISCLOSURE OF PROXY VOTING POLICIES AND PROCEDURES FOR CLOSED-END MANAGEMENT INVESTMENT COMPANIES
Not Applicable
ITEM 8. PORTFOLIO MANAGERS OF CLOSED-END MANAGEMENT INVESTMENT COMPANIES
Not Applicable
ITEM 9. PURCHASES OF EQUITY SECURITIES BY CLOSED-END MANAGEMENT INVESTMENT COMPANIES AND AFFILIATED PURCHASERS
Not Applicable
ITEM 10. SUBMISSION OF MATTERS TO A VOTE OF SECURITY HOLDERS
There have been no changes to the procedure by which shareholders may recommend nominees to the registrant’s Board of Trustees.
ITEM 11. CONTROLS AND PROCUDURES
| | (a) | The registrant’s principal executive officer and principal financial officer have concluded that the registrant’s disclosure controls and procedures (as defined in Rule 30a-3 (c) under the Investment Company Act of 1940, as amended) are effective as of a date within 90 days of the filing date of this report. |
| | (b) | There have been no significant changes in the registrant’s internal controls or in other factors that could significantly affect these controls. |
ITEM 12. EXHIBITS
(a)(1) Not Applicable
| | (a)(2) Certifications pursuant to Section 302 of the Sarbanes-Oxley Act of 2002 are attached. |
| | (b) Certifications pursuant to Section 906 of the Sarbanes-Oxley Act of 2002 are attached. |
Pursuant to the requirements of the Securities Exchange Act of 1934 and the Investment Company Act of 1940, the registrant has duly caused this report to be signed on its behalf by the undersigned, thereunto duly authorized.
DAVIS VARIABLE ACCOUNT FUND, INC.
| By | /s/ Kenneth C. Eich | |
| | Kenneth C. Eich | |
| | Principal Executive Officer |
| | | | |
Date: August 18, 2010
Pursuant to the requirements of the Securities Exchange Act of 1934 and the Investment Company Act of 1940, this report has been signed below by the following persons on behalf of the registrant and in the capacities and on the dates indicated.
| By | /s/ Kenneth C. Eich | |
| | Kenneth C. Eich | |
| | Principal Executive Officer |
| | | | |
Date: August 18, 2010
| By | /s/ Douglas A. Haines | |
| | Douglas A. Haines | |
| | Principal Financial Officer |
| | | | |
Date: August 18, 2010