UNITED STATES
SECURITIES AND EXCHANGE COMMISSION
Washington, DC 20549
FORM N-CSR
CERTIFIED SHAREHOLDER REPORT OF REGISTERED MANAGEMENT INVESTMENT COMPANY
Investment Company Act file number 811-09293
DAVIS VARIABLE ACCOUNT FUND, INC.
(Exact name of registrant as specified in charter)
2949 East Elvira Road, Suite 101
Tucson, AZ 85756
(Address of principal executive offices)
Ryan M. Charles
Davis Selected Advisers, L.P.
2949 East Elvira Road, Suite 101
Tucson, AZ 85756
(Name and address of agent for service)
Registrant’s telephone number, including area code: 520-806-7600
Date of fiscal year end: December 31, 2018
Date of reporting period: December 31, 2018
____________________
ITEM 1. REPORT TO STOCKHOLDERS
| DAVIS VALUE PORTFOLIO | Table of Contents |
| 2 |
| |
| 4 |
| |
| 6 |
| |
| 7 |
| |
| 10 |
| |
| 11 |
| | |
| 12 |
| |
| 13 |
| |
| 17 |
| |
| 18 |
| |
| 19 |
| |
| 20 |
This Annual Report is authorized for use by existing shareholders. Prospective shareholders must receive a current Davis Value Portfolio prospectus, which contains more information about investment strategies, risks, charges, and expenses. Please read the prospectus carefully before investing or sending money.
Shares of Davis Value Portfolio are not deposits or obligations of any bank, are not guaranteed by any bank, are not insured by the FDIC or any other agency, and involve investment risks, including possible loss of the principal amount invested.
Portfolio Proxy Voting Policies and Procedures
The Fund has adopted Portfolio Proxy Voting Policies and Procedures under which the Fund votes proxies relating to securities held by the Fund. A description of the Fund’s Portfolio Proxy Voting Policies and Procedures is available (i) without charge, upon request, by calling the Fund toll-free at 1-800-279-0279, (ii) on the Fund’s website at www.davisfunds.com, and (iii) on the SEC’s website at www.sec.gov.
In addition, the Fund is required to file Form N-PX, with its complete proxy voting record for the 12 months ended June 30th, no later than August 31st of each year. The Fund’s Form N-PX filing is available (i) without charge, upon request, by calling the Fund toll-free at 1-800-279-0279, (ii) on the Fund’s website at www.davisfunds.com, and (iii) on the SEC’s website at www.sec.gov.
Form N-Q
The Fund files its complete schedule of portfolio holdings with the SEC for the first and third quarters of each fiscal year on Form N-Q. The Fund’s Form N-Q is available without charge, upon request, by calling 1-800-279-0279, on the Fund’s website at www.davisfunds.com, and on the SEC’s website at www.sec.gov. Effective March 31, 2019, Form N-PORT Exhibit F will replace Form N-Q.
DAVIS VALUE PORTFOLIO | Management’s Discussion of Fund Performance |
Performance Overview
Davis Value Portfolio underperformed the Standard & Poor’s 500® Index (“S&P 500®”) for the twelve-month period ended December 31, 2018 (the “period”). The Fund delivered a total return of (13.60)%, versus a (4.38)% return for the S&P 500®. The sectors1 within the S&P 500® that reported the strongest performance were Health Care (up 6%), Consumer Discretionary (up 5%), and Utilities (up 4%). The sectors within the S&P 500® that reported the weakest performance were Energy (down 18%), Materials (down 15%), and Industrials (down 13%).
Detractors from Performance
The Fund’s holdings in the weakest performing sector within the S&P 500®, Energy, were the most significant detractor2 from relative performance and were also an important absolute detractor. Stock selection was the primary factor in the Fund’s underperformance relative to the S&P 500® (down 38%, compared with down 18%). Apache3 (down 36%) and Encana (down 56%) hindered performance.
Absolute performance was most negatively impacted by the Fund’s Financials holdings (down 11%). The Fund had an average weighting of 33% of its net assets in this sector. Wells Fargo (down 22%), the third-largest holding, and Capital One (down 23%) were laggards.
The Fund’s stock selection in both the Consumer Discretionary (down 10%, versus up 5%) and the Information Technology (down 6%, compared with down 1%) sectors hindered its performance relative to the S&P 500®. Adient (down 80%), a Consumer Discretionary holding, was the top detractor for the period and New Oriental Education & Technology Group (down 39%), also from the Consumer Discretionary sector, held back results. The Fund established a position in New Oriental Education & Technology Group during the first half of the period.
During the period, a new sector was launched, Communication Services. The Fund’s Communication Services holdings detracted on an absolute and relative basis (down 31%, versus down 12%), primarily due to Alphabet (down less than 1% in 2018) and Facebook (down 26% in 2018), two companies that moved from the Information Technology sector at the time of launch. Alphabet returned -13% after its move to Communication Services. Naspers (down 28% in 2018) was also a weak performer.
Within the Industrials sector, the Fund’s holdings of General Electric (down 43%) and United Technologies (down 15%) weakened returns. General Electric was purchased during the period.
The Fund ended the period with 18% of its net assets in foreign securities. The Fund’s foreign securities underperformed its domestic holdings (down 21%, versus down 12%).
Contributors to Performance
The Fund’s performance benefited from its holdings in repurchase agreements. The Fund ended the period with approximately 4% of its net assets in repurchase agreements. Additionally, when compared to the S&P 500®, it was helpful that the Fund did not hold any securities in the Consumer Staples sector.
Apart from the Fund’s repurchase agreement position and lack of Consumer Staples, when compared to the Index, each sector of the Fund was a detractor. For this reason, the following discussion is focused almost entirely on absolute performance and contributions thereto.
The Fund benefited on an absolute basis from its Health Care and Information Technology holdings. Aetna (up 19%), the second-top contributor, and Express Scripts Holding (up less than 1%), both from the Health Care sector, contributed to performance. As noted above, Alphabet was classified as a Communication Services holding at the end of the period but contributed heavily to Information Technology’s performance by returning 14% while classified in that sector. Microsoft (up 21%) also boosted performance. Aetna merged into CVS Health and Express Scripts Holding was sold during the period.
A number of notable contributors during the period came from the Consumer Discretionary sector, including Amazon (up 28%), the top contributor and fourth-largest holding, Aptiv (up 21%), Liberty TripAdvisor (up 69%), and Delphi Technologies (up 10%). Safran (up 28%), an Industrials holding, Occidental Petroleum (up 16%) from the Energy sector, and Berkshire Hathaway (up 3%), a Financials holding, also generated strong gains. Aptiv, Delphi Technologies, Safran, and Occidental Petroleum were sold during the period.
Davis Value Portfolio’s investment objective is long-term growth of capital. There can be no assurance that the Fund will achieve its objective. Davis Value Portfolio’s principal risks are: common stock risk, depositary receipts risk, emerging market risk, fees and expenses risk, financial services risk, foreign country risk, foreign currency risk, headline risk, large-capitalization companies risk, manager risk, mid- and small-capitalization companies risk, and stock market risk. See the prospectus for a full description of each risk.
Past performance does not guarantee future results, Fund prices fluctuate, and the value of an investment may be worth more or less than the purchase price. Data provided in this performance overview is for the twelve-month period ended December 31, 2018, unless otherwise noted. Return figures for underlying Fund positions reflect the return of the security from the beginning of the period or the date of first purchase if subsequent thereto through the end of the period or the date the position is completely liquidated. The actual contribution to the Fund will vary based on a number of factors (e.g., trading activity, weighting). Portfolio holding information is as of the end of the twelve-month period, December 31, 2018, unless otherwise noted.
| 1 | The companies included in the Standard & Poor’s 500® Index are divided into eleven sectors. One or more industry groups make up a sector. For purposes of measuring concentration, the Fund generally classifies companies at the industry group or industry level. See the SAI for additional information regarding the Fund’s concentration policy. |
| 2 | A company’s or sector’s contribution to or detraction from the Fund’s performance is a product both of its appreciation or depreciation and its weighting within the Fund. For example, a 5% holding that rises 20% has twice as much impact as a 1% holding that rises 50%. |
3 This Management Discussion of Fund Performance discusses a number of individual companies. The information provided in this report does not provide information reasonably sufficient upon which to base an investment decision and should not be considered a recommendation to purchase, sell, or hold any particular security. The Schedule of Investments lists the Fund’s holdings of each company discussed.
DAVIS VALUE PORTFOLIO | Management’s Discussion of Fund Performance – (Continued) |
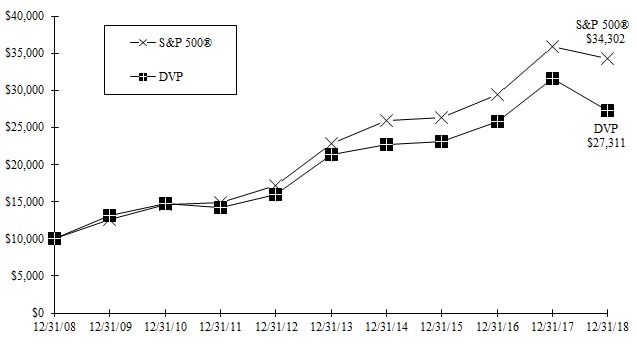
Comparison of a $10,000 investment in Davis Value Portfolio versus the Standard & Poor’s 500® Index
over 10 years for an investment made on December 31, 2008
Average Annual Total Return for periods ended December 31, 2018
| Fund & Benchmark Index | 1-Year | 5-Year | 10-Year | Since Fund’s Inception (07/01/99) | Gross Expense Ratio | Net Expense Ratio |
| Davis Value Portfolio | (13.60)% | 5.01% | 10.56% | 5.09% | 0.64% | 0.64% |
Standard & Poor’s 500® Index | (4.38)% | 8.49% | 13.11% | 5.10% | | |
The Standard & Poor’s 500® Index is an unmanaged index of 500 selected common stocks, most of which are listed on the New York Stock Exchange. The Index is adjusted for dividends, weighted towards stocks with large market capitalizations, and represents approximately two-thirds of the total market value of all domestic common stocks. Investments cannot be made directly in the Index.
The performance data quoted in this report represents past performance, assumes that all distributions were reinvested, and is not a guarantee of future results. The investment return and principal value will fluctuate so that shares may be worth more or less than their original cost when redeemed. Current performance may be higher or lower than performance data quoted. The operating expense ratio may vary in future years. For more recent month-end performance information, please call Investor Services at 1-800-279-0279 or visit the Fund’s website at www.davisfunds.com.
Fund performance numbers are net of all Fund operating expenses, but do not include any insurance charges imposed by your insurance company’s separate account. If performance included the effect of these additional charges, the return would be lower.
| DAVIS VALUE PORTFOLIO | |
| | December 31, 2018 |
| Portfolio Composition | | Industry Weightings |
| (% of Fund’s 12/31/18 Net Assets) | | (% of 12/31/18 Stock Holdings) |
| | | | | | |
| | | | | Fund | | S&P 500® |
| Common Stock (U.S.) | 77.40% | | Diversified Financials | 20.59% | | 5.32% |
| Common Stock (Foreign) | 15.23% | | Media & Entertainment | 16.07% | | 7.96% |
| Preferred Stock (Foreign) | 3.09% | | Banks | 15.23% | | 5.66% |
| Short-Term Investments | 4.24% | | Retailing | 12.64% | | 6.44% |
| Other Assets & Liabilities | 0.04% | | Capital Goods | 11.35% | | 6.45% |
| | 100.00% | | Information Technology | 7.86% | | 20.11% |
| | | | Energy | 5.86% | | 5.31% |
| | | | Insurance | 2.94% | | 2.38% |
| | | | Consumer Services | 2.44% | | 1.87% |
| | | | Materials | 2.24% | | 2.73% |
| | | | Health Care | 1.42% | | 15.53% |
| | | | Automobiles & Components | 0.78% | | 0.51% |
| | | | Consumer Durables & Apparel | 0.58% | | 1.11% |
| | | | Other | – | | 18.62% |
| | | | | 100.00% | | 100.00% |
| Top 10 Long-Term Holdings |
| (% of Fund’s 12/31/18 Net Assets) |
| | | |
| Alphabet Inc.* | Media & Entertainment | 8.73% |
| Berkshire Hathaway Inc., Class A | Diversified Financial Services | 6.78% |
| Wells Fargo & Co. | Banks | 5.64% |
| Amazon.com, Inc. | Retailing | 5.42% |
| Capital One Financial Corp. | Consumer Finance | 4.86% |
| Bank of New York Mellon Corp. | Capital Markets | 4.55% |
| JPMorgan Chase & Co. | Banks | 4.41% |
| United Technologies Corp. | Capital Goods | 4.32% |
| Facebook, Inc., Class A | Media & Entertainment | 3.91% |
| American Express Co. | Consumer Finance | 3.52% |
| |
| |
| *Alphabet Inc. holding includes Class A and Class C. | | |
| DAVIS VALUE PORTFOLIO | Fund Overview – (Continued) |
| | December 31, 2018 |
New Positions Added (01/01/18-12/31/18)
(Highlighted positions are those greater than 2.00% of the Fund’s 12/31/18 net assets)
| Security | Industry | Date of 1st Purchase | % of Fund’s 12/31/18 Net Assets |
| Applied Materials, Inc. | Semiconductors & Semiconductor | | |
| | Equipment | 07/09/18 | 2.56% |
| CVS Health Corp. | Health Care Equipment & Services | 11/29/18 | 1.36% |
| Danske Bank A/S | Banks | 09/26/18 | 1.25% |
| DBS Group Holdings Ltd. | Banks | 04/09/18 | 1.59% |
| General Electric Co. | Capital Goods | 07/05/18 | 1.95% |
| Magnolia Oil & Gas Corp., Class A | Energy | 07/30/18 | 1.04% |
| New Oriental Education & Technology | | | |
| Group, Inc., ADR | Consumer Services | 01/24/18 | 2.33% |
| U.S. Bancorp | Banks | 06/18/18 | 1.69% |
Positions Closed (01/01/18-12/31/18)
(Gains and losses greater than $1,000,000 are highlighted)
| Security | Industry | Date of Final Sale | Realized Gain (Loss) |
| Aetna Inc. | Health Care Equipment & Services | 11/29/18 | $ | 4,050,500 |
| Aptiv PLC | Automobiles & Components | 06/12/18 | | 1,138,289 |
| Axalta Coating Systems Ltd. | Materials | 06/28/18 | | 316,225 |
| Cabot Oil & Gas Corp. | Energy | 07/09/18 | | (850,556) |
| CommerceHub, Inc., Series A | Media & Entertainment | 05/22/18 | | 32,530 |
| CommerceHub, Inc., Series C | Media & Entertainment | 05/22/18 | | 65,054 |
| Delphi Technologies PLC | Automobiles & Components | 01/29/18 | | 212,096 |
| Express Scripts Holding Co. | Health Care Equipment & Services | 02/14/18 | | 2,666,035 |
| Fang Holdings Ltd., Class A, ADR | Media & Entertainment | 05/10/18 | | (467,922) |
| FedEx Corp. | Transportation | 05/21/18 | | 982,161 |
| Occidental Petroleum Corp. | Energy | 07/31/18 | | 599,485 |
| Safran S.A. | Capital Goods | 11/07/18 | | 3,433,816 |
As a shareholder of the Fund, you incur ongoing costs only, including advisory and administrative fees and other Fund expenses. The Expense Example is intended to help you understand your ongoing costs (in dollars) of investing in the Fund and to compare these costs with the ongoing costs of investing in other mutual funds. The Expense Example is based on an investment of $1,000 invested at the beginning of the period and held for the entire period indicated, which for the Fund is for the six-month period ended December 31, 2018. Please note that the Expense Example is general and does not reflect charges imposed by your insurance company’s separate account or account specific costs, which may increase your total costs of investing in the Fund. If these charges or account specific costs were included in the Expense Example, the expenses would be higher.
Actual Expenses
The information represented in the row entitled “Actual” provides information about actual account values and actual expenses. You may use the information in this row, together with the amount you invested, to estimate the expenses that you paid over the period. Simply divide your account value by $1,000 (for example, an $8,600 account value divided by $1,000 = 8.6), then multiply the result by the number under the heading “Expenses Paid During Period” to estimate the expenses you paid on your account during this period.
Hypothetical Example for Comparison Purposes
The information represented in the row entitled “Hypothetical” provides information about hypothetical account values and hypothetical expenses based on the Fund’s actual expense ratio and an assumed rate of return of 5% per year before expenses, which is not the Fund’s actual return. The hypothetical account values and expenses may not be used to estimate the actual ending account balance or expenses you paid for the period. You may use this information to compare the ongoing costs of investing in the Fund and other funds. To do so, compare this 5% hypothetical example with the 5% hypothetical examples that appear in the shareholder reports of the other funds.
Please note that the expenses shown in the table are meant to highlight your ongoing costs only. Therefore, the information in the row entitled “Hypothetical” is useful in comparing ongoing costs only, and will not help you determine the relative total costs of owning different funds.
| | Beginning Account Value (07/01/18) | | Ending Account Value (12/31/18) | | Expenses Paid During Period* (07/01/18-12/31/18) |
Actual | $1,000.00 | | $848.16 | | $2.98 |
| Hypothetical | $1,000.00 | | $1,021.98 | | $3.26 |
Hypothetical assumes 5% annual return before expenses.
* Expenses are equal to the Fund’s annualized operating expense ratio (0.64%)**, multiplied by the average account value over the period, multiplied by 184/365 (to reflect the one-half year period).
** The expense ratio reflects the impact, if any, of certain reimbursements from the Adviser.
| DAVIS VALUE PORTFOLIO | |
| | December 31, 2018 |
| | Shares | | Value
(Note 1) |
| COMMON STOCK – (92.63%) |
| | COMMUNICATION SERVICES – (15.39%) |
| | Media & Entertainment – (15.39%) |
| | | | | | | | |
| | | | | | | | |
| | Facebook, Inc., Class A * | | | | | | |
| | GCI Liberty, Inc., Class A * | | | | | | |
| | Liberty Global plc, Series C * | | | | | | |
| | Liberty Latin America Ltd., Class C * | | | | | | |
| | Liberty TripAdvisor Holdings, Inc., Series A * | | | | | | |
| | Naspers Ltd. - N (South Africa) | | | | | | |
| | Total Communication Services | | | |
| | CONSUMER DISCRETIONARY – (12.65%) |
| | Automobiles & Components – (0.75%) |
| | | | | | | | |
| | Consumer Durables & Apparel – (0.56%) |
| | Hunter Douglas N.V. (Netherlands) | | | | | | |
| | Consumer Services – (2.33%) |
| | New Oriental Education & Technology Group, Inc., ADR (China)* | | | | | | |
| | Retailing – (9.01%) |
| | Alibaba Group Holding Ltd., ADR (China)* | | | | | | |
| | | | | | | | |
| | | | | | | | |
| | Liberty Expedia Holdings, Inc., Series A * | | | | | | |
| | Qurate Retail, Inc., Series A * | | | | | | |
| | | | 17,478,184 |
| | Total Consumer Discretionary | | | |
| | ENERGY – (5.61%) |
| | | | | | | | |
| | | | | | | | |
| | Magnolia Oil & Gas Corp., Class A * | | | | | | |
| | | | | |
| | FINANCIALS – (37.10%) |
| | Banks – (14.58%) |
| | Danske Bank A/S (Denmark) | | | | | | |
| | DBS Group Holdings Ltd. (Singapore) | | | | | | |
| | | | | | | | |
| | | | | | | | |
| | | | | | | | |
| | | | 28,278,967 |
| | Diversified Financials – (19.71%) |
| | Capital Markets – (4.55%) |
| | Bank of New York Mellon Corp. | | | | | | |
| | Consumer Finance – (8.38%) |
| | | | | | | | |
| | Capital One Financial Corp. | | | | | | |
| | | 16,253,486 |
| DAVIS VALUE PORTFOLIO | Schedule of Investments - (Continued) |
| | December 31, 2018 |
| | Shares | | Value
(Note 1) |
| COMMON STOCK – (CONTINUED) |
| | FINANCIALS – (CONTINUED) |
| | Diversified Financials – (Continued) |
| | Diversified Financial Services – (6.78%) |
| | Berkshire Hathaway Inc., Class A * | | | | | | |
| | | | 38,230,521 |
| | Insurance – (2.81%) |
| | Multi-line Insurance – (1.01%) |
| | | | | | | | |
| | Property & Casualty Insurance – (1.80%) |
| | | | | | | | |
| | | | | | | | |
| | | 3,505,296 |
| | | | 5,461,745 |
| | | | | | | |
| | HEALTH CARE – (1.36%) |
| | Health Care Equipment & Services – (1.36%) |
| | | | | | | | |
| | | | | |
| | INDUSTRIALS – (10.86%) |
| | Capital Goods – (10.86%) |
| | Ferguson PLC (United Kingdom) | | | | | | |
| | | | | | | | |
| | Johnson Controls International plc | | | | | | |
| | Orascom Construction PLC (United Arab Emirates) | | | | | | |
| | United Technologies Corp. | | | | | | |
| | | | | |
| | INFORMATION TECHNOLOGY – (7.52%) |
| | Semiconductors & Semiconductor Equipment – (5.08%) |
| | | | | | | | |
| | | | | | | | |
| | | | 9,866,416 |
| | Software & Services – (2.44%) |
| | | | | | | | |
| | | | | | | | |
| | | | 4,731,049 |
| | Total Information Technology | | | |
| | MATERIALS – (2.14%) |
| | LafargeHolcim Ltd. (Switzerland) | | | | | | |
| | | | | | | | |
| | | | | |
| | TOTAL COMMON STOCK – (Identified cost $135,045,570)
| | | |
| PREFERRED STOCK – (3.09%) |
| | CONSUMER DISCRETIONARY – (3.09%) |
| | Retailing – (3.09%) |
| | Didi Chuxing Joint Co., Series A (China)*(a)(b) | | | | | | |
| | TOTAL PREFERRED STOCK – (Identified cost $3,959,579)
| | | |
| DAVIS VALUE PORTFOLIO | Schedule of Investments - (Continued) |
| | December 31, 2018 |
| | Principal | | Value
(Note 1) |
| SHORT-TERM INVESTMENTS – (4.24%) |
| | INTL FCStone Financial Inc. Joint Repurchase Agreement, 3.05%, 01/02/19, dated 12/31/18, repurchase value of $3,262,553 (collateralized by: U.S. Government agency mortgages and obligations in a pooled cash account, 0.00%-10.25%, 01/15/19-09/20/68, total market value $3,327,240) | | | | | | |
| | Mizuho Securities USA Inc. Joint Repurchase Agreement, 2.90%, 01/02/19, dated 12/31/18, repurchase value of $266,043 (collateralized by: U.S. Government agency obligation in a pooled cash account, 2.625%, 12/31/23, total market value $271,320) | | | | | | |
| | Nomura Securities International, Inc. Joint Repurchase Agreement, 3.00%, 01/02/19, dated 12/31/18, repurchase value of $783,131 (collateralized by: U.S. Government agency mortgages in a pooled cash account, 3.00%-4.04%, 04/01/24-12/01/47, total market value $798,660) | | | | | | |
| | SunTrust Robinson Humphrey, Inc. Joint Repurchase Agreement, 3.21%, 01/02/19, dated 12/31/18, repurchase value of $3,914,698 (collateralized by: U.S. Government agency mortgages in a pooled cash account, 2.50%-5.00%, 10/01/25-08/01/48, total market value $3,992,280) | | | | | | |
| | | | TOTAL SHORT-TERM INVESTMENTS – (Identified cost $8,225,000)
| | | |
| |
Total Investments – (99.96%) – (Identified cost $147,230,149) | | | 193,936,476 |
| | Other Assets Less Liabilities – (0.04%) | | | 70,619 |
| | Net Assets – (100.00%) | | $ | 194,007,095 |
| | |
| | ADR: American Depositary Receipt |
| | | |
| | * | Non-income producing security. |
| | | |
| | (a) | Restricted Security – See Note 7 of the Notes to Financial Statements. |
| | | |
| | (b) | The value of this security was determined using significant unobservable inputs. See Note 1 of the Notes to Financial Statements. |
| |
| See Notes to Financial Statements |
| DAVIS VALUE PORTFOLIO | Statement of Assets and Liabilities |
| | At December 31, 2018 |
| ASSETS: | | | | | |
| Investments in securities, at value* (see accompanying Schedule of Investments) | | $ | 193,936,476 |
| Cash | | | 5,134 |
| Receivables: | | | |
| | Capital stock sold | | | 186,365 |
| | Dividends and interest | | | 84,371 |
| Prepaid expenses | | | 7,732 |
| | | Total assets | | | 194,220,078 |
LIABILITIES: | | | |
| Payables: | | | |
| | Capital stock redeemed | | | 59,930 |
| Accrued audit fees | | | 15,961 |
| Accrued custodian fees | | | 26,700 |
| Accrued investment advisory fee | | | 95,693 |
| Other accrued expenses | | | 14,699 |
| | Total liabilities | | | 212,983 |
NET ASSETS | | $ | 194,007,095 |
SHARES OUTSTANDING | | | 28,141,224 |
NET ASSET VALUE, offering, and redemption price per share (Net assets ÷ Shares outstanding) | | $ | 6.89 |
NET ASSETS CONSIST OF: | | | |
| Par value of shares of capital stock | | $ | 28,141 |
| | | | |
| Additional paid-in capital | | | 142,594,921 |
| | | | |
| Distributable earnings | | | 51,384,033 |
| | Net Assets | | $ | 194,007,095 |
| | | | | |
| *Including: | | | |
| | Cost of investments | | $ | 147,230,149 |
| See Notes to Financial Statements |
| DAVIS VALUE PORTFOLIO | |
| | For the year ended December 31, 2018 |
| INVESTMENT INCOME: | | | | | | |
| Income: | | | |
| Dividends* | | $ | 3,464,669 |
| Interest | | | 101,273 |
| | | Total income | | | | 3,565,942 |
Expenses: | | | |
| Investment advisory fees (Note 3) | | $ | 1,308,435 | | | |
| Custodian fees | | | 60,739 | | | |
| Transfer agent fees | | | 14,736 | | | |
| Audit fees | | | 23,148 | | | |
| Legal fees | | | 7,757 | | | |
| Accounting fees (Note 3) | | | 8,000 | | | |
| Reports to shareholders | | | 8,815 | | | |
| Directors’ fees and expenses | | | 73,326 | | | |
| Registration and filing fees | | | 48 | | | |
| Miscellaneous | | | 20,155 | | | |
| | Total expenses | | | | 1,525,159 |
| Net investment income | | | 2,040,783 |
REALIZED & UNREALIZED GAIN (LOSS) ON INVESTMENTS AND FOREIGN CURRENCY TRANSACTIONS: | | | | | | |
| Net realized gain (loss) from: | | | |
| | Investment transactions | | | 31,628,082 |
| | Foreign currency transactions | | | (6,404) |
| Net realized gain | | | 31,621,678 |
| Net decrease in unrealized appreciation | | | (63,334,795) |
| | Net realized and unrealized loss on investments and foreign currency transactions | | | | (31,713,117) |
| Net decrease in net assets resulting from operations | | $ | (29,672,334) |
| | | | | | | | | |
| *Net of foreign taxes withheld of | | $ | 24,073 |
| See Notes to Financial Statements |
| DAVIS VALUE PORTFOLIO | Statements of Changes in Net Assets |
| | | Year ended December 31, |
| | | 2018 | | 2017* |
OPERATIONS: | | | | | | |
| Net investment income | | $ | 2,040,783 | | $ | 1,818,229 |
| Net realized gain from investments and foreign currency transactions | | | 31,621,678 | | | 28,006,767 |
Net increase (decrease) in unrealized appreciation on investments and foreign currency transactions | | | (63,334,795) | | | 21,400,155 |
| | | Net increase (decrease) in net assets resulting from operations | | | (29,672,334) | | | 51,225,151 |
DIVIDENDS AND DISTRIBUTIONS TO SHAREHOLDERS: | | | (41,857,203) | | | (22,163,286) |
CAPITAL SHARE TRANSACTIONS: | | | | | | |
Net increase (decrease) in net assets resulting from capital share transactions (Note 4) | | | 11,504,217 | | | (24,372,813) |
| | Total increase (decrease) in net assets | | | (60,025,320) | | | 4,689,052 |
NET ASSETS: | | | | | | |
| Beginning of year | | | 254,032,415 | | | 249,343,363 |
| End of year | | $ | 194,007,095 | | $ | 254,032,415 |
| | | | | | | | |
| *Includes dividends and distributions to shareholders from net investment income $(1,827,900) and realized gains from investment transactions $(20,335,386). End of year net assets includes undistributed net investment income $237,074. |
| See Notes to Financial Statements |
| DAVIS VALUE PORTFOLIO | Notes to Financial Statements |
| | December 31, 2018 |
NOTE 1 - SUMMARY OF SIGNIFICANT ACCOUNTING POLICIES
The Fund is a separate series of Davis Variable Account Fund, Inc. (a Maryland corporation), is registered under the Investment Company Act of 1940, as amended, as a diversified, open-end management investment company. The Fund follows the reporting guidance of the Financial Accounting Standards Board (“FASB”) Accounting Standards Codification Topic 946, Financial Services – Investment Companies. Only insurance companies, for the purpose of funding variable annuity or variable life insurance contracts, may purchase shares of the Fund. The following is a summary of significant accounting policies followed by the Fund in the preparation of its financial statements.
Security Valuation - The Fund calculates the net asset value of its shares as of the close of the New York Stock Exchange (“Exchange”), normally 4:00 P.M. Eastern time, on each day the Exchange is open for business. Securities listed on the Exchange (and other national exchanges including NASDAQ) are valued at the last reported sales price on the day of valuation. Listed securities for which no sale was reported on that date are valued at the last quoted bid price. Securities traded on foreign exchanges are valued based upon the last sales price on the principal exchange on which the security is traded prior to the time when the Fund’s assets are valued. Securities (including restricted securities) for which market quotations are not readily available or securities whose values have been materially affected by what Davis Selected Advisers, L.P. (“Davis Advisors” or “Adviser”), the Fund’s investment adviser, identifies as a significant event occurring before the Fund’s assets are valued, but after the close of their respective exchanges will be fair valued using a fair valuation methodology applicable to the security type or the significant event as previously approved by the Fund’s Pricing Committee and Board of Directors. The Pricing Committee considers all facts it deems relevant that are reasonably available, through either public information or information available to the Adviser’s portfolio management team, when determining the fair value of a security. To assess the appropriateness of security valuations, the Adviser may consider (i) comparing prior day prices and/or prices of comparable securities; (ii) comparing sale prices to the prior or current day prices and challenge those prices exceeding certain tolerance levels with the third-party pricing service or broker source; (iii) new rounds of financing; (iv) the performance of the market or the issuer’s industry; (v) the liquidity of the security; (vi) the size of the holding in a fund; and/or (vii) any other appropriate information. The determination of a security’s fair value price often involves the consideration of a number of subjective factors and is therefore subject to the unavoidable risk that the value assigned to a security may be higher or lower than the security’s value would be if a reliable market quotation of the security was readily available. Fair value determinations are subject to review, approval, and ratification by the Fund’s Board of Directors at its next regularly scheduled meeting covering the period in which the fair valuation was determined. Fair valuation methods used by the Fund may include, but are not limited to, valuing securities initially at cost (excluding commissions) and subsequently adjusting the value due to: additional transactions by the issuer, changes in company specific fundamentals, and changes in the value of similar securities. Values may be further adjusted for any discounts related to security-specific resale restrictions.
Short-term securities purchased within 60 days to maturity are valued at amortized cost, which approximates market value.
The Fund’s valuation procedures are reviewed and subject to approval by the Board of Directors. There have been no significant changes to the fair valuation procedures during the period.
Fair Value Measurements - Fair value is defined as the price that the Fund would receive upon selling an investment in an orderly transaction to an independent buyer in the principal market for the investment. Various inputs are used to determine the fair value of the Fund’s investments. These inputs are summarized in the three broad levels listed below.
Level 1 – quoted prices in active markets for identical securities
Level 2 – other significant observable inputs (including quoted prices for similar investments, interest rates, prepayment speeds, credit risk, etc.)
Level 3 – significant unobservable inputs (including the Fund’s own assumptions in determining the fair value of investments)
The inputs or methodologies used for valuing securities are not necessarily an indication of the risks associated with investing in those securities nor can it be assured that the Fund can obtain the fair value assigned to a security if it were to sell the security.
| DAVIS VALUE PORTFOLIO | Notes to Financial Statements – (Continued) |
| | December 31, 2018 |
NOTE 1 - SUMMARY OF SIGNIFICANT ACCOUNTING POLICIES – (CONTINUED)
Fair Value Measurements - (Continued)
The following is a summary of the inputs used as of December 31, 2018 in valuing the Fund’s investments carried at value:
| | Investments in Securities at Value |
| | Valuation Inputs |
| | | | Level 2: | | Level 3: | | |
| | | | Other Significant | | Significant | | |
| | Level 1: | | Observable | | Unobservable | | |
| | Quoted Prices | | Inputs | | Inputs | | Total |
Common Stock: | | | | | | | | | | | |
| Communication Services | $ | 29,852,140 | | $ | – | | $ | – | | $ | 29,852,140 |
| Consumer Discretionary | | 24,544,547 | | | – | | | – | | | 24,544,547 |
| Energy | | 10,876,183 | | | – | | | – | | | 10,876,183 |
| Financials | | 71,971,233 | | | – | | | – | | | 71,971,233 |
| Health Care | | 2,635,345 | | | – | | | – | | | 2,635,345 |
| Industrials | | 21,079,779 | | | – | | | – | | | 21,079,779 |
| Information Technology | | 14,597,465 | | | – | | | – | | | 14,597,465 |
| Materials | | 4,158,888 | | | – | | | – | | | 4,158,888 |
Preferred Stock: | | | | | | | | | | | |
| Consumer Discretionary | | – | | | – | | | 5,995,896 | | | 5,995,896 |
| Short-term securities | | – | | | 8,225,000 | | | – | | | 8,225,000 |
| Total Investments | $ | 179,715,580 | | $ | 8,225,000 | | $ | 5,995,896 | | $ | 193,936,476 |
The following table reconciles the valuation of assets in which significant unobservable inputs (Level 3) were used in determining fair value during the year ended December 31, 2018. The net decrease in unrealized appreciation during the period on Level 3 securities still held at December 31, 2018 was $(571,492). There were no transfers of investments into or out of Level 3 of the fair value hierarchy during the period. The cost of purchases or proceeds from sales may include securities received or delivered through corporate actions or exchanges. Realized and unrealized gains (losses) are included in the related amounts on investments in the Statement of Operations.
| | | Beginning Balance January 1, 2018 | | Cost of Purchases | | Net Decrease in Unrealized Appreciation | | Net Realized Gain (Loss) | | Proceeds from Sales | | Ending Balance December 31, 2018 |
| Investments in Securities: | | | | | | | | | | | | | | | | | | |
| Preferred Stock | | $ | 6,567,388 | | $ | – | | $ | (571,492) | | $ | – | | $ | – | | $ | 5,995,896 |
| Total Level 3 | | $ | 6,567,388 | | $ | – | | $ | (571,492) | | $ | – | | $ | – | | $ | 5,995,896 |
The following table is a summary of those assets in which significant unobservable inputs (Level 3) were used by the Adviser in determining fair value. Note that these amounts exclude any valuations provided by a pricing service or broker.
| | | Fair Value at | | Valuation | | Unobservable | | | | Impact to Valuation from |
| | | December 31, 2018 | | Technique | | Input | | Amount | | an Increase in Input |
| Investments in Securities: | | | | | | | | | | | |
| Preferred Stock | | $ | 5,995,896 | | Market Approach | | Transaction Price | | $46.50 | | Increase |
| Total Level 3 | | $ | 5,995,896 | | | | | | | | |
The significant unobservable input listed in the above table is attributable to a private security and includes assumptions made from a private transaction, and if changed, would affect the fair value of the Fund’s investment. The “Impact to Valuation from an Increase in Input” represents the change in fair value measurement resulting from an increase in the corresponding input. A decrease in the input would have the opposite effect.
Master Repurchase Agreements - The Fund, along with other affiliated funds, may transfer uninvested cash balances into one or more master repurchase agreement accounts. These balances are invested in one or more repurchase agreements, secured by U.S. Government securities. A custodian bank holds securities pledged as collateral for repurchase agreements until the agreements mature. Each agreement requires that the market value of the collateral be sufficient to cover payments of interest and principal; however, in the event of default by the other party to the agreement, retention of the collateral may be subject to legal proceedings.
| DAVIS VALUE PORTFOLIO | Notes to Financial Statements – (Continued) |
| | December 31, 2018 |
NOTE 1 - SUMMARY OF SIGNIFICANT ACCOUNTING POLICIES – (CONTINUED)
Currency Translation - The market values of all assets and liabilities denominated in foreign currencies are recorded in the financial statements after translation to the U.S. dollar based upon the mean between the bid and offered quotations of the currencies against U.S. dollars on the date of valuation. The cost basis of such assets and liabilities is determined based upon historical exchange rates. Income and expenses are translated at average exchange rates in effect as accrued or incurred.
Foreign Currency - The Fund may enter into forward purchases or sales of foreign currencies to hedge certain foreign currency denominated assets and liabilities against declines in market value relative to the U.S. dollar. Forward currency contracts are marked-to-market daily and the change in market value is recorded by the Fund as an unrealized gain or loss. When the forward currency contract is closed, the Fund records a realized gain or loss equal to the difference between the value of the forward currency contract at the time it was opened and value at the time it was closed. Investments in forward currency contracts may expose the Fund to risks resulting from unanticipated movements in foreign currency exchange rates or failure of the counter-party to the agreement to perform in accordance with the terms of the contract. There were no forward contracts entered into by the Fund.
Reported net realized foreign exchange gains or losses arise from the sales of foreign currencies, currency gains or losses realized between the trade and settlement dates on security transactions, the difference between the amounts of dividends, interest, and foreign withholding taxes recorded on the Fund’s books, and the U.S. dollar equivalent of the amounts actually received or paid. Net unrealized foreign exchange gains or losses arise from changes in the value of assets and liabilities other than investments in securities at fiscal year end, resulting from changes in the exchange rate. The Fund includes foreign currency gains and losses realized on the sales of investments together with market gains and losses on such investments in the Statement of Operations.
Federal Income Taxes - It is the Fund’s policy to comply with the requirements of the Internal Revenue Code applicable to regulated investment companies, and to distribute substantially all of its taxable income, including any net realized gains on investments not offset by loss carryovers, to shareholders. Therefore, no provision for federal income or excise tax is required. The Adviser analyzed the Fund’s tax positions taken on federal and state income tax returns for all open tax years and concluded that as of December 31, 2018, no provision for income tax is required in the Fund’s financial statements related to these tax positions. The Fund’s federal and state (Arizona) income and federal excise tax returns for tax years for which the applicable statutes of limitations have not expired are subject to examination by the Internal Revenue Service and state Department of Revenue. The earliest tax year that remains subject to examination by these jurisdictions is 2015.
At December 31, 2018, the unrealized appreciation (depreciation) and aggregate cost of investments for federal income tax purposes were as follows:
| Unrealized appreciation | $ | 69,772,526 |
| Unrealized depreciation | | (24,301,039) |
| Net unrealized appreciation | $ | 45,471,487 |
Aggregate cost | $ | 148,464,989 |
Securities Transactions and Related Investment Income - Securities transactions are accounted for on the trade date (date the order to buy or sell is executed) with realized gain or loss on the sale of securities being determined based upon identified cost. Dividend income is recorded on the ex-dividend date. Interest income, which includes accretion of discount and amortization of premium, is accrued as earned.
Dividends and Distributions to Shareholders - Dividends and distributions to shareholders are recorded on the ex-dividend date. Net investment income (loss), net realized gains (losses), and net unrealized appreciation (depreciation) on investments [collectively “Distributable earnings (losses)”] may differ for financial statement and tax purposes primarily due to differing treatments of wash sales, corporate actions, Directors’ deferred compensation payments, and foreign currency transactions. The character of dividends and distributions made during the fiscal year from net investment income and net realized securities gains may differ from their ultimate characterization for federal income tax purposes. Also, due to the timing of dividends and distributions, the fiscal year in which amounts are distributed may differ from the fiscal year in which income or realized gain was recorded by the Fund. The Fund adjusts certain components of capital to reflect permanent differences between financial statement amounts and net income and realized gains/losses determined in accordance with income tax rules.
| DAVIS VALUE PORTFOLIO | Notes to Financial Statements – (Continued) |
| | December 31, 2018 |
NOTE 1 - SUMMARY OF SIGNIFICANT ACCOUNTING POLICIES – (CONTINUED)
Dividends and Distributions to Shareholders – (Continued)
The tax character of distributions paid during the years ended December 31, 2018 and 2017 was as follows:
| | 2018 | | 2017 |
| Ordinary income | $ | 1,982,710 | | $ | 1,827,900 |
| Long-term capital gain | | 39,874,493 | | | 20,335,386 |
| Total | $ | 41,857,203 | | $ | 22,163,286 |
As of December 31, 2018, the components of distributable earnings on a tax basis were as follows:
| Undistributed ordinary income | $ | 416,580 |
| Undistributed long-term capital gain | | 5,619,124 |
Net unrealized appreciation on investments and foreign currency transactions | | 45,471,487 |
| Total | $ | 51,507,191 |
Indemnification - Under the Fund’s organizational documents, its officers and directors are indemnified against certain liabilities arising out of the performance of their duties to the Fund. In addition, some of the Fund’s contracts with its service providers contain general indemnification clauses. The Fund’s maximum exposure under these arrangements is unknown since the amount of any future claims that may be made against the Fund cannot be determined and the Fund has no historical basis for predicting the likelihood of any such claims.
Use of Estimates in Financial Statements - In preparing financial statements in conformity with accounting principles generally accepted in the United States of America, management makes estimates and assumptions that affect the reported amounts of assets and liabilities and disclosure of contingent assets and liabilities at the date of the financial statements, as well as the reported amounts of income and expenses during the reporting period. Actual results may differ from these estimates.
Directors Fees and Expenses - The Fund set up a Rabbi Trust to provide for the deferred compensation plan for Independent Directors that enables them to elect to defer receipt of all or a portion of annual fees they are entitled to receive. The value of an eligible Director’s account is based upon years of service and fees paid to each Director during the years of service. The amount paid to the Director by the Trust under the plan will be determined based upon the performance of the Davis Funds in which the amounts are invested.
NOTE 2 - PURCHASES AND SALES OF SECURITIES
The cost of purchases and proceeds from sales of investment securities (excluding short-term securities) during the year ended December 31, 2018 were $53,092,404 and $82,158,691, respectively.
NOTE 3 - FEES AND OTHER TRANSACTIONS WITH SERVICE PROVIDERS (INCLUDING AFFILIATES)
Davis Selected Advisers-NY, Inc. (“DSA-NY”), a wholly-owned subsidiary of the Adviser, acts as sub-adviser to the Fund. DSA-NY performs research and portfolio management services for the Fund under a Sub-Advisory Agreement with the Adviser. The Fund pays no fees directly to DSA-NY.
All officers of the Fund (including Interested Directors) hold positions as executive officers with the Adviser or its affiliates.
Investment Advisory Fees and Reimbursement of Expenses - Advisory fees are paid monthly to the Adviser at an annual rate of 0.55% of the Fund’s average net assets. The Adviser is contractually committed to waive fees and/or reimburse the Fund’s expenses to the extent necessary to cap total annual Fund operating expenses at 1.00% until May 1, 2019.
Accounting Fees - State Street Bank and Trust Company (“State Street Bank”) is the Fund’s primary accounting provider. Fees for accounting services are included in the custodian fees as State Street Bank also serves as the Fund’s custodian. The Adviser is also paid for certain accounting services. The fee paid to the Adviser for these services during the year ended December 31, 2018 amounted to $8,000.
| DAVIS VALUE PORTFOLIO | Notes to Financial Statements – (Continued) |
| | December 31, 2018 |
NOTE 4 - CAPITAL STOCK
At December 31, 2018, there were 500 million shares of capital stock ($0.001 par value per share) authorized. Transactions in capital stock were as follows:
| | Year ended December 31, 2018 |
| | | Sold | | | Reinvestment of
Distributions | | | Redeemed | | | Net Increase |
| | | | | | | | | | | | |
| Shares: | | 1,198,466 | | | 6,119,474 | | | (4,111,979) | | | 3,205,961 |
| Value: | $ | 11,768,533 | | $ | 41,857,203 | | $ | (42,121,519) | | $ | 11,504,217 |
| |
| |
| | Year ended December 31, 2017 |
| | | Sold | | | Reinvestment of Distributions | | | Redeemed | | | Net Decrease |
| | | | | | | | | | | | |
| Shares: | | 497,879 | | | 2,172,871 | | | (5,150,910) | | | (2,480,160) |
| Value: | $ | 4,991,218 | | $ | 22,163,286 | | $ | (51,527,317) | | $ | (24,372,813) |
| |
NOTE 5 - BANK BORROWINGS
The Fund may borrow up to 5% of its assets from a bank to purchase portfolio securities, or for temporary and emergency purposes. The purchase of securities with borrowed funds creates leverage in the Fund. The Fund has entered into an agreement, which enables it to participate with certain other funds managed by the Adviser in an unsecured line of credit with a bank, which permits borrowings of up to $50 million, collectively. Interest is charged based on its borrowings, at a rate equal to the higher of the Federal Funds Rate or the one month LIBOR Rate, plus 1.25%. The Fund had no borrowings during the year ended December 31, 2018.
NOTE 6 - SECURITIES LOANED
The Fund has entered into a securities lending arrangement with State Street Bank. Under the terms of the agreement, the Fund receives fee income from lending transactions; in exchange for such fees, State Street Bank is authorized to loan securities on behalf of the Fund, against receipt of collateral at least equal to the value of the securities loaned. As of December 31, 2018, the Fund did not have any securities on loan. The Fund bears the risk of any deficiency in the amount of the collateral available for return to a borrower due to a loss in an approved investment.
NOTE 7 - RESTRICTED SECURITIES
Restricted securities are not registered under the Securities Act of 1933 and may have contractual restrictions on resale. They are fair valued under methods approved by the Board of Directors. The aggregate value of restricted securities amounted to $5,995,896 or 3.09% of the Fund’s net assets as of December 31, 2018. Information regarding restricted securities is as follows:
| Security | | Initial Acquisition Date | | Shares | | Cost per Share | | Valuation per Share as of December 31, 2018 |
| Didi Chuxing Joint Co., Series A, Pfd. | | 07/27/15 | | 128,944 | | $ | 30.7077 | | $ | 46.50 |
FEDERAL INCOME TAX INFORMATION (UNAUDITED)
During the calendar year ended December 31, 2018, the Fund declared and paid long-term capital gain distributions in the amount of $39,874,493.
During the calendar year ended December 31, 2018, $1,982,710 of dividends paid by the Fund constituted income dividends for federal income tax purposes. The Fund designates $1,982,710 or 100% as income qualifying for the corporate dividends-received deduction.
| The following financial information represents selected data for each share of capital stock outstanding throughout each period: |
| | Year ended December 31, |
| | | | 2018 | | 2017 | | 2016 | | 2015 | | 2014 |
| Net Asset Value, Beginning of Period | | $ | 10.19 | | $ | 9.10 | | $ | 9.62 | | $ | 11.32 | | $ | 13.48 |
Income (Loss) from Investment Operations: | | | | | | | | | | | | | | | | | | | | | | | | | |
| Net Investment Income | | 0.09a | | 0.07a | | 0.07a | | 0.10 | | 0.12 |
| Net Realized and Unrealized Gains (Losses) | | (1.49) | | 1.99 | | 1.09 | | 0.10 | | 0.73 |
| | Total from Investment Operations | | (1.40) | | 2.06 | | 1.16 | | 0.20 | | 0.85 |
Dividends and Distributions: | | | | | | | | | | | | | | | | | | | | | | | | | |
| Dividends from Net Investment Income | | (0.09) | | (0.08) | | (0.13) | | (0.09) | | (0.13) |
| Distributions from Realized Gains | | (1.81) | | (0.89) | | (1.55) | | (1.81) | | (2.88) |
| | Total Dividends and Distributions | | (1.90) | | (0.97) | | (1.68) | | (1.90) | | (3.01) |
Net Asset Value, End of Period | | $ | 6.89 | | $ | 10.19 | | $ | 9.10 | | $ | 9.62 | | $ | 11.32 |
Total Returnb | | (13.60) | % | | 22.63 | % | | 11.88 | % | | 1.60 | % | | 6.06 | % |
Ratios/Supplemental Data: | | | | | | | | | | | | | | | | | | | | | | | | | |
| Net Assets, End of Period (in thousands) | | $ | 194,007 | | | $ | 254,032 | | | $ | 249,343 | | | $ | 321,746 | | | $ | 365,125 | |
| Ratio of Expenses to Average Net Assets: | | | | | | | | | | | | | | | | | | | | | | | | | |
| | Gross | | 0.64 | % | | 0.64 | % | | 0.62 | % | | 0.62 | % | | 0.62 | % |
| | Netc | | 0.64 | % | | 0.64 | % | | 0.62 | % | | 0.62 | % | | 0.62 | % |
| Ratio of Net Investment Income to Average Net Assets | | 0.86 | % | | 0.72 | % | | 0.78 | % | | 0.86 | % | | 0.82 | % |
Portfolio Turnover Rated | | 23 | % | | 12 | % | | 18 | % | | 27 | % | | 26 | % |
| a | Per share calculations were based on average shares outstanding for the period. |
| |
| b | Assumes hypothetical initial investment on the business day before the first day of the fiscal period, with all dividends and distributions reinvested in additional shares on the reinvestment date, and redemption at the net asset value calculated on the last business day of the fiscal period. Total returns do not reflect charges attributable to your insurance company’s separate account. Inclusion of these charges would reduce the total returns shown. |
| |
| c | The Net Ratio of Expenses to Average Net Assets reflects the impact, if any, of certain reimbursements. |
| |
| d | The lesser of purchases or sales of portfolio securities for a period, divided by the monthly average of the market value of portfolio securities owned during the period. Securities with a maturity or expiration date at the time of acquisition of one year or less are excluded from the calculation. |
| |
| See Notes to Financial Statements |
DAVIS VALUE PORTFOLIO | Report of Independent Registered Public Accounting Firm |
The Shareholders and Board of Directors
Davis Variable Account Fund, Inc.:
Opinion on the Financial Statements
We have audited the accompanying statement of assets and liabilities of Davis Value Portfolio (a separate series of Davis Variable Account Fund, Inc.) (the “Fund”), including the schedule of investments, as of December 31, 2018, the related statement of operations for the year then ended, the statements of changes in net assets for each of the years in the two-year period then ended, and the related notes (collectively, the “financial statements”) and the financial highlights for each of the years in the five-year period then ended. In our opinion, the financial statements and financial highlights present fairly, in all material respects, the financial position of the Fund as of December 31, 2018, the results of its operations for the year then ended, the changes in its net assets for each of the years in the two-year period then ended, and the financial highlights for each of the years in the five-year period then ended, in conformity with U.S. generally accepted accounting principles.
Basis for Opinion
These financial statements and financial highlights are the responsibility of the Fund’s management. Our responsibility is to express an opinion on these financial statements and financial highlights based on our audits. We are a public accounting firm registered with the Public Company Accounting Oversight Board (United States) (“PCAOB”) and are required to be independent with respect to the Fund in accordance with the U.S. federal securities laws and the applicable rules and regulations of the Securities and Exchange Commission and the PCAOB.
We conducted our audits in accordance with the standards of the PCAOB. Those standards require that we plan and perform the audit to obtain reasonable assurance about whether the financial statements and financial highlights are free of material misstatement, whether due to error or fraud. Our audits included performing procedures to assess the risks of material misstatement of the financial statements and financial highlights, whether due to error or fraud, and performing procedures that respond to those risks. Such procedures included examining, on a test basis, evidence regarding the amounts and disclosures in the financial statements and financial highlights. Such procedures also included confirmation of securities owned as of December 31, 2018, by correspondence with the custodian and brokers or by other appropriate auditing procedures. Our audits also included evaluating the accounting principles used and significant estimates made by management, as well as evaluating the overall presentation of the financial statements and financial highlights. We believe that our audits provide a reasonable basis for our opinion.
KPMG LLP
We have served as the auditor of one or more Davis Funds investment companies since 1998.
Denver, Colorado
February 7, 2019
For the purpose of their service as Directors to the Davis Funds, the business address for each of the Directors is 2949 E. Elvira Road, Suite 101, Tucson, AZ 85756. Subject to exceptions and exemptions, which may be granted by the Independent Directors, Directors must retire at the close of business on the last day of the calendar year in which the Director attains age seventy-eight (78).
Name, Date of Birth, Position(s) Held with Fund, Length of Service | Principal Occupation(s) During Past Five Years | Number of Portfolios Overseen | Other Directorships |
Independent Directors
| | | | |
Marc P. Blum (09/09/42) Director since 1986 | Chief Executive Officer, World Total Return Fund, LLLP; of Counsel to Gordon Feinblatt LLC (law firm). | 13 | Director, Rodney Trust Company (trust and asset management company). |
| | | | |
John S. Gates Jr. (08/02/53) Director since 2007 | Chairman and Chief Executive Officer of PortaeCo LLC (private investment company). | 13 | Director, Care Capital Properties (REIT); Trustee, DCT Industrial Trust (REIT); Director, Miami Corp. (diversified investment company). |
| | | | |
Thomas S. Gayner (12/16/61) Director since 2004 Chairman since 2009 | Co-Chief Executive Officer and Director, Markel Corp. (diversified financial holding company). | 13 | Director, Graham Holdings Company (educational and media company); Director, Colfax Corp. (engineering and manufacturer of pumps and fluid handling equipment); Director, Cable ONE Inc. (cable service provider). |
| | | | |
Samuel H. Iapalucci (07/19/52) Director since 2006 | Retired; Executive Vice President and Chief Financial Officer, CH2M-HILL Companies, Ltd. (engineering) until 2008. | 13 | None |
| | | | |
Robert P. Morgenthau (03/22/57) Director since 2002 | Principal, Spears Abacus Advisors, LLC (investment management firm) since 2011; Chairman, NorthRoad Capital Management, LLC (investment management firm) 2002-2011. | 13 | None |
| | | | |
Marsha C. Williams (03/28/51) Director since 1999 | Retired; Senior Vice President and Chief Financial Officer, Orbitz Worldwide, Inc. (travel-service provider) 2007-2010. | 13 | Lead Independent Director, Modine Manufacturing Company (heat transfer technology); Director, McDermott International, Inc. (industrial construction and engineering); Lead Independent Director, Fifth Third Bancorp (diversified financial services). |
Interested Directors*
| | | | |
Andrew A. Davis (06/25/63) Director since 1997 | President or Vice President of each Davis Fund, Selected Fund, and Clipper Fund; President, Davis Selected Advisers, L.P., and also serves as an Executive Officer of certain companies affiliated with the Adviser. | 16 | Director, Selected Funds (consisting of two portfolios) since 1998; Trustee, Clipper Funds Trust (consisting of one portfolio) since 2014. |
| | | | |
Christopher C. Davis (07/13/65) Director since 1997 | President or Vice President of each Davis Fund, Selected Fund, Clipper Fund, and Davis Fundamental ETF; Chairman, Davis Selected Advisers, L.P., and also serves as an Executive Officer of certain companies affiliated with the Adviser, including sole member of the Adviser’s general partner, Davis Investments, LLC. | 16 | Director, Selected Funds (consisting of two portfolios) since 1998; Trustee, Clipper Funds Trust (consisting of one portfolio) since 2014; Lead Independent Director, Graham Holdings Company (educational and media company); Director, The Coca Cola Company (beverage company). |
* Andrew A. Davis and Christopher C. Davis own partnership units (directly, indirectly, or both) of the Adviser and are considered to be “interested persons” of the Funds as defined in the Investment Company Act of 1940. Andrew A. Davis and Christopher C. Davis are brothers.
Officers
Andrew A. Davis (born 06/25/63, Davis Funds officer since 1997). See description in the section on Interested Directors.
Christopher C. Davis (born 07/13/65, Davis Funds officer since 1997). See description in the section on Interested Directors.
Kenneth C. Eich (born 08/14/53, Davis Funds officer since 1997). Executive Vice President and Principal Executive Officer of the Davis Funds (consisting of 13 portfolios), Selected Funds (consisting of two portfolios), and Clipper Funds Trust (consisting of one portfolio); Trustee/Chairman, Executive Vice President, and Principal Executive Officer of Davis Fundamental ETF Trust (consisting of four portfolios); Chief Operating Officer, Davis Selected Advisers, L.P., and also serves as an Executive Officer of certain companies affiliated with the Adviser.
Douglas A. Haines (born 03/04/71, Davis Funds officer since 2004). Vice President, Treasurer, Chief Financial Officer, Principal Financial Officer, and Principal Accounting Officer of the Davis Funds (consisting of 13 portfolios), Selected Funds (consisting of two portfolios), Clipper Funds Trust (consisting of one portfolio), and Davis Fundamental ETF Trust (consisting of four portfolios); Vice President and Director of Fund Accounting, Davis Selected Advisers, L.P.
Randi J. Roessler (born 06/26/81, Davis Funds officer since 2018). Vice President and Chief Compliance Officer of the Davis Funds (consisting of 13 portfolios), Selected Funds (consisting of two portfolios), Clipper Funds Trust (consisting of one portfolio), and Davis Fundamental ETF Trust (consisting of four portfolios); Vice President and Chief Compliance Officer, Davis Selected Advisers, L.P., and also serves as an Executive Officer of certain companies affiliated with the Adviser.
Ryan M. Charles (born 07/25/78, Davis Funds officer since 2014). Vice President and Secretary of the Davis Funds (consisting of 13 portfolios), Selected Funds (consisting of two portfolios), Clipper Funds Trust (consisting of one portfolio), and Davis Fundamental ETF Trust (consisting of four portfolios); Vice President, Chief Legal Officer, and Secretary, Davis Selected Advisers, L.P., and also serves as an Executive Officer of certain companies affiliated with the Adviser.
| Investment Adviser |
| Davis Selected Advisers, L.P. (Doing business as “Davis Advisors”) |
| 2949 East Elvira Road, Suite 101 |
| Tucson, Arizona 85756 |
| (800) 279-0279 |
| |
| Distributor |
| Davis Distributors, LLC |
| 2949 East Elvira Road, Suite 101 |
| Tucson, Arizona 85756 |
| |
| Transfer Agent |
| DST Asset Manager Solutions, Inc. |
| c/o The Davis Funds |
| P.O. Box 219197 |
| Kansas City, Missouri 64121-9197 |
| |
| Custodian |
| State Street Bank and Trust Co. |
| One Lincoln Street |
| Boston, Massachusetts 02111 |
| |
| Counsel |
| Greenberg Traurig, LLP |
| 77 West Wacker Drive, Suite 3100 |
| Chicago, Illinois 60601 |
| |
| Independent Registered Public Accounting Firm |
| KPMG LLP |
| 1225 Seventeenth Street, Suite 800 |
| Denver, Colorado 80202 |
For more information about Davis Value Portfolio, including management fee, charges, and expenses, see the current prospectus, which must precede or accompany this report. The Fund’s Statement of Additional Information contains additional information about the Fund’s Directors and is available without charge, upon request, by calling 1-800-279-0279 and on the Fund’s website at www.davisfunds.com. Quarterly Fact Sheets are available on the Fund’s website at www.davisfunds.com.
| DAVIS FINANCIAL PORTFOLIO | Table of Contents |
| 2 |
| |
| 4 |
| |
| 5 |
| |
| 6 |
| |
| 8 |
| |
| 9 |
| |
| 10 |
| |
| 11 |
| |
| 15 |
| |
| 16 |
| |
| 17 |
| |
| 18 |
This Annual Report is authorized for use by existing shareholders. Prospective shareholders must receive a current Davis Financial Portfolio prospectus, which contains more information about investment strategies, risks, charges, and expenses. Please read the prospectus carefully before investing or sending money.
Shares of Davis Financial Portfolio are not deposits or obligations of any bank, are not guaranteed by any bank, are not insured by the FDIC or any other agency, and involve investment risks, including possible loss of the principal amount invested.
Portfolio Proxy Voting Policies and Procedures
The Fund has adopted Portfolio Proxy Voting Policies and Procedures under which the Fund votes proxies relating to securities held by the Fund. A description of the Fund’s Portfolio Proxy Voting Policies and Procedures is available (i) without charge, upon request, by calling the Fund toll-free at 1-800-279-0279, (ii) on the Fund’s website at www.davisfunds.com, and (iii) on the SEC’s website at www.sec.gov.
In addition, the Fund is required to file Form N-PX, with its complete proxy voting record for the 12 months ended June 30th, no later than August 31st of each year. The Fund’s Form N-PX filing is available (i) without charge, upon request, by calling the Fund toll-free at 1-800-279-0279, (ii) on the Fund’s website at www.davisfunds.com, and (iii) on the SEC’s website at www.sec.gov.
Form N-Q
The Fund files its complete schedule of portfolio holdings with the SEC for the first and third quarters of each fiscal year on Form N-Q. The Fund’s Form N-Q is available without charge, upon request, by calling 1-800-279-0279, on the Fund’s website at www.davisfunds.com, and on the SEC’s website at www.sec.gov. Effective March 31, 2019, Form N-PORT Exhibit F will replace Form N-Q.
| DAVIS FINANCIAL PORTFOLIO | Management’s Discussion of Fund Performance |
Performance Overview
Davis Financial Portfolio underperformed the Standard & Poor’s 500® Index (“S&P 500®”) for the twelve-month period ended December 31, 2018 (the “period”). The Fund delivered a total return of (10.67)%, versus a (4.38)% return for the S&P 500®. The Financials sector1 holdings for both the Fund and the S&P 500® produced negative returns during the period (both down 11%). The sectors within the S&P 500® that reported the strongest performance were Health Care (up 6%), Consumer Discretionary (up 5%), and Utilities (up 4%). The sectors within the S&P 500® that reported the weakest performance were Energy (down 18%), Materials (down 15%), and Industrials (down 13%).
Detractors from Performance
The Fund’s Capital Market securities were the most substantial detractor2 from performance. The Fund’s significant overweight position in Capital Markets securities (21%, versus 3% for the S&P 500®) and its weaker stock choices (down 20%, versus down 15% for the S&P 500®) hindered both absolute and relative performance. Julius Baer3 (down 41%), Goldman Sachs (down 34%), State Street (down 34%), and Bank of New York Mellon (down 11%) all hindered the Fund’s performance.
The Fund’s Bank holdings hindered performance. Four of the Fund’s Bank securities were among the top laggards for the period, including Wells Fargo (down 22%), U.S. Bancorp (down 12%), DNB ASA (down 14%), and Bank of N.T. Butterfield & Son (down 14%). DNB ASA and Bank of N.T. Butterfield & Son were both acquired during the period. U.S. Bancorp was the largest position at the end of the period representing 7.60% of net assets.
Likewise, the Fund’s performance was negatively impacted by the Fund’s position in Consumer Finance holdings. While the Fund’s Consumer Finance holdings outperformed those of the S&P 500®, they still produced negative returns (down 13%, compared with down 17%). Capital One (down 23%) was the top detractor for the period.
Markel (down 9%), an Insurance holding, hindered performance, and the Fund’s foreign holdings significantly underperformed its domestic holdings (down 17%, compared to down 9%).
Contributors to Performance
The Fund’s Diversified Financial Services holdings were the most significant contributor to performance during the period. The Fund benefited from its stronger returns in this industry (up 11%, versus up 7% for the S&P 500®). Visa (up 16%) was the top contributor for the period. Berkshire Hathaway (up 3%), the Fund’s second-largest holding at the end of the period, also aided absolute performance.
A number of the Fund’s Insurance holdings were key contributors, including Alleghany (up 6%), Everest Re Group (up 1%), Swiss Re AG (up 3%), and Marsh & McLennan (up 2%). The Fund no longer owns Marsh & McLennan. While KKR, a Capital Markets holding, was down 4% for the year, it was a key contributor as the Fund sold a large number of shares for a profit during the period.
The Fund had an average weighting of 4% of its assets in repurchase agreements, which helped performance.
Davis Financial Portfolio’s investment objective is long-term growth of capital. There can be no assurance that the Fund will achieve its objective. Davis Financial Portfolio’s principal risks are: common stock risk, credit risk, depositary receipts risk, emerging market risk, fees and expenses risk, financial services risk, focused portfolio risk, foreign country risk, foreign currency risk, headline risk, interest rate sensitivity risk, large-capitalization companies risk, manager risk, mid- and small-capitalization companies risk, and stock market risk. See the prospectus for a full description of each risk.
Davis Financial Portfolio concentrates its investments in the financial sector, and it may be subject to greater risks than a fund that does not concentrate its investments in a particular sector. The Fund’s investment performance, both good and bad, is expected to reflect the economic performance of the financial sector more than a fund that does not concentrate its portfolio.
Davis Financial Portfolio is allowed to focus its investments in fewer companies, and it may be subject to greater risks than a more diversified portfolio that is not allowed to focus its investments in a few companies. Should the portfolio manager determine that it is prudent to focus the Fund’s portfolio in a few companies, the Fund’s investment performance, both good and bad, is expected to reflect the economic performance of its more focused portfolio.
Past performance does not guarantee future results, Fund prices fluctuate, and the value of an investment may be worth more or less than the purchase price. Data provided in this performance overview is for the twelve-month period ended December 31, 2018, unless otherwise noted. Return figures for underlying Fund positions reflect the return of the security from the beginning of the period or the date of first purchase if subsequent thereto through the end of the period or the date the position is completely liquidated. The actual contribution to the Fund will vary based on a number of factors (e.g., trading activity, weighting). Portfolio holding information is as of the end of the twelve-month period, December 31, 2018, unless otherwise noted.
| 1 | The companies included in the Standard & Poor’s 500® Index are divided into eleven sectors. One or more industry groups make up a sector. For purposes of measuring concentration, the Fund generally classifies companies at the industry group or industry level. See the SAI for additional information regarding the Fund’s concentration policy. |
| 2 | A company’s or sector’s contribution to or detraction from the Fund’s performance is a product both of its appreciation or depreciation and its weighting within the Fund. For example, a 5% holding that rises 20% has twice as much impact as a 1% holding that rises 50%. |
| 3 | This Management Discussion of Fund Performance discusses a number of individual companies. The information provided in this report does not provide information reasonably sufficient upon which to base an investment decision and should not be considered a recommendation to purchase, sell, or hold any particular security. The Schedule of Investments lists the Fund’s holdings of each company discussed. |
| DAVIS FINANCIAL PORTFOLIO | Management’s Discussion of Fund Performance – (Continued) |
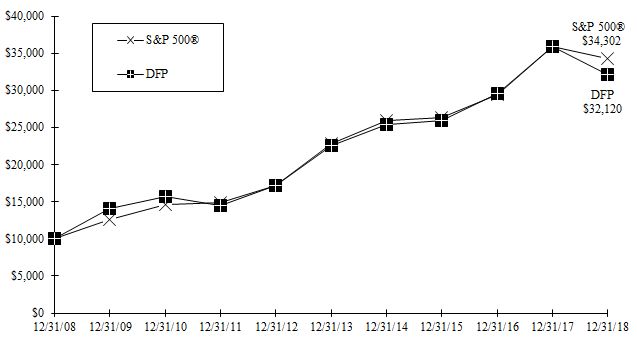
Comparison of a $10,000 investment in Davis Financial Portfolio versus the Standard & Poor’s 500®
Index over 10 years for an investment made on December 31, 2008
Average Annual Total Return for periods ended December 31, 2018
| Fund & Benchmark Index | 1-Year | 5-Year | 10-Year | Since Fund’s Inception (07/01/99) | Gross Expense Ratio | Net Expense Ratio |
| Davis Financial Portfolio | (10.67)% | 7.36% | 12.37% | 5.31% | 0.69% | 0.69% |
Standard & Poor’s 500® Index | (4.38)% | 8.49% | 13.11% | 5.10% | | |
The Standard & Poor’s 500® Index is an unmanaged index of 500 selected common stocks, most of which are listed on the New York Stock Exchange. The Index is adjusted for dividends, weighted towards stocks with large market capitalizations, and represents approximately two-thirds of the total market value of all domestic common stocks. Investments cannot be made directly in the Index.
The performance data quoted in this report represents past performance, assumes that all distributions were reinvested, and is not a guarantee of future results. The investment return and principal value will fluctuate so that shares may be worth more or less than their original cost when redeemed. Current performance may be higher or lower than performance data quoted. The operating expense ratio may vary in future years. For more recent month-end performance information, please call Investor Services at 1-800-279-0279 or visit the Fund’s website at www.davisfunds.com.
Fund performance numbers are net of all Fund operating expenses, but do not include any insurance charges imposed by your insurance company’s separate account. If performance included the effect of these additional charges, the return would be lower.
| DAVIS FINANCIAL PORTFOLIO | |
| | December 31, 2018 |
| Portfolio Composition | | Industry Weightings |
| (% of Fund’s 12/31/18 Net Assets) | | (% of 12/31/18 Stock Holdings) |
| | | | | | | |
| | | | | Fund | | S&P 500® |
| Common Stock (U.S.) | 82.59% | | Diversified Financials | 41.72% | | 5.32% |
| Common Stock (Foreign) | 15.99% | | Banks | 31.01% | | 5.66% |
| Short-Term Investments | 1.39% | | Insurance | 24.06% | | 2.38% |
| Other Assets & Liabilities | 0.03% | | Media & Entertainment | 3.21% | | 7.96% |
| | 100.00% | | Information Technology | – | | 20.11% |
| | | | Health Care | – | | 15.53% |
| | | | Capital Goods | – | | 6.45% |
| | | | Retailing | – | | 6.44% |
| | | | Energy | – | | 5.31% |
| | | | Food, Beverage & Tobacco | – | | 4.00% |
| | | | Other | – | | 20.84% |
| | | | | 100.00% | | 100.00% |
| Top 10 Long-Term Holdings |
| (% of Fund’s 12/31/18 Net Assets) |
| | | |
| U.S. Bancorp | Banks | 7.60% |
| Berkshire Hathaway Inc., Class A | Diversified Financial Services | 7.44% |
| Capital One Financial Corp. | Consumer Finance | 6.23% |
| Markel Corp. | Property & Casualty Insurance | 5.85% |
| American Express Co. | Consumer Finance | 5.78% |
| Bank of New York Mellon Corp. | Capital Markets | 5.44% |
| JPMorgan Chase & Co. | Banks | 5.06% |
| Wells Fargo & Co. | Banks | 4.87% |
| Chubb Ltd. | Property & Casualty Insurance | 4.83% |
| Loews Corp. | Multi-line Insurance | 4.24% |
New Positions Added (01/01/18-12/31/18)
(Highlighted positions are those greater than 2.40% of the Fund’s 12/31/18 net assets)
| Security | Industry | Date of 1st Purchase | % of Fund’s 12/31/18 Net Assets |
| Bank of N.T. Butterfield & Son Ltd. | Banks | 01/08/18 | 2.47% |
| Blackstone Group L.P. | Capital Markets | 02/14/18 | 1.05% |
| Danske Bank A/S | Banks | 09/18/18 | 0.88% |
| DNB ASA | Banks | 02/22/18 | 3.98% |
| Greenlight Capital Re, Ltd., Class A | Reinsurance | 06/28/18 | 0.72% |
| Oaktree Capital Group LLC, Class A | Capital Markets | 02/21/18 | 2.32% |
Positions Closed (01/01/18-12/31/18)
(Gains greater than $450,000 are highlighted)
| Security | Industry | Date of Final Sale | | | Realized Gain |
| American International Group, Inc. | Multi-line Insurance | 07/23/18 | | $ | 323,760 |
| Brookfield Asset Management Inc., Class A | Capital Markets | 06/20/18 | | | 1,070,693 |
| Brookfield Business Partners L.P. | Capital Goods | 06/15/18 | | | 13,990 |
| Cielo S.A. | Software & Services | 06/15/18 | | | 12,233 |
| ICICI Bank Ltd., ADR | Banks | 06/15/18 | | | 193,242 |
| Marsh & McLennan Cos, Inc. | Insurance Brokers | 10/25/18 | | | 458,608 |
| Trisura Group Ltd. | Property & Casualty Insurance | 06/15/18 | | | 3,137 |
| DAVIS FINANCIAL PORTFOLIO | |
As a shareholder of the Fund, you incur ongoing costs only, including advisory and administrative fees and other Fund expenses. The Expense Example is intended to help you understand your ongoing costs (in dollars) of investing in the Fund and to compare these costs with the ongoing costs of investing in other mutual funds. The Expense Example is based on an investment of $1,000 invested at the beginning of the period and held for the entire period indicated, which for the Fund is for the six-month period ended December 31, 2018. Please note that the Expense Example is general and does not reflect charges imposed by your insurance company’s separate account or account specific costs, which may increase your total costs of investing in the Fund. If these charges or account specific costs were included in the Expense Example, the expenses would be higher.
Actual Expenses
The information represented in the row entitled “Actual” provides information about actual account values and actual expenses. You may use the information in this row, together with the amount you invested, to estimate the expenses that you paid over the period. Simply divide your account value by $1,000 (for example, an $8,600 account value divided by $1,000 = 8.6), then multiply the result by the number under the heading “Expenses Paid During Period” to estimate the expenses you paid on your account during this period.
Hypothetical Example for Comparison Purposes
The information represented in the row entitled “Hypothetical” provides information about hypothetical account values and hypothetical expenses based on the Fund’s actual expense ratio and an assumed rate of return of 5% per year before expenses, which is not the Fund’s actual return. The hypothetical account values and expenses may not be used to estimate the actual ending account balance or expenses you paid for the period. You may use this information to compare the ongoing costs of investing in the Fund and other funds. To do so, compare this 5% hypothetical example with the 5% hypothetical examples that appear in the shareholder reports of the other funds.
Please note that the expenses shown in the table are meant to highlight your ongoing costs only. Therefore, the information in the row entitled “Hypothetical” is useful in comparing ongoing costs only, and will not help you determine the relative total costs of owning different funds.
| | Beginning Account Value (07/01/18) | | Ending Account Value (12/31/18) | | Expenses Paid During Period* (07/01/18-12/31/18) |
Actual | $1,000.00 | | $904.96 | | $3.31 |
| Hypothetical | $1,000.00 | | $1,021.73 | | $3.52 |
Hypothetical assumes 5% annual return before expenses.
* Expenses are equal to the Fund’s annualized operating expense ratio (0.69%)**, multiplied by the average account value over the period, multiplied by 184/365 (to reflect the one-half year period).
** The expense ratio reflects the impact, if any, of certain reimbursements from the Adviser.
| DAVIS FINANCIAL PORTFOLIO | |
| | December 31, 2018 |
| | Shares/Units | | Value
(Note 1) |
| COMMON STOCK – (98.58%) |
| | COMMUNICATION SERVICES – (3.16%) |
| | Media & Entertainment – (3.16%) |
| | | | | | | | |
| | | | | | | | |
| | | | Total Communication Services | | | |
| | FINANCIALS – (95.42%) |
| | Banks – (30.57%) |
| | Bank of N.T. Butterfield & Son Ltd. (Bermuda) | | | | | | |
| | Danske Bank A/S (Denmark) | | | | | | |
| | DBS Group Holdings Ltd. (Singapore) | | | | | | |
| | | | | | | | |
| | | | | | | | |
| | PNC Financial Services Group, Inc. | | | | | | |
| | | | | | | | |
| | | | | | | | |
| | | | 18,861,337 |
| | Diversified Financials – (41.13%) |
| | Capital Markets – (20.51%) |
| | Bank of New York Mellon Corp. | | | | | | |
| | | | | | | | |
| | | | | | | | |
| | Goldman Sachs Group, Inc. | | | | | | |
| | Julius Baer Group Ltd. (Switzerland) | | | | | | |
| | | | | | | | |
| | Oaktree Capital Group LLC, Class A | | | | | | |
| | | | | | | | |
| | | 12,651,846 |
| | Consumer Finance – (12.01%) |
| | | | | | | | |
| | Capital One Financial Corp. | | | | | | |
| | | 7,407,964 |
| | Diversified Financial Services – (8.61%) |
| | Berkshire Hathaway Inc., Class A * | | | | | | |
| | | | | | | | |
| | | 5,311,712 |
| | | | 25,371,522 |
| | Insurance – (23.72%) |
| | Multi-line Insurance – (4.24%) |
| | | | | | | | |
| | Property & Casualty Insurance – (10.68%) |
| | | | | | | | |
| | | | | | | | |
| | | 6,590,765 |
| | Reinsurance – (8.80%) |
| | | | | | | | |
| | | | | | | | |
| | Greenlight Capital Re, Ltd., Class A * | | | | | | |
| DAVIS FINANCIAL PORTFOLIO | Schedule of Investments - (Continued) |
| | December 31, 2018 |
| | Shares/Principal | | Value
(Note 1) |
| COMMON STOCK – (CONTINUED) |
| | FINANCIALS – (CONTINUED) |
| | Insurance – (Continued) |
| | Reinsurance – (Continued) |
| | Swiss Re AG (Switzerland) | | | | | | |
| | | 5,431,219 |
| | | | 14,634,832 |
| | | | | |
| | | TOTAL COMMON STOCK – (Identified cost $43,943,425)
| | | |
| SHORT-TERM INVESTMENTS – (1.39%) |
| | INTL FCStone Financial Inc. Joint Repurchase Agreement, 3.05%, 01/02/19, dated 12/31/18, repurchase value of $339,057 (collateralized by: U.S. Government agency mortgages and obligations in a pooled cash account, 0.00%-10.25%, 01/15/19-09/20/68, total market value $345,780) | | | | | | |
| | Mizuho Securities USA Inc. Joint Repurchase Agreement, 2.90%, 01/02/19, dated 12/31/18, repurchase value of $28,005 (collateralized by: U.S. Government agency obligation in a pooled cash account, 2.625%, 12/31/23, total market value $28,560) | | | | | | |
| | Nomura Securities International, Inc. Joint Repurchase Agreement, 3.00%, 01/02/19, dated 12/31/18, repurchase value of $81,014 (collateralized by: U.S. Government agency mortgages in a pooled cash account, 2.50%-4.50%, 04/01/22-07/01/47, total market value $82,620) | | | | | | |
| | SunTrust Robinson Humphrey, Inc. Joint Repurchase Agreement, 3.21%, 01/02/19, dated 12/31/18, repurchase value of $406,072 (collateralized by: U.S. Government agency mortgages in a pooled cash account, 2.50%-4.00%, 11/01/25-12/01/38, total market value $414,120) | | | | | | |
| | TOTAL SHORT-TERM INVESTMENTS – (Identified cost $854,000)
| | | |
| |
Total Investments – (99.97%) – (Identified cost $44,797,425) | | | 61,670,379 |
| | Other Assets Less Liabilities – (0.03%) | | | 21,356 |
| | Net Assets – (100.00%) | | $ | 61,691,735 |
| |
| | * | Non-income producing security. |
| |
| See Notes to Financial Statements |
| DAVIS FINANCIAL PORTFOLIO | Statement of Assets and Liabilities |
| | At December 31, 2018 |
| ASSETS: | | | | | |
| Investments in securities, at value* (see accompanying Schedule of Investments) | | $ | 61,670,379 |
| Cash | | | 327 |
| Receivables: | | | |
| | Capital stock sold | | | 18,752 |
| | Dividends and interest | | | 84,587 |
| Prepaid expenses | | | 2,188 |
| | | Total assets | | | 61,776,233 |
LIABILITIES: | | | |
| Payables: | | | |
| | Capital stock redeemed | | | 20,109 |
| Accrued audit fees | | | 13,935 |
| Accrued custodian fees | | | 10,975 |
| Accrued investment advisory fee | | | 30,851 |
| Other accrued expenses | | | 8,628 |
| | Total liabilities | | | 84,498 |
NET ASSETS | | $ | 61,691,735 |
SHARES OUTSTANDING | | | 5,343,241 |
NET ASSET VALUE, offering, and redemption price per share (Net assets ÷ Shares outstanding) | | $ | 11.55 |
NET ASSETS CONSIST OF: | | | |
| Par value of shares of capital stock | | $ | 5,343 |
Additional paid-in capital | | | 44,004,791 |
Distributable earnings | | | 17,681,601 |
| | Net Assets | | $ | 61,691,735 |
| | | | | |
| *Including: | | | |
| | Cost of investments | | $ | 44,797,425 |
| See Notes to Financial Statements |
| DAVIS FINANCIAL PORTFOLIO | |
| | For the year ended December 31, 2018 |
| INVESTMENT INCOME: | | | | | | |
| Income: | | | |
| Dividends* | | $ | 1,424,137 |
| Interest | | | 52,517 |
| | | Total income | | | | 1,476,654 |
Expenses: | | | |
| Investment advisory fees (Note 3) | | $ | 406,169 | | | |
| Custodian fees | | | 28,288 | | | |
| Transfer agent fees | | | 10,657 | | | |
| Audit fees | | | 20,445 | | | |
| Legal fees | | | 2,400 | | | |
| Accounting fees (Note 3) | | | 2,000 | | | |
| Reports to shareholders | | | 3,356 | | | |
| Directors’ fees and expenses | | | 24,863 | | | |
| Registration and filing fees | | | 15 | | | |
| Miscellaneous | | | 12,806 | | | |
| | Total expenses | | | | 510,999 |
| Net investment income | | | 965,655 |
REALIZED & UNREALIZED GAIN (LOSS) ON INVESTMENTS AND FOREIGN CURRENCY TRANSACTIONS: | | | | | | |
| Net realized gain (loss) from: | | | |
| | Investment transactions | | | 9,913,726 |
| | Foreign currency transactions | | | (3,798) |
| Net realized gain | | | 9,909,928 |
| Net decrease in unrealized appreciation | | | (18,677,699) |
| | Net realized and unrealized loss on investments and foreign currency transactions | | | | (8,767,771) |
| Net decrease in net assets resulting from operations | | $ | (7,802,116) |
| | | | | | | | | |
| *Net of foreign taxes withheld of | | $ | 30,444 |
| See Notes to Financial Statements |
| DAVIS FINANCIAL PORTFOLIO | Statements of Changes in Net Assets |
| | | Year ended December 31, |
| | | 2018 | | 2017* |
OPERATIONS: | | | | | | |
| Net investment income | | $ | 965,655 | | $ | 527,239 |
| Net realized gain from investments and foreign currency transactions | | | 9,909,928 | | | 5,612,375 |
Net increase (decrease) in unrealized appreciation on investments and foreign currency transactions | | | (18,677,699) | | | 7,645,217 |
| | | Net increase (decrease) in net assets resulting from operations | | | (7,802,116) | | | 13,784,831 |
DIVIDENDS AND DISTRIBUTIONS TO SHAREHOLDERS: | | | (10,113,630) | | | (6,839,331) |
CAPITAL SHARE TRANSACTIONS: | | | | | | |
Net increase (decrease) in net assets resulting from capital share transactions (Note 4) | | | 4,229,381 | | | (1,332,761) |
| | Total increase (decrease) in net assets | | | (13,686,365) | | | 5,612,739 |
NET ASSETS: | | | | | | |
| Beginning of year | | | 75,378,100 | | | 69,765,361 |
| End of year | | $ | 61,691,735 | | $ | 75,378,100 |
| | | | | | | | |
| *Includes dividends and distributions to shareholders from net investment income $(512,393) and realized gains from investment transactions $(6,326,938). End of year net assets including distributions in excess of net investment income $(22,123). |
| |
| See Notes to Financial Statements |
| DAVIS FINANCIAL PORTFOLIO | Notes to Financial Statements |
| | December 31, 2018 |
NOTE 1 - SUMMARY OF SIGNIFICANT ACCOUNTING POLICIES
The Fund is a separate series of Davis Variable Account Fund, Inc. (a Maryland corporation), is registered under the Investment Company Act of 1940, as amended, as a non-diversified, open-end management investment company. The Fund follows the reporting guidance of the Financial Accounting Standards Board (“FASB”) Accounting Standards Codification Topic 946, Financial Services – Investment Companies. Only insurance companies, for the purpose of funding variable annuity or variable life insurance contracts, may purchase shares of the Fund. The Fund concentrates its investments in the financial sector, and it may be subject to greater risks than a fund that does not concentrate its investments in a particular sector. The following is a summary of significant accounting policies followed by the Fund in the preparation of its financial statements.
Security Valuation - The Fund calculates the net asset value of its shares as of the close of the New York Stock Exchange (“Exchange”), normally 4:00 P.M. Eastern time, on each day the Exchange is open for business. Securities listed on the Exchange (and other national exchanges including NASDAQ) are valued at the last reported sales price on the day of valuation. Listed securities for which no sale was reported on that date are valued at the last quoted bid price. Securities traded on foreign exchanges are valued based upon the last sales price on the principal exchange on which the security is traded prior to the time when the Fund’s assets are valued. Securities (including restricted securities) for which market quotations are not readily available or securities whose values have been materially affected by what Davis Selected Advisers, L.P. (“Davis Advisors” or “Adviser”), the Fund’s investment adviser, identifies as a significant event occurring before the Fund’s assets are valued, but after the close of their respective exchanges will be fair valued using a fair valuation methodology applicable to the security type or the significant event as previously approved by the Fund’s Pricing Committee and Board of Directors. The Pricing Committee considers all facts it deems relevant that are reasonably available, through either public information or information available to the Adviser’s portfolio management team, when determining the fair value of a security. To assess the appropriateness of security valuations, the Adviser may consider (i) comparing prior day prices and/or prices of comparable securities; (ii) comparing sale prices to the prior or current day prices and challenge those prices exceeding certain tolerance levels with the third-party pricing service or broker source; (iii) new rounds of financing; (iv) the performance of the market or the issuer’s industry; (v) the liquidity of the security; (vi) the size of the holding in a fund; and/or (vii) any other appropriate information. The determination of a security’s fair value price often involves the consideration of a number of subjective factors and is therefore subject to the unavoidable risk that the value assigned to a security may be higher or lower than the security’s value would be if a reliable market quotation of the security was readily available. Fair value determinations are subject to review, approval, and ratification by the Fund’s Board of Directors at its next regularly scheduled meeting covering the period in which the fair valuation was determined.
Short-term securities purchased within 60 days to maturity are valued at amortized cost, which approximates market value.
The Fund’s valuation procedures are reviewed and subject to approval by the Board of Directors. There have been no significant changes to the fair valuation procedures during the period.
Fair Value Measurements - Fair value is defined as the price that the Fund would receive upon selling an investment in an orderly transaction to an independent buyer in the principal market for the investment. Various inputs are used to determine the fair value of the Fund’s investments. These inputs are summarized in the three broad levels listed below.
Level 1 – quoted prices in active markets for identical securities
Level 2 – other significant observable inputs (including quoted prices for similar investments, interest rates, prepayment speeds, credit risk, etc.)
Level 3 – significant unobservable inputs (including the Fund’s own assumptions in determining the fair value of investments)
The inputs or methodologies used for valuing securities are not necessarily an indication of the risks associated with investing in those securities nor can it be assured that the Fund can obtain the fair value assigned to a security if it were to sell the security.
| DAVIS FINANCIAL PORTFOLIO | Notes to Financial Statements – (Continued) |
| | December 31, 2018 |
NOTE 1 - SUMMARY OF SIGNIFICANT ACCOUNTING POLICIES – (CONTINUED)
Fair Value Measurements - (Continued)
The following is a summary of the inputs used as of December 31, 2018 in valuing the Fund’s investments carried at value:
| | Investments in Securities at Value |
| | Valuation Inputs |
| | | | Level 2: | | Level 3: | | |
| | | | Other Significant | | Significant | | |
| | Level 1: | | Observable | | Unobservable | | |
| | Quoted Prices | | Inputs | | Inputs | | Total |
Common Stock: | | | | | | | | | | | |
| Communication Services | $ | 1,948,688 | | $ | – | | $ | – | | $ | 1,948,688 |
| Financials | | 58,867,691 | | | – | | | – | | | 58,867,691 |
| Short-term securities | | – | | | 854,000 | | | – | | | 854,000 |
| Total Investments | $ | 60,816,379 | | $ | 854,000 | | $ | – | | $ | 61,670,379 |
Master Repurchase Agreements - The Fund, along with other affiliated funds, may transfer uninvested cash balances into one or more master repurchase agreement accounts. These balances are invested in one or more repurchase agreements, secured by U.S. Government securities. A custodian bank holds securities pledged as collateral for repurchase agreements until the agreements mature. Each agreement requires that the market value of the collateral be sufficient to cover payments of interest and principal; however, in the event of default by the other party to the agreement, retention of the collateral may be subject to legal proceedings.
Currency Translation - The market values of all assets and liabilities denominated in foreign currencies are recorded in the financial statements after translation to the U.S. dollar based upon the mean between the bid and offered quotations of the currencies against U.S. dollars on the date of valuation. The cost basis of such assets and liabilities is determined based upon historical exchange rates. Income and expenses are translated at average exchange rates in effect as accrued or incurred.
Foreign Currency - The Fund may enter into forward purchases or sales of foreign currencies to hedge certain foreign currency denominated assets and liabilities against declines in market value relative to the U.S. dollar. Forward currency contracts are marked-to-market daily and the change in market value is recorded by the Fund as an unrealized gain or loss. When the forward currency contract is closed, the Fund records a realized gain or loss equal to the difference between the value of the forward currency contract at the time it was opened and value at the time it was closed. Investments in forward currency contracts may expose the Fund to risks resulting from unanticipated movements in foreign currency exchange rates or failure of the counter-party to the agreement to perform in accordance with the terms of the contract. There were no forward contracts entered into by the Fund.
Reported net realized foreign exchange gains or losses arise from the sales of foreign currencies, currency gains or losses realized between the trade and settlement dates on security transactions, the difference between the amounts of dividends, interest, and foreign withholding taxes recorded on the Fund’s books, and the U.S. dollar equivalent of the amounts actually received or paid. Net unrealized foreign exchange gains or losses arise from changes in the value of assets and liabilities other than investments in securities at fiscal year end, resulting from changes in the exchange rate. The Fund includes foreign currency gains and losses realized on the sales of investments together with market gains and losses on such investments in the Statement of Operations.
| DAVIS FINANCIAL PORTFOLIO | Notes to Financial Statements – (Continued) |
| | December 31, 2018 |
NOTE 1 - SUMMARY OF SIGNIFICANT ACCOUNTING POLICIES – (CONTINUED)
Federal Income Taxes - It is the Fund’s policy to comply with the requirements of the Internal Revenue Code applicable to regulated investment companies, and to distribute substantially all of its taxable income, including any net realized gains on investments not offset by loss carryovers, to shareholders. Therefore, no provision for federal income or excise tax is required. The Adviser analyzed the Fund’s tax positions taken on federal and state income tax returns for all open tax years and concluded that as of December 31, 2018, no provision for income tax is required in the Fund’s financial statements related to these tax positions. The Fund’s federal and state (Arizona) income and federal excise tax returns for tax years for which the applicable statutes of limitations have not expired are subject to examination by the Internal Revenue Service and state Department of Revenue. The earliest tax year that remains subject to examination by these jurisdictions is 2015.
At December 31, 2018, the unrealized appreciation (depreciation) and aggregate cost of investments for federal income tax purposes were as follows:
| Unrealized appreciation | $ | 18,638,470 |
| Unrealized depreciation | | (1,946,555) |
| Net unrealized appreciation | $ | 16,691,915 |
Aggregate cost | $ | 44,978,464 |
Securities Transactions and Related Investment Income - Securities transactions are accounted for on the trade date (date the order to buy or sell is executed) with realized gain or loss on the sale of securities being determined based upon identified cost. Dividend income is recorded on the ex-dividend date. Interest income, which includes accretion of discount and amortization of premium, is accrued as earned.
Dividends and Distributions to Shareholders - Dividends and distributions to shareholders are recorded on the ex-dividend date. Net investment income (loss), net realized gains (losses), and net unrealized appreciation (depreciation) on investments [collectively “Distributable earnings (losses)”] may differ for financial statement and tax purposes primarily due to differing treatments of wash sales, foreign currency transactions, Directors’ deferred compensation payments, and partnership income. The character of dividends and distributions made during the fiscal year from net investment income and net realized securities gains may differ from their ultimate characterization for federal income tax purposes. Also, due to the timing of dividends and distributions, the fiscal year in which amounts are distributed may differ from the fiscal year in which income or realized gain was recorded by the Fund. The Fund adjusts certain components of capital to reflect permanent differences between financial statement amounts and net income and realized gains/losses determined in accordance with income tax rules.
The tax character of distributions paid during the years ended December 31, 2018 and 2017 was as follows:
| | 2018 | | 2017 |
| Ordinary income | $ | 1,292,050 | | $ | 637,150 |
| Long-term capital gain | | 8,821,580 | | | 6,202,181 |
| Total | $ | 10,113,630 | | $ | 6,839,331 |
As of December 31, 2018, the components of distributable earnings on a tax basis were as follows:
| Undistributed ordinary income | $ | 151,358 |
| Undistributed long-term capital gain | | 864,100 |
Net unrealized appreciation on investments and foreign currency transactions | | 16,691,882 |
| Total | $ | 17,707,340 |
| DAVIS FINANCIAL PORTFOLIO | Notes to Financial Statements – (Continued) |
| | December 31, 2018 |
NOTE 1 - SUMMARY OF SIGNIFICANT ACCOUNTING POLICIES – (CONTINUED)
Indemnification - Under the Fund’s organizational documents, its officers and directors are indemnified against certain liabilities arising out of the performance of their duties to the Fund. In addition, some of the Fund’s contracts with its service providers contain general indemnification clauses. The Fund’s maximum exposure under these arrangements is unknown since the amount of any future claims that may be made against the Fund cannot be determined and the Fund has no historical basis for predicting the likelihood of any such claims.
Use of Estimates in Financial Statements - In preparing financial statements in conformity with accounting principles generally accepted in the United States of America, management makes estimates and assumptions that affect the reported amounts of assets and liabilities and disclosure of contingent assets and liabilities at the date of the financial statements, as well as the reported amounts of income and expenses during the reporting period. Actual results may differ from these estimates.
Directors Fees and Expenses - The Fund set up a Rabbi Trust to provide for the deferred compensation plan for Independent Directors that enables them to elect to defer receipt of all or a portion of annual fees they are entitled to receive. The value of an eligible Director’s account is based upon years of service and fees paid to each Director during the years of service. The amount paid to the Director by the Trust under the plan will be determined based upon the performance of the Davis Funds in which the amounts are invested.
NOTE 2 - PURCHASES AND SALES OF SECURITIES
The cost of purchases and proceeds from sales of investment securities (excluding short-term securities) during the year ended December 31, 2018 were $16,094,291 and $18,659,001, respectively.
NOTE 3 - FEES AND OTHER TRANSACTIONS WITH SERVICE PROVIDERS (INCLUDING AFFILIATES)
Davis Selected Advisers-NY, Inc. (“DSA-NY”), a wholly-owned subsidiary of the Adviser, acts as sub-adviser to the Fund. DSA-NY performs research and portfolio management services for the Fund under a Sub-Advisory Agreement with the Adviser. The Fund pays no fees directly to DSA-NY.
All officers of the Fund (including Interested Directors) hold positions as executive officers with the Adviser or its affiliates.
Investment Advisory Fees and Reimbursement of Expenses - Advisory fees are paid monthly to the Adviser at an annual rate of 0.55% of the Fund’s average net assets. The Adviser is contractually committed to waive fees and/or reimburse the Fund’s expenses to the extent necessary to cap total annual Fund operating expenses at 1.00% until May 1, 2019.
Accounting Fees - State Street Bank and Trust Company (“State Street Bank”) is the Fund’s primary accounting provider. Fees for accounting services are included in the custodian fees as State Street Bank also serves as the Fund’s custodian. The Adviser is also paid for certain accounting services. The fee paid to the Adviser for these services during the year ended December 31, 2018 amounted to $2,000.
| DAVIS FINANCIAL PORTFOLIO | Notes to Financial Statements – (Continued) |
| | December 31, 2018 |
NOTE 4 - CAPITAL STOCK
At December 31, 2018, there were 500 million shares of capital stock ($0.001 par value per share) authorized. Transactions in capital stock were as follows:
| | Year ended December 31, 2018 |
| | | Sold | | | Reinvestment of Distributions | | | Redeemed | | | Net Increase |
| | | | | | | | | | | | |
| Shares: | | 858,859 | | | 885,607 | | | (1,263,306) | | | 481,160 |
| Value: | $ | 13,637,652 | | $ | 10,113,630 | | $ | (19,521,901) | | $ | 4,229,381 |
| | | | | | | | | | | | |
| |
| | Year ended December 31, 2017 |
| | | Sold | | | Reinvestment of Distributions | | | Redeemed | | | Net Decrease |
| | | | | | | | | | | | |
| Shares: | | 496,470 | | | 441,248 | | | (1,049,527) | | | (111,809) |
| Value: | $ | 7,738,356 | | $ | 6,839,331 | | $ | (15,910,448) | | $ | (1,332,761) |
| | | | | | | | | | | | |
NOTE 5 - BANK BORROWINGS
The Fund may borrow up to 5% of its assets from a bank to purchase portfolio securities, or for temporary and emergency purposes. The purchase of securities with borrowed funds creates leverage in the Fund. The Fund has entered into an agreement, which enables it to participate with certain other funds managed by the Adviser in an unsecured line of credit with a bank, which permits borrowings of up to $50 million, collectively. Interest is charged based on its borrowings, at a rate equal to the higher of the Federal Funds Rate or the one month LIBOR Rate, plus 1.25%. The Fund had no borrowings during the year ended December 31, 2018.
FEDERAL INCOME TAX INFORMATION (UNAUDITED)
During the calendar year ended December 31, 2018, the Fund declared and paid long-term capital gain distributions in the amount of $8,821,580.
During the calendar year ended December 31, 2018, $1,292,050 of dividends paid by the Fund constituted income dividends for federal income tax purposes. The Fund designates $722,292 or 56% as income qualifying for the corporate dividends-received deduction.
| DAVIS FINANCIAL PORTFOLIO | |
| The following financial information represents selected data for each share of capital stock outstanding throughout each period: |
| | Year ended December 31, |
| | | | 2018 | | 2017 | | 2016 | | 2015 | | 2014 |
| Net Asset Value, Beginning of Period | | $ | 15.50 | | $ | 14.03 | | $ | 13.31 | | $ | 14.98 | | $ | 15.08 |
Income (Loss) from Investment Operations: | | | | | | | | | | | | | | | | | | | | | | | | | |
| Net Investment Income | | 0.21 | | 0.12 | | 0.14 | | 0.13 | | 0.17 |
| Net Realized and Unrealized Gains (Losses) | | (1.89) | | 2.89 | | 1.76 | | 0.20 | | 1.79 |
| | Total from Investment Operations | | (1.68) | | 3.01 | | 1.90 | | 0.33 | | 1.96 |
Dividends and Distributions: | | | | | | | | | | | | | | | | | | | | | | | | | |
| Dividends from Net Investment Income | | (0.20) | | (0.12) | | (0.14) | | (0.14) | | (0.20) |
| Distributions from Realized Gains | | (2.07) | | (1.42) | | (1.04) | | (1.86) | | (1.86) |
| | Total Dividends and Distributions | | (2.27) | | (1.54) | | (1.18) | | (2.00) | | (2.06) |
Net Asset Value, End of Period | | $ | 11.55 | | $ | 15.50 | | $ | 14.03 | | $ | 13.31 | | $ | 14.98 |
Total Returna | | (10.67) | % | | 21.42 | % | | 14.25 | % | | 2.01 | % | | 12.85 | % |
Ratios/Supplemental Data: | | | | | | | | | | | | | | | | | | | | | | | | | |
| Net Assets, End of Period (in thousands) | | $ | 61,692 | | | $ | 75,378 | | | $ | 69,765 | | | $ | 67,541 | | | $ | 77,859 | |
| Ratio of Expenses to Average Net Assets: | | | | | | | | | | | | | | | | | | | | | | | | | |
| | Gross | | 0.69 | % | | 0.72 | % | | 0.70 | % | | 0.68 | % | | 0.68 | % |
| | Netb | | 0.69 | % | | 0.72 | % | | 0.65 | % | | 0.68 | % | | 0.68 | % |
Ratio of Net Investment Income to Average Net Assets | | 1.31 | % | | 0.75 | % | | 1.04 | % | | 0.82 | % | | 0.96 | % |
Portfolio Turnover Ratec | | 23 | % | | 14 | % | | 12 | % | | 12 | % | | 32 | % |
| a | Assumes hypothetical initial investment on the business day before the first day of the fiscal period, with all dividends and distributions reinvested in additional shares on the reinvestment date, and redemption at the net asset value calculated on the last business day of the fiscal period. Total returns do not reflect charges attributable to your insurance company’s separate account. Inclusion of these charges would reduce the total returns shown. |
| |
| b | The Net Ratio of Expenses to Average Net Assets reflects the impact, if any, of certain reimbursements. |
| |
| c | The lesser of purchases or sales of portfolio securities for a period, divided by the monthly average of the market value of portfolio securities owned during the period. Securities with a maturity or expiration date at the time of acquisition of one year or less are excluded from the calculation. |
| |
| See Notes to Financial Statements |
| DAVIS FINANCIAL PORTFOLIO | Report of Independent Registered Public Accounting Firm |
The Shareholders and Board of Directors
Davis Variable Account Fund, Inc.:
Opinion on the Financial Statements
We have audited the accompanying statement of assets and liabilities of Davis Financial Portfolio (a separate series of Davis Variable Account Fund, Inc.) (the “Fund”), including the schedule of investments, as of December 31, 2018, the related statement of operations for the year then ended, the statements of changes in net assets for each of the years in the two-year period then ended, and the related notes (collectively, the “financial statements”) and the financial highlights for each of the years in the five-year period then ended. In our opinion, the financial statements and financial highlights present fairly, in all material respects, the financial position of the Fund as of December 31, 2018, the results of its operations for the year then ended, the changes in its net assets for each of the years in the two-year period then ended, and the financial highlights for each of the years in the five-year period then ended, in conformity with U.S. generally accepted accounting principles.
Basis for Opinion
These financial statements and financial highlights are the responsibility of the Fund’s management. Our responsibility is to express an opinion on these financial statements and financial highlights based on our audits. We are a public accounting firm registered with the Public Company Accounting Oversight Board (United States) (“PCAOB”) and are required to be independent with respect to the Fund in accordance with the U.S. federal securities laws and the applicable rules and regulations of the Securities and Exchange Commission and the PCAOB.
We conducted our audits in accordance with the standards of the PCAOB. Those standards require that we plan and perform the audit to obtain reasonable assurance about whether the financial statements and financial highlights are free of material misstatement, whether due to error or fraud. Our audits included performing procedures to assess the risks of material misstatement of the financial statements and financial highlights, whether due to error or fraud, and performing procedures that respond to those risks. Such procedures included examining, on a test basis, evidence regarding the amounts and disclosures in the financial statements and financial highlights. Such procedures also included confirmation of securities owned as of December 31, 2018, by correspondence with the custodian and brokers or by other appropriate auditing procedures. Our audits also included evaluating the accounting principles used and significant estimates made by management, as well as evaluating the overall presentation of the financial statements and financial highlights. We believe that our audits provide a reasonable basis for our opinion.
KPMG LLP
We have served as the auditor of one or more Davis Funds investment companies since 1998.
Denver, Colorado
February 7, 2019
| DAVIS FINANCIAL PORTFOLIO | |
For the purpose of their service as Directors to the Davis Funds, the business address for each of the Directors is 2949 E. Elvira Road, Suite 101, Tucson, AZ 85756. Subject to exceptions and exemptions, which may be granted by the Independent Directors, Directors must retire at the close of business on the last day of the calendar year in which the Director attains age seventy-eight (78).
Name, Date of Birth, Position(s) Held with Fund, Length of Service | Principal Occupation(s) During Past Five Years | Number of Portfolios Overseen | Other Directorships |
Independent Directors
| | | | |
Marc P. Blum (09/09/42) Director since 1986 | Chief Executive Officer, World Total Return Fund, LLLP; of Counsel to Gordon Feinblatt LLC (law firm). | 13 | Director, Rodney Trust Company (trust and asset management company). |
| | | | |
John S. Gates Jr. (08/02/53) Director since 2007 | Chairman and Chief Executive Officer of PortaeCo LLC (private investment company). | 13 | Director, Care Capital Properties (REIT); Trustee, DCT Industrial Trust (REIT); Director, Miami Corp. (diversified investment company). |
| | | | |
Thomas S. Gayner (12/16/61) Director since 2004 Chairman since 2009 | Co-Chief Executive Officer and Director, Markel Corp. (diversified financial holding company). | 13 | Director, Graham Holdings Company (educational and media company); Director, Colfax Corp. (engineering and manufacturer of pumps and fluid handling equipment); Director, Cable ONE Inc. (cable service provider). |
| | | | |
Samuel H. Iapalucci (07/19/52) Director since 2006 | Retired; Executive Vice President and Chief Financial Officer, CH2M-HILL Companies, Ltd. (engineering) until 2008. | 13 | None |
| | | | |
Robert P. Morgenthau (03/22/57) Director since 2002 | Principal, Spears Abacus Advisors, LLC (investment management firm) since 2011; Chairman, NorthRoad Capital Management, LLC (investment management firm) 2002-2011. | 13 | None |
| | | | |
Marsha C. Williams (03/28/51) Director since 1999 | Retired; Senior Vice President and Chief Financial Officer, Orbitz Worldwide, Inc. (travel-service provider) 2007-2010. | 13 | Lead Independent Director, Modine Manufacturing Company (heat transfer technology); Director, McDermott International, Inc. (industrial construction and engineering); Lead Independent Director, Fifth Third Bancorp (diversified financial services). |
Interested Directors*
| | | | |
Andrew A. Davis (06/25/63) Director since 1997 | President or Vice President of each Davis Fund, Selected Fund, and Clipper Fund; President, Davis Selected Advisers, L.P., and also serves as an Executive Officer of certain companies affiliated with the Adviser. | 16 | Director, Selected Funds (consisting of two portfolios) since 1998; Trustee, Clipper Funds Trust (consisting of one portfolio) since 2014. |
| | | | |
Christopher C. Davis (07/13/65) Director since 1997 | President or Vice President of each Davis Fund, Selected Fund, Clipper Fund, and Davis Fundamental ETF; Chairman, Davis Selected Advisers, L.P., and also serves as an Executive Officer of certain companies affiliated with the Adviser, including sole member of the Adviser’s general partner, Davis Investments, LLC. | 16 | Director, Selected Funds (consisting of two portfolios) since 1998; Trustee, Clipper Funds Trust (consisting of one portfolio) since 2014; Lead Independent Director, Graham Holdings Company (educational and media company); Director, The Coca Cola Company (beverage company). |
* Andrew A. Davis and Christopher C. Davis own partnership units (directly, indirectly, or both) of the Adviser and are considered to be “interested persons” of the Funds as defined in the Investment Company Act of 1940. Andrew A. Davis and Christopher C. Davis are brothers.
Officers
Andrew A. Davis (born 06/25/63, Davis Funds officer since 1997). See description in the section on Interested Directors.
Christopher C. Davis (born 07/13/65, Davis Funds officer since 1997). See description in the section on Interested Directors.
Kenneth C. Eich (born 08/14/53, Davis Funds officer since 1997). Executive Vice President and Principal Executive Officer of the Davis Funds (consisting of 13 portfolios), Selected Funds (consisting of two portfolios), and Clipper Funds Trust (consisting of one portfolio); Trustee/Chairman, Executive Vice President, and Principal Executive Officer of Davis Fundamental ETF Trust (consisting of four portfolios); Chief Operating Officer, Davis Selected Advisers, L.P., and also serves as an Executive Officer of certain companies affiliated with the Adviser.
Douglas A. Haines (born 03/04/71, Davis Funds officer since 2004). Vice President, Treasurer, Chief Financial Officer, Principal Financial Officer, and Principal Accounting Officer of the Davis Funds (consisting of 13 portfolios), Selected Funds (consisting of two portfolios), Clipper Funds Trust (consisting of one portfolio), and Davis Fundamental ETF Trust (consisting of four portfolios); Vice President and Director of Fund Accounting, Davis Selected Advisers, L.P.
Randi J. Roessler (born 06/26/81, Davis Funds officer since 2018). Vice President and Chief Compliance Officer of the Davis Funds (consisting of 13 portfolios), Selected Funds (consisting of two portfolios), Clipper Funds Trust (consisting of one portfolio), and Davis Fundamental ETF Trust (consisting of four portfolios); Vice President and Chief Compliance Officer, Davis Selected Advisers, L.P., and also serves as an Executive Officer of certain companies affiliated with the Adviser.
Ryan M. Charles (born 07/25/78, Davis Funds officer since 2014). Vice President and Secretary of the Davis Funds (consisting of 13 portfolios), Selected Funds (consisting of two portfolios), Clipper Funds Trust (consisting of one portfolio), and Davis Fundamental ETF Trust (consisting of four portfolios); Vice President, Chief Legal Officer, and Secretary, Davis Selected Advisers, L.P., and also serves as an Executive Officer of certain companies affiliated with the Adviser.
| DAVIS FINANCIAL PORTFOLIO |
| Investment Adviser |
| Davis Selected Advisers, L.P. (Doing business as “Davis Advisors”) |
| 2949 East Elvira Road, Suite 101 |
| Tucson, Arizona 85756 |
| (800) 279-0279 |
| |
| Distributor |
| Davis Distributors, LLC |
| 2949 East Elvira Road, Suite 101 |
| Tucson, Arizona 85756 |
| |
| Transfer Agent |
| DST Asset Manager Solutions, Inc. |
| c/o The Davis Funds |
| P.O. Box 219197 |
| Kansas City, Missouri 64121-9197 |
| |
| Custodian |
| State Street Bank and Trust Co. |
| One Lincoln Street |
| Boston, Massachusetts 02111 |
| |
| Counsel |
| Greenberg Traurig, LLP |
| 77 West Wacker Drive, Suite 3100 |
| Chicago, Illinois 60601 |
| |
| Independent Registered Public Accounting Firm |
| KPMG LLP |
| 1225 Seventeenth Street, Suite 800 |
| Denver, Colorado 80202 |
For more information about Davis Financial Portfolio, including management fee, charges, and expenses, see the current prospectus, which must precede or accompany this report. The Fund’s Statement of Additional Information contains additional information about the Fund’s Directors and is available without charge, upon request, by calling 1-800-279-0279 and on the Fund’s website at www.davisfunds.com. Quarterly Fact Sheets are available on the Fund’s website at www.davisfunds.com.
| DAVIS REAL ESTATE PORTFOLIO | Table of Contents |
| 2 |
| |
| 4 |
| |
| 6 |
| |
| 7 |
| |
| 10 |
| |
| 11 |
| |
| 12 |
| |
| 13 |
| |
| 17 |
| |
| 18 |
| |
| 19 |
| |
| 20 |
This Annual Report is authorized for use by existing shareholders. Prospective shareholders must receive a current Davis Real Estate Portfolio prospectus, which contains more information about investment strategies, risks, charges, and expenses. Please read the prospectus carefully before investing or sending money.
Shares of Davis Real Estate Portfolio are not deposits or obligations of any bank, are not guaranteed by any bank, are not insured by the FDIC or any other agency, and involve investment risks, including possible loss of the principal amount invested.
Portfolio Proxy Voting Policies and Procedures
The Fund has adopted Portfolio Proxy Voting Policies and Procedures under which the Fund votes proxies relating to securities held by the Fund. A description of the Fund’s Portfolio Proxy Voting Policies and Procedures is available (i) without charge, upon request, by calling the Fund toll-free at 1-800-279-0279, (ii) on the Fund’s website at www.davisfunds.com, and (iii) on the SEC’s website at www.sec.gov.
In addition, the Fund is required to file Form N-PX, with its complete proxy voting record for the 12 months ended June 30th, no later than August 31st of each year. The Fund’s Form N-PX filing is available (i) without charge, upon request, by calling the Fund toll-free at 1-800-279-0279, (ii) on the Fund’s website at www.davisfunds.com, and (iii) on the SEC’s website at www.sec.gov.
Form N-Q
The Fund files its complete schedule of portfolio holdings with the SEC for the first and third quarters of each fiscal year on Form N-Q. The Fund’s Form N-Q is available without charge, upon request, by calling 1-800-279-0279, on the Fund’s website at www.davisfunds.com, and on the SEC’s website at www.sec.gov. Effective March 31, 2019, Form N-PORT Exhibit F will replace Form N-Q.
| DAVIS REAL ESTATE PORTFOLIO | Management’s Discussion of Fund Performance |
Performance Overview
Davis Real Estate Portfolio performed in line with the Wilshire U.S. Real Estate Securities Index (“Wilshire Index”) for the twelve-month period ended December 31, 2018 (the “period”). The Fund delivered a total return of (4.82)%, versus a (4.80)% return for the Wilshire Index. The sub-industries1 within the Wilshire Index that reported the strongest performance were Real Estate Operating Companies (up 9%), Health Care REITs (up 8%), and Residential REITs (up 3%). The sub-industries within the Wilshire Index that reported the weakest performance were Hotel & Resort REITs (down 14%), Office REITs (down 14%), and Retail REITs (down 10%).
Contributors to Performance
The Fund’s holdings in the Residential REITs sub-industry made the most significant contribution2 to absolute performance, returning approximately 3%. Top performers for the period included Education Realty Trust3 (up 28%), AvalonBay Communities (up 1%), the second-largest holding at the end of the period, and Equity Residential (up 7%). Education Realty Trust was a new position acquired during the period that was subsequently liquidated as part of a merger.
On a relative basis, the Fund benefited most from its Hotel & Resort REITs sub-industry holdings. Stock selection and an underweight position were primary factors in the Fund’s outperformance relative to the Wilshire Index in this sector (2% average weighting and down 6% versus 7% average weighting and down 14% for the Wilshire Index). LaSalle Hotel Properties (up 45%) aided Fund performance. LaSalle Hotel Properties was purchased, and subsequently sold, during the period.
Industrial REITs helped the Fund’s performance relative to the Wilshire Index due to its stronger stock selection (down less than 1%, compared with down 4%) and slightly overweight position (14% average weighting, versus 9% for the Wilshire Index). DCT Industrial Trust (up 14%), which merged into Prologis during the period, aided performance.
Diversified REITs (up 6%) helped the Fund’s absolute return. Specialized REITs boosted the Fund’s performance relative to the Wilshire Index due to its slightly overweight position (20%, versus 17% average weighting) and stronger stock selection (down 5%, versus down 7%). Forest City Realty Trust (up 6%) from the Diversified REITs category and Extra Space Storage (up 7%), Life Storage (up 9%), and CubeSmart (up 3%), all from the Specialized REITs category, were top contributors. The Fund no longer owns Forest City Realty Trust.
A new Health Care REIT holding, HCP, was up 22% and was the top contributor for the period.
Detractors from Performance
The Fund’s Office REIT holdings were the most significant detractor from performance on an absolute basis (down 13%). Five of the top ten detractors came from this sub-industry. They include Brandywine Realty Trust (down 26%), Boston Properties (down 11%), Cousins Properties (down 13%), SL Green Realty (down 19%), and Hudson Pacific Properties (down 13%).
On a relative basis, the most important detractor from the Fund’s performance was its lower average weighting (3% average weight, compared with 11% average weight for the Wilshire Index) in Health Care REIT securities. No individual Health Care REIT security was among the Fund’s top detractors during the period.
Likewise, no Real Estate Operating Company holding was among the top detractors for the period, however the Fund’s holdings in this sub-industry underperformed those of the Wilshire Index (down 17%, versus up 9%), which made this a key detractor from relative performance.
Retail REITs negatively impacted the Fund’s absolute results (down 9%). A number of securities from within this sub-industry were laggards, including Acadia Realty Trust (down 9%), Retail Opportunity Investments (down 17%), and Regency Centers (down 12%).
Specialized REITs weighed on the Fund’s absolute performance. Equinix (down 19%), the top detractor for the period and fourth-largest holding at the end of the period, and CatchMark Timber Trust (down 43%) hindered performance. Equinix was a new purchase during the first half of the period.
Davis Real Estate Portfolio’s investment objective is total return through a combination of growth and income. There can be no assurance that the Fund will achieve its objective. Davis Real Estate Portfolio’s principal risks are: common stock risk, fees and expenses risk, headline risk, large-capitalization companies risk, manager risk, mid- and small-capitalization companies risk, real estate risk, stock market risk, and variable current income risk. See the prospectus for a full description of each risk.
Davis Real Estate Portfolio concentrates its investments in the real estate sector, and it may be subject to greater risks than a fund that does not concentrate its investments in a particular sector. The Fund’s investment performance, both good and bad, is expected to reflect the economic performance of the real estate sector more than a fund that does not concentrate its portfolio.
Past performance does not guarantee future results, Fund prices fluctuate, and the value of an investment may be worth more or less than the purchase price. Data provided in this performance overview is for the twelve-month period ended December 31, 2018, unless otherwise noted. Return figures for underlying Fund positions reflect the return of the security from the beginning of the period or the date of first purchase if subsequent thereto through the end of the period or the date the position is completely liquidated. The actual contribution to the Fund will vary based on a number of factors (e.g., trading activity, weighting). Portfolio holding information is as of the end of the twelve-month period, December 31, 2018, unless otherwise noted.| 1 | The companies included in the Wilshire U.S. Real Estate Securities Index are divided into ten sub-industries. |
| 2 | A company’s or sector’s contribution to or detraction from the Fund’s performance is a product both of its appreciation or depreciation and its weighting within the Fund. For example, a 5% holding that rises 20% has twice as much impact as a 1% holding that rises 50%. |
| 3 | This Management Discussion of Fund Performance discusses a number of individual companies. The information provided in this report does not provide information reasonably sufficient upon which to base an investment decision and should not be considered a recommendation to purchase, sell, or hold any particular security. The Schedule of Investments lists the Fund’s holdings of each company discussed. |
| DAVIS REAL ESTATE PORTFOLIO | Management’s Discussion of Fund Performance – (Continued) |
Comparison of a $10,000 investment in Davis Real Estate Portfolio versus the
Standard & Poor’s 500® Index and the Wilshire U.S. Real Estate Securities Index
over 10 years for an investment made on December 31, 2008
Average Annual Total Return for periods ended December 31, 2018
| Fund & Benchmark Indices | 1-Year | 5-Year | 10-Year | Since Fund’s Inception (07/01/99) | Gross Expense Ratio | Net Expense Ratio |
| Davis Real Estate Portfolio | (4.82)% | 7.94% | 11.26% | 7.95% | 1.00% | 1.00% |
Standard & Poor’s 500® Index | (4.38)% | 8.49% | 13.11% | 5.10% | | |
Wilshire U.S. Real Estate Securities Index | (4.80)% | 8.17% | 12.41% | 9.73% | | |
The Standard & Poor’s 500® Index is an unmanaged index of 500 selected common stocks, most of which are listed on the New York Stock Exchange. The Index is adjusted for dividends, weighted towards stocks with large market capitalizations, and represents approximately two-thirds of the total market value of all domestic common stocks. Investments cannot be made directly in the Index.
The Wilshire U.S. Real Estate Securities Index is a broad measure of the performance of publicly traded real estate securities. It reflects no deduction for fees or expenses. Investments cannot be made directly in the Index.
The performance data quoted in this report represents past performance, assumes that all distributions were reinvested, and is not a guarantee of future results. The investment return and principal value will fluctuate so that shares may be worth more or less than their original cost when redeemed. Current performance may be higher or lower than performance data quoted. The operating expense ratio may vary in future years. For more recent month-end performance information, please call Investor Services at 1-800-279-0279 or visit the Fund’s website at www.davisfunds.com.
Fund performance numbers are net of all Fund operating expenses, but do not include any insurance charges imposed by your insurance company’s separate account. If performance included the effect of these additional charges, the return would be lower.
| DAVIS REAL ESTATE PORTFOLIO | |
| | December 31, 2018 |
| Portfolio Composition | | Industry Weightings |
| (% of Fund’s 12/31/18 Net Assets) | | (% of 12/31/18 Stock Holdings) |
| | | | | | |
| | | | | | Wilshire U.S. |
| | | | | | Real Estate |
| | | | | Fund | | Securities Index |
| Common Stock (U.S.) | 97.12% | | Residential REITs | 22.98% | | 20.19% |
| Common Stock (Foreign) | 1.30% | | Retail REITs | 20.85% | | 16.28% |
| Preferred Stock | 0.32% | | Specialized REITs | 19.60% | | 17.01% |
| Short-Term Investments | 1.11% | | Office REITs | 18.47% | | 14.26% |
| Other Assets & Liabilities | 0.15% | | Industrial REITs | 11.42% | | 9.34% |
| | 100.00% | | Health Care REITs | 3.12% | | 12.72% |
| | | | Hotel & Resort REITs | 2.53% | | 5.77% |
| | | | Diversified REITs | 1.03% | | 3.80% |
| | | | Real Estate Operating Companies | – | | 0.35% |
| | | | Hotels, Resorts & Cruise Lines | – | | 0.28% |
| | | | | 100.00% | | 100.00% |
| Top 10 Long-Term Holdings |
| (% of Fund’s 12/31/18 Net Assets) |
| |
| Simon Property Group, Inc. | Retail REITs | 7.72% |
| AvalonBay Communities, Inc. | Residential REITs | 6.12% |
| Prologis, Inc. | Industrial REITs | 4.57% |
| Equinix, Inc. | Specialized REITs | 4.15% |
| Boston Properties, Inc. | Office REITs | 3.67% |
| Public Storage | Specialized REITs | 3.46% |
| Digital Realty Trust, Inc. | Specialized REITs | 3.27% |
| Hudson Pacific Properties, Inc. | Office REITs | 3.16% |
| Essex Property Trust, Inc. | Residential REITs | 3.16% |
| American Campus Communities, Inc. | Residential REITs | 3.15% |
| DAVIS REAL ESTATE PORTFOLIO | Fund Overview – (Continued) |
| | December 31, 2018 |
New Positions Added (01/01/18-12/31/18)
(Highlighted positions are those greater than 1.50% of the Fund’s 12/31/18 net assets)
| Security | Industry | Date of 1st Purchase | % of Fund’s 12/31/18 Net Assets |
| CoreSite Realty Corp. | Specialized REITs | 02/08/18 | 1.52% |
| Digital Realty Trust, Inc. | Specialized REITs | 01/10/18 | 3.27% |
| Education Realty Trust, Inc. | Residential REITs | 01/29/18 | – |
| Equinix, Inc. | Specialized REITs | 01/10/18 | 4.15% |
| Equity LifeStyle Properties, Inc. | Residential REITs | 09/14/18 | 1.25% |
| HCP, Inc. | Health Care REITs | 05/08/18 | 1.04% |
| LaSalle Hotel Properties | Hotel & Resort REITs | 02/22/18 | – |
| Liberty Property Trust | Diversified REITs | 10/24/18 | 1.02% |
| Macerich Co. | Retail REITs | 12/13/18 | 0.49% |
| Mid-America Apartment Communities, Inc. | Residential REITs | 09/14/18 | 0.53% |
| Ryman Hospitality Properties, Inc. | Hotel & Resort REITs | 07/13/18 | 0.66% |
| Sun Communities, Inc. | Residential REITs | 09/14/18 | 1.24% |
| Switch, Inc., Class A | Software & Services | 04/03/18 | – |
Positions Closed (01/01/18-12/31/18)
(Gains and losses greater than $55,000 are highlighted)
| Security | Industry | Date of Final Sale | | | Realized Gain (Loss) |
| Brookfield Property Partners L.P. | Real Estate Operating Companies | 12/12/18 | | $ | (13,467) |
| Cedar Realty Trust Inc. | Retail REITs | 01/16/18 | | | (6,720) |
| CyrusOne Inc. | Specialized REITs | 10/25/18 | | | 125,030 |
| DDR Corp. | Retail REITs | 02/14/18 | | | (24,583) |
| Education Realty Trust, Inc. | Residential REITs | 09/20/18 | | | 39,457 |
| Forest City Realty Trust Inc., Class A | Diversified REITs | 10/10/18 | | | 84,800 |
| GGP Inc. | Retail REITs | 08/28/18 | | | (42,078) |
| InterXion Holding N.V. | Software & Services | 01/30/18 | | | 122,085 |
| JBG SMITH Properties | Office REITs | 08/27/18 | | | 19,615 |
| Kite Realty Group Trust | Retail REITs | 01/10/18 | | | (23,171) |
| LaSalle Hotel Properties | Hotel & Resort REITs | 06/07/18 | | | 35,480 |
| Ramco-Gershenson Properties Trust | Retail REITs | 01/12/18 | | | 354 |
| Switch, Inc., Class A | Software & Services | 08/14/18 | | | (15,414) |
| Welltower Inc. | Health Care REITs | 12/07/18 | | | (55,741) |
| Weyerhaeuser Co. | Specialized REITs | 10/24/18 | | | 35,420 |
| DAVIS REAL ESTATE PORTFOLIO | |
As a shareholder of the Fund, you incur ongoing costs only, including advisory and administrative fees and other Fund expenses. The Expense Example is intended to help you understand your ongoing costs (in dollars) of investing in the Fund and to compare these costs with the ongoing costs of investing in other mutual funds. The Expense Example is based on an investment of $1,000 invested at the beginning of the period and held for the entire period indicated, which for the Fund is for the six-month period ended December 31, 2018. Please note that the Expense Example is general and does not reflect charges imposed by your insurance company’s separate account or account specific costs, which may increase your total costs of investing in the Fund. If these charges or account specific costs were included in the Expense Example, the expenses would be higher.
Actual Expenses
The information represented in the row entitled “Actual” provides information about actual account values and actual expenses. You may use the information in this row, together with the amount you invested, to estimate the expenses that you paid over the period. Simply divide your account value by $1,000 (for example, an $8,600 account value divided by $1,000 = 8.6), then multiply the result by the number under the heading “Expenses Paid During Period” to estimate the expenses you paid on your account during this period.
Hypothetical Example for Comparison Purposes
The information represented in the row entitled “Hypothetical” provides information about hypothetical account values and hypothetical expenses based on the Fund’s actual expense ratio and an assumed rate of return of 5% per year before expenses, which is not the Fund’s actual return. The hypothetical account values and expenses may not be used to estimate the actual ending account balance or expenses you paid for the period. You may use this information to compare the ongoing costs of investing in the Fund and other funds. To do so, compare this 5% hypothetical example with the 5% hypothetical examples that appear in the shareholder reports of the other funds.
Please note that the expenses shown in the table are meant to highlight your ongoing costs only. Therefore, the information in the row entitled “Hypothetical” is useful in comparing ongoing costs only, and will not help you determine the relative total costs of owning different funds.
| | Beginning Account Value (07/01/18) | | Ending Account Value (12/31/18) | | Expenses Paid During Period* (07/01/18-12/31/18) |
Actual | $1,000.00 | | $930.74 | | $4.87 |
| Hypothetical | $1,000.00 | | $1,020.16 | | $5.09 |
Hypothetical assumes 5% annual return before expenses.
* Expenses are equal to the Fund’s annualized operating expense ratio (1.00%)**, multiplied by the average account value over the period, multiplied by 184/365 (to reflect the one-half year period).
** The expense ratio reflects the impact, if any, of certain reimbursements from the Adviser.
| DAVIS REAL ESTATE PORTFOLIO | |
| | December 31, 2018 |
| | Shares | | Value
(Note 1) |
| COMMON STOCK – (98.42%) |
| | REAL ESTATE – (98.42%) |
| | Equity Real Estate Investment Trusts (REITs) – (98.42%) |
| | Diversified REITs – (1.02%) |
| | | | | | | | |
| | Health Care REITs – (3.08%) |
| | | | | | | | |
| | | | | | | | |
| | | 386,444 |
| | Hotel & Resort REITs – (2.50%) |
| | Host Hotels & Resorts Inc. | | | | | | |
| | Ryman Hospitality Properties, Inc. | | | | | | |
| | | 314,075 |
| | Industrial REITs – (11.27%) |
| | EastGroup Properties, Inc. | | | | | | |
| | First Industrial Realty Trust, Inc. | | | | | | |
| | | | | | | | |
| | Rexford Industrial Realty, Inc. | | | | | | |
| | | | | | | | |
| | | 1,416,606 |
| | Office REITs – (18.24%) |
| | Alexandria Real Estate Equities, Inc. | | | | | | |
| | | | | | | | |
| | | | | | | | |
| | | | | | | | |
| | Great Portland Estates PLC (United Kingdom) | | | | | | |
| | Hudson Pacific Properties, Inc. | | | | | | |
| | | | | | | | |
| | | | | | | | |
| | | 2,291,161 |
| | Residential REITs – (22.69%) |
| | American Campus Communities, Inc. | | | | | | |
| | American Homes 4 Rent, Class A | | | | | | |
| | AvalonBay Communities, Inc. | | | | | | |
| | | | | | | | |
| | Equity LifeStyle Properties, Inc. | | | | | | |
| | | | | | | | |
| | Essex Property Trust, Inc. | | | | | | |
| | | | | | | | |
| | Mid-America Apartment Communities, Inc. | | | | | | |
| | | | | | | | |
| | | 2,851,083 |
| | Retail REITs – (20.27%) |
| | | | | | | | |
| | Brixmor Property Group, Inc. | | | | | | |
| | Federal Realty Investment Trust | | | | | | |
| | | | | | | | |
| | | | | | | | |
| | | | | | | | |
| DAVIS REAL ESTATE PORTFOLIO | Schedule of Investments - (Continued) |
| | December 31, 2018 |
| | Shares/Principal | | Value
(Note 1) |
| COMMON STOCK – (CONTINUED) |
| | REAL ESTATE – (CONTINUED) |
| | Equity Real Estate Investment Trusts (REITs) – (Continued) |
| | Retail REITs – (Continued) |
| | Retail Opportunity Investments Corp. | | | | | | |
| | Simon Property Group, Inc. | | | | | | |
| | | 2,546,250 |
| | Specialized REITs – (19.35%) |
| | CatchMark Timber Trust Inc., Class A | | | | | | |
| | | | | | | | |
| | Crown Castle International Corp. | | | | | | |
| | | | | | | | |
| | Digital Realty Trust, Inc. | | | | | | |
| | | | | | | | |
| | | | | | | | |
| | | | | | | | |
| | | | | | | | |
| | | 2,431,226 |
| | | | | | | |
| | | TOTAL COMMON STOCK – (Identified cost $12,131,561)
| | | |
| PREFERRED STOCK – (0.32%) |
| | REAL ESTATE – (0.32%) |
| | Equity Real Estate Investment Trusts (REITs) – (0.32%) |
| | Retail REITs – (0.32%) |
| | CBL & Associates Properties, Inc., Series D, 7.375%, Cum. Pfd. | | | | | | |
| | CBL & Associates Properties, Inc., Series E, 6.625%, Cum. Pfd. | | | | | | |
| | | | | |
| | TOTAL PREFERRED STOCK – (Identified cost $71,885)
| | | |
| SHORT-TERM INVESTMENTS – (1.11%) |
| | INTL FCStone Financial Inc. Joint Repurchase Agreement, 3.05%, 01/02/19, dated 12/31/18, repurchase value of $55,009 (collateralized by: U.S. Government agency mortgages and obligations in a pooled cash account, 0.00%-10.25%, 01/15/19-09/20/68, total market value $56,100) | | | | | | |
| | Mizuho Securities USA Inc. Joint Repurchase Agreement, 2.90%, 01/02/19, dated 12/31/18, repurchase value of $5,001 (collateralized by: U.S. Government agency obligation in a pooled cash account, 2.625%, 12/31/23, total market value $5,100) | | | | | | |
| | Nomura Securities International, Inc. Joint Repurchase Agreement, 3.00%, 01/02/19, dated 12/31/18, repurchase value of $13,002 (collateralized by: U.S. Government agency mortgage in a pooled cash account, 2.79%, 07/01/27, total market value $13,260) | | | | | | |
| DAVIS REAL ESTATE PORTFOLIO | Schedule of Investments - (Continued) |
| | December 31, 2018 |
| | Principal | | Value
(Note 1) |
| SHORT-TERM INVESTMENTS – (CONTINUED) |
| | SunTrust Robinson Humphrey, Inc. Joint Repurchase Agreement, 3.21%, 01/02/19, dated 12/31/18, repurchase value of $66,012 (collateralized by: U.S. Government agency mortgages in a pooled cash account, 2.50%-5.00%, 11/01/25-08/01/48, total market value $67,320) | | | | | | |
| | TOTAL SHORT-TERM INVESTMENTS – (Identified cost $139,000)
| | | |
| |
Total Investments – (99.85%) – (Identified cost $12,342,446) | | | 12,544,264 |
| | Other Assets Less Liabilities – (0.15%) | | | 19,435 |
| | | | Net Assets – (100.00%) |
| | $ | 12,563,699 |
| |
| See Notes to Financial Statements |
| DAVIS REAL ESTATE PORTFOLIO | Statement of Assets and Liabilities |
| | At December 31, 2018 |
| ASSETS: | | | | | |
| Investments in securities, at value* (see accompanying Schedule of Investments) | | $ | 12,544,264 |
| Cash | | | 1,275 |
| Receivables: | | | |
| | Capital stock sold | | | 2,508 |
| | Dividends and interest | | | 58,627 |
| Prepaid expenses | | | 460 |
| | | Total assets | | | 12,607,134 |
LIABILITIES: | | | |
| Payables: | | | |
| | Capital stock redeemed | | | 8,117 |
| Accrued audit fees | | | 13,935 |
| Accrued custodian fees | | | 5,500 |
| Accrued investment advisory fee | | | 8,208 |
| Other accrued expenses | | | 7,675 |
| | Total liabilities | | | 43,435 |
NET ASSETS | | $ | 12,563,699 |
SHARES OUTSTANDING | | | 964,673 |
NET ASSET VALUE, offering, and redemption price per share (Net assets ÷ Shares outstanding) | | $ | 13.02 |
NET ASSETS CONSIST OF: | | | |
| Par value of shares of capital stock | | $ | 965 |
| | | | |
| Additional paid-in capital | | | 12,110,247 |
| | | | |
| Distributable earnings | | | 452,487 |
| | Net Assets | | $ | 12,563,699 |
| | | | | |
| *Including: | | | |
| | Cost of investments | | $ | 12,342,446 |
| See Notes to Financial Statements |
| DAVIS REAL ESTATE PORTFOLIO | |
| | For the year ended December 31, 2018 |
| INVESTMENT INCOME: | | | | | | |
| Income: | | | |
| Dividends* | | $ | 418,305 |
| Interest | | | 8,752 |
| | | Total income | | | | 427,057 |
Expenses: | | | |
| Investment advisory fees (Note 3) | | $ | 76,591 | | | |
| Custodian fees | | | 15,271 | | | |
| Transfer agent fees | | | 7,016 | | | |
| Audit fees | | | 20,445 | | | |
| Legal fees | | | 450 | | | |
| Accounting fees (Note 3) | | | 2,000 | | | |
| Reports to shareholders | | | 15 | | | |
| Directors’ fees and expenses | | | 7,308 | | | |
| Registration and filing fees | | | 3 | | | |
| Miscellaneous | | | 10,331 | | | |
| | Total expenses | | | | 139,430 |
| Net investment income | | | 287,627 |
REALIZED & UNREALIZED GAIN (LOSS) ON INVESTMENTS AND FOREIGN CURRENCY TRANSACTIONS: | | | | | | |
| Net realized gain (loss) from: | | | |
| | Investment transactions | | | 698,422 |
| | Foreign currency transactions | | | (142) |
| Net realized gain | | | 698,280 |
| Net decrease in unrealized appreciation | | | (1,683,897) |
| | Net realized and unrealized loss on investments and foreign currency transactions | | | | (985,617) |
| Net decrease in net assets resulting from operations | | $ | (697,990) |
| | | | | | | | | |
| *Net of foreign taxes withheld of | | $ | 349 |
| See Notes to Financial Statements |
| DAVIS REAL ESTATE PORTFOLIO | Statements of Changes in Net Assets |
| | | Year ended December 31, |
| | | 2018 | | 2017* |
OPERATIONS: | | | | | | |
| Net investment income | | $ | 287,627 | | $ | 249,639 |
| Net realized gain from investments and foreign currency transactions | | | 698,280 | | | 1,139,457 |
Net decrease in unrealized appreciation on investments and foreign currency transactions | | | (1,683,897) | | | (92,451) |
| | | Net increase (decrease) in net assets resulting from operations | | | (697,990) | | | 1,296,645 |
DIVIDENDS AND DISTRIBUTIONS TO SHAREHOLDERS: | | | (1,014,706) | | | (710,074) |
CAPITAL SHARE TRANSACTIONS: | | | | | | |
| Net decrease in net assets resulting from capital share transactions (Note 4) | | | (1,325,899) | | | (2,838,936) |
| | Total decrease in net assets | | | (3,038,595) | | | (2,252,365) |
NET ASSETS: | | | | | | |
| Beginning of year | | | 15,602,294 | | | 17,854,659 |
End of year* | | $ | 12,563,699 | | $ | 15,602,294 |
| | | | | | | | |
| *Includes dividends and distributions to shareholders from net investment income $(198,001) and realized gains from investment transactions $(512,073). End of year net assets including undistributed net investment income $183,220. |
| | | | | | | | |
| See Notes to Financial Statements |
| DAVIS REAL ESTATE PORTFOLIO | Notes to Financial Statements |
| | December 31, 2018 |
NOTE 1 - SUMMARY OF SIGNIFICANT ACCOUNTING POLICIES
The Fund is a separate series of Davis Variable Account Fund, Inc. (a Maryland corporation), is registered under the Investment Company Act of 1940, as amended, as a diversified, open-end management investment company. The Fund follows the reporting guidance of the Financial Accounting Standards Board (“FASB”) Accounting Standards Codification Topic 946, Financial Services – Investment Companies. Only insurance companies, for the purpose of funding variable annuity or variable life insurance contracts, may purchase shares of the Fund. The Fund concentrates its investments in the real estate sector, and it may be subject to greater risks than a fund that does not concentrate its investments in a particular sector. The following is a summary of significant accounting policies followed by the Fund in the preparation of its financial statements.
Security Valuation - The Fund calculates the net asset value of its shares as of the close of the New York Stock Exchange (“Exchange”), normally 4:00 P.M. Eastern time, on each day the Exchange is open for business. Securities listed on the Exchange (and other national exchanges including NASDAQ) are valued at the last reported sales price on the day of valuation. Listed securities for which no sale was reported on that date are valued at the last quoted bid price. Securities traded on foreign exchanges are valued based upon the last sales price on the principal exchange on which the security is traded prior to the time when the Fund’s assets are valued. Securities (including restricted securities) for which market quotations are not readily available or securities whose values have been materially affected by what Davis Selected Advisers, L.P. (“Davis Advisors” or “Adviser”), the Fund’s investment adviser, identifies as a significant event occurring before the Fund’s assets are valued, but after the close of their respective exchanges will be fair valued using a fair valuation methodology applicable to the security type or the significant event as previously approved by the Fund’s Pricing Committee and Board of Directors. The Pricing Committee considers all facts it deems relevant that are reasonably available, through either public information or information available to the Adviser’s portfolio management team, when determining the fair value of a security. To assess the appropriateness of security valuations, the Adviser may consider (i) comparing prior day prices and/or prices of comparable securities; (ii) comparing sale prices to the prior or current day prices and challenge those prices exceeding certain tolerance levels with the third-party pricing service or broker source; (iii) new rounds of financing; (iv) the performance of the market or the issuer’s industry; (v) the liquidity of the security; (vi) the size of the holding in a fund; and/or (vii) any other appropriate information. The determination of a security’s fair value price often involves the consideration of a number of subjective factors and is therefore subject to the unavoidable risk that the value assigned to a security may be higher or lower than the security’s value would be if a reliable market quotation of the security was readily available. Fair value determinations are subject to review, approval, and ratification by the Fund’s Board of Directors at its next regularly scheduled meeting covering the period in which the fair valuation was determined.
Short-term securities purchased within 60 days to maturity are valued at amortized cost, which approximates market value.
The Fund’s valuation procedures are reviewed and subject to approval by the Board of Directors. There have been no significant changes to the fair valuation procedures during the period.
Fair Value Measurements - Fair value is defined as the price that the Fund would receive upon selling an investment in an orderly transaction to an independent buyer in the principal market for the investment. Various inputs are used to determine the fair value of the Fund’s investments. These inputs are summarized in the three broad levels listed below.
Level 1 – quoted prices in active markets for identical securities
Level 2 – other significant observable inputs (including quoted prices for similar investments, interest rates, prepayment speeds, credit risk, etc.)
Level 3 – significant unobservable inputs (including the Fund’s own assumptions in determining the fair value of investments)
The inputs or methodologies used for valuing securities are not necessarily an indication of the risks associated with investing in those securities nor can it be assured that the Fund can obtain the fair value assigned to a security if it were to sell the security.
| DAVIS REAL ESTATE PORTFOLIO | Notes to Financial Statements – (Continued) |
| | December 31, 2018 |
NOTE 1 - SUMMARY OF SIGNIFICANT ACCOUNTING POLICIES – (CONTINUED)
Fair Value Measurements - (Continued)
The following is a summary of the inputs used as of December 31, 2018 in valuing the Fund’s investments carried at value:
| | Investments in Securities at Value |
| | Valuation Inputs |
| | | | Level 2: | | Level 3: | | |
| | | | Other Significant | | Significant | | |
| | Level 1: | | Observable | | Unobservable | | |
| | Quoted Prices | | Inputs | | Inputs | | Total |
Common Stock: | | | | | | | | | | | |
| Real Estate | $ | 12,364,998 | | $ | – | | $ | – | | $ | 12,364,998 |
Preferred Stock: | | | | | | | | | | | |
| Real Estate | | 40,266 | | | – | | | – | | | 40,266 |
| Short-term securities | | – | | | 139,000 | | | – | | | 139,000 |
| Total Investments | $ | 12,405,264 | | $ | 139,000 | | $ | – | | $ | 12,544,264 |
Master Repurchase Agreements - The Fund, along with other affiliated funds, may transfer uninvested cash balances into one or more master repurchase agreement accounts. These balances are invested in one or more repurchase agreements, secured by U.S. Government securities. A custodian bank holds securities pledged as collateral for repurchase agreements until the agreements mature. Each agreement requires that the market value of the collateral be sufficient to cover payments of interest and principal; however, in the event of default by the other party to the agreement, retention of the collateral may be subject to legal proceedings.
Currency Translation - The market values of all assets and liabilities denominated in foreign currencies are recorded in the financial statements after translation to the U.S. dollar based upon the mean between the bid and offered quotations of the currencies against U.S. dollars on the date of valuation. The cost basis of such assets and liabilities is determined based upon historical exchange rates. Income and expenses are translated at average exchange rates in effect as accrued or incurred.
Foreign Currency - The Fund may enter into forward purchases or sales of foreign currencies to hedge certain foreign currency denominated assets and liabilities against declines in market value relative to the U.S. dollar. Forward currency contracts are marked-to-market daily and the change in market value is recorded by the Fund as an unrealized gain or loss. When the forward currency contract is closed, the Fund records a realized gain or loss equal to the difference between the value of the forward currency contract at the time it was opened and value at the time it was closed. Investments in forward currency contracts may expose the Fund to risks resulting from unanticipated movements in foreign currency exchange rates or failure of the counter-party to the agreement to perform in accordance with the terms of the contract. There were no forward contracts entered into by the Fund.
Reported net realized foreign exchange gains or losses arise from the sales of foreign currencies, currency gains or losses realized between the trade and settlement dates on security transactions, the difference between the amounts of dividends, interest, and foreign withholding taxes recorded on the Fund’s books, and the U.S. dollar equivalent of the amounts actually received or paid. Net unrealized foreign exchange gains or losses arise from changes in the value of assets and liabilities other than investments in securities at fiscal year-end, resulting from changes in the exchange rate. The Fund includes foreign currency gains and losses realized on the sales of investments together with market gains and losses on such investments in the Statement of Operations.
| DAVIS REAL ESTATE PORTFOLIO | Notes to Financial Statements – (Continued) |
| | December 31, 2018 |
NOTE 1 - SUMMARY OF SIGNIFICANT ACCOUNTING POLICIES – (CONTINUED)
Federal Income Taxes - It is the Fund’s policy to comply with the requirements of the Internal Revenue Code applicable to regulated investment companies, and to distribute substantially all of its taxable income, including any net realized gains on investments not offset by loss carryovers, to shareholders. Therefore, no provision for federal income or excise tax is required. The Adviser analyzed the Fund’s tax positions taken on federal and state income tax returns for all open tax years and concluded that as of December 31, 2018, no provision for income tax is required in the Fund’s financial statements related to these tax positions. The Fund’s federal and state (Arizona) income and federal excise tax returns for tax years for which the applicable statutes of limitations have not expired are subject to examination by the Internal Revenue Service and state Department of Revenue. The earliest tax year that remains subject to examination by these jurisdictions is 2015.
At December 31, 2018, the unrealized appreciation (depreciation) and aggregate cost of investments for federal income tax purposes were as follows:
| Unrealized appreciation | $ | 954,626 |
| Unrealized depreciation | | (778,719) |
| Net unrealized appreciation | $ | 175,907 |
Aggregate cost | $ | 12,368,357 |
Securities Transactions and Related Investment Income - Securities transactions are accounted for on the trade date (date the order to buy or sell is executed) with realized gain or loss on the sale of securities being determined based upon identified cost. Dividend income is recorded on the ex-dividend date. Dividend income from REIT securities may include return of capital. Upon notification from the issuer, the amount of the return of capital is reclassified to adjust dividend income, reduce the cost basis, and/or adjust realized gain/loss. Interest income, which includes accretion of discount and amortization of premium, is accrued as earned.
Dividends and Distributions to Shareholders - Dividends and distributions to shareholders are recorded on the ex-dividend date. Net investment income (loss), net realized gains (losses), and net unrealized appreciation (depreciation) on investments [collectively “Distributable earnings (losses)”] may differ for financial statement and tax purposes primarily due to differing treatments of wash sales, Directors’ deferred compensation payments, and foreign currency transactions. The character of dividends and distributions made during the fiscal year from net investment income and net realized securities gains may differ from their ultimate characterization for federal income tax purposes. Also, due to the timing of dividends and distributions, the fiscal year in which amounts are distributed may differ from the fiscal year in which income or realized gain was recorded by the Fund. The Fund adjusts certain components of capital to reflect permanent differences between financial statement amounts and net income and realized gains/losses determined in accordance with income tax rules.
| DAVIS REAL ESTATE PORTFOLIO | Notes to Financial Statements – (Continued) |
| | December 31, 2018 |
NOTE 1 - SUMMARY OF SIGNIFICANT ACCOUNTING POLICIES – (CONTINUED)
Dividends and Distributions to Shareholders - (Continued)
The tax character of distributions paid during the years ended December 31, 2018 and 2017 was as follows:
| | 2018 | | 2017 |
| Ordinary income | $ | 464,795 | | $ | 198,001 |
| Long-term capital gain | | 549,911 | | | 512,073 |
| Total | $ | 1,014,706 | | $ | 710,074 |
As of December 31, 2018, the components of distributable earnings on a tax basis were as follows:
| Undistributed ordinary income | $ | 169,538 |
| Undistributed long-term capital gain | | 114,745 |
Net unrealized appreciation on investments and foreign currency transactions | | 175,897 |
| Total | $ | 460,180 |
Indemnification - Under the Fund’s organizational documents, its officers and directors are indemnified against certain liabilities arising out of the performance of their duties to the Fund. In addition, some of the Fund’s contracts with its service providers contain general indemnification clauses. The Fund’s maximum exposure under these arrangements is unknown since the amount of any future claims that may be made against the Fund cannot be determined and the Fund has no historical basis for predicting the likelihood of any such claims.
Use of Estimates in Financial Statements - In preparing financial statements in conformity with accounting principles generally accepted in the United States of America, management makes estimates and assumptions that affect the reported amounts of assets and liabilities and disclosure of contingent assets and liabilities at the date of the financial statements, as well as the reported amounts of income and expenses during the reporting period. Actual results may differ from these estimates.
Directors Fees and Expenses - The Fund set up a Rabbi Trust to provide for the deferred compensation plan for Independent Directors that enables them to elect to defer receipt of all or a portion of annual fees they are entitled to receive. The value of an eligible Director’s account is based upon years of service and fees paid to each Director during the years of service. The amount paid to the Director by the Trust under the plan will be determined based upon the performance of the Davis Funds in which the amounts are invested.
NOTE 2 - PURCHASES AND SALES OF SECURITIES
The cost of purchases and proceeds from sales of investment securities (excluding short-term securities) during the year ended December 31, 2018 were $5,479,819 and $6,629,458, respectively.
NOTE 3 - FEES AND OTHER TRANSACTIONS WITH SERVICE PROVIDERS (INCLUDING AFFILIATES)
Davis Selected Advisers-NY, Inc. (“DSA-NY”), a wholly-owned subsidiary of the Adviser, acts as sub-adviser to the Fund. DSA-NY performs research and portfolio management services for the Fund under a Sub-Advisory Agreement with the Adviser. The Fund pays no fees directly to DSA-NY.
All officers of the Fund (including Interested Directors) hold positions as executive officers with the Adviser or its affiliates.
Investment Advisory Fees and Reimbursement of Expenses - Advisory fees are paid monthly to the Adviser at an annual rate of 0.55% of the Fund’s average net assets. The Adviser is contractually committed to waive fees and/or reimburse the Fund’s expenses to the extent necessary to cap total annual Fund operating expenses at 1.00% until May 1, 2019.
Accounting Fees - State Street Bank and Trust Company (“State Street Bank”) is the Fund’s primary accounting provider. Fees for accounting services are included in the custodian fees as State Street Bank also serves as the Fund’s custodian. The Adviser is also paid for certain accounting services. The fee paid to the Adviser for these services during the year ended December 31, 2018 amounted to $2,000.
| DAVIS REAL ESTATE PORTFOLIO | Notes to Financial Statements – (Continued) |
| | December 31, 2018 |
NOTE 4 - CAPITAL STOCK
At December 31, 2018, there were 500 million shares of capital stock ($0.001 par value per share) authorized. Transactions in capital stock were as follows:
| | Year ended December 31, 2018 |
| | | Sold | | | Reinvestment of Distributions | | | Redeemed | | | Net Decrease |
| | | | | | | | | | | | |
| Shares: | | 35,768 | | | 77,006 | | | (198,628) | | | (85,854) |
| Value: | $ | 525,608 | | $ | 1,014,706 | | $ | (2,866,213) | | $ | (1,325,899) |
| | | | | | | | | | | | |
| |
| | Year ended December 31, 2017 |
| | | Sold | | | Reinvestment of Distributions | | | Redeemed | | | Net Decrease |
| | | | | | | | | | | | |
| Shares: | | 40,639 | | | 48,097 | | | (281,463) | | | (192,727) |
| Value: | $ | 597,438 | | $ | 710,074 | | $ | (4,146,448) | | $ | (2,838,936) |
| | | | | | | | | | | | |
NOTE 5 - BANK BORROWINGS
The Fund may borrow up to 5% of its assets from a bank to purchase portfolio securities, or for temporary and emergency purposes. The purchase of securities with borrowed funds creates leverage in the Fund. The Fund has entered into an agreement, which enables it to participate with certain other funds managed by the Adviser in an unsecured line of credit with a bank, which permits borrowings of up to $50 million, collectively. Interest is charged based on its borrowings, at a rate equal to the higher of the Federal Funds Rate or the one month LIBOR Rate, plus 1.25%. The Fund had no borrowings during the year ended December 31, 2018.
FEDERAL INCOME TAX INFORMATION (UNAUDITED)
During the calendar year ended December 31, 2018, the Fund declared and paid long-term capital gain distributions in the amount of $549,911.
During the calendar year ended December 31, 2018, $464,795 of dividends paid by the Fund constituted income dividends for federal income tax purposes. The Fund designates $90 or 0.02% as income qualifying for the corporate dividends-received deduction.
| DAVIS REAL ESTATE PORTFOLIO | |
| The following financial information represents selected data for each share of capital stock outstanding throughout each period: |
| | Year ended December 31, |
| | | | 2018 | | 2017 | | 2016 | | 2015 | | 2014 |
| Net Asset Value, Beginning of Period | | $ | 14.85 | | $ | 14.36 | | $ | 13.31 | | $ | 13.31 | | $ | 10.56 |
Income (Loss) from Investment Operations: | | | | | | | | | | | | | | | | | | | | | | | | | |
| Net Investment Income | | 0.30a | | 0.22a | | 0.18a | | 0.14a | | 0.17 |
| Net Realized and Unrealized Gains (Losses) | | (1.01) | | 0.96 | | 1.11 | | 0.08 | | 2.73 |
| | Total from Investment Operations | | (0.71) | | 1.18 | | 1.29 | | 0.22 | | 2.90 |
Dividends and Distributions: | | | | | | | | | | | | | | | | | | | | | | | | | |
| Dividends from Net Investment Income | | (0.41) | | (0.18) | | (0.24) | | (0.22) | | (0.15) |
| Distributions from Realized Gains | | (0.71) | | (0.51) | | – | | – | | – |
| | Total Dividends and Distributions | | (1.12) | | (0.69) | | (0.24) | | (0.22) | | (0.15) |
Net Asset Value, End of Period | | $ | 13.02 | | $ | 14.85 | | $ | 14.36 | | $ | 13.31 | | $ | 13.31 |
| | | | | | | | | | | | | | | | | | | | | | | | | | | | |
Total Returnb | | (4.82) | % | | 8.25 | % | | 9.70 | % | | 1.65 | % | | 27.54 | % |
| | | | | | | | | | | | | | | | | | | | | | | | | | | | |
| Ratios/Supplemental Data: | | | | | | | | | | | | | | | | | | | | | | | | | |
| Net Assets, End of Period (in thousands) | | $ | 12,564 | | | $ | 15,602 | | | $ | 17,855 | | | $ | 17,921 | | | $ | 26,137 | |
| Ratio of Expenses to Average Net Assets: | | | | | | | | | | | | | | | | | | | | | | | | | |
| | Gross | | 1.00 | % | | 0.93 | % | | 0.87 | % | | 0.85 | % | | 0.81 | % |
| | Netc | | 1.00 | % | | 0.93 | % | | 0.74 | % | | 0.85 | % | | 0.81 | % |
| Ratio of Net Investment Income to Average Net Assets | | 2.07 | % | | 1.50 | % | | 1.29 | % | | 1.02 | % | | 1.34 | % |
Portfolio Turnover Rated | | 40 | % | | 22 | % | | 55 | % | | 95 | % | | 54 | % |
| a | Per share calculations were based on average shares outstanding for the period. |
| |
| b | Assumes hypothetical initial investment on the business day before the first day of the fiscal period, with all dividends and distributions reinvested in additional shares on the reinvestment date, and redemption at the net asset value calculated on the last business day of the fiscal period. Total returns do not reflect charges attributable to your insurance company’s separate account. Inclusion of these charges would reduce the total returns shown. |
| |
| c | The Net Ratio of Expenses to Average Net Assets reflects the impact, if any, of certain reimbursements. |
| |
| d | The lesser of purchases or sales of portfolio securities for a period, divided by the monthly average of the market value of portfolio securities owned during the period. Securities with a maturity or expiration date at the time of acquisition of one year or less are excluded from the calculation. |
| |
| See Notes to Financial Statements |
| DAVIS REAL ESTATE PORTFOLIO | Report of Independent Registered Public Accounting Firm |
The Shareholders and Board of Directors
Davis Variable Account Fund, Inc.:
Opinion on the Financial Statements
We have audited the accompanying statement of assets and liabilities of Davis Real Estate Portfolio (a separate series of Davis Variable Account Fund, Inc.) (the “Fund”), including the schedule of investments, as of December 31, 2018, the related statement of operations for the year then ended, the statements of changes in net assets for each of the years in the two-year period then ended, and the related notes (collectively, the “financial statements”) and the financial highlights for each of the years in the five-year period then ended. In our opinion, the financial statements and financial highlights present fairly, in all material respects, the financial position of the Fund as of December 31, 2018, the results of its operations for the year then ended, the changes in its net assets for each of the years in the two-year period then ended, and the financial highlights for each of the years in the five-year period then ended, in conformity with U.S. generally accepted accounting principles.
Basis for Opinion
These financial statements and financial highlights are the responsibility of the Fund’s management. Our responsibility is to express an opinion on these financial statements and financial highlights based on our audits. We are a public accounting firm registered with the Public Company Accounting Oversight Board (United States) (“PCAOB”) and are required to be independent with respect to the Fund in accordance with the U.S. federal securities laws and the applicable rules and regulations of the Securities and Exchange Commission and the PCAOB.
We conducted our audits in accordance with the standards of the PCAOB. Those standards require that we plan and perform the audit to obtain reasonable assurance about whether the financial statements and financial highlights are free of material misstatement, whether due to error or fraud. Our audits included performing procedures to assess the risks of material misstatement of the financial statements and financial highlights, whether due to error or fraud, and performing procedures that respond to those risks. Such procedures included examining, on a test basis, evidence regarding the amounts and disclosures in the financial statements and financial highlights. Such procedures also included confirmation of securities owned as of December 31, 2018, by correspondence with the custodian and brokers or by other appropriate auditing procedures. Our audits also included evaluating the accounting principles used and significant estimates made by management, as well as evaluating the overall presentation of the financial statements and financial highlights. We believe that our audits provide a reasonable basis for our opinion.
KPMG LLP
We have served as the auditor of one or more Davis Funds investment companies since 1998.
Denver, Colorado
February 7, 2019
| DAVIS REAL ESTATE PORTFOLIO | |
For the purpose of their service as Directors to the Davis Funds, the business address for each of the Directors is 2949 E. Elvira Road, Suite 101, Tucson, AZ 85756. Subject to exceptions and exemptions, which may be granted by the Independent Directors, Directors must retire at the close of business on the last day of the calendar year in which the Director attains age seventy-eight (78).
Name, Date of Birth, Position(s) Held with Fund, Length of Service | Principal Occupation(s) During Past Five Years | Number of Portfolios Overseen | Other Directorships |
Independent Directors
| | | | |
Marc P. Blum (09/09/42) Director since 1986 | Chief Executive Officer, World Total Return Fund, LLLP; of Counsel to Gordon Feinblatt LLC (law firm). | 13 | Director, Rodney Trust Company (trust and asset management company). |
| | | | |
John S. Gates Jr. (08/02/53) Director since 2007 | Chairman and Chief Executive Officer of PortaeCo LLC (private investment company). | 13 | Director, Care Capital Properties (REIT); Trustee, DCT Industrial Trust (REIT); Director, Miami Corp. (diversified investment company). |
| | | | |
Thomas S. Gayner (12/16/61) Director since 2004 Chairman since 2009 | Co-Chief Executive Officer and Director, Markel Corp. (diversified financial holding company). | 13 | Director, Graham Holdings Company (educational and media company); Director, Colfax Corp. (engineering and manufacturer of pumps and fluid handling equipment); Director, Cable ONE Inc. (cable service provider). |
| | | | |
Samuel H. Iapalucci (07/19/52) Director since 2006 | Retired; Executive Vice President and Chief Financial Officer, CH2M-HILL Companies, Ltd. (engineering) until 2008. | 13 | None |
| | | | |
Robert P. Morgenthau (03/22/57) Director since 2002 | Principal, Spears Abacus Advisors, LLC (investment management firm) since 2011; Chairman, NorthRoad Capital Management, LLC (investment management firm) 2002-2011. | 13 | None |
| | | | |
Marsha C. Williams (03/28/51) Director since 1999 | Retired; Senior Vice President and Chief Financial Officer, Orbitz Worldwide, Inc. (travel-service provider) 2007-2010. | 13 | Lead Independent Director, Modine Manufacturing Company (heat transfer technology); Director, McDermott International, Inc. (industrial construction and engineering); Lead Independent Director, Fifth Third Bancorp (diversified financial services). |
Interested Directors*
| | | | |
Andrew A. Davis (06/25/63) Director since 1997 | President or Vice President of each Davis Fund, Selected Fund, and Clipper Fund; President, Davis Selected Advisers, L.P., and also serves as an Executive Officer of certain companies affiliated with the Adviser. | 16 | Director, Selected Funds (consisting of two portfolios) since 1998; Trustee, Clipper Funds Trust (consisting of one portfolio) since 2014. |
| | | | |
Christopher C. Davis (07/13/65) Director since 1997 | President or Vice President of each Davis Fund, Selected Fund, Clipper Fund, and Davis Fundamental ETF; Chairman, Davis Selected Advisers, L.P., and also serves as an Executive Officer of certain companies affiliated with the Adviser, including sole member of the Adviser’s general partner, Davis Investments, LLC. | 16 | Director, Selected Funds (consisting of two portfolios) since 1998; Trustee, Clipper Funds Trust (consisting of one portfolio) since 2014; Lead Independent Director, Graham Holdings Company (educational and media company); Director, The Coca Cola Company (beverage company). |
* Andrew A. Davis and Christopher C. Davis own partnership units (directly, indirectly, or both) of the Adviser and are considered to be “interested persons” of the Funds as defined in the Investment Company Act of 1940. Andrew A. Davis and Christopher C. Davis are brothers.
Officers
Andrew A. Davis (born 06/25/63, Davis Funds officer since 1997). See description in the section on Interested Directors.
Christopher C. Davis (born 07/13/65, Davis Funds officer since 1997). See description in the section on Interested Directors.
Kenneth C. Eich (born 08/14/53, Davis Funds officer since 1997). Executive Vice President and Principal Executive Officer of the Davis Funds (consisting of 13 portfolios), Selected Funds (consisting of two portfolios), and Clipper Funds Trust (consisting of one portfolio); Trustee/Chairman, Executive Vice President, and Principal Executive Officer of Davis Fundamental ETF Trust (consisting of four portfolios); Chief Operating Officer, Davis Selected Advisers, L.P., and also serves as an Executive Officer of certain companies affiliated with the Adviser.
Douglas A. Haines (born 03/04/71, Davis Funds officer since 2004). Vice President, Treasurer, Chief Financial Officer, Principal Financial Officer, and Principal Accounting Officer of the Davis Funds (consisting of 13 portfolios), Selected Funds (consisting of two portfolios), Clipper Funds Trust (consisting of one portfolio), and Davis Fundamental ETF Trust (consisting of four portfolios); Vice President and Director of Fund Accounting, Davis Selected Advisers, L.P.
Randi J. Roessler (born 06/26/81, Davis Funds officer since 2018). Vice President and Chief Compliance Officer of the Davis Funds (consisting of 13 portfolios), Selected Funds (consisting of two portfolios), Clipper Funds Trust (consisting of one portfolio), and Davis Fundamental ETF Trust (consisting of four portfolios); Vice President and Chief Compliance Officer, Davis Selected Advisers, L.P., and also serves as an Executive Officer of certain companies affiliated with the Adviser.
Ryan M. Charles (born 07/25/78, Davis Funds officer since 2014). Vice President and Secretary of the Davis Funds (consisting of 13 portfolios), Selected Funds (consisting of two portfolios), Clipper Funds Trust (consisting of one portfolio), and Davis Fundamental ETF Trust (consisting of four portfolios); Vice President, Chief Legal Officer, and Secretary, Davis Selected Advisers, L.P., and also serves as an Executive Officer of certain companies affiliated with the Adviser.
| DAVIS REAL ESTATE PORTFOLIO |
| Investment Adviser |
| Davis Selected Advisers, L.P. (Doing business as “Davis Advisors”) |
| 2949 East Elvira Road, Suite 101 |
| Tucson, Arizona 85756 |
| (800) 279-0279 |
| |
| Distributor |
| Davis Distributors, LLC |
| 2949 East Elvira Road, Suite 101 |
| Tucson, Arizona 85756 |
| |
| Transfer Agent |
| DST Asset Manager Solutions, Inc. |
| c/o The Davis Funds |
| P.O. Box 219197 |
| Kansas City, Missouri 64121-9197 |
| |
| Custodian |
| State Street Bank and Trust Co. |
| One Lincoln Street |
| Boston, Massachusetts 02111 |
| |
| Counsel |
| Greenberg Traurig, LLP |
| 77 West Wacker Drive, Suite 3100 |
| Chicago, Illinois 60601 |
| |
| Independent Registered Public Accounting Firm |
| KPMG LLP |
| 1225 Seventeenth Street, Suite 800 |
| Denver, Colorado 80202 |
For more information about Davis Real Estate Portfolio, including management fee, charges, and expenses, see the current prospectus, which must precede or accompany this report. The Fund’s Statement of Additional Information contains additional information about the Fund’s Directors and is available without charge, upon request, by calling 1-800-279-0279 and on the Fund’s website at www.davisfunds.com. Quarterly Fact Sheets are available on the Fund’s website at www.davisfunds.com.
ITEM 2. CODE OF ETHICS
The registrant has adopted a code of ethics that applies to the registrant’s principal executive officer, principal financial officer, principal accounting officer or controller, or persons performing similar functions.
A copy of the code of ethics is filed as an exhibit to this form N-CSR.
No waivers were granted to this code of ethics during the period covered by this report.
ITEM 3. AUDIT COMMITTEE FINANCIAL EXPERT
The registrant’s board of directors has determined that independent trustee Marsha Williams qualifies as the “audit committee financial expert”, as defined in Item 3 of form N-CSR.
ITEM 4. PRINCIPAL ACCOUNTANT FEES AND SERVICES
(a)
| Audit Fees. The aggregate Audit Fees billed by KPMP LLP (“KPMG”) for professional services rendered for the audits of the audits of the financial statements, or services that are normally provided in connection with statutory and regulatory filings or engagements for the fiscal year ends December 31, 2018 and December 31, 2017 were $64,038 and $61,454, respectively. |
| | |
(b)
| Audit-Related Fees. The aggregate Audit-Related Fees billed by KPMG for services rendered for assurance and related services that are not reasonably related to the performance of the audit or review of the fund financial statements, but not reported as Audit Fees for fiscal year ends December 31, 2018 and December 31, 2017 were $0 and $0, respectively. |
| | |
(c)
| Tax Fees. The aggregate Tax Fees billed by KPMG for professional services rendered for tax compliance, tax advice and tax planning for the fiscal year ends December 31, 2018 and December 31, 2017 were $25,536 and $23,466, respectively. Fees included in the Tax Fee category comprise all services performed by professional staff in the independent accountant’s tax division except those services related to the audit. These services include preparation of tax returns, tax advice related to mergers and a review of the fund income and capital gain distributions. |
| | |
(d)
| All Other Fees. The aggregate Other Fees billed by KPMG for all other non-audit services rendered to the fund for the fiscal year ends December 31, 2018 and December 31, 2017 were $0 and $0, respectively. |
| | |
(e)(1)
| Audit Committee Pre-Approval Policies and Procedures. The fund Audit Committee must pre-approve all audit and non-audit services provided by the independent accountant relating to the operations or financial reporting of the funds. Prior to the commencement of any audit or non-audit services to a fund, the Audit Committee reviews the services to determine whether they are appropriate and permissible under applicable law. The fund Audit Committee has adopted a policy whereby audit and non-audit services performed by the fund independent accountant require pre-approval in advance at regularly scheduled Audit Committee meetings. If such a service is required between regularly scheduled Audit Committee meetings, pre-approval may be authorized by the Audit Committee Chairperson with ratification at the next scheduled audit committee meeting. |
| | |
(e)(2)
| No services included in (b) – (d) above were approved pursuant to paragraph (c)(7)(i)(C) of Rule 2-01 of Regulation S-X. |
(f)
| Not applicable |
| | |
(g)
| The Funds’ independent accountant did not provide any services to the investment advisor or any affiliate for the fiscal years ended December 31, 2018 and December 31, 2017. The fund has not paid any fees for non-audit not previously disclosed in items 4 (b) – (d). |
| | |
(h)
| The registrant’s audit committee of the board of trustees has considered whether the provision of non-audit services that were rendered to the registrant’s investment adviser, and any entity controlling, controlled by, or under common control with the investment adviser that provides ongoing services to the registrant that not pre-approved pursuant to paragraph (c)(7)(ii) of Rule 2-01 of Regulation S-X is compatible with maintaining the principal accountant’s independence. No such services were rendered. |
ITEM 5. AUDIT COMMITTEE OF LISTED REGISTRANTS
Not Applicable
ITEM 6. SCHEDULE OF INVESTMENTS
(a)
| Not Applicable. The complete Schedule of Investments is included in Item 1 of this Form N-CSR |
| | |
(b)
| Not Applicable. |
ITEM 7. DISCLOSURE OF PROXY VOTING POLICIES AND PROCEDURES FOR CLOSED-END MANAGEMENT INVESTMENT COMPANIES
Not Applicable
ITEM 8. PORTFOLIO MANAGERS OF CLOSED-END MANAGEMENT INVESTMENT COMPANIES
Not Applicable
ITEM 9. PURCHASES OF EQUITY SECURITIES BY CLOSED-END MANAGEMENT INVESTMENT COMPANIES AND AFFILIATED PURCHASERS
Not Applicable
ITEM 10. SUBMISSION OF MATTERS TO A VOTE OF SECURITY HOLDERS
There have been no changes to the procedure by which shareholders may recommend nominees to the registrant’s Board of Trustees.
ITEM 11. CONTROLS AND PROCUDURES
(a)
| The registrant’s principal executive officer and principal financial officer have concluded that the registrant’s disclosure controls and procedures (as defined in Rule 30a-3 (c) under the Investment Company Act of 1940, as amended) are effective as of a date within 90 days of the filing date of this report. |
| | |
(b)
| There have been no significant changes in the registrant’s internal controls or in other factors that could significantly affect these controls. |
ITEM 12. DISCLOSURE OF SECURITIES LENDING ACTIVITIES FOR CLOSED-END MANAGEMENT INVESTMENT COMPANIES
Not Applicable.
ITEM 13. EXHIBITS
(a)(1)
| The registrant’s code of ethics pursuant to Item 2 of Form N-CSR is filed as an exhibit to this form N-CSR. |
| | |
(a)(2)
| Certifications pursuant to Section 302 of the Sarbanes-Oxley Act of 2002 are attached. |
| | |
(b)
| Certifications pursuant to Section 906 of the Sarbanes-Oxley Act of 2002 are attached. |
SIGNATURES
Pursuant to the requirements of the Securities Exchange Act of 1934 and the Investment Company Act of 1940, the registrant has duly caused this report to be signed on its behalf by the undersigned, thereunto duly authorized.
DAVIS VARIABLE ACCOUNT FUND, INC.
| By | /s/ Kenneth C. Eich |
| | Kenneth C. Eich |
| | Principal Executive Officer |
| | |
| Date: February 7, 2019 |
Pursuant to the requirements of the Securities Exchange Act of 1934 and the Investment Company Act of 1940, this report has been signed below by the following persons on behalf of the registrant and in the capacities and on the dates indicated.
| By | /s/ Kenneth C. Eich |
| | Kenneth C. Eich |
| | Principal Executive Officer |
| | |
| Date: February 7, 2019 |
| By | /s/ Douglas A. Haines |
| | Douglas A. Haines |
| | Principal Financial Officer and Principal Accounting Officer |
| | |
| Date: February 7, 2019 |