Exhibit 99.1
EXCERPTS FROM PRELIMINARY OFFERING MEMORANDUM, DATED JANUARY 22, 2007
SUMMARY
The following summary is not complete and may not contain all of the information that may be important to you. Yankee Acquisition Corp., the issuer of the notes, has been formed solely for the purpose of completing the acquisition described in this offering memorandum and, concurrently with the closing of this offering, will be merged with and into The Yankee Candle Company, Inc., which will be the surviving corporation and will assume the obligations of Yankee Acquisition Corp. under the notes and related indentures by operation of law. Accordingly, this offering memorandum assumes the completion of the acquisition and, unless the context requires otherwise, the terms “we,” “us,” “the Company,” “our” and other similar terms refer to the business of The Yankee Candle Company, Inc., and its consolidated subsidiaries following the acquisition.
Our Company
We are the largest designer, manufacturer and distributor of premium scented candles in the U.S. based on annual sales. Through our multi-channel, global distribution network, we operate 420 specialty retail stores (as of December 30, 2006), supply approximately 19,900 wholesale locations and operate consumer direct mail catalogs and proprietary Internet websites. We have a 37-year history of offering our distinctive products and marketing them as affordable luxuries and consumable gifts. We offer approximately 2,900 stock-keeping units (SKUs) of candle products in approximately 200 fragrances, which include a wide variety of jar candles, Samplers® votive candles, Tarts® wax potpourri, pillars and other candle products, the vast majority of which are marketed under the Yankee Candle® brand. We also sell a wide range of other home fragrance products, including Yankee Candle® branded electric home fragrancers, potpourri, scented oils, reed diffusers, room sprays, Yankee Candle Car Jars® auto air fresheners, and candle related home décor accessories. We operate a vertically integrated business model with approximately 71% of our estimated 2006 sales generated by products we manufactured at our Whately, Massachusetts facility.
During the twelve months ended September 30, 2006, we generated sales of $646.6 million and Adjusted EBITDA of $170.1 million, resulting in an Adjusted EBITDA margin of 26.3%. Our strong and stable Adjusted EBITDA margins, combined with our limited capital expenditure and working capital needs, have resulted in significant free cash flow of approximately $365 million (measured as net cash provided from operating activities less capital expenditures) for the period from September 30, 2001 to September 30, 2006. We believe our strong operating performance has primarily been the result of the strength of the Yankee Candle® brand, the loyalty of our customer base, our commitment to product quality and innovation, the efficiency of our vertically integrated business model and the success of our multi-channel distribution strategy.
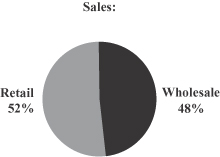
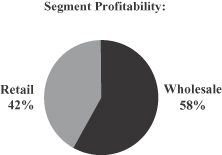
We operate our business through our wholesale and retail segments. The charts below set forth our sales by segment as a percentage of total sales and segment profitability as a percentage of total retail and wholesale segment profitability for the twelve months ended September 30, 2006. Segment profitability is sales less cost of sales and selling expenses.
1
Wholesale Segment: We have an extensive and growing national and international wholesale segment with a diverse customer base that as of December 30, 2006 consisted of approximately 17,400 locations in North America, including independent gift stores, leading national gift retailers such as Hallmark, leading home specialty retailers such as Bed, Bath & Beyond and Linens ‘n Things, national and regional department stores, “premium mass” retailers such as Kohl’s, selected club stores, and other national accounts. Outside of North America, we sell our products through international distributors and to our international wholesale customer network of approximately 2,500 locations. In recent years, we acquired GBI Marketing, a fundraising organization, and Aroma Naturals, Inc., a specialized line of wellness candles and aromatherapy products. We believe that these acquisitions strengthen our distribution capabilities, diversify our customer base and expand our expertise in the candle category. The strength of our Yankee Candle® brand, the profitability and quality of our products, and our successful in-store merchandising and display system have made us the top selling brand for many of our wholesale customers. We have consistently been ranked first in gift store sales in the domestic candle category, and have consistently been ranked either first or second in product reorders across all giftware categories by Giftbeat, a giftware industry publication. We were named Giftbeat’s vendor of the year in 2004 and 2005, the first two years of the award. In 2006, we were awarded second place in both vendor of the year and best customer service of the year.
Retail Segment: We are the largest specialty retailer of premium scented candles in the U.S. We operate 420 specialty retail stores under the Yankee Candle® and Illuminations® names in 43 states (as of December 30, 2006), operate consumer direct mail catalogs and maintain Internet websites at www.yankeecandle.com, www.aromanaturals.com and www.illuminations.com. Our retail stores, excluding our two flagship stores, average approximately 1,660 square feet and are primarily located in high traffic shopping malls and lifestyle centers. We operate two flagship stores, a 90,000-square-foot store in South Deerfield, Massachusetts, which is a major tourist destination in Massachusetts, and a second 42,000-square-foot store in Williamsburg, Virginia. These stores promote our brand image and culture and allow us to test new product and fragrance introductions. We recently acquired the Illuminations® brand and certain related assets. Illuminations is a designer and marketer of premium scented candles, candle accessories, and other home décor products under the Illuminations® brand. We operate 16 Illuminations stores (as of December 30, 2006) in California, Arizona and Washington. We believe Illuminations provides us with an attractive, multi-channel growth platform targeting a younger, more contemporary and more affluent customer in urban markets.
Industry Overview
We operate in the domestic giftware industry, including various sub-segments such as the total candle, home fragrance, scented candle and premium scented candle segments. Based upon market data from Kline & Company, we believe that:
| | • | | the domestic home fragrance segment, including candles, has grown at an approximately 4% compound annual growth rate from 2001 to 2005, reaching approximately $6.2 billion; |
| | • | | the domestic scented candle segment has grown at an approximately 1% compound annual growth rate from 2001 to 2005, reaching approximately $3.1 billion; |
| | • | | the domestic premium scented candle segment, which is our primary market, has grown at an approximately 3% compound annual growth rate from 2001 to 2005, reaching approximately $1.7 billion; and |
| | • | | the mass retail sales channel represented 25% of the domestic scented candle market in 2005, versus 30% in 2001. |
Based upon these trends and our own market assessments, we expect that growth of the premium scented candle market will continue to exceed the total candle market in the near term, and that the home fragrance market is likely to grow at least as quickly as the premium scented candle market.
2
Competitive Strengths
We believe the following strengths differentiate us from our competitors and contribute to our success:
Leading Market Position in the Premium Scented Candle Market With a Loyal Customer Base.We have successfully established the Yankee Candle® brand as a powerful and well-recognized brand among consumers in the premium scented candle market and broader home fragrance segment. Our market share of the premium scented candle market has increased each year since 1998 and was 43% as of December 30, 2005. Based upon market data from Kline & Company, we believe our market share in the premium scented candle market is nearly four times the share of our nearest competitor. We also believe that we are well positioned to further increase our market share as we continue to (i) expand our retail and wholesale networks, (ii) introduce new fragrances, products and line extensions and (iii) grow the businesses we recently acquired. According to Kline & Company, the Yankee Candle® brand name is the most recognized brand in the premium scented candle market. Based upon the Stax Report, the Yankee Candle® brand ranks first in awareness, quality and preference within the premium scented candle market. According to the Stax Report, candle usage among our customers is strong with approximately 74% of our customers using candles at least weekly and 30% reporting using candles daily. In addition, we believe our customers typically purchase our products for personal consumption rather than for gifting, which results in higher repeat purchases. Our wholesale customers are also loyal, with 59% of our wholesale accounts having been customers for more than five years.
Diversified Multi-Channel Distribution Strategy. Our multi-channel distribution strategy, including our wholesale customer network and retail stores and our consumer direct mail catalogs and proprietary Internet websites, enables us to offer our products to a wide variety of venues. We believe this multi-channel distribution strategy allows us to efficiently capture industry growth across all channels. Additionally, this strategy complements and promotes the diversity of our businesses, brands and retail store format, and allows us to target a broad mix of customers with different shopping preferences. Our retail stores are typically located in shopping malls and lifestyle centers while our wholesale accounts are typically located in non-shopping mall locations. We believe our consumer direct mail catalogs and Internet websites serve to increase the awareness and strength of the Yankee Candle® brand thereby increasing sales across all of our distribution channels.
Highly Efficient, Vertically Integrated Business Model. Through our vertically integrated business model, we believe we have an important competitive advantage that allows us to provide excellent customer service and respond effectively to changing consumer demands and trends. Approximately 71% of our estimated 2006 sales were generated by products manufactured at our 294,000 square foot facility in Whately, Massachusetts. The production of our products is highly automated, which significantly reduces our labor costs. Our model enables us to closely monitor the quality of our products, control our production costs and effectively manage inventory to achieve high fill rates, quick order turnaround times and working capital efficiencies.
Industry Leader in the Innovation and Design of High Quality Candle and Home Fragrance Products. Our long history as a product innovator in the premium scented candle segment has been supported by our strong and experienced in-house product design and development team that focuses on designing new products that are attractive to customers and can be manufactured in a cost-efficient manner. Each year we introduce a number of in-line extensions of our core candle lines, such as new Housewarmer® fragrances and candle forms. We use high quality fragrances, premium grade, highly refined paraffin waxes, and superior wicks and dyes to maintain the premium quality characteristics of our products. In addition to our core Housewarmer® fragrance line, we also introduced several new candle lines and channel-specific sub-brands in 2006, including our Celebrate Home™, Simply Home™, Farmers Market™ and Mystic Harbour™ lines. Our product design and development team continuously works to broaden our product portfolio by extending our brand into the home fragrance segment and other fragrance related categories, as well as candle related and home décor accessories. We have substantial product diversification, with non-candle productsaccounting for 29% of total estimated sales in fiscal 2006.
3
Strong and Consistent Operating Performance and Cash Flow. We have consistently demonstrated our ability to grow sales while maintaining strong operating margins and generating significant free cash flow. Our retail segment has achieved 10.3% compound annual sales growth and 6.4% compound annual segment profitability growth for the period from fiscal 2001 through the twelve months ended September 30, 2006. Our wholesale segment has achieved a 13.7% compound annual sales growth and 13% compound annual segment profitability growth for the period from fiscal 2001 through the twelve months ended September 30, 2006. Over this same period, we have sustained an average EBITDA margin of 27% and our capital expenditures have averaged approximately 21% of EBITDA, which has resulted in strong free cash flows.
Experienced Management Team and Equity Sponsor. Our senior management team has extensive consumer packaged goods, retail, wholesale and manufacturing experience with an average of over 20 years of relevant experience. Our equity sponsor is an affiliate of Madison Dearborn Partners, LLC which is one of the largest and most active private investment firms in the United States with considerable experience investing in consumer and retail companies.
Our Business Strategy
Our business objective is to expand our leadership position within the premium scented candle and home fragrance segments of the giftware industry while increasing our profitability and maximizing our cash flows. Our key strategies to achieve our business objective are as follows:
Grow Our Sales Through Our Wholesale Distribution Channel. Over the past five years, we have increased our wholesale locations from approximately 15,000 to approximately 19,900. We are committed to continuing to grow our wholesale business, which had compound annual sales growth of over 13.7% for the period from fiscal 2001 through the twelve months ended September 30, 2006. We plan to increase “same door” sales to existing accounts through, among other things, the introduction of new fragrances and products, and improved account management, including training and increased marketing support. Additionally, we plan to add new accounts and increase distribution in under-penetrated markets such as the Southern and Western United States, while also adding new “doors” as our existing national accounts add their own stores. We also plan to continue to extend our market penetration by targeting additional candle channels, such as the “premium mass” channel and other select retailers. Acquisitions such as Aroma Naturals and GBI Marketing, as well as our international division, provide additional growth opportunities.
Continue to Increase Retail Productivity. During fiscal 2005, we initiated a plan to re-invest in talent and focus on various strategic growth initiatives related to our retail segment. As part of this plan, we hired a new senior retail management team that has extensive retail and marketing experience. The growth initiatives that our new retail leadership team has implemented include:
| | • | | rationalizing our active retail SKUs with an increased emphasis on moving older inventory to maintain “newness” and “freshness” in our merchandise assortment; |
| | • | | revitalizing our in-store marketing by updating our front-window displays and initiating a key product focus within each store; |
| | • | | optimizing our merchandising calendar, with effective promotions during key high traffic periods; |
| | • | | improving our customer relationship management marketing activities, including discounts and promotional offers designed to drive retail traffic; and |
| | • | | increasing emphasis on recruiting, sales training and development of our associates. |
As a result of these initiatives, we have reported positive comparable store sales in each of the last four quarters. We intend to continue to implement and refine these initiatives.
4
Capitalize on attractive store economics. In fiscal 2006, we increased our retail sales base by 30 net stores, including 16 Illuminations stores. Productivity and low initial capital outlay typically result in cash payback on our investment within two years. The average capital requirement to open a new Yankee Candle store, including working capital, is approximately $300,000. Our retail stores (excluding our two flagship stores) average approximately 1,660 square feet and are highly productive, generating strong average estimated sales per square foot of approximately $600 for fiscal 2006. Due to these attractive new store economics and favorable market conditions we believe, and have confirmed by independent research we have commissioned, that there is significant opportunity to continue opening Yankee Candle and Illuminations stores throughout the United States. Additionally, our recent acquisition of Illuminations provides us with a strong platform and brand to expand into under-penetrated geographic areas such as the West Coast of the United States.
Continue To Introduce New Products and Categories. As a product and market innovator in the premium scented candle segment of the giftware industry, our product design and development team evaluates hundreds of new fragrances each year. In 2006, we introduced 44 new fragrances, three new product lines and several new product forms to our existing candle portfolio. We continue to expand our home fragrance product offerings, adding a number of new fragrances and styles to our existing products, such as our electric home fragrancers and other product lines, an enhanced version of our auto air fresheners and introducing new products such as our reed diffusers and scented oils to our portfolio. Finally, our acquisitions of the Illuminations® and Aroma Naturals® brands will enable us to further penetrate various segments of the candle market that are complementary to our existing product portfolio, including the introduction of more contemporary and design-oriented products and candle forms as well as those featuring natural essential oils and other aromatherapy products, thereby reaching new customers.
Leverage Operating Efficiencies. We are focused on continuing to drive total system productivity and efficiency by leveraging our vertically integrated supply chain and our growing sourcing capabilities to increase our profitability and enhance our margins. We have demonstrated a proven ability to drive operating improvements in our business. For the period from fiscal 2001 through fiscal 2006, manufacturing output has grown at a compound annual growth rate of 8% based on a jars per shift metric and logistics output has grown at a compound annual growth rate of 25% based on a carton per hour metric. For the period from fiscal 2001 through fiscal 2006, we have consistently generated annual productivity savings through manufacturing and logistics efficiencies, improved sourcing and other measures. We believe further opportunities exist for continued productivity savings and efficiencies.
5
Recent Developments
Estimated Results of Operations
On January 10, 2007, we announced the following estimated financial data for the thirteen weeks ended December 30, 2006 and the fifty-two weeks ended December 30, 2006. Estimates of financial results are inherently uncertain and subject to change, and we undertake no obligation to update this information. See “Risk Factors—Risk Factors Related to the Notes—The estimates for the thirteen weeks and the fifty-two weeks ended December 30, 2006 contained in this offering memorandum may differ from actual results.”
| | | | | | | | | | | | | | | | | | | | | |
| | | Thirteen Weeks Ended | | | Fifty-Two Weeks Ended | |
| | | December 31,
2005 | | | December 30,
2006 | | | % Change | | | December 31,
2005(1) | | | December 30,
2006 | | | % Change | |
| | | (actual) | | | (estimated) | | | | | | (actual) | | | (estimated) | | | | |
| | | | | | | | | (dollars in millions) | | | | | | | |
Statement of Income Data: | | | | | | | | | | | | | | | | | | | | | |
Retail sales | | $ | 144.5 | | | $177.0 – $178.0 | | | 22.5% – 23.2 | % | | $ | 304.1 | | | $ | 369.0 – $370.0 | | | 21.3% – 21.7 | % |
Wholesale sales | | | 92.4 | | | 98.0 – 100.0 | | | 6.1% – 8.2 | % | | | 297.1 | | | | 315.0 – 317.0 | | | 6.0% – 6.7 | % |
| | | | | | | | | | | | | | | | | | | | | |
Total sales | | | 236.9 | | | 275.0 – 278.0 | | | 16.1% – 17.3 | % | | | 601.2 | | | | 684.0 – 687.0 | | | 13.8% – 14.3 | % |
Adjusted EBITDA(1) | | | 86.3 | | | 98.0 – 100.0 | | | 13.6% – 15.9 | % | | | 168.5 | | | | 182.0 – 184.0 | | | 8.0% – 9.2 | % |
Other Financial Data: | | | | | | | | | | | | | | | | | | | | | |
Comparable store sales including Consumer Direct(2) | | | (3 | )% | | 12 | % | | NA | | | | (2 | )% | | | 10 | % | | NA | |
Rent expense | | | NA | | | NA | | | NA | | | $ | 26.7 | | | | $ 29.0 | | | 8.6 | % |
Capital expenditures | | $ | 16.8 | | | $ 10.8 | | | (35.7 | )% | | | 39.2 | | | | 25.0 | | | (36.2 | )% |
Balance Sheet Data (as of end of period): | | | | | | | | | | | | | | | | | | | | | |
Cash and cash equivalents | | | | $ 22.8 | | | | |
Total debt | | | | 140.0 | | | | |
Inventory | | | | 62.0 | | | | |
| (1) | “EBITDA” is net income before net interest expense, income taxes, depreciation and amortization and amortization of deferred financing costs. “Adjusted EBITDA” is EBITDA adjusted to exclude items which are not considered by management to be indicative of our ongoing operating performance. Following the Transactions, we believe that the presentation of EBITDA and Adjusted EBITDA will provide useful information to investors regarding our results of operations because such presentation assists in analyzing and benchmarking the performance and value of our business. We believe EBITDA and Adjusted EBITDA are useful to investors because they help enable investors to evaluate our business in the same manner as our management will evaluate our business following the Transactions and because they are frequently used by securities analysts, investors and other interested parties in the evaluation of companies with substantial financial leverage. EBITDA and Adjusted EBITDA, as presented, may not be comparable to similarly titled measures reported by other companies since not all companies necessarily calculate EBITDA in an identical manner and therefore are not necessarily an accurate means of comparison between companies. EBITDA is not intended to represent cash flows for the period or funds available for management’s discretionary use nor has it been represented as an alternative to operating income as an indicator of operating performance and should not be considered in isolation or as a substitute for measures of performance prepared in accordance with GAAP. See “Non-GAAP Financial Measures.” In order to compensate for differences in the calculation of EBITDA across companies, EBITDA should be evaluated in conjunction with GAAP measures such as operating income, net income, cash flow from operations and other measures of equal importance. |
6
| | EBITDA and Adjusted EBITDA are calculated as follows: |
| | | | | | | | | | | |
| | | Thirteen Weeks Ended | | | Fifty-Two Weeks Ended | |
| | | December 31,
2005 | | | December 30,
2006 | | | December 31,
2005 | | December 30,
2006 | |
| | | (actual) | | | (estimated) | | | (actual) | | (estimated) | |
| | | (in millions) | |
Net income | | $43.4 | | | $49.6 – $51.6 | | | $ 78.1 | | $82.4 – $84.4 | |
Interest expense, net | | 2.4 | | | 4.0 | | | 7.2 | | 14.8 | |
Income taxes | | 27.8 | | | 33.2 | | | 49.9 | | 49.9 | |
Depreciation and amortization | | 6.5 | | | 7.1 | | | 24.8 | | 26.8 | |
Amortization of deferred financing costs | | (0.1 | ) | | (0.2 | ) | | (0.4) | | (0.5 | ) |
| | | | | | | | | | | |
EBITDA | | 80.0 | | | 93.7 – 95.7 | | | 159.6 | | 173.4 – 175.4 | |
Restructuring(a) | | 5.5 | | | (0.4 | ) | | 5.5 | | (0.4 | ) |
Stock-based compensation(b) | | 0.8 | | | 1.5 | | | 3.4 | | 5.8 | |
Transaction costs(c) | | — | | | 3.2 | | | — | | 3.2 | |
| | | | | | | | | | | |
Adjusted EBITDA | | $86.3 | | | $98.0 – $100.0 | | | $168.5 | | $182.0 – $184.0 | |
| | | | | | | | | | | |
| | (a) | During the fourth quarter of fiscal 2005, we initiated a restructuring plan designed to close 17 underperforming stores and re-invest in talent and other strategic growth initiatives. In connection with this restructuring plan, a charge of $5.5 million was recorded in the fourth quarter of fiscal 2005. Included in the restructuring charge was $2.4 million related to lease termination costs, $2.5 million related to non-cash fixed assets write-offs and other costs, and $0.6 million in employee-related costs. All of the 17 underperforming stores have been closed and we have reversed the remaining reserve of $0.4 million in the fourth quarter of fiscal 2006. |
| | (b) | Non-cash charges relating to stock-based compensation. |
| | (c) | Represents non-recurring costs incurred in connection with the Transactions. |
| (2) | Comparable store sales represent a comparison of sales during the corresponding fiscal periods for stores in our comparable store sales base (excluding Illuminations). A store first enters our comparable store sales base in the fourteenth fiscal month of operation. We have relocated eight stores and had six store expansions or remodels over the last five years. In these instances, the stores were not therefore, excluded from our comparable store calculation due to the short period of time that the stores were closed. Permanently closed stores are excluded from the comparable store calculation beginning in the month in which the store closes. |
We prepared the above estimates of our operating performance for the thirteen weeks ended December 30, 2006 and used those amounts to estimate certain results for the fifty-two weeks ended December 30, 2006. Actual results remain subject to the completion of management’s and the audit committee’s final review, as well as the year-end audit by our independent registered public accountants. Moreover, none of our independent registered public accountants, the initial purchasers, our equity sponsor (excluding management investors), or any independent expert participated in the preparation of the estimates, assumes any responsibility for the accuracy of the estimates or is providing any opinion or other assurance with respect to the estimates. In light of the foregoing, prospective purchasers of the notes are cautioned not to place undue reliance on the estimates. The estimates set forth above were prepared by our management and are based upon a number of assumptions. These estimates were prepared on the basis of GAAP. This information is a summary of estimated financial data and should be read in conjunction with the “Risk Factors,” “Unaudited Pro Forma Condensed Consolidated Financial Statements,” “Selected Historical Financial Data,” “Management’s Discussion and Analysis of Financial Condition and Results of Operations”, our unaudited condensed consolidated financial statements and the accompanying notes, and our consolidated financial statements and the accompanying notes appearing elsewhere in this offering memorandum.
7