UNITED STATES
SECURITIES AND EXCHANGE COMMISSION
Washington, DC 20549
FORM N-CSR
CERTIFIED SHAREHOLDER REPORT OF REGISTERED MANAGEMENT
INVESTMENT COMPANIES
Investment Company Act file number File No. 811-09301
TIAA-CREF FUNDS
(Exact Name of Registrant as specified in charter)
730 Third Avenue, New York, New York 10017-3206
(Address of Principal Executive Offices) (Zip code)
Jeremy D. Franklin, Esq.
TIAA-CREF Funds
8500 Andrew Carnegie Blvd.
Charlotte, N.C. 28262-8500
(Name and address of agent for service)
Registrant’s telephone number, including area code: 704-595-1000
Date of fiscal year end: May 31
Date of reporting period: May 31, 2022
Item 1. Reports to Stockholders.
| TIAA-CREF Funds | May 31, 2022 | |
TIAA-CREF
Lifecycle Funds
The annual report contains the audited financial statements.
| Fund name | Institutional Class | Advisor Class | Premier Class | Retirement Class | Retail Class |
| Lifecycle Retirement Income Fund | TLRIX | TLRHX | TPILX | TLIRX | TLRRX |
| Lifecycle 2010 Fund | TCTIX | TCLHX | TCTPX | TCLEX | — |
| Lifecycle 2015 Fund | TCNIX | TCNHX | TCFPX | TCLIX | — |
| Lifecycle 2020 Fund | TCWIX | TCWHX | TCWPX | TCLTX | — |
| Lifecycle 2025 Fund | TCYIX | TCQHX | TCQPX | TCLFX | — |
| Lifecycle 2030 Fund | TCRIX | TCHHX | TCHPX | TCLNX | — |
| Lifecycle 2035 Fund | TCIIX | TCYHX | TCYPX | TCLRX | — |
| Lifecycle 2040 Fund | TCOIX | TCZHX | TCZPX | TCLOX | — |
| Lifecycle 2045 Fund | TTFIX | TTFHX | TTFPX | TTFRX | — |
| Lifecycle 2050 Fund | TFTIX | TFTHX | TCLPX | TLFRX | — |
| Lifecycle 2055 Fund | TTRIX | TTRHX | TTRPX | TTRLX | — |
| Lifecycle 2060 Fund | TLXNX | TLXHX | TLXPX | TLXRX | — |
| Lifecycle 2065 Fund | TSFTX | TSFHX | TSFPX | TCFRX | — |
Annual
Report
Contents
This annual report contains information about certain TIAA-CREF Funds and describes their results for the twelve months ended May 31, 2022. The report contains four main sections:
| • | A letter from Brad Finkle, Principal Executive Officer and President of the TIAA–CREF Funds and TIAA-CREF Life Funds. | |
| • | The fund performance section compares each fund’s investment returns with those of its composite benchmark and broad market index. | |
| • | The portfolios of investments list the underlying funds in which each fund had investments as of May 31, 2022. | |
| • | The financial statements provide detailed information about the operations and financial condition of each fund. |
The views and opinions expressed in this report are through the end of the period, as stated on the cover of this report. They are subject to change at any time based on a variety of factors. As such, they are not guarantees of future performance or investment results and should not be taken as investment advice. To see the risks of investing in any fund, please read the latest prospectus.
As always, you should carefully consider the investment objectives, risks, charges and expenses of any fund before investing. For a prospectus that contains this and other important information, please visit our websites at TIAA.org or nuveen.com, or call 800-842-2252 for the Institutional, Advisor, Premier and Retirement classes or 800-223-1200 for the Retail Class. We urge you to read the prospectus carefully before investing.
| TIAA-CREF Lifecycle Funds ■ 2022 Annual Report | 3 |
Global financial markets produced negative results for the twelve months ended May 31, 2022. As inflationary pressures persisted, the Federal Reserve responded by raising short-term interest rates in March and May, and indicated that further increases were likely. U.S. equities lost ground as the economy contracted in the first quarter of 2022—the first negative quarter since 2020. A widening trade gap and lower government spending contributed to the slowdown, but spending by consumers and businesses remained strong. Foreign stocks also posted losses, with emerging markets falling more than international developed markets. U.S. fixed-income securities declined as U.S. Treasury yields rose across all maturities (bond prices move in the opposite direction of yields). These market conditions were reflected in the performance of the TIAA-CREF Lifecycle Funds by way of their investments in various asset classes through underlying funds.
| • | All of the TIAA-CREF Lifecycle Funds declined for the period and underperformed their respective composite benchmarks. (All fund returns are for the Retirement Class.) | |
| • | Returns for the Retirement Class ranged from –6.5% for the Lifecycle Retirement Income Fund to –9.0% for the Lifecycle 2055 and 2060 Funds. |
Both stocks and bonds posted losses
U.S. equities declined for the twelve months as inflation, rising interest rates and Russia’s invasion of Ukraine weighed on the financial markets. Furthermore, oil prices rose to levels not seen since 2008, while unemployment fell to rates approaching pre-pandemic lows. The broad domestic stock market, as represented by the Russell 3000® Index, returned –3.7%. The Fed raised the federal funds target rate to 0.75%–1.00% in May 2022 and decided to begin reducing its portfolio of bonds that had been purchased to support the economy.
International stocks trailed their U.S. counterparts. The MSCI ACWI ex USA Investable Market Index (IMI), which measures the performance of large-, mid- and small-cap equities in 22 of 23 developed-markets countries (excluding the United States) and 24 emerging-markets countries, returned –12.5% in U.S.-dollar terms. Despite widespread market losses, the economies in the 19-nation euro area grew at a moderate rate in the fourth quarter of 2021 and the first quarter of 2022. Among developing markets, the Chinese economy continued to expand at a solid pace through the first quarter of 2022.
U.S. investment-grade bonds lost ground as U.S. Treasury yields rose substantially across all maturities. The domestic investment-grade fixed-rate bond market, as measured by the Bloomberg U.S. Aggregate Bond Index, returned –8.2% for the period.
| 4 | 2022 Annual Report ■ TIAA-CREF Lifecycle Funds |
Planning for an unpredictable future For more than a decade, equity investors have enjoyed a long stretch of above-average returns, while bond performance during the same period has not kept pace. Now we may be at an inflection point. Equities have become more volatile, tempered by a host of factors that could affect global economic growth. Fixed-income securities, after years of historically low interest rates, are now offering higher yields, which is good news for bond investors seeking higher income. Meanwhile, real estate continues to benefit from high demand and limited supply, which enhances property values and bolsters rental income. The challenge of planning for the future always lies in its inherent uncertainty. As a result, we believe that a prudent strategy is to stay invested in a diversified portfolio that includes multiple asset classes. The TIAA-CREF Lifecycle Funds use dynamic diversification strategies designed to help mitigate the effects of market volatility and keep you on track to achieve your financial goals. Of course, diversification does not guarantee against market losses, and past performance cannot guarantee future results. We thank you for trusting us to manage your investments through the TIAA-CREF Lifecycle Funds. If you have any questions or concerns, please consult your financial advisor or call a TIAA financial consultant at 800-842-2252. You can also reach us online by visiting TIAA.org. We always stand ready to assist you.
/s/ Brad Finkle
Brad Finkle Principal Executive Officer and President of the TIAA-CREF Funds and TIAA-CREF Life Funds
|
Brad Finkle |

| TIAA-CREF Lifecycle Funds ■ 2022 Annual Report | 5 |
Portfolio holdings
The complete portfolios of investments for the Lifecycle Funds begin on page 48 of this report. You can obtain complete lists of the holdings of the Lifecycle Funds and of the underlying TIAA-CREF Funds in which the Lifecycle Funds invest as of the most recently completed fiscal quarter in the following ways:
| • | By visiting our websites at TIAA.org or nuveen.com; or | |
| • | By calling us at 800-842-2252 to request a copy, which will be provided free of charge. |
You can also obtain a complete list of the Lifecycle Funds’ portfolio holdings as of the most recently completed fiscal quarter, and for prior quarter-ends, from our Securities and Exchange Commission (SEC) Form N-CSR and Form N-PORT filings. Form N-CSR filings are as of May 31 or November 30; Form N-PORT filings are as of the last day of February or August 31. Copies of these forms are available:
| • | Through the Electronic Data Gathering and Retrieval System (EDGAR) on the SEC’s website at sec.gov; or | |
| • | From the SEC’s Office of Investor Education and Advocacy. | |
| Call 202-551-8090 for more information. |
TIAA-CREF Real Property Fund, LP
Financial statements of the TIAA-CREF Real Property Fund, LP, in which the Lifecycle Funds invest, have been filed as an exhibit to the Funds’ Form N-CSR filing, which is available on EDGAR at the SEC’s website, sec.gov.
| 6 | 2022 Annual Report ■ TIAA-CREF Lifecycle Funds |
Information for investors
Proxy voting
A description of our proxy voting policies and procedures for the underlying TIAA-CREF Funds of the Lifecycle Funds can be found on our website at TIAA.org or on the SEC’s website at sec.gov. You can also call us at 800-842-2252 to request a free copy. A report of how the Lifecycle Funds’ underlying TIAA-CREF Funds voted during the most recently completed twelve-month period ended June 30 can be found on our website or on Form N-PX at sec.gov.
Contacting TIAA
There are three easy ways to contact us: by email, using the Contact Us link under Get Help at the top of our home page; by mail at TIAA, 730 Third Avenue, New York, NY 10017-3206; or by phone at 800-842-2252.
Fund management
The Lifecycle Funds are managed by a portfolio management team of Teachers Advisors, LLC. The members of this team are responsible for the day-to-day investment management of the funds.
| TIAA-CREF Lifecycle Funds ■ 2022 Annual Report | 7 |
Composite benchmark
Each Lifecycle Fund uses a composite benchmark that represents the general market sectors in which that fund invests. These may include U.S. equity (stocks), international equity (foreign stocks), fixed income, short-term fixed income and inflation-protected assets. A fund’s composite benchmark combines the following public indexes in proportions that correspond to the fund’s target allocations:
| • | The Russell 3000® Index (U.S. equity) measures the performance of the stocks of the 3,000 largest publicly traded U.S. companies, based on market capitalization. The index measures the performance of about 98% of the total market capitalization of the publicly traded U.S. equity market. | |
| • | The MSCI ACWI ex USA Investable Market Index (IMI) (international equity) measures the performance of large-, mid- and small-cap equities across 22 of 23 developed-markets countries (excluding the United States) and 24 emerging-markets countries. The index is a free-float-adjusted market capitalization index that covers approximately 99% of the global equity opportunity set outside the United States. | |
| • | The Bloomberg U.S. Aggregate Bond Index (fixed income) measures the performance of the domestic investment-grade fixed-rate bond market, including government and corporate securities, agency mortgage pass-through securities, asset-backed securities and commercial mortgage-backed securities. | |
| • | The Bloomberg U.S. 1–3 Year Government/Credit Bond Index (short-term fixed income) measures the performance of U.S. Treasury and agency securities and corporate bonds with 1- to 3-year maturities. | |
| • | The Bloomberg U.S. Treasury Inflation Protected Securities (TIPS) 1–10 Year Index (inflation-protected assets) measures the performance of fixed-income securities with maturities between 1 and 10 years that are adjusted for inflation, as measured by the Consumer Price Index for All Urban Consumers (CPI-U). |
Broad market indexes
The returns shown against the broad-based securities market index compare a fund’s average annual returns with a broad measure of market performance. The S&P Target Date Index Series represents a broadly derived consensus of asset class exposure for the target retirement dates in the series based on market observations acquired through an annual survey of target-date fund managers. The returns of the S&P Target Date Index Series reflect multi-asset class exposure for the same target dates as the Funds.
| 8 | 2022 Annual Report ■ TIAA-CREF Lifecycle Funds |
About the funds’ benchmarks
You cannot invest directly in any index. Index returns do not include a deduction for fees or expenses. For additional details about the benchmark indexes, please read the funds’ latest prospectus.
London Stock Exchange Group plc and its group undertakings (collectively, the “LSE Group”). © LSE Group 2022. FTSE Russell is a trading name of certain of the LSE Group companies. “FTSE®,” “Russell®” and “FTSE Russell®” are trademarks of the relevant LSE Group companies and are used by any other LSE Group company under license. All rights in the FTSE Russell indexes or data vest in the relevant LSE Group company which owns the index or the data. Neither LSE Group nor its licensors accept any liability for any errors or omissions in the indexes or data and no party may rely on any indexes or data contained in this communication. No further distribution of data from the LSE Group is permitted without the relevant LSE Group company’s express written consent. The LSE Group does not promote, sponsor or endorse the content of this communication. MSCI makes no express or implied warranties or representations and shall have no liability whatsoever with respect to any MSCI data contained herein. This report is not approved, reviewed or produced by MSCI.
| TIAA-CREF Lifecycle Funds ■ 2022 Annual Report | 9 |
Important information about expenses
All shareholders of the TIAA-CREF Funds incur ongoing costs, including management fees and other fund expenses. They may also incur transactional costs for redemptions or account maintenance fees.
The expense examples that appear in this report are intended to help you understand your ongoing costs only (in U.S. dollars) and do not reflect transactional costs. The examples are designed to help you compare these ongoing costs with the ongoing costs of investing in other mutual funds.
The expenses shown do not include redemption fees or account maintenance fees, which may or may not be applicable, as described in the prospectus. If such fees were included, your total costs for investing in the funds would be higher. Note also that shareholders of the TIAA-CREF Funds do not incur a sales charge for purchases, reinvested dividends or other distributions.
The examples are based on an investment of $1,000 invested at the beginning of the six-month period and held for the entire period (December 1, 2021–May 31, 2022).
Actual expenses
The first line of the two lines listed for each fund in the tables uses the Fund’s actual expenses and its actual rate of return. You may use the information in this line, together with the amount you invested, to estimate the expenses that you paid over the six-month period.
Simply divide your account value by $1,000 (for example, an $8,600 account value divided by $1,000 = 8.6), then multiply the result by the number in the first line under the heading “Expenses paid during period” to estimate the expenses you paid during the six-month period. All of the funds have a contractual fee reimbursement. Had these not been in effect, fund expenses would have been higher.
Hypothetical example for comparison purposes
The second line in each Fund’s entry shows a hypothetical account value and hypothetical expenses based on the share class’ actual expense ratio for the six-month period and an assumed 5%-per-year rate of return before expenses. This was not the Fund’s actual return.
This hypothetical example cannot be used to estimate the actual expenses you paid for the period, but rather allows you to compare the ongoing costs of investing in the Fund with the costs of other funds. To do so, compare this 5% hypothetical example with the 5% hypothetical examples that appear in the shareholder reports of other mutual funds.
| 10 | 2022 Annual Report ■ TIAA-CREF Lifecycle Funds |
[This page intentionally left blank]
| TIAA-CREF Lifecycle Funds ■ 2022 Annual Report | 11 |
Important information about expenses
Expense examples
Six months ended May 31, 2022
| Lifecycle Funds Institutional Class | Beginning account value (12/1/21 | ) | Ending account value (5/31/22 | ) | Expenses paid during period (12/1/21–5/31/22 | * ) | Effective expenses paid during period (12/1/21–5/31/22 | † ) | ||||||||
| Retirement Income Fund actual return | $1,000.00 | $ | 926.14 | $1.25 | $1.78 | |||||||||||
| 5% annual hypothetical return | 1,000.00 | 1,023.64 | 1.31 | 1.87 | ||||||||||||
| 2010 Fund actual return | 1,000.00 | 926.00 | 1.25 | 1.73 | ||||||||||||
| 5% annual hypothetical return | 1,000.00 | 1,023.64 | 1.31 | 1.82 | ||||||||||||
| 2015 Fund actual return | 1,000.00 | 923.77 | 1.25 | 1.82 | ||||||||||||
| 5% annual hypothetical return | 1,000.00 | 1,023.64 | 1.31 | 1.92 | ||||||||||||
| 2020 Fund actual return | 1,000.00 | 919.99 | 1.24 | 1.87 | ||||||||||||
| 5% annual hypothetical return | 1,000.00 | 1,023.64 | 1.31 | 1.97 | ||||||||||||
| 2025 Fund actual return | 1,000.00 | 915.85 | 1.24 | 1.96 | ||||||||||||
| 5% annual hypothetical return | 1,000.00 | 1,023.64 | 1.31 | 2.07 | ||||||||||||
| 2030 Fund actual return | 1,000.00 | 911.24 | 1.19 | 2.00 | ||||||||||||
| 5% annual hypothetical return | 1,000.00 | 1,023.68 | 1.26 | 2.12 | ||||||||||||
| 2035 Fund actual return | 1,000.00 | 906.42 | 1.14 | 2.04 | ||||||||||||
| 5% annual hypothetical return | 1,000.00 | 1,023.73 | 1.21 | 2.17 | ||||||||||||
| 2040 Fund actual return | 1,000.00 | 903.78 | 1.09 | 2.09 | ||||||||||||
| 5% annual hypothetical return | 1,000.00 | 1,023.78 | 1.16 | 2.22 | ||||||||||||
| 2045 Fund actual return | 1,000.00 | 902.10 | 1.04 | 2.13 | ||||||||||||
| 5% annual hypothetical return | 1,000.00 | 1,023.83 | 1.11 | 2.27 | ||||||||||||
| 2050 Fund actual return | 1,000.00 | 901.31 | 1.00 | 2.13 | ||||||||||||
| 5% annual hypothetical return | 1,000.00 | 1,023.88 | 1.06 | 2.27 | ||||||||||||
| 2055 Fund actual return | 1,000.00 | 900.90 | 1.00 | 2.13 | ||||||||||||
| 5% annual hypothetical return | 1,000.00 | 1,023.88 | 1.06 | 2.27 | ||||||||||||
| 2060 Fund actual return | 1,000.00 | 900.59 | 0.95 | 2.13 | ||||||||||||
| 5% annual hypothetical return | 1,000.00 | 1,023.93 | 1.01 | 2.27 | ||||||||||||
| 2065 Fund actual return | 1,000.00 | 902.53 | 1.00 | 2.18 | ||||||||||||
| 5% annual hypothetical return | 1,000.00 | 1,023.88 | 1.06 | 2.32 | ||||||||||||
| 12 | 2022 Annual Report ■ TIAA-CREF Lifecycle Funds |
Important information about expenses
| * | “Expenses paid during period” is based on each fund’s actual expense ratio for the most recent fiscal half-year, multiplied by the average account value over the six-month period, multiplied by 182/365. There were 182 days in the six months ended May 31, 2022. The expense charges of one or more of the fund’s share classes may at times reflect a waiver or reimbursement. Please see the prospectus for an explanation, including the date on which this waiver or reimbursement is scheduled to end. Without such waiver or reimbursement, the expenses of the affected share classes would be higher and their performance lower. The annualized expense ratio for the six-month period was 0.26% for the Retirement Income Fund, 0.26% for the 2010 Fund, 0.26% for the 2015 Fund, 0.26% for the 2020 Fund, 0.26% for the 2025 Fund, 0.25% for the 2030 Fund, 0.24% for the 2035 Fund, 0.23% for the 2040 Fund, 0.22% for the 2045 Fund, 0.21% for the 2050 Fund, 0.21% for the 2055 Fund, 0.20% for the 2060 Fund and 0.21% for the 2065 Fund. |
| † | “Effective expenses paid during period” is based on each fund’s total expense ratio for the most recent fiscal half-year, which includes the fund’s own expense ratio plus its pro rata share of its underlying funds’ expenses (which the fund bears through its investment in the underlying funds). For the six-month period, the total annualized weighted average expense ratio was 0.37% for the Retirement Income Fund, 0.36% for the 2010 Fund, 0.38% for the 2015 Fund, 0.39% for the 2020 Fund, 0.41% for the 2025 Fund, 0.42% for the 2030 Fund, 0.43% for the 2035 Fund, 0.44% for the 2040 Fund, 0.45% for the 2045 Fund, 0.45% for the 2050 Fund, 0.45% for the 2055 Fund, 0.45% for the 2060 Fund and 0.46% for the 2065 Fund. |
| TIAA-CREF Lifecycle Funds ■ 2022 Annual Report | 13 |
Important information about expenses
Expense examples
Six months ended May 31, 2022
| Lifecycle Funds Advisor Class | Beginning account value (12/1/21 | ) | Ending account value (5/31/22 | ) | Expenses paid during period (12/1/21–5/31/22 | * ) | Effective expenses paid during period (12/1/21–5/31/22 | † ) | ||||||||
| Retirement Income Fund actual return | $1,000.00 | $ | 925.74 | $1.58 | $2.11 | |||||||||||
| 5% annual hypothetical return | 1,000.00 | 1,023.29 | 1.66 | 2.22 | ||||||||||||
| 2010 Fund actual return | 1,000.00 | 925.41 | 1.58 | 2.06 | ||||||||||||
| 5% annual hypothetical return | 1,000.00 | 1,023.29 | 1.66 | 2.17 | ||||||||||||
| 2015 Fund actual return | 1,000.00 | 923.63 | 1.82 | 2.35 | ||||||||||||
| 5% annual hypothetical return | 1,000.00 | 1,023.04 | 1.92 | 2.47 | ||||||||||||
| 2020 Fund actual return | 1,000.00 | 919.26 | 1.63 | 2.25 | ||||||||||||
| 5% annual hypothetical return | 1,000.00 | 1,023.24 | 1.72 | 2.37 | ||||||||||||
| 2025 Fund actual return | 1,000.00 | 915.91 | 1.62 | 2.34 | ||||||||||||
| 5% annual hypothetical return | 1,000.00 | 1,023.24 | 1.72 | 2.47 | ||||||||||||
| 2030 Fund actual return | 1,000.00 | 911.48 | 1.48 | 2.24 | ||||||||||||
| 5% annual hypothetical return | 1,000.00 | 1,023.39 | 1.56 | 2.37 | ||||||||||||
| 2035 Fund actual return | 1,000.00 | 906.26 | 1.57 | 2.47 | ||||||||||||
| 5% annual hypothetical return | 1,000.00 | 1,023.29 | 1.66 | 2.62 | ||||||||||||
| 2040 Fund actual return | 1,000.00 | 902.93 | 1.47 | 2.42 | ||||||||||||
| 5% annual hypothetical return | 1,000.00 | 1,023.39 | 1.56 | 2.57 | ||||||||||||
| 2045 Fund actual return | 1,000.00 | 901.73 | 1.33 | 2.37 | ||||||||||||
| 5% annual hypothetical return | 1,000.00 | 1,023.54 | 1.41 | 2.52 | ||||||||||||
| 2050 Fund actual return | 1,000.00 | 901.10 | 1.42 | 2.51 | ||||||||||||
| 5% annual hypothetical return | 1,000.00 | 1,023.44 | 1.51 | 2.67 | ||||||||||||
| 2055 Fund actual return | 1,000.00 | 900.40 | 1.18 | 2.32 | ||||||||||||
| 5% annual hypothetical return | 1,000.00 | 1,023.68 | 1.26 | 2.47 | ||||||||||||
| 2060 Fund actual return | 1,000.00 | 900.52 | 1.23 | 2.37 | ||||||||||||
| 5% annual hypothetical return | 1,000.00 | 1,023.64 | 1.31 | 2.52 | ||||||||||||
| 2065 Fund actual return | 1,000.00 | 898.16 | 0.99 | 2.18 | ||||||||||||
| 5% annual hypothetical return | 1,000.00 | 1,023.88 | 1.06 | 2.32 | ||||||||||||
| 14 | 2022 Annual Report ■ TIAA-CREF Lifecycle Funds |
Important information about expenses
| * | “Expenses paid during period” is based on each fund’s actual expense ratio for the most recent fiscal half-year, multiplied by the average account value over the six-month period, multiplied by 182/365. There were 182 days in the six months ended May 31, 2022. The expense charges of one or more of the fund’s share classes may at times reflect a waiver or reimbursement. Please see the prospectus for an explanation, including the date on which this waiver or reimbursement is scheduled to end. Without such waiver or reimbursement, the expenses of the affected share classes would be higher and their performance lower. The annualized expense ratio for the six-month period was 0.33% for the Retirement Income Fund, 0.33% for the 2010 Fund, 0.38% for the 2015 Fund, 0.34% for the 2020 Fund, 0.34% for the 2025 Fund, 0.31% for the 2030 Fund, 0.33% for the 2035 Fund, 0.31% for the 2040 Fund, 0.28% for the 2045 Fund, 0.30% for the 2050 Fund, 0.25% for the 2055 Fund, 0.26% for the 2060 Fund and 0.21% for the 2065 Fund. |
| † | “Effective expenses paid during period” is based on each fund’s total expense ratio for the most recent fiscal half-year, which includes the fund’s own expense ratio plus its pro rata share of its underlying funds’ expenses (which the fund bears through its investment in the underlying funds). For the six-month period, the total annualized weighted average expense ratio was 0.44% for the Retirement Income Fund, 0.43% for the 2010 Fund, 0.49% for the 2015 Fund, 0.47% for the 2020 Fund, 0.49% for the 2025 Fund, 0.47% for the 2030 Fund, 0.52% for the 2035 Fund, 0.51% for the 2040 Fund, 0.50% for the 2045 Fund, 0.53% for the 2050 Fund, 0.49% for the 2055 Fund, 0.50% for the 2060 Fund and 0.46% for the 2065 Fund. |
| TIAA-CREF Lifecycle Funds ■ 2022 Annual Report | 15 |
Important information about expenses
Expense examples
Six months ended May 31, 2022
| Lifecycle Funds Premier Class | Beginning account value (12/1/21 | ) | Ending account value (5/31/22 | ) | Expenses paid during period (12/1/21–5/31/22 | * ) | Effective expenses paid during period (12/1/21–5/31/22 | † ) | ||||||||
| Retirement Income Fund actual return | $1,000.00 | $ | 925.31 | $1.97 | $2.50 | |||||||||||
| 5% annual hypothetical return | 1,000.00 | 1,022.89 | 2.07 | 2.62 | ||||||||||||
| 2010 Fund actual return | 1,000.00 | 925.59 | 1.97 | 2.45 | ||||||||||||
| 5% annual hypothetical return | 1,000.00 | 1,022.89 | 2.07 | 2.57 | ||||||||||||
| 2015 Fund actual return | 1,000.00 | 923.41 | 1.97 | 2.54 | ||||||||||||
| 5% annual hypothetical return | 1,000.00 | 1,022.89 | 2.07 | 2.67 | ||||||||||||
| 2020 Fund actual return | 1,000.00 | 918.81 | 1.96 | 2.58 | ||||||||||||
| 5% annual hypothetical return | 1,000.00 | 1,022.89 | 2.07 | 2.72 | ||||||||||||
| 2025 Fund actual return | 1,000.00 | 914.65 | 1.96 | 2.67 | ||||||||||||
| 5% annual hypothetical return | 1,000.00 | 1,022.89 | 2.07 | 2.82 | ||||||||||||
| 2030 Fund actual return | 1,000.00 | 910.68 | 1.91 | 2.72 | ||||||||||||
| 5% annual hypothetical return | 1,000.00 | 1,022.94 | 2.02 | 2.87 | ||||||||||||
| 2035 Fund actual return | 1,000.00 | 906.78 | 1.85 | 2.76 | ||||||||||||
| 5% annual hypothetical return | 1,000.00 | 1,022.99 | 1.97 | 2.92 | ||||||||||||
| 2040 Fund actual return | 1,000.00 | 903.44 | 1.80 | 2.80 | ||||||||||||
| 5% annual hypothetical return | 1,000.00 | 1,023.04 | 1.92 | 2.97 | ||||||||||||
| 2045 Fund actual return | 1,000.00 | 901.26 | 1.75 | 2.84 | ||||||||||||
| 5% annual hypothetical return | 1,000.00 | 1,023.09 | 1.87 | 3.02 | ||||||||||||
| 2050 Fund actual return | 1,000.00 | 900.54 | 1.71 | 2.84 | ||||||||||||
| 5% annual hypothetical return | 1,000.00 | 1,023.14 | 1.82 | 3.02 | ||||||||||||
| 2055 Fund actual return | 1,000.00 | 900.06 | 1.71 | 2.84 | ||||||||||||
| 5% annual hypothetical return | 1,000.00 | 1,023.14 | 1.82 | 3.02 | ||||||||||||
| 2060 Fund actual return | 1,000.00 | 899.66 | 1.66 | 2.84 | ||||||||||||
| 5% annual hypothetical return | 1,000.00 | 1,023.19 | 1.77 | 3.02 | ||||||||||||
| 2065 Fund actual return | 1,000.00 | 900.65 | 1.71 | 2.89 | ||||||||||||
| 5% annual hypothetical return | 1,000.00 | 1,023.14 | 1.82 | 3.07 | ||||||||||||
| 16 | 2022 Annual Report ■ TIAA-CREF Lifecycle Funds |
Important information about expenses
| * | “Expenses paid during period” is based on each fund’s actual expense ratio for the most recent fiscal half-year, multiplied by the average account value over the six-month period, multiplied by 182/365. There were 182 days in the six months ended May 31, 2022. The expense charges of one or more of the fund’s share classes may at times reflect a waiver or reimbursement. Please see the prospectus for an explanation, including the date on which this waiver or reimbursement is scheduled to end. Without such waiver or reimbursement, the expenses of the affected share classes would be higher and their performance lower. The annualized expense ratio for the six-month period was 0.41% for the Retirement Income Fund, 0.41% for the 2010 Fund, 0.41% for the 2015 Fund, 0.41% for the 2020 Fund, 0.41% for the 2025 Fund, 0.40% for the 2030 Fund, 0.39% for the 2035 Fund, 0.38% for the 2040 Fund, 0.37% for the 2045 Fund, 0.36% for the 2050 Fund, 0.36% for the 2055 Fund, 0.35% for the 2060 Fund and 0.36% for the 2065 Fund. |
| † | “Effective expenses paid during period” is based on each fund’s total expense ratio for the most recent fiscal half-year, which includes the fund’s own expense ratio plus its pro rata share of its underlying funds’ expenses (which the fund bears through its investment in the underlying funds). For the six-month period, the total annualized weighted average expense ratio was 0.52% for the Retirement Income Fund, 0.51% for the 2010 Fund, 0.53% for the 2015 Fund, 0.54% for the 2020 Fund, 0.56% for the 2025 Fund, 0.57% for the 2030 Fund, 0.58% for the 2035 Fund, 0.59% for the 2040 Fund, 0.60% for the 2045 Fund, 0.60% for the 2050 Fund, 0.60% for the 2055 Fund, 0.60% for the 2060 Fund and 0.61% for the 2065 Fund. |
| TIAA-CREF Lifecycle Funds ■ 2022 Annual Report | 17 |
Important information about expenses
Expense examples
Six months ended May 31, 2022
| Lifecycle Funds Retirement Class | Beginning account value (12/1/21 | ) | Ending account value (5/31/22 | ) | Expenses paid during period (12/1/21–5/31/22 | * ) | Effective expenses paid during period (12/1/21–5/31/22 | † ) | ||||||||
| Retirement Income Fund actual return | $1,000.00 | $ | 924.84 | $2.40 | $2.93 | |||||||||||
| 5% annual hypothetical return | 1,000.00 | 1,022.44 | 2.52 | 3.07 | ||||||||||||
| 2010 Fund actual return | 1,000.00 | 924.39 | 2.45 | 2.93 | ||||||||||||
| 5% annual hypothetical return | 1,000.00 | 1,022.39 | 2.57 | 3.07 | ||||||||||||
| 2015 Fund actual return | 1,000.00 | 922.71 | 2.44 | 3.02 | ||||||||||||
| 5% annual hypothetical return | 1,000.00 | 1,022.39 | 2.57 | 3.18 | ||||||||||||
| 2020 Fund actual return | 1,000.00 | 918.33 | 2.44 | 3.06 | ||||||||||||
| 5% annual hypothetical return | 1,000.00 | 1,022.39 | 2.57 | 3.23 | ||||||||||||
| 2025 Fund actual return | 1,000.00 | 914.55 | 2.43 | 3.15 | ||||||||||||
| 5% annual hypothetical return | 1,000.00 | 1,022.39 | 2.57 | 3.33 | ||||||||||||
| 2030 Fund actual return | 1,000.00 | 910.54 | 2.38 | 3.19 | ||||||||||||
| 5% annual hypothetical return | 1,000.00 | 1,022.44 | 2.52 | 3.38 | ||||||||||||
| 2035 Fund actual return | 1,000.00 | 905.30 | 2.33 | 3.23 | ||||||||||||
| 5% annual hypothetical return | 1,000.00 | 1,022.49 | 2.47 | 3.43 | ||||||||||||
| 2040 Fund actual return | 1,000.00 | 902.80 | 2.28 | 3.27 | ||||||||||||
| 5% annual hypothetical return | 1,000.00 | 1,022.54 | 2.42 | 3.48 | ||||||||||||
| 2045 Fund actual return | 1,000.00 | 900.55 | 2.23 | 3.32 | ||||||||||||
| 5% annual hypothetical return | 1,000.00 | 1,022.59 | 2.37 | 3.53 | ||||||||||||
| 2050 Fund actual return | 1,000.00 | 900.33 | 2.18 | 3.32 | ||||||||||||
| 5% annual hypothetical return | 1,000.00 | 1,022.64 | 2.32 | 3.53 | ||||||||||||
| 2055 Fund actual return | 1,000.00 | 900.00 | 2.18 | 3.32 | ||||||||||||
| 5% annual hypothetical return | 1,000.00 | 1,022.64 | 2.32 | 3.53 | ||||||||||||
| 2060 Fund actual return | 1,000.00 | 899.76 | 2.13 | 3.32 | ||||||||||||
| 5% annual hypothetical return | 1,000.00 | 1,022.69 | 2.27 | 3.53 | ||||||||||||
| 2065 Fund actual return | 1,000.00 | 900.22 | 2.18 | 3.36 | ||||||||||||
| 5% annual hypothetical return | 1,000.00 | 1,022.64 | 2.32 | 3.58 | ||||||||||||
| 18 | 2022 Annual Report ■ TIAA-CREF Lifecycle Funds |
Important information about expenses
| * | “Expenses paid during period” is based on each fund’s actual expense ratio for the most recent fiscal half-year, multiplied by the average account value over the six-month period, multiplied by 182/365. There were 182 days in the six months ended May 31, 2022. The expense charges of one or more of the fund’s share classes may at times reflect a waiver or reimbursement. Please see the prospectus for an explanation, including the date on which this waiver or reimbursement is scheduled to end. Without such waiver or reimbursement, the expenses of the affected share classes would be higher and their performance lower. The annualized expense ratio for the six-month period was 0.50% for the Retirement Income Fund, 0.51% for the 2010 Fund, 0.51% for the 2015 Fund, 0.51% for the 2020 Fund, 0.51% for the 2025 Fund, 0.50% for the 2030 Fund, 0.49% for the 2035 Fund, 0.48% for the 2040 Fund, 0.47% for the 2045 Fund, 0.46% for the 2050 Fund, 0.46% for the 2055 Fund, 0.45% for the 2060 Fund and 0.46% for the 2065 Fund. |
| † | “Effective expenses paid during period” is based on each fund’s total expense ratio for the most recent fiscal half-year, which includes the fund’s own expense ratio plus its pro rata share of its underlying funds’ expenses (which the fund bears through its investment in the underlying funds). For the six-month period, the total annualized weighted average expense ratio was 0.61% for the Retirement Income Fund, 0.61% for the 2010 Fund, 0.63% for the 2015 Fund, 0.64% for the 2020 Fund, 0.66% for the 2025 Fund, 0.67% for the 2030 Fund, 0.68% for the 2035 Fund, 0.69% for the 2040 Fund, 0.70% for the 2045 Fund, 0.70% for the 2050 Fund, 0.70% for the 2055 Fund, 0.70% for the 2060 Fund and 0.71% for the 2065 Fund. |
Expense examples
Six months ended May 31, 2022
| Lifecycle Funds Retail Class | Beginning account value (12/1/21 | ) | Ending account value (5/31/22 | ) | Expenses paid during period (12/1/21–5/31/22 | * ) | Effective expenses paid during period (12/1/21–5/31/22 | † ) | ||||||||
| Retirement Income Fund actual return | $1,000.00 | $ | 924.92 | $2.35 | $2.88 | |||||||||||
| 5% annual hypothetical return | 1,000.00 | 1,022.49 | 2.47 | 3.02 | ||||||||||||
| * | “Expenses paid during period” is based on the Fund’s actual expense ratio for the most recent fiscal half-year, multiplied by the average account value over the six-month period, multiplied by 182/365. There were 182 days in the six months ended May 31, 2022. The expense charges of this fund may at times reflect a waiver or reimbursement. Please see the prospectus for an explanation, including the date on which this waiver or reimbursement is scheduled to end. Without such waiver or reimbursement, the expenses of the fund would be higher and its performance lower. The annualized expense ratio for the six-month period was 0.49% for the Retirement Income Fund. |
| † | “Effective expenses paid during period” is based on the Fund’s total expense ratio for the most recent fiscal half-year, which includes the fund’s own expense ratio plus its pro rata share of its underlying funds’ expenses (which the fund bears through its investment in the underlying funds). For the six-month period, the total annualized weighted average expense ratio was 0.60% for the Retirement Income Fund. |
| TIAA-CREF Lifecycle Funds ■ 2022 Annual Report | 19 |
Investment results of the Lifecycle Funds
Performance for the twelve months ended May 31, 2022
All of the TIAA-CREF Lifecycle Funds generated losses and trailed their respective benchmarks. Returns for the Retirement Class ranged from –6.49% for the Retirement Income Fund to –8.97% for the 2055 and 2060 Funds. The performance tables show returns for all share classes of the funds.
For the twelve months, the margin of underperformance of the Lifecycle Funds, in relation to their respective composite benchmarks, ranged from 0.46 of a percentage point for the Retirement Income Fund to 2.35 percentage points for the 2060 Fund. (All results for the Lifecycle Funds are for the Retirement Class.)
Financial markets generally declined in a difficult environment
The U.S. economy expanded early in the period before contracting in the first quarter of 2022. Real gross domestic product (GDP), which measures the value of all goods and services produced in the United States, grew at annualized rates of 2.3% and 6.9%, respectively, in the third and fourth quarters of 2021. However, GDP contracted by 1.5% in the first quarter of 2022, according to the government’s “second” estimate. Unemployment declined from 5.9% in June 2021 to 3.6% in May 2022. Core inflation, which measures all items except food and energy, rose 6.0% over the twelve months ended May 31, 2022. Oil prices increased from nearly $68 per barrel to more than $114.
The Federal Reserve responded to rising inflation by increasing the federal funds target rate in March and May of 2022. Over the period, policymakers raised the key short-term interest-rate measure to 0.75%–1.00% and indicated further increases were likely.
Domestic and foreign stocks both recorded losses for the period. The Russell 3000® Index, a broad measure of the U.S. stock market, returned –3.68%. The MSCI ACWI ex USA Investable Market Index (IMI), which measures the performance of large-, mid- and small-cap equities in 22 of 23 developed-markets countries (excluding the United States) and 24 emerging-markets countries, returned –12.54% in U.S.-dollar terms.
U.S. investment-grade bonds were hurt by the impact of rising yields across both short- and long-term maturities (bond prices move in the opposite direction of yields). The broad domestic investment-grade fixed-rate bond market, as measured by the Bloomberg U.S. Aggregate Bond Index, returned –8.22%. Short-term bonds, as measured by the Bloomberg U.S. 1–3 Year Government/Credit Index, returned –3.03%.
Equity funds recorded largest losses
The Lifecycle Funds may invest in up to six sectors of the investment markets, including U.S. equity (stocks), international equity (foreign stocks),
| 20 | 2022 Annual Report ■ TIAA-CREF Lifecycle Funds |
fixed income, short-term fixed income, inflation-protected assets and direct real estate. The Lifecycle Funds do this by investing in various underlying funds that, in turn, buy stocks, fixed-income instruments and commercial real estate in these six market sectors. (Other than the Nuveen International Growth Fund, the Nuveen Growth Opportunities ETF and the Nuveen Dividend Growth Fund, all funds mentioned below are TIAA-CREF Funds.)
For the twelve-month period, the funds’ absolute returns—that is, without regard to the performance of their respective composite benchmarks—were hampered by losses among domestic and international stocks, as well as declines among most fixed-income investments. Among domestic stock funds, the Large-Cap Growth Fund recorded the largest loss, followed by the Quant Small-Cap Equity Fund. The Large-Cap Value Fund registered a modest gain. Among foreign stock funds, the Emerging Markets Equity Fund produced the largest loss, followed by the International Opportunities Fund and the International Equity Fund.
Among fixed-income funds, the Emerging Markets Debt Fund was the worst performer, followed by declines in the Core Bond Fund, International Bond Fund, Core Plus Bond Fund and the High-Yield Fund. The Inflation-Linked Bond Fund produced a small gain.
Stock and bond funds hindered relative performance
All of the Lifecycle Funds trailed their composite benchmarks, primarily due to the performance of underlying funds investing in U.S. and foreign stocks. Among domestic equity funds, the Large-Cap Growth Fund detracted most from relative performance, followed by the Nuveen Growth Opportunities ETF and the Growth & Income Fund. That impact was partially offset by superior relative performance from the Nuveen Dividend Growth Fund, the Quant Small/Mid-Cap Equity Fund and the Quant Small-Cap Equity Fund. Among international funds, the Nuveen International Growth Fund was the largest detractor from relative performance, followed by the International Opportunities Fund.
Among fixed-income funds, the Core Bond Fund and the International Bond Fund detracted most from relative performance, while the Emerging Markets Debt Fund and the Short-Term Bond Fund were the most beneficial.
The Lifecycle Funds with larger fixed-income allocations produced smaller losses for the twelve-month period. For example, the Retirement Income Fund and the 2010 Fund, which seek to invest about 60% of their assets in fixed-income securities, recorded the smallest declines. By contrast, the 2055 and 2060 Funds, each of which invests more than 90% of its assets in stocks, generated the largest losses. (Performance of the Lifecycle Funds’ underlying TIAA-CREF Funds can be found at TIAA.org/performance.)
| TIAA-CREF Lifecycle Funds ■ 2022 Annual Report | 21 |
Lifecycle Retirement Income Fund
Performance as of May 31, 2022
| Lifecycle Retirement Income Fund | Total Return | Average annual total return | Annual operating expenses*# | |||||||||||||||||||
| Inception date | 1 year | 5 years | 10 years | gross | net | |||||||||||||||||
| Institutional Class | 11/30/07 | –6.25 | % | 4.93 | % | 5.89 | % | 0.53 | % | 0.37 | % | |||||||||||
| Advisor Class | 12/4/15 | –6.33 | 4.85 | 5.76 | † | 0.61 | 0.46 | |||||||||||||||
| Premier Class | 9/30/09 | –6.40 | 4.76 | 5.73 | 0.68 | 0.52 | ||||||||||||||||
| Retirement Class | 11/30/07 | –6.49 | 4.66 | 5.63 | 0.78 | 0.62 | ||||||||||||||||
| Retail Class | 11/30/07 | –6.49 | 4.66 | 5.63 | 0.81 | 0.62 | ||||||||||||||||
| Lifecycle Retirement Income Fund Composite Index‡ | — | –6.03 | 5.28 | 5.81 | — | — | ||||||||||||||||
| Broad market index | ||||||||||||||||||||||
| S&P Target Date Retirement Income Index | — | –5.63 | 3.94 | 4.48 | — | — | ||||||||||||||||
The returns in this report show past performance, which is no guarantee of future results. The returns do not reflect taxes that a shareholder would pay on fund distributions or on the sale of fund shares. Returns and the principal value of your investment will fluctuate. Current performance may be higher or lower than that shown, and you may have a gain or a loss when you redeem your shares. For current performance information, including performance to the most recent month-end, please visit TIAA.org. Performance may reflect waivers or reimbursements of certain expenses. Absent these waivers or reimbursement arrangements, performance would be lower.
You cannot invest directly in any index. Index returns do not include a deduction for fees or expenses.
| * | The gross and net annual operating expenses are taken from the Fund’s prospectus. The net annual operating expenses may at times reflect a contractual waiver or reimbursement of various expenses. The expense reimbursements and certain waivers will continue through at least September 30, 2022, and certain other waivers will remain in effect through at least September 30, 2024, unless changed with the approval of the Board of Trustees. Without these reimbursements and waivers, expenses would be higher and returns lower. Refer to the Financial highlights later in this report for the Fund’s expense ratios as of the end of the reporting period. |
| # | These expenses include underlying fund expenses. |
| † | The performance shown for the Advisor Class that is prior to its inception date is based on performance of the Retirement Class. The performance for these periods has not been restated to reflect the actual expenses of the Advisor Class. If these actual expenses had been reflected, the performance of the Advisor Class shown for these periods would have been different because the Advisor Class has different expenses than the Retirement Class. |
| ‡ | As of the close of business on May 31, 2022, the Lifecycle Retirement Income Fund Composite Index consisted of: 40.0% Bloomberg U.S. Aggregate Bond Index; 26.0% Russell 3000® Index; 14.0% MSCI All Country World Index ex USA Investable Market Index; 10.0% Bloomberg U.S. 1–3 Year Government/Credit Bond Index; and 10.0% Bloomberg U.S. Treasury Inflation Protected Securities (TIPS) 1–10 Year Index. The Fund’s benchmark, the components that make up the composite benchmark and the method of calculating the composite benchmark’s performance may vary over time. |
| 22 | 2022 Annual Report ■ TIAA-CREF Lifecycle Funds |
Lifecycle Retirement Income Fund
$10,000 over 10 years
Retirement Class
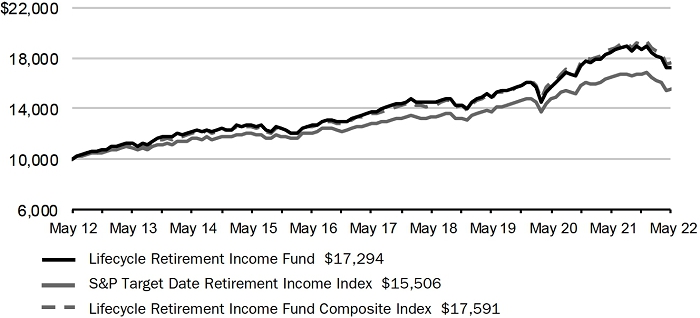
Ending amounts are as of May 31, 2022. For the purpose of comparison, the graph also shows the change in the values of the Fund’s composite benchmark and broad market index during the same period. The performance of the other share classes varies due to differences in expense charges.
Asset allocation
| % of net assets as of 5/31/22 | % of target allocation for 6/30/22 | |
| Equity | ||
| U.S. equity | 22.12 | 22.75 |
| International equity | 12.07 | 12.25 |
| Fixed income | ||
| Fixed income | 40.12 | 40.00 |
| Short-term fixed income | 10.03 | 10.00 |
| Inflation-protected assets | 9.99 | 10.00 |
| Direct real estate | 5.79 | 5.00 |
| Other assets & liabilities, net | –0.12 | — |
| Total | 100.00 | 100.00 |
Target allocation
For June 30, 2022

| TIAA-CREF Lifecycle Funds ■ 2022 Annual Report | 23 |
Performance as of May 31, 2022
| Lifecycle 2010 Fund | Total Return | Average annual total return | Annual operating expenses*# | |||||||||||||||||||
| Inception date | 1 year | 5 years | 10 years | gross | net | |||||||||||||||||
| Institutional Class | 1/17/07 | –6.34 | % | 5.00 | % | 6.30 | % | 0.52 | % | 0.37 | % | |||||||||||
| Advisor Class | 12/4/15 | –6.32 | 5.01 | 6.20 | † | 0.60 | 0.45 | |||||||||||||||
| Premier Class | 9/30/09 | –6.45 | 4.85 | 6.14 | 0.67 | 0.52 | ||||||||||||||||
| Retirement Class | 10/15/04 | –6.56 | 4.73 | 6.03 | 0.77 | 0.62 | ||||||||||||||||
| Lifecycle 2010 Fund Composite Index‡ | — | –5.94 | 5.35 | 6.23 | — | — | ||||||||||||||||
| Broad market index | ||||||||||||||||||||||
| S&P Target Date 2010 Index | — | –5.50 | 4.56 | 5.41 | — | — | ||||||||||||||||
The returns in this report show past performance, which is no guarantee of future results. The returns do not reflect taxes that a shareholder would pay on fund distributions or on the sale of fund shares. Returns and the principal value of your investment will fluctuate. Current performance may be higher or lower than that shown, and you may have a gain or a loss when you redeem your shares. For current performance information, including performance to the most recent month-end, please visit TIAA.org. Performance may reflect waivers or reimbursements of certain expenses. Absent these waivers or reimbursement arrangements, performance would be lower.
You cannot invest directly in any index. Index returns do not include a deduction for fees or expenses.
| * | The gross and net annual operating expenses are taken from the Fund’s prospectus. The net annual operating expenses may at times reflect a contractual waiver or reimbursement of various expenses. The expense reimbursements and certain waivers will continue through at least September 30, 2022, and certain other waivers will remain in effect through at least September 30, 2024, unless changed with the approval of the Board of Trustees. Without these reimbursements and waivers, expenses would be higher and returns lower. Refer to the Financial highlights later in this report for the Fund’s expense ratios as of the end of the reporting period. |
| # | These expenses include underlying fund expenses. |
| † | The performance shown for the Advisor Class that is prior to its inception date is based on performance of the Retirement Class. The performance for these periods has not been restated to reflect the actual expenses of the Advisor Class. If these actual expenses had been reflected, the performance of the Advisor Class shown for these periods would have been different because the Advisor Class has different expenses than the Retirement Class. |
| ‡ | As of the close of business on May 31, 2022, the Lifecycle 2010 Fund Composite Index consisted of: 40.0% Bloomberg U.S. Aggregate Bond Index; 24.8% Russell 3000® Index; 13.3% MSCI All Country World Index ex USA Investable Market Index; 11.9% Bloomberg U.S. 1–3 Year Government/Credit Bond Index; and 10.0% Bloomberg U.S. Treasury Inflation Protected Securities (TIPS) 1–10 Year Index. The Fund’s benchmark, the components that make up the composite benchmark and the method of calculating the composite benchmark’s performance may vary over time. |
| 24 | 2022 Annual Report ■ TIAA-CREF Lifecycle Funds |
Lifecycle 2010 Fund
$10,000 over 10 years
Retirement Class
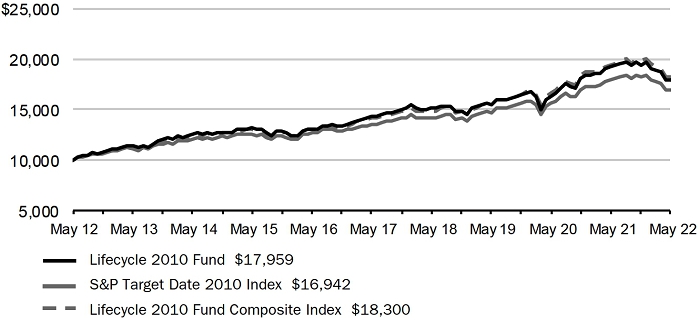
Ending amounts are as of May 31, 2022. For the purpose of comparison, the graph also shows the change in the values of the Fund’s composite benchmark and broad market index during the same period. The performance of the other share classes varies due to differences in expense charges.
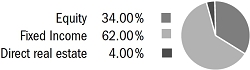
Asset allocation
| % of net assets as of 5/31/22 | % of target allocation for 6/30/22 | |
| Equity | ||
| U.S. equity | 21.56 | 22.10 |
| International equity | 11.77 | 11.90 |
| Fixed income | ||
| Fixed income | 40.06 | 40.00 |
| Short-term fixed income | 11.90 | 12.00 |
| Inflation-protected assets | 9.97 | 10.00 |
| Direct real estate | 4.71 | 4.00 |
| Other assets & liabilities, net | 0.03 | — |
| Total | 100.00 | 100.00 |
Target allocation
For June 30, 2022
| TIAA-CREF Lifecycle Funds ■ 2022 Annual Report | 25 |
Performance as of May 31, 2022
| Lifecycle 2015 Fund | Total Return | Average annual total return | Annual operating expenses*# | |||||||||||||||||||
| Inception date | 1 year | 5 years | 10 years | gross | net | |||||||||||||||||
| Institutional Class | 1/17/07 | –6.43 | % | 5.37 | % | 6.83 | % | 0.53 | % | 0.38 | % | |||||||||||
| Advisor Class | 12/4/15 | –6.61 | 5.32 | 6.70 | † | 0.62 | 0.48 | |||||||||||||||
| Premier Class | 9/30/09 | –6.54 | 5.24 | 6.68 | 0.68 | 0.53 | ||||||||||||||||
| Retirement Class | 10/15/04 | –6.73 | 5.12 | 6.57 | 0.78 | 0.63 | ||||||||||||||||
| Lifecycle 2015 Fund Composite Index‡ | — | –6.13 | 5.76 | 6.80 | — | — | ||||||||||||||||
| Broad market index | ||||||||||||||||||||||
| S&P Target Date 2015 Index | — | –5.47 | 5.01 | 6.22 | — | — | ||||||||||||||||
The returns in this report show past performance, which is no guarantee of future results. The returns do not reflect taxes that a shareholder would pay on fund distributions or on the sale of fund shares. Returns and the principal value of your investment will fluctuate. Current performance may be higher or lower than that shown, and you may have a gain or a loss when you redeem your shares. For current performance information, including performance to the most recent month-end, please visit TIAA.org. Performance may reflect waivers or reimbursements of certain expenses. Absent these waivers or reimbursement arrangements, performance would be lower.
You cannot invest directly in any index. Index returns do not include a deduction for fees or expenses.
| * | The gross and net annual operating expenses are taken from the Fund’s prospectus. The net annual operating expenses may at times reflect a contractual waiver or reimbursement of various expenses. The expense reimbursements and certain waivers will continue through at least September 30, 2022, and certain other waivers will remain in effect through at least September 30, 2024, unless changed with the approval of the Board of Trustees. Without these reimbursements and waivers, expenses would be higher and returns lower. Refer to the Financial highlights later in this report for the Fund’s expense ratios as of the end of the reporting period. |
| # | These expenses include underlying fund expenses. |
| † | The performance shown for the Advisor Class that is prior to its inception date is based on performance of the Retirement Class. The performance for these periods has not been restated to reflect the actual expenses of the Advisor Class. If these actual expenses had been reflected, the performance of the Advisor Class shown for these periods would have been different because the Advisor Class has different expenses than the Retirement Class. |
| ‡ | As of the close of business on May 31, 2022, the Lifecycle 2015 Fund Composite Index consisted of: 39.3% Bloomberg U.S. Aggregate Bond Index; 28.0% Russell 3000® Index; 15.1% MSCI All Country World Index ex USA Investable Market Index; 8.8% Bloomberg U.S. 1–3 Year Government/Credit Bond Index; and 8.8% Bloomberg U.S. Treasury Inflation Protected Securities (TIPS) 1–10 Year Index. The Fund’s benchmark, the components that make up the composite benchmark and the method of calculating the composite benchmark’s performance may vary over time. |
| 26 | 2022 Annual Report ■ TIAA-CREF Lifecycle Funds |
Lifecycle 2015 Fund
$10,000 over 10 years
Retirement Class
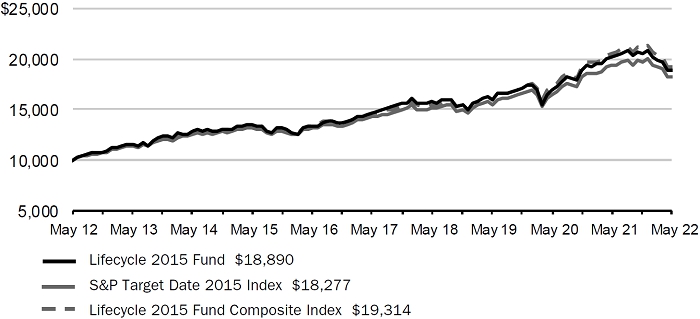
Ending amounts are as of May 31, 2022. For the purpose of comparison, the graph also shows the change in the values of the Fund’s composite benchmark and broad market index during the same period. The performance of the other share classes varies due to differences in expense charges.
Asset allocation
| % of net assets as of 5/31/22 | % of target allocation for 6/30/22 | |
| Equity | ||
| U.S. equity | 24.09 | 24.70 |
| International equity | 13.15 | 13.30 |
| Fixed income | ||
| Fixed income | 39.43 | 39.40 |
| Short-term fixed income | 8.76 | 8.80 |
| Inflation-protected assets | 8.73 | 8.80 |
| Direct real estate | 5.77 | 5.00 |
| Other assets & liabilities, net | 0.07 | — |
| Total | 100.00 | 100.00 |
Target allocation
For June 30, 2022

| TIAA-CREF Lifecycle Funds ■ 2022 Annual Report | 27 |
Performance as of May 31, 2022
| Lifecycle 2020 Fund | Total Return | Average annual total return | Annual operating expenses*# | |||||||||||||||||||
| Inception date | 1 year | 5 years | 10 years | gross | net | |||||||||||||||||
| Institutional Class | 1/17/07 | –6.86 | % | 5.74 | % | 7.45 | % | 0.53 | % | 0.39 | % | |||||||||||
| Advisor Class | 12/4/15 | –6.93 | 5.69 | 7.33 | † | 0.61 | 0.47 | |||||||||||||||
| Premier Class | 9/30/09 | –7.06 | 5.57 | 7.29 | 0.68 | 0.54 | ||||||||||||||||
| Retirement Class | 10/15/04 | –7.17 | 5.47 | 7.18 | 0.78 | 0.64 | ||||||||||||||||
| Lifecycle 2020 Fund Composite Index‡ | — | –6.32 | 6.20 | 7.49 | — | — | ||||||||||||||||
| Broad market index | ||||||||||||||||||||||
| S&P Target Date 2020 Index | — | –5.67 | 5.29 | 6.85 | — | — | ||||||||||||||||
The returns in this report show past performance, which is no guarantee of future results. The returns do not reflect taxes that a shareholder would pay on fund distributions or on the sale of fund shares. Returns and the principal value of your investment will fluctuate. Current performance may be higher or lower than that shown, and you may have a gain or a loss when you redeem your shares. For current performance information, including performance to the most recent month-end, please visit TIAA.org. Performance may reflect waivers or reimbursements of certain expenses. Absent these waivers or reimbursement arrangements, performance would be lower.
You cannot invest directly in any index. Index returns do not include a deduction for fees or expenses.
| * | The gross and net annual operating expenses are taken from the Fund’s prospectus. The net annual operating expenses may at times reflect a contractual waiver or reimbursement of various expenses. The expense reimbursements and certain waivers will continue through at least September 30, 2022, and certain other waivers will remain in effect through at least September 30, 2024, unless changed with the approval of the Board of Trustees. Without these reimbursements and waivers, expenses would be higher and returns lower. Refer to the Financial highlights later in this report for the Fund’s expense ratios as of the end of the reporting period. |
| # | These expenses include underlying fund expenses. |
| † | The performance shown for the Advisor Class that is prior to its inception date is based on performance of the Retirement Class. The performance for these periods has not been restated to reflect the actual expenses of the Advisor Class. If these actual expenses had been reflected, the performance of the Advisor Class shown for these periods would have been different because the Advisor Class has different expenses than the Retirement Class. |
| ‡ | As of the close of business on May 31, 2022, the Lifecycle 2020 Fund Composite Index consisted of: 38.4% Bloomberg U.S. Aggregate Bond Index; 31.2% Russell 3000® Index; 16.8% MSCI All Country World Index ex USA Investable Market Index; 6.8% Bloomberg U.S. 1–3 Year Government/Credit Bond Index; and 6.8% Bloomberg U.S. Treasury Inflation Protected Securities (TIPS) 1–10 Year Index. The Fund’s benchmark, the components that make up the composite benchmark and the method of calculating the composite benchmark’s performance may vary over time. |
| 28 | 2022 Annual Report ■ TIAA-CREF Lifecycle Funds |
Lifecycle 2020 Fund
$10,000 over 10 years
Retirement Class
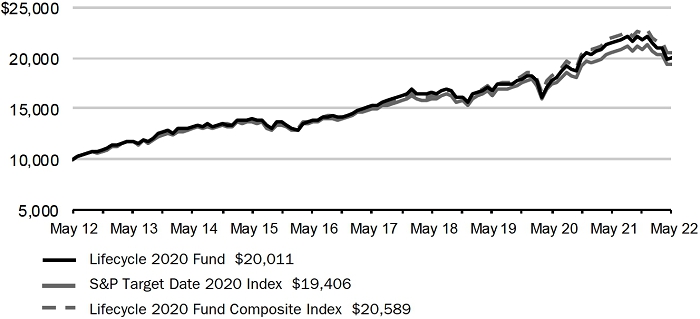
Ending amounts are as of May 31, 2022. For the purpose of comparison, the graph also shows the change in the values of the Fund’s composite benchmark and broad market index during the same period. The performance of the other share classes varies due to differences in expense charges.
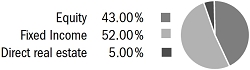
Asset allocation
| % of net assets as of 5/31/22 | % of target allocation for 6/30/22 | |
| Equity | ||
| U.S. equity | 27.32 | 27.95 |
| International equity | 14.92 | 15.05 |
| Fixed income | ||
| Fixed income | 38.40 | 38.40 |
| Short-term fixed income | 6.76 | 6.80 |
| Inflation-protected assets | 6.73 | 6.80 |
| Direct real estate | 5.75 | 5.00 |
| Other assets & liabilities, net | 0.12 | — |
| Total | 100.00 | 100.00 |
Target allocation
For June 30, 2022
| TIAA-CREF Lifecycle Funds ■ 2022 Annual Report | 29 |
Performance as of May 31, 2022
| Lifecycle 2025 Fund | Total Return | Average annual total return | Annual operating expenses*# | |||||||||||||||||||
| Inception date | 1 year | 5 years | 10 years | gross | net | |||||||||||||||||
| Institutional Class | 1/17/07 | –7.33 | % | 6.33 | % | 8.20 | % | 0.56 | % | 0.41 | % | |||||||||||
| Advisor Class | 12/4/15 | –7.32 | 6.28 | 8.07 | † | 0.64 | 0.49 | |||||||||||||||
| Premier Class | 9/30/09 | –7.44 | 6.18 | 8.04 | 0.71 | 0.56 | ||||||||||||||||
| Retirement Class | 10/15/04 | –7.55 | 6.06 | 7.92 | 0.81 | 0.66 | ||||||||||||||||
| Lifecycle 2025 Fund Composite Index‡ | — | –6.47 | 6.85 | 8.29 | — | — | ||||||||||||||||
| Broad market index | ||||||||||||||||||||||
| S&P Target Date 2025 Index | — | –5.82 | 6.09 | 7.67 | — | — | ||||||||||||||||
The returns in this report show past performance, which is no guarantee of future results. The returns do not reflect taxes that a shareholder would pay on fund distributions or on the sale of fund shares. Returns and the principal value of your investment will fluctuate. Current performance may be higher or lower than that shown, and you may have a gain or a loss when you redeem your shares. For current performance information, including performance to the most recent month-end, please visit TIAA.org. Performance may reflect waivers or reimbursements of certain expenses. Absent these waivers or reimbursement arrangements, performance would be lower.
You cannot invest directly in any index. Index returns do not include a deduction for fees or expenses.
| * | The gross and net annual operating expenses are taken from the Fund’s prospectus. The net annual operating expenses may at times reflect a contractual waiver or reimbursement of various expenses. The expense reimbursements and certain waivers will continue through at least September 30, 2022, and certain other waivers will remain in effect through at least September 30, 2024, unless changed with the approval of the Board of Trustees. Without these reimbursements and waivers, expenses would be higher and returns lower. Refer to the Financial highlights later in this report for the Fund’s expense ratios as of the end of the reporting period. |
| # | These expenses include underlying fund expenses. |
| † | The performance shown for the Advisor Class that is prior to its inception date is based on performance of the Retirement Class. The performance for these periods has not been restated to reflect the actual expenses of the Advisor Class. If these actual expenses had been reflected, the performance of the Advisor Class shown for these periods would have been different because the Advisor Class has different expenses than the Retirement Class. |
| ‡ | As of the close of business on May 31, 2022, the Lifecycle 2025 Fund Composite Index consisted of: 35.7% Russell 3000® Index; 35.5% Bloomberg U.S. Aggregate Bond Index; 19.2% MSCI All Country World Index ex USA Investable Market Index; 4.8% Bloomberg U.S. 1–3 Year Government/Credit Bond Index; and 4.8% Bloomberg U.S. Treasury Inflation Protected Securities (TIPS) 1–10 Year Index. The Fund’s benchmark, the components that make up the composite benchmark and the method of calculating the composite benchmark’s performance may vary over time. |
| 30 | 2022 Annual Report ■ TIAA-CREF Lifecycle Funds |
Lifecycle 2025 Fund
$10,000 over 10 years
Retirement Class
![]()
Ending amounts are as of May 31, 2022. For the purpose of comparison, the graph also shows the change in the values of the Fund’s composite benchmark and broad market index during the same period. The performance of the other share classes varies due to differences in expense charges.
Asset allocation
| % of net assets as of 5/31/22 | % of target allocation for 6/30/22 | |
| Equity | ||
| U.S. equity | 32.24 | 32.76 |
| International equity | 17.61 | 17.64 |
| Fixed income | ||
| Fixed income | 34.81 | 35.00 |
| Short-term fixed income | 4.76 | 4.80 |
| Inflation-protected assets | 4.75 | 4.80 |
| Direct real estate | 5.74 | 5.00 |
| Other assets & liabilities, net | 0.09 | — |
| Total | 100.00 | 100.00 |
Target allocation
For June 30, 2022
| TIAA-CREF Lifecycle Funds ■ 2022 Annual Report | 31 |
Performance as of May 31, 2022
| Lifecycle 2030 Fund | Total Return | Average annual total return | Annual operating expenses*# | |||||||||||||||||||
| Inception date | 1 year | 5 years | 10 years | gross | net | |||||||||||||||||
| Institutional Class | 1/17/07 | –7.66 | % | 6.94 | % | 8.92 | % | 0.58 | % | 0.42 | % | |||||||||||
| Advisor Class | 12/4/15 | –7.71 | 6.87 | 8.79 | † | 0.66 | 0.50 | |||||||||||||||
| Premier Class | 9/30/09 | –7.87 | 6.78 | 8.75 | 0.73 | 0.57 | ||||||||||||||||
| Retirement Class | 10/15/04 | –7.94 | 6.65 | 8.65 | 0.83 | 0.67 | ||||||||||||||||
| Lifecycle 2030 Fund Composite Index‡ | — | –6.62 | 7.51 | 9.09 | — | — | ||||||||||||||||
| Broad market index | ||||||||||||||||||||||
| S&P Target Date 2030 Index | — | –5.97 | 6.81 | 8.42 | — | — | ||||||||||||||||
The returns in this report show past performance, which is no guarantee of future results. The returns do not reflect taxes that a shareholder would pay on fund distributions or on the sale of fund shares. Returns and the principal value of your investment will fluctuate. Current performance may be higher or lower than that shown, and you may have a gain or a loss when you redeem your shares. For current performance information, including performance to the most recent month-end, please visit TIAA.org. Performance may reflect waivers or reimbursements of certain expenses. Absent these waivers or reimbursement arrangements, performance would be lower.
You cannot invest directly in any index. Index returns do not include a deduction for fees or expenses.
| * | The gross and net annual operating expenses are taken from the Fund’s prospectus. The net annual operating expenses may at times reflect a contractual waiver or reimbursement of various expenses. The expense reimbursements and certain waivers will continue through at least September 30, 2022, and certain other waivers will remain in effect through at least September 30, 2024, unless changed with the approval of the Board of Trustees. Without these reimbursements and waivers, expenses would be higher and returns lower. Refer to the Financial highlights later in this report for the Fund’s expense ratios as of the end of the reporting period. |
| # | These expenses include underlying fund expenses. |
| † | The performance shown for the Advisor Class that is prior to its inception date is based on performance of the Retirement Class. The performance for these periods has not been restated to reflect the actual expenses of the Advisor Class. If these actual expenses had been reflected, the performance of the Advisor Class shown for these periods would have been different because the Advisor Class has different expenses than the Retirement Class. |
| ‡ | As of the close of business on May 31, 2022, the Lifecycle 2030 Fund Composite Index consisted of: 40.9% Russell 3000® Index; 31.5% Bloomberg U.S. Aggregate Bond Index; 22.0% MSCI All Country World Index ex USA Investable Market Index; 2.8% Bloomberg U.S. 1–3 Year Government/Credit Bond Index; and 2.8% Bloomberg U.S. Treasury Inflation Protected Securities (TIPS) 1–10 Year Index. The Fund’s benchmark, the components that make up the composite benchmark and the method of calculating the composite benchmark’s performance may vary over time. |
| 32 | 2022 Annual Report ■ TIAA-CREF Lifecycle Funds |
Lifecycle 2030 Fund
$10,000 over 10 years
Retirement Class
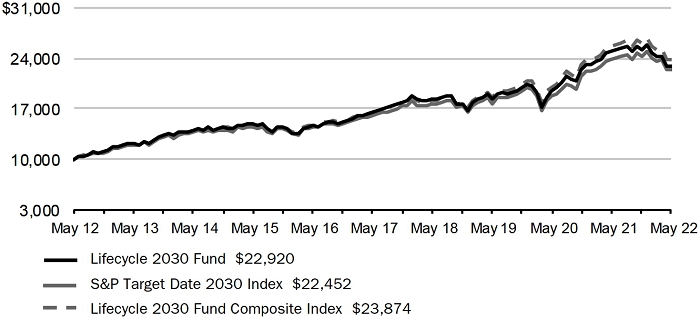
Ending amounts are as of May 31, 2022. For the purpose of comparison, the graph also shows the change in the values of the Fund’s composite benchmark and broad market index during the same period. The performance of the other share classes varies due to differences in expense charges.
Asset allocation
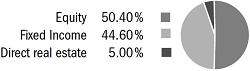
| % of net assets as of 5/31/22 | % of target allocation for 6/30/22 | |
| Equity | ||
| U.S. equity | 38.17 | 38.61 |
| International equity | 20.84 | 20.79 |
| Fixed income | ||
| Fixed income | 29.64 | 30.00 |
| Short-term fixed income | 2.76 | 2.80 |
| Inflation-protected assets | 2.75 | 2.80 |
| Direct real estate | 5.72 | 5.00 |
| Other assets & liabilities, net | 0.12 | — |
| Total | 100.00 | 100.00 |
Target allocation
For June 30, 2022

| TIAA-CREF Lifecycle Funds ■ 2022 Annual Report | 33 |
Performance as of May 31, 2022
| Lifecycle 2035 Fund | Total Return | Average annual total return | Annual operating expenses*# | |||||||||||||||||||
| Inception date | 1 year | 5 years | 10 years | gross | net | |||||||||||||||||
| Institutional Class | 1/17/07 | –8.19 | % | 7.48 | % | 9.59 | % | 0.60 | % | 0.43 | % | |||||||||||
| Advisor Class | 12/4/15 | –8.20 | 7.43 | 9.45 | † | 0.69 | 0.52 | |||||||||||||||
| Premier Class | 9/30/09 | –8.29 | 7.32 | 9.42 | 0.75 | 0.58 | ||||||||||||||||
| Retirement Class | 10/15/04 | –8.42 | 7.21 | 9.30 | 0.85 | 0.68 | ||||||||||||||||
| Lifecycle 2035 Fund Composite Index‡ | — | –6.78 | 8.14 | 9.85 | — | — | ||||||||||||||||
| Broad market index | ||||||||||||||||||||||
| S&P Target Date 2035 Index | — | –6.07 | 7.57 | 9.13 | — | — | ||||||||||||||||
The returns in this report show past performance, which is no guarantee of future results. The returns do not reflect taxes that a shareholder would pay on fund distributions or on the sale of fund shares. Returns and the principal value of your investment will fluctuate. Current performance may be higher or lower than that shown, and you may have a gain or a loss when you redeem your shares. For current performance information, including performance to the most recent month-end, please visit TIAA.org. Performance may reflect waivers or reimbursements of certain expenses. Absent these waivers or reimbursement arrangements, performance would be lower.
You cannot invest directly in any index. Index returns do not include a deduction for fees or expenses.
| * | The gross and net annual operating expenses are taken from the Fund’s prospectus. The net annual operating expenses may at times reflect a contractual waiver or reimbursement of various expenses. The expense reimbursements and certain waivers will continue through at least September 30, 2022, and certain other waivers will remain in effect through at least September 30, 2024, unless changed with the approval of the Board of Trustees. Without these reimbursements and waivers, expenses would be higher and returns lower. Refer to the Financial highlights later in this report for the Fund’s expense ratios as of the end of the reporting period. |
| # | These expenses include underlying fund expenses. |
| † | The performance shown for the Advisor Class that is prior to its inception date is based on performance of the Retirement Class. The performance for these periods has not been restated to reflect the actual expenses of the Advisor Class. If these actual expenses had been reflected, the performance of the Advisor Class shown for these periods would have been different because the Advisor Class has different expenses than the Retirement Class. |
| ‡ | As of the close of business on May 31, 2022, the Lifecycle 2035 Fund Composite Index consisted of: 46.1% Russell 3000® Index; 27.5% Bloomberg U.S. Aggregate Bond Index; 24.8% MSCI All Country World Index ex USA Investable Market Index; 0.8% Bloomberg U.S. 1–3 Year Government/Credit Bond Index; and 0.8% Bloomberg U.S. Treasury Inflation Protected Securities (TIPS) 1–10 Year Index. The Fund’s benchmark, the components that make up the composite benchmark and the method of calculating the composite benchmark’s performance may vary over time. |
| 34 | 2022 Annual Report ■ TIAA-CREF Lifecycle Funds |
Lifecycle 2035 Fund
$10,000 over 10 years
Retirement Class
Ending amounts are as of May 31, 2022. For the purpose of comparison, the graph also shows the change in the values of the Fund’s composite benchmark and broad market index during the same period. The performance of the other share classes varies due to differences in expense charges.
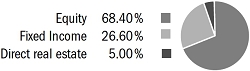
Asset allocation
| % of net assets as of 5/31/22 | % of target allocation for 6/30/22 | |
| Equity | ||
| U.S. equity | 44.07 | 44.46 |
| International equity | 24.07 | 23.94 |
| Fixed income | ||
| Fixed income | 24.52 | 25.00 |
| Short-term fixed income | 0.75 | 0.80 |
| Inflation-protected assets | 0.75 | 0.80 |
| Direct real estate | 5.70 | 5.00 |
| Other assets & liabilities, net | 0.14 | — |
| Total | 100.00 | 100.00 |
Target allocation
For June 30, 2022
| TIAA-CREF Lifecycle Funds ■ 2022 Annual Report | 35 |
Performance as of May 31, 2022
| Lifecycle 2040 Fund | Total Return | Average annual total return | Annual operating expenses*# | |||||||||||||||||||
| Inception date | 1 year | 5 years | 10 years | gross | net | |||||||||||||||||
| Institutional Class | 1/17/07 | –8.47 | % | 8.04 | % | 10.11 | % | 0.62 | % | 0.44 | % | |||||||||||
| Advisor Class | 12/4/15 | –8.55 | 8.00 | 9.98 | † | 0.70 | 0.52 | |||||||||||||||
| Premier Class | 9/30/09 | –8.57 | 7.91 | 9.96 | 0.77 | 0.59 | ||||||||||||||||
| Retirement Class | 10/15/04 | –8.67 | 7.80 | 9.85 | 0.87 | 0.69 | ||||||||||||||||
| Lifecycle 2040 Fund Composite Index‡ | — | –6.77 | 8.79 | 10.47 | — | — | ||||||||||||||||
| Broad market index | ||||||||||||||||||||||
| S&P Target Date 2040 Index | — | –6.07 | 8.11 | 9.64 | — | — | ||||||||||||||||
The returns in this report show past performance, which is no guarantee of future results. The returns do not reflect taxes that a shareholder would pay on fund distributions or on the sale of fund shares. Returns and the principal value of your investment will fluctuate. Current performance may be higher or lower than that shown, and you may have a gain or a loss when you redeem your shares. For current performance information, including performance to the most recent month-end, please visit TIAA.org. Performance may reflect waivers or reimbursements of certain expenses. Absent these waivers or reimbursement arrangements, performance would be lower.
You cannot invest directly in any index. Index returns do not include a deduction for fees or expenses.
| * | The gross and net annual operating expenses are taken from the Fund’s prospectus. The net annual operating expenses may at times reflect a contractual waiver or reimbursement of various expenses. The expense reimbursements and certain waivers will continue through at least September 30, 2022, and certain other waivers will remain in effect through at least September 30, 2024, unless changed with the approval of the Board of Trustees. Without these reimbursements and waivers, expenses would be higher and returns lower. Refer to the Financial highlights later in this report for the Fund’s expense ratios as of the end of the reporting period. |
| # | These expenses include underlying fund expenses. |
| † | The performance shown for the Advisor Class that is prior to its inception date is based on performance of the Retirement Class. The performance for these periods has not been restated to reflect the actual expenses of the Advisor Class. If these actual expenses had been reflected, the performance of the Advisor Class shown for these periods would have been different because the Advisor Class has different expenses than the Retirement Class. |
| ‡ | As of the close of business on May 31, 2022, the Lifecycle 2040 Fund Composite Index consisted of: 51.3% Russell 3000® Index; 27.6% MSCI All Country World Index ex USA Investable Market Index; and 21.1% Bloomberg U.S. Aggregate Bond Index. The Fund’s benchmark, the components that make up the composite benchmark and the method of calculating the composite benchmark’s performance may vary over time. |
| 36 | 2022 Annual Report ■ TIAA-CREF Lifecycle Funds |
Lifecycle 2040 Fund
$10,000 over 10 years
Retirement Class

Ending amounts are as of May 31, 2022. For the purpose of comparison, the graph also shows the change in the values of the Fund’s composite benchmark and broad market index during the same period. The performance of the other share classes varies due to differences in expense charges.
Asset allocation
| % of net assets as of 5/31/22 | % of target allocation for 6/30/22 | |
| Equity | ||
| U.S. equity | 49.95 | 50.31 |
| International equity | 27.31 | 27.09 |
| Fixed income | 16.91 | 17.60 |
| Direct real estate | 5.68 | 5.00 |
| Other assets & liabilities, net | 0.15 | — |
| Total | 100.00 | 100.00 |
Target allocation
For June 30, 2022
| TIAA-CREF Lifecycle Funds ■ 2022 Annual Report | 37 |
Performance as of May 31, 2022
| Lifecycle 2045 Fund | Total Return | Average annual total return | Annual operating expenses*# | |||||||||||||||||||
| Inception date | 1 year | 5 years | 10 years | gross | net | |||||||||||||||||
| Institutional Class | 11/30/07 | –8.63 | % | 8.57 | % | 10.43 | % | 0.64 | % | 0.45 | % | |||||||||||
| Advisor Class | 12/4/15 | –8.67 | 8.54 | 10.31 | † | 0.72 | 0.53 | |||||||||||||||
| Premier Class | 9/30/09 | –8.77 | 8.40 | 10.26 | 0.79 | 0.60 | ||||||||||||||||
| Retirement Class | 11/30/07 | –8.89 | 8.29 | 10.15 | 0.89 | 0.70 | ||||||||||||||||
| Lifecycle 2045 Fund Composite Index‡ | — | –6.66 | 9.38 | 10.83 | — | — | ||||||||||||||||
| Broad market index | ||||||||||||||||||||||
| S&P Target Date 2045 Index | — | –6.04 | 8.40 | 9.98 | — | — | ||||||||||||||||
The returns in this report show past performance, which is no guarantee of future results. The returns do not reflect taxes that a shareholder would pay on fund distributions or on the sale of fund shares. Returns and the principal value of your investment will fluctuate. Current performance may be higher or lower than that shown, and you may have a gain or a loss when you redeem your shares. For current performance information, including performance to the most recent month-end, please visit TIAA.org. Performance may reflect waivers or reimbursements of certain expenses. Absent these waivers or reimbursement arrangements, performance would be lower.
You cannot invest directly in any index. Index returns do not include a deduction for fees or expenses.
| * | The gross and net annual operating expenses are taken from the Fund’s prospectus. The net annual operating expenses may at times reflect a contractual waiver or reimbursement of various expenses. The expense reimbursements and certain waivers will continue through at least September 30, 2022, and certain other waivers will remain in effect through at least September 30, 2024, unless changed with the approval of the Board of Trustees. Without these reimbursements and waivers, expenses would be higher and returns lower. Refer to the Financial highlights later in this report for the Fund’s expense ratios as of the end of the reporting period. |
| # | These expenses include underlying fund expenses. |
| † | The performance shown for the Advisor Class that is prior to its inception date is based on performance of the Retirement Class. The performance for these periods has not been restated to reflect the actual expenses of the Advisor Class. If these actual expenses had been reflected, the performance of the Advisor Class shown for these periods would have been different because the Advisor Class has different expenses than the Retirement Class. |
| ‡ | As of the close of business on May 31, 2022, the Lifecycle 2045 Fund Composite Index consisted of: 56.5% Russell 3000® Index; 30.4% MSCI All Country World Index ex USA Investable Market Index; and 13.1% Bloomberg U.S. Aggregate Bond Index. The Fund’s benchmark, the components that make up the composite benchmark and the method of calculating the composite benchmark’s performance may vary over time. |
| 38 | 2022 Annual Report ■ TIAA-CREF Lifecycle Funds |
Lifecycle 2045 Fund
$10,000 over 10 years
Retirement Class

Ending amounts are as of May 31, 2022. For the purpose of comparison, the graph also shows the change in the values of the Fund’s composite benchmark and broad market index during the same period. The performance of the other share classes varies due to differences in expense charges.
Asset allocation
| % of net assets as of 5/31/22 | % of target allocation for 6/30/22 | |
| Equity | ||
| U.S. equity | 55.83 | 56.16 |
| International equity | 30.51 | 30.24 |
| Fixed income | 7.82 | 8.60 |
| Direct real estate | 5.66 | 5.00 |
| Other assets & liabilities, net | 0.18 | — |
| Total | 100.00 | 100.00 |
Target allocation
For June 30, 2022

| TIAA-CREF Lifecycle Funds ■ 2022 Annual Report | 39 |
Performance as of May 31, 2022
| Lifecycle 2050 Fund | Total Return | Average annual total return | Annual operating expenses*# | |||||||||||||||||||
| Inception date | 1 year | 5 years | 10 years | gross | net | |||||||||||||||||
| Institutional Class | 11/30/07 | –8.73 | % | 8.68 | % | 10.50 | % | 0.65 | % | 0.45 | % | |||||||||||
| Advisor Class | 12/4/15 | –8.75 | 8.65 | 10.38 | † | 0.73 | 0.53 | |||||||||||||||
| Premier Class | 9/30/09 | –8.86 | 8.52 | 10.34 | 0.80 | 0.60 | ||||||||||||||||
| Retirement Class | 11/30/07 | –8.93 | 8.42 | 10.23 | 0.90 | 0.70 | ||||||||||||||||
| Lifecycle 2050 Fund Composite Index‡ | — | –6.65 | 9.53 | 10.93 | — | — | ||||||||||||||||
| Broad market index | ||||||||||||||||||||||
| S&P Target Date 2050 Index | — | –6.07 | 8.57 | 10.24 | — | — | ||||||||||||||||
The returns in this report show past performance, which is no guarantee of future results. The returns do not reflect taxes that a shareholder would pay on fund distributions or on the sale of fund shares. Returns and the principal value of your investment will fluctuate. Current performance may be higher or lower than that shown, and you may have a gain or a loss when you redeem your shares. For current performance information, including performance to the most recent month-end, please visit TIAA.org. Performance may reflect waivers or reimbursements of certain expenses. Absent these waivers or reimbursement arrangements, performance would be lower.
You cannot invest directly in any index. Index returns do not include a deduction for fees or expenses.
| * | The gross and net annual operating expenses are taken from the Fund’s prospectus. The net annual operating expenses may at times reflect a contractual waiver or reimbursement of various expenses. The expense reimbursements and certain waivers will continue through at least September 30, 2022, and certain other waivers will remain in effect through at least September 30, 2024, unless changed with the approval of the Board of Trustees. Without these reimbursements and waivers, expenses would be higher and returns lower. Refer to the Financial highlights later in this report for the Fund’s expense ratios as of the end of the reporting period. |
| # | These expenses include underlying fund expenses. |
| † | The performance shown for the Advisor Class that is prior to its inception date is based on performance of the Retirement Class. The performance for these periods has not been restated to reflect the actual expenses of the Advisor Class. If these actual expenses had been reflected, the performance of the Advisor Class shown for these periods would have been different because the Advisor Class has different expenses than the Retirement Class. |
| ‡ | As of the close of business on May 31, 2022, the Lifecycle 2050 Fund Composite Index consisted of: 59.0% Russell 3000® Index; 31.8% MSCI All Country World Index ex USA Investable Market Index; and 9.2% Bloomberg U.S. Aggregate Bond Index. The Fund’s benchmark, the components that make up the composite benchmark and the method of calculating the composite benchmark’s performance may vary over time. |
| 40 | 2022 Annual Report ■ TIAA-CREF Lifecycle Funds |
Lifecycle 2050 Fund
$10,000 over 10 years
Retirement Class
![]()
Ending amounts are as of May 31, 2022. For the purpose of comparison, the graph also shows the change in the values of the Fund’s composite benchmark and broad market index during the same period. The performance of the other share classes varies due to differences in expense charges.
Asset allocation
| % of net assets as of 5/31/22 | % of target allocation for 6/30/22 | |
| Equity | ||
| U.S. equity | 58.56 | 58.99 |
| International equity | 31.99 | 31.76 |
| Fixed income | 3.62 | 4.25 |
| Direct real estate | 5.65 | 5.00 |
| Other assets & liabilities, net | 0.18 | — |
| Total | 100.00 | 100.00 |
Target allocation
For June 30, 2022

| TIAA-CREF Lifecycle Funds ■ 2022 Annual Report | 41 |
Performance as of May 31, 2022
| Lifecycle 2055 Fund | Total Return | Average annual total return | Annual operating expenses*# | |||||||||||||||||||
| Inception date | 1 year | 5 years | 10 years | gross | net | |||||||||||||||||
| Institutional Class | 4/29/11 | –8.73 | % | 8.75 | % | 10.56 | % | 0.68 | % | 0.45 | % | |||||||||||
| Advisor Class | 12/4/15 | –8.78 | 8.72 | 10.44 | † | 0.76 | 0.53 | |||||||||||||||
| Premier Class | 4/29/11 | –8.86 | 8.59 | 10.40 | 0.81 | 0.60 | ||||||||||||||||
| Retirement Class | 4/29/11 | –8.97 | 8.49 | 10.28 | 0.91 | 0.70 | ||||||||||||||||
| Lifecycle 2055 Fund Composite Index‡ | — | –6.63 | 9.63 | 11.01 | — | — | ||||||||||||||||
| Broad market index | ||||||||||||||||||||||
| S&P Target Date 2055 Index | — | –6.08 | 8.63 | 10.41 | — | — | ||||||||||||||||
The returns in this report show past performance, which is no guarantee of future results. The returns do not reflect taxes that a shareholder would pay on fund distributions or on the sale of fund shares. Returns and the principal value of your investment will fluctuate. Current performance may be higher or lower than that shown, and you may have a gain or a loss when you redeem your shares. For current performance information, including performance to the most recent month-end, please visit TIAA.org. Performance may reflect waivers or reimbursements of certain expenses. Absent these waivers or reimbursement arrangements, performance would be lower.
You cannot invest directly in any index. Index returns do not include a deduction for fees or expenses.
| * | The gross and net annual operating expenses are taken from the Fund’s prospectus. The net annual operating expenses may at times reflect a contractual waiver or reimbursement of various expenses. The expense reimbursements and certain waivers will continue through at least September 30, 2022, and certain other waivers will remain in effect through at least September 30, 2024, unless changed with the approval of the Board of Trustees. Without these reimbursements and waivers, expenses would be higher and returns lower. Refer to the Financial highlights later in this report for the Fund’s expense ratios as of the end of the reporting period. |
| # | These expenses include underlying fund expenses. |
| † | The performance shown for the Advisor Class that is prior to its inception date is based on performance of the Retirement Class. The performance for these periods has not been restated to reflect the actual expenses of the Advisor Class. If these actual expenses had been reflected, the performance of the Advisor Class shown for these periods would have been different because the Advisor Class has different expenses than the Retirement Class. |
| ‡ | As of the close of business on May 31, 2022, the Lifecycle 2055 Fund Composite Index consisted of: 59.8% Russell 3000® Index; 32.2% MSCI All Country World Index ex USA Investable Market Index; and 8.0% Bloomberg U.S. Aggregate Bond Index. The Fund’s benchmark, the components that make up the composite benchmark and the method of calculating the composite benchmark’s performance may vary over time. |
| 42 | 2022 Annual Report ■ TIAA-CREF Lifecycle Funds |
Lifecycle 2055 Fund
$10,000 over 10 years
Retirement Class

Ending amounts are as of May 31, 2022. For the purpose of comparison, the graph also shows the change in the values of the Fund’s composite benchmark and broad market index during the same period. The performance of the other share classes varies due to differences in expense charges.
Asset allocation
| % of net assets as of 5/31/22 | % of target allocation for 6/30/22 | |
| Equity | ||
| U.S. equity | 59.35 | 59.80 |
| International equity | 32.42 | 32.20 |
| Fixed income | 2.38 | 3.00 |
| Direct real estate | 5.65 | 5.00 |
| Other assets & liabilities, net | 0.20 | — |
| Total | 100.00 | 100.00 |
Target allocation
For June 30, 2022

| TIAA-CREF Lifecycle Funds ■ 2022 Annual Report | 43 |
Performance as of May 31, 2022
| Lifecycle 2060 Fund | Total Return | Average annual total return | Annual operating expenses*# | |||||||||||||||||||
| Inception date | 1 year | 5 years | since inception | gross | net | |||||||||||||||||
| Institutional Class | 9/26/14 | –8.71 | % | 8.85 | % | 8.45 | % | 0.71 | % | 0.45 | % | |||||||||||
| Advisor Class | 12/4/15 | –8.77 | 8.80 | 8.37 | † | 0.79 | 0.53 | |||||||||||||||
| Premier Class | 9/26/14 | –8.92 | 8.68 | 8.28 | 0.86 | 0.60 | ||||||||||||||||
| Retirement Class | 9/26/14 | –8.97 | 8.58 | 8.18 | 0.96 | 0.70 | ||||||||||||||||
| Lifecycle 2060 Fund Composite Index‡ | — | –6.62 | 9.73 | 8.95 | § | — | — | |||||||||||||||
| Broad market index | ||||||||||||||||||||||
| S&P Target Date 2060 Index | — | –6.14 | 8.70 | 8.18 | § | — | — | |||||||||||||||
The returns in this report show past performance, which is no guarantee of future results. The returns do not reflect taxes that a shareholder would pay on fund distributions or on the sale of fund shares. Returns and the principal value of your investment will fluctuate. Current performance may be higher or lower than that shown, and you may have a gain or a loss when you redeem your shares. For current performance information, including performance to the most recent month-end, please visit TIAA.org. Performance may reflect waivers or reimbursements of certain expenses. Absent these waivers or reimbursement arrangements, performance would be lower.
You cannot invest directly in any index. Index returns do not include a deduction for fees or expenses.
| * | The gross and net annual operating expenses are taken from the Fund’s prospectus. The net annual operating expenses may at times reflect a contractual waiver or reimbursement of various expenses. The expense reimbursements and certain waivers will continue through at least September 30, 2022, and certain other waivers will remain in effect through at least September 30, 2024, unless changed with the approval of the Board of Trustees. Without these reimbursements and waivers, expenses would be higher and returns lower. Refer to the Financial highlights later in this report for the Fund’s expense ratios as of the end of the reporting period. |
| # | These expenses include underlying fund expenses. |
| † | The performance shown for the Advisor Class that is prior to its inception date is based on performance of the Retirement Class. The performance for these periods has not been restated to reflect the actual expenses of the Advisor Class. If these actual expenses had been reflected, the performance of the Advisor Class shown for these periods would have been different because the Advisor Class has different expenses than the Retirement Class. |
| ‡ | As of the close of business on May 31, 2022, the Lifecycle 2060 Fund Composite Index consisted of: 60.6% Russell 3000® Index; 32.7% MSCI All Country World Index ex USA Investable Market Index; and 6.7% Bloomberg U.S. Aggregate Bond Index. The Fund’s benchmark, the components that make up the composite benchmark and the method of calculating the composite benchmark’s performance may vary over time. |
| § | Performance is calculated from the inception date of the Retirement Class. |
| 44 | 2022 Annual Report ■ TIAA-CREF Lifecycle Funds |
Lifecycle 2060 Fund
$10,000 invested at Fund’s inception
Retirement Class (inception September 26, 2014)

Ending amounts are as of May 31, 2022. For the purpose of comparison, the graph also shows the change in the values of the Fund’s composite benchmark and broad market index during the same period. The performance of the other share classes varies due to differences in expense charges.
Asset allocation
| % of net assets as of 5/31/22 | % of target allocation for 6/30/22 | |
| Equity | ||
| U.S. equity | 60.16 | 60.61 |
| International equity | 32.84 | 32.64 |
| Fixed income | 1.16 | 1.75 |
| Direct real estate | 5.63 | 5.00 |
| Other assets & liabilities, net | 0.21 | — |
| Total | 100.00 | 100.00 |
Target allocation
For June 30, 2022

| TIAA-CREF Lifecycle Funds ■ 2022 Annual Report | 45 |
Performance as of May 31, 2022
| Lifecycle 2065 Fund | Total Return | Average annual total return | Annual operating expenses*# | |||||||||||||||
| Inception date | 1 year | since inception | gross | net | ||||||||||||||
| Institutional Class | 9/30/20 | –8.52 | % | 9.82 | % | 3.74 | % | 0.45 | % | |||||||||
| Advisor Class | 9/30/20 | –8.96 | 9.42 | 3.82 | 0.53 | |||||||||||||
| Premier Class | 9/30/20 | –8.78 | 9.50 | 3.91 | 0.60 | |||||||||||||
| Retirement Class | 9/30/20 | –8.46 | 9.66 | 4.04 | 0.70 | |||||||||||||
| Lifecycle 2065 Fund Composite Index‡ | — | –6.60 | 10.93 | § | — | — | ||||||||||||
| Broad market index** | ||||||||||||||||||
| S&P Target Date 2065+ Index | — | –6.00 | 11.48 | § | — | — | ||||||||||||
| S&P Target Date 2060 Index | — | –6.14 | 11.39 | § | — | — | ||||||||||||
The returns in this report show past performance, which is no guarantee of future results. The returns do not reflect taxes that a shareholder would pay on fund distributions or on the sale of fund shares. Returns and the principal value of your investment will fluctuate. Current performance may be higher or lower than that shown, and you may have a gain or a loss when you redeem your shares. For current performance information, including performance to the most recent month-end, please visit TIAA.org. Performance may reflect waivers or reimbursements of certain expenses. Absent these waivers or reimbursement arrangements, performance would be lower.
You cannot invest directly in any index. Index returns do not include a deduction for fees or expenses.
| * | The gross and net annual operating expenses are taken from the Fund’s prospectus. The net annual operating expenses may at times reflect a contractual waiver or reimbursement of various expenses. The expense reimbursements and certain waivers will continue through at least September 30, 2022, and certain other waivers will remain in effect through at least September 30, 2024, unless changed with the approval of the Board of Trustees. Without these reimbursements and waivers, expenses would be higher and returns lower. Refer to the Financial highlights later in this report for the Fund’s expense ratios as of the end of the reporting period. |
| # | These expenses include underlying fund expenses. |
| ‡ | As of the close of business on May 31, 2022, the Lifecycle 2065 Fund Composite Index consisted of: 61.4% Russell 3000® Index; 33.1% MSCI All Country World Index ex USA Investable Market Index; and 5.5% Bloomberg U.S. Aggregate Bond Index. The Fund’s benchmark, the components that make up the composite benchmark and the method of calculating the composite benchmark’s performance may vary over time. |
| § | Performance is calculated from the inception date of the Retirement Class. |
| ** | Previously, the Fund’s broad-market index comparison was to the S&P Target Date 2060 Index (formerly known as the S&P Target Date 2060+ Index), instead of the S&P Target Date 2065+ Index shown in the chart above. The returns of the S&P Target Date 2065+ Index, which Standard & Poor’s launched in 2021, are more appropriate for comparison purposes because they reflect multi-asset class exposure for the same target date as the Fund. |
| 46 | 2022 Annual Report ■ TIAA-CREF Lifecycle Funds |
Lifecycle 2065 Fund
$10,000 invested at Fund’s inception
Retirement Class (inception September 30, 2020)
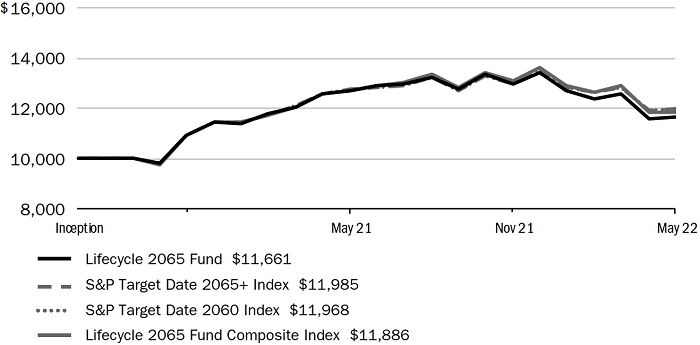
Ending amounts are as of May 31, 2022. For the purpose of comparison, the graph also shows the change in the values of the Fund’s composite benchmark and broad market index during the same period. The performance of the other share classes varies due to differences in expense charges.
Asset allocation
| % of net assets as of 5/31/22 | % of target allocation for 6/30/22 | |
| Equity | ||
| U.S. equity | 60.86 | 61.43 |
| International equity | 33.23 | 33.07 |
| Fixed income | 0.03 | 0.50 |
| Direct real estate | 5.62 | 5.00 |
| Other assets & liabilities, net | 0.26 | — |
| Total | 100.00 | 100.00 |
Target allocation
For June 30, 2022

| TIAA-CREF Lifecycle Funds ■ 2022 Annual Report | 47 |
Lifecycle Retirement Income Fund ■ May 31, 2022
| Shares | Security | Value | % of net assets | |||||||||||
| AFFILIATED INVESTMENT COMPANIES—100.1%a | ||||||||||||||
| DIRECT REAL ESTATE—5.8% | ||||||||||||||
| 2,256,802 | b | TIAA-CREF Real Property Fund LP (purchased 8/01/16–5/26/22; cost $24,186,249) | $ | 30,624,809 | 5.8 | % | ||||||||
| TOTAL DIRECT REAL ESTATE | 30,624,809 | 5.8 | ||||||||||||
| FIXED INCOME—40.1% | ||||||||||||||
| 11,553,547 | TIAA-CREF Core Bond Fund | 110,567,449 | 20.9 | |||||||||||
| 7,194,948 | TIAA-CREF Core Plus Bond Fund | 69,071,504 | 13.0 | |||||||||||
| 1,288,679 | TIAA-CREF Emerging Markets Debt Fund | 10,863,568 | 2.1 | |||||||||||
| 1,229,059 | TIAA-CREF High-Yield Fund | 10,754,270 | 2.0 | |||||||||||
| 1,240,843 | TIAA-CREF International Bond Fund | 11,068,322 | 2.1 | |||||||||||
| TOTAL FIXED INCOME | 212,325,113 | 40.1 | ||||||||||||
| INFLATION-PROTECTED ASSETS—10.0% | ||||||||||||||
| 4,515,787 | TIAA-CREF Inflation-Linked Bond Fund | 52,879,871 | 10.0 | |||||||||||
| TOTAL INFLATION-PROTECTED ASSETS | 52,879,871 | 10.0 | ||||||||||||
| INTERNATIONAL EQUITY—12.1% | ||||||||||||||
| 310,971 | Nuveen International Growth Fund | 13,648,513 | 2.6 | |||||||||||
| 968,291 | TIAA-CREF Emerging Markets Equity Fund | 7,910,935 | 1.5 | |||||||||||
| 1,588,096 | TIAA-CREF International Equity Fund | 19,454,174 | 3.7 | |||||||||||
| 954,494 | TIAA-CREF International Opportunities Fund | 13,735,162 | 2.6 | |||||||||||
| 879,764 | TIAA-CREF Quant International Small-Cap Equity Fund | 9,149,542 | 1.7 | |||||||||||
| TOTAL INTERNATIONAL EQUITY | 63,898,326 | 12.1 | ||||||||||||
| SHORT-TERM FIXED INCOME—10.0% | ||||||||||||||
| 5,286,913 | TIAA-CREF Short-Term Bond Fund | 53,080,604 | 10.0 | |||||||||||
| TOTAL SHORT-TERM FIXED INCOME | 53,080,604 | 10.0 | ||||||||||||
| U.S. EQUITY—22.1% | ||||||||||||||
| 316,196 | Nuveen Dividend Growth Fund | 16,654,039 | 3.2 | |||||||||||
| 1,284,505 | Nuveen Dividend Value Fund | 19,062,054 | 3.6 | |||||||||||
| 897,046 | Nuveen Growth Opportunities ETF | 17,698,718 | 3.3 | |||||||||||
| 1,158,977 | TIAA-CREF Growth & Income Fund | 16,758,801 | 3.2 | |||||||||||
| 975,695 | TIAA-CREF Large-Cap Growth Fund | 17,650,331 | 3.3 | |||||||||||
| 932,257 | TIAA-CREF Large-Cap Value Fund | 19,083,300 | 3.6 | |||||||||||
| 283,397 | TIAA-CREF Quant Small-Cap Equity Fund | 4,636,375 | 0.9 | |||||||||||
| 412,710 | TIAA-CREF Quant Small/Mid-Cap Equity Fund | 5,517,928 | 1.0 | |||||||||||
| TOTAL U.S. EQUITY | 117,061,546 | 22.1 | ||||||||||||
| TOTAL AFFILIATED INVESTMENT COMPANIES | (Cost $516,008,619) | 529,870,269 | 100.1 | |||||||||||
| TOTAL PORTFOLIO | (Cost $516,008,619) | 529,870,269 | 100.1 | |||||||||||
| OTHER ASSETS & LIABILITIES, NET | (635,822 | ) | (0.1 | ) | ||||||||||
| NET ASSETS | $ | 529,234,447 | 100.0 | % | ||||||||||
ETF Exchange Traded Fund
| a | The Fund invests its assets in the affiliated TIAA-CREF Real Property Fund LP, the affiliated Nuveen Growth Opportunities ETF, Class W shares of the affiliated TIAA-CREF Funds and Class R6 shares of the affiliated Nuveen Funds. |
| b | Restricted security. At 5/31/22, the total value of this security amounted to $30,624,809 or 5.8% of net assets. |
| 48 | 2022 Annual Report ■ TIAA-CREF Lifecycle Funds | See notes to financial statements |
Portfolio of investments
Lifecycle 2010 Fund ■ May 31, 2022
| Shares | Security | Value | % of net assets | |||||||||||
| AFFILIATED INVESTMENT COMPANIES—100.0%a | ||||||||||||||
| DIRECT REAL ESTATE—4.7% | ||||||||||||||
| 3,619,973 | b | TIAA-CREF Real Property Fund LP (purchased 7/01/16–5/26/22; cost $37,835,366) | $ | 49,123,040 | 4.7 | % | ||||||||
| TOTAL DIRECT REAL ESTATE | 49,123,040 | 4.7 | ||||||||||||
| FIXED INCOME—40.0% | ||||||||||||||
| 22,702,070 | TIAA-CREF Core Bond Fund | 217,258,806 | 20.9 | |||||||||||
| 14,165,631 | TIAA-CREF Core Plus Bond Fund | 135,990,055 | 13.0 | |||||||||||
| 2,519,638 | TIAA-CREF Emerging Markets Debt Fund | 21,240,547 | 2.0 | |||||||||||
| 2,394,565 | TIAA-CREF High-Yield Fund | 20,952,445 | 2.0 | |||||||||||
| 2,437,905 | TIAA-CREF International Bond Fund | 21,746,110 | 2.1 | |||||||||||
| TOTAL FIXED INCOME | 417,187,963 | 40.0 | ||||||||||||
| INFLATION-PROTECTED ASSETS—10.0% | ||||||||||||||
| 8,873,915 | TIAA-CREF Inflation-Linked Bond Fund | 103,913,550 | 10.0 | |||||||||||
| TOTAL INFLATION-PROTECTED ASSETS | 103,913,550 | 10.0 | ||||||||||||
| INTERNATIONAL EQUITY—11.8% | ||||||||||||||
| 597,917 | Nuveen International Growth Fund | 26,242,571 | 2.5 | |||||||||||
| 1,859,874 | TIAA-CREF Emerging Markets Equity Fund | 15,195,170 | 1.5 | |||||||||||
| 3,046,295 | TIAA-CREF International Equity Fund | 37,317,111 | 3.6 | |||||||||||
| 1,831,012 | TIAA-CREF International Opportunities Fund | 26,348,256 | 2.5 | |||||||||||
| 1,689,147 | TIAA-CREF Quant International Small-Cap Equity Fund | 17,567,129 | 1.7 | |||||||||||
| TOTAL INTERNATIONAL EQUITY | 122,670,237 | 11.8 | ||||||||||||
| SHORT-TERM FIXED INCOME—11.9% | ||||||||||||||
| 12,352,901 | TIAA-CREF Short-Term Bond Fund | 124,023,123 | 11.9 | |||||||||||
| TOTAL SHORT-TERM FIXED INCOME | 124,023,123 | 11.9 | ||||||||||||
| U.S. EQUITY—21.6% | ||||||||||||||
| 606,889 | Nuveen Dividend Growth Fund | 31,964,855 | 3.1 | |||||||||||
| 2,463,960 | Nuveen Dividend Value Fund | 36,565,173 | 3.5 | |||||||||||
| 1,723,107 | Nuveen Growth Opportunities ETF | 33,996,901 | 3.3 | |||||||||||
| 2,223,439 | TIAA-CREF Growth & Income Fund | 32,150,930 | 3.1 | |||||||||||
| 1,872,205 | TIAA-CREF Large-Cap Growth Fund | 33,868,182 | 3.2 | |||||||||||
| 1,788,498 | TIAA-CREF Large-Cap Value Fund | 36,610,558 | 3.5 | |||||||||||
| 543,623 | TIAA-CREF Quant Small-Cap Equity Fund | 8,893,667 | 0.9 | |||||||||||
| 791,806 | TIAA-CREF Quant Small/Mid-Cap Equity Fund | 10,586,451 | 1.0 | |||||||||||
| TOTAL U.S. EQUITY | 224,636,717 | 21.6 | ||||||||||||
| TOTAL AFFILIATED INVESTMENT COMPANIES | (Cost $989,265,794) | 1,041,554,630 | 100.0 | |||||||||||
| TOTAL PORTFOLIO | (Cost $989,265,794) | 1,041,554,630 | 100.0 | |||||||||||
| OTHER ASSETS & LIABILITIES, NET | 324,341 | 0.0 | ||||||||||||
| NET ASSETS | $ | 1,041,878,971 | 100.0 | % | ||||||||||
ETF Exchange Traded Fund
| a | The Fund invests its assets in the affiliated TIAA-CREF Real Property Fund LP, the affiliated Nuveen Growth Opportunities ETF, Class W shares of the affiliated TIAA-CREF Funds and Class R6 shares of the affiliated Nuveen Funds. |
| b | Restricted security. At 5/31/22, the total value of this security amounted to $49,123,040 or 4.7% of net assets. |
| See notes to financial statements | TIAA-CREF Lifecycle Funds ■ 2022 Annual Report | 49 |
Portfolio of investments
Lifecycle 2015 Fund ■ May 31, 2022
| Shares | Security | Value | % of net assets | |||||||||||
| AFFILIATED INVESTMENT COMPANIES—99.9%a | ||||||||||||||
| DIRECT REAL ESTATE—5.8% | ||||||||||||||
| 6,259,166 | b | TIAA-CREF Real Property Fund LP (purchased 11/28/16–5/26/22; cost $66,459,647) | $ | 84,936,878 | 5.8 | % | ||||||||
| TOTAL DIRECT REAL ESTATE | 84,936,878 | 5.8 | ||||||||||||
| FIXED INCOME—39.4% | ||||||||||||||
| 31,601,630 | TIAA-CREF Core Bond Fund | 302,427,596 | 20.6 | |||||||||||
| 19,659,403 | TIAA-CREF Core Plus Bond Fund | 188,730,264 | 12.8 | |||||||||||
| 3,492,490 | TIAA-CREF Emerging Markets Debt Fund | 29,441,694 | 2.0 | |||||||||||
| 3,325,196 | TIAA-CREF High-Yield Fund | 29,095,466 | 2.0 | |||||||||||
| 3,377,530 | TIAA-CREF International Bond Fund | 30,127,569 | 2.0 | |||||||||||
| TOTAL FIXED INCOME | 579,822,589 | 39.4 | ||||||||||||
| INFLATION-PROTECTED ASSETS—8.7% | ||||||||||||||
| 10,963,085 | TIAA-CREF Inflation-Linked Bond Fund | 128,377,721 | 8.7 | |||||||||||
| TOTAL INFLATION-PROTECTED ASSETS | 128,377,721 | 8.7 | ||||||||||||
| INTERNATIONAL EQUITY—13.1% | ||||||||||||||
| 942,008 | Nuveen International Growth Fund | 41,344,736 | 2.8 | |||||||||||
| 2,931,052 | TIAA-CREF Emerging Markets Equity Fund | 23,946,693 | 1.6 | |||||||||||
| 4,808,307 | TIAA-CREF International Equity Fund | 58,901,761 | 4.0 | |||||||||||
| 2,889,234 | TIAA-CREF International Opportunities Fund | 41,576,071 | 2.8 | |||||||||||
| 2,661,741 | TIAA-CREF Quant International Small-Cap Equity Fund | 27,682,108 | 1.9 | |||||||||||
| TOTAL INTERNATIONAL EQUITY | 193,451,369 | 13.1 | ||||||||||||
| SHORT-TERM FIXED INCOME—8.8% | ||||||||||||||
| 12,838,609 | TIAA-CREF Short-Term Bond Fund | 128,899,632 | 8.8 | |||||||||||
| TOTAL SHORT-TERM FIXED INCOME | 128,899,632 | 8.8 | ||||||||||||
| U.S. EQUITY—24.1% | ||||||||||||||
| 955,470 | Nuveen Dividend Growth Fund | 50,324,601 | 3.4 | |||||||||||
| 3,888,039 | Nuveen Dividend Value Fund | 57,698,499 | 3.9 | |||||||||||
| 2,722,225 | Nuveen Growth Opportunities ETF | 53,709,499 | 3.7 | |||||||||||
| 3,507,329 | TIAA-CREF Growth & Income Fund | 50,715,974 | 3.5 | |||||||||||
| 2,951,304 | TIAA-CREF Large-Cap Growth Fund | 53,389,094 | 3.6 | |||||||||||
| 2,821,317 | TIAA-CREF Large-Cap Value Fund | 57,752,362 | 3.9 | |||||||||||
| 857,833 | TIAA-CREF Quant Small-Cap Equity Fund | 14,034,147 | 1.0 | |||||||||||
| 1,248,752 | TIAA-CREF Quant Small/Mid-Cap Equity Fund | 16,695,813 | 1.1 | |||||||||||
| TOTAL U.S. EQUITY | 354,319,989 | 24.1 | ||||||||||||
| TOTAL AFFILIATED INVESTMENT COMPANIES | (Cost $1,460,034,510) | 1,469,808,178 | 99.9 | |||||||||||
| TOTAL PORTFOLIO | (Cost $1,460,034,510) | 1,469,808,178 | 99.9 | |||||||||||
| OTHER ASSETS & LIABILITIES, NET | 1,063,256 | 0.1 | ||||||||||||
| NET ASSETS | $ | 1,470,871,434 | 100.0 | % | ||||||||||
ETF Exchange Traded Fund
| a | The Fund invests its assets in the affiliated TIAA-CREF Real Property Fund LP, the affiliated Nuveen Growth Opportunities ETF, Class W shares of the affiliated TIAA-CREF Funds and Class R6 shares of the affiliated Nuveen Funds. |
| b | Restricted security. At 5/31/22, the total value of this security amounted to $84,936,878 or 5.8% of net assets. |
| 50 | 2022 Annual Report ■ TIAA-CREF Lifecycle Funds | See notes to financial statements |
Portfolio of investments
Lifecycle 2020 Fund ■ May 31, 2022
| Shares | Security | Value | % of net assets | |||||||||||
| AFFILIATED INVESTMENT COMPANIES—99.9%a | ||||||||||||||
| DIRECT REAL ESTATE—5.8% | ||||||||||||||
| 13,710,738 | b | TIAA-CREF Real Property Fund LP (purchased 11/28/16–5/26/22; cost $145,982,794) | $ | 186,054,719 | 5.8 | % | ||||||||
| TOTAL DIRECT REAL ESTATE | 186,054,719 | 5.8 | ||||||||||||
| FIXED INCOME—38.4% | ||||||||||||||
| 67,618,000 | TIAA-CREF Core Bond Fund | 647,104,258 | 20.0 | |||||||||||
| 42,077,122 | TIAA-CREF Core Plus Bond Fund | 403,940,373 | 12.5 | |||||||||||
| 7,515,618 | TIAA-CREF Emerging Markets Debt Fund | 63,356,656 | 2.0 | |||||||||||
| 7,114,439 | TIAA-CREF High-Yield Fund | 62,251,339 | 1.9 | |||||||||||
| 7,233,406 | TIAA-CREF International Bond Fund | 64,521,978 | 2.0 | |||||||||||
| TOTAL FIXED INCOME | 1,241,174,604 | 38.4 | ||||||||||||
| INFLATION-PROTECTED ASSETS—6.7% | ||||||||||||||
| 18,598,940 | TIAA-CREF Inflation-Linked Bond Fund | 217,793,589 | 6.7 | |||||||||||
| TOTAL INFLATION-PROTECTED ASSETS | 217,793,589 | 6.7 | ||||||||||||
| INTERNATIONAL EQUITY—14.9% | ||||||||||||||
| 2,353,489 | Nuveen International Growth Fund | 103,294,654 | 3.2 | |||||||||||
| 7,302,400 | TIAA-CREF Emerging Markets Equity Fund | 59,660,607 | 1.9 | |||||||||||
| 11,987,286 | TIAA-CREF International Equity Fund | 146,844,248 | 4.5 | |||||||||||
| 7,202,419 | TIAA-CREF International Opportunities Fund | 103,642,814 | 3.2 | |||||||||||
| 6,652,412 | TIAA-CREF Quant International Small-Cap Equity Fund | 69,185,085 | 2.1 | |||||||||||
| TOTAL INTERNATIONAL EQUITY | 482,627,408 | 14.9 | ||||||||||||
| SHORT-TERM FIXED INCOME—6.8% | ||||||||||||||
| 21,780,199 | TIAA-CREF Short-Term Bond Fund | 218,673,196 | 6.8 | |||||||||||
| TOTAL SHORT-TERM FIXED INCOME | 218,673,196 | 6.8 | ||||||||||||
| U.S. EQUITY—27.3% | ||||||||||||||
| 2,387,755 | Nuveen Dividend Growth Fund | 125,763,057 | 3.9 | |||||||||||
| 9,693,808 | Nuveen Dividend Value Fund | 143,856,116 | 4.4 | |||||||||||
| 6,773,644 | Nuveen Growth Opportunities ETF | 133,643,996 | 4.1 | |||||||||||
| 8,747,420 | TIAA-CREF Growth & Income Fund | 126,487,695 | 3.9 | |||||||||||
| 7,365,114 | TIAA-CREF Large-Cap Growth Fund | 133,234,907 | 4.1 | |||||||||||
| 7,036,216 | TIAA-CREF Large-Cap Value Fund | 144,031,344 | 4.5 | |||||||||||
| 2,138,760 | TIAA-CREF Quant Small-Cap Equity Fund | 34,990,119 | 1.1 | |||||||||||
| 3,115,055 | TIAA-CREF Quant Small/Mid-Cap Equity Fund | 41,648,283 | 1.3 | |||||||||||
| TOTAL U.S. EQUITY | 883,655,517 | 27.3 | ||||||||||||
| TOTAL AFFILIATED INVESTMENT COMPANIES | (Cost $3,191,830,277) | 3,229,979,033 | 99.9 | |||||||||||
| TOTAL PORTFOLIO | (Cost $3,191,830,277) | 3,229,979,033 | 99.9 | |||||||||||
| OTHER ASSETS & LIABILITIES, NET | 3,939,810 | 0.1 | ||||||||||||
| NET ASSETS | $ | 3,233,918,843 | 100.0 | % | ||||||||||
ETF Exchange Traded Fund
| a | The Fund invests its assets in the affiliated TIAA-CREF Real Property Fund LP, the affiliated Nuveen Growth Opportunities ETF, Class W shares of the affiliated TIAA-CREF Funds and Class R6 shares of the affiliated Nuveen Funds. |
| b | Restricted security. At 5/31/22, the total value of this security amounted to $186,054,719 or 5.8% of net assets. |
| See notes to financial statements | TIAA-CREF Lifecycle Funds ■ 2022 Annual Report | 51 |
Portfolio of investments
Lifecycle 2025 Fund ■ May 31, 2022
| Shares | Security | Value | % of net assets | |||||||||||
| AFFILIATED INVESTMENT COMPANIES—99.9%a | ||||||||||||||
| DIRECT REAL ESTATE—5.7% | ||||||||||||||
| 19,863,502 | b | TIAA-CREF Real Property Fund LP (purchased 8/01/16–5/26/22; cost $213,115,096) | $ | 269,547,721 | 5.7 | % | ||||||||
| TOTAL DIRECT REAL ESTATE | 269,547,721 | 5.7 | ||||||||||||
| FIXED INCOME—34.8% | ||||||||||||||
| 89,037,099 | TIAA-CREF Core Bond Fund | 852,085,039 | 18.1 | |||||||||||
| 55,435,573 | TIAA-CREF Core Plus Bond Fund | 532,181,504 | 11.3 | |||||||||||
| 9,951,487 | TIAA-CREF Emerging Markets Debt Fund | 83,891,036 | 1.8 | |||||||||||
| 9,361,291 | TIAA-CREF High-Yield Fund | 81,911,293 | 1.8 | |||||||||||
| 9,535,127 | TIAA-CREF International Bond Fund | 85,053,333 | 1.8 | |||||||||||
| TOTAL FIXED INCOME | 1,635,122,205 | 34.8 | ||||||||||||
| INFLATION-PROTECTED ASSETS—4.7% | ||||||||||||||
| 19,056,283 | TIAA-CREF Inflation-Linked Bond Fund | 223,149,075 | 4.7 | |||||||||||
| TOTAL INFLATION-PROTECTED ASSETS | 223,149,075 | 4.7 | ||||||||||||
| INTERNATIONAL EQUITY—17.6% | ||||||||||||||
| 4,033,635 | Nuveen International Growth Fund | 177,036,224 | 3.8 | |||||||||||
| 12,544,114 | TIAA-CREF Emerging Markets Equity Fund | 102,485,410 | 2.2 | |||||||||||
| 20,566,190 | TIAA-CREF International Equity Fund | 251,935,833 | 5.3 | |||||||||||
| 12,299,978 | TIAA-CREF International Opportunities Fund | 176,996,684 | 3.8 | |||||||||||
| 11,437,079 | TIAA-CREF Quant International Small-Cap Equity Fund | 118,945,621 | 2.5 | |||||||||||
| TOTAL INTERNATIONAL EQUITY | 827,399,772 | 17.6 | ||||||||||||
| SHORT-TERM FIXED INCOME—4.8% | ||||||||||||||
| 22,271,280 | TIAA-CREF Short-Term Bond Fund | 223,603,650 | 4.8 | |||||||||||
| TOTAL SHORT-TERM FIXED INCOME | 223,603,650 | 4.8 | ||||||||||||
| U.S. EQUITY—32.3% | ||||||||||||||
| 4,094,885 | Nuveen Dividend Growth Fund | 215,677,614 | 4.6 | |||||||||||
| 16,610,543 | Nuveen Dividend Value Fund | 246,500,459 | 5.2 | |||||||||||
| 11,606,759 | Nuveen Growth Opportunities ETF | 229,001,355 | 4.9 | |||||||||||
| 14,994,856 | TIAA-CREF Growth & Income Fund | 216,825,616 | 4.6 | |||||||||||
| 12,626,065 | TIAA-CREF Large-Cap Growth Fund | 228,405,525 | 4.9 | |||||||||||
| 12,058,329 | TIAA-CREF Large-Cap Value Fund | 246,833,985 | 5.3 | |||||||||||
| 3,666,119 | TIAA-CREF Quant Small-Cap Equity Fund | 59,977,699 | 1.3 | |||||||||||
| 5,345,889 | TIAA-CREF Quant Small/Mid-Cap Equity Fund | 71,474,541 | 1.5 | |||||||||||
| TOTAL U.S. EQUITY | 1,514,696,794 | 32.3 | ||||||||||||
| TOTAL AFFILIATED INVESTMENT COMPANIES | (Cost $4,634,724,775) | 4,693,519,217 | 99.9 | |||||||||||
| TOTAL PORTFOLIO | (Cost $4,634,724,775) | 4,693,519,217 | 99.9 | |||||||||||
| OTHER ASSETS & LIABILITIES, NET | 4,452,266 | 0.1 | ||||||||||||
| NET ASSETS | $ | 4,697,971,483 | 100.0 | % | ||||||||||
ETF Exchange Traded Fund
| a | The Fund invests its assets in the affiliated TIAA-CREF Real Property Fund LP, the affiliated Nuveen Growth Opportunities ETF, Class W shares of the affiliated TIAA-CREF Funds and Class R6 shares of the affiliated Nuveen Funds. |
| b | Restricted security. At 5/31/22, the total value of this security amounted to $269,547,721 or 5.7% of net assets. |
| 52 | 2022 Annual Report ■ TIAA-CREF Lifecycle Funds | See notes to financial statements |
Portfolio of investments
Lifecycle 2030 Fund ■ May 31, 2022
| Shares | Security | Value | % of net assets | |||||||||||
| AFFILIATED INVESTMENT COMPANIES—99.9%a | ||||||||||||||
| DIRECT REAL ESTATE—5.7% | ||||||||||||||
| 21,686,267 | b | TIAA-CREF Real Property Fund LP (purchased 8/01/16–5/26/22; cost $233,758,768) | $ | 294,282,643 | 5.7 | % | ||||||||
| TOTAL DIRECT REAL ESTATE | 294,282,643 | 5.7 | ||||||||||||
| FIXED INCOME—29.6% | ||||||||||||||
| 82,926,925 | TIAA-CREF Core Bond Fund | 793,610,673 | 15.4 | |||||||||||
| 51,695,498 | TIAA-CREF Core Plus Bond Fund | 496,276,776 | 9.6 | |||||||||||
| 9,407,043 | TIAA-CREF Emerging Markets Debt Fund | 79,301,376 | 1.5 | |||||||||||
| 8,743,484 | TIAA-CREF High-Yield Fund | 76,505,482 | 1.5 | |||||||||||
| 8,918,984 | TIAA-CREF International Bond Fund | 79,557,336 | 1.6 | |||||||||||
| TOTAL FIXED INCOME | 1,525,251,643 | 29.6 | ||||||||||||
| INFLATION-PROTECTED ASSETS—2.8% | ||||||||||||||
| 12,082,360 | TIAA-CREF Inflation-Linked Bond Fund | 141,484,431 | 2.8 | |||||||||||
| TOTAL INFLATION-PROTECTED ASSETS | 141,484,431 | 2.8 | ||||||||||||
| INTERNATIONAL EQUITY—20.8% | ||||||||||||||
| 5,208,911 | Nuveen International Growth Fund | 228,619,103 | 4.4 | |||||||||||
| 16,275,678 | TIAA-CREF Emerging Markets Equity Fund | 132,972,286 | 2.6 | |||||||||||
| 26,733,585 | TIAA-CREF International Equity Fund | 327,486,418 | 6.4 | |||||||||||
| 15,901,865 | TIAA-CREF International Opportunities Fund | 228,827,843 | 4.4 | |||||||||||
| 14,881,909 | TIAA-CREF Quant International Small-Cap Equity Fund | 154,771,852 | 3.0 | |||||||||||
| TOTAL INTERNATIONAL EQUITY | 1,072,677,502 | 20.8 | ||||||||||||
| SHORT-TERM FIXED INCOME—2.8% | ||||||||||||||
| 14,129,798 | TIAA-CREF Short-Term Bond Fund | 141,863,168 | 2.8 | |||||||||||
| TOTAL SHORT-TERM FIXED INCOME | 141,863,168 | 2.8 | ||||||||||||
| U.S. EQUITY—38.2% | ||||||||||||||
| 5,370,742 | Nuveen Dividend Growth Fund | 282,876,971 | 5.5 | |||||||||||
| 21,509,757 | Nuveen Dividend Value Fund | 319,204,792 | 6.2 | |||||||||||
| 15,027,955 | Nuveen Growth Opportunities ETF | 296,501,552 | 5.8 | |||||||||||
| 19,410,336 | TIAA-CREF Growth & Income Fund | 280,673,465 | 5.5 | |||||||||||
| 16,336,318 | TIAA-CREF Large-Cap Growth Fund | 295,523,991 | 5.7 | |||||||||||
| 15,614,713 | TIAA-CREF Large-Cap Value Fund | 319,633,182 | 6.2 | |||||||||||
| 4,752,876 | TIAA-CREF Quant Small-Cap Equity Fund | 77,757,060 | 1.5 | |||||||||||
| 6,949,449 | TIAA-CREF Quant Small/Mid-Cap Equity Fund | 92,914,131 | 1.8 | |||||||||||
| TOTAL U.S. EQUITY | 1,965,085,144 | 38.2 | ||||||||||||
| TOTAL AFFILIATED INVESTMENT COMPANIES | (Cost $5,060,399,275) | 5,140,644,531 | 99.9 | |||||||||||
| TOTAL PORTFOLIO | (Cost $5,060,399,275) | 5,140,644,531 | 99.9 | |||||||||||
| OTHER ASSETS & LIABILITIES, NET | 6,120,113 | 0.1 | ||||||||||||
| NET ASSETS | $ | 5,146,764,644 | 100.0 | % | ||||||||||
ETF Exchange Traded Fund
| a | The Fund invests its assets in the affiliated TIAA-CREF Real Property Fund LP, the affiliated Nuveen Growth Opportunities ETF, Class W shares of the affiliated TIAA-CREF Funds and Class R6 shares of the affiliated Nuveen Funds. |
| b | Restricted security. At 5/31/22, the total value of this security amounted to $294,282,643 or 5.7% of net assets. |
| See notes to financial statements | TIAA-CREF Lifecycle Funds ■ 2022 Annual Report | 53 |
Portfolio of investments
Lifecycle 2035 Fund ■ May 31, 2022
| Shares | Security | Value | % of net assets | |||||||||||
| AFFILIATED INVESTMENT COMPANIES—99.9%a | ||||||||||||||
| DIRECT REAL ESTATE—5.7% | ||||||||||||||
| 22,279,689 | b | TIAA-CREF Real Property Fund LP (purchased 8/01/16–5/26/22; cost $239,929,847) | $ | 302,335,381 | 5.7 | % | ||||||||
| TOTAL DIRECT REAL ESTATE | 302,335,381 | 5.7 | ||||||||||||
| FIXED INCOME—24.5% | ||||||||||||||
| 70,651,026 | TIAA-CREF Core Bond Fund | 676,130,315 | 12.7 | |||||||||||
| 44,066,997 | TIAA-CREF Core Plus Bond Fund | 423,043,167 | 8.0 | |||||||||||
| 8,164,070 | TIAA-CREF Emerging Markets Debt Fund | 68,823,108 | 1.3 | |||||||||||
| 7,461,281 | TIAA-CREF High-Yield Fund | 65,286,209 | 1.2 | |||||||||||
| 7,603,833 | TIAA-CREF International Bond Fund | 67,826,189 | 1.3 | |||||||||||
| TOTAL FIXED INCOME | 1,301,108,988 | 24.5 | ||||||||||||
| INFLATION-PROTECTED ASSETS—0.8% | ||||||||||||||
| 3,411,086 | TIAA-CREF Inflation-Linked Bond Fund | 39,943,822 | 0.8 | |||||||||||
| TOTAL INFLATION-PROTECTED ASSETS | 39,943,822 | 0.8 | ||||||||||||
| INTERNATIONAL EQUITY—24.1% | ||||||||||||||
| 6,194,159 | Nuveen International Growth Fund | 271,861,625 | 5.1 | |||||||||||
| 19,379,872 | TIAA-CREF Emerging Markets Equity Fund | 158,333,556 | 3.0 | |||||||||||
| 31,881,234 | TIAA-CREF International Equity Fund | 390,545,112 | 7.4 | |||||||||||
| 18,912,831 | TIAA-CREF International Opportunities Fund | 272,155,637 | 5.1 | |||||||||||
| 17,713,974 | TIAA-CREF Quant International Small-Cap Equity Fund | 184,225,334 | 3.5 | |||||||||||
| TOTAL INTERNATIONAL EQUITY | 1,277,121,264 | 24.1 | ||||||||||||
| SHORT-TERM FIXED INCOME—0.8% | ||||||||||||||
| 3,987,775 | TIAA-CREF Short-Term Bond Fund | 40,037,261 | 0.8 | |||||||||||
| TOTAL SHORT-TERM FIXED INCOME | 40,037,261 | 0.8 | ||||||||||||
| U.S. EQUITY—44.0% | ||||||||||||||
| 6,382,962 | Nuveen Dividend Growth Fund | 336,190,612 | 6.3 | |||||||||||
| 25,570,193 | Nuveen Dividend Value Fund | 379,461,663 | 7.2 | |||||||||||
| 17,873,162 | Nuveen Growth Opportunities ETF | 352,637,486 | 6.6 | |||||||||||
| 23,085,679 | TIAA-CREF Growth & Income Fund | 333,818,925 | 6.3 | |||||||||||
| 19,427,006 | TIAA-CREF Large-Cap Growth Fund | 351,434,534 | 6.6 | |||||||||||
| 18,589,260 | TIAA-CREF Large-Cap Value Fund | 380,522,146 | 7.2 | |||||||||||
| 5,658,499 | TIAA-CREF Quant Small-Cap Equity Fund | 92,573,043 | 1.7 | |||||||||||
| 8,285,191 | TIAA-CREF Quant Small/Mid-Cap Equity Fund | 110,773,008 | 2.1 | |||||||||||
| TOTAL U.S. EQUITY | 2,337,411,417 | 44.0 | ||||||||||||
| TOTAL AFFILIATED INVESTMENT COMPANIES | (Cost $5,169,842,252) | 5,297,958,133 | 99.9 | |||||||||||
| TOTAL PORTFOLIO | (Cost $5,169,842,252) | 5,297,958,133 | 99.9 | |||||||||||
| OTHER ASSETS & LIABILITIES, NET | 7,631,146 | 0.1 | ||||||||||||
| NET ASSETS | $ | 5,305,589,279 | 100.0 | % | ||||||||||
ETF Exchange Traded Fund
| a | The Fund invests its assets in the affiliated TIAA-CREF Real Property Fund LP, the affiliated Nuveen Growth Opportunities ETF, Class W shares of the affiliated TIAA-CREF Funds and Class R6 shares of the affiliated Nuveen Funds. |
| b | Restricted security. At 5/31/22, the total value of this security amounted to $302,335,381 or 5.7% of net assets. |
| 54 | 2022 Annual Report ■ TIAA-CREF Lifecycle Funds | See notes to financial statements |
Portfolio of investments
Lifecycle 2040 Fund ■ May 31, 2022
| Shares | Security | Value | % of net assets | |||||||||||
| AFFILIATED INVESTMENT COMPANIES—99.9%a | ||||||||||||||
| DIRECT REAL ESTATE—5.7% | ||||||||||||||
| 26,175,739 | b | TIAA-CREF Real Property Fund LP (purchased 8/01/16–5/26/22; cost $280,990,429) | $ | 355,204,775 | 5.7 | % | ||||||||
| TOTAL DIRECT REAL ESTATE | 355,204,775 | 5.7 | ||||||||||||
| FIXED INCOME—16.9% | ||||||||||||||
| 57,127,208 | TIAA-CREF Core Bond Fund | 546,707,380 | 8.7 | |||||||||||
| 35,791,855 | TIAA-CREF Core Plus Bond Fund | 343,601,807 | 5.5 | |||||||||||
| 6,950,674 | TIAA-CREF Emerging Markets Debt Fund | 58,594,183 | 0.9 | |||||||||||
| 6,071,038 | TIAA-CREF High-Yield Fund | 53,121,583 | 0.9 | |||||||||||
| 6,180,027 | TIAA-CREF International Bond Fund | 55,125,845 | 0.9 | |||||||||||
| TOTAL FIXED INCOME | 1,057,150,798 | 16.9 | ||||||||||||
| INTERNATIONAL EQUITY—27.3% | ||||||||||||||
| 8,271,642 | Nuveen International Growth Fund | 363,042,368 | 5.8 | |||||||||||
| 25,841,116 | TIAA-CREF Emerging Markets Equity Fund | 211,121,918 | 3.4 | |||||||||||
| 42,738,454 | TIAA-CREF International Equity Fund | 523,546,057 | 8.4 | |||||||||||
| 25,256,490 | TIAA-CREF International Opportunities Fund | 363,440,893 | 5.8 | |||||||||||
| 23,652,871 | TIAA-CREF Quant International Small-Cap Equity Fund | 245,989,860 | 3.9 | |||||||||||
| TOTAL INTERNATIONAL EQUITY | 1,707,141,096 | 27.3 | ||||||||||||
| U.S. EQUITY—50.0% | ||||||||||||||
| 8,545,933 | Nuveen Dividend Growth Fund | 450,114,292 | 7.2 | |||||||||||
| 34,187,034 | Nuveen Dividend Value Fund | 507,335,589 | 8.1 | |||||||||||
| 23,858,698 | Nuveen Growth Opportunities ETF | 470,732,112 | 7.5 | |||||||||||
| 30,866,528 | TIAA-CREF Growth & Income Fund | 446,330,002 | 7.2 | |||||||||||
| 25,938,073 | TIAA-CREF Large-Cap Growth Fund | 469,219,743 | 7.5 | |||||||||||
| 24,838,711 | TIAA-CREF Large-Cap Value Fund | 508,448,418 | 8.1 | |||||||||||
| 7,573,239 | TIAA-CREF Quant Small-Cap Equity Fund | 123,898,184 | 2.0 | |||||||||||
| 11,012,478 | TIAA-CREF Quant Small/Mid-Cap Equity Fund | 147,236,834 | 2.4 | |||||||||||
| TOTAL U.S. EQUITY | 3,123,315,174 | 50.0 | ||||||||||||
| TOTAL AFFILIATED INVESTMENT COMPANIES | (Cost $6,018,515,383) | 6,242,811,843 | 99.9 | |||||||||||
| TOTAL PORTFOLIO | (Cost $6,018,515,383) | 6,242,811,843 | 99.9 | |||||||||||
| OTHER ASSETS & LIABILITIES, NET | 9,277,856 | 0.1 | ||||||||||||
| NET ASSETS | $ | 6,252,089,699 | 100.0 | % | ||||||||||
ETF Exchange Traded Fund
| a | The Fund invests its assets in the affiliated TIAA-CREF Real Property Fund LP, the affiliated Nuveen Growth Opportunities ETF, Class W shares of the affiliated TIAA-CREF Funds and Class R6 shares of the affiliated Nuveen Funds. |
| b | Restricted security. At 5/31/22, the total value of this security amounted to $355,204,775 or 5.7% of net assets. |
| See notes to financial statements | TIAA-CREF Lifecycle Funds ■ 2022 Annual Report | 55 |
Portfolio of investments
Lifecycle 2045 Fund ■ May 31, 2022
| Shares | Security | Value | % of net assets | |||||||||||
| AFFILIATED INVESTMENT COMPANIES—99.8%a | ||||||||||||||
| DIRECT REAL ESTATE—5.7% | ||||||||||||||
| 17,481,076 | b | TIAA-CREF Real Property Fund LP (purchased 8/01/16–5/26/22; cost $189,253,284) | $ | 237,218,197 | 5.7 | % | ||||||||
| TOTAL DIRECT REAL ESTATE | 237,218,197 | 5.7 | ||||||||||||
| FIXED INCOME—7.8% | ||||||||||||||
| 17,400,858 | TIAA-CREF Core Bond Fund | 166,526,213 | 4.0 | |||||||||||
| 11,098,043 | TIAA-CREF Core Plus Bond Fund | 106,541,209 | 2.5 | |||||||||||
| 2,526,770 | TIAA-CREF Emerging Markets Debt Fund | 21,300,669 | 0.5 | |||||||||||
| 1,872,850 | TIAA-CREF High-Yield Fund | 16,387,435 | 0.4 | |||||||||||
| 1,907,834 | TIAA-CREF International Bond Fund | 17,017,883 | 0.4 | |||||||||||
| TOTAL FIXED INCOME | 327,773,409 | 7.8 | ||||||||||||
| INTERNATIONAL EQUITY—30.5% | ||||||||||||||
| 6,187,982 | Nuveen International Growth Fund | 271,590,528 | 6.5 | |||||||||||
| 19,328,598 | TIAA-CREF Emerging Markets Equity Fund | 157,914,642 | 3.7 | |||||||||||
| 32,065,460 | TIAA-CREF International Equity Fund | 392,801,887 | 9.4 | |||||||||||
| 18,923,136 | TIAA-CREF International Opportunities Fund | 272,303,921 | 6.5 | |||||||||||
| 17,697,830 | TIAA-CREF Quant International Small-Cap Equity Fund | 184,057,436 | 4.4 | |||||||||||
| TOTAL INTERNATIONAL EQUITY | 1,278,668,414 | 30.5 | ||||||||||||
| U.S. EQUITY—55.8% | ||||||||||||||
| 6,399,092 | Nuveen Dividend Growth Fund | 337,040,174 | 8.0 | |||||||||||
| 25,589,147 | Nuveen Dividend Value Fund | 379,742,946 | 9.1 | |||||||||||
| 17,850,799 | Nuveen Growth Opportunities ETF | 352,196,264 | 8.4 | |||||||||||
| 23,103,304 | TIAA-CREF Growth & Income Fund | 334,073,777 | 8.0 | |||||||||||
| 19,479,928 | TIAA-CREF Large-Cap Growth Fund | 352,391,906 | 8.4 | |||||||||||
| 18,589,338 | TIAA-CREF Large-Cap Value Fund | 380,523,753 | 9.1 | |||||||||||
| 5,669,057 | TIAA-CREF Quant Small-Cap Equity Fund | 92,745,776 | 2.2 | |||||||||||
| 8,260,163 | TIAA-CREF Quant Small/Mid-Cap Equity Fund | 110,438,385 | 2.6 | |||||||||||
| TOTAL U.S. EQUITY | 2,339,152,981 | 55.8 | ||||||||||||
| TOTAL AFFILIATED INVESTMENT COMPANIES | (Cost $3,949,964,533) | 4,182,813,001 | 99.8 | |||||||||||
| TOTAL PORTFOLIO | (Cost $3,949,964,533) | 4,182,813,001 | 99.8 | |||||||||||
| OTHER ASSETS & LIABILITIES, NET | 7,501,539 | 0.2 | ||||||||||||
| NET ASSETS | $ | 4,190,314,540 | 100.0 | % | ||||||||||
ETF Exchange Traded Fund
| a | The Fund invests its assets in the affiliated TIAA-CREF Real Property Fund LP, the affiliated Nuveen Growth Opportunities ETF, Class W shares of the affiliated TIAA-CREF Funds and Class R6 shares of the affiliated Nuveen Funds. |
| b | Restricted security. At 5/31/22, the total value of this security amounted to $237,218,197 or 5.7% of net assets. |
| 56 | 2022 Annual Report ■ TIAA-CREF Lifecycle Funds | See notes to financial statements |
Portfolio of investments
Lifecycle 2050 Fund ■ May 31, 2022
| Shares | Security | Value | % of net assets | |||||||||||
| AFFILIATED INVESTMENT COMPANIES—99.8%a | ||||||||||||||
| DIRECT REAL ESTATE—5.7% | ||||||||||||||
| 13,037,081 | b | TIAA-CREF Real Property Fund LP (purchased 8/01/16–5/26/22; cost $141,921,222) | $ | 176,913,185 | 5.7 | % | ||||||||
| TOTAL DIRECT REAL ESTATE | 176,913,185 | 5.7 | ||||||||||||
| FIXED INCOME—3.6% | ||||||||||||||
| 5,763,723 | TIAA-CREF Core Bond Fund | 55,158,833 | 1.7 | |||||||||||
| 3,853,262 | TIAA-CREF Core Plus Bond Fund | 36,991,318 | 1.2 | |||||||||||
| 1,153,538 | TIAA-CREF Emerging Markets Debt Fund | 9,724,323 | 0.3 | |||||||||||
| 649,666 | TIAA-CREF High-Yield Fund | 5,684,576 | 0.2 | |||||||||||
| 655,569 | TIAA-CREF International Bond Fund | 5,847,676 | 0.2 | |||||||||||
| TOTAL FIXED INCOME | 113,406,726 | 3.6 | ||||||||||||
| INTERNATIONAL EQUITY—32.0% | ||||||||||||||
| 4,844,560 | Nuveen International Growth Fund | 212,627,717 | 6.8 | |||||||||||
| 15,171,342 | TIAA-CREF Emerging Markets Equity Fund | 123,949,865 | 4.0 | |||||||||||
| 25,071,181 | TIAA-CREF International Equity Fund | 307,121,967 | 9.8 | |||||||||||
| 14,846,441 | TIAA-CREF International Opportunities Fund | 213,640,293 | 6.8 | |||||||||||
| 13,840,344 | TIAA-CREF Quant International Small-Cap Equity Fund | 143,939,577 | 4.6 | |||||||||||
| TOTAL INTERNATIONAL EQUITY | 1,001,279,419 | 32.0 | ||||||||||||
| U.S. EQUITY—58.5% | ||||||||||||||
| 5,009,608 | Nuveen Dividend Growth Fund | 263,856,041 | 8.4 | |||||||||||
| 20,058,659 | Nuveen Dividend Value Fund | 297,670,495 | 9.5 | |||||||||||
| 13,979,572 | Nuveen Growth Opportunities ETF | 275,816,956 | 8.8 | |||||||||||
| 18,100,681 | TIAA-CREF Growth & Income Fund | 261,735,853 | 8.4 | |||||||||||
| 15,281,850 | TIAA-CREF Large-Cap Growth Fund | 276,448,661 | 8.8 | |||||||||||
| 14,554,499 | TIAA-CREF Large-Cap Value Fund | 297,930,591 | 9.5 | |||||||||||
| 4,440,840 | TIAA-CREF Quant Small-Cap Equity Fund | 72,652,138 | 2.3 | |||||||||||
| 6,473,220 | TIAA-CREF Quant Small/Mid-Cap Equity Fund | 86,546,958 | 2.8 | |||||||||||
| TOTAL U.S. EQUITY | 1,832,657,693 | 58.5 | ||||||||||||
| TOTAL AFFILIATED INVESTMENT COMPANIES | (Cost $2,982,355,849) | 3,124,257,023 | 99.8 | |||||||||||
| TOTAL PORTFOLIO | (Cost $2,982,355,849) | 3,124,257,023 | 99.8 | |||||||||||
| OTHER ASSETS & LIABILITIES, NET | 5,610,508 | 0.2 | ||||||||||||
| NET ASSETS | $ | 3,129,867,531 | 100.0 | % | ||||||||||
ETF Exchange Traded Fund
| a | The Fund invests its assets in the affiliated TIAA-CREF Real Property Fund LP, the affiliated Nuveen Growth Opportunities ETF, Class W shares of the affiliated TIAA-CREF Funds and Class R6 shares of the affiliated Nuveen Funds. |
| b | Restricted security. At 5/31/22, the total value of this security amounted to $176,913,185 or 5.7% of net assets. |
| See notes to financial statements | TIAA-CREF Lifecycle Funds ■ 2022 Annual Report | 57 |
Portfolio of investments
Lifecycle 2055 Fund ■ May 31, 2022
| Shares | Security | Value | % of net assets | |||||||||||
| AFFILIATED INVESTMENT COMPANIES—99.8%a | ||||||||||||||
| DIRECT REAL ESTATE—5.6% | ||||||||||||||
| 5,822,780 | b | TIAA-CREF Real Property Fund LP (purchased 8/01/16–5/26/22; cost $64,240,085) | $ | 79,015,123 | 5.6 | % | ||||||||
| TOTAL DIRECT REAL ESTATE | 79,015,123 | 5.6 | ||||||||||||
| FIXED INCOME—2.4% | ||||||||||||||
| 1,609,427 | TIAA-CREF Core Bond Fund | 15,402,221 | 1.1 | |||||||||||
| 1,141,033 | TIAA-CREF Core Plus Bond Fund | 10,953,921 | 0.8 | |||||||||||
| 419,513 | TIAA-CREF Emerging Markets Debt Fund | 3,536,492 | 0.3 | |||||||||||
| 191,026 | TIAA-CREF High-Yield Fund | 1,671,477 | 0.1 | |||||||||||
| 191,296 | TIAA-CREF International Bond Fund | 1,706,364 | 0.1 | |||||||||||
| TOTAL FIXED INCOME | 33,270,475 | 2.4 | ||||||||||||
| INTERNATIONAL EQUITY—32.4% | ||||||||||||||
| 2,193,634 | Nuveen International Growth Fund | 96,278,602 | 6.9 | |||||||||||
| 6,885,370 | TIAA-CREF Emerging Markets Equity Fund | 56,253,471 | 4.0 | |||||||||||
| 11,358,608 | TIAA-CREF International Equity Fund | 139,142,949 | 9.9 | |||||||||||
| 6,737,245 | TIAA-CREF International Opportunities Fund | 96,948,952 | 6.9 | |||||||||||
| 6,267,991 | TIAA-CREF Quant International Small-Cap Equity Fund | 65,187,111 | 4.7 | |||||||||||
| TOTAL INTERNATIONAL EQUITY | 453,811,085 | 32.4 | ||||||||||||
| U.S. EQUITY—59.4% | ||||||||||||||
| 2,265,167 | Nuveen Dividend Growth Fund | 119,306,325 | 8.5 | |||||||||||
| 9,087,673 | Nuveen Dividend Value Fund | 134,861,064 | 9.6 | |||||||||||
| 6,344,140 | Nuveen Growth Opportunities ETF | 125,169,882 | 8.9 | |||||||||||
| 8,218,650 | TIAA-CREF Growth & Income Fund | 118,841,676 | 8.5 | |||||||||||
| 6,930,776 | TIAA-CREF Large-Cap Growth Fund | 125,377,736 | 9.0 | |||||||||||
| 6,598,556 | TIAA-CREF Large-Cap Value Fund | 135,072,433 | 9.7 | |||||||||||
| 2,012,011 | TIAA-CREF Quant Small-Cap Equity Fund | 32,916,502 | 2.4 | |||||||||||
| 2,932,856 | TIAA-CREF Quant Small/Mid-Cap Equity Fund | 39,212,281 | 2.8 | |||||||||||
| TOTAL U.S. EQUITY | 830,757,899 | 59.4 | ||||||||||||
| TOTAL AFFILIATED INVESTMENT COMPANIES | (Cost $1,373,902,310) | 1,396,854,582 | 99.8 | |||||||||||
| �� | ||||||||||||||
| TOTAL PORTFOLIO | (Cost $1,373,902,310) | 1,396,854,582 | 99.8 | |||||||||||
| OTHER ASSETS & LIABILITIES, NET | 2,856,935 | 0.2 | ||||||||||||
| NET ASSETS | $ | 1,399,711,517 | 100.0 | % | ||||||||||
ETF Exchange Traded Fund
| a | The Fund invests its assets in the affiliated TIAA-CREF Real Property Fund LP, the affiliated Nuveen Growth Opportunities ETF, Class W shares of the affiliated TIAA-CREF Funds and Class R6 shares of the affiliated Nuveen Funds. |
| b | Restricted security. At 5/31/22, the total value of this security amounted to $79,015,123 or 5.6% of net assets. |
| 58 | 2022 Annual Report ■ TIAA-CREF Lifecycle Funds | See notes to financial statements |
Portfolio of investments
Lifecycle 2060 Fund ■ May 31, 2022
| Shares | Security | Value | % of net assets | |||||||||||
| AFFILIATED INVESTMENT COMPANIES—99.8%a | ||||||||||||||
| DIRECT REAL ESTATE—5.6% | ||||||||||||||
| 1,841,608 | b | TIAA-CREF Real Property Fund LP (purchased 8/01/16–5/26/22; cost $20,603,596) | $ | 24,990,614 | 5.6 | % | ||||||||
| TOTAL DIRECT REAL ESTATE | 24,990,614 | 5.6 | ||||||||||||
| FIXED INCOME—1.2% | ||||||||||||||
| 211,984 | TIAA-CREF Core Bond Fund | 2,028,688 | 0.4 | |||||||||||
| 178,254 | TIAA-CREF Core Plus Bond Fund | 1,711,241 | 0.4 | |||||||||||
| 103,624 | TIAA-CREF Emerging Markets Debt Fund | 873,546 | 0.2 | |||||||||||
| 30,763 | TIAA-CREF High-Yield Fund | 269,179 | 0.1 | |||||||||||
| 28,617 | TIAA-CREF International Bond Fund | 255,266 | 0.1 | |||||||||||
| TOTAL FIXED INCOME | 5,137,920 | 1.2 | ||||||||||||
| INTERNATIONAL EQUITY—32.8% | ||||||||||||||
| 706,090 | Nuveen International Growth Fund | 30,990,305 | 7.0 | |||||||||||
| 2,213,733 | TIAA-CREF Emerging Markets Equity Fund | 18,086,195 | 4.1 | |||||||||||
| 3,630,934 | TIAA-CREF International Equity Fund | 44,478,938 | 10.0 | |||||||||||
| 2,172,589 | TIAA-CREF International Opportunities Fund | 31,263,555 | 7.0 | |||||||||||
| 2,013,175 | TIAA-CREF Quant International Small-Cap Equity Fund | 20,937,017 | 4.7 | |||||||||||
| TOTAL INTERNATIONAL EQUITY | 145,756,010 | 32.8 | ||||||||||||
| U.S. EQUITY—60.2% | ||||||||||||||
| 725,071 | Nuveen Dividend Growth Fund | 38,189,468 | 8.6 | |||||||||||
| 2,922,950 | Nuveen Dividend Value Fund | 43,376,576 | 9.8 | |||||||||||
| 2,039,009 | Nuveen Growth Opportunities ETF | 40,229,648 | 9.1 | |||||||||||
| 2,645,293 | TIAA-CREF Growth & Income Fund | 38,250,933 | 8.6 | |||||||||||
| 2,227,790 | TIAA-CREF Large-Cap Growth Fund | 40,300,714 | 9.1 | |||||||||||
| 2,126,952 | TIAA-CREF Large-Cap Value Fund | 43,538,712 | 9.8 | |||||||||||
| 646,413 | TIAA-CREF Quant Small-Cap Equity Fund | 10,575,310 | 2.4 | |||||||||||
| 942,269 | TIAA-CREF Quant Small/Mid-Cap Equity Fund | 12,598,139 | 2.8 | |||||||||||
| TOTAL U.S. EQUITY | 267,059,500 | 60.2 | ||||||||||||
| TOTAL AFFILIATED INVESTMENT COMPANIES | (Cost $452,598,613) | 442,944,044 | 99.8 | |||||||||||
| TOTAL PORTFOLIO | (Cost $452,598,613) | 442,944,044 | 99.8 | |||||||||||
| OTHER ASSETS & LIABILITIES, NET | 953,922 | 0.2 | ||||||||||||
| NET ASSETS | $ | 443,897,966 | 100.0 | % | ||||||||||
ETF Exchange Traded Fund
| a | The Fund invests its assets in the affiliated TIAA-CREF Real Property Fund LP, the affiliated Nuveen Growth Opportunities ETF, Class W shares of the affiliated TIAA-CREF Funds and Class R6 shares of the affiliated Nuveen Funds. |
| b | Restricted security. At 5/31/22, the total value of this security amounted to $24,990,614 or 5.6% of net assets. |
| See notes to financial statements | TIAA-CREF Lifecycle Funds ■ 2022 Annual Report | 59 |
Portfolio of investments
Lifecycle 2065 Fund ■ May 31, 2022
| Shares | Security | Value | % of net assets | |||||||||||
| AFFILIATED INVESTMENT COMPANIES—99.7%a | ||||||||||||||
| DIRECT REAL ESTATE—5.6% | ||||||||||||||
| 98,321 | b | TIAA-CREF Real Property Fund LP (purchased 9/30/20–5/26/22; cost $1,196,916) | $ | 1,334,216 | 5.6 | % | ||||||||
| TOTAL DIRECT REAL ESTATE | 1,334,216 | 5.6 | ||||||||||||
| FIXED INCOME—0.0% | ||||||||||||||
| 17 | TIAA-CREF Core Bond Fund | 162 | 0.0 | |||||||||||
| 286 | TIAA-CREF Core Plus Bond Fund | 2,746 | 0.0 | |||||||||||
| 308 | TIAA-CREF Emerging Markets Debt Fund | 2,595 | 0.0 | |||||||||||
| 29 | TIAA-CREF High-Yield Fund | 256 | 0.0 | |||||||||||
| 27 | TIAA-CREF International Bond Fund | 238 | 0.0 | |||||||||||
| TOTAL FIXED INCOME | 5,997 | 0.0 | ||||||||||||
| INTERNATIONAL EQUITY—33.2% | ||||||||||||||
| 38,418 | Nuveen International Growth Fund | 1,686,149 | 7.1 | |||||||||||
| 119,612 | TIAA-CREF Emerging Markets Equity Fund | 977,233 | 4.1 | |||||||||||
| 196,060 | TIAA-CREF International Equity Fund | 2,401,741 | 10.1 | |||||||||||
| 117,664 | TIAA-CREF International Opportunities Fund | 1,693,189 | 7.1 | |||||||||||
| 109,172 | TIAA-CREF Quant International Small-Cap Equity Fund | 1,135,387 | 4.8 | |||||||||||
| TOTAL INTERNATIONAL EQUITY | 7,893,699 | 33.2 | ||||||||||||
| U.S. EQUITY—60.9% | ||||||||||||||
| 39,194 | Nuveen Dividend Growth Fund | 2,064,345 | 8.7 | |||||||||||
| 158,568 | Nuveen Dividend Value Fund | 2,353,149 | 9.9 | |||||||||||
| 110,317 | Nuveen Growth Opportunities ETF | 2,176,555 | 9.2 | |||||||||||
| 143,168 | TIAA-CREF Growth & Income Fund | 2,070,204 | 8.7 | |||||||||||
| 120,635 | TIAA-CREF Large-Cap Growth Fund | 2,182,286 | 9.2 | |||||||||||
| 115,149 | TIAA-CREF Large-Cap Value Fund | 2,357,093 | 9.9 | |||||||||||
| 34,995 | TIAA-CREF Quant Small-Cap Equity Fund | 572,519 | 2.4 | |||||||||||
| 51,015 | TIAA-CREF Quant Small/Mid-Cap Equity Fund | 682,065 | 2.9 | |||||||||||
| TOTAL U.S. EQUITY | 14,458,216 | 60.9 | ||||||||||||
| TOTAL AFFILIATED INVESTMENT COMPANIES | (Cost $25,230,411) | 23,692,128 | 99.7 | |||||||||||
| TOTAL PORTFOLIO | (Cost $25,230,411) | 23,692,128 | 99.7 | |||||||||||
| OTHER ASSETS & LIABILITIES, NET | 62,723 | 0.3 | ||||||||||||
| NET ASSETS | $ | 23,754,851 | 100.0 | % | ||||||||||
ETF Exchange Traded Fund
| a | The Fund invests its assets in the affiliated TIAA-CREF Real Property Fund LP, the affiliated Nuveen Growth Opportunities ETF, Class W shares of the affiliated TIAA-CREF Funds and Class R6 shares of the affiliated Nuveen Funds. |
| b | Restricted security. At 5/31/22, the total value of this security amounted to $1,334,216 or 5.6% of net assets. |
| 60 | 2022 Annual Report ■ TIAA-CREF Lifecycle Funds | See notes to financial statements |
[This page intentionally left blank.]
| TIAA-CREF Lifecycle Funds ■ 2022 Annual Report | 61 |
Statements of assets and liabilities
TIAA-CREF Funds ■ May 31, 2022
| Lifecycle Retirement Income Fund | Lifecycle 2010 Fund | Lifecycle 2015 Fund | Lifecycle 2020 Fund | Lifecycle 2025 Fund | Lifecycle 2030 Fund | |||||||||||||||||||
| ASSETS | ||||||||||||||||||||||||
| Affiliated investments, at value‡ | $ | 529,870,269 | $ | 1,041,554,630 | $ | 1,469,808,178 | $ | 3,229,979,033 | $ | 4,693,519,217 | $ | 5,140,644,531 | ||||||||||||
| Cash | 363,848 | 1,387,503 | — | 4,225,052 | 6,457,271 | 8,568,418 | ||||||||||||||||||
| Receivable from securities transactions | 647,472 | 1,352,452 | 3,195,866 | 4,202,685 | 5,059,877 | 6,398,000 | ||||||||||||||||||
| Receivable from Fund shares sold | 33,813 | 17,685 | 107,536 | 2,263,881 | 1,047,451 | 2,733,142 | ||||||||||||||||||
| Dividends receivable | 654,015 | 1,337,185 | 1,749,566 | 3,590,630 | 4,558,042 | 4,073,124 | ||||||||||||||||||
| Due from affiliates | 68,264 | 157,893 | 174,593 | 377,733 | 555,913 | 656,399 | ||||||||||||||||||
| Other | 34,119 | 112,280 | 164,364 | 263,470 | 286,170 | 281,973 | ||||||||||||||||||
| Total assets | 531,671,800 | 1,045,919,628 | 1,475,200,103 | 3,244,902,484 | 4,711,483,941 | 5,163,355,587 | ||||||||||||||||||
| LIABILITIES | ||||||||||||||||||||||||
| Management fees payable | 165,275 | 327,726 | 461,754 | 1,018,025 | 1,485,245 | 1,629,286 | ||||||||||||||||||
| Service agreement fees payable | 33,303 | 61,616 | 83,617 | 161,581 | 205,053 | 211,974 | ||||||||||||||||||
| Distribution fees payable | 29,588 | 6,157 | 8,790 | 20,560 | 29,025 | 32,295 | ||||||||||||||||||
| Due to affiliates | 12,387 | 12,122 | 13,509 | 19,169 | 23,653 | 24,921 | ||||||||||||||||||
| Overdraft payable | — | — | 1,106,503 | — | — | — | ||||||||||||||||||
| Payable for securities transactions | 1,111,032 | 2,986,332 | 2,304,061 | 8,653,751 | 11,206,753 | 13,735,103 | ||||||||||||||||||
| Payable for Fund shares redeemed | 1,027,891 | 498,880 | 147,929 | 762,709 | 149,898 | 518,190 | ||||||||||||||||||
| Payable for trustee compensation | 33,960 | 111,976 | 163,935 | 262,522 | 284,797 | 280,479 | ||||||||||||||||||
| Accrued expenses and other payables | 23,917 | 35,848 | 38,571 | 85,324 | 128,034 | 158,695 | ||||||||||||||||||
| Total liabilities | 2,437,353 | 4,040,657 | 4,328,669 | 10,983,641 | 13,512,458 | 16,590,943 | ||||||||||||||||||
| NET ASSETS | $ | 529,234,447 | $ | 1,041,878,971 | $ | 1,470,871,434 | $ | 3,233,918,843 | $ | 4,697,971,483 | $ | 5,146,764,644 | ||||||||||||
| NET ASSETS CONSIST OF: | ||||||||||||||||||||||||
| Paid-in-capital | $ | 511,136,944 | $ | 975,713,778 | $ | 1,438,529,011 | $ | 3,133,059,903 | $ | 4,516,711,162 | $ | 4,897,470,159 | ||||||||||||
| Total distributable earnings (loss) | 18,097,503 | 66,165,193 | 32,342,423 | 100,858,940 | 181,260,321 | 249,294,485 | ||||||||||||||||||
| NET ASSETS | $ | 529,234,447 | $ | 1,041,878,971 | $ | 1,470,871,434 | $ | 3,233,918,843 | $ | 4,697,971,483 | $ | 5,146,764,644 | ||||||||||||
| INSTITUTIONAL CLASS: | ||||||||||||||||||||||||
| Net assets | $ | 222,226,542 | $ | 700,874,533 | $ | 1,005,382,360 | $ | 2,303,415,014 | $ | 3,488,041,799 | $ | 3,872,654,364 | ||||||||||||
| Outstanding shares of beneficial interest, unlimited shares authorized ($.0001 par value) | 19,948,293 | 68,100,756 | 109,542,646 | 243,021,699 | 354,006,369 | 388,536,080 | ||||||||||||||||||
| Net asset value per share | $ | 11.14 | $ | 10.29 | $ | 9.18 | $ | 9.48 | $ | 9.85 | $ | 9.97 | ||||||||||||
| ADVISOR CLASS: | ||||||||||||||||||||||||
| Net assets | $ | 608,615 | $ | 176,966 | $ | 390,216 | $ | 497,646 | $ | 390,506 | $ | 496,829 | ||||||||||||
| Outstanding shares of beneficial interest, unlimited shares authorized ($.0001 par value) | 54,615 | 17,153 | 42,566 | 52,537 | 39,651 | 49,845 | ||||||||||||||||||
| Net asset value per share | $ | 11.14 | $ | 10.32 | $ | 9.17 | $ | 9.47 | $ | 9.85 | $ | 9.97 | ||||||||||||
| PREMIER CLASS: | ||||||||||||||||||||||||
| Net assets | $ | 17,623,746 | $ | 50,141,387 | $ | 71,144,301 | $ | 165,761,063 | $ | 236,146,652 | $ | 265,244,636 | ||||||||||||
| Outstanding shares of beneficial interest, unlimited shares authorized ($.0001 par value) | 1,582,793 | 4,883,860 | 7,787,928 | 17,535,871 | 24,090,396 | 26,768,224 | ||||||||||||||||||
| Net asset value per share | $ | 11.13 | $ | 10.27 | $ | 9.14 | $ | 9.45 | $ | 9.80 | $ | 9.91 | ||||||||||||
| RETIREMENT CLASS: | ||||||||||||||||||||||||
| Net assets | $ | 157,609,028 | $ | 290,686,085 | $ | 393,954,557 | $ | 764,245,120 | $ | 973,392,526 | $ | 1,008,368,815 | ||||||||||||
| Outstanding shares of beneficial interest, unlimited shares authorized ($.0001 par value) | 14,187,006 | 22,830,864 | 32,857,212 | 59,919,712 | 72,405,118 | 72,136,999 | ||||||||||||||||||
| Net asset value per share | $ | 11.11 | $ | 12.73 | $ | 11.99 | $ | 12.75 | $ | 13.44 | $ | 13.98 | ||||||||||||
| RETAIL CLASS: | ||||||||||||||||||||||||
| Net assets | $ | 131,166,516 | $ | — | $ | — | $ | — | $ | — | $ | — | ||||||||||||
| Outstanding shares of beneficial interest, unlimited shares authorized ($.0001 par value) | 11,793,894 | — | — | — | — | — | ||||||||||||||||||
| Net asset value per share | $ | 11.12 | $ | — | $ | — | $ | — | $ | — | $ | — | ||||||||||||
| ‡ Affiliated investments, cost | $ | 516,008,619 | $ | 989,265,794 | $ | 1,460,034,510 | $ | 3,191,830,277 | $ | 4,634,724,775 | $ | 5,060,399,275 | ||||||||||||
| 62 | 2022 Annual Report ■ TIAA-CREF Lifecycle Funds | See notes to financial statements | See notes to financial statements | TIAA-CREF Lifecycle Funds ■ 2022 Annual Report | 63 |
| Statements of assets and liabilities | concluded |
| TIAA-CREF Funds ■ May 31, 2022 |
| Lifecycle 2035 Fund | Lifecycle 2040 Fund | Lifecycle 2045 Fund | Lifecycle 2050 Fund | Lifecycle 2055 Fund | Lifecycle 2060 Fund | Lifecycle 2065 Fund | ||||||||||||||||||||||
| ASSETS | ||||||||||||||||||||||||||||
| Affiliated investments, at value‡ | $ | 5,297,958,133 | $ | 6,242,811,843 | $ | 4,182,813,001 | $ | 3,124,257,023 | $ | 1,396,854,582 | $ | 442,944,044 | $ | 23,692,128 | ||||||||||||||
| Cash | 9,086,743 | 10,718,680 | 7,983,035 | 6,823,653 | 3,619,062 | 1,869,819 | 153,913 | |||||||||||||||||||||
| Receivable from securities transactions | 8,508,990 | 11,293,795 | 8,786,424 | 6,908,147 | 2,695,062 | 614,656 | 23,717 | |||||||||||||||||||||
| Receivable from Fund shares sold | 3,639,642 | 4,683,826 | 4,308,943 | 3,232,939 | 1,818,198 | 739,279 | 61,771 | |||||||||||||||||||||
| Dividends receivable | 3,269,770 | 2,567,520 | 789,329 | 274,409 | 79,867 | 12,028 | 41 | |||||||||||||||||||||
| Due from affiliates | 729,039 | 900,029 | 637,706 | 503,451 | 230,688 | 83,582 | 11,875 | |||||||||||||||||||||
| Other | 284,499 | 361,808 | 150,018 | 96,766 | 28,714 | 5,421 | 48 | |||||||||||||||||||||
| Total assets | 5,323,476,816 | 6,273,337,501 | 4,205,468,456 | 3,142,096,388 | 1,405,326,173 | 446,268,829 | 23,943,493 | |||||||||||||||||||||
| LIABILITIES | ||||||||||||||||||||||||||||
| Management fees payable | 1,686,329 | 1,984,451 | 1,323,969 | 987,035 | 440,172 | 138,600 | 7,037 | |||||||||||||||||||||
| Service agreement fees payable | 193,753 | 227,219 | 128,093 | 91,625 | 40,619 | 12,351 | 770 | |||||||||||||||||||||
| Distribution fees payable | 34,006 | 38,439 | 27,322 | 19,500 | 9,317 | 2,283 | 219 | |||||||||||||||||||||
| Due to affiliates | 25,440 | 28,546 | 21,952 | 18,534 | 13,082 | 10,160 | 8,885 | |||||||||||||||||||||
| Payable for securities transactions | 15,427,644 | 18,211,959 | 13,319,096 | 10,847,528 | 4,983,317 | 2,048,774 | 152,783 | |||||||||||||||||||||
| Payable for Fund shares redeemed | 64,810 | 190,267 | 32,528 | 48,417 | 41,102 | 131,063 | 12,014 | |||||||||||||||||||||
| Payable for trustee compensation | 282,956 | 359,989 | 148,803 | 95,864 | 28,315 | 5,295 | 41 | |||||||||||||||||||||
| Accrued expenses and other payables | 172,599 | 206,932 | 152,153 | 120,354 | 58,732 | 22,337 | 6,893 | |||||||||||||||||||||
| Total liabilities | 17,887,537 | 21,247,802 | 15,153,916 | 12,228,857 | 5,614,656 | 2,370,863 | 188,642 | |||||||||||||||||||||
| NET ASSETS | $ | 5,305,589,279 | $ | 6,252,089,699 | $ | 4,190,314,540 | $ | 3,129,867,531 | $ | 1,399,711,517 | $ | 443,897,966 | $ | 23,754,851 | ||||||||||||||
| NET ASSETS CONSIST OF: | ||||||||||||||||||||||||||||
| Paid-in-capital | $ | 4,976,849,580 | $ | 5,761,915,636 | $ | 3,770,209,870 | $ | 2,843,353,631 | $ | 1,314,689,952 | $ | 438,594,252 | $ | 25,032,264 | ||||||||||||||
| Total distributable earnings (loss) | 328,739,699 | 490,174,063 | 420,104,670 | 286,513,900 | 85,021,565 | 5,303,714 | (1,277,413 | ) | ||||||||||||||||||||
| NET ASSETS | $ | 5,305,589,279 | $ | 6,252,089,699 | $ | 4,190,314,540 | $ | 3,129,867,531 | $ | 1,399,711,517 | $ | 443,897,966 | $ | 23,754,851 | ||||||||||||||
| INSTITUTIONAL CLASS: | ||||||||||||||||||||||||||||
| Net assets | $ | 4,103,430,017 | $ | 4,851,096,401 | $ | 3,351,968,383 | $ | 2,529,399,312 | $ | 1,127,411,442 | $ | 364,640,267 | $ | 17,581,467 | ||||||||||||||
| Outstanding shares of beneficial interest, unlimited shares authorized ($.0001 par value) | 404,995,513 | 479,128,867 | 265,791,710 | 196,243,199 | 74,282,874 | 28,141,704 | 1,637,543 | |||||||||||||||||||||
| Net asset value per share | $ | 10.13 | $ | 10.12 | $ | 12.61 | $ | 12.89 | $ | 15.18 | $ | 12.96 | $ | 10.74 | ||||||||||||||
| ADVISOR CLASS: | ||||||||||||||||||||||||||||
| Net assets | $ | 446,853 | $ | 239,168 | $ | 167,902 | $ | 580,205 | $ | 154,577 | $ | 208,381 | $ | 527,412 | ||||||||||||||
| Outstanding shares of beneficial interest, unlimited shares authorized ($.0001 par value) | 44,168 | 23,650 | 13,314 | 45,029 | 10,187 | 16,096 | 50,000 | |||||||||||||||||||||
| Net asset value per share | $ | 10.12 | $ | 10.11 | $ | 12.61 | $ | 12.89 | $ | 15.17 | $ | 12.95 | $ | 10.55 | ||||||||||||||
| PREMIER CLASS: | ||||||||||||||||||||||||||||
| Net assets | $ | 277,894,433 | $ | 314,758,015 | $ | 224,447,611 | $ | 159,977,556 | $ | 76,684,734 | $ | 19,013,258 | $ | 1,784,174 | ||||||||||||||
| Outstanding shares of beneficial interest, unlimited shares authorized ($.0001 par value) | 27,526,193 | 31,201,743 | 17,895,400 | 12,468,964 | 5,075,054 | 1,471,341 | 168,506 | |||||||||||||||||||||
| Net asset value per share | $ | 10.10 | $ | 10.09 | $ | 12.54 | $ | 12.83 | $ | 15.11 | $ | 12.92 | $ | 10.59 | ||||||||||||||
| RETIREMENT CLASS: | ||||||||||||||||||||||||||||
| Net assets | $ | 923,817,976 | $ | 1,085,996,115 | $ | 613,730,644 | $ | 439,910,458 | $ | 195,460,764 | $ | 60,036,060 | $ | 3,861,798 | ||||||||||||||
| Outstanding shares of beneficial interest, unlimited shares authorized ($.0001 par value) | 63,138,581 | 71,558,262 | 49,158,671 | 34,483,662 | 12,947,438 | 4,654,454 | 359,862 | |||||||||||||||||||||
| Net asset value per share | $ | 14.63 | $ | 15.18 | $ | 12.48 | $ | 12.76 | $ | 15.10 | $ | 12.90 | $ | 10.73 | ||||||||||||||
| ‡ Affiliated investments, cost | $ | 5,169,842,252 | $ | 6,018,515,383 | $ | 3,949,964,533 | $ | 2,982,355,849 | $ | 1,373,902,310 | $ | 452,598,613 | $ | 25,230,411 | ||||||||||||||
| 64 | 2022 Annual Report ■ TIAA-CREF Lifecycle Funds | See notes to financial statements | See notes to financial statements | TIAA-CREF Lifecycle Funds ■ 2022 Annual Report | 65 |
TIAA-CREF Funds ■ For the year ended May 31, 2022
| Lifecycle Retirement Income Fund | Lifecycle 2010 Fund | Lifecycle 2015 Fund | Lifecycle 2020 Fund | Lifecycle 2025 Fund | Lifecycle 2030 Fund | |||||||||||||||||||
| INVESTMENT INCOME | ||||||||||||||||||||||||
| Dividends from affiliated investments | $ | 15,972,597 | $ | 31,010,252 | $ | 42,843,450 | $ | 90,108,302 | $ | 120,417,342 | $ | 121,226,792 | ||||||||||||
| Total income | 15,972,597 | 31,010,252 | 42,843,450 | 90,108,302 | 120,417,342 | 121,226,792 | ||||||||||||||||||
| EXPENSES | ||||||||||||||||||||||||
| Management fees | 2,281,772 | 4,467,481 | 6,398,942 | 14,143,624 | 20,191,901 | 21,959,948 | ||||||||||||||||||
| Shareholder servicing – Institutional Class | 920 | 1,014 | 1,262 | 2,516 | 3,509 | 3,665 | ||||||||||||||||||
| Shareholder servicing – Advisor Class | 622 | 124 | 462 | 286 | 333 | 297 | ||||||||||||||||||
| Shareholder servicing – Premier Class | 86 | 93 | 101 | 177 | 217 | 233 | ||||||||||||||||||
| Shareholder servicing – Retirement Class | 461,101 | 843,831 | 1,158,711 | 2,272,248 | 2,841,134 | 2,944,755 | ||||||||||||||||||
| Shareholder servicing – Retail Class | 37,757 | — | — | — | — | — | ||||||||||||||||||
| Distribution fees – Premier Class | 27,719 | 93,170 | 138,610 | 315,297 | 439,506 | 471,780 | ||||||||||||||||||
| Distribution fees – Retail Class | 357,240 | — | — | — | — | — | ||||||||||||||||||
| Registration fees | 78,331 | 66,064 | 67,641 | 73,960 | 79,749 | 74,597 | ||||||||||||||||||
| Administrative service fees | 62,612 | 61,572 | 68,788 | 97,669 | 120,367 | 126,665 | ||||||||||||||||||
| Professional fees | 25,803 | 36,696 | 20,663 | 26,365 | 30,759 | 32,100 | ||||||||||||||||||
| Trustee fees and expenses | 6,059 | 11,778 | 16,876 | 37,038 | 52,485 | 56,686 | ||||||||||||||||||
| Shareholder reports | 23,427 | 32,295 | 34,900 | 56,002 | 75,403 | 82,244 | ||||||||||||||||||
| Other expenses | 133,443 | 232,185 | 309,510 | 631,719 | 863,837 | 920,932 | ||||||||||||||||||
| Total expenses | 3,496,892 | 5,846,303 | 8,216,466 | 17,656,901 | 24,699,200 | 26,673,902 | ||||||||||||||||||
| Less: Expenses reimbursed by the investment adviser | (258,346 | ) | (248,250 | ) | (249,435 | ) | (345,300 | ) | (427,696 | ) | (461,209 | ) | ||||||||||||
| Fee waiver by investment adviser and Nuveen Securities | (814,980 | ) | (1,529,420 | ) | (2,153,577 | ) | (4,802,917 | ) | (6,937,838 | ) | (7,967,730 | ) | ||||||||||||
| Net expenses | 2,423,566 | 4,068,633 | 5,813,454 | 12,508,684 | 17,333,666 | 18,244,963 | ||||||||||||||||||
| Net investment income (loss) | 13,549,031 | 26,941,619 | 37,029,996 | 77,599,618 | 103,083,676 | 102,981,829 | ||||||||||||||||||
| NET REALIZED AND UNREALIZED GAIN (LOSS) ON TOTAL INVESTMENTS | ||||||||||||||||||||||||
| Realized gain (loss) from sale of affiliated investments | 4,689,851 | 26,549,029 | 35,886,042 | 77,659,572 | 114,910,044 | 142,902,421 | ||||||||||||||||||
| Realized gain distributions from affiliated investments | 17,757,631 | 32,943,371 | 51,647,115 | 125,830,900 | 204,496,155 | 252,001,633 | ||||||||||||||||||
| Net realized gain (loss) from investments | 22,447,482 | 59,492,400 | 87,533,157 | 203,490,472 | 319,406,199 | 394,904,054 | ||||||||||||||||||
| Net change in unrealized appreciation (depreciation) from affiliated investments | (74,014,563 | ) | (158,163,873 | ) | (228,041,271 | ) | (525,099,654 | ) | (798,711,133 | ) | (935,032,311 | ) | ||||||||||||
| Net realized and unrealized gain (loss) from investments | (51,567,081 | ) | (98,671,473 | ) | (140,508,114 | ) | (321,609,182 | ) | (479,304,934 | ) | (540,128,257 | ) | ||||||||||||
| Net increase (decrease) in net assets from operations | $ | (38,018,050 | ) | $ | (71,729,854 | ) | $ | (103,478,118 | ) | $ | (244,009,564 | ) | $ | (376,221,258 | ) | $ | (437,146,428 | ) | ||||||
| 66 | 2022 Annual Report ■ TIAA-CREF Lifecycle Funds | See notes to financial statements | See notes to financial statements | TIAA-CREF Lifecycle Funds ■ 2022 Annual Report | 67 |
| Statement of operations | concluded |
| TIAA-CREF Funds ■ For the year ended May 31, 2022 |
| Lifecycle 2035 Fund | Lifecycle 2040 Fund | Lifecycle 2045 Fund | Lifecycle 2050 Fund | Lifecycle 2055 Fund | Lifecycle 2060 Fund | Lifecycle 2065 Fund | ||||||||||||||||||||||
| INVESTMENT INCOME | ||||||||||||||||||||||||||||
| Dividends from affiliated investments | $ | 116,050,142 | $ | 129,701,689 | $ | 81,090,890 | $ | 58,402,114 | $ | 25,082,661 | $ | 7,540,353 | $ | 190,706 | ||||||||||||||
| Total income | 116,050,142 | 129,701,689 | 81,090,890 | 58,402,114 | 25,082,661 | 7,540,353 | 190,706 | |||||||||||||||||||||
| EXPENSES | ||||||||||||||||||||||||||||
| Management fees | 22,817,058 | 27,072,607 | 17,872,621 | 13,163,760 | 5,702,049 | 1,715,404 | 45,715 | |||||||||||||||||||||
| Shareholder servicing – Institutional Class | 3,859 | 4,497 | 3,513 | 3,004 | 2,539 | 1,389 | 241 | |||||||||||||||||||||
| Shareholder servicing – Advisor Class | 410 | 208 | 69 | 343 | 54 | 141 | 39 | |||||||||||||||||||||
| Shareholder servicing – Premier Class | 239 | 268 | 208 | 162 | 117 | 87 | 48 | |||||||||||||||||||||
| Shareholder servicing – Retirement Class | 2,699,555 | 3,213,216 | 1,805,671 | 1,281,858 | 561,036 | 161,804 | 4,243 | |||||||||||||||||||||
| Distribution fees – Premier Class | 507,334 | 576,202 | 407,590 | 283,592 | 132,859 | 30,902 | 1,412 | |||||||||||||||||||||
| Registration fees | 70,481 | 72,741 | 68,386 | 66,572 | 62,961 | 62,809 | 64,731 | |||||||||||||||||||||
| Administrative service fees | 129,407 | 145,216 | 111,350 | 93,873 | 66,072 | 51,240 | 44,868 | |||||||||||||||||||||
| Professional fees | 32,685 | 35,924 | 29,288 | 25,763 | 20,206 | 17,238 | 13,993 | |||||||||||||||||||||
| Trustee fees and expenses | 58,531 | 69,427 | 45,827 | 33,725 | 14,574 | 4,377 | 101 | |||||||||||||||||||||
| Shareholder reports | 85,424 | 101,288 | 77,341 | 68,847 | 46,885 | 34,093 | 11,873 | |||||||||||||||||||||
| Other expenses | 927,547 | 1,050,793 | 688,744 | 515,330 | 244,854 | 97,982 | 32,884 | |||||||||||||||||||||
| Total expenses | 27,332,530 | 32,342,387 | 21,110,608 | 15,536,829 | 6,854,206 | 2,177,466 | 220,148 | |||||||||||||||||||||
| Less: Expenses reimbursed by the investment adviser | (471,073 | ) | (530,003 | ) | (426,257 | ) | (374,019 | ) | (271,455 | ) | (212,783 | ) | (167,052 | ) | ||||||||||||||
| Fee waiver by investment adviser and Nuveen Securities | (8,894,573 | ) | (11,173,779 | ) | (7,661,829 | ) | (5,966,726 | ) | (2,582,791 | ) | (809,740 | ) | (22,225 | ) | ||||||||||||||
| Net expenses | 17,966,884 | 20,638,605 | 13,022,522 | 9,196,084 | 3,999,960 | 1,154,943 | 30,871 | |||||||||||||||||||||
| Net investment income (loss) | 98,083,258 | 109,063,084 | 68,068,368 | 49,206,030 | 21,082,701 | 6,385,410 | 159,835 | |||||||||||||||||||||
| NET REALIZED AND UNREALIZED GAIN (LOSS) ON TOTAL INVESTMENTS | ||||||||||||||||||||||||||||
| Realized gain (loss) from sale of affiliated investments | 164,826,791 | 215,413,623 | 135,417,117 | 93,135,903 | 32,580,125 | 4,586,362 | (196,579 | ) | ||||||||||||||||||||
| Realized gain distributions from affiliated investments | 292,189,220 | 385,584,241 | 280,681,355 | 213,877,581 | 93,830,596 | 28,938,078 | 741,651 | |||||||||||||||||||||
| Realized gain (loss) from sale of unaffiliated investments | — | — | — | — | — | — | 15,312 | |||||||||||||||||||||
| Net realized gain (loss) from investments | 457,016,011 | 600,997,864 | 416,098,472 | 307,013,484 | 126,410,721 | 33,524,440 | 560,384 | |||||||||||||||||||||
| Net change in unrealized appreciation (depreciation) from affiliated investments | (1,033,105,549 | ) | (1,293,667,975 | ) | (884,016,468 | ) | (657,604,318 | ) | (282,297,754 | ) | (82,809,174 | ) | (2,556,188 | ) | ||||||||||||||
| Net realized and unrealized gain (loss) from investments | (576,089,538 | ) | (692,670,111 | ) | (467,917,996 | ) | (350,590,834 | ) | (155,887,033 | ) | (49,284,734 | ) | (1,995,804 | ) | ||||||||||||||
| Net increase (decrease) in net assets from operations | $ | (478,006,280 | ) | $ | (583,607,027 | ) | $ | (399,849,628 | ) | $ | (301,384,804 | ) | $ | (134,804,332 | ) | $ | (42,899,324 | ) | $ | (1,835,969 | ) | |||||||
| 68 | 2022 Annual Report ■ TIAA-CREF Lifecycle Funds | See notes to financial statements | See notes to financial statements | TIAA-CREF Lifecycle Funds ■ 2022 Annual Report | 69 |
Statement of changes in net assets
TIAA-CREF Funds ■ For the year ended
| Lifecycle Retirement Income Fund | Lifecycle 2010 Fund | Lifecycle 2015 Fund | ||||||||||||||||||||||||
| May 31, 2022 | May 31, 2021 | May 31, 2022 | May 31, 2021 | May 31, 2022 | May 31, 2021 | |||||||||||||||||||||
| OPERATIONS | ||||||||||||||||||||||||||
| Net investment income (loss) | $ | 13,549,031 | $ | 9,979,078 | $ | 26,941,619 | $ | 21,865,262 | $ | 37,029,996 | $ | 31,460,127 | ||||||||||||||
| Net realized gain (loss) from investments | 22,447,482 | 42,410,187 | 59,492,400 | 115,876,689 | 87,533,157 | 122,089,493 | ||||||||||||||||||||
| Net change in unrealized appreciation (depreciation) from affiliated investments | (74,014,563 | ) | 39,922,185 | (158,163,873 | ) | 60,717,409 | (228,041,271 | ) | 162,629,645 | |||||||||||||||||
| Net increase (decrease) in net assets from operations | (38,018,050 | ) | 92,311,450 | (71,729,854 | ) | 198,459,360 | (103,478,118 | ) | 316,179,265 | |||||||||||||||||
| DISTRIBUTIONS TO SHAREHOLDERS | ||||||||||||||||||||||||||
| Institutional Class | (20,368,059 | ) | (13,292,127 | ) | (79,301,833 | ) | (63,091,692 | ) | (106,959,992 | ) | (70,995,502 | ) | ||||||||||||||
| Advisor Class | (77,250 | ) | (19,563 | ) | (17,924 | ) | (13,352 | ) | (39,839 | ) | (14,828 | ) | ||||||||||||||
| Premier Class | (1,323,354 | ) | (994,097 | ) | (5,444,960 | ) | (6,130,724 | ) | (7,688,659 | ) | (6,453,978 | ) | ||||||||||||||
| Retirement Class | (13,344,233 | ) | (10,268,344 | ) | (26,904,852 | ) | (24,848,226 | ) | (32,608,089 | ) | (23,365,699 | ) | ||||||||||||||
| Retail | (10,319,340 | ) | (7,195,960 | ) | — | — | — | — | ||||||||||||||||||
| Total distributions | (45,432,236 | ) | (31,770,091 | ) | (111,669,569 | ) | (94,083,994 | ) | (147,296,579 | ) | (100,830,007 | ) | ||||||||||||||
| SHAREHOLDER TRANSACTIONS | ||||||||||||||||||||||||||
| Subscriptions: | Institutional Class | 64,956,781 | 43,900,793 | 58,676,210 | 169,967,222 | 50,196,899 | 128,945,911 | |||||||||||||||||||
| Advisor Class | 872,339 | 238,116 | 40,999 | 4,195 | 175,000 | 35,000 | ||||||||||||||||||||
| Premier Class | 7,254,130 | 4,897,482 | 7,217,688 | 10,144,416 | 7,878,198 | 14,025,542 | ||||||||||||||||||||
| Retirement Class | 6,371,163 | 22,640,293 | 16,208,559 | 31,070,718 | 25,841,707 | 20,342,406 | ||||||||||||||||||||
| Retail | 10,352,335 | 12,729,295 | — | — | — | — | ||||||||||||||||||||
| Reinvestments of distributions: | Institutional Class | 20,233,170 | 13,191,569 | 79,291,903 | 63,079,864 | 106,768,180 | 70,875,182 | |||||||||||||||||||
| Advisor Class | 68,492 | 13,004 | 6,462 | 3,790 | 29,142 | 7,916 | ||||||||||||||||||||
| Premier Class | 1,321,773 | 993,063 | 5,444,960 | 6,130,724 | 7,688,659 | 6,453,978 | ||||||||||||||||||||
| Retirement Class | 13,344,233 | 10,268,346 | 26,904,852 | 24,848,226 | 32,608,089 | 23,365,699 | ||||||||||||||||||||
| Retail | 9,997,096 | 6,988,443 | — | — | — | — | ||||||||||||||||||||
| Redemptions: | Institutional Class | (70,948,029 | ) | (55,656,684 | ) | (146,447,146 | ) | (180,930,067 | ) | (192,279,261 | ) | (207,223,499 | ) | |||||||||||||
| Advisor Class | (806,496 | ) | (8,337 | ) | (5,478 | ) | (338 | ) | — | — | ||||||||||||||||
| Premier Class | (7,738,929 | ) | (6,074,799 | ) | (32,019,270 | ) | (17,791,112 | ) | (48,490,682 | ) | (24,739,297 | ) | ||||||||||||||
| Retirement Class | (37,916,338 | ) | (31,796,413 | ) | (73,000,609 | ) | (75,481,816 | ) | (103,670,534 | ) | (100,996,727 | ) | ||||||||||||||
| Retail | (13,687,705 | ) | (12,425,992 | ) | — | — | — | — | ||||||||||||||||||
| Net increase (decrease) from shareholder transactions | 3,674,015 | 9,898,179 | (57,680,870 | ) | 31,045,822 | (113,254,603 | ) | (68,907,889 | ) | |||||||||||||||||
| Net increase (decrease) in net assets | (79,776,271 | ) | 70,439,538 | (241,080,293 | ) | 135,421,188 | (364,029,300 | ) | 146,441,369 | |||||||||||||||||
| NET ASSETS | ||||||||||||||||||||||||||
| Beginning of period | 609,010,718 | 538,571,180 | 1,282,959,264 | 1,147,538,076 | 1,834,900,734 | 1,688,459,365 | ||||||||||||||||||||
| End of period | $ | 529,234,447 | $ | 609,010,718 | $ | 1,041,878,971 | $ | 1,282,959,264 | $ | 1,470,871,434 | $ | 1,834,900,734 | ||||||||||||||
| CHANGE IN FUND SHARES | ||||||||||||||||||||||||||
| Shares sold: | Institutional Class | 5,093,690 | 3,559,443 | 5,023,114 | 14,418,958 | 4,837,755 | 12,603,762 | |||||||||||||||||||
| Advisor Class | 69,747 | 19,210 | 3,621 | 364 | 16,038 | 3,597 | ||||||||||||||||||||
| Premier Class | 599,871 | 397,719 | 642,907 | 857,964 | 785,970 | 1,361,143 | ||||||||||||||||||||
| Retirement Class | 508,539 | 1,842,517 | 1,133,657 | 2,174,784 | 1,934,172 | 1,540,135 | ||||||||||||||||||||
| Retail | 829,780 | 1,030,119 | — | — | — | — | ||||||||||||||||||||
| Shares reinvested: | Institutional Class | 1,663,321 | 1,078,515 | 7,111,381 | 5,409,937 | 10,708,945 | 6,901,186 | |||||||||||||||||||
| Advisor Class | 5,634 | 1,061 | 578 | 324 | 2,926 | 771 | ||||||||||||||||||||
| Premier Class | 108,627 | 81,178 | 489,215 | 527,147 | 774,286 | 630,887 | ||||||||||||||||||||
| Retirement Class | 1,099,644 | 840,635 | 1,948,215 | 1,754,818 | 2,500,620 | 1,778,211 | ||||||||||||||||||||
| Retail | 822,805 | 571,584 | — | — | — | — | ||||||||||||||||||||
| Shares redeemed: | Institutional Class | (5,927,678 | ) | (4,527,666 | ) | (12,621,540 | ) | (15,215,826 | ) | (18,601,692 | ) | (20,100,659 | ) | |||||||||||||
| Advisor Class | (67,294 | ) | (655 | ) | (491 | ) | (29 | ) | — | — | ||||||||||||||||
| Premier Class | (622,368 | ) | (494,181 | ) | (2,646,518 | ) | (1,484,308 | ) | (4,560,902 | ) | (2,382,966 | ) | ||||||||||||||
| Retirement Class | (3,097,503 | ) | (2,590,037 | ) | (5,133,914 | ) | (5,258,927 | ) | (7,821,062 | ) | (7,693,734 | ) | ||||||||||||||
| Retail | (1,119,182 | ) | (1,008,412 | ) | — | — | — | — | ||||||||||||||||||
| Net increase (decrease) from shareholder transactions | (32,367 | ) | 801,030 | (4,049,775 | ) | 3,185,206 | (9,422,944 | ) | (5,357,667 | ) | ||||||||||||||||
| 70 | 2022 Annual Report ■ TIAA-CREF Lifecycle Funds | See notes to financial statements | See notes to financial statements | TIAA-CREF Lifecycle Funds ■ 2022 Annual Report | 71 |
| Statement of changes in net assets | continued |
| TIAA-CREF Funds ■ For the year ended |
| Lifecycle 2020 Fund | Lifecycle 2025 Fund | Lifecycle 2030 Fund | ||||||||||||||||||||||||
| May 31, 2022 | May 31, 2021 | May 31, 2022 | May 31, 2021 | May 31, 2022 | May 31, 2021 | |||||||||||||||||||||
| OPERATIONS | ||||||||||||||||||||||||||
| Net investment income (loss) | $ | 77,599,618 | $ | 67,317,017 | $ | 103,083,676 | $ | 85,718,140 | $ | 102,981,829 | $ | 85,850,166 | ||||||||||||||
| Net realized gain (loss) from investments | 203,490,472 | 290,435,751 | 319,406,199 | 408,597,677 | 394,904,054 | 456,745,539 | ||||||||||||||||||||
| Net change in unrealized appreciation (depreciation) from affiliated investments | (525,099,654 | ) | 383,314,339 | (798,711,133 | ) | 615,869,733 | (935,032,311 | ) | 757,057,969 | |||||||||||||||||
| Net increase (decrease) in net assets from operations | (244,009,564 | ) | 741,067,107 | (376,221,258 | ) | 1,110,185,550 | (437,146,428 | ) | 1,299,653,674 | |||||||||||||||||
| DISTRIBUTIONS TO SHAREHOLDERS | ||||||||||||||||||||||||||
| Institutional Class | (256,343,041 | ) | (169,542,639 | ) | (380,804,874 | ) | (228,400,100 | ) | (437,831,967 | ) | (253,904,486 | ) | ||||||||||||||
| Advisor Class | (53,457 | ) | (7,787 | ) | (43,970 | ) | (9,950 | ) | (61,587 | ) | (31,365 | ) | ||||||||||||||
| Premier Class | (18,654,021 | ) | (15,870,159 | ) | (26,753,172 | ) | (19,632,772 | ) | (29,995,512 | ) | (22,524,246 | ) | ||||||||||||||
| Retirement Class | (64,591,406 | ) | (48,465,010 | ) | (79,998,508 | ) | (55,917,737 | ) | (85,359,273 | ) | (58,159,418 | ) | ||||||||||||||
| Total distributions | (339,641,925 | ) | (233,885,595 | ) | (487,600,524 | ) | (303,960,559 | ) | (553,248,339 | ) | (334,619,515 | ) | ||||||||||||||
| SHAREHOLDER TRANSACTIONS | ||||||||||||||||||||||||||
| Subscriptions: | Institutional Class | 152,100,452 | 273,046,939 | 258,741,518 | 400,871,182 | 343,831,067 | 423,447,803 | |||||||||||||||||||
| Advisor Class | 168,960 | 944,061 | 30,944 | 383,323 | 125,669 | 140,974 | ||||||||||||||||||||
| Premier Class | 22,751,832 | 17,377,062 | 40,209,994 | 32,920,235 | 46,133,714 | 39,187,488 | ||||||||||||||||||||
| Retirement Class | 38,342,851 | 45,567,956 | 64,386,912 | 71,398,285 | 66,854,810 | 81,716,107 | ||||||||||||||||||||
| Reinvestments of distributions: | Institutional Class | 255,911,089 | 169,095,637 | 379,028,275 | 227,226,911 | 437,033,952 | 253,167,318 | |||||||||||||||||||
| Advisor Class | 42,012 | 262 | 32,026 | 2,302 | 48,642 | 23,125 | ||||||||||||||||||||
| Premier Class | 18,647,903 | 15,867,142 | 26,753,132 | 19,632,772 | 29,995,512 | 22,524,246 | ||||||||||||||||||||
| Retirement Class | 64,587,181 | 48,462,386 | 79,995,939 | 55,916,502 | 85,358,315 | 58,158,131 | ||||||||||||||||||||
| Redemptions: | Institutional Class | (388,312,165 | ) | (435,250,022 | ) | (400,732,044 | ) | (413,178,900 | ) | (359,646,334 | ) | (373,856,722 | ) | |||||||||||||
| Advisor Class | (351,054 | ) | (628,688 | ) | (148,621 | ) | (5,318 | ) | (88,684 | ) | (38,856 | ) | ||||||||||||||
| Premier Class | (98,479,847 | ) | (63,109,751 | ) | (123,448,064 | ) | (61,742,663 | ) | (130,631,782 | ) | (64,887,458 | ) | ||||||||||||||
| Retirement Class | (207,792,659 | ) | (190,216,613 | ) | (227,624,303 | ) | (217,012,692 | ) | (223,239,881 | ) | (183,071,813 | ) | ||||||||||||||
| Net increase (decrease) from shareholder transactions | (142,383,445 | ) | (118,843,629 | ) | 97,225,708 | 116,411,939 | 295,775,000 | 256,510,343 | ||||||||||||||||||
| Net increase (decrease) in net assets | (726,034,934 | ) | 388,337,883 | (766,596,074 | ) | 922,636,930 | (694,619,767 | ) | 1,221,544,502 | |||||||||||||||||
| NET ASSETS | ||||||||||||||||||||||||||
| Beginning of period | 3,959,953,777 | 3,571,615,894 | 5,464,567,557 | 4,541,930,627 | 5,841,384,411 | 4,619,839,909 | ||||||||||||||||||||
| End of period | $ | 3,233,918,843 | $ | 3,959,953,777 | $ | 4,697,971,483 | $ | 5,464,567,557 | $ | 5,146,764,644 | $ | 5,841,384,411 | ||||||||||||||
| CHANGE IN FUND SHARES | ||||||||||||||||||||||||||
| Shares sold: | Institutional Class | 14,043,786 | 25,649,378 | 22,978,555 | 36,496,743 | 30,071,947 | 37,991,391 | |||||||||||||||||||
| Advisor Class | 14,711 | 87,067 | 2,770 | 34,023 | 10,610 | 12,974 | ||||||||||||||||||||
| Premier Class | 2,128,099 | 1,630,836 | 3,623,408 | 2,986,571 | 4,124,063 | 3,506,632 | ||||||||||||||||||||
| Retirement Class | 2,669,296 | 3,260,988 | 4,261,456 | 4,896,842 | 4,210,167 | 5,399,842 | ||||||||||||||||||||
| Shares reinvested: | Institutional Class | 24,749,622 | 15,892,447 | 35,095,211 | 20,656,992 | 39,766,511 | 22,766,845 | |||||||||||||||||||
| Advisor Class | 4,063 | 25 | 2,965 | 210 | 4,426 | 2,080 | ||||||||||||||||||||
| Premier Class | 1,806,967 | 1,495,489 | 2,488,663 | 1,792,947 | 2,744,328 | 2,036,550 | ||||||||||||||||||||
| Retirement Class | 4,636,553 | 3,469,033 | 5,423,454 | 3,822,044 | 5,535,559 | 3,836,288 | ||||||||||||||||||||
| Shares redeemed: | Institutional Class | (36,674,302 | ) | (40,645,402 | ) | (36,611,176 | ) | (37,691,035 | ) | (32,258,878 | ) | (33,867,496 | ) | |||||||||||||
| Advisor Class | (30,785 | ) | (58,111 | ) | (13,110 | ) | (471 | ) | (8,466 | ) | (3,453 | ) | ||||||||||||||
| Premier Class | (8,921,550 | ) | (5,879,748 | ) | (10,807,226 | ) | (5,586,772 | ) | (11,042,822 | ) | (5,780,028 | ) | ||||||||||||||
| Retirement Class | (14,638,656 | ) | (13,584,155 | ) | (15,183,640 | ) | (14,830,291 | ) | (14,285,202 | ) | (12,064,916 | ) | ||||||||||||||
| Net increase (decrease) from shareholder transactions | (10,212,196 | ) | (8,682,153 | ) | 11,261,330 | 12,577,803 | 28,872,243 | 23,836,709 | ||||||||||||||||||
| 72 | 2022 Annual Report ■ TIAA-CREF Lifecycle Funds | See notes to financial statements | See notes to financial statements | TIAA-CREF Lifecycle Funds ■ 2022 Annual Report | 73 |
| Statement of changes in net assets | continued |
| TIAA-CREF Funds ■ For the year ended |
| Lifecycle 2035 Fund | Lifecycle 2040 Fund | Lifecycle 2045 Fund | ||||||||||||||||||||||||
| May 31, 2022 | May 31, 2021 | May 31, 2022 | May 31, 2021 | May 31, 2022 | May 31, 2021 | |||||||||||||||||||||
| OPERATIONS | ||||||||||||||||||||||||||
| Net investment income (loss) | $ | 98,083,258 | $ | 84,808,429 | $ | 109,063,084 | $ | 94,311,326 | $ | 68,068,368 | $ | 55,636,861 | ||||||||||||||
| Net realized gain (loss) from investments | 457,016,011 | 516,134,180 | 600,997,864 | 674,545,233 | 416,098,472 | 456,446,338 | ||||||||||||||||||||
| Net change in unrealized appreciation (depreciation) from affiliated investments | (1,033,105,549 | ) | 874,364,600 | (1,293,667,975 | ) | 1,149,563,307 | (884,016,468 | ) | 802,570,683 | |||||||||||||||||
| Net increase (decrease) in net assets from operations | (478,006,280 | ) | 1,475,307,209 | (583,607,027 | ) | 1,918,419,866 | (399,849,628 | ) | 1,314,653,882 | |||||||||||||||||
| DISTRIBUTIONS TO SHAREHOLDERS | ||||||||||||||||||||||||||
| Institutional Class | (496,360,782 | ) | (286,156,220 | ) | (638,658,275 | ) | (371,346,365 | ) | (424,578,191 | ) | (219,792,380 | ) | ||||||||||||||
| Advisor Class | (52,417 | ) | (30,802 | ) | (32,522 | ) | (20,305 | ) | (20,597 | ) | (13,606 | ) | ||||||||||||||
| Premier Class | (34,545,686 | ) | (25,272,007 | ) | (43,722,661 | ) | (31,398,502 | ) | (29,929,350 | ) | (19,260,742 | ) | ||||||||||||||
| Retirement Class | (81,745,103 | ) | (55,861,878 | ) | (102,004,924 | ) | (71,910,536 | ) | (81,517,458 | ) | (51,651,316 | ) | ||||||||||||||
| Total distributions | (612,703,988 | ) | (367,320,907 | ) | (784,418,382 | ) | (474,675,708 | ) | (536,045,596 | ) | (290,718,044 | ) | ||||||||||||||
| SHAREHOLDER TRANSACTIONS | ||||||||||||||||||||||||||
| Subscriptions: | Institutional Class | 371,177,950 | 400,726,391 | 379,833,667 | 393,505,873 | 363,983,500 | 358,204,753 | |||||||||||||||||||
| Advisor Class | 36,497 | 7,000 | 35,502 | 44,310 | 61,674 | — | ||||||||||||||||||||
| Premier Class | 46,025,870 | 33,730,604 | 46,889,238 | 30,467,712 | 43,883,742 | 28,909,155 | ||||||||||||||||||||
| Retirement Class | 62,199,522 | 64,509,776 | 49,462,497 | 61,605,749 | 46,177,270 | 54,990,544 | ||||||||||||||||||||
| Reinvestments of distributions: | Institutional Class | 495,763,411 | 285,384,360 | 638,065,449 | 370,539,877 | 423,819,514 | 219,189,825 | |||||||||||||||||||
| Advisor Class | 38,208 | 21,817 | 16,950 | 10,334 | 3,010 | 3,319 | ||||||||||||||||||||
| Premier Class | 34,545,687 | 25,272,007 | 43,722,138 | 31,398,502 | 29,929,349 | 19,260,742 | ||||||||||||||||||||
| Retirement Class | 81,745,103 | 55,849,449 | 101,973,720 | 71,892,450 | 81,503,696 | 51,644,106 | ||||||||||||||||||||
| Redemptions: | Institutional Class | (366,942,911 | ) | (378,123,271 | ) | (388,075,690 | ) | (412,209,014 | ) | (248,768,014 | ) | (230,254,889 | ) | |||||||||||||
| Advisor Class | (8,001 | ) | (4,341 | ) | (64,467 | ) | (9,362 | ) | (12,685 | ) | (47,195 | ) | ||||||||||||||
| Premier Class | (141,930,250 | ) | (62,116,062 | ) | (146,871,580 | ) | (85,769,384 | ) | (109,034,656 | ) | (44,242,600 | ) | ||||||||||||||
| Retirement Class | (209,077,226 | ) | (183,116,951 | ) | (249,877,458 | ) | (225,239,956 | ) | (151,886,506 | ) | (132,607,623 | ) | ||||||||||||||
| Net increase (decrease) from shareholder transactions | 373,573,860 | 242,140,779 | 475,109,966 | 236,237,091 | 479,659,894 | 325,050,137 | ||||||||||||||||||||
| Net increase (decrease) in net assets | (717,136,408 | ) | 1,350,127,081 | (892,915,443 | ) | 1,679,981,249 | (456,235,330 | ) | 1,348,985,975 | |||||||||||||||||
| NET ASSETS | ||||||||||||||||||||||||||
| Beginning of period | 6,022,725,687 | 4,672,598,606 | 7,145,005,142 | 5,465,023,893 | 4,646,549,870 | 3,297,563,895 | ||||||||||||||||||||
| End of period | $ | 5,305,589,279 | $ | 6,022,725,687 | $ | 6,252,089,699 | $ | 7,145,005,142 | $ | 4,190,314,540 | $ | 4,646,549,870 | ||||||||||||||
| CHANGE IN FUND SHARES | ||||||||||||||||||||||||||
| Shares sold: | Institutional Class | 31,843,272 | 35,285,927 | 32,492,908 | 34,643,712 | 24,969,570 | 25,783,485 | |||||||||||||||||||
| Advisor Class | 3,237 | 607 | 3,137 | 3,861 | 4,268 | — | ||||||||||||||||||||
| Premier Class | 3,965,620 | 2,950,557 | 4,037,072 | 2,660,627 | 3,010,126 | 2,062,781 | ||||||||||||||||||||
| Retirement Class | 3,739,851 | 4,074,502 | 2,860,690 | 3,796,695 | 3,164,604 | 3,962,329 | ||||||||||||||||||||
| Shares reinvested: | Institutional Class | 44,146,341 | 25,188,381 | 56,666,558 | 32,675,474 | 30,143,635 | 15,723,804 | |||||||||||||||||||
| Advisor Class | 3,405 | 1,927 | 1,507 | 912 | 214 | 238 | ||||||||||||||||||||
| Premier Class | 3,084,436 | 2,236,461 | 3,893,334 | 2,778,628 | 2,139,339 | 1,388,662 | ||||||||||||||||||||
| Retirement Class | 5,036,667 | 3,528,076 | 6,033,948 | 4,397,092 | 5,850,947 | 3,736,911 | ||||||||||||||||||||
| Shares redeemed: | Institutional Class | (32,207,800 | ) | (33,775,898 | ) | (34,139,265 | ) | (36,762,028 | ) | (17,772,833 | ) | (16,750,949 | ) | |||||||||||||
| Advisor Class | (714 | ) | (383 | ) | (5,338 | ) | (827 | ) | (964 | ) | (3,399 | ) | ||||||||||||||
| Premier Class | (11,654,409 | ) | (5,429,866 | ) | (12,145,236 | ) | (7,456,320 | ) | (7,215,317 | ) | (3,155,713 | ) | ||||||||||||||
| Retirement Class | (12,642,694 | ) | (11,583,502 | ) | (14,476,480 | ) | (13,764,325 | ) | (10,402,406 | ) | (9,460,984 | ) | ||||||||||||||
| Net increase (decrease) from shareholder transactions | 35,317,212 | 22,476,789 | 45,222,835 | 22,973,501 | 33,891,183 | 23,287,165 | ||||||||||||||||||||
| 74 | 2022 Annual Report ■ TIAA-CREF Lifecycle Funds | See notes to financial statements | See notes to financial statements | TIAA-CREF Lifecycle Funds ■ 2022 Annual Report | 75 |
| Statement of changes in net assets | continued |
| TIAA-CREF Funds ■ For the year ended |
| Lifecycle 2050 Fund | Lifecycle 2055 Fund | Lifecycle 2060 Fund | ||||||||||||||||||||||||
| May 31, 2022 | May 31, 2021 | May 31, 2022 | May 31, 2021 | May 31, 2022 | May 31, 2021 | |||||||||||||||||||||
| OPERATIONS | ||||||||||||||||||||||||||
| Net investment income (loss) | $ | 49,206,030 | $ | 39,461,321 | $ | 21,082,701 | $ | 15,890,035 | $ | 6,385,410 | $ | 3,933,864 | ||||||||||||||
| Net realized gain (loss) from investments | 307,013,484 | 302,167,739 | 126,410,721 | 103,131,321 | 33,524,440 | 21,466,861 | ||||||||||||||||||||
| Net change in unrealized appreciation (depreciation) from affiliated investments | (657,604,318 | ) | 613,929,377 | (282,297,754 | ) | 273,582,516 | (82,809,174 | ) | 73,268,079 | |||||||||||||||||
| Net increase (decrease) in net assets from operations | (301,384,804 | ) | 955,558,437 | (134,804,332 | ) | 392,603,872 | (42,899,324 | ) | 98,668,804 | |||||||||||||||||
| DISTRIBUTIONS TO SHAREHOLDERS | ||||||||||||||||||||||||||
| Institutional Class | (299,794,302 | ) | (148,512,585 | ) | (113,893,879 | ) | (49,583,491 | ) | (28,362,442 | ) | (10,426,088 | ) | ||||||||||||||
| Advisor Class | (33,565 | ) | (9,660 | ) | (16,266 | ) | (8,250 | ) | (16,960 | ) | (6,520 | ) | ||||||||||||||
| Premier Class | (20,282,431 | ) | (11,719,937 | ) | (8,521,898 | ) | (4,268,491 | ) | (1,640,428 | ) | (684,320 | ) | ||||||||||||||
| Retirement Class | (54,655,174 | ) | (32,907,302 | ) | (20,883,417 | ) | (11,625,296 | ) | (4,864,206 | ) | (2,264,142 | ) | ||||||||||||||
| Total distributions | (374,765,472 | ) | (193,149,484 | ) | (143,315,460 | ) | (65,485,528 | ) | (34,884,036 | ) | (13,381,070 | ) | ||||||||||||||
| SHAREHOLDER TRANSACTIONS | ||||||||||||||||||||||||||
| Subscriptions: | Institutional Class | 296,761,919 | 293,468,235 | 205,641,316 | 193,224,719 | 114,913,785 | 98,630,215 | |||||||||||||||||||
| Advisor Class | 361,859 | 235,170 | 22,678 | — | 28,300 | 78,019 | ||||||||||||||||||||
| Premier Class | 35,328,256 | 23,008,007 | 20,559,715 | 14,998,337 | 9,584,808 | 5,891,351 | ||||||||||||||||||||
| Retirement Class | 39,623,443 | 48,985,065 | 25,031,044 | 27,529,742 | 16,984,215 | 17,187,660 | ||||||||||||||||||||
| Reinvestments of distributions: | Institutional Class | 299,563,125 | 148,342,907 | 113,667,316 | 49,456,094 | 28,323,915 | 10,404,168 | |||||||||||||||||||
| Advisor Class | 16,645 | — | 796 | 62 | 5,200 | 197 | ||||||||||||||||||||
| Premier Class | 20,278,896 | 11,717,967 | 8,520,147 | 4,267,574 | 1,628,720 | 678,121 | ||||||||||||||||||||
| Retirement Class | 54,655,174 | 32,907,260 | 20,877,867 | 11,622,900 | 4,863,057 | 2,263,534 | ||||||||||||||||||||
| Redemptions: | Institutional Class | (150,432,796 | ) | (126,856,018 | ) | (61,631,484 | ) | (48,460,548 | ) | (28,941,694 | ) | (16,914,706 | ) | |||||||||||||
| Advisor Class | (96,314 | ) | (16,000 | ) | (23 | ) | — | (29,743 | ) | (98 | ) | |||||||||||||||
| Premier Class | (66,445,060 | ) | (30,167,278 | ) | (30,202,499 | ) | (10,645,488 | ) | (7,548,888 | ) | (3,042,802 | ) | ||||||||||||||
| Retirement Class | (105,962,482 | ) | (89,070,051 | ) | (47,958,670 | ) | (42,766,910 | ) | (14,907,626 | ) | (9,098,680 | ) | ||||||||||||||
| Net increase (decrease) from shareholder transactions | 423,652,665 | 312,555,264 | 254,528,203 | 199,226,482 | 124,904,049 | 106,076,979 | ||||||||||||||||||||
| Net increase (decrease) in net assets | (252,497,611 | ) | 1,074,964,217 | (23,591,589 | ) | 526,344,826 | 47,120,689 | 191,364,713 | ||||||||||||||||||
| NET ASSETS | ||||||||||||||||||||||||||
| Beginning of period | 3,382,365,142 | 2,307,400,925 | 1,423,303,106 | 896,958,280 | 396,777,277 | 205,412,564 | ||||||||||||||||||||
| End of period | $ | 3,129,867,531 | $ | 3,382,365,142 | $ | 1,399,711,517 | $ | 1,423,303,106 | $ | 443,897,966 | $ | 396,777,277 | ||||||||||||||
| CHANGE IN FUND SHARES | ||||||||||||||||||||||||||
| Shares sold: | Institutional Class | 19,978,756 | 20,942,238 | 11,839,213 | 11,972,711 | 7,796,785 | 7,240,931 | |||||||||||||||||||
| Advisor Class | 24,867 | 16,210 | 1,340 | — | 1,967 | 5,354 | ||||||||||||||||||||
| Premier Class | 2,358,856 | 1,626,882 | 1,180,758 | 925,109 | 651,727 | 438,803 | ||||||||||||||||||||
| Retirement Class | 2,665,561 | 3,508,863 | 1,440,198 | 1,700,785 | 1,165,981 | 1,264,795 | ||||||||||||||||||||
| Shares reinvested: | Institutional Class | 20,831,928 | 10,505,871 | 6,709,995 | 3,019,298 | 1,957,423 | 761,095 | |||||||||||||||||||
| Advisor Class | 1,157 | — | 47 | 4 | 360 | 14 | ||||||||||||||||||||
| Premier Class | 1,415,136 | 832,833 | 504,748 | 261,494 | 112,792 | 49,716 | ||||||||||||||||||||
| Retirement Class | 3,835,451 | 2,348,841 | 1,237,574 | 712,624 | 337,244 | 166,070 | ||||||||||||||||||||
| Shares redeemed: | Institutional Class | (10,516,356 | ) | (9,127,666 | ) | (3,684,574 | ) | (2,999,911 | ) | (2,040,940 | ) | (1,293,940 | ) | |||||||||||||
| Advisor Class | (5,952 | ) | (1,059 | ) | (1 | ) | — | (1,903 | ) | (7 | ) | |||||||||||||||
| Premier Class | (4,358,794 | ) | (2,133,139 | ) | (1,715,537 | ) | (646,619 | ) | (519,134 | ) | (219,819 | ) | ||||||||||||||
| Retirement Class | (7,089,620 | ) | (6,329,649 | ) | (2,726,891 | ) | (2,618,595 | ) | (1,023,654 | ) | (677,230 | ) | ||||||||||||||
| Net increase (decrease) from shareholder transactions | 29,140,990 | 22,190,225 | 14,786,870 | 12,326,900 | 8,438,648 | 7,735,782 | ||||||||||||||||||||
| 76 | 2022 Annual Report ■ TIAA-CREF Lifecycle Funds | See notes to financial statements | See notes to financial statements | TIAA-CREF Lifecycle Funds ■ 2022 Annual Report | 77 |
| Statement of changes in net assets | concluded |
| TIAA-CREF Funds ■ For the year ended |
| Lifecycle 2065 Fund | ||||||||||
| May 31, 2022 | May 31, 2021 | |||||||||
| OPERATIONS | ||||||||||
| Net investment income (loss) | $ | 159,835 | $ | 68,119 | ||||||
| Net realized gain (loss) from investments | 560,384 | 301,764 | ||||||||
| Net change in unrealized appreciation (depreciation) from affiliated investments | (2,556,188 | ) | 1,017,905 | |||||||
| Net increase (decrease) in net assets from operations | (1,835,969 | ) | 1,387,788 | |||||||
| DISTRIBUTIONS TO SHAREHOLDERS | ||||||||||
| Institutional Class | (514,419 | ) | (101,770 | ) | ||||||
| Advisor Class | (43,385 | ) | (14,285 | ) | ||||||
| Premier Class | (50,862 | ) | (14,286 | ) | ||||||
| Retirement Class | (75,261 | ) | (14,151 | ) | ||||||
| Total distributions | (683,927 | ) | (144,492 | ) | ||||||
| SHAREHOLDER TRANSACTIONS | ||||||||||
| Subscriptions: | Institutional Class | 16,260,732 | 3,988,378 | |||||||
| Advisor Class | — | 500,000 | ||||||||
| Premier Class | 1,365,228 | 598,791 | ||||||||
| Retirement Class | 3,673,748 | 678,273 | ||||||||
| Reinvestments of distributions: | Institutional Class | 261,127 | 461 | |||||||
| Premier Class | 9,085 | — | ||||||||
| Retirement Class | 39,549 | — | ||||||||
| Redemptions: | Institutional Class | (1,902,277 | ) | (41,150 | ) | |||||
| Premier Class | (128,143 | ) | (14 | ) | ||||||
| Retirement Class | (272,297 | ) | (40 | ) | ||||||
| Net increase (decrease) from shareholder transactions | 19,306,752 | 5,724,699 | ||||||||
| Net increase (decrease) in net assets | 16,786,856 | 6,967,995 | ||||||||
| NET ASSETS | ||||||||||
| Beginning of period | 6,967,995 | — | ||||||||
| End of period | $ | 23,754,851 | $ | 6,967,995 | ||||||
| CHANGE IN FUND SHARES | ||||||||||
| Shares sold: | Institutional Class | 1,392,373 | 390,564 | |||||||
| Advisor Class | — | 50,000 | ||||||||
| Premier Class | 121,522 | 58,403 | ||||||||
| Retirement Class | 314,556 | 64,587 | ||||||||
| Shares reinvested: | Institutional Class | 21,833 | 42 | |||||||
| Premier Class | 769 | — | ||||||||
| Retirement Class | 3,301 | — | ||||||||
| Shares redeemed: | Institutional Class | (163,809 | ) | (3,460 | ) | |||||
| Premier Class | (12,187 | ) | (1 | ) | ||||||
| Retirement Class | (22,578 | ) | (4 | ) | ||||||
| Net increase (decrease) from shareholder transactions | 1,655,780 | 560,131 | ||||||||
| 78 | 2022 Annual Report ■ TIAA-CREF Lifecycle Funds | See notes to financial statements |
[This page intentionally left blank.]
| TIAA-CREF Lifecycle Funds ■ 2022 Annual Report | 79 |
TIAA-CREF Funds
| Selected per share data | Ratios and supplemental data | |||||||||||||||||||||||||||||||||||||||||||||||||||||||||
| Gain (loss) from investment operations | ||||||||||||||||||||||||||||||||||||||||||||||||||||||||||
| Net realized | Ratios to average net assets | |||||||||||||||||||||||||||||||||||||||||||||||||||||||||
| For the | Net asset | Net | and unrealized | Total gain | Less distributions from | Total | Net asset | Net assets | Net | |||||||||||||||||||||||||||||||||||||||||||||||||
| period | value, | investment | gain (loss | ) | (loss) from | Net | Net | dividends | value, | at end of | investment | Portfolio | ||||||||||||||||||||||||||||||||||||||||||||||
| or year | beginning | income | on total | investment | investment | realized | and | end of | Total | period | Gross | Net | income | turnover | ||||||||||||||||||||||||||||||||||||||||||||
| ended | of period | (loss | )a | investments | j | operations | income | gains | distributions | period | return | (in thousands | ) | expenses | expenses | (loss | ) | rate | ||||||||||||||||||||||||||||||||||||||||
| LIFECYCLE RETIREMENT INCOME FUND | ||||||||||||||||||||||||||||||||||||||||||||||||||||||||||
| Institutional Class: | 5/31/22 | $ | 12.81 | $ | 0.29 | $ | (1.02 | ) | $ | (0.73 | ) | $ | (0.38 | ) | $ | (0.56 | ) | $ | (0.94 | ) | $ | 11.14 | (6.25 | )% | $ | 222,227 | 0.43 | %g | 0.26 | %g | 2.37 | % | 28 | % | ||||||||||||||||||||||||
| 5/31/21 | 11.52 | 0.23 | 1.76 | 1.99 | (0.31 | ) | (0.39 | ) | (0.70 | ) | 12.81 | 17.67 | 244,923 | 0.43 | g | 0.29 | g | 1.87 | 41 | |||||||||||||||||||||||||||||||||||||||
| 5/31/20 | 11.29 | 0.33 | 0.36 | 0.69 | (0.29 | ) | (0.17 | ) | (0.46 | ) | 11.52 | 6.14 | 219,016 | 0.48 | g | 0.33 | g | 2.84 | 30 | |||||||||||||||||||||||||||||||||||||||
| 5/31/19 | 11.68 | 0.29 | (0.04 | ) | 0.25 | (0.32 | ) | (0.32 | ) | (0.64 | ) | 11.29 | 2.48 | 192,832 | 0.38 | f | 0.22 | f | 2.52 | 25 | ||||||||||||||||||||||||||||||||||||||
| 5/31/18 | 11.40 | 0.26 | 0.43 | 0.69 | (0.31 | ) | (0.10 | ) | (0.41 | ) | 11.68 | 6.02 | 202,413 | 0.15 | e | 0.00 | e | 2.24 | 18 | |||||||||||||||||||||||||||||||||||||||
| Advisor Class: | 5/31/22 | 12.81 | 0.30 | (1.04 | ) | (0.74 | ) | (0.37 | ) | (0.56 | ) | (0.93 | ) | 11.14 | (6.33 | ) | 609 | 0.50 | g | 0.34 | g | 2.44 | 28 | |||||||||||||||||||||||||||||||||||
| 5/31/21 | 11.52 | 0.20 | 1.78 | 1.98 | (0.30 | ) | (0.39 | ) | (0.69 | ) | 12.81 | 17.57 | 596 | 0.52 | g | 0.38 | g | 1.63 | 41 | |||||||||||||||||||||||||||||||||||||||
| 5/31/20 | 11.29 | 0.32 | 0.36 | 0.68 | (0.28 | ) | (0.17 | ) | (0.45 | ) | 11.52 | 6.04 | 310 | 0.57 | g | 0.42 | g | 2.74 | 30 | |||||||||||||||||||||||||||||||||||||||
| 5/31/19 | 11.68 | 0.30 | (0.05 | ) | 0.25 | (0.32 | ) | (0.32 | ) | (0.64 | ) | 11.29 | 2.43 | 296 | 0.47 | f | 0.31 | f | 2.68 | 25 | ||||||||||||||||||||||||||||||||||||||
| 5/31/18 | 11.41 | 0.25 | 0.43 | 0.68 | (0.31 | ) | (0.10 | ) | (0.41 | ) | 11.68 | 5.91 | 216 | 0.18 | e | 0.03 | e | 2.14 | 18 | |||||||||||||||||||||||||||||||||||||||
| Premier Class: | 5/31/22 | 12.80 | 0.27 | (1.01 | ) | (0.74 | ) | (0.37 | ) | (0.56 | ) | (0.93 | ) | 11.13 | (6.40 | ) | 17,624 | 0.58 | g | 0.41 | g | 2.17 | 28 | |||||||||||||||||||||||||||||||||||
| 5/31/21 | 11.51 | 0.21 | 1.76 | 1.97 | (0.29 | ) | (0.39 | ) | (0.68 | ) | 12.80 | 17.51 | 19,161 | 0.58 | g | 0.44 | g | 1.71 | 41 | |||||||||||||||||||||||||||||||||||||||
| 5/31/20 | 11.28 | 0.31 | 0.36 | 0.67 | (0.27 | ) | (0.17 | ) | (0.44 | ) | 11.51 | 5.97 | 17,410 | 0.63 | g | 0.48 | g | 2.69 | 30 | |||||||||||||||||||||||||||||||||||||||
| 5/31/19 | 11.67 | 0.27 | (0.03 | ) | 0.24 | (0.31 | ) | (0.32 | ) | (0.63 | ) | 11.28 | 2.33 | 28,947 | 0.53 | f | 0.37 | f | 2.40 | 25 | ||||||||||||||||||||||||||||||||||||||
| 5/31/18 | 11.40 | 0.25 | 0.42 | 0.67 | (0.30 | ) | (0.10 | ) | (0.40 | ) | 11.67 | 5.77 | 36,733 | 0.30 | e | 0.15 | e | 2.11 | 18 | |||||||||||||||||||||||||||||||||||||||
| Retirement Class: | 5/31/22 | 12.78 | 0.26 | (1.02 | ) | (0.76 | ) | (0.35 | ) | (0.56 | ) | (0.91 | ) | 11.11 | (6.49 | ) | 157,609 | 0.68 | g | 0.50 | g | 2.11 | 28 | |||||||||||||||||||||||||||||||||||
| 5/31/21 | 11.49 | 0.20 | 1.76 | 1.96 | (0.28 | ) | (0.39 | ) | (0.67 | ) | 12.78 | 17.43 | 200,300 | 0.68 | g | 0.54 | g | 1.61 | 41 | |||||||||||||||||||||||||||||||||||||||
| 5/31/20 | 11.26 | 0.30 | 0.36 | 0.66 | (0.26 | ) | (0.17 | ) | (0.43 | ) | 11.49 | 5.88 | 179,106 | 0.73 | g | 0.58 | g | 2.59 | 30 | |||||||||||||||||||||||||||||||||||||||
| 5/31/19 | 11.65 | 0.26 | (0.04 | ) | 0.22 | (0.29 | ) | (0.32 | ) | (0.61 | ) | 11.26 | 2.23 | 179,625 | 0.63 | f | 0.48 | f | 2.27 | 25 | ||||||||||||||||||||||||||||||||||||||
| 5/31/18 | 11.38 | 0.23 | 0.43 | 0.66 | (0.29 | ) | (0.10 | ) | (0.39 | ) | 11.65 | 5.68 | 192,819 | 0.40 | e | 0.25 | e | 2.00 | 18 | |||||||||||||||||||||||||||||||||||||||
| Retail Class: | 5/31/22 | 12.79 | 0.26 | (1.02 | ) | (0.76 | ) | (0.35 | ) | (0.56 | ) | (0.91 | ) | 11.12 | (6.49 | ) | 131,167 | 0.70 | g | 0.51 | g | 2.10 | 28 | |||||||||||||||||||||||||||||||||||
| 5/31/21 | 11.51 | 0.20 | 1.75 | 1.95 | (0.28 | ) | (0.39 | ) | (0.67 | ) | 12.79 | 17.31 | 144,030 | 0.71 | g | 0.54 | g | 1.62 | 41 | |||||||||||||||||||||||||||||||||||||||
| 5/31/20 | 11.27 | 0.30 | 0.37 | 0.67 | (0.26 | ) | (0.17 | ) | (0.43 | ) | 11.51 | 5.97 | 122,730 | 0.75 | g | 0.58 | g | 2.58 | 30 | |||||||||||||||||||||||||||||||||||||||
| 5/31/19 | 11.66 | 0.26 | (0.04 | ) | 0.22 | (0.29 | ) | (0.32 | ) | (0.61 | ) | 11.27 | 2.14 | 117,869 | 0.66 | f | 0.48 | f | 2.28 | 25 | ||||||||||||||||||||||||||||||||||||||
| 5/31/18 | 11.39 | 0.23 | 0.43 | 0.66 | (0.29 | ) | (0.10 | ) | (0.39 | ) | 11.66 | 5.76 | 115,783 | 0.43 | e | 0.25 | e | 2.00 | 18 | |||||||||||||||||||||||||||||||||||||||
| 80 | 2022 Annual Report ■ TIAA-CREF Lifecycle Funds | See notes to financial statements | See notes to financial statements | TIAA-CREF Lifecycle Funds ■ 2022 Annual Report | 81 |
| Financial highlights | continued |
| TIAA-CREF Funds |
| Selected per share data | Ratios and supplemental data | |||||||||||||||||||||||||||||||||||||||||||||||||||||||||
| Gain (loss) from investment operations | ||||||||||||||||||||||||||||||||||||||||||||||||||||||||||
| Net realized | Ratios to average net assets | |||||||||||||||||||||||||||||||||||||||||||||||||||||||||
| For the | Net asset | Net | and unrealized | Total gain | Less distributions from | Total | Net asset | Net assets | Net | |||||||||||||||||||||||||||||||||||||||||||||||||
| period | value, | investment | gain (loss | ) | (loss) from | Net | Net | dividends | value, | at end of | investment | Portfolio | ||||||||||||||||||||||||||||||||||||||||||||||
| or year | beginning | income | on total | investment | investment | realized | and | end of | Total | period | Gross | Net | income | turnover | ||||||||||||||||||||||||||||||||||||||||||||
| ended | of period | (loss | )a | investments | j | operations | income | gains | distributions | period | return | (in thousands | ) | expenses | expenses | (loss | ) | rate | ||||||||||||||||||||||||||||||||||||||||
| LIFECYCLE 2010 FUND | ||||||||||||||||||||||||||||||||||||||||||||||||||||||||||
| Institutional Class: | 5/31/22 | $ | 12.20 | $ | 0.27 | $ | (0.94 | ) | $ | (0.67 | ) | $ | (0.41 | ) | $ | (0.83 | ) | $ | (1.24 | ) | $ | 10.29 | (6.34 | )% | $ | 700,875 | 0.41 | %g | 0.26 | %g | 2.34 | % | 21 | % | ||||||||||||||||||||||||
| 5/31/21 | 11.27 | 0.22 | 1.73 | 1.95 | (0.34 | ) | (0.68 | ) | (1.02 | ) | 12.20 | 17.75 | 836,684 | 0.42 | g | 0.29 | g | 1.84 | 38 | |||||||||||||||||||||||||||||||||||||||
| 5/31/20 | 11.14 | 0.32 | 0.38 | 0.70 | (0.30 | ) | (0.27 | ) | (0.57 | ) | 11.27 | 6.29 | 720,990 | 0.46 | g | 0.33 | g | 2.85 | 28 | |||||||||||||||||||||||||||||||||||||||
| 5/31/19 | 11.65 | 0.28 | (0.06 | ) | 0.22 | (0.35 | ) | (0.38 | ) | (0.73 | ) | 11.14 | 2.26 | 675,843 | 0.35 | f | 0.23 | f | 2.50 | 22 | ||||||||||||||||||||||||||||||||||||||
| 5/31/18 | 11.48 | 0.26 | 0.47 | 0.73 | (0.33 | ) | (0.23 | ) | (0.56 | ) | 11.65 | 6.45 | 698,687 | 0.12 | e | 0.00 | e | 2.23 | 21 | |||||||||||||||||||||||||||||||||||||||
| Advisor Class: | 5/31/22 | 12.22 | 0.26 | (0.93 | ) | (0.67 | ) | (0.40 | ) | (0.83 | ) | (1.23 | ) | 10.32 | (6.32 | ) | 177 | 0.48 | g | 0.33 | g | 2.29 | 21 | |||||||||||||||||||||||||||||||||||
| 5/31/21 | 11.30 | 0.22 | 1.71 | 1.93 | (0.33 | ) | (0.68 | ) | (1.01 | ) | 12.22 | 17.57 | 164 | 0.49 | g | 0.36 | g | 1.81 | 38 | |||||||||||||||||||||||||||||||||||||||
| 5/31/20 | 11.15 | 0.19 | 0.53 | 0.72 | (0.30 | ) | (0.27 | ) | (0.57 | ) | 11.30 | 6.45 | 144 | 0.56 | g | 0.37 | g | 1.67 | 28 | |||||||||||||||||||||||||||||||||||||||
| 5/31/19 | 11.66 | 0.27 | (0.06 | ) | 0.21 | (0.34 | ) | (0.38 | ) | (0.72 | ) | 11.15 | 2.33 | 131 | 0.39 | f | 0.27 | f | 2.39 | 22 | ||||||||||||||||||||||||||||||||||||||
| 5/31/18 | 11.48 | 0.26 | 0.48 | 0.74 | (0.33 | ) | (0.23 | ) | (0.56 | ) | 11.66 | 6.44 | 117 | 0.13 | e | 0.01 | e | 2.24 | 21 | |||||||||||||||||||||||||||||||||||||||
| Premier Class: | 5/31/22 | 12.17 | 0.25 | (0.94 | ) | (0.69 | ) | (0.38 | ) | (0.83 | ) | (1.21 | ) | 10.27 | (6.45 | ) | 50,141 | 0.56 | g | 0.41 | g | 2.16 | 21 | |||||||||||||||||||||||||||||||||||
| 5/31/21 | 11.24 | 0.20 | 1.73 | 1.93 | (0.32 | ) | (0.68 | ) | (1.00 | ) | 12.17 | 17.62 | 77,845 | 0.57 | g | 0.44 | g | 1.70 | 38 | |||||||||||||||||||||||||||||||||||||||
| 5/31/20 | 11.11 | 0.31 | 0.37 | 0.68 | (0.28 | ) | (0.27 | ) | (0.55 | ) | 11.24 | 6.10 | 73,048 | 0.61 | g | 0.48 | g | 2.68 | 28 | |||||||||||||||||||||||||||||||||||||||
| 5/31/19 | 11.62 | 0.27 | (0.07 | ) | 0.20 | (0.33 | ) | (0.38 | ) | (0.71 | ) | 11.11 | 2.10 | 112,673 | 0.50 | f | 0.37 | f | 2.39 | 22 | ||||||||||||||||||||||||||||||||||||||
| 5/31/18 | 11.45 | 0.24 | 0.47 | 0.71 | (0.31 | ) | (0.23 | ) | (0.54 | ) | 11.62 | 6.31 | 147,851 | 0.27 | e | 0.15 | e | 2.09 | 21 | |||||||||||||||||||||||||||||||||||||||
| Retirement Class: | 5/31/22 | 14.80 | 0.30 | (1.17 | ) | (0.87 | ) | (0.37 | ) | (0.83 | ) | (1.20 | ) | 12.73 | (6.56 | ) | 290,686 | 0.66 | g | 0.51 | g | 2.09 | 21 | |||||||||||||||||||||||||||||||||||
| 5/31/21 | 13.48 | 0.23 | 2.07 | 2.30 | (0.30 | ) | (0.68 | ) | (0.98 | ) | 14.80 | 17.45 | 368,266 | 0.67 | g | 0.54 | g | 1.62 | 38 | |||||||||||||||||||||||||||||||||||||||
| 5/31/20 | 13.22 | 0.35 | 0.45 | 0.80 | (0.27 | ) | (0.27 | ) | (0.54 | ) | 13.48 | 6.02 | 353,355 | 0.71 | g | 0.58 | g | 2.58 | 28 | |||||||||||||||||||||||||||||||||||||||
| 5/31/19 | 13.68 | 0.30 | (0.07 | ) | 0.23 | (0.31 | ) | (0.38 | ) | (0.69 | ) | 13.22 | 2.01 | 374,999 | 0.60 | f | 0.48 | f | 2.26 | 22 | ||||||||||||||||||||||||||||||||||||||
| 5/31/18 | 13.39 | 0.27 | 0.55 | 0.82 | (0.30 | ) | (0.23 | ) | (0.53 | ) | 13.68 | 6.16 | 409,891 | 0.37 | e | 0.25 | e | 1.97 | 21 | |||||||||||||||||||||||||||||||||||||||
| 82 | 2022 Annual Report ■ TIAA-CREF Lifecycle Funds | See notes to financial statements | See notes to financial statements | TIAA-CREF Lifecycle Funds ■ 2022 Annual Report | 83 |
| Financial highlights | continued |
| TIAA-CREF Funds |
| Selected per share data | Ratios and supplemental data | |||||||||||||||||||||||||||||||||||||||||||||||||||||||||
| Gain (loss) from investment operations | ||||||||||||||||||||||||||||||||||||||||||||||||||||||||||
| Net realized | Ratios to average net assets | |||||||||||||||||||||||||||||||||||||||||||||||||||||||||
| For the | Net asset | Net | and unrealized | Total gain | Less distributions from | Total | Net asset | Net assets | Net | |||||||||||||||||||||||||||||||||||||||||||||||||
| period | value, | investment | gain (loss | ) | (loss) from | Net | Net | dividends | value, | at end of | investment | Portfolio | ||||||||||||||||||||||||||||||||||||||||||||||
| or year | beginning | income | on total | investment | investment | realized | and | end of | Total | period | Gross | Net | income | turnover | ||||||||||||||||||||||||||||||||||||||||||||
| ended | of period | (loss | )a | investments | j | operations | income | gains | distributions | period | return | (in thousands | ) | expenses | expenses | (loss | ) | rate | ||||||||||||||||||||||||||||||||||||||||
| LIFECYCLE 2015 FUND | ||||||||||||||||||||||||||||||||||||||||||||||||||||||||||
| Institutional Class: | 5/31/22 | $ | 10.81 | $ | 0.23 | $ | (0.85 | ) | $ | (0.62 | ) | $ | (0.36 | ) | $ | (0.65 | ) | $ | (1.01 | ) | $ | 9.18 | (6.43 | )% | $ | 1,005,382 | 0.41 | %g | 0.27 | %g | 2.25 | % | 20 | % | ||||||||||||||||||||||||
| 5/31/21 | 9.62 | 0.19 | 1.66 | 1.85 | (0.30 | ) | (0.36 | ) | (0.66 | ) | 10.81 | 19.56 | 1,217,691 | 0.42 | g | 0.29 | g | 1.83 | 36 | |||||||||||||||||||||||||||||||||||||||
| 5/31/20 | 9.45 | 0.27 | 0.34 | 0.61 | (0.26 | ) | (0.18 | ) | (0.44 | ) | 9.62 | 6.43 | 1,088,594 | 0.46 | g | 0.34 | g | 2.80 | 26 | |||||||||||||||||||||||||||||||||||||||
| 5/31/19 | 10.05 | 0.24 | (0.10 | ) | 0.14 | (0.30 | ) | (0.44 | ) | (0.74 | ) | 9.45 | 1.89 | 1,061,156 | 0.35 | f | 0.23 | f | 2.43 | 21 | ||||||||||||||||||||||||||||||||||||||
| 5/31/18 | 9.97 | 0.22 | 0.48 | 0.70 | (0.29 | ) | (0.33 | ) | (0.62 | ) | 10.05 | 7.09 | 1,070,488 | 0.12 | e | 0.00 | e | 2.18 | 19 | |||||||||||||||||||||||||||||||||||||||
| Advisor Class: | 5/31/22 | 10.81 | 0.22 | (0.86 | ) | (0.64 | ) | (0.35 | ) | (0.65 | ) | (1.00 | ) | 9.17 | (6.61 | ) | 390 | 0.52 | g | 0.38 | g | 2.15 | 20 | |||||||||||||||||||||||||||||||||||
| 5/31/21 | 9.61 | 0.18 | 1.67 | 1.85 | (0.29 | ) | (0.36 | ) | (0.65 | ) | 10.81 | 19.60 | 255 | 0.52 | g | 0.39 | g | 1.75 | 36 | |||||||||||||||||||||||||||||||||||||||
| 5/31/20 | 9.45 | 0.26 | 0.34 | 0.60 | (0.26 | ) | (0.18 | ) | (0.44 | ) | 9.61 | 6.29 | 185 | 0.55 | g | 0.39 | g | 2.66 | 26 | |||||||||||||||||||||||||||||||||||||||
| 5/31/19 | 10.05 | 0.23 | (0.09 | ) | 0.14 | (0.30 | ) | (0.44 | ) | (0.74 | ) | 9.45 | 1.88 | 126 | 0.38 | f | 0.26 | f | 2.38 | 21 | ||||||||||||||||||||||||||||||||||||||
| 5/31/18 | 9.96 | 0.22 | 0.49 | 0.71 | (0.29 | ) | (0.33 | ) | (0.62 | ) | 10.05 | 7.16 | 107 | 0.13 | e | 0.02 | e | 2.19 | 19 | |||||||||||||||||||||||||||||||||||||||
| Premier Class: | 5/31/22 | 10.76 | 0.21 | (0.84 | ) | (0.63 | ) | (0.34 | ) | (0.65 | ) | (0.99 | ) | 9.14 | (6.54 | ) | 71,144 | 0.56 | g | 0.42 | g | 2.06 | 20 | |||||||||||||||||||||||||||||||||||
| 5/31/21 | 9.57 | 0.17 | 1.66 | 1.83 | (0.28 | ) | (0.36 | ) | (0.64 | ) | 10.76 | 19.47 | 116,117 | 0.57 | g | 0.44 | g | 1.67 | 36 | |||||||||||||||||||||||||||||||||||||||
| 5/31/20 | 9.41 | 0.25 | 0.33 | 0.58 | (0.24 | ) | (0.18 | ) | (0.42 | ) | 9.57 | 6.14 | 107,025 | 0.61 | g | 0.49 | g | 2.61 | 26 | |||||||||||||||||||||||||||||||||||||||
| 5/31/19 | 10.01 | 0.22 | (0.09 | ) | 0.13 | (0.29 | ) | (0.44 | ) | (0.73 | ) | 9.41 | 1.83 | 173,266 | 0.49 | f | 0.37 | f | 2.31 | 21 | ||||||||||||||||||||||||||||||||||||||
| 5/31/18 | 9.92 | 0.21 | 0.49 | 0.70 | (0.28 | ) | (0.33 | ) | (0.61 | ) | 10.01 | 6.96 | 235,104 | 0.27 | e | 0.15 | e | 2.04 | 19 | |||||||||||||||||||||||||||||||||||||||
| Retirement Class: | 5/31/22 | 13.82 | 0.27 | (1.12 | ) | (0.85 | ) | (0.33 | ) | (0.65 | ) | (0.98 | ) | 11.99 | (6.73 | ) | 393,955 | 0.66 | g | 0.52 | g | 2.01 | 20 | |||||||||||||||||||||||||||||||||||
| 5/31/21 | 12.13 | 0.21 | 2.11 | 2.32 | (0.27 | ) | (0.36 | ) | (0.63 | ) | 13.82 | 19.34 | 500,838 | 0.67 | g | 0.54 | g | 1.60 | 36 | |||||||||||||||||||||||||||||||||||||||
| 5/31/20 | 11.82 | 0.31 | 0.41 | 0.72 | (0.23 | ) | (0.18 | ) | (0.41 | ) | 12.13 | 6.06 | 492,656 | 0.71 | g | 0.59 | g | 2.54 | 26 | |||||||||||||||||||||||||||||||||||||||
| 5/31/19 | 12.37 | 0.26 | (0.10 | ) | 0.16 | (0.27 | ) | (0.44 | ) | (0.71 | ) | 11.82 | 1.74 | 548,992 | 0.60 | f | 0.48 | f | 2.19 | 21 | ||||||||||||||||||||||||||||||||||||||
| 5/31/18 | 12.12 | 0.24 | 0.60 | 0.84 | (0.26 | ) | (0.33 | ) | (0.59 | ) | 12.37 | 6.87 | 635,454 | 0.37 | e | 0.25 | e | 1.93 | 19 | |||||||||||||||||||||||||||||||||||||||
| 84 | 2022 Annual Report ■ TIAA-CREF Lifecycle Funds | See notes to financial statements | See notes to financial statements | TIAA-CREF Lifecycle Funds ■ 2022 Annual Report | 85 |
| Financial highlights | continued |
| TIAA-CREF Funds |
| Selected per share data | Ratios and supplemental data | |||||||||||||||||||||||||||||||||||||||||||||||||||||||||
| Gain (loss) from investment operations | ||||||||||||||||||||||||||||||||||||||||||||||||||||||||||
| Net realized | Ratios to average net assets | |||||||||||||||||||||||||||||||||||||||||||||||||||||||||
| For the | Net asset | Net | and unrealized | Total gain | Less distributions from | Total | Net asset | Net assets | Net | |||||||||||||||||||||||||||||||||||||||||||||||||
| period | value, | investment | gain (loss | ) | (loss) from | Net | Net | dividends | value, | at end of | investment | Portfolio | ||||||||||||||||||||||||||||||||||||||||||||||
| or year | beginning | income | on total | investment | investment | realized | and | end of | Total | period | Gross | Net | income | turnover | ||||||||||||||||||||||||||||||||||||||||||||
| ended | of period | (loss | )a | investments | j | operations | income | gains | distributions | period | return | (in thousands | ) | expenses | expenses | (loss | ) | rate | ||||||||||||||||||||||||||||||||||||||||
| LIFECYCLE 2020 FUND | ||||||||||||||||||||||||||||||||||||||||||||||||||||||||||
| Institutional Class: | 5/31/22 | $ | 11.26 | $ | 0.23 | $ | (0.91 | ) | $ | (0.68 | ) | $ | (0.38 | ) | $ | (0.72 | ) | $ | (1.10 | ) | $ | 9.48 | (6.86 | )% | $ | 2,303,415 | 0.40 | %g | 0.27 | %g | 2.15 | % | 22 | % | ||||||||||||||||||||||||
| 5/31/21 | 9.89 | 0.20 | 1.90 | 2.10 | (0.32 | ) | (0.41 | ) | (0.73 | ) | 11.26 | 21.61 | 2,712,681 | 0.42 | g | 0.29 | g | 1.82 | 38 | |||||||||||||||||||||||||||||||||||||||
| 5/31/20 | 9.73 | 0.27 | 0.37 | 0.64 | (0.25 | ) | (0.23 | ) | (0.48 | ) | 9.89 | 6.43 | 2,374,405 | 0.47 | g | 0.35 | g | 2.75 | 26 | |||||||||||||||||||||||||||||||||||||||
| 5/31/19 | 10.43 | 0.23 | (0.13 | ) | 0.10 | (0.31 | ) | (0.49 | ) | (0.80 | ) | 9.73 | 1.45 | 2,247,877 | 0.36 | f | 0.24 | f | 2.33 | 23 | ||||||||||||||||||||||||||||||||||||||
| 5/31/18 | 10.22 | 0.22 | 0.61 | 0.83 | (0.30 | ) | (0.32 | ) | (0.62 | ) | 10.43 | 8.07 | 2,188,054 | 0.11 | e | 0.00 | e | 2.11 | 17 | |||||||||||||||||||||||||||||||||||||||
| Advisor Class: | 5/31/22 | 11.25 | 0.21 | (0.90 | ) | (0.69 | ) | (0.37 | ) | (0.72 | ) | (1.09 | ) | 9.47 | (6.93 | ) | 498 | 0.46 | g | 0.32 | g | 1.91 | 22 | |||||||||||||||||||||||||||||||||||
| 5/31/21 | 9.89 | 0.14 | 1.94 | 2.08 | (0.31 | ) | (0.41 | ) | (0.72 | ) | 11.25 | 21.43 | 726 | 0.48 | g | 0.35 | g | 1.26 | 38 | |||||||||||||||||||||||||||||||||||||||
| 5/31/20 | 9.73 | 0.26 | 0.38 | 0.64 | (0.25 | ) | (0.23 | ) | (0.48 | ) | 9.89 | 6.42 | 352 | 0.51 | g | 0.39 | g | 2.61 | 26 | |||||||||||||||||||||||||||||||||||||||
| 5/31/19 | 10.42 | 0.23 | (0.13 | ) | 0.10 | (0.30 | ) | (0.49 | ) | (0.79 | ) | 9.73 | 1.39 | 200 | 0.35 | f | 0.24 | f | 2.32 | 23 | ||||||||||||||||||||||||||||||||||||||
| 5/31/18 | 10.21 | 0.19 | 0.64 | 0.83 | (0.30 | ) | (0.32 | ) | (0.62 | ) | 10.42 | 8.17 | 226 | 0.17 | e | 0.06 | e | 1.85 | 17 | |||||||||||||||||||||||||||||||||||||||
| Premier Class: | 5/31/22 | 11.23 | 0.21 | (0.92 | ) | (0.71 | ) | (0.35 | ) | (0.72 | ) | (1.07 | ) | 9.45 | (7.06 | ) | 165,761 | 0.55 | g | 0.42 | g | 1.96 | 22 | |||||||||||||||||||||||||||||||||||
| 5/31/21 | 9.87 | 0.18 | 1.89 | 2.07 | (0.30 | ) | (0.41 | ) | (0.71 | ) | 11.23 | 21.37 | 252,876 | 0.57 | g | 0.45 | g | 1.66 | 38 | |||||||||||||||||||||||||||||||||||||||
| 5/31/20 | 9.70 | 0.25 | 0.38 | 0.63 | (0.23 | ) | (0.23 | ) | (0.46 | ) | 9.87 | 6.35 | 249,364 | 0.62 | g | 0.50 | g | 2.53 | 26 | |||||||||||||||||||||||||||||||||||||||
| 5/31/19 | 10.40 | 0.22 | (0.14 | ) | 0.08 | (0.29 | ) | (0.49 | ) | (0.78 | ) | 9.70 | 1.27 | 401,306 | 0.50 | f | 0.38 | f | 2.21 | 23 | ||||||||||||||||||||||||||||||||||||||
| 5/31/18 | 10.19 | 0.21 | 0.61 | 0.82 | (0.29 | ) | (0.32 | ) | (0.61 | ) | 10.40 | 7.94 | 503,806 | 0.26 | e | 0.15 | e | 1.97 | 17 | |||||||||||||||||||||||||||||||||||||||
| Retirement Class: | 5/31/22 | 14.78 | 0.27 | (1.24 | ) | (0.97 | ) | (0.34 | ) | (0.72 | ) | (1.06 | ) | 12.75 | (7.17 | ) | 764,245 | 0.65 | g | 0.52 | g | 1.89 | 22 | |||||||||||||||||||||||||||||||||||
| 5/31/21 | 12.79 | 0.22 | 2.46 | 2.68 | (0.28 | ) | (0.41 | ) | (0.69 | ) | 14.78 | 21.27 | 993,670 | 0.67 | g | 0.55 | g | 1.59 | 38 | |||||||||||||||||||||||||||||||||||||||
| 5/31/20 | 12.45 | 0.32 | 0.47 | 0.79 | (0.22 | ) | (0.23 | ) | (0.45 | ) | 12.79 | 6.21 | 947,495 | 0.72 | g | 0.60 | g | 2.50 | 26 | |||||||||||||||||||||||||||||||||||||||
| 5/31/19 | 13.10 | 0.27 | (0.16 | ) | 0.11 | (0.27 | ) | (0.49 | ) | (0.76 | ) | 12.45 | 1.18 | 1,032,037 | 0.60 | f | 0.49 | f | 2.09 | 23 | ||||||||||||||||||||||||||||||||||||||
| 5/31/18 | 12.69 | 0.24 | 0.76 | 1.00 | (0.27 | ) | (0.32 | ) | (0.59 | ) | 13.10 | 7.89 | 1,146,465 | 0.36 | e | 0.25 | e | 1.86 | 17 | |||||||||||||||||||||||||||||||||||||||
| 86 | 2022 Annual Report ■ TIAA-CREF Lifecycle Funds | See notes to financial statements | See notes to financial statements | TIAA-CREF Lifecycle Funds ■ 2022 Annual Report | 87 |
| Financial highlights | continued |
| TIAA-CREF Funds |
| Selected per share data | Ratios and supplemental data | |||||||||||||||||||||||||||||||||||||||||||||||||||||||||
| Gain (loss) from investment operations | ||||||||||||||||||||||||||||||||||||||||||||||||||||||||||
| Net realized | Ratios to average net assets | |||||||||||||||||||||||||||||||||||||||||||||||||||||||||
| For the | Net asset | Net | and unrealized | Total gain | Less distributions from | Total | Net asset | Net assets | Net | |||||||||||||||||||||||||||||||||||||||||||||||||
| period | value, | investment | gain (loss | ) | (loss) from | Net | Net | dividends | value, | at end of | investment | Portfolio | ||||||||||||||||||||||||||||||||||||||||||||||
| or year | beginning | income | on total | investment | investment | realized | and | end of | Total | period | Gross | Net | income | turnover | ||||||||||||||||||||||||||||||||||||||||||||
| ended | of period | (loss | )a | investments | j | operations | income | gains | distributions | period | return | (in thousands | ) | expenses | expenses | (loss | ) | rate | ||||||||||||||||||||||||||||||||||||||||
| LIFECYCLE 2025 FUND | ||||||||||||||||||||||||||||||||||||||||||||||||||||||||||
| Institutional Class: | 5/31/22 | $ | 11.76 | $ | 0.23 | $ | (0.99 | ) | $ | (0.76 | ) | $ | (0.39 | ) | $ | (0.76 | ) | $ | (1.15 | ) | $ | 9.85 | (7.33 | )% | $ | 3,488,042 | 0.40 | %g | 0.27 | %g | 2.01 | % | 25 | % | ||||||||||||||||||||||||
| 5/31/21 | 10.04 | 0.19 | 2.27 | 2.46 | (0.31 | ) | (0.43 | ) | (0.74 | ) | 11.76 | 24.96 | 3,909,833 | 0.43 | g | 0.30 | g | 1.76 | 40 | |||||||||||||||||||||||||||||||||||||||
| 5/31/20 | 9.89 | 0.27 | 0.40 | 0.67 | (0.25 | ) | (0.27 | ) | (0.52 | ) | 10.04 | 6.59 | 3,142,487 | 0.48 | g | 0.36 | g | 2.66 | 28 | |||||||||||||||||||||||||||||||||||||||
| 5/31/19 | 10.68 | 0.22 | (0.21 | ) | 0.01 | (0.30 | ) | (0.50 | ) | (0.80 | ) | 9.89 | 0.58 | 2,786,751 | 0.37 | f | 0.25 | f | 2.18 | 20 | ||||||||||||||||||||||||||||||||||||||
| 5/31/18 | 10.33 | 0.21 | 0.75 | 0.96 | (0.30 | ) | (0.31 | ) | (0.61 | ) | 10.68 | 9.46 | 2,580,691 | 0.11 | e | 0.00 | e | 2.00 | 16 | |||||||||||||||||||||||||||||||||||||||
| Advisor Class: | 5/31/22 | 11.75 | 0.22 | (0.98 | ) | (0.76 | ) | (0.38 | ) | (0.76 | ) | (1.14 | ) | 9.85 | (7.32 | ) | 391 | 0.48 | g | 0.34 | g | 1.93 | 25 | |||||||||||||||||||||||||||||||||||
| 5/31/21 | 10.03 | 0.15 | 2.31 | 2.46 | (0.31 | ) | (0.43 | ) | (0.74 | ) | 11.75 | 24.93 | 553 | 0.49 | g | 0.36 | g | 1.35 | 40 | |||||||||||||||||||||||||||||||||||||||
| 5/31/20 | 9.88 | 0.27 | 0.39 | 0.66 | (0.24 | ) | (0.27 | ) | (0.51 | ) | 10.03 | 6.55 | 133 | 0.54 | g | 0.42 | g | 2.66 | 28 | |||||||||||||||||||||||||||||||||||||||
| 5/31/19 | 10.68 | 0.22 | (0.22 | ) | 0.00 | (0.30 | ) | (0.50 | ) | (0.80 | ) | 9.88 | 0.53 | 125 | 0.40 | f | 0.28 | f | 2.18 | 20 | ||||||||||||||||||||||||||||||||||||||
| 5/31/18 | 10.33 | 0.21 | 0.75 | 0.96 | (0.30 | ) | (0.31 | ) | (0.61 | ) | 10.68 | 9.30 | 133 | 0.17 | e | 0.05 | e | 1.96 | 16 | |||||||||||||||||||||||||||||||||||||||
| Premier Class: | 5/31/22 | 11.70 | 0.21 | (0.98 | ) | (0.77 | ) | (0.37 | ) | (0.76 | ) | (1.13 | ) | 9.80 | (7.44 | ) | 236,147 | 0.55 | g | 0.42 | g | 1.83 | 25 | |||||||||||||||||||||||||||||||||||
| 5/31/21 | 9.99 | 0.18 | 2.25 | 2.43 | (0.29 | ) | (0.43 | ) | (0.72 | ) | 11.70 | 24.80 | 336,773 | 0.58 | g | 0.45 | g | 1.59 | 40 | |||||||||||||||||||||||||||||||||||||||
| 5/31/20 | 9.84 | 0.24 | 0.40 | 0.64 | (0.22 | ) | (0.27 | ) | (0.49 | ) | 9.99 | 6.41 | 295,668 | 0.63 | g | 0.51 | g | 2.39 | 28 | |||||||||||||||||||||||||||||||||||||||
| 5/31/19 | 10.63 | 0.21 | (0.22 | ) | (0.01 | ) | (0.28 | ) | (0.50 | ) | (0.78 | ) | 9.84 | 0.51 | 488,247 | 0.51 | f | 0.39 | f | 2.06 | 20 | |||||||||||||||||||||||||||||||||||||
| 5/31/18 | 10.28 | 0.20 | 0.75 | 0.95 | (0.29 | ) | (0.31 | ) | (0.60 | ) | 10.63 | 9.24 | 573,643 | 0.26 | e | 0.15 | e | 1.86 | 16 | |||||||||||||||||||||||||||||||||||||||
| Retirement Class: | 5/31/22 | 15.63 | 0.26 | (1.35 | ) | (1.09 | ) | (0.34 | ) | (0.76 | ) | (1.10 | ) | 13.44 | (7.55 | ) | 973,393 | 0.65 | g | 0.52 | g | 1.75 | 25 | |||||||||||||||||||||||||||||||||||
| 5/31/21 | 13.14 | 0.22 | 2.97 | 3.19 | (0.27 | ) | (0.43 | ) | (0.70 | ) | 15.63 | 24.64 | 1,217,409 | 0.68 | g | 0.55 | g | 1.52 | 40 | |||||||||||||||||||||||||||||||||||||||
| 5/31/20 | 12.79 | 0.32 | 0.51 | 0.83 | (0.21 | ) | (0.27 | ) | (0.48 | ) | 13.14 | 6.40 | 1,103,642 | 0.73 | g | 0.61 | g | 2.39 | 28 | |||||||||||||||||||||||||||||||||||||||
| 5/31/19 | 13.57 | 0.26 | (0.27 | ) | (0.01 | ) | (0.27 | ) | (0.50 | ) | (0.77 | ) | 12.79 | 0.33 | 1,131,196 | 0.61 | f | 0.50 | f | 1.95 | 20 | |||||||||||||||||||||||||||||||||||||
| 5/31/18 | 12.97 | 0.24 | 0.94 | 1.18 | (0.27 | ) | (0.31 | ) | (0.58 | ) | 13.57 | 9.12 | 1,220,041 | 0.36 | e | 0.25 | e | 1.75 | 16 | |||||||||||||||||||||||||||||||||||||||
| 88 | 2022 Annual Report ■ TIAA-CREF Lifecycle Funds | See notes to financial statements | See notes to financial statements | TIAA-CREF Lifecycle Funds ■ 2022 Annual Report | 89 |
| Financial highlights | continued |
| TIAA-CREF Funds |
| Selected per share data | Ratios and supplemental data | |||||||||||||||||||||||||||||||||||||||||||||||||||||||||
| Gain (loss) from investment operations | ||||||||||||||||||||||||||||||||||||||||||||||||||||||||||
| Net realized | Ratios to average net assets | |||||||||||||||||||||||||||||||||||||||||||||||||||||||||
| For the | Net asset | Net | and unrealized | Total gain | Less distributions from | Total | Net asset | Net assets | Net | |||||||||||||||||||||||||||||||||||||||||||||||||
| period | value, | investment | gain (loss | ) | (loss) from | Net | Net | dividends | value, | at end of | investment | Portfolio | ||||||||||||||||||||||||||||||||||||||||||||||
| or year | beginning | income | on total | investment | investment | realized | and | end of | Total | period | Gross | Net | income | turnover | ||||||||||||||||||||||||||||||||||||||||||||
| ended | of period | (loss | )a | investments | j | operations | income | gains | distributions | period | return | (in thousands | ) | expenses | expenses | (loss | ) | rate | ||||||||||||||||||||||||||||||||||||||||
| LIFECYCLE 2030 FUND | ||||||||||||||||||||||||||||||||||||||||||||||||||||||||||
| Institutional Class: | 5/31/22 | $ | 12.01 | $ | 0.21 | $ | (1.02 | ) | $ | (0.81 | ) | $ | (0.40 | ) | $ | (0.83 | ) | $ | (1.23 | ) | $ | 9.97 | (7.66 | )% | $ | 3,872,654 | 0.41 | %g | 0.26 | %g | 1.86 | % | 26 | % | ||||||||||||||||||||||||
| 5/31/21 | 10.01 | 0.19 | 2.60 | 2.79 | (0.32 | ) | (0.47 | ) | (0.79 | ) | 12.01 | 28.49 | 4,216,718 | 0.43 | g | 0.30 | g | 1.69 | 41 | |||||||||||||||||||||||||||||||||||||||
| 5/31/20 | 9.87 | 0.26 | 0.42 | 0.68 | (0.23 | ) | (0.31 | ) | (0.54 | ) | 10.01 | 6.69 | 3,244,106 | 0.49 | g | 0.37 | g | 2.57 | 26 | |||||||||||||||||||||||||||||||||||||||
| 5/31/19 | 10.78 | 0.21 | (0.29 | ) | (0.08 | ) | (0.30 | ) | (0.53 | ) | (0.83 | ) | 9.87 | (0.25 | ) | 2,793,594 | 0.38 | f | 0.26 | f | 2.03 | 20 | ||||||||||||||||||||||||||||||||||||
| 5/31/18 | 10.33 | 0.20 | 0.90 | 1.10 | (0.31 | ) | (0.34 | ) | (0.65 | ) | 10.78 | 10.76 | 2,626,467 | 0.11 | e | 0.00 | e | 1.89 | 12 | |||||||||||||||||||||||||||||||||||||||
| Advisor Class: | 5/31/22 | 12.01 | 0.21 | (1.03 | ) | (0.82 | ) | (0.39 | ) | (0.83 | ) | (1.22 | ) | 9.97 | (7.71 | ) | 497 | 0.46 | g | 0.31 | g | 1.88 | 26 | |||||||||||||||||||||||||||||||||||
| 5/31/21 | 10.01 | 0.18 | 2.60 | 2.78 | (0.31 | ) | (0.47 | ) | (0.78 | ) | 12.01 | 28.41 | 520 | 0.50 | g | 0.37 | g | 1.65 | 41 | |||||||||||||||||||||||||||||||||||||||
| 5/31/20 | 9.87 | 0.20 | 0.47 | 0.67 | (0.22 | ) | (0.31 | ) | (0.53 | ) | 10.01 | 6.65 | 317 | 0.56 | g | 0.44 | g | 2.02 | 26 | |||||||||||||||||||||||||||||||||||||||
| 5/31/19 | 10.78 | 0.21 | (0.30 | ) | (0.09 | ) | (0.29 | ) | (0.53 | ) | (0.82 | ) | 9.87 | (0.32 | ) | 117 | 0.43 | f | 0.32 | f | 2.01 | 20 | ||||||||||||||||||||||||||||||||||||
| 5/31/18 | 10.34 | 0.20 | 0.89 | 1.09 | (0.31 | ) | (0.34 | ) | (0.65 | ) | 10.78 | 10.63 | 124 | 0.15 | e | 0.04 | e | 1.88 | 12 | |||||||||||||||||||||||||||||||||||||||
| Premier Class: | 5/31/22 | 11.95 | 0.19 | (1.02 | ) | (0.83 | ) | (0.38 | ) | (0.83 | ) | (1.21 | ) | 9.91 | (7.87 | ) | 265,245 | 0.56 | g | 0.41 | g | 1.66 | 26 | |||||||||||||||||||||||||||||||||||
| 5/31/21 | 9.96 | 0.17 | 2.59 | 2.76 | (0.30 | ) | (0.47 | ) | (0.77 | ) | 11.95 | 28.35 | 369,690 | 0.58 | g | 0.45 | g | 1.52 | 41 | |||||||||||||||||||||||||||||||||||||||
| 5/31/20 | 9.82 | 0.23 | 0.42 | 0.65 | (0.20 | ) | (0.31 | ) | (0.51 | ) | 9.96 | 6.52 | 310,511 | 0.64 | g | 0.52 | g | 2.26 | 26 | |||||||||||||||||||||||||||||||||||||||
| 5/31/19 | 10.73 | 0.20 | (0.30 | ) | (0.10 | ) | (0.28 | ) | (0.53 | ) | (0.81 | ) | 9.82 | (0.33 | ) | 505,271 | 0.52 | f | 0.40 | f | 1.90 | 20 | ||||||||||||||||||||||||||||||||||||
| 5/31/18 | 10.28 | 0.19 | 0.89 | 1.08 | (0.29 | ) | (0.34 | ) | (0.63 | ) | 10.73 | 10.56 | 585,462 | 0.26 | e | 0.15 | e | 1.76 | 12 | |||||||||||||||||||||||||||||||||||||||
| Retirement Class: | 5/31/22 | 16.36 | 0.25 | (1.44 | ) | (1.19 | ) | (0.36 | ) | (0.83 | ) | (1.19 | ) | 13.98 | (7.94 | ) | 1,008,369 | 0.66 | g | 0.51 | g | 1.60 | 26 | |||||||||||||||||||||||||||||||||||
| 5/31/21 | 13.39 | 0.22 | 3.51 | 3.73 | (0.29 | ) | (0.47 | ) | (0.76 | ) | 16.36 | 28.25 | 1,254,456 | 0.68 | g | 0.55 | g | 1.46 | 41 | |||||||||||||||||||||||||||||||||||||||
| 5/31/20 | 13.04 | 0.31 | 0.54 | 0.85 | (0.19 | ) | (0.31 | ) | (0.50 | ) | 13.39 | 6.42 | 1,064,906 | 0.74 | g | 0.62 | g | 2.29 | 26 | |||||||||||||||||||||||||||||||||||||||
| 5/31/19 | 13.96 | 0.24 | (0.37 | ) | (0.13 | ) | (0.26 | ) | (0.53 | ) | (0.79 | ) | 13.04 | (0.54 | ) | 1,062,709 | 0.62 | f | 0.50 | f | 1.79 | 20 | ||||||||||||||||||||||||||||||||||||
| 5/31/18 | 13.21 | 0.23 | 1.14 | 1.37 | (0.28 | ) | (0.34 | ) | (0.62 | ) | 13.96 | 10.43 | 1,139,069 | 0.36 | e | 0.25 | e | 1.64 | 12 | |||||||||||||||||||||||||||||||||||||||
| 90 | 2022 Annual Report ■ TIAA-CREF Lifecycle Funds | See notes to financial statements | See notes to financial statements | TIAA-CREF Lifecycle Funds ■ 2022 Annual Report | 91 |
| Financial highlights | continued |
| TIAA-CREF Funds |
| Selected per share data | Ratios and supplemental data | |||||||||||||||||||||||||||||||||||||||||||||||||||||||||
| Gain (loss) from investment operations | ||||||||||||||||||||||||||||||||||||||||||||||||||||||||||
| Net realized | Ratios to average net assets | |||||||||||||||||||||||||||||||||||||||||||||||||||||||||
| For the | Net asset | Net | and unrealized | Total gain | Less distributions from | Total | Net asset | Net assets | Net | |||||||||||||||||||||||||||||||||||||||||||||||||
| period | value, | investment | gain (loss | ) | (loss) from | Net | Net | dividends | value, | at end of | investment | Portfolio | ||||||||||||||||||||||||||||||||||||||||||||||
| or year | beginning | income | on total | investment | investment | realized | and | end of | Total | period | Gross | Net | income | turnover | ||||||||||||||||||||||||||||||||||||||||||||
| ended | of period | (loss | )a | investments | j | operations | income | gains | distributions | period | return | (in thousands | ) | expenses | expenses | (loss | ) | rate | ||||||||||||||||||||||||||||||||||||||||
| LIFECYCLE 2035 FUND | ||||||||||||||||||||||||||||||||||||||||||||||||||||||||||
| Institutional Class: | 5/31/22 | $ | 12.37 | $ | 0.20 | $ | (1.08 | ) | $ | (0.88 | ) | $ | (0.42 | ) | $ | (0.94 | ) | $ | (1.36 | ) | $ | 10.13 | (8.19 | )% | $ | 4,103,430 | 0.41 | %g | 0.25 | %g | 1.72 | % | 27 | % | ||||||||||||||||||||||||
| 5/31/21 | 10.07 | 0.19 | 2.97 | 3.16 | (0.32 | ) | (0.54 | ) | (0.86 | ) | 12.37 | 32.19 | 4,468,950 | 0.44 | g | 0.30 | g | 1.63 | 44 | |||||||||||||||||||||||||||||||||||||||
| 5/31/20 | 9.97 | 0.25 | 0.44 | 0.69 | (0.23 | ) | (0.36 | ) | (0.59 | ) | 10.07 | 6.67 | 3,369,098 | 0.50 | g | 0.38 | g | 2.48 | 23 | |||||||||||||||||||||||||||||||||||||||
| 5/31/19 | 10.99 | 0.20 | (0.38 | ) | (0.18 | ) | (0.29 | ) | (0.55 | ) | (0.84 | ) | 9.97 | (1.08 | ) | 2,855,455 | 0.38 | f | 0.27 | f | 1.87 | 17 | ||||||||||||||||||||||||||||||||||||
| 5/31/18 | 10.44 | 0.19 | 1.04 | 1.23 | (0.31 | ) | (0.37 | ) | (0.68 | ) | 10.99 | 11.98 | 2,729,789 | 0.11 | e | 0.00 | e | 1.76 | 13 | |||||||||||||||||||||||||||||||||||||||
| Advisor Class: | 5/31/22 | 12.35 | 0.19 | (1.07 | ) | (0.88 | ) | (0.41 | ) | (0.94 | ) | (1.35 | ) | 10.12 | (8.20 | ) | 447 | 0.49 | g | 0.34 | g | 1.64 | 27 | |||||||||||||||||||||||||||||||||||
| 5/31/21 | 10.06 | 0.18 | 2.96 | 3.14 | (0.31 | ) | (0.54 | ) | (0.85 | ) | 12.35 | 32.02 | 472 | 0.52 | g | 0.39 | g | 1.56 | 44 | |||||||||||||||||||||||||||||||||||||||
| 5/31/20 | 9.96 | 0.28 | 0.40 | 0.68 | (0.22 | ) | (0.36 | ) | (0.58 | ) | 10.06 | 6.64 | 363 | 0.58 | g | 0.46 | g | 2.74 | 23 | |||||||||||||||||||||||||||||||||||||||
| 5/31/19 | 10.98 | 0.20 | (0.38 | ) | (0.18 | ) | (0.29 | ) | (0.55 | ) | (0.84 | ) | 9.96 | (1.11 | ) | 110 | 0.40 | f | 0.29 | f | 1.89 | 17 | ||||||||||||||||||||||||||||||||||||
| 5/31/18 | 10.43 | 0.19 | 1.04 | 1.23 | (0.31 | ) | (0.37 | ) | (0.68 | ) | 10.98 | 11.96 | 121 | 0.15 | e | 0.04 | e | 1.74 | 13 | |||||||||||||||||||||||||||||||||||||||
| Premier Class: | 5/31/22 | 12.33 | 0.18 | (1.07 | ) | (0.89 | ) | (0.40 | ) | (0.94 | ) | (1.34 | ) | 10.10 | (8.29 | ) | 277,894 | 0.56 | g | 0.40 | g | 1.52 | 27 | |||||||||||||||||||||||||||||||||||
| 5/31/21 | 10.04 | 0.17 | 2.96 | 3.13 | (0.30 | ) | (0.54 | ) | (0.84 | ) | 12.33 | 31.99 | 396,128 | 0.59 | g | 0.45 | g | 1.46 | 44 | |||||||||||||||||||||||||||||||||||||||
| 5/31/20 | 9.93 | 0.22 | 0.45 | 0.67 | (0.20 | ) | (0.36 | ) | (0.56 | ) | 10.04 | 6.59 | 324,978 | 0.65 | g | 0.53 | g | 2.14 | 23 | |||||||||||||||||||||||||||||||||||||||
| 5/31/19 | 10.95 | 0.18 | (0.38 | ) | (0.20 | ) | (0.27 | ) | (0.55 | ) | (0.82 | ) | 9.93 | (1.25 | ) | 550,501 | 0.52 | f | 0.41 | f | 1.75 | 17 | ||||||||||||||||||||||||||||||||||||
| 5/31/18 | 10.41 | 0.18 | 1.03 | 1.21 | (0.30 | ) | (0.37 | ) | (0.67 | ) | 10.95 | 11.76 | 627,471 | 0.26 | e | 0.15 | e | 1.63 | 13 | |||||||||||||||||||||||||||||||||||||||
| Retirement Class: | 5/31/22 | 17.27 | 0.24 | (1.56 | ) | (1.32 | ) | (0.38 | ) | (0.94 | ) | (1.32 | ) | 14.63 | (8.42 | ) | 923,818 | 0.66 | g | 0.50 | g | 1.46 | 27 | |||||||||||||||||||||||||||||||||||
| 5/31/21 | 13.78 | 0.22 | 4.09 | 4.31 | (0.28 | ) | (0.54 | ) | (0.82 | ) | 17.27 | 31.86 | 1,157,175 | 0.69 | g | 0.55 | g | 1.40 | 44 | |||||||||||||||||||||||||||||||||||||||
| 5/31/20 | 13.44 | 0.31 | 0.58 | 0.89 | (0.19 | ) | (0.36 | ) | (0.55 | ) | 13.78 | 6.48 | 978,160 | 0.75 | g | 0.63 | g | 2.21 | 23 | |||||||||||||||||||||||||||||||||||||||
| 5/31/19 | 14.50 | 0.23 | (0.49 | ) | (0.26 | ) | (0.25 | ) | (0.55 | ) | (0.80 | ) | 13.44 | (1.37 | ) | 980,659 | 0.63 | f | 0.51 | f | 1.63 | 17 | ||||||||||||||||||||||||||||||||||||
| 5/31/18 | 13.58 | 0.22 | 1.35 | 1.57 | (0.28 | ) | (0.37 | ) | (0.65 | ) | 14.50 | 11.67 | 1,038,703 | 0.36 | e | 0.25 | e | 1.51 | 13 | |||||||||||||||||||||||||||||||||||||||
| 92 | 2022 Annual Report ■ TIAA-CREF Lifecycle Funds | See notes to financial statements | See notes to financial statements | TIAA-CREF Lifecycle Funds ■ 2022 Annual Report | 93 |
| Financial highlights | continued |
TIAA-CREF Funds
| Selected per share data | Ratios and supplemental data | |||||||||||||||||||||||||||||||||||||||||||||||||||||||||
| Gain (loss) from investment operations | ||||||||||||||||||||||||||||||||||||||||||||||||||||||||||
| Net realized | Ratios to average net assets | |||||||||||||||||||||||||||||||||||||||||||||||||||||||||
| For the | Net asset | Net | and unrealized | Total gain | Less distributions from | Total | Net asset | Net assets | Net | |||||||||||||||||||||||||||||||||||||||||||||||||
| period | value, | investment | gain (loss | ) | (loss) from | Net | Net | dividends | value, | at end of | investment | Portfolio | ||||||||||||||||||||||||||||||||||||||||||||||
| or year ended | beginning of period | income (loss | )a | on total investments | j | investment operations | investment income | realized gains | and distributions | end of period | Total return | period (in thousands | ) | Gross expenses | Net expenses | income (loss | ) | turnover rate | ||||||||||||||||||||||||||||||||||||||||
| LIFECYCLE 2040 FUND | ||||||||||||||||||||||||||||||||||||||||||||||||||||||||||
| Institutional Class: | 5/31/22 | $12.52 | $0.19 | $(1.10 | ) | $(0.91 | ) | $(0.44 | ) | $(1.05 | ) | $(1.49 | ) | $10.12 | (8.47 | )% | $4,851,096 | 0.41 | %g | 0.24 | %g | 1.61 | % | 29 | % | |||||||||||||||||||||||||||||||||
| 5/31/21 | 9.99 | 0.18 | 3.30 | 3.48 | (0.33 | ) | (0.62 | ) | (0.95 | ) | 12.52 | 35.87 | 5,311,332 | 0.44 | g | 0.29 | g | 1.54 | 46 | |||||||||||||||||||||||||||||||||||||||
| 5/31/20 | 9.91 | 0.24 | 0.46 | 0.70 | (0.20 | ) | (0.42 | ) | (0.62 | ) | 9.99 | 6.74 | 3,930,425 | 0.51 | g | 0.39 | g | 2.36 | 23 | |||||||||||||||||||||||||||||||||||||||
| 5/31/19 | 11.15 | 0.18 | (0.47 | ) | (0.29 | ) | (0.29 | ) | (0.66 | ) | (0.95 | ) | 9.91 | (2.09 | ) | 3,346,627 | 0.39 | f | 0.27 | f | 1.68 | 18 | ||||||||||||||||||||||||||||||||||||
| 5/31/18 | 10.51 | 0.18 | 1.20 | 1.38 | (0.32 | ) | (0.42 | ) | (0.74 | ) | 11.15 | 13.28 | 3,322,450 | 0.11 | e | 0.00 | e | 1.60 | 14 | |||||||||||||||||||||||||||||||||||||||
| Advisor Class: | 5/31/22 | 12.51 | 0.18 | (1.10 | ) | (0.92 | ) | (0.43 | ) | (1.05 | ) | (1.48 | ) | 10.11 | (8.55 | ) | 239 | 0.48 | g | 0.31 | g | 1.53 | 29 | |||||||||||||||||||||||||||||||||||
| 5/31/21 | 9.98 | 0.17 | 3.30 | 3.47 | (0.32 | ) | (0.62 | ) | (0.94 | ) | 12.51 | 35.84 | 305 | 0.51 | g | 0.37 | g | 1.48 | 46 | |||||||||||||||||||||||||||||||||||||||
| 5/31/20 | 9.90 | 0.23 | 0.47 | 0.70 | (0.20 | ) | (0.42 | ) | (0.62 | ) | 9.98 | 6.70 | 204 | 0.57 | g | 0.45 | g | 2.27 | 23 | |||||||||||||||||||||||||||||||||||||||
| 5/31/19 | 11.14 | 0.18 | (0.48 | ) | (0.30 | ) | (0.28 | ) | (0.66 | ) | (0.94 | ) | 9.90 | (2.13 | ) | 130 | 0.41 | f | 0.30 | f | 1.70 | 18 | ||||||||||||||||||||||||||||||||||||
| 5/31/18 | 10.50 | 0.18 | 1.20 | 1.38 | (0.32 | ) | (0.42 | ) | (0.74 | ) | 11.14 | 13.27 | 117 | 0.14 | e | 0.03 | e | 1.62 | 14 | |||||||||||||||||||||||||||||||||||||||
| Premier Class: | 5/31/22 | 12.48 | 0.17 | (1.09 | ) | (0.92 | ) | (0.42 | ) | (1.05 | ) | (1.47 | ) | 10.09 | (8.57 | ) | 314,758 | 0.56 | g | 0.39 | g | 1.44 | 29 | |||||||||||||||||||||||||||||||||||
| 5/31/21 | 9.95 | 0.15 | 3.31 | 3.46 | (0.31 | ) | (0.62 | ) | (0.93 | ) | 12.48 | 35.81 | 441,951 | 0.59 | g | 0.45 | g | 1.36 | 46 | |||||||||||||||||||||||||||||||||||||||
| 5/31/20 | 9.87 | 0.20 | 0.48 | 0.68 | (0.18 | ) | (0.42 | ) | (0.60 | ) | 9.95 | 6.55 | 372,625 | 0.66 | g | 0.54 | g | 1.97 | 23 | |||||||||||||||||||||||||||||||||||||||
| 5/31/19 | 11.11 | 0.16 | (0.47 | ) | (0.31 | ) | (0.27 | ) | (0.66 | ) | (0.93 | ) | 9.87 | (2.28 | ) | 678,439 | 0.53 | f | 0.41 | f | 1.56 | 18 | ||||||||||||||||||||||||||||||||||||
| 5/31/18 | 10.47 | 0.16 | 1.20 | 1.36 | (0.30 | ) | (0.42 | ) | (0.72 | ) | 11.11 | 13.17 | 781,576 | 0.26 | e | 0.15 | e | 1.48 | 14 | |||||||||||||||||||||||||||||||||||||||
| Retirement Class: | 5/31/22 | 18.04 | 0.24 | (1.66 | ) | (1.42 | ) | (0.39 | ) | (1.05 | ) | (1.44 | ) | 15.18 | (8.67 | ) | 1,085,996 | 0.66 | g | 0.49 | g | 1.36 | 29 | |||||||||||||||||||||||||||||||||||
| 5/31/21 | 14.05 | 0.21 | 4.69 | 4.90 | (0.29 | ) | (0.62 | ) | (0.91 | ) | 18.04 | 35.59 | 1,391,417 | 0.69 | g | 0.55 | g | 1.31 | 46 | |||||||||||||||||||||||||||||||||||||||
| 5/31/20 | 13.71 | 0.30 | 0.62 | 0.92 | (0.16 | ) | (0.42 | ) | (0.58 | ) | 14.05 | 6.51 | 1,161,770 | 0.76 | g | 0.64 | g | 2.08 | 23 | |||||||||||||||||||||||||||||||||||||||
| 5/31/19 | 15.03 | 0.21 | (0.62 | ) | (0.41 | ) | (0.25 | ) | (0.66 | ) | (0.91 | ) | 13.71 | (2.37 | ) | 1,176,223 | 0.63 | f | 0.52 | f | 1.44 | 18 | ||||||||||||||||||||||||||||||||||||
| 5/31/18 | 13.93 | 0.20 | 1.60 | 1.80 | (0.28 | ) | (0.42 | ) | (0.70 | ) | 15.03 | 13.05 | 1,283,032 | 0.36 | e | 0.25 | e | 1.36 | 14 | |||||||||||||||||||||||||||||||||||||||
| 94 | 2022 Annual Report ■ TIAA-CREF Lifecycle Funds | See notes to financial statements | See notes to financial statements | TIAA-CREF Lifecycle Funds ■ 2022 Annual Report | 95 |
| Financial highlights | continued |
TIAA-CREF Funds
| Selected per share data | Ratios and supplemental data | |||||||||||||||||||||||||||||||||||||||||||||||||||||||||
| Gain (loss) from investment operations | ||||||||||||||||||||||||||||||||||||||||||||||||||||||||||
| Net realized | Ratios to average net assets | |||||||||||||||||||||||||||||||||||||||||||||||||||||||||
| For the | Net asset | Net | and unrealized | Total gain | Less distributions from | Total | Net asset | Net assets | Net | |||||||||||||||||||||||||||||||||||||||||||||||||
| period | value, | investment | gain (loss | ) | (loss) from | Net | Net | dividends | value, | at end of | investment | Portfolio | ||||||||||||||||||||||||||||||||||||||||||||||
| or year ended | beginning of period | income (loss | )a | on total investments | j | investment operations | investment income | realized gains | and distributions | end of period | Total return | period (in thousands | ) | Gross expenses | Net expenses | income (loss | ) | turnover rate | ||||||||||||||||||||||||||||||||||||||||
| LIFECYCLE 2045 FUND | ||||||||||||||||||||||||||||||||||||||||||||||||||||||||||
| Institutional Class: | 5/31/22 | $15.57 | $0.22 | $(1.38 | ) | $(1.16 | ) | $(0.53 | ) | $(1.27 | ) | $(1.80 | ) | $12.61 | (8.63 | )% | $3,351,968 | 0.41 | %g | 0.23 | %g | 1.52 | % | 29 | % | |||||||||||||||||||||||||||||||||
| 5/31/21 | 11.98 | 0.20 | 4.45 | 4.65 | (0.36 | ) | (0.70 | ) | (1.06 | ) | 15.57 | 39.80 | 3,557,269 | 0.44 | g | 0.30 | g | 1.44 | 46 | |||||||||||||||||||||||||||||||||||||||
| 5/31/20 | 11.89 | 0.28 | 0.55 | 0.83 | (0.22 | ) | (0.52 | ) | (0.74 | ) | 11.98 | 6.60 | 2,441,105 | 0.52 | g | 0.40 | g | 2.25 | 19 | |||||||||||||||||||||||||||||||||||||||
| 5/31/19 | 12.88 | 0.19 | (0.59 | ) | (0.40 | ) | (0.30 | ) | (0.29 | ) | (0.59 | ) | 11.89 | (2.79 | ) | 1,915,136 | 0.40 | f | 0.28 | f | 1.55 | 13 | ||||||||||||||||||||||||||||||||||||
| 5/31/18 | 11.73 | 0.19 | 1.44 | 1.63 | (0.37 | ) | (0.11 | ) | (0.48 | ) | 12.88 | 13.96 | 1,756,138 | 0.11 | e | 0.00 | e | 1.52 | 11 | |||||||||||||||||||||||||||||||||||||||
| Advisor Class: | 5/31/22 | 15.57 | 0.23 | (1.40 | ) | (1.17 | ) | (0.52 | ) | (1.27 | ) | (1.79 | ) | 12.61 | (8.67 | ) | 168 | 0.45 | g | 0.27 | g | 1.55 | 29 | |||||||||||||||||||||||||||||||||||
| 5/31/21 | 11.99 | 0.22 | 4.41 | 4.63 | (0.35 | ) | (0.70 | ) | (1.05 | ) | 15.57 | 39.64 | 153 | 0.50 | g | 0.35 | g | 1.57 | 46 | |||||||||||||||||||||||||||||||||||||||
| 5/31/20 | 11.89 | 0.27 | 0.57 | 0.84 | (0.22 | ) | (0.52 | ) | (0.74 | ) | 11.99 | 6.66 | 155 | 0.56 | g | 0.44 | g | 2.23 | 19 | |||||||||||||||||||||||||||||||||||||||
| 5/31/19 | 12.88 | 0.20 | (0.60 | ) | (0.40 | ) | (0.30 | ) | (0.29 | ) | (0.59 | ) | 11.89 | (2.79 | ) | 117 | 0.39 | f | 0.28 | f | 1.57 | 13 | ||||||||||||||||||||||||||||||||||||
| 5/31/18 | 11.73 | 0.19 | 1.44 | 1.63 | (0.37 | ) | (0.11 | ) | (0.48 | ) | 12.88 | 13.94 | 126 | 0.12 | e | 0.01 | e | 1.53 | 11 | |||||||||||||||||||||||||||||||||||||||
| Premier Class: | 5/31/22 | 15.49 | 0.20 | (1.38 | ) | (1.18 | ) | (0.50 | ) | (1.27 | ) | (1.77 | ) | 12.54 | (8.77 | ) | 224,448 | 0.56 | g | 0.38 | g | 1.34 | 29 | |||||||||||||||||||||||||||||||||||
| 5/31/21 | 11.93 | 0.18 | 4.42 | 4.60 | (0.34 | ) | (0.70 | ) | (1.04 | ) | 15.49 | 39.52 | 309,234 | 0.59 | g | 0.45 | g | 1.26 | 46 | |||||||||||||||||||||||||||||||||||||||
| 5/31/20 | 11.83 | 0.22 | 0.59 | 0.81 | (0.19 | ) | (0.52 | ) | (0.71 | ) | 11.93 | 6.50 | 234,573 | 0.67 | g | 0.55 | g | 1.81 | 19 | |||||||||||||||||||||||||||||||||||||||
| 5/31/19 | 12.82 | 0.17 | (0.59 | ) | (0.42 | ) | (0.28 | ) | (0.29 | ) | (0.57 | ) | 11.83 | (2.96 | ) | 435,004 | 0.54 | f | 0.42 | f | 1.41 | 13 | ||||||||||||||||||||||||||||||||||||
| 5/31/18 | 11.68 | 0.17 | 1.43 | 1.60 | (0.35 | ) | (0.11 | ) | (0.46 | ) | 12.82 | 13.78 | 451,707 | 0.26 | e | 0.15 | e | 1.39 | 11 | |||||||||||||||||||||||||||||||||||||||
| Retirement Class: | 5/31/22 | 15.43 | 0.18 | (1.37 | ) | (1.19 | ) | (0.49 | ) | (1.27 | ) | (1.76 | ) | 12.48 | (8.89 | ) | 613,731 | 0.66 | g | 0.48 | g | 1.26 | 29 | |||||||||||||||||||||||||||||||||||
| 5/31/21 | 11.89 | 0.17 | 4.39 | 4.56 | (0.32 | ) | (0.70 | ) | (1.02 | ) | 15.43 | 39.38 | 779,894 | 0.69 | g | 0.55 | g | 1.21 | 46 | |||||||||||||||||||||||||||||||||||||||
| 5/31/20 | 11.80 | 0.24 | 0.56 | 0.80 | (0.19 | ) | (0.52 | ) | (0.71 | ) | 11.89 | 6.40 | 621,730 | 0.77 | g | 0.65 | g | 1.98 | 19 | |||||||||||||||||||||||||||||||||||||||
| 5/31/19 | 12.78 | 0.16 | (0.58 | ) | (0.42 | ) | (0.27 | ) | (0.29 | ) | (0.56 | ) | 11.80 | (3.00 | ) | 599,598 | 0.64 | f | 0.52 | f | 1.30 | 13 | ||||||||||||||||||||||||||||||||||||
| 5/31/18 | 11.65 | 0.16 | 1.42 | 1.58 | (0.34 | ) | (0.11 | ) | (0.45 | ) | 12.78 | 13.62 | 609,733 | 0.36 | e | 0.25 | e | 1.27 | 11 | |||||||||||||||||||||||||||||||||||||||
| 96 | 2022 Annual Report ■ TIAA-CREF Lifecycle Funds | See notes to financial statements | See notes to financial statements | TIAA-CREF Lifecycle Funds ■ 2022 Annual Report | 97 |
| Financial highlights | continued |
TIAA-CREF Funds
| Selected per share data | Ratios and supplemental data | |||||||||||||||||||||||||||||||||||||||||||||||||||||||||
| Gain (loss) from investment operations | ||||||||||||||||||||||||||||||||||||||||||||||||||||||||||
| Net realized | Ratios to average net assets | |||||||||||||||||||||||||||||||||||||||||||||||||||||||||
| For the | Net asset | Net | and unrealized | Total gain | Less distributions from | Total | Net asset | Net assets | Net | |||||||||||||||||||||||||||||||||||||||||||||||||
| period | value, | investment | gain (loss | ) | (loss) from | Net | Net | dividends | value, | at end of | investment | Portfolio | ||||||||||||||||||||||||||||||||||||||||||||||
| or year ended | beginning of period | income (loss | )a | on total investments | j | investment operations | investment income | realized gains | and distributions | end of period | Total return | period (in thousands | ) | Gross expenses | Net expenses | income (loss | ) | turnover rate | ||||||||||||||||||||||||||||||||||||||||
| LIFECYCLE 2050 FUND | ||||||||||||||||||||||||||||||||||||||||||||||||||||||||||
| Institutional Class: | 5/31/22 | $15.83 | $0.22 | $(1.42 | ) | $(1.20 | ) | $(0.55 | ) | $(1.19 | ) | $(1.74 | ) | $12.89 | (8.73 | )% | $2,529,399 | 0.41 | %g | 0.22 | %g | 1.49 | % | 27 | % | |||||||||||||||||||||||||||||||||
| 5/31/21 | 12.05 | 0.20 | 4.57 | 4.77 | (0.36 | ) | (0.63 | ) | (0.99 | ) | 15.83 | 40.55 | 2,626,383 | 0.45 | g | 0.29 | g | 1.43 | 43 | |||||||||||||||||||||||||||||||||||||||
| 5/31/20 | 11.94 | 0.28 | 0.56 | 0.84 | (0.22 | ) | (0.51 | ) | (0.73 | ) | 12.05 | 6.70 | 1,730,080 | 0.52 | g | 0.40 | g | 2.24 | 18 | |||||||||||||||||||||||||||||||||||||||
| 5/31/19 | 12.95 | 0.19 | (0.61 | ) | (0.42 | ) | (0.30 | ) | (0.29 | ) | (0.59 | ) | 11.94 | (2.97 | ) | 1,267,704 | 0.40 | f | 0.28 | f | 1.52 | 12 | ||||||||||||||||||||||||||||||||||||
| 5/31/18 | 11.77 | 0.19 | 1.47 | 1.66 | (0.37 | ) | (0.11 | ) | (0.48 | ) | 12.95 | 14.16 | 1,131,187 | 0.12 | e | 0.00 | e | 1.49 | 10 | |||||||||||||||||||||||||||||||||||||||
| Advisor Class: | 5/31/22 | 15.82 | 0.13 | (1.34 | ) | (1.21 | ) | (0.53 | ) | (1.19 | ) | (1.72 | ) | 12.89 | (8.75 | ) | 580 | 0.49 | g | 0.30 | g | 0.93 | 27 | |||||||||||||||||||||||||||||||||||
| 5/31/21 | 12.04 | 0.14 | 4.63 | 4.77 | (0.36 | ) | (0.63 | ) | (0.99 | ) | 15.82 | 40.56 | 395 | 0.49 | g | 0.33 | g | 0.96 | 43 | |||||||||||||||||||||||||||||||||||||||
| 5/31/20 | 11.95 | 0.28 | 0.54 | 0.82 | (0.22 | ) | (0.51 | ) | (0.73 | ) | 12.04 | 6.51 | 118 | 0.55 | g | 0.42 | g | 2.22 | 18 | |||||||||||||||||||||||||||||||||||||||
| 5/31/19 | 12.95 | 0.19 | (0.60 | ) | (0.41 | ) | (0.30 | ) | (0.29 | ) | (0.59 | ) | 11.95 | (2.90 | ) | 117 | 0.40 | f | 0.28 | f | 1.55 | 12 | ||||||||||||||||||||||||||||||||||||
| 5/31/18 | 11.77 | 0.19 | 1.47 | 1.66 | (0.37 | ) | (0.11 | ) | (0.48 | ) | 12.95 | 14.15 | 127 | 0.13 | e | 0.01 | e | 1.50 | 10 | |||||||||||||||||||||||||||||||||||||||
| Premier Class: | 5/31/22 | 15.76 | 0.20 | (1.42 | ) | (1.22 | ) | (0.52 | ) | (1.19 | ) | (1.71 | ) | 12.83 | (8.86 | ) | 159,978 | 0.56 | g | 0.37 | g | 1.34 | 27 | |||||||||||||||||||||||||||||||||||
| 5/31/21 | 12.00 | 0.18 | 4.55 | 4.73 | (0.34 | ) | (0.63 | ) | (0.97 | ) | 15.76 | 40.35 | 205,713 | 0.60 | g | 0.44 | g | 1.25 | 43 | |||||||||||||||||||||||||||||||||||||||
| 5/31/20 | 11.89 | 0.22 | 0.59 | 0.81 | (0.19 | ) | (0.51 | ) | (0.70 | ) | 12.00 | 6.50 | 152,698 | 0.67 | g | 0.55 | g | 1.74 | 18 | |||||||||||||||||||||||||||||||||||||||
| 5/31/19 | 12.89 | 0.17 | (0.60 | ) | (0.43 | ) | (0.28 | ) | (0.29 | ) | (0.57 | ) | 11.89 | (3.07 | ) | 319,987 | 0.55 | f | 0.43 | f | 1.38 | 12 | ||||||||||||||||||||||||||||||||||||
| 5/31/18 | 11.72 | 0.17 | 1.46 | 1.63 | (0.35 | ) | (0.11 | ) | (0.46 | ) | 12.89 | 13.99 | 319,950 | 0.27 | e | 0.15 | e | 1.37 | 10 | |||||||||||||||||||||||||||||||||||||||
| Retirement Class: | 5/31/22 | 15.68 | 0.18 | (1.40 | ) | (1.22 | ) | (0.51 | ) | (1.19 | ) | (1.70 | ) | 12.76 | (8.93 | ) | 439,910 | 0.66 | g | 0.47 | g | 1.22 | 27 | |||||||||||||||||||||||||||||||||||
| 5/31/21 | 11.94 | 0.17 | 4.53 | 4.70 | (0.33 | ) | (0.63 | ) | (0.96 | ) | 15.68 | 40.27 | 549,874 | 0.70 | g | 0.54 | g | 1.19 | 43 | |||||||||||||||||||||||||||||||||||||||
| 5/31/20 | 11.85 | 0.24 | 0.55 | 0.79 | (0.19 | ) | (0.51 | ) | (0.70 | ) | 11.94 | 6.33 | 424,505 | 0.77 | g | 0.65 | g | 1.95 | 18 | |||||||||||||||||||||||||||||||||||||||
| 5/31/19 | 12.85 | 0.16 | (0.60 | ) | (0.44 | ) | (0.27 | ) | (0.29 | ) | (0.56 | ) | 11.85 | (3.19 | ) | 399,296 | 0.65 | f | 0.53 | f | 1.27 | 12 | ||||||||||||||||||||||||||||||||||||
| 5/31/18 | 11.68 | 0.16 | 1.46 | 1.62 | (0.34 | ) | (0.11 | ) | (0.45 | ) | 12.85 | 13.93 | 396,498 | 0.37 | e | 0.25 | e | 1.25 | 10 | |||||||||||||||||||||||||||||||||||||||
| 98 | 2022 Annual Report ■ TIAA-CREF Lifecycle Funds | See notes to financial statements | See notes to financial statements | TIAA-CREF Lifecycle Funds ■ 2022 Annual Report | 99 |
| Financial highlights | continued |
TIAA-CREF Funds
| Selected per share data | Ratios and supplemental data | |||||||||||||||||||||||||||||||||||||||||||||||||||||||||
| Gain (loss) from investment operations | ||||||||||||||||||||||||||||||||||||||||||||||||||||||||||
| Net realized | Ratios to average net assets | |||||||||||||||||||||||||||||||||||||||||||||||||||||||||
| For the | Net asset | Net | and unrealized | Total gain | Less distributions from | Total | Net asset | Net assets | Net | |||||||||||||||||||||||||||||||||||||||||||||||||
| period | value, | investment | gain (loss | ) | (loss) from | Net | Net | dividends | value, | at end of | investment | Portfolio | ||||||||||||||||||||||||||||||||||||||||||||||
| or year ended | beginning of period | income (loss | )a | on total investments | j | investment operations | investment income | realized gains | and distributions | end of period | Total return | period (in thousands | ) | Gross expenses | Net expenses | income (loss | ) | turnover rate | ||||||||||||||||||||||||||||||||||||||||
| LIFECYCLE 2055 FUND | ||||||||||||||||||||||||||||||||||||||||||||||||||||||||||
| Institutional Class: | 5/31/22 | $18.38 | $0.26 | $(1.68 | ) | $(1.42 | ) | $(0.63 | ) | $(1.15 | ) | $(1.78 | ) | $15.18 | (8.73 | )% | $1,127,411 | 0.42 | %g | 0.22 | %g | 1.47 | % | 26 | % | |||||||||||||||||||||||||||||||||
| 5/31/21 | 13.77 | 0.23 | 5.32 | 5.55 | (0.41 | ) | (0.53 | ) | (0.94 | ) | 18.38 | 41.14 | 1,092,033 | 0.47 | g | 0.29 | g | 1.41 | 41 | |||||||||||||||||||||||||||||||||||||||
| 5/31/20 | 13.61 | 0.31 | 0.63 | 0.94 | (0.25 | ) | (0.53 | ) | (0.78 | ) | 13.77 | 6.56 | 653,177 | 0.54 | g | 0.40 | g | 2.24 | 18 | |||||||||||||||||||||||||||||||||||||||
| 5/31/19 | 14.69 | 0.21 | (0.70 | ) | (0.49 | ) | (0.33 | ) | (0.26 | ) | (0.59 | ) | 13.61 | (3.04 | ) | 404,603 | 0.43 | f | 0.29 | f | 1.49 | 10 | ||||||||||||||||||||||||||||||||||||
| 5/31/18 | 13.31 | 0.21 | 1.67 | 1.88 | (0.39 | ) | (0.11 | ) | (0.50 | ) | 14.69 | 14.29 | 307,441 | 0.14 | e | 0.00 | e | 1.45 | 9 | |||||||||||||||||||||||||||||||||||||||
| Advisor Class: | 5/31/22 | 18.37 | 0.26 | (1.69 | ) | (1.43 | ) | (0.62 | ) | (1.15 | ) | (1.77 | ) | 15.17 | (8.78 | ) | 155 | 0.45 | g | 0.26 | g | 1.49 | 26 | |||||||||||||||||||||||||||||||||||
| 5/31/21 | 13.77 | 0.23 | 5.30 | 5.53 | (0.40 | ) | (0.53 | ) | (0.93 | ) | 18.37 | 41.04 | 162 | 0.50 | g | 0.33 | g | 1.40 | 41 | |||||||||||||||||||||||||||||||||||||||
| 5/31/20 | 13.61 | 0.31 | 0.63 | 0.94 | (0.25 | ) | (0.53 | ) | (0.78 | ) | 13.77 | 6.56 | 121 | 0.56 | g | 0.41 | g | 2.20 | 18 | |||||||||||||||||||||||||||||||||||||||
| 5/31/19 | 14.69 | 0.22 | (0.71 | ) | (0.49 | ) | (0.33 | ) | (0.26 | ) | (0.59 | ) | 13.61 | (3.05 | ) | 119 | 0.42 | f | 0.28 | f | 1.52 | 10 | ||||||||||||||||||||||||||||||||||||
| 5/31/18 | 13.31 | 0.21 | 1.67 | 1.88 | (0.39 | ) | (0.11 | ) | (0.50 | ) | 14.69 | 14.28 | 128 | 0.15 | e | 0.01 | e | 1.47 | 9 | |||||||||||||||||||||||||||||||||||||||
| Premier Class: | 5/31/22 | 18.30 | 0.23 | (1.67 | ) | (1.44 | ) | (0.60 | ) | (1.15 | ) | (1.75 | ) | 15.11 | (8.86 | ) | 76,685 | 0.57 | g | 0.37 | g | 1.33 | 26 | |||||||||||||||||||||||||||||||||||
| 5/31/21 | 13.72 | 0.20 | 5.29 | 5.49 | (0.38 | ) | (0.53 | ) | (0.91 | ) | 18.30 | 40.88 | 93,442 | 0.60 | g | 0.44 | g | 1.24 | 41 | |||||||||||||||||||||||||||||||||||||||
| 5/31/20 | 13.56 | 0.24 | 0.67 | 0.91 | (0.22 | ) | (0.53 | ) | (0.75 | ) | 13.72 | 6.37 | 62,637 | 0.69 | g | 0.55 | g | 1.68 | 18 | |||||||||||||||||||||||||||||||||||||||
| 5/31/19 | 14.63 | 0.19 | (0.69 | ) | (0.50 | ) | (0.31 | ) | (0.26 | ) | (0.57 | ) | 13.56 | (3.14 | ) | 135,603 | 0.57 | f | 0.43 | f | 1.35 | 10 | ||||||||||||||||||||||||||||||||||||
| 5/31/18 | 13.26 | 0.19 | 1.67 | 1.86 | (0.38 | ) | (0.11 | ) | (0.49 | ) | 14.63 | 14.13 | 118,351 | �� | 0.29 | e | 0.15 | e | 1.35 | 9 | ||||||||||||||||||||||||||||||||||||||
| Retirement Class: | 5/31/22 | 18.29 | 0.21 | (1.67 | ) | (1.46 | ) | (0.58 | ) | (1.15 | ) | (1.73 | ) | 15.10 | (8.97 | ) | 195,461 | 0.67 | g | 0.47 | g | 1.21 | 26 | |||||||||||||||||||||||||||||||||||
| 5/31/21 | 13.71 | 0.19 | 5.29 | 5.48 | (0.37 | ) | (0.53 | ) | (0.90 | ) | 18.29 | 40.80 | 237,666 | 0.71 | g | 0.54 | g | 1.18 | 41 | |||||||||||||||||||||||||||||||||||||||
| 5/31/20 | 13.56 | 0.27 | 0.63 | 0.90 | (0.22 | ) | (0.53 | ) | (0.75 | ) | 13.71 | 6.28 | 181,024 | 0.79 | g | 0.65 | g | 1.95 | 18 | |||||||||||||||||||||||||||||||||||||||
| 5/31/19 | 14.63 | 0.17 | (0.68 | ) | (0.51 | ) | (0.30 | ) | (0.26 | ) | (0.56 | ) | 13.56 | (3.24 | ) | 155,354 | 0.67 | f | 0.53 | f | 1.24 | 10 | ||||||||||||||||||||||||||||||||||||
| 5/31/18 | 13.26 | 0.17 | 1.67 | 1.84 | (0.36 | ) | (0.11 | ) | (0.47 | ) | 14.63 | 14.03 | 137,389 | 0.39 | e | 0.25 | e | 1.22 | 9 | |||||||||||||||||||||||||||||||||||||||
| 100 | 2022 Annual Report ■ TIAA-CREF Lifecycle Funds | See notes to financial statements | See notes to financial statements | TIAA-CREF Lifecycle Funds ■ 2022 Annual Report | 101 |
| Financial highlights | continued |
TIAA-CREF Funds
| Selected per share data | Ratios and supplemental data | |||||||||||||||||||||||||||||||||||||||||||||||||||||||||
| Gain (loss) from investment operations | ||||||||||||||||||||||||||||||||||||||||||||||||||||||||||
| Net realized | Ratios to average net assets | |||||||||||||||||||||||||||||||||||||||||||||||||||||||||
| For the | Net asset | Net | and unrealized | Total gain | Less distributions from | Total | Net asset | Net assets | Net | |||||||||||||||||||||||||||||||||||||||||||||||||
| period | value, | investment | gain (loss | ) | (loss) from | Net | Net | dividends | value, | at end of | investment | Portfolio | ||||||||||||||||||||||||||||||||||||||||||||||
| or year ended | beginning of period | income (loss | )a | on total investments | j | investment operations | investment income | realized gains | and distributions | end of period | Total return | period (in thousands | ) | Gross expenses | Net expenses | income (loss | ) | turnover rate | ||||||||||||||||||||||||||||||||||||||||
| LIFECYCLE 2060 FUND | ||||||||||||||||||||||||||||||||||||||||||||||||||||||||||
| Institutional Class: | 5/31/22 | $15.36 | $0.22 | $(1.43 | ) | $(1.21 | ) | $(0.53 | ) | $(0.66 | ) | $(1.19 | ) | $12.96 | (8.71 | )% | $364,640 | 0.45 | %g | 0.22 | %g | 1.48 | % | 26 | % | |||||||||||||||||||||||||||||||||
| 5/31/21 | 11.35 | 0.19 | 4.45 | 4.64 | (0.32 | ) | (0.31 | ) | (0.63 | ) | 15.36 | 41.61 | 313,864 | 0.49 | g | 0.29 | g | 1.39 | 40 | |||||||||||||||||||||||||||||||||||||||
| 5/31/20 | 11.13 | 0.25 | 0.52 | 0.77 | (0.21 | ) | (0.34 | ) | (0.55 | ) | 11.35 | 6.60 | 155,744 | 0.62 | g | 0.39 | g | 2.18 | 22 | |||||||||||||||||||||||||||||||||||||||
| 5/31/19 | 12.02 | 0.18 | (0.59 | ) | (0.41 | ) | (0.27 | ) | (0.21 | ) | (0.48 | ) | 11.13 | (3.17 | ) | 81,477 | 0.55 | f | 0.29 | f | 1.54 | 36 | ||||||||||||||||||||||||||||||||||||
| 5/31/18 | 10.81 | 0.16 | 1.39 | 1.55 | (0.29 | ) | (0.05 | ) | (0.34 | ) | 12.02 | 14.51 | 58,836 | 0.34 | e | 0.00 | e | 1.39 | 37 | |||||||||||||||||||||||||||||||||||||||
| Advisor Class: | 5/31/22 | 15.35 | 0.22 | (1.44 | ) | (1.22 | ) | (0.52 | ) | (0.66 | ) | (1.18 | ) | 12.95 | (8.77 | ) | 208 | 0.51 | g | 0.28 | g | 1.48 | 26 | |||||||||||||||||||||||||||||||||||
| 5/31/21 | 11.35 | 0.17 | 4.46 | 4.63 | (0.32 | ) | (0.31 | ) | (0.63 | ) | 15.35 | 41.50 | 241 | 0.54 | g | 0.34 | g | 1.25 | 40 | |||||||||||||||||||||||||||||||||||||||
| 5/31/20 | 11.13 | 0.25 | 0.51 | 0.76 | (0.20 | ) | (0.34 | ) | (0.54 | ) | 11.35 | 6.60 | 117 | 0.66 | g | 0.44 | g | 2.16 | 22 | |||||||||||||||||||||||||||||||||||||||
| 5/31/19 | 12.02 | 0.17 | (0.58 | ) | (0.41 | ) | (0.27 | ) | (0.21 | ) | (0.48 | ) | 11.13 | (3.20 | ) | 115 | 0.55 | f | 0.30 | f | 1.51 | 36 | ||||||||||||||||||||||||||||||||||||
| 5/31/18 | 10.81 | 0.16 | 1.39 | 1.55 | (0.29 | ) | (0.05 | ) | (0.34 | ) | 12.02 | 14.47 | 133 | 0.38 | e | 0.04 | e | 1.41 | 37 | |||||||||||||||||||||||||||||||||||||||
| Premier Class: | 5/31/22 | 15.33 | 0.20 | (1.44 | ) | (1.24 | ) | (0.51 | ) | (0.66 | ) | (1.17 | ) | 12.92 | (8.92 | ) | 19,013 | 0.60 | g | 0.37 | g | 1.39 | 26 | |||||||||||||||||||||||||||||||||||
| 5/31/21 | 11.33 | 0.17 | 4.44 | 4.61 | (0.30 | ) | (0.31 | ) | (0.61 | ) | 15.33 | 41.44 | 18,792 | 0.64 | g | 0.44 | g | 1.25 | 40 | |||||||||||||||||||||||||||||||||||||||
| 5/31/20 | 11.11 | 0.19 | 0.56 | 0.75 | (0.19 | ) | (0.34 | ) | (0.53 | ) | 11.33 | 6.48 | 10,846 | 0.77 | g | 0.55 | g | 1.68 | 22 | |||||||||||||||||||||||||||||||||||||||
| 5/31/19 | 12.00 | 0.16 | (0.59 | ) | (0.43 | ) | (0.25 | ) | (0.21 | ) | (0.46 | ) | 11.11 | (3.31 | ) | 18,553 | 0.70 | f | 0.44 | f | 1.39 | 36 | ||||||||||||||||||||||||||||||||||||
| 5/31/18 | 10.80 | 0.15 | 1.38 | 1.53 | (0.28 | ) | (0.05 | ) | (0.33 | ) | 12.00 | 14.32 | 13,028 | 0.49 | e | 0.15 | e | 1.30 | 37 | |||||||||||||||||||||||||||||||||||||||
| Retirement Class: | 5/31/22 | 15.30 | 0.18 | (1.43 | ) | (1.25 | ) | (0.49 | ) | (0.66 | ) | (1.15 | ) | 12.90 | (8.97 | ) | 60,036 | 0.70 | g | 0.47 | g | 1.22 | 26 | |||||||||||||||||||||||||||||||||||
| 5/31/21 | 11.31 | 0.16 | 4.43 | 4.59 | (0.29 | ) | (0.31 | ) | (0.60 | ) | 15.30 | 41.31 | 63,880 | 0.74 | g | 0.54 | g | 1.16 | 40 | |||||||||||||||||||||||||||||||||||||||
| 5/31/20 | 11.10 | 0.22 | 0.51 | 0.73 | (0.18 | ) | (0.34 | ) | (0.52 | ) | 11.31 | 6.32 | 38,705 | 0.87 | g | 0.65 | g | 1.91 | 22 | |||||||||||||||||||||||||||||||||||||||
| 5/31/19 | 11.99 | 0.15 | (0.59 | ) | (0.44 | ) | (0.24 | ) | (0.21 | ) | (0.45 | ) | 11.10 | (3.41 | ) | 27,045 | 0.79 | f | 0.53 | f | 1.27 | 36 | ||||||||||||||||||||||||||||||||||||
| 5/31/18 | 10.79 | 0.13 | 1.39 | 1.52 | (0.27 | ) | (0.05 | ) | (0.32 | ) | 11.99 | 14.24 | 24,314 | 0.59 | e | 0.25 | e | 1.07 | 37 | |||||||||||||||||||||||||||||||||||||||
| 102 | 2022 Annual Report ■ TIAA-CREF Lifecycle Funds | See notes to financial statements | See notes to financial statements | TIAA-CREF Lifecycle Funds ■ 2022 Annual Report | 103 |
| Financial highlights | concluded |
TIAA-CREF Funds
| Selected per share data | Ratios and supplemental data | |||||||||||||||||||||||||||||||||||||||||||||||||||||||||
| Gain (loss) from investment operations | ||||||||||||||||||||||||||||||||||||||||||||||||||||||||||
| Net realized | Ratios to average net assets | |||||||||||||||||||||||||||||||||||||||||||||||||||||||||
| For the | Net asset | Net | and unrealized | Total gain | Less distributions from | Total | Net asset | Net assets | Net | |||||||||||||||||||||||||||||||||||||||||||||||||
| period | value, | investment | gain (loss | ) | (loss) from | Net | Net | dividends | value, | at end of | investment | Portfolio | ||||||||||||||||||||||||||||||||||||||||||||||
| or year ended | beginning of period | income (loss | )a | on total investments | j | investment operations | investment income | realized gains | and distributions | end of period | Total return | period (in thousands | ) | Gross expenses | Net expenses | income (loss | ) | turnover rate | ||||||||||||||||||||||||||||||||||||||||
| LIFECYCLE 2065 FUND | ||||||||||||||||||||||||||||||||||||||||||||||||||||||||||
| Institutional Class: | 5/31/22 | $12.45 | $0.17 | $(1.15 | ) | $(0.98 | ) | $(0.41 | ) | $(0.32 | ) | $(0.73 | ) | $10.74 | (8.52 | )% | $17,581 | 1.80 | %g | 0.21 | %g | 1.44 | % | 109 | % | |||||||||||||||||||||||||||||||||
| 5/31/21 | § | 10.00 | 0.14 | 2.60 | 2.74 | (0.26 | ) | (0.03 | ) | (0.29 | ) | 12.45 | 27.76 | b | 4,818 | 4.73 | c,g | 0.26 | c,g | 1.81 | c | 49 | b | |||||||||||||||||||||||||||||||||||
| Advisor Class: | 5/31/22 | 12.44 | 0.19 | (1.21 | ) | (1.02 | ) | (0.55 | ) | (0.32 | ) | (0.87 | ) | 10.55 | (8.96 | ) | 527 | 1.81 | g | 0.23 | g | 1.55 | 109 | |||||||||||||||||||||||||||||||||||
| 5/31/21 | § | 10.00 | 0.13 | 2.60 | 2.73 | (0.26 | ) | (0.03 | ) | (0.29 | ) | 12.44 | 27.62 | b | 622 | 5.07 | c,g | 0.41 | c,g | 1.70 | c | 49 | b | |||||||||||||||||||||||||||||||||||
| Premier Class: | 5/31/22 | 12.43 | 0.13 | (1.13 | ) | (1.00 | ) | (0.52 | ) | (0.32 | ) | (0.84 | ) | 10.59 | (8.78 | ) | 1,784 | 1.96 | g | 0.36 | g | 1.11 | 109 | |||||||||||||||||||||||||||||||||||
| 5/31/21 | § | 10.00 | 0.12 | 2.60 | 2.72 | (0.26 | ) | (0.03 | ) | (0.29 | ) | 12.43 | 27.51 | b | 726 | 5.20 | c,g | 0.41 | c,g | 1.60 | c | 49 | b | |||||||||||||||||||||||||||||||||||
| Retirement Class: | 5/31/22 | 12.42 | 0.10 | (1.07 | ) | (0.97 | ) | (0.40 | ) | (0.32 | ) | (0.72 | ) | 10.73 | (8.46 | ) | 3,862 | 2.06 | g | 0.46 | g | 0.91 | 109 | |||||||||||||||||||||||||||||||||||
| 5/31/21 | § | 10.00 | 0.12 | 2.58 | 2.70 | (0.25 | ) | (0.03 | ) | (0.28 | ) | 12.42 | 27.38 | b | 802 | 5.33 | c,g | 0.51 | c,g | 1.54 | c | 49 | b | |||||||||||||||||||||||||||||||||||
| § | The Fund commenced operations on September 30, 2020. |
| a | Based on average shares outstanding. |
| b | The percentages shown for this period are not annualized. |
| c | The percentages shown for this period are annualized. |
| e | The Fund’s expenses do not include the expenses of the Underlying Funds. |
| f | From June 1, 2018 through September 30, 2018, the Fund’s expenses do not include the expenses of the Underlying Funds. Beginning October 1, 2018, the Lifecycle Funds expenses include the expenses of the Underlying Funds, excluding the expenses of the Real Property Fund. |
| g | The Fund’s expenses include the expenses of the Underlying Funds, excluding the expenses of the Nuveen Dividend Growth, Nuveen Dividend Value, Nuveen Growth Opportunities ETF, Nuveen International Growth and Real Property Fund. |
| j | Short-term and long-term capital gain distributions received from the underlying Funds are presented in net realized and unrealized gain (loss) on total investments for all periods presented. |
| 104 | 2022 Annual Report ■ TIAA-CREF Lifecycle Funds | See notes to financial statements | See notes to financial statements | TIAA-CREF Lifecycle Funds ■ 2022 Annual Report | 105 |
TIAA-CREF Lifecycle Funds
Note 1—organization
The Lifecycle Funds (collectively the “Funds,” each individually referred to as a “Fund”) are a sub-family of mutual funds offered by the TIAA-CREF Funds (the “Trust”), a Delaware statutory trust, that is registered with the U.S. Securities and Exchange Commission (“SEC”) under the Investment Company Act of 1940, as amended (“1940 Act”), as an open-end management investment company.
Teachers Advisors, LLC (“Advisors”), a wholly owned indirect subsidiary of Teachers Insurance and Annuity Association of America (“TIAA”), is registered with the SEC as an investment adviser and provides investment management services for the Funds.
The Funds offer their shares, without a sales load, through their principal underwriter, Nuveen Securities, LLC (“Nuveen Securities”), which is a wholly owned indirect subsidiary of TIAA.
Each Fund is a “fund of funds” that diversifies its assets by investing in Class W shares of other funds of the Trust and potentially other investment pools or investment products. The Funds offer up to five share classes, although any one Fund may not necessarily offer all five classes. The Funds may offer Institutional Class, Advisor Class, Premier Class, Retirement Class and Retail Class shares. Each class differs by the allocation of class-specific expenses and voting rights in matters affecting a single class.
Note 2—significant accounting policies
The accompanying financial statements were prepared in accordance with accounting principles generally accepted in the United States of America (“U.S. GAAP”), which may require the use of estimates made by management and the evaluation of subsequent events. Actual results may differ from those estimates. The Funds are investment companies and follow the accounting guidance in the Financial Accounting Standards Board (“FASB”) Accounting Standards Codification 946, Financial Services—Investment Companies. The net asset value (“NAV”) for financial reporting purposes may differ from the NAV for processing transactions. The NAV for financial reporting purposes includes security and shareholder transactions through the date of the report. Total return is computed based on the NAV used for processing transactions. The following is a summary of the significant accounting policies consistently followed by the Funds.
Investments and investment income: Securities transactions are accounted for as of the trade date for financial reporting purposes. Interest income is recorded on an accrual basis and includes accretion of discounts and amortization of premiums. Dividend income is recorded on the ex-dividend date. Realized gains and losses on securities transactions are based upon the specific identification method. Distributions received on securities that represent a return of capital or capital gains are recorded
| 106 | 2022 Annual Report ■ TIAA-CREF Lifecycle Funds |
as a reduction of cost of investments and/or as a realized gain. The Funds estimate the components of distributions received that may be considered return of capital distributions or capital gain distributions.
Multiclass operations and allocations: Income, expenses, realized gains and losses and unrealized appreciation and depreciation of a Fund are allocated on a pro rata basis to each class of shares, except for service agreement fees, distribution fees and transfer agency fees and expenses, which are unique to each class of shares. Most expenses of the Trust can be directly attributed to a fund. Expenses that cannot be directly attributed are allocated to each fund in the Trust based upon the average net assets of each fund.
Distributions to shareholders: Distributions to shareholders are recorded on the ex-dividend date. The amount, character and timing of distributions are determined in accordance with federal income tax regulations, which may differ from U.S. GAAP.
Trustee compensation: The Funds pay the members of the Board of Trustees (“Board”), all of whom are independent, certain remuneration for their services, plus travel and other expenses. Trustees may elect to participate in a deferred compensation plan and defer all or a portion of their compensation. In addition, trustees participate in a long-term compensation plan. Amounts deferred are retained by the Funds until paid. Amounts payable to the trustees for compensation are included separately in the accompanying Statements of assets and liabilities. Trustees’ fees, including any deferred and long-term compensation incurred, are reflected in the Statements of operations.
Indemnification: Under the Trust’s organizational documents, its officers and directors are indemnified against certain liabilities arising out of the performance of their duties to the Trust. In addition, in the normal course of business, the Trust enters into contracts that provide general indemnifications to other parties. The Trust’s maximum exposure under these arrangements is unknown as this would involve future claims that may be made against the Trust that have not yet occurred. However, the Trust has not had prior claims or losses pursuant to these contracts and expects the risk of loss to be remote.
Other matters: The outbreak of the novel coronavirus (“COVID-19”) and subsequent global pandemic began significantly impacting the U.S. and global financial markets and economies during the calendar quarter ended March 31, 2020. The worldwide spread of COVID-19 has created significant uncertainty in the global economy. The duration and extent of COVID-19 over the long term cannot be reasonably estimated at this time. The ultimate impact of COVID-19 and the extent to which COVID-19 impacts the Funds’ normal course of business, results of operations, investments, and cash flows will depend on future developments, which are highly uncertain and difficult to predict. Management continues to monitor and evaluate this situation.
| TIAA-CREF Lifecycle Funds ■ 2022 Annual Report | 107 |
Notes to financial statements
New rule issuance: In December 2020, the SEC voted to adopt a new rule providing a framework for fund valuation practices. New Rule 2a-5 (“Rule 2a-5”) under the 1940 Act establishes requirements for determining fair value in good faith for purposes of the 1940 Act. Rule 2a-5 will permit boards, subject to board oversight and certain other conditions, to designate certain parties to perform fair value determinations. Rule 2a-5 also defines when market quotations are “readily available” for purposes of the 1940 Act and the threshold for determining whether a fund must fair value a security. The SEC also adopted new Rule 31a-4 (“Rule 31a-4”), which provides the recordkeeping requirements associated with fair value determinations. Finally, the SEC is rescinding previously issued guidance on related issues, including the role of the board in determining fair value and the accounting and auditing of fund investments. Rule 2a-5 and Rule 31a-4 became effective on March 8, 2021. The compliance date for Rule 2a-5 and Rule 31a-4 is September 8, 2022. A fund may voluntarily comply with the rules after the effective date, and in advance of the compliance date, under certain conditions. Management is currently assessing the impact of these provisions on the Funds’ financial statements.
Note 3—valuation of investments
The Funds’ investments in securities are recorded at their estimated fair value utilizing valuation methods approved by the Board. Fair value is defined as the price that would be received upon selling an investment or transferring a liability in an orderly transaction to an independent buyer in the principal or most advantageous market for the investment. U.S. GAAP establishes the three-tier hierarchy that is used to maximize the use of observable market data and minimize the use of unobservable inputs and to establish classification of fair value measurements for disclosure purposes. Observable inputs reflect the assumptions market participants would use in pricing the asset or liability. Observable inputs are based on market data obtained from sources independent of the reporting entity. Unobservable inputs reflect management’s assumptions about the assumptions market participants would use in pricing the asset or liability. Unobservable inputs are based on the best information available in the circumstances. The following is a summary of the three-tiered hierarchy of valuation input levels.
| • | Level 1 – Inputs are unadjusted and prices are determined using quoted prices in active markets for identical securities. |
| • | Level 2 – Prices are determined using other significant observable inputs (including quoted prices for similar securities, interest rates, credit spreads, etc.). |
| • | Level 3 – Prices are determined using significant unobservable inputs (including management’s assumptions in determining the fair value of investments). |
| 108 | 2022 Annual Report ■ TIAA-CREF Lifecycle Funds |
continued
A description of the valuation techniques applied to the Funds’ major classifications of assets and liabilities measured at fair value follows:
Investments in exchange-traded funds: Exchange-traded funds listed or traded on a national market or exchange are valued based on their sale price at the official close of business of such market or exchange on the valuation date. To the extent these securities are actively traded and that valuation adjustments are not applied, they are generally classified as Level 1. If there is no official close of business, then the latest available sale price is utilized. If no sales are reported, then the mean of the latest available bid and asked prices is utilized and the securities are generally classified as Level 2.
Investments in registered investment companies: Investments in investment companies are valued at their respective NAVs on the valuation date and are generally classified as Level 1.
Investments in unregistered limited partnerships: Investments in unregistered limited partnerships are measured at fair value as of the valuation date using the NAV per share practical expedient and are not classified within the fair value hierarchy.
The following table summarizes the market value of the Funds’ investments as of May 31, 2022, based on the inputs used to value them:
| Fund | Level 1 | Level 2 | Level 3 | Fair value using practical expedienta | Total | |||||||||||||||
| Lifecycle Retirement Income | ||||||||||||||||||||
| Registered investment companies | $ | 499,245,460 | $ | – | $ | – | $ | – | $ | 499,245,460 | ||||||||||
| TIAA-CREF Real Property Fund LP | – | – | – | 30,624,809 | 30,624,809 | |||||||||||||||
| Total | $ | 499,245,460 | $ | – | $ | – | $ | 30,624,809 | $ | 529,870,269 | ||||||||||
| Lifecycle 2010 | ||||||||||||||||||||
| Registered investment companies | $ | 992,431,590 | $ | – | $ | – | $ | – | $ | 992,431,590 | ||||||||||
| TIAA-CREF Real Property Fund LP | – | – | – | 49,123,040 | 49,123,040 | |||||||||||||||
| Total | $ | 992,431,590 | $ | – | $ | – | $ | 49,123,040 | $ | 1,041,554,630 | ||||||||||
| Lifecycle 2015 | ||||||||||||||||||||
| Registered investment companies | $ | 1,384,871,300 | $ | – | $ | – | $ | – | $ | 1,384,871,300 | ||||||||||
| TIAA-CREF Real Property Fund LP | – | – | – | 84,936,878 | 84,936,878 | |||||||||||||||
| Total | $ | 1,384,871,300 | $ | – | $ | – | $ | 84,936,878 | $ | 1,469,808,178 | ||||||||||
| Lifecycle 2020 | ||||||||||||||||||||
| Registered investment companies | $ | 3,043,924,314 | $ | – | $ | – | $ | – | $ | 3,043,924,314 | ||||||||||
| TIAA-CREF Real Property Fund LP | – | – | – | 186,054,719 | 186,054,719 | |||||||||||||||
| Total | $ | 3,043,924,314 | $ | – | $ | – | $ | 186,054,719 | $ | 3,229,979,033 | ||||||||||
| Lifecycle 2025 | ||||||||||||||||||||
| Registered investment companies | $ | 4,423,971,496 | $ | – | $ | – | $ | – | $ | 4,423,971,496 | ||||||||||
| TIAA-CREF Real Property Fund LP | – | – | – | 269,547,721 | 269,547,721 | |||||||||||||||
| Total | $ | 4,423,971,496 | $ | – | $ | – | $ | 269,547,721 | $ | 4,693,519,217 | ||||||||||
| TIAA-CREF Lifecycle Funds ■ 2022 Annual Report | 109 |
Notes to financial statements
| Fund | Level 1 | Level 2 | Level 3 | Fair value using practical expedienta | Total | |||||||||||||||
| Lifecycle 2030 | ||||||||||||||||||||
| Registered investment companies | $ | 4,846,361,888 | $ | – | $ | – | $ | – | $ | 4,846,361,888 | ||||||||||
| TIAA-CREF Real Property Fund LP | – | – | – | 294,282,643 | 294,282,643 | |||||||||||||||
| Total | $ | 4,846,361,888 | $ | – | $ | – | $ | 294,282,643 | $ | 5,140,644,531 | ||||||||||
| Lifecycle 2035 | ||||||||||||||||||||
| Registered investment companies | $ | 4,995,622,752 | $ | – | $ | – | $ | – | $ | 4,995,622,752 | ||||||||||
| TIAA-CREF Real Property Fund LP | – | – | – | 302,335,381 | 302,335,381 | |||||||||||||||
| Total | $ | 4,995,622,752 | $ | – | $ | – | $ | 302,335,381 | $ | 5,297,958,133 | ||||||||||
| Lifecycle 2040 | ||||||||||||||||||||
| Registered investment companies | $ | 5,887,607,068 | $ | – | $ | – | $ | – | $ | 5,887,607,068 | ||||||||||
| TIAA-CREF Real Property Fund LP | – | – | – | 355,204,775 | 355,204,775 | |||||||||||||||
| Total | $ | 5,887,607,068 | $ | – | $ | – | $ | 355,204,775 | $ | 6,242,811,843 | ||||||||||
| Lifecycle 2045 | ||||||||||||||||||||
| Registered investment companies | $ | 3,945,594,804 | $ | – | $ | – | $ | – | $ | 3,945,594,804 | ||||||||||
| TIAA-CREF Real Property Fund LP | – | – | – | 237,218,197 | 237,218,197 | |||||||||||||||
| Total | $ | 3,945,594,804 | $ | – | $ | – | $ | 237,218,197 | $ | 4,182,813,001 | ||||||||||
| Lifecycle 2050 | ||||||||||||||||||||
| Registered investment companies | $ | 2,947,343,838 | $ | – | $ | – | $ | – | $ | 2,947,343,838 | ||||||||||
| TIAA-CREF Real Property Fund LP | – | – | – | 176,913,185 | 176,913,185 | |||||||||||||||
| Total | $ | 2,947,343,838 | $ | – | $ | – | $ | 176,913,185 | $ | 3,124,257,023 | ||||||||||
| Lifecycle 2055 | ||||||||||||||||||||
| Registered investment companies | $ | 1,317,839,459 | $ | – | $ | – | $ | – | $ | 1,317,839,459 | ||||||||||
| TIAA-CREF Real Property Fund LP | – | – | – | 79,015,123 | 79,015,123 | |||||||||||||||
| Total | $ | 1,317,839,459 | $ | – | $ | – | $ | 79,015,123 | $ | 1,396,854,582 | ||||||||||
| Lifecycle 2060 | ||||||||||||||||||||
| Registered investment companies | $ | 417,953,430 | $ | – | $ | – | $ | – | $ | 417,953,430 | ||||||||||
| TIAA-CREF Real Property Fund LP | – | – | – | 24,990,614 | 24,990,614 | |||||||||||||||
| Total | $ | 417,953,430 | $ | – | $ | – | $ | 24,990,614 | $ | 442,944,044 | ||||||||||
| Lifecycle 2065 | ||||||||||||||||||||
| Registered investment companies | $ | 22,357,912 | $ | – | $ | – | $ | – | $ | 22,357,912 | ||||||||||
| TIAA-CREF Real Property Fund LP | – | – | – | 1,334,216 | 1,334,216 | |||||||||||||||
| Total | $ | 22,357,912 | $ | – | $ | – | $ | 1,334,216 | $ | 23,692,128 | ||||||||||
| a | In accordance with ASC 820, certain investments that are measured at fair value using the net asset value per share practical expedient have not been classified in the fair value hierarchy. The fair value amounts presented in this table are intended to permit reconciliation of the fair value hierarchy to the amounts presented in the Statements of assets and liabilities. |
| 110 | 2022 Annual Report ■ TIAA-CREF Lifecycle Funds |
continued
Note 4—investments
Restricted securities: Restricted securities held by the Funds, if any, may not be sold except in exempt transactions or in a public offering registered under the Securities Act of 1933, as amended. The risk of investing in such securities is generally greater than the risk of investing in securities that are widely held and publicly traded.
Real Property Fund (“RPF”): The Funds invest in the RPF, which is an affiliated real estate limited partnership. The RPF is an unregistered open-end fund that intends to invest in direct real estate holdings and may invest a portion of its assets in REIT securities, mortgage related securitization and money market instruments in accordance with exemptive relief received from the SEC. The Funds are not liable for the debts of the RPF beyond the amounts the Funds have contributed. The Funds can redeem from RPF daily subject to certain approvals. Investments in the RPF are illiquid and the Funds may be unable to dispose of such investments at opportune times. As such, this investment has been designated as restricted and the value is reflected in the schedule of investments.
Purchases and sales: Purchases and sales of securities (other than short-term instruments) for all of the Funds for the year ended May 31, 2022 were as follows (dollar amounts are in thousands):
| Fund | Non-U.S. government purchases | Non-U.S. government sales | ||||||
| Lifecycle Retirement Income | $ | 167,507 | $ | 176,731 | ||||
| Lifecycle 2010 | 246,691 | 354,562 | ||||||
| Lifecycle 2015 | 342,745 | 513,253 | ||||||
| Lifecycle 2020 | 812,438 | 1,089,367 | ||||||
| Lifecycle 2025 | 1,306,286 | 1,385,530 | ||||||
| Lifecycle 2030 | 1,572,024 | 1,468,850 | ||||||
| Lifecycle 2035 | 1,736,895 | 1,581,356 | ||||||
| Lifecycle 2040 | 2,182,011 | 1,992,801 | ||||||
| Lifecycle 2045 | 1,617,205 | 1,321,301 | ||||||
| Lifecycle 2050 | 1,248,509 | 933,544 | ||||||
| Lifecycle 2055 | 609,478 | 382,177 | ||||||
| Lifecycle 2060 | 241,483 | 115,422 | ||||||
| Lifecycle 2065 | 32,887 | 13,422 | ||||||
Note 5—income tax information
Each Fund is a separate taxpayer for federal income tax purposes. Each Fund intends to distribute substantially all of its net investment income and net capital gains to shareholders and otherwise comply with the requirements of Subchapter M of the Internal Revenue Code applicable to regulated investment companies. Therefore, no federal income tax provision is required.
| TIAA-CREF Lifecycle Funds ■ 2022 Annual Report | 111 |
Notes to financial statements
Each Fund files income tax returns in U.S. federal and applicable state and local jurisdictions. A Fund’s federal income tax returns are generally subject to examination for a period of three fiscal years after being filed. State and local tax returns may be subject to examination for an additional period of time depending on the jurisdiction. Management has analyzed each Fund’s tax positions taken for all open tax years and has concluded that no provision for income tax is required in the Fund’s financial statements.
Differences between amounts for financial statement and federal income tax purposes are primarily due to timing differences in recognizing gains and losses on investment transactions. Temporary differences do not require reclassification. As of year end, permanent differences that resulted in reclassifications among the components of net assets relate primarily to distribution reallocations, investments in partnerships, investments in underlying funds, and tax equalization. Temporary and permanent differences have no impact on a Fund’s net assets.
As of year end, the aggregate cost and the net unrealized appreciation/(depreciation) of all investments for federal income tax purposes was as follows (dollar amounts are in thousands):
| Fund | Tax cost | Gross unrealized appreciation | Gross unrealized (depreciation | ) | Net unrealized appreciation (depreciation | ) | ||||||||||
| Lifecycle Retirement Income | $ | 525,903 | $ | 40,544 | $ | (36,576 | ) | $ | 3,968 | |||||||
| Lifecycle 2010 | 1,011,571 | 98,632 | (68,648 | ) | 29,984 | |||||||||||
| Lifecycle 2015 | 1,488,758 | 95,286 | (114,235 | ) | (18,949 | ) | ||||||||||
| Lifecycle 2020 | 3,249,116 | 226,207 | (245,344 | ) | (19,137 | ) | ||||||||||
| Lifecycle 2025 | 4,709,277 | 339,384 | (355,141 | ) | (15,757 | ) | ||||||||||
| Lifecycle 2030 | 5,128,459 | 390,769 | (378,584 | ) | 12,185 | |||||||||||
| Lifecycle 2035 | 5,238,217 | 446,847 | (387,105 | ) | 59,742 | |||||||||||
| Lifecycle 2040 | 6,096,674 | 585,907 | (439,770 | ) | 146,137 | |||||||||||
| Lifecycle 2045 | 4,008,211 | 447,118 | (272,516 | ) | 174,602 | |||||||||||
| Lifecycle 2050 | 3,021,844 | 299,229 | (196,816 | ) | 102,413 | |||||||||||
| Lifecycle 2055 | 1,391,729 | 98,904 | (93,779 | ) | 5,125 | |||||||||||
| Lifecycle 2060 | 460,643 | 21,177 | (38,876 | ) | (17,699 | ) | ||||||||||
| Lifecycle 2065 | 25,381 | 311 | (1,999 | ) | (1,688 | ) | ||||||||||
For purposes of this disclosure, tax cost generally includes the cost of portfolio investments as well as up-front fees or premiums exchanged on derivatives and any amounts unrealized for income statement reporting but realized income and/or capital gains for tax reporting, if applicable.
| 112 | 2022 Annual Report ■ TIAA-CREF Lifecycle Funds |
continued
As of year end, the components of accumulated earnings on a tax basis were as follows:
| Fund | Undistributed ordinary income | Undistributed long-term capital gains | Unrealized appreciation (depreciation | ) | Capital loss carry forwards | Late-year loss deferrals | Other book-to-tax differences | Total | ||||||||||||||||||||
| Lifecycle Retirement Income | $ | – | $ | 14,164,372 | $ | 3,967,252 | $ | – | $ | – | $ | (34,121 | ) | $ | 18,097,503 | |||||||||||||
| Lifecycle 2010 | 7,146,136 | 29,147,249 | 29,984,089 | – | – | (112,281 | ) | 66,165,193 | ||||||||||||||||||||
| Lifecycle 2015 | 6,365,436 | 45,091,411 | (18,950,060 | ) | – | – | (164,364 | ) | 32,342,423 | |||||||||||||||||||
| Lifecycle 2020 | 12,294,448 | 107,965,174 | (19,137,212 | ) | – | – | (263,470 | ) | 100,858,940 | |||||||||||||||||||
| Lifecycle 2025 | 16,010,019 | 181,293,762 | (15,757,287 | ) | – | – | (286,173 | ) | 181,260,321 | |||||||||||||||||||
| Lifecycle 2030 | 13,718,284 | 223,672,284 | 12,185,890 | – | – | (281,973 | ) | 249,294,485 | ||||||||||||||||||||
| Lifecycle 2035 | 8,898,660 | 260,383,909 | 59,741,628 | – | – | (284,498 | ) | 328,739,699 | ||||||||||||||||||||
| Lifecycle 2040 | 455,839 | 343,941,755 | 146,138,275 | – | – | (361,806 | ) | 490,174,063 | ||||||||||||||||||||
| Lifecycle 2045 | – | 245,652,309 | 174,602,378 | – | – | (150,017 | ) | 420,104,670 | ||||||||||||||||||||
| Lifecycle 2050 | – | 184,197,498 | 102,413,168 | – | – | (96,766 | ) | 286,513,900 | ||||||||||||||||||||
| Lifecycle 2055 | 1,145,841 | 78,779,045 | 5,125,392 | – | – | (28,713 | ) | 85,021,565 | ||||||||||||||||||||
| Lifecycle 2060 | 591,529 | 22,416,153 | (17,698,547 | ) | – | – | (5,421 | ) | 5,303,714 | |||||||||||||||||||
| Lifecycle 2065 | – | 411,062 | (1,688,427 | ) | – | – | (48 | ) | (1,277,413 | ) | ||||||||||||||||||
The tax character of distributions paid were as follows:
| 5/31/2022 | 5/31/2021 | |||||||||||||||
| Fund | Ordinary income | Long-term capital gains | Ordinary income | Long-term capital gains | ||||||||||||
| Lifecycle Retirement Income | $ | 23,161,764 | $ | 22,270,472 | $ | 14,302,738 | $ | 17,467,353 | ||||||||
| Lifecycle 2010 | 47,060,380 | 64,609,189 | 34,604,447 | 59,479,547 | ||||||||||||
| Lifecycle 2015 | 67,018,907 | 80,277,672 | 48,522,263 | 52,307,744 | ||||||||||||
| Lifecycle 2020 | 151,455,657 | 188,186,268 | 108,863,757 | 125,021,838 | ||||||||||||
| Lifecycle 2025 | 216,449,270 | 271,151,254 | 134,425,131 | 169,535,428 | ||||||||||||
| Lifecycle 2030 | 237,785,666 | 315,462,673 | 143,026,796 | 191,592,719 | ||||||||||||
| Lifecycle 2035 | 256,415,712 | 356,288,276 | 142,574,750 | 224,746,157 | ||||||||||||
| Lifecycle 2040 | 322,023,104 | 462,395,165 | 169,558,271 | 305,117,437 | ||||||||||||
| Lifecycle 2045 | 218,120,431 | 317,925,165 | 108,458,841 | 182,259,203 | ||||||||||||
| Lifecycle 2050 | 161,435,133 | 213,330,339 | 80,540,450 | 112,609,034 | ||||||||||||
| Lifecycle 2055 | 68,542,535 | 74,772,925 | 34,830,539 | 30,654,989 | ||||||||||||
| Lifecycle 2060 | 19,701,972 | 15,182,064 | 8,321,478 | 5,059,592 | ||||||||||||
| Lifecycle 2065 | 302,017 | 381,910 | 144,492 | – | ||||||||||||
| TIAA-CREF Lifecycle Funds ■ 2022 Annual Report | 113 |
Notes to financial statements
Note 6—investment adviser and other transactions with affiliates
Under the terms of its Investment Management Agreement, Advisors is entitled to a fee that is made up of two components, which are added together to create the total investment management fee. The first component, the asset allocation fee rate, is an annual rate of 0.10% of the average daily net assets of each Fund. The second component, the Underlying Funds fee rate, is calculated as follows: for each Underlying Fund of the Trust in which a Fund is invested, the effective Underlying Fund’s annual investment management agreement, net of any fee waivers or reimbursements applicable to the Underlying Fund (excluding the Class W shares investment management fee waiver and/or reimbursement) in proportion to the percentage of the Fund’s net assets invested in the Underlying Fund, applied to the average daily net assets of the Fund. Advisors has contractually agreed to waive in full the asset allocation fee rate component of the management fee on each Fund. This waiver will remain in effect through September 30, 2024, unless changed with approval of the Board. In addition, Advisors has contractually agreed to waive certain amounts of the Underlying Funds fee rate portion of each Fund’s management fee through September 30, 2022. As of May 31, 2022, Advisors received from the Funds the following effective annual rate as a percentage of average daily net assets of each Fund:
| Investment management fee waiver | ||||||||||||
| Fund | Investment management fee—effective rate | Effective 10/1/21 | Prior to 10/1/21 | |||||||||
| Lifecycle Retirement Income | 0.27 | % | 0.128 | % | 0.120 | % | ||||||
| Lifecycle 2010 | 0.28 | 0.129 | 0.120 | |||||||||
| Lifecycle 2015 | 0.28 | 0.129 | 0.122 | |||||||||
| Lifecycle 2020 | 0.28 | 0.131 | 0.124 | |||||||||
| Lifecycle 2025 | 0.28 | 0.134 | 0.125 | |||||||||
| Lifecycle 2030 | 0.28 | 0.146 | 0.126 | |||||||||
| Lifecycle 2035 | 0.29 | 0.158 | 0.136 | |||||||||
| Lifecycle 2040 | 0.29 | 0.167 | 0.145 | |||||||||
| Lifecycle 2045 | 0.29 | 0.177 | 0.143 | |||||||||
| Lifecycle 2050 | 0.29 | 0.186 | 0.153 | |||||||||
| Lifecycle 2055 | 0.29 | 0.186 | 0.152 | |||||||||
| Lifecycle 2060 | 0.29 | 0.196 | 0.152 | |||||||||
| Lifecycle 2065 | 0.28 | 0.196 | 0.152 | |||||||||
The Funds have entered into an Administrative Service Agreement with Advisors under which the Funds pay Advisors for its costs in providing certain administrative and compliance services to the Funds.
Under the terms of a Retirement Class Service Agreement with respect to each Fund, the Retirement Class of the Fund pays Advisors a monthly fee based on the annual rate of 0.25% of a Fund’s average daily net assets attributable to Retirement Class shares of a Fund for providing certain administrative services related to the
| 114 | 2022 Annual Report ■ TIAA-CREF Lifecycle Funds |
continued
maintenance of Retirement Class shares on retirement plan or other platforms. Substantially all of the Retirement Class shareholder servicing fees reported on the Statements of operations are paid to Advisors under the Service Agreement.
Under the terms of the distribution Rule 12b-1 plan, the Retirement Class of each Fund and the Retail Class of the Retirement Income Fund compensated Nuveen Securities for providing distribution, promotional and/or shareholder services to the Retirement Class of each Fund and the Retail Class of the Retirement Income Fund at the maximum annual rates of 0.05% and 0.25% of the average daily net assets attributable to each Fund’s Retirement Class and the Retirement Income Fund’s Retail Class, respectively. However, Nuveen Securities has agreed not to seek any reimbursements under the distribution Rule 12b-1 plan from the Retirement Class and the plan is suspended through September 30, 2022. This agreement may be terminated before this date with the approval of the Board. The Premier Class of each Fund is subject to a distribution Rule 12b-1 plan that compensated Nuveen Securities for providing distribution, promotional and/or shareholder services to the Premier Class of the Fund at the annual rate of 0.15% of average daily net assets attributable to the Fund’s Premier Class.
Advisors has agreed to reimburse each Fund if its total expense ratio (excluding interest, taxes, brokerage commissions and other transactional expenses, Acquired fund fees and expenses, extraordinary expenses and the management fees and certain other expenses originally attributable to Class W shares of the affiliated TIAA-CREF Funds) exceeds 0.00% of average daily net assets for the Institutional Class shares; 0.15% of average daily net assets for the Advisor Class shares; 0.15% of average daily net assets for the Premier Class shares; 0.25% of average daily net assets for the Retirement Class shares; and 0.25% of average daily net assets for the Retail Class shares of the Retirement Income Fund. The expense reimbursement arrangements will continue through at least September 30, 2022, unless changed with approval of the Board.
With respect to the Lifecycle 2010 Fund, Advisors has voluntarily agreed to reimburse the Fund for 0.035% of the Total Expenses of the Institutional Class that are originally attributable to Class W shares of the Underlying Funds. This voluntary commitment is effective May 1, 2022 to April 30, 2023. Prior to May 1, 2022, the expense cap for the Retirement Class of the Lifecycle Retirement Income Fund was 0.235%.
The Funds may purchase or sell investment securities in transactions with affiliated entities under procedures adopted by the Board, pursuant to the 1940 Act. These transactions are effected at market rates without incurring broker commissions. For the year ended, May 31, 2022, these transactions did not materially impact the funds.
| TIAA-CREF Lifecycle Funds ■ 2022 Annual Report | 115 |
Notes to financial statements
The following is the percentage of the Funds’ shares owned by TIAA and its registered separate account (“TIAA Access”) as of May 31, 2022:
| Fund | TIAA | TIAA Access | Total | |||||||||
| Lifecycle Retirement Income | — | % | 10 | % | 10 | % | ||||||
| Lifecycle 2010 | — | 11 | 11 | |||||||||
| Lifecycle 2015 | — | 12 | 12 | |||||||||
| Lifecycle 2020 | — | 14 | 14 | |||||||||
| Lifecycle 2025 | — | 14 | 14 | |||||||||
| Lifecycle 2030 | — | 14 | 14 | |||||||||
| Lifecycle 2035 | — | 14 | 14 | |||||||||
| Lifecycle 2040 | — | 14 | 14 | |||||||||
| Lifecycle 2045 | — | 15 | 15 | |||||||||
| Lifecycle 2050 | — | 18 | 18 | |||||||||
| Lifecycle 2055 | — | 14 | 14 | |||||||||
| Lifecycle 2060 | — | 15 | 15 | |||||||||
| Lifecycle 2065 | 23 | 3 | 26 | |||||||||
Investments in other investment companies advised by Advisors and Nuveen Fund Advisors, LLC are deemed to be affiliated investments. The Fund invests its assets in the affiliated RPF, Nuveen Growth Opportunities ETF, Class W shares of the affiliated TIAA-CREF Funds and Class R6 shares of the affiliated Nuveen Funds. Information regarding transactions with affiliated companies is as follows (dollar amounts are in thousands^):
| 116 | 2022 Annual Report ■ TIAA-CREF Lifecycle Funds |
continued
| Change in | ||||||||||||||||||||||||||||
| unrealized | ||||||||||||||||||||||||||||
| Value at | Purchases | Sales | Realized | appreciation | Dividend | Value at | ||||||||||||||||||||||
| Issue | 5/31/21 | cost | proceeds | gain (loss | ) | (depreciation | ) | income | 5/31/22 | |||||||||||||||||||
| Lifecycle Retirement Income Fund | ||||||||||||||||||||||||||||
| Nuveen Funds: | ||||||||||||||||||||||||||||
| Dividend Growth | $ | 21,633 | $ | 5,139 | $ | 10,269 | $ | 1,196 | $ | (529 | ) | $ | 298 | $ | 16,654 | |||||||||||||
| Dividend Value | 24,445 | 6,447 | 9,958 | 1,892 | (2,138 | ) | 361 | 19,062 | ||||||||||||||||||||
| Growth Opportunities ETF | — | 25,882 | 2,532 | (352 | ) | (5,299 | ) | 1 | 17,699 | |||||||||||||||||||
| International Growth | 14,423 | 6,628 | 2,762 | 77 | (4,320 | ) | 114 | 13,647 | ||||||||||||||||||||
| TIAA CREF Funds: | ||||||||||||||||||||||||||||
| Core Bond | 125,912 | 21,100 | 22,094 | (717 | ) | (13,099 | ) | 2,985 | 110,568 | |||||||||||||||||||
| Core Plus Bond | 78,920 | 12,261 | 12,207 | 375 | (9,149 | ) | 2,241 | 69,072 | ||||||||||||||||||||
| Emerging Markets Debt | 13,019 | 2,595 | 2,558 | (87 | ) | (2,105 | ) | 677 | 10,864 | |||||||||||||||||||
| Emerging Markets Equity | 8,768 | 6,765 | 2,708 | 794 | (4,084 | ) | 471 | 7,911 | ||||||||||||||||||||
| Growth & Income | 21,831 | 7,058 | 7,759 | 4,307 | (5,262 | ) | 262 | 16,759 | ||||||||||||||||||||
| High-Yield | 12,115 | 2,093 | 2,391 | (65 | ) | (998 | ) | 619 | 10,754 | |||||||||||||||||||
| Inflation-Linked Bond | 60,887 | 10,085 | 14,138 | 408 | (3,687 | ) | 3,797 | 52,880 | ||||||||||||||||||||
| International Bond | 12,684 | 2,567 | 2,738 | (41 | ) | (1,298 | ) | 307 | 11,068 | |||||||||||||||||||
| International Equity | 20,089 | 8,687 | 5,479 | (356 | ) | (3,486 | ) | 776 | 19,455 | |||||||||||||||||||
| International Opportunities | 14,415 | 7,765 | 3,840 | 1,021 | (4,488 | ) | 252 | 13,735 | ||||||||||||||||||||
| Large-Cap Growth | 23,666 | 8,067 | 7,657 | 2,048 | (6,127 | ) | 131 | 17,650 | ||||||||||||||||||||
| Large-Cap Growth Index | 23,586 | 1,862 | 29,161 | 6,357 | (2,644 | ) | — | — | ||||||||||||||||||||
| Large-Cap Value | 24,430 | 6,507 | 10,105 | 2,705 | (2,874 | ) | 395 | 19,083 | ||||||||||||||||||||
| Quant International Small-Cap Equity | 9,443 | 4,038 | 2,466 | 55 | (1,566 | ) | 423 | 9,150 | ||||||||||||||||||||
| Quant Small-Cap Equity | 6,881 | 2,436 | 3,015 | 1,364 | (1,973 | ) | 61 | 4,636 | ||||||||||||||||||||
| Quant Small/Mid-Cap Equity | 7,881 | 2,782 | 3,579 | 1,507 | (1,889 | ) | 110 | 5,518 | ||||||||||||||||||||
| Short-Term Bond | 60,650 | 9,945 | 14,862 | (238 | ) | (2,340 | ) | 1,199 | 53,080 | |||||||||||||||||||
| TIAA-CREF Real Property Fund LPa | 22,742 | 6,798 | 4,452 | 197 | 5,340 | 493 | 30,625 | |||||||||||||||||||||
| $ | 608,420 | $ | 167,507 | $ | 176,730 | $ | 22,447 | $ | (74,015 | ) | $ | 15,973 | $ | 529,870 | ||||||||||||||
| TIAA-CREF Lifecycle Funds ■ 2022 Annual Report | 117 |
Notes to financial statements
| Change in | ||||||||||||||||||||||||||||
| unrealized | ||||||||||||||||||||||||||||
| Value at | Purchases | Sales | Realized | appreciation | Dividend | Value at | ||||||||||||||||||||||
| Issue | 5/31/21 | cost | proceeds | gain (loss | ) | (depreciation | ) | income | 5/31/22 | |||||||||||||||||||
| Lifecycle 2010 Fund | ||||||||||||||||||||||||||||
| Nuveen Funds: | ||||||||||||||||||||||||||||
| Dividend Growth | $ | 44,845 | $ | 8,505 | $ | 21,800 | $ | 2,822 | $ | (1,444 | ) | $ | 573 | $ | 31,965 | |||||||||||||
| Dividend Value | 50,727 | 8,559 | 19,180 | 4,287 | (4,820 | ) | 693 | 36,565 | ||||||||||||||||||||
| Growth Opportunities ETF | — | 48,041 | 3,396 | (363 | ) | (10,285 | ) | 2 | 33,997 | |||||||||||||||||||
| International Growth | 29,879 | 11,360 | 6,353 | 365 | (8,271 | ) | 211 | 26,243 | ||||||||||||||||||||
| TIAA-CREF Funds: | ||||||||||||||||||||||||||||
| Core Bond | 265,132 | 23,491 | 44,063 | (687 | ) | (25,605 | ) | 5,834 | 217,259 | |||||||||||||||||||
| Core Plus Bond | 166,250 | 14,360 | 25,786 | 1,299 | (18,012 | ) | 4,371 | 135,990 | ||||||||||||||||||||
| Emerging Markets Debt | 27,418 | 3,637 | 5,618 | 20 | (4,216 | ) | 1,319 | 21,241 | ||||||||||||||||||||
| Emerging Markets Equity | 18,212 | 11,959 | 5,675 | 1,901 | (8,218 | ) | 865 | 15,195 | ||||||||||||||||||||
| Growth & Income | 45,255 | 10,275 | 15,400 | 11,899 | (13,541 | ) | 498 | 32,151 | ||||||||||||||||||||
| High-Yield | 25,492 | 1,460 | 3,942 | 65 | (2,123 | ) | 1,208 | 20,952 | ||||||||||||||||||||
| Inflation-Linked Bond | 128,240 | 13,254 | 30,061 | 1,628 | (7,870 | ) | 7,372 | 103,914 | ||||||||||||||||||||
| International Bond | 26,717 | 3,027 | 5,263 | 42 | (2,577 | ) | 582 | 21,746 | ||||||||||||||||||||
| International Equity | 41,600 | 13,825 | 10,993 | (218 | ) | (6,897 | ) | 1,435 | 37,317 | |||||||||||||||||||
| International Opportunities | 29,784 | 13,031 | 8,008 | 2,580 | (8,957 | ) | 460 | 26,348 | ||||||||||||||||||||
| Large-Cap Growth | 48,995 | 11,693 | 15,119 | 4,874 | (12,239 | ) | 241 | 33,868 | ||||||||||||||||||||
| Large-Cap Growth Index | 48,854 | 588 | 56,857 | 13,137 | (5,722 | ) | — | — | ||||||||||||||||||||
| Large-Cap Value | 50,652 | 8,836 | 19,658 | 8,260 | (8,554 | ) | 731 | 36,611 | ||||||||||||||||||||
| Quant International Small-Cap Equity | 19,571 | 6,685 | 5,236 | 325 | (3,121 | ) | 783 | 17,567 | ||||||||||||||||||||
| Quant Small-Cap Equity | 14,269 | 3,696 | 5,953 | 3,444 | (4,606 | ) | 112 | 8,894 | ||||||||||||||||||||
| Quant Small/Mid-Cap Equity | 16,357 | 4,404 | 7,277 | 3,654 | (4,362 | ) | 204 | 10,586 | ||||||||||||||||||||
| Short-Term Bond | 138,878 | 18,451 | 27,438 | (342 | ) | (5,364 | ) | 2,667 | 124,023 | |||||||||||||||||||
| TIAA-CREF Real Property Fund LPa | 43,915 | 7,555 | 11,487 | 500 | 8,640 | 849 | 49,123 | |||||||||||||||||||||
| $ | 1,281,042 | $ | 246,692 | $ | 354,563 | $ | 59,492 | $ | (158,164 | ) | $ | 31,010 | $ | 1,041,555 | ||||||||||||||
| 118 | 2022 Annual Report ■ TIAA-CREF Lifecycle Funds |
continued
| Change in | ||||||||||||||||||||||||||||
| unrealized | ||||||||||||||||||||||||||||
| Value at | Purchases | Sales | Realized | appreciation | Dividend | Value at | ||||||||||||||||||||||
| Issue | 5/31/21 | cost | proceeds | gain (loss | ) | (depreciation | ) | income | 5/31/22 | |||||||||||||||||||
| Lifecycle 2015 Fund | ||||||||||||||||||||||||||||
| Nuveen Funds: | ||||||||||||||||||||||||||||
| Dividend Growth | $ | 72,636 | $ | 8,078 | $ | 31,137 | $ | 4,831 | $ | (2,541 | ) | $ | 922 | $ | 50,325 | |||||||||||||
| Dividend Value | 82,016 | 11,139 | 29,820 | 6,910 | (7,726 | ) | 1,115 | 57,697 | ||||||||||||||||||||
| Growth Opportunities ETF | — | 76,049 | 5,270 | (662 | ) | (16,408 | ) | 3 | 53,709 | |||||||||||||||||||
| International Growth | 48,209 | 16,409 | 9,447 | 705 | (13,348 | ) | 339 | 41,345 | ||||||||||||||||||||
| TIAA-CREF Funds: | ||||||||||||||||||||||||||||
| Core Bond | 371,267 | 32,197 | 62,912 | (1,023 | ) | (35,686 | ) | 8,178 | 302,428 | |||||||||||||||||||
| Core Plus Bond | 232,885 | 17,620 | 35,468 | 1,824 | (25,148 | ) | 6,130 | 188,730 | ||||||||||||||||||||
| Emerging Markets Debt | 38,552 | 5,239 | 8,482 | (99 | ) | (5,768 | ) | 1,855 | 29,442 | |||||||||||||||||||
| Emerging Markets Equity | 29,494 | 18,166 | 8,808 | 2,702 | (12,836 | ) | 1,383 | 23,947 | ||||||||||||||||||||
| Growth & Income | 73,262 | 14,890 | 24,783 | 16,307 | (18,777 | ) | 802 | 50,716 | ||||||||||||||||||||
| High-Yield | 35,732 | 1,784 | 5,553 | (377 | ) | (2,491 | ) | 1,695 | 29,095 | |||||||||||||||||||
| Inflation-Linked Bond | 153,204 | 18,181 | 33,792 | 1,548 | (9,201 | ) | 8,974 | 128,378 | ||||||||||||||||||||
| International Bond | 37,427 | 3,971 | 7,451 | 40 | (3,579 | ) | 815 | 30,128 | ||||||||||||||||||||
| International Equity | 67,154 | 20,808 | 17,731 | (530 | ) | (10,799 | ) | 2,309 | 58,902 | |||||||||||||||||||
| International Opportunities | 48,032 | 19,627 | 12,544 | 4,127 | (14,325 | ) | 739 | 41,576 | ||||||||||||||||||||
| Large-Cap Growth | 79,258 | 15,477 | 22,755 | 8,166 | (19,798 | ) | 387 | 53,389 | ||||||||||||||||||||
| Large-Cap Growth Index | 79,104 | 341 | 91,506 | 21,403 | (9,342 | ) | — | — | ||||||||||||||||||||
| Large-Cap Value | 81,996 | 12,508 | 31,661 | 10,402 | (10,788 | ) | 1,175 | 57,752 | ||||||||||||||||||||
| Quant International Small-Cap Equity | 31,629 | 9,534 | 7,954 | 531 | (5,002 | ) | 1,258 | 27,682 | ||||||||||||||||||||
| Quant Small-Cap Equity | 23,091 | 5,252 | 9,332 | 4,978 | (6,811 | ) | 180 | 14,034 | ||||||||||||||||||||
| Quant Small/Mid-Cap Equity | 26,513 | 6,047 | 11,219 | 5,798 | (6,914 | ) | 329 | 16,696 | ||||||||||||||||||||
| Short-Term Bond | 152,450 | 15,482 | 32,792 | (361 | ) | (5,706 | ) | 2,861 | 128,900 | |||||||||||||||||||
| TIAA-CREF Real Property Fund LPa | 68,560 | 13,946 | 12,835 | 313 | 14,953 | 1,394 | 84,937 | |||||||||||||||||||||
| $ | 1,832,471 | $ | 342,745 | $ | 513,252 | $ | 87,533 | $ | (228,041 | ) | $ | 42,843 | $ | 1,469,808 | ||||||||||||||
| TIAA-CREF Lifecycle Funds ■ 2022 Annual Report | 119 |
Notes to financial statements
| Change in | ||||||||||||||||||||||||||||
| unrealized | ||||||||||||||||||||||||||||
| Value at | Purchases | Sales | Realized | appreciation | Dividend | Value at | ||||||||||||||||||||||
| Issue | 5/31/21 | cost | proceeds | gain (loss | ) | (depreciation | ) | income | 5/31/22 | |||||||||||||||||||
| Lifecycle 2020 Fund | ||||||||||||||||||||||||||||
| Nuveen Funds: | ||||||||||||||||||||||||||||
| Dividend Growth | $ | 176,233 | $ | 19,674 | $ | 71,875 | $ | 11,332 | $ | (5,747 | ) | $ | 2,280 | $ | 125,763 | |||||||||||||
| Dividend Value | 198,734 | 28,254 | 69,058 | 15,784 | (17,826 | ) | 2,748 | 143,856 | ||||||||||||||||||||
| Growth Opportunities ETF | — | 190,813 | 14,741 | (1,820 | ) | (40,608 | ) | 8 | 133,644 | |||||||||||||||||||
| International Growth | 116,976 | 39,806 | 18,951 | 1,780 | (33,365 | ) | 842 | 103,295 | ||||||||||||||||||||
| TIAA-CREF Funds: | ||||||||||||||||||||||||||||
| Core Bond | 780,211 | 74,136 | 125,053 | (2,476 | ) | (76,664 | ) | 17,491 | 647,104 | |||||||||||||||||||
| Core Plus Bond | 489,542 | 40,712 | 69,606 | 3,562 | (53,833 | ) | 13,114 | 403,940 | ||||||||||||||||||||
| Emerging Markets Debt | 81,487 | 11,417 | 16,888 | (159 | ) | (12,500 | ) | 3,970 | 63,357 | |||||||||||||||||||
| Emerging Markets Equity | 71,568 | 46,106 | 20,954 | 6,572 | (31,723 | ) | 3,451 | 59,661 | ||||||||||||||||||||
| Growth & Income | 177,622 | 37,792 | 56,920 | 38,212 | (44,828 | ) | 1,986 | 126,488 | ||||||||||||||||||||
| High-Yield | 75,079 | 5,799 | 12,439 | (549 | ) | (5,639 | ) | 3,620 | 62,251 | |||||||||||||||||||
| Inflation-Linked Bond | 251,232 | 33,310 | 51,114 | 2,055 | (15,040 | ) | 15,081 | 217,794 | ||||||||||||||||||||
| International Bond | 78,585 | 9,818 | 15,644 | 16 | (7,650 | ) | 1,755 | 64,522 | ||||||||||||||||||||
| International Equity | 162,977 | 49,693 | 37,273 | (1,471 | ) | (27,082 | ) | 5,757 | 146,844 | |||||||||||||||||||
| International Opportunities | 116,694 | 48,019 | 27,102 | 8,893 | (34,531 | ) | 1,841 | 103,643 | ||||||||||||||||||||
| Large-Cap Growth | 191,889 | 37,328 | 49,226 | 18,739 | (48,148 | ) | 965 | 133,235 | ||||||||||||||||||||
| Large-Cap Growth Index | 191,699 | 998 | 222,111 | 52,057 | (22,643 | ) | — | — | ||||||||||||||||||||
| Large-Cap Value | 198,892 | 29,790 | 71,857 | 24,633 | (25,700 | ) | 2,929 | 144,031 | ||||||||||||||||||||
| Quant International Small-Cap Equity | 76,705 | 24,108 | 17,838 | 1,102 | (12,259 | ) | 3,138 | 69,185 | ||||||||||||||||||||
| Quant Small-Cap Equity | 55,983 | 13,013 | 21,579 | 11,494 | (16,082 | ) | 449 | 34,990 | ||||||||||||||||||||
| Quant Small/Mid-Cap Equity | 64,241 | 15,170 | 26,155 | 13,685 | (16,507 | ) | 819 | 41,648 | ||||||||||||||||||||
| Short-Term Bond | 250,139 | 29,443 | 50,339 | (730 | ) | (9,547 | ) | 4,813 | 218,673 | |||||||||||||||||||
| TIAA-CREF Real Property Fund LPa | 147,859 | 27,239 | 22,644 | 779 | 32,822 | 3,051 | 186,055 | |||||||||||||||||||||
| $ | 3,954,347 | $ | 812,438 | $ | 1,089,367 | $ | 203,490 | $ | (525,100 | ) | $ | 90,108 | $ | 3,229,979 | ||||||||||||||
| 120 | 2022 Annual Report ■ TIAA-CREF Lifecycle Funds |
continued
| Change in | ||||||||||||||||||||||||||||
| unrealized | ||||||||||||||||||||||||||||
| Value at | Purchases | Sales | Realized | appreciation | Dividend | Value at | ||||||||||||||||||||||
| Issue | 5/31/21 | cost | proceeds | gain (loss | ) | (depreciation | ) | income | 5/31/22 | |||||||||||||||||||
| Lifecycle 2025 Fund | ||||||||||||||||||||||||||||
| Nuveen Funds: | ||||||||||||||||||||||||||||
| Dividend Growth | $ | 287,516 | $ | 31,119 | $ | 105,406 | $ | 16,984 | $ | (8,111 | ) | $ | 3,801 | $ | 215,678 | |||||||||||||
| Dividend Value | 323,309 | 41,589 | 94,639 | 24,367 | (27,993 | ) | 4,598 | 246,500 | ||||||||||||||||||||
| Growth Opportunities ETF | — | 320,089 | 19,187 | (2,321 | ) | (69,580 | ) | 14 | 229,001 | |||||||||||||||||||
| International Growth | 189,630 | 67,950 | 22,285 | 3,200 | (56,523 | ) | 1,414 | 177,036 | ||||||||||||||||||||
| TIAA-CREF Funds: | ||||||||||||||||||||||||||||
| Core Bond | 959,634 | 128,409 | 128,824 | (4,461 | ) | (98,758 | ) | 22,364 | 852,085 | |||||||||||||||||||
| Core Plus Bond | 602,554 | 72,427 | 68,918 | 4,041 | (69,643 | ) | 16,767 | 532,182 | ||||||||||||||||||||
| Emerging Markets Debt | 101,716 | 18,340 | 19,729 | (436 | ) | (16,000 | ) | 5,062 | 83,891 | |||||||||||||||||||
| Emerging Markets Equity | 116,447 | 78,802 | 31,245 | 10,737 | (52,328 | ) | 5,776 | 102,485 | ||||||||||||||||||||
| Growth & Income | 288,270 | 57,191 | 74,291 | 61,015 | (72,957 | ) | 3,309 | 216,826 | ||||||||||||||||||||
| High-Yield | 92,306 | 9,942 | 12,253 | (490 | ) | (7,594 | ) | 4,623 | 81,911 | |||||||||||||||||||
| Inflation-Linked Bond | 237,503 | 40,347 | 39,061 | 1,699 | (14,719 | ) | 14,773 | 223,149 | ||||||||||||||||||||
| International Bond | 96,698 | 16,094 | 16,997 | (117 | ) | (9,849 | ) | 2,270 | 85,053 | |||||||||||||||||||
| International Equity | 265,281 | 82,934 | 48,450 | (2,319 | ) | (45,510 | ) | 9,621 | 251,936 | |||||||||||||||||||
| International Opportunities | 189,536 | 81,334 | 36,427 | 14,178 | (57,572 | ) | 3,107 | 176,996 | ||||||||||||||||||||
| Large-Cap Growth | 312,012 | 59,154 | 63,259 | 31,467 | (82,003 | ) | 1,611 | 228,406 | ||||||||||||||||||||
| Large-Cap Growth Index | 311,361 | 668 | 360,338 | 84,479 | (36,170 | ) | — | — | ||||||||||||||||||||
| Large-Cap Value | 322,456 | 44,834 | 98,786 | 36,600 | (38,688 | ) | 4,891 | 246,835 | ||||||||||||||||||||
| Quant International Small-Cap Equity | 124,786 | 38,982 | 21,579 | 1,988 | (20,838 | ) | 5,237 | 118,945 | ||||||||||||||||||||
| Quant Small-Cap Equity | 90,981 | 19,903 | 29,918 | 17,960 | (25,829 | ) | 751 | 59,978 | ||||||||||||||||||||
| Quant Small/Mid-Cap Equity | 104,348 | 22,655 | 35,932 | 21,208 | (26,122 | ) | 1,368 | 71,475 | ||||||||||||||||||||
| Short-Term Bond | 236,602 | 39,005 | 41,447 | (705 | ) | (9,562 | ) | 4,754 | 223,603 | |||||||||||||||||||
| TIAA-CREF Real Property Fund LPa | 203,618 | 34,518 | 16,558 | 332 | 47,638 | 4,306 | 269,548 | |||||||||||||||||||||
| $ | 5,456,564 | $ | 1,306,286 | $ | 1,385,529 | $ | 319,406 | $ | (798,711 | ) | $ | 120,417 | $ | 4,693,519 | ||||||||||||||
| TIAA-CREF Lifecycle Funds ■ 2022 Annual Report | 121 |
Notes to financial statements
| Change in | ||||||||||||||||||||||||||||
| unrealized | ||||||||||||||||||||||||||||
| Value at | Purchases | Sales | Realized | appreciation | Dividend | Value at | ||||||||||||||||||||||
| Issue | 5/31/21 | cost | proceeds | gain (loss | ) | (depreciation | ) | income | 5/31/22 | |||||||||||||||||||
| Lifecycle 2030 Fund | ||||||||||||||||||||||||||||
| Nuveen Funds: | ||||||||||||||||||||||||||||
| Dividend Growth | $ | 357,117 | $ | 32,790 | $ | 109,740 | $ | 18,700 | $ | (7,871 | ) | $ | 4,781 | $ | 282,877 | |||||||||||||
| Dividend Value | 402,425 | 49,345 | 102,494 | 30,085 | (34,719 | ) | 5,808 | 319,205 | ||||||||||||||||||||
| Growth Opportunities ETF | — | 408,603 | 20,189 | (2,408 | ) | (89,504 | ) | 18 | 296,502 | |||||||||||||||||||
| International Growth | 236,286 | 90,129 | 23,617 | 4,710 | (72,679 | ) | 1,784 | 228,620 | ||||||||||||||||||||
| TIAA-CREF Funds: | ||||||||||||||||||||||||||||
| Core Bond | 879,449 | 151,896 | 137,760 | (5,686 | ) | (90,653 | ) | 20,743 | 793,611 | |||||||||||||||||||
| Core Plus Bond | 553,750 | 81,231 | 69,856 | 3,384 | (64,556 | ) | 15,553 | 496,277 | ||||||||||||||||||||
| Emerging Markets Debt | 95,301 | 21,062 | 21,687 | (528 | ) | (14,847 | ) | 4,715 | 79,301 | |||||||||||||||||||
| Emerging Markets Equity | 144,353 | 98,922 | 31,975 | 15,609 | (68,680 | ) | 7,320 | 132,972 | ||||||||||||||||||||
| Growth & Income | 358,006 | 71,964 | 79,507 | 74,797 | (91,001 | ) | 4,175 | 280,673 | ||||||||||||||||||||
| High-Yield | 84,945 | 10,394 | 11,302 | (362 | ) | (7,170 | ) | 4,289 | 76,505 | |||||||||||||||||||
| Inflation-Linked Bond | 137,038 | 34,645 | 20,605 | 906 | (8,910 | ) | 8,871 | 141,484 | ||||||||||||||||||||
| International Bond | 88,966 | 18,409 | 17,819 | (267 | ) | (9,015 | ) | 2,101 | 79,557 | |||||||||||||||||||
| International Equity | 329,081 | 107,308 | 48,128 | (1,814 | ) | (58,961 | ) | 12,142 | 327,486 | |||||||||||||||||||
| International Opportunities | 235,319 | 102,064 | 35,726 | 19,029 | (74,259 | ) | 3,891 | 228,828 | ||||||||||||||||||||
| Large-Cap Growth | 387,447 | 74,267 | 63,578 | 39,093 | (105,081 | ) | 2,038 | 295,524 | ||||||||||||||||||||
| Large-Cap Growth Index | 387,398 | 703 | 448,294 | 104,564 | (44,371 | ) | — | — | ||||||||||||||||||||
| Large-Cap Value | 401,174 | 53,780 | 107,661 | 44,076 | (46,995 | ) | 6,178 | 319,634 | ||||||||||||||||||||
| Quant International Small-Cap Equity | 154,582 | 49,310 | 19,524 | 3,309 | (27,352 | ) | 6,618 | 154,772 | ||||||||||||||||||||
| Quant Small-Cap Equity | 113,124 | 24,582 | 33,349 | 21,889 | (31,950 | ) | 947 | 77,757 | ||||||||||||||||||||
| Quant Small/Mid-Cap Equity | 130,049 | 25,772 | 38,043 | 26,122 | (32,441 | ) | 1,728 | 92,914 | ||||||||||||||||||||
| Short-Term Bond | 136,452 | 32,281 | 20,387 | (350 | ) | (5,957 | ) | 2,885 | 141,863 | |||||||||||||||||||
| TIAA-CREF Real Property Fund LPa | 217,338 | 32,568 | 7,609 | 46 | 51,940 | 4,642 | 294,283 | |||||||||||||||||||||
| $ | 5,829,600 | $ | 1,572,025 | $ | 1,468,850 | $ | 394,904 | $ | (935,032 | ) | $ | 121,227 | $ | 5,140,645 | ||||||||||||||
| 122 | 2022 Annual Report ■ TIAA-CREF Lifecycle Funds |
continued
| Change in | ||||||||||||||||||||||||||||
| unrealized | ||||||||||||||||||||||||||||
| Value at | Purchases | Sales | Realized | appreciation | Dividend | Value at | ||||||||||||||||||||||
| Issue | 5/31/21 | cost | proceeds | gain (loss | ) | (depreciation | ) | income | 5/31/22 | |||||||||||||||||||
| Lifecycle 2035 Fund | ||||||||||||||||||||||||||||
| Nuveen Funds: | ||||||||||||||||||||||||||||
| Dividend Growth | $ | 418,613 | $ | 37,602 | $ | 122,936 | $ | 20,921 | $ | (8,413 | ) | $ | 5,644 | $ | 336,191 | |||||||||||||
| Dividend Value | 473,288 | 55,743 | 113,741 | 34,971 | (40,771 | ) | 6,863 | 379,462 | ||||||||||||||||||||
| Growth Opportunities ETF | — | 484,782 | 22,972 | (2,709 | ) | (106,464 | ) | 21 | 352,637 | |||||||||||||||||||
| International Growth | 278,455 | 105,649 | 24,211 | 5,687 | (86,372 | ) | 2,108 | 271,862 | ||||||||||||||||||||
| TIAA-CREF Funds: | ||||||||||||||||||||||||||||
| Core Bond | 757,070 | 151,165 | 146,042 | (6,966 | ) | (75,960 | ) | 17,864 | 676,130 | |||||||||||||||||||
| Core Plus Bond | 478,051 | 76,722 | 72,476 | 1,891 | (54,540 | ) | 13,398 | 423,043 | ||||||||||||||||||||
| Emerging Markets Debt | 84,560 | 18,989 | 21,429 | (502 | ) | (12,795 | ) | 4,095 | 68,823 | |||||||||||||||||||
| Emerging Markets Equity | 169,834 | 119,428 | 38,194 | 18,014 | (80,753 | ) | 8,693 | 158,334 | ||||||||||||||||||||
| Growth & Income | 420,677 | 85,024 | 89,053 | 87,440 | (107,062 | ) | 4,933 | 333,819 | ||||||||||||||||||||
| High-Yield | 73,328 | 10,249 | 11,794 | (371 | ) | (6,126 | ) | 3,698 | 65,286 | |||||||||||||||||||
| Inflation-Linked Bond | 21,093 | 23,016 | 1,855 | 282 | (2,232 | ) | 1,874 | 39,944 | ||||||||||||||||||||
| International Bond | 76,808 | 16,079 | 16,446 | (385 | ) | (7,611 | ) | 1,816 | 67,826 | |||||||||||||||||||
| International Equity | 386,883 | 126,096 | 50,365 | (2,385 | ) | (69,684 | ) | 14,329 | 390,545 | |||||||||||||||||||
| International Opportunities | 277,329 | 117,551 | 35,903 | 21,027 | (86,964 | ) | 4,617 | 272,156 | ||||||||||||||||||||
| Large-Cap Growth | 455,471 | 87,134 | 69,394 | 46,317 | (124,901 | ) | 2,403 | 351,435 | ||||||||||||||||||||
| Large-Cap Growth Index | 455,314 | 1,084 | 527,216 | 122,512 | (51,694 | ) | — | — | ||||||||||||||||||||
| Large-Cap Value | 471,601 | 56,433 | 114,729 | 51,139 | (54,731 | ) | 7,290 | 380,522 | ||||||||||||||||||||
| Quant International Small-Cap Equity | 181,429 | 58,642 | 20,801 | 4,128 | (32,621 | ) | 7,808 | 184,225 | ||||||||||||||||||||
| Quant Small-Cap Equity | 132,959 | 27,264 | 36,094 | 25,349 | (37,353 | ) | 1,119 | 92,573 | ||||||||||||||||||||
| Quant Small/Mid-Cap Equity | 152,953 | 28,632 | 41,383 | 30,642 | (38,186 | ) | 2,040 | 110,773 | ||||||||||||||||||||
| Short-Term Bond | 20,995 | 22,739 | 2,133 | (19 | ) | (1,505 | ) | 649 | 40,037 | |||||||||||||||||||
| TIAA-CREF Real Property Fund LPa | 223,987 | 26,872 | 2,189 | 33 | 53,632 | 4,788 | 302,335 | |||||||||||||||||||||
| $ | 6,010,698 | $ | 1,736,895 | $ | 1,581,356 | $ | 457,016 | $ | (1,033,106 | ) | $ | 116,050 | $ | 5,297,958 | ||||||||||||||
| TIAA-CREF Lifecycle Funds ■ 2022 Annual Report | 123 |
Notes to financial statements
| Change in | ||||||||||||||||||||||||||||
| unrealized | ||||||||||||||||||||||||||||
| Value at | Purchases | Sales | Realized | appreciation | Dividend | Value at | ||||||||||||||||||||||
| Issue | 5/31/21 | cost | proceeds | gain (loss | ) | (depreciation | ) | income | 5/31/22 | |||||||||||||||||||
| Lifecycle 2040 Fund | ||||||||||||||||||||||||||||
| Nuveen Funds: | ||||||||||||||||||||||||||||
| Dividend Growth | $ | 556,953 | $ | 52,515 | $ | 163,061 | $ | 27,193 | $ | (10,605 | ) | $ | 7,535 | $ | 450,114 | |||||||||||||
| Dividend Value | 629,102 | 74,691 | 148,350 | 46,229 | (54,085 | ) | 9,153 | 507,336 | ||||||||||||||||||||
| Growth Opportunities ETF | — | 646,423 | 29,351 | (3,589 | ) | (142,751 | ) | 28 | 470,732 | |||||||||||||||||||
| International Growth | 371,415 | 144,414 | 34,756 | 7,627 | (115,861 | ) | 2,818 | 363,042 | ||||||||||||||||||||
| TIAA-CREF Funds: | ||||||||||||||||||||||||||||
| Core Bond | 598,044 | 166,490 | 147,421 | (7,982 | ) | (59,861 | ) | 14,464 | 546,707 | |||||||||||||||||||
| Core Plus Bond | 381,437 | 87,937 | 77,293 | 282 | (43,360 | ) | 10,867 | 343,602 | ||||||||||||||||||||
| Emerging Markets Debt | 73,261 | 21,066 | 24,728 | (451 | ) | (10,554 | ) | 3,391 | 58,594 | |||||||||||||||||||
| Emerging Markets Equity | 226,154 | 161,042 | 52,550 | 22,713 | (106,301 | ) | 11,575 | 211,122 | ||||||||||||||||||||
| Growth & Income | 560,768 | 109,977 | 112,755 | 115,258 | (142,113 | ) | 6,591 | 446,330 | ||||||||||||||||||||
| High-Yield | 58,508 | 11,405 | 11,468 | (358 | ) | (4,965 | ) | 3,001 | 53,122 | |||||||||||||||||||
| International Bond | 61,285 | 17,042 | 16,170 | (531 | ) | (5,994 | ) | 1,479 | 55,126 | |||||||||||||||||||
| International Equity | 515,718 | 163,738 | 58,855 | (3,341 | ) | (93,714 | ) | 19,225 | 523,546 | |||||||||||||||||||
| International Opportunities | 367,994 | 156,172 | 44,426 | 27,008 | (115,297 | ) | 6,192 | 363,441 | ||||||||||||||||||||
| Large-Cap Growth | 606,728 | 111,842 | 85,657 | 60,732 | (166,502 | ) | 3,223 | 469,220 | ||||||||||||||||||||
| Large-Cap Growth Index | 606,868 | 461 | 701,659 | 162,993 | (68,663 | ) | — | — | ||||||||||||||||||||
| Large-Cap Value | 629,317 | 66,737 | 143,617 | 67,860 | (72,685 | ) | 9,780 | 508,448 | ||||||||||||||||||||
| Quant International Small-Cap Equity | 241,733 | 80,118 | 28,755 | 5,138 | (43,456 | ) | 10,472 | 245,990 | ||||||||||||||||||||
| Quant Small-Cap Equity | 176,905 | 35,441 | 46,159 | 33,120 | (49,223 | ) | 1,499 | 123,898 | ||||||||||||||||||||
| Quant Small/Mid-Cap Equity | 204,130 | 34,942 | 52,287 | 40,574 | (50,748 | ) | 2,738 | 147,237 | ||||||||||||||||||||
| TIAA-CREF Real Property Fund LPa | 265,536 | 39,558 | 13,482 | 523 | 63,070 | 5,671 | 355,205 | |||||||||||||||||||||
| $ | 7,131,856 | $ | 2,182,011 | $ | 1,992,800 | $ | 600,998 | $ | (1,293,668 | ) | $ | 129,702 | $ | 6,242,812 | ||||||||||||||
| 124 | 2022 Annual Report ■ TIAA-CREF Lifecycle Funds |
continued
| Change in | ||||||||||||||||||||||||||||
| unrealized | ||||||||||||||||||||||||||||
| Value at | Purchases | Sales | Realized | appreciation | Dividend | Value at | ||||||||||||||||||||||
| Issue | 5/31/21 | cost | proceeds | gain (loss | ) | (depreciation | ) | income | 5/31/22 | |||||||||||||||||||
| Lifecycle 2045 Fund | ||||||||||||||||||||||||||||
| Nuveen Funds: | ||||||||||||||||||||||||||||
| Dividend Growth | $ | 401,127 | $ | 34,011 | $ | 99,796 | $ | 17,051 | $ | (5,876 | ) | $ | 5,522 | $ | 337,040 | |||||||||||||
| Dividend Value | 453,962 | 60,377 | 98,927 | 33,209 | (39,231 | ) | 6,726 | 379,743 | ||||||||||||||||||||
| Growth Opportunities ETF | — | 480,403 | 19,488 | (2,551 | ) | (106,168 | ) | 21 | 352,196 | |||||||||||||||||||
| International Growth | 267,576 | 113,218 | 21,757 | 4,868 | (85,077 | ) | 2,079 | 271,591 | ||||||||||||||||||||
| TIAA-CREF Funds: | ||||||||||||||||||||||||||||
| Core Bond | 177,332 | 88,720 | 77,271 | (4,319 | ) | (17,125 | ) | 4,508 | 166,526 | |||||||||||||||||||
| Core Plus Bond | 116,786 | 44,239 | 39,102 | (897 | ) | (12,777 | ) | 3,410 | 106,541 | |||||||||||||||||||
| Emerging Markets Debt | 28,581 | 10,948 | 14,588 | (47 | ) | (3,593 | ) | 1,140 | 21,301 | |||||||||||||||||||
| Emerging Markets Equity | 163,597 | 122,385 | 37,010 | 15,689 | (77,182 | ) | 8,569 | 157,915 | ||||||||||||||||||||
| Growth & Income | 403,371 | 83,957 | 69,881 | 79,957 | (100,857 | ) | 4,832 | 334,074 | ||||||||||||||||||||
| High-Yield | 17,913 | 5,606 | 5,435 | (206 | ) | (1,491 | ) | 942 | 16,387 | |||||||||||||||||||
| International Bond | 18,765 | 8,309 | 7,834 | (374 | ) | (1,688 | ) | 468 | 17,018 | |||||||||||||||||||
| International Equity | 371,531 | 132,996 | 40,113 | (3,245 | ) | (68,367 | ) | 14,155 | 392,802 | |||||||||||||||||||
| International Opportunities | 266,294 | 126,826 | 34,125 | 16,104 | (82,135 | ) | 4,567 | 272,304 | ||||||||||||||||||||
| Large-Cap Growth | 437,556 | 94,893 | 57,844 | 42,745 | (122,279 | ) | 2,374 | 352,392 | ||||||||||||||||||||
| Large-Cap Growth Index | 436,636 | 1,535 | 506,582 | 117,103 | (48,692 | ) | — | — | ||||||||||||||||||||
| Large-Cap Value | 452,890 | 55,693 | 95,169 | 44,317 | (48,353 | ) | 7,206 | 380,524 | ||||||||||||||||||||
| Quant International Small-Cap Equity | 174,012 | 63,640 | 18,640 | 3,829 | (32,311 | ) | 7,713 | 184,057 | ||||||||||||||||||||
| Quant Small-Cap Equity | 127,786 | 26,316 | 29,814 | 24,242 | (36,486 | ) | 1,105 | 92,746 | ||||||||||||||||||||
| Quant Small/Mid-Cap Equity | 147,447 | 26,471 | 33,933 | 28,270 | (36,176 | ) | 2,017 | 110,438 | ||||||||||||||||||||
| TIAA-CREF Real Property Fund LPa | 172,347 | 36,663 | 13,993 | 353 | 41,848 | 3,737 | 237,218 | |||||||||||||||||||||
| $ | 4,635,509 | $ | 1,617,206 | $ | 1,321,302 | $ | 416,098 | $ | (884,016 | ) | $ | 81,091 | $ | 4,182,813 | ||||||||||||||
| TIAA-CREF Lifecycle Funds ■ 2022 Annual Report | 125 |
Notes to financial statements
| Change in | ||||||||||||||||||||||||||||
| unrealized | ||||||||||||||||||||||||||||
| Value at | Purchases | Sales | Realized | appreciation | Dividend | Value at | ||||||||||||||||||||||
| Issue | 5/31/21 | cost | proceeds | gain (loss | ) | (depreciation | ) | income | 5/31/22 | |||||||||||||||||||
| Lifecycle 2050 Fund | ||||||||||||||||||||||||||||
| Nuveen Funds: | ||||||||||||||||||||||||||||
| Dividend Growth | $ | 301,504 | $ | 30,337 | $ | 68,813 | $ | 11,247 | $ | (3,179 | ) | $ | 4,206 | $ | 263,856 | |||||||||||||
| Dividend Value | 338,928 | 48,981 | 62,836 | 24,713 | (29,432 | ) | 5,145 | 297,670 | ||||||||||||||||||||
| Growth Opportunities ETF | — | 371,375 | 11,340 | (1,429 | ) | (82,789 | ) | 16 | 275,817 | |||||||||||||||||||
| International Growth | 200,075 | 91,547 | 11,652 | 4,200 | (66,015 | ) | 1,590 | 212,627 | ||||||||||||||||||||
| TIAA-CREF Funds: | ||||||||||||||||||||||||||||
| Core Bond | 83,983 | 41,532 | 61,577 | (3,128 | ) | (5,304 | ) | 1,907 | 55,159 | |||||||||||||||||||
| Core Plus Bond | 57,235 | 16,557 | 30,662 | (1,071 | ) | (4,336 | ) | 1,458 | 36,991 | |||||||||||||||||||
| Emerging Markets Debt | 16,755 | 6,026 | 11,468 | 191 | (1,780 | ) | 545 | 9,724 | ||||||||||||||||||||
| Emerging Markets Equity | 122,688 | 97,298 | 26,600 | 12,165 | (59,063 | ) | 6,532 | 123,950 | ||||||||||||||||||||
| Growth & Income | 301,687 | 68,351 | 43,606 | 57,764 | (74,663 | ) | 3,686 | 261,736 | ||||||||||||||||||||
| High-Yield | 8,791 | 1,937 | 4,369 | 68 | (742 | ) | 404 | 5,685 | ||||||||||||||||||||
| International Bond | 9,195 | 3,343 | 5,805 | (252 | ) | (565 | ) | 196 | 5,848 | |||||||||||||||||||
| International Equity | 278,007 | 110,127 | 25,705 | (2,476 | ) | (52,831 | ) | 10,836 | 307,122 | |||||||||||||||||||
| International Opportunities | 200,207 | 103,570 | 23,110 | 12,726 | (63,853 | ) | 3,515 | 213,640 | ||||||||||||||||||||
| Large-Cap Growth | 327,901 | 78,998 | 35,346 | 32,262 | (94,670 | ) | 1,819 | 276,449 | ||||||||||||||||||||
| Large-Cap Growth Index | 326,552 | 4,146 | 382,228 | 87,518 | (35,988 | ) | — | — | ||||||||||||||||||||
| Large-Cap Value | 338,761 | 47,242 | 62,610 | 30,884 | (34,272 | ) | 5,513 | 297,931 | ||||||||||||||||||||
| Quant International Small-Cap Equity | 130,367 | 52,812 | 12,282 | 3,057 | (25,064 | ) | 5,899 | 143,940 | ||||||||||||||||||||
| Quant Small-Cap Equity | 95,572 | 22,057 | 20,774 | 17,742 | (27,182 | ) | 845 | 72,652 | ||||||||||||||||||||
| Quant Small/Mid-Cap Equity | 110,176 | 20,680 | 21,518 | 20,597 | (26,827 | ) | 1,543 | 86,547 | ||||||||||||||||||||
| TIAA-CREF Real Property Fund LPa | 125,377 | 31,593 | 11,243 | 235 | 30,951 | 2,747 | 176,913 | |||||||||||||||||||||
| $ | 3,373,761 | $ | 1,248,509 | $ | 933,544 | $ | 307,013 | $ | (657,604 | ) | $ | 58,402 | $ | 3,124,257 | ||||||||||||||
| 126 | 2022 Annual Report ■ TIAA-CREF Lifecycle Funds |
continued
| Change in | ||||||||||||||||||||||||||||
| unrealized | ||||||||||||||||||||||||||||
| Value at | Purchases | Sales | Realized | appreciation | Dividend | Value at | ||||||||||||||||||||||
| Issue | 5/31/21 | cost | proceeds | gain (loss | ) | (depreciation | ) | income | 5/31/22 | |||||||||||||||||||
| Lifecycle 2055 Fund | ||||||||||||||||||||||||||||
| Nuveen Funds: | ||||||||||||||||||||||||||||
| Dividend Growth | $ | 128,593 | $ | 17,291 | $ | 26,676 | $ | 3,894 | $ | (632 | ) | $ | 1,841 | $ | 119,306 | |||||||||||||
| Dividend Value | 144,638 | 24,873 | 22,528 | 10,530 | (12,682 | ) | 2,258 | 134,861 | ||||||||||||||||||||
| Growth Opportunities ETF | — | 166,644 | 4,037 | (524 | ) | (36,913 | ) | 7 | 125,170 | |||||||||||||||||||
| International Growth | 85,350 | 46,696 | 5,957 | 1,547 | (28,918 | ) | 702 | 96,279 | ||||||||||||||||||||
| TIAA-CREF Funds: | ||||||||||||||||||||||||||||
| Core Bond | 26,120 | 15,979 | 23,945 | (1,281 | ) | (1,360 | ) | 601 | 15,402 | |||||||||||||||||||
| Core Plus Bond | 18,372 | 6,805 | 12,289 | (511 | ) | (1,189 | ) | 464 | 10,954 | |||||||||||||||||||
| Emerging Markets Debt | 6,217 | 2,660 | 4,809 | 82 | (614 | ) | 185 | 3,536 | ||||||||||||||||||||
| Emerging Markets Equity | 52,248 | 45,357 | 10,855 | 5,233 | (25,842 | ) | 2,866 | 56,253 | ||||||||||||||||||||
| Growth & Income | 128,671 | 35,627 | 16,581 | 23,070 | (30,930 | ) | 1,612 | 118,842 | ||||||||||||||||||||
| High-Yield | 2,822 | 792 | 1,731 | 38 | (250 | ) | 129 | 1,671 | ||||||||||||||||||||
| International Bond | 2,951 | 1,407 | 2,373 | (112 | ) | (145 | ) | 62 | 1,706 | |||||||||||||||||||
| International Equity | 118,625 | 54,806 | 9,832 | (1,020 | ) | (23,436 | ) | 4,767 | 139,143 | |||||||||||||||||||
| International Opportunities | 85,161 | 52,267 | 10,559 | 5,016 | (27,942 | ) | 1,546 | 96,949 | ||||||||||||||||||||
| Large-Cap Growth | 139,901 | 43,906 | 15,737 | 13,550 | (41,873 | ) | 799 | 125,378 | ||||||||||||||||||||
| Large-Cap Growth Index | 139,268 | 4,350 | 165,821 | 37,310 | (15,107 | ) | — | — | ||||||||||||||||||||
| Large-Cap Value | 144,353 | 25,404 | 23,354 | 12,249 | (13,884 | ) | 2,421 | 135,072 | ||||||||||||||||||||
| Quant International Small-Cap Equity | 55,578 | 25,489 | 3,945 | 1,493 | (11,256 | ) | 2,589 | 65,187 | ||||||||||||||||||||
| Quant Small-Cap Equity | 40,785 | 11,209 | 8,333 | 7,313 | (11,571 | ) | 371 | 32,917 | ||||||||||||||||||||
| Quant Small/Mid-Cap Equity | 46,895 | 11,121 | 8,707 | 8,466 | (11,291 | ) | 678 | 39,213 | ||||||||||||||||||||
| TIAA-CREF Real Property Fund LPa | 52,724 | 16,795 | 4,108 | 68 | 13,537 | 1,185 | 79,016 | |||||||||||||||||||||
| $ | 1,419,272 | $ | 609,478 | $ | 382,177 | $ | 126,411 | $ | (282,298 | ) | $ | 25,083 | $ | 1,396,855 | ||||||||||||||
| TIAA-CREF Lifecycle Funds ■ 2022 Annual Report | 127 |
Notes to financial statements
| Change in | ||||||||||||||||||||||||||||
| unrealized | ||||||||||||||||||||||||||||
| Value at | Purchases | Sales | Realized | appreciation | Dividend | Value at | ||||||||||||||||||||||
| Issue | 5/31/21 | cost | proceeds | gain (loss | ) | (depreciation | ) | income | 5/31/22 | |||||||||||||||||||
| Lifecycle 2060 Fund | ||||||||||||||||||||||||||||
| Nuveen Funds: | ||||||||||||||||||||||||||||
| Dividend Growth | $ | 36,272 | $ | 9,652 | $ | 7,621 | $ | 817 | $ | 37 | $ | 556 | $ | 38,189 | ||||||||||||||
| Dividend Value | 40,776 | 12,600 | 6,275 | 2,980 | (3,621 | ) | 688 | 43,377 | ||||||||||||||||||||
| Growth Opportunities ETF | — | 53,378 | 1,382 | (222 | ) | (11,544 | ) | 2 | 40,230 | |||||||||||||||||||
| International Growth | 24,042 | 18,788 | 2,543 | 248 | (8,788 | ) | 218 | 30,990 | ||||||||||||||||||||
| TIAA-CREF Funds: | ||||||||||||||||||||||||||||
| Core Bond | 4,716 | 4,787 | 6,969 | (367 | ) | (116 | ) | 113 | 2,029 | |||||||||||||||||||
| Core Plus Bond | 3,531 | 2,145 | 3,601 | (173 | ) | (145 | ) | 89 | 1,711 | |||||||||||||||||||
| Emerging Markets Debt | 1,499 | 877 | 1,390 | 17 | (129 | ) | 40 | 874 | ||||||||||||||||||||
| Emerging Markets Equity | 14,746 | 15,915 | 3,260 | 1,413 | (7,657 | ) | 890 | 18,086 | ||||||||||||||||||||
| Growth & Income | 36,373 | 16,396 | 5,381 | 6,235 | (8,883 | ) | 490 | 38,251 | ||||||||||||||||||||
| High-Yield | 542 | 287 | 520 | 10 | (50 | ) | 25 | 269 | ||||||||||||||||||||
| International Bond | 567 | 429 | 689 | (31 | ) | (17 | ) | 12 | 255 | |||||||||||||||||||
| International Equity | 33,418 | 22,101 | 3,393 | (425 | ) | (7,222 | ) | 1,472 | 44,479 | |||||||||||||||||||
| International Opportunities | 24,060 | 20,788 | 4,201 | 1,208 | (8,435 | ) | 477 | 31,264 | ||||||||||||||||||||
| Large-Cap Growth | 39,484 | 19,958 | 5,508 | 3,841 | (13,038 | ) | 247 | 40,301 | ||||||||||||||||||||
| Large-Cap Growth Index | 39,204 | 4,102 | 49,789 | 10,464 | (3,981 | ) | — | — | ||||||||||||||||||||
| Large-Cap Value | 40,755 | 12,531 | 6,199 | 2,974 | (3,530 | ) | 747 | 43,539 | ||||||||||||||||||||
| Quant International Small-Cap Equity | 15,767 | 10,229 | 1,338 | 452 | (3,504 | ) | 797 | 20,937 | ||||||||||||||||||||
| Quant Small-Cap Equity | 11,506 | 4,452 | 2,037 | 1,879 | (3,222 | ) | 115 | 10,575 | ||||||||||||||||||||
| Quant Small/Mid-Cap Equity | 13,191 | 5,004 | 2,444 | 2,194 | (3,106 | ) | 209 | 12,598 | ||||||||||||||||||||
| TIAA-CREF Real Property Fund LPa | 14,655 | 7,065 | 882 | 10 | 4,142 | 353 | 24,990 | |||||||||||||||||||||
| $ | 395,104 | $ | 241,484 | $ | 115,422 | $ | 33,524 | $ | (82,809 | ) | $ | 7,540 | $ | 442,944 | ||||||||||||||
| 128 | 2022 Annual Report ■ TIAA-CREF Lifecycle Funds |
continued
| Change in | ||||||||||||||||||||||||||||
| unrealized | ||||||||||||||||||||||||||||
| Value at | Purchases | Sales | Realized | appreciation | Dividend | Value at | ||||||||||||||||||||||
| Issue | 5/31/21 | cost | proceeds | gain (loss | ) | (depreciation | ) | income | 5/31/22 | |||||||||||||||||||
| Lifecycle 2065 Fund | ||||||||||||||||||||||||||||
| Nuveen Funds: | ||||||||||||||||||||||||||||
| Dividend Growth | $ | 649 | $ | 1,829 | $ | 365 | $ | 10 | $ | (40 | ) | $ | 14 | $ | 2,064 | |||||||||||||
| Dividend Value | 729 | 2,043 | 295 | 63 | (107 | ) | 20 | 2,353 | ||||||||||||||||||||
| Growth Opportunities ETF | — | 2,710 | 108 | (15 | ) | (410 | ) | — | ^ | 2,177 | ||||||||||||||||||
| International Growth | 430 | 1,685 | 146 | (5 | ) | (258 | ) | 5 | 1,686 | |||||||||||||||||||
| TIAA-CREF Funds: | ||||||||||||||||||||||||||||
| Core Bond | 47 | 240 | 282 | (5 | ) | — | ^ | 1 | — | ^ | ||||||||||||||||||
| Core Plus Bond | 34 | 141 | 167 | (4 | ) | — | ^ | 1 | 3 | |||||||||||||||||||
| Emerging Markets Debt | 12 | 31 | 39 | (1 | ) | 1 | — | ^ | 4 | |||||||||||||||||||
| Emerging Markets Equity | 263 | 1,063 | 110 | 31 | (191 | ) | 24 | 977 | ||||||||||||||||||||
| Growth & Income | 651 | 2,014 | 250 | 119 | (296 | ) | 12 | 2,070 | ||||||||||||||||||||
| High-Yield | 5 | 21 | 26 | — | ^ | — | ^ | — | ^ | — | ^ | |||||||||||||||||
| International Bond | 5 | 24 | 28 | (1 | ) | — | ^ | — | ^ | — | ^ | |||||||||||||||||
| International Equity | 596 | 2,304 | 269 | (30 | ) | (199 | ) | 38 | 2,402 | |||||||||||||||||||
| International Opportunities | 429 | 1,713 | 152 | 19 | (260 | ) | 12 | 1,693 | ||||||||||||||||||||
| Large-Cap Growth | 704 | 2,353 | 349 | 47 | (458 | ) | 6 | 2,182 | ||||||||||||||||||||
| Large-Cap Growth Index | 702 | 157 | 976 | 188 | (71 | ) | — | — | ||||||||||||||||||||
| Large-Cap Value | 728 | 2,066 | 301 | 55 | (114 | ) | 19 | 2,357 | ||||||||||||||||||||
| Quant International Small-Cap Equity | 280 | 1,083 | 113 | 1 | (99 | ) | 21 | 1,135 | ||||||||||||||||||||
| Quant Small-Cap Equity | 206 | 558 | 79 | 33 | (93 | ) | 3 | 573 | ||||||||||||||||||||
| Quant Small/Mid-Cap Equity | 236 | 645 | 90 | 39 | (90 | ) | 5 | 682 | ||||||||||||||||||||
| TIAA-CREF Real Property Fund LPa | 259 | 1,004 | 59 | 1 | 129 | 10 | 1,334 | |||||||||||||||||||||
| $ | 6,965 | $ | 23,684 | $ | 4,204 | $ | 545 | $ | (2,556 | ) | $ | 191 | $ | 23,692 | ||||||||||||||
| ^ | Some amounts represent less than $1,000. |
| a | Restricted security |
Note 7—inter-fund lending program
Pursuant to an exemptive order issued by the SEC, the Funds may participate in an inter-fund lending program. This program allows the Funds to lend cash to and/or borrow cash from certain other affiliated Funds for temporary purposes, (e.g., to satisfy redemption requests or to cover unanticipated cash shortfalls). The program is subject to a number of conditions, including the requirement that no Fund may borrow or lend money under the program unless it receives a more favorable interest rate than is available from a bank or other financial institution for a comparable transaction. In addition, a Fund may participate in the program only if its participation is consistent with the Fund’s investment policies and limitations and authorized by its portfolio manager(s). During the year ended May 31, 2022, there were no inter-fund borrowing or lending transactions.
| TIAA-CREF Lifecycle Funds ■ 2022 Annual Report | 129 |
| Notes to financial statements | concluded |
Note 8—line of credit
The Funds participate in a $1 billion unsecured revolving credit facility that can be used for temporary purposes, including, without limitation, the funding of shareholder redemptions. The current facility was entered into on June 14, 2022 expiring on June 13, 2023, replacing the previous facility, which expired June 2022. Certain affiliated accounts and mutual funds, each of which is managed by Advisors, or an affiliate of Advisors, also participate in this facility. An annual commitment fee for the credit facility is borne by the participating accounts and mutual funds on a pro rata basis. Interest associated with any borrowing under the facility is charged to the borrowing accounts or mutual funds at a specified rate of interest. The Funds are not liable for borrowings under the facility by other affiliated accounts or mutual funds. For the year ended May 31, 2022, there were no borrowings under this credit facility by the Funds.
| 130 | 2022 Annual Report ■ TIAA-CREF Lifecycle Funds |
Report of independent registered public accounting firm
To the Board of Trustees of TIAA-CREF Funds and Shareholders of TIAA-CREF Lifecycle Retirement Income Fund, TIAA-CREF Lifecycle 2010 Fund, TIAA-CREF Lifecycle 2015 Fund, TIAA-CREF Lifecycle 2020 Fund, TIAA-CREF Lifecycle 2025 Fund, TIAA-CREF Lifecycle 2030 Fund, TIAA-CREF Lifecycle 2035 Fund, TIAA-CREF Lifecycle 2040 Fund, TIAA-CREF Lifecycle 2045 Fund, TIAA-CREF Lifecycle 2050 Fund, TIAA-CREF Lifecycle 2055 Fund, TIAA-CREF Lifecycle 2060 Fund, and TIAA-CREF Lifecycle 2065 Fund
Opinions on the Financial Statements
We have audited the accompanying statements of assets and liabilities, including the portfolios of investments, of TIAA-CREF Lifecycle Retirement Income Fund, TIAA-CREF Lifecycle 2010 Fund, TIAA-CREF Lifecycle 2015 Fund, TIAA-CREF Lifecycle 2020 Fund, TIAA-CREF Lifecycle 2025 Fund, TIAA-CREF Lifecycle 2030 Fund, TIAA-CREF Lifecycle 2035 Fund, TIAA-CREF Lifecycle 2040 Fund, TIAA-CREF Lifecycle 2045 Fund, TIAA-CREF Lifecycle 2050 Fund, TIAA-CREF Lifecycle 2055 Fund, TIAA-CREF Lifecycle 2060 Fund, and TIAA-CREF Lifecycle 2065 Fund (thirteen of the funds constituting TIAA-CREF Funds, hereafter collectively referred to as the “Funds”) as of May 31, 2022, the related statements of operations for the year ended May 31, 2022, the statements of changes in net assets for each of the periods indicated in the table below, including the related notes, and the financial highlights for each of the periods indicated therein (collectively referred to as the “financial statements”). In our opinion, the financial statements present fairly, in all material respects, the financial position of each of the Funds as of May 31, 2022, the results of each of their operations for the year then ended, the changes in each of their net assets for each of the periods indicated in the table below and each of the financial highlights for each of the periods indicated therein in conformity with accounting principles generally accepted in the United States of America.
| TIAA-CREF Lifecycle Retirement Income Fund(1) | TIAA-CREF Lifecycle 2040 Fund(1) | |
| TIAA-CREF Lifecycle 2010 Fund(1) | TIAA-CREF Lifecycle 2045 Fund(1) | |
| TIAA-CREF Lifecycle 2015 Fund(1) | TIAA-CREF Lifecycle 2050 Fund(1) | |
| TIAA-CREF Lifecycle 2020 Fund(1) | TIAA-CREF Lifecycle 2055 Fund(1) | |
| TIAA-CREF Lifecycle 2025 Fund(1) | TIAA-CREF Lifecycle 2060 Fund(1) | |
| TIAA-CREF Lifecycle 2030 Fund(1) | TIAA-CREF Lifecycle 2065 Fund(2) | |
| TIAA-CREF Lifecycle 2035 Fund(1) |
| (1) | Statement of changes in net assets for the years ended May 31, 2022 and 2021 |
| (2) | Statement of changes in net assets for the year ended May 31, 2022 and the period September 30, 2020 (commencement of operations) through May 31, 2021 |
| TIAA-CREF Lifecycle Funds ■ 2022 Annual Report | 131 |
| Report of independent registered public accounting firm | concluded |
Basis for Opinions
These financial statements are the responsibility of the Funds’ management. Our responsibility is to express an opinion on the Funds’ financial statements based on our audits. We are a public accounting firm registered with the Public Company Accounting Oversight Board (United States) (PCAOB) and are required to be independent with respect to the Funds in accordance with the U.S. federal securities laws and the applicable rules and regulations of the Securities and Exchange Commission and the PCAOB.
We conducted our audits of these financial statements in accordance with the standards of the PCAOB. Those standards require that we plan and perform the audit to obtain reasonable assurance about whether the financial statements are free of material misstatement, whether due to error or fraud.
Our audits included performing procedures to assess the risks of material misstatement of the financial statements, whether due to error or fraud, and performing procedures that respond to those risks. Such procedures included examining, on a test basis, evidence regarding the amounts and disclosures in the financial statements. Our audits also included evaluating the accounting principles used and significant estimates made by management, as well as evaluating the overall presentation of the financial statements. Our procedures included confirmation of securities owned as of May 31, 2022 by correspondence with the transfer agent or custodian. We believe that our audits provide a reasonable basis for our opinions.
/s/ PricewaterhouseCoopers LLP
Baltimore, Maryland
July 15, 2022
We have served as the auditor of one or more investment companies in TIAA-CREF Funds’ investment company group since 2005.
| 132 | 2022 Annual Report ■ TIAA-CREF Lifecycle Funds |
Important tax information (unaudited)
As required by the Internal Revenue Code and Treasury Regulations, certain tax information, as detailed below, must be provided to shareholders. Shareholders are advised to consult their tax advisor with respect to the tax implications of their investment. The amounts listed below may differ from the actual amounts reported on Form 1099-DIV, which will be sent to shareholders shortly after calendar year end.
Long-term capital gains
As of year end, each fund designates the following distribution amounts, or maximum amount allowable, as being from net long-term capital gains pursuant to Section 852(b)(3) of the Internal Revenue Code:
| Fund | Net long-term capital gains | |||
| Lifecycle Retirement Income | $ 23,696,961 | |||
| Lifecycle 2010 | 67,928,472 | |||
| Lifecycle 2015 | 84,996,550 | |||
| Lifecycle 2020 | 198,489,049 | |||
| Lifecycle 2025 | 283,726,218 | |||
| Lifecycle 2030 | 327,726,945 | |||
| Lifecycle 2035 | 369,885,156 | |||
| Lifecycle 2040 | 478,942,826 | |||
| Lifecycle 2045 | 328,895,907 | |||
| Lifecycle 2050 | 220,197,035 | |||
| Lifecycle 2055 | 77,379,957 | |||
| Lifecycle 2060 | 16,262,805 | |||
| Lifecycle 2065 | 381,910 | |||
Dividends received deduction (DRD)
Each Fund listed below had the following percentage, or maximum amount allowable, of ordinary income distributions eligible for the dividends received deduction for corporate shareholders:
| Fund | Percentage | |||
| Lifecycle Retirement Income | 6.9 | % | ||
| Lifecycle 2010 | 7.0 | |||
| Lifecycle 2015 | 7.3 | |||
| Lifecycle 2020 | 8.0 | |||
| Lifecycle 2025 | 9.3 | |||
| Lifecycle 2030 | 10.6 | |||
| Lifecycle 2035 | 11.6 | |||
| Lifecycle 2040 | 12.4 | |||
| Lifecycle 2045 | 13.2 | |||
| Lifecycle 2050 | 13.8 | |||
| Lifecycle 2055 | 14.2 | |||
| Lifecycle 2060 | 14.9 | |||
| Lifecycle 2065 | 14.6 | |||
| TIAA-CREF Lifecycle Funds ■ 2022 Annual Report | 133 |
| Important tax information | concluded |
Qualified dividend income (QDI)
Each Fund listed below had the following percentage, or maximum amount allowable, of ordinary income distributions treated as qualified dividend income for individuals pursuant to Section 1(h)(11) of the Internal Revenue Code:
| Fund | Percentage | |||
| Lifecycle Retirement Income | 13.0 | % | ||
| Lifecycle 2010 | 12.5 | |||
| Lifecycle 2015 | 13.5 | |||
| Lifecycle 2020 | 14.8 | |||
| Lifecycle 2025 | 17.3 | |||
| Lifecycle 2030 | 19.8 | |||
| Lifecycle 2035 | 21.7 | |||
| Lifecycle 2040 | 23.1 | |||
| Lifecycle 2045 | 24.7 | |||
| Lifecycle 2050 | 25.8 | |||
| Lifecycle 2055 | 26.6 | |||
| Lifecycle 2060 | 28.2 | |||
| Lifecycle 2065 | 28.8 | |||
Foreign source income and foreign tax credit pass through
Each Fund listed below has made an election under Section 853 of the Internal Revenue Code to pass through foreign taxes paid:
| Fund | Foreign source income | Foreign source income per share | Qualifying foreign taxes paid | Qualifying foreign taxes paid per share | ||||||||||||
| Lifecycle Retirement Income | $ 1,345,689 | $0.02829 | $ 153,819 | $0.00323 | ||||||||||||
| Lifecycle 2010 | 2,467,181 | 0.02574 | 284,088 | 0.00296 | ||||||||||||
| Lifecycle 2015 | 3,958,718 | 0.02635 | 456,230 | 0.00304 | ||||||||||||
| Lifecycle 2020 | 9,835,697 | 0.03069 | 1,137,570 | 0.00355 | ||||||||||||
| Lifecycle 2025 | 16,375,789 | 0.03635 | 1,902,103 | 0.00422 | ||||||||||||
| Lifecycle 2030 | 20,565,033 | 0.04219 | 2,401,156 | 0.00493 | ||||||||||||
| Lifecycle 2035 | 24,131,487 | 0.04868 | 2,839,499 | 0.00573 | ||||||||||||
| Lifecycle 2040 | 32,139,832 | 0.05523 | 3,801,163 | 0.00653 | ||||||||||||
| Lifecycle 2045 | 23,541,832 | 0.07073 | 2,802,788 | 0.00842 | ||||||||||||
| Lifecycle 2050 | 17,932,649 | 0.07372 | 2,143,122 | 0.00881 | ||||||||||||
| Lifecycle 2055 | 7,881,146 | 0.08537 | 941,513 | 0.01020 | ||||||||||||
| Lifecycle 2060 | 2,424,672 | 0.07072 | 290,810 | 0.00848 | ||||||||||||
| Lifecycle 2065 | 61,900 | 0.02793 | 7,518 | 0.00339 | ||||||||||||
| 134 | 2022 Annual Report ■ TIAA-CREF Lifecycle Funds |
Trustees and officers (unaudited)
TIAA-CREF Funds ■ May 31, 2022
Trustees
| Name, Address and Year of Birth (“YOB”) | Position(s) Held with Fund | Term of Office and Length of Time Served | Principal Occupation(s) During Past 5 Years and other relevant experience and qualifications | Number of Portfolios in Fund complex Overseen by Trustee | Other Directorship(s) held by Trustee | |||||
| Forrest Berkley c/o Corporate Secretary 730 Third Avenue New York, NY 10017-3206 YOB: 1954 | Trustee | Indefinite term. Trustee since 2006. | Retired Partner (since 2006), Partner (1990–2005) and Head of Global Product Management (2003–2005), GMO (formerly, Grantham, Mayo, Van Otterloo & Co.) (investment management); and member of asset allocation portfolio management team, GMO (2003–2005). | 88 | Director, Save the Children Federation, Inc.; Investment Committee Member, Maine Community Foundation. | |||||
| Joseph A. Boateng c/o Corporate Secretary 730 Third Avenue New York, NY 10017-3206 YOB: 1963 | Trustee | Indefinite term. Trustee since 2019. | Chief Investment Officer, Casey Family Programs (since 2007). Director of U.S. Pension Plans, Johnson & Johnson (2002–2006). Manager, Financial Services Consultant, KPMG Consulting (2000–2002). | 88 | Board member, Lumina Foundation and Waterside School; Emeritus Board Member, Year-Up Puget Sound; Investment Advisory Committee Member, Seattle City Employees’ Retirement System; Investment Committee Member, The Seattle Foundation. | |||||
| Janice C. Eberly c/o Corporate Secretary 730 Third Avenue New York, NY 10017-3206 YOB: 1962 | Trustee | Indefinite term. Trustee since 2018. | James R. and Helen D. Russell Professor of Finance at the Kellogg School of Management, Northwestern University (2002–2011 and since 2013), Senior Associate Dean for Strategy and Academics (since 2020) and Chair of the Finance Department (2005–2007). Vice President, American Economic Association (2020–2021). Assistant Secretary for Economic Policy, United States Department of the Treasury (2011–2013). | 88 | Member of the Board of the Office of Finance, Federal Home Loan Banks; Director, Avant, LLC; |
| TIAA-CREF Lifecycle Funds ■ 2022 Annual Report | 135 |
| Trustees and officers (unaudited) | continued |
| TIAA-CREF Funds ■ May 31, 2022 | |
| Trustees – concluded |
| Name, Address and Year of Birth (“YOB”) | Position(s) Held with Fund | Term of Office and Length of Time Served | Principal Occupation(s) During Past 5 Years and other relevant experience and qualifications | Number of Portfolios in Fund complex Overseen by Trustee | Other Directorship(s) held by Trustee | |||||
| Nancy A. Eckl c/o Corporate Secretary 730 Third Avenue New York, NY 10017-3206 YOB: 1962 | Trustee | Indefinite term. Trustee since 2007. | Vice President (1990–2006), American Beacon Advisors, Inc., and of certain funds advised by American Beacon Advisors, Inc. | 88 | Independent Director, The Lazard Funds, Inc., Lazard Retirement Series, Inc., and Lazard Global Total Return and Income Fund, Inc. | |||||
| Michael A. Forrester c/o Corporate Secretary 730 Third Avenue New York, NY 10017-3206 YOB: 1967 | Trustee | Indefinite term. Trustee since 2007. | Chief Executive Officer (2014–2021) and Chief Operating Officer (2007–2014), Copper Rock Capital Partners, LLC. Chief Operating Officer, DDJ Capital Management (2003–2006). | 88 | Trustee, Dexter Southfield School; Member, Governing Council of the Independent Directors Council. | |||||
| Howell E. Jackson c/o Corporate Secretary 730 Third Avenue New York, NY 10017-3206 YOB: 1954 | Trustee | Indefinite term. Trustee since 2005. | James S. Reid, Jr. Professor of Law (since 2004), Senior Adviser to President and Provost (2010–2012), Acting Dean (2009), Vice Dean for Budget (2003–2006) and on the faculty (since 1989) of Harvard Law School. | 88 | Director, Build Commonwealth (non-profit organization). | |||||
| Thomas J. Kenny c/o Corporate Secretary 730 Third Avenue New York, NY 10017-3206 YOB: 1963 | Chairman of the Board and Trustee | Indefinite term. Trustee since 2011; Chairman for term ending June 30, 2023. Chairman since September 13, 2017. | Advisory Director (2010–2011), Partner (2004–2010), Managing Director (1999–2004) and Co-Head of Global Cash and Fixed Income Portfolio Management Team (2002–2010), Goldman Sachs Asset Management. | 88 | Director and Chair of the Finance and Investment Committee, Aflac Incorporated; Director and Investment Committee Member, Sansum Clinic; Director, ParentSquare; Member, University of California at Santa Barbara Arts and Lectures Advisory Council. |
| 136 | 2022 Annual Report ■ TIAA-CREF Lifecycle Funds |
| James M. Poterba c/o Corporate Secretary 730 Third Avenue New York, NY 10017-3206 YOB: 1958 | Trustee | Indefinite term. Trustee since 2006. | President and Chief Executive Officer (since 2008) and Program Director (1990–2008), National Bureau of Economic Research. Mitsui Professor of Economics, Massachusetts Institute of Technology (“MIT”) (since 1996); Affiliated Faculty Member of the Finance Group, Alfred P. Sloan School of Management (since 2014); Head (2006–2008) and Associate Head (1994–2000 and 2001–2006), Economics Department of MIT. | 88 | Director, National Bureau of Economic Research; Member, Congressional Budget Office Panel of Economic Advisers. | |||||
| Maceo K. Sloan c/o Corporate Secretary 730 Third Avenue New York, NY 10017-3206 YOB: 1949 | Trustee | Indefinite term. Trustee since 1999. | Chairman, President and Chief Executive Officer, Sloan Financial Group, Inc. (1991–2018); Chairman and Chief Executive Officer (1991–2016), Chief Investment Officer (1991–2013) and Chief Compliance Officer (2015–2016), NCM Capital Management Group, Inc.; Chairman, Chief Executive Officer (2003–2016), Chief Investment Officer (2003–2013) and Chief Compliance Officer (2015–2016), NCM Capital Advisers, Inc.; and Chairman, President and Principal Executive Officer, NCM Capital Investment Trust (2007–2012). | 88 | Director, TheraTrue Inc. |
| TIAA-CREF Lifecycle Funds ■ 2022 Annual Report | 137 |
| Trustees and officers (unaudited) | continued |
| TIAA-CREF Funds ■ May 31, 2022 | |
| Officers |
| Name, Address and Year of Birth (“YOB”) | Position(s) Held with Fund | Term of Office and Length of Time Served | Principal Occupation(s) During Past 5 Years | |||
| Richard S. Biegen TIAA 730 Third Avenue New York, NY 10017-3206 YOB: 1962 | Chief Compliance Officer | One-year term. Chief Compliance Officer since 2008. | Senior Managing Director, TIAA. Chief Compliance Officer of the College Retirement Equities Fund (“CREF”), TIAA Separate Account VA-1, TIAA-CREF Funds and TIAA-CREF Life Funds (collectively, the “TIAA-CREF Fund Complex”). | |||
| Derek B. Dorn TIAA 730 Third Avenue New York, NY 10017-3206 YOB: 1976 | Senior Managing Director and Corporate Secretary | One-year term. Senior Managing Director and Corporate Secretary since 2020. | Senior Managing Director and Corporate Secretary of Teachers Insurance and Annuity Association of America (“TIAA”) and the TIAA-CREF Fund Complex. Formerly, Managing Director, Special Assistant to the CEO, and Managing Director, Regulatory Affairs, TIAA. Prior to joining TIAA, Mr. Dorn served as a partner at Davis & Harman LLP and an adjunct professor of Law at Georgetown University Law Center. | |||
| John L. Douglas TIAA 730 Third Avenue New York, NY 10017-3206 YOB: 1950 | Executive Vice President, Chief Legal, Risk and Compliance Officer | One-year term. Executive Vice President since 2021 and Chief Legal, Risk and Compliance Officer since 2022. | Senior Executive Vice President, Chief Legal, Risk and Compliance Officer of TIAA, Executive Vice President, Chief Legal, Risk and Compliance Officer of the TIAA-CREF Fund Complex. Formerly, Senior Executive Vice President, Senior Advisor to the CEO, and Senior Executive Vice President, Chief Advocacy & Oversight Officer, TIAA. Prior to joining TIAA, Mr. Douglas was a Partner at Davis Polk & Wardwell LLP. |
| 138 | 2022 Annual Report ■ TIAA-CREF Lifecycle Funds |
| W. Dave Dowrich TIAA 730 Third Avenue New York, NY 10017-3206 YOB: 1967 | Executive Vice President | One-year term. Executive Vice President since 2022. | Senior Executive Vice President and Chief Financial Officer of TIAA. Executive Vice President of the TIAA-CREF Fund Complex. Prior to joining TIAA, Mr. Dowrich served as Chief Financial Officer, International Businesses at Prudential Financial, Inc. | |||
| Bradley Finkle TIAA 730 Third Avenue New York, NY 10017-3206 YOB: 1973 | Principal Executive Officer and President | One-year term. Principal Executive Officer and President since 2017. | Executive Vice President, Chief Administrative Officer of the Chief Operating Office, TIAA. Principal Executive Officer and President of the TIAA-CREF Funds and TIAA-CREF Life Funds. Formerly, Executive Vice President, Chief Operating Officer, Nuveen, President and Chief Executive Officer of CREF and TIAA Separate Account VA-1; Senior Managing Director, Co-Head Nuveen Equities & Fixed Income and President of TIAA Investments. | |||
| Jose Minaya TIAA 730 Third Avenue New York, NY 10017-3206 YOB: 1971 | Executive Vice President | One-year term. Executive Vice President since 2018. | Chief Executive Officer, Nuveen. Executive Vice President of the TIAA-CREF Fund Complex. Formerly, Executive Vice President, President and Chief Investment Officer, Nuveen; Executive Vice President, Chief Investment Officer and President, Nuveen Global Investments; and Senior Managing Director, President, Global Investments, TIAA. | |||
| Colbert Narcisse TIAA 730 Third Avenue New York, NY 10017-3206 YOB: 1965 | Executive Vice President | One-year term. Executive Vice President since 2022. | Senior Executive Vice President, Chief Product and Business Development Officer of TIAA. President and Chief Executive Officer of CREF and TIAA Separate Account VA-1. Executive Vice President of TIAA-CREF Funds and TIAA-CREF Life Funds. Formerly, Executive Vice President and Head of Advisory and Corporate Solutions, TIAA. Prior to joining TIAA, Mr. Narcisse served as Managing Director and Head of International Wealth Management and Head of Traditional and Alternative Investment Products at Morgan Stanley. | |||
| David G. Nason TIAA 730 Third Avenue New York, NY 10017-3206 YOB: 1970 | Executive Vice President | One-year term. Executive Vice President since 2020. | Senior Executive Vice President, Chief Operating Officer of TIAA. Executive Vice President of the TIAA-CREF Fund Complex. Formerly, Senior Executive Vice President, Chief Legal, Risk and Compliance Officer of TIAA. Executive Vice President, Chief Risk and Compliance Officer, TIAA. Prior to joining TIAA, Mr. Nason served as President and CEO of GE Energy Financial Services. |
| TIAA-CREF Lifecycle Funds ■ 2022 Annual Report | 139 |
| Trustees and officers (unaudited) | concluded |
| TIAA-CREF Funds ■ May 31, 2022 | |
| Officers – concluded |
| Name, Address and Year of Birth (“YOB”) | Position(s) Held with Fund | Term of Office and Length of Time Served | Principal Occupation(s) During Past 5 Years | |||
| E. Scott Wickerham TIAA 730 Third Avenue New York, NY 10017-3206 YOB: 1973 | Principal Financial Officer, Principal Accounting Officer and Treasurer | One-year term. Principal Financial Officer, Principal Accounting Officer and Treasurer since 2017. | Senior Managing Director, Head, Publics Investment Finance, Nuveen. Principal Financial Officer, Principal Accounting Officer and Treasurer of the TIAA-CREF Fund Complex; and Vice President and Controller of the Nuveen Funds. Formerly, Managing Director, Head, TC Fund Administration, Nuveen. | |||
| Sean N. Woodroffe TIAA 730 Third Avenue New York, NY 10017-3206 YOB: 1963 | Executive Vice President | One-year term. Executive Vice President since 2018. | Senior Executive Vice President, Chief People Officer of TIAA, and Executive Vice President of the TIAA-CREF Fund Complex. Prior to joining TIAA, Mr. Woodroffe served as Chief People Officer at National Life Group. |
Please note that the Funds’ Statement of Additional Information (SAI) includes additional information about the Funds’ trustees and is available, without charge, through our website, TIAA.org, or by calling 800 223-1200.
| 140 | 2022 Annual Report ■ TIAA-CREF Lifecycle Funds |
Approval of investment management agreement (unaudited)
Board renewal of the investment management agreement for the TIAA-CREF Lifecycle Funds
The Board of Trustees (the “Board” or the “Trustees”) of the TIAA-CREF Funds (the “Trust”) determines whether to initially approve and periodically renew the investment management agreement (the “Agreement”) between Teachers Advisors, LLC (“Advisors”) and the Trust on behalf of each series of the Trust. Under the Agreement, Advisors is responsible for providing investment advisory services to each series of the Trust and overseeing the everyday operations and other service providers of the Trust. Below is a summary of the process the Board undertook related to its most recent renewal of the Agreement with respect to each series of the TIAA-CREF Lifecycle Funds (the “Funds”).
Section 15(c) of the Investment Company Act of 1940, as amended (the “1940 Act”), requires that, after an initial period of up to two years, the Agreement for each Fund will remain in effect only if the Board, including a majority of those Trustees who have no direct or indirect interest in the Agreement, and who are independent Trustees because they are not “interested persons” of the Trust, as that term is defined in the 1940 Act, annually renews the Agreement. None of the Trustees is an interested person of the Trust under the 1940 Act. Rather, they are all deemed to be independent Trustees.
Under normal circumstances, Section 15(c) requires any initial approval or annual renewal of an investment management agreement to be made at an in-person meeting of the Board. However, due to the COVID-19 pandemic, the Securities and Exchange Commission (“SEC”) issued and extended a temporary, conditional exemptive order (the “SEC Order”), permitting mutual fund boards to vote to approve matters subject to the Section 15(c) in-person approval requirement at a meeting that is not held in person if the board determines that reliance on the SEC Order is necessary or appropriate due to prevailing circumstances related to the current or potential effects of COVID-19 and the board ratifies any action taken pursuant to the SEC Order at its next in-person meeting.
Overview of the renewal process
The Board held a virtual meeting via videoconference on March 11, 2022, in order to consider the annual renewal of the Agreement with respect to each applicable Fund using the process established by the Board described further below. At the outset of the meeting, the Board considered reliance upon the SEC Order and determined that such reliance was necessary due to, among other considerations, COVID-19 pandemic-related public health protocols imposed for health and safety reasons. The Board noted that it would ratify actions taken at this meeting pursuant to the SEC Order at its next in-person meeting.
As part of the Board’s established process, the Board delegated certain tasks to its Operations Committee. Among these tasks, the Operations Committee or certain of
| TIAA-CREF Lifecycle Funds ■ 2022 Annual Report | 141 |
Approval of investment management agreement (unaudited)
its designated members worked with Advisors, other Board members and legal counsel to the Trustees to develop guidance and specific requests relating to the types of information to be provided to the Board in connection with the proposed contract renewals.
Among other matters, the Operations Committee or certain of its designated members, following consultations with representatives of Advisors, other Board members, legal counsel to the Trustees and legal counsel to Advisors and the Trust, confirmed or established certain guidance regarding the preparation of reports to be provided to the Board with respect to each Fund by the Board Reporting and Compliance unit of Broadridge Financial Solutions, Inc. (“Broadridge”), using data from Lipper, Inc., an independent provider of investment company data. The Operations Committee considered that Broadridge is widely recognized as a leading provider of comparative analyses used by independent directors and trustees of investment companies during their advisory contract review processes.
Based on guidance provided by the Operations Committee or certain of its designated members on behalf of the Board, Broadridge produced, among other information, comparative performance and expense data for each Fund, including data relating to each Fund’s management fee rate, total expense ratio, short-term and long-term investment performance, brokerage commission costs and portfolio turnover rate (as applicable). Broadridge compared this data, as relevant, for each Fund against a universe of investment companies (except for brokerage commission costs) and against a more selective peer group of mutual funds with similar investment objectives and strategies, each of which was selected by Broadridge, and also compared the performance of each Fund against one or more appropriate broad-based indices. In each case, Broadridge summarized, and the Board considered, the methodologies Broadridge employed to provide the data contained in its reports. In addition, Broadridge represented to the Board that its reports were designed specifically to provide the Board with the fee, expense and performance information that is necessary to help the Board satisfy its duties under Section 15(c) of the 1940 Act. Broadridge also represented that the purpose of its reports is to provide an objective view of each Fund’s relative position regarding the level of fees, expenses and performance against a competitive peer group and universe (as applicable) selected by Broadridge (and not Advisors or the Board). The Board considered the propriety of each Fund’s applicable peer group as selected by Broadridge and use of the Institutional Class as the base class for comparison purposes.
Among other matters, the Board also considered information from Advisors to facilitate the Trustees’ evaluation of the reasonableness of any profits earned by Advisors with respect to its services to each Fund pursuant to the Agreement.
Legal counsel for the Trustees also requested on behalf of the Board, and Advisors provided, information that was designed to assist the Board in its consideration of whether to renew the Agreement for each Fund. In addition to the data provided by Broadridge as described above, this information included, but was not limited to, the
| 142 | 2022 Annual Report ■ TIAA-CREF Lifecycle Funds |
continued
following: (1) further information relating to each Fund’s investment performance and a narrative analysis of the performance of each Fund that had underperformed certain Board-specified criteria, together with an explanation of any events that had a material impact on the Fund’s performance during that period; (2) a description of any fee waiver or expense reimbursement arrangements that were proposed or were in place during the prior year and the extent to which such arrangements would be continued or modified in the coming year; (3) a comparison of each Fund’s management fee rate and performance to other accounts with comparable strategies managed by Advisors or certain of its affiliates; (4) any “fall-out” benefits that accrued or were identified as reasonably likely to accrue to Advisors or its affiliates due to their relationship with the Funds in addition to the Funds’ direct fee payments to Advisors pursuant to the Agreement; (5) information regarding Advisors’ financial resources, senior professional personnel, overall staffing levels, portfolio manager compensation arrangements, capacity to manage the Funds at current and foreseeable asset levels, insurance coverage, portfolio trading and best execution practices, and any actual and potential conflicts of interest identified by Advisors in connection with rendering services to the Funds; (6) information as to any profits earned by Advisors in connection with its services pursuant to the Agreement; (7) a copy of the Agreement and certain related agreements between the Funds and affiliates of Advisors; (8) a copy of Advisors’ Form ADV as filed with the SEC (which was presented only to legal counsel for the Trustees); and (9) draft narrative explanations to be included in the shareholder reports of reasons why the Board should renew the Agreement. The Trustees were also provided with performance ratings of Morningstar, Inc. (“Morningstar”), which is a widely recognized mutual fund ranking service. In addition, the Board received information from management on the continued impact of the COVID-19 pandemic and certain geopolitical events on the Teachers Insurance and Annuity Association of America (“TIAA”) enterprise’s operations generally and on the Funds’ operations and performance.
On March 3, 2022, the Board held a virtual meeting via videoconference with legal counsel to the Trustees to discuss Advisors’ materials, which led to the Trustees providing additional questions to, and requesting additional information from, Advisors. Subsequently, at the March 11, 2022 meeting, the Trustees were given the opportunity to, and did, ask additional questions and they discussed responses from Advisors to the Board’s follow-up questions and requests presented by the Board after its initial review of the information described above.
In considering whether to renew the Agreement with respect to each Fund, the Board considered various factors, including: (1) the nature, extent and quality of services provided or to be provided by Advisors to the Fund; (2) the Fund’s investment performance; (3) the costs of the services provided to the Fund and the profits realized or potential profits to be realized (if any) by Advisors and its affiliates from their relationship with the Fund; (4) fees charged to comparable mutual funds by other advisers; (5) the extent to which economies of scale have been realized or are anticipated to be realized as the Fund grows; (6) how such economies of scale are
| TIAA-CREF Lifecycle Funds ■ 2022 Annual Report | 143 |
Approval of investment management agreement (unaudited)
shared with the Fund for the benefit of its investors, such as, if applicable, through management fee breakpoints; (7) comparisons, if applicable, of the services provided by Advisors to, and the fee rates and performance of, the Fund to other clients to whom Advisors provides comparable services; and (8) any other benefits identified by Advisors derived or anticipated to be derived by Advisors or its affiliates from their relationship with the Fund. As a general matter, the Board considered these factors, and any other factors deemed relevant by the Trustees, in their totality, and no single factor was identified as being the determining factor in deciding whether to renew the Agreement.
In addition to the March 11, 2022 meeting that included Advisors’ personnel, the Trustees met in executive sessions, at which no representatives of Advisors were present, to discuss the proposed renewal of the Agreement for each Fund. The Board also received and considered information from its legal counsel as to certain relevant guidance that relates to the renewal process under Section 15(c) of the 1940 Act and certain other legal authorities.
While the contract renewal process included a series of discussions and meetings leading up to the March 11, 2022 meeting, the oversight and evaluation of Advisors’ services to the Funds by the Board and its Committees is an ongoing process. The Board, as well as its Committees, considered reports on various investment and operational topics that had been identified by the Board or its Committees for review in the year since the last annual renewal process. Further, at their regularly scheduled meetings, the Board and its Investment Committee and its other Committees receive and consider, among other matters, information regarding the performance of the Funds. Thus, in reaching its decisions regarding the renewal of the Agreement for each Fund, the Board took into account the information described herein and other information provided to the Board and its Committees throughout the year.
The Board received and considered both Trust-level and Fund-specific information, but made its renewal determinations on a Fund-by-Fund basis. In deciding whether to renew the Agreement for each Fund, each Trustee may have accorded different weight to different factors and, thus, may have had a different basis for his or her ultimate decision to vote to renew the Agreement for each Fund. At its meeting on March 11, 2022, Board members voted unanimously to renew the Agreement for each Fund. Set forth below is a summary of the primary factors the Board considered with respect to each Fund.
The nature, extent and quality of services
The Board considered the level and depth of knowledge of Advisors, including the professional experience and qualifications of its personnel. The Board also considered that Advisors is an experienced investment adviser that has managed the Funds since their operations commenced. Investment professionals at Advisors also manage various other funds and accounts of the Trust, College Retirement Equities
| 144 | 2022 Annual Report ■ TIAA-CREF Lifecycle Funds |
continued
Fund, the TIAA-CREF Life Funds and TIAA Separate Account VA-1, as well as advise and sub-advise other investment companies and vehicles. Under the Agreement, Advisors is responsible for, among other duties: managing the assets of the Funds (which are funds of funds that may invest their assets in the securities of affiliated and unaffiliated investment companies or other investment pools, referred to as “Underlying Funds”), including conducting research, identifying investments and placing orders to buy and sell shares of Underlying Funds for the Funds’ investment portfolios; active daily monitoring of the Funds’ investment portfolios; reporting on the investment performance and other metrics of the Funds to the Board on a regular basis; responding to Fund flows; compliance monitoring; coordinating the activities of each Fund’s service providers; and overseeing the provision of various administrative services to the Funds. The Board considered that Advisors has carried out these responsibilities in a competent and professional manner. The Board also considered that Advisors has committed significant resources to supporting the series of the Trust, including the Funds. It also considered Advisors’ compliance program and resources and its compliance record with respect to the Funds.
The Board also considered, among other factors, the performance of each Fund, as discussed below. In addition, the Board considered the nature and quality of non-portfolio management services provided by Advisors and its affiliates. In this regard, the Board considered its ongoing review of the performance of certain affiliated and unaffiliated service providers, including the quality of services provided by those firms and Advisors’ oversight of those service providers and the outsourcing of certain services to other firms.
During its review, the Board noted its ongoing review of the level of personnel and other resources available to Advisors to provide portfolio management and other services to the Funds, including the impact of recent and anticipated regulatory requirements and operational changes on such resources, so as to assess the adequacy of the resources devoted to these services. Based on all factors considered, the Board concluded that the nature, extent, and quality of services provided by Advisors to each Fund under the Agreement was reasonable.
Investment performance
The Board considered the investment performance of each Fund, over the periods indicated in the Fund-by-Fund synopsis below. The Board considered each Fund’s performance as compared to its peer group and peer universe (as applicable) and its benchmark index. For details regarding each Fund’s performance, see the Fund-by-Fund synopsis below. The Board concluded that, under the totality of circumstances considered, the investment performance of each Fund was reasonable.
| TIAA-CREF Lifecycle Funds ■ 2022 Annual Report | 145 |
Approval of investment management agreement (unaudited)
Cost and profitability
The Board considered financial and profitability data relating to Advisors’ services to the Funds for the calendar year 2021. The Board considered Advisors’ profit calculations with respect to its services to each Fund both before and after taking into account the costs incurred directly or indirectly by Advisors in connection with the distribution of shares of the Fund. The Board considered that this data included the effect of the Fund’s unique fee structure where the Funds invest in fee-waived Class W shares of the TIAA-CREF Underlying Funds and the Funds pay the equivalent of these Underlying Funds’ management fees and other expenses directly as part of the Funds’ management fee rates under the Agreement, along with the Funds’ existing annual management fee rate of 0.10% of average daily net assets. The Board considered that the Broadridge fee comparisons would be affected because most of the Funds’ peers do not have a similar fee structure.
The Board acknowledged the reasonableness of having management fee rates which permit Advisors to maintain and improve the quality of services provided to the Funds and recognized the entrepreneurial and other risks assumed by Advisors in managing the Funds. The Board also noted Advisors’ waiver of 0.10% of each Fund’s management fee since inception, which will continue through at least September 30, 2024. The Board also considered that Advisors had agreed to additional waivers of the Funds’ fees, which will continue through at least September 30, 2022. The Board also acknowledged certain fee waivers and reimbursements of expenses above specified amounts undertaken by Advisors with respect to many of the Underlying Funds which, in turn, reduce the management fees charged to the Funds. The Board also recognized Advisors’ commitment to reimburse Fund expenses to the extent that total annual operating expenses exceeded certain specified amounts. The Board considered that Advisors had calculated that it incurred losses with respect to each Fund under the Agreement for the one-year period ended December 31, 2021.
Fees charged by other advisers
The Board considered comparative information regarding each Fund’s contractual and effective management fee rates and the contractual and effective management fee rates paid by similar mutual funds to other advisers, as analyzed by Broadridge and reflected in the Fund-by-Fund synopsis below. The Board acknowledged Advisors’ assertion that, while the Funds’ expense structure makes the Funds’ contractual and effective management fee rates appear higher as compared to its peers (most of whom have a traditional funds of funds fee structure), the Funds’ total expenses were favorable as compared to most of their peers. In this regard, the Board also considered the inherent limitations of such comparisons in light of uncertainty as to how the fees of such similar mutual funds are set and potentially material differences between a Fund and its comparable mutual funds. The Board considered Broadridge’s treatment of all fund fee waivers, regardless of their type, as management fee waivers, which could materially impact how the Funds’ actual management fee rates
| 146 | 2022 Annual Report ■ TIAA-CREF Lifecycle Funds |
continued
compare to those of similar mutual funds. Additionally, the Board considered the potential limitations of such comparisons due to, among other factors, the fact that, in many instances, Broadridge based its comparisons on financial data relating to fiscal periods that differed from the period for which the Fund’s data were derived. Based on all factors considered, the Board concluded that the management fee rates under the Agreement with respect to each Fund were reasonable in relation to those charged by appropriate groups of comparable mutual funds.
Economies of scale
The Board considered whether Advisors has experienced or is anticipated to experience economies of scale in connection with the operation of each Fund, and whether any such economies are shared with the Funds. The Board also considered that because Advisors operated each Fund at a loss, and has waived 0.10% of its management fees for the Funds since inception, there had been little opportunity to pass on economies of scale to Fund shareholders. Based on all factors considered, the Board concluded that the Funds’ management fee rate schedules were reasonable in light of current economies of scale considerations and current asset levels.
Fee and performance comparisons with other Advisors clients
The Board considered that Advisors provides similar investment management services to other investment companies. The Board noted that Advisors provides funds of funds management services to the TIAA-CREF Lifestyle Funds and the TIAA-CREF Life Balanced Fund, with annual management fee rates of 0.10% of average daily net assets, and the TIAA-CREF Managed Allocation Fund, for which Advisors receives no management fee. The Board also considered that Advisors also manages the TIAA-CREF Lifecycle Index Funds, which have the same fee structure as the Funds. The Board also discussed the performance of these other funds of funds while discussing the performance of the Funds. Based on all factors considered, the Board concluded that the management fee rates under the Agreement with respect to each Fund were reasonable in relation to those charged by Advisors to its comparable clients.
Other benefits
The Board also considered additional “fall-out benefits” to Advisors and its affiliates arising from the Agreement. Such benefits include, among others, other fees paid by the Funds to Advisors or its affiliates for other services, such as distribution and administration, and investment-related benefits, such as economies of scale to the extent the Funds share investment resources and/or personnel with other clients of Advisors and the ability to incubate strategies within one or more Funds that could be subsequently utilized to manage other non-Fund products. Advisors and its affiliates may also benefit from the level of business and relationships the Funds
| TIAA-CREF Lifecycle Funds ■ 2022 Annual Report | 147 |
Approval of investment management agreement (unaudited)
have with certain service providers. Advisors and/or its affiliates also may benefit to the extent that the Funds add scale to the TIAA-CREF Underlying Funds or other affiliated underlying funds. Also, Advisers and its affiliates earn fees on the Funds’ investments in other affiliated products, such as Nuveen Funds and the TIAA-CREF Real Property Fund. Additionally, the Funds may be utilized as investment options for other products and businesses of Advisors and its affiliates, such as variable products, fund of funds and 529 education savings plans. Also, Advisors and its affiliates may benefit from their relationship with the Funds to the extent that this relationship results in potential investors viewing TIAA, of which Advisors is an indirect, wholly-owned subsidiary, as a leading retirement plan provider in the academic and non-profit markets and as a single source for all their financial service needs. The Board concluded that other benefits to Advisors and its affiliates arising from the Agreement were reasonable in light of various relevant factors.
Fund-by-fund synopsis of factors
The Board considered the following specific factors (among others) in connection with its determination to renew the Agreement with respect to each Fund. If a Fund is described in the following discussions as being in the “1st” quintile, it is in the best of five groups (that is, the group has the best performance or the lowest expenses, as the case may be). References below to quintiles are based on data provided to the Board in the reports prepared by Broadridge. The specific management fee, expense and performance factors outlined below are based on the Institutional Class of each Fund. Because the Institutional Class generally has lower non-management expenses than the other classes of these Funds, the expenses and performance of these other classes will differ from the expenses and performance shown for the Institutional Class. All time periods referenced below are ended December 31, 2021. Under the Morningstar rating system, an Overall Morningstar Rating of 5 stars is the highest (best) rating category and 1 star is the lowest (worst) rating category. The Morningstar data is as of December 31, 2021. Statements below regarding a Fund’s “effective management fee rate” refer to the overall effective blended fee rate that applied to that Fund after taking into account any breakpoints in the management fee rate schedule for the Fund and any applicable fee waivers and/or expense reimbursements. Statements below regarding “net loss” refer to Advisors’ calculation that it incurred a loss for the services that it rendered to a Fund during 2021 under the Agreement.
Lifecycle Retirement Income Fund
| • | As discussed above, instead of incurring the TIAA-CREF Underlying Fund expenses indirectly, the Fund invests in the fee-waived Class W of the TIAA-CREF Underlying Funds and pays such expenses directly. These expenses may fluctuate daily based upon the Fund’s actual allocations to the Underlying Funds. The Fund also incurs an annual asset allocation fee of 0.10% of average daily net assets as part of its management fee rate. As of December 31, 2021, the Fund’s effective |
| 148 | 2022 Annual Report ■ TIAA-CREF Lifecycle Funds |
continued
| management fee rate was 0.238% of average daily net assets, which includes the effect of a voluntary management fee rate waiver of 0.10% ending September 30, 2023, as well as the effect of a voluntary waiver on the Fund’s other expense by Advisors. The voluntary management fee rate waiver subsequently has been extended by Advisors through September 30, 2024. | |
| • | The Fund’s total expense ratio was in the 1st quintile of the group of comparable funds selected by Broadridge for expense comparison purposes (“Expense Group”), while the Fund’s actual management fee rate (including the waiver) and contractual management fee rate each ranked 1 out of 5 funds within its Expense Group. The Fund’s total expense ratio, actual management fee rate (including the waiver) and contractual management fee rate were in the 1st, 4th and 2nd quintiles of the universe of comparable funds selected by Broadridge for expense comparison purposes (“Expense Universe”), respectively. |
| • | The Fund was in the 2nd, 3rd and 3rd quintiles and ranked 2 out of 5 funds within the group of comparable funds selected by Broadridge for performance comparison purposes (“Performance Group”) for the one-, three-, five- and ten-year periods, respectively. The Fund was in the 2nd, 1st, 1st and 1st quintiles of the universe of comparable funds selected by Broadridge for performance comparison purposes (“Performance Universe”) for the one-, three-, five- and ten-year periods, respectively. |
| • | The Fund received an Overall Morningstar Rating of 4 stars. |
| • | Advisors calculated that it incurred a net loss with respect to its services to the Fund for the one-year period without taking into account profits Advisors earned in the aggregate with respect to the Underlying Funds that are also managed by Advisors in which this Fund invests. |
Lifecycle 2010 Fund
| • | As discussed above, instead of incurring the TIAA-CREF Underlying Fund expenses indirectly, the Fund invests in the fee-waived Class W of the TIAA-CREF Underlying Funds and pays such expenses directly. These expenses may fluctuate daily based upon the Fund’s actual allocations to the Underlying Funds. The Fund also incurs an annual asset allocation fee of 0.10% of average daily net assets as part of its management fee rate. As of December 31, 2021, the Fund’s effective management fee rate was 0.257% of average daily net assets, which includes the effect of a voluntary management fee rate waiver of 0.10% ending September 30, 2023, as well as the effect of a voluntary waiver on the Fund’s other expense by Advisors. The voluntary management fee rate waiver subsequently has been extended by Advisors through September 30, 2024. |
| • | The Fund’s total expense ratio was in the 1st quintile of its Expense Group, while the Fund’s actual management fee rate (including the waiver) and contractual management fee rate each ranked 2 out of 4 funds within its Expense Group. The Fund’s total expense ratio, actual management fee rate (including the waiver) and contractual management fee rate were in the 1st, 2nd and 2nd quintiles of its Expense Universe, respectively. |
| TIAA-CREF Lifecycle Funds ■ 2022 Annual Report | 149 |
Approval of investment management agreement (unaudited)
| • | The Fund was in the 3rd, 1st and 1st quintiles and ranked 1 out of 3 funds within its Performance Group for the one-, three-, five- and ten-year periods, respectively. The Fund was in the 3rd, 2nd, 1st and 1st quintiles of its Performance Universe for the one-, three-, five- and ten-year periods, respectively. |
| • | The Fund received an Overall Morningstar Rating of 5 stars. |
| • | Advisors calculated that it incurred a net loss with respect to its services to the Fund for the one-year period without taking into account profits Advisors earned in the aggregate with respect to the Underlying Funds that are also managed by Advisors in which this Fund invests. |
Lifecycle 2015 Fund
| • | As discussed above, instead of incurring the TIAA-CREF Underlying Fund expenses indirectly, the Fund invests in the fee-waived Class W of the TIAA-CREF Underlying Funds and pays such expenses directly. These expenses may fluctuate daily based upon the Fund’s actual allocations to the Underlying Funds. The Fund also incurs an annual asset allocation fee of 0.10% of average daily net assets as part of its management fee rate. As of December 31, 2021, the Fund’s effective management fee rate was 0.266% of average daily net assets, which includes the effect of a voluntary management fee rate waiver of 0.10% ending September 30, 2023, as well as the effect of a voluntary waiver on the Fund’s other expense by Advisors. The voluntary management fee rate waiver subsequently has been extended by Advisors through September 30, 2024. |
| • | The Fund’s total expense ratio was in the 1st quintile of its Expense Group, while the Fund’s actual management fee rate (including the waiver) and contractual management fee rate each ranked 2 out of 4 funds within its Expense Group. The Fund’s total expense ratio, actual management fee rate (including the waiver) and contractual management fee rate were in the 1st, 3rd and 3rd quintiles of its Expense Universe, respectively. |
| • | The Fund was in the 3rd, 2nd and 2nd quintiles and ranked 1 out of 3 funds within its Performance Group for the one-, three-, five- and ten-year periods, respectively. The Fund was in the 3rd, 2nd, 1st and 1st quintiles of its Performance Universe for the one-, three-, five- and ten-year periods, respectively. |
| • | The Fund received an Overall Morningstar Rating of 4 stars. |
| • | Advisors calculated that it incurred a net loss with respect to its services to the Fund for the one-year period without taking into account profits Advisors earned in the aggregate with respect to the Underlying Funds that are also managed by Advisors in which this Fund invests. |
Lifecycle 2020 Fund
| • | As discussed above, instead of incurring the TIAA-CREF Underlying Fund expenses indirectly, the Fund invests in the fee-waived Class W of the TIAA-CREF Underlying Funds and pays such expenses directly. These expenses may fluctuate daily based upon the Fund’s actual allocations to the Underlying Funds. The Fund also incurs an annual asset allocation fee of 0.10% of average daily net assets as part |
| 150 | 2022 Annual Report ■ TIAA-CREF Lifecycle Funds |
continued
| of its management fee rate. As of December 31, 2021, the Fund’s effective management fee rate was 0.273% of average daily net assets, which includes the effect of a voluntary management fee rate waiver of 0.10% ending September 30, 2023, as well as the effect of a voluntary waiver on the Fund’s other expense by Advisors. The voluntary management fee rate waiver subsequently has been extended by Advisors through September 30, 2024. | |
| • | The Fund’s total expense ratio was in the 1st quintile of its Expense Group, while the Fund’s actual management fee rate (including the waiver) ranked 3 out of 5 funds and contractual management fee rate ranked 2 out of 5 funds within its Expense Group. The Fund’s total expense ratio, actual management fee rate (including the waiver) and contractual management fee rate were in the 1st, 4th and 3rd quintiles of its Expense Universe, respectively. |
| • | The Fund was in the 5th, 3rd and 3rd quintiles and ranked 1 out of 4 funds within its Performance Group for the one-, three-, five- and ten-year periods, respectively. The Fund was in the 3rd, 2nd, 1st and 1st quintiles of its Performance Universe for the one-, three-, five- and ten-year periods, respectively. |
| • | The Fund received an Overall Morningstar Rating of 4 stars. |
| • | Advisors calculated that it incurred a net loss with respect to its services to the Fund for the one-year period without taking into account profits Advisors earned in the aggregate with respect to the Underlying Funds that are also managed by Advisors in which this Fund invests. |
Lifecycle 2025 Fund
| • | As discussed above, instead of incurring the TIAA-CREF Underlying Fund expenses indirectly, the Fund invests in the fee-waived Class W of the TIAA-CREF Underlying Funds and pays such expenses directly. These expenses may fluctuate daily based upon the Fund’s actual allocations to the Underlying Funds. The Fund also incurs an annual asset allocation fee of 0.10% of average daily net assets as part of its management fee rate. As of December 31, 2021, the Fund’s effective management fee rate was 0.278% of average daily net assets, which includes the effect of a voluntary management fee rate waiver of 0.10% ending September 30, 2023, as well as the effect of a voluntary waiver on the Fund’s other expense by Advisors. The voluntary management fee rate waiver subsequently has been extended by Advisors through September 30, 2024. |
| • | The Fund’s total expense ratio and contractual management fee rate were each in the 1st quintile of its Expense Group, while its actual management fee rate (including the waiver) was in the 2nd quintile of its Expense Group. The Fund’s total expense ratio, actual management fee rate (including the waiver) and contractual management fee rate were in the 1st, 4th and 2nd quintiles of its Expense Universe, respectively. |
| • | The Fund was in the 3rd, 3rd, 3rd and 1st quintiles of its Performance Group for the one-, three-, five- and ten-year periods, respectively. The Fund was in the 3rd, 2nd, 1st and 1st quintiles of its Performance Universe for the one-, three-, five- and ten-year periods, respectively. |
| TIAA-CREF Lifecycle Funds ■ 2022 Annual Report | 151 |
Approval of investment management agreement (unaudited)
| • | The Fund received an Overall Morningstar Rating of 4 stars. |
| • | Advisors calculated that it incurred a net loss with respect to its services to the Fund for the one-year period without taking into account profits Advisors earned in the aggregate with respect to the Underlying Funds that are also managed by Advisors in which this Fund invests. |
Lifecycle 2030 Fund
| • | As discussed above, instead of incurring the TIAA-CREF Underlying Fund expenses indirectly, the Fund invests in the fee-waived Class W of the TIAA-CREF Underlying Funds and pays such expenses directly. These expenses may fluctuate daily based upon the Fund’s actual allocations to the Underlying Funds. The Fund also incurs an annual asset allocation fee of 0.10% of average daily net assets as part of its management fee rate. As of December 31, 2021, the Fund’s effective management fee rate was 0.282% of average daily net assets, which includes the effect of a voluntary management fee rate waiver of 0.10% ending September 30, 2023, as well as the effect of a voluntary waiver on the Fund’s other expense by Advisors. The voluntary management fee rate waiver subsequently has been extended by Advisors through September 30, 2024. |
| • | The Fund’s total expense ratio and contractual management fee rate were each in the 1st quintile of its Expense Group, while its actual management fee rate (including the waiver) was in the 2nd quintile of its Expense Group. The Fund’s total expense ratio, actual management fee rate (including the waiver) and contractual management fee rate were in the 1st, 4th and 2nd quintiles of its Expense Universe, respectively. |
| • | The Fund was in the 4th, 3rd, 3rd and 1st quintiles of its Performance Group for the one-, three-, five- and ten-year periods, respectively. The Fund was in the 3rd, 2nd, 2nd and 1st quintiles of its Performance Universe for the one-, three-, five- and ten-year periods, respectively. |
| • | The Fund received an Overall Morningstar Rating of 4 stars. |
| • | Advisors calculated that it incurred a net loss with respect to its services to the Fund for the one-year period without taking into account profits Advisors earned in the aggregate with respect to the Underlying Funds that are also managed by Advisors in which this Fund invests. |
Lifecycle 2035 Fund
| • | As discussed above, instead of incurring the TIAA-CREF Underlying Fund expenses indirectly, the Fund invests in the fee-waived Class W of the TIAA-CREF Underlying Funds and pays such expenses directly. These expenses may fluctuate daily based upon the Fund’s actual allocations to the Underlying Funds. The Fund also incurs an annual asset allocation fee of 0.10% of average daily net assets as part of its management fee rate. As of December 31, 2021, the Fund’s effective management fee rate was 0.281% of average daily net assets, which includes the effect of a voluntary management fee rate waiver of 0.10% ending |
| 152 | 2022 Annual Report ■ TIAA-CREF Lifecycle Funds |
continued
| September 30, 2023, as well as the effect of a voluntary waiver on the Fund’s other expense by Advisors. The voluntary management fee rate waiver subsequently has been extended by Advisors through September 30, 2024. | |
| • | The Fund’s total expense ratio and contractual management fee rate were each in the 1st quintile of its Expense Group, while its actual management fee rate (including the waiver) was in the 2nd quintile of its Expense Group. The Fund’s total expense ratio, actual management fee rate (including the waiver) and contractual management fee rate were in the 1st, 4th and 2nd quintiles of its Expense Universe, respectively. |
| • | The Fund was in the 5th, 4th, 4th and 1st quintiles of its Performance Group for the one-, three-, five- and ten-year periods, respectively. The Fund was in the 5th, 3rd, 2nd and 1st quintiles of its Performance Universe for the one-, three-, five- and ten-year periods, respectively. |
| • | The Fund received an Overall Morningstar Rating of 4 stars. |
| • | Advisors calculated that it incurred a net loss with respect to its services to the Fund for the one-year period without taking into account profits Advisors earned in the aggregate with respect to the Underlying Funds that are also managed by Advisors in which this Fund invests. |
Lifecycle 2040 Fund
| • | As discussed above, instead of incurring the TIAA-CREF Underlying Fund expenses indirectly, the Fund invests in the fee-waived Class W of the TIAA-CREF Underlying Funds and pays such expenses directly. These expenses may fluctuate daily based upon the Fund’s actual allocations to the Underlying Funds. The Fund also incurs an annual asset allocation fee of 0.10% of average daily net assets as part of its management fee rate. As of December 31, 2021, the Fund’s effective management fee rate was 0.275% of average daily net assets, which includes the effect of a voluntary management fee rate waiver of 0.10% ending September 30, 2023, as well as the effect of a voluntary waiver on the Fund’s other expense by Advisors. The voluntary management fee rate waiver subsequently has been extended by Advisors through September 30, 2024. |
| • | The Fund’s total expense ratio and contractual management fee rate were each in the 1st quintile of its Expense Group, while its actual management fee rate (including the waiver) was in the 2nd quintile of its Expense Group. The Fund’s total expense ratio, actual management fee rate (including the waiver) and contractual management fee rate were in the 1st, 4th and 2nd quintiles of its Expense Universe, respectively. |
| • | The Fund was in the 5th, 4th, 4th and 1st quintiles of its Performance Group for the one-, three-, five- and ten-year periods, respectively. The Fund was in the 5th, 2nd, 2nd and 1st quintiles of its Performance Universe for the one-, three-, five- and ten-year periods, respectively. |
| • | The Fund received an Overall Morningstar Rating of 4 stars. |
| • | Advisors calculated that it incurred a net loss with respect to its services to the Fund for the one-year period without taking into account profits Advisors earned in |
| TIAA-CREF Lifecycle Funds ■ 2022 Annual Report | 153 |
Approval of investment management agreement (unaudited)
| the aggregate with respect to the Underlying Funds that are also managed by Advisors in which this Fund invests. |
Lifecycle 2045 Fund
| • | As discussed above, instead of incurring the TIAA-CREF Underlying Fund expenses indirectly, the Fund invests in the fee-waived Class W of the TIAA-CREF Underlying Funds and pays such expenses directly. These expenses may fluctuate daily based upon the Fund’s actual allocations to the Underlying Funds. The Fund also incurs an annual asset allocation fee of 0.10% of average daily net assets as part of its management fee rate. As of December 31, 2021, the Fund’s effective management fee rate was 0.277% of average daily net assets, which includes the effect of a voluntary management fee rate waiver of 0.10% ending September 30, 2023, as well as the effect of a voluntary waiver on the Fund’s other expense by Advisors. The voluntary management fee rate waiver subsequently has been extended by Advisors through September 30, 2024. |
| • | The Fund’s total expense ratio and contractual management fee rate were each in the 1st quintile of its Expense Group, while its actual management fee rate (including the waiver) was in the 2nd quintile of its Expense Group. The Fund’s total expense ratio, actual management fee rate (including the waiver) and contractual management fee rate were in the 1st, 4th and 2nd quintiles of its Expense Universe, respectively. |
| • | The Fund was in the 4th, 3rd, 3rd and 1st quintiles of its Performance Group for the one-, three-, five- and ten-year periods, respectively. The Fund was in the 4th, 2nd, 1st and 1st quintiles of its Performance Universe for the one-, three-, five- and ten-year periods, respectively. |
| • | The Fund received an Overall Morningstar Rating of 4 stars. |
| • | Advisors calculated that it incurred a net loss with respect to its services to the Fund for the one-year period without taking into account profits Advisors earned in the aggregate with respect to the Underlying Funds that are also managed by Advisors in which this Fund invests. |
Lifecycle 2050 Fund
| • | As discussed above, instead of incurring the TIAA-CREF Underlying Fund expenses indirectly, the Fund invests in the fee-waived Class W of the TIAA-CREF Underlying Funds and pays such expenses directly. These expenses may fluctuate daily based upon the Fund’s actual allocations to the Underlying Funds. The Fund also incurs an annual asset allocation fee of 0.10% of average daily net assets as part of its management fee rate. As of December 31, 2021, the Fund’s effective management fee rate was 0.267% of average daily net assets, which includes the effect of a voluntary management fee rate waiver of 0.10% ending September 30, 2023, as well as the effect of a voluntary waiver on the Fund’s other expense by Advisors. The voluntary management fee rate waiver subsequently has been extended by Advisors through September 30, 2024. |
| 154 | 2022 Annual Report ■ TIAA-CREF Lifecycle Funds |
continued
| • | The Fund’s total expense ratio and contractual management fee rate were each in the 1st quintile of its Expense Group, while its actual management fee rate (including the waiver) was in the 2nd quintile of its Expense Group. The Fund’s total expense ratio, actual management fee rate (including the waiver) and contractual management fee rate were in the 1st, 4th and 2nd quintiles of its Expense Universe, respectively. |
| • | The Fund was in the 4th, 3rd, 2nd and 1st quintiles of its Performance Group for the one-, three-, five- and ten-year periods, respectively. The Fund was in the 4th, 2nd, 1st and 1st quintiles of its Performance Universe for the one-, three-, five- and ten-year periods, respectively. |
| • | The Fund received an Overall Morningstar Rating of 4 stars. |
| • | Advisors calculated that it incurred a net loss with respect to its services to the Fund for the one-year period without taking into account profits Advisors earned in the aggregate with respect to the Underlying Funds that are also managed by Advisors in which this Fund invests. |
Lifecycle 2055 Fund
| • | As discussed above, instead of incurring the TIAA-CREF Underlying Fund expenses indirectly, the Fund invests in the fee-waived Class W of the TIAA-CREF Underlying Funds and pays such expenses directly. These expenses may fluctuate daily based upon the Fund’s actual allocations to the Underlying Funds. The Fund also incurs an annual asset allocation fee of 0.10% of average daily net assets as part of its management fee rate. As of December 31, 2021, the Fund’s effective management fee rate was 0.243% of average daily net assets, which includes the effect of a voluntary management fee rate waiver of 0.10% ending September 30, 2023, as well as the effect of a voluntary waiver on the Fund’s other expense by Advisors. The voluntary management fee rate waiver subsequently has been extended by Advisors through September 30, 2024. |
| • | The Fund’s total expense ratio, actual management fee rate (including the waiver) and contractual management fee rate were each in the 1st quintile of its Expense Group. The Fund’s total expense ratio, actual management fee rate (including the waiver) and contractual management fee rate were in the 1st, 4th and 2nd quintiles of its Expense Universe, respectively. |
| • | The Fund was in the 4th, 3rd and 3rd quintiles and ranked 1 out of 5 funds within its Performance Group for the one-, three-, five- and ten-year periods, respectively. The Fund was in the 4th, 2nd, 1st and 1st quintiles of its Performance Universe for the one-, three-, five- and ten-year periods, respectively. |
| • | The Fund received an Overall Morningstar Rating of 4 stars. |
| • | Advisors calculated that it incurred a net loss with respect to its services to the Fund for the one-year period without taking into account profits Advisors earned in the aggregate with respect to the Underlying Funds that are also managed by Advisors in which this Fund invests. |
| TIAA-CREF Lifecycle Funds ■ 2022 Annual Report | 155 |
Approval of investment management agreement (unaudited)
Lifecycle 2060 Fund
| • | As discussed above, instead of incurring the TIAA-CREF Underlying Fund expenses indirectly, the Fund invests in the fee-waived Class W of the TIAA-CREF Underlying Funds and pays such expenses directly. These expenses may fluctuate daily based upon the Fund’s actual allocations to the Underlying Funds. The Fund also incurs an annual asset allocation fee of 0.10% of average daily net assets as part of its management fee rate. As of December 31, 2021, the Fund’s effective management fee rate was 0.214% of average daily net assets, which includes the effect of a voluntary management fee rate waiver of 0.10% ending September 30, 2023, as well as the effect of a voluntary waiver on the Fund’s other expense by Advisors. The voluntary management fee rate waiver subsequently has been extended by Advisors through September 30, 2024. |
| • | The Fund’s total expense ratio and contractual management fee rate were each in the 1st quintile of its Expense Group, while its actual management fee rate (including the waiver) was in the 2nd quintile of its Expense Group. The Fund’s total expense ratio, actual management fee rate (including the waiver) and contractual management fee rate were in the 1st, 4th and 2nd quintiles of its Expense Universe, respectively. |
| • | The Fund was in the 4th, 2nd and 3rd quintiles of its Performance Group for the one-, three- and five-year periods, respectively. The Fund was in the 4th, 1st and 1st quintiles of its Performance Universe for the one-, three- and five-year periods, respectively. |
| • | The Fund received an Overall Morningstar Rating of 4 stars. |
| • | Advisors calculated that it incurred a net loss with respect to its services to the Fund for the one-year period without taking into account profits Advisors earned in the aggregate with respect to the Underlying Funds that are also managed by Advisors in which this Fund invests. |
Lifecycle 2065 Fund
| • | As discussed above, instead of incurring the TIAA-CREF Underlying Fund expenses indirectly, the Fund invests in the fee-waived Class W of the TIAA-CREF Underlying Funds and pays such expenses directly. These expenses may fluctuate daily based upon the Fund’s actual allocations to the Underlying Funds. The Fund also incurs an annual asset allocation fee of 0.10% of average daily net assets as part of its management fee rate. As of December 31, 2021, the Fund’s effective management fee rate was 0.000% of average daily net assets, which includes the effect of a voluntary management fee rate waiver of 0.10% ending September 30, 2023, as well as the effect of a voluntary waiver on the Fund’s other expense by Advisors. The voluntary management fee rate waiver subsequently has been extended by Advisors through September 30, 2024. |
| • | The Fund’s total expense ratio, actual management fee rate (including the waiver) and contractual management fee rate were each in the 1st quintile of its Expense Group. The Fund’s total expense ratio and actual management fee rate (including |
| 156 | 2022 Annual Report ■ TIAA-CREF Lifecycle Funds |
concluded
| the waiver) were each in the 1st quintile of its Expense Universe, while the contractual management fee rate was in the 2nd quintile of its Expense Universe. | |
| • | The Fund was in the 3rd and 2nd quintiles of its Performance Group for the one-year and since inception periods, respectively. The Fund was in the 3rd quintile of its Performance Universe for each of the one-year and since inception periods. |
| • | The Fund is too new to have an Overall Morningstar Rating. |
| • | Advisors calculated that it incurred a net loss with respect to its services to the Fund for the one-year period without taking into account profits Advisors earned in the aggregate with respect to the Underlying Funds that are also managed by Advisors in which this Fund invests. |
Based primarily on the foregoing factors and conclusions, the Board renewed the Agreement for each Fund.
| TIAA-CREF Lifecycle Funds ■ 2022 Annual Report | 157 |
Liquidity risk management program (unaudited)
Discussion of the operation and effectiveness of the Funds’ liquidity risk management program
In compliance with Rule 22e-4 under the Investment Company Act of 1940, as amended (the “Liquidity Rule”), each series of the Trust covered by this Report (the “Funds”) has adopted and implemented a liquidity risk management program (the “Program”), which is reasonably designed to assess and manage the Funds’ liquidity risk. The Program consists of various provisions relating to assessing and managing Fund liquidity risk, as discussed further below. The Funds’ Board of Trustees (the “Board”) previously approved the designation of Advisors (the “Administrator”) as Program administrator. The Liquidity Monitoring and Analysis Team (the “LMAT”) carries out day-to-day Program management with oversight by the Liquidity Oversight Committee (the “LOSC”). Personnel from the Administrator and Nuveen Fund Advisors, LLC, an affiliate of the Administrator, comprise the LMAT and LOSC.
At a February 15, 2022 Board meeting, the Administrator provided the Board with a written report addressing the Program’s operation, adequacy, and effectiveness of implementation for the period from January 1, 2021 through December 31, 2021 (the “Review Period”), as required under the Liquidity Rule. The report noted that the Program has been and continues to be adequately and effectively implemented to monitor and (as applicable) respond to the Funds’ liquidity developments.
In accordance with the Program, the LMAT assesses each Fund’s liquidity risk no less frequently than annually based on various factors, such as (i) the Fund’s investment strategy and the liquidity of portfolio investments, (ii) cash flow projections, and (iii) holdings of cash and cash equivalents and borrowing arrangements and other funding sources. Certain factors are considered under both normal and reasonably foreseeable stressed conditions.
Each Fund portfolio investment is classified into one of four liquidity categories (including “highly liquid investments” and “illiquid investments,” discussed below). The classification is based on a determination of how long it is reasonably expected to take to convert the investment into cash, or sell or dispose of the investment, in current market conditions without significantly changing the market value of the investment. Liquidity classification determinations take into account various market, trading, and investment-specific considerations, as well as market depth, and utilize third-party vendor data.
Any Fund that does not primarily hold highly liquid investments must, among other things, determine a minimum percentage of Fund net assets that must be invested in highly liquid investments (a “Highly Liquid Investment Minimum”). During the Review Period, each Fund primarily held highly liquid investments and therefore was exempt from the requirement to adopt a Highly Liquid Investment Minimum and to comply with the related requirements under the Liquidity Rule.
| 158 | 2022 Annual Report ■ TIAA-CREF Lifecycle Funds |
The Liquidity Rule also limits the Funds’ investments in illiquid investments. Specifically, the Liquidity Rule prohibits acquisition of illiquid investments if doing so would result in the Fund holding more than 15% of its net assets in illiquid investments and requires certain reporting anytime a Fund’s holdings of illiquid investments exceed 15% of net assets. During the Review Period, no Fund exceeded the 15% limit on illiquid investments.
| TIAA-CREF Lifecycle Funds ■ 2022 Annual Report | 159 |
Additional information about index providers (unaudited)
Russell Indexes
Source: London Stock Exchange Group plc and its group undertakings (collectively, the “LSE Group”). © LSE Group 2022. FTSE Russell is a trading name of certain of the LSE Group companies. “FTSE®,” “Russell®” and “FTSE Russell®” are trademarks of the relevant LSE Group companies and are used by any other LSE Group company under license. All rights in the FTSE Russell indexes or data vest in the relevant LSE Group company which owns the index or the data. Neither LSE Group nor its licensors accept any liability for any errors or omissions in the indexes or data and no party may rely on any indexes or data contained in this communication. No further distribution of data from the LSE Group is permitted without the relevant LSE Group company’s express written consent. The LSE Group does not promote, sponsor or endorse the content of this communication.
MSCI Indexes
Source: MSCI. The MSCI information may only be used for your internal use, may not be reproduced or redisseminated in any form and may not be used as a basis for or a component of any financial instruments or products or indices. None of the MSCI information is intended to constitute investment advice or a recommendation to make (or refrain from making) any kind of investment decision and may not be relied on as such. Historical data and analysis should not be taken as an indication or guarantee of any future performance analysis, forecast or prediction. The MSCI information is provided on an “as is” basis and the user of this information assumes the entire risk of any use made of this information. MSCI, each of its affiliates and each other person involved in or related to compiling, computing or creating any MSCI information (collectively, the “MSCI Parties”) expressly disclaims all warranties (including, without limitation, any warranties of originality, accuracy, completeness, timeliness, non-infringement, merchantability and fitness for a particular purpose) with respect to this information. Without limiting any of the foregoing, in no event shall any MSCI Party have any liability for any direct, indirect, special, incidental, punitive, consequential (including, without limitation, lost profits) or any other damages. (www.msci.com)
Bloomberg Indexes
Source: Bloomberg Index Services Limited. BLOOMBERG® is a trademark and service mark of Bloomberg Finance L.P. and its affiliates (collectively “Bloomberg”). Bloomberg or Bloomberg’s licensors own all proprietary rights in the Bloomberg Indices. Bloomberg neither approves nor endorses this material, nor guarantees the accuracy or completeness of any information herein, nor makes any warranty, express or implied, as to the results to be obtained therefrom and, to the maximum extent allowed by law, neither shall have any liability or responsibility for injury or damages arising in connection therewith.
Standard & Poor’s Index
The Indexes in the S&P Target Date Index Series are products of S&P Dow Jones Indices LLC, a division of S&P Global, or its affiliates (“SPDJI”), and have been licensed
| 160 | 2022 Annual Report ■ TIAA-CREF Lifecycle Funds |
for use by the funds. Standard & Poor’s® and S&P® are registered trademarks of Standard & Poor’s Financial Services LLC, a division of S&P Global (“S&P”); Dow Jones® is a registered trademark of Dow Jones Trademark Holdings LLC (“Dow Jones”). It is not possible to invest directly in an index. The funds are not sponsored, endorsed, sold or promoted by SPDJI, Dow Jones, S&P, any of their respective affiliates (collectively, “S&P Dow Jones Indices”). S&P Dow Jones Indices does not make any representation or warranty, express or implied, to the owners of the funds or any member of the public regarding the advisability of investing in securities generally or in the funds particularly or the ability of the S&P Target Date Index Series to track general market performance. Past performance of an index is not an indication or guarantee of future results. S&P Dow Jones Indices’ only relationship to the funds with respect to the S&P Target Date Index Series is the licensing of the Indexes and certain trademarks, service marks and/or trade names of S&P Dow Jones Indices and/or its licensors. The Indexes in the S&P Target Date Index Series are determined, composed and calculated by S&P Dow Jones Indices without regard to the funds. S&P Dow Jones Indices has no obligation to take the needs of the funds or the owners of the funds into consideration in determining, composing or calculating the S&P Target Date Index Series. S&P Dow Jones Indices is not responsible for and has not participated in the determination of the prices, and amount of the funds or the timing of the issuance or sale of fund shares or in the determination or calculation of the equation by which fund shares are to be converted into cash, surrendered or redeemed, as the case may be. S&P Dow Jones Indices has no obligation or liability in connection with the administration, marketing or trading of the funds. There is no assurance that investment products based on the S&P Target Date Index Series will accurately track index performance or provide positive investment returns. S&P Dow Jones Indices LLC is not an investment or tax advisor. A tax advisor should be consulted to evaluate the impact of any tax-exempt securities on portfolios and the tax consequences of making any particular investment decision. Inclusion of a security within an index is not a recommendation by S&P Dow Jones Indices to buy, sell, or hold such security, nor is it considered to be investment advice.
S&P DOW JONES INDICES DOES NOT GUARANTEE THE ADEQUACY, ACCURACY, TIMELINESS AND/OR THE COMPLETENESS OF THE S&P TARGET DATE INDEX SERIES OR ANY DATA RELATED THERETO OR ANY COMMUNICATION, INCLUDING BUT NOT LIMITED TO, ORAL OR WRITTEN COMMUNICATION (INCLUDING ELECTRONIC COMMUNICATIONS) WITH RESPECT THERETO. S&P DOW JONES INDICES SHALL NOT BE SUBJECT TO ANY DAMAGES OR LIABILITY FOR ANY ERRORS, OMISSIONS, OR DELAYS THEREIN. S&P DOW JONES INDICES MAKES NO EXPRESS OR IMPLIED WARRANTIES, AND EXPRESSLY DISCLAIMS ALL WARRANTIES, OF MERCHANTABILITY OR FITNESS FOR A PARTICULAR PURPOSE OR USE OR AS TO RESULTS TO BE OBTAINED BY THE FUNDS, OWNERS OF THE FUNDS, OR ANY OTHER PERSON OR ENTITY FROM THE USE OF THE S&P TARGET DATE INDEX SERIES OR WITH RESPECT TO ANY DATA RELATED THERETO. WITHOUT LIMITING ANY OF THE FOREGOING, IN NO EVENT WHATSOEVER SHALL S&P DOW JONES INDICES BE LIABLE FOR ANY INDIRECT, SPECIAL, INCIDENTAL, PUNITIVE, OR CONSEQUENTIAL DAMAGES INCLUDING BUT NOT LIMITED TO, LOSS OF PROFITS, TRADING LOSSES, LOST TIME OR GOODWILL, EVEN IF THEY HAVE BEEN ADVISED OF THE POSSIBILITY OF SUCH DAMAGES, WHETHER IN CONTRACT, TORT, STRICT LIABILITY, OR OTHERWISE. THERE ARE NO THIRD PARTY BENEFICIARIES OF ANY AGREEMENTS OR ARRANGEMENTS BETWEEN S&P DOW JONES INDICES AND THE FUNDS, OTHER THAN THE LICENSORS OF S&P DOW JONES INDICES.
| TIAA-CREF Lifecycle Funds ■ 2022 Annual Report | 161 |
[This page intentionally left blank.]
Websites
TIAA.org
nuveen.com
Automated telephone service
800-842-2252
24 hours a day, 7 days a week
For the hearing- or speech-impaired
800-842-2755
8 a.m. to 10 p.m. (ET), Monday–Friday
You should carefully consider the investment objectives, risks, charges and expenses of any fund before investing. For a prospectus that contains this and other information, please visit TIAA.org, or call 800-842-2252 for the Institutional, Advisor, Premier and Retirement classes or 800-223-1200 for the Retail Class. Please read the prospectus carefully before investing. Investment, insurance and annuity products are not Federal Deposit Insurance Corporation (FDIC) insured, are not bank guaranteed, are not bank deposits, are not insured by any federal government agency, are not a condition to any banking service or activity, and may lose value. Nuveen, a subsidiary of TIAA, provides investment advice and portfolio management services through a dozen affiliated registered investment advisers. Nuveen Securities, LLC and TIAA-CREF Individual & Institutional Services, LLC, members FINRA, distribute securities products.
This material is for informational or educational purposes only and does not constitute fiduciary investment advice under ERISA, a securities recommendation under all securities laws, or an insurance product recommendation under state insurance laws or regulations. This material does not take into account any specific objectives or circumstances of any particular investor, or suggest any specific course of action. Investment decisions should be made based on the investor’s own objectives and circumstances.
©2022 Teachers Insurance and Annuity Association of America—College Retirement Equities Fund,
730 Third Avenue, New York, NY 10017-3206
| 730 Third Avenue New York, NY 10017-3206 | PRESORTED STANDARD U.S. POSTAGE PAID TIAA |

 | Printed on paper containing recycled fiber |
 | We’re fond of paper…in its original form. Switch to eDelivery at TIAA.org/eDelivery | |
| 2217962 | A11067 (7/22) |
| 730 Third Avenue New York, NY 10017-3206 |
| Printed on paper containing recycled fiber |
| 2217962 | A11067 (7/22) |
| 730 Third Avenue New York, NY 10017-3206 |
| 2217962 | A11067 (7/22) |
| TIAA-CREF Funds | May 31, 2022 | |
TIAA-CREF
Lifecycle Index Funds
The annual report contains the audited financial statements.
| Fund name | Institutional Class | Advisor Class | Premier Class | Retirement Class |
| Lifecycle Index Retirement Income Fund | TRILX | TLIHX | TLIPX | TRCIX |
| Lifecycle Index 2010 Fund | TLTIX | TLTHX | TLTPX | TLTRX |
| Lifecycle Index 2015 Fund | TLFIX | TLFAX | TLFPX | TLGRX |
| Lifecycle Index 2020 Fund | TLWIX | TLWHX | TLWPX | TLWRX |
| Lifecycle Index 2025 Fund | TLQIX | TLQHX | TLVPX | TLQRX |
| Lifecycle Index 2030 Fund | TLHIX | TLHHX | TLHPX | TLHRX |
| Lifecycle Index 2035 Fund | TLYIX | TLYHX | TLYPX | TLYRX |
| Lifecycle Index 2040 Fund | TLZIX | TLZHX | TLPRX | TLZRX |
| Lifecycle Index 2045 Fund | TLXIX | TLMHX | TLMPX | TLMRX |
| Lifecycle Index 2050 Fund | TLLIX | TLLHX | TLLPX | TLLRX |
| Lifecycle Index 2055 Fund | TTIIX | TTIHX | TTIPX | TTIRX |
| Lifecycle Index 2060 Fund | TVIIX | TVIHX | TVIPX | TVITX |
| Lifecycle Index 2065 Fund | TFITX | TFIHX | TFIPX | TFIRX |
Annual
Report
Contents
This annual report contains information about certain TIAA-CREF Funds and describes their results for the twelve months ended May 31, 2022. The report contains four main sections:
| • | A letter from Brad Finkle, Principal Executive Officer and President of the TIAA-CREF Funds and TIAA-CREF Life Funds. | |
| • | The fund performance section compares each fund’s investment returns with those of its composite benchmark and broad market index. | |
| • | The portfolios of investments list the underlying TIAA-CREF Funds in which each fund had investments as of May 31, 2022. | |
| • | The financial statements provide detailed information about the operations and financial condition of each fund. |
The views and opinions expressed in this report are through the end of the period, as stated on the cover of this report. They are subject to change at any time based on a variety of factors. As such, they are not guarantees of future performance or investment results and should not be taken as investment advice. To see the risks of investing in any fund, please read the latest prospectus.
As always, you should carefully consider the investment objectives, risks, charges and expenses of any fund before investing. For a prospectus that contains this and other important information, please visit our websites at TIAA.org or nuveen.com, or call 800-842-2252. We urge you to read the prospectus carefully before investing.
| TIAA-CREF Lifecycle Index Funds ■ 2022 Annual Report | 3 |
Global financial markets produced negative results for the twelve months ended May 31, 2022. As inflationary pressures persisted, the Federal Reserve responded by raising short-term interest rates in March and May, and indicated that further increases were likely. U.S. equities lost ground as the economy contracted in the first quarter of 2022—the first negative quarter since 2020. A widening trade gap and lower government spending contributed to the slowdown, but spending by consumers and businesses remained strong. Foreign stocks also posted losses, with emerging markets falling more than international developed markets. U.S. fixed-income securities declined as U.S. Treasury yields rose across all maturities (bond prices move in the opposite direction of yields). These market conditions were reflected in the performance of the TIAA-CREF Lifecycle Index Funds by way of their investments in various asset classes through underlying funds.
| • | All of the TIAA-CREF Lifecycle Index Funds declined for the period and underperformed their respective composite benchmarks. (All fund returns are for the Retirement Class.) | |
| • | Returns for the Retirement Class ranged from −6.3% for the Lifecycle Index 2010 Fund to −7.3% for the Lifecycle Index 2035, 2040 and 2065 Funds. |
Both stocks and bonds posted losses
U.S. equities declined for the twelve months as inflation, rising interest rates and Russia’s invasion of Ukraine weighed on the financial markets. Furthermore, oil prices rose to levels not seen since 2008, while unemployment fell to rates approaching pre-pandemic lows. The broad domestic stock market, as represented by the Russell 3000® Index, returned −3.7%. The Fed raised the federal funds target rate to 0.75%–1.00% in May 2022 and decided to begin reducing its portfolio of bonds that had been purchased to support the economy.
International stocks trailed their U.S. counterparts. The MSCI EAFE+Emerging Markets (EM) Index, which measures the performance of leading stocks in 21 developed-markets countries outside North America and 24 emerging-markets countries, returned –13.6% in U.S.-dollar terms. Despite widespread market losses, the economies in the 19-nation euro area grew at a moderate rate in the fourth quarter of 2021 and the first quarter of 2022. Among developing markets, the Chinese economy continued to expand at a solid pace through the first quarter of 2022.
U.S. investment-grade bonds lost ground as U.S. Treasury yields rose substantially across all maturities. The domestic investment-grade fixed-rate bond market, as measured by the Bloomberg U.S. Aggregate Bond Index, returned −8.2% for the period.
| 4 | 2022 Annual Report ■ TIAA-CREF Lifecycle Index Funds |
Planning for an unpredictable future For more than a decade, equity investors have enjoyed a long stretch of above-average returns, while bond performance during the same period has not kept pace. Now we may be at an inflection point. Equities have become more volatile, tempered by a host of factors that could affect global economic growth. Fixed-income securities, after years of historically low interest rates, are now offering higher yields, which is good news for bond investors seeking higher income. Meanwhile, real estate continues to benefit from high demand and limited supply, which enhances property values and bolsters rental income. The challenge of planning for the future always lies in its inherent uncertainty. As a result, we believe that a prudent strategy is to stay invested in a diversified portfolio that includes multiple asset classes. The TIAA-CREF Lifecycle Index Funds use dynamic diversification strategies designed to help mitigate the effects of market volatility and keep you on track to achieve your financial goals. Of course, diversification does not guarantee against market losses, and past performance cannot guarantee future results. We thank you for trusting us to manage your investments through the TIAA-CREF Lifecycle Index Funds. If you have any questions or concerns, please consult your financial advisor or call a TIAA financial consultant at 800-842-2252. You can also reach us online by visiting TIAA.org. We always stand ready to assist you.
/s/ Brad Finkle
Brad Finkle Principal Executive Officer and President of the TIAA-CREF Funds and TIAA-CREF Life Funds
|
Brad Finkle |

| TIAA-CREF Lifecycle Index Funds ■ 2022 Annual Report | 5 |
Portfolio holdings
The complete portfolios of investments for the Lifecycle Index Funds begin on page 46 of this report. You can obtain complete lists of the holdings of the Lifecycle Index Funds and of the underlying funds in which the Lifecycle Index Funds invest as of the most recently completed fiscal quarter in the following ways:
| • | By visiting our websites at TIAA.org or nuveen.com; or | |
| • | By calling us at 800-842-2252 to request a copy, which will be provided free of charge. |
You can also obtain a complete list of the Lifecycle Index Funds’ portfolio holdings as of the most recently completed fiscal quarter, and for prior quarter-ends, from our Securities and Exchange Commission (SEC) Form N-CSR and Form N-PORT filings. Form N-CSR filings are as of May 31 or November 30; Form N-PORT filings are as of the last day of February or August 31. Copies of these forms are available:
| • | Through the Electronic Data Gathering and Retrieval System (EDGAR) on the SEC’s website at sec.gov; or | |
| • | From the SEC’s Office of Investor Education and Advocacy. Call 202-551-8090 for more information. |
Proxy voting
A description of our proxy voting policies and procedures for the underlying funds of the Lifecycle Index Funds can be found on our website at TIAA.org or on the SEC’s website at sec.gov. You can also call us at 800-842-2252 to request a free copy. A report of how the Lifecycle Index Funds’ underlying funds voted during the most recently completed twelve-month period ended June 30 can be found on our website or on Form N-PX at sec.gov.
Contacting TIAA
There are three easy ways to contact us: by email, using the Contact Us link under Get Help at the top of our home page; by mail at TIAA, 730 Third Avenue, New York, NY 10017-3206; or by phone at 800-842-2252.
Fund management
The Lifecycle Index Funds are managed by a portfolio management team of Teachers Advisors, LLC. The members of this team are responsible for the day-to-day investment management of the funds.
| 6 | 2022 Annual Report ■ TIAA-CREF Lifecycle Index Funds |
Composite benchmarks
Each Lifecycle Index Fund uses a composite benchmark that represents the general market sectors in which that fund invests. These may include U.S. equity (stocks), international equity (foreign stocks), fixed income, short-term fixed income and inflation-protected assets. A fund’s composite benchmark combines the following public indexes in proportions that correspond to the fund’s target market sector allocations:
| • | The Russell 3000® Index (U.S. equity) measures the performance of the stocks of the 3,000 largest publicly traded U.S. companies, based on market capitalization. The index measures the performance of about 98% of the total market capitalization of the publicly traded U.S. equity market. | |
| • | The MSCI EAFE+EM Index (international equity) measures the performance of the leading stocks in 21 developed-markets countries outside North America—in Europe, Australasia and the Far East—and in 24 emerging-markets countries in Europe, Asia, Africa, Latin America and the Middle East. | |
| • | The Bloomberg U.S. Aggregate Bond Index (fixed income) measures the performance of the domestic investment-grade fixed-rate bond market, including government and corporate securities, agency mortgage pass-through securities, asset-backed securities and commercial mortgage-backed securities. | |
| • | The Bloomberg U.S. 1–3 Year Government/Credit Bond Index (short-term fixed income) measures the performance of U.S. Treasury and agency securities and corporate bonds with 1- to 3-year maturities. | |
| • | The Bloomberg U.S. Treasury Inflation Protected Securities (TIPS) 1–10 Year Index (inflation-protected assets) measures the performance of fixed-income securities with maturities between 1 and 10 years that are adjusted for inflation, as measured by the Consumer Price Index for All Urban Consumers (CPI-U). |
Broad market indexes
The returns shown against the broad-based securities market index compare a fund’s average annual returns with a broad measure of market performance. The S&P Target Date Index Series represents a broadly derived consensus of asset class exposure for the target retirement dates in the series based on market observations acquired through an annual survey of target-date fund managers. The returns of the S&P Target Date Index Series reflect multi-asset class exposure for the same target dates as the Funds.
| TIAA-CREF Lifecycle Index Funds ■ 2022 Annual Report | 7 |
About the funds’ benchmarks
You cannot invest directly in any index. Index returns do not include a deduction for fees or expenses. For additional details about the benchmark indexes, please read the funds’ latest prospectus.
London Stock Exchange Group plc and its group undertakings (collectively, the “LSE Group”). © LSE Group 2022. FTSE Russell is a trading name of certain of the LSE Group companies. “FTSE®,” “Russell®” and “FTSE Russell®” are trademarks of the relevant LSE Group companies and are used by any other LSE Group company under license. All rights in the FTSE Russell indexes or data vest in the relevant LSE Group company which owns the index or the data. Neither LSE Group nor its licensors accept any liability for any errors or omissions in the indexes or data and no party may rely on any indexes or data contained in this communication. No further distribution of data from the LSE Group is permitted without the relevant LSE Group company’s express written consent. The LSE Group does not promote, sponsor or endorse the content of this communication. MSCI makes no express or implied warranties or representations and shall have no liability whatsoever with respect to any MSCI data contained herein. This report is not approved, reviewed or produced by MSCI.
| 8 | 2022 Annual Report ■ TIAA-CREF Lifecycle Index Funds |
Important information about expenses
All shareholders of the TIAA-CREF Funds incur ongoing costs, including management fees and other fund expenses. They may also incur transactional costs for redemptions or account maintenance fees.
The expense examples that appear in this report are intended to help you understand your ongoing costs only (in U.S. dollars) and do not reflect transactional costs. The examples are designed to help you compare these ongoing costs with the ongoing costs of investing in other mutual funds.
The expenses shown do not include redemption fees or account maintenance fees, which may or may not be applicable, as described in the prospectus. If such fees were included, your total costs for investing in the funds would be higher. Note also that shareholders of the TIAA-CREF Funds do not incur a sales charge for purchases, reinvested dividends or other distributions.
The examples are based on an investment of $1,000 invested at the beginning of the six-month period and held for the entire period (December 1, 2021–May 31, 2022).
Actual expenses
The first line of the two lines listed for each fund in the tables uses the Fund’s actual expenses and its actual rate of return. You may use the information in this line, together with the amount you invested, to estimate the expenses that you paid over the six-month period.
Simply divide your account value by $1,000 (for example, an $8,600 account value divided by $1,000 = 8.6), then multiply the result by the number in the first line under the heading “Expenses paid during period” to estimate the expenses you paid during the six-month period. All of the funds have a contractual fee reimbursement. Had these not been in effect, fund expenses would have been higher.
Hypothetical example for comparison purposes
The second line in each Fund’s entry shows a hypothetical account value and hypothetical expenses based on the share class’ actual expense ratio for the six-month period and an assumed 5%-per-year rate of return before expenses. This was not the Fund’s actual return.
This hypothetical example cannot be used to estimate the actual expenses you paid for the period, but rather allows you to compare the ongoing costs of investing in the Fund with the costs of other funds. To do so, compare this 5% hypothetical example with the 5% hypothetical examples that appear in the shareholder reports of other mutual funds.
| TIAA-CREF Lifecycle Index Funds ■ 2022 Annual Report | 9 |
Important information about expenses
Expense examples
Six months ended May 31, 2022
| Lifecycle Index Funds Institutional Class | Beginning account value (12/1/21 | ) | Ending account value (5/31/22 | ) | Expenses paid during period (12/1/21–5/31/22 | * ) | ||||||
| Retirement Income Fund actual return | $1,000.00 | $ | 920.60 | $0.53 | ||||||||
| 5% annual hypothetical return | 1,000.00 | 1,024.38 | 0.56 | |||||||||
| 2010 Fund actual return | 1,000.00 | 921.98 | 0.53 | |||||||||
| 5% annual hypothetical return | 1,000.00 | 1,024.38 | 0.56 | |||||||||
| 2015 Fund actual return | 1,000.00 | 918.60 | 0.53 | |||||||||
| 5% annual hypothetical return | 1,000.00 | 1,024.38 | 0.56 | |||||||||
| 2020 Fund actual return | 1,000.00 | 915.91 | 0.53 | |||||||||
| 5% annual hypothetical return | 1,000.00 | 1,024.38 | 0.56 | |||||||||
| 2025 Fund actual return | 1,000.00 | 913.08 | 0.52 | |||||||||
| 5% annual hypothetical return | 1,000.00 | 1,024.38 | 0.56 | |||||||||
| 2030 Fund actual return | 1,000.00 | 909.91 | 0.52 | |||||||||
| 5% annual hypothetical return | 1,000.00 | 1,024.38 | 0.56 | |||||||||
| 2035 Fund actual return | 1,000.00 | 906.79 | 0.52 | |||||||||
| 5% annual hypothetical return | 1,000.00 | 1,024.38 | 0.56 | |||||||||
| 2040 Fund actual return | 1,000.00 | 905.66 | 0.52 | |||||||||
| 5% annual hypothetical return | 1,000.00 | 1,024.38 | 0.56 | |||||||||
| 2045 Fund actual return | 1,000.00 | 905.23 | 0.52 | |||||||||
| 5% annual hypothetical return | 1,000.00 | 1,024.38 | 0.56 | |||||||||
| 2050 Fund actual return | 1,000.00 | 904.85 | 0.52 | |||||||||
| 5% annual hypothetical return | 1,000.00 | 1,024.38 | 0.56 | |||||||||
| 2055 Fund actual return | 1,000.00 | 904.96 | 0.52 | |||||||||
| 5% annual hypothetical return | 1,000.00 | 1,024.38 | 0.56 | |||||||||
| 2060 Fund actual return | 1,000.00 | 904.35 | 0.52 | |||||||||
| 5% annual hypothetical return | 1,000.00 | 1,024.38 | 0.56 | |||||||||
| 2065 Fund actual return | 1,000.00 | 905.37 | 0.52 | |||||||||
| 5% annual hypothetical return | 1,000.00 | 1,024.38 | 0.56 | |||||||||
| 10 | 2022 Annual Report ■ TIAA-CREF Lifecycle Index Funds |
Important information about expenses
| * | “Expenses paid during period” is based on each fund’s actual expense ratio for the most recent fiscal half-year, multiplied by the average account value over the six-month period, multiplied by 182/365. There were 182 days in the six months ended May 31, 2022. The expense charges of one or more of the fund’s share classes may at times reflect a waiver or reimbursement. Please see the prospectus for an explanation, including the date on which this waiver or reimbursement is scheduled to end. Without such waiver or reimbursement, the expenses of the affected share classes would be higher and their performance lower. The annualized expense ratio for the six-month period was 0.11% for the Retirement Income Fund, 0.11% for the 2010 Fund, 0.11% for the 2015 Fund, 0.11% for the 2020 Fund, 0.11% for the 2025 Fund, 0.11% for the 2030 Fund, 0.11% for the 2035 Fund, 0.11% for the 2040 Fund, 0.11% for the 2045 Fund, 0.11% for the 2050 Fund, 0.11% for the 2055 Fund, 0.11% for the 2060 Fund and 0.11% for the 2065 Fund. |
| TIAA-CREF Lifecycle Index Funds ■ 2022 Annual Report | 11 |
Important information about expenses
Expense examples
Six months ended May 31, 2022
| Lifecycle Index Funds Advisor Class | Beginning account value (12/1/21 | ) | Ending account value (5/31/22 | ) | Expenses paid during period (12/1/21–5/31/22 | * ) | ||||||
| Retirement Income Fund actual return | $1,000.00 | $ | 919.56 | $1.01 | ||||||||
| 5% annual hypothetical return | 1,000.00 | 1,023.88 | 1.06 | |||||||||
| 2010 Fund actual return | 1,000.00 | 921.62 | 0.96 | |||||||||
| 5% annual hypothetical return | 1,000.00 | 1,023.93 | 1.01 | |||||||||
| 2015 Fund actual return | 1,000.00 | 918.25 | 0.96 | |||||||||
| 5% annual hypothetical return | 1,000.00 | 1,023.93 | 1.01 | |||||||||
| 2020 Fund actual return | 1,000.00 | 915.43 | 1.00 | |||||||||
| 5% annual hypothetical return | 1,000.00 | 1,023.88 | 1.06 | |||||||||
| 2025 Fund actual return | 1,000.00 | 912.55 | 1.00 | |||||||||
| 5% annual hypothetical return | 1,000.00 | 1,023.88 | 1.06 | |||||||||
| 2030 Fund actual return | 1,000.00 | 909.37 | 1.00 | |||||||||
| 5% annual hypothetical return | 1,000.00 | 1,023.88 | 1.06 | |||||||||
| 2035 Fund actual return | 1,000.00 | 906.57 | 1.00 | |||||||||
| 5% annual hypothetical return | 1,000.00 | 1,023.88 | 1.06 | |||||||||
| 2040 Fund actual return | 1,000.00 | 905.15 | 1.00 | |||||||||
| 5% annual hypothetical return | 1,000.00 | 1,023.88 | 1.06 | |||||||||
| 2045 Fund actual return | 1,000.00 | 904.63 | 1.00 | |||||||||
| 5% annual hypothetical return | 1,000.00 | 1,023.88 | 1.06 | |||||||||
| 2050 Fund actual return | 1,000.00 | 904.29 | 1.00 | |||||||||
| 5% annual hypothetical return | 1,000.00 | 1,023.88 | 1.06 | |||||||||
| 2055 Fund actual return | 1,000.00 | 904.10 | 1.00 | |||||||||
| 5% annual hypothetical return | 1,000.00 | 1,023.88 | 1.06 | |||||||||
| 2060 Fund actual return | 1,000.00 | 904.12 | 1.00 | |||||||||
| 5% annual hypothetical return | 1,000.00 | 1,023.88 | 1.06 | |||||||||
| 2065 Fund actual return | 1,000.00 | 904.09 | 0.66 | |||||||||
| 5% annual hypothetical return | 1,000.00 | 1,024.23 | 0.71 | |||||||||
| 12 | 2022 Annual Report ■ TIAA-CREF Lifecycle Index Funds |
Important information about expenses
| * | “Expenses paid during period” is based on each fund’s actual expense ratio for the most recent fiscal half-year, multiplied by the average account value over the six-month period, multiplied by 182/365. There were 182 days in the six months ended May 31, 2022. The expense charges of one or more of the fund’s share classes may at times reflect a waiver or reimbursement. Please see the prospectus for an explanation, including the date on which this waiver or reimbursement is scheduled to end. Without such waiver or reimbursement, the expenses of the affected share classes would be higher and their performance lower. The annualized expense ratio for the six-month period was 0.21% for the Retirement Income Fund, 0.20% for the 2010 Fund, 0.20% for the 2015 Fund, 0.21% for the 2020 Fund, 0.21% for the 2025 Fund, 0.21% for the 2030 Fund, 0.21% for the 2035 Fund, 0.21% for the 2040 Fund, 0.21% for the 2045 Fund, 0.21% for the 2050 Fund, 0.21% for the 2055 Fund, 0.21% for the 2060 Fund and 0.14% for the 2065 Fund. |
| TIAA-CREF Lifecycle Index Funds ■ 2022 Annual Report | 13 |
Important information about expenses
Expense examples
Six months ended May 31, 2022
| Lifecycle Index Funds Premier Class | Beginning account value (12/1/21 | ) | Ending account value (5/31/22 | ) | Expenses paid during period (12/1/21–5/31/22 | * ) | ||||||
| Retirement Income Fund actual return | $1,000.00 | $ | 919.12 | $1.20 | ||||||||
| 5% annual hypothetical return | 1,000.00 | 1,023.68 | 1.26 | |||||||||
| 2010 Fund actual return | 1,000.00 | 921.25 | 1.20 | |||||||||
| 5% annual hypothetical return | 1,000.00 | 1,023.68 | 1.26 | |||||||||
| 2015 Fund actual return | 1,000.00 | 917.74 | 1.20 | |||||||||
| 5% annual hypothetical return | 1,000.00 | 1,023.68 | 1.26 | |||||||||
| 2020 Fund actual return | 1,000.00 | 914.85 | 1.19 | |||||||||
| 5% annual hypothetical return | 1,000.00 | 1,023.68 | 1.26 | |||||||||
| 2025 Fund actual return | 1,000.00 | 912.44 | 1.19 | |||||||||
| 5% annual hypothetical return | 1,000.00 | 1,023.68 | 1.26 | |||||||||
| 2030 Fund actual return | 1,000.00 | 908.79 | 1.19 | |||||||||
| 5% annual hypothetical return | 1,000.00 | 1,023.68 | 1.26 | |||||||||
| 2035 Fund actual return | 1,000.00 | 905.92 | 1.24 | |||||||||
| 5% annual hypothetical return | 1,000.00 | 1,023.64 | 1.31 | |||||||||
| 2040 Fund actual return | 1,000.00 | 904.78 | 1.23 | |||||||||
| 5% annual hypothetical return | 1,000.00 | 1,023.64 | 1.31 | |||||||||
| 2045 Fund actual return | 1,000.00 | 904.37 | 1.19 | |||||||||
| 5% annual hypothetical return | 1,000.00 | 1,023.68 | 1.26 | |||||||||
| 2050 Fund actual return | 1,000.00 | 903.98 | 1.19 | |||||||||
| 5% annual hypothetical return | 1,000.00 | 1,023.68 | 1.26 | |||||||||
| 2055 Fund actual return | 1,000.00 | 904.19 | 1.19 | |||||||||
| 5% annual hypothetical return | 1,000.00 | 1,023.68 | 1.26 | |||||||||
| 2060 Fund actual return | 1,000.00 | 904.03 | 1.19 | |||||||||
| 5% annual hypothetical return | 1,000.00 | 1,023.68 | 1.26 | |||||||||
| 2065 Fund actual return | 1,000.00 | 905.55 | 1.24 | |||||||||
| 5% annual hypothetical return | 1,000.00 | 1,023.64 | 1.31 | |||||||||
| 14 | 2022 Annual Report ■ TIAA-CREF Lifecycle Index Funds |
Important information about expenses
| * | “Expenses paid during period” is based on each fund’s actual expense ratio for the most recent fiscal half-year, multiplied by the average account value over the six-month period, multiplied by 182/365. There were 182 days in the six months ended May 31, 2022. The expense charges of one or more of the fund’s share classes may at times reflect a waiver or reimbursement. Please see the prospectus for an explanation, including the date on which this waiver or reimbursement is scheduled to end. Without such waiver or reimbursement, the expenses of the affected share classes would be higher and their performance lower. The annualized expense ratio for the six-month period was 0.25% for the Retirement Income Fund, 0.25% for the 2010 Fund, 0.25% for the 2015 Fund, 0.25% for the 2020 Fund, 0.25% for the 2025 Fund, 0.25% for the 2030 Fund, 0.26% for the 2035 Fund, 0.26% for the 2040 Fund, 0.25% for the 2045 Fund, 0.25% for the 2050 Fund, 0.25% for the 2055 Fund, 0.25% for the 2060 Fund and 0.26% for the 2065 Fund. |
| TIAA-CREF Lifecycle Index Funds ■ 2022 Annual Report | 15 |
Important information about expenses
Expense examples
Six months ended May 31, 2022
| Lifecycle Index Funds Retirement Class | Beginning account value (12/1/21 | ) | Ending account value (5/31/22 | ) | Expenses paid during period (12/1/21–5/31/22 | * ) | ||||||
| Retirement Income Fund actual return | $1,000.00 | $ | 919.25 | $1.72 | ||||||||
| 5% annual hypothetical return | 1,000.00 | 1,023.14 | 1.82 | |||||||||
| 2010 Fund actual return | 1,000.00 | 920.43 | 1.72 | |||||||||
| 5% annual hypothetical return | 1,000.00 | 1,023.14 | 1.82 | |||||||||
| 2015 Fund actual return | 1,000.00 | 917.53 | 1.72 | |||||||||
| 5% annual hypothetical return | 1,000.00 | 1,023.14 | 1.82 | |||||||||
| 2020 Fund actual return | 1,000.00 | 914.53 | 1.72 | |||||||||
| 5% annual hypothetical return | 1,000.00 | 1,023.14 | 1.82 | |||||||||
| 2025 Fund actual return | 1,000.00 | 911.60 | 1.72 | |||||||||
| 5% annual hypothetical return | 1,000.00 | 1,023.14 | 1.82 | |||||||||
| 2030 Fund actual return | 1,000.00 | 908.77 | 1.71 | |||||||||
| 5% annual hypothetical return | 1,000.00 | 1,023.14 | 1.82 | |||||||||
| 2035 Fund actual return | 1,000.00 | 905.77 | 1.71 | |||||||||
| 5% annual hypothetical return | 1,000.00 | 1,023.14 | 1.82 | |||||||||
| 2040 Fund actual return | 1,000.00 | 904.19 | 1.71 | |||||||||
| 5% annual hypothetical return | 1,000.00 | 1,023.14 | 1.82 | |||||||||
| 2045 Fund actual return | 1,000.00 | 903.75 | 1.71 | |||||||||
| 5% annual hypothetical return | 1,000.00 | 1,023.14 | 1.82 | |||||||||
| 2050 Fund actual return | 1,000.00 | 903.63 | 1.71 | |||||||||
| 5% annual hypothetical return | 1,000.00 | 1,023.14 | 1.82 | |||||||||
| 2055 Fund actual return | 1,000.00 | 903.84 | 1.71 | |||||||||
| 5% annual hypothetical return | 1,000.00 | 1,023.14 | 1.82 | |||||||||
| 2060 Fund actual return | 1,000.00 | 904.00 | 1.71 | |||||||||
| 5% annual hypothetical return | 1,000.00 | 1,023.14 | 1.82 | |||||||||
| 2065 Fund actual return | 1,000.00 | 903.40 | 1.71 | |||||||||
| 5% annual hypothetical return | 1,000.00 | 1,023.14 | 1.82 | |||||||||
| 16 | 2022 Annual Report ■ TIAA-CREF Lifecycle Index Funds |
Important information about expenses
| * | “Expenses paid during period” is based on each fund’s actual expense ratio for the most recent fiscal half-year, multiplied by the average account value over the six-month period, multiplied by 182/365. There were 182 days in the six months ended May 31, 2022. The expense charges of one or more of the fund’s share classes may at times reflect a waiver or reimbursement. Please see the prospectus for an explanation, including the date on which this waiver or reimbursement is scheduled to end. Without such waiver or reimbursement, the expenses of the affected share classes would be higher and their performance lower. The annualized expense ratio for the six-month period was 0.36% for the Retirement Income Fund, 0.36% for the 2010 Fund, 0.36% for the 2015 Fund, 0.36% for the 2020 Fund, 0.36% for the 2025 Fund, 0.36% for the 2030 Fund, 0.36% for the 2035 Fund, 0.36% for the 2040 Fund, 0.36% for the 2045 Fund, 0.36% for the 2050 Fund, 0.36% for the 2055 Fund, 0.36% for the 2060 Fund and 0.36% for the 2065 Fund. |
| TIAA-CREF Lifecycle Index Funds ■ 2022 Annual Report | 17 |
Investment results of the Lifecycle Index Funds
Performance for the twelve months ended May 31, 2022
All of the TIAA-CREF Lifecycle Index Funds produced losses that generally approximated the performance of their respective composite benchmarks. Returns for the Retirement Class ranged from −6.32% for the 2010 Fund to −7.26% for the 2035, 2040 and 2065 Funds. The performance tables show returns for all share classes of the funds.
While lower, the funds’ returns were generally within range of their composite benchmarks, which represent market performance without any fees or expenses. For the twelve months, the difference between individual Lifecycle Index Funds’ returns and those of their respective benchmarks ranged from 0.17 of a percentage point for the 2060 Fund to 0.33 of a percentage point for the 2065 Fund. (All results for the Lifecycle Index Funds are for the Retirement Class.)
Financial markets generally declined in a difficult environment
The U.S. economy expanded early in the period before contracting in the first quarter of 2022. Real gross domestic product (GDP), which measures the value of all goods and services produced in the United States, grew at annualized rates of 2.3% and 6.9%, respectively, in the third and fourth quarters of 2021. However, GDP contracted at an annualized rate of 1.5% in the first quarter of 2022, according to the government’s “second” estimate. Growth stalled amid a widening trade deficit and lower government expenditures, but consumer and business spending remained strong. Unemployment declined throughout the period, falling from 5.9% in June 2021 to 3.6% in May 2022. Core inflation, which measures all items except food and energy, rose 6.0% over the twelve months ended May 31, 2022. Oil prices increased sharply, climbing from nearly $68 per barrel to more than $114 by the end of the period.
The Federal Reserve responded to rising inflation by increasing the federal funds target rate in March and May of 2022. Over the period, policymakers raised the key short-term interest-rate measure to 0.75%–1.00% and indicated further increases were likely.
Domestic and foreign stocks both recorded losses for the period. The Russell 3000® Index, a broad measure of the U.S. stock market, returned −3.68%. The MSCI EAFE+Emerging Markets (EM) Index, which measures the performance of leading stocks in 21 developed-markets countries outside North America and 24 emerging-markets countries, returned −13.55% in U.S.-dollar terms.
U.S. investment-grade bonds were hurt by the impact of rising yields across both short- and long-term maturities (bond prices move in the opposite direction of yields). The broad domestic investment-grade fixed-rate bond market, as measured by the Bloomberg U.S. Aggregate Bond Index, returned −8.22%.
| 18 | 2022 Annual Report ■ TIAA-CREF Lifecycle Index Funds |
Short-term bonds, as measured by the Bloomberg U.S. 1–3 Year Government/Credit Index, returned −3.03%.
Equity funds produced largest losses
The Lifecycle Index Funds may invest in up to five sectors of the investment market: U.S. equity (stocks), international equity (foreign stocks), fixed income, short-term fixed income and inflation-protected assets. The Lifecycle Index Funds do this by investing in various underlying funds that are managed to track individual benchmark indexes.
For the twelve-month period, the funds’ absolute returns—that is, without regard to the performance of their respective composite benchmarks—were hindered most by declines in stock funds. Among these, the Emerging Markets Equity Index Fund lost the most ground, followed by the International Equity Index Fund. The Equity Index Fund registered a smaller decline in the low single digits. Within fixed-income funds, the Bond Index Fund also produced a negative return, while the Inflation-Linked Bond Fund generated a modest gain.
Funds generated similar results that reflected a down market
The Lifecycle Index Funds produced an unusually narrow range of results, despite having a wide range of asset allocations and investment horizons. For example, the Retirement Income Fund returned –6.45% with a portfolio that seeks to invest 60% of its assets in fixed-income securities. The 2065 Fund, which invests more than 90% of its assets in stocks, returned –7.26% for the period. (Performance of the Lifecycle Index Funds’ underlying funds can be found at TIAA.org/performance.)
| TIAA-CREF Lifecycle Index Funds ■ 2022 Annual Report | 19 |
Lifecycle Index Retirement Income Fund
Performance as of May 31, 2022
| Lifecycle Index Retirement Income Fund | Total Return | Average annual total return | Annual operating expenses*# | |||||||||||||||||||
| Inception date | 1 year | 5 years | 10 years | gross | net | |||||||||||||||||
| Institutional Class | 9/30/09 | –6.20 | % | 5.17 | % | 5.73 | % | 0.22 | % | 0.10 | % | |||||||||||
| Advisor Class | 12/4/15 | –6.30 | 5.08 | 5.59 | † | 0.33 | 0.21 | |||||||||||||||
| Premier Class | 9/30/09 | –6.36 | 4.99 | 5.56 | 0.37 | 0.25 | ||||||||||||||||
| Retirement Class | 9/30/09 | –6.45 | 4.89 | 5.46 | 0.47 | 0.35 | ||||||||||||||||
| Lifecycle Index Retirement Income Fund Composite Index‡ | — | –6.17 | 5.22 | 5.83 | — | — | ||||||||||||||||
| Broad market index | ||||||||||||||||||||||
| S&P Target Date Retirement Income Index | — | –5.63 | 3.94 | 4.48 | — | — | ||||||||||||||||
The returns in this report show past performance, which is no guarantee of future results. The returns do not reflect taxes that a shareholder would pay on fund distributions or on the sale of fund shares. Returns and the principal value of your investment will fluctuate. Current performance may be higher or lower than that shown, and you may have a gain or a loss when you redeem your shares. For current performance information, including performance to the most recent month-end, please visit TIAA.org. Performance may reflect waivers or reimbursements of certain expenses. Absent these waivers or reimbursement arrangements, performance would be lower.
You cannot invest directly in any index. Index returns do not include a deduction for fees or expenses.
| * | The gross and net annual operating expenses are taken from the Fund’s prospectus. The net annual operating expenses may at times reflect a contractual waiver or reimbursement of various expenses. The expense reimbursements and waivers will continue through at least September 30, 2022, unless changed with the approval of the Board of Trustees. Without these reimbursements and waivers, expenses would be higher and returns lower. Refer to the Financial highlights later in this report for the Fund’s expense ratios as of the end of the reporting period. |
| # | These expenses include underlying fund expenses. |
| ��� | The performance shown for the Advisor Class that is prior to its inception date is based on performance of the Retirement Class. The performance for these periods has not been restated to reflect the actual expenses of the Advisor Class. If these actual expenses had been reflected, the performance of the Advisor Class shown for these periods would have been different because the Advisor Class has different expenses than the Retirement Class. |
| ‡ | As of the close of business on May 31, 2022, the Lifecycle Index Retirement Income Fund Composite Index consisted of: 40.0% Bloomberg U.S. Aggregate Bond Index; 26.0% Russell 3000® Index; 14.0% MSCI EAFE + Emerging Markets Index; 10.0% Bloomberg U.S. 1–3 Year Government/Credit Bond Index; and 10.0% Bloomberg U.S. Treasury Inflation Protected Securities (TIPS) 1–10 Year Index. The Fund’s benchmark, the components that make up the composite benchmark and the method of calculating the composite benchmark’s performance may vary over time. |
| 20 | 2022 Annual Report ■ TIAA-CREF Lifecycle Index Funds |
Lifecycle Index Retirement Income Fund
$10,000 over 10 years
Retirement Class
![]()
Ending amounts are as of May 31, 2022. For the purpose of comparison, the graph also shows the change in the values of the Fund’s composite benchmark and a broad market index during the same period. The performance of the other share classes varies due to differences in expense charges.
Asset allocation
| % of net assets as of 5/31/22 | % of target allocation for 6/30/22 | |
| Equity | ||
| U.S. equity | 25.91 | 26.00 |
| International equity | 14.15 | 14.00 |
| Fixed income | ||
| Fixed income | 40.01 | 40.00 |
| Short-term fixed income | 10.03 | 10.00 |
| Inflation-protected assets | 9.99 | 10.00 |
| Other assets & liabilities, net | –0.09 | — |
| Total | 100.00 | 100.00 |
Target allocation
For June 30, 2022

| TIAA-CREF Lifecycle Index Funds ■ 2022 Annual Report | 21 |
Performance as of May 31, 2022
| Lifecycle Index 2010 Fund | Total Return | Average annual total return | Annual operating expenses*# | |||||||||||||||||||
| Inception date | 1 year | 5 years | 10 years | gross | net | |||||||||||||||||
| Institutional Class | 9/30/09 | –6.07 | % | 5.19 | % | 6.13 | % | 0.22 | % | 0.10 | % | |||||||||||
| Advisor Class | 12/4/15 | –6.16 | 5.15 | 6.01 | † | 0.31 | 0.20 | |||||||||||||||
| Premier Class | 9/30/09 | –6.19 | 5.04 | 5.97 | 0.37 | 0.25 | ||||||||||||||||
| Retirement Class | 9/30/09 | –6.32 | 4.93 | 5.86 | 0.47 | 0.35 | ||||||||||||||||
| Lifecycle Index 2010 Fund Composite Index‡ | — | –6.08 | 5.28 | 6.24 | — | — | ||||||||||||||||
| Broad market index | ||||||||||||||||||||||
| S&P Target Date 2010 Index | — | –5.50 | 4.56 | 5.41 | — | — | ||||||||||||||||
The returns in this report show past performance, which is no guarantee of future results. The returns do not reflect taxes that a shareholder would pay on fund distributions or on the sale of fund shares. Returns and the principal value of your investment will fluctuate. Current performance may be higher or lower than that shown, and you may have a gain or a loss when you redeem your shares. For current performance information, including performance to the most recent month-end, please visit TIAA.org. Performance may reflect waivers or reimbursements of certain expenses. Absent these waivers or reimbursement arrangements, performance would be lower.
You cannot invest directly in any index. Index returns do not include a deduction for fees or expenses.
| * | The gross and net annual operating expenses are taken from the Fund’s prospectus. The net annual operating expenses may at times reflect a contractual waiver or reimbursement of various expenses. The expense reimbursements and waivers will continue through at least September 30, 2022, unless changed with the approval of the Board of Trustees. Without these reimbursements and waivers, expenses would be higher and returns lower. Refer to the Financial highlights later in this report for the Fund’s expense ratios as of the end of the reporting period. |
| # | These expenses include underlying fund expenses. |
| † | The performance shown for the Advisor Class that is prior to its inception date is based on performance of the Retirement Class. The performance for these periods has not been restated to reflect the actual expenses of the Advisor Class. If these actual expenses had been reflected, the performance of the Advisor Class shown for these periods would have been different because the Advisor Class has different expenses than the Retirement Class. |
| ‡ | As of the close of business on May 31, 2022, the Lifecycle Index 2010 Fund Composite Index consisted of: 40.0% Bloomberg U.S. Aggregate Bond Index; 24.8% Russell 3000® Index; 13.3% MSCI EAFE + Emerging Markets Index; 11.9% Bloomberg U.S. 1–3 Year Government/Credit Bond Index; and 10.0% Bloomberg U.S. Treasury Inflation Protected Securities (TIPS) 1–10 Year Index. The Fund’s benchmark, the components that make up the composite benchmark and the method of calculating the composite benchmark’s performance may vary over time. |
| 22 | 2022 Annual Report ■ TIAA-CREF Lifecycle Index Funds |
Lifecycle Index 2010 Fund
$10,000 over 10 years
Retirement Class

Ending amounts are as of May 31, 2022. For the purpose of comparison, the graph also shows the change in the values of the Fund’s composite benchmark and a broad market index during the same period. The performance of the other share classes varies due to differences in expense charges.
Asset allocation
| % of net assets as of 5/31/22 | % of target allocation for 6/30/22 | |
| Equity | ||
| U.S. equity | 24.62 | 24.70 |
| International equity | 13.46 | 13.30 |
| Fixed income | ||
| Fixed income | 39.91 | 40.00 |
| Short-term fixed income | 11.90 | 12.00 |
| Inflation-protected assets | 9.97 | 10.00 |
| Other assets & liabilities, net | 0.14 | — |
| Total | 100.00 | 100.00 |
Target allocation
For June 30, 2022

| TIAA-CREF Lifecycle Index Funds ■ 2022 Annual Report | 23 |
Performance as of May 31, 2022
| Lifecycle Index 2015 Fund | Total Return | Average annual total return | Annual operating expenses*# | |||||||||||||||||||
| Inception date | 1 year | 5 years | 10 years | gross | net | |||||||||||||||||
| Institutional Class | 9/30/09 | –6.32 | % | 5.60 | % | 6.69 | % | 0.20 | % | 0.10 | % | |||||||||||
| Advisor Class | 12/4/15 | –6.40 | 5.53 | 6.57 | † | 0.30 | 0.20 | |||||||||||||||
| Premier Class | 9/30/09 | –6.49 | 5.43 | 6.53 | 0.35 | 0.25 | ||||||||||||||||
| Retirement Class | 9/30/09 | –6.51 | 5.34 | 6.43 | 0.45 | 0.35 | ||||||||||||||||
| Lifecycle Index 2015 Fund Composite Index‡ | — | –6.28 | 5.68 | 6.80 | — | — | ||||||||||||||||
| Broad market index | ||||||||||||||||||||||
| S&P Target Date 2015 Index | — | –5.47 | 5.01 | 6.22 | — | — | ||||||||||||||||
The returns in this report show past performance, which is no guarantee of future results. The returns do not reflect taxes that a shareholder would pay on fund distributions or on the sale of fund shares. Returns and the principal value of your investment will fluctuate. Current performance may be higher or lower than that shown, and you may have a gain or a loss when you redeem your shares. For current performance information, including performance to the most recent month-end, please visit TIAA.org. Performance may reflect waivers or reimbursements of certain expenses. Absent these waivers or reimbursement arrangements, performance would be lower.
You cannot invest directly in any index. Index returns do not include a deduction for fees or expenses.
| * | The gross and net annual operating expenses are taken from the Fund’s prospectus. The net annual operating expenses may at times reflect a contractual waiver or reimbursement of various expenses. The expense reimbursements and waivers will continue through at least September 30, 2022, unless changed with the approval of the Board of Trustees. Without these reimbursements and waivers, expenses would be higher and returns lower. Refer to the Financial highlights later in this report for the Fund’s expense ratios as of the end of the reporting period. |
| # | These expenses include underlying fund expenses. |
| † | The performance shown for the Advisor Class that is prior to its inception date is based on performance of the Retirement Class. The performance for these periods has not been restated to reflect the actual expenses of the Advisor Class. If these actual expenses had been reflected, the performance of the Advisor Class shown for these periods would have been different because the Advisor Class has different expenses than the Retirement Class. |
| ‡ | As of the close of business on May 31, 2022, the Lifecycle Index 2015 Fund Composite Index consisted of: 39.3% Bloomberg U.S. Aggregate Bond Index; 28.0% Russell 3000® Index; 15.1% MSCI EAFE + Emerging Markets Index; 8.8% Bloomberg U.S. 1–3 Year Government/Credit Bond Index; and 8.8% Bloomberg U.S. Treasury Inflation Protected Securities (TIPS) 1–10 Year Index. The Fund’s benchmark, the components that make up the composite benchmark and the method of calculating the composite benchmark’s performance may vary over time. |
| 24 | 2022 Annual Report ■ TIAA-CREF Lifecycle Index Funds |
Lifecycle Index 2015 Fund
$10,000 over 10 years
Retirement Class

Ending amounts are as of May 31, 2022. For the purpose of comparison, the graph also shows the change in the values of the Fund’s composite benchmark and a broad market index during the same period. The performance of the other share classes varies due to differences in expense charges.
Asset allocation
| % of net assets as of 5/31/22 | % of target allocation for 6/30/22 | |
| Equity | ||
| U.S. equity | 27.88 | 27.95 |
| International equity | 15.23 | 15.05 |
| Fixed income | ||
| Fixed income | 39.32 | 39.40 |
| Short-term fixed income | 8.76 | 8.80 |
| Inflation-protected assets | 8.73 | 8.80 |
| Other assets & liabilities, net | 0.08 | — |
| Total | 100.00 | 100.00 |
Target allocation
For June 30, 2022

| TIAA-CREF Lifecycle Index Funds ■ 2022 Annual Report | 25 |
Performance as of May 31, 2022
| Lifecycle Index 2020 Fund | Total Return | Average annual total return | Annual operating expenses*# | |||||||||||||||||||
| Inception date | 1 year | 5 years | 10 years | gross | net | |||||||||||||||||
| Institutional Class | 9/30/09 | –6.51 | % | 6.03 | % | 7.38 | % | 0.19 | % | 0.10 | % | |||||||||||
| Advisor Class | 12/4/15 | –6.60 | 5.95 | 7.22 | † | 0.29 | 0.21 | |||||||||||||||
| Premier Class | 9/30/09 | –6.65 | 5.87 | 7.21 | 0.34 | 0.25 | ||||||||||||||||
| Retirement Class | 9/30/09 | –6.76 | 5.77 | 7.10 | 0.44 | 0.35 | ||||||||||||||||
| Lifecycle Index 2020 Fund Composite Index‡ | — | –6.49 | 6.12 | 7.48 | — | — | ||||||||||||||||
| Broad market index | ||||||||||||||||||||||
| S&P Target Date 2020 Index | — | –5.67 | 5.29 | 6.85 | — | — | ||||||||||||||||
The returns in this report show past performance, which is no guarantee of future results. The returns do not reflect taxes that a shareholder would pay on fund distributions or on the sale of fund shares. Returns and the principal value of your investment will fluctuate. Current performance may be higher or lower than that shown, and you may have a gain or a loss when you redeem your shares. For current performance information, including performance to the most recent month-end, please visit TIAA.org. Performance may reflect waivers or reimbursements of certain expenses. Absent these waivers or reimbursement arrangements, performance would be lower.
You cannot invest directly in any index. Index returns do not include a deduction for fees or expenses.
| * | The gross and net annual operating expenses are taken from the Fund’s prospectus. The net annual operating expenses may at times reflect a contractual waiver or reimbursement of various expenses. The expense reimbursements and waivers will continue through at least September 30, 2022, unless changed with the approval of the Board of Trustees. Without these reimbursements and waivers, expenses would be higher and returns lower. Refer to the Financial highlights later in this report for the Fund’s expense ratios as of the end of the reporting period. |
| # | These expenses include underlying fund expenses. |
| † | The performance shown for the Advisor Class that is prior to its inception date is based on performance of the Retirement Class. The performance for these periods has not been restated to reflect the actual expenses of the Advisor Class. If these actual expenses had been reflected, the performance of the Advisor Class shown for these periods would have been different because the Advisor Class has different expenses than the Retirement Class. |
| ‡ | As of the close of business on May 31, 2022, the Lifecycle Index 2020 Fund Composite Index consisted of: 38.4% Bloomberg U.S. Aggregate Bond Index; 31.2% Russell 3000® Index; 16.8% MSCI EAFE + Emerging Markets Index; 6.8% Bloomberg U.S. 1–3 Year Government/Credit Bond Index; and 6.8% Bloomberg U.S. Treasury Inflation Protected Securities (TIPS) 1–10 Year Index. The Fund’s benchmark, the components that make up the composite benchmark and the method of calculating the composite benchmark’s performance may vary over time. |
| 26 | 2022 Annual Report ■ TIAA-CREF Lifecycle Index Funds |
Lifecycle Index 2020 Fund
$10,000 over 10 years
Retirement Class

Ending amounts are as of May 31, 2022. For the purpose of comparison, the graph also shows the change in the values of the Fund’s composite benchmark and a broad market index during the same period. The performance of the other share classes varies due to differences in expense charges.
Asset allocation
| % of net assets as of 5/31/22 | % of target allocation for 6/30/22 | |
| Equity | ||
| U.S. equity | 31.12 | 31.20 |
| International equity | 17.00 | 16.80 |
| Fixed income | ||
| Fixed income | 38.30 | 38.40 |
| Short-term fixed income | 6.77 | 6.80 |
| Inflation-protected assets | 6.75 | 6.80 |
| Other assets & liabilities, net | 0.06 | — |
| Total | 100.00 | 100.00 |
Target allocation
For June 30, 2022

| TIAA-CREF Lifecycle Index Funds ■ 2022 Annual Report | 27 |
Performance as of May 31, 2022
| Lifecycle Index 2025 Fund | Total Return | Average annual total return | Annual operating expenses*# | |||||||||||||||||||
| Inception date | 1 year | 5 years | 10 years | gross | net | |||||||||||||||||
| Institutional Class | 9/30/09 | –6.65 | % | 6.68 | % | 8.17 | % | 0.19 | % | 0.10 | % | |||||||||||
| Advisor Class | 12/4/15 | –6.78 | 6.57 | 8.02 | † | 0.28 | 0.20 | |||||||||||||||
| Premier Class | 9/30/09 | –6.79 | 6.53 | 8.00 | 0.34 | 0.25 | ||||||||||||||||
| Retirement Class | 9/30/09 | –6.91 | 6.41 | 7.90 | 0.44 | 0.35 | ||||||||||||||||
| Lifecycle Index 2025 Fund Composite Index‡ | — | –6.67 | 6.76 | 8.27 | — | — | ||||||||||||||||
| Broad market index | ||||||||||||||||||||||
| S&P Target Date 2025 Index | — | –5.82 | 6.09 | 7.67 | — | — | ||||||||||||||||
The returns in this report show past performance, which is no guarantee of future results. The returns do not reflect taxes that a shareholder would pay on fund distributions or on the sale of fund shares. Returns and the principal value of your investment will fluctuate. Current performance may be higher or lower than that shown, and you may have a gain or a loss when you redeem your shares. For current performance information, including performance to the most recent month-end, please visit TIAA.org. Performance may reflect waivers or reimbursements of certain expenses. Absent these waivers or reimbursement arrangements, performance would be lower.
You cannot invest directly in any index. Index returns do not include a deduction for fees or expenses.
| * | The gross and net annual operating expenses are taken from the Fund’s prospectus. The net annual operating expenses may at times reflect a contractual waiver or reimbursement of various expenses. The expense reimbursements and waivers will continue through at least September 30, 2022, unless changed with the approval of the Board of Trustees. Without these reimbursements and waivers, expenses would be higher and returns lower. Refer to the Financial highlights later in this report for the Fund’s expense ratios as of the end of the reporting period. |
| # | These expenses include underlying fund expenses. |
| † | The performance shown for the Advisor Class that is prior to its inception date is based on performance of the Retirement Class. The performance for these periods has not been restated to reflect the actual expenses of the Advisor Class. If these actual expenses had been reflected, the performance of the Advisor Class shown for these periods would have been different because the Advisor Class has different expenses than the Retirement Class. |
| ‡ | As of the close of business on May 31, 2022, the Lifecycle Index 2025 Fund Composite Index consisted of: 35.7% Russell 3000® Index; 35.5% Bloomberg U.S. Aggregate Bond Index; 19.2% MSCI EAFE + Emerging Markets Index; 4.8% Bloomberg U.S. 1–3 Year Government/Credit Bond Index; and 4.8% Bloomberg U.S. Treasury Inflation Protected Securities (TIPS) 1–10 Year Index. The Fund’s benchmark, the components that make up the composite benchmark and the method of calculating the composite benchmark’s performance may vary over time. |
| 28 | 2022 Annual Report ■ TIAA-CREF Lifecycle Index Funds |
Lifecycle Index 2025 Fund
$10,000 over 10 years
Retirement Class

Ending amounts are as of May 31, 2022. For the purpose of comparison, the graph also shows the change in the values of the Fund’s composite benchmark and a broad market index during the same period. The performance of the other share classes varies due to differences in expense charges.
Asset allocation
| % of net assets as of 5/31/22 | % of target allocation for 6/30/22 | |
| Equity | ||
| U.S. equity | 35.56 | 35.62 |
| International equity | 19.42 | 19.18 |
| Fixed income | ||
| Fixed income | 35.45 | 35.60 |
| Short-term fixed income | 4.77 | 4.80 |
| Inflation-protected assets | 4.75 | 4.80 |
| Other assets & liabilities, net | 0.05 | — |
| Total | 100.00 | 100.00 |
Target allocation
For June 30, 2022

| TIAA-CREF Lifecycle Index Funds ■ 2022 Annual Report | 29 |
Performance as of May 31, 2022
| Lifecycle Index 2030 Fund | Total Return | Average annual total return | Annual operating expenses*# | |||||||||||||||||||
| Inception date | 1 year | 5 years | 10 years | gross | net | |||||||||||||||||
| Institutional Class | 9/30/09 | –6.86 | % | 7.32 | % | 8.95 | % | 0.18 | % | 0.10 | % | |||||||||||
| Advisor Class | 12/4/15 | –6.94 | 7.22 | 8.80 | † | 0.28 | 0.21 | |||||||||||||||
| Premier Class | 9/30/09 | –7.00 | 7.16 | 8.79 | 0.33 | 0.25 | ||||||||||||||||
| Retirement Class | 9/30/09 | –7.07 | 7.06 | 8.68 | 0.43 | 0.35 | ||||||||||||||||
| Lifecycle Index 2030 Fund Composite Index‡ | — | –6.85 | 7.40 | 9.06 | — | — | ||||||||||||||||
| Broad market index | ||||||||||||||||||||||
| S&P Target Date 2030 Index | — | –5.97 | 6.81 | 8.42 | — | — | ||||||||||||||||
The returns in this report show past performance, which is no guarantee of future results. The returns do not reflect taxes that a shareholder would pay on fund distributions or on the sale of fund shares. Returns and the principal value of your investment will fluctuate. Current performance may be higher or lower than that shown, and you may have a gain or a loss when you redeem your shares. For current performance information, including performance to the most recent month-end, please visit TIAA.org. Performance may reflect waivers or reimbursements of certain expenses. Absent these waivers or reimbursement arrangements, performance would be lower.
You cannot invest directly in any index. Index returns do not include a deduction for fees or expenses.
| * | The gross and net annual operating expenses are taken from the Fund’s prospectus. The net annual operating expenses may at times reflect a contractual waiver or reimbursement of various expenses. The expense reimbursements and waivers will continue through at least September 30, 2022, unless changed with the approval of the Board of Trustees. Without these reimbursements and waivers, expenses would be higher and returns lower. Refer to the Financial highlights later in this report for the Fund’s expense ratios as of the end of the reporting period. |
| # | These expenses include underlying fund expenses. |
| † | The performance shown for the Advisor Class that is prior to its inception date is based on performance of the Retirement Class. The performance for these periods has not been restated to reflect the actual expenses of the Advisor Class. If these actual expenses had been reflected, the performance of the Advisor Class shown for these periods would have been different because the Advisor Class has different expenses than the Retirement Class. |
| ‡ | As of the close of business on May 31, 2022, the Lifecycle Index 2030 Fund Composite Index consisted of: 40.9% Russell 3000® Index; 31.5% Bloomberg U.S. Aggregate Bond Index; 22.0% MSCI EAFE + Emerging Markets Index; 2.8% Bloomberg U.S. 1–3 Year Government/Credit Bond Index; and 2.8% Bloomberg U.S. Treasury Inflation Protected Securities (TIPS) 1–10 Year Index. The Fund’s benchmark, the components that make up the composite benchmark and the method of calculating the composite benchmark’s performance may vary over time. |
| 30 | 2022 Annual Report ■ TIAA-CREF Lifecycle Index Funds |
Lifecycle Index 2030 Fund
$10,000 over 10 years
Retirement Class
![]()
Ending amounts are as of May 31, 2022. For the purpose of comparison, the graph also shows the change in the values of the Fund’s composite benchmark and a broad market index during the same period. The performance of the other share classes varies due to differences in expense charges.
Asset allocation
| % of net assets as of 5/31/22 | % of target allocation for 6/30/22 | |
| Equity | ||
| U.S. equity | 40.72 | 40.82 |
| International equity | 22.25 | 21.98 |
| Fixed income | ||
| Fixed income | 31.46 | 31.60 |
| Short-term fixed income | 2.76 | 2.80 |
| Inflation-protected assets | 2.75 | 2.80 |
| Other assets & liabilities, net | 0.06 | — |
| Total | 100.00 | 100.00 |
Target allocation
For June 30, 2022

| TIAA-CREF Lifecycle Index Funds ■ 2022 Annual Report | 31 |
Performance as of May 31, 2022
| Lifecycle Index 2035 Fund | Total Return | Average annual total return | Annual operating expenses*# | |||||||||||||||||||
| Inception date | 1 year | 5 years | 10 years | gross | net | |||||||||||||||||
| Institutional Class | 9/30/09 | –7.00 | % | 7.94 | % | 9.72 | % | 0.18 | % | 0.10 | % | |||||||||||
| Advisor Class | 12/4/15 | –7.09 | 7.87 | 9.58 | † | 0.27 | 0.20 | |||||||||||||||
| Premier Class | 9/30/09 | –7.18 | 7.77 | 9.55 | 0.32 | 0.25 | ||||||||||||||||
| Retirement Class | 9/30/09 | –7.26 | 7.68 | 9.45 | 0.43 | 0.35 | ||||||||||||||||
| Lifecycle Index 2035 Fund Composite Index‡ | — | –7.03 | 8.02 | 9.82 | — | — | ||||||||||||||||
| Broad market index | ||||||||||||||||||||||
| S&P Target Date 2035 Index | — | –6.07 | 7.57 | 9.13 | — | — | ||||||||||||||||
The returns in this report show past performance, which is no guarantee of future results. The returns do not reflect taxes that a shareholder would pay on fund distributions or on the sale of fund shares. Returns and the principal value of your investment will fluctuate. Current performance may be higher or lower than that shown, and you may have a gain or a loss when you redeem your shares. For current performance information, including performance to the most recent month-end, please visit TIAA.org. Performance may reflect waivers or reimbursements of certain expenses. Absent these waivers or reimbursement arrangements, performance would be lower.
You cannot invest directly in any index. Index returns do not include a deduction for fees or expenses.
| * | The gross and net annual operating expenses are taken from the Fund’s prospectus. The net annual operating expenses may at times reflect a contractual waiver or reimbursement of various expenses. The expense reimbursements and waivers will continue through at least September 30, 2022, unless changed with the approval of the Board of Trustees. Without these reimbursements and waivers, expenses would be higher and returns lower. Refer to the Financial highlights later in this report for the Fund’s expense ratios as of the end of the reporting period. |
| # | These expenses include underlying fund expenses. |
| † | The performance shown for the Advisor Class that is prior to its inception date is based on performance of the Retirement Class. The performance for these periods has not been restated to reflect the actual expenses of the Advisor Class. If these actual expenses had been reflected, the performance of the Advisor Class shown for these periods would have been different because the Advisor Class has different expenses than the Retirement Class. |
| ‡ | As of the close of business on May 31, 2022, the Lifecycle Index 2035 Fund Composite Index consisted of: 46.1% Russell 3000® Index; 27.5% Bloomberg U.S. Aggregate Bond Index; 24.8% MSCI EAFE + Emerging Markets Index; 0.8% Bloomberg U.S. 1–3 Year Government/Credit Bond Index; and 0.8% Bloomberg U.S. Treasury Inflation Protected Securities (TIPS) 1–10 Year Index. The Fund’s benchmark, the components that make up the composite benchmark and the method of calculating the composite benchmark’s performance may vary over time. |
| 32 | 2022 Annual Report ■ TIAA-CREF Lifecycle Index Funds |
Lifecycle Index 2035 Fund
$10,000 over 10 years
Retirement Class

Ending amounts are as of May 31, 2022. For the purpose of comparison, the graph also shows the change in the values of the Fund’s composite benchmark and a broad market index during the same period. The performance of the other share classes varies due to differences in expense charges.
Asset allocation
| % of net assets as of 5/31/22 | % of target allocation for 6/30/22 | |
| Equity | ||
| U.S. equity | 45.86 | 46.02 |
| International equity | 25.06 | 24.78 |
| Fixed income | ||
| Fixed income | 27.45 | 27.60 |
| Short-term fixed income | 0.76 | 0.80 |
| Inflation-protected assets | 0.76 | 0.80 |
| Other assets & liabilities, net | 0.11 | — |
| Total | 100.00 | 100.00 |
Target allocation
For June 30, 2022

| TIAA-CREF Lifecycle Index Funds ■ 2022 Annual Report | 33 |
Performance as of May 31, 2022
| Lifecycle Index 2040 Fund | Total Return | Average annual total return | Annual operating expenses*# | |||||||||||||||||||
| Inception date | 1 year | 5 years | 10 years | gross | net | |||||||||||||||||
| Institutional Class | 9/30/09 | –7.00 | % | 8.59 | % | 10.34 | % | 0.17 | % | 0.10 | % | |||||||||||
| Advisor Class | 12/4/15 | –7.12 | 8.51 | 10.20 | † | 0.27 | 0.20 | |||||||||||||||
| Premier Class | 9/30/09 | –7.18 | 8.43 | 10.17 | 0.32 | 0.25 | ||||||||||||||||
| Retirement Class | 9/30/09 | –7.26 | 8.32 | 10.06 | 0.42 | 0.35 | ||||||||||||||||
| Lifecycle Index 2040 Fund Composite Index‡ | — | –7.04 | 8.67 | 10.43 | — | — | ||||||||||||||||
| Broad market index | ||||||||||||||||||||||
| S&P Target Date 2040 Index | — | –6.07 | 8.11 | 9.64 | — | — | ||||||||||||||||
The returns in this report show past performance, which is no guarantee of future results. The returns do not reflect taxes that a shareholder would pay on fund distributions or on the sale of fund shares. Returns and the principal value of your investment will fluctuate. Current performance may be higher or lower than that shown, and you may have a gain or a loss when you redeem your shares. For current performance information, including performance to the most recent month-end, please visit TIAA.org. Performance may reflect waivers or reimbursements of certain expenses. Absent these waivers or reimbursement arrangements, performance would be lower.
You cannot invest directly in any index. Index returns do not include a deduction for fees or expenses.
| * | The gross and net annual operating expenses are taken from the Fund’s prospectus. The net annual operating expenses may at times reflect a contractual waiver or reimbursement of various expenses. The expense reimbursements and waivers will continue through at least September 30, 2022, unless changed with the approval of the Board of Trustees. Without these reimbursements and waivers, expenses would be higher and returns lower. Refer to the Financial highlights later in this report for the Fund’s expense ratios as of the end of the reporting period. |
| # | These expenses include underlying fund expenses. |
| † | The performance shown for the Advisor Class that is prior to its inception date is based on performance of the Retirement Class. The performance for these periods has not been restated to reflect the actual expenses of the Advisor Class. If these actual expenses had been reflected, the performance of the Advisor Class shown for these periods would have been different because the Advisor Class has different expenses than the Retirement Class. |
| ‡ | As of the close of business on May 31, 2022, the Lifecycle Index 2040 Fund Composite Index consisted of: 51.3% Russell 3000® Index; 27.6% MSCI EAFE + Emerging Markets Index; and 21.1% Bloomberg U.S. Aggregate Bond Index. The Fund’s benchmark, the components that make up the composite benchmark and the method of calculating the composite benchmark’s performance may vary over time. |
| 34 | 2022 Annual Report ■ TIAA-CREF Lifecycle Index Funds |
Lifecycle Index 2040 Fund
$10,000 over 10 years
Retirement Class
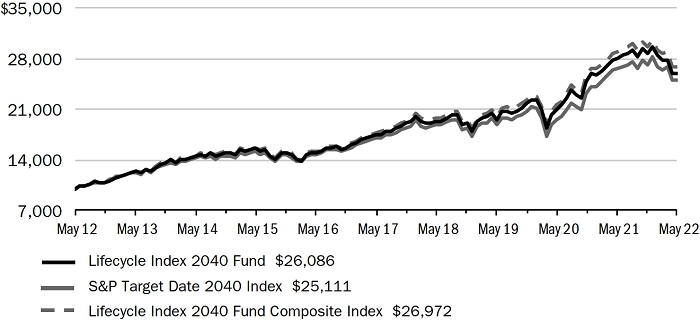
Ending amounts are as of May 31, 2022. For the purpose of comparison, the graph also shows the change in the values of the Fund’s composite benchmark and a broad market index during the same period. The performance of the other share classes varies due to differences in expense charges.
Asset allocation
| % of net assets as of 5/31/22 | % of target allocation for 6/30/22 | |
| Equity | ||
| U.S. equity | 51.03 | 51.22 |
| International equity | 27.88 | 27.58 |
| Fixed income | 20.98 | 21.20 |
| Other assets & liabilities, net | 0.11 | — |
| Total | 100.00 | 100.00 |
Target allocation
For June 30, 2022

| TIAA-CREF Lifecycle Index Funds ■ 2022 Annual Report | 35 |
Performance as of May 31, 2022
| Lifecycle Index 2045 Fund | Total Return | Average annual total return | Annual operating expenses*# | |||||||||||||||||||
| Inception date | 1 year | 5 years | 10 years | gross | net | |||||||||||||||||
| Institutional Class | 9/30/09 | –6.92 | % | 9.17 | % | 10.69 | % | 0.17 | % | 0.10 | % | |||||||||||
| Advisor Class | 12/4/15 | –7.04 | 9.05 | 10.52 | † | 0.27 | 0.21 | |||||||||||||||
| Premier Class | 9/30/09 | –7.06 | 9.01 | 10.52 | 0.32 | 0.25 | ||||||||||||||||
| Retirement Class | 9/30/09 | –7.18 | 8.90 | 10.40 | 0.42 | 0.35 | ||||||||||||||||
| Lifecycle Index 2045 Fund Composite Index‡ | — | –6.97 | 9.24 | 10.79 | — | — | ||||||||||||||||
| Broad market index | ||||||||||||||||||||||
| S&P Target Date 2045 Index | — | –6.04 | 8.40 | 9.98 | — | — | ||||||||||||||||
The returns in this report show past performance, which is no guarantee of future results. The returns do not reflect taxes that a shareholder would pay on fund distributions or on the sale of fund shares. Returns and the principal value of your investment will fluctuate. Current performance may be higher or lower than that shown, and you may have a gain or a loss when you redeem your shares. For current performance information, including performance to the most recent month-end, please visit TIAA.org. Performance may reflect waivers or reimbursements of certain expenses. Absent these waivers or reimbursement arrangements, performance would be lower.
You cannot invest directly in any index. Index returns do not include a deduction for fees or expenses.
| * | The gross and net annual operating expenses are taken from the Fund’s prospectus. The net annual operating expenses may at times reflect a contractual waiver or reimbursement of various expenses. The expense reimbursements and waivers will continue through at least September 30, 2022, unless changed with the approval of the Board of Trustees. Without these reimbursements and waivers, expenses would be higher and returns lower. Refer to the Financial highlights later in this report for the Fund’s expense ratios as of the end of the reporting period. |
| # | These expenses include underlying fund expenses. |
| † | The performance shown for the Advisor Class that is prior to its inception date is based on performance of the Retirement Class. The performance for these periods has not been restated to reflect the actual expenses of the Advisor Class. If these actual expenses had been reflected, the performance of the Advisor Class shown for these periods would have been different because the Advisor Class has different expenses than the Retirement Class. |
| ‡ | As of the close of business on May 31, 2022, the Lifecycle Index 2045 Fund Composite Index consisted of: 56.5% Russell 3000® Index; 30.4% MSCI EAFE + Emerging Markets Index; and 13.1% Bloomberg U.S. Aggregate Bond Index. The Fund’s benchmark, the components that make up the composite benchmark and the method of calculating the composite benchmark’s performance may vary over time. |
| 36 | 2022 Annual Report ■ TIAA-CREF Lifecycle Index Funds |
Lifecycle Index 2045 Fund
$10,000 over 10 years
Retirement Class
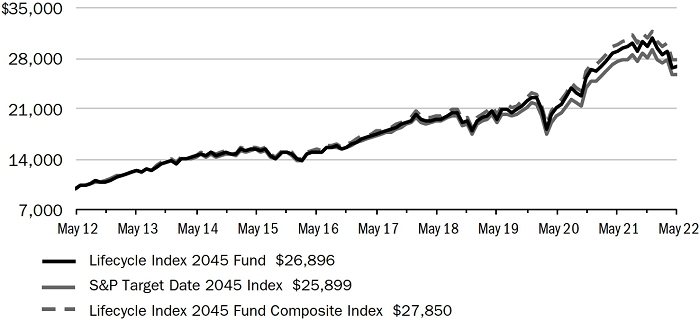
Ending amounts are as of May 31, 2022. For the purpose of comparison, the graph also shows the change in the values of the Fund’s composite benchmark and a broad market index during the same period. The performance of the other share classes varies due to differences in expense charges.
Asset allocation
| % of net assets as of 5/31/22 | % of target allocation for 6/30/22 | |
| Equity | ||
| U.S. equity | 56.18 | 56.42 |
| International equity | 30.69 | 30.38 |
| Fixed income | 12.99 | 13.20 |
| Other assets & liabilities, net | 0.14 | — |
| Total | 100.00 | 100.00 |
Target allocation
For June 30, 2022

| TIAA-CREF Lifecycle Index Funds ■ 2022 Annual Report | 37 |
Performance as of May 31, 2022
| Lifecycle Index 2050 Fund | Total Return | Average annual total return | Annual operating expenses*# | |||||||||||||||||||
| Inception date | 1 year | 5 years | 10 years | gross | net | |||||||||||||||||
| Institutional Class | 9/30/09 | –6.92 | % | 9.32 | % | 10.78 | % | 0.17 | % | 0.10 | % | |||||||||||
| Advisor Class | 12/4/15 | –7.04 | 9.22 | 10.63 | † | 0.27 | 0.20 | |||||||||||||||
| Premier Class | 9/30/09 | –7.06 | 9.15 | 10.62 | 0.32 | 0.25 | ||||||||||||||||
| Retirement Class | 9/30/09 | –7.15 | 9.04 | 10.51 | 0.43 | 0.35 | ||||||||||||||||
| Lifecycle Index 2050 Fund Composite Index‡ | — | –6.96 | 9.38 | 10.89 | — | — | ||||||||||||||||
| Broad market index | ||||||||||||||||||||||
| S&P Target Date 2050 Index | — | –6.07 | 8.57 | 10.24 | — | — | ||||||||||||||||
The returns in this report show past performance, which is no guarantee of future results. The returns do not reflect taxes that a shareholder would pay on fund distributions or on the sale of fund shares. Returns and the principal value of your investment will fluctuate. Current performance may be higher or lower than that shown, and you may have a gain or a loss when you redeem your shares. For current performance information, including performance to the most recent month-end, please visit TIAA.org. Performance may reflect waivers or reimbursements of certain expenses. Absent these waivers or reimbursement arrangements, performance would be lower.
You cannot invest directly in any index. Index returns do not include a deduction for fees or expenses.
| * | The gross and net annual operating expenses are taken from the Fund’s prospectus. The net annual operating expenses may at times reflect a contractual waiver or reimbursement of various expenses. The expense reimbursements and waivers will continue through at least September 30, 2022, unless changed with the approval of the Board of Trustees. Without these reimbursements and waivers, expenses would be higher and returns lower. Refer to the Financial highlights later in this report for the Fund’s expense ratios as of the end of the reporting period. |
| # | These expenses include underlying fund expenses. |
| † | The performance shown for the Advisor Class that is prior to its inception date is based on performance of the Retirement Class. The performance for these periods has not been restated to reflect the actual expenses of the Advisor Class. If these actual expenses had been reflected, the performance of the Advisor Class shown for these periods would have been different because the Advisor Class has different expenses than the Retirement Class. |
| ‡ | As of the close of business on May 31, 2022, the Lifecycle Index 2050 Fund Composite Index consisted of: 59.0% Russell 3000® Index; 31.8% MSCI EAFE + Emerging Markets Index; and 9.2% Bloomberg U.S. Aggregate Bond Index. The Fund’s benchmark, the components that make up the composite benchmark and the method of calculating the composite benchmark’s performance may vary over time. |
| 38 | 2022 Annual Report ■ TIAA-CREF Lifecycle Index Funds |
Lifecycle Index 2050 Fund
$10,000 over 10 years
Retirement Class
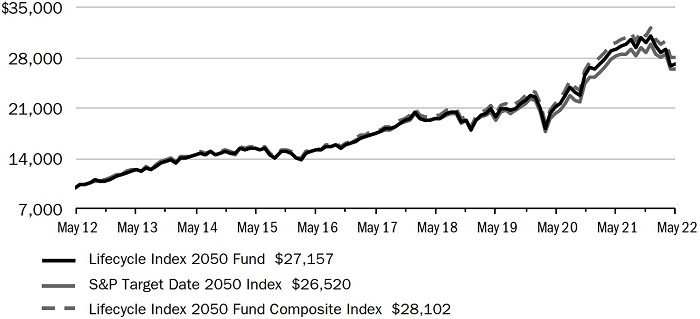
Ending amounts are as of May 31, 2022. For the purpose of comparison, the graph also shows the change in the values of the Fund’s composite benchmark and a broad market index during the same period. The performance of the other share classes varies due to differences in expense charges.
Asset allocation
| % of net assets as of 5/31/22 | % of target allocation for 6/30/22 | |
| Equity | ||
| U.S. equity | 58.62 | 58.99 |
| International equity | 32.03 | 31.76 |
| Fixed income | 9.19 | 9.25 |
| Other assets & liabilities, net | 0.16 | — |
| Total | 100.00 | 100.00 |
Target allocation
For June 30, 2022

| TIAA-CREF Lifecycle Index Funds ■ 2022 Annual Report | 39 |
Performance as of May 31, 2022
| Lifecycle Index 2055 Fund | Total Return | Average annual total return | Annual operating expenses*# | |||||||||||||||||||
| Inception date | 1 year | 5 years | 10 years | gross | net | |||||||||||||||||
| Institutional Class | 4/29/11 | –6.91 | % | 9.41 | % | 10.86 | % | 0.18 | % | 0.10 | % | |||||||||||
| Advisor Class | 12/4/15 | –7.00 | 9.31 | 10.72 | † | 0.28 | 0.20 | |||||||||||||||
| Premier Class | 4/29/11 | –7.02 | 9.25 | 10.71 | 0.33 | 0.25 | ||||||||||||||||
| Retirement Class | 4/29/11 | –7.13 | 9.13 | 10.59 | 0.43 | 0.35 | ||||||||||||||||
| Lifecycle Index 2055 Fund Composite Index‡ | — | –6.95 | 9.48 | 10.97 | — | — | ||||||||||||||||
| Broad market index | ||||||||||||||||||||||
| S&P Target Date 2055 Index | — | –6.08 | 8.63 | 10.41 | — | — | ||||||||||||||||
The returns in this report show past performance, which is no guarantee of future results. The returns do not reflect taxes that a shareholder would pay on fund distributions or on the sale of fund shares. Returns and the principal value of your investment will fluctuate. Current performance may be higher or lower than that shown, and you may have a gain or a loss when you redeem your shares. For current performance information, including performance to the most recent month-end, please visit TIAA.org. Performance may reflect waivers or reimbursements of certain expenses. Absent these waivers or reimbursement arrangements, performance would be lower.
You cannot invest directly in any index. Index returns do not include a deduction for fees or expenses.
| * | The gross and net annual operating expenses are taken from the Fund’s prospectus. The net annual operating expenses may at times reflect a contractual waiver or reimbursement of various expenses. The expense reimbursements and waivers will continue through at least September 30, 2022, unless changed with the approval of the Board of Trustees. Without these reimbursements and waivers, expenses would be higher and returns lower. Refer to the Financial highlights later in this report for the Fund’s expense ratios as of the end of the reporting period. |
| # | These expenses include underlying fund expenses. |
| † | The performance shown for the Advisor Class that is prior to its inception date is based on performance of the Retirement Class. The performance for these periods has not been restated to reflect the actual expenses of the Advisor Class. If these actual expenses had been reflected, the performance of the Advisor Class shown for these periods would have been different because the Advisor Class has different expenses than the Retirement Class. |
| ‡ | As of the close of business on May 31, 2022, the Lifecycle Index 2055 Fund Composite Index consisted of: 59.8% Russell 3000® Index; 32.2% MSCI EAFE + Emerging Markets Index; and 8.0% Bloomberg U.S. Aggregate Bond Index. The Fund’s benchmark, the components that make up the composite benchmark and the method of calculating the composite benchmark’s performance may vary over time. |
| 40 | 2022 Annual Report ■ TIAA-CREF Lifecycle Index Funds |
Lifecycle Index 2055 Fund
$10,000 over 10 years
Retirement Class
![]()
Ending amounts are as of May 31, 2022. For the purpose of comparison, the graph also shows the change in the values of the Fund’s composite benchmark and a broad market index during the same period. The performance of the other share classes varies due to differences in expense charges.
Asset allocation
| % of net assets as of 5/31/22 | % of target allocation for 6/30/22 | |
| Equity | ||
| U.S. equity | 59.43 | 59.80 |
| International equity | 32.46 | 32.20 |
| Fixed income | 7.95 | 8.00 |
| Other assets & liabilities, net | 0.16 | — |
| Total | 100.00 | 100.00 |
Target allocation
For June 30, 2022

| TIAA-CREF Lifecycle Index Funds ■ 2022 Annual Report | 41 |
Performance as of May 31, 2022
| Lifecycle Index 2060 Fund | Total Return | Average annual total return | Annual operating expenses*# | |||||||||||||||||||
| Inception date | 1 year | 5 years | since inception | gross | net | |||||||||||||||||
| Institutional Class | 9/26/14 | –6.93 | % | 9.49 | % | 8.81 | % | 0.20 | % | 0.10 | % | |||||||||||
| Advisor Class | 12/4/15 | –7.01 | 9.42 | 8.71 | † | 0.30 | 0.20 | |||||||||||||||
| Premier Class | 9/26/14 | –7.01 | 9.34 | 8.66 | 0.35 | 0.25 | ||||||||||||||||
| Retirement Class | 9/26/14 | –7.11 | 9.24 | 8.55 | 0.45 | 0.35 | ||||||||||||||||
| Lifecycle Index 2060 Fund Composite Index‡ | — | –6.94 | 9.58 | 8.90 | § | — | — | |||||||||||||||
| Broad market index | ||||||||||||||||||||||
| S&P Target Date 2060 Index | — | –6.14 | 8.70 | 8.18 | § | — | — | |||||||||||||||
The returns in this report show past performance, which is no guarantee of future results. The returns do not reflect taxes that a shareholder would pay on fund distributions or on the sale of fund shares. Returns and the principal value of your investment will fluctuate. Current performance may be higher or lower than that shown, and you may have a gain or a loss when you redeem your shares. For current performance information, including performance to the most recent month-end, please visit TIAA.org. Performance may reflect waivers or reimbursements of certain expenses. Absent these waivers or reimbursement arrangements, performance would be lower.
You cannot invest directly in any index. Index returns do not include a deduction for fees or expenses.
| * | The gross and net annual operating expenses are taken from the Fund’s prospectus. The net annual operating expenses may at times reflect a contractual waiver or reimbursement of various expenses. The expense reimbursements and waivers will continue through at least September 30, 2022, unless changed with the approval of the Board of Trustees. Without these reimbursements and waivers, expenses would be higher and returns lower. Refer to the Financial highlights later in this report for the Fund’s expense ratios as of the end of the reporting period. |
| # | These expenses include underlying fund expenses. |
| † | The performance shown for the Advisor Class that is prior to its inception date is based on performance of the Retirement Class. The performance for these periods has not been restated to reflect the actual expenses of the Advisor Class. If these actual expenses had been reflected, the performance of the Advisor Class shown for these periods would have been different because the Advisor Class has different expenses than the Retirement Class. |
| ‡ | As of the close of business on May 31, 2022, the Lifecycle Index 2060 Fund Composite Index consisted of: 60.6% Russell 3000® Index; 32.7% MSCI EAFE + Emerging Markets Index; and 6.7% Bloomberg U.S. Aggregate Bond Index. The Fund’s benchmark, the components that make up the composite benchmark and the method of calculating the composite benchmark’s performance may vary over time. |
| § | Performance is calculated from the inception date of the Retirement Class. |
| 42 | 2022 Annual Report ■ TIAA-CREF Lifecycle Index Funds |
Lifecycle Index 2060 Fund
$10,000 invested at Fund’s inception
Retirement Class (inception September 26, 2014)
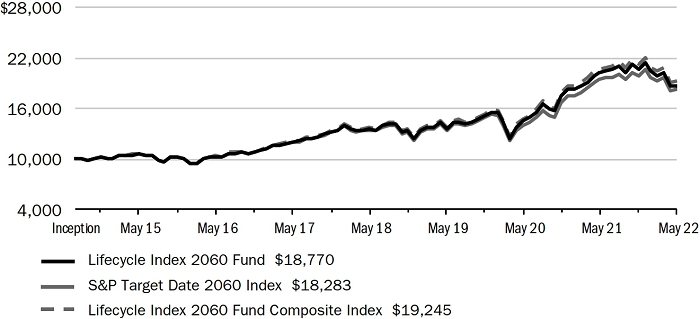
Ending amounts are as of May 31, 2022. For the purpose of comparison, the graph also shows the change in the values of the Fund’s composite benchmark and a broad market index during the same period. The performance of the other share classes varies due to differences in expense charges.
Asset allocation
| % of net assets as of 5/31/22 | % of target allocation for 6/30/22 | |
| Equity | ||
| U.S. equity | 60.23 | 60.61 |
| International equity | 32.88 | 32.64 |
| Fixed income | 6.70 | 6.75 |
| Other assets & liabilities, net | 0.19 | — |
| Total | 100.00 | 100.00 |
Target allocation
For June 30, 2022

| TIAA-CREF Lifecycle Index Funds ■ 2022 Annual Report | 43 |
Performance as of May 31, 2022
| Lifecycle Index 2065 Fund | Total Return | Average annual total return | Annual operating expenses*# | |||||||||||||||
| Inception date | 1 year | since inception | gross | net | ||||||||||||||
| Institutional Class | 9/30/20 | –6.70 | % | 10.44 | % | 2.08 | % | 0.10 | % | |||||||||
| Advisor Class | 9/30/20 | –6.83 | 10.36 | 2.16 | 0.18 | |||||||||||||
| Premier Class | 9/30/20 | –6.90 | 10.31 | 2.24 | 0.25 | |||||||||||||
| Retirement Class | 9/30/20 | –7.26 | 9.98 | 2.34 | 0.35 | |||||||||||||
| Lifecycle Index 2065 Fund Composite Index‡ | — | –6.93 | 10.50 | § | — | — | ||||||||||||
| Broad market index** | ||||||||||||||||||
| S&P Target Date 2065+ Index | — | –6.00 | 11.48 | § | — | — | ||||||||||||
| S&P Target Date 2060 Index | — | –6.14 | 11.39 | § | — | — | ||||||||||||
The returns in this report show past performance, which is no guarantee of future results. The returns do not reflect taxes that a shareholder would pay on fund distributions or on the sale of fund shares. Returns and the principal value of your investment will fluctuate. Current performance may be higher or lower than that shown, and you may have a gain or a loss when you redeem your shares. For current performance information, including performance to the most recent month-end, please visit TIAA.org. Performance may reflect waivers or reimbursements of certain expenses. Absent these waivers or reimbursement arrangements, performance would be lower.
You cannot invest directly in any index. Index returns do not include a deduction for fees or expenses.
| * | The gross and net annual operating expenses are taken from the Fund’s prospectus. The net annual operating expenses may at times reflect a contractual waiver or reimbursement of various expenses. The expense reimbursements and waivers will continue through at least September 30, 2022, unless changed with the approval of the Board of Trustees. Without these reimbursements and waivers, expenses would be higher and returns lower. Refer to the Financial highlights later in this report for the Fund’s expense ratios as of the end of the reporting period. |
| # | These expenses include underlying fund expenses. |
| ‡ | As of the close of business on May 31, 2022, the Lifecycle Index 2065 Fund Composite Index consisted of: 61.4% Russell 3000® Index; 33.1% MSCI EAFE + Emerging Markets Index; and 5.5% Bloomberg U.S. Aggregate Bond Index. The Fund’s benchmark, the components that make up the composite benchmark and the method of calculating the composite benchmark’s performance may vary over time. |
| § | Performance is calculated from the inception date of the Retirement Class. |
| ** | Previously, the Fund’s broad-market index comparison was to the S&P Target Date 2060 Index (formerly known as the S&P Target Date 2060+ Index), instead of the S&P Target Date 2065+ Index shown in the chart above. The returns of the S&P Target Date 2065+ Index, which Standard & Poor’s launched in 2021, are more appropriate for comparison purposes because they reflect multi-asset class exposure for the same target date as the Fund. |
| 44 | 2022 Annual Report ■ TIAA-CREF Lifecycle Index Funds |
Lifecycle Index 2065 Fund
$10,000 invested at Fund’s inception
Retirement Class (inception September 30, 2020)

Ending amounts are as of May 31, 2022. For the purpose of comparison, the graph also shows the change in the values of the Fund’s composite benchmark and a broad market index during the same period. The performance of the other share classes varies due to differences in expense charges.
Asset allocation
| % of net assets as of 5/31/22 | % of target allocation for 6/30/22 | |
| Equity | ||
| U.S. equity | 61.16 | 61.43 |
| International equity | 33.35 | 33.07 |
| Fixed income | 5.46 | 5.50 |
| Other assets & liabilities, net | 0.03 | — |
| Total | 100.00 | 100.00 |
Target allocation
For June 30, 2022

| TIAA-CREF Lifecycle Index Funds ■ 2022 Annual Report | 45 |
Lifecycle Index Retirement Income Fund ■ May 31, 2022
| Shares | Security | Value | % of net assets | |||||||||||
| AFFILIATED INVESTMENT COMPANIES—100.1%a | ||||||||||||||
| FIXED INCOME—40.0% | ||||||||||||||
| 24,031,447 | TIAA-CREF Bond Index Fund | $ | 241,996,676 | 40.0 | % | |||||||||
| TOTAL FIXED INCOME | 241,996,676 | 40.0 | ||||||||||||
| INFLATION-PROTECTED ASSETS—10.0% | ||||||||||||||
| 5,160,954 | TIAA-CREF Inflation-Linked Bond Fund | 60,434,770 | 10.0 | |||||||||||
| TOTAL INFLATION-PROTECTED ASSETS | 60,434,770 | 10.0 | ||||||||||||
| INTERNATIONAL EQUITY—14.2% | ||||||||||||||
| 2,434,555 | TIAA-CREF Emerging Markets Equity Index Fund | 27,072,248 | 4.5 | |||||||||||
| 2,876,854 | TIAA-CREF International Equity Index Fund | 58,543,978 | 9.7 | |||||||||||
| TOTAL INTERNATIONAL EQUITY | 85,616,226 | 14.2 | ||||||||||||
| SHORT-TERM FIXED INCOME—10.0% | ||||||||||||||
| 6,247,358 | TIAA-CREF Short-Term Bond Index Fund | 60,661,850 | 10.0 | |||||||||||
| TOTAL SHORT-TERM FIXED INCOME | 60,661,850 | 10.0 | ||||||||||||
| U.S. EQUITY—25.9% | ||||||||||||||
| 5,319,472 | TIAA-CREF Equity Index Fund | 156,711,650 | 25.9 | |||||||||||
| TOTAL U.S. EQUITY | 156,711,650 | 25.9 | ||||||||||||
| TOTAL AFFILIATED INVESTMENT COMPANIES | (Cost $554,531,350) | 605,421,172 | 100.1 | |||||||||||
| TOTAL PORTFOLIO | (Cost $554,531,350) | 605,421,172 | 100.1 | |||||||||||
| OTHER ASSETS & LIABILITIES, NET | (531,480 | ) | (0.1 | ) | ||||||||||
| NET ASSETS | $ | 604,889,692 | 100.0 | % | ||||||||||
| a | The Fund invests its assets in Class W shares of the affiliated TIAA-CREF Funds. |
| 46 | 2022 Annual Report ■ TIAA-CREF Lifecycle Index Funds | See notes to financial statements |
Portfolio of investments
Lifecycle Index 2010 Fund ■ May 31, 2022
| Shares | Security | Value | % of net assets | |||||||||||
| AFFILIATED INVESTMENT COMPANIES—99.9%a | ||||||||||||||
| FIXED INCOME—39.9% | ||||||||||||||
| 24,497,087 | TIAA-CREF Bond Index Fund | $ | 246,685,666 | 39.9 | % | |||||||||
| TOTAL FIXED INCOME | 246,685,666 | 39.9 | ||||||||||||
| INFLATION-PROTECTED ASSETS—10.0% | ||||||||||||||
| 5,260,185 | TIAA-CREF Inflation-Linked Bond Fund | 61,596,769 | 10.0 | |||||||||||
| TOTAL INFLATION-PROTECTED ASSETS | 61,596,769 | 10.0 | ||||||||||||
| INTERNATIONAL EQUITY—13.5% | ||||||||||||||
| 2,365,258 | TIAA-CREF Emerging Markets Equity Index Fund | 26,301,667 | 4.3 | |||||||||||
| 2,793,758 | TIAA-CREF International Equity Index Fund | 56,852,982 | 9.2 | |||||||||||
| TOTAL INTERNATIONAL EQUITY | 83,154,649 | 13.5 | ||||||||||||
| SHORT-TERM FIXED INCOME—11.9% | ||||||||||||||
| 7,573,075 | TIAA-CREF Short-Term Bond Index Fund | 73,534,554 | 11.9 | |||||||||||
| TOTAL SHORT-TERM FIXED INCOME | 73,534,554 | 11.9 | ||||||||||||
| U.S. EQUITY—24.6% | ||||||||||||||
| 5,165,301 | TIAA-CREF Equity Index Fund | 152,169,777 | 24.6 | |||||||||||
| TOTAL U.S. EQUITY | 152,169,777 | 24.6 | ||||||||||||
| TOTAL AFFILIATED INVESTMENT COMPANIES | (Cost $533,255,323) | 617,141,415 | 99.9 | |||||||||||
| TOTAL PORTFOLIO | (Cost $533,255,323) | 617,141,415 | 99.9 | |||||||||||
| OTHER ASSETS & LIABILITIES, NET | 870,089 | 0.1 | ||||||||||||
| NET ASSETS | $ | 618,011,504 | 100.0 | % | ||||||||||
| a | The Fund invests its assets in Class W shares of the affiliated TIAA-CREF Funds. |
| See notes to financial statements | TIAA-CREF Lifecycle Index Funds ■ 2022 Annual Report | 47 |
Portfolio of investments
Lifecycle Index 2015 Fund ■ May 31, 2022
| Shares | Security | Value | % of net assets | |||||||||||
| AFFILIATED INVESTMENT COMPANIES—99.9%a | ||||||||||||||
| FIXED INCOME—39.3% | ||||||||||||||
| 43,101,952 | TIAA-CREF Bond Index Fund | $ | 434,036,659 | 39.3 | % | |||||||||
| TOTAL FIXED INCOME | 434,036,659 | 39.3 | ||||||||||||
| INFLATION-PROTECTED ASSETS—8.7% | ||||||||||||||
| 8,227,902 | TIAA-CREF Inflation-Linked Bond Fund | 96,348,730 | 8.7 | |||||||||||
| TOTAL INFLATION-PROTECTED ASSETS | 96,348,730 | 8.7 | ||||||||||||
| INTERNATIONAL EQUITY—15.2% | ||||||||||||||
| 4,766,102 | TIAA-CREF Emerging Markets Equity Index Fund | 52,999,052 | 4.8 | |||||||||||
| 5,652,475 | TIAA-CREF International Equity Index Fund | 115,027,863 | 10.4 | |||||||||||
| TOTAL INTERNATIONAL EQUITY | 168,026,915 | 15.2 | ||||||||||||
| SHORT-TERM FIXED INCOME—8.8% | ||||||||||||||
| 9,958,340 | TIAA-CREF Short-Term Bond Index Fund | 96,695,481 | 8.8 | |||||||||||
| TOTAL SHORT-TERM FIXED INCOME | 96,695,481 | 8.8 | ||||||||||||
| U.S. EQUITY—27.9% | ||||||||||||||
| 10,442,255 | TIAA-CREF Equity Index Fund | 307,628,837 | 27.9 | |||||||||||
| TOTAL U.S. EQUITY | 307,628,837 | 27.9 | ||||||||||||
| TOTAL AFFILIATED INVESTMENT COMPANIES | (Cost $931,201,940) | 1,102,736,622 | 99.9 | |||||||||||
| TOTAL PORTFOLIO | (Cost $931,201,940) | 1,102,736,622 | 99.9 | |||||||||||
| OTHER ASSETS & LIABILITIES, NET | 854,134 | 0.1 | ||||||||||||
| NET ASSETS | $ | 1,103,590,756 | 100.0 | % | ||||||||||
| a | The Fund invests its assets in Class W shares of the affiliated TIAA-CREF Funds. |
| 48 | 2022 Annual Report ■ TIAA-CREF Lifecycle Index Funds | See notes to financial statements |
Portfolio of investments
Lifecycle Index 2020 Fund ■ May 31, 2022
| Shares | Security | Value | % of net assets | |||||||||||
| AFFILIATED INVESTMENT COMPANIES—99.9%a | ||||||||||||||
| FIXED INCOME—38.3% | ||||||||||||||
| 117,818,583 | TIAA-CREF Bond Index Fund | $ | 1,186,433,129 | 38.3 | % | |||||||||
| TOTAL FIXED INCOME | 1,186,433,129 | 38.3 | ||||||||||||
| INFLATION-PROTECTED ASSETS—6.7% | ||||||||||||||
| 17,844,560 | TIAA-CREF Inflation-Linked Bond Fund | 208,959,802 | 6.7 | |||||||||||
| TOTAL INFLATION-PROTECTED ASSETS | 208,959,802 | 6.7 | ||||||||||||
| INTERNATIONAL EQUITY—17.0% | ||||||||||||||
| 14,974,705 | TIAA-CREF Emerging Markets Equity Index Fund | 166,518,723 | 5.4 | |||||||||||
| 17,684,685 | TIAA-CREF International Equity Index Fund | 359,883,345 | 11.6 | |||||||||||
| TOTAL INTERNATIONAL EQUITY | 526,402,068 | 17.0 | ||||||||||||
| SHORT-TERM FIXED INCOME—6.8% | ||||||||||||||
| 21,596,495 | TIAA-CREF Short-Term Bond Index Fund | 209,701,967 | 6.8 | |||||||||||
| TOTAL SHORT-TERM FIXED INCOME | 209,701,967 | 6.8 | ||||||||||||
| U.S. EQUITY—31.1% | ||||||||||||||
| 32,713,155 | TIAA-CREF Equity Index Fund | 963,729,539 | 31.1 | |||||||||||
| TOTAL U.S. EQUITY | 963,729,539 | 31.1 | ||||||||||||
| TOTAL AFFILIATED INVESTMENT COMPANIES | (Cost $2,652,095,825) | 3,095,226,505 | 99.9 | |||||||||||
| TOTAL PORTFOLIO | (Cost $2,652,095,825) | 3,095,226,505 | 99.9 | |||||||||||
| OTHER ASSETS & LIABILITIES, NET | 2,008,058 | 0.1 | ||||||||||||
| NET ASSETS | $ | 3,097,234,563 | 100.0 | % | ||||||||||
| a | The Fund invests its assets in Class W shares of the affiliated TIAA-CREF Funds. |
| See notes to financial statements | TIAA-CREF Lifecycle Index Funds ■ 2022 Annual Report | 49 |
Portfolio of investments
Lifecycle Index 2025 Fund ■ May 31, 2022
| Shares | Security | Value | % of net assets | |||||||||||
| AFFILIATED INVESTMENT COMPANIES—100.0%a | ||||||||||||||
| FIXED INCOME—35.5% | ||||||||||||||
| 181,275,410 | TIAA-CREF Bond Index Fund | $ | 1,825,443,378 | 35.5 | % | |||||||||
| TOTAL FIXED INCOME | 1,825,443,378 | 35.5 | ||||||||||||
| INFLATION-PROTECTED ASSETS—4.7% | ||||||||||||||
| 20,882,670 | TIAA-CREF Inflation-Linked Bond Fund | 244,536,062 | 4.7 | |||||||||||
| TOTAL INFLATION-PROTECTED ASSETS | 244,536,062 | 4.7 | ||||||||||||
| INTERNATIONAL EQUITY—19.4% | ||||||||||||||
| 28,438,203 | TIAA-CREF Emerging Markets Equity Index Fund | 316,232,813 | 6.1 | |||||||||||
| 33,605,746 | TIAA-CREF International Equity Index Fund | 683,876,937 | 13.3 | |||||||||||
| TOTAL INTERNATIONAL EQUITY | 1,000,109,750 | 19.4 | ||||||||||||
| SHORT-TERM FIXED INCOME—4.8% | ||||||||||||||
| 25,275,865 | TIAA-CREF Short-Term Bond Index Fund | 245,428,646 | 4.8 | |||||||||||
| TOTAL SHORT-TERM FIXED INCOME | 245,428,646 | 4.8 | ||||||||||||
| U.S. EQUITY—35.6% | ||||||||||||||
| 62,143,982 | TIAA-CREF Equity Index Fund | 1,830,761,711 | 35.6 | |||||||||||
| TOTAL U.S. EQUITY | 1,830,761,711 | 35.6 | ||||||||||||
| TOTAL AFFILIATED INVESTMENT COMPANIES | (Cost $4,464,669,077) | 5,146,279,547 | 100.0 | |||||||||||
| TOTAL PORTFOLIO | (Cost $4,464,669,077) | 5,146,279,547 | 100.0 | |||||||||||
| OTHER ASSETS & LIABILITIES, NET | 2,368,022 | 0.0 | ||||||||||||
| NET ASSETS | $ | 5,148,647,569 | 100.0 | % | ||||||||||
| a | The Fund invests its assets in Class W shares of the affiliated TIAA-CREF Funds. |
| 50 | 2022 Annual Report ■ TIAA-CREF Lifecycle Index Funds | See notes to financial statements |
Portfolio of investments
Lifecycle Index 2030 Fund ■ May 31, 2022
| Shares | Security | Value | % of net assets | |||||||||||
| AFFILIATED INVESTMENT COMPANIES—99.9%a | ||||||||||||||
| FIXED INCOME—31.4% | ||||||||||||||
| 190,738,795 | TIAA-CREF Bond Index Fund | $ | 1,920,739,667 | 31.4 | % | |||||||||
| TOTAL FIXED INCOME | 1,920,739,667 | 31.4 | ||||||||||||
| INFLATION-PROTECTED ASSETS—2.7% | ||||||||||||||
| 14,352,915 | TIAA-CREF Inflation-Linked Bond Fund | 168,072,631 | 2.7 | |||||||||||
| TOTAL INFLATION-PROTECTED ASSETS | 168,072,631 | 2.7 | ||||||||||||
| INTERNATIONAL EQUITY—22.3% | ||||||||||||||
| 38,616,011 | TIAA-CREF Emerging Markets Equity Index Fund | 429,410,046 | 7.1 | |||||||||||
| 45,649,813 | TIAA-CREF International Equity Index Fund | 928,973,690 | 15.2 | |||||||||||
| TOTAL INTERNATIONAL EQUITY | 1,358,383,736 | 22.3 | ||||||||||||
| SHORT-TERM FIXED INCOME—2.8% | ||||||||||||||
| 17,372,553 | TIAA-CREF Short-Term Bond Index Fund | 168,687,488 | 2.8 | |||||||||||
| TOTAL SHORT-TERM FIXED INCOME | 168,687,488 | 2.8 | ||||||||||||
| U.S. EQUITY—40.7% | ||||||||||||||
| 84,411,676 | TIAA-CREF Equity Index Fund | 2,486,767,967 | 40.7 | |||||||||||
| TOTAL U.S. EQUITY | 2,486,767,967 | 40.7 | ||||||||||||
| TOTAL AFFILIATED INVESTMENT COMPANIES | (Cost $5,225,106,548) | 6,102,651,489 | 99.9 | |||||||||||
| TOTAL PORTFOLIO | (Cost $5,225,106,548) | 6,102,651,489 | 99.9 | |||||||||||
| OTHER ASSETS & LIABILITIES, NET | 3,508,068 | 0.1 | ||||||||||||
| NET ASSETS | $ | 6,106,159,557 | 100.0 | % | ||||||||||
| a | The Fund invests its assets in Class W shares of the affiliated TIAA-CREF Funds. |
| See notes to financial statements | TIAA-CREF Lifecycle Index Funds ■ 2022 Annual Report | 51 |
Portfolio of investments
Lifecycle Index 2035 Fund ■ May 31, 2022
| Shares | Security | Value | % of net assets | |||||||||||
| AFFILIATED INVESTMENT COMPANIES—99.9%a | ||||||||||||||
| FIXED INCOME—27.4% | ||||||||||||||
| 161,127,233 | TIAA-CREF Bond Index Fund | $ | 1,622,551,233 | 27.4 | % | |||||||||
| TOTAL FIXED INCOME | 1,622,551,233 | 27.4 | ||||||||||||
| INFLATION-PROTECTED ASSETS—0.8% | ||||||||||||||
| 3,815,461 | TIAA-CREF Inflation-Linked Bond Fund | 44,679,048 | 0.8 | |||||||||||
| TOTAL INFLATION-PROTECTED ASSETS | 44,679,048 | 0.8 | ||||||||||||
| INTERNATIONAL EQUITY—25.0% | ||||||||||||||
| 42,139,257 | TIAA-CREF Emerging Markets Equity Index Fund | 468,588,533 | 7.9 | |||||||||||
| 49,759,165 | TIAA-CREF International Equity Index Fund | 1,012,599,001 | 17.1 | |||||||||||
| TOTAL INTERNATIONAL EQUITY | 1,481,187,534 | 25.0 | ||||||||||||
| SHORT-TERM FIXED INCOME—0.8% | ||||||||||||||
| 4,617,881 | TIAA-CREF Short-Term Bond Index Fund | 44,839,629 | 0.8 | |||||||||||
| TOTAL SHORT-TERM FIXED INCOME | 44,839,629 | 0.8 | ||||||||||||
| U.S. EQUITY—45.9% | ||||||||||||||
| 92,027,252 | TIAA-CREF Equity Index Fund | 2,711,122,852 | 45.9 | |||||||||||
| TOTAL U.S. EQUITY | 2,711,122,852 | 45.9 | ||||||||||||
| TOTAL AFFILIATED INVESTMENT COMPANIES | (Cost $4,952,157,076) | 5,904,380,296 | 99.9 | |||||||||||
| TOTAL PORTFOLIO | (Cost $4,952,157,076) | 5,904,380,296 | 99.9 | |||||||||||
| OTHER ASSETS & LIABILITIES, NET | 6,458,652 | 0.1 | ||||||||||||
| NET ASSETS | $ | 5,910,838,948 | 100.0 | % | ||||||||||
| a | The Fund invests its assets in Class W shares of the affiliated TIAA-CREF Funds. |
| 52 | 2022 Annual Report ■ TIAA-CREF Lifecycle Index Funds | See notes to financial statements |
Portfolio of investments
Lifecycle Index 2040 Fund ■ May 31, 2022
| Shares | Security | Value | % of net assets | |||||||||||
| AFFILIATED INVESTMENT COMPANIES—99.9%a | ||||||||||||||
| FIXED INCOME—21.0% | ||||||||||||||
| 126,963,547 | TIAA-CREF Bond Index Fund | $ | 1,278,522,913 | 21.0 | % | |||||||||
| TOTAL FIXED INCOME | 1,278,522,913 | 21.0 | ||||||||||||
| INTERNATIONAL EQUITY—27.9% | ||||||||||||||
| 48,329,122 | TIAA-CREF Emerging Markets Equity Index Fund | 537,419,834 | 8.8 | |||||||||||
| 57,091,981 | TIAA-CREF International Equity Index Fund | 1,161,821,811 | 19.1 | |||||||||||
| TOTAL INTERNATIONAL EQUITY | 1,699,241,645 | 27.9 | ||||||||||||
| U.S. EQUITY—51.0% | ||||||||||||||
| 105,567,469 | TIAA-CREF Equity Index Fund | 3,110,017,627 | 51.0 | |||||||||||
| TOTAL U.S. EQUITY | 3,110,017,627 | 51.0 | ||||||||||||
| TOTAL AFFILIATED INVESTMENT COMPANIES | (Cost $4,926,238,248) | 6,087,782,185 | 99.9 | |||||||||||
| TOTAL PORTFOLIO | (Cost $4,926,238,248) | 6,087,782,185 | 99.9 | |||||||||||
| OTHER ASSETS & LIABILITIES, NET | 6,774,523 | 0.1 | ||||||||||||
| NET ASSETS | $ | 6,094,556,708 | 100.0 | % | ||||||||||
| a | The Fund invests its assets in Class W shares of the affiliated TIAA-CREF Funds. |
| See notes to financial statements | TIAA-CREF Lifecycle Index Funds ■ 2022 Annual Report | 53 |
Portfolio of investments
Lifecycle Index 2045 Fund ■ May 31, 2022
| Shares | Security | Value | % of net assets | |||||||||||
| AFFILIATED INVESTMENT COMPANIES—99.9%a | ||||||||||||||
| FIXED INCOME—13.0% | ||||||||||||||
| 59,888,099 | TIAA-CREF Bond Index Fund | $ | 603,073,159 | 13.0 | % | |||||||||
| TOTAL FIXED INCOME | 603,073,159 | 13.0 | ||||||||||||
| INTERNATIONAL EQUITY—30.7% | ||||||||||||||
| 40,471,390 | TIAA-CREF Emerging Markets Equity Index Fund | 450,041,862 | 9.7 | |||||||||||
| 47,894,993 | TIAA-CREF International Equity Index Fund | 974,663,106 | 21.0 | |||||||||||
| TOTAL INTERNATIONAL EQUITY | 1,424,704,968 | 30.7 | ||||||||||||
| U.S. EQUITY—56.2% | ||||||||||||||
| 88,526,257 | TIAA-CREF Equity Index Fund | 2,607,983,536 | 56.2 | |||||||||||
| TOTAL U.S. EQUITY | 2,607,983,536 | 56.2 | ||||||||||||
| TOTAL AFFILIATED INVESTMENT COMPANIES | (Cost $3,784,603,932) | 4,635,761,663 | 99.9 | |||||||||||
| TOTAL PORTFOLIO | (Cost $3,784,603,932) | 4,635,761,663 | 99.9 | |||||||||||
| OTHER ASSETS & LIABILITIES, NET | 6,302,940 | 0.1 | ||||||||||||
| NET ASSETS | $ | 4,642,064,603 | 100.0 | % | ||||||||||
| a | The Fund invests its assets in Class W shares of the affiliated TIAA-CREF Funds. |
| 54 | 2022 Annual Report ■ TIAA-CREF Lifecycle Index Funds | See notes to financial statements |
Portfolio of investments
Lifecycle Index 2050 Fund ■ May 31, 2022
| Shares | Security | Value | % of net assets | |||||||||||
| AFFILIATED INVESTMENT COMPANIES—99.8%a | ||||||||||||||
| FIXED INCOME—9.2% | ||||||||||||||
| 35,052,840 | TIAA-CREF Bond Index Fund | $ | 352,982,102 | 9.2 | % | |||||||||
| TOTAL FIXED INCOME | 352,982,102 | 9.2 | ||||||||||||
| INTERNATIONAL EQUITY—32.0% | ||||||||||||||
| 34,944,509 | TIAA-CREF Emerging Markets Equity Index Fund | 388,582,935 | 10.1 | |||||||||||
| 41,327,381 | TIAA-CREF International Equity Index Fund | 841,012,196 | 21.9 | |||||||||||
| TOTAL INTERNATIONAL EQUITY | 1,229,595,131 | 32.0 | ||||||||||||
| U.S. EQUITY—58.6% | ||||||||||||||
| 76,389,751 | TIAA-CREF Equity Index Fund | 2,250,442,051 | 58.6 | |||||||||||
| TOTAL U.S. EQUITY | 2,250,442,051 | 58.6 | ||||||||||||
| TOTAL AFFILIATED INVESTMENT COMPANIES | (Cost $3,148,961,629) | 3,833,019,284 | 99.8 | |||||||||||
| TOTAL PORTFOLIO | (Cost $3,148,961,629) | 3,833,019,284 | 99.8 | |||||||||||
| OTHER ASSETS & LIABILITIES, NET | 6,314,411 | 0.2 | ||||||||||||
| NET ASSETS | $ | 3,839,333,695 | 100.0 | % | ||||||||||
| a | The Fund invests its assets in Class W shares of the affiliated TIAA-CREF Funds. |
| See notes to financial statements | TIAA-CREF Lifecycle Index Funds ■ 2022 Annual Report | 55 |
Portfolio of investments
Lifecycle Index 2055 Fund ■ May 31, 2022
| Shares | Security | Value | % of net assets | |||||||||||
| AFFILIATED INVESTMENT COMPANIES—99.8%a | ||||||||||||||
| FIXED INCOME—7.9% | ||||||||||||||
| 15,915,854 | TIAA-CREF Bond Index Fund | $ | 160,272,647 | 7.9 | % | |||||||||
| TOTAL FIXED INCOME | 160,272,647 | 7.9 | ||||||||||||
| INTERNATIONAL EQUITY—32.5% | ||||||||||||||
| 18,642,214 | TIAA-CREF Emerging Markets Equity Index Fund | 207,301,415 | 10.3 | |||||||||||
| 21,977,484 | TIAA-CREF International Equity Index Fund | 447,241,795 | 22.2 | |||||||||||
| TOTAL INTERNATIONAL EQUITY | 654,543,210 | 32.5 | ||||||||||||
| U.S. EQUITY—59.4% | ||||||||||||||
| 40,685,274 | TIAA-CREF Equity Index Fund | 1,198,588,179 | 59.4 | |||||||||||
| TOTAL U.S. EQUITY | 1,198,588,179 | 59.4 | ||||||||||||
| TOTAL AFFILIATED INVESTMENT COMPANIES | (Cost $1,729,230,550) | 2,013,404,036 | 99.8 | |||||||||||
| TOTAL PORTFOLIO | (Cost $1,729,230,550) | 2,013,404,036 | 99.8 | |||||||||||
| OTHER ASSETS & LIABILITIES, NET | 3,310,759 | 0.2 | ||||||||||||
| NET ASSETS | $ | 2,016,714,795 | 100.0 | % | ||||||||||
| a | The Fund invests its assets in Class W shares of the affiliated TIAA-CREF Funds. |
| 56 | 2022 Annual Report ■ TIAA-CREF Lifecycle Index Funds | See notes to financial statements |
Portfolio of investments
Lifecycle Index 2060 Fund ■ May 31, 2022
| Shares | Security | Value | % of net assets | |||||||||||
| AFFILIATED INVESTMENT COMPANIES—99.8%a | ||||||||||||||
| FIXED INCOME—6.7% | ||||||||||||||
| 6,124,534 | TIAA-CREF Bond Index Fund | $ | 61,674,053 | 6.7 | % | |||||||||
| TOTAL FIXED INCOME | 61,674,053 | 6.7 | ||||||||||||
| INTERNATIONAL EQUITY—32.9% | ||||||||||||||
| 8,623,755 | TIAA-CREF Emerging Markets Equity Index Fund | 95,896,156 | 10.4 | |||||||||||
| 10,161,580 | TIAA-CREF International Equity Index Fund | 206,788,145 | 22.5 | |||||||||||
| TOTAL INTERNATIONAL EQUITY | 302,684,301 | 32.9 | ||||||||||||
| U.S. EQUITY—60.2% | ||||||||||||||
| 18,822,228 | TIAA-CREF Equity Index Fund | 554,502,836 | 60.2 | |||||||||||
| TOTAL U.S. EQUITY | 554,502,836 | 60.2 | ||||||||||||
| TOTAL AFFILIATED INVESTMENT COMPANIES | (Cost $843,725,122) | 918,861,190 | 99.8 | |||||||||||
| TOTAL PORTFOLIO | (Cost $843,725,122) | 918,861,190 | 99.8 | |||||||||||
| OTHER ASSETS & LIABILITIES, NET | 1,712,053 | 0.2 | ||||||||||||
| NET ASSETS | $ | 920,573,243 | 100.0 | % | ||||||||||
| a | The Fund invests its assets in Class W shares of the affiliated TIAA-CREF Funds. |
| See notes to financial statements | TIAA-CREF Lifecycle Index Funds ■ 2022 Annual Report | 57 |
Portfolio of investments
Lifecycle Index 2065 Fund ■ May 31, 2022
| Shares | Security | Value | % of net assets | |||||||||||
| AFFILIATED INVESTMENT COMPANIES—100.0%a | ||||||||||||||
| FIXED INCOME—5.5% | ||||||||||||||
| 259,260 | TIAA-CREF Bond Index Fund | $ | 2,610,749 | 5.5 | % | |||||||||
| TOTAL FIXED INCOME | 2,610,749 | 5.5 | ||||||||||||
| INTERNATIONAL EQUITY—33.3% | ||||||||||||||
| 454,956 | TIAA-CREF Emerging Markets Equity Index Fund | 5,059,110 | 10.6 | |||||||||||
| 534,647 | TIAA-CREF International Equity Index Fund | 10,880,059 | 22.7 | |||||||||||
| TOTAL INTERNATIONAL EQUITY | 15,939,169 | 33.3 | ||||||||||||
| U.S. EQUITY—61.2% | ||||||||||||||
| 992,055 | TIAA-CREF Equity Index Fund | 29,225,942 | 61.2 | |||||||||||
| TOTAL U.S. EQUITY | 29,225,942 | 61.2 | ||||||||||||
| TOTAL AFFILIATED INVESTMENT COMPANIES | (Cost $50,417,123) | 47,775,860 | 100.0 | |||||||||||
| TOTAL PORTFOLIO | (Cost $50,417,123) | 47,775,860 | 100.0 | |||||||||||
| OTHER ASSETS & LIABILITIES, NET | 14,621 | 0.0 | ||||||||||||
| NET ASSETS | $ | 47,790,481 | 100.0 | % | ||||||||||
| a | The Fund invests its assets in Class W shares of the affiliated TIAA-CREF Funds. |
| 58 | 2022 Annual Report ■ TIAA-CREF Lifecycle Index Funds | See notes to financial statements |
[This page intentionally left blank.]
| TIAA-CREF Lifecycle Index Funds ■ 2022 Annual Report | 59 |
Statements of assets and liabilities
TIAA-CREF Funds ■ May 31, 2022
| Lifecycle Index | ||||||||||||||||||||||||
| Retirement | Lifecycle Index | Lifecycle Index | Lifecycle Index | Lifecycle Index | Lifecycle Index | |||||||||||||||||||
| Income Fund | 2010 Fund | 2015 Fund | 2020 Fund | 2025 Fund | 2030 Fund | |||||||||||||||||||
| ASSETS | ||||||||||||||||||||||||
| Affiliated investments, at value‡ | $ | 605,421,172 | $ | 617,141,415 | $ | 1,102,736,622 | $ | 3,095,226,505 | $ | 5,146,279,547 | $ | 6,102,651,489 | ||||||||||||
| Cash | 1,009,586 | 989,574 | 876,548 | 7,278,868 | 10,919,148 | 13,888,340 | ||||||||||||||||||
| Receivable from securities transactions | 538,555 | 588,122 | 1,237,055 | 2,309,227 | 4,205,101 | 5,666,908 | ||||||||||||||||||
| Receivable from Fund shares sold | 104,647 | 484,417 | 777,374 | 1,850,965 | 4,025,970 | 4,651,736 | ||||||||||||||||||
| Dividends receivable | 528,734 | 551,951 | 946,877 | 2,534,786 | 3,824,712 | 3,942,905 | ||||||||||||||||||
| Due from affiliates | 55,749 | 56,099 | 94,443 | 221,947 | 345,729 | 376,018 | ||||||||||||||||||
| Other | 13,864 | 24,093 | 43,514 | 93,537 | 117,699 | 127,231 | ||||||||||||||||||
| Total assets | 607,672,307 | 619,835,671 | 1,106,712,433 | 3,109,515,835 | 5,169,717,906 | 6,131,304,627 | ||||||||||||||||||
| LIABILITIES | ||||||||||||||||||||||||
| Management fees payable | 89,096 | 91,725 | 161,589 | 440,994 | 711,578 | 816,823 | ||||||||||||||||||
| Service agreement fees payable | 9,247 | 14,854 | 22,344 | 55,728 | 93,796 | 101,011 | ||||||||||||||||||
| Distribution fees payable | 506 | 2,647 | 4,345 | 10,402 | 15,447 | 18,745 | ||||||||||||||||||
| Due to affiliates | 10,621 | 10,788 | 12,275 | 18,404 | 24,369 | 27,011 | ||||||||||||||||||
| Payable for securities transactions | 1,449,880 | 1,490,689 | 1,920,366 | 8,927,339 | 13,649,256 | 17,232,916 | ||||||||||||||||||
| Payable for Fund shares redeemed | 1,184,699 | 168,948 | 926,221 | 2,648,259 | 6,289,101 | 6,599,189 | ||||||||||||||||||
| Payable for trustee compensation | 13,693 | 23,912 | 43,191 | 92,639 | 116,226 | 125,494 | ||||||||||||||||||
| Accrued expenses and other payables | 24,873 | 20,604 | 31,346 | 87,507 | 170,564 | 223,881 | ||||||||||||||||||
| Total liabilities | 2,782,615 | 1,824,167 | 3,121,677 | 12,281,272 | 21,070,337 | 25,145,070 | ||||||||||||||||||
| NET ASSETS | $ | 604,889,692 | $ | 618,011,504 | $ | 1,103,590,756 | $ | 3,097,234,563 | $ | 5,148,647,569 | $ | 6,106,159,557 | ||||||||||||
| NET ASSETS CONSIST OF: | ||||||||||||||||||||||||
| Paid-in-capital | $ | 559,407,316 | $ | 536,942,482 | $ | 937,563,807 | $ | 2,666,138,019 | $ | 4,477,777,570 | $ | 5,245,685,860 | ||||||||||||
| Total distributable earnings (loss) | 45,482,376 | 81,069,022 | 166,026,949 | 431,096,544 | 670,869,999 | 860,473,697 | ||||||||||||||||||
| NET ASSETS | $ | 604,889,692 | $ | 618,011,504 | $ | 1,103,590,756 | $ | 3,097,234,563 | $ | 5,148,647,569 | $ | 6,106,159,557 | ||||||||||||
| INSTITUTIONAL CLASS: | ||||||||||||||||||||||||
| Net assets | $ | 557,296,462 | $ | 526,582,790 | $ | 966,867,423 | $ | 2,756,707,012 | $ | 4,582,422,933 | $ | 5,483,742,811 | ||||||||||||
| Outstanding shares of beneficial interest, unlimited shares authorized ($.0001 par value) | 36,010,521 | 32,434,390 | 56,691,494 | 149,918,232 | 228,348,093 | 252,420,395 | ||||||||||||||||||
| Net asset value per share | $ | 15.48 | $ | 16.24 | $ | 17.05 | $ | 18.39 | $ | 20.07 | $ | 21.72 | ||||||||||||
| ADVISOR CLASS: | ||||||||||||||||||||||||
| Net assets | $ | 2,699,047 | $ | 1,715,060 | $ | 1,656,892 | $ | 10,671,961 | $ | 21,745,678 | $ | 26,880,411 | ||||||||||||
| Outstanding shares of beneficial interest, unlimited shares authorized ($.0001 par value) | 174,439 | 105,633 | 97,217 | 581,295 | 1,086,053 | 1,239,624 | ||||||||||||||||||
| Net asset value per share | $ | 15.47 | $ | 16.24 | $ | 17.04 | $ | 18.36 | $ | 20.02 | $ | 21.68 | ||||||||||||
| PREMIER CLASS: | ||||||||||||||||||||||||
| Net assets | $ | 3,993,371 | $ | 21,047,992 | $ | 34,529,113 | $ | 82,754,349 | $ | 123,482,191 | $ | 150,514,591 | ||||||||||||
| Outstanding shares of beneficial interest, unlimited shares authorized ($.0001 par value) | 258,253 | 1,301,205 | 2,034,612 | 4,524,279 | 6,181,047 | 6,967,028 | ||||||||||||||||||
| Net asset value per share | $ | 15.46 | $ | 16.18 | $ | 16.97 | $ | 18.29 | $ | 19.98 | $ | 21.60 | ||||||||||||
| RETIREMENT CLASS: | ||||||||||||||||||||||||
| Net assets | $ | 40,900,812 | $ | 68,665,662 | $ | 100,537,328 | $ | 247,101,241 | $ | 420,996,767 | $ | 445,021,744 | ||||||||||||
| Outstanding shares of beneficial interest, unlimited shares authorized ($.0001 par value) | 2,648,780 | 4,269,984 | 5,943,418 | 13,560,298 | 21,182,857 | 20,691,270 | ||||||||||||||||||
| Net asset value per share | $ | 15.44 | $ | 16.08 | $ | 16.92 | $ | 18.22 | $ | 19.87 | $ | 21.51 | ||||||||||||
| ‡ Affiliated investments, cost | $ | 554,531,350 | $ | 533,255,323 | $ | 931,201,940 | $ | 2,652,095,825 | $ | 4,464,669,077 | $ | 5,225,106,548 | ||||||||||||
| 60 | 2022 Annual Report ■ TIAA-CREF Lifecycle Index Funds | See notes to financial statements | See notes to financial statements | TIAA-CREF Lifecycle Index Funds ■ 2022 Annual Report | 61 |
| Statements of assets and liabilities | concluded |
TIAA-CREF Funds ■ May 31, 2022
| Lifecycle Index | Lifecycle Index | Lifecycle Index | Lifecycle Index | Lifecycle Index | Lifecycle Index | Lifecycle Index | ||||||||||||||||||||||
| 2035 Fund | 2040 Fund | 2045 Fund | 2050 Fund | 2055 Fund | 2060 Fund | 2065 Fund | ||||||||||||||||||||||
| ASSETS | ||||||||||||||||||||||||||||
| Affiliated investments, at value‡ | $ | 5,904,380,296 | $ | 6,087,782,185 | $ | 4,635,761,663 | $ | 3,833,019,284 | $ | 2,013,404,036 | $ | 918,861,190 | $ | 47,775,860 | ||||||||||||||
| Cash | 13,467,153 | 12,757,773 | 12,793,087 | 11,020,585 | 6,836,734 | 4,401,174 | 391,681 | |||||||||||||||||||||
| Receivable from securities transactions | 5,792,389 | 6,827,205 | 6,186,657 | 4,964,529 | 2,048,906 | 859,114 | 29,617 | |||||||||||||||||||||
| Receivable from Fund shares sold | 6,779,241 | 5,308,583 | 5,569,395 | 5,798,335 | 3,213,858 | 2,132,118 | 205,165 | |||||||||||||||||||||
| Dividends receivable | 3,247,641 | 2,523,341 | 1,186,014 | 697,273 | 315,989 | 120,904 | 4,995 | |||||||||||||||||||||
| Due from affiliates | 344,592 | 340,771 | 256,720 | 205,539 | 112,743 | 57,339 | 12,568 | |||||||||||||||||||||
| Other | 118,665 | 128,091 | 80,642 | 61,475 | 25,448 | 7,853 | 91 | |||||||||||||||||||||
| Total assets | 5,934,129,977 | 6,115,667,949 | 4,661,834,178 | 3,855,767,020 | 2,025,957,714 | 926,439,692 | 48,419,977 | |||||||||||||||||||||
| LIABILITIES | ||||||||||||||||||||||||||||
| Management fees payable | 765,072 | 773,018 | 580,406 | 476,178 | 248,828 | 112,726 | 5,707 | |||||||||||||||||||||
| Service agreement fees payable | 89,511 | 86,635 | 69,317 | 60,125 | 33,404 | 15,303 | 373 | |||||||||||||||||||||
| Distribution fees payable | 20,035 | 21,372 | 11,227 | 9,929 | 4,107 | 1,915 | 99 | |||||||||||||||||||||
| Due to affiliates | 26,161 | 26,732 | 22,354 | 20,036 | 14,584 | 11,362 | 8,938 | |||||||||||||||||||||
| Payable for securities transactions | 16,464,044 | 15,904,360 | 15,466,072 | 12,805,984 | 7,166,871 | 4,452,879 | 377,624 | |||||||||||||||||||||
| Payable for Fund shares redeemed | 5,576,394 | 3,925,737 | 3,340,534 | 2,827,140 | 1,649,952 | 1,204,994 | 226,201 | |||||||||||||||||||||
| Payable for trustee compensation | 117,005 | 126,381 | 79,346 | 60,398 | 24,891 | 7,601 | 67 | |||||||||||||||||||||
| Accrued expenses and other payables | 232,807 | 247,006 | 200,319 | 173,535 | 100,282 | 59,669 | 10,487 | |||||||||||||||||||||
| Total liabilities | 23,291,029 | 21,111,241 | 19,769,575 | 16,433,325 | 9,242,919 | 5,866,449 | 629,496 | |||||||||||||||||||||
| NET ASSETS | $ | 5,910,838,948 | $ | 6,094,556,708 | $ | 4,642,064,603 | $ | 3,839,333,695 | $ | 2,016,714,795 | $ | 920,573,243 | $ | 47,790,481 | ||||||||||||||
| NET ASSETS CONSIST OF: | ||||||||||||||||||||||||||||
| Paid-in-capital | $ | 4,972,577,834 | $ | 4,952,591,708 | $ | 3,799,629,109 | $ | 3,166,747,738 | $ | 1,737,612,706 | $ | 849,310,931 | $ | 50,640,717 | ||||||||||||||
| Total distributable earnings (loss) | 938,261,114 | 1,141,965,000 | 842,435,494 | 672,585,957 | 279,102,089 | 71,262,312 | (2,850,236 | ) | ||||||||||||||||||||
| NET ASSETS | $ | 5,910,838,948 | $ | 6,094,556,708 | $ | 4,642,064,603 | $ | 3,839,333,695 | $ | 2,016,714,795 | $ | 920,573,243 | $ | 47,790,481 | ||||||||||||||
| INSTITUTIONAL CLASS: | ||||||||||||||||||||||||||||
| Net assets | $ | 5,330,114,198 | $ | 5,515,470,272 | $ | 4,224,772,412 | $ | 3,473,689,190 | $ | 1,822,271,635 | $ | 828,871,261 | $ | 44,525,944 | ||||||||||||||
| Outstanding shares of beneficial interest, unlimited shares authorized ($.0001 par value) | 228,949,115 | 224,693,320 | 166,426,635 | 135,222,919 | 88,051,605 | 51,821,609 | 3,906,741 | |||||||||||||||||||||
| Net asset value per share | $ | 23.28 | $ | 24.55 | $ | 25.39 | $ | 25.69 | $ | 20.70 | $ | 15.99 | $ | 11.40 | ||||||||||||||
| ADVISOR CLASS: | ||||||||||||||||||||||||||||
| Net assets | $ | 18,142,735 | $ | 21,468,280 | $ | 18,259,281 | $ | 14,241,594 | $ | 12,049,780 | $ | 9,091,791 | $ | 716,221 | ||||||||||||||
| Outstanding shares of beneficial interest, unlimited shares authorized ($.0001 par value) | 780,813 | 875,924 | 720,840 | 555,442 | 583,310 | 568,947 | 63,550 | |||||||||||||||||||||
| Net asset value per share | $ | 23.24 | $ | 24.51 | $ | 25.33 | $ | 25.64 | $ | 20.66 | $ | 15.98 | $ | 11.27 | ||||||||||||||
| PREMIER CLASS: | ||||||||||||||||||||||||||||
| Net assets | $ | 161,086,663 | $ | 172,179,848 | $ | 90,923,730 | $ | 80,317,888 | $ | 33,219,439 | $ | 15,601,317 | $ | 808,165 | ||||||||||||||
| Outstanding shares of beneficial interest, unlimited shares authorized ($.0001 par value) | 6,960,373 | 7,056,699 | 3,600,291 | 3,144,774 | 1,610,373 | 977,748 | 71,780 | |||||||||||||||||||||
| Net asset value per share | $ | 23.14 | $ | 24.40 | $ | 25.25 | $ | 25.54 | $ | 20.63 | $ | 15.96 | $ | 11.26 | ||||||||||||||
| RETIREMENT CLASS: | ||||||||||||||||||||||||||||
| Net assets | $ | 401,495,352 | $ | 385,438,308 | $ | 308,109,180 | $ | 271,085,023 | $ | 149,173,941 | $ | 67,008,874 | $ | 1,740,151 | ||||||||||||||
| Outstanding shares of beneficial interest, unlimited shares authorized ($.0001 par value) | 17,426,065 | 15,858,456 | 12,263,724 | 10,669,399 | 7,253,271 | 4,210,358 | 154,350 | |||||||||||||||||||||
| Net asset value per share | $ | 23.04 | $ | 24.30 | $ | 25.12 | $ | 25.41 | $ | 20.57 | $ | 15.92 | $ | 11.27 | ||||||||||||||
| ‡ Affiliated investments, cost | $ | 4,952,157,076 | $ | 4,926,238,248 | $ | 3,784,603,932 | $ | 3,148,961,629 | $ | 1,729,230,550 | $ | 843,725,122 | $ | 50,417,123 | ||||||||||||||
| 62 | 2022 Annual Report ■ TIAA-CREF Lifecycle Index Funds | See notes to financial statements | See notes to financial statements | TIAA-CREF Lifecycle Index Funds ■ 2022 Annual Report | 63 |
TIAA-CREF Funds ■ For the year ended May 31, 2022
| Lifecycle Index | ||||||||||||||||||||||||
| Retirement | Lifecycle Index | Lifecycle Index | Lifecycle Index | Lifecycle Index | Lifecycle Index | |||||||||||||||||||
| Income Fund | 2010 Fund | 2015 Fund | 2020 Fund | 2025 Fund | 2030 Fund | |||||||||||||||||||
| INVESTMENT INCOME | ||||||||||||||||||||||||
| Dividends from affiliated investments | $ | 14,219,383 | $ | 15,211,502 | $ | 26,443,702 | $ | 72,086,900 | $ | 112,066,409 | $ | 126,475,394 | ||||||||||||
| Total income | 14,219,383 | 15,211,502 | 26,443,702 | 72,086,900 | 112,066,409 | 126,475,394 | ||||||||||||||||||
| EXPENSES | ||||||||||||||||||||||||
| Management fees | 1,124,506 | 1,212,280 | 2,101,902 | 5,768,883 | 9,000,229 | 10,193,218 | ||||||||||||||||||
| Shareholder servicing — Institutional Class | 7,597 | 3,473 | 5,018 | 12,755 | 13,898 | 16,263 | ||||||||||||||||||
| Shareholder servicing — Advisor Class | 2,888 | 1,777 | 2,123 | 13,472 | 22,837 | 29,885 | ||||||||||||||||||
| Shareholder servicing — Premier Class | 99 | 85 | 108 | 185 | 247 | 254 | ||||||||||||||||||
| Shareholder servicing — Retirement Class | 114,384 | 196,274 | 295,876 | 724,889 | 1,183,494 | 1,243,644 | ||||||||||||||||||
| Distribution fees — Premier Class | 25,698 | 49,839 | 108,034 | 318,800 | 475,100 | 512,993 | ||||||||||||||||||
| Registration fees | 66,569 | 67,462 | 72,854 | 73,530 | 77,676 | 80,745 | ||||||||||||||||||
| Administrative service fees | 53,770 | 54,481 | 61,956 | 93,014 | 122,573 | 135,662 | ||||||||||||||||||
| Professional fees | 24,621 | 26,660 | 19,184 | 24,676 | 28,886 | 31,488 | ||||||||||||||||||
| Shareholder reports | 20,091 | 21,623 | 24,830 | 40,984 | 56,957 | 65,859 | ||||||||||||||||||
| Trustee fees and expenses | 6,227 | 6,730 | 11,841 | 33,278 | 53,183 | 61,879 | ||||||||||||||||||
| Other expenses | 134,717 | 138,960 | 214,842 | 518,752 | 812,032 | 918,743 | ||||||||||||||||||
| Total expenses | 1,581,167 | 1,779,644 | 2,918,568 | 7,623,218 | 11,847,112 | 13,290,633 | ||||||||||||||||||
| Less: Expenses reimbursed by the investment adviser | (217,432 | ) | (215,662 | ) | (238,040 | ) | (340,387 | ) | (467,701 | ) | (534,476 | ) | ||||||||||||
| Fee waiver by investment adviser and Nuveen Securities | (579,083 | ) | (624,120 | ) | (1,044,250 | ) | (2,774,380 | ) | (4,134,294 | ) | (4,416,589 | ) | ||||||||||||
| Net expenses | 784,652 | 939,862 | 1,636,278 | 4,508,451 | 7,245,117 | 8,339,568 | ||||||||||||||||||
| Net investment income (loss) | 13,434,731 | 14,271,640 | 24,807,424 | 67,578,449 | 104,821,292 | 118,135,826 | ||||||||||||||||||
| NET REALIZED AND UNREALIZED GAIN (LOSS) ON TOTAL INVESTMENTS | ||||||||||||||||||||||||
| Realized gain (loss) from sale of affiliated investments | 5,124,268 | 10,013,768 | 16,266,226 | 51,740,199 | 58,286,677 | 45,019,275 | ||||||||||||||||||
| Realized gain (loss) from sale of unaffiliated investments | — | 26,116 | — | — | — | — | ||||||||||||||||||
| Realized gain distributions from affiliated investments | 2,887,432 | 3,094,970 | 5,473,966 | 15,277,144 | 24,904,673 | 29,702,295 | ||||||||||||||||||
| Net realized gain (loss) from investments | 8,011,700 | 13,134,854 | 21,740,192 | 67,017,343 | 83,191,350 | 74,721,570 | ||||||||||||||||||
| Net change in unrealized appreciation (depreciation) from affiliated investments | (61,112,423 | ) | (68,940,130 | ) | (123,346,417 | ) | (355,369,871 | ) | (563,732,307 | ) | (649,186,753 | ) | ||||||||||||
| Net realized and unrealized gain (loss) from investments | (53,100,723 | ) | (55,805,276 | ) | (101,606,225 | ) | (288,352,528 | ) | (480,540,957 | ) | (574,465,183 | ) | ||||||||||||
| Net increase (decrease) in net assets from operations | $ | (39,665,992 | ) | $ | (41,533,636 | ) | $ | (76,798,801 | ) | $ | (220,774,079 | ) | $ | (375,719,665 | ) | $ | (456,329,357 | ) | ||||||
| 64 | 2022 Annual Report ■ TIAA-CREF Lifecycle Index Funds | See notes to financial statements | See notes to financial statements | TIAA-CREF Lifecycle Index Funds ■ 2022 Annual Report | 65 |
| Statements of operations | concluded |
TIAA-CREF Funds ■ For the year ended May 31, 2022
| Lifecycle Index | Lifecycle Index | Lifecycle Index | Lifecycle Index | Lifecycle Index | Lifecycle Index | Lifecycle Index | ||||||||||||||||||||||
| 2035 Fund | 2040 Fund | 2045 Fund | 2050 Fund | 2055 Fund | 2060 Fund | 2065 Fund | ||||||||||||||||||||||
| INVESTMENT INCOME | ||||||||||||||||||||||||||||
| Dividends from affiliated investments | $ | 116,459,229 | $ | 118,481,538 | $ | 88,637,807 | $ | 72,865,646 | $ | 37,305,226 | $ | 15,810,615 | $ | 492,777 | ||||||||||||||
| Total income | 116,459,229 | 118,481,538 | 88,637,807 | 72,865,646 | 37,305,226 | 15,810,615 | 492,777 | |||||||||||||||||||||
| EXPENSES | ||||||||||||||||||||||||||||
| Management fees | 9,442,265 | 9,575,044 | 7,114,089 | 5,830,623 | 2,976,837 | 1,265,328 | 39,597 | |||||||||||||||||||||
| Shareholder servicing — Institutional Class | 14,979 | 17,263 | 14,446 | 16,021 | 13,652 | 12,235 | 2,880 | |||||||||||||||||||||
| Shareholder servicing — Advisor Class | 18,609 | 20,548 | 17,485 | 14,190 | 10,717 | 7,854 | 139 | |||||||||||||||||||||
| Shareholder servicing — Premier Class | 259 | 264 | 213 | 194 | 187 | 121 | 70 | |||||||||||||||||||||
| Shareholder servicing — Retirement Class | 1,126,323 | 1,092,903 | 848,804 | 736,596 | 394,266 | 161,148 | 2,955 | |||||||||||||||||||||
| Distribution fees — Premier Class | 517,704 | 515,355 | 380,041 | 325,344 | 155,617 | 50,180 | 1,102 | |||||||||||||||||||||
| Registration fees | 84,501 | 76,900 | 76,581 | 73,231 | 68,152 | 66,330 | 65,238 | |||||||||||||||||||||
| Administrative service fees | 131,404 | 134,182 | 112,221 | 100,483 | 73,368 | 57,038 | 45,090 | |||||||||||||||||||||
| Professional fees | 30,768 | 31,393 | 27,177 | 24,897 | 19,475 | 16,289 | 14,018 | |||||||||||||||||||||
| Shareholder reports | 65,628 | 69,164 | 62,000 | 60,211 | 47,801 | 41,503 | 11,998 | |||||||||||||||||||||
| Trustee fees and expenses | 58,952 | 60,855 | 45,809 | 37,735 | 19,313 | 8,156 | 219 | |||||||||||||||||||||
| Other expenses | 858,740 | 867,324 | 661,625 | 551,410 | 305,931 | 159,374 | 37,306 | |||||||||||||||||||||
| Total expenses | 12,350,132 | 12,461,195 | 9,360,491 | 7,770,935 | 4,085,316 | 1,845,556 | 220,612 | |||||||||||||||||||||
| Less: Expenses reimbursed by the investment adviser | (536,733 | ) | (541,336 | ) | (467,019 | ) | (425,719 | ) | (322,873 | ) | (263,598 | ) | (173,295 | ) | ||||||||||||||
| Fee waiver by investment adviser and Nuveen Securities | (3,871,966 | ) | (3,832,764 | ) | (2,778,082 | ) | (2,262,205 | ) | (1,150,883 | ) | (489,875 | ) | (15,002 | ) | ||||||||||||||
| Net expenses | 7,941,433 | 8,087,095 | 6,115,390 | 5,083,011 | 2,611,560 | 1,092,083 | 32,315 | |||||||||||||||||||||
| Net investment income (loss) | 108,517,796 | 110,394,443 | 82,522,417 | 67,782,635 | 34,693,666 | 14,718,532 | 460,462 | |||||||||||||||||||||
| NET REALIZED AND UNREALIZED GAIN (LOSS) ON TOTAL INVESTMENTS | ||||||||||||||||||||||||||||
| Realized gain (loss) from sale of affiliated investments | 33,804,226 | 35,141,090 | 14,172,622 | (997,066 | ) | (4,478,738 | ) | (3,807,013 | ) | (325,124 | ) | |||||||||||||||||
| Realized gain (loss) from sale of unaffiliated investments | — | — | — | — | — | — | 38,638 | |||||||||||||||||||||
| Realized gain distributions from affiliated investments | 28,902,657 | 31,478,160 | 25,289,776 | 21,349,263 | 11,045,910 | 4,727,339 | 148,494 | |||||||||||||||||||||
| Net realized gain (loss) from investments | 62,706,883 | 66,619,250 | 39,462,398 | 20,352,197 | 6,567,172 | 920,326 | (137,992 | ) | ||||||||||||||||||||
| Net change in unrealized appreciation (depreciation) from affiliated investments | (622,209,030 | ) | (644,141,053 | ) | (474,055,366 | ) | (380,325,233 | ) | (193,279,045 | ) | (86,316,189 | ) | (4,003,794 | ) | ||||||||||||||
| Net realized and unrealized gain (loss) from investments | (559,502,147 | ) | (577,521,803 | ) | (434,592,968 | ) | (359,973,036 | ) | (186,711,873 | ) | (85,395,863 | ) | (4,141,786 | ) | ||||||||||||||
| Net increase (decrease) in net assets from operations | $ | (450,984,351 | ) | $ | (467,127,360 | ) | $ | (352,070,551 | ) | $ | (292,190,401 | ) | $ | (152,018,207 | ) | $ | (70,677,331 | ) | $ | (3,681,324 | ) | |||||||
| 66 | 2022 Annual Report ■ TIAA-CREF Lifecycle Index Funds | See notes to financial statements | See notes to financial statements | TIAA-CREF Lifecycle Index Funds ■ 2022 Annual Report | 67 |
Statements of changes in net assets
TIAA-CREF Funds ■ For the period or year ended
| Lifecycle Index Retirement Income Fund | Lifecycle Index 2010 Fund | Lifecycle Index 2015 Fund | ||||||||||||||||||||||||
| May 31, 2022 | May 31, 2021 | May 31, 2022 | May 31, 2021 | May 31, 2022 | May 31, 2021 | |||||||||||||||||||||
| OPERATIONS | ||||||||||||||||||||||||||
| Net investment income (loss) | $ | 13,434,731 | $ | 9,606,683 | $ | 14,271,640 | $ | 10,610,367 | $ | 24,807,424 | $ | 18,543,920 | ||||||||||||||
| Net realized gain (loss) from investments | 8,011,700 | 8,080,794 | 13,134,854 | 12,842,243 | 21,740,192 | 31,347,940 | ||||||||||||||||||||
| Net change in unrealized appreciation (depreciation) from affiliated investments | (61,112,423 | ) | 67,871,509 | (68,940,130 | ) | 70,795,592 | (123,346,417 | ) | 134,741,041 | |||||||||||||||||
| Net increase (decrease) in net assets from operations | (39,665,992 | ) | 85,558,986 | (41,533,636 | ) | 94,248,202 | (76,798,801 | ) | 184,632,901 | |||||||||||||||||
| DISTRIBUTIONS TO SHAREHOLDERS | ||||||||||||||||||||||||||
| Institutional Class | (23,367,380 | ) | (10,719,953 | ) | (26,899,334 | ) | (12,730,910 | ) | (50,722,893 | ) | (24,713,823 | ) | ||||||||||||||
| Advisor Class | (119,013 | ) | (27,271 | ) | (85,571 | ) | (11,125 | ) | (124,912 | ) | (55,732 | ) | ||||||||||||||
| Premier Class | (919,478 | ) | (475,508 | ) | (1,672,994 | ) | (844,649 | ) | (4,365,306 | ) | (2,362,930 | ) | ||||||||||||||
| Retirement Class | (1,803,151 | ) | (839,863 | ) | (3,559,797 | ) | (1,726,732 | ) | (5,639,852 | ) | (3,021,603 | ) | ||||||||||||||
| Total distributions | (26,209,022 | ) | (12,062,595 | ) | (32,217,696 | ) | (15,313,416 | ) | (60,852,963 | ) | (30,154,088 | ) | ||||||||||||||
| SHAREHOLDER TRANSACTIONS | ||||||||||||||||||||||||||
| Subscriptions: | Institutional Class | 210,675,605 | 191,059,210 | 137,440,086 | 204,675,178 | 277,166,164 | 256,019,114 | |||||||||||||||||||
| Advisor Class | 1,716,222 | 1,151,737 | 219,811 | 2,040,506 | 1,512,539 | 2,283,793 | ||||||||||||||||||||
| Premier Class | 2,776,065 | 5,387,782 | 3,983,386 | 14,807,214 | 6,105,260 | 17,437,097 | ||||||||||||||||||||
| Retirement Class | 10,343,368 | 16,656,962 | 11,313,904 | 21,371,071 | 13,755,009 | 23,321,006 | ||||||||||||||||||||
| Reinvestments of distributions: | Institutional Class | 21,490,375 | 9,891,486 | 25,807,942 | 12,335,607 | 48,779,749 | 24,089,091 | |||||||||||||||||||
| Advisor Class | 113,592 | 24,677 | 79,288 | 8,082 | 117,985 | 52,169 | ||||||||||||||||||||
| Premier Class | 775,303 | 401,241 | 1,590,722 | 649,065 | 4,179,785 | 2,030,375 | ||||||||||||||||||||
| Retirement Class | 1,802,485 | 839,553 | 3,559,797 | 1,726,732 | 5,639,851 | 3,021,603 | ||||||||||||||||||||
| Redemptions: | Institutional Class | (162,321,585 | ) | (154,741,004 | ) | (134,974,480 | ) | (162,616,004 | ) | (202,244,641 | ) | (261,631,976 | ) | |||||||||||||
| Advisor Class | (1,024,166 | ) | (103,505 | ) | (340,286 | ) | (293,271 | ) | (1,049,625 | ) | (1,658,284 | ) | ||||||||||||||
| Premier Class | (24,249,034 | ) | (13,145,146 | ) | (25,502,732 | ) | (7,935,555 | ) | (68,419,546 | ) | (19,377,422 | ) | ||||||||||||||
| Retirement Class | (14,915,227 | ) | (10,549,640 | ) | (19,415,719 | ) | (26,196,110 | ) | (32,958,095 | ) | (39,554,431 | ) | ||||||||||||||
| Net increase (decrease) from shareholder transactions | 47,183,003 | 46,873,353 | 3,761,719 | 60,572,515 | 52,584,435 | 6,032,135 | ||||||||||||||||||||
| Net increase (decrease) in net assets | (18,692,011 | ) | 120,369,744 | (69,989,613 | ) | 139,507,301 | (85,067,329 | ) | 160,510,948 | |||||||||||||||||
| NET ASSETS | ||||||||||||||||||||||||||
| Beginning of period | 623,581,703 | 503,211,959 | 688,001,117 | 548,493,816 | 1,188,658,085 | 1,028,147,137 | ||||||||||||||||||||
| End of period | $ | 604,889,692 | $ | 623,581,703 | $ | 618,011,504 | $ | 688,001,117 | $ | 1,103,590,756 | $ | 1,188,658,085 | ||||||||||||||
| CHANGE IN FUND SHARES | ||||||||||||||||||||||||||
| Shares sold: | Institutional Class | 12,575,758 | 11,729,754 | 7,692,685 | 11,895,936 | 14,720,742 | 14,121,658 | |||||||||||||||||||
| Advisor Class | 102,421 | 69,635 | 12,364 | 115,954 | 79,095 | 122,916 | ||||||||||||||||||||
| Premier Class | 161,041 | 328,083 | 221,777 | 857,362 | 323,706 | 966,252 | ||||||||||||||||||||
| Retirement Class | 607,456 | 1,034,496 | 640,586 | 1,248,175 | 742,144 | 1,280,351 | ||||||||||||||||||||
| Shares reinvested: | Institutional Class | 1,270,015 | 606,170 | 1,460,551 | 708,535 | 2,618,344 | 1,317,064 | |||||||||||||||||||
| Advisor Class | 6,715 | 1,507 | 4,487 | 464 | 6,333 | 2,854 | ||||||||||||||||||||
| Premier Class | 45,685 | 24,708 | 90,331 | 37,389 | 225,204 | 111,437 | ||||||||||||||||||||
| Retirement Class | 106,694 | 51,449 | 203,185 | 99,984 | 304,857 | 166,388 | ||||||||||||||||||||
| Shares redeemed: | Institutional Class | (9,676,743 | ) | (9,450,485 | ) | (7,656,887 | ) | (9,353,376 | ) | (10,887,395 | ) | (14,411,717 | ) | |||||||||||||
| Advisor Class | (65,088 | ) | (6,247 | ) | (18,799 | ) | (16,521 | ) | (61,159 | ) | (88,396 | ) | ||||||||||||||
| Premier Class | (1,429,368 | ) | (800,784 | ) | (1,428,331 | ) | (461,304 | ) | (3,661,529 | ) | (1,078,201 | ) | ||||||||||||||
| Retirement Class | (882,919 | ) | (647,992 | ) | (1,112,863 | ) | (1,521,120 | ) | (1,782,248 | ) | (2,195,503 | ) | ||||||||||||||
| Net increase (decrease) from shareholder transactions | 2,821,667 | 2,940,294 | 109,086 | 3,611,478 | 2,628,094 | 315,103 | ||||||||||||||||||||
| 68 | 2022 Annual Report ■ TIAA-CREF Lifecycle Index Funds | See notes to financial statements | See notes to financial statements | TIAA-CREF Lifecycle Index Funds ■ 2022 Annual Report | 69 |
| Statements of changes in net assets | continued |
TIAA-CREF Funds ■ For the period or year ended
| Lifecycle Index 2020 Fund | Lifecycle Index 2025 Fund | Lifecycle Index 2030 Fund | ||||||||||||||||||||||||
| May 31, 2022 | May 31, 2021 | May 31, 2022 | May 31, 2021 | May 31, 2022 | May 31, 2021 | |||||||||||||||||||||
| OPERATIONS | ||||||||||||||||||||||||||
| Net investment income (loss) | $ | 67,578,449 | $ | 52,306,972 | $ | 104,821,292 | $ | 76,866,070 | $ | 118,135,826 | $ | 85,033,262 | ||||||||||||||
| Net realized gain (loss) from investments | 67,017,343 | 69,900,692 | 83,191,350 | 60,152,650 | 74,721,570 | 39,491,536 | ||||||||||||||||||||
| Net change in unrealized appreciation (depreciation) from affiliated investments | (355,369,871 | ) | 443,123,278 | (563,732,307 | ) | 810,056,672 | (649,186,753 | ) | 1,055,965,505 | |||||||||||||||||
| Net increase (decrease) in net assets from operations | (220,774,079 | ) | 565,330,942 | (375,719,665 | ) | 947,075,392 | (456,329,357 | ) | 1,180,490,303 | |||||||||||||||||
| DISTRIBUTIONS TO SHAREHOLDERS | ||||||||||||||||||||||||||
| Institutional Class | (143,493,366 | ) | (59,350,887 | ) | (179,479,086 | ) | (82,165,521 | ) | (174,866,931 | ) | (89,228,567 | ) | ||||||||||||||
| Advisor Class | (728,037 | ) | (138,305 | ) | (912,408 | ) | (187,460 | ) | (970,266 | ) | (221,354 | ) | ||||||||||||||
| Premier Class | (13,108,202 | ) | (6,260,956 | ) | (14,902,560 | ) | (8,459,860 | ) | (13,345,660 | ) | (7,879,150 | ) | ||||||||||||||
| Retirement Class | (14,022,004 | ) | (6,560,542 | ) | (17,495,737 | ) | (8,941,972 | ) | (15,210,821 | ) | (8,721,340 | ) | ||||||||||||||
| Total distributions | (171,351,609 | ) | (72,310,690 | ) | (212,789,791 | ) | (99,754,813 | ) | (204,393,678 | ) | (106,050,411 | ) | ||||||||||||||
| SHAREHOLDER TRANSACTIONS | ||||||||||||||||||||||||||
| Subscriptions: | Institutional Class | 825,834,111 | 702,553,353 | 1,385,975,613 | 1,165,705,174 | 1,665,137,152 | 1,321,985,086 | |||||||||||||||||||
| Advisor Class | 7,726,756 | 8,409,953 | 11,693,861 | 14,368,483 | 14,038,747 | 18,010,084 | ||||||||||||||||||||
| Premier Class | 16,902,954 | 46,561,317 | 32,510,840 | 78,190,697 | 32,107,901 | 78,554,197 | ||||||||||||||||||||
| Retirement Class | 30,973,529 | 53,648,706 | 63,301,713 | 81,639,842 | 66,511,008 | 87,820,262 | ||||||||||||||||||||
| Reinvestments of distributions: | Institutional Class | 136,195,252 | 57,085,062 | 168,462,488 | 78,478,792 | 166,951,460 | 86,314,543 | |||||||||||||||||||
| Advisor Class | 720,772 | 135,232 | 906,520 | 184,443 | 965,225 | 218,383 | ||||||||||||||||||||
| Premier Class | 12,347,169 | 4,958,387 | 13,684,810 | 6,556,141 | 12,540,204 | 6,544,917 | ||||||||||||||||||||
| Retirement Class | 14,022,004 | 6,560,541 | 17,495,737 | 8,941,972 | 15,210,821 | 8,721,340 | ||||||||||||||||||||
| Redemptions: | Institutional Class | (589,965,470 | ) | (648,385,502 | ) | (712,841,620 | ) | (817,662,750 | ) | (721,299,548 | ) | (779,002,362 | ) | |||||||||||||
| Advisor Class | (7,388,574 | ) | (3,012,073 | ) | (5,508,338 | ) | (1,458,004 | ) | (7,901,355 | ) | (2,975,477 | ) | ||||||||||||||
| Premier Class | (249,302,384 | ) | (49,438,854 | ) | (375,387,419 | ) | (51,651,674 | ) | (355,718,525 | ) | (39,349,260 | ) | ||||||||||||||
| Retirement Class | (75,890,372 | ) | (103,546,576 | ) | (92,069,524 | ) | (118,617,109 | ) | (83,629,097 | ) | (118,598,827 | ) | ||||||||||||||
| Net increase (decrease) from shareholder transactions | 122,175,747 | 75,529,546 | 508,224,681 | 444,676,007 | 804,913,993 | 668,242,886 | ||||||||||||||||||||
| Net increase (decrease) in net assets | (269,949,941 | ) | 568,549,798 | (80,284,775 | ) | 1,291,996,586 | 144,190,958 | 1,742,682,778 | ||||||||||||||||||
| NET ASSETS | ||||||||||||||||||||||||||
| Beginning of period | 3,367,184,504 | 2,798,634,706 | 5,228,932,344 | 3,936,935,758 | 5,961,968,599 | 4,219,285,821 | ||||||||||||||||||||
| End of period | $ | 3,097,234,563 | $ | 3,367,184,504 | $ | 5,148,647,569 | $ | 5,228,932,344 | $ | 6,106,159,557 | $ | 5,961,968,599 | ||||||||||||||
| CHANGE IN FUND SHARES | ||||||||||||||||||||||||||
| Shares sold: | Institutional Class | 40,609,276 | 36,277,439 | 62,619,037 | 56,100,150 | 69,562,608 | 59,733,903 | |||||||||||||||||||
| Advisor Class | 382,531 | 424,790 | 527,041 | 688,505 | 588,711 | 797,998 | ||||||||||||||||||||
| Premier Class | 828,312 | 2,386,110 | 1,460,832 | 3,793,312 | 1,340,454 | 3,538,775 | ||||||||||||||||||||
| Retirement Class | 1,527,331 | 2,765,304 | 2,888,763 | 3,928,447 | 2,815,024 | 3,966,169 | ||||||||||||||||||||
| Shares reinvested: | Institutional Class | 6,755,717 | 2,905,092 | 7,626,188 | 3,729,981 | 6,953,414 | 3,846,459 | |||||||||||||||||||
| Advisor Class | 35,788 | 6,885 | 41,112 | 8,779 | 40,251 | 9,745 | ||||||||||||||||||||
| Premier Class | 615,205 | 253,367 | 622,037 | 312,793 | 524,695 | 292,969 | ||||||||||||||||||||
| Retirement Class | 701,100 | 336,438 | 798,892 | 428,461 | 639,110 | 391,970 | ||||||||||||||||||||
| Shares redeemed: | Institutional Class | (29,292,538 | ) | (33,359,287 | ) | (32,555,546 | ) | (39,311,519 | ) | (30,334,567 | ) | (35,125,172 | ) | |||||||||||||
| Advisor Class | (389,534 | ) | (153,543 | ) | (265,005 | ) | (67,729 | ) | (360,673 | ) | (129,075 | ) | ||||||||||||||
| Premier Class | (12,276,671 | ) | (2,578,410 | ) | (16,878,190 | ) | (2,525,387 | ) | (14,755,878 | ) | (1,819,139 | ) | ||||||||||||||
| Retirement Class | (3,797,714 | ) | (5,341,634 | ) | (4,230,217 | ) | (5,728,505 | ) | (3,598,413 | ) | (5,351,773 | ) | ||||||||||||||
| Net increase (decrease) from shareholder transactions | 5,698,803 | 3,922,551 | 22,654,944 | 21,357,288 | 33,414,736 | 30,152,829 | ||||||||||||||||||||
| 70 | 2022 Annual Report ■ TIAA-CREF Lifecycle Index Funds | See notes to financial statements | See notes to financial statements | TIAA-CREF Lifecycle Index Funds ■ 2022 Annual Report | 71 |
| Statements of changes in net assets | continued |
TIAA-CREF Funds ■ For the period or year ended
| Lifecycle Index 2035 Fund | Lifecycle Index 2040 Fund | Lifecycle Index 2045 Fund | ||||||||||||||||||||||||
| May 31, 2022 | May 31, 2021 | May 31, 2022 | May 31, 2021 | May 31, 2022 | May 31, 2021 | |||||||||||||||||||||
| OPERATIONS | ||||||||||||||||||||||||||
| Net investment income (loss) | $ | 108,517,796 | $ | 79,249,282 | $ | 110,394,443 | $ | 80,743,207 | $ | 82,522,417 | $ | 57,469,992 | ||||||||||||||
| Net realized gain (loss) from investments | 62,706,883 | 28,564,665 | 66,619,250 | 26,391,309 | 39,462,398 | 6,398,253 | ||||||||||||||||||||
| Net change in unrealized appreciation (depreciation) from affiliated investments | (622,209,030 | ) | 1,119,326,981 | (644,141,053 | ) | 1,296,453,349 | (474,055,366 | ) | 1,049,794,069 | |||||||||||||||||
| Net increase (decrease) in net assets from operations | (450,984,351 | ) | 1,227,140,928 | (467,127,360 | ) | 1,403,587,865 | (352,070,551 | ) | 1,113,662,314 | |||||||||||||||||
| DISTRIBUTIONS TO SHAREHOLDERS | ||||||||||||||||||||||||||
| Institutional Class | (151,468,330 | ) | (82,185,463 | ) | (160,002,570 | ) | (83,659,458 | ) | (103,134,683 | ) | (54,740,019 | ) | ||||||||||||||
| Advisor Class | (531,231 | ) | (153,634 | ) | (629,974 | ) | (131,413 | ) | (459,337 | ) | (105,720 | ) | ||||||||||||||
| Premier Class | (11,963,664 | ) | (7,680,349 | ) | (12,167,868 | ) | (6,708,888 | ) | (8,260,023 | ) | (4,787,925 | ) | ||||||||||||||
| Retirement Class | (12,253,439 | ) | (7,749,057 | ) | (12,094,241 | ) | (7,058,535 | ) | (8,029,629 | ) | (4,714,349 | ) | ||||||||||||||
| Total distributions | (176,216,664 | ) | (97,768,503 | ) | (184,894,653 | ) | (97,558,294 | ) | (119,883,672 | ) | (64,348,013 | ) | ||||||||||||||
| SHAREHOLDER TRANSACTIONS | ||||||||||||||||||||||||||
| Subscriptions: | Institutional Class | 1,619,543,581 | 1,241,437,681 | 1,582,174,468 | 1,149,358,957 | 1,341,462,527 | 939,605,770 | |||||||||||||||||||
| Advisor Class | 9,992,294 | 10,974,172 | 10,656,519 | 12,207,148 | 9,666,839 | 9,715,991 | ||||||||||||||||||||
| Premier Class | 33,308,908 | 78,268,375 | 34,907,398 | 82,514,378 | 26,121,199 | 61,217,669 | ||||||||||||||||||||
| Retirement Class | 64,016,488 | 75,491,056 | 54,700,394 | 83,180,775 | 58,582,308 | 61,598,832 | ||||||||||||||||||||
| Reinvestments of distributions: | Institutional Class | 144,405,578 | 79,186,655 | 154,240,411 | 81,363,405 | 99,203,074 | 52,966,805 | |||||||||||||||||||
| Advisor Class | 526,475 | 150,602 | 624,907 | 128,407 | 454,832 | 102,944 | ||||||||||||||||||||
| Premier Class | 11,182,234 | 6,335,010 | 11,636,545 | 5,966,697 | 7,810,166 | 4,266,206 | ||||||||||||||||||||
| Retirement Class | 12,253,439 | 7,749,057 | 12,094,241 | 7,058,535 | 8,029,628 | 4,714,349 | ||||||||||||||||||||
| Redemptions: | Institutional Class | (563,977,793 | ) | (708,354,007 | ) | (543,368,779 | ) | (716,339,444 | ) | (422,308,311 | ) | (498,315,421 | ) | |||||||||||||
| Advisor Class | (5,439,604 | ) | (1,412,301 | ) | (3,372,665 | ) | (1,355,923 | ) | (2,653,378 | ) | (1,360,605 | ) | ||||||||||||||
| Premier Class | (340,422,523 | ) | (39,105,175 | ) | (306,870,714 | ) | (28,603,553 | ) | (292,405,889 | ) | (22,075,495 | ) | ||||||||||||||
| Retirement Class | (82,152,229 | ) | (103,950,144 | ) | (73,992,453 | ) | (109,354,690 | ) | (53,969,491 | ) | (82,098,171 | ) | ||||||||||||||
| Net increase (decrease) from shareholder transactions | 903,236,848 | 646,770,981 | 933,430,272 | 566,124,692 | 779,993,504 | 530,338,874 | ||||||||||||||||||||
| Net increase (decrease) in net assets | 276,035,833 | 1,776,143,406 | 281,408,259 | 1,872,154,263 | 308,039,281 | 1,579,653,175 | ||||||||||||||||||||
| NET ASSETS | ||||||||||||||||||||||||||
| Beginning of period | 5,634,803,115 | 3,858,659,709 | 5,813,148,449 | 3,940,994,186 | 4,334,025,322 | 2,754,372,147 | ||||||||||||||||||||
| End of period | $ | 5,910,838,948 | $ | 5,634,803,115 | $ | 6,094,556,708 | $ | 5,813,148,449 | $ | 4,642,064,603 | $ | 4,334,025,322 | ||||||||||||||
| CHANGE IN FUND SHARES | ||||||||||||||||||||||||||
| Shares sold: | Institutional Class | 63,191,652 | 53,093,882 | 58,503,434 | 47,330,590 | 47,926,028 | 38,051,346 | |||||||||||||||||||
| Advisor Class | 393,351 | 465,332 | 392,807 | 486,605 | 347,237 | 386,255 | ||||||||||||||||||||
| Premier Class | 1,297,709 | 3,332,791 | 1,286,616 | 3,326,310 | 932,881 | 2,460,351 | ||||||||||||||||||||
| Retirement Class | 2,525,546 | 3,210,198 | 2,038,343 | 3,384,557 | 2,106,350 | 2,462,770 | ||||||||||||||||||||
| Shares reinvested: | Institutional Class | 5,588,451 | 3,328,569 | 5,649,832 | 3,278,139 | 3,509,129 | 2,096,865 | |||||||||||||||||||
| Advisor Class | 20,406 | 6,339 | 22,916 | 5,178 | 16,117 | 4,080 | ||||||||||||||||||||
| Premier Class | 434,937 | 267,639 | 428,444 | 241,567 | 277,547 | 169,630 | ||||||||||||||||||||
| Retirement Class | 478,650 | 328,628 | 446,776 | 286,816 | 286,670 | 188,273 | ||||||||||||||||||||
| Shares redeemed: | Institutional Class | (22,071,387 | ) | (30,110,477 | ) | (20,187,224 | ) | (29,104,126 | ) | (15,124,315 | ) | (19,783,206 | ) | |||||||||||||
| Advisor Class | (224,895 | ) | (59,228 | ) | (131,587 | ) | (55,341 | ) | (102,325 | ) | (51,774 | ) | ||||||||||||||
| Premier Class | (13,126,222 | ) | (1,712,473 | ) | (11,193,100 | ) | (1,199,194 | ) | (10,274,622 | ) | (928,111 | ) | ||||||||||||||
| Retirement Class | (3,290,744 | ) | (4,423,500 | ) | (2,808,142 | ) | (4,456,676 | ) | (1,982,851 | ) | (3,308,782 | ) | ||||||||||||||
| Net increase (decrease) from shareholder transactions | 35,217,454 | 27,727,700 | 34,449,115 | 23,524,425 | 27,917,846 | 21,747,697 | ||||||||||||||||||||
| 72 | 2022 Annual Report ■ TIAA-CREF Lifecycle Index Funds | See notes to financial statements | See notes to financial statements | TIAA-CREF Lifecycle Index Funds ■ 2022 Annual Report | 73 |
| Statements of changes in net assets | continued |
TIAA-CREF Funds ■ For the period or year ended
| Lifecycle Index 2050 Fund | Lifecycle Index 2055 Fund | Lifecycle Index 2060 Fund | ||||||||||||||||||||||||
| May 31, 2022 | May 31, 2021 | May 31, 2022 | May 31, 2021 | May 31, 2022 | May 31, 2021 | |||||||||||||||||||||
| OPERATIONS | ||||||||||||||||||||||||||
| Net investment income (loss) | $ | 67,782,635 | $ | 46,165,969 | $ | 34,693,666 | $ | 21,715,539 | $ | 14,718,532 | $ | 7,765,010 | ||||||||||||||
| Net realized gain (loss) from investments | 20,352,197 | 2,673,483 | 6,567,172 | (429,284 | ) | 920,326 | (253,461 | ) | ||||||||||||||||||
| Net change in unrealized appreciation (depreciation) from affiliated investments | (380,325,233 | ) | 868,582,425 | (193,279,045 | ) | 418,136,772 | (86,316,189 | ) | 151,099,298 | |||||||||||||||||
| Net increase (decrease) in net assets from operations | (292,190,401 | ) | 917,421,877 | (152,018,207 | ) | 439,423,027 | (70,677,331 | ) | 158,610,847 | |||||||||||||||||
| DISTRIBUTIONS TO SHAREHOLDERS | ||||||||||||||||||||||||||
| Institutional Class | (77,510,635 | ) | (42,430,221 | ) | (35,180,792 | ) | (19,292,672 | ) | (14,471,207 | ) | (6,976,807 | ) | ||||||||||||||
| Advisor Class | (340,993 | ) | (91,551 | ) | (223,836 | ) | (72,735 | ) | (155,309 | ) | (42,596 | ) | ||||||||||||||
| Premier Class | (6,498,486 | ) | (3,947,333 | ) | (2,815,516 | ) | (1,715,800 | ) | (846,898 | ) | (432,574 | ) | ||||||||||||||
| Retirement Class | (6,265,450 | ) | (4,010,091 | ) | (2,917,882 | ) | (2,153,322 | ) | (1,128,612 | ) | (737,157 | ) | ||||||||||||||
| Total distributions | (90,615,564 | ) | (50,479,196 | ) | (41,138,026 | ) | (23,234,529 | ) | (16,602,026 | ) | (8,189,134 | ) | ||||||||||||||
| SHAREHOLDER TRANSACTIONS | ||||||||||||||||||||||||||
| Subscriptions: | Institutional Class | 1,171,798,343 | 813,431,107 | 714,967,259 | 479,956,773 | 423,652,731 | 281,188,730 | |||||||||||||||||||
| Advisor Class | 7,853,890 | 7,206,914 | 5,903,461 | 5,757,157 | 5,291,432 | 3,754,798 | ||||||||||||||||||||
| Premier Class | 23,003,492 | 52,560,460 | 18,527,070 | 38,644,994 | 13,184,457 | 18,114,313 | ||||||||||||||||||||
| Retirement Class | 51,095,665 | 54,707,156 | 36,073,275 | 34,204,930 | 27,596,512 | 21,821,410 | ||||||||||||||||||||
| Reinvestments of distributions: | Institutional Class | 74,344,572 | 40,994,173 | 33,228,545 | 18,203,312 | 13,831,699 | 6,684,976 | |||||||||||||||||||
| Advisor Class | 336,827 | 88,840 | 220,118 | 70,061 | 151,928 | 40,105 | ||||||||||||||||||||
| Premier Class | 6,030,364 | 3,507,602 | 2,597,053 | 1,498,630 | 748,307 | 359,085 | ||||||||||||||||||||
| Retirement Class | 6,265,450 | 4,010,091 | 2,917,457 | 2,153,020 | 1,128,301 | 736,927 | ||||||||||||||||||||
| Redemptions: | Institutional Class | (369,938,596 | ) | (407,143,274 | ) | (226,734,529 | ) | (161,196,776 | ) | (129,659,523 | ) | (81,222,292 | ) | |||||||||||||
| Advisor Class | (3,166,096 | ) | (675,195 | ) | (1,115,572 | ) | (385,131 | ) | (982,616 | ) | (422,458 | ) | ||||||||||||||
| Premier Class | (242,092,087 | ) | (20,998,387 | ) | (130,625,721 | ) | (9,636,115 | ) | (38,656,420 | ) | (3,853,209 | ) | ||||||||||||||
| Retirement Class | (44,251,283 | ) | (69,958,388 | ) | (24,674,927 | ) | (44,408,997 | ) | (11,156,113 | ) | (18,899,836 | ) | ||||||||||||||
| Net increase (decrease) from shareholder transactions | 681,280,541 | 477,731,099 | 431,283,489 | 364,861,858 | 305,130,695 | 228,302,549 | ||||||||||||||||||||
| Net increase (decrease) in net assets | 298,474,576 | 1,344,673,780 | 238,127,256 | 781,050,356 | 217,851,338 | 378,724,262 | ||||||||||||||||||||
| NET ASSETS | ||||||||||||||||||||||||||
| Beginning of period | 3,540,859,119 | 2,196,185,339 | 1,778,587,539 | 997,537,183 | 702,721,905 | 323,997,643 | ||||||||||||||||||||
| End of period | $ | 3,839,333,695 | $ | 3,540,859,119 | $ | 2,016,714,795 | $ | 1,778,587,539 | $ | 920,573,243 | $ | 702,721,905 | ||||||||||||||
| CHANGE IN FUND SHARES | ||||||||||||||||||||||||||
| Shares sold: | Institutional Class | 41,378,867 | 32,551,557 | 31,434,359 | 23,898,376 | 24,189,443 | 18,088,666 | |||||||||||||||||||
| Advisor Class | 277,034 | 284,899 | 260,613 | 287,032 | 300,674 | 239,023 | ||||||||||||||||||||
| Premier Class | 809,191 | 2,119,729 | 806,254 | 1,916,847 | 743,805 | 1,163,078 | ||||||||||||||||||||
| Retirement Class | 1,829,383 | 2,183,270 | 1,599,823 | 1,715,991 | 1,581,294 | 1,418,338 | ||||||||||||||||||||
| Shares reinvested: | Institutional Class | 2,596,737 | 1,611,406 | 1,440,336 | 892,319 | 775,754 | 424,983 | |||||||||||||||||||
| Advisor Class | 11,781 | 3,496 | 9,554 | 3,438 | 8,526 | 2,551 | ||||||||||||||||||||
| Premier Class | 211,740 | 138,586 | 112,915 | 73,643 | 42,040 | 22,857 | ||||||||||||||||||||
| Retirement Class | 221,004 | 159,131 | 127,122 | 106,060 | 63,530 | 47,028 | ||||||||||||||||||||
| Shares redeemed: | Institutional Class | (13,115,403 | ) | (15,906,221 | ) | (9,948,062 | ) | (7,976,809 | ) | (7,411,531 | ) | (5,222,822 | ) | |||||||||||||
| Advisor Class | (118,080 | ) | (26,590 | ) | (50,954 | ) | (18,933 | ) | (55,957 | ) | (27,251 | ) | ||||||||||||||
| Premier Class | (8,402,233 | ) | (866,647 | ) | (5,615,842 | ) | (491,181 | ) | (2,149,761 | ) | (252,220 | ) | ||||||||||||||
| Retirement Class | (1,602,795 | ) | (2,777,186 | ) | (1,103,245 | ) | (2,161,601 | ) | (640,121 | ) | (1,195,996 | ) | ||||||||||||||
| Net increase (decrease) from shareholder transactions | 24,097,226 | 19,475,430 | 19,072,873 | 18,245,182 | 17,447,696 | 14,708,235 | ||||||||||||||||||||
| 74 | 2022 Annual Report ■ TIAA-CREF Lifecycle Index Funds | See notes to financial statements | See notes to financial statements | TIAA-CREF Lifecycle Index Funds ■ 2022 Annual Report | 75 |
| Statements of changes in net assets | concluded |
TIAA-CREF Funds ■ For the period or year ended
| Lifecycle Index 2065 Fund | ||||||||||
| May 31, 2022 | May 31, 2021 | § | ||||||||
| OPERATIONS | ||||||||||
| Net investment income (loss) | $ | 460,462 | $ | 89,704 | ||||||
| Net realized gain (loss) from investments | (137,992 | ) | 3,408 | |||||||
| Net change in unrealized appreciation (depreciation) from affiliated investments | (4,003,794 | ) | 1,362,531 | |||||||
| Net increase (decrease) in net assets from operations | (3,681,324 | ) | 1,455,643 | |||||||
| DISTRIBUTIONS TO SHAREHOLDERS | ||||||||||
| Institutional Class | (467,220 | ) | (66,007 | ) | ||||||
| Advisor Class | (20,417 | ) | (8,865 | ) | ||||||
| Premier Class | (19,975 | ) | (8,865 | ) | ||||||
| Retirement Class | (24,669 | ) | (8,734 | ) | ||||||
| Total distributions | (532,281 | ) | (92,471 | ) | ||||||
| SHAREHOLDER TRANSACTIONS | ||||||||||
| Subscriptions: | Institutional Class | 49,994,766 | 6,581,831 | |||||||
| Advisor Class | 180,844 | 503,092 | ||||||||
| Premier Class | 307,613 | 516,791 | ||||||||
| Retirement Class | 1,416,630 | 583,151 | ||||||||
| Reinvestments of distributions: | Institutional Class | 379,906 | 4,735 | |||||||
| Advisor Class | 2,045 | — | ||||||||
| Premier Class | 1,538 | — | ||||||||
| Retirement Class | 9,802 | 8 | ||||||||
| Redemptions: | Institutional Class | (9,076,696 | ) | (448,475 | ) | |||||
| Advisor Class | (17,739 | ) | — | |||||||
| Premier Class | (52,656 | ) | (3,596 | ) | ||||||
| Retirement Class | (228,620 | ) | (14,056 | ) | ||||||
| Net increase (decrease) from shareholder transactions | 42,917,433 | 7,723,481 | ||||||||
| Net increase (decrease) in net assets | 38,703,828 | 9,086,653 | ||||||||
| NET ASSETS | ||||||||||
| Beginning of period | 9,086,653 | — | ||||||||
| End of period | $ | 47,790,481 | $ | 9,086,653 | ||||||
| CHANGE IN FUND SHARES | ||||||||||
| Shares sold: | Institutional Class | 4,030,415 | 609,815 | |||||||
| Advisor Class | 14,601 | 50,259 | ||||||||
| Premier Class | 24,677 | 51,411 | ||||||||
| Retirement Class | 116,709 | 56,856 | ||||||||
| Shares reinvested: | Institutional Class | 29,914 | 424 | |||||||
| Advisor Class | 163 | — | ||||||||
| Premier Class | 122 | — | ||||||||
| Retirement Class | 779 | 1 | ||||||||
| Shares redeemed: | Institutional Class | (726,234 | ) | (37,593 | ) | |||||
| Advisor Class | (1,473 | ) | — | |||||||
| Premier Class | (4,135 | ) | (295 | ) | ||||||
| Retirement Class | (18,852 | ) | (1,143 | ) | ||||||
| Net increase (decrease) from shareholder transactions | 3,466,686 | 729,735 | ||||||||
| § | For the period September 30, 2020 to May 31, 2021. |
| 76 | 2022 Annual Report ■ TIAA-CREF Lifecycle Index Funds | See notes to financial statements |
[This page intentionally left blank.]
| TIAA-CREF Lifecycle Index Funds ■ 2022 Annual Report | 77 |
TIAA-CREF Funds
| Selected per share data | Ratios and supplemental data | |||||||||||||||||||||||||||||||||||||||||||||||||||||||||
| Gain (loss) from investment operations | ||||||||||||||||||||||||||||||||||||||||||||||||||||||||||
| Net realized | Ratios to average net assets | |||||||||||||||||||||||||||||||||||||||||||||||||||||||||
| For the | Net asset | Net | and unrealized | Total gain | Less distributions from | Total | Net asset | Net assets | Net | |||||||||||||||||||||||||||||||||||||||||||||||||
| period or year ended | value, beginning of period | investment income (loss | )a | gain (loss on total investments | ) j | (loss) from investment operations | Net investment income | Net realized gains | dividends and distributions | value, end of period | Total return | at end of period (in thousands | ) | Gross expenses | Net expenses | investment income (loss | ) | Portfolio turnover rate | ||||||||||||||||||||||||||||||||||||||||
| LIFECYCLE INDEX RETIREMENT INCOME FUND | ||||||||||||||||||||||||||||||||||||||||||||||||||||||||||
| Institutional Class: | 5/31/22 | $17.20 | $0.36 | $(1.37 | ) | $(1.01 | ) | $(0.38 | ) | $(0.33 | ) | $(0.71 | ) | $15.48 | (6.20 | )% | $557,296 | 0.23 | %g | 0.10 | %g | 2.13 | % | 24 | % | |||||||||||||||||||||||||||||||||
| 5/31/21 | 15.10 | 0.28 | 2.16 | 2.44 | (0.29 | ) | (0.05 | ) | (0.34 | ) | 17.20 | 16.36 | 547,545 | 0.23 | g | 0.10 | g | 1.69 | 23 | |||||||||||||||||||||||||||||||||||||||
| 5/31/20 | 14.31 | 0.34 | 0.82 | 1.16 | (0.35 | ) | (0.02 | ) | (0.37 | ) | 15.10 | 8.17 | 437,256 | 0.26 | g | 0.10 | g | 2.32 | 27 | |||||||||||||||||||||||||||||||||||||||
| 5/31/19 | 14.22 | 0.34 | 0.15 | 0.49 | (0.34 | ) | (0.06 | ) | (0.40 | ) | 14.31 | 3.66 | 306,742 | 0.24 | f | 0.07 | f | 2.39 | 23 | |||||||||||||||||||||||||||||||||||||||
| 5/31/18 | 13.81 | 0.29 | 0.43 | 0.72 | (0.29 | ) | (0.02 | ) | (0.31 | ) | 14.22 | 5.16 | 233,165 | 0.21 | e | 0.00 | e | 2.09 | 26 | |||||||||||||||||||||||||||||||||||||||
| Advisor Class: | 5/31/22 | 17.19 | 0.35 | (1.38 | ) | (1.03 | ) | (0.36 | ) | (0.33 | ) | (0.69 | ) | 15.47 | (6.30 | ) | 2,699 | 0.33 | g | 0.20 | g | 2.08 | 24 | |||||||||||||||||||||||||||||||||||
| 5/31/21 | 15.10 | 0.24 | 2.18 | 2.42 | (0.28 | ) | (0.05 | ) | (0.33 | ) | 17.19 | 16.16 | 2,242 | 0.34 | g | 0.20 | g | 1.49 | 23 | |||||||||||||||||||||||||||||||||||||||
| 5/31/20 | 14.31 | 0.36 | 0.79 | 1.15 | (0.34 | ) | (0.02 | ) | (0.36 | ) | 15.10 | 8.08 | 989 | 0.37 | g | 0.22 | g | 2.41 | 27 | |||||||||||||||||||||||||||||||||||||||
| 5/31/19 | 14.22 | 0.33 | 0.16 | 0.49 | (0.34 | ) | (0.06 | ) | (0.40 | ) | 14.31 | 3.64 | 160 | 0.27 | f | 0.10 | f | 2.33 | 23 | |||||||||||||||||||||||||||||||||||||||
| 5/31/18 | 13.82 | 0.30 | 0.41 | 0.71 | (0.29 | ) | (0.02 | ) | (0.31 | ) | 14.22 | 5.07 | 111 | 0.21 | e | 0.01 | e | 2.13 | 26 | |||||||||||||||||||||||||||||||||||||||
| Premier Class: | 5/31/22 | 17.18 | 0.41 | (1.45 | ) | (1.04 | ) | (0.35 | ) | (0.33 | ) | (0.68 | ) | 15.46 | (6.36 | ) | 3,993 | 0.38 | g | 0.25 | g | 2.37 | 24 | |||||||||||||||||||||||||||||||||||
| 5/31/21 | 15.09 | 0.27 | 2.14 | 2.41 | (0.27 | ) | (0.05 | ) | (0.32 | ) | 17.18 | 16.12 | 25,449 | 0.38 | g | 0.25 | g | 1.63 | 23 | |||||||||||||||||||||||||||||||||||||||
| 5/31/20 | 14.30 | 0.32 | 0.82 | 1.14 | (0.33 | ) | (0.02 | ) | (0.35 | ) | 15.09 | 8.09 | 29,105 | 0.40 | g | 0.25 | g | 2.17 | 27 | |||||||||||||||||||||||||||||||||||||||
| 5/31/19 | 14.20 | 0.31 | 0.17 | 0.48 | (0.32 | ) | (0.06 | ) | (0.38 | ) | 14.30 | 3.44 | 29,443 | 0.39 | f | 0.22 | f | 2.20 | 23 | |||||||||||||||||||||||||||||||||||||||
| 5/31/18 | 13.81 | 0.28 | 0.40 | 0.68 | (0.27 | ) | (0.02 | ) | (0.29 | ) | 14.20 | 4.94 | 20,117 | 0.35 | e | 0.15 | e | 2.00 | 26 | |||||||||||||||||||||||||||||||||||||||
| Retirement Class: | 5/31/22 | 17.16 | 0.32 | (1.38 | ) | (1.06 | ) | (0.33 | ) | (0.33 | ) | (0.66 | ) | 15.44 | (6.45 | ) | 40,901 | 0.48 | g | 0.35 | g | 1.90 | 24 | |||||||||||||||||||||||||||||||||||
| 5/31/21 | 15.07 | 0.24 | 2.16 | 2.40 | (0.26 | ) | (0.05 | ) | (0.31 | ) | 17.16 | 16.04 | 48,346 | 0.48 | g | 0.35 | g | 1.45 | 23 | |||||||||||||||||||||||||||||||||||||||
| 5/31/20 | 14.28 | 0.31 | 0.81 | 1.12 | (0.31 | ) | (0.02 | ) | (0.33 | ) | 15.07 | 7.91 | 35,862 | 0.50 | g | 0.35 | g | 2.09 | 27 | |||||||||||||||||||||||||||||||||||||||
| 5/31/19 | 14.19 | 0.31 | 0.15 | 0.46 | (0.31 | ) | (0.06 | ) | (0.37 | ) | 14.28 | 3.40 | 34,847 | 0.49 | f | 0.32 | f | 2.19 | 23 | |||||||||||||||||||||||||||||||||||||||
| 5/31/18 | 13.79 | 0.26 | 0.42 | 0.68 | (0.26 | ) | (0.02 | ) | (0.28 | ) | 14.19 | 4.83 | 39,058 | 0.45 | e | 0.25 | e | 1.88 | 26 | |||||||||||||||||||||||||||||||||||||||
| LIFECYCLE INDEX 2010 FUND | ||||||||||||||||||||||||||||||||||||||||||||||||||||||||||
| Institutional Class: | 5/31/22 | 18.13 | 0.38 | (1.41 | ) | (1.03 | ) | (0.38 | ) | (0.48 | ) | (0.86 | ) | 16.24 | (6.07 | ) | 526,583 | 0.22 | g | 0.10 | g | 2.12 | 23 | |||||||||||||||||||||||||||||||||||
| 5/31/21 | 15.97 | 0.30 | 2.28 | 2.58 | (0.31 | ) | (0.11 | ) | (0.42 | ) | 18.13 | 16.22 | 560,852 | 0.23 | g | 0.10 | g | 1.71 | 28 | |||||||||||||||||||||||||||||||||||||||
| 5/31/20 | 15.11 | 0.36 | 0.87 | 1.23 | (0.35 | ) | (0.02 | ) | (0.37 | ) | 15.97 | 8.18 | 442,192 | 0.25 | g | 0.10 | g | 2.32 | 22 | |||||||||||||||||||||||||||||||||||||||
| 5/31/19 | 15.04 | 0.36 | 0.15 | 0.51 | (0.35 | ) | (0.09 | ) | (0.44 | ) | 15.11 | 3.57 | 335,348 | 0.22 | f | 0.07 | f | 2.40 | 19 | |||||||||||||||||||||||||||||||||||||||
| 5/31/18 | 14.59 | 0.32 | 0.45 | 0.77 | (0.29 | ) | (0.03 | ) | (0.32 | ) | 15.04 | 5.29 | 265,521 | 0.15 | e | 0.00 | e | 2.13 | 16 | |||||||||||||||||||||||||||||||||||||||
| Advisor Class: | 5/31/22 | 18.13 | 0.36 | (1.40 | ) | (1.04 | ) | (0.37 | ) | (0.48 | ) | (0.85 | ) | 16.24 | (6.16 | ) | 1,715 | 0.32 | g | 0.20 | g | 2.03 | 23 | |||||||||||||||||||||||||||||||||||
| 5/31/21 | 15.97 | 0.22 | 2.35 | 2.57 | (0.30 | ) | (0.11 | ) | (0.41 | ) | 18.13 | 16.18 | 1,950 | 0.32 | g | 0.19 | g | 1.28 | 28 | |||||||||||||||||||||||||||||||||||||||
| 5/31/20 | 15.11 | 0.36 | 0.87 | 1.23 | (0.35 | ) | (0.02 | ) | (0.37 | ) | 15.97 | 8.16 | 123 | 0.26 | g | 0.12 | g | 2.30 | 22 | |||||||||||||||||||||||||||||||||||||||
| 5/31/19 | 15.05 | 0.39 | 0.11 | 0.50 | (0.35 | ) | (0.09 | ) | (0.44 | ) | 15.11 | 3.52 | 113 | 0.27 | f | 0.13 | f | 2.57 | 19 | |||||||||||||||||||||||||||||||||||||||
| 5/31/18 | 14.59 | 0.31 | 0.47 | 0.78 | (0.29 | ) | (0.03 | ) | (0.32 | ) | 15.05 | 5.28 | 177 | 0.17 | e | 0.02 | e | 2.06 | 16 | |||||||||||||||||||||||||||||||||||||||
| Premier Class: | 5/31/22 | 18.06 | 0.37 | (1.42 | ) | (1.05 | ) | (0.35 | ) | (0.48 | ) | (0.83 | ) | 16.18 | (6.19 | ) | 21,048 | 0.38 | g | 0.25 | g | 2.07 | 23 | |||||||||||||||||||||||||||||||||||
| 5/31/21 | 15.92 | 0.27 | 2.26 | 2.53 | (0.28 | ) | (0.11 | ) | (0.39 | ) | 18.06 | 15.99 | 43,665 | 0.38 | g | 0.25 | g | 1.56 | 28 | |||||||||||||||||||||||||||||||||||||||
| 5/31/20 | 15.06 | 0.35 | 0.86 | 1.21 | (0.33 | ) | (0.02 | ) | (0.35 | ) | 15.92 | 8.06 | 31,580 | 0.40 | g | 0.25 | g | 2.20 | 22 | |||||||||||||||||||||||||||||||||||||||
| 5/31/19 | 15.00 | 0.35 | 0.13 | 0.48 | (0.33 | ) | (0.09 | ) | (0.42 | ) | 15.06 | 3.42 | 32,634 | 0.36 | f | 0.21 | f | 2.35 | 19 | |||||||||||||||||||||||||||||||||||||||
| 5/31/18 | 14.54 | 0.30 | 0.47 | 0.77 | (0.28 | ) | (0.03 | ) | (0.31 | ) | 15.00 | 5.18 | 47,385 | 0.30 | e | 0.15 | e | 2.03 | 16 | |||||||||||||||||||||||||||||||||||||||
| Retirement Class: | 5/31/22 | 17.96 | 0.33 | (1.39 | ) | (1.06 | ) | (0.34 | ) | (0.48 | ) | (0.82 | ) | 16.08 | (6.32 | ) | 68,666 | 0.47 | g | 0.35 | g | 1.88 | 23 | |||||||||||||||||||||||||||||||||||
| 5/31/21 | 15.83 | 0.25 | 2.26 | 2.51 | (0.27 | ) | (0.11 | ) | (0.38 | ) | 17.96 | 15.91 | 81,534 | 0.48 | g | 0.35 | g | 1.46 | 28 | |||||||||||||||||||||||||||||||||||||||
| 5/31/20 | 14.98 | 0.32 | 0.87 | 1.19 | (0.32 | ) | (0.02 | ) | (0.34 | ) | 15.83 | 7.93 | 74,599 | 0.50 | g | 0.35 | g | 2.08 | 22 | |||||||||||||||||||||||||||||||||||||||
| 5/31/19 | 14.92 | 0.32 | 0.14 | 0.46 | (0.31 | ) | (0.09 | ) | (0.40 | ) | 14.98 | 3.32 | 70,013 | 0.47 | e,f | 0.32 | e,f | 2.16 | 19 | |||||||||||||||||||||||||||||||||||||||
| 5/31/18 | 14.47 | 0.28 | 0.46 | 0.74 | (0.26 | ) | (0.03 | ) | (0.29 | ) | 14.92 | 5.02 | 77,207 | 0.40 | e | 0.25 | e | 1.88 | 16 | |||||||||||||||||||||||||||||||||||||||
| 78 | 2022 Annual Report ■ TIAA-CREF Lifecycle Index Funds | See notes to financial statements | See notes to financial statements | TIAA-CREF Lifecycle Index Funds ■ 2022 Annual Report | 79 |
| Financial highlights | continued |
TIAA-CREF Funds
| Selected per share data | Ratios and supplemental data | |||||||||||||||||||||||||||||||||||||||||||||||||||||||||
| Gain (loss) from investment operations | ||||||||||||||||||||||||||||||||||||||||||||||||||||||||||
| Net realized | Ratios to average net assets | |||||||||||||||||||||||||||||||||||||||||||||||||||||||||
| For the | Net asset | Net | and unrealized | Total gain | Less distributions from | Total | Net asset | Net assets | Net | |||||||||||||||||||||||||||||||||||||||||||||||||
| period or year ended | value, beginning of period | investment income (loss | )a | gain (loss on total investments | ) j | (loss) from investment operations | Net investment income | Net realized gains | dividends and distributions | value, end of period | Total return | at end of period (in thousands | ) | Gross expenses | Net expenses | investment income (loss | ) | Portfolio turnover rate | ||||||||||||||||||||||||||||||||||||||||
| LIFECYCLE INDEX 2015 FUND | ||||||||||||||||||||||||||||||||||||||||||||||||||||||||||
| Institutional Class: | 5/31/22 | $19.15 | $0.39 | $(1.52 | ) | $(1.13 | ) | $(0.40 | ) | $(0.57 | ) | $(0.97 | ) | $17.05 | (6.32 | )% | $ 966,867 | 0.21 | %g | 0.10 | %g | 2.08 | % | 19 | % | |||||||||||||||||||||||||||||||||
| 5/31/21 | 16.65 | 0.31 | 2.69 | 3.00 | (0.34 | ) | (0.16 | ) | (0.50 | ) | 19.15 | 18.16 | 962,220 | 0.21 | g | 0.10 | g | 1.71 | 26 | |||||||||||||||||||||||||||||||||||||||
| 5/31/20 | 15.76 | 0.38 | 0.92 | 1.30 | (0.38 | ) | (0.03 | ) | (0.41 | ) | 16.65 | 8.24 | 819,474 | 0.23 | g | 0.10 | g | 2.33 | 25 | |||||||||||||||||||||||||||||||||||||||
| 5/31/19 | 15.74 | 0.37 | 0.13 | 0.50 | (0.37 | ) | (0.11 | ) | (0.48 | ) | 15.76 | 3.40 | 654,257 | 0.20 | f | 0.07 | f | 2.38 | 17 | |||||||||||||||||||||||||||||||||||||||
| 5/31/18 | 15.15 | 0.34 | 0.58 | 0.92 | (0.30 | ) | (0.03 | ) | (0.33 | ) | 15.74 | 6.01 | 533,409 | 0.13 | e | 0.00 | e | 2.16 | 11 | |||||||||||||||||||||||||||||||||||||||
| Advisor Class: | 5/31/22 | 19.14 | 0.40 | (1.55 | ) | (1.15 | ) | (0.38 | ) | (0.57 | ) | (0.95 | ) | 17.04 | (6.40 | ) | 1,657 | 0.31 | g | 0.20 | g | 2.13 | 19 | |||||||||||||||||||||||||||||||||||
| 5/31/21 | 16.65 | 0.23 | 2.75 | 2.98 | (0.33 | ) | (0.16 | ) | (0.49 | ) | 19.14 | 18.05 | 1,396 | 0.31 | g | 0.20 | g | 1.28 | 26 | |||||||||||||||||||||||||||||||||||||||
| 5/31/20 | 15.76 | 0.39 | 0.90 | 1.29 | (0.37 | ) | (0.03 | ) | (0.40 | ) | 16.65 | 8.19 | 592 | 0.30 | g | 0.18 | g | 2.38 | 25 | |||||||||||||||||||||||||||||||||||||||
| 5/31/19 | 15.74 | 0.37 | 0.12 | 0.49 | (0.36 | ) | (0.11 | ) | (0.47 | ) | 15.76 | 3.31 | 164 | 0.24 | f | 0.11 | f | 2.38 | 17 | |||||||||||||||||||||||||||||||||||||||
| 5/31/18 | 15.16 | 0.33 | 0.58 | 0.91 | (0.30 | ) | (0.03 | ) | (0.33 | ) | 15.74 | 5.99 | 114 | 0.14 | e | 0.01 | e | 2.13 | 11 | |||||||||||||||||||||||||||||||||||||||
| Premier Class: | 5/31/22 | 19.07 | 0.41 | (1.57 | ) | (1.16 | ) | (0.37 | ) | (0.57 | ) | (0.94 | ) | 16.97 | (6.49 | ) | 34,529 | 0.36 | g | 0.25 | g | 2.16 | 19 | |||||||||||||||||||||||||||||||||||
| 5/31/21 | 16.58 | 0.28 | 2.68 | 2.96 | (0.31 | ) | (0.16 | ) | (0.47 | ) | 19.07 | 18.00 | 98,140 | 0.36 | g | 0.25 | g | 1.55 | 26 | |||||||||||||||||||||||||||||||||||||||
| 5/31/20 | 15.69 | 0.36 | 0.91 | 1.27 | (0.35 | ) | (0.03 | ) | (0.38 | ) | 16.58 | 8.12 | 85,350 | 0.37 | g | 0.25 | g | 2.18 | 25 | |||||||||||||||||||||||||||||||||||||||
| 5/31/19 | 15.68 | 0.36 | 0.10 | 0.46 | (0.34 | ) | (0.11 | ) | (0.45 | ) | 15.69 | 3.19 | 94,174 | 0.34 | f | 0.21 | f | 2.31 | 17 | |||||||||||||||||||||||||||||||||||||||
| 5/31/18 | 15.10 | 0.32 | 0.57 | 0.89 | (0.28 | ) | (0.03 | ) | (0.31 | ) | 15.68 | 5.83 | 101,715 | 0.28 | e | 0.15 | e | 2.05 | 11 | |||||||||||||||||||||||||||||||||||||||
| Retirement Class: | 5/31/22 | 19.00 | 0.34 | (1.50 | ) | (1.16 | ) | (0.35 | ) | (0.57 | ) | (0.92 | ) | 16.92 | (6.51 | ) | 100,537 | 0.46 | g | 0.35 | g | 1.83 | 19 | |||||||||||||||||||||||||||||||||||
| 5/31/21 | 16.52 | 0.26 | 2.67 | 2.93 | (0.29 | ) | (0.16 | ) | (0.45 | ) | 19.00 | 17.88 | 126,902 | 0.46 | g | 0.35 | g | 1.44 | 26 | |||||||||||||||||||||||||||||||||||||||
| 5/31/20 | 15.64 | 0.33 | 0.91 | 1.24 | (0.33 | ) | (0.03 | ) | (0.36 | ) | 16.52 | 7.96 | 122,731 | 0.47 | g | 0.35 | g | 2.05 | 25 | |||||||||||||||||||||||||||||||||||||||
| 5/31/19 | 15.62 | 0.33 | 0.13 | 0.46 | (0.33 | ) | (0.11 | ) | (0.44 | ) | 15.64 | 3.09 | 130,910 | 0.45 | f | 0.32 | f | 2.14 | 17 | |||||||||||||||||||||||||||||||||||||||
| 5/31/18 | 15.05 | 0.29 | 0.58 | 0.87 | (0.27 | ) | (0.03 | ) | (0.30 | ) | 15.62 | 5.73 | 133,557 | 0.38 | e | 0.25 | e | 1.87 | 11 | |||||||||||||||||||||||||||||||||||||||
| LIFECYCLE INDEX 2020 FUND | ||||||||||||||||||||||||||||||||||||||||||||||||||||||||||
| Institutional Class: | 5/31/22 | 20.70 | 0.41 | (1.66 | ) | (1.25 | ) | (0.43 | ) | (0.63 | ) | (1.06 | ) | 18.39 | (6.51 | ) | 2,756,707 | 0.19 | g | 0.10 | g | 2.01 | 19 | |||||||||||||||||||||||||||||||||||
| 5/31/21 | 17.63 | 0.33 | 3.20 | 3.53 | (0.36 | ) | (0.10 | ) | (0.46 | ) | 20.70 | 20.14 | 2,729,084 | 0.20 | g | 0.10 | g | 1.72 | 21 | |||||||||||||||||||||||||||||||||||||||
| 5/31/20 | 16.65 | 0.40 | 0.99 | 1.39 | (0.39 | ) | (0.02 | ) | (0.41 | ) | 17.63 | 8.36 | 2,221,699 | 0.21 | g | 0.10 | g | 2.32 | 20 | |||||||||||||||||||||||||||||||||||||||
| 5/31/19 | 16.63 | 0.39 | 0.08 | 0.47 | (0.38 | ) | (0.07 | ) | (0.45 | ) | 16.65 | 3.07 | 1,636,541 | 0.19 | f | 0.08 | f | 2.34 | 12 | |||||||||||||||||||||||||||||||||||||||
| 5/31/18 | 15.87 | 0.36 | 0.73 | 1.09 | (0.31 | ) | (0.02 | ) | (0.33 | ) | 16.63 | 6.85 | 1,176,623 | 0.12 | e | 0.01 | e | 2.17 | 8 | |||||||||||||||||||||||||||||||||||||||
| Advisor Class: | 5/31/22 | 20.67 | 0.41 | (1.68 | ) | (1.27 | ) | (0.41 | ) | (0.63 | ) | (1.04 | ) | 18.36 | (6.60 | ) | 10,672 | 0.30 | g | 0.20 | g | 2.03 | 19 | |||||||||||||||||||||||||||||||||||
| 5/31/21 | 17.61 | 0.27 | 3.23 | 3.50 | (0.34 | ) | (0.10 | ) | (0.44 | ) | 20.67 | 20.00 | 11,420 | 0.30 | g | 0.20 | g | 1.37 | 21 | |||||||||||||||||||||||||||||||||||||||
| 5/31/20 | 16.64 | 0.43 | 0.94 | 1.37 | (0.38 | ) | (0.02 | ) | (0.40 | ) | 17.61 | 8.25 | 4,832 | 0.31 | g | 0.21 | g | 2.51 | 20 | |||||||||||||||||||||||||||||||||||||||
| 5/31/19 | 16.62 | 0.38 | 0.08 | 0.46 | (0.37 | ) | (0.07 | ) | (0.44 | ) | 16.64 | 2.95 | 708 | 0.27 | f | 0.16 | f | 2.30 | 12 | |||||||||||||||||||||||||||||||||||||||
| 5/31/18 | 15.86 | 0.36 | 0.72 | 1.08 | (0.30 | ) | (0.02 | ) | (0.32 | ) | 16.62 | 6.85 | 200 | 0.18 | e | 0.07 | e | 2.17 | 8 | |||||||||||||||||||||||||||||||||||||||
| Premier Class: | 5/31/22 | 20.59 | 0.44 | (1.72 | ) | (1.28 | ) | (0.39 | ) | (0.63 | ) | (1.02 | ) | 18.29 | (6.65 | ) | 82,754 | 0.35 | g | 0.25 | g | 2.13 | 19 | |||||||||||||||||||||||||||||||||||
| 5/31/21 | 17.55 | 0.30 | 3.17 | 3.47 | (0.33 | ) | (0.10 | ) | (0.43 | ) | 20.59 | 19.89 | 316,253 | 0.35 | g | 0.25 | g | 1.55 | 21 | |||||||||||||||||||||||||||||||||||||||
| 5/31/20 | 16.57 | 0.38 | 0.99 | 1.37 | (0.37 | ) | (0.02 | ) | (0.39 | ) | 17.55 | 8.25 | 268,403 | 0.36 | g | 0.25 | g | 2.16 | 20 | |||||||||||||||||||||||||||||||||||||||
| 5/31/19 | 16.55 | 0.37 | 0.07 | 0.44 | (0.35 | ) | (0.07 | ) | (0.42 | ) | 16.57 | 2.86 | 257,430 | 0.33 | f | 0.22 | f | 2.24 | 12 | |||||||||||||||||||||||||||||||||||||||
| 5/31/18 | 15.80 | 0.33 | 0.73 | 1.06 | (0.29 | ) | (0.02 | ) | (0.31 | ) | 16.55 | 6.75 | 250,375 | 0.27 | e | 0.16 | e | 2.02 | 8 | |||||||||||||||||||||||||||||||||||||||
| Retirement Class: | 5/31/22 | 20.52 | 0.36 | (1.66 | ) | (1.30 | ) | (0.37 | ) | (0.63 | ) | (1.00 | ) | 18.22 | (6.76 | ) | 247,101 | 0.44 | g | 0.35 | g | 1.78 | 19 | |||||||||||||||||||||||||||||||||||
| 5/31/21 | 17.48 | 0.28 | 3.17 | 3.45 | (0.31 | ) | (0.10 | ) | (0.41 | ) | 20.52 | 19.85 | 310,428 | 0.45 | g | 0.35 | g | 1.46 | 21 | |||||||||||||||||||||||||||||||||||||||
| 5/31/20 | 16.51 | 0.35 | 0.99 | 1.34 | (0.35 | ) | (0.02 | ) | (0.37 | ) | 17.48 | 8.10 | 303,700 | 0.46 | g | 0.35 | g | 2.05 | 20 | |||||||||||||||||||||||||||||||||||||||
| 5/31/19 | 16.49 | 0.34 | 0.09 | 0.43 | (0.34 | ) | (0.07 | ) | (0.41 | ) | 16.51 | 2.76 | 316,512 | 0.43 | f | 0.32 | f | 2.09 | 12 | |||||||||||||||||||||||||||||||||||||||
| 5/31/18 | 15.74 | 0.30 | 0.74 | 1.04 | (0.27 | ) | (0.02 | ) | (0.29 | ) | 16.49 | 6.66 | 318,125 | 0.37 | e | 0.26 | e | 1.86 | 8 | |||||||||||||||||||||||||||||||||||||||
| 80 | 2022 Annual Report ■ TIAA-CREF Lifecycle Index Funds | See notes to financial statements | See notes to financial statements | TIAA-CREF Lifecycle Index Funds ■ 2022 Annual Report | 81 |
| Financial highlights | continued |
TIAA-CREF Funds
| Selected per share data | Ratios and supplemental data | |||||||||||||||||||||||||||||||||||||||||||||||||||||||||
| Gain (loss) from investment operations | ||||||||||||||||||||||||||||||||||||||||||||||||||||||||||
| Net realized | Ratios to average net assets | |||||||||||||||||||||||||||||||||||||||||||||||||||||||||
| For the | Net asset | Net | and unrealized | Total gain | Less distributions from | Total | Net asset | Net assets | Net | |||||||||||||||||||||||||||||||||||||||||||||||||
| period or year ended | value, beginning of period | investment income (loss | )a | gain (loss on total investments | ) j | (loss) from investment operations | Net investment income | Net realized gains | dividends and distributions | value, end of period | Total return | at end of period (in thousands | ) | Gross expenses | Net expenses | investment income (loss | ) | Portfolio turnover rate | ||||||||||||||||||||||||||||||||||||||||
| LIFECYCLE INDEX 2025 FUND | ||||||||||||||||||||||||||||||||||||||||||||||||||||||||||
| Institutional Class: | 5/31/22 | $22.36 | $0.43 | $(1.83 | ) | $(1.40 | ) | $(0.45 | ) | $(0.44 | ) | $(0.89 | ) | $20.07 | (6.65 | )% | $4,582,423 | 0.19 | %g | 0.10 | %g | 1.95 | % | 14 | % | |||||||||||||||||||||||||||||||||
| 5/31/21 | 18.53 | 0.35 | 3.94 | 4.29 | (0.37 | ) | (0.09 | ) | (0.46 | ) | 22.36 | 23.29 | 4,263,286 | 0.19 | g | 0.10 | g | 1.71 | 18 | |||||||||||||||||||||||||||||||||||||||
| 5/31/20 | 17.49 | 0.42 | 1.05 | 1.47 | (0.41 | ) | (0.02 | ) | (0.43 | ) | 18.53 | 8.35 | 3,152,216 | 0.20 | g | 0.11 | g | 2.31 | 17 | |||||||||||||||||||||||||||||||||||||||
| 5/31/19 | 17.51 | 0.40 | 0.02 | 0.42 | (0.39 | ) | (0.05 | ) | (0.44 | ) | 17.49 | 2.58 | 2,108,199 | 0.18 | f | 0.08 | f | 2.28 | 11 | |||||||||||||||||||||||||||||||||||||||
| 5/31/18 | 16.54 | 0.37 | 0.95 | 1.32 | (0.33 | ) | (0.02 | ) | (0.35 | ) | 17.51 | 7.99 | 1,456,072 | 0.12 | e | 0.01 | e | 2.14 | 7 | |||||||||||||||||||||||||||||||||||||||
| Advisor Class: | 5/31/22 | 22.32 | 0.42 | (1.85 | ) | (1.43 | ) | (0.43 | ) | (0.44 | ) | (0.87 | ) | 20.02 | (6.78 | ) | 21,746 | 0.29 | g | 0.21 | g | 1.92 | 14 | |||||||||||||||||||||||||||||||||||
| 5/31/21 | 18.50 | 0.31 | 3.96 | 4.27 | (0.36 | ) | (0.09 | ) | (0.45 | ) | 22.32 | 23.20 | 17,472 | 0.29 | g | 0.20 | g | 1.47 | 18 | |||||||||||||||||||||||||||||||||||||||
| 5/31/20 | 17.47 | 0.42 | 1.03 | 1.45 | (0.40 | ) | (0.02 | ) | (0.42 | ) | 18.50 | 8.23 | 2,837 | 0.30 | g | 0.21 | g | 2.30 | 17 | |||||||||||||||||||||||||||||||||||||||
| 5/31/19 | 17.50 | 0.40 | 0.00 | 0.40 | (0.38 | ) | (0.05 | ) | (0.43 | ) | 17.47 | 2.51 | 1,001 | 0.28 | f | 0.18 | f | 2.28 | 11 | |||||||||||||||||||||||||||||||||||||||
| 5/31/18 | 16.53 | 0.31 | 1.00 | 1.31 | (0.32 | ) | (0.02 | ) | (0.34 | ) | 17.50 | 7.89 | 438 | 0.21 | e | 0.09 | e | 1.82 | 7 | |||||||||||||||||||||||||||||||||||||||
| Premier Class: | 5/31/22 | 22.26 | 0.47 | (1.90 | ) | (1.43 | ) | (0.41 | ) | (0.44 | ) | (0.85 | ) | 19.98 | (6.79 | ) | 123,482 | 0.34 | g | 0.25 | g | 2.06 | 14 | |||||||||||||||||||||||||||||||||||
| 5/31/21 | 18.45 | 0.32 | 3.92 | 4.24 | (0.34 | ) | (0.09 | ) | (0.43 | ) | 22.26 | 23.11 | 466,892 | 0.34 | g | 0.25 | g | 1.55 | 18 | |||||||||||||||||||||||||||||||||||||||
| 5/31/20 | 17.41 | 0.39 | 1.05 | 1.44 | (0.38 | ) | (0.02 | ) | (0.40 | ) | 18.45 | 8.24 | 357,784 | 0.35 | g | 0.26 | g | 2.15 | 17 | |||||||||||||||||||||||||||||||||||||||
| 5/31/19 | 17.44 | 0.38 | 0.01 | 0.39 | (0.37 | ) | (0.05 | ) | (0.42 | ) | 17.41 | 2.44 | 328,028 | 0.33 | f | 0.22 | f | 2.20 | 11 | |||||||||||||||||||||||||||||||||||||||
| 5/31/18 | 16.47 | 0.35 | 0.95 | 1.30 | (0.31 | ) | (0.02 | ) | (0.33 | ) | 17.44 | 7.84 | 299,291 | 0.27 | e | 0.16 | e | 2.01 | 7 | |||||||||||||||||||||||||||||||||||||||
| Retirement Class: | 5/31/22 | 22.15 | 0.37 | (1.82 | ) | (1.45 | ) | (0.39 | ) | (0.44 | ) | (0.83 | ) | 19.87 | (6.91 | ) | 420,997 | 0.44 | g | 0.35 | g | 1.71 | 14 | |||||||||||||||||||||||||||||||||||
| 5/31/21 | 18.36 | 0.30 | 3.90 | 4.20 | (0.32 | ) | (0.09 | ) | (0.41 | ) | 22.15 | 22.99 | 481,282 | 0.44 | g | 0.35 | g | 1.46 | 18 | |||||||||||||||||||||||||||||||||||||||
| 5/31/20 | 17.34 | 0.37 | 1.03 | 1.40 | (0.36 | ) | (0.02 | ) | (0.38 | ) | 18.36 | 8.05 | 424,099 | 0.46 | g | 0.36 | g | 2.05 | 17 | |||||||||||||||||||||||||||||||||||||||
| 5/31/19 | 17.36 | 0.35 | 0.03 | 0.38 | (0.35 | ) | (0.05 | ) | (0.40 | ) | 17.34 | 2.33 | 408,411 | 0.43 | f | 0.32 | f | 2.03 | 11 | |||||||||||||||||||||||||||||||||||||||
| 5/31/18 | 16.40 | 0.31 | �� | 0.96 | 1.27 | (0.29 | ) | (0.02 | ) | (0.31 | ) | 17.36 | 7.76 | 372,112 | 0.37 | e | 0.26 | e | 1.84 | 7 | ||||||||||||||||||||||||||||||||||||||
| LIFECYCLE INDEX 2030 FUND | ||||||||||||||||||||||||||||||||||||||||||||||||||||||||||
| Institutional Class: | 5/31/22 | 24.08 | 0.45 | (2.03 | ) | (1.58 | ) | (0.47 | ) | (0.31 | ) | (0.78 | ) | 21.72 | (6.86 | ) | 5,483,743 | 0.18 | g | 0.10 | g | 1.88 | 13 | |||||||||||||||||||||||||||||||||||
| 5/31/21 | 19.40 | 0.38 | 4.77 | 5.15 | (0.39 | ) | (0.08 | ) | (0.47 | ) | 24.08 | 26.70 | 4,966,053 | 0.19 | g | 0.10 | g | 1.70 | 16 | |||||||||||||||||||||||||||||||||||||||
| 5/31/20 | 18.33 | 0.44 | 1.08 | 1.52 | (0.43 | ) | (0.02 | ) | (0.45 | ) | 19.40 | 8.25 | 3,449,438 | 0.20 | g | 0.10 | g | 2.30 | 15 | |||||||||||||||||||||||||||||||||||||||
| 5/31/19 | 18.42 | 0.41 | (0.04 | ) | 0.37 | (0.41 | ) | (0.05 | ) | (0.46 | ) | 18.33 | 2.13 | 2,291,258 | 0.18 | f | 0.08 | f | 2.24 | 10 | ||||||||||||||||||||||||||||||||||||||
| 5/31/18 | 17.23 | 0.38 | 1.19 | 1.57 | (0.35 | ) | (0.03 | ) | (0.38 | ) | 18.42 | 9.10 | 1,517,858 | 0.12 | e | 0.02 | e | 2.11 | 5 | |||||||||||||||||||||||||||||||||||||||
| Advisor Class: | 5/31/22 | 24.04 | 0.43 | (2.03 | ) | (1.60 | ) | (0.45 | ) | (0.31 | ) | (0.76 | ) | 21.68 | (6.94 | ) | 26,880 | 0.28 | g | 0.20 | g | 1.83 | 13 | |||||||||||||||||||||||||||||||||||
| 5/31/21 | 19.38 | 0.31 | 4.80 | 5.11 | (0.37 | ) | (0.08 | ) | (0.45 | ) | 24.04 | 26.54 | 23,352 | 0.29 | g | 0.20 | g | 1.38 | 16 | |||||||||||||||||||||||||||||||||||||||
| 5/31/20 | 18.31 | 0.42 | 1.09 | 1.51 | (0.42 | ) | (0.02 | ) | (0.44 | ) | 19.38 | 8.20 | 5,671 | 0.30 | g | 0.21 | g | 2.20 | 15 | |||||||||||||||||||||||||||||||||||||||
| 5/31/19 | 18.41 | 0.43 | (0.08 | ) | 0.35 | (0.40 | ) | (0.05 | ) | (0.45 | ) | 18.31 | 2.03 | 1,311 | 0.28 | f | 0.18 | f | 2.36 | 10 | ||||||||||||||||||||||||||||||||||||||
| 5/31/18 | 17.22 | 0.36 | 1.19 | 1.55 | (0.33 | ) | (0.03 | ) | (0.36 | ) | 18.41 | 9.00 | 165 | 0.21 | e | 0.11 | e | 2.00 | 5 | |||||||||||||||||||||||||||||||||||||||
| Premier Class: | 5/31/22 | 23.96 | 0.50 | (2.12 | ) | (1.62 | ) | (0.43 | ) | (0.31 | ) | (0.74 | ) | 21.60 | (7.00 | ) | 150,515 | 0.33 | g | 0.25 | g | 2.04 | 13 | |||||||||||||||||||||||||||||||||||
| 5/31/21 | 19.31 | 0.34 | 4.75 | 5.09 | (0.36 | ) | (0.08 | ) | (0.44 | ) | 23.96 | 26.45 | 475,693 | 0.34 | g | 0.25 | g | 1.54 | 16 | |||||||||||||||||||||||||||||||||||||||
| 5/31/20 | 18.24 | 0.41 | 1.09 | 1.50 | (0.41 | ) | (0.02 | ) | (0.43 | ) | 19.31 | 8.14 | 344,547 | 0.35 | g | 0.25 | g | 2.14 | 15 | |||||||||||||||||||||||||||||||||||||||
| 5/31/19 | 18.34 | 0.40 | (0.07 | ) | 0.33 | (0.38 | ) | (0.05 | ) | (0.43 | ) | 18.24 | 1.98 | 318,862 | 0.32 | f | 0.22 | f | 2.16 | 10 | ||||||||||||||||||||||||||||||||||||||
| 5/31/18 | 17.15 | 0.36 | 1.19 | 1.55 | (0.33 | ) | (0.03 | ) | (0.36 | ) | 18.34 | 8.95 | 307,155 | 0.27 | e | 0.17 | e | 1.97 | 5 | |||||||||||||||||||||||||||||||||||||||
| Retirement Class: | 5/31/22 | 23.85 | 0.39 | (2.01 | ) | (1.62 | ) | (0.41 | ) | (0.31 | ) | (0.72 | ) | 21.51 | (7.07 | ) | 445,022 | 0.43 | g | 0.35 | g | 1.66 | 13 | |||||||||||||||||||||||||||||||||||
| 5/31/21 | 19.22 | 0.32 | 4.72 | 5.04 | (0.33 | ) | (0.08 | ) | (0.41 | ) | 23.85 | 26.40 | 496,871 | 0.44 | g | 0.35 | g | 1.45 | 16 | |||||||||||||||||||||||||||||||||||||||
| 5/31/20 | 18.16 | 0.39 | 1.08 | 1.47 | (0.39 | ) | (0.02 | ) | (0.41 | ) | 19.22 | 8.02 | 419,628 | 0.45 | g | 0.35 | g | 2.04 | 15 | |||||||||||||||||||||||||||||||||||||||
| 5/31/19 | 18.26 | 0.36 | (0.05 | ) | 0.31 | (0.36 | ) | (0.05 | ) | (0.41 | ) | 18.16 | 1.88 | 392,792 | 0.42 | f | 0.32 | f | 2.01 | 10 | ||||||||||||||||||||||||||||||||||||||
| 5/31/18 | 17.08 | 0.33 | 1.19 | 1.52 | (0.31 | ) | (0.03 | ) | (0.34 | ) | 18.26 | 8.82 | 368,806 | 0.37 | e | 0.27 | e | 1.81 | 5 | |||||||||||||||||||||||||||||||||||||||
| 82 | 2022 Annual Report ■ TIAA-CREF Lifecycle Index Funds | See notes to financial statements | See notes to financial statements | TIAA-CREF Lifecycle Index Funds ■ 2022 Annual Report | 83 |
| Financial highlights | continued |
TIAA-CREF Funds
| Selected per share data | Ratios and supplemental data | |||||||||||||||||||||||||||||||||||||||||||||||||||||||||
| Gain (loss) from investment operations | ||||||||||||||||||||||||||||||||||||||||||||||||||||||||||
| Net realized | Ratios to average net assets | |||||||||||||||||||||||||||||||||||||||||||||||||||||||||
| For the | Net asset | Net | and unrealized | Total gain | Less distributions from | Total | Net asset | Net assets | Net | |||||||||||||||||||||||||||||||||||||||||||||||||
| period or year ended | value, beginning of period | investment income (loss | )a | gain (loss on total investments | ) j | (loss) from investment operations | Net investment income | Net realized gains | dividends and distributions | value, end of period | Total return | at end of period (in thousands | ) | Gross expenses | Net expenses | investment income (loss | ) | Portfolio turnover rate | ||||||||||||||||||||||||||||||||||||||||
| LIFECYCLE INDEX 2035 FUND | ||||||||||||||||||||||||||||||||||||||||||||||||||||||||||
| Institutional Class: | 5/31/22 | $25.77 | $0.46 | $(2.18 | ) | $(1.72 | ) | $(0.50 | ) | $(0.27 | ) | $(0.77 | ) | $23.28 | (7.00 | )% | $5,330,114 | 0.18 | %g | 0.10 | %g | 1.81 | % | 12 | % | |||||||||||||||||||||||||||||||||
| 5/31/21 | 20.21 | 0.40 | 5.64 | 6.04 | (0.40 | ) | (0.08 | ) | (0.48 | ) | 25.77 | 30.12 | 4,697,189 | 0.18 | g | 0.10 | g | 1.70 | 15 | |||||||||||||||||||||||||||||||||||||||
| 5/31/20 | 19.12 | 0.46 | 1.11 | 1.57 | (0.46 | ) | (0.02 | ) | (0.48 | ) | 20.21 | 8.12 | 3,151,680 | 0.19 | g | 0.11 | g | 2.30 | 14 | |||||||||||||||||||||||||||||||||||||||
| 5/31/19 | 19.32 | 0.42 | (0.14 | ) | 0.28 | (0.42 | ) | (0.06 | ) | (0.48 | ) | 19.12 | 1.66 | 2,077,146 | 0.17 | f | 0.08 | f | 2.20 | 7 | ||||||||||||||||||||||||||||||||||||||
| 5/31/18 | 17.89 | 0.40 | 1.43 | 1.83 | (0.37 | ) | (0.03 | ) | (0.40 | ) | 19.32 | 10.17 | 1,453,606 | 0.12 | e | 0.02 | e | 2.09 | 5 | |||||||||||||||||||||||||||||||||||||||
| Advisor Class: | 5/31/22 | 25.73 | 0.44 | (2.19 | ) | (1.75 | ) | (0.47 | ) | (0.27 | ) | (0.74 | ) | 23.24 | (7.09 | ) | 18,143 | 0.28 | g | 0.20 | g | 1.72 | 12 | |||||||||||||||||||||||||||||||||||
| 5/31/21 | 20.18 | 0.32 | 5.70 | 6.02 | (0.39 | ) | (0.08 | ) | (0.47 | ) | 25.73 | 30.03 | 15,231 | 0.28 | g | 0.20 | g | 1.37 | 15 | |||||||||||||||||||||||||||||||||||||||
| 5/31/20 | 19.10 | 0.50 | 1.04 | 1.54 | (0.44 | ) | (0.02 | ) | (0.46 | ) | 20.18 | 8.02 | 3,623 | 0.29 | g | 0.20 | g | 2.51 | 14 | |||||||||||||||||||||||||||||||||||||||
| 5/31/19 | 19.31 | 0.40 | (0.13 | ) | 0.27 | (0.42 | ) | (0.06 | ) | (0.48 | ) | 19.10 | 1.52 | 1,036 | 0.27 | f | 0.18 | f | 2.12 | 7 | ||||||||||||||||||||||||||||||||||||||
| 5/31/18 | 17.88 | 0.38 | 1.44 | 1.82 | (0.36 | ) | (0.03 | ) | (0.39 | ) | 19.31 | 10.22 | 133 | 0.14 | e | 0.04 | e | 2.02 | 5 | |||||||||||||||||||||||||||||||||||||||
| Premier Class: | 5/31/22 | 25.63 | 0.51 | (2.27 | ) | (1.76 | ) | (0.46 | ) | (0.27 | ) | (0.73 | ) | 23.14 | (7.18 | ) | 161,087 | 0.33 | g | 0.25 | g | 1.97 | 12 | |||||||||||||||||||||||||||||||||||
| 5/31/21 | 20.11 | 0.36 | 5.61 | 5.97 | (0.37 | ) | (0.08 | ) | (0.45 | ) | 25.63 | 29.90 | 470,422 | 0.33 | g | 0.25 | g | 1.54 | 15 | |||||||||||||||||||||||||||||||||||||||
| 5/31/20 | 19.02 | 0.43 | 1.11 | 1.54 | (0.43 | ) | (0.02 | ) | (0.45 | ) | 20.11 | 8.02 | 331,062 | 0.34 | g | 0.26 | g | 2.15 | 14 | |||||||||||||||||||||||||||||||||||||||
| 5/31/19 | 19.22 | 0.40 | (0.14 | ) | 0.26 | (0.40 | ) | (0.06 | ) | (0.46 | ) | 19.02 | 1.46 | 295,473 | 0.32 | f | 0.23 | f | 2.10 | 7 | ||||||||||||||||||||||||||||||||||||||
| 5/31/18 | 17.81 | 0.37 | 1.41 | 1.78 | (0.34 | ) | (0.03 | ) | (0.37 | ) | 19.22 | 10.03 | 276,476 | 0.27 | e | 0.17 | e | 1.95 | 5 | |||||||||||||||||||||||||||||||||||||||
| Retirement Class: | 5/31/22 | 25.52 | 0.40 | (2.18 | ) | (1.78 | ) | (0.43 | ) | (0.27 | ) | (0.70 | ) | 23.04 | (7.26 | ) | 401,495 | 0.43 | g | 0.35 | g | 1.58 | 12 | |||||||||||||||||||||||||||||||||||
| 5/31/21 | 20.02 | 0.33 | 5.60 | 5.93 | (0.35 | ) | (0.08 | ) | (0.43 | ) | 25.52 | 29.81 | 451,962 | 0.43 | g | 0.35 | g | 1.45 | 15 | |||||||||||||||||||||||||||||||||||||||
| 5/31/20 | 18.94 | 0.41 | 1.10 | 1.51 | (0.41 | ) | (0.02 | ) | (0.43 | ) | 20.02 | 7.89 | 372,294 | 0.44 | g | 0.36 | g | 2.04 | 14 | |||||||||||||||||||||||||||||||||||||||
| 5/31/19 | 19.14 | 0.37 | (0.13 | ) | 0.24 | (0.38 | ) | (0.06 | ) | (0.44 | ) | 18.94 | 1.36 | 353,729 | 0.42 | f | 0.33 | f | 1.94 | 7 | ||||||||||||||||||||||||||||||||||||||
| 5/31/18 | 17.73 | 0.33 | 1.43 | 1.76 | (0.32 | ) | (0.03 | ) | (0.35 | ) | 19.14 | 9.97 | 331,850 | 0.37 | e | 0.27 | e | 1.78 | 5 | |||||||||||||||||||||||||||||||||||||||
| LIFECYCLE INDEX 2040 FUND | ||||||||||||||||||||||||||||||||||||||||||||||||||||||||||
| Institutional Class: | 5/31/22 | 27.19 | 0.48 | (2.30 | ) | (1.82 | ) | (0.53 | ) | (0.29 | ) | (0.82 | ) | 24.55 | (7.00 | ) | 5,515,470 | 0.17 | g | 0.10 | g | 1.78 | 12 | |||||||||||||||||||||||||||||||||||
| 5/31/21 | 20.71 | 0.41 | 6.56 | 6.97 | (0.41 | ) | (0.08 | ) | (0.49 | ) | 27.19 | 33.87 | 4,914,220 | 0.18 | g | 0.10 | g | 1.68 | 14 | |||||||||||||||||||||||||||||||||||||||
| 5/31/20 | 19.65 | 0.47 | 1.08 | 1.55 | (0.47 | ) | (0.02 | ) | (0.49 | ) | 20.71 | 7.81 | 3,297,735 | 0.19 | g | 0.10 | g | 2.28 | 11 | |||||||||||||||||||||||||||||||||||||||
| 5/31/19 | 19.96 | 0.42 | (0.25 | ) | 0.17 | (0.43 | ) | (0.05 | ) | (0.48 | ) | 19.65 | 1.08 | 2,269,054 | 0.17 | f | 0.08 | f | 2.14 | 6 | ||||||||||||||||||||||||||||||||||||||
| 5/31/18 | 18.30 | 0.39 | 1.68 | 2.07 | (0.38 | ) | (0.03 | ) | (0.41 | ) | 19.96 | 11.32 | 1,613,765 | 0.12 | e | 0.03 | e | 2.02 | 3 | |||||||||||||||||||||||||||||||||||||||
| Advisor Class: | 5/31/22 | 27.16 | 0.47 | (2.32 | ) | (1.85 | ) | (0.51 | ) | (0.29 | ) | (0.80 | ) | 24.51 | (7.12 | ) | 21,468 | 0.27 | g | 0.20 | g | 1.75 | 12 | |||||||||||||||||||||||||||||||||||
| 5/31/21 | 20.69 | 0.31 | 6.64 | 6.95 | (0.40 | ) | (0.08 | ) | (0.48 | ) | 27.16 | 33.78 | 16,071 | 0.28 | g | 0.20 | g | 1.25 | 14 | |||||||||||||||||||||||||||||||||||||||
| 5/31/20 | 19.63 | 0.47 | 1.07 | 1.54 | (0.46 | ) | (0.02 | ) | (0.48 | ) | 20.69 | 7.75 | 3,215 | 0.28 | g | 0.19 | g | 2.30 | 11 | |||||||||||||||||||||||||||||||||||||||
| 5/31/19 | 19.94 | 0.40 | (0.24 | ) | 0.16 | (0.42 | ) | (0.05 | ) | (0.47 | ) | 19.63 | 0.96 | 2,047 | 0.25 | f | 0.16 | f | 2.02 | 6 | ||||||||||||||||||||||||||||||||||||||
| 5/31/18 | 18.29 | 0.50 | 1.55 | 2.05 | (0.37 | ) | (0.03 | ) | (0.40 | ) | 19.94 | 11.29 | 547 | 0.23 | e | 0.14 | e | 2.53 | 3 | |||||||||||||||||||||||||||||||||||||||
| Premier Class: | 5/31/22 | 27.04 | 0.54 | (2.40 | ) | (1.86 | ) | (0.49 | ) | (0.29 | ) | (0.78 | ) | 24.40 | (7.18 | ) | 172,180 | 0.32 | g | 0.25 | g | 1.98 | 12 | |||||||||||||||||||||||||||||||||||
| 5/31/21 | 20.60 | 0.36 | 6.54 | 6.90 | (0.38 | ) | (0.08 | ) | (0.46 | ) | 27.04 | 33.69 | 447,061 | 0.33 | g | 0.25 | g | 1.50 | 14 | |||||||||||||||||||||||||||||||||||||||
| 5/31/20 | 19.55 | 0.44 | 1.07 | 1.51 | (0.44 | ) | (0.02 | ) | (0.46 | ) | 20.60 | 7.65 | 291,837 | 0.34 | g | 0.25 | g | 2.12 | 11 | |||||||||||||||||||||||||||||||||||||||
| 5/31/19 | 19.86 | 0.41 | (0.27 | ) | 0.14 | (0.40 | ) | (0.05 | ) | (0.45 | ) | 19.55 | 0.87 | 258,812 | 0.31 | f | 0.23 | f | 2.09 | 6 | ||||||||||||||||||||||||||||||||||||||
| 5/31/18 | 18.21 | 0.37 | 1.67 | 2.04 | (0.36 | ) | (0.03 | ) | (0.39 | ) | 19.86 | 11.24 | 264,272 | 0.27 | e | 0.18 | e | 1.88 | 3 | |||||||||||||||||||||||||||||||||||||||
| Retirement Class: | 5/31/22 | 26.93 | 0.42 | (2.30 | ) | (1.88 | ) | (0.46 | ) | (0.29 | ) | (0.75 | ) | 24.30 | (7.26 | ) | 385,438 | 0.42 | g | 0.35 | g | 1.55 | 12 | |||||||||||||||||||||||||||||||||||
| 5/31/21 | 20.52 | 0.34 | 6.51 | 6.85 | (0.36 | ) | (0.08 | ) | (0.44 | ) | 26.93 | 33.55 | 435,795 | 0.43 | g | 0.35 | g | 1.42 | 14 | |||||||||||||||||||||||||||||||||||||||
| 5/31/20 | 19.47 | 0.42 | 1.07 | 1.49 | (0.42 | ) | (0.02 | ) | (0.44 | ) | 20.52 | 7.58 | 348,208 | 0.44 | g | 0.35 | g | 2.02 | 11 | |||||||||||||||||||||||||||||||||||||||
| 5/31/19 | 19.78 | 0.37 | (0.25 | ) | 0.12 | (0.38 | ) | (0.05 | ) | (0.43 | ) | 19.47 | 0.77 | 336,720 | 0.42 | f | 0.33 | f | 1.89 | 6 | ||||||||||||||||||||||||||||||||||||||
| 5/31/18 | 18.15 | 0.33 | 1.67 | 2.00 | (0.34 | ) | (0.03 | ) | (0.37 | ) | 19.78 | 11.05 | 310,574 | 0.37 | e | 0.28 | e | 1.70 | 3 | |||||||||||||||||||||||||||||||||||||||
| 84 | 2022 Annual Report ■ TIAA-CREF Lifecycle Index Funds | See notes to financial statements | See notes to financial statements | TIAA-CREF Lifecycle Index Funds ■ 2022 Annual Report | 85 |
| Financial highlights | continued |
TIAA-CREF Funds
| Selected per share data | Ratios and supplemental data | |||||||||||||||||||||||||||||||||||||||||||||||||||||||||
| Gain (loss) from investment operations | ||||||||||||||||||||||||||||||||||||||||||||||||||||||||||
| Net realized | Ratios to average net assets | |||||||||||||||||||||||||||||||||||||||||||||||||||||||||
| For the | Net asset | Net | and unrealized | Total gain | Less distributions from | Total | Net asset | Net assets | Net | |||||||||||||||||||||||||||||||||||||||||||||||||
| period or year ended | value, beginning of period | investment income (loss | )a | gain (loss on total investments | ) j | (loss) from investment operations | Net investment income | Net realized gains | dividends and distributions | value, end of period | Total return | at end of period (in thousands | ) | Gross expenses | Net expenses | investment income (loss | ) | Portfolio turnover rate | ||||||||||||||||||||||||||||||||||||||||
| LIFECYCLE INDEX 2045 FUND | ||||||||||||||||||||||||||||||||||||||||||||||||||||||||||
| Institutional Class: | 5/31/22 | $27.98 | $0.49 | $(2.35 | ) | $(1.86 | ) | $(0.55 | ) | $(0.18 | ) | $(0.73 | ) | $25.39 | (6.92 | )% | $4,224,772 | 0.17 | %g | 0.10 | %g | 1.75 | % | 11 | % | |||||||||||||||||||||||||||||||||
| 5/31/21 | 20.68 | 0.41 | 7.34 | 7.75 | (0.41 | ) | (0.04 | ) | (0.45 | ) | 27.98 | 37.71 | 3,640,347 | 0.17 | g | 0.10 | g | 1.65 | 11 | |||||||||||||||||||||||||||||||||||||||
| 5/31/20 | 19.69 | 0.47 | 1.02 | 1.49 | (0.48 | ) | (0.02 | ) | (0.50 | ) | 20.68 | 7.43 | 2,269,913 | 0.19 | g | 0.10 | g | 2.27 | 6 | |||||||||||||||||||||||||||||||||||||||
| 5/31/19 | 20.09 | 0.42 | (0.34 | ) | 0.08 | (0.43 | ) | (0.05 | ) | (0.48 | ) | 19.69 | 0.58 | 1,451,216 | 0.17 | f | 0.08 | f | 2.10 | 4 | ||||||||||||||||||||||||||||||||||||||
| 5/31/18 | 18.32 | 0.40 | 1.78 | 2.18 | (0.38 | ) | (0.03 | ) | (0.41 | ) | 20.09 | 11.97 | 982,189 | 0.13 | e | 0.03 | e | 2.02 | 3 | |||||||||||||||||||||||||||||||||||||||
| Advisor Class: | 5/31/22 | 27.93 | 0.49 | (2.38 | ) | (1.89 | ) | (0.53 | ) | (0.18 | ) | (0.71 | ) | 25.33 | (7.04 | ) | 18,259 | 0.27 | g | 0.20 | g | 1.77 | 11 | |||||||||||||||||||||||||||||||||||
| 5/31/21 | 20.65 | 0.32 | 7.39 | 7.71 | (0.39 | ) | (0.04 | ) | (0.43 | ) | 27.93 | 37.58 | 12,840 | 0.28 | g | 0.20 | g | 1.29 | 11 | |||||||||||||||||||||||||||||||||||||||
| 5/31/20 | 19.66 | 0.48 | 0.99 | 1.47 | (0.46 | ) | (0.02 | ) | (0.48 | ) | 20.65 | 7.37 | 2,504 | 0.29 | g | 0.21 | g | 2.31 | 6 | |||||||||||||||||||||||||||||||||||||||
| 5/31/19 | 20.08 | 0.42 | (0.37 | ) | 0.05 | (0.42 | ) | (0.05 | ) | (0.47 | ) | 19.66 | 0.41 | 1,162 | 0.27 | f | 0.18 | f | 2.10 | 4 | ||||||||||||||||||||||||||||||||||||||
| 5/31/18 | 18.32 | 0.37 | 1.79 | 2.16 | (0.37 | ) | (0.03 | ) | (0.40 | ) | 20.08 | 11.85 | 422 | 0.25 | e | 0.15 | e | 1.88 | 3 | |||||||||||||||||||||||||||||||||||||||
| Premier Class: | 5/31/22 | 27.83 | 0.62 | (2.51 | ) | (1.89 | ) | (0.51 | ) | (0.18 | ) | (0.69 | ) | 25.25 | (7.06 | ) | 90,924 | 0.32 | g | 0.25 | g | 2.17 | 11 | |||||||||||||||||||||||||||||||||||
| 5/31/21 | 20.58 | 0.36 | 7.31 | 7.67 | (0.38 | ) | (0.04 | ) | (0.42 | ) | 27.83 | 37.48 | 352,496 | 0.32 | g | 0.25 | g | 1.47 | 11 | |||||||||||||||||||||||||||||||||||||||
| 5/31/20 | 19.60 | 0.44 | 1.01 | 1.45 | (0.45 | ) | (0.02 | ) | (0.47 | ) | 20.58 | 7.28 | 225,642 | 0.34 | g | 0.25 | g | 2.12 | 6 | |||||||||||||||||||||||||||||||||||||||
| 5/31/19 | 20.00 | 0.41 | (0.35 | ) | 0.06 | (0.41 | ) | (0.05 | ) | (0.46 | ) | 19.60 | 0.43 | 195,595 | 0.32 | f | 0.22 | f | 2.05 | 4 | ||||||||||||||||||||||||||||||||||||||
| 5/31/18 | 18.24 | 0.36 | 1.79 | 2.15 | (0.36 | ) | (0.03 | ) | (0.39 | ) | 20.00 | 11.83 | 191,402 | 0.28 | e | 0.18 | e | 1.86 | 3 | |||||||||||||||||||||||||||||||||||||||
| Retirement Class: | 5/31/22 | 27.70 | 0.43 | (2.35 | ) | (1.92 | ) | (0.48 | ) | (0.18 | ) | (0.66 | ) | 25.12 | (7.18 | ) | 308,109 | 0.42 | g | 0.35 | g | 1.54 | 11 | |||||||||||||||||||||||||||||||||||
| 5/31/21 | 20.49 | 0.34 | 7.26 | 7.60 | (0.35 | ) | (0.04 | ) | (0.39 | ) | 27.70 | 37.32 | 328,342 | 0.42 | g | 0.35 | g | 1.40 | 11 | |||||||||||||||||||||||||||||||||||||||
| 5/31/20 | 19.51 | 0.42 | 1.01 | 1.43 | (0.43 | ) | (0.02 | ) | (0.45 | ) | 20.49 | 7.21 | 256,314 | 0.44 | g | 0.35 | g | 2.03 | 6 | |||||||||||||||||||||||||||||||||||||||
| 5/31/19 | 19.91 | 0.36 | (0.32 | ) | 0.04 | (0.39 | ) | (0.05 | ) | (0.44 | ) | 19.51 | 0.32 | 236,400 | 0.42 | f | 0.32 | f | 1.83 | 4 | ||||||||||||||||||||||||||||||||||||||
| 5/31/18 | 18.16 | 0.32 | 1.80 | 2.12 | (0.34 | ) | (0.03 | ) | (0.37 | ) | 19.91 | 11.71 | 219,919 | 0.38 | e | 0.28 | e | 1.66 | 3 | |||||||||||||||||||||||||||||||||||||||
| LIFECYCLE INDEX 2050 FUND | ||||||||||||||||||||||||||||||||||||||||||||||||||||||||||
| Institutional Class: | 5/31/22 | 28.25 | 0.49 | (2.37 | ) | (1.88 | ) | (0.56 | ) | (0.12 | ) | (0.68 | ) | 25.69 | (6.92 | ) | 3,473,689 | 0.17 | g | 0.10 | g | 1.75 | 11 | |||||||||||||||||||||||||||||||||||
| 5/31/21 | 20.75 | 0.41 | 7.53 | 7.94 | (0.41 | ) | (0.03 | ) | (0.44 | ) | 28.25 | 38.50 | 2,948,578 | 0.18 | g | 0.10 | g | 1.63 | 9 | |||||||||||||||||||||||||||||||||||||||
| 5/31/20 | 19.75 | 0.47 | 1.03 | 1.50 | (0.48 | ) | (0.02 | ) | (0.50 | ) | 20.75 | 7.46 | 1,786,312 | 0.19 | g | 0.10 | g | 2.26 | 5 | |||||||||||||||||||||||||||||||||||||||
| 5/31/19 | 20.17 | 0.42 | (0.35 | ) | 0.07 | (0.44 | ) | (0.05 | ) | (0.49 | ) | 19.75 | 0.47 | 1,066,667 | 0.18 | f | 0.08 | f | 2.08 | 5 | ||||||||||||||||||||||||||||||||||||||
| 5/31/18 | 18.36 | 0.39 | 1.84 | 2.23 | (0.39 | ) | (0.03 | ) | (0.42 | ) | 20.17 | 12.16 | 667,846 | 0.13 | e | 0.03 | e | 2.01 | 3 | |||||||||||||||||||||||||||||||||||||||
| Advisor Class: | 5/31/22 | 28.21 | 0.49 | (2.40 | ) | (1.91 | ) | (0.54 | ) | (0.12 | ) | (0.66 | ) | 25.64 | (7.04 | ) | 14,242 | 0.27 | g | 0.20 | g | 1.75 | 11 | |||||||||||||||||||||||||||||||||||
| 5/31/21 | 20.72 | 0.33 | 7.58 | 7.91 | (0.39 | ) | (0.03 | ) | (0.42 | ) | 28.21 | 38.42 | 10,851 | 0.27 | g | 0.20 | g | 1.30 | 9 | |||||||||||||||||||||||||||||||||||||||
| 5/31/20 | 19.73 | 0.50 | 0.97 | 1.47 | (0.46 | ) | (0.02 | ) | (0.48 | ) | 20.72 | 7.35 | 2,546 | 0.28 | g | 0.20 | g | 2.41 | 5 | |||||||||||||||||||||||||||||||||||||||
| 5/31/19 | 20.16 | 0.41 | (0.36 | ) | 0.05 | (0.43 | ) | (0.05 | ) | (0.48 | ) | 19.73 | 0.37 | 1,200 | 0.27 | f | 0.17 | f | 2.07 | 5 | ||||||||||||||||||||||||||||||||||||||
| 5/31/18 | 18.35 | 0.37 | 1.84 | 2.21 | (0.37 | ) | (0.03 | ) | (0.40 | ) | 20.16 | 12.08 | 212 | 0.19 | e | 0.09 | e | 1.90 | 3 | |||||||||||||||||||||||||||||||||||||||
| Premier Class: | 5/31/22 | 28.09 | 0.64 | (2.55 | ) | (1.91 | ) | (0.52 | ) | (0.12 | ) | (0.64 | ) | 25.54 | (7.06 | ) | 80,318 | 0.32 | g | 0.25 | g | 2.20 | 11 | |||||||||||||||||||||||||||||||||||
| 5/31/21 | 20.63 | 0.36 | 7.51 | 7.87 | (0.38 | ) | (0.03 | ) | (0.41 | ) | 28.09 | 38.36 | 295,691 | 0.33 | g | 0.25 | g | 1.47 | 9 | |||||||||||||||||||||||||||||||||||||||
| 5/31/20 | 19.65 | 0.44 | 1.01 | 1.45 | (0.45 | ) | (0.02 | ) | (0.47 | ) | 20.63 | 7.26 | 188,481 | 0.34 | g | 0.25 | g | 2.11 | 5 | |||||||||||||||||||||||||||||||||||||||
| 5/31/19 | 20.07 | 0.41 | (0.37 | ) | 0.04 | (0.41 | ) | (0.05 | ) | (0.46 | ) | 19.65 | 0.32 | 157,105 | 0.32 | f | 0.22 | f | 2.06 | 5 | ||||||||||||||||||||||||||||||||||||||
| 5/31/18 | 18.28 | 0.36 | 1.82 | 2.18 | (0.36 | ) | (0.03 | ) | (0.39 | ) | 20.07 | 11.97 | 148,822 | 0.28 | e | 0.18 | e | 1.83 | 3 | |||||||||||||||||||||||||||||||||||||||
| Retirement Class: | 5/31/22 | 27.95 | 0.42 | (2.35 | ) | (1.93 | ) | (0.49 | ) | (0.12 | ) | (0.61 | ) | 25.41 | (7.15 | ) | 271,085 | 0.42 | g | 0.35 | g | 1.52 | 11 | |||||||||||||||||||||||||||||||||||
| 5/31/21 | 20.54 | 0.34 | 7.45 | 7.79 | (0.35 | ) | (0.03 | ) | (0.38 | ) | 27.95 | 38.15 | 285,738 | 0.43 | g | 0.35 | g | 1.41 | 9 | |||||||||||||||||||||||||||||||||||||||
| 5/31/20 | 19.56 | 0.42 | 1.01 | 1.43 | (0.43 | ) | (0.02 | ) | (0.45 | ) | 20.54 | 7.19 | 218,846 | 0.45 | g | 0.35 | g | 2.04 | 5 | |||||||||||||||||||||||||||||||||||||||
| 5/31/19 | 19.98 | 0.36 | (0.34 | ) | 0.02 | (0.39 | ) | (0.05 | ) | (0.44 | ) | 19.56 | 0.21 | 202,199 | 0.42 | f | 0.32 | f | 1.83 | 5 | ||||||||||||||||||||||||||||||||||||||
| 5/31/18 | 18.20 | 0.33 | 1.82 | 2.15 | (0.34 | ) | (0.03 | ) | (0.37 | ) | 19.98 | 11.86 | 178,268 | 0.38 | e | 0.28 | e | 1.68 | 3 | |||||||||||||||||||||||||||||||||||||||
| 86 | 2022 Annual Report ■ TIAA-CREF Lifecycle Index Funds | See notes to financial statements | See notes to financial statements | TIAA-CREF Lifecycle Index Funds ■ 2022 Annual Report | 87 |
| Financial highlights | continued |
TIAA-CREF Funds
| Selected per share data | Ratios and supplemental data | |||||||||||||||||||||||||||||||||||||||||||||||||||||||||
| Gain (loss) from investment operations | ||||||||||||||||||||||||||||||||||||||||||||||||||||||||||
| Net realized | Ratios to average net assets | |||||||||||||||||||||||||||||||||||||||||||||||||||||||||
| For the | Net asset | Net | and unrealized | Total gain | Less distributions from | Total | Net asset | Net assets | Net | |||||||||||||||||||||||||||||||||||||||||||||||||
| period or year ended | value, beginning of period | investment income (loss | )a | gain (loss on total investments | ) j | (loss) from investment operations | Net investment income | Net realized gains | dividends and distributions | value, end of period | Total return | at end of period (in thousands | ) | Gross expenses | Net expenses | investment income (loss | ) | Portfolio turnover rate | ||||||||||||||||||||||||||||||||||||||||
| LIFECYCLE INDEX 2055 FUND | ||||||||||||||||||||||||||||||||||||||||||||||||||||||||||
| Institutional Class: | 5/31/22 | $22.70 | $0.40 | $(1.92 | ) | $(1.52 | ) | $(0.45 | ) | $(0.03 | ) | $(0.48 | ) | $20.70 | (6.91 | )% | $1,822,272 | 0.18 | %g | 0.10 | %g | 1.75 | % | 11 | % | |||||||||||||||||||||||||||||||||
| 5/31/21 | 16.59 | 0.32 | 6.14 | 6.46 | (0.33 | ) | (0.02 | ) | (0.35 | ) | 22.70 | 39.14 | 1,478,111 | 0.18 | g | 0.10 | g | 1.61 | 6 | |||||||||||||||||||||||||||||||||||||||
| 5/31/20 | 15.80 | 0.37 | 0.82 | 1.19 | (0.38 | ) | (0.02 | ) | (0.40 | ) | 16.59 | 7.37 | 801,496 | 0.20 | g | 0.11 | g | 2.23 | 7 | |||||||||||||||||||||||||||||||||||||||
| 5/31/19 | 16.15 | 0.33 | (0.30 | ) | 0.03 | (0.35 | ) | (0.03 | ) | (0.38 | ) | 15.80 | 0.34 | 439,798 | 0.20 | f | 0.09 | f | 2.04 | 4 | ||||||||||||||||||||||||||||||||||||||
| 5/31/18 | 14.67 | 0.32 | 1.49 | 1.81 | (0.31 | ) | (0.02 | ) | (0.33 | ) | 16.15 | 12.35 | 239,571 | 0.18 | e | 0.03 | e | 2.02 | 5 | |||||||||||||||||||||||||||||||||||||||
| Advisor Class: | 5/31/22 | 22.66 | 0.38 | (1.92 | ) | (1.54 | ) | (0.43 | ) | (0.03 | ) | (0.46 | ) | 20.66 | (7.00 | ) | 12,050 | 0.28 | g | 0.20 | g | 1.71 | 11 | |||||||||||||||||||||||||||||||||||
| 5/31/21 | 16.57 | 0.29 | 6.13 | 6.42 | (0.31 | ) | (0.02 | ) | (0.33 | ) | 22.66 | 38.98 | 8,251 | 0.28 | g | 0.20 | g | 1.46 | 6 | |||||||||||||||||||||||||||||||||||||||
| 5/31/20 | 15.79 | 0.35 | 0.82 | 1.17 | (0.37 | ) | (0.02 | ) | (0.39 | ) | 16.57 | 7.24 | 1,534 | 0.29 | g | 0.20 | g | 2.13 | 7 | |||||||||||||||||||||||||||||||||||||||
| 5/31/19 | 16.14 | 0.33 | (0.31 | ) | 0.02 | (0.34 | ) | (0.03 | ) | (0.37 | ) | 15.79 | 0.30 | 755 | 0.28 | f | 0.17 | f | 2.11 | 4 | ||||||||||||||||||||||||||||||||||||||
| 5/31/18 | 14.67 | 0.31 | 1.49 | 1.80 | (0.31 | ) | (0.02 | ) | (0.33 | ) | 16.14 | 12.27 | 142 | 0.19 | e | 0.05 | e | 1.95 | 5 | |||||||||||||||||||||||||||||||||||||||
| Premier Class: | 5/31/22 | 22.62 | 0.53 | (2.07 | ) | (1.54 | ) | (0.42 | ) | (0.03 | ) | (0.45 | ) | 20.63 | (7.02 | ) | 33,219 | 0.33 | g | 0.25 | g | 2.28 | 11 | |||||||||||||||||||||||||||||||||||
| 5/31/21 | 16.54 | 0.29 | 6.11 | 6.40 | (0.30 | ) | (0.02 | ) | (0.32 | ) | 22.62 | 38.91 | 142,662 | 0.33 | g | 0.25 | g | 1.45 | 6 | |||||||||||||||||||||||||||||||||||||||
| 5/31/20 | 15.76 | 0.35 | 0.81 | 1.16 | (0.36 | ) | (0.02 | ) | (0.38 | ) | 16.54 | 7.19 | 79,521 | 0.35 | g | 0.26 | g | 2.09 | 7 | |||||||||||||||||||||||||||||||||||||||
| 5/31/19 | 16.11 | 0.34 | (0.33 | ) | 0.01 | (0.33 | ) | (0.03 | ) | (0.36 | ) | 15.76 | 0.20 | 57,625 | 0.34 | f | 0.23 | f | 2.10 | 4 | ||||||||||||||||||||||||||||||||||||||
| 5/31/18 | 14.64 | 0.28 | 1.50 | 1.78 | (0.29 | ) | (0.02 | ) | (0.31 | ) | 16.11 | 12.19 | 47,812 | 0.32 | e | 0.18 | e | 1.80 | 5 | |||||||||||||||||||||||||||||||||||||||
| Retirement Class: | 5/31/22 | 22.56 | 0.34 | (1.91 | ) | (1.57 | ) | (0.39 | ) | (0.03 | ) | (0.42 | ) | 20.57 | (7.13 | ) | 149,174 | 0.43 | g | 0.35 | g | 1.52 | 11 | |||||||||||||||||||||||||||||||||||
| 5/31/21 | 16.50 | 0.28 | 6.08 | 6.36 | (0.28 | ) | (0.02 | ) | (0.30 | ) | 22.56 | 38.76 | 149,564 | 0.43 | g | 0.35 | g | 1.44 | 6 | |||||||||||||||||||||||||||||||||||||||
| 5/31/20 | 15.73 | 0.34 | 0.79 | 1.13 | (0.34 | ) | (0.02 | ) | (0.36 | ) | 16.50 | 7.05 | 114,986 | 0.46 | g | 0.36 | g | 2.02 | 7 | |||||||||||||||||||||||||||||||||||||||
| 5/31/19 | 16.07 | 0.29 | (0.29 | ) | 0.00 | d | (0.31 | ) | (0.03 | ) | (0.34 | ) | 15.73 | 0.16 | 98,131 | 0.44 | f | 0.33 | f | 1.84 | 4 | |||||||||||||||||||||||||||||||||||||
| 5/31/18 | 14.61 | 0.26 | 1.50 | 1.76 | (0.28 | ) | (0.02 | ) | (0.30 | ) | 16.07 | 12.03 | 78,137 | 0.42 | e | 0.28 | e | 1.68 | 5 | |||||||||||||||||||||||||||||||||||||||
| LIFECYCLE INDEX 2060 FUND | ||||||||||||||||||||||||||||||||||||||||||||||||||||||||||
| Institutional Class: | 5/31/22 | 17.52 | 0.30 | (1.47 | ) | (1.17 | ) | (0.35 | ) | (0.01 | ) | (0.36 | ) | 15.99 | (6.93 | ) | 828,871 | 0.19 | g | 0.10 | g | 1.75 | 10 | |||||||||||||||||||||||||||||||||||
| 5/31/21 | 12.75 | 0.25 | 4.78 | 5.03 | (0.25 | ) | (0.01 | ) | (0.26 | ) | 17.52 | 39.68 | 600,348 | 0.21 | g | 0.10 | g | 1.59 | 6 | |||||||||||||||||||||||||||||||||||||||
| 5/31/20 | 12.14 | 0.28 | 0.63 | 0.91 | (0.29 | ) | (0.01 | ) | (0.30 | ) | 12.75 | 7.36 | 267,485 | 0.26 | g | 0.11 | g | 2.21 | 16 | |||||||||||||||||||||||||||||||||||||||
| 5/31/19 | 12.44 | 0.26 | (0.24 | ) | 0.02 | (0.27 | ) | (0.05 | ) | (0.32 | ) | 12.14 | 0.25 | 112,059 | 0.32 | f | 0.08 | f | 2.15 | 28 | ||||||||||||||||||||||||||||||||||||||
| 5/31/18 | 11.29 | 0.25 | 1.16 | 1.41 | (0.24 | ) | (0.02 | ) | (0.26 | ) | 12.44 | 12.44 | 58,145 | 0.42 | e | 0.03 | e | 2.04 | 32 | |||||||||||||||||||||||||||||||||||||||
| Advisor Class: | 5/31/22 | 17.51 | 0.29 | (1.48 | ) | (1.19 | ) | (0.33 | ) | (0.01 | ) | (0.34 | ) | 15.98 | (7.01 | ) | 9,092 | 0.29 | g | 0.20 | g | 1.69 | 10 | |||||||||||||||||||||||||||||||||||
| 5/31/21 | 12.75 | 0.20 | 4.81 | 5.01 | (0.24 | ) | (0.01 | ) | (0.25 | ) | 17.51 | 39.51 | 5,527 | 0.30 | g | 0.20 | g | 1.31 | 6 | |||||||||||||||||||||||||||||||||||||||
| 5/31/20 | 12.15 | 0.27 | 0.62 | 0.89 | (0.28 | ) | (0.01 | ) | (0.29 | ) | 12.75 | 7.21 | 1,292 | 0.35 | g | 0.20 | g | 2.11 | 16 | |||||||||||||||||||||||||||||||||||||||
| 5/31/19 | 12.45 | 0.26 | (0.25 | ) | 0.01 | (0.26 | ) | (0.05 | ) | (0.31 | ) | 12.15 | 0.22 | 590 | 0.39 | f | 0.17 | f | 2.16 | 28 | ||||||||||||||||||||||||||||||||||||||
| 5/31/18 | 11.29 | 0.23 | 1.18 | 1.41 | (0.23 | ) | (0.02 | ) | (0.25 | ) | 12.45 | 12.52 | 157 | 0.42 | e | 0.05 | e | 1.92 | 32 | |||||||||||||||||||||||||||||||||||||||
| Premier Class: | 5/31/22 | 17.48 | 0.40 | (1.59 | ) | (1.19 | ) | (0.32 | ) | (0.01 | ) | (0.33 | ) | 15.96 | (7.01 | ) | 15,601 | 0.34 | g | 0.25 | g | 2.23 | 10 | |||||||||||||||||||||||||||||||||||
| 5/31/21 | 12.73 | 0.22 | 4.77 | 4.99 | (0.23 | ) | (0.01 | ) | (0.24 | ) | 17.48 | 39.44 | 40,943 | 0.35 | g | 0.25 | g | 1.42 | 6 | |||||||||||||||||||||||||||||||||||||||
| 5/31/20 | 12.13 | 0.27 | 0.61 | 0.88 | (0.27 | ) | (0.01 | ) | (0.28 | ) | 12.73 | 7.17 | 17,927 | 0.41 | g | 0.26 | g | 2.09 | 16 | |||||||||||||||||||||||||||||||||||||||
| 5/31/19 | 12.43 | 0.24 | (0.24 | ) | 0.00 | d | (0.25 | ) | (0.05 | ) | (0.30 | ) | 12.13 | 0.12 | 8,644 | 0.46 | f | 0.23 | f | 1.95 | 28 | |||||||||||||||||||||||||||||||||||||
| 5/31/18 | 11.28 | 0.18 | 1.21 | 1.39 | (0.22 | ) | (0.02 | ) | (0.24 | ) | 12.43 | 12.34 | 5,040 | 0.55 | e | 0.18 | e | 1.51 | 32 | |||||||||||||||||||||||||||||||||||||||
| Retirement Class: | 5/31/22 | 17.44 | 0.26 | (1.46 | ) | (1.20 | ) | (0.31 | ) | (0.01 | ) | (0.32 | ) | 15.92 | (7.11 | ) | 67,009 | 0.44 | g | 0.35 | g | 1.50 | 10 | |||||||||||||||||||||||||||||||||||
| 5/31/21 | 12.70 | 0.22 | 4.75 | 4.97 | (0.22 | ) | (0.01 | ) | (0.23 | ) | 17.44 | 39.33 | 55,903 | 0.45 | g | 0.35 | g | 1.43 | 6 | |||||||||||||||||||||||||||||||||||||||
| 5/31/20 | 12.11 | 0.26 | 0.60 | 0.86 | (0.26 | ) | (0.01 | ) | (0.27 | ) | 12.70 | 7.01 | 37,293 | 0.51 | g | 0.36 | g | 2.00 | 16 | |||||||||||||||||||||||||||||||||||||||
| 5/31/19 | 12.41 | 0.23 | (0.24 | ) | (0.01 | ) | (0.24 | ) | (0.05 | ) | (0.29 | ) | 12.11 | 0.05 | 25,636 | 0.56 | f | 0.33 | f | 1.89 | 28 | |||||||||||||||||||||||||||||||||||||
| 5/31/18 | 11.26 | 0.19 | 1.19 | 1.38 | (0.21 | ) | (0.02 | ) | (0.23 | ) | 12.41 | 12.29 | 15,437 | 0.65 | e | 0.28 | e | 1.59 | 32 | |||||||||||||||||||||||||||||||||||||||
| 88 | 2022 Annual Report ■ TIAA-CREF Lifecycle Index Funds | See notes to financial statements | See notes to financial statements | TIAA-CREF Lifecycle Index Funds ■ 2022 Annual Report | 89 |
| Financial highlights | concluded |
TIAA-CREF Funds
| Selected per share data | Ratios and supplemental data | |||||||||||||||||||||||||||||||||||||||||||||||||||||||||
| Gain (loss) from investment operations | ||||||||||||||||||||||||||||||||||||||||||||||||||||||||||
| Net realized | Ratios to average net assets | |||||||||||||||||||||||||||||||||||||||||||||||||||||||||
| For the | Net asset | Net | and unrealized | Total gain | Less distributions from | Total | Net asset | Net assets | Net | |||||||||||||||||||||||||||||||||||||||||||||||||
| period or year ended | value, beginning of period | investment income (loss | )a | gain (loss on total investments | ) j | (loss) from investment operations | Net investment income | Net realized gains | dividends and distributions | value, end of period | Total return | at end of period (in thousands | ) | Gross expenses | Net expenses | investment income (loss | ) | Portfolio turnover rate | ||||||||||||||||||||||||||||||||||||||||
| LIFECYCLE INDEX 2065 FUND | ||||||||||||||||||||||||||||||||||||||||||||||||||||||||||
| Institutional Class: | 5/31/22 | $12.45 | $0.21 | $(1.02 | ) | $(0.81 | ) | $(0.23 | ) | $(0.01 | ) | $(0.24 | ) | $11.40 | (6.70 | )% | $44,526 | 0.82 | %g | 0.11 | %g | 1.76 | % | 108 | % | |||||||||||||||||||||||||||||||||
| 5/31/21 | § | 10.00 | 0.15 | 2.48 | 2.63 | (0.18 | ) | — | (0.18 | ) | 12.45 | 26.45 | b | 7,131 | 3.91 | c,g | 0.10 | c,g | 2.02 | c | 36 | b | ||||||||||||||||||||||||||||||||||||
| Advisor Class: | 5/31/22 | 12.46 | 0.22 | (1.04 | ) | (0.82 | ) | (0.36 | ) | (0.01 | ) | (0.37 | ) | 11.27 | (6.83 | ) | 716 | 0.83 | g | 0.13 | g | 1.81 | 108 | |||||||||||||||||||||||||||||||||||
| 5/31/21 | § | 10.00 | 0.16 | 2.48 | 2.64 | (0.18 | ) | — | (0.18 | ) | 12.46 | 26.48 | b | 626 | 4.26 | c,g | 0.25 | c,g | 2.16 | c | 36 | b | ||||||||||||||||||||||||||||||||||||
| Premier Class: | 5/31/22 | 12.46 | 0.18 | (1.01 | ) | (0.83 | ) | (0.36 | ) | (0.01 | ) | (0.37 | ) | 11.26 | (6.90 | ) | 808 | 0.97 | g | 0.25 | g | 1.49 | 108 | |||||||||||||||||||||||||||||||||||
| 5/31/21 | § | 10.00 | 0.16 | 2.48 | 2.64 | (0.18 | ) | — | (0.18 | ) | 12.46 | 26.48 | b | 637 | 4.41 | c,g | 0.25 | c,g | 2.14 | c | 36 | b | ||||||||||||||||||||||||||||||||||||
| Retirement Class: | 5/31/22 | 12.44 | 0.17 | (1.04 | ) | (0.87 | ) | (0.29 | ) | (0.01 | ) | (0.30 | ) | 11.27 | (7.26 | ) | 1,740 | 1.08 | g | 0.36 | g | 1.42 | 108 | |||||||||||||||||||||||||||||||||||
| 5/31/21 | § | 10.00 | 0.15 | 2.46 | 2.61 | (0.17 | ) | — | (0.17 | ) | 12.44 | 26.35 | b | 693 | 4.54 | c,g | 0.35 | c,g | 2.00 | c | 36 | b | ||||||||||||||||||||||||||||||||||||
| § | The Fund commenced operations on September 30, 2020. |
| a | Based on average shares outstanding. |
| b | The percentages shown for this period are not annualized. |
| c | The percentages shown for this period are annualized. |
| d | Amount represents less than $0.01 per share. |
| e | The Fund’s expenses do not include the expenses of the Underlying Funds. |
| f | From June 1, 2018 through September 30, 2018, the Fund’s expenses do not include the expenses of the Underlying Funds. Beginning October 1, 2018, the Lifecycle Index Fund’s expenses include the expenses of the Underlying Funds. |
| g | The Fund’s expenses include the expenses of the Underlying Funds. |
| j | Short-term and long-term capital gain distributions received from the underlying Funds are presented in net realized and unrealized gain (loss) on total investments for all periods presented. |
| 90 | 2022 Annual Report ■ TIAA-CREF Lifecycle Index Funds | See notes to financial statements | See notes to financial statements | TIAA-CREF Lifecycle Index Funds ■ 2022 Annual Report | 91 |
TIAA-CREF Lifecycle Index Funds
Note 1—organization
The Lifecycle Index Funds (collectively the “Funds,” each individually referred to as a “Fund”) are a sub-family of mutual funds offered by the TIAA-CREF Funds (the “Trust”), a Delaware statutory trust, that is registered with the U.S. Securities and Exchange Commission (“SEC”) under the Investment Company Act of 1940, as amended (“1940 Act”), as an open-end management investment company.
Teachers Advisors, LLC (“Advisors”), a wholly owned indirect subsidiary of Teachers Insurance and Annuity Association of America (“TIAA”), is registered with the SEC as an investment adviser and provides investment management services for the Funds.
The Funds offer their shares, without a sales load, through their principal underwriter, Nuveen Securities, LLC (“Nuveen Securities”), which is a wholly owned indirect subsidiary of TIAA.
Each Fund is a “fund of funds” that diversifies its assets by investing in Class W shares of other funds of the Trust and potentially other investment pools or investment products. The Funds offer Institutional Class, Advisor Class, Premier Class and Retirement Class shares. Each class differs by the allocation of class-specific expenses and voting rights in matters affecting a single class.
Note 2—significant accounting policies
The accompanying financial statements were prepared in accordance with accounting principles generally accepted in the United States of America (“U.S. GAAP”), which may require the use of estimates made by management and the evaluation of subsequent events. Actual results may differ from those estimates. The Funds are investment companies and follow the accounting guidance in the Financial Accounting Standards Board (“FASB”) Accounting Standards Codification 946, Financial Services—Investment Companies. The net asset value (“NAV”) for financial reporting purposes may differ from the NAV for processing transactions. The NAV for financial reporting purposes includes security and shareholder transactions through the date of the report. Total return is computed based on the NAV used for processing transactions. The following is a summary of the significant accounting policies consistently followed by the Funds.
Investments and investment income: Securities transactions are accounted for as of the trade date for financial reporting purposes. Interest income is recorded on an accrual basis and includes accretion of discounts and amortization of premiums. Dividend income is recorded on the ex-dividend date. Realized gains and losses on securities transactions are based upon the specific identification method. Distributions received on securities that represent a return of capital or capital gains are recorded as a reduction of cost of investments and/or as a realized gain. The Funds estimate the components of distributions received that may be considered return of capital distributions or capital gain distributions.
| 92 | 2022 Annual Report ■ TIAA-CREF Lifecycle Index Funds |
Multiclass operations and allocations: Income, expenses, realized gains and losses and unrealized appreciation and depreciation of a Fund are allocated on a pro rata basis to each class of shares, except for service agreement fees, distribution fees and transfer agency fees and expenses, which are unique to each class of shares. Most expenses of the Trust can be directly attributed to a fund. Expenses that cannot be directly attributed are allocated to each fund in the Trust based upon the average net assets of each fund.
Distributions to shareholders: Distributions to shareholders are recorded on the ex-dividend date. The amount, character and timing of distributions are determined in accordance with federal income tax regulations, which may differ from U.S. GAAP.
Trustee compensation: The Funds pay the members of the Board of Trustees (“Board”), all of whom are independent, certain remuneration for their services, plus travel and other expenses. Trustees may elect to participate in a deferred compensation plan and defer all or a portion of their compensation. In addition, trustees participate in a long-term compensation plan. Amounts deferred are retained by the Funds until paid. Amounts payable to the trustees for compensation are included separately in the accompanying Statements of assets and liabilities. Trustees’ fees, including any deferred and long-term compensation incurred, are reflected in the Statements of operations.
Indemnification: Under the Trust’s organizational documents, its officers and directors are indemnified against certain liabilities arising out of the performance of their duties to the Trust. In addition, in the normal course of business, the Trust enters into contracts that provide general indemnifications to other parties. The Trust’s maximum exposure under these arrangements is unknown as this would involve future claims that may be made against the Trust that have not yet occurred. However, the Trust has not had prior claims or losses pursuant to these contracts and expects the risk of loss to be remote.
Other matters: The outbreak of the novel coronavirus (“COVID-19”) and subsequent global pandemic began significantly impacting the U.S. and global financial markets and economies during the calendar quarter ended March 31, 2020. The worldwide spread of COVID-19 has created significant uncertainty in the global economy. The duration and extent of COVID-19 over the long term cannot be reasonably estimated at this time. The ultimate impact of COVID-19 and the extent to which COVID-19 impacts the Funds’ normal course of business, results of operations, investments, and cash flows will depend on future developments, which are highly uncertain and difficult to predict. Management continues to monitor and evaluate this situation.
New rule issuance: In December 2020, the SEC voted to adopt a new rule providing a framework for fund valuation practices. New Rule 2a-5 (“Rule 2a-5”) under the 1940 Act establishes requirements for determining fair value in good faith for purposes of the 1940 Act. Rule 2a-5 will permit boards, subject to board oversight and certain other conditions, to designate certain parties to perform fair value determinations. Rule 2a-5 also defines when market quotations are “readily available” for purposes
| TIAA-CREF Lifecycle Index Funds ■ 2022 Annual Report | 93 |
Notes to financial statements
of the 1940 Act and the threshold for determining whether a fund must fair value a security. The SEC also adopted new Rule 31a-4 (“Rule 31a-4”), which provides the recordkeeping requirements associated with fair value determinations. Finally, the SEC is rescinding previously issued guidance on related issues, including the role of the board in determining fair value and the accounting and auditing of fund investments. Rule 2a-5 and Rule 31a-4 became effective on March 8, 2021. The compliance date for Rule 2a-5 and Rule 31a-4 is September 8, 2022. A fund may voluntarily comply with the rules after the effective date, and in advance of the compliance date, under certain conditions. Management is currently assessing the impact of these provisions on the Funds’ financial statements.
Note 3—valuation of investments
The Funds’ investments in securities are recorded at their estimated fair value utilizing valuation methods approved by the Board. Fair value is defined as the price that would be received upon selling an investment or transferring a liability in an orderly transaction to an independent buyer in the principal or most advantageous market for the investment. U.S. GAAP establishes the three-tier hierarchy that is used to maximize the use of observable market data and minimize the use of unobservable inputs and to establish classification of fair value measurements for disclosure purposes. Observable inputs reflect the assumptions market participants would use in pricing the asset or liability. Observable inputs are based on market data obtained from sources independent of the reporting entity. Unobservable inputs reflect management’s assumptions about the assumptions market participants would use in pricing the asset or liability. Unobservable inputs are based on the best information available in the circumstances. The following is a summary of the three-tiered hierarchy of valuation input levels.
| • | Level 1 – Inputs are unadjusted and prices are determined using quoted prices in active markets for identical securities. |
| • | Level 2 – Prices are determined using other significant observable inputs (including quoted prices for similar securities, interest rates, credit spreads, etc.). |
| • | Level 3 – Prices are determined using significant unobservable inputs (including management’s assumptions in determining the fair value of investments). |
A description of the valuation techniques applied to the Funds’ major classifications of assets and liabilities measured at fair value follows:
Investments in registered investment companies: Investments in investment companies are valued at their respective NAVs on the valuation date and are generally classified as Level 1.
As of May 31, 2022, all of the investments in the Funds were valued based on Level 1 inputs.
| 94 | 2022 Annual Report ■ TIAA-CREF Lifecycle Index Funds |
continued
Note 4—investments
Purchases and sales: Purchases and sales of securities (other than short-term instruments) for all of the Funds for the year ended May 31, 2022 were as follows (dollar amounts are in thousands):
| Fund | Non-U.S. government Purchases | Non-U.S. government Sales | ||||||
| Lifecycle Index Retirement Income | $ | 190,381 | $ | 153,402 | ||||
| Lifecycle Index 2010 | 153,518 | 164,561 | ||||||
| Lifecycle Index 2015 | 254,865 | 232,073 | ||||||
| Lifecycle Index 2020 | 661,767 | 626,934 | ||||||
| Lifecycle Index 2025 | 1,194,351 | 765,307 | ||||||
| Lifecycle Index 2030 | 1,550,361 | 799,595 | ||||||
| Lifecycle Index 2035 | 1,586,256 | 719,870 | ||||||
| Lifecycle Index 2040 | 1,623,593 | 731,913 | ||||||
| Lifecycle Index 2045 | 1,281,521 | 511,752 | ||||||
| Lifecycle Index 2050 | 1,094,444 | 413,244 | ||||||
| Lifecycle Index 2055 | 645,966 | 208,213 | ||||||
| Lifecycle Index 2060 | 390,418 | 81,327 | ||||||
| Lifecycle Index 2065 | 71,850 | 28,835 | ||||||
Note 5—income tax information
Each Fund is a separate taxpayer for federal income tax purposes. Each Fund intends to distribute substantially all of its net investment income and net capital gains to shareholders and otherwise comply with the requirements of Subchapter M of the Internal Revenue Code applicable to regulated investment companies. Therefore, no federal income tax provision is required.
Each Fund files income tax returns in U.S. federal and applicable state and local jurisdictions. A Fund’s federal income tax returns are generally subject to examination for a period of three fiscal years after being filed. State and local tax returns may be subject to examination for an additional period of time depending on the jurisdiction. Management has analyzed each Fund’s tax positions taken for all open tax years and has concluded that no provision for income tax is required in the Fund’s financial statements.
Differences between amounts for financial statement and federal income tax purposes are primarily due to timing differences in recognizing gains and losses on investment transactions. Temporary differences do not require reclassification. As of year end, permanent differences that resulted in reclassifications among the components of net assets relate primarily to distribution reallocations, investments in underlying funds and tax equalization. Temporary and permanent differences have no impact on a Fund’s net assets.
| TIAA-CREF Lifecycle Index Funds ■ 2022 Annual Report | 95 |
Notes to financial statements
As of year end, the aggregate cost and the net unrealized appreciation/(depreciation) of all investments for federal income tax purposes was as follows (dollar amounts are in thousands):
| Fund | Tax cost | Gross unrealized appreciation | Gross unrealized (depreciation | ) | Net unrealized appreciation (depreciation | ) | ||||||||||
| Lifecycle Index Retirement Income | $ | 565,635 | $ | 69,423 | $ | (29,637 | ) | $ | 39,786 | |||||||
| Lifecycle Index 2010 | 544,037 | 102,898 | (29,793 | ) | 73,105 | |||||||||||
| Lifecycle Index 2015 | 948,765 | 203,301 | (49,330 | ) | 153,971 | |||||||||||
| Lifecycle Index 2020 | 2,696,575 | 537,942 | (139,290 | ) | 398,652 | |||||||||||
| Lifecycle Index 2025 | 4,523,936 | 846,579 | (224,236 | ) | 622,343 | |||||||||||
| Lifecycle Index 2030 | 5,294,694 | 1,055,744 | (247,786 | ) | 807,958 | |||||||||||
| Lifecycle Index 2035 | 5,011,567 | 1,104,897 | (212,083 | ) | 892,814 | |||||||||||
| Lifecycle Index 2040 | 4,986,466 | 1,281,856 | (180,539 | ) | 1,101,317 | |||||||||||
| Lifecycle Index 2045 | 3,817,988 | 917,134 | (99,360 | ) | 817,774 | |||||||||||
| Lifecycle Index 2050 | 3,175,995 | 727,489 | (70,464 | ) | 657,025 | |||||||||||
| Lifecycle Index 2055 | 1,741,708 | 309,228 | (37,532 | ) | 271,696 | |||||||||||
| Lifecycle Index 2060 | 850,583 | 90,980 | (22,701 | ) | 68,279 | |||||||||||
| Lifecycle Index 2065 | 50,752 | 0 | (2,977 | ) | (2,977 | ) | ||||||||||
For purposes of this disclosure, tax cost generally includes the cost of portfolio investments as well as up-front fees or premiums exchanged on derivatives and any amounts unrealized for income statement reporting but realized income and/or capital gains for tax reporting, if applicable.
As of year end, the components of accumulated earnings on a tax basis were as follows:
| Fund | Undistributed ordinary income | Undistributed long-term capital gains | Unrealized appreciation (depreciation) | Capital loss carryforwards | Late-year loss deferrals | Other book-to-tax differences | Total | |||||||||||||||||||||
| Lifecycle Index Retirement Income | $ | 1,068,919 | $ | 4,641,149 | $ | 39,786,172 | $ | — | $ | — | $ | (13,864 | ) | $ | 45,482,376 | |||||||||||||
| Lifecycle Index 2010 | 2,972,861 | 5,015,648 | 73,104,605 | — | — | (24,092 | ) | 81,069,022 | ||||||||||||||||||||
| Lifecycle Index 2015 | 5,052,592 | 7,046,711 | 153,971,158 | — | — | (43,512 | ) | 166,026,949 | ||||||||||||||||||||
| Lifecycle Index 2020 | 12,800,852 | 19,737,387 | 398,651,843 | — | — | (93,538 | ) | 431,096,544 | ||||||||||||||||||||
| Lifecycle Index 2025 | 17,979,035 | 30,665,450 | 622,343,213 | — | — | (117,699 | ) | 670,869,999 | ||||||||||||||||||||
| Lifecycle Index 2030 | 16,963,139 | 35,680,269 | 807,957,521 | — | — | (127,232 | ) | 860,473,697 | ||||||||||||||||||||
| Lifecycle Index 2035 | 11,999,441 | 33,567,023 | 892,813,315 | — | — | (118,665 | ) | 938,261,114 | ||||||||||||||||||||
| Lifecycle Index 2040 | 7,288,457 | 33,488,518 | 1,101,316,116 | — | — | (128,091 | ) | 1,141,965,000 | ||||||||||||||||||||
| Lifecycle Index 2045 | 2,026,271 | 22,716,510 | 817,773,356 | — | — | (80,643 | ) | 842,435,494 | ||||||||||||||||||||
| Lifecycle Index 2050 | 2,591,997 | 13,030,863 | 657,024,571 | — | — | (61,474 | ) | 672,585,957 | ||||||||||||||||||||
| Lifecycle Index 2055 | 616,181 | 6,814,872 | 271,696,486 | — | — | (25,450 | ) | 279,102,089 | ||||||||||||||||||||
| Lifecycle Index 2060 | 87,788 | 2,903,980 | 68,278,396 | — | — | (7,852 | ) | 71,262,312 | ||||||||||||||||||||
| Lifecycle Index 2065 | 31,436 | 94,990 | (2,976,571 | ) | — | — | (91 | ) | (2,850,236 | ) | ||||||||||||||||||
| 96 | 2022 Annual Report ■ TIAA-CREF Lifecycle Index Funds |
continued
The tax character of distributions paid were as follows:
| 5/31/2022 | 5/31/2021 | |||||||||||||||
| Fund | Ordinary income | Long-term capital gains | Ordinary income | Long-term capital gains | ||||||||||||
| Lifecycle Index Retirement Income | $ 15,294,862 | $10,914,160 | $ 11,237,378 | $ 825,217 | ||||||||||||
| Lifecycle Index 2010 | 17,855,451 | 14,362,245 | 12,439,690 | 2,873,726 | ||||||||||||
| Lifecycle Index 2015 | 27,582,507 | 33,270,456 | 22,866,991 | 7,287,097 | ||||||||||||
| Lifecycle Index 2020 | 78,091,181 | 93,260,428 | 63,783,593 | 8,527,097 | ||||||||||||
| Lifecycle Index 2025 | 123,609,053 | 89,180,738 | 94,822,266 | 4,932,547 | ||||||||||||
| Lifecycle Index 2030 | 156,283,713 | 48,109,965 | 103,718,573 | 2,331,838 | ||||||||||||
| Lifecycle Index 2035 | 156,706,880 | 19,509,784 | 95,237,190 | 2,531,313 | ||||||||||||
| Lifecycle Index 2040 | 172,363,213 | 12,531,440 | 94,411,870 | 3,146,424 | ||||||||||||
| Lifecycle Index 2045 | 115,649,595 | 4,234,077 | 61,965,333 | 2,382,680 | ||||||||||||
| Lifecycle Index 2050 | 89,206,724 | 1,408,840 | 48,633,893 | 1,845,303 | ||||||||||||
| Lifecycle Index 2055 | 40,570,606 | 567,420 | 22,398,370 | 836,159 | ||||||||||||
| Lifecycle Index 2060 | 16,453,830 | 148,196 | 7,954,357 | 234,777 | ||||||||||||
| Lifecycle Index 2065 | 530,699 | 1,582 | 92,471 | — | ||||||||||||
Note 6—investment adviser and other transactions with affiliates
Under the terms of its Investment Management Agreement, Advisors is entitled to a fee that is made up of two components, which are added together to create the total investment management fee. The first component, the asset allocation fee rate, is an annual rate of 0.10% of the average daily net assets of each Fund. The second component, the Underlying Funds fee rate is calculated as follows: for each Underlying Fund of the Trust in which a Fund is invested, the effective Underlying Fund’s annual investment management fee rate, as determined pursuant to its investment management agreement, net of any fee waivers or reimbursements applicable to the Underlying Fund (excluding the Class W shares investment management fee waiver and/or reimbursement), in proportion to the percentage of the Fund’s net assets invested in the Underlying Fund, applied to the Fund’s average daily net assets. Advisors has contractually agreed to waive a portion of the asset allocation fee rate (and, for the Lifecycle Index Retirement Income and Lifecycle Index 2010 Funds, a portion of the Underlying Funds fee rate prior to October 1, 2021) equal to, on an annual basis, the following percentages of the average daily net assets of each Fund. As of May 31, 2022, Advisors received from the Funds the following effective annual rate as a percentage of average daily net assets of each Fund:
| TIAA-CREF Lifecycle Index Funds ■ 2022 Annual Report | 97 |
Notes to financial statements
| Investment management fee waiver | ||||||||||||
| Fund | Investment management fee — effective rate | Effective 10/1/21 | * | Prior to 10/1/21 | ||||||||
| Lifecycle Index Retirement Income | 0.09 | % | 0.085 | % | 0.104 | % | ||||||
| Lifecycle Index 2010 | 0.09 | 0.085 | 0.104 | |||||||||
| Lifecycle Index 2015 | 0.09 | 0.081 | 0.098 | |||||||||
| Lifecycle Index 2020 | 0.09 | 0.077 | 0.092 | |||||||||
| Lifecycle Index 2025 | 0.09 | 0.072 | 0.085 | |||||||||
| Lifecycle Index 2030 | 0.09 | 0.066 | 0.078 | |||||||||
| Lifecycle Index 2035 | 0.09 | 0.061 | 0.071 | |||||||||
| Lifecycle Index 2040 | 0.09 | 0.059 | 0.067 | |||||||||
| Lifecycle Index 2045 | 0.09 | 0.058 | 0.062 | |||||||||
| Lifecycle Index 2050 | 0.09 | 0.057 | 0.062 | |||||||||
| Lifecycle Index 2055 | 0.09 | 0.057 | 0.061 | |||||||||
| Lifecycle Index 2060 | 0.09 | 0.057 | 0.061 | |||||||||
| Lifecycle Index 2065 | 0.09 | 0.056 | 0.060 | |||||||||
| * | These waivers will remain in effect through September 30, 2022, unless changed with approval of the Board of Trustees. |
The Funds have entered into an Administrative Service Agreement with Advisors under which the Funds pay Advisors for its cost in providing certain administrative and compliance services to the Funds.
Under the terms of a Retirement Class Service Agreement with respect to each Fund, the Retirement Class of the Fund pays Advisors a monthly fee based on the annual rate of 0.25% of the Fund’s average daily net assets attributable to Retirement Class shares of the Fund for providing certain administrative services related to the maintenance of Retirement Class shares on retirement plan or other platforms. Substantially, all of the Retirement Class shareholder servicing fees reported on the Statements of operations are paid to Advisors under the Service Agreement.
Under the terms of a distribution Rule 12b-1 plan, the Retirement Class and Premier Class of the Funds compensated Nuveen Securities for providing distribution, promotional and/or shareholder services to the Retirement Class and Premier Class at the annual rate of 0.05% and 0.15% of the average daily net assets attributable to the Retirement Class shares and Premier Class shares, respectively. However, Nuveen Securities has agreed not to seek any reimbursements under the distribution Rule 12b-1 plan from the Retirement Class and the plan is suspended through September 30, 2022. This agreement may be terminated before this date with the approval of the Board.
| 98 | 2022 Annual Report ■ TIAA-CREF Lifecycle Index Funds |
continued
Advisors has agreed to reimburse each Fund if its total expense ratio (excluding interest, taxes, brokerage commissions and other transactional expenses, acquired fund fees and expenses, extraordinary expenses and the management fees and certain other expenses originally attributable to Class W shares of the affiliated TIAA-CREF Funds) exceeds the following percentages of average daily net assets for each class:
| Maximum expense amounts | ||||||||||||||||||||||||||||||||
| Institutional Class | Advisor Class | Premier Class | Retirement Class | |||||||||||||||||||||||||||||
| Fund | Effective 10/1/21 | † | Prior to 10/1/21 | Effective 10/1/21 | † | Prior to 10/1/21 | Effective 10/1/21 | † | Prior to 10/1/21 | Effective 10/1/21 | † | Prior to 10/1/21 | ||||||||||||||||||||
| Lifecycle Index Retirement Income | 0.015 | % | 0.000 | % | 0.165 | % | 0.150 | % | 0.165 | % | 0.150 | % | 0.265 | % | 0.250 | % | ||||||||||||||||
| Lifecycle Index 2010 | 0.015 | 0.000 | 0.165 | 0.150 | 0.165 | 0.150 | 0.265 | 0.250 | ||||||||||||||||||||||||
| Lifecycle Index 2015 | 0.019 | 0.002 | 0.169 | 0.152 | 0.169 | 0.152 | 0.269 | 0.252 | ||||||||||||||||||||||||
| Lifecycle Index 2020 | 0.023 | 0.008 | 0.173 | 0.158 | 0.173 | 0.158 | 0.273 | 0.258 | ||||||||||||||||||||||||
| Lifecycle Index 2025 | 0.028 | 0.015 | 0.178 | 0.165 | 0.178 | 0.165 | 0.278 | 0.265 | ||||||||||||||||||||||||
| Lifecycle Index 2030 | 0.034 | 0.022 | 0.184 | 0.172 | 0.184 | 0.172 | 0.284 | 0.272 | ||||||||||||||||||||||||
| Lifecycle Index 2035 | 0.039 | 0.029 | 0.189 | 0.179 | 0.189 | 0.179 | 0.289 | 0.279 | ||||||||||||||||||||||||
| Lifecycle Index 2040 | 0.041 | 0.033 | 0.191 | 0.183 | 0.191 | 0.183 | 0.291 | 0.283 | ||||||||||||||||||||||||
| Lifecycle Index 2045 | 0.042 | 0.038 | 0.192 | 0.188 | 0.192 | 0.188 | 0.292 | 0.288 | ||||||||||||||||||||||||
| Lifecycle Index 2050 | 0.043 | 0.038 | 0.193 | 0.188 | 0.193 | 0.188 | 0.293 | 0.288 | ||||||||||||||||||||||||
| Lifecycle Index 2055 | 0.043 | 0.039 | 0.193 | 0.189 | 0.193 | 0.189 | 0.293 | 0.289 | ||||||||||||||||||||||||
| Lifecycle Index 2060 | 0.043 | 0.039 | 0.193 | 0.189 | 0.193 | 0.189 | 0.293 | 0.289 | ||||||||||||||||||||||||
| Lifecycle Index 2065 | 0.044 | 0.040 | 0.194 | 0.190 | 0.194 | 0.190 | 0.294 | 0.290 | ||||||||||||||||||||||||
| † | The expense reimbursement arrangements will continue through at least September 30, 2022, unless changed with approval of the Board. |
The Funds may purchase or sell investment securities in transactions with affiliated entities under procedure adopted by the Board, pursuant to the 1940 Act. These transactions are effected at market rates without incurring broker commissions. For the year ended May 31, 2022, the Funds did not engage in security transactions with affiliated entities.
The following is the percentage of the Funds’ shares owned by TIAA as of May 31, 2022:
| Fund | TIAA | |||
| Lifecycle Index Retirement Income | — | % | ||
| Lifecycle Index 2010 | — | |||
| Lifecycle Index 2015 | — | |||
| Lifecycle Index 2020 | — | |||
| Lifecycle Index 2025 | — | |||
| Lifecycle Index 2030 | — | |||
| Lifecycle Index 2035 | — | |||
| Lifecycle Index 2040 | — | |||
| Lifecycle Index 2045 | — | |||
| Lifecycle Index 2050 | — | |||
| Lifecycle Index 2055 | — | |||
| Lifecycle Index 2060 | — | |||
| Lifecycle Index 2065 | 12 | |||
| TIAA-CREF Lifecycle Index Funds ■ 2022 Annual Report | 99 |
Notes to financial statements
Investments in other investment companies advised by Advisors and Nuveen Fund Advisors, LLC are deemed to be affiliated investments. The Funds invest their assets in the Class W shares of the affiliated TIAA-CREF Funds. Information regarding transactions with affiliated companies is as follows (dollar amounts are in thousands):
| Issue | Value at 5/31/21 | Purchases cost | Sales proceeds | Realized gain (loss | ) | Change in unrealized appreciation (depreciation | ) | Dividend income | Value at 5/31/22 | |||||||||||||||||||
| Lifecycle Index Retirement Income Fund | ||||||||||||||||||||||||||||
| TIAA-CREF Funds: | ||||||||||||||||||||||||||||
| Bond Index | $ | 249,105 | $ | 65,645 | $ | 45,559 | $ | (2,517 | ) | $ | (24,236 | ) | $ | 5,187 | $ | 241,997 | ||||||||||||
| Emerging Markets Equity Index | 24,983 | 15,374 | 6,930 | (340 | ) | (6,016 | ) | 691 | 27,071 | |||||||||||||||||||
| Equity Index | 174,676 | 45,910 | 56,357 | 10,855 | (16,875 | ) | 2,134 | 156,712 | ||||||||||||||||||||
| Inflation-Linked Bond | 62,514 | 18,353 | 16,261 | 389 | (3,871 | ) | 3,874 | 60,435 | ||||||||||||||||||||
| International Equity Index | 50,885 | 28,227 | 12,453 | (234 | ) | (7,881 | ) | 1,913 | 58,544 | |||||||||||||||||||
| Short-Term Bond Index | 62,267 | 16,874 | 15,842 | (142 | ) | (2,235 | ) | 420 | 60,662 | |||||||||||||||||||
| $ | 624,430 | $ | 190,383 | $ | 153,402 | $ | 8,011 | $ | (61,114 | ) | $ | 14,219 | $ | 605,421 | ||||||||||||||
| Lifecycle Index 2010 Fund | ||||||||||||||||||||||||||||
| TIAA-CREF Funds: | ||||||||||||||||||||||||||||
| Bond Index | $ | 274,591 | $ | 47,332 | $ | 46,312 | $ | (2,690 | ) | $ | (25,760 | ) | $ | 5,577 | $ | 246,686 | ||||||||||||
| Emerging Markets Equity Index | 26,800 | 12,819 | 6,720 | (304 | ) | (6,294 | ) | 717 | 26,301 | |||||||||||||||||||
| Equity Index | 188,090 | 33,441 | 62,079 | 16,106 | (21,832 | ) | 2,219 | 152,170 | ||||||||||||||||||||
| Inflation-Linked Bond | 68,762 | 13,674 | 16,436 | 489 | (4,149 | ) | 4,192 | 61,597 | ||||||||||||||||||||
| International Equity Index | 54,203 | 22,433 | 11,334 | (375 | ) | (8,075 | ) | 1,994 | 56,852 | |||||||||||||||||||
| Short-Term Bond Index | 74,639 | 17,584 | 15,419 | (118 | ) | (2,831 | ) | 513 | 73,535 | |||||||||||||||||||
| $ | 687,085 | $ | 147,283 | $ | 158,300 | $ | 13,108 | $ | (68,941 | ) | $ | 15,212 | $ | 617,141 | ||||||||||||||
| Lifecycle Index 2015 Fund | ||||||||||||||||||||||||||||
| TIAA-CREF Funds: | ||||||||||||||||||||||||||||
| Bond Index | $ | 463,648 | $ | 83,704 | $ | 62,743 | $ | (3,624 | ) | $ | (46,125 | ) | $ | 9,666 | $ | 434,037 | ||||||||||||
| Emerging Markets Equity Index | 52,278 | 24,730 | 10,745 | (800 | ) | (12,464 | ) | 1,431 | 52,999 | |||||||||||||||||||
| Equity Index | 366,189 | 57,834 | 101,106 | 26,137 | (38,322 | ) | 4,423 | 307,629 | ||||||||||||||||||||
| Inflation-Linked Bond | 99,252 | 23,152 | 19,347 | 656 | (6,241 | ) | 6,277 | 96,349 | ||||||||||||||||||||
| International Equity Index | 106,825 | 44,464 | 19,339 | (513 | ) | (16,409 | ) | 3,965 | 115,028 | |||||||||||||||||||
| Short-Term Bond Index | 98,833 | 20,982 | 18,796 | (115 | ) | (3,785 | ) | 681 | 96,695 | |||||||||||||||||||
| $ | 1,187,025 | $ | 254,866 | $ | 232,076 | $ | 21,741 | $ | (123,346 | ) | $ | 26,443 | $ | 1,102,737 | ||||||||||||||
| Lifecycle Index 2020 Fund | ||||||||||||||||||||||||||||
| TIAA-CREF Funds: | ||||||||||||||||||||||||||||
| Bond Index | $ | 1,280,267 | $ | 213,214 | $ | 169,103 | $ | (10,571 | ) | $ | (125,124 | ) | $ | 26,438 | $ | 1,186,433 | ||||||||||||
| Emerging Markets Equity Index | 164,918 | 67,519 | 24,570 | (1,737 | ) | (39,611 | ) | 4,492 | 166,519 | |||||||||||||||||||
| Equity Index | 1,155,050 | 162,732 | 306,428 | 79,364 | (117,291 | ) | 13,822 | 963,730 | ||||||||||||||||||||
| Inflation-Linked Bond | 213,883 | 47,708 | 38,110 | 1,380 | (13,484 | ) | 13,496 | 208,960 | ||||||||||||||||||||
| International Equity Index | 336,866 | 128,085 | 52,164 | (1,162 | ) | (51,742 | ) | 12,374 | 359,883 | |||||||||||||||||||
| Short-Term Bond Index | 213,039 | 42,511 | 36,560 | (257 | ) | (8,118 | ) | 1,465 | 209,702 | |||||||||||||||||||
| $ | 3,364,023 | $ | 661,769 | $ | 626,935 | $ | 67,017 | $ | (355,370 | ) | $ | 72,087 | $ | 3,095,227 | ||||||||||||||
| 100 | 2022 Annual Report ■ TIAA-CREF Lifecycle Index Funds |
continued
| Issue | Value at 5/31/21 | Purchases cost | Sales proceeds | Realized gain (loss | ) | Change in unrealized appreciation (depreciation | ) | Dividend income | Value at 5/31/22 | |||||||||||||||||||
| Lifecycle Index 2025 Fund | ||||||||||||||||||||||||||||
| TIAA-CREF Funds: | ||||||||||||||||||||||||||||
| Bond Index | $ | 1,806,498 | $ | 395,241 | $ | 168,572 | $ | (10,786 | ) | $ | (193,619 | ) | $ | 38,928 | $ | 1,825,443 | ||||||||||||
| Emerging Markets Equity Index | 294,635 | 134,169 | 36,375 | (3,103 | ) | (73,093 | ) | 8,271 | 316,233 | |||||||||||||||||||
| Equity Index | 2,065,076 | 295,290 | 433,428 | 97,696 | (176,003 | ) | 25,471 | 1,830,762 | ||||||||||||||||||||
| Inflation-Linked Bond | 227,460 | 66,397 | 32,940 | 1,483 | (15,167 | ) | 14,909 | 244,536 | ||||||||||||||||||||
| International Equity Index | 602,409 | 243,622 | 63,630 | (2,050 | ) | (96,474 | ) | 22,850 | 683,877 | |||||||||||||||||||
| Short-Term Bond Index | 226,603 | 59,633 | 30,362 | (49 | ) | (9,377 | ) | 1,636 | 245,429 | |||||||||||||||||||
| $ | 5,222,681 | $ | 1,194,352 | $ | 765,307 | $ | 83,191 | $ | (563,733 | ) | $ | 112,065 | $ | 5,146,280 | ||||||||||||||
| Lifecycle Index 2030 Fund | ||||||||||||||||||||||||||||
| TIAA-CREF Funds: | ||||||||||||||||||||||||||||
| Bond Index | $ | 1,821,385 | $ | 488,890 | $ | 172,646 | $ | (11,556 | ) | $ | (201,903 | ) | $ | 40,233 | $ | 1,920,740 | ||||||||||||
| Emerging Markets Equity Index | 383,708 | 191,933 | 44,080 | (5,441 | ) | (96,710 | ) | 10,999 | 429,410 | |||||||||||||||||||
| Equity Index | 2,687,460 | 424,529 | 490,299 | 93,766 | (204,851 | ) | 33,977 | 2,486,768 | ||||||||||||||||||||
| Inflation-Linked Bond | 140,109 | 55,083 | 16,234 | 988 | (10,105 | ) | 9,661 | 168,073 | ||||||||||||||||||||
| International Equity Index | 783,908 | 337,961 | 60,470 | (3,106 | ) | (129,320 | ) | 30,533 | 928,973 | |||||||||||||||||||
| Short-Term Bond Index | 139,483 | 51,964 | 15,865 | 71 | (6,298 | ) | 1,072 | 168,687 | ||||||||||||||||||||
| $ | 5,956,053 | $ | 1,550,360 | $ | 799,594 | $ | 74,722 | $ | (649,187 | ) | $ | 126,475 | $ | 6,102,651 | ||||||||||||||
| Lifecycle Index 2035 Fund | ||||||||||||||||||||||||||||
| TIAA-CREF Funds: | ||||||||||||||||||||||||||||
| Bond Index | $ | 1,495,980 | $ | 456,508 | $ | 148,620 | $ | (9,714 | ) | $ | (168,755 | ) | $ | 33,470 | $ | 1,622,551 | ||||||||||||
| Emerging Markets Equity Index | 407,103 | 214,517 | 43,048 | (4,912 | ) | (105,071 | ) | 11,835 | 468,589 | |||||||||||||||||||
| Equity Index | 2,851,937 | 479,137 | 469,843 | 80,743 | (205,308 | ) | 36,410 | 2,711,123 | ||||||||||||||||||||
| Inflation-Linked Bond | 19,819 | 28,074 | 783 | 323 | (2,383 | ) | 1,898 | 44,679 | ||||||||||||||||||||
| International Equity Index | 831,820 | 380,510 | 56,673 | (3,829 | ) | (139,230 | ) | 32,623 | 1,012,598 | |||||||||||||||||||
| Short-Term Bond Index | 19,739 | 27,510 | 903 | 96 | (1,462 | ) | 224 | 44,840 | ||||||||||||||||||||
| $ | 5,626,398 | $ | 1,586,256 | $ | 719,870 | $ | 62,707 | $ | (622,209 | ) | $ | 116,460 | $ | 5,904,380 | ||||||||||||||
| Lifecycle Index 2040 Fund | ||||||||||||||||||||||||||||
| TIAA-CREF Funds: | ||||||||||||||||||||||||||||
| Bond Index | $ | 1,120,711 | $ | 415,569 | $ | 116,078 | $ | (8,530 | ) | $ | (130,954 | ) | $ | 25,780 | $ | 1,278,523 | ||||||||||||
| Emerging Markets Equity Index | 467,040 | 244,007 | 47,262 | (5,697 | ) | (120,668 | ) | 13,594 | 537,420 | |||||||||||||||||||
| Equity Index | 3,264,503 | 523,942 | 502,591 | 86,118 | (232,671 | ) | 41,741 | 3,110,018 | ||||||||||||||||||||
| International Equity Index | 952,848 | 440,075 | 65,982 | (5,272 | ) | (159,848 | ) | 37,366 | 1,161,821 | |||||||||||||||||||
| $ | 5,805,102 | $ | 1,623,593 | $ | 731,913 | $ | 66,619 | $ | (644,141 | ) | $ | 118,481 | $ | 6,087,782 | ||||||||||||||
| Lifecycle Index 2045 Fund | ||||||||||||||||||||||||||||
| TIAA-CREF Funds: | ||||||||||||||||||||||||||||
| Bond Index | $ | 490,739 | $ | 224,579 | $ | 46,476 | $ | (3,266 | ) | $ | (61,502 | ) | $ | 11,746 | $ | 603,073 | ||||||||||||
| Emerging Markets Equity Index | 381,615 | 210,524 | 36,941 | (4,907 | ) | (100,249 | ) | 11,246 | 450,042 | |||||||||||||||||||
| Equity Index | 2,673,539 | 465,164 | 379,714 | 51,769 | (178,486 | ) | 34,621 | 2,607,984 | ||||||||||||||||||||
| International Equity Index | 779,982 | 381,254 | 48,622 | (4,133 | ) | (133,818 | ) | 31,025 | 974,663 | |||||||||||||||||||
| $ | 4,325,875 | $ | 1,281,521 | $ | 511,753 | $ | 39,463 | $ | (474,055 | ) | $ | 88,638 | $ | 4,635,762 | ||||||||||||||
| TIAA-CREF Lifecycle Index Funds ■ 2022 Annual Report | 101 |
Notes to financial statements
| Issue | Value at 5/31/21 | Purchases cost | Sales proceeds | Realized gain (loss | ) | Change in unrealized appreciation (depreciation | ) | Dividend income | Value at 5/31/22 | |||||||||||||||||||
| Lifecycle Index 2050 Fund | ||||||||||||||||||||||||||||
| TIAA-CREF Funds: | ||||||||||||||||||||||||||||
| Bond Index | $ | 315,210 | $ | 117,441 | $ | 40,163 | $ | (3,090 | ) | $ | (35,803 | ) | $ | 7,200 | $ | 352,982 | ||||||||||||
| Emerging Markets Equity Index | 320,165 | 188,715 | 30,259 | (4,456 | ) | (85,582 | ) | 9,665 | 388,583 | |||||||||||||||||||
| Equity Index | 2,243,432 | 447,080 | 306,860 | 31,374 | (143,848 | ) | 29,557 | 2,250,442 | ||||||||||||||||||||
| International Equity Index | 654,334 | 341,208 | 35,963 | (3,475 | ) | (115,092 | ) | 26,443 | 841,012 | |||||||||||||||||||
| $ | 3,533,141 | $ | 1,094,444 | $ | 413,245 | $ | 20,353 | $ | (380,325 | ) | $ | 72,865 | $ | 3,833,019 | ||||||||||||||
| Lifecycle Index 2055 Fund | ||||||||||||||||||||||||||||
| TIAA-CREF Funds: | ||||||||||||||||||||||||||||
| Bond Index | $ | 136,177 | $ | 58,461 | $ | 16,782 | $ | (1,184 | ) | $ | (16,128 | ) | $ | 3,181 | $ | 160,273 | ||||||||||||
| Emerging Markets Equity Index | 162,916 | 108,825 | 17,605 | (2,454 | ) | (44,381 | ) | 5,012 | 207,301 | |||||||||||||||||||
| Equity Index | 1,141,501 | 283,609 | 155,048 | 11,787 | (72,486 | ) | 15,359 | 1,198,588 | ||||||||||||||||||||
| International Equity Index | 332,815 | 195,071 | 18,778 | (1,582 | ) | (60,284 | ) | 13,753 | 447,242 | |||||||||||||||||||
| $ | 1,773,409 | $ | 645,966 | $ | 208,213 | $ | 6,567 | $ | (193,279 | ) | $ | 37,305 | $ | 2,013,404 | ||||||||||||||
| Lifecycle Index 2060 Fund | ||||||||||||||||||||||||||||
| TIAA-CREF Funds: | ||||||||||||||||||||||||||||
| Bond Index | $ | 45,021 | $ | 29,194 | $ | 5,975 | $ | (473 | ) | $ | (5,997 | ) | $ | 1,144 | $ | 61,674 | ||||||||||||
| Emerging Markets Equity Index | 65,451 | 57,598 | 6,665 | (1,128 | ) | (19,360 | ) | 2,153 | 95,896 | |||||||||||||||||||
| Equity Index | 456,354 | 194,121 | 60,334 | 3,424 | (34,431 | ) | 6,601 | 554,503 | ||||||||||||||||||||
| International Equity Index | 133,068 | 109,504 | 8,353 | (903 | ) | (26,528 | ) | 5,913 | 206,788 | |||||||||||||||||||
| $ | 699,894 | $ | 390,417 | $ | 81,327 | $ | 920 | $ | (86,316 | ) | $ | 15,811 | $ | 918,861 | ||||||||||||||
| Lifecycle Index 2065 Fund | ||||||||||||||||||||||||||||
| TIAA-CREF Funds: | ||||||||||||||||||||||||||||
| Bond Index | $ | 470 | $ | 2,652 | $ | 297 | $ | (20 | ) | $ | (192 | ) | $ | 30 | $ | 2,611 | ||||||||||||
| Emerging Markets Equity Index | 859 | 5,488 | 577 | (89 | ) | (622 | ) | 67 | 5,059 | |||||||||||||||||||
| Equity Index | 5,981 | 29,365 | 3,764 | 4 | (2,214 | ) | 208 | 29,226 | ||||||||||||||||||||
| International Equity Index | 1,741 | 11,109 | 923 | (72 | ) | (975 | ) | 187 | 10,880 | |||||||||||||||||||
| $ | 9,051 | $ | 48,614 | $ | 5,561 | $ | (177 | ) | $ | (4,003 | ) | $ | 492 | $ | 47,776 | |||||||||||||
| 102 | 2022 Annual Report ■ TIAA-CREF Lifecycle Index Funds |
concluded
Note 7—inter-fund lending program
Pursuant to an exemptive order issued by the SEC, the Funds may participate in an inter-fund lending program. This program allows the Funds to lend cash to and/or borrow cash from certain other affiliated Funds for temporary purposes (e.g., to satisfy redemption requests or to cover unanticipated cash shortfalls). The program is subject to a number of conditions, including the requirement that no Fund may borrow or lend money under the program unless it receives a more favorable interest rate than is available from a bank or other financial institution for a comparable transaction. In addition, a Fund may participate in the program only if its participation is consistent with the Fund’s investment policies and limitations and authorized by its portfolio manager(s). During the year ended May 31, 2022, there were no inter-fund borrowing or lending transactions.
Note 8—line of credit
The Funds participate in a $1 billion unsecured revolving credit facility that can be used for temporary purposes, including, without limitation, the funding of shareholder redemptions. The current facility was entered into on June 14, 2022 expiring on June 13, 2023, replacing the previous facility, which expired June 2022. Certain affiliated accounts and mutual funds, each of which is managed by Advisors, or an affiliate of Advisors, also participate in this facility. An annual commitment fee for the credit facility is borne by the participating accounts and mutual funds on a pro rata basis. Interest associated with any borrowing under the facility is charged to the borrowing accounts or mutual funds at a specified rate of interest. The Funds are not liable for borrowings under the facility by other affiliated accounts or mutual funds. For the year ended May 31, 2022, there were no borrowings under this credit facility by the Funds.
| TIAA-CREF Lifecycle Index Funds ■ 2022 Annual Report | 103 |
Report of independent registered public accounting firm
To the Board of Trustees of TIAA-CREF Funds and Shareholders of TIAA-CREF Lifecycle Index Retirement Income Fund, TIAA-CREF Lifecycle Index 2010 Fund, TIAA-CREF Lifecycle Index 2015 Fund, TIAA-CREF Lifecycle Index 2020 Fund, TIAA-CREF Lifecycle Index 2025 Fund, TIAA-CREF Lifecycle Index 2030 Fund, TIAA-CREF Lifecycle Index 2035 Fund, TIAA-CREF Lifecycle Index 2040 Fund, TIAA-CREF Lifecycle Index 2045 Fund, TIAA-CREF Lifecycle Index 2050 Fund, TIAA-CREF Lifecycle Index 2055 Fund, TIAA-CREF Lifecycle Index 2060 Fund, and TIAA-CREF Lifecycle Index 2065 Fund
Opinions on the Financial Statements
We have audited the accompanying statements of assets and liabilities, including the portfolios of investments, of TIAA-CREF Lifecycle Index Retirement Income Fund, TIAA-CREF Lifecycle Index 2010 Fund, TIAA-CREF Lifecycle Index 2015 Fund, TIAA-CREF Lifecycle Index 2020 Fund, TIAA-CREF Lifecycle Index 2025 Fund, TIAA-CREF Lifecycle Index 2030 Fund, TIAA-CREF Lifecycle Index 2035 Fund, TIAA-CREF Lifecycle Index 2040 Fund, TIAA-CREF Lifecycle Index 2045 Fund, TIAA-CREF Lifecycle Index 2050 Fund, TIAA-CREF Lifecycle Index 2055 Fund, TIAA-CREF Lifecycle Index 2060 Fund, and TIAA-CREF Lifecycle Index 2065 Fund (thirteen of the funds constituting TIAA-CREF Funds, hereafter collectively referred to as the “Funds”) as of May 31, 2022, the related statements of operations for the year ended May 31, 2022, the statements of changes in net assets for each of the periods indicated in the table below, including the related notes, and the financial highlights for each of the periods indicated therein (collectively referred to as the “financial statements”). In our opinion, the financial statements present fairly, in all material respects, the financial position of each of the Funds as of May 31, 2022, the results of each of their operations for the year then ended, the changes in each of their net assets for each of the periods indicated in the table below and each of the financial highlights for each of the periods indicated therein in conformity with accounting principles generally accepted in the United States of America.
| TIAA-CREF Lifecycle Index Retirement Income Fund(1) | TIAA-CREF Lifecycle Index 2040 Fund(1) | ||
| TIAA-CREF Lifecycle Index 2010 Fund(1) | TIAA-CREF Lifecycle Index 2045 Fund(1) | ||
| TIAA-CREF Lifecycle Index 2015 Fund(1) | TIAA-CREF Lifecycle Index 2050 Fund(1) | ||
| TIAA-CREF Lifecycle Index 2020 Fund(1) | TIAA-CREF Lifecycle Index 2055 Fund(1) | ||
| TIAA-CREF Lifecycle Index 2025 Fund(1) | TIAA-CREF Lifecycle Index 2060 Fund(1) | ||
| TIAA-CREF Lifecycle Index 2030 Fund(1) | TIAA-CREF Lifecycle Index 2065 Fund(2) | ||
| TIAA-CREF Lifecycle Index 2035 Fund(1) |
| (1) | Statement of changes in net assets for the years ended May 31, 2022 and 2021 |
| (2) | Statement of changes in net assets for year ended May 31, 2022 and the period September 30, 2020 (commencement of operations) through May 31, 2021 |
| 104 | 2022 Annual Report ■ TIAA-CREF Lifecycle Index Funds |
concluded
Basis for Opinions
These financial statements are the responsibility of the Funds’ management. Our responsibility is to express an opinion on the Funds’ financial statements based on our audits. We are a public accounting firm registered with the Public Company Accounting Oversight Board (United States) (PCAOB) and are required to be independent with respect to the Funds in accordance with the U.S. federal securities laws and the applicable rules and regulations of the Securities and Exchange Commission and the PCAOB.
We conducted our audits of these financial statements in accordance with the standards of the PCAOB. Those standards require that we plan and perform the audit to obtain reasonable assurance about whether the financial statements are free of material misstatement, whether due to error or fraud.
Our audits included performing procedures to assess the risks of material misstatement of the financial statements, whether due to error or fraud, and performing procedures that respond to those risks. Such procedures included examining, on a test basis, evidence regarding the amounts and disclosures in the financial statements. Our audits also included evaluating the accounting principles used and significant estimates made by management, as well as evaluating the overall presentation of the financial statements. Our procedures included confirmation of securities owned as of May 31, 2022 by correspondence with the transfer agent. We believe that our audits provide a reasonable basis for our opinions.
/s/ PricewaterhouseCoopers LLP
Baltimore Maryland
July 15, 2022
We have served as the auditor of one or more investment companies in TIAA-CREF Funds’ investment company group since 2005.
| TIAA-CREF Lifecycle Index Funds ■ 2022 Annual Report | 105 |
Important tax information (unaudited)
As required by the Internal Revenue Code and Treasury Regulations, certain tax information, as detailed below, must be provided to shareholders. Shareholders are advised to consult their tax advisor with respect to the tax implications of their investment. The amounts listed below may differ from the actual amounts reported on Form 1099-DIV, which will be sent to shareholders shortly after calendar year end.
Long-term capital gains
As of year end, each Fund designates the following distribution amounts, or maximum amount allowable, as being from net long-term capital gains pursuant to Section 852(b)(3) of the Internal Revenue Code:
| Fund | Net long-term capital gains | ||
| Lifecycle Index Retirement Income | $ | 11,512,904 | |
| Lifecycle Index 2010 | 15,258,938 | ||
| Lifecycle Index 2015 | 34,692,773 | ||
| Lifecycle Index 2020 | 97,500,380 | ||
| Lifecycle Index 2025 | 93,030,371 | ||
| Lifecycle Index 2030 | 51,502,146 | ||
| Lifecycle Index 2035 | 21,845,355 | ||
| Lifecycle Index 2040 | 14,633,031 | ||
| Lifecycle Index 2045 | 5,466,672 | ||
| Lifecycle Index 2050 | 2,132,615 | ||
| Lifecycle Index 2055 | 851,451 | ||
| Lifecycle Index 2060 | 275,109 | ||
| Lifecycle Index 2065 | 1,582 | ||
Dividends received deduction (DRD)
Each Fund listed below had the following percentage, or maximum amount allowable, of ordinary income distributions eligible for the dividends received deduction for corporate shareholders:
| Fund | Percentage | |||
| Lifecycle Index Retirement Income | 13.4 | % | ||
| Lifecycle Index 2010 | 11.5 | |||
| Lifecycle Index 2015 | 14.8 | |||
| Lifecycle Index 2020 | 16.3 | |||
| Lifecycle Index 2025 | 19.0 | |||
| Lifecycle Index 2030 | 20.0 | |||
| Lifecycle Index 2035 | 21.4 | |||
| Lifecycle Index 2040 | 22.3 | |||
| Lifecycle Index 2045 | 27.4 | |||
| Lifecycle Index 2050 | 30.2 | |||
| Lifecycle Index 2055 | 34.4 | |||
| Lifecycle Index 2060 | 36.4 | |||
| Lifecycle Index 2065 | 35.5 | |||
| 106 | 2022 Annual Report ■ TIAA-CREF Lifecycle Index Funds |
concluded
Qualified dividend income (QDI)
Each Fund listed below had the following percentage, or maximum amount allowable, of ordinary income distributions treated as qualified dividend income for individuals pursuant to Section 1(h)(11) of the Internal Revenue Code:
| Fund | Percentage | |||
| Lifecycle Index Retirement Income | 25.6 | % | ||
| Lifecycle Index 2010 | 22.0 | |||
| Lifecycle Index 2015 | 28.3 | |||
| Lifecycle Index 2020 | 31.2 | |||
| Lifecycle Index 2025 | 36.2 | |||
| Lifecycle Index 2030 | 38.2 | |||
| Lifecycle Index 2035 | 40.7 | |||
| Lifecycle Index 2040 | 42.4 | |||
| Lifecycle Index 2045 | 52.2 | |||
| Lifecycle Index 2050 | 57.7 | |||
| Lifecycle Index 2055 | 65.7 | |||
| Lifecycle Index 2060 | 69.5 | |||
| Lifecycle Index 2065 | 67.9 | |||
Foreign source income and foreign tax credit pass through
Each Fund listed below has made an election under Section 853 of the Internal Revenue Code to pass through foreign taxes paid:
| Fund | Foreign source income | Foreign source income per share | Qualifying foreign taxes paid | Qualifying foreign taxes paid per share | ||||||||||||
| Lifecycle Index Retirement Income | $ | 1,974,375 | $ | 0.05051 | $ | 163,611 | $ | 0.00419 | ||||||||
| Lifecycle Index 2010 | 2,068,954 | 0.05429 | 170,171 | 0.00447 | ||||||||||||
| Lifecycle Index 2015 | 4,115,367 | 0.06354 | 338,881 | 0.00523 | ||||||||||||
| Lifecycle Index 2020 | 12,857,065 | 0.07626 | 1,060,070 | 0.00629 | ||||||||||||
| Lifecycle Index 2025 | 23,700,846 | 0.09229 | 1,955,419 | 0.00761 | ||||||||||||
| Lifecycle Index 2030 | 31,560,231 | 0.11219 | 2,608,214 | 0.00927 | ||||||||||||
| Lifecycle Index 2035 | 33,744,907 | 0.13279 | 2,794,018 | 0.01100 | ||||||||||||
| Lifecycle Index 2040 | 38,564,890 | 0.15520 | 3,203,676 | 0.01289 | ||||||||||||
| Lifecycle Index 2045 | 31,953,397 | 0.17460 | 2,656,353 | 0.01451 | ||||||||||||
| Lifecycle Index 2050 | 27,280,106 | 0.18236 | 2,271,109 | 0.01518 | ||||||||||||
| Lifecycle Index 2055 | 14,180,578 | 0.14544 | 1,179,913 | 0.01210 | ||||||||||||
| Lifecycle Index 2060 | 6,078,473 | 0.10557 | 507,085 | 0.00881 | ||||||||||||
| Lifecycle Index 2065 | 189,293 | 0.04511 | 15,975 | 0.00381 | ||||||||||||
| TIAA-CREF Lifecycle Index Funds ■ 2022 Annual Report | 107 |
Trustees and officers (unaudited)
TIAA-CREF Funds ■ May 31, 2022
Trustees
| Name, Address and Year of Birth (“YOB”) | Position(s) Held with Fund | Term of Office and Length of Time Served | Principal Occupation(s) During Past 5 Years and other relevant experience and qualifications | Number of Portfolios in Fund complex Overseen by Trustee | Other Directorship(s) held by Trustee | |||||
| Forrest Berkley c/o Corporate Secretary 730 Third Avenue New York, NY 10017-3206 YOB: 1954 | Trustee | Indefinite term. Trustee since 2006. | Retired Partner (since 2006), Partner (1990–2005) and Head of Global Product Management (2003–2005), GMO (formerly, Grantham, Mayo, Van Otterloo & Co.) (investment management); and member of asset allocation portfolio management team, GMO (2003–2005). | 88 | Director, Save the Children Federation, Inc.; Investment Committee Member, Maine Community Foundation. | |||||
| Joseph A. Boateng c/o Corporate Secretary 730 Third Avenue New York, NY 10017-3206 YOB: 1963 | Trustee | Indefinite term. Trustee since 2019. | Chief Investment Officer, Casey Family Programs (since 2007). Director of U.S. Pension Plans, Johnson & Johnson (2002–2006). Manager, Financial Services Consultant, KPMG Consulting (2000–2002). | 88 | Board member, Lumina Foundation and Waterside School; Emeritus Board Member, Year-Up Puget Sound; Investment Advisory Committee Member, Seattle City Employees’ Retirement System; Investment Committee Member, The Seattle Foundation. | |||||
| Janice C. Eberly c/o Corporate Secretary 730 Third Avenue New York, NY 10017-3206 YOB: 1962 | Trustee | Indefinite term. Trustee since 2018. | James R. and Helen D. Russell Professor of Finance at the Kellogg School of Management, Northwestern University (2002–2011 and since 2013), Senior Associate Dean for Strategy and Academics (since 2020) and Chair of the Finance Department (2005–2007). Vice President, American Economic Association (2020–2021). Assistant Secretary for Economic Policy, United States Department of the Treasury (2011–2013). | 88 | Member of the Board of the Office of Finance, Federal Home Loan Banks; Director, Avant, LLC; |
| 108 | 2022 Annual Report ■ TIAA-CREF Lifecycle Index Funds |
| Nancy A. Eckl c/o Corporate Secretary 730 Third Avenue New York, NY 10017-3206 YOB: 1962 | Trustee | Indefinite term. Trustee since 2007. | Vice President (1990–2006), American Beacon Advisors, Inc., and of certain funds advised by American Beacon Advisors, Inc. | 88 | Independent Director, The Lazard Funds, Inc., Lazard Retirement Series, Inc., and Lazard Global Total Return and Income Fund, Inc. | |||||
| Michael A. Forrester c/o Corporate Secretary 730 Third Avenue New York, NY 10017-3206 YOB: 1967 | Trustee | Indefinite term. Trustee since 2007. | Chief Executive Officer (2014–2021) and Chief Operating Officer (2007–2014), Copper Rock Capital Partners, LLC. Chief Operating Officer, DDJ Capital Management (2003–2006). | 88 | Trustee, Dexter Southfield School; Member, Governing Council of the Independent Directors Council. | |||||
| Howell E. Jackson c/o Corporate Secretary 730 Third Avenue New York, NY 10017-3206 YOB: 1954 | Trustee | Indefinite term. Trustee since 2005. | James S. Reid, Jr. Professor of Law (since 2004), Senior Adviser to President and Provost (2010–2012), Acting Dean (2009), Vice Dean for Budget (2003–2006) and on the faculty (since 1989) of Harvard Law School. | 88 | Director, Build Commonwealth (non-profit organization). | |||||
| Thomas J. Kenny c/o Corporate Secretary 730 Third Avenue New York, NY 10017-3206 YOB: 1963 | Chairman of the Board and Trustee | Indefinite term. Trustee since 2011; Chairman for term ending June 30, 2023. Chairman since September 13, 2017. | Advisory Director (2010–2011), Partner (2004–2010), Managing Director (1999–2004) and Co-Head of Global Cash and Fixed Income Portfolio Management Team (2002–2010), Goldman Sachs Asset Management. | 88 | Director and Chair of the Finance and Investment Committee, Aflac Incorporated; Director and Investment Committee Member, Sansum Clinic; Director, ParentSquare; Member, University of California at Santa Barbara Arts and Lectures Advisory Council. |
| TIAA-CREF Lifecycle Index Funds ■ 2022 Annual Report | 109 |
| Trustees and officers (unaudited) | continued |
TIAA-CREF Funds ■ May 31, 2022
Trustees – concluded
| Name, Address and Year of Birth (“YOB”) | Position(s) Held with Fund | Term of Office and Length of Time Served | Principal Occupation(s) During Past 5 Years and other relevant experience and qualifications | Number of Portfolios in Fund complex Overseen by Trustee | Other Directorship(s) held by Trustee | |||||
| James M. Poterba c/o Corporate Secretary 730 Third Avenue New York, NY 10017-3206 YOB: 1958 | Trustee | Indefinite term. Trustee since 2006. | President and Chief Executive Officer (since 2008) and Program Director (1990–2008), National Bureau of Economic Research. Mitsui Professor of Economics, Massachusetts Institute of Technology (“MIT”) (since 1996); Affiliated Faculty Member of the Finance Group, Alfred P. Sloan School of Management (since 2014); Head (2006–2008) and Associate Head (1994–2000 and 2001–2006), Economics Department of MIT. | 88 | Director, National Bureau of Economic Research; Member, Congressional Budget Office Panel of Economic Advisers. | |||||
| Maceo K. Sloan c/o Corporate Secretary 730 Third Avenue New York, NY 10017-3206 YOB: 1949 | Trustee | Indefinite term. Trustee since 1999. | Chairman, President and Chief Executive Officer, Sloan Financial Group, Inc. (1991–2018); Chairman and Chief Executive Officer (1991–2016), Chief Investment Officer (1991–2013) and Chief Compliance Officer (2015–2016), NCM Capital Management Group, Inc.; Chairman, Chief Executive Officer (2003–2016), Chief Investment Officer (2003–2013) and Chief Compliance Officer (2015–2016), NCM Capital Advisers, Inc.; and Chairman, President and Principal Executive Officer, NCM Capital Investment Trust (2007–2012). | 88 | Director, TheraTrue Inc. |
| 110 | 2022 Annual Report ■ TIAA-CREF Lifecycle Index Funds |
Officers
| Name, Address and Year of Birth (“YOB”) | Position(s) Held with Fund | Term of Office and Length of Time Served | Principal Occupation(s) During Past 5 Years | |||
| Richard S. Biegen TIAA 730 Third Avenue New York, NY 10017-3206 YOB: 1962 | Chief Compliance Officer | One-year term. Chief Compliance Officer since 2008. | Senior Managing Director, TIAA. Chief Compliance Officer of the College Retirement Equities Fund (“CREF”), TIAA Separate Account VA-1, TIAA-CREF Funds and TIAA-CREF Life Funds (collectively, the “TIAA-CREF Fund Complex”). | |||
| Derek B. Dorn TIAA 730 Third Avenue New York, NY 10017-3206 YOB: 1976 | Senior Managing Director and Corporate Secretary | One-year term. Senior Managing Director and Corporate Secretary since 2020. | Senior Managing Director and Corporate Secretary of Teachers Insurance and Annuity Association of America (“TIAA”) and the TIAA-CREF Fund Complex. Formerly, Managing Director, Special Assistant to the CEO, and Managing Director, Regulatory Affairs, TIAA. Prior to joining TIAA, Mr. Dorn served as a partner at Davis & Harman LLP and an adjunct professor of Law at Georgetown University Law Center. | |||
| John L. Douglas TIAA 730 Third Avenue New York, NY 10017-3206 YOB: 1950 | Executive Vice President, Chief Legal, Risk and Compliance Officer | One-year term. Executive Vice President since 2021 and Chief Legal, Risk and Compliance Officer since 2022. | Senior Executive Vice President, Chief Legal, Risk and Compliance Officer of TIAA, Executive Vice President, Chief Legal, Risk and Compliance Officer of the TIAA-CREF Fund Complex. Formerly, Senior Executive Vice President, Senior Advisor to the CEO, and Senior Executive Vice President, Chief Advocacy & Oversight Officer, TIAA. Prior to joining TIAA, Mr. Douglas was a Partner at Davis Polk & Wardwell LLP. | |||
| W. Dave Dowrich TIAA 730 Third Avenue New York, NY 10017-3206 YOB: 1967 | Executive Vice President | One-year term. Executive Vice President since 2022. | Senior Executive Vice President and Chief Financial Officer of TIAA. Executive Vice President of the TIAA-CREF Fund Complex. Prior to joining TIAA, Mr. Dowrich served as Chief Financial Officer, International Businesses at Prudential Financial, Inc. |
| TIAA-CREF Lifecycle Index Funds ■ 2022 Annual Report | 111 |
| Trustees and officers (unaudited) | concluded |
TIAA-CREF Funds ■ May 31, 2022
Officers – concluded
| Name, Address and Year of Birth (“YOB”) | Position(s) Held with Fund | Term of Office and Length of Time Served | Principal Occupation(s) During Past 5 Years | |||
| Bradley Finkle TIAA 730 Third Avenue New York, NY 10017-3206 YOB: 1973 | Principal Executive Officer and President | One-year term. Principal Executive Officer and President since 2017. | Executive Vice President, Chief Administrative Officer of the Chief Operating Office, TIAA. Principal Executive Officer and President of the TIAA-CREF Funds and TIAA-CREF Life Funds. Formerly, Executive Vice President, Chief Operating Officer, Nuveen, President and Chief Executive Officer of CREF and TIAA Separate Account VA-1; Senior Managing Director, Co-Head Nuveen Equities & Fixed Income and President of TIAA Investments. | |||
| Jose Minaya TIAA 730 Third Avenue New York, NY 10017-3206 YOB: 1971 | Executive Vice President | One-year term. Executive Vice President since 2018. | Chief Executive Officer, Nuveen. Executive Vice President of the TIAA-CREF Fund Complex. Formerly, Executive Vice President, President and Chief Investment Officer, Nuveen; Executive Vice President, Chief Investment Officer and President, Nuveen Global Investments; and Senior Managing Director, President, Global Investments, TIAA. | |||
| Colbert Narcisse TIAA 730 Third Avenue New York, NY 10017-3206 YOB: 1965 | Executive Vice President | One-year term. Executive Vice President since 2022. | Senior Executive Vice President, Chief Product and Business Development Officer of TIAA. President and Chief Executive Officer of CREF and TIAA Separate Account VA-1. Executive Vice President of TIAA-CREF Funds and TIAA-CREF Life Funds. Formerly, Executive Vice President and Head of Advisory and Corporate Solutions, TIAA. Prior to joining TIAA, Mr. Narcisse served as Managing Director and Head of International Wealth Management and Head of Traditional and Alternative Investment Products at Morgan Stanley. |
| 112 | 2022 Annual Report ■ TIAA-CREF Lifecycle Index Funds |
| David G. Nason TIAA 730 Third Avenue New York, NY 10017-3206 YOB: 1970 | Executive Vice President | One-year term. Executive Vice President since 2020. | Senior Executive Vice President, Chief Operating Officer of TIAA. Executive Vice President of the TIAA-CREF Fund Complex. Formerly, Senior Executive Vice President, Chief Legal, Risk and Compliance Officer of TIAA. Executive Vice President, Chief Risk and Compliance Officer, TIAA. Prior to joining TIAA, Mr. Nason served as President and CEO of GE Energy Financial Services. | |||
| E. Scott Wickerham TIAA 730 Third Avenue New York, NY 10017-3206 YOB: 1973 | Principal Financial Officer, Principal Accounting Officer and Treasurer | One-year term. Principal Financial Officer, Principal Accounting Officer and Treasurer since 2017. | Senior Managing Director, Head, Publics Investment Finance, Nuveen. Principal Financial Officer, Principal Accounting Officer and Treasurer of the TIAA-CREF Fund Complex; and Vice President and Controller of the Nuveen Funds. Formerly, Managing Director, Head, TC Fund Administration, Nuveen. | |||
| Sean N. Woodroffe TIAA 730 Third Avenue New York, NY 10017-3206 YOB: 1963 | Executive Vice President | One-year term. Executive Vice President since 2018. | Senior Executive Vice President, Chief People Officer of TIAA, and Executive Vice President of the TIAA-CREF Fund Complex. Prior to joining TIAA, Mr. Woodroffe served as Chief People Officer at National Life Group. |
Please note that the Funds’ Statement of Additional Information (SAI) includes additional information about the Funds’ trustees and is available, without charge, through our website, TIAA.org, or by calling 800 223-1200.
| TIAA-CREF Lifecycle Index Funds ■ 2022 Annual Report | 113 |
Approval of investment management agreement (unaudited)
Board renewal of the investment management agreement for the TIAA-CREF Lifecycle Index Funds
The Board of Trustees (the “Board” or the “Trustees”) of the TIAA-CREF Funds (the “Trust”) determines whether to initially approve and periodically renew the investment management agreement (the “Agreement”) between Teachers Advisors, LLC (“Advisors”) and the Trust on behalf of each series of the Trust. Under the Agreement, Advisors is responsible for providing investment advisory services to each series of the Trust and overseeing the everyday operations and other service providers of the Trust. Below is a summary of the process the Board undertook related to its most recent renewal of the Agreement with respect to each series of the TIAA-CREF Lifecycle Index Funds (the “Funds”).
Section 15(c) of the Investment Company Act of 1940, as amended (the “1940 Act”), requires that, after an initial period of up to two years, the Agreement for each Fund will remain in effect only if the Board, including a majority of those Trustees who have no direct or indirect interest in the Agreement, and who are independent Trustees because they are not “interested persons” of the Trust, as that term is defined in the 1940 Act, annually renews the Agreement. None of the Trustees is an interested person of the Trust under the 1940 Act. Rather, they are all deemed to be independent Trustees.
Under normal circumstances, Section 15(c) requires any initial approval or annual renewal of an investment management agreement to be made at an in-person meeting of the Board. However, due to the COVID-19 pandemic, the Securities and Exchange Commission (“SEC”) issued and extended a temporary, conditional exemptive order (the “SEC Order”), permitting mutual fund boards to vote to approve matters subject to the Section 15(c) in-person approval requirement at a meeting that is not held in person if the board determines that reliance on the SEC Order is necessary or appropriate due to prevailing circumstances related to the current or potential effects of COVID-19 and the board ratifies any action taken pursuant to the SEC Order at its next in-person meeting.
Overview of the renewal process
The Board held a virtual meeting via videoconference on March 11, 2022, in order to consider the annual renewal of the Agreement with respect to each applicable Fund using the process established by the Board described further below. At the outset of the meeting, the Board considered reliance upon the SEC Order and determined that such reliance was necessary due to, among other considerations, COVID-19 pandemic-related public health protocols imposed for health and safety reasons. The Board noted that it would ratify actions taken at this meeting pursuant to the SEC Order at its next in-person meeting.
| 114 | 2022 Annual Report ■ TIAA-CREF Lifecycle Index Funds |
As part of the Board’s established process, the Board delegated certain tasks to its Operations Committee. Among these tasks, the Operations Committee or certain of its designated members worked with Advisors, other Board members and legal counsel to the Trustees to develop guidance and specific requests relating to the types of information to be provided to the Board in connection with the proposed contract renewals.
Among other matters, the Operations Committee or certain of its designated members, following consultations with representatives of Advisors, other Board members, legal counsel to the Trustees and legal counsel to Advisors and the Trust, confirmed or established certain guidance regarding the preparation of reports to be provided to the Board with respect to each Fund by the Board Reporting and Compliance unit of Broadridge Financial Solutions, Inc. (“Broadridge”), using data from Lipper, Inc., an independent provider of investment company data. The Operations Committee considered that Broadridge is widely recognized as a leading provider of comparative analyses used by independent directors and trustees of investment companies during their advisory contract review processes.
Based on guidance provided by the Operations Committee or certain of its designated members on behalf of the Board, Broadridge produced, among other information, comparative performance and expense data for each Fund, including data relating to each Fund’s management fee rate, total expense ratio, short-term and long-term investment performance, brokerage commission costs and portfolio turnover rate (as applicable). Broadridge compared this data, as relevant, for each Fund against a universe of investment companies (except for brokerage commission costs) and against a more selective peer group of mutual funds with similar investment objectives and strategies, each of which was selected by Broadridge, and also compared the performance of each Fund against one or more appropriate broad-based indices. In each case, Broadridge summarized, and the Board considered, the methodologies Broadridge employed to provide the data contained in its reports. In addition, Broadridge represented to the Board that its reports were designed specifically to provide the Board with the fee, expense and performance information that is necessary to help the Board satisfy its duties under Section 15(c) of the 1940 Act. Broadridge also represented that the purpose of its reports is to provide an objective view of each Fund’s relative position regarding the level of fees, expenses and performance against a competitive peer group and universe (as applicable) selected by Broadridge (and not Advisors or the Board). The Board considered the propriety of each Fund’s applicable peer group as selected by Broadridge and use of the Institutional Class shares as the base share class for comparison purposes.
Among other matters, the Board also considered information from Advisors to facilitate the Trustees’ evaluation of the reasonableness of any profits earned by Advisors with respect to its services to each Fund pursuant to the Agreement.
| TIAA-CREF Lifecycle Index Funds ■ 2022 Annual Report | 115 |
Approval of investment management agreement (unaudited)
Legal counsel for the Trustees also requested on behalf of the Board, and Advisors provided, information that was designed to assist the Board in its consideration of whether to renew the Agreement for each Fund. In addition to the data provided by Broadridge as described above, this information included, but was not limited to, the following: (1) further information relating to each Fund’s investment performance and a narrative analysis of the performance of each Fund that had underperformed certain Board-specified criteria, together with an explanation of any events that had a material impact on the Fund’s performance during that period; (2) a description of any fee waiver or expense reimbursement arrangements that were proposed or were in place during the prior year and the extent to which such arrangements would be continued or modified in the coming year; (3) a comparison of each Fund’s management fee rate and performance to other accounts with comparable strategies managed by Advisors or certain of its affiliates; (4) any “fall-out” benefits that accrued or were identified as reasonably likely to accrue to Advisors or its affiliates due to their relationship with the Funds in addition to the Funds’ direct fee payments to Advisors pursuant to the Agreement; (5) information regarding Advisors’ financial resources, senior professional personnel, overall staffing levels, portfolio manager compensation arrangements, capacity to manage the Funds at current and foreseeable asset levels, insurance coverage, portfolio trading, soft dollar usage and best execution practices, and any actual and potential conflicts of interest identified by Advisors in connection with rendering services to the Funds; (6) information as to any profits earned by Advisors in connection with its services pursuant to the Agreement; (7) a copy of the Agreement and certain related agreements between the Funds and affiliates of Advisors; (8) a copy of Advisors’ Form ADV as filed with the SEC (which was presented only to legal counsel for the Trustees); and (9) draft narrative explanations to be included in the shareholder reports of reasons why the Board should renew the Agreement. The Trustees were also provided with performance ratings of Morningstar, Inc. (“Morningstar”), which is a widely recognized mutual fund ranking service. In addition, the Board received information from management on the continued impact of the COVID-19 pandemic and certain geopolitical events on the Teachers Insurance and Annuity Association of America (“TIAA”) enterprise’s operations generally and on the Funds’ operations and performance.
On March 3, 2022, the Board held a virtual meeting via videoconference with legal counsel to the Trustees to discuss Advisors’ materials, which led to the Trustees providing additional questions to, and requesting additional information from, Advisors. Subsequently, at the March 11, 2022 meeting, the Trustees were given the opportunity to, and did, ask additional questions and they discussed responses from Advisors to the Board’s follow-up questions and requests presented by the Board after its initial review of the information described above.
In considering whether to renew the Agreement with respect to each Fund, the Board considered various factors, including: (1) the nature, extent and quality of services provided or to be provided by Advisors to the Fund; (2) the Fund’s investment
| 116 | 2022 Annual Report ■ TIAA-CREF Lifecycle Index Funds |
continued
performance; (3) the costs of the services provided to the Fund and the profits realized or potential profits to be realized (if any) by Advisors and its affiliates from their relationship with the Fund; (4) fees charged to comparable mutual funds by other advisers; (5) the extent to which economies of scale have been realized or are anticipated to be realized as the Fund grows; (6) how such economies of scale are shared with the Fund for the benefit of its investors, such as, if applicable, through management fee breakpoints; (7) comparisons, if applicable, of the services provided by Advisors to, and the fee rates and performance of, the Fund to other clients to whom Advisors provides comparable services; and (8) any other benefits identified by Advisors derived or anticipated to be derived by Advisors or its affiliates from their relationship with the Fund. As a general matter, the Board considered these factors, and any other factors deemed relevant by the Trustees, in their totality, and no single factor was identified as being the determining factor in deciding whether to renew the Agreement.
In addition to the March 11, 2022 meeting that included Advisors’ personnel, the Trustees met in executive sessions, at which no representatives of Advisors were present, to discuss the proposed renewal of the Agreement for each Fund. The Board also received and considered information from its legal counsel as to certain relevant guidance that relates to the renewal process under Section 15(c) of the 1940 Act and certain other legal authorities.
While the contract renewal process included a series of discussions and meetings leading up to the March 11, 2022 meeting, the oversight and evaluation of Advisors’ services to the Funds by the Board and its Committees is an ongoing process. The Board, as well as its Committees, considered reports on various investment and operational topics that had been identified by the Board or its Committees for review in the year since the last annual renewal process. Further, at their regularly scheduled meetings, the Board and its Investment Committee and its other Committees receive and consider, among other matters, information regarding the performance of the Funds. Thus, in reaching its decisions regarding the renewal of the Agreement for each Fund, the Board took into account the information described herein and other information provided to the Board and its Committees throughout the year.
The Board received and considered both Trust-level and Fund-specific information, but made its renewal determinations on a Fund-by-Fund basis. In deciding whether to renew the Agreement for each Fund, each Trustee may have accorded different weight to different factors and, thus, may have had a different basis for his or her ultimate decision to vote to renew the Agreement for each Fund. At its meeting on March 11, 2022, Board members voted unanimously to renew the Agreement for each Fund. Set forth below is a summary of the primary factors the Board considered with respect to each Fund.
| TIAA-CREF Lifecycle Index Funds ■ 2022 Annual Report | 117 |
Approval of investment management agreement (unaudited)
The nature, extent and quality of services
The Board considered the level and depth of knowledge of Advisors, including the professional experience and qualifications of its personnel. The Board also considered that Advisors is an experienced investment adviser that has managed the Funds since their operations commenced. Investment professionals at Advisors also manage various other funds and accounts of the Trust, College Retirement Equities Fund, the TIAA-CREF Life Funds and TIAA Separate Account VA-1, as well as advise and sub-advise other investment companies and vehicles. Under the Agreement, Advisors is responsible for, among other duties: managing the assets of the Funds (which are funds of funds that may invest their assets in the securities of affiliated and unaffiliated investment companies or other investment pools, referred to as “Underlying Funds”), including conducting research, identifying investments and placing orders to buy and sell shares of Underlying Funds for the Funds’ investment portfolios; active daily monitoring of the Funds’ investment portfolios; reporting on the investment performance and other metrics of the Funds to the Board on a regular basis; responding to Fund flows; compliance monitoring; coordinating the activities of each Fund’s service providers; and overseeing the provision of various administrative services to the Funds. The Board considered that Advisors has carried out these responsibilities in a competent and professional manner. The Board also considered that Advisors has committed significant resources to supporting the series of the Trust, including the Funds. It also considered Advisors’ compliance program and resources and its compliance record with respect to the Funds.
The Board also considered, among other factors, the performance of each Fund, as discussed below. In addition, the Board considered the nature and quality of non-portfolio management services provided by Advisors and its affiliates. In this regard, the Board considered its ongoing review of the performance of certain affiliated and unaffiliated service providers, including the quality of services provided by those firms and Advisors’ oversight of those service providers and the outsourcing of certain services to other firms.
During its review, the Board noted its ongoing review of the level of personnel and other resources available to Advisors to provide portfolio management and other services to the Funds, including the impact of recent and anticipated regulatory requirements and operational changes on such resources, so as to assess the adequacy of the resources devoted to these services. Based on all factors considered, the Board concluded that the nature, extent, and quality of services provided by Advisors to each Fund under the Agreement was reasonable.
Investment performance
The Board considered the investment performance of each Fund, over the periods indicated in the Fund-by-Fund synopsis below. The Board considered each Fund’s performance as compared to its peer group and peer universe (as applicable) and its benchmark index. For details regarding each Fund’s performance, see the Fund-by-Fund synopsis below. The Board concluded that, under the totality of circumstances considered, the investment performance of each Fund was reasonable.
| 118 | 2022 Annual Report ■ TIAA-CREF Lifecycle Index Funds |
continued
Cost and profitability
The Board considered financial and profitability data relating to Advisors’ services to the Funds for the calendar year 2021. The Board considered Advisors’ profit calculations with respect to its services to each Fund both before and after taking into account the costs incurred directly or indirectly by Advisors in connection with the distribution of shares of the Fund. The Board considered that this data included the effect of the Fund’s unique fee structure where the Funds invest in fee-waived Class W shares of the TIAA-CREF Underlying Funds and the Funds pay the equivalent of these Underlying Funds’ management fees and other expenses directly as part of the Funds’ management fee rates under the Agreement, along with the Funds’ existing annual management fee rate of 0.10% of average daily net assets. The Board considered that the Broadridge fee comparisons would be affected because most of the Funds’ peers do not have a similar fee structure.
The Board acknowledged the reasonableness of having management fee rates which permit Advisors to maintain and improve the quality of services provided to the Funds and recognized the entrepreneurial and other risks assumed by Advisors in managing the Funds. The Board also considered that Advisors had agreed to waive a portion of each Fund’s fees through at least September 30, 2022. The Board also acknowledged certain reimbursements of expenses above specified amounts undertaken by Advisors with respect to many of the Underlying Funds which, in turn, reduce the management fees charged to the Funds. The Board also recognized Advisors’ commitment to reimburse Fund expenses to the extent that total annual operating expenses exceeded certain specified amounts. The Board considered that Advisors had calculated that it incurred losses with respect to each Fund under the Agreement for the one-year period ended December 31, 2021.
Fees charged by other advisers
The Board considered comparative information regarding each Fund’s contractual and effective management fee rates and the contractual and effective management fee rates paid by similar mutual funds to other advisers, as analyzed by Broadridge and reflected in the Fund-by-Fund synopsis below. The Board acknowledged Advisors’ assertion that, while the Funds’ expense structure makes the Funds’ contractual and effective management fee rates appear higher as compared to its peers (most of whom have a traditional funds of funds fee structure), the Funds’ total expenses were favorable as compared to most of their peers. In this regard, the Board also considered the inherent limitations of such comparisons in light of uncertainty as to how the fees of such similar mutual funds are set and potentially material differences between a Fund and its comparable mutual funds. The Board considered Broadridge’s treatment of all fund fee waivers, regardless of their type, as management fee waivers, which could materially impact how the Funds’ actual management fee rates compare to those of similar mutual funds. Additionally, the Board considered the potential limitations of such comparisons due to, among other factors, the fact that, in
| TIAA-CREF Lifecycle Index Funds ■ 2022 Annual Report | 119 |
Approval of investment management agreement (unaudited)
many instances, Broadridge based its comparisons on financial data relating to fiscal periods that differed from the period for which the Fund’s data were derived. Based on all factors considered, the Board concluded that the management fee rates under the Agreement with respect to each Fund were reasonable in relation to those charged by appropriate groups of comparable mutual funds.
Economies of scale
The Board considered whether Advisors has experienced or is anticipated to experience economies of scale in connection with the operation of each Fund, and whether any such economies are shared with the Funds. The Board also considered that because Advisors operated each Fund at a loss, and has waived a portion of its management fees for each of the Funds, there had been little opportunity to pass on economies of scale to Fund shareholders. Based on all factors considered, the Board concluded that the Funds’ management fee rate schedules were reasonable in light of current economies of scale considerations and current asset levels.
Fee and performance comparisons with other Advisors clients
The Board considered that Advisors provides similar investment management services to other investment companies. The Board noted that Advisors provides funds of funds management services to the TIAA-CREF Lifestyle Funds and the TIAA-CREF Life Balanced Fund, with annual management fee rates of 0.10% of average daily net assets, and the TIAA-CREF Managed Allocation Fund, for which Advisors receives no management fee. The Board also considered that Advisors also manages the TIAA-CREF Lifecycle Funds, which have the same fee structure as the Funds. The Board also discussed the performance of these other funds of funds while discussing the performance of the Funds. Based on all factors considered, the Board concluded that the management fee rates under the Agreement with respect to each Fund were reasonable in relation to those charged by Advisors to its comparable clients.
Other benefits
The Board also considered additional “fall-out benefits” to Advisors and its affiliates arising from the Agreement. Such benefits include, among others, other fees paid by the Funds to Advisors or its affiliates for other services, such as distribution and administration, and investment-related benefits, such as economies of scale to the extent the Funds share investment resources and/or personnel with other clients of Advisors and the ability to incubate strategies within one or more Funds that could be subsequently utilized to manage other non-Fund products. Advisors and its affiliates may also benefit from the level of business and relationships the Funds have with certain service providers. Advisors and/or its affiliates also may benefit to the extent that the Funds add scale to the TIAA-CREF Underlying Funds or other
| 120 | 2022 Annual Report ■ TIAA-CREF Lifecycle Index Funds |
continued
affiliated underlying funds. Additionally, the Funds may be utilized as investment options for other products and businesses of Advisors and its affiliates, such as variable products, fund of funds and 529 education savings plans. Also, Advisors and its affiliates may benefit from their relationship with the Funds to the extent that this relationship results in potential investors viewing TIAA, of which Advisors is an indirect, wholly-owned subsidiary, as a leading retirement plan provider in the academic and non-profit markets and as a single source for all their financial service needs. The Board concluded that other benefits to Advisors and its affiliates arising from the Agreement were reasonable in light of various relevant factors.
Fund-by-fund synopsis of factors
The Board considered the following specific factors (among others) in connection with its determination to renew the Agreement with respect to each Fund. If a Fund is described in the following discussions as being in the “1st” quintile, it is in the best of five groups (that is, the group has the best performance or the lowest expenses, as the case may be). References below to quintiles are based on data provided to the Board in the reports prepared by Broadridge. The specific management fee, expense and performance factors outlined below are based on the Institutional Class of each Fund. Because the Institutional Class generally has lower non-management expenses than the other classes of these Funds, the expenses and performance of these other classes will differ from the expenses and performance shown for the Institutional Class. All time periods referenced below are ended December 31, 2021. Under the Morningstar rating system, an Overall Morningstar Rating of 5 stars is the highest (best) rating category and 1 star is the lowest (worst) rating category. The Morningstar data is as of December 31, 2021. Statements below regarding a Fund’s “effective management fee rate” refer to the overall effective blended fee rate that applied to that Fund after taking into account any breakpoints in the management fee rate schedule for the Fund and any applicable fee waivers and/or expense reimbursements. Statements below regarding “net loss” refer to Advisors’ calculation that it incurred a loss for the services that it rendered to a Fund during 2021 under the Agreement.
Lifecycle Index Retirement Income Fund
| • | As discussed above, instead of incurring the TIAA-CREF Underlying Fund expenses indirectly, the Fund invests in the fee-waived Class W of the TIAA-CREF Underlying Funds and pays such expenses directly. These expenses may fluctuate daily based upon the Fund’s actual allocations to the Underlying Funds. The Fund also incurs an annual asset allocation fee of 0.10% of average daily net assets as part of its management fee rate. As of December 31, 2021, the Fund’s effective management fee rate was 0.052% of average daily net assets, which includes the effect of a voluntary waiver provided by Advisors extending through September 30, 2022. |
| TIAA-CREF Lifecycle Index Funds ■ 2022 Annual Report | 121 |
Approval of investment management agreement (unaudited)
| • | The Fund’s total expense ratio, actual management fee rate (including the waiver) and contractual management fee rate ranked 1 out of 3 funds, 2 out of 3 funds and 1 out of 3 funds within the group of comparable funds selected by Broadridge for expense comparison purposes (“Expense Group”), respectively. The Fund’s total expense ratio, actual management fee rate (including the waiver) and contractual management fee rate were in the 1st, 1st and 3rd quintiles of the universe of comparable funds selected by Broadridge for expense comparison purposes (“Expense Universe”), respectively. |
| • | The Fund ranked 1 out of 3 funds, 2 out of 3 funds, 1 out of 3 funds and 1 out of 2 funds within the group of comparable funds selected by Broadridge for performance comparison purposes (“Performance Group”) for the one-, three, five- and ten-year periods, respectively. The Fund was in the 2nd, 1st, 1st and 1st quintiles of the universe of comparable funds selected by Broadridge for performance comparison (“Performance Universe”) for the one-, three, five- and ten-year periods, respectively. |
| • | The Fund received an Overall Morningstar Rating of 4 stars. |
| • | Advisors calculated that it incurred a net loss with respect to its services to the Fund for the one-year period without taking into account profits Advisors earned in the aggregate with respect to the Underlying Funds that are also managed by Advisors in which this Fund invests. |
Lifecycle Index 2010 Fund
| • | As discussed above, instead of incurring the TIAA-CREF Underlying Fund expenses indirectly, the Fund invests in the fee-waived Class W of the TIAA-CREF Underlying Funds and pays such expenses directly. These expenses may fluctuate daily based upon the Fund’s actual allocations to the Underlying Funds. The Fund also incurs an annual asset allocation fee of 0.10% of average daily net assets as part of its management fee rate. As of December 31, 2021, the Fund’s effective management fee rate was 0.056% of average daily net assets, which includes the effect of a voluntary waiver provided by Advisors extending through September 30, 2022. |
| • | The Fund’s total expense ratio, actual management fee rate (including the waiver) and contractual management fee rate each ranked 2 out of 2 funds within its Expense Group. The Fund’s total expense ratio, actual management fee rate (including the waiver) and contractual management fee rate were in the 2nd, 2nd and 4th quintiles of its Expense Universe, respectively. |
| • | The Fund ranked 2 out of 2 funds, 1 out of 2 funds, 1 out of 2 funds and 1 out of 1 fund within its Performance Group for the one-, three-, five- and ten-year periods, respectively. The Fund was in the 3rd, 1st, 1st and 1st quintiles of its Performance Universe for the one-, three-, five- and ten-year periods, respectively. |
| • | The Fund received an Overall Morningstar Rating of 5 stars. |
| • | Advisors calculated that it incurred a net loss with respect to its services to the Fund for the one-year period without taking into account profits Advisors earned in the aggregate with respect to the Underlying Funds that are also managed by Advisors in which this Fund invests. |
| 122 | 2022 Annual Report ■ TIAA-CREF Lifecycle Index Funds |
continued
Lifecycle Index 2015 Fund
| • | As discussed above, instead of incurring the TIAA-CREF Underlying Fund expenses indirectly, the Fund invests in the fee-waived Class W of the TIAA-CREF Underlying Funds and pays such expenses directly. These expenses may fluctuate daily based upon the Fund’s actual allocations to the Underlying Funds. The Fund also incurs an annual asset allocation fee of 0.10% of average daily net assets as part of its management fee rate. As of December 31, 2021, the Fund’s effective management fee rate was 0.069% of average daily net assets, which includes the effect of a voluntary waiver provided by Advisors extending through September 30, 2022. |
| • | The Fund’s total expense ratio, actual management fee rate (including the waiver) and contractual management fee rate each ranked 2 out of 2 funds within its Expense Group. The Fund’s total expense ratio, actual management fee rate (including the waiver) and contractual management fee rate were in the 2nd, 2nd and 3rd quintiles of its Expense Universe, respectively. |
| • | The Fund ranked 1 out of 2 funds, 1 out of 2 funds, 1 out of 2 funds and 1 out of 1 fund within its Performance Group for the one-, three-, five- and ten-year periods, respectively. The Fund was in the 3rd, 1st, 1st and 1st quintiles of its Performance Universe for the one-, three-, five- and ten-year periods, respectively. |
| • | The Fund received an Overall Morningstar Rating of 4 stars. |
| • | Advisors calculated that it incurred a net loss with respect to its services to the Fund for the one-year period without taking into account profits Advisors earned in the aggregate with respect to the Underlying Funds that are also managed by Advisors in which this Fund invests. |
Lifecycle Index 2020 Fund
| • | As discussed above, instead of incurring the TIAA-CREF Underlying Fund expenses indirectly, the Fund invests in the fee-waived Class W of the TIAA-CREF Underlying Funds and pays such expenses directly. These expenses may fluctuate daily based upon the Fund’s actual allocations to the Underlying Funds. The Fund also incurs an annual asset allocation fee of 0.10% of average daily net assets as part of its management fee rate. As of December 31, 2021, the Fund’s effective management fee rate was 0.079% of average daily net assets, which includes the effect of a voluntary waiver provided by Advisors extending through September 30, 2022. |
| • | The Fund’s total expense ratio, actual management fee rate (including the waiver) and contractual management fee rate ranked 2 out of 4 funds, 4 out of 4 funds and 2 out of 4 funds within its Expense Group, respectively. The Fund’s total expense ratio, actual management fee rate (including the waiver) and contractual management fee rate were in the 2nd, 3rd and 2nd quintiles of its Expense Universe, respectively. |
| • | The Fund ranked 2 out of 4 funds, 1 out of 4 funds, 1 out of 4 funds and 1 out of 1 fund within its Performance Group for the one-, three-, five- and ten-year periods, respectively. The Fund was in the 3rd, 2nd, 1st and 1st quintiles of its Performance Universe for the one-, three-, five- and ten-year periods, respectively. |
| • | The Fund received an Overall Morningstar Rating of 5 stars. |
| TIAA-CREF Lifecycle Index Funds ■ 2022 Annual Report | 123 |
Approval of investment management agreement (unaudited)
| • | Advisors calculated that it incurred a net loss with respect to its services to the Fund for the one-year period without taking into account profits Advisors earned in the aggregate with respect to the Underlying Funds that are also managed by Advisors in which this Fund invests. |
Lifecycle Index 2025 Fund
| • | As discussed above, instead of incurring the TIAA-CREF Underlying Fund expenses indirectly, the Fund invests in the fee-waived Class W of the TIAA-CREF Underlying Funds and pays such expenses directly. These expenses may fluctuate daily based upon the Fund’s actual allocations to the Underlying Funds. The Fund also incurs an annual asset allocation fee of 0.10% of average daily net assets as part of its management fee rate. As of December 31, 2021, the Fund’s effective management fee rate was 0.081% of average daily net assets, which includes the effect of a voluntary waiver provided by Advisors extending through September 30, 2022. |
| • | The Fund’s total expense ratio, actual management fee rate (including the waiver) and contractual management fee rate ranked 2 out of 5 funds, 5 out of 5 funds and 2 out of 5 funds within its Expense Group, respectively. The Fund’s total expense ratio, actual management fee rate (including the waiver) and contractual management fee rate were in the 1st, 4th and 2nd quintiles of its Expense Universe, respectively. |
| • | The Fund ranked 2 out of 5 funds, 2 out of 5 funds, 2 out of 5 funds and 1 out of 2 funds within its Performance Group for the one-, three-, five- and ten-year periods, respectively. The Fund was in the 2nd, 2nd, 1st and 1st quintiles of its Performance Universe for the one-, three-, five- and ten-year periods, respectively. |
| • | The Fund received an Overall Morningstar Rating of 4 stars. |
| • | Advisors calculated that it incurred a net loss with respect to its services to the Fund for the one-year period without taking into account profits Advisors earned in the aggregate with respect to the Underlying Funds that are also managed by Advisors in which this Fund invests. |
Lifecycle Index 2030 Fund
| • | As discussed above, instead of incurring the TIAA-CREF Underlying Fund expenses indirectly, the Fund invests in the fee-waived Class W of the TIAA-CREF Underlying Funds and pays such expenses directly. These expenses may fluctuate daily based upon the Fund’s actual allocations to the Underlying Funds. The Fund also incurs an annual asset allocation fee of 0.10% of average daily net assets as part of its management fee rate. As of December 31, 2021, the Fund’s effective management fee rate was 0.082% of average daily net assets, which includes the effect of a voluntary waiver provided by Advisors extending through September 30, 2022. |
| • | The Fund’s total expense ratio, actual management fee rate (including the waiver) and contractual management fee rate ranked 2 out of 5 funds, 5 out of 5 funds and 2 out of 5 funds within its Expense Group, respectively. The Fund’s total expense ratio, actual management fee rate (including the waiver) and contractual management fee rate were in the 1st, 4th and 2nd quintiles of its Expense Universe, respectively. |
| 124 | 2022 Annual Report ■ TIAA-CREF Lifecycle Index Funds |
continued
| • | The Fund ranked 2 out of 5 funds, 2 out of 5 funds, 2 out of 5 funds and 1 out of 2 funds within its Performance Group for the one-, three-, five- and ten-year periods, respectively. The Fund was in the 3rd, 2nd, 1st and 1st quintiles of its Performance Universe for the one-, three-, five- and ten-year periods, respectively. |
| • | The Fund received an Overall Morningstar Rating of 4 stars. |
| • | Advisors calculated that it incurred a net loss with respect to its services to the Fund for the one-year period without taking into account profits Advisors earned in the aggregate with respect to the Underlying Funds that are also managed by Advisors in which this Fund invests. |
Lifecycle Index 2035 Fund
| • | As discussed above, instead of incurring the TIAA-CREF Underlying Fund expenses indirectly, the Fund invests in the fee-waived Class W of the TIAA-CREF Underlying Funds and pays such expenses directly. These expenses may fluctuate daily based upon the Fund’s actual allocations to the Underlying Funds. The Fund also incurs an annual asset allocation fee of 0.10% of average daily net assets as part of its management fee rate. As of December 31, 2021, the Fund’s effective management fee rate was 0.083% of average daily net assets, which includes the effect of a voluntary waiver provided by Advisors extending through September 30, 2022. |
| • | The Fund’s total expense ratio, actual management fee rate (including the waiver) and contractual management fee rate ranked 2 out of 5 funds, 5 out of 5 funds and 2 out of 5 funds within its Expense Group, respectively. The Fund’s total expense ratio, actual management fee rate (including the waiver) and contractual management fee rate were in the 1st, 4th and 2nd quintiles of its Expense Universe, respectively. |
| • | The Fund ranked 3 out of 5 funds, 2 out of 5 funds, 2 out of 5 funds and 1 out of 2 funds within its Performance Group for the one-, three-, five- and ten-year periods, respectively. The Fund was in the 4th, 2nd, 2nd and 1st quintiles of its Performance Universe for the one-, three-, five- and ten-year periods, respectively. |
| • | The Fund received an Overall Morningstar Rating of 4 stars. |
| • | Advisors calculated that it incurred a net loss with respect to its services to the Fund for the one-year period without taking into account profits Advisors earned in the aggregate with respect to the Underlying Funds that are also managed by Advisors in which this Fund invests. |
Lifecycle Index 2040 Fund
| • | As discussed above, instead of incurring the TIAA-CREF Underlying Fund expenses indirectly, the Fund invests in the fee-waived Class W of the TIAA-CREF Underlying Funds and pays such expenses directly. These expenses may fluctuate daily based upon the Fund’s actual allocations to the Underlying Funds. The Fund also incurs an annual asset allocation fee of 0.10% of average daily net assets as part of its management fee rate. As of December 31, 2021, the Fund’s effective management fee rate was 0.083% of average daily net assets, which includes the effect of a voluntary waiver provided by Advisors extending through September 30, 2022. |
| TIAA-CREF Lifecycle Index Funds ■ 2022 Annual Report | 125 |
Approval of investment management agreement (unaudited)
| • | The Fund’s total expense ratio, actual management fee rate (including the waiver) and contractual management fee rate ranked 2 out of 5 funds, 5 out of 5 funds and 2 out of 5 funds within its Expense Group, respectively. The Fund’s total expense ratio, actual management fee rate (including the waiver) and contractual management fee rate were in the 1st, 4th and 2nd quintiles of its Expense Universe, respectively. |
| • | The Fund ranked 4 out of 5 funds, 1 out of 5 funds, 1 out of 5 funds and 1 out of 2 funds within its Performance Group for the one-, three-, five- and ten-year periods, respectively. The Fund was in the 4th, 2nd, 2nd and 1st quintiles of its Performance Universe for the one-, three-, five- and ten-year periods, respectively. |
| • | The Fund received an Overall Morningstar Rating of 5 stars. |
| • | Advisors calculated that it incurred a net loss with respect to its services to the Fund for the one-year period without taking into account profits Advisors earned in the aggregate with respect to the Underlying Funds that are also managed by Advisors in which this Fund invests. |
Lifecycle Index 2045 Fund
| • | As discussed above, instead of incurring the TIAA-CREF Underlying Fund expenses indirectly, the Fund invests in the fee-waived Class W of the TIAA-CREF Underlying Funds and pays such expenses directly. These expenses may fluctuate daily based upon the Fund’s actual allocations to the Underlying Funds. The Fund also incurs an annual asset allocation fee of 0.10% of average daily net assets as part of its management fee rate. As of December 31, 2021, the Fund’s effective management fee rate was 0.082% of average daily net assets, which includes the effect of a voluntary waiver provided by Advisors extending through September 30, 2022. |
| • | The Fund’s total expense ratio, actual management fee rate (including the waiver) and contractual management fee rate ranked 2 out of 5 funds, 5 out of 5 funds and 2 out of 5 funds within its Expense Group, respectively. The Fund’s total expense ratio, actual management fee rate (including the waiver) and contractual management fee rate were in the 1st, 4th and 2nd quintiles of its Expense Universe, respectively. |
| • | The Fund ranked 4 out of 5 funds, 1 out of 5 funds, 1 out of 5 funds and 1 out of 2 funds within its Performance Group for the one-, three-, five- and ten-year periods, respectively. The Fund was in the 3rd, 2nd, 1st and 1st quintiles of its Performance Universe for the one-, three-, five- and ten-year periods, respectively. |
| • | The Fund received an Overall Morningstar Rating of 5 stars. |
| • | Advisors calculated that it incurred a net loss with respect to its services to the Fund for the one-year period without taking into account profits Advisors earned in the aggregate with respect to the Underlying Funds that are also managed by Advisors in which this Fund invests. |
| 126 | 2022 Annual Report ■ TIAA-CREF Lifecycle Index Funds |
continued
Lifecycle Index 2050 Fund
| • | As discussed above, instead of incurring the TIAA-CREF Underlying Fund expenses indirectly, the Fund invests in the fee-waived Class W of the TIAA-CREF Underlying Funds and pays such expenses directly. These expenses may fluctuate daily based upon the Fund’s actual allocations to the Underlying Funds. The Fund also incurs an annual asset allocation fee of 0.10% of average daily net assets as part of its management fee rate. As of December 31, 2021, the Fund’s effective management fee rate was 0.079% of average daily net assets, which includes the effect of a voluntary waiver provided by Advisors extending through September 30, 2022. |
| • | The Fund’s total expense ratio, actual management fee rate (including the waiver) and contractual management fee rate ranked 2 out of 5 funds, 5 out of 5 funds and 2 out of 5 funds within its Expense Group, respectively. The Fund’s total expense ratio, actual management fee rate (including the waiver) and contractual management fee rate were in the 1st, 4th and 2nd quintiles of its Expense Universe, respectively. |
| • | The Fund ranked 4 out of 5 funds, 1 out of 5 funds, 1 out of 5 funds and 1 out of 2 funds within its Performance Group for the one-, three-, five- and ten-year periods, respectively. The Fund was in the 3rd, 1st, 1st and 1st quintiles of its Performance Universe for the one-, three-, five- and ten-year periods, respectively. |
| • | The Fund received an Overall Morningstar Rating of 5 stars. |
| • | Advisors calculated that it incurred a net loss with respect to its services to the Fund for the one-year period without taking into account profits Advisors earned in the aggregate with respect to the Underlying Funds that are also managed by Advisors in which this Fund invests. |
Lifecycle Index 2055 Fund
| • | As discussed above, instead of incurring the TIAA-CREF Underlying Fund expenses indirectly, the Fund invests in the fee-waived Class W of the TIAA-CREF Underlying Funds and pays such expenses directly. These expenses may fluctuate daily based upon the Fund’s actual allocations to the Underlying Funds. The Fund also incurs an annual asset allocation fee of 0.10% of average daily net assets as part of its management fee rate. As of December 31, 2021, the Fund’s effective management fee rate was 0.073% of average daily net assets, which includes the effect of a voluntary waiver provided by Advisors extending through September 30, 2022. |
| • | The Fund’s total expense ratio, actual management fee rate (including the waiver) and contractual management fee rate ranked 2 out of 5 funds, 5 out of 5 funds and 2 out of 5 funds within its Expense Group, respectively. The Fund’s total expense ratio, actual management fee rate and contractual management fee rate (including the waiver) were in the 1st, 4th and 1st quintiles of its Expense Universe, respectively. |
| • | The Fund ranked 4 out of 5 funds, 1 out of 5 funds, 1 out of 5 funds and 1 out of 2 funds within its Performance Group for the one-, three, five- and ten-year periods, respectively. The Fund was in the 3rd, 1st, 1st and 1st quintiles of its Performance Universe for the one-, three- five-, and ten-year periods, respectively. |
| TIAA-CREF Lifecycle Index Funds ■ 2022 Annual Report | 127 |
Approval of investment management agreement (unaudited)
| • | The Fund received an Overall Morningstar Rating of 5 stars. |
| • | Advisors calculated that it incurred a net loss with respect to its services to the Fund for the one-year period without taking into account profits Advisors earned in the aggregate with respect to the Underlying Funds that are also managed by Advisors in which this Fund invests. |
Lifecycle Index 2060 Fund
| • | As discussed above, instead of incurring the TIAA-CREF Underlying Fund expenses indirectly, the Fund invests in the fee-waived Class W of the TIAA-CREF Underlying Funds and pays such expenses directly. These expenses may fluctuate daily based upon the Fund’s actual allocations to the Underlying Funds. The Fund also incurs an annual asset allocation fee of 0.10% of average daily net assets as part of its management fee rate. As of December 31, 2021, the Fund’s effective management fee rate was 0.049% of average daily net assets, which includes the effect of a voluntary waiver provided by Advisors extending through September 30, 2022. |
| • | The Fund’s total expense ratio, actual management fee rate (including the waiver) and contractual management fee rate ranked 2 out of 4 funds, 4 out of 4 funds and 2 out of 4 funds within its Expense Group, respectively. The Fund’s total expense ratio, actual management fee rate (including the waiver) and contractual management fee rate were in the 1st, 4th and 1st quintiles of its Expense Universe, respectively. |
| • | The Fund ranked 3 out of 4 funds, 1 out of 4 funds and 1 out of 4 funds within its Performance Group for the one-, three- and five-year periods, respectively. The Fund was in the 2nd, 1st and 1st quintiles of its Performance Universe for the one-, three- and five-year periods, respectively. |
| • | The Fund received an Overall Morningstar Rating of 5 stars. |
| • | Advisors calculated that it incurred a net loss with respect to its services to the Fund for the one-year period without taking into account profits Advisors earned in the aggregate with respect to the Underlying Funds that are also managed by Advisors in which this Fund invests. |
Lifecycle Index 2065 Fund
| • | As discussed above, instead of incurring the TIAA-CREF Underlying Fund expenses indirectly, the Fund invests in the fee-waived Class W of the TIAA-CREF Underlying Funds and pays such expenses directly. These expenses may fluctuate daily based upon the Fund’s actual allocations to the Underlying Funds. The Fund also incurs an annual asset allocation fee of 0.10% of average daily net assets as part of its management fee rate. As of December 31, 2021, the Fund’s effective management fee rate was 0.000% of average daily net assets, which includes the effect of a voluntary waiver provided by Advisors extending through September 30, 2022. |
| • | The Fund’s total expense ratio, actual management fee rate (including the waiver) and contractual management fee rate each ranked 1 out of 3 funds within its Expense Group. The Fund’s total expense ratio, actual management fee rate (including the waiver) and contractual management fee rate were in the 1st, 1st and 2nd quintiles of its Expense Universe, respectively. |
| 128 | 2022 Annual Report ■ TIAA-CREF Lifecycle Index Funds |
concluded
| • | The Fund ranked 2 out of 3 funds within its Performance Group for each of the one-year and since inception periods. The Fund was in the 2nd and 3rd quintiles of its Performance Universe for each of the one-year and since inception periods, respectively. |
| • | The Fund is too new to have received an Overall Morningstar Rating. |
| • | Advisors calculated that it incurred a net loss with respect to its services to the Fund for the one-year period without taking into account profits Advisors earned in the aggregate with respect to the Underlying Funds that are also managed by Advisors in which this Fund invests. |
Based primarily on the foregoing factors and conclusions, the Board renewed the Agreement for each Fund.
| TIAA-CREF Lifecycle Index Funds ■ 2022 Annual Report | 129 |
Liquidity risk management program (unaudited)
Discussion of the operation and effectiveness of the Funds’ liquidity risk management program
In compliance with Rule 22e-4 under the Investment Company Act of 1940, as amended (the “Liquidity Rule”), each series of the Trust covered by this Report (the “Funds”) has adopted and implemented a liquidity risk management program (the “Program”), which is reasonably designed to assess and manage the Funds’ liquidity risk. The Program consists of various provisions relating to assessing and managing Fund liquidity risk, as discussed further below. The Funds’ Board of Trustees (the “Board”) previously approved the designation of Advisors (the “Administrator”) as Program administrator. The Liquidity Monitoring and Analysis Team (the “LMAT”) carries out day-to-day Program management with oversight by the Liquidity Oversight Committee (the “LOSC”). Personnel from the Administrator and Nuveen Fund Advisors, LLC, an affiliate of the Administrator, comprise the LMAT and LOSC.
At a February 15, 2022 Board meeting, the Administrator provided the Board with a written report addressing the Program’s operation, adequacy, and effectiveness of implementation for the period from January 1, 2021 through December 31, 2021 (the “Review Period”), as required under the Liquidity Rule. The report noted that the Program has been and continues to be adequately and effectively implemented to monitor and (as applicable) respond to the Funds’ liquidity developments.
In accordance with the Program, the LMAT assesses each Fund’s liquidity risk no less frequently than annually based on various factors, such as (i) the Fund’s investment strategy and the liquidity of portfolio investments, (ii) cash flow projections, and (iii) holdings of cash and cash equivalents and borrowing arrangements and other funding sources. Certain factors are considered under both normal and reasonably foreseeable stressed conditions.
Each Fund portfolio investment is classified into one of four liquidity categories (including “highly liquid investments” and “illiquid investments,” discussed below). The classification is based on a determination of how long it is reasonably expected to take to convert the investment into cash, or sell or dispose of the investment, in current market conditions without significantly changing the market value of the investment. Liquidity classification determinations take into account various market, trading, and investment-specific considerations, as well as market depth, and utilize third-party vendor data.
Any Fund that does not primarily hold highly liquid investments must, among other things, determine a minimum percentage of Fund net assets that must be invested in highly liquid investments (a “Highly Liquid Investment Minimum”). During the Review Period, each Fund primarily held highly liquid investments and therefore was exempt from the requirement to adopt a Highly Liquid Investment Minimum and to comply with the related requirements under the Liquidity Rule.
| 130 | 2022 Annual Report ■ TIAA-CREF Lifecycle Index Funds |
The Liquidity Rule also limits the Funds’ investments in illiquid investments. Specifically, the Liquidity Rule prohibits acquisition of illiquid investments if doing so would result in the Fund holding more than 15% of its net assets in illiquid investments and requires certain reporting anytime a Fund’s holdings of illiquid investments exceed 15% of net assets. During the Review Period, no Fund exceeded the 15% limit on illiquid investments.
| TIAA-CREF Lifecycle Index Funds ■ 2022 Annual Report | 131 |
Additional information about index providers (unaudited)
Russell Indexes
Source: London Stock Exchange Group plc and its group undertakings (collectively, the “LSE Group”). © LSE Group 2022. FTSE Russell is a trading name of certain of the LSE Group companies. “FTSE®,” “Russell®” and “FTSE Russell®” are trademarks of the relevant LSE Group companies and are used by any other LSE Group company under license. All rights in the FTSE Russell indexes or data vest in the relevant LSE Group company which owns the index or the data. Neither LSE Group nor its licensors accept any liability for any errors or omissions in the indexes or data and no party may rely on any indexes or data contained in this communication. No further distribution of data from the LSE Group is permitted without the relevant LSE Group company’s express written consent. The LSE Group does not promote, sponsor or endorse the content of this communication.
MSCI Indexes
Source: MSCI. The MSCI information may only be used for your internal use, may not be reproduced or redisseminated in any form and may not be used as a basis for or a component of any financial instruments or products or indices. None of the MSCI information is intended to constitute investment advice or a recommendation to make (or refrain from making) any kind of investment decision and may not be relied on as such. Historical data and analysis should not be taken as an indication or guarantee of any future performance analysis, forecast or prediction. The MSCI information is provided on an “as is” basis and the user of this information assumes the entire risk of any use made of this information. MSCI, each of its affiliates and each other person involved in or related to compiling, computing or creating any MSCI information (collectively, the “MSCI Parties”) expressly disclaims all warranties (including, without limitation, any warranties of originality, accuracy, completeness, timeliness, non-infringement, merchantability and fitness for a particular purpose) with respect to this information. Without limiting any of the foregoing, in no event shall any MSCI Party have any liability for any direct, indirect, special, incidental, punitive, consequential (including, without limitation, lost profits) or any other damages. (www.msci.com)
Bloomberg Indexes
Source: Bloomberg Index Services Limited. BLOOMBERG® is a trademark and service mark of Bloomberg Finance L.P. and its affiliates (collectively “Bloomberg”). Bloomberg or Bloomberg’s licensors own all proprietary rights in the Bloomberg Indices. Bloomberg neither approves nor endorses this material, nor guarantees the accuracy or completeness of any information herein, nor makes any warranty, express or implied, as to the results to be obtained therefrom and, to the maximum extent allowed by law, neither shall have any liability or responsibility for injury or damages arising in connection therewith.
Standard & Poor’s Index
The Indexes in the S&P Target Date Index Series are products of S&P Dow Jones Indices LLC, a division of S&P Global, or its affiliates (“SPDJI”), and have been
| 132 | 2022 Annual Report ■ TIAA-CREF Lifecycle Index Funds |
licensed for use by the funds. Standard & Poor’s® and S&P® are registered trademarks of Standard & Poor’s Financial Services LLC, a division of S&P Global (“S&P”); Dow Jones® is a registered trademark of Dow Jones Trademark Holdings LLC (“Dow Jones”). It is not possible to invest directly in an index. The funds are not sponsored, endorsed, sold or promoted by SPDJI, Dow Jones, S&P, any of their respective affiliates (collectively, “S&P Dow Jones Indices”). S&P Dow Jones Indices does not make any representation or warranty, express or implied, to the owners of the funds or any member of the public regarding the advisability of investing in securities generally or in the funds particularly or the ability of the S&P Target Date Index Series to track general market performance. Past performance of an index is not an indication or guarantee of future results. S&P Dow Jones Indices’ only relationship to the funds with respect to the S&P Target Date Index Series is the licensing of the Indexes and certain trademarks, service marks and/or trade names of S&P Dow Jones Indices and/or its licensors. The Indexes in the S&P Target Date Index Series are determined, composed and calculated by S&P Dow Jones Indices without regard to the funds. S&P Dow Jones Indices has no obligation to take the needs of the funds or the owners of the funds into consideration in determining, composing or calculating the S&P Target Date Index Series. S&P Dow Jones Indices is not responsible for and has not participated in the determination of the prices, and amount of the funds or the timing of the issuance or sale of fund shares or in the determination or calculation of the equation by which fund shares are to be converted into cash, surrendered or redeemed, as the case may be. S&P Dow Jones Indices has no obligation or liability in connection with the administration, marketing or trading of the funds. There is no assurance that investment products based on the S&P Target Date Index Series will accurately track index performance or provide positive investment returns. S&P Dow Jones Indices LLC is not an investment or tax advisor. A tax advisor should be consulted to evaluate the impact of any tax-exempt securities on portfolios and the tax consequences of making any particular investment decision. Inclusion of a security within an index is not a recommendation by S&P Dow Jones Indices to buy, sell, or hold such security, nor is it considered to be investment advice.
S&P DOW JONES INDICES DOES NOT GUARANTEE THE ADEQUACY, ACCURACY, TIMELINESS AND/OR THE COMPLETENESS OF THE S&P TARGET DATE INDEX SERIES OR ANY DATA RELATED THERETO OR ANY COMMUNICATION, INCLUDING BUT NOT LIMITED TO, ORAL OR WRITTEN COMMUNICATION (INCLUDING ELECTRONIC COMMUNICATIONS) WITH RESPECT THERETO. S&P DOW JONES INDICES SHALL NOT BE SUBJECT TO ANY DAMAGES OR LIABILITY FOR ANY ERRORS, OMISSIONS, OR DELAYS THEREIN. S&P DOW JONES INDICES MAKES NO EXPRESS OR IMPLIED WARRANTIES, AND EXPRESSLY DISCLAIMS ALL WARRANTIES, OF MERCHANTABILITY OR FITNESS FOR A PARTICULAR PURPOSE OR USE OR AS TO RESULTS TO BE OBTAINED BY THE FUNDS, OWNERS OF THE FUNDS, OR ANY OTHER PERSON OR ENTITY FROM THE USE OF THE S&P TARGET DATE INDEX SERIES OR WITH RESPECT TO ANY DATA RELATED THERETO. WITHOUT LIMITING ANY OF THE FOREGOING, IN NO EVENT WHATSOEVER SHALL S&P DOW JONES INDICES BE LIABLE FOR ANY INDIRECT, SPECIAL, INCIDENTAL, PUNITIVE, OR CONSEQUENTIAL DAMAGES INCLUDING BUT NOT LIMITED TO, LOSS OF PROFITS, TRADING LOSSES, LOST TIME OR GOODWILL, EVEN IF THEY HAVE BEEN ADVISED OF THE POSSIBILITY OF SUCH DAMAGES, WHETHER IN CONTRACT, TORT, STRICT LIABILITY, OR OTHERWISE. THERE ARE NO THIRD PARTY BENEFICIARIES OF ANY AGREEMENTS OR ARRANGEMENTS BETWEEN S&P DOW JONES INDICES AND THE FUNDS, OTHER THAN THE LICENSORS OF S&P DOW JONES INDICES.
| TIAA-CREF Lifecycle Index Funds ■ 2022 Annual Report | 133 |
[This page intentionally left blank.]
[This page intentionally left blank.]
[This page intentionally left blank.]
[This page intentionally left blank.]
[This page intentionally left blank.]
Websites
TIAA.org
nuveen.com
Automated telephone service
800-842-2252
24 hours a day, 7 days a week
For the hearing- or speech-impaired
800-842-2755
8 a.m. to 10 p.m. (ET), Monday–Friday
You should carefully consider the investment objectives, risks, charges and expenses of any fund before investing. For a prospectus that contains this and other information, please visit TIAA.org, or call 800-842-2252. Please read the prospectus carefully before investing. Investment, insurance and annuity products are not Federal Deposit Insurance Corporation (FDIC) insured, are not bank guaranteed, are not bank deposits, are not insured by any federal government agency, are not a condition to any banking service or activity, and may lose value. Nuveen, a subsidiary of TIAA, provides investment advice and portfolio management services through a dozen affiliated registered investment advisers. Nuveen Securities, LLC and TIAA-CREF Individual & Institutional Services, LLC, members FINRA, distribute securities products.
This material is for informational or educational purposes only and does not constitute fiduciary investment advice under ERISA, a securities recommendation under all securities laws, or an insurance product recommendation under state insurance laws or regulations. This material does not take into account any specific objectives or circumstances of any particular investor, or suggest any specific course of action. Investment decisions should be made based on the investor’s own objectives and circumstances.
©2022 Teachers Insurance and Annuity Association of America—College Retirement Equities Fund, 730 Third Avenue, New York, NY 10017-3206
 | 730 Third Avenue New York, NY 10017-3206 | PRESORTED STANDARD U.S. POSTAGE PAID TIAA |

 | Printed on paper containing recycled fiber |
 | We’re fond of paper…in its original form. Switch to eDelivery at TIAA.org/eDelivery | |
| 2217970 | A12027 (7/22) |
| 730 Third Avenue New York, NY 10017-3206 |
| Printed on paper containing recycled fiber |
| 2217970 | A12027 (7/22) |
| 730 Third Avenue New York, NY 10017-3206 |
| 2217970 | A12027 (7/22) |
| TIAA-CREF Funds | May 31, 2022 | |
TIAA-CREF
Lifestyle Funds
The annual report contains the audited financial statements.
| Fund name | Institutional Class | Advisor Class | Premier Class | Retirement Class | Retail Class |
| Lifestyle Income Fund | TSITX | TSIHX | TSIPX | TLSRX | TSILX |
| Lifestyle Conservative Fund | TCSIX | TLSHX | TLSPX | TSCTX | TSCLX |
| Lifestyle Moderate Fund | TSIMX | TSMHX | TSMPX | TSMTX | TSMLX |
| Lifestyle Growth Fund | TSGGX | TSGHX | TSGPX | TSGRX | TSGLX |
| Lifestyle Aggressive Growth Fund | TSAIX | TSAHX | TSAPX | TSARX | TSALX |
Annual
Report
Contents
This annual report contains information about certain TIAA-CREF Funds and describes their results for the twelve months ended May 31, 2022. The report contains four main sections:
| • | A letter from Brad Finkle, Principal Executive Officer and President of the TIAA-CREF Funds and TIAA-CREF Life Funds. |
| • | The fund performance section compares each fund’s investment returns with those of its composite benchmark and broad market index. |
| • | The portfolios of investments list the underlying funds in which each fund had investments as of May 31, 2022. |
| • | The financial statements provide detailed information about the operations and financial condition of each fund. |
The views and opinions expressed in this report are through the end of the period, as stated on the cover of this report. They are subject to change at any time based on a variety of factors. As such, they are not guarantees of future performance or investment results and should not be taken as investment advice. To see the risks of investing in any fund, please read the latest prospectus.
As always, you should carefully consider the investment objectives, risks, charges and expenses of any fund before investing. For a prospectus that contains this and other important information, please visit our websites at TIAA.org or nuveen.com, or call 800-842-2252 for the Institutional, Advisor, Premier and Retirement classes or 800-223-1200 for the Retail Class. We urge you to read the prospectus carefully before investing.
| TIAA-CREF Lifestyle Funds ■ 2022 Annual Report | 3 |
Global financial markets produced negative results for the twelve months ended May 31, 2022. As inflationary pressures persisted, the Federal Reserve responded by raising short-term interest rates in March and May, and indicated that further increases were likely. U.S. equities lost ground as the economy contracted in the first quarter of 2022—the first negative quarter since 2020. A widening trade gap and lower government spending contributed to the slowdown, but spending by consumers and businesses remained strong. Foreign stocks also posted losses, with emerging markets falling more than international developed markets. U.S. fixed-income securities declined as U.S. Treasury yields rose across all maturities (bond prices move in the opposite direction of yields). These market conditions were reflected in the performance of the TIAA-CREF Lifestyle Funds by way of their investments in various asset classes through underlying funds.
| • | All five TIAA-CREF Lifestyle Funds declined for the period and underperformed their respective composite benchmarks. (All fund returns are for the Institutional Class.) |
| • | Returns for the Institutional Class ranged from –6.6% for the Lifestyle Income Fund to –10.3% for the Lifestyle Aggressive Growth Fund. |
Both stocks and bonds posted losses
U.S. equities declined for the twelve months as inflation, rising interest rates and Russia’s invasion of Ukraine weighed on the financial markets. Furthermore, oil prices rose to levels not seen since 2008, while unemployment fell to rates approaching pre-pandemic lows. The broad domestic stock market, as represented by the Russell 3000® Index, returned –3.7%. The Fed raised the federal funds target rate to 0.75%–1.00% in May 2022 and decided to begin reducing its portfolio of bonds that had been purchased to support the economy.
International stocks trailed their U.S. counterparts. The MSCI ACWI ex USA Investable Market Index (IMI), which measures the performance of large-, mid-and small-cap equities in 22 of 23 developed-markets countries (excluding the United States) and 24 emerging-markets countries, returned –12.5% in U.S.-dollar terms. Despite widespread market losses, the economies in the 19-nation euro area grew at a moderate rate in the fourth quarter of 2021 and the first quarter of 2022. Among developing markets, the Chinese economy continued to expand at a solid pace through the first quarter of 2022.
U.S. investment-grade bonds lost ground as U.S. Treasury yields rose substantially across all maturities. The domestic investment-grade fixed-rate bond market, as measured by the Bloomberg U.S. Aggregate Bond Index, returned –8.2% for the period.
| 4 | 2022 Annual Report ■ TIAA-CREF Lifestyle Funds |

Brad Finkle
Planning for an unpredictable future
For more than a decade, equity investors have enjoyed a long stretch of above-average returns, while bond performance during the same period has not kept pace. Now we may be at an inflection point. Equities have become more volatile, tempered by a host of factors that could affect global economic growth. Fixed-income securities, after years of historically low interest rates, are now offering higher yields, which is good news for bond investors seeking higher income. Meanwhile, real estate continues to benefit from high demand and limited supply, which enhances property values and bolsters rental income.
The challenge of planning for the future always lies in its inherent uncertainty. As a result, we believe that a prudent strategy is to stay invested in a diversified portfolio that includes multiple asset classes. The TIAA-CREF Lifestyle Funds use dynamic diversification strategies designed to help mitigate the effects of market volatility and keep you on track to achieve your financial goals. Of course, diversification does not guarantee against market losses, and past performance cannot guarantee future results.
We thank you for trusting us to manage your investments through the TIAA-CREF Lifestyle Funds. If you have any questions or concerns, please consult your financial advisor or call a TIAA financial consultant at 800-842-2252. You can also reach us online by visiting TIAA.org. We always stand ready to assist you.
/s/ Brad Finkle
Brad Finkle
Principal Executive Officer and President of the TIAA-CREF Funds and TIAA-CREF Life Funds
| TIAA-CREF Lifestyle Funds ■ 2022 Annual Report | 5 |
Portfolio holdings
The complete portfolios of investments for the Lifestyle Funds begin on page 28 of this report. You can obtain complete lists of the holdings of the Lifestyle Funds and of the underlying TIAA-CREF Funds in which the Lifestyle Funds invest as of the most recently completed fiscal quarter in the following ways:
| • | By visiting our websites at TIAA.org or nuveen.com; or |
| • | By calling us at 800-842-2252 to request a copy, which will be provided free of charge. |
You can also obtain a complete list of the Lifestyle Funds’ portfolio holdings as of the most recently completed fiscal quarter, and for prior quarter-ends, from our Securities and Exchange Commission (SEC) Form N-CSR and Form N-PORT filings. Form N-CSR filings are as of May 31 or November 30; Form N-PORT filings are as of the last day of February or August 31. Copies of these forms are available:
| • | Through the Electronic Data Gathering and Retrieval System (EDGAR) on the SEC’s website at sec.gov; or |
| • | From the SEC’s Office of Investor Education and Advocacy. Call 202-551-8090 for more information. |
Proxy voting
A description of our proxy voting policies and procedures for the underlying TIAA-CREF Funds of the Lifestyle Funds can be found on our website at TIAA.org or on the SEC’s website at sec.gov. You can also call us at 800-842-2252 to request a free copy. A report of how the Lifestyle Funds’ underlying TIAA-CREF Funds voted during the most recently completed twelve-month period ended June 30 can be found on our website or on Form N-PX at sec.gov.
Contacting TIAA
There are three easy ways to contact us: by email, using the Contact Us link under Get Help at the top of our home page; by mail at TIAA, 730 Third Avenue, New York, NY 10017-3206; or by phone at 800-842-2252.
Fund management
The Lifestyle Funds are managed by a portfolio management team of Teachers Advisors, LLC. The members of this team are responsible for the day-to-day investment management of the funds.
| 6 | 2022 Annual Report ■ TIAA-CREF Lifestyle Funds |
Composite benchmarks
Each Lifestyle Fund uses a composite benchmark that represents the general market sectors in which that fund invests. These may include U.S. equity (stocks), international equity (foreign stocks), fixed income and short-term fixed income. A fund’s composite benchmark may combine the following public indexes in proportions that reflect the fund’s target market sector allocations:
| • | The Russell 3000® Index (U.S. equity) measures the performance of the stocks of the 3,000 largest publicly traded U.S. companies, based on market capitalization. The index measures the performance of about 98% of the total market capitalization of the publicly traded U.S. equity market. |
| • | The MSCI ACWI ex USA Investable Market Index (IMI) (international equity) measures the performance of large-, mid- and small-cap equities across 22 of 23 developed-markets countries (excluding the United States) and 24 emerging-markets countries. The index is a free-float-adjusted market capitalization index that covers approximately 99% of the global equity opportunity set outside the United States. |
| • | The Bloomberg U.S. Aggregate Bond Index (fixed income) measures the performance of the domestic investment-grade fixed-rate bond market, including government and corporate securities, agency mortgage pass-through securities, asset-backed securities and commercial mortgage-backed securities. |
| • | The Bloomberg U.S. 1–3 Year Government/Credit Bond Index (short-term fixed income) measures the performance of U.S. Treasury and agency securities and corporate bonds with 1- to 3-year maturities. |
Broad market indexes
The returns shown against the broad-based securities market index compare a fund’s average annual returns with a broad measure of market performance. The Morningstar Target Risk Index Series is an asset allocation index series comprised of constituent Morningstar indexes and reflects global equity market exposures of 20%, 40%, 60%, 80% or 95% based on an asset allocation methodology from Ibbotson Associates, a Morningstar company. The returns of the Morningstar Target Risk Index Series reflect multi-asset class exposure and similar risk profiles as the Funds.
You cannot invest directly in any index. Index returns do not include a deduction for fees or expenses. For additional details about the benchmark indexes, please read the funds’ latest prospectus.
| TIAA-CREF Lifestyle Funds ■ 2022 Annual Report | 7 |
About the funds’ benchmarks
London Stock Exchange Group plc and its group undertakings (collectively, the “LSE Group”). © LSE Group 2022. FTSE Russell is a trading name of certain of the LSE Group companies. “FTSE®,” “Russell®” and “FTSE Russell®” are trademarks of the relevant LSE Group companies and are used by any other LSE Group company under license. All rights in the FTSE Russell indexes or data vest in the relevant LSE Group company which owns the index or the data. Neither LSE Group nor its licensors accept any liability for any errors or omissions in the indexes or data and no party may rely on any indexes or data contained in this communication. No further distribution of data from the LSE Group is permitted without the relevant LSE Group company’s express written consent. The LSE Group does not promote, sponsor or endorse the content of this communication. MSCI makes no express or implied warranties or representations and shall have no liability whatsoever with respect to any MSCI data contained herein. This report is not approved, reviewed or produced by MSCI.
| 8 | 2022 Annual Report ■ TIAA-CREF Lifestyle Funds |
Important information about expenses
All shareholders of the TIAA-CREF Funds incur ongoing costs, including management fees and other fund expenses. They may also incur transactional costs for redemptions or account maintenance fees.
The expense examples that appear in this report are intended to help you understand your ongoing costs only (in U.S. dollars) and do not reflect transactional costs. The examples are designed to help you compare these ongoing costs with the ongoing costs of investing in other mutual funds.
The expenses shown do not include redemption fees or account maintenance fees, which may or may not be applicable, as described in the prospectus. If such fees were included, your total costs for investing in the funds would be higher. Note also that shareholders of the TIAA-CREF Funds do not incur a sales charge for purchases, reinvested dividends or other distributions.
The examples are based on an investment of $1,000 invested at the beginning of the six-month period and held for the entire period (December 1, 2021–May 31, 2022).
Actual expenses
The first line of the two lines listed for each fund in the tables uses the Fund’s actual expenses and its actual rate of return. You may use the information in this line, together with the amount you invested, to estimate the expenses that you paid over the six-month period.
Simply divide your account value by $1,000 (for example, an $8,600 account value divided by $1,000 = 8.6), then multiply the result by the number in the first line under the heading “Expenses paid during period” to estimate the expenses you paid during the six-month period. All of the funds have a contractual fee reimbursement. Had these not been in effect, fund expenses would have been higher.
Hypothetical example for comparison purposes
The second line in each Fund’s entry shows a hypothetical account value and hypothetical expenses based on the share class’ actual expense ratio for the six-month period and an assumed 5%-per-year rate of return before expenses. This was not the Fund’s actual return.
This hypothetical example cannot be used to estimate the actual expenses you paid for the period, but rather allows you to compare the ongoing costs of investing in the Fund with the costs of other funds. To do so, compare this 5% hypothetical example with the 5% hypothetical examples that appear in the shareholder reports of other mutual funds.
| TIAA-CREF Lifestyle Funds ■ 2022 Annual Report | 9 |
Important information about expenses
Expense examples
Six months ended May 31, 2022
| Lifestyle Funds Institutional Class | Beginning account value (12/1/21 | ) | Ending account value (5/31/22 | ) | Expenses paid during period (12/1/21–5/31/22 | * ) | Effective expenses paid during period (12/1/21–5/31/22 | † ) | ||||||||
| Income Fund actual return | $ 1,000.00 | $ 931.04 | $ 0.48 | $ 2.07 | ||||||||||||
| 5% annual hypothetical return | 1,000.00 | 1,024.43 | 0.50 | 2.17 | ||||||||||||
| Conservative Fund actual return | 1,000.00 | 913.93 | 0.48 | 2.34 | ||||||||||||
| 5% annual hypothetical return | 1,000.00 | 1,024.43 | 0.50 | 2.47 | ||||||||||||
| Moderate Fund actual return | 1,000.00 | 895.88 | 0.43 | 2.55 | ||||||||||||
| 5% annual hypothetical return | 1,000.00 | 1,024.48 | 0.45 | 2.72 | ||||||||||||
| Growth Fund actual return | 1,000.00 | 892.36 | 0.28 | 2.59 | ||||||||||||
| 5% annual hypothetical return | 1,000.00 | 1,024.63 | 0.30 | 2.77 | ||||||||||||
| Aggressive Growth Fund actual return | 1,000.00 | 888.49 | 0.14 | 2.68 | ||||||||||||
| 5% annual hypothetical return | 1,000.00 | 1,024.78 | 0.15 | 2.87 | ||||||||||||
| * | “Expenses paid during period” is based on each fund’s actual expense ratio for the most recent fiscal half-year, multiplied by the average account value over the six-month period, multiplied by 182/365. There were 182 days in the six months ended May 31, 2022. The expense charges of one or more of the fund’s share classes may at times reflect a reimbursement. Please see the prospectus for an explanation, including the date on which this reimbursement is scheduled to end. Without such reimbursement, the expenses of the affected share classes would be higher and their performance lower. The expense ratio for the period was 0.10% for the Income Fund, 0.10% for the Conservative Fund, 0.09% for the Moderate Fund, 0.06% for the Growth Fund and 0.03% for the Aggressive Growth Fund. |
| † | “Effective expenses paid during period” is based on each fund’s total expense ratio for the most recent fiscal half-year, which includes the fund’s own expense ratio plus its pro rata share of its underlying funds’ expenses (which the fund bears through its investment in the underlying funds). For the six-month period, the total annualized weighted average expense ratio was 0.43% for the Income Fund, 0.49% for the Conservative Fund, 0.54% for the Moderate Fund, 0.55% for the Growth Fund and 0.57% for the Aggressive Growth Fund. |
| 10 | 2022 Annual Report ■ TIAA-CREF Lifestyle Funds |
Important information about expenses
Expense examples
Six months ended May 31, 2022
| Lifestyle Funds Advisor Class | Beginning account value (12/1/21 | ) | Ending account value (5/31/22 | ) | Expenses paid during period (12/1/21–5/31/22 | * ) | Effective expenses paid during period (12/1/21–5/31/22 | † ) | ||||||||
| Income Fund actual return | $ 1,000.00 | $ 930.69 | $ 0.72 | $ 2.31 | ||||||||||||
| 5% annual hypothetical return | 1,000.00 | 1,024.18 | 0.76 | 2.42 | ||||||||||||
| Conservative Fund actual return | 1,000.00 | 913.37 | 0.95 | 2.81 | ||||||||||||
| 5% annual hypothetical return | 1,000.00 | 1,023.93 | 1.01 | 2.97 | ||||||||||||
| Moderate Fund actual return | 1,000.00 | 896.07 | 0.85 | 2.93 | ||||||||||||
| 5% annual hypothetical return | 1,000.00 | 1,024.03 | 0.91 | 3.13 | ||||||||||||
| Growth Fund actual return | 1,000.00 | 892.04 | 0.71 | 3.02 | ||||||||||||
| 5% annual hypothetical return | 1,000.00 | 1,024.18 | 0.76 | 3.23 | ||||||||||||
| Aggressive Growth Fund actual return | 1,000.00 | 888.11 | 0.52 | 3.06 | ||||||||||||
| 5% annual hypothetical return | 1,000.00 | 1,024.38 | 0.56 | 3.28 | ||||||||||||
| * | “Expenses paid during period” is based on each fund’s actual expense ratio for the most recent fiscal half-year, multiplied by the average account value over the six-month period, multiplied by 182/365. There were 182 days in the six months ended May 31, 2022. The expense charges of one or more of the fund’s share classes may at times reflect a waiver or reimbursement. Please see the prospectus for an explanation, including the date on which this waiver or reimbursement is scheduled to end. Without such waiver or reimbursement, the expenses of the affected share classes would be higher and their performance lower. The annualized expense ratio for the six-month period was 0.15% for the Income Fund, 0.20% for the Conservative Fund, 0.18% for the Moderate Fund, 0.15% for the Growth Fund and 0.11% for the Aggressive Growth Fund. |
| † | “Effective expenses paid during period” is based on each fund’s total expense ratio for the most recent fiscal half-year, which includes the fund’s own expense ratio plus its pro rata share of its underlying funds’ expenses (which the fund bears through its investment in the underlying funds). For the six-month period, the total annualized weighted average expense ratio was 0.48% for the Income Fund, 0.59% for the Conservative Fund, 0.62% for the Moderate Fund, 0.64% for the Growth Fund and 0.65% for the Aggressive Growth Fund. |
| TIAA-CREF Lifestyle Funds ■ 2022 Annual Report | 11 |
Important information about expenses
Expense examples
Six months ended May 31, 2022
| Lifestyle Funds Premier Class | Beginning account value (12/1/21 | ) | Ending account value (5/31/22 | ) | Expenses paid during period (12/1/21–5/31/22 | * ) | Effective expenses paid during period (12/1/21–5/31/22 | † ) | ||||||||
| Income Fund actual return | $ 1,000.00 | $ 930.39 | $ 1.20 | $ 2.79 | ||||||||||||
| 5% annual hypothetical return | 1,000.00 | 1,023.68 | 1.26 | 2.92 | ||||||||||||
| Conservative Fund actual return | 1,000.00 | 912.52 | 1.19 | 3.05 | ||||||||||||
| 5% annual hypothetical return | 1,000.00 | 1,023.68 | 1.26 | 3.23 | ||||||||||||
| Moderate Fund actual return | 1,000.00 | 896.01 | 1.18 | 3.31 | ||||||||||||
| 5% annual hypothetical return | 1,000.00 | 1,023.68 | 1.26 | 3.53 | ||||||||||||
| Growth Fund actual return | 1,000.00 | 893.16 | 0.99 | 3.35 | ||||||||||||
| 5% annual hypothetical return | 1,000.00 | 1,023.88 | 1.06 | 3.58 | ||||||||||||
| Aggressive Growth Fund actual return | 1,000.00 | 887.81 | 0.85 | 3.44 | ||||||||||||
| 5% annual hypothetical return | 1,000.00 | 1,024.03 | 0.91 | 3.68 | ||||||||||||
| * | “Expenses paid during period” is based on each fund’s actual expense ratio for the most recent fiscal half-year, multiplied by the average account value over the six-month period, multiplied by 182/365. There were 182 days in the six months ended May 31, 2022. The expense charges of one or more of the fund’s share classes may at times reflect a waiver or reimbursement. Please see the prospectus for an explanation, including the date on which this waiver or reimbursement is scheduled to end. Without such waiver or reimbursement, the expenses of the affected share classes would be higher and their performance lower. The annualized expense ratio for the six-month period was 0.25% for the Income Fund, 0.25% for the Conservative Fund, 0.25% for the Moderate Fund, 0.21% for the Growth Fund and 0.18% for the Aggressive Growth Fund. |
| † | “Effective expenses paid during period” is based on each fund’s total expense ratio for the most recent fiscal half-year, which includes the fund’s own expense ratio plus its pro rata share of its underlying funds’ expenses (which the fund bears through its investment in the underlying funds). For the six-month period, the total annualized weighted average expense ratio was 0.58% for the Income Fund, 0.64% for the Conservative Fund, 0.70% for the Moderate Fund, 0.71% for the Growth Fund and 0.73% for the Aggressive Growth Fund. |
| 12 | 2022 Annual Report ■ TIAA-CREF Lifestyle Funds |
Important information about expenses
Expense examples
Six months ended May 31, 2022
| Lifestyle Funds Retirement Class | Beginning account value (12/1/21 | ) | Ending account value (5/31/22 | ) | Expenses paid during period (12/1/21–5/31/22 | * ) | Effective expenses paid during period (12/1/21–5/31/22 | † ) | ||||||||
| Income Fund actual return | $ 1,000.00 | $ 929.79 | $ 1.68 | $ 3.27 | ||||||||||||
| 5% annual hypothetical return | 1,000.00 | 1,023.19 | 1.77 | 3.43 | ||||||||||||
| Conservative Fund actual return | 1,000.00 | 913.25 | 1.67 | 3.53 | ||||||||||||
| 5% annual hypothetical return | 1,000.00 | 1,023.19 | 1.77 | 3.73 | ||||||||||||
| Moderate Fund actual return | 1,000.00 | 895.15 | 1.61 | 3.73 | ||||||||||||
| 5% annual hypothetical return | 1,000.00 | 1,023.24 | 1.72 | 3.98 | ||||||||||||
| Growth Fund actual return | 1,000.00 | 891.24 | 1.46 | 3.82 | ||||||||||||
| 5% annual hypothetical return | 1,000.00 | 1,023.39 | 1.56 | 4.08 | ||||||||||||
| Aggressive Growth Fund actual return | 1,000.00 | 887.51 | 1.27 | 3.86 | ||||||||||||
| 5% annual hypothetical return | 1,000.00 | 1,023.59 | 1.36 | 4.13 | ||||||||||||
| * | “Expenses paid during period” is based on each fund’s actual expense ratio for the most recent fiscal half-year, multiplied by the average account value over the six-month period, multiplied by 182/365. There were 182 days in the six months ended May 31, 2022. The expense charges of one or more of the fund’s share classes may at times reflect a waiver or reimbursement. Please see the prospectus for an explanation, including the date on which this waiver or reimbursement is scheduled to end. Without such waiver or reimbursement, the expenses of the affected share classes would be higher and their performance lower. The annualized expense ratio for the six-month period was 0.35% for the Income Fund, 0.35% for the Conservative Fund, 0.34% for the Moderate Fund, 0.31% for the Growth Fund and 0.27% for the Aggressive Growth Fund. |
| † | “Effective expenses paid during period” is based on each fund’s total expense ratio for the most recent fiscal half-year, which includes the fund’s own expense ratio plus its pro rata share of its underlying funds’ expenses (which the fund bears through its investment in the underlying funds). For the six-month period, the total annualized weighted average expense ratio was 0.68% for the Income Fund, 0.74% for the Conservative Fund, 0.79% for the Moderate Fund, 0.81% for the Growth Fund and 0.82% for the Aggressive Growth Fund. |
| TIAA-CREF Lifestyle Funds ■ 2022 Annual Report | 13 |
Important information about expenses
Expense examples
Six months ended May 31, 2022
| Lifestyle Funds Retail Class | Beginning account value (12/1/21 | ) | Ending account value (5/31/22 | ) | Expenses paid during period (12/1/21–5/31/22 | * ) | Effective expenses paid during period (12/1/21–5/31/22 | † ) | ||||||||
| Income Fund actual return | $ 1,000.00 | $ 929.93 | $ 1.54 | $ 3.13 | ||||||||||||
| 5% annual hypothetical return | 1,000.00 | 1,023.34 | 1.61 | 3.28 | ||||||||||||
| Conservative Fund actual return | 1,000.00 | 912.60 | 1.62 | 3.48 | ||||||||||||
| 5% annual hypothetical return | 1,000.00 | 1,023.24 | 1.72 | 3.68 | ||||||||||||
| Moderate Fund actual return | 1,000.00 | 895.07 | 1.65 | 3.73 | ||||||||||||
| 5% annual hypothetical return | 1,000.00 | 1,023.19 | 1.77 | 3.98 | ||||||||||||
| Growth Fund actual return | 1,000.00 | 891.22 | 1.46 | 3.82 | ||||||||||||
| 5% annual hypothetical return | 1,000.00 | 1,023.39 | 1.56 | 4.08 | ||||||||||||
| Aggressive Growth Fund actual return | 1,000.00 | 886.93 | 1.32 | 3.90 | ||||||||||||
| 5% annual hypothetical return | 1,000.00 | 1,023.54 | 1.41 | 4.18 | ||||||||||||
| * | “Expenses paid during period” is based on each fund’s actual expense ratio for the most recent fiscal half-year, multiplied by the average account value over the six-month period, multiplied by 182/365. There were 182 days in the six months ended May 31, 2022. The expense charges of one or more of the fund’s share classes may at times reflect a waiver or reimbursement. Please see the prospectus for an explanation, including the date on which this waiver or reimbursement is scheduled to end. Without such waiver or reimbursement, the expenses of the affected share classes would be higher and their performance lower. The annualized expense ratio for the six-month period was 0.32% for the Income Fund, 0.34% for the Conservative Fund, 0.35% for the Moderate Fund, 0.31% for the Growth Fund and 0.28% for the Aggressive Growth Fund. |
| † | “Effective expenses paid during period” is based on each fund’s total expense ratio for the most recent fiscal half-year, which includes the fund’s own expense ratio plus its pro rata share of its underlying funds’ expenses (which the fund bears through its investment in the underlying funds). For the six-month period, the total annualized weighted average expense ratio was 0.65% for the Income Fund, 0.73% for the Conservative Fund, 0.79% for the Moderate Fund, 0.81% for the Growth Fund and 0.83% for the Aggressive Growth Fund. |
| 14 | 2022 Annual Report ■ TIAA-CREF Lifestyle Funds |
[This page intentionally left blank]
| TIAA-CREF Lifestyle Funds ■ 2022 Annual Report | 15 |
Investment results of the Lifestyle Funds
Performance for the twelve months ended May 31, 2022
All five of the Lifestyle Funds posted losses for the twelve-month period and underperformed their respective composite benchmarks. Institutional Class returns ranged from –6.56% for the Lifestyle Income Fund to –10.32% for the Lifestyle Aggressive Growth Fund. The performance tables show returns for all share classes of the funds.
The margin of underperformance of individual Lifestyle Funds, in relation to their respective composite benchmarks, ranged from 0.85 of a percentage point for the Lifestyle Income Fund to 3.77 percentage points for the Lifestyle Aggressive Growth Fund. (All results for the Lifestyle Funds are for the Institutional Class.)
Financial markets generally declined in a difficult environment
The U.S. economy expanded early in the period before contracting in the first quarter of 2022. Real gross domestic product (GDP), which measures the value of all goods and services produced in the United States, grew at annualized rates of 2.3% and 6.9%, respectively, in the third and fourth quarters of 2021. However, GDP contracted at an annualized rate of 1.5% in the first quarter of 2022, according to the government’s “second” estimate. Growth stalled amid a widening trade deficit and lower government expenditures, but consumer and business spending remained strong. Unemployment declined throughout the period, falling from 5.9% in June 2021 to 3.6% in May 2022. Core inflation, which measures all items except food and energy, rose 6.0% over the twelve months ended May 31, 2022. Oil prices increased sharply, climbing from nearly $68 per barrel to more than $114 by the end of the period.
The Federal Reserve responded to rising inflation by increasing the federal funds target rate in March and May of 2022. Over the period, policymakers raised the key short-term interest-rate measure to 0.75%–1.00% and indicated further increases were likely.
Domestic and foreign stocks both recorded losses for the period. The Russell 3000® Index, a broad measure of the U.S. stock market, returned –3.68%. The MSCI ACWI ex USA Investable Market Index (IMI), which measures the performance of large-, mid- and small-cap equities in 22 of 23 developed-markets countries (excluding the United States) and 24 emerging-markets countries, returned –12.54% in U.S.-dollar terms.
U.S. investment-grade bonds were hurt by the impact of rising yields across both short- and long-term maturities (bond prices move in the opposite direction of yields). The broad domestic investment-grade fixed-rate bond market, as measured by the Bloomberg U.S. Aggregate Bond Index, returned –8.22%. Short-term bonds, as measured by the Bloomberg U.S. 1–3 Year Government/Credit Index, returned –3.03%.
| 16 | 2022 Annual Report ■ TIAA-CREF Lifestyle Funds |
Equity funds posted largest losses
The Lifestyle Funds may invest in up to four sectors of the investment markets: U.S. equity (stocks), international equity (foreign stocks), fixed income and short-term fixed income. The Lifestyle Funds do this by investing in various underlying funds that, in turn, buy stocks, bonds and other securities in these market sectors. (Other than the Nuveen Dividend Growth Fund, the Nuveen Growth Opportunities ETF and the Nuveen International Growth Fund, all funds mentioned below are TIAA-CREF Funds.)
For the twelve months, equity funds generally recorded negative results and detracted most from the funds’ absolute returns—that is, without regard to performance relative to their respective composite benchmarks. Within the U.S. equity category, the Large-Cap Growth Fund and the Quant Small-Cap Equity Fund declined most. Among foreign stock funds, all posted double-digit losses, with the Emerging Markets Equity Fund declining the most. Within fixed income, the Core Bond Fund and the Core Plus Bond Fund were the worst performers. (All fund returns are for the Institutional Class.)
Stock and U.S. bond funds hurt relative performance
All of the Lifestyle Funds underperformed their respective composite benchmarks, primarily due to the relative weakness of underlying funds investing in equities and fixed income.
Within U.S. equities, the Large-Cap Growth Fund was the largest detractor from relative performance across all Lifestyle Funds. The Nuveen Growth Opportunities ETF and the Growth & Income Fund also hurt the funds’ relative performance. In contrast, the Nuveen Dividend Growth Fund, the Quant Small/Mid-Cap Equity Fund and the Quant Small-Cap Equity Fund contributed most to the relative performance of all Lifestyle Funds.
In the foreign stock category, the Nuveen International Growth Fund detracted most from the Lifestyle Funds’ relative performance, followed by the International Opportunities Fund. However, these negative effects were partly offset by the relative outperformance of the Quant International Small-Cap Equity Fund.
In the fixed-income sector, the Core Plus Bond Fund detracted from the relative performance of all Lifestyle Funds except the Lifestyle Aggressive Growth Fund, which has a target allocation of 100% equities. The Core Bond Fund also hindered the performance of the Lifestyle Income Fund and the Lifestyle Conservative Fund, while the Short-Term Bond Fund benefited their relative performance. (Performance of the Lifestyle Funds’ underlying TIAA-CREF Funds can be found at TIAA.org/performance.)
| TIAA-CREF Lifestyle Funds ■ 2022 Annual Report | 17 |
Performance as of May 31, 2022
| Lifestyle Income Fund | Total Return | Average annual total return | Annual operating expenses*# | |||||||||||||||||||
| Inception date | 1 year | 5 years | 10 years | gross | net | |||||||||||||||||
| Institutional Class | 12/9/11 | –6.56 | % | 3.06 | % | 3.84 | % | 0.62 | % | 0.43 | % | |||||||||||
| Advisor Class | 12/4/15 | –6.55 | 3.03 | 3.82 | † | 0.70 | 0.51 | |||||||||||||||
| Premier Class | 12/9/11 | –6.61 | 2.91 | 3.68 | 0.78 | 0.58 | ||||||||||||||||
| Retirement Class | 12/9/11 | –6.71 | 2.81 | 3.57 | 0.87 | 0.68 | ||||||||||||||||
| Retail Class | 12/9/11 | –6.73 | 2.78 | 3.56 | 0.90 | 0.72 | ||||||||||||||||
| Lifestyle Income Fund Composite Index‡ | — | –5.71 | 3.16 | 3.54 | — | — | ||||||||||||||||
| Broad market index | ||||||||||||||||||||||
| Morningstar Conservative Target Risk Index | — | –7.76 | 2.96 | 3.28 | — | — | ||||||||||||||||
The returns in this report show past performance, which is no guarantee of future results. The returns do not reflect taxes that a shareholder would pay on fund distributions or on the sale of fund shares. Returns and the principal value of your investment will fluctuate. Current performance may be higher or lower than that shown, and you may have a gain or a loss when you redeem your shares. For current performance information, including performance to the most recent month-end, please visit TIAA.org. Performance may reflect waivers or reimbursements of certain expenses. Absent these waivers or reimbursement arrangements, performance would be lower.
You cannot invest directly in any index. Index returns do not include a deduction for fees or expenses.
| * | The gross and net annual operating expenses are taken from the Fund’s prospectus. The net annual operating expenses may at times reflect a contractual reimbursement of various expenses. The expense reimbursement will continue through at least September 30, 2022, unless changed with the approval of the Board of Trustees. Without these reimbursements, expenses would be higher and returns lower. Refer to the Financial highlights later in this report for the Fund’s expense ratios as of the end of the reporting period. |
| # | These expenses include underlying fund expenses. |
| † | The performance shown for the Advisor Class that is prior to its inception date is based on performance of the Institutional Class. The performance for these periods has not been restated to reflect the actual expenses of the Advisor Class. If these actual expenses had been reflected, the performance of the Advisor Class shown for these periods would have been different because the Advisor Class has different expenses than the Institutional Class. |
| ‡ | As of the close of business on May 31, 2022, the Lifestyle Income Fund Composite Index consisted of: 40.0% Bloomberg U.S. Aggregate Bond Index; 40.0% Bloomberg U.S. 1–3 Year Government/Credit Bond Index; 13.0% Russell 3000® Index; and 7.0% MSCI All Country World Index ex USA Investable Market Index. The Fund’s benchmark, the components that make up the composite benchmark and the method of calculating the composite benchmark’s performance may vary over time. |
| 18 | 2022 Annual Report ■ TIAA-CREF Lifestyle Funds |
Lifestyle Income Fund
$2,000,000 over 10 years
Institutional Class

Ending amounts are as of May 31, 2022. For the purpose of comparison, the graph also shows the change in the values of the Fund’s composite benchmark and broad market index during the same period. The performance of the other share classes varies due to differences in expense charges.
Asset allocation
| % of net assets as of 5/31/22 | |||
| Equity | |||
| U.S. equity | 12.91 | ||
| International equity | 7.05 | ||
| Fixed income | |||
| Fixed income | 39.99 | ||
| Short-term fixed income | 40.01 | ||
| Other assets & liabilities, net | 0.04 | ||
| Total | 100.00 | ||
Target allocation

| TIAA-CREF Lifestyle Funds ■ 2022 Annual Report | 19 |
Performance as of May 31, 2022
| Lifestyle Conservative Fund | Total Return | Average annual total return | Annual operating expenses*# | |||||||||||||||||||
| Inception date | 1 year | 5 years | 10 years | gross | net | |||||||||||||||||
| Institutional Class | 12/9/11 | –7.99 | % | 4.66 | % | 5.84 | % | 0.56 | % | 0.49 | % | |||||||||||
| Advisor Class | 12/4/15 | –8.09 | 4.55 | 5.79 | † | 0.65 | 0.59 | |||||||||||||||
| Premier Class | 12/9/11 | –8.14 | 4.48 | 5.68 | 0.71 | 0.64 | ||||||||||||||||
| Retirement Class | 12/9/11 | –8.17 | 4.39 | 5.58 | 0.80 | 0.74 | ||||||||||||||||
| Retail Class | 12/9/11 | –8.25 | 4.37 | 5.55 | 0.83 | 0.76 | ||||||||||||||||
| Lifestyle Conservative Fund Composite Index‡ | — | –6.36 | 5.04 | 5.71 | — | — | ||||||||||||||||
| Broad market index | ||||||||||||||||||||||
| Morningstar Moderately Conservative Target Risk Index | — | –7.46 | 4.84 | 5.46 | — | — | ||||||||||||||||
The returns in this report show past performance, which is no guarantee of future results. The returns do not reflect taxes that a shareholder would pay on fund distributions or on the sale of fund shares. Returns and the principal value of your investment will fluctuate. Current performance may be higher or lower than that shown, and you may have a gain or a loss when you redeem your shares. For current performance information, including performance to the most recent month-end, please visit TIAA.org. Performance may reflect waivers or reimbursements of certain expenses. Absent these waivers or reimbursement arrangements, performance would be lower.
You cannot invest directly in any index. Index returns do not include a deduction for fees or expenses.
| * | The gross and net annual operating expenses are taken from the Fund’s prospectus. The net annual operating expenses may at times reflect a contractual reimbursement of various expenses. The expense reimbursement will continue through at least September 30, 2022, unless changed with the approval of the Board of Trustees. Without these reimbursements, expenses would be higher and returns lower. Refer to the Financial highlights later in this report for the Fund’s expense ratios as of the end of the reporting period. |
| # | These expenses include underlying fund expenses. |
| † | The performance shown for the Advisor Class that is prior to its inception date is based on performance of the Institutional Class. The performance for these periods has not been restated to reflect the actual expenses of the Advisor Class. If these actual expenses had been reflected, the performance of the Advisor Class shown for these periods would have been different because the Advisor Class has different expenses than the Institutional Class. |
| ‡ | As of the close of business on May 31, 2022, the Lifestyle Conservative Fund Composite Index consisted of: 40.0% Bloomberg U.S. Aggregate Bond Index; 26.0% Russell 3000® Index; 20.0% Bloomberg U.S. 1–3 Year Government/Credit Bond Index; and 14.0% MSCI All Country World Index ex USA Investable Market Index. The Fund’s benchmark, the components that make up the composite benchmark and the method of calculating the composite benchmark’s performance may vary over time. |
| 20 | 2022 Annual Report ■ TIAA-CREF Lifestyle Funds |
Lifestyle Conservative Fund
$2,000,000 over 10 years
Institutional Class

Ending amounts are as of May 31, 2022. For the purpose of comparison, the graph also shows the change in the values of the Fund’s composite benchmark and broad market index during the same period. The performance of the other share classes varies due to differences in expense charges.
Asset allocation
| % of net assets as of 5/31/22 | |||
| Equity | |||
| U.S. equity | 25.84 | ||
| International equity | 14.09 | ||
| Fixed income | |||
| Fixed income | 39.97 | ||
| Short-term fixed income | 20.01 | ||
| Other assets & liabilities, net | 0.09 | ||
| Total | 100.00 | ||
Target allocation

| TIAA-CREF Lifestyle Funds ■ 2022 Annual Report | 21 |
Performance as of May 31, 2022
| Lifestyle Moderate Fund | Total Return | Average annual total return | Annual operating expenses*# | |||||||||||||||||||
| Inception date | 1 year | 5 years | 10 years | gross | net | |||||||||||||||||
| Institutional Class | 12/9/11 | –9.58 | % | 6.18 | % | 7.81 | % | 0.60 | % | 0.55 | % | |||||||||||
| Advisor Class | 12/4/15 | –9.60 | 6.10 | 7.77 | † | 0.68 | 0.63 | |||||||||||||||
| Premier Class | 12/9/11 | –9.64 | 6.01 | 7.66 | 0.76 | 0.70 | ||||||||||||||||
| Retirement Class | 12/9/11 | –9.77 | 5.90 | 7.55 | 0.85 | 0.80 | ||||||||||||||||
| Retail Class | 12/9/11 | –9.78 | 5.89 | 7.52 | 0.87 | 0.82 | ||||||||||||||||
| Lifestyle Moderate Fund Composite Index‡ | — | –7.08 | 6.85 | 7.84 | — | — | ||||||||||||||||
| Broad market index | ||||||||||||||||||||||
| Morningstar Moderate Target Risk Index | — | –7.42 | 6.32 | 7.27 | — | — | ||||||||||||||||
The returns in this report show past performance, which is no guarantee of future results. The returns do not reflect taxes that a shareholder would pay on fund distributions or on the sale of fund shares. Returns and the principal value of your investment will fluctuate. Current performance may be higher or lower than that shown, and you may have a gain or a loss when you redeem your shares. For current performance information, including performance to the most recent month-end, please visit TIAA.org. Performance may reflect waivers or reimbursements of certain expenses. Absent these waivers or reimbursement arrangements, performance would be lower.
You cannot invest directly in any index. Index returns do not include a deduction for fees or expenses.
| * | The gross and net annual operating expenses are taken from the Fund’s prospectus. The net annual operating expenses may at times reflect a contractual reimbursement of various expenses. The expense reimbursement will continue through at least September 30, 2022, unless changed with the approval of the Board of Trustees. Without these reimbursements, expenses would be higher and returns lower. Refer to the Financial highlights later in this report for the Fund’s expense ratios as of the end of the reporting period. |
| # | These expenses include underlying fund expenses. |
| † | The performance shown for the Advisor Class that is prior to its inception date is based on performance of the Institutional Class. The performance for these periods has not been restated to reflect the actual expenses of the Advisor Class. If these actual expenses had been reflected, the performance of the Advisor Class shown for these periods would have been different because the Advisor Class has different expenses than the Institutional Class. |
| ‡ | As of the close of business on May 31, 2022, the Lifestyle Moderate Fund Composite Index consisted of: 40.0% Bloomberg U.S. Aggregate Bond Index; 39.0% Russell 3000® Index; and 21.0% MSCI All Country World Index ex USA Investable Market Index. The Fund’s benchmark, the components that make up the composite benchmark and the method of calculating the composite benchmark’s performance may vary over time. |
| 22 | 2022 Annual Report ■ TIAA-CREF Lifestyle Funds |
Lifestyle Moderate Fund
$2,000,000 over 10 years
Institutional Class

Ending amounts are as of May 31, 2022. For the purpose of comparison, the graph also shows the change in the values of the Fund’s composite benchmark and broad market index during the same period. The performance of the other share classes varies due to differences in expense charges.
Asset allocation
| % of net assets as of 5/31/22 | |||
| Equity | |||
| U.S. equity | 38.76 | ||
| International equity | 21.14 | ||
| Fixed income | 40.03 | ||
| Other assets & liabilities, net | 0.07 | ||
| Total | 100.00 | ||
Target allocation

| TIAA-CREF Lifestyle Funds ■ 2022 Annual Report | 23 |
Performance as of May 31, 2022
| Lifestyle Growth Fund | Total Return | Average annual total return | Annual operating expenses*# | |||||||||||||||||||
| Inception date | 1 year | 5 years | 10 years | gross | net | |||||||||||||||||
| Institutional Class | 12/9/11 | –9.96 | % | 7.54 | % | 9.48 | % | 0.68 | % | 0.60 | % | |||||||||||
| Advisor Class | 12/4/15 | –10.00 | 7.47 | 9.43 | † | 0.76 | 0.68 | |||||||||||||||
| Premier Class | 12/9/11 | –9.93 | 7.42 | 9.32 | 0.83 | 0.75 | ||||||||||||||||
| Retirement Class | 12/9/11 | –10.12 | 7.29 | 9.20 | 0.93 | 0.85 | ||||||||||||||||
| Retail Class | 12/9/11 | –10.17 | 7.25 | 9.16 | 0.96 | 0.88 | ||||||||||||||||
| Lifestyle Growth Fund Composite Index‡ | — | –6.79 | 8.58 | 9.81 | — | — | ||||||||||||||||
| Broad market index | ||||||||||||||||||||||
| Morningstar Moderately Aggressive Target Risk Index | — | –7.44 | 7.72 | 9.03 | — | — | ||||||||||||||||
The returns in this report show past performance, which is no guarantee of future results. The returns do not reflect taxes that a shareholder would pay on fund distributions or on the sale of fund shares. Returns and the principal value of your investment will fluctuate. Current performance may be higher or lower than that shown, and you may have a gain or a loss when you redeem your shares. For current performance information, including performance to the most recent month-end, please visit TIAA.org. Performance may reflect waivers or reimbursements of certain expenses. Absent these waivers or reimbursement arrangements, performance would be lower.
You cannot invest directly in any index. Index returns do not include a deduction for fees or expenses.
| * | The gross and net annual operating expenses are taken from the Fund’s prospectus. The net annual operating expenses may at times reflect a contractual reimbursement of various expenses. The expense reimbursement will continue through at least September 30, 2022, unless changed with the approval of the Board of Trustees. Without these reimbursements, expenses would be higher and returns lower. Refer to the Financial highlights later in this report for the Fund’s expense ratios as of the end of the reporting period. |
| # | These expenses include underlying fund expenses. |
| † | The performance shown for the Advisor Class that is prior to its inception date is based on performance of the Institutional Class. The performance for these periods has not been restated to reflect the actual expenses of the Advisor Class. If these actual expenses had been reflected, the performance of the Advisor Class shown for these periods would have been different because the Advisor Class has different expenses than the Institutional Class. |
| ‡ | As of the close of business on May 31, 2022, the Lifestyle Growth Fund Composite Index consisted of: 52.0% Russell 3000® Index; 28.0% MSCI All Country World Index ex USA Investable Market Index; and 20.0% Bloomberg U.S. Aggregate Bond Index. The Fund’s benchmark, the components that make up the composite benchmark and the method of calculating the composite benchmark’s performance may vary over time. |
| 24 | 2022 Annual Report ■ TIAA-CREF Lifestyle Funds |
Lifestyle Growth Fund
$2,000,000 over 10 years
Institutional Class

Ending amounts are as of May 31, 2022. For the purpose of comparison, the graph also shows the change in the values of the Fund’s composite benchmark and broad market index during the same period. The performance of the other share classes varies due to differences in expense charges.
Asset allocation
| % of net assets as of 5/31/22 | |||
| Equity | |||
| U.S. equity | 51.67 | ||
| International equity | 28.22 | ||
| Fixed income | 20.03 | ||
| Other assets & liabilities, net | 0.08 | ||
| Total | 100.00 | ||
Target allocation

| TIAA-CREF Lifestyle Funds ■ 2022 Annual Report | 25 |
Lifestyle Aggressive Growth Fund
Performance as of May 31, 2022
| Lifestyle Aggressive Growth Fund | Total Return | Average annual total return | Annual operating expenses*# | |||||||||||||||||||
| Inception date | 1 year | 5 years | 10 years | gross | net | |||||||||||||||||
| Institutional Class | 12/9/11 | –10.32 | % | 8.96 | % | 11.13 | % | 0.76 | % | 0.65 | % | |||||||||||
| Advisor Class | 12/4/15 | –10.40 | 8.89 | 11.09 | † | 0.85 | 0.74 | |||||||||||||||
| Premier Class | 12/9/11 | –10.43 | 8.79 | 10.98 | 0.92 | 0.80 | ||||||||||||||||
| Retirement Class | 12/9/11 | –10.54 | 8.69 | 10.86 | 1.00 | 0.90 | ||||||||||||||||
| Retail Class | 12/9/11 | –10.59 | 8.64 | 10.79 | 1.05 | 0.95 | ||||||||||||||||
| Lifestyle Aggressive Growth Fund Composite Index‡ | — | –6.55 | 10.23 | 11.72 | — | — | ||||||||||||||||
| Broad market index | ||||||||||||||||||||||
| Morningstar Aggressive Target Risk Index | — | –7.15 | 8.72 | 10.33 | — | — | ||||||||||||||||
The returns in this report show past performance, which is no guarantee of future results. The returns do not reflect taxes that a shareholder would pay on fund distributions or on the sale of fund shares. Returns and the principal value of your investment will fluctuate. Current performance may be higher or lower than that shown, and you may have a gain or a loss when you redeem your shares. For current performance information, including performance to the most recent month-end, please visit TIAA.org. Performance may reflect waivers or reimbursements of certain expenses. Absent these waivers or reimbursement arrangements, performance would be lower.
You cannot invest directly in any index. Index returns do not include a deduction for fees or expenses.
| * | The gross and net annual operating expenses are taken from the Fund’s prospectus. The net annual operating expenses may at times reflect a contractual reimbursement of various expenses. The expense reimbursement will continue through at least September 30, 2022, unless changed with the approval of the Board of Trustees. Without these reimbursements, expenses would be higher and returns lower. Refer to the Financial highlights later in this report for the Fund’s expense ratios as of the end of the reporting period. |
| # | These expenses include underlying fund expenses. |
| † | The performance shown for the Advisor Class that is prior to its inception date is based on performance of the Institutional Class. The performance for these periods has not been restated to reflect the actual expenses of the Advisor Class. If these actual expenses had been reflected, the performance of the Advisor Class shown for these periods would have been different because the Advisor Class has different expenses than the Institutional Class. |
| ‡ | As of the close of business on May 31, 2022, the Lifestyle Aggressive Growth Fund Composite Index consisted of: 65.0% Russell 3000® Index; and 35.0% MSCI All Country World Index ex USA Investable Market Index. The Fund’s benchmark, the components that make up the composite benchmark and the method of calculating the composite benchmark’s performance may vary over time. |
| 26 | 2022 Annual Report ■ TIAA-CREF Lifestyle Funds |
Lifestyle Aggressive Growth Fund
$2,000,000 over 10 years
Institutional Class

Ending amounts are as of May 31, 2022. For the purpose of comparison, the graph also shows the change in the values of the Fund’s composite benchmark and broad market index during the same period. The performance of the other share classes varies due to differences in expense charges.
Asset allocation
| % of net assets as of 5/31/22 | |||
| Equity | |||
| U.S. equity | 64.70 | ||
| International equity | 35.30 | ||
| Other assets & liabilities, net | — | ||
| Total | 100.00 | ||
Target allocation

| TIAA-CREF Lifestyle Funds ■ 2022 Annual Report | 27 |
Lifestyle Income Fund ■ May 31, 2022
| Shares | Security | Value | % of net assets | |||||||||||
| AFFILIATED INVESTMENT COMPANIES—100.0%a | ||||||||||||||
| FIXED INCOME—40.0% | ||||||||||||||
| 1,907,894 | TIAA-CREF Core Bond Fund | $ | 18,258,549 | 20.0 | % | |||||||||
| 1,903,396 | TIAA-CREF Core Plus Bond Fund | 18,272,601 | 20.0 | |||||||||||
| TOTAL FIXED INCOME | 36,531,150 | 40.0 | ||||||||||||
| INTERNATIONAL EQUITY—7.1% | ||||||||||||||
| 31,252 | Nuveen International Growth Fund | 1,371,667 | 1.5 | |||||||||||
| 97,409 | TIAA-CREF Emerging Markets Equity Fund | 793,884 | 0.9 | |||||||||||
| 161,282 | TIAA-CREF International Equity Fund | 1,967,643 | 2.2 | |||||||||||
| 96,167 | TIAA-CREF International Opportunities Fund | 1,378,074 | 1.5 | |||||||||||
| 89,382 | TIAA-CREF Quant International Small-Cap Equity Fund | 924,211 | 1.0 | |||||||||||
| TOTAL INTERNATIONAL EQUITY | 6,435,479 | 7.1 | ||||||||||||
| SHORT-TERM FIXED INCOME—40.0% | ||||||||||||||
| 3,640,917 | TIAA-CREF Short-Term Bond Fund | 36,554,807 | 40.0 | |||||||||||
| TOTAL SHORT-TERM FIXED INCOME | 36,554,807 | 40.0 | ||||||||||||
| U.S. EQUITY—12.9% | ||||||||||||||
| 32,121 | Nuveen Dividend Growth Fund | 1,691,815 | 1.9 | |||||||||||
| 128,894 | Nuveen Dividend Value Fund | 1,912,791 | 2.1 | |||||||||||
| 89,995 | Nuveen Growth Opportunities ETF | 1,775,601 | 1.9 | |||||||||||
| 116,475 | TIAA-CREF Growth & Income Fund | 1,684,223 | 1.8 | |||||||||||
| 98,485 | TIAA-CREF Large-Cap Growth Fund | 1,779,629 | 2.0 | |||||||||||
| 94,173 | TIAA-CREF Large-Cap Value Fund | 1,924,904 | 2.1 | |||||||||||
| 28,617 | TIAA-CREF Quant Small-Cap Equity Fund | 467,896 | 0.5 | |||||||||||
| 42,092 | TIAA-CREF Quant Small/Mid-Cap Equity Fund | 561,079 | 0.6 | |||||||||||
| TOTAL U.S. EQUITY | 11,797,938 | 12.9 | ||||||||||||
| TOTAL AFFILIATED INVESTMENT COMPANIES | (Cost $94,923,553) | 91,319,374 | 100.0 | |||||||||||
| TOTAL PORTFOLIO | (Cost $94,923,553) | 91,319,374 | 100.0 | |||||||||||
| OTHER ASSETS & LIABILITIES, NET | 40,997 | 0.0 | ||||||||||||
| NET ASSETS | $ | 91,360,371 | 100.0 | % | ||||||||||
| ETF | Exchange Traded Fund |
| a | The Fund invests its assets in the Institutional Class shares of the affiliated TIAA-CREF Funds, the affiliated Nuveen Growth Opportunities ETF and Class R6 shares of the affiliated Nuveen Funds. |
| 28 | 2022 Annual Report ■ TIAA-CREF Lifestyle Funds | See notes to financial statements |
Portfolio of investments
Lifestyle Conservative Fund ■ May 31, 2022
| Shares | Security | Value | % of net assets | |||||||||||
| AFFILIATED INVESTMENT COMPANIES—99.9%a | ||||||||||||||
| FIXED INCOME—40.0% | ||||||||||||||
| 3,560,893 | TIAA-CREF Core Bond Fund | $ | 34,077,744 | 10.0 | % | |||||||||
| 10,660,441 | TIAA-CREF Core Plus Bond Fund | 102,340,233 | 30.0 | |||||||||||
| TOTAL FIXED INCOME | 136,417,977 | 40.0 | ||||||||||||
| INTERNATIONAL EQUITY—14.1% | ||||||||||||||
| 233,759 | Nuveen International Growth Fund | 10,259,696 | 3.0 | |||||||||||
| 731,881 | TIAA-CREF Emerging Markets Equity Fund | 5,964,830 | 1.8 | |||||||||||
| 1,202,491 | TIAA-CREF International Equity Fund | 14,670,393 | 4.3 | |||||||||||
| 717,872 | TIAA-CREF International Opportunities Fund | 10,287,111 | 3.0 | |||||||||||
| 670,062 | TIAA-CREF Quant International Small-Cap Equity Fund | 6,928,444 | 2.0 | |||||||||||
| TOTAL INTERNATIONAL EQUITY | 48,110,474 | 14.1 | ||||||||||||
| SHORT-TERM FIXED INCOME—20.0% | ||||||||||||||
| 6,804,195 | TIAA-CREF Short-Term Bond Fund | 68,314,118 | 20.0 | |||||||||||
| TOTAL SHORT-TERM FIXED INCOME | 68,314,118 | 20.0 | ||||||||||||
| U.S. EQUITY—25.8% | ||||||||||||||
| 239,147 | Nuveen Dividend Growth Fund | 12,595,850 | 3.7 | |||||||||||
| 966,645 | Nuveen Dividend Value Fund | 14,345,007 | 4.2 | |||||||||||
| 674,433 | Nuveen Growth Opportunities ETF | 13,306,563 | 3.9 | |||||||||||
| 873,993 | TIAA-CREF Growth & Income Fund | 12,637,942 | 3.7 | |||||||||||
| 736,362 | TIAA-CREF Large-Cap Growth Fund | 13,306,055 | 3.9 | |||||||||||
| 703,233 | TIAA-CREF Large-Cap Value Fund | 14,374,090 | 4.2 | |||||||||||
| 213,562 | TIAA-CREF Quant Small-Cap Equity Fund | 3,491,731 | 1.0 | |||||||||||
| 313,623 | TIAA-CREF Quant Small/Mid-Cap Equity Fund | 4,180,591 | 1.2 | |||||||||||
| TOTAL U.S. EQUITY | 88,237,829 | 25.8 | ||||||||||||
| TOTAL AFFILIATED INVESTMENT COMPANIES | (Cost $350,494,495) | 341,080,398 | 99.9 | |||||||||||
| TOTAL PORTFOLIO | (Cost $350,494,495) | 341,080,398 | 99.9 | |||||||||||
| OTHER ASSETS & LIABILITIES, NET | 268,260 | 0.1 | ||||||||||||
| NET ASSETS | $ | 341,348,658 | 100.0 | % | ||||||||||
| ETF | Exchange Traded Fund |
| a | The Fund invests its assets in the Institutional Class shares of the affiliated TIAA-CREF Funds, the affiliated Nuveen Growth Opportunities ETF and Class R6 shares of the affiliated Nuveen Funds. |
| See notes to financial statements | TIAA-CREF Lifestyle Funds ■ 2022 Annual Report | 29 |
Portfolio of investments
Lifestyle Moderate Fund ■ May 31, 2022
| Shares | Security | Value | % of net assets | |||||||||||
| AFFILIATED INVESTMENT COMPANIES—99.9%a | ||||||||||||||
| FIXED INCOME—40.0% | ||||||||||||||
| 23,728,716 | TIAA-CREF Core Plus Bond Fund | $ | 227,795,677 | 40.0 | % | |||||||||
| TOTAL FIXED INCOME | 227,795,677 | 40.0 | ||||||||||||
| INTERNATIONAL EQUITY—21.1% | ||||||||||||||
| 586,497 | Nuveen International Growth Fund | 25,741,337 | 4.5 | |||||||||||
| 1,818,759 | TIAA-CREF Emerging Markets Equity Fund | 14,822,888 | 2.6 | |||||||||||
| 3,009,816 | TIAA-CREF International Equity Fund | 36,719,759 | 6.5 | |||||||||||
| 1,796,783 | TIAA-CREF International Opportunities Fund | 25,747,900 | 4.5 | |||||||||||
| 1,666,821 | TIAA-CREF Quant International Small-Cap Equity Fund | 17,234,930 | 3.0 | |||||||||||
| TOTAL INTERNATIONAL EQUITY | 120,266,814 | 21.1 | ||||||||||||
| U.S. EQUITY—38.8% | ||||||||||||||
| 596,208 | Nuveen Dividend Growth Fund | 31,402,256 | 5.5 | |||||||||||
| 2,418,431 | Nuveen Dividend Value Fund | 35,889,510 | 6.3 | |||||||||||
| 1,686,381 | Nuveen Growth Opportunities ETF | 33,272,297 | 5.9 | |||||||||||
| 2,185,548 | TIAA-CREF Growth & Income Fund | 31,603,028 | 5.6 | |||||||||||
| 1,841,934 | TIAA-CREF Large-Cap Growth Fund | 33,283,739 | 5.9 | |||||||||||
| 1,759,216 | TIAA-CREF Large-Cap Value Fund | 35,958,371 | 6.3 | |||||||||||
| 534,056 | TIAA-CREF Quant Small-Cap Equity Fund | 8,731,821 | 1.5 | |||||||||||
| 780,415 | TIAA-CREF Quant Small/Mid-Cap Equity Fund | 10,402,929 | 1.8 | |||||||||||
| TOTAL U.S. EQUITY | 220,543,951 | 38.8 | ||||||||||||
| TOTAL AFFILIATED INVESTMENT COMPANIES | (Cost $577,638,891) | 568,606,442 | 99.9 | |||||||||||
| TOTAL PORTFOLIO | (Cost $577,638,891) | 568,606,442 | 99.9 | |||||||||||
| OTHER ASSETS & LIABILITIES, NET | 425,786 | 0.1 | ||||||||||||
| NET ASSETS | $ | 569,032,228 | 100.0 | % | ||||||||||
| ETF | Exchange Traded Fund |
| a | The Fund invests its assets in the Institutional Class shares of the affiliated TIAA-CREF Funds, the affiliated Nuveen Growth Opportunities ETF and Class R6 shares of the affiliated Nuveen Funds. |
| 30 | 2022 Annual Report ■ TIAA-CREF Lifestyle Funds | See notes to financial statements |
Portfolio of investments
Lifestyle Growth Fund ■ May 31, 2022
| Shares | Security | Value | % of net assets | |||||||||||
| AFFILIATED INVESTMENT COMPANIES—99.9%a | ||||||||||||||
| FIXED INCOME—20.0% | ||||||||||||||
| 6,248,498 | TIAA-CREF Core Plus Bond Fund | $ | 59,985,579 | 20.0 | % | |||||||||
| TOTAL FIXED INCOME | 59,985,579 | 20.0 | ||||||||||||
| INTERNATIONAL EQUITY—28.2% | ||||||||||||||
| 412,146 | Nuveen International Growth Fund | 18,089,087 | 6.0 | |||||||||||
| 1,278,290 | TIAA-CREF Emerging Markets Equity Fund | 10,418,066 | 3.5 | |||||||||||
| 2,112,468 | TIAA-CREF International Equity Fund | 25,772,104 | 8.6 | |||||||||||
| 1,264,422 | TIAA-CREF International Opportunities Fund | 18,119,170 | 6.1 | |||||||||||
| 1,170,808 | TIAA-CREF Quant International Small-Cap Equity Fund | 12,106,152 | 4.0 | |||||||||||
| TOTAL INTERNATIONAL EQUITY | 84,504,579 | 28.2 | ||||||||||||
| U.S. EQUITY—51.7% | ||||||||||||||
| 417,193 | Nuveen Dividend Growth Fund | 21,973,571 | 7.3 | |||||||||||
| 1,698,097 | Nuveen Dividend Value Fund | 25,199,756 | 8.4 | |||||||||||
| 1,186,162 | Nuveen Growth Opportunities ETF | 23,402,976 | 7.8 | |||||||||||
| 1,533,285 | TIAA-CREF Growth & Income Fund | 22,171,305 | 7.4 | |||||||||||
| 1,290,745 | TIAA-CREF Large-Cap Growth Fund | 23,323,753 | 7.8 | |||||||||||
| 1,234,695 | TIAA-CREF Large-Cap Value Fund | 25,237,174 | 8.4 | |||||||||||
| 375,134 | TIAA-CREF Quant Small-Cap Equity Fund | 6,133,438 | 2.1 | |||||||||||
| 548,425 | TIAA-CREF Quant Small/Mid-Cap Equity Fund | 7,310,502 | 2.5 | |||||||||||
| TOTAL U.S. EQUITY | 154,752,475 | 51.7 | ||||||||||||
| TOTAL AFFILIATED INVESTMENT COMPANIES | (Cost $298,509,811) | 299,242,633 | 99.9 | |||||||||||
| TOTAL PORTFOLIO | (Cost $298,509,811) | 299,242,633 | 99.9 | |||||||||||
| OTHER ASSETS & LIABILITIES, NET | 225,958 | 0.1 | ||||||||||||
| NET ASSETS | $ | 299,468,591 | 100.0 | % | ||||||||||
| ETF | Exchange Traded Fund |
| a | The Fund invests its assets in the Institutional Class shares of the affiliated TIAA-CREF Funds, the affiliated Nuveen Growth Opportunities ETF and Class R6 shares of the affiliated Nuveen Funds. |
| See notes to financial statements | TIAA-CREF Lifestyle Funds ■ 2022 Annual Report | 31 |
Portfolio of investments
Lifestyle Aggressive Growth Fund ■ May 31, 2022
| Shares | Security | Value | % of net assets | |||||||||||
| AFFILIATED INVESTMENT COMPANIES—100.0%a | ||||||||||||||
| INTERNATIONAL EQUITY—35.3% | ||||||||||||||
| 377,038 | Nuveen International Growth Fund | $ | 16,548,191 | 7.5 | % | |||||||||
| 1,169,776 | TIAA-CREF Emerging Markets Equity Fund | 9,533,672 | 4.3 | |||||||||||
| 1,940,605 | TIAA-CREF International Equity Fund | 23,675,384 | 10.8 | |||||||||||
| 1,155,193 | TIAA-CREF International Opportunities Fund | 16,553,918 | 7.6 | |||||||||||
| 1,074,310 | TIAA-CREF Quant International Small-Cap Equity Fund | 11,108,368 | 5.1 | |||||||||||
| TOTAL INTERNATIONAL EQUITY | 77,419,533 | 35.3 | ||||||||||||
| U.S. EQUITY—64.7% | ||||||||||||||
| 385,261 | Nuveen Dividend Growth Fund | 20,291,697 | 9.2 | |||||||||||
| 1,556,354 | Nuveen Dividend Value Fund | 23,096,290 | 10.5 | |||||||||||
| 1,083,663 | Nuveen Growth Opportunities ETF | 21,380,671 | 9.7 | |||||||||||
| 1,407,382 | TIAA-CREF Growth & Income Fund | 20,350,737 | 9.3 | |||||||||||
| 1,184,301 | TIAA-CREF Large-Cap Growth Fund | 21,400,319 | 9.8 | |||||||||||
| 1,128,423 | TIAA-CREF Large-Cap Value Fund | 23,064,960 | 10.5 | |||||||||||
| 344,304 | TIAA-CREF Quant Small-Cap Equity Fund | 5,629,363 | 2.6 | |||||||||||
| 503,487 | TIAA-CREF Quant Small/Mid-Cap Equity Fund | 6,711,483 | 3.1 | |||||||||||
| TOTAL U.S. EQUITY | 141,925,520 | 64.7 | ||||||||||||
| TOTAL AFFILIATED INVESTMENT COMPANIES | (Cost $215,457,365) | 219,345,053 | 100.0 | |||||||||||
| TOTAL PORTFOLIO | (Cost $215,457,365) | 219,345,053 | 100.0 | |||||||||||
| OTHER ASSETS & LIABILITIES, NET | (2,812 | ) | (0.0 | ) | ||||||||||
| NET ASSETS | $ | 219,342,241 | 100.0 | % | ||||||||||
| ETF | Exchange Traded Fund |
| a | The Fund invests its assets in the Institutional Class shares of the affiliated TIAA-CREF Funds, the affiliated Nuveen Growth Opportunities ETF and Class R6 shares of the affiliated Nuveen Funds. |
| 32 | 2022 Annual Report ■ TIAA-CREF Lifestyle Funds | See notes to financial statements |
[This page intentionally left blank.]
| TIAA-CREF Lifestyle Funds ■ 2022 Annual Report | 33 |
Statements of assets & liabilities
TIAA-CREF Lifestyle Funds ■ May 31, 2022
| Lifestyle | Lifestyle | |||||||||||||||||||
| Lifestyle | Conservative | Lifestyle | Lifestyle | Aggressive | ||||||||||||||||
| Income Fund | Fund | Moderate Fund | Growth Fund | Growth Fund | ||||||||||||||||
| ASSETS | ||||||||||||||||||||
| Affiliated investments, at value‡ | $ | 91,319,374 | $ | 341,080,398 | $ | 568,606,442 | $ | 299,242,633 | $ | 219,345,053 | ||||||||||
| Cash | — | 809,586 | 253,062 | 267,234 | 218,369 | |||||||||||||||
| Receivable from securities transactions | 89,902 | 219,173 | 718,715 | 482,878 | 333,037 | |||||||||||||||
| Receivable from Fund shares sold | 10,540 | 138,452 | 160,215 | 84,085 | 64,836 | |||||||||||||||
| Dividends receivable | 173,329 | 499,501 | 592,389 | 155,820 | — | |||||||||||||||
| Due from affiliates | 9,248 | 13,103 | 36,964 | 36,350 | 19,535 | |||||||||||||||
| Other | 4,204 | 11,713 | 17,658 | 8,625 | 6,080 | |||||||||||||||
| Total assets | 91,606,597 | 342,771,926 | 570,385,445 | 300,277,625 | 219,986,910 | |||||||||||||||
| LIABILITIES | ||||||||||||||||||||
| Management fees payable | 7,737 | 28,643 | 47,704 | 24,975 | 18,166 | |||||||||||||||
| Service agreement fees payable | 4,335 | 12,433 | 25,702 | 12,606 | 12,601 | |||||||||||||||
| Distribution fees payable | 11,719 | 47,287 | 76,866 | 39,712 | 22,009 | |||||||||||||||
| Due to affiliates | 10,944 | 11,720 | 12,440 | 11,601 | 11,347 | |||||||||||||||
| Overdraft payable | 4,877 | — | — | — | — | |||||||||||||||
| Payable for securities transactions | 160,221 | 1,168,123 | 972,926 | 599,228 | 330,501 | |||||||||||||||
| Payable for Fund shares redeemed | 36,419 | 123,374 | 165,367 | 91,358 | 226,098 | |||||||||||||||
| Payable for trustee compensation | 4,180 | 11,583 | 17,360 | 8,530 | 6,017 | |||||||||||||||
| Accrued expenses and other payables | 5,794 | 20,105 | 34,852 | 21,024 | 17,930 | |||||||||||||||
| Total liabilities | 246,226 | 1,423,268 | 1,353,217 | 809,034 | 644,669 | |||||||||||||||
| NET ASSETS | $ | 91,360,371 | $ | 341,348,658 | $ | 569,032,228 | $ | 299,468,591 | $ | 219,342,241 | ||||||||||
| NET ASSETS CONSIST OF: | ||||||||||||||||||||
| Paid-in-capital | $ | 94,751,749 | $ | 344,652,329 | $ | 562,203,156 | $ | 288,994,369 | $ | 206,338,961 | ||||||||||
| Total distributable earnings (loss) | (3,391,378 | ) | (3,303,671 | ) | 6,829,072 | 10,474,222 | 13,003,280 | |||||||||||||
| NET ASSETS | $ | 91,360,371 | $ | 341,348,658 | $ | 569,032,228 | $ | 299,468,591 | $ | 219,342,241 | ||||||||||
| INSTITUTIONAL CLASS: | ||||||||||||||||||||
| Net assets | $ | 15,246,835 | $ | 55,791,407 | $ | 76,453,334 | $ | 47,024,147 | $ | 50,496,941 | ||||||||||
| Outstanding shares of beneficial interest, unlimited shares authorized ($.0001 par value) | 1,430,977 | 4,571,088 | 5,563,353 | 3,064,891 | 2,965,423 | |||||||||||||||
| Net asset value per share | $ | 10.65 | $ | 12.21 | $ | 13.74 | $ | 15.34 | $ | 17.03 | ||||||||||
| ADVISOR CLASS: | ||||||||||||||||||||
| Net assets | $ | 119,551 | $ | 3,876,299 | $ | 10,895,477 | $ | 5,138,298 | $ | 6,247,866 | ||||||||||
| Outstanding shares of beneficial interest, unlimited shares authorized ($.0001 par value) | 11,223 | 317,666 | 793,111 | 335,238 | 366,872 | |||||||||||||||
| Net asset value per share | $ | 10.65 | $ | 12.20 | $ | 13.74 | $ | 15.33 | $ | 17.03 | ||||||||||
| PREMIER CLASS: | ||||||||||||||||||||
| Net assets | $ | 349,270 | $ | 262,206 | $ | 275,529 | $ | 315,582 | $ | 341,525 | ||||||||||
| Outstanding shares of beneficial interest, unlimited shares authorized ($.0001 par value) | 32,762 | 21,479 | 20,000 | 20,552 | 20,000 | |||||||||||||||
| Net asset value per share | $ | 10.66 | $ | 12.21 | $ | 13.78 | $ | 15.36 | $ | 17.08 | ||||||||||
| RETIREMENT CLASS: | ||||||||||||||||||||
| Net assets | $ | 20,442,559 | $ | 56,686,203 | $ | 114,335,153 | $ | 56,946,060 | $ | 56,151,504 | ||||||||||
| Outstanding shares of beneficial interest, unlimited shares authorized ($.0001 par value) | 1,920,858 | 4,651,621 | 8,334,726 | 3,730,307 | 3,313,210 | |||||||||||||||
| Net asset value per share | $ | 10.64 | $ | 12.19 | $ | 13.72 | $ | 15.27 | $ | 16.95 | ||||||||||
| RETAIL CLASS: | ||||||||||||||||||||
| Net assets | $ | 55,202,156 | $ | 224,732,543 | $ | 367,072,735 | $ | 190,044,504 | $ | 106,104,405 | ||||||||||
| Outstanding shares of beneficial interest, unlimited shares authorized ($.0001 par value) | 5,186,913 | 18,450,413 | 26,773,720 | 12,468,305 | 6,273,036 | |||||||||||||||
| Net asset value per share | $ | 10.64 | $ | 12.18 | $ | 13.71 | $ | 15.24 | $ | 16.91 | ||||||||||
| ‡ Affiliated investments, cost | $ | 94,923,553 | $ | 350,494,495 | $ | 577,638,891 | $ | 298,509,811 | $ | 215,457,365 | ||||||||||
| 34 | 2022 Annual Report ■ TIAA-CREF Lifestyle Funds | See notes to financial statements | See notes to financial statements | TIAA-CREF Lifestyle Funds ■ 2022 Annual Report | 35 |
TIAA-CREF Lifestyle Funds ■ For the year ended May 31, 2022
| Lifestyle | Lifestyle | |||||||||||||||||||
| Lifestyle | Conservative | Lifestyle | Lifestyle | Aggressive | ||||||||||||||||
| Income Fund | Fund | Moderate Fund | Growth Fund | Growth Fund | ||||||||||||||||
| INVESTMENT INCOME | ||||||||||||||||||||
| Dividends from affiliated investments | $ | 1,888,429 | $ | 6,928,858 | $ | 11,517,820 | $ | 5,293,369 | $ | 3,327,469 | ||||||||||
| Total income | 1,888,429 | 6,928,858 | 11,517,820 | 5,293,369 | 3,327,469 | |||||||||||||||
| EXPENSES | ||||||||||||||||||||
| Management fees | 100,898 | 374,496 | 630,668 | 333,358 | 245,586 | |||||||||||||||
| Shareholder servicing – Institutional Class | 455 | 1,409 | 639 | 642 | 1,234 | |||||||||||||||
| Shareholder servicing – Advisor Class | 66 | 5,197 | 10,429 | 5,666 | 7,579 | |||||||||||||||
| Shareholder servicing – Premier Class | 58 | 73 | 58 | 66 | 49 | |||||||||||||||
| Shareholder servicing – Retirement Class | 61,714 | 154,431 | 309,956 | 151,853 | 161,351 | |||||||||||||||
| Shareholder servicing – Retail Class | 20,315 | 50,620 | 81,845 | 57,088 | 50,718 | |||||||||||||||
| Distribution fees – Premier Class | 546 | 1,086 | 966 | 2,802 | 608 | |||||||||||||||
| Distribution fees – Retail Class | 147,582 | 615,300 | 1,017,538 | 531,691 | 298,908 | |||||||||||||||
| Registration fees | 77,899 | 84,277 | 89,240 | 78,983 | 78,862 | |||||||||||||||
| Administrative service fees | 55,308 | 59,240 | 62,925 | 58,660 | 57,407 | |||||||||||||||
| Trustee fees and expenses | 993 | 3,667 | 6,236 | 3,297 | 2,422 | |||||||||||||||
| Other expenses | 64,128 | 78,522 | 85,184 | 70,137 | 73,856 | |||||||||||||||
| Total expenses | 529,962 | 1,428,318 | 2,295,684 | 1,294,243 | 978,580 | |||||||||||||||
| Less: Expenses reimbursed by the investment adviser | (198,009 | ) | (225,571 | ) | (262,761 | ) | (290,577 | ) | (361,945 | ) | ||||||||||
| Fee waiver by investment adviser and Nuveen Securities | (19,820 | ) | (39,481 | ) | (32,045 | ) | (25,017 | ) | (19,650 | ) | ||||||||||
| Net expenses | 312,133 | 1,163,266 | 2,000,878 | 978,649 | 596,985 | |||||||||||||||
| Net investment income (loss) | 1,576,296 | 5,765,592 | 9,516,942 | 4,314,720 | 2,730,484 | |||||||||||||||
| NET REALIZED AND UNREALIZED GAIN (LOSS) ON TOTAL INVESTMENTS | ||||||||||||||||||||
| Realized gain (loss) from sale of affiliated investments | 395,430 | 4,761,834 | 12,435,312 | 9,021,257 | 6,648,999 | |||||||||||||||
| Realized gain (loss) from sale of unaffiliated investments | — | — | — | — | 17,767 | |||||||||||||||
| Realized gain distributions from affiliated investments | 1,814,162 | 12,243,919 | 29,840,073 | 19,383,939 | 17,093,111 | |||||||||||||||
| Net realized gain (loss) from investments | 2,209,592 | 17,005,753 | 42,275,385 | 28,405,196 | 23,759,877 | |||||||||||||||
| Net change in unrealized appreciation (depreciation) from affiliated investments | (10,696,141 | ) | (54,077,906 | ) | (114,633,540 | ) | (67,414,056 | ) | (52,907,742 | ) | ||||||||||
| Net realized and unrealized gain (loss) from investments | (8,486,549 | ) | (37,072,153 | ) | (72,358,155 | ) | (39,008,860 | ) | (29,147,865 | ) | ||||||||||
| Net increase (decrease) in net assets from operations | $ | (6,910,253 | ) | $ | (31,306,561 | ) | $ | (62,841,213 | ) | $ | (34,694,140 | ) | $ | (26,417,381 | ) | |||||
| 36 | 2022 Annual Report ■ TIAA-CREF Lifestyle Funds | See notes to financial statements | See notes to financial statements | TIAA-CREF Lifestyle Funds ■ 2022 Annual Report | 37 |
Statements of changes in net assets
TIAA-CREF Lifestyle Funds ■ For the year ended
| Lifestyle Income Fund | Lifestyle Conservative Fund | Lifestyle Moderate Fund | ||||||||||||||||||||||||
| May 31, 2022 | May 31, 2021 | May 31, 2022 | May 31, 2021 | May 31, 2022 | May 31, 2021 | |||||||||||||||||||||
| OPERATIONS | ||||||||||||||||||||||||||
| Net investment income (loss) | $ | 1,576,296 | $ | 1,303,532 | $ | 5,765,592 | $ | 4,678,933 | $ | 9,516,942 | $ | 7,660,536 | ||||||||||||||
| Net realized gain (loss) from investments | 2,209,592 | 3,743,680 | 17,005,753 | 21,135,264 | 42,275,385 | 48,001,637 | ||||||||||||||||||||
| Net change in unrealized appreciation (depreciation) from affiliated investments | (10,696,141 | ) | 3,544,521 | (54,077,906 | ) | 29,481,343 | (114,633,540 | ) | 76,880,654 | |||||||||||||||||
| Net increase (decrease) in net assets from operations | (6,910,253 | ) | 8,591,733 | (31,306,561 | ) | 55,295,540 | (62,841,213 | ) | 132,542,827 | |||||||||||||||||
| DISTRIBUTIONS TO SHAREHOLDERS | ||||||||||||||||||||||||||
| Institutional Class | (836,728 | ) | (427,252 | ) | (4,431,319 | ) | (1,992,675 | ) | (8,103,346 | ) | (3,642,954 | ) | ||||||||||||||
| Advisor Class | (6,307 | ) | (4,121 | ) | (339,685 | ) | (322,458 | ) | (1,171,871 | ) | (733,146 | ) | ||||||||||||||
| Premier Class | (17,464 | ) | (11,719 | ) | (52,692 | ) | (32,907 | ) | (61,004 | ) | (34,762 | ) | ||||||||||||||
| Retirement Class | (1,157,098 | ) | (773,711 | ) | (4,185,093 | ) | (2,464,691 | ) | (11,237,327 | ) | (5,988,959 | ) | ||||||||||||||
| Retail Class | (2,756,387 | ) | (1,833,065 | ) | (16,856,416 | ) | (9,960,005 | ) | (36,277,173 | ) | (19,898,063 | ) | ||||||||||||||
| Total distributions | (4,773,984 | ) | (3,049,868 | ) | (25,865,205 | ) | (14,772,736 | ) | (56,850,721 | ) | (30,297,884 | ) | ||||||||||||||
| SHAREHOLDER TRANSACTIONS | ||||||||||||||||||||||||||
| Subscriptions: | Institutional Class | 4,263,659 | 11,740,958 | 23,362,833 | 39,283,272 | 26,123,926 | 59,135,882 | |||||||||||||||||||
| Advisor Class | — | 16,008 | 473,505 | 924,621 | 931,203 | 1,450,139 | ||||||||||||||||||||
| Premier Class | 24,522 | 22,871 | 1,854 | 1,849 | — | — | ||||||||||||||||||||
| Retirement Class | 2,357,343 | 8,824,223 | 8,891,734 | 12,591,347 | 19,396,801 | 14,594,049 | ||||||||||||||||||||
| Retail Class | 9,519,545 | 8,401,620 | 31,346,297 | 28,522,800 | 42,046,707 | 33,062,718 | ||||||||||||||||||||
| Reinvestments of distributions: | Institutional Class | 835,911 | 426,579 | 4,430,324 | 1,991,976 | 8,101,844 | 3,642,068 | |||||||||||||||||||
| Advisor Class | 958 | 130 | 312,471 | 300,444 | 1,138,162 | 703,866 | ||||||||||||||||||||
| Premier Class | 6,308 | 3,608 | 33,362 | 20,492 | 31,451 | 17,483 | ||||||||||||||||||||
| Retirement Class | 1,156,553 | 773,317 | 4,184,140 | 2,464,030 | 11,235,866 | 5,988,110 | ||||||||||||||||||||
| Retail Class | 2,697,330 | 1,786,314 | 16,437,360 | 9,682,138 | 35,444,015 | 19,414,934 | ||||||||||||||||||||
| Redemptions: | Institutional Class | (3,384,411 | ) | (5,564,950 | ) | (15,936,143 | ) | (27,525,400 | ) | (18,516,305 | ) | (49,057,996 | ) | |||||||||||||
| Advisor Class | — | — | (3,384,957 | ) | (1,532,103 | ) | (2,549,794 | ) | (3,918,131 | ) | ||||||||||||||||
| Premier Class | — | — | (431,738 | ) | (3,558 | ) | (319,497 | ) | (826 | ) | ||||||||||||||||
| Retirement Class | (6,421,522 | ) | (4,600,573 | ) | (10,126,408 | ) | (4,878,768 | ) | (13,879,667 | ) | (12,889,828 | ) | ||||||||||||||
| Retail Class | (8,204,860 | ) | (6,466,973 | ) | (30,066,499 | ) | (27,554,449 | ) | (44,191,047 | ) | (40,690,105 | ) | ||||||||||||||
| Net increase (decrease) from shareholder transactions | 2,851,336 | 15,363,132 | 29,528,135 | 34,288,691 | 64,993,665 | 31,452,363 | ||||||||||||||||||||
| Net increase (decrease) in net assets | (8,832,901 | ) | 20,904,997 | (27,643,631 | ) | 74,811,495 | (54,698,269 | ) | 133,697,306 | |||||||||||||||||
| NET ASSETS | ||||||||||||||||||||||||||
| Beginning of period | 100,193,272 | 79,288,275 | 368,992,289 | 294,180,794 | 623,730,497 | 490,033,191 | ||||||||||||||||||||
| End of period | $ | 91,360,371 | $ | 100,193,272 | $ | 341,348,658 | $ | 368,992,289 | $ | 569,032,228 | $ | 623,730,497 | ||||||||||||||
| 38 | 2022 Annual Report ■ TIAA-CREF Lifestyle Funds | See notes to financial statements | See notes to financial statements | TIAA-CREF Lifestyle Funds ■ 2022 Annual Report | 39 |
| Statements of changes in net assets | continued |
TIAA-CREF Lifestyle Funds ■ For the year ended
| Lifestyle Income Fund | Lifestyle Conservative Fund | Lifestyle Moderate Fund | ||||||||||||||||||||||||
| May 31, 2022 | May 31, 2021 | May 31, 2022 | May 31, 2021 | May 31, 2022 | May 31, 2021 | |||||||||||||||||||||
| CHANGE IN FUND SHARES | ||||||||||||||||||||||||||
| Shares sold: | Institutional Class | 361,498 | 998,197 | 1,671,625 | 2,849,607 | 1,583,711 | 3,714,237 | |||||||||||||||||||
| Advisor Class | — | 1,366 | 34,696 | 68,305 | 58,233 | 92,621 | ||||||||||||||||||||
| Premier Class | 2,109 | 1,948 | 135 | 136 | — | �� | ||||||||||||||||||||
| Retirement Class | 203,018 | 750,041 | 664,895 | 924,631 | 1,212,420 | 959,969 | ||||||||||||||||||||
| Retail Class | 812,775 | 715,344 | 2,275,778 | 2,091,802 | 2,642,992 | 2,097,629 | ||||||||||||||||||||
| Shares reinvested: | Institutional Class | 72,451 | 36,471 | 328,770 | 146,803 | 523,566 | 235,023 | |||||||||||||||||||
| Advisor Class | 83 | 11 | 23,156 | 22,152 | 73,543 | 45,461 | ||||||||||||||||||||
| Premier Class | 547 | 308 | 2,472 | 1,509 | 2,028 | 1,125 | ||||||||||||||||||||
| Retirement Class | 100,314 | 66,176 | 310,828 | 181,659 | 727,459 | 386,540 | ||||||||||||||||||||
| Retail Class | 234,085 | 152,817 | 1,222,242 | 714,563 | 2,296,349 | 1,254,035 | ||||||||||||||||||||
| Shares redeemed: | Institutional Class | (299,059 | ) | (472,175 | ) | (1,178,318 | ) | (2,000,061 | ) | (1,185,849 | ) | (3,070,275 | ) | |||||||||||||
| Advisor Class | — | — | (240,150 | ) | (112,355 | ) | (161,424 | ) | (252,998 | ) | ||||||||||||||||
| Premier Class | — | — | (35,378 | ) | (263 | ) | (23,228 | ) | (53 | ) | ||||||||||||||||
| Retirement Class | (568,567 | ) | (390,892 | ) | (753,489 | ) | (361,252 | ) | (893,057 | ) | (828,902 | ) | ||||||||||||||
| Retail Class | (714,785 | ) | (551,745 | ) | (2,250,452 | ) | (2,027,385 | ) | (2,831,103 | ) | (2,630,036 | ) | ||||||||||||||
| Net increase (decrease) from shareholder transactions | 204,469 | 1,307,867 | 2,076,810 | 2,499,851 | 4,025,640 | 2,004,376 | ||||||||||||||||||||
| 40 | 2022 Annual Report ■ TIAA-CREF Lifestyle Funds | See notes to financial statements | See notes to financial statements | TIAA-CREF Lifestyle Funds ■ 2022 Annual Report | 41 |
| Statements of changes in net assets | continued |
TIAA-CREF Lifestyle Funds ■ For the year ended
| Lifestyle Growth Fund | Lifestyle Aggressive Growth Fund | |||||||||||||||||
| May 31, 2022 | May 31, 2021 | May 31, 2022 | May 31, 2021 | |||||||||||||||
| OPERATIONS | ||||||||||||||||||
| Net investment income (loss) | $ | 4,314,720 | $ | 3,159,185 | $ | 2,730,484 | $ | 1,678,533 | ||||||||||
| Net realized gain (loss) from investments | 28,405,196 | 28,508,884 | 23,759,877 | 21,677,204 | ||||||||||||||
| Net change in unrealized appreciation (depreciation) from affiliated investments | (67,414,056 | ) | 54,177,879 | (52,907,742 | ) | 47,534,325 | ||||||||||||
| Net increase (decrease) in net assets from operations | (34,694,140 | ) | 85,845,948 | (26,417,381 | ) | 70,890,062 | ||||||||||||
| DISTRIBUTIONS TO SHAREHOLDERS | ||||||||||||||||||
| Institutional Class | (5,355,950 | ) | (2,455,260 | ) | (5,778,488 | ) | (1,920,530 | ) | ||||||||||
| Advisor Class | (694,923 | ) | (554,493 | ) | (989,824 | ) | (448,551 | ) | ||||||||||
| Premier Class | (205,101 | ) | (100,977 | ) | (46,479 | ) | (20,795 | ) | ||||||||||
| Retirement Class | (6,371,554 | ) | (3,004,778 | ) | (7,035,640 | ) | (2,865,671 | ) | ||||||||||
| Retail Class | (21,994,766 | ) | (11,319,326 | ) | (13,194,207 | ) | (5,277,511 | ) | ||||||||||
| Total distributions | (34,622,294 | ) | (17,434,834 | ) | (27,044,638 | ) | (10,533,058 | ) | ||||||||||
| SHAREHOLDER TRANSACTIONS | ||||||||||||||||||
| Subscriptions: | Institutional Class | 12,980,353 | 27,347,896 | 22,751,702 | 21,912,076 | |||||||||||||
| Advisor Class | 598,661 | 665,627 | 898,962 | 768,249 | ||||||||||||||
| Premier Class | 82,521 | 248,456 | — | — | ||||||||||||||
| Retirement Class | 12,450,340 | 10,155,112 | 7,448,262 | 11,885,468 | ||||||||||||||
| Retail Class | 19,945,763 | 16,934,283 | 15,244,543 | 10,570,580 | ||||||||||||||
| Reinvestments of distributions: | Institutional Class | 5,328,047 | 2,454,427 | 5,776,132 | 1,919,463 | |||||||||||||
| Advisor Class | 510,525 | 437,229 | 548,325 | 251,697 | ||||||||||||||
| Premier Class | 166,262 | 79,238 | — | — | ||||||||||||||
| Retirement Class | 6,369,630 | 3,003,707 | 7,020,358 | 2,856,907 | ||||||||||||||
| Retail Class | 21,770,984 | 11,172,649 | 12,973,531 | 5,217,620 | ||||||||||||||
| Redemptions: | Institutional Class | (9,118,197 | ) | (24,541,484 | ) | (12,126,619 | ) | (14,978,368 | ) | |||||||||
| Advisor Class | (2,681,582 | ) | (4,170,543 | ) | (2,551,515 | ) | (1,453,916 | ) | ||||||||||
| Premier Class | (1,545,777 | ) | (53,082 | ) | — | (889 | ) | |||||||||||
| Retirement Class | (8,175,321 | ) | (8,298,491 | ) | (10,209,697 | ) | (8,052,833 | ) | ||||||||||
| Retail Class | (20,166,846 | ) | (22,460,424 | ) | (14,044,120 | ) | (12,455,733 | ) | ||||||||||
| Net increase (decrease) from shareholder transactions | 38,515,363 | 12,974,600 | 33,729,864 | 18,440,321 | ||||||||||||||
| Net increase (decrease) in net assets | (30,801,071 | ) | 81,385,714 | (19,732,155 | ) | 78,797,325 | ||||||||||||
| NET ASSETS | ||||||||||||||||||
| Beginning of period | 330,269,662 | 248,883,948 | 239,074,396 | 160,277,071 | ||||||||||||||
| End of period | $ | 299,468,591 | $ | 330,269,662 | $ | 219,342,241 | $ | 239,074,396 | ||||||||||
| 42 | 2022 Annual Report ■ TIAA-CREF Lifestyle Funds | See notes to financial statements | See notes to financial statements | TIAA-CREF Lifestyle Funds ■ 2022 Annual Report | 43 |
| Statements of changes in net assets | concluded |
TIAA-CREF Lifestyle Funds ■ For the year ended
| Lifestyle Growth Fund | Lifestyle Aggressive Growth Fund | |||||||||||||||||
| May 31, 2022 | May 31, 2021 | May 31, 2022 | May 31, 2021 | |||||||||||||||
| CHANGE IN FUND SHARES | ||||||||||||||||||
| Shares sold: | Institutional Class | 718,957 | 1,530,465 | 1,119,149 | 1,131,984 | |||||||||||||
| Advisor Class | 35,763 | 38,117 | 46,946 | 40,697 | ||||||||||||||
| Premier Class | 4,633 | 13,630 | — | — | ||||||||||||||
| Retirement Class | 686,408 | 583,370 | 365,593 | 623,284 | ||||||||||||||
| Retail Class | 1,088,075 | 965,753 | 749,628 | 554,398 | ||||||||||||||
| Shares reinvested: | Institutional Class | 308,336 | 142,533 | 299,592 | 101,828 | |||||||||||||
| Advisor Class | 29,561 | 25,406 | 28,425 | 13,345 | ||||||||||||||
| Premier Class | 9,622 | 4,598 | — | — | ||||||||||||||
| Retirement Class | 370,112 | 175,041 | 365,454 | 152,044 | ||||||||||||||
| Retail Class | 1,267,228 | 651,847 | 676,762 | 278,125 | ||||||||||||||
| Shares redeemed: | Institutional Class | (513,704 | ) | (1,406,655 | ) | (607,525 | ) | (782,424 | ) | |||||||||
| Advisor Class | (150,710 | ) | (239,820 | ) | (138,272 | ) | (77,673 | ) | ||||||||||
| Premier Class | (100,267 | ) | (2,878 | ) | — | (50 | ) | |||||||||||
| Retirement Class | (460,999 | ) | (480,635 | ) | (510,140 | ) | (435,841 | ) | ||||||||||
| Retail Class | (1,156,887 | ) | (1,322,215 | ) | (719,021 | ) | (685,883 | ) | ||||||||||
| Net increase (decrease) from shareholder transactions | 2,136,128 | 678,557 | 1,676,591 | 913,834 | ||||||||||||||
| 44 | 2022 Annual Report ■ TIAA-CREF Lifestyle Funds | See notes to financial statements | See notes to financial statements | TIAA-CREF Lifestyle Funds ■ 2022 Annual Report | 45 |
TIAA-CREF Lifestyle Funds
| Selected per share data | Ratios and supplemental data | |||||||||||||||||||||||||||||||||||||||||||||||||||||||||
| Gain (loss) from investment operations | ||||||||||||||||||||||||||||||||||||||||||||||||||||||||||
| Net realized | Ratios to average net assets | |||||||||||||||||||||||||||||||||||||||||||||||||||||||||
| For the | Net asset | Net | and unrealized | Total gain | Less distributions from | Total | Net asset | Net assets | Net | |||||||||||||||||||||||||||||||||||||||||||||||||
| period or year ended | value, beginning of period | investment income (loss | )a | gain (loss on total investments | ) j | (loss) from investment operations | Net investment income | Net realized gains | dividends and distributions | value, end of period | Total return | at end of period or year (in thousands | ) | Gross expenses | e | Net expenses | e | investment income (loss | ) | Portfolio turnover rate | ||||||||||||||||||||||||||||||||||||||
| LIFESTYLE INCOME FUND | ||||||||||||||||||||||||||||||||||||||||||||||||||||||||||
| Institutional Class: | 5/31/22 | $11.97 | $0.21 | $(0.96 | ) | $(0.75 | ) | $(0.25 | ) | $(0.32 | ) | $(0.57 | ) | $10.65 | (6.56 | )% | $15,247 | 0.30 | % | 0.10 | % | 1.78 | % | 20 | % | |||||||||||||||||||||||||||||||||
| 5/31/21 | 11.22 | 0.20 | 0.98 | 1.18 | (0.26 | ) | (0.17 | ) | (0.43 | ) | 11.97 | 10.58 | 15,514 | 0.29 | 0.10 | 1.67 | 27 | |||||||||||||||||||||||||||||||||||||||||
| 5/31/20 | 11.02 | 0.26 | 0.33 | 0.59 | (0.27 | ) | (0.12 | ) | (0.39 | ) | 11.22 | 5.53 | 8,234 | 0.36 | 0.10 | 2.37 | 27 | |||||||||||||||||||||||||||||||||||||||||
| 5/31/19 | 11.08 | 0.28 | 0.05 | 0.33 | (0.29 | ) | (0.10 | ) | (0.39 | ) | 11.02 | 3.26 | 8,683 | 0.36 | 0.10 | 2.57 | 29 | |||||||||||||||||||||||||||||||||||||||||
| 5/31/18 | 11.04 | 0.24 | 0.13 | 0.37 | (0.27 | ) | (0.06 | ) | (0.33 | ) | 11.08 | 3.25 | 3,498 | 0.36 | 0.10 | 2.19 | 19 | |||||||||||||||||||||||||||||||||||||||||
| Advisor Class: | 5/31/22 | 11.96 | 0.20 | (0.95 | ) | (0.75 | ) | (0.24 | ) | (0.32 | ) | (0.56 | ) | 10.65 | (6.55 | ) | 120 | 0.35 | 0.15 | 1.72 | 20 | |||||||||||||||||||||||||||||||||||||
| 5/31/21 | 11.22 | 0.19 | 0.98 | 1.17 | (0.26 | ) | (0.17 | ) | (0.43 | ) | 11.96 | 10.48 | 133 | 0.33 | 0.14 | 1.63 | 27 | |||||||||||||||||||||||||||||||||||||||||
| 5/31/20 | 11.02 | 0.26 | 0.33 | 0.59 | (0.27 | ) | (0.12 | ) | (0.39 | ) | 11.22 | 5.47 | 110 | 0.41 | 0.15 | 2.31 | 27 | |||||||||||||||||||||||||||||||||||||||||
| 5/31/19 | 11.07 | 0.28 | 0.06 | 0.34 | (0.29 | ) | (0.10 | ) | (0.39 | ) | 11.02 | 3.24 | 110 | 0.37 | 0.13 | 2.53 | 29 | |||||||||||||||||||||||||||||||||||||||||
| 5/31/18 | 11.04 | 0.24 | 0.12 | 0.36 | (0.27 | ) | (0.06 | ) | (0.33 | ) | 11.07 | 3.24 | 105 | 0.37 | 0.11 | 2.17 | 19 | |||||||||||||||||||||||||||||||||||||||||
| Premier Class: | 5/31/22 | 11.98 | 0.19 | (0.96 | ) | (0.77 | ) | (0.23 | ) | (0.32 | ) | (0.55 | ) | 10.66 | (6.61 | ) | 349 | 0.46 | 0.25 | 1.63 | 20 | |||||||||||||||||||||||||||||||||||||
| 5/31/21 | 11.23 | 0.18 | 0.98 | 1.16 | (0.24 | ) | (0.17 | ) | (0.41 | ) | 11.98 | 10.32 | 361 | 0.45 | 0.25 | 1.53 | 27 | |||||||||||||||||||||||||||||||||||||||||
| 5/31/20 | 11.02 | 0.25 | 0.34 | 0.59 | (0.26 | ) | (0.12 | ) | (0.38 | ) | 11.23 | 5.47 | 313 | 0.52 | 0.25 | 2.15 | 27 | |||||||||||||||||||||||||||||||||||||||||
| 5/31/19 | 11.09 | 0.27 | 0.04 | 0.31 | (0.28 | ) | (0.10 | ) | (0.38 | ) | 11.02 | 3.02 | 810 | 0.51 | 0.25 | 2.44 | 29 | |||||||||||||||||||||||||||||||||||||||||
| 5/31/18 | 11.05 | 0.23 | 0.12 | 0.35 | (0.25 | ) | (0.06 | ) | (0.31 | ) | 11.09 | 3.10 | 255 | 0.52 | 0.25 | 2.04 | 19 | |||||||||||||||||||||||||||||||||||||||||
| Retirement Class: | 5/31/22 | 11.96 | 0.18 | (0.96 | ) | (0.78 | ) | (0.22 | ) | (0.32 | ) | (0.54 | ) | 10.64 | (6.71 | ) | 20,443 | 0.55 | 0.35 | 1.51 | 20 | |||||||||||||||||||||||||||||||||||||
| 5/31/21 | 11.21 | 0.17 | 0.98 | 1.15 | (0.23 | ) | (0.17 | ) | (0.40 | ) | 11.96 | 10.23 | 26,139 | 0.54 | 0.35 | 1.43 | 27 | |||||||||||||||||||||||||||||||||||||||||
| 5/31/20 | 11.00 | 0.24 | 0.34 | 0.58 | (0.25 | ) | (0.12 | ) | (0.37 | ) | 11.21 | 5.35 | 19,742 | 0.60 | 0.35 | 2.11 | 27 | |||||||||||||||||||||||||||||||||||||||||
| 5/31/19 | 11.06 | 0.25 | 0.06 | 0.31 | (0.27 | ) | (0.10 | ) | (0.37 | ) | 11.00 | 2.92 | 15,504 | 0.60 | 0.35 | 2.29 | 29 | |||||||||||||||||||||||||||||||||||||||||
| 5/31/18 | 11.03 | 0.21 | 0.12 | 0.33 | (0.24 | ) | (0.06 | ) | (0.30 | ) | 11.06 | 3.00 | 16,847 | 0.61 | 0.35 | 1.93 | 19 | |||||||||||||||||||||||||||||||||||||||||
| Retail Class: | 5/31/22 | 11.96 | 0.18 | (0.96 | ) | (0.78 | ) | (0.22 | ) | (0.32 | ) | (0.54 | ) | 10.64 | (6.73 | ) | 55,202 | 0.58 | 0.35 | 1.52 | 20 | |||||||||||||||||||||||||||||||||||||
| 5/31/21 | 11.21 | 0.16 | 0.99 | 1.15 | (0.23 | ) | (0.17 | ) | (0.40 | ) | 11.96 | 10.21 | 58,046 | 0.57 | 0.38 | 1.40 | 27 | |||||||||||||||||||||||||||||||||||||||||
| 5/31/20 | 11.01 | 0.23 | 0.33 | 0.56 | (0.24 | ) | (0.12 | ) | (0.36 | ) | 11.21 | 5.23 | 50,890 | 0.63 | 0.38 | 2.09 | 27 | |||||||||||||||||||||||||||||||||||||||||
| 5/31/19 | 11.07 | 0.25 | 0.05 | 0.30 | (0.26 | ) | (0.10 | ) | (0.36 | ) | 11.01 | 2.98 | 48,233 | 0.63 | 0.38 | 2.27 | 29 | |||||||||||||||||||||||||||||||||||||||||
| 5/31/18 | 11.03 | 0.21 | 0.13 | 0.34 | (0.24 | ) | (0.06 | ) | (0.30 | ) | 11.07 | 2.97 | 50,449 | 0.63 | 0.37 | 1.91 | 19 | |||||||||||||||||||||||||||||||||||||||||
| 46 | 2022 Annual Report ■ TIAA-CREF Lifestyle Funds | See notes to financial statements | See notes to financial statements | TIAA-CREF Lifestyle Funds ■ 2022 Annual Report | 47 |
| Financial highlights | continued |
TIAA-CREF Lifestyle Funds
| Selected per share data | Ratios and supplemental data | |||||||||||||||||||||||||||||||||||||||||||||||||||||||||
| Gain (loss) from investment operations | ||||||||||||||||||||||||||||||||||||||||||||||||||||||||||
| Net realized | Less distributions from | Ratios to average net assets | ||||||||||||||||||||||||||||||||||||||||||||||||||||||||
| For the period or year ended | Net asset value, beginning of period | Net investment income (loss | )a | and unrealized gain (loss on total investments | ) j | Total gain (loss) from investment operations | Net investment income | Net realized gains | Total dividends and distributions | Net asset value, end of period | Total return | Net assets at end of period or year (in thousands | ) | Gross expenses | e | Net expenses | e | Net investment income (loss | ) | Portfolio turnover rate | ||||||||||||||||||||||||||||||||||||||
| LIFESTYLE CONSERVATIVE FUND | ||||||||||||||||||||||||||||||||||||||||||||||||||||||||||
| Institutional Class: | 5/31/22 | $14.25 | $0.24 | $(1.29 | ) | $(1.05 | ) | $(0.36 | ) | $(0.63 | ) | $(0.99 | ) | $12.21 | (7.99 | )% | $ 55,791 | 0.16 | % | 0.10 | % | 1.77 | % | 21 | % | |||||||||||||||||||||||||||||||||
| 5/31/21 | 12.57 | 0.22 | 2.11 | 2.33 | (0.32 | ) | (0.33 | ) | (0.65 | ) | 14.25 | 18.77 | 53,420 | 0.17 | 0.10 | 1.63 | 35 | |||||||||||||||||||||||||||||||||||||||||
| 5/31/20 | 12.26 | 0.28 | 0.49 | 0.77 | (0.23 | ) | (0.23 | ) | (0.46 | ) | 12.57 | 6.44 | 34,603 | 0.19 | 0.10 | 2.25 | 29 | |||||||||||||||||||||||||||||||||||||||||
| 5/31/19 | 12.58 | 0.29 | (0.10 | ) | 0.19 | (0.33 | ) | (0.18 | ) | (0.51 | ) | 12.26 | 1.68 | 27,635 | 0.20 | 0.10 | 2.34 | 24 | ||||||||||||||||||||||||||||||||||||||||
| 5/31/18 | 12.22 | 0.26 | 0.49 | 0.75 | (0.32 | ) | (0.07 | ) | (0.39 | ) | 12.58 | 6.17 | 18,299 | 0.25 | 0.10 | 2.05 | 13 | |||||||||||||||||||||||||||||||||||||||||
| Advisor Class: | 5/31/22 | 14.25 | 0.22 | (1.30 | ) | (1.08 | ) | (0.34 | ) | (0.63 | ) | (0.97 | ) | 12.20 | (8.09 | ) | 3,876 | 0.26 | 0.20 | 1.62 | 20 | |||||||||||||||||||||||||||||||||||||
| 5/31/21 | 12.57 | 0.21 | 2.10 | 2.31 | (0.30 | ) | (0.33 | ) | (0.63 | ) | 14.25 | 18.57 | 7,122 | 0.26 | 0.20 | 1.54 | 35 | |||||||||||||||||||||||||||||||||||||||||
| 5/31/20 | 12.26 | 0.30 | 0.46 | 0.76 | (0.22 | ) | (0.23 | ) | (0.45 | ) | 12.57 | 6.33 | 6,559 | 0.29 | 0.20 | 2.45 | 29 | |||||||||||||||||||||||||||||||||||||||||
| 5/31/19 | 12.58 | 0.26 | (0.08 | ) | 0.18 | (0.32 | ) | (0.18 | ) | (0.50 | ) | 12.26 | 1.62 | 379 | 0.27 | 0.18 | 2.16 | 24 | ||||||||||||||||||||||||||||||||||||||||
| 5/31/18 | 12.23 | 0.25 | 0.48 | 0.73 | (0.31 | ) | (0.07 | ) | (0.38 | ) | 12.58 | 6.07 | 172 | 0.22 | 0.12 | 2.00 | 13 | |||||||||||||||||||||||||||||||||||||||||
| Premier Class: | 5/31/22 | 14.26 | 0.22 | (1.30 | ) | (1.08 | ) | (0.34 | ) | (0.63 | ) | (0.97 | ) | 12.21 | (8.14 | ) | 262 | 0.32 | 0.25 | 1.60 | 20 | |||||||||||||||||||||||||||||||||||||
| 5/31/21 | 12.58 | 0.20 | 2.11 | 2.31 | (0.30 | ) | (0.33 | ) | (0.63 | ) | 14.26 | 18.49 | 774 | 0.32 | 0.25 | 1.48 | 35 | |||||||||||||||||||||||||||||||||||||||||
| 5/31/20 | 12.27 | 0.26 | 0.49 | 0.75 | (0.21 | ) | (0.23 | ) | (0.44 | ) | 12.58 | 6.27 | 665 | 0.35 | 0.25 | 2.05 | 29 | |||||||||||||||||||||||||||||||||||||||||
| 5/31/19 | 12.59 | 0.27 | (0.10 | ) | 0.17 | (0.31 | ) | (0.18 | ) | (0.49 | ) | 12.27 | 1.62 | 699 | 0.35 | 0.25 | 2.17 | 24 | ||||||||||||||||||||||||||||||||||||||||
| 5/31/18 | 12.23 | 0.24 | 0.49 | 0.73 | (0.30 | ) | (0.07 | ) | (0.37 | ) | 12.59 | 5.93 | 269 | 0.38 | 0.25 | 1.91 | 13 | |||||||||||||||||||||||||||||||||||||||||
| Retirement Class: | 5/31/22 | 14.23 | 0.20 | (1.29 | ) | (1.09 | ) | (0.32 | ) | (0.63 | ) | (0.95 | ) | 12.19 | (8.17 | ) | 56,686 | 0.41 | 0.35 | 1.50 | 20 | |||||||||||||||||||||||||||||||||||||
| 5/31/21 | 12.55 | 0.19 | 2.10 | 2.29 | (0.28 | ) | (0.33 | ) | (0.61 | ) | 14.23 | 18.44 | 63,022 | 0.41 | 0.34 | 1.39 | 35 | |||||||||||||||||||||||||||||||||||||||||
| 5/31/20 | 12.25 | 0.25 | 0.48 | 0.73 | (0.20 | ) | (0.23 | ) | (0.43 | ) | 12.55 | 6.11 | 46,255 | 0.43 | 0.33 | 1.98 | 29 | |||||||||||||||||||||||||||||||||||||||||
| 5/31/19 | 12.57 | 0.26 | (0.10 | ) | 0.16 | (0.30 | ) | (0.18 | ) | (0.48 | ) | 12.25 | 1.51 | 44,397 | 0.44 | 0.35 | 2.08 | 24 | ||||||||||||||||||||||||||||||||||||||||
| 5/31/18 | 12.21 | 0.23 | 0.49 | 0.72 | (0.29 | ) | (0.07 | ) | (0.36 | ) | 12.57 | 5.83 | 42,506 | 0.45 | 0.35 | 1.81 | 13 | |||||||||||||||||||||||||||||||||||||||||
| Retail Class: | 5/31/22 | 14.22 | 0.20 | (1.29 | ) | (1.09 | ) | (0.32 | ) | (0.63 | ) | (0.95 | ) | 12.18 | (8.25 | ) | 224,733 | 0.43 | 0.36 | 1.49 | 20 | |||||||||||||||||||||||||||||||||||||
| 5/31/21 | 12.55 | 0.18 | 2.10 | 2.28 | (0.28 | ) | (0.33 | ) | (0.61 | ) | 14.22 | 18.40 | 244,655 | 0.44 | 0.37 | 1.36 | 35 | |||||||||||||||||||||||||||||||||||||||||
| 5/31/20 | 12.24 | 0.25 | 0.49 | 0.74 | (0.20 | ) | (0.23 | ) | (0.43 | ) | 12.55 | 6.16 | 206,100 | 0.45 | 0.37 | 1.99 | 29 | |||||||||||||||||||||||||||||||||||||||||
| 5/31/19 | 12.56 | 0.25 | (0.10 | ) | 0.15 | (0.29 | ) | (0.18 | ) | (0.47 | ) | 12.24 | 1.41 | 157,919 | 0.46 | 0.37 | 2.06 | 24 | ||||||||||||||||||||||||||||||||||||||||
| 5/31/18 | 12.20 | 0.22 | 0.49 | 0.71 | (0.28 | ) | (0.07 | ) | (0.35 | ) | 12.56 | 5.90 | 163,097 | 0.47 | 0.37 | 1.79 | 13 | |||||||||||||||||||||||||||||||||||||||||
| 48 | 2022 Annual Report ■ TIAA-CREF Lifestyle Funds | See notes to financial statements | See notes to financial statements | TIAA-CREF Lifestyle Funds ■ 2022 Annual Report | 49 |
| Financial highlights | continued |
TIAA-CREF Lifestyle Funds
| Selected per share data | Ratios and supplemental data | |||||||||||||||||||||||||||||||||||||||||||||||||||||||||
| Gain (loss) from investment operations | ||||||||||||||||||||||||||||||||||||||||||||||||||||||||||
| Net realized | Less distributions from | Ratios to average net assets | ||||||||||||||||||||||||||||||||||||||||||||||||||||||||
| For the period or year ended | Net asset value, beginning of period | Net investment income (loss | )a | and unrealized gain (loss on total investments | ) j | Total gain (loss) from investment operations | Net investment income | Net realized gains | Total dividends and distributions | Net asset value, end of period | Total return | Net assets at end of period or year (in thousands | ) | Gross expenses | e | Net expenses | e | Net investment income (loss | ) | Portfolio turnover rate | ||||||||||||||||||||||||||||||||||||||
| LIFESTYLE MODERATE FUND | ||||||||||||||||||||||||||||||||||||||||||||||||||||||||||
| Institutional Class: | 5/31/22 | $16.68 | $0.28 | $(1.71 | ) | $(1.43 | ) | $(0.49 | ) | $(1.02 | ) | $(1.51 | ) | $13.74 | (9.58 | )% | $ 76,453 | 0.14 | % | 0.10 | % | 1.75 | % | 21 | % | |||||||||||||||||||||||||||||||||
| 5/31/21 | 13.84 | 0.25 | 3.47 | 3.72 | (0.38 | ) | (0.50 | ) | (0.88 | ) | 16.68 | 27.47 | 77,429 | 0.15 | 0.09 | 1.58 | 47 | |||||||||||||||||||||||||||||||||||||||||
| 5/31/20 | 13.55 | 0.29 | 0.67 | 0.96 | (0.28 | ) | (0.39 | ) | (0.67 | ) | 13.84 | 7.23 | 52,090 | 0.16 | 0.10 | 2.10 | 31 | |||||||||||||||||||||||||||||||||||||||||
| 5/31/19 | 14.18 | 0.29 | (0.30 | ) | (0.01 | ) | (0.36 | ) | (0.26 | ) | (0.62 | ) | 13.55 | 0.14 | 39,367 | 0.17 | 0.10 | 2.16 | 23 | |||||||||||||||||||||||||||||||||||||||
| 5/31/18 | 13.44 | 0.26 | 0.94 | 1.20 | (0.37 | ) | (0.09 | ) | (0.46 | ) | 14.18 | 9.04 | 24,246 | 0.18 | 0.10 | 1.88 | 10 | |||||||||||||||||||||||||||||||||||||||||
| Advisor Class: | 5/31/22 | 16.67 | 0.26 | (1.70 | ) | (1.44 | ) | (0.47 | ) | (1.02 | ) | (1.49 | ) | 13.74 | (9.60 | ) | 10,895 | 0.22 | 0.18 | 1.64 | 21 | |||||||||||||||||||||||||||||||||||||
| 5/31/21 | 13.84 | 0.23 | 3.47 | 3.70 | (0.37 | ) | (0.50 | ) | (0.87 | ) | 16.67 | 27.29 | 13,719 | 0.23 | 0.17 | 1.50 | 47 | |||||||||||||||||||||||||||||||||||||||||
| 5/31/20 | 13.55 | 0.37 | 0.58 | 0.95 | (0.27 | ) | (0.39 | ) | (0.66 | ) | 13.84 | 7.12 | 12,977 | 0.26 | 0.20 | 2.64 | 31 | |||||||||||||||||||||||||||||||||||||||||
| 5/31/19 | 14.18 | 0.28 | (0.29 | ) | (0.01 | ) | (0.36 | ) | (0.26 | ) | (0.62 | ) | 13.55 | 0.09 | 707 | 0.23 | 0.16 | 2.02 | 23 | |||||||||||||||||||||||||||||||||||||||
| 5/31/18 | 13.44 | 0.26 | 0.93 | 1.19 | (0.36 | ) | (0.09 | ) | (0.45 | ) | 14.18 | 8.96 | 163 | 0.26 | 0.18 | 1.86 | 10 | |||||||||||||||||||||||||||||||||||||||||
| Premier Class: | 5/31/22 | 16.72 | 0.26 | (1.72 | ) | (1.46 | ) | (0.46 | ) | (1.02 | ) | (1.48 | ) | 13.78 | (9.64 | ) | 276 | 0.30 | 0.25 | 1.60 | 21 | |||||||||||||||||||||||||||||||||||||
| 5/31/21 | 13.87 | 0.23 | 3.48 | 3.71 | (0.36 | ) | (0.50 | ) | (0.86 | ) | 16.72 | 27.22 | 689 | 0.31 | 0.24 | 1.45 | 47 | |||||||||||||||||||||||||||||||||||||||||
| 5/31/20 | 13.58 | 0.24 | 0.70 | 0.94 | (0.26 | ) | (0.39 | ) | (0.65 | ) | 13.87 | 7.03 | 557 | 0.32 | 0.25 | 1.72 | 31 | |||||||||||||||||||||||||||||||||||||||||
| 5/31/19 | 14.21 | 0.28 | (0.30 | ) | (0.02 | ) | (0.35 | ) | (0.26 | ) | (0.61 | ) | 13.58 | 0.01 | 1,001 | 0.32 | 0.25 | 2.06 | 23 | |||||||||||||||||||||||||||||||||||||||
| 5/31/18 | 13.47 | 0.21 | 0.96 | 1.17 | (0.34 | ) | (0.09 | ) | (0.43 | ) | 14.21 | 8.79 | 310 | 0.34 | 0.25 | 1.53 | 10 | |||||||||||||||||||||||||||||||||||||||||
| Retirement Class: | 5/31/22 | 16.65 | 0.23 | (1.70 | ) | (1.47 | ) | (0.44 | ) | (1.02 | ) | (1.46 | ) | 13.72 | (9.77 | ) | 114,335 | 0.39 | 0.35 | 1.48 | 21 | |||||||||||||||||||||||||||||||||||||
| 5/31/21 | 13.82 | 0.21 | 3.47 | 3.68 | (0.35 | ) | (0.50 | ) | (0.85 | ) | 16.65 | 27.12 | 121,361 | 0.40 | 0.34 | 1.35 | 47 | |||||||||||||||||||||||||||||||||||||||||
| 5/31/20 | 13.53 | 0.25 | 0.68 | 0.93 | (0.25 | ) | (0.39 | ) | (0.64 | ) | 13.82 | 6.95 | 93,587 | 0.41 | 0.35 | 1.81 | 31 | |||||||||||||||||||||||||||||||||||||||||
| 5/31/19 | 14.17 | 0.26 | (0.31 | ) | (0.05 | ) | (0.33 | ) | (0.26 | ) | (0.59 | ) | 13.53 | (0.11 | ) | 92,295 | 0.42 | 0.35 | 1.87 | 23 | ||||||||||||||||||||||||||||||||||||||
| 5/31/18 | 13.43 | 0.23 | 0.94 | 1.17 | (0.34 | ) | (0.09 | ) | (0.43 | ) | 14.17 | 8.70 | 93,842 | 0.43 | 0.35 | 1.68 | 10 | |||||||||||||||||||||||||||||||||||||||||
| Retail Class: | 5/31/22 | 16.64 | 0.23 | (1.70 | ) | (1.47 | ) | (0.44 | ) | (1.02 | ) | (1.46 | ) | 13.71 | (9.78 | ) | 367,073 | 0.41 | 0.36 | 1.46 | 21 | |||||||||||||||||||||||||||||||||||||
| 5/31/21 | 13.82 | 0.20 | 3.46 | 3.66 | (0.34 | ) | (0.50 | ) | (0.84 | ) | 16.64 | 27.02 | 410,533 | 0.42 | 0.36 | 1.32 | 47 | |||||||||||||||||||||||||||||||||||||||||
| 5/31/20 | 13.52 | 0.27 | 0.67 | 0.94 | (0.25 | ) | (0.39 | ) | (0.64 | ) | 13.82 | 7.01 | 330,823 | 0.43 | 0.37 | 1.95 | 31 | |||||||||||||||||||||||||||||||||||||||||
| 5/31/19 | 14.16 | 0.25 | (0.30 | ) | (0.05 | ) | (0.33 | ) | (0.26 | ) | (0.59 | ) | 13.52 | (0.20 | ) | 215,314 | 0.43 | 0.37 | 1.85 | 23 | ||||||||||||||||||||||||||||||||||||||
| 5/31/18 | 13.42 | 0.23 | 0.93 | 1.16 | (0.33 | ) | (0.09 | ) | (0.42 | ) | 14.16 | 8.76 | 213,691 | 0.44 | 0.37 | 1.67 | 10 | |||||||||||||||||||||||||||||||||||||||||
| 50 | 2022 Annual Report ■ TIAA-CREF Lifestyle Funds | See notes to financial statements | See notes to financial statements | TIAA-CREF Lifestyle Funds ■ 2022 Annual Report | 51 |
| Financial highlights | continued |
TIAA-CREF Lifestyle Funds
| Selected per share data | Ratios and supplemental data | |||||||||||||||||||||||||||||||||||||||||||||||||||||||||
| Gain (loss) from investment operations | ||||||||||||||||||||||||||||||||||||||||||||||||||||||||||
| Net realized | Less distributions from | Ratios to average net assets | ||||||||||||||||||||||||||||||||||||||||||||||||||||||||
| For the period or year ended | Net asset value, beginning of period | Net investment income (loss | )a | and unrealized gain (loss on total investments | ) j | Total gain (loss) from investment operations | Net investment income | Net realized gains | Total dividends and distributions | Net asset value, end of period | Total return | Net assets at end of period or year (in thousands | ) | Gross expenses | e | Net expenses | e | Net investment income (loss | ) | Portfolio turnover rate | ||||||||||||||||||||||||||||||||||||||
| LIFESTYLE GROWTH FUND | ||||||||||||||||||||||||||||||||||||||||||||||||||||||||||
| Institutional Class: | 5/31/22 | $18.98 | $0.27 | $(1.94 | ) | $(1.67 | ) | $(0.62 | ) | $(1.35 | ) | $(1.97 | ) | $15.34 | (9.96 | )% | $ 47,024 | 0.16 | % | 0.08 | % | 1.50 | % | 26 | % | |||||||||||||||||||||||||||||||||
| 5/31/21 | 14.87 | 0.23 | 4.99 | 5.22 | (0.41 | ) | (0.70 | ) | (1.11 | ) | 18.98 | 35.87 | 48,422 | 0.18 | 0.09 | 1.34 | 54 | |||||||||||||||||||||||||||||||||||||||||
| 5/31/20 | 14.66 | 0.28 | 0.78 | 1.06 | (0.28 | ) | (0.57 | ) | (0.85 | ) | 14.87 | 7.18 | 33,985 | 0.21 | 0.10 | 1.87 | 35 | |||||||||||||||||||||||||||||||||||||||||
| 5/31/19 | 15.75 | 0.26 | (0.63 | ) | (0.37 | ) | (0.36 | ) | (0.36 | ) | (0.72 | ) | 14.66 | (2.07 | ) | 33,809 | 0.23 | 0.10 | 1.76 | 29 | ||||||||||||||||||||||||||||||||||||||
| 5/31/18 | 14.53 | 0.25 | 1.49 | 1.74 | (0.42 | ) | (0.10 | ) | (0.52 | ) | 15.75 | 12.02 | 18,485 | 0.24 | 0.10 | 1.59 | 18 | |||||||||||||||||||||||||||||||||||||||||
| Advisor Class: | 5/31/22 | 18.96 | 0.26 | (1.94 | ) | (1.68 | ) | (0.60 | ) | (1.35 | ) | (1.95 | ) | 15.33 | (10.00 | ) | 5,138 | 0.25 | 0.16 | 1.44 | 26 | |||||||||||||||||||||||||||||||||||||
| 5/31/21 | 14.86 | 0.22 | 4.98 | 5.20 | (0.40 | ) | (0.70 | ) | (1.10 | ) | 18.96 | 35.72 | 7,976 | 0.26 | 0.17 | 1.28 | 54 | |||||||||||||||||||||||||||||||||||||||||
| 5/31/20 | 14.65 | 0.38 | 0.66 | 1.04 | (0.26 | ) | (0.57 | ) | (0.83 | ) | 14.86 | 7.03 | 8,870 | 0.30 | 0.20 | 2.57 | 35 | |||||||||||||||||||||||||||||||||||||||||
| 5/31/19 | 15.74 | 0.22 | (0.60 | ) | (0.38 | ) | (0.35 | ) | (0.36 | ) | (0.71 | ) | 14.65 | (2.13 | ) | 346 | 0.29 | 0.17 | 1.45 | 29 | ||||||||||||||||||||||||||||||||||||||
| 5/31/18 | 14.52 | 0.22 | 1.52 | 1.74 | (0.42 | ) | (0.10 | ) | (0.52 | ) | 15.74 | 12.03 | 195 | 0.31 | 0.17 | 1.41 | 18 | |||||||||||||||||||||||||||||||||||||||||
| Premier Class: | 5/31/22 | 18.97 | 0.26 | (1.93 | ) | (1.67 | ) | (0.59 | ) | (1.35 | ) | (1.94 | ) | 15.36 | (9.93 | ) | 316 | 0.32 | 0.23 | 1.41 | 26 | |||||||||||||||||||||||||||||||||||||
| 5/31/21 | 14.87 | 0.20 | 4.99 | 5.19 | (0.39 | ) | (0.70 | ) | (1.09 | ) | 18.97 | 35.62 | 2,022 | 0.33 | 0.24 | 1.18 | 54 | |||||||||||||||||||||||||||||||||||||||||
| 5/31/20 | 14.65 | 0.25 | 0.79 | 1.04 | (0.25 | ) | (0.57 | ) | (0.82 | ) | 14.87 | 7.02 | 1,356 | 0.36 | 0.25 | 1.64 | 35 | |||||||||||||||||||||||||||||||||||||||||
| 5/31/19 | 15.75 | 0.24 | (0.64 | ) | (0.40 | ) | (0.34 | ) | (0.36 | ) | (0.70 | ) | 14.65 | (2.24 | ) | 1,553 | 0.38 | 0.25 | 1.63 | 29 | ||||||||||||||||||||||||||||||||||||||
| 5/31/18 | 14.53 | 0.22 | 1.51 | 1.73 | (0.41 | ) | (0.10 | ) | (0.51 | ) | 15.75 | 11.93 | 361 | 0.42 | 0.25 | 1.39 | 18 | |||||||||||||||||||||||||||||||||||||||||
| Retirement Class: | 5/31/22 | 18.90 | 0.22 | (1.93 | ) | (1.71 | ) | (0.57 | ) | (1.35 | ) | (1.92 | ) | 15.27 | (10.12 | ) | 56,946 | 0.41 | 0.33 | 1.26 | 26 | |||||||||||||||||||||||||||||||||||||
| 5/31/21 | 14.81 | 0.18 | 4.98 | 5.16 | (0.37 | ) | (0.70 | ) | (1.07 | ) | 18.90 | 35.51 | 59,232 | 0.43 | 0.34 | 1.07 | 54 | |||||||||||||||||||||||||||||||||||||||||
| 5/31/20 | 14.60 | 0.23 | 0.78 | 1.01 | (0.23 | ) | (0.57 | ) | (0.80 | ) | 14.81 | 6.87 | 42,326 | 0.45 | 0.35 | 1.55 | 35 | |||||||||||||||||||||||||||||||||||||||||
| 5/31/19 | 15.69 | 0.23 | (0.64 | ) | (0.41 | ) | (0.32 | ) | (0.36 | ) | (0.68 | ) | 14.60 | (2.34 | ) | 40,228 | 0.47 | 0.35 | 1.52 | 29 | ||||||||||||||||||||||||||||||||||||||
| 5/31/18 | 14.48 | 0.19 | 1.52 | 1.71 | (0.40 | ) | (0.10 | ) | (0.50 | ) | 15.69 | 11.83 | 45,329 | 0.49 | 0.35 | 1.26 | 18 | |||||||||||||||||||||||||||||||||||||||||
| Retail Class: | 5/31/22 | 18.87 | 0.22 | (1.94 | ) | (1.72 | ) | (0.56 | ) | (1.35 | ) | (1.91 | ) | 15.24 | (10.17 | ) | 190,045 | 0.44 | 0.34 | 1.25 | 26 | |||||||||||||||||||||||||||||||||||||
| 5/31/21 | 14.79 | 0.18 | 4.97 | 5.15 | (0.37 | ) | (0.70 | ) | (1.07 | ) | 18.87 | 35.45 | 212,617 | 0.46 | 0.37 | 1.05 | 54 | |||||||||||||||||||||||||||||||||||||||||
| 5/31/20 | 14.58 | 0.27 | 0.74 | 1.01 | (0.23 | ) | (0.57 | ) | (0.80 | ) | 14.79 | 6.85 | 162,347 | 0.48 | 0.38 | 1.79 | 35 | |||||||||||||||||||||||||||||||||||||||||
| 5/31/19 | 15.67 | 0.22 | (0.64 | ) | (0.42 | ) | (0.31 | ) | (0.36 | ) | (0.67 | ) | 14.58 | (2.32 | ) | 85,422 | 0.50 | 0.38 | 1.44 | 29 | ||||||||||||||||||||||||||||||||||||||
| 5/31/18 | 14.46 | 0.19 | 1.51 | 1.70 | (0.39 | ) | (0.10 | ) | (0.49 | ) | 15.67 | 11.73 | 89,044 | 0.52 | 0.38 | 1.25 | 18 | |||||||||||||||||||||||||||||||||||||||||
| 52 | 2022 Annual Report ■ TIAA-CREF Lifestyle Funds | See notes to financial statements | See notes to financial statements | TIAA-CREF Lifestyle Funds ■ 2022 Annual Report | 53 |
| Financial highlights | concluded |
TIAA-CREF Lifestyle Funds
| Selected per share data | Ratios and supplemental data | |||||||||||||||||||||||||||||||||||||||||||||||||||||||||
| Gain (loss) from investment operations | ||||||||||||||||||||||||||||||||||||||||||||||||||||||||||
| Net realized | Less distributions from | Ratios to average net assets | ||||||||||||||||||||||||||||||||||||||||||||||||||||||||
| For the period or year ended | Net asset value, beginning of period | Net investment income (loss | )a | and unrealized gain (loss on total investments | ) j | Total gain (loss) from investment operations | Net investment income | Net realized gains | Total dividends and distributions | Net asset value, end of period | Total return | Net assets at end of period or year (in thousands | ) | Gross expenses | e | Net expenses | e | Net investment income (loss | ) | Portfolio turnover rate | ||||||||||||||||||||||||||||||||||||||
| LIFESTYLE AGGRESSIVE GROWTH FUND | ||||||||||||||||||||||||||||||||||||||||||||||||||||||||||
| Institutional Class: | 5/31/22 | $21.32 | $0.26 | $(2.19 | ) | $(1.93 | ) | $(0.70 | ) | $(1.66 | ) | $(2.36 | ) | $17.03 | (10.32 | )% | $50,497 | 0.19 | % | 0.04 | % | 1.28 | % | 30 | % | |||||||||||||||||||||||||||||||||
| 5/31/21 | 15.55 | 0.20 | 6.64 | 6.84 | (0.50 | ) | (0.57 | ) | (1.07 | ) | 21.32 | 44.79 | 45,923 | 0.21 | 0.08 | 1.08 | 56 | |||||||||||||||||||||||||||||||||||||||||
| 5/31/20 | 15.40 | 0.25 | 0.87 | 1.12 | (0.17 | ) | (0.80 | ) | (0.97 | ) | 15.55 | 7.14 | 26,474 | 0.25 | 0.10 | 1.56 | 33 | |||||||||||||||||||||||||||||||||||||||||
| 5/31/19 | 16.95 | 0.23 | (0.98 | ) | (0.75 | ) | (0.37 | ) | (0.43 | ) | (0.80 | ) | 15.40 | (4.11 | ) | 25,052 | 0.28 | 0.10 | 1.42 | 24 | ||||||||||||||||||||||||||||||||||||||
| 5/31/18 | 15.28 | 0.18 | 2.12 | 2.30 | (0.44 | ) | (0.19 | ) | (0.63 | ) | 16.95 | 15.14 | 15,252 | 0.30 | 0.10 | 1.09 | 38 | |||||||||||||||||||||||||||||||||||||||||
| Advisor Class: | 5/31/22 | 21.32 | 0.26 | (2.21 | ) | (1.95 | ) | (0.68 | ) | (1.66 | ) | (2.34 | ) | 17.03 | (10.40 | ) | 6,248 | 0.28 | 0.13 | 1.28 | 30 | |||||||||||||||||||||||||||||||||||||
| 5/31/21 | 15.55 | 0.18 | 6.64 | 6.82 | (0.48 | ) | (0.57 | ) | (1.05 | ) | 21.32 | 44.68 | 9,163 | 0.30 | 0.18 | 0.98 | 56 | |||||||||||||||||||||||||||||||||||||||||
| 5/31/20 | 15.40 | 0.37 | 0.72 | 1.09 | (0.14 | ) | (0.80 | ) | (0.94 | ) | 15.55 | 7.01 | 7,051 | 0.33 | 0.19 | 2.39 | 33 | |||||||||||||||||||||||||||||||||||||||||
| 5/31/19 | 16.94 | 0.18 | (0.93 | ) | (0.75 | ) | (0.36 | ) | (0.43 | ) | (0.79 | ) | 15.40 | (4.10 | ) | 205 | 0.30 | 0.14 | 1.08 | 24 | ||||||||||||||||||||||||||||||||||||||
| 5/31/18 | 15.28 | 0.19 | 2.09 | 2.28 | (0.43 | ) | (0.19 | ) | (0.62 | ) | 16.94 | 15.04 | 164 | 0.35 | 0.15 | 1.14 | 38 | |||||||||||||||||||||||||||||||||||||||||
| Premier Class: | 5/31/22 | 21.37 | 0.24 | (2.20 | ) | (1.96 | ) | (0.67 | ) | (1.66 | ) | (2.33 | ) | 17.08 | (10.43 | ) | 342 | 0.35 | 0.20 | 1.21 | 30 | |||||||||||||||||||||||||||||||||||||
| 5/31/21 | 15.59 | 0.18 | 6.64 | 6.82 | (0.47 | ) | (0.57 | ) | (1.04 | ) | 21.37 | 44.54 | 427 | 0.37 | 0.23 | 0.95 | 56 | |||||||||||||||||||||||||||||||||||||||||
| 5/31/20 | 15.43 | 0.03 | 1.06 | 1.09 | (0.13 | ) | (0.80 | ) | (0.93 | ) | 15.59 | 7.00 | 313 | 0.39 | 0.25 | 0.17 | 33 | |||||||||||||||||||||||||||||||||||||||||
| 5/31/19 | 16.99 | 0.20 | (0.99 | ) | (0.79 | ) | (0.34 | ) | (0.43 | ) | (0.77 | ) | 15.43 | (4.31 | ) | 363 | 0.43 | 0.25 | 1.22 | 24 | ||||||||||||||||||||||||||||||||||||||
| 5/31/18 | 15.32 | 0.17 | 2.10 | 2.27 | (0.41 | ) | (0.19 | ) | (0.60 | ) | 16.99 | 14.93 | 390 | 0.46 | 0.25 | 1.01 | 38 | |||||||||||||||||||||||||||||||||||||||||
| Retirement Class: | 5/31/22 | 21.23 | 0.22 | (2.19 | ) | (1.97 | ) | (0.65 | ) | (1.66 | ) | (2.31 | ) | 16.95 | (10.54 | ) | 56,152 | 0.44 | 0.29 | 1.08 | 30 | |||||||||||||||||||||||||||||||||||||
| 5/31/21 | 15.49 | 0.15 | 6.62 | 6.77 | (0.46 | ) | (0.57 | ) | (1.03 | ) | 21.23 | 44.47 | 65,640 | 0.45 | 0.33 | 0.82 | 56 | |||||||||||||||||||||||||||||||||||||||||
| 5/31/20 | 15.35 | 0.20 | 0.87 | 1.07 | (0.13 | ) | (0.80 | ) | (0.93 | ) | 15.49 | 6.85 | 42,644 | 0.49 | 0.35 | 1.29 | 33 | |||||||||||||||||||||||||||||||||||||||||
| 5/31/19 | 16.89 | 0.18 | (0.96 | ) | (0.78 | ) | (0.33 | ) | (0.43 | ) | (0.76 | ) | 15.35 | (4.33 | ) | 42,107 | 0.52 | 0.35 | 1.09 | 24 | ||||||||||||||||||||||||||||||||||||||
| 5/31/18 | 15.24 | 0.15 | 2.09 | 2.24 | (0.40 | ) | (0.19 | ) | (0.59 | ) | 16.89 | 14.82 | 46,425 | 0.55 | 0.35 | 0.90 | 38 | |||||||||||||||||||||||||||||||||||||||||
| Retail Class: | 5/31/22 | 21.19 | 0.21 | (2.19 | ) | (1.98 | ) | (0.64 | ) | (1.66 | ) | (2.30 | ) | 16.91 | (10.59 | ) | 106,104 | 0.48 | 0.32 | 1.04 | 30 | |||||||||||||||||||||||||||||||||||||
| 5/31/21 | 15.46 | 0.14 | 6.61 | 6.75 | (0.45 | ) | (0.57 | ) | (1.02 | ) | 21.19 | 44.41 | 117,922 | 0.50 | 0.38 | 0.78 | 56 | |||||||||||||||||||||||||||||||||||||||||
| 5/31/20 | 15.33 | 0.24 | 0.82 | 1.06 | (0.13 | ) | (0.80 | ) | (0.93 | ) | 15.46 | 6.80 | 83,795 | 0.54 | 0.40 | 1.56 | 33 | |||||||||||||||||||||||||||||||||||||||||
| 5/31/19 | 16.88 | 0.17 | (0.97 | ) | (0.80 | ) | (0.32 | ) | (0.43 | ) | (0.75 | ) | 15.33 | (4.45 | ) | 48,507 | 0.57 | 0.40 | 1.04 | 24 | ||||||||||||||||||||||||||||||||||||||
| 5/31/18 | 15.22 | 0.14 | 2.10 | 2.24 | (0.39 | ) | (0.19 | ) | (0.58 | ) | 16.88 | 14.84 | 52,360 | 0.60 | 0.41 | 0.85 | 38 | |||||||||||||||||||||||||||||||||||||||||
| a | Based on average shares outstanding. |
| e | The Fund’s expenses do not include the expenses of the Underlying Funds. |
| j | Short-term and long-term capital gain distributions received from the underlying Funds are presented in net realized and unrealized gain (loss) on total investments for all periods presented. |
| 54 | 2022 Annual Report ■ TIAA-CREF Lifestyle Funds | See notes to financial statements | See notes to financial statements | TIAA-CREF Lifestyle Funds ■ 2022 Annual Report | 55 |
TIAA-CREF Lifestyle Funds
Note 1—organization
The Lifestyle Funds (collectively the “Funds,” each individually referred to as a “Fund”) are a sub-family of mutual funds offered by the TIAA-CREF Funds (the “Trust”), a Delaware statutory trust, that is registered with the U.S. Securities and Exchange Commission (“SEC”) under the Investment Company Act of 1940, as amended (“1940 Act”), as an open-end management investment company.
Teachers Advisors, LLC (“Advisors”), a wholly owned indirect subsidiary of Teachers Insurance and Annuity Association of America (“TIAA”), is registered with the SEC as an investment adviser and provides investment management services for the Funds.
The Funds offer their shares, without a sales load, through their principal underwriter, Nuveen Securities, LLC (“Nuveen Securities”), which is a wholly owned indirect subsidiary of TIAA.
Each Fund is a “fund of funds” that diversifies its assets by investing in Institutional Class shares of other funds of the Trust and potentially other investment pools or investment products. The Funds offer Institutional Class, Advisor Class, Premier Class, Retirement Class and Retail Class shares. Each class differs by the allocation of class-specific expenses and voting rights in matters affecting a single class.
Note 2—significant accounting policies
The accompanying financial statements were prepared in accordance with accounting principles generally accepted in the United States of America (“U.S. GAAP”), which may require the use of estimates made by management and the evaluation of subsequent events. Actual results may differ from those estimates. The Funds are investment companies and follow the accounting guidance in the Financial Accounting Standards Board (“FASB”) Accounting Standards Codification 946, Financial Services—Investment Companies. The net asset value (“NAV”) for financial reporting purposes may differ from the NAV for processing transactions. The NAV for financial reporting purposes includes security and shareholder transactions through the date of the report. Total return is computed based on the NAV used for processing transactions. The following is a summary of the significant accounting policies consistently followed by the Funds.
Investments and investment income: Securities transactions are accounted for as of the trade date for financial reporting purposes. Interest income is recorded on an accrual basis and includes accretion of discounts and amortization of premiums. Dividend income is recorded on the ex-dividend date. Realized gains and losses on securities transactions are based upon the specific identification method. Distributions received on securities that represent a return of capital or capital gains are recorded as a reduction of cost of investments and/or as a realized gain. The Funds estimate the components of distributions received that may be considered return of capital distributions or capital gain distributions.
| 56 | 2022 Annual Report ■ TIAA-CREF Lifestyle Funds |
Multiclass operations and allocations: Income, expenses, realized gains and losses and unrealized appreciation and depreciation of a Fund are allocated on a pro rata basis to each class of shares, except for service agreement fees, distribution fees and transfer agency fees and expenses, which are unique to each class of shares. Most expenses of the Trust can be directly attributed to a fund. Expenses that cannot be directly attributed are allocated to each fund in the Trust based upon the average net assets of each fund.
Distributions to shareholders: Distributions to shareholders are recorded on the ex-dividend date. The amount, character and timing of distributions are determined in accordance with federal income tax regulations, which may differ from U.S. GAAP.
Trustee compensation: The Funds pay the members of the Board of Trustees (“Board”), all of whom are independent, certain remuneration for their services, plus travel and other expenses. Trustees may elect to participate in a deferred compensation plan and defer all or a portion of their compensation. In addition, trustees participate in a long-term compensation plan. Amounts deferred are retained by the Funds until paid. Amounts payable to the trustees for compensation are included separately in the accompanying Statements of assets and liabilities. Trustees’ fees, including any deferred and long-term compensation incurred, are reflected in the Statements of operations.
Indemnification: Under the Trust’s organizational documents, its officers and directors are indemnified against certain liabilities arising out of the performance of their duties to the Trust. In addition, in the normal course of business, the Trust enters into contracts that provide general indemnifications to other parties. The Trust’s maximum exposure under these arrangements is unknown as this would involve future claims that may be made against the Trust that have not yet occurred. However, the Trust has not had prior claims or losses pursuant to these contracts and expects the risk of loss to be remote.
Other matters: The outbreak of the novel coronavirus (“COVID-19”) and subsequent global pandemic began significantly impacting the U.S. and global financial markets and economies during the calendar quarter ended March 31, 2020. The worldwide spread of COVID-19 has created significant uncertainty in the global economy. The duration and extent of COVID-19 over the long term cannot be reasonably estimated at this time. The ultimate impact of COVID-19 and the extent to which COVID-19 impacts the Funds’ normal course of business, results of operations, investments, and cash flows will depend on future developments, which are highly uncertain and difficult to predict. Management continues to monitor and evaluate this situation.
New rule issuance: In December 2020, the SEC voted to adopt a new rule providing a framework for fund valuation practices. New Rule 2a-5 (“Rule 2a-5”) under the 1940 Act establishes requirements for determining fair value in good faith for purposes of the 1940 Act. Rule 2a-5 will permit boards, subject to board oversight and certain other conditions, to designate certain parties to perform fair value determinations. Rule 2a-5 also defines when market quotations are “readily available” for purposes
| TIAA-CREF Lifestyle Funds ■ 2022 Annual Report | 57 |
Notes to financial statements
of the 1940 Act and the threshold for determining whether a fund must fair value a security. The SEC also adopted new Rule 31a-4 (“Rule 31a-4”), which provides the recordkeeping requirements associated with fair value determinations. Finally, the SEC is rescinding previously issued guidance on related issues, including the role of the board in determining fair value and the accounting and auditing of fund investments. Rule 2a-5 and Rule 31a-4 became effective on March 8, 2021. The compliance date for Rule 2a-5 and Rule 31a-4 is September 8, 2022. A fund may voluntarily comply with the rules after the effective date, and in advance of the compliance date, under certain conditions. Management is currently assessing the impact of these provisions on the Funds’ financial statements.
Note 3—valuation of investments
The Funds’ investments in securities are recorded at their estimated fair value utilizing valuation methods approved by the Board. Fair value is defined as the price that would be received upon selling an investment or transferring a liability in an orderly transaction to an independent buyer in the principal or most advantageous market for the investment. U.S. GAAP establishes the three-tier hierarchy that is used to maximize the use of observable market data and minimize the use of unobservable inputs and to establish classification of fair value measurements for disclosure purposes. Observable inputs reflect the assumptions market participants would use in pricing the asset or liability. Observable inputs are based on market data obtained from sources independent of the reporting entity. Unobservable inputs reflect management’s assumptions about the assumptions market participants would use in pricing the asset or liability. Unobservable inputs are based on the best information available in the circumstances. The following is a summary of the three-tiered hierarchy of valuation input levels.
| • | Level 1 – Inputs are unadjusted and prices are determined using quoted prices in active markets for identical securities. |
| • | Level 2 – Prices are determined using other significant observable inputs (including quoted prices for similar securities, interest rates, credit spreads, etc.). |
| • | Level 3 – Prices are determined using significant unobservable inputs (including management’s assumptions in determining the fair value of investments). |
A description of the valuation techniques applied to the Funds’ major classifications of assets and liabilities measured at fair value follows:
Investments in exchange-traded funds: Exchange-traded funds listed or traded on a national market or exchange are valued based on their sale price at the official close of business of such market or exchange on the valuation date. To the extent these securities are actively traded and that valuation adjustments are not applied, they are generally classified as Level 1. If there is no official close of business, then the latest available sale price is utilized. If no sales are reported, then the mean of the latest available bid and asked prices is utilized and the securities are generally classified as Level 2.
| 58 | 2022 Annual Report ■ TIAA-CREF Lifestyle Funds |
continued
Investments in registered investment companies: Investments in investment companies are valued at their respective NAVs on the valuation date and are generally classified as Level 1.
As of May 31, 2022, all of the investments in the Funds were valued based on Level 1 inputs.
Note 4—investments
Purchases and sales: Purchases and sales of securities (other than short-term instruments) for all of the Funds for the year ended May 31, 2022 were as follows (dollar amounts are in thousands):
| Fund | Non-U.S. government purchases | Non-U.S. government sales | ||||||
| Lifestyle Income | $ | 21,566 | $ | 19,916 | ||||
| Lifestyle Conservative | 99,040 | 77,220 | ||||||
| Lifestyle Moderate | 181,704 | 134,111 | ||||||
| Lifestyle Growth | 112,972 | 85,337 | ||||||
| Lifestyle Aggressive Growth | 100,767 | 74,172 | ||||||
Note 5—income tax information
Each Fund is a separate taxpayer for federal income tax purposes. Each Fund intends to distribute substantially all of its net investment income and net capital gains to shareholders and otherwise comply with the requirements of Subchapter M of the Internal Revenue Code applicable to regulated investment companies. Therefore, no federal income tax provision is required.
Each Fund files income tax returns in U.S. federal and applicable state and local jurisdictions. A Fund’s federal income tax returns are generally subject to examination for a period of three fiscal years after being filed. State and local tax returns may be subject to examination for an additional period of time depending on the jurisdiction. Management has analyzed each Fund’s tax positions taken for all open tax years and has concluded that no provision for income tax is required in the Fund’s financial statements.
Differences between amounts for financial statement and federal income tax purposes are primarily due to timing differences in recognizing gains and losses on investment transactions. Temporary differences do not require reclassification. As of year end, permanent differences that resulted in reclassifications among the components of net assets relate primarily to distribution reallocations, investments in underlying funds, and tax equalization. Temporary and permanent differences have no impact on a Fund’s net assets.
As of year end, the aggregate cost and the net unrealized appreciation/(depreciation)of all investments for federal income tax purposes was as follows (dollar amounts are in thousands):
| TIAA-CREF Lifestyle Funds ■ 2022 Annual Report | 59 |
Notes to financial statements
| Fund | Tax cost | Gross unrealized appreciation | Gross unrealized (depreciation | ) | Net unrealized appreciation (depreciation | ) | ||||||||||
| Lifestyle Income | $ | 96,351 | $ | 1,708 | $ | (6,740 | ) | $ | (5,032 | ) | ||||||
| Lifestyle Conservative | 356,656 | 11,869 | (27,444 | ) | (15,575 | ) | ||||||||||
| Lifestyle Moderate | 587,984 | 29,231 | (48,609 | ) | (19,378 | ) | ||||||||||
| Lifestyle Growth | 304,782 | 19,435 | (24,974 | ) | (5,539 | ) | ||||||||||
| Lifestyle Aggressive Growth | 220,707 | 16,545 | (17,907 | ) | (1,362 | ) | ||||||||||
For purposes of this disclosure, tax cost generally includes the cost of portfolio investments as well as up-front fees or premiums exchanged on derivatives and any amounts unrealized for income statement reporting but realized income and/or capital gains for tax reporting, if applicable.
As of year end, the components of accumulated earnings on a tax basis were as follows:
| Fund | Undistributed ordinary income | Undistributed long-term capital gains | Unrealized appreciation (depreciation | ) | Capital loss carryforwards | Late-year loss deferrals | Other book-to-tax differences | Total | ||||||||||||||||||||
| Lifestyle Income | $ | 300,019 | $ | 1,344,620 | $ | (5,031,813 | ) | $ | — | $ | — | $ | (4,204 | ) | $ | (3,391,378 | ) | |||||||||||
| Lifestyle Conservative | 2,767,836 | 9,515,473 | (15,575,267 | ) | — | — | (11,713 | ) | (3,303,671 | ) | ||||||||||||||||||
| Lifestyle Moderate | 2,853,928 | 23,370,267 | (19,377,598 | ) | — | — | (17,525 | ) | 6,829,072 | |||||||||||||||||||
| Lifestyle Growth | 1,340,437 | 14,681,846 | (5,539,436 | ) | — | — | (8,625 | ) | 10,474,222 | |||||||||||||||||||
| Lifestyle Aggressive Growth | 2,132,467 | 12,238,447 | (1,361,554 | ) | — | — | (6,080 | ) | 13,003,280 | |||||||||||||||||||
The tax character of distributions paid were as follows:
| 5/31/2022 | 5/31/2021 | |||||||||||||||
| Fund | Ordinary income | Long-term capital gains | Ordinary income | Long-term capital gains | ||||||||||||
| Lifestyle Income | $ | 2,024,504 | $ | 2,749,480 | $ | 1,752,910 | $ | 1,296,958 | ||||||||
| Lifestyle Conservative | 9,127,147 | 16,738,058 | 6,911,296 | 7,861,440 | ||||||||||||
| Lifestyle Moderate | 18,156,687 | 38,694,034 | 12,508,904 | 17,788,980 | ||||||||||||
| Lifestyle Growth | 10,977,768 | 23,644,526 | 6,110,621 | 11,324,213 | ||||||||||||
| Lifestyle Aggressive Growth | 8,598,770 | 18,445,868 | 4,718,204 | 5,814,854 | ||||||||||||
Note 6—investment adviser and other transactions with affiliates
Under the terms of its Investment Management Agreement, each Fund pays Advisors a monthly fee based on the annual rate of 0.10% of the Fund’s average daily net assets for the management of the Fund’s investment portfolio. The Funds have entered into an Administrative Service Agreement with Advisors under which the Funds pay Advisors for its costs in providing certain administrative and compliance services to the Funds.
Under the terms of a Retirement Class Service Agreement with respect to each Fund, the Retirement Class of the Fund pays Advisors a monthly fee based on the annual rate of 0.25% of a Fund’s average daily net assets attributable to Retirement Class shares of a Fund for providing certain administrative services related to the
| 60 | 2022 Annual Report ■ TIAA-CREF Lifestyle Funds |
continued
maintenance of Retirement Class shares on retirement plan or other platforms. Substantially, all of the Retirement Class shareholder servicing fees reported on the Statements of operations are paid to Advisors under the Service Agreement.
Under the terms of a distribution Rule 12b-1 plan, the Retail Class of each Fund compensates Nuveen Securities for providing distribution, promotional and/or shareholder services to the Retail Class of the Fund at the annual rate of 0.25% of the average daily net assets attributable to the Fund’s Retail Class. The Premier Class of each Fund is subject to a distribution Rule 12b-1 plan that compensates Nuveen Securities for providing distribution, promotional and/or shareholder services to the Premier Class of the Fund at the annual rate of 0.15% of the average daily net assets attributable to the Fund’s Premier Class.
Advisors has agreed to reimburse each Fund if its total expense ratio (excluding interest, taxes, brokerage commissions and other transactional expenses, acquired fund fees and expenses and extraordinary expenses) exceeds certain percentages. As of May 31, 2022, the maximum expense amounts (after waivers and reimbursements) are equal to the following noted annual percentage of average daily net assets for each class:
| Investment | Maximum expense amounts‡ | |||||||||||||||||||||||
| Fund | management fee - effective rate | Institutional Class | Advisor Class | Premier Class | Retirement Class | Retail Class | ||||||||||||||||||
| Lifestyle Income | 0.100 | % | 0.100 | % | 0.250 | % | 0.250 | % | 0.350 | % | 0.490 | % | ||||||||||||
| Lifestyle Conservative | 0.100 | 0.100 | 0.250 | 0.250 | 0.350 | 0.490 | ||||||||||||||||||
| Lifestyle Moderate | 0.100 | 0.055 | a | 0.250 | 0.250 | 0.350 | 0.490 | |||||||||||||||||
| Lifestyle Growth | 0.100 | 0.010 | b | 0.250 | 0.250 | 0.350 | 0.490 | |||||||||||||||||
| Lifestyle Aggressive Growth | 0.100 | 0.050 | c | 0.250 | 0.250 | 0.350 | 0.490 | |||||||||||||||||
| ‡ | Maximum expense amounts reflect all expenses excluding interest, taxes, brokerage commissions or other transactional expenses, Acquired fund fees and expenses and extraordinary expenses. The expense reimbursement arrangements will continue through at least September 30, 2022. The reimbursement arrangements can only be changed with the approval of the Board of Trustees. |
| a | Effective May 1, 2022, Advisors agreed to voluntarily waive a portion of the expense cap for the Lifestyle Moderate Fund Institutional Class. This waiver is voluntary in nature and can be discontinued at any time without prior notice to shareholders upon Board approval. Prior to May 1, 2022, the expense cap was 0.100% for Institutional Class. |
| b | Effective May 1, 2022, Advisors agreed to voluntarily waive a portion of the expense cap for the Lifestyle Growth Fund Institutional Class. This waiver is voluntary in nature and can be discontinued at any time without prior notice to shareholders upon Board approval. Prior to May 1, 2022, the expense cap was 0.070% for Institutional Class. |
| c | Effective May 1, 2022, Advisors agreed to voluntarily waive a portion of the expense cap for the Lifestyle Aggressive Growth Fund Institutional Class. This waiver is voluntary in nature and can be discontinued at any time without prior notice to shareholders upon Board approval. Prior to May 1, 2022, the expense cap was 0.020% for Institutional Class. |
The Funds may purchase or sell investment securities in transactions with affiliated entities under procedures adopted by the Board, pursuant to the 1940 Act. These transactions are effected at market rates without incurring broker commissions. For
| TIAA-CREF Lifestyle Funds ■ 2022 Annual Report | 61 |
Notes to financial statements
the year ended May 31, 2022, the Funds did not engage in security transactions with affiliated entities.
Investments in other investment companies advised by Advisors and Nuveen Fund Advisors, LLC are deemed to be affiliated investments. The Funds invest their assets in Institutional Class shares of the affiliated TIAA-CREF Funds, the affiliated Nuveen Growth Opportunities ETF and Class R6 shares of the affiliated Nuveen Funds. Information regarding transactions with affiliated companies is as follows (dollar amounts are in thousands):
| Issue | Value at 5/31/21 | Purchases cost | Sales proceeds | Realized gain (loss | ) | Change in unrealized appreciation (depreciation | ) | Dividend income | Value at 5/31/22 | |||||||||||||||||||
| Lifestyle Income Fund | ||||||||||||||||||||||||||||
| Nuveen Funds: | ||||||||||||||||||||||||||||
| Dividend Growth | $ | 1,974 | $ | 498 | $ | 798 | $ | 105 | $ | (41 | ) | $ | 28 | $ | 1,692 | |||||||||||||
| Dividend Value | 2,218 | 587 | 723 | 232 | (252 | ) | 34 | 1,913 | ||||||||||||||||||||
| Growth Opportunities ETF | — | 2,451 | 135 | (21 | ) | (519 | ) | — | ^ | 1,776 | ||||||||||||||||||
| International Growth | 1,306 | 740 | 240 | 16 | (413 | ) | 11 | 1,372 | ||||||||||||||||||||
| TIAA-CREF Funds: | ||||||||||||||||||||||||||||
| Core Bond | 19,971 | 3,049 | 2,461 | (74 | ) | (2,143 | ) | 414 | 18,259 | |||||||||||||||||||
| Core Plus Bond | 19,971 | 3,154 | 2,300 | 138 | (2,408 | ) | 510 | 18,272 | ||||||||||||||||||||
| Emerging Markets Equity | 803 | 708 | 263 | 75 | (381 | ) | 35 | 794 | ||||||||||||||||||||
| Growth & Income | 1,977 | 666 | 547 | 394 | (491 | ) | 16 | 1,683 | ||||||||||||||||||||
| International Equity | 1,818 | 934 | 431 | 6 | (359 | ) | 63 | 1,968 | ||||||||||||||||||||
| International Opportunities | 1,302 | 827 | 320 | 100 | (426 | ) | 15 | 1,378 | ||||||||||||||||||||
| Large-Cap Growth | 2,142 | 786 | 539 | 229 | (623 | ) | 3 | 1,779 | ||||||||||||||||||||
| Large-Cap Growth Index | 2,137 | 95 | 2,570 | 586 | (248 | ) | — | — | ||||||||||||||||||||
| Large-Cap Value | 2,216 | 541 | 674 | 253 | (266 | ) | 27 | 1,925 | ||||||||||||||||||||
| Quant International Small-Cap Equity | 862 | 407 | 172 | 19 | (159 | ) | 33 | 924 | ||||||||||||||||||||
| Quant Small-Cap Equity | 626 | 223 | 227 | 126 | (183 | ) | 3 | 468 | ||||||||||||||||||||
| Quant Small/Mid-Cap Equity | 717 | 244 | 255 | 141 | (177 | ) | 7 | 561 | ||||||||||||||||||||
| Short-Term Bond | 39,931 | 5,656 | 7,261 | (115 | ) | (1,607 | ) | 689 | 36,555 | |||||||||||||||||||
| $ | 99,971 | $ | 21,566 | $ | 19,916 | $ | 2,210 | $ | (10,696 | ) | $ | 1,888 | $ | 91,319 | ||||||||||||||
| 62 | 2022 Annual Report ■ TIAA-CREF Lifestyle Funds |
continued
| Issue | Value at 5/31/21 | Purchases cost | Sales proceeds | Realized gain (loss | ) | Change in unrealized appreciation (depreciation | ) | Dividend income | Value at 5/31/22 | |||||||||||||||||||
| Lifestyle Conservative Fund | ||||||||||||||||||||||||||||
| Nuveen Funds: | ||||||||||||||||||||||||||||
| Dividend Growth | $ | 14,587 | $ | 2,891 | $ | 4,982 | $ | 701 | $ | (254 | ) | $ | 204 | $ | 12,596 | |||||||||||||
| Dividend Value | 16,358 | 3,701 | 4,421 | 1,414 | (1,599 | ) | 250 | 14,345 | ||||||||||||||||||||
| Growth Opportunities ETF | — | 18,012 | 666 | (81 | ) | (3,958 | ) | 1 | 13,307 | |||||||||||||||||||
| International Growth | 9,657 | 5,082 | 1,258 | 170 | (3,120 | ) | 77 | 10,260 | ||||||||||||||||||||
| TIAA-CREF Funds: | ||||||||||||||||||||||||||||
| Core Bond | 36,762 | 5,829 | 4,257 | (106 | ) | (3,995 | ) | 770 | 34,078 | |||||||||||||||||||
| Core Plus Bond | 110,287 | 16,944 | 10,709 | 929 | (13,537 | ) | 2,842 | 102,339 | ||||||||||||||||||||
| Emerging Markets Equity | 5,884 | 5,066 | 1,619 | 507 | (2,758 | ) | 267 | 5,965 | ||||||||||||||||||||
| Growth & Income | 14,536 | 4,471 | 3,288 | 2,980 | (3,723 | ) | 120 | 12,638 | ||||||||||||||||||||
| International Equity | 13,352 | 5,898 | 1,906 | (5 | ) | (2,669 | ) | 467 | 14,670 | |||||||||||||||||||
| International Opportunities | 9,655 | 5,538 | 1,686 | 796 | (3,232 | ) | 109 | 10,287 | ||||||||||||||||||||
| Large-Cap Growth | 15,777 | 4,829 | 2,739 | 1,731 | (4,689 | ) | 24 | 13,306 | ||||||||||||||||||||
| Large-Cap Growth Index | 15,748 | 443 | 18,703 | 4,320 | (1,808 | ) | — | — | ||||||||||||||||||||
| Large-Cap Value | 16,288 | 3,208 | 3,916 | 1,793 | (1,920 | ) | 204 | 14,374 | ||||||||||||||||||||
| Quant International Small-Cap Equity | 6,315 | 2,680 | 762 | 153 | (1,213 | ) | 243 | 6,928 | ||||||||||||||||||||
| Quant Small-Cap Equity | 4,606 | 1,492 | 1,448 | 908 | (1,344 | ) | 22 | 3,492 | ||||||||||||||||||||
| Quant Small/Mid-Cap Equity | 5,278 | 1,535 | 1,547 | 1,021 | (1,294 | ) | 50 | 4,181 | ||||||||||||||||||||
| Short-Term Bond | 73,487 | 11,421 | 13,313 | (225 | ) | (2,965 | ) | 1,279 | 68,314 | |||||||||||||||||||
| $ | 368,577 | $ | 99,040 | $ | 77,220 | $ | 17,006 | $ | (54,078 | ) | $ | 6,929 | $ | 341,080 | ||||||||||||||
| TIAA-CREF Lifestyle Funds ■ 2022 Annual Report | 63 |
Notes to financial statements
| Issue | Value at 5/31/21 | Purchases cost | Sales proceeds | Realized gain (loss | ) | Change in unrealized appreciation (depreciation | ) | Dividend income | Value at 5/31/22 | |||||||||||||||||||
| Lifestyle Moderate Fund | ||||||||||||||||||||||||||||
| Nuveen Funds: | ||||||||||||||||||||||||||||
| Dividend Growth | $ | 36,728 | $ | 5,499 | $ | 10,994 | $ | 1,607 | $ | (559 | ) | $ | 515 | $ | 31,402 | |||||||||||||
| Dividend Value | 41,377 | 6,046 | 8,196 | 3,220 | (3,758 | ) | 630 | 35,890 | ||||||||||||||||||||
| Growth Opportunities ETF | — | 44,732 | 1,239 | (140 | ) | (10,081 | ) | 2 | 33,272 | |||||||||||||||||||
| International Growth | 24,379 | 11,084 | 1,536 | 573 | (8,074 | ) | 197 | 25,741 | ||||||||||||||||||||
| TIAA-CREF Funds: | ||||||||||||||||||||||||||||
| Core Plus Bond | 248,274 | 41,282 | 29,932 | 1,806 | (30,102 | ) | 6,383 | 227,796 | ||||||||||||||||||||
| Emerging Markets Equity | 14,934 | 11,633 | 3,177 | 1,530 | (7,290 | ) | 673 | 14,823 | ||||||||||||||||||||
| Growth & Income | 36,924 | 8,349 | 5,790 | 7,154 | (9,136 | ) | 304 | 31,603 | ||||||||||||||||||||
| International Equity | 33,994 | 12,847 | 3,337 | (93 | ) | (6,691 | ) | 1,178 | 36,720 | |||||||||||||||||||
| International Opportunities | 24,339 | 12,002 | 2,419 | 2,044 | (8,239 | ) | 276 | 25,748 | ||||||||||||||||||||
| Large-Cap Growth | 40,021 | 10,233 | 5,401 | 4,332 | (11,855 | ) | 54 | 33,284 | ||||||||||||||||||||
| Large-Cap Growth Index | 39,877 | 440 | 46,628 | 10,855 | (4,544 | ) | — | — | ||||||||||||||||||||
| Large-Cap Value | 41,367 | 5,603 | 7,921 | 4,267 | (4,630 | ) | 515 | 35,957 | ||||||||||||||||||||
| Quant International Small-Cap Equity | 15,984 | 6,281 | 1,728 | 348 | (3,037 | ) | 608 | 17,235 | ||||||||||||||||||||
| Quant Small-Cap Equity | 11,656 | 2,881 | 2,836 | 2,265 | (3,409 | ) | 56 | 8,732 | ||||||||||||||||||||
| Quant Small/Mid-Cap Equity | 13,363 | 2,791 | 2,981 | 2,507 | (3,229 | ) | 127 | 10,403 | ||||||||||||||||||||
| $ | 623,217 | $ | 181,703 | $ | 134,115 | $ | 42,275 | $ | (114,634 | ) | $ | 11,518 | $ | 568,606 | ||||||||||||||
| 64 | 2022 Annual Report ■ TIAA-CREF Lifestyle Funds |
continued
| Issue | Value at 5/31/21 | Purchases cost | Sales proceeds | Realized gain (loss | ) | Change in unrealized appreciation (depreciation | ) | Dividend income | Value at 5/31/22 | |||||||||||||||||||
| Lifestyle Growth Fund | ||||||||||||||||||||||||||||
| Nuveen Funds: | ||||||||||||||||||||||||||||
| Dividend Growth | $ | 25,886 | $ | 4,296 | $ | 8,289 | $ | 1,091 | $ | (386 | ) | $ | 364 | $ | 21,974 | |||||||||||||
| Dividend Value | 29,175 | 4,818 | 6,427 | 2,179 | (2,585 | ) | 445 | 25,200 | ||||||||||||||||||||
| Growth Opportunities ETF | — | 31,317 | 657 | (86 | ) | (7,171 | ) | 1 | 23,403 | |||||||||||||||||||
| International Growth | 17,207 | 7,857 | 1,171 | 414 | (5,738 | ) | 138 | 18,089 | ||||||||||||||||||||
| TIAA-CREF Funds: | ||||||||||||||||||||||||||||
| Core Plus Bond | 65,636 | 13,435 | 10,651 | 313 | (7,818 | ) | 1,686 | 59,986 | ||||||||||||||||||||
| Emerging Markets Equity | 10,546 | 8,154 | 2,269 | 1,069 | (5,125 | ) | 469 | 10,418 | ||||||||||||||||||||
| Growth & Income | 26,016 | 5,811 | 4,086 | 5,053 | (6,485 | ) | 214 | 22,171 | ||||||||||||||||||||
| International Equity | 23,986 | 9,155 | 2,525 | (138 | ) | (4,706 | ) | 826 | 25,772 | |||||||||||||||||||
| International Opportunities | 17,172 | 8,370 | 1,629 | 1,536 | (5,939 | ) | 194 | 18,119 | ||||||||||||||||||||
| Large-Cap Growth | 28,192 | 6,440 | 3,105 | 2,932 | (8,297 | ) | 38 | 23,324 | ||||||||||||||||||||
| Large-Cap Growth Index | 28,143 | 508 | 33,086 | 7,566 | (3,131 | ) | — | — | ||||||||||||||||||||
| Large-Cap Value | 29,167 | 4,044 | 5,765 | 2,881 | (3,176 | ) | 362 | 25,237 | ||||||||||||||||||||
| Quant International Small-Cap Equity | 11,230 | 4,572 | 1,339 | 223 | (2,149 | ) | 428 | 12,106 | ||||||||||||||||||||
| Quant Small-Cap Equity | 8,213 | 2,207 | 2,193 | 1,609 | (2,422 | ) | 39 | 6,133 | ||||||||||||||||||||
| Quant Small/Mid-Cap Equity | 9,432 | 1,987 | 2,145 | 1,763 | (2,286 | ) | 89 | 7,311 | ||||||||||||||||||||
| $ | 330,001 | $ | 112,971 | $ | 85,337 | $ | 28,405 | $ | (67,414 | ) | $ | 5,293 | $ | 299,243 | ||||||||||||||
| Lifestyle Aggressive Growth Fund | ||||||||||||||||||||||||||||
| Nuveen Funds: | ||||||||||||||||||||||||||||
| Dividend Growth | $ | 23,459 | $ | 3,996 | $ | 7,211 | $ | 880 | $ | (248 | ) | $ | 332 | $ | 20,292 | |||||||||||||
| Dividend Value | 26,380 | 4,880 | 5,968 | 1,910 | (2,295 | ) | 407 | 23,096 | ||||||||||||||||||||
| Growth Opportunities ETF | — | 28,937 | 905 | (95 | ) | (6,556 | ) | 1 | 21,381 | |||||||||||||||||||
| International Growth | 15,519 | 7,375 | 980 | 318 | (5,242 | ) | 126 | 16,548 | ||||||||||||||||||||
| TIAA-CREF Funds: | ||||||||||||||||||||||||||||
| Emerging Markets Equity | 9,548 | 7,827 | 2,261 | 817 | (4,584 | ) | 435 | 9,534 | ||||||||||||||||||||
| Growth & Income | 23,527 | 5,869 | 3,897 | 4,293 | (5,605 | ) | 197 | 20,351 | ||||||||||||||||||||
| International Equity | 21,647 | 8,979 | 2,497 | (144 | ) | (4,310 | ) | 763 | 23,675 | |||||||||||||||||||
| International Opportunities | 15,511 | 8,086 | 1,678 | 1,088 | (5,171 | ) | 179 | 16,555 | ||||||||||||||||||||
| Large-Cap Growth | 25,482 | 7,245 | 3,721 | 2,447 | (7,427 | ) | 35 | 21,400 | ||||||||||||||||||||
| Large-Cap Growth Index | 25,426 | 1,163 | 30,639 | 6,734 | (2,684 | ) | — | — | ||||||||||||||||||||
| Large-Cap Value | 26,333 | 4,048 | 5,266 | 2,419 | (2,691 | ) | 336 | 23,065 | ||||||||||||||||||||
| Quant International Small-Cap Equity | 10,197 | 4,254 | 1,165 | 198 | (1,976 | ) | 397 | 11,108 | ||||||||||||||||||||
| Quant Small-Cap Equity | 7,422 | 1,996 | 1,855 | 1,320 | (2,067 | ) | 36 | 5,629 | ||||||||||||||||||||
| Quant Small/Mid-Cap Equity | 8,540 | 1,899 | 1,897 | 1,557 | (2,052 | ) | 83 | 6,711 | ||||||||||||||||||||
| $ | 238,991 | $ | 96,554 | $ | 69,940 | $ | 23,742 | $ | (52,908 | ) | $ | 3,327 | $ | 219,345 | ||||||||||||||
| ^ | Some amounts represent less than $1,000. |
| TIAA-CREF Lifestyle Funds ■ 2022 Annual Report | 65 |
| Notes to financial statements | concluded |
Note 7—inter-fund lending program
Pursuant to an exemptive order issued by the SEC, the Funds may participate in an inter-fund lending program. This program allows the Funds to lend cash to and/or borrow cash from certain other affiliated Funds for temporary purposes, (e.g., to satisfy redemption requests or to cover unanticipated cash shortfalls). The program is subject to a number of conditions, including the requirement that no Fund may borrow or lend money under the program unless it receives a more favorable interest rate than is available from a bank or other financial institution for a comparable transaction. In addition, a Fund may participate in the program only if its participation is consistent with the Fund’s investment policies and limitations and authorized by its portfolio manager(s). During the year ended May 31, 2022, there were no inter-fund borrowing or lending transactions.
Note 8—line of credit
The Funds participate in a $1 billion unsecured revolving credit facility that can be used for temporary purposes, including, without limitation, the funding of shareholder redemptions. The current facility was entered into on June 14, 2022 expiring on June 13, 2023, replacing the previous facility, which expired June 2022. Certain affiliated accounts and mutual funds, each of which is managed by Advisors, or an affiliate of Advisors, also participate in this facility. An annual commitment fee for the credit facility is borne by the participating accounts and mutual funds on a pro rata basis. Interest associated with any borrowing under the facility is charged to the borrowing accounts or mutual funds at a specified rate of interest. The Funds are not liable for borrowings under the facility by other affiliated accounts or mutual funds. For the year ended May 31, 2022, there were no borrowings under this credit facility by the Funds.
| 66 | 2022 Annual Report ■ TIAA-CREF Lifestyle Funds |
Report of independent registered public accounting firm
To the Board of Trustees of TIAA-CREF Funds and Shareholders of TIAA-CREF Lifestyle Income Fund, TIAA-CREF Lifestyle Conservative Fund, TIAA-CREF Lifestyle Moderate Fund, TIAA-CREF Lifestyle Growth Fund, and TIAA-CREF Lifestyle Aggressive Growth Fund
Opinions on the Financial Statements
We have audited the accompanying statements of assets and liabilities, including the portfolios of investments, of TIAA-CREF Lifestyle Income Fund, TIAA-CREF Lifestyle Conservative Fund, TIAA-CREF Lifestyle Moderate Fund, TIAA-CREF Lifestyle Growth Fund, and TIAA-CREF Lifestyle Aggressive Growth Fund (five of the funds constituting TIAA-CREF Funds, hereafter collectively referred to as the “Funds”) as of May 31, 2022, the related statements of operations for the year ended May 31, 2022, the statements of changes in net assets for each of the two years in the period ended May 31, 2022, including the related notes, and the financial highlights for each of the five years in the period ended May 31, 2022 (collectively referred to as the “financial statements”). In our opinion, the financial statements present fairly, in all material respects, the financial position of each of the Funds as of May 31, 2022, the results of each of their operations for the year then ended, the changes in each of their net assets for each of the two years in the period ended May 31, 2022 and each of the financial highlights for each of the five years in the period ended May 31, 2022 in conformity with accounting principles generally accepted in the United States of America.
Basis for Opinions
These financial statements are the responsibility of the Funds’ management. Our responsibility is to express an opinion on the Funds’ financial statements based on our audits. We are a public accounting firm registered with the Public Company Accounting Oversight Board (United States) (PCAOB) and are required to be independent with respect to the Funds in accordance with the U.S. federal securities laws and the applicable rules and regulations of the Securities and Exchange Commission and the PCAOB.
We conducted our audits of these financial statements in accordance with the standards of the PCAOB. Those standards require that we plan and perform the audit to obtain reasonable assurance about whether the financial statements are free of material misstatement, whether due to error or fraud.
Our audits included performing procedures to assess the risks of material misstatement of the financial statements, whether due to error or fraud, and performing procedures that respond to those risks. Such procedures included examining, on a test basis, evidence regarding the amounts and disclosures in the financial statements. Our audits also included evaluating the accounting principles used and significant estimates made by management, as well as evaluating the overall presentation of the financial statements. Our procedures included confirmation of securities owned as of May 31, 2022 by correspondence with the
| TIAA-CREF Lifestyle Funds ■ 2022 Annual Report | 67 |
| Report of independent registered public accounting firm | concluded |
transfer agent or custodian. We believe that our audits provide a reasonable basis for our opinions.
/s/ PricewaterhouseCoopers LLP
Baltimore Maryland
July 15, 2022
We have served as the auditor of one or more investment companies in TIAA-CREF Funds’ investment company group since 2005.
| 68 | 2022 Annual Report ■ TIAA-CREF Lifestyle Funds |
Important tax information (unaudited)
As required by the Internal Revenue Code and Treasury Regulations, certain tax information, as detailed below, must be provided to shareholders. Shareholders are advised to consult their tax adviser with respect to the tax implications of their investment. The amounts listed below may differ from the actual amounts reported on Form 1099-DIV, which will be sent to shareholders shortly after calendar year end.
Long-term capital gains
As of year end, each Fund designates the following distribution amounts, or maximum amount allowable, as being from net long-term capital gains pursuant to Section 852(b)(3) of the Internal Revenue Code:
| Fund | Net long-term capital gains | |||
| Lifestyle Income | $ | 2,870,377 | ||
| Lifestyle Conservative | 17,641,460 | |||
| Lifestyle Moderate | 40,360,229 | |||
| Lifestyle Growth | 24,639,906 | |||
| Lifestyle Aggressive Growth | 19,620,620 | |||
Dividends received deduction (DRD)
Each Fund listed below had the following percentage, or maximum amount allowable, of ordinary income distributions eligible for the dividends received deduction for corporate shareholders:
| Fund | Percentage | |||
| Lifestyle Income | 6.8 | % | ||
| Lifestyle Conservative | 10.9 | |||
| Lifestyle Moderate | 13.4 | |||
| Lifestyle Growth | 16.0 | |||
| Lifestyle Aggressive Growth | 18.8 | |||
Qualified dividend income (QDI)
Each Fund listed below had the following percentage, or maximum amount allowable, of ordinary income distributions treated as qualified dividend income for individuals pursuant to Section 1(h)(11) of the Internal Revenue Code:
| Fund | Percentage | |||
| Lifestyle Income | 12.5 | % | ||
| Lifestyle Conservative | 19.3 | |||
| Lifestyle Moderate | 24.7 | |||
| Lifestyle Growth | 29.5 | |||
| Lifestyle Aggressive Growth | 34.7 | |||
Foreign source income and foreign tax credit pass through
Each Fund listed below has made an election under Section 853 of the Internal Revenue Code to pass through foreign taxes paid:
| Fund | Foreign source income | Foreign source income per share | Qualifying foreign taxes paid | Qualifying foreign taxes paid per share | ||||||||||||
| Lifestyle Income | $ | 105,850 | $ | 0.01233 | $ | 14,149 | $ | 0.00165 | ||||||||
| Lifestyle Conservative | 765,490 | 0.02733 | 105,822 | 0.00378 | ||||||||||||
| Lifestyle Moderate | 1,894,803 | 0.04567 | 266,477 | 0.00642 | ||||||||||||
| Lifestyle Growth | 1,314,697 | 0.06701 | 186,674 | 0.00951 | ||||||||||||
| Lifestyle Aggressive Growth | 1,193,287 | 0.09223 | 172,619 | 0.01334 | ||||||||||||
| TIAA-CREF Lifestyle Funds ■ 2022 Annual Report | 69 |
Trustees and officers (unaudited)
TIAA-CREF Funds ■ May 31, 2022
Trustees
| Name, Address and Year of Birth (“YOB”) | Position(s) Held with Fund | Term of Office and Length of Time Served | Principal Occupation(s) During Past 5 Years and other relevant experience and qualifications | Number of Portfolios in Fund complex Overseen by Trustee | Other Directorship(s) held by Trustee | |||||
| Forrest Berkley c/o Corporate Secretary 730 Third Avenue New York, NY 10017-3206 YOB: 1954 | Trustee | Indefinite term. Trustee since 2006. | Retired Partner (since 2006), Partner (1990–2005) and Head of Global Product Management (2003–2005), GMO (formerly, Grantham, Mayo, Van Otterloo & Co.) (investment management); and member of asset allocation portfolio management team, GMO (2003–2005). | 88 | Director, Save the Children Federation, Inc.; Investment Committee Member, Maine Community Foundation. | |||||
| Joseph A. Boateng c/o Corporate Secretary 730 Third Avenue New York, NY 10017-3206 YOB: 1963 | Trustee | Indefinite term. Trustee since 2019. | Chief Investment Officer, Casey Family Programs (since 2007). Director of U.S. Pension Plans, Johnson & Johnson (2002–2006). Manager, Financial Services Consultant, KPMG Consulting (2000–2002). | 88 | Board member, Lumina Foundation and Waterside School; Emeritus Board Member, Year-Up Puget Sound; Investment Advisory Committee Member, Seattle City Employees’ Retirement System; Investment Committee Member, The Seattle Foundation. | |||||
| Janice C. Eberly c/o Corporate Secretary 730 Third Avenue New York, NY 10017-3206 YOB: 1962 | Trustee | Indefinite term. Trustee since 2018. | James R. and Helen D. Russell Professor of Finance at the Kellogg School of Management, Northwestern University (2002–2011 and since 2013), Senior Associate Dean for Strategy and Academics (since 2020) and Chair of the Finance Department (2005– 2007). Vice President, American Economic Association (2020–2021). Assistant Secretary for Economic Policy, United States Department of the Treasury (2011–2013). | 88 | Member of the Board of the Office of Finance, Federal Home Loan Banks; Director, Avant, LLC; |
| 70 | 2022 Annual Report ■ TIAA-CREF Lifestyle Funds |
| Nancy A. Eckl c/o Corporate Secretary 730 Third Avenue New York, NY 10017-3206 YOB: 1962 | Trustee | Indefinite term. Trustee since 2007. | Vice President (1990–2006), American Beacon Advisors, Inc., and of certain funds advised by American Beacon Advisors, Inc. | 88 | Independent Director, The Lazard Funds, Inc., Lazard Retirement Series, Inc., and Lazard Global Total Return and Income Fund, Inc. | |||||
| Michael A. Forrester c/o Corporate Secretary 730 Third Avenue New York, NY 10017-3206 YOB: 1967 | Trustee | Indefinite term. Trustee since 2007. | Chief Executive Officer (2014–2021) and Chief Operating Officer (2007–2014), Copper Rock Capital Partners, LLC. Chief Operating Officer, DDJ Capital Management (2003–2006). | 88 | Trustee, Dexter Southfield School; Member, Governing Council of the Independent Directors Council. | |||||
| Howell E. Jackson c/o Corporate Secretary 730 Third Avenue New York, NY 10017-3206 YOB: 1954 | Trustee | Indefinite term. Trustee since 2005. | James S. Reid, Jr. Professor of Law (since 2004), Senior Adviser to President and Provost (2010–2012), Acting Dean (2009), Vice Dean for Budget (2003–2006) and on the faculty (since 1989) of Harvard Law School. | 88 | Director, Build Commonwealth (non-profit organization). | |||||
| Thomas J. Kenny c/o Corporate Secretary 730 Third Avenue New York, NY 10017-3206 YOB: 1963 | Chairman of the Board and Trustee | Indefinite term. Trustee since 2011; Chairman for term ending June 30, 2023. Chairman since September 13, 2017. | Advisory Director (2010–2011), Partner (2004–2010), Managing Director (1999–2004) and Co-Head of Global Cash and Fixed Income Portfolio Management Team (2002–2010), Goldman Sachs Asset Management. | 88 | Director and Chair of the Finance and Investment Committee, Aflac Incorporated; Director and Investment Committee Member, Sansum Clinic; Director, ParentSquare; Member, University of California at Santa Barbara Arts and Lectures Advisory Council. |
| TIAA-CREF Lifestyle Funds ■ 2022 Annual Report | 71 |
| Trustees and officers (unaudited) | continued |
TIAA-CREF Funds ■ May 31, 2022
Trustees – concluded
| Name, Address and Year of Birth (“YOB”) | Position(s) Held with Fund | Term of Office and Length of Time Served | Principal Occupation(s) During Past 5 Years and other relevant experience and qualifications | Number of Portfolios in Fund complex Overseen by Trustee | Other Directorship(s) held by Trustee | |||||
| James M. Poterba c/o Corporate Secretary 730 Third Avenue New York, NY 10017-3206 YOB: 1958 | Trustee | Indefinite term. Trustee since 2006. | President and Chief Executive Officer (since 2008) and Program Director (1990–2008), National Bureau of Economic Research. Mitsui Professor of Economics, Massachusetts Institute of Technology (“MIT”) (since 1996); Affiliated Faculty Member of the Finance Group, Alfred P. Sloan School of Management (since 2014); Head (2006–2008) and Associate Head (1994–2000 and 2001–2006), Economics Department of MIT. | 88 | Director, National Bureau of Economic Research; Member, Congressional Budget Office Panel of Economic Advisers. | |||||
| Maceo K. Sloan c/o Corporate Secretary 730 Third Avenue New York, NY 10017-3206 YOB: 1949 | Trustee | Indefinite term. Trustee since 1999. | Chairman, President and Chief Executive Officer, Sloan Financial Group, Inc. (1991–2018); Chairman and Chief Executive Officer (1991–2016), Chief Investment Officer (1991–2013) and Chief Compliance Officer (2015–2016), NCM Capital Management Group, Inc.; Chairman, Chief Executive Officer (2003–2016), Chief Investment Officer (2003–2013) and Chief Compliance Officer (2015–2016), NCM Capital Advisers, Inc.; and Chairman, President and Principal Executive Officer, NCM Capital Investment Trust (2007–2012). | 88 | Director, TheraTrue Inc. |
| 72 | 2022 Annual Report ■ TIAA-CREF Lifestyle Funds |
Officers
| Name, Address and Year of Birth (“YOB”) | Position(s) Held with Fund | Term of Office and Length of Time Served | Principal Occupation(s) During Past 5 Years | |||
| Richard S. Biegen TIAA 730 Third Avenue New York, NY 10017-3206 YOB: 1962 | Chief Compliance Officer | One-year term. Chief Compliance Officer since 2008. | Senior Managing Director, TIAA. Chief Compliance Officer of the College Retirement Equities Fund (“CREF”), TIAA Separate Account VA-1, TIAA-CREF Funds and TIAA-CREF Life Funds (collectively, the “TIAA-CREF Fund Complex”). | |||
| Derek B. Dorn TIAA 730 Third Avenue New York, NY 10017-3206 YOB: 1976 | Senior Managing Director and Corporate Secretary | One-year term. Senior Managing Director and Corporate Secretary since 2020. | Senior Managing Director and Corporate Secretary of Teachers Insurance and Annuity Association of America (“TIAA”) and the TIAA-CREF Fund Complex. Formerly, Managing Director, Special Assistant to the CEO, and Managing Director, Regulatory Affairs, TIAA. Prior to joining TIAA, Mr. Dorn served as a partner at Davis & Harman LLP and an adjunct professor of Law at Georgetown University Law Center. | |||
| John L. Douglas TIAA 730 Third Avenue New York, NY 10017-3206 YOB: 1950 | Executive Vice President, Chief Legal, Risk and Compliance Officer | One-year term. Executive Vice President since 2021 and Chief Legal, Risk and Compliance Officer since 2022. | Senior Executive Vice President, Chief Legal, Risk and Compliance Officer of TIAA, Executive Vice President, Chief Legal, Risk and Compliance Officer of the TIAA-CREF Fund Complex. Formerly, Senior Executive Vice President, Senior Advisor to the CEO, and Senior Executive Vice President, Chief Advocacy & Oversight Officer, TIAA. Prior to joining TIAA, Mr. Douglas was a Partner at Davis Polk & Wardwell LLP. | |||
| W. Dave Dowrich TIAA 730 Third Avenue New York, NY 10017-3206 YOB: 1967 | Executive Vice President | One-year term. Executive Vice President since 2022. | Senior Executive Vice President and Chief Financial Officer of TIAA. Executive Vice President of the TIAA-CREF Fund Complex. Prior to joining TIAA, Mr. Dowrich served as Chief Financial Officer, International Businesses at Prudential Financial, Inc. |
| TIAA-CREF Lifestyle Funds ■ 2022 Annual Report | 73 |
| Trustees and officers (unaudited) | concluded |
TIAA-CREF Funds ■ May 31, 2022
Officers – concluded
| Name, Address and Year of Birth (“YOB”) | Position(s) Held with Fund | Term of Office and Length of Time Served | Principal Occupation(s) During Past 5 Years | |||
| Bradley Finkle TIAA 730 Third Avenue New York, NY 10017-3206 YOB: 1973 | Principal Executive Officer and President | One-year term. Principal Executive Officer and President since 2017. | Executive Vice President, Chief Administrative Officer of the Chief Operating Office, TIAA. Principal Executive Officer and President of the TIAA-CREF Funds and TIAA-CREF Life Funds. Formerly, Executive Vice President, Chief Operating Officer, Nuveen, President and Chief Executive Officer of CREF and TIAA Separate Account VA-1; Senior Managing Director, Co-Head Nuveen Equities & Fixed Income and President of TIAA Investments. | |||
| Jose Minaya TIAA 730 Third Avenue New York, NY 10017-3206 YOB: 1971 | Executive Vice President | One-year term. Executive Vice President since 2018. | Chief Executive Officer, Nuveen. Executive Vice President of the TIAA-CREF Fund Complex. Formerly, Executive Vice President, President and Chief Investment Officer, Nuveen; Executive Vice President, Chief Investment Officer and President, Nuveen Global Investments; and Senior Managing Director, President, Global Investments, TIAA. | |||
| Colbert Narcisse TIAA 730 Third Avenue New York, NY 10017-3206 YOB: 1965 | Executive Vice President | One-year term. Executive Vice President since 2022. | Senior Executive Vice President, Chief Product and Business Development Officer of TIAA. President and Chief Executive Officer of CREF and TIAA Separate Account VA-1. Executive Vice President of TIAA-CREF Funds and TIAA-CREF Life Funds. Formerly, Executive Vice President and Head of Advisory and Corporate Solutions, TIAA. Prior to joining TIAA, Mr. Narcisse served as Managing Director and Head of International Wealth Management and Head of Traditional and Alternative Investment Products at Morgan Stanley. |
| 74 | 2022 Annual Report ■ TIAA-CREF Lifestyle Funds |
| David G. Nason TIAA 730 Third Avenue New York, NY 10017-3206 YOB: 1970 | Executive Vice President | One-year term. Executive Vice President since 2020. | Senior Executive Vice President, Chief Operating Officer of TIAA. Executive Vice President of the TIAA-CREF Fund Complex. Formerly, Senior Executive Vice President, Chief Legal, Risk and Compliance Officer of TIAA. Executive Vice President, Chief Risk and Compliance Officer, TIAA. Prior to joining TIAA, Mr. Nason served as President and CEO of GE Energy Financial Services. | |||
| E. Scott Wickerham TIAA 730 Third Avenue New York, NY 10017-3206 YOB: 1973 | Principal Financial Officer, Principal Accounting Officer and Treasurer | One-year term. Principal Financial Officer, Principal Accounting Officer and Treasurer since 2017. | Senior Managing Director, Head, Publics Investment Finance, Nuveen. Principal Financial Officer, Principal Accounting Officer and Treasurer of the TIAA-CREF Fund Complex; and Vice President and Controller of the Nuveen Funds. Formerly, Managing Director, Head, TC Fund Administration, Nuveen. | |||
| Sean N. Woodroffe TIAA 730 Third Avenue New York, NY 10017-3206 YOB: 1963 | Executive Vice President | One-year term. Executive Vice President since 2018. | Senior Executive Vice President, Chief People Officer of TIAA, and Executive Vice President of the TIAA-CREF Fund Complex. Prior to joining TIAA, Mr. Woodroffe served as Chief People Officer at National Life Group. |
Please note that the Funds’ Statement of Additional Information (SAI) includes additional information about the Funds’ trustees and is available, without charge, through our website, TIAA.org, or by calling 800 223-1200.
| TIAA-CREF Lifestyle Funds ■ 2022 Annual Report | 75 |
Approval of investment management agreement (unaudited)
Board renewal of the investment management agreement for the TIAA-CREF Lifestyle Funds
The Board of Trustees (the “Board” or the “Trustees”) of the TIAA-CREF Funds (the “Trust”) determines whether to initially approve and periodically renew the investment management agreement (the “Agreement”) between Teachers Advisors, LLC (“Advisors”) and the Trust on behalf of each series of the Trust. Under the Agreement, Advisors is responsible for providing investment advisory services to each series of the Trust and overseeing the everyday operations and other service providers of the Trust. Below is a summary of the process the Board undertook related to its most recent renewal of the Agreement with respect to each series of the TIAA-CREF Lifestyle Funds (the “Funds”).
Section 15(c) of the Investment Company Act of 1940, as amended (the “1940 Act”), requires that, after an initial period of up to two years, the Agreement for each Fund will remain in effect only if the Board, including a majority of those Trustees who have no direct or indirect interest in the Agreement, and who are independent Trustees because they are not “interested persons” of the Trust, as that term is defined in the 1940 Act, annually renews the Agreement. None of the Trustees is an interested person of the Trust under the 1940 Act. Rather, they are all deemed to be independent Trustees.
Under normal circumstances, Section 15(c) requires any initial approval or annual renewal of an investment management agreement to be made at an in-person meeting of the Board. However, due to the COVID-19 pandemic, the Securities and Exchange Commission (“SEC”) issued and extended a temporary, conditional exemptive order (the “SEC Order”), permitting mutual fund boards to vote to approve matters subject to the Section 15(c) in-person approval requirement at a meeting that is not held in person if the board determines that reliance on the SEC Order is necessary or appropriate due to prevailing circumstances related to the current or potential effects of COVID-19 and the board ratifies any action taken pursuant to the SEC Order at its next in-person meeting.
Overview of the renewal process
The Board held a virtual meeting via videoconference on March 11, 2022, in order to consider the annual renewal of the Agreement with respect to each applicable Fund using the process established by the Board described further below. At the outset of the meeting, the Board considered reliance upon the SEC Order and determined that such reliance was necessary due to, among other considerations, COVID-19 pandemic-related public health protocols imposed for health and safety reasons. The Board noted that it would ratify actions taken at this meeting pursuant to the SEC Order at its next in-person meeting.
| 76 | 2022 Annual Report ■ TIAA-CREF Lifestyle Funds |
As part of the Board’s established process, the Board delegated certain tasks to its Operations Committee. Among these tasks, the Operations Committee or certain of its designated members worked with Advisors, other Board members and legal counsel to the Trustees to develop guidance and specific requests relating to the types of information to be provided to the Board in connection with the proposed contract renewals.
Among other matters, the Operations Committee or certain of its designated members, following consultations with representatives of Advisors, other Board members, legal counsel to the Trustees and legal counsel to Advisors and the Trust, confirmed or established certain guidance regarding the preparation of reports to be provided to the Board with respect to each Fund by the Board Reporting and Compliance unit of Broadridge Financial Solutions, Inc. (“Broadridge”), using data from Lipper, Inc., an independent provider of investment company data. The Operations Committee considered that Broadridge is widely recognized as a leading provider of comparative analyses used by independent directors and trustees of investment companies during their advisory contract review processes.
Based on guidance provided by the Operations Committee or certain of its designated members on behalf of the Board, Broadridge produced, among other information, comparative performance and expense data for each Fund, including data relating to each Fund’s management fee rate, total expense ratio, short-term and long-term investment performance and portfolio turnover rate (as applicable). Broadridge compared this data, as relevant, for each Fund against a universe of investment companies and against a more selective peer group of mutual funds with similar investment objectives and strategies, each of which was selected by Broadridge, and also compared the performance of each Fund against one or more appropriate broad-based indices. In each case, Broadridge summarized, and the Board considered, the methodologies Broadridge employed to provide the data contained in its reports. In addition, Broadridge represented to the Board that its reports were designed specifically to provide the Board with the fee, expense and performance information that is necessary to help the Board satisfy its duties under Section 15(c) of the 1940 Act. Broadridge also represented that the purpose of its reports is to provide an objective view of each Fund’s relative position regarding the level of fees, expenses and performance against a competitive peer group and universe (as applicable) selected by Broadridge (and not Advisors or the Board). The Board considered the propriety of each Fund’s applicable peer group as selected by Broadridge and use of the Retail Class as the base class for comparison purposes.
Among other matters, the Board also considered information from Advisors to facilitate the Trustees’ evaluation of the reasonableness of any profits earned by Advisors with respect to its services to each Fund pursuant to the Agreement.
Legal counsel for the Trustees also requested on behalf of the Board, and Advisors provided, information that was designed to assist the Board in its consideration of whether to renew the Agreement for each Fund. In addition to the data provided by
| TIAA-CREF Lifestyle Funds ■ 2022 Annual Report | 77 |
Approval of investment management agreement (unaudited)
Broadridge as described above, this information included, but was not limited to, the following: (1) further information relating to each Fund’s investment performance and a narrative analysis of the performance of each Fund that had underperformed certain Board-specified criteria, together with an explanation of any events that had a material impact on the Fund’s performance during that period; (2) a description of any fee waiver or expense reimbursement arrangements that were proposed or were in place during the prior year and the extent to which such arrangements would be continued or modified in the coming year; (3) a comparison of each Fund’s management fee rate and performance to other accounts with comparable strategies managed by Advisors or certain of its affiliates; (4) any “fall-out” benefits that accrued or were identified as reasonably likely to accrue to Advisors or its affiliates due to their relationship with the Funds in addition to the Funds’ direct fee payments to Advisors pursuant to the Agreement; (5) information regarding Advisors’ financial resources, senior professional personnel, overall staffing levels, portfolio manager compensation arrangements, capacity to manage the Funds at current and foreseeable asset levels, insurance coverage, portfolio trading and best execution practices, and any actual and potential conflicts of interest identified by Advisors in connection with rendering services to the Funds; (6) information as to any profits earned by Advisors in connection with its services pursuant to the Agreement; (7) a copy of the Agreement and certain related agreements between the Funds and affiliates of Advisors; (8) a copy of Advisors’ Form ADV as filed with the SEC (which was presented only to legal counsel for the Trustees); and (9) draft narrative explanations to be included in the shareholder reports of reasons why the Board should renew the Agreement. The Trustees were also provided with performance ratings of Morningstar, Inc. (“Morningstar”), which is a widely recognized mutual fund ranking service. In addition, the Board received information from management on the continued impact of the COVID-19 pandemic and certain geopolitical events on the Teachers Insurance and Annuity Association of America (“TIAA”) enterprise’s operations generally and on the Funds’ operations and performance.
On March 3, 2022, the Board held a virtual meeting via videoconference with legal counsel to the Trustees to discuss Advisors’ materials, which led to the Trustees providing additional questions to, and requesting additional information from, Advisors. Subsequently, at the March 11, 2022 meeting, the Trustees were given the opportunity to, and did, ask additional questions and they discussed responses from Advisors to the Board’s follow-up questions and requests presented by the Board after its initial review of the information described above.
In considering whether to renew the Agreement with respect to each Fund, the Board considered various factors, including: (1) the nature, extent and quality of services provided or to be provided by Advisors to the Fund; (2) the Fund’s investment performance; (3) the costs of the services provided to the Fund and the profits realized or potential profits to be realized (if any) by Advisors and its affiliates from their relationship with the Fund; (4) fees charged to comparable mutual funds by other advisers; (5) the extent to which economies of scale have been realized or are
| 78 | 2022 Annual Report ■ TIAA-CREF Lifestyle Funds |
continued
anticipated to be realized as the Fund grows; (6) how such economies of scale are shared with the Fund for the benefit of its investors, such as, if applicable, through management fee breakpoints; (7) comparisons, if applicable, of the services provided by Advisors to, and the fee rates and performance of, the Fund to other clients to whom Advisors provides comparable services; and (8) any other benefits identified by Advisors derived or anticipated to be derived by Advisors or its affiliates from their relationship with the Fund. As a general matter, the Board considered these factors, and any other factors deemed relevant by the Trustees, in their totality, and no single factor was identified as being the determining factor in deciding whether to renew the Agreement.
In addition to the March 11, 2022 meeting that included Advisors’ personnel, the Trustees met in executive sessions, at which no representatives of Advisors were present, to discuss the proposed renewal of the Agreement for each Fund. The Board also received and considered information from its legal counsel as to certain relevant guidance that relates to the renewal process under Section 15(c) of the 1940 Act and certain other legal authorities.
While the contract renewal process included a series of discussions and meetings leading up to the March 11, 2022 meeting, the oversight and evaluation of Advisors’ services to the Funds by the Board and its Committees is an ongoing process. The Board, as well as its Committees, considered reports on various investment and operational topics that had been identified by the Board or its Committees for review in the year since the last annual renewal process. Further, at their regularly scheduled meetings, the Board and its Investment Committee and its other Committees receive and consider, among other matters, information regarding the performance of the Funds. Thus, in reaching its decisions regarding the renewal of the Agreement for each Fund, the Board took into account the information described herein and other information provided to the Board and its Committees throughout the year.
The Board received and considered both Trust-level and Fund-specific information, but made its renewal determinations on a Fund-by-Fund basis. In deciding whether to renew the Agreement for each Fund, each Trustee may have accorded different weight to different factors and, thus, may have had a different basis for his or her ultimate decision to vote to renew the Agreement for each Fund. At its meeting on March 11, 2022, Board members voted unanimously to renew the Agreement for each Fund. Set forth below is a summary of the primary factors the Board considered with respect to each Fund.
The nature, extent and quality of services
The Board considered the level and depth of knowledge of Advisors, including the professional experience and qualifications of its personnel. The Board also considered that Advisors is an experienced investment adviser that has managed the Funds since their operations commenced. Investment professionals at Advisors also
| TIAA-CREF Lifestyle Funds ■ 2022 Annual Report | 79 |
Approval of investment management agreement (unaudited)
manage various other funds and accounts of the Trust, College Retirement Equities Fund, the TIAA-CREF Life Funds and TIAA Separate Account VA-1, as well as advise and sub-advise other investment companies and vehicles. Under the Agreement, Advisors is responsible for, among other duties: managing the assets of the Funds (which are funds of funds that may invest their assets in the securities of affiliated and unaffiliated investment companies or other investment pools, referred to as “Underlying Funds”), including conducting research, identifying investments and placing orders to buy and sell shares of Underlying Funds for the Funds’ investment portfolios; active daily monitoring of the Funds’ investment portfolios; reporting on the investment performance and other metrics of the Funds to the Board on a regular basis; responding to Fund flows; compliance monitoring; coordinating the activities of each Fund’s service providers; and overseeing the provision of various administrative services to the Funds. The Board considered that Advisors has carried out these responsibilities in a competent and professional manner. The Board also considered that Advisors has committed significant resources to supporting the series of the Trust, including the Funds. It also considered Advisors’ compliance program and resources and its compliance record with respect to the Funds.
The Board also considered, among other factors, the performance of each Fund, as discussed below. In addition, the Board considered the nature and quality of non-portfolio management services provided by Advisors and its affiliates. In this regard, the Board considered its ongoing review of the performance of certain affiliated and unaffiliated service providers, including the quality of services provided by those firms and Advisors’ oversight of those service providers and the outsourcing of certain services to other firms.
The Board, as well as its Committees, considered reports on various investment and operational topics that had been identified by the Board or its Committees for review in the year since the last annual renewal process. Further, at their regularly scheduled meetings, the Board and its Investment Committee and its other Committees receive and consider, among other matters, information regarding the performance of the Funds. Thus, in reaching its decisions regarding the renewal of the Agreement for each Fund, the Board took into account the information described herein and other information provided to the Board and its Committees throughout the year.
Investment performance
The Board considered the investment performance of each Fund, over the periods indicated in the Fund-by-Fund synopsis below. The Board considered each Fund’s performance as compared to its peer group and peer universe (as applicable) and its benchmark index. For details regarding each Fund’s performance, see the Fund-by-Fund synopsis below. The Board concluded that, under the totality of circumstances considered, the investment performance of each Fund was reasonable.
| 80 | 2022 Annual Report ■ TIAA-CREF Lifestyle Funds |
continued
Cost and profitability
The Board considered financial and profitability data relating to Advisors’ services to the Funds for the calendar year 2021. The Board considered Advisors’ profit calculations with respect to its services to each Fund both before and after taking into account the costs incurred directly or indirectly by Advisors in connection with the distribution of shares of the Fund. The Board acknowledged the reasonableness of having management fee rates which permit Advisors to maintain and improve the quality of services provided to the Funds and recognized the entrepreneurial and other risks assumed by Advisors in managing the Funds. The Board also acknowledged certain fee waivers and reimbursements of expenses above specified amounts undertaken by Advisors with respect to many of the Underlying Funds which, in turn, reduce the expenses of the Funds. The Board also recognized Advisors’ commitment to reimburse Fund expenses to the extent that total annual operating expenses exceeded certain specified amounts. The Board considered that Advisors had calculated that it incurred losses with respect to each Fund under the Agreement for the one-year period ended December 31, 2021. The Board also considered that, in the aggregate, Advisors had generated indirect earnings with respect to the Funds’ investment in Underlying Funds also managed by Advisors.
Fees charged by other advisers
The Board considered comparative information regarding each Fund’s contractual and effective management fee rates and the contractual and effective management fee rates paid by similar mutual funds to other advisers, as analyzed by Broadridge and reflected in the Fund-by-Fund synopsis below. The Board determined that the management fee rate charged to a Fund under the Agreement typically was lower than the management fee rates charged to many or most other comparable mutual funds. In this regard, the Board also considered the inherent limitations of such comparisons in light of uncertainty as to how the fees of such similar mutual funds are set and potentially material differences between a Fund and its comparable mutual funds. The Board considered Broadridge’s treatment of all fund fee waivers, regardless of their type, as management fee waivers, which could materially impact how the Funds’ actual management fee rates compare to those of similar mutual funds. Additionally, the Board considered the potential limitations of such comparisons due to, among other factors, the fact that, in many instances, Broadridge based its comparisons on financial data relating to fiscal periods that differed from the period for which the Fund’s data were derived. Based on all factors considered, the Board concluded that the management fee rates under the Agreement with respect to each Fund were reasonable in relation to those charged by appropriate groups of comparable mutual funds.
| TIAA-CREF Lifestyle Funds ■ 2022 Annual Report | 81 |
Approval of investment management agreement (unaudited)
Economies of scale
The Board considered whether Advisors has experienced or is anticipated to experience economies of scale in connection with the operation of each Fund, and whether any such economies are shared with the Funds. The Board also considered that because Advisors operated each Fund at a loss, there had been little opportunity to pass on economies of scale to Fund shareholders. Based on all factors considered, the Board concluded that the Funds’ management fee rate schedules were reasonable in light of current economies of scale considerations and current asset levels.
Fee and performance comparisons with other Advisors clients
The Board considered that Advisors provides similar investment management services to other investment companies. The Board noted that Advisors provides funds of funds management services to the TIAA-CREF Life Balanced Fund, with an annual management fee rate of 0.10% of average daily net assets, and the TIAA-CREF Managed Allocation Fund, for which Advisors receives no management fee. The Board also considered that Advisors also manages the TIAA-CREF Lifecycle and Lifecycle Index Funds, which have a different expense structure where both the fund of fund fees and the underlying fund fees are charged to the funds of funds directly. The Board also discussed the performance of these other funds of funds while discussing the performance of the Funds. Based on all factors considered, the Board concluded that the management fee rates under the Agreement with respect to each Fund were reasonable in relation to those charged by Advisors to its comparable clients.
Other benefits
The Board also considered additional “fall-out benefits” to Advisors and its affiliates arising from the Agreement. Such benefits include, among others, other fees paid by the Funds to Advisors or its affiliates for other services, such as distribution and administration, and investment-related benefits, such as economies of scale to the extent the Funds share investment resources and/or personnel with other clients of Advisors and the ability to incubate strategies within one or more Funds that could be subsequently utilized to manage other non-Fund products. Advisors and its affiliates may also benefit from the level of business and relationships the Funds have with certain service providers. Advisors and/or its affiliates also may benefit to the extent that the Funds add scale to the TIAA-CREF Underlying Funds or other affiliated underlying funds. Also, Advisers and its affiliates earn fees on the Funds’ investments in other affiliated products, such as Nuveen Funds. Additionally, the Funds may be utilized as investment options for other products and businesses of Advisors and its affiliates, such as variable products, fund of funds and 529 education savings plans. Also, Advisors and its affiliates may benefit from their
| 82 | 2022 Annual Report ■ TIAA-CREF Lifestyle Funds |
continued
relationship with the Funds to the extent that this relationship results in potential investors viewing TIAA, of which Advisors is an indirect, wholly-owned subsidiary, as a leading retirement plan provider in the academic and non-profit markets and as a single source for all their financial service needs. The Board concluded that other benefits to Advisors and its affiliates arising from the Agreement were reasonable in light of various relevant factors.
Fund-by-fund synopsis of factors
The Board considered the following specific factors (among others) in connection with its determination to renew the Agreement with respect to each Fund. If a Fund is described in the following discussions as being in the “1st” quintile, it is in the best of five groups (that is, the group has the best performance or the lowest expenses, as the case may be). References below to quintiles are based on data provided to the Board in the reports prepared by Broadridge. The specific management fee, expense and performance factors outlined below are based on the Retail Class of each Fund. Because the Retail Class generally has higher non-management expenses than the other classes of these Funds, the expenses and performance of these other classes will differ from the expenses and performance shown for the Retail Class. All time periods referenced below are ended December 31, 2021. Under the Morningstar rating system, an Overall Morningstar Rating of 5 stars is the highest (best) rating category and 1 star is the lowest (worst) rating category. The Morningstar data is as of December 31, 2021. Statements below regarding “net loss” refer to Advisors’ calculation that it incurred a loss for the services that it rendered to a Fund during 2021 under the Agreement.
Lifestyle Aggressive Growth Fund
| • | The Fund’s annual contractual management fee rate is 0.10% of average daily net assets. |
| • | The Fund’s total expense ratio, actual management fee rate and contractual management fee rate were each in the 1st quintile of both the group of comparable funds selected by Broadridge for expense comparison purposes (“Expense Group”) and of the universe of comparable funds selected by Broadridge for expense comparison purposes (“Expense Universe”). |
| • | The Fund was in the 4th, 1st, 1st and 1st quintiles of both the group of comparable funds selected by Broadridge for performance comparison purposes (“Performance Group”) and the universe of comparable funds selected by Broadridge for performance comparison purposes (“Performance Universe”) for the one-, three-, five- and ten-year periods, respectively. |
| • | The Fund received an Overall Morningstar Rating of 5 stars. |
| • | Advisors calculated that it incurred a net loss with respect to its services to the Fund for the one-year period without taking into account profits Advisors earned in the aggregate with respect to the Underlying Funds that are also managed by Advisors in which this Fund invests. |
| TIAA-CREF Lifestyle Funds ■ 2022 Annual Report | 83 |
Approval of investment management agreement (unaudited)
Lifestyle Growth Fund
| • | The Fund’s annual contractual management fee rate is 0.10% of average daily net assets. |
| • | The Fund’s total expense ratio, actual management fee rate and contractual management fee rate were each in the 1st quintile of its Expense Group. The Fund’s total expense ratio, actual management fee rate and contractual management fee rate were each in the 1st, 1st and 2nd quintiles of its Expense Universe, respectively. |
| • | The Fund was in the 4th, 1st, 1st and 1st quintiles of its Performance Group for the one-, three-, five- and ten-year periods, respectively. The Fund was in the 5th, 1st, 2nd and 1st quintiles of its Performance Universe for the one-, three-, five-and ten-year periods, respectively. |
| • | The Fund received an Overall Morningstar Rating of 4 stars. |
| • | Advisors calculated that it incurred a net loss with respect to its services to the Fund for the one-year period without taking into account profits Advisors earned in the aggregate with respect to the Underlying Funds that are also managed by Advisors in which this Fund invests. |
Lifestyle Moderate Fund
| • | The Fund’s annual contractual management fee rate is 0.10% of average daily net assets. |
| • | The Fund’s total expense ratio, actual management fee rate and contractual management fee rate were each in the 1st quintile of its Expense Group. The Fund’s total expense ratio, actual management fee rate and contractual management fee rate were in the 2nd, 1st and 2nd quintiles of its Expense Universe, respectively. |
| • | The Fund was in the 2nd, 1st, 1st and 1st quintiles of its Performance Group for the one-, three-, five- and ten-year periods, respectively. The Fund was in the 4th, 2nd, 1st and 1st quintiles of its Performance Universe for the one-, three-, five-and ten-year periods, respectively. |
| • | The Fund received an Overall Morningstar Rating of 3 stars. |
| • | Advisors calculated that it incurred a net loss with respect to its services to the Fund for the one-year period without taking into account profits Advisors earned in the aggregate with respect to the Underlying Funds that are also managed by Advisors in which this Fund invests. |
Lifestyle Conservative Fund
| • | The Fund’s annual contractual management fee rate is 0.10% of average daily net assets. |
| • | The Fund’s total expense ratio, actual management fee rate and contractual management fee rate were each in the 1st quintile of its Expense Group. The Fund’s total expense ratio, actual management fee rate and contractual management fee rate were in the 1st, 1st and 2nd quintiles of its Expense Universe, respectively. |
| 84 | 2022 Annual Report ■ TIAA-CREF Lifestyle Funds |
concluded
| • | The Fund was in the 2nd, 1st, 1st and 1st quintiles of its Performance Group for the one-, three-, five- and ten-year periods, respectively. The Fund was in the 3rd, 1st, 1st and 1st quintiles of its Performance Universe for the one-, three, five- and ten-year periods, respectively. |
| • | The Fund received an Overall Morningstar Rating of 4 stars. |
| • | Advisors calculated that it incurred a net loss with respect to its services to the Fund for the one-year period without taking into account profits Advisors earned in the aggregate with respect to the Underlying Funds that are also managed by Advisors in which this Fund invests. |
Lifestyle Income Fund
| • | The Fund’s annual contractual management fee rate is 0.10% of average daily net assets. |
| • | The Fund’s total expense ratio, actual management fee rate and contractual management fee rate were in the 1st, 1st and 2nd quintiles of both its Expense Group and its Expense Universe, respectively. |
| • | The Fund was in the 5th, 5th, 5th and 4th quintiles of its Performance Group for the one-, three-, five- and ten-year periods, respectively. The Fund was in the 5th quintile of its Performance Universe for each of the one-, three-, five- and ten-year periods. |
| • | The Fund received an Overall Morningstar Rating of 3 stars. |
| • | Advisors calculated that it incurred a net loss with respect to its services to the Fund for the one-year period without taking into account profits Advisors earned in the aggregate with respect to the Underlying Funds that are also managed by Advisors in which this Fund invests. |
Based primarily on the foregoing factors and conclusions, the Board renewed the Agreement for each Fund.
| TIAA-CREF Lifestyle Funds ■ 2022 Annual Report | 85 |
Liquidity risk management program (unaudited)
Discussion of the operation and effectiveness of the Funds’ liquidity risk management program
In compliance with Rule 22e-4 under the Investment Company Act of 1940, as amended (the “Liquidity Rule”), each series of the Trust covered by this Report (the “Funds”) has adopted and implemented a liquidity risk management program (the “Program”), which is reasonably designed to assess and manage the Funds’ liquidity risk. The Program consists of various provisions relating to assessing and managing Fund liquidity risk, as discussed further below. The Funds’ Board of Trustees (the “Board”) previously approved the designation of Advisors (the “Administrator”) as Program administrator. The Liquidity Monitoring and Analysis Team (the “LMAT”) carries out day-to-day Program management with oversight by the Liquidity Oversight Committee (the “LOSC”). Personnel from the Administrator and Nuveen Fund Advisors, LLC, an affiliate of the Administrator, comprise the LMAT and LOSC.
At a February 15, 2022 Board meeting, the Administrator provided the Board with a written report addressing the Program’s operation, adequacy, and effectiveness of implementation for the period from January 1, 2021 through December 31, 2021 (the “Review Period”), as required under the Liquidity Rule. The report noted that the Program has been and continues to be adequately and effectively implemented to monitor and (as applicable) respond to the Funds’ liquidity developments.
In accordance with the Program, the LMAT assesses each Fund’s liquidity risk no less frequently than annually based on various factors, such as (i) the Fund’s investment strategy and the liquidity of portfolio investments, (ii) cash flow projections, and (iii) holdings of cash and cash equivalents and borrowing arrangements and other funding sources. Certain factors are considered under both normal and reasonably foreseeable stressed conditions.
Each Fund portfolio investment is classified into one of four liquidity categories (including “highly liquid investments” and “illiquid investments,” discussed below). The classification is based on a determination of how long it is reasonably expected to take to convert the investment into cash, or sell or dispose of the investment, in current market conditions without significantly changing the market value of the investment. Liquidity classification determinations take into account various market, trading, and investment-specific considerations, as well as market depth, and utilize third-party vendor data.
Any Fund that does not primarily hold highly liquid investments must, among other things, determine a minimum percentage of Fund net assets that must be invested in highly liquid investments (a “Highly Liquid Investment Minimum”). During the Review Period, each Fund primarily held highly liquid investments and therefore was exempt from the requirement to adopt a Highly Liquid Investment Minimum and to comply with the related requirements under the Liquidity Rule.
| 86 | 2022 Annual Report ■ TIAA-CREF Lifestyle Funds |
The Liquidity Rule also limits the Funds’ investments in illiquid investments. Specifically, the Liquidity Rule prohibits acquisition of illiquid investments if doing so would result in the Fund holding more than 15% of its net assets in illiquid investments and requires certain reporting anytime a Fund’s holdings of illiquid investments exceed 15% of net assets. During the Review Period, no Fund exceeded the 15% limit on illiquid investments.
| TIAA-CREF Lifestyle Funds ■ 2022 Annual Report | 87 |
Additional information about index providers (unaudited)
Russell Indexes
Source: London Stock Exchange Group plc and its group undertakings (collectively, the “LSE Group”). © LSE Group 2022. FTSE Russell is a trading name of certain of the LSE Group companies. “FTSE®,” “Russell®” and “FTSE Russell®” are trademarks of the relevant LSE Group companies and are used by any other LSE Group company under license. All rights in the FTSE Russell indexes or data vest in the relevant LSE Group company which owns the index or the data. Neither LSE Group nor its licensors accept any liability for any errors or omissions in the indexes or data and no party may rely on any indexes or data contained in this communication. No further distribution of data from the LSE Group is permitted without the relevant LSE Group company’s express written consent. The LSE Group does not promote, sponsor or endorse the content of this communication.
MSCI Indexes
Source: MSCI. The MSCI information may only be used for your internal use, may not be reproduced or redisseminated in any form and may not be used as a basis for or a component of any financial instruments or products or indices. None of the MSCI information is intended to constitute investment advice or a recommendation to make (or refrain from making) any kind of investment decision and may not be relied on as such. Historical data and analysis should not be taken as an indication or guarantee of any future performance analysis, forecast or prediction. The MSCI information is provided on an “as is” basis and the user of this information assumes the entire risk of any use made of this information. MSCI, each of its affiliates and each other person involved in or related to compiling, computing or creating any MSCI information (collectively, the “MSCI Parties”) expressly disclaims all warranties (including, without limitation, any warranties of originality, accuracy, completeness, timeliness, non-infringement, merchantability and fitness for a particular purpose) with respect to this information. Without limiting any of the foregoing, in no event shall any MSCI Party have any liability for any direct, indirect, special, incidental, punitive, consequential (including, without limitation, lost profits) or any other damages. (www.msci.com)
Bloomberg Indexes
Source: Bloomberg Index Services Limited. BLOOMBERG® is a trademark and service mark of Bloomberg Finance L.P. and its affiliates (collectively “Bloomberg”). Bloomberg or Bloomberg’s licensors own all proprietary rights in the Bloomberg Indices. Bloomberg neither approves nor endorses this material, nor guarantees the accuracy or completeness of any information herein, nor makes any warranty, express or implied, as to the results to be obtained therefrom and, to the maximum extent allowed by law, neither shall have any liability or responsibility for injury or damages arising in connection therewith.
| 88 | 2022 Annual Report ■ TIAA-CREF Lifestyle Funds |
Morningstar Index
©2022 Morningstar. All Rights Reserved. The information contained herein: (1) is proprietary to Morningstar and/or its content providers; (2) may not be copied or distributed; and (3) is not warranted to be accurate, complete or timely. Neither Morningstar nor its content providers are responsible for any damages or losses arising from any use of this information.
| TIAA-CREF Lifestyle Funds ■ 2022 Annual Report | 89 |
[This page intentionally left blank.]
Websites
TIAA.org
nuveen.com
Automated telephone service
800-842-2252
24 hours a day, 7 days a week
For the hearing- or speech-impaired
800-842-2755
8 a.m. to 10 p.m. (ET), Monday–Friday
You should carefully consider the investment objectives, risks, charges and expenses of any fund before investing. For a prospectus that contains this and other information, please visit TIAA.org, or call 800-842-2252 for the Institutional, Advisor, Premier and Retirement classes or 800-223-1200 for the Retail Class. Please read the prospectus carefully before investing. Investment, insurance and annuity products are not Federal Deposit Insurance Corporation (FDIC) insured, are not bank guaranteed, are not bank deposits, are not insured by any federal government agency, are not a condition to any banking service or activity, and may lose value. Nuveen, a subsidiary of TIAA, provides investment advice and portfolio management services through a dozen affiliated registered investment advisers. Nuveen Securities, LLC and TIAA-CREF Individual & Institutional Services, LLC, members FINRA, distribute securities products.
This material is for informational or educational purposes only and does not constitute fiduciary investment advice under ERISA, a securities recommendation under all securities laws, or an insurance product recommendation under state insurance laws or regulations. This material does not take into account any specific objectives or circumstances of any particular investor, or suggest any specific course of action. Investment decisions should be made based on the investor’s own objectives and circumstances.
©2022 Teachers Insurance and Annuity Association of America—College Retirement Equities Fund, 730 Third Avenue, New York, NY 10017-3206
| 730 Third Avenue New York, NY 10017-3206 | PRESORTED STANDARD U.S. POSTAGE PAID TIAA |

 | Printed on paper containing recycled fiber |
 | We’re fond of paper…in its original form. Switch to eDelivery at TIAA.org/eDelivery | |
| 2217961 | A13442 (7/22) |
| 730 Third Avenue New York, NY 10017-3206 |
| Printed on paper containing recycled fiber |
| 2217961 | A13442 (7/22) |
| 730 Third Avenue New York, NY 10017-3206 |
| 2217961 | A13442 (7/22) |
| TIAA-CREF Funds | May 31, 2022 | |
TIAA-CREF
Managed Allocation Fund
The annual report contains the audited financial statements.
| Fund name | Institutional Class | Retirement Class | Retail Class |
| Managed Allocation Fund | TIMIX | TITRX | TIMRX |
Annual
Report
Contents
This annual report contains information about the Managed Allocation Fund and describes the Fund’s results for the twelve months ended May 31, 2022. The report contains four main sections:
| • | A letter from Brad Finkle, Principal Executive Officer and President of the TIAA-CREF Funds and TIAA-CREF Life Funds. | |
| • | The Fund performance section compares the Fund’s investment returns with those of its composite benchmark and broad market index. | |
| • | The portfolio of investments lists the underlying funds in which the Fund had investments as of May 31, 2022. | |
| • | The financial statements provide detailed information about the operations and financial condition of the Fund. |
The views and opinions expressed in this report are through the end of the period, as stated on the cover of this report. They are subject to change at any time based on a variety of factors. As such, they are not guarantees of future performance or investment results and should not be taken as investment advice. To see the risks of investing in the Fund, please read the latest prospectus.
As always, you should carefully consider the investment objectives, risks, charges and expenses of any fund before investing. For a prospectus that contains this and other important information, please visit our websites at TIAA.org or nuveen.com, or call 800-842-2252 for the Institutional and Retirement classes or 800-223-1200 for the Retail Class. We urge you to read the prospectus carefully before investing.
| TIAA-CREF Managed Allocation Fund ■ 2022 Annual Report | 3 |
Global financial markets produced negative results for the twelve months ended May 31, 2022. As inflationary pressures persisted, the Federal Reserve responded by raising short-term interest rates in March and May, and indicated that further increases were likely. U.S. equities lost ground as the economy contracted in the first quarter of 2022—the first negative quarter since 2020. A widening trade gap and lower government spending contributed to the slowdown, but spending by consumers and businesses remained strong. Foreign stocks also posted losses, with emerging markets falling more than international developed markets. U.S. fixed-income securities declined as U.S. Treasury yields rose across all maturities (bond prices move in the opposite direction of yields). These market conditions were reflected in the performance of the TIAA-CREF Managed Allocation Fund by way of its investments in various asset classes through underlying funds.
| • | The Fund’s Institutional Class returned –9.5%, trailing the –7.1% return of its composite benchmark. | |
| • | Relative underperformance of the Fund’s underlying funds, across asset classes, detracted from its return. |
Both stocks and bonds posted losses
U.S. equities declined for the twelve months as inflation, rising interest rates and Russia’s invasion of Ukraine weighed on the financial markets. Furthermore, oil prices rose to levels not seen since 2008, while unemployment fell to rates approaching pre-pandemic lows. The broad domestic stock market, as represented by the Russell 3000® Index, returned –3.7%. The Fed raised the federal funds target rate to 0.75%–1.00% in May 2022 and decided to begin reducing its portfolio of bonds that had been purchased to support the economy.
International stocks trailed their U.S. counterparts. The MSCI ACWI ex USA Investable Market Index (IMI), which measures the performance of large-, mid- and small-cap equities in 22 of 23 developed-markets countries (excluding the United States) and 24 emerging-markets countries, returned –12.5% in U.S.-dollar terms. Despite widespread market losses, the economies in the 19-nation euro area grew at a moderate rate in the fourth quarter of 2021 and the first quarter of 2022. Among developing markets, the Chinese economy continued to expand at a solid pace through the first quarter of 2022.
U.S. investment-grade bonds lost ground as U.S. Treasury yields rose substantially across all maturities. The domestic investment-grade fixed-rate bond market, as measured by the Bloomberg U.S. Aggregate Bond Index, returned –8.2% for the period.
| 4 | 2022 Annual Report ■ TIAA-CREF Managed Allocation Fund |
Planning for an unpredictable future For more than a decade, equity investors have enjoyed a long stretch of above-average returns, while bond performance during the same period has not kept pace. Now we may be at an inflection point. Equities have become more volatile, tempered by a host of factors that could affect global economic growth. Fixed-income securities, after years of historically low interest rates, are now offering higher yields, which is good news for bond investors seeking higher income. Meanwhile, real estate continues to benefit from high demand and limited supply, which enhances property values and bolsters rental income. The challenge of planning for the future always lies in its inherent uncertainty. As a result, we believe that a prudent strategy is to stay invested in a diversified portfolio that includes multiple asset classes. The TIAA-CREF Managed Allocation Fund uses a dynamic diversification strategy designed to help mitigate the effects of market volatility and keep you on track to achieve your financial goals. Of course, diversification does not guarantee against market losses, and past performance cannot guarantee future results. We thank you for trusting us to manage your investments through the TIAA-CREF Managed Allocation Fund. If you have any questions or concerns, please consult your financial advisor or call a TIAA financial consultant at 800-842-2252. You can also reach us online by visiting TIAA.org. We always stand ready to assist you.
/s/ Brad Finkle
Brad Finkle Principal Executive Officer and President of the TIAA-CREF Funds and TIAA-CREF Life Funds
|
Brad Finkle
|

| TIAA-CREF Managed Allocation Fund ■ 2022 Annual Report | 5 |
Portfolio holdings
The complete portfolio of investments for the Managed Allocation Fund appears on page 14 of this report. You can obtain a complete list of the holdings of the Managed Allocation Fund and of the underlying TIAA-CREF Funds in which the Managed Allocation Fund invests as of the most recently completed fiscal quarter in the following ways:
| • | By visiting our websites at TIAA.org or nuveen.com; or | |
| • | By calling us at 800-842-2252 to request a copy, which will be provided free of charge. |
You can also obtain a complete list of the Managed Allocation Fund’s portfolio holdings as of the most recently completed fiscal quarter, and for prior quarter-ends, from our Securities and Exchange Commission (SEC) Form N-CSR and Form N-PORT filings. Form N-CSR filings are as of May 31 or November 30; Form N-PORT filings are as of the last day of February or August 31. Copies of these forms are available:
| • | Through the Electronic Data Gathering and Retrieval System (EDGAR) on the SEC’s website at sec.gov; or | |
| • | From the SEC’s Office of Investor Education and Advocacy. Call 202-551-8090 for more information. |
Proxy voting
A description of our proxy voting policies and procedures for the underlying TIAA-CREF Funds of the Managed Allocation Fund can be found on our website at TIAA.org or on the SEC’s website at sec.gov. You can also call us at 800-842-2252 to request a free copy. A report of how the Managed Allocation Fund’s underlying TIAA-CREF Funds voted during the most recently completed twelve-month period ended June 30 can be found on our website or on Form N-PX at sec.gov.
Contacting TIAA
There are three easy ways to contact us: by email, using the Contact Us link under Get Help at the top of our home page; by mail at TIAA, 730 Third Avenue, New York, NY 10017-3206; or by phone at 800-842-2252.
Fund management
The Managed Allocation Fund is managed by a portfolio management team of Teachers Advisors, LLC. The members of this team are responsible for the day-to-day investment management of the Fund.
| 6 | 2022 Annual Report ■ TIAA-CREF Managed Allocation Fund |
Composite benchmark
The Managed Allocation Fund uses a composite benchmark that combines the following public indexes in proportions that reflect the Fund’s target market sector allocations:
| • | The Russell 3000® Index (U.S. equity) measures the performance of the stocks of the 3,000 largest publicly traded U.S. companies, based on market capitalization. The index measures the performance of about 98% of the total market capitalization of the publicly traded U.S. equity market. | |
| • | The MSCI ACWI ex USA Investable Market Index (IMI) (international equity) measures the performance of large-, mid- and small-cap equities across 22 of 23 developed-markets countries (excluding the United States) and 24 emerging-markets countries. The index is a free-float-adjusted market capitalization index that covers approximately 99% of the global equity opportunity set outside the United States. | |
| • | The Bloomberg U.S. Aggregate Bond Index (fixed income) measures the performance of the domestic investment-grade fixed-rate bond market, including government and corporate securities, agency mortgage pass-through securities, asset-backed securities and commercial mortgage-backed securities. |
Broad market index
The returns shown against the broad-based securities market index compare the Fund’s average annual returns with a broad measure of market performance. The Morningstar Moderate Target Risk Index is an asset allocation index comprised of constituent Morningstar indexes and reflects global equity market exposure of 60% based on an asset allocation methodology from Ibbotson Associates, a Morningstar company. The returns of the Morningstar Moderate Target Risk Index reflect multi-asset class exposure and a similar risk profile as the Fund.
You cannot invest directly in any index. Index returns do not include a deduction for fees or expenses. For additional details about the benchmark index, please read the Fund’s latest prospectus.
London Stock Exchange Group plc and its group undertakings (collectively, the “LSE Group”). © LSE Group 2022. FTSE Russell is a trading name of certain of the LSE Group companies. “FTSE®,” “Russell®” and “FTSE Russell®” are trademarks of the relevant LSE Group companies and are used by any other LSE Group company under license. All rights in the FTSE Russell indexes or data vest in the relevant LSE Group company which owns the index or the data. Neither LSE Group nor its licensors accept any liability for any errors or omissions in the indexes or data and no party may rely on any indexes or data contained in this communication. No further distribution of data from the LSE Group is permitted without the relevant LSE Group company’s express written consent. The LSE Group does not promote, sponsor or endorse the content of this communication. MSCI makes no express or implied warranties or representations and shall have no liability whatsoever with respect to any MSCI data contained herein. This report is not approved, reviewed or produced by MSCI.
| TIAA-CREF Managed Allocation Fund ■ 2022 Annual Report | 7 |
Important information about expenses
All shareholders of the TIAA-CREF Funds incur ongoing costs, including management fees and other fund expenses. They may also incur transactional costs for redemptions or account maintenance fees.
The expense example that appears in this report is intended to help you understand your ongoing costs only (in U.S. dollars) and does not reflect transactional costs. The example is designed to help you compare these ongoing costs with the ongoing costs of investing in other mutual funds.
The expenses shown do not include redemption fees or account maintenance fees, which may or may not be applicable, as described in the prospectus. If such fees were included, your total costs for investing in the Fund would be higher. Note also that shareholders of the TIAA-CREF Funds do not incur a sales charge for purchases, reinvested dividends or other distributions.
The example is based on an investment of $1,000 invested at the beginning of the six-month period and held for the entire period (December 1, 2021–May 31, 2022).
Actual expenses
The first line of the two lines listed for each share class in the table uses that class’ actual expenses and its actual rate of return. You may use the information in this line, together with the amount you invested, to estimate the expenses that you paid over the six-month period.
Simply divide your account value by $1,000 (for example, an $8,600 account value divided by $1,000 = 8.6), then multiply the result by the number in the first line under the heading “Expenses paid during period” to estimate the expenses you paid during the six-month period. The fund has a contractual fee reimbursement. Had it not been in effect, fund expenses would have been higher.
Hypothetical example for comparison purposes
The second line in each share class’ entry shows hypothetical account values and expenses based on the share class’ actual expense ratio for the six-month period and an assumed 5%-per-year rate of return before expenses. This was not the share class’ actual return.
This hypothetical example cannot be used to estimate the actual expenses you paid for the period, but rather allows you to compare the ongoing costs of investing in the Fund with the costs of other funds. To do so, compare this 5% hypothetical example with the 5% hypothetical examples that appear in the shareholder reports of other mutual funds.
| 8 | 2022 Annual Report ■ TIAA-CREF Managed Allocation Fund |
Important information about expenses
Expense example
Six months ended May 31, 2022
| Managed Allocation Fund | Beginning account value (12/1/21 | ) | Ending account value (5/31/22 | ) | Expenses paid during period (12/1/21–5/31/22 | * ) | Effective expenses paid during period (12/1/21–5/31/22 | † ) | ||||||||
| Actual return | ||||||||||||||||
| Institutional Class | $1,000.00 | $ | 896.76 | $0.00 | $2.08 | |||||||||||
| Retirement Class | 1,000.00 | 895.41 | 1.18 | 3.26 | ||||||||||||
| Retail Class | 1,000.00 | 895.46 | 0.95 | 3.02 | ||||||||||||
| 5% annual hypothetical return | ||||||||||||||||
| Institutional Class | 1,000.00 | 1,024.93 | 0.00 | 2.22 | ||||||||||||
| Retirement Class | 1,000.00 | 1,023.68 | 1.26 | 3.48 | ||||||||||||
| Retail Class | 1,000.00 | 1,023.93 | 1.01 | 3.23 | ||||||||||||
| * | “Expenses paid during period” is based on the Fund’s actual expense ratio for the most recent fiscal half-year, multiplied by the average account value over the six-month period, multiplied by 182/365. There were 182 days in the six months ended May 31, 2022. The Fund’s annualized six-month expense ratios for that period were 0.00% for the Institutional Class, 0.25% for the Retirement Class and 0.20% for the Retail Class. The expense charges of one or more of the Fund’s share classes may reflect a waiver and/or reimbursement. Please see the prospectus for an explanation, including the date on which this reimbursement is scheduled to end. Without such waiver and/or reimbursement, the expenses of the affected share classes would be higher and their performance lower. |
| † | “Effective expenses paid during period” is based on the Fund’s total expense ratio for the most recent fiscal half-year, which includes the Fund’s own expense ratio plus its pro rata share of its underlying funds’ expenses (which the Fund bears through its investment in the underlying funds). For the six-month period, the total annualized weighted average expense ratio was 0.44% for the Institutional Class, 0.69% for the Retirement Class and 0.64% for the Retail Class. |
| TIAA-CREF Managed Allocation Fund ■ 2022 Annual Report | 9 |
Performance for the twelve months ended May 31, 2022
The Managed Allocation Fund returned –9.45% for the Institutional Class, compared with the –7.08% return of its benchmark, the Managed Allocation Fund Composite Index. The performance table shows returns for all share classes of the Fund.
Financial markets generally declined in a difficult environment
The U.S. economy expanded early in the period before contracting in the first quarter of 2022. Real gross domestic product (GDP), which measures the value of all goods and services produced in the United States, grew at annualized rates of 2.3% and 6.9%, respectively, in the third and fourth quarters of 2021. However, GDP contracted at an annualized rate of 1.5% in the first quarter of 2022, according to the government’s “second” estimate. Growth stalled amid a widening trade deficit and lower government expenditures, but consumer and business spending remained strong. Unemployment declined throughout the period, falling from 5.9% in June 2021 to 3.6% in May 2022. Core inflation, which measures all items except food and energy, rose 6.0% over the twelve months ended May 31, 2022. Oil prices increased sharply, climbing from nearly $68 per barrel to more than $114 by the end of the period.
The Federal Reserve responded to rising inflation by increasing the federal funds target rate in March and May of 2022. Over the period, policymakers raised the key short-term interest-rate measure to 0.75%–1.00% and indicated further increases were likely.
Domestic and foreign stocks both recorded losses for the period. The Russell 3000® Index, a broad measure of the U.S. stock market, returned –3.68%. The MSCI ACWI ex USA Investable Market Index (IMI), which measures the performance of large-, mid- and small-cap equities in 22 of 23 developed-markets countries (excluding the United States) and 24 emerging-markets countries, returned –12.54% in U.S.-dollar terms.
U.S. investment-grade bonds were hurt by the impact of rising yields across both short- and long-term maturities (bond prices move in the opposite direction of yields). The broad domestic investment-grade fixed-rate bond market, as measured by the Bloomberg U.S. Aggregate Bond Index, returned –8.22%.
| 10 | 2022 Annual Report ■ TIAA-CREF Managed Allocation Fund |
Equity funds posted largest losses
The Managed Allocation Fund may invest in up to three sectors of the investment markets: U.S. equity (stocks), international equity (foreign stocks) and fixed income. The Fund does this by investing in various underlying funds that, in turn, buy stocks, bonds and other securities in these market sectors. (Other than the Nuveen Dividend Growth Fund, the Nuveen Growth Opportunities ETF and the Nuveen International Growth Fund, all funds mentioned below are TIAA-CREF Funds.)
For the twelve months, equity funds generally recorded negative results and detracted most from the Fund’s absolute return—that is, without regard to the performance of its composite benchmark. Within the U.S. equity category, the Large-Cap Growth Fund and the Quant Small-Cap Equity Fund declined most. Among foreign stock funds, all posted double-digit losses, with the Emerging Markets Equity Fund declining the most. Within fixed income, the Core Plus Bond Fund produced a negative return. (All fund returns are for the Institutional Class.)
Stock and U.S. bond funds hurt relative performance
For the twelve months, the Fund underperformed its composite benchmark primarily due to the relative weakness of underlying funds investing in equities and fixed income.
Within U.S. equities, the Large-Cap Growth Fund was the largest detractor from relative performance. The Nuveen Growth Opportunities ETF and the Growth & Income Fund also hurt the Fund’s relative return. In contrast, the Nuveen Dividend Growth Fund, the Quant Small/Mid-Cap Equity Fund and the Quant Small-Cap Equity Fund contributed most to relative performance.
In the foreign stock category, the Nuveen International Growth Fund detracted most from the Fund’s relative performance, followed by the International Opportunities Fund. However, these negative effects were partly offset by the relative outperformance of the Quant International Small-Cap Equity Fund.
In the fixed-income sector, the Core Plus Bond Fund also hurt the Fund’s relative performance. (Performance of the Managed Allocation Fund’s underlying TIAA-CREF Funds can be found at TIAA.org/performance.)
| TIAA-CREF Managed Allocation Fund ■ 2022 Annual Report | 11 |
Managed Allocation Fund
Performance as of May 31, 2022
| Managed Allocation Fund | Total Return | Average annual total return | Annual operating expenses*# | |||||||||||||||||||
| Inception date | 1 year | 5 years | 10 years | gross | net | |||||||||||||||||
| Institutional Class | 3/31/06 | –9.45 | % | 6.25 | % | 7.86 | % | 0.47 | % | 0.45 | % | |||||||||||
| Retirement Class | 3/31/06 | –9.70 | 5.97 | 7.59 | 0.72 | 0.70 | ||||||||||||||||
| Retail Class | 3/31/06 | –9.69 | 5.98 | 7.59 | 0.76 | 0.70 | ||||||||||||||||
| Managed Allocation Fund Composite Index‡ | — | –7.08 | 6.85 | 7.88 | — | — | ||||||||||||||||
| Broad market index | ||||||||||||||||||||||
| Morningstar Moderate Target Risk Index | — | –7.42 | 6.32 | 7.27 | — | — | ||||||||||||||||
The returns in this report show past performance, which is no guarantee of future results. The returns do not reflect taxes that a shareholder would pay on fund distributions or on the sale of fund shares. Returns and the principal value of your investment will fluctuate. Current performance may be higher or lower than that shown, and you may have a gain or a loss when you redeem your shares. For current performance information, including performance to the most recent month-end, please visit TIAA.org. Performance may reflect waivers or reimbursements of certain expenses. Absent these waivers or reimbursement arrangements, performance would be lower.
You cannot invest directly in any index. Index returns do not include a deduction for fees or expenses.
| * | The gross and net annual operating expenses are taken from the Fund’s prospectus. The net annual operating expenses may at times reflect a contractual reimbursement of various expenses. The expense reimbursement will continue through at least September 30, 2022, unless changed with the approval of the Board of Trustees. Without these reimbursements, expenses would be higher and returns lower. Refer to the Financial highlights later in this report for the Fund’s expense ratios as of the end of the reporting period. |
| # | These expenses include underlying fund expenses. |
| ‡ | As of the close of business on May 31, 2022, the Managed Allocation Fund Composite Index consisted of: 40.0% Bloomberg U.S. Aggregate Bond Index; 39.0% Russell 3000® Index; and 21.0% MSCI All Country World Index ex USA Investable Market Index. The Fund’s benchmark, the components that make up the composite benchmark and the method of calculating the composite benchmark’s performance may vary over time. |
| 12 | 2022 Annual Report ■ TIAA-CREF Managed Allocation Fund |
Managed Allocation Fund
$2,000,000 over 10 years
Institutional Class

Ending amounts are as of May 31, 2022. For the purpose of comparison, the graph also shows the change in the values of the Fund’s composite benchmark and a broad market index during the same period. The performance of the other share classes varies due to differences in expense charges.
Asset allocation
| % of net assets as of 5/31/22 | |
| Equity | |
| U.S. equity | 38.74 |
| International equity | 21.17 |
| Fixed income | 40.01 |
| Other assets & liabilities, net | 0.08 |
| Total | 100.00 |
Target allocation
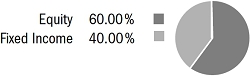
| TIAA-CREF Managed Allocation Fund ■ 2022 Annual Report | 13 |
Managed Allocation Fund ■ May 31, 2022
| Shares | Security | Value | % of net assets | ||||||||||
| AFFILIATED INVESTMENT COMPANIES—99.9%a | |||||||||||||
| FIXED INCOME—40.0% | |||||||||||||
| 37,016,538 | TIAA-CREF Core Plus Bond Fund | $ | 355,358,767 | 40.0 | % | ||||||||
| TOTAL FIXED INCOME | 355,358,767 | 40.0 | |||||||||||
| INTERNATIONAL EQUITY—21.2% | |||||||||||||
| 913,886 | Nuveen International Growth Fund | 40,110,446 | 4.5 | ||||||||||
| 2,846,578 | TIAA-CREF Emerging Markets Equity Fund | 23,199,608 | 2.6 | ||||||||||
| 4,716,305 | TIAA-CREF International Equity Fund | 57,538,927 | 6.5 | ||||||||||
| 2,798,694 | TIAA-CREF International Opportunities Fund | 40,105,285 | 4.5 | ||||||||||
| 2,621,167 | TIAA-CREF Quant International Small-Cap Equity Fund | 27,102,872 | 3.1 | ||||||||||
| TOTAL INTERNATIONAL EQUITY | 188,057,138 | 21.2 | |||||||||||
| U.S. EQUITY—38.7% | |||||||||||||
| 937,814 | Nuveen Dividend Growth Fund | 49,394,678 | 5.6 | ||||||||||
| 3,770,551 | Nuveen Dividend Value Fund | 55,954,978 | 6.3 | ||||||||||
| 2,633,954 | Nuveen Growth Opportunities ETF | 51,967,912 | 5.9 | ||||||||||
| 3,402,143 | TIAA-CREF Growth & Income Fund | 49,194,988 | 5.5 | ||||||||||
| 2,862,641 | TIAA-CREF Large-Cap Growth Fund | 51,727,919 | 5.8 | ||||||||||
| 2,739,843 | TIAA-CREF Large-Cap Value Fund | 56,002,385 | 6.3 | ||||||||||
| 834,330 | TIAA-CREF Quant Small-Cap Equity Fund | 13,641,291 | 1.5 | ||||||||||
| 1,223,873 | TIAA-CREF Quant Small/Mid-Cap Equity Fund | 16,314,221 | 1.8 | ||||||||||
| TOTAL U.S. EQUITY | 344,198,372 | 38.7 | |||||||||||
| TOTAL AFFILIATED INVESTMENT COMPANIES | (Cost $849,759,567) | 887,614,277 | 99.9 | ||||||||||
| TOTAL PORTFOLIO | (Cost $849,759,567) | 887,614,277 | 99.9 | ||||||||||
| OTHER ASSETS & LIABILITIES, NET | 509,603 | 0.1 | |||||||||||
| NET ASSETS | $ | 888,123,880 | 100.0 | % | |||||||||
| ETF Exchange Traded Fund | |
| a | The Fund invests its assets in the affiliated Nuveen Growth Opportunities ETF, Institutional Class shares of the affiliated TIAA-CREF Funds and Class R6 shares of the affiliated Nuveen Funds. |
| 14 | 2022 Annual Report ■ TIAA-CREF Managed Allocation Fund | See notes to financial statements |
Statement of assets and liabilities
Managed Allocation Fund ■ May 31, 2022
| ASSETS | ||||
| Affiliated investments, at value‡ | $ | 887,614,277 | ||
| Receivable from securities transactions | 1,258,791 | |||
| Receivable from Fund shares sold | 55,102 | |||
| Dividends receivable | 922,073 | |||
| Due from affiliates | 18,020 | |||
| Other | 86,259 | |||
| Total assets | 889,954,522 | |||
| LIABILITIES | ||||
| Service agreement fees payable | 15,306 | |||
| Distribution fees payable | 165,271 | |||
| Due to affiliates | 9,838 | |||
| Overdraft payable | 28,506 | |||
| Payable for securities transactions | 1,229,551 | |||
| Payable for Fund shares redeemed | 224,730 | |||
| Payable for trustee compensation | 86,001 | |||
| Accrued expenses and other payables | 71,439 | |||
| Total liabilities | 1,830,642 | |||
| NET ASSETS | $ | 888,123,880 | ||
| NET ASSETS CONSIST OF: | ||||
| Paid-in-capital | $ | 819,397,801 | ||
| Total distributable earnings (loss) | 68,726,079 | |||
| NET ASSETS | $ | 888,123,880 | ||
| INSTITUTIONAL CLASS: | ||||
| Net assets | $ | 24,213,636 | ||
| Outstanding shares of beneficial interest, unlimited shares authorized ($.0001 par value) | 2,064,236 | |||
| Net asset value per share | $ | 11.73 | ||
| RETIREMENT CLASS: | ||||
| Net assets | $ | 73,346,769 | ||
| Outstanding shares of beneficial interest, unlimited shares authorized ($.0001 par value) | 6,262,721 | |||
| Net asset value per share | $ | 11.71 | ||
| RETAIL CLASS: | ||||
| Net assets | $ | 790,563,475 | ||
| Outstanding shares of beneficial interest, unlimited shares authorized ($.0001 par value) | 67,150,814 | |||
| Net asset value per share | $ | 11.77 | ||
| ‡ Affiliated investments, cost | $ | 849,759,567 |
| See notes to financial statements | TIAA-CREF Managed Allocation Fund ■ 2022 Annual Report | 15 |
Managed Allocation Fund ■ For the year ended May 31, 2022
| INVESTMENT INCOME | ||||
| Dividends from affiliated investments | $ | 18,229,990 | ||
| Total income | 18,229,990 | |||
| EXPENSES | ||||
| Shareholder servicing — Institutional Class | 104 | |||
| Shareholder servicing — Retirement Class | 207,222 | |||
| Shareholder servicing — Retail Class | 298,517 | |||
| Distribution fees — Retail Class | 2,233,092 | |||
| Administrative service fees | 49,913 | |||
| Trustee fees and expenses | 9,918 | |||
| Other expenses | 196,494 | |||
| Total expenses | 2,995,260 | |||
| Less: Expenses reimbursed by the investment adviser | (255,326 | ) | ||
| Fee waiver by investment adviser and Nuveen Securities | (492,020 | ) | ||
| Net expenses | 2,247,914 | |||
| Net investment income (loss) | 15,982,076 | |||
| NET REALIZED AND UNREALIZED GAIN (LOSS) ON TOTAL INVESTMENTS | ||||
| Realized gain (loss) from sale of affiliated investments | 27,224,393 | |||
| Realized gain distributions from affiliated investments | 47,083,075 | |||
| Realized gain (loss) from sale of unaffiliated investments | (242,177 | ) | ||
| Net realized gain (loss) from affiliated investments | 74,065,291 | |||
| Net change in unrealized appreciation (depreciation) from affiliated investments | (185,924,714 | ) | ||
| Net realized and unrealized gain (loss) from affiliated investments | (111,859,423 | ) | ||
| Net increase (decrease) in net assets from operations | $ | (95,877,347 | ) |
| 16 | 2022 Annual Report ■ TIAA-CREF Managed Allocation Fund | See notes to financial statements |
Statements of changes in net assets
Managed Allocation Fund ■ For the year ended
| May 31, 2022 | May 31, 2021 | |||||||||
| OPERATIONS | ||||||||||
| Net investment income (loss) | $ | 15,982,076 | $ | 14,040,537 | ||||||
| Net realized gain (loss) from affiliated investments | 74,065,291 | 104,337,904 | ||||||||
| Net change in unrealized appreciation (depreciation) from affiliated investments | (185,924,714 | ) | 105,074,208 | |||||||
| Net increase (decrease) in net assets from operations | (95,877,347 | ) | 223,452,649 | |||||||
| DISTRIBUTIONS TO SHAREHOLDERS | ||||||||||
| Institutional Class | (2,793,433 | ) | (1,525,703 | ) | ||||||
| Retirement Class | (8,680,010 | ) | (6,320,184 | ) | ||||||
| Retail Class | (93,479,940 | ) | (67,216,778 | ) | ||||||
| Total distributions | (104,953,383 | ) | (75,062,665 | ) | ||||||
| SHAREHOLDER TRANSACTIONS | ||||||||||
| Subscriptions: | Institutional Class | 10,633,191 | 9,502,258 | |||||||
| Retirement Class | 7,154,597 | 8,658,798 | ||||||||
| Retail Class | 28,478,105 | 33,364,881 | ||||||||
| Reinvestments of distributions: | Institutional Class | 2,751,461 | 1,489,157 | |||||||
| Retirement Class | 8,680,010 | 6,320,184 | ||||||||
| Retail Class | 90,137,449 | 64,644,539 | ||||||||
| Redemptions: | Institutional Class | (8,692,971 | ) | (6,142,752 | ) | |||||
| Retirement Class | (14,619,447 | ) | (9,103,439 | ) | ||||||
| Retail Class | (68,001,473 | ) | (62,934,267 | ) | ||||||
| Net increase (decrease) from shareholder transactions | 56,520,922 | 45,799,359 | ||||||||
| Net increase (decrease) in net assets | (144,309,808 | ) | 194,189,343 | |||||||
| NET ASSETS | ||||||||||
| Beginning of period | 1,032,433,688 | 838,244,345 | ||||||||
| End of period | $ | 888,123,880 | $ | 1,032,433,688 | ||||||
| CHANGE IN FUND SHARES | ||||||||||
| Shares sold: | Institutional Class | 756,173 | 689,159 | |||||||
| Retirement Class | 534,362 | 629,973 | ||||||||
| Retail Class | 2,055,949 | 2,424,304 | ||||||||
| Shares reinvested: | Institutional Class | 208,293 | 110,473 | |||||||
| Retirement Class | 657,794 | 469,041 | ||||||||
| Retail Class | 6,795,991 | 4,776,405 | ||||||||
| Shares redeemed: | Institutional Class | (620,879 | ) | (458,026 | ) | |||||
| Retirement Class | (1,070,985 | ) | (677,150 | ) | ||||||
| Retail Class | (5,025,103 | ) | (4,607,581 | ) | ||||||
| Net increase (decrease) from shareholder transactions | 4,291,595 | 3,356,598 | ||||||||
| See notes to financial statements | TIAA-CREF Managed Allocation Fund ■ 2022 Annual Report | 17 |
Managed Allocation Fund
| Selected per share data | Ratios and supplemental data | |||||||||||||||||||||||||||||||||||||||||||||||||||||||||
| Gain (loss) from investment operations | ||||||||||||||||||||||||||||||||||||||||||||||||||||||||||
| Ratios to average net assets | ||||||||||||||||||||||||||||||||||||||||||||||||||||||||||
| For the | Net asset | Net | Net realized and unrealized | Total gain | Less distributions from | Total | Net asset | Net assets | Net | |||||||||||||||||||||||||||||||||||||||||||||||||
| period or year ended | value, beginning of period | investment income (loss | )a | gain (loss) on total investments | j | (loss) from investment operations | Net investment income | Net realized gains | dividends and distributions | value, end of period | Total return | at end of period or year (in thousands | ) | Gross expenses | e | Net expenses | e | investment income (loss | ) | Portfolio turnover rate | ||||||||||||||||||||||||||||||||||||||
| Institutional Class: | 5/31/22 | $ | 14.46 | $ | 0.25 | $ | (1.45 | ) | $ | (1.20 | ) | $ | (0.44 | ) | $ | (1.09 | ) | $ | (1.53 | ) | $ | 11.73 | (9.45 | )% | $ | 24,214 | 0.03 | % | 0.00 | % | 1.84 | % | 23 | % | ||||||||||||||||||||||||
| 5/31/21 | 12.32 | 0.23 | 3.07 | 3.30 | (0.37 | ) | (0.79 | ) | (1.16 | ) | 14.46 | 27.52 | 24,885 | 0.02 | 0.00 | 1.71 | 42 | |||||||||||||||||||||||||||||||||||||||||
| 5/31/20 | 12.18 | 0.28 | 0.58 | 0.86 | (0.28 | ) | (0.44 | ) | (0.72 | ) | 12.32 | 7.09 | 16,997 | 0.03 | 0.00 | 2.21 | 27 | |||||||||||||||||||||||||||||||||||||||||
| 5/31/19 | 12.89 | 0.29 | (0.29 | ) | 0.00 | d | (0.35 | ) | (0.36 | ) | (0.71 | ) | 12.18 | 0.40 | 18,320 | 0.03 | 0.00 | 2.34 | 20 | |||||||||||||||||||||||||||||||||||||||
| 5/31/18 | 12.32 | 0.27 | 0.84 | 1.11 | (0.36 | ) | (0.18 | ) | (0.54 | ) | 12.89 | 9.04 | 17,468 | 0.03 | 0.00 | 2.09 | 12 | |||||||||||||||||||||||||||||||||||||||||
| Retirement Class: | 5/31/22 | 14.44 | 0.21 | (1.45 | ) | (1.24 | ) | (0.40 | ) | (1.09 | ) | (1.49 | ) | 11.71 | (9.70 | ) | 73,347 | 0.28 | 0.25 | 1.56 | 23 | |||||||||||||||||||||||||||||||||||||
| 5/31/21 | 12.31 | 0.20 | 3.05 | 3.25 | (0.33 | ) | (0.79 | ) | (1.12 | ) | 14.44 | 27.15 | 88,693 | 0.27 | 0.25 | 1.48 | 42 | |||||||||||||||||||||||||||||||||||||||||
| 5/31/20 | 12.16 | 0.25 | 0.59 | 0.84 | (0.25 | ) | (0.44 | ) | (0.69 | ) | 12.31 | 6.91 | 70,404 | 0.28 | 0.25 | 1.98 | 27 | |||||||||||||||||||||||||||||||||||||||||
| 5/31/19 | 12.87 | 0.25 | (0.28 | ) | (0.03 | ) | (0.32 | ) | (0.36 | ) | (0.68 | ) | 12.16 | 0.14 | 70,068 | 0.28 | 0.25 | 2.03 | 20 | |||||||||||||||||||||||||||||||||||||||
| 5/31/18 | 12.31 | 0.23 | 0.84 | 1.07 | (0.33 | ) | (0.18 | ) | (0.51 | ) | 12.87 | 8.70 | 72,981 | 0.28 | 0.25 | 1.83 | 12 | |||||||||||||||||||||||||||||||||||||||||
| Retail Class: | 5/31/22 | 14.51 | 0.22 | (1.46 | ) | (1.24 | ) | (0.41 | ) | (1.09 | ) | (1.50 | ) | 11.77 | (9.69 | ) | 790,563 | 0.31 | 0.23 | 1.59 | 23 | |||||||||||||||||||||||||||||||||||||
| 5/31/21 | 12.36 | 0.20 | 3.07 | 3.27 | (0.33 | ) | (0.79 | ) | (1.12 | ) | 14.51 | 27.20 | 918,856 | 0.31 | 0.25 | 1.48 | 42 | |||||||||||||||||||||||||||||||||||||||||
| 5/31/20 | 12.21 | 0.25 | 0.59 | 0.84 | (0.25 | ) | (0.44 | ) | (0.69 | ) | 12.36 | 6.87 | 750,844 | 0.32 | 0.25 | 1.97 | 27 | |||||||||||||||||||||||||||||||||||||||||
| 5/31/19 | 12.92 | 0.25 | (0.28 | ) | (0.03 | ) | (0.32 | ) | (0.36 | ) | (0.68 | ) | 12.21 | 0.14 | 745,328 | 0.32 | 0.25 | 2.00 | 20 | |||||||||||||||||||||||||||||||||||||||
| 5/31/18 | 12.35 | 0.23 | 0.85 | 1.08 | (0.33 | ) | (0.18 | ) | (0.51 | ) | 12.92 | 8.75 | 779,099 | 0.31 | 0.25 | 1.83 | 12 | |||||||||||||||||||||||||||||||||||||||||
| a | Based on average shares outstanding. |
| d | Amount represents less than $0.01 per share. |
| e | The Fund’s expenses do not include the expenses of the Underlying Funds. |
| j | Short-term and long-term capital gain distributions received from the underlying Funds are presented in net realized and unrealized gain (loss) on total investments for all periods presented. |
| 18 | 2022 Annual Report ■ TIAA-CREF Managed Allocation Fund | See notes to financial statements | See notes to financial statements | TIAA-CREF Managed Allocation Fund ■ 2022 Annual Report | 19 |
Managed Allocation Fund
Note 1—organization
The Managed Allocation Fund (the “Fund”) is one of the investment portfolios of the TIAA-CREF Funds (the “Trust”), a Delaware statutory trust, that is registered with the U.S. Securities and Exchange Commission (“SEC”) under the Investment Company Act of 1940, as amended (“1940 Act”), as an open-end management investment company.
Teachers Advisors, LLC (“Advisors”), a wholly owned indirect subsidiary of Teachers Insurance and Annuity Association of America (“TIAA”), is registered with the SEC as an investment adviser and provides investment management services for the Fund.
The Fund offers its shares, without a sales load, through its principal underwriter, Nuveen Securities, LLC (“Nuveen Securities”), which is a wholly owned indirect subsidiary of TIAA.
The Fund is a “fund of funds” that diversifies its assets by investing in Institutional Class shares of other funds of the Trust and potentially other investment pools or investment products. The Fund offers three share classes: Institutional Class, Retirement Class and Retail Class shares. Each class differs by the allocation of class-specific expenses and voting rights in matters affecting a single class.
Note 2—significant accounting policies
The accompanying financial statements were prepared in accordance with accounting principles generally accepted in the United States of America (“U.S. GAAP”), which may require the use of estimates made by management and the evaluation of subsequent events. Actual results may differ from those estimates. The Fund is an investment company and follows the accounting guidance in the Financial Accounting Standards Board (“FASB”) Accounting Standards Codification 946, Financial Services—Investment Companies. The net asset value (“NAV”) for financial reporting purposes may differ from the NAV for processing transactions. The NAV for financial reporting purposes includes security and shareholder transactions through the date of the report. Total return is computed based on the NAV used for processing transactions. The following is a summary of the significant accounting policies consistently followed by the Fund.
Investments and investment income: Securities transactions are accounted for as of the trade date for financial reporting purposes. Interest income is recorded on an accrual basis and includes accretion of discounts and amortization of premiums. Dividend income is recorded on the ex-dividend date. Foreign dividend income is recorded on the ex-dividend date or as soon as possible after the Fund determines the existence of a dividend declaration. Realized gains and losses on securities transactions are based upon the specific identification method. Distributions received on securities that represent a return of capital or capital gains are recorded as a reduction of cost of investments and/or as a realized gain. The Fund estimates the components of distributions received that may be considered return of capital distributions or capital gain distributions.
| 20 | 2022 Annual Report ■ TIAA-CREF Managed Allocation Fund |
Multiclass operations and allocations: Income, expenses, realized gains and losses and unrealized appreciation and depreciation of the Fund are allocated on a pro rata basis to each class of shares, except for service agreement fees, distribution fees and transfer agency fees and expenses, which are unique to each class of shares. Most expenses of the Trust can be directly attributed to a fund. Expenses that cannot be directly attributed are allocated to each fund in the Trust based upon the average net assets of each fund.
Distributions to shareholders: Distributions to shareholders are recorded on the ex-dividend date. The amount, character and timing of distributions are determined in accordance with federal income tax regulations, which may differ from U.S. GAAP.
Trustee compensation: The Fund pays the members of the Board of Trustees (“Board”), all of whom are independent, certain remuneration for their services, plus travel and other expenses. Trustees may elect to participate in a deferred compensation plan and defer all or a portion of their compensation. In addition, trustees participate in a long-term compensation plan. Amounts deferred are retained by the Fund until paid. Amounts payable to the trustees for compensation are included separately in the accompanying Statement of assets and liabilities. Trustees’ fees, including any deferred and long-term compensation incurred, are reflected in the Statement of operations.
Indemnification: Under the Trust’s organizational documents, its officers and directors are indemnified against certain liabilities arising out of the performance of their duties to the Trust. In addition, in the normal course of business, the Trust enters into contracts that provide general indemnifications to other parties. The Trust’s maximum exposure under these arrangements is unknown as this would involve future claims that may be made against the Trust that have not yet occurred. However, the Trust has not had prior claims or losses pursuant to these contracts and expects the risk of loss to be remote.
Other matters: The outbreak of the novel coronavirus (“COVID-19”) and subsequent global pandemic began significantly impacting the U.S. and global financial markets and economies during the calendar quarter ended March 31, 2020. The worldwide spread of COVID-19 has created significant uncertainty in the global economy. The duration and extent of COVID-19 over the long term cannot be reasonably estimated at this time. The ultimate impact of COVID-19 and the extent to which COVID-19 impacts the Fund’s normal course of business, results of operations, investments, and cash flows will depend on future developments, which are highly uncertain and difficult to predict. Management continues to monitor and evaluate this situation.
New rule issuance: In December 2020, the SEC voted to adopt a new rule providing a framework for fund valuation practices. New Rule 2a-5 (“Rule 2a-5”) under the 1940 Act establishes requirements for determining fair value in good faith for purposes of the 1940 Act. Rule 2a-5 will permit boards, subject to board oversight and certain other conditions, to designate certain parties to perform fair value determinations. Rule 2a-5 also defines when market quotations are “readily
| TIAA-CREF Managed Allocation Fund ■ 2022 Annual Report | 21 |
Notes to financial statements
available” for purposes of the 1940 Act and the threshold for determining whether a fund must fair value a security. The SEC also adopted new Rule 31a-4 (“Rule 31a-4”), which provides the recordkeeping requirements associated with fair value determinations. Finally, the SEC is rescinding previously issued guidance on related issues, including the role of the board in determining fair value and the accounting and auditing of fund investments. Rule 2a-5 and Rule 31a-4 became effective on March 8, 2021. The compliance date for Rule 2a-5 and Rule 31a-4 is September 8, 2022. A fund may voluntarily comply with the rules after the effective date, and in advance of the compliance date, under certain conditions. Management is currently assessing the impact of these provisions on the Fund’s financial statements.
Note 3—valuation of investments
The Fund’s investments in securities are recorded at their estimated fair value utilizing valuation methods approved by the Board of Trustees. Fair value is defined as the price that would be received upon selling an investment or transferring a liability in an orderly transaction to an independent buyer in the principal or most advantageous market for the investment. U.S. GAAP establishes the three-tier hierarchy that is used to maximize the use of observable market data and minimize the use of unobservable inputs and to establish classification of fair value measurements for disclosure purposes. Observable inputs reflect the assumptions market participants would use in pricing the asset or liability. Observable inputs are based on market data obtained from sources independent of the reporting entity. Unobservable inputs reflect management’s assumptions about the assumptions market participants would use in pricing the asset or liability. Unobservable inputs are based on the best information available in the circumstances. The following is a summary of the three-tiered hierarchy of valuation input levels.
| • | Level 1 – Inputs are unadjusted and prices are determined using quoted prices in active markets for identical securities. |
| • | Level 2 – Prices are determined using other significant observable inputs (including quoted prices for similar securities, interest rates, credit spreads, etc.). |
| • | Level 3 –- Prices are determined using significant unobservable inputs (including management’s assumptions in determining the fair value of investments). |
A description of the valuation techniques applied to the Fund’s major classifications of assets and liabilities measured at fair value follows:
Investments in exchange-traded funds: Exchange-traded funds listed or traded on a national market or exchange are valued based on their sale price at the official close of business of such market or exchange on the valuation date. To the extent these securities are actively traded and that valuation adjustments are not applied, they are generally classified as Level 1. If there is no official close of business, then the latest available sale price is utilized. If no sales are reported, then the mean of the latest available bid and asked prices is utilized and the securities are generally classified as Level 2.
| 22 | 2022 Annual Report ■ TIAA-CREF Managed Allocation Fund |
continued
Investments in registered investment companies: Investments in investment companies are valued at their respective NAVs on the valuation date and are generally classified as Level 1.
As of May 31, 2022, all of the investments in the Fund were valued based on Level 1 inputs.
Note 4—investments
Purchases and sales: Purchases and sales of securities (other than short-term instruments) for the Fund for the year ended May 31, 2022 were as follows (dollar amounts are in thousands):
| Fund | Non-U.S. government purchases | Non-U.S. government sales |
| Managed Allocation | $241,256 | $226,266 |
Note 5—income tax information
The Fund intends to distribute substantially all of its net investment income and net capital gains to shareholders and otherwise comply with the requirements of Subchapter M of the Internal Revenue Code applicable to regulated investment companies. Therefore, no federal income tax provision is required.
The Fund files income tax returns in U.S. federal and applicable state and local jurisdictions. A Fund’s federal income tax returns are generally subject to examination for a period of three fiscal years after being filed. State and local tax returns may be subject to examination for an additional period of time depending on the jurisdiction. Management has analyzed the Fund’s tax positions taken for all open tax years and has concluded that no provision for income tax is required in the Fund’s financial statements.
Differences between amounts for financial statement and federal income tax purposes are primarily due to timing differences in recognizing gains and losses on investment transactions. Temporary differences do not require reclassification. As of year end, permanent differences that resulted in reclassifications among the components of net assets relate primarily to distribution reallocations, investments in underlying funds, and tax equalization. Temporary and permanent differences have no impact on a Fund’s net assets.
As of year end, the aggregate cost and the net unrealized appreciation/(depreciation) of all investments for federal income tax purposes was as follows (dollar amounts are in thousands):
| Fund | Tax cost | Gross unrealized appreciation | Gross unrealized (depreciation | ) | Net unrealized appreciation (depreciation | ) |
| Managed Allocation | $863,137 | $92,201 | $(67,724 | ) | $24,477 |
| TIAA-CREF Managed Allocation Fund ■ 2022 Annual Report | 23 |
Notes to financial statements
For purposes of this disclosure, tax cost generally includes the cost of portfolio investments as well as up-front fees or premiums exchanged on derivatives and any amounts unrealized for income statement reporting but realized income and/or capital gains for tax reporting, if applicable.
As of year end, the components of accumulated earnings on a tax basis were as follows:
| Fund | Undistributed ordinary income | Undistributed long-term capital gains | Unrealized appreciation (depreciation | ) | Capital loss carryforwards | Late-year loss deferrals | Other book-to-tax differences | Total |
| Managed Allocation | $2,186,217 | $42,136,039 | $24,477,121 | $ — | $ — | $(73,298) | $68,726,079 |
The tax character of distributions paid were as follows:
| 5/31/2022 | 5/31/2021 | ||||
| Fund | Ordinary income | Long-term capital gains | Ordinary income | Long-term capital gains | |
| Managed Allocation | $43,671,754 | $61,281,629 | $24,932,075 | $50,130,590 | |
Note 6—investment adviser and other transactions with affiliates
Under the terms of its Investment Management Agreement, the Fund does not pay Advisors a fee for the management of the Fund’s investment portfolio. The Fund has entered into an Administrative Service Agreement with Advisors under which the Fund pays Advisors for its costs in providing certain administrative and compliance services to the Fund.
Under the terms of the Fund’s Retirement Class Service Agreement, the Retirement Class of the Fund pays Advisors a monthly fee based on the annual rate of 0.25% of the Fund’s average daily net assets attributable to Retirement Class shares of the Fund for providing certain administrative services related to the maintenance of Retirement Class shares on retirement plan or other platforms. Substantially, all of the Retirement Class shareholder servicing fees reported on the Statement of operations are paid to Advisors under the Service Agreement.
Under the terms of a distribution Rule 12b-1 plan, the Retail Class of the Fund compensated Nuveen Securities for providing distribution, promotional and/or shareholder services to the Retail Class of the Fund at the annual rate of 0.25% of the average daily net assets attributable to the Fund’s Retail Class.
Advisors has agreed to reimburse the Fund if its total expense ratio (excluding interest, taxes, brokerage commissions and other transactional expenses, acquired fund fees and expenses and extraordinary expenses) exceeds 0.00% of average daily net assets for the Institutional Class shares; and 0.25% of average daily net assets for the Retirement and Retail Class shares. The expense reimbursement arrangements will continue through at least September 30, 2022, unless changed with approval of the Board.
| 24 | 2022 Annual Report ■ TIAA-CREF Managed Allocation Fund |
continued
Investments in other investment companies advised by Advisors and Nuveen Fund Advisors, LLC are deemed to be affiliated investments. The Fund invests its assets in the affiliated Nuveen Growth Opportunities ETF, Institutional Class shares of the affiliated TIAA-CREF Funds and Class R6 shares of the affiliated Nuveen Funds. Information regarding transactions with affiliated companies is as follows (dollar amounts are in thousands):
| Issue | Value at 5/31/21 | Purchase cost | Sales proceeds | Realized gain (loss | ) | Change in unrealized appreciation (depreciation | ) | Dividend income | Value at 5/31/22 | |||||||||||||||||||
| Nuveen Funds: | ||||||||||||||||||||||||||||
| Dividend Growth | $ | 61,086 | $ | 4,595 | $ | 16,729 | $ | 3,083 | $ | (1,242 | ) | $ | 819 | $ | 49,395 | |||||||||||||
| Dividend Value | 68,567 | 8,288 | 15,615 | 5,037 | (5,906 | ) | 998 | 55,955 | ||||||||||||||||||||
| Growth Opportunities ETF | — | 70,249 | 2,294 | (242 | ) | (15,745 | ) | 3 | 51,968 | |||||||||||||||||||
| International Growth | 40,115 | 14,813 | 1,991 | 969 | (12,723 | ) | 307 | 40,110 | ||||||||||||||||||||
| TIAA-CREF Funds: | ||||||||||||||||||||||||||||
| Core Plus Bond | 410,752 | 45,573 | 51,306 | 2,495 | (46,559 | ) | 10,120 | 355,359 | ||||||||||||||||||||
| Emerging Markets Equity | 24,653 | 16,210 | 4,108 | 2,930 | (12,040 | ) | 1,065 | 23,200 | ||||||||||||||||||||
| Growth & Income | 61,184 | 11,956 | 11,734 | 13,817 | (16,716 | ) | 485 | 49,195 | ||||||||||||||||||||
| International Equity | 56,287 | 17,394 | 5,541 | (222 | ) | (10,379 | ) | 1,853 | 57,539 | |||||||||||||||||||
| International Opportunities | 40,125 | 16,500 | 3,870 | 3,173 | (12,753 | ) | 428 | 40,105 | ||||||||||||||||||||
| Large-Cap Growth | 66,267 | 11,240 | 7,880 | 6,882 | (18,415 | ) | 84 | 51,728 | ||||||||||||||||||||
| Large Cap Growth Index | 66,212 | 2 | 76,505 | 18,477 | (8,186 | ) | — | — | ||||||||||||||||||||
| Large-Cap Value | 68,484 | 7,932 | 15,548 | 8,436 | (8,986 | ) | 816 | 56,002 | ||||||||||||||||||||
| Quant International Small-Cap Equity | 26,425 | 8,468 | 2,614 | 657 | (4,863 | ) | 963 | 27,103 | ||||||||||||||||||||
| Quant Small-Cap Equity | 19,287 | 3,971 | 4,981 | 4,147 | (5,903 | ) | 88 | 13,641 | ||||||||||||||||||||
| Quant Small/Mid-Cap Equity | 22,122 | 4,065 | 5,550 | 4,426 | (5,509 | ) | 201 | 16,314 | ||||||||||||||||||||
| $ | 1,031,566 | $ | 241,256 | $ | 226,266 | $ | 74,065 | $ | (185,925 | ) | $ | 18,230 | $ | 887,614 | ||||||||||||||
Note 7—inter-fund lending program
Pursuant to an exemptive order issued by the SEC, the Fund may participate in an inter-fund lending program. This program allows the Fund to lend cash to and/or borrow cash from certain other affiliated Funds for temporary purposes, (e.g., to satisfy redemption requests or to cover unanticipated cash shortfalls). The program is subject to a number of conditions, including the requirement that no Fund may borrow or lend money under the program unless it receives a more favorable interest rate than is available from a bank or other financial institution for a comparable transaction. In addition, the Fund may participate in the program only if its participation is consistent with the Fund’s investment policies and limitations and authorized by its portfolio manager(s). During the year ended May 31, 2022, there were no inter-fund borrowing or lending transactions.
| TIAA-CREF Managed Allocation Fund ■ 2022 Annual Report | 25 |
| Notes to financial statements | concluded |
Note 8—line of credit
The Fund participates in a $1 billion unsecured revolving credit facility that can be used for temporary purposes, including, without limitation, the funding of shareholder redemptions. The current facility was entered into on June 14, 2022 expiring on June 13, 2023, replacing the previous facility, which expired June 2022. Certain affiliated accounts and mutual funds, each of which is managed by Advisors, or an affiliate of Advisors, also participate in this facility. An annual commitment fee for the credit facility is borne by the participating accounts and mutual funds on a pro rata basis. Interest associated with any borrowing under the facility is charged to the borrowing accounts or mutual funds at a specified rate of interest. The Fund is not liable for borrowings under the facility by other affiliated accounts or mutual funds. For the year ended May 31, 2022, there were no borrowings under this credit facility by the Fund.
| 26 | 2022 Annual Report ■ TIAA-CREF Managed Allocation Fund |
Report of independent registered public accounting firm
To the Board of Trustees of TIAA-CREF Funds and Shareholders of TIAA-CREF Managed Allocation Fund
Opinion on the Financial Statements
We have audited the accompanying statement of assets and liabilities, including the portfolio of investments, of TIAA-CREF Managed Allocation Fund (one of the funds constituting TIAA-CREF Funds, hereafter referred to as the “Fund”) as of May 31, 2022, the related statement of operations for the year ended May 31, 2022, the statement of changes in net assets for each of the two years in the period ended May 31, 2022, including the related notes, and the financial highlights for each of the five years in the period ended May 31, 2022 (collectively referred to as the “financial statements”). In our opinion, the financial statements present fairly, in all material respects, the financial position of the Fund as of May 31, 2022, the results of its operations for the year then ended, the changes in its net assets for each of the two years in the period ended May 31, 2022 and the financial highlights for each of the five years in the period ended May 31, 2022 in conformity with accounting principles generally accepted in the United States of America.
Basis for Opinion
These financial statements are the responsibility of the Fund’s management. Our responsibility is to express an opinion on the Fund’s financial statements based on our audits. We are a public accounting firm registered with the Public Company Accounting Oversight Board (United States) (PCAOB) and are required to be independent with respect to the Fund in accordance with the U.S. federal securities laws and the applicable rules and regulations of the Securities and Exchange Commission and the PCAOB.
We conducted our audits of these financial statements in accordance with the standards of the PCAOB. Those standards require that we plan and perform the audit to obtain reasonable assurance about whether the financial statements are free of material misstatement, whether due to error or fraud.
Our audits included performing procedures to assess the risks of material misstatement of the financial statements, whether due to error or fraud, and performing procedures that respond to those risks. Such procedures included examining, on a test basis, evidence regarding the amounts and disclosures in the financial statements. Our audits also included evaluating the accounting principles used and significant estimates made by management, as well as evaluating the overall presentation of the financial statements. Our procedures included confirmation of securities owned as of May 31, 2022 by correspondence with the transfer agent or custodian. We believe that our audits provide a reasonable basis for our opinion.
| TIAA-CREF Managed Allocation Fund ■ 2022 Annual Report | 27 |
| Report of independent registered public accounting firm | concluded |
/s/ PricewaterhouseCoopers LLP
Baltimore, Maryland
July 15, 2022
We have served as the auditor of one or more investment companies in TIAA-CREF Funds’ investment company group since 2005.
| 28 | 2022 Annual Report ■ TIAA-CREF Managed Allocation Fund |
Important tax information (unaudited)
As required by the Internal Revenue Code and Treasury Regulations, certain tax information, as detailed below, must be provided to shareholders. Shareholders are advised to consult their tax advisor with respect to the tax implications of their investment. The amounts listed below may differ from the actual amounts reported on Form 1099-DIV, which will be sent to shareholders shortly after calendar year end.
Long-term capital gains
As of year end, the Fund designates the following distribution amounts, or maximum amount allowable, as being from net long-term capital gains pursuant to Section 852(b)(3) of the Internal Revenue Code:
| Fund | Net long-term capital gains | ||
| Managed Allocation | $62,969,600 | ||
Dividends received deduction (DRD)
The Fund listed below had the following percentage, or maximum amount allowable, of ordinary income distributions eligible for the dividends received deduction for corporate shareholders:
| Fund | Percentage | |||
| Managed Allocation | 9.1 | % | ||
Qualified dividend income (QDI)
The Fund listed below had the following percentage, or maximum amount allowable, of ordinary income distributions treated as qualified dividend income for individuals pursuant to Section 1(h)(11) of the Internal Revenue Code:
| Fund | Percentage | |||
| Managed Allocation | 16.6 | % | ||
Foreign source income and foreign tax credit pass through
The Fund listed below has made an election under Section 853 of the Internal Revenue Code to pass through foreign taxes paid:
| Fund | Foreign source income | Foreign source income per share | Qualifying foreign taxes paid | Qualifying foreign taxes paid per share |
| Managed Allocation | $2,932,170 | $0.03885 | $419,938 | $0.00556 |
| TIAA-CREF Managed Allocation Fund ■ 2022 Annual Report | 29 |
Trustees and officers (unaudited)
TIAA-CREF Funds ■ May 31, 2022
Trustees
| Name, Address and Year of Birth (“YOB”) | Position(s) Held with Fund | Term of Office and Length of Time Served | Principal Occupation(s) During Past 5 Years and other relevant experience and qualifications | Number of Portfolios in Fund complex Overseen by Trustee | Other Directorship(s) held by Trustee | |||||
| Forrest Berkley c/o Corporate Secretary 730 Third Avenue New York, NY 10017-3206 YOB: 1954 | Trustee | Indefinite term. Trustee since 2006. | Retired Partner (since 2006), Partner (1990–2005) and Head of Global Product Management (2003–2005), GMO (formerly, Grantham, Mayo, Van Otterloo & Co.) (investment management); and member of asset allocation portfolio management team, GMO (2003–2005). | 88 | Director, Save the Children Federation, Inc.; Investment Committee Member, Maine Community Foundation. | |||||
| Joseph A. Boateng c/o Corporate Secretary 730 Third Avenue New York, NY 10017-3206 YOB: 1963 | Trustee | Indefinite term. Trustee since 2019. | Chief Investment Officer, Casey Family Programs (since 2007). Director of U.S. Pension Plans, Johnson & Johnson (2002–2006). Manager, Financial Services Consultant, KPMG Consulting (2000–2002). | 88 | Board member, Lumina Foundation and Waterside School; Emeritus Board Member, Year-Up Puget Sound; Investment Advisory Committee Member, Seattle City Employees’ Retirement System; Investment Committee Member, The Seattle Foundation. | |||||
| Janice C. Eberly c/o Corporate Secretary 730 Third Avenue New York, NY 10017-3206 YOB: 1962 | Trustee | Indefinite term. Trustee since 2018. | James R. and Helen D. Russell Professor of Finance at the Kellogg School of Management, Northwestern University (2002–2011 and since 2013), Senior Associate Dean for Strategy and Academics (since 2020) and Chair of the Finance Department (2005– 2007). Vice President, American Economic Association (2020–2021). Assistant Secretary for Economic Policy, United States Department of the Treasury (2011–2013). | 88 | Member of the Board of the Office of Finance, Federal Home Loan Banks; Director, Avant, LLC; |
| 30 | 2022 Annual Report ■ TIAA-CREF Managed Allocation Fund |
| Nancy A. Eckl c/o Corporate Secretary 730 Third Avenue New York, NY 10017-3206 YOB: 1962 | Trustee | Indefinite term. Trustee since 2007. | Vice President (1990–2006), American Beacon Advisors, Inc., and of certain funds advised by American Beacon Advisors, Inc. | 88 | Independent Director, The Lazard Funds, Inc., Lazard Retirement Series, Inc., and Lazard Global Total Return and Income Fund, Inc. | |||||
| Michael A. Forrester c/o Corporate Secretary 730 Third Avenue New York, NY 10017-3206 YOB: 1967 | Trustee | Indefinite term. Trustee since 2007. | Chief Executive Officer (2014–2021) and Chief Operating Officer (2007–2014), Copper Rock Capital Partners, LLC. Chief Operating Officer, DDJ Capital Management (2003–2006). | 88 | Trustee, Dexter Southfield School; Member, Governing Council of the Independent Directors Council. | |||||
| Howell E. Jackson c/o Corporate Secretary 730 Third Avenue New York, NY 10017-3206 YOB: 1954 | Trustee | Indefinite term. Trustee since 2005. | James S. Reid, Jr. Professor of Law (since 2004), Senior Adviser to President and Provost (2010–2012), Acting Dean (2009), Vice Dean for Budget (2003–2006) and on the faculty (since 1989) of Harvard Law School. | 88 | Director, Build Commonwealth (non-profit organization). | |||||
| Thomas J. Kenny c/o Corporate Secretary 730 Third Avenue New York, NY 10017-3206 YOB: 1963 | Chairman of the Board and Trustee | Indefinite term. Trustee since 2011; Chairman for term ending June 30, 2023. Chairman since September 13, 2017. | Advisory Director (2010–2011), Partner (2004–2010), Managing Director (1999–2004) and Co-Head of Global Cash and Fixed Income Portfolio Management Team (2002–2010), Goldman Sachs Asset Management. | 88 | Director and Chair of the Finance and Investment Committee, Aflac Incorporated; Director and Investment Committee Member, Sansum Clinic; Director, ParentSquare; Member, University of California at Santa Barbara Arts and Lectures Advisory Council. |
| TIAA-CREF Managed Allocation Fund ■ 2022 Annual Report | 31 |
| Trustees and officers (unaudited) | continued |
TIAA-CREF Funds ■ May 31, 2022
Trustees – concluded
| Name, Address and Year of Birth (“YOB”) | Position(s) Held with Fund | Term of Office and Length of Time Served | Principal Occupation(s) During Past 5 Years and other relevant experience and qualifications | Number of Portfolios in Fund complex Overseen by Trustee | Other Directorship(s) held by Trustee | |||||
| James M. Poterba c/o Corporate Secretary 730 Third Avenue New York, NY 10017-3206 YOB: 1958 | Trustee | Indefinite term. Trustee since 2006. | President and Chief Executive Officer (since 2008) and Program Director (1990–2008), National Bureau of Economic Research. Mitsui Professor of Economics, Massachusetts Institute of Technology (“MIT”) (since 1996); Affiliated Faculty Member of the Finance Group, Alfred P. Sloan School of Management (since 2014); Head (2006–2008) and Associate Head (1994–2000 and 2001–2006), Economics Department of MIT. | 88 | Director, National Bureau of Economic Research; Member, Congressional Budget Office Panel of Economic Advisers. | |||||
| Maceo K. Sloan c/o Corporate Secretary 730 Third Avenue New York, NY 10017-3206 YOB: 1949 | Trustee | Indefinite term. Trustee since 1999. | Chairman, President and Chief Executive Officer, Sloan Financial Group, Inc. (1991–2018); Chairman and Chief Executive Officer (1991–2016), Chief Investment Officer (1991–2013) and Chief Compliance Officer (2015–2016), NCM Capital Management Group, Inc.; Chairman, Chief Executive Officer (2003–2016), Chief Investment Officer (2003–2013) and Chief Compliance Officer (2015–2016), NCM Capital Advisers, Inc.; and Chairman, President and Principal Executive Officer, NCM Capital Investment Trust (2007–2012). | 88 | Director, TheraTrue Inc. |
| 32 | 2022 Annual Report ■ TIAA-CREF Managed Allocation Fund |
Officers
| Name, Address and Year of Birth (“YOB”) | Position(s) Held with Fund | Term of Office and Length of Time Served | Principal Occupation(s) During Past 5 Years | |||
| Richard S. Biegen TIAA 730 Third Avenue New York, NY 10017-3206 YOB: 1962 | Chief Compliance Officer | One-year term. Chief Compliance Officer since 2008. | Senior Managing Director, TIAA. Chief Compliance Officer of the College Retirement Equities Fund (“CREF”), TIAA Separate Account VA-1, TIAA-CREF Funds and TIAA-CREF Life Funds (collectively, the “TIAA-CREF Fund Complex”). | |||
| Derek B. Dorn TIAA 730 Third Avenue New York, NY 10017-3206 YOB: 1976 | Senior Managing Director and Corporate Secretary | One-year term. Senior Managing Director and Corporate Secretary since 2020. | Senior Managing Director and Corporate Secretary of Teachers Insurance and Annuity Association of America (“TIAA”) and the TIAA-CREF Fund Complex. Formerly, Managing Director, Special Assistant to the CEO, and Managing Director, Regulatory Affairs, TIAA. Prior to joining TIAA, Mr. Dorn served as a partner at Davis & Harman LLP and an adjunct professor of Law at Georgetown University Law Center. | |||
| John L. Douglas TIAA 730 Third Avenue New York, NY 10017-3206 YOB: 1950 | Executive Vice President, Chief Legal, Risk and Compliance Officer | One-year term. Executive Vice President since 2021 and Chief Legal, Risk and Compliance Officer since 2022. | Senior Executive Vice President, Chief Legal, Risk and Compliance Officer of TIAA, Executive Vice President, Chief Legal, Risk and Compliance Officer of the TIAA-CREF Fund Complex. Formerly, Senior Executive Vice President, Senior Advisor to the CEO, and Senior Executive Vice President, Chief Advocacy & Oversight Officer, TIAA. Prior to joining TIAA, Mr. Douglas was a Partner at Davis Polk & Wardwell LLP. | |||
| W. Dave Dowrich TIAA 730 Third Avenue New York, NY 10017-3206 YOB: 1967 | Executive Vice President | One-year term. Executive Vice President since 2022. | Senior Executive Vice President and Chief Financial Officer of TIAA. Executive Vice President of the TIAA-CREF Fund Complex. Prior to joining TIAA, Mr. Dowrich served as Chief Financial Officer, International Businesses at Prudential Financial, Inc. |
| TIAA-CREF Managed Allocation Fund ■ 2022 Annual Report | 33 |
| Trustees and officers (unaudited) | concluded |
TIAA-CREF Funds ■ May 31, 2022
Officers – concluded
| Name, Address and Year of Birth (“YOB”) | Position(s) Held with Fund | Term of Office and Length of Time Served | Principal Occupation(s) During Past 5 Years | |||
| Bradley Finkle TIAA 730 Third Avenue New York, NY 10017-3206 YOB: 1973 | Principal Executive Officer and President | One-year term. Principal Executive Officer and President since 2017. | Executive Vice President, Chief Administrative Officer of the Chief Operating Office, TIAA. Principal Executive Officer and President of the TIAA-CREF Funds and TIAA-CREF Life Funds. Formerly, Executive Vice President, Chief Operating Officer, Nuveen, President and Chief Executive Officer of CREF and TIAA Separate Account VA-1; Senior Managing Director, Co-Head Nuveen Equities & Fixed Income and President of TIAA Investments. | |||
| Jose Minaya TIAA 730 Third Avenue New York, NY 10017-3206 YOB: 1971 | Executive Vice President | One-year term. Executive Vice President since 2018. | Chief Executive Officer, Nuveen. Executive Vice President of the TIAA-CREF Fund Complex. Formerly, Executive Vice President, President and Chief Investment Officer, Nuveen; Executive Vice President, Chief Investment Officer and President, Nuveen Global Investments; and Senior Managing Director, President, Global Investments, TIAA. | |||
| Colbert Narcisse TIAA 730 Third Avenue New York, NY 10017-3206 YOB: 1965 | Executive Vice President | One-year term. Executive Vice President since 2022. | Senior Executive Vice President, Chief Product and Business Development Officer of TIAA. President and Chief Executive Officer of CREF and TIAA Separate Account VA-1. Executive Vice President of TIAA-CREF Funds and TIAA-CREF Life Funds. Formerly, Executive Vice President and Head of Advisory and Corporate Solutions, TIAA. Prior to joining TIAA, Mr. Narcisse served as Managing Director and Head of International Wealth Management and Head of Traditional and Alternative Investment Products at Morgan Stanley. |
| 34 | 2022 Annual Report ■ TIAA-CREF Managed Allocation Fund |
| David G. Nason TIAA 730 Third Avenue New York, NY 10017-3206 YOB: 1970 | Executive Vice President | One-year term. Executive Vice President since 2020. | Senior Executive Vice President, Chief Operating Officer of TIAA. Executive Vice President of the TIAA-CREF Fund Complex. Formerly, Senior Executive Vice President, Chief Legal, Risk and Compliance Officer of TIAA. Executive Vice President, Chief Risk and Compliance Officer, TIAA. Prior to joining TIAA, Mr. Nason served as President and CEO of GE Energy Financial Services. | |||
| E. Scott Wickerham TIAA 730 Third Avenue New York, NY 10017-3206 YOB: 1973 | Principal Financial Officer, Principal Accounting Officer and Treasurer | One-year term. Principal Financial Officer, Principal Accounting Officer and Treasurer since 2017. | Senior Managing Director, Head, Publics Investment Finance, Nuveen. Principal Financial Officer, Principal Accounting Officer and Treasurer of the TIAA-CREF Fund Complex; and Vice President and Controller of the Nuveen Funds. Formerly, Managing Director, Head, TC Fund Administration, Nuveen. | |||
| Sean N. Woodroffe TIAA 730 Third Avenue New York, NY 10017-3206 YOB: 1963 | Executive Vice President | One-year term. Executive Vice President since 2018. | Senior Executive Vice President, Chief People Officer of TIAA, and Executive Vice President of the TIAA-CREF Fund Complex. Prior to joining TIAA, Mr. Woodroffe served as Chief People Officer at National Life Group. |
Please note that the Funds’ Statement of Additional Information (SAI) includes additional information about the Funds’ trustees and is available, without charge, through our website, TIAA.org, or by calling 800 223-1200.
| TIAA-CREF Managed Allocation Fund ■ 2022 Annual Report | 35 |
Approval of investment management agreement (unaudited)
Board renewal of the investment management agreement for the TIAA-CREF Managed Allocation Fund
The Board of Trustees (the “Board” or the “Trustees”) of the TIAA-CREF Funds (the “Trust”) determines whether to initially approve and periodically renew the investment management agreement (the “Agreement”) between Teachers Advisors, LLC (“Advisors”) and the Trust on behalf of each series of the Trust. Under the Agreement, Advisors is responsible for providing investment advisory services to each series of the Trust and overseeing the everyday operations and other service providers of the Trust. Below is a summary of the process the Board undertook related to its most recent renewal of the Agreement with respect to the TIAA-CREF Managed Allocation Fund (the “Fund”).
Section 15(c) of the Investment Company Act of 1940, as amended (the “1940 Act”), requires that, after an initial period of up to two years, the Agreement for the Fund will remain in effect only if the Board, including a majority of those Trustees who have no direct or indirect interest in the Agreement, and who are independent Trustees because they are not “interested persons” of the Trust, as that term is defined in the 1940 Act, annually renews the Agreement. None of the Trustees is an interested person of the Trust under the 1940 Act. Rather, they are all deemed to be independent Trustees.
Under normal circumstances, Section 15(c) requires any initial approval or annual renewal of an investment management agreement to be made at an in-person meeting of the Board. However, due to the COVID-19 pandemic, the Securities and Exchange Commission (“SEC”) issued and extended a temporary, conditional exemptive order (the “SEC Order”), permitting mutual fund boards to vote to approve matters subject to the Section 15(c) in-person approval requirement at a meeting that is not held in person if the board determines that reliance on the SEC Order is necessary or appropriate due to prevailing circumstances related to the current or potential effects of COVID-19 and the board ratifies any action taken pursuant to the SEC Order at its next in-person meeting.
Overview of the renewal process
The Board held a virtual meeting via videoconference on March 11, 2022, in order to consider the annual renewal of the Agreement for the Fund using the process established by the Board described further below. At the outset of the meeting, the Board considered reliance upon the SEC Order and determined that such reliance was necessary due to, among other considerations, COVID-19 pandemic-related public health protocols imposed for health and safety reasons. The Board noted that it would ratify actions taken at this meeting pursuant to the SEC Order at its next in-person meeting.
As part of the Board’s established process, the Board delegated certain tasks to its Operations Committee. Among these tasks, the Operations Committee or certain of its designated members worked with Advisors, other Board members and legal
| 36 | 2022 Annual Report ■ TIAA-CREF Managed Allocation Fund |
counsel to the Trustees to develop guidance and specific requests relating to the types of information to be provided to the Board in connection with the proposed contract renewals.
Among other matters, the Operations Committee or certain of its designated members, following consultations with representatives of Advisors, other Board members, legal counsel to the Trustees and legal counsel to Advisors and the Trust, confirmed or established certain guidance regarding the preparation of reports to be provided to the Board with respect to the Fund by the Board Reporting and Compliance unit of Broadridge Financial Solutions, Inc. (“Broadridge”), using data from Lipper, Inc., an independent provider of investment company data. The Operations Committee considered that Broadridge is widely recognized as a leading provider of comparative analyses used by independent directors and trustees of investment companies during their advisory contract review processes.
Based on guidance provided by the Operations Committee or certain of its designated members on behalf of the Board, Broadridge produced, among other information, comparative performance and expense data for the Fund, including data relating to the Fund’s management fee rate, total expense ratio, short-term and long-term investment performance and portfolio turnover rate. Broadridge compared this data, as relevant, for the Fund against a universe of investment companies and against a more selective peer group of mutual funds with similar investment objectives and strategies, each of which was selected by Broadridge, and also compared the performance of the Fund against one or more appropriate broad-based indices. In each case, Broadridge summarized, and the Board considered, the methodologies Broadridge employed to provide the data contained in its reports. In addition, Broadridge represented to the Board that its reports were designed specifically to provide the Board with the fee, expense and performance information that is necessary to help the Board satisfy its duties under Section 15(c) of the 1940 Act. Broadridge also represented that the purpose of its reports is to provide an objective view of the Fund’s relative position regarding the level of fees, expenses and performance against a competitive peer group and universe (as applicable) selected by Broadridge (and not Advisors or the Board). The Board considered the propriety of the Fund’s applicable peer group as selected by Broadridge and use of the Institutional Class as the base class for comparison purposes.
Legal counsel for the Trustees also requested on behalf of the Board, and Advisors provided, information that was designed to assist the Board in its consideration of whether to renew the Agreement for the Fund. In addition to the data provided by Broadridge as described above, this information included, but was not limited to, the following: (1) further information relating to the Fund’s investment performance and an explanation of any events that had a material impact on the Fund’s performance during that period; (2) a description of any fee waiver or expense reimbursement arrangements that were proposed or were in place during the prior year and the extent to which such arrangements would be continued or modified in the coming year; (3) a comparison of the Fund’s management fee rate and performance to other
| TIAA-CREF Managed Allocation Fund ■ 2022 Annual Report | 37 |
Approval of investment management agreement (unaudited)
accounts with comparable strategies managed by Advisors or certain of its affiliates; (4) any “fall-out” benefits that accrued or were identified as reasonably likely to accrue to Advisors or its affiliates due to their relationship with the Fund in addition to the Fund’s direct fee payments to Advisors pursuant to the Agreement; (5) information regarding Advisors’ financial resources, senior professional personnel, overall staffing levels, portfolio manager compensation arrangements, capacity to manage the Fund at current and foreseeable asset levels, insurance coverage, portfolio trading and best execution practices, and any actual and potential conflicts of interest identified by Advisors in connection with rendering services to the Fund; (6) information as to any profits earned by Advisors in connection with its services pursuant to the Agreement; (7) a copy of the Agreement and certain related agreements between the Fund and affiliates of Advisors; (8) a copy of Advisors’ Form ADV as filed with the SEC (which was presented only to legal counsel for the Trustees); and (9) draft narrative explanations to be included in the shareholder report of reasons why the Board should renew the Agreement. The Trustees were also provided with performance ratings of Morningstar, Inc. (“Morningstar”), which is a widely recognized mutual fund ranking service. In addition, the Board received information from management on the continued impact of the COVID-19 pandemic and certain geopolitical events on the Teachers Insurance and Annuity Association of America (“TIAA”) enterprise’s operations generally and on the Fund’s operations and performance.
On March 3, 2022, the Board held a virtual meeting via videoconference with legal counsel to the Trustees to discuss Advisors’ materials, which led to the Trustees providing additional questions to, and requesting additional information from, Advisors. Subsequently, at the March 11, 2022 meeting, the Trustees were given the opportunity to, and did, ask additional questions and they discussed responses from Advisors to the Board’s follow-up questions and requests presented by the Board after its initial review of the information described above.
In considering whether to renew the Agreement with respect to the Fund, the Board considered various factors, including: (1) the nature, extent and quality of services provided or to be provided by Advisors to the Fund; (2) the Fund’s investment performance; (3) the costs of the services provided to the Fund and the profits realized or potential profits to be realized (if any) by Advisors and its affiliates from their relationship with the Fund; (4) fees charged to comparable mutual funds by other advisers; (5) the extent to which economies of scale have been realized or are anticipated to be realized as the Fund grows; (6) how such economies of scale are shared with the Fund for the benefit of its investors, such as, if applicable, through management fee breakpoints; (7) comparisons, if applicable, of the services provided by Advisors to, and the fee rates and performance of, the Fund to other clients to whom Advisors provides comparable services; and (8) any other benefits identified by Advisors derived or anticipated to be derived by Advisors or its affiliates from their relationship with the Fund. As a general matter, the Board considered these factors, and any other factors deemed relevant by the Trustees, in their totality, and no single factor was identified as being the determining factor in deciding whether to renew the Agreement.
| 38 | 2022 Annual Report ■ TIAA-CREF Managed Allocation Fund |
continued
In addition to the March 11, 2022 meeting that included Advisors’ personnel, the Trustees met in executive sessions, at which no representatives of Advisors were present, to discuss the proposed renewal of the Agreement for the Fund. The Board also received and considered information from its legal counsel as to certain relevant guidance that relates to the renewal process under Section 15(c) of the 1940 Act and certain other legal authorities.
While the contract renewal process included a series of discussions and meetings leading up to the March 11, 2022 meeting, the oversight and evaluation of Advisors’ services to the Fund by the Board and its Committees is an ongoing process. The Board, as well as its Committees, considered reports on various investment and operational topics that had been identified by the Board or its Committees for review in the year since the last annual renewal process. Further, at their regularly scheduled meetings, the Board and its Investment Committee and its other Committees receive and consider, among other matters, information regarding the performance of the Fund. Thus, in reaching its decisions regarding the renewal of the Agreement for the Fund, the Board took into account the information described herein and other information provided to the Board and its Committees throughout the year.
The Board received and considered both Trust-level and Fund-specific information, but made its renewal determinations on a Fund-level basis. In deciding whether to renew the Agreement for the Fund, each Trustee may have accorded different weight to different factors and, thus, may have had a different basis for his or her ultimate decision to vote to renew the Agreement for the Fund. At its meeting on March 11, 2022, Board members voted unanimously to renew the Agreement for the Fund. Set forth below is a summary of the primary factors the Board considered with respect to the Fund.
The nature, extent and quality of services
The Board considered the level and depth of knowledge of Advisors, including the professional experience and qualifications of its personnel. The Board also considered that Advisors is an experienced investment adviser that has managed the Fund since its operations commenced. Investment professionals at Advisors also manage various other funds and accounts of the Trust, College Retirement Equities Fund, the TIAA-CREF Life Funds and TIAA Separate Account VA-1, as well as advise and sub-advise other investment companies and vehicles. Under the Agreement, Advisors is responsible for, among other duties: managing the assets of the Fund (which is a fund of funds that may invest its assets in the securities of affiliated and unaffiliated investment companies or other investment pools, referred to as “Underlying Funds”), including conducting research, identifying investments and placing orders to buy and sell shares of Underlying Funds for the Fund’s investment portfolio; active daily monitoring of the Fund’s investment portfolios; reporting on the investment performance and other metrics of the Fund to the Board on a regular basis; responding to Fund flows; compliance monitoring; coordinating the activities of the Fund’s service providers; and overseeing the provision of various
| TIAA-CREF Managed Allocation Fund ■ 2022 Annual Report | 39 |
Approval of investment management agreement (unaudited)
administrative services to the Fund. The Board considered that Advisors has carried out these responsibilities in a competent and professional manner. The Board also considered that Advisors has committed significant resources to supporting the series of the Trust, including the Fund. It also considered Advisors’ compliance program and resources and its compliance record with respect to the Fund.
The Board also considered, among other factors, the performance of the Fund, as discussed below. In addition, the Board considered the nature and quality of non-portfolio management services provided by Advisors and its affiliates. In this regard, the Board considered its ongoing review of the performance of certain affiliated and unaffiliated service providers, including the quality of services provided by those firms and Advisors’ oversight of those service providers and the outsourcing of certain services to other firms.
The Board, as well as its Committees, considered reports on various investment and operational topics that had been identified by the Board or its Committees for review in the year since the last annual renewal process. Further, at their regularly scheduled meetings, the Board and its Investment Committee and its other Committees receive and consider, among other matters, information regarding the performance of the Fund. Thus, in reaching its decisions regarding the renewal of the Agreement for the Fund, the Board took into account the information described herein and other information provided to the Board and its Committees throughout the year.
Investment performance
The Board considered the investment performance of the Fund over the one-, three-, five- and ten-year periods ended December 31, 2021. The Board considered the Fund’s performance as compared to its peer group and peer universe and its benchmark index. For details regarding the Fund’s performance, see the Fund synopsis below. The Board concluded that, under the totality of circumstances considered, the investment performance of the Fund was reasonable.
Cost and profitability
The Board considered financial and profitability data relating to Advisors’ services to the Fund for the calendar year 2021. The Board considered Advisors’ profit calculations with respect to its services to the Fund both before and after taking into account the costs incurred directly or indirectly by Advisors in connection with the distribution of shares of the Fund. The Board considered that Advisors had incurred a net loss with respect to the Fund in 2021, which was because Advisors did not charge the Fund any fees under the Agreement. The Board also acknowledged certain fee waivers and reimbursements of expenses above specified amounts undertaken by Advisors with respect to many of the Underlying Funds which, in turn, reduce the expenses of the Fund. The Board also recognized Advisors’ commitment to reimburse Fund expenses to the extent that total annual operating expenses exceeded certain specified amounts. The Board also considered
| 40 | 2022 Annual Report ■ TIAA-CREF Managed Allocation Fund |
continued
that, in the aggregate, Advisors had generated indirect earnings with respect to the Fund’s investment in Underlying Funds also managed by Advisors.
Fees charged by other advisers
The Board considered comparative information regarding the Fund’s contractual and effective management fee rates and the contractual and effective management fee rates paid by similar mutual funds to other advisers, as analyzed by Broadridge and reflected in the Fund synopsis below. The Board acknowledged that Advisors did not charge a management fee to the Fund.
Economies of scale
The Board considered whether Advisors has experienced or is anticipated to experience economies of scale in connection with the operation of the Fund. The Board also considered that because Advisors operated the Fund at a loss and did not charge the Fund a management fee, there had been little opportunity to pass on economies of scale to Fund shareholders. Based on all factors considered, the Board concluded that the Fund’s management fee rate schedule was reasonable in light of current economies of scale considerations and the Fund’s current asset level.
Fee and performance comparisons with other Advisors clients
The Board considered that Advisors provides investment management services to other investment companies, including foreign funds (UCITS), and separately managed accounts. However, the Board acknowledged that Advisors did not charge a management fee to the Fund.
Other benefits
The Board also considered additional “fall-out benefits” to Advisors and its affiliates arising from the Agreement. Such benefits include, among others, other fees paid by the Fund to Advisors or its affiliates for other services, such as distribution and administration, and investment-related benefits, such as economies of scale to the extent the Fund shares investment resources and/or personnel with other clients of Advisors. Advisors and its affiliates may also benefit from the level of business and relationships the Fund has with certain service providers. Advisors and/or its affiliates also may benefit to the extent that the Fund adds scale to the TIAA-CREF Underlying Funds. Additionally, the Fund may be utilized as an investment option for other products and businesses of Advisors and its affiliates, such as variable products, fund of funds and 529 education savings plans. Also, Advisors and its affiliates may benefit from their relationship with the Fund to the extent that this relationship results in potential investors viewing TIAA, of which Advisors is an indirect, wholly-owned subsidiary, as a leading retirement plan provider in the academic and non-profit markets and as a single source for all their financial service needs. The Board concluded that other benefits to Advisors and its affiliates arising from the Agreement were reasonable in light of various relevant factors.
| TIAA-CREF Managed Allocation Fund ■ 2022 Annual Report | 41 |
| Approval of investment management agreement (unaudited) | concluded |
Fund synopsis of factors
The Board considered the following specific factors (among others) in connection with its determination to renew the Agreement with respect to the Fund. When the Fund is described in the following discussion as being in the “1st” quintile, it is in the best of five groups (that is, the group has the best performance or the lowest expenses, as the case may be). References below to quintiles are based on data provided to the Board in the reports prepared by Broadridge. The specific management fee, expense and performance factors outlined below are based on the Institutional Class of the Fund. Because the Institutional Class generally has lower non-management expenses than the other classes of the Fund, the expenses and performance of these other classes will differ from the expenses and performance shown for the Institutional Class. All time periods referenced below are ended December 31, 2021. Under the Morningstar rating system, an Overall Morningstar Rating of 5 stars is the highest (best) rating category and 1 star is the lowest (worst) rating category. The Morningstar data is as of December 31, 2021. The statement below regarding “net loss” refers to Advisors’ calculation that it incurred a loss for the services that it rendered to a Fund during 2021 under the Agreement.
| • | The Fund’s annual contractual management fee rate is 0.00% of average daily net assets. |
| • | The Fund’s total expense ratio was in the 1st quintile of both the group of comparable funds selected by Broadridge for expense comparison purposes (“Expense Group”) and the universe of comparable funds selected by Broadridge for expense comparison purposes (“Expense Universe”). The Fund’s actual management fee rate was in the 1st quintile of its Expense Universe. The Fund did not have an Expense Group for its actual management fee rate or its contractual management fee rate, nor did the Fund have an Expense Universe with respect to its contractual management fee rate, because the Fund is not charged a management fee. |
| • | The Fund was in the 3rd, 1st, 1st and 1st quintiles of the group of comparable funds selected by Broadridge for performance comparison purposes for the one-, three-, five- and ten-year periods, respectively. The Fund was in the 4th, 1st, 1st and 1st quintiles of the universe of comparable funds selected by Broadridge for performance comparison purposes for each of the one-, three-, five- and ten-year periods, respectively. |
| • | The Fund received an Overall Morningstar Rating of 3 stars. |
| • | Advisors calculated that it incurred a net loss with respect to its services to the Fund for the one-year period without taking into account profits Advisors earned with respect to the Underlying Funds that are also managed by Advisors in which this Fund invests. |
Based primarily on the foregoing factors and conclusions, the Board renewed the Agreement for the Fund.
| 42 | 2022 Annual Report ■ TIAA-CREF Managed Allocation Fund |
Liquidity risk management program (unaudited)
Discussion of the operation and effectiveness of the Fund’s liquidity risk management program
In compliance with Rule 22e-4 under the Investment Company Act of 1940, as amended (the “Liquidity Rule”), the series of the Trust covered by this Report (the “Fund”) has adopted and implemented a liquidity risk management program (the “Program”), which is reasonably designed to assess and manage the Fund’s liquidity risk. The Program consists of various provisions relating to assessing and managing Fund liquidity risk, as discussed further below. The Fund’s Board of Trustees (the “Board”) previously approved the designation of Advisors (the “Administrator”) as Program administrator. The Liquidity Monitoring and Analysis Team (the “LMAT”) carries out day-to-day Program management with oversight by the Liquidity Oversight Committee (the “LOSC”). Personnel from the Administrator and Nuveen Fund Advisors, LLC, an affiliate of the Administrator, comprise the LMAT and LOSC.
At a February 15, 2022 Board meeting, the Administrator provided the Board with a written report addressing the Program’s operation, adequacy, and effectiveness of implementation for the period from January 1, 2021 through December 31, 2021 (the “Review Period”), as required under the Liquidity Rule. The report noted that the Program has been and continues to be adequately and effectively implemented to monitor and (as applicable) respond to the Fund’s liquidity developments.
In accordance with the Program, the LMAT assesses the Fund’s liquidity risk no less frequently than annually based on various factors, such as (i) the Fund’s investment strategy and the liquidity of portfolio investments, (ii) cash flow projections, and (iii) holdings of cash and cash equivalents and borrowing arrangements and other funding sources. Certain factors are considered under both normal and reasonably foreseeable stressed conditions.
Fund portfolio investments are classified into one of four liquidity categories (including “highly liquid investments” and “illiquid investments,” discussed below). The classification is based on a determination of how long it is reasonably expected to take to convert the investment into cash, or sell or dispose of the investment, in current market conditions without significantly changing the market value of the investment. Liquidity classification determinations take into account various market, trading, and investment-specific considerations, as well as market depth, and utilize third-party vendor data.
A Fund that does not primarily hold highly liquid investments must, among other things, determine a minimum percentage of Fund net assets that must be invested in highly liquid investments (a “Highly Liquid Investment Minimum”). During the Review Period, the Fund primarily held highly liquid investments and therefore was exempt from the requirement to adopt a Highly Liquid Investment Minimum and to comply with the related requirements under the Liquidity Rule.
| TIAA-CREF Managed Allocation Fund ■ 2022 Annual Report | 43 |
| Liquidity risk management program (unaudited) | concluded |
The Liquidity Rule also limits the Fund’s investments in illiquid investments. Specifically, the Liquidity Rule prohibits acquisition of illiquid investments if doing so would result in the Fund holding more than 15% of its net assets in illiquid investments and requires certain reporting anytime a Fund’s holdings of illiquid investments exceed 15% of net assets. During the Review Period, the Fund did not exceed the 15% limit on illiquid investments.
| 44 | 2022 Annual Report ■ TIAA-CREF Managed Allocation Fund |
Additional information about index providers (unaudited)
Russell Indexes
Source: London Stock Exchange Group plc and its group undertakings (collectively, the “LSE Group”). © LSE Group 2022. FTSE Russell is a trading name of certain of the LSE Group companies. “FTSE®,” “Russell®” and “FTSE Russell®” are trademarks of the relevant LSE Group companies and are used by any other LSE Group company under license. All rights in the FTSE Russell indexes or data vest in the relevant LSE Group company which owns the index or the data. Neither LSE Group nor its licensors accept any liability for any errors or omissions in the indexes or data and no party may rely on any indexes or data contained in this communication. No further distribution of data from the LSE Group is permitted without the relevant LSE Group company’s express written consent. The LSE Group does not promote, sponsor or endorse the content of this communication.
MSCI Indexes
Source: MSCI. The MSCI information may only be used for your internal use, may not be reproduced or redisseminated in any form and may not be used as a basis for or a component of any financial instruments or products or indices. None of the MSCI information is intended to constitute investment advice or a recommendation to make (or refrain from making) any kind of investment decision and may not be relied on as such. Historical data and analysis should not be taken as an indication or guarantee of any future performance analysis, forecast or prediction. The MSCI information is provided on an “as is” basis and the user of this information assumes the entire risk of any use made of this information. MSCI, each of its affiliates and each other person involved in or related to compiling, computing or creating any MSCI information (collectively, the “MSCI Parties”) expressly disclaims all warranties (including, without limitation, any warranties of originality, accuracy, completeness, timeliness, non-infringement, merchantability and fitness for a particular purpose) with respect to this information. Without limiting any of the foregoing, in no event shall any MSCI Party have any liability for any direct, indirect, special, incidental, punitive, consequential (including, without limitation, lost profits) or any other damages. (www.msci.com)
Bloomberg Indexes
Source: Bloomberg Index Services Limited. BLOOMBERG® is a trademark and service mark of Bloomberg Finance L.P. and its affiliates (collectively “Bloomberg”). Bloomberg or Bloomberg’s licensors own all proprietary rights in the Bloomberg Indices. Bloomberg neither approves nor endorses this material, nor guarantees the accuracy or completeness of any information herein, nor makes any warranty, express or implied, as to the results to be obtained therefrom and, to the maximum extent allowed by law, neither shall have any liability or responsibility for injury or damages arising in connection therewith.
| TIAA-CREF Managed Allocation Fund ■ 2022 Annual Report | 45 |
| Additional information about index providers (unaudited) | concluded |
Morningstar Index
©2022 Morningstar. All Rights Reserved. The information contained herein: (1) is proprietary to Morningstar and/or its content providers; (2) may not be copied or distributed; and (3) is not warranted to be accurate, complete or timely. Neither Morningstar nor its content providers are responsible for any damages or losses arising from any use of this information.
| 46 | 2022 Annual Report ■ TIAA-CREF Managed Allocation Fund |
[This page intentionally left blank.]
[This page intentionally left blank.]
[This page intentionally left blank.]
[This page intentionally left blank.]
Websites
TIAA.org
nuveen.com
Automated telephone service
800-842-2252
24 hours a day, 7 days a week
For the hearing- or speech-impaired
800-842-2755
8 a.m. to 10 p.m. (ET), Monday–Friday
You should carefully consider the investment objectives, risks, charges and expenses of any fund before investing. For a prospectus that contains this and other information, please visit TIAA.org, or call 800-842-2252 for the Institutional and Retirement classes or 800-223-1200 for the Retail Class. Please read the prospectus carefully before investing. Investment, insurance and annuity products are not Federal Deposit Insurance Corporation (FDIC) insured, are not bank guaranteed, are not bank deposits, are not insured by any federal government agency, are not a condition to any banking service or activity, and may lose value. Nuveen, a subsidiary of TIAA, provides investment advice and portfolio management services through a dozen affiliated registered investment advisers. Nuveen Securities, LLC and TIAA-CREF Individual & Institutional Services, LLC, members FINRA, distribute securities products.
This material is for informational or educational purposes only and does not constitute fiduciary investment advice under ERISA, a securities recommendation under all securities laws, or an insurance product recommendation under state insurance laws or regulations. This material does not take into account any specific objectives or circumstances of any particular investor, or suggest any specific course of action. Investment decisions should be made based on the investor’s own objectives and circumstances.
©2022 Teachers Insurance and Annuity Association of America—College Retirement Equities Fund, 730 Third Avenue, New York, NY 10017-3206
| 730 Third Avenue New York, NY 10017-3206 | PRESORTED STANDARD U.S. POSTAGE PAID TIAA |

 | Printed on paper containing recycled fiber |
 | We’re fond of paper…in its original form. Switch to eDelivery at TIAA.org/eDelivery | |
| 2217969 | A12452 (7/22) |
 | 730 Third Avenue New York, NY 10017-3206 |

 | Printed on paper containing recycled fiber |
| 2217969 | A12452 (7/22) |
 | 730 Third Avenue New York, NY 10017-3206 |
| 2217969 | A12452 (7/22) |
Item 2. Code of Conduct.
2(a) The Board of Trustees of the TIAA-CREF Funds (the “Registrant”) has adopted a code of conduct for senior financial officers, including the Registrant’s principal executive officer, principal financial officer, principal accounting officer, or controller, and persons performing similar functions, in conformity with rules promulgated under the Sarbanes-Oxley Act of 2002.
2(b) No response required.
2(c) During the reporting period, there were no amendments to the code of conduct.
2(d) During the reporting period, there were no implicit or explicit waivers granted by the Registrant from any provision of the code of conduct.
2(e) Not applicable.
2(f) A copy of the current code of conduct is filed as an exhibit to this Form N-CSR.
Item 3. Audit Committee Financial Expert.
3(a)(1) The Registrant’s Board of Trustees has determined that the Registrant has at least one audit committee financial expert serving on its Audit and Compliance Committee.
3(a)(2) Maceo K. Sloan is the Registrant’s audit committee financial expert and is “independent” for purposes of Item 3 of Form N-CSR.
Item 4. Principal Accountant Fees and Services.
PricewaterhouseCoopers LLP (“PwC”) performs independent audits of the Registrant’s financial statements. To maintain auditor independence and avoid even the appearance of conflicts of interest, the Registrant, as a policy, does not engage PwC for management advisory or consulting services.
The aggregate fees billed by PwC as disclosed below for the fiscal years ended May 31, 2022 and May 31, 2021 may not align with the figures reported and filed with the Securities and Exchange Commission in Form N-CEN or Form N-CSR for each period, respectively, (SEC File No. 811-09301) because the fees disclosed in this proxy statement reflect fees updated after the date of that Form N-CEN or Form N-CSR for the relevant period.
4(a) Audit Fees.
For the fiscal years ended May 31, 2022 and May 31, 2021, PwC’s aggregate fees for the audit of the Registrant’s annual financial statements were $442,120 and $485,120, respectively.
4(b) Audit Related Fees.
For the fiscal years ended May 31, 2022 and May 31, 2021, PwC’s aggregate fees for services related to the performance of the audit of the Registrant’s annual financial statements were $0 and $0, respectively.
For the fiscal years ended May 31, 2022 and May 31, 2021, the Audit-Related Fees billed by PwC to Teachers Advisors, LLC (“Advisors”) or to any entity controlling, controlled by or under common control with Advisors that provides ongoing services to the Registrant (collectively, “Fund Service Providers”) were $0 and $0, respectively.
4(c) Tax Fees.
For the fiscal years ended May 31, 2022 and May 31, 2021, PwC’s aggregate fees for tax services billed to the Registrant were $0 and $0, respectively.
For the fiscal years ended May 31, 2022 and May 31, 2021, the Tax Fees billed by PwC to the Fund Service Providers were $0 and $0, respectively.
4(d) All Other Fees.
For the fiscal years ended May 31, 2022 and May 31, 2021, PwC’s aggregate fees for all other services billed to the Registrant were $0 and $0, respectively.
For the fiscal years ended May 31, 2022 and May 31, 2021, PwC’s aggregate fees for all other services billed to the Fund Service Providers were $0 and $0, respectively.
4(e)(1) Preapproval Policy.
The Registrant’s audit and compliance committee (“Audit Committee”) has adopted a Preapproval Policy for External Audit Firm Services (the “Policy”). The Policy describes the types of services that may be provided by the independent auditor to the Registrant and certain of its affiliates without impairing the auditor’s independence. Under the Policy, the Audit Committee is required to preapprove all services to be performed by the Registrant’s independent auditor in order to ensure that such services do not impair the auditor’s independence.
The Policy requires the Audit Committee to: (i) appoint the independent auditor to perform the financial statements audit for the Registrant and certain of its affiliates, including approving the terms of the engagement, and (ii) preapprove the audit, audit-related, tax and other services to be provided by the independent auditor to the Registrant and certain of its affiliates and the fees to be charged for provision of such services from year to year.
4(e)(2) Services provided pursuant to paragraph (c)(7)(i)(C) of Rule 2-01 of Regulation S-X (the “de minimis exception”):
Audit-Related Fees.
There were no amounts that were approved by the Audit Committee pursuant to the de minimis exception for the fiscal years ended May 31, 2022 and May 31, 2021 on behalf of the Registrant.
There were no amounts that were approved by the Audit Committee pursuant to the de minimis exception for the fiscal years ended May 31, 2022 and May 31, 2021 on behalf of the Fund Service Providers that relate directly to the operations and financial reporting of the Registrant.
Tax Fees.
There were no amounts that were approved by the Audit Committee pursuant to the de minimis exception for the fiscal years ended May 31, 2022 and May 31, 2021 on behalf of the Registrant.
There were no amounts that were approved by the Audit Committee pursuant to the de minimis exception for the fiscal years ended May 31, 2022 and May 31, 2021 on behalf of the Fund Service Providers that relate directly to the operations and financial reporting of the Registrant.
All Other Fees.
There were no amounts that were approved by the Audit Committee pursuant to the de minimis exception for the fiscal years ended May 31, 2022 and May 31, 2021 on behalf of the Registrant.
There were no amounts that were approved by the Audit Committee pursuant to the de minimis exception for the fiscal years ended May 31, 2022 and May 31, 2021 on behalf of the Fund Service Providers that relate directly to the operations and financial reporting of the Registrant.
4(f) The percentage of hours expended by PwC’s engagement to audit the Registrant’s financial statements for the most recent fiscal year attributable to work performed by persons other than PwC’s full-time, permanent employees was less than 50%.
4(g) Non-Audit Fees for Related Entities.
For the fiscal years ended May 31, 2022 and May 31, 2021, aggregate non-audit fees billed to the Registrant and to its Fund Service Providers by PwC were $1,067,853 and $1,240,605, respectively.
4(h) The Registrant’s Audit Committee has considered whether the non-audit services that were rendered by PwC to the Registrant’s Fund Service Providers that were not pre-approved pursuant to paragraph (c)(7)(ii) of Rule 2-01 of Regulation S-X are compatible with maintaining PwC’s independence.
Item 5. Audit Committee of Listed Registrants.
Not Applicable.
Item 6. Schedule of Investments.
Not Applicable. The complete schedule of investments is included in Item 1 of this Form N-CSR.
Item 7. Disclosure of Proxy Voting Policies and Procedures for Closed-End Management Investment Companies.
Not Applicable.
Item 8. Portfolio Managers of Closed-End Management Investment Companies.
Not Applicable.
Item 9. Purchases of Equity Securities by Closed-End Management Investment Company and Affiliated Purchasers.
Not Applicable.
Item 10. Submission of Matters to a Vote of Security Holders.
There were no material changes to the procedures by which shareholders may recommend nominees to the Registrant’s Board of Trustees.
Item 11. Controls and Procedures.
(a) An evaluation was performed within 90 days of the filing date of the report under the supervision of the Registrant’s management, including the principal executive officer and principal financial officer, of the effectiveness of the design and operation of the Registrant’s disclosure controls and procedures. Based on that evaluation, the Registrant’s management, including the principal executive officer and principal financial officer, concluded that the Registrant’s disclosure controls and procedures were effective for this annual reporting period.
(b) There were no changes in the Registrant’s internal control over financial reporting that occurred during the Registrant’s annual period covered by this report that materially affected, or are reasonably likely to materially affect, the Registrant’s internal control over financial reporting.
Item 12. Disclosure of Securities Lending Activities for Closed-End Management Investment Companies.
Not Applicable.
Item 13. Exhibits.
13(a)(1) Copy of current SOX code of conduct for Senior Financial Officers
13(a)(2)(i) Section 302 certification of the principal executive officer
13(a)(2)(ii) Section 302 certification of the principal financial officer
13(b) Section 906 certification of principal executive officer and principal financial officer
13(c) Copy of the financial statements for the TIAA-CREF Real Property Fund
SIGNATURES
Pursuant to the requirements of the Securities Exchange Act of 1934 and the Investment Company Act of 1940, the Registrant has duly caused this report to be signed on its behalf by the undersigned, thereunto duly authorized.
| TIAA-CREF FUNDS | ||
| Dated: July 15, 2022 | By: | /s/ Bradley Finkle |
| Bradley Finkle | ||
| Principal Executive Officer and President | ||
Pursuant to the requirements of the Securities Exchange Act of 1934 and the Investment Company Act of 1940, this report has been signed below by the following persons on behalf of the Registrant and in the capacities and on the dates indicated.
| Dated: July 15, 2022 | By: | /s/ Bradley Finkle |
| Bradley Finkle | ||
| Principal Executive Officer and President | ||
| (principal executive officer) |
| Dated: July 15, 2022 | By: | /s/ E. Scott Wickerham |
| E. Scott Wickerham | ||
| Principal Financial Officer, Principal Accounting Officer and Treasurer | ||
| (principal financial officer) |