13830 14294 13242 4.6 0.1 12985 4.6 11609 17625 11436 12309 1.5 38.5 12468 15951 14687 27.4 10000 10049 13541 31.5 10549 21.0 14566 0.1 16101 11381 12645 65.0 36.7 1.3 3.8 26 17734 13380 19.8 17.1 4.6 14.1 31.7 1.5 13745 16325 13.7 0.1 7.5 34.9 16.2 10607 3.5 10464 23.0 0.2 12985 0.2 30.4 19310 24.0 10542 15293 0.1 12653 50.8 4.6 39.1 10631 14823 3.5 10.0 27.9 9.6 30.2 7.5 5.50 13547 33.90 9.6 44.8 10000 10000 10000 10000 10000 10000 10015 10063 10000 9857 10000 10000 10000 10000 10000 10000 10000 10000 10000 14593 10000 10000 10000 10000 10000 9423 10000 10000 10000 10000 10000 10000 10000 10000 10000 10000 10000 10155 10000 10000 10000 10000 10000 10000 10000 10000 10036 10000 10000 10000 10000 10000 10000 10000 10000 10000 10000 10000 10000 9940 10000 10000 10000 10000 10000 10000 10000 10000 10000 10000 10000 10000 10000 10000 10000 10000 10000 10000 10125 10000 10000 10000 10000 10000 10000 10000 10000 10777 10000 10000 10000 10000 10000 10000 10000 10000 9821 10000 10000 10000 10000 10000 10000 9847 10000 10000 10000 10000 10000 10000 10000 10000 10000 10000 10000 10000 14664 19159 14376 14153 12535 15718 18634 9872 21740 22541 15413 22767 14640 17136 17865 17067 23041 10000 18267 15636 19175 19351 18608 14354 16332 12685 17094 14135 18654 16730 10000 22754 19283 18489 18349 20776 17690 10000 19031 15952 14698 13315 21967 17901 18562 14796 12553 17529 22541 18201 14028 15113 15864 14817 14263 19113 18866 18526 18095 15100 15316 23254 12678 17327 18616 22531 18751 17013 14607 15030 14176 19965 14447 22077 17401 17165 14588 18746 17478 13433 15783 16592 17722 15996 14476 15429 18690 15222 15632 15185 16061 13494 23034 16040 16509 14084 18853 16620 18850 15236 18924 16104 16364 15598 14396 16740 15751 13985 14067 21081 10000 12051 16207 9789 18453 15985 15653 16736 10704 13489 19575 17631 16358 15699 9889 20679 9788 17882 17091 22538 18257 9805 18980 21712 15957 10000 13531 9918 18070 22566 15578 13984 18763 13662 21317 17467 20497 17258 9751 20162 23889 23187 23306 22485 19243 15610 9930 16915 23540 23591 20547 9920 23398 21634 16012 20081 12562 10000 17000 19869 13238 16835 14673 22706 22001 14285 23054 10000 9787 23052 15583 10000 9920 18023 10000 16095 16645 18945 22814 13761 16012 18208 16383 22213 23274 22722 9778 15834 22050 10000 16230 19162 18675 18851 9930 18540 15421 23046 15774 20360 21099 20377 10000 22868 15440 17728 9838 18181 4.6 60.1 60.9 10139 9.5 10000 12.9 4.6 13467 12751 18066 10740 10000 10494 10000 10000 10626 10738 10000 10000 13523 10000 10000 10000 9425 10000 10000 9425 9869 9426 9938 10766 15743 14099 10000 10000 9425 9821 10000 9425 10000 10000 10000 10000 10000 23093 9920 56 0.1 5.50 32.5 7.1 10730 10750 10630 10000 10459 10000 10253 9875 10000 10069 10000 11985 10766 9949 10766 10000 10034 9768 10499 10000 10614 10000 10143 9861 10631 10716 9714 13316 10750 19601 32.0 12.4 13315 33.90 20680 10500 11968 9754 9938 9910 9885 9765 9906 9860 10480 9764 9866 12284 9819 10511 10482 9820 10645 10252 9890 9832 10000 13470 10412 9813 10472 10490 10490 13142 11507 14543 0.1 36.80 31.9 11922 13813 11752 11275 11486 10295 10000 10663 9912 9951 9826 12252 9764 12037 9832 11330 12012 12191 9910 14520 12219 9813 9902 11034 14640 10746 12223 60.9 15264 13860 13750 11984 13278 13697 12001 10602 12597 13284 13755 11293 9774 10000 13191 10995 9887 12729 19465 9922 13691 56 11789 31.8 0.1 39.3 13040 10000 12304 13815 13497 12240 11452 10917 18144 14870 13770 13471 13740 10000 12604 13785 11531 11977 23.2 0.1 16055 36.80 32.3 39.8 14439 4.6 14790 14590 14557 14789 12971 12817 14829 14121 11488 20766 13460 9936 12157 18212 13147 14749 12389 14748 10000 10750 19323 20637 19438 12661 17808 19058 21671 10000 20619 14394 16280 17502 20434 13479 19045 20451 15216 14126 0.1 11824 0.10 16742 14.10 16.2 14228 5.50 13873 0.1 9.5 32.3 10000 10497 11798 12.9 58.6 0.1 0.1 65.0 19455 13415 13808 13713 17346 10645 10459 10662 10744 10479 10634 10092 11582 10470 10610 10714 10093 10516 9930 10489 10553 10466 10831 10055 10735 9814 11030 10756 10602 10725 10651 10681 10879 10736 10345 12751 10132 10646 12635 10552 10830 10669 10665 10000 10597 10692 10913 10665 10693 10729 10722 10792 9879 10038 10783 10336 10821 10733 10691 10758 10496 10702 10157 9945 10809 10433 12648 10740 10555 10512 10121 10477 10653 10325 12738 9855 10778 10061 10167 11094 10835 10748 10800 10321 10309 10892 10450 12648 10537 11531 11433 10570 10762 10318 10338 10513 10761 10813 10111 10679 10755 10656 9961 10889 11636 10483 10306 10604 10000 10803 10435 10735 10760 9984 10831 10529 10488 12776 10810 10000 17765 16370 14687 12434 19265 17706 19011 19089 19183 11809 10004 15997 14229 13207 19528 17378 10450 10000 12124 0.1 13822 19380 23768 17828 19383 12169 19221 16330 13221 17829 11815 17581 14701 19220 16111 14131 10188 14.1 18161 11751 12715 15572 12808 18453 20809 23196 14753 16987 23531 11707 19318 21854 23538 23201 10000 20813 22314 40.0 14698 12906 40.0 10000 10000 10000 10000 10670 9.5 21 4.6 39.7 10666 10649 10614 13033 10416 10547 12.4 59.4 10.0 39.9 24.1 39.2 21.8 30.2 18319 9.90 10458 10452 12075 10434 13.2 13615 10431 33.90 27.9 0.0 11644 18348 11991 7.1 13529 12048 11863 19959 0.2 10000 10802 10391 12163 13870 13421 14263 20083 18282 18431 22490 15624 32.8 24960 13092 13375 16983 13379 12574 13485 27.4 3.5 4.6 58.7 12138 9.5 27.4 18109 12563 16769 13339 13264 12744 13079 13945 11.8 0.1 15697 10780 19644 13928 13756 13524 13861 19452 12.9 0.00 9.6 3.5 11635 0.0 0.2 65.0 8.4 12345 18218 21.1 1.3 0.2 12814 13097 4.6 14465 10497 5.5 10426 27.9 0.1 13.7 26.2 23775 9427 11081 14186 12067 13759 30.2 10440 12146 11775 10439 10468 10449 10445 10415 10462 10488 10398 12949 11306 10428 12648 10454 10420 10437 10424 10165 10468 10366 10424 10369 10542 12063 11999 10462 10450 10418 10407 10454 11664 10450 10480 10495 10419 11767 12101 10370 11704 10429 10443 10520 11661 11717 10411 10478 10431 10432 10406 10076 10747 10423 10503 9811 10439 11417 10397 10502 10454 11700 10483 10526 11078 10406 10459 11494 10470 10446 12117 10429 11702 10420 11188 10454 10421 10476 10420 10491 10168 10755 10000 13118 10430 10360 10419 10453 10466 11663 10000 10359 10370 10367 10611 12710 10419 10522 10452 10397 10435 10471 11632 10453 10444 10473 11759 10283 11792 11784 10499 10393 11171 10483 10521 10401 10466 19104 16618 18270 12021 18189 19349 33.90 16.7 60.9 15172 13285 18174 17085 15651 17951 10000 18407 11221 10525 9.5 13061 30.2 31.7 15737 17179 18080 10000 22282 18306 58.6 52.2 10.0 13936 22150 10000 21743 12166 17621 20054 10000 14935 4.6 12132 58.6 10000 11896 13194 61.0 13698 12452 10581 19354 18.20 58.6 1.5 4.6 16522 59.5 10455 0.3 11754 10491 0.1 14492 10000 15066 12837 9.5 61.0 4.6 10389 1.3 11302 39.8 13194 12418 4.6 14024 19.8 13684 8.4 32.0 4.6 0.1 10492 19.8 19479 19193 10472 9.90 5.5 19530 10 10612 24.1 15525 10507 12762 43.1 39.1 36.7 26.2 10000 36.7 0.1 0.2 5.9 30.4 10488 10 10000 15008 9.6 26 14680 12068 11776 12175 12168 11301 11623 12135 11397 13630 11968 12147 13074 13418 11331 12114 13842 11654 13398 11955 11971 12132 12154 11834 12445 11252 10897 12235 12189 11916 11514 11477 12055 11896 11742 13885 11424 11414 11813 11927 12199 11331 12839 11848 11733 12608 11872 12203 13431 11529 12877 11764 10922 12096 11656 12187 12010 12304 12067 11550 11798 11480 11634 9788 11358 11377 10377 11707 11809 11212 12209 10965 12259 11290 11837 10967 10930 11314 11906 10676 11916 13313 12009 11017 11889 12196 12215 11324 13268 12263 13546 10667 11500 11403 12148 9749 11714 11294 12128 9830 11956 11969 13088 11951 12903 11779 11745 12068 10469 13210 11763 12155 11829 12055 12096 11095 12221 11765 13594 11724 11963 12918 14.6 11543 13655 0.1 56.6 38.5 17375 0.0 60.9 10259 0.1 16303 12945 16337 9.5 11396 13731 14420 0.1 10000 10728 10404 12041 13372 13475 14496 19359 17952 18120 21512 14.4 36.7 16435 18402 18775 21.1 2.8 4.6 10000 7.2 26.2 13.2 10000 10679 18222 11874 19.8 10511 19.8 12897 15397 39.6 9.9 17402 11893 39.6 14372 12782 26.2 10797 10054 9940 27 5.9 20192 11379 10.0 10.0 13382 10364 24981 39.9 39.5 7.5 3.5 12158 13.7 20.0 39.7 1.5 31.9 10.0 0.0 12621 13996 11857 13130 12091 11247 12786 12195 12282 13019 13570 14025 13237 13370 13365 12313 12581 11305 11455 14166 11832 13423 13928 11910 13104 14087 13667 13707 12660 11598 12331 12290 13652 12920 11754 12954 12970 12876 12089 13913 13690 13144 13250 13764 13155 13570 11259 13421 13648 12838 12559 11523 13513 13624 13141 12505 9813 11292 9874 11982 12197 12927 14011 13878 13770 12799 12744 13109 13500 12459 11979 13365 13384 12733 11975 14561 13297 12308 12330 12203 12018 11877 13968 12738 11689 12031 13518 12049 12603 11992 13552 12888 13447 14433 13699 13425 12118 13629 13232 13938 14094 14406 14512 14529 13499 12166 12540 13610 12698 13821 11177 12868 13769 13152 14394 13682 11808 12641 12816 13014 0.0 27.9 13270 38.6 15712 14617 1.5 7.2 13268 44.8 13.7 23.0 14359 0.2 10543 4.6 16303 18292 12502 14093 22305 1.5 2.6 17081 11607 11746 36.7 17071 19.8 13518 12880 14743 19582 10519 0.1 18330 1.5 13827 0.1 10041 56.6 17.1 0.10 15715 0.1 10334 0.0 12.4 40.0 10.00 56.6 39.9 10432 19.8 5.0 10000 23.0 56 18649 0.1 59.4 11504 0.2 23.7 0.2 3.5 19410 9.4 32.3 12858 13628 12592 13253 12801 14503 13556 13452 13540 13055 13585 12422 13701 17267 13489 14214 10000 14988 11533 12407 14210 11759 14295 13352 13108 11587 13553 12251 13064 12082 18845 9849 11646 12804 13482 13080 13826 13293 13038 12389 12242 14255 12007 12606 11582 10000 14188 12226 13181 12843 11688 13372 11942 13204 13412 12556 13964 12504 14586 12580 15516 12321 18608 12150 12476 13768 12682 13771 12894 12324 12742 12214 13347 12964 13646 12852 13282 13486 12688 13599 13029 12745 13535 12730 12317 13452 13491 14613 9782 13667 12832 13070 13525 12311 13738 12172 13709 13143 12154 13353 13307 13377 14052 12620 13585 13324 14110 12933 13727 12708 13418 12868 11643 18124 12971 10480 19.8 16460 27.2 10747 40.0 12041 10580 0.0 11723 9.9 10000 12291 26.2 16.7 0.2 39.2 10000 39.9 24.1 40.0 23.7 14829 14620 9.9 15143 16537 9.4 38.6 10578 3.5 10451 14093 10528 17569 13289 17569 10488 12.4 12402 52.2 13716 27 5.5 26.2 26.20 11.8 2.8 14765 0.2 1.5 13136 10.0 16130 5.0 5.5 13366 31.8 12.7 39.6 59.5 4.6 0.0 13191 3.8 10415 58.7 59.5 31.5 7.5 11596 30.2 3.5 13851 10634 0.2 10000 0.1 14656 14387 12188 20338 12913 14330 14036 19923 14748 15988 13669 16839 14620 13327 14523 12987 13522 17174 14284 12504 13411 14711 19058 13776 13826 19278 14126 19749 13150 13875 14350 13968 13115 13729 14659 13317 14173 18307 14544 19888 14476 12727 17504 13489 14281 14554 14695 17384 14710 13891 13115 12948 12283 20086 20278 14984 12907 14390 13617 14128 13476 14417 12993 19353 14327 13222 14460 19564 14799 20219 13599 14418 19413 15505 13888 12898 13887 14430 14253 13642 13689 13422 13701 14150 13201 14337 14088 13681 13615 14533 13349 14576 12222 14244 13962 14577 13310 20207 17017 13550 12961 12690 13905 13262 16674 13635 12916 13949 14206 14214 15935 12413 11.8 12857 4.6 1.5 23.7 50.8 10000 19443 30.9 15126 39.8 0.1 32.8 27.9 20678 39.6 12319 30.9 27 32.9 13425 39.2 0.2 9956 11689 13359 12952 13801 19465 17756 17953 21922 10000 0.1 21.1 4.6 4.6 31.7 10677 14884 10425 15740 0.3 9.9 10000 60.3 14798 3.5 0.2 12713 32.5 7.5 13012 11407 0.0 4.6 4.6 14.6 34.9 13990 12502 10432 30.9 4.6 11426 0.1 12401 18620 11741 21.0 10590 14815 0.3 39.80 5.5 20 0.2 15220 16459 13977 15272 15917 18928 15089 15474 19800 14475 17308 17715 19957 20107 19487 17431 20100 20624 20546 16180 17794 15576 17624 14036 16089 12474 16804 20432 18729 15896 21073 18368 18494 16933 15326 17688 13202 14414 18829 17498 20413 17357 20139 16745 17355 20497 19552 16350 17858 14993 18831 16624 16177 15827 18894 18507 17273 15495 18101 18281 13551 20157 13502 18602 20858 15220 17080 20712 15600 17847 17165 20217 15949 16446 17852 17194 19217 18415 17053 16477 18046 11810 19358 14480 14337 17921 18925 17405 19929 17659 16342 13817 17973 11886 15396 19694 14934 20324 18285 18770 15922 12207 20283 20310 15809 13719 18645 15439 18912 13432 15298 15543 9983 11902 13399 23.2 15647 10000 26.20 23720 0.1 31.5 1.5 15382 10000 10739 32.5 12653 5.50 5.50 24040 14.1 2.6 3.5 1.5 18763 23.0 32.0 10471 15957 19.8 20624 39.7 16651 36.80 16597 3.5 0.1 15181 4.6 17349 18412 14758 10000 0.0 13.2 10337 7.5 5.9 12110 32.9 10766 15491 12430 32.0 19820 12.9 21 14593 34.9 39.9 7.5 32.3 11336 12600 13.2 39.6 14.4 18283 39.6 7.1 4.6 44.8 2.6 7.5 13486 13931 7.1 17029 15329 13407 18450 14238 14405 14884 18315 18992 15365 15244 15191 14331 17551 14159 18600 16596 17600 18980 16200 17252 15864 15685 14507 16618 17300 20412 18439 15072 15484 15717 16331 20545 17208 14357 18088 18648 14652 19078 14780 15286 18554 18326 18681 14048 15441 14893 17896 12655 15170 14233 18182 18525 16973 15751 16381 18550 18236 17012 17384 18090 18417 15534 12529 19738 13456 17288 15935 14881 18530 16004 17099 18899 17699 12512 17836 18688 11943 19100 21032 18904 14048 16084 14535 18039 17533 18303 15618 16715 18851 15901 19122 18425 15583 15188 15765 18939 16041 18028 11968 14143 14763 16511 16714 18683 12731 15658 13966 14483 16948 14012 18699 18.20 27.2 14962 17710 7.2 21 60.1 12736 32.8 1.5 12152 10465 13451 10.0 17175 13667 10.0 18649 13706 12156 27.9 60.1 4.6 24.1 65.0 7.5 10000 4.6 11723 12.7 0.0 7.5 31.9 17.1 7.2 0.1 39.5 26 27.2 14334 23.2 10226 23605 10489 16080 10 39.9 10.00 0.1 0.0 12.9 10 16748 13972 13257 0.1 3.5 0.1 44.8 14198 13168 59.4 12.4 32.8 13655 12349 11329 39.6 4.6 14845 39.8 26.2 21 14125 14840 39.6 12225 13.7 0.1 9.5 0.0 11705 10000 11254 16224 23737 30.4 10651 0.10 12.9 9.5 39.9 16112 21.8 0.1 10000 0.1 39.1 15557 36.7 12887 39.6 5.50 40.0 10088 23.0 0.1 21081 18621 10479 0.1 27.2 12220 60.3 4.6 0.2 32.8 0.0 0.1 10.0 0.2 9.9 15351 18479 52.2 12462 11409 0.1 0.0 15578 22307 32.8 61.0 2.8 10000 58.7 15901 16189 5.5 10000 14.4 0.2 12313 0.10 11110 27.9 0.1 18.20 18427 23.7 4.6 15448 30.2 16631 40.0 1.5 11022 19438 7.5 10000 24.0 39.6 11155 12653 10504 14845 7.5 7.5 19407 0.2 14.10 10369 11484 61.0 21.1 21.8 11434 34.9 3.5 16.2 59.5 13875 13.7 0.1 0.1 52.2 15383 4.6 34.9 9.1 10000 12046 0.1 16.7 11045 11534 19.8 39.6 14622 16916 12246 5.0 31.5 32.8 36.7 12783 2.8 10000 0.3 4.6 3.8 39.3 10515 17937 10472 13582 11885 39.80 10000 17295 11183 19245 21575 0.1 0.2 0.1 10750 15560 39.5 7.5 16.7 10607 10000 15833 15558 11.8 27.9 16640 10000 39.6 4.6 3.5 10000 30.2 27.9 19807 10449 56.6 0.3 38.5 16.2 12806 14.6 10000 32.5 13371 0.1 15384 0.1 11347 32.8 11310 10509 12801 8.4 10000 22182 13170 5.9 15746 39.5 0.1 10351 4.6 19.8 4.6 39.1 39.2 13680 60.3 60.1 4.6 10155 36.80 3.8 60.3 0.1 24529 58.7 9.5 7.1 14554 14.6 10444 65.0 9.5 10.0 38.6 0.0 10542 12353 13.7 39.7 19503 7.5 0.1 13.2 0.1 14161 14.1 16130 10000 0.1 23.2 17344 43.1 10619 10445 10374 19.8 17461 16325 4.6 0.1 7.5 0.0 21.1 4.6 0.0 9.1 52 12179 10474 13307 40.0 24.0 10494 39.8 0.2 19.8 40.0 10000 39.7 4.6 56 10.0 3.5 0.2 1.5 21.8 0.0 21434 15252 11211 27.9 0.1 5.5 52.0 27.4 9.9 16052 17530 12881 12402 11725 2.6 0.1 32.9 27.0 0.1 9.5 16957 14.4 0.1 15533 12446 17382 39.3 30.2 12106 31.7 17931 9888 8.4 14628 14.1 1.5 14.1 52.0 0.3 24.0 16406 5.50 4.6 4.6 12685 31.8 14.1 0.1 10479 18.20 21.0 4.6 4.6 4.6 5.0 9.4 12256 50.8 0.2 39.2 20.0 19.8 0.1 0.1 39.8 22184 14414 12343 12.9 9.4 43.1 4.6 12.9 10510 38.5 11619 0.3 59.4 10477 9.1 16226 10498 27.9 10000 12020 40.0 12.7 12965 17.1 0.0 9.1 11924 0.1 27.9 12.7 20786 4.6 30.9 43.1 0.1 4.6 31.9 3.5 0.00 10509 0.1 10303 20030 14088 19198 21438 15684 0.1 12174 36.7 31.8 5.5 1.5 10309 16779 0.1 0.3 39.9 30.4 10000 0.1 20 13354 13750 13365 50.8 27.9 39.9 26 12309 13805 11934 10632 12100 52 11428 14710 0.2 10798 31295 18176 32.9 15585 11186 11754 11950 13.7 38.6 52.2 1.3 4.6 5.50 0.1 0001084380 false 0001084380 tcf:SAndPTargetDate2035IndexMember 2023-05-31
UNITED STATES
SECURITIES AND EXCHANGE COMMISSION
Washington, D.C. 20549
FORM N-CSR
CERTIFIED SHAREHOLDER REPORT OF REGISTERED
MANAGEMENT INVESTMENT COMPANIES
| | |
| Investment Company Act file number | | 811-09301 |
TIAA-CREF Funds
(Exact name of registrant as specified in charter)
730 Third Avenue
New York, New York 10017-3206
(Address of principal executive offices) (Zip code)
Jeremy D. Franklin, Esq.
TIAA-CREF Funds
8500 Andrew Carnegie Boulevard
Charlotte, North Carolina 28262-8500
(Name and address of agent for service)
Registrant’s telephone number, including area code: (704) 595‑1000
Date of fiscal year end: May 31
Date of reporting period: May 31, 2024
| Item 1. | Reports to Stockholders. |
| | |
 | | Annual Shareholder Report May 31, 2024 |
Nuveen Lifecycle 2010 Fund
(Formerly known as TIAA-CREF Lifecycle 2010 Fund)
Retirement Class Shares/TCLEX
Annual Shareholder Report
This annual shareholder report contains important information about the Retirement Class Shares of the Nuveen Lifecycle 2010 Fund for the period of June 1, 2023 to May 31, 2024. You can find additional information at https://www.nuveen.com/en‑us/mutual‑funds/prospectuses. You can also request this information by contacting us at (800) 257‑8787.
This report describes changes to the Fund that occurred during the reporting period.
What were the Fund costs for the last year? (based on a hypothetical $10,000 investment)(1)
| | | | |
| | | Cost of a $10,000 investment | | Costs paid as a percentage of
$10,000 investment |
| Retirement Class Shares | | $51 | | 0.51% |
(1) These costs include the expenses of underlying funds in which the Fund invests except for the expenses of the Nuveen Dividend Growth Fund, Nuveen Dividend Value Fund, Nuveen Growth Opportunities ETF and TIAA-CREF Real Property Fund.
How did the Fund perform last year? What affected the Fund’s performance?
| | |
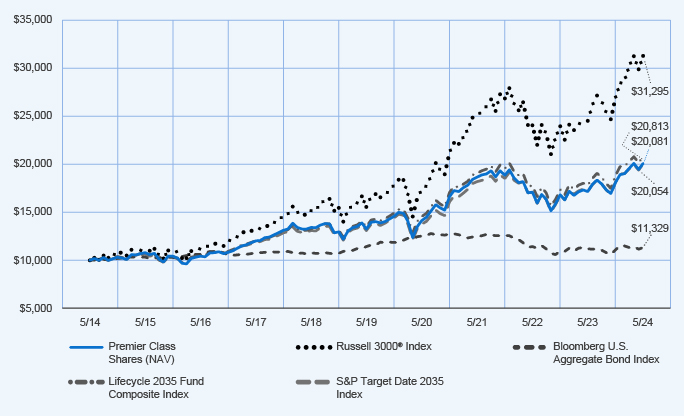
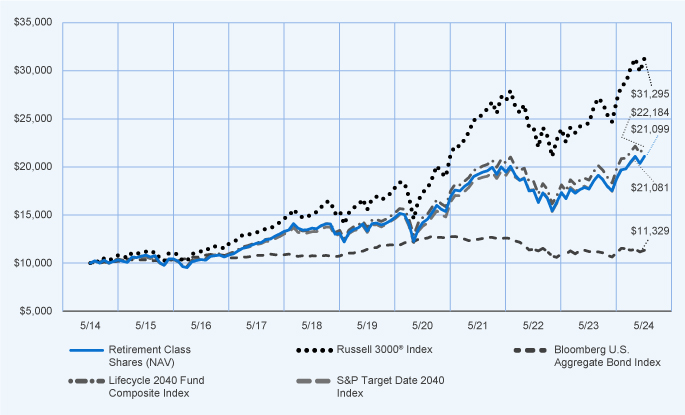
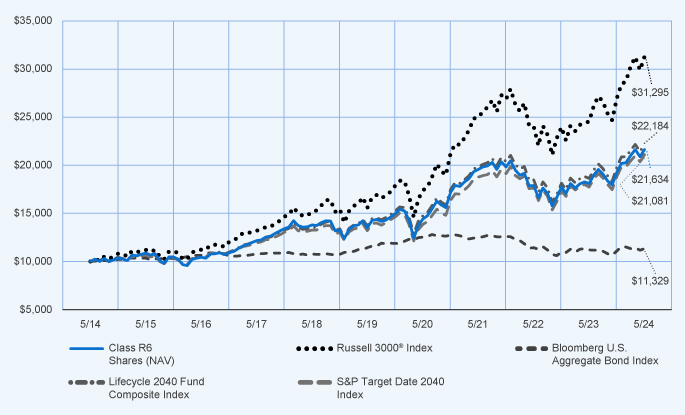
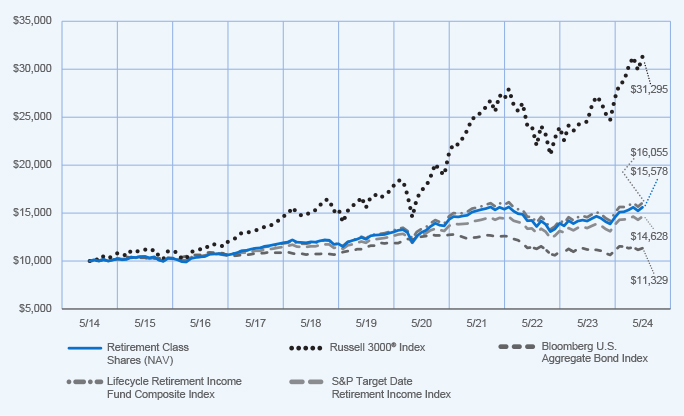
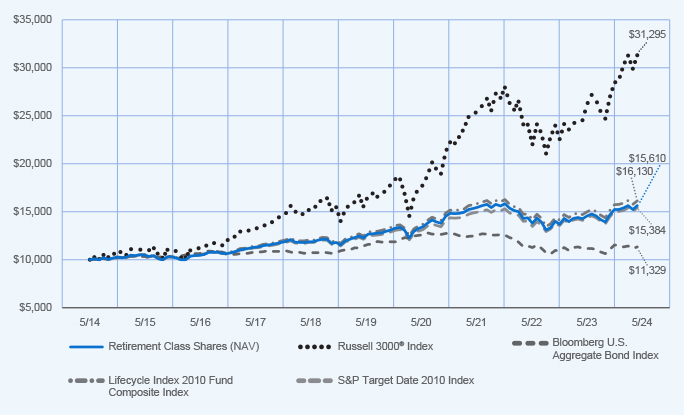
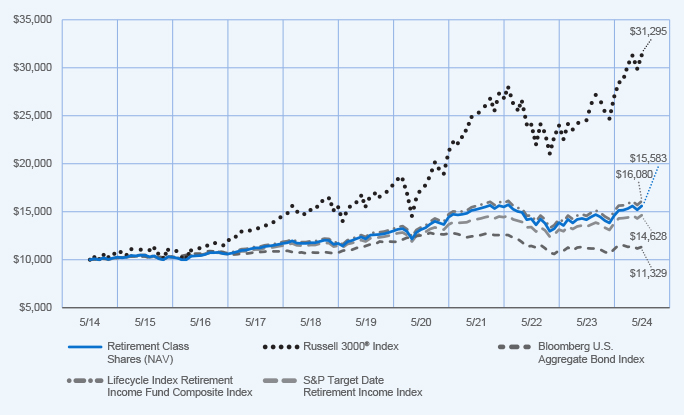
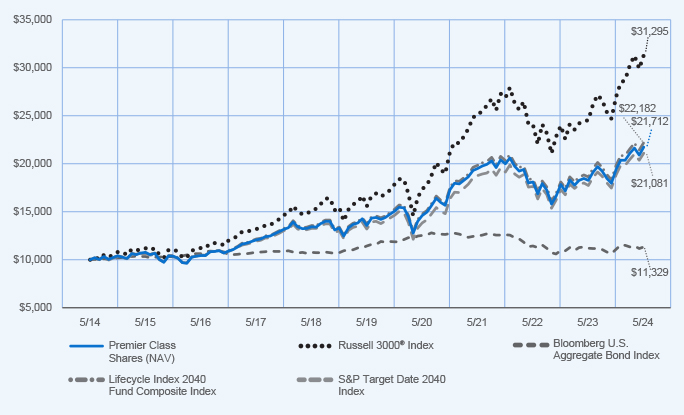
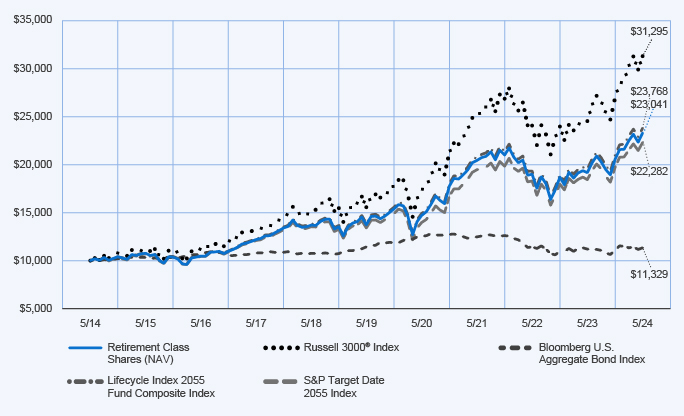
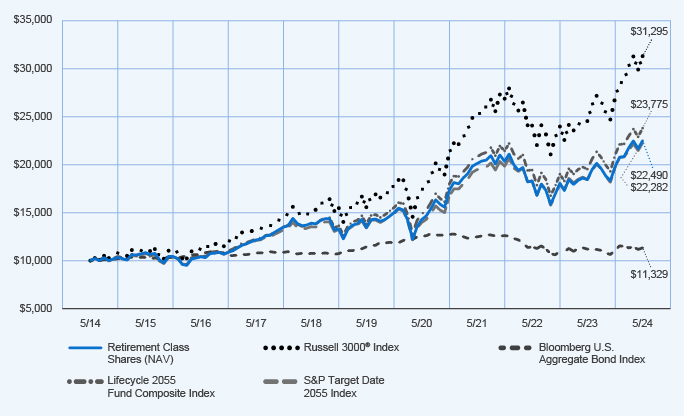
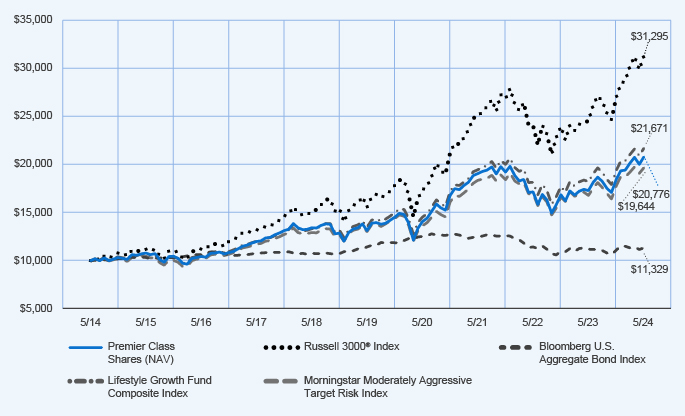
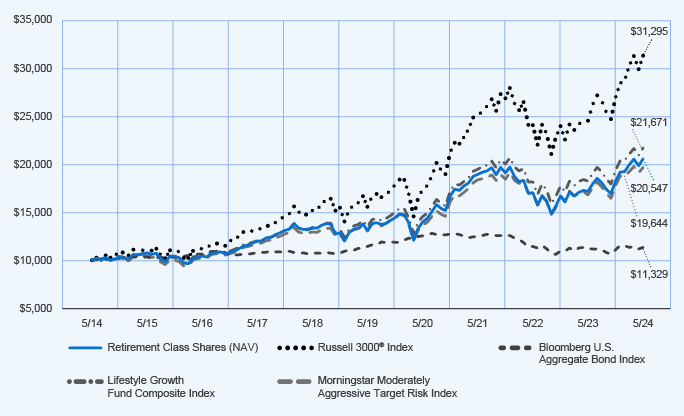
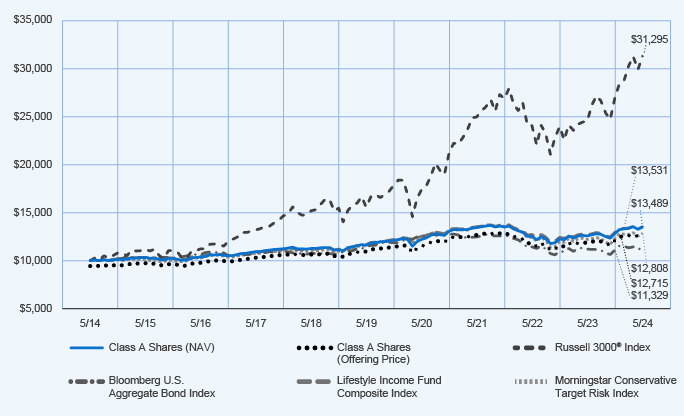
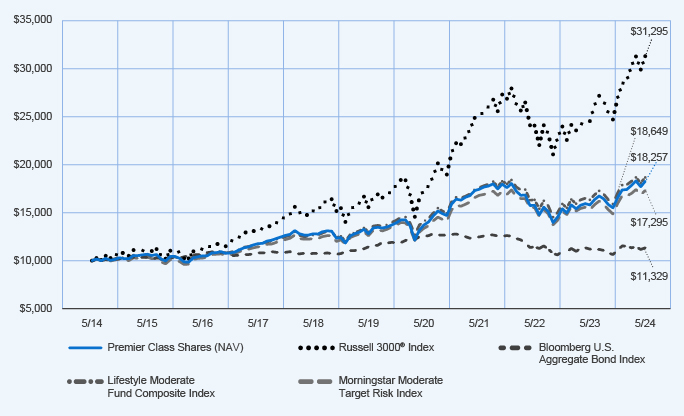
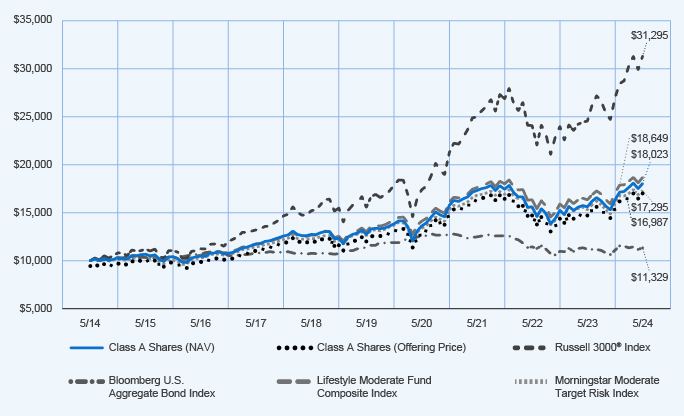
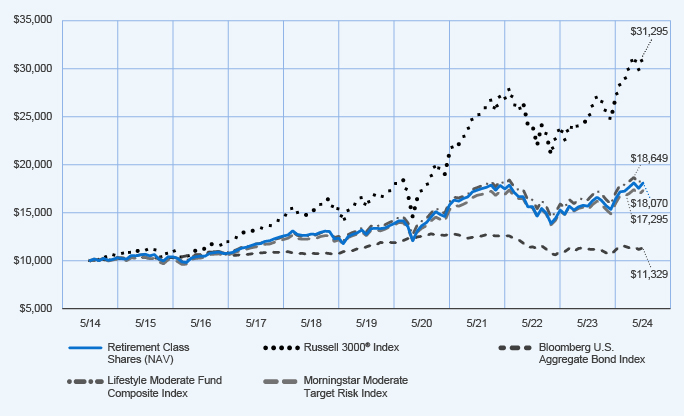
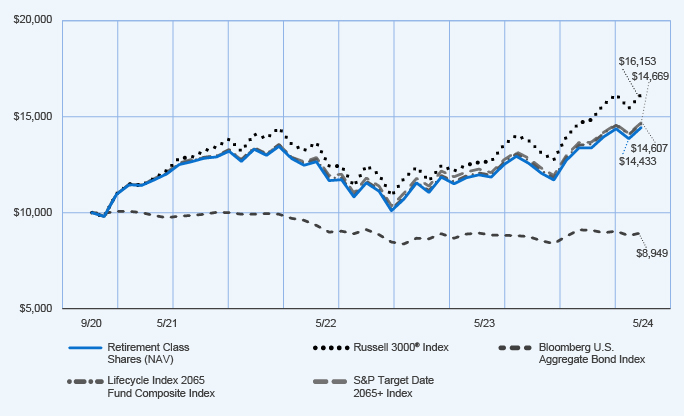
Performance Highlights • The Nuveen Lifecycle 2010 Fund returned 10.11% for Retirement Class shares at net asset value (NAV) for the 12 months ended May 31, 2024. The Fund outperformed the Lifecycle 2010 Fund Composite Index, which returned 9.75%. • The Lifecycle 2010 Fund Composite Index consisted of: 40.0% Bloomberg U.S. Aggregate Bond Index; 23.5% Russell 3000® Index; 12.6% MSCI All Country World Index ex USA Investable Market Index; 13.9% Bloomberg U.S. 1–3 Year Government/Credit Bond Index; and 10.0% Bloomberg U.S. Treasury Inflation Protected Securities (TIPS) 1-10 Year Index. • Top contributors to relative performance » Strong performance of the underlying funds investing in fixed income, led by the Nuveen Core Bond Fund and the Nuveen Core Plus Bond Fund. » Strong overall performance of the underlying funds investing in U.S. equities, led by the Nuveen Core Equity Fund. • Top detractors from relative performance » An allocation to the Nuveen Real Property Fund LP. » A position in the Nuveen International Opportunities Fund. | | Performance Attribution  Nuveen Core Bond Fund Nuveen Core Plus Bond Fund Nuveen Core Equity Fund  Nuveen Real Property Fund LP |
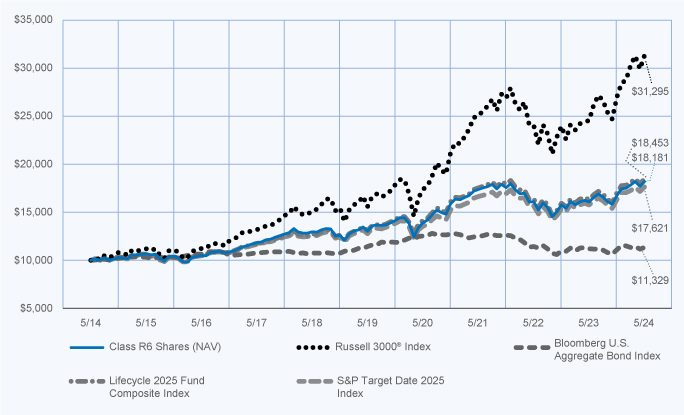
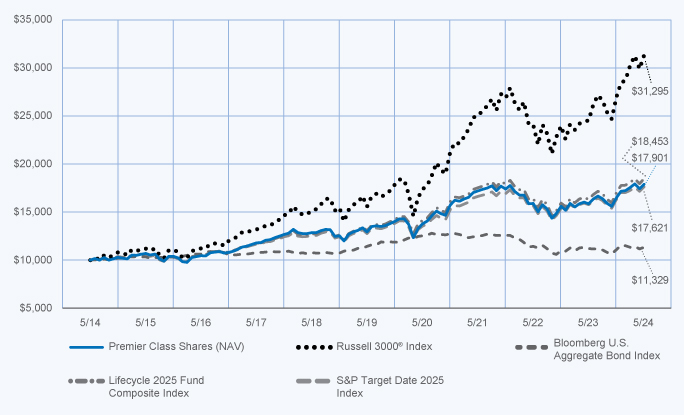
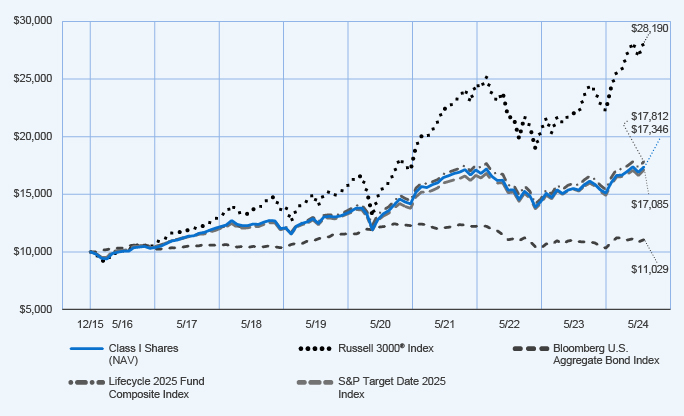
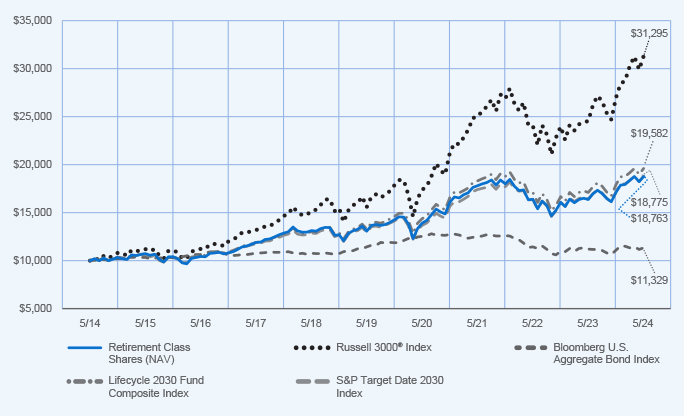
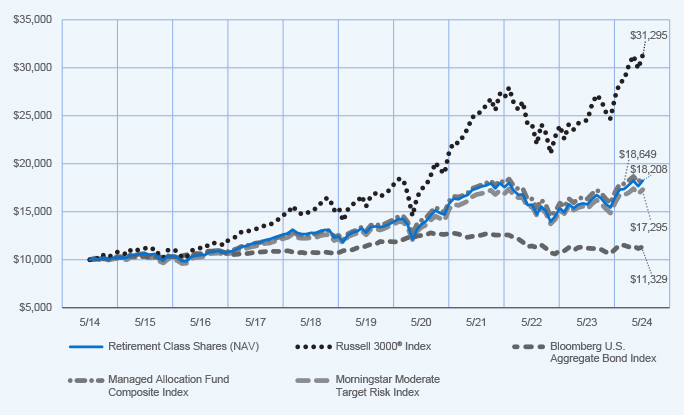
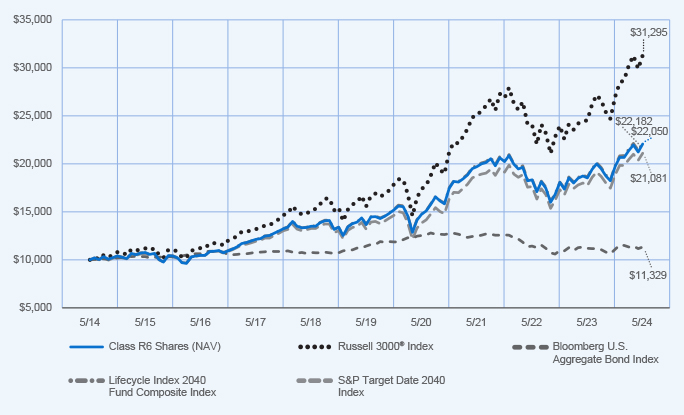
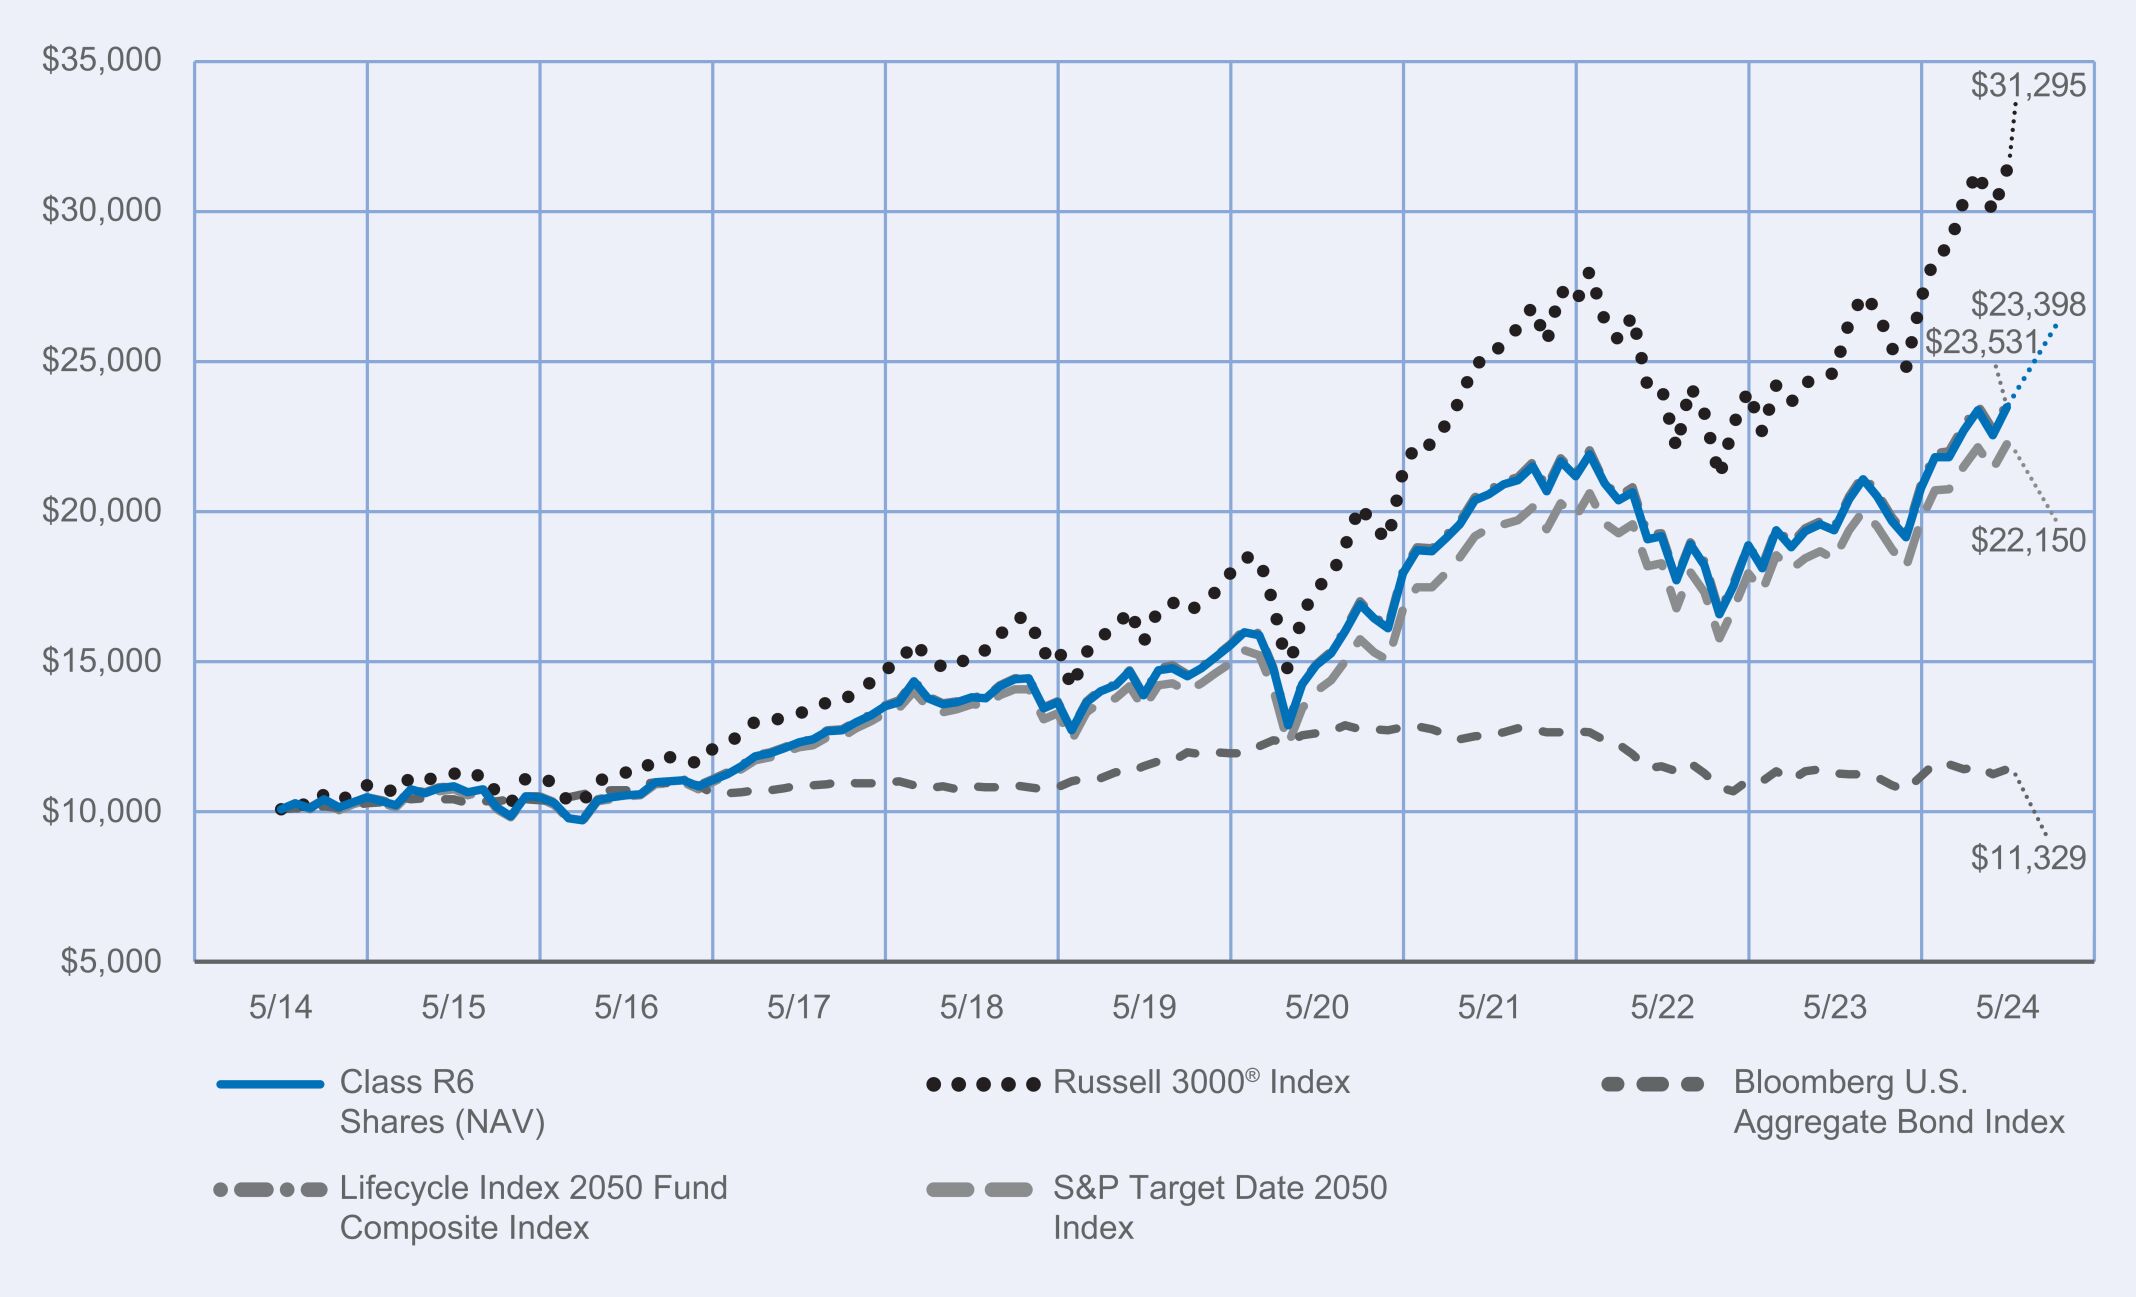
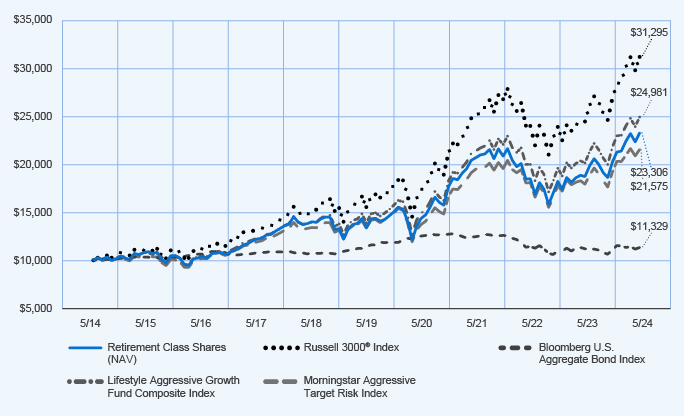
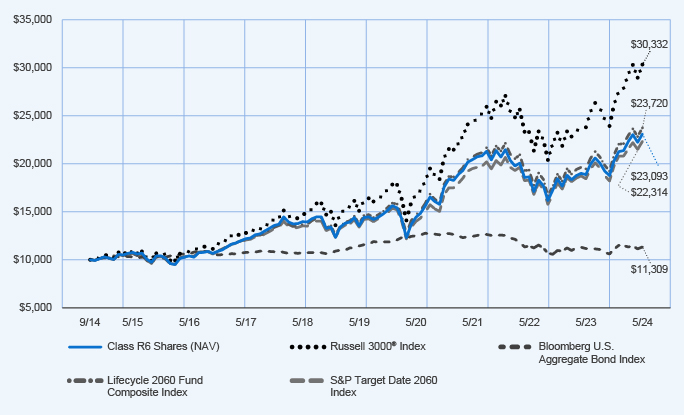
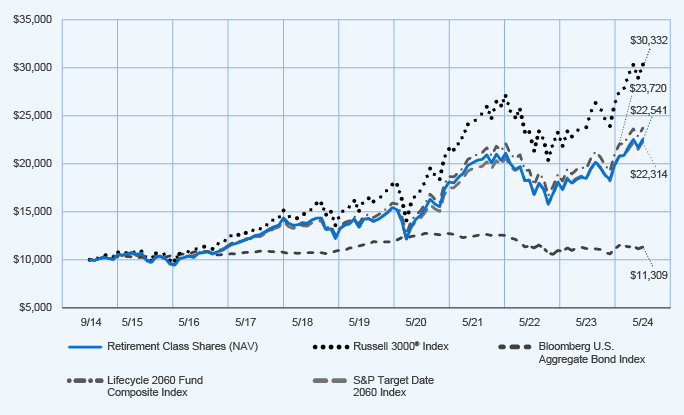
How did the Fund perform over the last 10 years?
Performance data shown represents past performance and does not predict or guarantee future results. The graph and table do not reflect the deduction of taxes that a shareholder would pay on Fund distributions or redemption of Fund Shares.
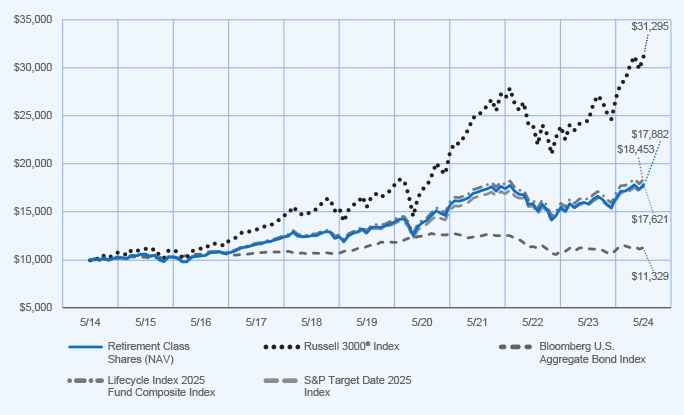
Fund Performance (June 1, 2014 through May 31, 2024) Initial Investment of $10,000
Average Annual Total Returns
| | | | | | | | | | | | |
| | | 1 year | | | 5 years | | | 10 years | |
| Retirement Class Shares at NAV | | | 10.11 | % | | | 4.96 | % | | | 4.64 | % |
Russell 3000® Index | | | 27.58 | % | | | 15.00 | % | | | 12.09 | % |
| Bloomberg U.S. Aggregate Bond Index | | | 1.31 | % | | | (0.17 | )% | | | 1.26 | % |
| Lifecycle 2010 Fund Composite Index | | | 9.75 | % | | | 5.32 | % | | | 4.89 | % |
| S&P Target Date 2010 Index | | | 9.20 | % | | | 4.91 | % | | | 4.40 | % |
Investment return and principal value will fluctuate, and you may have a gain or loss when you sell your shares. Current performance may differ from figures shown. For most recent month‑end performance, go to https://www.nuveen.com/en-us/mutual-funds/prospectuses or call (800) 257‑8787.
Fund Statistics (as of May 31, 2024)
| | | | |
| Fund net assets | | $ | 804,466,356 | |
| Total number of portfolio holdings | | | 21 | |
| Portfolio turnover (%) | | | 14% | |
| Total advisory fees paid for the year | | $ | 3,211,719 | |
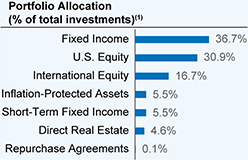
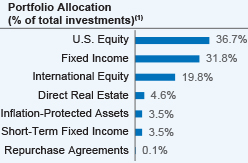
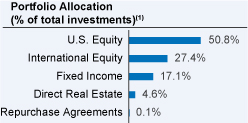
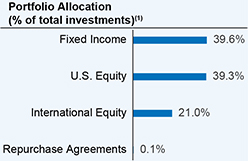
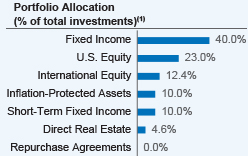
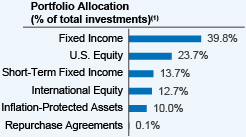
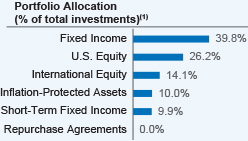
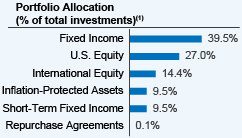
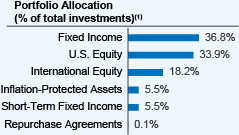
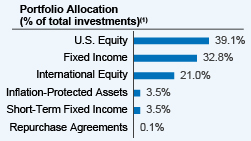
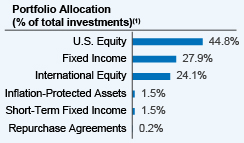
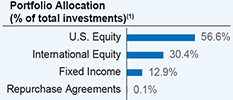
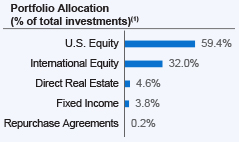
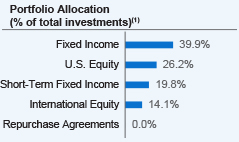
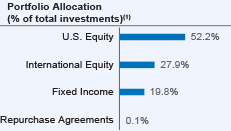
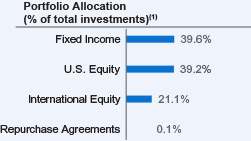
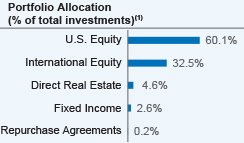
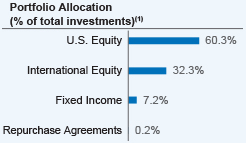
What did the Fund invest in? (as of May 31, 2024)
(1) Affiliated investment companies, except for repurchase agreements.
How has the Fund changed?
| | • | | Name change: Effective May 1, 2024, the Fund’s name changed from TIAA-CREF Lifecycle 2010 Fund to Nuveen Lifecycle 2010 Fund. | |
For more complete information, you may review the Fund’s next prospectus, which is expected to be available by October 1, 2024 at https://www.nuveen.com/en‑us/mutual‑funds/prospectuses or upon request at (800) 257‑8787.
Availability of additional information about the Fund
You can find additional information about the Fund at https://www.nuveen.com/en‑us/mutual‑funds/prospectuses, including its:
| | • | | prospectus • financial statements and other information • fund holdings • proxy voting information |
You can also request this information at (800) 257‑8787.
| | |
87244W458_AR_0524 3613681-INV-Y-07/25 (I, R6, Premier, Retirement) | | |
| | |
| | Annual Shareholder Report May 31, 2024 |
Nuveen Lifecycle 2010 Fund
(Formerly known as TIAA-CREF Lifecycle 2010 Fund)
Class R6 Shares (Formerly known as Institutional Class Shares)/TCTIX
Annual Shareholder Report
This annual shareholder report contains important information about the Class R6 Shares of the Nuveen Lifecycle 2010 Fund for the period of June 1, 2023 to May 31, 2024. You can find additional information at https://www.nuveen.com/en‑us/mutual‑funds/prospectuses. You can also request this information by contacting us at (800) 257‑8787.
This report describes changes to the Fund that occurred during the reporting period.
What were the Fund costs for the last year? (based on a hypothetical $10,000 investment)(1)
| | | | |
| | | Cost of a $10,000 investment | | Costs paid as a percentage of
$10,000 investment |
| Class R6 Shares | | $26 | | 0.26% |
(1) These costs include the expenses of underlying funds in which the Fund invests except for the expenses of the Nuveen Dividend Growth Fund, Nuveen Dividend Value Fund, Nuveen Growth Opportunities ETF and TIAA-CREF Real Property Fund.
How did the Fund perform last year? What affected the Fund’s performance?
| | |
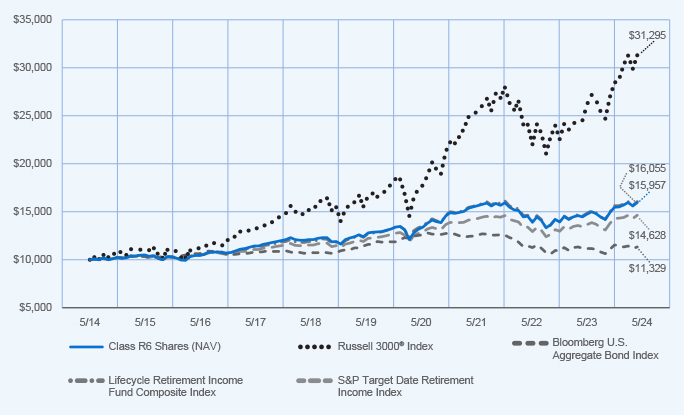
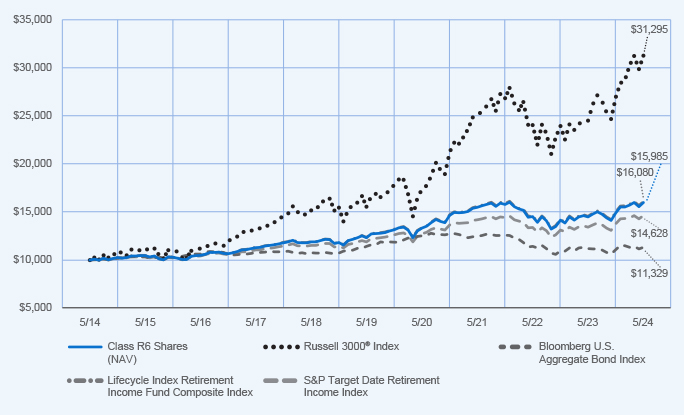
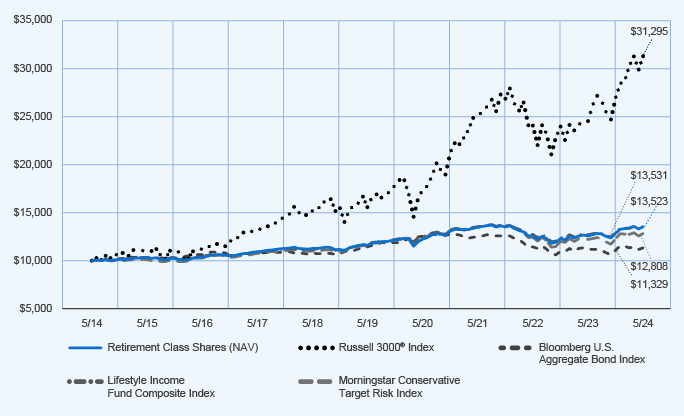
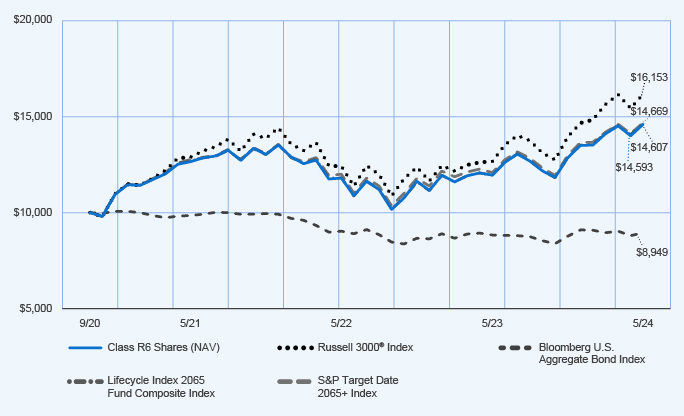
Performance Highlights • The Nuveen Lifecycle 2010 Fund returned 10.31% for Class R6 shares at net asset value (NAV) for the 12 months ended May 31, 2024. The Fund outperformed the Lifecycle 2010 Fund Composite Index, which returned 9.75%. • The Lifecycle 2010 Fund Composite Index consisted of: 40.0% Bloomberg U.S. Aggregate Bond Index; 23.5% Russell 3000® Index; 12.6% MSCI All Country World Index ex USA Investable Market Index; 13.9% Bloomberg U.S. 1–3 Year Government/Credit Bond Index; and 10.0% Bloomberg U.S. Treasury Inflation Protected Securities (TIPS) 1-10 Year Index. • Top contributors to relative performance » Strong performance of the underlying funds investing in fixed income, led by the Nuveen Core Bond Fund and the Nuveen Core Plus Bond Fund. » Strong overall performance of the underlying funds investing in U.S. equities, led by the Nuveen Core Equity Fund. • Top detractors from relative performance » An allocation to the Nuveen Real Property Fund LP. » A position in the Nuveen International Opportunities Fund. | | Performance Attribution Nuveen Core Bond Fund Nuveen Core Plus Bond Fund Nuveen Core Equity Fund Nuveen Real Property Fund LP |
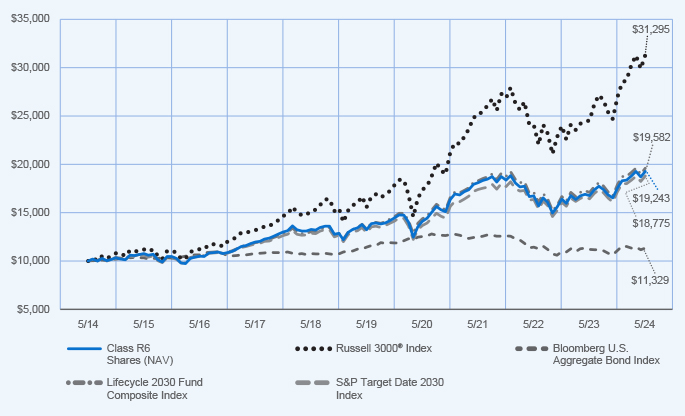
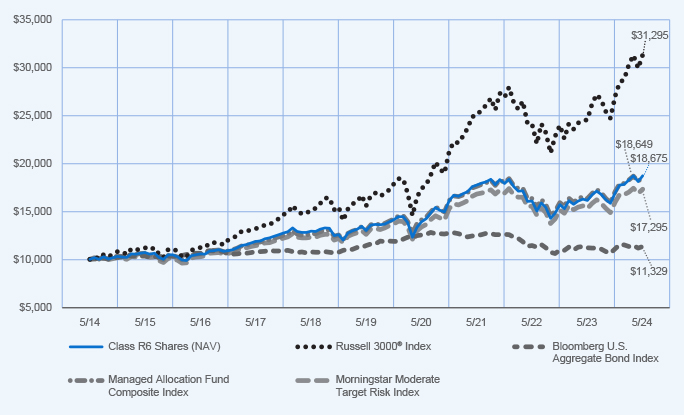
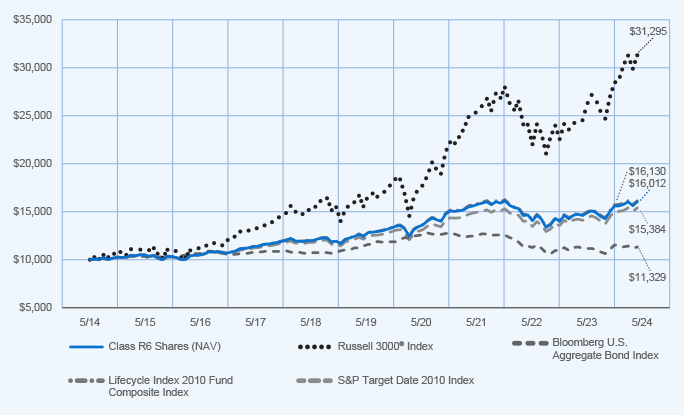
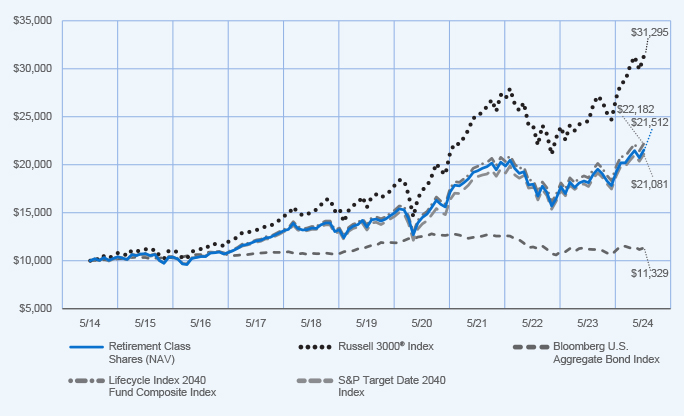
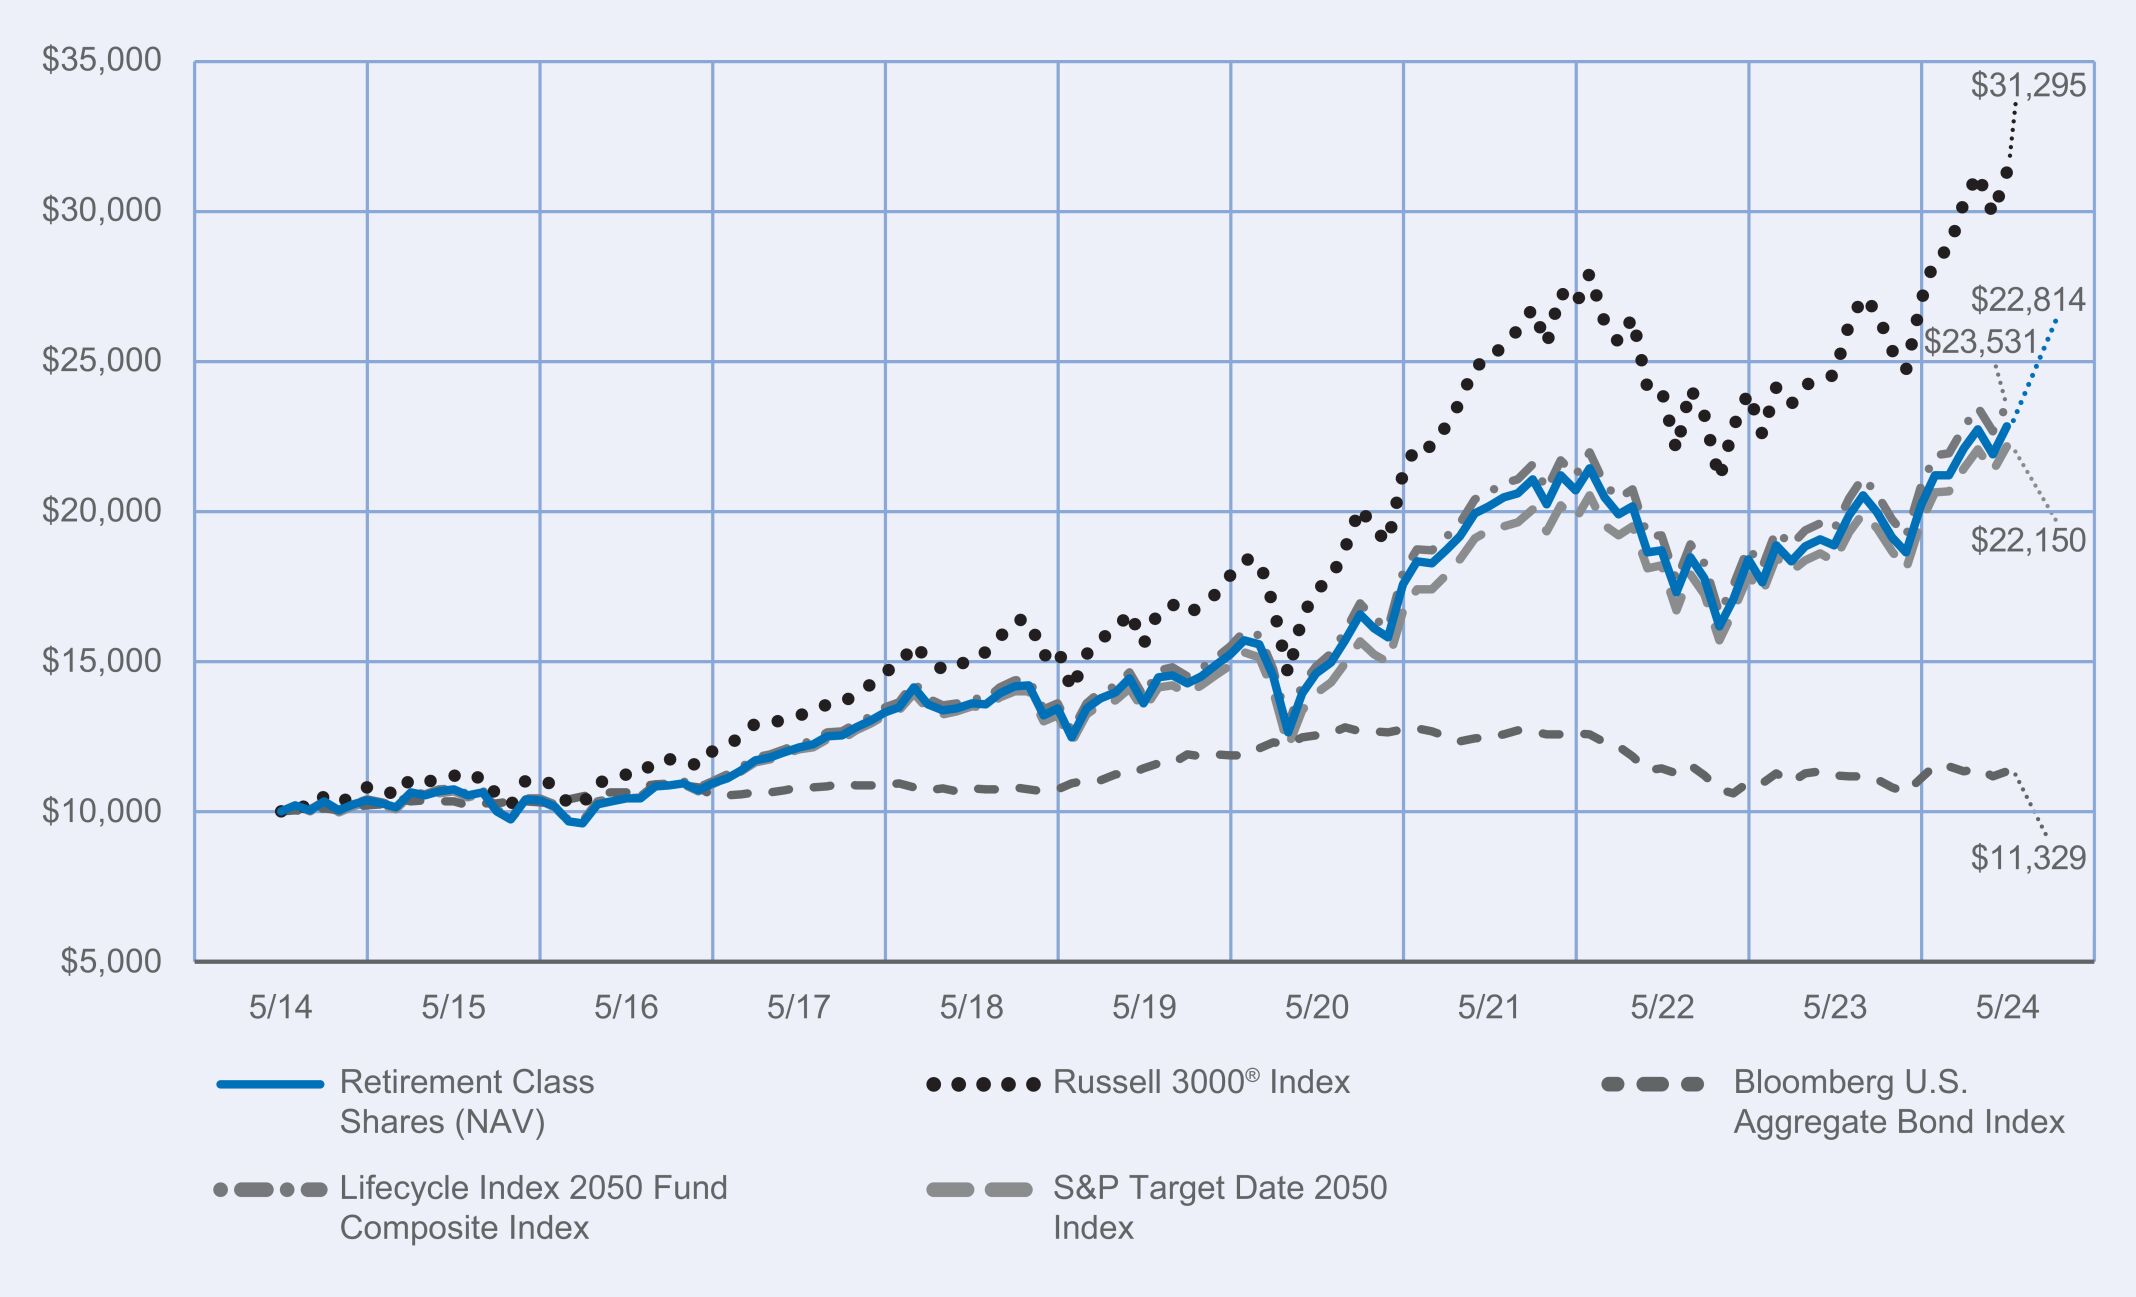
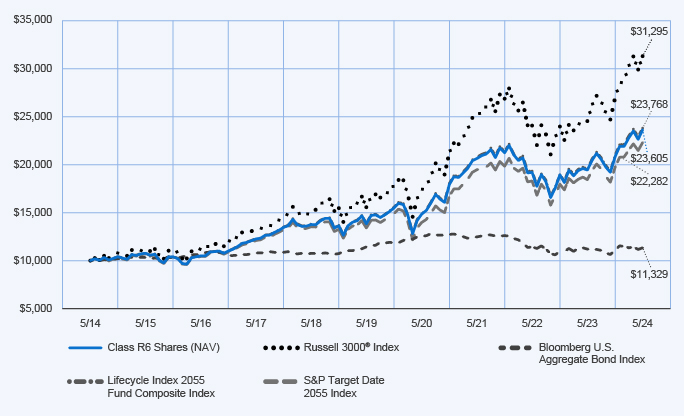
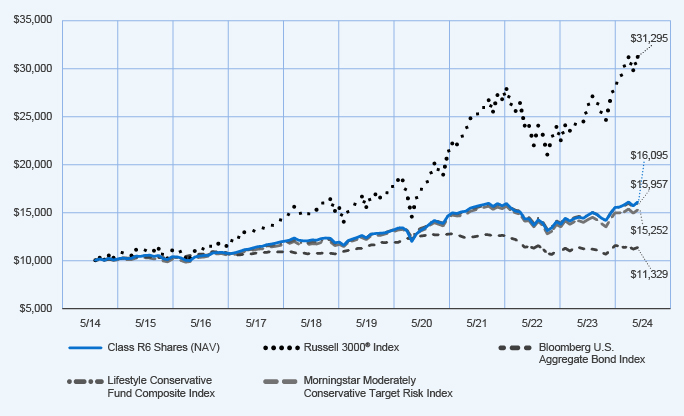
How did the Fund perform over the last 10 years?
Performance data shown represents past performance and does not predict or guarantee future results. The graph and table do not reflect the deduction of taxes that a shareholder would pay on Fund distributions or redemption of Fund Shares.
Fund Performance (June 1, 2014 through May 31, 2024) Initial Investment of $10,000
Average Annual Total Returns
| | | | | | | | | | | | |
| | | 1 year | | | 5 years | | | 10 years | |
| Class R6 Shares at NAV | | | 10.31 | % | | | 5.23 | % | | | 4.90 | % |
Russell 3000® Index | | | 27.58 | % | | | 15.00 | % | | | 12.09 | % |
| Bloomberg U.S. Aggregate Bond Index | | | 1.31 | % | | | (0.17 | )% | | | 1.26 | % |
| Lifecycle 2010 Fund Composite Index | | | 9.75 | % | | | 5.32 | % | | | 4.89 | % |
| S&P Target Date 2010 Index | | | 9.20 | % | | | 4.91 | % | | | 4.40 | % |
Investment return and principal value will fluctuate, and you may have a gain or loss when you sell your shares. Current performance may differ from figures shown. For most recent month‑end performance, go to https://www.nuveen.com/en‑us/mutual‑funds/prospectuses or call (800) 257‑8787.
Fund Statistics (as of May 31, 2024)
| | | | |
| Fund net assets | | $ | 804,466,356 | |
| Total number of portfolio holdings | | | 21 | |
| Portfolio turnover (%) | | | 14% | |
| Total advisory fees paid for the year | | $ | 3,211,719 | |
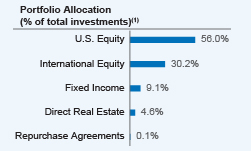
What did the Fund invest in? (as of May 31, 2024)
(1) Affiliated investment companies, except for repurchase agreements.
How has the Fund changed?
| | • | | Name change: Effective May 1, 2024, the Fund’s name changed from TIAA-CREF Lifecycle 2010 Fund to Nuveen Lifecycle 2010 Fund. | |
| | • | | Share class name change: Effective May 6, 2024, Institutional Class shares of the Fund were renamed Class R6 shares. | |
For more complete information, you may review the Fund’s next prospectus, which is expected to be available by October 1, 2024 at https://www.nuveen.com/en‑us/mutual‑funds/prospectuses or upon request at (800) 257‑8787.
Availability of additional information about the Fund
You can find additional information about the Fund at https://www.nuveen.com/en‑us/mutual‑funds/prospectuses, including its:
| | • | | prospectus • financial statements and other information • fund holdings • proxy voting information |
You can also request this information at (800) 257‑8787.
| | |
886315662_AR_0524 3613681-INV-Y-07/25 (I, R6, Premier, Retirement) | | |
| | |
| | Annual Shareholder Report May 31, 2024 |
Nuveen Lifecycle 2010 Fund
(Formerly known as TIAA-CREF Lifecycle 2010 Fund)
Premier Class Shares/TCTPX
Annual Shareholder Report
This annual shareholder report contains important information about the Premier Class Shares of the Nuveen Lifecycle 2010 Fund for the period of June 1, 2023 to May 31, 2024. You can find additional information at https://www.nuveen.com/en‑us/mutual‑funds/prospectuses. You can also request this information by contacting us at (800) 257‑8787.
This report describes changes to the Fund that occurred during the reporting period.
What were the Fund costs for the last year? (based on a hypothetical $10,000 investment)(1)
| | | | |
| | | Cost of a $10,000 investment | | Costs paid as a percentage of
$10,000 investment |
| Premier Class Shares | | $41 | | 0.41% |
(1) These costs include the expenses of underlying funds in which the Fund invests except for the expenses of the Nuveen Dividend Growth Fund, Nuveen Dividend Value Fund, Nuveen Growth Opportunities ETF and TIAA-CREF Real Property Fund.
How did the Fund perform last year? What affected the Fund’s performance?
| | |
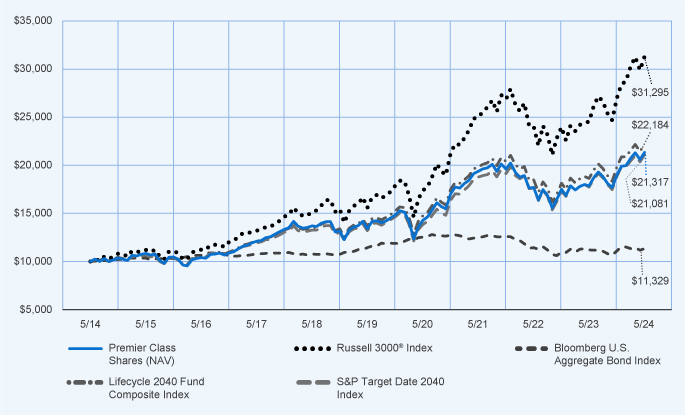
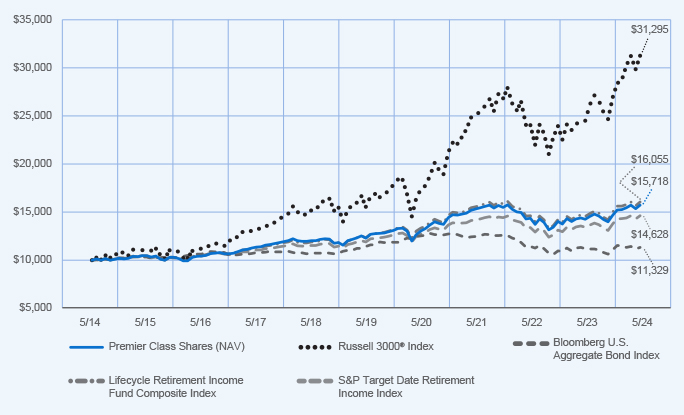
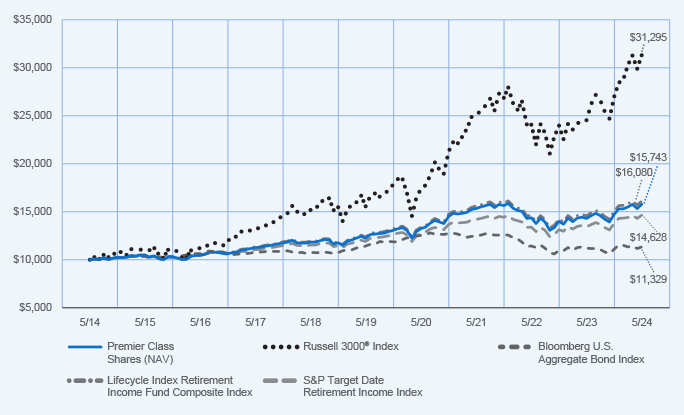
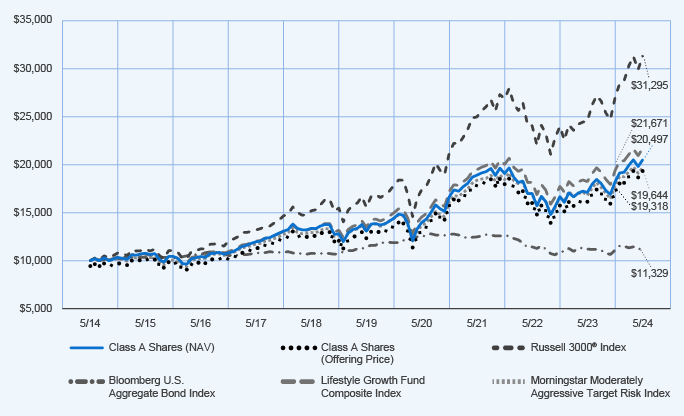
Performance Highlights • The Nuveen Lifecycle 2010 Fund returned 10.27% for Premier Class shares at net asset value (NAV) for the 12 months ended May 31, 2024. The Fund outperformed the Lifecycle 2010 Fund Composite Index, which returned 9.75%. • The Lifecycle 2010 Fund Composite Index consisted of: 40.0% Bloomberg U.S. Aggregate Bond Index; 23.5% Russell 3000® Index; 12.6% MSCI All Country World Index ex USA Investable Market Index; 13.9% Bloomberg U.S. 1–3 Year Government/Credit Bond Index; and 10.0% Bloomberg U.S. Treasury Inflation Protected Securities (TIPS) 1-10 Year Index. • Top contributors to relative performance » Strong performance of the underlying funds investing in fixed income, led by the Nuveen Core Bond Fund and the Nuveen Core Plus Bond Fund. » Strong overall performance of the underlying funds investing in U.S. equities, led by the Nuveen Core Equity Fund. • Top detractors from relative performance » An allocation to the Nuveen Real Property Fund LP. » A position in the Nuveen International Opportunities Fund. | | Performance Attribution Nuveen Core Bond Fund Nuveen Core Plus Bond Fund Nuveen Core Equity Fund Nuveen Real Property Fund LP |
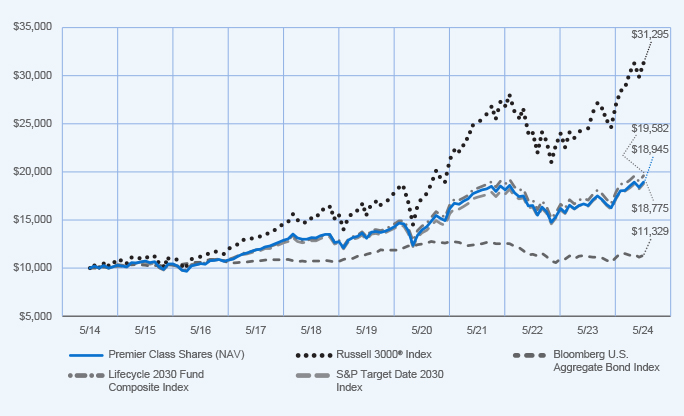
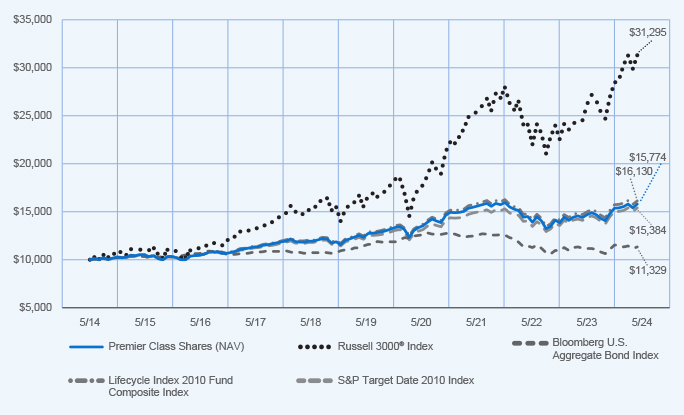
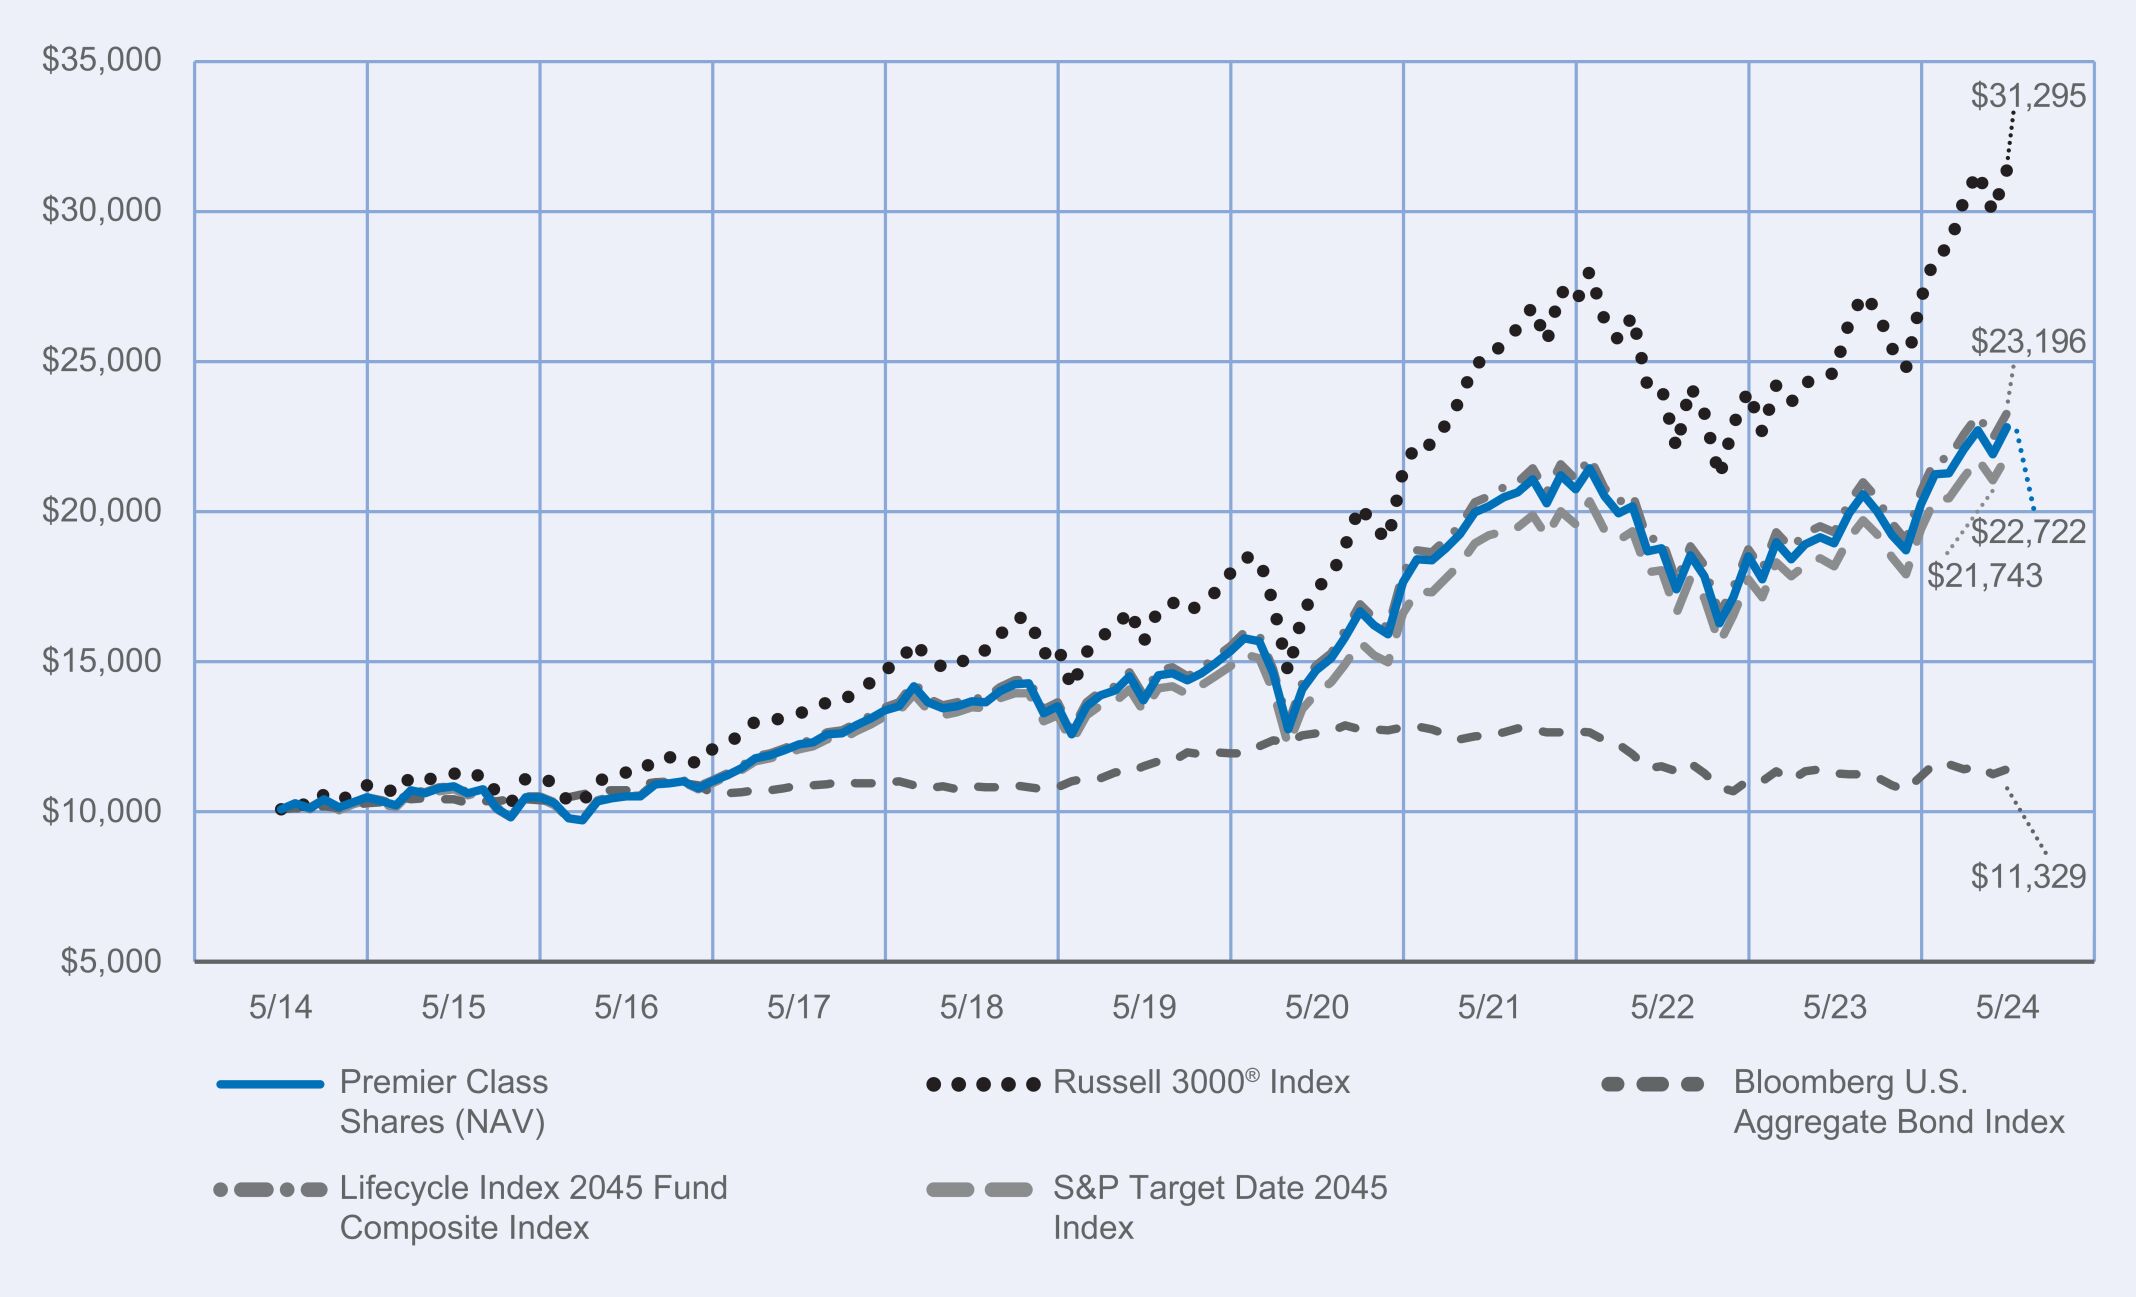
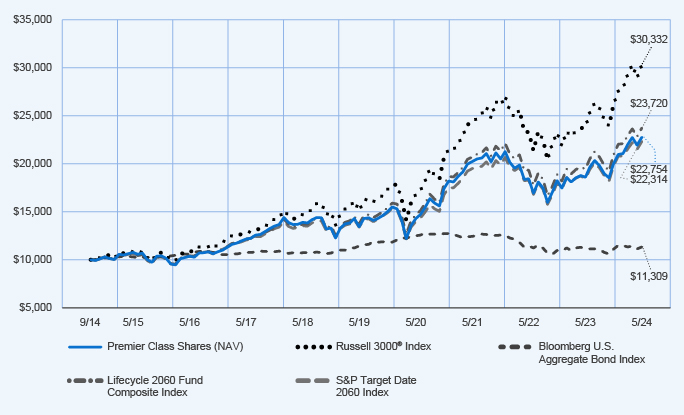
How did the Fund perform over the last 10 years?
Performance data shown represents past performance and does not predict or guarantee future results. The graph and table do not reflect the deduction of taxes that a shareholder would pay on Fund distributions or redemption of Fund Shares.
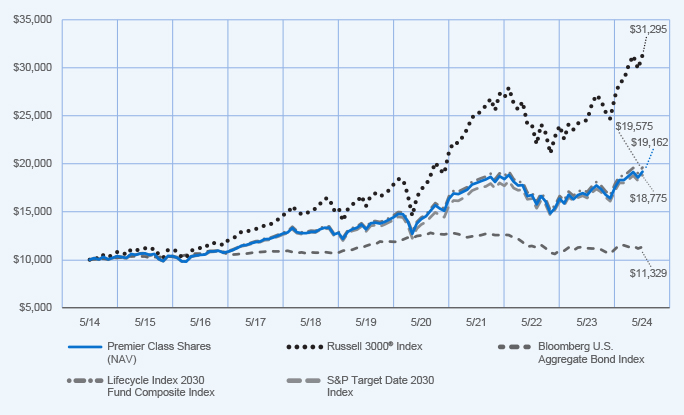
Fund Performance (June 1, 2014 through May 31, 2024) Initial Investment of $10,000
Average Annual Total Returns
| | | | | | | | | | | | |
| | | 1 year | | | 5 years | | | 10 years | |
| Premier Class Shares at NAV | | | 10.27 | % | | | 5.08 | % | | | 4.75 | % |
Russell 3000® Index | | | 27.58 | % | | | 15.00 | % | | | 12.09 | % |
| Bloomberg U.S. Aggregate Bond Index | | | 1.31 | % | | | (0.17 | )% | | | 1.26 | % |
| Lifecycle 2010 Fund Composite Index | | | 9.75 | % | | | 5.32 | % | | | 4.89 | % |
| S&P Target Date 2010 Index | | | 9.20 | % | | | 4.91 | % | | | 4.40 | % |
Investment return and principal value will fluctuate, and you may have a gain or loss when you sell your shares. Current performance may differ from figures shown. For most recent month‑end performance, go to https://www.nuveen.com/en‑us/mutual‑funds/prospectuses or call (800) 257‑8787.
Fund Statistics (as of May 31, 2024)
| | | | |
| Fund net assets | | $ | 804,466,356 | |
| Total number of portfolio holdings | | | 21 | |
| Portfolio turnover (%) | | | 14% | |
| Total advisory fees paid for the year | | $ | 3,211,719 | |
What did the Fund invest in? (as of May 31, 2024)
(1) Affiliated investment companies, except for repurchase agreements.
How has the Fund changed?
| | • | | Name change: Effective May 1, 2024, the Fund’s name changed from TIAA-CREF Lifecycle 2010 Fund to Nuveen Lifecycle 2010 Fund. | |
For more complete information, you may review the Fund’s next prospectus, which is expected to be available by October 1, 2024 at https://www.nuveen.com/en‑us/mutual‑funds/prospectuses or upon request at (800) 257‑8787.
Availability of additional information about the Fund
You can find additional information about the Fund at https://www.nuveen.com/en‑us/mutual‑funds/prospectuses, including its:
| | • | | prospectus • financial statements and other information • fund holdings • proxy voting information |
You can also request this information at (800) 257‑8787.
| | |
87245M434_AR_0524 3613681-INV-Y-07/25 (I, R6, Premier, Retirement) | | |
| | |
| | Annual Shareholder Report May 31, 2024 |
Nuveen Lifecycle 2010 Fund
(Formerly known as TIAA-CREF Lifecycle 2010 Fund)
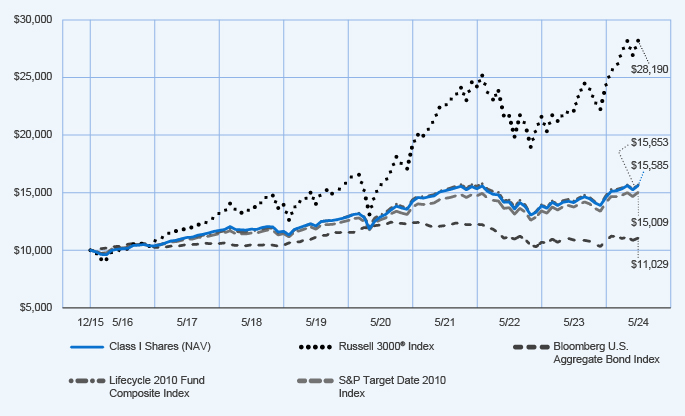
Class I Shares (Formerly known as Advisor Class Shares)/TCLHX
Annual Shareholder Report
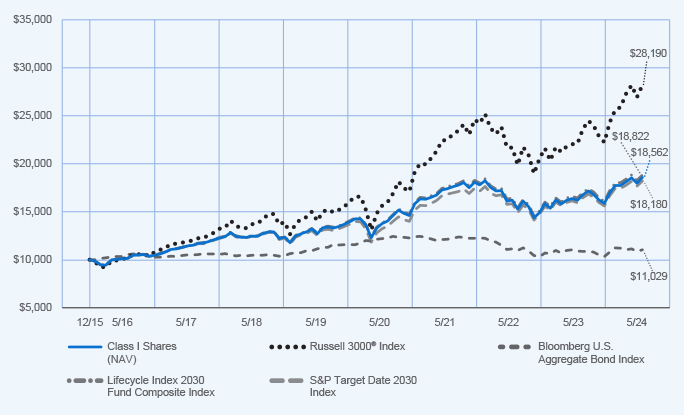
This annual shareholder report contains important information about the Class I Shares of the Nuveen Lifecycle 2010 Fund for the period of June 1, 2023 to May 31, 2024. You can find additional information at https://www.nuveen.com/en‑us/mutual‑funds/prospectuses. You can also request this information by contacting us at (800) 257‑8787.
This report describes changes to the Fund that occurred during the reporting period.
What were the Fund costs for the last year? (based on a hypothetical $10,000 investment)(1)
| | | | |
| | | Cost of a $10,000 investment | | Costs paid as a percentage of
$10,000 investment |
| Class I Shares | | $32 | | 0.32% |
(1) These costs include the expenses of underlying funds in which the Fund invests except for the expenses of the Nuveen Dividend Growth Fund, Nuveen Dividend Value Fund, Nuveen Growth Opportunities ETF and TIAA-CREF Real Property Fund.
How did the Fund perform last year? What affected the Fund’s performance?
| | |
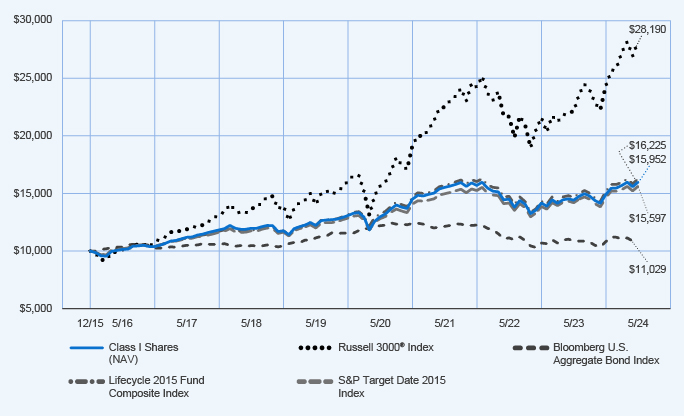
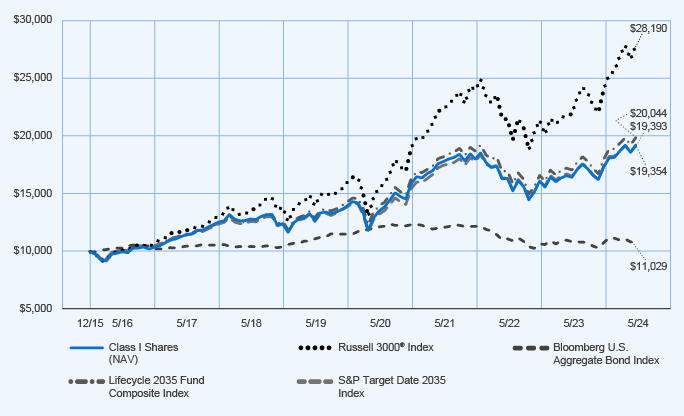
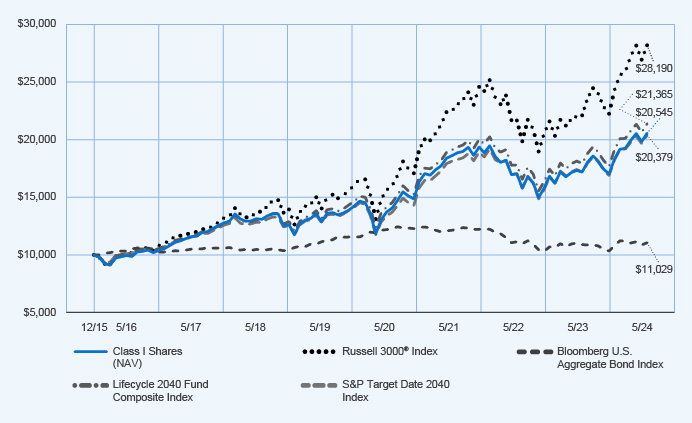
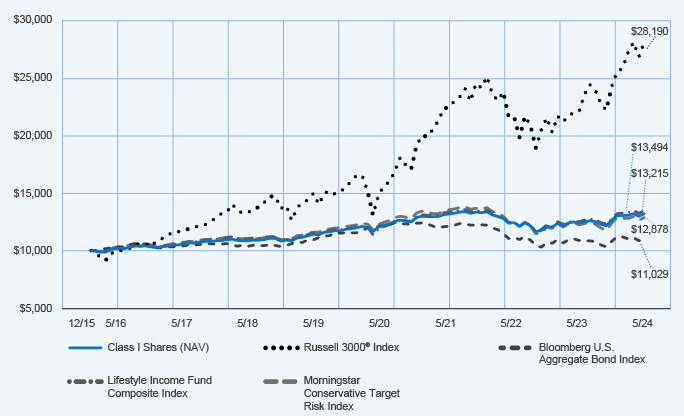
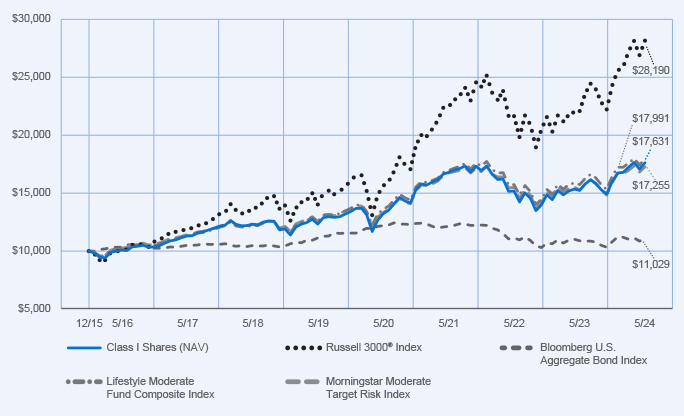
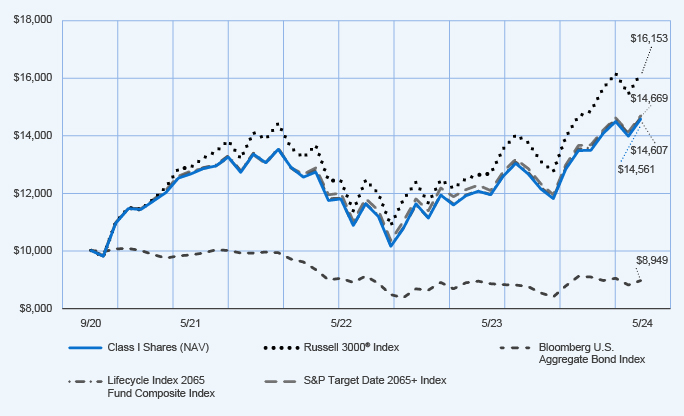
Performance Highlights • The Nuveen Lifecycle 2010 Fund returned 10.33% for Class I shares at net asset value (NAV) for the 12 months ended May 31, 2024. The Fund outperformed the Lifecycle 2010 Fund Composite Index, which returned 9.75%. • The Lifecycle 2010 Fund Composite Index consisted of: 40.0% Bloomberg U.S. Aggregate Bond Index; 23.5% Russell 3000® Index; 12.6% MSCI All Country World Index ex USA Investable Market Index; 13.9% Bloomberg U.S. 1-3 Year Government/Credit Bond Index; and 10.0% Bloomberg U.S. Treasury Inflation Protected Securities (TIPS) 1-10 Year Index. • Top contributors to relative performance » Strong performance of the underlying funds investing in fixed income, led by the Nuveen Core Bond Fund and the Nuveen Core Plus Bond Fund. » Strong overall performance of the underlying funds investing in U.S. equities, led by the Nuveen Core Equity Fund. • Top detractors from relative performance » An allocation to the Nuveen Real Property Fund LP. » A position in the Nuveen International Opportunities Fund. | | Performance Attribution Nuveen Core Bond Fund Nuveen Core Plus Bond Fund Nuveen Core Equity Fund Nuveen Real Property Fund LP |
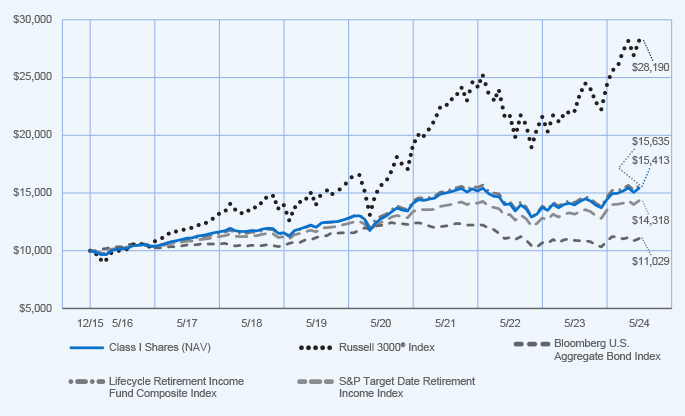
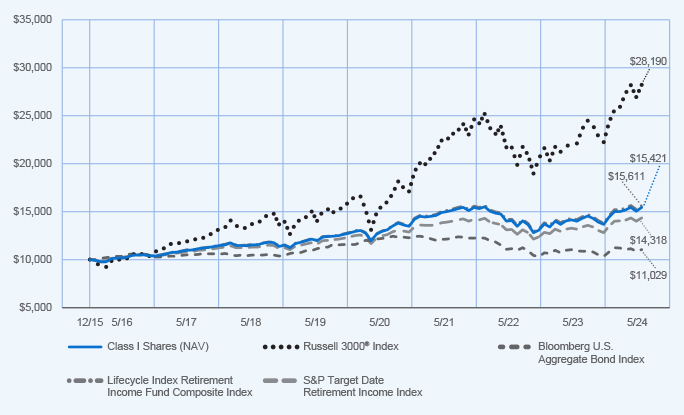
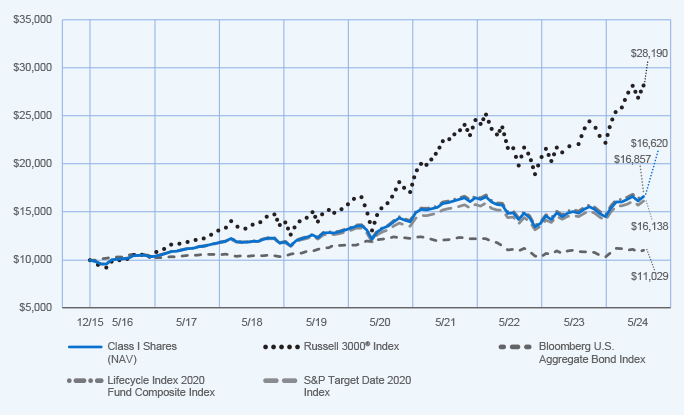
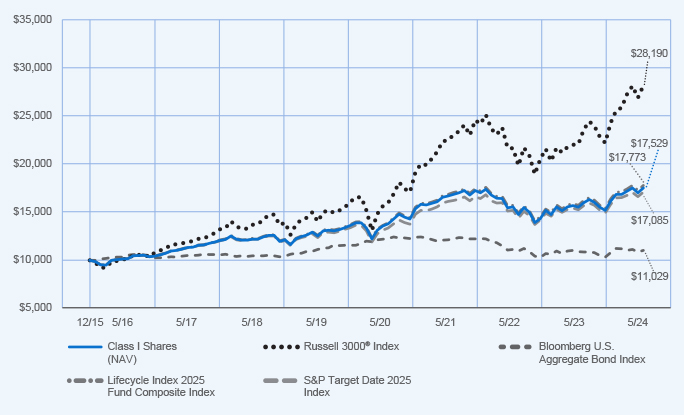
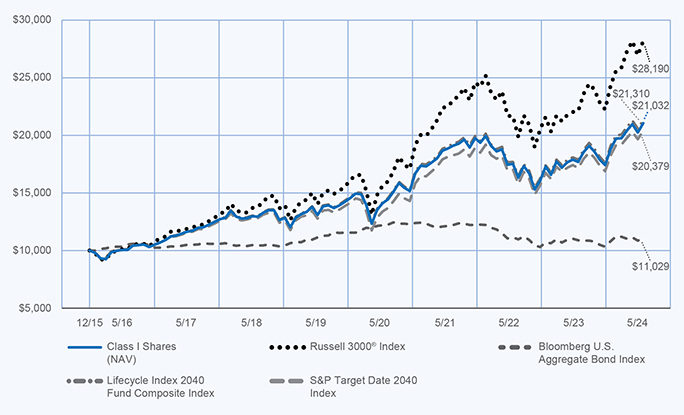
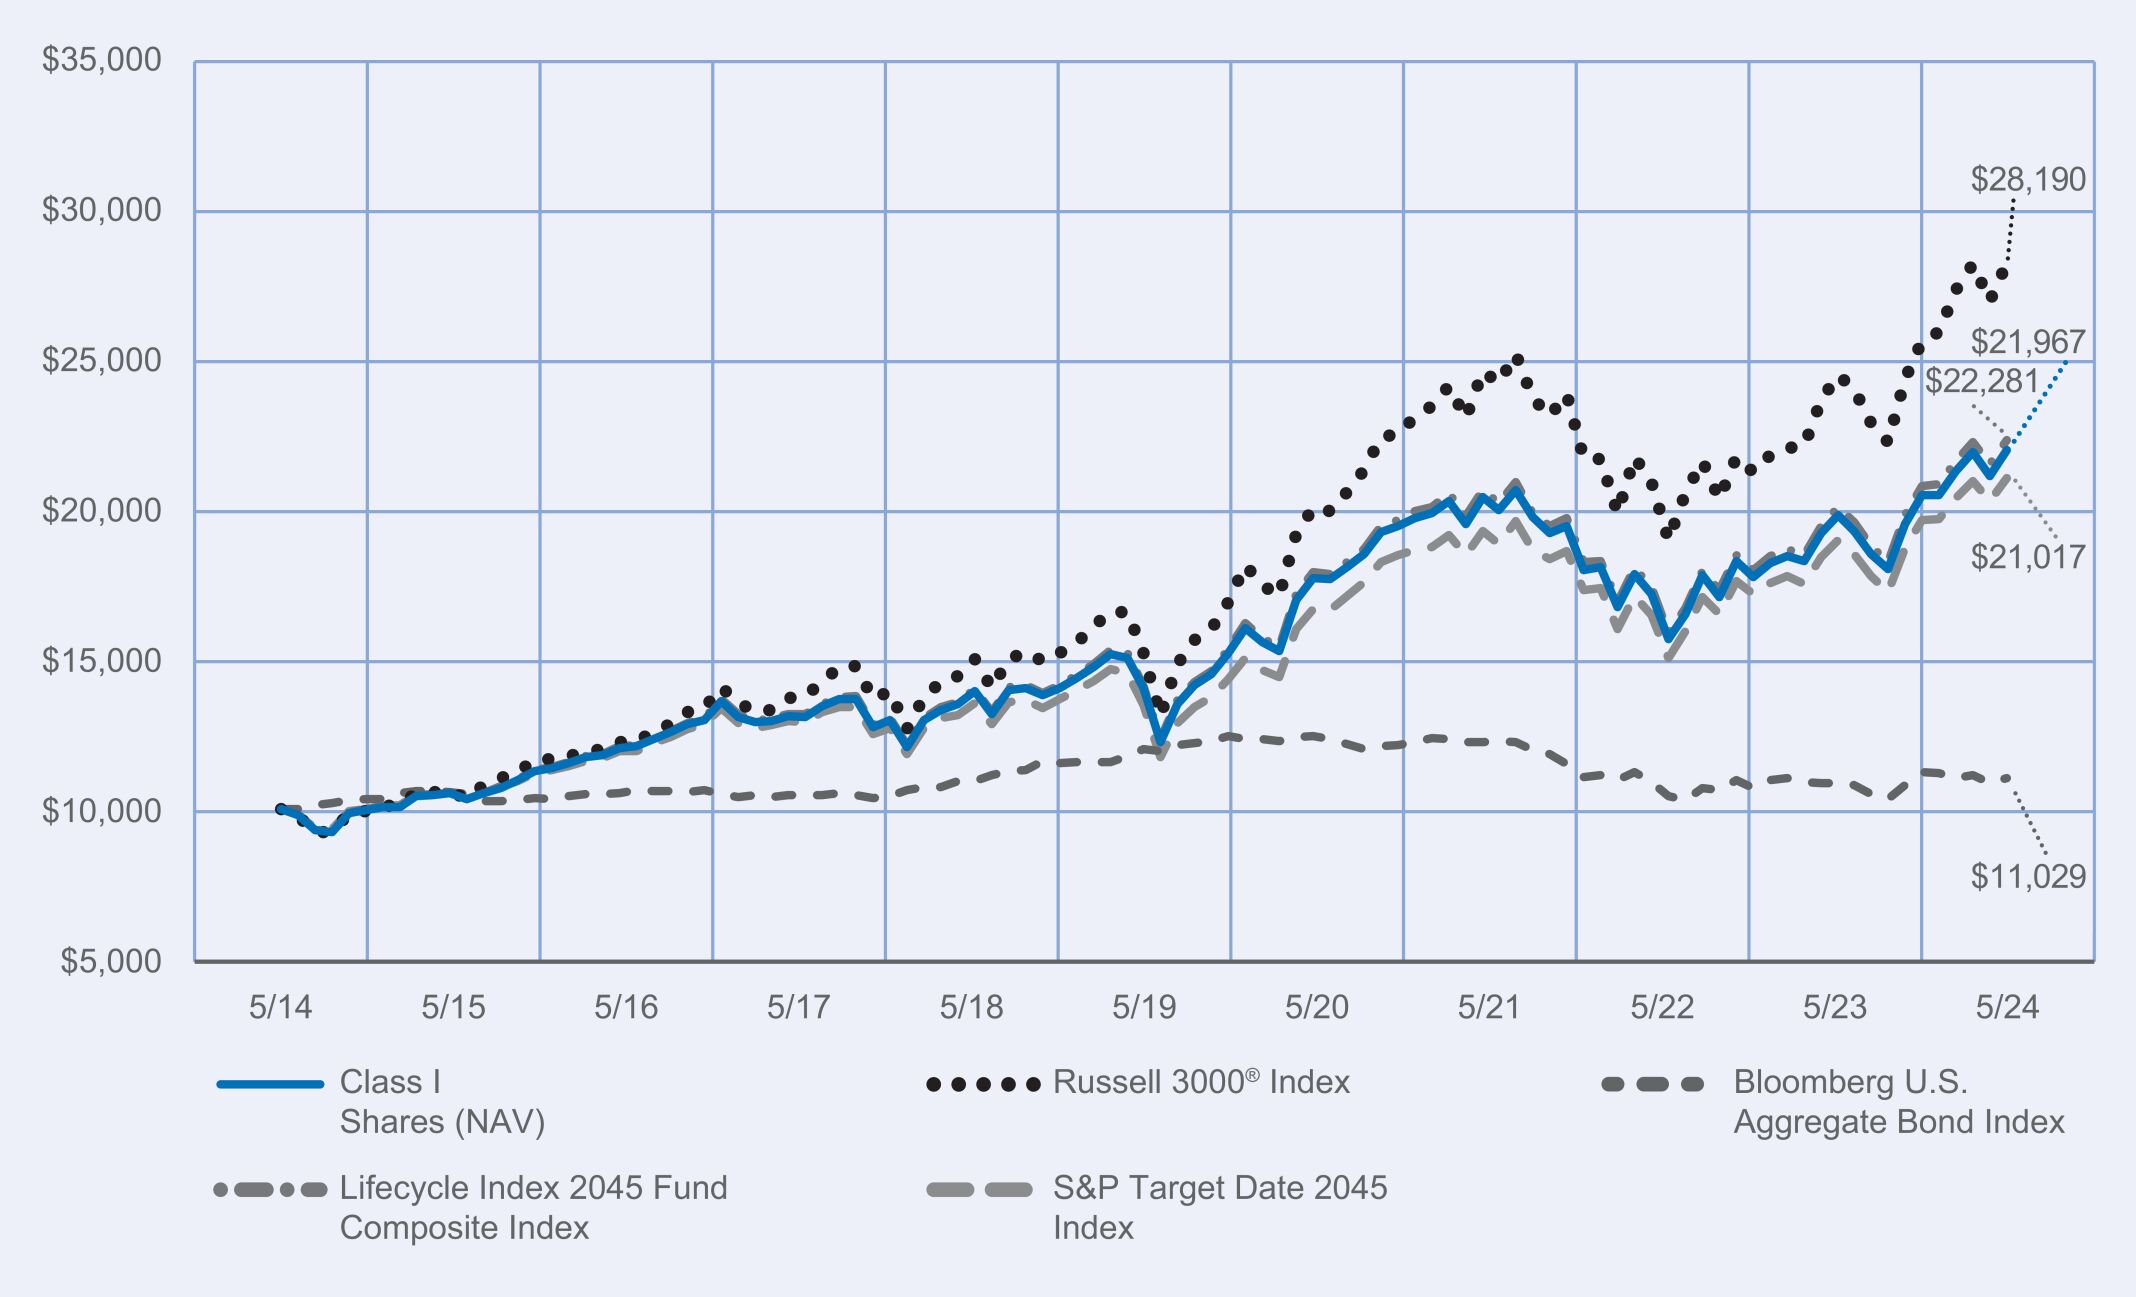
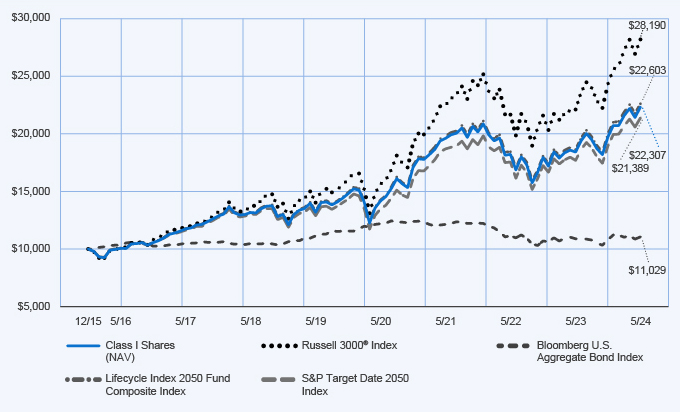
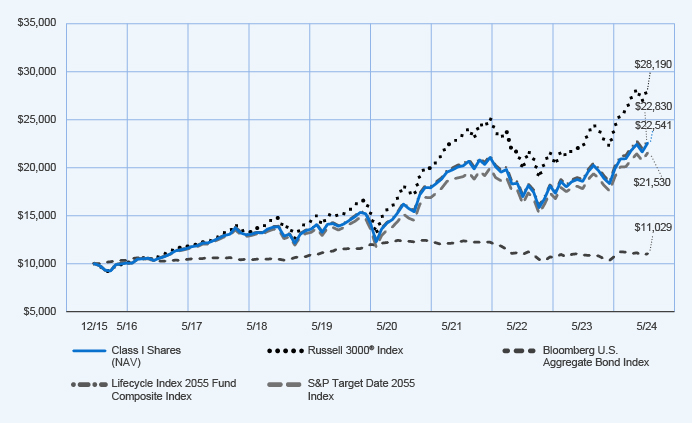
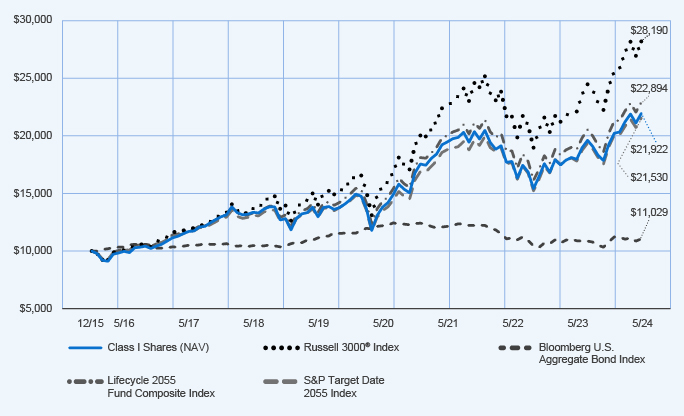
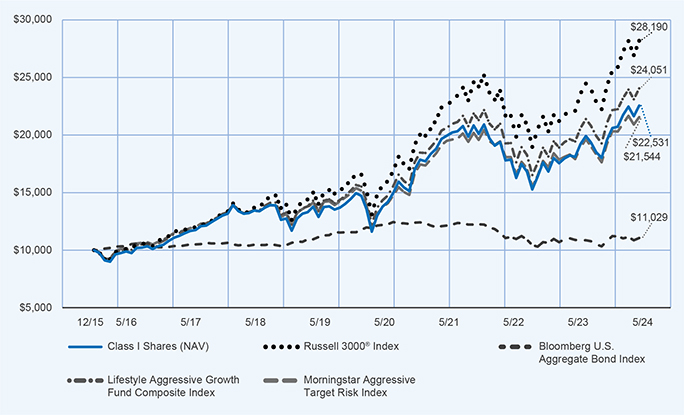
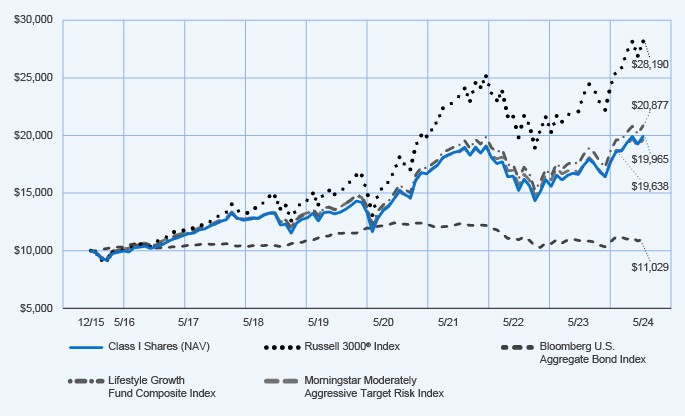
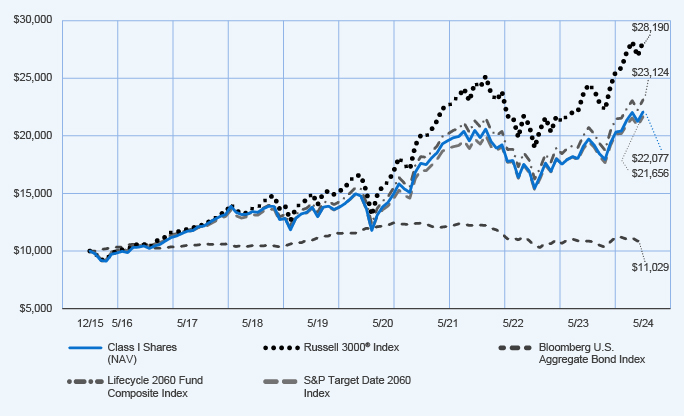
How did the Fund perform over the period since inception?
Performance data shown represents past performance and does not predict or guarantee future results. The graph and table do not reflect the deduction of taxes that a shareholder would pay on Fund distributions or redemption of Fund Shares.
Fund Performance (December 4, 2015 through May 31, 2024) Initial Investment of $10,000
Average Annual Total Returns
| | | | | | | | | | | | |
| | | 1 year | | | 5 years | | | Since Inception | |
| Class I Shares at NAV | | | 10.33 | % | | | 5.19 | % | | | 5.37 | % |
Russell 3000® Index | | | 27.58 | % | | | 15.00 | % | | | 12.98 | % |
| Bloomberg U.S. Aggregate Bond Index | | | 1.31 | % | | | (0.17 | )% | | | 1.16 | % |
| Lifecycle 2010 Fund Composite Index | | | 9.75 | % | | | 5.32 | % | | | 5.42 | % |
| S&P Target Date 2010 Index | | | 9.20 | % | | | 4.91 | % | | | 4.90 | % |
Investment return and principal value will fluctuate, and you may have a gain or loss when you sell your shares. Current performance may differ from figures shown. For most recent month‑end performance, go to https://www.nuveen.com/en‑us/mutual‑funds/prospectuses or call (800) 257‑8787.
Fund Statistics (as of May 31, 2024)
| | | | |
| Fund net assets | | $ | 804,466,356 | |
| Total number of portfolio holdings | | | 21 | |
| Portfolio turnover (%) | | | 14% | |
| Total advisory fees paid for the year | | $ | 3,211,719 | |
What did the Fund invest in? (as of May 31, 2024)
(1) Affiliated investment companies, except for repurchase agreements.
How has the Fund changed?
| | • | | Name change: Effective May 1, 2024, the Fund’s name changed from TIAA-CREF Lifecycle 2010 Fund to Nuveen Lifecycle 2010 Fund. | |
| | • | | Share class name change: Effective May 6, 2024, Advisor Class shares of the Fund were renamed Class I shares. | |
For more complete information, you may review the Fund’s next prospectus, which is expected to be available by October 1, 2024 at https://www.nuveen.com/en-us/mutual-funds/prospectuses or upon request at (800) 257‑8787.
Availability of additional information about the Fund
You can find additional information about the Fund at https://www.nuveen.com/en‑us/mutual‑funds/prospectuses, including its:
| | • | | prospectus • financial statements and other information • fund holdings • proxy voting information |
You can also request this information at (800) 257‑8787.
| | |
87245P205_AR_0524 3613681-INV-Y-07/25 (I, R6, Premier, Retirement) | | |
| | |
| | Annual Shareholder Report May 31, 2024 |
Nuveen Lifecycle 2015 Fund
(Formerly known as TIAA-CREF Lifecycle 2015 Fund)
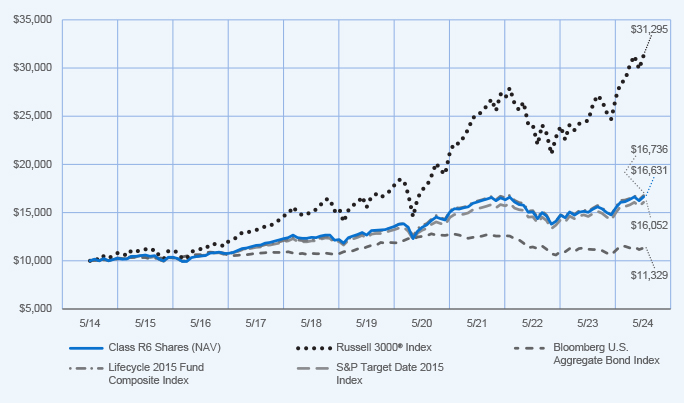
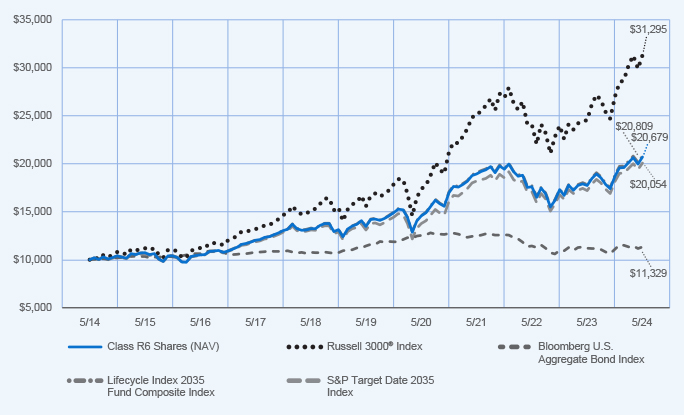
Class R6 Shares (Formerly known as Institutional Class Shares)/TCNIX
Annual Shareholder Report
This annual shareholder report contains important information about the Class R6 Shares of the Nuveen Lifecycle 2015 Fund for the period of June 1, 2023 to May 31, 2024. You can find additional information at https://www.nuveen.com/en‑us/mutual‑funds/prospectuses. You can also request this information by contacting us at (800) 257‑8787.
This report describes changes to the Fund that occurred during the reporting period.
What were the Fund costs for the last year? (based on a hypothetical $10,000 investment)(1)
| | | | |
| | | Cost of a $10,000 investment | | Costs paid as a percentage of
$10,000 investment |
| Class R6 Shares | | $24 | | 0.24% |
(1) These costs include the expenses of underlying funds in which the Fund invests except for the expenses of the Nuveen Dividend Growth Fund, Nuveen Dividend Value Fund, Nuveen Growth Opportunities ETF and TIAA-CREF Real Property Fund.
How did the Fund perform last year? What affected the Fund’s performance?
| | |
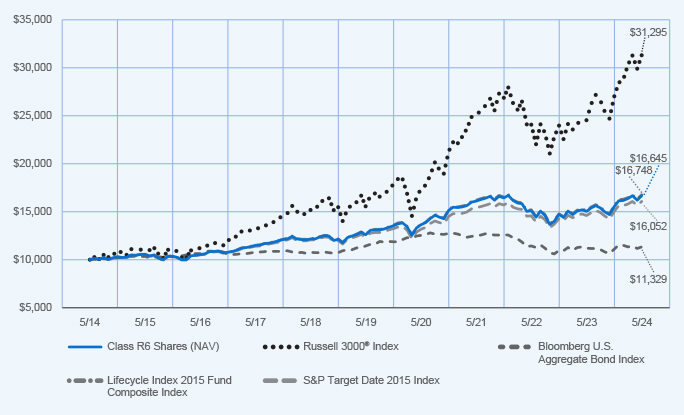
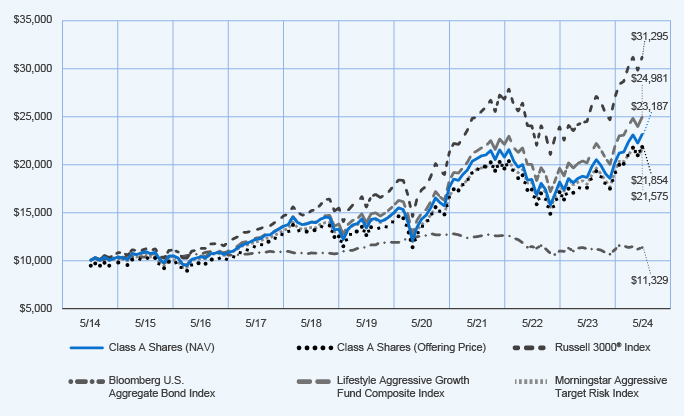
Performance Highlights • The Nuveen Lifecycle 2015 Fund returned 10.82% for Class R6 shares at net asset value (NAV) for the 12 months ended May 31, 2024. The Fund performed in line with the Lifecycle 2015 Fund Composite Index, which returned 10.74%. • The Lifecycle 2015 Fund Composite Index consisted of: 39.8% Bloomberg U.S. Aggregate Bond Index; 26.6% Russell 3000® Index; 14.4% MSCI All Country World Index ex USA Investable Market Index; 9.6% Bloomberg U.S. 1-3 Year Government/Credit Bond Index; and 9.6% Bloomberg U.S. Treasury Inflation Protected Securities (TIPS) 1-10 Year Index. • Top contributors to relative performance » Strong performance of the underlying funds investing in fixed income, led by the Nuveen Core Bond Fund and the Nuveen Core Plus Bond Fund. » Strong overall performance of the underlying funds investing in U.S. equities, led by the Nuveen Core Equity Fund. • Top detractors from relative performance » An allocation to the Nuveen Real Property Fund LP. » A position in the Nuveen International Opportunities Fund. | | Performance Attribution Nuveen Core Bond Fund Nuveen Core Plus Bond Fund Nuveen Core Equity Fund Nuveen Real Property Fund LP |
How did the Fund perform over the last 10 years?
Performance data shown represents past performance and does not predict or guarantee future results. The graph and table do not reflect the deduction of taxes that a shareholder would pay on Fund distributions or redemption of Fund Shares.
Fund Performance (June 1, 2014 through May 31, 2024) Initial Investment of $10,000
Average Annual Total Returns
| | | | | | | | | | | | |
| | | 1 year | | | 5 years | | | 10 years | |
| Class R6 Shares at NAV | | | 10.82 | % | | | 5.62 | % | | | 5.22 | % |
Russell 3000® Index | | | 27.58 | % | | | 15.00 | % | | | 12.09 | % |
| Bloomberg U.S. Aggregate Bond Index | | | 1.31 | % | | | (0.17 | )% | | | 1.26 | % |
| Lifecycle 2015 Fund Composite Index | | | 10.74 | % | | | 5.85 | % | | | 5.28 | % |
| S&P Target Date 2015 Index | | | 9.99 | % | | | 5.38 | % | | | 4.85 | % |
Investment return and principal value will fluctuate, and you may have a gain or loss when you sell your shares. Current performance may differ from figures shown. For most recent month‑end performance, go to https://www.nuveen.com/en‑us/mutual‑funds/prospectuses or call (800) 257‑8787.
Fund Statistics (as of May 31, 2024)
| | | | |
| Fund net assets | | $ | 1,158,115,781 | |
| Total number of portfolio holdings | | | 21 | |
| Portfolio turnover (%) | | | 13% | |
| Total advisory fees paid for the year | | $ | 4,598,952 | |
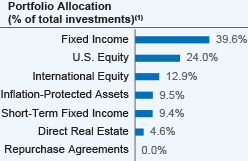
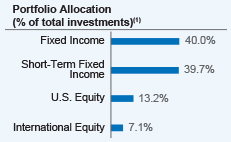
What did the Fund invest in? (as of May 31, 2024)
(1) Affiliated investment companies, except for repurchase agreements.
How has the Fund changed?
| | • | | Name change: Effective May 1, 2024, the Fund’s name changed from TIAA-CREF Lifecycle 2015 Fund to Nuveen Lifecycle 2015 Fund. | |
| | • | | Share class name change: Effective May 6, 2024, Institutional Class shares of the Fund were renamed Class R6 shares. | |
For more complete information, you may review the Fund’s next prospectus, which is expected to be available by October 1, 2024 at https://www.nuveen.com/en‑us/mutual‑funds/prospectuses or upon request at (800) 257‑8787.
Availability of additional information about the Fund
You can find additional information about the Fund at https://www.nuveen.com/en‑us/mutual‑funds/prospectuses, including its:
| | • | | prospectus • financial statements and other information • fund holdings • proxy voting information |
You can also request this information at (800) 257‑8787.
| | |
886315654_AR_0524 3613689-INV-Y-07/25 (I, R6, Premier, Retirement) | | |
| | |
| | Annual Shareholder Report May 31, 2024 |
Nuveen Lifecycle 2015 Fund
(Formerly known as TIAA-CREF Lifecycle 2015 Fund)
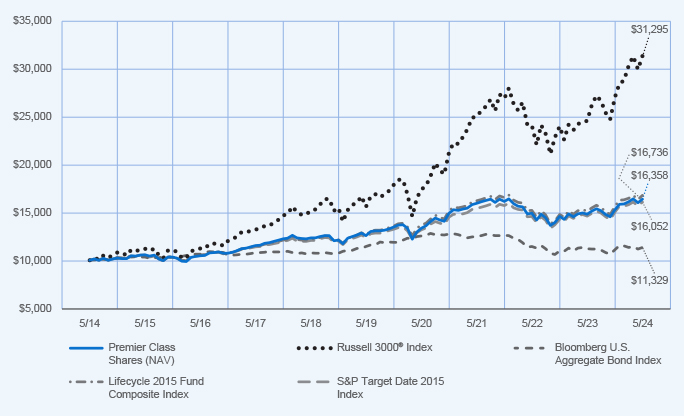
Premier Class Shares/TCFPX
Annual Shareholder Report
This annual shareholder report contains important information about the Premier Class Shares of the Nuveen Lifecycle 2015 Fund for the period of June 1, 2023 to May 31, 2024. You can find additional information at https://www.nuveen.com/en‑us/mutual‑funds/prospectuses. You can also request this information by contacting us at (800) 257‑8787.
This report describes changes to the Fund that occurred during the reporting period.
What were the Fund costs for the last year? (based on a hypothetical $10,000 investment)(1)
| | | | |
| | | Cost of a $10,000 investment | | Costs paid as a percentage of
$10,000 investment |
| Premier Class Shares | | $39 | | 0.39% |
(1) These costs include the expenses of underlying funds in which the Fund invests except for the expenses of the Nuveen Dividend Growth Fund, Nuveen Dividend Value Fund, Nuveen Growth Opportunities ETF and TIAA-CREF Real Property Fund.
How did the Fund perform last year? What affected the Fund’s performance?
| | |
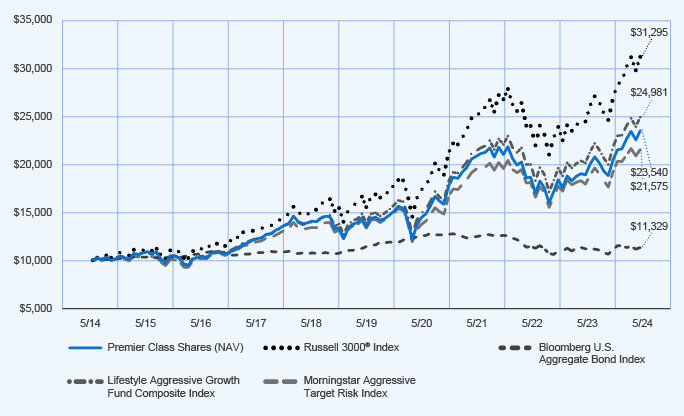
Performance Highlights • The Nuveen Lifecycle 2015 Fund returned 10.56% for Premier Class shares at net asset value (NAV) for the 12 months ended May 31, 2024. The Fund performed in line with the Lifecycle 2015 Fund Composite Index, which returned 10.74%. • The Lifecycle 2015 Fund Composite Index consisted of: 39.8% Bloomberg U.S. Aggregate Bond Index; 26.6% Russell 3000® Index; 14.4% MSCI All Country World Index ex USA Investable Market Index; 9.6% Bloomberg U.S. 1-3 Year Government/Credit Bond Index; and 9.6% Bloomberg U.S. Treasury Inflation Protected Securities (TIPS) 1-10 Year Index. • Top detractors from relative performance » An allocation to the Nuveen Real Property Fund LP. » A position in the Nuveen International Opportunities Fund. • Top contributors to relative performance » Strong performance of the underlying funds investing in fixed income, led by the Nuveen Core Bond Fund and the Nuveen Core Plus Bond Fund. » Strong overall performance of the underlying funds investing in U.S. equities, led by the Nuveen Core Equity Fund. | | Performance Attribution Nuveen Real Property Fund LP Nuveen International Opportunities Fund Nuveen Core Bond Fund Nuveen Core Plus Bond Fund |
How did the Fund perform over the last 10 years?
Performance data shown represents past performance and does not predict or guarantee future results. The graph and table do not reflect the deduction of taxes that a shareholder would pay on Fund distributions or redemption of Fund Shares.
Fund Performance (June 1, 2014 through May 31, 2024) Initial Investment of $10,000
Average Annual Total Returns
| | | | | | | | | | | | |
| | | 1 year | | | 5 years | | | 10 years | |
| Premier Class Shares at NAV | | | 10.56 | % | | | 5.43 | % | | | 5.04 | % |
Russell 3000® Index | | | 27.58 | % | | | 15.00 | % | | | 12.09 | % |
| Bloomberg U.S. Aggregate Bond Index | | | 1.31 | % | | | (0.17 | )% | | | 1.26 | % |
| Lifecycle 2015 Fund Composite Index | | | 10.74 | % | | | 5.85 | % | | | 5.28 | % |
| S&P Target Date 2015 Index | | | 9.99 | % | | | 5.38 | % | | | 4.85 | % |
Investment return and principal value will fluctuate, and you may have a gain or loss when you sell your shares. Current performance may differ from figures shown. For most recent month‑end performance, go to https://www.nuveen.com/en‑us/mutual‑funds/prospectuses or call (800) 257‑8787.
Fund Statistics (as of May 31, 2024)
| | | | |
| Fund net assets | | $ | 1,158,115,781 | |
| Total number of portfolio holdings | | | 21 | |
| Portfolio turnover (%) | | | 13% | |
| Total advisory fees paid for the year | | $ | 4,598,952 | |
What did the Fund invest in? (as of May 31, 2024)
(1) Affiliated investment companies, except for repurchase agreements.
How has the Fund changed?
| | • | | Name change: Effective May 1, 2024, the Fund’s name changed from TIAA-CREF Lifecycle 2015 Fund to Nuveen Lifecycle 2015 Fund. | |
For more complete information, you may review the Fund’s next prospectus, which is expected to be available by October 1, 2024 at https://www.nuveen.com/en‑us/mutual‑funds/prospectuses or upon request at (800) 257‑8787.
Availability of additional information about the Fund
You can find additional information about the Fund at https://www.nuveen.com/en‑us/mutual‑funds/prospectuses, including its:
| | • | | prospectus • financial statements and other information • fund holdings • proxy voting information |
You can also request this information at (800) 257‑8787.
| | |
87245M426_AR_0524 3613689-INV-Y-07/25 (I, R6, Premier, Retirement) | | |
| | |
| | Annual Shareholder Report May 31, 2024 |
Nuveen Lifecycle 2015 Fund
(Formerly known as TIAA-CREF Lifecycle 2015 Fund)
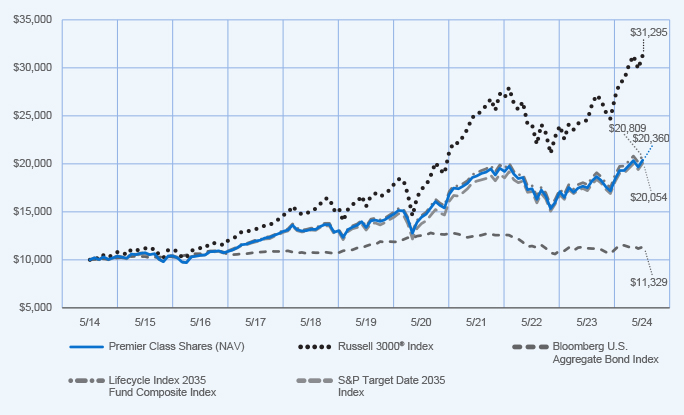
Class I Shares (Formerly known as Advisor Class Shares)/TCNHX
Annual Shareholder Report
This annual shareholder report contains important information about the Class I Shares of the Nuveen Lifecycle 2015 Fund for the period of June 1, 2023 to May 31, 2024. You can find additional information at https://www.nuveen.com/en‑us/mutual‑funds/prospectuses. You can also request this information by contacting us at (800) 257‑8787.
This report describes changes to the Fund that occurred during the reporting period.
What were the Fund costs for the last year? (based on a hypothetical $10,000 investment)(1)
| | | | |
| | | Cost of a $10,000 investment | | Costs paid as a percentage of $10,000 investment |
| Class I Shares | | $28 | | 0.28% |
(1) These costs include the expenses of underlying funds in which the Fund invests except for the expenses of the Nuveen Dividend Growth Fund, Nuveen Dividend Value Fund, Nuveen Growth Opportunities ETF and TIAA-CREF Real Property Fund.
How did the Fund perform last year? What affected the Fund’s performance?
| | |
Performance Highlights • The Nuveen Lifecycle 2015 Fund returned 10.74% for Class I shares at net asset value (NAV) for the 12 months ended May 31, 2024. The Fund performed in line with the Lifecycle 2015 Fund Composite Index, which returned 10.74%. • The Lifecycle 2015 Fund Composite Index consisted of: 39.8% Bloomberg U.S. Aggregate Bond Index; 26.6% Russell 3000® Index; 14.4% MSCI All Country World Index ex USA Investable Market Index; 9.6% Bloomberg U.S. 1-3 Year Government/Credit Bond Index; and 9.6% Bloomberg U.S. Treasury Inflation Protected Securities (TIPS) 1‑10 Year Index. • Top contributors to relative performance » Strong performance of the underlying funds investing in fixed income, led by the Nuveen Core Bond Fund and the Nuveen Core Plus Bond Fund. » Strong overall performance of the underlying funds investing in U.S. equities, led by the Nuveen Core Equity Fund. • Top detractors from relative performance » An allocation to the Nuveen Real Property Fund LP. » A position in the Nuveen International Opportunities Fund. | | Performance Attribution Nuveen Core Bond Fund Nuveen Core Plus Bond Fund Nuveen Core Equity Fund Nuveen Real Property Fund LP |
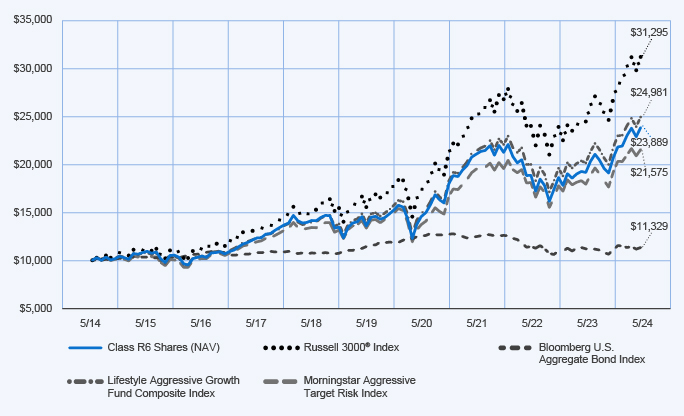
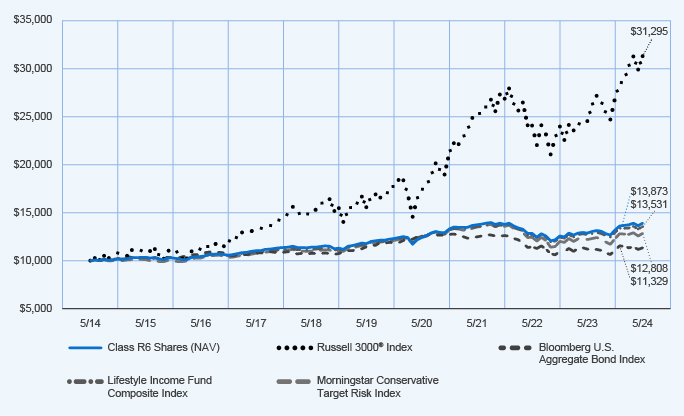
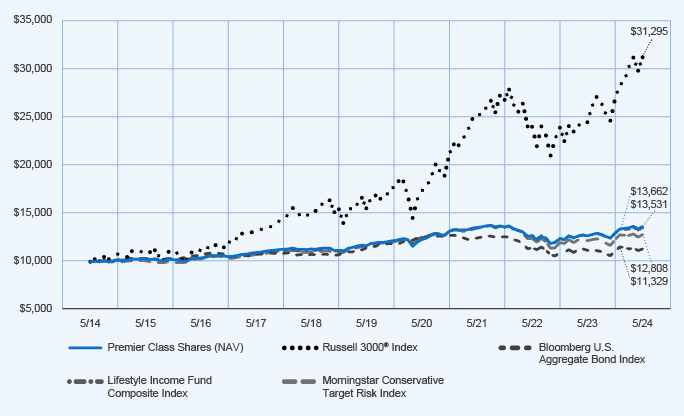
How did the Fund perform over the period since inception?
Performance data shown represents past performance and does not predict or guarantee future results. The graph and table do not reflect the deduction of taxes that a shareholder would pay on Fund distributions or redemption of Fund Shares.
Fund Performance (December 4, 2015 through May 31, 2024) Initial Investment of $10,000
Average Annual Total Returns
| | | | | | | | | | | | |
| | | 1 year | | | 5 years | | | Since Inception | |
| Class I Shares at NAV | | | 10.74 | % | | | 5.52 | % | | | 5.65 | % |
Russell 3000® Index | | | 27.58 | % | | | 15.00 | % | | | 12.98 | % |
| Bloomberg U.S. Aggregate Bond Index | | | 1.31 | % | | | (0.17 | )% | | | 1.16 | % |
| Lifecycle 2015 Fund Composite Index | | | 10.74 | % | | | 5.85 | % | | | 5.87 | % |
| S&P Target Date 2015 Index | | | 9.99 | % | | | 5.38 | % | | | 5.37 | % |
Investment return and principal value will fluctuate, and you may have a gain or loss when you sell your shares. Current performance may differ from figures shown. For most recent month‑end performance, go to https://www.nuveen.com/en‑us/mutual‑funds/prospectuses or call (800) 257‑8787.
Fund Statistics (as of May 31, 2024)
| | | | |
| Fund net assets | | $ | 1,158,115,781 | |
| Total number of portfolio holdings | | | 21 | |
| Portfolio turnover (%) | | | 13% | |
| Total advisory fees paid for the year | | $ | 4,598,952 | |
What did the Fund invest in? (as of May 31, 2024)
(1) Affiliated investment companies, except for repurchase agreements.
How has the Fund changed?
| | • | | Name change: Effective May 1, 2024, the Fund’s name changed from TIAA-CREF Lifecycle 2015 Fund to Nuveen Lifecycle 2015 Fund. | |
| | • | | Share class name change: Effective May 6, 2024, Advisor Class shares of the Fund were renamed Class I shares. | |
For more complete information, you may review the Fund’s next prospectus, which is expected to be available by October 1, 2024 at https://www.nuveen.com/en‑us/mutual‑funds/prospectuses or upon request at (800) 257‑8787.
Availability of additional information about the Fund
You can find additional information about the Fund at https://www.nuveen.com/en‑us/mutual‑funds/prospectuses, including its:
| | • | | prospectus • financial statements and other information • fund holdings • proxy voting information |
You can also request this information at (800) 257‑8787.
| | |
87245P304_AR_0524 3613689-INV-Y-07/25 (I, R6, Premier, Retirement) | | |
| | |
| | Annual Shareholder Report May 31, 2024 |
Nuveen Lifecycle 2015 Fund
(Formerly known as TIAA-CREF Lifecycle 2015 Fund)
Retirement Class Shares/TCLIX
Annual Shareholder Report
This annual shareholder report contains important information about the Retirement Class Shares of the Nuveen Lifecycle 2015 Fund for the period of June 1, 2023 to May 31, 2024. You can find additional information at https://www.nuveen.com/en‑us/mutual‑funds/prospectuses. You can also request this information by contacting us at (800) 257‑8787.
This report describes changes to the Fund that occurred during the reporting period.
What were the Fund costs for the last year? (based on a hypothetical $10,000 investment)(1)
| | | | |
| | | Cost of a $10,000 investment | | Costs paid as a percentage of
$10,000 investment |
| Retirement Class Shares | | $49 | | 0.49% |
(1) These costs include the expenses of underlying funds in which the Fund invests except for the expenses of the Nuveen Dividend Growth Fund, Nuveen Dividend Value Fund, Nuveen Growth Opportunities ETF and TIAA-CREF Real Property Fund.
How did the Fund perform last year? What affected the Fund’s performance?
| | |
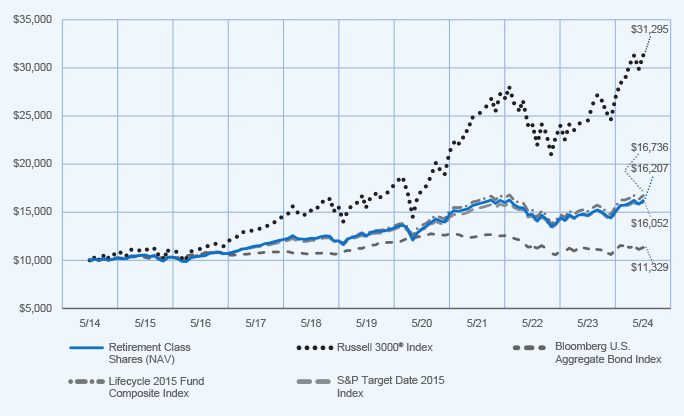
Performance Highlights • The Nuveen Lifecycle 2015 Fund returned 10.52% for Retirement Class shares at net asset value (NAV) for the 12 months ended May 31, 2024. The Fund performed in line with the Lifecycle 2015 Fund Composite Index, which returned 10.74%. • The Lifecycle 2015 Fund Composite Index consisted of: 39.8% Bloomberg U.S. Aggregate Bond Index; 26.6% Russell 3000® Index; 14.4% MSCI All Country World Index ex USA Investable Market Index; 9.6% Bloomberg U.S. 1-3 Year Government/Credit Bond Index; and 9.6% Bloomberg U.S. Treasury Inflation Protected Securities (TIPS) 1-10 Year Index. • Top detractors from relative performance » An allocation to the Nuveen Real Property Fund LP. » A position in the Nuveen International Opportunities Fund. • Top contributors to relative performance » Strong performance of the underlying funds investing in fixed income, led by the Nuveen Core Bond Fund and the Nuveen Core Plus Bond Fund. » Strong overall performance of the underlying funds investing in U.S. equities, led by the Nuveen Core Equity Fund. | | Performance Attribution Nuveen Real Property Fund LP Nuveen International Opportunities Fund Nuveen Core Bond Fund Nuveen Core Plus Bond Fund |
How did the Fund perform over the last 10 years?
Performance data shown represents past performance and does not predict or guarantee future results. The graph and table do not reflect the deduction of taxes that a shareholder would pay on Fund distributions or redemption of Fund Shares.
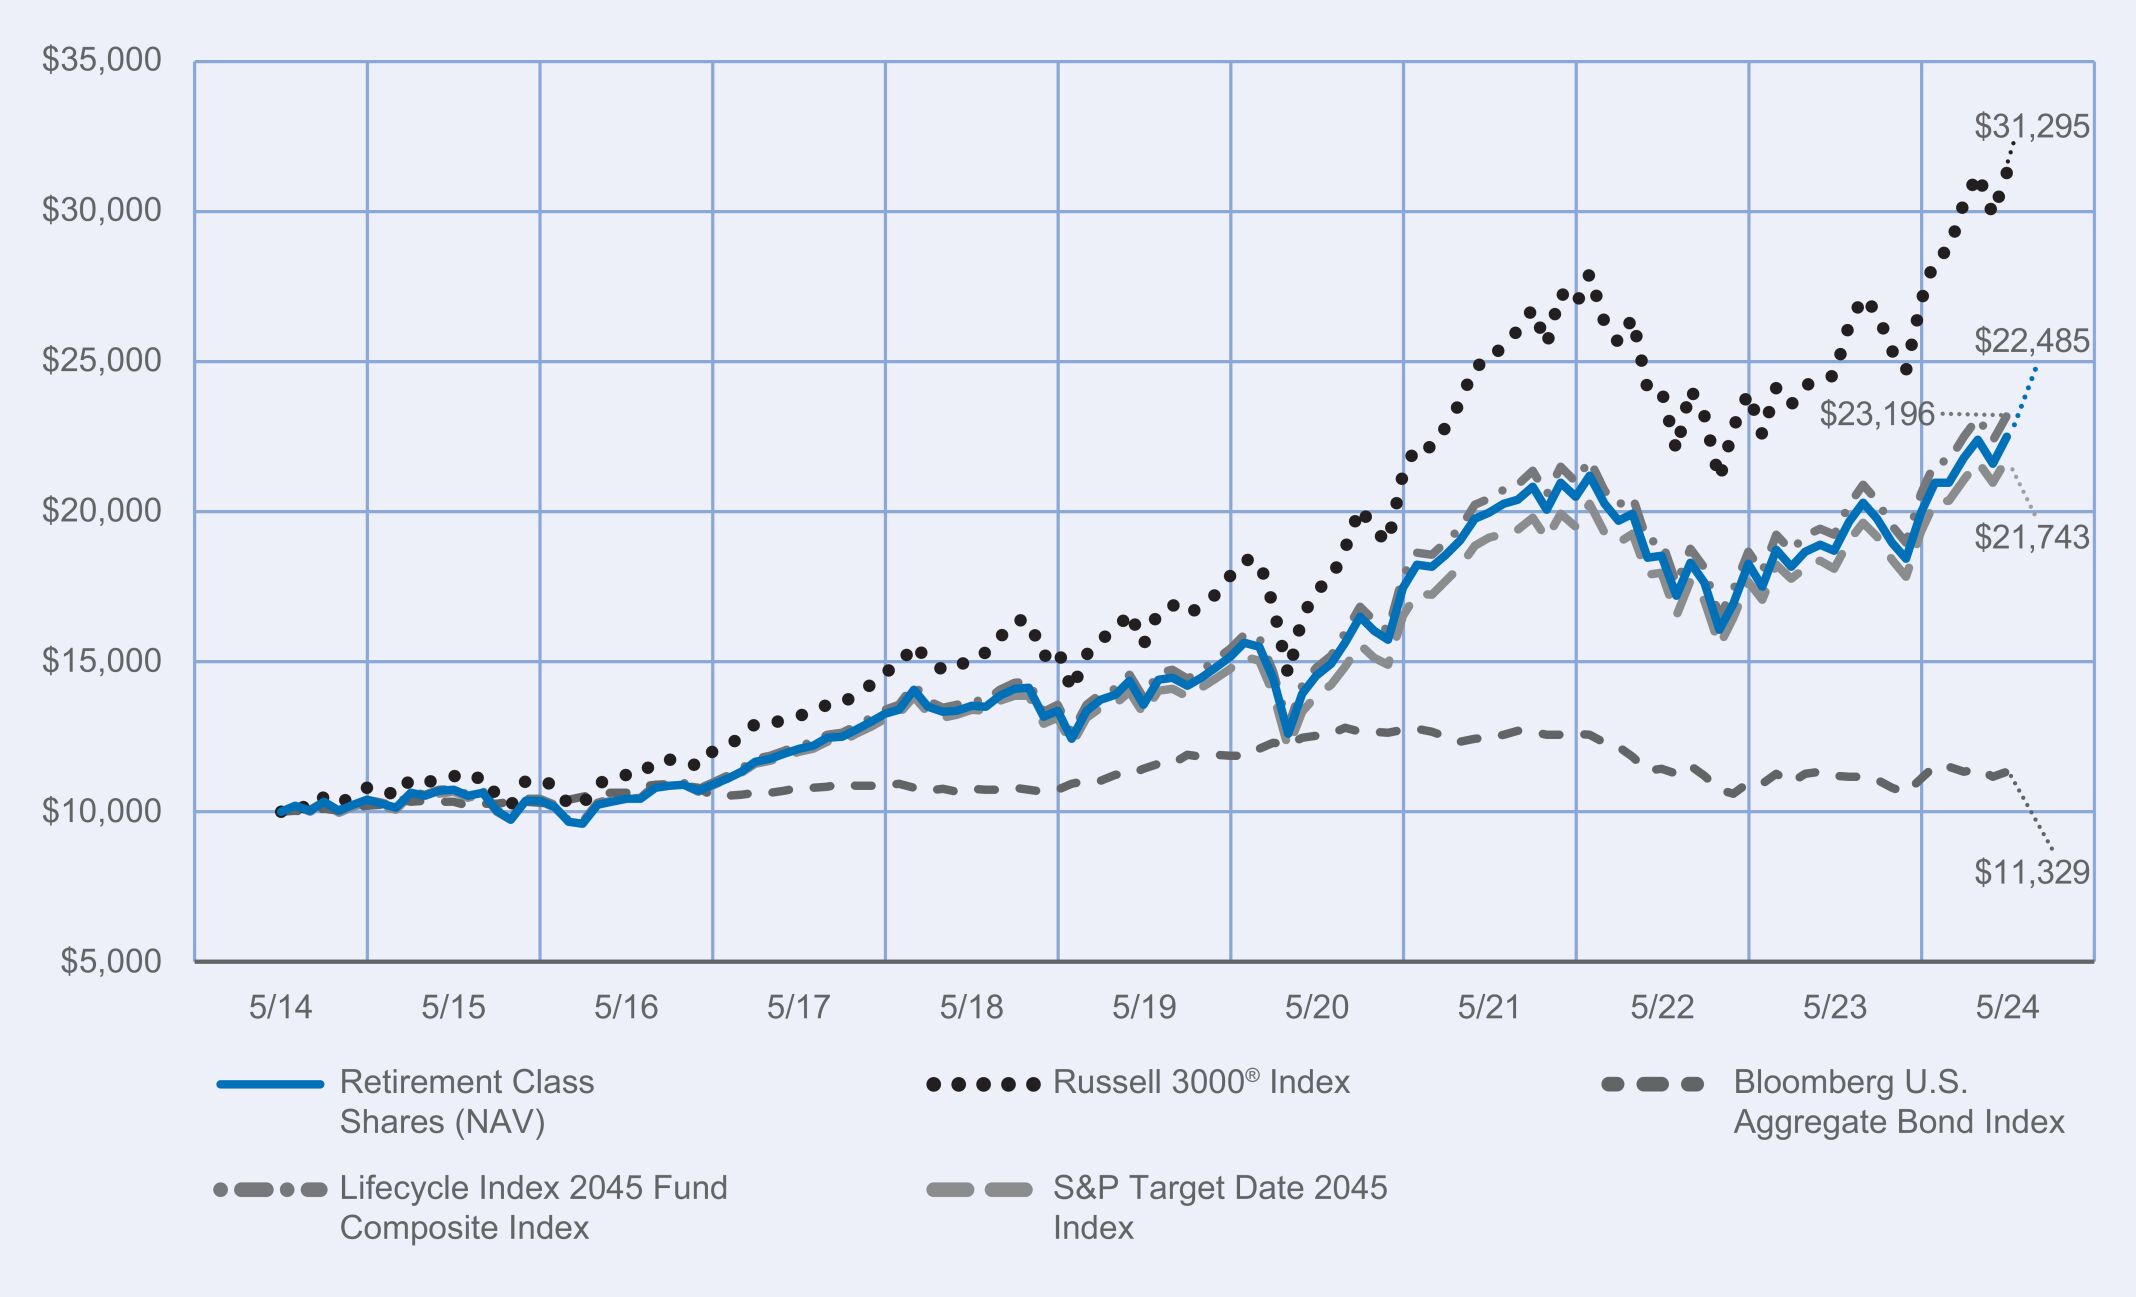
Fund Performance (June 1, 2014 through May 31, 2024) Initial Investment of $10,000
Average Annual Total Returns
| | | | | | | | | | | | |
| | | 1 year | | | 5 years | | | 10 years | |
| Retirement Class Shares at NAV | | | 10.52 | % | | | 5.32 | % | | | 4.95 | % |
Russell 3000® Index | | | 27.58 | % | | | 15.00 | % | | | 12.09 | % |
| Bloomberg U.S. Aggregate Bond Index | | | 1.31 | % | | | (0.17 | )% | | | 1.26 | % |
| Lifecycle 2015 Fund Composite Index | | | 10.74 | % | | | 5.85 | % | | | 5.28 | % |
| S&P Target Date 2015 Index | | | 9.99 | % | | | 5.38 | % | | | 4.85 | % |
Investment return and principal value will fluctuate, and you may have a gain or loss when you sell your shares. Current performance may differ from figures shown. For most recent month‑end performance, go to https://www.nuveen.com/en‑us/mutual‑funds/prospectuses or call (800) 257‑8787.
Fund Statistics (as of May 31, 2024)
| | | | |
| Fund net assets | | $ | 1,158,115,781 | |
| Total number of portfolio holdings | | | 21 | |
| Portfolio turnover (%) | | | 13% | |
| Total advisory fees paid for the year | | $ | 4,598,952 | |
What did the Fund invest in? (as of May 31, 2024)
(1) Affiliated investment companies, except for repurchase agreements.
How has the Fund changed?
| | • | | Name change: Effective May 1, 2024, the Fund’s name changed from TIAA-CREF Lifecycle 2015 Fund to Nuveen Lifecycle 2015 Fund. | |
For more complete information, you may review the Fund’s next prospectus, which is expected to be available by October 1, 2024 at https://www.nuveen.com/en‑us/mutual‑funds/prospectuses or upon request at (800) 257‑8787.
Availability of additional information about the Fund
You can find additional information about the Fund at https://www.nuveen.com/en‑us/mutual‑funds/prospectuses, including its:
| | • | | prospectus • financial statements and other information • fund holdings • proxy voting information |
You can also request this information at (800) 257‑8787.
| | |
87244W441_AR_0524 3613689-INV-Y-07/25 (I, R6, Premier, Retirement) | | |
| | |
| | Annual Shareholder Report May 31, 2024 |
Nuveen Lifecycle 2020 Fund
(Formerly known as TIAA-CREF Lifecycle 2020 Fund)
Retirement Class Shares/TCLTX
Annual Shareholder Report
This annual shareholder report contains important information about the Retirement Class Shares of the Nuveen Lifecycle 2020 Fund for the period of June 1, 2023 to May 31, 2024. You can find additional information at https://www.nuveen.com/en‑us/mutual‑funds/prospectuses. You can also request this information by contacting us at (800) 257‑8787.
This report describes changes to the Fund that occurred during the reporting period.
What were the Fund costs for the last year? (based on a hypothetical $10,000 investment)(1)
| | | | |
| | | Cost of a $10,000 investment | | Costs paid as a percentage of
$10,000 investment |
| Retirement Class Shares | | $51 | | 0.51% |
(1) These costs include the expenses of underlying funds in which the Fund invests except for the expenses of the Nuveen Dividend Growth Fund, Nuveen Dividend Value Fund, Nuveen Growth Opportunities ETF and TIAA-CREF Real Property Fund.
How did the Fund perform last year? What affected the Fund’s performance?
| | |
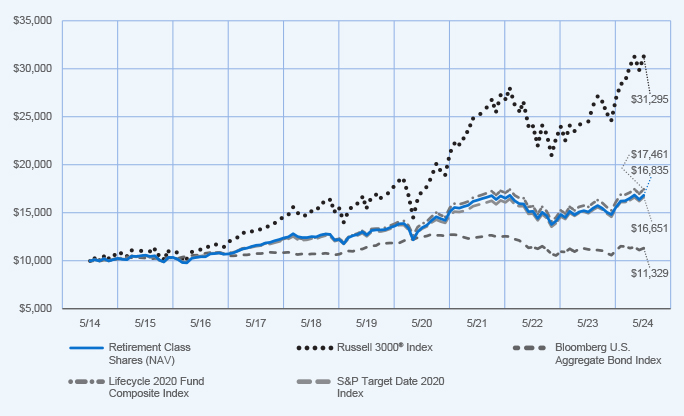
Performance Highlights • The Nuveen Lifecycle 2020 Fund returned 11.50% for Retirement Class shares at net asset value (NAV) for the 12 months ended May 31, 2024. The Fund performed in line with the Lifecycle 2020 Fund Composite Index, which returned 11.75%. • The Lifecycle 2020 Fund Composite Index consisted of: 38.8% Bloomberg U.S. Aggregate Bond Index; 29.9% Russell 3000® Index; 16.1% MSCI All Country World Index ex USA Investable Market Index; 7.6% Bloomberg U.S. 1-3 Year Government/Credit Bond Index; and 7.6% Bloomberg U.S. Treasury Inflation Protected Securities (TIPS) 1‑10 Year Index. • Top detractors from relative performance » An allocation to the Nuveen Real Property Fund LP. » A position in the Nuveen International Opportunities Fund. • Top contributors to relative performance » Strong performance of the underlying funds investing in fixed income, led by the Nuveen Core Bond Fund and the Nuveen Core Plus Bond Fund. » Strong overall performance of the underlying funds investing in U.S. equities, led by the Nuveen Core Equity Fund. | | Performance Attribution Nuveen Real Property Fund LP Nuveen International Opportunities Fund Nuveen Core Bond Fund Nuveen Core Plus Bond Fund |
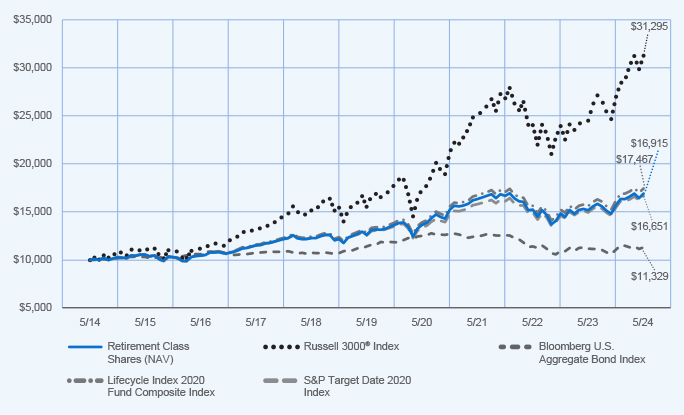
How did the Fund perform over the last 10 years?
Performance data shown represents past performance and does not predict or guarantee future results. The graph and table do not reflect the deduction of taxes that a shareholder would pay on Fund distributions or redemption of Fund Shares.
Fund Performance (June 1, 2014 through May 31, 2024) Initial Investment of $10,000
Average Annual Total Returns
| | | | | | | | | | | | |
| | | 1 year | | | 5 years | | | 10 years | |
| Retirement Class Shares at NAV | | | 11.50 | % | | | 5.82 | % | | | 5.35 | % |
Russell 3000® Index | | | 27.58 | % | | | 15.00 | % | | | 12.09 | % |
| Bloomberg U.S. Aggregate Bond Index | | | 1.31 | % | | | (0.17 | )% | | | 1.26 | % |
| Lifecycle 2020 Fund Composite Index | | | 11.75 | % | | | 6.40 | % | | | 5.73 | % |
| S&P Target Date 2020 Index | | | 11.28 | % | | | 5.80 | % | | | 5.23 | % |
Investment return and principal value will fluctuate, and you may have a gain or loss when you sell your shares. Current performance may differ from figures shown. For most recent month‑end performance, go to https://www.nuveen.com/en‑us/mutual‑funds/prospectuses or call (800) 257‑8787.
Fund Statistics (as of May 31, 2024)
| | | | |
| Fund net assets | | $ | 2,514,613,559 | |
| Total number of portfolio holdings | | | 21 | |
| Portfolio turnover (%) | | | 12% | |
| Total advisory fees paid for the year | | $ | 10,191,037 | |
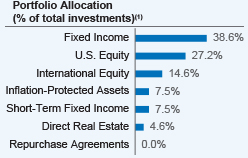
What did the Fund invest in? (as of May 31, 2024)
(1) Affiliated investment companies, except for repurchase agreements.
How has the Fund changed?
| | • | | Name change: Effective May 1, 2024, the Fund’s name changed from TIAA-CREF Lifecycle 2020 Fund to Nuveen Lifecycle 2020 Fund. | |
For more complete information, you may review the Fund’s next prospectus, which is expected to be available by October 1, 2024 at https://www.nuveen.com/en‑us/mutual‑funds/prospectuses or upon request at (800) 257‑8787.
Availability of additional information about the Fund
You can find additional information about the Fund at https://www.nuveen.com/en‑us/mutual‑funds/prospectuses, including its:
| | • | | prospectus • financial statements and other information • fund holdings • proxy voting information |
You can also request this information at (800) 257‑8787.
| | |
87244W433_AR_0524 3613701-INV-Y-07/25 (I, R6, Premier, Retirement) | | |
| | |
| | Annual Shareholder Report May 31, 2024 |
Nuveen Lifecycle 2020 Fund
(Formerly known as TIAA-CREF Lifecycle 2020 Fund)
Class R6 Shares (Formerly known as Institutional Class Shares)/TCWIX
Annual Shareholder Report
This annual shareholder report contains important information about the Class R6 Shares of the Nuveen Lifecycle 2020 Fund for the period of June 1, 2023 to May 31, 2024. You can find additional information at https://www.nuveen.com/en‑us/mutual‑funds/prospectuses. You can also request this information by contacting us at (800) 257‑8787.
This report describes changes to the Fund that occurred during the reporting period.
What were the Fund costs for the last year? (based on a hypothetical $10,000 investment)(1)
| | | | |
| | | Cost of a $10,000 investment | | Costs paid as a percentage of $10,000 investment |
| Class R6 Shares | | $26 | | 0.26% |
(1) These costs include the expenses of underlying funds in which the Fund invests except for the expenses of the Nuveen Dividend Growth Fund, Nuveen Dividend Value Fund, Nuveen Growth Opportunities ETF and TIAA-CREF Real Property Fund.
How did the Fund perform last year? What affected the Fund’s performance?
| | |
Performance Highlights • The Nuveen Lifecycle 2020 Fund returned 11.86% for Class R6 shares at net asset value (NAV) for the 12 months ended May 31, 2024. The Fund performed in line with the Lifecycle 2020 Fund Composite Index, which returned 11.75%. • The Lifecycle 2020 Fund Composite Index consisted of: 38.8% Bloomberg U.S. Aggregate Bond Index; 29.9% Russell 3000® Index; 16.1% MSCI All Country World Index ex USA Investable Market Index; 7.6% Bloomberg U.S. 1-3 Year Government/Credit Bond Index; and 7.6% Bloomberg U.S. Treasury Inflation Protected Securities (TIPS) 1‑10 Year Index. • Top contributors to relative performance » Strong performance of the underlying funds investing in fixed income, led by the Nuveen Core Bond Fund and the Nuveen Core Plus Bond Fund. » Strong overall performance of the underlying funds investing in U.S. equities, led by the Nuveen Core Equity Fund. • Top detractors from relative performance » An allocation to the Nuveen Real Property Fund LP. » A position in the Nuveen International Opportunities Fund. | | Performance Attribution Nuveen Core Bond Fund Nuveen Core Plus Bond Fund Nuveen Core Equity Fund Nuveen Real Property Fund LP |
How did the Fund perform over the last 10 years?
Performance data shown represents past performance and does not predict or guarantee future results. The graph and table do not reflect the deduction of taxes that a shareholder would pay on Fund distributions or redemption of Fund Shares.
Fund Performance (June 1, 2014 through May 31, 2024) Initial Investment of $10,000
Average Annual Total Returns
| | | | | | | | | | | | |
| | | 1 year | | | 5 years | | | 10 years | |
| Class R6 Shares at NAV | | | 11.86 | % | | | 6.09 | % | | | 5.61 | % |
Russell 3000® Index | | | 27.58 | % | | | 15.00 | % | | | 12.09 | % |
| Bloomberg U.S. Aggregate Bond Index | | | 1.31 | % | | | (0.17 | )% | | | 1.26 | % |
| Lifecycle 2020 Fund Composite Index | | | 11.75 | % | | | 6.40 | % | | | 5.73 | % |
| S&P Target Date 2020 Index | | | 11.28 | % | | | 5.80 | % | | | 5.23 | % |
Investment return and principal value will fluctuate, and you may have a gain or loss when you sell your shares. Current performance may differ from figures shown. For most recent month‑end performance, go to https://www.nuveen.com/en‑us/mutual‑funds/prospectuses or call (800) 257‑8787.
Fund Statistics (as of May 31, 2024)
| | | | |
| Fund net assets | | $ | 2,514,613,559 | |
| Total number of portfolio holdings | | | 21 | |
| Portfolio turnover (%) | | | 12% | |
| Total advisory fees paid for the year | | $ | 10,191,037 | |
What did the Fund invest in? (as of May 31, 2024)
(1) Affiliated investment companies, except for repurchase agreements.
How has the Fund changed?
| | • | | Name change: Effective May 1, 2024, the Fund’s name changed from TIAA-CREF Lifecycle 2020 Fund to Nuveen Lifecycle 2020 Fund. | |
| | • | | Share class name change: Effective May 6, 2024, Institutional Class shares of the Fund were renamed Class R6 shares. | |
For more complete information, you may review the Fund’s next prospectus, which is expected to be available by October 1, 2024 at https://www.nuveen.com/en‑us/mutual‑funds/prospectuses or upon request at (800) 257‑8787.
Availability of additional information about the Fund
You can find additional information about the Fund at https://www.nuveen.com/en‑us/mutual‑funds/prospectuses, including its:
| | • | | prospectus • financial statements and other information • fund holdings • proxy voting information |
You can also request this information at (800) 257‑8787.
| | |
886315647_AR_0524 3613701-INV-Y-07/25 (I, R6, Premier, Retirement) | | |
| | |
| | Annual Shareholder Report May 31, 2024 |
Nuveen Lifecycle 2020 Fund
(Formerly known as TIAA-CREF Lifecycle 2020 Fund)
Premier Class Shares/TCWPX
Annual Shareholder Report
This annual shareholder report contains important information about the Premier Class Shares of the Nuveen Lifecycle 2020 Fund for the period of June 1, 2023 to May 31, 2024. You can find additional information at https://www.nuveen.com/en‑us/mutual‑funds/prospectuses. You can also request this information by contacting us at (800) 257‑8787.
This report describes changes to the Fund that occurred during the reporting period.
What were the Fund costs for the last year? (based on a hypothetical $10,000 investment)(1)
| | | | |
| | | Cost of a $10,000 investment | | Costs paid as a percentage of
$10,000 investment |
| Premier Class Shares | | $41 | | 0.41% |
(1) These costs include the expenses of underlying funds in which the Fund invests except for the expenses of the Nuveen Dividend Growth Fund, Nuveen Dividend Value Fund, Nuveen Growth Opportunities ETF and TIAA-CREF Real Property Fund.
How did the Fund perform last year? What affected the Fund’s performance?
| | |
Performance Highlights • The Nuveen Lifecycle 2020 Fund returned 11.68% for Premier Class shares at net asset value (NAV) for the 12 months ended May 31, 2024. The Fund performed in line with the Lifecycle 2020 Fund Composite Index, which returned 11.75%. • The Lifecycle 2020 Fund Composite Index consisted of: 38.8% Bloomberg U.S. Aggregate Bond Index; 29.9% Russell 3000® Index; 16.1% MSCI All Country World Index ex USA Investable Market Index; 7.6% Bloomberg U.S. 1-3 Year Government/Credit Bond Index; and 7.6% Bloomberg U.S. Treasury Inflation Protected Securities (TIPS) 1‑10 Year Index. • Top detractors from relative performance » An allocation to the Nuveen Real Property Fund LP. » A position in the Nuveen International Opportunities Fund. • Top contributors to relative performance » Strong performance of the underlying funds investing in fixed income, led by the Nuveen Core Bond Fund and the Nuveen Core Plus Bond Fund. » Strong overall performance of the underlying funds investing in U.S. equities, led by the Nuveen Core Equity Fund. | | Performance Attribution Nuveen Real Property Fund LP Nuveen International Opportunities Fund Nuveen Core Bond Fund Nuveen Core Plus Bond Fund |
How did the Fund perform over the last 10 years?
Performance data shown represents past performance and does not predict or guarantee future results. The graph and table do not reflect the deduction of taxes that a shareholder would pay on Fund distributions or redemption of Fund Shares.
Fund Performance (June 1, 2014 through May 31, 2024) Initial Investment of $10,000
Average Annual Total Returns
| | | | | | | | | | | | |
| | | 1 year | | | 5 years | | | 10 years | |
| Premier Class Shares at NAV | | | 11.68 | % | | | 5.94 | % | | | 5.45 | % |
Russell 3000® Index | | | 27.58 | % | | | 15.00 | % | | | 12.09 | % |
| Bloomberg U.S. Aggregate Bond Index | | | 1.31 | % | | | (0.17 | )% | | | 1.26 | % |
| Lifecycle 2020 Fund Composite Index | | | 11.75 | % | | | 6.40 | % | | | 5.73 | % |
| S&P Target Date 2020 Index | | | 11.28 | % | | | 5.80 | % | | | 5.23 | % |
Investment return and principal value will fluctuate, and you may have a gain or loss when you sell your shares. Current performance may differ from figures shown. For most recent month‑end performance, go to https://www.nuveen.com/en‑us/mutual‑funds/prospectuses or call (800) 257‑8787.
Fund Statistics (as of May 31, 2024)
| | | | |
| Fund net assets | | $ | 2,514,613,559 | |
| Total number of portfolio holdings | | | 21 | |
| Portfolio turnover (%) | | | 12% | |
| Total advisory fees paid for the year | | $ | 10,191,037 | |
What did the Fund invest in? (as of May 31, 2024)
(1) Affiliated investment companies, except for repurchase agreements.
How has the Fund changed?
| | • | | Name change: Effective May 1, 2024, the Fund’s name changed from TIAA-CREF Lifecycle 2020 Fund to Nuveen Lifecycle 2020 Fund. | |
For more complete information, you may review the Fund’s next prospectus, which is expected to be available by October 1, 2024 at https://www.nuveen.com/en‑us/mutual‑funds/prospectuses or upon request at (800) 257‑8787.
Availability of additional information about the Fund
You can find additional information about the Fund at https://www.nuveen.com/en‑us/mutual‑funds/prospectuses, including its:
| | • | | prospectus • financial statements and other information • fund holdings • proxy voting information |
You can also request this information at (800) 257‑8787.
| | |
87245M418_AR_0524 3613701-INV-Y-07/25 (I, R6, Premier, Retirement) | | |
| | |
| | Annual Shareholder Report May 31, 2024 |
Nuveen Lifecycle 2020 Fund
(Formerly known as TIAA-CREF Lifecycle 2020 Fund)
Class I Shares (Formerly known as Advisor Class Shares)/TCWHX
Annual Shareholder Report
This annual shareholder report contains important information about the Class I Shares of the Nuveen Lifecycle 2020 Fund for the period of June 1, 2023 to May 31, 2024. You can find additional information at https://www.nuveen.com/en‑us/mutual‑funds/prospectuses. You can also request this information by contacting us at (800) 257‑8787.
This report describes changes to the Fund that occurred during the reporting period.
What were the Fund costs for the last year? (based on a hypothetical $10,000 investment)(1)
| | | | |
| | | Cost of a $10,000 investment | | Costs paid as a percentage of
$10,000 investment |
| Class I Shares | | $35 | | 0.35% |
(1) These costs include the expenses of underlying funds in which the Fund invests except for the expenses of the Nuveen Dividend Growth Fund, Nuveen Dividend Value Fund, Nuveen Growth Opportunities ETF and TIAA-CREF Real Property Fund.
How did the Fund perform last year? What affected the Fund’s performance?
| | |
Performance Highlights • The Nuveen Lifecycle 2020 Fund returned 11.65% for Class I shares at net asset value (NAV) for the 12 months ended May 31, 2024. The Fund performed in line with the Lifecycle 2020 Fund Composite Index, which returned 11.75%. • The Lifecycle 2020 Fund Composite Index consisted of: 38.8% Bloomberg U.S. Aggregate Bond Index; 29.9% Russell 3000® Index; 16.1% MSCI All Country World Index ex USA Investable Market Index; 7.6% Bloomberg U.S. 1-3 Year Government/Credit Bond Index; and 7.6% Bloomberg U.S. Treasury Inflation Protected Securities (TIPS) 1-10 Year Index. • Top detractors from relative performance » An allocation to the Nuveen Real Property Fund LP. » A position in the Nuveen International Opportunities Fund. • Top contributors to relative performance » Strong performance of the underlying funds investing in fixed income, led by the Nuveen Core Bond Fund and the Nuveen Core Plus Bond Fund. » Strong overall performance of the underlying funds investing in U.S. equities, led by the Nuveen Core Equity Fund. | | Performance Attribution Nuveen Real Property Fund LP Nuveen Dividend Growth Fund Nuveen International Opportunities Fund Nuveen Core Bond Fund Nuveen Core Plus Bond Fund |
How did the Fund perform over the period since inception?
Performance data shown represents past performance and does not predict or guarantee future results. The graph and table do not reflect the deduction of taxes that a shareholder would pay on Fund distributions or redemption of Fund Shares.
Fund Performance (December 4, 2015 through May 31, 2024) Initial Investment of $10,000
Average Annual Total Returns
| | | | | | | | | | | | |
| | | 1 year | | | 5 years | | | Since Inception | |
| Class I Shares at NAV | | | 11.65 | % | | | 6.01 | % | | | 6.09 | % |
Russell 3000® Index | | | 27.58 | % | | | 15.00 | % | | | 12.98 | % |
| Bloomberg U.S. Aggregate Bond Index | | | 1.31 | % | | | (0.17 | )% | | | 1.16 | % |
| Lifecycle 2020 Fund Composite Index | | | 11.75 | % | | | 6.40 | % | | | 6.37 | % |
| S&P Target Date 2020 Index | | | 11.28 | % | | | 5.80 | % | | | 5.80 | % |
Investment return and principal value will fluctuate, and you may have a gain or loss when you sell your shares. Current performance may differ from figures shown. For most recent month‑end performance, go to https://www.nuveen.com/en‑us/mutual‑funds/prospectuses or call (800) 257‑8787.
Fund Statistics (as of May 31, 2024)
| | | | |
| Fund net assets | | $ | 2,514,613,559 | |
| Total number of portfolio holdings | | | 21 | |
| Portfolio turnover (%) | | | 12% | |
| Total advisory fees paid for the year | | $ | 10,191,037 | |
What did the Fund invest in? (as of May 31, 2024)
(1) Affiliated investment companies, except for repurchase agreements.
How has the Fund changed?
| | • | | Name change: Effective May 1, 2024, the Fund’s name changed from TIAA-CREF Lifecycle 2020 Fund to Nuveen Lifecycle 2020 Fund. | |
| | • | | Share class name change: Effective May 6, 2024, Advisor Class shares of the Fund were renamed Class I shares. | |
For more complete information, you may review the Fund’s next prospectus, which is expected to be available by October 1, 2024 at https://www.nuveen.com/en‑us/mutual‑funds/prospectuses or upon request at (800) 257‑8787.
Availability of additional information about the Fund
You can find additional information about the Fund at https://www.nuveen.com/en‑us/mutual‑funds/prospectuses, including its:
| | • | | prospectus • financial statements and other information • fund holdings • proxy voting information |
You can also request this information at (800) 257‑8787.
| | |
87245P403_AR_0524 3613701-INV-Y-07/25 (I, R6, Premier, Retirement) | | |
| | |
| | Annual Shareholder Report May 31, 2024 |
Nuveen Lifecycle 2025 Fund
(Formerly known as TIAA-CREF Lifecycle 2025 Fund)
Retirement Class Shares/TCLFX
Annual Shareholder Report
This annual shareholder report contains important information about the Retirement Class Shares of the Nuveen Lifecycle 2025 Fund for the period of June 1, 2023 to May 31, 2024. You can find additional information at https://www.nuveen.com/en‑us/mutual‑funds/prospectuses. You can also request this information by contacting us at (800) 257‑8787.
This report describes changes to the Fund that occurred during the reporting period.
What were the Fund costs for the last year? (based on a hypothetical $10,000 investment)(1)
| | | | |
| | | Cost of a $10,000 investment | | Costs paid as a percentage of
$10,000 investment |
| Retirement Class Shares | | $53 | | 0.53% |
(1) These costs include the expenses of underlying funds in which the Fund invests except for the expenses of the Nuveen Dividend Growth Fund, Nuveen Dividend Value Fund, Nuveen Growth Opportunities ETF and TIAA-CREF Real Property Fund.
How did the Fund perform last year? What affected the Fund’s performance?
| | |
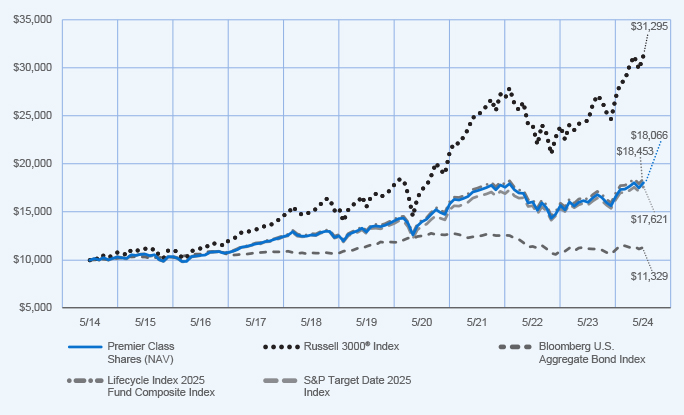
Performance Highlights • The Nuveen Lifecycle 2025 Fund returned 12.79% for Retirement Class shares at net asset value (NAV) for the 12 months ended May 31, 2024. The Fund performed in line with the Lifecycle 2025 Fund Composite Index, which returned 13.00%. • The Lifecycle 2025 Fund Composite Index consisted of: 37.1% Bloomberg U.S. Aggregate Bond Index; 33.6% Russell 3000® Index; 18.1% MSCI All Country World Index ex USA Investable Market Index; 5.6% Bloomberg U.S. 1-3 Year Government/Credit Bond Index; and 5.6% Bloomberg U.S. Treasury Inflation Protected Securities (TIPS) 1-10 Year Index. • Top detractors from relative performance » An allocation to the Nuveen Real Property Fund LP. » A position in the Nuveen International Opportunities Fund. • Top contributors to relative performance » Strong performance of the underlying funds investing in fixed income, led by the Nuveen Core Bond Fund and the Nuveen Core Plus Bond Fund. » Strong overall performance of the underlying funds investing in U.S. equities, led by the Nuveen Core Equity Fund. | | Performance Attribution Nuveen Real Property Fund LP Nuveen International Opportunities Fund Nuveen Core Bond Fund Nuveen Core Plus Bond Fund |
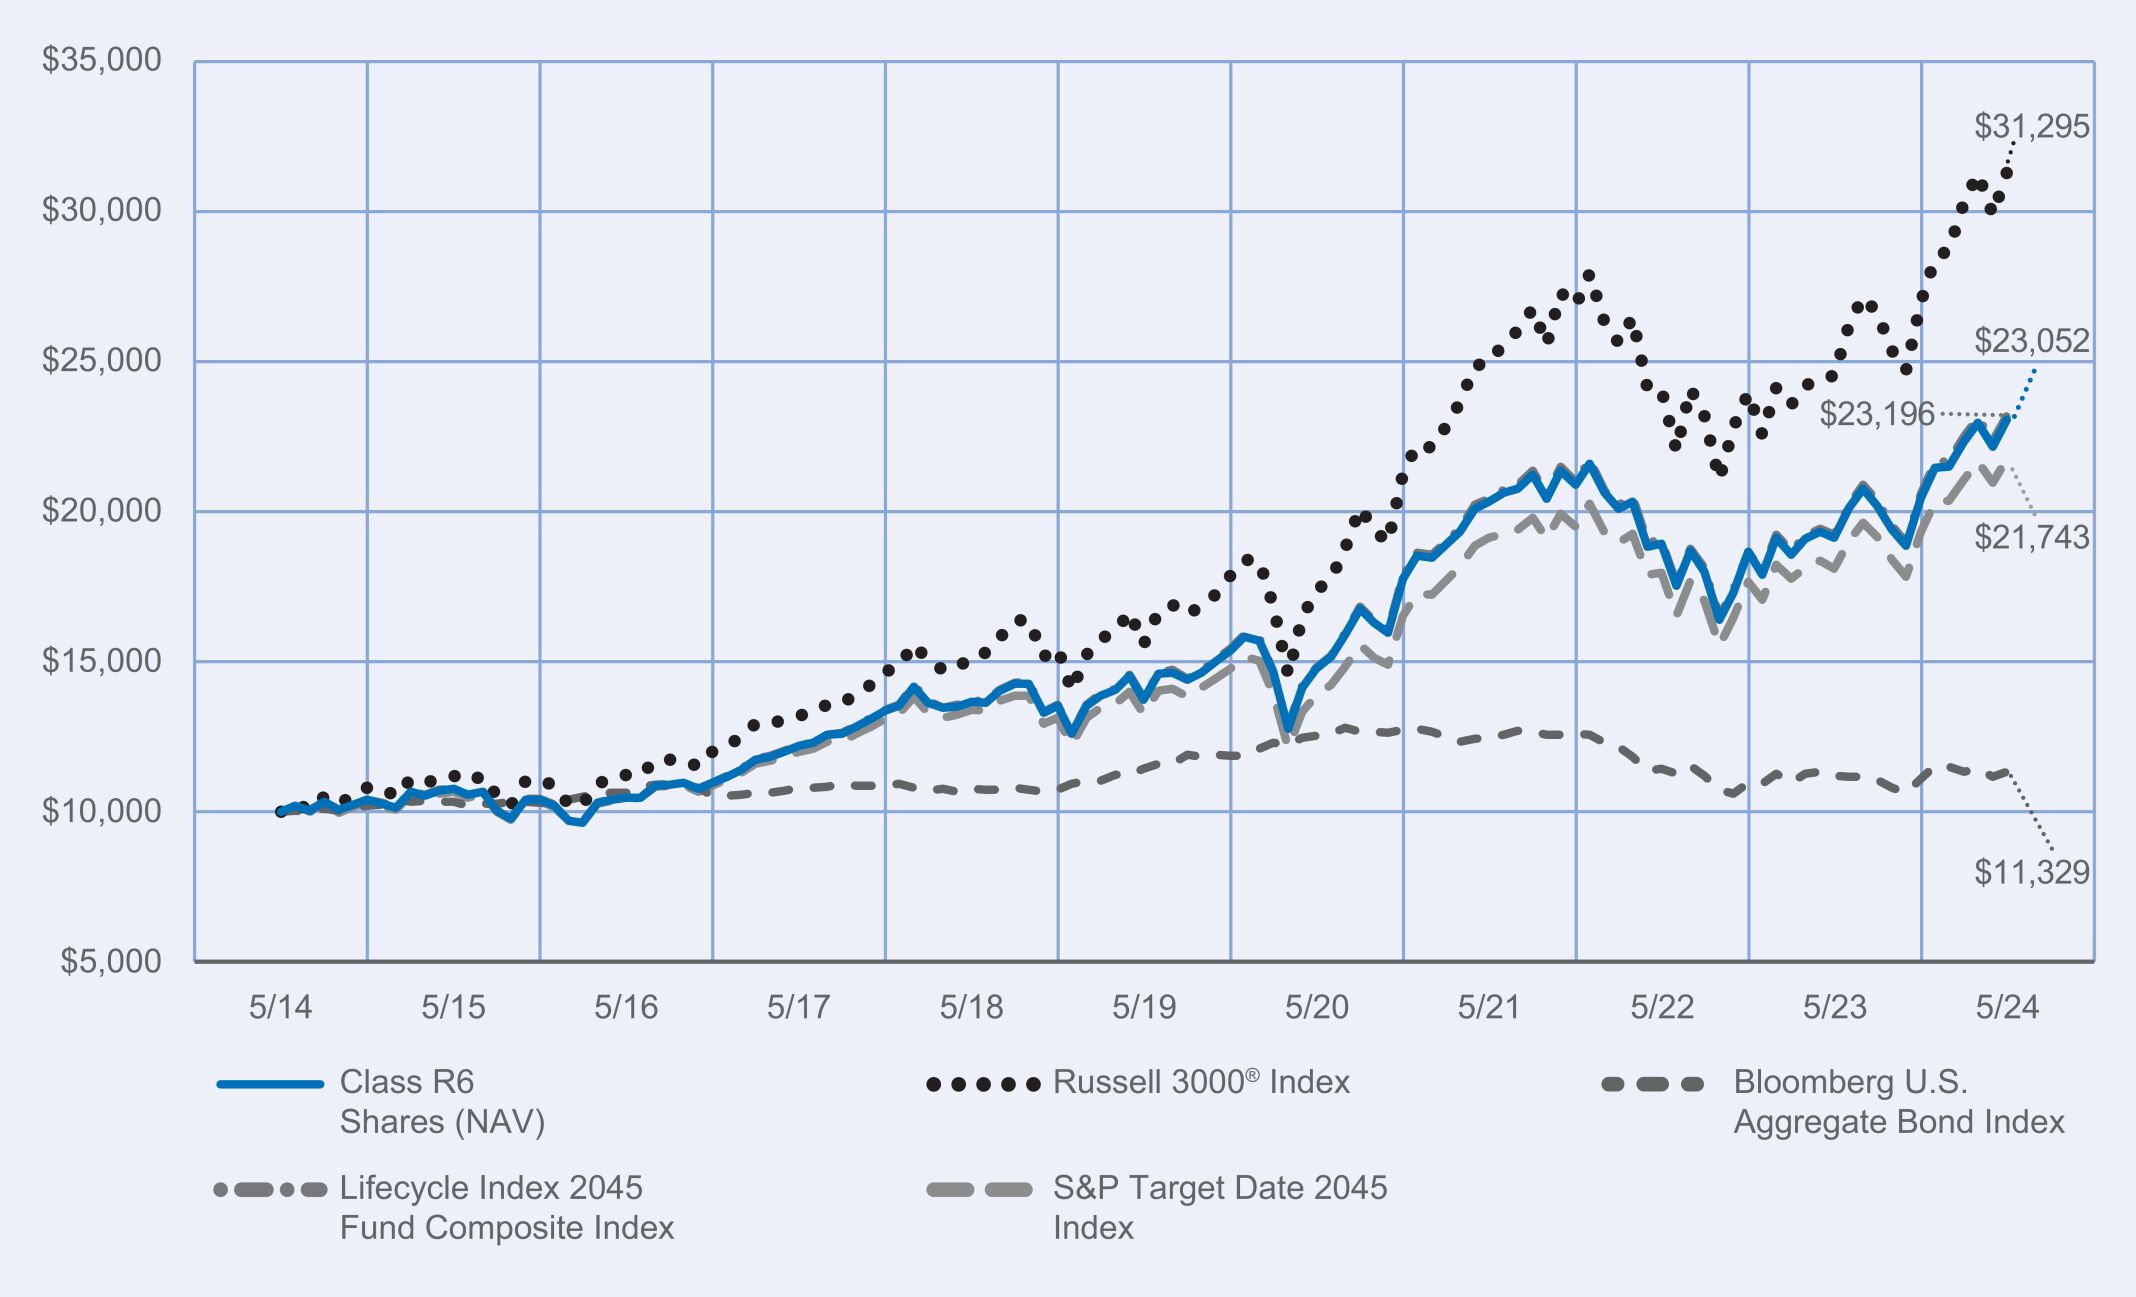
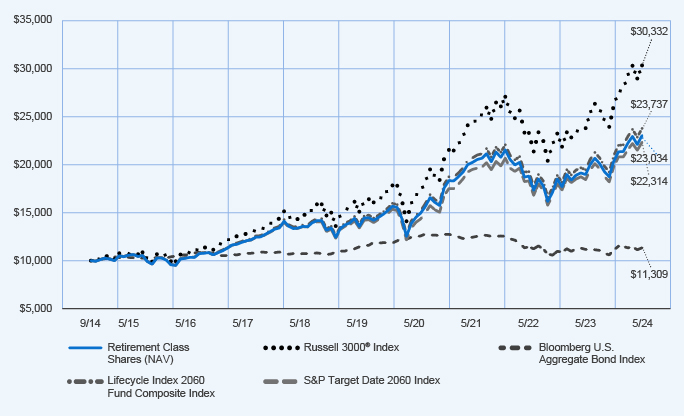
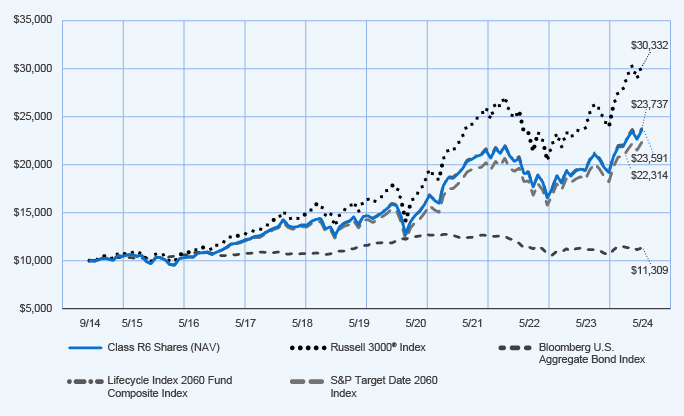
How did the Fund perform over the last 10 years?
Performance data shown represents past performance and does not predict or guarantee future results. The graph and table do not reflect the deduction of taxes that a shareholder would pay on Fund distributions or redemption of Fund Shares.
Fund Performance (June 1, 2014 through May 31, 2024) Initial Investment of $10,000
Average Annual Total Returns
| | | | | | | | | | | | |
| | | 1 year | | | 5 years | | | 10 years | |
| Retirement Class Shares at NAV | | | 12.79 | % | | | 6.63 | % | | | 5.89 | % |
Russell 3000® Index | | | 27.58 | % | | | 15.00 | % | | | 12.09 | % |
| Bloomberg U.S. Aggregate Bond Index | | | 1.31 | % | | | (0.17 | )% | | | 1.26 | % |
| Lifecycle 2025 Fund Composite Index | | | 13.00 | % | | | 7.19 | % | | | 6.32 | % |
| S&P Target Date 2025 Index | | | 11.97 | % | | | 6.70 | % | | | 5.83 | % |
Investment return and principal value will fluctuate, and you may have a gain or loss when you sell your shares. Current performance may differ from figures shown. For most recent month‑end performance, go to https://www.nuveen.com/en‑us/mutual‑funds/prospectuses or call (800) 257‑8787.
Fund Statistics (as of May 31, 2024)
| | | | |
| Fund net assets | | $ | 3,915,890,552 | |
| Total number of portfolio holdings | | | 21 | |
| Portfolio turnover (%) | | | 13% | |
| Total advisory fees paid for the year | | $ | 15,748,110 | |
What did the Fund invest in? (as of May 31, 2024)
(1) Affiliated investment companies, except for repurchase agreements.
How has the Fund changed?
| | • | | Name change: Effective May 1, 2024, the Fund’s name changed from TIAA-CREF Lifecycle 2025 Fund to Nuveen Lifecycle 2025 Fund. | |
For more complete information, you may review the Fund’s next prospectus, which is expected to be available by October 1, 2024 at https://www.nuveen.com/en‑us/mutual‑funds/prospectuses or upon request at (800) 257‑8787.
Availability of additional information about the Fund
You can find additional information about the Fund at https://www.nuveen.com/en‑us/mutual‑funds/prospectuses, including its:
| | • | | prospectus • financial statements and other information • fund holdings • proxy voting information |
You can also request this information at (800) 257‑8787.
| | |
87244W425_AR_0524 3613713-INV-Y-07/25 (I, R6, Premier, Retirement) | | |
| | |
| | Annual Shareholder Report May 31, 2024 |
Nuveen Lifecycle 2025 Fund
(Formerly known as TIAA-CREF Lifecycle 2025 Fund)
Class R6 Shares (Formerly known as Institutional Class Shares)/TCYIX
Annual Shareholder Report
This annual shareholder report contains important information about the Class R6 Shares of the Nuveen Lifecycle 2025 Fund for the period of June 1, 2023 to May 31, 2024. You can find additional information at https://www.nuveen.com/en‑us/mutual‑funds/prospectuses. You can also request this information by contacting us at (800) 257‑8787.
This report describes changes to the Fund that occurred during the reporting period.
What were the Fund costs for the last year? (based on a hypothetical $10,000 investment)(1)
| | | | |
| | | Cost of a $10,000 investment | | Costs paid as a percentage of
$10,000 investment |
| Class R6 Shares | | $28 | | 0.28% |
(1) These costs include the expenses of underlying funds in which the Fund invests except for the expenses of the Nuveen Dividend Growth Fund, Nuveen Dividend Value Fund, Nuveen Growth Opportunities ETF and TIAA-CREF Real Property Fund.
How did the Fund perform last year? What affected the Fund’s performance?
| | |
Performance Highlights • The Nuveen Lifecycle 2025 Fund returned 13.20% for Class R6 shares at net asset value (NAV) for the 12 months ended May 31, 2024. The Fund performed in line with the Lifecycle 2025 Fund Composite Index, which returned 13.00%. • The Lifecycle 2025 Fund Composite Index consisted of: 37.1% Bloomberg U.S. Aggregate Bond Index; 33.6% Russell 3000® Index; 18.1% MSCI All Country World Index ex USA Investable Market Index; 5.6% Bloomberg U.S. 1-3 Year Government/Credit Bond Index; and 5.6% Bloomberg U.S. Treasury Inflation Protected Securities (TIPS) 1-10 Year Index. • Top contributors to relative performance » Strong performance of the underlying funds investing in fixed income, led by the Nuveen Core Bond Fund and the Nuveen Core Plus Bond Fund. » Strong overall performance of the underlying funds investing in U.S. equities, led by the Nuveen Core Equity Fund. • Top detractors from relative performance » An allocation to the Nuveen Real Property Fund LP. | | Performance Attribution Nuveen Core Bond Fund Nuveen Core Plus Bond Fund Nuveen Core Equity Fund Nuveen Real Property Fund LP |
How did the Fund perform over the last 10 years?
Performance data shown represents past performance and does not predict or guarantee future results. The graph and table do not reflect the deduction of taxes that a shareholder would pay on Fund distributions or redemption of Fund Shares.
Fund Performance (June 1, 2014 through May 31, 2024) Initial Investment of $10,000
Average Annual Total Returns
| | | | | | | | | | | | |
| | | 1 year | | | 5 years | | | 10 years | |
| Class R6 Shares at NAV | | | 13.20 | % | | | 6.89 | % | | | 6.16 | % |
Russell 3000® Index | | | 27.58 | % | | | 15.00 | % | | | 12.09 | % |
| Bloomberg U.S. Aggregate Bond Index | | | 1.31 | % | | | (0.17 | )% | | | 1.26 | % |
| Lifecycle 2025 Fund Composite Index | | | 13.00 | % | | | 7.19 | % | | | 6.32 | % |
| S&P Target Date 2025 Index | | | 11.97 | % | | | 6.70 | % | | | 5.83 | % |
Investment return and principal value will fluctuate, and you may have a gain or loss when you sell your shares. Current performance may differ from figures shown. For most recent month‑end performance, go to https://www.nuveen.com/en‑us/mutual‑funds/prospectuses or call (800) 257‑8787.
Fund Statistics (as of May 31, 2024)
| | | | |
| Fund net assets | | $ | 3,915,890,552 | |
| Total number of portfolio holdings | | | 21 | |
| Portfolio turnover (%) | | | 13% | |
| Total advisory fees paid for the year | | $ | 15,748,110 | |
What did the Fund invest in? (as of May 31, 2024)
(1) Affiliated investment companies, except for repurchase agreements.
How has the Fund changed?
| | • | | Name change: Effective May 1, 2024, the Fund’s name changed from TIAA-CREF Lifecycle 2025 Fund to Nuveen Lifecycle 2025 Fund. | |
| | • | | Share class name change: Effective May 6, 2024, Institutional Class shares of the Fund were renamed Class R6 shares. | |
For more complete information, you may review the Fund’s next prospectus, which is expected to be available by October 1, 2024 at https://www.nuveen.com/en‑us/mutual‑funds/prospectuses or upon request at (800) 257‑8787.
Availability of additional information about the Fund
You can find additional information about the Fund at https://www.nuveen.com/en‑us/mutual‑funds/prospectuses, including its:
| | • | | prospectus • financial statements and other information • fund holdings • proxy voting information |
You can also request this information at (800) 257‑8787.
| | |
886315639_AR_0524 3613713-INV-Y-07/25 (I, R6, Premier, Retirement) | | |
| | |
| | Annual Shareholder Report May 31, 2024 |
Nuveen Lifecycle 2025 Fund
(Formerly known as TIAA-CREF Lifecycle 2025 Fund)
Premier Class Shares/TCQPX
Annual Shareholder Report
This annual shareholder report contains important information about the Premier Class Shares of the Nuveen Lifecycle 2025 Fund for the period of June 1, 2023 to May 31, 2024. You can find additional information at https://www.nuveen.com/en‑us/mutual‑funds/prospectuses. You can also request this information by contacting us at (800) 257‑8787.
This report describes changes to the Fund that occurred during the reporting period.
What were the Fund costs for the last year? (based on a hypothetical $10,000 investment)(1)
| | | | |
| | | Cost of a $10,000 investment | | Costs paid as a percentage of
$10,000 investment |
| Premier Class Shares | | $43 | | 0.43% |
(1) These costs include the expenses of underlying funds in which the Fund invests except for the expenses of the Nuveen Dividend Growth Fund, Nuveen Dividend Value Fund, Nuveen Growth Opportunities ETF and TIAA-CREF Real Property Fund.
How did the Fund perform last year? What affected the Fund’s performance?
| | |
Performance Highlights • The Nuveen Lifecycle 2025 Fund returned 12.84% for Premier Class shares at net asset value (NAV) for the 12 months ended May 31, 2024. The Fund performed in line with the Lifecycle 2025 Fund Composite Index, which returned 13.00%. • The Lifecycle 2025 Fund Composite Index consisted of: 37.1% Bloomberg U.S. Aggregate Bond Index; 33.6% Russell 3000® Index; 18.1% MSCI All Country World Index ex USA Investable Market Index; 5.6% Bloomberg U.S. 1-3 Year Government/Credit Bond Index; and 5.6% Bloomberg U.S. Treasury Inflation Protected Securities (TIPS) 1-10 Year Index. • Top detractors from relative performance » An allocation to the Nuveen Real Property Fund LP. » A position in the Nuveen International Opportunities Fund. • Top contributors to relative performance » Strong performance of the underlying funds investing in fixed income, led by the Nuveen Core Bond Fund and the Nuveen Core Plus Bond Fund. » Strong overall performance of the underlying funds investing in U.S. equities, led by the Nuveen Core Equity Fund. | | Performance Attribution Nuveen Real Property Fund LP Nuveen International Opportunities Fund Nuveen Core Bond Fund Nuveen Core Plus Bond Fund |
How did the Fund perform over the last 10 years?
Performance data shown represents past performance and does not predict or guarantee future results. The graph and table do not reflect the deduction of taxes that a shareholder would pay on Fund distributions or redemption of Fund Shares.
Fund Performance (June 1, 2014 through May 31, 2024) Initial Investment of $10,000
Average Annual Total Returns
| | | | | | | | | | | | |
| | | 1 year | | | 5 years | | | 10 years | |
| Premier Class Shares at NAV | | | 12.84 | % | | | 6.72 | % | | | 6.00 | % |
Russell 3000® Index | | | 27.58 | % | | | 15.00 | % | | | 12.09 | % |
| Bloomberg U.S. Aggregate Bond Index | | | 1.31 | % | | | (0.17 | )% | | | 1.26 | % |
| Lifecycle 2025 Fund Composite Index | | | 13.00 | % | | | 7.19 | % | | | 6.32 | % |
| S&P Target Date 2025 Index | | | 11.97 | % | | | 6.70 | % | | | 5.83 | % |
Investment return and principal value will fluctuate, and you may have a gain or loss when you sell your shares. Current performance may differ from figures shown. For most recent month‑end performance, go to https://www.nuveen.com/en‑us/mutual‑funds/prospectuses or call (800) 257‑8787.
Fund Statistics (as of May 31, 2024)
| | | | |
| Fund net assets | | $ | 3,915,890,552 | |
| Total number of portfolio holdings | | | 21 | |
| Portfolio turnover (%) | | | 13% | |
| Total advisory fees paid for the year | | $ | 15,748,110 | |
What did the Fund invest in? (as of May 31, 2024)
(1) Affiliated investment companies, except for repurchase agreements.
How has the Fund changed?
| | • | | Name change: Effective May 1, 2024, the Fund’s name changed from TIAA-CREF Lifecycle 2025 Fund to Nuveen Lifecycle 2025 Fund. | |
For more complete information, you may review the Fund’s next prospectus, which is expected to be available by October 1, 2024 at https://www.nuveen.com/en‑us/mutual‑funds/prospectuses or upon request at (800) 257‑8787.
Availability of additional information about the Fund
You can find additional information about the Fund at https://www.nuveen.com/en‑us/mutual‑funds/prospectuses, including its:
| | • | | prospectus • financial statements and other information • fund holdings • proxy voting information |
You can also request this information at (800) 257‑8787.
| | |
87245M392_AR_0524 3613713-INV-Y-07/25 (I, R6, Premier, Retirement) | | |
| | |
| | Annual Shareholder Report May 31, 2024 |
Nuveen Lifecycle 2025 Fund
(Formerly known as TIAA-CREF Lifecycle 2025 Fund)
Class I Shares (Formerly known as Advisor Class Shares)/TCQHX
Annual Shareholder Report
This annual shareholder report contains important information about the Class I Shares of the Nuveen Lifecycle 2025 Fund for the period of June 1, 2023 to May 31, 2024. You can find additional information at https://www.nuveen.com/en‑us/mutual‑funds/prospectuses. You can also request this information by contacting us at (800) 257‑8787.
This report describes changes to the Fund that occurred during the reporting period.
What were the Fund costs for the last year? (based on a hypothetical $10,000 investment)(1)
| | | | |
| | | Cost of a $10,000 investment | | Costs paid as a percentage of $10,000 investment |
| Class I Shares | | $35 | | 0.35% |
(1) These costs include the expenses of underlying funds in which the Fund invests except for the expenses of the Nuveen Dividend Growth Fund, Nuveen Dividend Value Fund, Nuveen Growth Opportunities ETF and TIAA-CREF Real Property Fund.
How did the Fund perform last year? What affected the Fund’s performance?
| | |
Performance Highlights • The Nuveen Lifecycle 2025 Fund returned 13.00% for Class I shares at net asset value (NAV) for the 12 months ended May 31, 2024. The Fund performed in line with the Lifecycle 2025 Fund Composite Index, which returned 13.00%. • The Lifecycle 2025 Fund Composite Index consisted of: 37.1% Bloomberg U.S. Aggregate Bond Index; 33.6% Russell 3000® Index; 18.1% MSCI All Country World Index ex USA Investable Market Index; 5.6% Bloomberg U.S. 1-3 Year Government/Credit Bond Index; and 5.6% Bloomberg U.S. Treasury Inflation Protected Securities (TIPS) 1-10 Year Index. • Top contributors to relative performance » Strong performance of the underlying funds investing in fixed income, led by the Nuveen Core Bond Fund and the Nuveen Core Plus Bond Fund. » Strong overall performance of the underlying funds investing in U.S. equities, led by the Nuveen Core Equity Fund. • Top detractors from relative performance » An allocation to the Nuveen Real Property Fund LP. » A position in the Nuveen International Opportunities Fund. | | Performance Attribution Nuveen Core Bond Fund Nuveen Core Plus Bond Fund Nuveen Core Equity Fund Nuveen Real Property Fund LP |
How did the Fund perform over the period since inception?
Performance data shown represents past performance and does not predict or guarantee future results. The graph and table do not reflect the deduction of taxes that a shareholder would pay on Fund distributions or redemption of Fund Shares.
Fund Performance (December 4, 2015 through May 31, 2024) Initial Investment of $10,000
Average Annual Total Returns
| | | | | | | | | | | | |
| | | 1 year | | | 5 years | | | Since Inception | |
| Class I Shares at NAV | | | 13.00 | % | | | 6.83 | % | | | 6.70 | % |
Russell 3000® Index | | | 27.58 | % | | | 15.00 | % | | | 12.98 | % |
| Bloomberg U.S. Aggregate Bond Index | | | 1.31 | % | | | (0.17 | )% | | | 1.16 | % |
| Lifecycle 2025 Fund Composite Index | | | 13.00 | % | | | 7.19 | % | | | 7.04 | % |
| S&P Target Date 2025 Index | | | 11.97 | % | | | 6.70 | % | | | 6.51 | % |
Investment return and principal value will fluctuate, and you may have a gain or loss when you sell your shares. Current performance may differ from figures shown. For most recent month‑end performance, go to https://www.nuveen.com/en-us/mutual-funds/prospectuses or call (800) 257‑8787.
Fund Statistics (as of May 31, 2024)
| | | | |
| Fund net assets | | $ | 3,915,890,552 | |
| Total number of portfolio holdings | | | 21 | |
| Portfolio turnover (%) | | | 13% | |
| Total advisory fees paid for the year | | $ | 15,748,110 | |
What did the Fund invest in? (as of May 31, 2024)
(1) Affiliated investment companies, except for repurchase agreements.
How has the Fund changed?
| | • | | Name change: Effective May 1, 2024, the Fund’s name changed from TIAA-CREF Lifecycle 2025 Fund to Nuveen Lifecycle 2025 Fund. | |
| | • | | Share class name change: Effective May 6, 2024, Advisor Class shares of the Fund were renamed Class I shares. | |
For more complete information, you may review the Fund’s next prospectus, which is expected to be available by October 1, 2024 at https://www.nuveen.com/en-us/mutual-funds/prospectuses or upon request at (800) 257‑8787.
Availability of additional information about the Fund
You can find additional information about the Fund at https://www.nuveen.com/en-us/mutual-funds/prospectuses, including its:
| | • | | prospectus • financial statements and other information • fund holdings • proxy voting information |
You can also request this information at (800) 257‑8787.
| | |
87245P502_AR_0524 3613713-INV-Y-07/25 (I, R6, Premier, Retirement) | | |
| | |
| | Annual Shareholder Report May 31, 2024 |
Nuveen Lifecycle 2030 Fund
(Formerly known as TIAA-CREF Lifecycle 2030 Fund)
Retirement Class Shares/TCLNX
Annual Shareholder Report
This annual shareholder report contains important information about the Retirement Class Shares of the Nuveen Lifecycle 2030 Fund for the period of June 1, 2023 to May 31, 2024. You can find additional information at https://www.nuveen.com/en‑us/mutual‑funds/prospectuses. You can also request this information by contacting us at (800) 257‑8787.
This report describes changes to the Fund that occurred during the reporting period.
What were the Fund costs for the last year? (based on a hypothetical $10,000 investment)(1)
| | | | |
| | | Cost of a $10,000 investment | | Costs paid as a percentage of
$10,000 investment |
| Retirement Class Shares | | $54 | | 0.54% |
(1) These costs include the expenses of underlying funds in which the Fund invests except for the expenses of the Nuveen Dividend Growth Fund, Nuveen Dividend Value Fund, Nuveen Growth Opportunities ETF and TIAA-CREF Real Property Fund.
How did the Fund perform last year? What affected the Fund’s performance?
| | |
Performance Highlights • The Nuveen Lifecycle 2030 Fund returned 14.66% for Retirement Class shares at net asset value (NAV) for the 12 months ended May 31, 2024. The Fund performed in line with the Lifecycle 2030 Fund Composite Index, which returned 14.71%. • The Lifecycle 2030 Fund Composite Index consisted of: 38.8% Russell 3000® Index; 33.1% Bloomberg U.S. Aggregate Bond Index; 20.9% MSCI All Country World Index ex USA Investable Market Index; 3.6% Bloomberg U.S. 1-3 Year Government/Credit Bond Index; and 3.6% Bloomberg U.S. Treasury Inflation Protected Securities (TIPS) 1-10 Year Index. • Top detractors from relative performance » An allocation to the Nuveen Real Property Fund LP. » A position in the Nuveen International Opportunities Fund. • Top contributors to relative performance » Strong performance of the underlying funds investing in fixed income, led by the Nuveen Core Bond Fund and the Nuveen Core Plus Bond Fund. » Strong overall performance of the underlying funds investing in U.S. equities, led by the Nuveen Core Equity Fund. | | Performance Attribution Nuveen Real Property Fund LP Nuveen International Opportunities Fund Nuveen Core Equity Fund Nuveen Core Bond Fund |
How did the Fund perform over the last 10 years?
Performance data shown represents past performance and does not predict or guarantee future results. The graph and table do not reflect the deduction of taxes that a shareholder would pay on Fund distributions or redemption of Fund Shares.
Fund Performance (June 1, 2014 through May 31, 2024) Initial Investment of $10,000
Average Annual Total Returns
| | | | | | | | | | | | |
| | | 1 year | | | 5 years | | | 10 years | |
| Retirement Class Shares at NAV | | | 14.66 | % | | | 7.55 | % | | | 6.50 | % |
Russell 3000® Index | | | 27.58 | % | | | 15.00 | % | | | 12.09 | % |
| Bloomberg U.S. Aggregate Bond Index | | | 1.31 | % | | | (0.17 | )% | | | 1.26 | % |
| Lifecycle 2030 Fund Composite Index | | | 14.71 | % | | | 8.09 | % | | | 6.95 | % |
| S&P Target Date 2030 Index | | | 14.24 | % | | | 7.77 | % | | | 6.50 | % |
Investment return and principal value will fluctuate, and you may have a gain or loss when you sell your shares. Current performance may differ from figures shown. For most recent month‑end performance, go to https://www.nuveen.com/en‑us/mutual‑funds/prospectuses or call (800) 257‑8787.
Fund Statistics (as of May 31, 2024)
| | | | |
| Fund net assets | | $ | 4,752,803,626 | |
| Total number of portfolio holdings | | | 21 | |
| Portfolio turnover (%) | | | 14% | |
| Total advisory fees paid for the year | | $ | 18,737,834 | |
What did the Fund invest in? (as of May 31, 2024)
(1) Affiliated investment companies, except for repurchase agreements.
How has the Fund changed?
| | • | | Name change: Effective May 1, 2024, the Fund’s name changed from TIAA-CREF Lifecycle 2030 Fund to Nuveen Lifecycle 2030 Fund. | |
For more complete information, you may review the Fund’s next prospectus, which is expected to be available by October 1, 2024 at https://www.nuveen.com/en‑us/mutual‑funds/prospectuses or upon request at (800) 257‑8787.
Availability of additional information about the Fund
You can find additional information about the Fund at https://www.nuveen.com/en‑us/mutual‑funds/prospectuses, including its:
| | • | | prospectus • financial statements and other information • fund holdings • proxy voting information |
You can also request this information at (800) 257‑8787.
| | |
87244W417_AR_0524 3613717-INV-Y-07/25 (I, R6, Premier, Retirement) | | |
| | |
| | Annual Shareholder Report May 31, 2024 |
Nuveen Lifecycle 2030 Fund
(Formerly known as TIAA-CREF Lifecycle 2030 Fund)
Class R6 Shares (Formerly known as Institutional Class Shares)/TCRIX
Annual Shareholder Report
This annual shareholder report contains important information about the Class R6 Shares of the Nuveen Lifecycle 2030 Fund for the period of June 1, 2023 to May 31, 2024. You can find additional information at https://www.nuveen.com/en‑us/mutual‑funds/prospectuses. You can also request this information by contacting us at (800) 257‑8787.
This report describes changes to the Fund that occurred during the reporting period.
What were the Fund costs for the last year? (based on a hypothetical $10,000 investment)(1)
| | | | |
| | | Cost of a $10,000 investment | | Costs paid as a percentage of $10,000 investment |
| Class R6 Shares | | $29 | | 0.29% |
(1) These costs include the expenses of underlying funds in which the Fund invests except for the expenses of the Nuveen Dividend Growth Fund, Nuveen Dividend Value Fund, Nuveen Growth Opportunities ETF and TIAA-CREF Real Property Fund.
How did the Fund perform last year? What affected the Fund’s performance?
| | |
Performance Highlights • The Nuveen Lifecycle 2030 Fund returned 14.95% for Class R6 shares at net asset value (NAV) for the 12 months ended May 31, 2024. The Fund performed in line with the Lifecycle 2030 Fund Composite Index, which returned 14.71%. • The Lifecycle 2030 Fund Composite Index consisted of: 38.8% Russell 3000® Index; 33.1% Bloomberg U.S. Aggregate Bond Index; 20.9% MSCI All Country World Index ex USA Investable Market Index; 3.6% Bloomberg U.S. 1-3 Year Government/Credit Bond Index; and 3.6% Bloomberg U.S. Treasury Inflation Protected Securities (TIPS) 1-10 Year Index. • Top contributors to relative performance » Strong performance of the underlying funds investing in fixed income, led by the Nuveen Core Bond Fund and the Nuveen Core Plus Bond Fund. » Strong overall performance of the underlying funds investing in U.S. equities, led by the Nuveen Core Equity Fund. • Top detractors from relative performance » An allocation to the Nuveen Real Property Fund LP. » A position in the Nuveen International Opportunities Fund. | | Performance Attribution Nuveen Core Equity Fund Nuveen Core Bond Fund Nuveen Core Plus Bond Fund Nuveen Real Property Fund LP |
How did the Fund perform over the last 10 years?
Performance data shown represents past performance and does not predict or guarantee future results. The graph and table do not reflect the deduction of taxes that a shareholder would pay on Fund distributions or redemption of Fund Shares.
Fund Performance (June 1, 2014 through May 31, 2024) Initial Investment of $10,000
Average Annual Total Returns
| | | | | | | | | | | | |
| | | 1 year | | | 5 years | | | 10 years | |
| Class R6 Shares at NAV | | | 14.95 | % | | | 7.82 | % | | | 6.76 | % |
Russell 3000® Index | | | 27.58 | % | | | 15.00 | % | | | 12.09 | % |
| Bloomberg U.S. Aggregate Bond Index | | | 1.31 | % | | | (0.17 | )% | | | 1.26 | % |
| Lifecycle 2030 Fund Composite Index | | | 14.71 | % | | | 8.09 | % | | | 6.95 | % |
| S&P Target Date 2030 Index | | | 14.24 | % | | | 7.77 | % | | | 6.50 | % |
Investment return and principal value will fluctuate, and you may have a gain or loss when you sell your shares. Current performance may differ from figures shown. For most recent month‑end performance, go to https://www.nuveen.com/en‑us/mutual‑funds/prospectuses or call (800) 257‑8787.
Fund Statistics (as of May 31, 2024)
| | | | |
| Fund net assets | | $ | 4,752,803,626 | |
| Total number of portfolio holdings | | | 21 | |
| Portfolio turnover (%) | | | 14% | |
| Total advisory fees paid for the year | | $ | 18,737,834 | |
What did the Fund invest in? (as of May 31, 2024)
(1) Affiliated investment companies, except for repurchase agreements.
How has the Fund changed?
| | • | | Name change: Effective May 1, 2024, the Fund’s name changed from TIAA-CREF Lifecycle 2030 Fund to Nuveen Lifecycle 2030 Fund. | |
| | • | | Share class name change: Effective May 6, 2024, Institutional Class shares of the Fund were renamed Class R6 shares. | |
For more complete information, you may review the Fund’s next prospectus, which is expected to be available by October 1, 2024 at https://www.nuveen.com/en‑us/mutual‑funds/prospectuses or upon request at (800) 257‑8787.
Availability of additional information about the Fund
You can find additional information about the Fund at https://www.nuveen.com/en‑us/mutual‑funds/prospectuses, including its:
| | • | | prospectus • financial statements and other information • fund holdings • proxy voting information |
You can also request this information at (800) 257‑8787.
| | |
886315621_AR_0524 3613717-INV-Y-07/25 (I, R6, Premier, Retirement) | | |
| | |
| | Annual Shareholder Report May 31, 2024 |
Nuveen Lifecycle 2030 Fund
(Formerly known as TIAA-CREF Lifecycle 2030 Fund)
Premier Class Shares/TCHPX
Annual Shareholder Report
This annual shareholder report contains important information about the Premier Class Shares of the Nuveen Lifecycle 2030 Fund for the period of June 1, 2023 to May 31, 2024. You can find additional information at https://www.nuveen.com/en‑us/mutual‑funds/prospectuses. You can also request this information by contacting us at (800) 257‑8787.
This report describes changes to the Fund that occurred during the reporting period.
What were the Fund costs for the last year? (based on a hypothetical $10,000 investment)(1)
| | | | |
| | | Cost of a $10,000 investment | | Costs paid as a percentage of
$10,000 investment |
| Premier Class Shares | | $44 | | 0.44% |
(1) These costs include the expenses of underlying funds in which the Fund invests except for the expenses of the Nuveen Dividend Growth Fund, Nuveen Dividend Value Fund, Nuveen Growth Opportunities ETF and TIAA-CREF Real Property Fund.
How did the Fund perform last year? What affected the Fund’s performance?
| | |
Performance Highlights • The Nuveen Lifecycle 2030 Fund returned 14.75% for Premier Class shares at net asset value (NAV) for the 12 months ended May 31, 2024. The Fund performed in line with the Lifecycle 2030 Fund Composite Index, which returned 14.71%. • The Lifecycle 2030 Fund Composite Index consisted of: 38.8% Russell 3000® Index; 33.1% Bloomberg U.S. Aggregate Bond Index; 20.9% MSCI All Country World Index ex USA Investable Market Index; 3.6% Bloomberg U.S. 1-3 Year Government/Credit Bond Index; and 3.6% Bloomberg U.S. Treasury Inflation Protected Securities (TIPS) 1-10 Year Index. • Top contributors to relative performance » Strong performance of the underlying funds investing in fixed income, led by the Nuveen Core Bond Fund and the Nuveen Core Plus Bond Fund. » Strong overall performance of the underlying funds investing in U.S. equities, led by the Nuveen Core Equity Fund. • Top detractors from relative performance » An allocation to the Nuveen Real Property Fund LP. » A position in the Nuveen International Opportunities Fund. | | Performance Attribution Nuveen Core Equity Fund Nuveen Core Bond Fund Nuveen Core Plus Bond Fund Nuveen Real Property Fund LP |
How did the Fund perform over the last 10 years?
Performance data shown represents past performance and does not predict or guarantee future results. The graph and table do not reflect the deduction of taxes that a shareholder would pay on Fund distributions or redemption of Fund Shares.
Fund Performance (June 1, 2014 through May 31, 2024) Initial Investment of $10,000
Average Annual Total Returns
| | | | | | | | | | | | |
| | | 1 year | | | 5 years | | | 10 years | |
| Premier Class Shares at NAV | | | 14.75 | % | | | 7.64 | % | | | 6.60 | % |
Russell 3000® Index | | | 27.58 | % | | | 15.00 | % | | | 12.09 | % |
| Bloomberg U.S. Aggregate Bond Index | | | 1.31 | % | | | (0.17 | )% | | | 1.26 | % |
| Lifecycle 2030 Fund Composite Index | | | 14.71 | % | | | 8.09 | % | | | 6.95 | % |
| S&P Target Date 2030 Index | | | 14.24 | % | | | 7.77 | % | | | 6.50 | % |
Investment return and principal value will fluctuate, and you may have a gain or loss when you sell your shares. Current performance may differ from figures shown. For most recent month‑end performance, go to https://www.nuveen.com/en‑us/mutual‑funds/prospectuses or call (800) 257‑8787.
Fund Statistics (as of May 31, 2024)
| | | | |
| Fund net assets | | $ | 4,752,803,626 | |
| Total number of portfolio holdings | | | 21 | |
| Portfolio turnover (%) | | | 14% | |
| Total advisory fees paid for the year | | $ | 18,737,834 | |
What did the Fund invest in? (as of May 31, 2024)
(1) Affiliated investment companies, except for repurchase agreements.
How has the Fund changed?
| | • | | Name change: Effective May 1, 2024, the Fund’s name changed from TIAA-CREF Lifecycle 2030 Fund to Nuveen Lifecycle 2030 Fund. | |
For more complete information, you may review the Fund’s next prospectus, which is expected to be available by October 1, 2024 at https://www.nuveen.com/en‑us/mutual‑funds/prospectuses or upon request at (800) 257‑8787.
Availability of additional information about the Fund
You can find additional information about the Fund at https://www.nuveen.com/en‑us/mutual‑funds/prospectuses, including its:
| | • | | prospectus • financial statements and other information • fund holdings • proxy voting information |
You can also request this information at (800) 257‑8787.
| | |
87245M384_AR_0524 3613717-INV-Y-07/25 (I, R6, Premier, Retirement) | | |
| | |
| | Annual Shareholder Report May 31, 2024 |
Nuveen Lifecycle 2030 Fund
(Formerly known as TIAA-CREF Lifecycle 2030 Fund)
Class I Shares (Formerly known as Advisor Class Shares)/TCHHX
Annual Shareholder Report
This annual shareholder report contains important information about the Class I Shares of the Nuveen Lifecycle 2030 Fund for the period of June 1, 2023 to May 31, 2024. You can find additional information at https://www.nuveen.com/en‑us/mutual‑funds/prospectuses. You can also request this information by contacting us at (800) 257‑8787.
This report describes changes to the Fund that occurred during the reporting period.
What were the Fund costs for the last year? (based on a hypothetical $10,000 investment)(1)
| | | | |
| | | Cost of a $10,000 investment | | Costs paid as a percentage of
$10,000 investment |
| Class I Shares | | $37 | | 0.37% |
(1) These costs include the expenses of underlying funds in which the Fund invests except for the expenses of the Nuveen Dividend Growth Fund, Nuveen Dividend Value Fund, Nuveen Growth Opportunities ETF and TIAA-CREF Real Property Fund.
How did the Fund perform last year? What affected the Fund’s performance?
| | |
Performance Highlights • The Nuveen Lifecycle 2030 Fund returned 14.76% for Class I shares at net asset value (NAV) for the 12 months ended May 31, 2024. The Fund performed in line with the Lifecycle 2030 Fund Composite Index, which returned 14.71%. • The Lifecycle 2030 Fund Composite Index consisted of: 38.8% Russell 3000® Index; 33.1% Bloomberg U.S. Aggregate Bond Index; 20.9% MSCI All Country World Index ex USA Investable Market Index; 3.6% Bloomberg U.S. 1-3 Year Government/Credit Bond Index; and 3.6% Bloomberg U.S. Treasury Inflation Protected Securities (TIPS) 1-10 Year Index. • Top contributors to relative performance » Strong performance of the underlying funds investing in fixed income, led by the Nuveen Core Bond Fund and the Nuveen Core Plus Bond Fund. » Strong overall performance of the underlying funds investing in U.S. equities, led by the Nuveen Core Equity Fund. • Top detractors from relative performance » An allocation to the Nuveen Real Property Fund LP. » A position in the Nuveen International Opportunities Fund. | | Performance Attribution Nuveen Core Equity Fund Nuveen Core Bond Fund Nuveen Core Plus Bond Fund Nuveen Real Property Fund LP |
How did the Fund perform over the period since inception?
Performance data shown represents past performance and does not predict or guarantee future results. The graph and table do not reflect the deduction of taxes that a shareholder would pay on Fund distributions or redemption of Fund Shares.
Fund Performance (December 4, 2015 through May 31, 2024) Initial Investment of $10,000
Average Annual Total Returns
| | | | | | | | | | | | |
| | | 1 year | | | 5 years | | | Since Inception | |
| Class I Shares at NAV | | | 14.76 | % | | | 7.74 | % | | | 7.38 | % |
Russell 3000® Index | | | 27.58 | % | | | 15.00 | % | | | 12.98 | % |
| Bloomberg U.S. Aggregate Bond Index | | | 1.31 | % | | | (0.17 | )% | | | 1.16 | % |
| Lifecycle 2030 Fund Composite Index | | | 14.71 | % | | | 8.09 | % | | | 7.76 | % |
| S&P Target Date 2030 Index | | | 14.24 | % | | | 7.77 | % | | | 7.29 | % |
Investment return and principal value will fluctuate, and you may have a gain or loss when you sell your shares. Current performance may differ from figures shown. For most recent month‑end performance, go to https://www.nuveen.com/en‑us/mutual‑funds/prospectuses or call (800) 257‑8787.
Fund Statistics (as of May 31, 2024)
| | | | |
| Fund net assets | | $ | 4,752,803,626 | |
| Total number of portfolio holdings | | | 21 | |
| Portfolio turnover (%) | | | 14% | |
| Total advisory fees paid for the year | | $ | 18,737,834 | |
What did the Fund invest in? (as of May 31, 2024)
(1) Affiliated investment companies, except for repurchase agreements.
How has the Fund changed?
| | • | | Name change: Effective May 1, 2024, the Fund’s name changed from TIAA-CREF Lifecycle 2030 Fund to Nuveen Lifecycle 2030 Fund. | |
| | • | | Share class name change: Effective May 6, 2024, Advisor Class shares of the Fund were renamed Class I shares. | |
For more complete information, you may review the Fund’s next prospectus, which is expected to be available by October 1, 2024 at https://www.nuveen.com/en‑us/mutual‑funds/prospectuses or upon request at (800) 257‑8787.
Availability of additional information about the Fund
You can find additional information about the Fund at https://www.nuveen.com/en‑us/mutual‑funds/prospectuses, including its:
| | • | | prospectus • financial statements and other information • fund holdings • proxy voting information |
You can also request this information at (800) 257‑8787.
| | |
87245P601_AR_0524 3613717-INV-Y-07/25 (I, R6, Premier, Retirement) | | |
| | |
| | Annual Shareholder Report May 31, 2024 |
Nuveen Lifecycle 2035 Fund
(Formerly known as TIAA-CREF Lifecycle 2035 Fund)
Retirement Class Shares/TCLRX
Annual Shareholder Report
This annual shareholder report contains important information about the Retirement Class Shares of the Nuveen Lifecycle 2035 Fund for the period of June 1, 2023 to May 31, 2024. You can find additional information at https://www.nuveen.com/en‑us/mutual‑funds/prospectuses. You can also request this information by contacting us at (800) 257‑8787.
This report describes changes to the Fund that occurred during the reporting period.
What were the Fund costs for the last year? (based on a hypothetical $10,000 investment)(1)
| | | | |
| | | Cost of a $10,000 investment | | Costs paid as a percentage of
$10,000 investment |
| Retirement Class Shares | | $53 | | 0.53% |
(1) These costs include the expenses of underlying funds in which the Fund invests except for the expenses of the Nuveen Dividend Growth Fund, Nuveen Dividend Value Fund, Nuveen Growth Opportunities ETF and TIAA-CREF Real Property Fund.
How did the Fund perform last year? What affected the Fund’s performance?
| | |
Performance Highlights • The Nuveen Lifecycle 2035 Fund returned 16.78% for Retirement Class shares at net asset value (NAV) for the 12 months ended May 31, 2024. The Fund performed in line with the Lifecycle 2035 Fund Composite Index, which returned 16.74%. • The Lifecycle 2035 Fund Composite Index consisted of: 44.6% Russell 3000® Index; 28.2% Bloomberg U.S. Aggregate Bond Index; 24.0% MSCI All Country World Index ex USA Investable Market Index; 1.6% Bloomberg U.S. 1-3 Year Government/Credit Bond Index; and 1.6% Bloomberg U.S. Treasury Inflation Protected Securities (TIPS) 1-10 Year Index. • Top contributors to relative performance » Strong overall performance of the underlying funds investing in U.S. equities, led by the Nuveen Core Equity Fund and Nuveen Growth Opportunities ETF. » Strong performance of the underlying funds investing in fixed income, led by the Nuveen Core Bond Fund. • Top detractors from relative performance » An allocation to the Nuveen Real Property Fund LP. » A position in the Nuveen International Opportunities Fund. | | Performance Attribution Nuveen Core Equity Fund Nuveen Growth Opportunities ETF Nuveen Core Bond Fund Nuveen Real Property Fund LP |
How did the Fund perform over the last 10 years?
Performance data shown represents past performance and does not predict or guarantee future results. The graph and table do not reflect the deduction of taxes that a shareholder would pay on Fund distributions or redemption of Fund Shares.
Fund Performance (June 1, 2014 through May 31, 2024) Initial Investment of $10,000
Average Annual Total Returns
| | | | | | | | | | | | |
| | | 1 year | | | 5 years | | | 10 years | |
| Retirement Class Shares at NAV | | | 16.78 | % | | | 8.55 | % | | | 7.11 | % |
Russell 3000® Index | | | 27.58 | % | | | 15.00 | % | | | 12.09 | % |
| Bloomberg U.S. Aggregate Bond Index | | | 1.31 | % | | | (0.17 | )% | | | 1.26 | % |
| Lifecycle 2035 Fund Composite Index | | | 16.74 | % | | | 9.09 | % | | | 7.61 | % |
| S&P Target Date 2035 Index | | | 16.73 | % | | | 8.92 | % | | | 7.21 | % |
Investment return and principal value will fluctuate, and you may have a gain or loss when you sell your shares. Current performance may differ from figures shown. For most recent month‑end performance, go to https://www.nuveen.com/en‑us/mutual‑funds/prospectuses or call (800) 257‑8787.
Fund Statistics (as of May 31, 2024)
| | | | |
| Fund net assets | | $ | 5,114,598,782 | |
| Total number of portfolio holdings | | | 21 | |
| Portfolio turnover (%) | | | 14% | |
| Total advisory fees paid for the year | | $ | 20,157,934 | |
What did the Fund invest in? (as of May 31, 2024)
(1) Affiliated investment companies, except for repurchase agreements.
How has the Fund changed?
| | • | | Name change: Effective May 1, 2024, the Fund’s name changed from TIAA-CREF Lifecycle 2035 Fund to Nuveen Lifecycle 2035 Fund. | |
For more complete information, you may review the Fund’s next prospectus, which is expected to be available by October 1, 2024 at https://www.nuveen.com/en‑us/mutual‑funds/prospectuses or upon request at (800) 257‑8787.
Availability of additional information about the Fund
You can find additional information about the Fund at https://www.nuveen.com/en‑us/mutual‑funds/prospectuses, including its:
| | • | | prospectus • financial statements and other information • fund holdings • proxy voting information |
You can also request this information at (800) 257‑8787.
| | |
87244W391_AR_0524 3613724-INV-Y-07/25 (I, R6, Premier, Retirement) | | |
| | |
| | Annual Shareholder Report May 31, 2024 |
Nuveen Lifecycle 2035 Fund
(Formerly known as TIAA-CREF Lifecycle 2035 Fund)
Class R6 Shares (Formerly known as Institutional Class Shares)/TCIIX
Annual Shareholder Report
This annual shareholder report contains important information about the Class R6 Shares of the Nuveen Lifecycle 2035 Fund for the period of June 1, 2023 to May 31, 2024. You can find additional information at https://www.nuveen.com/en‑us/mutual‑funds/prospectuses. You can also request this information by contacting us at (800) 257‑8787.
This report describes changes to the Fund that occurred during the reporting period.
What were the Fund costs for the last year? (based on a hypothetical $10,000 investment)(1)
| | | | |
| | | Cost of a $10,000 investment | | Costs paid as a percentage of
$10,000 investment |
| Class R6 Shares | | $28 | | 0.28% |
(1) These costs include the expenses of underlying funds in which the Fund invests except for the expenses of the Nuveen Dividend Growth Fund, Nuveen Dividend Value Fund, Nuveen Growth Opportunities ETF and TIAA-CREF Real Property Fund.
How did the Fund perform last year? What affected the Fund’s performance?
| | |
Performance Highlights • The Nuveen Lifecycle 2035 Fund returned 17.10% for Class R6 shares at net asset value (NAV) for the 12 months ended May 31, 2024. The Fund outperformed the Lifecycle 2035 Fund Composite Index, which returned 16.74%. • The Lifecycle 2035 Fund Composite Index consisted of: 44.6% Russell 3000® Index; 28.2% Bloomberg U.S. Aggregate Bond Index; 24.0% MSCI All Country World Index ex USA Investable Market Index; 1.6% Bloomberg U.S. 1-3 Year Government/Credit Bond Index; and 1.6% Bloomberg U.S. Treasury Inflation Protected Securities (TIPS) 1-10 Year Index. • Top contributors to relative performance » Strong overall performance of the underlying funds investing in U.S. equities, led by the Nuveen Core Equity Fund and Nuveen Growth Opportunities ETF. » Strong performance of the underlying funds investing in fixed income, led by the Nuveen Core Bond Fund. • Top detractors from relative performance » An allocation to the Nuveen Real Property Fund LP. » A position in the Nuveen International Opportunities Fund. | | Performance Attribution Nuveen Core Equity Fund Nuveen Growth Opportunities ETF Nuveen Core Bond Fund Nuveen Real Property Fund LP |
How did the Fund perform over the last 10 years?
Performance data shown represents past performance and does not predict or guarantee future results. The graph and table do not reflect the deduction of taxes that a shareholder would pay on Fund distributions or redemption of Fund Shares.
Fund Performance (June 1, 2014 through May 31, 2024) Initial Investment of $10,000
Average Annual Total Returns
| | | | | | | | | | | | |
| | | 1 year | | | 5 years | | | 10 years | |
| Class R6 Shares at NAV | | | 17.10 | % | | | 8.82 | % | | | 7.38 | % |
Russell 3000® Index | | | 27.58 | % | | | 15.00 | % | | | 12.09 | % |
| Bloomberg U.S. Aggregate Bond Index | | | 1.31 | % | | | (0.17 | )% | | | 1.26 | % |
| Lifecycle 2035 Fund Composite Index | | | 16.74 | % | | | 9.09 | % | | | 7.61 | % |
| S&P Target Date 2035 Index | | | 16.73 | % | | | 8.92 | % | | | 7.21 | % |
Investment return and principal value will fluctuate, and you may have a gain or loss when you sell your shares. Current performance may differ from figures shown. For most recent month‑end performance, go to https://www.nuveen.com/en‑us/mutual‑funds/prospectuses or call (800) 257‑8787.
Fund Statistics (as of May 31, 2024)
| | | | |
| Fund net assets | | $ | 5,114,598,782 | |
| Total number of portfolio holdings | | | 21 | |
| Portfolio turnover (%) | | | 14% | |
| Total advisory fees paid for the year | | $ | 20,157,934 | |
What did the Fund invest in? (as of May 31, 2024)
(1) Affiliated investment companies, except for repurchase agreements.
How has the Fund changed?
| | • | | Name change: Effective May 1, 2024, the Fund’s name changed from TIAA-CREF Lifecycle 2035 Fund to Nuveen Lifecycle 2035 Fund. | |
| | • | | Share class name change: Effective May 6, 2024, Institutional Class shares of the Fund were renamed Class R6 shares. | |
For more complete information, you may review the Fund’s next prospectus, which is expected to be available by October 1, 2024 at https://www.nuveen.com/en‑us/mutual‑funds/prospectuses or upon request at (800) 257‑8787.
Availability of additional information about the Fund
You can find additional information about the Fund at https://www.nuveen.com/en‑us/mutual‑funds/prospectuses, including its:
| | • | | prospectus • financial statements and other information • fund holdings • proxy voting information |
You can also request this information at (800) 257‑8787.
| | |
886315613_AR_0524 3613724-INV-Y-07/25 (I, R6, Premier, Retirement) | | |
| | |
| | Annual Shareholder Report May 31, 2024 |
Nuveen Lifecycle 2035 Fund
(Formerly known as TIAA-CREF Lifecycle 2035 Fund)
Premier Class Shares/TCYPX
Annual Shareholder Report
This annual shareholder report contains important information about the Premier Class Shares of the Nuveen Lifecycle 2035 Fund for the period of June 1, 2023 to May 31, 2024. You can find additional information at https://www.nuveen.com/en‑us/mutual‑funds/prospectuses. You can also request this information by contacting us at (800) 257‑8787.
This report describes changes to the Fund that occurred during the reporting period.
What were the Fund costs for the last year? (based on a hypothetical $10,000 investment)(1)
| | | | |
| | | Cost of a $10,000 investment | | Costs paid as a percentage of
$10,000 investment |
| Premier Class Shares | | $43 | | 0.43% |
(1) These costs include the expenses of underlying funds in which the Fund invests except for the expenses of the Nuveen Dividend Growth Fund, Nuveen Dividend Value Fund, Nuveen Growth Opportunities ETF and TIAA-CREF Real Property Fund.
How did the Fund perform last year? What affected the Fund’s performance?
| | |
Performance Highlights • The Nuveen Lifecycle 2035 Fund returned 16.98% for Premier Class shares at net asset value (NAV) for the 12 months ended May 31, 2024. The Fund performed in line with the Lifecycle 2035 Fund Composite Index, which returned 16.74%. • The Lifecycle 2035 Fund Composite Index consisted of: 44.6% Russell 3000® Index; 28.2% Bloomberg U.S. Aggregate Bond Index; 24.0% MSCI All Country World Index ex USA Investable Market Index; 1.6% Bloomberg U.S. 1-3 Year Government/Credit Bond Index; and 1.6% Bloomberg U.S. Treasury Inflation Protected Securities (TIPS) 1-10 Year Index. • Top contributors to relative performance » Strong overall performance of the underlying funds investing in U.S. equities, led by the Nuveen Core Equity Fund and Nuveen Growth Opportunities ETF. » Strong performance of the underlying funds investing in fixed income, led by the Nuveen Core Bond Fund. • Top detractors from relative performance » An allocation to the Nuveen Real Property Fund LP. » A position in the Nuveen International Opportunities Fund. | | Performance Attribution Nuveen Core Equity Fund Nuveen Growth Opportunities ETF Nuveen Core Bond Fund Nuveen Real Property Fund LP |
How did the Fund perform over the last 10 years?
Performance data shown represents past performance and does not predict or guarantee future results. The graph and table do not reflect the deduction of taxes that a shareholder would pay on Fund distributions or redemption of Fund Shares.
Fund Performance (June 1, 2014 through May 31, 2024) Initial Investment of $10,000
Average Annual Total Returns
| | | | | | | | | | | | |
| | | 1 year | | | 5 years | | | 10 years | |
| Premier Class Shares at NAV | | | 16.98 | % | | | 8.67 | % | | | 7.22 | % |
Russell 3000® Index | | | 27.58 | % | | | 15.00 | % | | | 12.09 | % |
| Bloomberg U.S. Aggregate Bond Index | | | 1.31 | % | | | (0.17 | )% | | | 1.26 | % |
| Lifecycle 2035 Fund Composite Index | | | 16.74 | % | | | 9.09 | % | | | 7.61 | % |
| S&P Target Date 2035 Index | | | 16.73 | % | | | 8.92 | % | | | 7.21 | % |
Investment return and principal value will fluctuate, and you may have a gain or loss when you sell your shares. Current performance may differ from figures shown. For most recent month‑end performance, go to https://www.nuveen.com/en‑us/mutual‑funds/prospectuses or call (800) 257‑8787.
Fund Statistics (as of May 31, 2024)
| | | | |
| Fund net assets | | $ | 5,114,598,782 | |
| Total number of portfolio holdings | | | 21 | |
| Portfolio turnover (%) | | | 14% | |
| Total advisory fees paid for the year | | $ | 20,157,934 | |
What did the Fund invest in? (as of May 31, 2024)
(1) Affiliated investment companies, except for repurchase agreements.
How has the Fund changed?
| | • | | Name change: Effective May 1, 2024, the Fund’s name changed from TIAA-CREF Lifecycle 2035 Fund to Nuveen Lifecycle 2035 Fund. | |
For more complete information, you may review the Fund’s next prospectus, which is expected to be available by October 1, 2024 at https://www.nuveen.com/en‑us/mutual‑funds/prospectuses or upon request at (800) 257‑8787.
Availability of additional information about the Fund
You can find additional information about the Fund at https://www.nuveen.com/en‑us/mutual‑funds/prospectuses, including its:
| | • | | prospectus • financial statements and other information • fund holdings • proxy voting information |
You can also request this information at (800) 257‑8787.
| | |
87245M376_AR_0524 3613724-INV-Y-07/25 (I, R6, Premier, Retirement) | | |
| | |
| | Annual Shareholder Report May 31, 2024 |
Nuveen Lifecycle 2035 Fund
(Formerly known as TIAA-CREF Lifecycle 2035 Fund)
Class I Shares (Formerly known as Advisor Class Shares)/TCYHX
Annual Shareholder Report
This annual shareholder report contains important information about the Class I Shares of the Nuveen Lifecycle 2035 Fund for the period of June 1, 2023 to May 31, 2024. You can find additional information at https://www.nuveen.com/en‑us/mutual‑funds/prospectuses. You can also request this information by contacting us at (800) 257‑8787.
This report describes changes to the Fund that occurred during the reporting period.
What were the Fund costs for the last year? (based on a hypothetical $10,000 investment)(1)
| | | | |
| | | Cost of a $10,000 investment | | Costs paid as a percentage of
$10,000 investment |
| Class I Shares | | $38 | | 0.38% |
(1) These costs include the expenses of underlying funds in which the Fund invests except for the expenses of the Nuveen Dividend Growth Fund, Nuveen Dividend Value Fund, Nuveen Growth Opportunities ETF and TIAA-CREF Real Property Fund.
How did the Fund perform last year? What affected the Fund’s performance?
| | |
Performance Highlights • The Nuveen Lifecycle 2035 Fund returned 17.03% for Class I shares at net asset value (NAV) for the 12 months ended May 31, 2024. The Fund outperformed the Lifecycle 2035 Fund Composite Index, which returned 16.74%. • The Lifecycle 2035 Fund Composite Index consisted of: 44.6% Russell 3000® Index; 28.2% Bloomberg U.S. Aggregate Bond Index; 24.0% MSCI All Country World Index ex USA Investable Market Index; 1.6% Bloomberg U.S. 1-3 Year Government/Credit Bond Index; and 1.6% Bloomberg U.S. Treasury Inflation Protected Securities (TIPS) 1-10 Year Index. • Top contributors to relative performance » Strong overall performance of the underlying funds investing in U.S. equities, led by the Nuveen Core Equity Fund and Nuveen Growth Opportunities ETF. » Strong performance of the underlying funds investing in fixed income, led by the Nuveen Core Bond Fund. • Top detractors from relative performance » An allocation to the Nuveen Real Property Fund LP. » A position in the Nuveen International Opportunities Fund. | | Performance Attribution Nuveen Core Equity Fund Nuveen Growth Opportunities ETF Nuveen Core Bond Fund Nuveen Real Property Fund LP |
How did the Fund perform over the period since inception?
Performance data shown represents past performance and does not predict or guarantee future results. The graph and table do not reflect the deduction of taxes that a shareholder would pay on Fund distributions or redemption of Fund Shares.
Fund Performance (December 4, 2015 through May 31, 2024) Initial Investment of $10,000
Average Annual Total Returns
| | | | | | | | | | | | |
| | | 1 year | | | 5 years | | | Since Inception | |
| Class I Shares at NAV | | | 17.03 | % | | | 8.73 | % | | | 8.09 | % |
Russell 3000® Index | | | 27.58 | % | | | 15.00 | % | | | 12.98 | % |
| Bloomberg U.S. Aggregate Bond Index | | | 1.31 | % | | | (0.17 | )% | | | 1.16 | % |
| Lifecycle 2035 Fund Composite Index | | | 16.74 | % | | | 9.09 | % | | | 8.53 | % |
| S&P Target Date 2035 Index | | | 16.73 | % | | | 8.92 | % | | | 8.11 | % |
Investment return and principal value will fluctuate, and you may have a gain or loss when you sell your shares. Current performance may differ from figures shown. For most recent month‑end performance, go to https://www.nuveen.com/en‑us/mutual‑funds/prospectuses or call (800) 257‑8787.
Fund Statistics (as of May 31, 2024)
| | | | |
| Fund net assets | | $ | 5,114,598,782 | |
| Total number of portfolio holdings | | | 21 | |
| Portfolio turnover (%) | | | 14% | |
| Total advisory fees paid for the year | | $ | 20,157,934 | |
What did the Fund invest in? (as of May 31, 2024)
(1) Affiliated investment companies, except for repurchase agreements.
How has the Fund changed?
| | • | | Name change: Effective May 1, 2024, the Fund’s name changed from TIAA-CREF Lifecycle 2035 Fund to Nuveen Lifecycle 2035 Fund. | |
| | • | | Share class name change: Effective May 6, 2024, Advisor Class shares of the Fund were renamed Class I shares. | |
For more complete information, you may review the Fund’s next prospectus, which is expected to be available by October 1, 2024 at https://www.nuveen.com/en‑us/mutual‑funds/prospectuses or upon request at (800) 257‑8787.
Availability of additional information about the Fund
You can find additional information about the Fund at https://www.nuveen.com/en‑us/mutual‑funds/prospectuses, including its:
| | • | | prospectus • financial statements and other information • fund holdings • proxy voting information |
You can also request this information at (800) 257‑8787.
| | |
87245P700_AR_0524 3613724-INV-Y-07/25 (I, R6, Premier, Retirement) | | |
| | |
| | Annual Shareholder Report May 31, 2024 |
Nuveen Lifecycle 2040 Fund
(Formerly known as TIAA-CREF Lifecycle 2040 Fund)
Retirement Class Shares/TCLOX
Annual Shareholder Report
This annual shareholder report contains important information about the Retirement Class Shares of the Nuveen Lifecycle 2040 Fund for the period of June 1, 2023 to May 31, 2024. You can find additional information at https://www.nuveen.com/en‑us/mutual‑funds/prospectuses. You can also request this information by contacting us at (800) 257‑8787.
This report describes changes to the Fund that occurred during the reporting period.
What were the Fund costs for the last year? (based on a hypothetical $10,000 investment)(1)
| | | | |
| | | Cost of a $10,000 investment | | Costs paid as a percentage of
$10,000 investment |
| Retirement Class Shares | | $52 | | 0.52% |
(1) These costs include the expenses of underlying funds in which the Fund invests except for the expenses of the Nuveen Dividend Growth Fund, Nuveen Dividend Value Fund, Nuveen Growth Opportunities ETF and TIAA-CREF Real Property Fund.
How did the Fund perform last year? What affected the Fund’s performance?
| | |
Performance Highlights • The Nuveen Lifecycle 2040 Fund returned 19.27% for Retirement Class shares at net asset value (NAV) for the 12 months ended May 31, 2024. The Fund performed in line with the Lifecycle 2040 Fund Composite Index, which returned 19.14%. • The Lifecycle 2040 Fund Composite Index consisted of: 51.8% Russell 3000® Index; 27.9% MSCI All Country World Index ex USA Investable Market Index; and 20.3% Bloomberg U.S. Aggregate Bond Index. • Top contributors to relative performance » Strong overall performance among underlying funds investing in U.S. equities. » Positions in the Nuveen Core Equity Fund, Nuveen Growth Opportunities ETF and the Nuveen Large Cap Value Fund. • Top detractors from relative performance » An allocation to the Nuveen Real Property Fund LP. » A position in the Nuveen International Opportunities Fund. | | Performance Attribution Nuveen Core Equity Fund Nuveen Growth Opportunities ETF Nuveen Large Cap Value Fund Nuveen Real Property Fund LP |
How did the Fund perform over the last 10 years?
Performance data shown represents past performance and does not predict or guarantee future results. The graph and table do not reflect the deduction of taxes that a shareholder would pay on Fund distributions or redemption of Fund Shares.
Fund Performance (June 1, 2014 through May 31, 2024) Initial Investment of $10,000
Average Annual Total Returns
| | | | | | | | | | | | |
| | | 1 year | | | 5 years | | | 10 years | |
| Retirement Class Shares at NAV | | | 19.27 | % | | | 9.66 | % | | | 7.75 | % |
Russell 3000® Index | | | 27.58 | % | | | 15.00 | % | | | 12.09 | % |
| Bloomberg U.S. Aggregate Bond Index | | | 1.31 | % | | | (0.17 | )% | | | 1.26 | % |
| Lifecycle 2040 Fund Composite Index | | | 19.14 | % | | | 10.19 | % | | | 8.29 | % |
| S&P Target Date 2040 Index | | | 18.88 | % | | | 9.82 | % | | | 7.74 | % |
Investment return and principal value will fluctuate, and you may have a gain or loss when you sell your shares. Current performance may differ from figures shown. For most recent month‑end performance, go to https://www.nuveen.com/en‑us/mutual‑funds/prospectuses or call (800) 257‑8787.
Fund Statistics (as of May 31, 2024)
| | | | |
| Fund net assets | | $ | 6,167,299,226 | |
| Total number of portfolio holdings | | | 19 | |
| Portfolio turnover (%) | | | 13% | |
| Total advisory fees paid for the year | | $ | 24,493,798 | |
What did the Fund invest in? (as of May 31, 2024)
(1) Affiliated investment companies, except for repurchase agreements.
How has the Fund changed?
| | • | | Name change: Effective May 1, 2024, the Fund’s name changed from TIAA-CREF Lifecycle 2040 Fund to Nuveen Lifecycle 2040 Fund. | |
For more complete information, you may review the Fund’s next prospectus, which is expected to be available by October 1, 2024 at https://www.nuveen.com/en‑us/mutual‑funds/prospectuses or upon request at (800) 257‑8787.
Availability of additional information about the Fund
You can find additional information about the Fund at https://www.nuveen.com/en‑us/mutual‑funds/prospectuses, including its:
| | • | | prospectus • financial statements and other information • fund holdings • proxy voting information |
You can also request this information at (800) 257‑8787.
| | |
87244W383_AR_0524 3613732-INV-Y-07/25 (I, R6, Premier, Retirement) | | |
| | |
| | Annual Shareholder Report May 31, 2024 |
Nuveen Lifecycle 2040 Fund
(Formerly known as TIAA-CREF Lifecycle 2040 Fund)
Class R6 Shares (Formerly known as Institutional Class Shares)/TCOIX
Annual Shareholder Report
This annual shareholder report contains important information about the Class R6 Shares of the Nuveen Lifecycle 2040 Fund for the period of June 1, 2023 to May 31, 2024. You can find additional information at https://www.nuveen.com/en‑us/mutual‑funds/prospectuses. You can also request this information by contacting us at (800) 257‑8787.
This report describes changes to the Fund that occurred during the reporting period.
What were the Fund costs for the last year? (based on a hypothetical $10,000 investment)(1)
| | | | |
| | | Cost of a $10,000 investment | | Costs paid as a percentage of
$10,000 investment |
| Class R6 Shares | | $27 | | 0.27% |
(1) These costs include the expenses of underlying funds in which the Fund invests except for the expenses of the Nuveen Dividend Growth Fund, Nuveen Dividend Value Fund, Nuveen Growth Opportunities ETF and TIAA-CREF Real Property Fund.
How did the Fund perform last year? What affected the Fund’s performance?
| | |
Performance Highlights • The Nuveen Lifecycle 2040 Fund returned 19.56% for Class R6 shares at net asset value (NAV) for the 12 months ended May 31, 2024. The Fund outperformed the Lifecycle 2040 Fund Composite Index, which returned 19.14%. • The Lifecycle 2040 Fund Composite Index consisted of: 51.8% Russell 3000® Index; 27.9% MSCI All Country World Index ex USA Investable Market Index; and 20.3% Bloomberg U.S. Aggregate Bond Index. • Top contributors to relative performance » Strong overall performance among underlying funds investing in U.S. equities. » Positions in the Nuveen Core Equity Fund, Nuveen Growth Opportunities ETF and the Nuveen Large Cap Value Fund. • Top detractors from relative performance » An allocation to the Nuveen Real Property Fund LP. » A position in the Nuveen International Opportunities Fund. | | Performance Attribution Nuveen Core Equity Fund Nuveen Growth Opportunities ETF Nuveen Large Cap Value Fund Nuveen Real Property Fund LP |
How did the Fund perform over the last 10 years?
Performance data shown represents past performance and does not predict or guarantee future results. The graph and table do not reflect the deduction of taxes that a shareholder would pay on Fund distributions or redemption of Fund Shares.
Fund Performance (June 1, 2014 through May 31, 2024) Initial Investment of $10,000
Average Annual Total Returns
| | | | | | | | | | | | |
| | | 1 year | | | 5 years | | | 10 years | |
| Class R6 Shares at NAV | | | 19.56 | % | | | 9.92 | % | | | 8.02 | % |
Russell 3000® Index | | | 27.58 | % | | | 15.00 | % | | | 12.09 | % |
| Bloomberg U.S. Aggregate Bond Index | | | 1.31 | % | | | (0.17 | )% | | | 1.26 | % |
| Lifecycle 2040 Fund Composite Index | | | 19.14 | % | | | 10.19 | % | | | 8.29 | % |
| S&P Target Date 2040 Index | | | 18.88 | % | | | 9.82 | % | | | 7.74 | % |
Investment return and principal value will fluctuate, and you may have a gain or loss when you sell your shares. Current performance may differ from figures shown. For most recent month‑end performance, go to https://www.nuveen.com/en‑us/mutual‑funds/prospectuses or call (800) 257‑8787.
Fund Statistics (as of May 31, 2024)
| | | | |
| Fund net assets | | $ | 6,167,299,226 | |
| Total number of portfolio holdings | | | 19 | |
| Portfolio turnover (%) | | | 13% | |
| Total advisory fees paid for the year | | $ | 24,493,798 | |
What did the Fund invest in? (as of May 31, 2024)
(1) Affiliated investment companies, except for repurchase agreements.
How has the Fund changed?
| | • | | Name change: Effective May 1, 2024, the Fund’s name changed from TIAA-CREF Lifecycle 2040 Fund to Nuveen Lifecycle 2040 Fund. | |
| | • | | Share class name change: Effective May 6, 2024, Institutional Class shares of the Fund were renamed Class R6 shares. | |
For more complete information, you may review the Fund’s next prospectus, which is expected to be available by October 1, 2024 at https://www.nuveen.com/en‑us/mutual‑funds/prospectuses or upon request at (800) 257‑8787.
Availability of additional information about the Fund
You can find additional information about the Fund at https://www.nuveen.com/en‑us/mutual‑funds/prospectuses, including its:
| | • | | prospectus • financial statements and other information • fund holdings • proxy voting information |
You can also request this information at (800) 257‑8787.
| | |
886315597_AR_0524 3613732-INV-Y-07/25 (I, R6, Premier, Retirement) | | |
| | |
| | Annual Shareholder Report May 31, 2024 |
Nuveen Lifecycle 2040 Fund
(Formerly known as TIAA-CREF Lifecycle 2040 Fund)
Premier Class Shares/TCZPX
Annual Shareholder Report
This annual shareholder report contains important information about the Premier Class Shares of the Nuveen Lifecycle 2040 Fund for the period of June 1, 2023 to May 31, 2024. You can find additional information at https://www.nuveen.com/en‑us/mutual‑funds/prospectuses. You can also request this information by contacting us at (800) 257‑8787.
This report describes changes to the Fund that occurred during the reporting period.
What were the Fund costs for the last year? (based on a hypothetical $10,000 investment)(1)
| | | | |
| | | Cost of a $10,000 investment | | Costs paid as a percentage of
$10,000 investment |
| Premier Class Shares | | $42 | | 0.42% |
(1) These costs include the expenses of underlying funds in which the Fund invests except for the expenses of the Nuveen Dividend Growth Fund, Nuveen Dividend Value Fund, Nuveen Growth Opportunities ETF and TIAA-CREF Real Property Fund.
How did the Fund perform last year? What affected the Fund’s performance?
| | |
Performance Highlights • The Nuveen Lifecycle 2040 Fund returned 19.32% for Premier Class shares at net asset value (NAV) for the 12 months ended May 31, 2024. The Fund performed in line with the Lifecycle 2040 Fund Composite Index, which returned 19.14%. • The Lifecycle 2040 Fund Composite Index consisted of: 51.8% Russell 3000® Index; 27.9% MSCI All Country World Index ex USA Investable Market Index; and 20.3% Bloomberg U.S. Aggregate Bond Index. • Top contributors to relative performance » Strong overall performance among underlying funds investing in U.S. equities. » Positions in the Nuveen Core Equity Fund, Nuveen Growth Opportunities ETF and the Nuveen Large Cap Value Fund. • Top detractors from relative performance » An allocation to the Nuveen Real Property Fund LP. » A position in the Nuveen International Opportunities Fund. | | Performance Attribution Nuveen Core Equity Fund Nuveen Growth Opportunities ETF Nuveen Large Cap Value Fund Nuveen Real Property Fund LP |
How did the Fund perform over the last 10 years?
Performance data shown represents past performance and does not predict or guarantee future results. The graph and table do not reflect the deduction of taxes that a shareholder would pay on Fund distributions or redemption of Fund Shares.
Fund Performance (June 1, 2014 through May 31, 2024) Initial Investment of $10,000
Average Annual Total Returns
| | | | | | | | | | | | |
| | | 1 year | | | 5 years | | | 10 years | |
| Premier Class Shares at NAV | | | 19.32 | % | | | 9.77 | % | | | 7.86 | % |
Russell 3000® Index | | | 27.58 | % | | | 15.00 | % | | | 12.09 | % |
| Bloomberg U.S. Aggregate Bond Index | | | 1.31 | % | | | (0.17 | )% | | | 1.26 | % |
| Lifecycle 2040 Fund Composite Index | | | 19.14 | % | | | 10.19 | % | | | 8.29 | % |
| S&P Target Date 2040 Index | | | 18.88 | % | | | 9.82 | % | | | 7.74 | % |
Investment return and principal value will fluctuate, and you may have a gain or loss when you sell your shares. Current performance may differ from figures shown. For most recent month‑end performance, go to https://www.nuveen.com/en‑us/mutual‑funds/prospectuses or call (800) 257-8787.
Fund Statistics (as of May 31, 2024)
| | | | |
| Fund net assets | | $ | 6,167,299,226 | |
| Total number of portfolio holdings | | | 19 | |
| Portfolio turnover (%) | | | 13% | |
| Total advisory fees paid for the year | | $ | 24,493,798 | |
What did the Fund invest in? (as of May 31, 2024)
(1) Affiliated investment companies, except for repurchase agreements.
How has the Fund changed?
| | • | | Name change: Effective May 1, 2024, the Fund’s name changed from TIAA-CREF Lifecycle 2040 Fund to Nuveen Lifecycle 2040 Fund. | |
For more complete information, you may review the Fund’s next prospectus, which is expected to be available by October 1, 2024 at https://www.nuveen.com/en-us/mutual-funds/prospectuses or upon request at (800) 257‑8787.
Availability of additional information about the Fund
You can find additional information about the Fund at https://www.nuveen.com/en‑us/mutual‑funds/prospectuses, including its:
| | • | | prospectus • financial statements and other information • fund holdings • proxy voting information |
You can also request this information at (800) 257‑8787.
| | |
87245M368_AR_0524 3613732-INV-Y-07/25 (I, R6, Premier, Retirement) | | |
| | |
| | Annual Shareholder Report May 31, 2024 |
Nuveen Lifecycle 2040 Fund
(Formerly known as TIAA-CREF Lifecycle 2040 Fund)
Class I Shares (Formerly known as Advisor Class Shares)/TCZHX
Annual Shareholder Report
This annual shareholder report contains important information about the Class I Shares of the Nuveen Lifecycle 2040 Fund for the period of June 1, 2023 to May 31, 2024. You can find additional information at https://www.nuveen.com/en‑us/mutual‑funds/prospectuses. You can also request this information by contacting us at (800) 257‑8787.
This report describes changes to the Fund that occurred during the reporting period.
What were the Fund costs for the last year? (based on a hypothetical $10,000 investment)(1)
| | | | |
| | | Cost of a $10,000 investment | | Costs paid as a percentage of $10,000 investment |
| Class I Shares | | $36 | | 0.36% |
(1) These costs include the expenses of underlying funds in which the Fund invests except for the expenses of the Nuveen Dividend Growth Fund, Nuveen Dividend Value Fund, Nuveen Growth Opportunities ETF and TIAA-CREF Real Property Fund.
How did the Fund perform last year? What affected the Fund’s performance?
| | |
Performance Highlights • The Nuveen Lifecycle 2040 Fund returned 19.49% for Class I shares at net asset value (NAV) for the 12 months ended May 31, 2024. The Fund outperformed the Lifecycle 2040 Fund Composite Index, which returned 19.14%. • The Lifecycle 2040 Fund Composite Index consisted of: 51.8% Russell 3000® Index; 27.9% MSCI All Country World Index ex USA Investable Market Index; and 20.3% Bloomberg U.S. Aggregate Bond Index. • Top contributors to relative performance » Strong overall performance among underlying funds investing in U.S. equities. » Positions in the Nuveen Core Equity Fund, Nuveen Growth Opportunities ETF and the Nuveen Large Cap Value Fund. • Top detractors from relative performance » An allocation to the Nuveen Real Property Fund LP. » A position in the Nuveen International Opportunities Fund. | | Performance Attribution Nuveen Core Equity Fund Nuveen Growth Opportunities ETF Nuveen Large Cap Value Fund Nuveen Real Property Fund LP |
How did the Fund perform over the period since inception?
Performance data shown represents past performance and does not predict or guarantee future results. The graph and table do not reflect the deduction of taxes that a shareholder would pay on Fund distributions or redemption of Fund Shares.
Fund Performance (December 4, 2015 through May 31, 2024) Initial Investment of $10,000
Average Annual Total Returns
| | | | | | | | | | | | |
| | | 1 year | | | 5 years | | | Since Inception | |
| Class I Shares at NAV | | | 19.49 | % | | | 9.86 | % | | | 8.85 | % |
Russell 3000® Index | | | 27.58 | % | | | 15.00 | % | | | 12.98 | % |
| Bloomberg U.S. Aggregate Bond Index | | | 1.31 | % | | | (0.17 | )% | | | 1.16 | % |
| Lifecycle 2040 Fund Composite Index | | | 19.14 | % | | | 10.19 | % | | | 9.35 | % |
| S&P Target Date 2040 Index | | | 18.88 | % | | | 9.82 | % | | | 8.75 | % |
Investment return and principal value will fluctuate, and you may have a gain or loss when you sell your shares. Current performance may differ from figures shown. For most recent month‑end performance, go to https://www.nuveen.com/en‑us/mutual‑funds/prospectuses or call (800) 257‑8787.
Fund Statistics (as of May 31, 2024)
| | | | |
| Fund net assets | | $ | 6,167,299,226 | |
| Total number of portfolio holdings | | | 19 | |
| Portfolio turnover (%) | | | 13% | |
| Total advisory fees paid for the year | | $ | 24,493,798 | |
What did the Fund invest in? (as of May 31, 2024)
(1) Affiliated investment companies, except for repurchase agreements.
How has the Fund changed?
| | • | | Name change: Effective May 1, 2024, the Fund’s name changed from TIAA-CREF Lifecycle 2040 Fund to Nuveen Lifecycle 2040 Fund. | |
| | • | | Share class name change: Effective May 6, 2024, Advisor Class shares of the Fund were renamed Class I shares. | |
For more complete information, you may review the Fund’s next prospectus, which is expected to be available by October 1, 2024 at https://www.nuveen.com/en‑us/mutual‑funds/prospectuses or upon request at (800) 257‑8787.
Availability of additional information about the Fund
You can find additional information about the Fund at https://www.nuveen.com/en‑us/mutual‑funds/prospectuses, including its:
| | • | | prospectus • financial statements and other information • fund holdings • proxy voting information |
You can also request this information at (800) 257‑8787.
| | |
87245P809_AR_0524 3613732-INV-Y-07/25 (I, R6, Premier, Retirement) | | |
| | |
| | Annual Shareholder Report May 31, 2024 |
Nuveen Managed Allocation Fund
(Formerly known as TIAA-CREF Managed Allocation Fund)
Class A Shares (Formerly known as Retail Class Shares)/TIMRX
Annual Shareholder Report
This annual shareholder report contains important information about the Class A Shares of the Nuveen Managed Allocation Fund for the period of June 1, 2023 to May 31, 2024. You can find additional information at https://www.nuveen.com/en‑us/mutual‑funds/prospectuses. You can also request this information by contacting us at (800) 257‑8787.
This report describes changes to the Fund that occurred during the reporting period.
What were the Fund costs for the last year? (based on a hypothetical $10,000 investment)(1)
| | | | |
| | | Cost of a $10,000 investment | | Costs paid as a percentage of
$10,000 investment |
| Class A Shares | | $25 | | 0.25% |
(1) These costs do not include the expenses of the underlying funds in which the Fund invests.
How did the Fund perform last year? What affected the Fund’s performance?
| | |
Performance Highlights • The Nuveen Managed Allocation Fund returned 15.70% for Class A shares at net asset value (NAV) for the 12 months ended May 31, 2024. The Fund outperformed the Managed Allocation Fund Composite Index, which returned 14.39%. • The Managed Allocation Fund Composite Index consisted of: 40.0% Bloomberg U.S. Aggregate Bond Index; 39.0% Russell 3000® Index; and 21.0% MSCI All Country World Index ex USA Investable Market Index. • Top contributors to relative performance » Strong overall performance of the underlying funds investing in U.S. equities, led by the Nuveen Core Equity Fund. » An allocation to the Nuveen Core Plus Bond Fund. • Top detractors from relative performance » A position in the Nuveen International Opportunities Fund. | | Performance Attribution U.S. Equities Nuveen Core Plus Bond Fund Nuveen International Opportunities Fund |
How did the Fund perform over the last 10 years?
Performance data shown represents past performance and does not predict or guarantee future results. The graph and table do not reflect the deduction of taxes that a shareholder would pay on Fund distributions or redemption of Fund Shares.
Fund Performance (June 1, 2014 through May 31, 2024) Initial Investment of $10,000
Average Annual Total Returns
| | | | | | | | | | | | |
| | | 1 year | | | 5 years | | | 10 years | |
| Class A Shares at NAV (excluding maximum sales charge) | | | 15.70 | % | | | 7.31 | % | | | 6.18 | % |
| Class A at maximum sales charge (Offering Price) | | | 9.02 | % | | | 6.06 | % | | | 5.56 | % |
Russell 3000® Index | | | 27.58 | % | | | 15.00 | % | | | 12.09 | % |
| Bloomberg U.S. Aggregate Bond Index | | | 1.31 | % | | | (0.17 | )% | | | 1.26 | % |
| Managed Allocation Fund Composite Index | | | 14.39 | % | | | 7.51 | % | | | 6.43 | % |
| Morningstar Moderate Target Risk Index | | | 13.09 | % | | | 6.54 | % | | | 5.63 | % |
Class A Shares at Offer reflect a maximum up‑front sales charge of 5.75% applicable to the purchase of Class A shares, which was effective as of May 6, 2024.
Investment return and principal value will fluctuate, and you may have a gain or loss when you sell your shares. Current performance may differ from figures shown. For most recent month‑end performance, go to https://www.nuveen.com/en‑us/mutual‑funds/prospectuses or call (800) 257‑8787.
Fund Statistics (as of May 31, 2024)
| | | | |
| Fund net assets | | $ | 881,106,752 | |
| Total number of portfolio holdings | | | 14 | |
| Portfolio turnover (%) | | | 11% | |
| Total advisory fees paid for the year | | $ | 0 | |
What did the Fund invest in? (as of May 31, 2024)
(1) Affiliated investment companies, except for repurchase agreements.
How has the Fund changed?
| | • | | Name change: Effective May 1, 2024, the Fund’s name changed from TIAA-CREF Managed Allocation Fund to Nuveen Managed Allocation Fund. | |
| | • | | Share class name change: Effective May 6, 2024, Retail Class shares of the Fund were renamed Class A shares. | |
| | • | | Sales charge: Effective May 6, 2024, a sales charge is imposed on purchases of Class A shares (formerly Retail Class shares) of the Fund of less than certain amounts, as set forth in the Fund’s prospectus. Therefore, effective as of May 6, 2024, Class A shares are available for purchase at the offering price, which will be the net asset value (NAV) per share plus an up‑front sales charge. | |
For more complete information, you may review the Fund’s next prospectus, which is expected to be available by October 1, 2024 at https://www.nuveen.com/en‑us/mutual‑funds/prospectuses or upon request at (800) 257‑8787.
Availability of additional information about the Fund
You can find additional information about the Fund at https://www.nuveen.com/en‑us/mutual‑funds/prospectuses, including its:
| | • | | prospectus • financial statements and other information • fund holdings • proxy voting information |
You can also request this information at (800) 257‑8787.
| | |
886315845_AR_0524 3613936-INV-Y-07/25 (A, R6, Retirement) | | |
| | |
| | Annual Shareholder Report May 31, 2024 |
Nuveen Managed Allocation Fund
(Formerly known as TIAA-CREF Managed Allocation Fund)
Retirement Class Shares/TITRX
Annual Shareholder Report
This annual shareholder report contains important information about the Retirement Class Shares of the Nuveen Managed Allocation Fund for the period of June 1, 2023 to May 31, 2024. You can find additional information at https://www.nuveen.com/en‑us/mutual‑funds/prospectuses. You can also request this information by contacting us at (800) 257‑8787.
This report describes changes to the Fund that occurred during the reporting period.
What were the Fund costs for the last year? (based on a hypothetical $10,000 investment)(1)
| | | | |
| | | Cost of a $10,000 investment | | Costs paid as a percentage of
$10,000 investment |
| Retirement Class Shares | | $25 | | 0.25% |
(1) These costs do not include the expenses of the underlying funds in which the Fund invests.
How did the Fund perform last year? What affected the Fund’s performance?
| | |
Performance Highlights • The Nuveen Managed Allocation Fund returned 15.60% for Retirement Class shares at net asset value (NAV) for the 12 months ended May 31, 2024, Year. The Fund outperformed the Managed Allocation Fund Composite Index, which returned 14.39%. • The Managed Allocation Fund Composite Index consisted of: 40.0% Bloomberg U.S. Aggregate Bond Index; 39.0% Russell 3000® Index; and 21.0% MSCI All Country World Index ex USA Investable Market Index. • Top contributors to relative performance » Strong overall performance of the underlying funds investing in U.S. equities, led by the Nuveen Core Equity Fund. » An allocation to the Nuveen Core Plus Bond Fund. • Top detractors from relative performance » A position in the Nuveen International Opportunities Fund. | | Performance Attribution U.S. Equities Nuveen Core Plus Bond Fund Nuveen International Opportunities Fund |
How did the Fund perform over the last 10 years?
Performance data shown represents past performance and does not predict or guarantee future results. The graph and table do not reflect the deduction of taxes that a shareholder would pay on Fund distributions or redemption of Fund Shares.
Fund Performance (June 1, 2014 through May 31, 2024) Initial Investment of $10,000
Average Annual Total Returns
| | | | | | | | | | | | |
| | | 1 year | | | 5 years | | | 10 years | |
| Retirement Class Shares at NAV | | | 15.60 | % | | | 7.30 | % | | | 6.18 | % |
Russell 3000® Index | | | 27.58 | % | | | 15.00 | % | | | 12.09 | % |
| Bloomberg U.S. Aggregate Bond Index | | | 1.31 | % | | | (0.17 | )% | | | 1.26 | % |
| Managed Allocation Fund Composite Index | | | 14.39 | % | | | 7.51 | % | | | 6.43 | % |
| Morningstar Moderate Target Risk Index | | | 13.09 | % | | | 6.54 | % | | | 5.63 | % |
Investment return and principal value will fluctuate, and you may have a gain or loss when you sell your shares. Current performance may differ from figures shown. For most recent month‑end performance, go to https://www.nuveen.com/en‑us/mutual‑funds/prospectuses or call (800) 257‑8787.
Fund Statistics (as of May 31, 2024)
| | | | |
| Fund net assets | | $ | 881,106,752 | |
| Total number of portfolio holdings | | | 14 | |
| Portfolio turnover (%) | | | 11% | |
| Total advisory fees paid for the year | | $ | 0 | |
What did the Fund invest in? (as of May 31, 2024)
(1) Affiliated investment companies, except for repurchase agreements.
How has the Fund changed?
| | • | | Name change: Effective May 1, 2024, the Fund’s name changed from TIAA-CREF Managed Allocation Fund to Nuveen Managed Allocation Fund. | |
For more complete information, you may review the Fund’s next prospectus, which is expected to be available by October 1, 2024 at https://www.nuveen.com/en‑us/mutual‑funds/prospectuses or upon request at (800) 257‑8787.
Availability of additional information about the Fund
You can find additional information about the Fund at https://www.nuveen.com/en‑us/mutual‑funds/prospectuses, including its:
| | • | | prospectus • financial statements and other information • fund holdings • proxy voting information |
You can also request this information at (800) 257‑8787.
| | |
886315829_AR_0524 3613936-INV-Y-07/25 (A, R6, Retirement) | | |
| | |
| | Annual Shareholder Report May 31, 2024 |
Nuveen Managed Allocation Fund
(Formerly known as TIAA-CREF Managed Allocation Fund)
Class R6 Shares (Formerly known as Institutional Class Shares)/TIMIX
Annual Shareholder Report
This annual shareholder report contains important information about the Class R6 Shares of the Nuveen Managed Allocation Fund for the period of June 1, 2023 to May 31, 2024. You can find additional information at https://www.nuveen.com/en‑us/mutual‑funds/prospectuses. You can also request this information by contacting us at (800) 257‑8787.
This report describes changes to the Fund that occurred during the reporting period.
What were the Fund costs for the last year? (based on a hypothetical $10,000 investment)(1)
| | | | |
| | | Cost of a $10,000 investment | | Costs paid as a percentage of
$10,000 investment |
| Class R6 Shares | | $0 | | 0.00% |
(1) These costs do not include the expenses of the underlying funds in which the Fund invests.
How did the Fund perform last year? What affected the Fund’s performance?
| | |
Performance Highlights • The Nuveen Managed Allocation Fund returned 15.97% for Class R6 shares at net asset value (NAV) for the 12 months ended May 31, 2024, Year. The Fund outperformed the Managed Allocation Fund Composite Index, which returned 14.39%. • The Managed Allocation Fund Composite Index consisted of: 40.0% Bloomberg U.S. Aggregate Bond Index; 39.0% Russell 3000® Index; and 21.0% MSCI All Country World Index ex USA Investable Market Index. • Top contributors to relative performance » Strong overall performance of the underlying funds investing in U.S. equities, led by the Nuveen Core Equity Fund. » An allocation to the Nuveen Core Plus Bond Fund. • Top detractors from relative performance » A position in the Nuveen International Opportunities Fund. | | Performance Attribution U.S. Equities Nuveen Core Plus Bond Fund Nuveen International Opportunities Fund |
How did the Fund perform over the last 10 years?
Performance data shown represents past performance and does not predict or guarantee future results. The graph and table do not reflect the deduction of taxes that a shareholder would pay on Fund distributions or redemption of Fund Shares.
Fund Performance (June 1, 2014 through May 31, 2024) Initial Investment of $10,000
Average Annual Total Returns
| | | | | | | | | | | | |
| | | 1 year | | | 5 years | | | 10 years | |
| Class R6 Shares at NAV | | | 15.97 | % | | | 7.56 | % | | | 6.44 | % |
Russell 3000® Index | | | 27.58 | % | | | 15.00 | % | | | 12.09 | % |
| Bloomberg U.S. Aggregate Bond Index | | | 1.31 | % | | | (0.17 | )% | | | 1.26 | % |
| Managed Allocation Fund Composite Index | | | 14.39 | % | | | 7.51 | % | | | 6.43 | % |
| Morningstar Moderate Target Risk Index | | | 13.09 | % | | | 6.54 | % | | | 5.63 | % |
Investment return and principal value will fluctuate, and you may have a gain or loss when you sell your shares. Current performance may differ from figures shown. For most recent month‑end performance, go to https://www.nuveen.com/en‑us/mutual‑funds/prospectuses or call (800) 257‑8787.
Fund Statistics (as of May 31, 2024)
| | | | |
| Fund net assets | | $ | 881,106,752 | |
| Total number of portfolio holdings | | | 14 | |
| Portfolio turnover (%) | | | 11% | |
| Total advisory fees paid for the year | | $ | 0 | |
What did the Fund invest in? (as of May 31, 2024)
(1) Affiliated investment companies, except for repurchase agreements.
How has the Fund changed?
| | • | | Name change: Effective May 1, 2024, the Fund’s name changed from TIAA-CREF Managed Allocation Fund to Nuveen Managed Allocation Fund. | |
| | • | | Share class name change: Effective May 6, 2024, Institutional Class shares of the Fund were renamed Class R6 shares. | |
For more complete information, you may review the Fund’s next prospectus, which is expected to be available by October 1, 2024 at https://www.nuveen.com/en‑us/mutual‑funds/prospectuses or upon request at (800) 257‑8787.
Availability of additional information about the Fund
You can find additional information about the Fund at https://www.nuveen.com/en‑us/mutual‑funds/prospectuses, including its:
| | • | | prospectus • financial statements and other information • fund holdings • proxy voting information |
You can also request this information at (800) 257‑8787.
| | |
886315837_AR_0524 3613936-INV-Y-07/25 (A, R6, Retirement) | | |
| | |
| | Annual Shareholder Report May 31, 2024 |
Nuveen Lifecycle 2045 Fund
(Formerly known as TIAA-CREF Lifecycle 2045 Fund)
Class R6 Shares (Formerly known as Institutional Class Shares)/TTFIX
Annual Shareholder Report
This annual shareholder report contains important information about the Class R6 Shares of the Nuveen Lifecycle 2045 Fund for the period of June 1, 2023 to May 31, 2024. You can find additional information at https://www.nuveen.com/en‑us/mutual‑funds/prospectuses. You can also request this information by contacting us at (800) 257‑8787.
This report describes changes to the Fund that occurred during the reporting period.
What were the Fund costs for the last year? (based on a hypothetical $10,000 investment)(1)
| | | | |
| | | Cost of a $10,000 investment | | Costs paid as a percentage of $10,000 investment |
| Class R6 Shares | | $27 | | 0.27% |
(1) These costs include the expenses of underlying funds in which the Fund invests except for the expenses of the Nuveen Dividend Growth Fund, Nuveen Dividend Value Fund, Nuveen Growth Opportunities ETF and TIAA-CREF Real Property Fund.
How did the Fund perform last year? What affected the Fund’s performance?
| | |
Performance Highlights • The Nuveen Lifecycle 2045 Fund returned 21.22% for Class R6 shares at net asset value (NAV) for the 12 months ended May 31, 2024. The Fund outperformed the Lifecycle 2045 Fund Composite Index, which returned 20.71%. • The Lifecycle 2045 Fund Composite Index consisted of: 56.5% Russell 3000® Index; 30.4% MSCI All Country World Index ex USA Investable Market Index; and 13.1% Bloomberg U.S. Aggregate Bond Index. • Top contributors to relative performance » Strong overall performance among underlying funds investing in U.S. equities. » Positions in the Nuveen Core Equity Fund, Nuveen Growth Opportunities ETF and the Nuveen Large Cap Value Fund. • Top detractors from relative performance » An allocation to the Nuveen Real Property Fund LP. » A position in the Nuveen International Opportunities Fund. | | Performance Attribution Nuveen Core Equity Fund Nuveen Growth Opportunities ETF Nuveen Large Cap Value Fund Nuveen Real Property Fund LP |
How did the Fund perform over the last 10 years?
Performance data shown represents past performance and does not predict or guarantee future results. The graph and table do not reflect the deduction of taxes that a shareholder would pay on Fund distributions or redemption of Fund Shares.
Fund Performance (June 1, 2014 through May 31, 2024) Initial Investment of $10,000
Average Annual Total Returns
| | | | | | | | | | | | |
| | | 1 year | | | 5 years | | | 10 years | |
| Class R6 Shares at NAV | | | 21.22 | % | | | 10.78 | % | | | 8.48 | % |
Russell 3000® Index | | | 27.58 | % | | | 15.00 | % | | | 12.09 | % |
| Bloomberg U.S. Aggregate Bond Index | | | 1.31 | % | | | (0.17 | )% | | | 1.26 | % |
| Lifecycle 2045 Fund Composite Index | | | 20.71 | % | | | 11.05 | % | | | 8.78 | % |
| S&P Target Date 2045 Index | | | 20.26 | % | | | 10.39 | % | | | 8.08 | % |
Investment return and principal value will fluctuate, and you may have a gain or loss when you sell your shares. Current performance may differ from figures shown. For most recent month‑end performance, go to https://www.nuveen.com/en‑us/mutual‑funds/prospectuses or call (800) 257‑8787.
Fund Statistics (as of May 31, 2024)
| | | | |
| Fund net assets | | $ | 4,447,242,431 | |
| Total number of portfolio holdings | | | 19 | |
| Portfolio turnover (%) | | | 14% | |
| Total advisory fees paid for the year | | $ | 17,421,709 | |
What did the Fund invest in? (as of May 31, 2024)
(1) Affiliated investment companies, except for repurchase agreements.
How has the Fund changed?
| | • | | Name change: Effective May 1, 2024, the Fund’s name changed from TIAA-CREF Lifecycle 2045 Fund to Nuveen Lifecycle 2045 Fund. | |
| | • | | Share class name change: Effective May 6, 2024, Institutional Class shares of the Fund were renamed Class R6 shares. | |
For more complete information, you may review the Fund’s next prospectus, which is expected to be available by October 1, 2024 at https://www.nuveen.com/en‑us/mutual‑funds/prospectuses or upon request at (800) 257‑8787.
Availability of additional information about the Fund
You can find additional information about the Fund at https://www.nuveen.com/en‑us/mutual‑funds/prospectuses, including its:
| | • | | prospectus • financial statements and other information • fund holdings • proxy voting information |
You can also request this information at (800) 257‑8787.
| | |
886315589_AR_0524 3613738-INV-Y-07/25 (I, R6, Premier, Retirement) | | |
| | |
| | Annual Shareholder Report May 31, 2024 |
Nuveen Lifecycle 2045 Fund
(Formerly known as TIAA-CREF Lifecycle 2045 Fund)
Retirement Class Shares/TTFRX
Annual Shareholder Report
This annual shareholder report contains important information about the Retirement Class Shares of the Nuveen Lifecycle 2045 Fund for the period of June 1, 2023 to May 31, 2024. You can find additional information at https://www.nuveen.com/en‑us/mutual‑funds/prospectuses. You can also request this information by contacting us at (800) 257‑8787.
This report describes changes to the Fund that occurred during the reporting period.
What were the Fund costs for the last year? (based on a hypothetical $10,000 investment)(1)
| | | | |
| | | Cost of a $10,000 investment | | Costs paid as a percentage of $10,000 investment |
| Retirement Class Shares | | $52 | | 0.52% |
(1) These costs include the expenses of underlying funds in which the Fund invests except for the expenses of the Nuveen Dividend Growth Fund, Nuveen Dividend Value Fund, Nuveen Growth Opportunities ETF and TIAA-CREF Real Property Fund.
How did the Fund perform last year? What affected the Fund’s performance?
| | |
Performance Highlights • The Nuveen Lifecycle 2045 Fund returned 20.88% for Retirement Class shares at net asset value (NAV) for the 12 months ended May 31, 2024. The Fund performed in line with the Lifecycle 2045 Fund Composite Index, which returned 20.71%. • The Lifecycle 2045 Fund Composite Index consisted of: 56.5% Russell 3000® Index; 30.4% MSCI All Country World Index ex USA Investable Market Index; and 13.1% Bloomberg U.S. Aggregate Bond Index. • Top contributors to relative performance » Strong overall performance among underlying funds investing in U.S. equities. » Positions in the Nuveen Core Equity Fund, Nuveen Growth Opportunities ETF and the Nuveen Large Cap Value Fund. • Top detractors from relative performance » An allocation to the Nuveen Real Property Fund LP. » A position in the Nuveen International Opportunities Fund. | | Performance Attribution Nuveen Core Equity Fund Nuveen Growth Opportunities ETF Nuveen Large Cap Value Fund Nuveen Real Property Fund LP |
How did the Fund perform over the last 10 years?
Performance data shown represents past performance and does not predict or guarantee future results. The graph and table do not reflect the deduction of taxes that a shareholder would pay on Fund distributions or redemption of Fund Shares.
Fund Performance (June 1, 2014 through May 31, 2024) Initial Investment of $10,000
Average Annual Total Returns
| | | | | | | | | | | | |
| | | 1 year | | | 5 years | | | 10 years | |
| Retirement Class Shares at NAV | | | 20.88 | % | | | 10.51 | % | | | 8.20 | % |
Russell 3000® Index | | | 27.58 | % | | | 15.00 | % | | | 12.09 | % |
| Bloomberg U.S. Aggregate Bond Index | | | 1.31 | % | | | (0.17 | )% | | | 1.26 | % |
| Lifecycle 2045 Fund Composite Index | | | 20.71 | % | | | 11.05 | % | | | 8.78 | % |
| S&P Target Date 2045 Index | | | 20.26 | % | | | 10.39 | % | | | 8.08 | % |
Investment return and principal value will fluctuate, and you may have a gain or loss when you sell your shares. Current performance may differ from figures shown. For most recent month‑end performance, go to https://www.nuveen.com/en‑us/mutual‑funds/prospectuses or call (800) 257‑8787.
Fund Statistics (as of May 31, 2024)
| | | | |
| Fund net assets | | $ | 4,447,242,431 | |
| Total number of portfolio holdings | | | 19 | |
| Portfolio turnover (%) | | | 14% | |
| Total advisory fees paid for the year | | $ | 17,421,709 | |
What did the Fund invest in? (as of May 31, 2024)
(1) Affiliated investment companies, except for repurchase agreements.
How has the Fund changed?
| | • | | Name change: Effective May 1, 2024, the Fund’s name changed from TIAA-CREF Lifecycle 2045 Fund to Nuveen Lifecycle 2045 Fund. | |
For more complete information, you may review the Fund’s next prospectus, which is expected to be available by October 1, 2024 at https://www.nuveen.com/en‑us/mutual‑funds/prospectuses or upon request at (800) 257‑8787.
Availability of additional information about the Fund
You can find additional information about the Fund at https://www.nuveen.com/en‑us/mutual‑funds/prospectuses, including its:
| | • | | prospectus • financial statements and other information • fund holdings • proxy voting information |
You can also request this information at (800) 257‑8787.
| | |
886315522_AR_0524 3613738-INV-Y-07/25 (I, R6, Premier, Retirement) | | |
| | |
| | Annual Shareholder Report May 31, 2024 |
Nuveen Lifecycle 2045 Fund
(Formerly known as TIAA-CREF Lifecycle 2045 Fund)
Premier Class Shares/TTFPX
Annual Shareholder Report
This annual shareholder report contains important information about the Premier Class Shares of the Nuveen Lifecycle 2045 Fund for the period of June 1, 2023 to May 31, 2024. You can find additional information at https://www.nuveen.com/en‑us/mutual‑funds/prospectuses. You can also request this information by contacting us at (800) 257‑8787.
This report describes changes to the Fund that occurred during the reporting period.
What were the Fund costs for the last year? (based on a hypothetical $10,000 investment)(1)
| | | | |
| | | Cost of a $10,000 investment | | Costs paid as a percentage of
$10,000 investment |
| Premier Class Shares | | $42 | | 0.42% |
(1) These costs include the expenses of underlying funds in which the Fund invests except for the expenses of the Nuveen Dividend Growth Fund, Nuveen Dividend Value Fund, Nuveen Growth Opportunities ETF and TIAA-CREF Real Property Fund.
How did the Fund perform last year? What affected the Fund’s performance?
| | |
Performance Highlights • The Nuveen Lifecycle 2045 Fund returned 21.06% for Premier Class shares at net asset value (NAV) for the 12 months ended May 31, 2024. The Fund outperformed the Lifecycle 2045 Fund Composite Index, which returned 20.71%. • The Lifecycle 2045 Fund Composite Index consisted of: 56.5% Russell 3000® Index; 30.4% MSCI All Country World Index ex USA Investable Market Index; and 13.1% Bloomberg U.S. Aggregate Bond Index. • Top contributors to relative performance » Strong overall performance among underlying funds investing in U.S. equities. » Positions in the Nuveen Core Equity Fund, Nuveen Growth Opportunities ETF and the Nuveen Large Cap Value Fund. • Top detractors from relative performance » An allocation to the Nuveen Real Property Fund LP. » A position in the Nuveen International Opportunities Fund. | | Performance Attribution Nuveen Core Equity Fund Nuveen Growth Opportunities ETF Nuveen Large Cap Value Fund Nuveen Real Property Fund LP |
How did the Fund perform over the last 10 years?
Performance data shown represents past performance and does not predict or guarantee future results. The graph and table do not reflect the deduction of taxes that a shareholder would pay on Fund distributions or redemption of Fund Shares.
Fund Performance (June 1, 2014 through May 31, 2024) Initial Investment of $10,000
Average Annual Total Returns
| | | | | | | | | | | | |
| | | 1 year | | | 5 years | | | 10 years | |
| Premier Class Shares at NAV | | | 21.06 | % | | | 10.62 | % | | | 8.31 | % |
Russell 3000® Index | | | 27.58 | % | | | 15.00 | % | | | 12.09 | % |
| Bloomberg U.S. Aggregate Bond Index | | | 1.31 | % | | | (0.17 | )% | | | 1.26 | % |
| Lifecycle 2045 Fund Composite Index | | | 20.71 | % | | | 11.05 | % | | | 8.78 | % |
| S&P Target Date 2045 Index | | | 20.26 | % | | | 10.39 | % | | | 8.08 | % |
Investment return and principal value will fluctuate, and you may have a gain or loss when you sell your shares. Current performance may differ from figures shown. For most recent month‑end performance, go to https://www.nuveen.com/en‑us/mutual‑funds/prospectuses or call (800) 257‑8787.
Fund Statistics (as of May 31, 2024)
| | | | |
| Fund net assets | | $ | 4,447,242,431 | |
| Total number of portfolio holdings | | | 19 | |
| Portfolio turnover (%) | | | 14% | |
| Total advisory fees paid for the year | | $ | 17,421,709 | |
What did the Fund invest in? (as of May 31, 2024)
(1) Affiliated investment companies, except for repurchase agreements.
How has the Fund changed?
| | • | | Name change: Effective May 1, 2024, the Fund’s name changed from TIAA-CREF Lifecycle 2045 Fund to Nuveen Lifecycle 2045 Fund. | |
For more complete information, you may review the Fund’s next prospectus, which is expected to be available by October 1, 2024 at https://www.nuveen.com/en-us/mutual-funds/prospectuses or upon request at (800) 257‑8787.
Availability of additional information about the Fund
You can find additional information about the Fund at https://www.nuveen.com/en‑us/mutual‑funds/prospectuses, including its:
| | • | | prospectus • financial statements and other information • fund holdings • proxy voting information |
You can also request this information at (800) 257‑8787.
| | |
87245M350_AR_0524 3613738-INV-Y-07/25 (I, R6, Premier, Retirement) | | |
| | |
| | Annual Shareholder Report May 31, 2024 |
Nuveen Lifecycle 2045 Fund
(Formerly known as TIAA-CREF Lifecycle 2045 Fund)
Class I Shares (Formerly known as Advisor Class Shares)/TTFHX
Annual Shareholder Report
This annual shareholder report contains important information about the Class I Shares of the Nuveen Lifecycle 2045 Fund for the period of June 1, 2023 to May 31, 2024. You can find additional information at https://www.nuveen.com/en‑us/mutual‑funds/prospectuses. You can also request this information by contacting us at (800) 257‑8787.
This report describes changes to the Fund that occurred during the reporting period.
What were the Fund costs for the last year? (based on a hypothetical $10,000 investment)(1)
| | | | |
| | | Cost of a $10,000 investment | | Costs paid as a percentage of $10,000 investment |
| Class I Shares | | $36 | | 0.36% |
(1) These costs include the expenses of underlying funds in which the Fund invests except for the expenses of the Nuveen Dividend Growth Fund, Nuveen Dividend Value Fund, Nuveen Growth Opportunities ETF and TIAA-CREF Real Property Fund.
How did the Fund perform last year? What affected the Fund’s performance?
| | |
Performance Highlights • The Nuveen Lifecycle 2045 Fund returned 21.04% for Class I shares at net asset value (NAV) for the 12 months ended May 31, 2024. The Fund outperformed the Lifecycle 2045 Fund Composite Index, which returned 20.71%. • The Lifecycle 2045 Fund Composite Index consisted of: 56.5% Russell 3000® Index; 30.4% MSCI All Country World Index ex USA Investable Market Index; and 13.1% Bloomberg U.S. Aggregate Bond Index. • Top contributors to relative performance » Strong overall performance among underlying funds investing in U.S. equities. » Positions in the Nuveen Core Equity Fund, Nuveen Growth Opportunities ETF and the Nuveen Large Cap Value Fund. • Top detractors from relative performance » An allocation to the Nuveen Real Property Fund LP. » A position in the Nuveen International Opportunities Fund. | | Performance Attribution Nuveen Core Equity Fund Nuveen Growth Opportunities ETF Nuveen Large Cap Value Fund Nuveen Real Property Fund LP |
How did the Fund perform over the period since inception?
Performance data shown represents past performance and does not predict or guarantee future results. The graph and table do not reflect the deduction of taxes that a shareholder would pay on Fund distributions or redemption of Fund Shares.
Fund Performance (December 4, 2015 through May 31, 2024) Initial Investment of $10,000
Average Annual Total Returns
| | | | | | | | | | | | |
| | | 1 year | | | 5 years | | | Since Inception | |
| Class I Shares at NAV | | | 21.04 | % | | | 10.72 | % | | | 9.40 | % |
Russell 3000® Index | | | 27.58 | % | | | 15.00 | % | | | 12.98 | % |
| Bloomberg U.S. Aggregate Bond Index | | | 1.31 | % | | | (0.17 | )% | | | 1.16 | % |
| Lifecycle 2045 Fund Composite Index | | | 20.71 | % | | | 11.05 | % | | | 9.93 | % |
| S&P Target Date 2045 Index | | | 20.26 | % | | | 10.39 | % | | | 9.14 | % |
Investment return and principal value will fluctuate, and you may have a gain or loss when you sell your shares. Current performance may differ from figures shown. For most recent month‑end performance, go to https://www.nuveen.com/en‑us/mutual‑funds/prospectuses or call (800) 257‑8787.
Fund Statistics (as of May 31, 2024)
| | | | |
| Fund net assets | | $ | 4,447,242,431 | |
| Total number of portfolio holdings | | | 19 | |
| Portfolio turnover (%) | | | 14% | |
| Total advisory fees paid for the year | | $ | 17,421,709 | |
What did the Fund invest in? (as of May 31, 2024)
(1) Affiliated investment companies, except for repurchase agreements.
How has the Fund changed?
| | • | | Name change: Effective May 1, 2024, the Fund’s name changed from TIAA-CREF Lifecycle 2045 Fund to Nuveen Lifecycle 2045 Fund. | |
| | • | | Share class name change: Effective May 6, 2024, Advisor Class shares of the Fund were renamed Class I shares. | |
For more complete information, you may review the Fund’s next prospectus, which is expected to be available by October 1, 2024 at https://www.nuveen.com/en‑us/mutual‑funds/prospectuses or upon request at (800) 257‑8787.
Availability of additional information about the Fund
You can find additional information about the Fund at https://www.nuveen.com/en‑us/mutual‑funds/prospectuses, including its:
| | • | | prospectus • financial statements and other information • fund holdings • proxy voting information |
You can also request this information at (800) 257‑8787.
| | |
87245P882_AR_0524 3613738-INV-Y-07/25 (I, R6, Premier, Retirement) | | |
| | |
| | Annual Shareholder Report May 31, 2024 |
Nuveen Lifecycle 2050 Fund
(Formerly known as TIAA-CREF Lifecycle 2050 Fund)
Class R6 Shares (Formerly known as Institutional Class Shares)/TFTIX
Annual Shareholder Report
This annual shareholder report contains important information about the Class R6 Shares of the Nuveen Lifecycle 2050 Fund for the period of June 1, 2023 to May 31, 2024. You can find additional information at https://www.nuveen.com/en‑us/mutual‑funds/prospectuses. You can also request this information by contacting us at (800) 257‑8787.
This report describes changes to the Fund that occurred during the reporting period.
What were the Fund costs for the last year? (based on a hypothetical $10,000 investment)(1)
| | | | |
| | | Cost of a $10,000 investment | | Costs paid as a percentage of $10,000 investment |
| Class R6 Shares | | $26 | | 0.26% |
(1) These costs include the expenses of underlying funds in which the Fund invests except for the expenses of the Nuveen Dividend Growth Fund, Nuveen Dividend Value Fund, Nuveen Growth Opportunities ETF and TIAA-CREF Real Property Fund.
How did the Fund perform last year? What affected the Fund’s performance?
| | |
Performance Highlights • The Nuveen Lifecycle 2050 Fund returned 21.99% for Class R6 shares at net asset value (NAV) for the 12 months ended May 31, 2024. The Fund outperformed the Lifecycle 2050 Fund Composite Index, which returned 21.44%. • The Lifecycle 2050 Fund Composite Index consisted of: 58.7% Russell 3000® Index; 31.6% MSCI All Country World Index ex USA Investable Market Index; and 9.7% Bloomberg U.S. Aggregate Bond Index. • Top contributors to relative performance » Strong overall performance among underlying funds investing in U.S. equities. » Positions in the Nuveen Core Equity Fund, Nuveen Growth Opportunities ETF and the Nuveen Large Cap Value Fund. • Top detractors from relative performance » An allocation to the Nuveen Real Property Fund LP. » A position in the Nuveen International Opportunities Fund. | | Performance Attribution Nuveen Core Equity Fund Nuveen Growth Opportunities ETF Nuveen Large Cap Value Fund Nuveen Real Property Fund LP |
How did the Fund perform over the last 10 years?
Performance data shown represents past performance and does not predict or guarantee future results. The graph and table do not reflect the deduction of taxes that a shareholder would pay on Fund distributions or redemption of Fund Shares.
Fund Performance (June 1, 2014 through May 31, 2024) Initial Investment of $10,000
Average Annual Total Returns
| | | | | | | | | | | | |
| | | 1 year | | | 5 years | | | 10 years | |
| Class R6 Shares at NAV | | | 21.99 | % | | | 11.03 | % | | | 8.62 | % |
Russell 3000® Index | | | 27.58 | % | | | 15.00 | % | | | 12.09 | % |
| Bloomberg U.S. Aggregate Bond Index | | | 1.31 | % | | | (0.17 | )% | | | 1.26 | % |
| Lifecycle 2050 Fund Composite Index | | | 21.44 | % | | | 11.29 | % | | | 8.94 | % |
| S&P Target Date 2050 Index | | | 21.00 | % | | | 10.68 | % | | | 8.28 | % |
Investment return and principal value will fluctuate, and you may have a gain or loss when you sell your shares. Current performance may differ from figures shown. For most recent month‑end performance, go to https://www.nuveen.com/en‑us/mutual‑funds/prospectuses or call (800) 257‑8787.
Fund Statistics (as of May 31, 2024)
| | | | |
| Fund net assets | | $ | 3,505,834,075 | |
| Total number of portfolio holdings | | | 19 | |
| Portfolio turnover (%) | | | 15% | |
| Total advisory fees paid for the year | | $ | 13,606,936 | |
What did the Fund invest in? (as of May 31, 2024)
(1) Affiliated investment companies, except for repurchase agreements.
How has the Fund changed?
| | • | | Name change: Effective May 1, 2024, the Fund’s name changed from TIAA-CREF Lifecycle 2050 Fund to Nuveen Lifecycle 2050 Fund. | |
| | • | | Share class name change: Effective May 6, 2024, Institutional Class shares of the Fund were renamed Class R6 shares. | |
For more complete information, you may review the Fund’s next prospectus, which is expected to be available by October 1, 2024 at https://www.nuveen.com/en‑us/mutual‑funds/prospectuses or upon request at (800) 257‑8787.
Availability of additional information about the Fund
You can find additional information about the Fund at https://www.nuveen.com/en‑us/mutual‑funds/prospectuses, including its:
| | • | | prospectus • financial statements and other information • fund holdings • proxy voting information |
You can also request this information at (800) 257‑8787.
| | |
886315571_AR_0524 3613751-INV-Y-07/25 (I, R6, Premier, Retirement) | | |
| | |
| | Annual Shareholder Report May 31, 2024 |
Nuveen Lifecycle 2050 Fund
(Formerly known as TIAA-CREF Lifecycle 2050 Fund)
Retirement Class Shares/TLFRX
Annual Shareholder Report
This annual shareholder report contains important information about the Retirement Class Shares of the Nuveen Lifecycle 2050 Fund for the period of June 1, 2023 to May 31, 2024. You can find additional information at https://www.nuveen.com/en‑us/mutual‑funds/prospectuses. You can also request this information by contacting us at (800) 257‑8787.
This report describes changes to the Fund that occurred during the reporting period.
What were the Fund costs for the last year? (based on a hypothetical $10,000 investment)(1)
| | | | |
| | | Cost of a $10,000 investment | | Costs paid as a percentage of $10,000 investment |
| Retirement Class Shares | | $51 | | 0.51% |
(1) These costs include the expenses of underlying funds in which the Fund invests except for the expenses of the Nuveen Dividend Growth Fund, Nuveen Dividend Value Fund, Nuveen Growth Opportunities ETF and TIAA-CREF Real Property Fund.
How did the Fund perform last year? What affected the Fund’s performance?
| | |
Performance Highlights • The Nuveen Lifecycle 2050 Fund returned 21.76% for Retirement Class shares at net asset value (NAV) for the 12 months ended May 31, 2024. The Fund outperformed the Lifecycle 2050 Fund Composite Index, which returned 21.44%. • The Lifecycle 2050 Fund Composite Index consisted of: 58.7% Russell 3000® Index; 31.6% MSCI All Country World Index ex USA Investable Market Index; and 9.7% Bloomberg U.S. Aggregate Bond Index. • Top contributors to relative performance » Strong overall performance among underlying funds investing in U.S. equities. » Positions in the Nuveen Core Equity Fund, Nuveen Growth Opportunities ETF and the Nuveen Large Cap Value Fund. • Top detractors from relative performance » An allocation to the Nuveen Real Property Fund LP. » A position in the Nuveen International Opportunities Fund. | | Performance Attribution Nuveen Core Equity Fund Nuveen Growth Opportunities ETF Nuveen Large Cap Value Fund Nuveen Real Property Fund LP |
How did the Fund perform over the last 10 years?
Performance data shown represents past performance and does not predict or guarantee future results. The graph and table do not reflect the deduction of taxes that a shareholder would pay on Fund distributions or redemption of Fund Shares.
Fund Performance (June 1, 2014 through May 31, 2024) Initial Investment of $10,000
Average Annual Total Returns
| | | | | | | | | | | | |
| | | 1 year | | | 5 years | | | 10 years | |
| Retirement Class Shares at NAV | | | 21.76 | % | | | 10.76 | % | | | 8.35 | % |
Russell 3000® Index | | | 27.58 | % | | | 15.00 | % | | | 12.09 | % |
| Bloomberg U.S. Aggregate Bond Index | | | 1.31 | % | | | (0.17 | )% | | | 1.26 | % |
| Lifecycle 2050 Fund Composite Index | | | 21.44 | % | | | 11.29 | % | | | 8.94 | % |
| S&P Target Date 2050 Index | | | 21.00 | % | | | 10.68 | % | | | 8.28 | % |
Investment return and principal value will fluctuate, and you may have a gain or loss when you sell your shares. Current performance may differ from figures shown. For most recent month‑end performance, go to https://www.nuveen.com/en‑us/mutual‑funds/prospectuses or call (800) 257‑8787.
Fund Statistics (as of May 31, 2024)
| | | | |
| Fund net assets | | $ | 3,505,834,075 | |
| Total number of portfolio holdings | | | 19 | |
| Portfolio turnover (%) | | | 15% | |
| Total advisory fees paid for the year | | $ | 13,606,936 | |
What did the Fund invest in? (as of May 31, 2024)
(1) Affiliated investment companies, except for repurchase agreements.
How has the Fund changed?
| | • | | Name change: Effective May 1, 2024, the Fund’s name changed from TIAA-CREF Lifecycle 2050 Fund to Nuveen Lifecycle 2050 Fund. | |
For more complete information, you may review the Fund’s next prospectus, which is expected to be available by October 1, 2024 at https://www.nuveen.com/en‑us/mutual‑funds/prospectuses or upon request at (800) 257‑8787.
Availability of additional information about the Fund
You can find additional information about the Fund at https://www.nuveen.com/en‑us/mutual‑funds/prospectuses, including its:
| | • | | prospectus • financial statements and other information • fund holdings • proxy voting information |
You can also request this information at (800) 257‑8787.
| | |
886315514_AR_0524 3613751-INV-Y-07/25 (I, R6, Premier, Retirement) | | |
| | |
| | Annual Shareholder Report May 31, 2024 |
Nuveen Lifecycle 2050 Fund
(Formerly known as TIAA-CREF Lifecycle 2050 Fund)
Premier Class Shares/TCLPX
Annual Shareholder Report
This annual shareholder report contains important information about the Premier Class Shares of the Nuveen Lifecycle 2050 Fund for the period of June 1, 2023 to May 31, 2024. You can find additional information at https://www.nuveen.com/en‑us/mutual‑funds/prospectuses. You can also request this information by contacting us at (800) 257‑8787.
This report describes changes to the Fund that occurred during the reporting period.
What were the Fund costs for the last year? (based on a hypothetical $10,000 investment)(1)
| | | | |
| | | Cost of a $10,000 investment | | Costs paid as a percentage of $10,000 investment |
| Premier Class Shares | | $41 | | 0.41% |
(1) These costs include the expenses of underlying funds in which the Fund invests except for the expenses of the Nuveen Dividend Growth Fund, Nuveen Dividend Value Fund, Nuveen Growth Opportunities ETF and TIAA-CREF Real Property Fund.
How did the Fund perform last year? What affected the Fund’s performance?
| | |
Performance Highlights • The Nuveen Lifecycle 2050 Fund returned 21.90% for Premier Class shares at net asset value (NAV) for the 12 months ended May 31, 2024. The Fund outperformed the Lifecycle 2050 Fund Composite Index, which returned 21.44%. • The Lifecycle 2050 Fund Composite Index consisted of: 58.7% Russell 3000® Index; 31.6% MSCI All Country World Index ex USA Investable Market Index; and 9.7% Bloomberg U.S. Aggregate Bond Index. • Top contributors to relative performance » Strong overall performance among underlying funds investing in U.S. equities. » Positions in the Nuveen Core Equity Fund, Nuveen Growth Opportunities ETF and the Nuveen Large Cap Value Fund. • Top detractors from relative performance » An allocation to the Nuveen Real Property Fund LP. » A position in the Nuveen International Opportunities Fund. | | Performance Attribution Nuveen Core Equity Fund Nuveen Growth Opportunities ETF Nuveen Large Cap Value Fund Nuveen Real Property Fund LP |
How did the Fund perform over the last 10 years?
Performance data shown represents past performance and does not predict or guarantee future results. The graph and table do not reflect the deduction of taxes that a shareholder would pay on Fund distributions or redemption of Fund Shares.
Fund Performance (June 1, 2014 through May 31, 2024) Initial Investment of $10,000
Average Annual Total Returns
| | | | | | | | | | | | |
| | | 1 year | | | 5 years | | | 10 years | |
| Premier Class Shares at NAV | | | 21.90 | % | | | 10.87 | % | | | 8.47 | % |
Russell 3000® Index | | | 27.58 | % | | | 15.00 | % | | | 12.09 | % |
| Bloomberg U.S. Aggregate Bond Index | | | 1.31 | % | | | (0.17 | )% | | | 1.26 | % |
| Lifecycle 2050 Fund Composite Index | | | 21.44 | % | | | 11.29 | % | | | 8.94 | % |
| S&P Target Date 2050 Index | | | 21.00 | % | | | 10.68 | % | | | 8.28 | % |
Investment return and principal value will fluctuate, and you may have a gain or loss when you sell your shares. Current performance may differ from figures shown. For most recent month‑end performance, go to https://www.nuveen.com/en‑us/mutual‑funds/prospectuses or call (800) 257‑8787.
Fund Statistics (as of May 31, 2024)
| | | | |
| Fund net assets | | $ | 3,505,834,075 | |
| Total number of portfolio holdings | | | 19 | |
| Portfolio turnover (%) | | | 15% | |
| Total advisory fees paid for the year | | $ | 13,606,936 | |
What did the Fund invest in? (as of May 31, 2024)
(1) Affiliated investment companies, except for repurchase agreements.
How has the Fund changed?
| | • | | Name change: Effective May 1, 2024, the Fund’s name changed from TIAA-CREF Lifecycle 2050 Fund to Nuveen Lifecycle 2050 Fund. | |
For more complete information, you may review the Fund’s next prospectus, which is expected to be available by October 1, 2024 at https://www.nuveen.com/en‑us/mutual‑funds/prospectuses or upon request at (800) 257‑8787.
Availability of additional information about the Fund
You can find additional information about the Fund at https://www.nuveen.com/en‑us/mutual‑funds/prospectuses, including its:
| | • | | prospectus • financial statements and other information • fund holdings • proxy voting information |
You can also request this information at (800) 257‑8787.
| | |
87245M343_AR_0524 3613751-INV-Y-07/25 (I, R6, Premier, Retirement) | | |
| | |
| | Annual Shareholder Report May 31, 2024 |
Nuveen Lifecycle 2050 Fund
(Formerly known as TIAA-CREF Lifecycle 2050 Fund)
Class I Shares (Formerly known as Advisor Class Shares)/TFTHX
Annual Shareholder Report
This annual shareholder report contains important information about the Class I Shares of the Nuveen Lifecycle 2050 Fund for the period of June 1, 2023 to May 31, 2024. You can find additional information at https://www.nuveen.com/en‑us/mutual‑funds/prospectuses. You can also request this information by contacting us at (800) 257‑8787.
This report describes changes to the Fund that occurred during the reporting period.
What were the Fund costs for the last year? (based on a hypothetical $10,000 investment)(1)
| | | | |
| | | Cost of a $10,000 investment | | Costs paid as a percentage of
$10,000 investment |
| Class I Shares | | $33 | | 0.33% |
(1) These costs include the expenses of underlying funds in which the Fund invests except for the expenses of the Nuveen Dividend Growth Fund, Nuveen Dividend Value Fund, Nuveen Growth Opportunities ETF and TIAA-CREF Real Property Fund.
How did the Fund perform last year? What affected the Fund’s performance?
| | |
Performance Highlights • The Nuveen Lifecycle 2050 Fund returned 21.89% for Class I shares at net asset value (NAV) for the 12 months ended May 31, 2024. The Fund outperformed the Lifecycle 2050 Fund Composite Index, which returned 21.44%. • The Lifecycle 2050 Fund Composite Index consisted of: 58.7% Russell 3000® Index; 31.6% MSCI All Country World Index ex USA Investable Market Index; and 9.7% Bloomberg U.S. Aggregate Bond Index. • Top contributors to relative performance » Strong overall performance among underlying funds investing in U.S. equities. » Positions in the Nuveen Core Equity Fund, Nuveen Growth Opportunities ETF and the Nuveen Large Cap Value Fund. • Top detractors from relative performance » An allocation to the Nuveen Real Property Fund LP. » A position in the Nuveen International Opportunities Fund. | | Performance Attribution Nuveen Core Equity Fund Nuveen Growth Opportunities ETF Nuveen Large Cap Value Fund Nuveen Real Property Fund LP |
How did the Fund perform over the period since inception?
Performance data shown represents past performance and does not predict or guarantee future results. The graph and table do not reflect the deduction of taxes that a shareholder would pay on Fund distributions or redemption of Fund Shares.
Fund Performance (December 4, 2015 through May 31, 2024) Initial Investment of $10,000
Average Annual Total Returns
| | | | | | | | | | | | |
| | | 1 year | | | 5 years | | | Since Inception | |
| Class I Shares at NAV | | | 21.89 | % | | | 10.96 | % | | | 9.58 | % |
Russell 3000® Index | | | 27.58 | % | | | 15.00 | % | | | 12.98 | % |
| Bloomberg U.S. Aggregate Bond Index | | | 1.31 | % | | | (0.17 | )% | | | 1.16 | % |
| Lifecycle 2050 Fund Composite Index | | | 21.44 | % | | | 11.29 | % | | | 10.12 | % |
| S&P Target Date 2050 Index | | | 21.00 | % | | | 10.68 | % | | | 9.37 | % |
Investment return and principal value will fluctuate, and you may have a gain or loss when you sell your shares. Current performance may differ from figures shown. For most recent month‑end performance, go to https://www.nuveen.com/en‑us/mutual‑funds/prospectuses or call (800) 257‑8787.
Fund Statistics (as of May 31, 2024)
| | | | |
| Fund net assets | | $ | 3,505,834,075 | |
| Total number of portfolio holdings | | | 19 | |
| Portfolio turnover (%) | | | 15% | |
| Total advisory fees paid for the year | | $ | 13,606,936 | |
What did the Fund invest in? (as of May 31, 2024)
(1) Affiliated investment companies, except for repurchase agreements.
How has the Fund changed?
| | • | | Name change: Effective May 1, 2024, the Fund’s name changed from TIAA-CREF Lifecycle 2050 Fund to Nuveen Lifecycle 2050 Fund. | |
| | • | | Share class name change: Effective May 6, 2024, Advisor Class shares of the Fund were renamed Class I shares. | |
For more complete information, you may review the Fund’s next prospectus, which is expected to be available by October 1, 2024 at https://www.nuveen.com/en‑us/mutual‑funds/prospectuses or upon request at (800) 257‑8787.
Availability of additional information about the Fund
You can find additional information about the Fund at https://www.nuveen.com/en‑us/mutual‑funds/prospectuses, including its:
| | • | | prospectus • financial statements and other information • fund holdings • proxy voting information |
You can also request this information at (800) 257‑8787.
| | |
87245P874_AR_0524 3613751-INV-Y-07/25 (I, R6, Premier, Retirement) | | |
| | |
| | Annual Shareholder Report May 31, 2024 |
Nuveen Lifecycle Retirement Income Fund
(Formerly known as TIAA-CREF Lifecycle Retirement Income Fund)
Class A Shares (Formerly known as Retail Class Shares)/TLRRX
Annual Shareholder Report
This annual shareholder report contains important information about the Class A Shares of the Nuveen Lifecycle Retirement Income Fund for the period of June 1, 2023 to May 31, 2024. You can find additional information at https://www.nuveen.com/en-us/mutual-funds/prospectuses. You can also request this information by contacting us at (800) 257‑8787.
This report describes changes to the Fund that occurred during the reporting period.
What were the Fund costs for the last year? (based on a hypothetical $10,000 investment)(1)
| | | | |
| | | Cost of a $10,000 investment | | Costs paid as a percentage of $10,000 investment |
| Class A Shares | | $53 | | 0.53% |
(1) These costs include the expenses of underlying funds in which the Fund invests except for the expenses of the Nuveen Dividend Growth Fund, Nuveen Dividend Value Fund, Nuveen Growth Opportunities ETF and TIAA-CREF Real Property Fund.
How did the Fund perform last year? What affected the Fund’s performance?
| | |
Performance Highlights • The Nuveen Lifecycle Retirement Income Fund returned 10.19% for Class A shares at net asset value (NAV) for the 12 months ended May 31, 2024. The Fund performed in line with the Lifecycle Retirement Income Fund Composite Index, which returned 10.40%. • The Lifecycle Retirement Income Fund Composite Index consisted of: 40.0% Bloomberg U.S. Aggregate Bond Index; 26.0% Russell 3000® Index; 14.0% MSCI All Country World Index ex USA Investable Market Index; 10.0% Bloomberg U.S. 1–3 Year Government/Credit Bond Index; and 10.0% Bloomberg U.S. Treasury Inflation Protected Securities (TIPS) 1‑10 Year Index. • Top detractors from relative performance » An allocation to the Nuveen Real Property Fund LP. • Top contributors to relative performance » Strong overall performance of the underlying funds investing in fixed income and U.S. equities, led by the Nuveen Core Bond Fund and the Nuveen Core Equity Fund. | | Performance Attribution Nuveen Real Property Fund LP Nuveen Core Bond Fund Nuveen Core Equity Fund |
How did the Fund perform over the last 10 years?
Performance data shown represents past performance and does not predict or guarantee future results. The graph and table do not reflect the deduction of taxes that a shareholder would pay on Fund distributions or redemption of Fund Shares.
Fund Performance (June 1, 2014 through May 31, 2024) Initial Investment of $10,000
Average Annual Total Returns
| | | | | | | | | | | | |
| | | 1 year | | | 5 years | | | 10 years | |
| Class A Shares at NAV (excluding maximum sales charge) | | | 10.19 | % | | | 4.93 | % | | | 4.53 | % |
| Class A at maximum sales charge (Offering Price) | | | 3.82 | % | | | 3.69 | % | | | 3.91 | % |
Russell 3000® Index | | | 27.58 | % | | | 15.00 | % | | | 12.09 | % |
| Bloomberg U.S. Aggregate Bond Index | | | 1.31 | % | | | (0.17 | )% | | | 1.26 | % |
| Lifecycle Retirement Income Fund Composite Index | | | 10.40 | % | | | 5.46 | % | | | 4.85 | % |
| S&P Target Date Retirement Income Index | | | 8.96 | % | | | 4.26 | % | | | 3.88 | % |
Class A Shares at Offer reflect a maximum up‑front sales charge of 5.75% applicable to the purchase of Class A shares, which was effective as of May 6, 2024.”
Investment return and principal value will fluctuate, and you may have a gain or loss when you sell your shares. Current performance may differ from figures shown. For most recent month‑end performance, go to https://www.nuveen.com/en-us/mutual-funds/prospectuses or call (800) 257‑8787.
Fund Statistics (as of May 31, 2024)
| | | | |
| Fund net assets | | $ | 418,700,199 | |
| Total number of portfolio holdings | | | 21 | |
| Portfolio turnover (%) | | | 12% | |
| Total advisory fees paid for the year | | $ | 1,684,797 | |
What did the Fund invest in? (as of May 31, 2024)
(1) Affiliated investment companies, except for repurchase agreements.
How has the Fund changed?
| | • | | Name change: Effective May 1, 2024, the Fund’s name changed from TIAA-CREF Lifecycle Retirement Income Fund to Nuveen Lifecycle Retirement Income Fund. | |
| | • | | Share class name change: Effective May 6, 2024, Retail Class shares of the Fund were renamed Class A shares. | |
| | • | | Sales charge: Effective May 6, 2024, a sales charge is imposed on purchases of Class A shares (formerly Retail Class shares) of the Fund of less than certain amounts. Therefore, effective as of May 6, 2024, Class A shares are available for purchase at the offering price, which will be the net asset value (NAV) per share plus an up‑front sales charge. | |
For more complete information, you may review the Fund’s next prospectus, which is expected to be available by October 1, 2024 at https://www.nuveen.com/en-us/mutual-funds/prospectuses or upon request at (800) 257‑8787.
Availability of additional information about the Fund
You can find additional information about the Fund at https://www.nuveen.com/en-us/mutual-funds/prospectuses, including its:
| | • | | prospectus • financial statements and other information • fund holdings • proxy voting information |
You can also request this information at (800) 257‑8787.
| | |
886315498_AR_0524 3613663-INV-Y-07/25 (A, I, R6, Premier, Retirement) | | |
| | |
| | Annual Shareholder Report May 31, 2024 |
Nuveen Lifecycle Retirement Income Fund
(Formerly known as TIAA-CREF Lifecycle Retirement Income Fund)
Class R6 Shares (Formerly known as Institutional Class Shares)/TLRIX
Annual Shareholder Report
This annual shareholder report contains important information about the Class R6 Shares of the Nuveen Lifecycle Retirement Income Fund for the period of June 1, 2023 to May 31, 2024. You can find additional information at https://www.nuveen.com/en-us/mutual-funds/prospectuses. You can also request this information by contacting us at (800) 257‑8787.
This report describes changes to the Fund that occurred during the reporting period.
What were the Fund costs for the last year? (based on a hypothetical $10,000 investment)(1)
| | | | |
| | | Cost of a $10,000 investment | | Costs paid as a percentage of
$10,000 investment |
| Class R6 Shares | | $28 | | 0.28% |
(1) These costs include the expenses of underlying funds in which the Fund invests except for the expenses of the Nuveen Dividend Growth Fund, Nuveen Dividend Value Fund, Nuveen Growth Opportunities ETF and TIAA-CREF Real Property Fund.
How did the Fund perform last year? What affected the Fund’s performance?
| | |
Performance Highlights • The Nuveen Lifecycle Retirement Income Fund returned 10.45% for Class R6 shares at net asset value (NAV) for the 12 months ended May 31, 2024. The Fund performed in line with the Lifecycle Retirement Income Fund Composite Index, which returned 10.40%. • The Lifecycle Retirement Income Fund Composite Index consisted of: 40.0% Bloomberg U.S. Aggregate Bond Index; 26.0% Russell 3000® Index; 14.0% MSCI All Country World Index ex USA Investable Market Index; 10.0% Bloomberg U.S. 1–3 Year Government/Credit Bond Index; and 10.0% Bloomberg U.S. Treasury Inflation Protected Securities (TIPS) 1‑10 Year Index. • Top contributors to relative performance » Strong overall performance of the underlying funds investing in fixed income and U.S. equities, led by the Nuveen Core Bond Fund and the Nuveen Core Equity Fund. • Top detractors from relative performance » An allocation to the Nuveen Real Property Fund LP. | | Performance Attribution Nuveen Core Bond Fund Nuveen Core Equity Fund Nuveen Real Property Fund LP |
How did the Fund perform over the last 10 years?
Performance data shown represents past performance and does not predict or guarantee future results. The graph and table do not reflect the deduction of taxes that a shareholder would pay on Fund distributions or redemption of Fund Shares.
Fund Performance (June 1, 2014 through May 31, 2024) Initial Investment of $10,000
Average Annual Total Returns
| | | | | | | | | | | | |
| | | 1 year | | | 5 years | | | 10 years | |
| Class R6 Shares at NAV | | | 10.45 | % | | | 5.19 | % | | | 4.78 | % |
Russell 3000® Index | | | 27.58 | % | | | 15.00 | % | | | 12.09 | % |
| Bloomberg U.S. Aggregate Bond Index | | | 1.31 | % | | | (0.17 | )% | | | 1.26 | % |
| Lifecycle Retirement Income Fund Composite Index | | | 10.40 | % | | | 5.46 | % | | | 4.85 | % |
| S&P Target Date Retirement Income Index | | | 8.96 | % | | | 4.26 | % | | | 3.88 | % |
Investment return and principal value will fluctuate, and you may have a gain or loss when you sell your shares. Current performance may differ from figures shown. For most recent month‑end performance, go to https://www.nuveen.com/en-us/mutual-funds/prospectuses or call (800) 257‑8787.
Fund Statistics (as of May 31, 2024)
| | | | |
| Fund net assets | | $ | 418,700,199 | |
| Total number of portfolio holdings | | | 21 | |
| Portfolio turnover (%) | | | 12% | |
| Total advisory fees paid for the year | | $ | 1,684,797 | |
What did the Fund invest in? (as of May 31, 2024)
(1) Affiliated investment companies, except for repurchase agreements.
How has the Fund changed?
| | • | | Name change: Effective May 1, 2024, the Fund’s name changed from TIAA-CREF Lifecycle Retirement Income Fund to Nuveen Lifecycle Retirement Income Fund. | |
| | • | | Share class name change: Effective May 6, 2024, Institutional Class shares of the Fund were renamed Class R6 shares. | |
For more complete information, you may review the Fund’s next prospectus, which is expected to be available by October 1, 2024 at https://www.nuveen.com/en-us/mutual-funds/prospectuses or upon request at (800) 257‑8787.
Availability of additional information about the Fund
You can find additional information about the Fund at https://www.nuveen.com/en-us/mutual-funds/prospectuses, including its:
| | • | | prospectus • financial statements and other information • fund holdings • proxy voting information |
You can also request this information at (800) 257‑8787.
| | |
886315563_AR_0524 3613663-INV-Y-07/25 (A, I, R6, Premier, Retirement) | | |
| | |
| | Annual Shareholder Report May 31, 2024 |
Nuveen Lifecycle Retirement Income Fund
(Formerly known as TIAA-CREF Lifecycle Retirement Income Fund)
Retirement Class Shares/TLIRX
Annual Shareholder Report
This annual shareholder report contains important information about the Retirement Class Shares of the Nuveen Lifecycle Retirement Income Fund for the period of June 1, 2023 to May 31, 2024. You can find additional information at https://www.nuveen.com/en-us/mutual-funds/prospectuses. You can also request this information by contacting us at (800) 257‑8787.
This report describes changes to the Fund that occurred during the reporting period.
What were the Fund costs for the last year? (based on a hypothetical $10,000 investment)(1)
| | | | |
| | | Cost of a $10,000 investment | | Costs paid as a percentage of
$10,000 investment |
| Retirement Class Shares | | $53 | | 0.53% |
(1) These costs include the expenses of underlying funds in which the Fund invests except for the expenses of the Nuveen Dividend Growth Fund, Nuveen Dividend Value Fund, Nuveen Growth Opportunities ETF and TIAA-CREF Real Property Fund.
How did the Fund perform last year? What affected the Fund’s performance?
| | |
Performance Highlights • The Nuveen Lifecycle Retirement Income Fund returned 10.20% for Retirement Class shares at net asset value (NAV) for the 12 months ended May 31, 2024. The Fund performed in line with the Lifecycle Retirement Income Fund Composite Index, which returned 10.40%. • The Lifecycle Retirement Income Fund Composite Index consisted of: 40.0% Bloomberg U.S. Aggregate Bond Index; 26.0% Russell 3000® Index; 14.0% MSCI All Country World Index ex USA Investable Market Index; 10.0% Bloomberg U.S. 1–3 Year Government/Credit Bond Index; and 10.0% Bloomberg U.S. Treasury Inflation Protected Securities (TIPS) 1‑10 Year Index. • Top detractors from relative performance » An allocation to the Nuveen Real Property Fund LP. • Top contributors to relative performance » Strong overall performance of the underlying funds investing in fixed income and U.S. equities, led by the Nuveen Core Bond Fund and the Nuveen Core Equity Fund. | | Performance Attribution Nuveen Real Property Fund LP Nuveen Core Bond Fund Nuveen Core Equity Fund |
Average Annual Total Returns
How did the Fund perform over the last 10 years?
Performance data shown represents past performance and does not predict or guarantee future results. The graph and table do not reflect the deduction of taxes that a shareholder would pay on Fund distributions or redemption of Fund Shares.
Fund Performance (June 1, 2014 through May 31, 2024) Initial Investment of $10,000
Average Annual Total Returns
| | | | | | | | | | | | |
| | | 1 year | | | 5 years | | | 10 years | |
| Retirement Class Shares at NAV | | | 10.20 | % | | | 4.94 | % | | | 4.53 | % |
Russell 3000® Index | | | 27.58 | % | | | 15.00 | % | | | 12.09 | % |
| Bloomberg U.S. Aggregate Bond Index | | | 1.31 | % | | | (0.17 | )% | | | 1.26 | % |
| Lifecycle Retirement Income Fund Composite Index | | | 10.40 | % | | | 5.46 | % | | | 4.85 | % |
| S&P Target Date Retirement Income Index | | | 8.96 | % | | | 4.26 | % | | | 3.88 | % |
Investment return and principal value will fluctuate, and you may have a gain or loss when you sell your shares. Current performance may differ from figures shown. For most recent month‑end performance, go to https://www.nuveen.com/en-us/mutual-funds/prospectuses or call (800) 257‑8787.
Fund Statistics (as of May 31, 2024)
| | | | |
| Fund net assets | | $ | 418,700,199 | |
| Total number of portfolio holdings | | | 21 | |
| Portfolio turnover (%) | | | 12% | |
| Total advisory fees paid for the year | | $ | 1,684,797 | |
What did the Fund invest in? (as of May 31, 2024)
(1) Affiliated investment companies, except for repurchase agreements.
How has the Fund changed?
| | • | | Name change: Effective May 1, 2024, the Fund’s name changed from TIAA-CREF Lifecycle Retirement Income Fund to Nuveen Lifecycle Retirement Income Fund. | |
For more complete information, you may review the Fund’s next prospectus, which is expected to be available by October 1, 2024 at https://www.nuveen.com/en-us/mutual-funds/prospectuses or upon request at (800) 257‑8787.
Availability of additional information about the Fund
You can find additional information about the Fund at https://www.nuveen.com/en-us/mutual-funds/prospectuses, including its:
| | • | | prospectus • financial statements and other information • fund holdings • proxy voting information |
You can also request this information at (800) 257‑8787.
| | |
886315480_AR_0524 3613663-INV-Y-07/25 (A, I, R6, Premier, Retirement) | | |
| | |
| | Annual Shareholder Report May 31, 2024 |
Nuveen Lifecycle Retirement Income Fund
(Formerly known as TIAA-CREF Lifecycle Retirement Income Fund)
Premier Class Shares/TPILX
Annual Shareholder Report
This annual shareholder report contains important information about the Premier Class Shares of the Nuveen Lifecycle Retirement Income Fund for the period of June 1, 2023 to May 31, 2024. You can find additional information at https://www.nuveen.com/en‑us/mutual‑funds/prospectuses. You can also request this information by contacting us at (800) 257‑8787.
This report describes changes to the Fund that occurred during the reporting period.
What were the Fund costs for the last year? (based on a hypothetical $10,000 investment)(1)
| | | | |
| | | Cost of a $10,000 investment | | Costs paid as a percentage of
$10,000 investment |
| Premier Class Shares | | $43 | | 0.43% |
(1) These costs include the expenses of underlying funds in which the Fund invests except for the expenses of the Nuveen Dividend Growth Fund, Nuveen Dividend Value Fund, Nuveen Growth Opportunities ETF and TIAA-CREF Real Property Fund.
How did the Fund perform last year? What affected the Fund’s performance?
| | |
Performance Highlights • The Nuveen Lifecycle Retirement Income Fund returned 10.29% for Premier Class shares at net asset value (NAV) for the 12 months ended May 31, 2024. The Fund performed in line with the Lifecycle Retirement Income Fund Composite Index, which returned 10.40%. • The Lifecycle Retirement Income Fund Composite Index consisted of: 40.0% Bloomberg U.S. Aggregate Bond Index; 26.0% Russell 3000® Index; 14.0% MSCI All Country World Index ex USA Investable Market Index; 10.0% Bloomberg U.S. 1-3 Year Government/Credit Bond Index; and 10.0% Bloomberg U.S. Treasury Inflation Protected Securities (TIPS) 1‑10 Year Index. • Top detractors from relative performance » An allocation to the Nuveen Real Property Fund LP. • Top contributors to relative performance » Strong overall performance of the underlying funds investing in fixed income and U.S. equities, led by the Nuveen Core Bond Fund and the Nuveen Core Equity Fund. | | Performance Attribution Nuveen Real Property Fund LP Nuveen Core Bond Fund Nuveen Core Equity Fund |
How did the Fund perform over the last 10 years?
Performance data shown represents past performance and does not predict or guarantee future results. The graph and table do not reflect the deduction of taxes that a shareholder would pay on Fund distributions or redemption of Fund Shares.
Fund Performance (June 1, 2014 through May 31, 2024) Initial Investment of $10,000
Average Annual Total Returns
| | | | | | | | | | | | |
| | | 1 year | | | 5 years | | | 10 years | |
| Premier Class Shares at NAV | | | 10.29 | % | | | 5.03 | % | | | 4.63 | % |
Russell 3000® Index | | | 27.58 | % | | | 15.00 | % | | | 12.09 | % |
| Bloomberg U.S. Aggregate Bond Index | | | 1.31 | % | | | (0.17 | )% | | | 1.26 | % |
| Lifecycle Retirement Income Fund Composite Index | | | 10.40 | % | | | 5.46 | % | | | 4.85 | % |
| S&P Target Date Retirement Income Index | | | 8.96 | % | | | 4.26 | % | | | 3.88 | % |
Investment return and principal value will fluctuate, and you may have a gain or loss when you sell your shares. Current performance may differ from figures shown. For most recent month‑end performance, go to https://www.nuveen.com/en‑us/mutual‑funds/prospectuses or call (800) 257‑8787.
Fund Statistics (as of May 31, 2024)
| | | | |
| Fund net assets | | $ | 418,700,199 | |
| Total number of portfolio holdings | | | 21 | |
| Portfolio turnover (%) | | | 12% | |
| Total advisory fees paid for the year | | $ | 1,684,797 | |
What did the Fund invest in? (as of May 31, 2024)
(1) Affiliated investment companies, except for repurchase agreements.
How has the Fund changed?
| | • | | Name change: Effective May 1, 2024, the Fund’s name changed from TIAA-CREF Lifecycle Retirement Income Fund to Nuveen Lifecycle Retirement Income Fund. | |
For more complete information, you may review the Fund’s next prospectus, which is expected to be available by October 1, 2024 at https://www.nuveen.com/en‑us/mutual‑funds/prospectuses or upon request at (800) 257‑8787.
Availability of additional information about the Fund
You can find additional information about the Fund at https://www.nuveen.com/en‑us/mutual‑funds/prospectuses, including its:
| | • | | prospectus • financial statements and other information • fund holdings • proxy voting information |
You can also request this information at (800) 257‑8787.
| | |
87245M335_AR_0524 3613663-INV-Y-07/25 (A, I, R6, Premier, Retirement) | | |
| | |
| | Annual Shareholder Report May 31, 2024 |
Nuveen Lifecycle Retirement Income Fund
(Formerly known as TIAA-CREF Lifecycle Retirement Income Fund)
Class I Shares (Formerly known as Advisor Class Shares)/TLRHX
Annual Shareholder Report
This annual shareholder report contains important information about the Class I Shares of the Nuveen Lifecycle Retirement Income Fund for the period of June 1, 2023 to May 31, 2024. You can find additional information at https://www.nuveen.com/en-us/mutual-funds/prospectuses. You can also request this information by contacting us at (800) 257‑8787.
This report describes changes to the Fund that occurred during the reporting period.
What were the Fund costs for the last year? (based on a hypothetical $10,000 investment)(1)
| | | | |
| | | Cost of a $10,000 investment | | Costs paid as a percentage of
$10,000 investment |
| Class I Shares | | $36 | | 0.36% |
(1) These costs include the expenses of underlying funds in which the Fund invests except for the expenses of the Nuveen Dividend Growth Fund, Nuveen Dividend Value Fund, Nuveen Growth Opportunities ETF and TIAA-CREF Real Property Fund.
How did the Fund perform last year? What affected the Fund’s performance?
| | |
Performance Highlights • The Nuveen Lifecycle Retirement Income Fund returned 10.36% for Class I shares at net asset value (NAV) for the 12 months ended May 31, 2024. The Fund performed in line with the Lifecycle Retirement Income Fund Composite Index, which returned 10.40%. • The Lifecycle Retirement Income Fund Composite Index consisted of: 40.0% Bloomberg U.S. Aggregate Bond Index; 26.0% Russell 3000® Index; 14.0% MSCI All Country World Index ex USA Investable Market Index; 10.0% Bloomberg U.S. 1-3 Year Government/Credit Bond Index; and 10.0% Bloomberg U.S. Treasury Inflation Protected Securities (TIPS) 1‑10 Year Index. • Top detractors from relative performance » An allocation to the Nuveen Real Property Fund LP. • Top contributors to relative performance » Strong overall performance of the underlying funds investing in fixed income and U.S. equities, led by the Nuveen Core Bond Fund and the Nuveen Core Equity Fund. | | Performance Attribution Nuveen Real Property Fund LP Nuveen Core Bond Fund Nuveen Core Equity Fund |
Average Annual Total Returns
How did the Fund perform over the period since inception?
Performance data shown represents past performance and does not predict or guarantee future results. The graph and table do not reflect the deduction of taxes that a shareholder would pay on Fund distributions or redemption of Fund Shares.
Fund Performance (December 4, 2015 through May 31, 2024) Initial Investment of $10,000
Average Annual Total Returns
| | | | | | | | | | | | |
| | | 1 year | | | 5 years | | | Since Inception | |
| Class I Shares at NAV | | | 10.36 | % | | | 5.10 | % | | | 5.23 | % |
Russell 3000® Index | | | 27.58 | % | | | 15.00 | % | | | 12.98 | % |
| Bloomberg U.S. Aggregate Bond Index | | | 1.31 | % | | | (0.17 | )% | | | 1.16 | % |
| Lifecycle Retirement Income Fund Composite Index | | | 10.40 | % | | | 5.46 | % | | | 5.40 | % |
| S&P Target Date Retirement Income Index | | | 8.96 | % | | | 4.26 | % | | | 4.32 | % |
Investment return and principal value will fluctuate, and you may have a gain or loss when you sell your shares. Current performance may differ from figures shown. For most recent month‑end performance, go to https://www.nuveen.com/en-us/mutual-funds/prospectuses or call (800) 257‑8787.
Fund Statistics (as of May 31, 2024)
| | | | |
| Fund net assets | | $ | 418,700,199 | |
| Total number of portfolio holdings | | | 21 | |
| Portfolio turnover (%) | | | 12% | |
| Total advisory fees paid for the year | | $ | 1,684,797 | |
What did the Fund invest in? (as of May 31, 2024)
(1) Affiliated investment companies, except for repurchase agreements.
How has the Fund changed?
| | • | | Name change: Effective May 1, 2024, the Fund’s name changed from TIAA-CREF Lifecycle Retirement Income Fund to Nuveen Lifecycle Retirement Income Fund. | |
| | • | | Share class name change: Effective May 6, 2024, Advisor Class shares of the Fund were renamed Class I shares. | |
For more complete information, you may review the Fund’s next prospectus, which is expected to be available by October 1, 2024 at https://www.nuveen.com/en-us/mutual-funds/prospectuses or upon request at (800) 257‑8787.
Availability of additional information about the Fund
You can find additional information about the Fund at https://www.nuveen.com/en-us/mutual-funds/prospectuses, including its:
| | • | | prospectus • financial statements and other information • fund holdings • proxy voting information |
You can also request this information at (800) 257‑8787.
| | |
87245P106_AR_0524 3613663-INV-Y-07/25 | | |
| | |
| | Annual Shareholder Report May 31, 2024 |
Nuveen Lifecycle Index 2010 Fund
(Formerly known as TIAA-CREF Lifecycle Index 2010 Fund)
Class R6 Shares (Formerly known as Institutional Class Shares)/TLTIX
Annual Shareholder Report
This annual shareholder report contains important information about the Class R6 Shares of the Nuveen Lifecycle Index 2010 Fund for the period of June 1, 2023 to May 31, 2024. You can find additional information at https://www.nuveen.com/en‑us/mutual‑funds/prospectuses. You can also request this information by contacting us at (800) 257‑8787.
This report describes changes to the Fund that occurred during the reporting period.
What were the Fund costs for the last year? (based on a hypothetical $10,000 investment)
| | | | |
| | | Cost of a $10,000 investment | | Costs paid as a percentage of
$10,000 investment |
| Class R6 Shares | | $10 | | 0.10% |
How did the Fund perform last year? What affected the Fund’s performance?
| | |
Performance Highlights • The Nuveen Lifecycle Index 2010 Fund returned 9.76% for Class R6 shares at net asset value (NAV) for the 12 months ended May 31, 2024. The Fund performed in line with the Lifecycle Index 2010 Fund Composite Index, which returned 9.74%. • The Lifecycle Index 2010 Fund Composite Index consisted of: 40.0% Bloomberg U.S. Aggregate Bond Index; 23.5% Russell 3000® Index; 12.6% MSCI EAFE + Emerging Markets Index; 13.9% Bloomberg U.S. 1-3 Year Government/Credit Bond Index; and 10.0% Bloomberg U.S. Treasury Inflation Protected Securities (TIPS) 1-10 Year Index. • Top contributors to absolute performance » Underlying equity and fixed income funds advanced for the period. Equity funds, led by the Nuveen Equity Index Fund, recorded the largest gains and contributed most. • Top detractors from absolute performance » Management fees and other expenses incurred by the Fund. | | Fund Performance Equity & Fixed Income Funds Fees/Other Expenses |
How did the Fund perform over the last 10 years?
Performance data shown represents past performance and does not predict or guarantee future results. The graph and table do not reflect the deduction of taxes that a shareholder would pay on Fund distributions or redemption of Fund Shares.
Fund Performance (June 1, 2014 through May 31, 2024) Initial Investment of $10,000
Average Annual Total Returns
| | | | | | | | | | | | |
| | | 1 year | | | 5 years | | | 10 years | |
| Class R6 Shares at NAV | | | 9.76 | % | | | 5.23 | % | | | 4.82 | % |
Russell 3000® Index | | | 27.58 | % | | | 15.00 | % | | | 12.09 | % |
| Bloomberg U.S. Aggregate Bond Index | | | 1.31 | % | | | (0.17 | )% | | | 1.26 | % |
| Lifecycle Index 2010 Fund Composite Index | | | 9.74 | % | | | 5.30 | % | | | 4.90 | % |
| S&P Target Date 2010 Index | | | 9.20 | % | | | 4.91 | % | | | 4.40 | % |
Investment return and principal value will fluctuate, and you may have a gain or loss when you sell your shares. Current performance may differ from figures shown. For most recent month‑end performance, go to https://www.nuveen.com/en-us/mutual-funds/prospectuses or call (800) 257‑8787.
Fund Statistics (as of May 31, 2024)
| | | | |
| Fund net assets | | $ | 629,213,431 | |
| Total number of portfolio holdings | | | 7 | |
| Portfolio turnover (%) | | | 17% | |
| Total advisory fees paid for the year | | $ | 1,073,502 | |
What did the Fund invest in? (as of May 31, 2024)
(1) Affiliated investment companies, except for repurchase agreements.
How has the Fund changed?
| | • | | Name change: Effective May 1, 2024, the Fund’s name changed from TIAA-CREF Lifecycle Index 2010 Fund to Nuveen Lifecycle Index 2010 Fund. | |
| | • | | Share class name change: Effective May 6, 2024, Institutional Class shares of the Fund were renamed Class R6 shares. | |
For more complete information, you may review the Fund’s next prospectus, which is expected to be available by October 1, 2024 at https://www.nuveen.com/en-us/mutual-funds/prospectuses or upon request at (800) 257‑8787.
Availability of additional information about the Fund
You can find additional information about the Fund at https://www.nuveen.com/en-us/mutual-funds/prospectuses, including its:
| | • | | prospectus • financial statements and other information • fund holdings • proxy voting information |
You can also request this information at (800) 257‑8787.
| | |
87245M830_AR_0524 3613794-INV-Y-07/25 (I, R6, Premier, Retirement) | | |
| | |
| | Annual Shareholder Report May 31, 2024 |
Nuveen Lifecycle Index 2010 Fund
(Formerly known as TIAA-CREF Lifecycle Index 2010 Fund)
Premier Class Shares/TLTPX
Annual Shareholder Report
This annual shareholder report contains important information about the Premier Class Shares of the Nuveen Lifecycle Index 2010 Fund for the period of June 1, 2023 to May 31, 2024. You can find additional information at https://www.nuveen.com/en‑us/mutual‑funds/prospectuses. You can also request this information by contacting us at (800) 257‑8787.
This report describes changes to the Fund that occurred during the reporting period.
What were the Fund costs for the last year? (based on a hypothetical $10,000 investment)
| | | | |
| | | Cost of a $10,000 investment | | Costs paid as a percentage of
$10,000 investment |
| Premier Class Shares | | $25 | | 0.25% |
How did the Fund perform last year? What affected the Fund’s performance?
| | |
Performance Highlights • The Nuveen Lifecycle Index 2010 Fund returned 9.57% for Premier Class shares at net asset value (NAV) for the 12 months ended May 31, 2024. The Fund performed in line with the Lifecycle Index 2010 Fund Composite Index, which returned 9.74%. • The Lifecycle Index 2010 Fund Composite Index consisted of: 40.0% Bloomberg U.S. Aggregate Bond Index; 23.5% Russell 3000® Index; 12.6% MSCI EAFE + Emerging Markets Index; 13.9% Bloomberg U.S. 1-3 Year Government/Credit Bond Index; and 10.0% Bloomberg U.S. Treasury Inflation Protected Securities (TIPS) 1-10 Year Index. • Top detractors from absolute performance » Management fees and other expenses incurred by the Fund. • Top contributors to absolute performance » Underlying equity and fixed income funds advanced for the period. Equity funds, led by the Nuveen Equity Index Fund, recorded the largest gains and contributed most. | | Fund Performance Fees/Other Expenses Equity & Fixed Income Funds |
How did the Fund perform over the last 10 years?
Performance data shown represents past performance and does not predict or guarantee future results. The graph and table do not reflect the deduction of taxes that a shareholder would pay on Fund distributions or redemption of Fund Shares.
Fund Performance (June 1, 2014 through May 31, 2024) Initial Investment of $10,000
Average Annual Total Returns
| | | | | | | | | | | | |
| | | 1 year | | | 5 years | | | 10 years | |
| Premier Class Shares at NAV | | | 9.57 | % | | | 5.07 | % | | | 4.66 | % |
Russell 3000® Index | | | 27.58 | % | | | 15.00 | % | | | 12.09 | % |
| Bloomberg U.S. Aggregate Bond Index | | | 1.31 | % | | | (0.17 | )% | | | 1.26 | % |
| Lifecycle Index 2010 Fund Composite Index | | | 9.74 | % | | | 5.30 | % | | | 4.90 | % |
| S&P Target Date 2010 Index | | | 9.20 | % | | | 4.91 | % | | | 4.40 | % |
Investment return and principal value will fluctuate, and you may have a gain or loss when you sell your shares. Current performance may differ from figures shown. For most recent month‑end performance, go to https://www.nuveen.com/en-us/mutual-funds/prospectuses or call (800) 257‑8787.
Fund Statistics (as of May 31, 2024)
| | | | |
| Fund net assets | | $ | 629,213,431 | |
| Total number of portfolio holdings | | | 7 | |
| Portfolio turnover (%) | | | 17% | |
| Total advisory fees paid for the year | | $ | 1,073,502 | |
What did the Fund invest in? (as of May 31, 2024)
(1) Affiliated investment companies, except for repurchase agreements.
How has the Fund changed?
| | • | | Name change: Effective May 1, 2024, the Fund’s name changed from TIAA-CREF Lifecycle Index 2010 Fund to Nuveen Lifecycle Index 2010 Fund. | |
For more complete information, you may review the Fund’s next prospectus, which is expected to be available by October 1, 2024 at https://www.nuveen.com/en-us/mutual-funds/prospectuses or upon request at (800) 257‑8787.
Availability of additional information about the Fund
You can find additional information about the Fund at https://www.nuveen.com/en-us/mutual-funds/prospectuses, including its:
| | • | | prospectus • financial statements and other information • fund holdings • proxy voting information |
You can also request this information at (800) 257‑8787.
| | |
87245M723_AR_0524 3613794-INV-Y-07/25 (I, R6, Premier, Retirement) | | |
| | |
| | Annual Shareholder Report May 31, 2024 |
Nuveen Lifecycle Index 2010 Fund
(Formerly known as TIAA-CREF Lifecycle Index 2010 Fund)
Retirement Class Shares/TLTRX
Annual Shareholder Report
This annual shareholder report contains important information about the Retirement Class Shares of the Nuveen Lifecycle Index 2010 Fund for the period of June 1, 2023 to May 31, 2024. You can find additional information at https://www.nuveen.com/en-us/mutual-funds/prospectuses. You can also request this information by contacting us at (800) 257‑8787.
This report describes changes to the Fund that occurred during the reporting period.
What were the Fund costs for the last year? (based on a hypothetical $10,000 investment)
| | | | |
| | | Cost of a $10,000 investment | | Costs paid as a percentage of
$10,000 investment |
Retirement Class Shares | | $35 | | 0.35% |
How did the Fund perform last year? What affected the Fund’s performance?
| | |
Performance Highlights • The Nuveen Lifecycle Index 2010 Fund returned 9.44% for Retirement Class shares at net asset value (NAV) for the 12 months ended May 31, 2024. The Fund underperformed the Lifecycle Index 2010 Fund Composite Index, which returned 9.74%. • The Lifecycle Index 2010 Fund Composite Index consisted of: 40.0% Bloomberg U.S. Aggregate Bond Index; 23.5% Russell 3000® Index; 12.6% MSCI EAFE + Emerging Markets Index; 13.9% Bloomberg U.S. 1-3 Year Government/Credit Bond Index; and 10.0% Bloomberg U.S. Treasury Inflation Protected Securities (TIPS) 1-10 Year Index. • Top detractors from absolute performance » Management fees and other expenses incurred by the Fund. • Top contributors to absolute performance » Underlying equity and fixed income funds advanced for the period. Equity funds, led by the Nuveen Equity Index Fund, recorded the largest gains and contributed most. | | Fund Performance Fees/Other Expenses Equity & Fixed Income Funds |
How did the Fund perform over the last 10 years?
Performance data shown represents past performance and does not predict or guarantee future results. The graph and table do not reflect the deduction of taxes that a shareholder would pay on Fund distributions or redemption of Fund Shares.
Fund Performance (June 1, 2014 through May 31, 2024) Initial Investment of $10,000
Average Annual Total Returns
| | | | | | | | | | | | |
| | | 1 year | | | 5 years | | | 10 years | |
| Retirement Class Shares at NAV | | | 9.44 | % | | | 4.97 | % | | | 4.55 | % |
Russell 3000® Index | | | 27.58 | % | | | 15.00 | % | | | 12.09 | % |
| Bloomberg U.S. Aggregate Bond Index | | | 1.31 | % | | | (0.17 | )% | | | 1.26 | % |
| Lifecycle Index 2010 Fund Composite Index | | | 9.74 | % | | | 5.30 | % | | | 4.90 | % |
| S&P Target Date 2010 Index | | | 9.20 | % | | | 4.91 | % | | | 4.40 | % |
Investment return and principal value will fluctuate, and you may have a gain or loss when you sell your shares. Current performance may differ from figures shown. For most recent month‑end performance, go to https://www.nuveen.com/en-us/mutual-funds/prospectuses or call (800) 257‑8787.
Fund Statistics (as of May 31, 2024)
| | | | |
| Fund net assets | | $ | 629,213,431 | |
| Total number of portfolio holdings | | | 7 | |
| Portfolio turnover (%) | | | 17% | |
| Total advisory fees paid for the year | | $ | 1,073,502 | |
What did the Fund invest in? (as of May 31, 2024)
(1) Affiliated investment companies, except for repurchase agreements.
How has the Fund changed?
| | • | | Name change: Effective May 1, 2024, the Fund’s name changed from TIAA-CREF Lifecycle Index 2010 Fund to Nuveen Lifecycle Index 2010 Fund. | |
For more complete information, you may review the Fund’s next prospectus, which is expected to be available by October 1, 2024 at https://www.nuveen.com/en-us/mutual-funds/prospectuses or upon request at (800) 257‑8787.
Availability of additional information about the Fund
You can find additional information about the Fund at https://www.nuveen.com/en-us/mutual-funds/prospectuses, including its:
| | • | | prospectus • financial statements and other information • fund holdings • proxy voting information |
You can also request this information at (800) 257‑8787.
| | |
87245M202_AR_0524 3613794-INV-Y-07/25 (I, R6, Premier, Retirement) | | |
| | |
| | Annual Shareholder Report May 31, 2024 |
Nuveen Lifecycle Index 2010 Fund
(Formerly known as TIAA-CREF Lifecycle Index 2010 Fund)
Class I Shares (Formerly known as Advisor Class Shares)/TLTHX
Annual Shareholder Report
This annual shareholder report contains important information about the Class I Shares of the Nuveen Lifecycle Index 2010 Fund for the period of June 1, 2023 to May 31, 2024. You can find additional information at https://www.nuveen.com/en‑us/mutual‑funds/prospectuses. You can also request this information by contacting us at (800) 257‑8787.
This report describes changes to the Fund that occurred during the reporting period.
What were the Fund costs for the last year? (based on a hypothetical $10,000 investment)
| | | | |
| | | Cost of a $10,000 investment | | Costs paid as a percentage of
$10,000 investment |
| Class I Shares | | $20 | | 0.20% |
How did the Fund perform last year? What affected the Fund’s performance?
| | |
Performance Highlights • The Nuveen Lifecycle Index 2010 Fund returned 9.63% for Class I shares at net asset value (NAV) for the 12 months ended May 31, 2024. The Fund performed in line with the Lifecycle Index 2010 Fund Composite Index, which returned 9.74%. • The Lifecycle Index 2010 Fund Composite Index consisted of: 40.0% Bloomberg U.S. Aggregate Bond Index; 23.5% Russell 3000® Index; 12.6% MSCI EAFE + Emerging Markets Index; 13.9% Bloomberg U.S. 1-3 Year Government/Credit Bond Index; and 10.0% Bloomberg U.S. Treasury Inflation Protected Securities (TIPS) 1-10 Year Index. • Top detractors from absolute performance » Management fees and other expenses incurred by the Fund. • Top contributors to absolute performance » Underlying equity and fixed income funds advanced for the period. Equity funds, led by the Nuveen Equity Index Fund, recorded the largest gains and contributed most. | | Fund Performance Fees/Other Expenses Equity & Fixed Income Funds |
How did the Fund perform over the period since inception?
Performance data shown represents past performance and does not predict or guarantee future results. The graph and table do not reflect the deduction of taxes that a shareholder would pay on Fund distributions or redemption of Fund Shares.
Fund Performance (December 4, 2015 through May 31, 2024) Initial Investment of $10,000
Average Annual Total Returns
| | | | | | | | | | | | |
| | | 1 year | | | 5 years | | | Since Inception | |
| Class I Shares at NAV | | | 9.63 | % | | | 5.16 | % | | | 5.25 | % |
Russell 3000® Index | | | 27.58 | % | | | 15.00 | % | | | 12.98 | % |
| Bloomberg U.S. Aggregate Bond Index | | | 1.31 | % | | | (0.17 | )% | | | 1.16 | % |
| Lifecycle Index 2010 Fund Composite Index | | | 9.74 | % | | | 5.30 | % | | | 5.40 | % |
| S&P Target Date 2010 Index | | | 9.20 | % | | | 4.91 | % | | | 4.90 | % |
Investment return and principal value will fluctuate, and you may have a gain or loss when you sell your shares. Current performance may differ from figures shown. For most recent month‑end performance, go to https://www.nuveen.com/en‑us/mutual‑funds/prospectuses or call (800) 257‑8787.
Fund Statistics (as of May 31, 2024)
| | | | |
| Fund net assets | | $ | 629,213,431 | |
| Total number of portfolio holdings | | | 7 | |
| Portfolio turnover (%) | | | 17% | |
| Total advisory fees paid for the year | | $ | 1,073,502 | |
What did the Fund invest in? (as of May 31, 2024)
(1) Affiliated investment companies, except for repurchase agreements.
How has the Fund changed?
| | • | | Name change: Effective May 1, 2024, the Fund’s name changed from TIAA-CREF Lifecycle Index 2010 Fund to Nuveen Lifecycle Index 2010 Fund. | |
| | • | | Share class name change: Effective May 6, 2024, Advisor Class shares of the Fund were renamed Class I shares. | |
For more complete information, you may review the Fund’s next prospectus, which is expected to be available by October 1, 2024 at https://www.nuveen.com/en‑us/mutual‑funds/prospectuses or upon request at (800) 257‑8787.
Availability of additional information about the Fund
You can find additional information about the Fund at https://www.nuveen.com/en‑us/mutual‑funds/prospectuses, including its:
| | • | | prospectus • financial statements and other information • fund holdings • proxy voting information |
You can also request this information at (800) 257‑8787.
| | |
87245P833_AR_0524 3613794-INV-Y-07/25 (I, R6, Premier, Retirement) | | |
| | |
| | Annual Shareholder Report May 31, 2024 |
Nuveen Lifecycle Index Retirement Income Fund
(Formerly known as TIAA-CREF Lifecycle Index Retirement Income Fund)
Class R6 Shares (Formerly known as Institutional Class Shares)/TRILX
Annual Shareholder Report
This annual shareholder report contains important information about the Class R6 Shares of the Nuveen Lifecycle Index Retirement Income Fund for the period of June 1, 2023 to May 31, 2024. You can find additional information at https://www.nuveen.com/en-us/mutual-funds/prospectuses. You can also request this information by contacting us at (800) 257‑8787.
This report describes changes to the Fund that occurred during the reporting period.
What were the Fund costs for the last year? (based on a hypothetical $10,000 investment)
| | | | |
| | | Cost of a $10,000 investment | | Costs paid as a percentage of
$10,000 investment |
| Class R6 Shares | | $10 | | 0.10% |
How did the Fund perform last year? What affected the Fund’s performance?
| | |
Performance Highlights • The Nuveen Lifecycle Index Retirement Income Fund returned 10.43% for Class R6 shares at net asset value (NAV) for the 12 months ended May 31, 2024. The Fund performed in line with the Lifecycle Index Retirement Income Fund Composite Index, which returned 10.39%. • The Lifecycle Index Retirement Income Fund Composite Index consisted of: 40.0% Bloomberg U.S. Aggregate Bond Index; 26.0% Russell 3000® Index; 14.0% MSCI EAFE + Emerging Markets Index; 10.0% Bloomberg U.S. 1–3 Year Government/Credit Bond Index; and 10.0% Bloomberg U.S. Treasury Inflation Protected Securities (TIPS) 1‑10 Year Index. • Top contributors to absolute performance » Underlying equity and fixed income funds advanced for the period. Equity funds, led by the Nuveen Equity Index Fund, recorded the largest gains and contributed most. • Top detractors from absolute performance » Management fees and other expenses incurred by the Fund. | | Fund Performance Equity & Fixed Income Funds Fees/Other Expenses |
How did the Fund perform over the last 10 years?
Performance data shown represents past performance and does not predict or guarantee future results. The graph and table do not reflect the deduction of taxes that a shareholder would pay on Fund distributions or redemption of Fund Shares.
Fund Performance (June 1, 2014 through May 31, 2024) Initial Investment of $10,000
Average Annual Total Returns
| | | | | | | | | | | | |
| | | 1 year | | | 5 years | | | 10 years | |
| Class R6 Shares at NAV | | | 10.43 | % | | | 5.36 | % | | | 4.80 | % |
Russell 3000® Index | | | 27.58 | % | | | 15.00 | % | | | 12.09 | % |
| Bloomberg U.S. Aggregate Bond Index | | | 1.31 | % | | | (0.17 | )% | | | 1.26 | % |
| Lifecycle Index Retirement Income Fund Composite Index | | | 10.39 | % | | | 5.43 | % | | | 4.86 | % |
| S&P Target Date Retirement Income Index | | | 8.96 | % | | | 4.26 | % | | | 3.88 | % |
Investment return and principal value will fluctuate, and you may have a gain or loss when you sell your shares. Current performance may differ from figures shown. For most recent month‑end performance, go to https://www.nuveen.com/en-us/mutual-funds/prospectuses or call (800) 257‑8787.
Fund Statistics (as of May 31, 2024)
| | | | |
| Fund net assets | | $ | 705,007,300 | |
| Total number of portfolio holdings | | | 7 | |
| Portfolio turnover (%) | | | 19% | |
| Total advisory fees paid for the year | | $ | 1,144,176 | |
What did the Fund invest in? (as of May 31, 2024)
(1) Affiliated investment companies, except for repurchase agreements.
How has the Fund changed?
| | • | | Name change: Effective May 1, 2024, the Fund’s name changed from TIAA-CREF Lifecycle Index Retirement Income Fund to Nuveen Lifecycle Index Retirement Income Fund. | |
| | • | | Share class name change: Effective May 6, 2024, Institutional Class shares of the Fund were renamed Class R6 shares. | |
For more complete information, you may review the Fund’s next prospectus, which is expected to be available by October 1, 2024 at https://www.nuveen.com/en-us/mutual-funds/prospectuses or upon request at (800) 257‑8787.
Availability of additional information about the Fund
You can find additional information about the Fund at https://www.nuveen.com/en-us/mutual-funds/prospectuses, including its:
| | • | | prospectus • financial statements and other information • fund holdings • proxy voting information |
You can also request this information at (800) 257‑8787.
| | |
87245M731_AR_0524 3613785-INV-Y-07/25 (I, R6, Premier, Retirement) | | |
| | |
| | Annual Shareholder Report May 31, 2024 |
Nuveen Lifecycle Index Retirement Income Fund
(Formerly known as TIAA-CREF Lifecycle Index Retirement Income Fund)
Premier Class Shares/TLIPX
Annual Shareholder Report
This annual shareholder report contains important information about the Premier Class Shares of the Nuveen Lifecycle Index Retirement Income Fund for the period of June 1, 2023 to May 31, 2024. You can find additional information at https://www.nuveen.com/en‑us/mutual‑funds/prospectuses. You can also request this information by contacting us at (800) 257‑8787.
This report describes changes to the Fund that occurred during the reporting period.
What were the Fund costs for the last year? (based on a hypothetical $10,000 investment)
| | | | |
| | | Cost of a $10,000 investment | | Costs paid as a percentage of
$10,000 investment |
| Premier Class Shares | | $25 | | 0.25% |
How did the Fund perform last year? What affected the Fund’s performance?
| | |
Performance Highlights • The Nuveen Lifecycle Index Retirement Income Fund returned 10.20% for Premier Class shares at net asset value (NAV) for the 12 months ended May 31, 2024. The Fund performed in line with the Lifecycle Index Retirement Income Fund Composite Index, which returned 10.39%. • The Lifecycle Index Retirement Income Fund Composite Index consisted of: 40.0% Bloomberg U.S. Aggregate Bond Index; 26.0% Russell 3000® Index; 14.0% MSCI EAFE + Emerging Markets Index; 10.0% Bloomberg U.S. 1 - 3 Year Government/Credit Bond Index; and 10.0% Bloomberg U.S. Treasury Inflation Protected Securities (TIPS) 1-10 Year Index. • Top detractors from absolute performance » Management fees and other expenses incurred by the Fund. • Top contributors to absolute performance » Underlying equity and fixed income funds advanced for the period. Equity funds, led by the Nuveen Equity Index Fund, recorded the largest gains and contributed most. | | Fund Performance Fees/Other Expenses Equity & Fixed Income Funds |
How did the Fund perform over the last 10 years?
Performance data shown represents past performance and does not predict or guarantee future results. The graph and table do not reflect the deduction of taxes that a shareholder would pay on Fund distributions or redemption of Fund Shares.
Fund Performance (June 1, 2014 through May 31, 2024) Initial Investment of $10,000
Average Annual Total Returns
| | | | | | | | | | | | |
| | | 1 year | | | 5 years | | | 10 years | |
| Premier Class Shares at NAV | | | 10.20 | % | | | 5.21 | % | | | 4.64 | % |
Russell 3000® Index | | | 27.58 | % | | | 15.00 | % | | | 12.09 | % |
| Bloomberg U.S. Aggregate Bond Index | | | 1.31 | % | | | (0.17 | )% | | | 1.26 | % |
| Lifecycle Index Retirement Income Fund Composite Index | | | 10.39 | % | | | 5.43 | % | | | 4.86 | % |
| S&P Target Date Retirement Income Index | | | 8.96 | % | | | 4.26 | % | | | 3.88 | % |
Investment return and principal value will fluctuate, and you may have a gain or loss when you sell your shares. Current performance may differ from figures shown. For most recent month‑end performance, go to https://www.nuveen.com/en‑us/mutual‑funds/prospectuses or call (800) 257‑8787.
Fund Statistics (as of May 31, 2024)
| | | | |
| Fund net assets | | $ | 705,007,300 | |
| Total number of portfolio holdings | | | 7 | |
| Portfolio turnover (%) | | | 19% | |
| Total advisory fees paid for the year | | $ | 1,144,176 | |
What did the Fund invest in? (as of May 31, 2024)
(1) Affiliated investment companies, except for repurchase agreements.
How has the Fund changed?
| | • | | Name change: Effective May 1, 2024, the Fund’s name changed from TIAA-CREF Lifecycle Index Retirement Income Fund to Nuveen Lifecycle Index Retirement Income Fund. | |
For more complete information, you may review the Fund’s next prospectus, which is expected to be available by October 1, 2024 at https://www.nuveen.com/en‑us/mutual‑funds/prospectuses or upon request at (800) 257‑8787.
Availability of additional information about the Fund
You can find additional information about the Fund at https://www.nuveen.com/en‑us/mutual‑funds/prospectuses, including its:
| | • | | prospectus • financial statements and other information • fund holdings • proxy voting information |
You can also request this information at (800) 257‑8787.
| | |
87245M624_AR_0524 3613785-INV-Y-07/25 (I, R6, Premier, Retirement) | | |
| | |
| | Annual Shareholder Report May 31, 2024 |
Nuveen Lifecycle Index Retirement Income Fund
(Formerly known as TIAA-CREF Lifecycle Index Retirement Income Fund)
Retirement Class Shares/TRCIX
Annual Shareholder Report
This annual shareholder report contains important information about the Retirement Class Shares of the Nuveen Lifecycle Index Retirement Income Fund for the period of June 1, 2023 to May 31, 2024. You can find additional information at https://www.nuveen.com/en‑us/mutual‑funds/prospectuses. You can also request this information by contacting us at (800) 257‑8787.
This report describes changes to the Fund that occurred during the reporting period.
What were the Fund costs for the last year? (based on a hypothetical $10,000 investment)
| | | | |
| | | Cost of a $10,000 investment | | Costs paid as a percentage of
$10,000 investment |
| Retirement Class Shares | | $35 | | 0.35% |
How did the Fund perform last year? What affected the Fund’s performance?
| | |
Performance Highlights • The Nuveen Lifecycle Index Retirement Income Fund returned 10.11% for Retirement Class shares at net asset value (NAV) for the 12 months ended May 31, 2024. The Fund underperformed the Lifecycle Index Retirement Income Fund Composite Index, which returned 10.39%. • The Lifecycle Index Retirement Income Fund Composite Index consisted of: 40.0% Bloomberg U.S. Aggregate Bond Index; 26.0% Russell 3000® Index; 14.0% MSCI EAFE + Emerging Markets Index; 10.0% Bloomberg U.S. 1-3 Year Government/Credit Bond Index; and 10.0% Bloomberg U.S. Treasury Inflation Protected Securities (TIPS) 1-10 Year Index. • Top detractors from absolute performance » Management fees and other expenses incurred by the Fund. • Top contributors to absolute performance » Underlying equity and fixed income funds advanced for the period. Equity funds, led by the Nuveen Equity Index Fund, recorded the largest gains and contributed most. | | Fund Performance Fees/Other Expenses Equity & Fixed Income Funds |
How did the Fund perform over the last 10 years?
Performance data shown represents past performance and does not predict or guarantee future results. The graph and table do not reflect the deduction of taxes that a shareholder would pay on Fund distributions or redemption of Fund Shares.
Fund Performance (June 1, 2014 through May 31, 2024) Initial Investment of $10,000
Average Annual Total Returns
| | | | | | | | | | | | |
| | | 1 year | | | 5 years | | | 10 years | |
| Retirement Class Shares at NAV | | | 10.11 | % | | | 5.10 | % | | | 4.54 | % |
Russell 3000® Index | | | 27.58 | % | | | 15.00 | % | | | 12.09 | % |
| Bloomberg U.S. Aggregate Bond Index | | | 1.31 | % | | | (0.17 | )% | | | 1.26 | % |
| Lifecycle Index Retirement Income Fund Composite Index | | | 10.39 | % | | | 5.43 | % | | | 4.86 | % |
| S&P Target Date Retirement Income Index | | | 8.96 | % | | | 4.26 | % | | | 3.88 | % |
Investment return and principal value will fluctuate, and you may have a gain or loss when you sell your shares. Current performance may differ from figures shown. For most recent month‑end performance, go to https://www.nuveen.com/en‑us/mutual‑funds/prospectuses or call (800) 257‑8787.
Fund Statistics (as of May 31, 2024)
| | | | |
| Fund net assets | | $ | 705,007,300 | |
| Total number of portfolio holdings | | | 7 | |
| Portfolio turnover (%) | | | 19% | |
| Total advisory fees paid for the year | | $ | 1,144,176 | |
What did the Fund invest in? (as of May 31, 2024)
(1) Affiliated investment companies, except for repurchase agreements.
How has the Fund changed?
| | • | | Name change: Effective May 1, 2024, the Fund’s name changed from TIAA-CREF Lifecycle Index Retirement Income Fund to Nuveen Lifecycle Index Retirement Income Fund. | |
For more complete information, you may review the Fund’s next prospectus, which is expected to be available by October 1, 2024 at https://www.nuveen.com/en‑us/mutual‑funds/prospectuses or upon request at (800) 257‑8787.
Availability of additional information about the Fund
You can find additional information about the Fund at https://www.nuveen.com/en‑us/mutual‑funds/prospectuses, including its:
| | • | | prospectus • financial statements and other information • fund holdings • proxy voting information |
You can also request this information at (800) 257‑8787.
| | |
87245M889_AR_0524 3613785-INV-Y-07/25 (I, R6, Premier, Retirement) | | |
| | |
| | Annual Shareholder Report May 31, 2024 |
Nuveen Lifecycle Index Retirement Income Fund
(Formerly known as TIAA-CREF Lifecycle Index Retirement Income Fund)
Class I Shares (Formerly known as Advisor Class Shares)/TLIHX
Annual Shareholder Report
This annual shareholder report contains important information about the Class I Shares of the Nuveen Lifecycle Index Retirement Income Fund for the period of June 1, 2023 to May 31, 2024. You can find additional information at https://www.nuveen.com/en‑us/mutual‑funds/prospectuses. You can also request this information by contacting us at (800) 257‑8787.
This report describes changes to the Fund that occurred during the reporting period.
What were the Fund costs for the last year? (based on a hypothetical $10,000 investment)
| | | | |
| | | Cost of a $10,000 investment | | Costs paid as a percentage of
$10,000 investment |
| Class I Shares | | $20 | | 0.20% |
How did the Fund perform last year? What affected the Fund’s performance?
| | |
Performance Highlights • The Nuveen Lifecycle Index Retirement Income Fund returned 10.27% for Class I shares at net asset value (NAV) for the 12 months ended May 31, 2024. The Fund performed in line with the Lifecycle Index Retirement Income Fund Composite Index, which returned 10.39%. • The Lifecycle Index Retirement Income Fund Composite Index consisted of: 40.0% Bloomberg U.S. Aggregate Bond Index; 26.0% Russell 3000® Index; 14.0% MSCI EAFE + Emerging Markets Index; 10.0% Bloomberg U.S. 1–3 Year Government/Credit Bond Index; and 10.0% Bloomberg U.S. Treasury Inflation Protected Securities (TIPS) 1‑10 Year Index. • Top detractors from absolute performance » Management fees and other expenses incurred by the Fund. • Top contributors to absolute performance » Underlying equity and fixed income funds advanced for the period. Equity funds, led by the Nuveen Equity Index Fund, recorded the largest gains and contributed most. | | Fund Performance Fees/Other Expenses Equity & Fixed Income Funds |
How did the Fund perform over the period since inception?
Performance data shown represents past performance and does not predict or guarantee future results. The graph and table do not reflect the deduction of taxes that a shareholder would pay on Fund distributions or redemption of Fund Shares.
Fund Performance (December 4, 2015 through May 31, 2024) Initial Investment of $10,000
Average Annual Total Returns
| | | | | | | | | | | | |
| | | 1 year | | | 5 years | | | Since Inception | |
| Class I Shares at NAV | | | 10.27 | % | | | 5.25 | % | | | 5.23 | % |
Russell 3000® Index | | | 27.58 | % | | | 15.00 | % | | | 12.98 | % |
| Bloomberg U.S. Aggregate Bond Index | | | 1.31 | % | | | (0.17 | )% | | | 1.16 | % |
| Lifecycle Index Retirement Income Fund Composite Index | | | 10.39 | % | | | 5.43 | % | | | 5.39 | % |
| S&P Target Date Retirement Income Index | | | 8.96 | % | | | 4.26 | % | | | 4.32 | % |
Investment return and principal value will fluctuate, and you may have a gain or loss when you sell your shares. Current performance may differ from figures shown. For most recent month‑end performance, go to https://www.nuveen.com/en‑us/mutual‑funds/prospectuses or call (800) 257‑8787.
Fund Statistics (as of May 31, 2024)
| | | | |
| Fund net assets | | $ | 705,007,300 | |
| Total number of portfolio holdings | | | 7 | |
| Portfolio turnover (%) | | | 19% | |
| Total advisory fees paid for the year | | $ | 1,144,176 | |
What did the Fund invest in? (as of May 31, 2024)
(1) Affiliated investment companies, except for repurchase agreements.
How has the Fund changed?
| | • | | Name change: Effective May 1, 2024, the Fund’s name changed from TIAA-CREF Lifecycle Index Retirement Income Fund to Nuveen Lifecycle Index Retirement Income Fund. | |
| | • | | Share class name change: Effective May 6, 2024, Advisor Class shares of the Fund were renamed Class I shares. | |
For more complete information, you may review the Fund’s next prospectus, which is expected to be available by October 1, 2024 at https://www.nuveen.com/en‑us/mutual‑funds/prospectuses or upon request at (800) 257‑8787.
Availability of additional information about the Fund
You can find additional information about the Fund at https://www.nuveen.com/en‑us/mutual‑funds/prospectuses, including its:
| | • | | prospectus • financial statements and other information • fund holdings • proxy voting information |
You can also request this information at (800) 257‑8787.
| | |
87245P841_AR_0524 3613785-INV-Y-07/25 (I, R6, Premier, Retirement) | | |
| | |
| | Annual Shareholder Report May 31, 2024 |
Nuveen Lifecycle Index 2015 Fund
(Formerly known as TIAA-CREF Lifecycle Index 2015 Fund)
Class R6 Shares (Formerly known as Institutional Class Shares)/TLFIX
Annual Shareholder Report
This annual shareholder report contains important information about the Class R6 Shares of the Nuveen Lifecycle Index 2015 Fund for the period of June 1, 2023 to May 31, 2024. You can find additional information at https://www.nuveen.com/en-us/mutual-funds/prospectuses. You can also request this information by contacting us at (800) 257‑8787.
This report describes changes to the Fund that occurred during the reporting period.
What were the Fund costs for the last year? (based on a hypothetical $10,000 investment)
| | | | |
| | | Cost of a $10,000 investment | | Costs paid as a percentage of
$10,000 investment |
| Class R6 Shares | | $10 | | 0.10% |
How did the Fund perform last year? What affected the Fund’s performance?
| | |
Performance Highlights • The Nuveen Lifecycle Index 2015 Fund returned 10.75% for Class R6 shares at net asset value (NAV) for the 12 months ended May 31, 2024. The Fund performed in line with the Lifecycle Index 2015 Fund Composite Index, which returned 10.73%. • The Lifecycle Index 2015 Fund Composite Index consisted of: 39.8% Bloomberg U.S. Aggregate Bond Index; 26.6% Russell 3000® Index; 14.4% MSCI EAFE + Emerging Markets Index; 9.6% Bloomberg U.S. 1–3 Year Government/Credit Bond Index; and 9.6% Bloomberg U.S. Treasury Inflation Protected Securities (TIPS) 1‑10 Year Index. • Top contributors to absolute performance » Underlying equity and fixed income funds advanced for the period. Equity funds, led by the Nuveen Equity Index Fund, recorded the largest gains and contributed most. • Top detractors from absolute performance » Management fees and other expenses incurred by the Fund. | | Fund Performance Equity & Fixed Income Funds Fees/Other Expenses |
How did the Fund perform over the last 10 years?
Performance data shown represents past performance and does not predict or guarantee future results. The graph and table do not reflect the deduction of taxes that a shareholder would pay on Fund distributions or redemption of Fund Shares.
Fund Performance (June 1, 2014 through May 31, 2024) Initial Investment of $10,000
Average Annual Total Returns
| | | | | | | | | | | | |
| | | 1 year | | | 5 years | | | 10 years | |
| Class R6 Shares at NAV | | | 10.75 | % | | | 5.76 | % | | | 5.23 | % |
Russell 3000® Index | | | 27.58 | % | | | 15.00 | % | | | 12.09 | % |
| Bloomberg U.S. Aggregate Bond Index | | | 1.31 | % | | | (0.17 | )% | | | 1.26 | % |
| Lifecycle Index 2015 Fund Composite Index | | | 10.73 | % | | | 5.82 | % | | | 5.29 | % |
| S&P Target Date 2015 Index | | | 9.99 | % | | | 5.38 | % | | | 4.85 | % |
Investment return and principal value will fluctuate, and you may have a gain or loss when you sell your shares. Current performance may differ from figures shown. For most recent month‑end performance, go to https://www.nuveen.com/en-us/mutual-funds/prospectuses or call (800) 257‑8787.
Fund Statistics (as of May 31, 2024)
| | | | |
| Fund net assets | | $ | 1,047,344,707 | |
| Total number of portfolio holdings | | | 7 | |
| Portfolio turnover (%) | | | 15% | |
| Total advisory fees paid for the year | | $ | 1,780,610 | |
What did the Fund invest in? (as of May 31, 2024)
(1) Affiliated investment companies, except for repurchase agreements.
How has the Fund changed?
| | • | | Name change: Effective May 1, 2024, the Fund’s name changed from TIAA-CREF Lifecycle Index 2015 Fund to Nuveen Lifecycle Index 2015 Fund. | |
| | • | | Share class name change: Effective May 6, 2024, Institutional Class shares of the Fund were renamed Class R6 shares. | |
For more complete information, you may review the Fund’s next prospectus, which is expected to be available by October 1, 2024 at https://www.nuveen.com/en-us/mutual-funds/prospectuses or upon request at (800) 257‑8787.
Availability of additional information about the Fund
You can find additional information about the Fund at https://www.nuveen.com/en-us/mutual-funds/prospectuses, including its:
| | • | | prospectus • financial statements and other information • fund holdings • proxy voting information |
You can also request this information at (800) 257‑8787.
| | |
87245M822_AR_0524 3613801-INV-Y-07/25 (I, R6, Premier, Retirement) | | |
| | |
| | Annual Shareholder Report May 31, 2024 |
Nuveen Lifecycle Index 2015 Fund
(Formerly known as TIAA-CREF Lifecycle Index 2015 Fund)
Premier Class Shares/TLFPX
Annual Shareholder Report
This annual shareholder report contains important information about the Premier Class Shares of the Nuveen Lifecycle Index 2015 Fund for the period of June 1, 2023 to May 31, 2024. You can find additional information at https://www.nuveen.com/en-us/mutual-funds/prospectuses. You can also request this information by contacting us at (800) 257‑8787.
This report describes changes to the Fund that occurred during the reporting period.
What were the Fund costs for the last year? (based on a hypothetical $10,000 investment)
| | | | |
| | | Cost of a $10,000 investment | | Costs paid as a percentage of $10,000 investment |
| Premier Class Shares | | $25 | | 0.25% |
How did the Fund perform last year? What affected the Fund’s performance?
| | |
Performance Highlights • The Nuveen Lifecycle Index 2015 Fund returned 10.57% for Premier Class shares at net asset value (NAV) for the 12 months ended May 31, 2024. The Fund performed in line with the Lifecycle Index 2015 Fund Composite Index, which returned 10.73%. • The Lifecycle Index 2015 Fund Composite Index consisted of: 39.8% Bloomberg U.S. Aggregate Bond Index; 26.6% Russell 3000® Index; 14.4% MSCI EAFE + Emerging Markets Index; 9.6% Bloomberg U.S. 1–3 Year Government/Credit Bond Index; and 9.6% Bloomberg U.S. Treasury Inflation Protected Securities (TIPS) 1‑10 Year Index. • Top detractors from absolute performance » Management fees and other expenses incurred by the Fund. • Top contributors to absolute performance » Underlying equity and fixed income funds advanced for the period. Equity funds, led by the Nuveen Equity Index Fund, recorded the largest gains and contributed most. | | Fund Performance Fees/Other Expenses Equity & Fixed Income Funds |
How did the Fund perform over the last 10 years?
Performance data shown represents past performance and does not predict or guarantee future results. The graph and table do not reflect the deduction of taxes that a shareholder would pay on Fund distributions or redemption of Fund Shares.
Fund Performance (June 1, 2014 through May 31, 2024) Initial Investment of $10,000
Average Annual Total Returns
| | | | | | | | | | | | |
| | | 1 year | | | 5 years | | | 10 years | |
| Premier Class Shares at NAV | | | 10.57 | % | | | 5.60 | % | | | 5.06 | % |
Russell 3000® Index | | | 27.58 | % | | | 15.00 | % | | | 12.09 | % |
| Bloomberg U.S. Aggregate Bond Index | | | 1.31 | % | | | (0.17 | )% | | | 1.26 | % |
| Lifecycle Index 2015 Fund Composite Index | | | 10.73 | % | | | 5.82 | % | | | 5.29 | % |
| S&P Target Date 2015 Index | | | 9.99 | % | | | 5.38 | % | | | 4.85 | % |
Investment return and principal value will fluctuate, and you may have a gain or loss when you sell your shares. Current performance may differ from figures shown. For most recent month‑end performance, go to https://www.nuveen.com/en-us/mutual-funds/prospectuses or call (800) 257‑8787.
Fund Statistics (as of May 31, 2024)
| | | | |
| Fund net assets | | $ | 1,047,344,707 | |
| Total number of portfolio holdings | | | 7 | |
| Portfolio turnover (%) | | | 15% | |
| Total advisory fees paid for the year | | $ | 1,780,610 | |
What did the Fund invest in? (as of May 31, 2024)
(1) Affiliated investment companies, except for repurchase agreements.
How has the Fund changed?
| | • | | Name change: Effective May 1, 2024, the Fund’s name changed from TIAA-CREF Lifecycle Index 2015 Fund to Nuveen Lifecycle Index 2015 Fund. | |
For more complete information, you may review the Fund’s next prospectus, which is expected to be available by October 1, 2024 at https://www.nuveen.com/en-us/mutual-funds/prospectuses or upon request at (800) 257‑8787.
Availability of additional information about the Fund
You can find additional information about the Fund at https://www.nuveen.com/en-us/mutual-funds/prospectuses, including its:
| | • | | prospectus • financial statements and other information • fund holdings • proxy voting information |
You can also request this information at (800) 257‑8787.
| | |
87245M715_AR_0524 3613801-INV-Y-07/25 (I, R6, Premier, Retirement) | | |
| | |
| | Annual Shareholder Report May 31, 2024 |
Nuveen Lifecycle Index 2015 Fund
(Formerly known as TIAA-CREF Lifecycle Index 2015 Fund)
Retirement Class Shares/TLGRX
Annual Shareholder Report
This annual shareholder report contains important information about the Retirement Class Shares of the Nuveen Lifecycle Index 2015 Fund for the period of June 1, 2023 to May 31, 2024. You can find additional information at https://www.nuveen.com/en‑us/mutual‑funds/prospectuses. You can also request this information by contacting us at (800) 257‑8787.
This report describes changes to the Fund that occurred during the reporting period.
What were the Fund costs for the last year? (based on a hypothetical $10,000 investment)
| | | | |
| | | Cost of a $10,000 investment | | Costs paid as a percentage of $10,000 investment |
| Retirement Class Shares | | $35 | | 0.35% |
How did the Fund perform last year? What affected the Fund’s performance?
| | |
Performance Highlights • The Nuveen Lifecycle Index 2015 Fund returned 10.43% for Retirement Class shares at net asset value (NAV) for the 12 months ended May 31, 2024. The Fund underperformed the Lifecycle Index 2015 Fund Composite Index, which returned 10.73%. • The Lifecycle Index 2015 Fund Composite Index consisted of: 39.8% Bloomberg U.S. Aggregate Bond Index; 26.6% Russell 3000® Index; 14.4% MSCI EAFE + Emerging Markets Index; 9.6% Bloomberg U.S. 1-3 Year Government/Credit Bond Index; and 9.6% Bloomberg U.S. Treasury Inflation Protected Securities (TIPS) 1-10 Year Index. • Top detractors from absolute performance » Management fees and other expenses incurred by the Fund. • Top contributors to absolute performance » Underlying equity and fixed income funds advanced for the period. Equity funds, led by the Nuveen Equity Index Fund, recorded the largest gains and contributed most. | | Fund Performance Fees/Other Expenses Equity & Fixed Income Funds |
How did the Fund perform over the last 10 years?
Performance data shown represents past performance and does not predict or guarantee future results. The graph and table do not reflect the deduction of taxes that a shareholder would pay on Fund distributions or redemption of Fund Shares.
Fund Performance (June 1, 2014 through May 31, 2024) Initial Investment of $10,000
Average Annual Total Returns
| | | | | | | | | | | | |
| | | 1 year | | | 5 years | | | 10 years | |
| Retirement Class Shares at NAV | | | 10.43 | % | | | 5.49 | % | | | 4.96 | % |
Russell 3000® Index | | | 27.58 | % | | | 15.00 | % | | | 12.09 | % |
| Bloomberg U.S. Aggregate Bond Index | | | 1.31 | % | | | (0.17 | )% | | | 1.26 | % |
| Lifecycle Index 2015 Fund Composite Index | | | 10.73 | % | | | 5.82 | % | | | 5.29 | % |
| S&P Target Date 2015 Index | | | 9.99 | % | | | 5.38 | % | | | 4.85 | % |
Investment return and principal value will fluctuate, and you may have a gain or loss when you sell your shares. Current performance may differ from figures shown. For most recent month‑end performance, go to https://www.nuveen.com/en‑us/mutual‑funds/prospectuses or call (800) 257‑8787.
Fund Statistics (as of May 31, 2024)
| | | | |
| Fund net assets | | $ | 1,047,344,707 | |
| Total number of portfolio holdings | | | 7 | |
| Portfolio turnover (%) | | | 15% | |
| Total advisory fees paid for the year | | $ | 1,780,610 | |
What did the Fund invest in? (as of May 31, 2024)
(1) Affiliated investment companies, except for repurchase agreements.
How has the Fund changed?
| | • | | Name change: Effective May 1, 2024, the Fund’s name changed from TIAA-CREF Lifecycle Index 2015 Fund to Nuveen Lifecycle Index 2015 Fund. | |
For more complete information, you may review the Fund’s next prospectus, which is expected to be available by October 1, 2024 at https://www.nuveen.com/en‑us/mutual‑funds/prospectuses or upon request at (800) 257‑8787.
Availability of additional information about the Fund
You can find additional information about the Fund at https://www.nuveen.com/en‑us/mutual‑funds/prospectuses, including its:
| | • | | prospectus • financial statements and other information • fund holdings • proxy voting information |
You can also request this information at (800) 257‑8787.
| | |
87245M301_AR_0524 3613801-INV-Y-07/25 (I, R6, Premier, Retirement) | |  |
| | |
| | Annual Shareholder Report May 31, 2024 |
Nuveen Lifecycle Index 2015 Fund
(Formerly known as TIAA-CREF Lifecycle Index 2015 Fund)
Class I Shares (Formerly known as Advisor Class Shares)/TLFAX
Annual Shareholder Report
This annual shareholder report contains important information about the Class I Shares of the Nuveen Lifecycle Index 2015 Fund for the period of June 1, 2023 to May 31, 2024. You can find additional information at https://www.nuveen.com/en‑us/mutual‑funds/prospectuses. You can also request this information by contacting us at (800) 257‑8787.
This report describes changes to the Fund that occurred during the reporting period.
What were the Fund costs for the last year? (based on a hypothetical $10,000 investment)
| | | | |
| | | Cost of a $10,000 investment | | Costs paid as a percentage of
$10,000 investment |
| Class I Shares | | $20 | | 0.20% |
How did the Fund perform last year? What affected the Fund’s performance?
| | |
Performance Highlights • The Nuveen Lifecycle Index 2015 Fund returned 10.57% for Class I shares at net asset value (NAV) for the 12 months ended May 31, 2024. The Fund performed in line with the Lifecycle Index 2015 Fund Composite Index, which returned 10.73%. • The Lifecycle Index 2015 Fund Composite Index consisted of: 39.8% Bloomberg U.S. Aggregate Bond Index; 26.6% Russell 3000® Index; 14.4% MSCI EAFE + Emerging Markets Index; 9.6% Bloomberg U.S. 1-3 Year Government/Credit Bond Index; and 9.6% Bloomberg U.S. Treasury Inflation Protected Securities (TIPS) 1-10 Year Index. • Top detractors from absolute performance » Management fees and other expenses incurred by the Fund. • Top contributors to absolute performance » Underlying equity and fixed income funds advanced for the period. Equity funds, led by the Nuveen Equity Index Fund, recorded the largest gains and contributed most. | | Fund Performance Fees/Other Expenses Equity & Fixed Income Funds |
How did the Fund perform over the period since inception?
Performance data shown represents past performance and does not predict or guarantee future results. The graph and table do not reflect the deduction of taxes that a shareholder would pay on Fund distributions or redemption of Fund Shares.
Fund Performance (December 4, 2015 through May 31, 2024) Initial Investment of $10,000
Average Annual Total Returns
| | | | | | | | | | | | |
| | | 1 year | | | 5 years | | | Since Inception | |
| Class I Shares at NAV | | | 10.57 | % | | | 5.67 | % | | | 5.70 | % |
Russell 3000® Index | | | 27.58 | % | | | 15.00 | % | | | 12.98 | % |
| Bloomberg U.S. Aggregate Bond Index | | | 1.31 | % | | | (0.17 | )% | | | 1.16 | % |
| Lifecycle Index 2015 Fund Composite Index | | | 10.73 | % | | | 5.82 | % | | | 5.84 | % |
| S&P Target Date 2015 Index | | | 9.99 | % | | | 5.38 | % | | | 5.37 | % |
Investment return and principal value will fluctuate, and you may have a gain or loss when you sell your shares. Current performance may differ from figures shown. For most recent month‑end performance, go to https://www.nuveen.com/en‑us/mutual‑funds/prospectuses or call (800) 257‑8787.
Fund Statistics (as of May 31, 2024)
| | | | |
| Fund net assets | | $ | 1,047,344,707 | |
| Total number of portfolio holdings | | | 7 | |
| Portfolio turnover (%) | | | 15% | |
| Total advisory fees paid for the year | | $ | 1,780,610 | |
What did the Fund invest in? (as of May 31, 2024)
(1) Affiliated investment companies, except for repurchase agreements.
How has the Fund changed?
| | • | | Name change: Effective May 1, 2024, the Fund’s name changed from TIAA-CREF Lifecycle Index 2015 Fund to Nuveen Lifecycle Index 2015 Fund. | |
| | • | | Share class name change: Effective May 6, 2024, Advisor Class shares of the Fund were renamed Class I shares. | |
For more complete information, you may review the Fund’s next prospectus, which is expected to be available by October 1, 2024 at https://www.nuveen.com/en‑us/mutual‑funds/prospectuses or upon request at (800) 257‑8787.
Availability of additional information about the Fund
You can find additional information about the Fund at https://www.nuveen.com/en‑us/mutual‑funds/prospectuses, including its:
| | • | | prospectus • financial statements and other information • fund holdings • proxy voting information |
You can also request this information at (800) 257‑8787.
| | |
87245P825_AR_0524 3613801-INV-Y-07/25 (I, R6, Premier, Retirement) | | |
| | |
| | Annual Shareholder Report May 31, 2024 |
Nuveen Lifecycle Index 2020 Fund
(Formerly known as TIAA-CREF Lifecycle Index 2020 Fund)
Class R6 Shares (Formerly known as Institutional Class Shares)/TLWIX
Annual Shareholder Report
This annual shareholder report contains important information about the Class R6 Shares of the Nuveen Lifecycle Index 2020 Fund for the period of June 1, 2023 to May 31, 2024. You can find additional information at https://www.nuveen.com/en‑us/mutual‑funds/prospectuses. You can also request this information by contacting us at (800) 257‑8787.
This report describes changes to the Fund that occurred during the reporting period.
What were the Fund costs for the last year? (based on a hypothetical $10,000 investment)
| | | | |
| | | Cost of a $10,000 investment | | Costs paid as a percentage of
$10,000 investment |
| Class R6 Shares | | $10 | | 0.10% |
How did the Fund perform last year? What affected the Fund’s performance?
| | |
Performance Highlights • The Nuveen Lifecycle Index 2020 Fund returned 11.75% for Class R6 shares at net asset value (NAV) for the 12 months ended May 31, 2024. The Fund performed in line with the Lifecycle Index 2020 Fund Composite Index, which returned 11.74%. • The Lifecycle Index 2020 Fund Composite Index consisted of: 38.8% Bloomberg U.S. Aggregate Bond Index; 29.9% Russell 3000® Index; 16.1% MSCI EAFE + Emerging Markets Index; 7.6% Bloomberg U.S. 1-3 Year Government/Credit Bond Index; and 7.6% Bloomberg U.S. Treasury Inflation Protected Securities (TIPS) 1-10 Year Index. • Top contributors to absolute performance » Underlying equity and fixed income funds advanced for the period. Equity funds, led by the Nuveen Equity Index Fund, recorded the largest gains and contributed most. • Top detractors from absolute performance » Management fees and other expenses incurred by the Fund. | | Fund Performance Equity & Fixed Income Funds Fees/Other Expenses |
How did the Fund perform over the last 10 years?
Performance data shown represents past performance and does not predict or guarantee future results. The graph and table do not reflect the deduction of taxes that a shareholder would pay on Fund distributions or redemption of Fund Shares.
Fund Performance (June 1, 2014 through May 31, 2024) Initial Investment of $10,000
Average Annual Total Returns
| | | | | | | | | | | | |
| | | 1 year | | | 5 years | | | 10 years | |
| Class R6 Shares at NAV | | | 11.75 | % | | | 6.30 | % | | | 5.66 | % |
Russell 3000® Index | | | 27.58 | % | | | 15.00 | % | | | 12.09 | % |
| Bloomberg U.S. Aggregate Bond Index | | | 1.31 | % | | | (0.17 | )% | | | 1.26 | % |
| Lifecycle Index 2020 Fund Composite Index | | | 11.74 | % | | | 6.36 | % | | | 5.74 | % |
| S&P Target Date 2020 Index | | | 11.28 | % | | | 5.80 | % | | | 5.23 | % |
Investment return and principal value will fluctuate, and you may have a gain or loss when you sell your shares. Current performance may differ from figures shown. For most recent month‑end performance, go to https://www.nuveen.com/en‑us/mutual‑funds/prospectuses or call (800) 257‑8787.
Fund Statistics (as of May 31, 2024)
| | | | |
| Fund net assets | | $ | 3,083,759,478 | |
| Total number of portfolio holdings | | | 7 | |
| Portfolio turnover (%) | | | 14% | |
| Total advisory fees paid for the year | | $ | 5,079,516 | |
What did the Fund invest in? (as of May 31, 2024)
(1) Affiliated investment companies, except for repurchase agreements.
How has the Fund changed?
| | • | | Name change: Effective May 1, 2024, the Fund’s name changed from TIAA-CREF Lifecycle Index 2020 Fund to Nuveen Lifecycle Index 2020 Fund. | |
| | • | | Share class name change: Effective May 6, 2024, Institutional Class shares of the Fund were renamed Class R6 shares. | |
For more complete information, you may review the Fund’s next prospectus, which is expected to be available by October 1, 2024 at https://www.nuveen.com/en‑us/mutual‑funds/prospectuses or upon request at (800) 257‑8787.
Availability of additional information about the Fund
You can find additional information about the Fund at https://www.nuveen.com/en‑us/mutual‑funds/prospectuses, including its:
| | • | | prospectus • financial statements and other information • fund holdings • proxy voting information |
You can also request this information at (800) 257‑8787.
| | |
87245M814_AR_0524 3613810-INV-Y-07/25 (I, R6, Premier, Retirement) | | |
| | |
| | Annual Shareholder Report May 31, 2024 |
Nuveen Lifecycle Index 2020 Fund
(Formerly known as TIAA-CREF Lifecycle Index 2020 Fund)
Premier Class Shares/TLWPX
Annual Shareholder Report
This annual shareholder report contains important information about the Premier Class Shares of the Nuveen Lifecycle Index 2020 Fund for the period of June 1, 2023 to May 31, 2024. You can find additional information at https://www.nuveen.com/en‑us/mutual‑funds/prospectuses. You can also request this information by contacting us at (800) 257‑8787.
This report describes changes to the Fund that occurred during the reporting period.
What were the Fund costs for the last year? (based on a hypothetical $10,000 investment)
| | | | |
| | | Cost of a $10,000 investment | | Costs paid as a percentage of $10,000 investment |
| Premier Class Shares | | $25 | | 0.25% |
How did the Fund perform last year? What affected the Fund’s performance?
| | |
Performance Highlights • The Nuveen Lifecycle Index 2020 Fund returned 11.59% for Premier Class shares at net asset value (NAV) for the 12 months ended May 31, 2024. The Fund performed in line with the Lifecycle Index 2020 Fund Composite Index, which returned 11.74%. • The Lifecycle Index 2020 Fund Composite Index consisted of: 38.8% Bloomberg U.S. Aggregate Bond Index; 29.9% Russell 3000® Index; 16.1% MSCI EAFE + Emerging Markets Index; 7.6% Bloomberg U.S. 1–3 Year Government/Credit Bond Index; and 7.6% Bloomberg U.S. Treasury Inflation Protected Securities (TIPS) 1-10 Year Index. • Top detractors from absolute performance » Management fees and other expenses incurred by the Fund. • Top contributors to absolute performance » Underlying equity and fixed income funds advanced for the period. Equity funds, led by the Nuveen Equity Index Fund, recorded the largest gains and contributed most. | | Fund Performance Fees/Other Expenses Equity & Fixed Income Funds |
How did the Fund perform over the last 10 years?
Performance data shown represents past performance and does not predict or guarantee future results. The graph and table do not reflect the deduction of taxes that a shareholder would pay on Fund distributions or redemption of Fund Shares.
Fund Performance (June 1, 2014 through May 31, 2024) Initial Investment of $10,000
Average Annual Total Returns
| | | | | | | | | | | | |
| | | 1 year | | | 5 years | | | 10 years | |
| Premier Class Shares at NAV | | | 11.59 | % | | | 6.15 | % | | | 5.51 | % |
Russell 3000® Index | | | 27.58 | % | | | 15.00 | % | | | 12.09 | % |
| Bloomberg U.S. Aggregate Bond Index | | | 1.31 | % | | | (0.17 | )% | | | 1.26 | % |
| Lifecycle Index 2020 Fund Composite Index | | | 11.74 | % | | | 6.36 | % | | | 5.74 | % |
| S&P Target Date 2020 Index | | | 11.28 | % | | | 5.80 | % | | | 5.23 | % |
Investment return and principal value will fluctuate, and you may have a gain or loss when you sell your shares. Current performance may differ from figures shown. For most recent month‑end performance, go to https://www.nuveen.com/en‑us/mutual‑funds/prospectuses or call (800) 257‑8787.
Fund Statistics (as of May 31, 2024)
| | | | |
| Fund net assets | | $ | 3,083,759,478 | |
| Total number of portfolio holdings | | | 7 | |
| Portfolio turnover (%) | | | 14% | |
| Total advisory fees paid for the year | | $ | 5,079,516 | |
What did the Fund invest in? (as of May 31, 2024)
(1) Affiliated investment companies, except for repurchase agreements.
How has the Fund changed?
| | • | | Name change: Effective May 1, 2024, the Fund’s name changed from TIAA-CREF Lifecycle Index 2020 Fund to Nuveen Lifecycle Index 2020 Fund. | |
For more complete information, you may review the Fund’s next prospectus, which is expected to be available by October 1, 2024 at https://www.nuveen.com/en‑us/mutual‑funds/prospectuses or upon request at (800) 257‑8787.
Availability of additional information about the Fund
You can find additional information about the Fund at https://www.nuveen.com/en‑us/mutual‑funds/prospectuses, including its:
| | • | | prospectus • financial statements and other information • fund holdings • proxy voting information |
You can also request this information at (800) 257‑8787.
| | |
87245M699_AR_0524 3613810-INV-Y-07/25 (I, R6, Premier, Retirement) | | |
| | |
| | Annual Shareholder Report May 31, 2024 |
Nuveen Lifecycle Index 2020 Fund
(Formerly known as TIAA-CREF Lifecycle Index 2020 Fund)
Retirement Class Shares/TLWRX
Annual Shareholder Report
This annual shareholder report contains important information about the Retirement Class Shares of the Nuveen Lifecycle Index 2020 Fund for the period of June 1, 2023 to May 31, 2024. You can find additional information at https://www.nuveen.com/en‑us/mutual‑funds/prospectuses. You can also request this information by contacting us at (800) 257‑8787.
This report describes changes to the Fund that occurred during the reporting period.
What were the Fund costs for the last year? (based on a hypothetical $10,000 investment)
| | | | |
| | | Cost of a $10,000 investment | | Costs paid as a percentage of
$10,000 investment |
| Retirement Class Shares | | $35 | | 0.35% |
How did the Fund perform last year? What affected the Fund’s performance?
| | |
Performance Highlights • The Nuveen Lifecycle Index 2020 Fund returned 11.39% for Retirement Class shares at net asset value (NAV) for the 12 months ended May 31, 2024. The Fund underperformed the Lifecycle Index 2020 Fund Composite Index, which returned 11.74%. • The Lifecycle Index 2020 Fund Composite Index consisted of: 38.8% Bloomberg U.S. Aggregate Bond Index; 29.9% Russell 3000® Index; 16.1% MSCI EAFE + Emerging Markets Index; 7.6% Bloomberg U.S. 1–3 Year Government/Credit Bond Index; and 7.6% Bloomberg U.S. Treasury Inflation Protected Securities (TIPS) 1-10 Year Index. • Top detractors from absolute performance » Management fees and other expenses incurred by the Fund. • Top contributors to absolute performance » Underlying equity and fixed income funds advanced for the period. Equity funds, led by the Nuveen Equity Index Fund, recorded the largest gains and contributed most. | | Fund Performance Fees/Other Expenses Equity & Fixed Income Funds |
How did the Fund perform over the last 10 years?
Performance data shown represents past performance and does not predict or guarantee future results. The graph and table do not reflect the deduction of taxes that a shareholder would pay on Fund distributions or redemption of Fund Shares.
Fund Performance (June 1, 2014 through May 31, 2024) Initial Investment of $10,000
Average Annual Total Returns
| | | | | | | | | | | | |
| | | 1 year | | | 5 years | | | 10 years | |
| Retirement Class Shares at NAV | | | 11.39 | % | | | 6.03 | % | | | 5.40 | % |
Russell 3000® Index | | | 27.58 | % | | | 15.00 | % | | | 12.09 | % |
| Bloomberg U.S. Aggregate Bond Index | | | 1.31 | % | | | (0.17 | )% | | | 1.26 | % |
| Lifecycle Index 2020 Fund Composite Index | | | 11.74 | % | | | 6.36 | % | | | 5.74 | % |
| S&P Target Date 2020 Index | | | 11.28 | % | | | 5.80 | % | | | 5.23 | % |
Investment return and principal value will fluctuate, and you may have a gain or loss when you sell your shares. Current performance may differ from figures shown. For most recent month‑end performance, go to https://www.nuveen.com/en‑us/mutual‑funds/prospectuses or call (800) 257‑8787.
Fund Statistics (as of May 31, 2024)
| | | | |
| Fund net assets | | $ | 3,083,759,478 | |
| Total number of portfolio holdings | | | 7 | |
| Portfolio turnover (%) | | | 14% | |
| Total advisory fees paid for the year | | $ | 5,079,516 | |
What did the Fund invest in? (as of May 31, 2024)
(1) Affiliated investment companies, except for repurchase agreements.
How has the Fund changed?
| | • | | Name change: Effective May 1, 2024, the Fund’s name changed from TIAA-CREF Lifecycle Index 2020 Fund to Nuveen Lifecycle Index 2020 Fund. | |
For more complete information, you may review the Fund’s next prospectus, which is expected to be available by October 1, 2024 at https://www.nuveen.com/en‑us/mutual‑funds/prospectuses or upon request at (800) 257‑8787.
Availability of additional information about the Fund
You can find additional information about the Fund at https://www.nuveen.com/en‑us/mutual‑funds/prospectuses, including its:
| | • | | prospectus • financial statements and other information • fund holdings • proxy voting information |
You can also request this information at (800) 257‑8787.
| | |
87245M400_AR_0524 3613810-INV-Y-07/25 (I, R6, Premier, Retirement) | | |
| | |
| | Annual Shareholder Report May 31, 2024 |
Nuveen Lifecycle Index 2020 Fund
(Formerly known as TIAA-CREF Lifecycle Index 2020 Fund)
Class I Shares (Formerly known as Advisor Class Shares)/TLWHX
Annual Shareholder Report
This annual shareholder report contains important information about the Class I Shares of the Nuveen Lifecycle Index 2020 Fund for the period of June 1, 2023 to May 31, 2024. You can find additional information at https://www.nuveen.com/en‑us/mutual‑funds/prospectuses. You can also request this information by contacting us at (800) 257‑8787.
This report describes changes to the Fund that occurred during the reporting period.
What were the Fund costs for the last year? (based on a hypothetical $10,000 investment)
| | | | |
| | | Cost of a $10,000 investment | | Costs paid as a percentage of
$10,000 investment |
| Class I Shares | | $20 | | 0.20% |
How did the Fund perform last year? What affected the Fund’s performance?
| | |
Performance Highlights • The Nuveen Lifecycle Index 2020 Fund returned 11.60% for Class I shares at net asset value (NAV) for the 12 months ended May 31, 2024. The Fund performed in line with the Lifecycle Index 2020 Fund Composite Index, which returned 11.74%. • The Lifecycle Index 2020 Fund Composite Index consisted of: 38.8% Bloomberg U.S. Aggregate Bond Index; 29.9% Russell 3000® Index; 16.1% MSCI EAFE + Emerging Markets Index; 7.6% Bloomberg U.S. 1–3 Year Government/Credit Bond Index; and 7.6% Bloomberg U.S. Treasury Inflation Protected Securities (TIPS) 1-10 Year Index. • Top detractors from absolute performance » Management fees and other expenses incurred by the Fund. • Top contributors to absolute performance » Underlying equity and fixed income funds advanced for the period. Equity funds, led by the Nuveen Equity Index Fund, recorded the largest gains and contributed most. | | Fund Performance Fees/Other Expenses Equity & Fixed Income Funds |
How did the Fund perform over the period since inception?
Performance data shown represents past performance and does not predict or guarantee future results. The graph and table do not reflect the deduction of taxes that a shareholder would pay on Fund distributions or redemption of Fund Shares.
Fund Performance (December 4, 2015 through May 31, 2024) Initial Investment of $10,000
Average Annual Total Returns
| | | | | | | | | | | | |
| | | 1 year | | | 5 years | | | Since Inception | |
| Class I Shares at NAV | | | 11.60 | % | | | 6.19 | % | | | 6.17 | % |
Russell 3000® Index | | | 27.58 | % | | | 15.00 | % | | | 12.98 | % |
| Bloomberg U.S. Aggregate Bond Index | | | 1.31 | % | | | (0.17 | )% | | | 1.16 | % |
| Lifecycle Index 2020 Fund Composite Index | | | 11.74 | % | | | 6.36 | % | | | 6.34 | % |
| S&P Target Date 2020 Index | | | 11.28 | % | | | 5.80 | % | | | 5.80 | % |
Investment return and principal value will fluctuate, and you may have a gain or loss when you sell your shares. Current performance may differ from figures shown. For most recent month‑end performance, go to https://www.nuveen.com/en‑us/mutual‑funds/prospectuses or call (800) 257‑8787.
Fund Statistics (as of May 31, 2024)
| | | | |
| Fund net assets | | $ | 3,083,759,478 | |
| Total number of portfolio holdings | | | 7 | |
| Portfolio turnover (%) | | | 14% | |
| Total advisory fees paid for the year | | $ | 5,079,516 | |
What did the Fund invest in? (as of May 31, 2024)
(1) Affiliated investment companies, except for repurchase agreements.
How has the Fund changed?
| | • | | Name change: Effective May 1, 2024, the Fund’s name changed from TIAA-CREF Lifecycle Index 2020 Fund to Nuveen Lifecycle Index 2020 Fund. | |
| | • | | Share class name change: Effective May 6, 2024, Advisor Class shares of the Fund were renamed Class I shares. | |
For more complete information, you may review the Fund’s next prospectus, which is expected to be available by October 1, 2024 at https://www.nuveen.com/en‑us/mutual‑funds/prospectuses or upon request at (800) 257‑8787.
Availability of additional information about the Fund
You can find additional information about the Fund at https://www.nuveen.com/en‑us/mutual‑funds/prospectuses, including its:
| | • | | prospectus • financial statements and other information • fund holdings • proxy voting information |
You can also request this information at (800) 257‑8787.
| | |
87245P817_AR_0524 3613810-INV-Y-07/25 (I, R6, Premier, Retirement) | | |
| | |
| | Annual Shareholder Report May 31, 2024 |
Nuveen Lifecycle Index 2025 Fund
(Formerly known as TIAA-CREF Lifecycle Index 2025 Fund)
Class R6 Shares (Formerly known as Institutional Class Shares)/TLQIX
Annual Shareholder Report
This annual shareholder report contains important information about the Class R6 Shares of the Nuveen Lifecycle Index 2025 Fund for the period of June 1, 2023 to May 31, 2024. You can find additional information at https://www.nuveen.com/en‑us/mutual‑funds/prospectuses. You can also request this information by contacting us at (800) 257‑8787.
This report describes changes to the Fund that occurred during the reporting period.
What were the Fund costs for the last year? (based on a hypothetical $10,000 investment)
| | | | |
| | | Cost of a $10,000 investment | | Costs paid as a percentage of
$10,000 investment |
| Class R6 Shares | | $10 | | 0.10% |
How did the Fund perform last year? What affected the Fund’s performance?
| | |
Performance Highlights • The Nuveen Lifecycle Index 2025 Fund returned 12.98% for Class R6 shares at net asset value (NAV) for the 12 months ended May 31, 2024. The Fund performed in line with the Lifecycle Index 2025 Fund Composite Index, which returned 12.99%. • The Lifecycle Index 2025 Fund Composite Index consisted of: 37.1% Bloomberg U.S. Aggregate Bond Index; 33.6% Russell 3000® Index; 18.1% MSCI EAFE + Emerging Markets Index; 5.6% Bloomberg U.S. 1–3 Year Government/Credit Bond Index; and 5.6% Bloomberg U.S. Treasury Inflation Protected Securities (TIPS) 1-10 Year Index. • Top detractors from absolute performance » Management fees and other expenses incurred by the Fund. • Top contributors to absolute performance » Underlying equity and fixed income funds advanced for the period. Equity funds, led by the Nuveen Equity Index Fund, recorded the largest gains and contributed most. | | Fund Performance Fees/Other Expenses Equity & Fixed Income Funds |
How did the Fund perform over the last 10 years?
Performance data shown represents past performance and does not predict or guarantee future results. The graph and table do not reflect the deduction of taxes that a shareholder would pay on Fund distributions or redemption of Fund Shares.
Fund Performance (June 1, 2014 through May 31, 2024) Initial Investment of $10,000
Average Annual Total Returns
| | | | | | | | | | | | |
| | | 1 year | | | 5 years | | | 10 years | |
| Class R6 Shares at NAV | | | 12.98 | % | | | 7.09 | % | | | 6.25 | % |
Russell 3000® Index | | | 27.58 | % | | | 15.00 | % | | | 12.09 | % |
| Bloomberg U.S. Aggregate Bond Index | | | 1.31 | % | | | (0.17 | )% | | | 1.26 | % |
| Lifecycle Index 2025 Fund Composite Index | | | 12.99 | % | | | 7.15 | % | | | 6.32 | % |
| S&P Target Date 2025 Index | | | 11.97 | % | | | 6.70 | % | | | 5.83 | % |
Investment return and principal value will fluctuate, and you may have a gain or loss when you sell your shares. Current performance may differ from figures shown. For most recent month‑end performance, go to https://www.nuveen.com/en‑us/mutual‑funds/prospectuses or call (800) 257‑8787.
Fund Statistics (as of May 31, 2024)
| | | | |
| Fund net assets | | $ | 5,952,010,421 | |
| Total number of portfolio holdings | | | 7 | |
| Portfolio turnover (%) | | | 15% | |
| Total advisory fees paid for the year | | $ | 9,214,120 | |
What did the Fund invest in? (as of May 31, 2024)
(1) Affiliated investment companies, except for repurchase agreements.
How has the Fund changed?
| | • | | Name change: Effective May 1, 2024, the Fund’s name changed from TIAA-CREF Lifecycle Index 2025 Fund to Nuveen Lifecycle Index 2025 Fund. | |
| | • | | Share class name change: Effective May 6, 2024, Institutional Class shares of the Fund were renamed Class R6 shares. | |
For more complete information, you may review the Fund’s next prospectus, which is expected to be available by October 1, 2024 at https://www.nuveen.com/en‑us/mutual‑funds/prospectuses or upon request at (800) 257‑8787.
Availability of additional information about the Fund
You can find additional information about the Fund at https://www.nuveen.com/en‑us/mutual‑funds/prospectuses, including its:
| | • | | prospectus • financial statements and other information • fund holdings • proxy voting information |
You can also request this information at (800) 257‑8787.
| | |
87245M798_AR_0524 3613821-INV-Y-07/25 (I, R6, Premier, Retirement) | | |
| | |
| | Annual Shareholder Report May 31, 2024 |
Nuveen Lifecycle Index 2025 Fund
(Formerly known as TIAA-CREF Lifecycle Index 2025 Fund)
Premier Class Shares/TLVPX
Annual Shareholder Report
This annual shareholder report contains important information about the Premier Class Shares of the Nuveen Lifecycle Index 2025 Fund for the period of June 1, 2023 to May 31, 2024. You can find additional information at https://www.nuveen.com/en‑us/mutual‑funds/prospectuses. You can also request this information by contacting us at (800) 257‑8787.
This report describes changes to the Fund that occurred during the reporting period.
What were the Fund costs for the last year? (based on a hypothetical $10,000 investment)
| | | | |
| | | Cost of a $10,000 investment | | Costs paid as a percentage of
$10,000 investment |
| Premier Class Shares | | $25 | | 0.25% |
How did the Fund perform last year? What affected the Fund’s performance?
| | |
Performance Highlights • The Nuveen Lifecycle Index 2025 Fund returned 12.83% for Premier Class shares at net asset value (NAV) for the 12 months ended May 31, 2024. The Fund performed in line with the Lifecycle Index 2025 Fund Composite Index, which returned 12.99%. • The Lifecycle Index 2025 Fund Composite Index consisted of: 37.1% Bloomberg U.S. Aggregate Bond Index; 33.6% Russell 3000® Index; 18.1% MSCI EAFE + Emerging Markets Index; 5.6% Bloomberg U.S. 1–3 Year Government/Credit Bond Index; and 5.6% Bloomberg U.S. Treasury Inflation Protected Securities (TIPS) 1-10 Year Index. • Top detractors from absolute performance » Management fees and other expenses incurred by the Fund. • Top contributors to absolute performance » Underlying equity and fixed income funds advanced for the period. Equity funds, led by the Nuveen Equity Index Fund, recorded the largest gains and contributed most. | | Fund Performance Fees/Other Expenses Equity & Fixed Income Funds |
How did the Fund perform over the last 10 years?
Performance data shown represents past performance and does not predict or guarantee future results. The graph and table do not reflect the deduction of taxes that a shareholder would pay on Fund distributions or redemption of Fund Shares.
Fund Performance (June 1, 2014 through May 31, 2024) Initial Investment of $10,000
Average Annual Total Returns
| | | | | | | | | | | | |
| | | 1 year | | | 5 years | | | 10 years | |
| Premier Class Shares at NAV | | | 12.83 | % | | | 6.95 | % | | | 6.09 | % |
Russell 3000® Index | | | 27.58 | % | | | 15.00 | % | | | 12.09 | % |
| Bloomberg U.S. Aggregate Bond Index | | | 1.31 | % | | | (0.17 | )% | | | 1.26 | % |
| Lifecycle Index 2025 Fund Composite Index | | | 12.99 | % | | | 7.15 | % | | | 6.32 | % |
| S&P Target Date 2025 Index | | | 11.97 | % | | | 6.70 | % | | | 5.83 | % |
Investment return and principal value will fluctuate, and you may have a gain or loss when you sell your shares. Current performance may differ from figures shown. For most recent month‑end performance, go to https://www.nuveen.com/en‑us/mutual‑funds/prospectuses or call (800) 257‑8787.
Fund Statistics (as of May 31, 2024)
| | | | |
| Fund net assets | | $ | 5,952,010,421 | |
| Total number of portfolio holdings | | | 7 | |
| Portfolio turnover (%) | | | 15% | |
| Total advisory fees paid for the year | | $ | 9,214,120 | |
What did the Fund invest in? (as of May 31, 2024)
(1) Affiliated investment companies, except for repurchase agreements.
How has the Fund changed?
| | • | | Name change: Effective May 1, 2024, the Fund’s name changed from TIAA-CREF Lifecycle Index 2025 Fund to Nuveen Lifecycle Index 2025 Fund. | |
For more complete information, you may review the Fund’s next prospectus, which is expected to be available by October 1, 2024 at https://www.nuveen.com/en‑us/mutual‑funds/prospectuses or upon request at (800) 257‑8787.
Availability of additional information about the Fund
You can find additional information about the Fund at https://www.nuveen.com/en‑us/mutual‑funds/prospectuses, including its:
| | • | | prospectus • financial statements and other information • fund holdings • proxy voting information |
You can also request this information at (800) 257‑8787.
| | |
87245M681_AR_0524 3613821-INV-Y-07/25 (I, R6, Premier, Retirement) | | |
| | |
| | Annual Shareholder Report May 31, 2024 |
Nuveen Lifecycle Index 2025 Fund
(Formerly known as TIAA-CREF Lifecycle Index 2025 Fund)
Retirement Class Shares/TLQRX
Annual Shareholder Report
This annual shareholder report contains important information about the Retirement Class Shares of the Nuveen Lifecycle Index 2025 Fund for the period of June 1, 2023 to May 31, 2024. You can find additional information at https://www.nuveen.com/en‑us/mutual‑funds/prospectuses. You can also request this information by contacting us at (800) 257‑8787.
This report describes changes to the Fund that occurred during the reporting period.
What were the Fund costs for the last year? (based on a hypothetical $10,000 investment)
| | | | |
| | | Cost of a $10,000 investment | | Costs paid as a percentage of $10,000 investment |
| Retirement Class Shares | | $35 | | 0.35% |
How did the Fund perform last year? What affected the Fund’s performance?
| | |
Performance Highlights • The Nuveen Lifecycle Index 2025 Fund returned 12.73% for Retirement Class shares at net asset value (NAV) for the 12 months ended May 31, 2024. The Fund underperformed the Lifecycle Index 2025 Fund Composite Index, which returned 12.99%. • The Lifecycle Index 2025 Fund Composite Index consisted of: 37.1% Bloomberg U.S. Aggregate Bond Index; 33.6% Russell 3000® Index; 18.1% MSCI EAFE + Emerging Markets Index; 5.6% Bloomberg U.S. 1–3 Year Government/Credit Bond Index; and 5.6% Bloomberg U.S. Treasury Inflation Protected Securities (TIPS) 1-10 Year Index. • Top detractors from absolute performance » Management fees and other expenses incurred by the Fund. • Top contributors to absolute performance » Underlying equity and fixed income funds advanced for the period. Equity funds, led by the Nuveen Equity Index Fund, recorded the largest gains and contributed most. | | Fund Performance Fees/Other Expenses Equity & Fixed Income Funds |
How did the Fund perform over the last 10 years?
Performance data shown represents past performance and does not predict or guarantee future results. The graph and table do not reflect the deduction of taxes that a shareholder would pay on Fund distributions or redemption of Fund Shares.
Fund Performance (June 1, 2014 through May 31, 2024) Initial Investment of $10,000
Average Annual Total Returns
| | | | | | | | | | | | |
| | | 1 year | | | 5 years | | | 10 years | |
| Retirement Class Shares at NAV | | | 12.73 | % | | | 6.83 | % | | | 5.98 | % |
Russell 3000® Index | | | 27.58 | % | | | 15.00 | % | | | 12.09 | % |
| Bloomberg U.S. Aggregate Bond Index | | | 1.31 | % | | | (0.17 | )% | | | 1.26 | % |
| Lifecycle Index 2025 Fund Composite Index | | | 12.99 | % | | | 7.15 | % | | | 6.32 | % |
| S&P Target Date 2025 Index | | | 11.97 | % | | | 6.70 | % | | | 5.83 | % |
Investment return and principal value will fluctuate, and you may have a gain or loss when you sell your shares. Current performance may differ from figures shown. For most recent month‑end performance, go to https://www.nuveen.com/en‑us/mutual‑funds/prospectuses or call (800) 257‑8787.
Fund Statistics (as of May 31, 2024)
| | | | |
| Fund net assets | | $ | 5,952,010,421 | |
| Total number of portfolio holdings | | | 7 | |
| Portfolio turnover (%) | | | 15% | |
| Total advisory fees paid for the year | | $ | 9,214,120 | |
What did the Fund invest in? (as of May 31, 2024)
(1) Affiliated investment companies, except for repurchase agreements.
How has the Fund changed?
| | • | | Name change: Effective May 1, 2024, the Fund’s name changed from TIAA-CREF Lifecycle Index 2025 Fund to Nuveen Lifecycle Index 2025 Fund. | |
For more complete information, you may review the Fund’s next prospectus, which is expected to be available by October 1, 2024 at https://www.nuveen.com/en‑us/mutual‑funds/prospectuses or upon request at (800) 257‑8787.
Availability of additional information about the Fund
You can find additional information about the Fund at https://www.nuveen.com/en‑us/mutual‑funds/prospectuses, including its:
| | • | | prospectus • financial statements and other information • fund holdings • proxy voting information |
You can also request this information at (800) 257‑8787.
| | |
87245M509_AR_0524 3613821-INV-Y-07/25 (I, R6, Premier, Retirement) | | |
| | |
| | Annual Shareholder Report May 31, 2024 |
Nuveen Lifecycle Index 2025 Fund
(Formerly known as TIAA-CREF Lifecycle Index 2025 Fund)
Class I Shares (Formerly known as Advisor Class Shares)/TLQHX
Annual Shareholder Report
This annual shareholder report contains important information about the Class I Shares of the Nuveen Lifecycle Index 2025 Fund for the period of June 1, 2023 to May 31, 2024. You can find additional information at https://www.nuveen.com/en‑us/mutual‑funds/prospectuses. You can also request this information by contacting us at (800) 257‑8787.
This report describes changes to the Fund that occurred during the reporting period.
What were the Fund costs for the last year? (based on a hypothetical $10,000 investment)
| | | | |
| | | Cost of a $10,000 investment | | Costs paid as a percentage of
$10,000 investment |
| Class I Shares | | $21 | | 0.21% |
How did the Fund perform last year? What affected the Fund’s performance?
| | |
Performance Highlights • The Nuveen Lifecycle Index 2025 Fund returned 12.84% for Class I shares at net asset value (NAV) for the 12 months ended May 31, 2024. The Fund performed in line with the Lifecycle Index 2025 Fund Composite Index, which returned 12.99%. • The Lifecycle Index 2025 Fund Composite Index consisted of: 37.1% Bloomberg U.S. Aggregate Bond Index; 33.6% Russell 3000® Index; 18.1% MSCI EAFE + Emerging Markets Index; 5.6% Bloomberg U.S. 1–3 Year Government/Credit Bond Index; and 5.6% Bloomberg U.S. Treasury Inflation Protected Securities (TIPS) 1-10 Year Index. • Top detractors from absolute performance » Management fees and other expenses incurred by the Fund. • Top contributors to absolute performance » Underlying equity and fixed income funds advanced for the period. Equity funds, led by the Nuveen Equity Index Fund, recorded the largest gains and contributed most. | | Fund Performance Fees/Other Expenses Equity & Fixed Income Funds |
How did the Fund perform over the period since inception?
Performance data shown represents past performance and does not predict or guarantee future results. The graph and table do not reflect the deduction of taxes that a shareholder would pay on Fund distributions or redemption of Fund Shares.
Fund Performance (December 4, 2015 through May 31, 2024) Initial Investment of $10,000
Average Annual Total Returns
| | | | | | | | | | | | |
| | | 1 year | | | 5 years | | | Since Inception | |
| Class I Shares at NAV | | | 12.84 | % | | | 6.99 | % | | | 6.83 | % |
Russell 3000® Index | | | 27.58 | % | | | 15.00 | % | | | 12.98 | % |
| Bloomberg U.S. Aggregate Bond Index | | | 1.31 | % | | | (0.17 | )% | | | 1.16 | % |
| Lifecycle Index 2025 Fund Composite Index | | | 12.99 | % | | | 7.15 | % | | | 7.01 | % |
| S&P Target Date 2025 Index | | | 11.97 | % | | | 6.70 | % | | | 6.51 | % |
Investment return and principal value will fluctuate, and you may have a gain or loss when you sell your shares. Current performance may differ from figures shown. For most recent month‑end performance, go to https://www.nuveen.com/en‑us/mutual‑funds/prospectuses or call (800) 257‑8787.
Fund Statistics (as of May 31, 2024)
| | | | |
| Fund net assets | | $ | 5,952,010,421 | |
| Total number of portfolio holdings | | | 7 | |
| Portfolio turnover (%) | | | 15% | |
| Total advisory fees paid for the year | | $ | 9,214,120 | |
What did the Fund invest in? (as of May 31, 2024)
(1) Affiliated investment companies, except for repurchase agreements.
How has the Fund changed?
| | • | | Name change: Effective May 1, 2024, the Fund’s name changed from TIAA-CREF Lifecycle Index 2025 Fund to Nuveen Lifecycle Index 2025 Fund. | |
| | • | | Share class name change: Effective May 6, 2024, Advisor Class shares of the Fund were renamed Class I shares. | |
For more complete information, you may review the Fund’s next prospectus, which is expected to be available by October 1, 2024 at https://www.nuveen.com/en‑us/mutual‑funds/prospectuses or upon request at (800) 257‑8787.
Availability of additional information about the Fund
You can find additional information about the Fund at https://www.nuveen.com/en‑us/mutual‑funds/prospectuses, including its:
| | • | | prospectus • financial statements and other information • fund holdings • proxy voting information |
You can also request this information at (800) 257‑8787.
| | |
87245P791_AR_0524 3613821-INV-Y-07/25 (I, R6, Premier, Retirement) | | |
| | |
| | Annual Shareholder Report May 31, 2024 |
Nuveen Lifecycle Index 2030 Fund
(Formerly known as TIAA-CREF Lifecycle Index 2030 Fund)
Class R6 Shares (Formerly known as Institutional Class Shares)/TLHIX
Annual Shareholder Report
This annual shareholder report contains important information about the Class R6 Shares of the Nuveen Lifecycle Index 2030 Fund for the period of June 1, 2023 to May 31, 2024. You can find additional information at https://www.nuveen.com/en‑us/mutual‑funds/prospectuses. You can also request this information by contacting us at (800) 257‑8787.
This report describes changes to the Fund that occurred during the reporting period.
What were the Fund costs for the last year? (based on a hypothetical $10,000 investment)
| | | | |
| | | Cost of a $10,000 investment | | Costs paid as a percentage of
$10,000 investment |
| Class R6 Shares | | $11 | | 0.11% |
How did the Fund perform last year? What affected the Fund’s performance?
| | |
Performance Highlights • The Nuveen Lifecycle Index 2030 Fund returned 14.66% for Class R6 shares at net asset value (NAV) for the 12 months ended May 31, 2024. The Fund performed in line with the Lifecycle Index 2030 Fund Composite Index, which returned 14.70%. • The Lifecycle Index 2030 Fund Composite Index consisted of: 38.8% Russell 3000® Index; 33.1% Bloomberg U.S. Aggregate Bond Index; 20.9% MSCI EAFE + Emerging Markets Index; 3.6% Bloomberg U.S. 1-3 Year Government/Credit Bond Index; and 3.6% Bloomberg U.S. Treasury Inflation Protected Securities (TIPS) 1-10 Year Index. • Top detractors from absolute performance » Management fees and other expenses incurred by the Fund. • Top contributors to absolute performance » Underlying equity and fixed income funds advanced for the period. Equity funds, led by the Nuveen Equity Index Fund, recorded the largest gains and contributed most. | | Fund Performance Fees/Other Expenses Equity & Fixed Income Funds |
How did the Fund perform over the last 10 years?
Performance data shown represents past performance and does not predict or guarantee future results. The graph and table do not reflect the deduction of taxes that a shareholder would pay on Fund distributions or redemption of Fund Shares.
Fund Performance (June 1, 2014 through May 31, 2024) Initial Investment of $10,000
Average Annual Total Returns
| | | | | | | | | | | | |
| | | 1 year | | | 5 years | | | 10 years | |
| Class R6 Shares at NAV | | | 14.66 | % | | | 7.98 | % | | | 6.87 | % |
Russell 3000® Index | | | 27.58 | % | | | 15.00 | % | | | 12.09 | % |
| Bloomberg U.S. Aggregate Bond Index | | | 1.31 | % | | | (0.17 | )% | | | 1.26 | % |
| Lifecycle Index 2030 Fund Composite Index | | | 14.70 | % | | | 8.05 | % | | | 6.95 | % |
| S&P Target Date 2030 Index | | | 14.24 | % | | | 7.77 | % | | | 6.50 | % |
Investment return and principal value will fluctuate, and you may have a gain or loss when you sell your shares. Current performance may differ from figures shown. For most recent month‑end performance, go to https://www.nuveen.com/en‑us/mutual‑funds/prospectuses or call (800) 257‑8787.
Fund Statistics (as of May 31, 2024)
| | | | |
| Fund net assets | | $ | 8,018,485,284 | |
| Total number of portfolio holdings | | | 7 | |
| Portfolio turnover (%) | | | 12% | |
| Total advisory fees paid for the year | | $ | 11,647,881 | |
What did the Fund invest in? (as of May 31, 2024)
(1) Affiliated investment companies, except for repurchase agreements.
How has the Fund changed?
| | • | | Name change: Effective May 1, 2024, the Fund’s name changed from TIAA-CREF Lifecycle Index 2030 Fund to Nuveen Lifecycle Index 2030 Fund. | |
| | • | | Share class name change: Effective May 6, 2024, Institutional Class shares of the Fund were renamed Class R6 shares. | |
For more complete information, you may review the Fund’s next prospectus, which is expected to be available by October 1, 2024 at https://www.nuveen.com/en‑us/mutual‑funds/prospectuses or upon request at (800) 257‑8787.
Availability of additional information about the Fund
You can find additional information about the Fund at https://www.nuveen.com/en‑us/mutual‑funds/prospectuses, including its:
| | • | | prospectus • financial statements and other information • fund holdings • proxy voting information |
You can also request this information at (800) 257‑8787.
| | |
87245M780_AR_0524 3613832-INV-Y-07/25 (I, R6, Premier, Retirement) | | |
| | |
| | Annual Shareholder Report May 31, 2024 |
Nuveen Lifecycle Index 2030 Fund
(Formerly known as TIAA-CREF Lifecycle Index 2030 Fund)
Premier Class Shares/TLHPX
Annual Shareholder Report
This annual shareholder report contains important information about the Premier Class Shares of the Nuveen Lifecycle Index 2030 Fund for the period of June 1, 2023 to May 31, 2024. You can find additional information at https://www.nuveen.com/en‑us/mutual‑funds/prospectuses. You can also request this information by contacting us at (800) 257‑8787.
This report describes changes to the Fund that occurred during the reporting period.
What were the Fund costs for the last year? (based on a hypothetical $10,000 investment)
| | | | |
| | | Cost of a $10,000 investment | | Costs paid as a percentage of
$10,000 investment |
| Premier Class Shares | | $26 | | 0.26% |
How did the Fund perform last year? What affected the Fund’s performance?
| | |
Performance Highlights • The Nuveen Lifecycle Index 2030 Fund returned 14.53% for Premier Class shares at net asset value (NAV) for the 12 months ended May 31, 2024. The Fund performed in line with the Lifecycle Index 2030 Fund Composite Index, which returned 14.70%. • The Lifecycle Index 2030 Fund Composite Index consisted of: 38.8% Russell 3000® Index; 33.1% Bloomberg U.S. Aggregate Bond Index; 20.9% MSCI EAFE + Emerging Markets Index; 3.6% Bloomberg U.S. 1–3 Year Government/Credit Bond Index; and 3.6% Bloomberg U.S. Treasury Inflation Protected Securities (TIPS) 1-10 Year Index. • Top detractors from absolute performance » Management fees and other expenses incurred by the Fund. • Top contributors to absolute performance » Underlying equity and fixed income funds advanced for the period. Equity funds, led by the Nuveen Equity Index Fund, recorded the largest gains and contributed most. | | Fund Performance Fees/Other Expenses Equity & Fixed Income Funds |
How did the Fund perform over the last 10 years?
Performance data shown represents past performance and does not predict or guarantee future results. The graph and table do not reflect the deduction of taxes that a shareholder would pay on Fund distributions or redemption of Fund Shares.
Fund Performance (June 1, 2014 through May 31, 2024) Initial Investment of $10,000
Average Annual Total Returns
| | | | | | | | | | | | |
| | | 1 year | | | 5 years | | | 10 years | |
| Premier Class Shares at NAV | | | 14.53 | % | | | 7.83 | % | | | 6.72 | % |
Russell 3000® Index | | | 27.58 | % | | | 15.00 | % | | | 12.09 | % |
| Bloomberg U.S. Aggregate Bond Index | | | 1.31 | % | | | (0.17 | )% | | | 1.26 | % |
| Lifecycle Index 2030 Fund Composite Index | | | 14.70 | % | | | 8.05 | % | | | 6.95 | % |
| S&P Target Date 2030 Index | | | 14.24 | % | | | 7.77 | % | | | 6.50 | % |
Investment return and principal value will fluctuate, and you may have a gain or loss when you sell your shares. Current performance may differ from figures shown. For most recent month‑end performance, go to https://www.nuveen.com/en‑us/mutual‑funds/prospectuses or call (800) 257‑8787.
Fund Statistics (as of May 31, 2024)
| | | | |
| Fund net assets | | $ | 8,018,485,284 | |
| Total number of portfolio holdings | | | 7 | |
| Portfolio turnover (%) | | | 12% | |
| Total advisory fees paid for the year | | $ | 11,647,881 | |
What did the Fund invest in? (as of May 31, 2024)
(1) Affiliated investment companies, except for repurchase agreements.
How has the Fund changed?
| | • | | Name change: Effective May 1, 2024, the Fund’s name changed from TIAA-CREF Lifecycle Index 2030 Fund to Nuveen Lifecycle Index 2030 Fund. | |
For more complete information, you may review the Fund’s next prospectus, which is expected to be available by October 1, 2024 at https://www.nuveen.com/en‑us/mutual‑funds/prospectuses or upon request at (800) 257‑8787.
Availability of additional information about the Fund
You can find additional information about the Fund at https://www.nuveen.com/en‑us/mutual‑funds/prospectuses, including its:
| | • | | prospectus • financial statements and other information • fund holdings • proxy voting information |
You can also request this information at (800) 257‑8787.
| | |
87245M673_AR_0524 3613832-INV-Y-07/25 (I, R6, Premier, Retirement) | | |
| | |
| | Annual Shareholder Report May 31, 2024 |
Nuveen Lifecycle Index 2030 Fund
(Formerly known as TIAA-CREF Lifecycle Index 2030 Fund)
Retirement Class Shares/TLHRX
Annual Shareholder Report
This annual shareholder report contains important information about the Retirement Class Shares of the Nuveen Lifecycle Index 2030 Fund for the period of June 1, 2023 to May 31, 2024. You can find additional information at https://www.nuveen.com/en‑us/mutual‑funds/prospectuses. You can also request this information by contacting us at (800) 257‑8787.
This report describes changes to the Fund that occurred during the reporting period.
What were the Fund costs for the last year? (based on a hypothetical $10,000 investment)
| | | | |
| | | Cost of a $10,000 investment | | Costs paid as a percentage of
$10,000 investment |
| Retirement Class Shares | | $ 36 | | 0.36% |
How did the Fund perform last year? What affected the Fund’s performance?
| | |
Performance Highlights • The Nuveen Lifecycle Index 2030 Fund returned 14.39% for Retirement Class shares at net asset value (NAV) for the 12 months ended May 31, 2024. The Fund underperformed the Lifecycle Index 2030 Fund Composite Index, which returned 14.70%. • The Lifecycle Index 2030 Fund Composite Index consisted of: 38.8% Russell 3000® Index; 33.1% Bloomberg U.S. Aggregate Bond Index; 20.9% MSCI EAFE + Emerging Markets Index; 3.6% Bloomberg U.S. 1-3 Year Government/Credit Bond Index; and 3.6% Bloomberg U.S. Treasury Inflation Protected Securities (TIPS) 1-10 Year Index. • Top detractors from absolute performance » Management fees and other expenses incurred by the Fund. • Top contributors to absolute performance » Underlying equity and fixed income funds advanced for the period. Equity funds, led by the Nuveen Equity Index Fund, recorded the largest gains and contributed most. | | Fund Performance Fees/Other Expenses Equity & Fixed Income Funds |
How did the Fund perform over the last 10 years?
Performance data shown represents past performance and does not predict or guarantee future results. The graph and table do not reflect the deduction of taxes that a shareholder would pay on Fund distributions or redemption of Fund Shares.
Fund Performance (June 1, 2014 through May 31, 2024) Initial Investment of $10,000
Average Annual Total Returns
| | | | | | | | | | | | |
| | | 1 year | | | 5 years | | | 10 years | |
| Retirement Class Shares at NAV | | | 14.39 | % | | | 7.73 | % | | | 6.62 | % |
Russell 3000® Index | | | 27.58 | % | | | 15.00 | % | | | 12.09 | % |
| Bloomberg U.S. Aggregate Bond Index | | | 1.31 | % | | | (0.17 | )% | | | 1.26 | % |
| Lifecycle Index 2030 Fund Composite Index | | | 14.70 | % | | | 8.05 | % | | | 6.95 | % |
| S&P Target Date 2030 Index | | | 14.24 | % | | | 7.77 | % | | | 6.50 | % |
Investment return and principal value will fluctuate, and you may have a gain or loss when you sell your shares. Current performance may differ from figures shown. For most recent month‑end performance, go to https://www.nuveen.com/en‑us/mutual‑funds/prospectuses or call (800) 257‑8787.
Fund Statistics (as of May 31, 2024)
| | | | |
| Fund net assets | | $ | 8,018,485,284 | |
| Total number of portfolio holdings | | | 7 | |
| Portfolio turnover (%) | | | 12% | |
| Total advisory fees paid for the year | | $ | 11,647,881 | |
What did the Fund invest in? (as of May 31, 2024)
(1) Affiliated investment companies, except for repurchase agreements.
How has the Fund changed?
| | • | | Name change: Effective May 1, 2024, the Fund’s name changed from TIAA-CREF Lifecycle Index 2030 Fund to Nuveen Lifecycle Index 2030 Fund. | |
For more complete information, you may review the Fund’s next prospectus, which is expected to be available by October 1, 2024 at https://www.nuveen.com/en‑us/mutual‑funds/prospectuses or upon request at (800) 257‑8787.
Availability of additional information about the Fund
You can find additional information about the Fund at https://www.nuveen.com/en‑us/mutual‑funds/prospectuses, including its:
| | • | | prospectus • financial statements and other information • fund holdings • proxy voting information |
You can also request this information at (800) 257‑8787.
| | |
87245M608_AR_0524 3613832-INV-Y-07/25 (I, R6, Premier, Retirement) | | |
| | |
| | Annual Shareholder Report May 31, 2024 |
Nuveen Lifecycle Index 2030 Fund
(Formerly known as TIAA-CREF Lifecycle Index 2030 Fund)
Class I Shares (Formerly known as Advisor Class Shares)/TLHHX
Annual Shareholder Report
This annual shareholder report contains important information about the Class I Shares of the Nuveen Lifecycle Index 2030 Fund for the period of June 1, 2023 to May 31, 2024. You can find additional information at https://www.nuveen.com/en‑us/mutual‑funds/prospectuses. You can also request this information by contacting us at (800) 257‑8787.
This report describes changes to the Fund that occurred during the reporting period.
What were the Fund costs for the last year? (based on a hypothetical $10,000 investment)
| | | | |
| | | Cost of a $10,000 investment | | Costs paid as a percentage of $10,000 investment |
| Class I Shares | | $21 | | 0.21% |
How did the Fund perform last year? What affected the Fund’s performance?
| | |
Performance Highlights • The Nuveen Lifecycle Index 2030 Fund returned 14.57% for Class I shares at net asset value (NAV) for the 12 months ended May 31, 2024. The Fund performed in line with the Lifecycle Index 2030 Fund Composite Index, which returned 14.70%. • The Lifecycle Index 2030 Fund Composite Index consisted of: 38.8% Russell 3000® Index; 33.1% Bloomberg U.S. Aggregate Bond Index; 20.9% MSCI EAFE + Emerging Markets Index; 3.6% Bloomberg U.S. 1-3 Year Government/Credit Bond Index; and 3.6% Bloomberg U.S. Treasury Inflation Protected Securities (TIPS) 1-10 Year Index. • Top detractors from absolute performance » Management fees and other expenses incurred by the Fund. • Top contributors to absolute performance » Underlying equity and fixed income funds advanced for the period. Equity funds, led by the Nuveen Equity Index Fund, recorded the largest gains and contributed most. | | Fund Performance Fees/Other Expenses Equity & Fixed Income Funds |
How did the Fund perform over the period since inception?
Performance data shown represents past performance and does not predict or guarantee future results. The graph and table do not reflect the deduction of taxes that a shareholder would pay on Fund distributions or redemption of Fund Shares.
Fund Performance (December 4, 2015 through May 31, 2024) Initial Investment of $10,000
Average Annual Total Returns
| | | | | | | | | | | | |
| | | 1 year | | | 5 years | | | Since Inception | |
| Class I Shares at NAV | | | 14.57 | % | | | 7.89 | % | | | 7.56 | % |
Russell 3000® Index | | | 27.58 | % | | | 15.00 | % | | | 12.98 | % |
| Bloomberg U.S. Aggregate Bond Index | | | 1.31 | % | | | (0.17 | )% | | | 1.16 | % |
| Lifecycle Index 2030 Fund Composite Index | | | 14.70 | % | | | 8.05 | % | | | 7.73 | % |
| S&P Target Date 2030 Index | | | 14.24 | % | | | 7.77 | % | | | 7.29 | % |
Investment return and principal value will fluctuate, and you may have a gain or loss when you sell your shares. Current performance may differ from figures shown. For most recent month‑end performance, go to https://www.nuveen.com/en‑us/mutual‑funds/prospectuses or call (800) 257‑8787.
Fund Statistics (as of May 31, 2024)
| | | | |
| Fund net assets | | $ | 8,018,485,284 | |
| Total number of portfolio holdings | | | 7 | |
| Portfolio turnover (%) | | | 12% | |
| Total advisory fees paid for the year | | $ | 11,647,881 | |
What did the Fund invest in? (as of May 31, 2024)
(1) Affiliated investment companies, except for repurchase agreements.
How has the Fund changed?
| | • | | Name change: Effective May 1, 2024, the Fund’s name changed from TIAA-CREF Lifecycle Index 2030 Fund to Nuveen Lifecycle Index 2030 Fund. | |
| | • | | Share class name change: Effective May 6, 2024, Advisor Class shares of the Fund were renamed Class I shares. | |
For more complete information, you may review the Fund’s next prospectus, which is expected to be available by October 1, 2024 at https://www.nuveen.com/en‑us/mutual‑funds/prospectuses or upon request at (800) 257‑8787.
Availability of additional information about the Fund
You can find additional information about the Fund at https://www.nuveen.com/en‑us/mutual‑funds/prospectuses, including its:
| | • | | prospectus • financial statements and other information • fund holdings • proxy voting information |
You can also request this information at (800) 257‑8787.
| | |
87245P783_AR_0524 3613832-INV-Y-07/25 (I, R6, Premier, Retirement) | | |
| | |
| | Annual Shareholder Report May 31, 2024 |
Nuveen Lifecycle Index 2035 Fund
(Formerly known as TIAA-CREF Lifecycle Index 2035 Fund)
Class R6 Shares (Formerly known as Institutional Class Shares)/TLYIX
Annual Shareholder Report
This annual shareholder report contains important information about the Class R6 Shares of the Nuveen Lifecycle Index 2035 Fund for the period of June 1, 2023 to May 31, 2024. You can find additional information at https://www.nuveen.com/en‑us/mutual‑funds/prospectuses. You can also request this information by contacting us at (800) 257‑8787.
This report describes changes to the Fund that occurred during the reporting period.
What were the Fund costs for the last year? (based on a hypothetical $10,000 investment)
| | | | |
| | | Cost of a $10,000 investment | | Costs paid as a percentage of
$10,000 investment |
| Class R6 Shares | | $11 | | 0.11% |
How did the Fund perform last year? What affected the Fund’s performance?
| | |
Performance Highlights • The Nuveen Lifecycle Index 2035 Fund returned 16.68% for Class R6 shares at net asset value (NAV) for the 12 months ended May 31, 2024. The Fund performed in line with the Lifecycle Index 2035 Fund Composite Index, which returned 16.72%. • The Lifecycle Index 2035 Fund Composite Index consisted of: 44.6% Russell 3000® Index; 28.2% Bloomberg U.S. Aggregate Bond Index; 24.0% MSCI EAFE + Emerging Markets Index; 1.6% Bloomberg U.S. 1-3 Year Government/Credit Bond Index; and 1.6% Bloomberg U.S. Treasury Inflation Protected Securities (TIPS) 1-10 Year Index. • Top detractors from absolute performance » Management fees and other expenses incurred by the Fund. • Top contributors to absolute performance » Underlying equity and fixed income funds advanced for the period. Equity funds, led by the Nuveen Equity Index Fund, recorded the largest gains and contributed most. | | Fund Performance Fees/Other Expenses Equity & Fixed Income Funds |
How did the Fund perform over the last 10 years?
Performance data shown represents past performance and does not predict or guarantee future results. The graph and table do not reflect the deduction of taxes that a shareholder would pay on Fund distributions or redemption of Fund Shares.
Fund Performance (June 1, 2014 through May 31, 2024) Initial Investment of $10,000
Average Annual Total Returns
| | | | | | | | | | | | |
| | | 1 year | | | 5 years | | | 10 years | |
| Class R6 Shares at NAV | | | 16.68 | % | | | 8.98 | % | | | 7.54 | % |
Russell 3000® Index | | | 27.58 | % | | | 15.00 | % | | | 12.09 | % |
| Bloomberg U.S. Aggregate Bond Index | | | 1.31 | % | | | (0.17 | )% | | | 1.26 | % |
| Lifecycle Index 2035 Fund Composite Index | | | 16.72 | % | | | 9.04 | % | | | 7.60 | % |
| S&P Target Date 2035 Index | | | 16.73 | % | | | 8.92 | % | | | 7.21 | % |
Investment return and principal value will fluctuate, and you may have a gain or loss when you sell your shares. Current performance may differ from figures shown. For most recent month‑end performance, go to https://www.nuveen.com/en‑us/mutual‑funds/prospectuses or call (800) 257‑8787.
Fund Statistics (as of May 31, 2024)
| | | | |
| Fund net assets | | $ | 8,457,873,052 | |
| Total number of portfolio holdings | | | 7 | |
| Portfolio turnover (%) | | | 11% | |
| Total advisory fees paid for the year | | $ | 11,652,990 | |
What did the Fund invest in? (as of May 31, 2024)
(1) Affiliated investment companies, except for repurchase agreements.
How has the Fund changed?
| | • | | Name change: Effective May 1, 2024, the Fund’s name changed from TIAA-CREF Lifecycle Index 2035 Fund to Nuveen Lifecycle Index 2035 Fund. | |
| | • | | Share class name change: Effective May 6, 2024, Institutional Class shares of the Fund were renamed Class R6 shares. | |
For more complete information, you may review the Fund’s next prospectus, which is expected to be available by October 1, 2024 at https://www.nuveen.com/en‑us/mutual‑funds/prospectuses or upon request at (800) 257‑8787.
Availability of additional information about the Fund
You can find additional information about the Fund at https://www.nuveen.com/en‑us/mutual‑funds/prospectuses, including its:
| | • | | prospectus • financial statements and other information • fund holdings • proxy voting information |
You can also request this information at (800) 257‑8787.
| | |
87245M772_AR_0524 3613843-INV-Y-07/25 (I, R6, Premier, Retirement) | | |
| | |
| | Annual Shareholder Report May 31, 2024 |
Nuveen Lifecycle Index 2035 Fund
(Formerly known as TIAA-CREF Lifecycle Index 2035 Fund)
Premier Class Shares/TLYPX
Annual Shareholder Report
This annual shareholder report contains important information about the Premier Class Shares of the Nuveen Lifecycle Index 2035 Fund for the period of June 1, 2023 to May 31, 2024. You can find additional information at https://www.nuveen.com/en‑us/mutual‑funds/prospectuses. You can also request this information by contacting us at (800) 257‑8787.
This report describes changes to the Fund that occurred during the reporting period.
What were the Fund costs for the last year? (based on a hypothetical $10,000 investment)
| | | | |
| | | Cost of a $10,000 investment | | Costs paid as a percentage of $10,000 investment |
| Premier Class Shares | | $26 | | 0.26% |
How did the Fund perform last year? What affected the Fund’s performance?
| | |
Performance Highlights • The Nuveen Lifecycle Index 2035 Fund returned 16.49% for Premier Class shares at net asset value (NAV) for the 12 months ended May 31, 2024. The Fund performed in line with the Lifecycle Index 2035 Fund Composite Index, which returned 16.72%. • The Lifecycle Index 2035 Fund Composite Index consisted of: 44.6% Russell 3000® Index; 28.2% Bloomberg U.S. Aggregate Bond Index; 24.0% MSCI EAFE + Emerging Markets Index; 1.6% Bloomberg U.S. 1–3 Year Government/Credit Bond Index; and 1.6% Bloomberg U.S. Treasury Inflation Protected Securities (TIPS) 1-10 Year Index. • Top detractors from absolute performance » Management fees and other expenses incurred by the Fund. • Top contributors to absolute performance » Underlying equity and fixed income funds advanced for the period. Equity funds, led by the Nuveen Equity Index Fund, recorded the largest gains and contributed most. | | Fund Performance Fees/Other Expenses Equity & Fixed Income Funds |
How did the Fund perform over the last 10 years?
Performance data shown represents past performance and does not predict or guarantee future results. The graph and table do not reflect the deduction of taxes that a shareholder would pay on Fund distributions or redemption of Fund Shares.
Fund Performance (June 1, 2014 through May 31, 2024) Initial Investment of $10,000
Average Annual Total Returns
| | | | | | | | | | | | |
| | | 1 year | | | 5 years | | | 10 years | |
| Premier Class Shares at NAV | | | 16.49 | % | | | 8.81 | % | | | 7.37 | % |
Russell 3000® Index | | | 27.58 | % | | | 15.00 | % | | | 12.09 | % |
| Bloomberg U.S. Aggregate Bond Index | | | 1.31 | % | | | (0.17 | )% | | | 1.26 | % |
| Lifecycle Index 2035 Fund Composite Index | | | 16.72 | % | | | 9.04 | % | | | 7.60 | % |
| S&P Target Date 2035 Index | | | 16.73 | % | | | 8.92 | % | | | 7.21 | % |
Investment return and principal value will fluctuate, and you may have a gain or loss when you sell your shares. Current performance may differ from figures shown. For most recent month‑end performance, go to https://www.nuveen.com/en‑us/mutual‑funds/prospectuses or call (800) 257‑8787.
Fund Statistics (as of May 31, 2024)
| | | | |
| Fund net assets | | $ | 8,457,873,052 | |
| Total number of portfolio holdings | | | 7 | |
| Portfolio turnover (%) | | | 11% | |
| Total advisory fees paid for the year | | $ | 11,652,990 | |
What did the Fund invest in? (as of May 31, 2024)
(1) Affiliated investment companies, except for repurchase agreements.
How has the Fund changed?
| | • | | Name change: Effective May 1, 2024, the Fund’s name changed from TIAA-CREF Lifecycle Index 2035 Fund to Nuveen Lifecycle Index 2035 Fund. | |
For more complete information, you may review the Fund’s next prospectus, which is expected to be available by October 1, 2024 at https://www.nuveen.com/en‑us/mutual‑funds/prospectuses or upon request at (800) 257‑8787.
Availability of additional information about the Fund
You can find additional information about the Fund at https://www.nuveen.com/en‑us/mutual‑funds/prospectuses, including its:
| | • | | prospectus • financial statements and other information • fund holdings • proxy voting information |
You can also request this information at (800) 257‑8787.
| | |
87245M665_AR_0524 3613843-INV-Y-07/25 (I, R6, Premier, Retirement) | | |
| | |
| | Annual Shareholder Report May 31, 2024 |
Nuveen Lifecycle Index 2035 Fund
(Formerly known as TIAA-CREF Lifecycle Index 2035 Fund)
Retirement Class Shares/TLYRX
Annual Shareholder Report
This annual shareholder report contains important information about the Retirement Class Shares of the Nuveen Lifecycle Index 2035 Fund for the period of June 1, 2023 to May 31, 2024. You can find additional information at https://www.nuveen.com/en‑us/mutual‑funds/prospectuses. You can also request this information by contacting us at (800) 257‑8787.
This report describes changes to the Fund that occurred during the reporting period.
What were the Fund costs for the last year? (based on a hypothetical $10,000 investment)
| | | | |
| | | Cost of a $10,000 investment | | Costs paid as a percentage of
$10,000 investment |
| Retirement Class Shares | | $36 | | 0.36% |
How did the Fund perform last year? What affected the Fund’s performance?
| | |
Performance Highlights • The Nuveen Lifecycle Index 2035 Fund returned 16.36% for Retirement Class shares at net asset value (NAV) for the 12 months ended May 31, 2024. The Fund underperformed the Lifecycle Index 2035 Fund Composite Index, which returned 16.72%. • The Lifecycle Index 2035 Fund Composite Index consisted of: 44.6% Russell 3000® Index; 28.2% Bloomberg U.S. Aggregate Bond Index; 24.0% MSCI EAFE + Emerging Markets Index; 1.6% Bloomberg U.S. 1-3 Year Government/Credit Bond Index; and 1.6% Bloomberg U.S. Treasury Inflation Protected Securities (TIPS) 1-10 Year Index. • Top detractors from absolute performance » Management fees and other expenses incurred by the Fund. • Top contributors to absolute performance » Underlying equity and fixed income funds advanced for the period. Equity funds, led by the Nuveen Equity Index Fund, recorded the largest gains and contributed most. | | Fund Performance Fees/Other Expenses Equity & Fixed Income Funds |
How did the Fund perform over the last 10 years?
Performance data shown represents past performance and does not predict or guarantee future results. The graph and table do not reflect the deduction of taxes that a shareholder would pay on Fund distributions or redemption of Fund Shares.
Fund Performance (June 1, 2014 through May 31, 2024) Initial Investment of $10,000
Average Annual Total Returns
| | | | | | | | | | | | |
| | | 1 year | | | 5 years | | | 10 years | |
| Retirement Class Shares at NAV | | | 16.36 | % | | | 8.71 | % | | | 7.26 | % |
Russell 3000® Index | | | 27.58 | % | | | 15.00 | % | | | 12.09 | % |
| Bloomberg U.S. Aggregate Bond Index | | | 1.31 | % | | | (0.17 | )% | | | 1.26 | % |
| Lifecycle Index 2035 Fund Composite Index | | | 16.72 | % | | | 9.04 | % | | | 7.60 | % |
| S&P Target Date 2035 Index | | | 16.73 | % | | | 8.92 | % | | | 7.21 | % |
Investment return and principal value will fluctuate, and you may have a gain or loss when you sell your shares. Current performance may differ from figures shown. For most recent month‑end performance, go to https://www.nuveen.com/en‑us/mutual‑funds/prospectuses or call (800) 257‑8787.
Fund Statistics (as of May 31, 2024)
| | | | |
| Fund net assets | | $ | 8,457,873,052 | |
| Total number of portfolio holdings | | | 7 | |
| Portfolio turnover (%) | | | 11% | |
| Total advisory fees paid for the year | | $ | 11,652,990 | |
What did the Fund invest in? (as of May 31, 2024)
(1) Affiliated investment companies, except for repurchase agreements.
How has the Fund changed?
| | • | | Name change: Effective May 1, 2024, the Fund’s name changed from TIAA-CREF Lifecycle Index 2035 Fund to Nuveen Lifecycle Index 2035 Fund. | |
For more complete information, you may review the Fund’s next prospectus, which is expected to be available by October 1, 2024 at https://www.nuveen.com/en‑us/mutual‑funds/prospectuses or upon request at (800) 257‑8787.
Availability of additional information about the Fund
You can find additional information about the Fund at https://www.nuveen.com/en‑us/mutual‑funds/prospectuses, including its:
| | • | | prospectus • financial statements and other information • fund holdings • proxy voting information |
You can also request this information at (800) 257‑8787.
| | |
87245M707_AR_0524 3613843-INV-Y-07/25 (I, R6, Premier, Retirement) | | |
| | |
| | Annual Shareholder Report May 31, 2024 |
Nuveen Lifecycle Index 2035 Fund
(Formerly known as TIAA-CREF Lifecycle Index 2035 Fund)
Class I Shares (Formerly known as Advisor Class Shares)/TLYHX
Annual Shareholder Report
This annual shareholder report contains important information about the Class I Shares of the Nuveen Lifecycle Index 2035 Fund for the period of June 1, 2023 to May 31, 2024. You can find additional information at https://www.nuveen.com/en‑us/mutual‑funds/prospectuses. You can also request this information by contacting us at (800) 257‑8787.
This report describes changes to the Fund that occurred during the reporting period.
What were the Fund costs for the last year? (based on a hypothetical $10,000 investment)
| | | | |
| | | Cost of a $10,000 investment | | Costs paid as a percentage of
$10,000 investment |
| Class I Shares | | $21 | | 0.21% |
How did the Fund perform last year? What affected the Fund’s performance?
| | |
Performance Highlights • The Nuveen Lifecycle Index 2035 Fund returned 16.57% for Class I shares at net asset value (NAV) for the 12 months ended May 31, 2024. The Fund performed in line with the Lifecycle Index 2035 Fund Composite Index, which returned 16.72%. • The Lifecycle Index 2035 Fund Composite Index consisted of: 44.6% Russell 3000® Index; 28.2% Bloomberg U.S. Aggregate Bond Index; 24.0% MSCI EAFE + Emerging Markets Index; 1.6% Bloomberg U.S. 1-3 Year Government/Credit Bond Index; and 1.6% Bloomberg U.S. Treasury Inflation Protected Securities (TIPS) 1-10 Year Index. • Top detractors from absolute performance » Management fees and other expenses incurred by the Fund. • Top contributors to absolute performance » Underlying equity and fixed income funds advanced for the period. Equity funds, led by the Nuveen Equity Index Fund, recorded the largest gains and contributed most. | | Fund Performance Fees/Other Expenses Equity & Fixed Income Funds |
How did the Fund perform over the period since inception?
Performance data shown represents past performance and does not predict or guarantee future results. The graph and table do not reflect the deduction of taxes that a shareholder would pay on Fund distributions or redemption of Fund Shares.
Fund Performance (December 4, 2015 through May 31, 2024) Initial Investment of $10,000
Average Annual Total Returns
| | | | | | | | | | | | |
| | | 1 year | | | 5 years | | | Since Inception | |
| Class I Shares at NAV | | | 16.57 | % | | | 8.87 | % | | | 8.34 | % |
Russell 3000® Index | | | 27.58 | % | | | 15.00 | % | | | 12.98 | % |
| Bloomberg U.S. Aggregate Bond Index | | | 1.31 | % | | | (0.17 | )% | | | 1.16 | % |
| Lifecycle Index 2035 Fund Composite Index | | | 16.72 | % | | | 9.04 | % | | | 8.50 | % |
| S&P Target Date 2035 Index | | | 16.73 | % | | | 8.92 | % | | | 8.11 | % |
Investment return and principal value will fluctuate, and you may have a gain or loss when you sell your shares. Current performance may differ from figures shown. For most recent month‑end performance, go to https://www.nuveen.com/en‑us/mutual‑funds/prospectuses or call (800) 257‑8787.
Fund Statistics (as of May 31, 2024)
| | | | |
| Fund net assets | | $ | 8,457,873,052 | |
| Total number of portfolio holdings | | | 7 | |
| Portfolio turnover (%) | | | 11% | |
| Total advisory fees paid for the year | | $ | 11,652,990 | |
What did the Fund invest in? (as of May 31, 2024)
(1) Affiliated investment companies, except for repurchase agreements.
How has the Fund changed?
| | • | | Name change: Effective May 1, 2024, the Fund’s name changed from TIAA-CREF Lifecycle Index 2035 Fund to Nuveen Lifecycle Index 2035 Fund. | |
| | • | | Share class name change: Effective May 6, 2024, Advisor Class shares of the Fund were renamed Class I shares. | |
For more complete information, you may review the Fund’s next prospectus, which is expected to be available by October 1, 2024 at https://www.nuveen.com/en‑us/mutual‑funds/prospectuses or upon request at (800) 257‑8787.
Availability of additional information about the Fund
You can find additional information about the Fund at https://www.nuveen.com/en‑us/mutual‑funds/prospectuses, including its:
| | • | | prospectus • financial statements and other information • fund holdings • proxy voting information |
You can also request this information at (800) 257‑8787.
| | |
87245P775_AR_0524 3613843-INV-Y-07/25 (I, R6, Premier, Retirement) | | |
| | |
| | Annual Shareholder Report May 31, 2024 |
Nuveen Lifecycle Index 2040 Fund
(Formerly known as TIAA-CREF Lifecycle Index 2040 Fund)
Class R6 Shares (Formerly known as Institutional Class Shares)/TLZIX
Annual Shareholder Report
This annual shareholder report contains important information about the Class R6 Shares of the Nuveen Lifecycle Index 2040 Fund for the period of June 1, 2023 to May 31, 2024. You can find additional information at https://www.nuveen.com/en‑us/mutual‑funds/prospectuses. You can also request this information by contacting us at (800) 257‑8787.
This report describes changes to the Fund that occurred during the reporting period.
What were the Fund costs for the last year? (based on a hypothetical $10,000 investment)
| | | | |
| | | Cost of a $10,000 investment | | Costs paid as a percentage of
$10,000 investment |
| Class R6 Shares | | $11 | | 0.11% |
How did the Fund perform last year? What affected the Fund’s performance?
| | |
Performance Highlights • The Nuveen Lifecycle Index 2040 Fund returned 19.02% for Class R6 shares at net asset value (NAV) for the 12 months ended May 31, 2024. The Fund performed in line with the Lifecycle Index 2040 Fund Composite Index, which returned 19.12%. • The Lifecycle Index 2040 Fund Composite Index consisted of: 51.8% Russell 3000® Index; 27.9% MSCI EAFE + Emerging Markets Index; and 20.3% Bloomberg U.S. Aggregate Bond Index. • Top detractors from absolute performance » Management fees and other expenses incurred by the Fund. • Top contributors to absolute performance » Underlying equity and fixed income funds advanced for the period. Equity funds, led by the Nuveen Equity Index Fund, recorded the largest gains and contributed most. | | Fund Performance Fees/Other Expenses Equity & Fixed Income Funds |
How did the Fund perform over the last 10 years?
Performance data shown represents past performance and does not predict or guarantee future results. The graph and table do not reflect the deduction of taxes that a shareholder would pay on Fund distributions or redemption of Fund Shares.
Fund Performance (June 1, 2014 through May 31, 2024) Initial Investment of $10,000
Average Annual Total Returns
| | | | | | | | | | | | |
| | | 1 year | | | 5 years | | | 10 years | |
| Class R6 Shares at NAV | | | 19.02 | % | | | 10.07 | % | | | 8.23 | % |
Russell 3000® Index | | | 27.58 | % | | | 15.00 | % | | | 12.09 | % |
| Bloomberg U.S. Aggregate Bond Index | | | 1.31 | % | | | (0.17 | )% | | | 1.26 | % |
| Lifecycle Index 2040 Fund Composite Index | | | 19.12 | % | | | 10.14 | % | | | 8.29 | % |
| S&P Target Date 2040 Index | | | 18.88 | % | | | 9.82 | % | | | 7.74 | % |
Investment return and principal value will fluctuate, and you may have a gain or loss when you sell your shares. Current performance may differ from figures shown. For most recent month‑end performance, go to https://www.nuveen.com/en‑us/mutual‑funds/prospectuses or call (800) 257‑8787.
Fund Statistics (as of May 31, 2024)
| | | | |
| Fund net assets | | $ | 8,874,158,019 | |
| Total number of portfolio holdings | | | 5 | |
| Portfolio turnover (%) | | | 9% | |
| Total advisory fees paid for the year | | $ | 11,856,216 | |
What did the Fund invest in? (as of May 31, 2024)
(1) Affiliated investment companies, except for repurchase agreements.
How has the Fund changed?
| | • | | Name change: Effective May 1, 2024, the Fund’s name changed from TIAA-CREF Lifecycle Index 2040 Fund to Nuveen Lifecycle Index 2040 Fund. | |
| | • | | Share class name change: Effective May 6, 2024, Institutional Class shares of the Fund were renamed Class R6 shares. | |
For more complete information, you may review the Fund’s next prospectus, which is expected to be available by October 1, 2024 at https://www.nuveen.com/en‑us/mutual‑funds/prospectuses or upon request at (800) 257‑8787.
Availability of additional information about the Fund
You can find additional information about the Fund at https://www.nuveen.com/en-us/mutual-funds/prospectuses, including its:
| | • | | prospectus • financial statements and other information • fund holdings • proxy voting information |
You can also request this information at (800) 257‑8787.
| | |
87245M764_AR_0524 3613851-INV-Y-07/25 (I, R6, Premier, Retirement) | | |
| | |
| | Annual Shareholder Report May 31, 2024 |
Nuveen Lifecycle Index 2040 Fund
(Formerly known as TIAA-CREF Lifecycle Index 2040 Fund)
Premier Class Shares/TLPRX
Annual Shareholder Report
This annual shareholder report contains important information about the Premier Class Shares of the Nuveen Lifecycle Index 2040 Fund for the period of June 1, 2023 to May 31, 2024. You can find additional information at https://www.nuveen.com/en-us/mutual-funds/prospectuses. You can also request this information by contacting us at (800) 257‑8787.
This report describes changes to the Fund that occurred during the reporting period.
What were the Fund costs for the last year? (based on a hypothetical $10,000 investment)
| | | | |
| | | Cost of a $10,000 investment | | Costs paid as a percentage of
$10,000 investment |
| Premier Class Shares | | $26 | | 0.26% |
How did the Fund perform last year? What affected the Fund’s performance?
| | |
Performance Highlights • The Nuveen Lifecycle Index 2040 Fund returned 18.86% for Premier Class shares at net asset value (NAV) for the 12 months ended May 31, 2024. The Fund underperformed the Lifecycle Index 2040 Fund Composite Index, which returned 19.12%. • The Lifecycle Index 2040 Fund Composite Index consisted of: 51.8% Russell 3000® Index; 27.9% MSCI EAFE + Emerging Markets Index; and 20.3% Bloomberg U.S. Aggregate Bond Index. • Top detractors from absolute performance » Management fees and other expenses incurred by the Fund. • Top contributors to absolute performance » Underlying equity and fixed income funds advanced for the period. Equity funds, led by the Nuveen Equity Index Fund, recorded the largest gains and contributed most. | | Fund Performance Fees/Other Expenses Equity & Fixed Income Funds |
How did the Fund perform over the last 10 years?
Performance data shown represents past performance and does not predict or guarantee future results. The graph and table do not reflect the deduction of taxes that a shareholder would pay on Fund distributions or redemption of Fund Shares.
Fund Performance (June 1, 2014 through May 31, 2024) Initial Investment of $10,000
Average Annual Total Returns
| | | | | | | | | | | | |
| | | 1 year | | | 5 years | | | 10 years | |
| Premier Class Shares at NAV | | | 18.86 | % | | | 9.90 | % | | | 8.06 | % |
Russell 3000® Index | | | 27.58 | % | | | 15.00 | % | | | 12.09 | % |
| Bloomberg U.S. Aggregate Bond Index | | | 1.31 | % | | | (0.17 | )% | | | 1.26 | % |
| Lifecycle Index 2040 Fund Composite Index | | | 19.12 | % | | | 10.14 | % | | | 8.29 | % |
| S&P Target Date 2040 Index | | | 18.88 | % | | | 9.82 | % | | | 7.74 | % |
Investment return and principal value will fluctuate, and you may have a gain or loss when you sell your shares. Current performance may differ from figures shown. For most recent month‑end performance, go to https://www.nuveen.com/en‑us/mutual‑funds/prospectuses or call (800) 257‑8787.
Fund Statistics (as of May 31, 2024)
| | | | |
| Fund net assets | | $ | 8,874,158,019 | |
| Total number of portfolio holdings | | | 5 | |
| Portfolio turnover (%) | | | 9% | |
| Total advisory fees paid for the year | | $ | 11,856,216 | |
What did the Fund invest in? (as of May 31, 2024)
(1) Affiliated investment companies, except for repurchase agreements.
How has the Fund changed?
| | • | | Name change: Effective May 1, 2024, the Fund’s name changed from TIAA-CREF Lifecycle Index 2040 Fund to Nuveen Lifecycle Index 2040 Fund. | |
For more complete information, you may review the Fund’s next prospectus, which is expected to be available by October 1, 2024 at https://www.nuveen.com/en‑us/mutual‑funds/prospectuses or upon request at (800) 257‑8787.
Availability of additional information about the Fund
You can find additional information about the Fund at https://www.nuveen.com/en‑us/mutual‑funds/prospectuses, including its:
| | • | | prospectus • financial statements and other information • fund holdings • proxy voting information |
You can also request this information at (800) 257‑8787.
| | |
87245M657_AR_0524 3613851-INV-Y-07/25 (I, R6, Premier, Retirement) | | |
| | |
| | Annual Shareholder Report May 31, 2024 |
Nuveen Lifecycle Index 2040 Fund
(Formerly known as TIAA-CREF Lifecycle Index 2040 Fund)
Retirement Class Shares/TLZRX
Annual Shareholder Report
This annual shareholder report contains important information about the Retirement Class Shares of the Nuveen Lifecycle Index 2040 Fund for the period of June 1, 2023 to May 31, 2024. You can find additional information at https://www.nuveen.com/en‑us/mutual‑funds/prospectuses. You can also request this information by contacting us at (800) 257‑8787.
This report describes changes to the Fund that occurred during the reporting period.
What were the Fund costs for the last year? (based on a hypothetical $10,000 investment)
| | | | |
| | | Cost of a $10,000 investment | | Costs paid as a percentage of
$10,000 investment |
| Retirement Class Shares | | $36 | | 0.36% |
How did the Fund perform last year? What affected the Fund’s performance?
| | |
Performance Highlights • The Nuveen Lifecycle Index 2040 Fund returned 18.72% for Retirement Class shares at net asset value (NAV) for the 12 months ended May 31, 2024. The Fund underperformed the Lifecycle Index 2040 Fund Composite Index, which returned 19.12%. • The Lifecycle Index 2040 Fund Composite Index consisted of: 51.8% Russell 3000® Index; 27.9% MSCI EAFE + Emerging Markets Index; and 20.3% Bloomberg U.S. Aggregate Bond Index. • Top detractors from absolute performance » Management fees and other expenses incurred by the Fund. • Top contributors to absolute performance » Underlying equity and fixed income funds advanced for the period. Equity funds, led by the Nuveen Equity Index Fund, recorded the largest gains and contributed most. | | Fund Performance Fees/Other Expenses Equity & Fixed Income Funds |
How did the Fund perform over the last 10 years?
Performance data shown represents past performance and does not predict or guarantee future results. The graph and table do not reflect the deduction of taxes that a shareholder would pay on Fund distributions or redemption of Fund Shares.
Fund Performance (June 1, 2014 through May 31, 2024) Initial Investment of $10,000
Average Annual Total Returns
| | | | | | | | | | | | |
| | | 1 year | | | 5 years | | | 10 years | |
| Retirement Class Shares at NAV | | | 18.72 | % | | | 9.81 | % | | | 7.96 | % |
Russell 3000® Index | | | 27.58 | % | | | 15.00 | % | | | 12.09 | % |
| Bloomberg U.S. Aggregate Bond Index | | | 1.31 | % | | | (0.17 | )% | | | 1.26 | % |
| Lifecycle Index 2040 Fund Composite Index | | | 19.12 | % | | | 10.14 | % | | | 8.29 | % |
| S&P Target Date 2040 Index | | | 18.88 | % | | | 9.82 | % | | | 7.74 | % |
Investment return and principal value will fluctuate, and you may have a gain or loss when you sell your shares. Current performance may differ from figures shown. For most recent month‑end performance, go to https://www.nuveen.com/en‑us/mutual‑funds/prospectuses or call (800) 257‑8787.
Fund Statistics (as of May 31, 2024)
| | | | |
| Fund net assets | | $ | 8,874,158,019 | |
| Total number of portfolio holdings | | | 5 | |
| Portfolio turnover (%) | | | 9% | |
| Total advisory fees paid for the year | | $ | 11,856,216 | |
What did the Fund invest in? (as of May 31, 2024)
(1) Affiliated investment companies, except for repurchase agreements.
How has the Fund changed?
| | • | | Name change: Effective May 1, 2024, the Fund’s name changed from TIAA-CREF Lifecycle Index 2040 Fund to Nuveen Lifecycle Index 2040 Fund. | |
For more complete information, you may review the Fund’s next prospectus, which is expected to be available by October 1, 2024 at https://www.nuveen.com/en‑us/mutual‑funds/prospectuses or upon request at (800) 257‑8787.
Availability of additional information about the Fund
You can find additional information about the Fund at https://www.nuveen.com/en‑us/mutual‑funds/prospectuses, including its:
| | • | | prospectus • financial statements and other information • fund holdings • proxy voting information |
You can also request this information at (800) 257‑8787.
| | |
87245M806_AR_0524 3613851-INV-Y-07/25 (I, R6, Premier, Retirement) | | |
| | |
| | Annual Shareholder Report May 31, 2024 |
Nuveen Lifecycle Index 2040 Fund
(Formerly known as TIAA-CREF Lifecycle Index 2040 Fund)
Class I Shares (Formerly known as Advisor Class Shares)/TLZHX
Annual Shareholder Report
This annual shareholder report contains important information about the Class I Shares of the Nuveen Lifecycle Index 2040 Fund for the period of June 1, 2023 to May 31, 2024. You can find additional information at https://www.nuveen.com/en‑us/mutual‑funds/prospectuses. You can also request this information by contacting us at (800) 257‑8787.
This report describes changes to the Fund that occurred during the reporting period.
What were the Fund costs for the last year? (based on a hypothetical $10,000 investment)
| | | | |
| | | Cost of a $10,000 investment | | Costs paid as a percentage of
$10,000 investment |
| Class I Shares | | $21 | | 0.21% |
How did the Fund perform last year? What affected the Fund’s performance?
| | |
Performance Highlights • The Nuveen Lifecycle Index 2040 Fund returned 18.90% for Class I shares at net asset value (NAV) for the 12 months ended May 31, 2024. The Fund performed in line with the Lifecycle Index 2040 Fund Composite Index, which returned 19.12%. • The Lifecycle Index 2040 Fund Composite Index consisted of: 51.8% Russell 3000® Index; 27.9% MSCI EAFE + Emerging Markets Index; and 20.3% Bloomberg U.S. Aggregate Bond Index. • Top detractors from absolute performance » Management fees and other expenses incurred by the Fund. • Top contributors to absolute performance » Underlying equity and fixed income funds advanced for the period. Equity funds, led by the Nuveen Equity Index Fund, recorded the largest gains and contributed most. | | Fund Performance Fees/Other Expenses Equity & Fixed Income Funds |
How did the Fund perform over the period since inception?
Performance data shown represents past performance and does not predict or guarantee future results. The graph and table do not reflect the deduction of taxes that a shareholder would pay on Fund distributions or redemption of Fund Shares.
Fund Performance (December 4, 2015 through May 31, 2024) Initial Investment of $10,000
Average Annual Total Returns
| | | | | | | | | | | | |
| | | 1 year | | | 5 years | | | Since Inception | |
| Class I Shares at NAV | | | 18.90 | % | | | 9.97 | % | | | 9.15 | % |
Russell 3000® Index | | | 27.58 | % | | | 15.00 | % | | | 12.98 | % |
| Bloomberg U.S. Aggregate Bond Index | | | 1.31 | % | | | (0.17 | )% | | | 1.16 | % |
| Lifecycle Index 2040 Fund Composite Index | | | 19.12 | % | | | 10.14 | % | | | 9.32 | % |
| S&P Target Date 2040 Index | | | 18.88 | % | | | 9.82 | % | | | 8.75 | % |
Investment return and principal value will fluctuate, and you may have a gain or loss when you sell your shares. Current performance may differ from figures shown. For most recent month‑end performance, go to https://www.nuveen.com/en-us/mutual-funds/prospectuses or call (800) 257‑8787.
Fund Statistics (as of May 31, 2024)
| | | | |
| Fund net assets | | $ | 8,874,158,019 | |
| Total number of portfolio holdings | | | 5 | |
| Portfolio turnover (%) | | | 9% | |
| Total advisory fees paid for the year | | $ | 11,856,216 | |
What did the Fund invest in? (as of May 31, 2024)
(1) Affiliated investment companies, except for repurchase agreements.
How has the Fund changed?
| | • | | Name change: Effective May 1, 2024, the Fund’s name changed from TIAA-CREF Lifecycle Index 2040 Fund to Nuveen Lifecycle Index 2040 Fund. | |
| | • | | Share class name change: Effective May 6, 2024, Advisor Class shares of the Fund were renamed Class I shares. | |
For more complete information, you may review the Fund’s next prospectus, which is expected to be available by October 1, 2024 at https://www.nuveen.com/en-us/mutual-funds/prospectuses or upon request at (800) 257‑8787.
Availability of additional information about the Fund
You can find additional information about the Fund at https://www.nuveen.com/en-us/mutual-funds/prospectuses, including its:
| | • | | prospectus • financial statements and other information • fund holdings • proxy voting information |
You can also request this information at (800) 257‑8787.
| | |
87245P767_AR_0524 3613851-INV-Y-07/25 (I, R6, Premier, Retirement) | | |
| | |
| | Annual Shareholder Report May 31, 2024 |
Nuveen Lifecycle Index 2045 Fund
(Formerly known as TIAA-CREF Lifecycle Index 2045 Fund)
Class R6 Shares (Formerly known as Institutional Class Shares)/TLXIX
Annual Shareholder Report
This annual shareholder report contains important information about the Class R6 Shares of the Nuveen Lifecycle Index 2045 Fund for the period of June 1, 2023 to May 31, 2024. You can find additional information at https://www.nuveen.com/en‑us/mutual‑funds/prospectuses. You can also request this information by contacting us at (800) 257‑8787.
This report describes changes to the Fund that occurred during the reporting period.
What were the Fund costs for the last year? (based on a hypothetical $10,000 investment)
| | | | |
| | | Cost of a $10,000 investment | | Costs paid as a percentage of $10,000 investment |
| Class R6 Shares | | $11 | | 0.11% |
How did the Fund perform last year? What affected the Fund’s performance?
| | |
Performance Highlights • The Nuveen Lifecycle Index 2045 Fund returned 20.61% for Class R6 shares at net asset value (NAV) for the 12 months ended May 31, 2024. The Fund performed in line with the Lifecycle Index 2045 Fund Composite Index, which returned 20.69%. • The Lifecycle Index 2045 Fund Composite Index consisted of: 56.5% Russell 3000® Index; 30.4% MSCI EAFE + Emerging Markets Index; and 13.1% Bloomberg U.S. Aggregate Bond Index. • Top detractors from absolute performance » Management fees and other expenses incurred by the Fund. • Top contributors to absolute performance » Underlying equity and fixed income funds advanced for the period. Equity funds, led by the Nuveen Equity Index Fund, recorded the largest gains and contributed most. | | Fund Performance Fees/Other Expenses Equity & Fixed Income Funds |
How did the Fund perform over the last 10 years?
Performance data shown represents past performance and does not predict or guarantee future results. The graph and table do not reflect the deduction of taxes that a shareholder would pay on Fund distributions or redemption of Fund Shares.
Fund Performance (June 1, 2014 through May 31, 2024) Initial Investment of $10,000
Average Annual Total Returns
| | | | | | | | | | | | |
| | | 1 year | | | 5 years | | | 10 years | |
| Class R6 Shares at NAV | | | 20.61 | % | | | 10.92 | % | | | 8.71 | % |
Russell 3000® Index | | | 27.58 | % | | | 15.00 | % | | | 12.09 | % |
| Bloomberg U.S. Aggregate Bond Index | | | 1.31 | % | | | (0.17 | )% | | | 1.26 | % |
| Lifecycle Index 2045 Fund Composite Index | | | 20.69 | % | | | 10.99 | % | | | 8.78 | % |
| S&P Target Date 2045 Index | | | 20.26 | % | | | 10.39 | % | | | 8.08 | % |
Investment return and principal value will fluctuate, and you may have a gain or loss when you sell your shares. Current performance may differ from figures shown. For most recent month‑end performance, go to https://www.nuveen.com/en‑us/mutual‑funds/prospectuses or call (800) 257‑8787.
Fund Statistics (as of May 31, 2024)
| | | | |
| Fund net assets | | $ | 7,419,395,769 | |
| Total number of portfolio holdings | | | 5 | |
| Portfolio turnover (%) | | | 8% | |
| Total advisory fees paid for the year | | $ | 9,615,348 | |
What did the Fund invest in? (as of May 31, 2024)
(1) Affiliated investment companies, except for repurchase agreements.
How has the Fund changed?
| | • | | Name change: Effective May 1, 2024, the Fund’s name changed from TIAA-CREF Lifecycle Index 2045 Fund to Nuveen Lifecycle Index 2045 Fund. | |
| | • | | Share class name change: Effective May 6, 2024, Institutional Class shares of the Fund were renamed Class R6 shares. | |
For more complete information, you may review the Fund’s next prospectus, which is expected to be available by October 1, 2024 at https://www.nuveen.com/en‑us/mutual‑funds/prospectuses or upon request at (800) 257‑8787.
Availability of additional information about the Fund
You can find additional information about the Fund at https://www.nuveen.com/en‑us/mutual‑funds/prospectuses, including its:
| | • | | prospectus • financial statements and other information • fund holdings • proxy voting information |
You can also request this information at (800) 257‑8787.
| | |
87245M756_AR_0524 3613858-INV-Y-07/25 (I, R6, Premier, Retirement) | | |
| | |
| | Annual Shareholder Report May 31, 2024 |
Nuveen Lifecycle Index 2045 Fund
(Formerly known as TIAA-CREF Lifecycle Index 2045 Fund)
Premier Class Shares/TLMPX
Annual Shareholder Report
This annual shareholder report contains important information about the Premier Class Shares of the Nuveen Lifecycle Index 2045 Fund for the period of June 1, 2023 to May 31, 2024. You can find additional information at https://www.nuveen.com/en‑us/mutual‑funds/prospectuses. You can also request this information by contacting us at (800) 257‑8787.
This report describes changes to the Fund that occurred during the reporting period.
What were the Fund costs for the last year? (based on a hypothetical $10,000 investment)
| | | | |
| | | Cost of a $10,000 investment | | Costs paid as a percentage of
$10,000 investment |
| Premier Class Shares | | $25 | | 0.25% |
How did the Fund perform last year? What affected the Fund’s performance?
| | |
Performance Highlights • The Nuveen Lifecycle Index 2045 Fund returned 20.44% for Premier Class shares at net asset value (NAV) for the 12 months ended May 31, 2024. The Fund performed in line with the Lifecycle Index 2045 Fund Composite Index, which returned 20.69%. • The Lifecycle Index 2045 Fund Composite Index consisted of: 56.5% Russell 3000® Index; 30.4% MSCI EAFE + Emerging Markets Index; and 13.1% Bloomberg U.S. Aggregate Bond Index. • Top detractors from absolute performance » Management fees and other expenses incurred by the Fund. • Top contributors to absolute performance » Underlying equity and fixed income funds advanced for the period. Equity funds, led by the Nuveen Equity Index Fund, recorded the largest gains and contributed most. | | Fund Performance Fees/Other Expenses Equity & Fixed Income Funds |
How did the Fund perform over the last 10 years?
Performance data shown represents past performance and does not predict or guarantee future results. The graph and table do not reflect the deduction of taxes that a shareholder would pay on Fund distributions or redemption of Fund Shares.
Fund Performance (June 1, 2014 through May 31, 2024) Initial Investment of $10,000
Average Annual Total Returns
| | | | | | | | | | | | |
| | | 1 year | | | 5 years | | | 10 years | |
| Premier Class Shares at NAV | | | 20.44 | % | | | 10.76 | % | | | 8.55 | % |
Russell 3000® Index | | | 27.58 | % | | | 15.00 | % | | | 12.09 | % |
| Bloomberg U.S. Aggregate Bond Index | | | 1.31 | % | | | (0.17 | )% | | | 1.26 | % |
| Lifecycle Index 2045 Fund Composite Index | | | 20.69 | % | | | 10.99 | % | | | 8.78 | % |
| S&P Target Date 2045 Index | | | 20.26 | % | | | 10.39 | % | | | 8.08 | % |
Investment return and principal value will fluctuate, and you may have a gain or loss when you sell your shares. Current performance may differ from figures shown. For most recent month‑end performance, go to https://www.nuveen.com/en‑us/mutual‑funds/prospectuses or call (800) 257‑8787.
Fund Statistics (as of May 31, 2024)
| | | | |
| Fund net assets | | $ | 7,419,395,769 | |
| Total number of portfolio holdings | | | 5 | |
| Portfolio turnover (%) | | | 8% | |
| Total advisory fees paid for the year | | $ | 9,615,348 | |
What did the Fund invest in? (as of May 31, 2024)
(1) Affiliated investment companies, except for repurchase agreements.
How has the Fund changed?
| | • | | Name change: Effective May 1, 2024, the Fund’s name changed from TIAA-CREF Lifecycle Index 2045 Fund to Nuveen Lifecycle Index 2045 Fund. | |
For more complete information, you may review the Fund’s next prospectus, which is expected to be available by October 1, 2024 at https://www.nuveen.com/en‑us/mutual‑funds/prospectuses or upon request at (800) 257‑8787.
Availability of additional information about the Fund
You can find additional information about the Fund at https://www.nuveen.com/en‑us/mutual‑funds/prospectuses, including its:
| | • | | prospectus • financial statements and other information • fund holdings • proxy voting information |
You can also request this information at (800) 257‑8787.
| | |
87245M640_AR_0524 3613858-INV-Y-07/25 (I, R6, Premier, Retirement) | | |
| | |
| | Annual Shareholder Report May 31, 2024 |
Nuveen Lifecycle Index 2045 Fund
(Formerly known as TIAA-CREF Lifecycle Index 2045 Fund)
Retirement Class Shares/TLMRX
Annual Shareholder Report
This annual shareholder report contains important information about the Retirement Class Shares of the Nuveen Lifecycle Index 2045 Fund for the period of June 1, 2023 to May 31, 2024. You can find additional information at https://www.nuveen.com/en‑us/mutual‑funds/prospectuses. You can also request this information by contacting us at (800) 257‑8787.
This report describes changes to the Fund that occurred during the reporting period.
What were the Fund costs for the last year? (based on a hypothetical $10,000 investment)
| | | | |
| | | Cost of a $10,000 investment | | Costs paid as a percentage of
$10,000 investment |
| Retirement Class Shares | | $35 | | 0.35% |
How did the Fund perform last year? What affected the Fund’s performance?
| | |
Performance Highlights • The Nuveen Lifecycle Index 2045 Fund returned 20.30% for Retirement Class shares at net asset value (NAV) for the 12 months ended May 31, 2024. The Fund underperformed the Lifecycle Index 2045 Fund Composite Index, which returned 20.69%. • The Lifecycle Index 2045 Fund Composite Index consisted of: 56.5% Russell 3000® Index; 30.4% MSCI EAFE + Emerging Markets Index; and 13.1% Bloomberg U.S. Aggregate Bond Index. • Top detractors from absolute performance » Management fees and other expenses incurred by the Fund. • Top contributors to absolute performance » Underlying equity and fixed income funds advanced for the period. Equity funds, led by the Nuveen Equity Index Fund, recorded the largest gains and contributed most. | | Fund Performance Fees/Other Expenses Equity & Fixed Income Funds |
How did the Fund perform over the last 10 years?
Performance data shown represents past performance and does not predict or guarantee future results. The graph and table do not reflect the deduction of taxes that a shareholder would pay on Fund distributions or redemption of Fund Shares.
Fund Performance (June 1, 2014 through May 31, 2024) Initial Investment of $10,000
Average Annual Total Returns
| | | | | | | | | | | | |
| | | 1 year | | | 5 years | | | 10 years | |
| Retirement Class Shares at NAV | | | 20.30 | % | | | 10.65 | % | | | 8.44 | % |
Russell 3000® Index | | | 27.58 | % | | | 15.00 | % | | | 12.09 | % |
| Bloomberg U.S. Aggregate Bond Index | | | 1.31 | % | | | (0.17 | )% | | | 1.26 | % |
| Lifecycle Index 2045 Fund Composite Index | | | 20.69 | % | | | 10.99 | % | | | 8.78 | % |
| S&P Target Date 2045 Index | | | 20.26 | % | | | 10.39 | % | | | 8.08 | % |
Investment return and principal value will fluctuate, and you may have a gain or loss when you sell your shares. Current performance may differ from figures shown. For most recent month‑end performance, go to https://www.nuveen.com/en‑us/mutual‑funds/prospectuses or call (800) 257‑8787.
Fund Statistics (as of May 31, 2024)
| | | | |
| Fund net assets | | $ | 7,419,395,769 | |
| Total number of portfolio holdings | | | 5 | |
| Portfolio turnover (%) | | | 8% | |
| Total advisory fees paid for the year | | $ | 9,615,348 | |
What did the Fund invest in? (as of May 31, 2024)
(1) Affiliated investment companies, except for repurchase agreements.
How has the Fund changed?
| | • | | Name change: Effective May 1, 2024, the Fund’s name changed from TIAA-CREF Lifecycle Index 2045 Fund to Nuveen Lifecycle Index 2045 Fund. | |
For more complete information, you may review the Fund’s next prospectus, which is expected to be available by October 1, 2024 at https://www.nuveen.com/en‑us/mutual‑funds/prospectuses or upon request at (800) 257‑8787.
Availability of additional information about the Fund
You can find additional information about the Fund at https://www.nuveen.com/en‑us/mutual‑funds/prospectuses, including its:
| | • | | prospectus • financial statements and other information • fund holdings • proxy voting information |
You can also request this information at (800) 257‑8787.
| | |
87245M863_AR_0524 3613858-INV-Y-07/25 (I, R6, Premier, Retirement) | | |
| | |
| | Annual Shareholder Report May 31, 2024 |
Nuveen Lifecycle Index 2045 Fund
(Formerly known as TIAA-CREF Lifecycle Index 2045 Fund)
Class I Shares (Formerly known as Advisor Class Shares)/TLMHX
Annual Shareholder Report
This annual shareholder report contains important information about the Class I Shares of the Nuveen Lifecycle Index 2045 Fund for the period of June 1, 2023 to May 31, 2024. You can find additional information at https://www.nuveen.com/en‑us/mutual‑funds/prospectuses. You can also request this information by contacting us at (800) 257‑8787.
This report describes changes to the Fund that occurred during the reporting period.
What were the Fund costs for the last year? (based on a hypothetical $10,000 investment)
| | | | |
| | | Cost of a $10,000 investment | | Costs paid as a percentage of
$10,000 investment |
| Class I Shares | | $21 | | 0.21% |
How did the Fund perform last year? What affected the Fund’s performance?
| | |
Performance Highlights • The Nuveen Lifecycle Index 2045 Fund returned 20.46% for Class I shares at net asset value (NAV) for the 12 months ended May 31, 2024. The Fund performed in line with the Lifecycle Index 2045 Fund Composite Index, which returned 20.69%. • The Lifecycle Index 2045 Fund Composite Index consisted of: 56.5% Russell 3000® Index; 30.4% MSCI EAFE + Emerging Markets Index; and 13.1% Bloomberg U.S. Aggregate Bond Index. • Top detractors from absolute performance » Management fees and other expenses incurred by the Fund. • Top contributors to absolute performance » Underlying equity and fixed income funds advanced for the period. Equity funds, led by the Nuveen Equity Index Fund, recorded the largest gains and contributed most. | | Fund Performance Fees/Other Expenses Equity & Fixed Income Funds |
How did the Fund perform over the period since inception?
Performance data shown represents past performance and does not predict or guarantee future results. The graph and table do not reflect the deduction of taxes that a shareholder would pay on Fund distributions or redemption of Fund Shares.
Fund Performance (December 4, 2015 through May 31, 2024) Initial Investment of $10,000
Average Annual Total Returns
| | | | | | | | | | | | |
| | | 1 year | | | 5 years | | | Since Inception | |
| Class I Shares at NAV | | | 20.46 | % | | | 10.82 | % | | | 9.71 | % |
Russell 3000® Index | | | 27.58 | % | | | 15.00 | % | | | 12.98 | % |
| Bloomberg U.S. Aggregate Bond Index | | | 1.31 | % | | | (0.17 | )% | | | 1.16 | % |
| Lifecycle Index 2045 Fund Composite Index | | | 20.69 | % | | | 10.99 | % | | | 9.90 | % |
| S&P Target Date 2045 Index | | | 20.26 | % | | | 10.39 | % | | | 9.14 | % |
Investment return and principal value will fluctuate, and you may have a gain or loss when you sell your shares. Current performance may differ from figures shown. For most recent month‑end performance, go to https://www.nuveen.com/en‑us/mutual‑funds/prospectuses or call (800) 257‑8787.
Fund Statistics (as of May 31, 2024)
| | | | |
| Fund net assets | | $ | 7,419,395,769 | |
| Total number of portfolio holdings | | | 5 | |
| Portfolio turnover (%) | | | 8% | |
| Total advisory fees paid for the year | | $ | 9,615,348 | |
What did the Fund invest in? (as of May 31, 2024)
(1) Affiliated investment companies, except for repurchase agreements.
How has the Fund changed?
| | • | | Name change: Effective May 1, 2024, the Fund’s name changed from TIAA-CREF Lifecycle Index 2045 Fund to Nuveen Lifecycle Index 2045 Fund. | |
| | • | | Share class name change: Effective May 6, 2024, Advisor Class shares of the Fund were renamed Class I shares. | |
For more complete information, you may review the Fund’s next prospectus, which is expected to be available by October 1, 2024 at https://www.nuveen.com/en‑us/mutual‑funds/prospectuses or upon request at (800) 257‑8787.
Availability of additional information about the Fund
You can find additional information about the Fund at https://www.nuveen.com/en‑us/mutual‑funds/prospectuses, including its:
| | • | | prospectus • financial statements and other information • fund holdings • proxy voting information |
You can also request this information at (800) 257‑8787.
| | |
87245P759_AR_0524 3613858-INV-Y-07/25 (I, R6, Premier, Retirement) | | |
| | |
| | Annual Shareholder Report May 31, 2024 |
Nuveen Lifecycle Index 2050 Fund
(Formerly known as TIAA-CREF Lifecycle Index 2050 Fund)
Class R6 Shares (Formerly known as Institutional Class Shares)/TLLIX
Annual Shareholder Report
This annual shareholder report contains important information about the Class R6 Shares of the Nuveen Lifecycle Index 2050 Fund for the period of June 1, 2023 to May 31, 2024. You can find additional information at https://www.nuveen.com/en‑us/mutual‑funds/prospectuses. You can also request this information by contacting us at (800) 257‑8787.
This report describes changes to the Fund that occurred during the reporting period.
What were the Fund costs for the last year? (based on a hypothetical $10,000 investment)
| | | | |
| | | Cost of a $10,000 investment | | Costs paid as a percentage of
$10,000 investment |
| Class R6 Shares | | $11 | | 0.11% |
How did the Fund perform last year? What affected the Fund’s performance?
| | |
Performance Highlights • The Nuveen Lifecycle Index 2050 Fund returned 21.34% for Class R6 shares at net asset value (NAV) for the 12 months ended May 31, 2024. The Fund performed in line with the Lifecycle Index 2050 Fund Composite Index, which returned 21.42%. • The Lifecycle Index 2050 Fund Composite Index consisted of: 58.7% Russell 3000® Index; 31.6% MSCI EAFE + Emerging Markets Index; and 9.7% Bloomberg U.S. Aggregate Bond Index. • Top detractors from absolute performance » Management fees and other expenses incurred by the Fund. • Top contributors to absolute performance » Underlying equity and fixed income funds advanced for the period. Equity funds, led by the Nuveen Equity Index Fund, recorded the largest gains and contributed most. | | Fund Performance Fees/Other Expenses Equity & Fixed Income Funds |
How did the Fund perform over the last 10 years?
Performance data shown represents past performance and does not predict or guarantee future results. The graph and table do not reflect the deduction of taxes that a shareholder would pay on Fund distributions or redemption of Fund Shares.
Fund Performance (June 1, 2014 through May 31, 2024) Initial Investment of $10,000
Average Annual Total Returns
| | | | | | | | | | | | |
| | | 1 year | | | 5 years | | | 10 years | |
| Class R6 Shares at NAV | | | 21.34 | % | | | 11.18 | % | | | 8.87 | % |
Russell 3000® Index | | | 27.58 | % | | | 15.00 | % | | | 12.09 | % |
| Bloomberg U.S. Aggregate Bond Index | | | 1.31 | % | | | (0.17 | )% | | | 1.26 | % |
| Lifecycle Index 2050 Fund Composite Index | | | 21.42 | % | | | 11.24 | % | | | 8.93 | % |
| S&P Target Date 2050 Index | | | 21.00 | % | | | 10.68 | % | | | 8.28 | % |
Investment return and principal value will fluctuate, and you may have a gain or loss when you sell your shares. Current performance may differ from figures shown. For most recent month‑end performance, go to https://www.nuveen.com/en‑us/mutual‑funds/prospectuses or call (800) 257‑8787.
Fund Statistics (as of May 31, 2024)
| | | | |
| Fund net assets | | $ | 6,264,949,959 | |
| Total number of portfolio holdings | | | 5 | |
| Portfolio turnover (%) | | | 7% | |
| Total advisory fees paid for the year | | $ | 8,068,565 | |
What did the Fund invest in? (as of May 31, 2024)
(1) Affiliated investment companies, except for repurchase agreements.
How has the Fund changed?
| | • | | Name change: Effective May 1, 2024, the Fund’s name changed from TIAA-CREF Lifecycle Index 2050 Fund to Nuveen Lifecycle Index 2050 Fund. | |
| | • | | Share class name change: Effective May 6, 2024, Institutional Class shares of the Fund were renamed Class R6 shares. | |
For more complete information, you may review the Fund’s next prospectus, which is expected to be available by October 1, 2024 at https://www.nuveen.com/en‑us/mutual‑funds/prospectuses or upon request at (800) 257‑8787.
Availability of additional information about the Fund
You can find additional information about the Fund at https://www.nuveen.com/en‑us/mutual‑funds/prospectuses, including its:
| | • | | prospectus • financial statements and other information • fund holdings • proxy voting information |
You can also request this information at (800) 257‑8787.
| | |
87245M749_AR_0524 3613869-INV-Y-07/25 (I, R6, Premier, Retirement) | | |
| | |
| | Annual Shareholder Report May 31, 2024 |
Nuveen Lifecycle Index 2050 Fund
(Formerly known as TIAA-CREF Lifecycle Index 2050 Fund)
Premier Class Shares/TLLPX
Annual Shareholder Report
This annual shareholder report contains important information about the Premier Class Shares of the Nuveen Lifecycle Index 2050 Fund for the period of June 1, 2023 to May 31, 2024. You can find additional information at https://www.nuveen.com/en‑us/mutual‑funds/prospectuses. You can also request this information by contacting us at (800) 257‑8787.
This report describes changes to the Fund that occurred during the reporting period.
What were the Fund costs for the last year? (based on a hypothetical $10,000 investment)
| | | | |
| | | Cost of a $10,000 investment | | Costs paid as a percentage of
$10,000 investment |
| Premier Class Shares | | $26 | | 0.26% |
How did the Fund perform last year? What affected the Fund’s performance?
| | |
Performance Highlights • The Nuveen Lifecycle Index 2050 Fund returned 21.13% for Premier Class shares at net asset value (NAV) for the 12 months ended May 31, 2024. The Fund underperformed the Lifecycle Index 2050 Fund Composite Index, which returned 21.42%. • The Lifecycle Index 2050 Fund Composite Index consisted of: 58.7% Russell 3000® Index; 31.6% MSCI EAFE + Emerging Markets Index; and 9.7% Bloomberg U.S. Aggregate Bond Index. • Top detractors from absolute performance » Management fees and other expenses incurred by the Fund. • Top contributors to absolute performance » Underlying equity and fixed income funds advanced for the period. Equity funds, led by the Nuveen Equity Index Fund, recorded the largest gains and contributed most. | | Fund Performance Fees/Other Expenses Equity & Fixed Income Funds |
How did the Fund perform over the last 10 years?
Performance data shown represents past performance and does not predict or guarantee future results. The graph and table do not reflect the deduction of taxes that a shareholder would pay on Fund distributions or redemption of Fund Shares.
Fund Performance (June 1, 2014 through May 31, 2024) Initial Investment of $10,000
Average Annual Total Returns
| | | | | | | | | | | | |
| | | 1 year | | | 5 years | | | 10 years | |
| Premier Class Shares at NAV | | | 21.13 | % | | | 11.02 | % | | | 8.71 | % |
Russell 3000® Index | | | 27.58 | % | | | 15.00 | % | | | 12.09 | % |
| Bloomberg U.S. Aggregate Bond Index | | | 1.31 | % | | | (0.17 | )% | | | 1.26 | % |
| Lifecycle Index 2050 Fund Composite Index | | | 21.42 | % | | | 11.24 | % | | | 8.93 | % |
| S&P Target Date 2050 Index | | | 21.00 | % | | | 10.68 | % | | | 8.28 | % |
Investment return and principal value will fluctuate, and you may have a gain or loss when you sell your shares. Current performance may differ from figures shown. For most recent month‑end performance, go to https://www.nuveen.com/en‑us/mutual‑funds/prospectuses or call (800) 257‑8787.
Fund Statistics (as of May 31, 2024)
| | | | |
| Fund net assets | | $ | 6,264,949,959 | |
| Total number of portfolio holdings | | | 5 | |
| Portfolio turnover (%) | | | 7% | |
| Total advisory fees paid for the year | | $ | 8,068,565 | |
What did the Fund invest in? (as of May 31, 2024)
(1) Affiliated investment companies, except for repurchase agreements.
How has the Fund changed?
| | • | | Name change: Effective May 1, 2024, the Fund’s name changed from TIAA-CREF Lifecycle Index 2050 Fund to Nuveen Lifecycle Index 2050 Fund. | |
For more complete information, you may review the Fund’s next prospectus, which is expected to be available by October 1, 2024 at https://www.nuveen.com/en‑us/mutual‑funds/prospectuses or upon request at (800) 257‑8787.
Availability of additional information about the Fund
You can find additional information about the Fund at https://www.nuveen.com/en‑us/mutual‑funds/prospectuses, including its:
| | • | | prospectus • financial statements and other information • fund holdings • proxy voting information |
You can also request this information at (800) 257‑8787.
| | |
87245M632_AR_0524 3613869-INV-Y-07/25 (I, R6, Premier, Retirement) | | |
| | |
| | Annual Shareholder Report May 31, 2024 |
Nuveen Lifecycle Index 2050 Fund
(Formerly known as TIAA-CREF Lifecycle Index 2050 Fund)
Retirement Class Shares/TLLRX
Annual Shareholder Report
This annual shareholder report contains important information about the Retirement Class Shares of the Nuveen Lifecycle Index 2050 Fund for the period of June 1, 2023 to May 31, 2024. You can find additional information at https://www.nuveen.com/en‑us/mutual‑funds/prospectuses. You can also request this information by contacting us at (800) 257‑8787.
This report describes changes to the Fund that occurred during the reporting period.
What were the Fund costs for the last year? (based on a hypothetical $10,000 investment)
| | | | |
| | | Cost of a $10,000 investment | | Costs paid as a percentage of
$10,000 investment |
| Retirement Class Shares | | $36 | | 0.36% |
How did the Fund perform last year? What affected the Fund’s performance?
| | |
Performance Highlights • The Nuveen Lifecycle Index 2050 Fund returned 21.01% for Retirement Class shares at net asset value (NAV) for the 12 months ended May 31, 2024. The Fund underperformed the Lifecycle Index 2050 Fund Composite Index, which returned 21.42%. • The Lifecycle Index 2050 Fund Composite Index consisted of: 58.7% Russell 3000® Index; 31.6% MSCI EAFE + Emerging Markets Index; and 9.7% Bloomberg U.S. Aggregate Bond Index. • Top detractors from absolute performance » Management fees and other expenses incurred by the Fund. • Top contributors to absolute performance » Underlying equity and fixed income funds advanced for the period. Equity funds, led by the Nuveen Equity Index Fund, recorded the largest gains and contributed most. | | Fund Performance Fees/Other Expenses Equity & Fixed Income Funds |
How did the Fund perform over the last 10 years?
Performance data shown represents past performance and does not predict or guarantee future results. The graph and table do not reflect the deduction of taxes that a shareholder would pay on Fund distributions or redemption of Fund Shares.
Fund Performance (June 1, 2014 through May 31, 2024) Initial Investment of $10,000
Average Annual Total Returns
| | | | | | | | | | | | |
| | | 1 year | | | 5 years | | | 10 years | |
| Retirement Class Shares at NAV | | | 21.01 | % | | | 10.90 | % | | | 8.60 | % |
Russell 3000® Index | | | 27.58 | % | | | 15.00 | % | | | 12.09 | % |
| Bloomberg U.S. Aggregate Bond Index | | | 1.31 | % | | | (0.17 | )% | | | 1.26 | % |
| Lifecycle Index 2050 Fund Composite Index | | | 21.42 | % | | | 11.24 | % | | | 8.93 | % |
| S&P Target Date 2050 Index | | | 21.00 | % | | | 10.68 | % | | | 8.28 | % |
Investment return and principal value will fluctuate, and you may have a gain or loss when you sell your shares. Current performance may differ from figures shown. For most recent month‑end performance, go to https://www.nuveen.com/en‑us/mutual‑funds/prospectuses or call (800) 257‑8787.
Fund Statistics (as of May 31, 2024)
| | | | |
| Fund net assets | | $ | 6,264,949,959 | |
| Total number of portfolio holdings | | | 5 | |
| Portfolio turnover (%) | | | 7% | |
| Total advisory fees paid for the year | | $ | 8,068,565 | |
What did the Fund invest in? (as of May 31, 2024)
(1) Affiliated investment companies, except for repurchase agreements.
How has the Fund changed?
| | • | | Name change: Effective May 1, 2024, the Fund’s name changed from TIAA-CREF Lifecycle Index 2050 Fund to Nuveen Lifecycle Index 2050 Fund. | |
For more complete information, you may review the Fund’s next prospectus, which is expected to be available by October 1, 2024 at https://www.nuveen.com/en‑us/mutual‑funds/prospectuses or upon request at (800) 257‑8787.
Availability of additional information about the Fund
You can find additional information about the Fund at https://www.nuveen.com/en‑us/mutual‑funds/prospectuses, including its:
| | • | | prospectus • financial statements and other information • fund holdings • proxy voting information |
You can also request this information at (800) 257‑8787.
| | |
87245M871_AR_0524 3613869-INV-Y-07/25 (I, R6, Premier, Retirement) | | |
| | |
| | Annual Shareholder Report May 31, 2024 |
Nuveen Lifecycle Index 2050 Fund
(Formerly known as TIAA-CREF Lifecycle Index 2050 Fund)
Class I Shares (Formerly known as Advisor Class Shares)/TLLHX
Annual Shareholder Report
This annual shareholder report contains important information about the Class I Shares of the Nuveen Lifecycle Index 2050 Fund for the period of June 1, 2023 to May 31, 2024. You can find additional information at https://www.nuveen.com/en‑us/mutual‑funds/prospectuses. You can also request this information by contacting us at (800) 257‑8787.
This report describes changes to the Fund that occurred during the reporting period.
What were the Fund costs for the last year? (based on a hypothetical $10,000 investment)
| | | | |
| | | Cost of a $10,000 investment | | Costs paid as a percentage of
$10,000 investment |
| Class I Shares | | $21 | | 0.21% |
How did the Fund perform last year? What affected the Fund’s performance?
| | |
Performance Highlights • The Nuveen Lifecycle Index 2050 Fund returned 21.23% for Class I shares at net asset value (NAV) for the 12 months ended May 31, 2024. The Fund performed in line with the Lifecycle Index 2050 Fund Composite Index, which returned 21.42%. • The Lifecycle Index 2050 Fund Composite Index consisted of: 58.7% Russell 3000® Index; 31.6% MSCI EAFE + Emerging Markets Index; and 9.7% Bloomberg U.S. Aggregate Bond Index. • Top detractors from absolute performance » Management fees and other expenses incurred by the Fund. • Top contributors to absolute performance » Underlying equity and fixed income funds advanced for the period. Equity funds, led by the Nuveen Equity Index Fund, recorded the largest gains and contributed most. | | Fund Performance Fees/Other Expenses Equity & Fixed Income Funds |
How did the Fund perform over the period since inception?
Performance data shown represents past performance and does not predict or guarantee future results. The graph and table do not reflect the deduction of taxes that a shareholder would pay on Fund distributions or redemption of Fund Shares.
Fund Performance (December 4, 2015 through May 31, 2024) Initial Investment of $10,000
Average Annual Total Returns
| | | | | | | | | | | | |
| | | 1 year | | | 5 years | | | Since Inception | |
| Class I Shares at NAV | | | 21.23 | % | | | 11.08 | % | | | 9.91 | % |
Russell 3000® Index | | | 27.58 | % | | | 15.00 | % | | | 12.98 | % |
| Bloomberg U.S. Aggregate Bond Index | | | 1.31 | % | | | (0.17 | )% | | | 1.16 | % |
| Lifecycle Index 2050 Fund Composite Index | | | 21.42 | % | | | 11.24 | % | | | 10.08 | % |
| S&P Target Date 2050 Index | | | 21.00 | % | | | 10.68 | % | | | 9.37 | % |
Investment return and principal value will fluctuate, and you may have a gain or loss when you sell your shares. Current performance may differ from figures shown. For most recent month‑end performance, go to https://www.nuveen.com/en-us/mutual-funds/prospectuses or call (800) 257‑8787.
Fund Statistics (as of May 31, 2024)
| | | | |
| Fund net assets | | $ | 6,264,949,959 | |
| Total number of portfolio holdings | | | 5 | |
| Portfolio turnover (%) | | | 7% | |
| Total advisory fees paid for the year | | $ | 8,068,565 | |
What did the Fund invest in? (as of May 31, 2024)
(1) Affiliated investment companies, except for repurchase agreements.
How has the Fund changed?
| | • | | Name change: Effective May 1, 2024, the Fund’s name changed from TIAA-CREF Lifecycle Index 2050 Fund to Nuveen Lifecycle Index 2050 Fund. | |
| | • | | Share class name change: Effective May 6, 2024, Advisor Class shares of the Fund were renamed Class I shares. | |
For more complete information, you may review the Fund’s next prospectus, which is expected to be available by October 1, 2024 at https://www.nuveen.com/en-us/mutual-funds/prospectuses or upon request at (800) 257‑8787.
Availability of additional information about the Fund
You can find additional information about the Fund at https://www.nuveen.com/en-us/mutual-funds/prospectuses, including its:
| | • | | prospectus • financial statements and other information • fund holdings • proxy voting information |
You can also request this information at (800) 257‑8787.
| | |
87245P742_AR_0524 3613869-INV-Y-07/25 (I, R6, Premier, Retirement) | | |
| | |
| | Annual Shareholder Report May 31, 2024 |
Nuveen Lifecycle Index 2055 Fund
(Formerly known as TIAA-CREF Lifecycle Index 2055 Fund)
Retirement Class Shares/TTIRX
Annual Shareholder Report
This annual shareholder report contains important information about the Retirement Class Shares of the Nuveen Lifecycle Index 2055 Fund for the period of June 1, 2023 to May 31, 2024. You can find additional information at https://www.nuveen.com/en‑us/mutual‑funds/prospectuses. You can also request this information by contacting us at (800) 257‑8787.
This report describes changes to the Fund that occurred during the reporting period.
What were the Fund costs for the last year? (based on a hypothetical $10,000 investment)
| | | | |
| | | Cost of a $10,000 investment | | Costs paid as a percentage of
$10,000 investment |
| Retirement Class Shares | | $36 | | 0.36% |
How did the Fund perform last year? What affected the Fund’s performance?
| | |
Performance Highlights • The Nuveen Lifecycle Index 2055 Fund returned 21.32% for Retirement Class shares at net asset value (NAV) for the 12 months ended May 31, 2024. The Fund underperformed the Lifecycle Index 2055 Fund Composite Index, which returned 21.71%. • The Lifecycle Index 2055 Fund Composite Index consisted of: 59.5% Russell 3000® Index; 32.0% MSCI EAFE + Emerging Markets Index; and 8.5% Bloomberg U.S. Aggregate Bond Index. • Top detractors from absolute performance » Management fees and other expenses incurred by the Fund. • Top contributors to absolute performance » Underlying equity and fixed income funds advanced for the period. Equity funds, led by the Nuveen Equity Index Fund, recorded the largest gains and contributed most. | | Fund Performance Fees/Other Expenses Equity & Fixed Income Funds |
How did the Fund perform over the last 10 years?
Performance data shown represents past performance and does not predict or guarantee future results. The graph and table do not reflect the deduction of taxes that a shareholder would pay on Fund distributions or redemption of Fund Shares.
Fund Performance (June 1, 2014 through May 31, 2024) Initial Investment of $10,000
Average Annual Total Returns
| | | | | | | | | | | | |
| | | 1 year | | | 5 years | | | 10 years | |
| Retirement Class Shares at NAV | | | 21.32 | % | | | 11.04 | % | | | 8.71 | % |
Russell 3000® Index | | | 27.58 | % | | | 15.00 | % | | | 12.09 | % |
| Bloomberg U.S. Aggregate Bond Index | | | 1.31 | % | | | (0.17 | )% | | | 1.26 | % |
| Lifecycle Index 2055 Fund Composite Index | | | 21.71 | % | | | 11.39 | % | | | 9.04 | % |
| S&P Target Date 2055 Index | | | 21.05 | % | | | 10.75 | % | | | 8.34 | % |
Investment return and principal value will fluctuate, and you may have a gain or loss when you sell your shares. Current performance may differ from figures shown. For most recent month‑end performance, go to https://www.nuveen.com/en‑us/mutual‑funds/prospectuses or call (800) 257‑8787.
Fund Statistics (as of May 31, 2024)
| | | | |
| Fund net assets | | $ | 3,748,381,346 | |
| Total number of portfolio holdings | | | 5 | |
| Portfolio turnover (%) | | | 7% | |
| Total advisory fees paid for the year | | $ | 4,710,433 | |
What did the Fund invest in? (as of May 31, 2024)
(1) Affiliated investment companies, except for repurchase agreements.
How has the Fund changed?
| | • | | Name change: Effective May 1, 2024, the Fund’s name changed from TIAA-CREF Lifecycle Index 2055 Fund to Nuveen Lifecycle Index 2055 Fund. | |
For more complete information, you may review the Fund’s next prospectus, which is expected to be available by October 1, 2024 at https://www.nuveen.com/en‑us/mutual‑funds/prospectuses or upon request at (800) 257‑8787.
Availability of additional information about the Fund
You can find additional information about the Fund at https://www.nuveen.com/en‑us/mutual‑funds/prospectuses, including its:
| | • | | prospectus • financial statements and other information • fund holdings • proxy voting information |
You can also request this information at (800) 257‑8787.
| | |
87245M152_AR_0524 3613876-INV-Y-07/25 (I, R6, Premier, Retirement) | | |
| | |
| | Annual Shareholder Report May 31, 2024 |
Nuveen Lifecycle Index 2055 Fund
(Formerly known as TIAA-CREF Lifecycle Index 2055 Fund)
Class R6 Shares (Formerly known as Institutional Class Shares)/TTIIX
Annual Shareholder Report
This annual shareholder report contains important information about the Class R6 Shares of the Nuveen Lifecycle Index 2055 Fund for the period of June 1, 2023 to May 31, 2024. You can find additional information at https://www.nuveen.com/en‑us/mutual‑funds/prospectuses. You can also request this information by contacting us at (800) 257‑8787.
This report describes changes to the Fund that occurred during the reporting period.
What were the Fund costs for the last year? (based on a hypothetical $10,000 investment)
| | | | |
| | | Cost of a $10,000 investment | | Costs paid as a percentage of
$10,000 investment |
| Class R6 Shares | | $11 | | 0.11% |
How did the Fund perform last year? What affected the Fund’s performance?
| | |
Performance Highlights • The Nuveen Lifecycle Index 2055 Fund returned 21.61% for Class R6 shares at net asset value (NAV) for the 12 months ended May 31, 2024. The Fund performed in line with the Lifecycle Index 2055 Fund Composite Index, which returned 21.71%. • The Lifecycle Index 2055 Fund Composite Index consisted of: 59.5% Russell 3000® Index; 32.0% MSCI EAFE + Emerging Markets Index; and 8.5% Bloomberg U.S. Aggregate Bond Index. • Top detractors from absolute performance » Management fees and other expenses incurred by the Fund. • Top contributors to absolute performance » Underlying equity and fixed income funds advanced for the period. Equity funds, led by the Nuveen Equity Index Fund, recorded the largest gains and contributed most. | | Fund Performance Fees/Other Expenses Equity & Fixed Income Funds |
How did the Fund perform over the last 10 years?
Performance data shown represents past performance and does not predict or guarantee future results. The graph and table do not reflect the deduction of taxes that a shareholder would pay on Fund distributions or redemption of Fund Shares.
Fund Performance (June 1, 2014 through May 31, 2024) Initial Investment of $10,000
Average Annual Total Returns
| | | | | | | | | | | | |
| | | 1 year | | | 5 years | | | 10 years | |
| Class R6 Shares at NAV | | | 21.61 | % | | | 11.32 | % | | | 8.97 | % |
Russell 3000® Index | | | 27.58 | % | | | 15.00 | % | | | 12.09 | % |
| Bloomberg U.S. Aggregate Bond Index | | | 1.31 | % | | | (0.17 | )% | | | 1.26 | % |
| Lifecycle Index 2055 Fund Composite Index | | | 21.71 | % | | | 11.39 | % | | | 9.04 | % |
| S&P Target Date 2055 Index | | | 21.05 | % | | | 10.75 | % | | | 8.34 | % |
Investment return and principal value will fluctuate, and you may have a gain or loss when you sell your shares. Current performance may differ from figures shown. For most recent month‑end performance, go to https://www.nuveen.com/en‑us/mutual‑funds/prospectuses or call (800) 257‑8787.
Fund Statistics (as of May 31, 2024)
| | | | |
| Fund net assets | | $ | 3,748,381,346 | |
| Total number of portfolio holdings | | | 5 | |
| Portfolio turnover (%) | | | 7% | |
| Total advisory fees paid for the year | | $ | 4,710,433 | |
What did the Fund invest in? (as of May 31, 2024)
(1) Affiliated investment companies, except for repurchase agreements.
How has the Fund changed?
| | • | | Name change: Effective May 1, 2024, the Fund’s name changed from TIAA-CREF Lifecycle Index 2055 Fund to Nuveen Lifecycle Index 2055 Fund. | |
| | • | | Share class name change: Effective May 6, 2024, Institutional Class shares of the Fund were renamed Class R6 shares. | |
For more complete information, you may review the Fund’s next prospectus, which is expected to be available by October 1, 2024 at https://www.nuveen.com/en‑us/mutual‑funds/prospectuses or upon request at (800) 257‑8787.
Availability of additional information about the Fund
You can find additional information about the Fund at https://www.nuveen.com/en‑us/mutual‑funds/prospectuses, including its:
| | • | | prospectus • financial statements and other information • fund holdings • proxy voting information |
You can also request this information at (800) 257‑8787.
| | |
87245M178_AR_0524 3613876-INV-Y-07/25 (I, R6, Premier, Retirement) | | |
| | |
| | Annual Shareholder Report May 31, 2024 |
Nuveen Lifecycle Index 2055 Fund
(Formerly known as TIAA-CREF Lifecycle Index 2055 Fund)
Premier Class Shares/TTIPX
Annual Shareholder Report
This annual shareholder report contains important information about the Premier Class Shares of the Nuveen Lifecycle Index 2055 Fund for the period of June 1, 2023 to May 31, 2024. You can find additional information at https://www.nuveen.com/en‑us/mutual‑funds/prospectuses. You can also request this information by contacting us at (800) 257‑8787.
This report describes changes to the Fund that occurred during the reporting period.
What were the Fund costs for the last year? (based on a hypothetical $10,000 investment)
| | | | |
| | | Cost of a $10,000 investment | | Costs paid as a percentage of
$10,000 investment |
| Premier Class Shares | | $26 | | 0.26% |
How did the Fund perform last year? What affected the Fund’s performance?
| | |
Performance Highlights • The Nuveen Lifecycle Index 2055 Fund returned 21.47% for Premier Class shares at net asset value (NAV) for the 12 months ended May 31, 2024. The Fund performed in line with the Lifecycle Index 2055 Fund Composite Index, which returned 21.71%. • The Lifecycle Index 2055 Fund Composite Index consisted of: 59.5% Russell 3000® Index; 32.0% MSCI EAFE + Emerging Markets Index; and 8.5% Bloomberg U.S. Aggregate Bond Index. • Top detractors from absolute performance » Management fees and other expenses incurred by the Fund. • Top contributors to absolute performance » Underlying equity and fixed income funds advanced for the period. Equity funds, led by the Nuveen Equity Index Fund, recorded the largest gains and contributed most. | | Fund Performance Fees/Other Expenses Equity & Fixed Income Funds |
How did the Fund perform over the last 10 years?
Performance data shown represents past performance and does not predict or guarantee future results. The graph and table do not reflect the deduction of taxes that a shareholder would pay on Fund distributions or redemption of Fund Shares.
Fund Performance (June 1, 2014 through May 31, 2024) Initial Investment of $10,000
Average Annual Total Returns
| | | | | | | | | | | | |
| | | 1 year | | | 5 years | | | 10 years | |
| Premier Class Shares at NAV | | | 21.47 | % | | | 11.17 | % | | | 8.81 | % |
Russell 3000® Index | | | 27.58 | % | | | 15.00 | % | | | 12.09 | % |
| Bloomberg U.S. Aggregate Bond Index | | | 1.31 | % | | | (0.17 | )% | | | 1.26 | % |
| Lifecycle Index 2055 Fund Composite Index | | | 21.71 | % | | | 11.39 | % | | | 9.04 | % |
| S&P Target Date 2055 Index | | | 21.05 | % | | | 10.75 | % | | | 8.34 | % |
Investment return and principal value will fluctuate, and you may have a gain or loss when you sell your shares. Current performance may differ from figures shown. For most recent month‑end performance, go to https://www.nuveen.com/en‑us/mutual‑funds/prospectuses or call (800) 257‑8787.
Fund Statistics (as of May 31, 2024)
| | | | |
| Fund net assets | | $ | 3,748,381,346 | |
| Total number of portfolio holdings | | | 5 | |
| Portfolio turnover (%) | | | 7% | |
| Total advisory fees paid for the year | | $ | 4,710,433 | |
What did the Fund invest in? (as of May 31, 2024)
(1) Affiliated investment companies, except for repurchase agreements.
How has the Fund changed?
| | • | | Name change: Effective May 1, 2024, the Fund’s name changed from TIAA-CREF Lifecycle Index 2055 Fund to Nuveen Lifecycle Index 2055 Fund. | |
For more complete information, you may review the Fund’s next prospectus, which is expected to be available by October 1, 2024 at https://www.nuveen.com/en‑us/mutual‑funds/prospectuses or upon request at (800) 257‑8787.
Availability of additional information about the Fund
You can find additional information about the Fund at https://www.nuveen.com/en‑us/mutual‑funds/prospectuses, including its:
| | • | | prospectus • financial statements and other information • fund holdings • proxy voting information |
You can also request this information at (800) 257‑8787.
| | |
87245M160_AR_0524 3613876-INV-Y-07/25 (I, R6, Premier, Retirement) | | |
| | |
| | Annual Shareholder Report May 31, 2024 |
Nuveen Lifecycle Index 2055 Fund
(Formerly known as TIAA-CREF Lifecycle Index 2055 Fund)
Class I Shares (Formerly known as Advisor Class Shares)/TTIHX
Annual Shareholder Report
This annual shareholder report contains important information about the Class I Shares of the Nuveen Lifecycle Index 2055 Fund for the period of June 1, 2023 to May 31, 2024. You can find additional information at https://www.nuveen.com/en‑us/mutual‑funds/prospectuses. You can also request this information by contacting us at (800) 257‑8787.
This report describes changes to the Fund that occurred during the reporting period.
What were the Fund costs for the last year? (based on a hypothetical $10,000 investment)
| | | | |
| | | Cost of a $10,000 investment | | Costs paid as a percentage of
$10,000 investment |
| Class I Shares | | $20 | | 0.20% |
How did the Fund perform last year? What affected the Fund’s performance?
| | |
Performance Highlights • The Nuveen Lifecycle Index 2055 Fund returned 21.49% for Class I shares at net asset value (NAV) for the 12 months ended May 31, 2024. The Fund performed in line with the Lifecycle Index 2055 Fund Composite Index, which returned 21.71%. • The Lifecycle Index 2055 Fund Composite Index consisted of: 59.5% Russell 3000® Index; 32.0% MSCI EAFE + Emerging Markets Index; and 8.5% Bloomberg U.S. Aggregate Bond Index. • Top detractors from absolute performance » Management fees and other expenses incurred by the Fund. • Top contributors to absolute performance » Underlying equity and fixed income funds advanced for the period. Equity funds, led by the Nuveen Equity Index Fund, recorded the largest gains and contributed most. | | Fund Performance Fees/Other Expenses Equity & Fixed Income Funds |
How did the Fund perform over the period since inception?
Performance data shown represents past performance and does not predict or guarantee future results. The graph and table do not reflect the deduction of taxes that a shareholder would pay on Fund distributions or redemption of Fund Shares.
Fund Performance (December 4, 2015 through May 31, 2024) Initial Investment of $10,000
Average Annual Total Returns
| | | | | | | | | | | | |
| | | 1 year | | | 5 years | | | Since Inception | |
| Class I Shares at NAV | | | 21.49 | % | | | 11.21 | % | | | 10.05 | % |
Russell 3000® Index | | | 27.58 | % | | | 15.00 | % | | | 12.98 | % |
| Bloomberg U.S. Aggregate Bond Index | | | 1.31 | % | | | (0.17 | )% | | | 1.16 | % |
| Lifecycle Index 2055 Fund Composite Index | | | 21.71 | % | | | 11.39 | % | | | 10.21 | % |
| S&P Target Date 2055 Index | | | 21.05 | % | | | 10.75 | % | | | 9.45 | % |
Investment return and principal value will fluctuate, and you may have a gain or loss when you sell your shares. Current performance may differ from figures shown. For most recent month‑end performance, go to https://www.nuveen.com/en‑us/mutual‑funds/prospectuses or call (800) 257‑8787.
Fund Statistics (as of May 31, 2024)
| | | | |
| Fund net assets | | $ | 3,748,381,346 | |
| Total number of portfolio holdings | | | 5 | |
| Portfolio turnover (%) | | | 7% | |
| Total advisory fees paid for the year | | $ | 4,710,433 | |
What did the Fund invest in? (as of May 31, 2024)
(1) Affiliated investment companies, except for repurchase agreements.
How has the Fund changed?
| | • | | Name change: Effective May 1, 2024, the Fund’s name changed from TIAA-CREF Lifecycle Index 2055 Fund to Nuveen Lifecycle Index 2055 Fund. | |
| | • | | Share class name change: Effective May 6, 2024, Advisor Class shares of the Fund were renamed Class I shares. | |
For more complete information, you may review the Fund’s next prospectus, which is expected to be available by October 1, 2024 at https://www.nuveen.com/en‑us/mutual‑funds/prospectuses or upon request at (800) 257‑8787.
Availability of additional information about the Fund
You can find additional information about the Fund at https://www.nuveen.com/en‑us/mutual‑funds/prospectuses, including its:
| | • | | prospectus • financial statements and other information • fund holdings • proxy voting information |
You can also request this information at (800) 257‑8787.
| | |
87245P734_AR_0524 3613876-INV-Y-07/25 (I, R6, Premier, Retirement) | | |
| | |
| | Annual Shareholder Report May 31, 2024 |
Nuveen Lifecycle 2055 Fund
(Formerly known as TIAA-CREF Lifecycle 2055 Fund)
Retirement Class Shares/TTRLX
Annual Shareholder Report
This annual shareholder report contains important information about the Retirement Class Shares of the Nuveen Lifecycle 2055 Fund for the period of June 1, 2023 to May 31, 2024. You can find additional information at https://www.nuveen.com/en‑us/mutual‑funds/prospectuses. You can also request this information by contacting us at (800) 257‑8787.
This report describes changes to the Fund that occurred during the reporting period.
What were the Fund costs for the last year? (based on a hypothetical $10,000 investment)(1)
| | | | |
| | | Cost of a $10,000 investment | | Costs paid as a percentage of
$10,000 investment |
| Retirement Class Shares | | $51 | | 0.51% |
(1) These costs include the expenses of underlying funds in which the Fund invests except for the expenses of the Nuveen Dividend Growth Fund, Nuveen Dividend Value Fund, Nuveen Growth Opportunities ETF and TIAA-CREF Real Property Fund.
How did the Fund perform last year? What affected the Fund’s performance?
| | |
Performance Highlights • The Nuveen Lifecycle 2055 Fund returned 22.02% for Retirement Class shares at net asset value (NAV) for the 12 months ended May 31, 2024. The Fund outperformed the Lifecycle 2055 Fund Composite Index, which returned 21.73%. • The Lifecycle 2055 Fund Composite Index consisted of: 59.5% Russell 3000® Index; 32.0% MSCI All Country World Index ex USA Investable Market Index; and 8.5% Bloomberg U.S. Aggregate Bond Index. • Top contributors to relative performance » Strong overall performance among underlying funds investing in U.S. equities. » Positions in the Nuveen Core Equity Fund, Nuveen Growth Opportunities ETF and the Nuveen Large Cap Value Fund. • Top detractors from relative performance » An allocation to the Nuveen Real Property Fund LP. » A position in the Nuveen International Opportunities Fund. | | Performance Attribution Nuveen Core Equity Fund Nuveen Growth Opportunities ETF Nuveen Large Cap Value Fund Nuveen Real Property Fund LP |
How did the Fund perform over the last 10 years?
Performance data shown represents past performance and does not predict or guarantee future results. The graph and table do not reflect the deduction of taxes that a shareholder would pay on Fund distributions or redemption of Fund Shares.
Fund Performance (June 1, 2014 through May 31, 2024) Initial Investment of $10,000
Average Annual Total Returns
| | | | | | | | | | | | |
| | | 1 year | | | 5 years | | | 10 years | |
| Retirement Class Shares at NAV | | | 22.02 | % | | | 10.88 | % | | | 8.44 | % |
Russell 3000® Index | | | 27.58 | % | | | 15.00 | % | | | 12.09 | % |
| Bloomberg U.S. Aggregate Bond Index | | | 1.31 | % | | | (0.17 | )% | | | 1.26 | % |
| Lifecycle 2055 Fund Composite Index | | | 21.73 | % | | | 11.44 | % | | | 9.05 | % |
| S&P Target Date 2055 Index | | | 21.05 | % | | | 10.75 | % | | | 8.34 | % |
Investment return and principal value will fluctuate, and you may have a gain or loss when you sell your shares. Current performance may differ from figures shown. For most recent month‑end performance, go to https://www.nuveen.com/en‑us/mutual‑funds/prospectuses or call (800) 257‑8787.
Fund Statistics (as of May 31, 2024)
| | | | |
| Fund net assets | | $ | 1,766,248,561 | |
| Total number of portfolio holdings | | | 19 | |
| Portfolio turnover (%) | | | 16% | |
| Total advisory fees paid for the year | | $ | 6,690,466 | |
What did the Fund invest in? (as of May 31, 2024)
(1) Affiliated investment companies, except for repurchase agreements.
How has the Fund changed?
| | • | | Name change: Effective May 1, 2024, the Fund’s name changed from TIAA-CREF Lifecycle 2055 Fund to Nuveen Lifecycle 2055 Fund. | |
For more complete information, you may review the Fund’s next prospectus, which is expected to be available by October 1, 2024 at https://www.nuveen.com/en‑us/mutual‑funds/prospectuses or upon request at (800) 257‑8787.
Availability of additional information about the Fund
You can find additional information about the Fund at https://www.nuveen.com/en‑us/mutual‑funds/prospectuses, including its:
| | • | | prospectus • financial statements and other information • fund holdings • proxy voting information |
You can also request this information at (800) 257‑8787.
| | |
87245M194_AR_0524 3613759-INV-Y-07/25 (I, R6, Premier, Retirement) | | |
| | |
| | Annual Shareholder Report May 31, 2024 |
Nuveen Lifecycle 2055 Fund
(Formerly known as TIAA-CREF Lifecycle 2055 Fund)
Class R6 Shares (Formerly known as Institutional Class Shares)/TTRIX
Annual Shareholder Report
This annual shareholder report contains important information about the Class R6 Shares of the Nuveen Lifecycle 2055 Fund for the period of June 1, 2023 to May 31, 2024. You can find additional information at https://www.nuveen.com/en‑us/mutual‑funds/prospectuses. You can also request this information by contacting us at (800) 257‑8787.
This report describes changes to the Fund that occurred during the reporting period.
What were the Fund costs for the last year? (based on a hypothetical $10,000 investment)(1)
| | | | |
| | | Cost of a $10,000 investment | | Costs paid as a percentage of
$10,000 investment |
| Class R6 Shares | | $26 | | 0.26% |
(1) These costs include the expenses of underlying funds in which the Fund invests except for the expenses of the Nuveen Dividend Growth Fund, Nuveen Dividend Value Fund, Nuveen Growth Opportunities ETF and TIAA-CREF Real Property Fund.
How did the Fund perform last year? What affected the Fund’s performance?
| | |
Performance Highlights • The Nuveen Lifecycle 2055 Fund returned 22.26% for Class R6 shares at net asset value (NAV) for the 12 months ended May 31, 2024. The Fund outperformed the Lifecycle 2055 Fund Composite Index, which returned 21.73%. • The Lifecycle 2055 Fund Composite Index consisted of: 59.5% Russell 3000® Index; 32.0% MSCI All Country World Index ex USA Investable Market Index; and 8.5% Bloomberg U.S. Aggregate Bond Index. • Top contributors to relative performance » Strong overall performance among underlying funds investing in U.S. equities. » Positions in the Nuveen Core Equity Fund, Nuveen Growth Opportunities ETF and the Nuveen Large Cap Value Fund. • Top detractors from relative performance » An allocation to the Nuveen Real Property Fund LP. » A position in the Nuveen International Opportunities Fund. | | Performance Attribution Nuveen Core Equity Fund Nuveen Growth Opportunities ETF Nuveen Large Cap Value Fund Nuveen Real Property Fund LP |
How did the Fund perform over the last 10 years?
Performance data shown represents past performance and does not predict or guarantee future results. The graph and table do not reflect the deduction of taxes that a shareholder would pay on Fund distributions or redemption of Fund Shares.
Fund Performance (June 1, 2014 through May 31, 2024) Initial Investment of $10,000
Average Annual Total Returns
| | | | | | | | | | | | |
| | | 1 year | | | 5 years | | | 10 years | |
| Class R6 Shares at NAV | | | 22.26 | % | | | 11.15 | % | | | 8.71 | % |
Russell 3000® Index | | | 27.58 | % | | | 15.00 | % | | | 12.09 | % |
| Bloomberg U.S. Aggregate Bond Index | | | 1.31 | % | | | (0.17 | )% | | | 1.26 | % |
| Lifecycle 2055 Fund Composite Index | | | 21.73 | % | | | 11.44 | % | | | 9.05 | % |
| S&P Target Date 2055 Index | | | 21.05 | % | | | 10.75 | % | | | 8.34 | % |
Investment return and principal value will fluctuate, and you may have a gain or loss when you sell your shares. Current performance may differ from figures shown. For most recent month‑end performance, go to https://www.nuveen.com/en‑us/mutual‑funds/prospectuses or call (800) 257‑8787.
Fund Statistics (as of May 31, 2024)
| | | | |
| Fund net assets | | $ | 1,766,248,561 | |
| Total number of portfolio holdings | | | 19 | |
| Portfolio turnover (%) | | | 16% | |
| Total advisory fees paid for the year | | $ | 6,690,466 | |
What did the Fund invest in? (as of May 31, 2024)
(1) Affiliated investment companies, except for repurchase agreements.
How has the Fund changed?
| | • | | Name change: Effective May 1, 2024, the Fund’s name changed from TIAA-CREF Lifecycle 2055 Fund to Nuveen Lifecycle 2055 Fund. | |
| | • | | Share class name change: Effective May 6, 2024, Institutional Class shares of the Fund were renamed Class R6 shares. | |
For more complete information, you may review the Fund’s next prospectus, which is expected to be available by October 1, 2024 at https://www.nuveen.com/en‑us/mutual‑funds/prospectuses or upon request at (800) 257‑8787.
Availability of additional information about the Fund
You can find additional information about the Fund at https://www.nuveen.com/en‑us/mutual‑funds/prospectuses, including its:
| | • | | prospectus • financial statements and other information • fund holdings • proxy voting information |
You can also request this information at (800) 257‑8787.
| | |
87245M210_AR_0524 3613759-INV-Y-07/25 (I, R6, Premier, Retirement) | | |
| | |
| | Annual Shareholder Report May 31, 2024 |
Nuveen Lifecycle 2055 Fund
(Formerly known as TIAA-CREF Lifecycle 2055 Fund)
Premier Class Shares/TTRPX
Annual Shareholder Report
This annual shareholder report contains important information about the Premier Class Shares of the Nuveen Lifecycle 2055 Fund for the period of June 1, 2023 to May 31, 2024. You can find additional information at https://www.nuveen.com/en‑us/mutual‑funds/prospectuses. You can also request this information by contacting us at (800) 257‑8787.
This report describes changes to the Fund that occurred during the reporting period.
What were the Fund costs for the last year? (based on a hypothetical $10,000 investment)(1)
| | | | |
| | | Cost of a $10,000 investment | | Costs paid as a percentage of
$10,000 investment |
| Premier Class Shares | | $41 | | 0.41% |
(1) These costs include the expenses of underlying funds in which the Fund invests except for the expenses of the Nuveen Dividend Growth Fund, Nuveen Dividend Value Fund, Nuveen Growth Opportunities ETF and TIAA-CREF Real Property Fund.
How did the Fund perform last year? What affected the Fund’s performance?
| | |
Performance Highlights • The Nuveen Lifecycle 2055 Fund returned 22.02% for Premier Class shares at net asset value (NAV) for the 12 months ended May 31, 2024. The Fund outperformed the Lifecycle 2055 Fund Composite Index, which returned 21.73%. • The Lifecycle 2055 Fund Composite Index consisted of: 59.5% Russell 3000® Index; 32.0% MSCI All Country World Index ex USA Investable Market Index; and 8.5% Bloomberg U.S. Aggregate Bond Index. • Top contributors to relative performance » Strong overall performance among underlying funds investing in U.S. equities. » Positions in the Nuveen Core Equity Fund, Nuveen Growth Opportunities ETF and the Nuveen Large Cap Value Fund. • Top detractors from relative performance » An allocation to the Nuveen Real Property Fund LP. » A position in the Nuveen International Opportunities Fund. | | Performance Attribution Nuveen Core Equity Fund Nuveen Growth Opportunities ETF Nuveen Large Cap Value Fund Nuveen Real Property Fund LP |
How did the Fund perform over the last 10 years?
Performance data shown represents past performance and does not predict or guarantee future results. The graph and table do not reflect the deduction of taxes that a shareholder would pay on Fund distributions or redemption of Fund Shares.
Fund Performance (June 1, 2014 through May 31, 2024) Initial Investment of $10,000
Average Annual Total Returns
| | | | | | | | | | | | |
| | | 1 year | | | 5 years | | | 10 years | |
| Premier Class Shares at NAV | | | 22.02 | % | | | 10.97 | % | | | 8.55 | % |
Russell 3000® Index | | | 27.58 | % | | | 15.00 | % | | | 12.09 | % |
| Bloomberg U.S. Aggregate Bond Index | | | 1.31 | % | | | (0.17 | )% | | | 1.26 | % |
| Lifecycle 2055 Fund Composite Index | | | 21.73 | % | | | 11.44 | % | | | 9.05 | % |
| S&P Target Date 2055 Index | | | 21.05 | % | | | 10.75 | % | | | 8.34 | % |
Investment return and principal value will fluctuate, and you may have a gain or loss when you sell your shares. Current performance may differ from figures shown. For most recent month‑end performance, go to https://www.nuveen.com/en‑us/mutual‑funds/prospectuses or call (800) 257‑8787.
Fund Statistics (as of May 31, 2024)
| | | | |
| Fund net assets | | $ | 1,766,248,561 | |
| Total number of portfolio holdings | | | 19 | |
| Portfolio turnover (%) | | | 16% | |
| Total advisory fees paid for the year | | $ | 6,690,466 | |
What did the Fund invest in? (as of May 31, 2024)
(1) Affiliated investment companies, except for repurchase agreements.
How has the Fund changed?
| | • | | Name change: Effective May 1, 2024, the Fund’s name changed from TIAA-CREF Lifecycle 2055 Fund to Nuveen Lifecycle 2055 Fund. | |
For more complete information, you may review the Fund’s next prospectus, which is expected to be available by October 1, 2024 at https://www.nuveen.com/en‑us/mutual‑funds/prospectuses or upon request at (800) 257‑8787.
Availability of additional information about the Fund
You can find additional information about the Fund at https://www.nuveen.com/en‑us/mutual‑funds/prospectuses, including its:
| | • | | prospectus • financial statements and other information • fund holdings • proxy voting information |
You can also request this information at (800) 257‑8787.
| | |
87245M186_AR_0524 3613759-INV-Y-07/25 (I, R6, Premier, Retirement) | | |
| | |
| | Annual Shareholder Report May 31, 2024 |
Nuveen Lifecycle 2055 Fund
(Formerly known as TIAA-CREF Lifecycle 2055 Fund)
Class I Shares (Formerly known as Advisor Class Shares)/TTRHX
Annual Shareholder Report
This annual shareholder report contains important information about the Class I Shares of the Nuveen Lifecycle 2055 Fund for the period of June 1, 2023 to May 31, 2024. You can find additional information at https://www.nuveen.com/en‑us/mutual‑funds/prospectuses. You can also request this information by contacting us at (800) 257‑8787.
This report describes changes to the Fund that occurred during the reporting period.
What were the Fund costs for the last year? (based on a hypothetical $10,000 investment)(1)
| | | | |
| | | Cost of a $10,000 investment | | Costs paid as a percentage of
$10,000 investment |
| Class I Shares | | $34 | | 0.34% |
(1) These costs include the expenses of underlying funds in which the Fund invests except for the expenses of the Nuveen Dividend Growth Fund, Nuveen Dividend Value Fund, Nuveen Growth Opportunities ETF and TIAA-CREF Real Property Fund.
How did the Fund perform last year? What affected the Fund’s performance?
| | |
Performance Highlights • The Nuveen Lifecycle 2055 Fund returned 22.11% for Class I shares at net asset value (NAV) for the 12 months ended May 31, 2024. The Fund outperformed the Lifecycle 2055 Fund Composite Index, which returned 21.73%. • The Lifecycle 2055 Fund Composite Index consisted of: 59.5% Russell 3000® Index; 32.0% MSCI All Country World Index ex USA Investable Market Index; and 8.5% Bloomberg U.S. Aggregate Bond Index. • Top contributors to relative performance » Strong overall performance among underlying funds investing in U.S. equities. » Positions in the Nuveen Core Equity Fund, Nuveen Growth Opportunities ETF and the Nuveen Large Cap Value Fund. • Top detractors from relative performance » An allocation to the Nuveen Real Property Fund LP. » A position in the Nuveen International Opportunities Fund. | | Performance Attribution Nuveen Core Equity Fund Nuveen Growth Opportunities ETF Nuveen Large Cap Value Fund Nuveen Real Property Fund LP |
How did the Fund perform over the period since inception?
Performance data shown represents past performance and does not predict or guarantee future results. The graph and table do not reflect the deduction of taxes that a shareholder would pay on Fund distributions or redemption of Fund Shares.
Fund Performance (December 4, 2015 through May 31, 2024) Initial Investment of $10,000
Average Annual Total Returns
| | | | | | | | | | | | |
| | | 1 year | | | 5 years | | | Since Inception | |
| Class I Shares at NAV | | | 22.11 | % | | | 11.10 | % | | | 9.69 | % |
Russell 3000® Index | | | 27.58 | % | | | 15.00 | % | | | 12.98 | % |
| Bloomberg U.S. Aggregate Bond Index | | | 1.31 | % | | | (0.17 | )% | | | 1.16 | % |
| Lifecycle 2055 Fund Composite Index | | | 21.73 | % | | | 11.44 | % | | | 10.25 | % |
| S&P Target Date 2055 Index | | | 21.05 | % | | | 10.75 | % | | | 9.45 | % |
Investment return and principal value will fluctuate, and you may have a gain or loss when you sell your shares. Current performance may differ from figures shown. For most recent month‑end performance, go to https://www.nuveen.com/en‑us/mutual‑funds/prospectuses or call (800) 257‑8787.
Fund Statistics (as of May 31, 2024)
| | | | |
| Fund net assets | | $ | 1,766,248,561 | |
| Total number of portfolio holdings | | | 19 | |
| Portfolio turnover (%) | | | 16% | |
| Total advisory fees paid for the year | | $ | 6,690,466 | |
What did the Fund invest in? (as of May 31, 2024)
(1) Affiliated investment companies, except for repurchase agreements.
How has the Fund changed?
| | • | | Name change: Effective May 1, 2024, the Fund’s name changed from TIAA-CREF Lifecycle 2055 Fund to Nuveen Lifecycle 2055 Fund. | |
| | • | | Share class name change: Effective May 6, 2024, Advisor Class shares of the Fund were renamed Class I shares. | |
For more complete information, you may review the Fund’s next prospectus, which is expected to be available by October 1, 2024 at https://www.nuveen.com/en‑us/mutual‑funds/prospectuses or upon request at (800) 257‑8787.
Availability of additional information about the Fund
You can find additional information about the Fund at https://www.nuveen.com/en‑us/mutual‑funds/prospectuses, including its:
| | • | | prospectus • financial statements and other information • fund holdings • proxy voting information |
You can also request this information at (800) 257‑8787.
| | |
87245P866_AR_0524 3613759-INV-Y-07/25 (I, R6, Premier, Retirement) | | |
| | |
| | Annual Shareholder Report May 31, 2024 |
Nuveen Lifestyle Aggressive Growth Fund
(Formerly known as TIAA-CREF Lifestyle Aggressive Growth Fund)
Class R6 Shares (Formerly known as Institutional Class Shares)/TSAIX
Annual Shareholder Report
This annual shareholder report contains important information about the Class R6 Shares of the Nuveen Lifestyle Aggressive Growth Fund for the period of June 1, 2023 to May 31, 2024. You can find additional information at https://www.nuveen.com/en‑us/mutual‑funds/prospectuses. You can also request this information by contacting us at (800) 257‑8787.
This report describes changes to the Fund that occurred during the reporting period.
What were the Fund costs for the last year? (based on a hypothetical $10,000 investment)(1)
| | | | |
| | | Cost of a $10,000 investment | | Costs paid as a percentage of
$10,000 investment |
| Class R6 Shares | | $10 | | 0.10% |
(1) These costs do not include the expenses of the underlying funds in which the Fund invests.
How did the Fund perform last year? What affected the Fund’s performance?
| | |
Performance Highlights • The Nuveen Lifestyle Aggressive Growth Fund returned 24.58% for Class R6 shares at net asset value (NAV) for the 12 months ended May 31, 2024. The Fund outperformed the Lifestyle Aggressive Growth Fund Composite Index, which returned 23.72%. • The Lifestyle Aggressive Growth Fund Composite Index consisted of: 65.0% Russell 3000® Index; and 35.0% MSCI All Country World Index ex USA Investable Market Index. • Top contributors to relative performance » Strong overall performance of the underlying funds investing in U.S. equities, led by the Nuveen Core Equity Fund and the Nuveen Growth Opportunities ETF. • Top detractors from relative performance » A position in the Nuveen International Opportunities Fund | | Performance Attribution Nuveen Core Equity Fund Nuveen Growth Opportunities ETF Nuveen International Opportunities Fund |
How did the Fund perform over the last 10 years?
Performance data shown represents past performance and does not predict or guarantee future results. The graph and table do not reflect the deduction of taxes that a shareholder would pay on Fund distributions or redemption of Fund Shares.
Fund Performance (June 1, 2014 through May 31, 2024) Initial Investment of $10,000
Average Annual Total Returns
| | | | | | | | | | | | |
| | | 1 year | | | 5 years | | | 10 years | |
| Class R6 Shares at NAV | | | 24.58 | % | | | 11.95 | % | | | 9.10 | % |
Russell 3000® Index | | | 27.58 | % | | | 15.00 | % | | | 12.09 | % |
| Bloomberg U.S. Aggregate Bond Index | | | 1.31 | % | | | (0.17 | )% | | | 1.26 | % |
| Lifestyle Aggressive Growth Fund Composite Index | | | 23.72 | % | | | 12.39 | % | | | 9.59 | % |
| Morningstar Aggressive Target Risk Index | | | 20.28 | % | | | 10.05 | % | | | 7.99 | % |
Investment return and principal value will fluctuate, and you may have a gain or loss when you sell your shares. Current performance may differ from figures shown. For most recent month‑end performance, go to https://www.nuveen.com/en‑us/mutual‑funds/prospectuses or call (800) 257‑8787.
Fund Statistics (as of May 31, 2024)
| | | | |
| Fund net assets | | $ | 247,850,700 | |
| Total number of portfolio holdings | | | 13 | |
| Portfolio turnover (%) | | | 12% | |
| Total advisory fees paid for the year | | $ | 228,825 | |
What did the Fund invest in? (as of May 31, 2024)
(1) Affiliated investment companies, except for repurchase agreements.
How has the Fund changed?
| | • | | Name change: Effective May 1, 2024, the Fund’s name changed from TIAA-CREF Lifestyle Aggressive Growth Fund to Nuveen Lifestyle Aggressive Growth Fund. | |
| | • | | Share class name change: Effective May 6, 2024, Institutional Class shares of the Fund were renamed Class R6 shares. | |
For more complete information, you may review the Fund’s next prospectus, which is expected to be available by October 1, 2024 at https://www.nuveen.com/en‑us/mutual‑funds/prospectuses or upon request at (800) 257‑8787.
Availability of additional information about the Fund
You can find additional information about the Fund at https://www.nuveen.com/en‑us/mutual‑funds/prospectuses, including its:
| | • | | prospectus • financial statements and other information • fund holdings • proxy voting information |
You can also request this information at (800) 257‑8787.
| | |
87245R748_AR_0524 3613927-INV-Y-07/25 (A, I, R6, Premier, Retirement) | | |
| | |
| | Annual Shareholder Report May 31, 2024 |
Nuveen Lifestyle Aggressive Growth Fund
(Formerly known as TIAA-CREF Lifestyle Aggressive Growth Fund)
Premier Class Shares/TSAPX
Annual Shareholder Report
This annual shareholder report contains important information about the Premier Class Shares of the Nuveen Lifestyle Aggressive Growth Fund for the period of June 1, 2023 to May 31, 2024. You can find additional information at https://www.nuveen.com/en‑us/mutual‑funds/prospectuses. You can also request this information by contacting us at (800) 257‑8787.
This report describes changes to the Fund that occurred during the reporting period.
What were the Fund costs for the last year? (based on a hypothetical $10,000 investment)(1)
| | | | |
| | | Cost of a $10,000 investment | | Costs paid as a percentage of
$10,000 investment |
| Premier Class Shares | | $25 | | 0.25% |
(1) These costs do not include the expenses of the underlying funds in which the Fund invests.
How did the Fund perform last year? What affected the Fund’s performance?
| | |
Performance Highlights • The Nuveen Lifestyle Aggressive Growth Fund returned 24.39% for Premier Class shares at net asset value (NAV) for the 12 months ended May 31, 2024. The Fund outperformed the Lifestyle Aggressive Growth Fund Composite Index, which returned 23.72%. • The Lifestyle Aggressive Growth Fund Composite Index consisted of: 65.0% Russell 3000® Index; and 35.0% MSCI All Country World Index ex USA Investable Market Index. • Top contributors to relative performance » Strong overall performance of the underlying funds investing in U.S. equities, led by the Nuveen Core Equity Fund and the Nuveen Growth Opportunities ETF. • Top detractors from relative performance » A position in the Nuveen International Opportunities Fund | | Performance Attribution Nuveen Core Equity Fund Nuveen Growth Opportunities ETF Nuveen International Opportunities Fund |
How did the Fund perform over the last 10 years?
Performance data shown represents past performance and does not predict or guarantee future results. The graph and table do not reflect the deduction of taxes that a shareholder would pay on Fund distributions or redemption of Fund Shares.
Fund Performance (June 1, 2014 through May 31, 2024) Initial Investment of $10,000
Average Annual Total Returns
| | | | | | | | | | | | |
| | | 1 year | | | 5 years | | | 10 years | |
| Premier Class Shares at NAV | | | 24.39 | % | | | 11.78 | % | | | 8.94 | % |
Russell 3000® Index | | | 27.58 | % | | | 15.00 | % | | | 12.09 | % |
| Bloomberg U.S. Aggregate Bond Index | | | 1.31 | % | | | (0.17 | )% | | | 1.26 | % |
| Lifestyle Aggressive Growth Fund Composite Index | | | 23.72 | % | | | 12.39 | % | | | 9.59 | % |
| Morningstar Aggressive Target Risk Index | | | 20.28 | % | | | 10.05 | % | | | 7.99 | % |
Investment return and principal value will fluctuate, and you may have a gain or loss when you sell your shares. Current performance may differ from figures shown. For most recent month‑end performance, go to https://www.nuveen.com/en‑us/mutual‑funds/prospectuses or call (800) 257‑8787.
Fund Statistics (as of May 31, 2024)
| | | | |
| Fund net assets | | $ | 247,850,700 | |
| Total number of portfolio holdings | | | 13 | |
| Portfolio turnover (%) | | | 12% | |
| Total advisory fees paid for the year | | $ | 228,825 | |
What did the Fund invest in? (as of May 31, 2024)
(1) Affiliated investment companies, except for repurchase agreements.
How has the Fund changed?
| | • | | Name change: Effective May 1, 2024, the Fund’s name changed from TIAA-CREF Lifestyle Aggressive Growth Fund to Nuveen Lifestyle Aggressive Growth Fund. | |
For more complete information, you may review the Fund’s next prospectus, which is expected to be available by October 1, 2024 at https://www.nuveen.com/en‑us/mutual‑funds/prospectuses or upon request at (800) 257‑8787.
Availability of additional information about the Fund
You can find additional information about the Fund at https://www.nuveen.com/en‑us/mutual‑funds/prospectuses, including its:
| | • | | prospectus • financial statements and other information • fund holdings • proxy voting information |
You can also request this information at (800) 257‑8787.
| | |
87245R730_AR_0524 3613927-INV-Y-07/25 (A, I, R6, Premier, Retirement) | | |
| | |
| | Annual Shareholder Report May 31, 2024 |
Nuveen Lifestyle Aggressive Growth Fund
(Formerly known as TIAA-CREF Lifestyle Aggressive Growth Fund)
Class A Shares (Formerly known as Retail Class Shares)/TSALX
Annual Shareholder Report
This annual shareholder report contains important information about the Class A Shares of the Nuveen Lifestyle Aggressive Growth Fund for the period of June 1, 2023 to May 31, 2024. You can find additional information at https://www.nuveen.com/en-us/mutual-funds/prospectuses. You can also request this information by contacting us at (800) 257‑8787.
This report describes changes to the Fund that occurred during the reporting period.
What were the Fund costs for the last year? (based on a hypothetical $10,000 investment)(1)
| | | | |
| | | Cost of a $10,000 investment | | Costs paid as a percentage of
$10,000 investment |
| Class A Shares | | $39 | | 0.39% |
(1) These costs do not include the expenses of the underlying funds in which the Fund invests.
How did the Fund perform last year? What affected the Fund’s performance?
| | |
Performance Highlights • The Nuveen Lifestyle Aggressive Growth Fund returned 24.30% for Class A shares at net asset value (NAV) for the 12 months ended May 31, 2024. The Fund outperformed the Lifestyle Aggressive Growth Fund Composite Index, which returned 23.72%. • The Lifestyle Aggressive Growth Fund Composite Index consisted of: 65.0% Russell 3000® Index; and 35.0% MSCI All Country World Index ex USA Investable Market Index. • Top contributors to relative performance » Strong overall performance of the underlying funds investing in U.S. equities, led by the Nuveen Core Equity Fund and the Nuveen Growth Opportunities ETF. • Top detractors from relative performance » A position in the Nuveen International Opportunities Fund | | Performance Attribution Nuveen Core Equity Fund Nuveen Growth Opportunities ETF Nuveen International Opportunities Fund |
How did the Fund perform over the last 10 years?
Performance data shown represents past performance and does not predict or guarantee future results. The graph and table do not reflect the deduction of taxes that a shareholder would pay on Fund distributions or redemption of Fund Shares.
Fund Performance (June 1, 2014 through May 31, 2024) Initial Investment of $10,000
Average Annual Total Returns
| | | | | | | | | | | | |
| | | 1 year | | | 5 years | | | 10 years | |
| Class A Shares at NAV (excluding maximum sales charge) | | | 24.30 | % | | | 11.64 | % | | | 8.77 | % |
| Class A at maximum sales charge (Offering Price) | | | 17.15 | % | | | 10.32 | % | | | 8.13 | % |
Russell 3000® Index | | | 27.58 | % | | | 15.00 | % | | | 12.09 | % |
| Bloomberg U.S. Aggregate Bond Index | | | 1.31 | % | | | (0.17 | )% | | | 1.26 | % |
| Lifestyle Aggressive Growth Fund Composite Index | | | 23.72 | % | | | 12.39 | % | | | 9.59 | % |
| Morningstar Aggressive Target Risk Index | | | 20.28 | % | | | 10.05 | % | | | 7.99 | % |
Class A Shares at Offer reflect a maximum up‑front sales charge of 5.75% applicable to the purchase of Class A shares, which was effective as of May 6, 2024.
Investment return and principal value will fluctuate, and you may have a gain or loss when you sell your shares. Current performance may differ from figures shown. For most recent month‑end performance, go to https://www.nuveen.com/en-us/mutual-funds/prospectuses or call (800) 257‑8787.
Fund Statistics (as of May 31, 2024)
| | | | |
| Fund net assets | | $ | 247,850,700 | |
| Total number of portfolio holdings | | | 13 | |
| Portfolio turnover (%) | | | 12% | |
| Total advisory fees paid for the year | | $ | 228,825 | |
What did the Fund invest in? (as of May 31, 2024)
(1) Affiliated investment companies, except for repurchase agreements.
How has the Fund changed?
| | • | | Name change: Effective May 1, 2024, the Fund’s name changed from TIAA-CREF Lifestyle Aggressive Growth Fund to Nuveen Lifestyle Aggressive Growth Fund. | |
| | • | | Share class name change: Effective May 6, 2024, Retail Class shares of the Fund were renamed Class A shares. | |
| | • | | Sales charge: Effective May 6, 2024, a sales charge is imposed on purchases of Class A shares (formerly Retail Class shares) of the Fund of less than certain amounts, as set forth in the Fund’s prospectus. Therefore, effective as of May 6, 2024, Class A shares are available for purchase at the offering price, which will be the net asset value (NAV) per share plus an up‑front sales charge. | |
For more complete information, you may review the Fund’s next prospectus, which is expected to be available by October 1, 2024 at https://www.nuveen.com/en-us/mutual-funds/prospectuses or upon request at (800) 257‑8787.
Availability of additional information about the Fund
You can find additional information about the Fund at https://www.nuveen.com/en-us/mutual-funds/prospectuses, including its:
| | • | | prospectus • financial statements and other information • fund holdings • proxy voting information |
You can also request this information at (800) 257‑8787.
| | |
87245R755_AR_0524 3613927-INV-Y-07/25 (A, I, R6, Premier, Retirement) | | |
| | |
| | Annual Shareholder Report May 31, 2024 |
Nuveen Lifestyle Aggressive Growth Fund
(Formerly known as TIAA-CREF Lifestyle Aggressive Growth Fund)
Retirement Class Shares/TSARX
Annual Shareholder Report
This annual shareholder report contains important information about the Retirement Class Shares of the Nuveen Lifestyle Aggressive Growth Fund for the period of June 1, 2023 to May 31, 2024. You can find additional information at https://www.nuveen.com/en‑us/mutual‑funds/prospectuses. You can also request this information by contacting us at (800) 257‑8787.
This report describes changes to the Fund that occurred during the reporting period.
What were the Fund costs for the last year? (based on a hypothetical $10,000 investment)(1)
| | | | |
| | | Cost of a $10,000 investment | | Costs paid as a percentage of
$10,000 investment |
| Retirement Class Shares | | $35 | | 0.35% |
(1) These costs do not include the expenses of the underlying funds in which the Fund invests.
How did the Fund perform last year? What affected the Fund’s performance?
| | |
Performance Highlights • The Nuveen Lifestyle Aggressive Growth Fund returned 24.29% for Retirement Class shares at net asset value (NAV) for the 12 months ended May 31, 2024. The Fund outperformed the Lifestyle Aggressive Growth Fund Composite Index, which returned 23.72%. • The Lifestyle Aggressive Growth Fund Composite Index consisted of: 65.0% Russell 3000® Index; and 35.0% MSCI All Country World Index ex USA Investable Market Index. • Top contributors to relative performance » Strong overall performance of the underlying funds investing in U.S. equities, led by the Nuveen Core Equity Fund and the Nuveen Growth Opportunities ETF. • Top detractors from relative performance » A position in the Nuveen International Opportunities Fund | | Performance Attribution Nuveen Core Equity Fund Nuveen Growth Opportunities ETF Nuveen International Opportunities Fund |
How did the Fund perform over the last 10 years?
Performance data shown represents past performance and does not predict or guarantee future results. The graph and table do not reflect the deduction of taxes that a shareholder would pay on Fund distributions or redemption of Fund Shares.
Fund Performance (June 1, 2014 through May 31, 2024) Initial Investment of $10,000
Average Annual Total Returns
| | | | | | | | | | | | |
| | | 1 year | | | 5 years | | | 10 years | |
| Retirement Class Shares at NAV | | | 24.29 | % | | | 11.68 | % | | | 8.83 | % |
Russell 3000® Index | | | 27.58 | % | | | 15.00 | % | | | 12.09 | % |
| Bloomberg U.S. Aggregate Bond Index | | | 1.31 | % | | | (0.17 | )% | | | 1.26 | % |
| Lifestyle Aggressive Growth Fund Composite Index | | | 23.72 | % | | | 12.39 | % | | | 9.59 | % |
| Morningstar Aggressive Target Risk Index | | | 20.28 | % | | | 10.05 | % | | | 7.99 | % |
Investment return and principal value will fluctuate, and you may have a gain or loss when you sell your shares. Current performance may differ from figures shown. For most recent month‑end performance, go to https://www.nuveen.com/en‑us/mutual‑funds/prospectuses or call (800) 257‑8787.
Fund Statistics (as of May 31, 2024)
| | | | |
| Fund net assets | | $ | 247,850,700 | |
| Total number of portfolio holdings | | | 13 | |
| Portfolio turnover (%) | | | 12% | |
| Total advisory fees paid for the year | | $ | 228,825 | |
What did the Fund invest in? (as of May 31, 2024)
(1) Affiliated investment companies, except for repurchase agreements.
How has the Fund changed?
| | • | | Name change: Effective May 1, 2024, the Fund’s name changed from TIAA-CREF Lifestyle Aggressive Growth Fund to Nuveen Lifestyle Aggressive Growth Fund. | |
For more complete information, you may review the Fund’s next prospectus, which is expected to be available by October 1, 2024 at https://www.nuveen.com/en‑us/mutual‑funds/prospectuses or upon request at (800) 257‑8787.
Availability of additional information about the Fund
You can find additional information about the Fund at https://www.nuveen.com/en‑us/mutual‑funds/prospectuses, including its:
| | • | | prospectus • financial statements and other information • fund holdings • proxy voting information |
You can also request this information at (800) 257‑8787.
| | |
87245R722_AR_0524 3613927-INV-Y-07/25 (A, I, R6, Premier, Retirement) | | |
| | |
| | Annual Shareholder Report May 31, 2024 |
Nuveen Lifestyle Aggressive Growth Fund
(Formerly known as TIAA-CREF Lifestyle Aggressive Growth Fund)
Class I Shares (Formerly known as Advisor Class Shares)/TSAHX
Annual Shareholder Report
This annual shareholder report contains important information about the Class I Shares of the Nuveen Lifestyle Aggressive Growth Fund for the period of June 1, 2023 to May 31, 2024. You can find additional information at https://www.nuveen.com/en‑us/mutual‑funds/prospectuses. You can also request this information by contacting us at (800) 257‑8787.
This report describes changes to the Fund that occurred during the reporting period.
What were the Fund costs for the last year? (based on a hypothetical $10,000 investment)(1)
| | | | |
| | | Cost of a $10,000 investment | | Costs paid as a percentage of
$10,000 investment |
| Class I Shares | | $20 | | 0.20% |
(1) These costs do not include the expenses of the underlying funds in which the Fund invests.
How did the Fund perform last year? What affected the Fund’s performance?
| | |
Performance Highlights • The Nuveen Lifestyle Aggressive Growth Fund returned 24.55% for Class I shares at net asset value (NAV) for the 12 months ended May 31, 2024. The Fund outperformed the Lifestyle Aggressive Growth Fund Composite Index, which returned 23.72%. • The Lifestyle Aggressive Growth Fund Composite Index consisted of: 65.0% Russell 3000® Index; and 35.0% MSCI All Country World Index ex USA Investable Market Index. • Top contributors to relative performance » Strong overall performance of the underlying funds investing in U.S. equities, led by the Nuveen Core Equity Fund and the Nuveen Growth Opportunities ETF. • Top detractors from relative performance » A position in the Nuveen International Opportunities Fund | | Performance Attribution Nuveen Core Equity Fund Nuveen Growth Opportunities ETF Nuveen International Opportunities Fund |
How did the Fund perform over the period since inception?
Performance data shown represents past performance and does not predict or guarantee future results. The graph and table do not reflect the deduction of taxes that a shareholder would pay on Fund distributions or redemption of Fund Shares.
Fund Performance (December 4, 2015 through May 31, 2024) Initial Investment of $10,000
Average Annual Total Returns
| | | | | | | | | | | | |
| | | 1 year | | | 5 years | | | Since Inception | |
| Class I Shares at NAV | | | 24.55 | % | | | 11.85 | % | | | 10.04 | % |
Russell 3000® Index | | | 27.58 | % | | | 15.00 | % | | | 12.98 | % |
| Bloomberg U.S. Aggregate Bond Index | | | 1.31 | % | | | (0.17 | )% | | | 1.16 | % |
| Lifestyle Aggressive Growth Fund Composite Index | | | 23.72 | % | | | 12.39 | % | | | 10.89 | % |
| Morningstar Aggressive Target Risk Index | | | 20.28 | % | | | 10.05 | % | | | 9.46 | % |
Investment return and principal value will fluctuate, and you may have a gain or loss when you sell your shares. Current performance may differ from figures shown. For most recent month‑end performance, go to https://www.nuveen.com/en‑us/mutual‑funds/prospectuses or call (800) 257‑8787.
Fund Statistics (as of May 31, 2024)
| | | | |
| Fund net assets | | $ | 247,850,700 | |
| Total number of portfolio holdings | | | 13 | |
| Portfolio turnover (%) | | | 12% | |
| Total advisory fees paid for the year | | $ | 228,825 | |
What did the Fund invest in? (as of May 31, 2024)
(1) Affiliated investment companies, except for repurchase agreements.
How has the Fund changed?
| | • | | Name change: Effective May 1, 2024, the Fund’s name changed from TIAA-CREF Lifestyle Aggressive Growth Fund to Nuveen Lifestyle Aggressive Growth Fund. | |
| | • | | Share class name change: Effective May 6, 2024, Advisor Class shares of the Fund were renamed Class I shares. | |
For more complete information, you may review the Fund’s next prospectus, which is expected to be available by October 1, 2024 at https://www.nuveen.com/en‑us/mutual‑funds/prospectuses or upon request at (800) 257‑8787.
Availability of additional information about the Fund
You can find additional information about the Fund at https://www.nuveen.com/en‑us/mutual‑funds/prospectuses, including its:
| | • | | prospectus • financial statements and other information • fund holdings • proxy voting information |
You can also request this information at (800) 257‑8787.
| | |
87245R227_AR_0524 3613927-INV-Y-07/25 (A, I, R6, Premier, Retirement) | | |
| | |
| | Annual Shareholder Report May 31, 2024 |
Nuveen Lifestyle Conservative Fund
(Formerly known as TIAA-CREF Lifestyle Conservative Fund)
Class R6 Shares (Formerly known as Institutional Class Shares)/TCSIX
Annual Shareholder Report
This annual shareholder report contains important information about the Class R6 Shares of the Nuveen Lifestyle Conservative Fund for the period of June 1, 2023 to May 31, 2024. You can find additional information at https://www.nuveen.com/en‑us/mutual‑funds/prospectuses. You can also request this information by contacting us at (800) 257‑8787.
This report describes changes to the Fund that occurred during the reporting period.
What were the Fund costs for the last year? (based on a hypothetical $10,000 investment)(1)
| | | | |
| | | Cost of a $10,000 investment | | Costs paid as a percentage of
$10,000 investment |
| Class R6 Shares | | $10 | | 0.10% |
(1) These costs do not include the expenses of the underlying funds in which the Fund invests.
How did the Fund perform last year? What affected the Fund’s performance?
| | |
Performance Highlights • The Nuveen Lifestyle Conservative Fund returned 11.96% for Class R6 shares at net asset value (NAV) for the 12 months ended May 31, 2024. The Fund outperformed the Lifestyle Conservative Fund Composite Index, which returned 10.51%. • The Lifestyle Conservative Fund Composite Index consisted of: 40.0% Bloomberg U.S. Aggregate Bond Index; 26.0% Russell 3000® Index; 20.0% Bloomberg U.S. 1‑3 Year Government/Credit Bond Index; and 14.0% MSCI All Country World Index ex USA Investable Market Index. • Top contributors to relative performance » Strong overall performance of the underlying funds investing in fixed income and U.S. equities, led by the Nuveen Core Plus Bond Fund and the Nuveen Core Equity Fund. » A position in the Nuveen Short Term Bond Fund. • Top detractors from relative performance » A position in the Nuveen International Opportunities Fund. | | Performance Attribution Nuveen Core Plus Bond Fund Nuveen Core Equity Fund Nuveen Short Term Bond Fund Nuveen International Opportunities Fund |
How did the Fund perform over the last 10 years?
Performance data shown represents past performance and does not predict or guarantee future results. The graph and table do not reflect the deduction of taxes that a shareholder would pay on Fund distributions or redemption of Fund Shares.
Fund Performance (June 1, 2014 through May 31, 2024) Initial Investment of $10,000
Average Annual Total Returns
| | | | | | | | | | | | |
| | | 1 year | | | 5 years | | | 10 years | |
| Class R6 Shares at NAV | | | 11.96 | % | | | 5.49 | % | | | 4.87 | % |
Russell 3000® Index | | | 27.58 | % | | | 15.00 | % | | | 12.09 | % |
| Bloomberg U.S. Aggregate Bond Index | | | 1.31 | % | | | (0.17 | )% | | | 1.26 | % |
| Lifestyle Conservative Fund Composite Index | | | 10.51 | % | | | 5.32 | % | | | 4.78 | % |
| Morningstar Moderately Conservative Target Risk Index | | | 9.44 | % | | | 4.64 | % | | | 4.31 | % |
Investment return and principal value will fluctuate, and you may have a gain or loss when you sell your shares. Current performance may differ from figures shown. For most recent month‑end performance, go to https://www.nuveen.com/en‑us/mutual‑funds/prospectuses or call (800) 257‑8787.
Fund Statistics (as of May 31, 2024)
| | | | |
| Fund net assets | | $ | 309,299,326 | |
| Total number of portfolio holdings | | | 16 | |
| Portfolio turnover (%) | | | 13% | |
| Total advisory fees paid for the year | | $ | 307,011 | |
What did the Fund invest in? (as of May 31, 2024)
(1) Affiliated investment companies, except for repurchase agreements.
How has the Fund changed?
| | • | | Name change: Effective May 1, 2024, the Fund’s name changed from TIAA-CREF Lifestyle Conservative Fund to Nuveen Lifestyle Conservative Fund. | |
| | • | | Share class name change: Effective May 6, 2024, Institutional Class shares of the Fund were renamed Class R6 shares. | |
For more complete information, you may review the Fund’s next prospectus, which is expected to be available by October 1, 2024 at https://www.nuveen.com/en‑us/mutual‑funds/prospectuses or upon request at (800) 257‑8787.
Availability of additional information about the Fund
You can find additional information about the Fund at https://www.nuveen.com/en‑us/mutual‑funds/prospectuses, including its:
| | • | | prospectus • financial statements and other information • fund holdings • proxy voting information |
You can also request this information at (800) 257‑8787.
| | |
87245R870_AR_0524 3613906-INV-Y-07/25 (A, I, R6, Premier, Retirement) | | |
| | |
| | Annual Shareholder Report May 31, 2024 |
Nuveen Lifestyle Conservative Fund
(Formerly known as TIAA-CREF Lifestyle Conservative Fund)
Premier Class Shares/TLSPX
Annual Shareholder Report
This annual shareholder report contains important information about the Premier Class Shares of the Nuveen Lifestyle Conservative Fund for the period of June 1, 2023 to May 31, 2024. You can find additional information at https://www.nuveen.com/en-us/mutual-funds/prospectuses. You can also request this information by contacting us at (800) 257‑8787.
This report describes changes to the Fund that occurred during the reporting period.
What were the Fund costs for the last year? (based on a hypothetical $10,000 investment)(1)
| | | | |
| | | Cost of a $10,000 investment | | Costs paid as a percentage of $10,000 investment |
| Premier Class Shares | | $25 | | 0.25% |
(1) These costs do not include the expenses of the underlying funds in which the Fund invests.
How did the Fund perform last year? What affected the Fund’s performance?
| | |
Performance Highlights • The Nuveen Lifestyle Conservative Fund returned 11.69% for Premier Class shares at net asset value (NAV) for the 12 months ended May 31, 2024. The Fund outperformed the Lifestyle Conservative Fund Composite Index, which returned 10.51% • The Lifestyle Conservative Fund Composite Index consisted of: 40.0% Bloomberg U.S. Aggregate Bond Index; 26.0% Russell 3000® Index; 20.0% Bloomberg U.S. 1-3 Year Government/Credit Bond Index; and 14.0% MSCI All Country World Index ex USA Investable Market Index. • Top contributors to relative performance » Strong overall performance of the underlying funds investing in fixed income and U.S. equities, led by the Nuveen Core Plus Bond Fund and the Nuveen Core Equity Fund. » A position in the Nuveen Short Term Bond Fund. • Top detractors from relative performance » A position in the Nuveen International Opportunities Fund. | | Performance Attribution Nuveen Core Plus Bond Fund Nuveen Core Equity Fund Nuveen Short Term Bond Fund Nuveen International Opportunities Fund |
How did the Fund perform over the last 10 years?
Performance data shown represents past performance and does not predict or guarantee future results. The graph and table do not reflect the deduction of taxes that a shareholder would pay on Fund distributions or redemption of Fund Shares.
Fund Performance (June 1, 2014 through May 31, 2024) Initial Investment of $10,000
Average Annual Total Returns
| | | | | | | | | | | | |
| | | 1 year | | | 5 years | | | 10 years | |
| Premier Class Shares at NAV | | | 11.69 | % | | | 5.31 | % | | | 4.70 | % |
Russell 3000® Index | | | 27.58 | % | | | 15.00 | % | | | 12.09 | % |
| Bloomberg U.S. Aggregate Bond Index | | | 1.31 | % | | | (0.17 | )% | | | 1.26 | % |
| Lifestyle Conservative Fund Composite Index | | | 10.51 | % | | | 5.32 | % | | | 4.78 | % |
| Morningstar Moderately Conservative Target Risk Index | | | 9.44 | % | | | 4.64 | % | | | 4.31 | % |
Investment return and principal value will fluctuate, and you may have a gain or loss when you sell your shares. Current performance may differ from figures shown. For most recent month‑end performance, go to https://www.nuveen.com/en-us/mutual-funds/prospectuses or call (800) 257‑8787.
Fund Statistics (as of May 31, 2024)
| | | | |
| Fund net assets | | $ | 309,299,326 | |
| Total number of portfolio holdings | | | 16 | |
| Portfolio turnover (%) | | | 13% | |
| Total advisory fees paid for the year | | $ | 307,011 | |
What did the Fund invest in? (as of May 31, 2024)
(1) Affiliated investment companies, except for repurchase agreements.
How has the Fund changed?
| | • | | Name change: Effective May 1, 2024, the Fund’s name changed from TIAA-CREF Lifestyle Conservative Fund to Nuveen Lifestyle Conservative Fund. | |
For more complete information, you may review the Fund’s next prospectus, which is expected to be available by October 1, 2024 at https://www.nuveen.com/en-us/mutual-funds/prospectuses or upon request at (800) 257‑8787.
Availability of additional information about the Fund
You can find additional information about the Fund at https://www.nuveen.com/en-us/mutual-funds/prospectuses, including its:
| | • | | prospectus • financial statements and other information • fund holdings • proxy voting information |
You can also request this information at (800) 257‑8787.
| | |
87245R862_AR_0524 3613906-INV-Y-07/25 (A, I, R6, Premier, Retirement) | | |
| | |
| | Annual Shareholder Report May 31, 2024 |
Nuveen Lifestyle Conservative Fund
(Formerly known as TIAA-CREF Lifestyle Conservative Fund)
Class A Shares (Formerly known as Retail Class Shares)/TSCLX
Annual Shareholder Report
This annual shareholder report contains important information about the Class A Shares of the Nuveen Lifestyle Conservative Fund for the period of June 1, 2023 to May 31, 2024. You can find additional information at https://www.nuveen.com/en-us/mutual-funds/prospectuses. You can also request this information by contacting us at (800) 257‑8787.
This report describes changes to the Fund that occurred during the reporting period.
What were the Fund costs for the last year? (based on a hypothetical $10,000 investment)(1)
| | | | |
| | | Cost of a $10,000 investment | | Costs paid as a percentage of
$10,000 investment |
| Class A Shares | | $37 | | 0.37% |
(1) These costs do not include the expenses of the underlying funds in which the Fund invests.
How did the Fund perform last year? What affected the Fund’s performance?
| | |
Performance Highlights • The Nuveen Lifestyle Conservative Fund returned 11.58% for Class A shares at net asset value (NAV) for the 12 months ended May 31, 2024. The Fund outperformed the Lifestyle Conservative Fund Composite Index, which returned 10.51%. • The Lifestyle Conservative Fund Composite Index consisted of: 40.0% Bloomberg U.S. Aggregate Bond Index; 26.0% Russell 3000® Index; 20.0% Bloomberg U.S. 1-3 Year Government/Credit Bond Index; and 14.0% MSCI All Country World Index ex USA Investable Market Index. • Top contributors to relative performance » Strong overall performance of the underlying funds investing in fixed income and U.S. equities, led by the Nuveen Core Plus Bond Fund and the Nuveen Core Equity Fund. » A position in the Nuveen Short Term Bond Fund. • Top detractors from relative performance » A position in the Nuveen International Opportunities Fund. | | Performance Attribution Nuveen Core Plus Bond Fund Nuveen Core Equity Fund Nuveen Short Term Bond Fund Nuveen International Opportunities Fund |
How did the Fund perform over the last 10 years?
Performance data shown represents past performance and does not predict or guarantee future results. The graph and table do not reflect the deduction of taxes that a shareholder would pay on Fund distributions or redemption of Fund Shares.
Fund Performance (June 1, 2014 through May 31, 2024) Initial Investment of $10,000
Average Annual Total Returns
| | | | | | | | | | | | |
| | | 1 year | | | 5 years | | | 10 years | |
| Class A Shares at NAV (excluding maximum sales charge) | | | 11.58 | % | | | 5.20 | % | | | 4.58 | % |
| Class A at maximum sales charge (Offering Price) | | | 5.17 | % | | | 3.96 | % | | | 3.96 | % |
Russell 3000® Index | | | 27.58 | % | | | 15.00 | % | | | 12.09 | % |
| Bloomberg U.S. Aggregate Bond Index | | | 1.31 | % | | | (0.17 | )% | | | 1.26 | % |
| Lifestyle Conservative Fund Composite Index | | | 10.51 | % | | | 5.32 | % | | | 4.78 | % |
| Morningstar Moderately Conservative Target Risk Index | | | 9.44 | % | | | 4.64 | % | | | 4.31 | % |
Class A Shares at Offer reflect a maximum up‑front sales charge of 5.75% applicable to the purchase of Class A shares, which was effective as of May 6, 2024.
Investment return and principal value will fluctuate, and you may have a gain or loss when you sell your shares. Current performance may differ from figures shown. For most recent month‑end performance, go to https://www.nuveen.com/en-us/mutual-funds/prospectuses or call (800) 257‑8787.
Fund Statistics (as of May 31, 2024)
| | | | |
| Fund net assets | | $ | 309,299,326 | |
| Total number of portfolio holdings | | | 16 | |
| Portfolio turnover (%) | | | 13% | |
| Total advisory fees paid for the year | | $ | 307,011 | |
What did the Fund invest in? (as of May 31, 2024)
(1) Affiliated investment companies, except for repurchase agreements.
How has the Fund changed?
| | • | | Name change: Effective May 1, 2024, the Fund’s name changed from TIAA-CREF Lifestyle Conservative Fund to Nuveen Lifestyle Conservative Fund. | |
| | • | | Share class name change: Effective May 6, 2024, Retail Class shares of the Fund were renamed Class A shares. | |
| | • | | Sales charge: Effective May 6, 2024, a sales charge is imposed on purchases of Class A shares (formerly Retail Class shares) of the Fund of less than certain amounts, as set forth in the Fund’s prospectus. Therefore, effective as of May 6, 2024, Class A shares are available for purchase at the offering price, which will be the net asset value (NAV) per share plus an up‑front sales charge. | |
For more complete information, you may review the Fund’s next prospectus, which is expected to be available by October 1, 2024 at https://www.nuveen.com/en-us/mutual-funds/prospectuses or upon request at (800) 257‑8787.
Availability of additional information about the Fund
You can find additional information about the Fund at https://www.nuveen.com/en-us/mutual-funds/prospectuses, including its:
| | • | | prospectus • financial statements and other information • fund holdings • proxy voting information |
You can also request this information at (800) 257‑8787.
| | |
87245R888_AR_0524 3613906-INV-Y-07/25 (A, I, R6, Premier, Retirement) | | |
| | |
| | Annual Shareholder Report May 31, 2024 |
Nuveen Lifestyle Conservative Fund
(Formerly known as TIAA-CREF Lifestyle Conservative Fund)
Retirement Class Shares/TSCTX
Annual Shareholder Report
This annual shareholder report contains important information about the Retirement Class Shares of the Nuveen Lifestyle Conservative Fund for the period of June 1, 2023 to May 31, 2024. You can find additional information at https://www.nuveen.com/en‑us/mutual‑funds/prospectuses. You can also request this information by contacting us at (800) 257‑8787.
This report describes changes to the Fund that occurred during the reporting period.
What were the Fund costs for the last year? (based on a hypothetical $10,000 investment)(1)
| | | | |
| | | Cost of a $10,000 investment | | Costs paid as a percentage of
$10,000 investment |
| Retirement Class Shares | | $35 | | 0.35% |
(1) These costs do not include the expenses of the underlying funds in which the Fund invests.
How did the Fund perform last year? What affected the Fund’s performance?
| | |
Performance Highlights • The Nuveen Lifestyle Conservative Fund returned 11.60% for Retirement Class shares at net asset value (NAV) for the 12 months ended May 31, 2024. The Fund outperformed the Lifestyle Conservative Fund Composite Index, which returned 10.51%. • The Lifestyle Conservative Fund Composite Index consisted of: 40.0% Bloomberg U.S. Aggregate Bond Index; 26.0% Russell 3000® Index; 20.0% Bloomberg U.S. 1‑3 Year Government/Credit Bond Index; and 14.0% MSCI All Country World Index ex USA Investable Market Index. • Top contributors to relative performance » Strong overall performance of the underlying funds investing in fixed income and U.S. equities, led by the Nuveen Core Plus Bond Fund and the Nuveen Core Equity Fund. » A position in the Nuveen Short Term Bond Fund. • Top detractors from relative performance » A position in the Nuveen International Opportunities Fund. | | Performance Attribution Nuveen Core Plus Bond Fund Nuveen Core Equity Fund Nuveen Short Term Bond Fund Nuveen International Opportunities Fund |
How did the Fund perform over the last 10 years?
Performance data shown represents past performance and does not predict or guarantee future results. The graph and table do not reflect the deduction of taxes that a shareholder would pay on Fund distributions or redemption of Fund Shares.
Fund Performance (June 1, 2014 through May 31, 2024) Initial Investment of $10,000
Average Annual Total Returns
| | | | | | | | | | | | |
| | | 1 year | | | 5 years | | | 10 years | |
| Retirement Class Shares at NAV | | | 11.60 | % | | | 5.22 | % | | | 4.61 | % |
Russell 3000® Index | | | 27.58 | % | | | 15.00 | % | | | 12.09 | % |
| Bloomberg U.S. Aggregate Bond Index | | | 1.31 | % | | | (0.17 | )% | | | 1.26 | % |
| Lifestyle Conservative Fund Composite Index | | | 10.51 | % | | | 5.32 | % | | | 4.78 | % |
| Morningstar Moderately Conservative Target Risk Index | | | 9.44 | % | | | 4.64 | % | | | 4.31 | % |
Investment return and principal value will fluctuate, and you may have a gain or loss when you sell your shares. Current performance may differ from figures shown. For most recent month‑end performance, go to https://www.nuveen.com/en‑us/mutual‑funds/prospectuses or call (800) 257‑8787.
Fund Statistics (as of May 31, 2024)
| | | | |
| Fund net assets | | $ | 309,299,326 | |
| Total number of portfolio holdings | | | 16 | |
| Portfolio turnover (%) | | | 13% | |
| Total advisory fees paid for the year | | $ | 307,011 | |
What did the Fund invest in? (as of May 31, 2024)
(1) Affiliated investment companies, except for repurchase agreements.
How has the Fund changed?
| | • | | Name change: Effective May 1, 2024, the Fund’s name changed from TIAA-CREF Lifestyle Conservative Fund to Nuveen Lifestyle Conservative Fund. | |
For more complete information, you may review the Fund’s next prospectus, which is expected to be available by October 1, 2024 at https://www.nuveen.com/en‑us/mutual‑funds/prospectuses or upon request at (800) 257‑8787.
Availability of additional information about the Fund
You can find additional information about the Fund at https://www.nuveen.com/en‑us/mutual‑funds/prospectuses, including its:
| | • | | prospectus • financial statements and other information • fund holdings • proxy voting information |
You can also request this information at (800) 257‑8787.
| | |
87245R854_AR_0524 3613906-INV-Y-07/25 (A, I, R6, Premier, Retirement) | | |
| | |
| | Annual Shareholder Report May 31, 2024 |
Nuveen Lifestyle Conservative Fund
(Formerly known as TIAA-CREF Lifestyle Conservative Fund)
Class I Shares (Formerly known as Advisor Class Shares)/TLSHX
Annual Shareholder Report
This annual shareholder report contains important information about the Class I Shares of the Nuveen Lifestyle Conservative Fund for the period of June 1, 2023 to May 31, 2024. You can find additional information at https://www.nuveen.com/en‑us/mutual‑funds/prospectuses. You can also request this information by contacting us at (800) 257‑8787.
This report describes changes to the Fund that occurred during the reporting period.
What were the Fund costs for the last year? (based on a hypothetical $10,000 investment)(1)
| | | | |
| | | Cost of a $10,000 investment | | Costs paid as a percentage of $10,000 investment |
| Class I Shares | | $20 | | 0.20% |
(1) These costs do not include the expenses of the underlying funds in which the Fund invests.
How did the Fund perform last year? What affected the Fund’s performance?
| | |
Performance Highlights • The Nuveen Lifestyle Conservative Fund returned 11.75% for Class I shares at net asset value (NAV) for the 12 months ended May 31, 2024. The Fund outperformed the Lifestyle Conservative Fund Composite Index, which returned 10.51%. • The Lifestyle Conservative Fund Composite Index consisted of: 40.0% Bloomberg U.S. Aggregate Bond Index; 26.0% Russell 3000® Index; 20.0% Bloomberg U.S. 1-3 Year Government/Credit Bond Index; and 14.0% MSCI All Country World Index ex USA Investable Market Index. • Top contributors to relative performance » Strong overall performance of the underlying funds investing in fixed income and U.S. equities, led by the Nuveen Core Plus Bond Fund and the Nuveen Core Equity Fund. » A position in the Nuveen Short Term Bond Fund. • Top detractors from relative performance » A position in the Nuveen International Opportunities Fund. | | Performance Attribution Nuveen Core Plus Bond Fund Nuveen Core Equity Fund Nuveen Short Term Bond Fund Nuveen International Opportunities Fund |
How did the Fund perform over the period since inception?
Performance data shown represents past performance and does not predict or guarantee future results. The graph and table do not reflect the deduction of taxes that a shareholder would pay on Fund distributions or redemption of Fund Shares.
Fund Performance (December 4, 2015 through May 31, 2024) Initial Investment of $10,000
Average Annual Total Returns
| | | | | | | | | | | | |
| | | 1 year | | | 5 years | | | Since Inception | |
| Class I Shares at NAV | | | 11.75 | % | | | 5.37 | % | | | 5.25 | % |
Russell 3000® Index | | | 27.58 | % | | | 15.00 | % | | | 12.98 | % |
| Bloomberg U.S. Aggregate Bond Index | | | 1.31 | % | | | (0.17 | )% | | | 1.16 | % |
| Lifestyle Conservative Fund Composite Index | | | 10.51 | % | | | 5.32 | % | | | 5.28 | % |
| Morningstar Moderately Conservative Target Risk Index | | | 9.44 | % | | | 4.64 | % | | | 5.05 | % |
Investment return and principal value will fluctuate, and you may have a gain or loss when you sell your shares. Current performance may differ from figures shown. For most recent month‑end performance, go to https://www.nuveen.com/en‑us/mutual‑funds/prospectuses or call (800) 257‑8787.
Fund Statistics (as of May 31, 2024)
| | | | |
| Fund net assets | | $ | 309,299,326 | |
| Total number of portfolio holdings | | | 16 | |
| Portfolio turnover (%) | | | 13% | |
| Total advisory fees paid for the year | | $ | 307,011 | |
What did the Fund invest in? (as of May 31, 2024)
(1) Affiliated investment companies, except for repurchase agreements.
How has the Fund changed?
| | • | | Name change: Effective May 1, 2024, the Fund’s name changed from TIAA-CREF Lifestyle Conservative Fund to Nuveen Lifestyle Conservative Fund. | |
| | • | | Share class name change: Effective May 6, 2024, Advisor Class shares of the Fund were renamed Class I shares. | |
For more complete information, you may review the Fund’s next prospectus, which is expected to be available by October 1, 2024 at https://www.nuveen.com/en‑us/mutual‑funds/prospectuses or upon request at (800) 257‑8787.
Availability of additional information about the Fund
You can find additional information about the Fund at https://www.nuveen.com/en‑us/mutual‑funds/prospectuses, including its:
| | • | | prospectus • financial statements and other information • fund holdings • proxy voting information |
You can also request this information at (800) 257‑8787.
| | |
87245R250_AR_0524 3613906-INV-Y-07/25 (A, I, R6, Premier, Retirement) | | |
| | |
| | Annual Shareholder Report May 31, 2024 |
Nuveen Lifestyle Growth Fund
(Formerly known as TIAA-CREF Lifestyle Growth Fund)
Premier Class Shares/TSGPX
Annual Shareholder Report
This annual shareholder report contains important information about the Premier Class Shares of the Nuveen Lifestyle Growth Fund for the period of June 1, 2023 to May 31, 2024. You can find additional information at https://www.nuveen.com/en‑us/mutual‑funds/prospectuses. You can also request this information by contacting us at (800) 257‑8787.
This report describes changes to the Fund that occurred during the reporting period.
What were the Fund costs for the last year? (based on a hypothetical $10,000 investment)(1)
| | | | |
| | | Cost of a $10,000 investment | | Costs paid as a percentage of
$10,000 investment |
| Premier Class Shares | | $18 | | 0.18% |
(1) These costs do not include the expenses of the underlying funds in which the Fund invests.
How did the Fund perform last year? What affected the Fund’s performance?
| | |
Performance Highlights • The Nuveen Lifestyle Growth Fund returned 20.09% for Premier Class shares at net asset value (NAV) for the 12 months ended May 31, 2024. The Fund outperformed the Lifestyle Growth Fund Composite Index, which returned 18.99%. • The Lifestyle Growth Fund Composite Index consisted of: 52.0% Russell 3000® Index; 28.0% MSCI All Country World Index ex USA Investable Market Index; and 20.0% Bloomberg U.S. Aggregate Bond Index. • Top contributors to relative performance » Strong overall performance of the underlying funds investing in U.S. equities, led by the Nuveen Core Equity Fund and Nuveen Growth Opportunities ETF. » An allocation to the Nuveen Core Plus Bond Fund. • Top detractors from relative performance » A position in the Nuveen International Opportunities Fund. | | Performance Attribution U.S. Equities Nuveen Core Plus Bond Fund Nuveen International Opportunities Fund |
How did the Fund perform over the last 10 years?
Performance data shown represents past performance and does not predict or guarantee future results. The graph and table do not reflect the deduction of taxes that a shareholder would pay on Fund distributions or redemption of Fund Shares.
Fund Performance (June 1, 2014 through May 31, 2024) Initial Investment of $10,000
Average Annual Total Returns
| | | | | | | | | | | | |
| | | 1 year | | | 5 years | | | 10 years | |
| Premier Class Shares at NAV | | | 20.09 | % | | | 9.61 | % | | | 7.59 | % |
Russell 3000® Index | | | 27.58 | % | | | 15.00 | % | | | 12.09 | % |
| Bloomberg U.S. Aggregate Bond Index | | | 1.31 | % | | | (0.17 | )% | | | 1.26 | % |
| Lifestyle Growth Fund Composite Index | | | 18.99 | % | | | 9.98 | % | | | 8.04 | % |
| Morningstar Moderately Aggressive Target Risk Index | | | 17.14 | % | | | 8.55 | % | | | 6.99 | % |
Investment return and principal value will fluctuate, and you may have a gain or loss when you sell your shares. Current performance may differ from figures shown. For most recent month‑end performance, go to https://www.nuveen.com/en‑us/mutual‑funds/prospectuses or call (800) 257‑8787.
Fund Statistics (as of May 31, 2024)
| | | | |
| Fund net assets | | $ | 306,250,622 | |
| Total number of portfolio holdings | | | 14 | |
| Portfolio turnover (%) | | | 15% | |
| Total advisory fees paid for the year | | $ | 288,025 | |
What did the Fund invest in? (as of May 31, 2024)
(1) Affiliated investment companies, except for repurchase agreements.
How has the Fund changed?
| | • | | Name change: Effective May 1, 2024, the Fund’s name changed from TIAA-CREF Lifestyle Growth Fund to Nuveen Lifestyle Growth Fund. | |
For more complete information, you may review the Fund’s next prospectus, which is expected to be available by October 1, 2024 at https://www.nuveen.com/en‑us/mutual‑funds/prospectuses or upon request at (800) 257‑8787.
Availability of additional information about the Fund
You can find additional information about the Fund at https://www.nuveen.com/en‑us/mutual‑funds/prospectuses, including its:
| | • | | prospectus • financial statements and other information • fund holdings • proxy voting information |
You can also request this information at (800) 257‑8787.
| | |
87245R771_AR_0524 3613923-INV-Y-07/25 (A, I, R6, Premier, Retirement) | | |
| | |
| | Annual Shareholder Report May 31, 2024 |
Nuveen Lifestyle Growth Fund
(Formerly known as TIAA-CREF Lifestyle Growth Fund)
Class A Shares (Formerly known as Retail Class Shares)/TSGLX
Annual Shareholder Report
This annual shareholder report contains important information about the Class A Shares of the Nuveen Lifestyle Growth Fund for the period of June 1, 2023 to May 31, 2024. You can find additional information at https://www.nuveen.com/en‑us/mutual‑funds/prospectuses. You can also request this information by contacting us at (800) 257‑8787.
This report describes changes to the Fund that occurred during the reporting period.
What were the Fund costs for the last year? (based on a hypothetical $10,000 investment)(1)
| | | | |
| | | Cost of a $10,000 investment | | Costs paid as a percentage of
$10,000 investment |
| Class A Shares | | $31 | | 0.31% |
(1) These costs do not include the expenses of the underlying funds in which the Fund invests.
How did the Fund perform last year? What affected the Fund’s performance?
| | |
Performance Highlights • The Nuveen Lifestyle Growth Fund returned 19.91% for Class A shares at net asset value (NAV) for the 12 months ended May 31, 2024. The Fund outperformed the Lifestyle Growth Fund Composite Index, which returned 18.99%. • The Lifestyle Growth Fund Composite Index consisted of: 52.0% Russell 3000® Index; 28.0% MSCI All Country World Index ex USA Investable Market Index; and 20.0% Bloomberg U.S. Aggregate Bond Index. • Top contributors to relative performance » Strong overall performance of the underlying funds investing in U.S. equities, led by the Nuveen Core Equity Fund and Nuveen Growth Opportunities ETF. » An allocation to the Nuveen Core Plus Bond Fund. • Top detractors from relative performance » A position in the Nuveen International Opportunities Fund. | | Performance Attribution U.S. Equities Nuveen Core Plus Bond Fund Nuveen International Opportunities Fund |
How did the Fund perform over the last 10 years?
Performance data shown represents past performance and does not predict or guarantee future results. The graph and table do not reflect the deduction of taxes that a shareholder would pay on Fund distributions or redemption of Fund Shares.
Fund Performance (June 1, 2014 through May 31, 2024) Initial Investment of $10,000
Average Annual Total Returns
| | | | | | | | | | | | |
| | | 1 year | | | 5 years | | | 10 years | |
| Class A Shares at NAV (excluding maximum sales charge) | | | 19.91 | % | | | 9.44 | % | | | 7.44 | % |
| Class A at maximum sales charge (Offering Price) | | | 13.01 | % | | | 8.15 | % | | | 6.81 | % |
Russell 3000® Index | | | 27.58 | % | | | 15.00 | % | | | 12.09 | % |
| Bloomberg U.S. Aggregate Bond Index | | | 1.31 | % | | | (0.17 | )% | | | 1.26 | % |
| Lifestyle Growth Fund Composite Index | | | 18.99 | % | | | 9.98 | % | | | 8.04 | % |
| Morningstar Moderately Aggressive Target Risk Index | | | 17.14 | % | | | 8.55 | % | | | 6.99 | % |
Class A Shares at Offer reflect a maximum up‑front sales charge of 5.75% applicable to the purchase of Class A shares, which was effective as of May 6, 2024.”
Investment return and principal value will fluctuate, and you may have a gain or loss when you sell your shares. Current performance may differ from figures shown. For most recent month‑end performance, go to https://www.nuveen.com/en-us/mutual-funds/prospectuses or call (800) 257‑8787.
Fund Statistics (as of May 31, 2024)
| | | | |
| Fund net assets | | $ | 306,250,622 | |
| Total number of portfolio holdings | | | 14 | |
| Portfolio turnover (%) | | | 15% | |
| Total advisory fees paid for the year | | $ | 288,025 | |
What did the Fund invest in? (as of May 31, 2024)
(1) Affiliated investment companies, except for repurchase agreements.
How has the Fund changed?
| | • | | Name change: Effective May 1, 2024, the Fund’s name changed from TIAA-CREF Lifestyle Growth Fund to Nuveen Lifestyle Growth Fund. | |
| | • | | Share class name change: Effective May 6, 2024, Retail Class shares of the Fund were renamed Class A shares. | |
| | • | | Sales charge: Effective May 6, 2024, a sales charge is imposed on purchases of Class A shares (formerly Retail Class shares) of the Fund of less than certain amounts, as set forth in the Fund’s prospectus. Therefore, effective as of May 6, 2024, Class A shares are available for purchase at the offering price, which will be the net asset value (NAV) per share plus an up‑front sales charge. | |
For more complete information, you may review the Fund’s next prospectus, which is expected to be available by October 1, 2024 at https://www.nuveen.com/en-us/mutual-funds/prospectuses or upon request at (800) 257‑8787.
Availability of additional information about the Fund
You can find additional information about the Fund at https://www.nuveen.com/en-us/mutual-funds/prospectuses, including its:
| | • | | prospectus • financial statements and other information • fund holdings • proxy voting information |
You can also request this information at (800) 257‑8787.
| | |
87245R797_AR_0524 3613923-INV-Y-07/25 (A, I, R6, Premier, Retirement) | | |
| | |
| | Annual Shareholder Report May 31, 2024 |
Nuveen Lifestyle Growth Fund
(Formerly known as TIAA-CREF Lifestyle Growth Fund)
Retirement Class Shares/TSGRX
Annual Shareholder Report
This annual shareholder report contains important information about the Retirement Class Shares of the Nuveen Lifestyle Growth Fund for the period of June 1, 2023 to May 31, 2024. You can find additional information at https://www.nuveen.com/en‑us/mutual‑funds/prospectuses. You can also request this information by contacting us at (800) 257‑8787.
This report describes changes to the Fund that occurred during the reporting period.
What were the Fund costs for the last year? (based on a hypothetical $10,000 investment)(1)
| | | | |
| | | Cost of a $10,000 investment | | Costs paid as a percentage of
$10,000 investment |
| Retirement Class Shares | | $28 | | 0.28% |
(1) These costs do not include the expenses of the underlying funds in which the Fund invests.
How did the Fund perform last year? What affected the Fund’s performance?
| | |
Performance Highlights • The Nuveen Lifestyle Growth Fund returned 19.90% for Retirement Class shares at net asset value (NAV) for the 12 months ended May 31, 2024. The Fund outperformed the Lifestyle Growth Fund Composite Index, which returned 18.99%. • The Lifestyle Growth Fund Composite Index consisted of: 52.0% Russell 3000® Index; 28.0% MSCI All Country World Index ex USA Investable Market Index; and 20.0% Bloomberg U.S. Aggregate Bond Index. • Top contributors to relative performance » Strong overall performance of the underlying funds investing in U.S. equities, led by the Nuveen Core Equity Fund and Nuveen Growth Opportunities ETF. » An allocation to the Nuveen Core Plus Bond Fund. • Top detractors from relative performance » A position in the Nuveen International Opportunities Fund. | | Performance Attribution U.S. Equities Nuveen Core Plus Bond Fund Nuveen International Opportunities Fund |
How did the Fund perform over the last 10 years?
Performance data shown represents past performance and does not predict or guarantee future results. The graph and table do not reflect the deduction of taxes that a shareholder would pay on Fund distributions or redemption of Fund Shares.
Fund Performance (June 1, 2014 through May 31, 2024) Initial Investment of $10,000
Average Annual Total Returns
| | | | | | | | | | | | |
| | | 1 year | | | 5 years | | | 10 years | |
| Retirement Class Shares at NAV | | | 19.90 | % | | | 9.47 | % | | | 7.47 | % |
Russell 3000® Index | | | 27.58 | % | | | 15.00 | % | | | 12.09 | % |
| Bloomberg U.S. Aggregate Bond Index | | | 1.31 | % | | | (0.17 | )% | | | 1.26 | % |
| Lifestyle Growth Fund Composite Index | | | 18.99 | % | | | 9.98 | % | | | 8.04 | % |
| Morningstar Moderately Aggressive Target Risk Index | | | 17.14 | % | | | 8.55 | % | | | 6.99 | % |
Investment return and principal value will fluctuate, and you may have a gain or loss when you sell your shares. Current performance may differ from figures shown. For most recent month‑end performance, go to https://www.nuveen.com/en‑us/mutual‑funds/prospectuses or call (800) 257‑8787.
Fund Statistics (as of May 31, 2024)
| | | | |
| Fund net assets | | $ | 306,250,622 | |
| Total number of portfolio holdings | | | 14 | |
| Portfolio turnover (%) | | | 15% | |
| Total advisory fees paid for the year | | $ | 288,025 | |
What did the Fund invest in? (as of May 31, 2024)
(1) Affiliated investment companies, except for repurchase agreements.
How has the Fund changed?
| | • | | Name change: Effective May 1, 2024, the Fund’s name changed from TIAA-CREF Lifestyle Growth Fund to Nuveen Lifestyle Growth Fund. | |
For more complete information, you may review the Fund’s next prospectus, which is expected to be available by October 1, 2024 at https://www.nuveen.com/en‑us/mutual‑funds/prospectuses or upon request at (800) 257‑8787.
Availability of additional information about the Fund
You can find additional information about the Fund at https://www.nuveen.com/en‑us/mutual‑funds/prospectuses, including its:
| | • | | prospectus • financial statements and other information • fund holdings • proxy voting information |
You can also request this information at (800) 257‑8787.
| | |
87245R763_AR_0524 3613923-INV-Y-07/25 (A, I, R6, Premier, Retirement) | | |
| | |
| | Annual Shareholder Report May 31, 2024 |
Nuveen Lifestyle Growth Fund
(Formerly known as TIAA-CREF Lifestyle Growth Fund)
Class R6 Shares (Formerly known as Institutional Class Shares)/TSGGX
Annual Shareholder Report
This annual shareholder report contains important information about the Class R6 Shares of the Nuveen Lifestyle Growth Fund for the period of June 1, 2023 to May 31, 2024. You can find additional information at https://www.nuveen.com/en‑us/mutual‑funds/prospectuses. You can also request this information by contacting us at (800) 257‑8787.
This report describes changes to the Fund that occurred during the reporting period.
What were the Fund costs for the last year? (based on a hypothetical $10,000 investment)(1)
| | | | |
| | | Cost of a $10,000 investment | | Costs paid as a percentage of
$10,000 investment |
| Class R6 Shares | | $3 | | 0.03% |
(1) These costs do not include the expenses of the underlying funds in which the Fund invests.
How did the Fund perform last year? What affected the Fund’s performance?
| | |
Performance Highlights • The Nuveen Lifestyle Growth Fund returned 20.24% for Class R6 shares at net asset value (NAV) for the 12 months ended May 31, 2024. The Fund outperformed the Lifestyle Growth Fund Composite Index, which returned 18.99%. • The Lifestyle Growth Fund Composite Index consisted of: 52.0% Russell 3000® Index; 28.0% MSCI All Country World Index ex USA Investable Market Index; and 20.0% Bloomberg U.S. Aggregate Bond Index. • Top contributors to relative performance » Strong overall performance of the underlying funds investing in U.S. equities, led by the Nuveen Core Equity Fund and Nuveen Growth Opportunities ETF. » An allocation to the Nuveen Core Plus Bond Fund. • Top detractors from relative performance » A position in the Nuveen International Opportunities Fund. | | Performance Attribution U.S. Equities Nuveen Core Plus Bond Fund Nuveen International Opportunities Fund |
How did the Fund perform over the last 10 years?
Performance data shown represents past performance and does not predict or guarantee future results. The graph and table do not reflect the deduction of taxes that a shareholder would pay on Fund distributions or redemption of Fund Shares.
Fund Performance (June 1, 2014 through May 31, 2024) Initial Investment of $10,000
Average Annual Total Returns
| | | | | | | | | | | | |
| | | 1 year | | | 5 years | | | 10 years | |
| Class R6 Shares at NAV | | | 20.24 | % | | | 9.75 | % | | | 7.74 | % |
Russell 3000® Index | | | 27.58 | % | | | 15.00 | % | | | 12.09 | % |
| Bloomberg U.S. Aggregate Bond Index | | | 1.31 | % | | | (0.17 | )% | | | 1.26 | % |
| Lifestyle Growth Fund Composite Index | | | 18.99 | % | | | 9.98 | % | | | 8.04 | % |
| Morningstar Moderately Aggressive Target Risk Index | | | 17.14 | % | | | 8.55 | % | | | 6.99 | % |
Investment return and principal value will fluctuate, and you may have a gain or loss when you sell your shares. Current performance may differ from figures shown. For most recent month‑end performance, go to https://www.nuveen.com/en‑us/mutual‑funds/prospectuses or call (800) 257‑8787.
Fund Statistics (as of May 31, 2024)
| | | | |
| Fund net assets | | $ | 306,250,622 | |
| Total number of portfolio holdings | | | 14 | |
| Portfolio turnover (%) | | | 15% | |
| Total advisory fees paid for the year | | $ | 288,025 | |
What did the Fund invest in? (as of May 31, 2024)
(1) Affiliated investment companies, except for repurchase agreements.
How has the Fund changed?
| | • | | Name change: Effective May 1, 2024, the Fund’s name changed from TIAA-CREF Lifestyle Growth Fund to Nuveen Lifestyle Growth Fund. | |
| | • | | Share class name change: Effective May 6, 2024, Institutional Class shares of the Fund were renamed Class R6 shares. | |
For more complete information, you may review the Fund’s next prospectus, which is expected to be available by October 1, 2024 at https://www.nuveen.com/en‑us/mutual‑funds/prospectuses or upon request at (800) 257‑8787.
Availability of additional information about the Fund
You can find additional information about the Fund at https://www.nuveen.com/en‑us/mutual‑funds/prospectuses, including its:
| | • | | prospectus • financial statements and other information • fund holdings • proxy voting information |
You can also request this information at (800) 257‑8787.
| | |
87245R789_AR_0524 3613923-INV-Y-07/25 (A, I, R6, Premier, Retirement) | | |
| | |
| | Annual Shareholder Report May 31, 2024 |
Nuveen Lifestyle Growth Fund
(Formerly known as TIAA-CREF Lifestyle Growth Fund)
Class I Shares (Formerly known as Advisor Class Shares)/TSGHX
Annual Shareholder Report
This annual shareholder report contains important information about the Class I Shares of the Nuveen Lifestyle Growth Fund for the period of June 1, 2023 to May 31, 2024. You can find additional information at https://www.nuveen.com/en‑us/mutual‑funds/prospectuses. You can also request this information by contacting us at (800) 257‑8787.
This report describes changes to the Fund that occurred during the reporting period.
What were the Fund costs for the last year? (based on a hypothetical $10,000 investment)(1)
| | | | |
| | | Cost of a $10,000 investment | | Costs paid as a percentage of $10,000 investment |
| Class I Shares | | $13 | | 0.13% |
(1) These costs do not include the expenses of the underlying funds in which the Fund invests.
How did the Fund perform last year? What affected the Fund’s performance?
| | |
Performance Highlights • The Nuveen Lifestyle Growth Fund returned 20.15% for Class I shares at net asset value (NAV) for the 12 months ended May 31, 2024. The Fund outperformed the Lifestyle Growth Fund Composite Index, which returned 18.99%. • The Lifestyle Growth Fund Composite Index consisted of: 52.0% Russell 3000® Index; 28.0% MSCI All Country World Index ex USA Investable Market Index; and 20.0% Bloomberg U.S. Aggregate Bond Index. • Top contributors to relative performance » Strong overall performance of the underlying funds investing in U.S. equities, led by the Nuveen Core Equity Fund and Nuveen Growth Opportunities ETF. » An allocation to the Nuveen Core Plus Bond Fund. • Top detractors from relative performance » A position in the Nuveen International Opportunities Fund. | | Performance Attribution U.S. Equities Nuveen Core Plus Bond Fund Nuveen International Opportunities Fund |
How did the Fund perform over the period since inception?
Performance data shown represents past performance and does not predict or guarantee future results. The graph and table do not reflect the deduction of taxes that a shareholder would pay on Fund distributions or redemption of Fund Shares.
Fund Performance (December 4, 2015 through May 31, 2024) Initial Investment of $10,000
Average Annual Total Returns
| | | | | | | | | | | | |
| | | 1 year | | | 5 years | | | Since Inception | |
| Class I Shares at NAV | | | 20.15 | % | | | 9.64 | % | | | 8.48 | % |
Russell 3000® Index | | | 27.58 | % | | | 15.00 | % | | | 12.98 | % |
| Bloomberg U.S. Aggregate Bond Index | | | 1.31 | % | | | (0.17 | )% | | | 1.16 | % |
| Lifestyle Growth Fund Composite Index | | | 18.99 | % | | | 9.98 | % | | | 9.06 | % |
| Morningstar Moderately Aggressive Target Risk Index | | | 17.14 | % | | | 8.55 | % | | | 8.27 | % |
Investment return and principal value will fluctuate, and you may have a gain or loss when you sell your shares. Current performance may differ from figures shown. For most recent month‑end performance, go to https://www.nuveen.com/en‑us/mutual‑funds/prospectuses or call (800) 257‑8787.
Fund Statistics (as of May 31, 2024)
| | | | |
| Fund net assets | | $ | 306,250,622 | |
| Total number of portfolio holdings | | | 14 | |
| Portfolio turnover (%) | | | 15% | |
| Total advisory fees paid for the year | | $ | 288,025 | |
What did the Fund invest in? (as of May 31, 2024)
(1) Affiliated investment companies, except for repurchase agreements.
How has the Fund changed?
| | • | | Name change: Effective May 1, 2024, the Fund’s name changed from TIAA-CREF Lifestyle Growth Fund to Nuveen Lifestyle Growth Fund. | |
| | • | | Share class name change: Effective May 6, 2024, Advisor Class shares of the Fund were renamed Class I shares. | |
For more complete information, you may review the Fund’s next prospectus, which is expected to be available by October 1, 2024 at https://www.nuveen.com/en‑us/mutual‑funds/prospectuses or upon request at (800) 257‑8787.
Availability of additional information about the Fund
You can find additional information about the Fund at https://www.nuveen.com/en‑us/mutual‑funds/prospectuses, including its:
| | • | | prospectus • financial statements and other information • fund holdings • proxy voting information |
You can also request this information at (800) 257‑8787.
| | |
87245R235_AR_0524 3613923-INV-Y-07/25 (A, I, R6, Premier, Retirement) | | |
| | |
| | Annual Shareholder Report May 31, 2024 |
Nuveen Lifestyle Income Fund
(Formerly known as TIAA-CREF Lifestyle Income Fund)
Class R6 Shares (Formerly known as Institutional Class Shares)/TSITX
Annual Shareholder Report
This annual shareholder report contains important information about the Class R6 Shares of the Nuveen Lifestyle Income Fund for the period of June 1, 2023 to May 31, 2024. You can find additional information at https://www.nuveen.com/en‑us/mutual‑funds/prospectuses. You can also request this information by contacting us at (800) 257‑8787.
This report describes changes to the Fund that occurred during the reporting period.
What were the Fund costs for the last year? (based on a hypothetical $10,000 investment)(1)
| | | | |
| | | Cost of a $10,000 investment | | Costs paid as a percentage of $10,000 investment |
| Class R6 Shares | | $10 | | 0.10% |
(1) These costs do not include the expenses of the underlying funds in which the Fund invests.
How did the Fund perform last year? What affected the Fund’s performance?
| | |
Performance Highlights • The Nuveen Lifestyle Income Fund returned 7.91% for Class R6 shares at net asset value (NAV) for the 12 months ended May 31, 2024. The Fund outperformed the Lifestyle Income Fund Composite Index, which returned 6.67%. • The Lifestyle Income Fund Composite Index consisted of: 40.0% Bloomberg U.S. Aggregate Bond Index; 40.0% Bloomberg U.S. 1–3 Year Government/Credit Bond Index; 13.0% Russell 3000® Index; and 7.0% MSCI All Country World Index ex USA Investable Market Index. • Top contributors to relative performance » Strong overall performance of the underlying funds investing in fixed income and U.S. equities, led by the Nuveen Core Plus Bond Fund and the Nuveen Core Equity Fund. » A position in the Nuveen Short Term Bond Fund. • Top detractors from relative performance » A position in the Nuveen International Opportunities Fund. | | Performance Attribution Nuveen Core Plus Bond Fund Nuveen Core Equity Fund Nuveen Short Term Bond Fund Nuveen International Opportunities Fund |
How did the Fund perform over the last 10 years?
Performance data shown represents past performance and does not predict or guarantee future results. The graph and table do not reflect the deduction of taxes that a shareholder would pay on Fund distributions or redemption of Fund Shares.
Fund Performance (June 1, 2014 through May 31, 2024) Initial Investment of $10,000
Average Annual Total Returns
| | | | | | | | | | | | |
| | | 1 year | | | 5 years | | | 10 years | |
| Class R6 Shares at NAV | | | 7.91 | % | | | 3.38 | % | | | 3.33 | % |
Russell 3000® Index | | | 27.58 | % | | | 15.00 | % | | | 12.09 | % |
| Bloomberg U.S. Aggregate Bond Index | | | 1.31 | % | | | (0.17 | )% | | | 1.26 | % |
| Lifestyle Income Fund Composite Index | | | 6.67 | % | | | 3.05 | % | | | 3.07 | % |
| Morningstar Conservative Target Risk Index | | | 5.26 | % | | | 2.12 | % | | | 2.51 | % |
Investment return and principal value will fluctuate, and you may have a gain or loss when you sell your shares. Current performance may differ from figures shown. For most recent month‑end performance, go to https://www.nuveen.com/en‑us/mutual‑funds/prospectuses or call (800) 257‑8787.
Fund Statistics (as of May 31, 2024)
| | | | |
| Fund net assets | | $ | 74,920,788 | |
| Total number of portfolio holdings | | | 15 | |
| Portfolio turnover (%) | | | 19% | |
| Total advisory fees paid for the year | | $ | 76,937 | |
What did the Fund invest in? (as of May 31, 2024)
(1) Affiliated investment companies.
How has the Fund changed?
| | • | | Name change: Effective May 1, 2024, the Fund’s name changed from TIAA-CREF Lifestyle Income Fund to Nuveen Lifestyle Income Fund. | |
| | • | | Share class name change: Effective May 6, 2024, Institutional Class shares of the Fund were renamed Class R6 shares. | |
For more complete information, you may review the Fund’s next prospectus, which is expected to be available by October 1, 2024 at https://www.nuveen.com/en‑us/mutual‑funds/prospectuses or upon request at (800) 257‑8787.
Availability of additional information about the Fund
You can find additional information about the Fund at https://www.nuveen.com/en‑us/mutual‑funds/prospectuses, including its:
| | • | | prospectus • financial statements and other information • fund holdings • proxy voting information |
You can also request this information at (800) 257‑8787.
| | |
87245R607_AR_0524 3613895-INV-Y-07/25 (A, I, R6, Premier, Retirement) | | |
| | |
| | Annual Shareholder Report May 31, 2024 |
Nuveen Lifestyle Income Fund
(Formerly known as TIAA-CREF Lifestyle Income Fund)
Premier Class Shares/TSIPX
Annual Shareholder Report
This annual shareholder report contains important information about the Premier Class Shares of the Nuveen Lifestyle Income Fund for the period of June 1, 2023 to May 31, 2024. You can find additional information at https://www.nuveen.com/en‑us/mutual‑funds/prospectuses. You can also request this information by contacting us at (800) 257‑8787.
This report describes changes to the Fund that occurred during the reporting period.
What were the Fund costs for the last year? (based on a hypothetical $10,000 investment)(1)
| | | | |
| | | Cost of a $10,000 investment | | Costs paid as a percentage of
$10,000 investment |
| Premier Class Shares | | $25 | | 0.25% |
(1) These costs do not include the expenses of the underlying funds in which the Fund invests.
How did the Fund perform last year? What affected the Fund’s performance?
| | |
Performance Highlights • The Nuveen Lifestyle Income Fund returned 7.76% for Premier Class shares at net asset value (NAV) for the 12 months ended May 31, 2024. The Fund outperformed the Lifestyle Income Fund Composite Index, which returned 6.67%. • The Lifestyle Income Fund Composite Index consisted of: 40.0% Bloomberg U.S. Aggregate Bond Index; 40.0% Bloomberg U.S. 1–3 Year Government/Credit Bond Index; 13.0% Russell 3000® Index; and 7.0% MSCI All Country World Index ex USA Investable Market Index. • Top contributors to relative performance » Strong overall performance of the underlying funds investing in fixed income and U.S. equities, led by the Nuveen Core Plus Bond Fund and the Nuveen Core Equity Fund. » A position in the Nuveen Short Term Bond Fund. • Top detractors from relative performance » A position in the Nuveen International Opportunities Fund. | | Performance Attribution Nuveen Core Plus Bond Fund Nuveen Core Equity Fund Nuveen Short Term Bond Fund Nuveen International Opportunities Fund |
How did the Fund perform over the last 10 years?
Performance data shown represents past performance and does not predict or guarantee future results. The graph and table do not reflect the deduction of taxes that a shareholder would pay on Fund distributions or redemption of Fund Shares.
Fund Performance (June 1, 2014 through May 31, 2024) Initial Investment of $10,000
Average Annual Total Returns
| | | | | | | | | | | | |
| | | 1 year | | | 5 years | | | 10 years | |
| Premier Class Shares at NAV | | | 7.76 | % | | | 3.24 | % | | | 3.17 | % |
Russell 3000® Index | | | 27.58 | % | | | 15.00 | % | | | 12.09 | % |
| Bloomberg U.S. Aggregate Bond Index | | | 1.31 | % | | | (0.17 | )% | | | 1.26 | % |
| Lifestyle Income Fund Composite Index | | | 6.67 | % | | | 3.05 | % | | | 3.07 | % |
| Morningstar Conservative Target Risk Index | | | 5.26 | % | | | 2.12 | % | | | 2.51 | % |
Investment return and principal value will fluctuate, and you may have a gain or loss when you sell your shares. Current performance may differ from figures shown. For most recent month‑end performance, go to https://www.nuveen.com/en‑us/mutual‑funds/prospectuses or call (800) 257‑8787.
Fund Statistics (as of May 31, 2024)
| | | | |
| Fund net assets | | $ | 74,920,788 | |
| Total number of portfolio holdings | | | 15 | |
| Portfolio turnover (%) | | | 19% | |
| Total advisory fees paid for the year | | $ | 76,937 | |
What did the Fund invest in? (as of May 31, 2024)
(1) Affiliated investment companies.
How has the Fund changed?
| | • | | Name change: Effective May 1, 2024, the Fund’s name changed from TIAA-CREF Lifestyle Income Fund to Nuveen Lifestyle Income Fund. | |
For more complete information, you may review the Fund’s next prospectus, which is expected to be available by October 1, 2024 at https://www.nuveen.com/en‑us/mutual‑funds/prospectuses or upon request at (800) 257‑8787.
Availability of additional information about the Fund
You can find additional information about the Fund at https://www.nuveen.com/en‑us/mutual‑funds/prospectuses, including its:
| | • | | prospectus • financial statements and other information • fund holdings • proxy voting information |
You can also request this information at (800) 257‑8787.
| | |
87245R706_AR_0524 3613895-INV-Y-07/25 (A, I, R6, Premier, Retirement) | | |
| | |
| | Annual Shareholder Report May 31, 2024 |
Nuveen Lifestyle Income Fund
(Formerly known as TIAA-CREF Lifestyle Income Fund)
Class A Shares (Formerly known as Retail Class Shares)/TSILX
Annual Shareholder Report
This annual shareholder report contains important information about the Class A Shares of the Nuveen Lifestyle Income Fund for the period of June 1, 2023 to May 31, 2024. You can find additional information at https://www.nuveen.com/en‑us/mutual‑funds/prospectuses. You can also request this information by contacting us at (800) 257‑8787.
This report describes changes to the Fund that occurred during the reporting period.
What were the Fund costs for the last year? (based on a hypothetical $10,000 investment)(1)
| | | | |
| | | Cost of a $10,000 investment | | Costs paid as a percentage of $10,000 investment |
| Class A Shares | | $38 | | 0.38% |
(1) These costs do not include the expenses of the underlying funds in which the Fund invests.
How did the Fund perform last year? What affected the Fund’s performance?
| | |
Performance Highlights • The Nuveen Lifestyle Income Fund returned 7.61% for Class A shares at net asset value (NAV) for the 12 months ended May 31, 2024. The Fund outperformed the Lifestyle Income Fund Composite Index, which returned 6.67%. • The Lifestyle Income Fund Composite Index consisted of: 40.0% Bloomberg U.S. Aggregate Bond Index; 40.0% Bloomberg U.S. 1-3 Year Government/Credit Bond Index; 13.0% Russell 3000® Index; and 7.0% MSCI All Country World Index ex USA Investable Market Index. • Top contributors to relative performance » Strong overall performance of the underlying funds investing in fixed income and U.S. equities, led by the Nuveen Core Plus Bond Fund and the Nuveen Core Equity Fund. » A position in the Nuveen Short Term Bond Fund. • Top detractors from relative performance » A position in the Nuveen International Opportunities Fund. | | Performance Attribution Nuveen Core Plus Bond Fund Nuveen Core Equity Fund Nuveen Short Term Bond Fund Nuveen International Opportunities Fund |
How did the Fund perform over the last 10 years?
Performance data shown represents past performance and does not predict or guarantee future results. The graph and table do not reflect the deduction of taxes that a shareholder would pay on Fund distributions or redemption of Fund Shares.
Fund Performance (June 1, 2014 through May 31, 2024) Initial Investment of $10,000
Average Annual Total Returns
| | | | | | | | | | | | |
| | | 1 year | | | 5 years | | | 10 years | |
| Class A Shares at NAV (excluding maximum sales charge) | | | 7.61 | % | | | 3.09 | % | | | 3.04 | % |
| Class A at maximum sales charge (Offering Price) | | | 1.45 | % | | | 1.88 | % | | | 2.43 | % |
Russell 3000® Index | | | 27.58 | % | | | 15.00 | % | | | 12.09 | % |
| Bloomberg U.S. Aggregate Bond Index | | | 1.31 | % | | | (0.17 | )% | | | 1.26 | % |
| Lifestyle Income Fund Composite Index | | | 6.67 | % | | | 3.05 | % | | | 3.07 | % |
| Morningstar Conservative Target Risk Index | | | 5.26 | % | | | 2.12 | % | | | 2.51 | % |
Class A Shares at Offer reflect a maximum up‑front sales charge of 5.75% applicable to the purchase of Class A shares, which was effective as of May 6, 2024.
Investment return and principal value will fluctuate, and you may have a gain or loss when you sell your shares. Current performance may differ from figures shown. For most recent month‑end performance, go to https://www.nuveen.com/en‑us/mutual‑funds/prospectuses or call (800) 257‑8787.
Fund Statistics (as of May 31, 2024)
| | | | |
| Fund net assets | | $ | 74,920,788 | |
| Total number of portfolio holdings | | | 15 | |
| Portfolio turnover (%) | | | 19% | |
| Total advisory fees paid for the year | | $ | 76,937 | |
What did the Fund invest in? (as of May 31, 2024)
(1) Affiliated investment companies.
How has the Fund changed?
| | • | | Name change: Effective May 1, 2024, the Fund’s name changed from TIAA-CREF Lifestyle Income Fund to Nuveen Lifestyle Income Fund. | |
| | • | | Share class name change: Effective May 6, 2024, Retail Class shares of the Fund were renamed Class A shares. | |
| | • | | Sales charge: Effective May 6, 2024, a sales charge is imposed on purchases of Class A shares (formerly Retail Class shares) of the Fund of less than certain amounts, as set forth in the Fund’s prospectus. Therefore, effective as of May 6, 2024, Class A shares are available for purchase at the offering price, which will be the net asset value (NAV) per share plus an up‑front sales charge. | |
For more complete information, you may review the Fund’s next prospectus, which is expected to be available by October 1, 2024 at https://www.nuveen.com/en-us/mutual-funds/prospectuses or upon request at (800) 257-8787.
Availability of additional information about the Fund
You can find additional information about the Fund at https://www.nuveen.com/en-us/mutual-funds/prospectuses, including its:
| | • | | prospectus • financial statements and other information • fund holdings • proxy voting information |
You can also request this information at (800) 257-8787.
| | |
87245R508_AR_0524 3613895-INV-Y-07/25 (A, I, R6, Premier, Retirement) | | |
| | |
| | Annual Shareholder Report May 31, 2024 |
Nuveen Lifestyle Income Fund
(Formerly known as TIAA-CREF Lifestyle Income Fund)
Retirement Class Shares/TLSRX
Annual Shareholder Report
This annual shareholder report contains important information about the Retirement Class Shares of the Nuveen Lifestyle Income Fund for the period of June 1, 2023 to May 31, 2024. You can find additional information at https://www.nuveen.com/en‑us/mutual‑funds/prospectuses. You can also request this information by contacting us at (800) 257‑8787.
This report describes changes to the Fund that occurred during the reporting period.
What were the Fund costs for the last year? (based on a hypothetical $10,000 investment)(1)
| | | | |
| | | Cost of a $10,000 investment | | Costs paid as a percentage of
$10,000 investment |
| Retirement Class Shares | | $35 | | 0.35% |
(1) These costs do not include the expenses of the underlying funds in which the Fund invests.
How did the Fund perform last year? What affected the Fund’s performance?
| | |
Performance Highlights • The Nuveen Lifestyle Income Fund returned 7.65% for Retirement Class shares at net asset value (NAV) for the 12 months ended May 31, 2024. The Fund outperformed the Lifestyle Income Fund Composite Index, which returned 6.67%. • The Lifestyle Income Fund Composite Index consisted of: 40.0% Bloomberg U.S. Aggregate Bond Index; 40.0% Bloomberg U.S. 1-3 Year Government/Credit Bond Index; 13.0% Russell 3000® Index; and 7.0% MSCI All Country World Index ex USA Investable Market Index. • Top contributors to relative performance » Strong overall performance of the underlying funds investing in fixed income and U.S. equities, led by the Nuveen Core Plus Bond Fund and the Nuveen Core Equity Fund. » A position in the Nuveen Short Term Bond Fund. • Top detractors from relative performance » A position in the Nuveen International Opportunities Fund. | | Performance Attribution Nuveen Core Plus Bond Fund Nuveen Core Equity Fund Nuveen Short Term Bond Fund Nuveen International Opportunities Fund |
How did the Fund perform over the last 10 years?
Performance data shown represents past performance and does not predict or guarantee future results. The graph and table do not reflect the deduction of taxes that a shareholder would pay on Fund distributions or redemption of Fund Shares.
Fund Performance (June 1, 2014 through May 31, 2024) Initial Investment of $10,000
Average Annual Total Returns
| | | | | | | | | | | | |
| | | 1 year | | | 5 years | | | 10 years | |
| Retirement Class Shares at NAV | | | 7.65 | % | | | 3.14 | % | | | 3.06 | % |
Russell 3000® Index | | | 27.58 | % | | | 15.00 | % | | | 12.09 | % |
| Bloomberg U.S. Aggregate Bond Index | | | 1.31 | % | | | (0.17 | )% | | | 1.26 | % |
| Lifestyle Income Fund Composite Index | | | 6.67 | % | | | 3.05 | % | | | 3.07 | % |
| Morningstar Conservative Target Risk Index | | | 5.26 | % | | | 2.12 | % | | | 2.51 | % |
Investment return and principal value will fluctuate, and you may have a gain or loss when you sell your shares. Current performance may differ from figures shown. For most recent month‑end performance, go to https://www.nuveen.com/en‑us/mutual‑funds/prospectuses or call (800) 257‑8787.
Fund Statistics (as of May 31, 2024)
| | | | |
| Fund net assets | | $ | 74,920,788 | |
| Total number of portfolio holdings | | | 15 | |
| Portfolio turnover (%) | | | 19% | |
| Total advisory fees paid for the year | | $ | 76,937 | |
What did the Fund invest in? (as of May 31, 2024)
(1) Affiliated investment companies.
How has the Fund changed?
| | • | | Name change: Effective May 1, 2024, the Fund’s name changed from TIAA-CREF Lifestyle Income Fund to Nuveen Lifestyle Income Fund. | |
For more complete information, you may review the Fund’s next prospectus, which is expected to be available by October 1, 2024 at https://www.nuveen.com/en‑us/mutual‑funds/prospectuses or upon request at (800) 257‑8787.
Availability of additional information about the Fund
You can find additional information about the Fund at https://www.nuveen.com/en‑us/mutual‑funds/prospectuses, including its:
| | • | | prospectus • financial statements and other information • fund holdings • proxy voting information |
You can also request this information at (800) 257‑8787.
| | |
87245R805_AR_0524 3613895-INV-Y-07/25 (A, I, R6, Premier, Retirement) | | |
| | |
| | Annual Shareholder Report May 31, 2024 |
Nuveen Lifestyle Income Fund
(Formerly known as TIAA-CREF Lifestyle Income Fund)
Class I Shares (Formerly known as Advisor Class Shares)/TSIHX
Annual Shareholder Report
This annual shareholder report contains important information about the Class I Shares of the Nuveen Lifestyle Income Fund for the period of June 1, 2023 to May 31, 2024. You can find additional information at https://www.nuveen.com/en‑us/mutual‑funds/prospectuses. You can also request this information by contacting us at (800) 257‑8787.
This report describes changes to the Fund that occurred during the reporting period.
What were the Fund costs for the last year? (based on a hypothetical $10,000 investment)(1)
| | | | |
| | | Cost of a $10,000 investment | | Costs paid as a percentage of
$10,000 investment |
| Class I Shares | | $19 | | 0.19% |
(1) These costs do not include the expenses of the underlying funds in which the Fund invests.
How did the Fund perform last year? What affected the Fund’s performance?
| | |
Performance Highlights • The Nuveen Lifestyle Income Fund returned 7.85% for Class I shares at net asset value (NAV) for the 12 months ended May 31, 2024. The Fund outperformed the Lifestyle Income Fund Composite Index, which returned 6.67%. • The Lifestyle Income Fund Composite Index consisted of: 40.0% Bloomberg U.S. Aggregate Bond Index; 40.0% Bloomberg U.S. 1-3 Year Government/Credit Bond Index; 13.0% Russell 3000® Index; and 7.0% MSCI All Country World Index ex USA Investable Market Index. • Top contributors to relative performance » Strong overall performance of the underlying funds investing in fixed income and U.S. equities, led by the Nuveen Core Plus Bond Fund and the Nuveen Core Equity Fund. » A position in the Nuveen Short Term Bond Fund. • Top detractors from relative performance » A position in the Nuveen International Opportunities Fund. | | Performance Attribution Nuveen Core Plus Bond Fund Nuveen Core Equity Fund Nuveen Short Term Bond Fund Nuveen International Opportunities Fund |
How did the Fund perform over the period since inception?
Performance data shown represents past performance and does not predict or guarantee future results. The graph and table do not reflect the deduction of taxes that a shareholder would pay on Fund distributions or redemption of Fund Shares.
Fund Performance (December 4, 2015 through May 31, 2024) Initial Investment of $10,000
Average Annual Total Returns
| | | | | | | | | | | | |
| | | 1 year | | | 5 years | | | Since Inception | |
| Class I Shares at NAV | | | 7.85 | % | | | 3.33 | % | | | 3.59 | % |
Russell 3000® Index | | | 27.58 | % | | | 15.00 | % | | | 12.98 | % |
| Bloomberg U.S. Aggregate Bond Index | | | 1.31 | % | | | (0.17 | )% | | | 1.16 | % |
| Lifestyle Income Fund Composite Index | | | 6.67 | % | | | 3.05 | % | | | 3.34 | % |
| Morningstar Conservative Target Risk Index | | | 5.26 | % | | | 2.12 | % | | | 3.02 | % |
Investment return and principal value will fluctuate, and you may have a gain or loss when you sell your shares. Current performance may differ from figures shown. For most recent month‑end performance, go to https://www.nuveen.com/en‑us/mutual‑funds/prospectuses or call (800) 257‑8787.
Fund Statistics (as of May 31, 2024)
| | | | |
| Fund net assets | | $ | 74,920,788 | |
| Total number of portfolio holdings | | | 15 | |
| Portfolio turnover (%) | | | 19% | |
| Total advisory fees paid for the year | | $ | 76,937 | |
What did the Fund invest in? (as of May 31, 2024)
(1) Affiliated investment companies.
How has the Fund changed?
| | • | | Name change: Effective May 1, 2024, the Fund’s name changed from TIAA-CREF Lifestyle Income Fund to Nuveen Lifestyle Income Fund. | |
| | • | | Share class name change: Effective May 6, 2024, Advisor Class shares of the Fund were renamed Class I shares. | |
For more complete information, you may review the Fund’s next prospectus, which is expected to be available by October 1, 2024 at https://www.nuveen.com/en‑us/mutual‑funds/prospectuses or upon request at (800) 257‑8787.
Availability of additional information about the Fund
You can find additional information about the Fund at https://www.nuveen.com/en‑us/mutual‑funds/prospectuses, including its:
| | • | | prospectus • financial statements and other information • fund holdings • proxy voting information |
You can also request this information at (800) 257‑8787.
| | |
87245R268_AR_0524 3613895-INV-Y-07/25 (A, I, R6, Premier, Retirement) | | |
| | |
| | Annual Shareholder Report May 31, 2024 |
Nuveen Lifestyle Moderate Fund
(Formerly known as TIAA-CREF Lifestyle Moderate Fund)
Class R6 Shares (Formerly known as Institutional Class Shares)/TSIMX
Annual Shareholder Report
This annual shareholder report contains important information about the Class R6 Shares of the Nuveen Lifestyle Moderate Fund for the period of June 1, 2023 to May 31, 2024. You can find additional information at https://www.nuveen.com/en‑us/mutual‑funds/prospectuses. You can also request this information by contacting us at (800) 257‑8787.
This report describes changes to the Fund that occurred during the reporting period.
What were the Fund costs for the last year? (based on a hypothetical $10,000 investment)(1)
| | | | |
| | | Cost of a $10,000 investment | | Costs paid as a percentage of $10,000 investment |
| Class R6 Shares | | $9 | | 0.09% |
(1) These costs do not include the expenses of the underlying funds in which the Fund invests.
How did the Fund perform last year? What affected the Fund’s performance?
| | |
Performance Highlights • The Nuveen Lifestyle Moderate Fund returned 15.90% for Class R6 shares at net asset value (NAV) for the 12 months ended May 31, 2024. The Fund outperformed the Lifestyle Moderate Fund Composite Index, which returned 14.39%. • The Lifestyle Moderate Fund Composite Index consisted of: 40.0% Bloomberg U.S. Aggregate Bond Index; 39.0% Russell 3000® Index; and 21.0% MSCI All Country World Index ex USA Investable Market Index. • Top contributors to relative performance » Strong overall performance of the underlying funds investing in U.S. equities, led by the Nuveen Core Equity Fund. » An allocation to the Nuveen Core Plus Bond Fund. • Top detractors from relative performance » A position in the Nuveen International Opportunities Fund. | | Performance Attribution U.S. Equities Nuveen Core Plus Bond Fund Nuveen International Opportunities Fund |
How did the Fund perform over the last 10 years?
Performance data shown represents past performance and does not predict or guarantee future results. The graph and table do not reflect the deduction of taxes that a shareholder would pay on Fund distributions or redemption of Fund Shares.
Fund Performance (June 1, 2014 through May 31, 2024) Initial Investment of $10,000
Average Annual Total Returns
| | | | | | | | | | | | |
| | | 1 year | | | 5 years | | | 10 years | |
| Class R6 Shares at NAV | | | 15.90 | % | | | 7.53 | % | | | 6.37 | % |
Russell 3000® Index | | | 27.58 | % | | | 15.00 | % | | | 12.09 | % |
| Bloomberg U.S. Aggregate Bond Index | | | 1.31 | % | | | (0.17 | )% | | | 1.26 | % |
| Lifestyle Moderate Fund Composite Index | | | 14.39 | % | | | 7.51 | % | | | 6.43 | % |
| Morningstar Moderate Target Risk Index | | | 13.09 | % | | | 6.54 | % | | | 5.63 | % |
Investment return and principal value will fluctuate, and you may have a gain or loss when you sell your shares. Current performance may differ from figures shown. For most recent month‑end performance, go to https://www.nuveen.com/en‑us/mutual‑funds/prospectuses or call (800) 257‑8787.
Fund Statistics (as of May 31, 2024)
| | | | |
| Fund net assets | | $ | 562,960,415 | |
| Total number of portfolio holdings | | | 14 | |
| Portfolio turnover (%) | | | 15% | |
| Total advisory fees paid for the year | | $ | 538,127 | |
What did the Fund invest in? (as of May 31, 2024)
(1) Affiliated investment companies, except for repurchase agreements.
How has the Fund changed?
| | • | | Name change: Effective May 1, 2024, the Fund’s name changed from TIAA-CREF Lifestyle Moderate Fund to Nuveen Lifestyle Moderate Fund. | |
| | • | | Share class name change: Effective May 6, 2024, Institutional Class shares of the Fund were renamed Class R6 shares. | |
For more complete information, you may review the Fund’s next prospectus, which is expected to be available by October 1, 2024 at https://www.nuveen.com/en‑us/mutual‑funds/prospectuses or upon request at (800) 257‑8787.
Availability of additional information about the Fund
You can find additional information about the Fund at https://www.nuveen.com/en‑us/mutual‑funds/prospectuses, including its:
| | • | | prospectus • financial statements and other information • fund holdings • proxy voting information |
You can also request this information at (800) 257‑8787.
| | |
87245R839_AR_0524 3613915-INV-Y-07/25 (A, I, R6, Premier, Retirement) | | |
| | |
| | Annual Shareholder Report May 31, 2024 |
Nuveen Lifestyle Moderate Fund
(Formerly known as TIAA-CREF Lifestyle Moderate Fund)
Premier Class Shares/TSMPX
Annual Shareholder Report
This annual shareholder report contains important information about the Premier Class Shares of the Nuveen Lifestyle Moderate Fund for the period of June 1, 2023 to May 31, 2024. You can find additional information at https://www.nuveen.com/en‑us/mutual‑funds/prospectuses. You can also request this information by contacting us at (800) 257‑8787.
This report describes changes to the Fund that occurred during the reporting period.
What were the Fund costs for the last year? (based on a hypothetical $10,000 investment)(1)
| | | | |
| | | Cost of a $10,000 investment | | Costs paid as a percentage of
$10,000 investment |
| Premier Class Shares | | $24 | | 0.24% |
(1) These costs do not include the expenses of the underlying funds in which the Fund invests.
How did the Fund perform last year? What affected the Fund’s performance?
| | |
Performance Highlights • The Nuveen Lifestyle Moderate Fund returned 15.68% for Premier Class shares at net asset value (NAV) for the 12 months ended May 31, 2024. The Fund outperformed the Lifestyle Moderate Fund Composite Index, which returned 14.39%. • The Lifestyle Moderate Fund Composite Index consisted of: 40.0% Bloomberg U.S. Aggregate Bond Index; 39.0% Russell 3000® Index; and 21.0% MSCI All Country World Index ex USA Investable Market Index. • Top contributors to relative performance » Strong overall performance of the underlying funds investing in U.S. equities, led by the Nuveen Core Equity Fund. » An allocation to the Nuveen Core Plus Bond Fund. • Top detractors from relative performance » A position in the Nuveen International Opportunities Fund. | | Performance Attribution U.S. Equities Nuveen Core Plus Bond Fund Nuveen International Opportunities Fund |
How did the Fund perform over the last 10 years?
Performance data shown represents past performance and does not predict or guarantee future results. The graph and table do not reflect the deduction of taxes that a shareholder would pay on Fund distributions or redemption of Fund Shares.
Fund Performance (June 1, 2014 through May 31, 2024) Initial Investment of $10,000
Average Annual Total Returns
| | | | | | | | | | | | |
| | | 1 year | | | 5 years | | | 10 years | |
| Premier Class Shares at NAV | | | 15.68 | % | | | 7.36 | % | | | 6.20 | % |
Russell 3000® Index | | | 27.58 | % | | | 15.00 | % | | | 12.09 | % |
| Bloomberg U.S. Aggregate Bond Index | | | 1.31 | % | | | (0.17 | )% | | | 1.26 | % |
| Lifestyle Moderate Fund Composite Index | | | 14.39 | % | | | 7.51 | % | | | 6.43 | % |
| Morningstar Moderate Target Risk Index | | | 13.09 | % | | | 6.54 | % | | | 5.63 | % |
Investment return and principal value will fluctuate, and you may have a gain or loss when you sell your shares. Current performance may differ from figures shown. For most recent month‑end performance, go to https://www.nuveen.com/en‑us/mutual‑funds/prospectuses or call (800) 257‑8787.
Fund Statistics (as of May 31, 2024)
| | | | |
| Fund net assets | | $ | 562,960,415 | |
| Total number of portfolio holdings | | | 14 | |
| Portfolio turnover (%) | | | 15% | |
| Total advisory fees paid for the year | | $ | 538,127 | |
What did the Fund invest in? (as of May 31, 2024)
(1) Affiliated investment companies, except for repurchase agreements.
How has the Fund changed?
| | • | | Name change: Effective May 1, 2024, the Fund’s name changed from TIAA-CREF Lifestyle Moderate Fund to Nuveen Lifestyle Moderate Fund. | |
For more complete information, you may review the Fund’s next prospectus, which is expected to be available by October 1, 2024 at https://www.nuveen.com/en‑us/mutual‑funds/prospectuses or upon request at (800) 257‑8787.
Availability of additional information about the Fund
You can find additional information about the Fund at https://www.nuveen.com/en‑us/mutual‑funds/prospectuses, including its:
| | • | | prospectus • financial statements and other information • fund holdings • proxy voting information |
You can also request this information at (800) 257‑8787.
| | |
87245R821_AR_0524 3613915-INV-Y-07/25 (A, I, R6, Premier, Retirement) | | |
| | |
| | Annual Shareholder Report May 31, 2024 |
Nuveen Lifestyle Moderate Fund
(Formerly known as TIAA-CREF Lifestyle Moderate Fund)
Class A Shares (Formerly known as Retail Class Shares)/TSMLX
Annual Shareholder Report
This annual shareholder report contains important information about the Class A Shares of the Nuveen Lifestyle Moderate Fund for the period of June 1, 2023 to May 31, 2024. You can find additional information at https://www.nuveen.com/en‑us/mutual‑funds/prospectuses. You can also request this information by contacting us at (800) 257‑8787.
This report describes changes to the Fund that occurred during the reporting period.
What were the Fund costs for the last year? (based on a hypothetical $10,000 investment)(1)
| | | | |
| | | Cost of a $10,000 investment | | Costs paid as a percentage of $10,000 investment |
| Class A Shares | | $36 | | 0.36% |
(1) These costs do not include the expenses of the underlying funds in which the Fund invests.
How did the Fund perform last year? What affected the Fund’s performance?
| | |
Performance Highlights • The Nuveen Lifestyle Moderate Fund returned 15.55% for Class A shares at net asset value (NAV) for the 12 months ended May 31, 2024. The Fund outperformed the Lifestyle Moderate Fund Composite Index, which returned 14.39%. • The Lifestyle Moderate Fund Composite Index consisted of: 40.0% Bloomberg U.S. Aggregate Bond Index; 39.0% Russell 3000® Index; and 21.0% MSCI All Country World Index ex USA Investable Market Index. • Top contributors to relative performance » Strong overall performance of the underlying funds investing in U.S. equities, led by the Nuveen Core Equity Fund. » An allocation to the Nuveen Core Plus Bond Fund. • Top detractors from relative performance » A position in the Nuveen International Opportunities Fund. | | Performance Attribution U.S. Equities Nuveen Core Plus Bond Fund Nuveen International Opportunities Fund |
How did the Fund perform over the last 10 years?
Performance data shown represents past performance and does not predict or guarantee future results. The graph and table do not reflect the deduction of taxes that a shareholder would pay on Fund distributions or redemption of Fund Shares.
Fund Performance (June 1, 2014 through May 31, 2024) Initial Investment of $10,000
Average Annual Total Returns
| | | | | | | | | | | | |
| | | 1 year | | | 5 years | | | 10 years | |
| Class A Shares at NAV (excluding maximum sales charge) | | | 15.55 | % | | | 7.24 | % | | | 6.07 | % |
| Class A at maximum sales charge (Offering Price) | | | 8.90 | % | | | 5.98 | % | | | 5.44 | % |
Russell 3000® Index | | | 27.58 | % | | | 15.00 | % | | | 12.09 | % |
| Bloomberg U.S. Aggregate Bond Index | | | 1.31 | % | | | (0.17 | )% | | | 1.26 | % |
| Lifestyle Moderate Fund Composite Index | | | 14.39 | % | | | 7.51 | % | | | 6.43 | % |
| Morningstar Moderate Target Risk Index | | | 13.09 | % | | | 6.54 | % | | | 5.63 | % |
Class A Shares at Offer reflect a maximum up‑front sales charge of 5.75% applicable to the purchase of Class A shares, which was effective as of May 6, 2024.
Investment return and principal value will fluctuate, and you may have a gain or loss when you sell your shares. Current performance may differ from figures shown. For most recent month‑end performance, go to https://www.nuveen.com/en-us/mutual-funds/prospectuses or call (800) 257‑8787.
Fund Statistics (as of May 31, 2024)
| | | | |
| Fund net assets | | $ | 562,960,415 | |
| Total number of portfolio holdings | | | 14 | |
| Portfolio turnover (%) | | | 15% | |
| Total advisory fees paid for the year | | $ | 538,127 | |
What did the Fund invest in? (as of May 31, 2024)
(1) Affiliated investment companies, except for repurchase agreements.
How has the Fund changed?
| | • | | Name change: Effective May 1, 2024, the Fund’s name changed from TIAA-CREF Lifestyle Moderate Fund to Nuveen Lifestyle Moderate Fund. | |
| | • | | Share class name change: Effective May 6, 2024, Retail Class shares of the Fund were renamed Class A shares. | |
| | • | | Sales charge: Effective May 6, 2024, a sales charge is imposed on purchases of Class A shares (formerly Retail Class shares) of the Fund of less than certain amounts, as set forth in the Fund’s prospectus. Therefore, effective as of May 6, 2024, Class A shares are available for purchase at the offering price, which will be the net asset value (NAV) per share plus an up‑front sales charge. | |
For more complete information, you may review the Fund’s next prospectus, which is expected to be available by October 1, 2024 at https://www.nuveen.com/en-us/mutual-funds/prospectuses or upon request at (800) 257‑8787.
Availability of additional information about the Fund
You can find additional information about the Fund at https://www.nuveen.com/en-us/mutual-funds/prospectuses, including its:
| | • | | prospectus • financial statements and other information • fund holdings • proxy voting information |
You can also request this information at (800) 257-8787.
| | |
87245R847_AR_0524 3613915-INV-Y-07/25 (A, I, R6, Premier, Retirement) | | |
| | |
| | Annual Shareholder Report May 31, 2024 |
Nuveen Lifestyle Moderate Fund
(Formerly known as TIAA-CREF Lifestyle Moderate Fund)
Retirement Class Shares/TSMTX
Annual Shareholder Report
This annual shareholder report contains important information about the Retirement Class Shares of the Nuveen Lifestyle Moderate Fund for the period of June 1, 2023 to May 31, 2024. You can find additional information at https://www.nuveen.com/en‑us/mutual‑funds/prospectuses. You can also request this information by contacting us at (800) 257‑8787.
This report describes changes to the Fund that occurred during the reporting period.
What were the Fund costs for the last year? (based on a hypothetical $10,000 investment)(1)
| | | | |
| | | Cost of a $10,000 investment | | Costs paid as a percentage of
$10,000 investment |
| Retirement Class Shares | | $34 | | 0.34% |
(1) These costs do not include the expenses of the underlying funds in which the Fund invests.
How did the Fund perform last year? What affected the Fund’s performance?
| | |
Performance Highlights • The Nuveen Lifestyle Moderate Fund returned 15.56% for Retirement Class shares at net asset value (NAV) for the 12 months ended May 31, 2024. The Fund outperformed the Lifestyle Moderate Fund Composite Index, which returned 14.39%. • The Lifestyle Moderate Fund Composite Index consisted of: 40.0% Bloomberg U.S. Aggregate Bond Index; 39.0% Russell 3000® Index; and 21.0% MSCI All Country World Index ex USA Investable Market Index. • Top contributors to relative performance » Strong overall performance of the underlying funds investing in U.S. equities, led by the Nuveen Core Equity Fund. » An allocation to the Nuveen Core Plus Bond Fund. • Top detractors from relative performance » A position in the Nuveen International Opportunities Fund. | | Performance Attribution U.S. Equities Nuveen Core Plus Bond Fund Nuveen International Opportunities Fund |
How did the Fund perform over the last 10 years?
Performance data shown represents past performance and does not predict or guarantee future results. The graph and table do not reflect the deduction of taxes that a shareholder would pay on Fund distributions or redemption of Fund Shares.
Fund Performance (June 1, 2014 through May 31, 2024) Initial Investment of $10,000
Average Annual Total Returns
| | | | | | | | | | | | |
| | | 1 year | | | 5 years | | | 10 years | |
| Retirement Class Shares at NAV | | | 15.56 | % | | | 7.26 | % | | | 6.10 | % |
Russell 3000® Index | | | 27.58 | % | | | 15.00 | % | | | 12.09 | % |
| Bloomberg U.S. Aggregate Bond Index | | | 1.31 | % | | | (0.17 | )% | | | 1.26 | % |
| Lifestyle Moderate Fund Composite Index | | | 14.39 | % | | | 7.51 | % | | | 6.43 | % |
| Morningstar Moderate Target Risk Index | | | 13.09 | % | | | 6.54 | % | | | 5.63 | % |
Investment return and principal value will fluctuate, and you may have a gain or loss when you sell your shares. Current performance may differ from figures shown. For most recent month‑end performance, go to https://www.nuveen.com/en‑us/mutual‑funds/prospectuses or call (800) 257‑8787.
Fund Statistics (as of May 31, 2024)
| | | | |
| Fund net assets | | $ | 562,960,415 | |
| Total number of portfolio holdings | | | 14 | |
| Portfolio turnover (%) | | | 15% | |
| Total advisory fees paid for the year | | $ | 538,127 | |
What did the Fund invest in? (as of May 31, 2024)
(1) Affiliated investment companies, except for repurchase agreements.
How has the Fund changed?
| | • | | Name change: Effective May 1, 2024, the Fund’s name changed from TIAA-CREF Lifestyle Moderate Fund to Nuveen Lifestyle Moderate Fund. | |
For more complete information, you may review the Fund’s next prospectus, which is expected to be available by October 1, 2024 at https://www.nuveen.com/en‑us/mutual‑funds/prospectuses or upon request at (800) 257‑8787.
Availability of additional information about the Fund
You can find additional information about the Fund at https://www.nuveen.com/en‑us/mutual‑funds/prospectuses, including its:
| | • | | prospectus • financial statements and other information • fund holdings • proxy voting information |
You can also request this information at (800) 257‑8787.
| | |
87245R813_AR_0524 3613915-INV-Y-07/25 (A, I, R6, Premier, Retirement) | | |
| | |
| | Annual Shareholder Report May 31, 2024 |
Nuveen Lifestyle Moderate Fund
(Formerly known as TIAA-CREF Lifestyle Moderate Fund)
Class I Shares (Formerly known as Advisor Class Shares)/TSMHX
Annual Shareholder Report
This annual shareholder report contains important information about the Class I Shares of the Nuveen Lifestyle Moderate Fund for the period of June 1, 2023 to May 31, 2024. You can find additional information at https://www.nuveen.com/en‑us/mutual‑funds/prospectuses. You can also request this information by contacting us at (800) 257‑8787.
This report describes changes to the Fund that occurred during the reporting period.
What were the Fund costs for the last year? (based on a hypothetical $10,000 investment)(1)
| | | | |
| | | Cost of a $10,000 investment | | Costs paid as a percentage of $10,000 investment |
| Class I Shares | | $18 | | 0.18% |
(1) These costs do not include the expenses of the underlying funds in which the Fund invests.
How did the Fund perform last year? What affected the Fund’s performance?
| | |
Performance Highlights • The Nuveen Lifestyle Moderate Fund returned 15.72% for Class I shares at net asset value (NAV) for the 12 months ended May 31, 2024. The Fund outperformed the Lifestyle Moderate Fund Composite Index, which returned 14.39%. • The Lifestyle Moderate Fund Composite Index consisted of: 40.0% Bloomberg U.S. Aggregate Bond Index; 39.0% Russell 3000® Index; and 21.0% MSCI All Country World Index ex USA Investable Market Index. • Top contributors to relative performance » Strong overall performance of the underlying funds investing in U.S. equities, led by the Nuveen Core Equity Fund. » An allocation to the Nuveen Core Plus Bond Fund. • Top detractors from relative performance » A position in the Nuveen International Opportunities Fund. | | Performance Attribution U.S. Equities Nuveen Core Plus Bond Fund Nuveen International Opportunities Fund |
How did the Fund perform over the period since inception?
Performance data shown represents past performance and does not predict or guarantee future results. The graph and table do not reflect the deduction of taxes that a shareholder would pay on Fund distributions or redemption of Fund Shares.
Fund Performance (December 4, 2015 through May 31, 2024) Initial Investment of $10,000
Average Annual Total Returns
| | | | | | | | | | | | |
| | | 1 year | | | 5 years | | | Since Inception | |
| Class I Shares at NAV | | | 15.72 | % | | | 7.42 | % | | | 6.91 | % |
Russell 3000® Index | | | 27.58 | % | | | 15.00 | % | | | 12.98 | % |
| Bloomberg U.S. Aggregate Bond Index | | | 1.31 | % | | | (0.17 | )% | | | 1.16 | % |
| Lifestyle Moderate Fund Composite Index | | | 14.39 | % | | | 7.51 | % | | | 7.16 | % |
| Morningstar Moderate Target Risk Index | | | 13.09 | % | | | 6.54 | % | | | 6.64 | % |
Investment return and principal value will fluctuate, and you may have a gain or loss when you sell your shares. Current performance may differ from figures shown. For most recent month‑end performance, go to https://www.nuveen.com/en-us/mutual-funds/prospectuses or call (800) 257‑8787.
Fund Statistics (as of May 31, 2024)
| | | | |
| Fund net assets | | $ | 562,960,415 | |
| Total number of portfolio holdings | | | 14 | |
| Portfolio turnover (%) | | | 15% | |
| Total advisory fees paid for the year | | $ | 538,127 | |
What did the Fund invest in? (as of May 31, 2024)
(1) Affiliated investment companies, except for repurchase agreements.
How has the Fund changed?
| | • | | Name change: Effective May 1, 2024, the Fund’s name changed from TIAA-CREF Lifestyle Moderate Fund to Nuveen Lifestyle Moderate Fund. | |
| | • | | Share class name change: Effective May 6, 2024, Advisor Class shares of the Fund were renamed Class I shares. | |
For more complete information, you may review the Fund’s next prospectus, which is expected to be available by October 1, 2024 at https://www.nuveen.com/en-us/mutual-funds/prospectuses or upon request at (800) 257‑8787.
Availability of additional information about the Fund
You can find additional information about the Fund at https://www.nuveen.com/en-us/mutual-funds/prospectuses, including its:
| | • | | prospectus • financial statements and other information • fund holdings • proxy voting information |
You can also request this information at (800) 257‑8787.
| | |
87245R243_AR_0524 3613915-INV-Y-07/25 (A, I, R6, Premier, Retirement) | | |
| | |
| | Annual Shareholder Report May 31, 2024 |
Nuveen Lifecycle 2060 Fund
(Formerly known as TIAA-CREF Lifecycle 2060 Fund)
Class R6 Shares (Formerly known as Institutional Class Shares)/TLXNX
Annual Shareholder Report
This annual shareholder report contains important information about the Class R6 Shares of the Nuveen Lifecycle 2060 Fund for the period of June 1, 2023 to May 31, 2024. You can find additional information at https://www.nuveen.com/en‑us/mutual‑funds/prospectuses. You can also request this information by contacting us at (800) 257‑8787.
This report describes changes to the Fund that occurred during the reporting period.
What were the Fund costs for the last year? (based on a hypothetical $10,000 investment)(1)
| | | | |
| | | Cost of a $10,000 investment | | Costs paid as a percentage of $10,000 investment |
| Class R6 Shares | | $26 | | 0.26% |
(1) These costs include the expenses of underlying funds in which the Fund invests except for the expenses of the Nuveen Dividend Growth Fund, Nuveen Dividend Value Fund, Nuveen Growth Opportunities ETF and TIAA-CREF Real Property Fund.
How did the Fund perform last year? What affected the Fund’s performance?
| | |
Performance Highlights • The Nuveen Lifecycle 2060 Fund returned 22.51% for Class R6 shares at net asset value (NAV) for the 12 months ended May 31, 2024. The Fund outperformed the Lifecycle 2060 Fund Composite Index, which returned 22.03%. • The Lifecycle 2060 Fund Composite Index consisted of: 60.3% Russell 3000® Index; 32.5% MSCI All Country World Index ex USA Investable Market Index; and 7.2% Bloomberg U.S. Aggregate Bond Index. • Top contributors to relative performance » Strong overall performance among underlying funds investing in U.S. equities. » Positions in the Nuveen Core Equity Fund, Nuveen Growth Opportunities ETF and the Nuveen Large Cap Value Fund. • Top detractors from relative performance » An allocation to the Nuveen Real Property Fund LP. » A position in the Nuveen International Opportunities Fund. | | Performance Attribution Nuveen Core Equity Fund Nuveen Growth Opportunities ETF Nuveen Large Cap Value Fund Nuveen Real Property Fund LP |
How did the Fund perform over the last 10 years?
Performance data shown represents past performance and does not predict or guarantee future results. The graph and table do not reflect the deduction of taxes that a shareholder would pay on Fund distributions or redemption of Fund Shares.
Fund Performance (September 26, 2014 through May 31, 2024) Initial Investment of $10,000
Average Annual Total Returns
| | | | | | | | | | | | |
| | | 1 year | | | 5 years | | | Since Inception | |
| Class R6 Shares at NAV | | | 22.51 | % | | | 11.30 | % | | | 9.03 | % |
Russell 3000® Index | | | 27.58 | % | | | 15.00 | % | | | 12.15 | % |
| Bloomberg U.S. Aggregate Bond Index | | | 1.31 | % | | | (0.17 | )% | | | 1.28 | % |
| Lifecycle 2060 Fund Composite Index | | | 22.03 | % | | | 11.59 | % | | | 9.34 | % |
| S&P Target Date 2060 Index | | | 21.09 | % | | | 10.78 | % | | | 8.65 | % |
Investment return and principal value will fluctuate, and you may have a gain or loss when you sell your shares. Current performance may differ from figures shown. For most recent month‑end performance, go to https://www.nuveen.com/en-us/mutual-funds/prospectuses or call (800) 257‑8787.
Fund Statistics (as of May 31, 2024)
| | | | |
| Fund net assets | | $ | 734,710,348 | |
| Total number of portfolio holdings | | | 19 | |
| Portfolio turnover (%) | | | 15% | |
| Total advisory fees paid for the year | | $ | 2,615,957 | |
What did the Fund invest in? (as of May 31, 2024)
(1) Affiliated investment companies, except for repurchase agreements.
How has the Fund changed?
| | • | | Name change: Effective May 1, 2024, the Fund’s name changed from TIAA-CREF Lifecycle 2060 Fund to Nuveen Lifecycle 2060 Fund. | |
| | • | | Share class name change: Effective May 6, 2024, Institutional Class shares of the Fund were renamed Class R6 shares. | |
For more complete information, you may review the Fund’s next prospectus, which is expected to be available by October 1, 2024 at https://www.nuveen.com/en-us/mutual-funds/prospectuses or upon request at (800) 257‑8787.
Availability of additional information about the Fund
You can find additional information about the Fund at https://www.nuveen.com/en-us/mutual-funds/prospectuses, including its:
| | • | | prospectus • financial statements and other information • fund holdings • proxy voting information |
You can also request this information at (800) 257‑8787.
| | |
87245R573_AR_0524 3613765-INV-Y-07/25 (I, R6, Premier, Retirement | | |
| | |
| | Annual Shareholder Report May 31, 2024 |
Nuveen Lifecycle 2060 Fund
(Formerly known as TIAA-CREF Lifecycle 2060 Fund)
Premier Class Shares/TLXPX
Annual Shareholder Report
This annual shareholder report contains important information about the Premier Class Shares of the Nuveen Lifecycle 2060 Fund for the period of June 1, 2023 to May 31, 2024. You can find additional information at https://www.nuveen.com/en‑us/mutual‑funds/prospectuses. You can also request this information by contacting us at (800) 257‑8787.
This report describes changes to the Fund that occurred during the reporting period.
What were the Fund costs for the last year? (based on a hypothetical $10,000 investment)(1)
| | | | |
| | | Cost of a $10,000 investment | | Costs paid as a percentage of
$10,000 investment |
| Premier Class Shares | | $41 | | 0.41% |
(1) These costs include the expenses of underlying funds in which the Fund invests except for the expenses of the Nuveen Dividend Growth Fund, Nuveen Dividend Value Fund, Nuveen Growth Opportunities ETF and TIAA-CREF Real Property Fund.
How did the Fund perform last year? What affected the Fund’s performance?
| | |
Performance Highlights • The Nuveen Lifecycle 2060 Fund returned 22.33% for Premier Class shares at net asset value (NAV) for the 12 months ended May 31, 2024. The Fund outperformed the Lifecycle 2060 Fund Composite Index, which returned 22.03%. • The Lifecycle 2060 Fund Composite Index consisted of: 60.3% Russell 3000® Index; 32.5% MSCI All Country World Index ex USA Investable Market Index; and 7.2% Bloomberg U.S. Aggregate Bond Index. • Top contributors to relative performance » Strong overall performance among underlying funds investing in U.S. equities. » Positions in the Nuveen Core Equity Fund, Nuveen Growth Opportunities ETF and the Nuveen Large Cap Value Fund. • Top detractors from relative performance » An allocation to the Nuveen Real Property Fund LP. » A position in the Nuveen International Opportunities Fund. | | Performance Attribution Nuveen Core Equity Fund Nuveen Growth Opportunities ETF Nuveen Large Cap Value Fund Nuveen Real Property Fund LP |
How did the Fund perform over the last 10 years?
Performance data shown represents past performance and does not predict or guarantee future results. The graph and table do not reflect the deduction of taxes that a shareholder would pay on Fund distributions or redemption of Fund Shares.
Fund Performance (September 26, 2014 through May 31, 2024) Initial Investment of $10,000
Average Annual Total Returns
| | | | | | | | | | | | |
| | | 1 year | | | 5 years | | | Since Inception | |
| Premier Class Shares at NAV | | | 22.33 | % | | | 11.13 | % | | | 8.87 | % |
Russell 3000® Index | | | 27.58 | % | | | 15.00 | % | | | 12.15 | % |
| Bloomberg U.S. Aggregate Bond Index | | | 1.31 | % | | | (0.17 | )% | | | 1.28 | % |
| Lifecycle 2060 Fund Composite Index | | | 22.03 | % | | | 11.59 | % | | | 9.34 | % |
| S&P Target Date 2060 Index | | | 21.09 | % | | | 10.78 | % | | | 8.65 | % |
Investment return and principal value will fluctuate, and you may have a gain or loss when you sell your shares. Current performance may differ from figures shown. For most recent month‑end performance, go to https://www.nuveen.com/en‑us/mutual‑funds/prospectuses or call (800) 257‑8787.
Fund Statistics (as of May 31, 2024)
| | | | |
| Fund net assets | | $ | 734,710,348 | |
| Total number of portfolio holdings | | | 19 | |
| Portfolio turnover (%) | | | 15% | |
| Total advisory fees paid for the year | | $ | 2,615,957 | |
What did the Fund invest in? (as of May 31, 2024)
(1) Affiliated investment companies, except for repurchase agreements.
How has the Fund changed?
| | • | | Name change: Effective May 1, 2024, the Fund’s name changed from TIAA-CREF Lifecycle 2060 Fund to Nuveen Lifecycle 2060 Fund. | |
For more complete information, you may review the Fund’s next prospectus, which is expected to be available by October 1, 2024 at https://www.nuveen.com/en‑us/mutual‑funds/prospectuses or upon request at (800) 257‑8787.
Availability of additional information about the Fund
You can find additional information about the Fund at https://www.nuveen.com/en‑us/mutual‑funds/prospectuses, including its:
| | • | | prospectus • financial statements and other information • fund holdings • proxy voting information |
You can also request this information at (800) 257‑8787.
| | |
87245R524_AR_0524 3613765-INV-Y-07/25 (I, R6, Premier, Retirement) | | |
| | |
| | Annual Shareholder Report May 31, 2024 |
Nuveen Lifecycle 2060 Fund
(Formerly known as TIAA-CREF Lifecycle 2060 Fund)
Retirement Class Shares/TLXRX
Annual Shareholder Report
This annual shareholder report contains important information about the Retirement Class Shares of the Nuveen Lifecycle 2060 Fund for the period of June 1, 2023 to May 31, 2024. You can find additional information at https://www.nuveen.com/en‑us/mutual‑funds/prospectuses. You can also request this information by contacting us at (800) 257‑8787.
This report describes changes to the Fund that occurred during the reporting period.
What were the Fund costs for the last year? (based on a hypothetical $10,000 investment)(1)
| | | | |
| | | Cost of a $10,000 investment | | Costs paid as a percentage of $10,000 investment |
| Retirement Class Shares | | $51 | | 0.51% |
(1) These costs include the expenses of underlying funds in which the Fund invests except for the expenses of the Nuveen Dividend Growth Fund, Nuveen Dividend Value Fund, Nuveen Growth Opportunities ETF and TIAA-CREF Real Property Fund.
How did the Fund perform last year? What affected the Fund’s performance?
| | |
Performance Highlights • The Nuveen Lifecycle 2060 Fund returned 22.17% for Retirement Class shares at net asset value (NAV) for the 12 months ended May 31, 2024. The Fund performed in line with the Lifecycle 2060 Fund Composite Index, which returned 22.03%. • The Lifecycle 2060 Fund Composite Index consisted of: 60.3% Russell 3000® Index; 32.5% MSCI All Country World Index ex USA Investable Market Index; and 7.2% Bloomberg U.S. Aggregate Bond Index. • Top contributors to relative performance » Strong overall performance among underlying funds investing in U.S. equities. » Positions in the Nuveen Core Equity Fund, Nuveen Growth Opportunities ETF and the Nuveen Large Cap Value Fund. • Top detractors from relative performance » An allocation to the Nuveen Real Property Fund LP. » A position in the Nuveen International Opportunities Fund. | | Performance Attribution Nuveen Core Equity Fund Nuveen Growth Opportunities ETF Nuveen Large Cap Value Fund Nuveen Real Property Fund LP |
How did the Fund perform over the last 10 years?
Performance data shown represents past performance and does not predict or guarantee future results. The graph and table do not reflect the deduction of taxes that a shareholder would pay on Fund distributions or redemption of Fund Shares.
Fund Performance (September 26, 2014 through May 31, 2024) Initial Investment of $10,000
Average Annual Total Returns
| | | | | | | | | | | | |
| | | 1 year | | | 5 years | | | Since Inception | |
| Retirement Class Shares at NAV | | | 22.17 | % | | | 11.01 | % | | | 8.76 | % |
Russell 3000® Index | | | 27.58 | % | | | 15.00 | % | | | 12.15 | % |
| Bloomberg U.S. Aggregate Bond Index | | | 1.31 | % | | | (0.17 | )% | | | 1.28 | % |
| Lifecycle 2060 Fund Composite Index | | | 22.03 | % | | | 11.59 | % | | | 9.34 | % |
| S&P Target Date 2060 Index | | | 21.09 | % | | | 10.78 | % | | | 8.65 | % |
Investment return and principal value will fluctuate, and you may have a gain or loss when you sell your shares. Current performance may differ from figures shown. For most recent month‑end performance, go to https://www.nuveen.com/en-us/mutual-funds/prospectuses or call (800) 257‑8787.
Fund Statistics (as of May 31, 2024)
| | | | |
| Fund net assets | | $ | 734,710,348 | |
| Total number of portfolio holdings | | | 19 | |
| Portfolio turnover (%) | | | 15% | |
| Total advisory fees paid for the year | | $ | 2,615,957 | |
What did the Fund invest in? (as of May 31, 2024)
(1) Affiliated investment companies, except for repurchase agreements.
How has the Fund changed?
| | • | | Name change: Effective May 1, 2024, the Fund’s name changed from TIAA-CREF Lifecycle 2060 Fund to Nuveen Lifecycle 2060 Fund. | |
For more complete information, you may review the Fund’s next prospectus, which is expected to be available by October 1, 2024 at https://www.nuveen.com/en-us/mutual-funds/prospectuses or upon request at (800) 257‑8787.
Availability of additional information about the Fund
You can find additional information about the Fund at https://www.nuveen.com/en-us/mutual-funds/prospectuses, including its:
| | • | | prospectus • financial statements and other information • fund holdings • proxy voting information |
You can also request this information at (800) 257‑8787.
| | |
87245R532_AR_0524 3613765-INV-Y-07/25 (I, R6, Premier, Retirement) | | |
| | |
| | Annual Shareholder Report May 31, 2024 |
Nuveen Lifecycle 2060 Fund
(Formerly known as TIAA-CREF Lifecycle 2060 Fund)
Class I Shares (Formerly known as Advisor Class Shares)/TLXHX
Annual Shareholder Report
This annual shareholder report contains important information about the Class I Shares of the Nuveen Lifecycle 2060 Fund for the period of June 1, 2023 to May 31, 2024. You can find additional information at https://www.nuveen.com/en‑us/mutual‑funds/prospectuses. You can also request this information by contacting us at (800) 257‑8787.
This report describes changes to the Fund that occurred during the reporting period.
What were the Fund costs for the last year? (based on a hypothetical $10,000 investment)(1)
| | | | |
| | | Cost of a $10,000 investment | | Costs paid as a percentage of
$10,000 investment |
| Class I Shares | | $35 | | 0.35% |
(1) These costs include the expenses of underlying funds in which the Fund invests except for the expenses of the Nuveen Dividend Growth Fund, Nuveen Dividend Value Fund, Nuveen Growth Opportunities ETF and TIAA-CREF Real Property Fund.
How did the Fund perform last year? What affected the Fund’s performance?
| | |
Performance Highlights • The Nuveen Lifecycle 2060 Fund returned 22.46% for Class I shares at net asset value (NAV) for the 12 months ended May 31, 2024. The Fund outperformed the Lifecycle 2060 Fund Composite Index, which returned 22.03%. • The Lifecycle 2060 Fund Composite Index consisted of: 60.3% Russell 3000® Index; 32.5% MSCI All Country World Index ex USA Investable Market Index; and 7.2% Bloomberg U.S. Aggregate Bond Index. • Top contributors to relative performance » Strong overall performance among underlying funds investing in U.S. equities. » Positions in the Nuveen Core Equity Fund, Nuveen Growth Opportunities ETF and the Nuveen Large Cap Value Fund. • Top detractors from relative performance » An allocation to the Nuveen Real Property Fund LP. » A position in the Nuveen International Opportunities Fund. | | Performance Attribution Nuveen Core Equity Fund Nuveen Growth Opportunities ETF Nuveen Large Cap Value Fund Nuveen Real Property Fund LP |
How did the Fund perform over the period since inception?
Performance data shown represents past performance and does not predict or guarantee future results. The graph and table do not reflect the deduction of taxes that a shareholder would pay on Fund distributions or redemption of Fund Shares.
Fund Performance (December 4, 2015 through May 31, 2024) Initial Investment of $10,000
Average Annual Total Returns
| | | | | | | | | | | | |
| | | 1 year | | | 5 years | | | Since Inception | |
| Class I Shares at NAV | | | 22.46 | % | | | 11.22 | % | | | 9.78 | % |
Russell 3000® Index | | | 27.58 | % | | | 15.00 | % | | | 12.98 | % |
| Bloomberg U.S. Aggregate Bond Index | | | 1.31 | % | | | (0.17 | )% | | | 1.16 | % |
| Lifecycle 2060 Fund Composite Index | | | 22.03 | % | | | 11.59 | % | | | 10.38 | % |
| S&P Target Date 2060 Index | | | 21.09 | % | | | 10.78 | % | | | 9.53 | % |
Investment return and principal value will fluctuate, and you may have a gain or loss when you sell your shares. Current performance may differ from figures shown. For most recent month‑end performance, go to https://www.nuveen.com/en‑us/mutual‑funds/prospectuses or call (800) 257‑8787.
Fund Statistics (as of May 31, 2024)
| | | | |
| Fund net assets | | $ | 734,710,348 | |
| Total number of portfolio holdings | | | 19 | |
| Portfolio turnover (%) | | | 15% | |
| Total advisory fees paid for the year | | $ | 2,615,957 | |
What did the Fund invest in? (as of May 31, 2024)
(1) Affiliated investment companies, except for repurchase agreements.
How has the Fund changed?
| | • | | Name change: Effective May 1, 2024, the Fund’s name changed from TIAA-CREF Lifecycle 2060 Fund to Nuveen Lifecycle 2060 Fund. | |
| | • | | Share class name change: Effective May 6, 2024, Advisor Class shares of the Fund were renamed Class I shares. | |
For more complete information, you may review the Fund’s next prospectus, which is expected to be available by October 1, 2024 at https://www.nuveen.com/en‑us/mutual‑funds/prospectuses or upon request at (800) 257‑8787.
Availability of additional information about the Fund
You can find additional information about the Fund at https://www.nuveen.com/en‑us/mutual‑funds/prospectuses, including its:
| | • | | prospectus • financial statements and other information • fund holdings • proxy voting information |
You can also request this information at (800) 257‑8787.
| | |
87245P858_AR_0524 3613765-INV-Y-07/25 (I, R6, Premier, Retirement) | | |
| | |
| | Annual Shareholder Report May 31, 2024 |
Nuveen Lifecycle Index 2060 Fund
(Formerly known as TIAA-CREF Lifecycle Index 2060 Fund)
Retirement Class Shares/TVITX
Annual Shareholder Report
This annual shareholder report contains important information about the Retirement Class Shares of the Nuveen Lifecycle Index 2060 Fund for the period of June 1, 2023 to May 31, 2024. You can find additional information at https://www.nuveen.com/en‑us/mutual‑funds/prospectuses. You can also request this information by contacting us at (800) 257‑8787.
This report describes changes to the Fund that occurred during the reporting period.
What were the Fund costs for the last year? (based on a hypothetical $10,000 investment)
| | | | |
| | | Cost of a $10,000 investment | | Costs paid as a percentage of
$10,000 investment |
| Retirement Class Shares | | $36 | | 0.36% |
How did the Fund perform last year? What affected the Fund’s performance?
| | |
Performance Highlights • The Nuveen Lifecycle Index 2060 Fund returned 21.62% for Retirement Class shares at net asset value (NAV) for the 12 months ended May 31, 2024. The Fund underperformed the Lifecycle Index 2060 Fund Composite Index, which returned 22.01%. • The Lifecycle Index 2060 Fund Composite Index consisted of: 60.3% Russell 3000® Index; 32.5% MSCI EAFE + Emerging Markets Index; and 7.2% Bloomberg U.S. Aggregate Bond Index. • Top detractors from absolute performance » Management fees and other expenses incurred by the Fund. • Top contributors to absolute performance » Underlying equity and fixed income funds advanced for the period. Equity funds, led by the Nuveen Equity Index Fund, recorded the largest gains and contributed most. | | Fund Performance Fees/Other Expenses Equity & Fixed Income Funds |
How did the Fund perform over the last 10 years?
Performance data shown represents past performance and does not predict or guarantee future results. The graph and table do not reflect the deduction of taxes that a shareholder would pay on Fund distributions or redemption of Fund Shares.
Fund Performance (September 26, 2014 through May 31, 2024) Initial Investment of $10,000
Average Annual Total Returns
| | | | | | | | | | | | |
| | | 1 year | | | 5 years | | | Since Inception | |
| Retirement Class Shares at NAV | | | 21.62 | % | | | 11.19 | % | | | 9.01 | % |
Russell 3000® Index | | | 27.58 | % | | | 15.00 | % | | | 12.15 | % |
| Bloomberg U.S. Aggregate Bond Index | | | 1.31 | % | | | (0.17 | )% | | | 1.28 | % |
| Lifecycle Index 2060 Fund Composite Index | | | 22.01 | % | | | 11.54 | % | | | 9.34 | % |
| S&P Target Date 2060 Index | | | 21.09 | % | | | 10.78 | % | | | 8.65 | % |
Investment return and principal value will fluctuate, and you may have a gain or loss when you sell your shares. Current performance may differ from figures shown. For most recent month‑end performance, go to https://www.nuveen.com/en‑us/mutual‑funds/prospectuses or call (800) 257‑8787.
Fund Statistics (as of May 31, 2024)
| | | | |
| Fund net assets | | $ | 2,078,107,035 | |
| Total number of portfolio holdings | | | 5 | |
| Portfolio turnover (%) | | | 7% | |
| Total advisory fees paid for the year | | $ | 2,518,111 | |
What did the Fund invest in? (as of May 31, 2024)
(1) Affiliated investment companies, except for repurchase agreements.
How has the Fund changed?
| | • | | Name change: Effective May 1, 2024, the Fund’s name changed from TIAA-CREF Lifecycle Index 2060 Fund to Nuveen Lifecycle Index 2060 Fund. | |
For more complete information, you may review the Fund’s next prospectus, which is expected to be available by October 1, 2024 at https://www.nuveen.com/en‑us/mutual‑funds/prospectuses or upon request at (800) 257‑8787.
Availability of additional information about the Fund
You can find additional information about the Fund at https://www.nuveen.com/en‑us/mutual‑funds/prospectuses, including its:
| | • | | prospectus • financial statements and other information • fund holdings • proxy voting information |
You can also request this information at (800) 257‑8787.
| | |
87245R557_AR_0524 3613882-INV-Y-07/25 (I, R6, Premier, Retirement) | | |
| | |
| | Annual Shareholder Report May 31, 2024 |
Nuveen Lifecycle Index 2060 Fund
(Formerly known as TIAA-CREF Lifecycle Index 2060 Fund)
Class R6 Shares (Formerly known as Institutional Class Shares)/TVIIX
Annual Shareholder Report
This annual shareholder report contains important information about the Class R6 Shares of the Nuveen Lifecycle Index 2060 Fund for the period of June 1, 2023 to May 31, 2024. You can find additional information at https://www.nuveen.com/en‑us/mutual‑funds/prospectuses. You can also request this information by contacting us at (800) 257‑8787.
This report describes changes to the Fund that occurred during the reporting period.
What were the Fund costs for the last year? (based on a hypothetical $10,000 investment)
| | | | |
| | | Cost of a $10,000 investment | | Costs paid as a percentage of
$10,000 investment |
| Class R6 Shares | | $11 | | 0.11% |
How did the Fund perform last year? What affected the Fund’s performance?
| | |
Performance Highlights • The Nuveen Lifecycle Index 2060 Fund returned 21.91% for Class R6 shares at net asset value (NAV) for the 12 months ended May 31, 2024. The Fund performed in line with the Lifecycle Index 2060 Fund Composite Index, which returned 22.01%. • The Lifecycle Index 2060 Fund Composite Index consisted of: 60.3% Russell 3000® Index; 32.5% MSCI EAFE + Emerging Markets Index; and 7.2% Bloomberg U.S. Aggregate Bond Index. • Top detractors from absolute performance » Management fees and other expenses incurred by the Fund. • Top contributors to absolute performance » Underlying equity and fixed income funds advanced for the period. Equity funds, led by the Nuveen Equity Index Fund, recorded the largest gains and contributed most. | | Fund Performance Fees/Other Expenses Equity & Fixed Income Funds |
How did the Fund perform over the last 10 years?
Performance data shown represents past performance and does not predict or guarantee future results. The graph and table do not reflect the deduction of taxes that a shareholder would pay on Fund distributions or redemption of Fund Shares.
Fund Performance (September 26, 2014 through May 31, 2024) Initial Investment of $10,000
Average Annual Total Returns
| | | | | | | | | | | | |
| | | 1 year | | | 5 years | | | Since Inception | |
| Class R6 Shares at NAV | | | 21.91 | % | | | 11.48 | % | | | 9.27 | % |
Russell 3000® Index | | | 27.58 | % | | | 15.00 | % | | | 12.15 | % |
| Bloomberg U.S. Aggregate Bond Index | | | 1.31 | % | | | (0.17 | )% | | | 1.28 | % |
| Lifecycle Index 2060 Fund Composite Index | | | 22.01 | % | | | 11.54 | % | | | 9.34 | % |
| S&P Target Date 2060 Index | | | 21.09 | % | | | 10.78 | % | | | 8.65 | % |
Investment return and principal value will fluctuate, and you may have a gain or loss when you sell your shares. Current performance may differ from figures shown. For most recent month‑end performance, go to https://www.nuveen.com/en‑us/mutual‑funds/prospectuses or call (800) 257‑8787.
Fund Statistics (as of May 31, 2024)
| | | | |
| Fund net assets | | $ | 2,078,107,035 | |
| Total number of portfolio holdings | | | 5 | |
| Portfolio turnover (%) | | | 7% | |
| Total advisory fees paid for the year | | $ | 2,518,111 | |
What did the Fund invest in? (as of May 31, 2024)
(1) Affiliated investment companies, except for repurchase agreements.
How has the Fund changed?
| | • | | Name change: Effective May 1, 2024, the Fund’s name changed from TIAA-CREF Lifecycle Index 2060 Fund to Nuveen Lifecycle Index 2060 Fund. | |
| | • | | Share class name change: Effective May 6, 2024, Institutional Class shares of the Fund were renamed Class R6 shares. | |
For more complete information, you may review the Fund’s next prospectus, which is expected to be available by October 1, 2024 at https://www.nuveen.com/en‑us/mutual‑funds/prospectuses or upon request at (800) 257‑8787.
Availability of additional information about the Fund
You can find additional information about the Fund at https://www.nuveen.com/en‑us/mutual‑funds/prospectuses, including its:
| | • | | prospectus • financial statements and other information • fund holdings • proxy voting information |
You can also request this information at (800) 257‑8787.
| | |
87245R565_AR_0524 3613882-INV-Y-07/25 (I, R6, Premier, Retirement) | | |
| | |
| | Annual Shareholder Report May 31, 2024 |
Nuveen Lifecycle Index 2060 Fund
(Formerly known as TIAA-CREF Lifecycle Index 2060 Fund)
Premier Class Shares/TVIPX
Annual Shareholder Report
This annual shareholder report contains important information about the Premier Class Shares of the Nuveen Lifecycle Index 2060 Fund for the period of June 1, 2023 to May 31, 2024. You can find additional information at https://www.nuveen.com/en-us/mutual-funds/prospectuses. You can also request this information by contacting us at (800) 257‑8787.
This report describes changes to the Fund that occurred during the reporting period.
What were the Fund costs for the last year? (based on a hypothetical $10,000 investment)
| | | | |
| | | Cost of a $10,000 investment | | Costs paid as a percentage of $10,000 investment |
| Premier Class Shares | | $26 | | 0.26% |
How did the Fund perform last year? What affected the Fund’s performance?
| | |
Performance Highlights • The Nuveen Lifecycle Index 2060 Fund returned 21.74% for Premier Class shares at net asset value (NAV) for the 12 months ended May 31, 2024. The Fund underperformed the Lifecycle Index 2060 Fund Composite Index, which returned 22.01%. • The Lifecycle Index 2060 Fund Composite Index consisted of: 60.3% Russell 3000® Index; 32.5% MSCI EAFE + Emerging Markets Index; and 7.2% Bloomberg U.S. Aggregate Bond Index. • Top detractors from absolute performance » Management fees and other expenses incurred by the Fund. • Top contributors to absolute performance » Underlying equity and fixed income funds advanced for the period. Equity funds, led by the Nuveen Equity Index Fund, recorded the largest gains and contributed most. | | Fund Performance Fees/Other Expenses Equity & Fixed Income Funds |
How did the Fund perform over the last 10 years?
Performance data shown represents past performance and does not predict or guarantee future results. The graph and table do not reflect the deduction of taxes that a shareholder would pay on Fund distributions or redemption of Fund Shares.
Fund Performance (September 26, 2014 through May 31, 2024) Initial Investment of $10,000
Average Annual Total Returns
| | | | | | | | | | | | |
| | | 1 year | | | 5 years | | | Since Inception | |
| Premier Class Shares at NAV | | | 21.74 | % | | | 11.31 | % | | | 9.11 | % |
Russell 3000® Index | | | 27.58 | % | | | 15.00 | % | | | 12.15 | % |
| Bloomberg U.S. Aggregate Bond Index | | | 1.31 | % | | | (0.17 | )% | | | 1.28 | % |
| Lifecycle Index 2060 Fund Composite Index | | | 22.01 | % | | | 11.54 | % | | | 9.34 | % |
| S&P Target Date 2060 Index | | | 21.09 | % | | | 10.78 | % | | | 8.65 | % |
Investment return and principal value will fluctuate, and you may have a gain or loss when you sell your shares. Current performance may differ from figures shown. For most recent month‑end performance, go to https://www.nuveen.com/en-us/mutual-funds/prospectuses or call (800) 257‑8787.
Fund Statistics (as of May 31, 2024)
| | | | |
| Fund net assets | | $ | 2,078,107,035 | |
| Total number of portfolio holdings | | | 5 | |
| Portfolio turnover (%) | | | 7% | |
| Total advisory fees paid for the year | | $ | 2,518,111 | |
What did the Fund invest in? (as of May 31, 2024)
(1) Affiliated investment companies, except for repurchase agreements.
How has the Fund changed?
| | • | | Name change: Effective May 1, 2024, the Fund’s name changed from TIAA-CREF Lifecycle Index 2060 Fund to Nuveen Lifecycle Index 2060 Fund. | |
For more complete information, you may review the Fund’s next prospectus, which is expected to be available by October 1, 2024 at https://www.nuveen.com/en-us/mutual-funds/prospectuses or upon request at (800) 257‑8787.
Availability of additional information about the Fund
You can find additional information about the Fund at https://www.nuveen.com/en-us/mutual-funds/prospectuses, including its:
| | • | | prospectus • financial statements and other information • fund holdings • proxy voting information |
You can also request this information at (800) 257‑8787.
| | |
87245R540_AR_0524 3613882-INV-Y-07/25 (I, R6, Premier, Retirement) | | |
| | |
| | Annual Shareholder Report May 31, 2024 |
Nuveen Lifecycle Index 2060 Fund
(Formerly known as TIAA-CREF Lifecycle Index 2060 Fund)
Class I Shares (Formerly known as Advisor Class Shares)/TVIHX
Annual Shareholder Report
This annual shareholder report contains important information about the Class I Shares of the Nuveen Lifecycle Index 2060 Fund for the period of June 1, 2023 to May 31, 2024. You can find additional information at https://www.nuveen.com/en‑us/mutual‑funds/prospectuses. You can also request this information by contacting us at (800) 257‑8787.
This report describes changes to the Fund that occurred during the reporting period.
What were the Fund costs for the last year? (based on a hypothetical $10,000 investment)
| | | | |
| | | Cost of a $10,000 investment | | Costs paid as a percentage of $10,000
investment |
| Class I Shares | | $21 | | 0.21% |
How did the Fund perform last year? What affected the Fund’s performance?
| | |
Performance Highlights • The Nuveen Lifecycle Index 2060 Fund returned 21.83% for Class I shares at net asset value (NAV) for the 12 months ended May 31, 2024. The Fund performed in line with the Lifecycle Index 2060 Fund Composite Index, which returned 22.01%. • The Lifecycle Index 2060 Fund Composite Index consisted of: 60.3% Russell 3000® Index; 32.5% MSCI EAFE + Emerging Markets Index; and 7.2% Bloomberg U.S. Aggregate Bond Index. • Top detractors from absolute performance » Management fees and other expenses incurred by the Fund. • Top contributors to absolute performance » Underlying equity and fixed income funds advanced for the period. Equity funds, led by the Nuveen Equity Index Fund, recorded the largest gains and contributed most. | | Fund Performance Fees/Other Expenses Equity & Fixed Income Funds |
How did the Fund perform over the period since inception?
Performance data shown represents past performance and does not predict or guarantee future results. The graph and table do not reflect the deduction of taxes that a shareholder would pay on Fund distributions or redemption of Fund Shares.
Fund Performance (December 4, 2015 through May 31, 2024) Initial Investment of $10,000
Average Annual Total Returns
| | | | | | | | | | | | |
| | | 1 year | | | 5 years | | | Since Inception | |
| Class I Shares at NAV | | | 21.83 | % | | | 11.36 | % | | | 10.18 | % |
Russell 3000® Index | | | 27.58 | % | | | 15.00 | % | | | 12.98 | % |
| Bloomberg U.S. Aggregate Bond Index | | | 1.31 | % | | | (0.17 | )% | | | 1.16 | % |
| Lifecycle Index 2060 Fund Composite Index | | | 22.01 | % | | | 11.54 | % | | | 10.34 | % |
| S&P Target Date 2060 Index | | | 21.09 | % | | | 10.78 | % | | | 9.53 | % |
Investment return and principal value will fluctuate, and you may have a gain or loss when you sell your shares. Current performance may differ from figures shown. For most recent month‑end performance, go to https://www.nuveen.com/en-us/mutual-funds/prospectuses or call (800) 257‑8787.
Fund Statistics (as of May 31, 2024)
| | | | |
| Fund net assets | | $ | 2,078,107,035 | |
| Total number of portfolio holdings | | | 5 | |
| Portfolio turnover (%) | | | 7% | |
| Total advisory fees paid for the year | | $ | 2,518,111 | |
What did the Fund invest in? (as of May 31, 2024)
(1) Affiliated investment companies, except for repurchase agreements.
How has the Fund changed?
| | • | | Name change: Effective May 1, 2024, the Fund’s name changed from TIAA-CREF Lifecycle Index 2060 Fund to Nuveen Lifecycle Index 2060 Fund. | |
| | • | | Share class name change: Effective May 6, 2024, Advisor Class shares of the Fund were renamed Class I shares. | |
For more complete information, you may review the Fund’s next prospectus, which is expected to be available by October 1, 2024 at https://www.nuveen.com/en-us/mutual-funds/prospectuses or upon request at (800) 257‑8787.
Availability of additional information about the Fund
You can find additional information about the Fund at https://www.nuveen.com/en-us/mutual-funds/prospectuses, including its:
| | • | | prospectus • financial statements and other information • fund holdings • proxy voting information |
You can also request this information at (800) 257‑8787.
| | |
87245P726_AR_0524 3613882-INV-Y-07/25 (I, R6, Premier, Retirement) | | |
| | |
| | Annual Shareholder Report May 31, 2024 |
Nuveen Lifecycle 2065 Fund
(Formerly known as TIAA-CREF Lifecycle 2065 Fund)
Premier Class Shares/TSFPX
Annual Shareholder Report
This annual shareholder report contains important information about the Premier Class Shares of the Nuveen Lifecycle 2065 Fund for the period of June 1, 2023 to May 31, 2024. You can find additional information at https://www.nuveen.com/en‑us/mutual‑funds/prospectuses. You can also request this information by contacting us at (800) 257‑8787.
This report describes changes to the Fund that occurred during the reporting period.
What were the Fund costs for the last year? (based on a hypothetical $10,000 investment)(1)
| | | | |
| | | Cost of a $10,000 investment | | Costs paid as a percentage of
$10,000 investment |
| Premier Class Shares | | $40 | | 0.40% |
(1) These costs include the expenses of underlying funds in which the Fund invests except for the expenses of the Nuveen Dividend Growth Fund, Nuveen Dividend Value Fund, Nuveen Growth Opportunities ETF and TIAA-CREF Real Property Fund.
How did the Fund perform last year? What affected the Fund’s performance?
| | |
Performance Highlights • The Nuveen Lifecycle 2065 Fund returned 22.58% for Premier Class shares at net asset value (NAV) for the 12 months ended May 31, 2024. The Fund outperformed the Lifecycle 2065 Fund Composite Index, which returned 22.32%. • The Lifecycle 2065 Fund Composite Index consisted of: 61.1% Russell 3000® Index; 32.9% MSCI All Country World Index ex USA Investable Market Index; and 6.0% Bloomberg U.S. Aggregate Bond Index. • Top contributors to relative performance » Strong overall performance among underlying funds investing in U.S. equities. » Positions in the Nuveen Core Equity Fund, Nuveen Growth Opportunities ETF and the Nuveen Large Cap Value Fund. • Top detractors from relative performance » An allocation to the Nuveen Real Property Fund LP. » A position in the Nuveen International Opportunities Fund. | | Performance Attribution Nuveen Core Equity Fund Nuveen Growth Opportunities ETF Nuveen Large Cap Value Fund Nuveen Real Property Fund LP |
How did the Fund perform over the last 10 years?
Performance data shown represents past performance and does not predict or guarantee future results. The graph and table do not reflect the deduction of taxes that a shareholder would pay on Fund distributions or redemption of Fund Shares.
Fund Performance (September 30, 2020 through May 31, 2024) Initial Investment of $10,000
Average Annual Total Returns
| | | | | | | | |
| | | 1 year | | | Since Inception | |
| Premier Class Shares at NAV | | | 22.58 | % | | | 10.45 | % |
Russell 3000® Index | | | 27.58 | % | | | 13.98 | % |
| Bloomberg U.S. Aggregate Bond Index | | | 1.31 | % | | | (2.98 | )% |
| Lifecycle 2065 Fund Composite Index | | | 22.32 | % | | | 10.96 | % |
| S&P Target Date 2065+ Index | | | 21.48 | % | | | 11.02 | % |
Investment return and principal value will fluctuate, and you may have a gain or loss when you sell your shares. Current performance may differ from figures shown. For most recent month‑end performance, go to https://www.nuveen.com/en‑us/mutual‑funds/prospectuses or call (800) 257‑8787.
Fund Statistics (as of May 31, 2024)
| | | | |
| Fund net assets | | $ | 90,936,844 | |
| Total number of portfolio holdings | | | 19 | |
| Portfolio turnover (%) | | | 34% | |
| Total advisory fees paid for the year | | $ | 269,137 | |
What did the Fund invest in? (as of May 31, 2024)
(1) Affiliated investment companies, except for repurchase agreements.
How has the Fund changed?
| | • | | Name change: Effective May 1, 2024, the Fund’s name changed from TIAA-CREF Lifecycle 2065 Fund to Nuveen Lifecycle 2065 Fund. | |
For more complete information, you may review the Fund’s next prospectus, which is expected to be available by October 1, 2024 at https://www.nuveen.com/en‑us/mutual‑funds/prospectuses or upon request at (800) 257‑8787.
Availability of additional information about the Fund
You can find additional information about the Fund at https://www.nuveen.com/en‑us/mutual‑funds/prospectuses, including its:
| | • | | prospectus • financial statements and other information • fund holdings • proxy voting information |
You can also request this information at (800) 257‑8787.
| | |
87249N750_AR_0524 3613772-INV-Y-07/25 (I, R6, Premier, Retirement) | | |
| | |
| | Annual Shareholder Report May 31, 2024 |
Nuveen Lifecycle 2065 Fund
(Formerly known as TIAA-CREF Lifecycle 2065 Fund)
Class I Shares (Formerly known as Advisor Class Shares)/TSFHX
Annual Shareholder Report
This annual shareholder report contains important information about the Class I Shares of the Nuveen Lifecycle 2065 Fund for the period of June 1, 2023 to May 31, 2024. You can find additional information at https://www.nuveen.com/en‑us/mutual‑funds/prospectuses. You can also request this information by contacting us at (800) 257‑8787.
This report describes changes to the Fund that occurred during the reporting period.
What were the Fund costs for the last year? (based on a hypothetical $10,000 investment)(1)
| | | | |
| | | Cost of a $10,000 investment | | Costs paid as a percentage of
$10,000 investment |
| Class I Shares | | $26 | | 0.26% |
(1) These costs include the expenses of underlying funds in which the Fund invests except for the expenses of the Nuveen Dividend Growth Fund, Nuveen Dividend Value Fund, Nuveen Growth Opportunities ETF and TIAA-CREF Real Property Fund.
How did the Fund perform last year? What affected the Fund’s performance?
| | |
Performance Highlights • The Nuveen Lifecycle 2065 Fund returned 22.77% for Class I shares at net asset value (NAV) for the 12 months ended May 31, 2024. The Fund outperformed the Lifecycle 2065 Fund Composite Index, which returned 22.32%. • The Lifecycle 2065 Fund Composite Index consisted of: 61.1% Russell 3000® Index; 32.9% MSCI All Country World Index ex USA Investable Market Index; and 6.0% Bloomberg U.S. Aggregate Bond Index. • Top contributors to relative performance » Strong overall performance among underlying funds investing in U.S. equities. » Positions in the Nuveen Core Equity Fund, Nuveen Growth Opportunities ETF and the Nuveen Large Cap Value Fund. • Top detractors from relative performance » An allocation to the Nuveen Real Property Fund LP. » A position in the Nuveen International Opportunities Fund. | | Performance Attribution Nuveen Core Equity Fund Nuveen Growth Opportunities ETF Nuveen Large Cap Value Fund Nuveen Real Property Fund LP |
How did the Fund perform over the period since inception?
Performance data shown represents past performance and does not predict or guarantee future results. The graph and table do not reflect the deduction of taxes that a shareholder would pay on Fund distributions or redemption of Fund Shares.
Fund Performance (September 30, 2020 through May 31, 2024) Initial Investment of $10,000
Average Annual Total Returns
| | | | | | | | |
| | | 1 year | | | Since Inception | |
| Class I Shares at NAV | | | 22.77 | % | | | 10.49 | % |
Russell 3000® Index | | | 27.58 | % | | | 13.98 | % |
| Bloomberg U.S. Aggregate Bond Index | | | 1.31 | % | | | (2.98 | )% |
| Lifecycle 2065 Fund Composite Index | | | 22.32 | % | | | 10.96 | % |
| S&P Target Date 2065+ Index | | | 21.48 | % | | | 11.02 | % |
Investment return and principal value will fluctuate, and you may have a gain or loss when you sell your shares. Current performance may differ from figures shown. For most recent month‑end performance, go to https://www.nuveen.com/en‑us/mutual‑funds/prospectuses or call (800) 257‑8787.
Fund Statistics (as of May 31, 2024)
| | | | |
| Fund net assets | | $ | 90,936,844 | |
| Total number of portfolio holdings | | | 19 | |
| Portfolio turnover (%) | | | 34% | |
| Total advisory fees paid for the year | | $ | 269,137 | |
What did the Fund invest in? (as of May 31, 2024)
(1) Affiliated investment companies, except for repurchase agreements.
How has the Fund changed?
| | • | | Name change: Effective May 1, 2024, the Fund’s name changed from TIAA-CREF Lifecycle 2065 Fund to Nuveen Lifecycle 2065 Fund. | |
| | • | | Share class name change: Effective May 6, 2024, Advisor Class shares of the Fund were renamed Class I shares. | |
For more complete information, you may review the Fund’s next prospectus, which is expected to be available by October 1, 2024 at https://www.nuveen.com/en‑us/mutual‑funds/prospectuses or upon request at (800) 257‑8787.
Availability of additional information about the Fund
You can find additional information about the Fund at https://www.nuveen.com/en‑us/mutual‑funds/prospectuses, including its:
| | • | | prospectus • financial statements and other information • fund holdings • proxy voting information |
You can also request this information at (800) 257‑8787.
| | |
87249N776_AR_0524 3613772-INV-Y-07/25 (I, R6, Premier, Retirement) | | |
| | |
| | Annual Shareholder Report May 31, 2024 |
Nuveen Lifecycle 2065 Fund
(Formerly known as TIAA-CREF Lifecycle 2065 Fund)
Class R6 Shares (Formerly known as Institutional Class Shares)/TSFTX
Annual Shareholder Report
This annual shareholder report contains important information about the Class R6 Shares of the Nuveen Lifecycle 2065 Fund for the period of June 1, 2023 to May 31, 2024. You can find additional information at https://www.nuveen.com/en‑us/mutual‑funds/prospectuses. You can also request this information by contacting us at (800) 257‑8787.
This report describes changes to the Fund that occurred during the reporting period.
What were the Fund costs for the last year? (based on a hypothetical $10,000 investment)(1)
| | | | |
| | | Cost of a $10,000 investment | | Costs paid as a percentage of
$10,000 investment |
| Class R6 Shares | | $25 | | 0.25% |
(1) These costs include the expenses of underlying funds in which the Fund invests except for the expenses of the Nuveen Dividend Growth Fund, Nuveen Dividend Value Fund, Nuveen Growth Opportunities ETF and TIAA-CREF Real Property Fund.
How did the Fund perform last year? What affected the Fund’s performance?
| | |
Performance Highlights • The Nuveen Lifecycle 2065 Fund returned 22.85% for Class R6 shares at net asset value (NAV) for the 12 months ended May 31, 2024. The Fund outperformed the Lifecycle 2065 Fund Composite Index, which returned 22.32%. • The Lifecycle 2065 Fund Composite Index consisted of: 61.1% Russell 3000® Index; 32.9% MSCI All Country World Index ex USA Investable Market Index; and 6.0% Bloomberg U.S. Aggregate Bond Index. • Top contributors to relative performance » Strong overall performance among underlying funds investing in U.S. equities. » Positions in the Nuveen Core Equity Fund, Nuveen Growth Opportunities ETF and the Nuveen Large Cap Value Fund. • Top detractors from relative performance » An allocation to the Nuveen Real Property Fund LP. » A position in the Nuveen International Opportunities Fund. | | Performance Attribution Nuveen Core Equity Fund Nuveen Growth Opportunities ETF Nuveen Large Cap Value Fund Nuveen Real Property Fund LP |
How did the Fund perform over the last 10 years?
Performance data shown represents past performance and does not predict or guarantee future results. The graph and table do not reflect the deduction of taxes that a shareholder would pay on Fund distributions or redemption of Fund Shares.
Fund Performance (September 30, 2020 through May 31, 2024) Initial Investment of $10,000
Average Annual Total Returns
| | | | | | | | |
| | | 1 year | | | Since Inception | |
| Class R6 Shares at NAV | | | 22.85 | % | | | 10.69 | % |
Russell 3000® Index | | | 27.58 | % | | | 13.98 | % |
| Bloomberg U.S. Aggregate Bond Index | | | 1.31 | % | | | (2.98 | )% |
| Lifecycle 2065 Fund Composite Index | | | 22.32 | % | | | 10.96 | % |
| S&P Target Date 2065+ Index | | | 21.48 | % | | | 11.02 | % |
Investment return and principal value will fluctuate, and you may have a gain or loss when you sell your shares. Current performance may differ from figures shown. For most recent month‑end performance, go to https://www.nuveen.com/en‑us/mutual‑funds/prospectuses or call (800) 257‑8787.
Fund Statistics (as of May 31, 2024)
| | | | |
| Fund net assets | | $ | 90,936,844 | |
| Total number of portfolio holdings | | | 19 | |
| Portfolio turnover (%) | | | 34% | |
| Total advisory fees paid for the year | | $ | 269,137 | |
What did the Fund invest in? (as of May 31, 2024)
(1) Affiliated investment companies, except for repurchase agreements.
How has the Fund changed?
| | • | | Name change: Effective May 1, 2024, the Fund’s name changed from TIAA-CREF Lifecycle 2065 Fund to Nuveen Lifecycle 2065 Fund. | |
| | • | | Share class name change: Effective May 6, 2024, Institutional Class shares of the Fund were renamed Class R6 shares. | |
For more complete information, you may review the Fund’s next prospectus, which is expected to be available by October 1, 2024 at https://www.nuveen.com/en‑us/mutual‑funds/prospectuses or upon request at (800) 257‑8787.
Availability of additional information about the Fund
You can find additional information about the Fund at https://www.nuveen.com/en‑us/mutual‑funds/prospectuses, including its:
| | • | | prospectus • financial statements and other information • fund holdings • proxy voting information |
You can also request this information at (800) 257‑8787.
| | |
87249N768_AR_0524 3613772-INV-Y-07/25 (I, R6, Premier, Retirement) | | |
| | |
| | Annual Shareholder Report May 31, 2024 |
Nuveen Lifecycle 2065 Fund
(Formerly known as TIAA-CREF Lifecycle 2065 Fund)
Retirement Class Shares/TSFRX
Annual Shareholder Report
This annual shareholder report contains important information about the Retirement Class Shares of the Nuveen Lifecycle 2065 Fund for the period of June 1, 2023 to May 31, 2024. You can find additional information at https://www.nuveen.com/en‑us/mutual‑funds/prospectuses. You can also request this information by contacting us at (800) 257‑8787.
This report describes changes to the Fund that occurred during the reporting period.
What were the Fund costs for the last year? (based on a hypothetical $10,000 investment)(1)
| | | | |
| | | Cost of a $10,000 investment | | Costs paid as a percentage of $10,000 investment |
| Retirement Class Shares | | $50 | | 0.50% |
(1) These costs include the expenses of underlying funds in which the Fund invests except for the expenses of the Nuveen Dividend Growth Fund, Nuveen Dividend Value Fund, Nuveen Growth Opportunities ETF and TIAA-CREF Real Property Fund.
How did the Fund perform last year? What affected the Fund’s performance?
| | |
Performance Highlights • The Nuveen Lifecycle 2065 Fund returned 22.46% for Retirement Class shares at net asset value (NAV) for the 12 months ended May 31, 2024. The Fund performed in line with the Lifecycle 2065 Fund Composite Index, which returned 22.32%. • The Lifecycle 2065 Fund Composite Index consisted of: 61.1% Russell 3000® Index; 32.9% MSCI All Country World Index ex USA Investable Market Index; and 6.0% Bloomberg U.S. Aggregate Bond Index. • Top contributors to relative performance » Strong overall performance among underlying funds investing in U.S. equities. » Positions in the Nuveen Core Equity Fund, Nuveen Growth Opportunities ETF and the Nuveen Large Cap Value Fund. • Top detractors from relative performance » An allocation to the Nuveen Real Property Fund LP. » A position in the Nuveen International Opportunities Fund. | | Performance Attribution Nuveen Core Equity Fund Nuveen Growth Opportunities ETF Nuveen Large Cap Value Fund Nuveen Real Property Fund LP |
How did the Fund perform over the last 10 years?
Performance data shown represents past performance and does not predict or guarantee future results. The graph and table do not reflect the deduction of taxes that a shareholder would pay on Fund distributions or redemption of Fund Shares.
Fund Performance (September 30, 2020 through May 31, 2024) Initial Investment of $10,000
Average Annual Total Returns
| | | | | | | | |
| | | 1 year | | | Since Inception | |
| Retirement Class Shares at NAV | | | 22.46 | % | | | 10.47 | % |
Russell 3000® Index | | | 27.58 | % | | | 13.98 | % |
| Bloomberg U.S. Aggregate Bond Index | | | 1.31 | % | | | (2.98 | )% |
| Lifecycle 2065 Fund Composite Index | | | 22.32 | % | | | 10.96 | % |
| S&P Target Date 2065+ Index | | | 21.48 | % | | | 11.02 | % |
Investment return and principal value will fluctuate, and you may have a gain or loss when you sell your shares. Current performance may differ from figures shown. For most recent month‑end performance, go to https://www.nuveen.com/en-us/mutual-funds/prospectuses or call (800) 257‑8787.
Fund Statistics (as of May 31, 2024)
| | | | |
| Fund net assets | | $ | 90,936,844 | |
| Total number of portfolio holdings | | | 19 | |
| Portfolio turnover (%) | | | 34% | |
| Total advisory fees paid for the year | | $ | 269,137 | |
What did the Fund invest in? (as of May 31, 2024)
(1) Affiliated investment companies, except for repurchase agreements.
How has the Fund changed?
| | • | | Name change: Effective May 1, 2024, the Fund’s name changed from TIAA-CREF Lifecycle 2065 Fund to Nuveen Lifecycle 2065 Fund. | |
For more complete information, you may review the Fund’s next prospectus, which is expected to be available by October 1, 2024 at https://www.nuveen.com/en-us/mutual-funds/prospectuses or upon request at (800) 257‑8787.
Availability of additional information about the Fund
You can find additional information about the Fund at https://www.nuveen.com/en-us/mutual-funds/prospectuses, including its:
| | • | | prospectus • financial statements and other information • fund holdings • proxy voting information |
You can also request this information at (800) 257‑8787.
| | |
87249N743_AR_0524 3613772-INV-Y-07/25 (I, R6, Premier, Retirement) | | |
| | |
| | Annual Shareholder Report May 31, 2024 |
Nuveen Lifecycle Index 2065 Fund
(Formerly known as TIAA-CREF Lifecycle Index 2065 Fund)
Premier Class Shares/TFIPX
Annual Shareholder Report
This annual shareholder report contains important information about the Premier Class Shares of the Nuveen Lifecycle Index 2065 Fund for the period of June 1, 2023 to May 31, 2024. You can find additional information at https://www.nuveen.com/en‑us/mutual‑funds/prospectuses. You can also request this information by contacting us at (800) 257‑8787.
This report describes changes to the Fund that occurred during the reporting period.
What were the Fund costs for the last year? (based on a hypothetical $10,000 investment)
| | | | |
| | | Cost of a $10,000 investment | | Costs paid as a percentage of
$10,000 investment |
| Premier Class Shares | | $26 | | 0.26% |
How did the Fund perform last year? What affected the Fund’s performance?
| | |
Performance Highlights • The Nuveen Lifecycle Index 2065 Fund returned 22.03% for Premier Class shares at net asset value (NAV) for the 12 months ended May 31, 2024. The Fund underperformed the Lifecycle Index 2065 Fund Composite Index, which returned 22.31%. • The Lifecycle Index 2065 Fund Composite Index consisted of: 61.1% Russell 3000® Index; 32.9% MSCI EAFE + Emerging Markets Index; and 6.0% Bloomberg U.S. Aggregate Bond Index. • Top detractors from absolute performance » Management fees and other expenses incurred by the Fund. • Top contributors to absolute performance » Underlying equity and fixed income funds advanced for the period. Equity funds, led by the Nuveen Equity Index Fund, recorded the largest gains and contributed most. | | Fund Performance Fees/Other Expenses Equity & Fixed Income Funds |
How did the Fund perform over the last 10 years?
Performance data shown represents past performance and does not predict or guarantee future results. The graph and table do not reflect the deduction of taxes that a shareholder would pay on Fund distributions or redemption of Fund Shares.
Fund Performance (September 30, 2020 through May 31, 2024) Initial Investment of $10,000
Average Annual Total Returns
| | | | | | | | |
| | | 1 year | | | Since Inception | |
| Premier Class Shares at NAV | | | 22.03 | % | | | 10.73 | % |
Russell 3000® Index | | | 27.58 | % | | | 13.98 | % |
| Bloomberg U.S. Aggregate Bond Index | | | 1.31 | % | | | (2.98 | )% |
| Lifecycle Index 2065 Fund Composite Index | | | 22.31 | % | | | 10.89 | % |
| S&P Target Date 2065+ Index | | | 21.48 | % | | | 11.02 | % |
Investment return and principal value will fluctuate, and you may have a gain or loss when you sell your shares. Current performance may differ from figures shown. For most recent month‑end performance, go to https://www.nuveen.com/en‑us/mutual‑funds/prospectuses or call (800) 257‑8787.
Fund Statistics (as of May 31, 2024)
| | | | |
| Fund net assets | | $ | 339,024,079 | |
| Total number of portfolio holdings | | | 5 | |
| Portfolio turnover (%) | | | 14% | |
| Total advisory fees paid for the year | | $ | 334,084 | |
What did the Fund invest in? (as of May 31, 2024)
(1) Affiliated investment companies, except for repurchase agreements.
How has the Fund changed?
| | • | | Name change: Effective May 1, 2024, the Fund’s name changed from TIAA-CREF Lifecycle Index 2065 Fund to Nuveen Lifecycle Index 2065 Fund. | |
For more complete information, you may review the Fund’s next prospectus, which is expected to be available by October 1, 2024 at https://www.nuveen.com/en‑us/mutual‑funds/prospectuses or upon request at (800) 257‑8787.
Availability of additional information about the Fund
You can find additional information about the Fund at https://www.nuveen.com/en‑us/mutual‑funds/prospectuses, including its:
| | • | | prospectus • financial statements and other information • fund holdings • proxy voting information |
You can also request this information at (800) 257‑8787.
| | |
87249N719_AR_0524 3613889-INV-Y-07/25 (I, R6, Premier, Retirement) | | |
| | |
| | Annual Shareholder Report May 31, 2024 |
Nuveen Lifecycle Index 2065 Fund
(Formerly known as TIAA-CREF Lifecycle Index 2065 Fund)
Retirement Class Shares/TFIRX
Annual Shareholder Report
This annual shareholder report contains important information about the Retirement Class Shares of the Nuveen Lifecycle Index 2065 Fund for the period of June 1, 2023 to May 31, 2024. You can find additional information at https://www.nuveen.com/en‑us/mutual‑funds/prospectuses. You can also request this information by contacting us at (800) 257‑8787.
This report describes changes to the Fund that occurred during the reporting period.
What were the Fund costs for the last year? (based on a hypothetical $10,000 investment)
| | | | |
| | | Cost of a $10,000 investment | | Costs paid as a percentage of $10,000 investment |
| Retirement Class Shares | | $36 | | 0.36% |
How did the Fund perform last year? What affected the Fund’s performance?
| | |
Performance Highlights • The Nuveen Lifecycle Index 2065 Fund returned 21.93% for Retirement Class shares at net asset value (NAV) for the 12 months ended May 31, 2024. The Fund underperformed the Lifecycle Index 2065 Fund Composite Index, which returned 22.31%. • The Lifecycle Index 2065 Fund Composite Index consisted of: 61.1% Russell 3000® Index; 32.9% MSCI EAFE + Emerging Markets Index; and 6.0% Bloomberg U.S. Aggregate Bond Index. • Top detractors from absolute performance » Management fees and other expenses incurred by the Fund. • Top contributors to absolute performance » Underlying equity and fixed income funds advanced for the period. Equity funds, led by the Nuveen Equity Index Fund, recorded the largest gains and contributed most. | | Fund Performance Fees/Other Expenses Equity & Fixed Income Funds |
How did the Fund perform over the last 10 years?
Performance data shown represents past performance and does not predict or guarantee future results. The graph and table do not reflect the deduction of taxes that a shareholder would pay on Fund distributions or redemption of Fund Shares.
Fund Performance (September 30, 2020 through May 31, 2024) Initial Investment of $10,000
Average Annual Total Returns
| | | | | | | | |
| | | 1 year | | | Since Inception | |
| Retirement Class Shares at NAV | | | 21.93 | % | | | 10.53 | % |
Russell 3000® Index | | | 27.58 | % | | | 13.98 | % |
| Bloomberg U.S. Aggregate Bond Index | | | 1.31 | % | | | (2.98 | )% |
| Lifecycle Index 2065 Fund Composite Index | | | 22.31 | % | | | 10.89 | % |
| S&P Target Date 2065+ Index | | | 21.48 | % | | | 11.02 | % |
Investment return and principal value will fluctuate, and you may have a gain or loss when you sell your shares. Current performance may differ from figures shown. For most recent month‑end performance, go to https://www.nuveen.com/en‑us/mutual‑funds/prospectuses or call (800) 257‑8787.
Fund Statistics (as of May 31, 2024)
| | | | |
| Fund net assets | | $ | 339,024,079 | |
| Total number of portfolio holdings | | | 5 | |
| Portfolio turnover (%) | | | 14% | |
| Total advisory fees paid for the year | | $ | 334,084 | |
What did the Fund invest in? (as of May 31, 2024)
(1) Affiliated investment companies, except for repurchase agreements.
How has the Fund changed?
| | • | | Name change: Effective May 1, 2024, the Fund’s name changed from TIAA-CREF Lifecycle Index 2065 Fund to Nuveen Lifecycle Index 2065 Fund. | |
For more complete information, you may review the Fund’s next prospectus, which is expected to be available by October 1, 2024 at https://www.nuveen.com/en‑us/mutual‑funds/prospectuses or upon request at (800) 257‑8787.
Availability of additional information about the Fund
You can find additional information about the Fund at https://www.nuveen.com/en‑us/mutual‑funds/prospectuses, including its:
| | • | | prospectus • financial statements and other information • fund holdings • proxy voting information |
You can also request this information at (800) 257‑8787.
| | |
87249N693_AR_0524 3613889-INV-Y-07/25 (I, R6, Premier, Retirement) | | |
| | |
| | Annual Shareholder Report May 31, 2024 |
Nuveen Lifecycle Index 2065 Fund
(Formerly known as TIAA-CREF Lifecycle Index 2065 Fund)
Class I Shares (Formerly known as Advisor Class Shares)/TFIHX
Annual Shareholder Report
This annual shareholder report contains important information about the Class I Shares of the Nuveen Lifecycle Index 2065 Fund for the period of June 1, 2023 to May 31, 2024. You can find additional information at https://www.nuveen.com/en‑us/mutual‑funds/prospectuses. You can also request this information by contacting us at (800) 257‑8787.
This report describes changes to the Fund that occurred during the reporting period.
What were the Fund costs for the last year? (based on a hypothetical $10,000 investment)
| | | | |
| | | Cost of a $10,000 investment | | Costs paid as a percentage of
$10,000 investment |
| Class I Shares | | $19 | | 0.19% |
How did the Fund perform last year? What affected the Fund’s performance?
| | |
Performance Highlights • The Nuveen Lifecycle Index 2065 Fund returned 22.08% for Class I shares at net asset value (NAV) for the 12 months ended May 31, 2024. The Fund performed in line with the Lifecycle Index 2065 Fund Composite Index, which returned 22.31%. • The Lifecycle Index 2065 Fund Composite Index consisted of: 61.1% Russell 3000® Index; 32.9% MSCI EAFE + Emerging Markets Index; and 6.0% Bloomberg U.S. Aggregate Bond Index. • Top detractors from absolute performance » Management fees and other expenses incurred by the Fund. • Top contributors to absolute performance » Underlying equity and fixed income funds advanced for the period. Equity funds, led by the Nuveen Equity Index Fund, recorded the largest gains and contributed most. | | Fund Performance Fees/Other Expenses Equity & Fixed Income Funds |
How did the Fund perform over the period since inception?
Performance data shown represents past performance and does not predict or guarantee future results. The graph and table do not reflect the deduction of taxes that a shareholder would pay on Fund distributions or redemption of Fund Shares.
Fund Performance (September 30, 2020 through May 31, 2024) Initial Investment of $10,000
Average Annual Total Returns
| | | | | | | | |
| | | 1 year | | | Since Inception | |
| Class I Shares at NAV | | | 22.08 | % | | | 10.79 | % |
Russell 3000® Index | | | 27.58 | % | | | 13.98 | % |
| Bloomberg U.S. Aggregate Bond Index | | | 1.31 | % | | | (2.98 | )% |
| Lifecycle Index 2065 Fund Composite Index | | | 22.31 | % | | | 10.89 | % |
| S&P Target Date 2065+ Index | | | 21.48 | % | | | 11.02 | % |
Investment return and principal value will fluctuate, and you may have a gain or loss when you sell your shares. Current performance may differ from figures shown. For most recent month‑end performance, go to https://www.nuveen.com/en‑us/mutual‑funds/prospectuses or call (800) 257‑8787.
Fund Statistics (as of May 31, 2024)
| | | | |
| Fund net assets | | $ | 339,024,079 | |
| Total number of portfolio holdings | | | 5 | |
| Portfolio turnover (%) | | | 14% | |
| Total advisory fees paid for the year | | $ | 334,084 | |
What did the Fund invest in? (as of May 31, 2024)
(1) Affiliated investment companies, except for repurchase agreements.
How has the Fund changed?
| | • | | Name change: Effective May 1, 2024, the Fund’s name changed from TIAA-CREF Lifecycle Index 2065 Fund to Nuveen Lifecycle Index 2065 Fund. | |
| | • | | Share class name change: Effective May 6, 2024, Advisor Class shares of the Fund were renamed Class I shares. | |
For more complete information, you may review the Fund’s next prospectus, which is expected to be available by October 1, 2024 at https://www.nuveen.com/en‑us/mutual‑funds/prospectuses or upon request at (800) 257‑8787.
Availability of additional information about the Fund
You can find additional information about the Fund at https://www.nuveen.com/en‑us/mutual‑funds/prospectuses, including its:
| | • | | prospectus • financial statements and other information • fund holdings • proxy voting information |
You can also request this information at (800) 257‑8787.
| | |
87249N735_AR_0524 3613889-INV-Y-07/25 (I, R6, Premier, Retirement) | | |
| | |
| | Annual Shareholder Report May 31, 2024 |
Nuveen Lifecycle Index 2065 Fund
(Formerly known as TIAA-CREF Lifecycle Index 2065 Fund)
Class R6 Shares (Formerly known as Institutional Class Shares)/TFITX
Annual Shareholder Report
This annual shareholder report contains important information about the Class R6 Shares of the Nuveen Lifecycle Index 2065 Fund for the period of June 1, 2023 to May 31, 2024. You can find additional information at https://www.nuveen.com/en‑us/mutual‑funds/prospectuses. You can also request this information by contacting us at (800) 257‑8787.
This report describes changes to the Fund that occurred during the reporting period.
What were the Fund costs for the last year? (based on a hypothetical $10,000 investment)
| | | | |
| | | Cost of a $10,000 investment | | Costs paid as a percentage of
$10,000 investment |
| Class R6 Shares | | $11 | | 0.11% |
How did the Fund perform last year? What affected the Fund’s performance?
| | |
Performance Highlights • The Nuveen Lifecycle Index 2065 Fund returned 22.12% for Class R6 shares at net asset value (NAV) for the 12 months ended May 31, 2024. The Fund performed in line with the Lifecycle Index 2065 Fund Composite Index, which returned 22.31%. • The Lifecycle Index 2065 Fund Composite Index consisted of: 61.1% Russell 3000® Index; 32.9% MSCI EAFE + Emerging Markets Index; and 6.0% Bloomberg U.S. Aggregate Bond Index. • Top detractors from absolute performance » Management fees and other expenses incurred by the Fund . • Top contributors to absolute performance » Underlying equity and fixed income funds advanced for the period. Equity funds, led by the Nuveen Equity Index Fund, recorded the largest gains and contributed most. | | Fund Performance Fees/Other Expenses Equity & Fixed Income Funds |
How did the Fund perform over the last 10 years?
Performance data shown represents past performance and does not predict or guarantee future results. The graph and table do not reflect the deduction of taxes that a shareholder would pay on Fund distributions or redemption of Fund Shares.
Fund Performance (September 30, 2020 through May 31, 2024) Initial Investment of $10,000
Average Annual Total Returns
| | | | | | | | |
| | | 1 year | | | Since Inception | |
| Class R6 Shares at NAV | | | 22.12 | % | | | 10.86 | % |
Russell 3000® Index | | | 27.58 | % | | | 13.98 | % |
| Bloomberg U.S. Aggregate Bond Index | | | 1.31 | % | | | (2.98 | )% |
| Lifecycle Index 2065 Fund Composite Index | | | 22.31 | % | | | 10.89 | % |
| S&P Target Date 2065+ Index | | | 21.48 | % | | | 11.02 | % |
Investment return and principal value will fluctuate, and you may have a gain or loss when you sell your shares. Current performance may differ from figures shown. For most recent month‑end performance, go to https://www.nuveen.com/en‑us/mutual‑funds/prospectuses or call (800) 257‑8787.
Fund Statistics (as of May 31, 2024)
| | | | |
| Fund net assets | | $ | 339,024,079 | |
| Total number of portfolio holdings | | | 5 | |
| Portfolio turnover (%) | | | 14% | |
| Total advisory fees paid for the year | | $ | 334,084 | |
What did the Fund invest in? (as of May 31, 2024)
(1) Affiliated investment companies, except for repurchase agreements.
How has the Fund changed?
| | • | | Name change: Effective May 1, 2024, the Fund’s name changed from TIAA-CREF Lifecycle Index 2065 Fund to Nuveen Lifecycle Index 2065 Fund. | |
| | • | | Share class name change: Effective May 6, 2024, Institutional Class shares of the Fund were renamed Class R6 shares. | |
For more complete information, you may review the Fund’s next prospectus, which is expected to be available by October 1, 2024 at https://www.nuveen.com/en‑us/mutual‑funds/prospectuses or upon request at (800) 257‑8787.
Availability of additional information about the Fund
You can find additional information about the Fund at https://www.nuveen.com/en‑us/mutual‑funds/prospectuses, including its:
| | • | | prospectus • financial statements and other information • fund holdings • proxy voting information |
You can also request this information at (800) 257‑8787.
| | |
87249N727_AR_0524 3613889-INV-Y-07/25 (I, R6, Premier, Retirement) | | |
As of the end of the period covered by this report, the registrant has adopted a code of ethics that applies to the registrant’s principal executive officer, principal financial officer, principal accounting officer or controller, or persons performing similar functions. There were no amendments to or waivers from the code during the period covered by this report. Upon request, a copy of the registrant’s code of ethics is available without charge by calling 800-257-8787.
| Item 3. | Audit Committee Financial Expert. |
As of the end of the period covered by this report, the registrant’s Board of Directors or Trustees (“Board”) had determined that the registrant has at least one “audit committee financial expert” (as defined in Item 3 of Form N-CSR) serving on its Audit Committee. The members of the registrant’s audit committee that have been designated as audit committee financial experts are Joseph A. Boateng, Albin F. Moschner, John K. Nelson, Loren M. Starr and Robert L. Young, who are “independent” for purposes of Item 3 of Form N-CSR.
Mr. Boateng has served as the Chief Investment Officer for Casey Family Programs since 2007. He was previously Director of U.S. Pension Plans for Johnson & Johnson from 2002-2006. Mr. Boateng is a board member of the Lumina Foundation and Waterside School, an emeritus board member of Year Up Puget Sound, member of the Investment Advisory Committee and former Chair for the Seattle City Employees’ Retirement System, and an Investment Committee Member for The Seattle Foundation. Mr. Boateng previously served on the Board of Trustees for the College Retirement Equities Fund (2018-2023) and on the Management Committee for TIAA Separate Account VA-1 (2019-2023).
Mr. Moschner is a consultant in the wireless industry and, in July 2012, founded Northcroft Partners, LLC, a management consulting firm that provides operational, management and governance solutions. Prior to founding Northcroft Partners, LLC, Mr. Moschner held various positions at Leap Wireless International, Inc., a provider of wireless services, where he was as a consultant from February 2011 to July 2012, Chief Operating Officer from July 2008 to February 2011, and Chief Marketing Officer from August 2004 to June 2008. Before he joined Leap Wireless International, Inc., Mr. Moschner was President of the Verizon Card Services division of Verizon Communications, Inc. from 2000 to 2003, and President of One Point Services at One Point Communications from 1999 to 2000. Mr. Moschner also served at Zenith Electronics Corporation as Director, President and Chief Executive Officer from 1995 to 1996, and as Director, President and Chief Operating Officer from 1994 to 1995.
Mr. Nelson formerly served on the Board of Directors of Core12, LLC from 2008 to 2023, a private firm which develops branding, marketing, and communications strategies for clients. Mr. Nelson has extensive experience in global banking and markets, having served in several senior executive positions with ABN AMRO Holdings N.V. and its affiliated entities and predecessors, including LaSalle Bank Corporation from 1996 to 2008, ultimately serving as Chief Executive Officer of ABN AMRO N.V. North America. During his tenure at the bank, he also served as Global Head of its Financial Markets Division, which encompassed the bank’s Currency, Commodity, Fixed Income, Emerging Markets, and Derivatives businesses. He was a member of the Foreign Exchange Committee of the Federal Reserve Bank of the United States and during his tenure with ABN AMRO served as the bank’s representative on various committees of The Bank of Canada, European Central Bank, and The Bank of England. Mr. Nelson previously served as a senior, external advisor to the financial services practice of Deloitte Consulting LLP. (2012-2014).
Mr. Starr was Vice Chair, Senior Managing Director from 2020 to 2021, and Chief Financial Officer, Senior Managing Director from 2005 to 2020, for Invesco Ltd. Mr. Starr is also a Director and member of the Audit Committee for AMG. He is former Chair and member of the Board of Directors, Georgia Leadership Institute for School Improvement (GLISI); former Chair and member of the Board of Trustees, Georgia Council on Economic Education (GCEE). Mr. Starr previously served on the Board of Trustees for the College Retirement Equities Fund and on the Management Committee for TIAA Separate Account VA-1 (2022-2023).
Mr. Young has more than 30 years of experience in the investment management industry. From 1997 to 2017, he held various positions with J.P. Morgan Investment Management Inc. (“J.P. Morgan Investment”) and its affiliates (collectively, “J.P. Morgan”). Most recently, he served as Chief Operating Officer and Director of J.P. Morgan Investment (from 2010 to 2016) and as President and Principal Executive Officer of the J.P. Morgan Funds (from 2013 to 2016). As Chief Operating Officer of J.P. Morgan Investment, Mr. Young led service, administration and business platform support activities for J.P. Morgan’s domestic retail mutual fund and institutional commingled and separate account businesses and co-led these activities for J.P. Morgan’s global retail and institutional
investment management businesses. As President of the J.P. Morgan Funds, Mr. Young interacted with various service providers to these funds, facilitated the relationship between such funds and their boards, and was directly involved in establishing board agendas, addressing regulatory matters, and establishing policies and procedures. Before joining J.P. Morgan, Mr. Young, a former Certified Public Accountant (CPA), was a Senior Manager (Audit) with Deloitte & Touche LLP (formerly, Touche Ross LLP), where he was employed from 1985 to 1996. During his tenure there, he actively participated in creating, and ultimately led, the firm’s midwestern mutual fund practice.
| Item 4. | Principal Accountant Fees and Services. |
PricewaterhouseCoopers LLP (“PwC”) performs independent audits of the Registrant’s financial statements. To maintain auditor independence and avoid even the appearance of conflicts of interest, the Registrant, as a policy, does not engage PwC for management advisory or consulting services.
The aggregate fees billed by PwC as disclosed below for the fiscal year ended May 31, 2023 may not align with the figures reported and filed with the Securities and Exchange Commission in the Form N-CSR for the fiscal year ended May 31, 2023 because the fees disclosed in this Form N-CSR reflect fees updated after the date of the May 31, 2023 Form N-CSR.
For the fiscal years ended May 31, 2024 and May 31, 2023, PwC’s aggregate fees for the audit of the Registrant’s annual financial statements were $478,208 and $475,805, respectively.
For the fiscal years ended May 31, 2024 and May 31, 2023, PwC’s aggregate fees for services related to the performance of the audit of the Registrant’s annual financial statements were $0 and $3,832, respectively.
For the fiscal years ended May 31, 2024 and May 31, 2023, the Audit-Related Fees billed by PwC to Teachers Advisors, LLC (“Advisors”) or to any entity controlling, controlled by or under common control with Advisors that provides ongoing services to the Registrant (collectively, “Fund Service Providers”) were $0 and $0, respectively.
For the fiscal years ended May 31, 2024 and May 31, 2023, PwC’s aggregate fees for tax services billed to the Registrant were $0 and $0, respectively.
For the fiscal years ended May 31, 2024 and May 31, 2023, the Tax Fees billed by PwC to the Fund Service Providers were $0 and $0, respectively.
For the fiscal years ended May 31, 2024 and May 31, 2023, PwC’s aggregate fees for all other services billed to the Registrant were $0 and $0, respectively.
For the fiscal years ended May 31, 2024 and May 31, 2023, PwC’s aggregate fees for all other services billed to the Fund Service Providers were $0 and $0, respectively.
| (e)(1) | Preapproval Policy. |
The Registrant’s audit and compliance committee (“Audit Committee”) has adopted a Preapproval Policy for External Audit Firm Services (the “Policy”). The Policy describes the types of services that may be provided by the independent auditor to the Registrant and certain of its affiliates without impairing the auditor’s independence. Under the Policy, the Audit Committee is required to preapprove all services to be performed by the Registrant’s independent auditor in order to ensure that such services do not impair the auditor’s independence.
The Policy requires the Audit Committee to: (i) appoint the independent auditor to perform the financial statements audit for the Registrant and certain of its affiliates, including approving the terms of the engagement, and (ii) preapprove the audit, audit-related, tax and other services to be provided by the independent auditor to
the Registrant and certain of its affiliates and the fees to be charged for provision of such services from year to year.
(e)(2) Services provided pursuant to paragraph (c)(7)(i)(C) of Rule 2-01 of Regulation S-X (the “de minimis exception”):
Audit-Related Fees:
There were no amounts that were approved by the Audit Committee pursuant to the de minimis exception for the fiscal years ended May 31, 2024 and May 31, 2023 on behalf of the Registrant.
There were no amounts that were approved by the Audit Committee pursuant to the de minimis exception for the fiscal years ended May 31, 2024 and May 31, 2023 on behalf of the Fund Service Providers that relate directly to the operations and financial reporting of the Registrant.
Tax Fees:
There were no amounts that were approved by the Audit Committee pursuant to the de minimis exception for the fiscal years ended May 31, 2024 and May 31, 2023 on behalf of the Registrant.
There were no amounts that were approved by the Audit Committee pursuant to the de minimis exception for the fiscal years ended May 31, 2024 and May 31, 2023 on behalf of the Fund Service Providers that relate directly to the operations and financial reporting of the Registrant.
All Other Fees:
There were no amounts that were approved by the Audit Committee pursuant to the de minimis exception for the fiscal years ended May 31, 2024 and May 31, 2023 on behalf of the Registrant.
There were no amounts that were approved by the Audit Committee pursuant to the de minimis exception for the fiscal years ended May 31, 2024 and May 31, 2023 on behalf of the Fund Service Providers that relate directly to the operations and financial reporting of the Registrant.
(f) The percentage of hours expended by PwC’s engagement to audit the Registrant’s financial statements for the most recent fiscal year attributable to work performed by persons other than PwC’s full-time, permanent employees was less than 50%.
| (g) | Non-Audit Fees for Related Entities. |
For the fiscal years ended May 31, 2024 and May 31, 2023, aggregate non-audit fees billed to the Registrant and to its Fund Service Providers by PwC were $756,059 and $1,402,275, respectively.
(h) The Registrant’s Audit Committee has considered whether the non-audit services that were rendered by PwC to the Registrant’s Fund Service Providers that were not pre-approved pursuant to paragraph (c)(7)(ii) of Rule 2-01 of Regulation S-X are compatible with maintaining PwC’s independence.
| Item 5. | Audit Committee of Listed Registrants. |
Not applicable to this registrant.
| (a) | Schedule of Investments is included as part of the financial statements filed under Item 7 of this Form N-CSR. |
| Item 7. | Financial Statements and Financial Highlights for Open-End Management Investment Companies. |
Item
7.
Financial
Statements
and
Financial
Highlights
for
Open-
End
Management
Investment
Companies
Report
of
Independent
Registered
Public
Accounting
Firm
To
the
Board
of
Trustees
of
TIAA-CREF
Funds
and
Shareholders
of
Nuveen
Lifecycle
Retirement
Income
Fund,
Nuveen
Lifecycle
2010
Fund,
Nuveen
Lifecycle
2015
Fund,
Nuveen
Lifecycle
2020
Fund,
Nuveen
Lifecycle
2025
Fund,
Nuveen
Lifecycle
2030
Fund,
Nuveen
Lifecycle
2035
Fund,
Nuveen
Lifecycle
2040
Fund,
Nuveen
Lifecycle
2045
Fund,
Nuveen
Lifecycle
2050
Fund,
Nuveen
Lifecycle
2055
Fund,
Nuveen
Lifecycle
2060
Fund
and
Nuveen
Lifecycle
2065
Fund
Opinions
on
the
Financial
Statements
We
have
audited
the
accompanying
statements
of
assets
and
liabilities,
including
the
portfolios
of
investments,
of
Nuveen
Lifecycle
Retirement
Income
Fund,
Nuveen
Lifecycle
2010
Fund,
Nuveen
Lifecycle
2015
Fund,
Nuveen
Lifecycle
2020
Fund,
Nuveen
Lifecycle
2025
Fund,
Nuveen
Lifecycle
2030
Fund,
Nuveen
Lifecycle
2035
Fund,
Nuveen
Lifecycle
2040
Fund,
Nuveen
Lifecycle
2045
Fund,
Nuveen
Lifecycle
2050
Fund,
Nuveen
Lifecycle
2055
Fund,
Nuveen
Lifecycle
2060
Fund
and
Nuveen
Lifecycle
2065
Fund
(thirteen
of
the
funds
constituting
TIAA-CREF
Funds,
hereafter
collectively
referred
to
as
the
"Funds")
as
of
May
31,
2024,
the
related
statements
of
operations
for
the
year
ended
May
31,
2024,
the
statements
of
changes
in
net
assets
for
each
of
the
two
years
in
the
period
ended
May
31,
2024,
including
the
related
notes,
and
the
financial
highlights
for
each
of
the
periods
indicated
therein
(collectively
referred
to
as
the
“financial
statements”).
In
our
opinion,
the
financial
statements
present
fairly,
in
all
material
respects,
the
financial
position
of
each
of
the
Funds
as
of
May
31,
2024,
the
results
of
each
of
their
operations
for
the
year
then
ended,
the
changes
in
each
of
their
net
assets
for
each
of
the
two
years
in
the
period
ended
May
31,
2024
and
each
of
the
financial
highlights
for
each
of
the
periods
indicated
therein
in
conformity
with
accounting
principles
generally
accepted
in
the
United
States
of
America.
Basis
for
Opinions
These
financial
statements
are
the
responsibility
of
the
Funds’
management.
Our
responsibility
is
to
express
an
opinion
on
the
Funds’
financial
statements
based
on
our
audits.
We
are
a
public
accounting
firm
registered
with
the
Public
Company
Accounting
Oversight
Board
(United
States)
(PCAOB)
and
are
required
to
be
independent
with
respect
to
the
Funds
in
accordance
with
the
U.S.
federal
securities
laws
and
the
applicable
rules
and
regulations
of
the
Securities
and
Exchange
Commission
and
the
PCAOB.
We
conducted
our
audits
of
these
financial
statements
in
accordance
with
the
standards
of
the
PCAOB.
Those
standards
require
that
we
plan
and
perform
the
audit
to
obtain
reasonable
assurance
about
whether
the
financial
statements
are
free
of
material
misstatement,
whether
due
to
error
or
fraud.
Our
audits
included
performing
procedures
to
assess
the
risks
of
material
misstatement
of
the
financial
statements,
whether
due
to
error
or
fraud,
and
performing
procedures
that
respond
to
those
risks.
Such
procedures
included
examining,
on
a
test
basis,
evidence
regarding
the
amounts
and
disclosures
in
the
financial
statements.
Our
audits
also
included
evaluating
the
accounting
principles
used
and
significant
estimates
made
by
management,
as
well
as
evaluating
the
overall
presentation
of
the
financial
statements.
Our
procedures
included
confirmation
of
securities
owned
as
of
May
31,
2024
by
correspondence
with
the
custodian,
transfer
agent
and
brokers;
when
replies
were
not
received
from
brokers,
we
performed
other
auditing
procedures.
We
believe
that
our
audits
provide
a
reasonable
basis
for
our
opinions.
/s/
PricewaterhouseCoopers
LLP
Chicago,
Illinois
July
25,
2024
We
have
served
as
the
auditor
of
one
or
more
investment
companies
in
Nuveen
Funds
since
2002.
Lifecycle
Retirement
Income
Fund
May
31,
2024
See
Notes
to
Financial
Statements
SHARES
DESCRIPTION
VALUE
AFFILIATED
INVESTMENT
COMPANIES—99.9%(a)
DIRECT
REAL
ESTATE—4.6%
1,878,985
(b)
TIAA-CREF
Real
Property
Fund
LP
(purchased
8/01/16-5/02/24;
cost
$19,781,848)
$
19,278,385
TOTAL
DIRECT
REAL
ESTATE
19,278,385
FIXED
INCOME—40.0%
9,807,765
Nuveen
Core
Bond
Fund,
Class
W
87,975,648
6,052,765
Nuveen
Core
Plus
Bond
Fund,
Class
W
54,474,884
933,459
Nuveen
Emerging
Markets
Debt
Fund,
Class
W
7,897,064
966,136
Nuveen
High
Yield
Fund,
Class
W
8,337,757
1,035,764
Nuveen
International
Bond
Fund,
Class
W
8,741,851
TOTAL
FIXED
INCOME
167,427,204
INFLATION-PROTECTED
ASSETS—10.0%
3,975,530
Nuveen
Inflation
Linked
Bond
Fund,
Class
W
41,862,326
TOTAL
INFLATION-PROTECTED
ASSETS
41,862,326
INTERNATIONAL
EQUITY—12.4%
1,077,587
Nuveen
Emerging
Markets
Equity
Fund,
Class
W
8,696,125
1,574,127
Nuveen
International
Equity
Fund,
Class
W
22,525,752
866,278
Nuveen
International
Opportunities
Fund,
Class
W
13,392,653
659,604
Nuveen
Quant
International
Small
Cap
Equity
Fund,
Class
W
7,308,415
TOTAL
INTERNATIONAL
EQUITY
51,922,945
SHORT-TERM
FIXED
INCOME—9.9%
4,184,548
Nuveen
Short
Term
Bond
Fund,
Class
W
41,678,096
TOTAL
SHORT-TERM
FIXED
INCOME
41,678,096
U.S.
EQUITY—23.0%
933,621
Nuveen
Core
Equity
Fund,
Class
W
14,125,691
239,942
Nuveen
Dividend
Growth
Fund,
Class
R6
14,221,385
884,409
Nuveen
Dividend
Value
Fund,
Class
R6
13,584,517
566,027
Nuveen
Growth
Opportunities
ETF
16,777,040
641,657
Nuveen
Large
Cap
Growth
Fund,
Class
W
16,843,484
625,800
Nuveen
Large
Cap
Value
Fund,
Class
W
13,642,436
172,933
Nuveen
Quant
Small
Cap
Equity
Fund,
Class
W
3,237,313
255,286
Nuveen
Quant
Small/Mid
Cap
Equity
Fund,
Class
W
3,847,166
TOTAL
U.S.
EQUITY
96,279,032
TOTAL
AFFILIATED
INVESTMENT
COMPANIES
418,447,988
(Cost
$389,451,750)
PRINCIPAL
RATE
MATURITY
DATE
SHORT-TERM
INVESTMENTS—0.1%
REPURCHASE
AGREEMENT—0.1%
$169,000
(c)
Fixed
Income
Clearing
Corporation
5
.320
%
06/03/24
169,000
TOTAL
REPURCHASE
AGREEMENT
169,000
TOTAL
SHORT-TERM
INVESTMENTS
169,000
(Cost
$169,000)
TOTAL
INVESTMENTS—100.0%
418,616,988
(Cost
$389,620,750)
OTHER
ASSETS
&
LIABILITIES,
NET—0.0%
83,211
NET
ASSETS—100.0%
$
418,700,199
Lifecycle
Retirement
Income
Fund
May
31,
2024
See
Notes
to
Financial
Statements
Portfolio
of
Investments
(continued)
Portfolio
of
Investments
(continued)
ETF
Exchange
Traded
Fund
(a)
Affiliated
fund.
(b)
Restricted
security.
(c)
Agreement
with
Fixed
Income
Clearing
Corporation,
5.320%
dated
5/31/24
to
be
repurchased
at
$169,075
on
6/3/24,
collateralized
by
Government
Agency
Securities,
with
coupon
rate
4.250%
and
maturity
date
3/15/27,
valued
at
$172,473.
Lifecycle
2010
Fund
May
31,
2024
See
Notes
to
Financial
Statements
SHARES
DESCRIPTION
VALUE
AFFILIATED
INVESTMENT
COMPANIES—99.8%(a)
DIRECT
REAL
ESTATE—2.8%
2,224,764
(b)
TIAA-CREF
Real
Property
Fund
LP
(purchased
7/01/16-5/24/24;
cost
$22,712,741)
$
22,826,075
TOTAL
DIRECT
REAL
ESTATE
22,826,075
FIXED
INCOME—39.8%
18,747,470
Nuveen
Core
Bond
Fund,
Class
W
168,164,809
11,573,578
Nuveen
Core
Plus
Bond
Fund,
Class
W
104,162,201
1,786,977
Nuveen
Emerging
Markets
Debt
Fund,
Class
W
15,117,825
1,847,691
Nuveen
High
Yield
Fund,
Class
W
15,945,572
1,974,097
Nuveen
International
Bond
Fund,
Class
W
16,661,376
TOTAL
FIXED
INCOME
320,051,783
INFLATION-PROTECTED
ASSETS—9.9%
7,590,756
Nuveen
Inflation
Linked
Bond
Fund,
Class
W
79,930,661
TOTAL
INFLATION-PROTECTED
ASSETS
79,930,661
INTERNATIONAL
EQUITY—11.8%
1,934,384
Nuveen
Emerging
Markets
Equity
Fund,
Class
W
15,610,476
2,878,584
Nuveen
International
Equity
Fund,
Class
W
41,192,533
1,576,376
Nuveen
International
Opportunities
Fund,
Class
W
24,370,778
1,198,986
Nuveen
Quant
International
Small
Cap
Equity
Fund,
Class
W
13,284,767
TOTAL
INTERNATIONAL
EQUITY
94,458,554
SHORT-TERM
FIXED
INCOME—13.7%
11,087,591
Nuveen
Short
Term
Bond
Fund,
Class
W
110,432,411
TOTAL
SHORT-TERM
FIXED
INCOME
110,432,411
U.S.
EQUITY—21.8%
1,707,200
Nuveen
Core
Equity
Fund,
Class
W
25,829,931
435,525
Nuveen
Dividend
Growth
Fund,
Class
R6
25,813,585
1,619,881
Nuveen
Dividend
Value
Fund,
Class
R6
24,881,373
1,035,093
Nuveen
Growth
Opportunities
ETF
30,680,157
1,170,971
Nuveen
Large
Cap
Growth
Fund,
Class
W
30,737,977
1,145,851
Nuveen
Large
Cap
Value
Fund,
Class
W
24,979,543
311,514
Nuveen
Quant
Small
Cap
Equity
Fund,
Class
W
5,831,537
460,759
Nuveen
Quant
Small/Mid
Cap
Equity
Fund,
Class
W
6,943,641
TOTAL
U.S.
EQUITY
175,697,744
TOTAL
AFFILIATED
INVESTMENT
COMPANIES
803,397,228
(Cost
$735,551,840)
PRINCIPAL
RATE
MATURITY
DATE
SHORT-TERM
INVESTMENTS—0.1%
REPURCHASE
AGREEMENT—0.1%
$572,000
(c)
Fixed
Income
Clearing
Corporation
5
.320
%
06/03/24
572,000
TOTAL
REPURCHASE
AGREEMENT
572,000
TOTAL
SHORT-TERM
INVESTMENTS
572,000
(Cost
$572,000)
TOTAL
INVESTMENTS—99.9%
803,969,228
(Cost
$736,123,840)
OTHER
ASSETS
&
LIABILITIES,
NET—0.1%
497,128
NET
ASSETS—100.0%
$
804,466,356
Lifecycle
2010
Fund
May
31,
2024
See
Notes
to
Financial
Statements
Portfolio
of
Investments
(continued)
Portfolio
of
Investments
(continued)
ETF
Exchange
Traded
Fund
(a)
Affiliated
fund.
(b)
Restricted
security.
(c)
Agreement
with
Fixed
Income
Clearing
Corporation,
5.320%
dated
5/31/24
to
be
repurchased
at
$572,254
on
6/3/24,
collateralized
by
Government
Agency
Securities,
with
coupon
rate
4.250%
and
maturity
date
3/15/27,
valued
at
$583,524.
Lifecycle
2015
Fund
May
31,
2024
See
Notes
to
Financial
Statements
SHARES
DESCRIPTION
VALUE
AFFILIATED
INVESTMENT
COMPANIES—99.9%(a)
DIRECT
REAL
ESTATE—4.6%
5,195,814
(b)
TIAA-CREF
Real
Property
Fund
LP
(purchased
11/28/16-5/24/24;
cost
$54,334,692)
$
53,309,054
TOTAL
DIRECT
REAL
ESTATE
53,309,054
FIXED
INCOME—39.5%
26,813,015
Nuveen
Core
Bond
Fund,
Class
W
240,512,746
16,551,569
Nuveen
Core
Plus
Bond
Fund,
Class
W
148,964,120
2,557,368
Nuveen
Emerging
Markets
Debt
Fund,
Class
W
21,635,333
2,642,360
Nuveen
High
Yield
Fund,
Class
W
22,803,563
2,823,271
Nuveen
International
Bond
Fund,
Class
W
23,828,405
TOTAL
FIXED
INCOME
457,744,167
INFLATION-PROTECTED
ASSETS—9.5%
10,426,761
Nuveen
Inflation
Linked
Bond
Fund,
Class
W
109,793,793
TOTAL
INFLATION-PROTECTED
ASSETS
109,793,793
INTERNATIONAL
EQUITY—12.9%
3,075,922
Nuveen
Emerging
Markets
Equity
Fund,
Class
W
24,822,688
4,543,102
Nuveen
International
Equity
Fund,
Class
W
65,011,796
2,488,842
Nuveen
International
Opportunities
Fund,
Class
W
38,477,503
1,884,093
Nuveen
Quant
International
Small
Cap
Equity
Fund,
Class
W
20,875,745
TOTAL
INTERNATIONAL
EQUITY
149,187,732
SHORT-TERM
FIXED
INCOME—9.4%
10,980,350
Nuveen
Short
Term
Bond
Fund,
Class
W
109,364,287
TOTAL
SHORT-TERM
FIXED
INCOME
109,364,287
U.S.
EQUITY—24.0%
2,699,556
Nuveen
Core
Equity
Fund,
Class
W
40,844,281
689,913
Nuveen
Dividend
Growth
Fund,
Class
R6
40,891,151
2,555,320
Nuveen
Dividend
Value
Fund,
Class
R6
39,249,713
1,633,991
Nuveen
Growth
Opportunities
ETF
48,431,493
1,846,758
Nuveen
Large
Cap
Growth
Fund,
Class
W
48,477,397
1,807,930
Nuveen
Large
Cap
Value
Fund,
Class
W
39,412,880
500,458
Nuveen
Quant
Small
Cap
Equity
Fund,
Class
W
9,368,576
738,749
Nuveen
Quant
Small/Mid
Cap
Equity
Fund,
Class
W
11,132,953
TOTAL
U.S.
EQUITY
277,808,444
TOTAL
AFFILIATED
INVESTMENT
COMPANIES
1,157,207,477
(Cost
$1,102,286,722)
PRINCIPAL
RATE
MATURITY
DATE
SHORT-TERM
INVESTMENTS—0.0%
REPURCHASE
AGREEMENT—0.0%
$77,000
(c)
Fixed
Income
Clearing
Corporation
5
.320
%
06/03/24
77,000
TOTAL
REPURCHASE
AGREEMENT
77,000
TOTAL
SHORT-TERM
INVESTMENTS
77,000
(Cost
$77,000)
TOTAL
INVESTMENTS—99.9%
1,157,284,477
(Cost
$1,102,363,722)
OTHER
ASSETS
&
LIABILITIES,
NET—0.1%
831,304
NET
ASSETS—100.0%
$
1,158,115,781
Lifecycle
2015
Fund
May
31,
2024
See
Notes
to
Financial
Statements
Portfolio
of
Investments
(continued)
Portfolio
of
Investments
(continued)
ETF
Exchange
Traded
Fund
(a)
Affiliated
fund.
(b)
Restricted
security.
(c)
Agreement
with
Fixed
Income
Clearing
Corporation,
5.320%
dated
5/31/24
to
be
repurchased
at
$77,034
on
6/3/24,
collateralized
by
Government
Agency
Securities,
with
coupon
rate
4.250%
and
maturity
date
3/15/27,
valued
at
$78,555.
Lifecycle
2020
Fund
May
31,
2024
See
Notes
to
Financial
Statements
SHARES
DESCRIPTION
VALUE
AFFILIATED
INVESTMENT
COMPANIES—99.9%(a)
DIRECT
REAL
ESTATE—4.6%
11,278,362
(b)
TIAA-CREF
Real
Property
Fund
LP
(purchased
11/28/16-5/02/24;
cost
$118,304,459)
$
115,715,998
TOTAL
DIRECT
REAL
ESTATE
115,715,998
FIXED
INCOME—38.5%
56,784,940
Nuveen
Core
Bond
Fund,
Class
W
509,360,911
35,046,918
Nuveen
Core
Plus
Bond
Fund,
Class
W
315,422,259
5,417,458
Nuveen
Emerging
Markets
Debt
Fund,
Class
W
45,831,691
5,596,105
Nuveen
High
Yield
Fund,
Class
W
48,294,386
5,978,925
Nuveen
International
Bond
Fund,
Class
W
50,462,130
TOTAL
FIXED
INCOME
969,371,377
INFLATION-PROTECTED
ASSETS—7.5%
17,909,224
Nuveen
Inflation
Linked
Bond
Fund,
Class
W
188,584,130
TOTAL
INFLATION-PROTECTED
ASSETS
188,584,130
INTERNATIONAL
EQUITY—14.6%
7,565,761
Nuveen
Emerging
Markets
Equity
Fund,
Class
W
61,055,693
11,209,300
Nuveen
International
Equity
Fund,
Class
W
160,405,078
6,102,662
Nuveen
International
Opportunities
Fund,
Class
W
94,347,148
4,675,553
Nuveen
Quant
International
Small
Cap
Equity
Fund,
Class
W
51,805,126
TOTAL
INTERNATIONAL
EQUITY
367,613,045
SHORT-TERM
FIXED
INCOME—7.5%
18,840,305
Nuveen
Short
Term
Bond
Fund,
Class
W
187,649,437
TOTAL
SHORT-TERM
FIXED
INCOME
187,649,437
U.S.
EQUITY—27.2%
6,657,626
Nuveen
Core
Equity
Fund,
Class
W
100,729,883
1,699,133
Nuveen
Dividend
Growth
Fund,
Class
R6
100,707,619
6,317,009
Nuveen
Dividend
Value
Fund,
Class
R6
97,029,263
4,046,911
Nuveen
Growth
Opportunities
ETF
119,950,442
4,505,003
Nuveen
Large
Cap
Growth
Fund,
Class
W
118,256,330
4,450,713
Nuveen
Large
Cap
Value
Fund,
Class
W
97,025,535
1,215,055
Nuveen
Quant
Small
Cap
Equity
Fund,
Class
W
22,745,821
1,795,195
Nuveen
Quant
Small/Mid
Cap
Equity
Fund,
Class
W
27,053,595
TOTAL
U.S.
EQUITY
683,498,488
TOTAL
AFFILIATED
INVESTMENT
COMPANIES
2,512,432,475
(Cost
$2,348,912,744)
PRINCIPAL
RATE
MATURITY
DATE
SHORT-TERM
INVESTMENTS—0.0%
REPURCHASE
AGREEMENT—0.0%
$361,000
(c)
Fixed
Income
Clearing
Corporation
5
.320
%
06/03/24
361,000
TOTAL
REPURCHASE
AGREEMENT
361,000
TOTAL
SHORT-TERM
INVESTMENTS
361,000
(Cost
$361,000)
TOTAL
INVESTMENTS—99.9%
2,512,793,475
(Cost
$2,349,273,744)
OTHER
ASSETS
&
LIABILITIES,
NET—0.1%
1,820,084
NET
ASSETS—100.0%
$
2,514,613,559
Lifecycle
2020
Fund
May
31,
2024
See
Notes
to
Financial
Statements
Portfolio
of
Investments
(continued)
Portfolio
of
Investments
(continued)
ETF
Exchange
Traded
Fund
(a)
Affiliated
fund.
(b)
Restricted
security.
(c)
Agreement
with
Fixed
Income
Clearing
Corporation,
5.320%
dated
5/31/24
to
be
repurchased
at
$361,160
on
6/3/24,
collateralized
by
Government
Agency
Securities,
with
coupon
rate
4.250%
and
maturity
date
3/15/27,
valued
at
$368,276.
Lifecycle
2025
Fund
May
31,
2024
See
Notes
to
Financial
Statements
SHARES
DESCRIPTION
VALUE
AFFILIATED
INVESTMENT
COMPANIES—99.8%(a)
DIRECT
REAL
ESTATE—4.6%
17,551,699
(b)
TIAA-CREF
Real
Property
Fund
LP
(purchased
8/01/16-5/02/24;
cost
$186,005,215)
$
180,080,434
TOTAL
DIRECT
REAL
ESTATE
180,080,434
FIXED
INCOME—36.6%
84,099,005
Nuveen
Core
Bond
Fund,
Class
W
754,368,071
51,910,934
Nuveen
Core
Plus
Bond
Fund,
Class
W
467,198,403
8,021,804
Nuveen
Emerging
Markets
Debt
Fund,
Class
W
67,864,459
8,288,479
Nuveen
High
Yield
Fund,
Class
W
71,529,572
8,858,731
Nuveen
International
Bond
Fund,
Class
W
74,767,692
TOTAL
FIXED
INCOME
1,435,728,197
INFLATION-PROTECTED
ASSETS—5.5%
20,496,673
Nuveen
Inflation
Linked
Bond
Fund,
Class
W
215,829,969
TOTAL
INFLATION-PROTECTED
ASSETS
215,829,969
INTERNATIONAL
EQUITY—16.7%
13,402,944
Nuveen
Emerging
Markets
Equity
Fund,
Class
W
108,161,757
19,913,156
Nuveen
International
Equity
Fund,
Class
W
284,957,264
10,835,685
Nuveen
International
Opportunities
Fund,
Class
W
167,519,697
8,308,151
Nuveen
Quant
International
Small
Cap
Equity
Fund,
Class
W
92,054,309
TOTAL
INTERNATIONAL
EQUITY
652,693,027
SHORT-TERM
FIXED
INCOME—5.5%
21,562,703
Nuveen
Short
Term
Bond
Fund,
Class
W
214,764,525
TOTAL
SHORT-TERM
FIXED
INCOME
214,764,525
U.S.
EQUITY—30.9%
11,823,211
Nuveen
Core
Equity
Fund,
Class
W
178,885,188
3,016,660
Nuveen
Dividend
Growth
Fund,
Class
R6
178,797,426
11,212,587
Nuveen
Dividend
Value
Fund,
Class
R6
172,225,331
7,172,179
Nuveen
Growth
Opportunities
ETF
212,583,386
8,001,766
Nuveen
Large
Cap
Growth
Fund,
Class
W
210,046,370
7,832,256
Nuveen
Large
Cap
Value
Fund,
Class
W
170,743,171
2,157,971
Nuveen
Quant
Small
Cap
Equity
Fund,
Class
W
40,397,214
3,187,971
Nuveen
Quant
Small/Mid
Cap
Equity
Fund,
Class
W
48,042,729
TOTAL
U.S.
EQUITY
1,211,720,815
TOTAL
AFFILIATED
INVESTMENT
COMPANIES
3,910,816,967
(Cost
$3,578,063,644)
PRINCIPAL
RATE
MATURITY
DATE
SHORT-TERM
INVESTMENTS—0.1%
REPURCHASE
AGREEMENT—0.1%
$2,619,000
(c)
Fixed
Income
Clearing
Corporation
5
.320
%
06/03/24
2,619,000
TOTAL
REPURCHASE
AGREEMENT
2,619,000
TOTAL
SHORT-TERM
INVESTMENTS
2,619,000
(Cost
$2,619,000)
TOTAL
INVESTMENTS—99.9%
3,913,435,967
(Cost
$3,580,682,644)
OTHER
ASSETS
&
LIABILITIES,
NET—0.1%
2,454,585
NET
ASSETS—100.0%
$
3,915,890,552
Lifecycle
2025
Fund
May
31,
2024
See
Notes
to
Financial
Statements
Portfolio
of
Investments
(continued)
Portfolio
of
Investments
(continued)
ETF
Exchange
Traded
Fund
(a)
Affiliated
fund.
(b)
Restricted
security.
(c)
Agreement
with
Fixed
Income
Clearing
Corporation,
5.320%
dated
5/31/24
to
be
repurchased
at
$2,620,161
on
6/3/24,
collateralized
by
Government
Agency
Securities,
with
coupon
rate
4.250%
and
maturity
date
3/15/27,
valued
at
$2,671,448.
Lifecycle
2030
Fund
May
31,
2024
See
Notes
to
Financial
Statements
SHARES
DESCRIPTION
VALUE
AFFILIATED
INVESTMENT
COMPANIES—99.8%(a)
DIRECT
REAL
ESTATE—4.6%
21,297,184
(b)
TIAA-CREF
Real
Property
Fund
LP
(purchased
8/01/16-5/02/24;
cost
$227,871,007)
$
218,509,112
TOTAL
DIRECT
REAL
ESTATE
218,509,112
FIXED
INCOME—31.7%
88,331,242
Nuveen
Core
Bond
Fund,
Class
W
792,331,236
54,522,540
Nuveen
Core
Plus
Bond
Fund,
Class
W
490,702,863
8,421,769
Nuveen
Emerging
Markets
Debt
Fund,
Class
W
71,248,168
8,704,927
Nuveen
High
Yield
Fund,
Class
W
75,123,517
9,300,465
Nuveen
International
Bond
Fund,
Class
W
78,495,925
TOTAL
FIXED
INCOME
1,507,901,709
INFLATION-PROTECTED
ASSETS—3.5%
15,894,525
Nuveen
Inflation
Linked
Bond
Fund,
Class
W
167,369,351
TOTAL
INFLATION-PROTECTED
ASSETS
167,369,351
INTERNATIONAL
EQUITY—19.8%
19,304,211
Nuveen
Emerging
Markets
Equity
Fund,
Class
W
155,784,982
28,683,518
Nuveen
International
Equity
Fund,
Class
W
410,461,145
15,645,835
Nuveen
International
Opportunities
Fund,
Class
W
241,884,610
11,954,072
Nuveen
Quant
International
Small
Cap
Equity
Fund,
Class
W
132,451,116
TOTAL
INTERNATIONAL
EQUITY
940,581,853
SHORT-TERM
FIXED
INCOME—3.5%
16,720,151
Nuveen
Short
Term
Bond
Fund,
Class
W
166,532,708
TOTAL
SHORT-TERM
FIXED
INCOME
166,532,708
U.S.
EQUITY—36.7%
17,022,764
Nuveen
Core
Equity
Fund,
Class
W
257,554,423
4,343,935
Nuveen
Dividend
Growth
Fund,
Class
R6
257,465,020
16,140,092
Nuveen
Dividend
Value
Fund,
Class
R6
247,911,817
10,323,921
Nuveen
Growth
Opportunities
ETF
306,001,018
11,543,372
Nuveen
Large
Cap
Growth
Fund,
Class
W
303,013,517
11,309,744
Nuveen
Large
Cap
Value
Fund,
Class
W
246,552,419
3,113,041
Nuveen
Quant
Small
Cap
Equity
Fund,
Class
W
58,276,119
4,599,154
Nuveen
Quant
Small/Mid
Cap
Equity
Fund,
Class
W
69,309,247
TOTAL
U.S.
EQUITY
1,746,083,580
TOTAL
AFFILIATED
INVESTMENT
COMPANIES
4,746,978,313
(Cost
$4,214,131,514)
PRINCIPAL
RATE
MATURITY
DATE
SHORT-TERM
INVESTMENTS—0.1%
REPURCHASE
AGREEMENT—0.1%
$3,105,000
(c)
Fixed
Income
Clearing
Corporation
5
.320
%
06/03/24
3,105,000
TOTAL
REPURCHASE
AGREEMENT
3,105,000
TOTAL
SHORT-TERM
INVESTMENTS
3,105,000
(Cost
$3,105,000)
TOTAL
INVESTMENTS—99.9%
4,750,083,313
(Cost
$4,217,236,514)
OTHER
ASSETS
&
LIABILITIES,
NET—0.1%
2,720,313
NET
ASSETS—100.0%
$
4,752,803,626
Lifecycle
2030
Fund
May
31,
2024
See
Notes
to
Financial
Statements
Portfolio
of
Investments
(continued)
Portfolio
of
Investments
(continued)
ETF
Exchange
Traded
Fund
(a)
Affiliated
fund.
(b)
Restricted
security.
(c)
Agreement
with
Fixed
Income
Clearing
Corporation,
5.320%
dated
5/31/24
to
be
repurchased
at
$3,106,377
on
6/3/24,
collateralized
by
Government
Agency
Securities,
with
coupon
rate
4.250%
and
maturity
date
3/15/27,
valued
at
$3,167,279.
Lifecycle
2035
Fund
May
31,
2024
See
Notes
to
Financial
Statements
SHARES
DESCRIPTION
VALUE
AFFILIATED
INVESTMENT
COMPANIES—99.9%(a)
DIRECT
REAL
ESTATE—4.6%
22,912,918
(b)
TIAA-CREF
Real
Property
Fund
LP
(purchased
8/01/16-5/06/24;
cost
$246,630,286)
$
235,086,540
TOTAL
DIRECT
REAL
ESTATE
235,086,540
FIXED
INCOME—26.0%
77,715,452
Nuveen
Core
Bond
Fund,
Class
W
697,107,601
47,972,148
Nuveen
Core
Plus
Bond
Fund,
Class
W
431,749,333
7,414,170
Nuveen
Emerging
Markets
Debt
Fund,
Class
W
62,723,875
7,658,002
Nuveen
High
Yield
Fund,
Class
W
66,088,555
8,181,948
Nuveen
International
Bond
Fund,
Class
W
69,055,642
TOTAL
FIXED
INCOME
1,326,725,006
INFLATION-PROTECTED
ASSETS—1.5%
7,472,975
Nuveen
Inflation
Linked
Bond
Fund,
Class
W
78,690,426
TOTAL
INFLATION-PROTECTED
ASSETS
78,690,426
INTERNATIONAL
EQUITY—23.2%
24,409,834
Nuveen
Emerging
Markets
Equity
Fund,
Class
W
196,987,361
36,220,340
Nuveen
International
Equity
Fund,
Class
W
518,313,061
19,751,948
Nuveen
International
Opportunities
Fund,
Class
W
305,365,115
15,081,528
Nuveen
Quant
International
Small
Cap
Equity
Fund,
Class
W
167,103,330
TOTAL
INTERNATIONAL
EQUITY
1,187,768,867
SHORT-TERM
FIXED
INCOME—1.5%
7,862,089
Nuveen
Short
Term
Bond
Fund,
Class
W
78,306,402
TOTAL
SHORT-TERM
FIXED
INCOME
78,306,402
U.S.
EQUITY—43.1%
21,494,621
Nuveen
Core
Equity
Fund,
Class
W
325,213,613
5,482,613
Nuveen
Dividend
Growth
Fund,
Class
R6
324,954,451
20,388,974
Nuveen
Dividend
Value
Fund,
Class
R6
313,174,633
12,977,488
Nuveen
Growth
Opportunities
ETF
384,652,744
14,585,928
Nuveen
Large
Cap
Growth
Fund,
Class
W
382,880,611
14,233,736
Nuveen
Large
Cap
Value
Fund,
Class
W
310,295,436
3,933,361
Nuveen
Quant
Small
Cap
Equity
Fund,
Class
W
73,632,517
5,810,816
Nuveen
Quant
Small/Mid
Cap
Equity
Fund,
Class
W
87,569,000
TOTAL
U.S.
EQUITY
2,202,373,005
TOTAL
AFFILIATED
INVESTMENT
COMPANIES
5,108,950,246
(Cost
$4,352,348,036)
PRINCIPAL
RATE
MATURITY
DATE
SHORT-TERM
INVESTMENTS—0.1%
REPURCHASE
AGREEMENT—0.1%
$5,357,000
(c)
Fixed
Income
Clearing
Corporation
5
.320
%
06/03/24
5,357,000
TOTAL
REPURCHASE
AGREEMENT
5,357,000
TOTAL
SHORT-TERM
INVESTMENTS
5,357,000
(Cost
$5,357,000)
TOTAL
INVESTMENTS—100.0%
5,114,307,246
(Cost
$4,357,705,036)
OTHER
ASSETS
&
LIABILITIES,
NET—0.0%
291,536
NET
ASSETS—100.0%
$
5,114,598,782
Lifecycle
2035
Fund
May
31,
2024
See
Notes
to
Financial
Statements
Portfolio
of
Investments
(continued)
Portfolio
of
Investments
(continued)
ETF
Exchange
Traded
Fund
(a)
Affiliated
fund.
(b)
Restricted
security.
(c)
Agreement
with
Fixed
Income
Clearing
Corporation,
5.320%
dated
5/31/24
to
be
repurchased
at
$5,359,375
on
6/3/24,
collateralized
by
Government
Agency
Securities,
with
coupon
rate
4.250%
and
maturity
date
3/15/27,
valued
at
$5,464,227.
Lifecycle
2040
Fund
May
31,
2024
See
Notes
to
Financial
Statements
SHARES
DESCRIPTION
VALUE
AFFILIATED
INVESTMENT
COMPANIES—99.9%(a)
DIRECT
REAL
ESTATE—4.6%
27,608,278
(b)
TIAA-CREF
Real
Property
Fund
LP
(purchased
8/01/16-5/24/24;
cost
$296,639,890)
$
283,260,936
TOTAL
DIRECT
REAL
ESTATE
283,260,936
FIXED
INCOME—17.1%
61,584,834
Nuveen
Core
Bond
Fund,
Class
W
552,415,963
38,035,591
Nuveen
Core
Plus
Bond
Fund,
Class
W
342,320,320
5,877,700
Nuveen
Emerging
Markets
Debt
Fund,
Class
W
49,725,346
6,077,562
Nuveen
High
Yield
Fund,
Class
W
52,449,357
6,496,722
Nuveen
International
Bond
Fund,
Class
W
54,832,333
TOTAL
FIXED
INCOME
1,051,743,319
INTERNATIONAL
EQUITY—27.4%
34,672,709
Nuveen
Emerging
Markets
Equity
Fund,
Class
W
279,808,766
51,491,215
Nuveen
International
Equity
Fund,
Class
W
736,839,292
28,169,405
Nuveen
International
Opportunities
Fund,
Class
W
435,498,994
21,451,926
Nuveen
Quant
International
Small
Cap
Equity
Fund,
Class
W
237,687,343
TOTAL
INTERNATIONAL
EQUITY
1,689,834,395
U.S.
EQUITY—50.8%
30,518,467
Nuveen
Core
Equity
Fund,
Class
W
461,744,407
7,794,603
Nuveen
Dividend
Growth
Fund,
Class
R6
461,986,145
29,012,115
Nuveen
Dividend
Value
Fund,
Class
R6
445,626,093
18,432,052
Nuveen
Growth
Opportunities
ETF
546,326,021
20,794,199
Nuveen
Large
Cap
Growth
Fund,
Class
W
545,847,725
20,290,908
Nuveen
Large
Cap
Value
Fund,
Class
W
442,341,794
5,607,169
Nuveen
Quant
Small
Cap
Equity
Fund,
Class
W
104,966,203
8,283,438
Nuveen
Quant
Small/Mid
Cap
Equity
Fund,
Class
W
124,831,410
TOTAL
U.S.
EQUITY
3,133,669,798
TOTAL
AFFILIATED
INVESTMENT
COMPANIES
6,158,508,448
(Cost
$5,003,599,841)
PRINCIPAL
RATE
MATURITY
DATE
SHORT-TERM
INVESTMENTS—0.1%
REPURCHASE
AGREEMENT—0.1%
$7,726,000
(c)
Fixed
Income
Clearing
Corporation
5
.320
%
06/03/24
7,726,000
TOTAL
REPURCHASE
AGREEMENT
7,726,000
TOTAL
SHORT-TERM
INVESTMENTS
7,726,000
(Cost
$7,726,000)
TOTAL
INVESTMENTS—100.0%
6,166,234,448
(Cost
$5,011,325,841)
OTHER
ASSETS
&
LIABILITIES,
NET—0.0%
1,064,778
NET
ASSETS—100.0%
$
6,167,299,226
ETF
Exchange
Traded
Fund
(a)
Affiliated
fund.
(b)
Restricted
security.
(c)
Agreement
with
Fixed
Income
Clearing
Corporation,
5.320%
dated
5/31/24
to
be
repurchased
at
$7,729,425
on
6/3/24,
collateralized
by
Government
Agency
Securities,
with
coupon
rate
4.250%
and
maturity
date
3/15/27,
valued
at
$7,880,564.
Lifecycle
2045
Fund
May
31,
2024
See
Notes
to
Financial
Statements
SHARES
DESCRIPTION
VALUE
AFFILIATED
INVESTMENT
COMPANIES—99.9%(a)
DIRECT
REAL
ESTATE—4.6%
19,903,771
(b)
TIAA-CREF
Real
Property
Fund
LP
(purchased
8/01/16-5/15/24;
cost
$216,511,492)
$
204,212,687
TOTAL
DIRECT
REAL
ESTATE
204,212,687
FIXED
INCOME—9.1%
23,677,751
Nuveen
Core
Bond
Fund,
Class
W
212,389,427
14,612,631
Nuveen
Core
Plus
Bond
Fund,
Class
W
131,513,680
2,258,936
Nuveen
Emerging
Markets
Debt
Fund,
Class
W
19,110,596
2,335,390
Nuveen
High
Yield
Fund,
Class
W
20,154,412
2,494,145
Nuveen
International
Bond
Fund,
Class
W
21,050,584
TOTAL
FIXED
INCOME
404,218,699
INTERNATIONAL
EQUITY—30.2%
27,632,425
Nuveen
Emerging
Markets
Equity
Fund,
Class
W
222,993,673
40,917,221
Nuveen
International
Equity
Fund,
Class
W
585,525,433
22,388,220
Nuveen
International
Opportunities
Fund,
Class
W
346,121,880
17,005,139
Nuveen
Quant
International
Small
Cap
Equity
Fund,
Class
W
188,416,941
TOTAL
INTERNATIONAL
EQUITY
1,343,057,927
U.S.
EQUITY—56.0%
24,104,805
Nuveen
Core
Equity
Fund,
Class
W
364,705,694
6,190,512
Nuveen
Dividend
Growth
Fund,
Class
R6
366,911,656
23,074,472
Nuveen
Dividend
Value
Fund,
Class
R6
354,423,893
14,651,429
Nuveen
Growth
Opportunities
ETF
434,268,355
16,550,358
Nuveen
Large
Cap
Growth
Fund,
Class
W
434,446,909
16,143,799
Nuveen
Large
Cap
Value
Fund,
Class
W
351,934,811
4,461,089
Nuveen
Quant
Small
Cap
Equity
Fund,
Class
W
83,511,581
6,590,375
Nuveen
Quant
Small/Mid
Cap
Equity
Fund,
Class
W
99,316,947
TOTAL
U.S.
EQUITY
2,489,519,846
TOTAL
AFFILIATED
INVESTMENT
COMPANIES
4,441,009,159
(Cost
$3,484,916,193)
PRINCIPAL
RATE
MATURITY
DATE
SHORT-TERM
INVESTMENTS—0.1%
REPURCHASE
AGREEMENT—0.1%
$5,433,000
(c)
Fixed
Income
Clearing
Corporation
5
.320
%
06/03/24
5,433,000
TOTAL
REPURCHASE
AGREEMENT
5,433,000
TOTAL
SHORT-TERM
INVESTMENTS
5,433,000
(Cost
$5,433,000)
TOTAL
INVESTMENTS—100.0%
4,446,442,159
(Cost
$3,490,349,193)
OTHER
ASSETS
&
LIABILITIES,
NET—0.0%
800,272
NET
ASSETS—100.0%
$
4,447,242,431
ETF
Exchange
Traded
Fund
(a)
Affiliated
fund.
(b)
Restricted
security.
(c)
Agreement
with
Fixed
Income
Clearing
Corporation,
5.320%
dated
5/31/24
to
be
repurchased
at
$5,435,409
on
6/3/24,
collateralized
by
Government
Agency
Securities,
with
coupon
rate
4.250%
and
maturity
date
3/15/27,
valued
at
$5,541,811.
Lifecycle
2050
Fund
May
31,
2024
See
Notes
to
Financial
Statements
SHARES
DESCRIPTION
VALUE
AFFILIATED
INVESTMENT
COMPANIES—99.9%(a)
DIRECT
REAL
ESTATE—4.6%
15,686,672
(b)
TIAA-CREF
Real
Property
Fund
LP
(purchased
8/01/16-5/24/24;
cost
$172,141,037)
$
160,945,252
TOTAL
DIRECT
REAL
ESTATE
160,945,252
FIXED
INCOME—5.0%
10,298,512
Nuveen
Core
Bond
Fund,
Class
W
92,377,656
6,364,383
Nuveen
Core
Plus
Bond
Fund,
Class
W
57,279,443
983,351
Nuveen
Emerging
Markets
Debt
Fund,
Class
W
8,319,149
1,013,023
Nuveen
High
Yield
Fund,
Class
W
8,742,392
1,082,347
Nuveen
International
Bond
Fund,
Class
W
9,135,013
TOTAL
FIXED
INCOME
175,853,653
INTERNATIONAL
EQUITY—31.7%
22,755,475
Nuveen
Emerging
Markets
Equity
Fund,
Class
W
183,636,680
33,813,542
Nuveen
International
Equity
Fund,
Class
W
483,871,786
18,481,935
Nuveen
International
Opportunities
Fund,
Class
W
285,730,721
14,064,810
Nuveen
Quant
International
Small
Cap
Equity
Fund,
Class
W
155,838,095
TOTAL
INTERNATIONAL
EQUITY
1,109,077,282
U.S.
EQUITY—58.6%
19,912,047
Nuveen
Core
Equity
Fund,
Class
W
301,269,264
5,111,244
Nuveen
Dividend
Growth
Fund,
Class
R6
302,943,434
18,999,686
Nuveen
Dividend
Value
Fund,
Class
R6
291,835,182
12,054,611
Nuveen
Growth
Opportunities
ETF
357,298,670
13,700,040
Nuveen
Large
Cap
Growth
Fund,
Class
W
359,626,037
13,334,492
Nuveen
Large
Cap
Value
Fund,
Class
W
290,691,920
3,684,770
Nuveen
Quant
Small
Cap
Equity
Fund,
Class
W
68,978,896
5,443,983
Nuveen
Quant
Small/Mid
Cap
Equity
Fund,
Class
W
82,040,817
TOTAL
U.S.
EQUITY
2,054,684,220
TOTAL
AFFILIATED
INVESTMENT
COMPANIES
3,500,560,407
(Cost
$2,766,142,540)
PRINCIPAL
RATE
MATURITY
DATE
SHORT-TERM
INVESTMENTS—0.1%
REPURCHASE
AGREEMENT—0.1%
$3,913,000
(c)
Fixed
Income
Clearing
Corporation
5
.320
%
06/03/24
3,913,000
TOTAL
REPURCHASE
AGREEMENT
3,913,000
TOTAL
SHORT-TERM
INVESTMENTS
3,913,000
(Cost
$3,913,000)
TOTAL
INVESTMENTS—100.0%
3,504,473,407
(Cost
$2,770,055,540)
OTHER
ASSETS
&
LIABILITIES,
NET—0.0%
1,360,668
NET
ASSETS—100.0%
$
3,505,834,075
ETF
Exchange
Traded
Fund
(a)
Affiliated
fund.
(b)
Restricted
security.
(c)
Agreement
with
Fixed
Income
Clearing
Corporation,
5.320%
dated
5/31/24
to
be
repurchased
at
$3,914,735
on
6/3/24,
collateralized
by
Government
Agency
Securities,
with
coupon
rate
4.250%
and
maturity
date
3/15/27,
valued
at
$3,991,324.
Lifecycle
2055
Fund
May
31,
2024
See
Notes
to
Financial
Statements
SHARES
DESCRIPTION
VALUE
AFFILIATED
INVESTMENT
COMPANIES—99.8%(a)
DIRECT
REAL
ESTATE—4.6%
7,897,913
(b)
TIAA-CREF
Real
Property
Fund
LP
(purchased
8/01/16-5/24/24;
cost
$88,275,790)
$
81,032,584
TOTAL
DIRECT
REAL
ESTATE
81,032,584
FIXED
INCOME—3.8%
3,917,775
Nuveen
Core
Bond
Fund,
Class
W
35,142,441
2,418,741
Nuveen
Core
Plus
Bond
Fund,
Class
W
21,768,666
373,656
Nuveen
Emerging
Markets
Debt
Fund,
Class
W
3,161,134
386,704
Nuveen
High
Yield
Fund,
Class
W
3,337,260
411,235
Nuveen
International
Bond
Fund,
Class
W
3,470,825
TOTAL
FIXED
INCOME
66,880,326
INTERNATIONAL
EQUITY—32.1%
11,642,114
Nuveen
Emerging
Markets
Equity
Fund,
Class
W
93,951,862
17,255,161
Nuveen
International
Equity
Fund,
Class
W
246,921,357
9,436,706
Nuveen
International
Opportunities
Fund,
Class
W
145,891,467
7,176,933
Nuveen
Quant
International
Small
Cap
Equity
Fund,
Class
W
79,520,416
TOTAL
INTERNATIONAL
EQUITY
566,285,102
U.S.
EQUITY—59.3%
10,163,501
Nuveen
Core
Equity
Fund,
Class
W
153,773,771
2,612,584
Nuveen
Dividend
Growth
Fund,
Class
R6
154,847,847
9,662,677
Nuveen
Dividend
Value
Fund,
Class
R6
148,418,726
6,152,947
Nuveen
Growth
Opportunities
ETF
182,373,349
6,987,068
Nuveen
Large
Cap
Growth
Fund,
Class
W
183,410,530
6,807,542
Nuveen
Large
Cap
Value
Fund,
Class
W
148,404,416
1,881,151
Nuveen
Quant
Small
Cap
Equity
Fund,
Class
W
35,215,143
2,778,766
Nuveen
Quant
Small/Mid
Cap
Equity
Fund,
Class
W
41,876,006
TOTAL
U.S.
EQUITY
1,048,319,788
TOTAL
AFFILIATED
INVESTMENT
COMPANIES
1,762,517,800
(Cost
$1,438,186,979)
PRINCIPAL
RATE
MATURITY
DATE
SHORT-TERM
INVESTMENTS—0.1%
REPURCHASE
AGREEMENT—0.1%
$2,700,000
(c)
Fixed
Income
Clearing
Corporation
5
.320
%
06/03/24
2,700,000
TOTAL
REPURCHASE
AGREEMENT
2,700,000
TOTAL
SHORT-TERM
INVESTMENTS
2,700,000
(Cost
$2,700,000)
TOTAL
INVESTMENTS—99.9%
1,765,217,800
(Cost
$1,440,886,979)
OTHER
ASSETS
&
LIABILITIES,
NET—0.1%
1,030,761
NET
ASSETS—100.0%
$
1,766,248,561
ETF
Exchange
Traded
Fund
(a)
Affiliated
fund.
(b)
Restricted
security.
(c)
Agreement
with
Fixed
Income
Clearing
Corporation,
5.320%
dated
5/31/24
to
be
repurchased
at
$2,701,197
on
6/3/24,
collateralized
by
Government
Agency
Securities,
with
coupon
rate
1.875%
and
maturity
date
2/28/27,
valued
at
$2,754,183.
Lifecycle
2060
Fund
May
31,
2024
See
Notes
to
Financial
Statements
SHARES
DESCRIPTION
VALUE
AFFILIATED
INVESTMENT
COMPANIES—99.8%(a)
DIRECT
REAL
ESTATE—4.6%
3,284,197
(b)
TIAA-CREF
Real
Property
Fund
LP
(purchased
8/01/16-5/24/24;
cost
$37,355,248)
$
33,695,865
TOTAL
DIRECT
REAL
ESTATE
33,695,865
FIXED
INCOME—2.6%
1,097,297
Nuveen
Core
Bond
Fund,
Class
W
9,842,758
677,923
Nuveen
Core
Plus
Bond
Fund,
Class
W
6,101,307
104,598
Nuveen
Emerging
Markets
Debt
Fund,
Class
W
884,897
107,919
Nuveen
High
Yield
Fund,
Class
W
931,342
115,306
Nuveen
International
Bond
Fund,
Class
W
973,181
TOTAL
FIXED
INCOME
18,733,485
INTERNATIONAL
EQUITY—32.5%
4,918,692
Nuveen
Emerging
Markets
Equity
Fund,
Class
W
39,693,845
7,254,202
Nuveen
International
Equity
Fund,
Class
W
103,807,630
3,984,918
Nuveen
International
Opportunities
Fund,
Class
W
61,606,835
3,028,220
Nuveen
Quant
International
Small
Cap
Equity
Fund,
Class
W
33,552,681
TOTAL
INTERNATIONAL
EQUITY
238,660,991
U.S.
EQUITY—60.1%
4,283,508
Nuveen
Core
Equity
Fund,
Class
W
64,809,478
1,107,520
Nuveen
Dividend
Growth
Fund,
Class
R6
65,642,739
4,054,579
Nuveen
Dividend
Value
Fund,
Class
R6
62,278,337
2,591,941
Nuveen
Growth
Opportunities
ETF
76,825,131
2,942,378
Nuveen
Large
Cap
Growth
Fund,
Class
W
77,237,417
2,869,533
Nuveen
Large
Cap
Value
Fund,
Class
W
62,555,817
792,940
Nuveen
Quant
Small
Cap
Equity
Fund,
Class
W
14,843,832
1,171,154
Nuveen
Quant
Small/Mid
Cap
Equity
Fund,
Class
W
17,649,286
TOTAL
U.S.
EQUITY
441,842,037
TOTAL
AFFILIATED
INVESTMENT
COMPANIES
732,932,378
(Cost
$620,545,080)
PRINCIPAL
RATE
MATURITY
DATE
SHORT-TERM
INVESTMENTS—0.2%
REPURCHASE
AGREEMENT—0.2%
$1,552,000
(c)
Fixed
Income
Clearing
Corporation
5
.320
%
06/03/24
1,552,000
TOTAL
REPURCHASE
AGREEMENT
1,552,000
TOTAL
SHORT-TERM
INVESTMENTS
1,552,000
(Cost
$1,552,000)
TOTAL
INVESTMENTS—100.0%
734,484,378
(Cost
$622,097,080)
OTHER
ASSETS
&
LIABILITIES,
NET—0.0%
225,970
NET
ASSETS—100.0%
$
734,710,348
ETF
Exchange
Traded
Fund
(a)
Affiliated
fund.
(b)
Restricted
security.
(c)
Agreement
with
Fixed
Income
Clearing
Corporation,
5.320%
dated
5/31/24
to
be
repurchased
at
$1,552,688
on
6/3/24,
collateralized
by
Government
Agency
Securities,
with
coupon
rate
3.250%
and
maturity
date
6/30/27,
valued
at
$1,583,189.
Lifecycle
2065
Fund
May
31,
2024
See
Notes
to
Financial
Statements
SHARES
DESCRIPTION
VALUE
AFFILIATED
INVESTMENT
COMPANIES—99.4%(a)
DIRECT
REAL
ESTATE—4.6%
405,030
(b)
TIAA-CREF
Real
Property
Fund
LP
(purchased
9/30/20-5/24/24;
cost
$4,676,349)
$
4,155,605
TOTAL
DIRECT
REAL
ESTATE
4,155,605
FIXED
INCOME—1.3%
70,851
Nuveen
Core
Bond
Fund,
Class
W
635,532
43,738
Nuveen
Core
Plus
Bond
Fund,
Class
W
393,646
6,753
Nuveen
Emerging
Markets
Debt
Fund,
Class
W
57,126
6,989
Nuveen
High
Yield
Fund,
Class
W
60,318
7,421
Nuveen
International
Bond
Fund,
Class
W
62,630
TOTAL
FIXED
INCOME
1,209,252
INTERNATIONAL
EQUITY—32.8%
618,166
Nuveen
Emerging
Markets
Equity
Fund,
Class
W
4,988,599
903,719
Nuveen
International
Equity
Fund,
Class
W
12,932,219
497,657
Nuveen
International
Opportunities
Fund,
Class
W
7,693,778
378,748
Nuveen
Quant
International
Small
Cap
Equity
Fund,
Class
W
4,196,524
TOTAL
INTERNATIONAL
EQUITY
29,811,120
U.S.
EQUITY—60.7%
535,408
Nuveen
Core
Equity
Fund,
Class
W
8,100,722
137,837
Nuveen
Dividend
Growth
Fund,
Class
R6
8,169,619
507,077
Nuveen
Dividend
Value
Fund,
Class
R6
7,788,700
324,424
Nuveen
Growth
Opportunities
ETF
9,615,927
367,841
Nuveen
Large
Cap
Growth
Fund,
Class
W
9,655,831
358,827
Nuveen
Large
Cap
Value
Fund,
Class
W
7,822,425
99,154
Nuveen
Quant
Small
Cap
Equity
Fund,
Class
W
1,856,160
146,392
Nuveen
Quant
Small/Mid
Cap
Equity
Fund,
Class
W
2,206,131
TOTAL
U.S.
EQUITY
55,215,515
TOTAL
AFFILIATED
INVESTMENT
COMPANIES
90,391,492
(Cost
$78,864,458)
PRINCIPAL
RATE
MATURITY
DATE
SHORT-TERM
INVESTMENTS—0.3%
REPURCHASE
AGREEMENT—0.3%
$256,000
(c)
Fixed
Income
Clearing
Corporation
5
.320
%
06/03/24
256,000
TOTAL
REPURCHASE
AGREEMENT
256,000
TOTAL
SHORT-TERM
INVESTMENTS
256,000
(Cost
$256,000)
TOTAL
INVESTMENTS—99.7%
90,647,492
(Cost
$79,120,458)
OTHER
ASSETS
&
LIABILITIES,
NET—0.3%
289,352
NET
ASSETS—100.0%
$
90,936,844
ETF
Exchange
Traded
Fund
(a)
Affiliated
fund.
(b)
Restricted
security.
(c)
Agreement
with
Fixed
Income
Clearing
Corporation,
5.320%
dated
5/31/24
to
be
repurchased
at
$256,113
on
6/3/24,
collateralized
by
Government
Agency
Securities,
with
coupon
rate
3.250%
and
maturity
date
6/30/27,
valued
at
$261,175.
Statements
of
Assets
and
Liabilities
See
Notes
to
Financial
Statements
May
31,
2024
12.1
Lifecycle
Retirement
Income
12.2
Lifecycle
2010
12.3
Lifecycle
2015
12.4
Lifecycle
2020
ASSETS
Affiliated
investments,
at
value
‡
$
418,447,988
$
803,397,228
$
1,157,207,477
$
2,512,432,475
Short-term
investments,
at
value
#
169,000
572,000
77,000
361,000
Cash
711
442
87
685
Receivables:
Dividends
795,303
1,603,555
2,111,470
4,316,860
Interest
25
85
11
53
Investments
sold
514,159
2,519,773
4,030,071
7,838,610
Reimbursement
from
Adviser
63,905
120,362
145,730
309,915
Shares
sold
173,956
490,119
481,858
710,145
Other
54,703
209,811
299,769
443,649
Total
assets
420,219,750
808,913,375
1,164,353,473
2,526,413,392
LIABILITIES
Due
to
affiliates
17,926
16,759
18,210
23,966
Cash
overdraft
–
–
–
–
Payables:
Management
fees
142,362
267,296
384,063
846,947
Investments
purchased
-
regular
settlement
1,038,641
3,847,922
5,004,689
9,891,527
Shares
redeemed
180,472
12,858
402,194
347,377
Service
agreement
fees
27,382
50,394
70,890
128,272
Accrued
expenses:
Custodian
fees
1,895
1,900
1,903
1,906
Professional
fees
209
350
480
998
Shareholder
reporting
expenses
8,652
14,071
18,087
31,666
Shareholder
servicing
agent
fees
9,666
373
406
703
Trustees
fees
56,509
213,308
304,794
454,737
12b-1
distribution
and
service
fees
27,801
4,298
5,383
11,809
Other
8,036
17,490
26,593
59,925
Total
liabilities
1,519,551
4,447,019
6,237,692
11,799,833
Net
assets
$
418,700,199
$
804,466,356
$
1,158,115,781
$
2,514,613,559
NET
ASSETS
CONSIST
OF:
Paid-in
capital
$
405,583,762
$
755,178,374
$
1,141,700,722
$
2,422,577,948
Total
distributable
earnings
(loss)
13,116,437
49,287,982
16,415,059
92,035,611
Net
assets
$
418,700,199
$
804,466,356
$
1,158,115,781
$
2,514,613,559
‡
Affiliated
investments,
cost
$
389,451,750
$
735,551,840
$
1,102,286,722
$
2,348,912,744
#
Short-term
investments,
cost
$
169,000
$
572,000
$
77,000
$
361,000
See
Notes
to
Financial
Statements
12.5
Lifecycle
2025
12.6
Lifecycle
2030
12.7
Lifecycle
2035
12.8
Lifecycle
2040
12.9
Lifecycle
2045
13.01
Lifecycle
2050
$
3,910,816,967
$
4,746,978,313
$
5,108,950,246
$
6,158,508,448
$
4,441,009,159
$
3,500,560,407
2,619,000
3,105,000
5,357,000
7,726,000
5,433,000
3,913,000
–
995
–
235
1,121
1,336
6,144,425
6,216,484
5,188,355
3,863,490
1,483,649
646,485
387
459
792
1,142
803
578
12,014,684
14,910,932
15,907,824
16,285,342
9,352,189
7,100,280
457,493
571,017
686,590
902,305
663,691
558,032
2,432,668
2,482,326
2,324,800
4,409,395
3,102,918
3,387,172
469,908
463,266
467,070
608,039
221,115
142,113
3,934,955,532
4,774,728,792
5,138,882,677
6,192,304,396
4,461,267,645
3,516,309,403
29,615
32,514
33,678
37,640
30,592
26,799
9,179
–
12,169
–
–
–
1,334,666
1,640,088
1,789,291
2,185,358
1,587,806
1,254,142
16,710,196
19,333,014
21,221,738
21,637,064
11,807,586
8,156,594
160,195
53,185
350,494
63,160
66,013
658,678
173,510
196,380
194,106
225,150
137,788
99,229
1,915
1,895
1,908
1,903
1,887
1,892
1,500
1,752
1,850
2,195
1,566
1,228
43,687
49,824
51,520
60,082
41,777
37,074
901
948
937
1,035
912
948
486,655
482,413
487,128
631,891
237,734
154,931
20,651
25,565
27,243
31,564
23,586
17,368
92,310
107,588
111,833
128,128
87,967
66,445
19,064,980
21,925,166
24,283,895
25,005,170
14,025,214
10,475,328
$
3,915,890,552
$
4,752,803,626
$
5,114,598,782
$
6,167,299,226
$
4,447,242,431
$
3,505,834,075
$
3,686,431,029
$
4,333,694,044
$
4,486,798,663
$
5,164,411,256
$
3,588,816,686
$
2,836,770,153
229,459,523
419,109,582
627,800,119
1,002,887,970
858,425,745
669,063,922
$
3,915,890,552
$
4,752,803,626
$
5,114,598,782
$
6,167,299,226
$
4,447,242,431
$
3,505,834,075
$
3,578,063,644
$
4,214,131,514
$
4,352,348,036
$
5,003,599,841
$
3,484,916,193
$
2,766,142,540
$
2,619,000
$
3,105,000
$
5,357,000
$
7,726,000
$
5,433,000
$
3,913,000
Statements
of
Assets
and
Liabilities
(continued)
See
Notes
to
Financial
Statements
Statements
of
Assets
and
Liabilities
(continued)
May
31,
2024
12.1
Lifecycle
Retirement
Income
12.2
Lifecycle
2010
12.3
Lifecycle
2015
12.4
Lifecycle
2020
CLASS
A:
Net
assets
$
124,234,754
$
–
$
–
$
–
Shares
outstanding
11,183,560
–
–
–
Net
asset
value
("NAV")
per
share
$
11
.11
$
–
$
–
$
–
Maximum
sales
charge
5.75%
–%
–%
–%
Offering
price
per
share
(NAV
per
share
plus
maximum
sales
charge)
$
11
.79
$
–
$
–
$
–
CLASS
I:
Net
assets
$
336,769
$
156,776
$
355,013
$
520,097
Shares
outstanding
30,258
15,471
39,188
55,020
NAV
and
offering
price
per
share
$
11
.13
$
10
.13
$
9
.06
$
9
.45
PREMIER
CLASS:
Net
assets
$
9,939,506
$
34,028,925
$
42,131,427
$
93,229,690
Shares
outstanding
893,710
3,376,231
4,668,679
9,878,107
NAV
and
offering
price
per
share
$
11
.12
$
10
.08
$
9
.02
$
9
.44
CLASS
R6:
Net
assets
$
156,205,611
$
534,127,269
$
782,264,998
$
1,821,625,180
Shares
outstanding
14,038,568
52,869,310
86,287,407
192,538,734
NAV
and
offering
price
per
share
$
11
.13
$
10
.10
$
9
.07
$
9
.46
RETIREMENT
CLASS:
Net
assets
$
127,983,559
$
236,153,386
$
333,364,343
$
599,238,592
Shares
outstanding
11,535,215
18,458,092
27,385,480
45,674,074
NAV
and
offering
price
per
share
$
11
.10
$
12
.79
$
12
.17
$
13
.12
Authorized
shares
-
per
class
Unlimited
Unlimited
Unlimited
Unlimited
Par
value
per
share
$
0
.0001
$
0
.0001
$
0
.0001
$
0
.0001
See
Notes
to
Financial
Statements
12.5
Lifecycle
2025
12.6
Lifecycle
2030
12.7
Lifecycle
2035
12.8
Lifecycle
2040
12.9
Lifecycle
2045
13.01
Lifecycle
2050
$
–
$
–
$
–
$
–
$
–
$
–
–
–
–
–
–
–
$
–
$
–
$
–
$
–
$
–
$
–
–%
–%
–%
–%
–%
–%
$
–
$
–
$
–
$
–
$
–
$
–
$
773,323
$
853,318
$
918,021
$
590,706
$
837,733
$
457,546
77,784
83,214
86,397
54,266
60,433
31,946
$
9
.94
$
10
.25
$
10
.63
$
10
.89
$
13
.86
$
14
.32
$
161,318,604
$
199,926,983
$
215,180,543
$
249,803,918
$
186,993,187
$
137,821,012
16,304,591
19,616,867
20,287,630
23,000,803
13,561,156
9,674,828
$
9
.89
$
10
.19
$
10
.61
$
10
.86
$
13
.79
$
14
.25
$
2,940,148,006
$
3,630,601,764
$
3,987,847,952
$
4,859,805,266
$
3,613,759,961
$
2,901,702,208
295,594,944
354,011,971
374,587,757
445,788,219
260,549,804
202,711,615
$
9
.95
$
10
.26
$
10
.65
$
10
.90
$
13
.87
$
14
.31
$
813,650,619
$
921,421,561
$
910,652,266
$
1,057,099,336
$
645,651,550
$
465,853,309
58,086,608
61,933,494
57,094,207
62,143,265
47,064,371
32,910,188
$
14
.01
$
14
.88
$
15
.95
$
17
.01
$
13
.72
$
14
.16
Unlimited
Unlimited
Unlimited
Unlimited
Unlimited
Unlimited
$
0
.0001
$
0
.0001
$
0
.0001
$
0
.0001
$
0
.0001
$
0
.0001
Statements
of
Assets
and
Liabilities
(continued)
See
Notes
to
Financial
Statements
Statements
of
Assets
and
Liabilities
(continued)
May
31,
2024
13.1
Lifecycle
2055
13.2
Lifecycle
2060
13.3
Lifecycle
2065
ASSETS
Affiliated
investments,
at
value
‡
$
1,762,517,800
$
732,932,378
$
90,391,492
Short-term
investments,
at
value
#
2,700,000
1,552,000
256,000
Cash
818
996
978
Receivables:
Dividends
244,641
68,219
4,386
Interest
399
229
38
Investments
sold
3,249,304
1,528,297
154,713
Reimbursement
from
Adviser
286,311
128,147
27,081
Shares
sold
2,458,092
1,266,046
500,817
Other
41,650
9,348
409
Total
assets
1,771,499,015
737,485,660
91,335,914
LIABILITIES
Due
to
affiliates
20,032
16,024
13,681
Payables:
Management
fees
631,664
262,538
32,404
Investments
purchased
-
regular
settlement
4,432,066
2,417,223
325,669
Shares
redeemed
8,588
14,921
9,199
Service
agreement
fees
47,204
18,653
2,995
Accrued
expenses:
Custodian
fees
1,925
1,943
1,909
Professional
fees
631
277
72
Shareholder
reporting
expenses
19,479
11,415
9,868
Shareholder
servicing
agent
fees
840
642
228
Trustees
fees
47,815
11,630
593
12b-1
distribution
and
service
fees
9,057
3,296
534
Other
31,153
16,750
1,918
Total
liabilities
5,250,454
2,775,312
399,070
Net
assets
$
1,766,248,561
$
734,710,348
$
90,936,844
NET
ASSETS
CONSIST
OF:
Paid-in
capital
$
1,470,844,574
$
633,655,122
$
79,739,620
Total
distributable
earnings
(loss)
295,403,987
101,055,226
11,197,224
Net
assets
$
1,766,248,561
$
734,710,348
$
90,936,844
‡
Affiliated
investments,
cost
$
1,438,186,979
$
620,545,080
$
78,864,458
#
Short-term
investments,
cost
$
2,700,000
$
1,552,000
$
256,000
CLASS
I:
Net
assets
$
541,765
$
529,983
$
687,004
Shares
outstanding
31,878
36,031
54,983
NAV
and
offering
price
per
share
$
16
.99
$
14
.71
$
12
.49
PREMIER
CLASS:
Net
assets
$
71,797,693
$
26,358,007
$
4,320,481
Shares
outstanding
4,242,500
1,795,280
344,198
NAV
and
offering
price
per
share
$
16
.92
$
14
.68
$
12
.55
CLASS
R6:
Net
assets
$
1,472,020,013
$
620,376,691
$
71,436,510
Shares
outstanding
86,571,804
42,122,833
5,609,329
NAV
and
offering
price
per
share
$
17
.00
$
14
.73
$
12
.74
RETIREMENT
CLASS:
Net
assets
$
221,889,090
$
87,445,667
$
14,492,849
Shares
outstanding
13,124,408
5,967,491
1,139,211
NAV
and
offering
price
per
share
$
16
.91
$
14
.65
$
12
.72
Authorized
shares
-
per
class
Unlimited
Unlimited
Unlimited
Par
value
per
share
$
0
.0001
$
0
.0001
$
0
.0001
See
Notes
to
Financial
Statements
Year
Ended
May
31,
2024
12.1
Lifecycle
Retirement
Income
12.2
Lifecycle
2010
12.3
Lifecycle
2015
12.4
Lifecycle
2020
12.5
Lifecycle
2025
INVESTMENT
INCOME
Dividends
from
affiliated
investments
$
15,326,305
$
29,281,481
$
41,163,450
$
87,200,488
$
126,981,351
Interest
14,656
27,399
34,345
69,509
130,586
Total
investment
income
15,340,961
29,308,880
41,197,795
87,269,997
127,111,937
EXPENSES
Management
fees
1,684,797
3,211,719
4,598,952
10,191,037
15,748,110
12b-1
distribution
and
service
fees
—
Class
A
311,324
–
–
–
–
12b-1
distribution
and
service
fees
—
Premier
Class
17,583
55,339
72,824
167,257
281,121
Shareholder
servicing
agent
fees
—
Class
A
32,183
–
–
–
–
Shareholder
servicing
agent
fees
—
Class
I
259
82
152
556
597
Shareholder
servicing
agent
fees
—
Premier
Class
106
76
85
140
190
Shareholder
servicing
agent
fees
—
Class
R6
1,034
1,018
1,222
2,422
3,398
Shareholder
servicing
agent
fees
—
Retirement
Class
326,333
605,566
845,317
1,559,676
2,090,630
Administrative
service
fees
67,133
63,052
68,667
90,862
112,166
Trustees
fees
6,976
13,340
19,142
41,914
63,095
Custodian
expenses
7,476
7,463
7,478
7,474
7,512
Overdraft
expense
3,424
12,204
9,707
12,799
6,058
Professional
fees
17,239
18,517
19,784
24,541
29,099
Registration
fees
73,658
62,639
68,331
65,436
63,602
Shareholder
reporting
expenses
34,091
49,152
60,418
98,928
135,931
Other
107,315
184,885
249,161
514,913
766,189
Total
expenses
2,690,931
4,285,052
6,021,240
12,777,955
19,307,698
Expenses
reimbursed
by
the
investment
adviser
(
266,886
)
(
244,100
)
(
276,216
)
(
372,471
)
(
464,737
)
Fee
waiver
by
investment
adviser
and
Nuveen
Securities
(
540,249
)
(
1,221,130
)
(
1,968,697
)
(
3,923,533
)
(
5,519,495
)
Net
expenses
1,883,796
2,819,822
3,776,327
8,481,951
13,323,466
Net
investment
income
(loss)
13,457,165
26,489,058
37,421,468
78,788,046
113,788,471
REALIZED
AND
UNREALIZED
GAIN
(LOSS)
Realized
gain
(loss):
Investments
–
–
–
–
–
Affiliated
investments
(
278,748
)
3,296,439
(
4,250,124
)
(
1,087,860
)
10,725,097
Distributions
from
affiliated
investments
4,480,053
8,020,429
12,591,066
31,464,223
55,362,076
Net
realized
gain
(loss)
4,201,305
11,316,868
8,340,942
30,376,363
66,087,173
Change
in
unrealized
appreciation
(depreciation)
on:
Affiliated
investments
24,912,587
42,222,166
73,193,086
177,006,342
303,399,538
Net
change
in
unrealized
appreciation
(depreciation)
24,912,587
42,222,166
73,193,086
177,006,342
303,399,538
Net
realized
and
unrealized
gain
(loss)
29,113,892
53,539,034
81,534,028
207,382,705
369,486,711
Net
increase
(decrease)
in
net
assets
from
operations
$
42,571,057
$
80,028,092
$
118,955,496
$
286,170,751
$
483,275,182
See
Notes
to
Financial
Statements
12.6
Lifecycle
2030
12.7
Lifecycle
2035
12.8
Lifecycle
2040
12.9
Lifecycle
2045
13.01
Lifecycle
2050
13.1
Lifecycle
2055
13.2
Lifecycle
2060
$
138,346,623
$
133,843,607
$
142,642,916
$
92,268,970
$
68,480,749
$
33,150,376
$
12,720,980
206,382
248,295
293,876
233,277
192,737
109,737
58,284
138,553,005
134,091,902
142,936,792
92,502,247
68,673,486
33,260,113
12,779,264
18,737,834
20,157,934
24,493,798
17,421,709
13,606,936
6,690,466
2,615,957
–
–
–
–
–
–
–
331,094
339,818
394,745
283,764
204,215
102,622
32,642
–
–
–
–
–
–
–
568
691
428
623
273
351
414
220
211
244
178
177
145
116
3,685
3,892
4,480
3,681
3,369
2,603
1,749
2,278,129
2,218,213
2,580,901
1,545,003
1,109,305
523,416
193,957
122,633
126,773
141,739
114,687
100,343
74,734
59,650
72,667
76,314
91,172
63,651
49,271
23,831
8,959
7,458
7,488
7,472
7,448
7,437
7,529
7,632
3,390
7,747
14,596
11,555
9,662
5,024
1,084
31,383
32,244
35,536
29,744
26,711
21,165
17,902
64,817
65,916
69,892
66,945
65,082
61,166
61,636
157,422
163,680
189,858
137,846
123,668
71,483
46,068
878,383
908,370
1,050,747
732,142
570,155
291,785
132,686
22,689,683
24,109,291
29,075,608
20,418,976
15,876,604
7,876,320
3,180,452
(
513,821
)
(
531,525
)
(
601,460
)
(
473,877
)
(
421,594
)
(
297,638
)
(
236,252
)
(
6,172,375
)
(
7,289,327
)
(
9,711,038
)
(
6,931,126
)
(
5,741,555
)
(
2,818,791
)
(
1,104,317
)
16,003,487
16,288,439
18,763,110
13,013,973
9,713,455
4,759,891
1,839,883
122,549,518
117,803,463
124,173,682
79,488,274
58,960,031
28,500,222
10,939,381
–
–
–
–
–
2,119
(
26,325
)
10,058,670
18,460,830
20,409,700
827,243
(
8,676,520
)
(
7,950,425
)
(
5,097,401
)
76,993,442
96,079,410
134,701,573
104,397,924
84,614,203
42,303,883
16,746,912
87,052,112
114,540,240
155,111,273
105,225,167
75,937,683
34,355,577
11,623,186
433,504,193
540,919,202
772,123,597
616,594,431
513,205,206
260,129,409
104,781,601
433,504,193
540,919,202
772,123,597
616,594,431
513,205,206
260,129,409
104,781,601
520,556,305
655,459,442
927,234,870
721,819,598
589,142,889
294,484,986
116,404,787
$
643,105,823
$
773,262,905
$
1,051,408,552
$
801,307,872
$
648,102,920
$
322,985,208
$
127,344,168
Statements
of
Operations
(continued)
See
Notes
to
Financial
Statements
Statements
of
Operations
(continued)
Year
Ended
May
31,
2024
13.3
Lifecycle
2065
INVESTMENT
INCOME
Dividends
from
affiliated
investments
$
1,267,387
Interest
12,386
Total
investment
income
1,279,773
EXPENSES
Management
fees
269,137
12b-1
distribution
and
service
fees
—
Premier
Class
4,618
Shareholder
servicing
agent
fees
—
Class
I
76
Shareholder
servicing
agent
fees
—
Premier
Class
67
Shareholder
servicing
agent
fees
—
Class
R6
473
Shareholder
servicing
agent
fees
—
Retirement
Class
26,503
Administrative
service
fees
51,044
Trustees
fees
819
Custodian
expenses
7,532
Overdraft
expense
1,947
Professional
fees
16,007
Registration
fees
58,948
Shareholder
reporting
expenses
38,052
Other
36,422
Total
expenses
511,645
Expenses
reimbursed
by
the
investment
adviser
(
199,085
)
Fee
waiver
by
investment
adviser
and
Nuveen
Securities
(
120,682
)
Net
expenses
191,878
Net
investment
income
(loss)
1,087,895
REALIZED
AND
UNREALIZED
GAIN
(LOSS)
Realized
gain
(loss):
Investments
(
8,292
)
Affiliated
investments
(
342,301
)
Distributions
from
affiliated
investments
1,719,171
Net
realized
gain
(loss)
1,368,578
Change
in
unrealized
appreciation
(depreciation)
on:
Affiliated
investments
10,796,854
Net
change
in
unrealized
appreciation
(depreciation)
10,796,854
Net
realized
and
unrealized
gain
(loss)
12,165,432
Net
increase
(decrease)
in
net
assets
from
operations
$
13,253,327
Statements
of
Changes
in
Net
Assets
See
Notes
to
Financial
Statements
12.1
Lifecycle
Retirement
Income
12.2
Lifecycle
2010
Year
Ended
5/31/24
Year
Ended
5/31/23
Year
Ended
5/31/24
Year
Ended
5/31/23
OPERATIONS
Net
investment
income
(loss)
$
13,457,165
$
16,896,855
$
26,489,058
$
32,915,372
Net
realized
gain
(loss)
4,201,305
(12,492,443)
11,316,868
(14,807,095)
Net
change
in
unrealized
appreciation
(depreciation)
24,912,587
(9,777,999)
42,222,166
(26,665,614)
Net
increase
(decrease)
in
net
assets
from
operations
42,571,057
(5,373,587)
80,028,092
(8,557,337)
DISTRIBUTIONS
TO
SHAREHOLDERS
–
–
–
–
Dividends:
Class
A
(4,116,154)
(7,048,385)
–
–
Class
I
(11,163)
(23,042)
(5,954)
(10,477)
Premier
Class
(399,759)
(904,603)
(1,407,286)
(3,091,298)
Class
R6
(5,949,631)
(11,259,252)
(21,323,739)
(41,117,299)
Retirement
Class
(4,318,428)
(8,148,119)
(6,997,365)
(14,318,674)
Total
distributions
(14,795,135)
(27,383,401)
(29,734,344)
(58,537,748)
FUND
SHARE
TRANSACTIONS
Subscriptions
30,622,312
27,266,035
48,538,732
43,352,031
Reinvestments
of
distributions
14,629,488
27,107,363
29,730,651
58,525,779
Redemptions
(98,931,270)
(106,247,110)
(180,691,381)
(220,067,090)
Net
increase
(decrease)
from
Fund
share
transactions
(53,679,470)
(51,873,712)
(102,421,998)
(118,189,280)
Net
increase
(decrease)
in
net
assets
(25,903,548)
(84,630,700)
(52,128,250)
(185,284,365)
Net
assets
at
the
beginning
of
period
444,603,747
529,234,447
856,594,606
1,041,878,971
Net
assets
at
the
end
of
period
$
418,700,199
$
444,603,747
$
804,466,356
$
856,594,606
See
Notes
to
Financial
Statements
12.3
Lifecycle
2015
12.4
Lifecycle
2020
12.5
Lifecycle
2025
12.6
Lifecycle
2030
Year
Ended
5/31/24
Year
Ended
5/31/23
Year
Ended
5/31/24
Year
Ended
5/31/23
Year
Ended
5/31/24
Year
Ended
5/31/23
Year
Ended
5/31/24
Year
Ended
5/31/23
$
37,421,468
$
46,100,833
$
78,788,046
$
97,298,137
$
113,788,471
$
133,432,887
$
122,549,518
$
136,129,191
8,340,942
(31,625,462)
30,376,363
(72,698,752)
66,087,173
(134,911,067)
87,052,112
(175,085,250)
73,193,086
(28,045,999)
177,006,342
(51,635,367)
303,399,538
(29,440,657)
433,504,193
19,097,350
118,955,496
(13,570,628)
286,170,751
(27,035,982)
483,275,182
(30,918,837)
643,105,823
(19,858,709)
–
–
–
–
–
–
–
–
–
–
–
–
–
–
–
–
(12,512)
(26,173)
(24,576)
(48,155)
(30,026)
(48,996)
(20,519)
(37,638)
(1,716,848)
(4,190,586)
(3,674,578)
(10,166,282)
(5,781,619)
(16,314,664)
(6,248,703)
(19,099,591)
(29,407,552)
(59,331,850)
(66,477,947)
(139,123,559)
(97,183,078)
(220,770,603)
(105,109,214)
(257,578,243)
(8,650,230)
(17,976,483)
(14,602,705)
(33,813,771)
(17,686,177)
(46,297,782)
(16,705,312)
(48,611,349)
(39,787,142)
(81,525,092)
(84,779,806)
(183,151,767)
(120,680,900)
(283,432,045)
(128,083,748)
(325,326,821)
64,034,390
60,512,164
109,210,643
106,270,733
196,081,459
215,944,262
292,815,032
319,848,118
39,723,654
81,392,446
84,652,988
182,870,392
120,343,523
282,274,672
127,987,885
324,717,080
(252,426,006)
(290,064,935)
(586,806,808)
(606,706,428)
(770,449,630)
(874,518,617)
(734,878,265)
(894,287,413)
(148,667,962)
(148,160,325)
(392,943,177)
(317,565,303)
(454,024,648)
(376,299,683)
(314,075,348)
(249,722,215)
(69,499,608)
(243,256,045)
(191,552,232)
(527,753,052)
(91,430,366)
(690,650,565)
200,946,727
(594,907,745)
1,227,615,389
1,470,871,434
2,706,165,791
3,233,918,843
4,007,320,918
4,697,971,483
4,551,856,899
5,146,764,644
$
1,158,115,781
$
1,227,615,389
$
2,514,613,559
$
2,706,165,791
$
3,915,890,552
$
4,007,320,918
$
4,752,803,626
$
4,551,856,899
Statements
of
Changes
in
Net
Assets
(continued)
See
Notes
to
Financial
Statements
Statements
of
Changes
in
Net
Assets
(continued)
12.7
Lifecycle
2035
12.8
Lifecycle
2040
Year
Ended
5/31/24
Year
Ended
5/31/23
Year
Ended
5/31/24
Year
Ended
5/31/23
OPERATIONS
Net
investment
income
(loss)
$
117,803,463
$
126,858,201
$
124,173,682
$
136,127,345
Net
realized
gain
(loss)
114,540,240
(211,697,359)
155,111,273
(261,760,517)
Net
change
in
unrealized
appreciation
(depreciation)
540,919,202
87,567,127
772,123,597
158,488,550
Net
increase
(decrease)
in
net
assets
from
operations
773,262,905
2,727,969
1,051,408,552
32,855,378
DISTRIBUTIONS
TO
SHAREHOLDERS
–
–
–
–
Dividends:
Class
I
(18,308)
(41,729)
(11,242)
(24,341)
Premier
Class
(5,722,397)
(20,765,474)
(6,020,354)
(24,453,136)
Class
R6
(104,203,854)
(285,529,937)
(114,353,049)
(357,987,704)
Retirement
Class
(14,124,702)
(46,524,053)
(14,032,733)
(54,661,296)
Total
distributions
(124,069,261)
(352,861,193)
(134,417,378)
(437,126,477)
FUND
SHARE
TRANSACTIONS
Subscriptions
330,940,782
352,295,923
356,828,431
381,943,509
Reinvestments
of
distributions
123,950,460
352,422,977
134,330,432
436,660,600
Redemptions
(742,401,971)
(907,259,088)
(939,750,538)
(967,522,982)
Net
increase
(decrease)
from
Fund
share
transactions
(287,510,729)
(202,540,188)
(448,591,675)
(148,918,873)
Net
increase
(decrease)
in
net
assets
361,682,915
(552,673,412)
468,399,499
(553,189,972)
Net
assets
at
the
beginning
of
period
4,752,915,867
5,305,589,279
5,698,899,727
6,252,089,699
Net
assets
at
the
end
of
period
$
5,114,598,782
$
4,752,915,867
$
6,167,299,226
$
5,698,899,727
See
Notes
to
Financial
Statements
12.9
Lifecycle
2045
13.01
Lifecycle
2050
13.1
Lifecycle
2055
13.2
Lifecycle
2060
Year
Ended
5/31/24
Year
Ended
5/31/23
Year
Ended
5/31/24
Year
Ended
5/31/23
Year
Ended
5/31/24
Year
Ended
5/31/23
Year
Ended
5/31/24
Year
Ended
5/31/23
$
79,488,274
$
83,910,703
$
58,960,031
$
61,095,046
$
28,500,222
$
27,746,593
$
10,939,381
$
9,167,085
105,225,167
(162,760,604)
75,937,683
(114,870,525)
34,355,577
(52,336,379)
11,623,186
(18,030,952)
616,594,431
106,650,067
513,205,206
79,311,487
260,129,409
41,249,140
104,781,601
17,260,266
801,307,872
27,800,166
648,102,920
25,536,008
322,985,208
16,659,354
127,344,168
8,396,399
–
–
–
–
–
–
–
–
(14,037)
(18,018)
(7,741)
(23,936)
(7,680)
(15,583)
(7,924)
(15,773)
(3,589,833)
(17,159,472)
(2,435,974)
(12,030,740)
(1,176,582)
(5,607,246)
(351,954)
(1,340,228)
(71,073,943)
(241,209,677)
(53,020,684)
(183,507,675)
(24,606,427)
(80,343,625)
(8,843,631)
(24,303,302)
(11,619,998)
(46,040,804)
(7,770,079)
(32,224,835)
(3,385,358)
(13,902,252)
(1,109,516)
(3,897,583)
(86,297,811)
(304,427,971)
(63,234,478)
(227,787,186)
(29,176,047)
(99,868,706)
(10,313,025)
(29,556,886)
345,097,825
352,319,467
311,291,710
326,430,050
238,774,681
239,149,943
173,144,011
146,211,834
86,151,403
303,839,327
63,200,612
227,577,339
29,103,903
99,649,748
10,259,051
29,473,082
(648,559,949)
(620,302,438)
(519,282,102)
(415,868,329)
(261,084,816)
(189,656,224)
(93,812,271)
(70,333,981)
(217,310,721)
35,856,356
(144,789,780)
138,139,060
6,793,768
149,143,467
89,590,791
105,350,935
497,699,340
(240,771,449)
440,078,662
(64,112,118)
300,602,929
65,934,115
206,621,934
84,190,448
3,949,543,091
4,190,314,540
3,065,755,413
3,129,867,531
1,465,645,632
1,399,711,517
528,088,414
443,897,966
$
4,447,242,431
$
3,949,543,091
$
3,505,834,075
$
3,065,755,413
$
1,766,248,561
$
1,465,645,632
$
734,710,348
$
528,088,414
Statements
of
Changes
in
Net
Assets
(continued)
See
Notes
to
Financial
Statements
Statements
of
Changes
in
Net
Assets
(continued)
13.3
Lifecycle
2065
Year
Ended
5/31/24
Year
Ended
5/31/23
OPERATIONS
Net
investment
income
(loss)
$
1,087,895
$
568,643
Net
realized
gain
(loss)
1,368,578
(1,788,288)
Net
change
in
unrealized
appreciation
(depreciation)
10,796,854
2,268,463
Net
increase
(decrease)
in
net
assets
from
operations
13,253,327
1,048,818
DISTRIBUTIONS
TO
SHAREHOLDERS
–
–
Dividends:
Class
I
(9,894)
(15,480)
Premier
Class
(47,168)
(66,999)
Class
R6
(746,406)
(602,297)
Retirement
Class
(142,051)
(143,685)
Total
distributions
(945,519)
(828,461)
FUND
SHARE
TRANSACTIONS
Subscriptions
52,453,040
27,843,742
Reinvestments
of
distributions
857,443
679,235
Redemptions
(16,803,139)
(10,376,493)
Net
increase
(decrease)
from
Fund
share
transactions
36,507,344
18,146,484
Net
increase
(decrease)
in
net
assets
48,815,152
18,366,841
Net
assets
at
the
beginning
of
period
42,121,692
23,754,851
Net
assets
at
the
end
of
period
$
90,936,844
$
42,121,692
See
Notes
to
Financial
Statements
The
following
data
is
for
a
share outstanding
for
each
fiscal year
end
unless
otherwise
noted:
Investment
Operations
Less
Distributions
Net
Asset
Value,
Beginning
of
Period
Net
Investment
Income
(Loss)
a
Net
Realized/
Unrealized
Gain
(Loss)
j
Total
From
Net
Investment
Income
From
Net
Realized
Gains
Total
Net
Asset
Value,
End
of
Period
12.1
Lifecycle
Retirement
Income
Class
A:
5/31/24
$
10
.42
$
0
.32
$
0
.72
$
1
.04
$
(
0
.35
)
$
—
$
(
0
.35
)
$
11
.11
5/31/23
11
.12
0
.36
(
0
.46
)
(
0
.10
)
(
0
.28
)
(
0
.32
)
(
0
.60
)
10
.42
5/31/22
12
.79
0
.26
(
1
.02
)
(
0
.76
)
(
0
.35
)
(
0
.56
)
(
0
.91
)
11
.12
5/31/21
11
.51
0
.20
1
.75
1
.95
(
0
.28
)
(
0
.39
)
(
0
.67
)
12
.79
5/31/20
11
.27
0
.30
0
.37
0
.67
(
0
.26
)
(
0
.17
)
(
0
.43
)
11
.51
Class
I:
5/31/24
10
.44
0
.34
0
.72
1
.06
(
0
.37
)
—
(
0
.37
)
11
.13
5/31/23
11
.14
0
.41
(
0
.49
)
(
0
.08
)
(
0
.30
)
(
0
.32
)
(
0
.62
)
10
.44
5/31/22
12
.81
0
.30
(
1
.04
)
(
0
.74
)
(
0
.37
)
(
0
.56
)
(
0
.93
)
11
.14
5/31/21
11
.52
0
.20
1
.78
1
.98
(
0
.30
)
(
0
.39
)
(
0
.69
)
12
.81
5/31/20
11
.29
0
.32
0
.36
0
.68
(
0
.28
)
(
0
.17
)
(
0
.45
)
11
.52
Premier
Class:
5/31/24
10
.43
0
.33
0
.72
1
.05
(
0
.36
)
—
(
0
.36
)
11
.12
5/31/23
11
.13
0
.37
(
0
.46
)
(
0
.09
)
(
0
.29
)
(
0
.32
)
(
0
.61
)
10
.43
5/31/22
12
.80
0
.27
(
1
.01
)
(
0
.74
)
(
0
.37
)
(
0
.56
)
(
0
.93
)
11
.13
5/31/21
11
.51
0
.21
1
.76
1
.97
(
0
.29
)
(
0
.39
)
(
0
.68
)
12
.80
5/31/20
11
.28
0
.31
0
.36
0
.67
(
0
.27
)
(
0
.17
)
(
0
.44
)
11
.51
Class
R6:
5/31/24
10
.44
0
.35
0
.72
1
.07
(
0
.38
)
—
(
0
.38
)
11
.13
5/31/23
11
.14
0
.39
(
0
.46
)
(
0
.07
)
(
0
.31
)
(
0
.32
)
(
0
.63
)
10
.44
5/31/22
12
.81
0
.29
(
1
.02
)
(
0
.73
)
(
0
.38
)
(
0
.56
)
(
0
.94
)
11
.14
5/31/21
11
.52
0
.23
1
.76
1
.99
(
0
.31
)
(
0
.39
)
(
0
.70
)
12
.81
5/31/20
11
.29
0
.33
0
.36
0
.69
(
0
.29
)
(
0
.17
)
(
0
.46
)
11
.52
Retirement
Class:
5/31/24
10
.41
0
.32
0
.72
1
.04
(
0
.35
)
—
(
0
.35
)
11
.10
5/31/23
11
.11
0
.36
(
0
.46
)
(
0
.10
)
(
0
.28
)
(
0
.32
)
(
0
.60
)
10
.41
5/31/22
12
.78
0
.26
(
1
.02
)
(
0
.76
)
(
0
.35
)
(
0
.56
)
(
0
.91
)
11
.11
5/31/21
11
.49
0
.20
1
.76
1
.96
(
0
.28
)
(
0
.39
)
(
0
.67
)
12
.78
5/31/20
11
.26
0
.30
0
.36
0
.66
(
0
.26
)
(
0
.17
)
(
0
.43
)
11
.49
a
Based
on
average
shares
outstanding.
b
Total
returns
are
at
NAV
and
do
not
include
any
sales
charge.
Total
returns
are
not
annualized.
g
The
Fund's
expenses
include
the
expenses
of
the
Underlying
Funds,
excluding
the
expenses
of
the
Dividend
Growth,
Dividend
Value,
Growth
Opportunities
ETF
and
the
TIAA-CREF
Real
Property
Fund
LP.
j
Short-term
and
long-term
capital
gain
distributions
received
from
the
underlying
Funds
are
presented
in
net
realized
and
unrealized
gain
(loss)
on
total
investments
for
all
periods
presented.
See
Notes
to
Financial
Statements
Ratios
and
Supplemental
Data
Ratios
to
Average
Net
Assets
Total
Return
b
Net
Assets,
End
of
Period
(000)
Gross
Expenses
g
Net
Expenses
g
Net
Investment
Income
(Loss)
Portfolio
Turnover
Rate
10
.19
%
$
124,235
0
.74
%
0
.53
%
3
.00
%
12
%
(
0
.69
)
123,946
0
.72
0
.52
3
.43
19
(
6
.49
)
131,167
0
.70
0
.51
2
.10
28
17
.31
144,030
0
.71
0
.54
1
.62
41
5
.97
122,730
0
.75
0
.58
2
.58
30
10
.36
337
0
.54
0
.36
3
.16
12
(
0
.50
)
317
0
.52
0
.35
3
.86
19
(
6
.33
)
609
0
.50
0
.34
2
.44
28
17
.57
596
0
.52
0
.38
1
.63
41
6
.04
310
0
.57
0
.42
2
.74
30
10
.29
9,940
0
.61
0
.43
3
.09
12
(
0
.58
)
15,207
0
.59
0
.42
3
.55
19
(
6
.40
)
17,624
0
.58
0
.41
2
.17
28
17
.51
19,161
0
.58
0
.44
1
.71
41
5
.97
17,410
0
.63
0
.48
2
.69
30
10
.45
156,206
0
.46
0
.28
3
.25
12
(
0
.42
)
171,457
0
.44
0
.27
3
.72
19
(
6
.25
)
222,227
0
.43
0
.26
2
.37
28
17
.67
244,923
0
.43
0
.29
1
.87
41
6
.14
219,016
0
.48
0
.33
2
.84
30
10
.20
127,984
0
.71
0
.53
3
.00
12
(
0
.68
)
133,676
0
.69
0
.52
3
.45
19
(
6
.49
)
157,609
0
.68
0
.50
2
.11
28
17
.43
200,300
0
.68
0
.54
1
.61
41
5
.88
179,106
0
.73
0
.58
2
.59
30
Financial
Highlights
(continued)
See
Notes
to
Financial
Statements
Financial
Highlights
(continued)
Investment
Operations
Less
Distributions
Net
Asset
Value,
Beginning
of
Period
Net
Investment
Income
(Loss)
a
Net
Realized/
Unrealized
Gain
(Loss)
j
Total
From
Net
Investment
Income
From
Net
Realized
Gains
Total
Net
Asset
Value,
End
of
Period
12.2
Lifecycle
2010
Class
I:
5/31/24
$
9
.55
$
0
.32
$
0
.65
$
0
.97
$
(
0
.39
)
$
—
$
(
0
.39
)
$
10
.13
5/31/23
10
.32
0
.36
(
0
.42
)
(
0
.06
)
(
0
.36
)
(
0
.35
)
(
0
.71
)
9
.55
5/31/22
12
.22
0
.26
(
0
.93
)
(
0
.67
)
(
0
.40
)
(
0
.83
)
(
1
.23
)
10
.32
5/31/21
11
.30
0
.22
1
.71
1
.93
(
0
.33
)
(
0
.68
)
(
1
.01
)
12
.22
5/31/20
11
.15
0
.19
0
.53
0
.72
(
0
.30
)
(
0
.27
)
(
0
.57
)
11
.30
Premier
Class:
5/31/24
9
.50
0
.31
0
.65
0
.96
(
0
.38
)
—
(
0
.38
)
10
.08
5/31/23
10
.27
0
.34
(
0
.41
)
(
0
.07
)
(
0
.35
)
(
0
.35
)
(
0
.70
)
9
.50
5/31/22
12
.17
0
.25
(
0
.94
)
(
0
.69
)
(
0
.38
)
(
0
.83
)
(
1
.21
)
10
.27
5/31/21
11
.24
0
.20
1
.73
1
.93
(
0
.32
)
(
0
.68
)
(
1
.00
)
12
.17
5/31/20
11
.11
0
.31
0
.37
0
.68
(
0
.28
)
(
0
.27
)
(
0
.55
)
11
.24
Class
R6:
5/31/24
9
.53
0
.32
0
.65
0
.97
(
0
.40
)
—
(
0
.40
)
10
.10
5/31/23
10
.29
0
.36
(
0
.41
)
(
0
.05
)
(
0
.36
)
(
0
.35
)
(
0
.71
)
9
.53
5/31/22
12
.20
0
.27
(
0
.94
)
(
0
.67
)
(
0
.41
)
(
0
.83
)
(
1
.24
)
10
.29
5/31/21
11
.27
0
.22
1
.73
1
.95
(
0
.34
)
(
0
.68
)
(
1
.02
)
12
.20
5/31/20
11
.14
0
.32
0
.38
0
.70
(
0
.30
)
(
0
.27
)
(
0
.57
)
11
.27
Retirement
Class:
5/31/24
11
.96
0
.38
0
.82
1
.20
(
0
.37
)
—
(
0
.37
)
12
.79
5/31/23
12
.73
0
.41
(
0
.50
)
(
0
.09
)
(
0
.33
)
(
0
.35
)
(
0
.68
)
11
.96
5/31/22
14
.80
0
.30
(
1
.17
)
(
0
.87
)
(
0
.37
)
(
0
.83
)
(
1
.20
)
12
.73
5/31/21
13
.48
0
.23
2
.07
2
.30
(
0
.30
)
(
0
.68
)
(
0
.98
)
14
.80
5/31/20
13
.22
0
.35
0
.45
0
.80
(
0
.27
)
(
0
.27
)
(
0
.54
)
13
.48
a
Based
on
average
shares
outstanding.
b
Total
returns
are
not
annualized.
g
The
Fund's
expenses
include
the
expenses
of
the
Underlying
Funds,
excluding
the
expenses
of
the
Dividend
Growth,
Dividend
Value,
Growth
Opportunities
ETF
and
the
TIAA-CREF
Real
Property
Fund
LP.
j
Short-term
and
long-term
capital
gain
distributions
received
from
the
underlying
Funds
are
presented
in
net
realized
and
unrealized
gain
(loss)
on
total
investments
for
all
periods
presented.
See
Notes
to
Financial
Statements
Ratios
and
Supplemental
Data
Ratios
to
Average
Net
Assets
Total
Return
b
Net
Assets,
End
of
Period
(000)
Gross
Expenses
g
Net
Expenses
g
Net
Investment
Income
(Loss)
Portfolio
Turnover
Rate
10
.33
%
$
157
0
.50
%
0
.32
%
3
.25
%
14
%
(
0
.42
)
146
0
.50
0
.32
3
.69
18
(
6
.32
)
177
0
.48
0
.33
2
.29
21
17
.57
164
0
.49
0
.36
1
.81
38
6
.45
144
0
.56
0
.37
1
.67
28
10
.27
34,029
0
.59
0
.41
3
.17
14
(
0
.50
)
40,794
0
.57
0
.39
3
.53
18
(
6
.45
)
50,141
0
.56
0
.41
2
.16
21
17
.62
77,845
0
.57
0
.44
1
.70
38
6
.10
73,048
0
.61
0
.48
2
.68
28
10
.31
534,127
0
.44
0
.26
3
.30
14
(
0
.23
)
570,203
0
.42
0
.24
3
.66
18
(
6
.34
)
700,875
0
.41
0
.26
2
.34
21
17
.75
836,684
0
.42
0
.29
1
.84
38
6
.29
720,990
0
.46
0
.33
2
.85
28
10
.11
236,153
0
.69
0
.51
3
.05
14
(
0
.54
)
245,451
0
.67
0
.49
3
.42
18
(
6
.56
)
290,686
0
.66
0
.51
2
.09
21
17
.45
368,266
0
.67
0
.54
1
.62
38
6
.02
353,355
0
.71
0
.58
2
.58
28
Financial
Highlights
(continued)
See
Notes
to
Financial
Statements
Financial
Highlights
(continued)
Investment
Operations
Less
Distributions
Net
Asset
Value,
Beginning
of
Period
Net
Investment
Income
(Loss)
a
Net
Realized/
Unrealized
Gain
(Loss)
j
Total
From
Net
Investment
Income
From
Net
Realized
Gains
Total
Net
Asset
Value,
End
of
Period
12.3
Lifecycle
2015
Class
I:
5/31/24
$
8
.49
$
0
.29
$
0
.61
$
0
.90
$
(
0
.33
)
$
—
$
(
0
.33
)
$
9
.06
5/31/23
9
.17
0
.30
(
0
.37
)
(
0
.07
)
(
0
.27
)
(
0
.34
)
(
0
.61
)
8
.49
5/31/22
10
.81
0
.22
(
0
.86
)
(
0
.64
)
(
0
.35
)
(
0
.65
)
(
1
.00
)
9
.17
5/31/21
9
.61
0
.18
1
.67
1
.85
(
0
.29
)
(
0
.36
)
(
0
.65
)
10
.81
5/31/20
9
.45
0
.26
0
.34
0
.60
(
0
.26
)
(
0
.18
)
(
0
.44
)
9
.61
Premier
Class:
5/31/24
8
.46
0
.27
0
.61
0
.88
(
0
.32
)
—
(
0
.32
)
9
.02
5/31/23
9
.14
0
.30
(
0
.37
)
(
0
.07
)
(
0
.27
)
(
0
.34
)
(
0
.61
)
8
.46
5/31/22
10
.76
0
.21
(
0
.84
)
(
0
.63
)
(
0
.34
)
(
0
.65
)
(
0
.99
)
9
.14
5/31/21
9
.57
0
.17
1
.66
1
.83
(
0
.28
)
(
0
.36
)
(
0
.64
)
10
.76
5/31/20
9
.41
0
.25
0
.33
0
.58
(
0
.24
)
(
0
.18
)
(
0
.42
)
9
.57
Class
R6:
5/31/24
8
.50
0
.28
0
.62
0
.90
(
0
.33
)
—
(
0
.33
)
9
.07
5/31/23
9
.18
0
.31
(
0
.37
)
(
0
.06
)
(
0
.28
)
(
0
.34
)
(
0
.62
)
8
.50
5/31/22
10
.81
0
.23
(
0
.85
)
(
0
.62
)
(
0
.36
)
(
0
.65
)
(
1
.01
)
9
.18
5/31/21
9
.62
0
.19
1
.66
1
.85
(
0
.30
)
(
0
.36
)
(
0
.66
)
10
.81
5/31/20
9
.45
0
.27
0
.34
0
.61
(
0
.26
)
(
0
.18
)
(
0
.44
)
9
.62
Retirement
Class:
5/31/24
11
.30
0
.35
0
.83
1
.18
(
0
.31
)
—
(
0
.31
)
12
.17
5/31/23
11
.99
0
.38
(
0
.48
)
(
0
.10
)
(
0
.25
)
(
0
.34
)
(
0
.59
)
11
.30
5/31/22
13
.82
0
.27
(
1
.12
)
(
0
.85
)
(
0
.33
)
(
0
.65
)
(
0
.98
)
11
.99
5/31/21
12
.13
0
.21
2
.11
2
.32
(
0
.27
)
(
0
.36
)
(
0
.63
)
13
.82
5/31/20
11
.82
0
.31
0
.41
0
.72
(
0
.23
)
(
0
.18
)
(
0
.41
)
12
.13
a
Based
on
average
shares
outstanding.
b
Total
returns
are
not
annualized.
g
The
Fund's
expenses
include
the
expenses
of
the
Underlying
Funds,
excluding
the
expenses
of
the
Dividend
Growth,
Dividend
Value,
Growth
Opportunities
ETF
and
the
TIAA-CREF
Real
Property
Fund
LP.
j
Short-term
and
long-term
capital
gain
distributions
received
from
the
underlying
Funds
are
presented
in
net
realized
and
unrealized
gain
(loss)
on
total
investments
for
all
periods
presented.
See
Notes
to
Financial
Statements
Ratios
and
Supplemental
Data
Ratios
to
Average
Net
Assets
Total
Return
b
Net
Assets,
End
of
Period
(000)
Gross
Expenses
g
Net
Expenses
g
Net
Investment
Income
(Loss)
Portfolio
Turnover
Rate
10
.74
%
$
355
0
.47
%
0
.28
%
3
.26
%
13
%
(
0
.52
)
381
0
.53
0
.38
3
.49
18
(
6
.61
)
390
0
.52
0
.38
2
.15
20
19
.60
255
0
.52
0
.39
1
.75
36
6
.29
185
0
.55
0
.39
2
.66
26
10
.56
42,131
0
.58
0
.39
3
.11
13
(
0
.57
)
56,724
0
.57
0
.42
3
.48
18
(
6
.54
)
71,144
0
.56
0
.42
2
.06
20
19
.47
116,117
0
.57
0
.44
1
.67
36
6
.14
107,025
0
.61
0
.49
2
.61
26
10
.82
782,265
0
.43
0
.24
3
.25
13
(
0
.39
)
831,507
0
.42
0
.27
3
.61
18
(
6
.43
)
1,005,382
0
.41
0
.27
2
.25
20
19
.56
1,217,691
0
.42
0
.29
1
.83
36
6
.43
1,088,594
0
.46
0
.34
2
.80
26
10
.52
333,364
0
.68
0
.49
2
.99
13
(
0
.66
)
339,003
0
.67
0
.52
3
.36
18
(
6
.73
)
393,955
0
.66
0
.52
2
.01
20
19
.34
500,838
0
.67
0
.54
1
.60
36
6
.06
492,656
0
.71
0
.59
2
.54
26
Financial
Highlights
(continued)
See
Notes
to
Financial
Statements
Financial
Highlights
(continued)
Investment
Operations
Less
Distributions
Net
Asset
Value,
Beginning
of
Period
Net
Investment
Income
(Loss)
a
Net
Realized/
Unrealized
Gain
(Loss)
j
Total
From
Net
Investment
Income
From
Net
Realized
Gains
Total
Net
Asset
Value,
End
of
Period
12.4
Lifecycle
2020
Class
I:
5/31/24
$
8
.77
$
0
.28
$
0
.73
$
1
.01
$
(
0
.33
)
$
—
$
(
0
.33
)
$
9
.45
5/31/23
9
.47
0
.30
(
0
.35
)
(
0
.05
)
(
0
.27
)
(
0
.38
)
(
0
.65
)
8
.77
5/31/22
11
.25
0
.21
(
0
.90
)
(
0
.69
)
(
0
.37
)
(
0
.72
)
(
1
.09
)
9
.47
5/31/21
9
.89
0
.14
1
.94
2
.08
(
0
.31
)
(
0
.41
)
(
0
.72
)
11
.25
5/31/20
9
.73
0
.26
0
.38
0
.64
(
0
.25
)
(
0
.23
)
(
0
.48
)
9
.89
Premier
Class:
5/31/24
8
.75
0
.27
0
.74
1
.01
(
0
.32
)
—
(
0
.32
)
9
.44
5/31/23
9
.45
0
.29
(
0
.35
)
(
0
.06
)
(
0
.26
)
(
0
.38
)
(
0
.64
)
8
.75
5/31/22
11
.23
0
.21
(
0
.92
)
(
0
.71
)
(
0
.35
)
(
0
.72
)
(
1
.07
)
9
.45
5/31/21
9
.87
0
.18
1
.89
2
.07
(
0
.30
)
(
0
.41
)
(
0
.71
)
11
.23
5/31/20
9
.70
0
.25
0
.38
0
.63
(
0
.23
)
(
0
.23
)
(
0
.46
)
9
.87
Class
R6:
5/31/24
8
.77
0
.28
0
.74
1
.02
(
0
.33
)
—
(
0
.33
)
9
.46
5/31/23
9
.48
0
.31
(
0
.37
)
(
0
.06
)
(
0
.27
)
(
0
.38
)
(
0
.65
)
8
.77
5/31/22
11
.26
0
.23
(
0
.91
)
(
0
.68
)
(
0
.38
)
(
0
.72
)
(
1
.10
)
9
.48
5/31/21
9
.89
0
.20
1
.90
2
.10
(
0
.32
)
(
0
.41
)
(
0
.73
)
11
.26
5/31/20
9
.73
0
.27
0
.37
0
.64
(
0
.25
)
(
0
.23
)
(
0
.48
)
9
.89
Retirement
Class:
5/31/24
12
.05
0
.36
1
.01
1
.37
(
0
.30
)
—
(
0
.30
)
13
.12
5/31/23
12
.75
0
.39
(
0
.47
)
(
0
.08
)
(
0
.24
)
(
0
.38
)
(
0
.62
)
12
.05
5/31/22
14
.78
0
.27
(
1
.24
)
(
0
.97
)
(
0
.34
)
(
0
.72
)
(
1
.06
)
12
.75
5/31/21
12
.79
0
.22
2
.46
2
.68
(
0
.28
)
(
0
.41
)
(
0
.69
)
14
.78
5/31/20
12
.45
0
.32
0
.47
0
.79
(
0
.22
)
(
0
.23
)
(
0
.45
)
12
.79
a
Based
on
average
shares
outstanding.
b
Total
returns
are
not
annualized.
g
The
Fund's
expenses
include
the
expenses
of
the
Underlying
Funds,
excluding
the
expenses
of
the
Dividend
Growth,
Dividend
Value,
Growth
Opportunities
ETF
and
the
TIAA-CREF
Real
Property
Fund
LP.
j
Short-term
and
long-term
capital
gain
distributions
received
from
the
underlying
Funds
are
presented
in
net
realized
and
unrealized
gain
(loss)
on
total
investments
for
all
periods
presented.
See
Notes
to
Financial
Statements
Ratios
and
Supplemental
Data
Ratios
to
Average
Net
Assets
Total
Return
b
Net
Assets,
End
of
Period
(000)
Gross
Expenses
g
Net
Expenses
g
Net
Investment
Income
(Loss)
Portfolio
Turnover
Rate
11
.65
%
$
520
0
.51
%
0
.35
%
3
.10
%
12
%
(
0
.32
)
695
0
.50
0
.36
3
.33
18
(
6
.93
)
498
0
.46
0
.32
1
.91
22
21
.43
726
0
.48
0
.35
1
.26
38
6
.42
352
0
.51
0
.39
2
.61
26
11
.68
93,230
0
.58
0
.41
2
.97
12
(
0
.42
)
141,676
0
.57
0
.42
3
.31
18
(
7
.06
)
165,761
0
.55
0
.42
1
.96
22
21
.37
252,876
0
.57
0
.45
1
.66
38
6
.35
249,364
0
.62
0
.50
2
.53
26
11
.86
1,821,625
0
.43
0
.26
3
.11
12
(
0
.36
)
1,921,359
0
.41
0
.27
3
.45
18
(
6
.86
)
2,303,415
0
.40
0
.27
2
.15
22
21
.61
2,712,681
0
.42
0
.29
1
.82
38
6
.43
2,374,405
0
.47
0
.35
2
.75
26
11
.50
599,239
0
.68
0
.51
2
.86
12
(
0
.47
)
642,436
0
.67
0
.52
3
.21
18
(
7
.17
)
764,245
0
.65
0
.52
1
.89
22
21
.27
993,670
0
.67
0
.55
1
.59
38
6
.21
947,495
0
.72
0
.60
2
.50
26
Financial
Highlights
(continued)
See
Notes
to
Financial
Statements
Financial
Highlights
(continued)
Investment
Operations
Less
Distributions
Net
Asset
Value,
Beginning
of
Period
Net
Investment
Income
(Loss)
a
Net
Realized/
Unrealized
Gain
(Loss)
j
Total
From
Net
Investment
Income
From
Net
Realized
Gains
Total
Net
Asset
Value,
End
of
Period
12.5
Lifecycle
2025
Class
I:
5/31/24
$
9
.09
$
0
.28
$
0
.88
$
1
.16
$
(
0
.31
)
$
—
$
(
0
.31
)
$
9
.94
5/31/23
9
.85
0
.27
(
0
.31
)
(
0
.04
)
(
0
.26
)
(
0
.46
)
(
0
.72
)
9
.09
5/31/22
11
.75
0
.22
(
0
.98
)
(
0
.76
)
(
0
.38
)
(
0
.76
)
(
1
.14
)
9
.85
5/31/21
10
.03
0
.15
2
.31
2
.46
(
0
.31
)
(
0
.43
)
(
0
.74
)
11
.75
5/31/20
9
.88
0
.27
0
.39
0
.66
(
0
.24
)
(
0
.27
)
(
0
.51
)
10
.03
Premier
Class:
5/31/24
9
.05
0
.26
0
.89
1
.15
(
0
.31
)
—
(
0
.31
)
9
.89
5/31/23
9
.80
0
.28
(
0
.32
)
(
0
.04
)
(
0
.25
)
(
0
.46
)
(
0
.71
)
9
.05
5/31/22
11
.70
0
.21
(
0
.98
)
(
0
.77
)
(
0
.37
)
(
0
.76
)
(
1
.13
)
9
.80
5/31/21
9
.99
0
.18
2
.25
2
.43
(
0
.29
)
(
0
.43
)
(
0
.72
)
11
.70
5/31/20
9
.84
0
.24
0
.40
0
.64
(
0
.22
)
(
0
.27
)
(
0
.49
)
9
.99
Class
R6:
5/31/24
9
.09
0
.28
0
.90
1
.18
(
0
.32
)
—
(
0
.32
)
9
.95
5/31/23
9
.85
0
.30
(
0
.34
)
(
0
.04
)
(
0
.26
)
(
0
.46
)
(
0
.72
)
9
.09
5/31/22
11
.76
0
.23
(
0
.99
)
(
0
.76
)
(
0
.39
)
(
0
.76
)
(
1
.15
)
9
.85
5/31/21
10
.04
0
.19
2
.27
2
.46
(
0
.31
)
(
0
.43
)
(
0
.74
)
11
.76
5/31/20
9
.89
0
.27
0
.40
0
.67
(
0
.25
)
(
0
.27
)
(
0
.52
)
10
.04
Retirement
Class:
5/31/24
12
.69
0
.36
1
.25
1
.61
(
0
.29
)
—
(
0
.29
)
14
.01
5/31/23
13
.44
0
.38
(
0
.44
)
(
0
.06
)
(
0
.23
)
(
0
.46
)
(
0
.69
)
12
.69
5/31/22
15
.63
0
.26
(
1
.35
)
(
1
.09
)
(
0
.34
)
(
0
.76
)
(
1
.10
)
13
.44
5/31/21
13
.14
0
.22
2
.97
3
.19
(
0
.27
)
(
0
.43
)
(
0
.70
)
15
.63
5/31/20
12
.79
0
.32
0
.51
0
.83
(
0
.21
)
(
0
.27
)
(
0
.48
)
13
.14
a
Based
on
average
shares
outstanding.
b
Total
returns
are
not
annualized.
g
The
Fund's
expenses
include
the
expenses
of
the
Underlying
Funds,
excluding
the
expenses
of
the
Dividend
Growth,
Dividend
Value,
Growth
Opportunities
ETF
and
the
TIAA-CREF
Real
Property
Fund
LP.
j
Short-term
and
long-term
capital
gain
distributions
received
from
the
underlying
Funds
are
presented
in
net
realized
and
unrealized
gain
(loss)
on
total
investments
for
all
periods
presented.
See
Notes
to
Financial
Statements
Ratios
and
Supplemental
Data
Ratios
to
Average
Net
Assets
Total
Return
b
Net
Assets,
End
of
Period
(000)
Gross
Expenses
g
Net
Expenses
g
Net
Investment
Income
(Loss)
Portfolio
Turnover
Rate
13
.00
%
$
773
0
.50
%
0
.35
%
2
.92
%
13
%
(
0
.21
)
855
0
.51
0
.36
2
.99
20
(
7
.32
)
391
0
.48
0
.34
1
.93
25
24
.93
553
0
.49
0
.36
1
.35
40
6
.55
133
0
.54
0
.42
2
.66
28
12
.84
161,319
0
.58
0
.43
2
.80
13
(
0
.20
)
221,273
0
.57
0
.42
3
.09
20
(
7
.44
)
236,147
0
.55
0
.42
1
.83
25
24
.80
336,773
0
.58
0
.45
1
.59
40
6
.41
295,668
0
.63
0
.51
2
.39
28
13
.20
2,940,148
0
.43
0
.28
2
.94
13
(
0
.14
)
2,939,672
0
.42
0
.27
3
.23
20
(
7
.33
)
3,488,042
0
.40
0
.27
2
.01
25
24
.96
3,909,833
0
.43
0
.30
1
.76
40
6
.59
3,142,487
0
.48
0
.36
2
.66
28
12
.79
813,651
0
.68
0
.53
2
.69
13
(
0
.30
)
845,520
0
.67
0
.52
3
.00
20
(
7
.55
)
973,393
0
.65
0
.52
1
.75
25
24
.64
1,217,409
0
.68
0
.55
1
.52
40
6
.40
1,103,642
0
.73
0
.61
2
.39
28
Financial
Highlights
(continued)
See
Notes
to
Financial
Statements
Financial
Highlights
(continued)
Investment
Operations
Less
Distributions
Net
Asset
Value,
Beginning
of
Period
Net
Investment
Income
(Loss)
a
Net
Realized/
Unrealized
Gain
(Loss)
j
Total
From
Net
Investment
Income
From
Net
Realized
Gains
Total
Net
Asset
Value,
End
of
Period
12.6
Lifecycle
2030
Class
I:
5/31/24
$
9
.20
$
0
.25
$
1
.09
$
1
.34
$
(
0
.29
)
$
—
$
(
0
.29
)
$
10
.25
5/31/23
9
.97
0
.26
(
0
.29
)
(
0
.03
)
(
0
.23
)
(
0
.51
)
(
0
.74
)
9
.20
5/31/22
12
.01
0
.21
(
1
.03
)
(
0
.82
)
(
0
.39
)
(
0
.83
)
(
1
.22
)
9
.97
5/31/21
10
.01
0
.18
2
.60
2
.78
(
0
.31
)
(
0
.47
)
(
0
.78
)
12
.01
5/31/20
9
.87
0
.20
0
.47
0
.67
(
0
.22
)
(
0
.31
)
(
0
.53
)
10
.01
Premier
Class:
5/31/24
9
.14
0
.25
1
.08
1
.33
(
0
.28
)
—
(
0
.28
)
10
.19
5/31/23
9
.91
0
.26
(
0
.30
)
(
0
.04
)
(
0
.22
)
(
0
.51
)
(
0
.73
)
9
.14
5/31/22
11
.95
0
.19
(
1
.02
)
(
0
.83
)
(
0
.38
)
(
0
.83
)
(
1
.21
)
9
.91
5/31/21
9
.96
0
.17
2
.59
2
.76
(
0
.30
)
(
0
.47
)
(
0
.77
)
11
.95
5/31/20
9
.82
0
.23
0
.42
0
.65
(
0
.20
)
(
0
.31
)
(
0
.51
)
9
.96
Class
R6:
5/31/24
9
.20
0
.26
1
.10
1
.36
(
0
.30
)
—
(
0
.30
)
10
.26
5/31/23
9
.97
0
.28
(
0
.30
)
(
0
.02
)
(
0
.24
)
(
0
.51
)
(
0
.75
)
9
.20
5/31/22
12
.01
0
.21
(
1
.02
)
(
0
.81
)
(
0
.40
)
(
0
.83
)
(
1
.23
)
9
.97
5/31/21
10
.01
0
.19
2
.60
2
.79
(
0
.32
)
(
0
.47
)
(
0
.79
)
12
.01
5/31/20
9
.87
0
.26
0
.42
0
.68
(
0
.23
)
(
0
.31
)
(
0
.54
)
10
.01
Retirement
Class:
5/31/24
13
.22
0
.34
1
.58
1
.92
(
0
.26
)
—
(
0
.26
)
14
.88
5/31/23
13
.98
0
.36
(
0
.41
)
(
0
.05
)
(
0
.20
)
(
0
.51
)
(
0
.71
)
13
.22
5/31/22
16
.36
0
.25
(
1
.44
)
(
1
.19
)
(
0
.36
)
(
0
.83
)
(
1
.19
)
13
.98
5/31/21
13
.39
0
.22
3
.51
3
.73
(
0
.29
)
(
0
.47
)
(
0
.76
)
16
.36
5/31/20
13
.04
0
.31
0
.54
0
.85
(
0
.19
)
(
0
.31
)
(
0
.50
)
13
.39
a
Based
on
average
shares
outstanding.
b
Total
returns
are
not
annualized.
g
The
Fund's
expenses
include
the
expenses
of
the
Underlying
Funds,
excluding
the
expenses
of
the
Dividend
Growth,
Dividend
Value,
Growth
Opportunities
ETF
and
the
TIAA-CREF
Real
Property
Fund
LP.
j
Short-term
and
long-term
capital
gain
distributions
received
from
the
underlying
Funds
are
presented
in
net
realized
and
unrealized
gain
(loss)
on
total
investments
for
all
periods
presented.
See
Notes
to
Financial
Statements
Ratios
and
Supplemental
Data
Ratios
to
Average
Net
Assets
Total
Return
b
Net
Assets,
End
of
Period
(000)
Gross
Expenses
g
Net
Expenses
g
Net
Investment
Income
(Loss)
Portfolio
Turnover
Rate
14
.76
%
$
853
0
.51
%
0
.37
%
2
.57
%
14
%
0
.09
597
0
.50
0
.34
2
.77
22
(
7
.71
)
497
0
.46
0
.31
1
.88
26
28
.41
520
0
.50
0
.37
1
.65
41
6
.65
317
0
.56
0
.44
2
.02
26
14
.75
199,927
0
.58
0
.44
2
.56
14
(
0
.01
)
246,776
0
.57
0
.42
2
.84
22
(
7
.87
)
265,245
0
.56
0
.41
1
.66
26
28
.35
369,690
0
.58
0
.45
1
.52
41
6
.52
310,511
0
.64
0
.52
2
.26
26
14
.95
3,630,602
0
.43
0
.29
2
.70
14
0
.15
3,405,403
0
.42
0
.27
2
.97
22
(
7
.66
)
3,872,654
0
.41
0
.26
1
.86
26
28
.49
4,216,718
0
.43
0
.30
1
.69
41
6
.69
3,244,106
0
.49
0
.37
2
.57
26
14
.66
921,422
0
.68
0
.54
2
.45
14
(
0
.10
)
899,081
0
.67
0
.52
2
.74
22
(
7
.94
)
1,008,369
0
.66
0
.51
1
.60
26
28
.25
1,254,456
0
.68
0
.55
1
.46
41
6
.42
1,064,906
0
.74
0
.62
2
.29
26
Financial
Highlights
(continued)
See
Notes
to
Financial
Statements
Financial
Highlights
(continued)
Investment
Operations
Less
Distributions
Net
Asset
Value,
Beginning
of
Period
Net
Investment
Income
(Loss)
a
Net
Realized/
Unrealized
Gain
(Loss)
j
Total
From
Net
Investment
Income
From
Net
Realized
Gains
Total
Net
Asset
Value,
End
of
Period
12.7
Lifecycle
2035
Class
I:
5/31/24
$
9
.33
$
0
.23
$
1
.34
$
1
.57
$
(
0
.27
)
$
—
$
(
0
.27
)
$
10
.63
5/31/23
10
.12
0
.24
(
0
.23
)
0
.01
(
0
.21
)
(
0
.59
)
(
0
.80
)
9
.33
5/31/22
12
.35
0
.19
(
1
.07
)
(
0
.88
)
(
0
.41
)
(
0
.94
)
(
1
.35
)
10
.12
5/31/21
10
.06
0
.18
2
.96
3
.14
(
0
.31
)
(
0
.54
)
(
0
.85
)
12
.35
5/31/20
9
.96
0
.28
0
.40
0
.68
(
0
.22
)
(
0
.36
)
(
0
.58
)
10
.06
Premier
Class:
5/31/24
9
.31
0
.23
1
.33
1
.56
(
0
.26
)
—
(
0
.26
)
10
.61
5/31/23
10
.10
0
.24
(
0
.24
)
—
(
0
.20
)
(
0
.59
)
(
0
.79
)
9
.31
5/31/22
12
.33
0
.18
(
1
.07
)
(
0
.89
)
(
0
.40
)
(
0
.94
)
(
1
.34
)
10
.10
5/31/21
10
.04
0
.17
2
.96
3
.13
(
0
.30
)
(
0
.54
)
(
0
.84
)
12
.33
5/31/20
9
.93
0
.22
0
.45
0
.67
(
0
.20
)
(
0
.36
)
(
0
.56
)
10
.04
Class
R6:
5/31/24
9
.35
0
.24
1
.34
1
.58
(
0
.28
)
—
(
0
.28
)
10
.65
5/31/23
10
.13
0
.25
(
0
.22
)
0
.03
(
0
.22
)
(
0
.59
)
(
0
.81
)
9
.35
5/31/22
12
.37
0
.20
(
1
.08
)
(
0
.88
)
(
0
.42
)
(
0
.94
)
(
1
.36
)
10
.13
5/31/21
10
.07
0
.19
2
.97
3
.16
(
0
.32
)
(
0
.54
)
(
0
.86
)
12
.37
5/31/20
9
.97
0
.25
0
.44
0
.69
(
0
.23
)
(
0
.36
)
(
0
.59
)
10
.07
Retirement
Class:
5/31/24
13
.88
0
.33
1
.98
2
.31
(
0
.24
)
—
(
0
.24
)
15
.95
5/31/23
14
.63
0
.34
(
0
.32
)
0
.02
(
0
.18
)
(
0
.59
)
(
0
.77
)
13
.88
5/31/22
17
.27
0
.24
(
1
.56
)
(
1
.32
)
(
0
.38
)
(
0
.94
)
(
1
.32
)
14
.63
5/31/21
13
.78
0
.22
4
.09
4
.31
(
0
.28
)
(
0
.54
)
(
0
.82
)
17
.27
5/31/20
13
.44
0
.31
0
.58
0
.89
(
0
.19
)
(
0
.36
)
(
0
.55
)
13
.78
a
Based
on
average
shares
outstanding.
b
Total
returns
are
not
annualized.
g
The
Fund's
expenses
include
the
expenses
of
the
Underlying
Funds,
excluding
the
expenses
of
the
Dividend
Growth,
Dividend
Value,
Growth
Opportunities
ETF
and
the
TIAA-CREF
Real
Property
Fund
LP.
j
Short-term
and
long-term
capital
gain
distributions
received
from
the
underlying
Funds
are
presented
in
net
realized
and
unrealized
gain
(loss)
on
total
investments
for
all
periods
presented.
See
Notes
to
Financial
Statements
Ratios
and
Supplemental
Data
Ratios
to
Average
Net
Assets
Total
Return
b
Net
Assets,
End
of
Period
(000)
Gross
Expenses
g
Net
Expenses
g
Net
Investment
Income
(Loss)
Portfolio
Turnover
Rate
17
.03
%
$
918
0
.54
%
0
.38
%
2
.35
%
14
%
0
.46
597
0
.52
0
.36
2
.58
25
(
8
.20
)
447
0
.49
0
.34
1
.64
27
32
.02
472
0
.52
0
.39
1
.56
44
6
.64
363
0
.58
0
.46
2
.74
23
16
.98
215,181
0
.59
0
.43
2
.29
14
0
.39
264,692
0
.58
0
.41
2
.55
25
(
8
.29
)
277,894
0
.56
0
.40
1
.52
27
31
.99
396,128
0
.59
0
.45
1
.46
44
6
.59
324,978
0
.65
0
.53
2
.14
23
17
.10
3,987,848
0
.44
0
.28
2
.46
14
0
.66
3,634,034
0
.43
0
.26
2
.68
25
(
8
.19
)
4,103,430
0
.41
0
.25
1
.72
27
32
.19
4,468,950
0
.44
0
.30
1
.63
44
6
.67
3,369,098
0
.50
0
.38
2
.48
23
16
.78
910,652
0
.69
0
.53
2
.19
14
0
.38
853,592
0
.68
0
.51
2
.46
25
(
8
.42
)
923,818
0
.66
0
.50
1
.46
27
31
.86
1,157,175
0
.69
0
.55
1
.40
44
6
.48
978,160
0
.75
0
.63
2
.21
23
Financial
Highlights
(continued)
See
Notes
to
Financial
Statements
Financial
Highlights
(continued)
Investment
Operations
Less
Distributions
Net
Asset
Value,
Beginning
of
Period
Net
Investment
Income
(Loss)
a
Net
Realized/
Unrealized
Gain
(Loss)
j
Total
From
Net
Investment
Income
From
Net
Realized
Gains
Total
Net
Asset
Value,
End
of
Period
12.8
Lifecycle
2040
Class
I:
5/31/24
$
9
.34
$
0
.21
$
1
.59
$
1
.80
$
(
0
.25
)
$
—
$
(
0
.25
)
$
10
.89
5/31/23
10
.11
0
.21
(
0
.15
)
0
.06
(
0
.18
)
(
0
.65
)
(
0
.83
)
9
.34
5/31/22
12
.51
0
.18
(
1
.10
)
(
0
.92
)
(
0
.43
)
(
1
.05
)
(
1
.48
)
10
.11
5/31/21
9
.98
0
.17
3
.30
3
.47
(
0
.32
)
(
0
.62
)
(
0
.94
)
12
.51
5/31/20
9
.90
0
.23
0
.47
0
.70
(
0
.20
)
(
0
.42
)
(
0
.62
)
9
.98
Premier
Class:
5/31/24
9
.32
0
.20
1
.58
1
.78
(
0
.24
)
—
(
0
.24
)
10
.86
5/31/23
10
.09
0
.21
(
0
.16
)
0
.05
(
0
.17
)
(
0
.65
)
(
0
.82
)
9
.32
5/31/22
12
.48
0
.17
(
1
.09
)
(
0
.92
)
(
0
.42
)
(
1
.05
)
(
1
.47
)
10
.09
5/31/21
9
.95
0
.15
3
.31
3
.46
(
0
.31
)
(
0
.62
)
(
0
.93
)
12
.48
5/31/20
9
.87
0
.20
0
.48
0
.68
(
0
.18
)
(
0
.42
)
(
0
.60
)
9
.95
Class
R6:
5/31/24
9
.35
0
.22
1
.59
1
.81
(
0
.26
)
—
(
0
.26
)
10
.90
5/31/23
10
.12
0
.23
(
0
.17
)
0
.06
(
0
.18
)
(
0
.65
)
(
0
.83
)
9
.35
5/31/22
12
.52
0
.19
(
1
.10
)
(
0
.91
)
(
0
.44
)
(
1
.05
)
(
1
.49
)
10
.12
5/31/21
9
.99
0
.18
3
.30
3
.48
(
0
.33
)
(
0
.62
)
(
0
.95
)
12
.52
5/31/20
9
.91
0
.24
0
.46
0
.70
(
0
.20
)
(
0
.42
)
(
0
.62
)
9
.99
Retirement
Class:
5/31/24
14
.46
0
.30
2
.47
2
.77
(
0
.22
)
—
(
0
.22
)
17
.01
5/31/23
15
.18
0
.32
(
0
.25
)
0
.07
(
0
.14
)
(
0
.65
)
(
0
.79
)
14
.46
5/31/22
18
.04
0
.24
(
1
.66
)
(
1
.42
)
(
0
.39
)
(
1
.05
)
(
1
.44
)
15
.18
5/31/21
14
.05
0
.21
4
.69
4
.90
(
0
.29
)
(
0
.62
)
(
0
.91
)
18
.04
5/31/20
13
.71
0
.30
0
.62
0
.92
(
0
.16
)
(
0
.42
)
(
0
.58
)
14
.05
a
Based
on
average
shares
outstanding.
b
Total
returns
are
not
annualized.
g
The
Fund's
expenses
include
the
expenses
of
the
Underlying
Funds,
excluding
the
expenses
of
the
Dividend
Growth,
Dividend
Value,
Growth
Opportunities
ETF
and
the
TIAA-CREF
Real
Property
Fund
LP.
j
Short-term
and
long-term
capital
gain
distributions
received
from
the
underlying
Funds
are
presented
in
net
realized
and
unrealized
gain
(loss)
on
total
investments
for
all
periods
presented.
See
Notes
to
Financial
Statements
Ratios
and
Supplemental
Data
Ratios
to
Average
Net
Assets
Total
Return
b
Net
Assets,
End
of
Period
(000)
Gross
Expenses
g
Net
Expenses
g
Net
Investment
Income
(Loss)
Portfolio
Turnover
Rate
19
.49
%
$
591
0
.54
%
0
.36
%
2
.07
%
13
%
1
.04
367
0
.52
0
.33
2
.27
26
(
8
.55
)
239
0
.48
0
.31
1
.53
29
35
.84
305
0
.51
0
.37
1
.48
46
6
.70
204
0
.57
0
.45
2
.27
23
19
.32
249,804
0
.59
0
.42
2
.00
13
0
.94
305,164
0
.58
0
.40
2
.28
26
(
8
.57
)
314,758
0
.56
0
.39
1
.44
29
35
.81
441,951
0
.59
0
.45
1
.36
46
6
.55
372,625
0
.66
0
.54
1
.97
23
19
.56
4,859,805
0
.44
0
.27
2
.17
13
1
.11
4,401,861
0
.43
0
.25
2
.42
26
(
8
.47
)
4,851,096
0
.41
0
.24
1
.61
29
35
.87
5,311,332
0
.44
0
.29
1
.54
46
6
.74
3,930,425
0
.51
0
.39
2
.36
23
19
.27
1,057,099
0
.69
0
.52
1
.90
13
0
.79
991,507
0
.68
0
.50
2
.20
26
(
8
.67
)
1,085,996
0
.66
0
.49
1
.36
29
35
.59
1,391,417
0
.69
0
.55
1
.31
46
6
.51
1,161,770
0
.76
0
.64
2
.08
23
Financial
Highlights
(continued)
See
Notes
to
Financial
Statements
Financial
Highlights
(continued)
Investment
Operations
Less
Distributions
Net
Asset
Value,
Beginning
of
Period
Net
Investment
Income
(Loss)
a
Net
Realized/
Unrealized
Gain
(Loss)
j
Total
From
Net
Investment
Income
From
Net
Realized
Gains
Total
Net
Asset
Value,
End
of
Period
12.9
Lifecycle
2045
Class
I:
5/31/24
$
11
.69
$
0
.24
$
2
.19
$
2
.43
$
(
0
.26
)
$
—
$
(
0
.26
)
$
13
.86
5/31/23
12
.61
0
.19
(
0
.12
)
0
.07
(
0
.19
)
(
0
.80
)
(
0
.99
)
11
.69
5/31/22
15
.57
0
.23
(
1
.40
)
(
1
.17
)
(
0
.52
)
(
1
.27
)
(
1
.79
)
12
.61
5/31/21
11
.99
0
.22
4
.41
4
.63
(
0
.35
)
(
0
.70
)
(
1
.05
)
15
.57
5/31/20
11
.89
0
.27
0
.57
0
.84
(
0
.22
)
(
0
.52
)
(
0
.74
)
11
.99
Premier
Class:
5/31/24
11
.62
0
.23
2
.19
2
.42
(
0
.25
)
—
(
0
.25
)
13
.79
5/31/23
12
.54
0
.24
(
0
.18
)
0
.06
(
0
.18
)
(
0
.80
)
(
0
.98
)
11
.62
5/31/22
15
.49
0
.20
(
1
.38
)
(
1
.18
)
(
0
.50
)
(
1
.27
)
(
1
.77
)
12
.54
5/31/21
11
.93
0
.18
4
.42
4
.60
(
0
.34
)
(
0
.70
)
(
1
.04
)
15
.49
5/31/20
11
.83
0
.22
0
.59
0
.81
(
0
.19
)
(
0
.52
)
(
0
.71
)
11
.93
Class
R6:
5/31/24
11
.69
0
.25
2
.20
2
.45
(
0
.27
)
—
(
0
.27
)
13
.87
5/31/23
12
.61
0
.26
(
0
.18
)
0
.08
(
0
.20
)
(
0
.80
)
(
1
.00
)
11
.69
5/31/22
15
.57
0
.22
(
1
.38
)
(
1
.16
)
(
0
.53
)
(
1
.27
)
(
1
.80
)
12
.61
5/31/21
11
.98
0
.20
4
.45
4
.65
(
0
.36
)
(
0
.70
)
(
1
.06
)
15
.57
5/31/20
11
.89
0
.28
0
.55
0
.83
(
0
.22
)
(
0
.52
)
(
0
.74
)
11
.98
Retirement
Class:
5/31/24
11
.57
0
.21
2
.18
2
.39
(
0
.24
)
—
(
0
.24
)
13
.72
5/31/23
12
.48
0
.23
(
0
.18
)
0
.05
(
0
.16
)
(
0
.80
)
(
0
.96
)
11
.57
5/31/22
15
.43
0
.18
(
1
.37
)
(
1
.19
)
(
0
.49
)
(
1
.27
)
(
1
.76
)
12
.48
5/31/21
11
.89
0
.17
4
.39
4
.56
(
0
.32
)
(
0
.70
)
(
1
.02
)
15
.43
5/31/20
11
.80
0
.24
0
.56
0
.80
(
0
.19
)
(
0
.52
)
(
0
.71
)
11
.89
a
Based
on
average
shares
outstanding.
b
Total
returns
are
not
annualized.
g
The
Fund's
expenses
include
the
expenses
of
the
Underlying
Funds,
excluding
the
expenses
of
the
Dividend
Growth,
Dividend
Value,
Growth
Opportunities
ETF
and
the
TIAA-CREF
Real
Property
Fund
LP.
j
Short-term
and
long-term
capital
gain
distributions
received
from
the
underlying
Funds
are
presented
in
net
realized
and
unrealized
gain
(loss)
on
total
investments
for
all
periods
presented.
See
Notes
to
Financial
Statements
Ratios
and
Supplemental
Data
Ratios
to
Average
Net
Assets
Total
Return
b
Net
Assets,
End
of
Period
(000)
Gross
Expenses
g
Net
Expenses
g
Net
Investment
Income
(Loss)
Portfolio
Turnover
Rate
21
.04
%
$
838
0
.54
%
0
.36
%
1
.86
%
14
%
1
.03
565
0
.52
0
.33
1
.67
27
(
8
.67
)
168
0
.45
0
.27
1
.55
29
39
.64
153
0
.50
0
.35
1
.57
46
6
.66
155
0
.56
0
.44
2
.23
19
21
.06
186,993
0
.60
0
.42
1
.78
14
0
.92
225,586
0
.58
0
.40
2
.06
27
(
8
.77
)
224,448
0
.56
0
.38
1
.34
29
39
.52
309,234
0
.59
0
.45
1
.26
46
6
.50
234,573
0
.67
0
.55
1
.81
19
21
.22
3,613,760
0
.45
0
.27
1
.96
14
1
.08
3,141,514
0
.43
0
.25
2
.19
27
(
8
.63
)
3,351,968
0
.41
0
.23
1
.52
29
39
.80
3,557,269
0
.44
0
.30
1
.44
46
6
.60
2,441,105
0
.52
0
.40
2
.25
19
20
.88
645,652
0
.70
0
.52
1
.69
14
0
.90
581,879
0
.68
0
.50
1
.97
27
(
8
.89
)
613,731
0
.66
0
.48
1
.26
29
39
.38
779,894
0
.69
0
.55
1
.21
46
6
.40
621,730
0
.77
0
.65
1
.98
19
Financial
Highlights
(continued)
See
Notes
to
Financial
Statements
Financial
Highlights
(continued)
Investment
Operations
Less
Distributions
Net
Asset
Value,
Beginning
of
Period
Net
Investment
Income
(Loss)
a
Net
Realized/
Unrealized
Gain
(Loss)
j
Total
From
Net
Investment
Income
From
Net
Realized
Gains
Total
Net
Asset
Value,
End
of
Period
13.01
Lifecycle
2050
Class
I:
5/31/24
$
11
.98
$
0
.24
$
2
.36
$
2
.60
$
(
0
.26
)
$
—
$
(
0
.26
)
$
14
.32
5/31/23
12
.89
0
.23
(
0
.16
)
0
.07
(
0
.18
)
(
0
.80
)
(
0
.98
)
11
.98
5/31/22
15
.82
0
.13
(
1
.34
)
(
1
.21
)
(
0
.53
)
(
1
.19
)
(
1
.72
)
12
.89
5/31/21
12
.04
0
.14
4
.63
4
.77
(
0
.36
)
(
0
.63
)
(
0
.99
)
15
.82
5/31/20
11
.95
0
.28
0
.54
0
.82
(
0
.22
)
(
0
.51
)
(
0
.73
)
12
.04
Premier
Class:
5/31/24
11
.91
0
.22
2
.36
2
.58
(
0
.24
)
—
(
0
.24
)
14
.25
5/31/23
12
.83
0
.23
(
0
.18
)
0
.05
(
0
.17
)
(
0
.80
)
(
0
.97
)
11
.91
5/31/22
15
.76
0
.20
(
1
.42
)
(
1
.22
)
(
0
.52
)
(
1
.19
)
(
1
.71
)
12
.83
5/31/21
12
.00
0
.18
4
.55
4
.73
(
0
.34
)
(
0
.63
)
(
0
.97
)
15
.76
5/31/20
11
.89
0
.22
0
.59
0
.81
(
0
.19
)
(
0
.51
)
(
0
.70
)
12
.00
Class
R6:
5/31/24
11
.97
0
.24
2
.37
2
.61
(
0
.27
)
—
(
0
.27
)
14
.31
5/31/23
12
.89
0
.25
(
0
.18
)
0
.07
(
0
.19
)
(
0
.80
)
(
0
.99
)
11
.97
5/31/22
15
.83
0
.22
(
1
.42
)
(
1
.20
)
(
0
.55
)
(
1
.19
)
(
1
.74
)
12
.89
5/31/21
12
.05
0
.20
4
.57
4
.77
(
0
.36
)
(
0
.63
)
(
0
.99
)
15
.83
5/31/20
11
.94
0
.28
0
.56
0
.84
(
0
.22
)
(
0
.51
)
(
0
.73
)
12
.05
Retirement
Class:
5/31/24
11
.84
0
.21
2
.34
2
.55
(
0
.23
)
—
(
0
.23
)
14
.16
5/31/23
12
.76
0
.22
(
0
.18
)
0
.04
(
0
.16
)
(
0
.80
)
(
0
.96
)
11
.84
5/31/22
15
.68
0
.18
(
1
.40
)
(
1
.22
)
(
0
.51
)
(
1
.19
)
(
1
.70
)
12
.76
5/31/21
11
.94
0
.17
4
.53
4
.70
(
0
.33
)
(
0
.63
)
(
0
.96
)
15
.68
5/31/20
11
.85
0
.24
0
.55
0
.79
(
0
.19
)
(
0
.51
)
(
0
.70
)
11
.94
a
Based
on
average
shares
outstanding.
b
Total
returns
are
not
annualized.
g
The
Fund's
expenses
include
the
expenses
of
the
Underlying
Funds,
excluding
the
expenses
of
the
Dividend
Growth,
Dividend
Value,
Growth
Opportunities
ETF
and
the
TIAA-CREF
Real
Property
Fund
LP.
j
Short-term
and
long-term
capital
gain
distributions
received
from
the
underlying
Funds
are
presented
in
net
realized
and
unrealized
gain
(loss)
on
total
investments
for
all
periods
presented.
See
Notes
to
Financial
Statements
Ratios
and
Supplemental
Data
Ratios
to
Average
Net
Assets
Total
Return
b
Net
Assets,
End
of
Period
(000)
Gross
Expenses
g
Net
Expenses
g
Net
Investment
Income
(Loss)
Portfolio
Turnover
Rate
21
.89
%
$
458
0
.52
%
0
.33
%
1
.82
%
15
%
1
.00
331
0
.50
0
.31
1
.90
26
(
8
.75
)
580
0
.49
0
.30
0
.93
27
40
.56
395
0
.49
0
.33
0
.96
43
6
.51
118
0
.55
0
.42
2
.22
18
21
.90
137,821
0
.60
0
.41
1
.69
15
0
.89
163,684
0
.59
0
.39
1
.97
26
(
8
.86
)
159,978
0
.56
0
.37
1
.34
27
40
.35
205,713
0
.60
0
.44
1
.25
43
6
.50
152,698
0
.67
0
.55
1
.74
18
21
.99
2,901,702
0
.45
0
.26
1
.87
15
1
.06
2,485,183
0
.44
0
.24
2
.09
26
(
8
.73
)
2,529,399
0
.41
0
.22
1
.49
27
40
.55
2,626,383
0
.45
0
.29
1
.43
43
6
.70
1,730,080
0
.52
0
.40
2
.24
18
21
.76
465,853
0
.70
0
.51
1
.60
15
0
.79
416,557
0
.69
0
.49
1
.88
26
(
8
.93
)
439,910
0
.66
0
.47
1
.22
27
40
.27
549,874
0
.70
0
.54
1
.19
43
6
.33
424,505
0
.77
0
.65
1
.95
18
Financial
Highlights
(continued)
See
Notes
to
Financial
Statements
Financial
Highlights
(continued)
Investment
Operations
Less
Distributions
Net
Asset
Value,
Beginning
of
Period
Net
Investment
Income
(Loss)
a
Net
Realized/
Unrealized
Gain
(Loss)
j
Total
From
Net
Investment
Income
From
Net
Realized
Gains
Total
Net
Asset
Value,
End
of
Period
13.1
Lifecycle
2055
Class
I:
5/31/24
$
14
.17
$
0
.27
$
2
.83
$
3
.10
$
(
0
.28
)
$
—
$
(
0
.28
)
$
16
.99
5/31/23
15
.17
0
.25
(
0
.16
)
0
.09
(
0
.22
)
(
0
.87
)
(
1
.09
)
14
.17
5/31/22
18
.37
0
.26
(
1
.69
)
(
1
.43
)
(
0
.62
)
(
1
.15
)
(
1
.77
)
15
.17
5/31/21
13
.77
0
.23
5
.30
5
.53
(
0
.40
)
(
0
.53
)
(
0
.93
)
18
.37
5/31/20
13
.61
0
.31
0
.63
0
.94
(
0
.25
)
(
0
.53
)
(
0
.78
)
13
.77
Premier
Class:
5/31/24
14
.11
0
.26
2
.82
3
.08
(
0
.27
)
—
(
0
.27
)
16
.92
5/31/23
15
.11
0
.27
(
0
.20
)
0
.07
(
0
.20
)
(
0
.87
)
(
1
.07
)
14
.11
5/31/22
18
.30
0
.23
(
1
.67
)
(
1
.44
)
(
0
.60
)
(
1
.15
)
(
1
.75
)
15
.11
5/31/21
13
.72
0
.20
5
.29
5
.49
(
0
.38
)
(
0
.53
)
(
0
.91
)
18
.30
5/31/20
13
.56
0
.24
0
.67
0
.91
(
0
.22
)
(
0
.53
)
(
0
.75
)
13
.72
Class
R6:
5/31/24
14
.17
0
.29
2
.83
3
.12
(
0
.29
)
—
(
0
.29
)
17
.00
5/31/23
15
.18
0
.29
(
0
.21
)
0
.08
(
0
.22
)
(
0
.87
)
(
1
.09
)
14
.17
5/31/22
18
.38
0
.26
(
1
.68
)
(
1
.42
)
(
0
.63
)
(
1
.15
)
(
1
.78
)
15
.18
5/31/21
13
.77
0
.23
5
.32
5
.55
(
0
.41
)
(
0
.53
)
(
0
.94
)
18
.38
5/31/20
13
.61
0
.31
0
.63
0
.94
(
0
.25
)
(
0
.53
)
(
0
.78
)
13
.77
Retirement
Class:
5/31/24
14
.09
0
.24
2
.84
3
.08
(
0
.26
)
—
(
0
.26
)
16
.91
5/31/23
15
.10
0
.26
(
0
.21
)
0
.05
(
0
.19
)
(
0
.87
)
(
1
.06
)
14
.09
5/31/22
18
.29
0
.21
(
1
.67
)
(
1
.46
)
(
0
.58
)
(
1
.15
)
(
1
.73
)
15
.10
5/31/21
13
.71
0
.19
5
.29
5
.48
(
0
.37
)
(
0
.53
)
(
0
.90
)
18
.29
5/31/20
13
.56
0
.27
0
.63
0
.90
(
0
.22
)
(
0
.53
)
(
0
.75
)
13
.71
a
Based
on
average
shares
outstanding.
b
Total
returns
are
not
annualized.
g
The
Fund's
expenses
include
the
expenses
of
the
Underlying
Funds,
excluding
the
expenses
of
the
Dividend
Growth,
Dividend
Value,
Growth
Opportunities
ETF
and
the
TIAA-CREF
Real
Property
Fund
LP.
j
Short-term
and
long-term
capital
gain
distributions
received
from
the
underlying
Funds
are
presented
in
net
realized
and
unrealized
gain
(loss)
on
total
investments
for
all
periods
presented.
See
Notes
to
Financial
Statements
Ratios
and
Supplemental
Data
Ratios
to
Average
Net
Assets
Total
Return
b
Net
Assets,
End
of
Period
(000)
Gross
Expenses
g
Net
Expenses
g
Net
Investment
Income
(Loss)
Portfolio
Turnover
Rate
22
.11
%
$
542
0
.54
%
0
.34
%
1
.74
%
16
%
1
.11
334
0
.51
0
.31
1
.79
25
(
8
.78
)
155
0
.45
0
.26
1
.49
26
41
.04
162
0
.50
0
.33
1
.40
41
6
.56
121
0
.56
0
.41
2
.20
18
22
.02
71,798
0
.61
0
.41
1
.69
16
0
.99
81,671
0
.59
0
.39
1
.93
25
(
8
.86
)
76,685
0
.57
0
.37
1
.33
26
40
.88
93,442
0
.60
0
.44
1
.24
41
6
.37
62,637
0
.69
0
.55
1
.68
18
22
.26
1,472,020
0
.46
0
.26
1
.84
16
1
.08
1,189,521
0
.44
0
.24
2
.05
25
(
8
.73
)
1,127,411
0
.42
0
.22
1
.47
26
41
.14
1,092,033
0
.47
0
.29
1
.41
41
6
.56
653,177
0
.54
0
.40
2
.24
18
22
.02
221,889
0
.71
0
.51
1
.56
16
0
.82
194,120
0
.69
0
.49
1
.85
25
(
8
.97
)
195,461
0
.67
0
.47
1
.21
26
40
.80
237,666
0
.71
0
.54
1
.18
41
6
.28
181,024
0
.79
0
.65
1
.95
18
Financial
Highlights
(continued)
See
Notes
to
Financial
Statements
Financial
Highlights
(continued)
Investment
Operations
Less
Distributions
Net
Asset
Value,
Beginning
of
Period
Net
Investment
Income
(Loss)
a
Net
Realized/
Unrealized
Gain
(Loss)
j
Total
From
Net
Investment
Income
From
Net
Realized
Gains
Total
Net
Asset
Value,
End
of
Period
13.2
Lifecycle
2060
Class
I:
5/31/24
$
12
.21
$
0
.23
$
2
.49
$
2
.72
$
(
0
.22
)
$
(
0
.00
)
d
$
(
0
.22
)
$
14
.71
5/31/23
12
.95
0
.22
(
0
.15
)
0
.07
(
0
.18
)
(
0
.63
)
(
0
.81
)
12
.21
5/31/22
15
.35
0
.22
(
1
.44
)
(
1
.22
)
(
0
.52
)
(
0
.66
)
(
1
.18
)
12
.95
5/31/21
11
.35
0
.17
4
.46
4
.63
(
0
.32
)
(
0
.31
)
(
0
.63
)
15
.35
5/31/20
11
.13
0
.25
0
.51
0
.76
(
0
.20
)
(
0
.34
)
(
0
.54
)
11
.35
Premier
Class:
5/31/24
12
.19
0
.23
2
.47
2
.70
(
0
.21
)
(
0
.00
)
d
(
0
.21
)
14
.68
5/31/23
12
.92
0
.23
(
0
.16
)
0
.07
(
0
.17
)
(
0
.63
)
(
0
.80
)
12
.19
5/31/22
15
.33
0
.20
(
1
.44
)
(
1
.24
)
(
0
.51
)
(
0
.66
)
(
1
.17
)
12
.92
5/31/21
11
.33
0
.17
4
.44
4
.61
(
0
.30
)
(
0
.31
)
(
0
.61
)
15
.33
5/31/20
11
.11
0
.19
0
.56
0
.75
(
0
.19
)
(
0
.34
)
(
0
.53
)
11
.33
Class
R6:
5/31/24
12
.23
0
.24
2
.49
2
.73
(
0
.23
)
(
0
.00
)
d
(
0
.23
)
14
.73
5/31/23
12
.96
0
.24
(
0
.15
)
0
.09
(
0
.19
)
(
0
.63
)
(
0
.82
)
12
.23
5/31/22
15
.36
0
.22
(
1
.43
)
(
1
.21
)
(
0
.53
)
(
0
.66
)
(
1
.19
)
12
.96
5/31/21
11
.35
0
.19
4
.45
4
.64
(
0
.32
)
(
0
.31
)
(
0
.63
)
15
.36
5/31/20
11
.13
0
.25
0
.52
0
.77
(
0
.21
)
(
0
.34
)
(
0
.55
)
11
.35
Retirement
Class:
5/31/24
12
.17
0
.20
2
.48
2
.68
(
0
.20
)
(
0
.00
)
d
(
0
.20
)
14
.65
5/31/23
12
.90
0
.21
(
0
.15
)
0
.06
(
0
.16
)
(
0
.63
)
(
0
.79
)
12
.17
5/31/22
15
.30
0
.18
(
1
.43
)
(
1
.25
)
(
0
.49
)
(
0
.66
)
(
1
.15
)
12
.90
5/31/21
11
.31
0
.16
4
.43
4
.59
(
0
.29
)
(
0
.31
)
(
0
.60
)
15
.30
5/31/20
11
.10
0
.22
0
.51
0
.73
(
0
.18
)
(
0
.34
)
(
0
.52
)
11
.31
a
Based
on
average
shares
outstanding.
b
Total
returns
are
not
annualized.
d
Value
rounded
to
zero.
g
The
Fund's
expenses
include
the
expenses
of
the
Underlying
Funds,
excluding
the
expenses
of
the
Dividend
Growth,
Dividend
Value,
Growth
Opportunities
ETF
and
the
TIAA-CREF
Real
Property
Fund
LP.
j
Short-term
and
long-term
capital
gain
distributions
received
from
the
underlying
Funds
are
presented
in
net
realized
and
unrealized
gain
(loss)
on
total
investments
for
all
periods
presented.
See
Notes
to
Financial
Statements
Ratios
and
Supplemental
Data
Ratios
to
Average
Net
Assets
Total
Return
b
Net
Assets,
End
of
Period
(000)
Gross
Expenses
g
Net
Expenses
g
Net
Investment
Income
(Loss)
Portfolio
Turnover
Rate
22
.46
%
$
530
0
.56
%
0
.35
%
1
.75
%
15
%
1
.02
397
0
.55
0
.31
1
.85
24
(
8
.77
)
208
0
.51
0
.28
1
.48
26
41
.50
241
0
.54
0
.34
1
.25
40
6
.60
117
0
.66
0
.44
2
.16
22
22
.33
26,358
0
.63
0
.41
1
.70
15
1
.01
23,600
0
.62
0
.39
1
.90
24
(
8
.92
)
19,013
0
.60
0
.37
1
.39
26
41
.44
18,792
0
.64
0
.44
1
.25
40
6
.48
10,846
0
.77
0
.55
1
.68
22
22
.51
620,377
0
.48
0
.26
1
.80
15
1
.16
436,209
0
.47
0
.24
2
.00
24
(
8
.71
)
364,640
0
.45
0
.22
1
.48
26
41
.61
313,864
0
.49
0
.29
1
.39
40
6
.60
155,744
0
.62
0
.39
2
.18
22
22
.17
87,446
0
.73
0
.51
1
.51
15
0
.90
67,883
0
.72
0
.49
1
.78
24
(
8
.97
)
60,036
0
.70
0
.47
1
.22
26
41
.31
63,880
0
.74
0
.54
1
.16
40
6
.32
38,705
0
.87
0
.65
1
.91
22
Financial
Highlights
(continued)
See
Notes
to
Financial
Statements
Financial
Highlights
(continued)
e
Investment
Operations
Less
Distributions
Net
Asset
Value,
Beginning
of
Period
N
et
Investment
Income
(Loss)
a
Net
Realized/
Unrealized
Gain
(Loss)
j
Total
From
Net
Investment
Income
From
Net
Realized
Gains
Total
Net
Asset
Value,
End
of
Period
13.3
Lifecycle
2065
Class
I:
5/31/24
$
10.34
$
0.20
$
2.14
$
2.34
$
(0.18)
$
(0.01)
$
(0.19)
$
12.49
5/31/23
10.55
0.20
(0.11)
0.09
(0.15)
(0.15)
(0.30)
10.34
5/31/22
12.44
0.19
(1.21)
(1.02)
(0.55)
(0.32)
(0.87)
10.55
5/31/21
*
10.00
0.13
2.60
2.73
(0.26)
(0.03)
(0.29)
12.44
Premier
Class:
5/31/24
10.39
0.19
2.15
2.34
(0.17)
(0.01)
(0.18)
12.55
5/31/23
10.59
0.18
(0.10)
0.08
(0.13)
(0.15)
(0.28)
10.39
5/31/22
12.43
0.13
(1.13)
(1.00)
(0.52)
(0.32)
(0.84)
10.59
5/31/21
*
10.00
0.12
2.60
2.72
(0.26)
(0.03)
(0.29)
12.43
Class
R6:
5/31/24
10.53
0.20
2.20
2.40
(0.18)
(0.01)
(0.19)
12.74
5/31/23
10.74
0.19
(0.09)
0.10
(0.16)
(0.15)
(0.31)
10.53
5/31/22
12.45
0.17
(1.15)
(0.98)
(0.41)
(0.32)
(0.73)
10.74
5/31/21
*
10.00
0.14
2.60
2.74
(0.26)
(0.03)
(0.29)
12.45
Retirement
Class:
5/31/24
10.53
0.18
2.18
2.36
(0.16)
(0.01)
(0.17)
12.72
5/31/23
10.73
0.17
(0.09)
0.08
(0.13)
(0.15)
(0.28)
10.53
5/31/22
12.42
0.10
(1.07)
(0.97)
(0.40)
(0.32)
(0.72)
10.73
5/31/21
*
10.00
0.12
2.58
2.70
(0.25)
(0.03)
(0.28)
12.42
*
The
Fund
commenced
operations
on
September
30,
2020.
a
Based
on
average
shares
outstanding.
b
Total
returns
are
not
annualized.
c
Percentage
is
annualized.
g
The
Fund's
expenses
include
the
expenses
of
the
Underlying
Funds,
excluding
the
expenses
of
the
Dividend
Growth,
Dividend
Value,
Growth
Opportunities
ETF
and
the
TIAA-CREF
Real
Property
Fund
LP.
j
Short-term
and
long-term
capital
gain
distributions
received
from
the
underlying
Funds
are
presented
in
net
realized
and
unrealized
gain
(loss)
on
total
investments
for
all
periods
presented.
See
Notes
to
Financial
Statements
Ratios
and
Supplemental
Data
Ratios
to
Average
Net
Assets
Total
Return
b
Net
Assets,
End
of
Period
(000)
Gross
Expenses
g
Net
Expenses
g
Net
Investment
Income
(Loss)
Portfolio
Turnover
Rate
22.77
%
$
687
0.76
%
0.26
%
1.79
%
34
%
1.05
541
0.96
0.24
2.04
55
(8.96)
527
1.81
0.23
1.55
109
27.62
622
5.07
c
0.41
c
1.70
c
49
22.58
4,320
0.90
0.40
1.68
34
0.94
2,922
1.10
0.38
1.84
55
(8.78)
1,784
1.96
0.36
1.11
109
27.51
726
5.20
c
0.41
c
1.60
c
49
22.85
71,437
0.75
0.25
1.75
34
1.07
31,199
0.95
0.23
1.85
55
(8.52)
17,581
1.80
0.21
1.44
109
27.76
4,818
4.73
c
0.26
c
1.81
c
49
22.46
14,493
1.00
0.50
1.51
34
0.88
7,460
1.20
0.48
1.71
55
(8.46)
3,862
2.06
0.46
0.91
109
27.38
802
5.33
c
0.51
c
1.54
c
49
Notes
to
Financial
Statements
1.
General
Information
Trust
and
Fund
Information:
TIAA-CREF
Funds
(the
“Trust”)
is
an
open-end
management
investment
company
registered
under
the
Investment
Company
Act
of
1940,
(“1940
Act”),
as
amended.
The
Trust
is
comprised
of
the
following
(collectively
the
“Funds”
or
individually,
the
“Fund”),
among
others:
Fund
Name
Changes:
Effective
May
1,
2024,
each
Fund’s
name
changed
as
noted
above
and
therefore
all
references
to
the
names
of
the
Funds
in
this
report
have
been
updated.
Current
Fiscal
Period:
The
end
of
the
reporting
period
for
the Funds
is
May
31,
2024,
and
the
period
covered
by
these
Notes
to
Financial
Statements
is
the
fiscal
year
ended
May
31,
2024
(the
"current
fiscal
period").
Investment
Advisor:
Teachers
Advisors,
LLC
(the
“Adviser”),
a
wholly
owned
indirect
subsidiary
of
Teachers
Insurance
and
Annuity
Association
of
America
(“TIAA”),
is
registered
with
the
Securities
and
Exchange
Commission
(“SEC”)
as
an
investment
adviser
and
provides
investment
management
services
for
the
Funds.
Share
Class
and
Sales
Charges:
Each
Fund
is
a
“fund
of
funds”
that
diversifies
its
assets
by
investing
in
Class
W
shares
of
other
funds
of
the
Trust
and
potentially
other
investment
pools
or
investment
products.
The
Funds
offer
Class
A,
Class
I,
Premier
Class,
Class
R6
and
Retirement
Class
shares.
Each
class
differs
by
the
allocation
of
class-specific
expenses
and
voting
rights
in
matters
affecting
a
single
class.
Effective
May
6,
2024,
a
sales
charge
is
imposed
on
purchases
of
Class
A
shares
of
the
Funds,
of
less
than
certain
amounts,
as
set
forth
in
the
Funds’
prospectus.
The
Funds
offer
their
shares
through
their
principal
underwriter,
Nuveen
Securities,
LLC
(“Nuveen
Securities”),
which
is
a
wholly
owned
indirect
subsidiary
of
TIAA.
Share
Class
Name
Changes:
Effective
May
6,
2024,
the
names
of
certain
share
classes
for
the
Funds
changed
and
therefore
all
references
to
the
names
of
these
share
classes
in
this
report
have
changed
as
follows:
2.
Significant
Accounting
Policies
The
accompanying
financial
statements
were
prepared
in
accordance
with
accounting
principles
generally
accepted
in
the
United
States
of
America
(“U.S.
GAAP”),
which
may
require
the
use
of
estimates
made
by
management
and
the
evaluation
of
subsequent
events.
Actual
results
may
differ
from
those
estimates.
The Funds
are
investment
companies
and
follow
the
accounting
guidance
in
the
Financial
Accounting
Standards
Board
(“FASB”)
Accounting
Standards
Codification
946,
Financial
Services
—
Investment
Companies
. The net
asset
value (“NAV”)
for
financial
reporting
purposes
may
differ
from
the NAV
for
processing
transactions.
The NAV
for
financial
reporting
purposes
includes
security
and shareholder
transactions
through
the
date
of
the
report.
Total
return
is
computed
based
on
the NAV
used
for
processing
transactions.
The
following
is
a
summary
of
the
significant
accounting
policies
consistently
followed
by
the
Funds.
Compensation:
The
Funds pay
the
members
of
the
Board
of
Trustees
("Board"),
all
of
whom
are
independent,
certain
remuneration
for
their
services,
plus
travel
and
other
expenses.
The
Board
has
adopted
a
deferred
compensation
plan
for
independent
trustees
that
enables
trustees
to
elect
to
defer
receipt
of
all
or
a
portion
of
the
annual
compensation
they
are
entitled
to
receive
from
certain
Nuveen-advised
funds.
Under
the
plan,
deferred
amounts
are
treated
as
though
equal
dollar
amounts
had
been
invested
in
shares
of
select
Nuveen-advised
funds. Amounts
deferred
are
retained
by
the
Funds
until
paid.
Amounts
payable
to
the
trustees
for
compensation
are
included
separately
in the
accompanying
Statement
of
Assets
and
Liabilities.
Trustees’
fees,
including
any
deferred
compensation
incurred,
are
reflected
in
the
Statement
of
Operations.
New
Name
Former
Name
Short
Name
Nuveen
Lifecycle
Retirement
Income
Fund
TIAA-CREF
Lifecycle
Retirement
Income
Fund
Lifecycle
Retirement
Income
Nuveen
Lifecycle
2010
Fund
TIAA-CREF
Lifecycle
2010
Fund
Lifecycle
2010
Nuveen
Lifecycle
2015
Fund
TIAA-CREF
Lifecycle
2015
Fund
Lifecycle
2015
Nuveen
Lifecycle
2020
Fund
TIAA-CREF
Lifecycle
2020
Fund
Lifecycle
2020
Nuveen
Lifecycle
2025
Fund
TIAA-CREF
Lifecycle
2025
Fund
Lifecycle
2025
Nuveen
Lifecycle
2030
Fund
TIAA-CREF
Lifecycle
2030
Fund
Lifecycle
2030
Nuveen
Lifecycle
2035
Fund
TIAA-CREF
Lifecycle
2035
Fund
Lifecycle
2035
Nuveen
Lifecycle
2040
Fund
TIAA-CREF
Lifecycle
2040
Fund
Lifecycle
2040
Nuveen
Lifecycle
2045
Fund
TIAA-CREF
Lifecycle
2045
Fund
Lifecycle
2045
Nuveen
Lifecycle
2050
Fund
TIAA-CREF
Lifecycle
2050
Fund
Lifecycle
2050
Nuveen
Lifecycle
2055
Fund
TIAA-CREF
Lifecycle
2055
Fund
Lifecycle
2055
Nuveen
Lifecycle
2060
Fund
TIAA-CREF
Lifecycle
2060
Fund
Lifecycle
2060
Nuveen
Lifecycle
2065
Fund
TIAA-CREF
Lifecycle
2065
Fund
Lifecycle
2065
1
1
1
New
Name
Former
Name
Class
A
Retail
Class
Class
I
Advisor
Class
Class
R6
Institutional
Class
Distributions
to
Shareholders:
Distributions
to
shareholders
are
recorded
on
the
ex-dividend
date.
The
amount,
character
and
timing
of
distributions
are
determined
in
accordance
with
federal
income
tax
regulations,
which
may
differ
from
U.S.
GAAP.
Indemnification:
Under
the
Trust's
organizational
documents,
its
officers
and
trustees
are
indemnified
against
certain
liabilities
arising
out
of
the
performance
of
their
duties
to
the
Trust.
In
addition,
in
the
normal
course
of
business,
the
Trust
enters
into
contracts
that
provide
general
indemnifications
to
other
parties.
The
Trust's
maximum
exposure
under
these
arrangements
is
unknown
as
this
would
involve
future
claims
that
may
be
made
against
the
Trust
that
have
not
yet
occurred.
However,
the
Trust
has
not
had
prior
claims
or
losses
pursuant
to
these
contracts
and
expects
the
risk
of
loss
to
be
remote.
Investments
and
Investment
Income:
Securities
transactions
are
accounted
for
as
of
the
trade
date
for
financial
reporting
purposes.
Interest
income
is
recorded
on
an
accrual
basis
and
includes
accretion
of
discounts
and
amortization
of
premiums.
Dividend
income
is
recorded
on
the
ex-dividend
date. Realized
gains
and
losses
on
securities
transactions
are
based
upon
the
specific
identification
method.
Distributions
received
on
securities
that
represent
a
return
of
capital
or
capital
gains
are
recorded
as
a
reduction
of
cost
of
investments
and/or
as
a
realized
gain.
The
Funds
estimate
the
components
of
distributions
received
that
may
be
considered
return
of
capital
distributions
or
capital
gain
distributions.
Multiclass
Operations
and
Allocations:
Income, expenses,
realized
gains
and
losses
and
unrealized
appreciation
and
depreciation
of
a
Fund
are
allocated
on
a
pro
rata
basis
to
each
class
of
shares,
except
for
service
agreement
fees,
distribution
fees
and
transfer
agency
fees
and
expenses, which
are
unique
to
each
class
of
shares.
Most
expenses
of
the
Trust
can
be
directly
attributed
to
a
Fund.
Expenses
that
cannot
be
directly
attributed
are
allocated
to
each
Fund
in
the
Trust
based
upon
the
average
net
assets
of
each
Fund.
Netting
Agreements:
In
the
ordinary
course
of
business,
the
Funds
may
enter
into
transactions
subject
to
enforceable
master
repurchase
agreements,
International
Swaps
and
Derivatives
Association,
Inc.
(ISDA)
master
agreements
or
other
similar
arrangements
(“netting
agreements”).
Generally,
the
right
to
offset
in
netting
agreements
allows
each
Fund
to
offset
certain
securities
and
derivatives
with
a
specific
counterparty,
when
applicable,
as
well
as
any
collateral
received
or
delivered
to
that
counterparty
based
on
the
terms
of
the
agreements.
Generally,
each
Fund
manages
its
cash
collateral
and
securities
collateral
on
a
counterparty
basis.
With
respect
to
certain
counterparties,
in
accordance
with
the
terms
of
the
netting
agreements,
collateral
posted
to
the
Funds
is
held
in
a
segregated
account
by
the
Funds’
custodian
and/or
with
respect
to
those
amounts
which
can
be
sold
or
repledged,
are
presented
in
the
Funds’
Portfolio
of
Investments
or
Statement
of
Assets
and
Liabilities.
The
Funds’
investments
subject
to
netting
agreements
as
of
the
end
of
the
reporting
period,
if
any,
are
further
described
later
in
these
Notes
to
Financial
Statements.
3.
Investment
Valuation
and
Fair
Value
Measurements
The Funds'
investments
in
securities
are
recorded
at
their
estimated
fair
value
utilizing
valuation
methods
approved
by
the
Adviser,
subject
to
oversight
of
the
Board.
Fair
value
is
defined
as
the
price
that
would
be
received
upon
selling
an
investment
or
transferring
a
liability
in
an
orderly
transaction
to
an
independent
buyer
in
the
principal
or
most
advantageous
market
for
the
investment.
U.S.
GAAP
establishes
the
three-tier
hierarchy
that
is
used
to
maximize
the
use
of
observable
market
data
and
minimize
the
use
of
unobservable
inputs
and
to
establish
classification
of
fair
value
measurements
for
disclosure
purposes.
Observable
inputs
reflect
the
assumptions
market
participants
would
use
in
pricing
the
asset
or
liability.
Observable
inputs
are
based
on
market
data
obtained
from
sources
independent
of
the
reporting
entity.
Unobservable
inputs
reflect
management’s
assumptions
about
the
assumptions
market
participants
would
use
in
pricing
the
asset
or
liability.
Unobservable
inputs
are
based
on
the
best
information
available
in
the
circumstances.
The
following
is
a
summary
of
the
three-tiered
hierarchy
of
valuation
input
levels.
Level 1
–
Inputs
are
unadjusted
and
prices
are
determined
using
quoted
prices
in
active
markets
for
identical
securities.
Level
2
–
Prices
are
determined
using
other
significant
observable
inputs
(including
quoted
prices
for
similar
securities,
interest
rates,
credit
spreads,
etc.).
Level
3
–
Prices
are
determined
using
significant
unobservable
inputs
(including
management’s
assumptions
in
determining
the
fair
value
of
investments).
A
description
of
the
valuation
techniques
applied
to
the Funds'
major
classifications
of
assets
and
liabilities
measured
at
fair
value
follows:
Exchange-traded
funds
listed
or
traded
on
a
national
market
or
exchange
are
valued
based
on
their
sale
price
at
the
official
close
of
business
of
such
market
or
exchange
on
the
valuation
date.
To
the
extent
these
securities
are
actively
traded
and
that
valuation
adjustments
are
not
applied,
they
are
generally
classified
as
Level
1.
Investments
in
investment
companies
are
valued
at
their
respective NAVs
or
share
price
on
the
valuation
date
and
are
generally
classified
as Level
1.
Repurchase
agreements
are
valued
at
contract
amount
plus
accrued
interest,
which
approximates
market
value.
These
securities
are
generally
classified
as
Level
2.
Notes
to
Financial
Statements
(continued)
Investments
in
unregistered
limited
partnerships
are
measured
at
fair
value
as
of
the
valuation
date
using
the
NAV
per
share
practical
expedient
and
are
not
classified
within
the
fair
value
hierarchy.
The
following
table
summarizes
the
market
value
of
the Funds’
investments
as
of
the
end
of
the
current
fiscal
period, based
on
the
inputs
used
to
value
them:
Fund
Level
1
Level
2
Level
3
Fair
value
using
practical
expedient
a
Total
Lifecycle
Retirement
Income
Registered
investment
companies
$
399,169,603
$
—
$
—
$
—
$
399,169,603
TIAA-CREF
Real
Property
Fund
LP
—
—
—
19,278,385
19,278,385
Short-term
investments
—
169,000
—
—
169,000
Total
$
399,169,603
$
169,000
$
—
$
19,278,385
$
418,616,988
Lifecycle
2010
Registered
investment
companies
$
780,571,153
$
—
$
—
$
—
$
780,571,153
TIAA-CREF
Real
Property
Fund
LP
—
—
—
22,826,075
22,826,075
Short-term
investments
—
572,000
—
—
572,000
Total
$
780,571,153
$
572,000
$
—
$
22,826,075
$
803,969,228
Lifecycle
2015
Registered
investment
companies
$
1,103,898,423
$
—
$
—
$
—
$
1,103,898,423
TIAA-CREF
Real
Property
Fund
LP
—
—
—
53,309,054
53,309,054
Short-term
investments
—
77,000
—
—
77,000
Total
$
1,103,898,423
$
77,000
$
—
$
53,309,054
$
1,157,284,477
Lifecycle
2020
Registered
investment
companies
$
2,396,716,477
$
—
$
—
$
—
$
2,396,716,477
TIAA-CREF
Real
Property
Fund
LP
—
—
—
115,715,998
115,715,998
Short-term
investments
—
361,000
—
—
361,000
Total
$
2,396,716,477
$
361,000
$
—
$
115,715,998
$
2,512,793,475
Lifecycle
2025
Registered
investment
companies
$
3,730,736,533
$
—
$
—
$
—
$
3,730,736,533
TIAA-CREF
Real
Property
Fund
LP
—
—
—
180,080,434
180,080,434
Short-term
investments
—
2,619,000
—
—
2,619,000
Total
$
3,730,736,533
$
2,619,000
$
—
$
180,080,434
$
3,913,435,967
Lifecycle
2030
Registered
investment
companies
$
4,528,469,201
$
—
$
—
$
—
$
4,528,469,201
TIAA-CREF
Real
Property
Fund
LP
—
—
—
218,509,112
218,509,112
Short-term
investments
—
3,105,000
—
—
3,105,000
Total
$
4,528,469,201
$
3,105,000
$
—
$
218,509,112
$
4,750,083,313
Lifecycle
2035
Registered
investment
companies
$
4,873,863,706
$
—
$
—
$
—
$
4,873,863,706
TIAA-CREF
Real
Property
Fund
LP
—
—
—
235,086,540
235,086,540
Short-term
investments
—
5,357,000
—
—
5,357,000
Total
$
4,873,863,706
$
5,357,000
$
—
$
235,086,540
$
5,114,307,246
Lifecycle
2040
Registered
investment
companies
$
5,875,247,512
$
—
$
—
$
—
$
5,875,247,512
TIAA-CREF
Real
Property
Fund
LP
—
—
—
283,260,936
283,260,936
Short-term
investments
—
7,726,000
—
—
7,726,000
Total
$
5,875,247,512
$
7,726,000
$
—
$
283,260,936
$
6,166,234,448
Lifecycle
2045
Registered
investment
companies
$
4,236,796,472
$
—
$
—
$
—
$
4,236,796,472
TIAA-CREF
Real
Property
Fund
LP
—
—
—
204,212,687
204,212,687
Short-term
investments
—
5,433,000
—
—
5,433,000
Total
$
4,236,796,472
$
5,433,000
$
—
$
204,212,687
$
4,446,442,159
Lifecycle
2050
Registered
investment
companies
$
3,339,615,155
$
—
$
—
$
—
$
3,339,615,155
TIAA-CREF
Real
Property
Fund
LP
—
—
—
160,945,252
160,945,252
Short-term
investments
—
3,913,000
—
—
3,913,000
Total
$
3,339,615,155
$
3,913,000
$
—
$
160,945,252
$
3,504,473,407
Lifecycle
2055
Registered
investment
companies
$
1,681,485,216
$
—
$
—
$
—
$
1,681,485,216
TIAA-CREF
Real
Property
Fund
LP
—
—
—
81,032,584
81,032,584
Short-term
investments
—
2,700,000
—
—
2,700,000
Total
$
1,681,485,216
$
2,700,000
$
—
$
81,032,584
$
1,765,217,800
Lifecycle
2060
Registered
investment
companies
$
699,236,513
$
—
$
—
$
—
$
699,236,513
TIAA-CREF
Real
Property
Fund
LP
—
—
—
33,695,865
33,695,865
Short-term
investments
—
1,552,000
—
—
1,552,000
Total
$
699,236,513
$
1,552,000
$
—
$
33,695,865
$
734,484,378
4.
Portfolio
Securities
Repurchase
Agreements:
In
connection
with
transactions
in
repurchase
agreements,
it
is
the Fund’s policy
that
its
custodian
take
possession
of
the
underlying
collateral
securities,
the
fair
value
of
which
exceeds
the
principal
amount
of
the
repurchase
transaction,
including
accrued
interest,
at
all
times.
If
the
counterparty
defaults,
and
the
fair
value
of
the
collateral
declines,
realization
of
the
collateral
may
be
delayed
or
limited.
The
following
table
presents
the
repurchase
agreements
for
the Funds
that
are
subject
to
netting
agreements
as
of
the
end
of
the
reporting
period,
and
the
collateral
delivered
related
to
those
repurchase
agreements.
Real
Property
Fund
("RPF"):
The
Funds
invest
in
the
RPF,
which
is
an
affiliated
real
estate
limited
partnership.
The
RPF
is
an
unregistered
open-end
fund
that
intends
to
invest
in
direct
real
estate
holdings
and
may
invest
a
portion
of
its
assets
in
REIT
securities,
mortgage
related
securitization
and
money
market
instruments
in
accordance
with
exemptive
relief
received
from
the
SEC.
The
Funds
are
not
liable
for
the
debts
of
the
RPF
beyond
the
amounts
the
Funds
have
contributed.
The
Funds
can
redeem
from
RPF
daily
subject
to
certain
approvals.
Investments
in
the
RPF
are
illiquid
and
the
Funds
may
be
unable
to
dispose
of
such
investments
at
opportune
times.
As
such,
this
investment
has
been
designated
as
restricted
and
the
value
is
reflected
in
the
Portfolio
of
Investments.
As
a
restricted
security,
RPF
may
not
be
sold
except
in
exempt
transactions
or
in
a
public offering
registered
under
the
Securities
Act
of
1933,
as
amended.
The
risk
of
investing
in
such
securities
is
generally
greater
than
the
risk
of
investing
in
securities
that
are
widely
held
and
publicaly
traded.
Purchases
and
Sales:
Long-term
purchases
and
sales
during
the
current
fiscal
period were
as
follows:
Fund
Level
1
Level
2
Level
3
Fair
value
using
practical
expedient
a
Total
Lifecycle
2065
Registered
investment
companies
$
86,235,887
$
—
$
—
$
—
$
86,235,887
TIAA-CREF
Real
Property
Fund
LP
—
—
—
4,155,605
4,155,605
Short-term
investments
—
256,000
—
—
256,000
Total
$
86,235,887
$
256,000
$
—
$
4,155,605
$
90,647,492
a
In
accordance
with
ASC
820,
certain
investments
that
are
measured
at
fair
value
using
the
net
asset
value
per
share
practical
expedient
have
not
been
classified
in
the
fair
value
hierarchy.
The
fair
value
amounts
presented
in
this
table
are
intended
to
permit
reconciliation
of
the
fair
value
hierarchy
to
the
amounts
presented
in
the
Statements
of
assets
and
liabilities.
Fund
Counterparty
Short-term
Investments,
at
Value
Collateral
Pledged
(From)
Counterparty
Lifecycle
Retirement
Income
Fixed
Income
Clearing
Corporation
$
169,000
$
(172,473)
Lifecycle
2010
Fixed
Income
Clearing
Corporation
572,000
(583,524)
Lifecycle
2015
Fixed
Income
Clearing
Corporation
77,000
(78,555)
Lifecycle
2020
Fixed
Income
Clearing
Corporation
361,000
(368,276)
Lifecycle
2025
Fixed
Income
Clearing
Corporation
2,619,000
(2,671,448)
Lifecycle
2030
Fixed
Income
Clearing
Corporation
3,105,000
(3,167,279)
Lifecycle
2035
Fixed
Income
Clearing
Corporation
5,357,000
(5,464,227)
Lifecycle
2040
Fixed
Income
Clearing
Corporation
7,726,000
(7,880,564)
Lifecycle
2045
Fixed
Income
Clearing
Corporation
5,433,000
(5,541,811)
Lifecycle
2050
Fixed
Income
Clearing
Corporation
3,913,000
(3,991,324)
Lifecycle
2055
Fixed
Income
Clearing
Corporation
2,700,000
(2,754,183)
Lifecycle
2060
Fixed
Income
Clearing
Corporation
1,552,000
(1,583,189)
Lifecycle
2065
Fixed
Income
Clearing
Corporation
256,000
(261,175)
Notes
to
Financial
Statements
(continued)
5.
Fund
Shares
Transactions
in
Fund
shares
during
the
current
and
prior
fiscal
period
were
as
follows:
Fund
Non-U.S.
Government
Purchases
Non-U.S.
Government
Sales
12.1
Lifecycle
Retirement
Income
$
53,439,313
$
105,120,630
12.2
Lifecycle
2010
117,182,195
215,437,161
12.3
Lifecycle
2015
152,685,858
292,165,646
12.4
Lifecycle
2020
307,988,629
678,994,106
12.5
Lifecycle
2025
509,637,546
918,867,330
12.6
Lifecycle
2030
648,423,781
893,051,507
12.7
Lifecycle
2035
708,092,587
908,632,406
12.8
Lifecycle
2040
764,171,938
1,092,202,420
12.9
Lifecycle
2045
587,666,704
709,149,955
13.01
Lifecycle
2050
486,408,004
552,579,674
13.1
Lifecycle
2055
304,455,117
257,164,931
13.2
Lifecycle
2060
198,505,291
92,115,886
13.3
Lifecycle
2065
59,273,489
21,373,351
Year
Ended
5/31/24
Year
Ended
5/31/23
12.1
Lifecycle
Retirement
Income
Shares
Amount
Shares
Amount
Subscriptions:
Class
A
433,655
$
4,649,203
538,372
$
5,676,710
Class
I
–
–
2,200
23,540
Premier
Class
97,480
1,033,218
102,554
1,079,331
Class
R6
1,894,748
20,150,886
1,257,585
13,342,606
Retirement
Class
447,110
4,789,005
683,664
7,143,848
Total
subscriptions
2,872,993
30,622,312
2,584,375
27,266,035
Reinvestments
of
distributions:
Class
A
373,021
3,989,284
672,562
6,877,590
Class
I
713
7,653
1,676
17,187
Premier
Class
37,327
398,934
88,231
903,373
Class
R6
552,701
5,915,189
1,089,839
11,161,094
Retirement
Class
404,463
4,318,428
797,641
8,148,119
Total
reinvestments
of
distributions
1,368,225
14,629,488
2,649,949
27,107,363
Redemptions:
Class
A
(1,517,407)
(16,303,756)
(1,110,537)
(11,675,236)
Class
I
(855)
(9,006)
(28,091)
(301,425)
Premier
Class
(698,781)
(7,420,310)
(315,894)
(3,320,054)
Class
R6
(4,836,522)
(52,159,628)
(5,868,076)
(61,430,375)
Retirement
Class
(2,159,852)
(23,038,570)
(2,824,817)
(29,520,020)
Total
redemptions
(9,213,417)
(98,931,270)
(10,147,415)
(106,247,110)
Net
increase
(decrease)
from
shareholder
transactions
(4,972,199)
$
(53,679,470)
(4,913,091)
$
(51,873,712)
Year
Ended
5/31/24
Year
Ended
5/31/23
12.2
Lifecycle
2010
Shares
Amount
Shares
Amount
Subscriptions:
Class
I
–
$
–
–
$
–
Premier
Class
274,759
2,657,063
215,080
2,092,570
Class
R6
3,769,540
37,031,541
3,614,500
34,407,848
Retirement
Class
720,436
8,850,128
570,016
6,851,613
Total
subscriptions
4,764,735
48,538,732
4,399,596
43,352,031
Reinvestments
of
distributions:
Class
I
234
2,286
414
3,843
Premier
Class
145,231
1,407,286
334,556
3,091,298
Class
R6
2,196,057
21,323,714
4,439,737
41,111,964
Retirement
Class
568,429
6,997,365
1,230,126
14,318,674
Total
reinvestments
of
distributions
2,909,951
29,730,651
6,004,833
58,525,779
Redemptions:
Class
I
–
–
(2,330)
(23,392)
Premier
Class
(1,336,291)
(13,017,239)
(1,140,964)
(10,994,447)
Class
R6
(12,953,147)
(126,422,270)
(16,298,133)
(159,505,225)
Retirement
Class
(3,347,115)
(41,251,872)
(4,114,664)
(49,544,026)
Total
redemptions
(17,636,553)
(180,691,381)
(21,556,091)
(220,067,090)
Net
increase
(decrease)
from
shareholder
transactions
(9,961,867)
$
(102,421,998)
(11,151,662)
$
(118,189,280)
Year
Ended
5/31/24
Year
Ended
5/31/23
12.3
Lifecycle
2015
Shares
Amount
Shares
Amount
Subscriptions:
Class
I
–
$
–
–
$
–
Premier
Class
498,860
4,308,836
236,853
2,038,118
Class
R6
4,358,795
38,323,222
4,055,246
34,645,281
Retirement
Class
1,828,109
21,402,332
2,098,950
23,828,765
Total
subscriptions
6,685,764
64,034,390
6,391,049
60,512,164
Reinvestments
of
distributions:
Class
I
1,038
9,022
2,379
19,629
Premier
Class
198,250
1,716,848
509,804
4,190,586
Class
R6
3,377,164
29,347,554
7,176,454
59,205,748
Retirement
Class
740,602
8,650,230
1,635,713
17,976,483
Total
reinvestments
of
distributions
4,317,054
39,723,654
9,324,350
81,392,446
Redemptions:
Class
I
(6,795)
(59,999)
–
–
Premier
Class
(2,736,462)
(23,748,817)
(1,826,554)
(15,669,495)
Class
R6
(19,318,250)
(168,124,946)
(22,904,648)
(199,370,855)
Retirement
Class
(5,183,233)
(60,492,244)
(6,591,873)
(75,024,585)
Total
redemptions
(27,244,740)
(252,426,006)
(31,323,075)
(290,064,935)
Net
increase
(decrease)
from
shareholder
transactions
(16,241,922)
$
(148,667,962)
(15,607,676)
$
(148,160,325)
Year
Ended
5/31/24
Year
Ended
5/31/23
12.4
Lifecycle
2020
Shares
Amount
Shares
Amount
Subscriptions:
Class
I
433
$
4,098
27,164
$
243,662
Premier
Class
615,272
5,521,845
958,294
8,534,254
Class
R6
9,108,728
83,167,889
9,046,353
80,749,414
Retirement
Class
1,650,063
20,516,811
1,388,638
16,743,403
Total
subscriptions
11,374,496
109,210,643
11,420,449
106,270,733
Reinvestments
of
distributions:
Class
I
2,346
21,159
4,872
41,360
Premier
Class
407,611
3,672,579
1,198,371
10,162,188
Class
R6
7,348,605
66,357,906
16,335,969
138,855,737
Retirement
Class
1,165,311
14,601,344
2,894,787
33,811,107
Total
reinvestments
of
distributions
8,923,873
84,652,988
20,433,999
182,870,392
Redemptions:
Class
I
(26,993)
(244,878)
(5,339)
(46,545)
Premier
Class
(7,335,038)
(66,134,691)
(3,502,274)
(31,179,156)
Class
R6
(42,907,519)
(389,330,718)
(49,415,101)
(444,290,955)
Retirement
Class
(10,477,131)
(131,096,521)
(10,867,306)
(131,189,772)
Total
redemptions
(60,746,681)
(586,806,808)
(63,790,020)
(606,706,428)
Net
increase
(decrease)
from
shareholder
transactions
(40,448,312)
$
(392,943,177)
(31,935,572)
$
(317,565,303)
Year
Ended
5/31/24
Year
Ended
5/31/23
12.5
Lifecycle
2025
Shares
Amount
Shares
Amount
Subscriptions:
Class
I
13,326
$
125,471
57,120
$
527,161
Premier
Class
1,705,503
15,876,187
2,187,763
20,102,931
Class
R6
15,645,291
148,258,330
18,136,108
166,947,002
Retirement
Class
2,403,383
31,821,471
2,231,908
28,367,168
Total
subscriptions
19,767,503
196,081,459
22,612,899
215,944,262
Reinvestments
of
distributions:
Class
I
2,834
26,729
4,735
41,525
Premier
Class
615,708
5,781,500
1,868,790
16,314,540
Class
R6
10,270,415
96,850,017
25,042,494
219,622,671
Retirement
Class
1,329,720
17,685,277
3,782,348
46,295,936
Total
reinvestments
of
distributions
12,218,677
120,343,523
30,698,367
282,274,672
Redemptions:
Class
I
(32,414)
(308,366)
(7,468)
(67,270)
Premier
Class
(10,476,187)
(98,384,052)
(3,687,382)
(33,697,590)
Class
R6
(53,544,359)
(508,096,110)
(73,961,374)
(691,355,718)
Retirement
Class
(12,301,216)
(163,661,102)
(11,764,653)
(149,398,039)
Total
redemptions
(76,354,176)
(770,449,630)
(89,420,877)
(874,518,617)
Net
increase
(decrease)
from
shareholder
transactions
(44,367,996)
$
(454,024,648)
(36,109,611)
$
(376,299,683)
Notes
to
Financial
Statements
(continued)
Year
Ended
5/31/24
Year
Ended
5/31/23
12.6
Lifecycle
2030
Shares
Amount
Shares
Amount
Subscriptions:
Class
I
36,170
$
354,398
28,823
$
275,053
Premier
Class
2,460,993
23,328,078
2,343,037
21,792,289
Class
R6
22,894,247
221,980,026
27,344,443
255,067,752
Retirement
Class
3,377,573
47,152,530
3,233,094
42,713,024
Total
subscriptions
28,768,983
292,815,032
32,949,397
319,848,118
Reinvestments
of
distributions:
Class
I
1,812
17,467
3,379
29,774
Premier
Class
651,585
6,248,703
2,180,319
19,099,591
Class
R6
10,893,857
105,016,784
29,168,792
256,977,057
Retirement
Class
1,193,209
16,704,931
3,833,648
48,610,658
Total
reinvestments
of
distributions
12,740,463
127,987,885
35,186,138
324,717,080
Redemptions:
Class
I
(19,644)
(198,171)
(17,171)
(166,871)
Premier
Class
(10,496,353)
(100,691,110)
(4,290,938)
(39,666,590)
Class
R6
(50,051,694)
(484,938,640)
(74,773,754)
(707,187,201)
Retirement
Class
(10,654,918)
(149,050,344)
(11,186,111)
(147,266,751)
Total
redemptions
(71,222,609)
(734,878,265)
(90,267,974)
(894,287,413)
Net
increase
(decrease)
from
shareholder
transactions
(29,713,163)
$
(314,075,348)
(22,132,439)
$
(249,722,215)
Year
Ended
5/31/24
Year
Ended
5/31/23
12.7
Lifecycle
2035
Shares
Amount
Shares
Amount
Subscriptions:
Class
I
25,142
$
262,197
17,577
$
166,956
Premier
Class
2,702,997
26,291,383
2,611,737
24,490,486
Class
R6
25,621,992
253,828,740
30,668,720
289,812,700
Retirement
Class
3,409,573
50,558,462
2,741,861
37,825,781
Total
subscriptions
31,759,704
330,940,782
36,039,895
352,295,923
Reinvestments
of
distributions:
Class
I
1,563
15,472
3,755
33,342
Premier
Class
579,190
5,722,397
2,343,733
20,765,474
Class
R6
10,503,319
104,087,889
32,069,754
285,100,109
Retirement
Class
950,518
14,124,702
3,521,881
46,524,052
Total
reinvestments
of
distributions
12,034,590
123,950,460
37,939,123
352,422,977
Redemptions:
Class
I
(4,319)
(45,012)
(1,489)
(14,152)
Premier
Class
(11,418,018)
(111,382,410)
(4,058,202)
(38,116,862)
Class
R6
(50,307,243)
(500,942,206)
(78,964,298)
(760,415,932)
Retirement
Class
(8,772,119)
(130,032,343)
(7,896,088)
(108,712,142)
Total
redemptions
(70,501,699)
(742,401,971)
(90,920,077)
(907,259,088)
Net
increase
(decrease)
from
shareholder
transactions
(26,707,405)
$
(287,510,729)
(16,941,059)
$
(202,540,188)
Year
Ended
5/31/24
Year
Ended
5/31/23
12.8
Lifecycle
2040
Shares
Amount
Shares
Amount
Subscriptions:
Class
I
14,973
$
152,630
15,363
$
145,703
Premier
Class
3,495,767
34,199,040
2,594,363
24,231,645
Class
R6
27,883,638
278,770,192
33,689,108
317,712,234
Retirement
Class
2,813,218
43,706,569
2,787,493
39,853,927
Total
subscriptions
34,207,596
356,828,431
39,086,327
381,943,509
Reinvestments
of
distributions:
Class
I
861
8,627
1,777
15,656
Premier
Class
601,976
6,019,759
2,778,633
24,451,968
Class
R6
11,393,482
114,276,623
40,538,576
357,550,245
Retirement
Class
895,621
14,025,423
4,000,200
54,642,731
Total
reinvestments
of
distributions
12,891,940
134,330,432
47,319,186
436,660,600
Redemptions:
Class
I
(892)
(8,970)
(1,466)
(13,166)
Premier
Class
(13,853,760)
(136,330,356)
(3,817,919)
(36,053,685)
Class
R6
(64,252,883)
(645,033,029)
(82,592,569)
(791,662,756)
Retirement
Class
(10,132,726)
(158,378,183)
(9,778,803)
(139,793,375)
Total
redemptions
(88,240,261)
(939,750,538)
(96,190,757)
(967,522,982)
Net
increase
(decrease)
from
shareholder
transactions
(41,140,725)
$
(448,591,675)
(9,785,244)
$
(148,918,873)
Year
Ended
5/31/24
Year
Ended
5/31/23
12.9
Lifecycle
2045
Shares
Amount
Shares
Amount
Subscriptions:
Class
I
15,132
$
193,389
35,302
$
410,394
Premier
Class
2,219,476
27,470,385
2,165,378
25,226,927
Class
R6
21,973,395
277,220,123
24,617,995
288,447,994
Retirement
Class
3,193,589
40,213,928
3,298,000
38,234,152
Total
subscriptions
27,401,592
345,097,825
30,116,675
352,319,467
Reinvestments
of
distributions:
Class
I
905
11,443
761
8,356
Premier
Class
285,134
3,589,833
1,571,380
17,159,472
Class
R6
5,607,406
70,933,689
21,916,340
240,641,410
Retirement
Class
927,090
11,616,438
4,234,599
46,030,089
Total
reinvestments
of
distributions
6,820,535
86,151,403
27,723,080
303,839,327
Redemptions:
Class
I
(3,951)
(48,428)
(1,030)
(12,684)
Premier
Class
(8,349,883)
(102,647,216)
(2,225,729)
(26,072,753)
Class
R6
(35,711,665)
(453,214,173)
(43,645,377)
(520,487,999)
Retirement
Class
(7,357,392)
(92,650,132)
(6,390,186)
(73,729,002)
Total
redemptions
(51,422,891)
(648,559,949)
(52,262,322)
(620,302,438)
Net
increase
(decrease)
from
shareholder
transactions
(17,200,764)
$
(217,310,721)
5,577,433
$
35,856,356
Year
Ended
5/31/24
Year
Ended
5/31/23
13.01
Lifecycle
2050
Shares
Amount
Shares
Amount
Subscriptions:
Class
I
7,834
$
103,640
6,009
$
73,828
Premier
Class
2,032,289
25,822,530
1,922,913
22,788,492
Class
R6
19,505,170
252,685,367
22,648,264
271,013,243
Retirement
Class
2,532,808
32,680,173
2,744,846
32,554,487
Total
subscriptions
24,078,101
311,291,710
27,322,032
326,430,050
Reinvestments
of
distributions:
Class
I
401
5,223
1,283
14,393
Premier
Class
188,061
2,435,390
1,076,868
12,028,621
Class
R6
4,073,015
52,989,920
16,352,319
183,309,490
Retirement
Class
603,267
7,770,079
2,903,138
32,224,835
Total
reinvestments
of
distributions
4,864,744
63,200,612
20,333,608
227,577,339
Redemptions:
Class
I
(3,931)
(52,821)
(24,679)
(290,348)
Premier
Class
(6,283,935)
(79,284,743)
(1,730,332)
(20,561,690)
Class
R6
(28,450,518)
(370,290,822)
(27,659,834)
(336,520,581)
Retirement
Class
(5,401,775)
(69,653,716)
(4,955,758)
(58,495,710)
Total
redemptions
(40,140,159)
(519,282,102)
(34,370,603)
(415,868,329)
Net
increase
(decrease)
from
shareholder
transactions
(11,197,314)
$
(144,789,780)
13,285,037
$
138,139,060
Year
Ended
5/31/24
Year
Ended
5/31/23
13.1
Lifecycle
2055
Shares
Amount
Shares
Amount
Subscriptions:
Class
I
9,080
$
142,095
13,005
$
184,788
Premier
Class
1,147,339
17,310,104
1,018,870
14,258,603
Class
R6
12,759,571
196,379,956
14,206,786
200,594,633
Retirement
Class
1,625,713
24,942,526
1,715,773
24,111,919
Total
subscriptions
15,541,703
238,774,681
16,954,434
239,149,943
Reinvestments
of
distributions:
Class
I
337
5,202
455
6,036
Premier
Class
76,532
1,176,296
424,388
5,606,170
Class
R6
1,590,293
24,538,229
6,043,641
80,138,674
Retirement
Class
220,324
3,384,176
1,052,945
13,898,868
Total
reinvestments
of
distributions
1,887,486
29,103,903
7,521,429
99,649,748
Redemptions:
Class
I
(1,094)
(16,335)
(92)
(1,321)
Premier
Class
(2,770,787)
(41,477,392)
(728,896)
(10,190,769)
Class
R6
(11,709,796)
(181,340,565)
(10,601,565)
(152,428,904)
Retirement
Class
(2,494,528)
(38,250,524)
(1,943,257)
(27,035,230)
Total
redemptions
(16,976,205)
(261,084,816)
(13,273,810)
(189,656,224)
Net
increase
(decrease)
from
shareholder
transactions
452,984
$
6,793,768
11,202,053
$
149,143,467
Notes
to
Financial
Statements
(continued)
6.
Income
Tax
Information
Each
Fund
is
a
separate
taxpayer
for
federal
income
tax
purposes.
Each
Fund
intends
to
distribute
substantially
all
of
its
net
investment
income
and
net
capital
gains
to
shareholders
and
otherwise
comply
with
the
requirements
of
Subchapter
M
of
the
Internal
Revenue
Code
applicable
to
regulated
investment
companies.
Therefore,
no
federal
income
tax
provision
is
required.
Each
Fund
files
income
tax
returns
in
U.S.
federal
and
applicable
state
and
local
jurisdictions.
A
Fund’s
federal
income
tax
returns
are
generally
subject
to
examination
for
a
period
of
three
fiscal
years
after
being
filed.
State
and
local
tax
returns
may
be
subject
to
examination
for
an
additional
period
of
time
depending
on
the
jurisdiction.
Management
has
analyzed
each
Fund’s
tax
positions
taken
for
all
open
tax
years
and
has
concluded
that
no
provision
for
income
tax
is
required
in
the
Fund’s
financial
statements.
Differences
between
amounts
for
financial
statement
and
federal
income
tax
purposes
are
primarily
due
to
timing
differences
in
recognizing
gains
and
losses
on
investment
transactions.
Temporary
differences
do
not
require
reclassification.
As
of
year
end,
permanent
differences
that
resulted
in
reclassifications
among
the
components
of
net
assets
relate
primarily
to
distribution
reallocations,
investments
in
partnerships,
investments
in
underlying
funds,
and
tax
equalization.
Temporary
and
permanent
differences
have
no
impact
on
a
Fund’s
net
assets.
As
of
year
end,
the
aggregate
cost
and
the
net
unrealized
appreciation/(depreciation)
of
all
investments
for
federal
income
tax
purposes
were
as
follows:
Year
Ended
5/31/24
Year
Ended
5/31/23
13.2
Lifecycle
2060
Shares
Amount
Shares
Amount
Subscriptions:
Class
I
12,996
$
177,826
15,764
$
192,560
Premier
Class
848,687
11,194,422
651,373
7,856,747
Class
R6
10,633,692
142,198,740
10,060,337
121,775,409
Retirement
Class
1,464,735
19,573,023
1,359,186
16,387,118
Total
subscriptions
12,960,110
173,144,011
12,086,660
146,211,834
Reinvestments
of
distributions:
Class
I
429
5,728
667
7,622
Premier
Class
26,262
349,811
116,744
1,332,049
Class
R6
658,741
8,794,194
2,120,439
24,236,620
Retirement
Class
83,407
1,109,318
342,124
3,896,791
Total
reinvestments
of
distributions
768,839
10,259,051
2,579,974
29,473,082
Redemptions:
Class
I
(9,881)
(138,547)
(40)
(466)
Premier
Class
(1,015,377)
(13,219,250)
(303,750)
(3,606,591)
Class
R6
(4,848,320)
(65,068,293)
(4,643,760)
(57,436,613)
Retirement
Class
(1,159,473)
(15,386,181)
(776,942)
(9,290,311)
Total
redemptions
(7,033,051)
(93,812,271)
(5,724,492)
(70,333,981)
Net
increase
(decrease)
from
shareholder
transactions
6,695,898
$
89,590,791
8,942,142
$
105,350,935
Year
Ended
5/31/24
Year
Ended
5/31/23
13.3
Lifecycle
2065
Shares
Amount
Shares
Amount
Subscriptions:
Class
I
2,710
$
31,361
2,941
$
30,309
Premier
Class
243,089
2,762,441
177,922
1,787,554
Class
R6
3,506,620
40,721,685
2,056,822
21,030,683
Retirement
Class
766,945
8,937,553
489,198
4,995,196
Total
subscriptions
4,519,364
52,453,040
2,726,883
27,843,742
Reinvestments
of
distributions:
Class
I
55
621
51
497
Premier
Class
3,405
38,717
5,459
53,005
Class
R6
59,323
683,995
50,389
495,823
Retirement
Class
11,631
134,110
13,189
129,910
Total
reinvestments
of
distributions
74,414
857,443
69,088
679,235
Redemptions:
Class
I
(34)
(397)
(740)
(7,540)
Premier
Class
(183,521)
(2,055,662)
(70,662)
(703,971)
Class
R6
(918,906)
(10,723,870)
(782,462)
(8,093,958)
Retirement
Class
(347,858)
(4,023,210)
(153,756)
(1,571,024)
Total
redemptions
(1,450,319)
(16,803,139)
(1,007,620)
(10,376,493)
Net
increase
(decrease)
from
shareholder
transactions
3,143,459
$
36,507,344
1,788,351
$
18,146,484
For
purposes
of
this
disclosure,
tax
cost
generally
includes
the
cost
of
portfolio
investments
as
well
as
up-front
fees
or
premiums
exchanged
on
derivatives
and
any
amounts
unrealized
for
income
statement
reporting
but
realized
income
and/or
capital
gains
for
tax
reporting,
if
applicable.
As
of year
end,
the
components
of
accumulated
earnings
on
a
tax
basis
were
as
follows:
The
tax
character
of
distributions
paid was
as
follows:
Fund
Tax
Cost
Gross
Unrealized
Appreciation
Gross
Unrealized
(Depreciation)
Net
Unrealized
Appreciation
(Depreciation)
12.1
Lifecycle
Retirement
Income
$405,824,343
$49,004,383
$(36,211,738)
$12,792,645
12.2
Lifecycle
2010
769,717,079
100,245,120
(65,992,971)
34,252,149
12.3
Lifecycle
2015
1,151,678,867
115,171,754
(109,566,142)
5,605,612
12.4
Lifecycle
2020
2,451,427,320
282,394,885
(221,028,729)
61,366,156
12.5
Lifecycle
2025
3,736,325,102
493,028,494
(315,917,629)
177,110,865
12.6
Lifecycle
2030
4,385,125,706
685,959,107
(321,001,499)
364,957,608
12.7
Lifecycle
2035
4,515,428,270
867,645,393
(268,766,417)
598,878,976
12.8
Lifecycle
2040
5,189,752,863
1,222,827,291
(246,345,706)
976,481,585
12.9
Lifecycle
2045
3,624,219,504
976,081,933
(153,859,278)
822,222,655
13.01
Lifecycle
2050
2,867,266,573
746,089,930
(108,883,096)
637,206,834
13.1
Lifecycle
2055
1,493,516,152
331,586,523
(59,884,875)
271,701,648
13.2
Lifecycle
2060
643,715,308
116,046,681
(25,277,611)
90,769,070
13.3
Lifecycle
2065
80,661,111
12,047,779
(2,061,397)
9,986,382
Fund
Undistributed
Ordinary
Income
Undistributed
Long-Term
Capital
Gains
Unrealized
Appreciation
(Depreciation)
Capital
Loss
Carryforwards
Late-Year
Loss
Deferrals
Other
Book-to-Tax
Differences
Total
12.1
Lifecycle
Retirement
Income
$2,099,522
$–
$12,792,645
$(1,721,025)
$–
$(54,705)
$13,116,437
12.2
Lifecycle
2010
10,135,378
5,110,268
34,252,149
–
–
(209,813)
49,287,982
12.3
Lifecycle
2015
13,535,428
–
5,605,612
(2,426,212)
–
(299,769)
16,415,059
12.4
Lifecycle
2020
28,714,623
2,398,481
61,366,156
–
–
(443,649)
92,035,611
12.5
Lifecycle
2025
38,954,069
13,864,499
177,110,865
–
–
(469,910)
229,459,523
12.6
Lifecycle
2030
37,423,429
17,191,811
364,957,608
–
–
(463,266)
419,109,582
12.7
Lifecycle
2035
31,598,916
–
598,878,976
(2,210,702)
–
(467,071)
627,800,119
12.8
Lifecycle
2040
26,802,915
211,507
976,481,585
–
–
(608,037)
1,002,887,970
12.9
Lifecycle
2045
11,726,313
24,697,891
822,222,655
–
–
(221,114)
858,425,745
13.01
Lifecycle
2050
6,663,979
25,335,222
637,206,834
–
–
(142,113)
669,063,922
13.1
Lifecycle
2055
2,187,773
21,556,215
271,701,648
–
–
(41,649)
295,403,987
13.2
Lifecycle
2060
–
10,295,505
90,769,070
–
–
(9,349)
101,055,226
13.3
Lifecycle
2065
–
1,418,396
9,986,382
–
(207,145)
(409)
11,197,224
5/31/24
5/31/23
Fund
Ordinary
Income
Long-Term
Capital
Gains
Ordinary
Income
Long-Term
Capital
Gains
12.1
Lifecycle
Retirement
Income
$
14,795,135
$
–
$
13,270,979
$
14,112,422
12.2
Lifecycle
2010
29,734,344
–
29,379,383
29,158,365
12.3
Lifecycle
2015
39,787,142
–
36,413,594
45,111,498
12.4
Lifecycle
2020
84,779,806
–
75,174,490
107,977,277
12.5
Lifecycle
2025
120,680,900
–
102,138,283
181,293,762
12.6
Lifecycle
2030
128,083,748
–
101,654,559
223,672,262
12.7
Lifecycle
2035
124,069,261
–
92,477,284
260,383,909
12.8
Lifecycle
2040
134,417,378
–
93,184,722
343,941,755
12.9
Lifecycle
2045
86,297,811
–
58,744,900
245,683,071
13.01
Lifecycle
2050
63,234,478
–
43,573,826
184,213,360
13.1
Lifecycle
2055
29,176,047
–
21,085,365
78,783,341
13.2
Lifecycle
2060
10,253,441
59,584
7,135,213
22,421,673
13.3
Lifecycle
2065
916,863
28,656
358,995
469,466
Notes
to
Financial
Statements
(continued)
As
of
year
end,
the
Funds
had
capital
loss
carryforwards,
which
will
not
expire:
As
of
year
end,
the
Funds
utilized
the
following
capital
loss
carryovers:
7.
Investment
Adviser
and
Other
Transactions
with
Affiliates
Under
the
terms
of
its
Investment
Management
Agreement, the
Adviser is
entitled
to
a
fee
that
is
made
up
of
two
components,
which
are
added
together
to
create
the
total
investment
management
fee.
The
first
component,
the
asset
allocation
fee
rate,
is
an
annual
rate
of
0.10%
of
the
average
daily
net
assets
of
each
Fund.
The
second
component,
the
Underlying
Funds
fee
rate,
is
calculated
as
follows:
for
each
Underlying
Fund
of
the
Trust
in
which
a
Fund
is
invested,
the
effective
Underlying
Fund’s
annual
investment
management
agreement,
net
of
any
fee
waivers
or
reimbursements
applicable
to
the
Underlying
Fund
(excluding
the
Class
W
shares
investment
management
fee
waiver
and/or
reimbursement)
in
proportion
to
the
percentage
of
the
Fund’s
net
assets
invested
in
the
Underlying
Fund,
applied
to
the
average
daily
net
assets
of
the
Fund. The
Adviser has
contractually
agreed
to
waive
in
full
the
asset
allocation
fee
rate
component
of
the
management
fee
on
each
Fund.
This
waiver
will
remain
in
effect
through
September
30,
2026,
unless
changed
with
approval
of
the
Board.
In
addition, the
Adviser has
voluntarily
agreed
to
waive
certain
amounts
of
the
Underlying
Funds
fee
rate
portion
of
each
Fund’s
management
fee
through
September
30,
2024.
As
of
the
end
of
the
current
fiscal
period, the
Adviser received
from
the
Funds
the
following
effective
annual
rate
as
a
percentage
of
average
daily
net
assets
of
each
Fund:
The
Funds
have
entered
into
an
Administrative
Service
Agreement
with
the
Adviser
under
which
the
Funds
pay the
Adviser for
its
costs
in
providing
certain
administrative
and
compliance
services
to
the
Funds.
The
Adviser
has
agreed
to
gradually
reduce
expenses
allocated
to
the
Funds
under
the
Administrative
Service
Agreement
over
a
three-year
period
commencing
May
1,
2024.
After
the
expiration
of
this
three-year
period,
the
Adviser
will
no
longer
allocate
expenses
to
the
Funds
under
the
Administrative
Service
Agreement.
Fund
Short-Term
Long-Term
Total
12.1
Lifecycle
Retirement
Income
$
1,048,776
$
672,249
$
1,721,025
12.2
Lifecycle
2010
–
–
–
12.3
Lifecycle
2015
2,426,212
–
2,426,212
12.4
Lifecycle
2020
–
–
–
12.5
Lifecycle
2025
–
–
–
12.6
Lifecycle
2030
–
–
–
12.7
Lifecycle
2035
2,210,702
–
2,210,702
12.8
Lifecycle
2040
–
–
–
12.9
Lifecycle
2045
–
–
–
13.01
Lifecycle
2050
–
–
–
13.1
Lifecycle
2055
–
–
–
13.2
Lifecycle
2060
–
–
–
13.3
Lifecycle
2065
–
–
–
Fund
Utilized
12.1
Lifecycle
Retirement
Income
$5,081,500
12.2
Lifecycle
2010
9,486,241
12.3
Lifecycle
2015
15,233,301
12.4
Lifecycle
2020
41,207,994
12.5
Lifecycle
2025
71,060,985
12.6
Lifecycle
2030
85,960,191
12.7
Lifecycle
2035
112,500,233
12.8
Lifecycle
2040
136,256,036
12.9
Lifecycle
2045
73,684,881
13.01
Lifecycle
2050
46,121,741
13.1
Lifecycle
2055
14,981,184
13.2
Lifecycle
2060
3,967,877
13.3
Lifecycle
2065
–
Investment
Management
Fee
Waiver
Fund
Investment
Management
Fee—Effective
Rate
Effective
10/1/23
Prior
to
10/1/23
Lifecycle
Retirement
Income
0.29%
0.023%
0.127%
Lifecycle
2010
0.29
0.016
0.123
Lifecycle
2015
0.29
0.024
0.128
Lifecycle
2020
0.29
0.028
0.130
Lifecycle
2025
0.30
0.023
0.132
Lifecycle
2030
0.30
0.028
0.144
Lifecycle
2035
0.31
0.045
0.156
Lifecycle
2040
0.32
0.060
0.176
Lifecycle
2045
0.32
0.063
0.175
Lifecycle
2050
0.32
0.074
0.185
Lifecycle
2055
0.32
0.074
0.185
Lifecycle
2060
0.32
0.075
0.185
Lifecycle
2065
0.32
0.087
0.196
Under
the
terms
of
a
Retirement
Class
Service
Agreement
with
respect
to
each
Fund,
the
Retirement
Class
of
the
Fund
incurs
an
annual
fee
of
0.25%
of
the
daily
net
assets,
payable
monthly
to
the
Adviser,
for certain
administrative
costs
associated
with
the
maintenance
of
Retirement
Class
shares
on
retirement
plan
or
other
platforms.
Substantially
all
of
the
Retirement
Class
shareholder
servicing
fees
reported
on
the
Statements
of
operations
are
paid
to the
Adviser under
the
Service
Agreement.
Under
the
terms
of
the
distribution
Rule
12b-1
plan,
the
Retail
Class
of
the
Retirement
Income
Fund
compensated
Nuveen
Securities
for
providing
distribution,
promotional
and/or
shareholder
services
to
the
Retail
Class
of
the
Retirement
Income
Fund
at
the
maximum
annual
rates
of
0.25%
of
the
average
daily
net
assets
attributable
to the
Fund’s
Retail
Class.
The
Premier
Class
of
each
Fund
is
subject
to
a
distribution
Rule
12b-1
plan
that
compensated
Nuveen
Securities
for
providing
distribution,
promotional
and/
or
shareholder
services
to
the
Premier
Class
of
the
Fund
at
the
annual
rate
of
0.15%
of
average
daily
net
assets
attributable
to
the
Fund’s
Premier
Class.
The
Adviser
has
agreed
to
reimburse
each
Fund
if
its
total
expense
ratio
(excluding
interest,
taxes,
brokerage
commissions
and
other
transactional
expenses,
Acquired
fund
fees
and
expenses,
extraordinary
expenses
and
the
management
fees
and
certain
other
expenses
originally
attributable
to
Class
W
shares
of
the
affiliated
Nuveen
Funds)
exceeds
0.00%
of
average
daily
net
assets
for
the
Institutional
Class
shares;
0.15%
of
average
daily
net
assets
for
the
Advisor
Class
shares;
0.15%
of
average
daily
net
assets
for
the
Premier
Class
shares;
0.25%
of
average
daily
net
assets
for
the
Retirement
Class
shares;
and
0.25%
of
average
daily
net
assets
for
the
Retail
Class
shares
of
the
Retirement
Income
Fund.
The
expense
reimbursement
arrangements
will
continue
through
at
least
September
30,
2024,
unless
changed
with
approval
of
the
Board.
With
respect
to
Lifecycle
2010
Fund,
Lifecycle
2015
Fund,
Lifecycle
2020
Fund
and
Lifecycle
2025
Fund
the
Adviser
has
voluntarily
agreed
to
reimburse
the
Funds
for
0.030%,
0.045%,
0.025%
and
0.015%
respectively,
of
the
Total
Expenses
of
each
of
its
share
classes
that
are
originally
attributable
to
Class
W
shares
of
the
Underlying
Funds.
These
voluntary
commitments
were
effective
May
1,
2023
to
April
30,
2024.
The
Adviser
for
Lifecycle
2010
Fund
has
voluntarily
agreed
to
reimburse
the
Fund
for
0.030%
from
May
1,
2024
to
April
30,
2025.
The Funds are
permitted
to
purchase
or
sell securities
from
or
to
certain
other
funds
or
accounts
managed
by
the
Adviser
or
by
an
affiliate
of
the
Adviser
(each
an,
"Affiliated
Entity")
under
specified
conditions
outlined
in
procedures
adopted
by
the
Board
("cross-
trade").
These
procedures
have
been
designed
to
ensure
that
any
cross-trade
of
securities
by
the
Fund from
or
to
an
Affiliated
Entity
by
virtue
of
having
a
common
investment
adviser
(or
affiliated
investment
adviser),
common
officer
and/or
common
trustee complies
with
Rule
17a-7
under
the
1940
Act.
These
transactions
are
affected
at
the
current
market price
(as
provided
by
an
independent
pricing
service) without
incurring
broker
commissions.
During
the
current
fiscal
period,
the
Funds
engaged
in
the
following
security
transactions
with
affiliated
entities:
The
following
is
the
percentage
of
the
Funds’
shares
owned
by
TIAA
and
its
registered
separate
account
(“TIAA
Access”)
as
of
the
end
of
the
current
fiscal
period:
Fund
Purchases
Sales
Realized
Gain
(Loss)
Lifecycle
Retirement
Income
$
442,250
$
256,238
$
(18,157)
Lifecycle
2010
188,230
459,414
(3,245)
Lifecycle
2015
364,248
736,586
(18,636)
Lifecycle
2020
948,418
1,750,018
63,874
Lifecycle
2025
518,690
2,687,145
99,878
Lifecycle
2030
15,958
4,814,632
(8,894)
Lifecycle
2035
22,127
3,150,467
(291,211)
Lifecycle
2040
387,533
2,676,496
(175,732)
Lifecycle
2045
1,487,968
299,630
(26,258)
Lifecycle
2050
4,066,208
187,855
(10,190)
Lifecycle
2055
3,825,540
18,656
(1,861)
Lifecycle
2060
5,365,958
4,374,598
(24,364)
Underlying
Fund
TIAA
TIAA
Access
Total
12.1
Lifecycle
Retirement
Income
–
%
12
%
12
%
12.2
Lifecycle
2010
–
16
16
12.3
Lifecycle
2015
–
15
15
12.4
Lifecycle
2020
–
17
17
12.5
Lifecycle
2025
–
17
17
12.6
Lifecycle
2030
–
17
17
12.7
Lifecycle
2035
–
18
18
12.8
Lifecycle
2040
–
18
18
12.9
Lifecycle
2045
–
18
18
13.01
Lifecycle
2050
–
21
21
13.1
Lifecycle
2055
–
18
18
13.2
Lifecycle
2060
–
19
19
13.3
Lifecycle
2065
7
3
10
Notes
to
Financial
Statements
(continued)
Investments
in
other
investment
companies
advised
by
the
Adviser
and
Nuveen
Fund
Advisors,
LLC
are
deemed
to
be
affiliated
investments.
Information
regarding
transactions
with
affiliated
companies
is
as
follows:
Issue
Value
at
5/31/23
Purchases
Cost
Sales
Proceeds
Realized
Gain
(Loss)
Change
in
Unrealized
Appreciation
(Depreciation)
Value
at
5/31/24
Dividend
Income
Capital
Gain
Distributions
Lifecycle
Retirement
Income
Nuveen
Funds:
Core
Bond,
Class
W
$
93,775,625
$
9,295,460
$
13,918,893
$
(2,224,821)
$
1,048,277
$
87,975,648
$
4,023,035
$
–
Core
Equity,
Class
W
14,637,027
3,590,394
5,666,927
757,646
807,551
14,125,691
236,422
2,727,697
Core
Plus
Bond,
Class
W
58,133,260
5,332,120
8,450,102
(1,422,754)
882,360
54,474,884
2,672,413
–
Dividend
Growth,
Class
R6
14,460,610
1,975,393
4,342,983
284,026
1,844,339
14,221,385
203,010
239,042
Dividend
Value,
Class
R6
14,676,022
1,971,105
5,490,486
367,121
2,060,755
13,584,517
262,131
503,804
Emerging
Markets
Debt,
Class
W
8,441,143
826,370
1,961,154
(344,753)
935,458
7,897,064
504,296
–
Emerging
Markets
Equity,
Class
W
8,893,757
2,218,654
3,113,524
(325,377)
1,022,615
8,696,125
367,589
–
Growth
Opportunities
ETF
16,907,263
594,879
6,436,680
19,924
5,691,654
16,777,040
32,643
–
High
Yield,
Class
W
8,913,506
749,890
1,747,566
(51,409)
473,336
8,337,757
588,180
–
Inflation
Linked
Bond,
Class
W
44,615,805
6,112,149
8,417,670
(785,955)
337,997
41,862,326
1,755,133
–
International
Bond,
Class
W
9,305,909
886,031
1,946,858
(403,342)
900,111
8,741,851
73,772
–
International
Equity,
Class
W
23,023,075
3,649,560
7,879,424
882,701
2,849,840
22,525,752
715,414
–
International
Opportunities,
Class
W
13,753,419
1,990,923
3,926,640
96,604
1,478,347
13,392,653
250,105
–
Large
Cap
Growth,
Class
W
16,900,638
2,153,277
6,883,539
1,498,017
3,175,091
16,843,484
101,788
–
Large
Cap
Value,
Class
W
14,720,831
2,523,479
5,731,712
1,067,618
1,062,220
13,642,436
312,385
909,016
Quant
International
Small
Cap
Equity,
Class
W
7,294,908
903,858
2,110,689
(5,377)
1,225,715
7,308,415
272,576
–
Quant
Small
Cap
Equity,
Class
W
3,652,158
460,730
1,617,049
429,036
312,438
3,237,313
52,152
36,411
Quant
Small/Mid
Cap
Equity,
Class
W
4,250,245
442,848
1,875,425
410,194
619,304
3,847,166
61,396
64,083
Short
Term
Bond,
Class
W
44,686,676
6,638,043
10,004,585
(454,615)
812,577
41,678,096
1,810,834
–
TIAA-CREF
Real
Property
Fund
LP
a
24,453,592
1,124,150
3,598,727
(73,232)
(2,627,398)
19,278,385
1,031,031
–
$445,495,469
$53,439,313
$105,120,633
$(278,748)
$24,912,587
$418,447,988
$15,326,305
$4,480,053
Issue
Value
at
5/31/23
Purchases
Cost
Sales
Proceeds
Realized
Gain
(Loss)
Change
in
Unrealized
Appreciation
(Depreciation)
Value
at
5/31/24
Dividend
Income
Capital
Gain
Distributions
Lifecycle
2010
Nuveen
Funds:
Core
Bond,
Class
W
$
180,173,371
$
21,160,240
$
30,794,588
$
(4,403,741)
$
2,029,527
$
168,164,809
$
7,619,074
$
–
Core
Equity,
Class
W
26,896,079
6,967,785
10,857,035
1,874,467
948,635
25,829,931
427,628
4,880,978
Core
Plus
Bond,
Class
W
111,714,273
10,828,197
17,268,096
(2,893,278)
1,781,105
104,162,201
5,060,271
–
Dividend
Growth,
Class
R6
26,712,756
4,083,454
8,802,057
627,085
3,192,347
25,813,585
368,141
428,371
Dividend
Value,
Class
R6
27,172,786
3,473,311
10,147,270
729,045
3,653,501
24,881,373
475,884
904,030
Emerging
Markets
Debt,
Class
W
16,197,801
1,764,995
3,942,212
(683,096)
1,780,337
15,117,825
957,936
–
Emerging
Markets
Equity,
Class
W
16,431,042
4,016,910
6,085,544
(510,590)
1,758,658
15,610,476
657,586
–
Growth
Opportunities
ETF
31,294,354
308,556
11,199,057
(246,955)
10,523,259
30,680,157
58,368
–
High
Yield,
Class
W
17,063,549
1,731,384
3,640,510
(124,838)
915,987
15,945,572
1,113,972
–
Inflation
Linked
Bond,
Class
W
85,757,862
12,089,052
17,003,654
(1,442,837)
530,238
79,930,661
3,352,979
–
International
Bond,
Class
W
17,879,074
2,016,678
4,170,629
(862,623)
1,798,876
16,661,376
139,167
–
International
Equity,
Class
W
42,540,482
7,400,652
15,392,337
1,645,154
4,998,582
41,192,533
1,280,154
–
International
Opportunities,
Class
W
25,390,101
3,998,953
7,810,307
368,526
2,423,505
24,370,778
447,541
–
Large
Cap
Growth,
Class
W
31,265,091
4,562,833
13,470,738
5,765,076
2,615,715
30,737,977
182,210
–
Large
Cap
Value,
Class
W
27,220,226
5,676,706
11,781,212
2,706,173
1,157,650
24,979,543
559,199
1,627,226
Quant
International
Small
Cap
Equity,
Class
W
13,484,233
1,691,182
4,080,161
(41,273)
2,230,786
13,284,767
487,976
–
Quant
Small
Cap
Equity,
Class
W
6,746,910
911,226
3,161,417
835,842
498,976
5,831,537
93,321
65,154
Quant
Small/Mid
Cap
Equity,
Class
W
7,851,075
810,371
3,562,684
779,661
1,065,218
6,943,641
109,863
114,670
Short
Term
Bond,
Class
W
110,672,452
22,927,907
24,072,120
(1,075,264)
1,979,436
110,432,411
4,586,163
–
TIAA-CREF
Real
Property
Fund
LP
a
33,670,071
761,803
8,195,532
249,905
(3,660,172)
22,826,075
1,304,048
–
$856,133,588
$117,182,195
$215,437,160
$3,296,439
$42,222,166
$803,397,228
$29,281,481
$8,020,429
Issue
Value
at
5/31/23
Purchases
Cost
Sales
Proceeds
Realized
Gain
(Loss)
Change
in
Unrealized
Appreciation
(Depreciation)
Value
at
5/31/24
Dividend
Income
Capital
Gain
Distributions
Lifecycle
2015
Nuveen
Funds:
Core
Bond,
Class
W
$
255,795,924
$
29,374,344
$
41,166,612
$
(7,859,022)
$
4,368,112
$
240,512,746
$
10,844,564
$
–
Core
Equity,
Class
W
42,748,479
10,164,317
16,522,089
2,189,302
2,264,272
40,844,281
673,929
7,662,023
Core
Plus
Bond,
Class
W
158,489,178
16,264,744
24,118,035
(4,293,023)
2,621,256
148,964,120
7,203,118
–
Dividend
Growth,
Class
R6
42,282,469
5,699,215
13,087,765
937,528
5,059,704
40,891,151
580,484
671,652
Dividend
Value,
Class
R6
43,089,743
5,296,288
16,004,512
1,062,994
5,805,200
39,249,713
750,786
1,420,012
Emerging
Markets
Debt,
Class
W
23,029,986
2,295,197
5,234,157
(1,015,623)
2,559,930
21,635,333
1,363,730
–
Emerging
Markets
Equity,
Class
W
26,012,200
5,230,683
8,350,110
(1,325,515)
3,255,430
24,822,688
1,039,433
–
Growth
Opportunities
ETF
49,637,364
516,431
17,888,169
(516,036)
16,681,903
48,431,493
91,742
–
High
Yield,
Class
W
24,176,099
2,516,248
4,999,032
(203,422)
1,313,670
22,803,563
1,585,616
–
Inflation
Linked
Bond,
Class
W
112,555,832
18,871,970
20,453,274
(2,227,835)
1,047,100
109,793,793
4,463,899
–
International
Bond,
Class
W
25,405,072
2,825,324
5,724,071
(1,235,617)
2,557,697
23,828,405
196,587
–
International
Equity,
Class
W
67,290,347
8,854,157
21,543,764
1,951,024
8,460,032
65,011,796
2,009,667
–
International
Opportunities,
Class
W
40,165,769
5,122,384
11,140,019
511,831
3,817,538
38,477,503
702,535
–
Large
Cap
Growth,
Class
W
49,414,267
4,906,564
18,979,845
4,558,321
8,578,090
48,477,397
285,960
–
Large
Cap
Value,
Class
W
43,038,781
6,935,730
16,610,083
2,498,180
3,550,272
39,412,880
878,062
2,555,096
Quant
International
Small
Cap
Equity,
Class
W
21,354,378
2,180,074
6,092,893
(174,851)
3,609,037
20,875,745
767,043
–
Quant
Small
Cap
Equity,
Class
W
10,679,145
1,248,309
4,646,972
1,092,599
995,495
9,368,576
146,492
102,277
Quant
Small/Mid
Cap
Equity,
Class
W
12,426,867
1,143,937
5,339,636
1,092,666
1,809,119
11,132,953
172,459
180,006
Short
Term
Bond,
Class
W
112,747,713
21,286,384
25,556,812
(1,281,298)
2,168,300
109,364,287
4,602,401
–
TIAA-CREF
Real
Property
Fund
LP
a
67,404,688
1,953,560
8,707,796
(12,327)
(7,329,071)
53,309,054
2,804,943
–
$1,227,744,301
$152,685,860
$292,165,646
$(4,250,124)
$73,193,086
$1,157,207,477
$41,163,450
$12,591,066
Issue
Value
at
5/31/23
Purchases
Cost
Sales
Proceeds
Realized
Gain
(Loss)
Change
in
Unrealized
Appreciation
(Depreciation)
Value
at
5/31/24
Dividend
Income
Capital
Gain
Distributions
Lifecycle
2020
Nuveen
Funds:
Core
Bond,
Class
W
$
549,854,227
$
62,242,925
$
95,336,456
$
(17,619,232)
$
10,219,447
$
509,360,911
$
23,136,509
$
–
Core
Equity,
Class
W
107,576,356
23,173,910
41,126,631
5,801,981
5,304,267
100,729,883
1,680,490
19,157,788
Core
Plus
Bond,
Class
W
340,803,750
35,317,736
57,186,266
(10,087,343)
6,574,382
315,422,259
15,368,969
–
Dividend
Growth,
Class
R6
106,013,030
11,524,633
31,847,909
2,634,300
12,383,565
100,707,619
1,444,617
1,675,297
Dividend
Value,
Class
R6
107,316,416
10,679,798
38,159,167
2,656,331
14,535,885
97,029,263
1,867,926
3,541,879
Emerging
Markets
Debt,
Class
W
49,448,663
4,184,529
11,105,248
(2,159,582)
5,463,329
45,831,691
2,918,701
–
Emerging
Markets
Equity,
Class
W
65,327,864
11,657,105
20,866,605
(3,636,610)
8,573,939
61,055,693
2,592,286
–
Growth
Opportunities
ETF
124,237,721
1,007,755
45,623,055
(1,284,148)
41,612,169
119,950,442
228,409
–
High
Yield,
Class
W
52,048,595
5,537,579
11,682,976
(485,822)
2,877,010
48,294,386
3,382,043
–
Inflation
Linked
Bond,
Class
W
194,060,570
33,142,237
36,616,364
(3,913,326)
1,911,013
188,584,130
7,678,450
–
International
Bond,
Class
W
54,670,799
6,288,764
13,327,355
(2,843,567)
5,673,489
50,462,130
421,676
–
International
Equity,
Class
W
168,837,545
18,464,701
53,087,349
5,929,861
20,260,320
160,405,078
5,020,593
–
International
Opportunities,
Class
W
100,707,329
10,507,939
27,793,420
1,501,985
9,423,315
94,347,148
1,755,603
–
Large
Cap
Growth,
Class
W
123,903,251
10,586,778
49,205,610
12,472,573
20,499,338
118,256,330
714,402
–
Large
Cap
Value,
Class
W
108,177,167
12,886,509
39,142,691
6,663,242
8,441,308
97,025,535
2,193,818
6,383,846
Quant
International
Small
Cap
Equity,
Class
W
53,495,271
4,856,958
15,137,756
(380,999)
8,971,652
51,805,126
1,919,949
–
Quant
Small
Cap
Equity,
Class
W
26,775,371
2,768,890
12,028,674
2,850,623
2,379,611
22,745,821
366,078
255,587
Quant
Small/Mid
Cap
Equity,
Class
W
31,157,461
2,296,565
13,656,722
3,025,743
4,230,548
27,053,595
430,968
449,826
Short
Term
Bond,
Class
W
194,393,763
38,129,538
46,415,556
(2,191,418)
3,733,110
187,649,437
7,919,895
–
TIAA-CREF
Real
Property
Fund
LP
a
148,714,320
2,733,780
19,648,295
(22,452)
(16,061,355)
115,715,998
6,159,106
–
$2,707,519,469
$307,988,629
$678,994,105
$(1,087,860)
$177,006,342
$2,512,432,475
$87,200,488
$31,464,223
Notes
to
Financial
Statements
(continued)
Issue
Value
at
5/31/23
Purchases
Cost
Sales
Proceeds
Realized
Gain
(Loss)
Change
in
Unrealized
Appreciation
(Depreciation)
Value
at
5/31/24
Dividend
Income
Capital
Gain
Distributions
Lifecycle
2025
Nuveen
Funds:
Core
Bond,
Class
W
$
755,898,593
$
120,584,598
$
112,000,975
$
(20,768,876)
$
10,654,731
$
754,368,071
$
33,190,124
$
–
Core
Equity,
Class
W
184,641,583
38,294,625
63,494,914
8,997,040
10,446,854
178,885,188
2,945,491
33,713,813
Core
Plus
Bond,
Class
W
468,335,099
63,132,653
59,477,762
(10,793,081)
6,001,494
467,198,403
22,036,385
–
Dividend
Growth,
Class
R6
182,375,719
18,468,683
48,355,529
3,628,741
22,679,812
178,797,426
2,533,234
2,944,609
Dividend
Value,
Class
R6
185,154,151
17,266,056
60,314,854
3,396,709
26,723,269
172,225,331
3,275,793
6,225,280
Emerging
Markets
Debt,
Class
W
67,963,843
8,566,354
13,405,973
(2,596,556)
7,336,791
67,864,459
4,154,038
–
Emerging
Markets
Equity,
Class
W
112,240,623
19,661,308
32,258,563
(5,209,121)
13,727,510
108,161,757
4,566,365
–
Growth
Opportunities
ETF
213,902,566
931,237
72,972,924
(1,913,060)
72,635,567
212,583,386
402,224
–
High
Yield,
Class
W
71,985,414
10,291,670
14,147,604
(629,335)
4,029,427
71,529,572
4,850,438
–
Inflation
Linked
Bond,
Class
W
206,814,659
45,573,836
34,574,284
(4,157,716)
2,173,474
215,829,969
8,406,889
–
International
Bond,
Class
W
75,073,802
11,597,093
15,956,713
(3,431,166)
7,484,676
74,767,692
609,063
–
International
Equity,
Class
W
290,352,544
27,848,286
79,301,175
8,825,992
37,231,617
284,957,264
8,834,161
–
International
Opportunities,
Class
W
173,182,397
18,166,852
43,042,347
934,652
18,278,143
167,519,697
3,091,228
–
Large
Cap
Growth,
Class
W
213,023,982
16,395,127
77,273,926
19,765,351
38,135,836
210,046,370
1,257,845
–
Large
Cap
Value,
Class
W
185,862,100
22,540,534
64,038,011
10,841,663
15,536,885
170,743,171
3,861,369
11,236,297
Quant
International
Small
Cap
Equity,
Class
W
92,035,767
7,719,160
22,788,484
(689,091)
15,776,957
92,054,309
3,380,462
–
Quant
Small
Cap
Equity,
Class
W
46,097,362
3,823,238
18,673,090
2,628,029
6,521,675
40,397,214
644,582
450,032
Quant
Small/Mid
Cap
Equity,
Class
W
53,625,326
3,559,636
21,846,934
4,573,808
8,130,893
48,042,729
758,839
792,045
Short
Term
Bond,
Class
W
207,178,682
50,905,273
45,066,549
(2,108,900)
3,856,019
214,764,525
8,804,437
–
TIAA-CREF
Real
Property
Fund
LP
a
220,177,904
4,311,327
19,876,719
(569,986)
(23,962,092)
180,080,434
9,378,384
–
$4,005,922,116
$509,637,546
$918,867,330
$10,725,097
$303,399,538
$3,910,816,967
$126,981,351
$55,362,076
Issue
Value
at
5/31/23
Purchases
Cost
Sales
Proceeds
Realized
Gain
(Loss)
Change
in
Unrealized
Appreciation
(Depreciation)
Value
at
5/31/24
Dividend
Income
Capital
Gain
Distributions
Lifecycle
2030
Nuveen
Funds:
Core
Bond,
Class
W
$
735,906,071
$
156,114,142
$
89,505,984
$
(17,069,183)
$
6,886,190
$
792,331,236
$
33,543,180
$
–
Core
Equity,
Class
W
249,691,089
52,733,216
72,077,117
9,768,499
17,438,736
257,554,423
4,079,323
46,840,180
Core
Plus
Bond,
Class
W
455,629,303
82,916,290
43,025,307
(8,369,246)
3,551,823
490,702,863
22,256,361
–
Dividend
Growth,
Class
R6
246,337,191
22,362,286
47,718,690
2,145,975
34,338,258
257,465,020
3,508,358
4,133,185
Dividend
Value,
Class
R6
249,300,842
26,511,634
69,731,227
2,911,992
38,918,576
247,911,817
4,544,642
8,687,371
Emerging
Markets
Debt,
Class
W
66,097,600
11,473,640
11,091,565
(2,152,086)
6,920,579
71,248,168
4,164,992
–
Emerging
Markets
Equity,
Class
W
151,520,304
29,081,024
36,663,018
(8,188,275)
20,034,947
155,784,982
6,360,451
–
Growth
Opportunities
ETF
288,606,649
675,900
81,159,835
(2,960,498)
100,838,802
306,001,018
556,542
–
High
Yield,
Class
W
70,470,380
12,183,543
10,907,868
(413,151)
3,790,613
75,123,517
4,898,624
–
Inflation
Linked
Bond,
Class
W
143,737,020
43,462,040
18,615,566
(2,959,384)
1,745,241
167,369,351
6,048,494
–
International
Bond,
Class
W
73,293,209
15,598,981
14,465,905
(3,128,984)
7,198,624
78,495,925
610,875
–
International
Equity,
Class
W
391,989,911
39,793,173
85,641,248
7,453,817
56,865,492
410,461,145
12,266,765
–
International
Opportunities,
Class
W
233,847,520
27,320,585
46,119,551
(2,833,113)
29,669,169
241,884,610
4,297,686
–
Large
Cap
Growth,
Class
W
287,722,651
26,954,347
92,312,305
21,596,372
59,052,452
303,013,517
1,746,455
–
Large
Cap
Value,
Class
W
250,832,621
29,018,775
69,838,485
10,391,257
26,148,251
246,552,419
5,363,638
15,607,785
Quant
International
Small
Cap
Equity,
Class
W
124,188,029
9,902,468
22,734,316
(866,574)
21,961,509
132,451,116
4,693,598
–
Quant
Small
Cap
Equity,
Class
W
62,192,106
5,291,955
21,897,150
2,247,887
10,441,321
58,276,119
895,156
624,978
Quant
Small/Mid
Cap
Equity,
Class
W
72,370,869
3,837,120
24,494,057
4,711,770
12,883,545
69,309,247
1,053,828
1,099,943
Short
Term
Bond,
Class
W
144,111,178
46,297,413
25,164,870
(1,241,522)
2,530,509
166,532,708
6,473,162
–
TIAA-CREF
Real
Property
Fund
LP
a
250,198,632
6,895,250
9,887,443
(986,883)
(27,710,444)
218,509,112
10,984,493
–
$4,548,043,175
$648,423,782
$893,051,507
$10,058,670
$433,504,193
$4,746,978,313
$138,346,623
$76,993,442
Issue
Value
at
5/31/23
Purchases
Cost
Sales
Proceeds
Realized
Gain
(Loss)
Change
in
Unrealized
Appreciation
(Depreciation)
Value
at
5/31/24
Dividend
Income
Capital
Gain
Distributions
Lifecycle
2035
Nuveen
Funds:
Core
Bond,
Class
W
$
598,287,254
$
182,938,034
$
75,665,760
$
(13,712,725)
$
5,260,798
$
697,107,601
$
28,366,208
$
–
Core
Equity,
Class
W
310,018,073
63,068,010
81,826,718
10,828,529
23,125,719
325,213,613
5,089,964
58,434,921
Core
Plus
Bond,
Class
W
370,458,148
98,667,329
33,271,121
(6,208,534)
2,103,511
431,749,333
18,802,016
–
Dividend
Growth,
Class
R6
306,054,159
25,775,057
52,447,094
2,020,896
43,551,433
324,954,451
4,371,414
5,130,388
Dividend
Value,
Class
R6
309,935,108
27,494,535
76,454,840
2,776,623
49,423,207
313,174,633
5,670,428
10,857,750
Emerging
Markets
Debt,
Class
W
53,732,707
14,267,153
9,271,839
(1,592,398)
5,588,252
62,723,875
3,490,618
–
Emerging
Markets
Equity,
Class
W
187,791,050
38,222,489
43,585,938
(9,341,721)
23,901,481
196,987,361
7,979,452
–
Growth
Opportunities
ETF
358,116,181
937,411
96,623,503
(3,491,585)
125,714,240
384,652,744
695,950
–
High
Yield,
Class
W
57,127,570
14,828,790
8,654,948
(336,026)
3,123,169
66,088,555
4,134,125
–
Inflation
Linked
Bond,
Class
W
54,920,887
29,851,324
5,749,475
(1,073,274)
740,964
78,690,426
2,478,131
–
International
Bond,
Class
W
59,554,793
18,016,900
11,923,102
(2,613,340)
6,020,391
69,055,642
518,080
–
International
Equity,
Class
W
487,131,266
47,970,097
97,180,975
7,875,596
72,517,077
518,313,061
15,308,120
–
International
Opportunities,
Class
W
290,543,297
30,986,843
49,480,956
(4,967,506)
38,283,437
305,365,115
5,363,931
–
Large
Cap
Growth,
Class
W
357,015,516
24,935,679
99,283,260
21,413,874
78,798,802
382,880,611
2,180,013
–
Large
Cap
Value,
Class
W
311,141,469
34,000,032
80,297,741
11,254,563
34,197,113
310,295,436
6,700,304
19,497,383
Quant
International
Small
Cap
Equity,
Class
W
153,991,846
11,802,321
25,014,752
(1,020,074)
27,343,989
167,103,330
5,860,629
–
Quant
Small
Cap
Equity,
Class
W
77,702,224
4,622,743
24,474,841
2,472,474
13,309,917
73,632,517
1,120,643
782,407
Quant
Small/Mid
Cap
Equity,
Class
W
89,965,707
3,903,618
28,181,347
4,977,074
16,903,948
87,569,000
1,318,849
1,376,561
Short
Term
Bond,
Class
W
55,020,877
29,958,803
7,236,596
(445,313)
1,008,631
78,306,402
2,770,217
–
TIAA-CREF
Real
Property
Fund
LP
a
261,601,902
5,845,418
2,007,600
(356,303)
(29,996,877)
235,086,540
11,624,515
–
$4,750,110,034
$708,092,586
$908,632,406
$18,460,830
$540,919,202
$5,108,950,246
$133,843,607
$96,079,410
Issue
Value
at
5/31/23
Purchases
Cost
Sales
Proceeds
Realized
Gain
(Loss)
Change
in
Unrealized
Appreciation
(Depreciation)
Value
at
5/31/24
Dividend
Income
Capital
Gain
Distributions
Lifecycle
2040
Nuveen
Funds:
Core
Bond,
Class
W
$
444,191,735
$
183,710,224
$
68,773,431
$
(11,666,635)
$
4,954,070
$
552,415,963
$
21,715,127
$
–
Core
Equity,
Class
W
433,991,233
88,623,674
108,763,547
13,954,084
33,938,963
461,744,407
7,138,084
81,937,199
Core
Plus
Bond,
Class
W
274,856,544
99,850,736
29,094,164
(5,760,640)
2,467,844
342,320,320
14,393,199
–
Dividend
Growth,
Class
R6
427,936,876
31,170,023
60,679,954
1,457,349
62,101,851
461,986,145
6,137,941
7,253,382
Dividend
Value,
Class
R6
433,674,816
38,726,224
100,128,051
1,606,142
71,746,962
445,626,093
7,949,939
15,184,073
Emerging
Markets
Debt,
Class
W
39,823,640
14,245,729
7,372,051
(1,133,668)
4,161,696
49,725,346
2,654,219
–
Emerging
Markets
Equity,
Class
W
262,976,789
54,513,304
58,267,385
(14,221,046)
34,807,104
279,808,766
11,155,530
–
Growth
Opportunities
ETF
501,906,334
1,226,916
128,420,524
(5,576,917)
177,190,212
546,326,021
974,282
–
High
Yield,
Class
W
42,809,652
14,513,021
6,956,536
(208,839)
2,292,059
52,449,357
3,162,443
–
International
Bond,
Class
W
44,196,296
18,466,479
10,407,488
(2,190,522)
4,767,568
54,832,333
395,468
–
International
Equity,
Class
W
681,713,910
65,236,614
123,329,958
9,142,428
104,076,298
736,839,292
21,446,383
–
International
Opportunities,
Class
W
406,551,522
43,255,496
61,240,940
(8,285,138)
55,218,054
435,498,994
7,514,502
–
Large
Cap
Growth,
Class
W
499,709,494
28,971,382
123,281,887
24,636,798
115,811,938
545,847,725
3,053,673
–
Large
Cap
Value,
Class
W
435,663,948
42,198,695
99,360,742
12,948,325
50,891,568
442,341,794
9,383,899
27,306,445
Quant
International
Small
Cap
Equity,
Class
W
215,554,817
18,074,886
32,962,327
(1,597,733)
38,617,700
237,687,343
8,206,742
–
Quant
Small
Cap
Equity,
Class
W
108,591,918
5,194,090
30,887,778
2,531,414
19,536,559
104,966,203
1,568,676
1,095,214
Quant
Small/Mid
Cap
Equity,
Class
W
125,906,638
4,681,411
36,430,169
5,743,943
24,929,587
124,831,410
1,844,544
1,925,260
TIAA-CREF
Real
Property
Fund
LP
a
313,949,472
11,513,034
5,845,489
(969,645)
(35,386,436)
283,260,936
13,948,265
–
$5,694,005,634
$764,171,938
$1,092,202,421
$20,409,700
$772,123,597
$6,158,508,448
$142,642,916
$134,701,573
Notes
to
Financial
Statements
(continued)
Issue
Value
at
5/31/23
Purchases
Cost
Sales
Proceeds
Realized
Gain
(Loss)
Change
in
Unrealized
Appreciation
(Depreciation)
Value
at
5/31/24
Dividend
Income
Capital
Gain
Distributions
Lifecycle
2045
Nuveen
Funds:
Core
Bond,
Class
W
$
153,495,419
$
100,828,477
$
39,363,082
$
(4,943,313)
$
2,371,926
$
212,389,427
$
7,958,385
$
–
Core
Equity,
Class
W
328,478,709
69,678,832
70,664,823
8,155,378
29,057,598
364,705,694
5,516,956
63,522,333
Core
Plus
Bond,
Class
W
94,709,053
54,483,335
16,450,587
(2,446,683)
1,218,562
131,513,680
5,270,684
–
Dividend
Growth,
Class
R6
325,722,413
33,934,940
42,100,741
926,572
48,428,472
366,911,656
4,727,351
5,585,474
Dividend
Value,
Class
R6
329,063,416
33,851,954
65,357,433
(905,922)
57,771,878
354,423,893
6,149,491
11,777,782
Emerging
Markets
Debt,
Class
W
13,714,148
7,584,843
3,275,440
(239,571)
1,326,616
19,110,596
961,842
–
Emerging
Markets
Equity,
Class
W
199,379,589
57,586,316
49,791,580
(6,775,481)
22,594,829
222,993,673
8,649,158
–
Growth
Opportunities
ETF
380,031,986
2,942,988
81,308,419
(4,170,249)
136,772,049
434,268,355
752,540
–
High
Yield,
Class
W
15,071,772
7,841,068
3,505,329
(53,666)
800,567
20,154,412
1,155,513
–
International
Bond,
Class
W
15,231,781
9,345,264
4,444,609
(789,087)
1,707,235
21,050,584
144,501
–
International
Equity,
Class
W
516,224,527
62,127,487
81,020,984
3,750,709
84,443,694
585,525,433
16,612,703
–
International
Opportunities,
Class
W
308,280,663
40,298,557
38,771,855
(5,838,060)
42,152,575
346,121,880
5,828,256
–
Large
Cap
Growth,
Class
W
377,875,175
26,490,516
78,529,584
6,142,373
102,468,429
434,446,909
2,370,726
–
Large
Cap
Value,
Class
W
329,372,131
37,832,164
64,736,620
5,296,939
44,170,197
351,934,811
7,274,012
21,166,833
Quant
International
Small
Cap
Equity,
Class
W
163,005,500
16,297,619
19,719,030
(1,137,714)
29,970,566
188,416,941
6,397,816
–
Quant
Small
Cap
Equity,
Class
W
82,322,838
5,200,864
21,124,617
1,880,695
15,231,801
83,511,581
1,219,596
851,494
Quant
Small/Mid
Cap
Equity,
Class
W
95,400,240
3,959,769
23,776,071
2,891,011
20,841,998
99,316,947
1,431,372
1,494,008
TIAA-CREF
Real
Property
Fund
LP
a
217,691,379
17,381,708
5,209,151
(916,688)
(24,734,561)
204,212,687
9,848,068
–
$3,945,070,739
$587,666,701
$709,149,955
$827,243
$616,594,431
$4,441,009,159
$92,268,970
$104,397,924
Issue
Value
at
5/31/23
Purchases
Cost
Sales
Proceeds
Realized
Gain
(Loss)
Change
in
Unrealized
Appreciation
(Depreciation)
Value
at
5/31/24
Dividend
Income
Capital
Gain
Distributions
Lifecycle
2050
Nuveen
Funds:
Core
Bond,
Class
W
$
62,713,517
$
62,068,738
$
31,192,699
$
(1,372,277)
$
160,377
$
92,377,656
$
3,363,198
$
–
Core
Equity,
Class
W
264,956,947
59,373,015
53,660,708
4,059,220
26,540,790
301,269,264
4,471,316
51,475,604
Core
Plus
Bond,
Class
W
39,036,863
32,673,851
13,819,191
(1,622,475)
1,010,395
57,279,443
2,229,563
–
Dividend
Growth,
Class
R6
263,178,957
32,971,923
33,412,032
760,907
39,443,679
302,943,434
3,830,857
4,531,190
Dividend
Value,
Class
R6
265,435,660
31,396,593
51,294,369
(1,750,097)
48,047,395
291,835,182
4,986,607
9,552,912
Emerging
Markets
Debt,
Class
W
5,662,814
4,379,727
2,169,377
(77,891)
523,876
8,319,149
404,284
–
Emerging
Markets
Equity,
Class
W
161,087,953
48,446,745
38,864,248
(5,853,494)
18,819,724
183,636,680
7,009,889
–
Growth
Opportunities
ETF
306,537,281
6,017,299
62,946,003
(3,571,035)
111,261,128
357,298,670
609,483
–
High
Yield,
Class
W
6,702,118
4,721,626
2,986,717
(25,332)
330,697
8,742,392
487,664
–
International
Bond,
Class
W
6,294,940
5,579,048
3,114,582
(163,991)
539,598
9,135,013
60,641
–
International
Equity,
Class
W
416,504,492
58,164,176
62,953,390
2,004,899
70,151,609
483,871,786
13,479,500
–
International
Opportunities,
Class
W
248,753,836
40,294,692
33,075,882
(5,497,712)
35,255,787
285,730,721
4,723,451
–
Large
Cap
Growth,
Class
W
305,349,978
22,667,690
56,662,187
1,266,149
87,004,407
359,626,037
1,922,150
–
Large
Cap
Value,
Class
W
266,093,664
34,914,221
50,797,712
3,168,290
37,313,457
290,691,920
5,895,078
17,154,237
Quant
International
Small
Cap
Equity,
Class
W
131,388,179
16,301,216
15,342,229
(1,705,917)
25,196,846
155,838,095
5,183,839
–
Quant
Small
Cap
Equity,
Class
W
66,430,438
4,949,142
16,326,481
1,075,085
12,850,712
68,978,896
988,158
689,909
Quant
Small/Mid
Cap
Equity,
Class
W
77,039,261
3,975,305
18,309,064
1,573,364
17,761,951
82,040,817
1,159,607
1,210,351
TIAA-CREF
Real
Property
Fund
LP
a
169,036,492
17,512,998
5,652,803
(944,213)
(19,007,222)
160,945,252
7,675,464
–
$3,062,203,390
$486,408,005
$552,579,674
$(8,676,520)
$513,205,206
$3,500,560,407
$68,480,749
$84,614,203
Issue
Value
at
5/31/23
Purchases
Cost
Sales
Proceeds
Realized
Gain
(Loss)
Change
in
Unrealized
Appreciation
(Depreciation)
Value
at
5/31/24
Dividend
Income
Capital
Gain
Distributions
Lifecycle
2055
Nuveen
Funds:
Core
Bond,
Class
W
$
20,400,795
$
29,809,810
$
14,613,183
$
(413,838)
$
(41,143)
$
35,142,441
$
1,199,936
$
–
Core
Equity,
Class
W
128,243,594
33,922,775
23,686,100
351,774
14,941,728
153,773,771
2,216,638
25,742,575
Core
Plus
Bond,
Class
W
12,704,305
17,349,916
8,053,253
(347,872)
115,570
21,768,666
796,559
–
Dividend
Growth,
Class
R6
127,402,299
25,554,169
18,205,327
271,250
19,825,456
154,847,847
1,903,051
2,267,573
Dividend
Value,
Class
R6
128,830,473
20,582,305
24,093,760
(986,154)
24,085,862
148,418,726
2,471,024
4,773,629
Emerging
Markets
Debt,
Class
W
1,824,286
2,189,904
1,009,382
(9,347)
165,673
3,161,134
140,603
–
Emerging
Markets
Equity,
Class
W
78,014,913
28,400,584
18,928,842
(3,050,897)
9,516,104
93,951,862
3,496,901
–
Growth
Opportunities
ETF
148,160,824
5,907,472
25,298,880
(1,521,441)
55,125,374
182,373,349
304,202
–
High
Yield,
Class
W
2,289,034
2,391,908
1,449,387
(7,181)
112,886
3,337,260
174,432
–
International
Bond,
Class
W
2,010,606
2,809,292
1,478,975
(33,963)
163,865
3,470,825
21,624
–
International
Equity,
Class
W
201,829,340
39,533,686
30,620,930
453,368
35,725,893
246,921,357
6,734,905
–
International
Opportunities,
Class
W
120,402,225
26,778,087
16,209,503
(2,724,361)
17,645,019
145,891,467
2,360,871
–
Large
Cap
Growth,
Class
W
148,148,583
16,965,167
25,745,834
9,600
44,033,014
183,410,530
959,863
–
Large
Cap
Value,
Class
W
128,755,273
22,564,729
23,105,078
1,073,282
19,116,210
148,404,416
2,944,932
8,569,531
Quant
International
Small
Cap
Equity,
Class
W
63,843,634
10,806,152
6,926,553
(1,063,606)
12,860,789
79,520,416
2,588,121
–
Quant
Small
Cap
Equity,
Class
W
32,130,614
3,556,379
7,410,633
180,184
6,758,599
35,215,143
493,478
344,535
Quant
Small/Mid
Cap
Equity,
Class
W
37,284,490
2,947,818
7,988,513
318,608
9,313,603
41,876,006
580,632
606,040
TIAA-CREF
Real
Property
Fund
LP
a
80,773,342
12,384,964
2,340,798
(449,831)
(9,335,093)
81,032,584
3,762,604
–
$1,463,048,630
$304,455,117
$257,164,931
$(7,950,425)
$260,129,409
$1,762,517,800
$33,150,376
$42,303,883
Issue
Value
at
5/31/23
Purchases
Cost
Sales
Proceeds
Realized
Gain
(Loss)
Change
in
Unrealized
Appreciation
(Depreciation)
Value
at
5/31/24
Dividend
Income
Capital
Gain
Distributions
Lifecycle
2060
Nuveen
Funds:
Core
Bond,
Class
W
$
3,922,323
$
10,937,169
$
4,899,447
$
(150,597)
$
33,310
$
9,842,758
$
295,388
$
–
Core
Equity,
Class
W
46,754,736
19,045,109
7,075,370
(583,603)
6,668,606
64,809,478
868,785
10,181,555
Core
Plus
Bond,
Class
W
2,414,944
6,417,112
2,670,705
(73,856)
13,812
6,101,307
196,678
–
Dividend
Growth,
Class
R6
46,718,585
18,995,455
8,017,310
18,383
7,927,626
65,642,739
750,626
901,521
Dividend
Value,
Class
R6
46,983,616
14,098,970
7,910,707
(407,389)
9,513,847
62,278,337
970,259
1,895,768
Emerging
Markets
Debt,
Class
W
350,920
859,077
362,931
(3,973)
41,804
884,897
33,446
–
Emerging
Markets
Equity,
Class
W
28,452,591
14,958,463
6,197,947
(1,316,706)
3,797,444
39,693,845
1,379,093
–
Growth
Opportunities
ETF
53,920,681
7,074,791
5,250,779
(367,341)
21,447,779
76,825,131
120,076
–
High
Yield,
Class
W
455,243
885,364
432,652
(2,218)
25,605
931,342
43,009
–
International
Bond,
Class
W
378,488
1,059,225
494,368
(2,323)
32,159
973,181
5,276
–
International
Equity,
Class
W
73,656,200
26,541,109
10,828,506
(210,793)
14,649,620
103,807,630
2,675,523
–
International
Opportunities,
Class
W
43,937,811
18,043,172
6,336,190
(1,090,970)
7,053,012
61,606,835
935,792
–
Large
Cap
Growth,
Class
W
54,205,662
15,059,192
9,396,581
(204,722)
17,573,866
77,237,417
379,894
–
Large
Cap
Value,
Class
W
46,987,709
14,948,887
7,280,504
(22,074)
7,921,799
62,555,817
1,165,900
3,392,681
Quant
International
Small
Cap
Equity,
Class
W
23,341,734
8,187,269
2,665,844
(436,916)
5,126,438
33,552,681
1,019,254
–
Quant
Small
Cap
Equity,
Class
W
11,715,880
2,975,277
2,575,234
(109,335)
2,837,244
14,843,832
194,956
136,114
Quant
Small/Mid
Cap
Equity,
Class
W
13,595,208
2,798,460
2,530,492
(17,142)
3,803,252
17,649,286
229,242
239,273
TIAA-CREF
Real
Property
Fund
LP
a
29,093,445
8,898,936
495,068
(115,826)
(3,685,622)
33,695,865
1,457,783
–
$526,885,776
$191,783,037
$85,420,635
$(5,097,401)
$104,781,601
$732,932,378
$12,720,980
$16,746,912
Notes
to
Financial
Statements
(continued)
8.
Inter-Fund
Lending
Program
Pursuant
to
an
exemptive
order
issued
by
the
SEC,
the
Funds may
participate
in
an
inter-fund
lending
program.
This
program
allows
the
Funds to
lend
cash
to
and/or
borrow
cash
from
certain
other
affiliated
Funds for
temporary
purposes,
(e.g.,
to
satisfy
redemption
requests
or
to
cover
unanticipated
cash
shortfalls).
The
program
is
subject
to
a
number
of
conditions,
including
the
requirement
that
no
Fund may
borrow
or
lend
money
under
the
program
unless
it
receives
a
more
favorable
interest
rate
than
is
available
from
a
bank
or
other
financial
institution
for
a
comparable
transaction.
In
addition,
a
Fund may
participate
in
the
program
only
if
its
participation
is
consistent
with
the
Fund’s investment
policies
and
limitations
and
authorized
by
its
portfolio
manager(s).
During the current
fiscal
period,
there
were
no
inter-fund
borrowing
or
lending
transactions.
9.
Line
of
Credit
The Funds
participate
in
a
$1
billion
unsecured
revolving
credit
facility
that
can
be
used
for
temporary
purposes,
including,
without
limitation,
the
funding
of
shareholder
redemptions.
The
current
facility
was
entered
into
on
June
13,
2023
expiring
on
June
11,
2024,
replacing
the
previous facility,
which
expired
June
2023.
Certain
affiliated
accounts
and
mutual
funds,
each
of
which
is
managed
by the
Adviser,
or
an
affiliate
of
the
Adviser, also
participate
in
this
facility.
An
annual
commitment
fee
for
the
credit
facility
is
borne
by
the
participating
accounts
and
mutual
funds
on
a
pro
rata
basis.
Interest
associated
with
any
borrowing
under
the
facility
is
charged
to
the
borrowing
accounts
or
mutual
funds
at
a
specified
rate
of
interest.
The Funds are
not
liable
for
borrowings
under
the
facility
by
other
affiliated
accounts
or
mutual
funds.
There
were
no
borrowings
under
this
credit
facility
by
the
Funds during
the
current fiscal
period.
10.
Subsequent
Event
Line
of
Credit:
On
June
11,
2024,
the
Funds’
credit
facility
expired,
and
the
Funds
have
not
entered
into
another
credit
facility.
Issue
Value
at
5/31/23
Purchases
Cost
Sales
Proceeds
Realized
Gain
(Loss)
Change
in
Unrealized
Appreciation
(Depreciation)
Value
at
5/31/24
Dividend
Income
Capital
Gain
Distributions
Lifecycle
2065
Nuveen
Funds:
Core
Bond,
Class
W
$
41,000
$
1,341,555
$
740,831
$
(11,280)
$
5,088
$
635,532
$
13,552
$
–
Core
Equity,
Class
W
3,771,390
4,820,156
1,157,465
(69,470)
736,111
8,100,722
88,461
1,044,796
Core
Plus
Bond,
Class
W
25,396
795,466
423,724
(6,728)
3,236
393,646
9,058
–
Dividend
Growth,
Class
R6
3,771,778
4,828,476
1,248,500
(17,359)
835,224
8,169,619
76,066
92,481
Dividend
Value,
Class
R6
3,793,442
4,092,882
1,045,896
(67,997)
1,016,269
7,788,700
98,345
195,370
Emerging
Markets
Debt,
Class
W
3,675
109,136
57,075
(557)
1,947
57,126
1,485
–
Emerging
Markets
Equity,
Class
W
2,312,850
3,155,441
730,798
(5,838)
256,944
4,988,599
141,105
–
Growth
Opportunities
ETF
4,341,611
3,310,161
189,840
(1,508)
2,155,503
9,615,927
12,382
–
High
Yield,
Class
W
3,879
119,796
63,976
(357)
976
60,318
1,791
–
International
Bond,
Class
W
4,065
151,146
93,862
42
1,239
62,630
217
–
International
Equity,
Class
W
5,966,180
6,919,325
1,529,343
(3,841)
1,579,898
12,932,219
274,611
–
International
Opportunities,
Class
W
3,563,824
4,303,059
827,335
(32,326)
686,556
7,693,778
95,992
–
Large
Cap
Growth,
Class
W
4,391,410
5,997,937
2,519,923
(22,031)
1,808,438
9,655,831
39,236
–
Large
Cap
Value,
Class
W
3,796,407
4,358,436
1,149,010
(38,061)
854,653
7,822,425
119,597
348,018
Quant
International
Small
Cap
Equity,
Class
W
1,892,706
2,192,252
394,350
(22,991)
528,907
4,196,524
104,356
–
Quant
Small
Cap
Equity,
Class
W
943,942
954,146
321,521
(14,138)
293,731
1,856,160
19,998
13,962
Quant
Small/Mid
Cap
Equity,
Class
W
1,099,613
1,049,921
332,025
(12,620)
401,242
2,206,131
23,515
24,544
TIAA-CREF
Real
Property
Fund
LP
a
2,322,008
2,271,305
53,359
(15,241)
(369,108)
4,155,605
147,620
–
$42,045,176
$50,770,596
$12,878,833
$(342,301)
$10,796,854
$90,391,492
$1,267,387
$1,719,171
a
Restricted
security
Important
Tax
Information
(Unaudited)
As
required
by
the
Internal
Revenue
Code
and
Treasury
Regulations,
certain
tax
information,
as
detailed
below,
must
be
provided
to
shareholders.
Shareholders
are
advised
to
consult
their
tax
advisor
with
respect
to
the
tax
implications
of
their
investment.
The
amounts
listed
below
may
differ
from
the
actual
amounts
reported
on
Form
1099-DIV,
which
will
be
sent
to
shareholders
shortly
after
calendar
year
end.
Long-Term
Capital
Gains
As
of
year
end,
each
Fund
designates
the
following
distribution
amounts,
or
maximum
amount
allowable,
as
being
from
net
long-term
capital
gains
pursuant
to
Section
852(b)(3)
of
the
Internal
Revenue
Code:
Dividends
Received
Deduction
(DRD)
Each
Fund
listed
below
had
the
following
percentage,
or
maximum
amount
allowable,
of
ordinary
income
distributions
eligible
for
the
dividends
received
deduction
for
corporate
shareholders:
Qualified
Dividend
Income
(QDI)
Each
Fund
listed
below
had
the
following
percentage,
or
maximum
amount
allowable,
of
ordinary
income
distributions
treated
as
qualified
dividend
income
for
individuals
pursuant
to
Section
1(h)(11)
of
the
Internal
Revenue
Code:
Fund
Net
Long-Term
Capital
Gains
12.1
Lifecycle
Retirement
Income
$
–
12.2
Lifecycle
2010
75,874
12.3
Lifecycle
2015
–
12.4
Lifecycle
2020
26,526
12.5
Lifecycle
2025
44,198
12.6
Lifecycle
2030
21,427
12.7
Lifecycle
2035
–
12.8
Lifecycle
2040
6,168
12.9
Lifecycle
2045
61,181
13.01
Lifecycle
2050
67,240
13.1
Lifecycle
2055
221,683
13.2
Lifecycle
2060
184,248
13.3
Lifecycle
2065
82,185
Fund
Percentage
12.1
Lifecycle
Retirement
Income
8
.6
%
12.2
Lifecycle
2010
7
.4
12.3
Lifecycle
2015
8
.7
12.4
Lifecycle
2020
10
.2
12.5
Lifecycle
2025
12
.5
12.6
Lifecycle
2030
16
.2
12.7
Lifecycle
2035
20
.7
12.8
Lifecycle
2040
26
.6
12.9
Lifecycle
2045
31
.8
13.01
Lifecycle
2050
35
.0
13.1
Lifecycle
2055
37
.4
13.2
Lifecycle
2060
40
.8
13.3
Lifecycle
2065
43
.2
Fund
Percentage
12.1
Lifecycle
Retirement
Income
16
.8
%
12.2
Lifecycle
2010
14
.5
12.3
Lifecycle
2015
17
.0
12.4
Lifecycle
2020
19
.9
12.5
Lifecycle
2025
24
.4
12.6
Lifecycle
2030
31
.8
12.7
Lifecycle
2035
40
.7
12.8
Lifecycle
2040
52
.3
12.9
Lifecycle
2045
62
.6
13.01
Lifecycle
2050
68
.9
13.1
Lifecycle
2055
74
.0
13.2
Lifecycle
2060
81
.8
13.3
Lifecycle
2065
88
.9
Important
Tax
Information
(Unaudited)
(continued)
Foreign
Source
Income
and
Foreign
Tax
Credit
Pass
Through
Each
Fund
listed
below
has
made
an
election
under
Section
853
of
the
Internal
Revenue
Code
to
pass
through
foreign
taxes
paid:
Fund
Foreign
Source
Income
Foreign
Source
Income
Per
Share
Qualifying
Foreign
Taxes
Paid
Qualifying
Foreign
Taxes
Paid
per
Share
12.1
Lifecycle
Retirement
Income
$
1,485,411
$
0.03942
$
115,946
$
0.00308
12.2
Lifecycle
2010
2,659,778
0.03560
207,624
0.00278
12.3
Lifecycle
2015
4,179,914
0.03531
326,174
0.00276
12.4
Lifecycle
2020
10,443,294
0.04209
815,086
0.00328
12.5
Lifecycle
2025
18,372,258
0.04965
1,433,963
0.00387
12.6
Lifecycle
2030
25,538,571
0.05862
1,993,317
0.00458
12.7
Lifecycle
2035
31,900,337
0.07057
2,489,125
0.00551
12.8
Lifecycle
2040
44,677,304
0.08414
3,485,913
0.00656
12.9
Lifecycle
2045
34,634,003
0.10781
2,703,816
0.00842
13.01
Lifecycle
2050
28,076,016
0.11444
2,189,916
0.00893
13.1
Lifecycle
2055
14,016,983
0.13482
1,094,041
0.01052
13.2
Lifecycle
2060
5,550,048
0.11118
433,105
0.00868
13.3
Lifecycle
2065
569,002
0.07961
44,381
0.00621
Item
7.
Financial
Statements
and
Financial
Highlights
for
Open-
End
Management
Investment
Companies
Report
of
Independent
Registered
Public
Accounting
Firm
To
the
Board
of
Trustees
of
TIAA-CREF
Funds
and
Shareholders
of
Nuveen
Lifecycle
Index
Retirement
Income
Fund,
Nuveen
Lifecycle
Index
2010
Fund,
Nuveen
Lifecycle
Index
2015
Fund,
Nuveen
Lifecycle
Index
2020
Fund,
Nuveen
Lifecycle
Index
2025
Fund,
Nuveen
Lifecycle
Index
2030
Fund,
Nuveen
Lifecycle
Index
2035
Fund,
Nuveen
Lifecycle
Index
2040
Fund,
Nuveen
Lifecycle
Index
2045
Fund,
Nuveen
Lifecycle
Index
2050
Fund,
Nuveen
Lifecycle
Index
2055
Fund,
Nuveen
Lifecycle
Index
2060
Fund
and
Nuveen
Lifecycle
Index
2065
Fund
Opinions
on
the
Financial
Statements
We
have
audited
the
accompanying
statements
of
assets
and
liabilities,
including
the
portfolios
of
investments,
of
Nuveen
Lifecycle
Index
Retirement
Income
Fund,
Nuveen
Lifecycle
Index
2010
Fund,
Nuveen
Lifecycle
Index
2015
Fund,
Nuveen
Lifecycle
Index
2020
Fund,
Nuveen
Lifecycle
Index
2025
Fund,
Nuveen
Lifecycle
Index
2030
Fund,
Nuveen
Lifecycle
Index
2035
Fund,
Nuveen
Lifecycle
Index
2040
Fund,
Nuveen
Lifecycle
Index
2045
Fund,
Nuveen
Lifecycle
Index
2050
Fund,
Nuveen
Lifecycle
Index
2055
Fund,
Nuveen
Lifecycle
Index
2060
Fund
and
Nuveen
Lifecycle
Index
2065
Fund
(thirteen
of
the
funds
constituting
TIAA-CREF
Funds,
hereafter
collectively
referred
to
as
the
"Funds")
as
of
May
31,
2024,
the
related
statements
of
operations
for
the
year
ended
May
31,
2024,
the
statements
of
changes
in
net
assets
for
each
of
the
two
years
in
the
period
ended
May
31,
2024,
including
the
related
notes,
and
the
financial
highlights
for
each
of
the
periods
indicated
therein
(collectively
referred
to
as
the
“financial
statements”).
In
our
opinion,
the
financial
statements
present
fairly,
in
all
material
respects,
the
financial
position
of
each
of
the
Funds
as
of
May
31,
2024,
the
results
of
each
of
their
operations
for
the
year
then
ended,
the
changes
in
each
of
their
net
assets
for
each
of
the
two
years
in
the
period
ended
May
31,
2024
and
each
of
the
financial
highlights
for
each
of
the
periods
indicated
therein
in
conformity
with
accounting
principles
generally
accepted
in
the
United
States
of
America.
Basis
for
Opinions
These
financial
statements
are
the
responsibility
of
the
Funds’
management.
Our
responsibility
is
to
express
an
opinion
on
the
Funds’
financial
statements
based
on
our
audits.
We
are
a
public
accounting
firm
registered
with
the
Public
Company
Accounting
Oversight
Board
(United
States)
(PCAOB)
and
are
required
to
be
independent
with
respect
to
the
Funds
in
accordance
with
the
U.S.
federal
securities
laws
and
the
applicable
rules
and
regulations
of
the
Securities
and
Exchange
Commission
and
the
PCAOB.
We
conducted
our
audits
of
these
financial
statements
in
accordance
with
the
standards
of
the
PCAOB.
Those
standards
require
that
we
plan
and
perform
the
audit
to
obtain
reasonable
assurance
about
whether
the
financial
statements
are
free
of
material
misstatement,
whether
due
to
error
or
fraud.
Our
audits
included
performing
procedures
to
assess
the
risks
of
material
misstatement
of
the
financial
statements,
whether
due
to
error
or
fraud,
and
performing
procedures
that
respond
to
those
risks.
Such
procedures
included
examining,
on
a
test
basis,
evidence
regarding
the
amounts
and
disclosures
in
the
financial
statements.
Our
audits
also
included
evaluating
the
accounting
principles
used
and
significant
estimates
made
by
management,
as
well
as
evaluating
the
overall
presentation
of
the
financial
statements.
Our
procedures
included
confirmation
of
securities
owned
as
of
May
31,
2024
by
correspondence
with
the
custodian,
transfer
agent
and
broker.
We
believe
that
our
audits
provide
a
reasonable
basis
for
our
opinions.
/s/
PricewaterhouseCoopers
LLP
Chicago,
Illinois
July
25,
2024
We
have
served
as
the
auditor
of
one
or
more
investment
companies
in
Nuveen
Funds
since
2002.
Lifecycle
Index
Retirement
Income
Fund
May
31,
2024
See
Notes
to
Financial
Statements
SHARES
DESCRIPTION
VALUE
AFFILIATED
INVESTMENT
COMPANIES—99.9%(a)
FIXED
INCOME—39.8%
29,810,018
Nuveen
Bond
Index
Fund,
Class
W
$
280,512,273
TOTAL
FIXED
INCOME
280,512,273
INFLATION-PROTECTED
ASSETS—9.9%
6,644,449
Nuveen
Inflation
Linked
Bond
Fund,
Class
W
69,966,046
TOTAL
INFLATION-PROTECTED
ASSETS
69,966,046
INTERNATIONAL
EQUITY—14.1%
2,760,373
Nuveen
Emerging
Markets
Equity
Index
Fund,
Class
W
29,784,426
2,949,918
Nuveen
International
Equity
Index
Fund,
Class
W
69,559,068
TOTAL
INTERNATIONAL
EQUITY
99,343,494
SHORT-TERM
FIXED
INCOME—9.9%
7,309,564
Nuveen
Short
Term
Bond
Index
Fund,
Class
W
69,587,051
TOTAL
SHORT-TERM
FIXED
INCOME
69,587,051
U.S.
EQUITY—26.2%
4,979,238
Nuveen
Equity
Index
Fund,
Class
W
184,679,945
TOTAL
U.S.
EQUITY
184,679,945
TOTAL
AFFILIATED
INVESTMENT
COMPANIES
704,088,809
(Cost
$608,333,159)
PRINCIPAL
RATE
MATURITY
DATE
SHORT-TERM
INVESTMENTS—0.0%
REPURCHASE
AGREEMENT—0.0%
$212,000
(b)
Fixed
Income
Clearing
Corporation
5
.320
%
06/03/24
212,000
TOTAL
REPURCHASE
AGREEMENT
212,000
TOTAL
SHORT-TERM
INVESTMENTS
212,000
(Cost
$212,000)
TOTAL
INVESTMENTS—99.9%
704,300,809
(Cost
$608,545,159)
OTHER
ASSETS
&
LIABILITIES,
NET—0.1%
706,491
NET
ASSETS—100.0%
$
705,007,300
(a)
Affiliated
fund.
(b)
Agreement
with
Fixed
Income
Clearing
Corporation,
5.320%
dated
5/31/24
to
be
repurchased
at
$212,094
on
6/3/24,
collateralized
by
Government
Agency
Securities,
with
coupon
rate
4.250%
and
maturity
date
3/15/27,
valued
at
$216,419.
Lifecycle
Index
2010
Fund
May
31,
2024
See
Notes
to
Financial
Statements
SHARES
DESCRIPTION
VALUE
AFFILIATED
INVESTMENT
COMPANIES—100.0%(a)
FIXED
INCOME—39.8%
26,636,165
Nuveen
Bond
Index
Fund,
Class
W
$
250,646,311
TOTAL
FIXED
INCOME
250,646,311
INFLATION-PROTECTED
ASSETS—9.9%
5,936,773
Nuveen
Inflation
Linked
Bond
Fund,
Class
W
62,514,220
TOTAL
INFLATION-PROTECTED
ASSETS
62,514,220
INTERNATIONAL
EQUITY—12.7%
2,226,803
Nuveen
Emerging
Markets
Equity
Index
Fund,
Class
W
24,027,207
2,379,157
Nuveen
International
Equity
Index
Fund,
Class
W
56,100,514
TOTAL
INTERNATIONAL
EQUITY
80,127,721
SHORT-TERM
FIXED
INCOME—13.8%
9,078,735
Nuveen
Short
Term
Bond
Index
Fund,
Class
W
86,429,556
TOTAL
SHORT-TERM
FIXED
INCOME
86,429,556
U.S.
EQUITY—23.8%
4,029,159
Nuveen
Equity
Index
Fund,
Class
W
149,441,507
TOTAL
U.S.
EQUITY
149,441,507
TOTAL
AFFILIATED
INVESTMENT
COMPANIES
629,159,315
(Cost
$526,613,085)
PRINCIPAL
RATE
MATURITY
DATE
SHORT-TERM
INVESTMENTS—0.1%
REPURCHASE
AGREEMENT—0.1%
$416,000
(b)
Fixed
Income
Clearing
Corporation
5
.320
%
06/03/24
416,000
TOTAL
REPURCHASE
AGREEMENT
416,000
TOTAL
SHORT-TERM
INVESTMENTS
416,000
(Cost
$416,000)
TOTAL
INVESTMENTS—100.1%
629,575,315
(Cost
$527,029,085)
OTHER
ASSETS
&
LIABILITIES,
NET—(0.1)%
(
361,884
)
NET
ASSETS—100.0%
$
629,213,431
(a)
Affiliated
fund.
(b)
Agreement
with
Fixed
Income
Clearing
Corporation,
5.320%
dated
5/31/24
to
be
repurchased
at
$416,184
on
6/3/24,
collateralized
by
Government
Agency
Securities,
with
coupon
rate
3.250%
and
maturity
date
6/30/27,
valued
at
$424,336.
Lifecycle
Index
2015
Fund
May
31,
2024
See
Notes
to
Financial
Statements
SHARES
DESCRIPTION
VALUE
AFFILIATED
INVESTMENT
COMPANIES—99.9%(a)
FIXED
INCOME—39.5%
43,979,101
Nuveen
Bond
Index
Fund,
Class
W
$
413,843,341
TOTAL
FIXED
INCOME
413,843,341
INFLATION-PROTECTED
ASSETS—9.5%
9,417,052
Nuveen
Inflation
Linked
Bond
Fund,
Class
W
99,161,560
TOTAL
INFLATION-PROTECTED
ASSETS
99,161,560
INTERNATIONAL
EQUITY—14.4%
4,208,705
Nuveen
Emerging
Markets
Equity
Index
Fund,
Class
W
45,411,927
4,495,135
Nuveen
International
Equity
Index
Fund,
Class
W
105,995,276
TOTAL
INTERNATIONAL
EQUITY
151,407,203
SHORT-TERM
FIXED
INCOME—9.5%
10,400,422
Nuveen
Short
Term
Bond
Index
Fund,
Class
W
99,012,018
TOTAL
SHORT-TERM
FIXED
INCOME
99,012,018
U.S.
EQUITY—27.0%
7,613,370
Nuveen
Equity
Index
Fund,
Class
W
282,379,879
TOTAL
U.S.
EQUITY
282,379,879
TOTAL
AFFILIATED
INVESTMENT
COMPANIES
1,045,804,001
(Cost
$847,704,942)
PRINCIPAL
RATE
MATURITY
DATE
SHORT-TERM
INVESTMENTS—0.1%
REPURCHASE
AGREEMENT—0.1%
$1,027,000
(b)
Fixed
Income
Clearing
Corporation
5
.320
%
06/03/24
1,027,000
TOTAL
REPURCHASE
AGREEMENT
1,027,000
TOTAL
SHORT-TERM
INVESTMENTS
1,027,000
(Cost
$1,027,000)
TOTAL
INVESTMENTS—100.0%
1,046,831,001
(Cost
$848,731,942)
OTHER
ASSETS
&
LIABILITIES,
NET—0.0%
513,706
NET
ASSETS—100.0%
$
1,047,344,707
(a)
Affiliated
fund.
(b)
Agreement
with
Fixed
Income
Clearing
Corporation,
5.320%
dated
5/31/24
to
be
repurchased
at
$1,027,455
on
6/3/24,
collateralized
by
Government
Agency
Securities,
with
coupon
rate
4.250%
and
maturity
date
3/15/27,
valued
at
$1,047,659.
Lifecycle
Index
2020
Fund
May
31,
2024
See
Notes
to
Financial
Statements
SHARES
DESCRIPTION
VALUE
AFFILIATED
INVESTMENT
COMPANIES—99.8%(a)
FIXED
INCOME—38.5%
126,108,280
Nuveen
Bond
Index
Fund,
Class
W
$
1,186,678,917
TOTAL
FIXED
INCOME
1,186,678,917
INFLATION-PROTECTED
ASSETS—7.5%
21,901,788
Nuveen
Inflation
Linked
Bond
Fund,
Class
W
230,625,827
TOTAL
INFLATION-PROTECTED
ASSETS
230,625,827
INTERNATIONAL
EQUITY—16.2%
13,879,616
Nuveen
Emerging
Markets
Equity
Index
Fund,
Class
W
149,761,057
14,830,127
Nuveen
International
Equity
Index
Fund,
Class
W
349,694,387
TOTAL
INTERNATIONAL
EQUITY
499,455,444
SHORT-TERM
FIXED
INCOME—7.4%
24,102,478
Nuveen
Short
Term
Bond
Index
Fund,
Class
W
229,455,593
TOTAL
SHORT-TERM
FIXED
INCOME
229,455,593
U.S.
EQUITY—30.2%
25,071,936
Nuveen
Equity
Index
Fund,
Class
W
929,918,119
TOTAL
U.S.
EQUITY
929,918,119
TOTAL
AFFILIATED
INVESTMENT
COMPANIES
3,076,133,900
(Cost
$2,497,002,194)
PRINCIPAL
RATE
MATURITY
DATE
SHORT-TERM
INVESTMENTS—0.1%
REPURCHASE
AGREEMENT—0.1%
$3,755,000
(b)
Fixed
Income
Clearing
Corporation
5
.320
%
06/03/24
3,755,000
TOTAL
REPURCHASE
AGREEMENT
3,755,000
TOTAL
SHORT-TERM
INVESTMENTS
3,755,000
(Cost
$3,755,000)
TOTAL
INVESTMENTS—99.9%
3,079,888,900
(Cost
$2,500,757,194)
OTHER
ASSETS
&
LIABILITIES,
NET—0.1%
3,870,578
NET
ASSETS—100.0%
$
3,083,759,478
(a)
Affiliated
fund.
(b)
Agreement
with
Fixed
Income
Clearing
Corporation,
5.320%
dated
5/31/24
to
be
repurchased
at
$3,756,665
on
6/3/24,
collateralized
by
Government
Agency
Securities,
with
coupon
rate
4.250%
and
maturity
date
3/15/27,
valued
at
$3,830,130.
Lifecycle
Index
2025
Fund
May
31,
2024
See
Notes
to
Financial
Statements
SHARES
DESCRIPTION
VALUE
AFFILIATED
INVESTMENT
COMPANIES—99.9%(a)
FIXED
INCOME—36.8%
232,856,988
Nuveen
Bond
Index
Fund,
Class
W
$
2,191,184,253
TOTAL
FIXED
INCOME
2,191,184,253
INFLATION-PROTECTED
ASSETS—5.5%
31,062,318
Nuveen
Inflation
Linked
Bond
Fund,
Class
W
327,086,205
TOTAL
INFLATION-PROTECTED
ASSETS
327,086,205
INTERNATIONAL
EQUITY—18.2%
30,071,808
Nuveen
Emerging
Markets
Equity
Index
Fund,
Class
W
324,474,809
32,161,217
Nuveen
International
Equity
Index
Fund,
Class
W
758,361,492
TOTAL
INTERNATIONAL
EQUITY
1,082,836,301
SHORT-TERM
FIXED
INCOME—5.5%
34,170,457
Nuveen
Short
Term
Bond
Index
Fund,
Class
W
325,302,754
TOTAL
SHORT-TERM
FIXED
INCOME
325,302,754
U.S.
EQUITY—33.9%
54,406,949
Nuveen
Equity
Index
Fund,
Class
W
2,017,953,757
TOTAL
U.S.
EQUITY
2,017,953,757
TOTAL
AFFILIATED
INVESTMENT
COMPANIES
5,944,363,270
(Cost
$4,823,091,337)
PRINCIPAL
RATE
MATURITY
DATE
SHORT-TERM
INVESTMENTS—0.0%
REPURCHASE
AGREEMENT—0.0%
$4,042,000
(b)
Fixed
Income
Clearing
Corporation
5
.320
%
06/03/24
4,042,000
TOTAL
REPURCHASE
AGREEMENT
4,042,000
TOTAL
SHORT-TERM
INVESTMENTS
4,042,000
(Cost
$4,042,000)
TOTAL
INVESTMENTS—99.9%
5,948,405,270
(Cost
$4,827,133,337)
OTHER
ASSETS
&
LIABILITIES,
NET—0.1%
3,605,151
NET
ASSETS—100.0%
$
5,952,010,421
(a)
Affiliated
fund.
(b)
Agreement
with
Fixed
Income
Clearing
Corporation,
5.320%
dated
5/31/24
to
be
repurchased
at
$4,043,792
on
6/3/24,
collateralized
by
Government
Agency
Securities,
with
coupon
rate
4.250%
and
maturity
date
3/15/27,
valued
at
$4,122,963.
Lifecycle
Index
2030
Fund
May
31,
2024
See
Notes
to
Financial
Statements
SHARES
DESCRIPTION
VALUE
AFFILIATED
INVESTMENT
COMPANIES—99.9%(a)
FIXED
INCOME—32.8%
279,523,421
Nuveen
Bond
Index
Fund,
Class
W
$
2,630,315,393
TOTAL
FIXED
INCOME
2,630,315,393
INFLATION-PROTECTED
ASSETS—3.5%
26,744,393
Nuveen
Inflation
Linked
Bond
Fund,
Class
W
281,618,454
TOTAL
INFLATION-PROTECTED
ASSETS
281,618,454
INTERNATIONAL
EQUITY—21.0%
46,714,522
Nuveen
Emerging
Markets
Equity
Index
Fund,
Class
W
504,049,697
49,940,128
Nuveen
International
Equity
Index
Fund,
Class
W
1,177,588,216
TOTAL
INTERNATIONAL
EQUITY
1,681,637,913
SHORT-TERM
FIXED
INCOME—3.5%
29,424,753
Nuveen
Short
Term
Bond
Index
Fund,
Class
W
280,123,645
TOTAL
SHORT-TERM
FIXED
INCOME
280,123,645
U.S.
EQUITY—39.1%
84,515,305
Nuveen
Equity
Index
Fund,
Class
W
3,134,672,673
TOTAL
U.S.
EQUITY
3,134,672,673
TOTAL
AFFILIATED
INVESTMENT
COMPANIES
8,008,368,078
(Cost
$6,329,700,410)
PRINCIPAL
RATE
MATURITY
DATE
SHORT-TERM
INVESTMENTS—0.1%
REPURCHASE
AGREEMENT—0.1%
$8,764,000
(b)
Fixed
Income
Clearing
Corporation
5
.320
%
06/03/24
8,764,000
TOTAL
REPURCHASE
AGREEMENT
8,764,000
TOTAL
SHORT-TERM
INVESTMENTS
8,764,000
(Cost
$8,764,000)
TOTAL
INVESTMENTS—100.0%
8,017,132,078
(Cost
$6,338,464,410)
OTHER
ASSETS
&
LIABILITIES,
NET—0.0%
1,353,206
NET
ASSETS—100.0%
$
8,018,485,284
(a)
Affiliated
fund.
(b)
Agreement
with
Fixed
Income
Clearing
Corporation,
5.320%
dated
5/31/24
to
be
repurchased
at
$8,767,885
on
6/3/24,
collateralized
by
Government
Agency
Securities,
with
coupon
rate
4.250%
and
maturity
date
3/15/27,
valued
at
$8,939,303.
Lifecycle
Index
2035
Fund
May
31,
2024
See
Notes
to
Financial
Statements
SHARES
DESCRIPTION
VALUE
AFFILIATED
INVESTMENT
COMPANIES—99.8%(a)
FIXED
INCOME—27.9%
250,811,968
Nuveen
Bond
Index
Fund,
Class
W
$
2,360,140,621
TOTAL
FIXED
INCOME
2,360,140,621
INFLATION-PROTECTED
ASSETS—1.6%
12,309,846
Nuveen
Inflation
Linked
Bond
Fund,
Class
W
129,622,682
TOTAL
INFLATION-PROTECTED
ASSETS
129,622,682
INTERNATIONAL
EQUITY—24.0%
56,473,084
Nuveen
Emerging
Markets
Equity
Index
Fund,
Class
W
609,344,574
60,391,975
Nuveen
International
Equity
Index
Fund,
Class
W
1,424,042,766
TOTAL
INTERNATIONAL
EQUITY
2,033,387,340
SHORT-TERM
FIXED
INCOME—1.5%
13,545,676
Nuveen
Short
Term
Bond
Index
Fund,
Class
W
128,954,834
TOTAL
SHORT-TERM
FIXED
INCOME
128,954,834
U.S.
EQUITY—44.8%
102,197,904
Nuveen
Equity
Index
Fund,
Class
W
3,790,520,257
TOTAL
U.S.
EQUITY
3,790,520,257
TOTAL
AFFILIATED
INVESTMENT
COMPANIES
8,442,625,734
(Cost
$6,432,682,442)
PRINCIPAL
RATE
MATURITY
DATE
SHORT-TERM
INVESTMENTS—0.2%
REPURCHASE
AGREEMENT—0.2%
$14,308,000
(b)
Fixed
Income
Clearing
Corporation
5
.320
%
06/03/24
14,308,000
TOTAL
REPURCHASE
AGREEMENT
14,308,000
TOTAL
SHORT-TERM
INVESTMENTS
14,308,000
(Cost
$14,308,000)
TOTAL
INVESTMENTS—100.0%
8,456,933,734
(Cost
$6,446,990,442)
OTHER
ASSETS
&
LIABILITIES,
NET—0.0%
939,318
NET
ASSETS—100.0%
$
8,457,873,052
(a)
Affiliated
fund.
(b)
Agreement
with
Fixed
Income
Clearing
Corporation,
5.320%
dated
5/31/24
to
be
repurchased
at
$14,314,343
on
6/3/24,
collateralized
by
Government
Agency
Securities,
with
coupon
rate
1.875%
and
maturity
date
2/28/27,
valued
at
$14,594,335.
Lifecycle
Index
2040
Fund
May
31,
2024
See
Notes
to
Financial
Statements
SHARES
DESCRIPTION
VALUE
AFFILIATED
INVESTMENT
COMPANIES—99.8%(a)
FIXED
INCOME—19.9%
188,199,675
Nuveen
Bond
Index
Fund,
Class
W
$
1,770,958,941
TOTAL
FIXED
INCOME
1,770,958,941
INTERNATIONAL
EQUITY—27.9%
68,758,439
Nuveen
Emerging
Markets
Equity
Index
Fund,
Class
W
741,903,559
73,495,319
Nuveen
International
Equity
Index
Fund,
Class
W
1,733,019,627
TOTAL
INTERNATIONAL
EQUITY
2,474,923,186
U.S.
EQUITY—52.0%
124,367,482
Nuveen
Equity
Index
Fund,
Class
W
4,612,789,904
TOTAL
U.S.
EQUITY
4,612,789,904
TOTAL
AFFILIATED
INVESTMENT
COMPANIES
8,858,672,031
(Cost
$6,367,671,592)
PRINCIPAL
RATE
MATURITY
DATE
SHORT-TERM
INVESTMENTS—0.1%
REPURCHASE
AGREEMENT—0.1%
$10,840,000
(b)
Fixed
Income
Clearing
Corporation
5
.320
%
06/03/24
10,840,000
TOTAL
REPURCHASE
AGREEMENT
10,840,000
TOTAL
SHORT-TERM
INVESTMENTS
10,840,000
(Cost
$10,840,000)
TOTAL
INVESTMENTS—99.9%
8,869,512,031
(Cost
$6,378,511,592)
OTHER
ASSETS
&
LIABILITIES,
NET—0.1%
4,645,988
NET
ASSETS—100.0%
$
8,874,158,019
(a)
Affiliated
fund.
(b)
Agreement
with
Fixed
Income
Clearing
Corporation,
5.320%
dated
5/31/24
to
be
repurchased
at
$10,844,806
on
6/3/24,
collateralized
by
Government
Agency
Securities,
with
coupon
rate
4.250%
and
maturity
date
3/15/27,
valued
at
$11,056,981.
Lifecycle
Index
2045
Fund
May
31,
2024
See
Notes
to
Financial
Statements
SHARES
DESCRIPTION
VALUE
AFFILIATED
INVESTMENT
COMPANIES—99.8%(a)
FIXED
INCOME—12.9%
101,889,945
Nuveen
Bond
Index
Fund,
Class
W
$
958,784,380
TOTAL
FIXED
INCOME
958,784,380
INTERNATIONAL
EQUITY—30.3%
62,546,567
Nuveen
Emerging
Markets
Equity
Index
Fund,
Class
W
674,877,461
66,822,306
Nuveen
International
Equity
Index
Fund,
Class
W
1,575,669,972
TOTAL
INTERNATIONAL
EQUITY
2,250,547,433
U.S.
EQUITY—56.6%
113,104,565
Nuveen
Equity
Index
Fund,
Class
W
4,195,048,311
TOTAL
U.S.
EQUITY
4,195,048,311
TOTAL
AFFILIATED
INVESTMENT
COMPANIES
7,404,380,124
(Cost
$5,383,612,689)
PRINCIPAL
RATE
MATURITY
DATE
SHORT-TERM
INVESTMENTS—0.1%
REPURCHASE
AGREEMENT—0.1%
$9,586,000
(b)
Fixed
Income
Clearing
Corporation
5
.320
%
06/03/24
9,586,000
TOTAL
REPURCHASE
AGREEMENT
9,586,000
TOTAL
SHORT-TERM
INVESTMENTS
9,586,000
(Cost
$9,586,000)
TOTAL
INVESTMENTS—99.9%
7,413,966,124
(Cost
$5,393,198,689)
OTHER
ASSETS
&
LIABILITIES,
NET—0.1%
5,429,645
NET
ASSETS—100.0%
$
7,419,395,769
(a)
Affiliated
fund.
(b)
Agreement
with
Fixed
Income
Clearing
Corporation,
5.320%
dated
5/31/24
to
be
repurchased
at
$9,590,250
on
6/3/24,
collateralized
by
Government
Agency
Securities,
with
coupon
rates
1.875%–3.250%
and
maturity
dates
2/28/27–6/30/27,
valued
at
$9,777,741.
Lifecycle
Index
2050
Fund
May
31,
2024
See
Notes
to
Financial
Statements
SHARES
DESCRIPTION
VALUE
AFFILIATED
INVESTMENT
COMPANIES—99.8%(a)
FIXED
INCOME—9.6%
64,003,589
Nuveen
Bond
Index
Fund,
Class
W
$
602,273,775
TOTAL
FIXED
INCOME
602,273,775
INTERNATIONAL
EQUITY—31.5%
54,876,596
Nuveen
Emerging
Markets
Equity
Index
Fund,
Class
W
592,118,473
58,564,629
Nuveen
International
Equity
Index
Fund,
Class
W
1,380,953,944
TOTAL
INTERNATIONAL
EQUITY
1,973,072,417
U.S.
EQUITY—58.7%
99,090,098
Nuveen
Equity
Index
Fund,
Class
W
3,675,251,730
TOTAL
U.S.
EQUITY
3,675,251,730
TOTAL
AFFILIATED
INVESTMENT
COMPANIES
6,250,597,922
(Cost
$4,558,134,849)
PRINCIPAL
RATE
MATURITY
DATE
SHORT-TERM
INVESTMENTS—0.2%
REPURCHASE
AGREEMENT—0.2%
$13,920,000
(b)
Fixed
Income
Clearing
Corporation
5
.320
%
06/03/24
13,920,000
TOTAL
REPURCHASE
AGREEMENT
13,920,000
TOTAL
SHORT-TERM
INVESTMENTS
13,920,000
(Cost
$13,920,000)
TOTAL
INVESTMENTS—100.0%
6,264,517,922
(Cost
$4,572,054,849)
OTHER
ASSETS
&
LIABILITIES,
NET—0.0%
432,037
NET
ASSETS—100.0%
$
6,264,949,959
(a)
Affiliated
fund.
(b)
Agreement
with
Fixed
Income
Clearing
Corporation,
5.320%
dated
5/31/24
to
be
repurchased
at
$13,926,171
on
6/3/24,
collateralized
by
Government
Agency
Securities,
with
coupon
rate
1.875%
and
maturity
date
2/28/27,
valued
at
$14,198,505.
Lifecycle
Index
2055
Fund
May
31,
2024
See
Notes
to
Financial
Statements
SHARES
DESCRIPTION
VALUE
AFFILIATED
INVESTMENT
COMPANIES—99.8%(a)
FIXED
INCOME—8.4%
33,334,077
Nuveen
Bond
Index
Fund,
Class
W
$
313,673,664
TOTAL
FIXED
INCOME
313,673,664
INTERNATIONAL
EQUITY—31.9%
33,281,217
Nuveen
Emerging
Markets
Equity
Index
Fund,
Class
W
359,104,327
35,518,130
Nuveen
International
Equity
Index
Fund,
Class
W
837,517,510
TOTAL
INTERNATIONAL
EQUITY
1,196,621,837
U.S.
EQUITY—59.5%
60,120,460
Nuveen
Equity
Index
Fund,
Class
W
2,229,867,872
TOTAL
U.S.
EQUITY
2,229,867,872
TOTAL
AFFILIATED
INVESTMENT
COMPANIES
3,740,163,373
(Cost
$2,854,179,531)
PRINCIPAL
RATE
MATURITY
DATE
SHORT-TERM
INVESTMENTS—0.1%
REPURCHASE
AGREEMENT—0.1%
$5,894,000
(b)
Fixed
Income
Clearing
Corporation
5
.320
%
06/03/24
5,894,000
TOTAL
REPURCHASE
AGREEMENT
5,894,000
TOTAL
SHORT-TERM
INVESTMENTS
5,894,000
(Cost
$5,894,000)
TOTAL
INVESTMENTS—99.9%
3,746,057,373
(Cost
$2,860,073,531)
OTHER
ASSETS
&
LIABILITIES,
NET—0.1%
2,323,973
NET
ASSETS—100.0%
$
3,748,381,346
(a)
Affiliated
fund.
(b)
Agreement
with
Fixed
Income
Clearing
Corporation,
5.320%
dated
5/31/24
to
be
repurchased
at
$5,896,613
on
6/3/24,
collateralized
by
Government
Agency
Securities,
with
coupon
rate
3.250%
and
maturity
date
6/30/27,
valued
at
$6,011,976.
Lifecycle
Index
2060
Fund
May
31,
2024
See
Notes
to
Financial
Statements
SHARES
DESCRIPTION
VALUE
AFFILIATED
INVESTMENT
COMPANIES—99.7%(a)
FIXED
INCOME—7.2%
15,787,361
Nuveen
Bond
Index
Fund,
Class
W
$
148,559,066
TOTAL
FIXED
INCOME
148,559,066
INTERNATIONAL
EQUITY—32.3%
18,695,386
Nuveen
Emerging
Markets
Equity
Index
Fund,
Class
W
201,723,219
19,927,435
Nuveen
International
Equity
Index
Fund,
Class
W
469,888,911
TOTAL
INTERNATIONAL
EQUITY
671,612,130
U.S.
EQUITY—60.2%
33,738,536
Nuveen
Equity
Index
Fund,
Class
W
1,251,362,297
TOTAL
U.S.
EQUITY
1,251,362,297
TOTAL
AFFILIATED
INVESTMENT
COMPANIES
2,071,533,493
(Cost
$1,662,745,099)
PRINCIPAL
RATE
MATURITY
DATE
SHORT-TERM
INVESTMENTS—0.2%
REPURCHASE
AGREEMENT—0.2%
$4,608,000
(b)
Fixed
Income
Clearing
Corporation
5
.320
%
06/03/24
4,608,000
TOTAL
REPURCHASE
AGREEMENT
4,608,000
TOTAL
SHORT-TERM
INVESTMENTS
4,608,000
(Cost
$4,608,000)
TOTAL
INVESTMENTS—99.9%
2,076,141,493
(Cost
$1,667,353,099)
OTHER
ASSETS
&
LIABILITIES,
NET—0.1%
1,965,542
NET
ASSETS—100.0%
$
2,078,107,035
(a)
Affiliated
fund.
(b)
Agreement
with
Fixed
Income
Clearing
Corporation,
5.320%
dated
5/31/24
to
be
repurchased
at
$4,610,043
on
6/3/24,
collateralized
by
Government
Agency
Securities,
with
coupon
rate
4.250%
and
maturity
date
3/15/27,
valued
at
$4,700,263.
Lifecycle
Index
2065
Fund
May
31,
2024
See
Notes
to
Financial
Statements
SHARES
DESCRIPTION
VALUE
AFFILIATED
INVESTMENT
COMPANIES—99.0%(a)
FIXED
INCOME—5.9%
2,128,299
Nuveen
Bond
Index
Fund,
Class
W
$
20,027,291
TOTAL
FIXED
INCOME
20,027,291
INTERNATIONAL
EQUITY—32.5%
3,074,944
Nuveen
Emerging
Markets
Equity
Index
Fund,
Class
W
33,178,643
3,270,849
Nuveen
International
Equity
Index
Fund,
Class
W
77,126,631
TOTAL
INTERNATIONAL
EQUITY
110,305,274
U.S.
EQUITY—60.6%
5,537,696
Nuveen
Equity
Index
Fund,
Class
W
205,393,136
TOTAL
U.S.
EQUITY
205,393,136
TOTAL
AFFILIATED
INVESTMENT
COMPANIES
335,725,701
(Cost
$292,485,781)
PRINCIPAL
RATE
MATURITY
DATE
SHORT-TERM
INVESTMENTS—0.3%
REPURCHASE
AGREEMENT—0.3%
$962,000
(b)
Fixed
Income
Clearing
Corporation
5
.320
%
06/03/24
962,000
TOTAL
REPURCHASE
AGREEMENT
962,000
TOTAL
SHORT-TERM
INVESTMENTS
962,000
(Cost
$962,000)
TOTAL
INVESTMENTS—99.3%
336,687,701
(Cost
$293,447,781)
OTHER
ASSETS
&
LIABILITIES,
NET—0.7%
2,336,378
NET
ASSETS—100.0%
$
339,024,079
(a)
Affiliated
fund.
(b)
Agreement
with
Fixed
Income
Clearing
Corporation,
5.320%
dated
5/31/24
to
be
repurchased
at
$962,426
on
6/3/24,
collateralized
by
Government
Agency
Securities,
with
coupon
rate
4.250%
and
maturity
date
3/15/27,
valued
at
$981,354.
Statement
of
Assets
and
Liabilities
See
Notes
to
Financial
Statements
May
31,
2024
14.1
Lifecycle
Index
Retirement
Income
14.2
Lifecycle
Index
2010
14.3
Lifecycle
Index
2015
14.4
Lifecycle
Index
2020
ASSETS
Affiliated
investments,
at
value
‡
$
704,088,809
$
629,159,315
$
1,045,804,001
$
3,076,133,900
Short-term
investments,
at
value
#
212,000
416,000
1,027,000
3,755,000
Cash
927
925
285
883
Receivables:
Dividends
1,071,908
1,055,517
1,571,762
4,309,707
Interest
31
61
152
555
Investments
sold
1,831,657
2,042,388
3,299,761
9,352,243
Reimbursement
from
Adviser
61,199
57,710
84,702
218,210
Shares
sold
798,069
90,682
760,759
6,315,715
Other
19,709
37,660
65,642
133,240
Total
assets
708,084,309
632,860,258
1,052,614,064
3,100,219,453
LIABILITIES
Due
to
affiliates
16,271
16,013
17,799
26,227
Payables:
Management
fees
102,141
92,205
151,503
435,705
Investments
purchased
-
regular
settlement
2,380,223
2,853,467
4,805,949
14,214,501
Shares
redeemed
513,876
602,007
160,814
1,479,868
Service
agreement
fees
7,734
10,922
17,655
43,375
Accrued
expenses:
Custodian
fees
1,863
1,853
1,859
1,859
Professional
fees
305
282
444
1,196
Shareholder
reporting
expenses
9,889
11,402
14,167
30,363
Shareholder
servicing
agent
fees
2,916
1,732
2,250
4,663
Trustees
fees
22,530
40,396
70,238
146,497
12b-1
distribution
and
service
fees
419
2,295
3,698
9,213
Other
18,842
14,253
22,981
66,508
Total
liabilities
3,077,009
3,646,827
5,269,357
16,459,975
Net
assets
$
705,007,300
$
629,213,431
$
1,047,344,707
$
3,083,759,478
NET
ASSETS
CONSIST
OF:
Paid-in
capital
$
632,421,183
$
534,245,619
$
854,825,193
$
2,518,454,400
Total
distributable
earnings
(loss)
72,586,117
94,967,812
192,519,514
565,305,078
Net
assets
$
705,007,300
$
629,213,431
$
1,047,344,707
$
3,083,759,478
‡
Affiliated
investments,
cost
$
608,333,159
$
526,613,085
$
847,704,942
$
2,497,002,194
#
Short-term
investments,
cost
$
212,000
$
416,000
$
1,027,000
$
3,755,000
CLASS
I:
Net
assets
$
2,418,408
$
1,187,524
$
1,258,627
$
8,483,539
Shares
outstanding
151,199
71,610
71,902
442,529
Net
asset
value
("NAV")
and
offering
price
per
share
$
15.99
$
16.58
$
17.50
$
19.17
PREMIER
CLASS:
Net
assets
$
3,307,355
$
17,900,961
$
29,222,298
$
72,849,164
Shares
outstanding
206,937
1,084,065
1,677,433
3,815,084
NAV
and
offering
price
per
share
$
15.98
$
16.51
$
17.42
$
19.10
CLASS
R6:
Net
assets
$
664,434,447
$
559,325,035
$
934,069,658
$
2,805,492,779
Shares
outstanding
41,529,787
33,741,814
53,344,179
146,115,114
NAV
and
offering
price
per
share
$
16.00
$
16.58
$
17.51
$
19.20
RETIREMENT
CLASS:
Net
assets
$
34,847,090
$
50,799,911
$
82,794,124
$
196,933,996
Shares
outstanding
2,183,009
3,094,949
4,768,817
10,351,831
NAV
and
offering
price
per
share
$
15.96
$
16.41
$
17.36
$
19.02
Authorized
shares
-
per
class
Unlimited
Unlimited
Unlimited
Unlimited
Par
value
per
share
$
0.0001
$
0.0001
$
0.0001
$
0.0001
See
Notes
to
Financial
Statements
14.5
Lifecycle
Index
2025
14.6
Lifecycle
Index
2030
14.7
Lifecycle
Index
2035
14.8
Lifecycle
Index
2040
14.9
Lifecycle
Index
2045
15.01
Lifecycle
Index
2050
$
5,944,363,270
$
8,008,368,078
$
8,442,625,734
$
8,858,672,031
$
7,404,380,124
$
6,250,597,922
4,042,000
8,764,000
14,308,000
10,840,000
9,586,000
13,920,000
212
210
16
651
196
148
7,567,140
8,625,658
7,267,657
5,088,321
2,754,165
1,726,543
597
1,295
2,114
1,602
1,417
2,057
20,986,811
26,938,764
27,180,219
21,481,778
12,797,215
5,491,102
372,947
468,542
461,349
456,943
379,465
317,969
4,896,573
8,533,548
9,264,533
9,409,942
10,935,464
10,752,144
173,117
194,469
185,714
202,154
129,057
100,440
5,982,402,667
8,061,894,564
8,501,295,336
8,906,153,422
7,440,963,103
6,282,908,325
37,331
44,618
45,614
47,025
40,904
36,576
818,631
1,067,350
1,092,668
1,115,114
925,316
778,678
26,431,780
36,100,765
38,328,906
27,420,128
15,465,611
12,643,968
2,621,335
5,588,862
3,337,086
2,779,177
4,634,472
4,077,234
82,550
101,831
95,323
88,823
75,263
63,095
1,859
1,859
1,856
1,855
1,855
1,855
2,179
2,816
2,895
3,015
2,469
2,086
48,041
58,596
59,880
64,033
55,927
54,031
5,719
6,663
6,484
7,294
6,647
7,238
197,093
224,832
216,424
233,892
154,517
121,753
16,246
20,358
24,569
25,266
16,479
12,207
129,482
190,730
210,579
209,781
187,874
159,645
30,392,246
43,409,280
43,422,284
31,995,403
21,567,334
17,958,366
$
5,952,010,421
$
8,018,485,284
$
8,457,873,052
$
8,874,158,019
$
7,419,395,769
$
6,264,949,959
$
4,866,876,335
$
6,449,139,669
$
6,587,161,969
$
6,558,207,098
$
5,514,928,821
$
4,667,118,794
1,085,134,086
1,569,345,615
1,870,711,083
2,315,950,921
1,904,466,948
1,597,831,165
$
5,952,010,421
$
8,018,485,284
$
8,457,873,052
$
8,874,158,019
$
7,419,395,769
$
6,264,949,959
$
4,823,091,337
$
6,329,700,410
$
6,432,682,442
$
6,367,671,592
$
5,383,612,689
$
4,558,134,849
$
4,042,000
$
8,764,000
$
14,308,000
$
10,840,000
$
9,586,000
$
13,920,000
$
20,649,614
$
34,836,603
$
27,532,811
$
28,683,786
$
27,460,394
$
22,003,734
964,551
1,472,573
1,058,955
1,018,834
930,114
732,100
$
21.41
$
23.66
$
26.00
$
28.15
$
29.52
$
30.06
$
128,403,239
$
161,500,835
$
194,854,908
$
200,052,867
$
131,290,790
$
96,699,574
6,011,833
6,853,235
7,525,356
7,139,055
4,460,818
3,230,010
$
21.36
$
23.57
$
25.89
$
28.02
$
29.43
$
29.94
$
5,430,992,390
$
7,365,842,868
$
7,806,877,616
$
8,245,415,556
$
6,926,481,236
$
5,863,809,303
253,080,539
310,730,168
299,612,628
292,378,721
234,043,978
194,678,927
$
21.46
$
23.70
$
26.06
$
28.20
$
29.59
$
30.12
$
371,965,178
$
456,304,978
$
428,607,717
$
400,005,810
$
334,163,349
$
282,437,348
17,508,179
19,452,481
16,628,923
14,331,119
11,414,675
9,485,774
$
21.25
$
23.46
$
25.77
$
27.91
$
29.27
$
29.77
Unlimited
Unlimited
Unlimited
Unlimited
Unlimited
Unlimited
$
0.0001
$
0.0001
$
0.0001
$
0.0001
$
0.0001
$
0.0001
Statement
of
Assets
and
Liabilities
(continued)
See
Notes
to
Financial
Statements
Statement
of
Assets
and
Liabilities
(continued)
May
31,
2024
15.1
Lifecycle
Index
2055
15.2
Lifecycle
Index
2060
15.3
Lifecycle
Index
2065
ASSETS
Affiliated
investments,
at
value
‡
$
3,740,163,373
$
2,071,533,493
$
335,725,701
Short-term
investments,
at
value
#
5,894,000
4,608,000
962,000
Cash
703
785
673
Receivables:
Dividends
897,933
422,558
55,595
Interest
871
681
142
Investments
sold
3,441,917
1,129,404
–
Reimbursement
from
Adviser
197,570
118,541
30,181
Shares
sold
8,075,350
5,287,406
3,101,833
Other
45,602
18,188
1,182
Total
assets
3,758,717,319
2,083,119,056
339,877,307
LIABILITIES
Due
to
affiliates
26,995
20,702
14,426
Payables:
Management
fees
464,459
256,211
40,727
Investments
purchased
-
regular
settlement
6,485,127
4,111,206
682,117
Shares
redeemed
3,106,993
469,207
82,550
Service
agreement
fees
37,723
20,344
2,615
Accrued
expenses:
Custodian
fees
1,855
1,855
1,874
Professional
fees
1,242
687
136
Shareholder
reporting
expenses
40,695
34,717
9,436
Shareholder
servicing
agent
fees
6,427
6,085
2,492
Trustees
fees
57,888
24,557
1,871
12b-1
distribution
and
service
fees
5,209
3,234
344
Other
101,360
63,216
14,640
Total
liabilities
10,335,973
5,012,021
853,228
Net
assets
$
3,748,381,346
$
2,078,107,035
$
339,024,079
NET
ASSETS
CONSIST
OF:
Paid-in
capital
$
2,910,698,252
$
1,696,877,939
$
297,865,327
Total
distributable
earnings
(loss)
837,683,094
381,229,096
41,158,752
Net
assets
$
3,748,381,346
$
2,078,107,035
$
339,024,079
‡
Affiliated
investments,
cost
$
2,854,179,531
$
1,662,745,099
$
292,485,781
#
Short-term
investments,
cost
$
5,894,000
$
4,608,000
$
962,000
CLASS
I:
Net
assets
$
19,948,056
$
13,382,395
$
3,787,116
Shares
outstanding
820,914
709,330
283,455
Net
asset
value
("NAV")
and
offering
price
per
share
$
24.30
$
18.87
$
13.36
PREMIER
CLASS:
Net
assets
$
41,614,130
$
25,988,579
$
2,811,433
Shares
outstanding
1,714,951
1,379,691
210,552
NAV
and
offering
price
per
share
$
24.27
$
18.84
$
13.35
CLASS
R6:
Net
assets
$
3,521,488,823
$
1,951,599,148
$
322,206,174
Shares
outstanding
144,622,217
103,317,279
23,806,157
NAV
and
offering
price
per
share
$
24.35
$
18.89
$
13.53
RETIREMENT
CLASS:
Net
assets
$
165,330,337
$
87,136,913
$
10,219,356
Shares
outstanding
6,835,030
4,638,431
764,928
NAV
and
offering
price
per
share
$
24.19
$
18.79
$
13.36
Authorized
shares
-
per
class
Unlimited
Unlimited
Unlimited
Par
value
per
share
$
0.0001
$
0.0001
$
0.0001
See
Notes
to
Financial
Statements
Year
Ended
May
31,
2024
14.1
Lifecycle
Index
Retirement
Income
14.2
Lifecycle
Index
2010
14.3
Lifecycle
Index
2015
14.4
Lifecycle
Index
2020
14.5
Lifecycle
Index
2025
INVESTMENT
INCOME
Dividends
from
affiliated
investments
$
19,938,075
$
18,967,551
$
30,855,580
$
87,217,202
$
156,185,114
Interest
46,216
27,420
41,122
117,252
269,431
Total
investment
income
19,984,291
18,994,971
30,896,702
87,334,454
156,454,545
EXPENSES
Management
fees
1,144,176
1,073,502
1,780,610
5,079,516
9,214,120
12b-1
distribution
and
service
fees
—
Premier
Class
4,985
28,210
43,919
114,356
185,568
Shareholder
servicing
agent
fees
—
Class
I
2,295
1,299
1,382
9,953
21,656
Shareholder
servicing
agent
fees
—
Premier
Class
127
98
144
179
224
Shareholder
servicing
agent
fees
—
Class
R6
8,445
4,930
6,618
14,466
18,577
Shareholder
servicing
agent
fees
—
Retirement
Class
87,854
134,582
214,932
508,051
964,896
Administrative
service
fees
60,735
60,053
66,803
98,786
140,140
Trustees
fees
10,308
10,050
16,757
48,546
88,517
Custodian
expenses
7,359
7,325
7,338
7,341
7,327
Overdraft
expense
11,676
8,815
7,166
8,255
1,699
Professional
fees
18,116
18,019
19,429
26,469
35,684
Registration
fees
65,099
65,286
64,655
69,394
69,239
Shareholder
reporting
expenses
45,879
47,439
58,354
119,681
191,398
Other
125,073
117,347
174,769
456,090
813,583
Total
expenses
1,592,127
1,576,955
2,462,876
6,561,083
11,752,628
Expenses
reimbursed
by
the
investment
adviser
(
247,793
)
(
239,998
)
(
270,169
)
(
430,370
)
(
622,840
)
Fee
waiver
by
investment
adviser
and
Nuveen
Securities
(
541,459
)
(
512,252
)
(
824,707
)
(
2,272,186
)
(
3,951,568
)
Net
expenses
802,875
824,705
1,368,000
3,858,527
7,178,220
Net
investment
income
(loss)
19,181,416
18,170,266
29,528,702
83,475,927
149,276,325
REALIZED
AND
UNREALIZED
GAIN
(LOSS)
Realized
gain
(loss):
Investments
–
–
–
–
–
Affiliated
investments
(
1,863,287
)
11,515,679
29,191,861
72,223,040
64,679,933
Net
realized
gain
(loss)
(
1,863,287
)
11,515,679
29,191,861
72,223,040
64,679,933
Change
in
unrealized
appreciation
(depreciation)
on:
Affiliated
investments
50,865,338
28,715,167
48,941,127
185,928,230
486,567,331
Net
change
in
unrealized
appreciation
(depreciation)
50,865,338
28,715,167
48,941,127
185,928,230
486,567,331
Net
realized
and
unrealized
gain
(loss)
49,002,051
40,230,846
78,132,988
258,151,270
551,247,264
Net
increase
(decrease)
in
net
assets
from
operations
$
68,183,467
$
58,401,112
$
107,661,690
$
341,627,197
$
700,523,589
See
Notes
to
Financial
Statements
14.6
Lifecycle
Index
2030
14.7
Lifecycle
Index
2035
14.8
Lifecycle
Index
2040
14.9
Lifecycle
Index
2045
15.01
Lifecycle
Index
2050
15.1
Lifecycle
Index
2055
15.2
Lifecycle
Index
2060
$
193,727,158
$
189,113,806
$
185,899,447
$
146,883,540
$
121,565,064
$
70,716,786
$
37,456,045
448,363
509,300
532,686
482,189
409,659
273,209
174,852
194,175,521
189,623,106
186,432,133
147,365,729
121,974,723
70,989,995
37,630,897
11,647,881
11,652,990
11,856,216
9,615,348
8,068,565
4,710,433
2,518,111
234,687
272,545
284,852
175,850
135,270
59,920
35,122
34,466
27,684
27,103
26,341
20,491
18,120
12,055
271
273
298
230
209
209
173
21,826
21,378
24,010
21,673
22,853
19,567
18,014
1,119,376
1,043,800
985,551
801,194
678,344
377,311
188,418
166,475
169,356
174,114
150,978
134,900
99,588
76,468
112,759
114,396
118,492
95,445
80,062
46,243
24,270
7,325
7,312
7,307
7,308
7,308
7,309
7,308
892
322
542
604
537
618
748
41,501
42,099
43,079
37,920
34,405
26,709
21,643
75,196
77,634
73,393
71,345
71,125
65,185
65,664
238,164
244,262
259,994
230,308
222,647
171,097
144,400
1,050,852
1,070,940
1,085,798
908,843
770,472
472,742
273,295
14,751,671
14,744,991
14,940,749
12,143,387
10,247,188
6,075,051
3,385,689
(
780,324
)
(
817,077
)
(
841,500
)
(
754,708
)
(
697,704
)
(
530,875
)
(
428,954
)
(
4,753,474
)
(
4,481,669
)
(
4,427,491
)
(
3,566,781
)
(
2,946,668
)
(
1,721,834
)
(
921,256
)
9,217,873
9,446,245
9,671,758
7,821,898
6,602,816
3,822,342
2,035,479
184,957,648
180,176,861
176,760,375
139,543,831
115,371,907
67,167,653
35,595,418
–
–
–
–
–
6,396
3,669
14,699,286
(
474,339
)
(
6,246,244
)
(
18,462,193
)
(
18,290,248
)
(
10,688,820
)
(
7,557,938
)
14,699,286
(
474,339
)
(
6,246,244
)
(
18,462,193
)
(
18,290,248
)
(
10,682,424
)
(
7,554,269
)
821,935,951
1,005,567,850
1,226,215,207
1,103,795,492
965,448,337
572,567,307
312,641,706
821,935,951
1,005,567,850
1,226,215,207
1,103,795,492
965,448,337
572,567,307
312,641,706
836,635,237
1,005,093,511
1,219,968,963
1,085,333,299
947,158,089
561,884,883
305,087,437
$
1,021,592,885
$
1,185,270,372
$
1,396,729,338
$
1,224,877,130
$
1,062,529,996
$
629,052,536
$
340,682,855
Statement
of
Operations
(continued)
See
Notes
to
Financial
Statements
Statement
of
Operations
(continued)
Year
Ended
May
31,
2024
15.3
Lifecycle
Index
2065
INVESTMENT
INCOME
Dividends
from
affiliated
investments
$
4,972,156
Interest
44,509
Total
investment
income
5,016,665
EXPENSES
Management
fees
334,084
12b-1
distribution
and
service
fees
—
Premier
Class
3,092
Shareholder
servicing
agent
fees
—
Class
I
2,703
Shareholder
servicing
agent
fees
—
Premier
Class
98
Shareholder
servicing
agent
fees
—
Class
R6
6,355
Shareholder
servicing
agent
fees
—
Retirement
Class
18,372
Administrative
service
fees
53,493
Trustees
fees
2,816
Custodian
expenses
7,369
Overdraft
expense
2,168
Professional
fees
16,534
Registration
fees
59,507
Shareholder
reporting
expenses
46,531
Other
64,248
Total
expenses
617,370
Expenses
reimbursed
by
the
investment
adviser
(
230,000
)
Fee
waiver
by
investment
adviser
and
Nuveen
Securities
(
124,310
)
Net
expenses
263,060
Net
investment
income
(loss)
4,753,605
REALIZED
AND
UNREALIZED
GAIN
(LOSS)
Realized
gain
(loss):
Investments
(
78,329
)
Affiliated
investments
(
606,684
)
Net
realized
gain
(loss)
(
685,013
)
Change
in
unrealized
appreciation
(depreciation)
on:
Affiliated
investments
42,485,825
Net
change
in
unrealized
appreciation
(depreciation)
42,485,825
Net
realized
and
unrealized
gain
(loss)
41,800,812
Net
increase
(decrease)
in
net
assets
from
operations
$
46,554,417
Statement
of
Changes
in
Net
Assets
See
Notes
to
Financial
Statements
14.1
Lifecycle
Index
Retirement
Income
14.2
Lifecycle
Index
2010
Year
Ended
5/31/24
Year
Ended
5/31/23
Year
Ended
5/31/24
Year
Ended
5/31/23
OPERATIONS
Net
investment
income
(loss)
$
19,181,416
$
15,305,262
$
18,170,266
$
16,194,967
Net
realized
gain
(loss)
(
1,863,287
)
(
11,896,154
)
11,515,679
(
7,974,112
)
Net
change
in
unrealized
appreciation
(depreciation)
50,865,338
(
5,999,510
)
28,715,167
(
10,055,029
)
Net
increase
(decrease)
in
net
assets
from
operations
68,183,467
(
2,590,402
)
58,401,112
(
1,834,174
)
DISTRIBUTIONS
TO
SHAREHOLDERS
–
–
–
–
Dividends:
Class
I
(
66,654
)
(
75,799
)
(
40,636
)
(
59,758
)
Premier
Class
(
89,487
)
(
122,700
)
(
640,813
)
(
606,988
)
Class
R6
(
17,810,107
)
(
18,281,295
)
(
18,866,826
)
(
18,252,249
)
Retirement
Class
(
892,490
)
(
1,135,242
)
(
1,712,599
)
(
1,903,649
)
Total
distributions
(
18,858,738
)
(
19,615,036
)
(
21,260,874
)
(
20,822,644
)
FUND
SHARE
TRANSACTIONS
Subscriptions
228,699,434
182,382,054
102,244,672
143,562,938
Reinvestments
of
distributions
17,074,412
17,905,642
20,685,528
20,192,977
Redemptions
(
206,207,587
)
(
166,855,638
)
(
161,485,076
)
(
128,482,532
)
Net
increase
(decrease)
from
Fund
share
transactions
39,566,259
33,432,058
(
38,554,876
)
35,273,383
Net
increase
(decrease)
in
net
assets
88,890,988
11,226,620
(
1,414,638
)
12,616,565
Net
assets
at
the
beginning
of
period
616,116,312
604,889,692
630,628,069
618,011,504
Net
assets
at
the
end
of
period
$
705,007,300
$
616,116,312
$
629,213,431
$
630,628,069
See
Notes
to
Financial
Statements
14.3
Lifecycle
Index
2015
14.4
Lifecycle
Index
2020
14.5
Lifecycle
Index
2025
14.6
Lifecycle
Index
2030
Year
Ended
5/31/24
Year
Ended
5/31/23
Year
Ended
5/31/24
Year
Ended
5/31/23
Year
Ended
5/31/24
Year
Ended
5/31/23
Year
Ended
5/31/24
Year
Ended
5/31/23
$
29,528,702
$
26,394,608
$
83,475,927
$
71,550,107
$
149,276,325
$
118,257,558
$
184,957,648
$
136,708,107
29,191,861
(
8,870,827
)
72,223,040
(
30,607,980
)
64,679,933
(
63,420,083
)
14,699,286
(
80,537,992
)
48,941,127
(
22,376,751
)
185,928,230
(
49,927,204
)
486,567,331
(
46,905,868
)
821,935,951
(
20,813,225
)
107,661,690
(
4,852,970
)
341,627,197
(
8,985,077
)
700,523,589
7,931,607
1,021,592,885
35,356,890
–
–
–
–
–
–
–
–
(
51,579
)
(
53,333
)
(
344,758
)
(
302,701
)
(
516,749
)
(
636,179
)
(
787,909
)
(
827,972
)
(
1,130,702
)
(
938,974
)
(
2,630,651
)
(
2,263,316
)
(
3,088,317
)
(
3,231,783
)
(
3,774,690
)
(
3,801,250
)
(
37,227,345
)
(
29,330,849
)
(
95,417,147
)
(
80,849,668
)
(
134,076,644
)
(
129,927,780
)
(
165,971,088
)
(
150,753,060
)
(
3,222,645
)
(
2,794,638
)
(
6,456,175
)
(
6,188,502
)
(
9,192,903
)
(
10,200,914
)
(
10,065,889
)
(
10,424,052
)
(
41,632,271
)
(
33,117,794
)
(
104,848,731
)
(
89,604,187
)
(
146,874,613
)
(
143,996,656
)
(
180,599,576
)
(
165,806,334
)
151,507,550
155,138,426
439,324,873
511,641,269
960,723,344
1,066,264,676
1,352,337,152
1,429,792,810
40,289,147
32,005,375
99,481,968
85,700,117
137,705,788
136,276,129
171,408,393
159,086,047
(
252,534,883
)
(
210,710,319
)
(
725,515,692
)
(
562,296,822
)
(
1,121,209,317
)
(
793,981,695
)
(
1,129,816,307
)
(
781,026,233
)
(
60,738,186
)
(
23,566,518
)
(
186,708,851
)
35,044,564
(
22,780,185
)
408,559,110
393,929,238
807,852,624
5,291,233
(
61,537,282
)
50,069,615
(
63,544,700
)
530,868,791
272,494,061
1,234,922,547
677,403,180
1,042,053,474
1,103,590,756
3,033,689,863
3,097,234,563
5,421,141,630
5,148,647,569
6,783,562,737
6,106,159,557
$
1,047,344,707
$
1,042,053,474
$
3,083,759,478
$
3,033,689,863
$
5,952,010,421
$
5,421,141,630
$
8,018,485,284
$
6,783,562,737
Statement
of
Changes
in
Net
Assets
(continued)
See
Notes
to
Financial
Statements
Statement
of
Changes
in
Net
Assets
(continued)
14.7
Lifecycle
Index
2035
14.8
Lifecycle
Index
2040
Year
Ended
5/31/24
Year
Ended
5/31/23
Year
Ended
5/31/24
Year
Ended
5/31/23
OPERATIONS
Net
investment
income
(loss)
$
180,176,861
$
127,022,344
$
176,760,375
$
126,021,438
Net
realized
gain
(loss)
(
474,339
)
(
108,910,376
)
(
6,246,244
)
(
127,395,310
)
Net
change
in
unrealized
appreciation
(depreciation)
1,005,567,850
52,152,223
1,226,215,207
103,241,296
Net
increase
(decrease)
in
net
assets
from
operations
1,185,270,372
70,264,191
1,396,729,338
101,867,424
DISTRIBUTIONS
TO
SHAREHOLDERS
–
–
–
–
Dividends:
Class
I
(
567,772
)
(
533,018
)
(
538,589
)
(
572,660
)
Premier
Class
(
3,857,289
)
(
3,866,279
)
(
3,954,076
)
(
3,901,042
)
Class
R6
(
154,914,286
)
(
141,975,692
)
(
156,485,700
)
(
143,168,670
)
Retirement
Class
(
8,392,031
)
(
8,978,227
)
(
7,629,130
)
(
8,360,596
)
Total
distributions
(
167,731,378
)
(
155,353,216
)
(
168,607,495
)
(
156,002,968
)
FUND
SHARE
TRANSACTIONS
Subscriptions
1,550,811,050
1,452,823,028
1,499,345,228
1,374,271,792
Reinvestments
of
distributions
159,535,720
148,974,623
162,404,648
151,188,334
Redemptions
(
1,034,946,977
)
(
662,613,309
)
(
979,972,778
)
(
601,622,212
)
Net
increase
(decrease)
from
Fund
share
transactions
675,399,793
939,184,342
681,777,098
923,837,914
Net
increase
(decrease)
in
net
assets
1,692,938,787
854,095,317
1,909,898,941
869,702,370
Net
assets
at
the
beginning
of
period
6,764,934,265
5,910,838,948
6,964,259,078
6,094,556,708
Net
assets
at
the
end
of
period
$
8,457,873,052
$
6,764,934,265
$
8,874,158,019
$
6,964,259,078
See
Notes
to
Financial
Statements
14.9
Lifecycle
Index
2045
15.01
Lifecycle
Index
2050
15.1
Lifecycle
Index
2055
15.2
Lifecycle
Index
2060
Year
Ended
5/31/24
Year
Ended
5/31/23
Year
Ended
5/31/24
Year
Ended
5/31/23
Year
Ended
5/31/24
Year
Ended
5/31/23
Year
Ended
5/31/24
Year
Ended
5/31/23
$
139,543,831
$
94,467,100
$
115,371,907
$
77,383,398
$
67,167,653
$
42,136,432
$
35,595,418
$
20,668,501
(
18,462,193
)
(
73,341,754
)
(
18,290,248
)
(
47,836,878
)
(
10,682,424
)
(
24,338,071
)
(
7,554,269
)
(
12,553,618
)
1,103,795,492
65,814,212
965,448,337
42,957,082
572,567,307
29,243,049
312,641,706
21,010,620
1,224,877,130
86,939,558
1,062,529,996
72,503,602
629,052,536
47,041,410
340,682,855
29,125,503
–
–
–
–
–
–
–
–
(
509,242
)
(
479,857
)
(
420,271
)
(
395,306
)
(
357,393
)
(
299,126
)
(
243,062
)
(
210,367
)
(
2,377,862
)
(
2,106,951
)
(
1,913,988
)
(
1,658,463
)
(
879,223
)
(
683,266
)
(
487,237
)
(
340,958
)
(
126,387,605
)
(
105,335,198
)
(
111,468,488
)
(
83,092,318
)
(
64,935,523
)
(
44,335,827
)
(
34,405,231
)
(
21,238,837
)
(
6,085,403
)
(
6,503,116
)
(
5,413,361
)
(
5,337,628
)
(
2,974,797
)
(
2,954,895
)
(
1,483,183
)
(
1,388,588
)
(
135,360,112
)
(
114,425,122
)
(
119,216,108
)
(
90,483,715
)
(
69,146,936
)
(
48,273,114
)
(
36,618,713
)
(
23,178,750
)
1,496,589,665
1,279,041,500
1,274,445,721
1,129,030,987
974,906,030
816,853,280
696,416,289
578,045,540
129,762,323
110,763,392
114,459,662
87,252,009
66,096,262
46,341,525
34,946,899
22,172,619
(
817,713,723
)
(
483,143,445
)
(
679,999,600
)
(
424,906,290
)
(
470,471,723
)
(
260,732,719
)
(
310,232,315
)
(
173,826,135
)
808,638,265
906,661,447
708,905,783
791,376,706
570,530,569
602,462,086
421,130,873
426,392,024
1,898,155,283
879,175,883
1,652,219,671
773,396,593
1,130,436,169
601,230,382
725,195,015
432,338,777
5,521,240,486
4,642,064,603
4,612,730,288
3,839,333,695
2,617,945,177
2,016,714,795
1,352,912,020
920,573,243
$
7,419,395,769
$
5,521,240,486
$
6,264,949,959
$
4,612,730,288
$
3,748,381,346
$
2,617,945,177
$
2,078,107,035
$
1,352,912,020
Statement
of
Changes
in
Net
Assets
(continued)
See
Notes
to
Financial
Statements
Statement
of
Changes
in
Net
Assets
(continued)
15.3
Lifecycle
Index
2065
Year
Ended
5/31/24
Year
Ended
5/31/23
OPERATIONS
Net
investment
income
(loss)
$
4,753,605
$
1,487,709
Net
realized
gain
(loss)
(
685,013
)
(
1,032,563
)
Net
change
in
unrealized
appreciation
(depreciation)
42,485,825
3,395,359
Net
increase
(decrease)
in
net
assets
from
operations
46,554,417
3,850,505
DISTRIBUTIONS
TO
SHAREHOLDERS
–
–
Dividends:
Class
I
(
63,731
)
(
15,962
)
Premier
Class
(
52,902
)
(
18,435
)
Class
R6
(
4,551,523
)
(
1,496,866
)
Retirement
Class
(
144,162
)
(
52,353
)
Total
distributions
(
4,812,318
)
(
1,583,616
)
FUND
SHARE
TRANSACTIONS
Subscriptions
208,269,379
90,742,768
Reinvestments
of
distributions
4,604,356
1,462,476
Redemptions
(
43,759,994
)
(
14,094,375
)
Net
increase
(decrease)
from
Fund
share
transactions
169,113,741
78,110,869
Net
increase
(decrease)
in
net
assets
210,855,840
80,377,758
Net
assets
at
the
beginning
of
period
128,168,239
47,790,481
Net
assets
at
the
end
of
period
$
339,024,079
$
128,168,239
See
Notes
to
Financial
Statements
The
following
data
is
for
a
share outstanding
for
each
fiscal year
end
unless
otherwise
noted:
Investment
Operations
Less
Distributions
Net
Asset
Value,
Beginning
of
Period
Net
Investment
Income
(Loss)
a
Net
Realized/
Unrealized
Gain
(Loss)
j
Total
From
Net
Investment
Income
From
Net
Realized
Gains
Total
Net
Asset
Value,
End
of
Period
14.1
Lifecycle
Index
Retirement
Income
Class
I:
5/31/24
$
14
.90
$
0
.43
$
1
.08
$
1
.51
$
(
0
.41
)
$
(
0
.01
)
$
(
0
.42
)
$
15
.99
5/31/23
15
.47
0
.37
(
0
.46
)
(
0
.09
)
(
0
.36
)
(
0
.12
)
(
0
.48
)
14
.90
5/31/22
17
.19
0
.35
(
1
.38
)
(
1
.03
)
(
0
.36
)
(
0
.33
)
(
0
.69
)
15
.47
5/31/21
15
.10
0
.24
2
.18
2
.42
(
0
.28
)
(
0
.05
)
(
0
.33
)
17
.19
5/31/20
14
.31
0
.36
0
.79
1
.15
(
0
.34
)
(
0
.02
)
(
0
.36
)
15
.10
Premier
Class:
5/31/24
14
.89
0
.42
1
.08
1
.50
(
0
.40
)
(
0
.01
)
(
0
.41
)
15
.98
5/31/23
15
.46
0
.37
(
0
.46
)
(
0
.09
)
(
0
.36
)
(
0
.12
)
(
0
.48
)
14
.89
5/31/22
17
.18
0
.41
(
1
.45
)
(
1
.04
)
(
0
.35
)
(
0
.33
)
(
0
.68
)
15
.46
5/31/21
15
.09
0
.27
2
.14
2
.41
(
0
.27
)
(
0
.05
)
(
0
.32
)
17
.18
5/31/20
14
.30
0
.32
0
.82
1
.14
(
0
.33
)
(
0
.02
)
(
0
.35
)
15
.09
Class
R6:
5/31/24
14
.90
0
.44
1
.10
1
.54
(
0
.43
)
(
0
.01
)
(
0
.44
)
16
.00
5/31/23
15
.48
0
.39
(
0
.47
)
(
0
.08
)
(
0
.38
)
(
0
.12
)
(
0
.50
)
14
.90
5/31/22
17
.20
0
.36
(
1
.37
)
(
1
.01
)
(
0
.38
)
(
0
.33
)
(
0
.71
)
15
.48
5/31/21
15
.10
0
.28
2
.16
2
.44
(
0
.29
)
(
0
.05
)
(
0
.34
)
17
.20
5/31/20
14
.31
0
.34
0
.82
1
.16
(
0
.35
)
(
0
.02
)
(
0
.37
)
15
.10
Retirement
Class:
5/31/24
14
.87
0
.40
1
.09
1
.49
(
0
.39
)
(
0
.01
)
(
0
.40
)
15
.96
5/31/23
15
.44
0
.35
(
0
.46
)
(
0
.11
)
(
0
.34
)
(
0
.12
)
(
0
.46
)
14
.87
5/31/22
17
.16
0
.32
(
1
.38
)
(
1
.06
)
(
0
.33
)
(
0
.33
)
(
0
.66
)
15
.44
5/31/21
15
.07
0
.24
2
.16
2
.40
(
0
.26
)
(
0
.05
)
(
0
.31
)
17
.16
5/31/20
14
.28
0
.31
0
.81
1
.12
(
0
.31
)
(
0
.02
)
(
0
.33
)
15
.07
a
Based
on
average
shares
outstanding.
b
Total
returns
are
not
annualized.
g
The
Fund's
expenses
include
the
expenses
of
the
Underlying
Funds.
j
Short-term
and
long-term
capital
gain
distributions
received
from
the
underlying
Funds
are
presented
in
net
realized
and
unrealized
gain
(loss)
on
total
investments
for
all
periods
presented.
See
Notes
to
Financial
Statements
Ratios
and
Supplemental
Data
Ratios
to
Average
Net
Assets
Total
Return
b
Net
Assets,
End
of
Period
(000)
Gross
Expenses
g
Net
Expenses
g
Net
Investment
Income
(Loss)
Portfolio
Turnover
Rate
10
.27
%
$
2,418
0
.32
%
0
.20
%
2
.79
%
19
%
(
0
.45
)
2,312
0
.31
0
.19
2
.52
24
(
6
.30
)
2,699
0
.33
0
.20
2
.08
24
16
.16
2,242
0
.34
0
.20
1
.49
23
8
.08
989
0
.37
0
.22
2
.41
27
10
.20
3,307
0
.37
0
.25
2
.72
19
(
0
.48
)
3,277
0
.37
0
.25
2
.53
24
(
6
.36
)
3,993
0
.38
0
.25
2
.37
24
16
.12
25,449
0
.38
0
.25
1
.63
23
8
.09
29,105
0
.40
0
.25
2
.17
27
10
.43
664,434
0
.22
0
.10
2
.86
19
(
0
.40
)
574,299
0
.22
0
.10
2
.62
24
(
6
.20
)
557,296
0
.23
0
.10
2
.13
24
16
.36
547,545
0
.23
0
.10
1
.69
23
8
.17
437,256
0
.26
0
.10
2
.32
27
10
.11
34,847
0
.47
0
.35
2
.59
19
(
0
.60
)
36,227
0
.47
0
.35
2
.36
24
(
6
.45
)
40,901
0
.48
0
.35
1
.90
24
16
.04
48,346
0
.48
0
.35
1
.45
23
7
.91
35,862
0
.50
0
.35
2
.09
27
Financial
Highlights
(continued)
See
Notes
to
Financial
Statements
Financial
Highlights
(continued)
Investment
Operations
Less
Distributions
Net
Asset
Value,
Beginning
of
Period
Net
Investment
Income
(Loss)
a
Net
Realized/
Unrealized
Gain
(Loss)
j
Total
From
Net
Investment
Income
From
Net
Realized
Gains
Total
Net
Asset
Value,
End
of
Period
14.2
Lifecycle
Index
2010
Class
I:
5/31/24
$
15
.63
$
0
.44
$
1
.04
$
1
.48
$
(
0
.41
)
$
(
0
.12
)
$
(
0
.53
)
$
16
.58
5/31/23
16
.24
0
.39
(
0
.49
)
(
0
.10
)
(
0
.38
)
(
0
.13
)
(
0
.51
)
15
.63
5/31/22
18
.13
0
.36
(
1
.40
)
(
1
.04
)
(
0
.37
)
(
0
.48
)
(
0
.85
)
16
.24
5/31/21
15
.97
0
.22
2
.35
2
.57
(
0
.30
)
(
0
.11
)
(
0
.41
)
18
.13
5/31/20
15
.11
0
.36
0
.87
1
.23
(
0
.35
)
(
0
.02
)
(
0
.37
)
15
.97
Premier
Class:
5/31/24
15
.58
0
.45
1
.01
1
.46
(
0
.41
)
(
0
.12
)
(
0
.53
)
16
.51
5/31/23
16
.18
0
.38
(
0
.48
)
(
0
.10
)
(
0
.37
)
(
0
.13
)
(
0
.50
)
15
.58
5/31/22
18
.06
0
.37
(
1
.42
)
(
1
.05
)
(
0
.35
)
(
0
.48
)
(
0
.83
)
16
.18
5/31/21
15
.92
0
.27
2
.26
2
.53
(
0
.28
)
(
0
.11
)
(
0
.39
)
18
.06
5/31/20
15
.06
0
.35
0
.86
1
.21
(
0
.33
)
(
0
.02
)
(
0
.35
)
15
.92
Class
R6:
5/31/24
15
.63
0
.46
1
.04
1
.50
(
0
.43
)
(
0
.12
)
(
0
.55
)
16
.58
5/31/23
16
.24
0
.41
(
0
.50
)
(
0
.09
)
(
0
.39
)
(
0
.13
)
(
0
.52
)
15
.63
5/31/22
18
.13
0
.38
(
1
.41
)
(
1
.03
)
(
0
.38
)
(
0
.48
)
(
0
.86
)
16
.24
5/31/21
15
.97
0
.30
2
.28
2
.58
(
0
.31
)
(
0
.11
)
(
0
.42
)
18
.13
5/31/20
15
.11
0
.36
0
.87
1
.23
(
0
.35
)
(
0
.02
)
(
0
.37
)
15
.97
Retirement
Class:
5/31/24
15
.48
0
.42
1
.02
1
.44
(
0
.39
)
(
0
.12
)
(
0
.51
)
16
.41
5/31/23
16
.08
0
.37
(
0
.49
)
(
0
.12
)
(
0
.35
)
(
0
.13
)
(
0
.48
)
15
.48
5/31/22
17
.96
0
.33
(
1
.39
)
(
1
.06
)
(
0
.34
)
(
0
.48
)
(
0
.82
)
16
.08
5/31/21
15
.83
0
.25
2
.26
2
.51
(
0
.27
)
(
0
.11
)
(
0
.38
)
17
.96
5/31/20
14
.98
0
.32
0
.87
1
.19
(
0
.32
)
(
0
.02
)
(
0
.34
)
15
.83
a
Based
on
average
shares
outstanding.
b
Total
returns
are
not
annualized.
g
The
Fund's
expenses
include
the
expenses
of
the
Underlying
Funds.
j
Short-term
and
long-term
capital
gain
distributions
received
from
the
underlying
Funds
are
presented
in
net
realized
and
unrealized
gain
(loss)
on
total
investments
for
all
periods
presented.
See
Notes
to
Financial
Statements
Ratios
and
Supplemental
Data
Ratios
to
Average
Net
Assets
Total
Return
b
Net
Assets,
End
of
Period
(000)
Gross
Expenses
g
Net
Expenses
g
Net
Investment
Income
(Loss)
Portfolio
Turnover
Rate
9
.63
%
$
1,188
0
.32
%
0
.20
%
2
.74
%
17
%
(
0
.53
)
2,024
0
.31
0
.19
2
.52
22
(
6
.16
)
1,715
0
.32
0
.20
2
.03
23
16
.18
1,950
0
.32
0
.19
1
.28
28
8
.16
123
0
.26
0
.12
2
.30
22
9
.57
17,901
0
.37
0
.25
2
.79
17
(
0
.60
)
19,016
0
.37
0
.25
2
.47
22
(
6
.19
)
21,048
0
.38
0
.25
2
.07
23
15
.99
43,665
0
.38
0
.25
1
.56
28
8
.06
31,580
0
.40
0
.25
2
.20
22
9
.76
559,325
0
.22
0
.10
2
.90
17
(
0
.44
)
553,938
0
.22
0
.10
2
.63
22
(
6
.07
)
526,583
0
.22
0
.10
2
.12
23
16
.22
560,852
0
.23
0
.10
1
.71
28
8
.18
442,192
0
.25
0
.10
2
.32
22
9
.44
50,800
0
.47
0
.35
2
.66
17
(
0
.66
)
55,650
0
.47
0
.35
2
.39
22
(
6
.32
)
68,666
0
.47
0
.35
1
.88
23
15
.91
81,534
0
.48
0
.35
1
.46
28
7
.93
74,599
0
.50
0
.35
2
.08
22
Financial
Highlights
(continued)
See
Notes
to
Financial
Statements
Financial
Highlights
(continued)
Investment
Operations
Less
Distributions
Net
Asset
Value,
Beginning
of
Period
Net
Investment
Income
(Loss)
a
Net
Realized/
Unrealized
Gain
(Loss)
j
Total
From
Net
Investment
Income
From
Net
Realized
Gains
Total
Net
Asset
Value,
End
of
Period
14.3
Lifecycle
Index
2015
Class
I:
5/31/24
$
16
.45
$
0
.45
$
1
.26
$
1
.71
$
(
0
.43
)
$
(
0
.23
)
$
(
0
.66
)
$
17
.50
5/31/23
17
.04
0
.40
(
0
.48
)
(
0
.08
)
(
0
.40
)
(
0
.11
)
(
0
.51
)
16
.45
5/31/22
19
.14
0
.40
(
1
.55
)
(
1
.15
)
(
0
.38
)
(
0
.57
)
(
0
.95
)
17
.04
5/31/21
16
.65
0
.23
2
.75
2
.98
(
0
.33
)
(
0
.16
)
(
0
.49
)
19
.14
5/31/20
15
.76
0
.39
0
.90
1
.29
(
0
.37
)
(
0
.03
)
(
0
.40
)
16
.65
Premier
Class:
5/31/24
16
.37
0
.45
1
.25
1
.70
(
0
.42
)
(
0
.23
)
(
0
.65
)
17
.42
5/31/23
16
.97
0
.39
(
0
.49
)
(
0
.10
)
(
0
.39
)
(
0
.11
)
(
0
.50
)
16
.37
5/31/22
19
.07
0
.41
(
1
.57
)
(
1
.16
)
(
0
.37
)
(
0
.57
)
(
0
.94
)
16
.97
5/31/21
16
.58
0
.28
2
.68
2
.96
(
0
.31
)
(
0
.16
)
(
0
.47
)
19
.07
5/31/20
15
.69
0
.36
0
.91
1
.27
(
0
.35
)
(
0
.03
)
(
0
.38
)
16
.58
Class
R6:
5/31/24
16
.46
0
.48
1
.25
1
.73
(
0
.45
)
(
0
.23
)
(
0
.68
)
17
.51
5/31/23
17
.05
0
.42
(
0
.48
)
(
0
.06
)
(
0
.42
)
(
0
.11
)
(
0
.53
)
16
.46
5/31/22
19
.15
0
.39
(
1
.52
)
(
1
.13
)
(
0
.40
)
(
0
.57
)
(
0
.97
)
17
.05
5/31/21
16
.65
0
.31
2
.69
3
.00
(
0
.34
)
(
0
.16
)
(
0
.50
)
19
.15
5/31/20
15
.76
0
.38
0
.92
1
.30
(
0
.38
)
(
0
.03
)
(
0
.41
)
16
.65
Retirement
Class:
5/31/24
16
.32
0
.43
1
.25
1
.68
(
0
.41
)
(
0
.23
)
(
0
.64
)
17
.36
5/31/23
16
.92
0
.37
(
0
.48
)
(
0
.11
)
(
0
.38
)
(
0
.11
)
(
0
.49
)
16
.32
5/31/22
19
.00
0
.34
(
1
.50
)
(
1
.16
)
(
0
.35
)
(
0
.57
)
(
0
.92
)
16
.92
5/31/21
16
.52
0
.26
2
.67
2
.93
(
0
.29
)
(
0
.16
)
(
0
.45
)
19
.00
5/31/20
15
.64
0
.33
0
.91
1
.24
(
0
.33
)
(
0
.03
)
(
0
.36
)
16
.52
a
Based
on
average
shares
outstanding.
b
Total
returns
are
not
annualized.
g
The
Fund's
expenses
include
the
expenses
of
the
Underlying
Funds.
j
Short-term
and
long-term
capital
gain
distributions
received
from
the
underlying
Funds
are
presented
in
net
realized
and
unrealized
gain
(loss)
on
total
investments
for
all
periods
presented.
See
Notes
to
Financial
Statements
Ratios
and
Supplemental
Data
Ratios
to
Average
Net
Assets
Total
Return
b
Net
Assets,
End
of
Period
(000)
Gross
Expenses
g
Net
Expenses
g
Net
Investment
Income
(Loss)
Portfolio
Turnover
Rate
10
.57
%
$
1,259
0
.30
%
0
.20
%
2
.65
%
15
%
(
0
.33
)
1,700
0
.30
0
.20
2
.48
18
(
6
.40
)
1,657
0
.31
0
.20
2
.13
19
18
.05
1,396
0
.31
0
.20
1
.28
26
8
.19
592
0
.30
0
.18
2
.38
25
10
.57
29,222
0
.36
0
.25
2
.67
15
(
0
.45
)
30,386
0
.35
0
.25
2
.41
18
(
6
.49
)
34,529
0
.36
0
.25
2
.16
19
18
.00
98,140
0
.36
0
.25
1
.55
26
8
.12
85,350
0
.37
0
.25
2
.18
25
10
.75
934,070
0
.21
0
.10
2
.82
15
(
0
.28
)
921,164
0
.20
0
.10
2
.55
18
(
6
.32
)
966,867
0
.21
0
.10
2
.08
19
18
.16
962,220
0
.21
0
.10
1
.71
26
8
.24
819,474
0
.23
0
.10
2
.33
25
10
.43
82,794
0
.46
0
.35
2
.58
15
(
0
.56
)
88,804
0
.45
0
.35
2
.31
18
(
6
.51
)
100,537
0
.46
0
.35
1
.83
19
17
.88
126,902
0
.46
0
.35
1
.44
26
7
.96
122,731
0
.47
0
.35
2
.05
25
Financial
Highlights
(continued)
See
Notes
to
Financial
Statements
Financial
Highlights
(continued)
Investment
Operations
Less
Distributions
Net
Asset
Value,
Beginning
of
Period
Net
Investment
Income
(Loss)
a
Net
Realized/
Unrealized
Gain
(Loss)
j
Total
From
Net
Investment
Income
From
Net
Realized
Gains
Total
Net
Asset
Value,
End
of
Period
14.4
Lifecycle
Index
2020
Class
I:
5/31/24
$
17
.76
$
0
.49
$
1
.54
$
2
.03
$
(
0
.46
)
$
(
0
.16
)
$
(
0
.62
)
$
19
.17
5/31/23
18
.36
0
.41
(
0
.48
)
(
0
.07
)
(
0
.41
)
(
0
.12
)
(
0
.53
)
17
.76
5/31/22
20
.67
0
.41
(
1
.68
)
(
1
.27
)
(
0
.41
)
(
0
.63
)
(
1
.04
)
18
.36
5/31/21
17
.61
0
.27
3
.23
3
.50
(
0
.34
)
(
0
.10
)
(
0
.44
)
20
.67
5/31/20
16
.64
0
.43
0
.94
1
.37
(
0
.38
)
(
0
.02
)
(
0
.40
)
17
.61
Premier
Class:
5/31/24
17
.69
0
.48
1
.54
2
.02
(
0
.45
)
(
0
.16
)
(
0
.61
)
19
.10
5/31/23
18
.29
0
.40
(
0
.48
)
(
0
.08
)
(
0
.40
)
(
0
.12
)
(
0
.52
)
17
.69
5/31/22
20
.59
0
.44
(
1
.72
)
(
1
.28
)
(
0
.39
)
(
0
.63
)
(
1
.02
)
18
.29
5/31/21
17
.55
0
.30
3
.17
3
.47
(
0
.33
)
(
0
.10
)
(
0
.43
)
20
.59
5/31/20
16
.57
0
.38
0
.99
1
.37
(
0
.37
)
(
0
.02
)
(
0
.39
)
17
.55
Class
R6:
5/31/24
17
.79
0
.50
1
.55
2
.05
(
0
.48
)
(
0
.16
)
(
0
.64
)
19
.20
5/31/23
18
.39
0
.43
(
0
.48
)
(
0
.05
)
(
0
.43
)
(
0
.12
)
(
0
.55
)
17
.79
5/31/22
20
.70
0
.41
(
1
.66
)
(
1
.25
)
(
0
.43
)
(
0
.63
)
(
1
.06
)
18
.39
5/31/21
17
.63
0
.33
3
.20
3
.53
(
0
.36
)
(
0
.10
)
(
0
.46
)
20
.70
5/31/20
16
.65
0
.40
0
.99
1
.39
(
0
.39
)
(
0
.02
)
(
0
.41
)
17
.63
Retirement
Class:
5/31/24
17
.63
0
.45
1
.53
1
.98
(
0
.43
)
(
0
.16
)
(
0
.59
)
19
.02
5/31/23
18
.22
0
.38
(
0
.47
)
(
0
.09
)
(
0
.38
)
(
0
.12
)
(
0
.50
)
17
.63
5/31/22
20
.52
0
.36
(
1
.66
)
(
1
.30
)
(
0
.37
)
(
0
.63
)
(
1
.00
)
18
.22
5/31/21
17
.48
0
.28
3
.17
3
.45
(
0
.31
)
(
0
.10
)
(
0
.41
)
20
.52
5/31/20
16
.51
0
.35
0
.99
1
.34
(
0
.35
)
(
0
.02
)
(
0
.37
)
17
.48
a
Based
on
average
shares
outstanding.
b
Total
returns
are
not
annualized.
g
The
Fund's
expenses
include
the
expenses
of
the
Underlying
Funds.
j
Short-term
and
long-term
capital
gain
distributions
received
from
the
underlying
Funds
are
presented
in
net
realized
and
unrealized
gain
(loss)
on
total
investments
for
all
periods
presented.
See
Notes
to
Financial
Statements
Ratios
and
Supplemental
Data
Ratios
to
Average
Net
Assets
Total
Return
b
Net
Assets,
End
of
Period
(000)
Gross
Expenses
g
Net
Expenses
g
Net
Investment
Income
(Loss)
Portfolio
Turnover
Rate
11
.60
%
$
8,484
0
.29
%
0
.20
%
2
.66
%
14
%
(
0
.27
)
10,266
0
.29
0
.20
2
.36
19
(
6
.60
)
10,672
0
.30
0
.20
2
.03
19
20
.00
11,420
0
.30
0
.20
1
.37
21
8
.25
4,832
0
.31
0
.21
2
.51
20
11
.59
72,849
0
.34
0
.25
2
.63
14
(
0
.32
)
78,463
0
.34
0
.25
2
.30
19
(
6
.65
)
82,754
0
.35
0
.25
2
.13
19
19
.89
316,253
0
.35
0
.25
1
.55
21
8
.25
268,403
0
.36
0
.25
2
.16
20
11
.75
2,805,493
0
.19
0
.10
2
.73
14
(
0
.21
)
2,736,922
0
.19
0
.10
2
.44
19
(
6
.51
)
2,756,707
0
.19
0
.10
2
.01
19
20
.14
2,729,084
0
.20
0
.10
1
.72
21
8
.36
2,221,699
0
.21
0
.10
2
.32
20
11
.39
196,934
0
.44
0
.35
2
.48
14
(
0
.39
)
208,039
0
.44
0
.35
2
.20
19
(
6
.76
)
247,101
0
.44
0
.35
1
.78
19
19
.85
310,428
0
.45
0
.35
1
.46
21
8
.10
303,700
0
.46
0
.35
2
.05
20
Financial
Highlights
(continued)
See
Notes
to
Financial
Statements
Financial
Highlights
(continued)
Investment
Operations
Less
Distributions
Net
Asset
Value,
Beginning
of
Period
Net
Investment
Income
(Loss)
a
Net
Realized/
Unrealized
Gain
(Loss)
j
Total
From
Net
Investment
Income
From
Net
Realized
Gains
Total
Net
Asset
Value,
End
of
Period
14.5
Lifecycle
Index
2025
Class
I:
5/31/24
$
19
.45
$
0
.51
$
1
.96
$
2
.47
$
(
0
.48
)
$
(
0
.03
)
$
(
0
.51
)
$
21
.41
5/31/23
20
.02
0
.44
(
0
.47
)
(
0
.03
)
(
0
.42
)
(
0
.12
)
(
0
.54
)
19
.45
5/31/22
22
.32
0
.42
(
1
.85
)
(
1
.43
)
(
0
.43
)
(
0
.44
)
(
0
.87
)
20
.02
5/31/21
18
.50
0
.31
3
.96
4
.27
(
0
.36
)
(
0
.09
)
(
0
.45
)
22
.32
5/31/20
17
.47
0
.42
1
.03
1
.45
(
0
.40
)
(
0
.02
)
(
0
.42
)
18
.50
Premier
Class:
5/31/24
19
.40
0
.51
1
.95
2
.46
(
0
.47
)
(
0
.03
)
(
0
.50
)
21
.36
5/31/23
19
.98
0
.42
(
0
.47
)
(
0
.05
)
(
0
.41
)
(
0
.12
)
(
0
.53
)
19
.40
5/31/22
22
.26
0
.47
(
1
.90
)
(
1
.43
)
(
0
.41
)
(
0
.44
)
(
0
.85
)
19
.98
5/31/21
18
.45
0
.32
3
.92
4
.24
(
0
.34
)
(
0
.09
)
(
0
.43
)
22
.26
5/31/20
17
.41
0
.39
1
.05
1
.44
(
0
.38
)
(
0
.02
)
(
0
.40
)
18
.45
Class
R6:
5/31/24
19
.49
0
.53
1
.97
2
.50
(
0
.50
)
(
0
.03
)
(
0
.53
)
21
.46
5/31/23
20
.07
0
.45
(
0
.47
)
(
0
.02
)
(
0
.44
)
(
0
.12
)
(
0
.56
)
19
.49
5/31/22
22
.36
0
.43
(
1
.83
)
(
1
.40
)
(
0
.45
)
(
0
.44
)
(
0
.89
)
20
.07
5/31/21
18
.53
0
.35
3
.94
4
.29
(
0
.37
)
(
0
.09
)
(
0
.46
)
22
.36
5/31/20
17
.49
0
.42
1
.05
1
.47
(
0
.41
)
(
0
.02
)
(
0
.43
)
18
.53
Retirement
Class:
5/31/24
19
.30
0
.48
1
.95
2
.43
(
0
.45
)
(
0
.03
)
(
0
.48
)
21
.25
5/31/23
19
.87
0
.40
(
0
.47
)
(
0
.07
)
(
0
.38
)
(
0
.12
)
(
0
.50
)
19
.30
5/31/22
22
.15
0
.37
(
1
.82
)
(
1
.45
)
(
0
.39
)
(
0
.44
)
(
0
.83
)
19
.87
5/31/21
18
.36
0
.30
3
.90
4
.20
(
0
.32
)
(
0
.09
)
(
0
.41
)
22
.15
5/31/20
17
.34
0
.37
1
.03
1
.40
(
0
.36
)
(
0
.02
)
(
0
.38
)
18
.36
a
Based
on
average
shares
outstanding.
b
Total
returns
are
not
annualized.
g
The
Fund's
expenses
include
the
expenses
of
the
Underlying
Funds.
j
Short-term
and
long-term
capital
gain
distributions
received
from
the
underlying
Funds
are
presented
in
net
realized
and
unrealized
gain
(loss)
on
total
investments
for
all
periods
presented.
See
Notes
to
Financial
Statements
Ratios
and
Supplemental
Data
Ratios
to
Average
Net
Assets
Total
Return
b
Net
Assets,
End
of
Period
(000)
Gross
Expenses
g
Net
Expenses
g
Net
Investment
Income
(Loss)
Portfolio
Turnover
Rate
12
.84
%
$
20,650
0
.29
%
0
.21
%
2
.50
%
15
%
(
0
.06
)
22,052
0
.28
0
.20
2
.30
14
(
6
.78
)
21,746
0
.29
0
.21
1
.92
14
23
.20
17,472
0
.29
0
.20
1
.47
18
8
.23
2,837
0
.30
0
.21
2
.30
17
12
.83
128,403
0
.33
0
.25
2
.50
15
(
0
.17
)
119,308
0
.33
0
.25
2
.20
14
(
6
.79
)
123,482
0
.34
0
.25
2
.06
14
23
.11
466,892
0
.34
0
.25
1
.55
18
8
.24
357,784
0
.35
0
.26
2
.15
17
12
.98
5,430,992
0
.18
0
.10
2
.62
15
(
0
.01
)
4,888,761
0
.18
0
.10
2
.33
14
(
6
.65
)
4,582,423
0
.19
0
.10
1
.95
14
23
.29
4,263,286
0
.19
0
.10
1
.71
18
8
.35
3,152,216
0
.20
0
.11
2
.31
17
12
.73
371,965
0
.43
0
.35
2
.39
15
(
0
.23
)
391,021
0
.43
0
.35
2
.10
14
(
6
.91
)
420,997
0
.44
0
.35
1
.71
14
22
.99
481,282
0
.44
0
.35
1
.46
18
8
.05
424,099
0
.46
0
.36
2
.05
17
Financial
Highlights
(continued)
See
Notes
to
Financial
Statements
Financial
Highlights
(continued)
Investment
Operations
Less
Distributions
Net
Asset
Value,
Beginning
of
Period
Net
Investment
Income
(Loss)
a
Net
Realized/
Unrealized
Gain
(Loss)
j
Total
From
Net
Investment
Income
From
Net
Realized
Gains
Total
Net
Asset
Value,
End
of
Period
14.6
Lifecycle
Index
2030
Class
I:
5/31/24
$
21
.14
$
0
.53
$
2
.52
$
3
.05
$
(
0
.50
)
$
(
0
.03
)
$
(
0
.53
)
$
23
.66
5/31/23
21
.68
0
.45
(
0
.45
)
—
(
0
.42
)
(
0
.12
)
(
0
.54
)
21
.14
5/31/22
24
.04
0
.43
(
2
.03
)
(
1
.60
)
(
0
.45
)
(
0
.31
)
(
0
.76
)
21
.68
5/31/21
19
.38
0
.31
4
.80
5
.11
(
0
.37
)
(
0
.08
)
(
0
.45
)
24
.04
5/31/20
18
.31
0
.42
1
.09
1
.51
(
0
.42
)
(
0
.02
)
(
0
.44
)
19
.38
Premier
Class:
5/31/24
21
.06
0
.53
2
.50
3
.03
(
0
.49
)
(
0
.03
)
(
0
.52
)
23
.57
5/31/23
21
.60
0
.43
(
0
.44
)
(
0
.01
)
(
0
.41
)
(
0
.12
)
(
0
.53
)
21
.06
5/31/22
23
.96
0
.50
(
2
.12
)
(
1
.62
)
(
0
.43
)
(
0
.31
)
(
0
.74
)
21
.60
5/31/21
19
.31
0
.34
4
.75
5
.09
(
0
.36
)
(
0
.08
)
(
0
.44
)
23
.96
5/31/20
18
.24
0
.41
1
.09
1
.50
(
0
.41
)
(
0
.02
)
(
0
.43
)
19
.31
Class
R6:
5/31/24
21
.18
0
.56
2
.51
3
.07
(
0
.52
)
(
0
.03
)
(
0
.55
)
23
.70
5/31/23
21
.72
0
.46
(
0
.44
)
0
.02
(
0
.44
)
(
0
.12
)
(
0
.56
)
21
.18
5/31/22
24
.08
0
.45
(
2
.03
)
(
1
.58
)
(
0
.47
)
(
0
.31
)
(
0
.78
)
21
.72
5/31/21
19
.40
0
.38
4
.77
5
.15
(
0
.39
)
(
0
.08
)
(
0
.47
)
24
.08
5/31/20
18
.33
0
.44
1
.08
1
.52
(
0
.43
)
(
0
.02
)
(
0
.45
)
19
.40
Retirement
Class:
5/31/24
20
.97
0
.50
2
.49
2
.99
(
0
.47
)
(
0
.03
)
(
0
.50
)
23
.46
5/31/23
21
.51
0
.41
(
0
.44
)
(
0
.03
)
(
0
.39
)
(
0
.12
)
(
0
.51
)
20
.97
5/31/22
23
.85
0
.39
(
2
.01
)
(
1
.62
)
(
0
.41
)
(
0
.31
)
(
0
.72
)
21
.51
5/31/21
19
.22
0
.32
4
.72
5
.04
(
0
.33
)
(
0
.08
)
(
0
.41
)
23
.85
5/31/20
18
.16
0
.39
1
.08
1
.47
(
0
.39
)
(
0
.02
)
(
0
.41
)
19
.22
a
Based
on
average
shares
outstanding.
b
Total
returns
are
not
annualized.
g
The
Fund's
expenses
include
the
expenses
of
the
Underlying
Funds.
j
Short-term
and
long-term
capital
gain
distributions
received
from
the
underlying
Funds
are
presented
in
net
realized
and
unrealized
gain
(loss)
on
total
investments
for
all
periods
presented.
See
Notes
to
Financial
Statements
Ratios
and
Supplemental
Data
Ratios
to
Average
Net
Assets
Total
Return
b
Net
Assets,
End
of
Period
(000)
Gross
Expenses
g
Net
Expenses
g
Net
Investment
Income
(Loss)
Portfolio
Turnover
Rate
14
.57
%
$
34,837
0
.28
%
0
.21
%
2
.37
%
12
%
0
.15
33,509
0
.28
0
.20
2
.17
12
(
6
.94
)
26,880
0
.28
0
.20
1
.83
13
26
.54
23,352
0
.29
0
.20
1
.38
16
8
.20
5,671
0
.30
0
.21
2
.20
15
14
.53
161,501
0
.33
0
.26
2
.41
12
0
.09
150,728
0
.33
0
.25
2
.09
12
(
7
.00
)
150,515
0
.33
0
.25
2
.04
13
26
.45
475,693
0
.34
0
.25
1
.54
16
8
.14
344,547
0
.35
0
.25
2
.14
15
14
.66
7,365,843
0
.18
0
.11
2
.50
12
0
.24
6,168,804
0
.18
0
.10
2
.22
12
(
6
.86
)
5,483,743
0
.18
0
.10
1
.88
13
26
.70
4,966,053
0
.19
0
.10
1
.70
16
8
.25
3,449,438
0
.20
0
.10
2
.30
15
14
.39
456,305
0
.43
0
.36
2
.28
12
(
0
.02
)
430,522
0
.43
0
.35
1
.97
12
(
7
.07
)
445,022
0
.43
0
.35
1
.66
13
26
.40
496,871
0
.44
0
.35
1
.45
16
8
.02
419,628
0
.45
0
.35
2
.04
15
Financial
Highlights
(continued)
See
Notes
to
Financial
Statements
Financial
Highlights
(continued)
Investment
Operations
Less
Distributions
Net
Asset
Value,
Beginning
of
Period
Net
Investment
Income
(Loss)
a
Net
Realized/
Unrealized
Gain
(Loss)
j
Total
From
Net
Investment
Income
From
Net
Realized
Gains
Total
Net
Asset
Value,
End
of
Period
14.7
Lifecycle
Index
2035
Class
I:
5/31/24
$
22
.78
$
0
.55
$
3
.19
$
3
.74
$
(
0
.52
)
$
—
$
(
0
.52
)
$
26
.00
5/31/23
23
.24
0
.45
(
0
.35
)
0
.10
(
0
.43
)
(
0
.13
)
(
0
.56
)
22
.78
5/31/22
25
.73
0
.44
(
2
.19
)
(
1
.75
)
(
0
.47
)
(
0
.27
)
(
0
.74
)
23
.24
5/31/21
20
.18
0
.32
5
.70
6
.02
(
0
.39
)
(
0
.08
)
(
0
.47
)
25
.73
5/31/20
19
.10
0
.50
1
.04
1
.54
(
0
.44
)
(
0
.02
)
(
0
.46
)
20
.18
Premier
Class:
5/31/24
22
.69
0
.54
3
.17
3
.71
(
0
.51
)
—
(
0
.51
)
25
.89
5/31/23
23
.14
0
.43
(
0
.33
)
0
.10
(
0
.42
)
(
0
.13
)
(
0
.55
)
22
.69
5/31/22
25
.63
0
.51
(
2
.27
)
(
1
.76
)
(
0
.46
)
(
0
.27
)
(
0
.73
)
23
.14
5/31/21
20
.11
0
.36
5
.61
5
.97
(
0
.37
)
(
0
.08
)
(
0
.45
)
25
.63
5/31/20
19
.02
0
.43
1
.11
1
.54
(
0
.43
)
(
0
.02
)
(
0
.45
)
20
.11
Class
R6:
5/31/24
22
.83
0
.58
3
.19
3
.77
(
0
.54
)
—
(
0
.54
)
26
.06
5/31/23
23
.28
0
.47
(
0
.34
)
0
.13
(
0
.45
)
(
0
.13
)
(
0
.58
)
22
.83
5/31/22
25
.77
0
.46
(
2
.18
)
(
1
.72
)
(
0
.50
)
(
0
.27
)
(
0
.77
)
23
.28
5/31/21
20
.21
0
.40
5
.64
6
.04
(
0
.40
)
(
0
.08
)
(
0
.48
)
25
.77
5/31/20
19
.12
0
.46
1
.11
1
.57
(
0
.46
)
(
0
.02
)
(
0
.48
)
20
.21
Retirement
Class:
5/31/24
22
.59
0
.52
3
.14
3
.66
(
0
.48
)
—
(
0
.48
)
25
.77
5/31/23
23
.04
0
.41
(
0
.33
)
0
.08
(
0
.40
)
(
0
.13
)
(
0
.53
)
22
.59
5/31/22
25
.52
0
.40
(
2
.18
)
(
1
.78
)
(
0
.43
)
(
0
.27
)
(
0
.70
)
23
.04
5/31/21
20
.02
0
.33
5
.60
5
.93
(
0
.35
)
(
0
.08
)
(
0
.43
)
25
.52
5/31/20
18
.94
0
.41
1
.10
1
.51
(
0
.41
)
(
0
.02
)
(
0
.43
)
20
.02
a
Based
on
average
shares
outstanding.
b
Total
returns
are
not
annualized.
g
The
Fund's
expenses
include
the
expenses
of
the
Underlying
Funds.
j
Short-term
and
long-term
capital
gain
distributions
received
from
the
underlying
Funds
are
presented
in
net
realized
and
unrealized
gain
(loss)
on
total
investments
for
all
periods
presented.
See
Notes
to
Financial
Statements
Ratios
and
Supplemental
Data
Ratios
to
Average
Net
Assets
Total
Return
b
Net
Assets,
End
of
Period
(000)
Gross
Expenses
g
Net
Expenses
g
Net
Investment
Income
(Loss)
Portfolio
Turnover
Rate
16
.57
%
$
27,533
0
.28
%
0
.21
%
2
.26
%
11
%
0
.56
25,308
0
.27
0
.20
2
.03
12
(
7
.09
)
18,143
0
.28
0
.20
1
.72
12
30
.03
15,231
0
.28
0
.20
1
.37
15
8
.02
3,623
0
.29
0
.20
2
.51
14
16
.49
194,855
0
.33
0
.26
2
.25
11
0
.54
169,166
0
.32
0
.25
1
.96
12
(
7
.18
)
161,087
0
.33
0
.25
1
.97
12
29
.90
470,422
0
.33
0
.25
1
.54
15
8
.02
331,062
0
.34
0
.26
2
.15
14
16
.68
7,806,878
0
.18
0
.11
2
.37
11
0
.69
6,172,055
0
.17
0
.10
2
.11
12
(
7
.00
)
5,330,114
0
.18
0
.10
1
.81
12
30
.12
4,697,189
0
.18
0
.10
1
.70
15
8
.12
3,151,680
0
.19
0
.11
2
.30
14
16
.36
428,608
0
.43
0
.36
2
.14
11
0
.43
398,405
0
.42
0
.35
1
.86
12
(
7
.26
)
401,495
0
.43
0
.35
1
.58
12
29
.81
451,962
0
.43
0
.35
1
.45
15
7
.89
372,294
0
.44
0
.36
2
.04
14
Financial
Highlights
(continued)
See
Notes
to
Financial
Statements
Financial
Highlights
(continued)
Investment
Operations
Less
Distributions
Net
Asset
Value,
Beginning
of
Period
Net
Investment
Income
(Loss)
a
Net
Realized/
Unrealized
Gain
(Loss)
j
Total
From
Net
Investment
Income
From
Net
Realized
Gains
Total
Net
Asset
Value,
End
of
Period
14.8
Lifecycle
Index
2040
Class
I:
5/31/24
$
24
.16
$
0
.55
$
3
.97
$
4
.52
$
(
0
.53
)
$
—
$
(
0
.53
)
$
28
.15
5/31/23
24
.51
0
.47
(
0
.24
)
0
.23
(
0
.45
)
(
0
.13
)
(
0
.58
)
24
.16
5/31/22
27
.16
0
.47
(
2
.32
)
(
1
.85
)
(
0
.51
)
(
0
.29
)
(
0
.80
)
24
.51
5/31/21
20
.69
0
.31
6
.64
6
.95
(
0
.40
)
(
0
.08
)
(
0
.48
)
27
.16
5/31/20
19
.63
0
.47
1
.07
1
.54
(
0
.46
)
(
0
.02
)
(
0
.48
)
20
.69
Premier
Class:
5/31/24
24
.05
0
.56
3
.93
4
.49
(
0
.52
)
—
(
0
.52
)
28
.02
5/31/23
24
.40
0
.44
(
0
.23
)
0
.21
(
0
.43
)
(
0
.13
)
(
0
.56
)
24
.05
5/31/22
27
.04
0
.54
(
2
.40
)
(
1
.86
)
(
0
.49
)
(
0
.29
)
(
0
.78
)
24
.40
5/31/21
20
.60
0
.36
6
.54
6
.90
(
0
.38
)
(
0
.08
)
(
0
.46
)
27
.04
5/31/20
19
.55
0
.44
1
.07
1
.51
(
0
.44
)
(
0
.02
)
(
0
.46
)
20
.60
Class
R6:
5/31/24
24
.20
0
.58
3
.98
4
.56
(
0
.56
)
—
(
0
.56
)
28
.20
5/31/23
24
.55
0
.48
(
0
.23
)
0
.25
(
0
.47
)
(
0
.13
)
(
0
.60
)
24
.20
5/31/22
27
.19
0
.48
(
2
.30
)
(
1
.82
)
(
0
.53
)
(
0
.29
)
(
0
.82
)
24
.55
5/31/21
20
.71
0
.41
6
.56
6
.97
(
0
.41
)
(
0
.08
)
(
0
.49
)
27
.19
5/31/20
19
.65
0
.47
1
.08
1
.55
(
0
.47
)
(
0
.02
)
(
0
.49
)
20
.71
Retirement
Class:
5/31/24
23
.96
0
.52
3
.93
4
.45
(
0
.50
)
—
(
0
.50
)
27
.91
5/31/23
24
.30
0
.42
(
0
.22
)
0
.20
(
0
.41
)
(
0
.13
)
(
0
.54
)
23
.96
5/31/22
26
.93
0
.42
(
2
.30
)
(
1
.88
)
(
0
.46
)
(
0
.29
)
(
0
.75
)
24
.30
5/31/21
20
.52
0
.34
6
.51
6
.85
(
0
.36
)
(
0
.08
)
(
0
.44
)
26
.93
5/31/20
19
.47
0
.42
1
.07
1
.49
(
0
.42
)
(
0
.02
)
(
0
.44
)
20
.52
a
Based
on
average
shares
outstanding.
b
Total
returns
are
not
annualized.
g
The
Fund's
expenses
include
the
expenses
of
the
Underlying
Funds.
j
Short-term
and
long-term
capital
gain
distributions
received
from
the
underlying
Funds
are
presented
in
net
realized
and
unrealized
gain
(loss)
on
total
investments
for
all
periods
presented.
See
Notes
to
Financial
Statements
Ratios
and
Supplemental
Data
Ratios
to
Average
Net
Assets
Total
Return
b
Net
Assets,
End
of
Period
(000)
Gross
Expenses
g
Net
Expenses
g
Net
Investment
Income
(Loss)
Portfolio
Turnover
Rate
18
.90
%
$
28,684
0
.27
%
0
.21
%
2
.10
%
9
%
1
.05
24,491
0
.27
0
.20
2
.00
13
(
7
.12
)
21,468
0
.27
0
.20
1
.75
12
33
.78
16,071
0
.28
0
.20
1
.25
14
7
.75
3,215
0
.28
0
.19
2
.30
11
18
.86
200,053
0
.32
0
.26
2
.14
9
0
.99
176,064
0
.32
0
.25
1
.88
13
(
7
.18
)
172,180
0
.32
0
.25
1
.98
12
33
.69
447,061
0
.33
0
.25
1
.50
14
7
.65
291,837
0
.34
0
.25
2
.12
11
19
.02
8,245,416
0
.17
0
.11
2
.23
9
1
.15
6,388,981
0
.17
0
.10
2
.03
13
(
7
.00
)
5,515,470
0
.17
0
.10
1
.78
12
33
.87
4,914,220
0
.18
0
.10
1
.68
14
7
.81
3,297,735
0
.19
0
.10
2
.28
11
18
.72
400,006
0
.42
0
.36
2
.02
9
0
.93
374,723
0
.42
0
.35
1
.79
13
(
7
.26
)
385,438
0
.42
0
.35
1
.55
12
33
.55
435,795
0
.43
0
.35
1
.42
14
7
.58
348,208
0
.44
0
.35
2
.02
11
Financial
Highlights
(continued)
See
Notes
to
Financial
Statements
Financial
Highlights
(continued)
Investment
Operations
Less
Distributions
Net
Asset
Value,
Beginning
of
Period
Net
Investment
Income
(Loss)
a
Net
Realized/
Unrealized
Gain
(Loss)
j
Total
From
Net
Investment
Income
From
Net
Realized
Gains
Total
Net
Asset
Value,
End
of
Period
14.9
Lifecycle
Index
2045
Class
I:
5/31/24
$
25
.00
$
0
.55
$
4
.51
$
5
.06
$
(
0
.54
)
$
—
$
(
0
.54
)
$
29
.52
5/31/23
25
.33
0
.46
(
0
.23
)
0
.23
(
0
.45
)
(
0
.11
)
(
0
.56
)
25
.00
5/31/22
27
.93
0
.49
(
2
.38
)
(
1
.89
)
(
0
.53
)
(
0
.18
)
(
0
.71
)
25
.33
5/31/21
20
.65
0
.32
7
.39
7
.71
(
0
.39
)
(
0
.04
)
(
0
.43
)
27
.93
5/31/20
19
.66
0
.48
0
.99
1
.47
(
0
.46
)
(
0
.02
)
(
0
.48
)
20
.65
Premier
Class:
5/31/24
24
.92
0
.56
4
.48
5
.04
(
0
.53
)
—
(
0
.53
)
29
.43
5/31/23
25
.25
0
.44
(
0
.23
)
0
.21
(
0
.43
)
(
0
.11
)
(
0
.54
)
24
.92
5/31/22
27
.83
0
.62
(
2
.51
)
(
1
.89
)
(
0
.51
)
(
0
.18
)
(
0
.69
)
25
.25
5/31/21
20
.58
0
.36
7
.31
7
.67
(
0
.38
)
(
0
.04
)
(
0
.42
)
27
.83
5/31/20
19
.60
0
.44
1
.01
1
.45
(
0
.45
)
(
0
.02
)
(
0
.47
)
20
.58
Class
R6:
5/31/24
25
.05
0
.59
4
.52
5
.11
(
0
.57
)
—
(
0
.57
)
29
.59
5/31/23
25
.39
0
.48
(
0
.24
)
0
.24
(
0
.47
)
(
0
.11
)
(
0
.58
)
25
.05
5/31/22
27
.98
0
.49
(
2
.35
)
(
1
.86
)
(
0
.55
)
(
0
.18
)
(
0
.73
)
25
.39
5/31/21
20
.68
0
.41
7
.34
7
.75
(
0
.41
)
(
0
.04
)
(
0
.45
)
27
.98
5/31/20
19
.69
0
.47
1
.02
1
.49
(
0
.48
)
(
0
.02
)
(
0
.50
)
20
.68
Retirement
Class:
5/31/24
24
.79
0
.52
4
.47
4
.99
(
0
.51
)
—
(
0
.51
)
29
.27
5/31/23
25
.12
0
.42
(
0
.23
)
0
.19
(
0
.41
)
(
0
.11
)
(
0
.52
)
24
.79
5/31/22
27
.70
0
.43
(
2
.35
)
(
1
.92
)
(
0
.48
)
(
0
.18
)
(
0
.66
)
25
.12
5/31/21
20
.49
0
.34
7
.26
7
.60
(
0
.35
)
(
0
.04
)
(
0
.39
)
27
.70
5/31/20
19
.51
0
.42
1
.01
1
.43
(
0
.43
)
(
0
.02
)
(
0
.45
)
20
.49
a
Based
on
average
shares
outstanding.
b
Total
returns
are
not
annualized.
g
The
Fund's
expenses
include
the
expenses
of
the
Underlying
Funds.
j
Short-term
and
long-term
capital
gain
distributions
received
from
the
underlying
Funds
are
presented
in
net
realized
and
unrealized
gain
(loss)
on
total
investments
for
all
periods
presented.
See
Notes
to
Financial
Statements
Ratios
and
Supplemental
Data
Ratios
to
Average
Net
Assets
Total
Return
b
Net
Assets,
End
of
Period
(000)
Gross
Expenses
g
Net
Expenses
g
Net
Investment
Income
(Loss)
Portfolio
Turnover
Rate
20
.46
%
$
27,460
0
.27
%
0
.21
%
2
.01
%
8
%
1
.05
24,082
0
.27
0
.20
1
.90
10
(
7
.04
)
18,259
0
.27
0
.20
1
.77
11
37
.58
12,840
0
.28
0
.20
1
.29
11
7
.37
2,504
0
.29
0
.21
2
.31
6
20
.44
131,291
0
.32
0
.25
2
.06
8
0
.99
103,386
0
.32
0
.25
1
.84
10
(
7
.06
)
90,924
0
.32
0
.25
2
.17
11
37
.48
352,496
0
.32
0
.25
1
.47
11
7
.28
225,642
0
.34
0
.25
2
.12
6
20
.61
6,926,481
0
.17
0
.11
2
.16
8
1
.11
5,095,781
0
.17
0
.10
1
.96
10
(
6
.92
)
4,224,772
0
.17
0
.10
1
.75
11
37
.71
3,640,347
0
.17
0
.10
1
.65
11
7
.43
2,269,913
0
.19
0
.10
2
.27
6
20
.30
334,163
0
.42
0
.35
1
.94
8
0
.89
297,992
0
.42
0
.35
1
.76
10
(
7
.18
)
308,109
0
.42
0
.35
1
.54
11
37
.32
328,342
0
.42
0
.35
1
.40
11
7
.21
256,314
0
.44
0
.35
2
.03
6
Financial
Highlights
(continued)
See
Notes
to
Financial
Statements
Financial
Highlights
(continued)
Investment
Operations
Less
Distributions
Net
Asset
Value,
Beginning
of
Period
Net
Investment
Income
(Loss)
a
Net
Realized/
Unrealized
Gain
(Loss)
j
Total
From
Net
Investment
Income
From
Net
Realized
Gains
Total
Net
Asset
Value,
End
of
Period
15.01
Lifecycle
Index
2050
Class
I:
5/31/24
$
25
.32
$
0
.54
$
4
.78
$
5
.32
$
(
0
.55
)
$
(
0
.03
)
$
(
0
.58
)
$
30
.06
5/31/23
25
.64
0
.48
(
0
.26
)
0
.22
(
0
.45
)
(
0
.09
)
(
0
.54
)
25
.32
5/31/22
28
.21
0
.49
(
2
.40
)
(
1
.91
)
(
0
.54
)
(
0
.12
)
(
0
.66
)
25
.64
5/31/21
20
.72
0
.33
7
.58
7
.91
(
0
.39
)
(
0
.03
)
(
0
.42
)
28
.21
5/31/20
19
.73
0
.50
0
.97
1
.47
(
0
.46
)
(
0
.02
)
(
0
.48
)
20
.72
Premier
Class:
5/31/24
25
.23
0
.56
4
.72
5
.28
(
0
.54
)
(
0
.03
)
(
0
.57
)
29
.94
5/31/23
25
.54
0
.44
(
0
.23
)
0
.21
(
0
.43
)
(
0
.09
)
(
0
.52
)
25
.23
5/31/22
28
.09
0
.64
(
2
.55
)
(
1
.91
)
(
0
.52
)
(
0
.12
)
(
0
.64
)
25
.54
5/31/21
20
.63
0
.36
7
.51
7
.87
(
0
.38
)
(
0
.03
)
(
0
.41
)
28
.09
5/31/20
19
.65
0
.44
1
.01
1
.45
(
0
.45
)
(
0
.02
)
(
0
.47
)
20
.63
Class
R6:
5/31/24
25
.37
0
.59
4
.77
5
.36
(
0
.58
)
(
0
.03
)
(
0
.61
)
30
.12
5/31/23
25
.69
0
.47
(
0
.23
)
0
.24
(
0
.47
)
(
0
.09
)
(
0
.56
)
25
.37
5/31/22
28
.25
0
.49
(
2
.37
)
(
1
.88
)
(
0
.56
)
(
0
.12
)
(
0
.68
)
25
.69
5/31/21
20
.75
0
.41
7
.53
7
.94
(
0
.41
)
(
0
.03
)
(
0
.44
)
28
.25
5/31/20
19
.75
0
.47
1
.03
1
.50
(
0
.48
)
(
0
.02
)
(
0
.50
)
20
.75
Retirement
Class:
5/31/24
25
.09
0
.52
4
.70
5
.22
(
0
.51
)
(
0
.03
)
(
0
.54
)
29
.77
5/31/23
25
.41
0
.42
(
0
.25
)
0
.17
(
0
.40
)
(
0
.09
)
(
0
.49
)
25
.09
5/31/22
27
.95
0
.42
(
2
.35
)
(
1
.93
)
(
0
.49
)
(
0
.12
)
(
0
.61
)
25
.41
5/31/21
20
.54
0
.34
7
.45
7
.79
(
0
.35
)
(
0
.03
)
(
0
.38
)
27
.95
5/31/20
19
.56
0
.42
1
.01
1
.43
(
0
.43
)
(
0
.02
)
(
0
.45
)
20
.54
a
Based
on
average
shares
outstanding.
b
Total
returns
are
not
annualized.
g
The
Fund's
expenses
include
the
expenses
of
the
Underlying
Funds.
j
Short-term
and
long-term
capital
gain
distributions
received
from
the
underlying
Funds
are
presented
in
net
realized
and
unrealized
gain
(loss)
on
total
investments
for
all
periods
presented.
See
Notes
to
Financial
Statements
Ratios
and
Supplemental
Data
Ratios
to
Average
Net
Assets
Total
Return
b
Net
Assets,
End
of
Period
(000)
Gross
Expenses
g
Net
Expenses
g
Net
Investment
Income
(Loss)
Portfolio
Turnover
Rate
21
.23
%
$
22,004
0
.27
%
0
.21
%
1
.98
%
7
%
0
.99
19,403
0
.27
0
.20
1
.96
8
(
7
.04
)
14,242
0
.27
0
.20
1
.75
11
38
.42
10,851
0
.27
0
.20
1
.30
9
7
.35
2,546
0
.28
0
.20
2
.41
5
21
.13
96,700
0
.32
0
.26
2
.03
7
0
.96
83,196
0
.32
0
.25
1
.79
8
(
7
.06
)
80,318
0
.32
0
.25
2
.20
11
38
.36
295,691
0
.33
0
.25
1
.47
9
7
.26
188,481
0
.34
0
.25
2
.11
5
21
.34
5,863,809
0
.17
0
.11
2
.12
7
1
.07
4,258,463
0
.17
0
.10
1
.93
8
(
6
.92
)
3,473,689
0
.17
0
.10
1
.75
11
38
.50
2,948,578
0
.18
0
.10
1
.63
9
7
.46
1,786,312
0
.19
0
.10
2
.26
5
21
.01
282,437
0
.42
0
.36
1
.91
7
0
.82
251,668
0
.42
0
.35
1
.74
8
(
7
.15
)
271,085
0
.42
0
.35
1
.52
11
38
.15
285,738
0
.43
0
.35
1
.41
9
7
.19
218,846
0
.45
0
.35
2
.04
5
Financial
Highlights
(continued)
See
Notes
to
Financial
Statements
Financial
Highlights
(continued)
Investment
Operations
Less
Distributions
Net
Asset
Value,
Beginning
of
Period
Net
Investment
Income
(Loss)
a
Net
Realized/
Unrealized
Gain
(Loss)
j
Total
From
Net
Investment
Income
From
Net
Realized
Gains
Total
Net
Asset
Value,
End
of
Period
15.1
Lifecycle
Index
2055
Class
I:
5/31/24
$
20.42
$
0.42
$
3.92
$
4.34
$
(0.44)
$
(0.02)
$
(0.46)
$
24.30
5/31/23
20.66
0.36
(0.18)
0.18
(0.36)
(0.06)
(0.42)
20.42
5/31/22
22.66
0.38
(1.92)
(1.54)
(0.43)
(0.03)
(0.46)
20.66
5/31/21
16.57
0.29
6.13
6.42
(0.31)
(0.02)
(0.33)
22.66
5/31/20
15.79
0.35
0.82
1.17
(0.37)
(0.02)
(0.39)
16.57
Premier
Class:
5/31/24
20.39
0.47
3.86
4.33
(0.43)
(0.02)
(0.45)
24.27
5/31/23
20.63
0.35
(0.19)
0.16
(0.34)
(0.06)
(0.40)
20.39
5/31/22
22.62
0.53
(2.07)
(1.54)
(0.42)
(0.03)
(0.45)
20.63
5/31/21
16.54
0.29
6.11
6.40
(0.30)
(0.02)
(0.32)
22.62
5/31/20
15.76
0.35
0.81
1.16
(0.36)
(0.02)
(0.38)
16.54
Class
R6:
5/31/24
20.46
0.47
3.90
4.37
(0.46)
(0.02)
(0.48)
24.35
5/31/23
20.70
0.38
(0.19)
0.19
(0.37)
(0.06)
(0.43)
20.46
5/31/22
22.70
0.40
(1.92)
(1.52)
(0.45)
(0.03)
(0.48)
20.70
5/31/21
16.59
0.32
6.14
6.46
(0.33)
(0.02)
(0.35)
22.70
5/31/20
15.80
0.37
0.82
1.19
(0.38)
(0.02)
(0.40)
16.59
Retirement
Class:
5/31/24
20.33
0.42
3.87
4.29
(0.41)
(0.02)
(0.43)
24.19
5/31/23
20.57
0.35
(0.20)
0.15
(0.33)
(0.06)
(0.39)
20.33
5/31/22
22.56
0.34
(1.91)
(1.57)
(0.39)
(0.03)
(0.42)
20.57
5/31/21
16.50
0.28
6.08
6.36
(0.28)
(0.02)
(0.30)
22.56
5/31/20
15.73
0.34
0.79
1.13
(0.34)
(0.02)
(0.36)
16.50
a
Based
on
average
shares
outstanding.
b
Total
returns
are
not
annualized.
g
The
Fund's
expenses
include
the
expenses
of
the
Underlying
Funds.
j
Short-term
and
long-term
capital
gain
distributions
received
from
the
underlying
Funds
are
presented
in
net
realized
and
unrealized
gain
(loss)
on
total
investments
for
all
periods
presented.
See
Notes
to
Financial
Statements
Ratios
and
Supplemental
Data
Ratios
to
Average
Net
Assets
Total
Return
b
Net
Assets,
End
of
Period
(000)
Gross
Expenses
g
Net
Expenses
g
Net
Investment
Income
(Loss)
Portfolio
Turnover
Rate
21.49
%
$
19,948
0.27
%
0.20
%
1.90
%
7
%
1.02
16,680
0.27
0.20
1.85
7
(7.00)
12,050
0.28
0.20
1.71
11
38.98
8,251
0.28
0.20
1.46
6
7.24
1,534
0.29
0.20
2.13
7
21.47
41,614
0.33
0.26
2.11
7
0.95
37,212
0.33
0.25
1.78
7
(7.02)
33,219
0.33
0.25
2.28
11
38.91
142,662
0.33
0.25
1.45
6
7.19
79,521
0.35
0.26
2.09
7
21.61
3,521,489
0.18
0.11
2.11
7
1.10
2,428,738
0.18
0.10
1.92
7
(6.91)
1,822,272
0.18
0.10
1.75
11
39.14
1,478,111
0.18
0.10
1.61
6
7.37
801,496
0.20
0.11
2.23
7
21.32
165,330
0.43
0.36
1.89
7
0.85
135,316
0.43
0.35
1.76
7
(7.13)
149,174
0.43
0.35
1.52
11
38.76
149,564
0.43
0.35
1.44
6
7.05
114,986
0.46
0.36
2.02
7
Financial
Highlights
(continued)
See
Notes
to
Financial
Statements
Financial
Highlights
(continued)
Investment
Operations
Less
Distributions
Net
Asset
Value,
Beginning
of
Period
Net
Investment
Income
(Loss)
a
Net
Realized/
Unrealized
Gain
(Loss)
j
Total
From
Net
Investment
Income
From
Net
Realized
Gains
Total
Net
Asset
Value,
End
of
Period
15.2
Lifecycle
Index
2060
Class
I:
5/31/24
$
15
.81
$
0
.33
$
3
.09
$
3
.42
$
(
0
.34
)
$
(
0
.02
)
$
(
0
.36
)
$
18
.87
5/31/23
15
.98
0
.29
(
0
.15
)
0
.14
(
0
.27
)
(
0
.04
)
(
0
.31
)
15
.81
5/31/22
17
.51
0
.29
(
1
.48
)
(
1
.19
)
(
0
.33
)
(
0
.01
)
(
0
.34
)
15
.98
5/31/21
12
.75
0
.20
4
.81
5
.01
(
0
.24
)
(
0
.01
)
(
0
.25
)
17
.51
5/31/20
12
.15
0
.27
0
.62
0
.89
(
0
.28
)
(
0
.01
)
(
0
.29
)
12
.75
Premier
Class:
5/31/24
15
.79
0
.34
3
.06
3
.40
(
0
.33
)
(
0
.02
)
(
0
.35
)
18
.84
5/31/23
15
.96
0
.27
(
0
.13
)
0
.14
(
0
.27
)
(
0
.04
)
(
0
.31
)
15
.79
5/31/22
17
.48
0
.40
(
1
.59
)
(
1
.19
)
(
0
.32
)
(
0
.01
)
(
0
.33
)
15
.96
5/31/21
12
.73
0
.22
4
.77
4
.99
(
0
.23
)
(
0
.01
)
(
0
.24
)
17
.48
5/31/20
12
.13
0
.27
0
.61
0
.88
(
0
.27
)
(
0
.01
)
(
0
.28
)
12
.73
Class
R6:
5/31/24
15
.83
0
.36
3
.08
3
.44
(
0
.36
)
(
0
.02
)
(
0
.38
)
18
.89
5/31/23
15
.99
0
.29
(
0
.12
)
0
.17
(
0
.29
)
(
0
.04
)
(
0
.33
)
15
.83
5/31/22
17
.52
0
.30
(
1
.47
)
(
1
.17
)
(
0
.35
)
(
0
.01
)
(
0
.36
)
15
.99
5/31/21
12
.75
0
.25
4
.78
5
.03
(
0
.25
)
(
0
.01
)
(
0
.26
)
17
.52
5/31/20
12
.14
0
.28
0
.63
0
.91
(
0
.29
)
(
0
.01
)
(
0
.30
)
12
.75
Retirement
Class:
5/31/24
15
.75
0
.32
3
.06
3
.38
(
0
.32
)
(
0
.02
)
(
0
.34
)
18
.79
5/31/23
15
.92
0
.27
(
0
.15
)
0
.12
(
0
.25
)
(
0
.04
)
(
0
.29
)
15
.75
5/31/22
17
.44
0
.26
(
1
.46
)
(
1
.20
)
(
0
.31
)
(
0
.01
)
(
0
.32
)
15
.92
5/31/21
12
.70
0
.22
4
.75
4
.97
(
0
.22
)
(
0
.01
)
(
0
.23
)
17
.44
5/31/20
12
.11
0
.26
0
.60
0
.86
(
0
.26
)
(
0
.01
)
(
0
.27
)
12
.70
a
Based
on
average
shares
outstanding.
b
Total
returns
are
not
annualized.
g
The
Fund's
expenses
include
the
expenses
of
the
Underlying
Funds.
j
Short-term
and
long-term
capital
gain
distributions
received
from
the
underlying
Funds
are
presented
in
net
realized
and
unrealized
gain
(loss)
on
total
investments
for
all
periods
presented.
See
Notes
to
Financial
Statements
Ratios
and
Supplemental
Data
Ratios
to
Average
Net
Assets
Total
Return
b
Net
Assets,
End
of
Period
(000)
Gross
Expenses
g
Net
Expenses
g
Net
Investment
Income
(Loss)
Portfolio
Turnover
Rate
21
.83
%
$
13,382
0
.28
%
0
.21
%
1
.94
%
7
%
1
.05
10,940
0
.28
0
.20
1
.89
7
(
7
.01
)
9,092
0
.29
0
.20
1
.69
10
39
.51
5,527
0
.30
0
.20
1
.31
6
7
.21
1,292
0
.35
0
.20
2
.11
16
21
.74
25,989
0
.33
0
.26
1
.99
7
0
.99
21,158
0
.34
0
.25
1
.76
7
(
7
.01
)
15,601
0
.34
0
.25
2
.23
10
39
.44
40,943
0
.35
0
.25
1
.42
6
7
.17
17,927
0
.41
0
.26
2
.09
16
21
.91
1,951,599
0
.18
0
.11
2
.09
7
1
.20
1,257,068
0
.19
0
.10
1
.92
7
(
6
.93
)
828,871
0
.19
0
.10
1
.75
10
39
.68
600,348
0
.21
0
.10
1
.59
6
7
.36
267,485
0
.26
0
.11
2
.21
16
21
.62
87,137
0
.43
0
.36
1
.89
7
0
.90
63,746
0
.44
0
.35
1
.79
7
(
7
.11
)
67,009
0
.44
0
.35
1
.50
10
39
.33
55,903
0
.45
0
.35
1
.43
6
7
.01
37,293
0
.51
0
.36
2
.00
16
Financial
Highlights
(continued)
See
Notes
to
Financial
Statements
Financial
Highlights
(continued)
Investment
Operations
Less
Distributions
Net
Asset
Value,
Beginning
of
Period
Net
Investment
Income
(Loss)
a
Net
Realized/
Unrealized
Gain
(Loss)
j
Total
From
Net
Investment
Income
From
Net
Realized
Gains
Total
Net
Asset
Value,
End
of
Period
15.3
Lifecycle
Index
2065
Class
I:
5/31/24
$
11
.17
$
0
.25
$
2
.19
$
2
.44
$
(
0
.24
)
$
(
0
.01
)
$
(
0
.25
)
$
13
.36
5/31/23
11
.27
0
.12
0
.00
d
0
.12
(
0
.20
)
(
0
.02
)
(
0
.22
)
11
.17
5/31/22
12
.46
0
.22
(
1
.04
)
(
0
.82
)
(
0
.36
)
(
0
.01
)
(
0
.37
)
11
.27
5/31/21
*
10
.00
0
.16
2
.48
2
.64
(
0
.18
)
—
(
0
.18
)
12
.46
Premier
Class:
5/31/24
11
.16
0
.30
2
.14
2
.44
(
0
.24
)
(
0
.01
)
(
0
.25
)
13
.35
5/31/23
11
.26
0
.19
(
0
.08
)
0
.11
(
0
.19
)
(
0
.02
)
(
0
.21
)
11
.16
5/31/22
12
.46
0
.18
(
1
.01
)
(
0
.83
)
(
0
.36
)
(
0
.01
)
(
0
.37
)
11
.26
5/31/21
*
10
.00
0
.16
2
.48
2
.64
(
0
.18
)
—
(
0
.18
)
12
.46
Class
R6:
5/31/24
11
.31
0
.26
2
.22
2
.48
(
0
.25
)
(
0
.01
)
(
0
.26
)
13
.53
5/31/23
11
.40
0
.21
(
0
.08
)
0
.13
(
0
.20
)
(
0
.02
)
(
0
.22
)
11
.31
5/31/22
12
.45
0
.21
(
1
.02
)
(
0
.81
)
(
0
.23
)
(
0
.01
)
(
0
.24
)
11
.40
5/31/21
*
10
.00
0
.15
2
.48
2
.63
(
0
.18
)
—
(
0
.18
)
12
.45
Retirement
Class:
5/31/24
11
.17
0
.23
2
.20
2
.43
(
0
.23
)
(
0
.01
)
(
0
.24
)
13
.36
5/31/23
11
.27
0
.17
(
0
.07
)
0
.10
(
0
.18
)
(
0
.02
)
(
0
.20
)
11
.17
5/31/22
12
.44
0
.17
(
1
.04
)
(
0
.87
)
(
0
.29
)
(
0
.01
)
(
0
.30
)
11
.27
5/31/21
*
10
.00
0
.15
2
.46
2
.61
(
0
.17
)
—
(
0
.17
)
12
.44
*
The
Fund
commenced
operations
on
September
30,
2020.
a
Based
on
average
shares
outstanding.
b
Total
returns
are
not
annualized.
c
Percentage
is
annualized.
d
Value
rounded
to
zero.
g
The
Fund's
expenses
include
the
expenses
of
the
Underlying
Funds.
j
Short-term
and
long-term
capital
gain
distributions
received
from
the
underlying
Funds
are
presented
in
net
realized
and
unrealized
gain
(loss)
on
total
investments
for
all
periods
presented.
See
Notes
to
Financial
Statements
Ratios
and
Supplemental
Data
Ratios
to
Average
Net
Assets
Total
Return
b
Net
Assets,
End
of
Period
(000)
Gross
Expenses
g
Net
Expenses
g
Net
Investment
Income
(Loss)
Portfolio
Turnover
Rate
22
.08
%
$
3,787
0
.35
%
0
.19
%
2
.01
%
14
%
1
.22
2,377
0
.45
0
.18
1
.11
22
(
6
.83
)
716
0
.83
0
.13
1
.81
108
26
.48
626
4
.26
c
0
.25
c
2
.16
c
36
22
.03
2,811
0
.41
0
.26
2
.49
14
1
.11
1,229
0
.53
0
.25
1
.75
22
(
6
.90
)
808
0
.97
0
.25
1
.49
108
26
.48
637
4
.41
c
0
.25
c
2
.14
c
36
22
.12
322,206
0
.26
0
.11
2
.10
14
1
.29
119,873
0
.38
0
.10
1
.90
22
(
6
.70
)
44,526
0
.82
0
.11
1
.76
108
26
.45
7,131
3
.91
c
0
.10
c
2
.02
c
36
21
.93
10,219
0
.51
0
.36
1
.90
14
1
.03
4,689
0
.63
0
.35
1
.62
22
(
7
.26
)
1,740
1
.08
0
.36
1
.42
108
26
.35
693
4
.54
c
0
.35
c
2
.00
c
36
Notes
to
Financial
Statements
1.
General
Information
Trust
and
Fund
Information:
TIAA-CREF
Funds
(the
“Trust”)
is
an
open-end
management
investment
company
registered
under
the
Investment
Company
Act
of
1940,
(“1940
Act”),
as
amended.
The
Trust
is
comprised
of
the
following
(collectively
the
“Funds”
or
individually,
the
“Fund”),
among
others:
Fund
Name
Changes:
Effective
May
1,
2024,
each
Fund’s
name
changed
as
noted
above
and
therefore
all
references
to
the
names
of
the
Funds
in
this
report
have
been
updated.
Current
Fiscal
Period:
The
end
of
the
reporting
period
for
the Funds
is
May
31,
2024,
and
the
period
covered
by
these
Notes
to
Financial
Statements
is
the
fiscal
year
ended
May
31,
2024
(the
"current
fiscal
period").
Investment
Advisor:
Teachers
Advisors,
LLC
(the
"Adviser”),
a
wholly
owned
indirect
subsidiary
of
Teachers
Insurance
and
Annuity
Association
of
America
(“TIAA”),
is
registered
with
the
SEC
as
an
investment
adviser
and
provides
investment
management
services
for
the
Funds.
Share
Classes
and
Sales
Charges:
Each
Fund
is
a
“fund
of
funds”
that
diversifies
its
assets
by
investing
in
Class
W
shares
of
other
funds
of
the
Trust
and
potentially
other
investment
pools
or
investment
products.
The
Funds
offer
Class
I,
Premier
Class,
Class
R6
and
Retirement
Class
shares.
Each
class
differs
by
the
allocation
of
class-specific
expenses
and
voting
rights
in
matters
affecting
a
single
class.
The
Funds
offer
their
shares,
without
a
sales
load,
through
their
principal
underwriter,
Nuveen
Securities,
LLC
(“Nuveen
Securities”),
which
is
a
wholly
owned
indirect
subsidiary
of
TIAA.
Share
Class
Name
Changes:
Effective
May
6,
2024,
the
names
of
certain
share
classes
for
the
Funds
changed
and
therefore
all
references
to
the
names
of
these
share
classes
in
this
report
have
changed
as
follows:
2.
Significant
Accounting
Policies
The
accompanying
financial
statements
were
prepared
in
accordance
with
accounting
principles
generally
accepted
in
the
United
States
of
America
(“U.S.
GAAP”),
which
may
require
the
use
of
estimates
made
by
management
and
the
evaluation
of
subsequent
events.
Actual
results
may
differ
from
those
estimates.
The Funds
are
investment
companies
and
follow
the
accounting
guidance
in
the
Financial
Accounting
Standards
Board
(“FASB”)
Accounting
Standards
Codification
946,
Financial
Services
—
Investment
Companies
. The net
asset
value (“NAV”)
for
financial
reporting
purposes
may
differ
from
the NAV
for
processing
transactions.
The NAV
for
financial
reporting
purposes
includes
security
and shareholder
transactions
through
the
date
of
the
report.
Total
return
is
computed
based
on
the NAV
used
for
processing
transactions.
The
following
is
a
summary
of
the
significant
accounting
policies
consistently
followed
by
the
Funds.
Compensation:
The
Funds pay
the
members
of
the
Board
of
Trustees
("Board"),
all
of
whom
are
independent,
certain
remuneration
for
their
services,
plus
travel
and
other
expenses.
The
Board
has
adopted
a
deferred
compensation
plan
for
independent
trustees
that
enables
trustees
to
elect
to
defer
receipt
of
all
or
a
portion
of
the
annual
compensation
they
are
entitled
to
receive
from
certain
Nuveen-advised
funds.
Under
the
plan,
deferred
amounts
are
treated
as
though
equal
dollar
amounts
had
been
invested
in
shares
of
select
Nuveen-advised
funds. Amounts
deferred
are
retained
by
the
Funds
until
paid.
Amounts
payable
to
the
trustees
for
compensation
are
included
separately
in the
accompanying
Statement
of
Assets
and
Liabilities.
Trustees’
fees,
including
any
deferred
compensation
incurred,
are
reflected
in
the
Statement
of
Operations.
New
Name
Former
Name
Short
Name
Nuveen
Lifecycle
Index
Retirement
Income
Fund
TIAA-CREF
Lifecycle
Index
Retirement
Income
Fund
Lifecycle
Index
Retirement
Income
Fund
Nuveen
Lifecycle
Index
2010
Fund
TIAA-CREF
Lifecycle
Index
2010
Fund
Lifecycle
Index
2010
Fund
Nuveen
Lifecycle
Index
2015
Fund
TIAA-CREF
Lifecycle
Index
2015
Fund
Lifecycle
Index
2015
Fund
Nuveen
Lifecycle
Index
2020
Fund
TIAA-CREF
Lifecycle
Index
2020
Fund
Lifecycle
Index
2020
Fund
Nuveen
Lifecycle
Index
2025
Fund
TIAA-CREF
Lifecycle
Index
2025
Fund
Lifecycle
Index
2025
Fund
Nuveen
Lifecycle
Index
2030
Fund
TIAA-CREF
Lifecycle
Index
2030
Fund
Lifecycle
Index
2030
Fund
Nuveen
Lifecycle
Index
2035
Fund
TIAA-CREF
Lifecycle
Index
2035
Fund
Lifecycle
Index
2035
Fund
Nuveen
Lifecycle
Index
2040
Fund
TIAA-CREF
Lifecycle
Index
2040
Fund
Lifecycle
Index
2040
Fund
Nuveen
Lifecycle
Index
2045
Fund
TIAA-CREF
Lifecycle
Index
2045
Fund
Lifecycle
Index
2045
Fund
Nuveen
Lifecycle
Index
2050
Fund
TIAA-CREF
Lifecycle
Index
2050
Fund
Lifecycle
Index
2050
Fund
Nuveen
Lifecycle
Index
2055
Fund
TIAA-CREF
Lifecycle
Index
2055
Fund
Lifecycle
Index
2055
Fund
Nuveen
Lifecycle
Index
2060
Fund
TIAA-CREF
Lifecycle
Index
2060
Fund
Lifecycle
Index
2060
Fund
Nuveen
Lifecycle
Index
2065
Fund
TIAA-CREF
Lifecycle
Index
2065
Fund
Lifecycle
Index
2065
Fund
New
Name
Former
Name
Class
I
Advisor
Class
Class
R6
Institutional
Class
Distributions
to
Shareholders:
Distributions
to
shareholders
are
recorded
on
the
ex-dividend
date.
The
amount,
character
and
timing
of
distributions
are
determined
in
accordance
with
federal
income
tax
regulations,
which
may
differ
from
U.S.
GAAP.
Indemnification:
Under
the
Trust's
organizational
documents,
its
officers
and
trustees
are
indemnified
against
certain
liabilities
arising
out
of
the
performance
of
their
duties
to
the
Trust.
In
addition,
in
the
normal
course
of
business,
the
Trust
enters
into
contracts
that
provide
general
indemnifications
to
other
parties.
The
Trust's
maximum
exposure
under
these
arrangements
is
unknown
as
this
would
involve
future
claims
that
may
be
made
against
the
Trust
that
have
not
yet
occurred.
However,
the
Trust
has
not
had
prior
claims
or
losses
pursuant
to
these
contracts
and
expects
the
risk
of
loss
to
be
remote.
Investments
and
Investment
Income:
Securities
transactions
are
accounted
for
as
of
the
trade
date
for
financial
reporting
purposes.
Interest
income
is
recorded
on
an
accrual
basis
and
includes
accretion
of
discounts
and
amortization
of
premiums.
Dividend
income
is
recorded
on
the
ex-dividend
date. Realized
gains
and
losses
on
securities
transactions
are
based
upon
the
specific
identification
method.
Distributions
received
on
securities
that
represent
a
return
of
capital
or
capital
gains
are
recorded
as
a
reduction
of
cost
of
investments
and/or
as
a
realized
gain.
The
Funds
estimate
the
components
of
distributions
received
that
may
be
considered
return
of
capital
distributions
or
capital
gain
distributions.
Multiclass
Operations
and
Allocations:
Income, expenses,
realized
gains
and
losses
and
unrealized
appreciation
and
depreciation
of
a
Fund
are
allocated
on
a
pro
rata
basis
to
each
class
of
shares,
except
for
service
agreement
fees,
distribution
fees
and
transfer
agency
fees
and
expenses, which
are
unique
to
each
class
of
shares.
Most
expenses
of
the
Trust
can
be
directly
attributed
to
a
Fund.
Expenses
that
cannot
be
directly
attributed
are
allocated
to
each
Fund
in
the
Trust
based
upon
the
average
net
assets
of
each
Fund.
Netting
Agreements:
In
the
ordinary
course
of
business,
the
Funds
may
enter
into
transactions
subject
to
enforceable
master
repurchase
agreements,
International
Swaps
and
Derivatives
Association,
Inc.
(ISDA)
master
agreements
or
other
similar
arrangements
(“netting
agreements”).
Generally,
the
right
to
offset
in
netting
agreements
allows
each
Fund
to
offset
certain
securities
and
derivatives
with
a
specific
counterparty,
when
applicable,
as
well
as
any
collateral
received
or
delivered
to
that
counterparty
based
on
the
terms
of
the
agreements.
Generally,
each
Fund
manages
its
cash
collateral
and
securities
collateral
on
a
counterparty
basis.
With
respect
to
certain
counterparties,
in
accordance
with
the
terms
of
the
netting
agreements,
collateral
posted
to
the
Funds
is
held
in
a
segregated
account
by
the
Funds’
custodian
and/or
with
respect
to
those
amounts
which
can
be
sold
or
repledged,
are
presented
in
the
Funds’
Portfolio
of
Investments
or
Statement
of
Assets
and
Liabilities.
The
Funds’
investments
subject
to
netting
agreements
as
of
the
end
of
the
reporting
period,
if
any,
are
further
described
later
in
these
Notes
to
Financial
Statements.
3.
Investment
Valuation
and
Fair
Value
Measurements
The Funds'
investments
in
securities
are
recorded
at
their
estimated
fair
value
utilizing
valuation
methods
approved
by
the
Adviser,
subject
to
oversight
of
the
Board.
Fair
value
is
defined
as
the
price
that
would
be
received
upon
selling
an
investment
or
transferring
a
liability
in
an
orderly
transaction
to
an
independent
buyer
in
the
principal
or
most
advantageous
market
for
the
investment.
U.S.
GAAP
establishes
the
three-tier
hierarchy
that
is
used
to
maximize
the
use
of
observable
market
data
and
minimize
the
use
of
unobservable
inputs
and
to
establish
classification
of
fair
value
measurements
for
disclosure
purposes.
Observable
inputs
reflect
the
assumptions
market
participants
would
use
in
pricing
the
asset
or
liability.
Observable
inputs
are
based
on
market
data
obtained
from
sources
independent
of
the
reporting
entity.
Unobservable
inputs
reflect
management’s
assumptions
about
the
assumptions
market
participants
would
use
in
pricing
the
asset
or
liability.
Unobservable
inputs
are
based
on
the
best
information
available
in
the
circumstances.
The
following
is
a
summary
of
the
three-tiered
hierarchy
of
valuation
input
levels.
Level 1
–
Inputs
are
unadjusted
and
prices
are
determined
using
quoted
prices
in
active
markets
for
identical
securities.
Level
2
–
Prices
are
determined
using
other
significant
observable
inputs
(including
quoted
prices
for
similar
securities,
interest
rates,
credit
spreads,
etc.).
Level
3
–
Prices
are
determined
using
significant
unobservable
inputs
(including
management’s
assumptions
in
determining
the
fair
value
of
investments).
A
description
of
the
valuation
techniques
applied
to
the Funds'
major
classifications
of
assets
and
liabilities
measured
at
fair
value
follows:
Exchange-traded
funds
listed
or
traded
on
a
national
market
or
exchange
are
valued
based
on
their
sale
price
at
the
official
close
of
business
of
such
market
or
exchange
on
the
valuation
date.
To
the
extent
these
securities
are
actively
traded
and
that
valuation
adjustments
are
not
applied,
they
are
generally
classified
as
Level
1.
Investments
in
investment
companies
are
valued
at
their
respective NAVs
or
share
price
on
the
valuation
date
and
are
generally
classified
as Level
1.
Repurchase
agreements
are
valued
at
contract
amount
plus
accrued
interest,
which
approximates
market
value.
These
securities
are
generally
classified
as
Level
2.
Notes
to
Financial
Statements
(continued)
The
following
table
summarizes
the
market
value
of
the Funds’
investments
as
of
the
end
of
the
current
fiscal
period, based
on
the
inputs
used
to
value
them:
4.
Portfolio
Securities
Repurchase
Agreements:
In
connection
with
transactions
in
repurchase
agreements,
it
is
the Fund’s policy
that
its
custodian
take
possession
of
the
underlying
collateral
securities,
the
fair
value
of
which
exceeds
the
principal
amount
of
the
repurchase
transaction,
including
accrued
interest,
at
all
times.
If
the
counterparty
defaults,
and
the
fair
value
of
the
collateral
declines,
realization
of
the
collateral
may
be
delayed
or
limited.
Fund
Level
1
Level
2
Level
3
Total
Lifecycle
Index
Retirement
Income
Registered
investment
companies
$704,088,809
$—
$—
$704,088,809
Short-term
investments
—
212,000
—
212,000
Total
$704,088,809
$212,000
$—
$704,300,809
1
1
1
1
1
Lifecycle
Index
2010
Registered
investment
companies
$629,159,315
$—
$—
$629,159,315
Short-term
investments
—
416,000
—
416,000
Total
$629,159,315
$416,000
$—
$629,575,315
1
1
1
1
1
Lifecycle
Index
2015
Registered
investment
companies
$1,045,804,001
$—
$—
$1,045,804,001
Short-term
investments
—
1,027,000
—
1,027,000
Total
$1,045,804,001
$1,027,000
$—
$1,046,831,001
1
1
1
1
1
Lifecycle
Index
2020
Registered
investment
companies
$3,076,133,900
$—
$—
$3,076,133,900
Short-term
investments
—
3,755,000
—
3,755,000
Total
$3,076,133,900
$3,755,000
$—
$3,079,888,900
1
1
1
1
1
Lifecycle
Index
2025
Registered
investment
companies
$5,944,363,270
$—
$—
$5,944,363,270
Short-term
investments
—
4,042,000
—
4,042,000
Total
$5,944,363,270
$4,042,000
$—
$5,948,405,270
1
1
1
1
1
Lifecycle
Index
2030
Registered
investment
companies
$8,008,368,078
$—
$—
$8,008,368,078
Short-term
investments
—
8,764,000
—
8,764,000
Total
$8,008,368,078
$8,764,000
$—
$8,017,132,078
1
1
1
1
1
Lifecycle
Index
2035
Registered
investment
companies
$8,442,625,734
$—
$—
$8,442,625,734
Short-term
investments
—
14,308,000
—
14,308,000
Total
$8,442,625,734
$14,308,000
$—
$8,456,933,734
1
1
1
1
1
Lifecycle
Index
2040
Registered
investment
companies
$8,858,672,031
$—
$—
$8,858,672,031
Short-term
investments
—
10,840,000
—
10,840,000
Total
$8,858,672,031
$10,840,000
$—
$8,869,512,031
1
1
1
1
1
Lifecycle
Index
2045
Registered
investment
companies
$7,404,380,124
$—
$—
$7,404,380,124
Short-term
investments
—
9,586,000
—
9,586,000
Total
$7,404,380,124
$9,586,000
$—
$7,413,966,124
1
1
1
1
1
Lifecycle
Index
2050
Registered
investment
companies
$6,250,597,922
$—
$—
$6,250,597,922
Short-term
investments
—
13,920,000
—
13,920,000
Total
$6,250,597,922
$13,920,000
$—
$6,264,517,922
1
1
1
1
1
Lifecycle
Index
2055
Registered
investment
companies
$3,740,163,373
$—
$—
$3,740,163,373
Short-term
investments
—
5,894,000
—
5,894,000
Total
$3,740,163,373
$5,894,000
$—
$3,746,057,373
1
1
1
1
1
Lifecycle
Index
2060
Registered
investment
companies
$2,071,533,493
$—
$—
$2,071,533,493
Short-term
investments
—
4,608,000
—
4,608,000
Total
$2,071,533,493
$4,608,000
$—
$2,076,141,493
1
1
1
1
1
Lifecycle
Index
2065
Registered
investment
companies
$335,725,701
$—
$—
$335,725,701
Short-term
investments
—
962,000
—
962,000
Total
$335,725,701
$962,000
$—
$336,687,701
1
1
1
1
1
The
following
table
presents
the
repurchase
agreements
for
the Funds
that
are
subject
to
netting
agreements
as
of
the
end
of
the
reporting
period,
and
the
collateral
delivered
related
to
those
repurchase
agreements.
Purchases
and
Sales:
Long-term
purchases
and
sales
during
the
current
fiscal
period were
as
follows:
5.
Fund
Shares
Transactions
in
Fund
shares
during
the
current
and
prior
fiscal
period
were
as
follows:
Fund
Counterparty
Short-term
Investments,
at
Value
Collateral
Pledged
(From)
Counterparty
Lifecycle
Index
Retirement
Income
Fixed
Income
Clearing
Corporation
$
212,000
$
(216,419)
Lifecycle
Index
2010
Fixed
Income
Clearing
Corporation
416,000
(424,336)
Lifecycle
Index
2015
Fixed
Income
Clearing
Corporation
1,027,000
(1,047,659)
Lifecycle
Index
2020
Fixed
Income
Clearing
Corporation
3,755,000
(3,830,130)
Lifecycle
Index
2025
Fixed
Income
Clearing
Corporation
4,042,000
(4,122,963)
Lifecycle
Index
2030
Fixed
Income
Clearing
Corporation
8,764,000
(8,939,303)
Lifecycle
Index
2035
Fixed
Income
Clearing
Corporation
14,308,000
(14,594,335)
Lifecycle
Index
2040
Fixed
Income
Clearing
Corporation
10,840,000
(11,056,981)
Lifecycle
Index
2045
Fixed
Income
Clearing
Corporation
9,586,000
(9,777,741)
Lifecycle
Index
2050
Fixed
Income
Clearing
Corporation
13,920,000
(14,198,505)
Lifecycle
Index
2055
Fixed
Income
Clearing
Corporation
5,894,000
(6,011,976)
Lifecycle
Index
2060
Fixed
Income
Clearing
Corporation
4,608,000
(4,700,263)
Lifecycle
Index
2065
Fixed
Income
Clearing
Corporation
962,000
(981,354)
Fund
Non-U.S.
Government
Purchases
Non-U.S.
Government
Sales
14.1
Lifecycle
Index
Retirement
Income
$
166,126,419
$
126,396,790
14.2
Lifecycle
Index
2010
108,861,832
150,198,568
14.3
Lifecycle
Index
2015
159,087,395
232,544,939
14.4
Lifecycle
Index
2020
420,505,254
633,899,716
14.5
Lifecycle
Index
2025
858,061,173
879,822,472
14.6
Lifecycle
Index
2030
1,255,663,148
856,855,736
14.7
Lifecycle
Index
2035
1,490,184,069
810,075,276
14.8
Lifecycle
Index
2040
1,390,385,924
701,081,668
14.9
Lifecycle
Index
2045
1,297,958,911
490,067,461
15.01
Lifecycle
Index
2050
1,077,344,098
377,286,429
15.1
Lifecycle
Index
2055
780,663,209
214,568,910
15.2
Lifecycle
Index
2060
533,297,725
115,921,394
15.3
Lifecycle
Index
2065
197,442,546
30,996,580
Year
Ended
5/31/24
Year
Ended
5/31/23
14.1
Lifecycle
Index
Retirement
Income
Shares
Amount
Shares
Amount
Subscriptions:
Class
I
20,845
$
319,031
67,672
$
1,002,406
Premier
Class
62,116
946,739
48,132
717,389
Class
R6
14,539,705
221,787,860
11,986,225
177,145,467
Retirement
Class
367,049
5,645,804
236,422
3,516,792
Total
subscriptions
14,989,715
228,699,434
12,338,451
182,382,054
Reinvestments
of
distributions:
Class
I
4,125
63,371
4,988
72,028
Premier
Class
2,394
36,756
4,572
65,970
Class
R6
1,046,305
16,082,188
1,151,621
16,632,861
Retirement
Class
58,205
892,097
78,741
1,134,783
Total
reinvestments
of
distributions
1,111,029
17,074,412
1,239,922
17,905,642
Redemptions:
Class
I
(28,956)
(447,686)
(91,914)
(1,356,812)
Premier
Class
(77,682)
(1,194,080)
(90,848)
(1,337,916)
Class
R6
(12,590,697)
(194,216,256)
(10,613,893)
(156,450,550)
Retirement
Class
(678,392)
(10,349,565)
(527,796)
(7,710,360)
Total
redemptions
(13,375,727)
(206,207,587)
(11,324,451)
(166,855,638)
Net
increase
(decrease)
from
shareholder
transactions
2,725,017
$
39,566,259
2,253,922
$
33,432,058
Notes
to
Financial
Statements
(continued)
Year
Ended
5/31/24
Year
Ended
5/31/23
14.2
Lifecycle
Index
2010
Shares
Amount
Shares
Amount
Subscriptions:
Class
I
10,131
$
162,221
153,850
$
2,411,354
Premier
Class
99,816
1,591,307
117,623
1,824,406
Class
R6
5,871,430
94,247,976
8,598,657
133,984,767
Retirement
Class
395,902
6,243,168
348,180
5,342,411
Total
subscriptions
6,377,279
102,244,672
9,218,310
143,562,938
Reinvestments
of
distributions:
Class
I
2,288
36,633
3,692
55,966
Premier
Class
38,146
608,042
37,911
572,451
Class
R6
1,146,232
18,328,254
1,165,737
17,660,911
Retirement
Class
108,050
1,712,599
126,741
1,903,649
Total
reinvestments
of
distributions
1,294,716
20,685,528
1,334,081
20,192,977
Redemptions:
Class
I
(70,280)
(1,115,621)
(133,704)
(2,094,288)
Premier
Class
(274,858)
(4,413,763)
(235,778)
(3,646,327)
Class
R6
(8,711,198)
(139,980,798)
(6,763,434)
(105,147,400)
Retirement
Class
(1,003,364)
(15,974,894)
(1,150,544)
(17,594,517)
Total
redemptions
(10,059,700)
(161,485,076)
(8,283,460)
(128,482,532)
Net
increase
(decrease)
from
shareholder
transactions
(2,387,705)
$
(38,554,876)
2,268,931
$
35,273,383
Year
Ended
5/31/24
Year
Ended
5/31/23
14.3
Lifecycle
Index
2015
Shares
Amount
Shares
Amount
Subscriptions:
Class
I
54,921
$
937,881
18,825
$
307,570
Premier
Class
170,840
2,862,697
180,499
2,935,807
Class
R6
8,262,695
139,734,524
8,706,481
141,923,060
Retirement
Class
475,655
7,972,448
619,327
9,971,989
Total
subscriptions
8,964,111
151,507,550
9,525,132
155,138,426
Reinvestments
of
distributions:
Class
I
2,784
46,792
3,119
49,600
Premier
Class
62,007
1,038,002
54,348
860,335
Class
R6
2,139,222
35,981,708
1,779,925
28,300,802
Retirement
Class
193,088
3,222,645
176,988
2,794,638
Total
reinvestments
of
distributions
2,397,101
40,289,147
2,014,380
32,005,375
Redemptions:
Class
I
(89,142)
(1,505,944)
(15,822)
(258,604)
Premier
Class
(411,184)
(6,889,577)
(413,689)
(6,699,580)
Class
R6
(13,038,389)
(221,531,073)
(11,197,249)
(182,811,932)
Retirement
Class
(1,341,327)
(22,608,289)
(1,298,332)
(20,940,203)
Total
redemptions
(14,880,042)
(252,534,883)
(12,925,092)
(210,710,319)
Net
increase
(decrease)
from
shareholder
transactions
(3,518,830)
$
(60,738,186)
(1,385,580)
$
(23,566,518)
Year
Ended
5/31/24
Year
Ended
5/31/23
14.4
Lifecycle
Index
2020
Shares
Amount
Shares
Amount
Subscriptions:
Class
I
74,262
$
1,367,596
158,091
$
2,795,804
Premier
Class
503,271
9,200,844
590,138
10,319,910
Class
R6
22,424,807
412,766,301
27,127,506
477,461,227
Retirement
Class
878,109
15,990,132
1,211,104
21,064,328
Total
subscriptions
23,880,449
439,324,873
29,086,839
511,641,269
Reinvestments
of
distributions:
Class
I
18,571
340,408
17,475
298,992
Premier
Class
125,315
2,288,248
112,607
1,919,952
Class
R6
4,926,275
90,397,138
4,512,123
77,292,671
Retirement
Class
354,735
6,456,174
364,029
6,188,502
Total
reinvestments
of
distributions
5,424,896
99,481,968
5,006,234
85,700,117
Redemptions:
Class
I
(228,419)
(4,229,709)
(178,746)
(3,104,195)
Premier
Class
(1,248,756)
(22,962,439)
(791,770)
(13,840,191)
Class
R6
(35,125,181)
(649,197,428)
(27,668,648)
(487,395,995)
Retirement
Class
(2,683,928)
(49,126,116)
(3,332,516)
(57,956,441)
Total
redemptions
(39,286,284)
(725,515,692)
(31,971,680)
(562,296,822)
Net
increase
(decrease)
from
shareholder
transactions
(9,980,939)
$
(186,708,851)
2,121,393
$
35,044,564
Year
Ended
5/31/24
Year
Ended
5/31/23
14.5
Lifecycle
Index
2025
Shares
Amount
Shares
Amount
Subscriptions:
Class
I
243,371
$
4,930,631
275,521
$
5,221,601
Premier
Class
874,003
17,681,971
1,125,162
21,522,640
Class
R6
44,372,219
904,790,116
51,699,679
991,946,279
Retirement
Class
1,656,279
33,320,626
2,504,082
47,574,156
Total
subscriptions
47,145,872
960,723,344
55,604,444
1,066,264,676
Reinvestments
of
distributions:
Class
I
25,222
513,275
33,898
632,538
Premier
Class
121,096
2,459,456
135,927
2,532,319
Class
R6
6,156,947
125,540,155
6,572,746
122,910,358
Retirement
Class
454,869
9,192,902
550,211
10,200,914
Total
reinvestments
of
distributions
6,758,134
137,705,788
7,292,782
136,276,129
Redemptions:
Class
I
(437,995)
(8,805,941)
(261,519)
(5,009,768)
Premier
Class
(1,131,849)
(23,054,565)
(1,293,553)
(24,583,415)
Class
R6
(48,255,309)
(990,630,653)
(35,813,836)
(689,166,611)
Retirement
Class
(4,859,935)
(98,718,158)
(3,980,184)
(75,221,901)
Total
redemptions
(54,685,088)
(1,121,209,317)
(41,349,092)
(793,981,695)
Net
increase
(decrease)
from
shareholder
transactions
(781,082)
$
(22,780,185)
21,548,134
$
408,559,110
Year
Ended
5/31/24
Year
Ended
5/31/23
14.6
Lifecycle
Index
2030
Shares
Amount
Shares
Amount
Subscriptions:
Class
I
213,738
$
4,741,727
502,483
$
10,314,339
Premier
Class
1,020,220
22,666,628
1,207,434
24,959,433
Class
R6
56,495,639
1,263,257,332
64,118,120
1,331,942,651
Retirement
Class
2,789,961
61,671,465
3,049,170
62,576,387
Total
subscriptions
60,519,558
1,352,337,152
68,877,207
1,429,792,810
Reinvestments
of
distributions:
Class
I
35,160
784,418
40,830
824,368
Premier
Class
147,576
3,280,625
161,345
3,246,254
Class
R6
7,037,023
157,277,461
7,150,909
144,591,373
Retirement
Class
454,647
10,065,889
520,162
10,424,052
Total
reinvestments
of
distributions
7,674,406
171,408,393
7,873,246
159,086,047
Redemptions:
Class
I
(361,218)
(8,039,837)
(198,044)
(4,101,545)
Premier
Class
(1,470,090)
(32,858,904)
(1,180,278)
(24,354,540)
Class
R6
(44,001,301)
(992,421,774)
(32,490,617)
(676,170,775)
Retirement
Class
(4,321,884)
(96,495,792)
(3,730,845)
(76,399,373)
Total
redemptions
(50,154,493)
(1,129,816,307)
(37,599,784)
(781,026,233)
Net
increase
(decrease)
from
shareholder
transactions
18,039,471
$
393,929,238
39,150,669
$
807,852,624
Year
Ended
5/31/24
Year
Ended
5/31/23
14.7
Lifecycle
Index
2035
Shares
Amount
Shares
Amount
Subscriptions:
Class
I
223,278
$
5,367,607
444,830
$
9,814,231
Premier
Class
1,092,292
26,324,023
1,342,787
29,845,015
Class
R6
59,806,250
1,455,487,593
60,713,530
1,351,738,725
Retirement
Class
2,642,003
63,631,827
2,778,306
61,425,057
Total
subscriptions
63,763,823
1,550,811,050
65,279,453
1,452,823,028
Reinvestments
of
distributions:
Class
I
23,238
564,445
24,499
529,418
Premier
Class
132,558
3,207,899
150,915
3,249,191
Class
R6
6,054,698
147,371,345
6,291,815
136,217,788
Retirement
Class
348,217
8,392,031
418,760
8,978,226
Total
reinvestments
of
distributions
6,558,711
159,535,720
6,885,989
148,974,623
Redemptions:
Class
I
(298,338)
(7,198,241)
(139,365)
(3,084,341)
Premier
Class
(1,153,621)
(28,015,020)
(999,948)
(22,035,180)
Class
R6
(36,581,391)
(902,421,312)
(25,621,389)
(572,106,366)
Retirement
Class
(3,995,570)
(97,312,404)
(2,988,858)
(65,387,422)
Total
redemptions
(42,028,920)
(1,034,946,977)
(29,749,560)
(662,613,309)
Net
increase
(decrease)
from
shareholder
transactions
28,293,614
$
675,399,793
42,415,882
$
939,184,342
Notes
to
Financial
Statements
(continued)
Year
Ended
5/31/24
Year
Ended
5/31/23
14.8
Lifecycle
Index
2040
Shares
Amount
Shares
Amount
Subscriptions:
Class
I
193,374
$
5,009,272
271,658
$
6,332,337
Premier
Class
1,120,144
28,921,233
1,274,919
29,892,404
Class
R6
54,222,650
1,413,783,568
54,764,924
1,285,598,009
Retirement
Class
1,996,846
51,631,155
2,248,262
52,449,042
Total
subscriptions
57,533,014
1,499,345,228
58,559,763
1,374,271,792
Reinvestments
of
distributions:
Class
I
20,577
535,204
25,001
569,017
Premier
Class
136,836
3,542,683
155,530
3,524,310
Class
R6
5,787,159
150,697,631
6,090,185
138,734,411
Retirement
Class
295,703
7,629,130
370,265
8,360,596
Total
reinvestments
of
distributions
6,240,275
162,404,648
6,640,981
151,188,334
Redemptions:
Class
I
(208,960)
(5,446,746)
(158,740)
(3,748,544)
Premier
Class
(1,439,064)
(37,749,387)
(1,166,009)
(26,993,241)
Class
R6
(31,691,130)
(841,845,215)
(21,488,387)
(505,482,129)
Retirement
Class
(3,604,077)
(94,931,430)
(2,834,336)
(65,398,298)
Total
redemptions
(36,943,231)
(979,972,778)
(25,647,472)
(601,622,212)
Net
increase
(decrease)
from
shareholder
transactions
26,830,058
$
681,777,098
39,553,272
$
923,837,914
Year
Ended
5/31/24
Year
Ended
5/31/23
14.9
Lifecycle
Index
2045
Shares
Amount
Shares
Amount
Subscriptions:
Class
I
157,554
$
4,254,147
408,364
$
9,779,505
Premier
Class
993,274
26,788,207
1,077,402
26,118,036
Class
R6
52,266,925
1,418,998,974
49,155,216
1,193,128,535
Retirement
Class
1,731,177
46,548,337
2,080,973
50,015,424
Total
subscriptions
55,148,930
1,496,589,665
52,721,955
1,279,041,500
Reinvestments
of
distributions:
Class
I
18,683
505,761
20,310
476,279
Premier
Class
72,690
1,961,898
73,952
1,729,728
Class
R6
4,469,368
121,209,261
4,344,584
102,054,269
Retirement
Class
226,560
6,085,403
279,463
6,503,116
Total
reinvestments
of
distributions
4,787,301
129,762,323
4,718,309
110,763,392
Redemptions:
Class
I
(209,486)
(5,648,588)
(186,151)
(4,550,153)
Premier
Class
(753,142)
(20,519,310)
(603,649)
(14,458,358)
Class
R6
(26,078,253)
(721,370,997)
(16,540,497)
(401,847,490)
Retirement
Class
(2,562,142)
(70,174,828)
(2,605,080)
(62,287,444)
Total
redemptions
(29,603,023)
(817,713,723)
(19,935,377)
(483,143,445)
Net
increase
(decrease)
from
shareholder
transactions
30,333,208
$
808,638,265
37,504,887
$
906,661,447
Year
Ended
5/31/24
Year
Ended
5/31/23
15.01
Lifecycle
Index
2050
Shares
Amount
Shares
Amount
Subscriptions:
Class
I
151,795
$
4,162,023
310,326
$
7,491,969
Premier
Class
511,652
14,049,166
670,843
16,388,514
Class
R6
44,172,380
1,217,859,238
43,378,142
1,063,780,673
Retirement
Class
1,408,038
38,375,294
1,704,118
41,369,831
Total
subscriptions
46,243,865
1,274,445,721
46,063,429
1,129,030,987
Reinvestments
of
distributions:
Class
I
15,170
416,566
16,528
391,875
Premier
Class
53,428
1,461,248
53,352
1,260,711
Class
R6
3,897,036
107,168,487
3,379,444
80,261,796
Retirement
Class
198,874
5,413,361
227,036
5,337,627
Total
reinvestments
of
distributions
4,164,508
114,459,662
3,676,360
87,252,009
Redemptions:
Class
I
(201,159)
(5,454,329)
(116,002)
(2,854,817)
Premier
Class
(633,130)
(17,514,976)
(570,909)
(13,846,561)
Class
R6
(21,224,260)
(597,384,005)
(14,146,734)
(346,174,957)
Retirement
Class
(2,151,001)
(59,646,290)
(2,570,690)
(62,029,955)
Total
redemptions
(24,209,550)
(679,999,600)
(17,404,335)
(424,906,290)
Net
increase
(decrease)
from
shareholder
transactions
26,198,823
$
708,905,783
32,335,454
$
791,376,706
Year
Ended
5/31/24
Year
Ended
5/31/23
15.1
Lifecycle
Index
2055
Shares
Amount
Shares
Amount
Subscriptions:
Class
I
222,339
$
4,895,126
294,807
$
5,771,436
Premier
Class
480,554
10,667,739
543,669
10,710,895
Class
R6
41,577,792
926,627,050
38,723,314
765,646,583
Retirement
Class
1,482,023
32,716,115
1,763,013
34,724,366
Total
subscriptions
43,762,708
974,906,030
41,324,803
816,853,280
Reinvestments
of
distributions:
Class
I
15,953
353,668
15,484
295,744
Premier
Class
27,490
608,638
25,066
478,269
Class
R6
2,799,981
62,159,591
2,227,549
42,613,006
Retirement
Class
134,709
2,974,365
155,255
2,954,506
Total
reinvestments
of
distributions
2,978,133
66,096,262
2,423,354
46,341,525
Redemptions:
Class
I
(234,331)
(5,053,347)
(76,648)
(1,523,935)
Premier
Class
(617,905)
(13,841,189)
(354,296)
(6,950,693)
Class
R6
(18,474,311)
(419,542,678)
(10,283,713)
(202,946,605)
Retirement
Class
(1,437,927)
(32,034,509)
(2,515,314)
(49,311,486)
Total
redemptions
(20,764,474)
(470,471,723)
(13,229,971)
(260,732,719)
Net
increase
(decrease)
from
shareholder
transactions
25,976,367
$
570,530,569
30,518,186
$
602,462,086
Year
Ended
5/31/24
Year
Ended
5/31/23
15.2
Lifecycle
Index
2060
Shares
Amount
Shares
Amount
Subscriptions:
Class
I
237,912
$
4,089,310
298,688
$
4,539,800
Premier
Class
554,364
9,509,531
569,589
8,695,066
Class
R6
38,177,375
660,894,255
35,061,006
536,252,969
Retirement
Class
1,278,732
21,923,193
1,870,744
28,557,705
Total
subscriptions
40,248,383
696,416,289
37,800,027
578,045,540
Reinvestments
of
distributions:
Class
I
13,932
239,498
14,020
207,216
Premier
Class
18,860
323,633
15,611
230,427
Class
R6
1,912,844
32,900,918
1,375,705
20,346,681
Retirement
Class
86,565
1,482,850
94,250
1,388,295
Total
reinvestments
of
distributions
2,032,201
34,946,899
1,499,586
22,172,619
Redemptions:
Class
I
(234,297)
(3,954,887)
(189,872)
(2,926,764)
Premier
Class
(533,454)
(9,078,713)
(223,027)
(3,391,639)
Class
R6
(16,178,367)
(283,863,945)
(8,852,893)
(135,144,083)
Retirement
Class
(774,205)
(13,334,770)
(2,128,013)
(32,363,649)
Total
redemptions
(17,720,323)
(310,232,315)
(11,393,805)
(173,826,135)
Net
increase
(decrease)
from
shareholder
transactions
24,560,261
$
421,130,873
27,905,808
$
426,392,024
Year
Ended
5/31/24
Year
Ended
5/31/23
15.3
Lifecycle
Index
2065
Shares
Amount
Shares
Amount
Subscriptions:
Class
I
113,763
$
1,384,830
160,921
$
1,747,332
Premier
Class
186,945
2,229,957
43,518
467,516
Class
R6
16,027,662
198,759,351
7,791,179
85,276,166
Retirement
Class
481,317
5,895,241
299,613
3,251,754
Total
subscriptions
16,809,687
208,269,379
8,295,231
90,742,768
Reinvestments
of
distributions:
Class
I
4,210
51,147
468
4,882
Premier
Class
3,300
40,099
752
7,832
Class
R6
355,871
4,380,766
133,411
1,407,489
Retirement
Class
10,884
132,344
4,049
42,273
Total
reinvestments
of
distributions
374,265
4,604,356
138,680
1,462,476
Redemptions:
Class
I
(47,321)
(585,953)
(12,136)
(132,833)
Premier
Class
(89,827)
(1,106,252)
(5,916)
(63,613)
Class
R6
(3,178,895)
(40,267,990)
(1,229,812)
(13,481,070)
Retirement
Class
(146,895)
(1,799,799)
(38,390)
(416,859)
Total
redemptions
(3,462,938)
(43,759,994)
(1,286,254)
(14,094,375)
Net
increase
(decrease)
from
shareholder
transactions
13,721,014
$
169,113,741
7,147,657
$
78,110,869
Notes
to
Financial
Statements
(continued)
6.
Income
Tax
Information
Each
Fund
is
a
separate
taxpayer
for
federal
income
tax
purposes.
Each
Fund
intends
to
distribute
substantially
all
of
its
net
investment
income
and
net
capital
gains
to
shareholders
and
otherwise
comply
with
the
requirements
of
Subchapter
M
of
the
Internal
Revenue
Code
applicable
to
regulated
investment
companies.
Therefore,
no
federal
income
tax
provision
is
required.
Each
Fund
files
income
tax
returns
in
U.S.
federal
and
applicable
state
and
local
jurisdictions.
A
Fund’s
federal
income
tax
returns
are
generally
subject
to
examination
for
a
period
of
three
fiscal
years
after
being
filed.
State
and
local
tax
returns
may
be
subject
to
examination
for
an
additional
period
of
time
depending
on
the
jurisdiction.
Management
has
analyzed
each
Fund’s
tax
positions
taken
for
all
open
tax
years
and
has
concluded
that
no
provision
for
income
tax
is
required
in
the
Fund’s
financial
statements.
Differences
between
amounts
for
financial
statement
and
federal
income
tax
purposes
are
primarily
due
to
timing
differences
in
recognizing
gains
and
losses
on
investment
transactions.
Temporary
differences
do
not
require
reclassification.
As
of
year
end,
permanent
differences
that
resulted
in
reclassifications
among
the
components
of
net
assets
relate
primarily
to
distribution
reallocations
and
tax
equalization.
Temporary
and
permanent
differences
have
no
impact
on
a
Fund’s
net
assets.
As
of
year
end,
the
aggregate
cost
and
the
net
unrealized
appreciation/(depreciation)
of
all
investments
for
federal
income
tax
purposes
were
as
follows:
For
purposes
of
this
disclosure,
tax
cost
generally
includes
the
cost
of
portfolio
investments
as
well
as
up-front
fees
or
premiums
exchanged
on
derivatives
and
any
amounts
unrealized
for
income
statement
reporting
but
realized
income
and/or
capital
gains
for
tax
reporting,
if
applicable.
As
of year
end,
the
components
of
accumulated
earnings
on
a
tax
basis
were
as
follows:
Fund
Tax
Cost
Gross
Unrealized
Appreciation
Gross
Unrealized
(Depreciation)
Net
Unrealized
Appreciation
(Depreciation)
14.1
Lifecycle
Index
Retirement
Income
$637,247,065
$119,795,146
$(52,741,402)
$67,053,744
14.2
Lifecycle
Index
2010
552,709,390
128,461,944
(51,596,019)
76,865,925
14.3
Lifecycle
Index
2015
888,432,691
243,260,199
(84,861,890)
158,398,309
14.4
Lifecycle
Index
2020
2,599,231,505
712,765,956
(232,108,561)
480,657,395
14.5
Lifecycle
Index
2025
4,979,226,548
1,368,958,634
(399,779,912)
969,178,722
14.6
Lifecycle
Index
2030
6,523,503,668
1,949,418,343
(455,789,934)
1,493,628,409
14.7
Lifecycle
Index
2035
6,636,394,066
2,208,001,144
(387,461,475)
1,820,539,669
14.8
Lifecycle
Index
2040
6,564,923,785
2,617,613,648
(313,025,401)
2,304,588,247
14.9
Lifecycle
Index
2045
5,522,090,715
2,086,107,445
(194,232,036)
1,891,875,409
15.01
Lifecycle
Index
2050
4,674,237,707
1,734,744,631
(144,464,415)
1,590,280,216
15.1
Lifecycle
Index
2055
2,911,715,959
905,557,228
(71,215,814)
834,341,414
15.2
Lifecycle
Index
2060
1,696,103,617
416,423,728
(36,385,852)
380,037,876
15.3
Lifecycle
Index
2065
295,579,753
43,532,287
(2,424,338)
41,107,949
Fund
Undistributed
Ordinary
Income
Undistributed
Long-Term
Capital
Gains
Unrealized
Appreciation
(Depreciation)
Capital
Loss
Carryforwards
Late-Year
Loss
Deferrals
Other
Book-to-Tax
Differences
Total
14.1
Lifecycle
Index
Retirement
Income
$4,983,623
$568,458
$67,053,744
$–
$–
$(19,708)
$72,586,117
14.2
Lifecycle
Index
2010
5,477,181
12,662,365
76,865,925
–
–
(37,659)
94,967,812
14.3
Lifecycle
Index
2015
8,340,973
25,845,872
158,398,309
–
–
(65,640)
192,519,514
14.4
Lifecycle
Index
2020
22,468,089
62,312,834
480,657,395
–
–
(133,240)
565,305,078
14.5
Lifecycle
Index
2025
43,573,837
72,554,644
969,178,722
–
–
(173,117)
1,085,134,086
14.6
Lifecycle
Index
2030
50,705,956
25,205,720
1,493,628,409
–
–
(194,470)
1,569,345,615
14.7
Lifecycle
Index
2035
50,357,129
–
1,820,539,669
–
–
(185,715)
1,870,711,083
14.8
Lifecycle
Index
2040
19,756,044
–
2,304,588,247
(8,191,217)
–
(202,153)
2,315,950,921
14.9
Lifecycle
Index
2045
12,720,598
–
1,891,875,409
–
–
(129,059)
1,904,466,948
15.01
Lifecycle
Index
2050
7,651,387
–
1,590,280,216
–
–
(100,438)
1,597,831,165
15.1
Lifecycle
Index
2055
3,387,282
–
834,341,414
–
–
(45,602)
837,683,094
15.2
Lifecycle
Index
2060
1,209,407
–
380,037,876
–
–
(18,187)
381,229,096
15.3
Lifecycle
Index
2065
122,252
–
41,107,949
(70,267)
–
(1,182)
41,158,752
The
tax
character
of
distributions
paid was
as
follows:
As
of
year
end,
the
Funds
had
capital
loss
carryforwards,
which
will
not
expire:
As
of
year
end,
the
Funds
utilized
the
following
capital
loss
carryovers:
7.
Investment
Adviser
and
Other
Transactions
with
Affiliates
Under
the
terms
of
its
Investment
Management
Agreement,
the
Adviser
is
entitled
to
a
fee
that
is
made
up
of
two
components,
which
are
added
together
to
create
the
total
investment
management
fee.
The
first
component,
the
asset
allocation
fee
rate,
is
an
annual
rate
of
0.10%
of
the
average
daily
net
assets
of
each
Fund.
The
second
component,
the
Underlying
Funds
fee
rate
is
calculated
as
follows:
for
each
Underlying
Fund
of
the
Trust
in
which
a
Fund
is
invested,
the
effective
Underlying
Fund’s
annual
investment
management
fee
rate,
as
determined
pursuant
to
its
investment
management
agreement,
net
of
any
fee
waivers
or
reimbursements
applicable
to
the
Underlying
Fund
(excluding
the
Class
W
shares
investment
management
fee
waiver
and/or
reimbursement),
in
proportion
to
the
percentage
of
the
Fund’s
net
assets
invested
in
the
Underlying
Fund,
applied
to
the
Fund’s
average
daily
net
assets.
The
Adviser
has
contractually
agreed
to
waive
a
portion
of
the
asset
allocation
fee
rate
equal
to,
on
an
annual
basis,
the
following
percentages
of
the
average
daily
net
assets
of
each
Fund.
As
of
the
end
of
the
current
fiscal
period,
the
Adviser
received
from
the
Funds
the
following
effective
annual
rate
as
a
percentage
of
average
daily
net
assets
of
each
Fund:
5/31/24
5/31/23
Fund
Ordinary
Income
Long-Term
Capital
Gains
Ordinary
Income
Long-Term
Capital
Gains
14.1
Lifecycle
Index
Retirement
Income
$
18,858,738
$
–
$
14,973,887
$
4,641,149
14.2
Lifecycle
Index
2010
17,235,203
4,025,671
15,806,996
5,015,648
14.3
Lifecycle
Index
2015
28,466,179
13,166,092
26,070,743
7,047,051
14.4
Lifecycle
Index
2020
81,161,861
23,686,870
69,866,800
19,737,387
14.5
Lifecycle
Index
2025
146,874,613
–
113,331,702
30,664,954
14.6
Lifecycle
Index
2030
180,599,576
–
130,012,618
35,793,716
14.7
Lifecycle
Index
2035
167,731,378
–
121,786,193
33,567,023
14.8
Lifecycle
Index
2040
168,607,495
–
122,514,828
33,488,140
14.9
Lifecycle
Index
2045
135,360,112
–
91,708,612
22,716,510
15.01
Lifecycle
Index
2050
113,338,491
5,877,617
77,452,283
13,031,432
15.1
Lifecycle
Index
2055
65,982,693
3,164,243
41,457,487
6,815,627
15.2
Lifecycle
Index
2060
35,044,620
1,574,093
20,274,770
2,903,980
15.3
Lifecycle
Index
2065
4,698,152
114,166
1,488,626
94,990
Fund
Short-Term
Long-Term
Total
14.1
Lifecycle
Index
Retirement
Income
$
–
$
–
$
–
14.2
Lifecycle
Index
2010
–
–
–
14.3
Lifecycle
Index
2015
–
–
–
14.4
Lifecycle
Index
2020
–
–
–
14.5
Lifecycle
Index
2025
–
–
–
14.6
Lifecycle
Index
2030
–
–
–
14.7
Lifecycle
Index
2035
–
–
–
14.8
Lifecycle
Index
2040
–
8,191,217
8,191,217
14.9
Lifecycle
Index
2045
–
–
–
15.01
Lifecycle
Index
2050
–
–
–
15.1
Lifecycle
Index
2055
–
–
–
15.2
Lifecycle
Index
2060
–
–
–
15.3
Lifecycle
Index
2065
70,267
–
70,267
Fund
Utilized
14.1
Lifecycle
Index
Retirement
Income
$741,761
14.2
Lifecycle
Index
2010
216,559
14.3
Lifecycle
Index
2015
–
14.4
Lifecycle
Index
2020
–
14.5
Lifecycle
Index
2025
2,322,250
14.6
Lifecycle
Index
2030
2,113,634
14.7
Lifecycle
Index
2035
12,809,985
14.8
Lifecycle
Index
2040
23,376,909
14.9
Lifecycle
Index
2045
2,673,139
15.01
Lifecycle
Index
2050
–
15.1
Lifecycle
Index
2055
–
15.2
Lifecycle
Index
2060
–
15.3
Lifecycle
Index
2065
–
Notes
to
Financial
Statements
(continued)
The
Funds
have
entered
into
an
Administrative
Service
Agreement
with
the
Adviser
under
which
the
Funds
pay
the
Adviser
for
its
cost
in
providing
certain
administrative
and
compliance
services
to
the
Funds.
The
Adviser
has
agreed
to
gradually
reduce
expenses
allocated
to
the
Funds
under
the
Administrative
Service
Agreement
over
a
three-year
period
commencing
May
1,
2024.
After
the
expiration
of
this
three-year
period,
the
Adviser
will
no
longer
allocate
expenses
to
the
Funds
under
the
Administrative
Service
Agreement.
Under
the
terms
of
a
Retirement
Class
Service
Agreement
with
respect
to
each
Fund,
the
Retirement
Class
of
the
Fund
pays
the
Advisers
a
monthly
fee
based
on
the
annual
rate
of
0.25%
of
the
Fund’s
average
daily
net
assets
attributable
to
Retirement
Class
shares
of
the
Fund
for
providing
certain
administrative
services
related
to
the
maintenance
of
Retirement
Class
shares
on
retirement
plan
or
other
platforms.
Substantially
all
of
the
Retirement
Class
shareholder
servicing
fees
reported
on
the
Statements
of
operations
are
paid
to
the
Adviser
under
the
Service
Agreement.
Under
the
terms
of
a
distribution
Rule
12b-1
plan,
the
Premier
Class
of
the
Funds compensated
Nuveen
Securities
for
providing
distribution,
promotional
and/or
shareholder
services
to
the Premier
Class
at
the
annual
rate
of
0.15%
of
the
average
daily
net
assets
attributable
to
the
Retirement
Class
shares
and
Premier
Class
shares.
The
Adviser
has
agreed
to
reimburse
each
Fund
if
its
total
expense
ratio
(excluding
interest,
taxes,
brokerage
commissions
and
other
transactional
expenses,
acquired
fund
fees
and
expenses,
extraordinary
expenses
and
the
management
fees
and
certain
other
expenses
originally
attributable
to
Class
W
shares
of
the
affiliated
Nuveen
Funds)
exceeds
the
following
percentages
of
average
daily
net
assets
for
each
class:
Other
Transactions
with
Affiliates:
The
Funds
are
permitted
to
purchase
or
sell
securities
from
or
to
certain
other
funds
or
accounts
managed
by
the
Adviser
or
by
an
affiliate
of
the
Adviser
(each
an,
"Affiliated
Entity")
under
specified
conditions
outlined
in
procedures
adopted
by
the
Board
("cross-trade").
These
procedures
have
been
designed
to
ensure
that
any
cross-trade
of
securities
by
the
Fund
from
or
to
an
Affiliated
Entity
by
virtue
of
having
a
common
investment
adviser
(or
affiliated
investment
adviser),
common
officer
and/
or
common
trustee
complies
with
Rule
17a-7
under
the
1940
Act.
These
transactions
are
affected
at
the
current
market
price
(as
provided
by
an
independent
pricing
service)
without
incurring
broker
commissions.
During
the
current
fiscal
period,
the
Funds
did
not
engage
in
cross-trades
pursuant
to
these
procedures.
Investment
Management
Fee
Waiver
Fund
Investment
Management
Fee—Effective
Rate
Effective
10/1/23*
Prior
to
10/1/23
Lifecycle
Index
Retirement
Income
0.09%
0.079%
0.083%
Lifecycle
Index
2010
0.09
0.080
0.083
Lifecycle
Index
2015
0.09
0.077
0.080
Lifecycle
Index
2020
0.09
0.073
0.075
Lifecycle
Index
2025
0.09
0.068
0.071
Lifecycle
Index
2030
0.09
0.063
0.066
Lifecycle
Index
2035
0.09
0.058
0.060
Lifecycle
Index
2040
0.09
0.055
0.057
Lifecycle
Index
2045
0.09
0.054
0.057
Lifecycle
Index
2050
0.09
0.053
0.056
Lifecycle
Index
2055
0.09
0.053
0.056
Lifecycle
Index
2060
0.09
0.053
0.056
Lifecycle
Index
2065
0.09
0.054
0.057
*
These
waivers
will
remain
in
effect
through
September
30,
2024,
unless
changed
with
approval
of
the
Board
of
Trustees.
Maximum
Expense
Amounts
Class
I
Premier
Class
Class
R6
Retirement
Class
Fund
Effective
10/1/23*
Prior
to
10/1/23
Effective
10/1/23*
Prior
to
10/1/23
Effective
10/1/23*
Prior
to
10/1/23
Effective
10/1/23*
Prior
to
10/1/23
Lifecycle
Index
Retirement
Income
0.171%
0.167%
0.171%
0.167%
0.021%
0.017%
0.271%
0.267%
Lifecycle
Index
2010
0.170
0.167
0.170
0.167
0.020
0.017
0.270
0.267
Lifecycle
Index
2015
0.173
0.170
0.173
0.170
0.023
0.020
0.273
0.270
Lifecycle
Index
2020
0.177
0.175
0.177
0.175
0.027
0.025
0.277
0.275
Lifecycle
Index
2025
0.182
0.179
0.182
0.179
0.032
0.029
0.282
0.279
Lifecycle
Index
2030
0.187
0.184
0.187
0.184
0.037
0.034
0.287
0.284
Lifecycle
Index
2035
0.192
0.190
0.192
0.190
0.042
0.040
0.292
0.290
Lifecycle
Index
2040
0.195
0.193
0.195
0.193
0.045
0.043
0.295
0.293
Lifecycle
Index
2045
0.196
0.193
0.196
0.193
0.046
0.043
0.296
0.293
Lifecycle
Index
2050
0.197
0.194
0.197
0.194
0.047
0.044
0.297
0.294
Lifecycle
Index
2055
0.197
0.194
0.197
0.194
0.047
0.044
0.297
0.294
Lifecycle
Index
2060
0.197
0.194
0.197
0.194
0.047
0.044
0.297
0.294
Lifecycle
Index
2065
0.196
0.193
0.196
0.193
0.046
0.043
0.296
0.293
*
The
expense
reimbursement
agreements
will
continue
through
at
least
September
30,
2024,
unless
changed
with
approval
of
the
Board.
The
following
is
the
percentage
of
the
Funds’
shares
owned
by
TIAA
as
of
the
end
of
the
current
fiscal
period:
Investments
in
other
investment
companies
advised
by
the
Adviser
and
Nuveen
Fund
Advisors,
LLC
are
deemed
to
be
affiliated
investments.
Information
regarding
transactions
with
affiliated
companies
is
as
follows:
Underlying
Fund
TIAA
Total
15.3
Lifecycle
Index
2065
2
%
2
%
Issue
Value
at
5/31/23
Purchases
Cost
Sales
Proceeds
Realized
Gain
(Loss)
Change
in
Unrealized
Appreciation
(Depreciation)
Value
at
5/31/24
Dividend
Income
Lifecycle
Index
Retirement
Income
Nuveen
Funds:
Bond
Index,
Class
W
$
246,572,754
$
67,267,761
$
29,104,494
$
(5,375,051)
$
1,151,303
$
280,512,273
$
8,767,781
Emerging
Markets
Equity
Index,
Class
W
25,532,887
9,237,852
7,486,197
(244,262)
2,744,146
29,784,426
945,312
Equity
Index,
Class
W
160,671,766
34,920,371
52,447,842
4,993,641
36,542,009
184,679,945
2,774,758
Inflation
Linked
Bond,
Class
W
61,590,283
19,544,980
10,684,700
(1,248,399)
763,882
69,966,046
2,648,585
International
Equity
Index,
Class
W
59,296,719
15,570,862
15,057,474
564,420
9,184,541
69,559,068
2,146,394
Short
Term
Bond
Index,
Class
W
61,692,720
19,584,593
11,616,083
(553,636)
479,457
69,587,051
2,655,245
$615,357,129
$166,126,419
$126,396,790
$(1,863,287)
$50,865,338
$704,088,809
$19,938,075
Issue
Value
at
5/31/23
Purchases
Cost
Sales
Proceeds
Realized
Gain
(Loss)
Change
in
Unrealized
Appreciation
(Depreciation)
Value
at
5/31/24
Dividend
Income
Lifecycle
Index
2010
Nuveen
Funds:
Bond
Index,
Class
W
$
252,411,069
$
40,613,208
$
37,645,168
$
(6,905,166)
$
2,172,368
$
250,646,311
$
8,205,651
Emerging
Markets
Equity
Index,
Class
W
24,252,996
5,728,501
8,095,827
38,750
2,102,787
24,027,207
787,235
Equity
Index,
Class
W
152,745,142
19,720,706
58,487,146
18,947,829
16,514,976
149,441,507
2,310,837
Inflation
Linked
Bond,
Class
W
63,084,226
11,585,068
11,513,090
(1,297,271)
655,287
62,514,220
2,549,942
International
Equity
Index,
Class
W
56,362,599
9,835,560
18,238,715
1,622,918
6,518,152
56,100,514
1,790,137
Short
Term
Bond
Index,
Class
W
81,409,173
21,378,789
16,218,622
(891,381)
751,597
86,429,556
3,323,749
$630,265,205
$108,861,832
$150,198,568
$11,515,679
$28,715,167
$629,159,315
$18,967,551
Issue
Value
at
5/31/23
Purchases
Cost
Sales
Proceeds
Realized
Gain
(Loss)
Change
in
Unrealized
Appreciation
(Depreciation)
Value
at
5/31/24
Dividend
Income
Lifecycle
Index
2015
Nuveen
Funds:
Bond
Index,
Class
W
$
412,770,335
$
64,307,936
$
55,628,063
$
(9,508,124)
$
1,901,257
$
413,843,341
$
13,601,685
Emerging
Markets
Equity
Index,
Class
W
45,467,735
10,615,158
14,704,221
(24,538)
4,057,793
45,411,927
1,516,991
Equity
Index,
Class
W
286,321,636
26,928,594
98,184,321
38,714,382
28,599,588
282,379,879
4,453,229
Inflation
Linked
Bond,
Class
W
95,385,002
19,882,594
15,189,959
(1,936,795)
1,020,718
99,161,560
3,952,811
International
Equity
Index,
Class
W
105,634,404
14,136,054
29,229,584
2,957,059
12,497,343
105,995,276
3,449,622
Short
Term
Bond
Index,
Class
W
95,549,445
23,217,059
19,608,791
(1,010,123)
864,428
99,012,018
3,881,242
$1,041,128,557
$159,087,395
$232,544,939
$29,191,861
$48,941,127
$1,045,804,001
$30,855,580
Issue
Value
at
5/31/23
Purchases
Cost
Sales
Proceeds
Realized
Gain
(Loss)
Change
in
Unrealized
Appreciation
(Depreciation)
Value
at
5/31/24
Dividend
Income
Lifecycle
Index
2020
Nuveen
Funds:
Bond
Index,
Class
W
$
1,171,601,102
$
176,533,184
$
139,127,602
$
(26,521,629)
$
4,193,862
$
1,186,678,917
$
38,669,964
Emerging
Markets
Equity
Index,
Class
W
148,064,114
29,025,410
40,503,437
(810,096)
13,985,066
149,761,057
4,940,094
Equity
Index,
Class
W
932,919,130
74,036,303
296,503,142
98,994,901
120,470,927
929,918,119
14,479,698
Inflation
Linked
Bond,
Class
W
217,100,820
45,763,649
30,146,959
(4,417,525)
2,325,842
230,625,827
8,999,367
International
Equity
Index,
Class
W
344,202,730
43,290,653
88,114,607
7,114,094
43,201,517
349,694,387
11,226,513
Short
Term
Bond
Index,
Class
W
217,489,196
51,856,055
39,503,969
(2,136,705)
1,751,016
229,455,593
8,901,566
$3,031,377,092
$420,505,254
$633,899,716
$72,223,040
$185,928,230
$3,076,133,900
$87,217,202
Notes
to
Financial
Statements
(continued)
Issue
Value
at
5/31/23
Purchases
Cost
Sales
Proceeds
Realized
Gain
(Loss)
Change
in
Unrealized
Appreciation
(Depreciation)
Value
at
5/31/24
Dividend
Income
Lifecycle
Index
2025
Nuveen
Funds:
Bond
Index,
Class
W
$
1,969,895,823
$
405,011,751
$
145,673,308
$
(31,970,969)
$
(6,079,044)
$
2,191,184,253
$
68,192,593
Emerging
Markets
Equity
Index,
Class
W
299,300,681
59,256,263
61,736,172
(4,775,980)
32,430,017
324,474,809
10,310,269
Equity
Index,
Class
W
1,889,631,091
144,270,597
474,520,433
103,973,848
354,598,654
2,017,953,757
30,234,140
Inflation
Linked
Bond,
Class
W
279,336,542
79,096,464
28,938,161
(5,103,711)
2,695,071
327,086,205
11,955,159
International
Equity
Index,
Class
W
696,814,689
87,595,912
132,029,829
4,915,184
101,065,536
758,361,492
23,435,112
Short
Term
Bond
Index,
Class
W
279,898,479
82,830,186
36,924,569
(2,358,439)
1,857,097
325,302,754
12,057,841
$5,414,877,305
$858,061,173
$879,822,472
$64,679,933
$486,567,331
$5,944,363,270
$156,185,114
Issue
Value
at
5/31/23
Purchases
Cost
Sales
Proceeds
Realized
Gain
(Loss)
Change
in
Unrealized
Appreciation
(Depreciation)
Value
at
5/31/24
Dividend
Income
Lifecycle
Index
2030
Nuveen
Funds:
Bond
Index,
Class
W
$
2,192,975,077
$
603,378,582
$
122,580,629
$
(28,776,570)
$
(14,681,067)
$
2,630,315,393
$
78,842,139
Emerging
Markets
Equity
Index,
Class
W
430,956,780
94,014,897
62,052,701
(9,464,201)
50,594,922
504,049,697
15,393,548
Equity
Index,
Class
W
2,718,341,064
240,827,165
506,665,740
56,819,547
625,350,637
3,134,672,673
45,154,776
Inflation
Linked
Bond,
Class
W
213,850,678
82,323,265
12,956,780
(2,420,221)
821,512
281,618,454
9,503,206
International
Equity
Index,
Class
W
1,002,586,942
149,385,410
133,186,102
(157,409)
158,959,375
1,177,588,216
35,016,118
Short
Term
Bond
Index,
Class
W
214,214,888
85,733,829
19,413,784
(1,301,860)
890,572
280,123,645
9,817,371
$6,772,925,429
$1,255,663,148
$856,855,736
$14,699,286
$821,935,951
$8,008,368,078
$193,727,158
Issue
Value
at
5/31/23
Purchases
Cost
Sales
Proceeds
Realized
Gain
(Loss)
Change
in
Unrealized
Appreciation
(Depreciation)
Value
at
5/31/24
Dividend
Income
Lifecycle
Index
2035
Nuveen
Funds:
Bond
Index,
Class
W
$
1,803,501,301
$
687,910,349
$
94,812,020
$
(19,916,673)
$
(16,542,336)
$
2,360,140,621
$
67,995,699
Emerging
Markets
Equity
Index,
Class
W
498,560,668
127,324,681
65,036,113
(12,928,266)
61,423,604
609,344,574
18,222,434
Equity
Index,
Class
W
3,140,343,453
357,049,863
511,971,732
34,908,448
770,190,225
3,790,520,257
53,563,833
Inflation
Linked
Bond,
Class
W
78,054,178
55,187,315
3,278,491
(668,971)
328,651
129,622,682
3,780,003
International
Equity
Index,
Class
W
1,158,773,454
207,346,383
130,541,794
(1,569,001)
190,033,724
1,424,042,766
41,452,004
Short
Term
Bond
Index,
Class
W
78,190,376
55,365,478
4,435,126
(299,876)
133,982
128,954,834
4,099,833
$6,757,423,430
$1,490,184,069
$810,075,276
$(474,339)
$1,005,567,850
$8,442,625,734
$189,113,806
Issue
Value
at
5/31/23
Purchases
Cost
Sales
Proceeds
Realized
Gain
(Loss)
Change
in
Unrealized
Appreciation
(Depreciation)
Value
at
5/31/24
Dividend
Income
Lifecycle
Index
2040
Nuveen
Funds:
Bond
Index,
Class
W
$
1,296,962,363
$
576,287,302
$
75,488,595
$
(14,910,455)
$
(11,891,674)
$
1,770,958,941
$
50,125,994
Emerging
Markets
Equity
Index,
Class
W
586,287,196
160,055,929
62,217,876
(13,394,788)
71,173,098
741,903,559
21,835,499
Equity
Index,
Class
W
3,700,776,911
401,181,454
452,072,988
23,894,058
939,010,469
4,612,789,904
64,268,355
International
Equity
Index,
Class
W
1,365,372,342
252,861,239
111,302,209
(1,835,059)
227,923,314
1,733,019,627
49,669,599
$6,949,398,812
$1,390,385,924
$701,081,668
$(6,246,244)
$1,226,215,207
$8,858,672,031
$185,899,447
Issue
Value
at
5/31/23
Purchases
Cost
Sales
Proceeds
Realized
Gain
(Loss)
Change
in
Unrealized
Appreciation
(Depreciation)
Value
at
5/31/24
Dividend
Income
Lifecycle
Index
2045
Nuveen
Funds:
Bond
Index,
Class
W
$
680,449,841
$
339,115,486
$
46,571,946
$
(9,583,633)
$
(4,625,368)
$
958,784,380
$
26,777,869
Emerging
Markets
Equity
Index,
Class
W
501,346,097
174,650,777
52,034,044
(12,170,092)
63,084,723
674,877,461
19,373,589
Equity
Index,
Class
W
3,162,516,737
500,463,975
315,713,767
5,323,682
842,457,684
4,195,048,311
56,776,960
International
Equity
Index,
Class
W
1,166,842,700
283,728,673
75,747,704
(2,032,150)
202,878,453
1,575,669,972
43,955,122
$5,511,155,375
$1,297,958,911
$490,067,461
$(18,462,193)
$1,103,795,492
$7,404,380,124
$146,883,540
8.
Inter-Fund
Lending
Program
Pursuant
to
an
exemptive
order
issued
by
the
SEC,
the
Funds may
participate
in
an
inter-fund
lending
program.
This
program
allows
the
Funds to
lend
cash
to
and/or
borrow
cash
from
certain
other
affiliated
Funds for
temporary
purposes,
(e.g.,
to
satisfy
redemption
requests
or
to
cover
unanticipated
cash
shortfalls).
The
program
is
subject
to
a
number
of
conditions,
including
the
requirement
that
no
Fund may
borrow
or
lend
money
under
the
program
unless
it
receives
a
more
favorable
interest
rate
than
is
available
from
a
bank
or
other
financial
institution
for
a
comparable
transaction.
In
addition,
a
Fund may
participate
in
the
program
only
if
its
participation
is
consistent
with
the
Fund’s investment
policies
and
limitations
and
authorized
by
its
portfolio
manager(s).
During the current
fiscal
period,
there
were
no
inter-fund
borrowing
or
lending
transactions.
Issue
Value
at
5/31/23
Purchases
Cost
Sales
Proceeds
Realized
Gain
(Loss)
Change
in
Unrealized
Appreciation
(Depreciation)
Value
at
5/31/24
Dividend
Income
Lifecycle
Index
2050
Nuveen
Funds:
Bond
Index,
Class
W
$
437,478,752
$
209,808,186
$
35,819,596
$
(7,902,898)
$
(1,290,669)
$
602,273,775
$
16,999,413
Emerging
Markets
Equity
Index,
Class
W
432,436,103
161,191,964
45,836,513
(10,757,094)
55,084,013
592,118,473
16,868,990
Equity
Index,
Class
W
2,726,964,703
444,878,325
233,807,036
1,860,252
735,355,486
3,675,251,730
49,430,762
International
Equity
Index,
Class
W
1,006,502,606
261,465,623
61,823,284
(1,490,508)
176,299,507
1,380,953,944
38,265,899
$4,603,382,164
$1,077,344,098
$377,286,429
$(18,290,248)
$965,448,337
$6,250,597,922
$121,565,064
Issue
Value
at
5/31/23
Purchases
Cost
Sales
Proceeds
Realized
Gain
(Loss)
Change
in
Unrealized
Appreciation
(Depreciation)
Value
at
5/31/24
Dividend
Income
Lifecycle
Index
2055
Nuveen
Funds:
Bond
Index,
Class
W
$
215,487,985
$
121,134,352
$
18,403,412
$
(4,053,646)
$
(491,615)
$
313,673,664
$
8,648,079
Emerging
Markets
Equity
Index,
Class
W
248,863,768
107,991,126
23,971,117
(5,800,549)
32,021,099
359,104,327
10,010,305
Equity
Index,
Class
W
1,568,745,241
361,191,881
136,234,413
84,556
436,080,607
2,229,867,872
29,341,494
International
Equity
Index,
Class
W
579,093,593
190,345,850
35,959,968
(919,181)
104,957,216
837,517,510
22,716,908
$2,612,190,587
$780,663,209
$214,568,910
$(10,688,820)
$572,567,307
$3,740,163,373
$70,716,786
Issue
Value
at
5/31/23
Purchases
Cost
Sales
Proceeds
Realized
Gain
(Loss)
Change
in
Unrealized
Appreciation
(Depreciation)
Value
at
5/31/24
Dividend
Income
Lifecycle
Index
2060
Nuveen
Funds:
Bond
Index,
Class
W
$
94,384,779
$
65,307,360
$
9,078,897
$
(2,042,982)
$
(11,194)
$
148,559,066
$
3,940,096
Emerging
Markets
Equity
Index,
Class
W
130,356,535
72,163,881
15,071,718
(3,929,181)
18,203,702
201,723,219
5,415,438
Equity
Index,
Class
W
821,138,752
262,795,142
68,609,579
(612,589)
236,650,571
1,251,362,297
15,843,449
International
Equity
Index,
Class
W
303,193,328
133,031,342
23,161,200
(973,186)
57,798,627
469,888,911
12,257,062
$1,349,073,394
$533,297,725
$115,921,394
$(7,557,938)
$312,641,706
$2,071,533,493
$37,456,045
Issue
Value
at
5/31/23
Purchases
Cost
Sales
Proceeds
Realized
Gain
(Loss)
Change
in
Unrealized
Appreciation
(Depreciation)
Value
at
5/31/24
Dividend
Income
Lifecycle
Index
2065
Nuveen
Funds:
Bond
Index,
Class
W
$
7,329,583
$
13,579,902
$
721,725
$
(142,450)
$
(18,019)
$
20,027,291
$
435,228
Emerging
Markets
Equity
Index,
Class
W
12,535,747
19,828,010
1,191,327
(261,536)
2,267,749
33,178,643
731,313
Equity
Index,
Class
W
78,552,541
102,108,209
7,076,618
(133,975)
31,942,979
205,393,136
2,144,728
International
Equity
Index,
Class
W
29,061,972
42,322,382
2,482,116
(68,723)
8,293,116
77,126,631
1,660,887
$127,479,843
$177,838,503
$11,471,786
$(606,684)
$42,485,825
$335,725,701
$4,972,156
Notes
to
Financial
Statements
(continued)
9.
Line
of
Credit
The Funds
participate
in
a
$1
billion
unsecured
revolving
credit
facility
that
can
be
used
for
temporary
purposes,
including,
without
limitation,
the
funding
of
shareholder
redemptions.
The
current
facility
was
entered
into
on
June
13,
2023
expiring
on
June
11,
2024,
replacing
the
previous facility,
which
expired
June
2023.
Certain
affiliated
accounts
and
mutual
funds,
each
of
which
is
managed
by the
Adviser,
or
an
affiliate
of
the
Adviser, also
participate
in
this
facility.
An
annual
commitment
fee
for
the
credit
facility
is
borne
by
the
participating
accounts
and
mutual
funds
on
a
pro
rata
basis.
Interest
associated
with
any
borrowing
under
the
facility
is
charged
to
the
borrowing
accounts
or
mutual
funds
at
a
specified
rate
of
interest.
The Funds are
not
liable
for
borrowings
under
the
facility
by
other
affiliated
accounts
or
mutual
funds.
There
were
no
borrowings
under
this
credit
facility
by
the
Funds during
the
current fiscal
period.
10.
Subsequent
Events
Line
of
Credit:
On
June
11,
2024,
the
Funds’
credit
facility
expired,
and
the
Funds
have
not
entered
into
another
credit
facility.
Important
Tax
Information
(Unaudited)
As
required
by
the
Internal
Revenue
Code
and
Treasury
Regulations,
certain
tax
information,
as
detailed
below,
must
be
provided
to
shareholders.
Shareholders
are
advised
to
consult
their
tax
advisor
with
respect
to
the
tax
implications
of
their
investment.
The
amounts
listed
below
may
differ
from
the
actual
amounts
reported
on
Form
1099-DIV,
which
will
be
sent
to
shareholders
shortly
after
calendar
year
end.
Long-Term
Capital
Gains
As
of
year
end,
each
Fund
designates
the
following
distribution
amounts,
or
maximum
amount
allowable,
as
being
from
net
long-term
capital
gains
pursuant
to
Section
852(b)(3)
of
the
Internal
Revenue
Code:
Dividends
Received
Deduction
(DRD)
Each
Fund
listed
below
had
the
following
percentage,
or
maximum
amount
allowable,
of
ordinary
income
distributions
eligible
for
the
dividends
received
deduction
for
corporate
shareholders:
Qualified
Dividend
Income
(QDI)
Each
Fund
listed
below
had
the
following
percentage,
or
maximum
amount
allowable,
of
ordinary
income
distributions
treated
as
qualified
dividend
income
for
individuals
pursuant
to
Section
1(h)(11)
of
the
Internal
Revenue
Code:
Fund
Net
Long-Term
Capital
Gains
14.1
Lifecycle
Index
Retirement
Income
$
15,550
14.2
Lifecycle
Index
2010
4,610,301
14.3
Lifecycle
Index
2015
14,732,113
14.4
Lifecycle
Index
2020
27,667,538
14.5
Lifecycle
Index
2025
3,319,344
14.6
Lifecycle
Index
2030
1,671,214
14.7
Lifecycle
Index
2035
–
14.8
Lifecycle
Index
2040
–
14.9
Lifecycle
Index
2045
–
15.01
Lifecycle
Index
2050
5,966,184
15.1
Lifecycle
Index
2055
3,257,135
15.2
Lifecycle
Index
2060
1,618,204
15.3
Lifecycle
Index
2065
114,166
Fund
Percentage
14.1
Lifecycle
Index
Retirement
Income
13.5
%
14.2
Lifecycle
Index
2010
11.5
14.3
Lifecycle
Index
2015
13.4
14.4
Lifecycle
Index
2020
15.2
14.5
Lifecycle
Index
2025
17.5
14.6
Lifecycle
Index
2030
21.2
14.7
Lifecycle
Index
2035
26.9
14.8
Lifecycle
Index
2040
32.0
14.9
Lifecycle
Index
2045
35.1
15.01
Lifecycle
Index
2050
36.5
15.1
Lifecycle
Index
2055
37.2
15.2
Lifecycle
Index
2060
37.8
15.3
Lifecycle
Index
2065
38.1
Fund
Percentage
14.1
Lifecycle
Index
Retirement
Income
25.7
%
14.2
Lifecycle
Index
2010
21.9
14.3
Lifecycle
Index
2015
25.5
14.4
Lifecycle
Index
2020
29.0
14.5
Lifecycle
Index
2025
33.4
14.6
Lifecycle
Index
2030
40.5
14.7
Lifecycle
Index
2035
51.3
14.8
Lifecycle
Index
2040
60.9
14.9
Lifecycle
Index
2045
66.9
15.01
Lifecycle
Index
2050
69.5
15.1
Lifecycle
Index
2055
70.8
15.2
Lifecycle
Index
2060
72.0
15.3
Lifecycle
Index
2065
72.7
Important
Tax
Information
(Unaudited)
(continued)
Foreign
Source
Income
and
Foreign
Tax
Credit
Pass
Through
Each
Fund
listed
below
has
made
an
election
under
Section
853
of
the
Internal
Revenue
Code
to
pass
through
foreign
taxes
paid:
Fund
Foreign
Source
Income
Foreign
Source
Income
Per
Share
Qualifying
Foreign
Taxes
Paid
Qualifying
Foreign
Taxes
Paid
per
Share
14.1
Lifecycle
Index
Retirement
Income
$
2,731,451
$
0.06198
$
207,332
$
0.00470
14.2
Lifecycle
Index
2010
2,278,734
0.05998
172,992
0.00455
14.3
Lifecycle
Index
2015
4,392,473
0.07338
333,507
0.00557
14.4
Lifecycle
Index
2020
14,283,942
0.08887
1,084,133
0.00675
14.5
Lifecycle
Index
2025
29,840,449
0.10751
2,264,423
0.00816
14.6
Lifecycle
Index
2030
44,584,641
0.13171
3,382,692
0.00999
14.7
Lifecycle
Index
2035
52,715,745
0.16229
3,999,578
0.01231
14.8
Lifecycle
Index
2040
63,125,323
0.20048
4,788,508
0.01521
14.9
Lifecycle
Index
2045
55,906,545
0.22287
4,242,524
0.01691
15.01
Lifecycle
Index
2050
48,673,008
0.23386
3,693,695
0.01775
15.1
Lifecycle
Index
2055
28,891,589
0.18762
2,192,391
0.01424
15.2
Lifecycle
Index
2060
15,601,118
0.14177
1,184,324
0.01076
15.3
Lifecycle
Index
2065
2,111,842
0.08425
160,236
0.00639
Item
7.
Financial
Statements
and
Financial
Highlights
for
Open-
End
Management
Investment
Companies
Report
of
Independent
Registered
Public
Accounting
Firm
To
the
Board
of
Trustees
of
TIAA-CREF
Funds
and
Shareholders
of
Nuveen
Lifestyle
Income
Fund,
Nuveen
Lifestyle
Conservative
Fund,
Nuveen
Lifestyle
Moderate
Fund,
Nuveen
Lifestyle
Growth
Fund
and
Nuveen
Lifestyle
Aggressive
Growth
Fund
Opinions
on
the
Financial
Statements
We
have
audited
the
accompanying
statements
of
assets
and
liabilities,
including
the
portfolios
of
investments,
of
Nuveen
Lifestyle
Income
Fund,
Nuveen
Lifestyle
Conservative
Fund,
Nuveen
Lifestyle
Moderate
Fund,
Nuveen
Lifestyle
Growth
Fund
and
Nuveen
Lifestyle
Aggressive
Growth
Fund
(five
of
the
funds
constituting
TIAA-CREF
Funds,
hereafter
collectively
referred
to
as
the
"Funds")
as
of
May
31,
2024,
the
related
statements
of
operations
for
the
year
ended
May
31,
2024,
the
statements
of
changes
in
net
assets
for
each
of
the
two
years
in
the
period
ended
May
31,
2024,
including
the
related
notes,
and
the
financial
highlights
for
each
of
the
five
years
in
the
period
ended
May
31,
2024
(collectively
referred
to
as
the
“financial
statements”).
In
our
opinion,
the
financial
statements
present
fairly,
in
all
material
respects,
the
financial
position
of
each
of
the
Funds
as
of
May
31,
2024,
the
results
of
each
of
their
operations
for
the
year
then
ended,
the
changes
in
each
of
their
net
assets
for
each
of
the
two
years
in
the
period
ended
May
31,
2024
and
each
of
the
financial
highlights
for
each
of
the
five
years
in
the
period
ended
May
31,
2024
in
conformity
with
accounting
principles
generally
accepted
in
the
United
States
of
America.
Basis
for
Opinions
These
financial
statements
are
the
responsibility
of
the
Funds’
management.
Our
responsibility
is
to
express
an
opinion
on
the
Funds’
financial
statements
based
on
our
audits.
We
are
a
public
accounting
firm
registered
with
the
Public
Company
Accounting
Oversight
Board
(United
States)
(PCAOB)
and
are
required
to
be
independent
with
respect
to
the
Funds
in
accordance
with
the
U.S.
federal
securities
laws
and
the
applicable
rules
and
regulations
of
the
Securities
and
Exchange
Commission
and
the
PCAOB.
We
conducted
our
audits
of
these
financial
statements
in
accordance
with
the
standards
of
the
PCAOB.
Those
standards
require
that
we
plan
and
perform
the
audit
to
obtain
reasonable
assurance
about
whether
the
financial
statements
are
free
of
material
misstatement,
whether
due
to
error
or
fraud.
Our
audits
included
performing
procedures
to
assess
the
risks
of
material
misstatement
of
the
financial
statements,
whether
due
to
error
or
fraud,
and
performing
procedures
that
respond
to
those
risks.
Such
procedures
included
examining,
on
a
test
basis,
evidence
regarding
the
amounts
and
disclosures
in
the
financial
statements.
Our
audits
also
included
evaluating
the
accounting
principles
used
and
significant
estimates
made
by
management,
as
well
as
evaluating
the
overall
presentation
of
the
financial
statements.
Our
procedures
included
confirmation
of
securities
owned
as
of
May
31,
2024
by
correspondence
with
the
custodian,
transfer
agent
and
broker.
We
believe
that
our
audits
provide
a
reasonable
basis
for
our
opinions.
/s/PricewaterhouseCoopers
LLP
Chicago,
Illinois
July
25,
2024
We
have
served
as
the
auditor
of
one
or
more
investment
companies
in Nuveen
Funds
since
2002.
Lifestyle
Income
Fund
May
31,
2024
See
Notes
to
Financial
Statements
SHARES
DESCRIPTION
VALUE
AFFILIATED
INVESTMENT
COMPANIES—100.0%(a)
FIXED
INCOME—40.0%
1,670,287
Nuveen
Core
Bond
Fund,
Class
R6
$
14,965,769
1,664,711
Nuveen
Core
Plus
Bond
Fund,
Class
R6
14,982,396
TOTAL
FIXED
INCOME
29,948,165
INTERNATIONAL
EQUITY—7.1%
109,280
Nuveen
Emerging
Markets
Equity
Fund,
Class
R6
877,518
162,313
Nuveen
International
Equity
Fund,
Class
R6
2,312,964
88,778
Nuveen
International
Opportunities
Fund,
Class
R6
1,367,184
67,455
Nuveen
Quant
International
Small
Cap
Equity
Fund,
Class
R6
744,031
TOTAL
INTERNATIONAL
EQUITY
5,301,697
SHORT-TERM
FIXED
INCOME—39.7%
2,990,297
Nuveen
Short
Term
Bond
Fund,
Class
R6
29,783,358
TOTAL
SHORT-TERM
FIXED
INCOME
29,783,358
U.S.
EQUITY—13.2%
95,791
Nuveen
Core
Equity
Fund,
Class
R6
1,450,274
24,499
Nuveen
Dividend
Growth
Fund,
Class
R6
1,452,078
90,947
Nuveen
Dividend
Value
Fund,
Class
R6
1,396,945
59,306
Nuveen
Growth
Opportunities
ETF
1,757,830
65,069
Nuveen
Large
Cap
Growth
Fund,
Class
R6
1,706,749
64,385
Nuveen
Large
Cap
Value
Fund,
Class
R6
1,402,942
17,812
Nuveen
Quant
Small
Cap
Equity
Fund,
Class
R6
333,618
26,333
Nuveen
Quant
Small/Mid
Cap
Equity
Fund,
Class
R6
396,047
TOTAL
U.S.
EQUITY
9,896,483
TOTAL
AFFILIATED
INVESTMENT
COMPANIES
74,929,703
(Cost
$74,908,674)
TOTAL
INVESTMENTS—100.0%
74,929,703
(Cost
$74,908,674)
OTHER
ASSETS
&
LIABILITIES,
NET—(0.0)%
(
8,915
)
NET
ASSETS—100.0%
$
74,920,788
ETF
Exchange
Traded
Fund
(a)
Affiliated
fund.
Lifestyle
Conservative
Fund
May
31,
2024
See
Notes
to
Financial
Statements
SHARES
DESCRIPTION
VALUE
AFFILIATED
INVESTMENT
COMPANIES—100.0%(a)
FIXED
INCOME—39.8%
3,435,196
Nuveen
Core
Bond
Fund,
Class
R6
$
30,779,360
10,266,514
Nuveen
Core
Plus
Bond
Fund,
Class
R6
92,398,628
TOTAL
FIXED
INCOME
123,177,988
INTERNATIONAL
EQUITY—14.1%
901,360
Nuveen
Emerging
Markets
Equity
Fund,
Class
R6
7,237,917
1,335,091
Nuveen
International
Equity
Fund,
Class
R6
19,025,046
731,111
Nuveen
International
Opportunities
Fund,
Class
R6
11,259,106
554,524
Nuveen
Quant
International
Small
Cap
Equity
Fund,
Class
R6
6,116,404
TOTAL
INTERNATIONAL
EQUITY
43,638,473
SHORT-TERM
FIXED
INCOME—19.8%
6,148,316
Nuveen
Short
Term
Bond
Fund,
Class
R6
61,237,227
TOTAL
SHORT-TERM
FIXED
INCOME
61,237,227
U.S.
EQUITY—26.3%
788,346
Nuveen
Core
Equity
Fund,
Class
R6
11,935,559
201,331
Nuveen
Dividend
Growth
Fund,
Class
R6
11,932,905
747,825
Nuveen
Dividend
Value
Fund,
Class
R6
11,486,597
479,749
Nuveen
Growth
Opportunities
ETF
14,219,760
536,873
Nuveen
Large
Cap
Growth
Fund,
Class
R6
14,082,171
528,983
Nuveen
Large
Cap
Value
Fund,
Class
R6
11,526,542
144,209
Nuveen
Quant
Small
Cap
Equity
Fund,
Class
R6
2,701,026
213,643
Nuveen
Quant
Small/Mid
Cap
Equity
Fund,
Class
R6
3,213,194
TOTAL
U.S.
EQUITY
81,097,754
TOTAL
AFFILIATED
INVESTMENT
COMPANIES
309,151,442
(Cost
$293,719,491)
PRINCIPAL
RATE
MATURITY
DATE
SHORT-TERM
INVESTMENTS—0.0%
REPURCHASE
AGREEMENT—0.0%
$59,000
(b)
Fixed
Income
Clearing
Corporation
5
.320
%
06/03/24
59,000
TOTAL
REPURCHASE
AGREEMENT
59,000
TOTAL
SHORT-TERM
INVESTMENTS
59,000
(Cost
$59,000)
TOTAL
INVESTMENTS—100.0%
309,210,442
(Cost
$293,778,491)
OTHER
ASSETS
&
LIABILITIES,
NET—0.0%
88,884
NET
ASSETS—100.0%
$
309,299,326
ETF
Exchange
Traded
Fund
(a)
Affiliated
fund.
(b)
Agreement
with
Fixed
Income
Clearing
Corporation,
5.320%
dated
5/31/24
to
be
repurchased
at
$59,026
on
6/3/24,
collateralized
by
Government
Agency
Securities,
with
coupon
rate
1.875%
and
maturity
date
2/28/27,
valued
at
$60,243.
Lifestyle
Moderate
Fund
May
31,
2024
See
Notes
to
Financial
Statements
SHARES
DESCRIPTION
VALUE
AFFILIATED
INVESTMENT
COMPANIES—100.0%(a)
FIXED
INCOME—39.7%
24,813,879
Nuveen
Core
Plus
Bond
Fund,
Class
R6
$
223,324,907
TOTAL
FIXED
INCOME
223,324,907
INTERNATIONAL
EQUITY—21.1%
2,447,227
Nuveen
Emerging
Markets
Equity
Fund,
Class
R6
19,651,235
3,624,189
Nuveen
International
Equity
Fund,
Class
R6
51,644,687
1,986,181
Nuveen
International
Opportunities
Fund,
Class
R6
30,587,191
1,510,185
Nuveen
Quant
International
Small
Cap
Equity
Fund,
Class
R6
16,657,337
TOTAL
INTERNATIONAL
EQUITY
118,540,450
U.S.
EQUITY—39.2%
2,141,986
Nuveen
Core
Equity
Fund,
Class
R6
32,429,662
547,650
Nuveen
Dividend
Growth
Fund,
Class
R6
32,459,244
2,032,022
Nuveen
Dividend
Value
Fund,
Class
R6
31,211,857
1,303,984
Nuveen
Growth
Opportunities
ETF
38,650,086
1,470,825
Nuveen
Large
Cap
Growth
Fund,
Class
R6
38,579,738
1,437,388
Nuveen
Large
Cap
Value
Fund,
Class
R6
31,320,692
393,381
Nuveen
Quant
Small
Cap
Equity
Fund,
Class
R6
7,368,029
584,860
Nuveen
Quant
Small/Mid
Cap
Equity
Fund,
Class
R6
8,796,290
TOTAL
U.S.
EQUITY
220,815,598
TOTAL
AFFILIATED
INVESTMENT
COMPANIES
562,680,955
(Cost
$506,634,222)
PRINCIPAL
RATE
MATURITY
DATE
SHORT-TERM
INVESTMENTS—0.0%
REPURCHASE
AGREEMENT—0.0%
$380,000
(b)
Fixed
Income
Clearing
Corporation
5
.320
%
06/03/24
380,000
TOTAL
REPURCHASE
AGREEMENT
380,000
TOTAL
SHORT-TERM
INVESTMENTS
380,000
(Cost
$380,000)
TOTAL
INVESTMENTS—100.0%
563,060,955
(Cost
$507,014,222)
OTHER
ASSETS
&
LIABILITIES,
NET—(0.0)%
(
100,540
)
NET
ASSETS—100.0%
$
562,960,415
ETF
Exchange
Traded
Fund
(a)
Affiliated
fund.
(b)
Agreement
with
Fixed
Income
Clearing
Corporation,
5.320%
dated
5/31/24
to
be
repurchased
at
$380,168
on
6/3/24,
collateralized
by
Government
Agency
Securities,
with
coupon
rate
4.250%
and
maturity
date
3/15/27,
valued
at
$387,721.
Lifestyle
Growth
Fund
May
31,
2024
See
Notes
to
Financial
Statements
SHARES
DESCRIPTION
VALUE
AFFILIATED
INVESTMENT
COMPANIES—100.1%(a)
FIXED
INCOME—19.8%
6,742,671
Nuveen
Core
Plus
Bond
Fund,
Class
R6
$
60,684,043
TOTAL
FIXED
INCOME
60,684,043
INTERNATIONAL
EQUITY—28.1%
1,771,316
Nuveen
Emerging
Markets
Equity
Fund,
Class
R6
14,223,664
2,631,400
Nuveen
International
Equity
Fund,
Class
R6
37,497,445
1,439,825
Nuveen
International
Opportunities
Fund,
Class
R6
22,173,300
1,094,375
Nuveen
Quant
International
Small
Cap
Equity
Fund,
Class
R6
12,070,960
TOTAL
INTERNATIONAL
EQUITY
85,965,369
U.S.
EQUITY—52.2%
1,552,437
Nuveen
Core
Equity
Fund,
Class
R6
23,503,894
396,150
Nuveen
Dividend
Growth
Fund,
Class
R6
23,479,835
1,474,425
Nuveen
Dividend
Value
Fund,
Class
R6
22,647,175
944,202
Nuveen
Growth
Opportunities
ETF
27,986,147
1,064,801
Nuveen
Large
Cap
Growth
Fund,
Class
R6
27,929,733
1,043,426
Nuveen
Large
Cap
Value
Fund,
Class
R6
22,736,243
285,817
Nuveen
Quant
Small
Cap
Equity
Fund,
Class
R6
5,353,360
423,506
Nuveen
Quant
Small/Mid
Cap
Equity
Fund,
Class
R6
6,369,531
TOTAL
U.S.
EQUITY
160,005,918
TOTAL
AFFILIATED
INVESTMENT
COMPANIES
306,655,330
(Cost
$255,963,477)
PRINCIPAL
RATE
MATURITY
DATE
SHORT-TERM
INVESTMENTS—0.1%
REPURCHASE
AGREEMENT—0.1%
$240,000
(b)
Fixed
Income
Clearing
Corporation
5
.320
%
06/03/24
240,000
TOTAL
REPURCHASE
AGREEMENT
240,000
TOTAL
SHORT-TERM
INVESTMENTS
240,000
(Cost
$240,000)
TOTAL
INVESTMENTS—100.2%
306,895,330
(Cost
$256,203,477)
OTHER
ASSETS
&
LIABILITIES,
NET—(0.2)%
(
644,708
)
NET
ASSETS—100.0%
$
306,250,622
ETF
Exchange
Traded
Fund
(a)
Affiliated
fund.
(b)
Agreement
with
Fixed
Income
Clearing
Corporation,
5.320%
dated
5/31/24
to
be
repurchased
at
$240,106
on
6/3/24,
collateralized
by
Government
Agency
Securities,
with
coupon
rate
1.875%
and
maturity
date
2/28/27,
valued
at
$244,895.
Lifestyle
Aggressive
Growth
Fund
May
31,
2024
See
Notes
to
Financial
Statements
SHARES
DESCRIPTION
VALUE
AFFILIATED
INVESTMENT
COMPANIES—100.1%(a)
INTERNATIONAL
EQUITY—35.0%
1,784,948
Nuveen
Emerging
Markets
Equity
Fund,
Class
R6
$
14,333,131
2,649,638
Nuveen
International
Equity
Fund,
Class
R6
37,757,347
1,450,766
Nuveen
International
Opportunities
Fund,
Class
R6
22,341,793
1,103,694
Nuveen
Quant
International
Small
Cap
Equity
Fund,
Class
R6
12,173,739
TOTAL
INTERNATIONAL
EQUITY
86,606,010
U.S.
EQUITY—65.1%
1,564,541
Nuveen
Core
Equity
Fund,
Class
R6
23,687,152
399,698
Nuveen
Dividend
Growth
Fund,
Class
R6
23,690,114
1,486,872
Nuveen
Dividend
Value
Fund,
Class
R6
22,838,355
950,633
Nuveen
Growth
Opportunities
ETF
28,176,762
1,074,000
Nuveen
Large
Cap
Growth
Fund,
Class
R6
28,171,028
1,049,849
Nuveen
Large
Cap
Value
Fund,
Class
R6
22,876,210
290,194
Nuveen
Quant
Small
Cap
Equity
Fund,
Class
R6
5,435,340
429,414
Nuveen
Quant
Small/Mid
Cap
Equity
Fund,
Class
R6
6,458,389
TOTAL
U.S.
EQUITY
161,333,350
TOTAL
AFFILIATED
INVESTMENT
COMPANIES
247,939,360
(Cost
$195,270,583)
PRINCIPAL
RATE
MATURITY
DATE
SHORT-TERM
INVESTMENTS—0.1%
REPURCHASE
AGREEMENT—0.1%
$295,000
(b)
Fixed
Income
Clearing
Corporation
5
.320
%
06/03/24
295,000
TOTAL
REPURCHASE
AGREEMENT
295,000
TOTAL
SHORT-TERM
INVESTMENTS
295,000
(Cost
$295,000)
TOTAL
INVESTMENTS—100.2%
248,234,360
(Cost
$195,565,583)
OTHER
ASSETS
&
LIABILITIES,
NET—(0.2)%
(
383,660
)
NET
ASSETS—100.0%
$
247,850,700
ETF
Exchange
Traded
Fund
(a)
Affiliated
fund.
(b)
Agreement
with
Fixed
Income
Clearing
Corporation,
5.320%
dated
5/31/24
to
be
repurchased
at
$295,131
on
6/3/24,
collateralized
by
Government
Agency
Securities,
with
coupon
rate
4.250%
and
maturity
date
3/15/27,
valued
at
$300,999.
Statement
of
Assets
and
Liabilities
See
Notes
to
Financial
Statements
May
31,
2024
16.1
Lifestyle
Income
16.2
Lifestyle
Conservative
16.3
Lifestyle
Moderate
ASSETS
Affiliated
investments,
at
value
‡
$
74,929,703
$
309,151,442
$
562,680,955
Short-term
investments,
at
value
#
–
59,000
380,000
Cash
–
466
113
Receivables:
Dividends
225,531
697,151
873,156
Interest
–
9
56
Investments
sold
163,585
825,859
1,436,169
Reimbursement
from
Adviser
10,876
4,155
–
Shares
sold
1,508
99,143
755,738
Other
9,326
19,005
22,057
Total
assets
75,340,529
310,856,230
566,148,244
LIABILITIES
Due
to
affiliates
16,457
17,409
18,369
Cash
overdraft
28,895
–
–
Payables:
Management
fees
6,471
26,287
47,751
Investments
purchased
-
regular
settlement
278,846
1,254,779
2,109,072
Shares
redeemed
52,239
144,771
815,208
Service
agreement
fees
4,055
10,922
26,162
Accrued
expenses:
Custodian
fees
1,883
1,892
1,892
Professional
fees
73
158
243
Shareholder
reporting
expenses
10,782
27,770
46,498
Shareholder
servicing
agent
fees
3,958
12,777
22,323
Trustees
fees
6,516
17,549
26,147
12b-1
distribution
and
service
fees
9,566
42,590
74,164
Total
liabilities
419,741
1,556,904
3,187,829
Net
assets
$
74,920,788
$
309,299,326
$
562,960,415
NET
ASSETS
CONSIST
OF:
Paid-in
capital
$
78,815,153
$
307,262,557
$
529,471,446
Total
distributable
earnings
(loss)
(
3,894,365
)
2,036,769
33,488,969
Net
assets
$
74,920,788
$
309,299,326
$
562,960,415
‡
Affiliated
investments,
cost
$
74,908,674
$
293,719,491
$
506,634,222
#
Short-term
investments,
cost
$
–
$
59,000
$
380,000
CLASS
A:
Net
assets
$
44,779,700
$
200,323,535
$
350,207,622
Shares
outstanding
4,206,999
16,103,511
24,333,755
Net
asset
value
("NAV")
per
share
$
10
.64
$
12
.44
$
14
.39
Maximum
sales
charge
5.75%
5.75%
5.75%
Offering
price
per
share
(NAV
per
share
plus
maximum
sales
charge)
$
11
.29
$
13
.20
$
15
.27
CLASS
I:
Net
assets
$
100,749
$
3,376,521
$
7,867,771
Shares
outstanding
9,460
270,910
545,518
NAV
and
offering
price
per
share
$
10
.65
$
12
.46
$
14
.42
PREMIER
CLASS:
Net
assets
$
213,279
$
266,465
$
289,394
Shares
outstanding
20,001
21,368
20,000
NAV
and
offering
price
per
share
$
10
.66
$
12
.47
$
14
.47
CLASS
R6:
Net
assets
$
10,985,464
$
56,552,225
$
88,282,288
Shares
outstanding
1,031,026
4,536,542
6,119,237
NAV
and
offering
price
per
share
$
10
.65
$
12
.47
$
14
.43
RETIREMENT
CLASS:
Net
assets
$
18,841,596
$
48,780,580
$
116,313,340
Shares
outstanding
1,770,373
3,919,364
8,076,872
NAV
and
offering
price
per
share
$
10
.64
$
12
.45
$
14
.40
Authorized
shares
-
per
class
Unlimited
Unlimited
Unlimited
Par
value
per
share
$
0
.0001
$
0
.0001
$
0
.0001
See
Notes
to
Financial
Statements
16.4
Lifestyle
Growth
16.5
Lifestyle
Aggressive
Growth
$
306,655,330
$
247,939,360
240,000
295,000
912
163
236,382
–
35
44
714,108
313,189
4,699
7,336
52,554
35,063
15,059
11,818
307,919,079
248,601,973
17,329
17,089
–
–
25,945
20,976
879,999
361,579
633,827
265,463
12,703
13,714
1,881
1,886
150
128
26,847
21,530
15,341
14,162
13,236
9,713
41,199
25,033
1,668,457
751,273
$
306,250,622
$
247,850,700
$
268,091,867
$
203,320,064
38,158,755
44,530,636
$
306,250,622
$
247,850,700
$
255,963,477
$
195,270,583
$
240,000
$
295,000
$
194,578,077
$
118,311,085
11,643,913
6,163,231
$
16
.71
$
19
.20
5.75%
5.75%
$
17
.73
$
20
.37
$
4,432,357
$
5,423,441
263,660
280,463
$
16
.81
$
19
.34
$
347,386
$
388,505
20,608
20,023
$
16
.86
$
19
.40
$
50,685,934
$
63,319,431
3,011,812
3,273,610
$
16
.83
$
19
.34
$
56,206,868
$
60,408,238
3,357,203
3,139,446
$
16
.74
$
19
.24
Unlimited
Unlimited
$
0
.0001
$
0
.0001
See
Notes
to
Financial
Statements
Year
Ended
May
31,
2024
16.1
Lifestyle
Income
16.2
Lifestyle
Conservative
16.3
Lifestyle
Moderate
INVESTMENT
INCOME
Dividends
from
affiliated
investments
$
2,755,152
$
9,647,547
$
14,488,649
Interest
3,814
11,172
21,111
Total
investment
income
2,758,966
9,658,719
14,509,760
EXPENSES
Management
fees
76,937
307,011
538,127
12b-1
distribution
and
service
fees
—
Class
A
114,716
502,085
851,491
12b-1
distribution
and
service
fees
—
Premier
Class
441
384
407
Shareholder
servicing
agent
fees
—
Class
A
12,827
43,899
77,365
Shareholder
servicing
agent
fees
—
Class
I
135
3,240
7,051
Shareholder
servicing
agent
fees
—
Premier
Class
52
72
39
Shareholder
servicing
agent
fees
—
Class
R6
456
1,356
760
Shareholder
servicing
agent
fees
—
Retirement
Class
43,434
120,829
276,199
Administrative
service
fees
61,522
65,134
68,710
Trustees
fees
1,241
4,874
8,364
Custodian
expenses
7,444
7,395
7,395
Overdraft
expense
1,409
1,150
1,890
Professional
fees
15,134
15,900
16,674
Registration
fees
72,826
78,784
77,317
Shareholder
reporting
expenses
30,423
52,855
80,439
Other
24,328
25,674
27,228
Total
expenses
463,325
1,230,642
2,039,456
Expenses
reimbursed
by
the
investment
adviser
(213,482)
(252,111)
(360,173)
Net
expenses
249,843
978,531
1,679,283
Net
investment
income
(loss)
2,509,123
8,680,188
12,830,477
REALIZED
AND
UNREALIZED
GAIN
(LOSS)
Realized
gain
(loss):
Investments
(3,082)
–
990
Affiliated
investments
(1,297,215)
(1,909,407)
(4,656,961)
Distributions
from
affiliated
investments
444,034
3,651,361
9,517,098
Net
realized
gain
(loss)
(856,263)
1,741,954
4,861,127
Change
in
unrealized
appreciation
(depreciation)
on:
Affiliated
investments
4,001,194
23,366,289
60,395,683
Net
change
in
unrealized
appreciation
(depreciation)
4,001,194
23,366,289
60,395,683
Net
realized
and
unrealized
gain
(loss)
3,144,931
25,108,243
65,256,810
Net
increase
(decrease)
in
net
assets
from
operations
$
5,654,054
$
33,788,431
$
78,087,287
See
Notes
to
Financial
Statements
16.4
Lifestyle
Growth
16.5
Lifestyle
Aggressive
Growth
$
6,060,964
$
3,497,752
12,851
9,730
6,073,815
3,507,482
288,025
228,825
462,480
273,669
480
529
51,384
44,144
4,120
5,135
59
51
757
1,403
132,487
140,443
64,793
63,866
4,439
3,496
7,392
7,354
4,365
2,176
15,842
15,651
75,142
74,250
53,335
46,487
25,532
24,473
1,190,632
931,952
(443,176)
(237,192)
747,456
694,760
5,326,359
2,812,722
33,121
332
(2,281,123)
(1,884,934)
6,720,659
6,695,906
4,472,657
4,811,304
42,815,745
42,366,607
42,815,745
42,366,607
47,288,402
47,177,911
$
52,614,761
$
49,990,633
Statement
of
Changes
in
Net
Assets
See
Notes
to
Financial
Statements
16.1
Lifestyle
Income
16.2
Lifestyle
Conservative
Year
Ended
5/31/24
Year
Ended
5/31/23
Year
Ended
5/31/24
Year
Ended
5/31/23
OPERATIONS
Net
investment
income
(loss)
$
2,509,123
$
2,161,519
$
8,680,188
$
7,342,061
Net
realized
gain
(loss)
(
856,263
)
(
1,986,070
)
1,741,954
(
9,710,223
)
Net
change
in
unrealized
appreciation
(depreciation)
4,001,194
(
375,986
)
23,366,289
1,479,759
Net
increase
(decrease)
in
net
assets
from
operations
5,654,054
(
200,537
)
33,788,431
(
888,403
)
DISTRIBUTIONS
TO
SHAREHOLDERS
–
–
–
–
Dividends:
Class
A
(
1,479,675
)
(
2,056,252
)
(
5,739,986
)
(
12,276,108
)
Class
I
(
4,876
)
(
4,815
)
(
97,588
)
(
211,720
)
Premier
Class
(
9,509
)
(
14,930
)
(
7,602
)
(
15,317
)
Class
R6
(
466,864
)
(
615,404
)
(
1,696,086
)
(
3,153,197
)
Retirement
Class
(
543,140
)
(
761,038
)
(
1,390,953
)
(
2,971,032
)
Total
distributions
(
2,504,064
)
(
3,452,439
)
(
8,932,215
)
(
18,627,374
)
FUND
SHARE
TRANSACTIONS
Subscriptions
9,169,134
4,281,508
24,611,235
23,196,767
Reinvestments
of
distributions
2,442,009
3,385,963
8,813,774
18,327,367
Redemptions
(
18,516,223
)
(
16,698,988
)
(
52,166,608
)
(
60,172,306
)
Net
increase
(decrease)
from
Fund
share
transactions
(
6,905,080
)
(
9,031,517
)
(
18,741,599
)
(
18,648,172
)
Net
increase
(decrease)
in
net
assets
(
3,755,090
)
(
12,684,493
)
6,114,617
(
38,163,949
)
Net
assets
at
the
beginning
of
period
78,675,878
91,360,371
303,184,709
341,348,658
Net
assets
at
the
end
of
period
$
74,920,788
$
78,675,878
$
309,299,326
$
303,184,709
See
Notes
to
Financial
Statements
16.3
Lifestyle
Moderate
16.4
Lifestyle
Growth
16.5
Lifestyle
Aggressive
Growth
Year
Ended
5/31/24
Year
Ended
5/31/23
Year
Ended
5/31/24
Year
Ended
5/31/23
Year
Ended
5/31/24
Year
Ended
5/31/23
$
12,830,477
$
11,128,233
$
5,326,359
$
4,670,559
$
2,812,722
$
2,471,015
4,861,127
(
17,175,586
)
4,472,657
(
10,790,448
)
4,811,304
(
6,702,946
)
60,395,683
4,683,499
42,815,745
7,143,286
42,366,607
6,414,482
78,087,287
(
1,363,854
)
52,614,761
1,023,397
49,990,633
2,182,551
–
–
–
–
–
–
(
8,545,628
)
(
23,368,593
)
(
3,861,856
)
(
12,672,292
)
(
1,701,101
)
(
8,079,643
)
(
211,620
)
(
636,029
)
(
92,759
)
(
292,838
)
(
91,561
)
(
402,968
)
(
7,125
)
(
18,388
)
(
7,061
)
(
21,843
)
(
5,903
)
(
26,954
)
(
2,194,647
)
(
4,964,941
)
(
1,029,842
)
(
3,141,646
)
(
1,053,881
)
(
4,051,681
)
(
2,805,427
)
(
7,311,137
)
(
1,107,250
)
(
3,726,239
)
(
895,387
)
(
4,329,273
)
(
13,764,447
)
(
36,299,088
)
(
6,098,768
)
(
19,854,858
)
(
3,747,833
)
(
16,890,519
)
59,049,624
28,393,270
26,535,770
15,859,598
24,964,128
17,674,668
13,602,369
35,753,904
6,044,076
19,672,695
3,691,534
16,684,260
(
88,468,216
)
(
81,062,662
)
(
45,183,083
)
(
43,831,557
)
(
39,101,550
)
(
26,939,413
)
(
15,816,223
)
(
16,915,488
)
(
12,603,237
)
(
8,299,264
)
(
10,445,888
)
7,419,515
48,506,617
(
54,578,430
)
33,912,756
(
27,130,725
)
35,796,912
(
7,288,453
)
514,453,798
569,032,228
272,337,866
299,468,591
212,053,788
219,342,241
$
562,960,415
$
514,453,798
$
306,250,622
$
272,337,866
$
247,850,700
$
212,053,788
See
Notes
to
Financial
Statements
The
following
data
is
for
a
share
outstanding
for
each
fiscal year
end
unless
otherwise
noted:
Investment
Operations
Less
Distributions
Net
Asset
Value,
Beginning
of
Period
Net
Investment
Income
(Loss)
a
Net
Realized/
Unrealized
Gain
(Loss)
j
Total
From
Net
Investment
Income
From
Net
Realized
Gains
Total
Net
Asset
Value,
End
of
Period
16.1
Lifestyle
Income
Class
A:
5/31/24
$
10
.21
$
0
.33
$
0
.43
$
0
.76
$
(
0
.33
)
$
—
$
(
0
.33
)
$
10
.64
5/31/23
10
.64
0
.26
(
0
.27
)
(
0
.01
)
(
0
.25
)
(
0
.17
)
(
0
.42
)
10
.21
5/31/22
11
.96
0
.18
(
0
.96
)
(
0
.78
)
(
0
.22
)
(
0
.32
)
(
0
.54
)
10
.64
5/31/21
11
.21
0
.16
0
.99
1
.15
(
0
.23
)
(
0
.17
)
(
0
.40
)
11
.96
5/31/20
11
.01
0
.23
0
.33
0
.56
(
0
.24
)
(
0
.12
)
(
0
.36
)
11
.21
Class
I:
5/31/24
10
.22
0
.35
0
.44
0
.79
(
0
.36
)
—
(
0
.36
)
10
.65
5/31/23
10
.65
0
.28
(
0
.26
)
0
.02
(
0
.28
)
(
0
.17
)
(
0
.45
)
10
.22
5/31/22
11
.96
0
.20
(
0
.95
)
(
0
.75
)
(
0
.24
)
(
0
.32
)
(
0
.56
)
10
.65
5/31/21
11
.22
0
.19
0
.98
1
.17
(
0
.26
)
(
0
.17
)
(
0
.43
)
11
.96
5/31/20
11
.02
0
.26
0
.33
0
.59
(
0
.27
)
(
0
.12
)
(
0
.39
)
11
.22
Premier
Class:
5/31/24
10
.23
0
.33
0
.45
0
.78
(
0
.35
)
—
(
0
.35
)
10
.66
5/31/23
10
.66
0
.28
(
0
.27
)
0
.01
(
0
.27
)
(
0
.17
)
(
0
.44
)
10
.23
5/31/22
11
.98
0
.19
(
0
.96
)
(
0
.77
)
(
0
.23
)
(
0
.32
)
(
0
.55
)
10
.66
5/31/21
11
.23
0
.18
0
.98
1
.16
(
0
.24
)
(
0
.17
)
(
0
.41
)
11
.98
5/31/20
11
.02
0
.25
0
.34
0
.59
(
0
.26
)
(
0
.12
)
(
0
.38
)
11
.23
Class
R6:
5/31/24
10
.22
0
.36
0
.43
0
.79
(
0
.36
)
—
(
0
.36
)
10
.65
5/31/23
10
.65
0
.29
(
0
.27
)
0
.02
(
0
.28
)
(
0
.17
)
(
0
.45
)
10
.22
5/31/22
11
.97
0
.21
(
0
.96
)
(
0
.75
)
(
0
.25
)
(
0
.32
)
(
0
.57
)
10
.65
5/31/21
11
.22
0
.20
0
.98
1
.18
(
0
.26
)
(
0
.17
)
(
0
.43
)
11
.97
5/31/20
11
.02
0
.26
0
.33
0
.59
(
0
.27
)
(
0
.12
)
(
0
.39
)
11
.22
Retirement
Class:
5/31/24
10
.21
0
.33
0
.44
0
.77
(
0
.34
)
—
(
0
.34
)
10
.64
5/31/23
10
.64
0
.26
(
0
.26
)
—
(
0
.26
)
(
0
.17
)
(
0
.43
)
10
.21
5/31/22
11
.96
0
.18
(
0
.96
)
(
0
.78
)
(
0
.22
)
(
0
.32
)
(
0
.54
)
10
.64
5/31/21
11
.21
0
.17
0
.98
1
.15
(
0
.23
)
(
0
.17
)
(
0
.40
)
11
.96
5/31/20
11
.00
0
.24
0
.34
0
.58
(
0
.25
)
(
0
.12
)
(
0
.37
)
11
.21
a
Based
on
average
shares
outstanding.
b
Total
returns
are
at
NAV
and
do
not
include
any
sales
charge.
Total
returns
are
not
annualized.
e
The
Fund's
expenses
do
not
include
the
expenses
of
the
Underlying
Funds.
j
Short-term
and
long-term
capital
gain
distributions
received
from
the
underlying
Funds
are
presented
in
net
realized
and
unrealized
gain
(loss)
on
total
investments
for
all
periods
presented.
See
Notes
to
Financial
Statements
Ratios
and
Supplemental
Data
Ratios
to
Average
Net
Assets
Total
Return
b
Net
Assets,
End
of
Period
(000)
Gross
Expenses
e
Net
Expenses
e
Net
Investment
Income
(Loss)
Portfolio
Turnover
Rate
7
.61
%
$
44,780
0
.66
%
0
.38
%
3
.21
%
19
%
0
.05
47,233
0
.61
0
.38
2
.55
16
(
6
.73
)
55,202
0
.58
0
.35
1
.52
20
10
.21
58,046
0
.57
0
.38
1
.40
27
5
.23
50,890
0
.63
0
.38
2
.09
27
7
.85
101
0
.46
0
.19
3
.38
19
0
.30
105
0
.37
0
.15
2
.78
16
(
6
.55
)
120
0
.35
0
.15
1
.72
20
10
.48
133
0
.33
0
.14
1
.63
27
5
.47
110
0
.41
0
.15
2
.31
27
7
.76
213
0
.55
0
.25
3
.24
19
0
.18
366
0
.49
0
.25
2
.69
16
(
6
.61
)
349
0
.46
0
.25
1
.63
20
10
.32
361
0
.45
0
.25
1
.53
27
5
.47
313
0
.52
0
.25
2
.15
27
7
.91
10,985
0
.38
0
.10
3
.48
19
0
.34
13,663
0
.33
0
.10
2
.83
16
(
6
.56
)
15,247
0
.30
0
.10
1
.78
20
10
.58
15,514
0
.29
0
.10
1
.67
27
5
.53
8,234
0
.36
0
.10
2
.37
27
7
.65
18,842
0
.63
0
.35
3
.23
19
0
.08
17,310
0
.58
0
.35
2
.57
16
(
6
.71
)
20,443
0
.55
0
.35
1
.51
20
10
.23
26,139
0
.54
0
.35
1
.43
27
5
.35
19,742
0
.60
0
.35
2
.11
27
Financial
Highlights
(continued)
See
Notes
to
Financial
Statements
Financial
Highlights
(continued)
The
following
data
is
for
a
share
outstanding
for
each
fiscal year
end
unless
otherwise
noted:
Investment
Operations
Less
Distributions
Net
Asset
Value,
Beginning
of
Period
Net
Investment
Income
(Loss)
a
Net
Realized/
Unrealized
Gain
(Loss)
j
Total
From
Net
Investment
Income
From
Net
Realized
Gains
Total
Net
Asset
Value,
End
of
Period
16.2
Lifestyle
Conservative
Class
A:
5/31/24
$
11
.47
$
0
.33
$
0
.98
$
1
.31
$
(
0
.34
)
$
—
$
(
0
.34
)
$
12
.44
5/31/23
12
.18
0
.26
(
0
.27
)
(
0
.01
)
(
0
.32
)
(
0
.38
)
(
0
.70
)
11
.47
5/31/22
14
.22
0
.20
(
1
.29
)
(
1
.09
)
(
0
.32
)
(
0
.63
)
(
0
.95
)
12
.18
5/31/21
12
.55
0
.18
2
.10
2
.28
(
0
.28
)
(
0
.33
)
(
0
.61
)
14
.22
5/31/20
12
.24
0
.25
0
.49
0
.74
(
0
.20
)
(
0
.23
)
(
0
.43
)
12
.55
Class
I:
5/31/24
11
.49
0
.35
0
.98
1
.33
(
0
.36
)
—
(
0
.36
)
12
.46
5/31/23
12
.20
0
.29
(
0
.28
)
0
.01
(
0
.34
)
(
0
.38
)
(
0
.72
)
11
.49
5/31/22
14
.25
0
.22
(
1
.30
)
(
1
.08
)
(
0
.34
)
(
0
.63
)
(
0
.97
)
12
.20
5/31/21
12
.57
0
.21
2
.10
2
.31
(
0
.30
)
(
0
.33
)
(
0
.63
)
14
.25
5/31/20
12
.26
0
.30
0
.46
0
.76
(
0
.22
)
(
0
.23
)
(
0
.45
)
12
.57
Premier
Class:
5/31/24
11
.50
0
.34
0
.98
1
.32
(
0
.35
)
—
(
0
.35
)
12
.47
5/31/23
12
.21
0
.28
(
0
.28
)
—
(
0
.33
)
(
0
.38
)
(
0
.71
)
11
.50
5/31/22
14
.26
0
.22
(
1
.30
)
(
1
.08
)
(
0
.34
)
(
0
.63
)
(
0
.97
)
12
.21
5/31/21
12
.58
0
.20
2
.11
2
.31
(
0
.30
)
(
0
.33
)
(
0
.63
)
14
.26
5/31/20
12
.27
0
.26
0
.49
0
.75
(
0
.21
)
(
0
.23
)
(
0
.44
)
12
.58
Class
R6:
5/31/24
11
.49
0
.36
0
.99
1
.35
(
0
.37
)
—
(
0
.37
)
12
.47
5/31/23
12
.21
0
.30
(
0
.29
)
0
.01
(
0
.35
)
(
0
.38
)
(
0
.73
)
11
.49
5/31/22
14
.25
0
.24
(
1
.29
)
(
1
.05
)
(
0
.36
)
(
0
.63
)
(
0
.99
)
12
.21
5/31/21
12
.57
0
.22
2
.11
2
.33
(
0
.32
)
(
0
.33
)
(
0
.65
)
14
.25
5/31/20
12
.26
0
.28
0
.49
0
.77
(
0
.23
)
(
0
.23
)
(
0
.46
)
12
.57
Retirement
Class:
5/31/24
11
.48
0
.33
0
.98
1
.31
(
0
.34
)
—
(
0
.34
)
12
.45
5/31/23
12
.19
0
.27
(
0
.28
)
(
0
.01
)
(
0
.32
)
(
0
.38
)
(
0
.70
)
11
.48
5/31/22
14
.23
0
.20
(
1
.29
)
(
1
.09
)
(
0
.32
)
(
0
.63
)
(
0
.95
)
12
.19
5/31/21
12
.55
0
.19
2
.10
2
.29
(
0
.28
)
(
0
.33
)
(
0
.61
)
14
.23
5/31/20
12
.25
0
.25
0
.48
0
.73
(
0
.20
)
(
0
.23
)
(
0
.43
)
12
.55
a
Based
on
average
shares
outstanding.
b
Total
returns
are
at
NAV
and
do
not
include
any
sales
charge.
Total
returns
are
not
annualized.
e
The
Fund's
expenses
do
not
include
the
expenses
of
the
Underlying
Funds.
j
Short-term
and
long-term
capital
gain
distributions
received
from
the
underlying
Funds
are
presented
in
net
realized
and
unrealized
gain
(loss)
on
total
investments
for
all
periods
presented.
See
Notes
to
Financial
Statements
Ratios
and
Supplemental
Data
Ratios
to
Average
Net
Assets
Total
Return
b
Net
Assets,
End
of
Period
(000)
Gross
Expenses
e
Net
Expenses
e
Net
Investment
Income
(Loss)
Portfolio
Turnover
Rate
11
.58
%
$
200,324
0
.45
%
0
.37
%
2
.77
%
13
%
0
.11
201,363
0
.44
0
.37
2
.30
19
(
8
.25
)
224,733
0
.43
0
.36
1
.49
21
18
.40
244,655
0
.44
0
.37
1
.36
35
6
.16
206,100
0
.45
0
.37
1
.99
29
11
.75
3,377
0
.28
0
.20
2
.94
13
0
.29
3,076
0
.27
0
.20
2
.48
19
(
8
.09
)
3,876
0
.26
0
.20
1
.62
21
18
.57
7,122
0
.26
0
.20
1
.54
35
6
.33
6,559
0
.29
0
.20
2
.45
29
11
.69
266
0
.36
0
.25
2
.89
13
0
.23
249
0
.34
0
.25
2
.43
19
(
8
.14
)
262
0
.32
0
.25
1
.60
21
18
.49
774
0
.32
0
.25
1
.48
35
6
.27
665
0
.35
0
.25
2
.05
29
11
.96
56,552
0
.18
0
.10
3
.05
13
0
.31
51,084
0
.17
0
.10
2
.57
19
(
7
.99
)
55,791
0
.16
0
.10
1
.77
21
18
.77
53,420
0
.17
0
.10
1
.63
35
6
.44
34,603
0
.19
0
.10
2
.25
29
11
.60
48,781
0
.43
0
.35
2
.80
13
0
.13
47,413
0
.42
0
.35
2
.32
19
(
8
.17
)
56,686
0
.41
0
.35
1
.50
21
18
.44
63,022
0
.41
0
.34
1
.39
35
6
.11
46,255
0
.43
0
.33
1
.98
29
Financial
Highlights
(continued)
See
Notes
to
Financial
Statements
Financial
Highlights
(continued)
The
following
data
is
for
a
share
outstanding
for
each
fiscal year
end
unless
otherwise
noted:
Investment
Operations
Less
Distributions
Net
Asset
Value,
Beginning
of
Period
Net
Investment
Income
(Loss)
a
Net
Realized/
Unrealized
Gain
(Loss)
j
Total
From
Net
Investment
Income
From
Net
Realized
Gains
Total
Net
Asset
Value,
End
of
Period
16.3
Lifestyle
Moderate
Class
A:
5/31/24
$
12
.77
$
0
.31
$
1
.65
$
1
.96
$
(
0
.34
)
$
—
$
(
0
.34
)
$
14
.39
5/31/23
13
.71
0
.27
(
0
.31
)
(
0
.04
)
(
0
.29
)
(
0
.61
)
(
0
.90
)
12
.77
5/31/22
16
.64
0
.23
(
1
.70
)
(
1
.47
)
(
0
.44
)
(
1
.02
)
(
1
.46
)
13
.71
5/31/21
13
.82
0
.20
3
.46
3
.66
(
0
.34
)
(
0
.50
)
(
0
.84
)
16
.64
5/31/20
13
.52
0
.27
0
.67
0
.94
(
0
.25
)
(
0
.39
)
(
0
.64
)
13
.82
Class
I:
5/31/24
12
.80
0
.35
1
.63
1
.98
(
0
.36
)
—
(
0
.36
)
14
.42
5/31/23
13
.74
0
.30
(
0
.31
)
(
0
.01
)
(
0
.32
)
(
0
.61
)
(
0
.93
)
12
.80
5/31/22
16
.67
0
.26
(
1
.70
)
(
1
.44
)
(
0
.47
)
(
1
.02
)
(
1
.49
)
13
.74
5/31/21
13
.84
0
.23
3
.47
3
.70
(
0
.37
)
(
0
.50
)
(
0
.87
)
16
.67
5/31/20
13
.55
0
.37
0
.58
0
.95
(
0
.27
)
(
0
.39
)
(
0
.66
)
13
.84
Premier
Class:
5/31/24
12
.84
0
.33
1
.66
1
.99
(
0
.36
)
—
(
0
.36
)
14
.47
5/31/23
13
.78
0
.28
(
0
.30
)
(
0
.02
)
(
0
.31
)
(
0
.61
)
(
0
.92
)
12
.84
5/31/22
16
.72
0
.26
(
1
.72
)
(
1
.46
)
(
0
.46
)
(
1
.02
)
(
1
.48
)
13
.78
5/31/21
13
.87
0
.23
3
.48
3
.71
(
0
.36
)
(
0
.50
)
(
0
.86
)
16
.72
5/31/20
13
.58
0
.24
0
.70
0
.94
(
0
.26
)
(
0
.39
)
(
0
.65
)
13
.87
Class
R6:
5/31/24
12
.80
0
.36
1
.65
2
.01
(
0
.38
)
—
(
0
.38
)
14
.43
5/31/23
13
.74
0
.30
(
0
.30
)
—
(
0
.33
)
(
0
.61
)
(
0
.94
)
12
.80
5/31/22
16
.68
0
.28
(
1
.71
)
(
1
.43
)
(
0
.49
)
(
1
.02
)
(
1
.51
)
13
.74
5/31/21
13
.84
0
.25
3
.47
3
.72
(
0
.38
)
(
0
.50
)
(
0
.88
)
16
.68
5/31/20
13
.55
0
.29
0
.67
0
.96
(
0
.28
)
(
0
.39
)
(
0
.67
)
13
.84
Retirement
Class:
5/31/24
12
.78
0
.32
1
.64
1
.96
(
0
.34
)
—
(
0
.34
)
14
.40
5/31/23
13
.72
0
.27
(
0
.30
)
(
0
.03
)
(
0
.30
)
(
0
.61
)
(
0
.91
)
12
.78
5/31/22
16
.65
0
.23
(
1
.70
)
(
1
.47
)
(
0
.44
)
(
1
.02
)
(
1
.46
)
13
.72
5/31/21
13
.82
0
.21
3
.47
3
.68
(
0
.35
)
(
0
.50
)
(
0
.85
)
16
.65
5/31/20
13
.53
0
.25
0
.68
0
.93
(
0
.25
)
(
0
.39
)
(
0
.64
)
13
.82
a
Based
on
average
shares
outstanding.
b
Total
returns
are
at
NAV
and
do
not
include
any
sales
charge.
Total
returns
are
not
annualized.
e
The
Fund's
expenses
do
not
include
the
expenses
of
the
Underlying
Funds.
j
Short-term
and
long-term
capital
gain
distributions
received
from
the
underlying
Funds
are
presented
in
net
realized
and
unrealized
gain
(loss)
on
total
investments
for
all
periods
presented.
See
Notes
to
Financial
Statements
Ratios
and
Supplemental
Data
Ratios
to
Average
Net
Assets
Total
Return
b
Net
Assets,
End
of
Period
(000)
Gross
Expenses
e
Net
Expenses
e
Net
Investment
Income
(Loss)
Portfolio
Turnover
Rate
15
.55
%
$
350,208
0
.43
%
0
.36
%
2
.33
%
15
%
0
.09
333,435
0
.42
0
.33
2
.09
19
(
9
.78
)
367,073
0
.41
0
.36
1
.46
21
27
.02
410,533
0
.42
0
.36
1
.32
47
7
.01
330,823
0
.43
0
.37
1
.95
31
15
.72
7,868
0
.25
0
.18
2
.56
15
0
.30
7,294
0
.23
0
.14
2
.31
19
(
9
.60
)
10,895
0
.22
0
.18
1
.64
21
27
.29
13,719
0
.23
0
.17
1
.50
47
7
.12
12,977
0
.26
0
.20
2
.64
31
15
.68
289
0
.32
0
.24
2
.46
15
0
.20
257
0
.31
0
.22
2
.21
19
(
9
.64
)
276
0
.30
0
.25
1
.60
21
27
.22
689
0
.31
0
.24
1
.45
47
7
.03
557
0
.32
0
.25
1
.72
31
15
.90
88,282
0
.15
0
.09
2
.63
15
0
.38
68,231
0
.15
0
.06
2
.36
19
(
9
.58
)
76,453
0
.14
0
.10
1
.75
21
27
.47
77,429
0
.15
0
.09
1
.58
47
7
.23
52,090
0
.16
0
.10
2
.10
31
15
.56
116,313
0
.40
0
.34
2
.36
15
0
.12
105,238
0
.40
0
.31
2
.11
19
(
9
.77
)
114,335
0
.39
0
.35
1
.48
21
27
.12
121,361
0
.40
0
.34
1
.35
47
6
.95
93,587
0
.41
0
.35
1
.81
31
Financial
Highlights
(continued)
See
Notes
to
Financial
Statements
Financial
Highlights
(continued)
The
following
data
is
for
a
share
outstanding
for
each
fiscal year
end
unless
otherwise
noted:
Investment
Operations
Less
Distributions
Net
Asset
Value,
Beginning
of
Period
Net
Investment
Income
(Loss)
a
Net
Realized/
Unrealized
Gain
(Loss)
j
Total
From
Net
Investment
Income
From
Net
Realized
Gains
Total
Net
Asset
Value,
End
of
Period
16.4
Lifestyle
Growth
Class
A:
5/31/24
$
14
.23
$
0
.28
$
2
.52
$
2
.80
$
(
0
.32
)
$
—
$
(
0
.32
)
$
16
.71
5/31/23
15
.24
0
.23
(
0
.19
)
0
.04
(
0
.23
)
(
0
.82
)
(
1
.05
)
14
.23
5/31/22
18
.87
0
.22
(
1
.94
)
(
1
.72
)
(
0
.56
)
(
1
.35
)
(
1
.91
)
15
.24
5/31/21
14
.79
0
.18
4
.97
5
.15
(
0
.37
)
(
0
.70
)
(
1
.07
)
18
.87
5/31/20
14
.58
0
.27
0
.74
1
.01
(
0
.23
)
(
0
.57
)
(
0
.80
)
14
.79
Class
I:
5/31/24
14
.31
0
.31
2
.54
2
.85
(
0
.35
)
—
(
0
.35
)
16
.81
5/31/23
15
.33
0
.26
(
0
.20
)
0
.06
(
0
.26
)
(
0
.82
)
(
1
.08
)
14
.31
5/31/22
18
.96
0
.26
(
1
.94
)
(
1
.68
)
(
0
.60
)
(
1
.35
)
(
1
.95
)
15
.33
5/31/21
14
.86
0
.22
4
.98
5
.20
(
0
.40
)
(
0
.70
)
(
1
.10
)
18
.96
5/31/20
14
.65
0
.38
0
.66
1
.04
(
0
.26
)
(
0
.57
)
(
0
.83
)
14
.86
Premier
Class:
5/31/24
14
.35
0
.30
2
.55
2
.85
(
0
.34
)
—
(
0
.34
)
16
.86
5/31/23
15
.36
0
.25
(
0
.20
)
0
.05
(
0
.24
)
(
0
.82
)
(
1
.06
)
14
.35
5/31/22
18
.97
0
.26
(
1
.93
)
(
1
.67
)
(
0
.59
)
(
1
.35
)
(
1
.94
)
15
.36
5/31/21
14
.87
0
.20
4
.99
5
.19
(
0
.39
)
(
0
.70
)
(
1
.09
)
18
.97
5/31/20
14
.65
0
.25
0
.79
1
.04
(
0
.25
)
(
0
.57
)
(
0
.82
)
14
.87
Class
R6:
5/31/24
14
.33
0
.32
2
.55
2
.87
(
0
.37
)
—
(
0
.37
)
16
.83
5/31/23
15
.34
0
.27
(
0
.19
)
0
.08
(
0
.27
)
(
0
.82
)
(
1
.09
)
14
.33
5/31/22
18
.98
0
.27
(
1
.94
)
(
1
.67
)
(
0
.62
)
(
1
.35
)
(
1
.97
)
15
.34
5/31/21
14
.87
0
.23
4
.99
5
.22
(
0
.41
)
(
0
.70
)
(
1
.11
)
18
.98
5/31/20
14
.66
0
.28
0
.78
1
.06
(
0
.28
)
(
0
.57
)
(
0
.85
)
14
.87
Retirement
Class:
5/31/24
14
.26
0
.28
2
.53
2
.81
(
0
.33
)
—
(
0
.33
)
16
.74
5/31/23
15
.27
0
.24
(
0
.20
)
0
.04
(
0
.23
)
(
0
.82
)
(
1
.05
)
14
.26
5/31/22
18
.90
0
.22
(
1
.93
)
(
1
.71
)
(
0
.57
)
(
1
.35
)
(
1
.92
)
15
.27
5/31/21
14
.81
0
.18
4
.98
5
.16
(
0
.37
)
(
0
.70
)
(
1
.07
)
18
.90
5/31/20
14
.60
0
.23
0
.78
1
.01
(
0
.23
)
(
0
.57
)
(
0
.80
)
14
.81
a
Based
on
average
shares
outstanding.
b
Total
returns
are
at
NAV
and
do
not
include
any
sales
charge.
Total
returns
are
not
annualized.
e
The
Fund's
expenses
do
not
include
the
expenses
of
the
Underlying
Funds.
j
Short-term
and
long-term
capital
gain
distributions
received
from
the
underlying
Funds
are
presented
in
net
realized
and
unrealized
gain
(loss)
on
total
investments
for
all
periods
presented.
See
Notes
to
Financial
Statements
Ratios
and
Supplemental
Data
Ratios
to
Average
Net
Assets
Total
Return
b
Net
Assets,
End
of
Period
(000)
Gross
Expenses
e
Net
Expenses
e
Net
Investment
Income
(Loss)
Portfolio
Turnover
Rate
19
.91
%
$
194,578
0
.46
%
0
.31
%
1
.80
%
15
%
0
.71
175,919
0
.46
0
.29
1
.64
20
(
10
.17
)
190,045
0
.44
0
.34
1
.25
26
35
.45
212,617
0
.46
0
.37
1
.05
54
6
.85
162,347
0
.48
0
.38
1
.79
35
20
.15
4,432
0
.29
0
.13
1
.98
15
0
.85
3,807
0
.27
0
.11
1
.82
20
(
10
.00
)
5,138
0
.25
0
.16
1
.44
26
35
.72
7,976
0
.26
0
.17
1
.28
54
7
.03
8,870
0
.30
0
.20
2
.57
35
20
.09
347
0
.36
0
.18
1
.94
15
0
.78
296
0
.34
0
.18
1
.78
20
(
9
.93
)
316
0
.32
0
.23
1
.41
26
35
.62
2,022
0
.33
0
.24
1
.18
54
7
.02
1,356
0
.36
0
.25
1
.64
35
20
.24
50,686
0
.19
0
.03
2
.04
15
1
.01
43,616
0
.18
0
.01
1
.91
20
(
9
.96
)
47,024
0
.16
0
.08
1
.50
26
35
.87
48,422
0
.18
0
.09
1
.34
54
7
.18
33,985
0
.21
0
.10
1
.87
35
19
.90
56,207
0
.44
0
.28
1
.84
15
0
.73
48,701
0
.43
0
.26
1
.67
20
(
10
.12
)
56,946
0
.41
0
.33
1
.26
26
35
.51
59,232
0
.43
0
.34
1
.07
54
6
.87
42,326
0
.45
0
.35
1
.55
35
Financial
Highlights
(continued)
See
Notes
to
Financial
Statements
Financial
Highlights
(continued)
The
following
data
is
for
a
share
outstanding
for
each
fiscal year
end
unless
otherwise
noted:
Investment
Operations
Less
Distributions
Net
Asset
Value,
Beginning
of
Period
Net
Investment
Income
(Loss)
a
Net
Realized/
Unrealized
Gain
(Loss)
j
Total
From
Net
Investment
Income
From
Net
Realized
Gains
Total
Net
Asset
Value,
End
of
Period
16.5
Lifestyle
Aggressive
Growth
Class
A:
5/31/24
$
15
.69
$
0
.20
$
3
.58
$
3
.78
$
(
0
.27
)
$
(
0
.00
)
d
$
(
0
.27
)
$
19
.20
5/31/23
16
.91
0
.17
(
0
.07
)
0
.10
(
0
.25
)
(
1
.07
)
(
1
.32
)
15
.69
5/31/22
21
.19
0
.21
(
2
.19
)
(
1
.98
)
(
0
.64
)
(
1
.66
)
(
2
.30
)
16
.91
5/31/21
15
.46
0
.14
6
.61
6
.75
(
0
.45
)
(
0
.57
)
(
1
.02
)
21
.19
5/31/20
15
.33
0
.24
0
.82
1
.06
(
0
.13
)
(
0
.80
)
(
0
.93
)
15
.46
Class
I:
5/31/24
15
.80
0
.23
3
.61
3
.84
(
0
.30
)
(
0
.00
)
d
(
0
.30
)
19
.34
5/31/23
17
.03
0
.21
(
0
.09
)
0
.12
(
0
.28
)
(
1
.07
)
(
1
.35
)
15
.80
5/31/22
21
.32
0
.26
(
2
.21
)
(
1
.95
)
(
0
.68
)
(
1
.66
)
(
2
.34
)
17
.03
5/31/21
15
.55
0
.18
6
.64
6
.82
(
0
.48
)
(
0
.57
)
(
1
.05
)
21
.32
5/31/20
15
.40
0
.37
0
.72
1
.09
(
0
.14
)
(
0
.80
)
(
0
.94
)
15
.55
Premier
Class:
5/31/24
15
.86
0
.22
3
.62
3
.84
(
0
.30
)
(
0
.00
)
d
(
0
.30
)
19
.40
5/31/23
17
.08
0
.20
(
0
.08
)
0
.12
(
0
.27
)
(
1
.07
)
(
1
.34
)
15
.86
5/31/22
21
.37
0
.24
(
2
.20
)
(
1
.96
)
(
0
.67
)
(
1
.66
)
(
2
.33
)
17
.08
5/31/21
15
.59
0
.18
6
.64
6
.82
(
0
.47
)
(
0
.57
)
(
1
.04
)
21
.37
5/31/20
15
.43
0
.03
1
.06
1
.09
(
0
.13
)
(
0
.80
)
(
0
.93
)
15
.59
Class
R6:
5/31/24
15
.81
0
.25
3
.60
3
.85
(
0
.32
)
(
0
.00
)
d
(
0
.32
)
19
.34
5/31/23
17
.03
0
.22
(
0
.08
)
0
.14
(
0
.29
)
(
1
.07
)
(
1
.36
)
15
.81
5/31/22
21
.32
0
.26
(
2
.19
)
(
1
.93
)
(
0
.70
)
(
1
.66
)
(
2
.36
)
17
.03
5/31/21
15
.55
0
.20
6
.64
6
.84
(
0
.50
)
(
0
.57
)
(
1
.07
)
21
.32
5/31/20
15
.40
0
.25
0
.87
1
.12
(
0
.17
)
(
0
.80
)
(
0
.97
)
15
.55
Retirement
Class:
5/31/24
15
.73
0
.20
3
.59
3
.79
(
0
.28
)
(
0
.00
)
d
(
0
.28
)
19
.24
5/31/23
16
.95
0
.18
(
0
.08
)
0
.10
(
0
.25
)
(
1
.07
)
(
1
.32
)
15
.73
5/31/22
21
.23
0
.22
(
2
.19
)
(
1
.97
)
(
0
.65
)
(
1
.66
)
(
2
.31
)
16
.95
5/31/21
15
.49
0
.15
6
.62
6
.77
(
0
.46
)
(
0
.57
)
(
1
.03
)
21
.23
5/31/20
15
.35
0
.20
0
.87
1
.07
(
0
.13
)
(
0
.80
)
(
0
.93
)
15
.49
a
Based
on
average
shares
outstanding.
b
Total
returns
are
at
NAV
and
do
not
include
any
sales
charge.
Total
returns
are
not
annualized.
d
Value
rounded
to
zero.
e
The
Fund's
expenses
do
not
include
the
expenses
of
the
Underlying
Funds.
j
Short-term
and
long-term
capital
gain
distributions
received
from
the
underlying
Funds
are
presented
in
net
realized
and
unrealized
gain
(loss)
on
total
investments
for
all
periods
presented.
See
Notes
to
Financial
Statements
Ratios
and
Supplemental
Data
Ratios
to
Average
Net
Assets
Total
Return
b
Net
Assets,
End
of
Period
(000)
Gross
Expenses
e
Net
Expenses
e
Net
Investment
Income
(Loss)
Portfolio
Turnover
Rate
24
.30
%
$
118,311
0
.49
%
0
.39
%
1
.13
%
12
%
1
.17
102,309
0
.49
0
.35
1
.10
21
(
10
.59
)
106,104
0
.48
0
.32
1
.04
30
44
.41
117,922
0
.50
0
.38
0
.78
56
6
.80
83,795
0
.54
0
.40
1
.56
33
24
.55
5,423
0
.30
0
.20
1
.34
12
1
.33
4,908
0
.29
0
.15
1
.31
21
(
10
.40
)
6,248
0
.28
0
.13
1
.28
30
44
.68
9,163
0
.30
0
.18
0
.98
56
7
.01
7,051
0
.33
0
.19
2
.39
33
24
.39
389
0
.37
0
.25
1
.28
12
1
.29
320
0
.36
0
.22
1
.27
21
(
10
.43
)
342
0
.35
0
.20
1
.21
30
44
.54
427
0
.37
0
.23
0
.95
56
7
.00
313
0
.39
0
.25
0
.17
33
24
.58
63,319
0
.21
0
.10
1
.45
12
1
.46
51,862
0
.20
0
.05
1
.40
21
(
10
.32
)
50,497
0
.19
0
.04
1
.28
30
44
.79
45,923
0
.21
0
.08
1
.08
56
7
.14
26,474
0
.25
0
.10
1
.56
33
24
.29
60,408
0
.45
0
.35
1
.18
12
1
.20
52,655
0
.45
0
.31
1
.16
21
(
10
.54
)
56,152
0
.44
0
.29
1
.08
30
44
.47
65,640
0
.45
0
.33
0
.82
56
6
.85
42,644
0
.49
0
.35
1
.29
33
Notes
to
Financial
Statements
1.
General
Information
Trust
and
Fund
Information:
TIAA-CREF
Funds
(the
“Trust”)
is
an
open-end
management
investment
company
registered
under
the
Investment
Company
Act
of
1940,
(“1940
Act”),
as
amended.
The
Trust
is
comprised
of
the
following
(collectively
the
“Funds”
or
individually,
the
“Fund”),
among
others:
Fund
Name
Changes:
Effective
May
1,
2024,
each
Fund’s
name
changed
as
noted
above
and
therefore
all
references
to
the
names
of
the
Funds
in
this
report
have
been
updated.
Current
Fiscal
Period:
The
end
of
the
reporting
period
for
the Funds
is
May
31,
2024,
and
the
period
covered
by
these
Notes
to
Financial
Statements
is
the
fiscal
year
ended
May
31,
2024
(the
"current
fiscal
period").
Investment
Advisor:
Teachers
Advisors,
LLC
(the
“Adviser”),
a
wholly
owned
indirect
subsidiary
of
Teachers
Insurance
and
Annuity
Association
of
America
(“TIAA”),
is
registered
with
the
SEC
as
an
investment
adviser
and
provides
investment
management
services
for
the
Funds.
Share
Classes
and
Sales
Charges:
Each
Fund
is
a
“fund
of
funds”
that
diversifies
its
assets
by
investing
in
Institutional
Class
shares
of
other
funds
of
the
Trust
and
potentially
other
investment
pools
or
investment
products.
The
Funds
offer
Class
A,
Class
I,
Premier
Class,
Class
R6
and
Retirement
Class
shares.
Each
class
differs
by
the
allocation
of
class-specific
expenses
and
voting
rights
in
matters
affecting
a
single
class.
Effective
May
6,
2024,
a
sales
charge
is
imposed
on
purchases
of
Class
A
shares
of
the
Funds,
of
less
than
certain
amounts,
as
set
forth
in
the
Funds’
prospectus.
The
Funds
offer
their
shares
through
their
principal
underwriter,
Nuveen
Securities,
LLC
(“Nuveen
Securities”),
which
is
a
wholly
owned
indirect
subsidiary
of
TIAA.
Share
Class
Name
Changes:
Effective
May
6,
2024,
the
names
of
certain
share
classes
for
the
Funds
changed
and
therefore
all
references
to
the
names
of
these
share
classes
in
this
report
have
changed
as
follows:
2.
Significant
Accounting
Policies
The
accompanying
financial
statements
were
prepared
in
accordance
with
accounting
principles
generally
accepted
in
the
United
States
of
America
(“U.S.
GAAP”),
which
may
require
the
use
of
estimates
made
by
management
and
the
evaluation
of
subsequent
events.
Actual
results
may
differ
from
those
estimates.
The Funds
are
investment
companies
and
follow
the
accounting
guidance
in
the
Financial
Accounting
Standards
Board
(“FASB”)
Accounting
Standards
Codification
946,
Financial
Services
—
Investment
Companies
. The net
asset
value (“NAV”)
for
financial
reporting
purposes
may
differ
from
the NAV
for
processing
transactions.
The NAV
for
financial
reporting
purposes
includes
security
and shareholder
transactions
through
the
date
of
the
report.
Total
return
is
computed
based
on
the NAV
used
for
processing
transactions.
The
following
is
a
summary
of
the
significant
accounting
policies
consistently
followed
by
the
Funds.
Compensation:
The
Funds pay
the
members
of
the
Board
of
Trustees
("Board"),
all
of
whom
are
independent,
certain
remuneration
for
their
services,
plus
travel
and
other
expenses.
The
Board
has
adopted
a
deferred
compensation
plan
for
independent
trustees
that
enables
trustees
to
elect
to
defer
receipt
of
all
or
a
portion
of
the
annual
compensation
they
are
entitled
to
receive
from
certain
Nuveen-advised
funds.
Under
the
plan,
deferred
amounts
are
treated
as
though
equal
dollar
amounts
had
been
invested
in
shares
of
select
Nuveen-advised
funds. Amounts
deferred
are
retained
by
the
Funds
until
paid.
Amounts
payable
to
the
trustees
for
compensation
are
included
separately
in the
accompanying
Statement
of
Assets
and
Liabilities.
Trustees’
fees,
including
any
deferred
compensation
incurred,
are
reflected
in
the
Statement
of
Operations.
Distributions
to
Shareholders:
Distributions
to
shareholders
are
recorded
on
the
ex-dividend
date.
The
amount,
character
and
timing
of
distributions
are
determined
in
accordance
with
federal
income
tax
regulations,
which
may
differ
from
U.S.
GAAP.
New
Name
Former
Name
Short
Name
Nuveen
Lifestyle
Income
Fund
TIAA-CREF
Lifestyle
Income
Fund
Lifestyle
Income
Nuveen
Lifestyle
Conservative
Fund
TIAA-CREF
Lifestyle
Conservative
Fund
Lifestyle
Conservative
Nuveen
Lifestyle
Moderate
Fund
TIAA-CREF
Lifestyle
Moderate
Fund
Lifestyle
Moderate
Nuveen
Lifestyle
Growth
Fund
TIAA-CREF
Lifestyle
Growth
Fund
Lifestyle
Growth
Nuveen
Lifestyle
Aggressive
Growth
Fund
TIAA-CREF
Lifestyle
Aggressive
Growth
Fund
Lifestyle
Aggressive
Growth
New
Name
Former
Name
Class
A
Retail
Class
Class
I
Advisor
Class
Class
R6
Institutional
Class
Indemnification:
Under
the
Trust's
organizational
documents,
its
officers
and
trustees
are
indemnified
against
certain
liabilities
arising
out
of
the
performance
of
their
duties
to
the
Trust.
In
addition,
in
the
normal
course
of
business,
the
Trust
enters
into
contracts
that
provide
general
indemnifications
to
other
parties.
The
Trust's
maximum
exposure
under
these
arrangements
is
unknown
as
this
would
involve
future
claims
that
may
be
made
against
the
Trust
that
have
not
yet
occurred.
However,
the
Trust
has
not
had
prior
claims
or
losses
pursuant
to
these
contracts
and
expects
the
risk
of
loss
to
be
remote.
Investments
and
Investment
Income:
Securities
transactions
are
accounted
for
as
of
the
trade
date
for
financial
reporting
purposes.
Interest
income
is
recorded
on
an
accrual
basis
and
includes
accretion
of
discounts
and
amortization
of
premiums.
Dividend
income
is
recorded
on
the
ex-dividend
date. Realized
gains
and
losses
on
securities
transactions
are
based
upon
the
specific
identification
method.
Distributions
received
on
securities
that
represent
a
return
of
capital
or
capital
gains
are
recorded
as
a
reduction
of
cost
of
investments
and/or
as
a
realized
gain.
The
Funds
estimate
the
components
of
distributions
received
that
may
be
considered
return
of
capital
distributions
or
capital
gain
distributions.
Multiclass
Operations
and
Allocations:
Income, expenses,
realized
gains
and
losses
and
unrealized
appreciation
and
depreciation
of
a
Fund
are
allocated
on
a
pro
rata
basis
to
each
class
of
shares,
except
for
service
agreement
fees,
distribution
fees
and
transfer
agency
fees
and
expenses, which
are
unique
to
each
class
of
shares.
Most
expenses
of
the
Trust
can
be
directly
attributed
to
a
Fund.
Expenses
that
cannot
be
directly
attributed
are
allocated
to
each
Fund
in
the
Trust
based
upon
the
average
net
assets
of
each
Fund.
Netting
Agreements:
In
the
ordinary
course
of
business,
the
Funds
may
enter
into
transactions
subject
to
enforceable
master
repurchase
agreements,
International
Swaps
and
Derivatives
Association,
Inc.
(ISDA)
master
agreements
or
other
similar
arrangements
(“netting
agreements”).
Generally,
the
right
to
offset
in
netting
agreements
allows
each
Fund
to
offset
certain
securities
and
derivatives
with
a
specific
counterparty,
when
applicable,
as
well
as
any
collateral
received
or
delivered
to
that
counterparty
based
on
the
terms
of
the
agreements.
Generally,
each
Fund
manages
its
cash
collateral
and
securities
collateral
on
a
counterparty
basis.
With
respect
to
certain
counterparties,
in
accordance
with
the
terms
of
the
netting
agreements,
collateral
posted
to
the
Funds
is
held
in
a
segregated
account
by
the
Funds’
custodian
and/or
with
respect
to
those
amounts
which
can
be
sold
or
repledged,
are
presented
in
the
Funds’
Portfolio
of
Investments
or
Statement
of
Assets
and
Liabilities.
The
Funds’
investments
subject
to
netting
agreements
as
of
the
end
of
the
reporting
period,
if
any,
are
further
described
later
in
these
Notes
to
Financial
Statements.
3.
Investment
Valuation
and
Fair
Value
Measurements
The Funds'
investments
in
securities
are
recorded
at
their
estimated
fair
value
utilizing
valuation
methods
approved
by
the
Adviser,
subject
to
oversight
of
the
Board.
Fair
value
is
defined
as
the
price
that
would
be
received
upon
selling
an
investment
or
transferring
a
liability
in
an
orderly
transaction
to
an
independent
buyer
in
the
principal
or
most
advantageous
market
for
the
investment.
U.S.
GAAP
establishes
the
three-tier
hierarchy
that
is
used
to
maximize
the
use
of
observable
market
data
and
minimize
the
use
of
unobservable
inputs
and
to
establish
classification
of
fair
value
measurements
for
disclosure
purposes.
Observable
inputs
reflect
the
assumptions
market
participants
would
use
in
pricing
the
asset
or
liability.
Observable
inputs
are
based
on
market
data
obtained
from
sources
independent
of
the
reporting
entity.
Unobservable
inputs
reflect
management’s
assumptions
about
the
assumptions
market
participants
would
use
in
pricing
the
asset
or
liability.
Unobservable
inputs
are
based
on
the
best
information
available
in
the
circumstances.
The
following
is
a
summary
of
the
three-tiered
hierarchy
of
valuation
input
levels.
Level 1
–
Inputs
are
unadjusted
and
prices
are
determined
using
quoted
prices
in
active
markets
for
identical
securities.
Level
2
–
Prices
are
determined
using
other
significant
observable
inputs
(including
quoted
prices
for
similar
securities,
interest
rates,
credit
spreads,
etc.).
Level
3
–
Prices
are
determined
using
significant
unobservable
inputs
(including
management’s
assumptions
in
determining
the
fair
value
of
investments).
A
description
of
the
valuation
techniques
applied
to
the Funds'
major
classifications
of
assets
and
liabilities
measured
at
fair
value
follows:
Exchange-traded
funds
listed
or
traded
on
a
national
market
or
exchange
are
valued
based
on
their
sale
price
at
the
official
close
of
business
of
such
market
or
exchange
on
the
valuation
date.
To
the
extent
these
securities
are
actively
traded
and
that
valuation
adjustments
are
not
applied,
they
are
generally
classified
as
Level
1.
Investments
in
investment
companies
are
valued
at
their
respective NAVs
or
share
price
on
the
valuation
date
and
are
generally
classified
as Level
1.
Repurchase
agreements
are
valued
at
contract
amount
plus
accrued
interest,
which
approximates
market
value.
These
securities
are
generally
classified
as
Level
2.
The
following
table
summarizes
the
market
value
of
the Funds’
investments
as
of
the
end
of
the
current
fiscal
period, based
on
the
inputs
used
to
value
them:
Notes
to
Financial
Statements
(continued)
4.
Portfolio
Securities
Repurchase
Agreements:
In
connection
with
transactions
in
repurchase
agreements,
it
is
the Fund’s policy
that
its
custodian
take
possession
of
the
underlying
collateral
securities,
the
fair
value
of
which
exceeds
the
principal
amount
of
the
repurchase
transaction,
including
accrued
interest,
at
all
times.
If
the
counterparty
defaults,
and
the
fair
value
of
the
collateral
declines,
realization
of
the
collateral
may
be
delayed
or
limited.
The
following
table
presents
the
repurchase
agreements
for
the Funds
that
are
subject
to
netting
agreements
as
of
the
end
of
the
reporting
period,
and
the
collateral
delivered
related
to
those
repurchase
agreements.
Purchases
and
Sales:
Long-term
purchases
and
sales
during
the
current
fiscal
period were
as
follows:
Fund
Level
1
Level
2
Level
3
Total
Lifestyle
Income
Registered
investment
companies
$74,929,703
$—
$—
$74,929,703
Total
$74,929,703
$—
$—
$74,929,703
1
1
1
1
1
Lifestyle
Conservative
Registered
investment
companies
$309,151,442
$—
$—
$309,151,442
Short-term
investments
—
59,000
—
59,000
Total
$309,151,442
$59,000
$—
$309,210,442
1
1
1
1
1
Lifestyle
Moderate
Registered
investment
companies
$562,680,955
$—
$—
$562,680,955
Short-term
investments
—
380,000
—
380,000
Total
$562,680,955
$380,000
$—
$563,060,955
1
1
1
1
1
Lifestyle
Growth
Registered
investment
companies
$306,655,330
$—
$—
$306,655,330
Short-term
investments
—
240,000
—
240,000
Total
$306,655,330
$240,000
$—
$306,895,330
1
1
1
1
1
Lifestyle
Aggressive
Growth
Registered
investment
companies
$247,939,360
$—
$—
$247,939,360
Short-term
investments
—
295,000
—
295,000
Total
$247,939,360
$295,000
$—
$248,234,360
1
1
1
1
1
Fund
Counterparty
Short-term
Investments,
at
Value
Collateral
Pledged
(From)
Counterparty
Lifestyle
Conservative
Fixed
Income
Clearing
Corporation
$
59,000
$
(60,243)
Lifestyle
Moderate
Fixed
Income
Clearing
Corporation
380,000
(387,721)
Lifestyle
Growth
Fixed
Income
Clearing
Corporation
240,000
(244,895)
Lifestyle
Aggressive
Growth
Fixed
Income
Clearing
Corporation
295,000
(300,999)
Fund
Non-U.S.
Government
Purchases
Non-U.S.
Government
Sales
16.1
Lifestyle
Income
$
14,446,448
$
20,829,651
16.2
Lifestyle
Conservative
41,202,907
56,128,981
16.3
Lifestyle
Moderate
81,998,034
89,354,010
16.4
Lifestyle
Growth
44,030,651
50,221,405
16.5
Lifestyle
Aggressive
Growth
28,354,113
32,875,843
5.
Fund
Shares
Transactions
in
Fund
shares
during
the
current
and
prior
fiscal
period
were
as
follows:
Year
Ended
5/31/24
Year
Ended
5/31/23
16.1
Lifestyle
Income
Shares
Amount
Shares
Amount
Subscriptions:
Class
A
116,893
$
1,205,317
218,171
$
2,242,579
Class
I
18,224
191,218
790
8,095
Premier
Class
1,217
12,407
2,406
24,593
Class
R6
323,324
3,335,953
124,946
1,268,906
Retirement
Class
420,617
4,424,239
72,501
737,335
Total
subscriptions
880,275
9,169,134
418,814
4,281,508
Reinvestments
of
distributions:
Class
A
137,970
1,428,697
199,092
2,003,633
Class
I
141
1,495
56
567
Premier
Class
247
2,513
615
6,200
Class
R6
45,041
466,501
61,090
614,951
Retirement
Class
52,373
542,803
75,598
760,612
Total
reinvestments
of
distributions
235,772
2,442,009
336,451
3,385,963
Redemptions:
Class
A
(674,726)
(6,981,790)
(977,314)
(9,973,662)
Class
I
(19,154)
(202,925)
(1,820)
(18,572)
Premier
Class
(17,246)
(178,495)
–
–
Class
R6
(674,213)
(7,044,483)
(280,139)
(2,889,853)
Retirement
Class
(398,295)
(4,108,530)
(373,279)
(3,816,901)
Total
redemptions
(1,783,634)
(18,516,223)
(1,632,552)
(16,698,988)
Net
increase
(decrease)
from
shareholder
transactions
(667,587)
$
(6,905,080)
(877,287)
$
(9,031,517)
Year
Ended
5/31/24
Year
Ended
5/31/23
16.2
Lifestyle
Conservative
Shares
Amount
Shares
Amount
Subscriptions:
Class
A
611,170
$
7,244,176
944,805
$
10,832,881
Class
I
57,909
684,642
33,424
385,345
Premier
Class
–
–
96
1,121
Class
R6
1,011,683
12,039,211
790,867
9,101,958
Retirement
Class
394,823
4,643,206
249,651
2,875,462
Total
subscriptions
2,075,585
24,611,235
2,018,843
23,196,767
Reinvestments
of
distributions:
Class
A
474,106
5,633,793
1,075,188
12,006,978
Class
I
7,828
93,172
17,576
196,503
Premier
Class
44
522
101
1,125
Class
R6
142,418
1,695,676
281,938
3,152,427
Retirement
Class
116,942
1,390,611
265,956
2,970,334
Total
reinvestments
of
distributions
741,338
8,813,774
1,640,759
18,327,367
Redemptions:
Class
A
(2,536,609)
(30,167,425)
(2,915,562)
(33,394,241)
Class
I
(62,529)
(740,166)
(100,964)
(1,152,864)
Premier
Class
(345)
(4,078)
(7)
(83)
Class
R6
(1,061,988)
(12,649,170)
(1,199,464)
(13,669,410)
Retirement
Class
(723,725)
(8,605,769)
(1,035,904)
(11,955,708)
Total
redemptions
(4,385,196)
(52,166,608)
(5,251,901)
(60,172,306)
Net
increase
(decrease)
from
shareholder
transactions
(1,568,273)
$
(18,741,599)
(1,592,299)
$
(18,648,172)
Notes
to
Financial
Statements
(continued)
Year
Ended
5/31/24
Year
Ended
5/31/23
16.3
Lifestyle
Moderate
Shares
Amount
Shares
Amount
Subscriptions:
Class
A
1,246,873
$
16,827,918
1,074,375
$
13,788,138
Class
I
138,315
1,859,642
85,026
1,084,126
Premier
Class
–
–
–
–
Class
R6
1,961,198
26,382,636
507,911
6,505,288
Retirement
Class
1,024,366
13,979,428
541,195
7,015,718
Total
subscriptions
4,370,752
59,049,624
2,208,507
28,393,270
Reinvestments
of
distributions:
Class
A
622,317
8,401,316
1,864,384
22,863,045
Class
I
15,083
204,023
50,187
616,632
Premier
Class
–
–
–
–
Class
R6
161,895
2,192,609
403,943
4,963,999
Retirement
Class
207,562
2,804,421
595,611
7,310,228
Total
reinvestments
of
distributions
1,006,857
13,602,369
2,914,125
35,753,904
Redemptions:
Class
A
(3,644,375)
(49,067,532)
(3,603,539)
(46,087,425)
Class
I
(177,843)
(2,433,831)
(358,361)
(4,544,491)
Premier
Class
–
–
–
–
Class
R6
(1,334,074)
(18,140,742)
(1,144,989)
(14,645,725)
Retirement
Class
(1,390,479)
(18,826,111)
(1,236,109)
(15,785,021)
Total
redemptions
(6,546,771)
(88,468,216)
(6,342,998)
(81,062,662)
Net
increase
(decrease)
from
shareholder
transactions
(1,169,162)
$
(15,816,223)
(1,220,366)
$
(16,915,488)
Year
Ended
5/31/24
Year
Ended
5/31/23
16.4
Lifestyle
Growth
Shares
Amount
Shares
Amount
Subscriptions:
Class
A
455,430
$
7,012,826
573,885
$
8,108,366
Class
I
46,333
709,977
31,936
452,762
Premier
Class
–
–
1
15
Class
R6
563,669
8,863,216
285,013
4,079,973
Retirement
Class
650,306
9,949,751
223,886
3,218,482
Total
subscriptions
1,715,738
26,535,770
1,114,721
15,859,598
Reinvestments
of
distributions:
Class
A
248,632
3,818,993
936,308
12,537,165
Class
I
5,725
88,391
20,438
274,891
Premier
Class
13
204
43
586
Class
R6
66,639
1,029,567
232,903
3,134,869
Retirement
Class
71,971
1,106,921
277,792
3,725,184
Total
reinvestments
of
distributions
392,980
6,044,076
1,467,484
19,672,695
Redemptions:
Class
A
(1,423,342)
(21,981,315)
(1,615,305)
(22,901,710)
Class
I
(54,370)
(847,086)
(121,640)
(1,767,937)
Premier
Class
(1)
(18)
–
–
Class
R6
(662,750)
(10,267,541)
(538,553)
(7,572,429)
Retirement
Class
(781,469)
(12,087,123)
(815,590)
(11,589,481)
Total
redemptions
(2,921,932)
(45,183,083)
(3,091,088)
(43,831,557)
Net
increase
(decrease)
from
shareholder
transactions
(813,214)
$
(12,603,237)
(508,883)
$
(8,299,264)
6.
Income
Tax
Information
Each
Fund
is
a
separate
taxpayer
for
federal
income
tax
purposes.
Each
Fund
intends
to
distribute
substantially
all
of
its
net
investment
income
and
net
capital
gains
to
shareholders
and
otherwise
comply
with
the
requirements
of
Subchapter
M
of
the
Internal
Revenue
Code
applicable
to
regulated
investment
companies.
Therefore,
no
federal
income
tax
provision
is
required.
Each
Fund
files
income
tax
returns
in
U.S.
federal
and
applicable
state
and
local
jurisdictions.
A
Fund’s
federal
income
tax
returns
are
generally
subject
to
examination
for
a
period
of
three
fiscal
years
after
being
filed.
State
and
local
tax
returns
may
be
subject
to
examination
for
an
additional
period
of
time
depending
on
the
jurisdiction.
Management
has
analyzed
each
Fund’s
tax
positions
taken
for
all
open
tax
years
and
has
concluded
that
no
provision
for
income
tax
is
required
in
the
Fund’s
financial
statements.
Differences
between
amounts
for
financial
statement
and
federal
income
tax
purposes
are
primarily
due
to
timing
differences
in
recognizing
gains
and
losses
on
investment
transactions.
Temporary
differences
do
not
require
reclassification.
As
of
year
end,
permanent
differences
that
resulted
in
reclassifications
among
the
components
of
net
assets
relate
primarily
to
distribution
reallocations,
investments
in
underlying
funds,
and
tax
equalization.
Temporary
and
permanent
differences
have
no
impact
on
a
Fund’s
net
assets.
As
of
year
end,
the
aggregate
cost
and
the
net
unrealized
appreciation/(depreciation)
of
all
investments
for
federal
income
tax
purposes
were
as
follows:
For
purposes
of
this
disclosure,
tax
cost
generally
includes
the
cost
of
portfolio
investments
as
well
as
up-front
fees
or
premiums
exchanged
on
derivatives
and
any
amounts
unrealized
for
income
statement
reporting
but
realized
income
and/or
capital
gains
for
tax
reporting,
if
applicable.
As
of year
end,
the
components
of
accumulated
earnings
on
a
tax
basis
were
as
follows:
Year
Ended
5/31/24
Year
Ended
5/31/23
16.5
Lifestyle
Aggressive
Growth
Shares
Amount
Shares
Amount
Subscriptions:
Class
A
381,029
$
6,618,304
359,559
$
5,618,570
Class
I
33,839
589,855
22,520
347,628
Premier
Class
21
399
185
2,977
Class
R6
623,063
10,944,045
534,365
8,415,601
Retirement
Class
395,031
6,811,525
209,827
3,289,892
Total
subscriptions
1,432,983
24,964,128
1,126,456
17,674,668
Reinvestments
of
distributions:
Class
A
97,368
1,682,526
550,204
8,010,968
Class
I
3,522
61,249
20,527
300,716
Premier
Class
–
–
16
245
Class
R6
60,584
1,053,560
276,472
4,050,319
Retirement
Class
51,628
894,199
296,231
4,322,012
Total
reinvestments
of
distributions
213,102
3,691,534
1,143,450
16,684,260
Redemptions:
Class
A
(834,812)
(14,401,815)
(663,153)
(10,352,245)
Class
I
(67,434)
(1,197,770)
(99,383)
(1,589,719)
Premier
Class
(199)
(3,427)
–
–
Class
R6
(690,856)
(12,210,477)
(495,441)
(7,760,747)
Retirement
Class
(654,883)
(11,288,061)
(471,598)
(7,236,702)
Total
redemptions
(2,248,184)
(39,101,550)
(1,729,575)
(26,939,413)
Net
increase
(decrease)
from
shareholder
transactions
(602,099)
$
(10,445,888)
540,331
$
7,419,515
Fund
Tax
Cost
Gross
Unrealized
Appreciation
Gross
Unrealized
(Depreciation)
Net
Unrealized
Appreciation
(Depreciation)
16.1
Lifestyle
Income
$77,723,271
$4,310,328
$(7,103,896)
$(2,793,568)
16.2
Lifestyle
Conservative
306,227,714
32,247,617
(29,264,889)
2,982,728
16.3
Lifestyle
Moderate
529,195,068
80,617,777
(46,751,890)
33,865,887
16.4
Lifestyle
Growth
269,541,074
56,662,507
(19,308,250)
37,354,257
16.5
Lifestyle
Aggressive
Growth
205,496,602
52,668,777
(9,931,019)
42,737,758
Notes
to
Financial
Statements
(continued)
The
tax
character
of
distributions
paid was
as
follows:
As
of
year
end,
the
Funds
had
capital
loss
carryforwards,
which
will
not
expire:
As
of
year
end,
the
Funds
utilized
the
following
capital
loss
carryforwards:
7.
Investment
Adviser
and
Other
Transactions
with Affiliates
Under
the
terms
of
its
Investment
Management
Agreement,
each
Fund
pays
the
Adviser
a
monthly
fee
based
on
the
annual
rate
of
0.10%
of
the
Fund’s
average
daily
net
assets
for
the
management
of
the
Fund’s
investment
portfolio.
The
Funds
have
entered
into
an
Administrative
Service
Agreement
with
the
Adviser
under
which
the
Funds
pay
the
Adviser
for
its
costs
in
providing
certain
administrative
and
compliance
services
to
the
Funds.
The
Adviser
has
agreed
to
gradually
reduce
expenses
allocated
to
the
Funds
under
the
Administrative
Services
Agreement
over
a
three-year
period
commencing
May
1,
2024.
After
the
expiration
of
this
three-year
period,
the
Adviser
will
no
longer
allocate
expenses
to
the
Funds
under
the
Administrative
Service
Agreement.
Under
the
terms
of
a
Retirement
Class
Service
Agreement
with
respect
to
each
Fund,
the
Retirement
Class
of
the
Fund
pays
the
Adviser
a
monthly
fee
based
on
the
annual
rate
of
0.25%
of
a
Fund’s
average
daily
net
assets
attributable
to
Retirement
Class
shares
of
a
Fund
for
providing
certain
administrative
services
related
to
the
maintenance
of
Retirement
Class
shares
on
retirement
plan
or
other
platforms.
Substantially,
all
of
the
Retirement
Class
shareholder
servicing
fees
reported
on
the
Statements
of
Operations
are
paid
to
the
Adviser
under
the
Service
Agreement.
Under
the
terms
of
a
distribution
Rule
12b-1
plan, Class
A
Shares of
each
Fund
compensates
Nuveen
Securities
for
providing
distribution,
promotional
and/or
shareholder
services
to
Class
A
Shares
of
the
Fund
at
the
annual
rate
of
0.25%
of
the
average
daily
net
assets
attributable
to
the
Fund’s
Class
A
Shares.
The
Premier
Class
of
each
Fund
is
subject
to
a
distribution
Rule
12b-1
plan
that
compensates
Nuveen
Securities
for
providing
distribution,
promotional
and/or
shareholder
services
to
the
Premier
Class
of
the
Fund
at
the
annual
rate
of
0.15%
of
the
average
daily
net
assets
attributable
to
the
Fund’s
Premier
Class.
The
Adviser
has
agreed
to
reimburse
each
Fund
if
its
total
expense
ratio
(excluding
interest,
taxes,
brokerage
commissions
and
other
transactional
expenses,
acquired
fund
fees
and
expenses
and
extraordinary
expenses)
exceeds
certain
percentages.
As
of the
end
of
the
current
fiscal
period,
the
investment
management
fee
and
maximum
expense
amounts
(after
waivers
and
reimbursements)
are
equal
to
the
following
noted
annual
percentage
of
average
daily
net
assets
for
each
class:
Fund
Undistributed
Ordinary
Income
Undistributed
Long-Term
Capital
Gains
Unrealized
Appreciation
(Depreciation)
Capital
Loss
Carryforwards
Late-Year
Loss
Deferrals
Other
Book-to-Tax
Differences
Total
16.1
Lifestyle
Income
$433,189
$–
$(2,793,568)
$(1,527,762)
$–
$(6,224)
$(3,894,365)
16.2
Lifestyle
Conservative
1,286,988
–
2,982,728
(2,216,554)
–
(16,393)
2,036,769
16.3
Lifestyle
Moderate
1,514,876
–
33,865,887
(1,867,614)
–
(24,180)
33,488,969
16.4
Lifestyle
Growth
1,055,701
–
37,354,257
(238,986)
–
(12,217)
38,158,755
16.5
Lifestyle
Aggressive
Growth
–
1,801,763
42,737,758
–
–
(8,885)
44,530,636
5/31/24
5/31/23
Fund
Ordinary
Income
Long-Term
Capital
Gains
Ordinary
Income
Long-Term
Capital
Gains
16.1
Lifestyle
Income
$
2,504,064
$
–
$
2,107,819
$
1,344,620
16.2
Lifestyle
Conservative
8,932,215
–
9,111,900
9,515,474
16.3
Lifestyle
Moderate
13,764,447
–
12,928,821
23,370,267
16.4
Lifestyle
Growth
6,098,768
–
5,173,012
14,681,846
16.5
Lifestyle
Aggressive
Growth
3,696,213
51,620
4,652,072
12,238,447
Fund
Short-Term
Long-Term
Total
16.1
Lifestyle
Income
$
474,990
$
1,052,772
$
1,527,762
16.2
Lifestyle
Conservative
2,216,554
–
2,216,554
16.3
Lifestyle
Moderate
1,867,614
–
1,867,614
16.4
Lifestyle
Growth
238,986
–
238,986
16.5
Lifestyle
Aggressive
Growth
–
–
–
Fund
Utilized
16.1
Lifestyle
Income
$–
16.2
Lifestyle
Conservative
3,408,378
16.3
Lifestyle
Moderate
8,749,517
16.4
Lifestyle
Growth
5,494,503
16.5
Lifestyle
Aggressive
Growth
3,200,055
Effective
May
1,
2023,
for
a
one
year
period, the
Adviser agreed
to
voluntarily
waive
a
portion
of
the
investment
management
fee
and/or
the
expense
cap
for
certain
funds.
This
waiver
is
voluntary
in
nature
and
can
be
discontinued
at
any
time
without
prior
notice
to
shareholders
upon
Board
approval.
The
investment
management
fee
and
maximum
expense
amounts
(after
voluntary
waivers)
are
equal
to
the
following
noted
annual
percentage
of
average
daily
net
assets
for
each
class:
The Funds may
purchase
or
sell
investment
securities
in
transactions
with
affiliated
entities
under
procedures
adopted
by
the
Board,
pursuant
to
the
1940
Act.
These
transactions
are
effected
at
market
rates
without
incurring
broker
commissions.
the
current
fiscal
period,
the
Funds
engaged
in
the
following
security
transactions
with
affiliated
entities:
Investments
in
other
investment
companies
advised
by
the
Adviser
and
Nuveen
Fund
Advisors,
LLC
are
deemed
to
be
affiliated
investments.
Information
regarding
transactions
with
affiliated
companies
is
as
follows:
Investment
Management
Fee-
Effective
Rate
Maximum
Expense
Amounts‡
Fund
Class
A
Class
I
Premier
Class
Class
R6
Retirement
Class
16.1
Lifestyle
Income
0.100
%
0.450
%
0.250
%
0.250
%
0.100
%
0.350
%
16.2
Lifestyle
Conservative
0.100
0.450
0.250
0.250
0.100
0.350
16.3
Lifestyle
Moderate
0.100
0.450
0.250
0.250
0.100
0.350
16.4
Lifestyle
Growth
0.100
0.450
0.250
0.250
0.100
0.350
16.5
Lifestyle
Aggressive
Growth
0.100
0.450
0.250
0.250
0.100
0.350
‡
Maximum
expense
amounts
reflect
all
expenses
excluding
interest,
taxes,
brokerage
commissions
or
other
transactional
expenses,
Acquired
fund
fees
and
expenses
and
extraordinary
expenses.
The
expense
reimbursement
arrangements
will
continue
through
at
least
September
30,
2024.
The
reimbursement
arrangements
can
only
be
changed
with
the
approval
of
the
Board.
Investment
Management
Fee
Range
Maximum
Expense
Amounts‡
Fund
Class
A
Class
I
Premier
Class
Class
R6
Retirement
Class
16.3
Lifestyle
Moderate
0.100
%
0.435
%
0.235
%
0.235
%
0.085
%
0.335
%
16.4
Lifestyle
Growth
0.100
%
0.375
0.175
0.175
0.025
0.275
‡
Maximum
expense
amounts
reflect
all
expenses
excluding
interest,
taxes,
brokerage
commissions
or
other
transactional
expenses,
Acquired
fund
fees
and
expenses
and
extraordinary
expenses.
The
reimbursement
arrangements
can
only
be
changed
with
the
approval
of
the
Board.
Fund
Purchases
Sales
Realized
Gain
(Loss)
Lifestyle
Income
$
32,304
$
35,710
$
2,681
Lifestyle
Conservative
271,549
266,987
(4,683)
Lifestyle
Moderate
545,426
351,786
(4,481)
Lifestyle
Growth
218,382
266,071
(11,651)
Lifestyle
Aggressive
Growth
210,136
339,784
(48,772)
Notes
to
Financial
Statements
(continued)
Issue
Value
at
5/31/23
Purchases
Cost
Sales
Proceeds
Realized
Gain
(Loss)
Change
in
Unrealized
Appreciation
(Depreciation)
Value
at
5/31/24
Dividend
Income
Capital
Gain
Distributions
Lifestyle
Income
Nuveen
Funds:
Core
Bond,
Class
R6
$
15,740,917
$
2,427,711
$
2,973,093
$
(578,909)
$
349,143
$
14,965,769
$
635,189
$
–
Core
Equity,
Class
R6
1,488,000
501,495
708,943
73,973
95,749
1,450,274
17,958
270,191
Core
Plus
Bond,
Class
R6
15,740,917
2,355,771
2,952,167
(598,236)
436,111
14,982,396
682,569
–
Dividend
Growth,
Class
R6
1,485,237
326,905
579,824
25,030
194,730
1,452,078
20,462
23,625
Dividend
Value,
Class
R6
1,499,681
334,835
689,017
33,128
218,318
1,396,945
26,617
49,842
Emerging
Markets
Equity,
Class
R6
913,961
258,917
367,556
(25,016)
97,212
877,518
29,119
–
Growth
Opportunities
ETF
1,743,180
47,105
614,307
(4,515)
586,367
1,757,830
3,217
–
International
Equity,
Class
R6
2,354,581
492,721
919,081
69,351
315,392
2,312,964
60,903
–
International
Opportunities,
Class
R6
1,407,394
311,156
513,366
(68,265)
230,265
1,367,184
16,889
–
Large
Cap
Growth,
Class
R6
1,714,748
460,943
949,665
58,825
421,898
1,706,749
3,803
–
Large
Cap
Value,
Class
R6
1,498,903
336,536
654,858
65,744
156,617
1,402,942
25,044
90,367
Quant
International
Small
Cap
Equity,
Class
R6
747,258
147,172
276,029
(4,452)
130,082
744,031
22,022
–
Quant
Small
Cap
Equity,
Class
R6
373,203
72,124
187,973
19,644
56,620
333,618
3,697
3,620
Quant
Small/Mid
Cap
Equity,
Class
R6
434,210
72,828
216,404
20,304
85,109
396,047
4,104
6,389
Short
Term
Bond,
Class
R6
31,469,819
5,218,171
7,148,392
(383,821)
627,581
29,783,358
1,203,559
–
$78,612,009
$13,364,390
$19,750,675
$(1,297,215)
$4,001,194
$74,929,703
$2,755,152
$444,034
Issue
Value
at
5/31/23
Purchases
Cost
Sales
Proceeds
Realized
Gain
(Loss)
Change
in
Unrealized
Appreciation
(Depreciation)
Value
at
5/31/24
Dividend
Income
Capital
Gain
Distributions
Lifestyle
Conservative
Nuveen
Funds:
Core
Bond,
Class
R6
$
30,320,164
$
3,933,832
$
3,045,533
$
(612,795)
$
183,692
$
30,779,360
$
1,264,854
$
–
Core
Equity,
Class
R6
11,469,260
2,815,384
3,592,563
346,283
897,195
11,935,559
144,880
2,223,845
Core
Plus
Bond,
Class
R6
90,977,082
10,336,820
8,038,461
(1,724,122)
847,309
92,398,628
4,076,372
–
Dividend
Growth,
Class
R6
11,374,615
1,587,060
2,752,490
145,539
1,578,181
11,932,905
163,620
194,363
Dividend
Value,
Class
R6
11,605,558
1,598,974
3,679,734
164,132
1,797,667
11,486,597
211,436
410,058
Emerging
Markets
Equity,
Class
R6
7,010,174
1,471,679
1,787,560
(247,930)
791,554
7,237,917
239,148
–
Growth
Opportunities
ETF
13,453,388
323,809
4,161,592
(102,091)
4,706,246
14,219,760
26,315
–
International
Equity,
Class
R6
18,137,136
2,774,869
4,902,881
282,715
2,733,207
19,025,046
502,569
–
International
Opportunities,
Class
R6
10,823,409
1,654,181
2,477,830
(419,217)
1,678,563
11,259,106
139,394
–
Large
Cap
Growth,
Class
R6
13,271,050
1,249,886
4,218,535
220,024
3,559,746
14,082,171
31,262
–
Large
Cap
Value,
Class
R6
11,564,686
1,613,440
3,366,466
382,760
1,332,122
11,526,542
205,287
740,729
Quant
International
Small
Cap
Equity,
Class
R6
5,752,427
606,830
1,225,867
(71,671)
1,054,685
6,116,404
180,649
–
Quant
Small
Cap
Equity,
Class
R6
2,875,451
252,909
1,023,569
138,605
457,630
2,701,026
30,442
29,811
Quant
Small/Mid
Cap
Equity,
Class
R6
3,348,557
266,589
1,229,085
137,581
689,552
3,213,194
33,756
52,555
Short
Term
Bond,
Class
R6
60,637,677
10,716,645
10,626,815
(549,220)
1,058,940
61,237,227
2,397,563
–
$302,620,634
$41,202,907
$56,128,981
$(1,909,407)
$23,366,289
$309,151,442
$9,647,547
$3,651,361
Issue
Value
at
5/31/23
Purchases
Cost
Sales
Proceeds
Realized
Gain
(Loss)
Change
in
Unrealized
Appreciation
(Depreciation)
Value
at
5/31/24
Dividend
Income
Capital
Gain
Distributions
Lifestyle
Moderate
Nuveen
Funds:
Core
Equity,
Class
R6
$
29,289,490
$
7,166,864
$
7,299,924
$
560,314
$
2,712,918
$
32,429,662
$
377,220
$
5,787,027
Core
Plus
Bond,
Class
R6
206,289,559
41,205,184
21,998,680
(4,919,845)
2,748,689
223,324,907
9,514,472
–
Dividend
Growth,
Class
R6
29,091,239
4,573,369
5,688,334
143,884
4,339,086
32,459,244
427,331
507,923
Dividend
Value,
Class
R6
29,617,467
3,389,363
6,898,974
254,924
4,849,077
31,211,857
551,970
1,071,197
Emerging
Markets
Equity,
Class
R6
17,848,866
4,276,581
3,864,541
(779,431)
2,169,760
19,651,235
623,667
–
Growth
Opportunities
ETF
34,219,670
562,056
8,113,005
(315,560)
12,296,925
38,650,086
68,745
–
International
Equity,
Class
R6
46,281,780
5,486,876
7,993,315
83,296
7,786,050
51,644,687
1,302,972
–
International
Opportunities,
Class
R6
27,577,460
4,309,221
4,557,843
(976,208)
4,234,561
30,587,191
361,888
–
Large
Cap
Growth,
Class
R6
33,988,575
3,813,984
9,064,377
364,298
9,477,258
38,579,738
81,687
–
Large
Cap
Value,
Class
R6
29,532,896
4,180,687
6,841,067
578,015
3,870,161
31,320,692
536,740
1,936,698
Quant
International
Small
Cap
Equity,
Class
R6
14,665,833
1,747,329
2,321,994
(276,929)
2,843,098
16,657,337
474,984
–
Quant
Small
Cap
Equity,
Class
R6
7,343,111
691,173
2,212,137
382,416
1,163,466
7,368,029
79,129
77,487
Quant
Small/Mid
Cap
Equity,
Class
R6
8,552,263
595,347
2,499,819
243,865
1,904,634
8,796,290
87,844
136,766
$514,298,209
$81,998,034
$89,354,010
$(4,656,961)
$60,395,683
$562,680,955
$14,488,649
$9,517,098
Issue
Value
at
5/31/23
Purchases
Cost
Sales
Proceeds
Realized
Gain
(Loss)
Change
in
Unrealized
Appreciation
(Depreciation)
Value
at
5/31/24
Dividend
Income
Capital
Gain
Distributions
Lifestyle
Growth
Nuveen
Funds:
Core
Equity,
Class
R6
$
20,706,098
$
4,694,563
$
4,245,483
$
76,598
$
2,272,118
$
23,503,894
$
268,293
$
4,087,525
Core
Plus
Bond,
Class
R6
54,654,911
13,370,932
6,724,823
(1,481,477)
864,500
60,684,043
2,541,137
–
Dividend
Growth,
Class
R6
20,593,291
2,716,881
2,987,394
66,388
3,090,669
23,479,835
305,020
358,098
Dividend
Value,
Class
R6
20,913,650
2,180,254
4,088,048
139,993
3,501,326
22,647,175
393,659
756,760
Emerging
Markets
Equity,
Class
R6
12,592,564
3,520,693
2,878,305
(689,121)
1,677,833
14,223,664
438,927
–
Growth
Opportunities
ETF
24,166,078
218,382
4,890,683
(274,953)
8,767,323
27,986,147
48,507
–
International
Equity,
Class
R6
32,668,228
4,487,911
5,276,146
(74,106)
5,691,558
37,497,445
921,092
–
International
Opportunities,
Class
R6
19,490,527
2,986,485
2,607,963
(558,689)
2,862,940
22,173,300
255,609
–
Large
Cap
Growth,
Class
R6
24,047,744
2,633,744
5,721,564
142,411
6,827,398
27,929,733
57,611
–
Large
Cap
Value,
Class
R6
20,860,836
2,569,982
3,874,908
297,385
2,882,948
22,736,243
378,841
1,366,956
Quant
International
Small
Cap
Equity,
Class
R6
10,350,440
1,414,985
1,519,107
(242,594)
2,067,236
12,070,960
334,338
–
Quant
Small
Cap
Equity,
Class
R6
5,190,968
417,559
1,353,686
194,891
903,628
5,353,360
55,891
54,730
Quant
Small/Mid
Cap
Equity,
Class
R6
6,043,007
263,108
1,465,003
122,151
1,406,268
6,369,531
62,039
96,590
$272,278,342
$41,475,479
$47,633,113
$(2,281,123)
$42,815,745
$306,655,330
$6,060,964
$6,720,659
Issue
Value
at
5/31/23
Purchases
Cost
Sales
Proceeds
Realized
Gain
(Loss)
Change
in
Unrealized
Appreciation
(Depreciation)
Value
at
5/31/24
Dividend
Income
Capital
Gain
Distributions
Lifestyle
Aggressive
Growth
Nuveen
Funds:
Core
Equity,
Class
R6
$
20,224,168
$
4,824,882
$
3,648,415
$
(330,025)
$
2,616,542
$
23,687,152
$
265,943
$
4,073,861
Dividend
Growth,
Class
R6
20,047,915
3,163,583
2,623,668
19,525
3,082,759
23,690,114
298,724
356,428
Dividend
Value,
Class
R6
20,371,243
2,523,347
3,632,840
4,385
3,572,220
22,838,355
388,444
752,686
Emerging
Markets
Equity,
Class
R6
12,275,340
3,372,418
2,274,185
(620,362)
1,579,920
14,333,131
435,915
–
Growth
Opportunities
ETF
23,496,858
210,137
3,897,750
(266,562)
8,634,079
28,176,762
48,126
–
International
Equity,
Class
R6
31,843,322
4,817,512
4,460,546
(272,192)
5,829,251
37,757,347
921,364
–
International
Opportunities,
Class
R6
18,976,503
2,749,859
1,645,575
(434,041)
2,695,047
22,341,793
255,384
–
Large
Cap
Growth,
Class
R6
23,394,616
1,843,050
3,945,578
43,343
6,835,597
28,171,028
57,403
–
Large
Cap
Value,
Class
R6
20,325,418
2,651,321
3,213,346
151,581
2,961,236
22,876,210
377,493
1,362,092
Quant
International
Small
Cap
Equity,
Class
R6
10,072,595
1,395,100
1,094,294
(234,496)
2,034,834
12,173,739
331,388
–
Quant
Small
Cap
Equity,
Class
R6
5,065,103
438,169
1,144,546
18,263
1,058,351
5,435,340
55,750
54,593
Quant
Small/Mid
Cap
Equity,
Class
R6
5,886,336
364,735
1,295,100
35,647
1,466,771
6,458,389
61,818
96,246
$211,979,417
$28,354,113
$32,875,843
$(1,884,934)
$42,366,607
$247,939,360
$3,497,752
$6,695,906
Notes
to
Financial
Statements
(continued)
8.
Inter-Fund
Lending
Program
Pursuant
to
an
exemptive
order
issued
by
the
SEC,
the
Funds may
participate
in
an
inter-fund
lending
program.
This
program
allows
the
Funds to
lend
cash
to
and/or
borrow
cash
from
certain
other
affiliated
Funds for
temporary
purposes,
(e.g.,
to
satisfy
redemption
requests
or
to
cover
unanticipated
cash
shortfalls).
The
program
is
subject
to
a
number
of
conditions,
including
the
requirement
that
no
Fund may
borrow
or
lend
money
under
the
program
unless
it
receives
a
more
favorable
interest
rate
than
is
available
from
a
bank
or
other
financial
institution
for
a
comparable
transaction.
In
addition,
a
Fund may
participate
in
the
program
only
if
its
participation
is
consistent
with
the
Fund’s investment
policies
and
limitations
and
authorized
by
its
portfolio
manager(s).
During the current
fiscal
period,
there
were
no
inter-fund
borrowing
or
lending
transactions.
9.
Line
of
Credit
The Funds
participate
in
a
$1
billion
unsecured
revolving
credit
facility
that
can
be
used
for
temporary
purposes,
including,
without
limitation,
the
funding
of
shareholder
redemptions.
The
current
facility
was
entered
into
on
June
13,
2023
expiring
on
June
11,
2024,
replacing
the
previous facility,
which
expired
June
2023.
Certain
affiliated
accounts
and
mutual
funds,
each
of
which
is
managed
by the
Adviser,
or
an
affiliate
of
the
Adviser, also
participate
in
this
facility.
An
annual
commitment
fee
for
the
credit
facility
is
borne
by
the
participating
accounts
and
mutual
funds
on
a
pro
rata
basis.
Interest
associated
with
any
borrowing
under
the
facility
is
charged
to
the
borrowing
accounts
or
mutual
funds
at
a
specified
rate
of
interest.
The Funds are
not
liable
for
borrowings
under
the
facility
by
other
affiliated
accounts
or
mutual
funds.
There
were
no
borrowings
under
this
credit
facility
by
the
Funds during
the
current fiscal
period.
10.
Subsequent
Event
Line
of
Credit:
On
June
11,
2024,
the
Funds’
credit
facility
expired,
and
the
Funds
have
not
entered
into
another
credit
facility.
Important
Tax
Information
(Unaudited)
As
required
by
the
Internal
Revenue
Code
and
Treasury
Regulations,
certain
tax
information,
as
detailed
below,
must
be
provided
to
shareholders.
Shareholders
are
advised
to
consult
their
tax
advisor
with
respect
to
the
tax
implications
of
their
investment.
The
amounts
listed
below
may
differ
from
the
actual
amounts
reported
on
Form
1099-DIV,
which
will
be
sent
to
shareholders
shortly
after
calendar
year
end.
Long-Term
Capital
Gains
As
of
year
end,
each
Fund
designates
the
following
distribution
amounts,
or
maximum
amount
allowable,
as
being
from
net
long-term
capital
gains
pursuant
to
Section
852(b)(3)
of
the
Internal
Revenue
Code:
Dividends
Received
Deduction
(DRD)
Each
Fund
listed
below
had
the
following
percentage,
or
maximum
amount
allowable,
of
ordinary
income
distributions
eligible
for
the
dividends
received
deduction
for
corporate
shareholders:
Qualified
Dividend
Income
(QDI)
Each
Fund
listed
below
had
the
following
percentage,
or
maximum
amount
allowable,
of
ordinary
income
distributions
treated
as
qualified
dividend
income
for
individuals
pursuant
to
Section
1(h)(11)
of
the
Internal
Revenue
Code:
Foreign
Source
Income
and
Foreign
Tax
Credit
Pass
Through
Each
Fund
listed
below
has
made
an
election
under
Section
853
of
the
Internal
Revenue
Code
to
pass
through
foreign
taxes
paid:
Fund
Net
Long-Term
Capital
Gains
16.1
Lifestyle
Income
$
–
16.2
Lifestyle
Conservative
–
16.3
Lifestyle
Moderate
–
16.4
Lifestyle
Growth
–
16.5
Lifestyle
Aggressive
Growth
59,098
Fund
Percentage
16.1
Lifestyle
Income
4
.5
%
16.2
Lifestyle
Conservative
10
.0
16.3
Lifestyle
Moderate
16
.4
16.4
Lifestyle
Growth
25
.6
16.5
Lifestyle
Aggressive
Growth
40
.2
Fund
Percentage
16.1
Lifestyle
Income
8
.5
%
16.2
Lifestyle
Conservative
19
.0
16.3
Lifestyle
Moderate
31
.4
16.4
Lifestyle
Growth
49
.0
16.5
Lifestyle
Aggressive
Growth
77
.6
Fund
Foreign
Source
Income
Foreign
Source
Income
Per
Share
Qualifying
Foreign
Taxes
Paid
Qualifying
Foreign
Taxes
Paid
per
Share
16.1
Lifestyle
Income
$
119,389
$
0.01696
$
11,599
$
0.00165
16.2
Lifestyle
Conservative
982,006
0.03951
95,097
0.00383
16.3
Lifestyle
Moderate
2,551,799
0.06527
248,008
0.00634
16.4
Lifestyle
Growth
1,800,840
0.09842
175,000
0.00956
16.5
Lifestyle
Aggressive
Growth
1,795,847
0.13946
174,459
0.01355
Item
7.
Financial
Statements
and
Financial
Highlights
for
Open-
End
Management
Investment
Companies
Report
of
Independent
Registered
Public
Accounting
Firm
To
the
Board
of
Trustees
of
TIAA-CREF
Funds
and
Shareholders
of
Nuveen
Managed
Allocation
Fund
Opinion
on
the
Financial
Statements
We
have
audited
the
accompanying
statement
of
assets
and
liabilities,
including
the
portfolio
of
investments,
of
Nuveen
Managed
Allocation
Fund
(one
of
the
funds
constituting
TIAA-CREF
Funds,
hereafter
referred
to
as
the
“Fund”)
as
of
May
31,
2024,
the
related
statement
of
operations
for
the
year
ended
May
31,
2024,
the
statement
of
changes
in
net
assets
for
each
of
the
two
years
in
the
period
ended
May
31,
2024,
including
the
related
notes,
and
the
financial
highlights
for
each
of
the
five
years
in
the
period
ended
May
31,
2024
(collectively
referred
to
as
the
“financial
statements”).
In
our
opinion,
the
financial
statements
present
fairly,
in
all
material
respects,
the
financial
position
of
the
Fund
as
of
May
31,
2024,
the
results
of
its
operations
for
the
year
then
ended,
the
changes
in
its
net
assets
for
each
of
the
two
years
in
the
period
ended
May
31,
2024
and
the
financial
highlights
for
each
of
the
five
years
in
the
period
ended
May
31,
2024
in
conformity
with
accounting
principles
generally
accepted
in
the
United
States
of
America.
Basis
for
Opinion
These
financial
statements
are
the
responsibility
of
the
Fund’s
management.
Our
responsibility
is
to
express
an
opinion
on
the
Fund’s
financial
statements
based
on
our
audits.
We
are
a
public
accounting
firm
registered
with
the
Public
Company
Accounting
Oversight
Board
(United
States)
(PCAOB)
and
are
required
to
be
independent
with
respect
to
the
Fund
in
accordance
with
the
U.S.
federal
securities
laws
and
the
applicable
rules
and
regulations
of
the
Securities
and
Exchange
Commission
and
the
PCAOB.
We
conducted
our
audits
of
these
financial
statements
in
accordance
with
the
standards
of
the
PCAOB.
Those
standards
require
that
we
plan
and
perform
the
audit
to
obtain
reasonable
assurance
about
whether
the
financial
statements
are
free
of
material
misstatement,
whether
due
to
error
or
fraud.
Our
audits
included
performing
procedures
to
assess
the
risks
of
material
misstatement
of
the
financial
statements,
whether
due
to
error
or
fraud,
and
performing
procedures
that
respond
to
those
risks.
Such
procedures
included
examining,
on
a
test
basis,
evidence
regarding
the
amounts
and
disclosures
in
the
financial
statements.
Our
audits
also
included
evaluating
the
accounting
principles
used
and
significant
estimates
made
by
management,
as
well
as
evaluating
the
overall
presentation
of
the
financial
statements.
Our
procedures
included
confirmation
of
securities
owned
as
of
May
31,
2024
by
correspondence
with
the
custodian,
transfer
agent
and
broker.
We
believe
that
our
audits
provide
a
reasonable
basis
for
our
opinion.
/s/PricewaterhouseCoopers
LLP
Chicago,
Illinois
July
25,
2024
We
have
served
as
the
auditor
of
one
or
more
investment
companies
in Nuveen
Funds
since
2002.
Managed
Allocation
Fund
May
31,
2024
See
Notes
to
Financial
Statements
SHARES
DESCRIPTION
VALUE
AFFILIATED
INVESTMENT
COMPANIES—100.0%(a)
FIXED
INCOME—39.7%
38,865,643
Nuveen
Core
Plus
Bond
Fund,
Class
R6
$
349,790,789
TOTAL
FIXED
INCOME
349,790,789
INTERNATIONAL
EQUITY—21.1%
3,830,285
Nuveen
Emerging
Markets
Equity
Fund,
Class
R6
30,757,188
5,686,489
Nuveen
International
Equity
Fund,
Class
R6
81,032,462
3,107,626
Nuveen
International
Opportunities
Fund,
Class
R6
47,857,439
2,364,130
Nuveen
Quant
International
Small
Cap
Equity
Fund,
Class
R6
26,076,354
TOTAL
INTERNATIONAL
EQUITY
185,723,443
U.S.
EQUITY—39.2%
3,355,031
Nuveen
Core
Equity
Fund,
Class
R6
50,795,172
856,924
Nuveen
Dividend
Growth
Fund,
Class
R6
50,789,873
3,186,569
Nuveen
Dividend
Value
Fund,
Class
R6
48,945,705
2,042,268
Nuveen
Growth
Opportunities
ETF
60,532,824
2,300,453
Nuveen
Large
Cap
Growth
Fund,
Class
R6
60,340,876
2,251,696
Nuveen
Large
Cap
Value
Fund,
Class
R6
49,064,463
616,146
Nuveen
Quant
Small
Cap
Equity
Fund,
Class
R6
11,540,416
918,558
Nuveen
Quant
Small/Mid
Cap
Equity
Fund,
Class
R6
13,815,107
TOTAL
U.S.
EQUITY
345,824,436
TOTAL
AFFILIATED
INVESTMENT
COMPANIES
881,338,668
(Cost
$751,526,786)
PRINCIPAL
RATE
MATURITY
DATE
SHORT-TERM
INVESTMENTS—0.1%
REPURCHASE
AGREEMENT—0.1%
$522,000
(b)
Fixed
Income
Clearing
Corporation
5
.320
%
06/03/24
522,000
TOTAL
REPURCHASE
AGREEMENT
522,000
TOTAL
SHORT-TERM
INVESTMENTS
522,000
(Cost
$522,000)
TOTAL
INVESTMENTS—100.1%
881,860,668
(Cost
$752,048,786)
OTHER
ASSETS
&
LIABILITIES,
NET—(0.1)%
(
753,916
)
NET
ASSETS—100.0%
$
881,106,752
ETF
Exchange
Traded
Fund
(a)
Affiliated
fund.
(b)
Agreement
with
Fixed
Income
Clearing
Corporation,
5.320%
dated
5/31/24
to
be
repurchased
at
$522,231
on
6/3/24,
collateralized
by
Government
Agency
Securities,
with
coupon
rate
1.875%
and
maturity
date
2/28/27,
valued
at
$532,567.
Statement
of
Assets
and
Liabilities
See
Notes
to
Financial
Statements
May
31,
2024
18.1
Managed
Allocation
ASSETS
Affiliated
investments,
at
value
‡
$
881,338,668
Short-term
investments,
at
value
#
522,000
Cash
736
Receivables:
Dividends
1,366,406
Interest
77
Investments
sold
2,283,223
Reimbursement
from
Adviser
52,112
Shares
sold
24,227
Other
169,030
Total
assets
885,756,479
LIABILITIES
Due
to
affiliates
14,176
Payables:
Investments
purchased
-
regular
settlement
3,262,951
Shares
redeemed
897,636
Service
agreement
fees
15,425
Accrued
expenses:
Custodian
fees
1,892
Professional
fees
356
Shareholder
reporting
expenses
28,966
Shareholder
servicing
agent
fees
92,389
Trustees
fees
168,576
12b-1
distribution
and
service
fees
167,360
Total
liabilities
4,649,727
Net
assets
$
881,106,752
NET
ASSETS
CONSIST
OF:
Paid-in
capital
$
772,029,209
Total
distributable
earnings
(loss)
109,077,543
Net
assets
$
881,106,752
‡
Affiliated
investments,
cost
$
751,526,786
#
Short-term
investments,
cost
$
522,000
CLASS
A:
Net
assets
$
789,834,384
Shares
outstanding
64,129,101
Net
asset
value
("NAV")
per
share
$
12
.32
Maximum
sales
charge
5.75%
Offering
price
per
share
(NAV
per
share
plus
maximum
sales
charge)
$
13
.07
CLASS
R6:
Net
assets
$
18,768,818
Shares
outstanding
1,530,444
NAV
and
offering
price
per
share
$
12
.26
RETIREMENT
CLASS:
Net
assets
$
72,503,550
Shares
outstanding
5,921,579
NAV
and
offering
price
per
share
$
12
.24
Authorized
shares
-
per
class
Unlimited
Par
value
per
share
$
0
.0001
See
Notes
to
Financial
Statements
Year
Ended
May
31,
2024
18.1
Managed
Allocation
INVESTMENT
INCOME
Dividends
from
affiliated
investments
$
22,785,533
Interest
30,154
Total
investment
income
22,815,687
EXPENSES
12b-1
distribution
and
service
fees
—
Class
A
1,897,035
Shareholder
servicing
agent
fees
—
Class
A
302,414
Shareholder
servicing
agent
fees
—
Class
R6
151
Shareholder
servicing
agent
fees
—
Retirement
Class
175,366
Administrative
service
fees
53,113
Trustees
fees
13,224
Custodian
expenses
7,433
Overdraft
expense
1,686
Professional
fees
17,455
Registration
fees
54,567
Shareholder
reporting
expenses
66,381
Other
27,539
Total
expenses
2,616,364
Expenses
reimbursed
by
the
investment
adviser
(542,410)
Net
expenses
2,073,954
Net
investment
income
(loss)
20,741,733
REALIZED
AND
UNREALIZED
GAIN
(LOSS)
Realized
gain
(loss):
Affiliated
investments
1,084,241
Distributions
from
affiliated
investments
14,922,001
Net
realized
gain
(loss)
16,006,242
Change
in
unrealized
appreciation
(depreciation)
on:
Affiliated
investments
86,868,015
Net
change
in
unrealized
appreciation
(depreciation)
86,868,015
Net
realized
and
unrealized
gain
(loss)
102,874,257
Net
increase
(decrease)
in
net
assets
from
operations
$
123,615,990
Statement
of
Changes
in
Net
Assets
See
Notes
to
Financial
Statements
18.1
Managed
Allocation
Year
Ended
5/31/24
Year
Ended
5/31/23
OPERATIONS
Net
investment
income
(loss)
$
20,741,733
$
18,011,503
Net
realized
gain
(loss)
16,006,242
(
23,558,576
)
Net
change
in
unrealized
appreciation
(depreciation)
86,868,015
5,089,157
Net
increase
(decrease)
in
net
assets
from
operations
123,615,990
(
457,916
)
DISTRIBUTIONS
TO
SHAREHOLDERS
–
–
Dividends:
Class
A
(
19,854,680
)
(
53,781,744
)
Class
R6
(
529,165
)
(
1,557,184
)
Retirement
Class
(
1,844,718
)
(
5,228,672
)
Total
distributions
(
22,228,563
)
(
60,567,600
)
FUND
SHARE
TRANSACTIONS
Subscriptions
21,050,277
27,414,290
Reinvestments
of
distributions
21,516,639
58,701,042
Redemptions
(
85,680,824
)
(
90,380,463
)
Net
increase
(decrease)
from
Fund
share
transactions
(
43,113,908
)
(
4,265,131
)
Net
increase
(decrease)
in
net
assets
58,273,519
(
65,290,647
)
Net
assets
at
the
beginning
of
period
822,833,233
888,123,880
Net
assets
at
the
end
of
period
$
881,106,752
$
822,833,233
See
Notes
to
Financial
Statements
The
following
data
is
for
a
share outstanding
for
each
fiscal year
end
unless
otherwise
noted:
Investment
Operations
Less
Distributions
Net
Asset
Value,
Beginning
of
Period
Net
Investment
Income
(Loss)
a
Net
Realized/
Unrealized
Gain
(Loss)
j
Total
From
Net
Investment
Income
From
Net
Realized
Gains
Total
Net
Asset
Value,
End
of
Period
18.1
Managed
Allocation
Class
A:
5/31/24
$
10
.93
$
0
.28
$
1
.41
$
1
.69
$
(
0
.30
)
$
—
$
(
0
.30
)
$
12
.32
5/31/23
11
.77
0
.24
(
0
.26
)
(
0
.02
)
(
0
.25
)
(
0
.57
)
(
0
.82
)
10
.93
5/31/22
14
.51
0
.22
(
1
.46
)
(
1
.24
)
(
0
.41
)
(
1
.09
)
(
1
.50
)
11
.77
5/31/21
12
.36
0
.20
3
.07
3
.27
(
0
.33
)
(
0
.79
)
(
1
.12
)
14
.51
5/31/20
12
.21
0
.25
0
.59
0
.84
(
0
.25
)
(
0
.44
)
(
0
.69
)
12
.36
Class
R6:
5/31/24
10
.88
0
.31
1
.40
1
.71
(
0
.33
)
—
(
0
.33
)
12
.26
5/31/23
11
.73
0
.26
(
0
.26
)
—
(
0
.28
)
(
0
.57
)
(
0
.85
)
10
.88
5/31/22
14
.46
0
.25
(
1
.45
)
(
1
.20
)
(
0
.44
)
(
1
.09
)
(
1
.53
)
11
.73
5/31/21
12
.32
0
.23
3
.07
3
.30
(
0
.37
)
(
0
.79
)
(
1
.16
)
14
.46
5/31/20
12
.18
0
.28
0
.58
0
.86
(
0
.28
)
(
0
.44
)
(
0
.72
)
12
.32
Retirement
Class:
5/31/24
10
.87
0
.28
1
.39
1
.67
(
0
.30
)
—
(
0
.30
)
12
.24
5/31/23
11
.71
0
.24
(
0
.26
)
(
0
.02
)
(
0
.25
)
(
0
.57
)
(
0
.82
)
10
.87
5/31/22
14
.44
0
.21
(
1
.45
)
(
1
.24
)
(
0
.40
)
(
1
.09
)
(
1
.49
)
11
.71
5/31/21
12
.31
0
.20
3
.05
3
.25
(
0
.33
)
(
0
.79
)
(
1
.12
)
14
.44
5/31/20
12
.16
0
.25
0
.59
0
.84
(
0
.25
)
(
0
.44
)
(
0
.69
)
12
.31
a
Based
on
average
shares
outstanding.
b
Total
returns
are
at
NAV
and
do
not
include
any
sales
charge.
Total
returns
are
not
annualized.
e
The
Fund's
expenses
do
not
include
the
expenses
of
the
Underlying
Funds.
j
Short-term
and
long-term
capital
gain
distributions
received
from
the
underlying
Funds
are
presented
in
net
realized
and
unrealized
gain
(loss)
on
total
investments
for
all
periods
presented.
See
Notes
to
Financial
Statements
Ratios
and
Supplemental
Data
Ratios
to
Average
Net
Assets
Total
Return
b
Net
Assets,
End
of
Period
(000)
Gross
Expenses
e
Net
Expenses
e
Net
Investment
Income
(Loss)
Portfolio
Turnover
Rate
15
.70
%
$
789,834
0
.32
%
0
.25
%
2
.44
%
11
%
0
.20
734,814
0
.32
0
.25
2
.17
19
(
9
.69
)
790,563
0
.31
0
.23
1
.59
23
27
.20
918,856
0
.31
0
.25
1
.48
42
6
.87
750,844
0
.32
0
.25
1
.97
27
15
.97
18,769
0
.03
0.00
2
.68
11
0
.39
18,493
0
.03
0.00
2
.40
19
(
9
.45
)
24,214
0
.03
0.00
1
.84
23
27
.52
24,885
0
.02
0.00
1
.71
42
7
.09
16,997
0
.03
0.00
2
.21
27
15
.60
72,504
0
.28
0
.25
2
.44
11
0
.21
69,526
0
.28
0
.25
2
.18
19
(
9
.70
)
73,347
0
.28
0
.25
1
.56
23
27
.15
88,693
0
.27
0
.25
1
.48
42
6
.91
70,404
0
.28
0
.25
1
.98
27
Notes
to
Financial
Statements
1.
General
Information
Trust
and
Fund
Information:
TIAA-CREF
Funds
(the
“Trust”)
is
an
open-end
management
investment
company
registered
under
the
Investment
Company
Act
of
1940,
(“1940
Act”),
as
amended.
The
Trust
is
comprised
of
the
following
(the
“Fund”),
among
others:
Fund
Name
Changes:
Effective
May
1,
2024,
the
Fund's
name
changed
as
noted
above
and
therefore
all
references
to
the
name
of
the
Fund
in
this
report
have
been
updated.
Current
Fiscal
Period:
The
end
of
the
reporting
period
for
the
Fund
is
May
31,
2024,
and
the
period
covered
by
these
Notes
to
Financial
Statements
is
the
fiscal
year
ended
May
31,
2024
(the
"current
fiscal
period").
Investment
Advisor:
Teachers
Advisors,
LLC
(the
“Adviser”),
a
wholly
owned
indirect
subsidiary
of
Teachers
Insurance
and
Annuity
Association
of
America
(“TIAA”),
is
registered
with
the
SEC
as
an
investment
adviser
and
provides
investment
management
services
for
the
Fund.
Share
Classes
and
Sales
Charges:
The
Fund
is
a
“fund
of
funds”
that
diversifies
its
assets
by
investing
in
Class
R6
shares
of
other
funds
of
the
Trust
and
potentially
other
investment
pools
or
investment
products.
The
Fund
offers
Class
A,
Class
R6
and
Retirement
Class
shares.
Each
class
differs
by
the
allocation
of
class-specific
expenses
and
voting
rights
in
matters
affecting
a
single
class.
Effective
May
6,
2024,
a
sales
charge
is
imposed
on
purchases
of
Class
A
shares
of
the
Fund,
of
less
than
certain
amounts,
as
set
forth
in
the
Fund’s
prospectus.
The
Fund
offers
its
shares
through
its
principal
underwriter,
Nuveen
Securities,
LLC
(“Nuveen
Securities”),
which
is
a
wholly
owned
indirect
subsidiary
of
TIAA.
Share
Class
Name
Changes:
Effective
May
6,
2024,
the
names
of
certain
share
classes
for
the
Funds
changed
and
therefore
all
references
to
the
names
of
these
share
classes
in
this
report
have
changed
as
follows.
2.
Significant
Accounting
Policies
The
accompanying
financial
statements
were
prepared
in
accordance
with
accounting
principles
generally
accepted
in
the
United
States
of
America
(“U.S.
GAAP”),
which
may
require
the
use
of
estimates
made
by
management
and
the
evaluation
of
subsequent
events.
Actual
results
may
differ
from
those
estimates.
The Fund is
an
investment
company
and
follows
the
accounting
guidance
in
the
Financial
Accounting
Standards
Board
(“FASB”)
Accounting
Standards
Codification
946,
Financial
Services
—
Investment
Companies
.
The net
asset
value (“NAV”) for
financial
reporting
purposes
may
differ
from
the NAV
for
processing
transactions.
The NAV
for
financial
reporting
purposes
includes
security
and
shareholder
transactions
through
the
date
of
the
report.
Total
return
is
computed
based
on
the NAV
used
for
processing
transactions.
The
following
is
a
summary
of
the
significant
accounting
policies
consistently
followed
by
the
Fund.
Compensation:
The
Fund pays
the
members
of
the
Board
of
Trustees
("Board"),
all
of
whom
are
independent,
certain
remuneration
for
their
services,
plus
travel
and
other
expenses.
The
Board
has
adopted
a
deferred
compensation
plan
for
independent
trustees
that
enables
trustees
to
elect
to
defer
receipt
of
all
or
a
portion
of
the
annual
compensation
they
are
entitled
to
receive
from
certain
Nuveen-advised
funds.
Under
the
plan,
deferred
amounts
are
treated
as
though
equal
dollar
amounts
had
been
invested
in
shares
of
select
Nuveen-advised
funds. Amounts
deferred
are
retained
by
the
Fund
until
paid. Amounts
payable
to
the
trustees
for
compensation
are
included
separately in
the
accompanying
Statement
of
Assets
and
Liabilities. Trustees’
fees,
including
any
deferred
and compensation
incurred,
are
reflected
in
the
Statement
of
Operations.
Distributions
to
Shareholders:
Distributions
to
shareholders
are
recorded
on
the
ex-dividend
date.
The
amount,
character
and
timing
of
distributions
are
determined
in
accordance
with
federal
income
tax
regulations,
which
may
differ
from
U.S.
GAAP.
New
Name
Former
Name
Short
Name
Nuveen
Managed
Allocation
Fund
TIAA-CREF
Managed
Allocation
Fund
Managed
Allocation
New
Name
Former
Name
Class
A
Retail
Class
Class
R6
Institutional
Class
Indemnification:
Under
the
Trust's
organizational
documents,
its
officers
and
trustees
are
indemnified
against
certain
liabilities
arising
out
of
the
performance
of
their
duties
to
the
Trust.
In
addition,
in
the
normal
course
of
business,
the
Trust
enters
into
contracts
that
provide
general
indemnifications
to
other
parties.
The
Trust's
maximum
exposure
under
these
arrangements
is
unknown
as
this
would
involve
future
claims
that
may
be
made
against
the
Trust
that
have
not
yet
occurred.
However,
the
Trust
has
not
had
prior
claims
or
losses
pursuant
to
these
contracts
and
expects
the
risk
of
loss
to
be
remote.
Investments
and
Investment
Income:
Securities
transactions
are
accounted
for
as
of
the
trade
date
for
financial
reporting
purposes.
Interest
income
is
recorded
on
an
accrual
basis
and
includes
accretion
of
discounts
and
amortization
of
premiums.
Dividend
income
is
recorded
on
the
ex-dividend
date.
Foreign
dividend
income
is
recorded
on
the
ex-dividend
date
or
as
soon
as
possible
after
the
Fund
determines
the
existence
of
a
dividend
declaration.
Securities
lending
income
is
comprised
of
fees
earned
from
borrowers
and
income
earned
on
cash
collateral
investments.
Realized
gains
and
losses
on
securities
transactions
are
based
upon
the
specific
identification
method.
Distributions
received
on
securities
that
represent
a
return
of
capital
or
capital
gains
are
recorded
as
a
reduction
of
cost
of
investments
and/or
as
a
realized
gain.
The
Fund
estimates
the
components
of
distributions
received
that
may
be
considered
return
of
capital
distributions
or
capital
gain
distributions.
Multiclass
Operations
and
Allocations:
Income, expenses,
realized
gains
and
losses
and
unrealized
appreciation
and
depreciation of the
Fund
are
allocated
on
a
pro
rata
basis
to
each
class
of
shares,
except
for
service
agreement
fees,
distribution
fees
and
transfer
agency
fees
and
expenses,
which
are
unique
to
each
class
of
shares.
Most
expenses
of
the
Trust
can
be
directly
attributed
to a
Fund.
Expenses
that
cannot
be
directly
attributed
are
allocated
to
each
Fund
in
the
Trust
based
upon
the
average
net
assets
of
each
Fund.
Netting
Agreements:
In
the
ordinary
course
of
business,
the
Fund
may
enter
into
transactions
subject
to
enforceable
master
repurchase
agreements, International
Swaps
and
Derivatives
Association,
Inc.
(ISDA)
master
agreements
or
other
similar
arrangements
(“netting
agreements”).
Generally,
the
right
to
offset
in
netting
agreements
allows the
Fund
to
offset
certain
securities
and
derivatives
with
a
specific
counterparty,
when
applicable,
as
well
as
any
collateral
received
or
delivered
to
that
counterparty
based
on
the
terms
of
the
agreements.
Generally, the
Fund
manages
its
cash
collateral
and
securities
collateral
on
a
counterparty
basis.
With
respect
to
certain
counterparties,
in
accordance
with
the
terms
of
the
netting
agreements,
collateral
posted
to
the
Fund
is
held
in
a
segregated
account
by
the
Fund's
custodian
and/or
with
respect
to
those
amounts
which
can
be
sold
or
repledged,
are
presented
in
the
Fund's
Portfolio
of
Investments
or
Statements
of
Assets
and
Liabilities.
The
Fund’s
investments
subject
to
netting
agreements
as
of
the
end
of
the
reporting
period,
if
any,
are
further
described
later
in
these
Notes
to
Financial
Statements.
3.
Investment
Valuation
and
Fair
Value
Measurements
The Fund’s
investments
in
securities
are
recorded
at
their
estimated
fair
value
utilizing
valuation
methods
approved
by
the
Adviser,
subject
to
oversight
of
the
Board.
Fair
value
is
defined
as
the
price
that
would
be
received
upon
selling
an
investment
or
transferring
a
liability
in
an
orderly
transaction
to
an
independent
buyer
in
the
principal
or
most
advantageous
market
for
the
investment.
U.S.
GAAP
establishes
the
three-tier
hierarchy
that
is
used
to
maximize
the
use
of
observable
market
data
and
minimize
the
use
of
unobservable
inputs
and
to
establish
classification
of
fair
value
measurements
for
disclosure
purposes.
Observable
inputs
reflect
the
assumptions
market
participants
would
use
in
pricing
the
asset
or
liability.
Observable
inputs
are
based
on
market
data
obtained
from
sources
independent
of
the
reporting
entity.
Unobservable
inputs
reflect
management’s
assumptions
about
the
assumptions
market
participants
would
use
in
pricing
the
asset
or
liability.
Unobservable
inputs
are
based
on
the
best
information
available
in
the
circumstances.
The
following
is
a
summary
of
the
three-tiered
hierarchy
of
valuation
input
levels.
Level 1
–
Inputs
are
unadjusted
and
prices
are
determined
using
quoted
prices
in
active
markets
for
identical
securities.
Level
2
–
Prices
are
determined
using
other
significant
observable
inputs
(including
quoted
prices
for
similar
securities,
interest
rates,
credit
spreads,
etc.).
Level
3
–
Prices
are
determined
using
significant
unobservable
inputs
(including
management’s
assumptions
in
determining
the
fair
value
of
investments).
A
description
of
the
valuation
techniques
applied
to
the Fund's
major
classifications
of
assets
and
liabilities
measured
at
fair
value
follows:
Exchange-traded
funds
listed
or
traded
on
a
national
market
or
exchange
are
valued
based
on
their
sale
price
at
the
official
close
of
business
of
such
market
or
exchange
on
the
valuation
date.
To
the
extent
these
securities
are
actively
traded
and
that
valuation
adjustments
are
not
applied,
they
are
generally
classified
as
Level
1.
Investments
in
investment
companies
are
valued
at
their
respective NAVs
or
share
price
on
the
valuation
date
and
are
generally
classified
as Level
1.
Repurchase
agreements
are
valued
at
contract
amount
plus
accrued
interest,
which
approximates
market
value.
These
securities
are
generally
classified
as
Level
2.
Notes
to
Financial
Statements
(continued)
The
following
table
summarizes
the
market
value
of
the Fund’s
investments
as
of
the
end
of
the
current
fiscal
period,
based
on
the
inputs
used
to
value
them:
4.
Portfolio
Securities
Repurchase
Agreements:
In
connection
with
transactions
in
repurchase
agreements,
it
is
the Fund’s policy
that
its
custodian
take
possession
of
the
underlying
collateral
securities,
the
fair
value
of
which
exceeds
the
principal
amount
of
the
repurchase
transaction,
including
accrued
interest,
at
all
times.
If
the
counterparty
defaults,
and
the
fair
value
of
the
collateral
declines,
realization
of
the
collateral
may
be
delayed
or
limited.
The
following
table
presents
the
repurchase
agreements
for
the Funds
that
are
subject
to
netting
agreements
as
of
the
end
of
the
reporting
period,
and
the
collateral
delivered
related
to
those
repurchase
agreements.
Purchases
and
Sales:
Long-term
purchases
and
sales
during
the
current
fiscal
period
were
as
follows:
5.
Fund
Shares
Transactions
in
Fund
shares
during
the
current
and
prior
fiscal
period
were
as
follows:
6.
Income
Tax
Information
The Fund
intends
to
distribute
substantially
all
of
its
net
investment
income
and
net
capital
gains
to
shareholders
and
otherwise
comply
with
the
requirements
of
Subchapter
M
of
the
Internal
Revenue
Code
applicable
to
regulated
investment
companies.
Therefore,
no
federal
income
tax
provision
is
required.
The
Fund
files
income
tax
returns
in
U.S.
federal
and
applicable
state
and
local
jurisdictions.
A Fund’s
federal
income
tax
returns
are
generally
subject
to
examination
for
a
period
of
three
fiscal
years
after
being
filed.
State
and
local
tax
returns
may
be
subject
to
examination
for
an
additional
period
of
time
depending
on
the
jurisdiction.
Management
has
analyzed
the
Fund’s
tax
positions
taken
for
all
open
tax
years
and
has
concluded
that
no
provision
for
income
tax
is
required
in
the
Fund’s
financial
statements.
Fund
Level
1
Level
2
Level
3
Total
Managed
Allocation
Registered
investment
companies
$881,338,668
$—
$—
$881,338,668
Short-term
investments
—
522,000
—
522,000
Total
$881,338,668
$522,000
$—
$881,860,668
1
1
1
1
1
Fund
Counterparty
Short-term
Investments,
at
Value
Collateral
Pledged
(From)
Counterparty
Managed
Allocation
Fixed
Income
Clearing
Corporation
$
522,000
$
(532,567)
Fund
Non-U.S.
Government
Purchases
Non-U.S.
Government
Sales
18.1
Managed
Allocation
$
92,577,329
$
121,645,664
Year
Ended
5/31/24
Year
Ended
5/31/23
18.1
Managed
Allocation
Shares
Amount
Shares
Amount
Subscriptions:
Class
A
1,489,713
$
17,204,822
1,669,657
$
18,359,833
Class
R6
72,534
831,096
81,436
893,165
Retirement
Class
256,120
3,014,359
755,954
8,161,292
Total
subscriptions
1,818,367
21,050,277
2,507,047
27,414,290
Reinvestments
of
distributions:
Class
A
1,657,333
19,142,884
4,947,633
51,916,687
Class
R6
46,043
529,037
148,870
1,555,683
Retirement
Class
160,617
1,844,718
501,151
5,228,672
Total
reinvestments
of
distributions
1,863,993
21,516,639
5,597,654
58,701,042
Redemptions:
Class
A
(6,252,499)
(72,177,956)
(6,533,550)
(71,694,365)
Class
R6
(287,327)
(3,240,630)
(595,348)
(6,449,876)
Retirement
Class
(893,214)
(10,262,238)
(1,121,770)
(12,236,222)
Total
redemptions
(7,433,040)
(85,680,824)
(8,250,668)
(90,380,463)
Net
increase
(decrease)
from
shareholder
transactions
(3,750,680)
$
(43,113,908)
(145,967)
$
(4,265,131)
Differences
between
amounts
for
financial
statement
and
federal
income
tax
purposes
are
primarily
due
to
timing
differences
in
recognizing
gains
and
losses
on
investment
transactions.
Temporary
differences
do
not
require
reclassification.
As
of
year
end,
permanent
differences
that
resulted
in
reclassifications
among
the
components
of
net
assets
relate
primarily
to
investments
in
underlying
funds
and
tax
equalization.
Temporary
and
permanent
differences
have
no
impact
on
a
Fund’s
net
assets.
As
of
year
end,
the
aggregate
cost
and
the
net
unrealized
appreciation/(depreciation)
of
all
investments
for
federal
income
tax
purposes
were
as
follows:
For
purposes
of
this
disclosure,
tax
cost
generally
includes
the
cost
of
portfolio
investments
as
well
as
up-front
fees
or
premiums
exchanged
on
derivatives
and
any
amounts
unrealized
for
income
statement
reporting
but
realized
income
and/or
capital
gains
for
tax
reporting,
if
applicable.
As
of year
end,
the
components
of
accumulated
earnings
on
a
tax
basis
were
as
follows:
The
tax
character
of
distributions
paid was
as
follows:
As
of
year
end,
the
Fund
utilized
the
following
capital
loss
carryovers:
7.
Investment
Adviser
and
Other
Transactions
with
Affiliates
Under
the
terms
of
its
Investment
Management
Agreement,
the
Fund
does
not
pay
the
Adviser
a
fee
for
the
management
of
the
Fund’s
investment
portfolio.
The
Fund
has
entered
into
an
Administrative
Service
Agreement
with
the
Adviser
under
which
the
Fund
pays
the
Adviser
for
its
costs
in
providing
certain
administrative
and
compliance
services
to
the
Fund.
The
Adviser
has
agreed
to
gradually
reduce
expenses
allocated
to
the
Fund
under
the
Administrative
Services
Agreement
over
a
three-year
period
commencing
May
1,
2024.
After
the
expiration
of
this
three-year
period,
the
Adviser
will
no
longer
allocate
expenses
to
the
Fund
under
the
Administrative
Service
Agreement.
Under
the
terms
of
the
Fund’s
Retirement
Class
Service
Agreement,
the
Retirement
Class
of
the
Fund
pays
Advisors
a
monthly
fee
based
on
the
annual
rate
of
0.25%
of
the
Fund’s
average
daily
net
assets
attributable
to
Retirement
Class
shares
of
the
Fund
for
providing
certain
administrative
services
related
to
the
maintenance
of
Retirement
Class
shares
on
retirement
plan
or
other
platforms.
Substantially,
all
of
the
Retirement
Class
shareholder
servicing
fees
reported
on
the
Statement
of
Operations
are
paid
to
the
Adviser
under
the
Service
Agreement.
Under
the
terms
of
a
distribution
Rule
12b-1
plan, Class
A
Shares of
the
Fund
compensated
Nuveen
Securities
for
providing
distribution,
promotional
and/or
shareholder
services
to
Class
A
Shares
of
the
Fund
at
the
annual
rate
of
0.25%
of
the
average
daily
net
assets
attributable
to
the
Fund’s
Class
A
Shares.
The
Adviser has
agreed
to
reimburse
the
Fund
if
its
total
expense
ratio
(excluding
interest,
taxes,
brokerage
commissions
and
other
transactional
expenses,
acquired
fund
fees
and
expenses
and
extraordinary
expenses)
exceeds
0.00%
of
average
daily
net
assets
for
the
Class
R6 shares;
and
0.25%
of
average
daily
net
assets
for
the
Retirement
and
Class
A shares.
The
expense
reimbursement
arrangements
will
continue
through
at
least
September
30,
2024,
unless
changed
with
approval
of
the
Board.
The
Funds
may
purchase
or
sell
investment
securities
in
transactions
with
affiliated
entities
under
procedure
adopted
by
the
Board,
pursuant
to
the
1940
Act.
These
transactions
are
effected
at
market
rates
without
incurring
broker
commissions.
During
the
current
fiscal
period,
the
Fund
engaged
in
the
following
security
transactions
with
affiliated
entities:
Fund
Tax
Cost
Gross
Unrealized
Appreciation
Gross
Unrealized
(Depreciation)
Net
Unrealized
Appreciation
(Depreciation)
18.1
Managed
Allocation
$780,408,941
$164,960,764
$(63,509,037)
$101,451,727
Fund
Undistributed
Ordinary
Income
Undistributed
Long-Term
Capital
Gains
Unrealized
Appreciation
(Depreciation)
Capital
Loss
Carryforwards
Late-Year
Loss
Deferrals
Other
Book-to-Tax
Differences
Total
18.1
Managed
Allocation
$2,571,157
$5,207,406
$101,451,727
$–
$–
$(152,747)
$109,077,543
5/31/24
5/31/23
Fund
Ordinary
Income
Long-Term
Capital
Gains
Ordinary
Income
Long-Term
Capital
Gains
18.1
Managed
Allocation
$
22,228,563
$
–
$
18,431,561
$
42,136,039
Fund
Utilized
18.1
Managed
Allocation
$11,415,112
Notes
to
Financial
Statements
(continued)
Investments
in
other
investment
companies
advised
by
the
Adviser
and
Nuveen
Fund
Advisors,
LLC
are
deemed
to
be
affiliated
investments.
Information
regarding
transactions
with
affiliated
companies
is
as
follows:
8.
Inter-Fund
Lending
Program
Pursuant
to
an
exemptive
order
issued
by
the
SEC,
the
Fund
may
participate
in
an
inter-fund
lending
program.
This
program
allows
the
Fund
to
lend
cash
to
and/or
borrow
cash
from
certain other
affiliated
Funds
for
temporary
purposes,
(e.g.,
to
satisfy
redemption
requests
or
to
cover
unanticipated
cash
shortfalls).
The
program
is
subject
to
a
number
of
conditions,
including
the
requirement
that
the Fund
may
not
borrow
or
lend
money
under
the
program
unless
it
receives
a
more
favorable
interest
rate
than
is
available
from
a
bank
or
other
financial
institution
for
a
comparable
transaction.
In
addition,
the
Fund
may
participate
in
the
program
only
if
its
participation
is
consistent
with
the
Fund’s
investment
policies
and
limitations
and
authorized
by
its
portfolio
manager(s).
During
the current
fiscal
period,
there
were
no
inter-fund
borrowing
or
lending
transactions.
9.
Line
of
Credit
The Fund
participates
in
a
$1
billion
unsecured
revolving
credit
facility
that
can
be
used
for
temporary
purposes,
including,
without
limitation,
the
funding
of
shareholder
redemptions.
The
current
facility
was
entered
into
on
June
13,
2023
expiring
on
June
11,
2024,
replacing
the
previous facility,
which
expired
June
2023.
Certain
affiliated
accounts
and
mutual
funds,
each
of
which
is
managed
by the
Adviser,
or
an
affiliate
of
the
Adviser, also
participate
in
this
facility.
An
annual
commitment
fee
for
the
credit
facility
is
borne
by
the
participating
accounts
and
mutual
funds
on
a
pro
rata
basis.
Interest
associated
with
any
borrowing
under
the
facility
is
charged
to
the
borrowing
accounts
or
mutual
funds
at
a
specified
rate
of
interest.
The Fund is
not
liable
for
borrowings
under
the
facility
by
other
affiliated
accounts
or
mutual
funds.
There
were
no
borrowings
under
this
credit
facility
by
the
Fund during
the
current fiscal period.
10.
Subsequent
Events
Line
of
Credit:
On
June
11,
2024,
the
Fund’s
credit
facility
expired,
and
the
Fund
has
not
entered
into
another
credit
facility.
Fund
Purchases
Sales
Realized
Gain
(Loss)
Managed
Allocation
$
305,985
$
618,096
$
(3,179)
Issue
Value
at
5/31/23
Purchases
Cost
Sales
Proceeds
Realized
Gain
(Loss)
Change
in
Unrealized
Appreciation
(Depreciation)
Value
at
5/31/24
Dividend
Income
Capital
Gain
Distributions
Managed
Allocation
Nuveen
Funds:
Core
Equity,
Class
R6
$
46,918,306
$
9,879,900
$
11,199,568
$
1,407,231
$
3,789,303
$
50,795,172
$
595,253
$
9,071,592
Core
Plus
Bond,
Class
R6
329,819,616
49,700,984
26,243,246
(5,041,068)
1,554,503
349,790,789
14,975,224
–
Dividend
Growth,
Class
R6
46,444,219
3,590,036
6,275,443
227,118
6,803,943
50,789,873
670,698
796,594
Dividend
Value,
Class
R6
47,332,002
3,947,257
10,382,515
316,459
7,732,502
48,945,705
872,443
1,682,039
Emerging
Markets
Equity,
Class
R6
28,595,709
4,748,286
4,805,641
(914,876)
3,133,710
30,757,188
979,644
–
Growth
Opportunities
ETF
54,624,613
360,234
13,360,019
(533,905)
19,441,901
60,532,824
107,937
–
International
Equity,
Class
R6
73,956,884
5,965,307
11,312,656
898,278
11,524,649
81,032,462
2,045,599
–
International
Opportunities,
Class
R6
44,163,298
4,657,764
6,151,180
(1,057,446)
6,245,003
47,857,439
567,285
–
Large
Cap
Growth,
Class
R6
54,315,706
2,526,761
11,999,148
1,899,135
13,598,422
60,340,876
127,832
–
Large
Cap
Value,
Class
R6
47,394,445
4,605,343
9,977,033
2,565,078
4,476,630
49,064,463
841,380
3,035,919
Quant
International
Small
Cap
Equity,
Class
R6
23,484,883
1,570,517
3,037,288
(150,496)
4,208,738
26,076,354
740,495
–
Quant
Small
Cap
Equity,
Class
R6
11,738,669
577,978
3,213,350
757,880
1,679,239
11,540,416
124,041
121,466
Quant
Small/Mid
Cap
Equity,
Class
R6
13,666,397
446,962
3,688,577
710,853
2,679,472
13,815,107
137,702
214,391
$822,454,747
$92,577,329
$121,645,664
$1,084,241
$86,868,015
$881,338,668
$22,785,533
$14,922,001
Important
Tax
Information
(Unaudited)
As
required
by
the
Internal
Revenue
Code
and
Treasury
Regulations,
certain
tax
information,
as
detailed
below,
must
be
provided
to
shareholders.
Shareholders
are
advised
to
consult
their
tax
advisor
with
respect
to
the
tax
implications
of
their
investment.
The
amounts
listed
below
may
differ
from
the
actual
amounts
reported
on
Form
1099-DIV,
which
will
be
sent
to
shareholders
shortly
after
calendar
year
end.
Long-Term
Capital
Gains
As
of
year
end,
the
Fund
designates
the
following
distribution
amounts,
or
maximum
amount
allowable,
as
being
from
net
long-term
capital
gains
pursuant
to
Section
852(b)(3)
of
the
Internal
Revenue
Code:
Dividends
Received
Deduction
(DRD)
The
Fund
listed
below
had
the
following
percentage,
or
maximum
amount
allowable,
of
ordinary
income
distributions
eligible
for
the
dividends
received
deduction
for
corporate
shareholders:
Qualified
Dividend
Income
(QDI)
The
Fund
listed
below
had
the
following
percentage,
or
maximum
amount
allowable,
of
ordinary
income
distributions
treated
as
qualified
dividend
income
for
individuals
pursuant
to
Section
1(h)(11)
of
the
Internal
Revenue
Code:
Foreign
Source
Income
and
Foreign
Tax
Credit
Pass
Through
The
Fund
listed
below
has
made
an
election
under
Section
853
of
the
Internal
Revenue
Code
to
pass
through
foreign
taxes
paid:
Fund
Net
Long-Term
Capital
Gains
18.1
Managed
Allocation
$
10,447
Fund
Percentage
18.1
Managed
Allocation
16
.0
%
Fund
Percentage
18.1
Managed
Allocation
30
.6
%
Fund
Foreign
Source
Income
Foreign
Source
Income
Per
Share
Qualifying
Foreign
Taxes
Paid
Qualifying
Foreign
Taxes
Paid
per
Share
18.1
Managed
Allocation
$
4,002,885
$
0.05592
$
388,577
$
0.00543
| Item 8. | Changes in and Disagreements with Accountants for Open-End Management Investment Companies. |
Not applicable.
| Item 9. | Proxy Disclosures for Open-End Management Investment Companies. |
Not applicable.
| Item 10. | Remuneration Paid to Directors, Officers, and Others of Open-End Management Investment Companies. |
Remuneration paid to directors, officers and others is included in the Statement of Operations under the line items “Trustee Fees” and “Management Fees” as part of the financial statements filed under Item 7 of this Form N-CSR.
| Item 11. | Statement Regarding Basis for Approval of Investment Advisory Contract. |
Item 11. Statement Regarding Basis for Approval of Investment Advisory Contract
Nuveen Lifecycle Retirement Income Fund
Nuveen Lifecycle 2010 Fund
Nuveen Lifecycle 2015 Fund
Nuveen Lifecycle 2020 Fund
Nuveen Lifecycle 2025 Fund
Nuveen Lifecycle 2030 Fund
Nuveen Lifecycle 2035 Fund
Nuveen Lifecycle 2040 Fund
Nuveen Lifecycle 2045 Fund
Nuveen Lifecycle 2050 Fund
Nuveen Lifecycle 2055 Fund
Nuveen Lifecycle 2060 Fund
Nuveen Lifecycle 2065 Fund
The Approval Process
At meetings held on April 18 and 19, 2024 (the “Meeting”), the Board of Trustees (collectively, the “Board” and each Trustee, a “Board Member”) of TIAA-CREF Funds (the “Trust”) approved, for each applicable series of the Trust, the renewal of the investment management agreement with Teachers Advisors, LLC (“TAL” and TAL is an “Adviser”) pursuant to which TAL serves as investment adviser to such funds. The Board Members are not “interested persons” (as defined under the Investment Company Act of 1940 (the “1940 Act”)) and, therefore, the Board is deemed to be comprised of all disinterested Board Members. References to the Board and the Board Members are interchangeable. Below is a summary of the annual review process the Board undertook related to its most recent renewal of the investment management agreement (each an “Advisory Agreement”) with respect to each series listed above (the “Funds”).
In accordance with applicable law, following up to an initial two-year period, the Board considers the renewal of each Advisory Agreement on behalf of the applicable Fund on an annual basis. In addition, the fund complex consists of the group of funds advised by TAL (collectively referred to as the “TC funds”) and the group of funds advised by Nuveen Fund Advisors, LLC (“NFAL” and such funds are collectively, the “Nuveen funds”). For clarity, TAL serves as Adviser to the TC funds, including the Funds, and NFAL serves as “Adviser” to the Nuveen funds. The Board Members considered that the prior separate boards of the TC funds and Nuveen funds were consolidated effective in January 2024. Accordingly, at the Meeting, the Board Members considered the review of the advisory agreements for the TC funds as well as reviewed the investment management agreements and sub-advisory agreements for the Nuveen funds. Depending on the appropriate context, references to “the Adviser” may be to TAL with respect to the TC funds and/or NFAL with respect to the Nuveen funds.
The Board Members considered the review of the advisory agreements of the TC funds and the Nuveen funds to be an ongoing process. The Board Members therefore employed the accumulated information, knowledge and experience they had gained during their tenure on the respective board of the TC funds or Nuveen funds (as the case may be) governing the applicable funds and working with the respective investment advisers and sub-advisers, as applicable, in their review of the advisory agreements for the fund complex.
During the course of the year prior to the Meeting, the Board and/or its committees received a wide variety of materials that covered a range of topics relevant to the Board’s annual consideration of the renewal of the advisory agreements, including reports on fund investment results over various periods; product initiatives for various funds; fund expenses; compliance, regulatory and risk management matters; trading practices, including soft dollar arrangements (as applicable); the liquidity and derivatives risk management programs; management of distributions; valuation of securities; payments to financial intermediaries, including 12b-1 expenses (as applicable); securities lending (as applicable); and overall market and regulatory developments. The Board also met periodically with and/or received presentations by key investment professionals managing a fund’s portfolio. In particular, at the Board meeting held on February 27-29, 2024 (the “February Meeting”), the Board and/or its Investment Committee received the annual performance review of the funds as described in further detail below. The presentations, discussions and meetings throughout the year also provide a means for the Board to evaluate and consider the level, breadth and quality of services provided by the Adviser and how such services have changed over time in light of new or modified regulatory requirements, changes to market conditions or other factors.
In connection with its annual consideration of the advisory agreements, the Board, through its independent legal counsel, requested and received extensive materials and information prepared specifically for its review of the advisory agreements. The materials provided at the Meeting and/ or prior meetings covered a wide range of matters including, but not limited to, a description of the nature, extent and quality of services provided
1
Item 11. Statement Regarding Basis for Approval of Investment Advisory Contract (continued)
by the Adviser; the consolidation of the Nuveen fund family and TC fund family; a review of product actions advanced in 2023 for the benefit of particular funds and/or the fund complex; a review of the applicable investment team; an analysis of fund performance with a focus on funds considered to have met certain challenged performance measurements; an analysis of the fees and expense ratios of the funds with a focus on funds considered to have certain expense characteristics; a list of management fee schedules; a review of contractual and/or voluntary expense caps and fee waivers for the TC funds; a description of portfolio manager compensation; a description of the profitability and/or financial data of Nuveen and TAL; and a description of indirect benefits received by the Adviser as a result of its relationships with the funds. The Board also considered information provided by Broadridge Financial Solutions, Inc. (“Broadridge”), an independent provider of investment company data, comparing fee and expense levels of each respective fund to those of a peer universe and, with respect to open-end funds, also to a peer group of funds selected by Broadridge, subject to certain exceptions.
The information prepared specifically for the annual review supplemented the information provided to the Board and its committees and the evaluations of the funds by the Board and its committees during the year. The Board’s review of the advisory agreements for the fund complex is based on all the information provided to the Board and its committees over time. The performance, fee and expense data and other information provided by the Adviser, Broadridge or other service providers were not independently verified by the Board Members.
As part of their review, the Board Members and independent legal counsel met by videoconference in executive session on April 10, 2024 (the “April Executive Session”) to review and discuss materials provided in connection with their annual review of the advisory agreements for the fund complex. After reviewing this information, the Board Members requested, directly or through independent legal counsel, additional information, and the Board subsequently reviewed and discussed the responses to these follow-up questions and requests.
The Board Members were advised by independent legal counsel during the annual review process as well as throughout the year, including meeting in executive sessions with such counsel at which no representatives of management were present. In connection with their annual review, the Board Members also received a memorandum from independent legal counsel outlining their fiduciary duties and legal standards in reviewing the Advisory Agreements, including guidance from court cases evaluating advisory fees.
The Board’s decisions to renew each Advisory Agreement were not based on a single identified factor, but rather each decision reflected the comprehensive consideration of all the information provided to the Board and its committees throughout the year as well as the materials prepared specifically in connection with the annual review process. The contractual arrangements may reflect the results of prior year(s) of review, negotiation and information provided in connection with the Board’s annual review of the funds’ advisory arrangements and oversight of the funds. Each Board Member may have attributed different levels of importance to the various factors and information considered in connection with the annual review process and may have placed different emphasis on the relevant information year to year in light of, among other things, changing market and economic conditions. A summary of the principal factors and information, but not all the factors, the Board considered in deciding to renew the Advisory Agreements is set forth below.
A. Nature, Extent and Quality of Services
In evaluating the renewal of the Advisory Agreements, the Board Members received and considered information regarding the nature, extent and quality of the Adviser’s services provided to each respective Fund with particular focus on the services and enhancements or changes to such services provided during the last year.
The Board considered that the Adviser provides a wide array of management, oversight and other services to manage and operate the applicable funds. The Board considered the Adviser’s and its affiliates’ dedication of resources, time, people and capital as well as continual program of improvement and innovation aimed at enhancing the funds and fund complex for investors and meeting the needs of an increasingly complex regulatory environment. In particular, over the past several years, the Board considered the significant resources, both financial and personnel, the Adviser and its affiliates have committed in working to consolidate the Nuveen fund family and TC fund family under one centralized umbrella. The Board considered that the organizational changes in bringing together Nuveen, its affiliates and TIAA’s (as defined below) asset management businesses, consolidating the Nuveen and TC fund families and other initiatives were anticipated to provide various benefits for the funds through, among other things, enhanced operating efficiencies, centralized investment leadership and a centralized shared resources and support model. As part of these efforts, the boards of the TC funds and Nuveen funds were consolidated effective in January 2024.
The Board also reviewed information regarding other product actions undertaken or continued by management in the 2023 calendar year in seeking to improve the effectiveness of the organization, the product line-up as well as particular funds through, among other things, continuing to review and optimize the product line and gaining efficiencies through mergers and liquidations; reviewing and updating investment policies and benchmarks; implementing fee waivers and/or expense cap changes for certain funds; evaluating and adjusting portfolio management teams as appropriate for various funds; and developing policy positions on a broad range of regulatory proposals that may impact the funds and communicating with lawmakers and other regulatory authorities to help ensure these positions are considered. In its review, the Board considered that the funds operated in a highly regulated industry and the scope and complexity of the services and resources that the Adviser and its affiliates must provide to manage and operate the applicable funds have expanded over the years as a result of, among other things, regulatory, market and other developments, such as the adoption of the tailored shareholder report or the revised fund name rule.
In considering the breadth and quality of services TAL and its various teams provide with respect to the TC funds, the Board considered that TAL is responsible for providing various types of investment advisory services, including, among other things, furnishing an investment program for each TC fund; managing the assets of such funds, including conducting research, identifying investments and placing orders for the purchase or sale of the portfolio investments for the fund; and evaluating fund performance and implementing changes thereto. The Board further considered that over the course of the 2023 calendar year, the Nuveen global public product team which supports the funds in the fund complex and their shareholders assessed the investment personnel across the investment leadership teams which resulted in additions or other modifications to the portfolio management teams of various funds. The Board also reviewed a description of the compensation structure applicable to certain portfolio managers.
2
In addition to the above investment advisory services, the Board further considered the extensive compliance, regulatory, administrative and other services the Adviser and its various teams or affiliates provide to manage and operate the applicable funds. Given the highly regulated industry in which the funds operate, the Board considered the breadth of the Adviser’s compliance program and related policies and procedures. The Board reviewed various initiatives the Adviser’s compliance team undertook or continued in 2023, in part, to address new regulatory requirements, support international business growth and product development, enhance international trading capabilities, enhance monitoring capabilities in light of the new regulatory requirements and guidance and maintain a comprehensive training program. The Board further considered, among other things, that other non-advisory services provided included, among other things, board support and reporting; establishing and reviewing the services provided by other fund service providers (such as a fund’s custodian, accountant, and transfer agent); risk management, including reviews of the liquidity risk management and derivatives risk management programs; legal support services; regulatory advocacy; and cybersecurity, business continuity and disaster recovery planning and testing. With respect to the TC funds, the Board considered that certain non-investment and non-distribution services were provided by TAL or its affiliates pursuant to a separate administrative agreement; however, given the consolidation of the TC funds and Nuveen funds with the centralization of services and resources, such administrative agreement was anticipated to be phased out over a three-year period with the administrative services for the Funds to be provided under the respective Advisory Agreements at no additional cost.
Aside from the services provided, the Board considered the financial resources of the Adviser and/or its affiliates and their willingness to make investments in the technology, personnel and infrastructure to support the funds, including to enhance global talent, middle office systems, software and international and internal capabilities. The Board considered the access provided by the Adviser and its affiliates to a seed capital budget to support new or existing funds and/or facilitate changes for a respective fund. The Board considered the benefits to shareholders of investing in a fund that is a part of a large fund complex with a variety of investment disciplines, capabilities, expertise and resources available to navigate and support the funds including during stressed times. The Board considered the overall reputation and capabilities of the Adviser and its affiliates and the Adviser’s continuing commitment to provide high quality services.
In its review, the Board also considered the significant risks borne by the Adviser and its affiliates in connection with their services to the applicable funds, including entrepreneurial risks in sponsoring and supporting new funds and smaller funds and ongoing risks with managing the funds, such as investment, operational, reputational, regulatory, compliance and litigation risks.
Based on its review, the Board determined, in the exercise of its reasonable business judgment, that it was satisfied with the nature, extent and quality of services provided to the respective Funds under each applicable Advisory Agreement.
B. The Investment Performance of the Funds and Adviser
In evaluating the quality of the services provided by the Adviser, the Board also considered a variety of investment performance data of the Funds. In this regard, the Board and/or its Investment Committee reviewed, among other things, performance of the Funds over the quarter, one-, three- and five-year periods ending December 31, 2023 and March 31, 2024 (or for such shorter periods to the extent a Fund was not in existence during such periods). For those Funds with multiple share classes, the performance data was based on Class R6 shares (formerly, the Institutional Class shares); however, the performance of other share classes was substantially similar as those other share classes invest in the same portfolio of securities and differences in performance among the classes would be principally attributed to the variations in the expense structures of the share classes. The Board performed its annual review of fund performance at its February Meeting and an additional review at the April Executive Session and also reviewed and discussed performance data at its other regularly scheduled quarterly meetings throughout the year. The Board therefore took into account the performance data, presentations and discussions (written and oral) that were provided at the Meeting and in prior meetings over time in evaluating fund performance, including management’s analysis of a fund’s performance with particular focus on funds that met certain challenged performance measurements as determined pursuant to a methodology approved by the Board or additional measurements as determined by management’s investment analysts. As various funds have modified their portfolio teams and/or made significant changes to their portfolio strategies over time, the Board reviewed, among other things, certain tracking performance data over specific periods comparing performance before and after such changes.
The Board considered that performance data reflects performance over a specified period which may differ significantly depending on the ending dates selected, particularly during periods of market volatility. Further, the Board considered that shareholders may evaluate performance based on their own respective holding periods which may differ from the performance periods reviewed by the Board and lead to differing results.
In its evaluation, the Board reviewed fund performance results from different perspectives. In general, subject to certain exceptions, the Board reviewed both absolute and relative fund performance over the various time periods and considered performance results in light of a fund’s investment objective(s), strategies and risks. With respect to the relative performance, the Board considered fund performance in comparison to the performance of peer funds (the “Performance Peer Group”), subject to certain exceptions, and recognized and/or customized benchmarks (i.e., generally benchmarks derived from multiple recognized benchmarks). In reviewing such comparative performance, the Board was cognizant of the inherent limitations of such data which can make meaningful performance comparisons generally difficult. As an illustration, differences in the composition of the Performance Peer Group, the investment objective(s), strategies, dates of fund inception and other characteristics of the peers in the Performance Peer Group, and the varying sizes of peers all may contribute to differences in the performance results of a Performance Peer Group compared to the applicable fund. With respect to relative performance of a fund compared to a benchmark index, differences, among other things, in the investment objective(s) and strategies of a fund and the benchmark (particularly an actively managed fund that does not directly follow an index) as well as the costs of operating a fund would necessarily contribute to differences in performance results and limit the value of the comparative performance information. To assist the Board in its review of the comparability of the relative performance, management generally has ranked the relevancy of the Performance Peer Groups to the Funds as low, medium or high. In its review of relative performance, the Board considered a Fund’s performance relative to its Performance Peer Group, among other things, by evaluating its quartile ranking with the 1st quartile representing the top performing funds within the Performance Peer Group and the 4th quartile representing the lowest performing funds.
3
Item 11. Statement Regarding Basis for Approval of Investment Advisory Contract (continued)
The Board evaluated performance in light of various relevant factors which may include, among other things, general market conditions, issuer-specific information, asset class information, leverage and fund cash flows. The Board considered that long-term performance could be impacted by even one period of significant outperformance or underperformance and that a single investment theme could disproportionately affect performance. Further, the Board considered that market and economic conditions may significantly impact a fund’s performance, particularly over shorter periods, and such performance may be more reflective of such economic or market events and not necessarily reflective of management skill. Although the Board reviews short-, intermediate- and longer-term performance data, the Board considered that longer periods of performance may reflect full market cycles.
In their review from year to year, the Board Members consider and may place different emphasis on the relevant information in light of changing circumstances in market and economic conditions. In evaluating performance, the Board focused particular attention on funds with less favorable performance records. However, depending on the facts and circumstances, including any differences between the respective fund and its benchmark and/or Performance Peer Group, the Board may be satisfied with a fund’s performance notwithstanding that its performance may be below that of its benchmark and/or peer group for certain periods. With respect to any funds for which the Board has identified performance issues, the Board seeks to monitor such funds more closely until performance improves, discuss with the Adviser the reasons for such results, consider whether any steps are necessary or appropriate to address such issues, discuss and evaluate the potential consequences of such steps and review the results of any steps undertaken.
The performance determinations with respect to each Fund are summarized below.
● For Nuveen Lifecycle Retirement Income Fund (formerly, TIAA-CREF Lifecycle Retirement Income Fund), the Board considered that although the Fund’s performance was below the performance of its composite benchmark for the one-, three- and five-year periods ended December 31, 2023, the Fund ranked in the second quartile of its Performance Peer Group for the one-year period and first quartile for the three- and five-year periods ended December 31, 2023. In addition, although the Fund’s performance was below the performance of its composite benchmark for the three- and five-year periods ended March 31, 2024, the Fund outperformed its composite benchmark for the one-year period ended March 31, 2024 and ranked in the first quartile of its Performance Peer Group for the one-, three- and five-year periods ended March 31, 2024. On the basis of the Board’s ongoing review of investment performance and all relevant factors, including the relative market conditions during certain reporting periods, the Fund’s investment objective(s) and management’s discussion of performance, the Board concluded that the Fund’s performance supported renewal of the Advisory Agreement.
● For Nuveen Lifecycle 2010 Fund (formerly, TIAA-CREF Lifecycle 2010 Fund), the Board considered that although the Fund’s performance was below the performance of its composite benchmark for the one- and five-year periods ended December 31, 2023, the Fund outperformed its composite benchmark for the three-year period ended December 31, 2023 and ranked in the first quartile of its Performance Peer Group for the one- and five-year periods ended December 31, 2023 and second quartile for the three-year period ended December 31, 2023. In addition, although the Fund’s performance was below the performance of its composite benchmark for the five-year period ended March 31, 2024, the Fund outperformed its composite benchmark for the one- and three-year periods ended March 31, 2024 and ranked in the first quartile of its Performance Peer Group for the one-, three- and five-year periods ended March 31, 2024. On the basis of the Board’s ongoing review of investment performance and all relevant factors, including the relative market conditions during certain reporting periods, the Fund’s investment objective(s) and management’s discussion of performance, the Board concluded that the Fund’s performance supported renewal of the Advisory Agreement.
● For Nuveen Lifecycle 2015 Fund (formerly, TIAA-CREF Lifecycle 2015 Fund), the Board considered that although the Fund’s performance was below the performance of its composite benchmark for the one-, three- and five-year periods ended December 31, 2023, the Fund ranked in the second quartile of its Performance Peer Group for the one-, three- and five-year periods ended December 31, 2023. In addition, although the Fund’s performance was below the performance of its composite benchmark for the three- and five-year periods ended March 31, 2024, the Fund outperformed its composite benchmark for the one-year period ended March 31, 2024 and ranked in the first quartile of its Performance Peer Group for the one-, three- and five-year periods ended March 31, 2024. On the basis of the Board’s ongoing review of investment performance and all relevant factors, including the relative market conditions during certain reporting periods, the Fund’s investment objective(s) and management’s discussion of performance, the Board concluded that the Fund’s performance supported renewal of the Advisory Agreement.
● For Nuveen Lifecycle 2020 Fund (formerly, TIAA-CREF Lifecycle 2020 Fund), the Board considered that although the Fund’s performance was below the performance of its composite benchmark for the one-, three- and five-year periods ended December 31, 2023, the Fund ranked in the second quartile of its Performance Peer Group for the one- and three-year periods and first quartile for the five-year period ended December 31, 2023. In addition, although the Fund’s performance was below the performance of its composite benchmark for the three- and five-year periods ended March 31, 2024, the Fund outperformed its composite benchmark for the one-year period ended March 31, 2024 and ranked in the first quartile of its Performance Peer Group for the one-, three- and five-year periods ended March 31, 2024. On the basis of the Board’s ongoing review of investment performance and all relevant factors, including the relative market conditions during certain reporting periods, the Fund’s investment objective(s) and management’s discussion of performance, the Board concluded that the Fund’s performance supported renewal of the Advisory Agreement.
4
● For Nuveen Lifecycle 2025 Fund (formerly, TIAA-CREF Lifecycle 2025 Fund), the Board considered that although the Fund’s performance was below the performance of its composite benchmark for the one-, three- and five-year periods ended December 31, 2023, the Fund ranked in the second quartile of its Performance Peer Group for the one-year period and first quartile for the three- and five-year periods ended December 31, 2023. In addition, although the Fund’s performance was below the performance of its composite benchmark for the three- and five-year periods ended March 31, 2024, the Fund outperformed its composite benchmark for the one-year period ended March 31, 2024 and ranked in the first quartile of its Performance Peer Group for the one-, three- and five-year periods ended March 31, 2024. On the basis of the Board’s ongoing review of investment performance and all relevant factors, including the relative market conditions during certain reporting periods, the Fund’s investment objective(s) and management’s discussion of performance, the Board concluded that the Fund’s performance supported renewal of the Advisory Agreement.
● For Nuveen Lifecycle 2030 Fund (formerly, TIAA-CREF Lifecycle 2030 Fund), the Board considered that although the Fund’s performance was below the performance of its composite benchmark for the one-, three- and five-year periods ended December 31, 2023, the Fund ranked in the second quartile of its Performance Peer Group for the one-, three- and five-year periods ended December 31, 2023. In addition, although the Fund’s performance was below the performance of its composite benchmark for the three- and five-year periods ended March 31, 2024, the Fund outperformed its composite benchmark for the one-year period ended March 31, 2024 and ranked in the first quartile of its Performance Peer Group for the one-year period and second quartile for the three- and five-year periods ended March 31, 2024. On the basis of the Board’s ongoing review of investment performance and all relevant factors, including the relative market conditions during certain reporting periods, the Fund’s investment objective(s) and management’s discussion of performance, the Board concluded that the Fund’s performance supported renewal of the Advisory Agreement.
● For Nuveen Lifecycle 2035 Fund (formerly, TIAA-CREF Lifecycle 2035 Fund), the Board considered that although the Fund’s performance was below the performance of its composite benchmark for the one-, three- and five-year periods ended December 31, 2023, the Fund ranked in the third quartile of its Performance Peer Group for the one- and three-year periods and second quartile for the five-year period ended December 31, 2023. In addition, although the Fund’s performance was below the performance of its composite benchmark for the three- and five-year periods ended March 31, 2024, the Fund outperformed its composite benchmark for the one-year period ended March 31, 2024 and ranked in the second quartile of its Performance Peer Group for the one-, three- and five-year periods ended March 31, 2024. On the basis of the Board’s ongoing review of investment performance and all relevant factors, including the relative market conditions during certain reporting periods, the Fund’s investment objective(s) and management’s discussion of performance, the Board concluded that the Fund’s performance supported renewal of the Advisory Agreement.
● For Nuveen Lifecycle 2040 Fund (formerly, TIAA-CREF Lifecycle 2040 Fund), the Board considered that although the Fund’s performance was below the performance of its composite benchmark for the one-, three- and five-year periods ended December 31, 2023, the Fund ranked in the second quartile of its Performance Peer Group for the one- and five-year periods and third quartile for the three-year period ended December 31, 2023. In addition, although the Fund’s performance was below the performance of its composite benchmark for the three- and five-year periods ended March 31, 2024, the Fund outperformed its composite benchmark for the one-year period ended March 31, 2024 and ranked in the second quartile of its Performance Peer Group for the one-, three- and five-year periods ended March 31, 2024. On the basis of the Board’s ongoing review of investment performance and all relevant factors, including the relative market conditions during certain reporting periods, the Fund’s investment objective(s) and management’s discussion of performance, the Board concluded that the Fund’s performance supported renewal of the Advisory Agreement.
● For Nuveen Lifecycle 2045 Fund (formerly, TIAA-CREF Lifecycle 2045 Fund), the Board considered that although the Fund’s performance was below the performance of its composite benchmark for the one-, three- and five-year periods ended December 31, 2023, the Fund ranked in the second quartile of its Performance Peer Group for the one- and five-year periods and third quartile for the three-year period ended December 31, 2023. In addition, although the Fund’s performance was below the performance of its composite benchmark for the three- and five-year periods ended March 31, 2024, the Fund outperformed its composite benchmark for the one-year period ended March 31, 2024 and ranked in the first quartile of its Performance Peer Group for the one-year period and second quartile for the three- and five-year periods ended March 31, 2024. On the basis of the Board’s ongoing review of investment performance and all relevant factors, including the relative market conditions during certain reporting periods, the Fund’s investment objective(s) and management’s discussion of performance, the Board concluded that the Fund’s performance supported renewal of the Advisory Agreement.
● For Nuveen Lifecycle 2050 Fund (formerly, TIAA-CREF Lifecycle 2050 Fund), the Board considered that although the Fund’s performance was below the performance of its composite benchmark for the one-, three- and five-year periods ended December 31, 2023, the Fund ranked in the second quartile of its Performance Peer Group for the one- and three-year periods and first quartile for the five-year period ended December 31, 2023. In addition, although the Fund’s performance was below the performance of its composite benchmark for the three- and five-year periods ended March 31, 2024, the Fund outperformed its composite benchmark for the one-year period ended March 31, 2024 and ranked in the first quartile of its Performance Peer Group for the one- and five-year periods and second quartile for the three-year period ended March 31, 2024. On the basis of the Board’s ongoing review of investment performance and all relevant factors, including the relative market conditions during certain reporting periods, the Fund’s investment objective(s) and management’s discussion of performance, the Board concluded that the Fund’s performance supported renewal of the Advisory Agreement.
5
Item 11. Statement Regarding Basis for Approval of Investment Advisory Contract (continued)
● For Nuveen Lifecycle 2055 Fund (formerly, TIAA-CREF Lifecycle 2055 Fund), the Board considered that although the Fund’s performance was below the performance of its composite benchmark for the one-, three- and five-year periods ended December 31, 2023, the Fund ranked in the second quartile of its Performance Peer Group for the one- and three-year periods and first quartile for the five-year period ended December 31, 2023. In addition, although the Fund’s performance was below the performance of its composite benchmark for the three- and five-year periods ended March 31, 2024, the Fund outperformed its composite benchmark for the one-year period ended March 31, 2024 and ranked in the first quartile of its Performance Peer Group for the one- and five-year periods and second quartile for the three-year period ended March 31, 2024. On the basis of the Board’s ongoing review of investment performance and all relevant factors, including the relative market conditions during certain reporting periods, the Fund’s investment objective(s) and management’s discussion of performance, the Board concluded that the Fund’s performance supported renewal of the Advisory Agreement.
● For Nuveen Lifecycle 2060 Fund (formerly, TIAA-CREF Lifecycle 2060 Fund), the Board considered that although the Fund’s performance was below the performance of its composite benchmark for the one-, three- and five-year periods ended December 31, 2023, the Fund ranked in the second quartile of its Performance Peer Group for the one- and three-year periods and first quartile for the five-year period ended December 31, 2023. In addition, although the Fund’s performance was below the performance of its composite benchmark for the three- and five-year periods ended March 31, 2024, the Fund outperformed its composite benchmark for the one-year period ended March 31, 2024 and ranked in the first quartile of its Performance Peer Group for the one- and five-year periods and second quartile for the three-year period ended March 31, 2024. On the basis of the Board’s ongoing review of investment performance and all relevant factors, including the relative market conditions during certain reporting periods, the Fund’s investment objective(s) and management’s discussion of performance, the Board concluded that the Fund’s performance supported renewal of the Advisory Agreement.
● For Nuveen Lifecycle 2065 Fund (formerly, TIAA-CREF Lifecycle 2065 Fund), the Board considered that although the Fund’s performance was below the performance of its composite benchmark for the one- and three-year periods ended December 31, 2023, the Fund ranked in the second quartile of its Performance Peer Group for the one- and three-year periods ended December 31, 2023. In addition, although the Fund’s performance was below the performance of its composite benchmark for the three-year period ended March 31, 2024, the Fund outperformed its composite benchmark for the one-year period ended March 31, 2024 and ranked in the first quartile of its Performance Peer Group for the one-year period and second quartile for the three-year period ended March 31, 2024. On the basis of the Board’s ongoing review of investment performance and all relevant factors, including the relative market conditions during certain reporting periods, the Fund’s investment objective(s) and management’s discussion of performance, the Board concluded that the Fund’s performance supported renewal of the Advisory Agreement.
C. Fees, Expenses and Profitability
As part of its annual review, the Board generally reviewed, among other things, the contractual management fee and net/actual management fee (i.e., the management fee after taking into consideration fee waivers and/or expense reimbursements, if any) paid by a Fund to the Adviser in light of the nature, extent and quality of the services provided. The Board also reviewed information about other expenses and the total operating expense ratio of each Fund (after any fee waivers and/or expense reimbursements). More specifically, the Board Members reviewed, among other things, each Fund’s management fee rates and net total expense ratio in relation to similar data for a comparable universe of funds (the “Expense Universe”) and for a more focused subset of comparable funds (the “Expense Group”) established by Broadridge (subject to certain exceptions). The Board Members reviewed the methodology Broadridge employed to establish its Expense Universe and Expense Group (as applicable) and considered that differences between the applicable fund and its respective Expense Universe and/or Expense Group, as well as changes to the composition of the Expense Universe and/or Expense Group from year to year, may limit some of the value of the comparative data. The Board Members also considered that it can be difficult to compare management fees among funds as there are variations in the services that are included for the fees paid. Further, with respect to TC funds, including the Funds, investing in the fee-waived Class W shares of other TC funds (the “Fund of Funds”), the Board considered that peers in the Expense Universe and Expense Group generally would not reflect the Fund of Funds’ unique fee structure pursuant to which such funds pay their management fees (subject to any fee waivers) and the equivalent of the underlying funds’ management fees and other expenses, thereby limiting some of the value of the comparative data. The Board Members took these limitations and differences into account when reviewing comparative peer data.
The Board Members also considered a Fund’s operating expense ratio as it more directly reflected a shareholder’s total costs in investing in the respective fund. In their review, the Board Members considered, in particular, each Fund with a net total expense ratio meeting certain expense or fee criteria when compared to its Expense Universe and Expense Group (if any) and an analysis as to the factors contributing to each such fund’s relative net total expense ratio.
The Board Members also considered, in relevant part, a Fund’s management fee and net total expense ratio in light of the Fund’s performance history, including reviewing certain funds identified by management and/or the Board as having a higher net total expense ratio or management fee compared to their respective peers coupled with experiencing periods of challenged performance and considering the reasons for such comparative positions.
In their evaluation of the fee arrangements for the Funds, the Board Members also reviewed the management fee schedules and the expense reimbursements and/or fee waivers agreed to by the Adviser for the respective fund (if any). In addition, in conjunction with the consolidation of the Nuveen funds and TC funds, the TC funds will phase out the separate administrative agreement pursuant to which TAL provided certain administrative services as well as the reimbursement to TAL of certain costs thereunder over a three-year period.
6
The Board’s considerations regarding the comparative fee data for each of the Funds are set forth below. With respect to the quartile rankings noted below, the first quartile represents the range of funds with the lowest management fee rate or net total expense ratio, as applicable, and the fourth quartile represents the range of funds with the highest management fee rate or net total expense ratio, as applicable. The Board considered that Broadridge only calculates quartiles if a minimum number of peers is available and therefore quartile rankings may not be available for certain Expense Groups and/or Expense Universes.
● For Nuveen Lifecycle Retirement Income Fund, the Fund’s contractual management fee rate, actual management fee rate and net total expense ratio ranked in the first quartile, third quartile and first quartile of its Expense Group, respectively. In addition, the Fund’s contractual management fee rate, actual management fee rate and net total expense ratio ranked in the first quartile, fourth quartile and first quartile of its Expense Universe, respectively. Further, although the Fund’s actual management fee rate was above the Expense Group median, the Fund’s net total expense ratio was below the Expense Group median.
● For Nuveen Lifecycle 2010 Fund, the Fund’s actual management fee rate and net total expense ratio ranked in the first quartile and second quartile of its Expense Group, respectively. Given the small number of peers, a quartile ranking of the contractual management fee rate for the Expense Group was not available. In addition, the Fund’s contractual management fee rate, actual management fee rate and net total expense ratio ranked in the first quartile, third quartile and second quartile of its Expense Universe, respectively. Further, the Fund’s actual management fee rate was below the Expense Group median, and the Fund’s net total expense ratio matched the Expense Group median.
● For Nuveen Lifecycle 2015 Fund, the Fund’s actual management fee rate and net total expense ratio each ranked in the second quartile of its Expense Group. Given the small number of peers, a quartile ranking of the contractual management fee rate for the Expense Group was not available. In addition, the Fund’s contractual management fee rate, actual management fee rate and net total expense ratio ranked in the second quartile, third quartile and first quartile of its Expense Universe, respectively. Further, the Fund’s actual management fee rate and net total expense ratio were below the Expense Group median.
● For Nuveen Lifecycle 2020 Fund, the Fund’s actual management fee rate and net total expense ratio each ranked in the second quartile of its Expense Group. Given the small number of peers, a quartile ranking of the contractual management fee rate for the Expense Group was not available. In addition, the Fund’s contractual management fee rate, actual management fee rate and net total expense ratio ranked in the second quartile, fourth quartile and first quartile of its Expense Universe, respectively. Further, the Fund’s actual management fee rate and net total expense ratio were below the Expense Group median.
● For Nuveen Lifecycle 2025 Fund, the Fund’s contractual management fee rate, actual management fee rate and net total expense ratio ranked in the first quartile, second quartile and first quartile of its Expense Group, respectively. In addition, the Fund’s contractual management fee rate, actual management fee rate and net total expense ratio ranked in the second quartile, fourth quartile and first quartile of its Expense Universe, respectively. Further, the Fund’s actual management fee rate and net total expense ratio were below the Expense Group median.
● For Nuveen Lifecycle 2030 Fund, the Fund’s contractual management fee rate, actual management fee rate and net total expense ratio ranked in the first quartile, second quartile and first quartile of its Expense Group, respectively. In addition, the Fund’s contractual management fee rate, actual management fee rate and net total expense ratio ranked in the second quartile, fourth quartile and first quartile of its Expense Universe, respectively. Further, the Fund’s actual management fee rate matched the Expense Group median, and the Fund’s net total expense ratio was below the Expense Group median.
● For Nuveen Lifecycle 2035 Fund, the Fund’s contractual management fee rate, actual management fee rate and net total expense ratio ranked in the first quartile, second quartile and first quartile of its Expense Group, respectively. In addition, the Fund’s contractual management fee rate, actual management fee rate and net total expense ratio ranked in the second quartile, fourth quartile and first quartile of its Expense Universe, respectively. Further, the Fund’s actual management fee rate and net total expense ratio were below the Expense Group median.
● For Nuveen Lifecycle 2040 Fund, the Fund’s contractual management fee rate, actual management fee rate and net total expense ratio ranked in the first quartile, second quartile and first quartile of its Expense Group, respectively. In addition, the Fund’s contractual management fee rate, actual management fee rate and net total expense ratio ranked in the second quartile, fourth quartile and first quartile of its Expense Universe, respectively. Further, the Fund’s actual management fee rate and net total expense ratio were below the Expense Group median.
● For Nuveen Lifecycle 2045 Fund, the Fund’s contractual management fee rate, actual management fee rate and net total expense ratio ranked in the first quartile, second quartile and first quartile of its Expense Group, respectively. In addition, the Fund’s contractual management fee rate, actual management fee rate and net total expense ratio ranked in the second quartile, fourth quartile and first quartile of its Expense Universe, respectively. Further, the Fund’s actual management fee rate and net total expense ratio were below the Expense Group median.
● For Nuveen Lifecycle 2050 Fund, the Fund’s contractual management fee rate, actual management fee rate and net total expense ratio ranked in the first quartile, second quartile and first quartile of its Expense Group, respectively. In addition, the Fund’s contractual management fee rate, actual management fee rate and net total expense ratio ranked in the second quartile, fourth quartile and first quartile of its Expense Universe, respectively. Further, the Fund’s actual management fee rate and net total expense ratio were below the Expense Group median.
7
Item 11. Statement Regarding Basis for Approval of Investment Advisory Contract (continued)
● For Nuveen Lifecycle 2055 Fund, the Fund’s contractual management fee rate, actual management fee rate and net total expense ratio ranked in the first quartile, second quartile and first quartile of its Expense Group, respectively. In addition, the Fund’s contractual management fee rate, actual management fee rate and net total expense ratio ranked in the second quartile, fourth quartile and first quartile of its Expense Universe, respectively. Further, the Fund’s actual management fee rate and net total expense ratio were below the Expense Group median.
● For Nuveen Lifecycle 2060 Fund, the Fund’s contractual management fee rate, actual management fee rate and net total expense ratio ranked in the first quartile, third quartile and first quartile of its Expense Group, respectively. In addition, the Fund’s contractual management fee rate, actual management fee rate and net total expense ratio ranked in the second quartile, fourth quartile and first quartile of its Expense Universe, respectively. Further, the Fund’s actual management fee rate was in-line with and the net total expense ratio was below the Expense Group median.
● For Nuveen Lifecycle 2065 Fund, the Fund’s contractual management fee rate, actual management fee rate and net total expense ratio each ranked in the first quartile of its Expense Group. In addition, the Fund’s contractual management fee rate, actual management fee rate and net total expense ratio ranked in the second quartile, first quartile and first quartile of its Expense Universe, respectively. Further, the Fund’s actual management fee rate matched the Expense Group median, and the Fund’s net total expense ratio was below the Expense Group median.
Based on its review of the information provided, the Board determined that each Fund’s management fees (as applicable) to the Adviser were reasonable in light of the nature, extent and quality of services provided to the Fund.
| | 2. | Comparisons with the Fees of Other Clients |
In evaluating the appropriateness of fees, the Board also considered that the Adviser and/or its affiliate(s) provide investment management services to other types of clients which may include: separately managed accounts, retail managed accounts, foreign funds (UCITS), other investment companies (as sub-advisers), limited partnerships and collective investment trusts. The Board reviewed the equal weighted average fee or other fee data for the other types of clients managed in a similar manner to certain of the Nuveen funds and TC funds. The Board considered the Adviser’s rationale for the differences in the management fee rates of the funds compared to the management fee rates charged to these other types of clients. In this regard, the Board considered that differences, including but not limited to, the amount, type and level of services provided by the Adviser to the funds compared to that provided to other clients as well as differences in investment policies; regulatory, disclosure and governance requirements; servicing relationships with vendors; the manner of managing such assets; product structure; investor profiles; and account sizes all may contribute to variations in relative fee rates. Further, differences in the client base, governing bodies, distribution, jurisdiction and operational complexities also would contribute to variations in management fees assessed the funds compared to foreign fund clients. In addition, differences in the level of advisory services required for passively managed funds also contribute to differences in the management fee levels of such funds compared to actively managed funds. As a general matter, higher fee levels reflect higher levels of service provided by the Adviser, increased investment management complexity, greater product management requirements, and higher levels of business risk or some combination of these factors. The Board considered the wide range of services in addition to investment management that the Adviser had provided to the funds compared to other types of clients as well as the increased entrepreneurial, legal and regulatory risks that the Adviser incurs in sponsoring and managing the funds. The Board concluded that the varying levels of fees were reasonable given, among other things, the more extensive services, regulatory requirements and legal liabilities, and the entrepreneurial, legal and regulatory risks incurred in sponsoring and advising a registered investment company compared to that required in advising other types of clients.
| | 3. | Profitability of the Adviser |
In their review, the Board Members reviewed a variety of profitability information relating to TAL as a result of its advisory services to the TC funds. In developing the profitability data, the Board Members considered the subjective nature of calculating profitability as the information is not audited and is necessarily dependent on cost allocation methodologies to allocate expenses throughout the complex and among the various advisory products. The Board Members received profitability data for TAL attributable to the TC funds in the aggregate and on a per-TC fund basis. The Board Members reviewed, among other things, TAL’s profitability margin (pre- and post-distribution expenses) for the TC funds for each year from 2014 to 2023 as well as TAL’s revenue, expenses and net earnings before federal income tax (pre- and post-distribution expenses) from the TC funds for the year ended December 31, 2023 and as compared to December 31, 2022. The Board reviewed the profitability margins (pre- and post-marketing and pre-tax) of TAL for the TC funds for the 2023 fiscal year compared to the profitability margins (pre-marketing (subject to exceptions) and post-marketing and pre-tax) of a peer group of certain asset management firms for the 2022 fiscal year (the most recent year data available). The Board considered that TAL had calculated that it incurred a net loss for the one-year period ended December 31, 2023 with respect to its services to each of the Funds without taking into account profits TAL earned in the aggregate with respect to the underlying funds that are also managed by TAL in which the respective Fund invests. In evaluating profitability data, the Board Members considered the difficulty in calculating profitability particularly at the individual Fund level given that differing but reasonable allocation methodologies could be employed and lead to significantly different results. The Board Members also reviewed the unaudited financial statements for TAL dated December 31, 2023.
8
Aside from the profitability data, the Board considered that NFAL and TAL are affiliates of Teachers Insurance and Annuity Association of America (“TIAA”). NFAL is a subsidiary of Nuveen, LLC, the investment management arm of TIAA, and TAL is an indirect wholly owned subsidiary of TIAA. Accordingly, the Board also reviewed a balance sheet for TIAA reflecting its assets, liabilities and capital and contingency reserves for the 2023 and 2022 calendar years to consider the financial strength of TIAA. The Board considered the benefit of an investment adviser and its parent with significant resources, particularly during periods of market volatility. The Board also considered the reinvestments the Adviser, its parent and/or other affiliates made into their business through, among other things, the investment of seed capital in certain funds, initiatives in international expansion, investments in infrastructure and continued investments in enhancements to technological capabilities.
In evaluating the reasonableness of the compensation, the Board Members also considered the indirect benefits the Adviser received that were directly attributable to the management of the applicable funds as discussed in further detail below. Based on its review, the Board was satisfied that the Adviser’s level of profitability from its relationship with each Fund was not unreasonable over various time frames in light of the nature, extent and quality of services provided.
D. Economies of Scale and Whether Fee Levels Reflect These Economies of Scale
The Board considered whether there have been economies of scale with respect to the management of the funds in the fund complex, including the Funds, whether these economies of scale have been appropriately shared with such funds and whether there is potential for realization of further economies of scale. Although the Board considered that economies of scale are difficult to measure with any precision and the rates at which certain expenses are incurred may not decline with a rise in assets, the Board considered that there are various methods that may be employed to help share the benefits of economies of scale, including, among other things, through the use of breakpoints in the management fee schedule, fee waivers and/or expense limitations, the pricing of funds at scale at inception and investments in the Adviser’s business which can enhance the services provided to the applicable funds for the fees paid. The Board considered that the Adviser has generally employed one or more of these various methods among the applicable funds. The Board considered that the Funds, however, do not have breakpoint schedules.
In addition, the Board Members considered the contractual and/or voluntary expense caps (if any) applicable to a Fund. The Board considered that such waivers and reimbursements applicable to the respective funds are another means for potential economies of scale to be shared with shareholders of such funds and can provide a protection from an increase in expenses if the assets of the applicable funds decline.
The Board Members also considered the continued reinvestment in Nuveen/TIAA’s business to enhance its capabilities and services to the benefit of its various clients. The Board understood that many of these investments were not specific to individual funds, but rather incurred across a variety of products and services pursuant to which the family of funds as a whole may benefit. The Board further considered that the Adviser and its affiliates have provided certain additional services, including, but not limited to, services required by new regulations and regulatory interpretations, without raising advisory fees to the funds, and this was also a means of sharing economies of scale with the funds and their shareholders. The Board considered the Adviser’s and/or its affiliates’ ongoing efforts to streamline the product line-up, among other things, to create more scaled funds which may help improve both expense and trading economies.
Based on its review, the Board was satisfied that the current fee arrangements together with the reinvestment in management’s business appropriately shared any economies of scale with shareholders.
E. Indirect Benefits
The Board Members received and considered information regarding various indirect benefits the Adviser or its affiliates may receive as a result of their relationship with the funds in the fund complex, including the Funds. These benefits included, among other things, economies of scale to the extent the Adviser or its affiliates share investment resources and/or personnel with other clients of the Adviser. The funds may also be used as investment options for other products or businesses offered by the Adviser and/or its affiliates, such as variable products and 529 education savings plans, and affiliates of the Adviser may serve as sub-advisers to various funds in which case all advisory and sub-advisory fees generated by such funds stay within Nuveen.
Further, the funds may pay the Adviser and/or its affiliates for other services, such as distribution. In this regard, the Board Members considered that an affiliate of the Adviser serves as principal underwriter providing distribution and/or shareholder services to the open-end funds for which it may be compensated. The Board Members also considered that certain share classes of the funds (subject to certain exceptions) pay 12b-1 fees, some of which may be retained by the Adviser’s affiliate.
The Board Members considered that TAL or its affiliates were reimbursed for certain costs of administrative services pursuant to an administrative agreement; however, such administrative agreement was anticipated to be phased out over time.
In addition, the Board Members considered that the Adviser may utilize soft dollar brokerage arrangements attributable to the respective fund(s) to obtain research and other services for any or all of its clients, although the Board Members also considered that the Adviser reimburses the Funds for all such costs.
The Adviser and its affiliates may also benefit from the advisory relationships with the funds in the fund complex to the extent this relationship results in potential investors viewing the TIAA group of companies as a leading retirement plan provider in the academic and nonprofit market and a single source for all their financial service needs. The Adviser and/or its affiliates may further benefit to the extent that they have pricing or other information regarding vendors the funds utilize in establishing arrangements with such vendors for other products.
Based on its review, the Board concluded that any indirect benefits received by the Adviser as a result of its relationship with the Funds were reasonable in light of the services provided.
9
Item 11. Statement Regarding Basis for Approval of Investment Advisory Contract (continued)
F. Other Considerations
The Board Members did not identify any single factor discussed previously as all-important or controlling. The Board Members concluded that the terms of each Advisory Agreement were reasonable, that the Adviser’s fees were reasonable in light of the services provided to each Fund and that the Advisory Agreements be renewed for an additional one-year period.
10
Item 11. Statement Regarding Basis for Approval of Investment Advisory Contract
Nuveen Lifecycle Index Retirement Income Fund
Nuveen Lifecycle Index 2010 Fund
Nuveen Lifecycle Index 2015 Fund
Nuveen Lifecycle Index 2020 Fund
Nuveen Lifecycle Index 2025 Fund
Nuveen Lifecycle Index 2030 Fund
Nuveen Lifecycle Index 2035 Fund
Nuveen Lifecycle Index 2040 Fund
Nuveen Lifecycle Index 2045 Fund
Nuveen Lifecycle Index 2050 Fund
Nuveen Lifecycle Index 2055 Fund
Nuveen Lifecycle Index 2060 Fund
Nuveen Lifecycle Index 2065 Fund
The Approval Process
At meetings held on April 18 and 19, 2024 (the “Meeting”), the Board of Trustees (collectively, the “Board” and each Trustee, a “Board Member”) of TIAA-CREF Funds (the “Trust”) approved, for each applicable series of the Trust, the renewal of the investment management agreement with Teachers Advisors, LLC (“TAL” and TAL is an “Adviser”) pursuant to which TAL serves as investment adviser to such funds. The Board Members are not “interested persons” (as defined under the Investment Company Act of 1940 (the “1940 Act”)) and, therefore, the Board is deemed to be comprised of all disinterested Board Members. References to the Board and the Board Members are interchangeable. Below is a summary of the annual review process the Board undertook related to its most recent renewal of the investment management agreement (each an “Advisory Agreement”) with respect to each series listed above (the “Funds”).
In accordance with applicable law, following up to an initial two-year period, the Board considers the renewal of each Advisory Agreement on behalf of the applicable Fund on an annual basis. In addition, the fund complex consists of the group of funds advised by TAL (collectively referred to as the “TC funds”) and the group of funds advised by Nuveen Fund Advisors, LLC (“NFAL” and such funds are collectively, the “Nuveen funds”). For clarity, TAL serves as Adviser to the TC funds, including the Funds, and NFAL serves as “Adviser” to the Nuveen funds. The Board Members considered that the prior separate boards of the TC funds and Nuveen funds were consolidated effective in January 2024. Accordingly, at the Meeting, the Board Members considered the review of the advisory agreements for the TC funds as well as reviewed the investment management agreements and sub-advisory agreements for the Nuveen funds. Depending on the appropriate context, references to “the Adviser” may be to TAL with respect to the TC funds and/or NFAL with respect to the Nuveen funds.
The Board Members considered the review of the advisory agreements of the TC funds and the Nuveen funds to be an ongoing process. The Board Members therefore employed the accumulated information, knowledge and experience they had gained during their tenure on the respective board of the TC funds or Nuveen funds (as the case may be) governing the applicable funds and working with the respective investment advisers and sub-advisers, as applicable, in their review of the advisory agreements for the fund complex.
During the course of the year prior to the Meeting, the Board and/or its committees received a wide variety of materials that covered a range of topics relevant to the Board’s annual consideration of the renewal of the advisory agreements, including reports on fund investment results over various periods; product initiatives for various funds; fund expenses; compliance, regulatory and risk management matters; trading practices, including soft dollar arrangements (as applicable); the liquidity and derivatives risk management programs; management of distributions; valuation of securities; payments to financial intermediaries, including 12b-1 expenses (as applicable); securities lending (as applicable); and overall market and regulatory developments. The Board also met periodically with and/or received presentations by key investment professionals managing a fund’s portfolio. In particular, at the Board meeting held on February 27-29, 2024 (the “February Meeting”), the Board and/or its Investment Committee received the annual performance review of the funds as described in further detail below. The presentations, discussions and meetings throughout the year also provide a means for the Board to evaluate and consider the level, breadth and quality of services provided by the Adviser and how such services have changed over time in light of new or modified regulatory requirements, changes to market conditions or other factors.
In connection with its annual consideration of the advisory agreements, the Board, through its independent legal counsel, requested and received extensive materials and information prepared specifically for its review of the advisory agreements. The materials provided at the Meeting and/ or prior meetings covered a wide range of matters including, but not limited to, a description of the nature, extent and quality of services provided
1
Item 11. Statement Regarding Basis for Approval of Investment Advisory Contract (continued)
by the Adviser; the consolidation of the Nuveen fund family and TC fund family; a review of product actions advanced in 2023 for the benefit of particular funds and/or the fund complex; a review of the applicable investment team; an analysis of fund performance with a focus on funds considered to have met certain challenged performance measurements; an analysis of the fees and expense ratios of the funds with a focus on funds considered to have certain expense characteristics; a list of management fee schedules; a review of contractual and/or voluntary expense caps and fee waivers for the TC funds; a description of portfolio manager compensation; a description of the profitability and/or financial data of Nuveen and TAL; and a description of indirect benefits received by the Adviser as a result of its relationships with the funds. The Board also considered information provided by Broadridge Financial Solutions, Inc. (“Broadridge”), an independent provider of investment company data, comparing fee and expense levels of each respective fund to those of a peer universe and, with respect to open-end funds, also to a peer group of funds selected by Broadridge, subject to certain exceptions.
The information prepared specifically for the annual review supplemented the information provided to the Board and its committees and the evaluations of the funds by the Board and its committees during the year. The Board’s review of the advisory agreements for the fund complex is based on all the information provided to the Board and its committees over time. The performance, fee and expense data and other information provided by the Adviser, Broadridge or other service providers were not independently verified by the Board Members.
As part of their review, the Board Members and independent legal counsel met by videoconference in executive session on April 10, 2024 (the “April Executive Session”) to review and discuss materials provided in connection with their annual review of the advisory agreements for the fund complex. After reviewing this information, the Board Members requested, directly or through independent legal counsel, additional information, and the Board subsequently reviewed and discussed the responses to these follow-up questions and requests.
The Board Members were advised by independent legal counsel during the annual review process as well as throughout the year, including meeting in executive sessions with such counsel at which no representatives of management were present. In connection with their annual review, the Board Members also received a memorandum from independent legal counsel outlining their fiduciary duties and legal standards in reviewing the Advisory Agreements, including guidance from court cases evaluating advisory fees.
The Board’s decisions to renew each Advisory Agreement were not based on a single identified factor, but rather each decision reflected the comprehensive consideration of all the information provided to the Board and its committees throughout the year as well as the materials prepared specifically in connection with the annual review process. The contractual arrangements may reflect the results of prior year(s) of review, negotiation and information provided in connection with the Board’s annual review of the funds’ advisory arrangements and oversight of the funds. Each Board Member may have attributed different levels of importance to the various factors and information considered in connection with the annual review process and may have placed different emphasis on the relevant information year to year in light of, among other things, changing market and economic conditions. A summary of the principal factors and information, but not all the factors, the Board considered in deciding to renew the Advisory Agreements is set forth below.
A. Nature, Extent and Quality of Services
In evaluating the renewal of the Advisory Agreements, the Board Members received and considered information regarding the nature, extent and quality of the Adviser’s services provided to each respective Fund with particular focus on the services and enhancements or changes to such services provided during the last year.
The Board considered that the Adviser provides a wide array of management, oversight and other services to manage and operate the applicable funds. The Board considered the Adviser’s and its affiliates’ dedication of resources, time, people and capital as well as continual program of improvement and innovation aimed at enhancing the funds and fund complex for investors and meeting the needs of an increasingly complex regulatory environment. In particular, over the past several years, the Board considered the significant resources, both financial and personnel, the Adviser and its affiliates have committed in working to consolidate the Nuveen fund family and TC fund family under one centralized umbrella. The Board considered that the organizational changes in bringing together Nuveen, its affiliates and TIAA’s (as defined below) asset management businesses, consolidating the Nuveen and TC fund families and other initiatives were anticipated to provide various benefits for the funds through, among other things, enhanced operating efficiencies, centralized investment leadership and a centralized shared resources and support model. As part of these efforts, the boards of the TC funds and Nuveen funds were consolidated effective in January 2024.
The Board also reviewed information regarding other product actions undertaken or continued by management in the 2023 calendar year in seeking to improve the effectiveness of the organization, the product line-up as well as particular funds through, among other things, continuing to review and optimize the product line and gaining efficiencies through mergers and liquidations; reviewing and updating investment policies and benchmarks; implementing fee waivers and/or expense cap changes for certain funds; evaluating and adjusting portfolio management teams as appropriate for various funds; and developing policy positions on a broad range of regulatory proposals that may impact the funds and communicating with lawmakers and other regulatory authorities to help ensure these positions are considered. In its review, the Board considered that the funds operated in a highly regulated industry and the scope and complexity of the services and resources that the Adviser and its affiliates must provide to manage and operate the applicable funds have expanded over the years as a result of, among other things, regulatory, market and other developments, such as the adoption of the tailored shareholder report or the revised fund name rule.
In considering the breadth and quality of services TAL and its various teams provide with respect to the TC funds, the Board considered that TAL is responsible for providing various types of investment advisory services, including, among other things, furnishing an investment program for each TC fund; managing the assets of such funds, including conducting research, identifying investments and placing orders for the purchase or sale of the portfolio investments for the fund; and evaluating fund performance and implementing changes thereto. The Board further considered that over the course of the 2023 calendar year, the Nuveen global public product team which supports the funds in the fund complex and their shareholders assessed the investment personnel across the investment leadership teams which resulted in additions or other modifications to the portfolio management teams of various funds. The Board also reviewed a description of the compensation structure applicable to certain portfolio managers.
2
In addition to the above investment advisory services, the Board further considered the extensive compliance, regulatory, administrative and other services the Adviser and its various teams or affiliates provide to manage and operate the applicable funds. Given the highly regulated industry in which the funds operate, the Board considered the breadth of the Adviser’s compliance program and related policies and procedures. The Board reviewed various initiatives the Adviser’s compliance team undertook or continued in 2023, in part, to address new regulatory requirements, support international business growth and product development, enhance international trading capabilities, enhance monitoring capabilities in light of the new regulatory requirements and guidance and maintain a comprehensive training program. The Board further considered, among other things, that other non-advisory services provided included, among other things, board support and reporting; establishing and reviewing the services provided by other fund service providers (such as a fund’s custodian, accountant, and transfer agent); risk management, including reviews of the liquidity risk management and derivatives risk management programs; legal support services; regulatory advocacy; and cybersecurity, business continuity and disaster recovery planning and testing. With respect to the TC funds, the Board considered that certain non-investment and non-distribution services were provided by TAL or its affiliates pursuant to a separate administrative agreement; however, given the consolidation of the TC funds and Nuveen funds with the centralization of services and resources, such administrative agreement was anticipated to be phased out over a three-year period with the administrative services for the Funds to be provided under the respective Advisory Agreements at no additional cost.
Aside from the services provided, the Board considered the financial resources of the Adviser and/or its affiliates and their willingness to make investments in the technology, personnel and infrastructure to support the funds, including to enhance global talent, middle office systems, software and international and internal capabilities. The Board considered the access provided by the Adviser and its affiliates to a seed capital budget to support new or existing funds and/or facilitate changes for a respective fund. The Board considered the benefits to shareholders of investing in a fund that is a part of a large fund complex with a variety of investment disciplines, capabilities, expertise and resources available to navigate and support the funds including during stressed times. The Board considered the overall reputation and capabilities of the Adviser and its affiliates and the Adviser’s continuing commitment to provide high quality services.
In its review, the Board also considered the significant risks borne by the Adviser and its affiliates in connection with their services to the applicable funds, including entrepreneurial risks in sponsoring and supporting new funds and smaller funds and ongoing risks with managing the funds, such as investment, operational, reputational, regulatory, compliance and litigation risks.
Based on its review, the Board determined, in the exercise of its reasonable business judgment, that it was satisfied with the nature, extent and quality of services provided to the respective Funds under each applicable Advisory Agreement.
B. The Investment Performance of the Funds and Adviser
In evaluating the quality of the services provided by the Adviser, the Board also considered a variety of investment performance data of the Funds. In this regard, the Board and/or its Investment Committee reviewed, among other things, performance of the Funds over the quarter, one-, three- and five-year periods ending December 31, 2023 and March 31, 2024 (or for such shorter periods to the extent a Fund was not in existence during such periods). For those Funds with multiple share classes, the performance data was based on Class R6 shares (formerly, the Institutional Class shares); however, the performance of other share classes was substantially similar as those other share classes invest in the same portfolio of securities and differences in performance among the classes would be principally attributed to the variations in the expense structures of the share classes. The Board performed its annual review of fund performance at its February Meeting and an additional review at the April Executive Session and also reviewed and discussed performance data at its other regularly scheduled quarterly meetings throughout the year. The Board therefore took into account the performance data, presentations and discussions (written and oral) that were provided at the Meeting and in prior meetings over time in evaluating fund performance, including management’s analysis of a fund’s performance with particular focus on funds that met certain challenged performance measurements as determined pursuant to a methodology approved by the Board or additional measurements as determined by management’s investment analysts. As various funds have modified their portfolio teams and/or made significant changes to their portfolio strategies over time, the Board reviewed, among other things, certain tracking performance data over specific periods comparing performance before and after such changes.
The Board considered that performance data reflects performance over a specified period which may differ significantly depending on the ending dates selected, particularly during periods of market volatility. Further, the Board considered that shareholders may evaluate performance based on their own respective holding periods which may differ from the performance periods reviewed by the Board and lead to differing results.
In its evaluation, the Board reviewed fund performance results from different perspectives. In general, subject to certain exceptions, the Board reviewed both absolute and relative fund performance over the various time periods and considered performance results in light of a fund’s investment objective(s), strategies and risks. With respect to the relative performance, the Board considered fund performance in comparison to the performance of peer funds (the “Performance Peer Group”), subject to certain exceptions, and recognized and/or customized benchmarks (i.e., generally benchmarks derived from multiple recognized benchmarks). In reviewing such comparative performance, the Board was cognizant of the inherent limitations of such data which can make meaningful performance comparisons generally difficult. As an illustration, differences in the composition of the Performance Peer Group, the investment objective(s), strategies, dates of fund inception and other characteristics of the peers in the Performance Peer Group, and the varying sizes of peers all may contribute to differences in the performance results of a Performance Peer Group compared to the applicable fund. With respect to relative performance of a fund compared to a benchmark index, differences, among other things, in the investment objective(s) and strategies of a fund and the benchmark (particularly an actively managed fund that does not directly follow an index) as well as the costs of operating a fund would necessarily contribute to differences in performance results and limit the value of the comparative performance information. To assist the Board in its review of the comparability of the relative performance, management generally has ranked the relevancy of the Performance Peer Groups to the Funds as low, medium or high. In its review of relative performance, the Board considered a Fund’s performance relative to its Performance Peer Group, among other things, by evaluating its quartile ranking with the 1st quartile representing the top performing funds within the Performance Peer Group and the 4th quartile representing the lowest performing funds.
3
Item 11. Statement Regarding Basis for Approval of Investment Advisory Contract (continued)
The Board evaluated performance in light of various relevant factors which may include, among other things, general market conditions, issuer-specific information, asset class information, leverage and fund cash flows. The Board considered that long-term performance could be impacted by even one period of significant outperformance or underperformance and that a single investment theme could disproportionately affect performance. Further, the Board considered that market and economic conditions may significantly impact a fund’s performance, particularly over shorter periods, and such performance may be more reflective of such economic or market events and not necessarily reflective of management skill. Although the Board reviews short-, intermediate- and longer-term performance data, the Board considered that longer periods of performance may reflect full market cycles.
In their review from year to year, the Board Members consider and may place different emphasis on the relevant information in light of changing circumstances in market and economic conditions. In evaluating performance, the Board focused particular attention on funds with less favorable performance records. However, depending on the facts and circumstances, including any differences between the respective fund and its benchmark and/or Performance Peer Group, the Board may be satisfied with a fund’s performance notwithstanding that its performance may be below that of its benchmark and/or peer group for certain periods. With respect to any funds for which the Board has identified performance issues, the Board seeks to monitor such funds more closely until performance improves, discuss with the Adviser the reasons for such results, consider whether any steps are necessary or appropriate to address such issues, discuss and evaluate the potential consequences of such steps and review the results of any steps undertaken.
The performance determinations with respect to each Fund are summarized below.
● For Nuveen Lifecycle Index Retirement Income Fund (formerly, TIAA-CREF Lifecycle Index Retirement Income Fund), the Board considered that although the Fund’s performance was below the performance of its composite benchmark for the three- and five-year periods ended December 31, 2023, the Fund essentially matched the performance of its composite benchmark for the one-year period ended December 31, 2023 and ranked in the first quartile of its Performance Peer Group for the one-, three- and five-year periods ended December 31, 2023. In addition, although the Fund’s performance was below the performance of its composite benchmark for the one-, three- and five-year periods ended March 31, 2024, the Fund ranked in the second quartile of its Performance Peer Group for the one-year period ended March 31, 2024 and first quartile for the three- and five-year periods ended March 31, 2024. On the basis of the Board’s ongoing review of investment performance and all relevant factors, including the relative market conditions during certain reporting periods, the Fund’s investment objective(s) and management’s discussion of performance, the Board concluded that the Fund’s performance supported renewal of the Advisory Agreement.
● For Nuveen Lifecycle Index 2010 Fund (formerly, TIAA-CREF Lifecycle Index 2010 Fund), the Board considered that although the Fund’s performance was below the performance of its composite benchmark for the three- and five-year periods ended December 31, 2023, the Fund outperformed its composite benchmark for the one-year period ended December 31, 2023 and ranked in the first quartile of its Performance Peer Group for the one- and five-year periods and second quartile for the three-year period ended December 31, 2023. In addition, although the Fund’s performance was below the performance of its composite benchmark for the one-, three- and five-year periods ended March 31, 2024, the Fund ranked in the first quartile of its Performance Peer Group for the one- and five-year periods ended March 31, 2024 and second quartile for the three-year period ended March 31, 2024. On the basis of the Board’s ongoing review of investment performance and all relevant factors, including the relative market conditions during certain reporting periods, the Fund’s investment objective(s) and management’s discussion of performance, the Board concluded that the Fund’s performance supported renewal of the Advisory Agreement.
● For Nuveen Lifecycle Index 2015 Fund (formerly, TIAA-CREF Lifecycle Index 2015 Fund), the Board considered that although the Fund’s performance was below the performance of its composite benchmark for the one-, three- and five-year periods ended December 31, 2023 and March 31, 2024, the Fund ranked in the first quartile of its Performance Peer Group for the one- and five-year periods and second quartile for the three-year periods ended December 31, 2023 and March 31, 2024. On the basis of the Board’s ongoing review of investment performance and all relevant factors, including the relative market conditions during certain reporting periods, the Fund’s investment objective(s) and management’s discussion of performance, the Board concluded that the Fund’s performance supported renewal of the Advisory Agreement.
● For Nuveen Lifecycle Index 2020 Fund (formerly, TIAA-CREF Lifecycle Index 2020 Fund), the Board considered that although the Fund’s performance was below the performance of its composite benchmark for the one-, three- and five-year periods ended December 31, 2023 and March 31, 2024, the Fund ranked in the first quartile of its Performance Peer Group for the one- and five-year periods ended December 31, 2023 and second quartile for the three-year period ended December 31, 2023. In addition, the Fund ranked in the first quartile of its Performance Peer Group for the one-, three- and five-year periods ended March 31, 2024. On the basis of the Board’s ongoing review of investment performance and all relevant factors, including the relative market conditions during certain reporting periods, the Fund’s investment objective(s) and management’s discussion of performance, the Board concluded that the Fund’s performance supported renewal of the Advisory Agreement.
● For Nuveen Lifecycle Index 2025 Fund (formerly, TIAA-CREF Lifecycle Index 2025 Fund), the Board considered that although the Fund’s performance was below the performance of its composite benchmark for the one-, three- and five-year periods ended December 31, 2023 and March 31, 2024, the Fund ranked in the first quartile of its Performance Peer Group for the one-, three- and five-year periods ended December 31, 2023 and March 31, 2024. On the basis of the Board’s ongoing review of investment performance and all relevant factors, including the relative market conditions during certain reporting periods, the Fund’s investment objective(s) and management’s discussion of performance, the Board concluded that the Fund’s performance supported renewal of the Advisory Agreement.
4
● For Nuveen Lifecycle Index 2030 Fund (formerly, TIAA-CREF Lifecycle Index 2030 Fund), the Board considered that although the Fund’s performance was below the performance of its composite benchmark for the one-, three- and five-year periods ended December 31, 2023 and March 31, 2024, the Fund ranked in the first quartile of its Performance Peer Group for the one- and five-year periods ended December 31, 2023 and second quartile for the three-year period ended December 31, 2023. In addition, the Fund ranked in the second quartile of its Performance Peer Group for the one-year period ended March 31, 2024 and first quartile for the three- and five-year periods ended March 31, 2024. On the basis of the Board’s ongoing review of investment performance and all relevant factors, including the relative market conditions during certain reporting periods, the Fund’s investment objective(s) and management’s discussion of performance, the Board concluded that the Fund’s performance supported renewal of the Advisory Agreement.
● For Nuveen Lifecycle Index 2035 Fund (formerly, TIAA-CREF Lifecycle Index 2035 Fund), the Board considered that although the Fund’s performance was below the performance of its composite benchmark for the one-, three- and five-year periods ended December 31, 2023 and March 31, 2024, the Fund ranked in the first quartile of its Performance Peer Group for the one-year period ended December 31, 2023 and second quartile for the three- and five-year periods ended December 31, 2023. In addition, the Fund ranked in the second quartile of its Performance Peer Group for the one-, three- and five-year periods ended March 31, 2024. On the basis of the Board’s ongoing review of investment performance and all relevant factors, including the relative market conditions during certain reporting periods, the Fund’s investment objective(s) and management’s discussion of performance, the Board concluded that the Fund’s performance supported renewal of the Advisory Agreement.
● For Nuveen Lifecycle Index 2040 Fund (formerly, TIAA-CREF Lifecycle Index 2040 Fund), the Board considered that although the Fund’s performance was below the performance of its composite benchmark for the one-, three- and five-year periods ended December 31, 2023 and March 31, 2024, the Fund ranked in the second quartile of its Performance Peer Group for the one-, three- and five-year periods ended December 31, 2023. In addition, the Fund ranked in the third quartile of its Performance Peer Group for the one-year period ended March 31, 2024 and second quartile for the three- and five-year periods ended March 31, 2024. On the basis of the Board’s ongoing review of investment performance and all relevant factors, including the relative market conditions during certain reporting periods, the Fund’s investment objective(s) and management’s discussion of performance, the Board concluded that the Fund’s performance supported renewal of the Advisory Agreement.
● For Nuveen Lifecycle Index 2045 Fund (formerly, TIAA-CREF Lifecycle Index 2045 Fund), the Board considered that although the Fund’s performance was below the performance of its composite benchmark for the one-, three- and five-year periods ended December 31, 2023 and March 31, 2024, the Fund ranked in the first quartile of its Performance Peer Group for the one- and five-year periods ended December 31, 2023 and second quartile for the three-year period ended December 31, 2023. In addition, the Fund ranked in the second quartile of its Performance Peer Group for the one-year period ended March 31, 2024 and first quartile for the three- and five-year periods ended March 31, 2024. On the basis of the Board’s ongoing review of investment performance and all relevant factors, including the relative market conditions during certain reporting periods, the Fund’s investment objective(s) and management’s discussion of performance, the Board concluded that the Fund’s performance supported renewal of the Advisory Agreement.
● For Nuveen Lifecycle Index 2050 Fund (formerly, TIAA-CREF Lifecycle Index 2050 Fund), the Board considered that although the Fund’s performance was below the performance of its composite benchmark for the one-, three- and five-year periods ended December 31, 2023 and March 31, 2024, the Fund ranked in the second quartile of its Performance Peer Group for the one- and three-year periods ended December 31, 2023 and first quartile for the five-year period ended December 31, 2023. In addition, the Fund ranked in the third quartile of its Performance Peer Group for the one-year period ended March 31, 2024 and first quartile for the three- and five-year periods ended March 31, 2024. On the basis of the Board’s ongoing review of investment performance and all relevant factors, including the relative market conditions during certain reporting periods, the Fund’s investment objective(s) and management’s discussion of performance, the Board concluded that the Fund’s performance supported renewal of the Advisory Agreement.
● For Nuveen Lifecycle Index 2055 Fund (formerly, TIAA-CREF Lifecycle Index 2055 Fund), the Board considered that although the Fund’s performance was below the performance of its composite benchmark for the one-, three- and five-year periods ended December 31, 2023 and March 31, 2024, the Fund ranked in the second quartile of its Performance Peer Group for the one- and three-year periods ended December 31, 2023 and first quartile for the five-year period ended December 31, 2023. In addition, the Fund ranked in the second quartile of its Performance Peer Group for the one-year period ended March 31, 2024 and first quartile for the three- and five-year periods ended March 31, 2024. On the basis of the Board’s ongoing review of investment performance and all relevant factors, including the relative market conditions during certain reporting periods, the Fund’s investment objective(s) and management’s discussion of performance, the Board concluded that the Fund’s performance supported renewal of the Advisory Agreement.
● For Nuveen Lifecycle Index 2060 Fund (formerly, TIAA-CREF Lifecycle Index 2060 Fund), the Board considered that although the Fund’s performance was below the performance of its composite benchmark for the one-, three- and five-year periods ended December 31, 2023 and March 31, 2024, the Fund ranked in the second quartile of its Performance Peer Group for the one- and three-year periods ended December 31, 2023 and first quartile for the five-year period ended December 31, 2023. In addition, the Fund ranked in the second quartile of its Performance Peer Group for the one-year period ended March 31, 2024 and first quartile for the three- and five-year periods ended March 31, 2024. On the basis of the Board’s ongoing review of investment performance and all relevant factors, including the relative market conditions during certain reporting periods, the Fund’s investment objective(s) and management’s discussion of performance, the Board concluded that the Fund’s performance supported renewal of the Advisory Agreement.
5
Item 11. Statement Regarding Basis for Approval of Investment Advisory Contract (continued)
● For Nuveen Lifecycle Index 2065 Fund (formerly, TIAA-CREF Lifecycle Index 2065 Fund), the Board considered that although the Fund’s performance was below the performance of its composite benchmark for the one-year period ended December 31, 2023, the Fund matched the performance of its composite benchmark for the three-year period ended December 31, 2023 and ranked in the first quartile of its Performance Peer Group for the one-year period ended December 31, 2023 and second quartile for the three-year period ended December 31, 2023. In addition, although the Fund’s performance was below the performance of its composite benchmark for the one- and three-year periods ended March 31, 2024, the Fund ranked in the second quartile of its Performance Peer Group for the one- year period ended March 31, 2024 and first quartile for the three-year period ended March 31, 2024. On the basis of the Board’s ongoing review of investment performance and all relevant factors, including the relative market conditions during certain reporting periods, the Fund’s investment objective(s) and management’s discussion of performance, the Board concluded that the Fund’s performance supported renewal of the Advisory Agreement.
C. Fees, Expenses and Profitability
As part of its annual review, the Board generally reviewed, among other things, the contractual management fee and net/actual management fee (i.e., the management fee after taking into consideration fee waivers and/or expense reimbursements, if any) paid by a Fund to the Adviser in light of the nature, extent and quality of the services provided. The Board also reviewed information about other expenses and the total operating expense ratio of each Fund (after any fee waivers and/or expense reimbursements). More specifically, the Board Members reviewed, among other things, each Fund’s management fee rates and net total expense ratio in relation to similar data for a comparable universe of funds (the “Expense Universe”) and for a more focused subset of comparable funds (the “Expense Group”) established by Broadridge (subject to certain exceptions). The Board Members reviewed the methodology Broadridge employed to establish its Expense Universe and Expense Group (as applicable) and considered that differences between the applicable fund and its respective Expense Universe and/or Expense Group, as well as changes to the composition of the Expense Universe and/or Expense Group from year to year, may limit some of the value of the comparative data. The Board Members also considered that it can be difficult to compare management fees among funds as there are variations in the services that are included for the fees paid. Further, with respect to TC funds, including the Funds, investing in the fee-waived Class W shares of other TC funds (the “Fund of Funds”), the Board considered that peers in the Expense Universe and Expense Group generally would not reflect the Fund of Funds’ unique fee structure pursuant to which such funds pay their management fees (subject to any fee waivers) and the equivalent of the underlying funds’ management fees and other expenses, thereby limiting some of the value of the comparative data. The Board Members took these limitations and differences into account when reviewing comparative peer data.
The Board Members also considered a Fund’s operating expense ratio as it more directly reflected a shareholder’s total costs in investing in the respective fund. In their review, the Board Members considered, in particular, each Fund with a net total expense ratio meeting certain expense or fee criteria when compared to its Expense Universe and Expense Group (if any) and an analysis as to the factors contributing to each such fund’s relative net total expense ratio.
The Board Members also considered, in relevant part, a Fund’s management fee and net total expense ratio in light of the Fund’s performance history, including reviewing certain funds identified by management and/or the Board as having a higher net total expense ratio or management fee compared to their respective peers coupled with experiencing periods of challenged performance and considering the reasons for such comparative positions.
In their evaluation of the fee arrangements for the Funds, the Board Members also reviewed the management fee schedules and the expense reimbursements and/or fee waivers agreed to by the Adviser for the respective fund (if any). In addition, in conjunction with the consolidation of the Nuveen funds and TC funds, the TC funds will phase out the separate administrative agreement pursuant to which TAL provided certain administrative services as well as the reimbursement to TAL of certain costs thereunder over a three-year period.
The Board’s considerations regarding the comparative fee data for each of the Funds are set forth below. With respect to the quartile rankings noted below, the first quartile represents the range of funds with the lowest management fee rate or net total expense ratio, as applicable, and the fourth quartile represents the range of funds with the highest management fee rate or net total expense ratio, as applicable. The Board considered that Broadridge only calculates quartiles if a minimum number of peers is available and therefore quartile rankings may not be available for certain Expense Groups and/or Expense Universes.
● For Nuveen Lifecycle Index Retirement Income Fund, the Fund’s contractual management fee rate, actual management fee rate and net total expense ratio each ranked in the first quartile of its Expense Group. In addition, the Fund’s contractual management fee rate, actual management fee rate and net total expense ratio ranked in the first quartile, third quartile and first quartile of its Expense Universe, respectively. Further, the Fund’s actual management fee rate and net total expense ratio were below the Expense Group median.
● For Nuveen Lifecycle Index 2010 Fund, the Fund’s contractual management fee rate, actual management fee rate and net total expense ratio each ranked in the second quartile of its Expense Universe. Given the small number of peers, quartile rankings for the Expense Group were not available. Further, the Fund’s actual management fee rate matched the Expense Group median, and the Fund’s net total expense ratio was slightly above (within 5 basis points of) the Expense Group median.
● For Nuveen Lifecycle Index 2015 Fund, the Fund’s contractual management fee rate, actual management fee rate and net total expense ratio ranked in the second quartile, third quartile and second quartile of its Expense Universe, respectively. Given the small number of peers, quartile rankings for the Expense Group were not available. Further, the Fund’s actual management fee rate matched the Expense Group median, and the Fund’s net total expense ratio was slightly above (within 5 basis points of) the Expense Group median.
6
● For Nuveen Lifecycle Index 2020 Fund, the Fund’s contractual management fee rate, actual management fee rate and net total expense ratio ranked in the first quartile, fourth quartile and first quartile of its Expense Universe, respectively. Given the small number of peers, quartile rankings for the Expense Group were not available. Further, the Fund’s actual management fee rate and net total expense ratio were slightly above (within 5 basis points of) the Expense Group median.
● For Nuveen Lifecycle Index 2025 Fund, the Fund’s contractual management fee rate, actual management fee rate and net total expense ratio each ranked in the second quartile of its Expense Group. In addition, the Fund’s contractual management fee rate, actual management fee rate and net total expense ratio ranked in the first quartile, third quartile and first quartile of its Expense Universe, respectively. Further, the Fund’s actual management fee rate matched the Expense Group median, and the Fund’s net total expense ratio was below the Expense Group median.
● For Nuveen Lifecycle Index 2030 Fund, the Fund’s contractual management fee rate, actual management fee rate and net total expense ratio each ranked in the second quartile of its Expense Group. In addition, the Fund’s contractual management fee rate, actual management fee rate and net total expense ratio ranked in the first quartile, third quartile and first quartile of its Expense Universe, respectively. Further, the Fund’s actual management fee rate matched the Expense Group median, and the Fund’s net total expense ratio was below the Expense Group median.
● For Nuveen Lifecycle Index 2035 Fund, the Fund’s contractual management fee rate, actual management fee rate and net total expense ratio each ranked in the second quartile of its Expense Group. In addition, the Fund’s contractual management fee rate, actual management fee rate and net total expense ratio ranked in the first quartile, third quartile and first quartile of its Expense Universe, respectively. Further, the Fund’s actual management fee rate matched the Expense Group median, and the Fund’s net total expense ratio was below the Expense Group median.
● For Nuveen Lifecycle Index 2040 Fund, the Fund’s contractual management fee rate, actual management fee rate and net total expense ratio each ranked in the second quartile of its Expense Group. In addition, the Fund’s contractual management fee rate, actual management fee rate and net total expense ratio ranked in the first quartile, third quartile and first quartile of its Expense Universe, respectively. Further, the Fund’s actual management fee rate matched the Expense Group median, and the Fund’s net total expense ratio was below the Expense Group median.
● For Nuveen Lifecycle Index 2045 Fund, the Fund’s contractual management fee rate, actual management fee rate and net total expense ratio ranked in the second quartile, third quartile and second quartile of its Expense Group, respectively. In addition, the Fund’s contractual management fee rate, actual management fee rate and net total expense ratio ranked in the first quartile, third quartile and first quartile of its Expense Universe, respectively. Further, the Fund’s actual management fee rate matched the Expense Group median, and the Fund’s net total expense ratio was below the Expense Group median.
● For Nuveen Lifecycle Index 2050 Fund, the Fund’s contractual management fee rate, actual management fee rate and net total expense ratio ranked in the second quartile, third quartile and second quartile of its Expense Group, respectively. In addition, the Fund’s contractual management fee rate, actual management fee rate and net total expense ratio ranked in the first quartile, third quartile and first quartile of its Expense Universe, respectively. Further, the Fund’s actual management fee rate matched the Expense Group median, and the Fund’s net total expense ratio was below the Expense Group median.
● For Nuveen Lifecycle Index 2055 Fund, the Fund’s contractual management fee rate, actual management fee rate and net total expense ratio ranked in the second quartile, third quartile and second quartile of its Expense Group, respectively. In addition, the Fund’s contractual management fee rate, actual management fee rate and net total expense ratio ranked in the first quartile, fourth quartile and first quartile of its Expense Universe, respectively. Further, the Fund’s actual management fee rate was generally in-line with the Expense Group median, and the Fund’s net total expense ratio was below the Expense Group median.
● For Nuveen Lifecycle Index 2060 Fund, the Fund’s contractual management fee rate, actual management fee rate and net total expense ratio each ranked in the second quartile of its Expense Group. In addition, the Fund’s contractual management fee rate, actual management fee rate and net total expense ratio ranked in the first quartile, fourth quartile and first quartile of its Expense Universe, respectively. Further, the Fund’s actual management fee rate and net total expense ratio were below the Expense Group median.
● For Nuveen Lifecycle Index 2065 Fund, the Fund’s contractual management fee rate, actual management fee rate and net total expense ratio ranked in the second quartile, first quartile and second quartile of its Expense Group, respectively. In addition, the Fund’s contractual management fee rate, actual management fee rate and net total expense ratio each ranked in the first quartile of its Expense Universe. Further, the Fund’s actual management fee rate and net total expense ratio were below the Expense Group median.
Based on its review of the information provided, the Board determined that each Fund’s management fees (as applicable) to the Adviser were reasonable in light of the nature, extent and quality of services provided to the Fund.
7
Item 11. Statement Regarding Basis for Approval of Investment Advisory Contract (continued)
| | 2. | Comparisons with the Fees of Other Clients |
In evaluating the appropriateness of fees, the Board also considered that the Adviser and/or its affiliate(s) provide investment management services to other types of clients which may include: separately managed accounts, retail managed accounts, foreign funds (UCITS), other investment companies (as sub-advisers), limited partnerships and collective investment trusts. The Board reviewed the equal weighted average fee or other fee data for the other types of clients managed in a similar manner to certain of the Nuveen funds and TC funds. The Board considered the Adviser’s rationale for the differences in the management fee rates of the funds compared to the management fee rates charged to these other types of clients. In this regard, the Board considered that differences, including but not limited to, the amount, type and level of services provided by the Adviser to the funds compared to that provided to other clients as well as differences in investment policies; regulatory, disclosure and governance requirements; servicing relationships with vendors; the manner of managing such assets; product structure; investor profiles; and account sizes all may contribute to variations in relative fee rates. Further, differences in the client base, governing bodies, distribution, jurisdiction and operational complexities also would contribute to variations in management fees assessed the funds compared to foreign fund clients. In addition, differences in the level of advisory services required for passively managed funds also contribute to differences in the management fee levels of such funds compared to actively managed funds. As a general matter, higher fee levels reflect higher levels of service provided by the Adviser, increased investment management complexity, greater product management requirements, and higher levels of business risk or some combination of these factors. The Board considered the wide range of services in addition to investment management that the Adviser had provided to the funds compared to other types of clients as well as the increased entrepreneurial, legal and regulatory risks that the Adviser incurs in sponsoring and managing the funds. The Board concluded that the varying levels of fees were reasonable given, among other things, the more extensive services, regulatory requirements and legal liabilities, and the entrepreneurial, legal and regulatory risks incurred in sponsoring and advising a registered investment company compared to that required in advising other types of clients.
| | 3. | Profitability of the Adviser |
In their review, the Board Members reviewed a variety of profitability information relating to TAL as a result of its advisory services to the TC funds. In developing the profitability data, the Board Members considered the subjective nature of calculating profitability as the information is not audited and is necessarily dependent on cost allocation methodologies to allocate expenses throughout the complex and among the various advisory products. The Board Members received profitability data for TAL attributable to the TC funds in the aggregate and on a per-TC fund basis. The Board Members reviewed, among other things, TAL’s profitability margin (pre- and post-distribution expenses) for the TC funds for each year from 2014 to 2023 as well as TAL’s revenue, expenses and net earnings before federal income tax (pre- and post-distribution expenses) from the TC funds for the year ended December 31, 2023 and as compared to December 31, 2022. The Board reviewed the profitability margins (pre- and post-marketing and pre-tax) of TAL for the TC funds for the 2023 fiscal year compared to the profitability margins (pre-marketing (subject to exceptions) and post-marketing and pre-tax) of a peer group of certain asset management firms for the 2022 fiscal year (the most recent year data available). The Board considered that TAL had calculated that it earned profits (pre-distribution) for the one-year period ended December 31, 2023 with respect to each of the Funds subject to the following exceptions. The Board considered that TAL had calculated that it incurred a net loss for the one-year period ended December 31, 2023 with respect to its services to Nuveen Lifecycle Index Retirement Income Fund, Nuveen Lifecycle Index 2010 Fund, Nuveen Lifecycle Index 2015 Fund, Nuveen Lifecycle Index 2020 Fund, Nuveen Lifecycle Index 2055 Fund, Nuveen Lifecycle Index 2060 Fund and Nuveen Lifecycle Index 2065 Fund. In calculating profitability with respect to the Funds for the one-year period ended December 31, 2023, TAL did not take into account profits it earned in the aggregate with respect to the underlying funds that are also managed by TAL in which the respective Fund invests. In evaluating profitability data, the Board Members considered the difficulty in calculating profitability particularly at the individual Fund level given that differing but reasonable allocation methodologies could be employed and lead to significantly different results. The Board Members also reviewed the unaudited financial statements for TAL dated December 31, 2023.
Aside from the profitability data, the Board considered that NFAL and TAL are affiliates of Teachers Insurance and Annuity Association of America (“TIAA”). NFAL is a subsidiary of Nuveen, LLC, the investment management arm of TIAA, and TAL is an indirect wholly owned subsidiary of TIAA. Accordingly, the Board also reviewed a balance sheet for TIAA reflecting its assets, liabilities and capital and contingency reserves for the 2023 and 2022 calendar years to consider the financial strength of TIAA. The Board considered the benefit of an investment adviser and its parent with significant resources, particularly during periods of market volatility. The Board also considered the reinvestments the Adviser, its parent and/or other affiliates made into their business through, among other things, the investment of seed capital in certain funds, initiatives in international expansion, investments in infrastructure and continued investments in enhancements to technological capabilities.
In evaluating the reasonableness of the compensation, the Board Members also considered the indirect benefits the Adviser received that were directly attributable to the management of the applicable funds as discussed in further detail below. Based on its review, the Board was satisfied that the Adviser’s level of profitability from its relationship with each Fund was not unreasonable over various time frames in light of the nature, extent and quality of services provided.
D. Economies of Scale and Whether Fee Levels Reflect These Economies of Scale
The Board considered whether there have been economies of scale with respect to the management of the funds in the fund complex, including the Funds, whether these economies of scale have been appropriately shared with such funds and whether there is potential for realization of further economies of scale. Although the Board considered that economies of scale are difficult to measure with any precision and the rates at which certain expenses are incurred may not decline with a rise in assets, the Board considered that there are various methods that may be employed to help share the benefits of economies of scale, including, among other things, through the use of breakpoints in the management fee schedule,
8
fee waivers and/or expense limitations, the pricing of funds at scale at inception and investments in the Adviser’s business which can enhance the services provided to the applicable funds for the fees paid. The Board considered that the Adviser has generally employed one or more of these various methods among the applicable funds. The Board considered that the Funds, however, do not have breakpoint schedules.
In addition, the Board Members considered the contractual and/or voluntary expense caps (if any) applicable to a Fund. The Board considered that such waivers and reimbursements applicable to the respective funds are another means for potential economies of scale to be shared with shareholders of such funds and can provide a protection from an increase in expenses if the assets of the applicable funds decline.
The Board Members also considered the continued reinvestment in Nuveen/TIAA’s business to enhance its capabilities and services to the benefit of its various clients. The Board understood that many of these investments were not specific to individual funds, but rather incurred across a variety of products and services pursuant to which the family of funds as a whole may benefit. The Board further considered that the Adviser and its affiliates have provided certain additional services, including, but not limited to, services required by new regulations and regulatory interpretations, without raising advisory fees to the funds, and this was also a means of sharing economies of scale with the funds and their shareholders. The Board considered the Adviser’s and/or its affiliates’ ongoing efforts to streamline the product line-up, among other things, to create more scaled funds which may help improve both expense and trading economies.
Based on its review, the Board was satisfied that the current fee arrangements together with the reinvestment in management’s business appropriately shared any economies of scale with shareholders.
E. Indirect Benefits
The Board Members received and considered information regarding various indirect benefits the Adviser or its affiliates may receive as a result of their relationship with the funds in the fund complex, including the Funds. These benefits included, among other things, economies of scale to the extent the Adviser or its affiliates share investment resources and/or personnel with other clients of the Adviser. The funds may also be used as investment options for other products or businesses offered by the Adviser and/or its affiliates, such as variable products and 529 education savings plans, and affiliates of the Adviser may serve as sub-advisers to various funds in which case all advisory and sub-advisory fees generated by such funds stay within Nuveen.
Further, the funds may pay the Adviser and/or its affiliates for other services, such as distribution. In this regard, the Board Members considered that an affiliate of the Adviser serves as principal underwriter providing distribution and/or shareholder services to the open-end funds for which it may be compensated. The Board Members also considered that certain share classes of the funds (subject to certain exceptions) pay 12b-1 fees, some of which may be retained by the Adviser’s affiliate.
The Board Members considered that TAL or its affiliates were reimbursed for certain costs of administrative services pursuant to an administrative agreement; however, such administrative agreement was anticipated to be phased out over time.
In addition, the Board Members considered that the Adviser may utilize soft dollar brokerage arrangements attributable to the respective fund(s) to obtain research and other services for any or all of its clients, although the Board Members also considered that the Adviser reimburses the Funds for all such costs.
The Adviser and its affiliates may also benefit from the advisory relationships with the funds in the fund complex to the extent this relationship results in potential investors viewing the TIAA group of companies as a leading retirement plan provider in the academic and nonprofit market and a single source for all their financial service needs. The Adviser and/or its affiliates may further benefit to the extent that they have pricing or other information regarding vendors the funds utilize in establishing arrangements with such vendors for other products.
Based on its review, the Board concluded that any indirect benefits received by the Adviser as a result of its relationship with the Funds were reasonable in light of the services provided.
F. Other Considerations
The Board Members did not identify any single factor discussed previously as all-important or controlling. The Board Members concluded that the terms of each Advisory Agreement were reasonable, that the Adviser’s fees were reasonable in light of the services provided to each Fund and that the Advisory Agreements be renewed for an additional one-year period.
9
Item 11. Statement Regarding Basis for Approval of Investment Advisory Contract
Nuveen Lifestyle Income Fund
Nuveen Lifestyle Conservative Fund
Nuveen Lifestyle Moderate Fund
Nuveen Lifestyle Growth Fund
Nuveen Lifestyle Aggressive Growth Fund
The Approval Process
At meetings held on April 18 and 19, 2024 (the “Meeting”), the Board of Trustees (collectively, the “Board” and each Trustee, a “Board Member”) of TIAA-CREF Funds (the “Trust”) approved, for each applicable series of the Trust, the renewal of the investment management agreement with Teachers Advisors, LLC (“TAL” and TAL is an “Adviser”) pursuant to which TAL serves as investment adviser to such funds. The Board Members are not “interested persons” (as defined under the Investment Company Act of 1940 (the “1940 Act”)) and, therefore, the Board is deemed to be comprised of all disinterested Board Members. References to the Board and the Board Members are interchangeable. Below is a summary of the annual review process the Board undertook related to its most recent renewal of the investment management agreement (each an “Advisory Agreement”) with respect to each series listed above (the “Funds”).
In accordance with applicable law, following up to an initial two-year period, the Board considers the renewal of each Advisory Agreement on behalf of the applicable Fund on an annual basis. In addition, the fund complex consists of the group of funds advised by TAL (collectively referred to as the “TC funds”) and the group of funds advised by Nuveen Fund Advisors, LLC (“NFAL” and such funds are collectively, the “Nuveen funds”). For clarity, TAL serves as Adviser to the TC funds, including the Funds, and NFAL serves as “Adviser” to the Nuveen funds. The Board Members considered that the prior separate boards of the TC funds and Nuveen funds were consolidated effective in January 2024. Accordingly, at the Meeting, the Board Members considered the review of the advisory agreements for the TC funds as well as reviewed the investment management agreements and sub-advisory agreements for the Nuveen funds. Depending on the appropriate context, references to “the Adviser” may be to TAL with respect to the TC funds and/or NFAL with respect to the Nuveen funds.
The Board Members considered the review of the advisory agreements of the TC funds and the Nuveen funds to be an ongoing process. The Board Members therefore employed the accumulated information, knowledge and experience they had gained during their tenure on the respective board of the TC funds or Nuveen funds (as the case may be) governing the applicable funds and working with the respective investment advisers and sub-advisers, as applicable, in their review of the advisory agreements for the fund complex.
During the course of the year prior to the Meeting, the Board and/or its committees received a wide variety of materials that covered a range of topics relevant to the Board’s annual consideration of the renewal of the advisory agreements, including reports on fund investment results over various periods; product initiatives for various funds; fund expenses; compliance, regulatory and risk management matters; trading practices, including soft dollar arrangements (as applicable); the liquidity and derivatives risk management programs; management of distributions; valuation of securities; payments to financial intermediaries, including 12b-1 expenses (as applicable); securities lending (as applicable); and overall market and regulatory developments. The Board also met periodically with and/or received presentations by key investment professionals managing a fund’s portfolio. In particular, at the Board meeting held on February 27-29, 2024 (the “February Meeting”), the Board and/or its Investment Committee received the annual performance review of the funds as described in further detail below. The presentations, discussions and meetings throughout the year also provide a means for the Board to evaluate and consider the level, breadth and quality of services provided by the Adviser and how such services have changed over time in light of new or modified regulatory requirements, changes to market conditions or other factors.
In connection with its annual consideration of the advisory agreements, the Board, through its independent legal counsel, requested and received extensive materials and information prepared specifically for its review of the advisory agreements. The materials provided at the Meeting and/ or prior meetings covered a wide range of matters including, but not limited to, a description of the nature, extent and quality of services provided by the Adviser; the consolidation of the Nuveen fund family and TC fund family; a review of product actions advanced in 2023 for the benefit of particular funds and/or the fund complex; a review of the applicable investment team; an analysis of fund performance with a focus on funds considered to have met certain challenged performance measurements; an analysis of the fees and expense ratios of the funds with a focus on funds considered to have certain expense characteristics; a list of management fee schedules; a review of contractual and/or voluntary expense caps and fee waivers for the TC funds; a description of portfolio manager compensation; a description of the profitability and/or financial data of Nuveen and TAL; and a description of indirect benefits received by the Adviser as a result of its relationships with the funds. The Board also considered information provided by Broadridge Financial Solutions, Inc. (“Broadridge”), an independent provider of investment company data, comparing fee and expense levels of each respective fund to those of a peer universe and, with respect to open-end funds, also to a peer group of funds selected by Broadridge, subject to certain exceptions.
The information prepared specifically for the annual review supplemented the information provided to the Board and its committees and the evaluations of the funds by the Board and its committees during the year. The Board’s review of the advisory agreements for the fund complex is based on all the information provided to the Board and its committees over time. The performance, fee and expense data and other information provided by the Adviser, Broadridge or other service providers were not independently verified by the Board Members.
1
Item 11. Statement Regarding Basis for Approval of Investment Advisory Contract (continued)
As part of their review, the Board Members and independent legal counsel met by videoconference in executive session on April 10, 2024 (the “April Executive Session”) to review and discuss materials provided in connection with their annual review of the advisory agreements for the fund complex. After reviewing this information, the Board Members requested, directly or through independent legal counsel, additional information, and the Board subsequently reviewed and discussed the responses to these follow-up questions and requests.
The Board Members were advised by independent legal counsel during the annual review process as well as throughout the year, including meeting in executive sessions with such counsel at which no representatives of management were present. In connection with their annual review, the Board Members also received a memorandum from independent legal counsel outlining their fiduciary duties and legal standards in reviewing the Advisory Agreements, including guidance from court cases evaluating advisory fees.
The Board’s decisions to renew each Advisory Agreement were not based on a single identified factor, but rather each decision reflected the comprehensive consideration of all the information provided to the Board and its committees throughout the year as well as the materials prepared specifically in connection with the annual review process. The contractual arrangements may reflect the results of prior year(s) of review, negotiation and information provided in connection with the Board’s annual review of the funds’ advisory arrangements and oversight of the funds. Each Board Member may have attributed different levels of importance to the various factors and information considered in connection with the annual review process and may have placed different emphasis on the relevant information year to year in light of, among other things, changing market and economic conditions. A summary of the principal factors and information, but not all the factors, the Board considered in deciding to renew the Advisory Agreements is set forth below.
A. Nature, Extent and Quality of Services
In evaluating the renewal of the Advisory Agreements, the Board Members received and considered information regarding the nature, extent and quality of the Adviser’s services provided to each respective Fund with particular focus on the services and enhancements or changes to such services provided during the last year.
The Board considered that the Adviser provides a wide array of management, oversight and other services to manage and operate the applicable funds. The Board considered the Adviser’s and its affiliates’ dedication of resources, time, people and capital as well as continual program of improvement and innovation aimed at enhancing the funds and fund complex for investors and meeting the needs of an increasingly complex regulatory environment. In particular, over the past several years, the Board considered the significant resources, both financial and personnel, the Adviser and its affiliates have committed in working to consolidate the Nuveen fund family and TC fund family under one centralized umbrella. The Board considered that the organizational changes in bringing together Nuveen, its affiliates and TIAA’s (as defined below) asset management businesses, consolidating the Nuveen and TC fund families and other initiatives were anticipated to provide various benefits for the funds through, among other things, enhanced operating efficiencies, centralized investment leadership and a centralized shared resources and support model. As part of these efforts, the boards of the TC funds and Nuveen funds were consolidated effective in January 2024.
The Board also reviewed information regarding other product actions undertaken or continued by management in the 2023 calendar year in seeking to improve the effectiveness of the organization, the product line-up as well as particular funds through, among other things, continuing to review and optimize the product line and gaining efficiencies through mergers and liquidations; reviewing and updating investment policies and benchmarks; implementing fee waivers and/or expense cap changes for certain funds; evaluating and adjusting portfolio management teams as appropriate for various funds; and developing policy positions on a broad range of regulatory proposals that may impact the funds and communicating with lawmakers and other regulatory authorities to help ensure these positions are considered. In its review, the Board considered that the funds operated in a highly regulated industry and the scope and complexity of the services and resources that the Adviser and its affiliates must provide to manage and operate the applicable funds have expanded over the years as a result of, among other things, regulatory, market and other developments, such as the adoption of the tailored shareholder report or the revised fund name rule.
In considering the breadth and quality of services TAL and its various teams provide with respect to the TC funds, the Board considered that TAL is responsible for providing various types of investment advisory services, including, among other things, furnishing an investment program for each TC fund; managing the assets of such funds, including conducting research, identifying investments and placing orders for the purchase or sale of the portfolio investments for the fund; and evaluating fund performance and implementing changes thereto. The Board further considered that over the course of the 2023 calendar year, the Nuveen global public product team which supports the funds in the fund complex and their shareholders assessed the investment personnel across the investment leadership teams which resulted in additions or other modifications to the portfolio management teams of various funds. The Board also reviewed a description of the compensation structure applicable to certain portfolio managers.
In addition to the above investment advisory services, the Board further considered the extensive compliance, regulatory, administrative and other services the Adviser and its various teams or affiliates provide to manage and operate the applicable funds. Given the highly regulated industry in which the funds operate, the Board considered the breadth of the Adviser’s compliance program and related policies and procedures. The Board reviewed various initiatives the Adviser’s compliance team undertook or continued in 2023, in part, to address new regulatory requirements, support international business growth and product development, enhance international trading capabilities, enhance monitoring capabilities in light of the new regulatory requirements and guidance and maintain a comprehensive training program. The Board further considered, among other things, that other non-advisory services provided included, among other things, board support and reporting; establishing and reviewing the services provided by other fund service providers (such as a fund’s custodian, accountant, and transfer agent); risk management, including reviews of the liquidity risk management and derivatives risk management programs; legal support services; regulatory advocacy; and cybersecurity, business continuity and disaster recovery planning and testing. With respect to the TC funds, the Board considered that certain non-investment and non-distribution services were provided by TAL or its affiliates pursuant to a separate administrative agreement; however, given the consolidation of the TC funds and Nuveen funds with the centralization of services and resources, such administrative agreement was anticipated to be phased out over a three-year period with the administrative services for the Funds to be provided under the respective Advisory Agreements at no additional cost.
2
Aside from the services provided, the Board considered the financial resources of the Adviser and/or its affiliates and their willingness to make investments in the technology, personnel and infrastructure to support the funds, including to enhance global talent, middle office systems, software and international and internal capabilities. The Board considered the access provided by the Adviser and its affiliates to a seed capital budget to support new or existing funds and/or facilitate changes for a respective fund. The Board considered the benefits to shareholders of investing in a fund that is a part of a large fund complex with a variety of investment disciplines, capabilities, expertise and resources available to navigate and support the funds including during stressed times. The Board considered the overall reputation and capabilities of the Adviser and its affiliates and the Adviser’s continuing commitment to provide high quality services.
In its review, the Board also considered the significant risks borne by the Adviser and its affiliates in connection with their services to the applicable funds, including entrepreneurial risks in sponsoring and supporting new funds and smaller funds and ongoing risks with managing the funds, such as investment, operational, reputational, regulatory, compliance and litigation risks.
Based on its review, the Board determined, in the exercise of its reasonable business judgment, that it was satisfied with the nature, extent and quality of services provided to the respective Funds under each applicable Advisory Agreement.
B. The Investment Performance of the Funds and Adviser
In evaluating the quality of the services provided by the Adviser, the Board also considered a variety of investment performance data of the Funds. In this regard, the Board and/or its Investment Committee reviewed, among other things, performance of the Funds over the quarter, one-, three-and five-year periods ending December 31, 2023 and March 31, 2024. For those Funds with multiple share classes, the performance data was based on Class R6 shares (formerly, the Institutional Class shares); however, the performance of other share classes was substantially similar as those other share classes invest in the same portfolio of securities and differences in performance among the classes would be principally attributed to the variations in the expense structures of the share classes. The Board performed its annual review of fund performance at its February Meeting and an additional review at the April Executive Session and also reviewed and discussed performance data at its other regularly scheduled quarterly meetings throughout the year. The Board therefore took into account the performance data, presentations and discussions (written and oral) that were provided at the Meeting and in prior meetings over time in evaluating fund performance, including management’s analysis of a fund’s performance with particular focus on funds that met certain challenged performance measurements as determined pursuant to a methodology approved by the Board or additional measurements as determined by management’s investment analysts. As various funds have modified their portfolio teams and/or made significant changes to their portfolio strategies over time, the Board reviewed, among other things, certain tracking performance data over specific periods comparing performance before and after such changes.
The Board considered that performance data reflects performance over a specified period which may differ significantly depending on the ending dates selected, particularly during periods of market volatility. Further, the Board considered that shareholders may evaluate performance based on their own respective holding periods which may differ from the performance periods reviewed by the Board and lead to differing results.
In its evaluation, the Board reviewed fund performance results from different perspectives. In general, subject to certain exceptions, the Board reviewed both absolute and relative fund performance over the various time periods and considered performance results in light of a fund’s investment objective(s), strategies and risks. With respect to the relative performance, the Board considered fund performance in comparison to the performance of peer funds (the “Performance Peer Group”), subject to certain exceptions, and recognized and/or customized benchmarks (i.e., generally benchmarks derived from multiple recognized benchmarks). In reviewing such comparative performance, the Board was cognizant of the inherent limitations of such data which can make meaningful performance comparisons generally difficult. As an illustration, differences in the composition of the Performance Peer Group, the investment objective(s), strategies, dates of fund inception and other characteristics of the peers in the Performance Peer Group, and the varying sizes of peers all may contribute to differences in the performance results of a Performance Peer Group compared to the applicable fund. With respect to relative performance of a fund compared to a benchmark index, differences, among other things, in the investment objective(s) and strategies of a fund and the benchmark (particularly an actively managed fund that does not directly follow an index) as well as the costs of operating a fund would necessarily contribute to differences in performance results and limit the value of the comparative performance information. To assist the Board in its review of the comparability of the relative performance, management generally has ranked the relevancy of the Performance Peer Groups to the Funds as low, medium or high. In its review of relative performance, the Board considered a Fund’s performance relative to its Performance Peer Group, among other things, by evaluating its quartile ranking with the 1st quartile representing the top performing funds within the Performance Peer Group and the 4th quartile representing the lowest performing funds.
The Board evaluated performance in light of various relevant factors which may include, among other things, general market conditions, issuer-specific information, asset class information, leverage and fund cash flows. The Board considered that long-term performance could be impacted by even one period of significant outperformance or underperformance and that a single investment theme could disproportionately affect performance. Further, the Board considered that market and economic conditions may significantly impact a fund’s performance, particularly over shorter periods, and such performance may be more reflective of such economic or market events and not necessarily reflective of management skill. Although the Board reviews short-, intermediate- and longer-term performance data, the Board considered that longer periods of performance may reflect full market cycles.
In their review from year to year, the Board Members consider and may place different emphasis on the relevant information in light of changing circumstances in market and economic conditions. In evaluating performance, the Board focused particular attention on funds with less favorable performance records. However, depending on the facts and circumstances, including any differences between the respective fund and its benchmark and/or Performance Peer Group, the Board may be satisfied with a fund’s performance notwithstanding that its performance may be below that of its benchmark and/or peer group for certain periods. With respect to any funds for which the Board has identified performance issues, the Board seeks to monitor such funds more closely until performance improves, discuss with the Adviser the reasons for such results, consider whether any steps are necessary or appropriate to address such issues, discuss and evaluate the potential consequences of such steps and review the results of any steps undertaken.
3
Item 11. Statement Regarding Basis for Approval of Investment Advisory Contract (continued)
The performance determinations with respect to each Fund are summarized below.
● For Nuveen Lifestyle Income Fund (formerly, TIAA-CREF Lifestyle Income Fund), the Board considered that the Fund outperformed its composite benchmark and ranked in the third quartile of its Performance Peer Group for the one-, three- and five-year periods ended December 31, 2023. In addition, the Fund outperformed its composite benchmark for the one-, three- and five-year periods ended March 31, 2024 and ranked in the third quartile of its Performance Peer Group for the one- and five-year periods and second quartile for the three-year period ended March 31, 2024. On the basis of the Board’s ongoing review of investment performance and all relevant factors, including the relative market conditions during certain reporting periods, the Fund’s investment objective(s) and management’s discussion of performance, the Board concluded that the Fund’s performance supported renewal of the Advisory Agreement.
● For Nuveen Lifestyle Conservative Fund (formerly, TIAA-CREF Lifestyle Conservative Fund), the Board considered that although the Fund’s performance was below the performance of its composite benchmark for the three-year period ended December 31, 2023, the Fund outperformed its composite benchmark for the one- and five-year periods ended December 31, 2023 and ranked in the first quartile of its Performance Peer Group for the one-, three- and five-year periods ended December 31, 2023. In addition, the Fund outperformed its composite benchmark and ranked in the first quartile of its Performance Peer Group for the one-, three- and five-year periods ended March 31, 2024. On the basis of the Board’s ongoing review of investment performance and all relevant factors, including the relative market conditions during certain reporting periods, the Fund’s investment objective(s) and management’s discussion of performance, the Board concluded that the Fund’s performance supported renewal of the Advisory Agreement.
● For Nuveen Lifestyle Moderate Fund (formerly, TIAA-CREF Lifestyle Moderate Fund), the Board considered that although the Fund’s performance was below the performance of its composite benchmark for the three- and five-year periods ended December 31, 2023, the Fund outperformed its composite benchmark for the one-year period ended December 31, 2023 and ranked in the first quartile of its Performance Peer Group for the one- and five-year periods and third quartile for the three-year period ended December 31, 2023. In addition, although the Fund’s performance was below the performance of its composite benchmark for the three- and five-year periods ended March 31, 2024, the Fund outperformed its composite benchmark for the one-year period ended March 31, 2024 and ranked in the first quartile of its Performance Peer Group for the one-year period and second quartile for the three- and five-year periods ended March 31, 2024. On the basis of the Board’s ongoing review of investment performance and all relevant factors, including the relative market conditions during certain reporting periods, the Fund’s investment objective(s) and management’s discussion of performance, the Board concluded that the Fund’s performance supported renewal of the Advisory Agreement.
● For Nuveen Lifestyle Growth Fund (formerly, TIAA-CREF Lifestyle Growth Fund), the Board considered that although the Fund’s performance was below the performance of its composite benchmark for the three- and five-year periods ended December 31, 2023, the Fund outperformed its composite benchmark for the one-year period ended December 31, 2023 and ranked in the first quartile of its Performance Peer Group for the one- and five-year periods and third quartile for the three-year period ended December 31, 2023. In addition, although the Fund’s performance was below the performance of its composite benchmark for the three- and five-year periods ended March 31, 2024, the Fund outperformed its composite benchmark for the one-year period ended March 31, 2024 and ranked in the first quartile of its Performance Peer Group for the one-year period, third quartile for the three-year period and second quartile for the five-year period ended March 31, 2024. On the basis of the Board’s ongoing review of investment performance and all relevant factors, including the relative market conditions during certain reporting periods, the Fund’s investment objective(s) and management’s discussion of performance, the Board concluded that the Fund’s performance supported renewal of the Advisory Agreement.
● For Nuveen Lifestyle Aggressive Growth Fund (formerly, TIAA-CREF Lifestyle Aggressive Growth Fund), the Board considered that although the Fund’s performance was below the performance of its composite benchmark for the three- and five-year periods ended December 31, 2023 and March 31, 2024, the Fund outperformed its composite benchmark for the one-year periods ended December 31, 2023 and March 31, 2024. In addition, the Fund ranked in the first quartile of its Performance Peer Group for the one- and five-year periods ended December 31, 2023 and March 31, 2024 and second quartile for the three-year periods ended December 31, 2023 and March 31, 2024. On the basis of the Board’s ongoing review of investment performance and all relevant factors, including the relative market conditions during certain reporting periods, the Fund’s investment objective(s) and management’s discussion of performance, the Board concluded that the Fund’s performance supported renewal of the Advisory Agreement.
C. Fees, Expenses and Profitability
As part of its annual review, the Board generally reviewed, among other things, the contractual management fee and net/actual management fee (i.e., the management fee after taking into consideration fee waivers and/or expense reimbursements, if any) paid by a Fund to the Adviser in light of the nature, extent and quality of the services provided. The Board also reviewed information about other expenses and the total operating expense ratio of each Fund (after any fee waivers and/or expense reimbursements). More specifically, the Board Members reviewed, among other things, each Fund’s management fee rates and net total expense ratio in relation to similar data for a comparable universe of funds (the “Expense Universe”) and for a more focused subset of comparable funds (the “Expense Group”) established by Broadridge (subject to certain exceptions). The Board Members reviewed the methodology Broadridge employed to establish its Expense Universe and Expense Group (as applicable) and considered that differences between the applicable fund and its respective Expense Universe and/or Expense Group, as well as changes to the composition of the Expense Universe and/or Expense Group from year to year, may limit some of the value of the comparative data. The Board Members also considered that it can be difficult to compare management fees among funds as there are variations in the services that are included for the fees paid. The Board Members took these limitations and differences into account when reviewing comparative peer data.
4
The Board Members considered a Fund’s operating expense ratio as it more directly reflected a shareholder’s total costs in investing in the respective fund. The Board Members also considered, in relevant part, a Fund’s management fee and net total expense ratio in light of the Fund’s performance history, including reviewing certain funds identified by management and/or the Board as having a higher net total expense ratio or management fee compared to their respective peers coupled with experiencing periods of challenged performance and considering the reasons for such comparative positions.
In their evaluation of the fee arrangements for the Funds, the Board Members also reviewed the management fee schedules and the expense reimbursements and/or fee waivers agreed to by the Adviser for the respective fund (if any). In addition, in conjunction with the consolidation of the Nuveen funds and TC funds, the TC funds will phase out the separate administrative agreement pursuant to which TAL provided certain administrative services as well as the reimbursement to TAL of certain costs thereunder over a three-year period.
The Board’s considerations regarding the comparative fee data for each of the Funds are set forth below. With respect to the quartile rankings noted below, the first quartile represents the range of funds with the lowest management fee rate or net total expense ratio, as applicable, and the fourth quartile represents the range of funds with the highest management fee rate or net total expense ratio, as applicable. The Board considered that Broadridge only calculates quartiles if a minimum number of peers is available and therefore quartile rankings may not be available for certain Expense Groups and/or Expense Universes.
● For Nuveen Lifestyle Income Fund, the Fund’s contractual management fee rate, actual management fee rate and net total expense ratio each ranked in the first quartile of its Expense Group. In addition, the Fund’s contractual management fee rate, actual management fee rate and net total expense ratio ranked in the second quartile, first quartile and first quartile of its Expense Universe, respectively. Further, the Fund’s actual management fee rate and net total expense ratio were below the Expense Group median.
● For Nuveen Lifestyle Conservative Fund, the Fund’s contractual management fee rate, actual management fee rate and net total expense ratio ranked in the first quartile, second quartile and first quartile of its Expense Group, respectively. In addition, the Fund’s contractual management fee rate, actual management fee rate and net total expense ratio ranked in the second quartile, second quartile and first quartile of its Expense Universe, respectively. Further, the Fund’s actual management fee rate matched the Expense Group median, and the Fund’s net total expense ratio was below the Expense Group median.
● For Nuveen Lifestyle Moderate Fund, the Fund’s contractual management fee rate, actual management fee rate and net total expense ratio ranked in the first quartile, second quartile and first quartile of its Expense Group, respectively. In addition, the Fund’s contractual management fee rate, actual management fee rate and net total expense ratio ranked in the first quartile, second quartile and second quartile of its Expense Universe, respectively. Further, the Fund’s actual management fee rate and net total expense ratio were below the Expense Group median.
● For Nuveen Lifestyle Growth Fund, the Fund’s contractual management fee rate, actual management fee rate and net total expense ratio ranked in the first quartile, second quartile and first quartile of its Expense Group, respectively. In addition, the Fund’s contractual management fee rate, actual management fee rate and net total expense ratio ranked in the first quartile, second quartile and second quartile of its Expense Universe, respectively. Further, the Fund’s actual management fee rate and net total expense ratio were below the Expense Group median.
● For Nuveen Lifestyle Aggressive Growth Fund, the Fund’s contractual management fee rate, actual management fee rate and net total expense ratio ranked in the second quartile, first quartile and first quartile of its Expense Group, respectively. In addition, the Fund’s contractual management fee rate, actual management fee rate and net total expense ratio each ranked in the first quartile of its Expense Universe. Further, the Fund’s actual management fee rate and net total expense ratio were below the Expense Group median.
Based on its review of the information provided, the Board determined that each Fund’s management fees (as applicable) to the Adviser were reasonable in light of the nature, extent and quality of services provided to the Fund.
5
Item 11. Statement Regarding Basis for Approval of Investment Advisory Contract (continued)
| | 2. | Comparisons with the Fees of Other Clients |
In evaluating the appropriateness of fees, the Board also considered that the Adviser and/or its affiliate(s) provide investment management services to other types of clients which may include: separately managed accounts, retail managed accounts, foreign funds (UCITS), other investment companies (as sub-advisers), limited partnerships and collective investment trusts. The Board reviewed the equal weighted average fee or other fee data for the other types of clients managed in a similar manner to certain of the Nuveen funds and TC funds. The Board considered the Adviser’s rationale for the differences in the management fee rates of the funds compared to the management fee rates charged to these other types of clients. In this regard, the Board considered that differences, including but not limited to, the amount, type and level of services provided by the Adviser to the funds compared to that provided to other clients as well as differences in investment policies; regulatory, disclosure and governance requirements; servicing relationships with vendors; the manner of managing such assets; product structure; investor profiles; and account sizes all may contribute to variations in relative fee rates. Further, differences in the client base, governing bodies, distribution, jurisdiction and operational complexities also would contribute to variations in management fees assessed the funds compared to foreign fund clients. In addition, differences in the level of advisory services required for passively managed funds also contribute to differences in the management fee levels of such funds compared to actively managed funds. As a general matter, higher fee levels reflect higher levels of service provided by the Adviser, increased investment management complexity, greater product management requirements, and higher levels of business risk or some combination of these factors. The Board considered the wide range of services in addition to investment management that the Adviser had provided to the funds compared to other types of clients as well as the increased entrepreneurial, legal and regulatory risks that the Adviser incurs in sponsoring and managing the funds. The Board concluded that the varying levels of fees were reasonable given, among other things, the more extensive services, regulatory requirements and legal liabilities, and the entrepreneurial, legal and regulatory risks incurred in sponsoring and advising a registered investment company compared to that required in advising other types of clients.
| | 3. | Profitability of the Adviser |
In their review, the Board Members reviewed a variety of profitability information relating to TAL as a result of its advisory services to the TC funds. In developing the profitability data, the Board Members considered the subjective nature of calculating profitability as the information is not audited and is necessarily dependent on cost allocation methodologies to allocate expenses throughout the complex and among the various advisory products. The Board Members received profitability data for TAL attributable to the TC funds in the aggregate and on a per-TC fund basis. The Board Members reviewed, among other things, TAL’s profitability margin (pre- and post-distribution expenses) for the TC funds for each year from 2014 to 2023 as well as TAL’s revenue, expenses and net earnings before federal income tax (pre- and post-distribution expenses) from the TC funds for the year ended December 31, 2023 and as compared to December 31, 2022. The Board reviewed the profitability margins (pre- and post-marketing and pre-tax) of TAL for the TC funds for the 2023 fiscal year compared to the profitability margins (pre-marketing (subject to exceptions) and post-marketing and pre-tax) of a peer group of certain asset management firms for the 2022 fiscal year (the most recent year data available). The Board considered that TAL had calculated that it incurred a net loss for the one-year period ended December 31, 2023 with respect to its services to each of the Funds without taking into account profits TAL earned in the aggregate with respect to the underlying funds that are also managed by TAL in which the respective Fund invests. In evaluating profitability data, the Board Members considered the difficulty in calculating profitability particularly at the individual Fund level given that differing but reasonable allocation methodologies could be employed and lead to significantly different results. The Board Members also reviewed the unaudited financial statements for TAL dated December 31, 2023.
Aside from the profitability data, the Board considered that NFAL and TAL are affiliates of Teachers Insurance and Annuity Association of America (“TIAA”). NFAL is a subsidiary of Nuveen, LLC, the investment management arm of TIAA, and TAL is an indirect wholly owned subsidiary of TIAA. Accordingly, the Board also reviewed a balance sheet for TIAA reflecting its assets, liabilities and capital and contingency reserves for the 2023 and 2022 calendar years to consider the financial strength of TIAA. The Board considered the benefit of an investment adviser and its parent with significant resources, particularly during periods of market volatility. The Board also considered the reinvestments the Adviser, its parent and/or other affiliates made into their business through, among other things, the investment of seed capital in certain funds, initiatives in international expansion, investments in infrastructure and continued investments in enhancements to technological capabilities.
In evaluating the reasonableness of the compensation, the Board Members also considered the indirect benefits the Adviser received that were directly attributable to the management of the applicable funds as discussed in further detail below. Based on its review, the Board was satisfied that the Adviser’s level of profitability from its relationship with each Fund was not unreasonable over various time frames in light of the nature, extent and quality of services provided.
D. Economies of Scale and Whether Fee Levels Reflect These Economies of Scale
The Board considered whether there have been economies of scale with respect to the management of the funds in the fund complex, including the Funds, whether these economies of scale have been appropriately shared with such funds and whether there is potential for realization of further economies of scale. Although the Board considered that economies of scale are difficult to measure with any precision and the rates at which certain expenses are incurred may not decline with a rise in assets, the Board considered that there are various methods that may be employed to help share the benefits of economies of scale, including, among other things, through the use of breakpoints in the management fee schedule, fee waivers and/or expense limitations, the pricing of funds at scale at inception and investments in the Adviser’s business which can enhance the services provided to the applicable funds for the fees paid. The Board considered that the Adviser has generally employed one or more of these various methods among the applicable funds. The Board considered that the Funds, however, do not have breakpoint schedules.
6
In addition, the Board Members considered the contractual and/or voluntary expense caps (if any) applicable to a Fund. The Board considered that such waivers and reimbursements applicable to the respective funds are another means for potential economies of scale to be shared with shareholders of such funds and can provide a protection from an increase in expenses if the assets of the applicable funds decline.
The Board Members also considered the continued reinvestment in Nuveen/TIAA’s business to enhance its capabilities and services to the benefit of its various clients. The Board understood that many of these investments were not specific to individual funds, but rather incurred across a variety of products and services pursuant to which the family of funds as a whole may benefit. The Board further considered that the Adviser and its affiliates have provided certain additional services, including, but not limited to, services required by new regulations and regulatory interpretations, without raising advisory fees to the funds, and this was also a means of sharing economies of scale with the funds and their shareholders. The Board considered the Adviser’s and/or its affiliates’ ongoing efforts to streamline the product line-up, among other things, to create more scaled funds which may help improve both expense and trading economies.
Based on its review, the Board was satisfied that the current fee arrangements together with the reinvestment in management’s business appropriately shared any economies of scale with shareholders.
E. Indirect Benefits
The Board Members received and considered information regarding various indirect benefits the Adviser or its affiliates may receive as a result of their relationship with the funds in the fund complex, including the Funds. These benefits included, among other things, economies of scale to the extent the Adviser or its affiliates share investment resources and/or personnel with other clients of the Adviser. The funds may also be used as investment options for other products or businesses offered by the Adviser and/or its affiliates, such as variable products and 529 education savings plans, and affiliates of the Adviser may serve as sub-advisers to various funds in which case all advisory and sub-advisory fees generated by such funds stay within Nuveen.
Further, the funds may pay the Adviser and/or its affiliates for other services, such as distribution. In this regard, the Board Members considered that an affiliate of the Adviser serves as principal underwriter providing distribution and/or shareholder services to the open-end funds for which it may be compensated. The Board Members also considered that certain share classes of the funds (subject to certain exceptions) pay 12b-1 fees, some of which may be retained by the Adviser’s affiliate.
The Board Members considered that TAL or its affiliates were reimbursed for certain costs of administrative services pursuant to an administrative agreement; however, such administrative agreement was anticipated to be phased out over time.
In addition, the Board Members considered that the Adviser may utilize soft dollar brokerage arrangements attributable to the respective fund(s) to obtain research and other services for any or all of its clients, although the Board Members also considered that the Adviser reimburses the Funds for all such costs.
The Adviser and its affiliates may also benefit from the advisory relationships with the funds in the fund complex to the extent this relationship results in potential investors viewing the TIAA group of companies as a leading retirement plan provider in the academic and nonprofit market and a single source for all their financial service needs. The Adviser and/or its affiliates may further benefit to the extent that they have pricing or other information regarding vendors the funds utilize in establishing arrangements with such vendors for other products.
Based on its review, the Board concluded that any indirect benefits received by the Adviser as a result of its relationship with the Funds were reasonable in light of the services provided.
F. Other Considerations
The Board Members did not identify any single factor discussed previously as all-important or controlling. The Board Members concluded that the terms of each Advisory Agreement were reasonable, that the Adviser’s fees were reasonable in light of the services provided to each Fund and that the Advisory Agreements be renewed for an additional one-year period.
7
Item 11. Statement Regarding Basis for Approval of Investment Advisory Contract
Nuveen Managed Allocation Fund
The Approval Process
At meetings held on April 18 and 19, 2024 (the “Meeting”), the Board of Trustees (collectively, the “Board” and each Trustee, a “Board Member”) of TIAA-CREF Funds (the “Trust”) approved, for each applicable series of the Trust, the renewal of the investment management agreement with Teachers Advisors, LLC (“TAL” and TAL is an “Adviser”) pursuant to which TAL serves as investment adviser to such funds. The Board Members are not “interested persons” (as defined under the Investment Company Act of 1940 (the “1940 Act”)) and, therefore, the Board is deemed to be comprised of all disinterested Board Members. References to the Board and the Board Members are interchangeable. Below is a summary of the annual review process the Board undertook related to its most recent renewal of the investment management agreement (the “Advisory Agreement”) with respect to Nuveen Managed Allocation Fund (the “Fund”).
In accordance with applicable law, following up to an initial two-year period, the Board considers the renewal of the Advisory Agreement on behalf of the Fund on an annual basis. In addition, the fund complex consists of the group of funds advised by TAL (collectively referred to as the “TC funds”) and the group of funds advised by Nuveen Fund Advisors, LLC (“NFAL” and such funds are collectively, the “Nuveen funds”). For clarity, TAL serves as Adviser to the TC funds, including the Fund, and NFAL serves as “Adviser” to the Nuveen funds. The Board Members considered that the prior separate boards of the TC funds and Nuveen funds were consolidated effective in January 2024. Accordingly, at the Meeting, the Board Members considered the review of the advisory agreements for the TC funds as well as reviewed the investment management agreements and sub-advisory agreements for the Nuveen funds. Depending on the appropriate context, references to “the Adviser” may be to TAL with respect to the TC funds and/or NFAL with respect to the Nuveen funds.
The Board Members considered the review of the advisory agreements of the TC funds and the Nuveen funds to be an ongoing process. The Board Members therefore employed the accumulated information, knowledge and experience they had gained during their tenure on the respective board of the TC funds or Nuveen funds (as the case may be) governing the applicable funds and working with the respective investment advisers and sub-advisers, as applicable, in their review of the advisory agreements for the fund complex.
During the course of the year prior to the Meeting, the Board and/or its committees received a wide variety of materials that covered a range of topics relevant to the Board’s annual consideration of the renewal of the advisory agreements, including reports on fund investment results over various periods; product initiatives for various funds; fund expenses; compliance, regulatory and risk management matters; trading practices, including soft dollar arrangements (as applicable); the liquidity and derivatives risk management programs; management of distributions; valuation of securities; payments to financial intermediaries, including 12b-1 expenses (as applicable); securities lending (as applicable); and overall market and regulatory developments. The Board also met periodically with and/or received presentations by key investment professionals managing a fund’s portfolio. In particular, at the Board meeting held on February 27-29, 2024 (the “February Meeting”), the Board and/or its Investment Committee received the annual performance review of the funds as described in further detail below. The presentations, discussions and meetings throughout the year also provide a means for the Board to evaluate and consider the level, breadth and quality of services provided by the Adviser and how such services have changed over time in light of new or modified regulatory requirements, changes to market conditions or other factors.
In connection with its annual consideration of the advisory agreements, the Board, through its independent legal counsel, requested and received extensive materials and information prepared specifically for its review of the advisory agreements. The materials provided at the Meeting and/ or prior meetings covered a wide range of matters including, but not limited to, a description of the nature, extent and quality of services provided by the Adviser; the consolidation of the Nuveen fund family and TC fund family; a review of product actions advanced in 2023 for the benefit of particular funds and/or the fund complex; a review of the applicable investment team; an analysis of fund performance with a focus on funds considered to have met certain challenged performance measurements; an analysis of the fees and expense ratios of the funds with a focus on funds considered to have certain expense characteristics; a list of management fee schedules; a review of contractual and/or voluntary expense caps and fee waivers for the TC funds; a description of portfolio manager compensation; a description of the profitability and/or financial data of Nuveen and TAL; and a description of indirect benefits received by the Adviser as a result of its relationships with the funds. The Board also considered information provided by Broadridge Financial Solutions, Inc. (“Broadridge”), an independent provider of investment company data, comparing fee and expense levels of each respective fund to those of a peer universe and, with respect to open-end funds, also to a peer group of funds selected by Broadridge, subject to certain exceptions.
The information prepared specifically for the annual review supplemented the information provided to the Board and its committees and the evaluations of the funds by the Board and its committees during the year. The Board’s review of the advisory agreements for the fund complex is based on all the information provided to the Board and its committees over time. The performance, fee and expense data and other information provided by the Adviser, Broadridge or other service providers were not independently verified by the Board Members.
As part of their review, the Board Members and independent legal counsel met by videoconference in executive session on April 10, 2024 (the “April Executive Session”) to review and discuss materials provided in connection with their annual review of the advisory agreements for the fund complex. After reviewing this information, the Board Members requested, directly or through independent legal counsel, additional information, and the Board subsequently reviewed and discussed the responses to these follow-up questions and requests.
1
Item 11. Statement Regarding Basis for Approval of Investment Advisory Contract (continued)
The Board Members were advised by independent legal counsel during the annual review process as well as throughout the year, including meeting in executive sessions with such counsel at which no representatives of management were present. In connection with their annual review, the Board Members also received a memorandum from independent legal counsel outlining their fiduciary duties and legal standards in reviewing the Advisory Agreement, including guidance from court cases evaluating advisory fees.
The Board’s decisions to renew the Advisory Agreement were not based on a single identified factor, but rather each decision reflected the comprehensive consideration of all the information provided to the Board and its committees throughout the year as well as the materials prepared specifically in connection with the annual review process. The contractual arrangements may reflect the results of prior year(s) of review, negotiation and information provided in connection with the Board’s annual review of the funds’ advisory arrangements and oversight of the funds. Each Board Member may have attributed different levels of importance to the various factors and information considered in connection with the annual review process and may have placed different emphasis on the relevant information year to year in light of, among other things, changing market and economic conditions. A summary of the principal factors and information, but not all the factors, the Board considered in deciding to renew the Advisory Agreement is set forth below.
A. Nature, Extent and Quality of Services
In evaluating the renewal of the Advisory Agreement, the Board Members received and considered information regarding the nature, extent and quality of the Adviser’s services provided to the Fund with particular focus on the services and enhancements or changes to such services provided during the last year.
The Board considered that the Adviser provides a wide array of management, oversight and other services to manage and operate the applicable funds. The Board considered the Adviser’s and its affiliates’ dedication of resources, time, people and capital as well as continual program of improvement and innovation aimed at enhancing the funds and fund complex for investors and meeting the needs of an increasingly complex regulatory environment. In particular, over the past several years, the Board considered the significant resources, both financial and personnel, the Adviser and its affiliates have committed in working to consolidate the Nuveen fund family and TC fund family under one centralized umbrella. The Board considered that the organizational changes in bringing together Nuveen, its affiliates and TIAA’s (as defined below) asset management businesses, consolidating the Nuveen and TC fund families and other initiatives were anticipated to provide various benefits for the funds through, among other things, enhanced operating efficiencies, centralized investment leadership and a centralized shared resources and support model. As part of these efforts, the boards of the TC funds and Nuveen funds were consolidated effective in January 2024.
The Board also reviewed information regarding other product actions undertaken or continued by management in the 2023 calendar year in seeking to improve the effectiveness of the organization, the product line-up as well as particular funds through, among other things, continuing to review and optimize the product line and gaining efficiencies through mergers and liquidations; reviewing and updating investment policies and benchmarks; implementing fee waivers and/or expense cap changes for certain funds; evaluating and adjusting portfolio management teams as appropriate for various funds; and developing policy positions on a broad range of regulatory proposals that may impact the funds and communicating with lawmakers and other regulatory authorities to help ensure these positions are considered. In its review, the Board considered that the funds operated in a highly regulated industry and the scope and complexity of the services and resources that the Adviser and its affiliates must provide to manage and operate the applicable funds have expanded over the years as a result of, among other things, regulatory, market and other developments, such as the adoption of the tailored shareholder report or the revised fund name rule.
In considering the breadth and quality of services TAL and its various teams provide with respect to the TC funds, the Board considered that TAL is responsible for providing various types of investment advisory services, including, among other things, furnishing an investment program for each TC fund; managing the assets of such funds, including conducting research, identifying investments and placing orders for the purchase or sale of the portfolio investments for the fund; and evaluating fund performance and implementing changes thereto. The Board further considered that over the course of the 2023 calendar year, the Nuveen global public product team which supports the funds in the fund complex and their shareholders assessed the investment personnel across the investment leadership teams which resulted in additions or other modifications to the portfolio management teams of various funds. The Board also reviewed a description of the compensation structure applicable to certain portfolio managers.
In addition to the above investment advisory services, the Board further considered the extensive compliance, regulatory, administrative and other services the Adviser and its various teams or affiliates provide to manage and operate the applicable funds. Given the highly regulated industry in which the funds operate, the Board considered the breadth of the Adviser’s compliance program and related policies and procedures. The Board reviewed various initiatives the Adviser’s compliance team undertook or continued in 2023, in part, to address new regulatory requirements, support international business growth and product development, enhance international trading capabilities, enhance monitoring capabilities in light of the new regulatory requirements and guidance and maintain a comprehensive training program. The Board further considered, among other things, that other non-advisory services provided included, among other things, board support and reporting; establishing and reviewing the services provided by other fund service providers (such as a fund’s custodian, accountant, and transfer agent); risk management, including reviews of the liquidity risk management and derivatives risk management programs; legal support services; regulatory advocacy; and cybersecurity, business continuity and disaster recovery planning and testing. With respect to the TC funds, the Board considered that certain non-investment and non-distribution services were provided by TAL or its affiliates pursuant to a separate administrative agreement; however, given the consolidation of the TC funds and Nuveen funds with the centralization of services and resources, such administrative agreement was anticipated to be phased out over a three-year period with the administrative services for the Fund to be provided under the Advisory Agreement at no additional cost.
Aside from the services provided, the Board considered the financial resources of the Adviser and/or its affiliates and their willingness to make investments in the technology, personnel and infrastructure to support the funds, including to enhance global talent, middle office systems, software and international and internal capabilities. The Board considered the access provided by the Adviser and its affiliates to a seed capital budget to support new or existing funds and/or facilitate changes for a respective fund. The Board considered the benefits to shareholders of investing in a
2
fund that is a part of a large fund complex with a variety of investment disciplines, capabilities, expertise and resources available to navigate and support the funds including during stressed times. The Board considered the overall reputation and capabilities of the Adviser and its affiliates and the Adviser’s continuing commitment to provide high quality services.
In its review, the Board also considered the significant risks borne by the Adviser and its affiliates in connection with their services to the applicable funds, including entrepreneurial risks in sponsoring and supporting new funds and smaller funds and ongoing risks with managing the funds, such as investment, operational, reputational, regulatory, compliance and litigation risks.
Based on its review, the Board determined, in the exercise of its reasonable business judgment, that it was satisfied with the nature, extent and quality of services provided to the Fund under the Advisory Agreement.
B. The Investment Performance of the Fund and Adviser
In evaluating the quality of the services provided by the Adviser, the Board also considered a variety of investment performance data of the Fund. In this regard, the Board and/or its Investment Committee reviewed, among other things, performance of the Fund over the quarter, one-, three- and five-year periods ending December 31, 2023 and March 31, 2024. The performance data was based on Class R6 shares (formerly, the Institutional Class shares); however, the performance of other share classes was substantially similar as those other share classes invest in the same portfolio of securities and differences in performance among the classes would be principally attributed to the variations in the expense structures of the share classes. The Board performed its annual review of fund performance at its February Meeting and an additional review at the April Executive Session and also reviewed and discussed performance data at its other regularly scheduled quarterly meetings throughout the year. The Board therefore took into account the performance data, presentations and discussions (written and oral) that were provided at the Meeting and in prior meetings over time in evaluating fund performance, including management’s analysis of a fund’s performance with particular focus on funds that met certain challenged performance measurements as determined pursuant to a methodology approved by the Board or additional measurements as determined by management’s investment analysts. As various funds have modified their portfolio teams and/or made significant changes to their portfolio strategies over time, the Board reviewed, among other things, certain tracking performance data over specific periods comparing performance before and after such changes.
The Board considered that performance data reflects performance over a specified period which may differ significantly depending on the ending dates selected, particularly during periods of market volatility. Further, the Board considered that shareholders may evaluate performance based on their own respective holding periods which may differ from the performance periods reviewed by the Board and lead to differing results.
In its evaluation, the Board reviewed fund performance results from different perspectives. In general, subject to certain exceptions, the Board reviewed both absolute and relative fund performance over the various time periods and considered performance results in light of a fund’s investment objective(s), strategies and risks. With respect to the relative performance, the Board considered fund performance in comparison to the performance of peer funds (the “Performance Peer Group”), subject to certain exceptions, and recognized and/or customized benchmarks (i.e., generally benchmarks derived from multiple recognized benchmarks). In reviewing such comparative performance, the Board was cognizant of the inherent limitations of such data which can make meaningful performance comparisons generally difficult. As an illustration, differences in the composition of the Performance Peer Group, the investment objective(s), strategies, dates of fund inception and other characteristics of the peers in the Performance Peer Group, and the varying sizes of peers all may contribute to differences in the performance results of a Performance Peer Group compared to the applicable fund. With respect to relative performance of a fund compared to a benchmark index, differences, among other things, in the investment objective(s) and strategies of a fund and the benchmark (particularly an actively managed fund that does not directly follow an index) as well as the costs of operating a fund would necessarily contribute to differences in performance results and limit the value of the comparative performance information. To assist the Board in its review of the comparability of the relative performance, management generally has ranked the relevancy of the Performance Peer Groups to the Fund as low, medium or high. In its review of relative performance, the Board considered the Fund’s performance relative to its Performance Peer Group, among other things, by evaluating its quartile ranking with the 1st quartile representing the top performing funds within the Performance Peer Group and the 4th quartile representing the lowest performing funds.
The Board evaluated performance in light of various relevant factors which may include, among other things, general market conditions, issuer-specific information, asset class information, leverage and fund cash flows. The Board considered that long-term performance could be impacted by even one period of significant outperformance or underperformance and that a single investment theme could disproportionately affect performance. Further, the Board considered that market and economic conditions may significantly impact a fund’s performance, particularly over shorter periods, and such performance may be more reflective of such economic or market events and not necessarily reflective of management skill. Although the Board reviews short-, intermediate- and longer-term performance data, the Board considered that longer periods of performance may reflect full market cycles.
In their review from year to year, the Board Members consider and may place different emphasis on the relevant information in light of changing circumstances in market and economic conditions. In evaluating performance, the Board focused particular attention on funds with less favorable performance records. However, depending on the facts and circumstances, including any differences between the respective fund and its benchmark and/or Performance Peer Group, the Board may be satisfied with a fund’s performance notwithstanding that its performance may be below that of its benchmark and/or peer group for certain periods. With respect to any funds for which the Board has identified performance issues, the Board seeks to monitor such funds more closely until performance improves, discuss with the Adviser the reasons for such results, consider whether any steps are necessary or appropriate to address such issues, discuss and evaluate the potential consequences of such steps and review the results of any steps undertaken.
The performance determinations with respect to the Fund are summarized below.
3
Item 11. Statement Regarding Basis for Approval of Investment Advisory Contract (continued)
● The Board considered that although the Fund’s performance was below the performance of its composite benchmark for the three- and five-year periods ended December 31, 2023, the Fund outperformed its composite benchmark for the one-year period ended December 31, 2023 and ranked in the first quartile of its Performance Peer Group for the one- and five-year periods and third quartile for the three-year period ended December 31, 2023. In addition, although the Fund’s performance was below the performance of its composite benchmark for the three-year period ended March 31, 2024, the Fund outperformed its composite benchmark for the one-year period ended March 31, 2024 and matched the performance of its composite benchmark for the five-year period ended March 31, 2024. Further, the Fund ranked in the first quartile of its Performance Peer Group for the one-year period and second quartile for the three- and five-year periods ended March 31, 2024. On the basis of the Board’s ongoing review of investment performance and all relevant factors, including the relative market conditions during certain reporting periods, the Fund’s investment objective(s) and management’s discussion of performance, the Board concluded that the Fund’s performance supported renewal of the Advisory Agreement.
C. Fees, Expenses and Profitability
As part of its annual review, the Board generally reviewed, among other things, the contractual management fee and net/actual management fee (i.e., the management fee after taking into consideration fee waivers and/or expense reimbursements, if any) paid by the Fund to the Adviser in light of the nature, extent and quality of the services provided. The Board also reviewed information about other expenses and the total operating expense ratio of the Fund (after any fee waivers and/or expense reimbursements). More specifically, the Board Members reviewed, among other things, the Fund’s management fee rates and net total expense ratio in relation to similar data for a comparable universe of funds (the “Expense Universe”) and for a more focused subset of comparable funds (the “Expense Group”) established by Broadridge (subject to certain exceptions). The Board Members reviewed the methodology Broadridge employed to establish its Expense Universe and Expense Group (as applicable) and considered that differences between the applicable fund and its respective Expense Universe and/or Expense Group, as well as changes to the composition of the Expense Universe and/or Expense Group from year to year, may limit some of the value of the comparative data. The Board Members also considered that it can be difficult to compare management fees among funds as there are variations in the services that are included for the fees paid. The Board Members took these limitations and differences into account when reviewing comparative peer data. With respect to the Fund, the Board considered that the Adviser does not charge a management fee to the Fund; however, the Adviser may generate indirect earnings with respect to the Fund’s investment in underlying funds also managed by the Adviser.
The Board Members considered the Fund’s operating expense ratio as it more directly reflected a shareholder’s total costs in investing in the respective fund. The Board Members also considered, in relevant part, the Fund’s management fee and net total expense ratio in light of the Fund’s performance history, including reviewing certain funds identified by management and/or the Board as having a higher net total expense ratio or management fee compared to their respective peers coupled with experiencing periods of challenged performance and considering the reasons for such comparative positions.
In their evaluation of the fee arrangements for the Fund, the Board Members also reviewed the management fee schedules and the expense reimbursements and/or fee waivers agreed to by the Adviser for the respective fund (if any). In addition, in conjunction with the consolidation of the Nuveen funds and TC funds, the TC funds will phase out the separate administrative agreement pursuant to which TAL provided certain administrative services as well as the reimbursement to TAL of certain costs thereunder over a three-year period.
The Board’s considerations regarding the comparative fee data for the Fund are set forth below. With respect to the quartile rankings noted below, the first quartile represents the range of funds with the lowest management fee rate or net total expense ratio, as applicable, and the fourth quartile represents the range of funds with the highest management fee rate or net total expense ratio, as applicable. The Board considered that Broadridge only calculates quartiles if a minimum number of peers is available and therefore quartile rankings may not be available for certain Expense Groups and/or Expense Universes.
● The Fund’s actual management fee rate and net total expense ratio each ranked in the first quartile of its Expense Group and Expense Universe. Quartile rankings for the contractual management fee rate were not available. Further, the Fund’s actual management fee rate and net total expense ratio were below the Expense Group median.
Based on its review of the information provided, the Board determined that the Fund’s management fees (as applicable) to the Adviser were reasonable in light of the nature, extent and quality of services provided to the Fund.
4
| | 2. | Comparisons with the Fees of Other Clients |
In evaluating the appropriateness of fees, the Board also considered that the Adviser and/or its affiliate(s) provide investment management services to other types of clients which may include: separately managed accounts, retail managed accounts, foreign funds (UCITS), other investment companies (as sub-advisers), limited partnerships and collective investment trusts. The Board reviewed the equal weighted average fee or other fee data for the other types of clients managed in a similar manner to certain of the Nuveen funds and TC funds. The Board considered the Adviser’s rationale for the differences in the management fee rates of the funds compared to the management fee rates charged to these other types of clients. In this regard, the Board considered that differences, including but not limited to, the amount, type and level of services provided by the Adviser to the funds compared to that provided to other clients as well as differences in investment policies; regulatory, disclosure and governance requirements; servicing relationships with vendors; the manner of managing such assets; product structure; investor profiles; and account sizes all may contribute to variations in relative fee rates. Further, differences in the client base, governing bodies, distribution, jurisdiction and operational complexities also would contribute to variations in management fees assessed the funds compared to foreign fund clients. In addition, differences in the level of advisory services required for passively managed funds also contribute to differences in the management fee levels of such funds compared to actively managed funds. As a general matter, higher fee levels reflect higher levels of service provided by the Adviser, increased investment management complexity, greater product management requirements, and higher levels of business risk or some combination of these factors. The Board considered the wide range of services in addition to investment management that the Adviser had provided to the funds compared to other types of clients as well as the increased entrepreneurial, legal and regulatory risks that the Adviser incurs in sponsoring and managing the funds. The Board concluded that the varying levels of fees were reasonable given, among other things, the more extensive services, regulatory requirements and legal liabilities, and the entrepreneurial, legal and regulatory risks incurred in sponsoring and advising a registered investment company compared to that required in advising other types of clients. As noted, the Board considered that the Adviser does not charge a management fee to the Fund under the Advisory Agreement.
| | 3. | Profitability of the Adviser |
In their review, the Board Members reviewed a variety of profitability information relating to TAL as a result of its advisory services to the TC funds. In developing the profitability data, the Board Members considered the subjective nature of calculating profitability as the information is not audited and is necessarily dependent on cost allocation methodologies to allocate expenses throughout the complex and among the various advisory products. The Board Members received profitability data for TAL attributable to the TC funds in the aggregate and on a per-TC fund basis. The Board Members reviewed, among other things, TAL’s profitability margin (pre- and post-distribution expenses) for the TC funds for each year from 2014 to 2023 as well as TAL’s revenue, expenses and net earnings before federal income tax (pre- and post-distribution expenses) from the TC funds for the year ended December 31, 2023 and as compared to December 31, 2022. The Board reviewed the profitability margins (pre- and post-marketing and pre-tax) of TAL for the TC funds for the 2023 fiscal year compared to the profitability margins (pre-marketing (subject to exceptions) and post-marketing and pre-tax) of a peer group of certain asset management firms for the 2022 fiscal year (the most recent year data available). The Board considered that TAL had calculated that it incurred a net loss for the one-year period ended December 31, 2023 with respect to its services to the Fund given that TAL does not charge the Fund any management fees under the Advisory Agreement, and without taking into account profits TAL earned in the aggregate with respect to the underlying funds that are also managed by TAL in which the Fund invests. In evaluating profitability data, the Board Members considered the difficulty in calculating profitability particularly at the individual Fund level given that differing but reasonable allocation methodologies could be employed and lead to significantly different results. The Board Members also reviewed the unaudited financial statements for TAL dated December 31, 2023.
Aside from the profitability data, the Board considered that NFAL and TAL are affiliates of Teachers Insurance and Annuity Association of America (“TIAA”). NFAL is a subsidiary of Nuveen, LLC, the investment management arm of TIAA, and TAL is an indirect wholly owned subsidiary of TIAA. Accordingly, the Board also reviewed a balance sheet for TIAA reflecting its assets, liabilities and capital and contingency reserves for the 2023 and 2022 calendar years to consider the financial strength of TIAA. The Board considered the benefit of an investment adviser and its parent with significant resources, particularly during periods of market volatility. The Board also considered the reinvestments the Adviser, its parent and/or other affiliates made into their business through, among other things, the investment of seed capital in certain funds, initiatives in international expansion, investments in infrastructure and continued investments in enhancements to technological capabilities.
In evaluating the reasonableness of the compensation, the Board Members also considered the indirect benefits the Adviser received that were directly attributable to the management of the applicable funds as discussed in further detail below. Based on its review, the Board was satisfied that the Adviser’s level of profitability from its relationship with the Fund was not unreasonable over various time frames in light of the nature, extent and quality of services provided.
D. Economies of Scale and Whether Fee Levels Reflect These Economies of Scale
The Board considered whether there have been economies of scale with respect to the management of the funds in the fund complex, including the Fund, whether these economies of scale have been appropriately shared with such funds and whether there is potential for realization of further economies of scale. Although the Board considered that economies of scale are difficult to measure with any precision and the rates at which certain expenses are incurred may not decline with a rise in assets, the Board considered that there are various methods that may be employed to help share the benefits of economies of scale, including, among other things, through the use of breakpoints in the management fee schedule, fee waivers and/or expense limitations, the pricing of funds at scale at inception and investments in the Adviser’s business which can enhance the
5
Item 11. Statement Regarding Basis for Approval of Investment Advisory Contract (continued)
services provided to the applicable funds for the fees paid. The Board considered that the Adviser has generally employed one or more of these various methods among the applicable funds. The Board considered that the Fund, however, does not have a breakpoint schedule as the Adviser does not charge the Fund a management fee.
In addition, the Board Members considered the contractual and/or voluntary expense caps (if any) applicable to the Fund. The Board considered that such waivers and reimbursements applicable to the respective funds are another means for potential economies of scale to be shared with shareholders of such funds and can provide a protection from an increase in expenses if the assets of the applicable funds decline.
The Board Members also considered the continued reinvestment in Nuveen/TIAA’s business to enhance its capabilities and services to the benefit of its various clients. The Board understood that many of these investments were not specific to individual funds, but rather incurred across a variety of products and services pursuant to which the family of funds as a whole may benefit. The Board further considered that the Adviser and its affiliates have provided certain additional services, including, but not limited to, services required by new regulations and regulatory interpretations, without raising advisory fees to the funds, and this was also a means of sharing economies of scale with the funds and their shareholders. The Board considered the Adviser’s and/or its affiliates’ ongoing efforts to streamline the product line-up, among other things, to create more scaled funds which may help improve both expense and trading economies.
Based on its review, the Board was satisfied that the current fee arrangements together with the reinvestment in management’s business appropriately shared any economies of scale with shareholders.
E. Indirect Benefits
The Board Members received and considered information regarding various indirect benefits the Adviser or its affiliates may receive as a result of their relationship with the funds in the fund complex, including the Fund. These benefits included, among other things, economies of scale to the extent the Adviser or its affiliates share investment resources and/or personnel with other clients of the Adviser. The funds may also be used as investment options for other products or businesses offered by the Adviser and/or its affiliates, such as variable products and 529 education savings plans, and affiliates of the Adviser may serve as sub-advisers to various funds in which case all advisory and sub-advisory fees generated by such funds stay within Nuveen.
Further, the funds may pay the Adviser and/or its affiliates for other services, such as distribution. In this regard, the Board Members considered that an affiliate of the Adviser serves as principal underwriter providing distribution and/or shareholder services to the open-end funds for which it may be compensated. The Board Members also considered that certain share classes of the funds (subject to certain exceptions) pay 12b-1 fees, some of which may be retained by the Adviser’s affiliate.
The Board Members considered that TAL or its affiliates were reimbursed for certain costs of administrative services pursuant to an administrative agreement; however, such administrative agreement was anticipated to be phased out over time.
In addition, the Board Members considered that the Adviser may utilize soft dollar brokerage arrangements attributable to the respective fund(s) to obtain research and other services for any or all of its clients, although the Board Members also considered that the Adviser reimburses the Fund for all such costs.
The Adviser and its affiliates may also benefit from the advisory relationships with the funds in the fund complex to the extent this relationship results in potential investors viewing the TIAA group of companies as a leading retirement plan provider in the academic and nonprofit market and a single source for all their financial service needs. The Adviser and/or its affiliates may further benefit to the extent that they have pricing or other information regarding vendors the funds utilize in establishing arrangements with such vendors for other products.
Based on its review, the Board concluded that any indirect benefits received by the Adviser as a result of its relationship with the Fund were reasonable in light of the services provided.
F. Other Considerations
The Board Members did not identify any single factor discussed previously as all-important or controlling. The Board Members concluded that the terms of the Advisory Agreement were reasonable, that the Adviser’s fees were reasonable in light of the services provided to the Fund and that the Advisory Agreement be renewed for an additional one-year period.
6
| Item 12. | Disclosure of Proxy Voting Policies and Procedures for Closed-End Management Investment Companies. |
Not applicable to open-end investment companies.
| Item 13. | Portfolio Managers of Closed-End Management Investment Companies. |
Not applicable to open-end investment companies.
| Item 14. | Purchases of Equity Securities by Closed-End Management Investment Company and Affiliated Purchasers. |
Not applicable to open-end investment companies.
| Item 15. | Submission of Matters to a Vote of Security Holders. |
There have been no material changes to the procedures by which shareholders may recommend nominees to the registrant’s Board of Trustees implemented after the registrant last provided disclosure in response to this Item.
| Item 16. | Controls and Procedures. |
| (a) | The registrant’s principal executive and principal financial officers, or persons performing similar functions, have concluded that the registrant’s disclosure controls and procedures (as defined in Rule 30a-3(c) under the Investment Company Act of 1940, as amended (the “1940 Act”) (17 CFR 270.30a-3(c))) are effective, as of a date within 90 days of the filing date of this report that includes the disclosure required by this paragraph, based on their evaluation of the controls and procedures required by Rule 30a-3(b) under the 1940 Act (17 CFR 270.30a-3(b)) and Rules 13a-15(b) or 15d-15(b) under the Securities Exchange Act of 1934, as amended (the “Exchange Act”) (17 CFR 240.13a-15(b) or 240.15d-15(b)). |
| (b) | There were no changes in the registrant’s internal control over financial reporting (as defined in Rule 30a-3(d) under the 1940 Act (17 CFR 270.30a-3(d)) that occurred during the period covered by this report that has materially affected, or is reasonably likely to materially affect, the registrant’s internal control over financial reporting. |
| Item 17. | Disclosure of Securities Lending Activities for Closed-End Management Investment Companies. |
| (a) | Not applicable to open-end investment companies. |
| (b) | Not applicable to open-end investment companies. |
| Item 18. | Recovery of Erroneously Awarded Compensation. |
| (a)(1) | Not applicable because the code of ethics is available, upon request and without charge, by calling 800-257-8787 and there were no amendments during the period covered by this report. |
SIGNATURES
Pursuant to the requirements of the Securities Exchange Act of 1934 and the Investment Company Act of 1940, the registrant has duly caused this report to be signed on its behalf by the undersigned, thereunto duly authorized.
TIAA-CREF Funds
| | | | | | |
| Date: August 6, 2024 | | | | By: | | /s/ Jordan M. Farris |
| | | | | | Jordan M. Farris |
| | | | | | Chief Administrative Officer |
Pursuant to the requirements of the Securities Exchange Act of 1934 and the Investment Company Act of 1940, this report has been signed below by the following persons on behalf of the registrant and in the capacities and on the dates indicated.
| | | | | | |
| Date: August 6, 2024 | | | | By: | | /s/ Jordan M. Farris |
| | | | | | Jordan M. Farris |
| | | | | | Chief Administrative Officer |
| | | | | | (principal executive officer) |
| | | |
| Date: August 6, 2024 | | | | By: | | /s/ E. Scott Wickerham |
| | | | | | E. Scott Wickerham |
| | | | | | Vice President and Controller |
| | | | | | (principal financial officer) |