0001084380 tcf:C000145617Member tcf:InternationalEquityMember 2024-11-30
UNITED STATES
SECURITIES AND EXCHANGE COMMISSION
Washington, D.C. 20549
FORM N‑CSR
CERTIFIED SHAREHOLDER REPORT OF REGISTERED
MANAGEMENT INVESTMENT COMPANIES
Investment Company Act file number 811-09301
TIAA-CREF Funds
(Exact name of registrant as specified in charter)
730 Third Avenue
New York, New York 10017-3206
(Address of principal executive offices) (Zip code)
Jeremy D. Franklin, Esq.
TIAA-CREF Funds
8500 Andrew Carnegie Boulevard
Charlotte, North Carolina 28262
(Name and address of agent for service)
Registrant’s telephone number, including area code: (800) 842‑2733
Date of fiscal year end: May 31
Date of reporting period: November 30, 2024
| Item 1. | Reports to Stockholders. |
| | |
 | | Semi-Annual Shareholder Report November 30, 2024 |
Nuveen Lifecycle Retirement Income Fund
Class A Shares/TLRRX
Semi-Annual Report
This semi-annual shareholder report contains important information about the Class A Shares of the Nuveen Lifecycle Retirement Income Fund for the period of June 1, 2024 to November 30, 2024. You can find additional information at https://www.nuveen.com/en‑us/mutual‑funds/prospectuses. You can also request this information by contacting us at (800) 257‑8787.
What were the Fund costs for the last six months? (based on a hypothetical $10,000 investment)
| | | | |
| | |
| | | Cost of a $10,000 investment | | Costs paid as a percentage of $10,000 investment* |
| | | |
| Class A Shares | | $27 | | 0.53% |
* These costs include the expenses of the underlying funds in which the Fund invests except for the expenses of the Nuveen Dividend Growth Fund, Nuveen Dividend Value Fund, Nuveen Growth Opportunities ETF and the Nuveen Real Property Fund LP. Annualized for period less than one year.
Fund Statistics (as of November 30, 2024)
| | | | |
| |
| Fund net assets | | $ | 414,552,094 | |
| |
| Total number of portfolio holdings | | | 21 | |
| |
| Portfolio turnover (%) | | | 5% | |
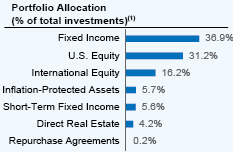
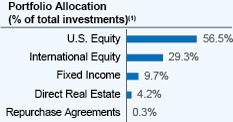
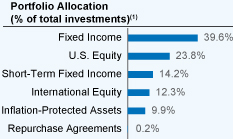
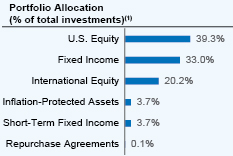
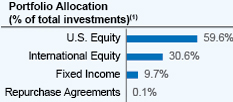
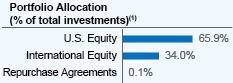
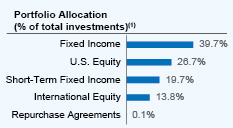
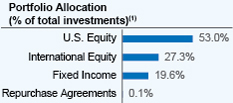
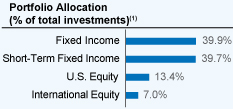
What did the Fund invest in? (as of November 30, 2024)
(1) Affiliated investment companies, except for repurchase agreements.
Availability of additional information about the Fund
You can find additional information about the Fund at https://www.nuveen.com/en‑us/mutual‑funds/prospectuses, including its:
| | • | | prospectus • financial statements and other information • fund holdings • proxy voting information |
You can also request this information at (800) 257‑8787.
| | |
886315498_SAR_1124 4086613-0126 | |  |
| | |
| | Semi-Annual Shareholder Report November 30, 2024 |
Nuveen Lifecycle Retirement Income Fund
Class I Shares/TLRHX
Semi-Annual Report
This semi-annual shareholder report contains important information about the Class I Shares of the Nuveen Lifecycle Retirement Income Fund for the period of June 1, 2024 to November 30, 2024. You can find additional information at https://www.nuveen.com/en‑us/mutual‑funds/prospectuses. You can also request this information by contacting us at (800) 257‑8787.
What were the Fund costs for the last six months? (based on a hypothetical $10,000 investment)
| | | | |
| | |
| | | Cost of a $10,000 investment | | Costs paid as a percentage of
$10,000 investment* |
| | | |
| Class I Shares | | $19 | | 0.37% |
* These costs include the expenses of the underlying funds in which the Fund invests except for the expenses of the Nuveen Dividend Growth Fund, Nuveen Dividend Value Fund, Nuveen Growth Opportunities ETF and the Nuveen Real Property Fund LP. Annualized for period less than one year.
Fund Statistics (as of November 30, 2024)
| | | | |
| |
| Fund net assets | | $ | 414,552,094 | |
| |
| Total number of portfolio holdings | | | 21 | |
| |
| Portfolio turnover (%) | | | 5% | |
What did the Fund invest in? (as of November 30, 2024)
(1) Affiliated investment companies, except for repurchase agreements.
Availability of additional information about the Fund
You can find additional information about the Fund at https://www.nuveen.com/en‑us/mutual‑funds/prospectuses, including its:
| | • | | prospectus • financial statements and other information • fund holdings • proxy voting information |
You can also request this information at (800) 257‑8787.
| | |
87245P106_SAR_1124 4086613-0126 | | |
| | |
| | Semi-Annual Shareholder Report November 30, 2024 |
Nuveen Lifecycle Retirement Income Fund
Premier Class Shares/TPILX
Semi-Annual Report
This semi-annual shareholder report contains important information about the Premier Class Shares of the Nuveen Lifecycle Retirement Income Fund for the period of June 1, 2024 to November 30, 2024. You can find additional information at https://www.nuveen.com/en‑us/mutual‑funds/prospectuses. You can also request this information by contacting us at (800) 257‑8787.
What were the Fund costs for the last six months? (based on a hypothetical $10,000 investment)
| | | | |
| | |
| | | Cost of a $10,000 investment | | Costs paid as a percentage of
$10,000 investment* |
| | | |
| Premier Class Shares | | $22 | | 0.43% |
* These costs include the expenses of the underlying funds in which the Fund invests except for the expenses of the Nuveen Dividend Growth Fund, Nuveen Dividend Value Fund, Nuveen Growth Opportunities ETF and the Nuveen Real Property Fund LP. Annualized for period less than one year.
Fund Statistics (as of November 30, 2024)
| | | | |
| |
| Fund net assets | | $ | 414,552,094 | |
| |
| Total number of portfolio holdings | | | 21 | |
| |
| Portfolio turnover (%) | | | 5% | |
What did the Fund invest in? (as of November 30, 2024)
(1) Affiliated investment companies, except for repurchase agreements.
Availability of additional information about the Fund
You can find additional information about the Fund at https://www.nuveen.com/en‑us/mutual‑funds/prospectuses, including its:
| | • | | prospectus • financial statements and other information • fund holdings • proxy voting information |
You can also request this information at (800) 257‑8787.
| | |
87245M335_SAR_1124 4086613-0126 | | |
| | |
| | Semi-Annual Shareholder Report November 30, 2024 |
Nuveen Lifecycle Retirement Income Fund
Class R6 Shares/TLRIX
Semi-Annual Report
This semi-annual shareholder report contains important information about the Class R6 Shares of the Nuveen Lifecycle Retirement Income Fund for the period of June 1, 2024 to November 30, 2024. You can find additional information at https://www.nuveen.com/en‑us/mutual‑funds/prospectuses. You can also request this information by contacting us at (800) 257‑8787.
What were the Fund costs for the last six months? (based on a hypothetical $10,000 investment)
| | | | |
| | |
| | | Cost of a $10,000 investment | | Costs paid as a percentage of
$10,000 investment* |
| | | |
| Class R6 Shares | | $14 | | 0.28% |
* These costs include the expenses of the underlying funds in which the Fund invests except for the expenses of the Nuveen Dividend Growth Fund, Nuveen Dividend Value Fund, Nuveen Growth Opportunities ETF and the Nuveen Real Property Fund LP. Annualized for period less than one year.
Fund Statistics (as of November 30, 2024)
| | | | |
| |
| Fund net assets | | $ | 414,552,094 | |
| |
| Total number of portfolio holdings | | | 21 | |
| |
| Portfolio turnover (%) | | | 5% | |
What did the Fund invest in? (as of November 30, 2024)
(1) Affiliated investment companies, except for repurchase agreements.
Availability of additional information about the Fund
You can find additional information about the Fund at https://www.nuveen.com/en‑us/mutual‑funds/prospectuses, including its:
| | • | | prospectus • financial statements and other information • fund holdings • proxy voting information |
You can also request this information at (800) 257‑8787.
| | |
886315563_SAR_1124 4086613-0126 | | |
| | |
| | Semi-Annual Shareholder Report November 30, 2024 |
Nuveen Lifecycle Retirement Income Fund
Retirement Class Shares/TLIRX
Semi-Annual Report
This semi-annual shareholder report contains important information about the Retirement Class Shares of the Nuveen Lifecycle Retirement Income Fund for the period of June 1, 2024 to November 30, 2024. You can find additional information at https://www.nuveen.com/en‑us/mutual‑funds/prospectuses. You can also request this information by contacting us at (800) 257‑8787.
What were the Fund costs for the last six months? (based on a hypothetical $10,000 investment)
| | | | |
| | |
| | | Cost of a $10,000 investment | | Costs paid as a percentage of
$10,000 investment* |
| | | |
| Retirement Class Shares | | $27 | | 0.53% |
* These costs include the expenses of the underlying funds in which the Fund invests except for the expenses of the Nuveen Dividend Growth Fund, Nuveen Dividend Value Fund, Nuveen Growth Opportunities ETF and the Nuveen Real Property Fund LP. Annualized for period less than one year.
Fund Statistics (as of November 30, 2024)
| | | | |
| |
| Fund net assets | | $ | 414,552,094 | |
| |
| Total number of portfolio holdings | | | 21 | |
| |
| Portfolio turnover (%) | | | 5% | |
What did the Fund invest in? (as of November 30, 2024)
(1) Affiliated investment companies, except for repurchase agreements.
Availability of additional information about the Fund
You can find additional information about the Fund at https://www.nuveen.com/en‑us/mutual‑funds/prospectuses, including its:
| | • | | prospectus • financial statements and other information • fund holdings • proxy voting information |
You can also request this information at (800) 257‑8787.
| | |
886315480_SAR_1124 4086613-0126 | | |
| | |
| | Semi-Annual Shareholder Report November 30, 2024 |
Nuveen Lifecycle 2010 Fund
Class I Shares/TCLHX
Semi-Annual Report
This semi-annual shareholder report contains important information about the Class I Shares of the Nuveen Lifecycle 2010 Fund for the period of June 1, 2024 to November 30, 2024. You can find additional information at https://www.nuveen.com/en‑us/mutual‑funds/prospectuses. You can also request this information by contacting us at (800) 257‑8787.
What were the Fund costs for the last six months? (based on a hypothetical $10,000 investment)
| | | | |
| | |
| | | Cost of a $10,000 investment | | Costs paid as a percentage of
$10,000 investment* |
| | | |
| Class I Shares | | $20 | | 0.39% |
* These costs include the expenses of the underlying funds in which the Fund invests except for the expenses of the Nuveen Dividend Growth Fund, Nuveen Dividend Value Fund, Nuveen Growth Opportunities ETF and the Nuveen Real Property Fund LP. Annualized for period less than one year.
Fund Statistics (as of November 30, 2024)
| | | | |
| |
| Fund net assets | | $ | 766,148,884 | |
| |
| Total number of portfolio holdings | | | 21 | |
| |
| Portfolio turnover (%) | | | 5% | |
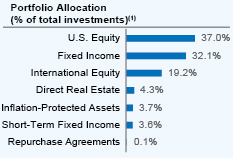
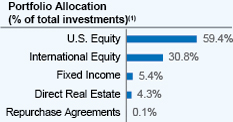
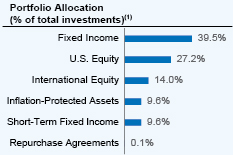
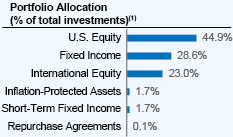
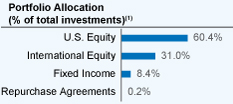
What did the Fund invest in? (as of November 30, 2024)
(1) Affiliated investment companies, except for repurchase agreements.
Availability of additional information about the Fund
You can find additional information about the Fund at https://www.nuveen.com/en‑us/mutual‑funds/prospectuses, including its:
| | • | | prospectus • financial statements and other information • fund holdings • proxy voting information |
You can also request this information at (800) 257‑8787.
| | |
87245P205_SAR_1124 4086627-0126 | | |
| | |
| | Semi-Annual Shareholder Report November 30, 2024 |
Nuveen Lifecycle 2010 Fund
Premier Class Shares/TCTPX
Semi-Annual Report
This semi-annual shareholder report contains important information about the Premier Class Shares of the Nuveen Lifecycle 2010 Fund for the period of June 1, 2024 to November 30, 2024. You can find additional information at https://www.nuveen.com/en‑us/mutual‑funds/prospectuses. You can also request this information by contacting us at (800) 257‑8787.
What were the Fund costs for the last six months? (based on a hypothetical $10,000 investment)
| | | | |
| | |
| | | Cost of a $10,000 investment | | Costs paid as a percentage of
$10,000 investment* |
| | | |
| Premier Class Shares | | $21 | | 0.41% |
* These costs include the expenses of the underlying funds in which the Fund invests except for the expenses of the Nuveen Dividend Growth Fund, Nuveen Dividend Value Fund, Nuveen Growth Opportunities ETF and the Nuveen Real Property Fund LP. Annualized for period less than one year.
Fund Statistics (as of November 30, 2024)
| | | | |
| |
| Fund net assets | | $ | 766,148,884 | |
| |
| Total number of portfolio holdings | | | 21 | |
| |
| Portfolio turnover (%) | | | 5% | |
What did the Fund invest in? (as of November 30, 2024)
(1) Affiliated investment companies, except for repurchase agreements.
Availability of additional information about the Fund
You can find additional information about the Fund at https://www.nuveen.com/en‑us/mutual‑funds/prospectuses, including its:
| | • | | prospectus • financial statements and other information • fund holdings • proxy voting information |
You can also request this information at (800) 257‑8787.
| | |
87245M434_SAR_1124 4086627-0126 | | |
| | |
| | Semi-Annual Shareholder Report November 30, 2024 |
Nuveen Lifecycle 2010 Fund
Class R6 Shares/TCTIX
Semi-Annual Report
This semi-annual shareholder report contains important information about the Class R6 Shares of the Nuveen Lifecycle 2010 Fund for the period of June 1, 2024 to November 30, 2024. You can find additional information at https://www.nuveen.com/en‑us/mutual‑funds/prospectuses. You can also request this information by contacting us at (800) 257‑8787.
What were the Fund costs for the last six months? (based on a hypothetical $10,000 investment)
| | | | |
| | |
| | | Cost of a $10,000 investment | | Costs paid as a percentage of
$10,000 investment* |
| | | |
| Class R6 Shares | | $13 | | 0.26% |
* These costs include the expenses of the underlying funds in which the Fund invests except for the expenses of the Nuveen Dividend Growth Fund, Nuveen Dividend Value Fund, Nuveen Growth Opportunities ETF and the Nuveen Real Property Fund LP. Annualized for period less than one year.
Fund Statistics (as of November 30, 2024)
| | | | |
| |
| Fund net assets | | $ | 766,148,884 | |
| |
| Total number of portfolio holdings | | | 21 | |
| |
| Portfolio turnover (%) | | | 5% | |
What did the Fund invest in? (as of November 30, 2024)
(1) Affiliated investment companies, except for repurchase agreements.
Availability of additional information about the Fund
You can find additional information about the Fund at https://www.nuveen.com/en‑us/mutual‑funds/prospectuses, including its:
| | • | | prospectus • financial statements and other information • fund holdings • proxy voting information |
You can also request this information at (800) 257‑8787.
| | |
886315662_SAR_1124 4086627-0126 | | |
| | |
| | Semi-Annual Shareholder Report November 30, 2024 |
Nuveen Lifecycle 2010 Fund
Retirement Class Shares/TCLEX
Semi-Annual Report
This semi-annual shareholder report contains important information about the Retirement Class Shares of the Nuveen Lifecycle 2010 Fund for the period of June 1, 2024 to November 30, 2024. You can find additional information at https://www.nuveen.com/en‑us/mutual‑funds/prospectuses. You can also request this information by contacting us at (800) 257‑8787.
What were the Fund costs for the last six months? (based on a hypothetical $10,000 investment)
| | | | |
| | |
| | | Cost of a $10,000 investment | | Costs paid as a percentage of
$10,000 investment* |
| | | |
| Retirement Class Shares | | $26 | | 0.51% |
* These costs include the expenses of the underlying funds in which the Fund invests except for the expenses of the Nuveen Dividend Growth Fund, Nuveen Dividend Value Fund, Nuveen Growth Opportunities ETF and the Nuveen Real Property Fund LP. Annualized for period less than one year.
Fund Statistics (as of November 30, 2024)
| | | | |
| |
| Fund net assets | | $ | 766,148,884 | |
| |
| Total number of portfolio holdings | | | 21 | |
| |
| Portfolio turnover (%) | | | 5% | |
What did the Fund invest in? (as of November 30, 2024)
(1) Affiliated investment companies, except for repurchase agreements.
Availability of additional information about the Fund
You can find additional information about the Fund at https://www.nuveen.com/en‑us/mutual‑funds/prospectuses, including its:
| | • | | prospectus • financial statements and other information • fund holdings • proxy voting information |
You can also request this information at (800) 257‑8787.
| | |
87244W458_SAR_1124 4086627-0126 | | |
| | |
| | Semi-Annual Shareholder Report November 30, 2024 |
Nuveen Lifecycle 2015 Fund
Class I Shares/TCNHX
Semi-Annual Report
This semi-annual shareholder report contains important information about the Class I Shares of the Nuveen Lifecycle 2015 Fund for the period of June 1, 2024 to November 30, 2024. You can find additional information at https://www.nuveen.com/en‑us/mutual‑funds/prospectuses. You can also request this information by contacting us at (800) 257‑8787.
What were the Fund costs for the last six months? (based on a hypothetical $10,000 investment)
| | | | |
| | |
| | | Cost of a $10,000 investment | | Costs paid as a percentage of
$10,000 investment* |
| | | |
| Class I Shares | | $22 | | 0.43% |
* These costs include the expenses of the underlying funds in which the Fund invests except for the expenses of the Nuveen Dividend Growth Fund, Nuveen Dividend Value Fund, Nuveen Growth Opportunities ETF and the Nuveen Real Property Fund LP. Annualized for period less than one year.
Fund Statistics (as of November 30, 2024)
| | | | |
| |
| Fund net assets | | $ | 1,089,220,952 | |
| |
| Total number of portfolio holdings | | | 21 | |
| |
| Portfolio turnover (%) | | | 5% | |
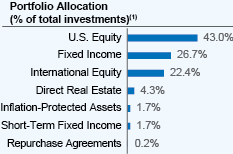
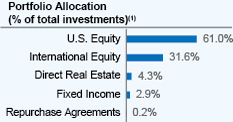
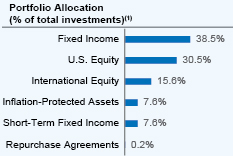
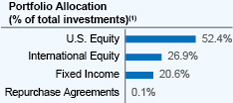
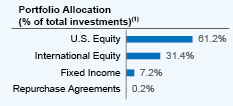
What did the Fund invest in? (as of November 30, 2024)
(1) Affiliated investment companies, except for repurchase agreements.
Availability of additional information about the Fund
You can find additional information about the Fund at https://www.nuveen.com/en‑us/mutual‑funds/prospectuses, including its:
| | • | | prospectus • financial statements and other information • fund holdings • proxy voting information |
You can also request this information at (800) 257‑8787.
| | |
87245P304_SAR_1124 4086650-0126 | | |
| | |
| | Semi-Annual Shareholder Report November 30, 2024 |
Nuveen Lifecycle 2015 Fund
Premier Class Shares/TCFPX
Semi-Annual Report
This semi-annual shareholder report contains important information about the Premier Class Shares of the Nuveen Lifecycle 2015 Fund for the period of June 1, 2024 to November 30, 2024. You can find additional information at https://www.nuveen.com/en‑us/mutual‑funds/prospectuses. You can also request this information by contacting us at (800) 257‑8787.
What were the Fund costs for the last six months? (based on a hypothetical $10,000 investment)
| | | | |
| | |
| | | Cost of a $10,000 investment | | Costs paid as a percentage of
$10,000 investment* |
| | | |
| Premier Class Shares | | $22 | | 0.43% |
* These costs include the expenses of the underlying funds in which the Fund invests except for the expenses of the Nuveen Dividend Growth Fund, Nuveen Dividend Value Fund, Nuveen Growth Opportunities ETF and the Nuveen Real Property Fund LP. Annualized for period less than one year.
Fund Statistics (as of November 30, 2024)
| | | | |
| |
| Fund net assets | | $ | 1,089,220,952 | |
| |
| Total number of portfolio holdings | | | 21 | |
| |
| Portfolio turnover (%) | | | 5% | |
What did the Fund invest in? (as of November 30, 2024)
(1) Affiliated investment companies, except for repurchase agreements.
Availability of additional information about the Fund
You can find additional information about the Fund at https://www.nuveen.com/en‑us/mutual‑funds/prospectuses, including its:
| | • | | prospectus • financial statements and other information • fund holdings • proxy voting information |
You can also request this information at (800) 257‑8787.
| | |
87245M426_SAR_1124 4086650-0126 | | |
| | |
| | Semi-Annual Shareholder Report November 30, 2024 |
Nuveen Lifecycle 2015 Fund
Class R6 Shares/TCNIX
Semi-Annual Report
This semi-annual shareholder report contains important information about the Class R6 Shares of the Nuveen Lifecycle 2015 Fund for the period of June 1, 2024 to November 30, 2024. You can find additional information at https://www.nuveen.com/en‑us/mutual‑funds/prospectuses. You can also request this information by contacting us at (800) 257‑8787.
What were the Fund costs for the last six months? (based on a hypothetical $10,000 investment)
| | | | |
| | |
| | | Cost of a $10,000 investment | | Costs paid as a percentage of
$10,000 investment* |
| | | |
| Class R6 Shares | | $14 | | 0.28% |
* These costs include the expenses of the underlying funds in which the Fund invests except for the expenses of the Nuveen Dividend Growth Fund, Nuveen Dividend Value Fund, Nuveen Growth Opportunities ETF and the Nuveen Real Property Fund LP. Annualized for period less than one year.
Fund Statistics (as of November 30, 2024)
| | | | |
| |
| Fund net assets | | $ | 1,089,220,952 | |
| |
| Total number of portfolio holdings | | | 21 | |
| |
| Portfolio turnover (%) | | | 5% | |
What did the Fund invest in? (as of November 30, 2024)
(1) Affiliated investment companies, except for repurchase agreements.
Availability of additional information about the Fund
You can find additional information about the Fund at https://www.nuveen.com/en‑us/mutual‑funds/prospectuses, including its:
| | • | | prospectus • financial statements and other information • fund holdings • proxy voting information |
You can also request this information at (800) 257‑8787.
| | |
886315654_SAR_1124 4086650-0126 | | |
| | |
| | Semi-Annual Shareholder Report November 30, 2024 |
Nuveen Lifecycle 2015 Fund
Retirement Class Shares/TCLIX
Semi-Annual Report
This semi-annual shareholder report contains important information about the Retirement Class Shares of the Nuveen Lifecycle 2015 Fund for the period of June 1, 2024 to November 30, 2024. You can find additional information at https://www.nuveen.com/en‑us/mutual‑funds/prospectuses. You can also request this information by contacting us at (800) 257‑8787.
What were the Fund costs for the last six months? (based on a hypothetical $10,000 investment)
| | | | |
| | |
| | | Cost of a $10,000 investment | | Costs paid as a percentage of $10,000 investment* |
| | | |
| Retirement Class Shares | | $27 | | 0.53% |
* These costs include the expenses of the underlying funds in which the Fund invests except for the expenses of the Nuveen Dividend Growth Fund, Nuveen Dividend Value Fund, Nuveen Growth Opportunities ETF and the Nuveen Real Property Fund LP. Annualized for period less than one year.
Fund Statistics (as of November 30, 2024)
| | | | |
| |
| Fund net assets | | $ | 1,089,220,952 | |
| |
| Total number of portfolio holdings | | | 21 | |
| |
| Portfolio turnover (%) | | | 5% | |
What did the Fund invest in? (as of November 30, 2024)
(1) Affiliated investment companies, except for repurchase agreements.
Availability of additional information about the Fund
You can find additional information about the Fund at https://www.nuveen.com/en‑us/mutual‑funds/prospectuses, including its:
| | • | | prospectus • financial statements and other information • fund holdings • proxy voting information |
You can also request this information at (800) 257‑8787.
| | |
87244W441_SAR_1124 4086650-0126 | | |
| | |
| | Semi-Annual Shareholder Report November 30, 2024 |
Nuveen Lifecycle 2020 Fund
Class I Shares/TCWHX
Semi-Annual Report
This semi-annual shareholder report contains important information about the Class I Shares of the Nuveen Lifecycle 2020 Fund for the period of June 1, 2024 to November 30, 2024. You can find additional information at https://www.nuveen.com/en‑us/mutual‑funds/prospectuses. You can also request this information by contacting us at (800) 257‑8787.
What were the Fund costs for the last six months? (based on a hypothetical $10,000 investment)
| | | | |
| | |
| | | Cost of a $10,000 investment | | Costs paid as a percentage of $10,000 investment* |
| | | |
| Class I Shares | | $20 | | 0.38% |
* These costs include the expenses of the underlying funds in which the Fund invests except for the expenses of the Nuveen Dividend Growth Fund, Nuveen Dividend Value Fund, Nuveen Growth Opportunities ETF and the Nuveen Real Property Fund LP. Annualized for period less than one year.
Fund Statistics (as of November 30, 2024)
| | | | |
| |
| Fund net assets | | $ | 2,328,313,945 | |
| |
| Total number of portfolio holdings | | | 21 | |
| |
| Portfolio turnover (%) | | | 4% | |
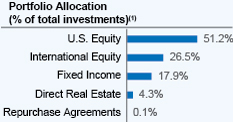
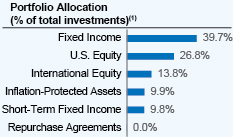
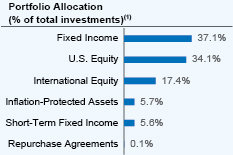
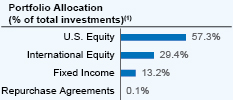
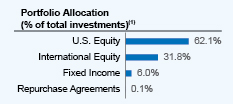
What did the Fund invest in? (as of November 30, 2024)
(1) Affiliated investment companies, except for repurchase agreements.
Availability of additional information about the Fund
You can find additional information about the Fund at https://www.nuveen.com/en‑us/mutual‑funds/prospectuses, including its:
| | • | | prospectus • financial statements and other information • fund holdings • proxy voting information |
You can also request this information at (800) 257‑8787.
| | |
87245P403_SAR_1124 4086654-0126 | | |
| | |
| | Semi-Annual Shareholder Report November 30, 2024 |
Nuveen Lifecycle 2020 Fund
Premier Class Shares/TCWPX
Semi-Annual Report
This semi-annual shareholder report contains important information about the Premier Class Shares of the Nuveen Lifecycle 2020 Fund for the period of June 1, 2024 to November 30, 2024. You can find additional information at https://www.nuveen.com/en‑us/mutual‑funds/prospectuses. You can also request this information by contacting us at (800) 257‑8787.
What were the Fund costs for the last six months? (based on a hypothetical $10,000 investment)
| | | | |
| | |
| | | Cost of a $10,000 investment | | Costs paid as a percentage of
$10,000 investment* |
| | | |
| Premier Class Shares | | $22 | | 0.43% |
* These costs include the expenses of the underlying funds in which the Fund invests except for the expenses of the Nuveen Dividend Growth Fund, Nuveen Dividend Value Fund, Nuveen Growth Opportunities ETF and the Nuveen Real Property Fund LP. Annualized for period less than one year.
Fund Statistics (as of November 30, 2024)
| | | | |
| |
| Fund net assets | | | $2,328,313,945 | |
| |
| Total number of portfolio holdings | | | 21 | |
| |
| Portfolio turnover (%) | | | 4% | |
What did the Fund invest in? (as of November 30, 2024)
(1) Affiliated investment companies, except for repurchase agreements.
Availability of additional information about the Fund
You can find additional information about the Fund at https://www.nuveen.com/en‑us/mutual‑funds/prospectuses, including its:
| | • | | prospectus • financial statements and other information • fund holdings • proxy voting information |
You can also request this information at (800) 257‑8787.
| | |
87245M418_SAR_1124 4086654-0126 | | |
| | |
| | Semi-Annual Shareholder Report November 30, 2024 |
Nuveen Lifecycle 2020 Fund
Class R6 Shares/TCWIX
Semi-Annual Report
This semi-annual shareholder report contains important information about the Class R6 Shares of the Nuveen Lifecycle 2020 Fund for the period of June 1, 2024 to November 30, 2024. You can find additional information at https://www.nuveen.com/en‑us/mutual‑funds/prospectuses. You can also request this information by contacting us at (800) 257‑8787.
What were the Fund costs for the last six months? (based on a hypothetical $10,000 investment)
| | | | |
| | |
| | | Cost of a $10,000 investment | | Costs paid as a percentage of
$10,000 investment* |
| | | |
| Class R6 Shares | | $14 | | 0.28% |
* These costs include the expenses of the underlying funds in which the Fund invests except for the expenses of the Nuveen Dividend Growth Fund, Nuveen Dividend Value Fund, Nuveen Growth Opportunities ETF and the Nuveen Real Property Fund LP. Annualized for period less than one year.
Fund Statistics (as of November 30, 2024)
| | | | |
| |
| Fund net assets | | | $2,328,313,945 | |
| |
| Total number of portfolio holdings | | | 21 | |
| |
| Portfolio turnover (%) | | | 4% | |
What did the Fund invest in? (as of November 30, 2024)
(1) Affiliated investment companies, except for repurchase agreements.
Availability of additional information about the Fund
You can find additional information about the Fund at https://www.nuveen.com/en‑us/mutual‑funds/prospectuses, including its:
| | • | | prospectus • financial statements and other information • fund holdings • proxy voting information |
You can also request this information at (800) 257‑8787.
| | |
886315647_SAR_1124 4086654-0126 | | |
| | |
| | Semi-Annual Shareholder Report November 30, 2024 |
Nuveen Lifecycle 2020 Fund
Retirement Class Shares/TCLTX
Semi-Annual Report
This semi-annual shareholder report contains important information about the Retirement Class Shares of the Nuveen Lifecycle 2020 Fund for the period of June 1, 2024 to November 30, 2024. You can find additional information at https://www.nuveen.com/en‑us/mutual‑funds/prospectuses. You can also request this information by contacting us at (800) 257‑8787.
What were the Fund costs for the last six months? (based on a hypothetical $10,000 investment)
| | | | |
| | |
| | | Cost of a $10,000 investment | | Costs paid as a percentage of
$10,000 investment* |
| | | |
| Retirement Class Shares | | $27 | | 0.53% |
* These costs include the expenses of the underlying funds in which the Fund invests except for the expenses of the Nuveen Dividend Growth Fund, Nuveen Dividend Value Fund, Nuveen Growth Opportunities ETF and the Nuveen Real Property Fund LP. Annualized for period less than one year.
Fund Statistics (as of November 30, 2024)
| | | | |
| |
| Fund net assets | | | $2,328,313,945 | |
| |
| Total number of portfolio holdings | | | 21 | |
| |
| Portfolio turnover (%) | | | 4% | |
What did the Fund invest in? (as of November 30, 2024)
(1) Affiliated investment companies, except for repurchase agreements.
Availability of additional information about the Fund
You can find additional information about the Fund at https://www.nuveen.com/en‑us/mutual‑funds/prospectuses, including its:
| | • | | prospectus • financial statements and other information • fund holdings • proxy voting information |
You can also request this information at (800) 257‑8787.
| | |
87244W433_SAR_1124 4086654-0126 | | |
| | |
| | Semi-Annual Shareholder Report November 30, 2024 |
Nuveen Lifecycle 2025 Fund
Class I Shares/TCQHX
Semi-Annual Report
This semi-annual shareholder report contains important information about the Class I Shares of the Nuveen Lifecycle 2025 Fund for the period of June 1, 2024 to November 30, 2024. You can find additional information at https://www.nuveen.com/en‑us/mutual‑funds/prospectuses. You can also request this information by contacting us at (800) 257‑8787.
What were the Fund costs for the last six months? (based on a hypothetical $10,000 investment)
| | | | |
| | |
| | | Cost of a $10,000 investment | | Costs paid as a percentage of
$10,000 investment* |
| | | |
| Class I Shares | | $20 | | 0.39% |
* These costs include the expenses of the underlying funds in which the Fund invests except for the expenses of the Nuveen Dividend Growth Fund, Nuveen Dividend Value Fund, Nuveen Growth Opportunities ETF and the Nuveen Real Property Fund LP. Annualized for period less than one year.
Fund Statistics (as of November 30, 2024)
| | | | |
| |
| Fund net assets | | $ | 3,745,940,060 | |
| |
| Total number of portfolio holdings | | | 21 | |
| |
| Portfolio turnover (%) | | | 4% | |
What did the Fund invest in? (as of November 30, 2024)
(1) Affiliated investment companies, except for repurchase agreements.
Availability of additional information about the Fund
You can find additional information about the Fund at https://www.nuveen.com/en‑us/mutual‑funds/prospectuses, including its:
| | • | | prospectus • financial statements and other information • fund holdings • proxy voting information |
You can also request this information at (800) 257‑8787.
| | |
87245P502_SAR_1124 4086663-0126 | | |
| | |
| | Semi-Annual Shareholder Report November 30, 2024 |
Nuveen Lifecycle 2025 Fund
Premier Class Shares/TCQPX
Semi‑Annual Report
This semi-annual shareholder report contains important information about the Premier Class Shares of the Nuveen Lifecycle 2025 Fund for the period of June 1, 2024 to November 30, 2024. You can find additional information at https://www.nuveen.com/en‑us/mutual‑funds/prospectuses. You can also request this information by contacting us at (800) 257‑8787.
What were the Fund costs for the last six months? (based on a hypothetical $10,000 investment)
| | | | |
| | |
| | | Cost of a $10,000 investment | | Costs paid as a percentage of
$10,000 investment* |
| | | |
| Premier Class Shares | | $23 | | 0.44% |
* These costs include the expenses of the underlying funds in which the Fund invests except for the expenses of the Nuveen Dividend Growth Fund, Nuveen Dividend Value Fund, Nuveen Growth Opportunities ETF and the Nuveen Real Property Fund LP. Annualized for period less than one year.
Fund Statistics (as of November 30, 2024)
| | | | |
| |
| Fund net assets | | $ | 3,745,940,060 | |
| |
| Total number of portfolio holdings | | | 21 | |
| |
| Portfolio turnover (%) | | | 4% | |
What did the Fund invest in? (as of November 30, 2024)
(1) Affiliated investment companies, except for repurchase agreements.
Availability of additional information about the Fund
You can find additional information about the Fund at https://www.nuveen.com/en‑us/mutual‑funds/prospectuses, including its:
| | • | | prospectus • financial statements and other information • fund holdings • proxy voting information |
You can also request this information at (800) 257‑8787.
| | |
87245M392_SAR_1124 4086663-0126 | | |
| | |
| | Semi-Annual Shareholder Report November 30, 2024 |
Nuveen Lifecycle 2025 Fund
Class R6 Shares/TCYIX
Semi-Annual Report
This semi-annual shareholder report contains important information about the Class R6 Shares of the Nuveen Lifecycle 2025 Fund for the period of June 1, 2024 to November 30, 2024. You can find additional information at https://www.nuveen.com/en‑us/mutual‑funds/prospectuses. You can also request this information by contacting us at (800) 257‑8787.
What were the Fund costs for the last six months? (based on a hypothetical $10,000 investment)
| | | | |
| | |
| | | Cost of a $10,000 investment | | Costs paid as a percentage of
$10,000 investment* |
| | | |
| Class R6 Shares | | $15 | | 0.29% |
* These costs include the expenses of the underlying funds in which the Fund invests except for the expenses of the Nuveen Dividend Growth Fund, Nuveen Dividend Value Fund, Nuveen Growth Opportunities ETF and the Nuveen Real Property Fund LP. Annualized for period less than one year.
Fund Statistics (as of November 30, 2024)
| | | | |
| |
| Fund net assets | | $ | 3,745,940,060 | |
| |
| Total number of portfolio holdings | | | 21 | |
| |
| Portfolio turnover (%) | | | 4% | |
What did the Fund invest in? (as of November 30, 2024)
(1) Affiliated investment companies, except for repurchase agreements.
Availability of additional information about the Fund
You can find additional information about the Fund at https://www.nuveen.com/en‑us/mutual‑funds/prospectuses, including its:
| | • | | prospectus • financial statements and other information • fund holdings • proxy voting information |
You can also request this information at (800) 257‑8787.
| | |
886315639_SAR_1124 4086663-0126 | | |
| | |
| | Semi-Annual Shareholder Report November 30, 2024 |
Nuveen Lifecycle 2025 Fund
Retirement Class Shares/TCLFX
Semi-Annual Report
This semi-annual shareholder report contains important information about the Retirement Class Shares of the Nuveen Lifecycle 2025 Fund for the period of June 1, 2024 to November 30, 2024. You can find additional information at https://www.nuveen.com/en‑us/mutual‑funds/prospectuses. You can also request this information by contacting us at (800) 257‑8787.
What were the Fund costs for the last six months? (based on a hypothetical $10,000 investment)
| | | | |
| | |
| | | Cost of a $10,000 investment | | Costs paid as a percentage of $10,000 investment* |
| | | |
| Retirement Class Shares | | $28 | | 0.54% |
* These costs include the expenses of the underlying funds in which the Fund invests except for the expenses of the Nuveen Dividend Growth Fund, Nuveen Dividend Value Fund, Nuveen Growth Opportunities ETF and the Nuveen Real Property Fund LP. Annualized for period less than one year.
Fund Statistics (as of November 30, 2024)
| | | | |
| |
| Fund net assets | | | $3,745,940,060 | |
| |
| Total number of portfolio holdings | | | 21 | |
| |
| Portfolio turnover (%) | | | 4% | |
What did the Fund invest in? (as of November 30, 2024)
(1) Affiliated investment companies, except for repurchase agreements.
Availability of additional information about the Fund
You can find additional information about the Fund at https://www.nuveen.com/en-us/mutual-funds/prospectuses, including its:
| | • | | prospectus • financial statements and other information • fund holdings • proxy voting information |
You can also request this information at (800) 257-8787.
| | |
87244W425_SAR_1124 4086663-0126 | | |
| | |
| | Semi-Annual Shareholder Report November 30, 2024 |
Nuveen Lifecycle 2030 Fund
Class I Shares/TCHHX
Semi-Annual Report
This semi-annual shareholder report contains important information about the Class I Shares of the Nuveen Lifecycle 2030 Fund for the period of June 1, 2024 to November 30, 2024. You can find additional information at https://www.nuveen.com/en‑us/mutual‑funds/prospectuses. You can also request this information by contacting us at (800) 257‑8787.
What were the Fund costs for the last six months? (based on a hypothetical $10,000 investment)
| | | | |
| | |
| | | Cost of a $10,000 investment | | Costs paid as a percentage of $10,000 investment* |
| | | |
| Class I Shares | | $20 | | 0.39% |
* These costs include the expenses of the underlying funds in which the Fund invests except for the expenses of the Nuveen Dividend Growth Fund, Nuveen Dividend Value Fund, Nuveen Growth Opportunities ETF and the Nuveen Real Property Fund LP. Annualized for period less than one year.
Fund Statistics (as of November 30, 2024)
| | | | |
| |
| Fund net assets | | $ | 4,664,330,896 | |
| |
| Total number of portfolio holdings | | | 21 | |
| |
| Portfolio turnover (%) | | | 4% | |
What did the Fund invest in? (as of November 30, 2024)
(1) Affiliated investment companies, except for repurchase agreements.
Availability of additional information about the Fund
You can find additional information about the Fund at https://www.nuveen.com/en‑us/mutual‑funds/prospectuses, including its:
| | • | | prospectus • financial statements and other information • fund holdings • proxy voting information |
You can also request this information at (800) 257‑8787.
| | |
87245P601_SAR_1124 4086678-0126 | | |
| | |
| | Semi-Annual Shareholder Report November 30, 2024 |
Nuveen Lifecycle 2030 Fund
Premier Class Shares/TCHPX
Semi-Annual Report
This semi-annual shareholder report contains important information about the Premier Class Shares of the Nuveen Lifecycle 2030 Fund for the period of June 1, 2024 to November 30, 2024. You can find additional information at https://www.nuveen.com/en‑us/mutual‑funds/prospectuses. You can also request this information by contacting us at (800) 257‑8787.
What were the Fund costs for the last six months? (based on a hypothetical $10,000 investment)
| | | | |
| | |
| | | Cost of a $10,000 investment | | Costs paid as a percentage of
$10,000 investment* |
| | | |
| Premier Class Shares | | $22 | | 0.43% |
* These costs include the expenses of the underlying funds in which the Fund invests except for the expenses of the Nuveen Dividend Growth Fund, Nuveen Dividend Value Fund, Nuveen Growth Opportunities ETF and the Nuveen Real Property Fund LP. Annualized for period less than one year.
Fund Statistics (as of November 30, 2024)
| | | | |
| |
| Fund net assets | | | $4,664,330,896 | |
| |
| Total number of portfolio holdings | | | 21 | |
| |
| Portfolio turnover (%) | | | 4% | |
What did the Fund invest in? (as of November 30, 2024)
(1) Affiliated investment companies, except for repurchase agreements.
Availability of additional information about the Fund
You can find additional information about the Fund at https://www.nuveen.com/en‑us/mutual‑funds/prospectuses, including its:
| | • | | prospectus • financial statements and other information • fund holdings • proxy voting information |
You can also request this information at (800) 257‑8787.
| | |
87245M384_SAR_1124 4086678-0126 | | |
| | |
| | Semi-Annual Shareholder Report November 30, 2024 |
Nuveen Lifecycle 2030 Fund
Class R6 Shares/TCRIX
Semi-Annual Report
This semi-annual shareholder report contains important information about the Class R6 Shares of the Nuveen Lifecycle 2030 Fund for the period of June 1, 2024 to November 30, 2024. You can find additional information at https://www.nuveen.com/en‑us/mutual‑funds/prospectuses. You can also request this information by contacting us at (800) 257‑8787.
What were the Fund costs for the last six months? (based on a hypothetical $10,000 investment)
| | | | |
| | |
| | | Cost of a $10,000 investment | | Costs paid as a percentage of
$10,000 investment* |
| | | |
| Class R6 Shares | | $14 | | 0.28% |
* These costs include the expenses of the underlying funds in which the Fund invests except for the expenses of the Nuveen Dividend Growth Fund, Nuveen Dividend Value Fund, Nuveen Growth Opportunities ETF and the Nuveen Real Property Fund LP. Annualized for period less than one year.
Fund Statistics (as of November 30, 2024)
| | | | |
| |
| Fund net assets | | | $4,664,330,896 | |
| |
| Total number of portfolio holdings | | | 21 | |
| |
| Portfolio turnover (%) | | | 4% | |
What did the Fund invest in? (as of November 30, 2024)
(1) Affiliated investment companies, except for repurchase agreements.
Availability of additional information about the Fund
You can find additional information about the Fund at https://www.nuveen.com/en‑us/mutual‑funds/prospectuses, including its:
| | • | | prospectus • financial statements and other information • fund holdings • proxy voting information |
You can also request this information at (800) 257‑8787.
| | |
886315621_SAR_1124 4086678-0126 | | |
| | |
| | Semi-Annual Shareholder Report November 30, 2024 |
Nuveen Lifecycle 2030 Fund
Retirement Class Shares/TCLNX
Semi-Annual Report
This semi-annual shareholder report contains important information about the Retirement Class Shares of the Nuveen Lifecycle 2030 Fund for the period of June 1, 2024 to November 30, 2024. You can find additional information at https://www.nuveen.com/en‑us/mutual‑funds/prospectuses. You can also request this information by contacting us at (800) 257‑8787.
What were the Fund costs for the last six months? (based on a hypothetical $10,000 investment)
| | | | |
| | |
| | | Cost of a $10,000 investment | | Costs paid as a percentage of
$10,000 investment* |
| | | |
| Retirement Class Shares | | $27 | | 0.53% |
* These costs include the expenses of the underlying funds in which the Fund invests except for the expenses of the Nuveen Dividend Growth Fund, Nuveen Dividend Value Fund, Nuveen Growth Opportunities ETF and the Nuveen Real Property Fund LP. Annualized for period less than one year.
Fund Statistics (as of November 30, 2024)
| | | | |
| |
| Fund net assets | | | $4,664,330,896 | |
| |
| Total number of portfolio holdings | | | 21 | |
| |
| Portfolio turnover (%) | | | 4% | |
What did the Fund invest in? (as of November 30, 2024)
(1) Affiliated investment companies, except for repurchase agreements.
Availability of additional information about the Fund
You can find additional information about the Fund at https://www.nuveen.com/en‑us/mutual‑funds/prospectuses, including its:
| | • | | prospectus • financial statements and other information • fund holdings • proxy voting information |
You can also request this information at (800) 257‑8787.
| | |
87244W417_SAR_1124 4086678-0126 | | |
| | |
| | Semi-Annual Shareholder Report November 30, 2024 |
Nuveen Lifecycle 2035 Fund
Class I Shares/TCYHX
Semi-Annual Report
This semi-annual shareholder report contains important information about the Class I Shares of the Nuveen Lifecycle 2035 Fund for the period of June 1, 2024 to November 30, 2024. You can find additional information at https://www.nuveen.com/en‑us/mutual‑funds/prospectuses. You can also request this information by contacting us at (800) 257‑8787.
What were the Fund costs for the last six months? (based on a hypothetical $10,000 investment)
| | | | |
| | |
| | | Cost of a $10,000 investment | | Costs paid as a percentage of
$10,000 investment* |
| | | |
| Class I Shares | | $20 | | 0.38% |
* These costs include the expenses of the underlying funds in which the Fund invests except for the expenses of the Nuveen Dividend Growth Fund, Nuveen Dividend Value Fund, Nuveen Growth Opportunities ETF and the Nuveen Real Property Fund LP. Annualized for period less than one year.
Fund Statistics (as of November 30, 2024)
| | | | |
| |
| Fund net assets | | $ | 5,088,706,869 | |
| |
| Total number of portfolio holdings | | | 21 | |
| |
| Portfolio turnover (%) | | | 5% | |
What did the Fund invest in? (as of November 30, 2024)
(1) Affiliated investment companies, except for repurchase agreements.
Availability of additional information about the Fund
You can find additional information about the Fund at https://www.nuveen.com/en‑us/mutual‑funds/prospectuses, including its:
| | • | | prospectus • financial statements and other information • fund holdings • proxy voting information |
You can also request this information at (800) 257‑8787.
| | |
87245P700_SAR_1124 4086691-0126 | | |
| | |
| | Semi-Annual Shareholder Report November 30, 2024 |
Nuveen Lifecycle 2035 Fund
Premier Class Shares/TCYPX
Semi-Annual Report
This semi-annual shareholder report contains important information about the Premier Class Shares of the Nuveen Lifecycle 2035 Fund for the period of June 1, 2024 to November 30, 2024. You can find additional information at https://www.nuveen.com/en‑us/mutual‑funds/prospectuses. You can also request this information by contacting us at (800) 257‑8787.
What were the Fund costs for the last six months? (based on a hypothetical $10,000 investment)
| | | | |
| | |
| | | Cost of a $10,000 investment | | Costs paid as a percentage of
$10,000 investment* |
| | | |
| Premier Class Shares | | $22 | | 0.42% |
* These costs include the expenses of the underlying funds in which the Fund invests except for the expenses of the Nuveen Dividend Growth Fund, Nuveen Dividend Value Fund, Nuveen Growth Opportunities ETF and the Nuveen Real Property Fund LP. Annualized for period less than one year.
Fund Statistics (as of November 30, 2024)
| | | | |
| |
| Fund net assets | | $ | 5,088,706,869 | |
| |
| Total number of portfolio holdings | | | 21 | |
| |
| Portfolio turnover (%) | | | 5% | |
What did the Fund invest in? (as of November 30, 2024)
(1) Affiliated investment companies, except for repurchase agreements.
Availability of additional information about the Fund
You can find additional information about the Fund at https://www.nuveen.com/en‑us/mutual‑funds/prospectuses, including its:
| | • | | prospectus • financial statements and other information • fund holdings • proxy voting information |
You can also request this information at (800) 257‑8787.
| | |
87245M376_SAR_1124 4086691-0126 | | |
| | |
| | Semi-Annual Shareholder Report November 30, 2024 |
Nuveen Lifecycle 2035 Fund
Class R6 Shares/TCIIX
Semi-Annual Report
This semi-annual shareholder report contains important information about the Class R6 Shares of the Nuveen Lifecycle 2035 Fund for the period of June 1, 2024 to November 30, 2024. You can find additional information at https://www.nuveen.com/en‑us/mutual‑funds/prospectuses. You can also request this information by contacting us at (800) 257‑8787.
What were the Fund costs for the last six months? (based on a hypothetical $10,000 investment)
| | | | |
| | |
| | | Cost of a $10,000 investment | | Costs paid as a percentage of $10,000 investment* |
| | | |
| Class R6 Shares | | $14 | | 0.27% |
* These costs include the expenses of the underlying funds in which the Fund invests except for the expenses of the Nuveen Dividend Growth Fund, Nuveen Dividend Value Fund, Nuveen Growth Opportunities ETF and the Nuveen Real Property Fund LP. Annualized for period less than one year.
Fund Statistics (as of November 30, 2024)
| | | | |
| |
| Fund net assets | | $ | 5,088,706,869 | |
| |
| Total number of portfolio holdings | | | 21 | |
| |
| Portfolio turnover (%) | | | 5% | |
What did the Fund invest in? (as of November 30, 2024)
(1) Affiliated investment companies, except for repurchase agreements.
Availability of additional information about the Fund
You can find additional information about the Fund at https://www.nuveen.com/en‑us/mutual‑funds/prospectuses, including its:
| | • | | prospectus • financial statements and other information • fund holdings • proxy voting information |
You can also request this information at (800) 257‑8787.
| | |
886315613_SAR_1124 4086691-0126 | | |
| | |
| | Semi-Annual Shareholder Report November 30, 2024 |
Nuveen Lifecycle 2035 Fund
Retirement Class Shares/TCLRX
Semi-Annual Report
This semi-annual shareholder report contains important information about the Retirement Class Shares of the Nuveen Lifecycle 2035 Fund for the period of June 1, 2024 to November 30, 2024. You can find additional information at https://www.nuveen.com/en‑us/mutual‑funds/prospectuses. You can also request this information by contacting us at (800) 257‑8787.
What were the Fund costs for the last six months? (based on a hypothetical $10,000 investment)
| | | | |
| | |
| | | Cost of a $10,000 investment | | Costs paid as a percentage of $10,000 investment* |
| | | |
| Retirement Class Shares | | $27 | | 0.52% |
* These costs include the expenses of the underlying funds in which the Fund invests except for the expenses of the Nuveen Dividend Growth Fund, Nuveen Dividend Value Fund, Nuveen Growth Opportunities ETF and the Nuveen Real Property Fund LP. Annualized for period less than one year.
Fund Statistics (as of November 30, 2024)
| | | | |
| |
| Fund net assets | | $ | 5,088,706,869 | |
| |
| Total number of portfolio holdings | | | 21 | |
| |
| Portfolio turnover (%) | | | 5% | |
What did the Fund invest in? (as of November 30, 2024)
(1) Affiliated investment companies, except for repurchase agreements.
Availability of additional information about the Fund
You can find additional information about the Fund at https://www.nuveen.com/en‑us/mutual‑funds/prospectuses, including its:
| | • | | prospectus • financial statements and other information • fund holdings • proxy voting information |
You can also request this information at (800) 257‑8787.
| | |
87244W391_SAR_1124 4086691-0126 | | |
| | |
| | Semi-Annual Shareholder Report November 30, 2024 |
Nuveen Lifecycle 2040 Fund
Class I Shares/TCZHX
Semi-Annual Report
This semi-annual shareholder report contains important information about the Class I Shares of the Nuveen Lifecycle 2040 Fund for the period of June 1, 2024 to November 30, 2024. You can find additional information at https://www.nuveen.com/en‑us/mutual‑funds/prospectuses. You can also request this information by contacting us at (800) 257‑8787.
What were the Fund costs for the last six months? (based on a hypothetical $10,000 investment)
| | | | |
| | |
| | | Cost of a $10,000 investment | | Costs paid as a percentage of
$10,000 investment* |
| | | |
| Class I Shares | | $19 | | 0.37% |
* These costs include the expenses of the underlying funds in which the Fund invests except for the expenses of the Nuveen Dividend Growth Fund, Nuveen Dividend Value Fund, Nuveen Growth Opportunities ETF and the Nuveen Real Property Fund LP. Annualized for period less than one year.
Fund Statistics (as of November 30, 2024)
| | | | |
| |
| Fund net assets | | | $6,209,776,488 | |
| |
| Total number of portfolio holdings | | | 19 | |
| |
| Portfolio turnover (%) | | | 5% | |
What did the Fund invest in? (as of November 30, 2024)
(1) Affiliated investment companies, except for repurchase agreements.
Availability of additional information about the Fund
You can find additional information about the Fund at https://www.nuveen.com/en‑us/mutual‑funds/prospectuses, including its:
| | • | | prospectus • financial statements and other information • fund holdings • proxy voting information |
You can also request this information at (800) 257‑8787.
| | |
87245P809_SAR_1124 4086699-0126 | | |
| | |
| | Semi-Annual Shareholder Report November 30, 2024 |
Nuveen Lifecycle 2040 Fund
Premier Class Shares/TCZPX
Semi-Annual Report
This semi-annual shareholder report contains important information about the Premier Class Shares of the Nuveen Lifecycle 2040 Fund for the period of June 1, 2024 to November 30, 2024. You can find additional information at https://www.nuveen.com/en‑us/mutual‑funds/prospectuses. You can also request this information by contacting us at (800) 257‑8787.
What were the Fund costs for the last six months? (based on a hypothetical $10,000 investment)
| | | | |
| | |
| | | Cost of a $10,000 investment | | Costs paid as a percentage of
$10,000 investment* |
| | | |
| Premier Class Shares | | $21 | | 0.41% |
* These costs include the expenses of the underlying funds in which the Fund invests except for the expenses of the Nuveen Dividend Growth Fund, Nuveen Dividend Value Fund, Nuveen Growth Opportunities ETF and the Nuveen Real Property Fund LP. Annualized for period less than one year.
Fund Statistics (as of November 30, 2024)
| | | | |
| |
| Fund net assets | | | $6,209,776,488 | |
| |
| Total number of portfolio holdings | | | 19 | |
| |
| Portfolio turnover (%) | | | 5% | |
What did the Fund invest in? (as of November 30, 2024)
(1) Affiliated investment companies, except for repurchase agreements.
Availability of additional information about the Fund
You can find additional information about the Fund at https://www.nuveen.com/en‑us/mutual‑funds/prospectuses, including its:
| | • | | prospectus • financial statements and other information • fund holdings • proxy voting information |
You can also request this information at (800) 257‑8787.
| | |
87245M368_SAR_1124 4086699-0126 | | |
| | |
| | Semi-Annual Shareholder Report November 30, 2024 |
Nuveen Lifecycle 2040 Fund
Class R6 Shares/TCOIX
Semi-Annual Report
This semi-annual shareholder report contains important information about the Class R6 Shares of the Nuveen Lifecycle 2040 Fund for the period of June 1, 2024 to November 30, 2024. You can find additional information at https://www.nuveen.com/en‑us/mutual‑funds/prospectuses. You can also request this information by contacting us at (800) 257‑8787.
What were the Fund costs for the last six months? (based on a hypothetical $10,000 investment)
| | | | |
| | |
| | | Cost of a $10,000 investment | | Costs paid as a percentage of
$10,000 investment* |
| | | |
| Class R6 Shares | | $14 | | 0.26% |
* These costs include the expenses of the underlying funds in which the Fund invests except for the expenses of the Nuveen Dividend Growth Fund, Nuveen Dividend Value Fund, Nuveen Growth Opportunities ETF and the Nuveen Real Property Fund LP. Annualized for period less than one year.
Fund Statistics (as of November 30, 2024)
| | | | |
| |
| Fund net assets | | | $6,209,776,488 | |
| |
| Total number of portfolio holdings | | | 19 | |
| |
| Portfolio turnover (%) | | | 5% | |
What did the Fund invest in? (as of November 30, 2024)
(1) Affiliated investment companies, except for repurchase agreements.
Availability of additional information about the Fund
You can find additional information about the Fund at https://www.nuveen.com/en‑us/mutual‑funds/prospectuses, including its:
| | • | | prospectus • financial statements and other information • fund holdings • proxy voting information |
You can also request this information at (800) 257‑8787.
| | |
886315597_SAR_1124 4086699-0126 | | |
| | |
| | Semi-Annual Shareholder Report November 30, 2024 |
Nuveen Lifecycle 2040 Fund
Retirement Class Shares/TCLOX
Semi-Annual Report
This semi-annual shareholder report contains important information about the Retirement Class Shares of the Nuveen Lifecycle 2040 Fund for the period of June 1, 2024 to November 30, 2024. You can find additional information at https://www.nuveen.com/en‑us/mutual‑funds/prospectuses. You can also request this information by contacting us at (800) 257‑8787.
What were the Fund costs for the last six months? (based on a hypothetical $10,000 investment)
| | | | |
| | |
| | | Cost of a $10,000 investment | | Costs paid as a percentage of $10,000 investment* |
| | | |
| Retirement Class Shares | | $27 | | 0.51% |
* These costs include the expenses of the underlying funds in which the Fund invests except for the expenses of the Nuveen Dividend Growth Fund, Nuveen Dividend Value Fund, Nuveen Growth Opportunities ETF and the Nuveen Real Property Fund LP. Annualized for period less than one year.
Fund Statistics (as of November 30, 2024)
| | | | |
| |
| Fund net assets | | $ | 6,209,776,488 | |
| |
| Total number of portfolio holdings | | | 19 | |
| |
| Portfolio turnover (%) | | | 5% | |
What did the Fund invest in? (as of November 30, 2024)
(1) Affiliated investment companies, except for repurchase agreements.
Availability of additional information about the Fund
You can find additional information about the Fund at https://www.nuveen.com/en‑us/mutual‑funds/prospectuses, including its:
| | • | | prospectus • financial statements and other information • fund holdings • proxy voting information |
You can also request this information at (800) 257‑8787.
| | |
87244W383_SAR_1124 4086699-0126 | | |
| | |
| | Semi-Annual Shareholder Report November 30, 2024 |
Nuveen Lifecycle 2045 Fund
Class I Shares/TTFHX
Semi-Annual Report
This semi-annual shareholder report contains important information about the Class I Shares of the Nuveen Lifecycle 2045 Fund for the period of June 1, 2024 to November 30, 2024. You can find additional information at https://www.nuveen.com/en‑us/mutual‑funds/prospectuses. You can also request this information by contacting us at (800) 257‑8787.
What were the Fund costs for the last six months? (based on a hypothetical $10,000 investment)
| | | | |
| | |
| | | Cost of a $10,000 investment | | Costs paid as a percentage of
$10,000 investment* |
| | | |
| Class I Shares | | $19 | | 0.36% |
* These costs include the expenses of the underlying funds in which the Fund invests except for the expenses of the Nuveen Dividend Growth Fund, Nuveen Dividend Value Fund, Nuveen Growth Opportunities ETF and the Nuveen Real Property Fund LP. Annualized for period less than one year.
Fund Statistics (as of November 30, 2024)
| | | | |
| |
| Fund net assets | | | $4,507,849,213 | |
| |
| Total number of portfolio holdings | | | 19 | |
| |
| Portfolio turnover (%) | | | 5% | |
What did the Fund invest in? (as of November 30, 2024)
(1) Affiliated investment companies, except for repurchase agreements.
Availability of additional information about the Fund
You can find additional information about the Fund at https://www.nuveen.com/en‑us/mutual‑funds/prospectuses, including its:
| | • | | prospectus • financial statements and other information • fund holdings • proxy voting information |
You can also request this information at (800) 257‑8787.
| | |
87245P882_SAR_1124 4086709-0126 | | |
| | |
| | Semi-Annual Shareholder Report November 30, 2024 |
Nuveen Lifecycle 2045 Fund
Premier Class Shares/TTFPX
Semi-Annual Report
This semi-annual shareholder report contains important information about the Premier Class Shares of the Nuveen Lifecycle 2045 Fund for the period of June 1, 2024 to November 30, 2024. You can find additional information at https://www.nuveen.com/en‑us/mutual‑funds/prospectuses. You can also request this information by contacting us at (800) 257‑8787.
What were the Fund costs for the last six months? (based on a hypothetical $10,000 investment)
| | | | |
| | |
| | | Cost of a $10,000 investment | | Costs paid as a percentage of
$10,000 investment* |
| | | |
| Premier Class Shares | | $21 | | 0.41% |
|
| * These costs include the expenses of the underlying funds in which the Fund invests except for the expenses of the Nuveen Dividend Growth Fund, Nuveen Dividend Value Fund, Nuveen Growth Opportunities ETF and the Nuveen Real Property Fund LP. Annualized for period less than one year. |
Fund Statistics (as of November 30, 2024)
| | | | |
| |
| Fund net assets | | $ | 4,507,849,213 | |
| |
| Total number of portfolio holdings | | | 19 | |
| |
| Portfolio turnover (%) | | | 5% | |
What did the Fund invest in? (as of November 30, 2024)
(1) Affiliated investment companies, except for repurchase agreements.
Availability of additional information about the Fund
You can find additional information about the Fund at https://www.nuveen.com/en‑us/mutual‑funds/prospectuses, including its:
| | • | | prospectus • financial statements and other information • fund holdings • proxy voting information |
You can also request this information at (800) 257‑8787.
| | |
87245M350_SAR_1124 4086709-0126 | | |
| | |
| | Semi-Annual Shareholder Report November 30, 2024 |
Nuveen Lifecycle 2045 Fund
Class R6 Shares/TTFIX
Semi-Annual Report
This semi-annual shareholder report contains important information about the Class R6 Shares of the Nuveen Lifecycle 2045 Fund for the period of June 1, 2024 to November 30, 2024. You can find additional information at https://www.nuveen.com/en‑us/mutual‑funds/prospectuses. You can also request this information by contacting us at (800) 257‑8787.
What were the Fund costs for the last six months? (based on a hypothetical $10,000 investment)
| | | | |
| | |
| | | Cost of a $10,000 investment | | Costs paid as a percentage of
$10,000 investment* |
| | | |
| Class R6 Shares | | $14 | | 0.26% |
|
* These costs include the expenses of the underlying funds in which the Fund invests except for the expenses of the Nuveen Dividend Growth Fund, Nuveen Dividend Value Fund, Nuveen Growth Opportunities ETF and the Nuveen Real Property Fund LP. Annualized for period less than one year. |
Fund Statistics (as of November 30, 2024)
| | | | |
| |
| Fund net assets | | | $4,507,849,213 | |
| |
| Total number of portfolio holdings | | | 19 | |
| |
| Portfolio turnover (%) | | | 5% | |
What did the Fund invest in? (as of November 30, 2024)
(1) Affiliated investment companies, except for repurchase agreements.
Availability of additional information about the Fund
You can find additional information about the Fund at https://www.nuveen.com/en‑us/mutual‑funds/prospectuses, including its:
| | • | | prospectus • financial statements and other information • fund holdings • proxy voting information |
You can also request this information at (800) 257‑8787.
| | |
886315589_SAR_1124 4086709-0126 | | |
| | |
| | Semi-Annual Shareholder Report November 30, 2024 |
Nuveen Lifecycle 2045 Fund
Retirement Class Shares/TTFRX
Semi-Annual Report
This semi-annual shareholder report contains important information about the Retirement Class Shares of the Nuveen Lifecycle 2045 Fund for the period of June 1, 2024 to November 30, 2024. You can find additional information at https://www.nuveen.com/en‑us/mutual‑funds/prospectuses. You can also request this information by contacting us at (800) 257‑8787.
What were the Fund costs for the last six months? (based on a hypothetical $10,000 investment)
| | | | |
| | |
| | | Cost of a $10,000 investment | | Costs paid as a percentage of $10,000 investment* |
| | | |
| Retirement Class Shares | | $27 | | 0.51% |
* These costs include the expenses of the underlying funds in which the Fund invests except for the expenses of the Nuveen Dividend Growth Fund, Nuveen Dividend Value Fund, Nuveen Growth Opportunities ETF and the Nuveen Real Property Fund LP. Annualized for period less than one year.
Fund Statistics (as of November 30, 2024)
| | | | |
| |
| Fund net assets | | | $ 4,507,849,213 | |
| |
| Total number of portfolio holdings | | | 19 | |
| |
| Portfolio turnover (%) | | | 5% | |
What did the Fund invest in? (as of November 30, 2024)
(1) Affiliated investment companies, except for repurchase agreements.
Availability of additional information about the Fund
You can find additional information about the Fund at https://www.nuveen.com/en‑us/mutual‑funds/prospectuses, including its:
| | • | | prospectus • financial statements and other information • fund holdings • proxy voting information |
You can also request this information at (800) 257‑8787.
| | |
886315522_SAR_1124 4086709-0126 | | |
| | |
| | Semi-Annual Shareholder Report November 30, 2024 |
Nuveen Lifecycle 2050 Fund
Class I Shares/TFTHX
Semi-Annual Report
This semi-annual shareholder report contains important information about the Class I Shares of the Nuveen Lifecycle 2050 Fund for the period of June 1, 2024 to November 30, 2024. You can find additional information at https://www.nuveen.com/en‑us/mutual‑funds/prospectuses. You can also request this information by contacting us at (800) 257‑8787.
What were the Fund costs for the last six months? (based on a hypothetical $10,000 investment)
| | | | |
| | |
| | | Cost of a $10,000 investment | | Costs paid as a percentage of
$10,000 investment* |
| | | |
| Class I Shares | | $18 | | 0.35% |
* These costs include the expenses of the underlying funds in which the Fund invests except for the expenses of the Nuveen Dividend Growth Fund, Nuveen Dividend Value Fund, Nuveen Growth Opportunities ETF and the Nuveen Real Property Fund LP. Annualized for period less than one year.
Fund Statistics (as of November 30, 2024)
| | | | |
| |
| Fund net assets | | $ | 3,606,022,377 | |
| |
| Total number of portfolio holdings | | | 19 | |
| |
| Portfolio turnover (%) | | | 6% | |
What did the Fund invest in? (as of November 30, 2024)
(1) Affiliated investment companies, except for repurchase agreements.
Availability of additional information about the Fund
You can find additional information about the Fund at https://www.nuveen.com/en‑us/mutual‑funds/prospectuses, including its:
| | • | | prospectus • financial statements and other information • fund holdings • proxy voting information |
You can also request this information at (800) 257‑8787.
| | |
87245P874_SAR_1124 4086720-0126 | | |
| | |
| | Semi-Annual Shareholder Report November 30, 2024 |
Nuveen Lifecycle 2050 Fund
Premier Class Shares/TCLPX
Semi-Annual Report
This semi-annual shareholder report contains important information about the Premier Class Shares of the Nuveen Lifecycle 2050 Fund for the period of June 1, 2024 to November 30, 2024. You can find additional information at https://www.nuveen.com/en‑us/mutual‑funds/prospectuses. You can also request this information by contacting us at (800) 257‑8787.
What were the Fund costs for the last six months? (based on a hypothetical $10,000 investment)
| | | | |
| | |
| | | Cost of a $10,000 investment | | Costs paid as a percentage of
$10,000 investment* |
| | | |
| Premier Class Shares | | $21 | | 0.40% |
* These costs include the expenses of the underlying funds in which the Fund invests except for the expenses of the Nuveen Dividend Growth Fund, Nuveen Dividend Value Fund, Nuveen Growth Opportunities ETF and the Nuveen Real Property Fund LP. Annualized for period less than one year.
Fund Statistics (as of November 30, 2024)
| | | | |
| |
| Fund net assets | | | $3,606,022,377 | |
| |
| Total number of portfolio holdings | | | 19 | |
| |
| Portfolio turnover (%) | | | 6% | |
What did the Fund invest in? (as of November 30, 2024)
(1) Affiliated investment companies, except for repurchase agreements.
Availability of additional information about the Fund
You can find additional information about the Fund at https://www.nuveen.com/en‑us/mutual‑funds/prospectuses, including its:
| | • | | prospectus • financial statements and other information • fund holdings • proxy voting information |
You can also request this information at (800) 257‑8787.
| | |
87245M343_SAR_1124 4086720-0126 | | |
| | |
| | Semi-Annual Shareholder Report November 30, 2024 |
Nuveen Lifecycle 2050 Fund
Class R6 Shares/TFTIX
Semi-Annual Report
This semi-annual shareholder report contains important information about the Class R6 Shares of the Nuveen Lifecycle 2050 Fund for the period of June 1, 2024 to November 30, 2024. You can find additional information at https://www.nuveen.com/en‑us/mutual‑funds/prospectuses. You can also request this information by contacting us at (800) 257‑8787.
What were the Fund costs for the last six months? (based on a hypothetical $10,000 investment)
| | | | |
| | |
| | | Cost of a $10,000 investment | | Costs paid as a percentage of
$10,000 investment* |
| | | |
| Class R6 Shares | | $13 | | 0.25% |
* These costs include the expenses of the underlying funds in which the Fund invests except for the expenses of the Nuveen Dividend Growth Fund, Nuveen Dividend Value Fund, Nuveen Growth Opportunities ETF and the Nuveen Real Property Fund LP. Annualized for period less than one year.
Fund Statistics (as of November 30, 2024)
| | | | |
| |
| Fund net assets | | | $3,606,022,377 | |
| |
| Total number of portfolio holdings | | | 19 | |
| |
| Portfolio turnover (%) | | | 6% | |
What did the Fund invest in? (as of November 30, 2024)
(1) Affiliated investment companies, except for repurchase agreements.
Availability of additional information about the Fund
You can find additional information about the Fund at https://www.nuveen.com/en‑us/mutual‑funds/prospectuses, including its:
| | • | | prospectus • financial statements and other information • fund holdings • proxy voting information |
You can also request this information at (800) 257‑8787.
| | |
886315571_SAR_1124 4086720-0126 | | |
| | |
| | Semi-Annual Shareholder Report November 30, 2024 |
Nuveen Lifecycle 2050 Fund
Retirement Class Shares/TLFRX
Semi-Annual Report
This semi-annual shareholder report contains important information about the Retirement Class Shares of the Nuveen Lifecycle 2050 Fund for the period of June 1, 2024 to November 30, 2024. You can find additional information at https://www.nuveen.com/en‑us/mutual‑funds/prospectuses. You can also request this information by contacting us at (800) 257‑8787.
What were the Fund costs for the last six months? (based on a hypothetical $10,000 investment)
| | | | |
| | |
| | | Cost of a $10,000 investment | | Costs paid as a percentage of
$10,000 investment* |
| | | |
| Retirement Class Shares | | $26 | | 0.50% |
* These costs include the expenses of the underlying funds in which the Fund invests except for the expenses of the Nuveen Dividend Growth Fund, Nuveen Dividend Value Fund, Nuveen Growth Opportunities ETF and the Nuveen Real Property Fund LP. Annualized for period less than one year.
Fund Statistics (as of November 30, 2024)
| | | | |
| |
| Fund net assets | | | $3,606,022,377 | |
| |
| Total number of portfolio holdings | | | 19 | |
| |
| Portfolio turnover (%) | | | 6% | |
What did the Fund invest in? (as of November 30, 2024)
(1) Affiliated investment companies, except for repurchase agreements.
Availability of additional information about the Fund
You can find additional information about the Fund at https://www.nuveen.com/en‑us/mutual‑funds/prospectuses, including its:
| | • | | prospectus • financial statements and other information • fund holdings • proxy voting information |
You can also request this information at (800) 257‑8787.
| | |
886315514_SAR_1124 4086720-0126 | | |
| | |
| | Semi-Annual Shareholder Report November 30, 2024 |
Nuveen Lifecycle 2055 Fund
Class I Shares/TTRHX
Semi-Annual Report
This semi-annual shareholder report contains important information about the Class I Shares of the Nuveen Lifecycle 2055 Fund for the period of June 1, 2024 to November 30, 2024. You can find additional information at https://www.nuveen.com/en‑us/mutual‑funds/prospectuses. You can also request this information by contacting us at (800) 257‑8787.
What were the Fund costs for the last six months? (based on a hypothetical $10,000 investment)
| | | | |
| | |
| | | Cost of a $10,000 investment | | Costs paid as a percentage of $10,000 investment* |
| | | |
| Class I Shares | | $18 | | 0.35% |
* These costs include the expenses of the underlying funds in which the Fund invests except for the expenses of the Nuveen Dividend Growth Fund, Nuveen Dividend Value Fund, Nuveen Growth Opportunities ETF and the Nuveen Real Property Fund LP. Annualized for period less than one year.
Fund Statistics (as of November 30, 2024)
| | | | |
| |
| Fund net assets | | $ | 1,872,520,143 | |
| |
| Total number of portfolio holdings | | | 19 | |
| |
| Portfolio turnover (%) | | | 8% | |
What did the Fund invest in? (as of November 30, 2024)
(1) Affiliated investment companies, except for repurchase agreements.
Availability of additional information about the Fund
You can find additional information about the Fund at https://www.nuveen.com/en‑us/mutual‑funds/prospectuses, including its:
| | • | | prospectus • financial statements and other information • fund holdings • proxy voting information |
You can also request this information at (800) 257‑8787.
| | |
87245P866_SAR_1124 4086726-0126 | | |
| | |
| | Semi-Annual Shareholder Report November 30, 2024 |
Nuveen Lifecycle 2055 Fund
Premier Class Shares/TTRPX
Semi-Annual Report
This semi-annual shareholder report contains important information about the Premier Class Shares of the Nuveen Lifecycle 2055 Fund for the period of June 1, 2024 to November 30, 2024. You can find additional information at https://www.nuveen.com/en‑us/mutual‑funds/prospectuses. You can also request this information by contacting us at (800) 257‑8787.
What were the Fund costs for the last six months? (based on a hypothetical $10,000 investment)
| | | | |
| | |
| | | Cost of a $10,000 investment | | Costs paid as a percentage of
$10,000 investment* |
| | | |
| Premier Class Shares | | $21 | | 0.40% |
* These costs include the expenses of the underlying funds in which the Fund invests except for the expenses of the Nuveen Dividend Growth Fund, Nuveen Dividend Value Fund, Nuveen Growth Opportunities ETF and the Nuveen Real Property Fund LP. Annualized for period less than one year.
Fund Statistics (as of November 30, 2024)
| | | | |
| |
| Fund net assets | | | $1,872,520,143 | |
| |
| Total number of portfolio holdings | | | 19 | |
| |
| Portfolio turnover (%) | | | 8% | |
What did the Fund invest in? (as of November 30, 2024)
(1) Affiliated investment companies, except for repurchase agreements.
Availability of additional information about the Fund
You can find additional information about the Fund at https://www.nuveen.com/en‑us/mutual‑funds/prospectuses, including its:
| | • | | prospectus • financial statements and other information • fund holdings • proxy voting information |
You can also request this information at (800) 257‑8787.
| | |
87245M186_SAR_1124 4086726-0126 | | |
| | |
| | Semi-Annual Shareholder Report November 30, 2024 |
Nuveen Lifecycle 2055 Fund
Class R6 Shares/TTRIX
Semi-Annual Report
This semi-annual shareholder report contains important information about the Class R6 Shares of the Nuveen Lifecycle 2055 Fund for the period of June 1, 2024 to November 30, 2024. You can find additional information at https://www.nuveen.com/en‑us/mutual‑funds/prospectuses. You can also request this information by contacting us at (800) 257‑8787.
What were the Fund costs for the last six months? (based on a hypothetical $10,000 investment)
| | | | |
| | |
| | | Cost of a $10,000 investment | | Costs paid as a percentage of $10,000 investment* |
| | | |
| Class R6 Shares | | $13 | | 0.25% |
* These costs include the expenses of the underlying funds in which the Fund invests except for the expenses of the Nuveen Dividend Growth Fund, Nuveen Dividend Value Fund, Nuveen Growth Opportunities ETF and the Nuveen Real Property Fund LP. Annualized for period less than one year.
Fund Statistics (as of November 30, 2024)
| | | | |
| |
| Fund net assets | | $ | 1,872,520,143 | |
| |
| Total number of portfolio holdings | | | 19 | |
| |
| Portfolio turnover (%) | | | 8% | |
What did the Fund invest in? (as of November 30, 2024)
(1) Affiliated investment companies, except for repurchase agreements.
Availability of additional information about the Fund
You can find additional information about the Fund at https://www.nuveen.com/en‑us/mutual‑funds/prospectuses, including its:
| | • | | prospectus • financial statements and other information • fund holdings • proxy voting information |
You can also request this information at (800) 257‑8787.
| | |
87245M210_SAR_1124 4086726-0126 | | |
| | |
| | Semi-Annual Shareholder Report November 30, 2024 |
Nuveen Lifecycle 2055 Fund
Retirement Class Shares/TTRLX
Semi-Annual Report
This semi-annual shareholder report contains important information about the Retirement Class Shares of the Nuveen Lifecycle 2055 Fund for the period of June 1, 2024 to November 30, 2024. You can find additional information at https://www.nuveen.com/en‑us/mutual‑funds/prospectuses. You can also request this information by contacting us at (800) 257‑8787.
What were the Fund costs for the last six months? (based on a hypothetical $10,000 investment)
| | | | |
| | |
| | | Cost of a $10,000 investment | | Costs paid as a percentage of
$10,000 investment* |
| | | |
| Retirement Class Shares | | $26 | | 0.50% |
* These costs include the expenses of the underlying funds in which the Fund invests except for the expenses of the Nuveen Dividend Growth Fund, Nuveen Dividend Value Fund, Nuveen Growth Opportunities ETF and the Nuveen Real Property Fund LP. Annualized for period less than one year.
Fund Statistics (as of November 30, 2024)
| | | | |
| |
| Fund net assets | | | $1,872,520,143 | |
| |
| Total number of portfolio holdings | | | 19 | |
| |
| Portfolio turnover (%) | | | 8% | |
What did the Fund invest in? (as of November 30, 2024)
(1) Affiliated investment companies, except for repurchase agreements.
Availability of additional information about the Fund
You can find additional information about the Fund at https://www.nuveen.com/en‑us/mutual‑funds/prospectuses, including its:
| | • | | prospectus • financial statements and other information • fund holdings • proxy voting information |
You can also request this information at (800) 257‑8787.
| | |
87245M194_SAR_1124 4086726-0126 | | |
| | |
| | Semi-Annual Shareholder Report November 30, 2024 |
Nuveen Lifecycle 2060 Fund
Class I Shares/TLXHX
Semi-Annual Report
This semi-annual shareholder report contains important information about the Class I Shares of the Nuveen Lifecycle 2060 Fund for the period of June 1, 2024 to November 30, 2024. You can find additional information at https://www.nuveen.com/en‑us/mutual‑funds/prospectuses. You can also request this information by contacting us at (800) 257‑8787.
What were the Fund costs for the last six months? (based on a hypothetical $10,000 investment)
| | | | |
| | |
| | | Cost of a $10,000 investment | | Costs paid as a percentage of $10,000 investment* |
| | | |
| Class I Shares | | $18 | | 0.35% |
* These costs include the expenses of the underlying funds in which the Fund invests except for the expenses of the Nuveen Dividend Growth Fund, Nuveen Dividend Value Fund, Nuveen Growth Opportunities ETF and the Nuveen Real Property Fund LP. Annualized for period less than one year.
Fund Statistics (as of November 30, 2024)
| | | | |
| |
| Fund net assets | | $ | 833,607,834 | |
| |
| Total number of portfolio holdings | | | 19 | |
| |
| Portfolio turnover (%) | | | 7% | |
What did the Fund invest in? (as of November 30, 2024)
(1) Affiliated investment companies, except for repurchase agreements.
Availability of additional information about the Fund
You can find additional information about the Fund at https://www.nuveen.com/en‑us/mutual‑funds/prospectuses, including its:
| | • | | prospectus • financial statements and other information • fund holdings • proxy voting information |
You can also request this information at (800) 257‑8787.
| | |
87245P858_SAR_1124 4086743-0126 | | |
| | |
| | Semi-Annual Shareholder Report November 30, 2024 |
Nuveen Lifecycle 2060 Fund
Premier Class Shares/TLXPX
Semi-Annual Report
This semi-annual shareholder report contains important information about the Premier Class Shares of the Nuveen Lifecycle 2060 Fund for the period of June 1, 2024 to November 30, 2024. You can find additional information at https://www.nuveen.com/en‑us/mutual‑funds/prospectuses. You can also request this information by contacting us at (800) 257‑8787.
What were the Fund costs for the last six months? (based on a hypothetical $10,000 investment)
| | | | |
| | |
| | | Cost of a $10,000 investment | | Costs paid as a percentage of
$10,000 investment* |
| | | |
| Premier Class Shares | | $21 | | 0.40% |
* These costs include the expenses of the underlying funds in which the Fund invests except for the expenses of the Nuveen Dividend Growth Fund, Nuveen Dividend Value Fund, Nuveen Growth Opportunities ETF and the Nuveen Real Property Fund LP. Annualized for period less than one year.
Fund Statistics (as of November 30, 2024)
| | | | |
| |
| Fund net assets | | | $833,607,834 | |
| |
| Total number of portfolio holdings | | | 19 | |
| |
| Portfolio turnover (%) | | | 7% | |
What did the Fund invest in? (as of November 30, 2024)
(1) Affiliated investment companies, except for repurchase agreements.
Availability of additional information about the Fund
You can find additional information about the Fund at https://www.nuveen.com/en‑us/mutual‑funds/prospectuses, including its:
| | • | | prospectus • financial statements and other information • fund holdings • proxy voting information |
You can also request this information at (800) 257‑8787.
| | |
87245R524_SAR_1124 4086743-0126 | | |
| | |
| | Semi-Annual Shareholder Report November 30, 2024 |
Nuveen Lifecycle 2060 Fund
Class R6 Shares/TLXNX
Semi-Annual Report
This semi-annual shareholder report contains important information about the Class R6 Shares of the Nuveen Lifecycle 2060 Fund for the period of June 1, 2024 to November 30, 2024. You can find additional information at https://www.nuveen.com/en‑us/mutual‑funds/prospectuses. You can also request this information by contacting us at (800) 257‑8787.
What were the Fund costs for the last six months? (based on a hypothetical $10,000 investment)
| | | | |
| | |
| | | Cost of a $10,000 investment | | Costs paid as a percentage of
$10,000 investment* |
| | | |
| Class R6 Shares | | $13 | | 0.25% |
* These costs include the expenses of the underlying funds in which the Fund invests except for the expenses of the Nuveen Dividend Growth Fund, Nuveen Dividend Value Fund, Nuveen Growth Opportunities ETF and the Nuveen Real Property Fund LP. Annualized for period less than one year.
Fund Statistics (as of November 30, 2024)
| | | | |
| |
| Fund net assets | | | $833,607,834 | |
| |
| Total number of portfolio holdings | | | 19 | |
| |
| Portfolio turnover (%) | | | 7% | |
What did the Fund invest in? (as of November 30, 2024)
(1) Affiliated investment companies, except for repurchase agreements.
Availability of additional information about the Fund
You can find additional information about the Fund at https://www.nuveen.com/en‑us/mutual‑funds/prospectuses, including its:
| | • | | prospectus • financial statements and other information • fund holdings • proxy voting information |
You can also request this information at (800) 257‑8787.
| | |
87245R573_SAR_1124 4086743-0126 | | |
| | |
| | Semi-Annual Shareholder Report November 30, 2024 |
Nuveen Lifecycle 2060 Fund
Retirement Class Shares/TLXRX
Semi-Annual Report
This semi-annual shareholder report contains important information about the Retirement Class Shares of the Nuveen Lifecycle 2060 Fund for the period of June 1, 2024 to November 30, 2024. You can find additional information at https://www.nuveen.com/en‑us/mutual‑funds/prospectuses. You can also request this information by contacting us at (800) 257‑8787.
What were the Fund costs for the last six months? (based on a hypothetical $10,000 investment)
| | | | |
| | |
| | | Cost of a $10,000 investment | | Costs paid as a percentage of
$10,000 investment* |
| | | |
| Retirement Class Shares | | $26 | | 0.50% |
* These costs include the expenses of the underlying funds in which the Fund invests except for the expenses of the Nuveen Dividend Growth Fund, Nuveen Dividend Value Fund, Nuveen Growth Opportunities ETF and the Nuveen Real Property Fund LP. Annualized for period less than one year.
Fund Statistics (as of November 30, 2024)
| | | | |
| |
| Fund net assets | | | $833,607,834 | |
| |
| Total number of portfolio holdings | | | 19 | |
| |
| Portfolio turnover (%) | | | 7% | |
What did the Fund invest in? (as of November 30, 2024)
(1) Affiliated investment companies, except for repurchase agreements.
Availability of additional information about the Fund
You can find additional information about the Fund at https://www.nuveen.com/en‑us/mutual‑funds/prospectuses, including its:
| | • | | prospectus • financial statements and other information • fund holdings • proxy voting information |
You can also request this information at (800) 257‑8787.
| | |
87245R532_SAR_1124 4086743-0126 | | |
| | |
| | Semi-Annual Shareholder Report November 30, 2024 |
Nuveen Lifecycle 2065 Fund
Class I Shares/TSFHX
Semi-Annual Report
This semi-annual shareholder report contains important information about the Class I Shares of the Nuveen Lifecycle 2065 Fund for the period of June 1, 2024 to November 30, 2024. You can find additional information at https://www.nuveen.com/en‑us/mutual‑funds/prospectuses. You can also request this information by contacting us at (800) 257‑8787.
What were the Fund costs for the last six months? (based on a hypothetical $10,000 investment)
| | | | |
| | |
| | | Cost of a $10,000 investment | | Costs paid as a percentage of
$10,000 investment* |
| | | |
| Class I Shares | | $13 | | 0.25% |
* These costs include the expenses of the underlying funds in which the Fund invests except for the expenses of the Nuveen Dividend Growth Fund, Nuveen Dividend Value Fund, Nuveen Growth Opportunities ETF and the Nuveen Real Property Fund LP. Annualized for period less than one year.
Fund Statistics (as of November 30, 2024)
| | | | |
| |
| Fund net assets | | | $117,259,596 | |
| |
| Total number of portfolio holdings | | | 19 | |
| |
| Portfolio turnover (%) | | | 20% | |
What did the Fund invest in? (as of November 30, 2024)
(1) Affiliated investment companies, except for repurchase agreements.
Availability of additional information about the Fund
You can find additional information about the Fund at https://www.nuveen.com/en‑us/mutual‑funds/prospectuses, including its:
| | • | | prospectus • financial statements and other information • fund holdings • proxy voting information |
You can also request this information at (800) 257‑8787.
| | |
87249N776_SAR_1124 4086751-0126 | | |
| | |
| | Semi-Annual Shareholder Report November 30, 2024 |
Nuveen Lifecycle 2065 Fund
Premier Class Shares/TSFPX
Semi-Annual Report
This semi-annual shareholder report contains important information about the Premier Class Shares of the Nuveen Lifecycle 2065 Fund for the period of June 1, 2024 to November 30, 2024. You can find additional information at https://www.nuveen.com/en‑us/mutual‑funds/prospectuses. You can also request this information by contacting us at (800) 257‑8787.
What were the Fund costs for the last six months? (based on a hypothetical $10,000 investment)
| | | | |
| | |
| | | Cost of a $10,000 investment | | Costs paid as a percentage of
$10,000 investment* |
| | | |
| Premier Class Shares | | $20 | | 0.39% |
* These costs include the expenses of the underlying funds in which the Fund invests except for the expenses of the Nuveen Dividend Growth Fund, Nuveen Dividend Value Fund, Nuveen Growth Opportunities ETF and the Nuveen Real Property Fund LP. Annualized for period less than one year.
Fund Statistics (as of November 30, 2024)
| | | | |
| |
| Fund net assets | | $ | 117,259,596 | |
| |
| Total number of portfolio holdings | | | 19 | |
| |
| Portfolio turnover (%) | | | 20% | |
What did the Fund invest in? (as of November 30, 2024)
(1) Affiliated investment companies, except for repurchase agreements.
Availability of additional information about the Fund
You can find additional information about the Fund at https://www.nuveen.com/en‑us/mutual‑funds/prospectuses, including its:
| | • | | prospectus • financial statements and other information • fund holdings • proxy voting information |
You can also request this information at (800) 257‑8787.
| | |
87249N750_SAR_1124 4086751-0126 | | |
| | |
| | Semi-Annual Shareholder Report November 30, 2024 |
Nuveen Lifecycle 2065 Fund
Class R6 Shares/TSFTX
Semi-Annual Report
This semi-annual shareholder report contains important information about the Class R6 Shares of the Nuveen Lifecycle 2065 Fund for the period of June 1, 2024 to November 30, 2024. You can find additional information at https://www.nuveen.com/en‑us/mutual‑funds/prospectuses. You can also request this information by contacting us at (800) 257‑8787.
What were the Fund costs for the last six months? (based on a hypothetical $10,000 investment)
| | | | |
| | |
| | | Cost of a $10,000 investment | | Costs paid as a percentage of
$10,000 investment* |
| | | |
| Class R6 Shares | | $13 | | 0.24% |
* These costs include the expenses of the underlying funds in which the Fund invests except for the expenses of the Nuveen Dividend Growth Fund, Nuveen Dividend Value Fund, Nuveen Growth Opportunities ETF and the Nuveen Real Property Fund LP. Annualized for period less than one year.
Fund Statistics (as of November 30, 2024)
| | | | |
| |
| Fund net assets | | | $117,259,596 | |
| |
| Total number of portfolio holdings | | | 19 | |
| |
| Portfolio turnover (%) | | | 20% | |
What did the Fund invest in? (as of November 30, 2024)
(1) Affiliated investment companies, except for repurchase agreements.
Availability of additional information about the Fund
You can find additional information about the Fund at https://www.nuveen.com/en‑us/mutual‑funds/prospectuses, including its:
| | • | | prospectus • financial statements and other information • fund holdings • proxy voting information |
You can also request this information at (800) 257‑8787.
| | |
87249N768_SAR_1124 4086751-0126 | | |
| | |
| | Semi-Annual Shareholder Report November 30, 2024 |
Nuveen Lifecycle 2065 Fund
Retirement Class Shares/TSFRX
Semi-Annual Report
This semi-annual shareholder report contains important information about the Retirement Class Shares of the Nuveen Lifecycle 2065 Fund for the period of June 1, 2024 to November 30, 2024. You can find additional information at https://www.nuveen.com/en‑us/mutual‑funds/prospectuses. You can also request this information by contacting us at (800) 257‑8787.
What were the Fund costs for the last six months? (based on a hypothetical $10,000 investment)
| | | | |
| | |
| | | Cost of a $10,000 investment | | Costs paid as a percentage of $10,000 investment* |
| | | |
| Retirement Class Shares | | $26 | | 0.49% |
* These costs include the expenses of the underlying funds in which the Fund invests except for the expenses of the Nuveen Dividend Growth Fund, Nuveen Dividend Value Fund, Nuveen Growth Opportunities ETF and the Nuveen Real Property Fund LP. Annualized for period less than one year.
Fund Statistics (as of November 30, 2024)
| | | | |
| |
| Fund net assets | | $ | 117,259,596 | |
| |
| Total number of portfolio holdings | | | 19 | |
| |
| Portfolio turnover (%) | | | 20% | |
What did the Fund invest in? (as of November 30, 2024)
(1) Affiliated investment companies, except for repurchase agreements.
Availability of additional information about the Fund
You can find additional information about the Fund at https://www.nuveen.com/en‑us/mutual‑funds/prospectuses, including its:
| | • | | prospectus • financial statements and other information • fund holdings • proxy voting information |
You can also request this information at (800) 257‑8787.
| | |
87249N743_SAR_1124 4086751-0126 | | |
| | |
| | Semi-Annual Shareholder Report November 30, 2024 |
Nuveen Lifecycle Index Retirement Income Fund
Class I Shares/TLIHX
Semi-Annual Report
This semi-annual shareholder report contains important information about the Class I Shares of the Nuveen Lifecycle Index Retirement Income Fund for the period of June 1, 2024 to November 30, 2024. You can find additional information at
https://www.nuveen.com/en‑us/mutual‑funds/prospectuses. You can also request this information by contacting us at (800) 257‑8787.
What were the Fund costs for the last six months? (based on a hypothetical $10,000 investment)
| | | | |
| | |
| | | Cost of a $10,000 investment | | Costs paid as a percentage of
$10,000 investment* |
| | | |
| Class I Shares | | $11 | | 0.22% |
* Annualized for period less than one year.
Fund Statistics (as of November 30, 2024)
| | | | |
| |
| Fund net assets | | $ | 699,986,141 | |
| |
| Total number of portfolio holdings | | | 7 | |
| |
| Portfolio turnover (%) | | | 8% | |
What did the Fund invest in? (as of November 30, 2024)
(1) Affiliated investment companies, except for repurchase agreements.
Availability of additional information about the Fund
You can find additional information about the Fund at https://www.nuveen.com/en‑us/mutual‑funds/prospectuses, including its:
| | • | | prospectus • financial statements and other information • fund holdings • proxy voting information |
You can also request this information at (800) 257‑8787.
| | |
87245P841_SAR_1124 4086765-0126 | | |
| | |
| | Semi-Annual Shareholder Report November 30, 2024 |
Nuveen Lifecycle Index Retirement Income Fund
Premier Class Shares/TLIPX
Semi-Annual Report
This semi-annual shareholder report contains important information about the Premier Class Shares of the Nuveen Lifecycle Index Retirement Income Fund for the period of June 1, 2024 to November 30, 2024. You can find additional information at https://www.nuveen.com/en‑us/mutual‑funds/prospectuses. You can also request this information by contacting us at (800) 257‑8787.
What were the Fund costs for the last six months? (based on a hypothetical $10,000 investment)
| | | | |
| | |
| | | Cost of a $10,000 investment | | Costs paid as a percentage of
$10,000 investment* |
| | | |
| Premier Class Shares | | $13 | | 0.25% |
* Annualized for period less than one year.
Fund Statistics (as of November 30, 2024)
| | | | |
| |
| Fund net assets | | $ | 699,986,141 | |
| |
| Total number of portfolio holdings | | | 7 | |
| |
| Portfolio turnover (%) | | | 8% | |
What did the Fund invest in? (as of November 30, 2024)
(1) Affiliated investment companies, except for repurchase agreements.
Availability of additional information about the Fund
You can find additional information about the Fund at https://www.nuveen.com/en‑us/mutual‑funds/prospectuses, including its:
| | • | | prospectus • financial statements and other information • fund holdings • proxy voting information |
You can also request this information at (800) 257‑8787.
| | |
87245M624_SAR_1124 4086765-0126 | | |
| | |
| | Semi-Annual Shareholder Report November 30, 2024 |
Nuveen Lifecycle Index Retirement Income Fund
Class R6 Shares/TRILX
Semi-Annual Report
This semi-annual shareholder report contains important information about the Class R6 Shares of the Nuveen Lifecycle Index Retirement Income Fund for the period of June 1, 2024 to November 30, 2024. You can find additional information at https://www.nuveen.com/en‑us/mutual‑funds/prospectuses. You can also request this information by contacting us at (800) 257‑8787.
What were the Fund costs for the last six months? (based on a hypothetical $10,000 investment)
| | | | |
| | |
| | | Cost of a $10,000 investment | | Costs paid as a percentage of
$10,000 investment* |
| | | |
| Class R6 Shares | | $5 | | 0.10% |
* Annualized for period less than one year.
Fund Statistics (as of November 30, 2024)
| | | | |
| |
| Fund net assets | | $ | 699,986,141 | |
| |
| Total number of portfolio holdings | | | 7 | |
| |
| Portfolio turnover (%) | | | 8% | |
What did the Fund invest in? (as of November 30, 2024)
(1) Affiliated investment companies, except for repurchase agreements.
Availability of additional information about the Fund
You can find additional information about the Fund at https://www.nuveen.com/en‑us/mutual‑funds/prospectuses, including its:
| | • | | prospectus • financial statements and other information • fund holdings • proxy voting information |
You can also request this information at (800) 257‑8787.
| | |
87245M731_SAR_1124 4086765-0126 | | |
| | |
| | Semi-Annual Shareholder Report November 30, 2024 |
Nuveen Lifecycle Index Retirement Income Fund
Retirement Class Shares/TRCIX
Semi-Annual Report
This semi-annual shareholder report contains important information about the Retirement Class Shares of the Nuveen Lifecycle Index Retirement Income Fund for the period of June 1, 2024 to November 30, 2024. You can find additional information at https://www.nuveen.com/en‑us/mutual‑funds/prospectuses. You can also request this information by contacting us at (800) 257‑8787.
What were the Fund costs for the last six months? (based on a hypothetical $10,000 investment)
| | | | |
| | |
| | | Cost of a $10,000 investment | | Costs paid as a percentage of
$10,000 investment* |
| | | |
| Retirement Class Shares | | $18 | | 0.35% |
* Annualized for period less than one year.
Fund Statistics (as of November 30, 2024)
| | | | |
| |
| Fund net assets | | $ | 699,986,141 | |
| |
| Total number of portfolio holdings | | | 7 | |
| |
| Portfolio turnover (%) | | | 8% | |
What did the Fund invest in? (as of November 30, 2024)
(1) Affiliated investment companies, except for repurchase agreements.
Availability of additional information about the Fund
You can find additional information about the Fund at https://www.nuveen.com/en‑us/mutual‑funds/prospectuses, including its:
| | • | | prospectus • financial statements and other information • fund holdings • proxy voting information |
You can also request this information at (800) 257‑8787.
| | |
87245M889_SAR_1124 4086765-0126 | | |
| | |
| | Semi-Annual Shareholder Report November 30, 2024 |
Nuveen Lifecycle Index 2010 Fund
Class I Shares/TLTHX
Semi-Annual Report
This semi-annual shareholder report contains important information about the Class I Shares of the Nuveen Lifecycle Index 2010 Fund for the period of June 1, 2024 to November 30, 2024. You can find additional information at
https://www.nuveen.com/en‑us/mutual‑funds/prospectuses. You can also request this information by contacting us at (800) 257‑8787.
What were the Fund costs for the last six months? (based on a hypothetical $10,000 investment)
| | | | |
| | |
| | | Cost of a $10,000 investment | | Costs paid as a percentage of
$10,000 investment* |
| | | |
| Class I Shares | | $11 | | 0.21% |
* Annualized for period less than one year.
Fund Statistics (as of November 30, 2024)
| | | | |
| |
| Fund net assets | | $ | 659,282,044 | |
| |
| Total number of portfolio holdings | | | 7 | |
| |
| Portfolio turnover (%) | | | 8% | |
What did the Fund invest in? (as of November 30, 2024)
(1) Affiliated investment companies, except for repurchase agreements.
Availability of additional information about the Fund
You can find additional information about the Fund at https://www.nuveen.com/en‑us/mutual‑funds/prospectuses, including its:
| | • | | prospectus • financial statements and other information • fund holdings • proxy voting information |
You can also request this information at (800) 257‑8787.
| | |
87245P833_SAR_1124 4086779-0126 | | |
| | |
| | Semi-Annual Shareholder Report November 30, 2024 |
Nuveen Lifecycle Index 2010 Fund
Premier Class Shares/TLTPX
Semi-Annual Report
This semi-annual shareholder report contains important information about the Premier Class Shares of the Nuveen Lifecycle Index 2010 Fund for the period of June 1, 2024 to November 30, 2024. You can find additional information at https://www.nuveen.com/en‑us/mutual‑funds/prospectuses. You can also request this information by contacting us at (800) 257‑8787.
What were the Fund costs for the last six months? (based on a hypothetical $10,000 investment)
| | | | |
| | |
| | | Cost of a $10,000 investment | | Costs paid as a percentage of
$10,000 investment* |
| | | |
| Premier Class Shares | | $13 | | 0.25% |
* Annualized for period less than one year.
Fund Statistics (as of November 30, 2024)
| | | | |
| |
| Fund net assets | | $ | 659,282,044 | |
| |
| Total number of portfolio holdings | | | 7 | |
| |
| Portfolio turnover (%) | | | 8% | |
What did the Fund invest in? (as of November 30, 2024)
(1) Affiliated investment companies, except for repurchase agreements.
Availability of additional information about the Fund
You can find additional information about the Fund at https://www.nuveen.com/en‑us/mutual‑funds/prospectuses, including its:
| | • | | prospectus • financial statements and other information • fund holdings • proxy voting information |
You can also request this information at (800) 257‑8787.
| | |
87245M723_SAR_1124 4086779-0126 | | |
| | |
| | Semi-Annual Shareholder Report November 30, 2024 |
Nuveen Lifecycle Index 2010 Fund
Class R6 Shares/TLTIX
Semi-Annual Report
This semi-annual shareholder report contains important information about the Class R6 Shares of the Nuveen Lifecycle Index 2010 Fund for the period of June 1, 2024 to November 30, 2024. You can find additional information at https://www.nuveen.com/en‑us/mutual‑funds/prospectuses. You can also request this information by contacting us at (800) 257‑8787.
What were the Fund costs for the last six months? (based on a hypothetical $10,000 investment)
| | | | |
| | |
| | | Cost of a $10,000 investment | | Costs paid as a percentage of
$10,000 investment* |
| | | |
| Class R6 Shares | | $5 | | 0.10% |
* Annualized for period less than one year.
Fund Statistics (as of November 30, 2024)
| | | | |
| |
| Fund net assets | | $ | 659,282,044 | |
| |
| Total number of portfolio holdings | | | 7 | |
| |
| Portfolio turnover (%) | | | 8% | |
What did the Fund invest in? (as of November 30, 2024)
(1) Affiliated investment companies, except for repurchase agreements.
Availability of additional information about the Fund
You can find additional information about the Fund at https://www.nuveen.com/en‑us/mutual‑funds/prospectuses, including its:
| | • | | prospectus • financial statements and other information • fund holdings • proxy voting information |
You can also request this information at (800) 257‑8787.
| | |
87245M830_SAR_1124 4086779-0126 | | |
| | |
| | Semi-Annual Shareholder Report November 30, 2024 |
Nuveen Lifecycle Index 2010 Fund
Retirement Class Shares/TLTRX
Semi-Annual Report
This semi-annual shareholder report contains important information about the Retirement Class Shares of the Nuveen Lifecycle Index 2010 Fund for the period of June 1, 2024 to November 30, 2024. You can find additional information at https://www.nuveen.com/en‑us/mutual‑funds/prospectuses. You can also request this information by contacting us at (800) 257‑8787.
What were the Fund costs for the last six months? (based on a hypothetical $10,000 investment)
| | | | |
| | |
| | | Cost of a $10,000 investment | | Costs paid as a percentage of
$10,000 investment* |
| | | |
| Retirement Class Shares | | $18 | | 0.35% |
* Annualized for period less than one year.
Fund Statistics (as of November 30, 2024)
| | | | |
| |
| Fund net assets | | $ | 659,282,044 | |
| |
| Total number of portfolio holdings | | | 7 | |
| |
| Portfolio turnover (%) | | | 8% | |
What did the Fund invest in? (as of November 30, 2024)
(1) Affiliated investment companies, except for repurchase agreements.
Availability of additional information about the Fund
You can find additional information about the Fund at https://www.nuveen.com/en‑us/mutual‑funds/prospectuses, including its:
| | • | | prospectus • financial statements and other information • fund holdings • proxy voting information |
You can also request this information at (800) 257‑8787.
| | |
87245M202_SAR_1124 4086779-0126 | | |
| | |
| | Semi-Annual Shareholder Report November 30, 2024 |
Nuveen Lifecycle Index 2015 Fund
Class I Shares/TLFAX
Semi-Annual Report
This semi-annual shareholder report contains important information about the Class I Shares of the Nuveen Lifecycle Index 2015 Fund for the period of June 1, 2024 to November 30, 2024. You can find additional information at https://www.nuveen.com/en‑us/mutual‑funds/prospectuses. You can also request this information by contacting us at (800) 257‑8787.
What were the Fund costs for the last six months? (based on a hypothetical $10,000 investment)
| | | | |
| | |
| | | Cost of a $10,000 investment | | Costs paid as a percentage of $10,000 investment* |
| | | |
| Class I Shares | | $11 | | 0.21% |
* Annualized for period less than one year.
Fund Statistics (as of November 30, 2024)
| | | | |
| |
| Fund net assets | | $ | 1,059,378,422 | |
| |
| Total number of portfolio holdings | | | 7 | |
| |
| Portfolio turnover (%) | | | 5% | |
What did the Fund invest in? (as of November 30, 2024)
(1) Affiliated investment companies, except for repurchase agreements.
Availability of additional information about the Fund
You can find additional information about the Fund at https://www.nuveen.com/en‑us/mutual‑funds/prospectuses, including its:
| | • | | prospectus • financial statements and other information • fund holdings • proxy voting information |
You can also request this information at (800) 257‑8787.
| | |
87245P825_SAR_1124 4086790-0126 | | |
| | |
| | Semi-Annual Shareholder Report November 30, 2024 |
Nuveen Lifecycle Index 2015 Fund
Premier Class Shares/TLFPX
Semi-Annual Report
This semi-annual shareholder report contains important information about the Premier Class Shares of the Nuveen Lifecycle Index 2015 Fund for the period of June 1, 2024 to November 30, 2024. You can find additional information at https://www.nuveen.com/en‑us/mutual‑funds/prospectuses. You can also request this information by contacting us at (800) 257‑8787.
What were the Fund costs for the last six months? (based on a hypothetical $10,000 investment)
| | | | |
| | |
| | | Cost of a $10,000 investment | | Costs paid as a percentage of
$10,000 investment* |
| | | |
| Premier Class Shares | | $13 | | 0.25% |
* Annualized for period less than one year.
Fund Statistics (as of November 30, 2024)
| | | | |
| |
| Fund net assets | | $ | 1,059,378,422 | |
| |
| Total number of portfolio holdings | | | 7 | |
| |
| Portfolio turnover (%) | | | 5% | |
What did the Fund invest in? (as of November 30, 2024)
(1) Affiliated investment companies, except for repurchase agreements.
Availability of additional information about the Fund
You can find additional information about the Fund at https://www.nuveen.com/en‑us/mutual‑funds/prospectuses, including its:
| | • | | prospectus • financial statements and other information • fund holdings • proxy voting information |
You can also request this information at (800) 257‑8787.
| | |
87245M715_SAR_1124 4086790-0126 | | |
| | |
| | Semi-Annual Shareholder Report November 30, 2024 |
Nuveen Lifecycle Index 2015 Fund
Class R6 Shares/TLFIX
Semi-Annual Report
This semi-annual shareholder report contains important information about the Class R6 Shares of the Nuveen Lifecycle Index 2015 Fund for the period of June 1, 2024 to November 30, 2024. You can find additional information at https://www.nuveen.com/en‑us/mutual‑funds/prospectuses. You can also request this information by contacting us at (800) 257‑8787.
What were the Fund costs for the last six months? (based on a hypothetical $10,000 investment)
| | | | |
| | |
| | | Cost of a $10,000 investment | | Costs paid as a percentage of
$10,000 investment* |
| | | |
| Class R6 Shares | | $5 | | 0.10% |
* Annualized for period less than one year.
Fund Statistics (as of November 30, 2024)
| | | | |
| |
| Fund net assets | | $ | 1,059,378,422 | |
| |
| Total number of portfolio holdings | | | 7 | |
| |
| Portfolio turnover (%) | | | 5% | |
What did the Fund invest in? (as of November 30, 2024)
(1) Affiliated investment companies, except for repurchase agreements.
Availability of additional information about the Fund
You can find additional information about the Fund at https://www.nuveen.com/en‑us/mutual‑funds/prospectuses, including its:
| | • | | prospectus • financial statements and other information • fund holdings • proxy voting information |
You can also request this information at (800) 257‑8787.
| | |
87245M822_SAR_1124 4086790-0126 | | |
| | |
| | Semi-Annual Shareholder Report November 30, 2024 |
Nuveen Lifecycle Index 2015 Fund
Retirement Class Shares/TLGRX
Semi-Annual Report
This semi-annual shareholder report contains important information about the Retirement Class Shares of the Nuveen Lifecycle Index 2015 Fund for the period of June 1, 2024 to November 30, 2024. You can find additional information at https://www.nuveen.com/en‑us/mutual‑funds/prospectuses. You can also request this information by contacting us at (800) 257‑8787.
What were the Fund costs for the last six months? (based on a hypothetical $10,000 investment)
| | | | |
| | |
| | | Cost of a $10,000 investment | | Costs paid as a percentage of $10,000 investment* |
| | | |
| Retirement Class Shares | | $18 | | 0.35% |
* Annualized for period less than one year.
Fund Statistics (as of November 30, 2024)
| | | | |
| |
| Fund net assets | | $ | 1,059,378,422 | |
| |
| Total number of portfolio holdings | | | 7 | |
| |
| Portfolio turnover (%) | | | 5% | |
What did the Fund invest in? (as of November 30, 2024)
(1) Affiliated investment companies, except for repurchase agreements.
Availability of additional information about the Fund
You can find additional information about the Fund at https://www.nuveen.com/en‑us/mutual‑funds/prospectuses, including its:
| | • | | prospectus • financial statements and other information • fund holdings • proxy voting information |
You can also request this information at (800) 257‑8787.
| | |
87245M301_SAR_1124 4086790-0126 | | |
| | |
| | Semi-Annual Shareholder Report November 30, 2024 |
Nuveen Lifecycle Index 2020 Fund
Class I Shares/TLWHX
Semi-Annual Report
This semi-annual shareholder report contains important information about the Class I Shares of the Nuveen Lifecycle Index 2020 Fund for the period of June 1, 2024 to November 30, 2024. You can find additional information at https://www.nuveen.com/en‑us/mutual‑funds/prospectuses. You can also request this information by contacting us at (800) 257‑8787.
What were the Fund costs for the last six months? (based on a hypothetical $10,000 investment)
| | | | |
| | |
| | | Cost of a $10,000 investment | | Costs paid as a percentage of
$10,000 investment* |
| | | |
| Class I Shares | | $11 | | 0.21% |
* Annualized for period less than one year.
Fund Statistics (as of November 30, 2024)
| | | | |
| |
| Fund net assets | | $ | 3,116,131,275 | |
| |
| Total number of portfolio holdings | | | 7 | |
| |
| Portfolio turnover (%) | | | 4% | |
What did the Fund invest in? (as of November 30, 2024)
(1) Affiliated investment companies, except for repurchase agreements.
Availability of additional information about the Fund
You can find additional information about the Fund at https://www.nuveen.com/en‑us/mutual‑funds/prospectuses, including its:
| | • | | prospectus • financial statements and other information • fund holdings • proxy voting information |
You can also request this information at (800) 257‑8787
| | |
87245P817_SAR_1124 4086797-0126 | | |
| | |
| | Semi-Annual Shareholder Report November 30, 2024 |
Nuveen Lifecycle Index 2020 Fund
Premier Class Shares/TLWPX
Semi-Annual Report
This semi-annual shareholder report contains important information about the Premier Class Shares of the Nuveen Lifecycle Index 2020 Fund for the period of June 1, 2024 to November 30, 2024. You can find additional information at
https://www.nuveen.com/en‑us/mutual‑funds/prospectuses. You can also request this information by contacting us at (800) 257‑8787.
What were the Fund costs for the last six months? (based on a hypothetical $10,000 investment)
| | | | |
| | |
| | | Cost of a $10,000 investment | | Costs paid as a percentage of
$10,000 investment* |
| | | |
| Premier Class Shares | | $13 | | 0.25% |
* Annualized for period less than one year.
Fund Statistics (as of November 30, 2024)
| | | | |
| |
| Fund net assets | | $ | 3,116,131,275 | |
| |
| Total number of portfolio holdings | | | 7 | |
| |
| Portfolio turnover (%) | | | 4% | |
What did the Fund invest in? (as of November 30, 2024)
(1) Affiliated investment companies, except for repurchase agreements.
Availability of additional information about the Fund
You can find additional information about the Fund at https://www.nuveen.com/en‑us/mutual‑funds/prospectuses, including its:
| | • | | prospectus • financial statements and other information • fund holdings • proxy voting information |
You can also request this information at (800) 257‑8787.
| | |
87245M699_SAR_1124 4086797-0126 | | |
| | |
| | Semi-Annual Shareholder Report November 30, 2024 |
Nuveen Lifecycle Index 2020 Fund
Class R6 Shares/TLWIX
Semi-Annual Report
This semi-annual shareholder report contains important information about the Class R6 Shares of the Nuveen Lifecycle Index 2020 Fund for the period of June 1, 2024 to November 30, 2024. You can find additional information at
https://www.nuveen.com/en‑us/mutual‑funds/prospectuses. You can also request this information by contacting us at (800) 257‑8787.
What were the Fund costs for the last six months? (based on a hypothetical $10,000 investment)
| | | | |
| | |
| | | Cost of a $10,000 investment | | Costs paid as a percentage of
$10,000 investment* |
| | | |
| Class R6 Shares | | $5 | | 0.10% |
* Annualized for period less than one year.
Fund Statistics (as of November 30, 2024)
| | | | |
| |
| Fund net assets | | $ | 3,116,131,275 | |
| |
| Total number of portfolio holdings | | | 7 | |
| |
| Portfolio turnover (%) | | | 4% | |
What did the Fund invest in? (as of November 30, 2024)
(1) Affiliated investment companies, except for repurchase agreements.
Availability of additional information about the Fund
You can find additional information about the Fund at https://www.nuveen.com/en‑us/mutual‑funds/prospectuses, including its:
| | • | | prospectus • financial statements and other information • fund holdings • proxy voting information |
You can also request this information at (800) 257‑8787.
| | |
87245M814_SAR_1124 4086797-0126 | | |
| | |
| | Semi-Annual Shareholder Report November 30, 2024 |
Nuveen Lifecycle Index 2020 Fund
Retirement Class Shares/TLWRX
Semi-Annual Report
This semi-annual shareholder report contains important information about the Retirement Class Shares of the Nuveen Lifecycle Index 2020 Fund for the period of June 1, 2024 to November 30, 2024. You can find additional information at https://www.nuveen.com/en‑us/mutual‑funds/prospectuses. You can also request this information by contacting us at (800) 257‑8787.
What were the Fund costs for the last six months? (based on a hypothetical $10,000 investment)
| | | | |
| | |
| | | Cost of a $10,000 investment | | Costs paid as a percentage of $10,000 investment* |
| | | |
| Retirement Class Shares | | $18 | | 0.35% |
* Annualized for period less than one year.
Fund Statistics (as of November 30, 2024)
| | | | |
| |
| Fund net assets | | $ | 3,116,131,275 | |
| |
| Total number of portfolio holdings | | | 7 | |
| |
| Portfolio turnover (%) | | | 4% | |
What did the Fund invest in? (as of November 30, 2024)
(1) Affiliated investment companies, except for repurchase agreements.
Availability of additional information about the Fund
You can find additional information about the Fund at https://www.nuveen.com/en‑us/mutual‑funds/prospectuses, including its:
| | • | | prospectus • financial statements and other information • fund holdings • proxy voting information |
You can also request this information at (800) 257‑8787.
| | |
87245M400_SAR_1124 4086797-0126 | | |
| | |
| | Semi-Annual Shareholder Report November 30, 2024 |
Nuveen Lifecycle Index 2025 Fund
Class I Shares/TLQHX
Semi-Annual Report
This semi-annual shareholder report contains important information about the Class I Shares of the Nuveen Lifecycle Index 2025 Fund for the period of June 1, 2024 to November 30, 2024. You can find additional information at https://www.nuveen.com/en‑us/mutual‑funds/prospectuses. You can also request this information by contacting us at (800) 257‑8787.
What were the Fund costs for the last six months? (based on a hypothetical $10,000 investment)
| | | | |
| | |
| | | Cost of a $10,000 investment | | Costs paid as a percentage of $10,000 investment* |
| | | |
| Class I Shares | | $11 | | 0.21% |
* Annualized for period less than one year.
Fund Statistics (as of November 30, 2024)
| | | | |
| |
| Fund net assets | | $ | 6,195,788,979 | |
| |
| Total number of portfolio holdings | | | 7 | |
| |
| Portfolio turnover (%) | | | 5% | |
What did the Fund invest in? (as of November 30, 2024)
(1) Affiliated investment companies, except for repurchase agreements.
Availability of additional information about the Fund
You can find additional information about the Fund at https://www.nuveen.com/en‑us/mutual‑funds/prospectuses, including its:
| | • | | prospectus • financial statements and other information • fund holdings • proxy voting information |
You can also request this information at (800) 257‑8787.
| | |
87245P791_SAR_1124 4086814-0126 | | |
| | |
| | Semi-Annual Shareholder Report November 30, 2024 |
Nuveen Lifecycle Index 2025 Fund
Premier Class Shares/TLVPX
Semi-Annual Report
This semi-annual shareholder report contains important information about the Premier Class Shares of the Nuveen Lifecycle Index 2025 Fund for the period of June 1, 2024 to November 30, 2024. You can find additional information at
https://www.nuveen.com/en‑us/mutual‑funds/prospectuses. You can also request this information by contacting us at (800) 257‑8787.
What were the Fund costs for the last six months? (based on a hypothetical $10,000 investment)
| | | | |
| | |
| | | Cost of a $10,000 investment | | Costs paid as a percentage of
$10,000 investment* |
| | | |
| Premier Class Shares | | $13 | | 0.25% |
* Annualized for period less than one year.
Fund Statistics (as of November 30, 2024)
| | | | |
| |
| Fund net assets | | $ | 6,195,788,979 | |
| |
| Total number of portfolio holdings | | | 7 | |
| |
| Portfolio turnover (%) | | | 5% | |
What did the Fund invest in? (as of November 30, 2024)
(1) Affiliated investment companies, except for repurchase agreements.
Availability of additional information about the Fund
You can find additional information about the Fund at https://www.nuveen.com/en‑us/mutual‑funds/prospectuses, including its:
| | • | | prospectus • financial statements and other information • fund holdings • proxy voting information |
You can also request this information at (800) 257‑8787.
| | |
87245M681_SAR_1124 4086814-0126 | | |
| | |
| | Semi-Annual Shareholder Report November 30, 2024 |
Nuveen Lifecycle Index 2025 Fund
Class R6 Shares/TLQIX
Semi-Annual Report
This semi-annual shareholder report contains important information about the Class R6 Shares of the Nuveen Lifecycle Index 2025 Fund for the period of June 1, 2024 to November 30, 2024. You can find additional information at https://www.nuveen.com/en‑us/mutual‑funds/prospectuses. You can also request this information by contacting us at (800) 257‑8787.
What were the Fund costs for the last six months? (based on a hypothetical $10,000 investment)
| | | | |
| | |
| | | Cost of a $10,000 investment | | Costs paid as a percentage of
$10,000 investment* |
| | | |
| Class R6 Shares | | $5 | | 0.10% |
* Annualized for period less than one year.
Fund Statistics (as of November 30, 2024)
| | | | |
| |
| Fund net assets | | $ | 6,195,788,979 | |
| |
| Total number of portfolio holdings | | | 7 | |
| |
| Portfolio turnover (%) | | | 5% | |
What did the Fund invest in? (as of November 30, 2024)
(1) Affiliated investment companies, except for repurchase agreements.
Availability of additional information about the Fund
You can find additional information about the Fund at https://www.nuveen.com/en‑us/mutual‑funds/prospectuses, including its:
| | • | | prospectus • financial statements and other information • fund holdings • proxy voting information |
You can also request this information at (800) 257‑8787.
| | |
87245M798_SAR_1124 4086814-0126 | | |
| | |
| | Semi-Annual Shareholder Report November 30, 2024 |
Nuveen Lifecycle Index 2025 Fund
Retirement Class Shares/TLQRX
Semi-Annual Report
This semi-annual shareholder report contains important information about the Retirement Class Shares of the Nuveen Lifecycle Index 2025 Fund for the period of June 1, 2024 to November 30, 2024. You can find additional information at https://www.nuveen.com/en‑us/mutual‑funds/prospectuses. You can also request this information by contacting us at (800) 257‑8787.
What were the Fund costs for the last six months? (based on a hypothetical $10,000 investment)
| | | | |
| | |
| | | Cost of a $10,000 investment | | Costs paid as a percentage of $10,000 investment* |
| | | |
| Retirement Class Shares | | $18 | | 0.35% |
* Annualized for period less than one year.
Fund Statistics (as of November 30, 2024)
| | | | |
| |
| Fund net assets | | $ | 6,195,788,979 | |
| |
| Total number of portfolio holdings | | | 7 | |
| |
| Portfolio turnover (%) | | | 5% | |
What did the Fund invest in? (as of November 30, 2024)
(1) Affiliated investment companies, except for repurchase agreements.
Availability of additional information about the Fund
You can find additional information about the Fund at https://www.nuveen.com/en‑us/mutual‑funds/prospectuses, including its:
| | • | | prospectus • financial statements and other information • fund holdings • proxy voting information |
You can also request this information at (800) 257‑8787.
| | |
87245M509_SAR_1124 4086814-0126 | | |
| | |
| | Semi-Annual Shareholder Report November 30, 2024 |
Nuveen Lifecycle Index 2030 Fund
Class I Shares/TLHHX
Semi-Annual Report
This semi-annual shareholder report contains important information about the Class I Shares of the Nuveen Lifecycle Index 2030 Fund for the period of June 1, 2024 to November 30, 2024. You can find additional information at
https://www.nuveen.com/en‑us/mutual‑funds/prospectuses. You can also request this information by contacting us at (800) 257‑8787.
What were the Fund costs for the last six months? (based on a hypothetical $10,000 investment)
| | | | |
| | |
| | | Cost of a $10,000 investment | | Costs paid as a percentage of
$10,000 investment* |
| | | |
| Class I Shares | | $11 | | 0.21% |
* Annualized for period less than one year.
Fund Statistics (as of November 30, 2024)
| | | | |
| |
| Fund net assets | | $ | 8,707,274,361 | |
| |
| Total number of portfolio holdings | | | 7 | |
| |
| Portfolio turnover (%) | | | 4% | |
What did the Fund invest in? (as of November 30, 2024)
(1) Affiliated investment companies, except for repurchase agreements.
Availability of additional information about the Fund
You can find additional information about the Fund at https://www.nuveen.com/en‑us/mutual‑funds/prospectuses, including its:
| | • | | prospectus • financial statements and other information • fund holdings • proxy voting information |
You can also request this information at (800) 257‑8787.
| | |
87245P783_SAR_1124 4086818-0126 | | |
| | |
| | Semi-Annual Shareholder Report November 30, 2024 |
Nuveen Lifecycle Index 2030 Fund
Premier Class Shares/TLHPX
Semi-Annual Report
This semi-annual shareholder report contains important information about the Premier Class Shares of the Nuveen Lifecycle Index 2030 Fund for the period of June 1, 2024 to November 30, 2024. You can find additional information at
https://www.nuveen.com/en‑us/mutual‑funds/prospectuses. You can also request this information by contacting us at (800) 257‑8787.
What were the Fund costs for the last six months? (based on a hypothetical $10,000 investment)
| | | | |
| | |
| | | Cost of a $10,000 investment | | Costs paid as a percentage of
$10,000 investment* |
| | | |
| Premier Class Shares | | $13 | | 0.25% |
* Annualized for period less than one year.
Fund Statistics (as of November 30, 2024)
| | | | |
| |
| Fund net assets | | $ | 8,707,274,361 | |
| |
| Total number of portfolio holdings | | | 7 | |
| |
| Portfolio turnover (%) | | | 4% | |
What did the Fund invest in? (as of November 30, 2024)
(1) Affiliated investment companies, except for repurchase agreements.
Availability of additional information about the Fund
You can find additional information about the Fund at https://www.nuveen.com/en‑us/mutual‑funds/prospectuses, including its:
| | • | | prospectus • financial statements and other information • fund holdings • proxy voting information |
You can also request this information at (800) 257‑8787.
| | |
87245M673_SAR_1124 4086818-0126 | | |
| | |
| | Semi-Annual Shareholder Report November 30, 2024 |
Nuveen Lifecycle Index 2030 Fund
Class R6 Shares/TLHIX
Semi-Annual Report
This semi-annual shareholder report contains important information about the Class R6 Shares of the Nuveen Lifecycle Index 2030 Fund for the period of June 1, 2024 to November 30, 2024. You can find additional information at
https://www.nuveen.com/en-us/mutual-funds/prospectuses. You can also request this information by contacting us at (800) 257‑8787.
What were the Fund costs for the last six months? (based on a hypothetical $10,000 investment)
| | | | |
| | |
| | | Cost of a $10,000 investment | | Costs paid as a percentage of
$10,000 investment* |
| | | |
| Class R6 Shares | | $5 | | 0.10% |
* Annualized for period less than one year.
Fund Statistics (as of November 30, 2024)
| | | | |
| |
| Fund net assets | | $ | 8,707,274,361 | |
| |
| Total number of portfolio holdings | | | 7 | |
| |
| Portfolio turnover (%) | | | 4% | |
What did the Fund invest in? (as of November 30, 2024)
(1) Affiliated investment companies, except for repurchase agreements.
Availability of additional information about the Fund
You can find additional information about the Fund at https://www.nuveen.com/en‑us/mutual‑funds/prospectuses, including its:
| | • | | prospectus • financial statements and other information • fund holdings • proxy voting information |
You can also request this information at (800) 257‑8787.
| | |
87245M780_SAR_1124 4086818-0126 | | |
| | |
| | Semi-Annual Shareholder Report November 30, 2024 |
Nuveen Lifecycle Index 2030 Fund
Retirement Class Shares/TLHRX
Semi-Annual Report
This semi-annual shareholder report contains important information about the Retirement Class Shares of the Nuveen Lifecycle Index 2030 Fund for the period of June 1, 2024 to November 30, 2024. You can find additional information at https://www.nuveen.com/en‑us/mutual‑funds/prospectuses. You can also request this information by contacting us at (800) 257‑8787.
What were the Fund costs for the last six months? (based on a hypothetical $10,000 investment)
| | | | |
| | |
| | | Cost of a $10,000 investment | | Costs paid as a percentage of
$10,000 investment* |
| | | |
| Retirement Class Shares | | $18 | | 0.35% |
* Annualized for period less than one year.
Fund Statistics (as of November 30, 2024)
| | | | |
| |
| Fund net assets | | $ | 8,707,274,361 | |
| |
| Total number of portfolio holdings | | | 7 | |
| |
| Portfolio turnover (%) | | | 4% | |
What did the Fund invest in? (as of November 30, 2024)
(1) Affiliated investment companies, except for repurchase agreements.
Availability of additional information about the Fund
You can find additional information about the Fund at https://www.nuveen.com/en‑us/mutual‑funds/prospectuses, including its:
| | • | | prospectus • financial statements and other information • fund holdings • proxy voting information |
You can also request this information at (800) 257‑8787.
| | |
87245M608_SAR_1124 4086818-0126 | | |
| | |
| | Semi-Annual Shareholder Report November 30, 2024 |
Nuveen Lifecycle Index 2035 Fund
Class I Shares/TLYHX
Semi-Annual Report
This semi-annual shareholder report contains important information about the Class I Shares of the Nuveen Lifecycle Index 2035 Fund for the period of June 1, 2024 to November 30, 2024. You can find additional information at https://www.nuveen.com/en‑us/mutual‑funds/prospectuses. You can also request this information by contacting us at (800) 257‑8787.
What were the Fund costs for the last six months? (based on a hypothetical $10,000 investment)
| | | | |
| | |
| | | Cost of a $10,000 investment | | Costs paid as a percentage of
$10,000 investment* |
| | | |
| Class I Shares | | $11 | | 0.21% |
* Annualized for period less than one year.
Fund Statistics (as of November 30, 2024)
| | | | |
| |
| Fund net assets | | $ | 9,337,792,739 | |
| |
| Total number of portfolio holdings | | | 7 | |
| |
| Portfolio turnover (%) | | | 4% | |
What did the Fund invest in? (as of November 30, 2024)
(1) Affiliated investment companies, except for repurchase agreements.
Availability of additional information about the Fund
You can find additional information about the Fund at https://www.nuveen.com/en‑us/mutual‑funds/prospectuses, including its:
| | • | | prospectus • financial statements and other information • fund holdings • proxy voting information |
You can also request this information at (800) 257‑8787.
| | |
87245P775_SAR_1124 4086829-0126 | | |
| | |
| | Semi-Annual Shareholder Report November 30, 2024 |
Nuveen Lifecycle Index 2035 Fund
Premier Class Shares/TLYPX
Semi-Annual Report
This semi-annual shareholder report contains important information about the Premier Class Shares of the Nuveen Lifecycle Index 2035 Fund for the period of June 1, 2024 to November 30, 2024. You can find additional information at
https://www.nuveen.com/en‑us/mutual‑funds/prospectuses. You can also request this information by contacting us at (800) 257‑8787.
What were the Fund costs for the last six months? (based on a hypothetical $10,000 investment)
| | | | |
| | |
| | | Cost of a $10,000 investment | | Costs paid as a percentage of
$10,000 investment* |
| | | |
| Premier Class Shares | | $13 | | 0.25% |
* Annualized for period less than one year.
Fund Statistics (as of November 30, 2024)
| | | | |
| |
| Fund net assets | | $ | 9,337,792,739 | |
| |
| Total number of portfolio holdings | | | 7 | |
| |
| Portfolio turnover (%) | | | 4% | |
What did the Fund invest in? (as of November 30, 2024)
(1) Affiliated investment companies, except for repurchase agreements.
Availability of additional information about the Fund
You can find additional information about the Fund at https://www.nuveen.com/en-us/mutual-funds/prospectuses, including its:
| | • | | prospectus • financial statements and other information • fund holdings • proxy voting information |
You can also request this information at (800) 257‑8787.
| | |
87245M665_SAR_1124 4086829-0126 | | |
| | |
| | Semi-Annual Shareholder Report November 30, 2024 |
Nuveen Lifecycle Index 2035 Fund
Class R6 Shares/TLYIX
Semi-Annual Report
This semi-annual shareholder report contains important information about the Class R6 Shares of the Nuveen Lifecycle Index 2035 Fund for the period of June 1, 2024 to November 30, 2024. You can find additional information at https://www.nuveen.com/en‑us/mutual‑funds/prospectuses. You can also request this information by contacting us at (800) 257‑8787.
What were the Fund costs for the last six months? (based on a hypothetical $10,000 investment)
| | | | |
| | |
| | | Cost of a $10,000 investment | | Costs paid as a percentage of $10,000 investment* |
| | | |
| Class R6 Shares | | $5 | | 0.10% |
* Annualized for period less than one year.
Fund Statistics (as of November 30, 2024)
| | | | |
| |
| Fund net assets | | $ | 9,337,792,739 | |
| |
| Total number of portfolio holdings | | | 7 | |
| |
| Portfolio turnover (%) | | | 4% | |
What did the Fund invest in? (as of November 30, 2024)
(1) Affiliated investment companies, except for repurchase agreements.
Availability of additional information about the Fund
You can find additional information about the Fund at https://www.nuveen.com/en‑us/mutual‑funds/prospectuses, including its:
| | • | | prospectus • financial statements and other information • fund holdings • proxy voting information |
You can also request this information at (800) 257‑8787.
| | |
87245M772_SAR_1124 4086829-0126 | | |
| | |
| | Semi-Annual Shareholder Report November 30, 2024 |
Nuveen Lifecycle Index 2035 Fund
Retirement Class Shares/TLYRX
Semi-Annual Report
This semi-annual shareholder report contains important information about the Retirement Class Shares of the Nuveen Lifecycle Index 2035 Fund for the period of June 1, 2024 to November 30, 2024. You can find additional information at
https://www.nuveen.com/en-us/mutual-funds/prospectuses. You can also request this information by contacting us at (800) 257‑8787.
What were the Fund costs for the last six months? (based on a hypothetical $10,000 investment)
| | | | |
| | |
| | | Cost of a $10,000 investment | | Costs paid as a percentage of
$10,000 investment* |
| | | |
| Retirement Class Shares | | $18 | | 0.35% |
* Annualized for period less than one year.
Fund Statistics (as of November 30, 2024)
| | | | |
| |
| Fund net assets | | $ | 9,337,792,739 | |
| |
| Total number of portfolio holdings | | | 7 | |
| |
| Portfolio turnover (%) | | | 4% | |
What did the Fund invest in? (as of November 30, 2024)
(1) Affiliated investment companies, except for repurchase agreements.
Availability of additional information about the Fund
You can find additional information about the Fund at https://www.nuveen.com/en‑us/mutual‑funds/prospectuses, including its:
| | • | | prospectus • financial statements and other information • fund holdings • proxy voting information |
You can also request this information at (800) 257‑8787.
| | |
87245M707_SAR_1124 4086829-0126 | | |
| | |
| | Semi-Annual Shareholder Report November 30, 2024 |
Nuveen Lifecycle Index 2040 Fund
Class I Shares/TLZHX
Semi-Annual Report
This semi-annual shareholder report contains important information about the Class I Shares of the Nuveen Lifecycle Index 2040 Fund for the period of June 1, 2024 to November 30, 2024. You can find additional information at https://www.nuveen.com/en‑us/mutual‑funds/prospectuses. You can also request this information by contacting us at (800) 257‑8787.
What were the Fund costs for the last six months? (based on a hypothetical $10,000 investment)
| | | | |
| | |
| | | Cost of a $10,000 investment | | Costs paid as a percentage of
$10,000 investment* |
| | | |
| Class I Shares | | $10 | | 0.20% |
* Annualized for period less than one year.
Fund Statistics (as of November 30, 2024)
| | | | |
| |
| Fund net assets | | $ | 9,868,514,463 | |
| |
| Total number of portfolio holdings | | | 5 | |
| |
| Portfolio turnover (%) | | | 4% | |
What did the Fund invest in? (as of November 30, 2024)
(1) Affiliated investment companies, except for repurchase agreements.
Availability of additional information about the Fund
You can find additional information about the Fund at https://www.nuveen.com/en‑us/mutual‑funds/prospectuses, including its:
| | • | | prospectus • financial statements and other information • fund holdings • proxy voting information |
You can also request this information at (800) 257‑8787.
| | |
87245P767_SAR_1124 4086845-0126 | | |
| | |
| | Semi-Annual Shareholder Report November 30, 2024 |
Nuveen Lifecycle Index 2040 Fund
Premier Class Shares/TLPRX
Semi-Annual Report
This semi-annual shareholder report contains important information about the Premier Class Shares of the Nuveen Lifecycle Index 2040 Fund for the period of June 1, 2024 to November 30, 2024. You can find additional information at https://www.nuveen.com/en‑us/mutual‑funds/prospectuses. You can also request this information by contacting us at (800) 257‑8787.
What were the Fund costs for the last six months? (based on a hypothetical $10,000 investment)
| | | | |
| | |
| | | Cost of a $10,000 investment | | Costs paid as a percentage of $10,000 investment* |
| | | |
| Premier Class Shares | | $13 | | 0.25% |
* Annualized for period less than one year.
Fund Statistics (as of November 30, 2024)
| | | | |
| |
| Fund net assets | | $ | 9,868,514,463 | |
| |
| Total number of portfolio holdings | | | 5 | |
| |
| Portfolio turnover (%) | | | 4% | |
What did the Fund invest in? (as of November 30, 2024)
(1) Affiliated investment companies, except for repurchase agreements.
Availability of additional information about the Fund
You can find additional information about the Fund at https://www.nuveen.com/en‑us/mutual‑funds/prospectuses, including its:
| | • | | prospectus • financial statements and other information • fund holdings • proxy voting information |
You can also request this information at (800) 257‑8787.
| | |
87245M657_SAR_1124 4086845-0126 | | |
| | |
| | Semi-Annual Shareholder Report November 30, 2024 |
Nuveen Lifecycle Index 2040 Fund
Class R6 Shares/TLZIX
Semi-Annual Report
This semi-annual shareholder report contains important information about the Class R6 Shares of the Nuveen Lifecycle Index 2040 Fund for the period of June 1, 2024 to November 30, 2024. You can find additional information at
https://www.nuveen.com/en‑us/mutual‑funds/prospectuses. You can also request this information by contacting us at (800) 257‑8787.
What were the Fund costs for the last six months? (based on a hypothetical $10,000 investment)
| | | | |
| | |
| | | Cost of a $10,000 investment | | Costs paid as a percentage of $10,000 investment* |
| | | |
| Class R6 Shares | | $5 | | 0.10% |
* Annualized for period less than one year.
Fund Statistics (as of November 30, 2024)
| | | | |
| |
| Fund net assets | | $ | 9,868,514,463 | |
| |
| Total number of portfolio holdings | | | 5 | |
| |
| Portfolio turnover (%) | | | 4% | |
What did the Fund invest in? (as of November 30, 2024)
(1) Affiliated investment companies, except for repurchase agreements.
Availability of additional information about the Fund
You can find additional information about the Fund at https://www.nuveen.com/en‑us/mutual‑funds/prospectuses, including its:
| | • | | prospectus • financial statements and other information • fund holdings • proxy voting information |
You can also request this information at (800) 257‑8787.
| | |
87245M764_SAR_1124 4086845-0126 | | |
| | |
| | Semi-Annual Shareholder Report November 30, 2024 |
Nuveen Lifecycle Index 2040 Fund
Retirement Class Shares/TLZRX
Semi-Annual Report
This semi-annual shareholder report contains important information about the Retirement Class Shares of the Nuveen Lifecycle Index 2040 Fund for the period of June 1, 2024 to November 30, 2024. You can find additional information at
https://www.nuveen.com/en‑us/mutual‑funds/prospectuses. You can also request this information by contacting us at (800) 257‑8787.
What were the Fund costs for the last six months? (based on a hypothetical $10,000 investment)
| | | | |
| | |
| | | Cost of a $10,000 investment | | Costs paid as a percentage of
$10,000 investment* |
| | | |
| Retirement Class Shares | | $18 | | 0.35% |
* Annualized for period less than one year.
Fund Statistics (as of November 30, 2024)
| | | | |
| |
| Fund net assets | | $ | 9,868,514,463 | |
| |
| Total number of portfolio holdings | | | 5 | |
| |
| Portfolio turnover (%) | | | 4% | |
What did the Fund invest in? (as of November 30, 2024)
(1) Affiliated investment companies, except for repurchase agreements.
Availability of additional information about the Fund
You can find additional information about the Fund at https://www.nuveen.com/en‑us/mutual‑funds/prospectuses, including its:
| | • | | prospectus • financial statements and other information • fund holdings • proxy voting information |
You can also request this information at (800) 257‑8787.
| | |
87245M806_SAR_1124 4086845-0126 | | |
| | |
| | Semi-Annual Shareholder Report November 30, 2024 |
Nuveen Lifecycle Index 2045 Fund
Class I Shares/TLMHX
Semi-Annual Report
This semi-annual shareholder report contains important information about the Class I Shares of the Nuveen Lifecycle Index 2045 Fund for the period of June 1, 2024 to November 30, 2024. You can find additional information at https://www.nuveen.com/en‑us/mutual‑funds/prospectuses. You can also request this information by contacting us at (800) 257‑8787.
What were the Fund costs for the last six months? (based on a hypothetical $10,000 investment)
| | | | |
| | |
| | | Cost of a $10,000 investment | | Costs paid as a percentage of
$10,000 investment* |
| | | |
| Class I Shares | | $11 | | 0.21% |
* Annualized for period less than one year.
Fund Statistics (as of November 30, 2024)
| | | | |
| |
| Fund net assets | | $ | 8,381,989,469 | |
| |
| Total number of portfolio holdings | | | 5 | |
| |
| Portfolio turnover (%) | | | 4% | |
What did the Fund invest in? (as of November 30, 2024)
(1) Affiliated investment companies, except for repurchase agreements.
Availability of additional information about the Fund
You can find additional information about the Fund at https://www.nuveen.com/en‑us/mutual‑funds/prospectuses, including its:
| | • | | prospectus • financial statements and other information • fund holdings • proxy voting information |
You can also request this information at (800) 257‑8787.
| | |
87245P759_SAR_1124 4086857-0126 | | |
| | |
| | Semi-Annual Shareholder Report November 30, 2024 |
Nuveen Lifecycle Index 2045 Fund
Premier Class Shares/TLMPX
Semi-Annual Report
This semi-annual shareholder report contains important information about the Premier Class Shares of the Nuveen Lifecycle Index 2045 Fund for the period of June 1, 2024 to November 30, 2024. You can find additional information at https://www.nuveen.com/en‑us/mutual‑funds/prospectuses. You can also request this information by contacting us at (800) 257‑8787.
What were the Fund costs for the last six months? (based on a hypothetical $10,000 investment)
| | | | |
| | |
| | | Cost of a $10,000 investment | | Costs paid as a percentage of $10,000 investment* |
| | | |
| Premier Class Shares | | $13 | | 0.25% |
* Annualized for period less than one year.
Fund Statistics (as of November 30, 2024)
| | | | |
| |
| Fund net assets | | $ | 8,381,989,469 | |
| |
| Total number of portfolio holdings | | | 5 | |
| |
| Portfolio turnover (%) | | | 4% | |
What did the Fund invest in? (as of November 30, 2024)
(1) Affiliated investment companies, except for repurchase agreements.
Availability of additional information about the Fund
You can find additional information about the Fund at https://www.nuveen.com/en‑us/mutual‑funds/prospectuses, including its:
| | • | | prospectus • financial statements and other information • fund holdings • proxy voting information |
You can also request this information at (800) 257‑8787.
| | |
87245M640_SAR_1124 4086857-0126 | | |
| | |
| | Semi-Annual Shareholder Report November 30, 2024 |
Nuveen Lifecycle Index 2045 Fund
Class R6 Shares/TLXIX
Semi-Annual Report
This semi-annual shareholder report contains important information about the Class R6 Shares of the Nuveen Lifecycle Index 2045 Fund for the period of June 1, 2024 to November 30, 2024. You can find additional information at https://www.nuveen.com/en‑us/mutual‑funds/prospectuses. You can also request this information by contacting us at (800) 257‑8787.
What were the Fund costs for the last six months? (based on a hypothetical $10,000 investment)
| | | | |
| | |
| | | Cost of a $10,000 investment | | Costs paid as a percentage of
$10,000 investment* |
| | | |
| Class R6 Shares | | $5 | | 0.10% |
* Annualized for period less than one year.
Fund Statistics (as of November 30, 2024)
| | | | |
| |
| Fund net assets | | $ | 8,381,989,469 | |
| |
| Total number of portfolio holdings | | | 5 | |
| |
| Portfolio turnover (%) | | | 4% | |
What did the Fund invest in? (as of November 30, 2024)
(1) Affiliated investment companies, except for repurchase agreements.
Availability of additional information about the Fund
You can find additional information about the Fund at https://www.nuveen.com/en‑us/mutual‑funds/prospectuses, including its:
| | • | | prospectus • financial statements and other information • fund holdings • proxy voting information |
You can also request this information at (800) 257‑8787.
| | |
87245M756_SAR_1124 4086857-0126 | | |
| | |
| | Semi-Annual Shareholder Report November 30, 2024 |
Nuveen Lifecycle Index 2045 Fund
Retirement Class Shares/TLMRX
Semi-Annual Report
This semi-annual shareholder report contains important information about the Retirement Class Shares of the Nuveen Lifecycle Index 2045 Fund for the period of June 1, 2024 to November 30, 2024. You can find additional information at https://www.nuveen.com/en‑us/mutual‑funds/prospectuses. You can also request this information by contacting us at (800) 257‑8787.
What were the Fund costs for the last six months? (based on a hypothetical $10,000 investment)
| | | | |
| | |
| | | Cost of a $10,000 investment | | Costs paid as a percentage of $10,000 investment* |
| | | |
| Retirement Class Shares | | $18 | | 0.35% |
* Annualized for period less than one year.
Fund Statistics (as of November 30, 2024)
| | | | |
| |
| Fund net assets | | $ | 8,381,989,469 | |
| |
| Total number of portfolio holdings | | | 5 | |
| |
| Portfolio turnover (%) | | | 4% | |
What did the Fund invest in? (as of November 30, 2024)
(1) Affiliated investment companies, except for repurchase agreements.
Availability of additional information about the Fund
You can find additional information about the Fund at https://www.nuveen.com/en‑us/mutual‑funds/prospectuses, including its:
| | • | | prospectus • financial statements and other information • fund holdings • proxy voting information |
You can also request this information at (800) 257‑8787.
| | |
87245M863_SAR_1124 4086857-0126 | | |
| | |
| | Semi-Annual Shareholder Report November 30, 2024 |
Nuveen Lifecycle Index 2050 Fund
Class I Shares/TLLHX
Semi-Annual Report
This semi-annual shareholder report contains important information about the Class I Shares of the Nuveen Lifecycle Index 2050 Fund for the period of June 1, 2024 to November 30, 2024. You can find additional information at https://www.nuveen.com/en‑us/mutual‑funds/prospectuses. You can also request this information by contacting us at (800) 257‑8787.
What were the Fund costs for the last six months? (based on a hypothetical $10,000 investment)
| | | | |
| | |
| | | Cost of a $10,000 investment | | Costs paid as a percentage of
$10,000 investment* |
| | | |
| Class I Shares | | $10 | | 0.20% |
* Annualized for period less than one year.
Fund Statistics (as of November 30, 2024)
| | | | |
| |
| Fund net assets | | $ | 7,146,144,441 | |
| |
| Total number of portfolio holdings | | | 5 | |
| |
| Portfolio turnover (%) | | | 3% | |
What did the Fund invest in? (as of November 30, 2024)
(1) Affiliated investment companies, except for repurchase agreements.
Availability of additional information about the Fund
You can find additional information about the Fund at https://www.nuveen.com/en‑us/mutual‑funds/prospectuses, including its:
| | • | | prospectus • financial statements and other information • fund holdings • proxy voting information |
You can also request this information at (800) 257‑8787.
| | |
87245P742_SAR_1124 4086859-0126 | | |
| | |
| | Semi-Annual Shareholder Report November 30, 2024 |
Nuveen Lifecycle Index 2050 Fund
Premier Class Shares/TLLPX
Semi-Annual Report
This semi-annual shareholder report contains important information about the Premier Class Shares of the Nuveen Lifecycle Index 2050 Fund for the period of June 1, 2024 to November 30, 2024. You can find additional information at https://www.nuveen.com/en‑us/mutual‑funds/prospectuses. You can also request this information by contacting us at (800) 257‑8787.
What were the Fund costs for the last six months? (based on a hypothetical $10,000 investment)
| | | | |
| | |
| | | Cost of a $10,000 investment | | Costs paid as a percentage of
$10,000 investment* |
| | | |
| Premier Class Shares | | $13 | | 0.25% |
* Annualized for period less than one year.
Fund Statistics (as of November 30, 2024)
| | | | |
| |
| Fund net assets | | | $7,146,144,441 | |
| |
| Total number of portfolio holdings | | | 5 | |
| |
| Portfolio turnover (%) | | | 3% | |
What did the Fund invest in? (as of November 30, 2024)
(1) Affiliated investment companies, except for repurchase agreements.
Availability of additional information about the Fund
You can find additional information about the Fund at https://www.nuveen.com/en‑us/mutual‑funds/prospectuses, including its:
| | • | | prospectus • financial statements and other information • fund holdings • proxy voting information |
You can also request this information at (800) 257‑8787.
| | |
87245M632_SAR_1124 4086859-0126 | | |
| | |
| | Semi-Annual Shareholder Report November 30, 2024 |
Nuveen Lifecycle Index 2050 Fund
Class R6 Shares/TLLIX
Semi-Annual Report
This semi-annual shareholder report contains important information about the Class R6 Shares of the Nuveen Lifecycle Index 2050 Fund for the period of June 1, 2024 to November 30, 2024. You can find additional information at https://www.nuveen.com/en‑us/mutual‑funds/prospectuses. You can also request this information by contacting us at (800) 257‑8787.
What were the Fund costs for the last six months? (based on a hypothetical $10,000 investment)
| | | | |
| | |
| | | Cost of a $10,000 investment | | Costs paid as a percentage of $10,000 investment* |
| | | |
| Class R6 Shares | | $5 | | 0.10% |
* Annualized for period less than one year.
Fund Statistics (as of November 30, 2024)
| | | | |
| |
| Fund net assets | | $ | 7,146,144,441 | |
| |
| Total number of portfolio holdings | | | 5 | |
| |
| Portfolio turnover (%) | | | 3% | |
What did the Fund invest in? (as of November 30, 2024)
(1) Affiliated investment companies, except for repurchase agreements.
Availability of additional information about the Fund
You can find additional information about the Fund at https://www.nuveen.com/en‑us/mutual‑funds/prospectuses, including its:
| | • | | prospectus • financial statements and other information • fund holdings • proxy voting information |
You can also request this information at (800) 257‑8787.
| | |
87245M749_SAR_1124 4086859-0126 | | |
| | |
| | Semi-Annual Shareholder Report November 30, 2024 |
Nuveen Lifecycle Index 2050 Fund
Retirement Class Shares/TLLRX
Semi-Annual Report
This semi-annual shareholder report contains important information about the Retirement Class Shares of the Nuveen Lifecycle Index 2050 Fund for the period of June 1, 2024 to November 30, 2024. You can find additional information at https://www.nuveen.com/en‑us/mutual‑funds/prospectuses. You can also request this information by contacting us at (800) 257‑8787.
What were the Fund costs for the last six months? (based on a hypothetical $10,000 investment)
| | | | |
| | |
| | | Cost of a $10,000 investment | | Costs paid as a percentage of
$10,000 investment* |
| | | |
| Retirement Class Shares | | $18 | | 0.35% |
* Annualized for period less than one year.
Fund Statistics (as of November 30, 2024)
| | | | |
| |
| Fund net assets | | $ | 7,146,144,441 | |
| |
| Total number of portfolio holdings | | | 5 | |
| |
| Portfolio turnover (%) | | | 3% | |
What did the Fund invest in? (as of November 30, 2024)
(1) Affiliated investment companies, except for repurchase agreements.
Availability of additional information about the Fund
You can find additional information about the Fund at https://www.nuveen.com/en‑us/mutual‑funds/prospectuses, including its:
| | • | | prospectus • financial statements and other information • fund holdings • proxy voting information |
You can also request this information at (800) 257‑8787.
| | |
87245M871_SAR_1124 4086859-0126 | | |
| | |
| | Semi-Annual Shareholder Report November 30, 2024 |
Nuveen Lifecycle Index 2055 Fund
Class I Shares/TTIHX
Semi-Annual Report
This semi-annual shareholder report contains important information about the Class I Shares of the Nuveen Lifecycle Index 2055 Fund for the period of June 1, 2024 to November 30, 2024. You can find additional information at https://www.nuveen.com/en‑us/mutual‑funds/prospectuses. You can also request this information by contacting us at (800) 257‑8787.
What were the Fund costs for the last six months? (based on a hypothetical $10,000 investment)
| | | | |
| | |
| | | Cost of a $10,000 investment | | Costs paid as a percentage of
$10,000 investment* |
| | | |
| Class I Shares | | $10 | | 0.20% |
* Annualized for period less than one year.
Fund Statistics (as of November 30, 2024)
| | | | |
| |
| Fund net assets | | $ | 4,387,961,025 | |
| |
| Total number of portfolio holdings | | | 5 | |
| |
| Portfolio turnover (%) | | | 3% | |
What did the Fund invest in? (as of November 30, 2024)
(1) Affiliated investment companies, except for repurchase agreements.
Availability of additional information about the Fund
You can find additional information about the Fund at https://www.nuveen.com/en‑us/mutual‑funds/prospectuses, including its:
| | • | | prospectus • financial statements and other information • fund holdings • proxy voting information |
You can also request this information at (800) 257‑8787.
| | |
87245P734_SAR_1124 4086873-0126 | | |
| | |
| | Semi-Annual Shareholder Report November 30, 2024 |
Nuveen Lifecycle Index 2055 Fund
Premier Class Shares/TTIPX
Semi-Annual Report
This semi-annual shareholder report contains important information about the Premier Class Shares of the Nuveen Lifecycle Index 2055 Fund for the period of June 1, 2024 to November 30, 2024. You can find additional information at https://www.nuveen.com/en‑us/mutual‑funds/prospectuses. You can also request this information by contacting us at (800) 257‑8787.
What were the Fund costs for the last six months? (based on a hypothetical $10,000 investment)
| | | | |
| | |
| | | Cost of a $10,000 investment | | Costs paid as a percentage of $10,000 investment* |
| | | |
| Premier Class Shares | | $13 | | 0.25% |
* Annualized for period less than one year.
Fund Statistics (as of November 30, 2024)
| | | | |
| |
| Fund net assets | | $ | 4,387,961,025 | |
| |
| Total number of portfolio holdings | | | 5 | |
| |
| Portfolio turnover (%) | | | 3% | |
What did the Fund invest in? (as of November 30, 2024)
(1) Affiliated investment companies, except for repurchase agreements.
Availability of additional information about the Fund
You can find additional information about the Fund at https://www.nuveen.com/en-us/mutual-funds/prospectuses, including its:
| | • | | prospectus • financial statements and other information • fund holdings • proxy voting information |
You can also request this information at (800) 257-8787.
| | |
87245M160_SAR_1124 4086873-0126 | | |
| | |
| | Semi-Annual Shareholder Report November 30, 2024 |
Nuveen Lifecycle Index 2055 Fund
Class R6 Shares/TTIIX
Semi-Annual Report
This semi-annual shareholder report contains important information about the Class R6 Shares of the Nuveen Lifecycle Index 2055 Fund for the period of June 1, 2024 to November 30, 2024. You can find additional information at https://www.nuveen.com/en‑us/mutual‑funds/prospectuses. You can also request this information by contacting us at (800) 257‑8787.
What were the Fund costs for the last six months? (based on a hypothetical $10,000 investment)
| | | | |
| | |
| | | Cost of a $10,000 investment | | Costs paid as a percentage of
$10,000 investment* |
| | | |
| Class R6 Shares | | $5 | | 0.10% |
* Annualized for period less than one year.
Fund Statistics (as of November 30, 2024)
| | | | |
| |
| Fund net assets | | $ | 4,387,961,025 | |
| |
| Total number of portfolio holdings | | | 5 | |
| |
| Portfolio turnover (%) | | | 3% | |
What did the Fund invest in? (as of November 30, 2024)
(1) Affiliated investment companies, except for repurchase agreements.
Availability of additional information about the Fund
You can find additional information about the Fund at https://www.nuveen.com/en‑us/mutual‑funds/prospectuses, including its:
| | • | | prospectus • financial statements and other information • fund holdings • proxy voting information |
You can also request this information at (800) 257‑8787.
| | |
87245M178_SAR_1124 4086873-0126 | | |
| | |
| | Semi-Annual Shareholder Report November 30, 2024 |
Nuveen Lifecycle Index 2055 Fund
Retirement Class Shares/TTIRX
Semi-Annual Report
This semi-annual shareholder report contains important information about the Retirement Class Shares of the Nuveen Lifecycle Index 2055 Fund for the period of June 1, 2024 to November 30, 2024. You can find additional information at
https://www.nuveen.com/en‑us/mutual‑funds/prospectuses. You can also request this information by contacting us at (800) 257‑8787.
What were the Fund costs for the last six months? (based on a hypothetical $10,000 investment)
| | | | |
| | |
| | | Cost of a $10,000 investment | | Costs paid as a percentage of
$10,000 investment* |
| | | |
| Retirement Class Shares | | $18 | | 0.35% |
* Annualized for period less than one year.
Fund Statistics (as of November 30, 2024)
| | | | |
| |
| Fund net assets | | $ | 4,387,961,025 | |
| |
| Total number of portfolio holdings | | | 5 | |
| |
| Portfolio turnover (%) | | | 3% | |
What did the Fund invest in? (as of November 30, 2024)
(1) Affiliated investment companies, except for repurchase agreements.
Availability of additional information about the Fund
You can find additional information about the Fund at https://www.nuveen.com/en‑us/mutual‑funds/prospectuses, including its:
| | • | | prospectus • financial statements and other information • fund holdings • proxy voting information |
You can also request this information at (800) 257‑8787.
| | |
87245M152_SAR_1124 4086873-0126 | | |
| | |
| | Semi-Annual Shareholder Report November 30, 2024 |
Nuveen Lifecycle Index 2060 Fund
Class I Shares/TVIHX
Semi-Annual Report
This semi-annual shareholder report contains important information about the Class I Shares of the Nuveen Lifecycle Index 2060 Fund for the period of June 1, 2024 to November 30, 2024. You can find additional information at https://www.nuveen.com/en‑us/mutual‑funds/prospectuses. You can also request this information by contacting us at (800) 257‑8787.
What were the Fund costs for the last six months? (based on a hypothetical $10,000 investment)
| | | | |
| | |
| | | Cost of a $10,000 investment | | Costs paid as a percentage of
$10,000 investment* |
| | | |
| Class I Shares | | $10 | | 0.20% |
* Annualized for period less than one year.
Fund Statistics (as of November 30, 2024)
| | | | |
| |
| Fund net assets | | $ | 2,492,080,837 | |
| |
| Total number of portfolio holdings | | | 5 | |
| |
| Portfolio turnover (%) | | | 3% | |
What did the Fund invest in? (as of November 30, 2024)
(1) Affiliated investment companies, except for repurchase agreements.
Availability of additional information about the Fund
You can find additional information about the Fund at https://www.nuveen.com/en‑us/mutual‑funds/prospectuses, including its:
| | • | | prospectus • financial statements and other information • fund holdings • proxy voting information |
You can also request this information at (800) 257‑8787.
| | |
87245P726_SAR_1124 4086889-0126 | | |
| | |
| | Semi-Annual Shareholder Report November 30, 2024 |
Nuveen Lifecycle Index 2060 Fund
Premier Class Shares/TVIPX
Semi-Annual Report
This semi-annual shareholder report contains important information about the Premier Class Shares of the Nuveen Lifecycle Index 2060 Fund for the period of June 1, 2024 to November 30, 2024. You can find additional information at https://www.nuveen.com/en‑us/mutual‑funds/prospectuses. You can also request this information by contacting us at (800) 257‑8787.
What were the Fund costs for the last six months? (based on a hypothetical $10,000 investment)
| | | | |
| | |
| | | Cost of a $10,000 investment | | Costs paid as a percentage of $10,000 investment* |
| | | |
| Premier Class Shares | | $13 | | 0.25% |
* Annualized for period less than one year.
Fund Statistics (as of November 30, 2024)
| | | | |
| |
| Fund net assets | | $ | 2,492,080,837 | |
| |
| Total number of portfolio holdings | | | 5 | |
| |
| Portfolio turnover (%) | | | 3% | |
What did the Fund invest in? (as of November 30, 2024)
(1) Affiliated investment companies, except for repurchase agreements.
Availability of additional information about the Fund
You can find additional information about the Fund at https://www.nuveen.com/en‑us/mutual‑funds/prospectuses, including its:
| | • | | prospectus • financial statements and other information • fund holdings • proxy voting information |
You can also request this information at (800) 257‑8787.
| | |
87245R540_SAR_1124 4086889-0126 | | |
| | |
| | Semi-Annual Shareholder Report November 30, 2024 |
Nuveen Lifecycle Index 2060 Fund
Class R6 Shares/TVIIX
Semi-Annual Report
This semi-annual shareholder report contains important information about the Class R6 Shares of the Nuveen Lifecycle Index 2060 Fund for the period of June 1, 2024 to November 30, 2024. You can find additional information at
https://www.nuveen.com/en‑us/mutual‑funds/prospectuses. You can also request this information by contacting us at (800) 257‑8787.
What were the Fund costs for the last six months? (based on a hypothetical $10,000 investment)
| | | | |
| | |
| | | Cost of a $10,000 investment | | Costs paid as a percentage of
$10,000 investment* |
| | | |
| Class R6 Shares | | $5 | | 0.10% |
* Annualized for period less than one year.
Fund Statistics (as of November 30, 2024)
| | | | |
| |
| Fund net assets | | $ | 2,492,080,837 | |
| |
| Total number of portfolio holdings | | | 5 | |
| |
| Portfolio turnover (%) | | | 3% | |
What did the Fund invest in? (as of November 30, 2024)
(1) Affiliated investment companies, except for repurchase agreements.
Availability of additional information about the Fund
You can find additional information about the Fund at https://www.nuveen.com/en‑us/mutual‑funds/prospectuses, including its:
| | • | | prospectus • financial statements and other information • fund holdings • proxy voting information |
You can also request this information at (800) 257‑8787.
| | |
87245R565_SAR_1124 4086889-0126 | | |
| | |
| | Semi-Annual Shareholder Report November 30, 2024 |
Nuveen Lifecycle Index 2060 Fund
Retirement Class Shares/TVITX
Semi-Annual Report
This semi-annual shareholder report contains important information about the Retirement Class Shares of the Nuveen Lifecycle Index 2060 Fund for the period of June 1, 2024 to November 30, 2024. You can find additional information at https://www.nuveen.com/en‑us/mutual‑funds/prospectuses. You can also request this information by contacting us at (800) 257‑8787.
What were the Fund costs for the last six months? (based on a hypothetical $10,000 investment)
| | | | |
| | |
| | | Cost of a $10,000 investment | | Costs paid as a percentage of $10,000 investment* |
| | | |
| Retirement Class Shares | | $18 | | 0.35% |
* Annualized for period less than one year.
Fund Statistics (as of November 30, 2024)
| | | | |
| |
| Fund net assets | | $ | 2,492,080,837 | |
| |
| Total number of portfolio holdings | | | 5 | |
| |
| Portfolio turnover (%) | | | 3% | |
What did the Fund invest in? (as of November 30, 2024)
(1) Affiliated investment companies, except for repurchase agreements.
Availability of additional information about the Fund
You can find additional information about the Fund at https://www.nuveen.com/en‑us/mutual‑funds/prospectuses, including its:
| | • | | prospectus • financial statements and other information • fund holdings • proxy voting information |
You can also request this information at (800) 257‑8787.
| | |
87245R557_SAR_1124 4086889-0126 | | |
| | |
| | Semi-Annual Shareholder Report November 30, 2024 |
Nuveen Lifecycle Index 2065 Fund
Class I Shares/TFIHX
Semi-Annual Report
This semi-annual shareholder report contains important information about the Class I Shares of the Nuveen Lifecycle Index 2065 Fund for the period of June 1, 2024 to November 30, 2024. You can find additional information at https://www.nuveen.com/en‑us/mutual‑funds/prospectuses. You can also request this information by contacting us at (800) 257‑8787.
What were the Fund costs for the last six months? (based on a hypothetical $10,000 investment)
| | | | |
| | |
| | | Cost of a $10,000 investment | | Costs paid as a percentage of
$10,000 investment* |
| | | |
| Class I Shares | | $10 | | 0.20% |
* Annualized for period less than one year.
Fund Statistics (as of November 30, 2024)
| | | | |
| |
| Fund net assets | | $ | 465,433,363 | |
| |
| Total number of portfolio holdings | | | 5 | |
| |
| Portfolio turnover (%) | | | 5% | |
What did the Fund invest in? (as of November 30, 2024)
(1) Affiliated investment companies, except for repurchase agreements.
Availability of additional information about the Fund
You can find additional information about the Fund at https://www.nuveen.com/en‑us/mutual‑funds/prospectuses, including its:
| | • | | prospectus • financial statements and other information • fund holdings • proxy voting information |
You can also request this information at (800) 257‑8787.
| | |
87249N735_SAR_1124 4086899-0126 | | |
| | |
| | Semi-Annual Shareholder Report November 30, 2024 |
Nuveen Lifecycle Index 2065 Fund
Premier Class Shares/TFIPX
Semi-Annual Report
This semi-annual shareholder report contains important information about the Premier Class Shares of the Nuveen Lifecycle Index 2065 Fund for the period of June 1, 2024 to November 30, 2024. You can find additional information at https://www.nuveen.com/en‑us/mutual‑funds/prospectuses. You can also request this information by contacting us at (800) 257‑8787.
What were the Fund costs for the last six months? (based on a hypothetical $10,000 investment)
| | | | |
| | |
| | | Cost of a $10,000 investment | | Costs paid as a percentage of
$10,000 investment* |
| | | |
| Premier Class Shares | | $13 | | 0.25% |
* Annualized for period less than one year.
Fund Statistics (as of November 30, 2024)
| | | | |
| |
| Fund net assets | | $ | 465,433,363 | |
| |
| Total number of portfolio holdings | | | 5 | |
| |
| Portfolio turnover (%) | | | 5% | |
What did the Fund invest in? (as of November 30, 2024)
(1) Affiliated investment companies, except for repurchase agreements.
Availability of additional information about the Fund
You can find additional information about the Fund at https://www.nuveen.com/en‑us/mutual‑funds/prospectuses, including its:
| | • | | prospectus • financial statements and other information • fund holdings • proxy voting information |
You can also request this information at (800) 257‑8787.
| | |
87249N719_SAR_1124 4086899-0126 | | |
| | |
| | Semi-Annual Shareholder Report November 30, 2024 |
Nuveen Lifecycle Index 2065 Fund
Class R6 Shares/TFITX
Semi-Annual Report
This semi-annual shareholder report contains important information about the Class R6 Shares of the Nuveen Lifecycle Index 2065 Fund for the period of June 1, 2024 to November 30, 2024. You can find additional information at https://www.nuveen.com/en‑us/mutual‑funds/prospectuses. You can also request this information by contacting us at (800) 257‑8787.
What were the Fund costs for the last six months? (based on a hypothetical $10,000 investment)
| | | | |
| | |
| | | Cost of a $10,000 investment | | Costs paid as a percentage of
$10,000 investment* |
| | | |
| Class R6 Shares | | $5 | | 0.10% |
* Annualized for period less than one year.
Fund Statistics (as of November 30, 2024)
| | | | |
| |
| Fund net assets | | $ | 465,433,363 | |
| |
| Total number of portfolio holdings | | | 5 | |
| |
| Portfolio turnover (%) | | | 5% | |
What did the Fund invest in? (as of November 30, 2024)
(1) Affiliated investment companies, except for repurchase agreements.
Availability of additional information about the Fund
You can find additional information about the Fund at https://www.nuveen.com/en‑us/mutual‑funds/prospectuses, including its:
| | • | | prospectus • financial statements and other information • fund holdings • proxy voting information |
You can also request this information at (800) 257‑8787.
| | |
87249N727_SAR_1124 4086899-0126 | | |
| | |
| | Semi-Annual Shareholder Report November 30, 2024 |
Nuveen Lifecycle Index 2065 Fund
Retirement Class Shares/TFIRX
Semi-Annual Report
This semi-annual shareholder report contains important information about the Retirement Class Shares of the Nuveen Lifecycle Index 2065 Fund for the period of June 1, 2024 to November 30, 2024. You can find additional information at https://www.nuveen.com/en‑us/mutual‑funds/prospectuses. You can also request this information by contacting us at (800) 257‑8787.
What were the Fund costs for the last six months? (based on a hypothetical $10,000 investment)
| | | | |
| | |
| | | Cost of a $10,000 investment | | Costs paid as a percentage of
$10,000 investment* |
| | | |
| Retirement Class Shares | | $18 | | 0.35% |
* Annualized for period less than one year.
Fund Statistics (as of November 30, 2024)
| | | | |
| |
| Fund net assets | | $ | 465,433,363 | |
| |
| Total number of portfolio holdings | | | 5 | |
| |
| Portfolio turnover (%) | | | 5% | |
What did the Fund invest in? (as of November 30, 2024)
(1) Affiliated investment companies, except for repurchase agreements.
Availability of additional information about the Fund
You can find additional information about the Fund at https://www.nuveen.com/en‑us/mutual‑funds/prospectuses, including its:
| | • | | prospectus • financial statements and other information • fund holdings • proxy voting information |
You can also request this information at (800) 257‑8787.
| | |
87249N693_SAR_1124 4086899-0126 | | |
| | |
| | Semi-Annual Shareholder Report November 30, 2024 |
Nuveen Lifestyle Aggressive Growth Fund
Class A Shares/TSALX
Semi-Annual Report
This semi-annual shareholder report contains important information about the Class A Shares of the Nuveen Lifestyle Aggressive Growth Fund for the period of June 1, 2024 to November 30, 2024. You can find additional information at https://www.nuveen.com/en‑us/mutual‑funds/prospectuses. You can also request this information by contacting us at (800) 257‑8787.
What were the Fund costs for the last six months? (based on a hypothetical $10,000 investment)
| | | | |
| | |
| | | Cost of a $10,000 investment | | Costs paid as a percentage of
$10,000 investment* |
| | | |
| Class A Shares | | $20 | | 0.38% |
* These costs do not include the expenses of the underlying funds in which the Fund invests. Annualized for period less than one year.
Fund Statistics (as of November 30, 2024)
| | | | |
| |
| Fund net assets | | $ | 262,545,091 | |
| |
| Total number of portfolio holdings | | | 13 | |
| |
| Portfolio turnover (%) | | | 6% | |
What did the Fund invest in? (as of November 30, 2024)
(1) Affiliated investment companies, except for repurchase agreements.
Availability of additional information about the Fund
You can find additional information about the Fund at https://www.nuveen.com/en‑us/mutual‑funds/prospectuses, including its:
| | • | | prospectus • financial statements and other information • fund holdings • proxy voting information |
You can also request this information at (800) 257‑8787.
| | |
4086945-0126 87245R755_SAR_1124 | | |
| | |
| | Semi-Annual Shareholder Report November 30, 2024 |
Nuveen Lifestyle Aggressive Growth Fund
Class I Shares/TSAHX
Semi-Annual Report
This semi-annual shareholder report contains important information about the Class I Shares of the Nuveen Lifestyle Aggressive Growth Fund for the period of June 1, 2024 to November 30, 2024. You can find additional information at https://www.nuveen.com/en‑us/mutual‑funds/prospectuses. You can also request this information by contacting us at (800) 257‑8787.
What were the Fund costs for the last six months? (based on a hypothetical $10,000 investment)
| | | | |
| | |
| | | Cost of a $10,000 investment | | Costs paid as a percentage of
$10,000 investment* |
| | | |
| Class I Shares | | $11 | | 0.21% |
* These costs do not include the expenses of the underlying funds in which the Fund invests. Annualized for period less than one year.
Fund Statistics (as of November 30, 2024)
| | | | |
| |
| Fund net assets | | $ | 262,545,091 | |
| |
| Total number of portfolio holdings | | | 13 | |
| |
| Portfolio turnover (%) | | | 6% | |
What did the Fund invest in? (as of November 30, 2024)
(1) Affiliated investment companies, except for repurchase agreements.
Availability of additional information about the Fund
You can find additional information about the Fund at https://www.nuveen.com/en‑us/mutual‑funds/prospectuses, including its:
| | • | | prospectus • financial statements and other information • fund holdings • proxy voting information |
You can also request this information at (800) 257‑8787.
| | |
4086945-0126 87245R227_SAR_1124 | | |
| | |
| | Semi-Annual Shareholder Report November 30, 2024 |
Nuveen Lifestyle Aggressive Growth Fund
Class R6 Shares/TSAIX
Semi-Annual Report
This semi-annual shareholder report contains important information about the Class R6 Shares of the Nuveen Lifestyle Aggressive Growth Fund for the period of June 1, 2024 to November 30, 2024. You can find additional information at https://www.nuveen.com/en‑us/mutual‑funds/prospectuses. You can also request this information by contacting us at (800) 257‑8787.
What were the Fund costs for the last six months? (based on a hypothetical $10,000 investment)
| | | | |
| | |
| | | Cost of a $10,000 investment | | Costs paid as a percentage of
$10,000 investment* |
| | | |
| Class R6 Shares | | $5 | | 0.10% |
* These costs do not include the expenses of the underlying funds in which the Fund invests. Annualized for period less than one year.
Fund Statistics (as of November 30, 2024)
| | | | |
| |
| Fund net assets | | $ | 262,545,091 | |
| |
| Total number of portfolio holdings | | | 13 | |
| |
| Portfolio turnover (%) | | | 6% | |
What did the Fund invest in? (as of November 30, 2024)
(1) Affiliated investment companies, except for repurchase agreements.
Availability of additional information about the Fund
You can find additional information about the Fund at https://www.nuveen.com/en‑us/mutual‑funds/prospectuses, including its:
| | • | | prospectus • financial statements and other information • fund holdings • proxy voting information |
You can also request this information at (800) 257‑8787.
| | |
4086945-0126 87245R748_SAR_1124 | | |
| | |
| | Semi-Annual Shareholder Report November 30, 2024 |
Nuveen Lifestyle Aggressive Growth Fund
Retirement Class Shares/TSARX
Semi-Annual Report
This semi-annual shareholder report contains important information about the Retirement Class Shares of the Nuveen Lifestyle Aggressive Growth Fund for the period of June 1, 2024 to November 30, 2024. You can find additional information at https://www.nuveen.com/en‑us/mutual‑funds/prospectuses. You can also request this information by contacting us at (800) 257‑8787.
What were the Fund costs for the last six months? (based on a hypothetical $10,000 investment)
| | | | |
| | |
| | | Cost of a $10,000 investment | | Costs paid as a percentage of
$10,000 investment* |
| | | |
| Retirement Class Shares | | $18 | | 0.35% |
* These costs do not include the expenses of the underlying funds in which the Fund invests. Annualized for period less than one year.
Fund Statistics (as of November 30, 2024)
| | | | |
| |
| Fund net assets | | $ | 262,545,091 | |
| |
| Total number of portfolio holdings | | | 13 | |
| |
| Portfolio turnover (%) | | | 6% | |
What did the Fund invest in? (as of November 30, 2024)
(1) Affiliated investment companies, except for repurchase agreements.
Availability of additional information about the Fund
You can find additional information about the Fund at https://www.nuveen.com/en‑us/mutual‑funds/prospectuses, including its:
| | • | | prospectus • financial statements and other information • fund holdings • proxy voting information |
You can also request this information at (800) 257‑8787.
| | |
4086945-0126 87245R722_SAR_1124 | | |
| | |
| | Semi-Annual Shareholder Report November 30, 2024 |
Nuveen Lifestyle Aggressive Growth Fund
Premier Class Shares/TSAPX
Semi-Annual Report
This semi-annual shareholder report contains important information about the Premier Class Shares of the Nuveen Lifestyle Aggressive Growth Fund for the period of June 1, 2024 to November 30, 2024. You can find additional information at https://www.nuveen.com/en‑us/mutual‑funds/prospectuses. You can also request this information by contacting us at (800) 257‑8787.
What were the Fund costs for the last six months? (based on a hypothetical $10,000 investment)
| | | | |
| | |
| | | Cost of a $10,000 investment | | Costs paid as a percentage of
$10,000 investment* |
| | | |
| Premier Class Shares | | $13 | | 0.25% |
* These costs do not include the expenses of the underlying funds in which the Fund invests. Annualized for period less than one year.
Fund Statistics (as of November 30, 2024)
| | | | |
| |
| Fund net assets | | $ | 262,545,091 | |
| |
| Total number of portfolio holdings | | | 13 | |
| |
| Portfolio turnover (%) | | | 6% | |
What did the Fund invest in? (as of November 30, 2024)
(1) Affiliated investment companies, except for repurchase agreements.
Availability of additional information about the Fund
You can find additional information about the Fund at https://www.nuveen.com/en‑us/mutual‑funds/prospectuses, including its:
| | • | | prospectus • financial statements and other information • fund holdings • proxy voting information |
You can also request this information at (800) 257‑8787.
| | |
4086945-0126 87245R730_SAR_1124 | | |
| | |
| | Semi-Annual Shareholder Report November 30, 2024 |
Nuveen Lifestyle Conservative Fund
Class A Shares/TSCLX
Semi-Annual Report
This semi-annual shareholder report contains important information about the Class A Shares of the Nuveen Lifestyle Conservative Fund for the period of June 1, 2024 to November 30, 2024. You can find additional information at https://www.nuveen.com/en‑us/mutual‑funds/prospectuses. You can also request this information by contacting us at (800) 257‑8787.
What were the Fund costs for the last six months? (based on a hypothetical $10,000 investment)
| | | | |
| | |
| | | Cost of a $10,000 investment | | Costs paid as a percentage of
$10,000 investment* |
| | | |
| Class A Shares | | $19 | | 0.37% |
* These costs do not include the expenses of the underlying funds in which the Fund invests. Annualized for period less than one year.
Fund Statistics (as of November 30, 2024)
| | | | |
| |
| Fund net assets | | $ | 316,830,650 | |
| |
| Total number of portfolio holdings | | | 16 | |
| |
| Portfolio turnover (%) | | | 5% | |
What did the Fund invest in? (as of November 30, 2024)
(1) Affiliated investment companies, except for repurchase agreements.
Availability of additional information about the Fund
You can find additional information about the Fund at https://www.nuveen.com/en‑us/mutual‑funds/prospectuses, including its:
| | • | | prospectus • financial statements and other information • fund holdings • proxy voting information |
You can also request this information at (800) 257‑8787.
| | |
4086917-0126 87245R888_SAR_1124 | | |
| | |
| | Semi-Annual Shareholder Report November 30, 2024 |
Nuveen Lifestyle Conservative Fund
Class I Shares/TLSHX
Semi-Annual Report
This semi-annual shareholder report contains important information about the Class I Shares of the Nuveen Lifestyle Conservative Fund for the period of June 1, 2024 to November 30, 2024. You can find additional information at https://www.nuveen.com/en‑us/mutual‑funds/prospectuses. You can also request this information by contacting us at (800) 257‑8787.
What were the Fund costs for the last six months? (based on a hypothetical $10,000 investment)
| | | | |
| | |
| | | Cost of a $10,000 investment | | Costs paid as a percentage of
$10,000 investment* |
| | | |
| Class I Shares | | $12 | | 0.23% |
* These costs do not include the expenses of the underlying funds in which the Fund invests. Annualized for period less than one year.
Fund Statistics (as of November 30, 2024)
| | | | |
| |
| Fund net assets | | $ | 316,830,650 | |
| |
| Total number of portfolio holdings | | | 16 | |
| |
| Portfolio turnover (%) | | | 5% | |
What did the Fund invest in? (as of November 30, 2024)
(1) Affiliated investment companies, except for repurchase agreements.
Availability of additional information about the Fund
You can find additional information about the Fund at https://www.nuveen.com/en‑us/mutual‑funds/prospectuses, including its:
| | • | | prospectus • financial statements and other information • fund holdings • proxy voting information |
You can also request this information at (800) 257‑8787.
| | |
4086917-0126 87245R250_SAR_1124 | | |
| | |
| | Semi-Annual Shareholder Report November 30, 2024 |
Nuveen Lifestyle Conservative Fund
Premier Class Shares/TLSPX
Semi-Annual Report
This semi-annual shareholder report contains important information about the Premier Class Shares of the Nuveen Lifestyle Conservative Fund for the period of June 1, 2024 to November 30, 2024. You can find additional information at https://www.nuveen.com/en‑us/mutual‑funds/prospectuses. You can also request this information by contacting us at (800) 257‑8787.
What were the Fund costs for the last six months? (based on a hypothetical $10,000 investment)
| | | | |
| | |
| | | Cost of a $10,000 investment | | Costs paid as a percentage of $10,000 investment* |
| | | |
| Premier Class Shares | | $13 | | 0.25% |
* These costs do not include the expenses of the underlying funds in which the Fund invests. Annualized for period less than one year.
Fund Statistics (as of November 30, 2024)
| | | | |
| |
| Fund net assets | | $ | 316,830,650 | |
| |
| Total number of portfolio holdings | | | 16 | |
| |
| Portfolio turnover (%) | | | 5% | |
What did the Fund invest in? (as of November 30, 2024)
(1) Affiliated investment companies, except for repurchase agreements.
Availability of additional information about the Fund
You can find additional information about the Fund at https://www.nuveen.com/en‑us/mutual‑funds/prospectuses, including its:
| | • | | prospectus • financial statements and other information • fund holdings • proxy voting information |
You can also request this information at (800) 257‑8787.
| | |
4086917-0126 87245R862_SAR_1124 | | |
| | |
| | Semi-Annual Shareholder Report November 30, 2024 |
Nuveen Lifestyle Conservative Fund
Class R6 Shares/TCSIX
Semi-Annual Report
This semi-annual shareholder report contains important information about the Class R6 Shares of the Nuveen Lifestyle Conservative Fund for the period of June 1, 2024 to November 30, 2024. You can find additional information at https://www.nuveen.com/en‑us/mutual‑funds/prospectuses. You can also request this information by contacting us at (800) 257‑8787.
What were the Fund costs for the last six months? (based on a hypothetical $10,000 investment)
| | | | |
| | |
| | | Cost of a $10,000 investment | | Costs paid as a percentage of $10,000 investment* |
| | | |
| Class R6 Shares | | $5 | | 0.10% |
* These costs do not include the expenses of the underlying funds in which the Fund invests. Annualized for period less than one year.
Fund Statistics (as of November 30, 2024)
| | | | |
| |
| Fund net assets | | $ | 316,830,650 | |
| |
| Total number of portfolio holdings | | | 16 | |
| |
| Portfolio turnover (%) | | | 5% | |
What did the Fund invest in? (as of November 30, 2024)
(1) Affiliated investment companies, except for repurchase agreements.
Availability of additional information about the Fund
You can find additional information about the Fund at https://www.nuveen.com/en‑us/mutual‑funds/prospectuses, including its:
| | • | | prospectus • financial statements and other information • fund holdings • proxy voting information |
You can also request this information at (800) 257‑8787.
| | |
4086917-0126 87245R870_SAR_1124 | | |
| | |
| | Semi-Annual Shareholder Report November 30, 2024 |
Nuveen Lifestyle Conservative Fund
Retirement Class Shares/TSCTX
Semi-Annual Report
This semi-annual shareholder report contains important information about the Retirement Class Shares of the Nuveen Lifestyle Conservative Fund for the period of June 1, 2024 to November 30, 2024. You can find additional information at https://www.nuveen.com/en‑us/mutual‑funds/prospectuses. You can also request this information by contacting us at (800) 257‑8787.
What were the Fund costs for the last six months? (based on a hypothetical $10,000 investment)
| | | | |
| | |
| | | Cost of a $10,000 investment | | Costs paid as a percentage of $10,000 investment* |
| | | |
| Retirement Class Shares | | $18 | | 0.35% |
* These costs do not include the expenses of the underlying funds in which the Fund invests. Annualized for period less than one year.
Fund Statistics (as of November 30, 2024)
| | | | |
| |
| Fund net assets | | $ | 316,830,650 | |
| |
| Total number of portfolio holdings | | | 16 | |
| |
| Portfolio turnover (%) | | | 5% | |
What did the Fund invest in? (as of November 30, 2024)
(1) Affiliated investment companies, except for repurchase agreements.
Availability of additional information about the Fund
You can find additional information about the Fund at https://www.nuveen.com/en‑us/mutual‑funds/prospectuses, including its:
| | • | | prospectus • financial statements and other information • fund holdings • proxy voting information |
You can also request this information at (800) 257‑8787.
| | |
4086917-0126 87245R854_SAR_1124 | | |
| | |
| | Semi-Annual Shareholder Report November 30, 2024 |
Nuveen Lifestyle Growth Fund
Class A Shares/TSGLX
Semi-Annual Report
This semi-annual shareholder report contains important information about the Class A Shares of the Nuveen Lifestyle Growth Fund for the period of June 1, 2024 to November 30, 2024. You can find additional information at https://www.nuveen.com/en‑us/mutual‑funds/prospectuses. You can also request this information by contacting us at (800) 257‑8787.
What were the Fund costs for the last six months? (based on a hypothetical $10,000 investment)
| | | | |
| | |
| | | Cost of a $10,000 investment | | Costs paid as a percentage of $10,000 investment* |
| | | |
| Class A Shares | | $19 | | 0.37% |
* These costs do not include the expenses of the underlying funds in which the Fund invests. Annualized for period less than one year.
Fund Statistics (as of November 30, 2024)
| | | | |
| |
| Fund net assets | | $ | 319,007,357 | |
| |
| Total number of portfolio holdings | | | 14 | |
| |
| Portfolio turnover (%) | | | 5% | |
What did the Fund invest in? (as of November 30, 2024)
(1) Affiliated investment companies, except for repurchase agreements.
Availability of additional information about the Fund
You can find additional information about the Fund at https://www.nuveen.com/en‑us/mutual‑funds/prospectuses, including its:
| | • | | prospectus • financial statements and other information • fund holdings • proxy voting information |
You can also request this information at (800) 257‑8787.
| | |
4086939-0126 87245R797_SAR_1124 | | |
| | |
| | Semi-Annual Shareholder Report November 30, 2024 |
Nuveen Lifestyle Growth Fund
Class I Shares/TSGHX
Semi-Annual Report
This semi-annual shareholder report contains important information about the Class I Shares of the Nuveen Lifestyle Growth Fund for the period of June 1, 2024 to November 30, 2024. You can find additional information at https://www.nuveen.com/en‑us/mutual‑funds/prospectuses. You can also request this information by contacting us at (800) 257‑8787.
What were the Fund costs for the last six months? (based on a hypothetical $10,000 investment)
| | | | |
| | |
| | | Cost of a $10,000 investment | | Costs paid as a percentage of $10,000 investment* |
| | | |
| Class I Shares | | $11 | | 0.22% |
* These costs do not include the expenses of the underlying funds in which the Fund invests. Annualized for period less than one year.
Fund Statistics (as of November 30, 2024)
| | |
| |
| Fund net assets | | $319,007,357 |
| |
| Total number of portfolio holdings | | 14 |
| |
| Portfolio turnover (%) | | 5% |
What did the Fund invest in? (as of November 30, 2024)
(1) Affiliated investment companies, except for repurchase agreements.
Availability of additional information about the Fund
You can find additional information about the Fund at https://www.nuveen.com/en‑us/mutual‑funds/prospectuses, including its:
| | • | | prospectus • financial statements and other information • fund holdings • proxy voting information |
You can also request this information at (800) 257‑8787.
| | |
4086939-0126 87245R235_SAR_1124 | | |
| | |
| | Semi-Annual Shareholder Report November 30, 2024 |
Nuveen Lifestyle Growth Fund
Premier Class Shares/TSGPX
Semi-Annual Report
This semi-annual shareholder report contains important information about the Premier Class Shares of the Nuveen Lifestyle Growth Fund for the period of June 1, 2024 to November 30, 2024. You can find additional information at https://www.nuveen.com/en‑us/mutual‑funds/prospectuses. You can also request this information by contacting us at (800) 257‑8787.
What were the Fund costs for the last six months? (based on a hypothetical $10,000 investment)
| | | | |
| | |
| | | Cost of a $10,000 investment | | Costs paid as a percentage of $10,000 investment* |
| | | |
| Premier Class Shares | | $13 | | 0.25% |
* These costs do not include the expenses of the underlying funds in which the Fund invests. Annualized for period less than one year.
Fund Statistics (as of November 30, 2024)
| | | | |
| |
| Fund net assets | | $ | 319,007,357 | |
| |
| Total number of portfolio holdings | | | 14 | |
| |
| Portfolio turnover (%) | | | 5% | |
What did the Fund invest in? (as of November 30, 2024)
(1) Affiliated investment companies, except for repurchase agreements.
Availability of additional information about the Fund
You can find additional information about the Fund at https://www.nuveen.com/en‑us/mutual‑funds/prospectuses, including its:
| | • | | prospectus • financial statements and other information • fund holdings • proxy voting information |
You can also request this information at (800) 257‑8787.
| | |
4086939-0126 87245R771_SAR_1124 | | |
| | |
| | Semi-Annual Shareholder Report November 30, 2024 |
Nuveen Lifestyle Growth Fund
Class R6 Shares/TSGGX
Semi-Annual Report
This semi-annual shareholder report contains important information about the Class R6 Shares of the Nuveen Lifestyle Growth Fund for the period of June 1, 2024 to November 30, 2024. You can find additional information at https://www.nuveen.com/en‑us/mutual‑funds/prospectuses. You can also request this information by contacting us at (800) 257‑8787.
What were the Fund costs for the last six months? (based on a hypothetical $10,000 investment)
| | | | |
| | |
| | | Cost of a $10,000 investment | | Costs paid as a percentage of
$10,000 investment* |
| | | |
| Class R6 Shares | | $5 | | 0.10% |
* These costs do not include the expenses of the underlying funds in which the Fund invests. Annualized for period less than one year.
Fund Statistics (as of November 30, 2024)
| | | | |
| |
| Fund net assets | | $ | 319,007,357 | |
| |
| Total number of portfolio holdings | | | 14 | |
| |
| Portfolio turnover (%) | | | 5% | |
What did the Fund invest in? (as of November 30, 2024)
(1) Affiliated investment companies, except for repurchase agreements.
Availability of additional information about the Fund
You can find additional information about the Fund at https://www.nuveen.com/en‑us/mutual‑funds/prospectuses, including its:
| | • | | prospectus • financial statements and other information • fund holdings • proxy voting information |
You can also request this information at (800) 257‑8787.
| | |
4086939-0126 87245R789_SAR_1124 | | |
| | |
| | Semi-Annual Shareholder Report November 30, 2024 |
Nuveen Lifestyle Growth Fund
Retirement Class Shares/TSGRX
Semi-Annual Report
This semi-annual shareholder report contains important information about the Retirement Class Shares of the Nuveen Lifestyle Growth Fund for the period of June 1, 2024 to November 30, 2024. You can find additional information at https://www.nuveen.com/en‑us/mutual‑funds/prospectuses. You can also request this information by contacting us at (800) 257‑8787.
What were the Fund costs for the last six months? (based on a hypothetical $10,000 investment)
| | | | |
| | |
| | | Cost of a $10,000 investment | | Costs paid as a percentage of
$10,000 investment* |
| | | |
| Retirement Class Shares | | $18 | | 0.35% |
* These costs do not include the expenses of the underlying funds in which the Fund invests. Annualized for period less than one year.
Fund Statistics (as of November 30, 2024)
| | | | |
| |
| Fund net assets | | $ | 319,007,357 | |
| |
| Total number of portfolio holdings | | | 14 | |
| |
| Portfolio turnover (%) | | | 5% | |
What did the Fund invest in? (as of November 30, 2024)
(1) Affiliated investment companies, except for repurchase agreements.
Availability of additional information about the Fund
You can find additional information about the Fund at https://www.nuveen.com/en‑us/mutual‑funds/prospectuses, including its:
| | • | | prospectus • financial statements and other information • fund holdings • proxy voting information |
You can also request this information at (800) 257‑8787.
| | |
4086939-0126 87245R763_SAR_1124 | | |
| | |
| | Semi-Annual Shareholder Report November 30, 2024 |
Nuveen Lifestyle Income Fund
Class A Shares/TSILX
Semi-Annual Report
This semi-annual shareholder report contains important information about the Class A Shares of the Nuveen Lifestyle Income Fund for the period of June 1, 2024 to November 30, 2024. You can find additional information at https://www.nuveen.com/en‑us/mutual‑funds/prospectuses. You can also request this information by contacting us at (800) 257‑8787.
What were the Fund costs for the last six months? (based on a hypothetical $10,000 investment)
| | | | |
| | |
| | | Cost of a $10,000 investment | | Costs paid as a percentage of
$10,000 investment* |
| | | |
| Class A Shares | | $19 | | 0.37% |
* These costs do not include the expenses of the underlying funds in which the Fund invests. Annualized for period less than one year.
Fund Statistics (as of November 30, 2024)
| | | | |
| |
| Fund net assets | | $ | 76,379,969 | |
| |
| Total number of portfolio holdings | | | 15 | |
| |
| Portfolio turnover (%) | | | 7% | |
What did the Fund invest in? (as of November 30, 2024)
(1) Affiliated investment companies.
Availability of additional information about the Fund
You can find additional information about the Fund at https://www.nuveen.com/en‑us/mutual‑funds/prospectuses, including its:
| | • | | prospectus • financial statements and other information • fund holdings • proxy voting information |
You can also request this information at (800) 257‑8787.
| | |
4086908-0126 87245R508_SAR_1124 | | |
| | |
| | Semi-Annual Shareholder Report November 30, 2024 |
Nuveen Lifestyle Income Fund
Class I Shares/TSIHX
Semi-Annual Report
This semi-annual shareholder report contains important information about the Class I Shares of the Nuveen Lifestyle Income Fund for the period of June 1, 2024 to November 30, 2024. You can find additional information at https://www.nuveen.com/en‑us/mutual‑funds/prospectuses. You can also request this information by contacting us at (800) 257‑8787.
What were the Fund costs for the last six months? (based on a hypothetical $10,000 investment)
| | | | |
| | |
| | | Cost of a $10,000 investment | | Costs paid as a percentage of
$10,000 investment* |
| | | |
| Class I Shares | | $8 | | 0.15% |
* These costs do not include the expenses of the underlying funds in which the Fund invests. Annualized for period less than one year.
Fund Statistics (as of November 30, 2024)
| | | | |
| |
| Fund net assets | | $ | 76,379,969 | |
| |
| Total number of portfolio holdings | | | 15 | |
| |
| Portfolio turnover (%) | | | 7% | |
What did the Fund invest in? (as of November 30, 2024)
(1) Affiliated investment companies.
Availability of additional information about the Fund
You can find additional information about the Fund at https://www.nuveen.com/en‑us/mutual‑funds/prospectuses, including its:
| | • | | prospectus • financial statements and other information • fund holdings • proxy voting information |
You can also request this information at (800) 257‑8787.
| | |
4086908-0126 87245R268_SAR_1124 | | |
| | |
| | Semi-Annual Shareholder Report November 30, 2024 |
Nuveen Lifestyle Income Fund
Premier Class Shares/TSIPX
Semi-Annual Report
This semi-annual shareholder report contains important information about the Premier Class Shares of the Nuveen Lifestyle Income Fund for the period of June 1, 2024 to November 30, 2024. You can find additional information at https://www.nuveen.com/en‑us/mutual‑funds/prospectuses. You can also request this information by contacting us at (800) 257‑8787.
What were the Fund costs for the last six months? (based on a hypothetical $10,000 investment)
| | | | |
| | |
| | | Cost of a $10,000 investment | | Costs paid as a percentage of
$10,000 investment* |
| | | |
| Premier Class Shares | | $13 | | 0.25% |
* These costs do not include the expenses of the underlying funds in which the Fund invests. Annualized for period less than one year.
Fund Statistics (as of November 30, 2024)
| | | | |
| |
| Fund net assets | | $ | 76,379,969 | |
| |
| Total number of portfolio holdings | | | 15 | |
| |
| Portfolio turnover (%) | | | 7% | |
What did the Fund invest in? (as of November 30, 2024)
(1) Affiliated investment companies.
Availability of additional information about the Fund
You can find additional information about the Fund at https://www.nuveen.com/en‑us/mutual‑funds/prospectuses, including its:
| | • | | prospectus • financial statements and other information • fund holdings • proxy voting information |
You can also request this information at (800) 257‑8787.
| | |
4086908-0126 87245R706_SAR_1124 | | |
| | |
| | Semi-Annual Shareholder Report November 30, 2024 |
Nuveen Lifestyle Income Fund
Class R6 Shares/TSITX
Semi-Annual Report
This semi-annual shareholder report contains important information about the Class R6 Shares of the Nuveen Lifestyle Income Fund for the period of June 1, 2024 to November 30, 2024. You can find additional information at https://www.nuveen.com/en‑us/mutual‑funds/prospectuses. You can also request this information by contacting us at (800) 257‑8787.
What were the Fund costs for the last six months? (based on a hypothetical $10,000 investment)
| | | | |
| | |
| | | Cost of a $10,000 investment | | Costs paid as a percentage of
$10,000 investment* |
| | | |
| Class R6 Shares | | $5 | | 0.10% |
* These costs do not include the expenses of the underlying funds in which the Fund invests. Annualized for period less than one year.
Fund Statistics (as of November 30, 2024)
| | | | |
| |
| Fund net assets | | $ | 76,379,969 | |
| |
| Total number of portfolio holdings | | | 15 | |
| |
| Portfolio turnover (%) | | | 7% | |
What did the Fund invest in? (as of November 30, 2024)
(1) Affiliated investment companies.
Availability of additional information about the Fund
You can find additional information about the Fund at https://www.nuveen.com/en‑us/mutual‑funds/prospectuses, including its:
| | • | | prospectus • financial statements and other information • fund holdings • proxy voting information |
You can also request this information at (800) 257‑8787.
| | |
4086908-0126 87245R607_SAR_1124 | | |
| | |
| | Semi-Annual Shareholder Report November 30, 2024 |
Nuveen Lifestyle Income Fund
Retirement Class Shares/TLSRX
Semi-Annual Report
This semi-annual shareholder report contains important information about the Retirement Class Shares of the Nuveen Lifestyle Income Fund for the period of June 1, 2024 to November 30, 2024. You can find additional information at https://www.nuveen.com/en‑us/mutual‑funds/prospectuses. You can also request this information by contacting us at (800) 257‑8787.
What were the Fund costs for the last six months? (based on a hypothetical $10,000 investment)
| | | | |
| | |
| | | Cost of a $10,000 investment | | Costs paid as a percentage of
$10,000 investment* |
| | | |
| Retirement Class Shares | | $18 | | 0.35% |
* These costs do not include the expenses of the underlying funds in which the Fund invests. Annualized for period less than one year.
Fund Statistics (as of November 30, 2024)
| | | | |
| |
| Fund net assets | | $ | 76,379,969 | |
| |
| Total number of portfolio holdings | | | 15 | |
| |
| Portfolio turnover (%) | | | 7% | |
What did the Fund invest in? (as of November 30, 2024)
(1) Affiliated investment companies.
Availability of additional information about the Fund
You can find additional information about the Fund at https://www.nuveen.com/en‑us/mutual‑funds/prospectuses, including its:
| | • | | prospectus • financial statements and other information • fund holdings • proxy voting information |
You can also request this information at (800) 257‑8787.
| | |
4086908-0126 87245R805_SAR_1124 | | |
| | |
| | Semi-Annual Shareholder Report November 30, 2024 |
Nuveen Lifestyle Moderate Fund
Class A Shares/TSMLX
Semi-Annual Report
This semi-annual shareholder report contains important information about the Class A Shares of the Nuveen Lifestyle Moderate Fund for the period of June 1, 2024 to November 30, 2024. You can find additional information at https://www.nuveen.com/en‑us/mutual‑funds/prospectuses. You can also request this information by contacting us at (800) 257‑8787.
What were the Fund costs for the last six months? (based on a hypothetical $10,000 investment)
| | | | |
| | |
| | | Cost of a $10,000 investment | | Costs paid as a percentage of $10,000 investment* |
| | | |
| Class A Shares | | $19 | | 0.37% |
* These costs do not include the expenses of the underlying funds in which the Fund invests. Annualized for period less than one year.
Fund Statistics (as of November 30, 2024)
| | | | |
| |
| Fund net assets | | $ | 586,605,184 | |
| |
| Total number of portfolio holdings | | | 14 | |
| |
| Portfolio turnover (%) | | | 6% | |
What did the Fund invest in? (as of November 30, 2024)
(1) Affiliated investment companies, except for repurchase agreements.
Availability of additional information about the Fund
You can find additional information about the Fund at https://www.nuveen.com/en‑us/mutual‑funds/prospectuses, including its:
| | • | | prospectus • financial statements and other information • fund holdings • proxy voting information |
You can also request this information at (800) 257‑8787.
| | |
4086930-0126 87245R847_SAR_1124 | | |
| | |
| | Semi-Annual Shareholder Report November 30, 2024 |
Nuveen Lifestyle Moderate Fund
Class I Shares/TSMHX
Semi-Annual Report
This semi-annual shareholder report contains important information about the Class I Shares of the Nuveen Lifestyle Moderate Fund for the period of June 1, 2024 to November 30, 2024. You can find additional information at https://www.nuveen.com/en‑us/mutual‑funds/prospectuses. You can also request this information by contacting us at (800) 257‑8787.
What were the Fund costs for the last six months? (based on a hypothetical $10,000 investment)
| | | | |
| | |
| | | Cost of a $10,000 investment | | Costs paid as a percentage of $10,000 investment* |
| | | |
| Class I Shares | | $11 | | 0.22% |
* These costs do not include the expenses of the underlying funds in which the Fund invests. Annualized for period less than one year.
Fund Statistics (as of November 30, 2024)
| | | | |
| |
| Fund net assets | | $ | 586,605,184 | |
| |
| Total number of portfolio holdings | | | 14 | |
| |
| Portfolio turnover (%) | | | 6% | |
What did the Fund invest in? (as of November 30, 2024)
(1) Affiliated investment companies, except for repurchase agreements.
Availability of additional information about the Fund
You can find additional information about the Fund at https://www.nuveen.com/en‑us/mutual‑funds/prospectuses, including its:
| | • | | prospectus • financial statements and other information • fund holdings • proxy voting information |
You can also request this information at (800) 257‑8787.
| | |
4086930-0126 87245R243_SAR_1124 | | |
| | |
| | Semi-Annual Shareholder Report November 30, 2024 |
Nuveen Lifestyle Moderate Fund
Premier Class Shares/TSMPX
Semi-Annual Report
This semi-annual shareholder report contains important information about the Premier Class Shares of the Nuveen Lifestyle Moderate Fund for the period of June 1, 2024 to November 30, 2024. You can find additional information at https://www.nuveen.com/en‑us/mutual‑funds/prospectuses. You can also request this information by contacting us at (800) 257‑8787.
What were the Fund costs for the last six months? (based on a hypothetical $10,000 investment)
| | | | |
| | |
| | | Cost of a $10,000 investment | | Costs paid as a percentage of $10,000 investment* |
| | | |
| Premier Class Shares | | $13 | | 0.25% |
* These costs do not include the expenses of the underlying funds in which the Fund invests. Annualized for period less than one year.
Fund Statistics (as of November 30, 2024)
| | | | |
| |
| Fund net assets | | $ | 586,605,184 | |
| |
| Total number of portfolio holdings | | | 14 | |
| |
| Portfolio turnover (%) | | | 6% | |
What did the Fund invest in? (as of November 30, 2024)
(1) Affiliated investment companies, except for repurchase agreements.
Availability of additional information about the Fund
You can find additional information about the Fund at https://www.nuveen.com/en‑us/mutual‑funds/prospectuses, including its:
| | • | | prospectus • financial statements and other information • fund holdings • proxy voting information |
You can also request this information at (800) 257‑8787.
| | |
4086930-0126 87245R821_SAR_1124 | | |
| | |
| | Semi-Annual Shareholder Report November 30, 2024 |
Nuveen Lifestyle Moderate Fund
Class R6 Shares/TSIMX
Semi-Annual Report
This semi-annual shareholder report contains important information about the Class R6 Shares of the Nuveen Lifestyle Moderate Fund for the period of June 1, 2024 to November 30, 2024. You can find additional information at https://www.nuveen.com/en‑us/mutual‑funds/prospectuses. You can also request this information by contacting us at (800) 257‑8787.
What were the Fund costs for the last six months? (based on a hypothetical $10,000 investment)
| | | | |
| | |
| | | Cost of a $10,000 investment | | Costs paid as a percentage of
$10,000 investment* |
| | | |
| Class R6 Shares | | $5 | | 0.10% |
* These costs do not include the expenses of the underlying funds in which the Fund invests. Annualized for period less than one year.
Fund Statistics (as of November 30, 2024)
| | | | |
| |
| Fund net assets | | $ | 586,605,184 | |
| |
| Total number of portfolio holdings | | | 14 | |
| |
| Portfolio turnover (%) | | | 6% | |
What did the Fund invest in? (as of November 30, 2024)
(1) Affiliated investment companies, except for repurchase agreements.
Availability of additional information about the Fund
You can find additional information about the Fund at https://www.nuveen.com/en‑us/mutual‑funds/prospectuses, including its:
| | • | | prospectus • financial statements and other information • fund holdings • proxy voting information |
You can also request this information at (800) 257‑8787.
| | |
4086930-0126 87245R839_SAR_1124 | | |
| | |
| | Semi-Annual Shareholder Report November 30, 2024 |
Nuveen Lifestyle Moderate Fund
Retirement Class Shares/TSMTX
Semi-Annual Report
This semi-annual shareholder report contains important information about the Retirement Class Shares of the Nuveen Lifestyle Moderate Fund for the period of June 1, 2024 to November 30, 2024. You can find additional information at https://www.nuveen.com/en‑us/mutual‑funds/prospectuses. You can also request this information by contacting us at (800) 257‑8787.
What were the Fund costs for the last six months? (based on a hypothetical $10,000 investment)
| | | | |
| | |
| | | Cost of a $10,000 investment | | Costs paid as a percentage of
$10,000 investment* |
| | | |
| Retirement Class Shares | | $18 | | 0.35% |
* These costs do not include the expenses of the underlying funds in which the Fund invests. Annualized for period less than one year.
Fund Statistics (as of November 30, 2024)
| | | | |
| |
| Fund net assets | | $ | 586,605,184 | |
| |
| Total number of portfolio holdings | | | 14 | |
| |
| Portfolio turnover (%) | | | 6% | |
What did the Fund invest in? (as of November 30, 2024)
(1) Affiliated investment companies, except for repurchase agreements.
Availability of additional information about the Fund
You can find additional information about the Fund at https://www.nuveen.com/en‑us/mutual‑funds/prospectuses, including its:
| | • | | prospectus • financial statements and other information • fund holdings • proxy voting information |
You can also request this information at (800) 257‑8787.
| | |
4086930-0126 87245R813_SAR_1124 | | |
| | |
| | Semi-Annual Shareholder Report November 30, 2024 |
Nuveen Managed Allocation Fund
Retirement Class Shares/TITRX
Semi-Annual Report
This semi-annual shareholder report contains important information about the Retirement Class Shares of the Nuveen Managed Allocation Fund for the period of June 1, 2024 to November 30, 2024. You can find additional information at https://www.nuveen.com/en‑us/mutual‑funds/prospectuses. You can also request this information by contacting us at (800) 257‑8787.
What were the Fund costs for the last six months? (based on a hypothetical $10,000 investment)
| | | | |
| | |
| | | Cost of a $10,000 investment | | Costs paid as a percentage of
$10,000 investment* |
| | | |
| Retirement Class Shares | | $13 | | 0.25% |
* These costs do not include the expenses of the underlying funds in which the Fund invests. Annualized for period less than one year.
Fund Statistics (as of November 30, 2024)
| | | | |
| |
| Fund net assets | | $ | 908,723,317 | |
| |
| Total number of portfolio holdings | | | 14 | |
| |
| Portfolio turnover (%) | | | 4% | |
What did the Fund invest in? (as of November 30, 2024)
(1) Affiliated investment companies, except for repurchase agreements.
Availability of additional information about the Fund
You can find additional information about the Fund at https://www.nuveen.com/en‑us/mutual‑funds/prospectuses, including its:
| | • | | prospectus • financial statements and other information • fund holdings • proxy voting information |
You can also request this information at (800) 257‑8787.
| | |
4086961-0126 886315829_SAR_1124 | | |
| | |
| | Semi-Annual Shareholder Report November 30, 2024 |
Nuveen Managed Allocation Fund
Class R6 Shares/TIMIX
Semi-Annual Report
This semi-annual shareholder report contains important information about the Class R6 Shares of the Nuveen Managed Allocation Fund for the period of June 1, 2024 to November 30, 2024. You can find additional information at https://www.nuveen.com/en‑us/mutual‑funds/prospectuses. You can also request this information by contacting us at (800) 257‑8787.
What were the Fund costs for the last six months? (based on a hypothetical $10,000 investment)
| | | | |
| | |
| | | Cost of a $10,000 investment | | Costs paid as a percentage of
$10,000 investment* |
| | | |
| Class R6 Shares | | $0 | | 0.00% |
* These costs do not include the expenses of the underlying funds in which the Fund invests. Annualized for period less than one year.
Fund Statistics (as of November 30, 2024)
| | | | |
| |
| Fund net assets | | $ | 908,723,317 | |
| |
| Total number of portfolio holdings | | | 14 | |
| |
| Portfolio turnover (%) | | | 4% | |
What did the Fund invest in? (as of November 30, 2024)
(1) Affiliated investment companies, except for repurchase agreements.
Availability of additional information about the Fund
You can find additional information about the Fund at https://www.nuveen.com/en‑us/mutual‑funds/prospectuses, including its:
| | • | | prospectus • financial statements and other information • fund holdings • proxy voting information |
You can also request this information at (800) 257‑8787.
| | |
4086961-0126 886315837_SAR_1124 | | |
| | |
| | Semi-Annual Shareholder Report November 30, 2024 |
Nuveen Managed Allocation Fund
Class A Shares/TIMRX
Semi-Annual Report
This semi-annual shareholder report contains important information about the Class A Shares of the Nuveen Managed Allocation Fund for the period of June 1, 2024 to November 30, 2024. You can find additional information at https://www.nuveen.com/en‑us/mutual‑funds/prospectuses. You can also request this information by contacting us at (800) 257‑8787.
What were the Fund costs for the last six months? (based on a hypothetical $10,000 investment)
| | | | |
| | |
| | | Cost of a $10,000 investment | | Costs paid as a percentage of
$10,000 investment* |
| | | |
| Class A Shares | | $13 | | 0.25% |
* These costs do not include the expenses of the underlying funds in which the Fund invests. Annualized for period less than one year.
Fund Statistics (as of November 30, 2024)
| | | | |
| |
| Fund net assets | | $ | 908,723,317 | |
| |
| Total number of portfolio holdings | | | 14 | |
| |
| Portfolio turnover (%) | | | 4% | |
What did the Fund invest in? (as of November 30, 2024)
(1) Affiliated investment companies, except for repurchase agreements.
Availability of additional information about the Fund
You can find additional information about the Fund at https://www.nuveen.com/en‑us/mutual‑funds/prospectuses, including its:
| | • | | prospectus • financial statements and other information • fund holdings • proxy voting information |
You can also request this information at (800) 257‑8787.
| | |
4086961-0126 886315845_SAR_1124 | | |
Not applicable to this filing.
| Item 3. | Audit Committee Financial Expert. |
Not applicable to this filing.
| Item 4. | Principal Accountant Fees and Services. |
Not applicable to this filing.
| Item 5. | Audit Committee of Listed Registrants. |
Not applicable to this registrant.
| (a) | Schedule of Investments is included as part of the financial statements filed under Item 7 of this Form N-CSR. |
| Item 7. | Financial Statements and Financial Highlights for Open-End Management Investment Companies. |
Item
7.
Financial
Statements
and
Financial
Highlights
for
Open-
End
Management
Investment
Companies
Lifecycle
Retirement
Income
Portfolio
of
Investments
November
30,
2024
See
Notes
to
Financial
Statements
(Unaudited)
SHARES
DESCRIPTION
VALUE
AFFILIATED
INVESTMENT
COMPANIES—99.9%(a)
DIRECT
REAL
ESTATE—4.2%
1,847,606
(b)
Nuveen
Real
Property
Fund
LP
(purchased
8/01/16-11/19/24;
cost
$19,260,054)
$
17,644,633
TOTAL
DIRECT
REAL
ESTATE
17,644,633
FIXED
INCOME—39.7%
9,378,916
Nuveen
Core
Bond
Fund,
Class
W
86,379,814
5,786,439
Nuveen
Core
Plus
Bond
Fund,
Class
W
53,524,562
884,229
Nuveen
Emerging
Markets
Debt
Fund,
Class
W
7,763,529
921,917
Nuveen
High
Yield
Fund,
Class
W
8,177,402
966,334
Nuveen
International
Bond
Fund,
Class
W
8,590,712
TOTAL
FIXED
INCOME
164,436,019
INFLATION-PROTECTED
ASSETS—9.9%
3,854,660
Nuveen
Inflation
Linked
Bond
Fund,
Class
W
40,975,037
TOTAL
INFLATION-PROTECTED
ASSETS
40,975,037
INTERNATIONAL
EQUITY—12.4%
1,085,372
Nuveen
Emerging
Markets
Equity
Fund,
Class
W
8,997,737
1,548,603
Nuveen
International
Equity
Fund,
Class
W
21,835,297
846,917
Nuveen
International
Opportunities
Fund,
Class
W
13,178,021
646,200
Nuveen
Quant
International
Small
Cap
Equity
Fund,
Class
W
7,218,052
TOTAL
INTERNATIONAL
EQUITY
51,229,107
SHORT-TERM
FIXED
INCOME—9.8%
4,043,987
Nuveen
Short
Term
Bond
Fund,
Class
W
40,844,272
TOTAL
SHORT-TERM
FIXED
INCOME
40,844,272
U.S.
EQUITY—23.9%
854,421
Nuveen
Core
Equity
Fund,
Class
W
14,610,603
215,055
Nuveen
Dividend
Growth
Fund,
Class
R6
14,582,875
884,575
Nuveen
Dividend
Value
Fund,
Class
R6
14,896,235
479,595
Nuveen
Growth
Opportunities
ETF
16,406,945
549,390
Nuveen
Large
Cap
Growth
Fund,
Class
W
16,547,618
609,091
Nuveen
Large
Cap
Value
Fund,
Class
W
14,971,459
146,063
Nuveen
Quant
Small
Cap
Equity
Fund,
Class
W
3,244,052
219,439
Nuveen
Quant
Small/Mid
Cap
Equity
Fund,
Class
W
3,916,990
TOTAL
U.S.
EQUITY
99,176,777
TOTAL
AFFILIATED
INVESTMENT
COMPANIES
(Cost
$369,947,873)
414,305,845
PRINCIPAL
DESCRIPTION
RATE
MATURITY
VALUE
SHORT-TERM
INVESTMENTS—0.1%
REPURCHASE
AGREEMENT—0.1%
$370,000
(c)
Fixed
Income
Clearing
Corporation
4
.580
%
12/02/24
370,000
TOTAL
REPURCHASE
AGREEMENT
370,000
TOTAL
SHORT-TERM
INVESTMENTS
(Cost
$370,000)
370,000
TOTAL
INVESTMENTS—100.0%
(Cost
$370,317,873)
414,675,845
OTHER
ASSETS
&
LIABILITIES,
NET—(0.0)%
(
123,751
)
NET
ASSETS—100.0%
$
414,552,094
ETF
Exchange
Traded
Fund
(a)
Affiliated
fund.
(b)
Restricted
security.
(c)
Agreement
with
Fixed
Income
Clearing
Corporation,
4.580%
dated
11/29/24
to
be
repurchased
at
$370,141
on
12/2/24,
collateralized
by
Government
Agency
Securities,
with
coupon
rate
0.000%
and
maturity
date
11/28/25,
valued
at
$377,423.
Portfolio
of
Investments
November
30,
2024
See
Notes
to
Financial
Statements
(Unaudited)
SHARES
DESCRIPTION
VALUE
AFFILIATED
INVESTMENT
COMPANIES—100.0%(a)
DIRECT
REAL
ESTATE—2.4%
1,934,113
(b)
Nuveen
Real
Property
Fund
LP
(purchased
7/01/16-11/27/24;
cost
$19,661,749)
$
18,470,778
TOTAL
DIRECT
REAL
ESTATE
18,470,778
FIXED
INCOME—39.7%
17,352,649
Nuveen
Core
Bond
Fund,
Class
W
159,817,898
10,704,577
Nuveen
Core
Plus
Bond
Fund,
Class
W
99,017,337
1,637,786
Nuveen
Emerging
Markets
Debt
Fund,
Class
W
14,379,757
1,706,375
Nuveen
High
Yield
Fund,
Class
W
15,135,544
1,789,028
Nuveen
International
Bond
Fund,
Class
W
15,904,458
TOTAL
FIXED
INCOME
304,254,994
INFLATION-PROTECTED
ASSETS—9.9%
7,130,372
Nuveen
Inflation
Linked
Bond
Fund,
Class
W
75,795,853
TOTAL
INFLATION-PROTECTED
ASSETS
75,795,853
INTERNATIONAL
EQUITY—11.5%
1,868,696
Nuveen
Emerging
Markets
Equity
Fund,
Class
W
15,491,494
2,663,216
Nuveen
International
Equity
Fund,
Class
W
37,551,338
1,456,569
Nuveen
International
Opportunities
Fund,
Class
W
22,664,217
1,110,368
Nuveen
Quant
International
Small
Cap
Equity
Fund,
Class
W
12,402,809
TOTAL
INTERNATIONAL
EQUITY
88,109,858
SHORT-TERM
FIXED
INCOME—14.2%
10,748,953
Nuveen
Short
Term
Bond
Fund,
Class
W
108,564,423
TOTAL
SHORT-TERM
FIXED
INCOME
108,564,423
U.S.
EQUITY—22.3%
1,465,944
Nuveen
Core
Equity
Fund,
Class
W
25,067,641
369,141
Nuveen
Dividend
Growth
Fund,
Class
R6
25,031,454
1,522,341
Nuveen
Dividend
Value
Fund,
Class
R6
25,636,218
823,123
Nuveen
Growth
Opportunities
ETF
28,159,038
947,028
Nuveen
Large
Cap
Growth
Fund,
Class
W
28,524,491
1,047,031
Nuveen
Large
Cap
Value
Fund,
Class
W
25,736,016
251,114
Nuveen
Quant
Small
Cap
Equity
Fund,
Class
W
5,577,244
377,818
Nuveen
Quant
Small/Mid
Cap
Equity
Fund,
Class
W
6,744,050
TOTAL
U.S.
EQUITY
170,476,152
TOTAL
AFFILIATED
INVESTMENT
COMPANIES
(Cost
$672,674,347)
765,672,058
PRINCIPAL
DESCRIPTION
RATE
MATURITY
VALUE
SHORT-TERM
INVESTMENTS—0.1%
REPURCHASE
AGREEMENT—0.1%
$920,000
(c)
Fixed
Income
Clearing
Corporation
4
.580
%
12/02/24
920,000
TOTAL
REPURCHASE
AGREEMENT
920,000
TOTAL
SHORT-TERM
INVESTMENTS
(Cost
$920,000)
920,000
TOTAL
INVESTMENTS—100.1%
(Cost
$673,594,347)
766,592,058
OTHER
ASSETS
&
LIABILITIES,
NET—(0.1)%
(
443,174
)
NET
ASSETS—100.0%
$
766,148,884
ETF
Exchange
Traded
Fund
(a)
Affiliated
fund.
(b)
Restricted
security.
(c)
Agreement
with
Fixed
Income
Clearing
Corporation,
4.580%
dated
11/29/24
to
be
repurchased
at
$920,351
on
12/2/24,
collateralized
by
Government
Agency
Securities,
with
coupon
rate
0.000%
and
maturity
date
11/28/25,
valued
at
$938,405.
Portfolio
of
Investments
November
30,
2024
See
Notes
to
Financial
Statements
(Unaudited)
SHARES
DESCRIPTION
VALUE
AFFILIATED
INVESTMENT
COMPANIES—99.9%(a)
DIRECT
REAL
ESTATE—4.2%
4,853,613
(b)
Nuveen
Real
Property
Fund
LP
(purchased
11/28/16-11/19/24;
cost
$50,344,795)
$
46,352,002
TOTAL
DIRECT
REAL
ESTATE
46,352,002
FIXED
INCOME—39.6%
24,557,909
Nuveen
Core
Bond
Fund,
Class
W
226,178,338
15,149,600
Nuveen
Core
Plus
Bond
Fund,
Class
W
140,133,797
2,316,489
Nuveen
Emerging
Markets
Debt
Fund,
Class
W
20,338,775
2,414,953
Nuveen
High
Yield
Fund,
Class
W
21,420,630
2,531,923
Nuveen
International
Bond
Fund,
Class
W
22,508,798
TOTAL
FIXED
INCOME
430,580,338
INFLATION-PROTECTED
ASSETS—9.6%
9,865,685
Nuveen
Inflation
Linked
Bond
Fund,
Class
W
104,872,233
TOTAL
INFLATION-PROTECTED
ASSETS
104,872,233
INTERNATIONAL
EQUITY—12.6%
2,901,923
Nuveen
Emerging
Markets
Equity
Fund,
Class
W
24,056,944
4,142,422
Nuveen
International
Equity
Fund,
Class
W
58,408,145
2,268,769
Nuveen
International
Opportunities
Fund,
Class
W
35,302,041
1,719,941
Nuveen
Quant
International
Small
Cap
Equity
Fund,
Class
W
19,211,739
TOTAL
INTERNATIONAL
EQUITY
136,978,869
SHORT-TERM
FIXED
INCOME—9.6%
10,349,696
Nuveen
Short
Term
Bond
Fund,
Class
W
104,531,925
TOTAL
SHORT-TERM
FIXED
INCOME
104,531,925
U.S.
EQUITY—24.3%
2,278,829
Nuveen
Core
Equity
Fund,
Class
W
38,967,973
576,219
Nuveen
Dividend
Growth
Fund,
Class
R6
39,073,422
2,363,730
Nuveen
Dividend
Value
Fund,
Class
R6
39,805,211
1,284,992
Nuveen
Growth
Opportunities
ETF
43,959,576
1,464,911
Nuveen
Large
Cap
Growth
Fund,
Class
W
44,123,115
1,625,376
Nuveen
Large
Cap
Value
Fund,
Class
W
39,951,730
391,263
Nuveen
Quant
Small
Cap
Equity
Fund,
Class
W
8,689,944
587,983
Nuveen
Quant
Small/Mid
Cap
Equity
Fund,
Class
W
10,495,501
TOTAL
U.S.
EQUITY
265,066,472
TOTAL
AFFILIATED
INVESTMENT
COMPANIES
(Cost
$993,467,614)
1,088,381,839
PRINCIPAL
DESCRIPTION
RATE
MATURITY
VALUE
SHORT-TERM
INVESTMENTS—0.1%
REPURCHASE
AGREEMENT—0.1%
$1,030,000
(c)
Fixed
Income
Clearing
Corporation
4
.580
%
12/02/24
1,030,000
TOTAL
REPURCHASE
AGREEMENT
1,030,000
TOTAL
SHORT-TERM
INVESTMENTS
(Cost
$1,030,000)
1,030,000
TOTAL
INVESTMENTS—100.0%
(Cost
$994,497,614)
1,089,411,839
OTHER
ASSETS
&
LIABILITIES,
NET—(0.0)%
(
190,887
)
NET
ASSETS—100.0%
$
1,089,220,952
ETF
Exchange
Traded
Fund
(a)
Affiliated
fund.
(b)
Restricted
security.
(c)
Agreement
with
Fixed
Income
Clearing
Corporation,
4.580%
dated
11/29/24
to
be
repurchased
at
$1,030,393
on
12/2/24,
collateralized
by
Government
Agency
Securities,
with
coupon
rate
0.000%
and
maturity
date
11/28/25,
valued
at
$1,050,601.
Portfolio
of
Investments
November
30,
2024
See
Notes
to
Financial
Statements
(Unaudited)
SHARES
DESCRIPTION
VALUE
AFFILIATED
INVESTMENT
COMPANIES—100.0%(a)
DIRECT
REAL
ESTATE—4.3%
10,378,796
(b)
Nuveen
Real
Property
Fund
LP
(purchased
11/28/16-11/19/24;
cost
$108,081,890)
$
99,117,502
TOTAL
DIRECT
REAL
ESTATE
99,117,502
FIXED
INCOME—38.5%
51,130,206
Nuveen
Core
Bond
Fund,
Class
W
470,909,198
31,542,832
Nuveen
Core
Plus
Bond
Fund,
Class
W
291,771,193
4,814,828
Nuveen
Emerging
Markets
Debt
Fund,
Class
W
42,274,186
5,013,887
Nuveen
High
Yield
Fund,
Class
W
44,473,177
5,276,223
Nuveen
International
Bond
Fund,
Class
W
46,905,625
TOTAL
FIXED
INCOME
896,333,379
INFLATION-PROTECTED
ASSETS—7.7%
16,760,981
Nuveen
Inflation
Linked
Bond
Fund,
Class
W
178,169,232
TOTAL
INFLATION-PROTECTED
ASSETS
178,169,232
INTERNATIONAL
EQUITY—14.3%
7,036,172
Nuveen
Emerging
Markets
Equity
Fund,
Class
W
58,329,869
10,064,843
Nuveen
International
Equity
Fund,
Class
W
141,914,284
5,519,095
Nuveen
International
Opportunities
Fund,
Class
W
85,877,111
4,184,004
Nuveen
Quant
International
Small
Cap
Equity
Fund,
Class
W
46,735,323
TOTAL
INTERNATIONAL
EQUITY
332,856,587
SHORT-TERM
FIXED
INCOME—7.6%
17,584,778
Nuveen
Short
Term
Bond
Fund,
Class
W
177,606,262
TOTAL
SHORT-TERM
FIXED
INCOME
177,606,262
U.S.
EQUITY—27.6%
5,534,706
Nuveen
Core
Equity
Fund,
Class
W
94,643,481
1,388,371
Nuveen
Dividend
Growth
Fund,
Class
R6
94,145,428
5,736,641
Nuveen
Dividend
Value
Fund,
Class
R6
96,605,036
3,128,749
Nuveen
Growth
Opportunities
ETF
107,034,503
3,552,314
Nuveen
Large
Cap
Growth
Fund,
Class
W
106,995,708
3,958,398
Nuveen
Large
Cap
Value
Fund,
Class
W
97,297,418
950,111
Nuveen
Quant
Small
Cap
Equity
Fund,
Class
W
21,101,967
1,434,209
Nuveen
Quant
Small/Mid
Cap
Equity
Fund,
Class
W
25,600,635
TOTAL
U.S.
EQUITY
643,424,176
TOTAL
AFFILIATED
INVESTMENT
COMPANIES
(Cost
$2,076,887,647)
2,327,507,138
PRINCIPAL
DESCRIPTION
RATE
MATURITY
VALUE
SHORT-TERM
INVESTMENTS—0.1%
REPURCHASE
AGREEMENT—0.1%
$2,460,000
(c)
Fixed
Income
Clearing
Corporation
4
.580
%
12/02/24
2,460,000
TOTAL
REPURCHASE
AGREEMENT
2,460,000
TOTAL
SHORT-TERM
INVESTMENTS
(Cost
$2,460,000)
2,460,000
TOTAL
INVESTMENTS—100.1%
(Cost
$2,079,347,647)
2,329,967,138
OTHER
ASSETS
&
LIABILITIES,
NET—(0.1)%
(
1,653,193
)
NET
ASSETS—100.0%
$
2,328,313,945
ETF
Exchange
Traded
Fund
(a)
Affiliated
fund.
(b)
Restricted
security.
(c)
Agreement
with
Fixed
Income
Clearing
Corporation,
4.580%
dated
11/29/24
to
be
repurchased
at
$2,460,939
on
12/2/24,
collateralized
by
Government
Agency
Securities,
with
coupon
rate
0.000%
and
maturity
date
11/28/25,
valued
at
$2,509,346.
Portfolio
of
Investments
November
30,
2024
See
Notes
to
Financial
Statements
(Unaudited)
SHARES
DESCRIPTION
VALUE
AFFILIATED
INVESTMENT
COMPANIES—99.9%(a)
DIRECT
REAL
ESTATE—4.2%
16,679,570
(b)
Nuveen
Real
Property
Fund
LP
(purchased
8/01/16-11/19/24;
cost
$175,669,273)
$
159,289,890
TOTAL
DIRECT
REAL
ESTATE
159,289,890
FIXED
INCOME—36.9%
78,948,855
Nuveen
Core
Bond
Fund,
Class
W
727,118,956
48,714,307
Nuveen
Core
Plus
Bond
Fund,
Class
W
450,607,343
7,434,479
Nuveen
Emerging
Markets
Debt
Fund,
Class
W
65,274,722
7,747,569
Nuveen
High
Yield
Fund,
Class
W
68,720,936
8,133,055
Nuveen
International
Bond
Fund,
Class
W
72,302,862
TOTAL
FIXED
INCOME
1,384,024,819
INFLATION-PROTECTED
ASSETS—5.7%
19,954,668
Nuveen
Inflation
Linked
Bond
Fund,
Class
W
212,118,116
TOTAL
INFLATION-PROTECTED
ASSETS
212,118,116
INTERNATIONAL
EQUITY—16.2%
12,795,386
Nuveen
Emerging
Markets
Equity
Fund,
Class
W
106,073,750
18,303,811
Nuveen
International
Equity
Fund,
Class
W
258,083,737
10,004,707
Nuveen
International
Opportunities
Fund,
Class
W
155,673,236
7,618,327
Nuveen
Quant
International
Small
Cap
Equity
Fund,
Class
W
85,096,710
TOTAL
INTERNATIONAL
EQUITY
604,927,433
SHORT-TERM
FIXED
INCOME—5.7%
20,946,241
Nuveen
Short
Term
Bond
Fund,
Class
W
211,557,039
TOTAL
SHORT-TERM
FIXED
INCOME
211,557,039
U.S.
EQUITY—31.2%
10,084,384
Nuveen
Core
Equity
Fund,
Class
W
172,442,969
2,524,497
Nuveen
Dividend
Growth
Fund,
Class
R6
171,186,155
10,434,713
Nuveen
Dividend
Value
Fund,
Class
R6
175,720,571
5,688,644
Nuveen
Growth
Opportunities
ETF
194,608,511
6,459,390
Nuveen
Large
Cap
Growth
Fund,
Class
W
194,556,838
7,195,731
Nuveen
Large
Cap
Value
Fund,
Class
W
176,871,073
1,724,840
Nuveen
Quant
Small
Cap
Equity
Fund,
Class
W
38,308,686
2,595,282
Nuveen
Quant
Small/Mid
Cap
Equity
Fund,
Class
W
46,325,792
TOTAL
U.S.
EQUITY
1,170,020,595
TOTAL
AFFILIATED
INVESTMENT
COMPANIES
(Cost
$3,262,873,508)
3,741,937,892
PRINCIPAL
DESCRIPTION
RATE
MATURITY
VALUE
SHORT-TERM
INVESTMENTS—0.1%
REPURCHASE
AGREEMENT—0.1%
$5,720,000
(c)
Fixed
Income
Clearing
Corporation
4
.580
%
12/02/24
5,720,000
TOTAL
REPURCHASE
AGREEMENT
5,720,000
TOTAL
SHORT-TERM
INVESTMENTS
(Cost
$5,720,000)
5,720,000
TOTAL
INVESTMENTS—100.0%
(Cost
$3,268,593,508)
3,747,657,892
OTHER
ASSETS
&
LIABILITIES,
NET—(0.0)%
(
1,717,832
)
NET
ASSETS—100.0%
$
3,745,940,060
ETF
Exchange
Traded
Fund
(a)
Affiliated
fund.
(b)
Restricted
security.
(c)
Agreement
with
Fixed
Income
Clearing
Corporation,
4.580%
dated
11/29/24
to
be
repurchased
at
$5,722,183
on
12/2/24,
collateralized
by
Government
Agency
Securities,
with
coupon
rate
0.000%
and
maturity
date
11/28/25,
valued
at
$5,834,404.
Portfolio
of
Investments
November
30,
2024
See
Notes
to
Financial
Statements
(Unaudited)
SHARES
DESCRIPTION
VALUE
AFFILIATED
INVESTMENT
COMPANIES—99.9%(a)
DIRECT
REAL
ESTATE—4.3%
20,777,232
(b)
Nuveen
Real
Property
Fund
LP
(purchased
8/01/16-11/04/24;
cost
$221,429,773)
$
198,422,564
TOTAL
DIRECT
REAL
ESTATE
198,422,564
FIXED
INCOME—32.0%
85,308,912
Nuveen
Core
Bond
Fund,
Class
W
785,695,075
52,625,722
Nuveen
Core
Plus
Bond
Fund,
Class
W
486,787,927
8,021,016
Nuveen
Emerging
Markets
Debt
Fund,
Class
W
70,424,524
8,373,904
Nuveen
High
Yield
Fund,
Class
W
74,276,530
8,795,222
Nuveen
International
Bond
Fund,
Class
W
78,189,528
TOTAL
FIXED
INCOME
1,495,373,584
INFLATION-PROTECTED
ASSETS—3.7%
16,184,785
Nuveen
Inflation
Linked
Bond
Fund,
Class
W
172,044,268
TOTAL
INFLATION-PROTECTED
ASSETS
172,044,268
INTERNATIONAL
EQUITY—19.2%
18,864,935
Nuveen
Emerging
Markets
Equity
Fund,
Class
W
156,390,308
27,017,740
Nuveen
International
Equity
Fund,
Class
W
380,950,139
14,839,977
Nuveen
International
Opportunities
Fund,
Class
W
230,910,046
11,215,379
Nuveen
Quant
International
Small
Cap
Equity
Fund,
Class
W
125,275,783
TOTAL
INTERNATIONAL
EQUITY
893,526,276
SHORT-TERM
FIXED
INCOME—3.7%
16,938,975
Nuveen
Short
Term
Bond
Fund,
Class
W
171,083,647
TOTAL
SHORT-TERM
FIXED
INCOME
171,083,647
U.S.
EQUITY—37.0%
14,841,636
Nuveen
Core
Equity
Fund,
Class
W
253,791,970
3,736,915
Nuveen
Dividend
Growth
Fund,
Class
R6
253,400,221
15,367,794
Nuveen
Dividend
Value
Fund,
Class
R6
258,793,646
8,393,379
Nuveen
Growth
Opportunities
ETF
287,137,496
9,544,244
Nuveen
Large
Cap
Growth
Fund,
Class
W
287,472,632
10,649,482
Nuveen
Large
Cap
Value
Fund,
Class
W
261,764,263
2,552,125
Nuveen
Quant
Small
Cap
Equity
Fund,
Class
W
56,682,697
3,831,930
Nuveen
Quant
Small/Mid
Cap
Equity
Fund,
Class
W
68,399,951
TOTAL
U.S.
EQUITY
1,727,442,876
TOTAL
AFFILIATED
INVESTMENT
COMPANIES
(Cost
$3,921,199,449)
4,657,893,215
PRINCIPAL
DESCRIPTION
RATE
MATURITY
VALUE
SHORT-TERM
INVESTMENTS—0.1%
REPURCHASE
AGREEMENT—0.1%
$4,930,000
(c)
Fixed
Income
Clearing
Corporation
4
.580
%
12/02/24
4,930,000
TOTAL
REPURCHASE
AGREEMENT
4,930,000
TOTAL
SHORT-TERM
INVESTMENTS
(Cost
$4,930,000)
4,930,000
TOTAL
INVESTMENTS—100.0%
(Cost
$3,926,129,449)
4,662,823,215
OTHER
ASSETS
&
LIABILITIES,
NET—0.0%
1,507,681
NET
ASSETS—100.0%
$
4,664,330,896
ETF
Exchange
Traded
Fund
(a)
Affiliated
fund.
(b)
Restricted
security.
(c)
Agreement
with
Fixed
Income
Clearing
Corporation,
4.580%
dated
11/29/24
to
be
repurchased
at
$4,931,882
on
12/2/24,
collateralized
by
Government
Agency
Securities,
with
coupon
rate
0.000%
and
maturity
date
11/28/25,
valued
at
$5,028,612.
Portfolio
of
Investments
November
30,
2024
See
Notes
to
Financial
Statements
(Unaudited)
SHARES
DESCRIPTION
VALUE
AFFILIATED
INVESTMENT
COMPANIES—99.9%(a)
DIRECT
REAL
ESTATE—4.2%
22,645,295
(b)
Nuveen
Real
Property
Fund
LP
(purchased
8/01/16-11/27/24;
cost
$242,816,178)
$
216,262,566
TOTAL
DIRECT
REAL
ESTATE
216,262,566
FIXED
INCOME—26.8%
77,556,835
Nuveen
Core
Bond
Fund,
Class
W
714,298,455
47,811,213
Nuveen
Core
Plus
Bond
Fund,
Class
W
442,253,717
7,296,068
Nuveen
Emerging
Markets
Debt
Fund,
Class
W
64,059,475
7,656,114
Nuveen
High
Yield
Fund,
Class
W
67,909,728
8,044,103
Nuveen
International
Bond
Fund,
Class
W
71,512,077
TOTAL
FIXED
INCOME
1,360,033,452
INFLATION-PROTECTED
ASSETS—1.7%
8,226,748
Nuveen
Inflation
Linked
Bond
Fund,
Class
W
87,450,333
TOTAL
INFLATION-PROTECTED
ASSETS
87,450,333
INTERNATIONAL
EQUITY—22.4%
24,021,205
Nuveen
Emerging
Markets
Equity
Fund,
Class
W
199,135,788
34,396,192
Nuveen
International
Equity
Fund,
Class
W
484,986,306
18,943,714
Nuveen
International
Opportunities
Fund,
Class
W
294,764,183
14,286,509
Nuveen
Quant
International
Small
Cap
Equity
Fund,
Class
W
159,580,309
TOTAL
INTERNATIONAL
EQUITY
1,138,466,586
SHORT-TERM
FIXED
INCOME—1.7%
8,610,665
Nuveen
Short
Term
Bond
Fund,
Class
W
86,967,717
TOTAL
SHORT-TERM
FIXED
INCOME
86,967,717
U.S.
EQUITY—43.1%
18,824,324
Nuveen
Core
Equity
Fund,
Class
W
321,895,933
4,726,492
Nuveen
Dividend
Growth
Fund,
Class
R6
320,503,390
19,602,195
Nuveen
Dividend
Value
Fund,
Class
R6
330,100,956
10,659,641
Nuveen
Growth
Opportunities
ETF
364,666,319
12,093,007
Nuveen
Large
Cap
Growth
Fund,
Class
W
364,241,363
13,504,477
Nuveen
Large
Cap
Value
Fund,
Class
W
331,940,041
3,242,919
Nuveen
Quant
Small
Cap
Equity
Fund,
Class
W
72,025,233
4,879,205
Nuveen
Quant
Small/Mid
Cap
Equity
Fund,
Class
W
87,093,806
TOTAL
U.S.
EQUITY
2,192,467,041
TOTAL
AFFILIATED
INVESTMENT
COMPANIES
(Cost
$4,090,681,411)
5,081,647,695
PRINCIPAL
DESCRIPTION
RATE
MATURITY
VALUE
SHORT-TERM
INVESTMENTS—0.2%
REPURCHASE
AGREEMENT—0.2%
$11,620,000
(c)
Fixed
Income
Clearing
Corporation
4
.580
%
12/02/24
11,620,000
TOTAL
REPURCHASE
AGREEMENT
11,620,000
TOTAL
SHORT-TERM
INVESTMENTS
(Cost
$11,620,000)
11,620,000
TOTAL
INVESTMENTS—100.1%
(Cost
$4,102,301,411)
5,093,267,695
OTHER
ASSETS
&
LIABILITIES,
NET—(0.1)%
(
4,560,826
)
NET
ASSETS—100.0%
$
5,088,706,869
ETF
Exchange
Traded
Fund
(a)
Affiliated
fund.
(b)
Restricted
security.
(c)
Agreement
with
Fixed
Income
Clearing
Corporation,
4.580%
dated
11/29/24
to
be
repurchased
at
$11,624,435
on
12/2/24,
collateralized
by
Government
Agency
Securities,
with
coupon
rate
0.125%
and
maturity
date
10/15/25,
valued
at
$11,852,585.
Portfolio
of
Investments
November
30,
2024
See
Notes
to
Financial
Statements
(Unaudited)
SHARES
DESCRIPTION
VALUE
AFFILIATED
INVESTMENT
COMPANIES—99.9%(a)
DIRECT
REAL
ESTATE—4.3%
27,667,346
(b)
Nuveen
Real
Property
Fund
LP
(purchased
8/01/16-11/27/24;
cost
$295,148,245)
$
264,223,158
TOTAL
DIRECT
REAL
ESTATE
264,223,158
FIXED
INCOME—17.9%
63,520,865
Nuveen
Core
Bond
Fund,
Class
W
585,027,168
39,098,199
Nuveen
Core
Plus
Bond
Fund,
Class
W
361,658,339
5,964,570
Nuveen
Emerging
Markets
Debt
Fund,
Class
W
52,368,922
6,230,206
Nuveen
High
Yield
Fund,
Class
W
55,261,927
6,583,614
Nuveen
International
Bond
Fund,
Class
W
58,528,333
TOTAL
FIXED
INCOME
1,112,844,689
INTERNATIONAL
EQUITY—26.5%
34,710,956
Nuveen
Emerging
Markets
Equity
Fund,
Class
W
287,753,827
49,715,107
Nuveen
International
Equity
Fund,
Class
W
700,983,004
27,454,262
Nuveen
International
Opportunities
Fund,
Class
W
427,188,312
20,637,399
Nuveen
Quant
International
Small
Cap
Equity
Fund,
Class
W
230,519,745
TOTAL
INTERNATIONAL
EQUITY
1,646,444,888
U.S.
EQUITY—51.2%
27,242,605
Nuveen
Core
Equity
Fund,
Class
W
465,848,552
6,851,920
Nuveen
Dividend
Growth
Fund,
Class
R6
464,628,668
28,398,085
Nuveen
Dividend
Value
Fund,
Class
R6
478,223,746
15,434,058
Nuveen
Growth
Opportunities
ETF
527,999,124
17,550,099
Nuveen
Large
Cap
Growth
Fund,
Class
W
528,608,995
19,553,640
Nuveen
Large
Cap
Value
Fund,
Class
W
480,628,471
4,696,734
Nuveen
Quant
Small
Cap
Equity
Fund,
Class
W
104,314,454
7,079,411
Nuveen
Quant
Small/Mid
Cap
Equity
Fund,
Class
W
126,367,484
TOTAL
U.S.
EQUITY
3,176,619,494
TOTAL
AFFILIATED
INVESTMENT
COMPANIES
(Cost
$4,720,144,430)
6,200,132,229
PRINCIPAL
DESCRIPTION
RATE
MATURITY
VALUE
SHORT-TERM
INVESTMENTS—0.1%
REPURCHASE
AGREEMENT—0.1%
$8,180,000
(c)
Fixed
Income
Clearing
Corporation
4
.580
%
12/02/24
8,180,000
TOTAL
REPURCHASE
AGREEMENT
8,180,000
TOTAL
SHORT-TERM
INVESTMENTS
(Cost
$8,180,000)
8,180,000
TOTAL
INVESTMENTS—100.0%
(Cost
$4,728,324,430)
6,208,312,229
OTHER
ASSETS
&
LIABILITIES,
NET—0.0%
1,464,259
NET
ASSETS—100.0%
$
6,209,776,488
ETF
Exchange
Traded
Fund
(a)
Affiliated
fund.
(b)
Restricted
security.
(c)
Agreement
with
Fixed
Income
Clearing
Corporation,
4.580%
dated
11/29/24
to
be
repurchased
at
$8,183,122
on
12/2/24,
collateralized
by
Government
Agency
Securities,
with
coupon
rate
0.000%
and
maturity
date
11/28/25,
valued
at
$8,343,749.
Portfolio
of
Investments
November
30,
2024
See
Notes
to
Financial
Statements
(Unaudited)
SHARES
DESCRIPTION
VALUE
AFFILIATED
INVESTMENT
COMPANIES—99.8%(a)
DIRECT
REAL
ESTATE—4.2%
20,060,377
(b)
Nuveen
Real
Property
Fund
LP
(purchased
8/01/16-11/27/24;
cost
$215,650,924)
$
191,576,605
TOTAL
DIRECT
REAL
ESTATE
191,576,605
FIXED
INCOME—9.7%
25,013,235
Nuveen
Core
Bond
Fund,
Class
W
230,371,892
15,364,653
Nuveen
Core
Plus
Bond
Fund,
Class
W
142,123,039
2,344,184
Nuveen
Emerging
Markets
Debt
Fund,
Class
W
20,581,934
2,471,106
Nuveen
High
Yield
Fund,
Class
W
21,918,709
2,595,656
Nuveen
International
Bond
Fund,
Class
W
23,075,377
TOTAL
FIXED
INCOME
438,070,951
INTERNATIONAL
EQUITY—29.4%
27,910,448
Nuveen
Emerging
Markets
Equity
Fund,
Class
W
231,377,615
39,940,029
Nuveen
International
Equity
Fund,
Class
W
563,154,412
22,023,248
Nuveen
International
Opportunities
Fund,
Class
W
342,681,745
16,592,671
Nuveen
Quant
International
Small
Cap
Equity
Fund,
Class
W
185,340,132
TOTAL
INTERNATIONAL
EQUITY
1,322,553,904
U.S.
EQUITY—56.5%
21,906,981
Nuveen
Core
Equity
Fund,
Class
W
374,609,372
5,491,185
Nuveen
Dividend
Growth
Fund,
Class
R6
372,357,257
22,771,081
Nuveen
Dividend
Value
Fund,
Class
R6
383,465,011
12,353,775
Nuveen
Growth
Opportunities
ETF
422,622,643
14,070,768
Nuveen
Large
Cap
Growth
Fund,
Class
W
423,811,534
15,676,084
Nuveen
Large
Cap
Value
Fund,
Class
W
385,318,150
3,762,917
Nuveen
Quant
Small
Cap
Equity
Fund,
Class
W
83,574,392
5,703,366
Nuveen
Quant
Small/Mid
Cap
Equity
Fund,
Class
W
101,805,082
TOTAL
U.S.
EQUITY
2,547,563,441
TOTAL
AFFILIATED
INVESTMENT
COMPANIES
(Cost
$3,284,943,276)
4,499,764,901
PRINCIPAL
DESCRIPTION
RATE
MATURITY
VALUE
SHORT-TERM
INVESTMENTS—0.3%
REPURCHASE
AGREEMENT—0.3%
$11,840,000
(c)
Fixed
Income
Clearing
Corporation
4
.580
%
12/02/24
11,840,000
TOTAL
REPURCHASE
AGREEMENT
11,840,000
TOTAL
SHORT-TERM
INVESTMENTS
(Cost
$11,840,000)
11,840,000
TOTAL
INVESTMENTS—100.1%
(Cost
$3,296,783,276)
4,511,604,901
OTHER
ASSETS
&
LIABILITIES,
NET—(0.1)%
(
3,755,688
)
NET
ASSETS—100.0%
$
4,507,849,213
ETF
Exchange
Traded
Fund
(a)
Affiliated
fund.
(b)
Restricted
security.
(c)
Agreement
with
Fixed
Income
Clearing
Corporation,
4.580%
dated
11/29/24
to
be
repurchased
at
$11,844,519
on
12/2/24,
collateralized
by
Government
Agency
Securities,
with
coupon
rate
0.000%
and
maturity
date
11/28/25,
valued
at
$12,076,951.
Portfolio
of
Investments
November
30,
2024
See
Notes
to
Financial
Statements
(Unaudited)
SHARES
DESCRIPTION
VALUE
AFFILIATED
INVESTMENT
COMPANIES—99.8%(a)
DIRECT
REAL
ESTATE—4.2%
16,065,811
(b)
Nuveen
Real
Property
Fund
LP
(purchased
8/01/16-11/27/24;
cost
$173,517,931)
$
153,428,495
TOTAL
DIRECT
REAL
ESTATE
153,428,495
FIXED
INCOME—5.4%
11,054,171
Nuveen
Core
Bond
Fund,
Class
W
101,808,912
6,833,887
Nuveen
Core
Plus
Bond
Fund,
Class
W
63,213,454
1,036,196
Nuveen
Emerging
Markets
Debt
Fund,
Class
W
9,097,804
1,099,654
Nuveen
High
Yield
Fund,
Class
W
9,753,932
1,145,775
Nuveen
International
Bond
Fund,
Class
W
10,185,938
TOTAL
FIXED
INCOME
194,060,040
INTERNATIONAL
EQUITY—30.8%
23,407,518
Nuveen
Emerging
Markets
Equity
Fund,
Class
W
194,048,326
33,484,717
Nuveen
International
Equity
Fund,
Class
W
472,134,513
18,470,853
Nuveen
International
Opportunities
Fund,
Class
W
287,406,470
13,929,079
Nuveen
Quant
International
Small
Cap
Equity
Fund,
Class
W
155,587,812
TOTAL
INTERNATIONAL
EQUITY
1,109,177,121
U.S.
EQUITY—59.4%
18,388,337
Nuveen
Core
Equity
Fund,
Class
W
314,440,558
4,618,256
Nuveen
Dividend
Growth
Fund,
Class
R6
313,163,917
19,157,569
Nuveen
Dividend
Value
Fund,
Class
R6
322,613,460
10,386,492
Nuveen
Growth
Opportunities
ETF
355,321,891
11,840,058
Nuveen
Large
Cap
Growth
Fund,
Class
W
356,622,560
13,188,976
Nuveen
Large
Cap
Value
Fund,
Class
W
324,185,019
3,165,745
Nuveen
Quant
Small
Cap
Equity
Fund,
Class
W
70,311,195
4,792,491
Nuveen
Quant
Small/Mid
Cap
Equity
Fund,
Class
W
85,545,960
TOTAL
U.S.
EQUITY
2,142,204,560
TOTAL
AFFILIATED
INVESTMENT
COMPANIES
(Cost
$2,637,167,195)
3,598,870,216
PRINCIPAL
DESCRIPTION
RATE
MATURITY
VALUE
SHORT-TERM
INVESTMENTS—0.1%
REPURCHASE
AGREEMENT—0.1%
$5,290,000
(c)
Fixed
Income
Clearing
Corporation
4
.580
%
12/02/24
5,290,000
TOTAL
REPURCHASE
AGREEMENT
5,290,000
TOTAL
SHORT-TERM
INVESTMENTS
(Cost
$5,290,000)
5,290,000
TOTAL
INVESTMENTS—99.9%
(Cost
$2,642,457,195)
3,604,160,216
OTHER
ASSETS
&
LIABILITIES,
NET—0.1%
1,862,161
NET
ASSETS—100.0%
$
3,606,022,377
ETF
Exchange
Traded
Fund
(a)
Affiliated
fund.
(b)
Restricted
security.
(c)
Agreement
with
Fixed
Income
Clearing
Corporation,
4.580%
dated
11/29/24
to
be
repurchased
at
$5,292,019
on
12/2/24,
collateralized
by
Government
Agency
Securities,
with
coupon
rate
0.000%
and
maturity
date
11/28/25,
valued
at
$5,395,922.
Portfolio
of
Investments
November
30,
2024
See
Notes
to
Financial
Statements
(Unaudited)
SHARES
DESCRIPTION
VALUE
AFFILIATED
INVESTMENT
COMPANIES—99.8%(a)
DIRECT
REAL
ESTATE—4.3%
8,330,725
(b)
Nuveen
Real
Property
Fund
LP
(purchased
8/01/16-11/27/24;
cost
$91,359,407)
$
79,558,427
TOTAL
DIRECT
REAL
ESTATE
79,558,427
FIXED
INCOME—4.1%
4,425,103
Nuveen
Core
Bond
Fund,
Class
W
40,755,197
2,738,144
Nuveen
Core
Plus
Bond
Fund,
Class
W
25,327,831
415,986
Nuveen
Emerging
Markets
Debt
Fund,
Class
W
3,652,359
435,117
Nuveen
High
Yield
Fund,
Class
W
3,859,488
457,391
Nuveen
International
Bond
Fund,
Class
W
4,066,209
TOTAL
FIXED
INCOME
77,661,084
INTERNATIONAL
EQUITY—31.2%
12,341,806
Nuveen
Emerging
Markets
Equity
Fund,
Class
W
102,313,573
17,657,931
Nuveen
International
Equity
Fund,
Class
W
248,976,833
9,710,050
Nuveen
International
Opportunities
Fund,
Class
W
151,088,380
7,361,894
Nuveen
Quant
International
Small
Cap
Equity
Fund,
Class
W
82,232,355
TOTAL
INTERNATIONAL
EQUITY
584,611,141
U.S.
EQUITY—60.2%
9,695,552
Nuveen
Core
Equity
Fund,
Class
W
165,793,935
2,450,376
Nuveen
Dividend
Growth
Fund,
Class
R6
166,159,985
10,040,490
Nuveen
Dividend
Value
Fund,
Class
R6
169,081,845
5,449,271
Nuveen
Growth
Opportunities
ETF
186,419,561
6,242,326
Nuveen
Large
Cap
Growth
Fund,
Class
W
188,018,870
6,911,969
Nuveen
Large
Cap
Value
Fund,
Class
W
169,896,199
1,663,498
Nuveen
Quant
Small
Cap
Equity
Fund,
Class
W
36,946,290
2,506,979
Nuveen
Quant
Small/Mid
Cap
Equity
Fund,
Class
W
44,749,579
TOTAL
U.S.
EQUITY
1,127,066,264
TOTAL
AFFILIATED
INVESTMENT
COMPANIES
(Cost
$1,417,923,172)
1,868,896,916
PRINCIPAL
DESCRIPTION
RATE
MATURITY
VALUE
SHORT-TERM
INVESTMENTS—0.3%
REPURCHASE
AGREEMENT—0.3%
$5,580,000
(c)
Fixed
Income
Clearing
Corporation
4
.580
%
12/02/24
5,580,000
TOTAL
REPURCHASE
AGREEMENT
5,580,000
TOTAL
SHORT-TERM
INVESTMENTS
(Cost
$5,580,000)
5,580,000
TOTAL
INVESTMENTS—100.1%
(Cost
$1,423,503,172)
1,874,476,916
OTHER
ASSETS
&
LIABILITIES,
NET—(0.1)%
(
1,956,773
)
NET
ASSETS—100.0%
$
1,872,520,143
ETF
Exchange
Traded
Fund
(a)
Affiliated
fund.
(b)
Restricted
security.
(c)
Agreement
with
Fixed
Income
Clearing
Corporation,
4.580%
dated
11/29/24
to
be
repurchased
at
$5,582,130
on
12/2/24,
collateralized
by
Government
Agency
Securities,
with
coupon
rate
0.000%
and
maturity
date
11/28/25,
valued
at
$5,691,678.
Portfolio
of
Investments
November
30,
2024
See
Notes
to
Financial
Statements
(Unaudited)
SHARES
DESCRIPTION
VALUE
AFFILIATED
INVESTMENT
COMPANIES—99.8%(a)
DIRECT
REAL
ESTATE—4.3%
3,710,663
(b)
Nuveen
Real
Property
Fund
LP
(purchased
8/01/16-11/27/24;
cost
$41,080,388)
$
35,436,834
TOTAL
DIRECT
REAL
ESTATE
35,436,834
FIXED
INCOME—2.9%
1,389,120
Nuveen
Core
Bond
Fund,
Class
W
12,793,798
858,613
Nuveen
Core
Plus
Bond
Fund,
Class
W
7,942,170
133,373
Nuveen
Emerging
Markets
Debt
Fund,
Class
W
1,171,019
138,392
Nuveen
High
Yield
Fund,
Class
W
1,227,540
145,448
Nuveen
International
Bond
Fund,
Class
W
1,293,035
TOTAL
FIXED
INCOME
24,427,562
INTERNATIONAL
EQUITY—31.6%
5,573,289
Nuveen
Emerging
Markets
Equity
Fund,
Class
W
46,202,564
7,948,347
Nuveen
International
Equity
Fund,
Class
W
112,071,695
4,366,787
Nuveen
International
Opportunities
Fund,
Class
W
67,947,199
3,318,000
Nuveen
Quant
International
Small
Cap
Equity
Fund,
Class
W
37,062,059
TOTAL
INTERNATIONAL
EQUITY
263,283,517
U.S.
EQUITY—61.0%
4,379,973
Nuveen
Core
Equity
Fund,
Class
W
74,897,534
1,106,711
Nuveen
Dividend
Growth
Fund,
Class
R6
75,046,088
4,529,900
Nuveen
Dividend
Value
Fund,
Class
R6
76,283,518
2,450,547
Nuveen
Growth
Opportunities
ETF
83,833,213
2,816,678
Nuveen
Large
Cap
Growth
Fund,
Class
W
84,838,345
3,123,880
Nuveen
Large
Cap
Value
Fund,
Class
W
76,784,970
751,197
Nuveen
Quant
Small
Cap
Equity
Fund,
Class
W
16,684,086
1,130,301
Nuveen
Quant
Small/Mid
Cap
Equity
Fund,
Class
W
20,175,880
TOTAL
U.S.
EQUITY
508,543,634
TOTAL
AFFILIATED
INVESTMENT
COMPANIES
(Cost
$659,991,146)
831,691,547
PRINCIPAL
DESCRIPTION
RATE
MATURITY
VALUE
SHORT-TERM
INVESTMENTS—0.2%
REPURCHASE
AGREEMENT—0.2%
$1,780,000
(c)
Fixed
Income
Clearing
Corporation
4
.580
%
12/02/24
1,780,000
TOTAL
REPURCHASE
AGREEMENT
1,780,000
TOTAL
SHORT-TERM
INVESTMENTS
(Cost
$1,780,000)
1,780,000
TOTAL
INVESTMENTS—100.0%
(Cost
$661,771,146)
833,471,547
OTHER
ASSETS
&
LIABILITIES,
NET—0.0%
136,287
NET
ASSETS—100.0%
$
833,607,834
ETF
Exchange
Traded
Fund
(a)
Affiliated
fund.
(b)
Restricted
security.
(c)
Agreement
with
Fixed
Income
Clearing
Corporation,
4.580%
dated
11/29/24
to
be
repurchased
at
$1,780,679
on
12/2/24,
collateralized
by
Government
Agency
Securities,
with
coupon
rate
0.000%
and
maturity
date
11/28/25,
valued
at
$1,815,751.
Portfolio
of
Investments
November
30,
2024
See
Notes
to
Financial
Statements
(Unaudited)
SHARES
DESCRIPTION
VALUE
AFFILIATED
INVESTMENT
COMPANIES—99.5%(a)
DIRECT
REAL
ESTATE—4.2%
519,693
(b)
Nuveen
Real
Property
Fund
LP
(purchased
9/30/20-11/27/24;
cost
$5,662,981)
$
4,963,064
TOTAL
DIRECT
REAL
ESTATE
4,963,064
FIXED
INCOME—1.7%
113,788
Nuveen
Core
Bond
Fund,
Class
W
1,047,984
70,194
Nuveen
Core
Plus
Bond
Fund,
Class
W
649,291
10,740
Nuveen
Emerging
Markets
Debt
Fund,
Class
W
94,300
11,185
Nuveen
High
Yield
Fund,
Class
W
99,208
11,731
Nuveen
International
Bond
Fund,
Class
W
104,291
TOTAL
FIXED
INCOME
1,995,074
INTERNATIONAL
EQUITY—32.0%
795,347
Nuveen
Emerging
Markets
Equity
Fund,
Class
W
6,593,430
1,135,556
Nuveen
International
Equity
Fund,
Class
W
16,011,336
620,442
Nuveen
International
Opportunities
Fund,
Class
W
9,654,078
472,599
Nuveen
Quant
International
Small
Cap
Equity
Fund,
Class
W
5,278,930
TOTAL
INTERNATIONAL
EQUITY
37,537,774
U.S.
EQUITY—61.6%
622,094
Nuveen
Core
Equity
Fund,
Class
W
10,637,805
157,305
Nuveen
Dividend
Growth
Fund,
Class
R6
10,666,853
644,970
Nuveen
Dividend
Value
Fund,
Class
R6
10,861,294
348,689
Nuveen
Growth
Opportunities
ETF
11,928,651
400,058
Nuveen
Large
Cap
Growth
Fund,
Class
W
12,049,752
443,633
Nuveen
Large
Cap
Value
Fund,
Class
W
10,904,489
106,472
Nuveen
Quant
Small
Cap
Equity
Fund,
Class
W
2,364,732
159,958
Nuveen
Quant
Small/Mid
Cap
Equity
Fund,
Class
W
2,855,248
TOTAL
U.S.
EQUITY
72,268,824
TOTAL
AFFILIATED
INVESTMENT
COMPANIES
(Cost
$97,089,989)
116,764,736
PRINCIPAL
DESCRIPTION
RATE
MATURITY
VALUE
SHORT-TERM
INVESTMENTS—0.5%
REPURCHASE
AGREEMENT—0.5%
$530,000
(c)
Fixed
Income
Clearing
Corporation
4.580
%
12/02/24
530,000
TOTAL
REPURCHASE
AGREEMENT
530,000
TOTAL
SHORT-TERM
INVESTMENTS
(Cost
$530,000)
530,000
TOTAL
INVESTMENTS—100.0%
(Cost
$97,619,989)
117,294,736
OTHER
ASSETS
&
LIABILITIES,
NET—(0.0)%
(35,140)
NET
ASSETS—100.0%
$
117,259,596
ETF
Exchange
Traded
Fund
(a)
Affiliated
fund.
(b)
Restricted
security.
(c)
Agreement
with
Fixed
Income
Clearing
Corporation,
4.580%
dated
11/29/24
to
be
repurchased
at
$530,202
on
12/2/24,
collateralized
by
Government
Agency
Securities,
with
coupon
rate
0.000%
and
maturity
date
11/28/25,
valued
at
$540,757.
Statement
of
Assets
and
Liabilities
See
Notes
to
Financial
Statements
November
30,
2024
(Unaudited)
12.1
Lifecycle
Retirement
Income
12.2
Lifecycle
2010
12.3
Lifecycle
2015
12.4
Lifecycle
2020
ASSETS
Affiliated
investments,
at
value
‡
$
414,305,845
$
765,672,058
$
1,088,381,839
$
2,327,507,138
Short-term
investments,
at
value
#
370,000
920,000
1,030,000
2,460,000
Cash
9,887
2,465
5,982
6,514
Receivables:
Dividends
737,921
1,480,082
1,918,734
3,858,738
Interest
94
234
262
626
Investments
sold
1,241,568
2,264,451
3,436,354
7,800,419
Reimbursement
from
Adviser
82,281
127,343
145,304
285,091
Shares
sold
183,626
56,496
172,091
183,941
Other
60,760
230,472
329,354
489,778
Total
assets
416,991,982
770,753,601
1,095,419,920
2,342,592,245
LIABILITIES
Due
to
affiliates
4,644
3,704
4,037
5,219
Payables:
Management
fees
131,630
243,158
345,501
749,559
Investments
purchased
-
regular
settlement
1,894,310
3,798,895
5,169,631
11,531,359
Shares
redeemed
235,084
210,769
195,074
1,240,260
Service
agreement
fees
25,845
45,322
64,277
112,605
Accrued
expenses:
Custodian
fees
2,515
2,528
2,533
2,559
Professional
fees
7,672
7,751
7,824
8,107
Shareholder
reporting
expenses
19,076
29,710
37,991
66,064
Shareholder
servicing
agent
fees
5,344
406
448
713
Trustees
fees
62,627
234,008
334,442
500,905
12b-1
distribution
and
service
fees
26,989
3,652
5,311
10,756
Other
24,152
24,814
31,899
50,194
Total
liabilities
2,439,888
4,604,717
6,198,968
14,278,300
Net
assets
$
414,552,094
$
766,148,884
$
1,089,220,952
$
2,328,313,945
NET
ASSETS
CONSIST
OF:
Paid-in
capital
$
382,970,208
$
671,878,682
$
1,007,342,284
$
2,088,274,163
Total
distributable
earnings
(loss)
31,581,886
94,270,202
81,878,668
240,039,782
Net
assets
$
414,552,094
$
766,148,884
$
1,089,220,952
$
2,328,313,945
‡
Affiliated
investments,
cost
$
369,947,873
$
672,674,347
$
993,467,614
$
2,076,887,647
#
Short-term
investments,
cost
370,000
920,000
1,030,000
2,460,000
See
Notes
to
Financial
Statements
12.5
Lifecycle
2025
12.6
Lifecycle
2030
12.7
Lifecycle
2035
12.8
Lifecycle
2040
12.9
Lifecycle
2045
13.01
Lifecycle
2050
$
3,741,937,892
$
4,657,893,215
$
5,081,647,695
$
6,200,132,229
$
4,499,764,901
$
3,598,870,216
5,720,000
4,930,000
11,620,000
8,180,000
11,840,000
5,290,000
8,725
2,188
3,573
1,881
9,117
4,222
5,711,477
5,943,312
5,117,672
3,922,180
1,537,784
683,894
1,455
1,254
2,957
2,081
3,013
1,346
13,937,025
18,909,699
20,985,088
27,449,525
18,942,566
15,753,661
454,621
614,245
730,936
965,055
757,957
620,006
1,703,158
3,396,578
3,337,494
5,165,468
4,815,257
4,530,431
522,425
517,678
522,862
679,313
253,398
164,780
3,769,996,778
4,692,208,169
5,123,968,277
6,246,497,732
4,537,923,993
3,625,918,556
5,875
6,282
6,413
7,211
5,866
5,532
1,216,179
1,531,153
1,686,693
2,086,547
1,522,046
1,222,526
21,238,993
24,713,426
32,287,651
33,079,828
27,726,379
18,084,818
713,109
690,890
326,968
370,963
222,346
143,717
152,142
178,924
178,424
207,840
127,449
92,465
2,524
2,546
2,573
2,580
2,543
2,523
8,404
8,584
8,662
8,891
8,524
8,329
90,913
103,456
107,029
124,890
87,355
76,788
895
975
950
1,029
945
944
539,730
538,579
545,347
706,467
272,940
180,173
18,467
23,341
25,010
28,550
21,715
15,685
69,487
79,117
85,688
96,448
76,672
62,679
24,056,718
27,877,273
35,261,408
36,721,244
30,074,780
19,896,179
$
3,745,940,060
$
4,664,330,896
$
5,088,706,869
$
6,209,776,488
$
4,507,849,213
$
3,606,022,377
$
3,272,257,903
$
3,926,601,244
$
4,095,092,662
$
4,731,633,131
$
3,292,325,352
$
2,647,124,558
473,682,157
737,729,652
993,614,207
1,478,143,357
1,215,523,861
958,897,819
$
3,745,940,060
$
4,664,330,896
$
5,088,706,869
$
6,209,776,488
$
4,507,849,213
$
3,606,022,377
$
3,262,873,508
$
3,921,199,449
$
4,090,681,411
$
4,720,144,430
$
3,284,943,276
$
2,637,167,195
5,720,000
4,930,000
11,620,000
8,180,000
11,840,000
5,290,000
Statement
of
Assets
and
Liabilities
(continued)
See
Notes
to
Financial
Statements
Statement
of
Assets
and
Liabilities
(continued)
November
30,
2024
(Unaudited)
12.1
Lifecycle
Retirement
Income
12.2
Lifecycle
2010
12.3
Lifecycle
2015
12.4
Lifecycle
2020
CLASS
A:
Net
assets
$
127,449,469
$
–
$
–
$
–
Shares
outstanding
10,975,915
–
–
–
Net
asset
value
("NAV")
per
share
$
11
.61
$
–
$
–
$
–
Maximum
sales
charge
5.75%
–%
–%
–%
Offering
price
per
share
(NAV
per
share
plus
maximum
sales
charge)
$
12
.32
$
–
$
–
$
–
CLASS
I:
Net
assets
$
210,043
$
90,505
$
274,028
$
421,421
Shares
outstanding
18,055
8,437
28,545
41,964
NAV
and
offering
price
per
share
$
11
.63
$
10
.73
$
9
.60
$
10
.04
PREMIER
CLASS:
Net
assets
$
8,319,823
$
29,840,807
$
42,920,934
$
87,184,590
Shares
outstanding
715,672
2,796,868
4,487,568
8,694,268
NAV
and
offering
price
per
share
$
11
.63
$
10
.67
$
9
.56
$
10
.03
CLASS
R6:
Net
assets
$
152,884,023
$
514,878,313
$
731,473,057
$
1,692,629,581
Shares
outstanding
13,144,509
48,107,919
76,074,026
168,257,291
NAV
and
offering
price
per
share
$
11
.63
$
10
.70
$
9
.62
$
10
.06
RETIREMENT
CLASS:
Net
assets
$
125,688,736
$
221,339,259
$
314,552,933
$
548,078,353
Shares
outstanding
10,837,594
16,351,580
24,393,571
39,338,850
NAV
and
offering
price
per
share
$
11
.60
$
13
.54
$
12
.89
$
13
.93
Authorized
shares
-
per
class
Unlimited
Unlimited
Unlimited
Unlimited
Par
value
per
share
$
0
.0001
$
0
.0001
$
0
.0001
$
0
.0001
See
Notes
to
Financial
Statements
12.5
Lifecycle
2025
12.6
Lifecycle
2030
12.7
Lifecycle
2035
12.8
Lifecycle
2040
12.9
Lifecycle
2045
13.01
Lifecycle
2050
$
–
$
–
$
–
$
–
$
–
$
–
–
–
–
–
–
–
$
–
$
–
$
–
$
–
$
–
$
–
–%
–%
–%
–%
–%
–%
$
–
$
–
$
–
$
–
$
–
$
–
$
686,079
$
854,062
$
937,803
$
576,253
$
799,224
$
435,494
64,771
77,860
82,162
49,036
53,248
28,038
$
10
.59
$
10
.97
$
11
.41
$
11
.75
$
15
.01
$
15
.53
$
150,694,694
$
189,871,171
$
205,185,473
$
233,327,664
$
177,056,308
$
127,728,609
14,297,678
17,419,395
18,012,606
19,904,914
11,861,385
8,269,605
$
10
.54
$
10
.90
$
11
.39
$
11
.72
$
14
.93
$
15
.45
$
2,851,688,727
$
3,602,107,613
$
4,009,936,476
$
4,955,168,950
$
3,706,749,833
$
3,024,026,551
268,935,225
328,167,449
350,465,246
420,795,259
246,694,027
194,703,658
$
10
.60
$
10
.98
$
11
.44
$
11
.78
$
15
.03
$
15
.53
$
742,870,560
$
871,498,050
$
872,647,117
$
1,020,703,621
$
623,243,848
$
453,831,723
49,810,426
54,799,675
50,970,346
55,620,741
41,987,999
29,585,234
$
14
.91
$
15
.90
$
17
.12
$
18
.35
$
14
.84
$
15
.34
Unlimited
Unlimited
Unlimited
Unlimited
Unlimited
Unlimited
$
0
.0001
$
0
.0001
$
0
.0001
$
0
.0001
$
0
.0001
$
0
.0001
Statement
of
Assets
and
Liabilities
(continued)
See
Notes
to
Financial
Statements
Statement
of
Assets
and
Liabilities
(continued)
November
30,
2024
(Unaudited)
13.1
Lifecycle
2055
13.2
Lifecycle
2060
13.3
Lifecycle
2065
ASSETS
Affiliated
investments,
at
value
‡
$
1,868,896,916
$
831,691,547
$
116,764,736
Short-term
investments,
at
value
#
5,580,000
1,780,000
530,000
Cash
9,249
2,999
9,532
Receivables:
Dividends
272,071
85,012
6,864
Interest
1,420
453
135
Investments
sold
7,964,679
3,653,212
481,939
Reimbursement
from
Adviser
343,835
181,364
53,336
Shares
sold
2,283,436
1,786,012
461,836
Other
50,476
12,370
733
Total
assets
1,885,402,082
839,192,969
118,309,111
LIABILITIES
Due
to
affiliates
4,254
3,713
3,266
Payables:
Management
fees
633,207
280,820
39,013
Investments
purchased
-
regular
settlement
11,941,192
4,685,759
910,482
Shares
redeemed
98,558
515,649
47,367
Service
agreement
fees
44,608
18,536
3,674
Accrued
expenses:
Custodian
fees
2,509
2,714
2,524
Professional
fees
8,462
7,743
7,605
Shareholder
reporting
expenses
40,822
23,961
16,020
Shareholder
servicing
agent
fees
885
688
275
Trustees
fees
58,219
15,561
1,129
12b-1
distribution
and
service
fees
8,518
3,270
586
Other
40,705
26,721
17,574
Total
liabilities
12,881,939
5,585,135
1,049,515
Net
assets
$
1,872,520,143
$
833,607,834
$
117,259,596
NET
ASSETS
CONSIST
OF:
Paid-in
capital
$
1,428,048,502
$
668,049,812
$
97,497,475
Total
distributable
earnings
(loss)
444,471,641
165,558,022
19,762,121
Net
assets
$
1,872,520,143
$
833,607,834
$
117,259,596
‡
Affiliated
investments,
cost
$
1,417,923,172
$
659,991,146
$
97,089,989
#
Short-term
investments,
cost
5,580,000
1,780,000
530,000
CLASS
I:
Net
assets
$
449,199
$
415,393
$
110,812
Shares
outstanding
24,364
26,021
8,162
NAV
and
offering
price
per
share
$
18
.44
$
15
.96
$
13
.58
PREMIER
CLASS:
Net
assets
$
69,680,237
$
26,978,550
$
4,917,404
Shares
outstanding
3,795,883
1,693,418
360,863
NAV
and
offering
price
per
share
$
18
.36
$
15
.93
$
13
.63
CLASS
R6:
Net
assets
$
1,583,575,821
$
715,655,138
$
93,844,456
Shares
outstanding
85,798,963
44,746,169
6,782,418
NAV
and
offering
price
per
share
$
18
.46
$
15
.99
$
13
.84
RETIREMENT
CLASS:
Net
assets
$
218,814,886
$
90,558,753
$
18,386,924
Shares
outstanding
11,938,531
5,697,940
1,331,953
NAV
and
offering
price
per
share
$
18
.33
$
15
.89
$
13
.80
Authorized
shares
-
per
class
Unlimited
Unlimited
Unlimited
Par
value
per
share
$
0
.0001
$
0
.0001
$
0
.0001
See
Notes
to
Financial
Statements
Six
Months
Ended
November
30,
2024
(Unaudited)
12.1
Lifecycle
Retirement
Income
12.2
Lifecycle
2010
12.3
Lifecycle
2015
12.4
Lifecycle
2020
12.5
Lifecycle
2025
INVESTMENT
INCOME
Dividends
from
affiliated
investments
$
7,851,469
$
14,224,672
$
20,943,391
$
42,752,300
$
62,685,685
Interest
7,628
14,007
18,954
36,952
77,104
Total
investment
income
7,859,097
14,238,679
20,962,345
42,789,252
62,762,789
EXPENSES
Management
fees
814,308
1,532,076
2,178,061
4,763,692
7,625,918
12b-1
distribution
and
service
fees
—
Class
A
158,777
–
–
–
–
12b-1
distribution
and
service
fees
—
Premier
Class
7,173
24,029
31,856
66,779
115,185
Shareholder
servicing
agent
fees
—
Class
A
12,029
–
–
–
–
Shareholder
servicing
agent
fees
—
Class
I
134
85
244
325
384
Shareholder
servicing
agent
fees
—
Premier
Class
62
60
64
133
217
Shareholder
servicing
agent
fees
—
Class
R6
1,132
1,230
1,523
3,026
4,569
Shareholder
servicing
agent
fees
—
Retirement
Class
158,747
289,321
404,770
719,682
968,401
Administrative
service
fees
20,967
19,270
20,740
26,309
32,520
Trustees
fees
4,931
9,217
13,208
28,641
45,349
Custodian
expenses
3,781
3,807
3,792
3,831
3,784
Overdraft
expense
3,202
7,324
6,090
7,151
7,822
Professional
fees
8,205
8,351
8,490
9,011
9,609
Registration
fees
75,954
48,980
53,406
54,582
57,510
Shareholder
reporting
expenses
24,812
32,321
34,244
50,606
66,025
Other
39,537
67,806
90,810
184,595
284,076
Total
expenses
1,333,751
2,043,877
2,847,298
5,918,363
9,221,369
Expenses
reimbursed
by
the
investment
adviser
(
161,758
)
(
133,525
)
(
146,526
)
(
189,386
)
(
234,902
)
Fee
waiver
by
investment
adviser
and
Nuveen
Securities
(
264,569
)
(
573,391
)
(
691,789
)
(
1,545,697
)
(
2,415,241
)
Net
expenses
907,424
1,336,961
2,008,983
4,183,280
6,571,226
Net
investment
income
(loss)
6,951,673
12,901,718
18,953,362
38,605,972
56,191,563
REALIZED
AND
UNREALIZED
GAIN
(LOSS)
Realized
gain
(loss):
Investments
–
–
–
–
–
Affiliated
investments
1,735,867
6,928,179
6,516,779
22,298,440
41,720,010
Net
realized
gain
(loss)
1,735,867
6,928,179
6,516,779
22,298,440
41,720,010
Change
in
unrealized
appreciation
(depreciation)
on:
Affiliated
investments
15,361,734
25,152,323
39,993,470
87,099,760
146,311,061
Net
change
in
unrealized
appreciation
(depreciation)
15,361,734
25,152,323
39,993,470
87,099,760
146,311,061
Net
realized
and
unrealized
gain
(loss)
17,097,601
32,080,502
46,510,249
109,398,200
188,031,071
Net
increase
(decrease)
in
net
assets
from
operations
$
24,049,274
$
44,982,220
$
65,463,611
$
148,004,172
$
244,222,634
See
Notes
to
Financial
Statements
12.6
Lifecycle
2030
12.7
Lifecycle
2035
12.8
Lifecycle
2040
12.9
Lifecycle
2045
13.01
Lifecycle
2050
13.1
Lifecycle
2055
13.2
Lifecycle
2060
$
67,883,714
$
62,887,501
$
60,412,558
$
35,952,506
$
25,381,386
$
12,410,633
$
5,039,949
109,295
136,430
168,934
129,332
111,050
59,747
33,794
67,993,009
63,023,931
60,581,492
36,081,838
25,492,436
12,470,380
5,073,743
9,505,280
10,400,054
12,804,656
9,291,833
7,425,547
3,809,041
1,643,735
–
–
–
–
–
–
–
144,279
157,226
185,574
138,315
102,023
54,072
20,381
–
–
–
–
–
–
–
477
531
335
444
212
272
265
259
273
324
237
200
125
73
5,428
5,842
6,944
5,485
4,690
3,065
1,820
1,124,000
1,111,910
1,292,934
785,865
568,696
272,111
110,158
36,678
38,574
43,550
36,117
32,050
24,222
19,551
56,175
60,969
74,050
53,827
42,825
21,954
9,450
3,834
3,869
3,888
3,840
3,802
3,752
4,035
4,474
3,059
3,607
3,130
1,965
1,341
1,943
10,026
10,215
10,706
10,000
9,612
9,341
8,394
53,430
49,699
52,056
65,945
65,950
36,930
62,735
74,148
77,533
87,752
69,649
64,846
50,241
45,251
340,471
357,975
417,640
294,892
233,220
123,192
56,235
11,358,959
12,277,729
14,984,016
10,759,579
8,555,638
4,409,659
1,984,026
(
256,870
)
(
264,042
)
(
298,119
)
(
260,945
)
(
238,497
)
(
161,351
)
(
159,689
)
(
3,167,701
)
(
3,843,634
)
(
5,138,956
)
(
3,847,163
)
(
3,200,250
)
(
1,640,299
)
(
710,343
)
7,934,388
8,170,053
9,546,941
6,651,471
5,116,891
2,608,009
1,113,994
60,058,621
54,853,878
51,034,551
29,430,367
20,375,545
9,862,371
3,959,749
–
–
–
–
–
543
202
54,714,483
76,596,136
99,141,644
68,939,090
42,173,198
12,561,817
1,229,742
54,714,483
76,596,136
99,141,644
68,939,090
42,173,198
12,562,360
1,229,944
203,846,967
234,364,074
325,079,192
258,728,659
227,285,154
126,642,923
59,313,103
203,846,967
234,364,074
325,079,192
258,728,659
227,285,154
126,642,923
59,313,103
258,561,450
310,960,210
424,220,836
327,667,749
269,458,352
139,205,283
60,543,047
$
318,620,071
$
365,814,088
$
475,255,387
$
357,098,116
$
289,833,897
$
149,067,654
$
64,502,796
Statement
of
Operations
(continued)
See
Notes
to
Financial
Statements
Statement
of
Operations
(continued)
Six
Months
Ended
November
30,
2024
(Unaudited)
13.3
Lifecycle
2065
INVESTMENT
INCOME
Dividends
from
affiliated
investments
$
613,128
Interest
8,570
Total
investment
income
621,698
EXPENSES
Management
fees
218,662
12b-1
distribution
and
service
fees
—
Premier
Class
3,543
Shareholder
servicing
agent
fees
—
Class
I
59
Shareholder
servicing
agent
fees
—
Premier
Class
36
Shareholder
servicing
agent
fees
—
Class
R6
545
Shareholder
servicing
agent
fees
—
Retirement
Class
20,635
Administrative
service
fees
16,428
Trustees
fees
1,282
Custodian
expenses
3,789
Overdraft
expense
880
Professional
fees
8,098
Registration
fees
63,901
Shareholder
reporting
expenses
28,903
Other
14,402
Total
expenses
381,163
Expenses
reimbursed
by
the
investment
adviser
(
131,148
)
Fee
waiver
by
investment
adviser
and
Nuveen
Securities
(
99,245
)
Net
expenses
150,770
Net
investment
income
(loss)
470,928
REALIZED
AND
UNREALIZED
GAIN
(LOSS)
Realized
gain
(loss):
Investments
24,604
Affiliated
investments
(
78,347
)
Net
realized
gain
(loss)
(
53,743
)
Change
in
unrealized
appreciation
(depreciation)
on:
Affiliated
investments
8,147,713
Net
change
in
unrealized
appreciation
(depreciation)
8,147,713
Net
realized
and
unrealized
gain
(loss)
8,093,970
Net
increase
(decrease)
in
net
assets
from
operations
$
8,564,898
Statement
of
Changes
in
Net
Assets
See
Notes
to
Financial
Statements
12.1
Lifecycle
Retirement
Income
12.2
Lifecycle
2010
Unaudited
Six
Months
Ended
11/30/24
Year
Ended
5/31/24
Unaudited
Six
Months
Ended
11/30/24
Year
Ended
5/31/24
OPERATIONS
Net
investment
income
(loss)
$
6,951,673
$
13,457,165
$
12,901,718
$
26,489,058
Net
realized
gain
(loss)
1,735,867
4,201,305
6,928,179
11,316,868
Net
change
in
unrealized
appreciation
(depreciation)
15,361,734
24,912,587
25,152,323
42,222,166
Net
increase
(decrease)
in
net
assets
from
operations
24,049,274
42,571,057
44,982,220
80,028,092
DISTRIBUTIONS
TO
SHAREHOLDERS
–
–
–
–
Dividends:
Class
A
(
1,625,461
)
(
4,116,154
)
–
–
Class
I
(
3,637
)
(
11,163
)
–
(
5,954
)
Premier
Class
(
131,657
)
(
399,759
)
–
(
1,407,286
)
Class
R6
(
2,190,384
)
(
5,949,631
)
–
(
21,323,739
)
Retirement
Class
(
1,632,687
)
(
4,318,428
)
–
(
6,997,365
)
Total
distributions
(
5,583,826
)
(
14,795,135
)
–
(
29,734,344
)
FUND
SHARE
TRANSACTIONS
Subscriptions
15,583,851
30,622,312
34,658,827
48,538,732
Reinvestments
of
distributions
5,518,322
14,629,488
–
29,730,651
Redemptions
(
43,715,726
)
(
98,931,270
)
(
117,958,519
)
(
180,691,381
)
Net
increase
(decrease)
from
Fund
share
transactions
(
22,613,553
)
(
53,679,470
)
(
83,299,692
)
(
102,421,998
)
Net
increase
(decrease)
in
net
assets
(
4,148,105
)
(
25,903,548
)
(
38,317,472
)
(
52,128,250
)
Net
assets
at
the
beginning
of
period
418,700,199
444,603,747
804,466,356
856,594,606
Net
assets
at
the
end
of
period
$
414,552,094
$
418,700,199
$
766,148,884
$
804,466,356
See
Notes
to
Financial
Statements
12.3
Lifecycle
2015
12.4
Lifecycle
2020
12.5
Lifecycle
2025
12.6
Lifecycle
2030
Unaudited
Six
Months
Ended
11/30/24
Year
Ended
5/31/24
Unaudited
Six
Months
Ended
11/30/24
Year
Ended
5/31/24
Unaudited
Six
Months
Ended
11/30/24
Year
Ended
5/31/24
Unaudited
Six
Months
Ended
11/30/24
Year
Ended
5/31/24
$
18,953,362
$
37,421,468
$
38,605,972
$
78,788,046
$
56,191,563
$
113,788,471
$
60,058,621
$
122,549,518
6,516,779
8,340,942
22,298,440
30,376,363
41,720,010
66,087,173
54,714,483
87,052,112
39,993,470
73,193,086
87,099,760
177,006,342
146,311,061
303,399,538
203,846,967
433,504,193
65,463,611
118,955,496
148,004,172
286,170,751
244,222,634
483,275,182
318,620,071
643,105,823
–
–
–
–
–
–
–
–
–
–
–
–
–
–
–
–
–
(
12,512
)
–
(
24,576
)
–
(
30,026
)
–
(
20,519
)
–
(
1,716,848
)
–
(
3,674,578
)
–
(
5,781,619
)
–
(
6,248,703
)
–
(
29,407,552
)
–
(
66,477,947
)
–
(
97,183,078
)
–
(
105,109,214
)
–
(
8,650,230
)
–
(
14,602,705
)
–
(
17,686,177
)
–
(
16,705,312
)
–
(
39,787,142
)
–
(
84,779,806
)
–
(
120,680,900
)
–
(
128,083,748
)
45,531,103
64,034,390
60,346,423
109,210,643
125,961,719
196,081,459
144,187,661
292,815,032
–
39,723,654
–
84,652,988
–
120,343,523
–
127,987,885
(
179,889,543
)
(
252,426,006
)
(
394,650,209
)
(
586,806,808
)
(
540,134,845
)
(
770,449,630
)
(
551,280,462
)
(
734,878,265
)
(
134,358,440
)
(
148,667,962
)
(
334,303,786
)
(
392,943,177
)
(
414,173,126
)
(
454,024,648
)
(
407,092,801
)
(
314,075,348
)
(
68,894,829
)
(
69,499,608
)
(
186,299,614
)
(
191,552,232
)
(
169,950,492
)
(
91,430,366
)
(
88,472,730
)
200,946,727
1,158,115,781
1,227,615,389
2,514,613,559
2,706,165,791
3,915,890,552
4,007,320,918
4,752,803,626
4,551,856,899
$
1,089,220,952
$
1,158,115,781
$
2,328,313,945
$
2,514,613,559
$
3,745,940,060
$
3,915,890,552
$
4,664,330,896
$
4,752,803,626
Statement
of
Changes
in
Net
Assets
(continued)
See
Notes
to
Financial
Statements
Statement
of
Changes
in
Net
Assets
(continued)
12.7
Lifecycle
2035
12.8
Lifecycle
2040
Unaudited
Six
Months
Ended
11/30/24
Year
Ended
5/31/24
Unaudited
Six
Months
Ended
11/30/24
Year
Ended
5/31/24
OPERATIONS
Net
investment
income
(loss)
$
54,853,878
$
117,803,463
$
51,034,551
$
124,173,682
Net
realized
gain
(loss)
76,596,136
114,540,240
99,141,644
155,111,273
Net
change
in
unrealized
appreciation
(depreciation)
234,364,074
540,919,202
325,079,192
772,123,597
Net
increase
(decrease)
in
net
assets
from
operations
365,814,088
773,262,905
475,255,387
1,051,408,552
DISTRIBUTIONS
TO
SHAREHOLDERS
–
–
–
–
Dividends:
Class
I
–
(
18,308
)
–
(
11,242
)
Premier
Class
–
(
5,722,397
)
–
(
6,020,354
)
Class
R6
–
(
104,203,854
)
–
(
114,353,049
)
Retirement
Class
–
(
14,124,702
)
–
(
14,032,733
)
Total
distributions
–
(
124,069,261
)
–
(
134,417,378
)
FUND
SHARE
TRANSACTIONS
Subscriptions
163,803,561
330,940,782
162,556,196
356,828,431
Reinvestments
of
distributions
–
123,950,460
–
134,330,432
Redemptions
(
555,509,562
)
(
742,401,971
)
(
595,334,321
)
(
939,750,538
)
Net
increase
(decrease)
from
Fund
share
transactions
(
391,706,001
)
(
287,510,729
)
(
432,778,125
)
(
448,591,675
)
Net
increase
(decrease)
in
net
assets
(
25,891,913
)
361,682,915
42,477,262
468,399,499
Net
assets
at
the
beginning
of
period
5,114,598,782
4,752,915,867
6,167,299,226
5,698,899,727
Net
assets
at
the
end
of
period
$
5,088,706,869
$
5,114,598,782
$
6,209,776,488
$
6,167,299,226
See
Notes
to
Financial
Statements
12.9
Lifecycle
2045
13.01
Lifecycle
2050
13.1
Lifecycle
2055
13.2
Lifecycle
2060
Unaudited
Six
Months
Ended
11/30/24
Year
Ended
5/31/24
Unaudited
Six
Months
Ended
11/30/24
Year
Ended
5/31/24
Unaudited
Six
Months
Ended
11/30/24
Year
Ended
5/31/24
Unaudited
Six
Months
Ended
11/30/24
Year
Ended
5/31/24
$
29,430,367
$
79,488,274
$
20,375,545
$
58,960,031
$
9,862,371
$
28,500,222
$
3,959,749
$
10,939,381
68,939,090
105,225,167
42,173,198
75,937,683
12,562,360
34,355,577
1,229,944
11,623,186
258,728,659
616,594,431
227,285,154
513,205,206
126,642,923
260,129,409
59,313,103
104,781,601
357,098,116
801,307,872
289,833,897
648,102,920
149,067,654
322,985,208
64,502,796
127,344,168
–
–
–
–
–
–
–
–
–
(
14,037
)
–
(
7,741
)
–
(
7,680
)
–
(
7,924
)
–
(
3,589,833
)
–
(
2,435,974
)
–
(
1,176,582
)
–
(
351,954
)
–
(
71,073,943
)
–
(
53,020,684
)
–
(
24,606,427
)
–
(
8,843,631
)
–
(
11,619,998
)
–
(
7,770,079
)
–
(
3,385,358
)
–
(
1,109,516
)
–
(
86,297,811
)
–
(
63,234,478
)
–
(
29,176,047
)
–
(
10,313,025
)
160,578,879
345,097,825
141,296,052
311,291,710
118,187,429
238,774,681
92,162,702
173,144,011
–
86,151,403
–
63,200,612
–
29,103,903
–
10,259,051
(
457,070,213
)
(
648,559,949
)
(
330,941,647
)
(
519,282,102
)
(
160,983,501
)
(
261,084,816
)
(
57,768,012
)
(
93,812,271
)
(
296,491,334
)
(
217,310,721
)
(
189,645,595
)
(
144,789,780
)
(
42,796,072
)
6,793,768
34,394,690
89,590,791
60,606,782
497,699,340
100,188,302
440,078,662
106,271,582
300,602,929
98,897,486
206,621,934
4,447,242,431
3,949,543,091
3,505,834,075
3,065,755,413
1,766,248,561
1,465,645,632
734,710,348
528,088,414
$
4,507,849,213
$
4,447,242,431
$
3,606,022,377
$
3,505,834,075
$
1,872,520,143
$
1,766,248,561
$
833,607,834
$
734,710,348
Statement
of
Changes
in
Net
Assets
(continued)
See
Notes
to
Financial
Statements
Statement
of
Changes
in
Net
Assets
(continued)
13.3
Lifecycle
2065
Unaudited
Six
Months
Ended
11/30/24
Year
Ended
5/31/24
OPERATIONS
Net
investment
income
(loss)
$
470,928
$
1,087,895
Net
realized
gain
(loss)
(
53,743
)
1,368,578
Net
change
in
unrealized
appreciation
(depreciation)
8,147,713
10,796,854
Net
increase
(decrease)
in
net
assets
from
operations
8,564,898
13,253,327
DISTRIBUTIONS
TO
SHAREHOLDERS
–
–
Dividends:
Class
I
–
(
9,894
)
Premier
Class
–
(
47,168
)
Class
R6
–
(
746,406
)
Retirement
Class
–
(
142,051
)
Total
distributions
–
(
945,519
)
FUND
SHARE
TRANSACTIONS
Subscriptions
36,056,164
52,453,040
Reinvestments
of
distributions
–
857,443
Redemptions
(
18,298,310
)
(
16,803,139
)
Net
increase
(decrease)
from
Fund
share
transactions
17,757,854
36,507,344
Net
increase
(decrease)
in
net
assets
26,322,752
48,815,152
Net
assets
at
the
beginning
of
period
90,936,844
42,121,692
Net
assets
at
the
end
of
period
$
117,259,596
$
90,936,844
See
Notes
to
Financial
Statements
The
following
data
is
for
a
share outstanding
for
each
fiscal year
end
unless
otherwise
noted:
Investment
Operations
Less
Distributions
Net
Asset
Value,
Beginning
of
Period
Net
Investment
Income
(Loss)
a
Net
Realized/
Unrealized
Gain
(Loss)
j
Total
From
Net
Investment
Income
From
Net
Realized
Gains
Total
Net
Asset
Value,
End
of
Period
12.1
Lifecycle
Retirement
Income
Class
A:
11/30/24
#
$
11
.11
$
0
.18
$
0
.47
$
0
.65
$
(
0
.15
)
$
—
$
(
0
.15
)
$
11
.61
5/31/24
10
.42
0
.32
0
.72
1
.04
(
0
.35
)
—
(
0
.35
)
11
.11
5/31/23
11
.12
0
.36
(
0
.46
)
(
0
.10
)
(
0
.28
)
(
0
.32
)
(
0
.60
)
10
.42
5/31/22
12
.79
0
.26
(
1
.02
)
(
0
.76
)
(
0
.35
)
(
0
.56
)
(
0
.91
)
11
.12
5/31/21
11
.51
0
.20
1
.75
1
.95
(
0
.28
)
(
0
.39
)
(
0
.67
)
12
.79
5/31/20
11
.27
0
.30
0
.37
0
.67
(
0
.26
)
(
0
.17
)
(
0
.43
)
11
.51
Class
I:
11/30/24
#
11
.13
0
.20
0
.46
0
.66
(
0
.16
)
—
(
0
.16
)
11
.63
5/31/24
10
.44
0
.34
0
.72
1
.06
(
0
.37
)
—
(
0
.37
)
11
.13
5/31/23
11
.14
0
.41
(
0
.49
)
(
0
.08
)
(
0
.30
)
(
0
.32
)
(
0
.62
)
10
.44
5/31/22
12
.81
0
.30
(
1
.04
)
(
0
.74
)
(
0
.37
)
(
0
.56
)
(
0
.93
)
11
.14
5/31/21
11
.52
0
.20
1
.78
1
.98
(
0
.30
)
(
0
.39
)
(
0
.69
)
12
.81
5/31/20
11
.29
0
.32
0
.36
0
.68
(
0
.28
)
(
0
.17
)
(
0
.45
)
11
.52
Premier
Class:
11/30/24
#
11
.12
0
.19
0
.47
0
.66
(
0
.15
)
—
(
0
.15
)
11
.63
5/31/24
10
.43
0
.33
0
.72
1
.05
(
0
.36
)
—
(
0
.36
)
11
.12
5/31/23
11
.13
0
.37
(
0
.46
)
(
0
.09
)
(
0
.29
)
(
0
.32
)
(
0
.61
)
10
.43
5/31/22
12
.80
0
.27
(
1
.01
)
(
0
.74
)
(
0
.37
)
(
0
.56
)
(
0
.93
)
11
.13
5/31/21
11
.51
0
.21
1
.76
1
.97
(
0
.29
)
(
0
.39
)
(
0
.68
)
12
.80
5/31/20
11
.28
0
.31
0
.36
0
.67
(
0
.27
)
(
0
.17
)
(
0
.44
)
11
.51
Class
R6:
11/30/24
#
11
.13
0
.20
0
.46
0
.66
(
0
.16
)
—
(
0
.16
)
11
.63
5/31/24
10
.44
0
.35
0
.72
1
.07
(
0
.38
)
—
(
0
.38
)
11
.13
5/31/23
11
.14
0
.39
(
0
.46
)
(
0
.07
)
(
0
.31
)
(
0
.32
)
(
0
.63
)
10
.44
5/31/22
12
.81
0
.29
(
1
.02
)
(
0
.73
)
(
0
.38
)
(
0
.56
)
(
0
.94
)
11
.14
5/31/21
11
.52
0
.23
1
.76
1
.99
(
0
.31
)
(
0
.39
)
(
0
.70
)
12
.81
5/31/20
11
.29
0
.33
0
.36
0
.69
(
0
.29
)
(
0
.17
)
(
0
.46
)
11
.52
Retirement
Class:
11/30/24
#
11
.10
0
.18
0
.47
0
.65
(
0
.15
)
—
(
0
.15
)
11
.60
5/31/24
10
.41
0
.32
0
.72
1
.04
(
0
.35
)
—
(
0
.35
)
11
.10
5/31/23
11
.11
0
.36
(
0
.46
)
(
0
.10
)
(
0
.28
)
(
0
.32
)
(
0
.60
)
10
.41
5/31/22
12
.78
0
.26
(
1
.02
)
(
0
.76
)
(
0
.35
)
(
0
.56
)
(
0
.91
)
11
.11
5/31/21
11
.49
0
.20
1
.76
1
.96
(
0
.28
)
(
0
.39
)
(
0
.67
)
12
.78
5/31/20
11
.26
0
.30
0
.36
0
.66
(
0
.26
)
(
0
.17
)
(
0
.43
)
11
.49
#
Unaudited
a
Based
on
average
shares
outstanding.
b
Total
returns
are
at
NAV
and
do
not
include
any
sales
charge.
Total
returns
are
not
annualized.
c
Percentage
is
annualized.
g
The
Fund's
expenses
include
the
expenses
of
the
Underlying
Funds,
excluding
the
expenses
of
the
Dividend
Growth,
Dividend
Value,
Growth
Opportunities
ETF
and
the
Nuveen
Real
Property
Fund
LP.
j
Short-term
and
long-term
capital
gain
distributions
received
from
the
underlying
Funds
are
presented
in
net
realized
and
unrealized
gain
(loss)
on
total
investments
for
all
periods
presented.
See
Notes
to
Financial
Statements
Ratios
and
Supplemental
Data
Ratios
to
Average
Net
Assets
Total
Return
b
Net
Assets,
End
of
Period
(000)
Gross
Expenses
g
Net
Expenses
g
Net
Investment
Income
(Loss)
Portfolio
Turnover
Rate
5
.85
%
$
127,449
0
.75
%
c
0
.53
%
c
3
.21
%
c
5
%
10
.19
124,235
0
.74
0
.53
3
.00
12
(
0
.69
)
123,946
0
.72
0
.52
3
.43
19
(
6
.49
)
131,167
0
.70
0
.51
2
.10
28
17
.31
144,030
0
.71
0
.54
1
.62
41
5
.97
122,730
0
.75
0
.58
2
.58
30
5
.92
210
0
.57
c
0
.37
c
3
.48
c
5
10
.36
337
0
.54
0
.36
3
.16
12
(
0
.50
)
317
0
.52
0
.35
3
.86
19
(
6
.33
)
609
0
.50
0
.34
2
.44
28
17
.57
596
0
.52
0
.38
1
.63
41
6
.04
310
0
.57
0
.42
2
.74
30
5
.99
8,320
0
.62
c
0
.43
c
3
.39
c
5
10
.29
9,940
0
.61
0
.43
3
.09
12
(
0
.58
)
15,207
0
.59
0
.42
3
.55
19
(
6
.40
)
17,624
0
.58
0
.41
2
.17
28
17
.51
19,161
0
.58
0
.44
1
.71
41
5
.97
17,410
0
.63
0
.48
2
.69
30
5
.97
152,884
0
.48
c
0
.28
c
3
.50
c
5
10
.45
156,206
0
.46
0
.28
3
.25
12
(
0
.42
)
171,457
0
.44
0
.27
3
.72
19
(
6
.25
)
222,227
0
.43
0
.26
2
.37
28
17
.67
244,923
0
.43
0
.29
1
.87
41
6
.14
219,016
0
.48
0
.33
2
.84
30
5
.86
125,689
0
.73
c
0
.53
c
3
.23
c
5
10
.20
127,984
0
.71
0
.53
3
.00
12
(
0
.68
)
133,676
0
.69
0
.52
3
.45
19
(
6
.49
)
157,609
0
.68
0
.50
2
.11
28
17
.43
200,300
0
.68
0
.54
1
.61
41
5
.88
179,106
0
.73
0
.58
2
.59
30
Financial
Highlights
(continued)
See
Notes
to
Financial
Statements
Financial
Highlights
(continued)
Investment
Operations
Less
Distributions
Net
Asset
Value,
Beginning
of
Period
Net
Investment
Income
(Loss)
a
Net
Realized/
Unrealized
Gain
(Loss)
j
Total
From
Net
Investment
Income
From
Net
Realized
Gains
Total
Net
Asset
Value,
End
of
Period
12.2
Lifecycle
2010
Class
I:
11/30/24
#
$
10
.13
$
0
.18
$
0
.42
$
0
.60
$
—
$
—
$
—
$
10
.73
5/31/24
9
.55
0
.32
0
.65
0
.97
(
0
.39
)
—
(
0
.39
)
10
.13
5/31/23
10
.32
0
.36
(
0
.42
)
(
0
.06
)
(
0
.36
)
(
0
.35
)
(
0
.71
)
9
.55
5/31/22
12
.22
0
.26
(
0
.93
)
(
0
.67
)
(
0
.40
)
(
0
.83
)
(
1
.23
)
10
.32
5/31/21
11
.30
0
.22
1
.71
1
.93
(
0
.33
)
(
0
.68
)
(
1
.01
)
12
.22
5/31/20
11
.15
0
.19
0
.53
0
.72
(
0
.30
)
(
0
.27
)
(
0
.57
)
11
.30
Premier
Class:
11/30/24
#
10
.08
0
.17
0
.42
0
.59
—
—
—
10
.67
5/31/24
9
.50
0
.31
0
.65
0
.96
(
0
.38
)
—
(
0
.38
)
10
.08
5/31/23
10
.27
0
.34
(
0
.41
)
(
0
.07
)
(
0
.35
)
(
0
.35
)
(
0
.70
)
9
.50
5/31/22
12
.17
0
.25
(
0
.94
)
(
0
.69
)
(
0
.38
)
(
0
.83
)
(
1
.21
)
10
.27
5/31/21
11
.24
0
.20
1
.73
1
.93
(
0
.32
)
(
0
.68
)
(
1
.00
)
12
.17
5/31/20
11
.11
0
.31
0
.37
0
.68
(
0
.28
)
(
0
.27
)
(
0
.55
)
11
.24
Class
R6:
11/30/24
#
10
.10
0
.18
0
.42
0
.60
—
—
—
10
.70
5/31/24
9
.53
0
.32
0
.65
0
.97
(
0
.40
)
—
(
0
.40
)
10
.10
5/31/23
10
.29
0
.36
(
0
.41
)
(
0
.05
)
(
0
.36
)
(
0
.35
)
(
0
.71
)
9
.53
5/31/22
12
.20
0
.27
(
0
.94
)
(
0
.67
)
(
0
.41
)
(
0
.83
)
(
1
.24
)
10
.29
5/31/21
11
.27
0
.22
1
.73
1
.95
(
0
.34
)
(
0
.68
)
(
1
.02
)
12
.20
5/31/20
11
.14
0
.32
0
.38
0
.70
(
0
.30
)
(
0
.27
)
(
0
.57
)
11
.27
Retirement
Class:
11/30/24
#
12
.79
0
.21
0
.54
0
.75
—
—
—
13
.54
5/31/24
11
.96
0
.38
0
.82
1
.20
(
0
.37
)
—
(
0
.37
)
12
.79
5/31/23
12
.73
0
.41
(
0
.50
)
(
0
.09
)
(
0
.33
)
(
0
.35
)
(
0
.68
)
11
.96
5/31/22
14
.80
0
.30
(
1
.17
)
(
0
.87
)
(
0
.37
)
(
0
.83
)
(
1
.20
)
12
.73
5/31/21
13
.48
0
.23
2
.07
2
.30
(
0
.30
)
(
0
.68
)
(
0
.98
)
14
.80
5/31/20
13
.22
0
.35
0
.45
0
.80
(
0
.27
)
(
0
.27
)
(
0
.54
)
13
.48
#
Unaudited
a
Based
on
average
shares
outstanding.
b
Total
returns
are
not
annualized.
c
Percentage
is
annualized.
g
The
Fund's
expenses
include
the
expenses
of
the
Underlying
Funds,
excluding
the
expenses
of
the
Dividend
Growth,
Dividend
Value,
Growth
Opportunities
ETF
and
the
Nuveen
Real
Property
Fund
LP.
j
Short-term
and
long-term
capital
gain
distributions
received
from
the
underlying
Funds
are
presented
in
net
realized
and
unrealized
gain
(loss)
on
total
investments
for
all
periods
presented.
See
Notes
to
Financial
Statements
Ratios
and
Supplemental
Data
Ratios
to
Average
Net
Assets
Total
Return
b
Net
Assets,
End
of
Period
(000)
Gross
Expenses
g
Net
Expenses
g
Net
Investment
Income
(Loss)
Portfolio
Turnover
Rate
5
.92
%
$
91
0
.57
%
c
0
.39
%
c
3
.33
%
c
5
%
10
.33
157
0
.50
0
.32
3
.25
14
(
0
.42
)
146
0
.50
0
.32
3
.69
18
(
6
.32
)
177
0
.48
0
.33
2
.29
21
17
.57
164
0
.49
0
.36
1
.81
38
6
.45
144
0
.56
0
.37
1
.67
28
5
.85
29,841
0
.59
c
0
.41
c
3
.24
c
5
10
.27
34,029
0
.59
0
.41
3
.17
14
(
0
.50
)
40,794
0
.57
0
.39
3
.53
18
(
6
.45
)
50,141
0
.56
0
.41
2
.16
21
17
.62
77,845
0
.57
0
.44
1
.70
38
6
.10
73,048
0
.61
0
.48
2
.68
28
5
.94
514,878
0
.44
c
0
.26
c
3
.38
c
5
10
.31
534,127
0
.44
0
.26
3
.30
14
(
0
.23
)
570,203
0
.42
0
.24
3
.66
18
(
6
.34
)
700,875
0
.41
0
.26
2
.34
21
17
.75
836,684
0
.42
0
.29
1
.84
38
6
.29
720,990
0
.46
0
.33
2
.85
28
5
.86
221,339
0
.69
c
0
.51
c
3
.12
c
5
10
.11
236,153
0
.69
0
.51
3
.05
14
(
0
.54
)
245,451
0
.67
0
.49
3
.42
18
(
6
.56
)
290,686
0
.66
0
.51
2
.09
21
17
.45
368,266
0
.67
0
.54
1
.62
38
6
.02
353,355
0
.71
0
.58
2
.58
28
Financial
Highlights
(continued)
See
Notes
to
Financial
Statements
Financial
Highlights
(continued)
Investment
Operations
Less
Distributions
Net
Asset
Value,
Beginning
of
Period
Net
Investment
Income
(Loss)
a
Net
Realized/
Unrealized
Gain
(Loss)
j
Total
From
Net
Investment
Income
From
Net
Realized
Gains
Total
Net
Asset
Value,
End
of
Period
12.3
Lifecycle
2015
Class
I:
11/30/24
#
$
9
.06
$
0
.16
$
0
.38
$
0
.54
$
—
$
—
$
—
$
9
.60
5/31/24
8
.49
0
.29
0
.61
0
.90
(
0
.33
)
—
(
0
.33
)
9
.06
5/31/23
9
.17
0
.30
(
0
.37
)
(
0
.07
)
(
0
.27
)
(
0
.34
)
(
0
.61
)
8
.49
5/31/22
10
.81
0
.22
(
0
.86
)
(
0
.64
)
(
0
.35
)
(
0
.65
)
(
1
.00
)
9
.17
5/31/21
9
.61
0
.18
1
.67
1
.85
(
0
.29
)
(
0
.36
)
(
0
.65
)
10
.81
5/31/20
9
.45
0
.26
0
.34
0
.60
(
0
.26
)
(
0
.18
)
(
0
.44
)
9
.61
Premier
Class:
11/30/24
#
9
.02
0
.15
0
.39
0
.54
—
—
—
9
.56
5/31/24
8
.46
0
.27
0
.61
0
.88
(
0
.32
)
—
(
0
.32
)
9
.02
5/31/23
9
.14
0
.30
(
0
.37
)
(
0
.07
)
(
0
.27
)
(
0
.34
)
(
0
.61
)
8
.46
5/31/22
10
.76
0
.21
(
0
.84
)
(
0
.63
)
(
0
.34
)
(
0
.65
)
(
0
.99
)
9
.14
5/31/21
9
.57
0
.17
1
.66
1
.83
(
0
.28
)
(
0
.36
)
(
0
.64
)
10
.76
5/31/20
9
.41
0
.25
0
.33
0
.58
(
0
.24
)
(
0
.18
)
(
0
.42
)
9
.57
Class
R6:
11/30/24
#
9
.07
0
.16
0
.39
0
.55
—
—
—
9
.62
5/31/24
8
.50
0
.28
0
.62
0
.90
(
0
.33
)
—
(
0
.33
)
9
.07
5/31/23
9
.18
0
.31
(
0
.37
)
(
0
.06
)
(
0
.28
)
(
0
.34
)
(
0
.62
)
8
.50
5/31/22
10
.81
0
.23
(
0
.85
)
(
0
.62
)
(
0
.36
)
(
0
.65
)
(
1
.01
)
9
.18
5/31/21
9
.62
0
.19
1
.66
1
.85
(
0
.30
)
(
0
.36
)
(
0
.66
)
10
.81
5/31/20
9
.45
0
.27
0
.34
0
.61
(
0
.26
)
(
0
.18
)
(
0
.44
)
9
.62
Retirement
Class:
11/30/24
#
12
.17
0
.20
0
.52
0
.72
—
—
—
12
.89
5/31/24
11
.30
0
.35
0
.83
1
.18
(
0
.31
)
—
(
0
.31
)
12
.17
5/31/23
11
.99
0
.38
(
0
.48
)
(
0
.10
)
(
0
.25
)
(
0
.34
)
(
0
.59
)
11
.30
5/31/22
13
.82
0
.27
(
1
.12
)
(
0
.85
)
(
0
.33
)
(
0
.65
)
(
0
.98
)
11
.99
5/31/21
12
.13
0
.21
2
.11
2
.32
(
0
.27
)
(
0
.36
)
(
0
.63
)
13
.82
5/31/20
11
.82
0
.31
0
.41
0
.72
(
0
.23
)
(
0
.18
)
(
0
.41
)
12
.13
#
Unaudited
a
Based
on
average
shares
outstanding.
b
Total
returns
are
not
annualized.
c
Percentage
is
annualized.
g
The
Fund's
expenses
include
the
expenses
of
the
Underlying
Funds,
excluding
the
expenses
of
the
Dividend
Growth,
Dividend
Value,
Growth
Opportunities
ETF
and
the
Nuveen
Real
Property
Fund
LP.
j
Short-term
and
long-term
capital
gain
distributions
received
from
the
underlying
Funds
are
presented
in
net
realized
and
unrealized
gain
(loss)
on
total
investments
for
all
periods
presented.
See
Notes
to
Financial
Statements
Ratios
and
Supplemental
Data
Ratios
to
Average
Net
Assets
Total
Return
b
Net
Assets,
End
of
Period
(000)
Gross
Expenses
g
Net
Expenses
g
Net
Investment
Income
(Loss)
Portfolio
Turnover
Rate
5
.96
%
$
274
0
.58
%
c
0
.43
%
c
3
.36
%
c
5
%
10
.74
355
0
.47
0
.28
3
.26
13
(
0
.52
)
381
0
.53
0
.38
3
.49
18
(
6
.61
)
390
0
.52
0
.38
2
.15
20
19
.60
255
0
.52
0
.39
1
.75
36
6
.29
185
0
.55
0
.39
2
.66
26
5
.99
42,921
0
.58
c
0
.43
c
3
.26
c
5
10
.56
42,131
0
.58
0
.39
3
.11
13
(
0
.57
)
56,724
0
.57
0
.42
3
.48
18
(
6
.54
)
71,144
0
.56
0
.42
2
.06
20
19
.47
116,117
0
.57
0
.44
1
.67
36
6
.14
107,025
0
.61
0
.49
2
.61
26
6
.06
731,473
0
.43
c
0
.28
c
3
.48
c
5
10
.82
782,265
0
.43
0
.24
3
.25
13
(
0
.39
)
831,507
0
.42
0
.27
3
.61
18
(
6
.43
)
1,005,382
0
.41
0
.27
2
.25
20
19
.56
1,217,691
0
.42
0
.29
1
.83
36
6
.43
1,088,594
0
.46
0
.34
2
.80
26
5
.92
314,553
0
.68
c
0
.53
c
3
.21
c
5
10
.52
333,364
0
.68
0
.49
2
.99
13
(
0
.66
)
339,003
0
.67
0
.52
3
.36
18
(
6
.73
)
393,955
0
.66
0
.52
2
.01
20
19
.34
500,838
0
.67
0
.54
1
.60
36
6
.06
492,656
0
.71
0
.59
2
.54
26
Financial
Highlights
(continued)
See
Notes
to
Financial
Statements
Financial
Highlights
(continued)
Investment
Operations
Less
Distributions
Net
Asset
Value,
Beginning
of
Period
Net
Investment
Income
(Loss)
a
Net
Realized/
Unrealized
Gain
(Loss)
j
Total
From
Net
Investment
Income
From
Net
Realized
Gains
Total
Net
Asset
Value,
End
of
Period
12.4
Lifecycle
2020
Class
I:
11/30/24
#
$
9
.45
$
0
.14
$
0
.45
$
0
.59
$
—
$
—
$
—
$
10
.04
5/31/24
8
.77
0
.28
0
.73
1
.01
(
0
.33
)
—
(
0
.33
)
9
.45
5/31/23
9
.47
0
.30
(
0
.35
)
(
0
.05
)
(
0
.27
)
(
0
.38
)
(
0
.65
)
8
.77
5/31/22
11
.25
0
.21
(
0
.90
)
(
0
.69
)
(
0
.37
)
(
0
.72
)
(
1
.09
)
9
.47
5/31/21
9
.89
0
.14
1
.94
2
.08
(
0
.31
)
(
0
.41
)
(
0
.72
)
11
.25
5/31/20
9
.73
0
.26
0
.38
0
.64
(
0
.25
)
(
0
.23
)
(
0
.48
)
9
.89
Premier
Class:
11/30/24
#
9
.44
0
.15
0
.44
0
.59
—
—
—
10
.03
5/31/24
8
.75
0
.27
0
.74
1
.01
(
0
.32
)
—
(
0
.32
)
9
.44
5/31/23
9
.45
0
.29
(
0
.35
)
(
0
.06
)
(
0
.26
)
(
0
.38
)
(
0
.64
)
8
.75
5/31/22
11
.23
0
.21
(
0
.92
)
(
0
.71
)
(
0
.35
)
(
0
.72
)
(
1
.07
)
9
.45
5/31/21
9
.87
0
.18
1
.89
2
.07
(
0
.30
)
(
0
.41
)
(
0
.71
)
11
.23
5/31/20
9
.70
0
.25
0
.38
0
.63
(
0
.23
)
(
0
.23
)
(
0
.46
)
9
.87
Class
R6:
11/30/24
#
9
.46
0
.16
0
.44
0
.60
—
—
—
10
.06
5/31/24
8
.77
0
.28
0
.74
1
.02
(
0
.33
)
—
(
0
.33
)
9
.46
5/31/23
9
.48
0
.31
(
0
.37
)
(
0
.06
)
(
0
.27
)
(
0
.38
)
(
0
.65
)
8
.77
5/31/22
11
.26
0
.23
(
0
.91
)
(
0
.68
)
(
0
.38
)
(
0
.72
)
(
1
.10
)
9
.48
5/31/21
9
.89
0
.20
1
.90
2
.10
(
0
.32
)
(
0
.41
)
(
0
.73
)
11
.26
5/31/20
9
.73
0
.27
0
.37
0
.64
(
0
.25
)
(
0
.23
)
(
0
.48
)
9
.89
Retirement
Class:
11/30/24
#
13
.12
0
.21
0
.60
0
.81
—
—
—
13
.93
5/31/24
12
.05
0
.36
1
.01
1
.37
(
0
.30
)
—
(
0
.30
)
13
.12
5/31/23
12
.75
0
.39
(
0
.47
)
(
0
.08
)
(
0
.24
)
(
0
.38
)
(
0
.62
)
12
.05
5/31/22
14
.78
0
.27
(
1
.24
)
(
0
.97
)
(
0
.34
)
(
0
.72
)
(
1
.06
)
12
.75
5/31/21
12
.79
0
.22
2
.46
2
.68
(
0
.28
)
(
0
.41
)
(
0
.69
)
14
.78
5/31/20
12
.45
0
.32
0
.47
0
.79
(
0
.22
)
(
0
.23
)
(
0
.45
)
12
.79
#
Unaudited
a
Based
on
average
shares
outstanding.
b
Total
returns
are
not
annualized.
c
Percentage
is
annualized.
g
The
Fund's
expenses
include
the
expenses
of
the
Underlying
Funds,
excluding
the
expenses
of
the
Dividend
Growth,
Dividend
Value,
Growth
Opportunities
ETF
and
the
Nuveen
Real
Property
Fund
LP.
j
Short-term
and
long-term
capital
gain
distributions
received
from
the
underlying
Funds
are
presented
in
net
realized
and
unrealized
gain
(loss)
on
total
investments
for
all
periods
presented.
See
Notes
to
Financial
Statements
Ratios
and
Supplemental
Data
Ratios
to
Average
Net
Assets
Total
Return
b
Net
Assets,
End
of
Period
(000)
Gross
Expenses
g
Net
Expenses
g
Net
Investment
Income
(Loss)
Portfolio
Turnover
Rate
6
.24
%
$
421
0
.53
%
c
0
.38
%
c
2
.88
%
c
4
%
11
.65
520
0
.51
0
.35
3
.10
12
(
0
.32
)
695
0
.50
0
.36
3
.33
18
(
6
.93
)
498
0
.46
0
.32
1
.91
22
21
.43
726
0
.48
0
.35
1
.26
38
6
.42
352
0
.51
0
.39
2
.61
26
6
.25
87,185
0
.58
c
0
.43
c
3
.10
c
4
11
.68
93,230
0
.58
0
.41
2
.97
12
(
0
.42
)
141,676
0
.57
0
.42
3
.31
18
(
7
.06
)
165,761
0
.55
0
.42
1
.96
22
21
.37
252,876
0
.57
0
.45
1
.66
38
6
.35
249,364
0
.62
0
.50
2
.53
26
6
.34
1,692,630
0
.43
c
0
.28
c
3
.26
c
4
11
.86
1,821,625
0
.43
0
.26
3
.11
12
(
0
.36
)
1,921,359
0
.41
0
.27
3
.45
18
(
6
.86
)
2,303,415
0
.40
0
.27
2
.15
22
21
.61
2,712,681
0
.42
0
.29
1
.82
38
6
.43
2,374,405
0
.47
0
.35
2
.75
26
6
.17
548,078
0
.67
c
0
.53
c
3
.01
c
4
11
.50
599,239
0
.68
0
.51
2
.86
12
(
0
.47
)
642,436
0
.67
0
.52
3
.21
18
(
7
.17
)
764,245
0
.65
0
.52
1
.89
22
21
.27
993,670
0
.67
0
.55
1
.59
38
6
.21
947,495
0
.72
0
.60
2
.50
26
Financial
Highlights
(continued)
See
Notes
to
Financial
Statements
Financial
Highlights
(continued)
Investment
Operations
Less
Distributions
Net
Asset
Value,
Beginning
of
Period
Net
Investment
Income
(Loss)
a
Net
Realized/
Unrealized
Gain
(Loss)
j
Total
From
Net
Investment
Income
From
Net
Realized
Gains
Total
Net
Asset
Value,
End
of
Period
12.5
Lifecycle
2025
Class
I:
11/30/24
#
$
9
.94
$
0
.15
$
0
.50
$
0
.65
$
—
$
—
$
—
$
10
.59
5/31/24
9
.09
0
.28
0
.88
1
.16
(
0
.31
)
—
(
0
.31
)
9
.94
5/31/23
9
.85
0
.27
(
0
.31
)
(
0
.04
)
(
0
.26
)
(
0
.46
)
(
0
.72
)
9
.09
5/31/22
11
.75
0
.22
(
0
.98
)
(
0
.76
)
(
0
.38
)
(
0
.76
)
(
1
.14
)
9
.85
5/31/21
10
.03
0
.15
2
.31
2
.46
(
0
.31
)
(
0
.43
)
(
0
.74
)
11
.75
5/31/20
9
.88
0
.27
0
.39
0
.66
(
0
.24
)
(
0
.27
)
(
0
.51
)
10
.03
Premier
Class:
11/30/24
#
9
.89
0
.15
0
.50
0
.65
—
—
—
10
.54
5/31/24
9
.05
0
.26
0
.89
1
.15
(
0
.31
)
—
(
0
.31
)
9
.89
5/31/23
9
.80
0
.28
(
0
.32
)
(
0
.04
)
(
0
.25
)
(
0
.46
)
(
0
.71
)
9
.05
5/31/22
11
.70
0
.21
(
0
.98
)
(
0
.77
)
(
0
.37
)
(
0
.76
)
(
1
.13
)
9
.80
5/31/21
9
.99
0
.18
2
.25
2
.43
(
0
.29
)
(
0
.43
)
(
0
.72
)
11
.70
5/31/20
9
.84
0
.24
0
.40
0
.64
(
0
.22
)
(
0
.27
)
(
0
.49
)
9
.99
Class
R6:
11/30/24
#
9
.95
0
.15
0
.50
0
.65
—
—
—
10
.60
5/31/24
9
.09
0
.28
0
.90
1
.18
(
0
.32
)
—
(
0
.32
)
9
.95
5/31/23
9
.85
0
.30
(
0
.34
)
(
0
.04
)
(
0
.26
)
(
0
.46
)
(
0
.72
)
9
.09
5/31/22
11
.76
0
.23
(
0
.99
)
(
0
.76
)
(
0
.39
)
(
0
.76
)
(
1
.15
)
9
.85
5/31/21
10
.04
0
.19
2
.27
2
.46
(
0
.31
)
(
0
.43
)
(
0
.74
)
11
.76
5/31/20
9
.89
0
.27
0
.40
0
.67
(
0
.25
)
(
0
.27
)
(
0
.52
)
10
.04
Retirement
Class:
11/30/24
#
14
.01
0
.20
0
.70
0
.90
—
—
—
14
.91
5/31/24
12
.69
0
.36
1
.25
1
.61
(
0
.29
)
—
(
0
.29
)
14
.01
5/31/23
13
.44
0
.38
(
0
.44
)
(
0
.06
)
(
0
.23
)
(
0
.46
)
(
0
.69
)
12
.69
5/31/22
15
.63
0
.26
(
1
.35
)
(
1
.09
)
(
0
.34
)
(
0
.76
)
(
1
.10
)
13
.44
5/31/21
13
.14
0
.22
2
.97
3
.19
(
0
.27
)
(
0
.43
)
(
0
.70
)
15
.63
5/31/20
12
.79
0
.32
0
.51
0
.83
(
0
.21
)
(
0
.27
)
(
0
.48
)
13
.14
#
Unaudited
a
Based
on
average
shares
outstanding.
b
Total
returns
are
not
annualized.
c
Percentage
is
annualized.
g
The
Fund's
expenses
include
the
expenses
of
the
Underlying
Funds,
excluding
the
expenses
of
the
Dividend
Growth,
Dividend
Value,
Growth
Opportunities
ETF
and
the
Nuveen
Real
Property
Fund
LP.
j
Short-term
and
long-term
capital
gain
distributions
received
from
the
underlying
Funds
are
presented
in
net
realized
and
unrealized
gain
(loss)
on
total
investments
for
all
periods
presented.
See
Notes
to
Financial
Statements
Ratios
and
Supplemental
Data
Ratios
to
Average
Net
Assets
Total
Return
b
Net
Assets,
End
of
Period
(000)
Gross
Expenses
g
Net
Expenses
g
Net
Investment
Income
(Loss)
Portfolio
Turnover
Rate
6
.54
%
$
686
0
.53
%
c
0
.39
%
c
2
.90
%
c
4
%
13
.00
773
0
.50
0
.35
2
.92
13
(
0
.21
)
855
0
.51
0
.36
2
.99
20
(
7
.32
)
391
0
.48
0
.34
1
.93
25
24
.93
553
0
.49
0
.36
1
.35
40
6
.55
133
0
.54
0
.42
2
.66
28
6
.57
150,695
0
.58
c
0
.44
c
2
.85
c
4
12
.84
161,319
0
.58
0
.43
2
.80
13
(
0
.20
)
221,273
0
.57
0
.42
3
.09
20
(
7
.44
)
236,147
0
.55
0
.42
1
.83
25
24
.80
336,773
0
.58
0
.45
1
.59
40
6
.41
295,668
0
.63
0
.51
2
.39
28
6
.53
2,851,689
0
.43
c
0
.29
c
2
.99
c
4
13
.20
2,940,148
0
.43
0
.28
2
.94
13
(
0
.14
)
2,939,672
0
.42
0
.27
3
.23
20
(
7
.33
)
3,488,042
0
.40
0
.27
2
.01
25
24
.96
3,909,833
0
.43
0
.30
1
.76
40
6
.59
3,142,487
0
.48
0
.36
2
.66
28
6
.42
742,871
0
.68
c
0
.54
c
2
.76
c
4
12
.79
813,651
0
.68
0
.53
2
.69
13
(
0
.30
)
845,520
0
.67
0
.52
3
.00
20
(
7
.55
)
973,393
0
.65
0
.52
1
.75
25
24
.64
1,217,409
0
.68
0
.55
1
.52
40
6
.40
1,103,642
0
.73
0
.61
2
.39
28
Financial
Highlights
(continued)
See
Notes
to
Financial
Statements
Financial
Highlights
(continued)
Investment
Operations
Less
Distributions
Net
Asset
Value,
Beginning
of
Period
Net
Investment
Income
(Loss)
a
Net
Realized/
Unrealized
Gain
(Loss)
j
Total
From
Net
Investment
Income
From
Net
Realized
Gains
Total
Net
Asset
Value,
End
of
Period
12.6
Lifecycle
2030
Class
I:
11/30/24
#
$
10
.25
$
0
.13
$
0
.59
$
0
.72
$
—
$
—
$
—
$
10
.97
5/31/24
9
.20
0
.25
1
.09
1
.34
(
0
.29
)
—
(
0
.29
)
10
.25
5/31/23
9
.97
0
.26
(
0
.29
)
(
0
.03
)
(
0
.23
)
(
0
.51
)
(
0
.74
)
9
.20
5/31/22
12
.01
0
.21
(
1
.03
)
(
0
.82
)
(
0
.39
)
(
0
.83
)
(
1
.22
)
9
.97
5/31/21
10
.01
0
.18
2
.60
2
.78
(
0
.31
)
(
0
.47
)
(
0
.78
)
12
.01
5/31/20
9
.87
0
.20
0
.47
0
.67
(
0
.22
)
(
0
.31
)
(
0
.53
)
10
.01
Premier
Class:
11/30/24
#
10
.19
0
.13
0
.58
0
.71
—
—
—
10
.90
5/31/24
9
.14
0
.25
1
.08
1
.33
(
0
.28
)
—
(
0
.28
)
10
.19
5/31/23
9
.91
0
.26
(
0
.30
)
(
0
.04
)
(
0
.22
)
(
0
.51
)
(
0
.73
)
9
.14
5/31/22
11
.95
0
.19
(
1
.02
)
(
0
.83
)
(
0
.38
)
(
0
.83
)
(
1
.21
)
9
.91
5/31/21
9
.96
0
.17
2
.59
2
.76
(
0
.30
)
(
0
.47
)
(
0
.77
)
11
.95
5/31/20
9
.82
0
.23
0
.42
0
.65
(
0
.20
)
(
0
.31
)
(
0
.51
)
9
.96
Class
R6:
11/30/24
#
10
.26
0
.14
0
.58
0
.72
—
—
—
10
.98
5/31/24
9
.20
0
.26
1
.10
1
.36
(
0
.30
)
—
(
0
.30
)
10
.26
5/31/23
9
.97
0
.28
(
0
.30
)
(
0
.02
)
(
0
.24
)
(
0
.51
)
(
0
.75
)
9
.20
5/31/22
12
.01
0
.21
(
1
.02
)
(
0
.81
)
(
0
.40
)
(
0
.83
)
(
1
.23
)
9
.97
5/31/21
10
.01
0
.19
2
.60
2
.79
(
0
.32
)
(
0
.47
)
(
0
.79
)
12
.01
5/31/20
9
.87
0
.26
0
.42
0
.68
(
0
.23
)
(
0
.31
)
(
0
.54
)
10
.01
Retirement
Class:
11/30/24
#
14
.88
0
.18
0
.84
1
.02
—
—
—
15
.90
5/31/24
13
.22
0
.34
1
.58
1
.92
(
0
.26
)
—
(
0
.26
)
14
.88
5/31/23
13
.98
0
.36
(
0
.41
)
(
0
.05
)
(
0
.20
)
(
0
.51
)
(
0
.71
)
13
.22
5/31/22
16
.36
0
.25
(
1
.44
)
(
1
.19
)
(
0
.36
)
(
0
.83
)
(
1
.19
)
13
.98
5/31/21
13
.39
0
.22
3
.51
3
.73
(
0
.29
)
(
0
.47
)
(
0
.76
)
16
.36
5/31/20
13
.04
0
.31
0
.54
0
.85
(
0
.19
)
(
0
.31
)
(
0
.50
)
13
.39
#
Unaudited
a
Based
on
average
shares
outstanding.
b
Total
returns
are
not
annualized.
c
Percentage
is
annualized.
g
The
Fund's
expenses
include
the
expenses
of
the
Underlying
Funds,
excluding
the
expenses
of
the
Dividend
Growth,
Dividend
Value,
Growth
Opportunities
ETF
and
the
Nuveen
Real
Property
Fund
LP.
j
Short-term
and
long-term
capital
gain
distributions
received
from
the
underlying
Funds
are
presented
in
net
realized
and
unrealized
gain
(loss)
on
total
investments
for
all
periods
presented.
See
Notes
to
Financial
Statements
Ratios
and
Supplemental
Data
Ratios
to
Average
Net
Assets
Total
Return
b
Net
Assets,
End
of
Period
(000)
Gross
Expenses
g
Net
Expenses
g
Net
Investment
Income
(Loss)
Portfolio
Turnover
Rate
7
.02
%
$
854
0
.54
%
c
0
.39
%
c
2
.47
%
c
4
%
14
.76
853
0
.51
0
.37
2
.57
14
0
.09
597
0
.50
0
.34
2
.77
22
(
7
.71
)
497
0
.46
0
.31
1
.88
26
28
.41
520
0
.50
0
.37
1
.65
41
6
.65
317
0
.56
0
.44
2
.02
26
6
.97
189,871
0
.58
c
0
.43
c
2
.46
c
4
14
.75
199,927
0
.58
0
.44
2
.56
14
(
0
.01
)
246,776
0
.57
0
.42
2
.84
22
(
7
.87
)
265,245
0
.56
0
.41
1
.66
26
28
.35
369,690
0
.58
0
.45
1
.52
41
6
.52
310,511
0
.64
0
.52
2
.26
26
7
.02
3,602,108
0
.43
c
0
.28
c
2
.60
c
4
14
.95
3,630,602
0
.43
0
.29
2
.70
14
0
.15
3,405,403
0
.42
0
.27
2
.97
22
(
7
.66
)
3,872,654
0
.41
0
.26
1
.86
26
28
.49
4,216,718
0
.43
0
.30
1
.69
41
6
.69
3,244,106
0
.49
0
.37
2
.57
26
6
.85
871,498
0
.68
c
0
.53
c
2
.36
c
4
14
.66
921,422
0
.68
0
.54
2
.45
14
(
0
.10
)
899,081
0
.67
0
.52
2
.74
22
(
7
.94
)
1,008,369
0
.66
0
.51
1
.60
26
28
.25
1,254,456
0
.68
0
.55
1
.46
41
6
.42
1,064,906
0
.74
0
.62
2
.29
26
Financial
Highlights
(continued)
See
Notes
to
Financial
Statements
Financial
Highlights
(continued)
Investment
Operations
Less
Distributions
Net
Asset
Value,
Beginning
of
Period
Net
Investment
Income
(Loss)
a
Net
Realized/
Unrealized
Gain
(Loss)
j
Total
From
Net
Investment
Income
From
Net
Realized
Gains
Total
Net
Asset
Value,
End
of
Period
12.7
Lifecycle
2035
Class
I:
11/30/24
#
$
10
.63
$
0
.12
$
0
.66
$
0
.78
$
—
$
—
$
—
$
11
.41
5/31/24
9
.33
0
.23
1
.34
1
.57
(
0
.27
)
—
(
0
.27
)
10
.63
5/31/23
10
.12
0
.24
(
0
.23
)
0
.01
(
0
.21
)
(
0
.59
)
(
0
.80
)
9
.33
5/31/22
12
.35
0
.19
(
1
.07
)
(
0
.88
)
(
0
.41
)
(
0
.94
)
(
1
.35
)
10
.12
5/31/21
10
.06
0
.18
2
.96
3
.14
(
0
.31
)
(
0
.54
)
(
0
.85
)
12
.35
5/31/20
9
.96
0
.28
0
.40
0
.68
(
0
.22
)
(
0
.36
)
(
0
.58
)
10
.06
Premier
Class:
11/30/24
#
10
.61
0
.11
0
.67
0
.78
—
—
—
11
.39
5/31/24
9
.31
0
.23
1
.33
1
.56
(
0
.26
)
—
(
0
.26
)
10
.61
5/31/23
10
.10
0
.24
(
0
.24
)
—
(
0
.20
)
(
0
.59
)
(
0
.79
)
9
.31
5/31/22
12
.33
0
.18
(
1
.07
)
(
0
.89
)
(
0
.40
)
(
0
.94
)
(
1
.34
)
10
.10
5/31/21
10
.04
0
.17
2
.96
3
.13
(
0
.30
)
(
0
.54
)
(
0
.84
)
12
.33
5/31/20
9
.93
0
.22
0
.45
0
.67
(
0
.20
)
(
0
.36
)
(
0
.56
)
10
.04
Class
R6:
11/30/24
#
10
.65
0
.12
0
.67
0
.79
—
—
—
11
.44
5/31/24
9
.35
0
.24
1
.34
1
.58
(
0
.28
)
—
(
0
.28
)
10
.65
5/31/23
10
.13
0
.25
(
0
.22
)
0
.03
(
0
.22
)
(
0
.59
)
(
0
.81
)
9
.35
5/31/22
12
.37
0
.20
(
1
.08
)
(
0
.88
)
(
0
.42
)
(
0
.94
)
(
1
.36
)
10
.13
5/31/21
10
.07
0
.19
2
.97
3
.16
(
0
.32
)
(
0
.54
)
(
0
.86
)
12
.37
5/31/20
9
.97
0
.25
0
.44
0
.69
(
0
.23
)
(
0
.36
)
(
0
.59
)
10
.07
Retirement
Class:
11/30/24
#
15
.95
0
.16
1
.01
1
.17
—
—
—
17
.12
5/31/24
13
.88
0
.33
1
.98
2
.31
(
0
.24
)
—
(
0
.24
)
15
.95
5/31/23
14
.63
0
.34
(
0
.32
)
0
.02
(
0
.18
)
(
0
.59
)
(
0
.77
)
13
.88
5/31/22
17
.27
0
.24
(
1
.56
)
(
1
.32
)
(
0
.38
)
(
0
.94
)
(
1
.32
)
14
.63
5/31/21
13
.78
0
.22
4
.09
4
.31
(
0
.28
)
(
0
.54
)
(
0
.82
)
17
.27
5/31/20
13
.44
0
.31
0
.58
0
.89
(
0
.19
)
(
0
.36
)
(
0
.55
)
13
.78
#
Unaudited
a
Based
on
average
shares
outstanding.
b
Total
returns
are
not
annualized.
c
Percentage
is
annualized.
g
The
Fund's
expenses
include
the
expenses
of
the
Underlying
Funds,
excluding
the
expenses
of
the
Dividend
Growth,
Dividend
Value,
Growth
Opportunities
ETF
and
the
Nuveen
Real
Property
Fund
LP.
j
Short-term
and
long-term
capital
gain
distributions
received
from
the
underlying
Funds
are
presented
in
net
realized
and
unrealized
gain
(loss)
on
total
investments
for
all
periods
presented.
See
Notes
to
Financial
Statements
Ratios
and
Supplemental
Data
Ratios
to
Average
Net
Assets
Total
Return
b
Net
Assets,
End
of
Period
(000)
Gross
Expenses
g
Net
Expenses
g
Net
Investment
Income
(Loss)
Portfolio
Turnover
Rate
7
.34
%
$
938
0
.54
%
c
0
.38
%
c
2
.09
%
c
5
%
17
.03
918
0
.54
0
.38
2
.35
14
0
.46
597
0
.52
0
.36
2
.58
25
(
8
.20
)
447
0
.49
0
.34
1
.64
27
32
.02
472
0
.52
0
.39
1
.56
44
6
.64
363
0
.58
0
.46
2
.74
23
7
.35
205,185
0
.58
c
0
.42
c
2
.07
c
5
16
.98
215,181
0
.59
0
.43
2
.29
14
0
.39
264,692
0
.58
0
.41
2
.55
25
(
8
.29
)
277,894
0
.56
0
.40
1
.52
27
31
.99
396,128
0
.59
0
.45
1
.46
44
6
.59
324,978
0
.65
0
.53
2
.14
23
7
.42
4,009,936
0
.43
c
0
.27
c
2
.21
c
5
17
.10
3,987,848
0
.44
0
.28
2
.46
14
0
.66
3,634,034
0
.43
0
.26
2
.68
25
(
8
.19
)
4,103,430
0
.41
0
.25
1
.72
27
32
.19
4,468,950
0
.44
0
.30
1
.63
44
6
.67
3,369,098
0
.50
0
.38
2
.48
23
7
.34
872,647
0
.68
c
0
.52
c
1
.97
c
5
16
.78
910,652
0
.69
0
.53
2
.19
14
0
.38
853,592
0
.68
0
.51
2
.46
25
(
8
.42
)
923,818
0
.66
0
.50
1
.46
27
31
.86
1,157,175
0
.69
0
.55
1
.40
44
6
.48
978,160
0
.75
0
.63
2
.21
23
Financial
Highlights
(continued)
See
Notes
to
Financial
Statements
Financial
Highlights
(continued)
Investment
Operations
Less
Distributions
Net
Asset
Value,
Beginning
of
Period
Net
Investment
Income
(Loss)
a
Net
Realized/
Unrealized
Gain
(Loss)
j
Total
From
Net
Investment
Income
From
Net
Realized
Gains
Total
Net
Asset
Value,
End
of
Period
12.8
Lifecycle
2040
Class
I:
11/30/24
#
$
10
.89
$
0
.09
$
0
.77
$
0
.86
$
—
$
—
$
—
$
11
.75
5/31/24
9
.34
0
.21
1
.59
1
.80
(
0
.25
)
—
(
0
.25
)
10
.89
5/31/23
10
.11
0
.21
(
0
.15
)
0
.06
(
0
.18
)
(
0
.65
)
(
0
.83
)
9
.34
5/31/22
12
.51
0
.18
(
1
.10
)
(
0
.92
)
(
0
.43
)
(
1
.05
)
(
1
.48
)
10
.11
5/31/21
9
.98
0
.17
3
.30
3
.47
(
0
.32
)
(
0
.62
)
(
0
.94
)
12
.51
5/31/20
9
.90
0
.23
0
.47
0
.70
(
0
.20
)
(
0
.42
)
(
0
.62
)
9
.98
Premier
Class:
11/30/24
#
10
.86
0
.09
0
.77
0
.86
—
—
—
11
.72
5/31/24
9
.32
0
.20
1
.58
1
.78
(
0
.24
)
—
(
0
.24
)
10
.86
5/31/23
10
.09
0
.21
(
0
.16
)
0
.05
(
0
.17
)
(
0
.65
)
(
0
.82
)
9
.32
5/31/22
12
.48
0
.17
(
1
.09
)
(
0
.92
)
(
0
.42
)
(
1
.05
)
(
1
.47
)
10
.09
5/31/21
9
.95
0
.15
3
.31
3
.46
(
0
.31
)
(
0
.62
)
(
0
.93
)
12
.48
5/31/20
9
.87
0
.20
0
.48
0
.68
(
0
.18
)
(
0
.42
)
(
0
.60
)
9
.95
Class
R6:
11/30/24
#
10
.90
0
.10
0
.78
0
.88
—
—
—
11
.78
5/31/24
9
.35
0
.22
1
.59
1
.81
(
0
.26
)
—
(
0
.26
)
10
.90
5/31/23
10
.12
0
.23
(
0
.17
)
0
.06
(
0
.18
)
(
0
.65
)
(
0
.83
)
9
.35
5/31/22
12
.52
0
.19
(
1
.10
)
(
0
.91
)
(
0
.44
)
(
1
.05
)
(
1
.49
)
10
.12
5/31/21
9
.99
0
.18
3
.30
3
.48
(
0
.33
)
(
0
.62
)
(
0
.95
)
12
.52
5/31/20
9
.91
0
.24
0
.46
0
.70
(
0
.20
)
(
0
.42
)
(
0
.62
)
9
.99
Retirement
Class:
11/30/24
#
17
.01
0
.13
1
.21
1
.34
—
—
—
18
.35
5/31/24
14
.46
0
.30
2
.47
2
.77
(
0
.22
)
—
(
0
.22
)
17
.01
5/31/23
15
.18
0
.32
(
0
.25
)
0
.07
(
0
.14
)
(
0
.65
)
(
0
.79
)
14
.46
5/31/22
18
.04
0
.24
(
1
.66
)
(
1
.42
)
(
0
.39
)
(
1
.05
)
(
1
.44
)
15
.18
5/31/21
14
.05
0
.21
4
.69
4
.90
(
0
.29
)
(
0
.62
)
(
0
.91
)
18
.04
5/31/20
13
.71
0
.30
0
.62
0
.92
(
0
.16
)
(
0
.42
)
(
0
.58
)
14
.05
#
Unaudited
a
Based
on
average
shares
outstanding.
b
Total
returns
are
not
annualized.
c
Percentage
is
annualized.
g
The
Fund's
expenses
include
the
expenses
of
the
Underlying
Funds,
excluding
the
expenses
of
the
Dividend
Growth,
Dividend
Value,
Growth
Opportunities
ETF
and
the
Nuveen
Real
Property
Fund
LP.
j
Short-term
and
long-term
capital
gain
distributions
received
from
the
underlying
Funds
are
presented
in
net
realized
and
unrealized
gain
(loss)
on
total
investments
for
all
periods
presented.
See
Notes
to
Financial
Statements
Ratios
and
Supplemental
Data
Ratios
to
Average
Net
Assets
Total
Return
b
Net
Assets,
End
of
Period
(000)
Gross
Expenses
g
Net
Expenses
g
Net
Investment
Income
(Loss)
Portfolio
Turnover
Rate
7
.90
%
$
576
0
.55
%
c
0
.37
%
c
1
.58
%
c
5
%
19
.49
591
0
.54
0
.36
2
.07
13
1
.04
367
0
.52
0
.33
2
.27
26
(
8
.55
)
239
0
.48
0
.31
1
.53
29
35
.84
305
0
.51
0
.37
1
.48
46
6
.70
204
0
.57
0
.45
2
.27
23
7
.92
233,328
0
.59
c
0
.41
c
1
.56
c
5
19
.32
249,804
0
.59
0
.42
2
.00
13
0
.94
305,164
0
.58
0
.40
2
.28
26
(
8
.57
)
314,758
0
.56
0
.39
1
.44
29
35
.81
441,951
0
.59
0
.45
1
.36
46
6
.55
372,625
0
.66
0
.54
1
.97
23
8
.07
4,955,169
0
.44
c
0
.26
c
1
.70
c
5
19
.56
4,859,805
0
.44
0
.27
2
.17
13
1
.11
4,401,861
0
.43
0
.25
2
.42
26
(
8
.47
)
4,851,096
0
.41
0
.24
1
.61
29
35
.87
5,311,332
0
.44
0
.29
1
.54
46
6
.74
3,930,425
0
.51
0
.39
2
.36
23
7
.88
1,020,704
0
.69
c
0
.51
c
1
.46
c
5
19
.27
1,057,099
0
.69
0
.52
1
.90
13
0
.79
991,507
0
.68
0
.50
2
.20
26
(
8
.67
)
1,085,996
0
.66
0
.49
1
.36
29
35
.59
1,391,417
0
.69
0
.55
1
.31
46
6
.51
1,161,770
0
.76
0
.64
2
.08
23
Financial
Highlights
(continued)
See
Notes
to
Financial
Statements
Financial
Highlights
(continued)
Investment
Operations
Less
Distributions
Net
Asset
Value,
Beginning
of
Period
Net
Investment
Income
(Loss)
a
Net
Realized/
Unrealized
Gain
(Loss)
j
Total
From
Net
Investment
Income
From
Net
Realized
Gains
Total
Net
Asset
Value,
End
of
Period
12.9
Lifecycle
2045
Class
I:
11/30/24
#
$
13
.86
$
0
.09
$
1
.06
$
1
.15
$
—
$
—
$
—
$
15
.01
5/31/24
11
.69
0
.24
2
.19
2
.43
(
0
.26
)
—
(
0
.26
)
13
.86
5/31/23
12
.61
0
.19
(
0
.12
)
0
.07
(
0
.19
)
(
0
.80
)
(
0
.99
)
11
.69
5/31/22
15
.57
0
.23
(
1
.40
)
(
1
.17
)
(
0
.52
)
(
1
.27
)
(
1
.79
)
12
.61
5/31/21
11
.99
0
.22
4
.41
4
.63
(
0
.35
)
(
0
.70
)
(
1
.05
)
15
.57
5/31/20
11
.89
0
.27
0
.57
0
.84
(
0
.22
)
(
0
.52
)
(
0
.74
)
11
.99
Premier
Class:
11/30/24
#
13
.79
0
.09
1
.05
1
.14
—
—
—
14
.93
5/31/24
11
.62
0
.23
2
.19
2
.42
(
0
.25
)
—
(
0
.25
)
13
.79
5/31/23
12
.54
0
.24
(
0
.18
)
0
.06
(
0
.18
)
(
0
.80
)
(
0
.98
)
11
.62
5/31/22
15
.49
0
.20
(
1
.38
)
(
1
.18
)
(
0
.50
)
(
1
.27
)
(
1
.77
)
12
.54
5/31/21
11
.93
0
.18
4
.42
4
.60
(
0
.34
)
(
0
.70
)
(
1
.04
)
15
.49
5/31/20
11
.83
0
.22
0
.59
0
.81
(
0
.19
)
(
0
.52
)
(
0
.71
)
11
.93
Class
R6:
11/30/24
#
13
.87
0
.10
1
.06
1
.16
—
—
—
15
.03
5/31/24
11
.69
0
.25
2
.20
2
.45
(
0
.27
)
—
(
0
.27
)
13
.87
5/31/23
12
.61
0
.26
(
0
.18
)
0
.08
(
0
.20
)
(
0
.80
)
(
1
.00
)
11
.69
5/31/22
15
.57
0
.22
(
1
.38
)
(
1
.16
)
(
0
.53
)
(
1
.27
)
(
1
.80
)
12
.61
5/31/21
11
.98
0
.20
4
.45
4
.65
(
0
.36
)
(
0
.70
)
(
1
.06
)
15
.57
5/31/20
11
.89
0
.28
0
.55
0
.83
(
0
.22
)
(
0
.52
)
(
0
.74
)
11
.98
Retirement
Class:
11/30/24
#
13
.72
0
.08
1
.04
1
.12
—
—
—
14
.84
5/31/24
11
.57
0
.21
2
.18
2
.39
(
0
.24
)
—
(
0
.24
)
13
.72
5/31/23
12
.48
0
.23
(
0
.18
)
0
.05
(
0
.16
)
(
0
.80
)
(
0
.96
)
11
.57
5/31/22
15
.43
0
.18
(
1
.37
)
(
1
.19
)
(
0
.49
)
(
1
.27
)
(
1
.76
)
12
.48
5/31/21
11
.89
0
.17
4
.39
4
.56
(
0
.32
)
(
0
.70
)
(
1
.02
)
15
.43
5/31/20
11
.80
0
.24
0
.56
0
.80
(
0
.19
)
(
0
.52
)
(
0
.71
)
11
.89
#
Unaudited
a
Based
on
average
shares
outstanding.
b
Total
returns
are
not
annualized.
c
Percentage
is
annualized.
g
The
Fund's
expenses
include
the
expenses
of
the
Underlying
Funds,
excluding
the
expenses
of
the
Dividend
Growth,
Dividend
Value,
Growth
Opportunities
ETF
and
the
Nuveen
Real
Property
Fund
LP.
j
Short-term
and
long-term
capital
gain
distributions
received
from
the
underlying
Funds
are
presented
in
net
realized
and
unrealized
gain
(loss)
on
total
investments
for
all
periods
presented.
See
Notes
to
Financial
Statements
Ratios
and
Supplemental
Data
Ratios
to
Average
Net
Assets
Total
Return
b
Net
Assets,
End
of
Period
(000)
Gross
Expenses
g
Net
Expenses
g
Net
Investment
Income
(Loss)
Portfolio
Turnover
Rate
8
.30
%
$
799
0
.55
%
c
0
.36
%
c
1
.25
%
c
5
%
21
.04
838
0
.54
0
.36
1
.86
14
1
.03
565
0
.52
0
.33
1
.67
27
(
8
.67
)
168
0
.45
0
.27
1
.55
29
39
.64
153
0
.50
0
.35
1
.57
46
6
.66
155
0
.56
0
.44
2
.23
19
8
.27
177,056
0
.59
c
0
.41
c
1
.22
c
5
21
.06
186,993
0
.60
0
.42
1
.78
14
0
.92
225,586
0
.58
0
.40
2
.06
27
(
8
.77
)
224,448
0
.56
0
.38
1
.34
29
39
.52
309,234
0
.59
0
.45
1
.26
46
6
.50
234,573
0
.67
0
.55
1
.81
19
8
.36
3,706,750
0
.44
c
0
.26
c
1
.36
c
5
21
.22
3,613,760
0
.45
0
.27
1
.96
14
1
.08
3,141,514
0
.43
0
.25
2
.19
27
(
8
.63
)
3,351,968
0
.41
0
.23
1
.52
29
39
.80
3,557,269
0
.44
0
.30
1
.44
46
6
.60
2,441,105
0
.52
0
.40
2
.25
19
8
.16
623,244
0
.69
c
0
.51
c
1
.12
c
5
20
.88
645,652
0
.70
0
.52
1
.69
14
0
.90
581,879
0
.68
0
.50
1
.97
27
(
8
.89
)
613,731
0
.66
0
.48
1
.26
29
39
.38
779,894
0
.69
0
.55
1
.21
46
6
.40
621,730
0
.77
0
.65
1
.98
19
Financial
Highlights
(continued)
See
Notes
to
Financial
Statements
Financial
Highlights
(continued)
Investment
Operations
Less
Distributions
Net
Asset
Value,
Beginning
of
Period
Net
Investment
Income
(Loss)
a
Net
Realized/
Unrealized
Gain
(Loss)
j
Total
From
Net
Investment
Income
From
Net
Realized
Gains
Total
Net
Asset
Value,
End
of
Period
13.01
Lifecycle
2050
Class
I:
11/30/24
#
$
14
.32
$
0
.08
$
1
.13
$
1
.21
$
—
$
—
$
—
$
15
.53
5/31/24
11
.98
0
.24
2
.36
2
.60
(
0
.26
)
—
(
0
.26
)
14
.32
5/31/23
12
.89
0
.23
(
0
.16
)
0
.07
(
0
.18
)
(
0
.80
)
(
0
.98
)
11
.98
5/31/22
15
.82
0
.13
(
1
.34
)
(
1
.21
)
(
0
.53
)
(
1
.19
)
(
1
.72
)
12
.89
5/31/21
12
.04
0
.14
4
.63
4
.77
(
0
.36
)
(
0
.63
)
(
0
.99
)
15
.82
5/31/20
11
.95
0
.28
0
.54
0
.82
(
0
.22
)
(
0
.51
)
(
0
.73
)
12
.04
Premier
Class:
11/30/24
#
14
.25
0
.08
1
.12
1
.20
—
—
—
15
.45
5/31/24
11
.91
0
.22
2
.36
2
.58
(
0
.24
)
—
(
0
.24
)
14
.25
5/31/23
12
.83
0
.23
(
0
.18
)
0
.05
(
0
.17
)
(
0
.80
)
(
0
.97
)
11
.91
5/31/22
15
.76
0
.20
(
1
.42
)
(
1
.22
)
(
0
.52
)
(
1
.19
)
(
1
.71
)
12
.83
5/31/21
12
.00
0
.18
4
.55
4
.73
(
0
.34
)
(
0
.63
)
(
0
.97
)
15
.76
5/31/20
11
.89
0
.22
0
.59
0
.81
(
0
.19
)
(
0
.51
)
(
0
.70
)
12
.00
Class
R6:
11/30/24
#
14
.31
0
.09
1
.13
1
.22
—
—
—
15
.53
5/31/24
11
.97
0
.24
2
.37
2
.61
(
0
.27
)
—
(
0
.27
)
14
.31
5/31/23
12
.89
0
.25
(
0
.18
)
0
.07
(
0
.19
)
(
0
.80
)
(
0
.99
)
11
.97
5/31/22
15
.83
0
.22
(
1
.42
)
(
1
.20
)
(
0
.55
)
(
1
.19
)
(
1
.74
)
12
.89
5/31/21
12
.05
0
.20
4
.57
4
.77
(
0
.36
)
(
0
.63
)
(
0
.99
)
15
.83
5/31/20
11
.94
0
.28
0
.56
0
.84
(
0
.22
)
(
0
.51
)
(
0
.73
)
12
.05
Retirement
Class:
11/30/24
#
14
.16
0
.07
1
.11
1
.18
—
—
—
15
.34
5/31/24
11
.84
0
.21
2
.34
2
.55
(
0
.23
)
—
(
0
.23
)
14
.16
5/31/23
12
.76
0
.22
(
0
.18
)
0
.04
(
0
.16
)
(
0
.80
)
(
0
.96
)
11
.84
5/31/22
15
.68
0
.18
(
1
.40
)
(
1
.22
)
(
0
.51
)
(
1
.19
)
(
1
.70
)
12
.76
5/31/21
11
.94
0
.17
4
.53
4
.70
(
0
.33
)
(
0
.63
)
(
0
.96
)
15
.68
5/31/20
11
.85
0
.24
0
.55
0
.79
(
0
.19
)
(
0
.51
)
(
0
.70
)
11
.94
#
Unaudited
a
Based
on
average
shares
outstanding.
b
Total
returns
are
not
annualized.
c
Percentage
is
annualized.
g
The
Fund's
expenses
include
the
expenses
of
the
Underlying
Funds,
excluding
the
expenses
of
the
Dividend
Growth,
Dividend
Value,
Growth
Opportunities
ETF
and
the
Nuveen
Real
Property
Fund
LP.
j
Short-term
and
long-term
capital
gain
distributions
received
from
the
underlying
Funds
are
presented
in
net
realized
and
unrealized
gain
(loss)
on
total
investments
for
all
periods
presented.
See
Notes
to
Financial
Statements
Ratios
and
Supplemental
Data
Ratios
to
Average
Net
Assets
Total
Return
b
Net
Assets,
End
of
Period
(000)
Gross
Expenses
g
Net
Expenses
g
Net
Investment
Income
(Loss)
Portfolio
Turnover
Rate
8
.45
%
$
435
0
.54
%
c
0
.35
%
c
1
.13
%
c
6
%
21
.89
458
0
.52
0
.33
1
.82
15
1
.00
331
0
.50
0
.31
1
.90
26
(
8
.75
)
580
0
.49
0
.30
0
.93
27
40
.56
395
0
.49
0
.33
0
.96
43
6
.51
118
0
.55
0
.42
2
.22
18
8
.42
127,729
0
.59
c
0
.40
c
1
.06
c
6
21
.90
137,821
0
.60
0
.41
1
.69
15
0
.89
163,684
0
.59
0
.39
1
.97
26
(
8
.86
)
159,978
0
.56
0
.37
1
.34
27
40
.35
205,713
0
.60
0
.44
1
.25
43
6
.50
152,698
0
.67
0
.55
1
.74
18
8
.53
3,024,027
0
.45
c
0
.25
c
1
.19
c
6
21
.99
2,901,702
0
.45
0
.26
1
.87
15
1
.06
2,485,183
0
.44
0
.24
2
.09
26
(
8
.73
)
2,529,399
0
.41
0
.22
1
.49
27
40
.55
2,626,383
0
.45
0
.29
1
.43
43
6
.70
1,730,080
0
.52
0
.40
2
.24
18
8
.33
453,832
0
.70
c
0
.50
c
0
.95
c
6
21
.76
465,853
0
.70
0
.51
1
.60
15
0
.79
416,557
0
.69
0
.49
1
.88
26
(
8
.93
)
439,910
0
.66
0
.47
1
.22
27
40
.27
549,874
0
.70
0
.54
1
.19
43
6
.33
424,505
0
.77
0
.65
1
.95
18
Financial
Highlights
(continued)
See
Notes
to
Financial
Statements
Financial
Highlights
(continued)
Investment
Operations
Less
Distributions
Net
Asset
Value,
Beginning
of
Period
Net
Investment
Income
(Loss)
a
Net
Realized/
Unrealized
Gain
(Loss)
j
Total
From
Net
Investment
Income
From
Net
Realized
Gains
Total
Net
Asset
Value,
End
of
Period
13.1
Lifecycle
2055
Class
I:
11/30/24
#
$
16
.99
$
0
.09
$
1
.36
$
1
.45
$
—
$
—
$
—
$
18
.44
5/31/24
14
.17
0
.27
2
.83
3
.10
(
0
.28
)
—
(
0
.28
)
16
.99
5/31/23
15
.17
0
.25
(
0
.16
)
0
.09
(
0
.22
)
(
0
.87
)
(
1
.09
)
14
.17
5/31/22
18
.37
0
.26
(
1
.69
)
(
1
.43
)
(
0
.62
)
(
1
.15
)
(
1
.77
)
15
.17
5/31/21
13
.77
0
.23
5
.30
5
.53
(
0
.40
)
(
0
.53
)
(
0
.93
)
18
.37
5/31/20
13
.61
0
.31
0
.63
0
.94
(
0
.25
)
(
0
.53
)
(
0
.78
)
13
.77
Premier
Class:
11/30/24
#
16
.92
0
.09
1
.35
1
.44
—
—
—
18
.36
5/31/24
14
.11
0
.26
2
.82
3
.08
(
0
.27
)
—
(
0
.27
)
16
.92
5/31/23
15
.11
0
.27
(
0
.20
)
0
.07
(
0
.20
)
(
0
.87
)
(
1
.07
)
14
.11
5/31/22
18
.30
0
.23
(
1
.67
)
(
1
.44
)
(
0
.60
)
(
1
.15
)
(
1
.75
)
15
.11
5/31/21
13
.72
0
.20
5
.29
5
.49
(
0
.38
)
(
0
.53
)
(
0
.91
)
18
.30
5/31/20
13
.56
0
.24
0
.67
0
.91
(
0
.22
)
(
0
.53
)
(
0
.75
)
13
.72
Class
R6:
11/30/24
#
17
.00
0
.10
1
.36
1
.46
—
—
—
18
.46
5/31/24
14
.17
0
.29
2
.83
3
.12
(
0
.29
)
—
(
0
.29
)
17
.00
5/31/23
15
.18
0
.29
(
0
.21
)
0
.08
(
0
.22
)
(
0
.87
)
(
1
.09
)
14
.17
5/31/22
18
.38
0
.26
(
1
.68
)
(
1
.42
)
(
0
.63
)
(
1
.15
)
(
1
.78
)
15
.18
5/31/21
13
.77
0
.23
5
.32
5
.55
(
0
.41
)
(
0
.53
)
(
0
.94
)
18
.38
5/31/20
13
.61
0
.31
0
.63
0
.94
(
0
.25
)
(
0
.53
)
(
0
.78
)
13
.77
Retirement
Class:
11/30/24
#
16
.91
0
.08
1
.34
1
.42
—
—
—
18
.33
5/31/24
14
.09
0
.24
2
.84
3
.08
(
0
.26
)
—
(
0
.26
)
16
.91
5/31/23
15
.10
0
.26
(
0
.21
)
0
.05
(
0
.19
)
(
0
.87
)
(
1
.06
)
14
.09
5/31/22
18
.29
0
.21
(
1
.67
)
(
1
.46
)
(
0
.58
)
(
1
.15
)
(
1
.73
)
15
.10
5/31/21
13
.71
0
.19
5
.29
5
.48
(
0
.37
)
(
0
.53
)
(
0
.90
)
18
.29
5/31/20
13
.56
0
.27
0
.63
0
.90
(
0
.22
)
(
0
.53
)
(
0
.75
)
13
.71
#
Unaudited
a
Based
on
average
shares
outstanding.
b
Total
returns
are
not
annualized.
c
Percentage
is
annualized.
g
The
Fund's
expenses
include
the
expenses
of
the
Underlying
Funds,
excluding
the
expenses
of
the
Dividend
Growth,
Dividend
Value,
Growth
Opportunities
ETF
and
the
Nuveen
Real
Property
Fund
LP.
j
Short-term
and
long-term
capital
gain
distributions
received
from
the
underlying
Funds
are
presented
in
net
realized
and
unrealized
gain
(loss)
on
total
investments
for
all
periods
presented.
See
Notes
to
Financial
Statements
Ratios
and
Supplemental
Data
Ratios
to
Average
Net
Assets
Total
Return
b
Net
Assets,
End
of
Period
(000)
Gross
Expenses
g
Net
Expenses
g
Net
Investment
Income
(Loss)
Portfolio
Turnover
Rate
8
.53
%
$
449
0
.55
%
c
0
.35
%
c
1
.06
%
c
8
%
22
.11
542
0
.54
0
.34
1
.74
16
1
.11
334
0
.51
0
.31
1
.79
25
(
8
.78
)
155
0
.45
0
.26
1
.49
26
41
.04
162
0
.50
0
.33
1
.40
41
6
.56
121
0
.56
0
.41
2
.20
18
8
.51
69,680
0
.60
c
0
.40
c
0
.99
c
8
22
.02
71,798
0
.61
0
.41
1
.69
16
0
.99
81,671
0
.59
0
.39
1
.93
25
(
8
.86
)
76,685
0
.57
0
.37
1
.33
26
40
.88
93,442
0
.60
0
.44
1
.24
41
6
.37
62,637
0
.69
0
.55
1
.68
18
8
.59
1,583,576
0
.45
c
0
.25
c
1
.12
c
8
22
.26
1,472,020
0
.46
0
.26
1
.84
16
1
.08
1,189,521
0
.44
0
.24
2
.05
25
(
8
.73
)
1,127,411
0
.42
0
.22
1
.47
26
41
.14
1,092,033
0
.47
0
.29
1
.41
41
6
.56
653,177
0
.54
0
.40
2
.24
18
8
.40
218,815
0
.70
c
0
.50
c
0
.89
c
8
22
.02
221,889
0
.71
0
.51
1
.56
16
0
.82
194,120
0
.69
0
.49
1
.85
25
(
8
.97
)
195,461
0
.67
0
.47
1
.21
26
40
.80
237,666
0
.71
0
.54
1
.18
41
6
.28
181,024
0
.79
0
.65
1
.95
18
Financial
Highlights
(continued)
See
Notes
to
Financial
Statements
Financial
Highlights
(continued)
Investment
Operations
Less
Distributions
Net
Asset
Value,
Beginning
of
Period
Net
Investment
Income
(Loss)
a
Net
Realized/
Unrealized
Gain
(Loss)
j
Total
From
Net
Investment
Income
From
Net
Realized
Gains
Total
Net
Asset
Value,
End
of
Period
13.2
Lifecycle
2060
Class
I:
11/30/24
#
$
14
.71
$
0
.08
$
1
.17
$
1
.25
$
—
$
—
$
—
$
15
.96
5/31/24
12
.21
0
.23
2
.49
2
.72
(
0
.22
)
(
0
.00
)
d
(
0
.22
)
14
.71
5/31/23
12
.95
0
.22
(
0
.15
)
0
.07
(
0
.18
)
(
0
.63
)
(
0
.81
)
12
.21
5/31/22
15
.35
0
.22
(
1
.44
)
(
1
.22
)
(
0
.52
)
(
0
.66
)
(
1
.18
)
12
.95
5/31/21
11
.35
0
.17
4
.46
4
.63
(
0
.32
)
(
0
.31
)
(
0
.63
)
15
.35
5/31/20
11
.13
0
.25
0
.51
0
.76
(
0
.20
)
(
0
.34
)
(
0
.54
)
11
.35
Premier
Class:
11/30/24
#
14
.68
0
.07
1
.18
1
.25
—
—
—
15
.93
5/31/24
12
.19
0
.23
2
.47
2
.70
(
0
.21
)
(
0
.00
)
d
(
0
.21
)
14
.68
5/31/23
12
.92
0
.23
(
0
.16
)
0
.07
(
0
.17
)
(
0
.63
)
(
0
.80
)
12
.19
5/31/22
15
.33
0
.20
(
1
.44
)
(
1
.24
)
(
0
.51
)
(
0
.66
)
(
1
.17
)
12
.92
5/31/21
11
.33
0
.17
4
.44
4
.61
(
0
.30
)
(
0
.31
)
(
0
.61
)
15
.33
5/31/20
11
.11
0
.19
0
.56
0
.75
(
0
.19
)
(
0
.34
)
(
0
.53
)
11
.33
Class
R6:
11/30/24
#
14
.73
0
.08
1
.18
1
.26
—
—
—
15
.99
5/31/24
12
.23
0
.24
2
.49
2
.73
(
0
.23
)
(
0
.00
)
d
(
0
.23
)
14
.73
5/31/23
12
.96
0
.24
(
0
.15
)
0
.09
(
0
.19
)
(
0
.63
)
(
0
.82
)
12
.23
5/31/22
15
.36
0
.22
(
1
.43
)
(
1
.21
)
(
0
.53
)
(
0
.66
)
(
1
.19
)
12
.96
5/31/21
11
.35
0
.19
4
.45
4
.64
(
0
.32
)
(
0
.31
)
(
0
.63
)
15
.36
5/31/20
11
.13
0
.25
0
.52
0
.77
(
0
.21
)
(
0
.34
)
(
0
.55
)
11
.35
Retirement
Class:
11/30/24
#
14
.65
0
.06
1
.18
1
.24
—
—
—
15
.89
5/31/24
12
.17
0
.20
2
.48
2
.68
(
0
.20
)
(
0
.00
)
d
(
0
.20
)
14
.65
5/31/23
12
.90
0
.21
(
0
.15
)
0
.06
(
0
.16
)
(
0
.63
)
(
0
.79
)
12
.17
5/31/22
15
.30
0
.18
(
1
.43
)
(
1
.25
)
(
0
.49
)
(
0
.66
)
(
1
.15
)
12
.90
5/31/21
11
.31
0
.16
4
.43
4
.59
(
0
.29
)
(
0
.31
)
(
0
.60
)
15
.30
5/31/20
11
.10
0
.22
0
.51
0
.73
(
0
.18
)
(
0
.34
)
(
0
.52
)
11
.31
#
Unaudited
a
Based
on
average
shares
outstanding.
b
Total
returns
are
not
annualized.
c
Percentage
is
annualized.
d
Value
rounded
to
zero.
g
The
Fund's
expenses
include
the
expenses
of
the
Underlying
Funds,
excluding
the
expenses
of
the
Dividend
Growth,
Dividend
Value,
Growth
Opportunities
ETF
and
the
Nuveen
Real
Property
Fund
LP.
j
Short-term
and
long-term
capital
gain
distributions
received
from
the
underlying
Funds
are
presented
in
net
realized
and
unrealized
gain
(loss)
on
total
investments
for
all
periods
presented.
See
Notes
to
Financial
Statements
Ratios
and
Supplemental
Data
Ratios
to
Average
Net
Assets
Total
Return
b
Net
Assets,
End
of
Period
(000)
Gross
Expenses
g
Net
Expenses
g
Net
Investment
Income
(Loss)
Portfolio
Turnover
Rate
8
.50
%
$
415
0
.57
%
c
0
.35
%
c
1
.02
%
c
7
%
22
.46
530
0
.56
0
.35
1
.75
15
1
.02
397
0
.55
0
.31
1
.85
24
(
8
.77
)
208
0
.51
0
.28
1
.48
26
41
.50
241
0
.54
0
.34
1
.25
40
6
.60
117
0
.66
0
.44
2
.16
22
8
.51
26,979
0
.62
c
0
.40
c
0
.93
c
7
22
.33
26,358
0
.63
0
.41
1
.70
15
1
.01
23,600
0
.62
0
.39
1
.90
24
(
8
.92
)
19,013
0
.60
0
.37
1
.39
26
41
.44
18,792
0
.64
0
.44
1
.25
40
6
.48
10,846
0
.77
0
.55
1
.68
22
8
.55
715,655
0
.47
c
0
.25
c
1
.04
c
7
22
.51
620,377
0
.48
0
.26
1
.80
15
1
.16
436,209
0
.47
0
.24
2
.00
24
(
8
.71
)
364,640
0
.45
0
.22
1
.48
26
41
.61
313,864
0
.49
0
.29
1
.39
40
6
.60
155,744
0
.62
0
.39
2
.18
22
8
.46
90,559
0
.72
c
0
.50
c
0
.82
c
7
22
.17
87,446
0
.73
0
.51
1
.51
15
0
.90
67,883
0
.72
0
.49
1
.78
24
(
8
.97
)
60,036
0
.70
0
.47
1
.22
26
41
.31
63,880
0
.74
0
.54
1
.16
40
6
.32
38,705
0
.87
0
.65
1
.91
22
Financial
Highlights
(continued)
See
Notes
to
Financial
Statements
Financial
Highlights
(continued)
e
Investment
Operations
Less
Distributions
Net
Asset
Value,
Beginning
of
Period
Net
Investment
Income
(Loss)
a
Net
Realized/
Unrealized
Gain
(Loss)
j
Total
From
Net
Investment
Income
From
Net
Realized
Gains
Total
Net
Asset
Value,
End
of
Period
13.3
Lifecycle
2065
Class
I:
11/30/24
#
$
12
.49
$
0
.09
$
1
.00
$
1
.09
$
—
$
—
$
—
$
13
.58
5/31/24
10
.34
0
.20
2
.14
2
.34
(
0
.18
)
(
0
.01
)
(
0
.19
)
12
.49
5/31/23
10
.55
0
.20
(
0
.11
)
0
.09
(
0
.15
)
(
0
.15
)
(
0
.30
)
10
.34
5/31/22
12
.44
0
.19
(
1
.21
)
(
1
.02
)
(
0
.55
)
(
0
.32
)
(
0
.87
)
10
.55
5/31/21
*
10
.00
0
.13
2
.60
2
.73
(
0
.26
)
(
0
.03
)
(
0
.29
)
12
.44
Premier
Class:
11/30/24
#
12
.55
0
.06
1
.02
1
.08
—
—
—
13
.63
5/31/24
10
.39
0
.19
2
.15
2
.34
(
0
.17
)
(
0
.01
)
(
0
.18
)
12
.55
5/31/23
10
.59
0
.18
(
0
.10
)
0
.08
(
0
.13
)
(
0
.15
)
(
0
.28
)
10
.39
5/31/22
12
.43
0
.13
(
1
.13
)
(
1
.00
)
(
0
.52
)
(
0
.32
)
(
0
.84
)
10
.59
5/31/21
*
10
.00
0
.12
2
.60
2
.72
(
0
.26
)
(
0
.03
)
(
0
.29
)
12
.43
Class
R6:
11/30/24
#
12
.74
0
.06
1
.04
1
.10
—
—
—
13
.84
5/31/24
10
.53
0
.20
2
.20
2
.40
(
0
.18
)
(
0
.01
)
(
0
.19
)
12
.74
5/31/23
10
.74
0
.19
(
0
.09
)
0
.10
(
0
.16
)
(
0
.15
)
(
0
.31
)
10
.53
5/31/22
12
.45
0
.17
(
1
.15
)
(
0
.98
)
(
0
.41
)
(
0
.32
)
(
0
.73
)
10
.74
5/31/21
*
10
.00
0
.14
2
.60
2
.74
(
0
.26
)
(
0
.03
)
(
0
.29
)
12
.45
Retirement
Class:
11/30/24
#
12
.72
0
.05
1
.03
1
.08
—
—
—
13
.80
5/31/24
10
.53
0
.18
2
.18
2
.36
(
0
.16
)
(
0
.01
)
(
0
.17
)
12
.72
5/31/23
10
.73
0
.17
(
0
.09
)
0
.08
(
0
.13
)
(
0
.15
)
(
0
.28
)
10
.53
5/31/22
12
.42
0
.10
(
1
.07
)
(
0
.97
)
(
0
.40
)
(
0
.32
)
(
0
.72
)
10
.73
5/31/21
*
10
.00
0
.12
2
.58
2
.70
(
0
.25
)
(
0
.03
)
(
0
.28
)
12
.42
#
Unaudited
*
The
Fund
commenced
operations
on
September
30,
2020.
a
Based
on
average
shares
outstanding.
b
Total
returns
are
not
annualized.
c
Percentage
is
annualized.
g
The
Fund's
expenses
include
the
expenses
of
the
Underlying
Funds,
excluding
the
expenses
of
the
Dividend
Growth,
Dividend
Value,
Growth
Opportunities
ETF
and
the
Nuveen
Real
Property
Fund
LP.
j
Short-term
and
long-term
capital
gain
distributions
received
from
the
underlying
Funds
are
presented
in
net
realized
and
unrealized
gain
(loss)
on
total
investments
for
all
periods
presented.
See
Notes
to
Financial
Statements
Ratios
and
Supplemental
Data
Ratios
to
Average
Net
Assets
Total
Return
b
Net
Assets,
End
of
Period
(000)
Gross
Expenses
g
Net
Expenses
g
Net
Investment
Income
(Loss)
Portfolio
Turnover
Rate
8
.73
%
$
111
0
.69
%
c
0
.25
%
c
1
.33
%
c
20
%
22
.77
687
0
.76
0
.26
1
.79
34
1
.05
541
0
.96
0
.24
2
.04
55
(
8
.96
)
527
1
.81
0
.23
1
.55
109
27
.62
622
5
.07
c
0
.41
c
1
.70
c
49
8
.61
4,917
0
.83
c
0
.39
c
0
.84
c
20
22
.58
4,320
0
.90
0
.40
1
.68
34
0
.94
2,922
1
.10
0
.38
1
.84
55
(
8
.78
)
1,784
1
.96
0
.36
1
.11
109
27
.51
726
5
.20
c
0
.41
c
1
.60
c
49
8
.63
93,844
0
.69
c
0
.24
c
0
.95
c
20
22
.85
71,437
0
.75
0
.25
1
.75
34
1
.07
31,199
0
.95
0
.23
1
.85
55
(
8
.52
)
17,581
1
.80
0
.21
1
.44
109
27
.76
4,818
4
.73
c
0
.26
c
1
.81
c
49
8
.49
18,387
0
.94
c
0
.49
c
0
.70
c
20
22
.46
14,493
1
.00
0
.50
1
.51
34
0
.88
7,460
1
.20
0
.48
1
.71
55
(
8
.46
)
3,862
2
.06
0
.46
0
.91
109
27
.38
802
5
.33
c
0
.51
c
1
.54
c
49
Notes
to
Financial
Statements
(U
naudited)
1.
General
Information
Trust
and
Fund
Information:
TIAA-CREF
Funds
(the
“Trust”)
is
an
open-end
management
investment
company
registered
under
the
Investment
Company
Act
of
1940,
(“1940
Act”),
as
amended.
The
Trust
is
comprised
of
the
following
(collectively
the
“Funds”
or
individually,
the
“Fund”),
among
others:
Current
Fiscal
Period:
The
end
of
the
reporting
period
for
the Funds
is
November
30,
2024,
and
the
period
covered
by
these
Notes
to
Financial
Statements
is
the
six
months
ended
November
30,
2024
(the
"current
fiscal
period").
Investment
Adviser:
Teachers
Advisors,
LLC
(the
“Adviser”),
a
wholly
owned
indirect
subsidiary
of
Teachers
Insurance
and
Annuity
Association
of
America
(“TIAA”),
is
registered
with
the
Securities
and
Exchange
Commission
(“SEC”)
as
an
investment
adviser
and
provides
investment
management
services
for
the
Funds.
Share
Classes
and
Sales
Charges:
Each
Fund
is
a
"fund
of
funds"
that
diversifies
its
assets
by
investing
in
Class
W
shares
of
other
funds
of
the
Trust
and
potentially
other
investment
pools
or
investment
products.
The
Funds offer
Class
A
(Lifecycle
Retirement
Income
only),
Class
I,
Premier
Class,
Class
R6
and Retirement
Class shares.
Each
class
differs
by
the
allocation
of
class-specific
expenses
and
voting
rights
in
matters
affecting
a
single
class. A
sales
charge
is
imposed
on
purchases
of
Class
A
Shares of
Lifecycle
Retirement
Income,
of less
than
certain
amounts,
as
set
forth
in the
prospectus.
Class
A
Shares
purchases
of
$1
million
or
more
are
sold
at
NAV
without
an
up-front
sales
charge
buy
may
be
subject
to
a
contingent
deferred
sales
charge
("CDSC") of
1%
if
redeemed
within
eighteen
months
of
purchase.
Class
I,
Premier
Class,
Class
R6
and Retirement
Class
are
sold
without
an
up-front
sales
charge.
The
Funds
offer
their
shares
through
their
principal
underwriter,
Nuveen
Securities,
LLC
(“Nuveen
Securities”),
which
is
a
wholly
owned
indirect
subsidiary
of
TIAA.
2.
Significant
Accounting
Policies
The
accompanying
financial
statements
were
prepared
in
accordance
with
accounting
principles
generally
accepted
in
the
United
States
of
America
(“U.S.
GAAP”),
which
may
require
the
use
of
estimates
made
by
management
and
the
evaluation
of
subsequent
events.
Actual
results
may
differ
from
those
estimates.
The Funds
are
investment
companies
and
follow
the
accounting
guidance
in
the
Financial
Accounting
Standards
Board
(“FASB”)
Accounting
Standards
Codification
946,
Financial
Services
—
Investment
Companies
. The net
asset
value
("NAV")
for
financial
reporting
purposes
may
differ
from
the NAV
for
processing
transactions.
The NAV
for
financial
reporting
purposes
includes
security
and shareholder
transactions
through
the
date
of
the
report.
Total
return
is
computed
based
on
the NAV
used
for
processing
transactions.
The
following
is
a
summary
of
the
significant
accounting
policies
consistently
followed
by
the
Funds.
Compensation:
The
Funds pay
the
members
of
the
Board
of
Trustees
("Board")
all
of
whom
are
independent,
certain
remuneration
for
their
services,
plus
travel
and
other
expenses.
The
Board
has
adopted
a
deferred
compensation
plan
for
independent
trustees
that
enables
trustees
to
elect
to
defer
receipt
of
all
or
a
portion
of
the
annual
compensation
they
are
entitled
to
receive
from
certain
Nuveen-advised
funds.
Under
the
plan,
deferred
amounts
are
treated
as
though
equal
dollar
amounts
had
been
invested
in
shares
of
select
Nuveen-advised
funds. Amounts
deferred
are
retained
by
the
Funds
until
paid.
Amounts
payable
to
the
trustees
for
compensation
are
included
separately
in the
accompanying
Statement
of
Assets
and
Liabilities.
Trustees’
fees,
including
any
deferred
compensation
incurred,
are
reflected
in
the
Statement
of
Operations.
Distributions
to
Shareholders:
Distributions
to
shareholders
are
recorded
on
the
ex-dividend
date.
The
amount,
character
and
timing
of
distributions
are
determined
in
accordance
with
federal
income
tax
regulations,
which
may
differ
from
U.S.
GAAP.
Fund
Name
Short
Name
Nuveen
Lifecycle
Retirement
Income
Fund
Lifecycle
Retirement
Income
Nuveen
Lifecycle
2010
Fund
Lifecycle
2010
Nuveen
Lifecycle
2015
Fund
Lifecycle
2015
Nuveen
Lifecycle
2020
Fund
Lifecycle
2020
Nuveen
Lifecycle
2025
Fund
Lifecycle
2025
Nuveen
Lifecycle
2030
Fund
Lifecycle
2030
Nuveen
Lifecycle
2035
Fund
Lifecycle
2035
Nuveen
Lifecycle
2040
Fund
Lifecycle
2040
Nuveen
Lifecycle
2045
Fund
Lifecycle
2045
Nuveen
Lifecycle
2050
Fund
Lifecycle
2050
Nuveen
Lifecycle
2055
Fund
Lifecycle
2055
Nuveen
Lifecycle
2060
Fund
Lifecycle
2060
Nuveen
Lifecycle
2065
Fund
Lifecycle
2065
Indemnification:
Under
the
Trust's
organizational
documents,
its
officers
and
trustees
are
indemnified
against
certain
liabilities
arising
out
of
the
performance
of
their
duties
to
the
Trust.
In
addition,
in
the
normal
course
of
business,
the
Trust
enters
into
contracts
that
provide
general
indemnifications
to
other
parties.
The
Trust's
maximum
exposure
under
these
arrangements
is
unknown
as
this
would
involve
future
claims
that
may
be
made
against
the
Trust
that
have
not
yet
occurred.
However,
the
Trust
has
not
had
prior
claims
or
losses
pursuant
to
these
contracts
and
expects
the
risk
of
loss
to
be
remote.
Investments
and
Investment
Income:
Securities
transactions
are
accounted
for
as
of
the
trade
date
for
financial
reporting
purposes.
Interest
income
is
recorded
on
an
accrual
basis
and
includes
accretion
of
discounts
and
amortization
of
premiums.
Dividend
income
is
recorded
on
the
ex-dividend
date. Realized
gains
and
losses
on
securities
transactions
are
based
upon
the
specific
identification
method.
Distributions
received
on
securities
that
represent
a
return
of
capital
or
capital
gains
are
recorded
as
a
reduction
of
cost
of
investments
and/or
as
a
realized
gain.
The
Funds
estimate
the
components
of
distributions
received
that
may
be
considered
return
of
capital
distributions
or
capital
gain
distributions.
Multiclass
Operations
and
Allocations:
Income, expenses,
realized
gains
and
losses
and
unrealized
appreciation
and
depreciation
of
a
Fund
are
allocated
on
a
pro
rata
basis
to
each
class
of
shares,
except
for
service
agreement
fees,
distribution
fees
and
transfer
agency
fees
and
expenses, which
are
unique
to
each
class
of
shares.
Most
expenses
of
the
Trust
can
be
directly
attributed
to
a
Fund.
Expenses
that
cannot
be
directly
attributed
are
allocated
to
each
Fund
in
the
Trust
based
upon
the
average
net
assets
of
each
Fund.
Netting
Agreements:
In
the
ordinary
course
of
business,
the Funds
may
enter
into
transactions
subject
to
enforceable
master
repurchase
agreements,
International
Swaps
and
Derivatives
Association,
Inc.
(ISDA)
master
agreements
or
other
similar
arrangements
(“netting
agreements”).
Generally,
the
right
to
offset
in
netting
agreements
allows
each Fund
to
offset
certain
securities
and
derivatives
with
a
specific
counterparty,
when
applicable,
as
well
as
any
collateral
received
or
delivered
to
that
counterparty
based
on
the
terms
of
the
agreements.
Generally,
each Fund
manages
its
cash
collateral
and
securities
collateral
on
a
counterparty
basis.
With
respect
to
certain
counterparties,
in
accordance
with
the
terms
of
the
netting
agreements,
collateral
posted
to
the Funds
is
held
in
a
segregated
account
by
the Funds'
custodian
and/or
with
respect
to
those
amounts
which
can
be
sold
or
repledged,
are
presented
in
the Funds'
Portfolio
of
Investments
or
Statement
of
Assets
and
Liabilities.
The Funds'
investments
subject
to
netting
agreements
as
of
the
end
of
the
reporting
period,
if
any,
are
further
described
later
in
these
Notes
to
Financial
Statements.
New
Accounting
Pronouncement:
In
November
2023,
the
FASB
issued
Accounting
Standard
Update
(“ASU”)
No.
2023-07,
Segment
Reporting
(Topic
280)
Improvements
to
Reportable
Segment
Disclosures
(“ASU
2023-07”).
The
amendments
in
ASU
2023-07
improve
reportable
segment
disclosure
requirements,
primarily
through
enhanced
disclosures
about
significant
segment
expenses.
ASU
2023-07
also
requires
a
public
entity
that
has
a
single
reportable
segment
to
provide
all
the
disclosures
required
by
the
amendments
in
ASU
2023-07
and
all
existing
segment
disclosures
in
Topic
280.
The
amendments
in
ASU
2023-07
are
effective
for
fiscal
years
beginning
after
December
15,
2023,
and
interim
periods
within
fiscal
years
beginning
after
December
15,
2024.
Early
adoption
is
permitted.
Management
has
assessed
the
new
guidance
and
determined
that
it
will
not
have
a
material
impact
on
the
financial
positions
or
results
of
operations
of
the
Funds.
3.
Investment
Valuation
and
Fair
Value
Measurements
The Funds'
investments
in
securities
are
recorded
at
their
estimated
fair
value
utilizing
valuation
methods
approved
by
the
Adviser,
subject
to
oversight
of
the
Board.
Fair
value
is
defined
as
the
price
that
would
be
received
upon
selling
an
investment
or
transferring
a
liability
in
an
orderly
transaction
to
an
independent
buyer
in
the
principal
or
most
advantageous
market
for
the
investment.
U.S.
GAAP
establishes
the
three-tier
hierarchy
that
is
used
to
maximize
the
use
of
observable
market
data
and
minimize
the
use
of
unobservable
inputs
and
to
establish
classification
of
fair
value
measurements
for
disclosure
purposes.
Observable
inputs
reflect
the
assumptions
market
participants
would
use
in
pricing
the
asset
or
liability.
Observable
inputs
are
based
on
market
data
obtained
from
sources
independent
of
the
reporting
entity.
Unobservable
inputs
reflect
management’s
assumptions
about
the
assumptions
market
participants
would
use
in
pricing
the
asset
or
liability.
Unobservable
inputs
are
based
on
the
best
information
available
in
the
circumstances.
The
following
is
a
summary
of
the
three-tiered
hierarchy
of
valuation
input
levels.
Level 1
–
Inputs
are
unadjusted
and
prices
are
determined
using
quoted
prices
in
active
markets
for
identical
securities.
Level
2
–
Prices
are
determined
using
other
significant
observable
inputs
(including
quoted
prices
for
similar
securities,
interest
rates,
credit
spreads,
etc.).
Level
3
–
Prices
are
determined
using
significant
unobservable
inputs
(including
management’s
assumptions
in
determining
the
fair
value
of
investments).
A
description
of
the
valuation
techniques
applied
to
the Funds'
major
classifications
of
assets
and
liabilities
measured
at
fair
value
follows:
Notes
to
Financial
Statements
(continued)
Exchange-traded
funds
listed
or
traded
on
a
national
market
or
exchange
are
valued
based
on
their
sale
price
at
the
official
close
of
business
of
such
market
or
exchange
on
the
valuation
date.
To
the
extent
these
securities
are
actively
traded
and
that
valuation
adjustments
are
not
applied,
they
are
generally
classified
as
Level
1.
Investments
in
investment
companies
are
valued
at
their
respective NAVs
or
share
price
on
the
valuation
date
and
are
generally
classified
as Level
1.
Repurchase
agreements
are
valued
at
contract
amount
plus
accrued
interest,
which
approximates
market
value.
These
securities
are
generally
classified
as
Level
2.
Investments
in
unregistered
limited
partnerships
are
measured
at
fair
value
as
of
the
valuation
date
using
the
NAV
per
share
practical
expedient
and
are
not
classified
within
the
fair
value
hierarchy.
The
following
table
summarizes
the
market
value
of
the Funds’
investments
as
of
the
end
of
the
current
fiscal
period, based
on
the
inputs
used
to
value
them:
Fund
Level
1
Level
2
Level
3
Fair
value
using
practical
expedient
a
Total
Lifecycle
Retirement
Income
Registered
investment
companies
$
396,661,212
$
—
$
—
$
—
$
396,661,212
Nuveen
Real
Property
Fund
LP
—
—
—
17,644,633
17,644,633
Short-term
investments
—
370,000
—
—
370,000
Total
$
396,661,212
$
370,000
$
—
$
17,644,633
$
414,675,845
Lifecycle
2010
Registered
investment
companies
$
747,201,280
$
—
$
—
$
—
$
747,201,280
Nuveen
Real
Property
Fund
LP
—
—
—
18,470,778
18,470,778
Short-term
investments
—
920,000
—
—
920,000
Total
$
747,201,280
$
920,000
$
—
$
18,470,778
$
766,592,058
Lifecycle
2015
Registered
investment
companies
$
1,042,029,837
$
—
$
—
$
—
$
1,042,029,837
Nuveen
Real
Property
Fund
LP
—
—
—
46,352,002
46,352,002
Short-term
investments
—
1,030,000
—
—
1,030,000
Total
$
1,042,029,837
$
1,030,000
$
—
$
46,352,002
$
1,089,411,839
Lifecycle
2020
Registered
investment
companies
$
2,228,389,636
$
—
$
—
$
—
$
2,228,389,636
Nuveen
Real
Property
Fund
LP
—
—
—
99,117,502
99,117,502
Short-term
investments
—
2,460,000
—
—
2,460,000
Total
$
2,228,389,636
$
2,460,000
$
—
$
99,117,502
$
2,329,967,138
Lifecycle
2025
Registered
investment
companies
$
3,582,648,002
$
—
$
—
$
—
$
3,582,648,002
Nuveen
Real
Property
Fund
LP
—
—
—
159,289,890
159,289,890
Short-term
investments
—
5,720,000
—
—
5,720,000
Total
$
3,582,648,002
$
5,720,000
$
—
$
159,289,890
$
3,747,657,892
Lifecycle
2030
Registered
investment
companies
$
4,459,470,651
$
—
$
—
$
—
$
4,459,470,651
Nuveen
Real
Property
Fund
LP
—
—
—
198,422,564
198,422,564
Short-term
investments
—
4,930,000
—
—
4,930,000
Total
$
4,459,470,651
$
4,930,000
$
—
$
198,422,564
$
4,662,823,215
Lifecycle
2035
Registered
investment
companies
$
4,865,385,129
$
—
$
—
$
—
$
4,865,385,129
Nuveen
Real
Property
Fund
LP
—
—
—
216,262,566
216,262,566
Short-term
investments
—
11,620,000
—
—
11,620,000
Total
$
4,865,385,129
$
11,620,000
$
—
$
216,262,566
$
5,093,267,695
Lifecycle
2040
Registered
investment
companies
$
5,935,909,071
$
—
$
—
$
—
$
5,935,909,071
Nuveen
Real
Property
Fund
LP
—
—
—
264,223,158
264,223,158
Short-term
investments
—
8,180,000
—
—
8,180,000
Total
$
5,935,909,071
$
8,180,000
$
—
$
264,223,158
$
6,208,312,229
Lifecycle
2045
Registered
investment
companies
$
4,308,188,296
$
—
$
—
$
—
$
4,308,188,296
Nuveen
Real
Property
Fund
LP
—
—
—
191,576,605
191,576,605
Short-term
investments
—
11,840,000
—
—
11,840,000
Total
$
4,308,188,296
$
11,840,000
$
—
$
191,576,605
$
4,511,604,901
Lifecycle
2050
Registered
investment
companies
$
3,445,441,721
$
—
$
—
$
—
$
3,445,441,721
Nuveen
Real
Property
Fund
LP
—
—
—
153,428,495
153,428,495
Short-term
investments
—
5,290,000
—
—
5,290,000
Total
$
3,445,441,721
$
5,290,000
$
—
$
153,428,495
$
3,604,160,216
4.
Portfolio
Securities
Repurchase
Agreements:
In
connection
with
transactions
in
repurchase
agreements,
it
is
the Fund’s policy
that
its
custodian
take
possession
of
the
underlying
collateral
securities,
the
fair
value
of
which
exceeds
the
principal
amount
of
the
repurchase
transaction,
including
accrued
interest,
at
all
times.
If
the
counterparty
defaults,
and
the
fair
value
of
the
collateral
declines,
realization
of
the
collateral
may
be
delayed
or
limited.
The
following
table
presents
the
repurchase
agreements
for
the Funds
that
are
subject
to
netting
agreements
as
of
the
end
of
the
reporting
period,
and
the
collateral
delivered
related
to
those
repurchase
agreements:
Real
Property
Fund
("RPF"):
The
Funds
invest
in
the
RPF,
which
is
an
affiliated
real
estate
limited
partnership.
The
RPF
is
an
unregistered
open-end
fund
that
intends
to
invest
in
direct
real
estate
holdings
and
may
invest
a
portion
of
its
assets
in
REIT
securities,
mortgage
related
securitization
and
money
market
instruments
in
accordance
with
exemptive
relief
received
from
the
SEC.
The
Funds
are
not
liable
for
the
debts
of
the
RPF
beyond
the
amounts
the
Funds
have
contributed.
The
Funds
can
redeem
from
RPF
daily
subject
to
certain
approvals.
Investments
in
the
RPF
are
illiquid
and
the
Funds
may
be
unable
to
dispose
of
such
investments
at
opportune
times.
As
such,
this
investment
has
been
designated
as
restricted
and
the
value
is
reflected
in
the
Portfolios
of
Investments.
As
a
restricted
security,
RPF
may
not
be
sold
except
in
exempt
transactions
or
in
a
public offering
registered
under
the
Securities
Act
of
1933,
as
amended.
The
risk
of
investing
in
such
securities
is
generally
greater
than
the
risk
of
investing
in
securities
that
are
widely
held
and
publicaly
traded.
Fund
Level
1
Level
2
Level
3
Fair
value
using
practical
expedient
a
Total
Lifecycle
2055
Registered
investment
companies
$
1,789,338,489
$
—
$
—
$
—
$
1,789,338,489
Nuveen
Real
Property
Fund
LP
—
—
—
79,558,427
79,558,427
Short-term
investments
—
5,580,000
—
—
5,580,000
Total
$
1,789,338,489
$
5,580,000
$
—
$
79,558,427
$
1,874,476,916
Lifecycle
2060
Registered
investment
companies
$
796,254,713
$
—
$
—
$
—
$
796,254,713
Nuveen
Real
Property
Fund
LP
—
—
—
35,436,834
35,436,834
Short-term
investments
—
1,780,000
—
—
1,780,000
Total
$
796,254,713
$
1,780,000
$
—
$
35,436,834
$
833,471,547
Lifecycle
2065
Registered
investment
companies
$
111,801,672
$
—
$
—
$
—
$
111,801,672
Nuveen
Real
Property
Fund
LP
—
—
—
4,963,064
4,963,064
Short-term
investments
—
530,000
—
—
530,000
Total
$
111,801,672
$
530,000
$
—
$
4,963,064
$
117,294,736
a
In
accordance
with
ASC
820,
certain
investments
that
are
measured
at
fair
value
using
the
net
asset
value
per
share
practical
expedient
have
not
been
classified
in
the
fair
value
hierarchy.
The
fair
value
amounts
presented
in
this
table
are
intended
to
permit
reconciliation
of
the
fair
value
hierarchy
to
the
amounts
presented
in
the
Statements
of
assets
and
liabilities.
Fund
Counterparty
Short-term
Investments,
at
Value
Collateral
Pledged
(From)
Counterparty
Lifecycle
Retirement
Income
Fixed
Income
Clearing
Corporation
$
370,000
$
(377,423)
Lifecycle
2010
Fixed
Income
Clearing
Corporation
920,000
(938,405)
Lifecycle
2015
Fixed
Income
Clearing
Corporation
1,030,000
(1,050,601)
Lifecycle
2020
Fixed
Income
Clearing
Corporation
2,460,000
(2,509,346)
Lifecycle
2025
Fixed
Income
Clearing
Corporation
5,720,000
(5,834,404)
Lifecycle
2030
Fixed
Income
Clearing
Corporation
4,930,000
(5,028,612)
Lifecycle
2035
Fixed
Income
Clearing
Corporation
11,620,000
(11,852,585)
Lifecycle
2040
Fixed
Income
Clearing
Corporation
8,180,000
(8,343,749)
Lifecycle
2045
Fixed
Income
Clearing
Corporation
11,840,000
(12,076,951)
Lifecycle
2050
Fixed
Income
Clearing
Corporation
5,290,000
(5,395,922)
Lifecycle
2055
Fixed
Income
Clearing
Corporation
5,580,000
(5,691,678)
Lifecycle
2060
Fixed
Income
Clearing
Corporation
1,780,000
(1,815,751)
Lifecycle
2065
Fixed
Income
Clearing
Corporation
530,000
(540,757)
Notes
to
Financial
Statements
(continued)
Purchases
and
Sales:
Long-term
purchases
and
sales
during
the
current
fiscal
period were
as
follows:
5.
Derivative
Investments
Each Fund is
authorized
to
invest
in
certain
derivative
instruments.
As
defined
by
U.S.
GAAP,
a
derivative is
a
financial
instrument
whose
value
is
derived
from
an
underlying
security
price,
foreign
exchange
rate,
interest
rate,
index
of
prices
or
rates,
or
other
variables.
Investments
in
derivatives
as
of
the
end
of
and/or
during
the
current
fiscal
period,
if
any,
are
included
within
the
Statement
of
Assets
and
Liabilities
and
the
Statement
of
Operations,
respectively.
6.
Fund
Shares
Transactions
in
Fund
shares
during
the
current
and
prior
fiscal
period
were
as
follows:
Fund
Non-U.S.
Government
Purchases
Non-U.S.
Government
Sales
12.1
Lifecycle
Retirement
Income
$
19,359,412
$
40,599,156
12.2
Lifecycle
2010
42,452,873
112,258,545
12.3
Lifecycle
2015
50,103,882
165,439,769
12.4
Lifecycle
2020
89,891,261
384,214,798
12.5
Lifecycle
2025
165,574,332
522,484,478
12.6
Lifecycle
2030
208,940,432
556,586,980
12.7
Lifecycle
2035
247,243,246
585,506,007
12.8
Lifecycle
2040
291,496,408
674,093,463
12.9
Lifecycle
2045
237,874,039
506,786,046
13.01
Lifecycle
2050
205,462,853
376,611,396
13.1
Lifecycle
2055
139,917,996
172,743,620
13.2
Lifecycle
2060
96,348,411
58,132,087
13.3
Lifecycle
2065
38,679,107
20,399,769
Six
Months
Ended
11/30/24
Year
Ended
5/31/24
12.1
Lifecycle
Retirement
Income
Shares
Amount
Shares
Amount
Subscriptions:
Class
A
174,663
$
1,994,280
433,655
$
4,649,203
Class
I
–
–
–
–
Premier
Class
75,857
865,506
97,480
1,033,218
Class
R6
846,526
9,666,200
1,894,748
20,150,886
Retirement
Class
269,114
3,057,865
447,110
4,789,005
Total
subscriptions
1,366,160
15,583,851
2,872,993
30,622,312
Reinvestments
of
distributions:
Class
A
139,051
1,576,868
373,021
3,989,284
Class
I
249
2,827
713
7,653
Premier
Class
11,572
131,304
37,327
398,934
Class
R6
191,567
2,174,636
552,701
5,915,189
Retirement
Class
144,121
1,632,687
404,463
4,318,428
Total
reinvestments
of
distributions
486,560
5,518,322
1,368,225
14,629,488
Redemptions:
Class
A
(521,359)
(5,946,488)
(1,517,407)
(16,303,756)
Class
I
(12,452)
(143,165)
(855)
(9,006)
Premier
Class
(265,467)
(3,057,964)
(698,781)
(7,420,310)
Class
R6
(1,932,152)
(21,988,256)
(4,836,522)
(52,159,628)
Retirement
Class
(1,110,856)
(12,579,853)
(2,159,852)
(23,038,570)
Total
redemptions
(3,842,286)
(43,715,726)
(9,213,417)
(98,931,270)
Net
increase
(decrease)
from
shareholder
transactions
(1,989,566)
$
(22,613,553)
(4,972,199)
$
(53,679,470)
Six
Months
Ended
11/30/24
Year
Ended
5/31/24
12.2
Lifecycle
2010
Shares
Amount
Shares
Amount
Subscriptions:
Class
I
–
$
–
–
$
–
Premier
Class
724,665
7,687,648
274,759
2,657,063
Class
R6
2,138,297
22,537,375
3,769,540
37,031,541
Retirement
Class
338,692
4,433,804
720,436
8,850,128
Total
subscriptions
3,201,654
34,658,827
4,764,735
48,538,732
Reinvestments
of
distributions:
Class
I
–
–
234
2,286
Premier
Class
–
–
145,231
1,407,286
Class
R6
–
–
2,196,057
21,323,714
Retirement
Class
–
–
568,429
6,997,365
Total
reinvestments
of
distributions
–
–
2,909,951
29,730,651
Redemptions:
Class
I
(7,034)
(74,774)
–
–
Premier
Class
(1,304,028)
(13,714,489)
(1,336,291)
(13,017,239)
Class
R6
(6,899,688)
(71,705,373)
(12,953,147)
(126,422,270)
Retirement
Class
(2,445,204)
(32,463,883)
(3,347,115)
(41,251,872)
Total
redemptions
(10,655,954)
(117,958,519)
(17,636,553)
(180,691,381)
Net
increase
(decrease)
from
shareholder
transactions
(7,454,300)
$
(83,299,692)
(9,961,867)
$
(102,421,998)
Six
Months
Ended
11/30/24
Year
Ended
5/31/24
12.3
Lifecycle
2015
Shares
Amount
Shares
Amount
Subscriptions:
Class
I
–
$
–
–
$
–
Premier
Class
1,063,844
10,123,273
498,860
4,308,836
Class
R6
2,453,253
23,084,825
4,358,795
38,323,222
Retirement
Class
974,324
12,323,005
1,828,109
21,402,332
Total
subscriptions
4,491,421
45,531,103
6,685,764
64,034,390
Reinvestments
of
distributions:
Class
I
–
–
1,038
9,022
Premier
Class
–
–
198,250
1,716,848
Class
R6
–
–
3,377,164
29,347,554
Retirement
Class
–
–
740,602
8,650,230
Total
reinvestments
of
distributions
–
–
4,317,054
39,723,654
Redemptions:
Class
I
(10,643)
(101,114)
(6,795)
(59,999)
Premier
Class
(1,244,955)
(11,694,702)
(2,736,462)
(23,748,817)
Class
R6
(12,666,634)
(118,125,109)
(19,318,250)
(168,124,946)
Retirement
Class
(3,966,233)
(49,968,618)
(5,183,233)
(60,492,244)
Total
redemptions
(17,888,465)
(179,889,543)
(27,244,740)
(252,426,006)
Net
increase
(decrease)
from
shareholder
transactions
(13,397,044)
$
(134,358,440)
(16,241,922)
$
(148,667,962)
Six
Months
Ended
11/30/24
Year
Ended
5/31/24
12.4
Lifecycle
2020
Shares
Amount
Shares
Amount
Subscriptions:
Class
I
80,358
$
781,084
433
$
4,098
Premier
Class
1,454,977
14,505,159
615,272
5,521,845
Class
R6
3,995,453
38,918,040
9,108,728
83,167,889
Retirement
Class
452,524
6,142,140
1,650,063
20,516,811
Total
subscriptions
5,983,312
60,346,423
11,374,496
109,210,643
Reinvestments
of
distributions:
Class
I
–
–
2,346
21,159
Premier
Class
–
–
407,611
3,672,579
Class
R6
–
–
7,348,605
66,357,906
Retirement
Class
–
–
1,165,311
14,601,344
Total
reinvestments
of
distributions
–
–
8,923,873
84,652,988
Redemptions:
Class
I
(93,414)
(904,125)
(26,993)
(244,878)
Premier
Class
(2,638,816)
(25,862,063)
(7,335,038)
(66,134,691)
Class
R6
(28,276,896)
(275,660,549)
(42,907,519)
(389,330,718)
Retirement
Class
(6,787,748)
(92,223,472)
(10,477,131)
(131,096,521)
Total
redemptions
(37,796,874)
(394,650,209)
(60,746,681)
(586,806,808)
Net
increase
(decrease)
from
shareholder
transactions
(31,813,562)
$
(334,303,786)
(40,448,312)
$
(392,943,177)
Notes
to
Financial
Statements
(continued)
Six
Months
Ended
11/30/24
Year
Ended
5/31/24
12.5
Lifecycle
2025
Shares
Amount
Shares
Amount
Subscriptions:
Class
I
2,585
$
26,625
13,326
$
125,471
Premier
Class
2,373,789
24,790,339
1,705,503
15,876,187
Class
R6
8,242,367
84,685,360
15,645,291
148,258,330
Retirement
Class
1,137,174
16,459,395
2,403,383
31,821,471
Total
subscriptions
11,755,915
125,961,719
19,767,503
196,081,459
Reinvestments
of
distributions:
Class
I
–
–
2,834
26,729
Premier
Class
–
–
615,708
5,781,500
Class
R6
–
–
10,270,415
96,850,017
Retirement
Class
–
–
1,329,720
17,685,277
Total
reinvestments
of
distributions
–
–
12,218,677
120,343,523
Redemptions:
Class
I
(15,598)
(162,421)
(32,414)
(308,366)
Premier
Class
(4,380,702)
(45,051,499)
(10,476,187)
(98,384,052)
Class
R6
(34,902,086)
(358,656,519)
(53,544,359)
(508,096,110)
Retirement
Class
(9,413,356)
(136,264,406)
(12,301,216)
(163,661,102)
Total
redemptions
(48,711,742)
(540,134,845)
(76,354,176)
(770,449,630)
Net
increase
(decrease)
from
shareholder
transactions
(36,955,827)
$
(414,173,126)
(44,367,996)
$
(454,024,648)
Six
Months
Ended
11/30/24
Year
Ended
5/31/24
12.6
Lifecycle
2030
Shares
Amount
Shares
Amount
Subscriptions:
Class
I
5,789
$
61,402
36,170
$
354,398
Premier
Class
2,388,415
25,697,199
2,460,993
23,328,078
Class
R6
9,390,443
99,525,829
22,894,247
221,980,026
Retirement
Class
1,224,109
18,903,231
3,377,573
47,152,530
Total
subscriptions
13,008,756
144,187,661
28,768,983
292,815,032
Reinvestments
of
distributions:
Class
I
–
–
1,812
17,467
Premier
Class
–
–
651,585
6,248,703
Class
R6
–
–
10,893,857
105,016,784
Retirement
Class
–
–
1,193,209
16,704,931
Total
reinvestments
of
distributions
–
–
12,740,463
127,987,885
Redemptions:
Class
I
(11,143)
(119,807)
(19,644)
(198,171)
Premier
Class
(4,585,887)
(48,631,502)
(10,496,353)
(100,691,110)
Class
R6
(35,234,965)
(373,485,192)
(50,051,694)
(484,938,640)
Retirement
Class
(8,357,928)
(129,043,961)
(10,654,918)
(149,050,344)
Total
redemptions
(48,189,923)
(551,280,462)
(71,222,609)
(734,878,265)
Net
increase
(decrease)
from
shareholder
transactions
(35,181,167)
$
(407,092,801)
(29,713,163)
$
(314,075,348)
Six
Months
Ended
11/30/24
Year
Ended
5/31/24
12.7
Lifecycle
2035
Shares
Amount
Shares
Amount
Subscriptions:
Class
I
9,369
$
102,638
25,142
$
262,197
Premier
Class
1,961,982
21,994,626
2,702,997
26,291,383
Class
R6
11,033,132
122,014,877
25,621,992
253,828,740
Retirement
Class
1,186,199
19,691,420
3,409,573
50,558,462
Total
subscriptions
14,190,682
163,803,561
31,759,704
330,940,782
Reinvestments
of
distributions:
Class
I
–
–
1,563
15,472
Premier
Class
–
–
579,190
5,722,397
Class
R6
–
–
10,503,319
104,087,889
Retirement
Class
–
–
950,518
14,124,702
Total
reinvestments
of
distributions
–
–
12,034,590
123,950,460
Redemptions:
Class
I
(13,604)
(151,374)
(4,319)
(45,012)
Premier
Class
(4,237,006)
(47,029,213)
(11,418,018)
(111,382,410)
Class
R6
(35,155,643)
(387,407,824)
(50,307,243)
(500,942,206)
Retirement
Class
(7,310,060)
(120,921,151)
(8,772,119)
(130,032,343)
Total
redemptions
(46,716,313)
(555,509,562)
(70,501,699)
(742,401,971)
Net
increase
(decrease)
from
shareholder
transactions
(32,525,631)
$
(391,706,001)
(26,707,405)
$
(287,510,729)
Six
Months
Ended
11/30/24
Year
Ended
5/31/24
12.8
Lifecycle
2040
Shares
Amount
Shares
Amount
Subscriptions:
Class
I
6,085
$
68,877
14,973
$
152,630
Premier
Class
1,547,971
17,739,722
3,495,767
34,199,040
Class
R6
11,202,149
127,179,569
27,883,638
278,770,192
Retirement
Class
991,457
17,568,028
2,813,218
43,706,569
Total
subscriptions
13,747,662
162,556,196
34,207,596
356,828,431
Reinvestments
of
distributions:
Class
I
–
–
861
8,627
Premier
Class
–
–
601,976
6,019,759
Class
R6
–
–
11,393,482
114,276,623
Retirement
Class
–
–
895,621
14,025,423
Total
reinvestments
of
distributions
–
–
12,891,940
134,330,432
Redemptions:
Class
I
(11,315)
(128,905)
(892)
(8,970)
Premier
Class
(4,643,860)
(53,285,447)
(13,853,760)
(136,330,356)
Class
R6
(36,195,109)
(409,304,623)
(64,252,883)
(645,033,029)
Retirement
Class
(7,513,981)
(132,615,346)
(10,132,726)
(158,378,183)
Total
redemptions
(48,364,265)
(595,334,321)
(88,240,261)
(939,750,538)
Net
increase
(decrease)
from
shareholder
transactions
(34,616,603)
$
(432,778,125)
(41,140,725)
$
(448,591,675)
Six
Months
Ended
11/30/24
Year
Ended
5/31/24
12.9
Lifecycle
2045
Shares
Amount
Shares
Amount
Subscriptions:
Class
I
4,520
$
65,003
15,132
$
193,389
Premier
Class
1,155,154
16,802,300
2,219,476
27,470,385
Class
R6
8,676,527
125,473,936
21,973,395
277,220,123
Retirement
Class
1,274,886
18,237,640
3,193,589
40,213,928
Total
subscriptions
11,111,087
160,578,879
27,401,592
345,097,825
Reinvestments
of
distributions:
Class
I
–
–
905
11,443
Premier
Class
–
–
285,134
3,589,833
Class
R6
–
–
5,607,406
70,933,689
Retirement
Class
–
–
927,090
11,616,438
Total
reinvestments
of
distributions
–
–
6,820,535
86,151,403
Redemptions:
Class
I
(11,705)
(169,654)
(3,951)
(48,428)
Premier
Class
(2,854,925)
(41,558,164)
(8,349,883)
(102,647,216)
Class
R6
(22,532,304)
(324,906,977)
(35,711,665)
(453,214,173)
Retirement
Class
(6,351,258)
(90,435,418)
(7,357,392)
(92,650,132)
Total
redemptions
(31,750,192)
(457,070,213)
(51,422,891)
(648,559,949)
Net
increase
(decrease)
from
shareholder
transactions
(20,639,105)
$
(296,491,334)
(17,200,764)
$
(217,310,721)
Six
Months
Ended
11/30/24
Year
Ended
5/31/24
13.01
Lifecycle
2050
Shares
Amount
Shares
Amount
Subscriptions:
Class
I
6,898
$
104,609
7,834
$
103,640
Premier
Class
846,239
12,700,081
2,032,289
25,822,530
Class
R6
7,685,930
114,383,587
19,505,170
252,685,367
Retirement
Class
955,744
14,107,775
2,532,808
32,680,173
Total
subscriptions
9,494,811
141,296,052
24,078,101
311,291,710
Reinvestments
of
distributions:
Class
I
–
–
401
5,223
Premier
Class
–
–
188,061
2,435,390
Class
R6
–
–
4,073,015
52,989,920
Retirement
Class
–
–
603,267
7,770,079
Total
reinvestments
of
distributions
–
–
4,864,744
63,200,612
Redemptions:
Class
I
(10,806)
(160,939)
(3,931)
(52,821)
Premier
Class
(2,251,462)
(33,992,405)
(6,283,935)
(79,284,743)
Class
R6
(15,693,887)
(233,915,714)
(28,450,518)
(370,290,822)
Retirement
Class
(4,280,698)
(62,872,589)
(5,401,775)
(69,653,716)
Total
redemptions
(22,236,853)
(330,941,647)
(40,140,159)
(519,282,102)
Net
increase
(decrease)
from
shareholder
transactions
(12,742,042)
$
(189,645,595)
(11,197,314)
$
(144,789,780)
Notes
to
Financial
Statements
(continued)
Six
Months
Ended
11/30/24
Year
Ended
5/31/24
13.1
Lifecycle
2055
Shares
Amount
Shares
Amount
Subscriptions:
Class
I
3,964
$
69,982
9,080
$
142,095
Premier
Class
514,466
9,189,525
1,147,339
17,310,104
Class
R6
5,480,092
96,954,728
12,759,571
196,379,956
Retirement
Class
679,345
11,973,194
1,625,713
24,942,526
Total
subscriptions
6,677,867
118,187,429
15,541,703
238,774,681
Reinvestments
of
distributions:
Class
I
–
–
337
5,202
Premier
Class
–
–
76,532
1,176,296
Class
R6
–
–
1,590,293
24,538,229
Retirement
Class
–
–
220,324
3,384,176
Total
reinvestments
of
distributions
–
–
1,887,486
29,103,903
Redemptions:
Class
I
(11,478)
(204,107)
(1,094)
(16,335)
Premier
Class
(961,083)
(17,276,262)
(2,770,787)
(41,477,392)
Class
R6
(6,252,933)
(110,764,464)
(11,709,796)
(181,340,565)
Retirement
Class
(1,865,222)
(32,738,668)
(2,494,528)
(38,250,524)
Total
redemptions
(9,090,716)
(160,983,501)
(16,976,205)
(261,084,816)
Net
increase
(decrease)
from
shareholder
transactions
(2,412,849)
$
(42,796,072)
452,984
$
6,793,768
Six
Months
Ended
11/30/24
Year
Ended
5/31/24
13.2
Lifecycle
2060
Shares
Amount
Shares
Amount
Subscriptions:
Class
I
7,333
$
111,724
12,996
$
177,826
Premier
Class
337,929
5,226,938
848,687
11,194,422
Class
R6
5,109,565
78,426,423
10,633,692
142,198,740
Retirement
Class
551,626
8,397,617
1,464,735
19,573,023
Total
subscriptions
6,006,453
92,162,702
12,960,110
173,144,011
Reinvestments
of
distributions:
Class
I
–
–
429
5,728
Premier
Class
–
–
26,262
349,811
Class
R6
–
–
658,741
8,794,194
Retirement
Class
–
–
83,407
1,109,318
Total
reinvestments
of
distributions
–
–
768,839
10,259,051
Redemptions:
Class
I
(17,343)
(267,522)
(9,881)
(138,547)
Premier
Class
(439,791)
(6,869,981)
(1,015,377)
(13,219,250)
Class
R6
(2,486,229)
(38,108,554)
(4,848,320)
(65,068,293)
Retirement
Class
(821,177)
(12,521,955)
(1,159,473)
(15,386,181)
Total
redemptions
(3,764,540)
(57,768,012)
(7,033,051)
(93,812,271)
Net
increase
(decrease)
from
shareholder
transactions
2,241,913
$
34,394,690
6,695,898
$
89,590,791
Six
Months
Ended
11/30/24
Year
Ended
5/31/24
13.3
Lifecycle
2065
Shares
Amount
Shares
Amount
Subscriptions:
Class
I
1,289
$
16,748
2,710
$
31,361
Premier
Class
126,955
1,669,661
243,089
2,762,441
Class
R6
2,123,671
28,244,303
3,506,620
40,721,685
Retirement
Class
463,207
6,125,452
766,945
8,937,553
Total
subscriptions
2,715,122
36,056,164
4,519,364
52,453,040
Reinvestments
of
distributions:
Class
I
–
–
55
621
Premier
Class
–
–
3,405
38,717
Class
R6
–
–
59,323
683,995
Retirement
Class
–
–
11,631
134,110
Total
reinvestments
of
distributions
–
–
74,414
857,443
Redemptions:
Class
I
(48,110)
(627,361)
(34)
(397)
Premier
Class
(110,290)
(1,464,669)
(183,521)
(2,055,662)
Class
R6
(950,582)
(12,615,663)
(918,906)
(10,723,870)
Retirement
Class
(270,465)
(3,590,617)
(347,858)
(4,023,210)
Total
redemptions
(1,379,447)
(18,298,310)
(1,450,319)
(16,803,139)
Net
increase
(decrease)
from
shareholder
transactions
1,335,675
$
17,757,854
3,143,459
$
36,507,344
7.
Income
Tax
Information
Each
Fund
is
a
separate
taxpayer
for
federal
income
tax
purposes.
Each
Fund
intends
to
distribute
substantially
all
of
its
net
investment
income
and
net
capital
gains
to
shareholders
and
otherwise
comply
with
the
requirements
of
Subchapter
M
of
the
Internal
Revenue
Code
applicable
to
regulated
investment
companies.
Therefore,
no
federal
income
tax
provision
is
required.
Each
Fund
files
income
tax
returns
in
U.S.
federal
and
applicable
state
and
local
jurisdictions.
A
Fund’s
federal
income
tax
returns
are
generally
subject
to
examination
for
a
period
of
three
fiscal
years
after
being
filed.
State
and
local
tax
returns
may
be
subject
to
examination
for
an
additional
period
of
time
depending
on
the
jurisdiction.
Management
has
analyzed
each
Fund’s
tax
positions
taken
for
all
open
tax
years
and
has
concluded
that
no
provision
for
income
tax
is
required
in
the
Fund’s
financial
statements.
As
of
the
end
of
the
reporting
period,
the
aggregate
cost
and
the
net
unrealized
appreciation/(depreciation)
of
all
investments
for
federal
income
tax
purposes
were
as
follows:
For
purposes
of
this
disclosure,
tax
cost
generally
includes
the
cost
of
portfolio
investments
as
well
as
up-front
fees
or
premiums
exchanged
on
derivatives
and
any
amounts
unrealized
for
income
statement
reporting
but
realized
income
and/or
capital
gains
for
tax
reporting,
if
applicable.
As
of prior
fiscal
period
end,
the
components
of
accumulated
earnings
on
a
tax
basis
were
as
follows:
Fund
Tax
Cost
Gross
Unrealized
Appreciation
Gross
Unrealized
(Depreciation)
Net
Unrealized
Appreciation
(Depreciation)
12.1
Lifecycle
Retirement
Income
$386,521,466
$58,244,062
$(30,089,683)
$28,154,379
12.2
Lifecycle
2010
707,187,586
111,401,248
(51,996,776)
59,404,472
12.3
Lifecycle
2015
1,043,812,759
134,639,340
(89,040,260)
45,599,080
12.4
Lifecycle
2020
2,181,501,223
325,992,192
(177,526,277)
148,465,915
12.5
Lifecycle
2025
3,424,235,966
584,133,029
(260,711,103)
323,421,926
12.6
Lifecycle
2030
4,094,018,641
841,006,882
(272,202,308)
568,804,574
12.7
Lifecycle
2035
4,260,024,645
1,068,680,355
(235,437,305)
833,243,050
12.8
Lifecycle
2040
4,906,751,452
1,530,987,500
(229,426,723)
1,301,560,777
12.9
Lifecycle
2045
3,430,653,587
1,238,895,945
(157,944,631)
1,080,951,314
13.01
Lifecycle
2050
2,739,668,228
981,792,457
(117,300,469)
864,491,988
13.1
Lifecycle
2055
1,476,132,345
462,774,724
(64,430,153)
398,344,571
13.2
Lifecycle
2060
683,389,374
177,343,955
(27,261,782)
150,082,173
13.3
Lifecycle
2065
99,160,642
20,374,664
(2,240,570)
18,134,094
Fund
Undistributed
Ordinary
Income
Undistributed
Long-Term
Capital
Gains
Unrealized
Appreciation
(Depreciation)
Capital
Loss
Carryforwards
Late-Year
Loss
Deferrals
Other
Book-to-Tax
Differences
Total
12.1
Lifecycle
Retirement
Income
$2,099,522
$–
$12,792,645
$(1,721,025)
$–
$(54,705)
$13,116,437
12.2
Lifecycle
2010
10,135,378
5,110,268
34,252,149
–
–
(209,813)
49,287,982
12.3
Lifecycle
2015
13,535,428
–
5,605,612
(2,426,212)
–
(299,769)
16,415,059
12.4
Lifecycle
2020
28,714,623
2,398,481
61,366,156
–
–
(443,649)
92,035,611
12.5
Lifecycle
2025
38,954,069
13,864,499
177,110,865
–
–
(469,910)
229,459,523
12.6
Lifecycle
2030
37,423,429
17,191,811
364,957,608
–
–
(463,266)
419,109,582
12.7
Lifecycle
2035
31,598,916
–
598,878,976
(2,210,702)
–
(467,071)
627,800,119
12.8
Lifecycle
2040
26,802,915
211,507
976,481,585
–
–
(608,037)
1,002,887,970
12.9
Lifecycle
2045
11,726,313
24,697,891
822,222,655
–
–
(221,114)
858,425,745
13.01
Lifecycle
2050
6,663,979
25,335,222
637,206,834
–
–
(142,113)
669,063,922
13.1
Lifecycle
2055
2,187,773
21,556,215
271,701,648
–
–
(41,649)
295,403,987
13.2
Lifecycle
2060
–
10,295,505
90,769,070
–
–
(9,349)
101,055,226
13.3
Lifecycle
2065
–
1,418,396
9,986,382
–
(207,145)
(409)
11,197,224
Notes
to
Financial
Statements
(continued)
As
of
prior
fiscal
period
end,
the
Funds
had
capital
loss
carryforwards,
which
will
not
expire:
8.
Investment
Adviser
and
Other
Transactions
with
Affiliates
Under
the
terms
of
its
Investment
Management
Agreement, the
Adviser is
entitled
to
a
fee
that
is
made
up
of
two
components,
which
are
added
together
to
create
the
total
investment
management
fee.
The
first
component,
the
asset
allocation
fee
rate,
is
an
annual
rate
of
0.10%
of
the
average
daily
net
assets
of
each
Fund.
The
second
component,
the
Underlying
Funds
fee
rate,
is
calculated
as
follows:
for
each
Underlying
Fund
of
the
Trust
in
which
a
Fund
is
invested,
the
effective
Underlying
Fund’s
annual
investment
management
agreement,
net
of
any
fee
waivers
or
reimbursements
applicable
to
the
Underlying
Fund
(excluding
the
Class
W
shares
investment
management
fee
waiver
and/or
reimbursement)
in
proportion
to
the
percentage
of
the
Fund’s
net
assets
invested
in
the
Underlying
Fund,
applied
to
the
average
daily
net
assets
of
the
Fund. The
Adviser has
contractually
agreed
to
waive
in
full
the
asset
allocation
fee
rate
component
of
the
management
fee
on
each
Fund.
This
waiver
will
remain
in
effect
through
September
30,
2026,
unless
changed
with
approval
of
the
Board.
In
addition, the
Adviser has
voluntarily
agreed
to
waive
certain
amounts
of
the
Underlying
Funds
fee
rate
portion
of
each
Fund’s
management
fee
through
September
30,
2024.
As
of
the
end
of
the
current
fiscal
period, the
Adviser received
from
the
Funds
the
following
effective
annual
rate
as
a
percentage
of
average
daily
net
assets
of
each
Fund:
The
Funds
have
entered
into
an
Administrative
Service
Agreement
with
the
Adviser
under
which
the
Funds
pay the
Adviser for
its
costs
in
providing
certain
administrative
and
compliance
services
to
the
Funds.
The
Adviser
has
agreed
to
gradually
reduce
expenses
allocated
to
the
Funds
under
the
Administrative
Service
Agreement
over
a
three-year
period
commencing
May
1,
2024.
After
the
expiration
of
this
three-year
period,
the
Adviser
will
no
longer
allocate
expenses
to
the
Funds
under
the
Administrative
Service
Agreement.
Under
the
terms
of
a
Retirement
Class
Service
Agreement
with
respect
to
each
Fund,
the
Retirement
Class
of
the
Fund pays
the
Adviser
a
monthly
fee
based
on
the
annual
fee
of
0.25%
of
the
Fund's
daily
net
assets
attributable
to
Retirement
Class
Shares
of
the
Fund
for
providing
certain
administrative
services
related
to
the
maintenance
of
Retirement
Class
shares
on
retirement
plan
or
other
platforms.
Substantially
all
of
the
Retirement
Class
shareholder
servicing
fees
reported
on
the
Statements
of
operations
are
paid
to the
Adviser under
the
Service
Agreement.
Under
the
terms
of
the
distribution
Rule
12b-1
plan,
Class
A
Shares
of
the
Retirement
Income
Fund
compensated
Nuveen
Securities
for
providing
distribution,
promotional
and/or
shareholder
services
to
Class
A
Shares
of
the
Retirement
Income
Fund
at
the
maximum
annual
rates
of
0.25%
of
the
average
daily
net
assets
attributable
to the
Fund’s Class
A
Shares. The
Premier
Class
of
each
Fund
is
subject
to
a
distribution
Rule
12b-1
plan
that
compensated
Nuveen
Securities
for
providing
distribution,
promotional
and/or
shareholder
services
to
the
Premier
Class
of
the
Fund
at
the
annual
rate
of
0.15%
of
average
daily
net
assets
attributable
to
the
Fund’s
Premier
Class.
Fund
Short-Term
Long-Term
Total
12.1
Lifecycle
Retirement
Income
$1,048,776
$672,249
$1,721,025
12.2
Lifecycle
2010
–
–
–
12.3
Lifecycle
2015
2,426,212
–
2,426,212
12.4
Lifecycle
2020
–
–
–
12.5
Lifecycle
2025
–
–
–
12.6
Lifecycle
2030
–
–
–
12.7
Lifecycle
2035
2,210,702
–
2,210,702
12.8
Lifecycle
2040
–
–
–
12.9
Lifecycle
2045
–
–
–
13.01
Lifecycle
2050
–
–
–
13.1
Lifecycle
2055
–
–
–
13.2
Lifecycle
2060
–
–
–
13.3
Lifecycle
2065
–
–
–
Investment
Management
Fee
Waiver
Fund
Investment
Management
Fee—Effective
Rate
Effective
10/1/24
Prior
to
10/1/24
Lifecycle
Retirement
Income
0.290%
0.034%
0.023%
Lifecycle
2010
0.290
0.018
0.016
Lifecycle
2015
0.290
0.024
0.024
Lifecycle
2020
0.290
0.028
0.028
Lifecycle
2025
0.300
0.033
0.023
Lifecycle
2030
0.300
0.048
0.028
Lifecycle
2035
0.310
0.064
0.045
Lifecycle
2040
0.320
0.080
0.060
Lifecycle
2045
0.320
0.093
0.063
Lifecycle
2050
0.320
0.094
0.074
Lifecycle
2055
0.320
0.094
0.074
Lifecycle
2060
0.320
0.094
0.075
Lifecycle
2065
0.320
0.098
0.087
The
Adviser
has
agreed
to
reimburse
each
Fund
if
its
total
expense
ratio
(excluding
interest,
taxes,
brokerage
commissions
and
other
transactional
expenses,
Acquired
fund
fees
and
expenses,
extraordinary
expenses
and
the
management
fees
and
certain
other
expenses
originally
attributable
to
Class
W
shares
of
the
affiliated
Nuveen
Funds)
exceeds
0.00%
of
average
daily
net
assets
for
Class
R6
Shares;
0.15%
of
average
daily
net
assets
for
Class
I
Shares;
0.15%
of
average
daily
net
assets
for
the
Premier
Class
shares;
0.25%
of
average
daily
net
assets
for
the
Retirement
Class
shares;
and
0.25%
of
average
daily
net
assets
for
Class
A
Shares
of
the
Retirement
Income
Fund.
The
expense
reimbursement
arrangements
will
continue
through
at
least
September
30,
2025,
unless
changed
with
approval
of
the
Board.
The
Adviser
for
Lifecycle
2010
Fund
has
voluntarily
agreed
to
reimburse
the
Fund
for
0.030%
from
May
1,
2024
to
April
30,
2025.
The Funds are
permitted
to
purchase
or
sell securities
from
or
to
certain
other
funds
or
accounts
managed
by
the
Adviser
or
by
an
affiliate
of
the
Adviser
(each
an,
"Affiliated
Entity")
under
specified
conditions
outlined
in
procedures
adopted
by
the
Board
("cross-
trade").
These
procedures
have
been
designed
to
ensure
that
any
cross-trade
of
securities
by
the
Fund from
or
to
an
Affiliated
Entity
by
virtue
of
having
a
common
investment
adviser
(or
affiliated
investment
adviser),
common
officer
and/or
common
trustee complies
with
Rule
17a-7
under
the
1940
Act.
These
transactions
are
affected
at
the
current
market price
(as
provided
by
an
independent
pricing
service) without
incurring
broker
commissions.
During
the
current
fiscal
period,
the
Funds
engaged
in
the
following
security
transactions
with
affiliated
entities:
The
following
is
the
percentage
of
the
Funds’
shares
owned
by
TIAA
and
its
registered
separate
account
(“TIAA
Access”)
as
of
the
end
of
the
current
fiscal
period:
Investments
in
other
investment
companies
advised
by
the
Adviser
and
Nuveen
Fund
Advisors,
LLC
are
deemed
to
be
affiliated
investments.
Information
regarding
transactions
with
affiliated
companies
is
as
follows:
Fund
Purchases
Sales
Realized
Gain
(Loss)
Lifecycle
Retirement
Income
$
59,368
$
22,155
$
(57,598)
Lifecycle
2010
–
406,697
(662,230)
Lifecycle
2015
–
489,999
91,671
Lifecycle
2020
83,709
1,091,720
187,374
Lifecycle
2025
–
1,879,940
342,696
Lifecycle
2030
197,992
1,890,639
(1,719,734)
Lifecycle
2035
379,696
1,204,726
218,314
Lifecycle
2040
654,703
529,792
(1,128,709)
Lifecycle
2045
1,223,986
277,131
(1,437,648)
Lifecycle
2050
2,395,757
167,698
(2,521,838)
Lifecycle
2055
1,834,866
13,213
(1,627,450)
Lifecycle
2060
2,131,216
–
(781,899)
Lifecycle
2065
255,857
10,558
(426)
Underlying
Fund
TIAA
Access
Total
12.1
Lifecycle
Retirement
Income
12
%
12
%
12.2
Lifecycle
2010
16
16
12.3
Lifecycle
2015
15
15
12.4
Lifecycle
2020
18
18
12.5
Lifecycle
2025
17
17
12.6
Lifecycle
2030
18
18
12.7
Lifecycle
2035
18
18
12.8
Lifecycle
2040
18
18
12.9
Lifecycle
2045
19
19
13.01
Lifecycle
2050
21
21
13.1
Lifecycle
2055
18
18
13.2
Lifecycle
2060
19
19
13.3
Lifecycle
2065
2
2
Notes
to
Financial
Statements
(continued)
Issue
Value
at
5/31/24
Purchases
Cost
Sales
Proceeds
Realized
Gain
(Loss)
Change
in
Unrealized
Appreciation
(Depreciation)
Value
at
11/30/24
Dividend
Income
Lifecycle
Retirement
Income
Nuveen
Funds:
Core
Bond,
Class
W
$
87,975,648
$
2,298,116
$
6,226,030
$
(790,179)
$
3,122,259
$
86,379,814
$
1,998,935
Core
Equity,
Class
W
14,125,691
463,860
1,724,075
336,393
1,408,734
14,610,603
104,870
Core
Plus
Bond,
Class
W
54,474,884
1,287,691
3,736,667
(508,725)
2,007,379
53,524,562
1,322,710
Dividend
Growth,
Class
R6
14,221,385
974,839
2,516,218
436,568
1,466,301
14,582,875
86,636
Dividend
Value,
Class
R6
13,584,517
1,455,400
1,474,946
38,620
1,292,644
14,896,235
111,456
Emerging
Markets
Debt,
Class
W
7,897,064
269,629
697,050
(63,794)
357,680
7,763,529
254,070
Emerging
Markets
Equity,
Class
W
8,696,125
1,173,321
1,116,152
1,799
242,644
8,997,737
–
Growth
Opportunities
ETF
16,777,040
205,092
2,973,700
524,037
1,874,476
16,406,945
–
High
Yield,
Class
W
8,337,757
291,593
680,334
4,041
224,345
8,177,402
286,419
Inflation
Linked
Bond,
Class
W
41,862,326
1,817,633
3,097,231
(213,716)
606,025
40,975,037
1,024,469
International
Bond,
Class
W
8,741,851
215,558
818,665
(106,692)
558,660
8,590,712
–
International
Equity,
Class
W
22,525,752
1,892,050
2,268,541
251,102
(565,066)
21,835,297
–
International
Opportunities,
Class
W
13,392,653
1,158,357
1,458,883
65,867
20,027
13,178,021
–
Large
Cap
Growth,
Class
W
16,843,484
572,083
3,156,047
1,460,962
827,136
16,547,618
–
Large
Cap
Value,
Class
W
13,642,436
1,275,635
1,693,059
147,633
1,598,814
14,971,459
–
Quant
International
Small
Cap
Equity,
Class
W
7,308,415
424,839
577,291
34,472
27,617
7,218,052
–
Quant
Small
Cap
Equity,
Class
W
3,237,313
141,813
661,456
214,322
312,060
3,244,052
–
Quant
Small/Mid
Cap
Equity,
Class
W
3,847,166
137,389
699,588
201,076
430,947
3,916,990
–
Short
Term
Bond,
Class
W
41,678,096
2,171,858
3,583,270
(83,422)
661,010
40,844,272
959,943
Nuveen
Real
Property
Fund
LP
a
19,278,385
1,132,656
1,439,953
(214,497)
(1,111,958)
17,644,633
1,701,961
$418,447,988
$19,359,412
$40,599,156
$1,735,867
$15,361,734
$414,305,845
$7,851,469
Issue
Value
at
5/31/24
Purchases
Cost
Sales
Proceeds
Realized
Gain
(Loss)
Change
in
Unrealized
Appreciation
(Depreciation)
Value
at
11/30/24
Dividend
Income
Lifecycle
2010
Nuveen
Funds:
Core
Bond,
Class
W
$
168,164,809
$
6,138,805
$
18,893,506
$
(1,997,654)
$
6,405,444
$
159,817,898
$
3,739,651
Core
Equity,
Class
W
25,829,931
463,713
4,281,078
1,573,209
1,481,866
25,067,641
185,743
Core
Plus
Bond,
Class
W
104,162,201
3,466,843
11,446,973
(1,536,125)
4,371,391
99,017,337
2,474,445
Dividend
Growth,
Class
R6
25,813,585
1,403,625
5,558,975
1,058,101
2,315,118
25,031,454
153,835
Dividend
Value,
Class
R6
24,881,373
2,193,821
3,753,662
346,305
1,968,381
25,636,218
196,626
Emerging
Markets
Debt,
Class
W
15,117,825
782,673
2,067,403
(182,541)
729,203
14,379,757
479,159
Emerging
Markets
Equity,
Class
W
15,610,476
1,949,298
2,539,995
67,505
404,210
15,491,494
–
Growth
Opportunities
ETF
30,680,157
–
6,790,720
1,374,728
2,894,873
28,159,038
–
High
Yield,
Class
W
15,945,572
986,678
2,227,937
24,904
406,327
15,135,544
535,297
Inflation
Linked
Bond,
Class
W
79,930,661
4,554,649
9,419,290
(618,832)
1,348,665
75,795,853
1,949,913
International
Bond,
Class
W
16,661,376
855,710
2,458,874
(317,027)
1,163,273
15,904,458
–
International
Equity,
Class
W
41,192,533
2,674,606
5,794,681
1,257,263
(1,778,383)
37,551,338
–
International
Opportunities,
Class
W
24,370,778
1,581,372
3,457,289
410,244
(240,888)
22,664,217
–
Large
Cap
Growth,
Class
W
30,737,977
1,385,697
7,610,324
3,859,748
151,393
28,524,491
–
Large
Cap
Value,
Class
W
24,979,543
2,021,729
4,310,883
1,049,726
1,995,901
25,736,016
–
Quant
International
Small
Cap
Equity,
Class
W
13,284,767
726,291
1,728,815
145,637
(25,071)
12,402,809
–
Quant
Small
Cap
Equity,
Class
W
5,831,537
171,641
1,347,446
516,498
405,014
5,577,244
–
Quant
Small/Mid
Cap
Equity,
Class
W
6,943,641
147,779
1,446,458
483,071
616,017
6,744,050
–
Short
Term
Bond,
Class
W
110,432,411
10,378,400
13,772,947
(317,335)
1,843,894
108,564,423
2,535,171
Nuveen
Real
Property
Fund
LP
a
22,826,075
569,543
3,351,289
(269,246)
(1,304,305)
18,470,778
1,974,832
$803,397,228
$42,452,873
$112,258,545
$6,928,179
$25,152,323
$765,672,058
$14,224,672
Issue
Value
at
5/31/24
Purchases
Cost
Sales
Proceeds
Realized
Gain
(Loss)
Change
in
Unrealized
Appreciation
(Depreciation)
Value
at
11/30/24
Dividend
Income
Lifecycle
2015
Nuveen
Funds:
Core
Bond,
Class
W
$
240,512,746
$
7,352,336
$
27,959,737
$
(4,452,207)
$
10,725,200
$
226,178,338
$
5,311,265
Core
Equity,
Class
W
40,844,281
817,183
7,457,553
1,605,000
3,159,062
38,967,973
290,969
Core
Plus
Bond,
Class
W
148,964,120
3,875,053
16,730,769
(2,394,331)
6,419,724
140,133,797
3,514,257
Dividend
Growth,
Class
R6
40,891,151
1,682,416
8,767,870
1,843,108
3,424,617
39,073,422
239,938
Dividend
Value,
Class
R6
39,249,713
3,412,082
6,464,451
670,089
2,937,778
39,805,211
308,506
Emerging
Markets
Debt,
Class
W
21,635,333
832,684
2,905,516
(293,493)
1,069,767
20,338,775
680,186
Emerging
Markets
Equity,
Class
W
24,822,688
2,636,105
4,136,836
(154,988)
889,975
24,056,944
–
Growth
Opportunities
ETF
48,431,493
19,434
11,204,863
2,266,414
4,447,098
43,959,576
–
High
Yield,
Class
W
22,803,563
823,211
2,815,587
18,248
591,195
21,420,630
759,747
Inflation
Linked
Bond,
Class
W
109,793,793
6,446,187
12,354,057
(1,120,166)
2,106,476
104,872,233
2,683,358
International
Bond,
Class
W
23,828,405
775,891
3,296,556
(459,252)
1,660,310
22,508,798
–
International
Equity,
Class
W
65,011,796
3,932,874
9,690,602
1,675,448
(2,521,371)
58,408,145
–
International
Opportunities,
Class
W
38,477,503
2,352,605
5,759,818
694,279
(462,528)
35,302,041
–
Large
Cap
Growth,
Class
W
48,477,397
1,139,878
11,775,680
4,453,653
1,827,867
44,123,115
–
Large
Cap
Value,
Class
W
39,412,880
2,963,061
7,173,463
1,355,779
3,393,473
39,951,730
–
Quant
International
Small
Cap
Equity,
Class
W
20,875,745
1,000,342
2,843,309
186,209
(7,248)
19,211,739
–
Quant
Small
Cap
Equity,
Class
W
9,368,576
245,610
2,359,514
911,442
523,830
8,689,944
–
Quant
Small/Mid
Cap
Equity,
Class
W
11,132,953
222,538
2,571,354
838,670
872,694
10,495,501
–
Short
Term
Bond,
Class
W
109,364,287
7,618,608
13,947,639
(406,037)
1,902,706
104,531,925
2,471,194
Nuveen
Real
Property
Fund
LP
a
53,309,054
1,955,784
5,224,595
(721,086)
(2,967,155)
46,352,002
4,683,971
$1,157,207,477
$50,103,882
$165,439,769
$6,516,779
$39,993,470
$1,088,381,839
$20,943,391
Issue
Value
at
5/31/24
Purchases
Cost
Sales
Proceeds
Realized
Gain
(Loss)
Change
in
Unrealized
Appreciation
(Depreciation)
Value
at
11/30/24
Dividend
Income
Lifecycle
2020
Nuveen
Funds:
Core
Bond,
Class
W
$
509,360,911
$
14,995,986
$
66,858,459
$
(10,092,195)
$
23,502,955
$
470,909,198
$
11,205,443
Core
Equity,
Class
W
100,729,883
188,226
17,998,614
4,465,599
7,258,387
94,643,481
717,091
Core
Plus
Bond,
Class
W
315,422,259
7,321,107
39,571,240
(5,557,226)
14,156,293
291,771,193
7,416,346
Dividend
Growth,
Class
R6
100,707,619
1,978,405
21,464,631
5,290,968
7,633,067
94,145,428
593,589
Dividend
Value,
Class
R6
97,029,263
7,394,780
16,663,938
2,038,915
6,806,016
96,605,036
758,517
Emerging
Markets
Debt,
Class
W
45,831,691
1,483,735
6,697,256
(692,791)
2,348,807
42,274,186
1,434,150
Emerging
Markets
Equity,
Class
W
61,055,693
6,057,531
10,600,640
(551,581)
2,368,866
58,329,869
–
Growth
Opportunities
ETF
119,950,442
154,121
29,491,380
5,869,410
10,551,910
107,034,503
–
High
Yield,
Class
W
48,294,386
1,328,865
6,447,569
63,547
1,233,948
44,473,177
1,604,017
Inflation
Linked
Bond,
Class
W
188,584,130
11,336,826
23,477,761
(2,046,301)
3,772,338
178,169,232
4,604,287
International
Bond,
Class
W
50,462,130
1,441,542
7,541,858
(1,031,992)
3,575,803
46,905,625
–
International
Equity,
Class
W
160,405,078
7,186,694
23,659,920
4,469,324
(6,486,892)
141,914,284
–
International
Opportunities,
Class
W
94,347,148
4,952,052
14,025,894
1,957,429
(1,353,624)
85,877,111
–
Large
Cap
Growth,
Class
W
118,256,330
208,570
26,878,342
11,928,001
3,481,149
106,995,708
–
Large
Cap
Value,
Class
W
97,025,535
6,321,584
17,742,860
3,819,787
7,873,372
97,297,418
–
Quant
International
Small
Cap
Equity,
Class
W
51,805,126
2,183,909
7,698,956
494,257
(49,013)
46,735,323
–
Quant
Small
Cap
Equity,
Class
W
22,745,821
218,021
5,401,376
2,146,275
1,393,226
21,101,967
–
Quant
Small/Mid
Cap
Equity,
Class
W
27,053,595
253,267
5,912,195
2,023,930
2,182,038
25,600,635
–
Short
Term
Bond,
Class
W
187,649,437
12,319,261
24,954,786
(634,691)
3,227,041
177,606,262
4,238,357
Nuveen
Real
Property
Fund
LP
a
115,715,998
2,566,779
11,127,123
(1,662,225)
(6,375,927)
99,117,502
10,180,503
$2,512,432,475
$89,891,261
$384,214,798
$22,298,440
$87,099,760
$2,327,507,138
$42,752,300
Notes
to
Financial
Statements
(continued)
Issue
Value
at
5/31/24
Purchases
Cost
Sales
Proceeds
Realized
Gain
(Loss)
Change
in
Unrealized
Appreciation
(Depreciation)
Value
at
11/30/24
Dividend
Income
Lifecycle
2025
Nuveen
Funds:
Core
Bond,
Class
W
$
754,368,071
$
29,852,798
$
77,018,472
$
(11,845,202)
$
31,761,761
$
727,118,956
$
16,978,040
Core
Equity,
Class
W
178,885,188
356,276
28,049,925
6,870,753
14,380,677
172,442,969
1,288,445
Core
Plus
Bond,
Class
W
467,198,403
17,972,012
47,357,001
(6,972,881)
19,766,810
450,607,343
11,234,623
Dividend
Growth,
Class
R6
178,797,426
3,174,177
34,130,744
8,498,723
14,846,573
171,186,155
1,061,228
Dividend
Value,
Class
R6
172,225,331
12,821,315
25,367,067
2,495,465
13,545,527
175,720,571
1,362,224
Emerging
Markets
Debt,
Class
W
67,864,459
3,214,453
8,300,658
(854,730)
3,351,198
65,274,722
2,158,098
Emerging
Markets
Equity,
Class
W
108,161,757
12,193,413
17,488,505
(803,399)
4,010,484
106,073,750
–
Growth
Opportunities
ETF
212,583,386
179,659
47,677,515
9,558,179
19,964,802
194,608,511
–
High
Yield,
Class
W
71,529,572
3,829,906
8,584,838
45,771
1,900,525
68,720,936
2,428,531
Inflation
Linked
Bond,
Class
W
215,829,969
15,638,401
21,357,690
(1,916,868)
3,924,304
212,118,116
5,316,546
International
Bond,
Class
W
74,767,692
3,342,706
9,643,978
(1,343,085)
5,179,527
72,302,862
–
International
Equity,
Class
W
284,957,264
14,897,792
38,118,059
6,658,164
(10,311,424)
258,083,737
–
International
Opportunities,
Class
W
167,519,697
10,242,666
23,197,944
2,454,871
(1,346,054)
155,673,236
–
Large
Cap
Growth,
Class
W
210,046,370
2,098,417
45,389,535
18,941,948
8,859,638
194,556,838
–
Large
Cap
Value,
Class
W
170,743,171
11,217,503
26,208,839
5,107,403
16,011,835
176,871,073
–
Quant
International
Small
Cap
Equity,
Class
W
92,054,309
4,661,718
12,432,357
781,028
32,012
85,096,710
–
Quant
Small
Cap
Equity,
Class
W
40,397,214
324,178
8,791,284
3,294,413
3,084,165
38,308,686
–
Quant
Small/Mid
Cap
Equity,
Class
W
48,042,729
165,682
9,480,443
3,328,694
4,269,130
46,325,792
–
Short
Term
Bond,
Class
W
214,764,525
15,629,350
21,816,814
(554,195)
3,534,173
211,557,039
4,956,218
Nuveen
Real
Property
Fund
LP
a
180,080,434
3,761,910
12,072,810
(2,025,042)
(10,454,602)
159,289,890
15,901,732
$3,910,816,967
$165,574,332
$522,484,478
$41,720,010
$146,311,061
$3,741,937,892
$62,685,685
Issue
Value
at
5/31/24
Purchases
Cost
Sales
Proceeds
Realized
Gain
(Loss)
Change
in
Unrealized
Appreciation
(Depreciation)
Value
at
11/30/24
Dividend
Income
Lifecycle
2030
Nuveen
Funds:
Core
Bond,
Class
W
$
792,331,236
$
37,799,012
$
65,407,104
$
(10,116,799)
$
31,088,730
$
785,695,075
$
18,142,557
Core
Equity,
Class
W
257,554,423
797,438
35,541,959
7,947,666
23,034,402
253,791,970
1,870,148
Core
Plus
Bond,
Class
W
490,702,863
21,683,979
39,069,348
(6,006,003)
19,476,436
486,787,927
12,002,369
Dividend
Growth,
Class
R6
257,465,020
4,305,148
42,592,184
10,136,867
24,085,370
253,400,221
1,546,799
Dividend
Value,
Class
R6
247,911,817
17,962,942
30,633,109
2,385,192
21,166,804
258,793,646
1,980,944
Emerging
Markets
Debt,
Class
W
71,248,168
4,114,946
7,603,898
(765,576)
3,430,884
70,424,524
2,290,694
Emerging
Markets
Equity,
Class
W
155,784,982
17,644,902
21,651,567
(1,531,520)
6,143,511
156,390,308
–
Growth
Opportunities
ETF
306,001,018
348,235
62,439,161
12,552,817
30,674,587
287,137,496
–
High
Yield,
Class
W
75,123,517
4,335,999
7,258,498
58,017
2,017,495
74,276,530
2,594,112
Inflation
Linked
Bond,
Class
W
167,369,351
15,355,115
12,266,346
(1,460,947)
3,047,095
172,044,268
4,168,495
International
Bond,
Class
W
78,495,925
4,878,724
9,277,338
(1,282,131)
5,374,348
78,189,528
–
International
Equity,
Class
W
410,461,145
21,013,129
45,266,702
6,877,709
(12,135,142)
380,950,139
–
International
Opportunities,
Class
W
241,884,610
14,505,279
27,138,787
1,507,857
151,087
230,910,046
–
Large
Cap
Growth,
Class
W
303,013,517
1,498,855
57,808,780
22,787,221
17,981,819
287,472,632
–
Large
Cap
Value,
Class
W
246,552,419
14,488,430
30,193,346
5,503,865
25,412,895
261,764,263
–
Quant
International
Small
Cap
Equity,
Class
W
132,451,116
6,707,060
15,036,513
725,954
428,166
125,275,783
–
Quant
Small
Cap
Equity,
Class
W
58,276,119
609,583
11,592,465
2,892,416
6,497,044
56,682,697
–
Quant
Small/Mid
Cap
Equity,
Class
W
69,309,247
203,373
12,373,679
4,328,601
6,932,409
68,399,951
–
Short
Term
Bond,
Class
W
166,532,708
18,004,685
15,785,134
(352,953)
2,684,341
171,083,647
3,939,266
Nuveen
Real
Property
Fund
LP
a
218,509,112
2,683,598
7,651,062
(1,473,770)
(13,645,314)
198,422,564
19,348,330
$4,746,978,313
$208,940,432
$556,586,980
$54,714,483
$203,846,967
$4,657,893,215
$67,883,714
Issue
Value
at
5/31/24
Purchases
Cost
Sales
Proceeds
Realized
Gain
(Loss)
Change
in
Unrealized
Appreciation
(Depreciation)
Value
at
11/30/24
Dividend
Income
Lifecycle
2035
Nuveen
Funds:
Core
Bond,
Class
W
$
697,107,601
$
49,555,153
$
50,865,212
$
(7,436,459)
$
25,937,372
$
714,298,455
$
16,205,702
Core
Equity,
Class
W
325,213,613
131,885
42,743,998
9,523,249
29,771,184
321,895,933
2,366,292
Core
Plus
Bond,
Class
W
431,749,333
27,197,809
28,572,077
(4,352,399)
16,231,051
442,253,717
10,714,853
Dividend
Growth,
Class
R6
324,954,451
4,468,306
52,230,146
12,098,527
31,212,252
320,503,390
1,960,031
Dividend
Value,
Class
R6
313,174,633
22,715,334
35,679,063
2,391,463
27,498,589
330,100,956
2,507,381
Emerging
Markets
Debt,
Class
W
62,723,875
4,609,653
5,643,657
(509,084)
2,878,688
64,059,475
2,044,761
Emerging
Markets
Equity,
Class
W
196,987,361
23,231,242
27,012,640
(1,658,358)
7,588,183
199,135,788
–
Growth
Opportunities
ETF
384,652,744
2,145,485
76,666,433
14,995,502
39,539,021
364,666,319
–
High
Yield,
Class
W
66,088,555
4,471,267
4,493,351
31,520
1,811,737
67,909,728
2,315,613
Inflation
Linked
Bond,
Class
W
78,690,426
12,815,924
4,824,751
(813,596)
1,582,330
87,450,333
1,990,313
International
Bond,
Class
W
69,055,642
5,192,653
6,389,083
(863,262)
4,516,127
71,512,077
–
International
Equity,
Class
W
518,313,061
26,670,603
53,458,660
8,318,474
(14,857,172)
484,986,306
–
International
Opportunities,
Class
W
305,365,115
19,144,903
32,043,323
1,784,639
512,849
294,764,183
–
Large
Cap
Growth,
Class
W
382,880,611
2,170,381
72,424,919
29,916,128
21,699,162
364,241,363
–
Large
Cap
Value,
Class
W
310,295,436
19,533,930
36,978,540
5,749,270
33,339,945
331,940,041
–
Quant
International
Small
Cap
Equity,
Class
W
167,103,330
7,387,719
16,430,461
970,866
548,855
159,580,309
–
Quant
Small
Cap
Equity,
Class
W
73,632,517
494,066
13,990,592
3,098,386
8,790,856
72,025,233
–
Quant
Small/Mid
Cap
Equity,
Class
W
87,569,000
160,588
14,920,383
4,885,819
9,398,782
87,093,806
–
Short
Term
Bond,
Class
W
78,306,402
14,088,709
6,535,990
(265,534)
1,374,130
86,967,717
1,921,123
Nuveen
Real
Property
Fund
LP
a
235,086,540
1,057,636
3,602,728
(1,269,015)
(15,009,867)
216,262,566
20,861,432
$5,108,950,246
$247,243,246
$585,506,007
$76,596,136
$234,364,074
$5,081,647,695
$62,887,501
Issue
Value
at
5/31/24
Purchases
Cost
Sales
Proceeds
Realized
Gain
(Loss)
Change
in
Unrealized
Appreciation
(Depreciation)
Value
at
11/30/24
Dividend
Income
Lifecycle
2040
Nuveen
Funds:
Core
Bond,
Class
W
$
552,415,963
$
58,504,469
$
40,750,366
$
(5,464,697)
$
20,321,799
$
585,027,168
$
13,146,613
Core
Equity,
Class
W
461,744,407
84,227
52,543,997
11,417,534
45,146,381
465,848,552
3,397,195
Core
Plus
Bond,
Class
W
342,320,320
31,993,378
22,189,738
(3,564,658)
13,099,037
361,658,339
8,683,763
Dividend
Growth,
Class
R6
461,986,145
7,174,924
66,728,728
14,219,355
47,976,972
464,628,668
2,811,869
Dividend
Value,
Class
R6
445,626,093
31,324,772
41,843,189
2,241,283
40,874,787
478,223,746
3,616,364
Emerging
Markets
Debt,
Class
W
49,725,346
5,256,701
4,539,837
(222,581)
2,149,293
52,368,922
1,648,278
Emerging
Markets
Equity,
Class
W
279,808,766
34,146,561
34,658,169
(2,157,839)
10,614,508
287,753,827
–
Growth
Opportunities
ETF
546,326,021
3,541,784
100,172,051
19,023,543
59,279,827
527,999,124
–
High
Yield,
Class
W
52,449,357
5,265,307
3,939,403
20,699
1,465,967
55,261,927
1,874,499
International
Bond,
Class
W
54,832,333
6,072,111
5,333,175
(657,009)
3,614,073
58,528,333
–
International
Equity,
Class
W
736,839,292
32,935,841
59,322,153
9,343,191
(18,813,167)
700,983,004
–
International
Opportunities,
Class
W
435,498,994
23,605,830
35,244,045
1,569,984
1,757,549
427,188,312
–
Large
Cap
Growth,
Class
W
545,847,725
6,674,135
98,227,183
37,985,088
36,329,230
528,608,995
–
Large
Cap
Value,
Class
W
442,341,794
26,223,908
44,302,680
6,075,684
50,289,765
480,628,471
–
Quant
International
Small
Cap
Equity,
Class
W
237,687,343
10,423,753
19,757,485
1,092,863
1,073,271
230,519,745
–
Quant
Small
Cap
Equity,
Class
W
104,966,203
886,411
18,680,410
4,076,393
13,065,857
104,314,454
–
Quant
Small/Mid
Cap
Equity,
Class
W
124,831,410
515,252
19,618,018
6,258,664
14,380,176
126,367,484
–
Nuveen
Real
Property
Fund
LP
a
283,260,936
6,867,044
6,242,836
(2,115,853)
(17,546,133)
264,223,158
25,233,977
$6,158,508,448
$291,496,408
$674,093,463
$99,141,644
$325,079,192
$6,200,132,229
$60,412,558
Notes
to
Financial
Statements
(continued)
Issue
Value
at
5/31/24
Purchases
Cost
Sales
Proceeds
Realized
Gain
(Loss)
Change
in
Unrealized
Appreciation
(Depreciation)
Value
at
11/30/24
Dividend
Income
Lifecycle
2045
Nuveen
Funds:
Core
Bond,
Class
W
$
212,389,427
$
34,296,374
$
22,089,499
$
(1,234,924)
$
7,010,514
$
230,371,892
$
5,159,708
Core
Equity,
Class
W
364,705,694
525,534
35,763,333
7,594,089
37,547,388
374,609,372
2,703,395
Core
Plus
Bond,
Class
W
131,513,680
19,896,663
13,004,418
(1,396,587)
5,113,701
142,123,039
3,400,614
Dividend
Growth,
Class
R6
366,911,656
7,567,328
51,674,025
7,537,167
42,015,131
372,357,257
2,231,981
Dividend
Value,
Class
R6
354,423,893
26,781,806
32,253,979
1,365,379
33,147,912
383,465,011
2,871,608
Emerging
Markets
Debt,
Class
W
19,110,596
2,998,187
2,283,288
10,159
746,280
20,581,934
643,373
Emerging
Markets
Equity,
Class
W
222,993,673
31,558,868
29,837,464
(909,133)
7,571,671
231,377,615
–
Growth
Opportunities
ETF
434,268,355
2,223,806
76,333,561
13,934,806
48,529,237
422,622,643
–
High
Yield,
Class
W
20,154,412
3,032,976
1,854,399
10,971
574,749
21,918,709
735,305
International
Bond,
Class
W
21,050,584
3,408,077
2,542,808
(59,769)
1,219,293
23,075,377
–
International
Equity,
Class
W
585,525,433
36,034,749
50,869,115
6,308,891
(13,845,546)
563,154,412
–
International
Opportunities,
Class
W
346,121,880
19,845,023
25,948,420
71,243
2,592,019
342,681,745
–
Large
Cap
Growth,
Class
W
434,446,909
5,638,798
75,695,576
27,180,208
32,241,195
423,811,534
–
Large
Cap
Value,
Class
W
351,934,811
24,310,804
35,956,702
2,866,357
42,162,880
385,318,150
–
Quant
International
Small
Cap
Equity,
Class
W
188,416,941
10,251,104
15,044,021
616,977
1,099,131
185,340,132
–
Quant
Small
Cap
Equity,
Class
W
83,511,581
910,443
14,565,589
3,146,033
10,571,924
83,574,392
–
Quant
Small/Mid
Cap
Equity,
Class
W
99,316,947
401,972
14,419,292
4,298,761
12,206,694
101,805,082
–
Nuveen
Real
Property
Fund
LP
a
204,212,687
8,191,527
6,650,557
(2,401,538)
(11,775,514)
191,576,605
18,206,522
$4,441,009,159
$237,874,039
$506,786,046
$68,939,090
$258,728,659
$4,499,764,901
$35,952,506
Issue
Value
at
5/31/24
Purchases
Cost
Sales
Proceeds
Realized
Gain
(Loss)
Change
in
Unrealized
Appreciation
(Depreciation)
Value
at
11/30/24
Dividend
Income
Lifecycle
2050
Nuveen
Funds:
Core
Bond,
Class
W
$
92,377,656
$
22,239,625
$
15,400,514
$
(62,323)
$
2,654,468
$
101,808,912
$
2,322,831
Core
Equity,
Class
W
301,269,264
980,068
25,494,443
5,333,728
32,351,941
314,440,558
2,250,856
Core
Plus
Bond,
Class
W
57,279,443
12,529,785
8,259,100
(177,391)
1,840,717
63,213,454
1,532,467
Dividend
Growth,
Class
R6
302,943,434
5,670,240
36,746,768
4,390,963
36,906,048
313,163,917
1,858,703
Dividend
Value,
Class
R6
291,835,182
23,919,470
22,030,133
759,534
28,129,407
322,613,460
2,397,581
Emerging
Markets
Debt,
Class
W
8,319,149
1,918,987
1,481,733
9,780
331,621
9,097,804
290,877
Emerging
Markets
Equity,
Class
W
183,636,680
29,185,082
24,258,780
(1,124,189)
6,609,533
194,048,326
–
Growth
Opportunities
ETF
357,298,670
3,300,575
57,240,986
9,850,420
42,113,212
355,321,891
–
High
Yield,
Class
W
8,742,392
1,833,893
1,087,287
7,647
257,287
9,753,932
330,824
International
Bond,
Class
W
9,135,013
2,193,552
1,662,319
13,214
506,478
10,185,938
–
International
Equity,
Class
W
483,871,786
32,267,749
37,606,598
2,820,615
(9,219,039)
472,134,513
–
International
Opportunities,
Class
W
285,730,721
20,126,727
20,714,540
(569,330)
2,832,892
287,406,470
–
Large
Cap
Growth,
Class
W
359,626,037
5,664,509
58,247,625
16,391,144
33,188,495
356,622,560
–
Large
Cap
Value,
Class
W
290,691,920
23,464,477
27,670,280
1,383,443
36,315,459
324,185,019
–
Quant
International
Small
Cap
Equity,
Class
W
155,838,095
9,430,705
11,091,462
324,175
1,086,299
155,587,812
–
Quant
Small
Cap
Equity,
Class
W
68,978,896
644,202
10,832,898
2,302,214
9,218,781
70,311,195
–
Quant
Small/Mid
Cap
Equity,
Class
W
82,040,817
444,792
10,801,621
2,806,766
11,055,206
85,545,960
–
Nuveen
Real
Property
Fund
LP
a
160,945,252
9,648,415
5,984,309
(2,287,212)
(8,893,651)
153,428,495
14,397,247
$3,500,560,407
$205,462,853
$376,611,396
$42,173,198
$227,285,154
$3,598,870,216
$25,381,386
Issue
Value
at
5/31/24
Purchases
Cost
Sales
Proceeds
Realized
Gain
(Loss)
Change
in
Unrealized
Appreciation
(Depreciation)
Value
at
11/30/24
Dividend
Income
Lifecycle
2055
Nuveen
Funds:
Core
Bond,
Class
W
$
35,142,441
$
12,803,522
$
8,203,256
$
(17,432)
$
1,029,922
$
40,755,197
$
919,850
Core
Equity,
Class
W
153,773,771
3,360,061
10,884,603
1,150,753
18,393,953
165,793,935
1,162,311
Core
Plus
Bond,
Class
W
21,768,666
7,347,331
4,440,857
(15,957)
668,648
25,327,831
607,989
Dividend
Growth,
Class
R6
154,847,847
8,090,317
18,228,698
1,354,935
20,095,584
166,159,985
959,759
Dividend
Value,
Class
R6
148,418,726
14,454,865
8,846,310
249,744
14,804,820
169,081,845
1,237,100
Emerging
Markets
Debt,
Class
W
3,161,134
934,084
578,691
2,533
133,299
3,652,359
114,433
Emerging
Markets
Equity,
Class
W
93,951,862
17,620,617
11,998,648
(584,837)
3,324,579
102,313,573
–
Growth
Opportunities
ETF
182,373,349
2,447,006
25,203,965
4,082,759
22,720,412
186,419,561
–
High
Yield,
Class
W
3,337,260
1,157,274
739,895
3,860
100,989
3,859,488
131,661
International
Bond,
Class
W
3,470,825
1,299,229
908,600
5,472
199,283
4,066,209
–
International
Equity,
Class
W
246,921,357
22,692,329
17,273,304
648,331
(4,011,880)
248,976,833
–
International
Opportunities,
Class
W
145,891,467
13,075,521
9,108,030
(301,840)
1,531,262
151,088,380
–
Large
Cap
Growth,
Class
W
183,410,530
5,315,367
26,391,262
4,829,630
20,854,605
188,018,870
–
Large
Cap
Value,
Class
W
148,404,416
14,126,675
12,300,246
459,121
19,206,233
169,896,199
–
Quant
International
Small
Cap
Equity,
Class
W
79,520,416
6,552,775
4,557,397
(17,727)
734,288
82,232,355
–
Quant
Small
Cap
Equity,
Class
W
35,215,143
935,079
5,193,887
761,096
5,228,859
36,946,290
–
Quant
Small/Mid
Cap
Equity,
Class
W
41,876,006
843,947
5,174,000
1,017,785
6,185,841
44,749,579
–
Nuveen
Real
Property
Fund
LP
a
81,032,584
6,861,997
2,711,971
(1,066,409)
(4,557,774)
79,558,427
7,277,530
$1,762,517,800
$139,917,996
$172,743,620
$12,561,817
$126,642,923
$1,868,896,916
$12,410,633
Issue
Value
at
5/31/24
Purchases
Cost
Sales
Proceeds
Realized
Gain
(Loss)
Change
in
Unrealized
Appreciation
(Depreciation)
Value
at
11/30/24
Dividend
Income
Lifecycle
2060
Nuveen
Funds:
Core
Bond,
Class
W
$
9,842,758
$
5,680,468
$
3,019,550
$
(11,035)
$
301,157
$
12,793,798
$
280,968
Core
Equity,
Class
W
64,809,478
5,190,062
3,693,035
17,934
8,573,095
74,897,534
501,203
Core
Plus
Bond,
Class
W
6,101,307
3,253,797
1,602,558
(5,451)
195,075
7,942,170
185,822
Dividend
Growth,
Class
R6
65,642,739
7,551,346
7,477,141
251,449
9,077,695
75,046,088
415,795
Dividend
Value,
Class
R6
62,278,337
9,876,884
2,484,332
(19,746)
6,632,375
76,283,518
534,914
Emerging
Markets
Debt,
Class
W
884,897
429,650
185,868
460
41,880
1,171,019
34,016
Emerging
Markets
Equity,
Class
W
39,693,845
9,278,413
3,870,585
(241,921)
1,342,812
46,202,564
–
Growth
Opportunities
ETF
76,825,131
2,734,126
7,314,206
904,200
10,683,962
83,833,213
–
High
Yield,
Class
W
931,342
489,380
225,696
1,167
31,347
1,227,540
40,398
International
Bond,
Class
W
973,181
554,353
297,070
1,576
60,995
1,293,035
–
International
Equity,
Class
W
103,807,630
15,213,773
5,456,792
19,410
(1,512,326)
112,071,695
–
International
Opportunities,
Class
W
61,606,835
9,251,683
3,475,904
(160,738)
725,323
67,947,199
–
Large
Cap
Growth,
Class
W
77,237,417
5,645,405
9,227,370
583,092
10,599,801
84,838,345
–
Large
Cap
Value,
Class
W
62,555,817
10,117,747
4,547,614
38,350
8,620,670
76,784,970
–
Quant
International
Small
Cap
Equity,
Class
W
33,552,681
4,296,890
1,067,437
(9,702)
289,627
37,062,059
–
Quant
Small
Cap
Equity,
Class
W
14,843,832
1,046,803
1,850,192
82,941
2,560,702
16,684,086
–
Quant
Small/Mid
Cap
Equity,
Class
W
17,649,286
910,464
1,573,702
116,748
3,073,084
20,175,880
–
Nuveen
Real
Property
Fund
LP
a
33,695,865
4,827,167
763,035
(338,992)
(1,984,171)
35,436,834
3,046,833
$732,932,378
$96,348,411
$58,132,087
$1,229,742
$59,313,103
$831,691,547
$5,039,949
Notes
to
Financial
Statements
(continued)
9.
Inter-Fund
Lending
Program
Pursuant
to
an
exemptive
order
issued
by
the
SEC,
the
Funds may
participate
in
an
inter-fund
lending
program.
This
program
allows
the
Funds to
lend
cash
to
and/or
borrow
cash
from
certain
other
affiliated
Funds for
temporary
purposes,
(e.g.,
to
satisfy
redemption
requests
or
to
cover
unanticipated
cash
shortfalls).
The
program
is
subject
to
a
number
of
conditions,
including
the
requirement
that
no
Fund may
borrow
or
lend
money
under
the
program
unless
it
receives
a
more
favorable
interest
rate
than
is
available
from
a
bank
or
other
financial
institution
for
a
comparable
transaction.
In
addition,
a
Fund may
participate
in
the
program
only
if
its
participation
is
consistent
with
the
Fund’s investment
policies
and
limitations
and
authorized
by
its
portfolio
manager(s).
During the current
fiscal
period,
there
were
no
inter-fund
borrowing
or
lending
transactions.
10.
Line
of
Credit
The Funds
participated
in
a
$1
billion unsecured
revolving
credit
facility
that
could
be
used
for
temporary
purposes,
including,
without
limitation,
the
funding
of
shareholder
redemptions.
The
facility
was
entered
into
on
June
13,
2023,
and
expired
on
June
11,
2024.
Certain
affiliated
accounts,
each
of
which
is
managed
by the
Adviser,
or
an
affiliate
of
the
Adviser, also
participated
in
this
facility.
An
annual
commitment
fee
for
the
credit
facility
was
borne
by
the
participating
accounts
on
a
pro
rata
basis.
Interest
associated
with
any
borrowing
under
the
facility
was
charged
to
the
borrowing
accounts
at
a
specified
rate
of
interest.
The Funds were
not
liable
for
borrowings
under
the
facility
by
other
affiliated
accounts.
There
were
no
borrowings
under
this
credit
facility
by
the
Funds during
the
current fiscal
period.
During
June
2024,
the
Funds,
along
with
certain
funds
managed
by
the
Adviser
or
by
an
affiliate
of
the
Adviser (“Participating
Funds”),
have
established
a
364-day,
$2.700
billion
standby
credit
facility
with
a
group
of
lenders,
under
which
the
Participating
Funds
may
borrow
for
temporary
purposes
(other
than
on-going
leveraging
for
investment
purposes),
and
replaces
the
previous
facility.
Each
Participating
Fund
is
allocated
a
designated
proportion
of
the
facility’s
capacity
(and
its
associated
costs,
as
described
below)
based
upon
a
multi-factor
assessment
of
the
likelihood
and
frequency
of
its
need
to
draw
on
the
facility,
the
size
of
the
Fund
and
its
anticipated
draws,
and
the
potential
importance
of
such
draws
to
the
operations
and
well-being
of
the
Fund,
relative
to
those
of
the
other
Funds.
A
Fund
may
effect
draws
on
the
facility
in
excess
of
its
designated
capacity
if
and
to
the
extent
that
other
Participating
Funds
have
undrawn
capacity.
The
credit
facility
expires
in
June
2025.
The
credit
facility
has
the
following
terms:
0.15%
per
annum
on
unused
commitment
amounts
and
a
drawn
interest
rate
equal
to
the
higher
of
(a)
OBFR
(Overnight
Bank
Funding
Rate)
plus
1.20%
per
annum
or
(b)
the
Fed
Funds
Effective
Rate
plus
1.20%
per
annum
on
amounts
borrowed. Interest
expense
incurred
by
the
Participating
Funds,
when
applicable,
is
recognized
as
a
component
of
“Interest
expense”
on
the
Statement
of
Operations.
Participating
Funds
paid
administration,
legal
and
arrangement
fees,
which
are
recognized
as
a
component
of
“Interest
expense”
on
the
Statement
of
Operations,
and
along
with
commitment
fees,
have
been
allocated
among
such
Participating
Funds
based
upon
the
relative
proportions
of
the
facility’s
aggregate
capacity
reserved
for
them
and
other
factors
deemed
relevant
by
the
Adviser
and
the
Board
of
each
Participating
Fund.
Issue
Value
at
5/31/24
Purchases
Cost
Sales
Proceeds
Realized
Gain
(Loss)
Change
in
Unrealized
Appreciation
(Depreciation)
Value
at
11/30/24
Dividend
Income
Lifecycle
2065
Nuveen
Funds:
Core
Bond,
Class
W
$
635,532
$
1,126,094
$
736,361
$
(685)
$
23,404
$
1,047,984
$
22,086
Core
Equity,
Class
W
8,100,722
2,610,591
1,230,575
7,782
1,149,285
10,637,805
65,259
Core
Plus
Bond,
Class
W
393,646
662,787
422,185
3
15,040
649,291
14,673
Dividend
Growth,
Class
R6
8,169,619
2,701,540
1,449,812
16,381
1,229,125
10,666,853
54,116
Dividend
Value,
Class
R6
7,788,700
3,425,406
1,261,445
4,044
904,589
10,861,294
69,817
Emerging
Markets
Debt,
Class
W
57,126
89,720
56,290
309
3,435
94,300
2,528
Emerging
Markets
Equity,
Class
W
4,988,599
2,326,067
832,408
(4,326)
115,498
6,593,430
–
Growth
Opportunities
ETF
9,615,927
1,821,365
1,019,948
17,206
1,494,101
11,928,651
–
High
Yield,
Class
W
60,318
93,319
57,169
319
2,421
99,208
3,194
International
Bond,
Class
W
62,630
110,571
73,767
240
4,617
104,291
–
International
Equity,
Class
W
12,932,219
5,292,166
2,015,382
(16,372)
(181,295)
16,011,336
–
International
Opportunities,
Class
W
7,693,778
3,213,128
1,319,348
(11,744)
78,264
9,654,078
–
Large
Cap
Growth,
Class
W
9,655,831
3,469,746
2,546,775
1,380
1,469,570
12,049,752
–
Large
Cap
Value,
Class
W
7,822,425
3,079,313
1,181,092
4,928
1,178,915
10,904,489
–
Quant
International
Small
Cap
Equity,
Class
W
4,196,524
1,651,610
610,220
(455)
41,471
5,278,930
–
Quant
Small
Cap
Equity,
Class
W
1,856,160
489,285
344,050
2,608
360,729
2,364,732
–
Quant
Small/Mid
Cap
Equity,
Class
W
2,206,131
562,055
355,848
5,194
437,716
2,855,248
–
Nuveen
Real
Property
Fund
LP
a
4,155,605
1,349,839
258,049
(105,159)
(179,172)
4,963,064
381,455
$90,391,492
$34,074,602
$15,770,724
$(78,347)
$8,147,713
$116,764,736
$613,128
a
Restricted
security
There
were
no
borrowings
under
this
credit
facility
by
the
Funds
during
the
current
fiscal
period.
Item
7.
Financial
Statements
and
Financial
Highlights
for
Open-
End
Management
Investment
Companies
Lifecycle
Index
Retirement
Income
Portfolio
of
Investments
November
30,
2024
See
Notes
to
Financial
Statements
(Unaudited)
SHARES
DESCRIPTION
VALUE
AFFILIATED
INVESTMENT
COMPANIES—99.8%(a)
FIXED
INCOME—39.6%
28,628,239
Nuveen
Bond
Index
Fund,
Class
W
$
277,121,355
TOTAL
FIXED
INCOME
277,121,355
INFLATION-PROTECTED
ASSETS—9.9%
6,492,833
Nuveen
Inflation
Linked
Bond
Fund,
Class
W
69,018,813
TOTAL
INFLATION-PROTECTED
ASSETS
69,018,813
INTERNATIONAL
EQUITY—13.7%
2,718,618
Nuveen
Emerging
Markets
Equity
Index
Fund,
Class
W
30,502,893
2,801,143
Nuveen
International
Equity
Index
Fund,
Class
W
65,462,705
TOTAL
INTERNATIONAL
EQUITY
95,965,598
SHORT-TERM
FIXED
INCOME—9.8%
7,145,662
Nuveen
Short
Term
Bond
Index
Fund,
Class
W
68,741,273
TOTAL
SHORT-TERM
FIXED
INCOME
68,741,273
U.S.
EQUITY—26.8%
4,353,640
Nuveen
Equity
Index
Fund,
Class
W
187,206,510
TOTAL
U.S.
EQUITY
187,206,510
TOTAL
AFFILIATED
INVESTMENT
COMPANIES
(Cost
$573,843,754)
698,053,549
PRINCIPAL
DESCRIPTION
RATE
MATURITY
VALUE
SHORT-TERM
INVESTMENTS—0.0%
REPURCHASE
AGREEMENT—0.0%
$280,000
(b)
Fixed
Income
Clearing
Corporation
4
.580
%
12/02/24
280,000
TOTAL
REPURCHASE
AGREEMENT
280,000
TOTAL
SHORT-TERM
INVESTMENTS
(Cost
$280,000)
280,000
TOTAL
INVESTMENTS—99.8%
(Cost
$574,123,754)
698,333,549
OTHER
ASSETS
&
LIABILITIES,
NET—0.2%
1,652,592
NET
ASSETS—100.0%
$
699,986,141
(a)
Affiliated
fund.
(b)
Agreement
with
Fixed
Income
Clearing
Corporation,
4.580%
dated
11/29/24
to
be
repurchased
at
$280,107
on
12/2/24,
collateralized
by
Government
Agency
Securities,
with
coupon
rate
0.000%
and
maturity
date
11/28/25,
valued
at
$285,643.
Portfolio
of
Investments
November
30,
2024
See
Notes
to
Financial
Statements
(Unaudited)
SHARES
DESCRIPTION
VALUE
AFFILIATED
INVESTMENT
COMPANIES—99.8%(a)
FIXED
INCOME—39.7%
27,029,516
Nuveen
Bond
Index
Fund,
Class
W
$
261,645,712
TOTAL
FIXED
INCOME
261,645,712
INFLATION-PROTECTED
ASSETS—9.9%
6,131,989
Nuveen
Inflation
Linked
Bond
Fund,
Class
W
65,183,048
TOTAL
INFLATION-PROTECTED
ASSETS
65,183,048
INTERNATIONAL
EQUITY—12.3%
2,292,254
Nuveen
Emerging
Markets
Equity
Index
Fund,
Class
W
25,719,091
2,361,968
Nuveen
International
Equity
Index
Fund,
Class
W
55,199,195
TOTAL
INTERNATIONAL
EQUITY
80,918,286
SHORT-TERM
FIXED
INCOME—14.1%
9,704,921
Nuveen
Short
Term
Bond
Index
Fund,
Class
W
93,361,340
TOTAL
SHORT-TERM
FIXED
INCOME
93,361,340
U.S.
EQUITY—23.8%
3,657,061
Nuveen
Equity
Index
Fund,
Class
W
157,253,629
TOTAL
U.S.
EQUITY
157,253,629
TOTAL
AFFILIATED
INVESTMENT
COMPANIES
(Cost
$531,780,742)
658,362,015
PRINCIPAL
DESCRIPTION
RATE
MATURITY
VALUE
SHORT-TERM
INVESTMENTS—0.3%
REPURCHASE
AGREEMENT—0.3%
$1,680,000
(b)
Fixed
Income
Clearing
Corporation
4
.580
%
12/02/24
1,680,000
TOTAL
REPURCHASE
AGREEMENT
1,680,000
TOTAL
SHORT-TERM
INVESTMENTS
(Cost
$1,680,000)
1,680,000
TOTAL
INVESTMENTS—100.1%
(Cost
$533,460,742)
660,042,015
OTHER
ASSETS
&
LIABILITIES,
NET—(0.1)%
(
759,971
)
NET
ASSETS—100.0%
$
659,282,044
(a)
Affiliated
fund.
(b)
Agreement
with
Fixed
Income
Clearing
Corporation,
4.580%
dated
11/29/24
to
be
repurchased
at
$1,680,641
on
12/2/24,
collateralized
by
Government
Agency
Securities,
with
coupon
rate
0.125%
and
maturity
date
10/15/25,
valued
at
$1,713,667.
Portfolio
of
Investments
November
30,
2024
See
Notes
to
Financial
Statements
(Unaudited)
SHARES
DESCRIPTION
VALUE
AFFILIATED
INVESTMENT
COMPANIES—99.9%(a)
FIXED
INCOME—39.5%
43,257,893
Nuveen
Bond
Index
Fund,
Class
W
$
418,736,406
TOTAL
FIXED
INCOME
418,736,406
INFLATION-PROTECTED
ASSETS—9.6%
9,589,085
Nuveen
Inflation
Linked
Bond
Fund,
Class
W
101,931,969
TOTAL
INFLATION-PROTECTED
ASSETS
101,931,969
INTERNATIONAL
EQUITY—14.0%
4,185,443
Nuveen
Emerging
Markets
Equity
Index
Fund,
Class
W
46,960,670
4,314,113
Nuveen
International
Equity
Index
Fund,
Class
W
100,820,820
TOTAL
INTERNATIONAL
EQUITY
147,781,490
SHORT-TERM
FIXED
INCOME—9.6%
10,554,012
Nuveen
Short
Term
Bond
Index
Fund,
Class
W
101,529,597
TOTAL
SHORT-TERM
FIXED
INCOME
101,529,597
U.S.
EQUITY—27.2%
6,702,003
Nuveen
Equity
Index
Fund,
Class
W
288,186,121
TOTAL
U.S.
EQUITY
288,186,121
TOTAL
AFFILIATED
INVESTMENT
COMPANIES
(Cost
$824,416,319)
1,058,165,583
PRINCIPAL
DESCRIPTION
RATE
MATURITY
VALUE
SHORT-TERM
INVESTMENTS—0.1%
REPURCHASE
AGREEMENT—0.1%
$750,000
(b)
Fixed
Income
Clearing
Corporation
4
.580
%
12/02/24
750,000
TOTAL
REPURCHASE
AGREEMENT
750,000
TOTAL
SHORT-TERM
INVESTMENTS
(Cost
$750,000)
750,000
TOTAL
INVESTMENTS—100.0%
(Cost
$825,166,319)
1,058,915,583
OTHER
ASSETS
&
LIABILITIES,
NET—0.0%
462,839
NET
ASSETS—100.0%
$
1,059,378,422
(a)
Affiliated
fund.
(b)
Agreement
with
Fixed
Income
Clearing
Corporation,
4.580%
dated
11/29/24
to
be
repurchased
at
$750,286
on
12/2/24,
collateralized
by
Government
Agency
Securities,
with
coupon
rate
0.125%
and
maturity
date
10/15/25,
valued
at
$765,227.
Portfolio
of
Investments
November
30,
2024
See
Notes
to
Financial
Statements
(Unaudited)
SHARES
DESCRIPTION
VALUE
AFFILIATED
INVESTMENT
COMPANIES—99.9%(a)
FIXED
INCOME—38.5%
123,882,771
Nuveen
Bond
Index
Fund,
Class
W
$
1,199,185,221
TOTAL
FIXED
INCOME
1,199,185,221
INFLATION-PROTECTED
ASSETS—7.6%
22,392,079
Nuveen
Inflation
Linked
Bond
Fund,
Class
W
238,027,800
TOTAL
INFLATION-PROTECTED
ASSETS
238,027,800
INTERNATIONAL
EQUITY—15.7%
13,827,873
Nuveen
Emerging
Markets
Equity
Index
Fund,
Class
W
155,148,732
14,235,387
Nuveen
International
Equity
Index
Fund,
Class
W
332,680,989
TOTAL
INTERNATIONAL
EQUITY
487,829,721
SHORT-TERM
FIXED
INCOME—7.6%
24,648,645
Nuveen
Short
Term
Bond
Index
Fund,
Class
W
237,119,964
TOTAL
SHORT-TERM
FIXED
INCOME
237,119,964
U.S.
EQUITY—30.5%
22,098,328
Nuveen
Equity
Index
Fund,
Class
W
950,228,112
TOTAL
U.S.
EQUITY
950,228,112
TOTAL
AFFILIATED
INVESTMENT
COMPANIES
(Cost
$2,414,076,581)
3,112,390,818
PRINCIPAL
DESCRIPTION
RATE
MATURITY
VALUE
SHORT-TERM
INVESTMENTS—0.1%
REPURCHASE
AGREEMENT—0.1%
$4,510,000
(b)
Fixed
Income
Clearing
Corporation
4
.580
%
12/02/24
4,510,000
TOTAL
REPURCHASE
AGREEMENT
4,510,000
TOTAL
SHORT-TERM
INVESTMENTS
(Cost
$4,510,000)
4,510,000
TOTAL
INVESTMENTS—100.0%
(Cost
$2,418,586,581)
3,116,900,818
OTHER
ASSETS
&
LIABILITIES,
NET—(0.0)%
(
769,543
)
NET
ASSETS—100.0%
$
3,116,131,275
(a)
Affiliated
fund.
(b)
Agreement
with
Fixed
Income
Clearing
Corporation,
4.580%
dated
11/29/24
to
be
repurchased
at
$4,511,721
on
12/2/24,
collateralized
by
Government
Agency
Securities,
with
coupon
rate
0.000%
and
maturity
date
11/28/25,
valued
at
$4,600,244.
Portfolio
of
Investments
November
30,
2024
See
Notes
to
Financial
Statements
(Unaudited)
SHARES
DESCRIPTION
VALUE
AFFILIATED
INVESTMENT
COMPANIES—99.8%(a)
FIXED
INCOME—37.1%
237,236,459
Nuveen
Bond
Index
Fund,
Class
W
$
2,296,448,921
TOTAL
FIXED
INCOME
2,296,448,921
INFLATION-PROTECTED
ASSETS—5.6%
32,968,612
Nuveen
Inflation
Linked
Bond
Fund,
Class
W
350,456,341
TOTAL
INFLATION-PROTECTED
ASSETS
350,456,341
INTERNATIONAL
EQUITY—17.4%
30,644,122
Nuveen
Emerging
Markets
Equity
Index
Fund,
Class
W
343,827,051
31,574,663
Nuveen
International
Equity
Index
Fund,
Class
W
737,899,874
TOTAL
INTERNATIONAL
EQUITY
1,081,726,925
SHORT-TERM
FIXED
INCOME—5.6%
36,282,581
Nuveen
Short
Term
Bond
Index
Fund,
Class
W
349,038,426
TOTAL
SHORT-TERM
FIXED
INCOME
349,038,426
U.S.
EQUITY—34.1%
49,082,926
Nuveen
Equity
Index
Fund,
Class
W
2,110,565,834
TOTAL
U.S.
EQUITY
2,110,565,834
TOTAL
AFFILIATED
INVESTMENT
COMPANIES
(Cost
$4,785,478,516)
6,188,236,447
PRINCIPAL
DESCRIPTION
RATE
MATURITY
VALUE
SHORT-TERM
INVESTMENTS—0.1%
REPURCHASE
AGREEMENT—0.1%
$4,190,000
(b)
Fixed
Income
Clearing
Corporation
4
.580
%
12/02/24
4,190,000
TOTAL
REPURCHASE
AGREEMENT
4,190,000
TOTAL
SHORT-TERM
INVESTMENTS
(Cost
$4,190,000)
4,190,000
TOTAL
INVESTMENTS—99.9%
(Cost
$4,789,668,516)
6,192,426,447
OTHER
ASSETS
&
LIABILITIES,
NET—0.1%
3,362,532
NET
ASSETS—100.0%
$
6,195,788,979
(a)
Affiliated
fund.
(b)
Agreement
with
Fixed
Income
Clearing
Corporation,
4.580%
dated
11/29/24
to
be
repurchased
at
$4,191,599
on
12/2/24,
collateralized
by
Government
Agency
Securities,
with
coupon
rate
0.000%
and
maturity
date
11/28/25,
valued
at
$4,273,959.
Portfolio
of
Investments
November
30,
2024
See
Notes
to
Financial
Statements
(Unaudited)
SHARES
DESCRIPTION
VALUE
AFFILIATED
INVESTMENT
COMPANIES—99.9%(a)
FIXED
INCOME—33.0%
297,253,908
Nuveen
Bond
Index
Fund,
Class
W
$
2,877,417,834
TOTAL
FIXED
INCOME
2,877,417,834
INFLATION-PROTECTED
ASSETS—3.7%
30,153,648
Nuveen
Inflation
Linked
Bond
Fund,
Class
W
320,533,281
TOTAL
INFLATION-PROTECTED
ASSETS
320,533,281
INTERNATIONAL
EQUITY—20.2%
49,705,944
Nuveen
Emerging
Markets
Equity
Index
Fund,
Class
W
557,700,689
51,263,622
Nuveen
International
Equity
Index
Fund,
Class
W
1,198,030,838
TOTAL
INTERNATIONAL
EQUITY
1,755,731,527
SHORT-TERM
FIXED
INCOME—3.7%
33,183,598
Nuveen
Short
Term
Bond
Index
Fund,
Class
W
319,226,216
TOTAL
SHORT-TERM
FIXED
INCOME
319,226,216
U.S.
EQUITY—39.3%
79,621,700
Nuveen
Equity
Index
Fund,
Class
W
3,423,733,094
TOTAL
U.S.
EQUITY
3,423,733,094
TOTAL
AFFILIATED
INVESTMENT
COMPANIES
(Cost
$6,498,743,653)
8,696,641,952
PRINCIPAL
DESCRIPTION
RATE
MATURITY
VALUE
SHORT-TERM
INVESTMENTS—0.1%
REPURCHASE
AGREEMENT—0.1%
$10,010,000
(b)
Fixed
Income
Clearing
Corporation
4
.580
%
12/02/24
10,010,000
TOTAL
REPURCHASE
AGREEMENT
10,010,000
TOTAL
SHORT-TERM
INVESTMENTS
(Cost
$10,010,000)
10,010,000
TOTAL
INVESTMENTS—100.0%
(Cost
$6,508,753,653)
8,706,651,952
OTHER
ASSETS
&
LIABILITIES,
NET—0.0%
622,409
NET
ASSETS—100.0%
$
8,707,274,361
(a)
Affiliated
fund.
(b)
Agreement
with
Fixed
Income
Clearing
Corporation,
4.580%
dated
11/29/24
to
be
repurchased
at
$10,013,820
on
12/2/24,
collateralized
by
Government
Agency
Securities,
with
coupon
rate
0.000%
and
maturity
date
11/28/25,
valued
at
$10,210,255.
Portfolio
of
Investments
November
30,
2024
See
Notes
to
Financial
Statements
(Unaudited)
SHARES
DESCRIPTION
VALUE
AFFILIATED
INVESTMENT
COMPANIES—99.9%(a)
FIXED
INCOME—28.6%
275,282,913
Nuveen
Bond
Index
Fund,
Class
W
$
2,664,738,594
TOTAL
FIXED
INCOME
2,664,738,594
INFLATION-PROTECTED
ASSETS—1.7%
15,028,578
Nuveen
Inflation
Linked
Bond
Fund,
Class
W
159,753,781
TOTAL
INFLATION-PROTECTED
ASSETS
159,753,781
INTERNATIONAL
EQUITY—23.0%
60,861,536
Nuveen
Emerging
Markets
Equity
Index
Fund,
Class
W
682,866,429
62,740,719
Nuveen
International
Equity
Index
Fund,
Class
W
1,466,250,602
TOTAL
INTERNATIONAL
EQUITY
2,149,117,031
SHORT-TERM
FIXED
INCOME—1.7%
16,543,673
Nuveen
Short
Term
Bond
Index
Fund,
Class
W
159,150,131
TOTAL
SHORT-TERM
FIXED
INCOME
159,150,131
U.S.
EQUITY—44.9%
97,550,774
Nuveen
Equity
Index
Fund,
Class
W
4,194,683,301
TOTAL
U.S.
EQUITY
4,194,683,301
TOTAL
AFFILIATED
INVESTMENT
COMPANIES
(Cost
$6,696,213,732)
9,327,442,838
PRINCIPAL
DESCRIPTION
RATE
MATURITY
VALUE
SHORT-TERM
INVESTMENTS—0.1%
REPURCHASE
AGREEMENT—0.1%
$8,940,000
(b)
Fixed
Income
Clearing
Corporation
4
.580
%
12/02/24
8,940,000
TOTAL
REPURCHASE
AGREEMENT
8,940,000
TOTAL
SHORT-TERM
INVESTMENTS
(Cost
$8,940,000)
8,940,000
TOTAL
INVESTMENTS—100.0%
(Cost
$6,705,153,732)
9,336,382,838
OTHER
ASSETS
&
LIABILITIES,
NET—0.0%
1,409,901
NET
ASSETS—100.0%
$
9,337,792,739
(a)
Affiliated
fund.
(b)
Agreement
with
Fixed
Income
Clearing
Corporation,
4.580%
dated
11/29/24
to
be
repurchased
at
$8,943,412
on
12/2/24,
collateralized
by
Government
Agency
Securities,
with
coupon
rate
0.000%
and
maturity
date
11/28/25,
valued
at
$9,118,820.
Portfolio
of
Investments
November
30,
2024
See
Notes
to
Financial
Statements
(Unaudited)
SHARES
DESCRIPTION
VALUE
AFFILIATED
INVESTMENT
COMPANIES—99.9%(a)
FIXED
INCOME—20.6%
209,987,625
Nuveen
Bond
Index
Fund,
Class
W
$
2,032,680,206
TOTAL
FIXED
INCOME
2,032,680,206
INTERNATIONAL
EQUITY—26.9%
75,083,552
Nuveen
Emerging
Markets
Equity
Index
Fund,
Class
W
842,437,452
77,371,758
Nuveen
International
Equity
Index
Fund,
Class
W
1,808,177,982
TOTAL
INTERNATIONAL
EQUITY
2,650,615,434
U.S.
EQUITY—52.4%
120,260,296
Nuveen
Equity
Index
Fund,
Class
W
5,171,192,747
TOTAL
U.S.
EQUITY
5,171,192,747
TOTAL
AFFILIATED
INVESTMENT
COMPANIES
(Cost
$6,615,213,350)
9,854,488,387
PRINCIPAL
DESCRIPTION
RATE
MATURITY
VALUE
SHORT-TERM
INVESTMENTS—0.1%
REPURCHASE
AGREEMENT—0.1%
$12,210,000
(b)
Fixed
Income
Clearing
Corporation
4
.580
%
12/02/24
12,210,000
TOTAL
REPURCHASE
AGREEMENT
12,210,000
TOTAL
SHORT-TERM
INVESTMENTS
(Cost
$12,210,000)
12,210,000
TOTAL
INVESTMENTS—100.0%
(Cost
$6,627,423,350)
9,866,698,387
OTHER
ASSETS
&
LIABILITIES,
NET—0.0%
1,816,076
NET
ASSETS—100.0%
$
9,868,514,463
(a)
Affiliated
fund.
(b)
Agreement
with
Fixed
Income
Clearing
Corporation,
4.580%
dated
11/29/24
to
be
repurchased
at
$12,214,660
on
12/2/24,
collateralized
by
Government
Agency
Securities,
with
coupon
rate
0.000%
and
maturity
date
11/28/25,
valued
at
$12,454,374.
Portfolio
of
Investments
November
30,
2024
See
Notes
to
Financial
Statements
(Unaudited)
SHARES
DESCRIPTION
VALUE
AFFILIATED
INVESTMENT
COMPANIES—99.8%(a)
FIXED
INCOME—13.2%
114,481,763
Nuveen
Bond
Index
Fund,
Class
W
$
1,108,183,464
TOTAL
FIXED
INCOME
1,108,183,464
INTERNATIONAL
EQUITY—29.3%
69,682,229
Nuveen
Emerging
Markets
Equity
Index
Fund,
Class
W
781,834,614
71,781,445
Nuveen
International
Equity
Index
Fund,
Class
W
1,677,532,379
TOTAL
INTERNATIONAL
EQUITY
2,459,366,993
U.S.
EQUITY—57.3%
111,650,823
Nuveen
Equity
Index
Fund,
Class
W
4,800,985,377
TOTAL
U.S.
EQUITY
4,800,985,377
TOTAL
AFFILIATED
INVESTMENT
COMPANIES
(Cost
$5,648,504,765)
8,368,535,834
PRINCIPAL
DESCRIPTION
RATE
MATURITY
VALUE
SHORT-TERM
INVESTMENTS—0.1%
REPURCHASE
AGREEMENT—0.1%
$8,440,000
(b)
Fixed
Income
Clearing
Corporation
4
.580
%
12/02/24
8,440,000
TOTAL
REPURCHASE
AGREEMENT
8,440,000
TOTAL
SHORT-TERM
INVESTMENTS
(Cost
$8,440,000)
8,440,000
TOTAL
INVESTMENTS—99.9%
(Cost
$5,656,944,765)
8,376,975,834
OTHER
ASSETS
&
LIABILITIES,
NET—0.1%
5,013,635
NET
ASSETS—100.0%
$
8,381,989,469
(a)
Affiliated
fund.
(b)
Agreement
with
Fixed
Income
Clearing
Corporation,
4.580%
dated
11/29/24
to
be
repurchased
at
$8,443,221
on
12/2/24,
collateralized
by
Government
Agency
Securities,
with
coupon
rate
0.000%
and
maturity
date
11/28/25,
valued
at
$8,608,976.
Portfolio
of
Investments
November
30,
2024
See
Notes
to
Financial
Statements
(Unaudited)
SHARES
DESCRIPTION
VALUE
AFFILIATED
INVESTMENT
COMPANIES—99.9%(a)
FIXED
INCOME—9.7%
71,155,797
Nuveen
Bond
Index
Fund,
Class
W
$
688,788,113
TOTAL
FIXED
INCOME
688,788,113
INTERNATIONAL
EQUITY—30.6%
61,954,017
Nuveen
Emerging
Markets
Equity
Index
Fund,
Class
W
695,124,069
63,726,404
Nuveen
International
Equity
Index
Fund,
Class
W
1,489,286,056
TOTAL
INTERNATIONAL
EQUITY
2,184,410,125
U.S.
EQUITY—59.6%
99,093,946
Nuveen
Equity
Index
Fund,
Class
W
4,261,039,675
TOTAL
U.S.
EQUITY
4,261,039,675
TOTAL
AFFILIATED
INVESTMENT
COMPANIES
(Cost
$4,826,416,776)
7,134,237,913
PRINCIPAL
DESCRIPTION
RATE
MATURITY
VALUE
SHORT-TERM
INVESTMENTS—0.1%
REPURCHASE
AGREEMENT—0.1%
$8,970,000
(b)
Fixed
Income
Clearing
Corporation
4
.580
%
12/02/24
8,970,000
TOTAL
REPURCHASE
AGREEMENT
8,970,000
TOTAL
SHORT-TERM
INVESTMENTS
(Cost
$8,970,000)
8,970,000
TOTAL
INVESTMENTS—100.0%
(Cost
$4,835,386,776)
7,143,207,913
OTHER
ASSETS
&
LIABILITIES,
NET—0.0%
2,936,528
NET
ASSETS—100.0%
$
7,146,144,441
(a)
Affiliated
fund.
(b)
Agreement
with
Fixed
Income
Clearing
Corporation,
4.580%
dated
11/29/24
to
be
repurchased
at
$8,973,424
on
12/2/24,
collateralized
by
Government
Agency
Securities,
with
coupon
rate
0.000%
and
maturity
date
11/28/25,
valued
at
$9,149,541.
Portfolio
of
Investments
November
30,
2024
See
Notes
to
Financial
Statements
(Unaudited)
SHARES
DESCRIPTION
VALUE
AFFILIATED
INVESTMENT
COMPANIES—99.8%(a)
FIXED
INCOME—8.4%
38,141,210
Nuveen
Bond
Index
Fund,
Class
W
$
369,206,916
TOTAL
FIXED
INCOME
369,206,916
INTERNATIONAL
EQUITY—31.0%
38,579,362
Nuveen
Emerging
Markets
Equity
Index
Fund,
Class
W
432,860,438
39,681,392
Nuveen
International
Equity
Index
Fund,
Class
W
927,354,136
TOTAL
INTERNATIONAL
EQUITY
1,360,214,574
U.S.
EQUITY—60.4%
61,672,870
Nuveen
Equity
Index
Fund,
Class
W
2,651,933,428
TOTAL
U.S.
EQUITY
2,651,933,428
TOTAL
AFFILIATED
INVESTMENT
COMPANIES
(Cost
$3,115,949,016)
4,381,354,918
PRINCIPAL
DESCRIPTION
RATE
MATURITY
VALUE
SHORT-TERM
INVESTMENTS—0.2%
REPURCHASE
AGREEMENT—0.2%
$6,790,000
(b)
Fixed
Income
Clearing
Corporation
4
.580
%
12/02/24
6,790,000
TOTAL
REPURCHASE
AGREEMENT
6,790,000
TOTAL
SHORT-TERM
INVESTMENTS
(Cost
$6,790,000)
6,790,000
TOTAL
INVESTMENTS—100.0%
(Cost
$3,122,739,016)
4,388,144,918
OTHER
ASSETS
&
LIABILITIES,
NET—(0.0)%
(
183,893
)
NET
ASSETS—100.0%
$
4,387,961,025
(a)
Affiliated
fund.
(b)
Agreement
with
Fixed
Income
Clearing
Corporation,
4.580%
dated
11/29/24
to
be
repurchased
at
$6,792,592
on
12/2/24,
collateralized
by
Government
Agency
Securities,
with
coupon
rate
0.000%
and
maturity
date
11/28/25,
valued
at
$6,925,838.
Portfolio
of
Investments
November
30,
2024
See
Notes
to
Financial
Statements
(Unaudited)
SHARES
DESCRIPTION
VALUE
AFFILIATED
INVESTMENT
COMPANIES—99.8%(a)
FIXED
INCOME—7.2%
18,492,063
Nuveen
Bond
Index
Fund,
Class
W
$
179,003,168
TOTAL
FIXED
INCOME
179,003,168
INTERNATIONAL
EQUITY—31.4%
22,180,802
Nuveen
Emerging
Markets
Equity
Index
Fund,
Class
W
248,868,601
22,803,597
Nuveen
International
Equity
Index
Fund,
Class
W
532,920,052
TOTAL
INTERNATIONAL
EQUITY
781,788,653
U.S.
EQUITY—61.2%
35,494,544
Nuveen
Equity
Index
Fund,
Class
W
1,526,265,383
TOTAL
U.S.
EQUITY
1,526,265,383
TOTAL
AFFILIATED
INVESTMENT
COMPANIES
(Cost
$1,862,792,616)
2,487,057,204
PRINCIPAL
DESCRIPTION
RATE
MATURITY
VALUE
SHORT-TERM
INVESTMENTS—0.2%
REPURCHASE
AGREEMENT—0.2%
$5,410,000
(b)
Fixed
Income
Clearing
Corporation
4
.580
%
12/02/24
5,410,000
TOTAL
REPURCHASE
AGREEMENT
5,410,000
TOTAL
SHORT-TERM
INVESTMENTS
(Cost
$5,410,000)
5,410,000
TOTAL
INVESTMENTS—100.0%
(Cost
$1,868,202,616)
2,492,467,204
OTHER
ASSETS
&
LIABILITIES,
NET—(0.0)%
(
386,367
)
NET
ASSETS—100.0%
$
2,492,080,837
(a)
Affiliated
fund.
(b)
Agreement
with
Fixed
Income
Clearing
Corporation,
4.580%
dated
11/29/24
to
be
repurchased
at
$5,412,065
on
12/2/24,
collateralized
by
Government
Agency
Securities,
with
coupon
rate
0.000%
and
maturity
date
11/28/25,
valued
at
$5,518,231.
Portfolio
of
Investments
November
30,
2024
See
Notes
to
Financial
Statements
(Unaudited)
SHARES
DESCRIPTION
VALUE
AFFILIATED
INVESTMENT
COMPANIES—99.6%(a)
FIXED
INCOME—6.0%
2,859,402
Nuveen
Bond
Index
Fund,
Class
W
$
27,679,012
TOTAL
FIXED
INCOME
27,679,012
INTERNATIONAL
EQUITY—31.7%
4,192,136
Nuveen
Emerging
Markets
Equity
Index
Fund,
Class
W
47,035,763
4,306,308
Nuveen
International
Equity
Index
Fund,
Class
W
100,638,420
TOTAL
INTERNATIONAL
EQUITY
147,674,183
U.S.
EQUITY—61.9%
6,701,310
Nuveen
Equity
Index
Fund,
Class
W
288,156,340
TOTAL
U.S.
EQUITY
288,156,340
TOTAL
AFFILIATED
INVESTMENT
COMPANIES
(Cost
$382,292,411)
463,509,535
PRINCIPAL
DESCRIPTION
RATE
MATURITY
VALUE
SHORT-TERM
INVESTMENTS—0.1%
REPURCHASE
AGREEMENT—0.1%
$660,000
(b)
Fixed
Income
Clearing
Corporation
4
.580
%
12/02/24
660,000
TOTAL
REPURCHASE
AGREEMENT
660,000
TOTAL
SHORT-TERM
INVESTMENTS
(Cost
$660,000)
660,000
TOTAL
INVESTMENTS—99.7%
(Cost
$382,952,411)
464,169,535
OTHER
ASSETS
&
LIABILITIES,
NET—0.3%
1,263,828
NET
ASSETS—100.0%
$
465,433,363
(a)
Affiliated
fund.
(b)
Agreement
with
Fixed
Income
Clearing
Corporation,
4.580%
dated
11/29/24
to
be
repurchased
at
$660,252
on
12/2/24,
collateralized
by
Government
Agency
Securities,
with
coupon
rate
0.000%
and
maturity
date
11/28/25,
valued
at
$673,370.
Statement
of
Assets
and
Liabilities
See
Notes
to
Financial
Statements
November
30,
2024
(Unaudited)
14.1
Lifecycle
Index
Retirement
Income
14.2
Lifecycle
Index
2010
14.3
Lifecycle
Index
2015
14.4
Lifecycle
Index
2020
ASSETS
Affiliated
investments,
at
value
‡
$
698,053,549
$
658,362,015
$
1,058,165,583
$
3,112,390,818
Short-term
investments,
at
value
#
280,000
1,680,000
750,000
4,510,000
Cash
3,819
243
9,272
7,660
Receivables:
Dividends
1,058,908
1,111,331
1,606,549
4,407,192
Interest
71
427
191
1,148
Investments
sold
2,354,078
2,038,941
3,736,818
11,648,685
Reimbursement
from
Adviser
85,802
82,497
109,756
248,429
Shares
sold
2,379,177
340,133
300,958
1,470,229
Other
23,476
42,864
74,503
154,042
Total
assets
704,238,880
663,658,451
1,064,753,630
3,134,838,203
LIABILITIES
Due
to
affiliates
4,414
3,842
4,309
6,687
Payables:
Management
fees
96,589
92,058
147,458
423,757
Investments
purchased
-
regular
settlement
2,929,214
4,099,485
4,940,002
17,177,858
Shares
redeemed
1,123,982
58,002
110,148
746,140
Service
agreement
fees
9,178
11,655
16,804
44,784
Accrued
expenses:
Custodian
fees
2,469
2,492
2,466
2,494
Professional
fees
7,734
7,718
7,806
8,240
Shareholder
reporting
expenses
19,362
22,360
26,931
54,760
Shareholder
servicing
agent
fees
6,155
4,687
5,212
7,749
Trustees
fees
26,586
45,643
79,150
167,734
12b-1
distribution
and
service
fees
406
2,244
3,541
8,888
Other
26,650
26,221
31,381
57,837
Total
liabilities
4,252,739
4,376,407
5,375,208
18,706,928
Net
assets
$
699,986,141
$
659,282,044
$
1,059,378,422
$
3,116,131,275
NET
ASSETS
CONSIST
OF:
Paid-in
capital
$
589,571,275
$
525,138,983
$
798,542,708
$
2,340,255,384
Total
distributable
earnings
(loss)
110,414,866
134,143,061
260,835,714
775,875,891
Net
assets
$
699,986,141
$
659,282,044
$
1,059,378,422
$
3,116,131,275
‡
Affiliated
investments,
cost
$
573,843,754
$
531,780,742
$
824,416,319
$
2,414,076,581
#
Short-term
investments,
cost
280,000
1,680,000
750,000
4,510,000
CLASS
I:
Net
assets
$
2,288,126
$
1,059,476
$
1,241,967
$
7,939,705
Shares
outstanding
135,648
60,122
66,537
387,213
Net
asset
value
("NAV")
and
offering
price
per
share
$
16
.87
$
17
.62
$
18
.67
$
20
.50
PREMIER
CLASS:
Net
assets
$
3,335,340
$
18,256,355
$
28,948,793
$
73,259,158
Shares
outstanding
197,888
1,040,611
1,558,771
3,587,714
NAV
and
offering
price
per
share
$
16
.85
$
17
.54
$
18
.57
$
20
.42
CLASS
R6:
Net
assets
$
657,170,141
$
586,494,824
$
951,288,571
$
2,844,347,905
Shares
outstanding
38,949,225
33,276,476
50,922,962
138,425,769
NAV
and
offering
price
per
share
$
16
.87
$
17
.62
$
18
.68
$
20
.55
RETIREMENT
CLASS:
Net
assets
$
37,192,534
$
53,471,389
$
77,899,091
$
190,584,507
Shares
outstanding
2,209,415
3,067,758
4,211,006
9,372,926
NAV
and
offering
price
per
share
$
16
.83
$
17
.43
$
18
.50
$
20
.33
Authorized
shares
-
per
class
Unlimited
Unlimited
Unlimited
Unlimited
Par
value
per
share
$
0
.0001
$
0
.0001
$
0
.0001
$
0
.0001
See
Notes
to
Financial
Statements
14.5
Lifecycle
Index
2025
14.6
Lifecycle
Index
2030
14.7
Lifecycle
Index
2035
14.8
Lifecycle
Index
2040
14.9
Lifecycle
Index
2045
15.01
Lifecycle
Index
2050
$
6,188,236,447
$
8,696,641,952
$
9,327,442,838
$
9,854,488,387
$
8,368,535,834
$
7,134,237,913
4,190,000
10,010,000
8,940,000
12,210,000
8,440,000
8,970,000
2,211
3,490
4,385
5,740
9,907
4,063
8,034,803
9,588,791
8,370,153
5,932,605
3,234,866
2,011,594
1,066
2,547
2,275
3,107
2,148
2,282
25,894,372
39,074,249
46,435,689
50,365,617
43,280,060
36,126,135
432,006
561,947
569,576
558,678
489,972
426,565
3,983,727
4,985,868
5,491,556
6,918,624
8,040,357
8,664,156
205,945
235,562
227,424
246,556
162,764
128,215
6,230,980,577
8,761,104,406
9,397,483,896
9,930,729,314
8,432,195,908
7,190,570,923
9,929
12,278
12,031
12,614
11,755
10,908
819,898
1,115,354
1,161,521
1,189,781
1,003,249
852,255
31,419,677
49,372,150
53,901,533
58,307,944
46,420,340
39,878,373
2,404,609
2,674,498
3,964,738
2,030,165
2,240,893
3,234,140
88,004
117,586
107,806
103,617
89,813
74,012
2,477
2,477
2,478
2,481
2,481
2,487
8,856
9,315
9,409
9,499
9,192
8,944
86,054
104,986
107,757
115,181
100,263
95,938
8,902
10,020
9,787
10,569
9,871
10,505
232,223
270,786
264,387
285,349
195,136
155,569
16,562
21,716
25,660
26,082
18,690
13,265
94,407
118,879
124,050
121,569
104,756
90,086
35,191,598
53,830,045
59,691,157
62,214,851
50,206,439
44,426,482
$
6,195,788,979
$
8,707,274,361
$
9,337,792,739
$
9,868,514,463
$
8,381,989,469
$
7,146,144,441
$
4,678,409,852
$
6,503,554,614
$
6,748,854,734
$
6,735,845,304
$
5,756,675,770
$
4,923,602,411
1,517,379,127
2,203,719,747
2,588,938,005
3,132,669,159
2,625,313,699
2,222,542,030
$
6,195,788,979
$
8,707,274,361
$
9,337,792,739
$
9,868,514,463
$
8,381,989,469
$
7,146,144,441
$
4,785,478,516
$
6,498,743,653
$
6,696,213,732
$
6,615,213,350
$
5,648,504,765
$
4,826,416,776
4,190,000
10,010,000
8,940,000
12,210,000
8,440,000
8,970,000
$
19,245,427
$
35,675,772
$
28,752,191
$
28,606,477
$
28,738,025
$
24,410,310
837,610
1,398,424
1,020,342
931,412
888,739
740,121
$
22
.98
$
25
.51
$
28
.18
$
30
.71
$
32
.34
$
32
.98
$
135,866,469
$
179,107,760
$
211,203,186
$
214,275,322
$
154,334,644
$
110,139,143
5,928,551
7,049,569
7,527,698
7,011,092
4,788,844
3,353,399
$
22
.92
$
25
.41
$
28
.06
$
30
.56
$
32
.23
$
32
.84
$
5,680,563,039
$
8,029,491,335
$
8,661,288,240
$
9,208,223,551
$
7,853,615,511
$
6,720,595,011
246,517,702
313,943,479
306,538,112
299,158,521
242,165,854
203,228,370
$
23
.04
$
25
.58
$
28
.26
$
30
.78
$
32
.43
$
33
.07
$
360,114,044
$
462,999,494
$
436,549,122
$
417,409,113
$
345,301,289
$
290,999,977
15,805,245
18,316,665
15,638,660
13,718,627
10,777,228
8,913,037
$
22
.78
$
25
.28
$
27
.91
$
30
.43
$
32
.04
$
32
.65
Unlimited
Unlimited
Unlimited
Unlimited
Unlimited
Unlimited
$
0
.0001
$
0
.0001
$
0
.0001
$
0
.0001
$
0
.0001
$
0
.0001
Statement
of
Assets
and
Liabilities
(continued)
See
Notes
to
Financial
Statements
Statement
of
Assets
and
Liabilities
(continued)
November
30,
2024
(Unaudited)
15.1
Lifecycle
Index
2055
15.2
Lifecycle
Index
2060
15.3
Lifecycle
Index
2065
ASSETS
Affiliated
investments,
at
value
‡
$
4,381,354,918
$
2,487,057,204
$
463,509,535
Short-term
investments,
at
value
#
6,790,000
5,410,000
660,000
Cash
4,747
9,475
6,324
Receivables:
Dividends
1,074,747
521,243
79,580
Interest
1,728
1,377
168
Investments
sold
22,031,752
12,840,345
2,374,637
Reimbursement
from
Adviser
300,662
199,986
73,893
Shares
sold
6,196,653
3,729,019
1,576,659
Other
61,042
26,185
2,376
Total
assets
4,417,816,249
2,509,794,834
468,283,172
LIABILITIES
Due
to
affiliates
8,229
5,897
3,699
Payables:
Management
fees
521,162
295,674
54,355
Investments
purchased
-
regular
settlement
25,469,969
13,354,598
2,653,553
Shares
redeemed
3,570,233
3,868,471
75,071
Service
agreement
fees
48,911
28,254
4,823
Accrued
expenses:
Custodian
fees
2,487
2,487
2,468
Professional
fees
8,402
8,041
7,660
Shareholder
reporting
expenses
71,399
60,469
18,684
Shareholder
servicing
agent
fees
9,686
9,429
3,379
Trustees
fees
77,365
35,198
3,819
12b-1
distribution
and
service
fees
5,806
3,681
388
Other
61,575
41,798
21,910
Total
liabilities
29,855,224
17,713,997
2,849,809
Net
assets
$
4,387,961,025
$
2,492,080,837
$
465,433,363
NET
ASSETS
CONSIST
OF:
Paid-in
capital
$
3,168,389,937
$
1,894,395,938
$
386,349,319
Total
distributable
earnings
(loss)
1,219,571,088
597,684,899
79,084,044
Net
assets
$
4,387,961,025
$
2,492,080,837
$
465,433,363
‡
Affiliated
investments,
cost
$
3,115,949,016
$
1,862,792,616
$
382,292,411
#
Short-term
investments,
cost
6,790,000
5,410,000
660,000
CLASS
I:
Net
assets
$
21,225,778
$
14,344,237
$
3,920,881
Shares
outstanding
795,461
691,938
266,967
Net
asset
value
("NAV")
and
offering
price
per
share
$
26
.68
$
20
.73
$
14
.69
PREMIER
CLASS:
Net
assets
$
48,127,396
$
30,787,380
$
3,366,648
Shares
outstanding
1,806,663
1,487,850
229,443
NAV
and
offering
price
per
share
$
26
.64
$
20
.69
$
14
.67
CLASS
R6:
Net
assets
$
4,141,692,836
$
2,351,865,963
$
445,312,633
Shares
outstanding
154,822,404
113,254,773
29,915,922
NAV
and
offering
price
per
share
$
26
.75
$
20
.77
$
14
.89
RETIREMENT
CLASS:
Net
assets
$
176,915,015
$
95,083,257
$
12,833,201
Shares
outstanding
6,665,673
4,609,733
874,514
NAV
and
offering
price
per
share
$
26
.54
$
20
.63
$
14
.67
Authorized
shares
-
per
class
Unlimited
Unlimited
Unlimited
Par
value
per
share
$
0
.0001
$
0
.0001
$
0
.0001
See
Notes
to
Financial
Statements
Six
Months
Ended
November
30,
2024
(Unaudited)
14.1
Lifecycle
Index
Retirement
Income
14.2
Lifecycle
Index
2010
14.3
Lifecycle
Index
2015
14.4
Lifecycle
Index
2020
14.5
Lifecycle
Index
2025
INVESTMENT
INCOME
Dividends
from
affiliated
investments
$
8,372,225
$
8,108,380
$
12,113,579
$
32,244,860
$
55,730,140
Interest
21,154
16,223
19,948
50,396
124,071
Total
investment
income
8,393,379
8,124,603
12,133,527
32,295,256
55,854,211
EXPENSES
Management
fees
617,967
556,688
905,937
2,607,033
4,977,512
12b-1
distribution
and
service
fees
—
Premier
Class
2,508
13,991
22,127
55,070
100,886
Shareholder
servicing
agent
fees
—
Class
I
1,333
602
666
4,583
10,570
Shareholder
servicing
agent
fees
—
Premier
Class
79
78
94
154
236
Shareholder
servicing
agent
fees
—
Class
R6
15,888
12,643
14,104
21,327
26,562
Shareholder
servicing
agent
fees
—
Retirement
Class
44,948
65,980
101,987
244,734
461,040
Administrative
service
fees
19,070
18,698
20,446
29,386
42,760
Trustees
fees
8,524
7,420
12,264
36,388
71,752
Custodian
expenses
3,705
3,742
3,707
3,743
3,724
Overdraft
expense
6,249
2,429
4,015
4,010
3,146
Professional
fees
8,338
8,302
8,468
9,328
10,631
Registration
fees
63,401
62,803
62,555
64,309
73,010
Shareholder
reporting
expenses
26,190
28,087
31,607
53,158
78,426
Other
47,478
47,178
68,507
179,802
328,309
Total
expenses
865,678
828,641
1,256,484
3,313,025
6,188,564
Expenses
reimbursed
by
the
investment
adviser
(
153,426
)
(
151,823
)
(
164,034
)
(
231,646
)
(
318,637
)
Fee
waiver
by
investment
adviser
and
Nuveen
Securities
(
287,221
)
(
260,752
)
(
412,281
)
(
1,152,749
)
(
2,104,020
)
Net
expenses
425,031
416,066
680,169
1,928,630
3,765,907
Net
investment
income
(loss)
7,968,348
7,708,537
11,453,358
30,366,626
52,088,304
REALIZED
AND
UNREALIZED
GAIN
(LOSS)
Realized
gain
(loss):
Investments
–
–
–
–
–
Affiliated
investments
9,338,994
7,431,669
21,212,636
61,021,656
98,670,739
Net
realized
gain
(loss)
9,338,994
7,431,669
21,212,636
61,021,656
98,670,739
Change
in
unrealized
appreciation
(depreciation)
on:
Affiliated
investments
28,454,145
24,035,043
35,650,205
119,182,531
281,485,998
Net
change
in
unrealized
appreciation
(depreciation)
28,454,145
24,035,043
35,650,205
119,182,531
281,485,998
Net
realized
and
unrealized
gain
(loss)
37,793,139
31,466,712
56,862,841
180,204,187
380,156,737
Net
increase
(decrease)
in
net
assets
from
operations
$
45,761,487
$
39,175,249
$
68,316,199
$
210,570,813
$
432,245,041
See
Notes
to
Financial
Statements
14.6
Lifecycle
Index
2030
14.7
Lifecycle
Index
2035
14.8
Lifecycle
Index
2040
14.9
Lifecycle
Index
2045
15.01
Lifecycle
Index
2050
15.1
Lifecycle
Index
2055
15.2
Lifecycle
Index
2060
$
62,983,179
$
51,303,120
$
33,785,190
$
18,398,407
$
11,474,031
$
6,070,373
$
2,914,071
230,550
271,492
278,342
256,014
228,728
160,941
103,608
63,213,729
51,574,612
34,063,532
18,654,421
11,702,759
6,231,314
3,017,679
6,662,147
6,869,065
7,009,532
5,871,953
4,963,280
3,006,800
1,689,013
129,948
154,574
157,347
108,673
77,893
33,848
21,097
18,066
14,821
14,586
14,861
11,637
10,199
6,936
294
358
336
253
216
150
115
30,646
30,816
32,733
30,105
30,147
25,994
23,802
579,535
543,835
515,524
427,133
359,675
215,082
115,014
53,208
55,909
58,037
51,756
46,316
34,442
26,458
98,798
105,234
110,850
93,725
79,474
48,104
27,136
3,725
3,725
3,727
3,727
3,733
3,733
3,733
1,216
439
878
181
109
93
332
11,689
11,966
11,680
11,080
10,545
9,370
9,085
83,182
92,215
77,625
76,874
72,722
42,295
66,780
94,952
99,703
105,736
101,537
101,805
98,485
84,834
430,063
437,704
450,849
378,315
321,898
195,691
111,899
8,197,469
8,420,364
8,549,440
7,170,173
6,079,450
3,724,286
2,186,234
(
381,686
)
(
397,793
)
(
398,532
)
(
363,047
)
(
340,167
)
(
259,992
)
(
242,327
)
(
2,699,689
)
(
2,658,033
)
(
2,617,333
)
(
2,181,375
)
(
1,816,271
)
(
1,101,772
)
(
619,744
)
5,116,094
5,364,538
5,533,575
4,625,751
3,923,012
2,362,522
1,324,163
58,097,635
46,210,074
28,529,957
14,028,670
7,779,747
3,868,792
1,693,516
–
–
–
–
–
1,946
609
57,045,865
50,731,035
39,913,684
7,554,447
1,573,055
(
1,404,804
)
(
714,516
)
57,045,865
50,731,035
39,913,684
7,554,447
1,573,055
(
1,402,858
)
(
713,907
)
519,230,631
621,285,814
748,274,598
699,263,634
615,358,064
379,422,060
215,476,194
519,230,631
621,285,814
748,274,598
699,263,634
615,358,064
379,422,060
215,476,194
576,276,496
672,016,849
788,188,282
706,818,081
616,931,119
378,019,202
214,762,287
$
634,374,131
$
718,226,923
$
816,718,239
$
720,846,751
$
624,710,866
$
381,887,994
$
216,455,803
Statement
of
Operations
(continued)
See
Notes
to
Financial
Statements
Statement
of
Operations
(continued)
Six
Months
Ended
November
30,
2024
(Unaudited)
15.3
Lifecycle
Index
2065
INVESTMENT
INCOME
Dividends
from
affiliated
investments
$
422,080
Interest
31,459
Total
investment
income
453,539
EXPENSES
Management
fees
294,738
12b-1
distribution
and
service
fees
—
Premier
Class
2,302
Shareholder
servicing
agent
fees
—
Class
I
1,896
Shareholder
servicing
agent
fees
—
Premier
Class
49
Shareholder
servicing
agent
fees
—
Class
R6
7,719
Shareholder
servicing
agent
fees
—
Retirement
Class
14,790
Administrative
service
fees
17,813
Trustees
fees
4,782
Custodian
expenses
3,692
Overdraft
expense
56
Professional
fees
7,730
Registration
fees
68,372
Shareholder
reporting
expenses
43,761
Other
25,030
Total
expenses
492,730
Expenses
reimbursed
by
the
investment
adviser
(
159,694
)
Fee
waiver
by
investment
adviser
and
Nuveen
Securities
(
110,394
)
Net
expenses
222,642
Net
investment
income
(loss)
230,897
REALIZED
AND
UNREALIZED
GAIN
(LOSS)
Realized
gain
(loss):
Investments
194
Affiliated
investments
(
283,002
)
Net
realized
gain
(loss)
(
282,808
)
Change
in
unrealized
appreciation
(depreciation)
on:
Affiliated
investments
37,977,204
Net
change
in
unrealized
appreciation
(depreciation)
37,977,204
Net
realized
and
unrealized
gain
(loss)
37,694,396
Net
increase
(decrease)
in
net
assets
from
operations
$
37,925,293
Statement
of
Changes
in
Net
Assets
See
Notes
to
Financial
Statements
14.1
Lifecycle
Index
Retirement
Income
14.2
Lifecycle
Index
2010
Unaudited
Six
Months
Ended
11/30/24
Year
Ended
5/31/24
Unaudited
Six
Months
Ended
11/30/24
Year
Ended
5/31/24
OPERATIONS
Net
investment
income
(loss)
$
7,968,348
$
19,181,416
$
7,708,537
$
18,170,266
Net
realized
gain
(loss)
9,338,994
(1,863,287)
7,431,669
11,515,679
Net
change
in
unrealized
appreciation
(depreciation)
28,454,145
50,865,338
24,035,043
28,715,167
Net
increase
(decrease)
in
net
assets
from
operations
45,761,487
68,183,467
39,175,249
58,401,112
DISTRIBUTIONS
TO
SHAREHOLDERS
–
–
–
–
Dividends:
Class
I
(24,892)
(66,654)
–
(40,636)
Premier
Class
(34,356)
(89,487)
–
(640,813)
Class
R6
(7,529,294)
(17,810,107)
–
(18,866,826)
Retirement
Class
(344,196)
(892,490)
–
(1,712,599)
Total
distributions
(7,932,738)
(18,858,738)
–
(21,260,874)
FUND
SHARE
TRANSACTIONS
Subscriptions
107,423,798
228,699,434
63,864,950
102,244,672
Reinvestments
of
distributions
7,137,826
17,074,412
–
20,685,528
Redemptions
(157,411,532)
(206,207,587)
(72,971,586)
(161,485,076)
Net
increase
(decrease)
from
Fund
share
transactions
(42,849,908)
39,566,259
(9,106,636)
(38,554,876)
Net
increase
(decrease)
in
net
assets
(5,021,159)
88,890,988
30,068,613
(1,414,638)
Net
assets
at
the
beginning
of
period
705,007,300
616,116,312
629,213,431
630,628,069
Net
assets
at
the
end
of
period
$
699,986,141
$
705,007,300
$
659,282,044
$
629,213,431
See
Notes
to
Financial
Statements
14.3
Lifecycle
Index
2015
14.4
Lifecycle
Index
2020
14.5
Lifecycle
Index
2025
14.6
Lifecycle
Index
2030
Unaudited
Six
Months
Ended
11/30/24
Year
Ended
5/31/24
Unaudited
Six
Months
Ended
11/30/24
Year
Ended
5/31/24
Unaudited
Six
Months
Ended
11/30/24
Year
Ended
5/31/24
Unaudited
Six
Months
Ended
11/30/24
Year
Ended
5/31/24
$
11,453,358
$
29,528,702
$
30,366,626
$
83,475,927
$
52,088,304
$
149,276,325
$
58,097,635
$
184,957,648
21,212,636
29,191,861
61,021,656
72,223,040
98,670,739
64,679,933
57,045,865
14,699,286
35,650,205
48,941,127
119,182,531
185,928,230
281,485,998
486,567,331
519,230,631
821,935,951
68,316,199
107,661,690
210,570,813
341,627,197
432,245,041
700,523,589
634,374,131
1,021,592,885
–
–
–
–
–
–
–
–
–
(51,579)
–
(344,758)
–
(516,749)
–
(787,909)
–
(1,130,702)
–
(2,630,651)
–
(3,088,317)
–
(3,774,690)
–
(37,227,345)
–
(95,417,147)
–
(134,076,644)
–
(165,971,088)
–
(3,222,645)
–
(6,456,175)
–
(9,192,903)
–
(10,065,889)
–
(41,632,271)
–
(104,848,731)
–
(146,874,613)
–
(180,599,576)
73,220,147
151,507,550
179,622,683
439,324,873
457,557,293
960,723,344
699,510,144
1,352,337,152
–
40,289,147
–
99,481,968
–
137,705,788
–
171,408,393
(129,502,631)
(252,534,883)
(357,821,699)
(725,515,692)
(646,023,776)
(1,121,209,317)
(645,095,198)
(1,129,816,307)
(56,282,484)
(60,738,186)
(178,199,016)
(186,708,851)
(188,466,483)
(22,780,185)
54,414,946
393,929,238
12,033,715
5,291,233
32,371,797
50,069,615
243,778,558
530,868,791
688,789,077
1,234,922,547
1,047,344,707
1,042,053,474
3,083,759,478
3,033,689,863
5,952,010,421
5,421,141,630
8,018,485,284
6,783,562,737
$
1,059,378,422
$
1,047,344,707
$
3,116,131,275
$
3,083,759,478
$
6,195,788,979
$
5,952,010,421
$
8,707,274,361
$
8,018,485,284
Statement
of
Changes
in
Net
Assets
(continued)
See
Notes
to
Financial
Statements
Statement
of
Changes
in
Net
Assets
(continued)
14.7
Lifecycle
Index
2035
14.8
Lifecycle
Index
2040
Unaudited
Six
Months
Ended
11/30/24
Year
Ended
5/31/24
Unaudited
Six
Months
Ended
11/30/24
Year
Ended
5/31/24
OPERATIONS
Net
investment
income
(loss)
$
46,210,074
$
180,176,861
$
28,529,957
$
176,760,375
Net
realized
gain
(loss)
50,731,035
(474,339)
39,913,684
(6,246,244)
Net
change
in
unrealized
appreciation
(depreciation)
621,285,814
1,005,567,850
748,274,598
1,226,215,207
Net
increase
(decrease)
in
net
assets
from
operations
718,226,923
1,185,270,372
816,718,239
1,396,729,338
DISTRIBUTIONS
TO
SHAREHOLDERS
–
–
–
–
Dividends:
Class
I
–
(567,772)
–
(538,589)
Premier
Class
–
(3,857,289)
–
(3,954,076)
Class
R6
–
(154,914,286)
–
(156,485,700)
Retirement
Class
–
(8,392,031)
–
(7,629,130)
Total
distributions
–
(167,731,378)
–
(168,607,495)
FUND
SHARE
TRANSACTIONS
Subscriptions
770,379,865
1,550,811,050
752,391,116
1,499,345,228
Reinvestments
of
distributions
–
159,535,720
–
162,404,648
Redemptions
(608,687,101)
(1,034,946,977)
(574,752,911)
(979,972,778)
Net
increase
(decrease)
from
Fund
share
transactions
161,692,764
675,399,793
177,638,205
681,777,098
Net
increase
(decrease)
in
net
assets
879,919,687
1,692,938,787
994,356,444
1,909,898,941
Net
assets
at
the
beginning
of
period
8,457,873,052
6,764,934,265
8,874,158,019
6,964,259,078
Net
assets
at
the
end
of
period
$
9,337,792,739
$
8,457,873,052
$
9,868,514,463
$
8,874,158,019
See
Notes
to
Financial
Statements
14.9
Lifecycle
Index
2045
15.01
Lifecycle
Index
2050
15.1
Lifecycle
Index
2055
15.2
Lifecycle
Index
2060
Unaudited
Six
Months
Ended
11/30/24
Year
Ended
5/31/24
Unaudited
Six
Months
Ended
11/30/24
Year
Ended
5/31/24
Unaudited
Six
Months
Ended
11/30/24
Year
Ended
5/31/24
Unaudited
Six
Months
Ended
11/30/24
Year
Ended
5/31/24
$
14,028,670
$
139,543,831
$
7,779,747
$
115,371,907
$
3,868,792
$
67,167,653
$
1,693,516
$
35,595,418
7,554,447
(18,462,193)
1,573,055
(18,290,248)
(1,402,858)
(10,682,424)
(713,907)
(7,554,269)
699,263,634
1,103,795,492
615,358,064
965,448,337
379,422,060
572,567,307
215,476,194
312,641,706
720,846,751
1,224,877,130
624,710,866
1,062,529,996
381,887,994
629,052,536
216,455,803
340,682,855
–
–
–
–
–
–
–
–
–
(509,242)
–
(420,271)
–
(357,393)
–
(243,062)
–
(2,377,862)
–
(1,913,988)
–
(879,223)
–
(487,237)
–
(126,387,605)
–
(111,468,488)
–
(64,935,523)
–
(34,405,231)
–
(6,085,403)
–
(5,413,361)
–
(2,974,797)
–
(1,483,183)
–
(135,360,112)
–
(119,216,108)
–
(69,146,936)
–
(36,618,713)
715,949,373
1,496,589,665
643,145,570
1,274,445,721
521,490,253
974,906,030
385,841,154
696,416,289
–
129,762,323
–
114,459,662
–
66,096,262
–
34,946,899
(474,202,424)
(817,713,723)
(386,661,954)
(679,999,600)
(263,798,568)
(470,471,723)
(188,323,155)
(310,232,315)
241,746,949
808,638,265
256,483,616
708,905,783
257,691,685
570,530,569
197,517,999
421,130,873
962,593,700
1,898,155,283
881,194,482
1,652,219,671
639,579,679
1,130,436,169
413,973,802
725,195,015
7,419,395,769
5,521,240,486
6,264,949,959
4,612,730,288
3,748,381,346
2,617,945,177
2,078,107,035
1,352,912,020
$
8,381,989,469
$
7,419,395,769
$
7,146,144,441
$
6,264,949,959
$
4,387,961,025
$
3,748,381,346
$
2,492,080,837
$
2,078,107,035
Statement
of
Changes
in
Net
Assets
(continued)
See
Notes
to
Financial
Statements
Statement
of
Changes
in
Net
Assets
(continued)
15.3
Lifecycle
Index
2065
Unaudited
Six
Months
Ended
11/30/24
Year
Ended
5/31/24
OPERATIONS
Net
investment
income
(loss)
$
230,897
$
4,753,605
Net
realized
gain
(loss)
(282,808)
(685,013)
Net
change
in
unrealized
appreciation
(depreciation)
37,977,204
42,485,825
Net
increase
(decrease)
in
net
assets
from
operations
37,925,293
46,554,417
DISTRIBUTIONS
TO
SHAREHOLDERS
–
–
Dividends:
Class
I
–
(63,731)
Premier
Class
–
(52,902)
Class
R6
–
(4,551,523)
Retirement
Class
–
(144,162)
Total
distributions
–
(4,812,318)
FUND
SHARE
TRANSACTIONS
Subscriptions
130,781,065
208,269,379
Reinvestments
of
distributions
–
4,604,356
Redemptions
(42,297,074)
(43,759,994)
Net
increase
(decrease)
from
Fund
share
transactions
88,483,991
169,113,741
Net
increase
(decrease)
in
net
assets
126,409,284
210,855,840
Net
assets
at
the
beginning
of
period
339,024,079
128,168,239
Net
assets
at
the
end
of
period
$
465,433,363
$
339,024,079
See
Notes
to
Financial
Statements
The
following
data
is
for
a
share outstanding
for
each
fiscal year
end
unless
otherwise
noted:
Investment
Operations
Less
Distributions
Net
Asset
Value,
Beginning
of
Period
Net
Investment
Income
(Loss)
a
Net
Realized/
Unrealized
Gain
(Loss)
j
Total
From
Net
Investment
Income
From
Net
Realized
Gains
Total
Net
Asset
Value,
End
of
Period
14.1
Lifecycle
Index
Retirement
Income
Class
I:
11/30/24
#
$
15
.99
$
0
.18
$
0
.87
$
1
.05
$
(
0
.17
)
$
—
$
(
0
.17
)
$
16
.87
5/31/24
14
.90
0
.43
1
.08
1
.51
(
0
.41
)
(
0
.01
)
(
0
.42
)
15
.99
5/31/23
15
.47
0
.37
(
0
.46
)
(
0
.09
)
(
0
.36
)
(
0
.12
)
(
0
.48
)
14
.90
5/31/22
17
.19
0
.35
(
1
.38
)
(
1
.03
)
(
0
.36
)
(
0
.33
)
(
0
.69
)
15
.47
5/31/21
15
.10
0
.24
2
.18
2
.42
(
0
.28
)
(
0
.05
)
(
0
.33
)
17
.19
5/31/20
14
.31
0
.36
0
.79
1
.15
(
0
.34
)
(
0
.02
)
(
0
.36
)
15
.10
Premier
Class:
11/30/24
#
15
.98
0
.17
0
.87
1
.04
(
0
.17
)
—
(
0
.17
)
16
.85
5/31/24
14
.89
0
.42
1
.08
1
.50
(
0
.40
)
(
0
.01
)
(
0
.41
)
15
.98
5/31/23
15
.46
0
.37
(
0
.46
)
(
0
.09
)
(
0
.36
)
(
0
.12
)
(
0
.48
)
14
.89
5/31/22
17
.18
0
.41
(
1
.45
)
(
1
.04
)
(
0
.35
)
(
0
.33
)
(
0
.68
)
15
.46
5/31/21
15
.09
0
.27
2
.14
2
.41
(
0
.27
)
(
0
.05
)
(
0
.32
)
17
.18
5/31/20
14
.30
0
.32
0
.82
1
.14
(
0
.33
)
(
0
.02
)
(
0
.35
)
15
.09
Class
R6:
11/30/24
#
16
.00
0
.18
0
.87
1
.05
(
0
.18
)
—
(
0
.18
)
16
.87
5/31/24
14
.90
0
.44
1
.10
1
.54
(
0
.43
)
(
0
.01
)
(
0
.44
)
16
.00
5/31/23
15
.48
0
.39
(
0
.47
)
(
0
.08
)
(
0
.38
)
(
0
.12
)
(
0
.50
)
14
.90
5/31/22
17
.20
0
.36
(
1
.37
)
(
1
.01
)
(
0
.38
)
(
0
.33
)
(
0
.71
)
15
.48
5/31/21
15
.10
0
.28
2
.16
2
.44
(
0
.29
)
(
0
.05
)
(
0
.34
)
17
.20
5/31/20
14
.31
0
.34
0
.82
1
.16
(
0
.35
)
(
0
.02
)
(
0
.37
)
15
.10
Retirement
Class:
11/30/24
#
15
.96
0
.16
0
.87
1
.03
(
0
.16
)
—
(
0
.16
)
16
.83
5/31/24
14
.87
0
.40
1
.09
1
.49
(
0
.39
)
(
0
.01
)
(
0
.40
)
15
.96
5/31/23
15
.44
0
.35
(
0
.46
)
(
0
.11
)
(
0
.34
)
(
0
.12
)
(
0
.46
)
14
.87
5/31/22
17
.16
0
.32
(
1
.38
)
(
1
.06
)
(
0
.33
)
(
0
.33
)
(
0
.66
)
15
.44
5/31/21
15
.07
0
.24
2
.16
2
.40
(
0
.26
)
(
0
.05
)
(
0
.31
)
17
.16
5/31/20
14
.28
0
.31
0
.81
1
.12
(
0
.31
)
(
0
.02
)
(
0
.33
)
15
.07
#
Unaudited
a
Based
on
average
shares
outstanding.
b
Total
returns
are
not
annualized.
c
Percentage
is
annualized.
g
The
Fund's
expenses
include
the
expenses
of
the
Underlying
Funds.
j
Short-term
and
long-term
capital
gain
distributions
received
from
the
underlying
Funds
are
presented
in
net
realized
and
unrealized
gain
(loss)
on
total
investments
for
all
periods
presented.
See
Notes
to
Financial
Statements
Ratios
and
Supplemental
Data
Ratios
to
Average
Net
Assets
Total
Return
b
Net
Assets,
End
of
Period
(000)
Gross
Expenses
g
Net
Expenses
g
Net
Investment
Income
(Loss)
Portfolio
Turnover
Rate
6
.61
%
$
2,288
0
.33
%
c
0
.22
%
c
2
.12
%
c
8
%
10
.27
2,418
0
.32
0
.20
2
.79
19
(
0
.45
)
2,312
0
.31
0
.19
2
.52
24
(
6
.30
)
2,699
0
.33
0
.20
2
.08
24
16
.16
2,242
0
.34
0
.20
1
.49
23
8
.08
989
0
.37
0
.22
2
.41
27
6
.54
3,335
0
.38
c
0
.25
c
2
.07
c
8
10
.20
3,307
0
.37
0
.25
2
.72
19
(
0
.48
)
3,277
0
.37
0
.25
2
.53
24
(
6
.36
)
3,993
0
.38
0
.25
2
.37
24
16
.12
25,449
0
.38
0
.25
1
.63
23
8
.09
29,105
0
.40
0
.25
2
.17
27
6
.61
657,170
0
.23
c
0
.10
c
2
.22
c
8
10
.43
664,434
0
.22
0
.10
2
.86
19
(
0
.40
)
574,299
0
.22
0
.10
2
.62
24
(
6
.20
)
557,296
0
.23
0
.10
2
.13
24
16
.36
547,545
0
.23
0
.10
1
.69
23
8
.17
437,256
0
.26
0
.10
2
.32
27
6
.49
37,193
0
.47
c
0
.35
c
1
.97
c
8
10
.11
34,847
0
.47
0
.35
2
.59
19
(
0
.60
)
36,227
0
.47
0
.35
2
.36
24
(
6
.45
)
40,901
0
.48
0
.35
1
.90
24
16
.04
48,346
0
.48
0
.35
1
.45
23
7
.91
35,862
0
.50
0
.35
2
.09
27
Financial
Highlights
(continued)
See
Notes
to
Financial
Statements
Financial
Highlights
(continued)
Investment
Operations
Less
Distributions
Net
Asset
Value,
Beginning
of
Period
Net
Investment
Income
(Loss)
a
Net
Realized/
Unrealized
Gain
(Loss)
j
Total
From
Net
Investment
Income
From
Net
Realized
Gains
Total
Net
Asset
Value,
End
of
Period
14.2
Lifecycle
Index
2010
Class
I:
11/30/24
#
$
16
.58
$
0
.20
$
0
.84
$
1
.04
$
—
$
—
$
—
$
17
.62
5/31/24
15
.63
0
.44
1
.04
1
.48
(
0
.41
)
(
0
.12
)
(
0
.53
)
16
.58
5/31/23
16
.24
0
.39
(
0
.49
)
(
0
.10
)
(
0
.38
)
(
0
.13
)
(
0
.51
)
15
.63
5/31/22
18
.13
0
.36
(
1
.40
)
(
1
.04
)
(
0
.37
)
(
0
.48
)
(
0
.85
)
16
.24
5/31/21
15
.97
0
.22
2
.35
2
.57
(
0
.30
)
(
0
.11
)
(
0
.41
)
18
.13
5/31/20
15
.11
0
.36
0
.87
1
.23
(
0
.35
)
(
0
.02
)
(
0
.37
)
15
.97
Premier
Class:
11/30/24
#
16
.51
0
.19
0
.84
1
.03
—
—
—
17
.54
5/31/24
15
.58
0
.45
1
.01
1
.46
(
0
.41
)
(
0
.12
)
(
0
.53
)
16
.51
5/31/23
16
.18
0
.38
(
0
.48
)
(
0
.10
)
(
0
.37
)
(
0
.13
)
(
0
.50
)
15
.58
5/31/22
18
.06
0
.37
(
1
.42
)
(
1
.05
)
(
0
.35
)
(
0
.48
)
(
0
.83
)
16
.18
5/31/21
15
.92
0
.27
2
.26
2
.53
(
0
.28
)
(
0
.11
)
(
0
.39
)
18
.06
5/31/20
15
.06
0
.35
0
.86
1
.21
(
0
.33
)
(
0
.02
)
(
0
.35
)
15
.92
Class
R6:
11/30/24
#
16
.58
0
.21
0
.83
1
.04
—
—
—
17
.62
5/31/24
15
.63
0
.46
1
.04
1
.50
(
0
.43
)
(
0
.12
)
(
0
.55
)
16
.58
5/31/23
16
.24
0
.41
(
0
.50
)
(
0
.09
)
(
0
.39
)
(
0
.13
)
(
0
.52
)
15
.63
5/31/22
18
.13
0
.38
(
1
.41
)
(
1
.03
)
(
0
.38
)
(
0
.48
)
(
0
.86
)
16
.24
5/31/21
15
.97
0
.30
2
.28
2
.58
(
0
.31
)
(
0
.11
)
(
0
.42
)
18
.13
5/31/20
15
.11
0
.36
0
.87
1
.23
(
0
.35
)
(
0
.02
)
(
0
.37
)
15
.97
Retirement
Class:
11/30/24
#
16
.41
0
.18
0
.84
1
.02
—
—
—
17
.43
5/31/24
15
.48
0
.42
1
.02
1
.44
(
0
.39
)
(
0
.12
)
(
0
.51
)
16
.41
5/31/23
16
.08
0
.37
(
0
.49
)
(
0
.12
)
(
0
.35
)
(
0
.13
)
(
0
.48
)
15
.48
5/31/22
17
.96
0
.33
(
1
.39
)
(
1
.06
)
(
0
.34
)
(
0
.48
)
(
0
.82
)
16
.08
5/31/21
15
.83
0
.25
2
.26
2
.51
(
0
.27
)
(
0
.11
)
(
0
.38
)
17
.96
5/31/20
14
.98
0
.32
0
.87
1
.19
(
0
.32
)
(
0
.02
)
(
0
.34
)
15
.83
#
Unaudited
a
Based
on
average
shares
outstanding.
b
Total
returns
are
not
annualized.
c
Percentage
is
annualized.
g
The
Fund's
expenses
include
the
expenses
of
the
Underlying
Funds.
j
Short-term
and
long-term
capital
gain
distributions
received
from
the
underlying
Funds
are
presented
in
net
realized
and
unrealized
gain
(loss)
on
total
investments
for
all
periods
presented.
See
Notes
to
Financial
Statements
Ratios
and
Supplemental
Data
Ratios
to
Average
Net
Assets
Total
Return
b
Net
Assets,
End
of
Period
(000)
Gross
Expenses
g
Net
Expenses
g
Net
Investment
Income
(Loss)
Portfolio
Turnover
Rate
6
.27
%
$
1,059
0
.33
%
c
0
.21
%
c
2
.31
%
c
8
%
9
.63
1,188
0
.32
0
.20
2
.74
17
(
0
.53
)
2,024
0
.31
0
.19
2
.52
22
(
6
.16
)
1,715
0
.32
0
.20
2
.03
23
16
.18
1,950
0
.32
0
.19
1
.28
28
8
.16
123
0
.26
0
.12
2
.30
22
6
.24
18,256
0
.38
c
0
.25
c
2
.26
c
8
9
.57
17,901
0
.37
0
.25
2
.79
17
(
0
.60
)
19,016
0
.37
0
.25
2
.47
22
(
6
.19
)
21,048
0
.38
0
.25
2
.07
23
15
.99
43,665
0
.38
0
.25
1
.56
28
8
.06
31,580
0
.40
0
.25
2
.20
22
6
.27
586,495
0
.23
c
0
.10
c
2
.40
c
8
9
.76
559,325
0
.22
0
.10
2
.90
17
(
0
.44
)
553,938
0
.22
0
.10
2
.63
22
(
6
.07
)
526,583
0
.22
0
.10
2
.12
23
16
.22
560,852
0
.23
0
.10
1
.71
28
8
.18
442,192
0
.25
0
.10
2
.32
22
6
.22
53,471
0
.48
c
0
.35
c
2
.15
c
8
9
.44
50,800
0
.47
0
.35
2
.66
17
(
0
.66
)
55,650
0
.47
0
.35
2
.39
22
(
6
.32
)
68,666
0
.47
0
.35
1
.88
23
15
.91
81,534
0
.48
0
.35
1
.46
28
7
.93
74,599
0
.50
0
.35
2
.08
22
Financial
Highlights
(continued)
See
Notes
to
Financial
Statements
Financial
Highlights
(continued)
Investment
Operations
Less
Distributions
Net
Asset
Value,
Beginning
of
Period
Net
Investment
Income
(Loss)
a
Net
Realized/
Unrealized
Gain
(Loss)
j
Total
From
Net
Investment
Income
From
Net
Realized
Gains
Total
Net
Asset
Value,
End
of
Period
14.3
Lifecycle
Index
2015
Class
I:
11/30/24
#
$
17
.50
$
0
.19
$
0
.98
$
1
.17
$
—
$
—
$
—
$
18
.67
5/31/24
16
.45
0
.45
1
.26
1
.71
(
0
.43
)
(
0
.23
)
(
0
.66
)
17
.50
5/31/23
17
.04
0
.40
(
0
.48
)
(
0
.08
)
(
0
.40
)
(
0
.11
)
(
0
.51
)
16
.45
5/31/22
19
.14
0
.40
(
1
.55
)
(
1
.15
)
(
0
.38
)
(
0
.57
)
(
0
.95
)
17
.04
5/31/21
16
.65
0
.23
2
.75
2
.98
(
0
.33
)
(
0
.16
)
(
0
.49
)
19
.14
5/31/20
15
.76
0
.39
0
.90
1
.29
(
0
.37
)
(
0
.03
)
(
0
.40
)
16
.65
Premier
Class:
11/30/24
#
17
.42
0
.18
0
.97
1
.15
—
—
—
18
.57
5/31/24
16
.37
0
.45
1
.25
1
.70
(
0
.42
)
(
0
.23
)
(
0
.65
)
17
.42
5/31/23
16
.97
0
.39
(
0
.49
)
(
0
.10
)
(
0
.39
)
(
0
.11
)
(
0
.50
)
16
.37
5/31/22
19
.07
0
.41
(
1
.57
)
(
1
.16
)
(
0
.37
)
(
0
.57
)
(
0
.94
)
16
.97
5/31/21
16
.58
0
.28
2
.68
2
.96
(
0
.31
)
(
0
.16
)
(
0
.47
)
19
.07
5/31/20
15
.69
0
.36
0
.91
1
.27
(
0
.35
)
(
0
.03
)
(
0
.38
)
16
.58
Class
R6:
11/30/24
#
17
.51
0
.20
0
.97
1
.17
—
—
—
18
.68
5/31/24
16
.46
0
.48
1
.25
1
.73
(
0
.45
)
(
0
.23
)
(
0
.68
)
17
.51
5/31/23
17
.05
0
.42
(
0
.48
)
(
0
.06
)
(
0
.42
)
(
0
.11
)
(
0
.53
)
16
.46
5/31/22
19
.15
0
.39
(
1
.52
)
(
1
.13
)
(
0
.40
)
(
0
.57
)
(
0
.97
)
17
.05
5/31/21
16
.65
0
.31
2
.69
3
.00
(
0
.34
)
(
0
.16
)
(
0
.50
)
19
.15
5/31/20
15
.76
0
.38
0
.92
1
.30
(
0
.38
)
(
0
.03
)
(
0
.41
)
16
.65
Retirement
Class:
11/30/24
#
17
.36
0
.18
0
.96
1
.14
—
—
—
18
.50
5/31/24
16
.32
0
.43
1
.25
1
.68
(
0
.41
)
(
0
.23
)
(
0
.64
)
17
.36
5/31/23
16
.92
0
.37
(
0
.48
)
(
0
.11
)
(
0
.38
)
(
0
.11
)
(
0
.49
)
16
.32
5/31/22
19
.00
0
.34
(
1
.50
)
(
1
.16
)
(
0
.35
)
(
0
.57
)
(
0
.92
)
16
.92
5/31/21
16
.52
0
.26
2
.67
2
.93
(
0
.29
)
(
0
.16
)
(
0
.45
)
19
.00
5/31/20
15
.64
0
.33
0
.91
1
.24
(
0
.33
)
(
0
.03
)
(
0
.36
)
16
.52
#
Unaudited
a
Based
on
average
shares
outstanding.
b
Total
returns
are
not
annualized.
c
Percentage
is
annualized.
g
The
Fund's
expenses
include
the
expenses
of
the
Underlying
Funds.
j
Short-term
and
long-term
capital
gain
distributions
received
from
the
underlying
Funds
are
presented
in
net
realized
and
unrealized
gain
(loss)
on
total
investments
for
all
periods
presented.
See
Notes
to
Financial
Statements
Ratios
and
Supplemental
Data
Ratios
to
Average
Net
Assets
Total
Return
b
Net
Assets,
End
of
Period
(000)
Gross
Expenses
g
Net
Expenses
g
Net
Investment
Income
(Loss)
Portfolio
Turnover
Rate
6
.69
%
$
1,242
0
.31
%
c
0
.21
%
c
2
.07
%
c
5
%
10
.57
1,259
0
.30
0
.20
2
.65
15
(
0
.33
)
1,700
0
.30
0
.20
2
.48
18
(
6
.40
)
1,657
0
.31
0
.20
2
.13
19
18
.05
1,396
0
.31
0
.20
1
.28
26
8
.19
592
0
.30
0
.18
2
.38
25
6
.60
28,949
0
.36
c
0
.25
c
2
.04
c
5
10
.57
29,222
0
.36
0
.25
2
.67
15
(
0
.45
)
30,386
0
.35
0
.25
2
.41
18
(
6
.49
)
34,529
0
.36
0
.25
2
.16
19
18
.00
98,140
0
.36
0
.25
1
.55
26
8
.12
85,350
0
.37
0
.25
2
.18
25
6
.68
951,289
0
.21
c
0
.10
c
2
.18
c
5
10
.75
934,070
0
.21
0
.10
2
.82
15
(
0
.28
)
921,164
0
.20
0
.10
2
.55
18
(
6
.32
)
966,867
0
.21
0
.10
2
.08
19
18
.16
962,220
0
.21
0
.10
1
.71
26
8
.24
819,474
0
.23
0
.10
2
.33
25
6
.57
77,899
0
.46
c
0
.35
c
1
.94
c
5
10
.43
82,794
0
.46
0
.35
2
.58
15
(
0
.56
)
88,804
0
.45
0
.35
2
.31
18
(
6
.51
)
100,537
0
.46
0
.35
1
.83
19
17
.88
126,902
0
.46
0
.35
1
.44
26
7
.96
122,731
0
.47
0
.35
2
.05
25
Financial
Highlights
(continued)
See
Notes
to
Financial
Statements
Financial
Highlights
(continued)
Investment
Operations
Less
Distributions
Net
Asset
Value,
Beginning
of
Period
Net
Investment
Income
(Loss)
a
Net
Realized/
Unrealized
Gain
(Loss)
j
Total
From
Net
Investment
Income
From
Net
Realized
Gains
Total
Net
Asset
Value,
End
of
Period
14.4
Lifecycle
Index
2020
Class
I:
11/30/24
#
$
19
.17
$
0
.19
$
1
.14
$
1
.33
$
—
$
—
$
—
$
20
.50
5/31/24
17
.76
0
.49
1
.54
2
.03
(
0
.46
)
(
0
.16
)
(
0
.62
)
19
.17
5/31/23
18
.36
0
.41
(
0
.48
)
(
0
.07
)
(
0
.41
)
(
0
.12
)
(
0
.53
)
17
.76
5/31/22
20
.67
0
.41
(
1
.68
)
(
1
.27
)
(
0
.41
)
(
0
.63
)
(
1
.04
)
18
.36
5/31/21
17
.61
0
.27
3
.23
3
.50
(
0
.34
)
(
0
.10
)
(
0
.44
)
20
.67
5/31/20
16
.64
0
.43
0
.94
1
.37
(
0
.38
)
(
0
.02
)
(
0
.40
)
17
.61
Premier
Class:
11/30/24
#
19
.10
0
.18
1
.14
1
.32
—
—
—
20
.42
5/31/24
17
.69
0
.48
1
.54
2
.02
(
0
.45
)
(
0
.16
)
(
0
.61
)
19
.10
5/31/23
18
.29
0
.40
(
0
.48
)
(
0
.08
)
(
0
.40
)
(
0
.12
)
(
0
.52
)
17
.69
5/31/22
20
.59
0
.44
(
1
.72
)
(
1
.28
)
(
0
.39
)
(
0
.63
)
(
1
.02
)
18
.29
5/31/21
17
.55
0
.30
3
.17
3
.47
(
0
.33
)
(
0
.10
)
(
0
.43
)
20
.59
5/31/20
16
.57
0
.38
0
.99
1
.37
(
0
.37
)
(
0
.02
)
(
0
.39
)
17
.55
Class
R6:
11/30/24
#
19
.20
0
.20
1
.15
1
.35
—
—
—
20
.55
5/31/24
17
.79
0
.50
1
.55
2
.05
(
0
.48
)
(
0
.16
)
(
0
.64
)
19
.20
5/31/23
18
.39
0
.43
(
0
.48
)
(
0
.05
)
(
0
.43
)
(
0
.12
)
(
0
.55
)
17
.79
5/31/22
20
.70
0
.41
(
1
.66
)
(
1
.25
)
(
0
.43
)
(
0
.63
)
(
1
.06
)
18
.39
5/31/21
17
.63
0
.33
3
.20
3
.53
(
0
.36
)
(
0
.10
)
(
0
.46
)
20
.70
5/31/20
16
.65
0
.40
0
.99
1
.39
(
0
.39
)
(
0
.02
)
(
0
.41
)
17
.63
Retirement
Class:
11/30/24
#
19
.02
0
.17
1
.14
1
.31
—
—
—
20
.33
5/31/24
17
.63
0
.45
1
.53
1
.98
(
0
.43
)
(
0
.16
)
(
0
.59
)
19
.02
5/31/23
18
.22
0
.38
(
0
.47
)
(
0
.09
)
(
0
.38
)
(
0
.12
)
(
0
.50
)
17
.63
5/31/22
20
.52
0
.36
(
1
.66
)
(
1
.30
)
(
0
.37
)
(
0
.63
)
(
1
.00
)
18
.22
5/31/21
17
.48
0
.28
3
.17
3
.45
(
0
.31
)
(
0
.10
)
(
0
.41
)
20
.52
5/31/20
16
.51
0
.35
0
.99
1
.34
(
0
.35
)
(
0
.02
)
(
0
.37
)
17
.48
#
Unaudited
a
Based
on
average
shares
outstanding.
b
Total
returns
are
not
annualized.
c
Percentage
is
annualized.
g
The
Fund's
expenses
include
the
expenses
of
the
Underlying
Funds.
j
Short-term
and
long-term
capital
gain
distributions
received
from
the
underlying
Funds
are
presented
in
net
realized
and
unrealized
gain
(loss)
on
total
investments
for
all
periods
presented.
See
Notes
to
Financial
Statements
Ratios
and
Supplemental
Data
Ratios
to
Average
Net
Assets
Total
Return
b
Net
Assets,
End
of
Period
(000)
Gross
Expenses
g
Net
Expenses
g
Net
Investment
Income
(Loss)
Portfolio
Turnover
Rate
6
.94
%
$
7,940
0
.30
%
c
0
.21
%
c
1
.86
%
c
4
%
11
.60
8,484
0
.29
0
.20
2
.66
14
(
0
.27
)
10,266
0
.29
0
.20
2
.36
19
(
6
.60
)
10,672
0
.30
0
.20
2
.03
19
20
.00
11,420
0
.30
0
.20
1
.37
21
8
.25
4,832
0
.31
0
.21
2
.51
20
6
.91
73,259
0
.34
c
0
.25
c
1
.81
c
4
11
.59
72,849
0
.34
0
.25
2
.63
14
(
0
.32
)
78,463
0
.34
0
.25
2
.30
19
(
6
.65
)
82,754
0
.35
0
.25
2
.13
19
19
.89
316,253
0
.35
0
.25
1
.55
21
8
.25
268,403
0
.36
0
.25
2
.16
20
7
.03
2,844,348
0
.19
c
0
.10
c
1
.96
c
4
11
.75
2,805,493
0
.19
0
.10
2
.73
14
(
0
.21
)
2,736,922
0
.19
0
.10
2
.44
19
(
6
.51
)
2,756,707
0
.19
0
.10
2
.01
19
20
.14
2,729,084
0
.20
0
.10
1
.72
21
8
.36
2,221,699
0
.21
0
.10
2
.32
20
6
.89
190,585
0
.44
c
0
.35
c
1
.72
c
4
11
.39
196,934
0
.44
0
.35
2
.48
14
(
0
.39
)
208,039
0
.44
0
.35
2
.20
19
(
6
.76
)
247,101
0
.44
0
.35
1
.78
19
19
.85
310,428
0
.45
0
.35
1
.46
21
8
.10
303,700
0
.46
0
.35
2
.05
20
Financial
Highlights
(continued)
See
Notes
to
Financial
Statements
Financial
Highlights
(continued)
Investment
Operations
Less
Distributions
Net
Asset
Value,
Beginning
of
Period
Net
Investment
Income
(Loss)
a
Net
Realized/
Unrealized
Gain
(Loss)
j
Total
From
Net
Investment
Income
From
Net
Realized
Gains
Total
Net
Asset
Value,
End
of
Period
14.5
Lifecycle
Index
2025
Class
I:
11/30/24
#
$
21
.41
$
0
.18
$
1
.39
$
1
.57
$
—
$
—
$
—
$
22
.98
5/31/24
19
.45
0
.51
1
.96
2
.47
(
0
.48
)
(
0
.03
)
(
0
.51
)
21
.41
5/31/23
20
.02
0
.44
(
0
.47
)
(
0
.03
)
(
0
.42
)
(
0
.12
)
(
0
.54
)
19
.45
5/31/22
22
.32
0
.42
(
1
.85
)
(
1
.43
)
(
0
.43
)
(
0
.44
)
(
0
.87
)
20
.02
5/31/21
18
.50
0
.31
3
.96
4
.27
(
0
.36
)
(
0
.09
)
(
0
.45
)
22
.32
5/31/20
17
.47
0
.42
1
.03
1
.45
(
0
.40
)
(
0
.02
)
(
0
.42
)
18
.50
Premier
Class:
11/30/24
#
21
.36
0
.18
1
.38
1
.56
—
—
—
22
.92
5/31/24
19
.40
0
.51
1
.95
2
.46
(
0
.47
)
(
0
.03
)
(
0
.50
)
21
.36
5/31/23
19
.98
0
.42
(
0
.47
)
(
0
.05
)
(
0
.41
)
(
0
.12
)
(
0
.53
)
19
.40
5/31/22
22
.26
0
.47
(
1
.90
)
(
1
.43
)
(
0
.41
)
(
0
.44
)
(
0
.85
)
19
.98
5/31/21
18
.45
0
.32
3
.92
4
.24
(
0
.34
)
(
0
.09
)
(
0
.43
)
22
.26
5/31/20
17
.41
0
.39
1
.05
1
.44
(
0
.38
)
(
0
.02
)
(
0
.40
)
18
.45
Class
R6:
11/30/24
#
21
.46
0
.19
1
.39
1
.58
—
—
—
23
.04
5/31/24
19
.49
0
.53
1
.97
2
.50
(
0
.50
)
(
0
.03
)
(
0
.53
)
21
.46
5/31/23
20
.07
0
.45
(
0
.47
)
(
0
.02
)
(
0
.44
)
(
0
.12
)
(
0
.56
)
19
.49
5/31/22
22
.36
0
.43
(
1
.83
)
(
1
.40
)
(
0
.45
)
(
0
.44
)
(
0
.89
)
20
.07
5/31/21
18
.53
0
.35
3
.94
4
.29
(
0
.37
)
(
0
.09
)
(
0
.46
)
22
.36
5/31/20
17
.49
0
.42
1
.05
1
.47
(
0
.41
)
(
0
.02
)
(
0
.43
)
18
.53
Retirement
Class:
11/30/24
#
21
.25
0
.16
1
.37
1
.53
—
—
—
22
.78
5/31/24
19
.30
0
.48
1
.95
2
.43
(
0
.45
)
(
0
.03
)
(
0
.48
)
21
.25
5/31/23
19
.87
0
.40
(
0
.47
)
(
0
.07
)
(
0
.38
)
(
0
.12
)
(
0
.50
)
19
.30
5/31/22
22
.15
0
.37
(
1
.82
)
(
1
.45
)
(
0
.39
)
(
0
.44
)
(
0
.83
)
19
.87
5/31/21
18
.36
0
.30
3
.90
4
.20
(
0
.32
)
(
0
.09
)
(
0
.41
)
22
.15
5/31/20
17
.34
0
.37
1
.03
1
.40
(
0
.36
)
(
0
.02
)
(
0
.38
)
18
.36
#
Unaudited
a
Based
on
average
shares
outstanding.
b
Total
returns
are
not
annualized.
c
Percentage
is
annualized.
g
The
Fund's
expenses
include
the
expenses
of
the
Underlying
Funds.
j
Short-term
and
long-term
capital
gain
distributions
received
from
the
underlying
Funds
are
presented
in
net
realized
and
unrealized
gain
(loss)
on
total
investments
for
all
periods
presented.
See
Notes
to
Financial
Statements
Ratios
and
Supplemental
Data
Ratios
to
Average
Net
Assets
Total
Return
b
Net
Assets,
End
of
Period
(000)
Gross
Expenses
g
Net
Expenses
g
Net
Investment
Income
(Loss)
Portfolio
Turnover
Rate
7
.33
%
$
19,245
0
.28
%
c
0
.21
%
c
1
.62
%
c
5
%
12
.84
20,650
0
.29
0
.21
2
.50
15
(
0
.06
)
22,052
0
.28
0
.20
2
.30
14
(
6
.78
)
21,746
0
.29
0
.21
1
.92
14
23
.20
17,472
0
.29
0
.20
1
.47
18
8
.23
2,837
0
.30
0
.21
2
.30
17
7
.30
135,866
0
.33
c
0
.25
c
1
.57
c
5
12
.83
128,403
0
.33
0
.25
2
.50
15
(
0
.17
)
119,308
0
.33
0
.25
2
.20
14
(
6
.79
)
123,482
0
.34
0
.25
2
.06
14
23
.11
466,892
0
.34
0
.25
1
.55
18
8
.24
357,784
0
.35
0
.26
2
.15
17
7
.36
5,680,563
0
.18
c
0
.10
c
1
.72
c
5
12
.98
5,430,992
0
.18
0
.10
2
.62
15
(
0
.01
)
4,888,761
0
.18
0
.10
2
.33
14
(
6
.65
)
4,582,423
0
.19
0
.10
1
.95
14
23
.29
4,263,286
0
.19
0
.10
1
.71
18
8
.35
3,152,216
0
.20
0
.11
2
.31
17
7
.20
360,114
0
.43
c
0
.35
c
1
.47
c
5
12
.73
371,965
0
.43
0
.35
2
.39
15
(
0
.23
)
391,021
0
.43
0
.35
2
.10
14
(
6
.91
)
420,997
0
.44
0
.35
1
.71
14
22
.99
481,282
0
.44
0
.35
1
.46
18
8
.05
424,099
0
.46
0
.36
2
.05
17
Financial
Highlights
(continued)
See
Notes
to
Financial
Statements
Financial
Highlights
(continued)
Investment
Operations
Less
Distributions
Net
Asset
Value,
Beginning
of
Period
Net
Investment
Income
(Loss)
a
Net
Realized/
Unrealized
Gain
(Loss)
j
Total
From
Net
Investment
Income
From
Net
Realized
Gains
Total
Net
Asset
Value,
End
of
Period
14.6
Lifecycle
Index
2030
Class
I:
11/30/24
#
$
23
.66
$
0
.16
$
1
.69
$
1
.85
$
—
$
—
$
—
$
25
.51
5/31/24
21
.14
0
.53
2
.52
3
.05
(
0
.50
)
(
0
.03
)
(
0
.53
)
23
.66
5/31/23
21
.68
0
.45
(
0
.45
)
—
(
0
.42
)
(
0
.12
)
(
0
.54
)
21
.14
5/31/22
24
.04
0
.43
(
2
.03
)
(
1
.60
)
(
0
.45
)
(
0
.31
)
(
0
.76
)
21
.68
5/31/21
19
.38
0
.31
4
.80
5
.11
(
0
.37
)
(
0
.08
)
(
0
.45
)
24
.04
5/31/20
18
.31
0
.42
1
.09
1
.51
(
0
.42
)
(
0
.02
)
(
0
.44
)
19
.38
Premier
Class:
11/30/24
#
23
.57
0
.15
1
.69
1
.84
—
—
—
25
.41
5/31/24
21
.06
0
.53
2
.50
3
.03
(
0
.49
)
(
0
.03
)
(
0
.52
)
23
.57
5/31/23
21
.60
0
.43
(
0
.44
)
(
0
.01
)
(
0
.41
)
(
0
.12
)
(
0
.53
)
21
.06
5/31/22
23
.96
0
.50
(
2
.12
)
(
1
.62
)
(
0
.43
)
(
0
.31
)
(
0
.74
)
21
.60
5/31/21
19
.31
0
.34
4
.75
5
.09
(
0
.36
)
(
0
.08
)
(
0
.44
)
23
.96
5/31/20
18
.24
0
.41
1
.09
1
.50
(
0
.41
)
(
0
.02
)
(
0
.43
)
19
.31
Class
R6:
11/30/24
#
23
.70
0
.17
1
.71
1
.88
—
—
—
25
.58
5/31/24
21
.18
0
.56
2
.51
3
.07
(
0
.52
)
(
0
.03
)
(
0
.55
)
23
.70
5/31/23
21
.72
0
.46
(
0
.44
)
0
.02
(
0
.44
)
(
0
.12
)
(
0
.56
)
21
.18
5/31/22
24
.08
0
.45
(
2
.03
)
(
1
.58
)
(
0
.47
)
(
0
.31
)
(
0
.78
)
21
.72
5/31/21
19
.40
0
.38
4
.77
5
.15
(
0
.39
)
(
0
.08
)
(
0
.47
)
24
.08
5/31/20
18
.33
0
.44
1
.08
1
.52
(
0
.43
)
(
0
.02
)
(
0
.45
)
19
.40
Retirement
Class:
11/30/24
#
23
.46
0
.14
1
.68
1
.82
—
—
—
25
.28
5/31/24
20
.97
0
.50
2
.49
2
.99
(
0
.47
)
(
0
.03
)
(
0
.50
)
23
.46
5/31/23
21
.51
0
.41
(
0
.44
)
(
0
.03
)
(
0
.39
)
(
0
.12
)
(
0
.51
)
20
.97
5/31/22
23
.85
0
.39
(
2
.01
)
(
1
.62
)
(
0
.41
)
(
0
.31
)
(
0
.72
)
21
.51
5/31/21
19
.22
0
.32
4
.72
5
.04
(
0
.33
)
(
0
.08
)
(
0
.41
)
23
.85
5/31/20
18
.16
0
.39
1
.08
1
.47
(
0
.39
)
(
0
.02
)
(
0
.41
)
19
.22
#
Unaudited
a
Based
on
average
shares
outstanding.
b
Total
returns
are
not
annualized.
c
Percentage
is
annualized.
g
The
Fund's
expenses
include
the
expenses
of
the
Underlying
Funds.
j
Short-term
and
long-term
capital
gain
distributions
received
from
the
underlying
Funds
are
presented
in
net
realized
and
unrealized
gain
(loss)
on
total
investments
for
all
periods
presented.
See
Notes
to
Financial
Statements
Ratios
and
Supplemental
Data
Ratios
to
Average
Net
Assets
Total
Return
b
Net
Assets,
End
of
Period
(000)
Gross
Expenses
g
Net
Expenses
g
Net
Investment
Income
(Loss)
Portfolio
Turnover
Rate
7
.82
%
$
35,676
0
.28
%
c
0
.21
%
c
1
.30
%
c
4
%
14
.57
34,837
0
.28
0
.21
2
.37
12
0
.15
33,509
0
.28
0
.20
2
.17
12
(
6
.94
)
26,880
0
.28
0
.20
1
.83
13
26
.54
23,352
0
.29
0
.20
1
.38
16
8
.20
5,671
0
.30
0
.21
2
.20
15
7
.81
179,108
0
.33
c
0
.25
c
1
.25
c
4
14
.53
161,501
0
.33
0
.26
2
.41
12
0
.09
150,728
0
.33
0
.25
2
.09
12
(
7
.00
)
150,515
0
.33
0
.25
2
.04
13
26
.45
475,693
0
.34
0
.25
1
.54
16
8
.14
344,547
0
.35
0
.25
2
.14
15
7
.93
8,029,491
0
.18
c
0
.10
c
1
.39
c
4
14
.66
7,365,843
0
.18
0
.11
2
.50
12
0
.24
6,168,804
0
.18
0
.10
2
.22
12
(
6
.86
)
5,483,743
0
.18
0
.10
1
.88
13
26
.70
4,966,053
0
.19
0
.10
1
.70
16
8
.25
3,449,438
0
.20
0
.10
2
.30
15
7
.76
462,999
0
.43
c
0
.35
c
1
.15
c
4
14
.39
456,305
0
.43
0
.36
2
.28
12
(
0
.02
)
430,522
0
.43
0
.35
1
.97
12
(
7
.07
)
445,022
0
.43
0
.35
1
.66
13
26
.40
496,871
0
.44
0
.35
1
.45
16
8
.02
419,628
0
.45
0
.35
2
.04
15
Financial
Highlights
(continued)
See
Notes
to
Financial
Statements
Financial
Highlights
(continued)
Investment
Operations
Less
Distributions
Net
Asset
Value,
Beginning
of
Period
Net
Investment
Income
(Loss)
a
Net
Realized/
Unrealized
Gain
(Loss)
j
Total
From
Net
Investment
Income
From
Net
Realized
Gains
Total
Net
Asset
Value,
End
of
Period
14.7
Lifecycle
Index
2035
Class
I:
11/30/24
#
$
26
.00
$
0
.13
$
2
.05
$
2
.18
$
—
$
—
$
—
$
28
.18
5/31/24
22
.78
0
.55
3
.19
3
.74
(
0
.52
)
—
(
0
.52
)
26
.00
5/31/23
23
.24
0
.45
(
0
.35
)
0
.10
(
0
.43
)
(
0
.13
)
(
0
.56
)
22
.78
5/31/22
25
.73
0
.44
(
2
.19
)
(
1
.75
)
(
0
.47
)
(
0
.27
)
(
0
.74
)
23
.24
5/31/21
20
.18
0
.32
5
.70
6
.02
(
0
.39
)
(
0
.08
)
(
0
.47
)
25
.73
5/31/20
19
.10
0
.50
1
.04
1
.54
(
0
.44
)
(
0
.02
)
(
0
.46
)
20
.18
Premier
Class:
11/30/24
#
25
.89
0
.12
2
.05
2
.17
—
—
—
28
.06
5/31/24
22
.69
0
.54
3
.17
3
.71
(
0
.51
)
—
(
0
.51
)
25
.89
5/31/23
23
.14
0
.43
(
0
.33
)
0
.10
(
0
.42
)
(
0
.13
)
(
0
.55
)
22
.69
5/31/22
25
.63
0
.51
(
2
.27
)
(
1
.76
)
(
0
.46
)
(
0
.27
)
(
0
.73
)
23
.14
5/31/21
20
.11
0
.36
5
.61
5
.97
(
0
.37
)
(
0
.08
)
(
0
.45
)
25
.63
5/31/20
19
.02
0
.43
1
.11
1
.54
(
0
.43
)
(
0
.02
)
(
0
.45
)
20
.11
Class
R6:
11/30/24
#
26
.06
0
.14
2
.06
2
.20
—
—
—
28
.26
5/31/24
22
.83
0
.58
3
.19
3
.77
(
0
.54
)
—
(
0
.54
)
26
.06
5/31/23
23
.28
0
.47
(
0
.34
)
0
.13
(
0
.45
)
(
0
.13
)
(
0
.58
)
22
.83
5/31/22
25
.77
0
.46
(
2
.18
)
(
1
.72
)
(
0
.50
)
(
0
.27
)
(
0
.77
)
23
.28
5/31/21
20
.21
0
.40
5
.64
6
.04
(
0
.40
)
(
0
.08
)
(
0
.48
)
25
.77
5/31/20
19
.12
0
.46
1
.11
1
.57
(
0
.46
)
(
0
.02
)
(
0
.48
)
20
.21
Retirement
Class:
11/30/24
#
25
.77
0
.11
2
.03
2
.14
—
—
—
27
.91
5/31/24
22
.59
0
.52
3
.14
3
.66
(
0
.48
)
—
(
0
.48
)
25
.77
5/31/23
23
.04
0
.41
(
0
.33
)
0
.08
(
0
.40
)
(
0
.13
)
(
0
.53
)
22
.59
5/31/22
25
.52
0
.40
(
2
.18
)
(
1
.78
)
(
0
.43
)
(
0
.27
)
(
0
.70
)
23
.04
5/31/21
20
.02
0
.33
5
.60
5
.93
(
0
.35
)
(
0
.08
)
(
0
.43
)
25
.52
5/31/20
18
.94
0
.41
1
.10
1
.51
(
0
.41
)
(
0
.02
)
(
0
.43
)
20
.02
#
Unaudited
a
Based
on
average
shares
outstanding.
b
Total
returns
are
not
annualized.
c
Percentage
is
annualized.
g
The
Fund's
expenses
include
the
expenses
of
the
Underlying
Funds.
j
Short-term
and
long-term
capital
gain
distributions
received
from
the
underlying
Funds
are
presented
in
net
realized
and
unrealized
gain
(loss)
on
total
investments
for
all
periods
presented.
See
Notes
to
Financial
Statements
Ratios
and
Supplemental
Data
Ratios
to
Average
Net
Assets
Total
Return
b
Net
Assets,
End
of
Period
(000)
Gross
Expenses
g
Net
Expenses
g
Net
Investment
Income
(Loss)
Portfolio
Turnover
Rate
8
.38
%
$
28,752
0
.28
%
c
0
.21
%
c
0
.94
%
c
4
%
16
.57
27,533
0
.28
0
.21
2
.26
11
0
.56
25,308
0
.27
0
.20
2
.03
12
(
7
.09
)
18,143
0
.28
0
.20
1
.72
12
30
.03
15,231
0
.28
0
.20
1
.37
15
8
.02
3,623
0
.29
0
.20
2
.51
14
8
.38
211,203
0
.32
c
0
.25
c
0
.90
c
4
16
.49
194,855
0
.33
0
.26
2
.25
11
0
.54
169,166
0
.32
0
.25
1
.96
12
(
7
.18
)
161,087
0
.33
0
.25
1
.97
12
29
.90
470,422
0
.33
0
.25
1
.54
15
8
.02
331,062
0
.34
0
.26
2
.15
14
8
.44
8,661,288
0
.17
c
0
.10
c
1
.05
c
4
16
.68
7,806,878
0
.18
0
.11
2
.37
11
0
.69
6,172,055
0
.17
0
.10
2
.11
12
(
7
.00
)
5,330,114
0
.18
0
.10
1
.81
12
30
.12
4,697,189
0
.18
0
.10
1
.70
15
8
.12
3,151,680
0
.19
0
.11
2
.30
14
8
.30
436,549
0
.42
c
0
.35
c
0
.80
c
4
16
.36
428,608
0
.43
0
.36
2
.14
11
0
.43
398,405
0
.42
0
.35
1
.86
12
(
7
.26
)
401,495
0
.43
0
.35
1
.58
12
29
.81
451,962
0
.43
0
.35
1
.45
15
7
.89
372,294
0
.44
0
.36
2
.04
14
Financial
Highlights
(continued)
See
Notes
to
Financial
Statements
Financial
Highlights
(continued)
Investment
Operations
Less
Distributions
Net
Asset
Value,
Beginning
of
Period
Net
Investment
Income
(Loss)
a
Net
Realized/
Unrealized
Gain
(Loss)
j
Total
From
Net
Investment
Income
From
Net
Realized
Gains
Total
Net
Asset
Value,
End
of
Period
14.8
Lifecycle
Index
2040
Class
I:
11/30/24
#
$
28
.15
$
0
.08
$
2
.48
$
2
.56
$
—
$
—
$
—
$
30
.71
5/31/24
24
.16
0
.55
3
.97
4
.52
(
0
.53
)
—
(
0
.53
)
28
.15
5/31/23
24
.51
0
.47
(
0
.24
)
0
.23
(
0
.45
)
(
0
.13
)
(
0
.58
)
24
.16
5/31/22
27
.16
0
.47
(
2
.32
)
(
1
.85
)
(
0
.51
)
(
0
.29
)
(
0
.80
)
24
.51
5/31/21
20
.69
0
.31
6
.64
6
.95
(
0
.40
)
(
0
.08
)
(
0
.48
)
27
.16
5/31/20
19
.63
0
.47
1
.07
1
.54
(
0
.46
)
(
0
.02
)
(
0
.48
)
20
.69
Premier
Class:
11/30/24
#
28
.02
0
.07
2
.47
2
.54
—
—
—
30
.56
5/31/24
24
.05
0
.56
3
.93
4
.49
(
0
.52
)
—
(
0
.52
)
28
.02
5/31/23
24
.40
0
.44
(
0
.23
)
0
.21
(
0
.43
)
(
0
.13
)
(
0
.56
)
24
.05
5/31/22
27
.04
0
.54
(
2
.40
)
(
1
.86
)
(
0
.49
)
(
0
.29
)
(
0
.78
)
24
.40
5/31/21
20
.60
0
.36
6
.54
6
.90
(
0
.38
)
(
0
.08
)
(
0
.46
)
27
.04
5/31/20
19
.55
0
.44
1
.07
1
.51
(
0
.44
)
(
0
.02
)
(
0
.46
)
20
.60
Class
R6:
11/30/24
#
28
.20
0
.09
2
.49
2
.58
—
—
—
30
.78
5/31/24
24
.20
0
.58
3
.98
4
.56
(
0
.56
)
—
(
0
.56
)
28
.20
5/31/23
24
.55
0
.48
(
0
.23
)
0
.25
(
0
.47
)
(
0
.13
)
(
0
.60
)
24
.20
5/31/22
27
.19
0
.48
(
2
.30
)
(
1
.82
)
(
0
.53
)
(
0
.29
)
(
0
.82
)
24
.55
5/31/21
20
.71
0
.41
6
.56
6
.97
(
0
.41
)
(
0
.08
)
(
0
.49
)
27
.19
5/31/20
19
.65
0
.47
1
.08
1
.55
(
0
.47
)
(
0
.02
)
(
0
.49
)
20
.71
Retirement
Class:
11/30/24
#
27
.91
0
.05
2
.47
2
.52
—
—
—
30
.43
5/31/24
23
.96
0
.52
3
.93
4
.45
(
0
.50
)
—
(
0
.50
)
27
.91
5/31/23
24
.30
0
.42
(
0
.22
)
0
.20
(
0
.41
)
(
0
.13
)
(
0
.54
)
23
.96
5/31/22
26
.93
0
.42
(
2
.30
)
(
1
.88
)
(
0
.46
)
(
0
.29
)
(
0
.75
)
24
.30
5/31/21
20
.52
0
.34
6
.51
6
.85
(
0
.36
)
(
0
.08
)
(
0
.44
)
26
.93
5/31/20
19
.47
0
.42
1
.07
1
.49
(
0
.42
)
(
0
.02
)
(
0
.44
)
20
.52
#
Unaudited
a
Based
on
average
shares
outstanding.
b
Total
returns
are
not
annualized.
c
Percentage
is
annualized.
g
The
Fund's
expenses
include
the
expenses
of
the
Underlying
Funds.
j
Short-term
and
long-term
capital
gain
distributions
received
from
the
underlying
Funds
are
presented
in
net
realized
and
unrealized
gain
(loss)
on
total
investments
for
all
periods
presented.
See
Notes
to
Financial
Statements
Ratios
and
Supplemental
Data
Ratios
to
Average
Net
Assets
Total
Return
b
Net
Assets,
End
of
Period
(000)
Gross
Expenses
g
Net
Expenses
g
Net
Investment
Income
(Loss)
Portfolio
Turnover
Rate
9
.09
%
$
28,606
0
.27
%
c
0
.20
%
c
0
.52
%
c
4
%
18
.90
28,684
0
.27
0
.21
2
.10
9
1
.05
24,491
0
.27
0
.20
2
.00
13
(
7
.12
)
21,468
0
.27
0
.20
1
.75
12
33
.78
16,071
0
.28
0
.20
1
.25
14
7
.75
3,215
0
.28
0
.19
2
.30
11
9
.06
214,275
0
.32
c
0
.25
c
0
.47
c
4
18
.86
200,053
0
.32
0
.26
2
.14
9
0
.99
176,064
0
.32
0
.25
1
.88
13
(
7
.18
)
172,180
0
.32
0
.25
1
.98
12
33
.69
447,061
0
.33
0
.25
1
.50
14
7
.65
291,837
0
.34
0
.25
2
.12
11
9
.15
9,208,224
0
.17
c
0
.10
c
0
.62
c
4
19
.02
8,245,416
0
.17
0
.11
2
.23
9
1
.15
6,388,981
0
.17
0
.10
2
.03
13
(
7
.00
)
5,515,470
0
.17
0
.10
1
.78
12
33
.87
4,914,220
0
.18
0
.10
1
.68
14
7
.81
3,297,735
0
.19
0
.10
2
.28
11
9
.03
417,409
0
.42
c
0
.35
c
0
.37
c
4
18
.72
400,006
0
.42
0
.36
2
.02
9
0
.93
374,723
0
.42
0
.35
1
.79
13
(
7
.26
)
385,438
0
.42
0
.35
1
.55
12
33
.55
435,795
0
.43
0
.35
1
.42
14
7
.58
348,208
0
.44
0
.35
2
.02
11
Financial
Highlights
(continued)
See
Notes
to
Financial
Statements
Financial
Highlights
(continued)
Investment
Operations
Less
Distributions
Net
Asset
Value,
Beginning
of
Period
Net
Investment
Income
(Loss)
a
Net
Realized/
Unrealized
Gain
(Loss)
j
Total
From
Net
Investment
Income
From
Net
Realized
Gains
Total
Net
Asset
Value,
End
of
Period
14.9
Lifecycle
Index
2045
Class
I:
11/30/24
#
$
29
.52
$
0
.04
$
2
.78
$
2
.82
$
—
$
—
$
—
$
32
.34
5/31/24
25
.00
0
.55
4
.51
5
.06
(
0
.54
)
—
(
0
.54
)
29
.52
5/31/23
25
.33
0
.46
(
0
.23
)
0
.23
(
0
.45
)
(
0
.11
)
(
0
.56
)
25
.00
5/31/22
27
.93
0
.49
(
2
.38
)
(
1
.89
)
(
0
.53
)
(
0
.18
)
(
0
.71
)
25
.33
5/31/21
20
.65
0
.32
7
.39
7
.71
(
0
.39
)
(
0
.04
)
(
0
.43
)
27
.93
5/31/20
19
.66
0
.48
0
.99
1
.47
(
0
.46
)
(
0
.02
)
(
0
.48
)
20
.65
Premier
Class:
11/30/24
#
29
.43
0
.03
2
.77
2
.80
—
—
—
32
.23
5/31/24
24
.92
0
.56
4
.48
5
.04
(
0
.53
)
—
(
0
.53
)
29
.43
5/31/23
25
.25
0
.44
(
0
.23
)
0
.21
(
0
.43
)
(
0
.11
)
(
0
.54
)
24
.92
5/31/22
27
.83
0
.62
(
2
.51
)
(
1
.89
)
(
0
.51
)
(
0
.18
)
(
0
.69
)
25
.25
5/31/21
20
.58
0
.36
7
.31
7
.67
(
0
.38
)
(
0
.04
)
(
0
.42
)
27
.83
5/31/20
19
.60
0
.44
1
.01
1
.45
(
0
.45
)
(
0
.02
)
(
0
.47
)
20
.58
Class
R6:
11/30/24
#
29
.59
0
.06
2
.78
2
.84
—
—
—
32
.43
5/31/24
25
.05
0
.59
4
.52
5
.11
(
0
.57
)
—
(
0
.57
)
29
.59
5/31/23
25
.39
0
.48
(
0
.24
)
0
.24
(
0
.47
)
(
0
.11
)
(
0
.58
)
25
.05
5/31/22
27
.98
0
.49
(
2
.35
)
(
1
.86
)
(
0
.55
)
(
0
.18
)
(
0
.73
)
25
.39
5/31/21
20
.68
0
.41
7
.34
7
.75
(
0
.41
)
(
0
.04
)
(
0
.45
)
27
.98
5/31/20
19
.69
0
.47
1
.02
1
.49
(
0
.48
)
(
0
.02
)
(
0
.50
)
20
.68
Retirement
Class:
11/30/24
#
29
.27
0
.02
2
.75
2
.77
—
—
—
32
.04
5/31/24
24
.79
0
.52
4
.47
4
.99
(
0
.51
)
—
(
0
.51
)
29
.27
5/31/23
25
.12
0
.42
(
0
.23
)
0
.19
(
0
.41
)
(
0
.11
)
(
0
.52
)
24
.79
5/31/22
27
.70
0
.43
(
2
.35
)
(
1
.92
)
(
0
.48
)
(
0
.18
)
(
0
.66
)
25
.12
5/31/21
20
.49
0
.34
7
.26
7
.60
(
0
.35
)
(
0
.04
)
(
0
.39
)
27
.70
5/31/20
19
.51
0
.42
1
.01
1
.43
(
0
.43
)
(
0
.02
)
(
0
.45
)
20
.49
#
Unaudited
a
Based
on
average
shares
outstanding.
b
Total
returns
are
not
annualized.
c
Percentage
is
annualized.
g
The
Fund's
expenses
include
the
expenses
of
the
Underlying
Funds.
j
Short-term
and
long-term
capital
gain
distributions
received
from
the
underlying
Funds
are
presented
in
net
realized
and
unrealized
gain
(loss)
on
total
investments
for
all
periods
presented.
See
Notes
to
Financial
Statements
Ratios
and
Supplemental
Data
Ratios
to
Average
Net
Assets
Total
Return
b
Net
Assets,
End
of
Period
(000)
Gross
Expenses
g
Net
Expenses
g
Net
Investment
Income
(Loss)
Portfolio
Turnover
Rate
9
.55
%
$
28,738
0
.27
%
c
0
.21
%
c
0
.26
%
c
4
%
20
.46
27,460
0
.27
0
.21
2
.01
8
1
.05
24,082
0
.27
0
.20
1
.90
10
(
7
.04
)
18,259
0
.27
0
.20
1
.77
11
37
.58
12,840
0
.28
0
.20
1
.29
11
7
.37
2,504
0
.29
0
.21
2
.31
6
9
.51
154,335
0
.32
c
0
.25
c
0
.22
c
4
20
.44
131,291
0
.32
0
.25
2
.06
8
0
.99
103,386
0
.32
0
.25
1
.84
10
(
7
.06
)
90,924
0
.32
0
.25
2
.17
11
37
.48
352,496
0
.32
0
.25
1
.47
11
7
.28
225,642
0
.34
0
.25
2
.12
6
9
.60
7,853,616
0
.17
c
0
.10
c
0
.37
c
4
20
.61
6,926,481
0
.17
0
.11
2
.16
8
1
.11
5,095,781
0
.17
0
.10
1
.96
10
(
6
.92
)
4,224,772
0
.17
0
.10
1
.75
11
37
.71
3,640,347
0
.17
0
.10
1
.65
11
7
.43
2,269,913
0
.19
0
.10
2
.27
6
9
.46
345,301
0
.42
c
0
.35
c
0
.12
c
4
20
.30
334,163
0
.42
0
.35
1
.94
8
0
.89
297,992
0
.42
0
.35
1
.76
10
(
7
.18
)
308,109
0
.42
0
.35
1
.54
11
37
.32
328,342
0
.42
0
.35
1
.40
11
7
.21
256,314
0
.44
0
.35
2
.03
6
Financial
Highlights
(continued)
See
Notes
to
Financial
Statements
Financial
Highlights
(continued)
Investment
Operations
Less
Distributions
Net
Asset
Value,
Beginning
of
Period
Net
Investment
Income
(Loss)
a
Net
Realized/
Unrealized
Gain
(Loss)
j
Total
From
Net
Investment
Income
From
Net
Realized
Gains
Total
Net
Asset
Value,
End
of
Period
15.01
Lifecycle
Index
2050
Class
I:
11/30/24
#
$
30
.06
$
0
.02
$
2
.90
$
2
.92
$
—
$
—
$
—
$
32
.98
5/31/24
25
.32
0
.54
4
.78
5
.32
(
0
.55
)
(
0
.03
)
(
0
.58
)
30
.06
5/31/23
25
.64
0
.48
(
0
.26
)
0
.22
(
0
.45
)
(
0
.09
)
(
0
.54
)
25
.32
5/31/22
28
.21
0
.49
(
2
.40
)
(
1
.91
)
(
0
.54
)
(
0
.12
)
(
0
.66
)
25
.64
5/31/21
20
.72
0
.33
7
.58
7
.91
(
0
.39
)
(
0
.03
)
(
0
.42
)
28
.21
5/31/20
19
.73
0
.50
0
.97
1
.47
(
0
.46
)
(
0
.02
)
(
0
.48
)
20
.72
Premier
Class:
11/30/24
#
29
.94
0
.01
2
.89
2
.90
—
—
—
32
.84
5/31/24
25
.23
0
.56
4
.72
5
.28
(
0
.54
)
(
0
.03
)
(
0
.57
)
29
.94
5/31/23
25
.54
0
.44
(
0
.23
)
0
.21
(
0
.43
)
(
0
.09
)
(
0
.52
)
25
.23
5/31/22
28
.09
0
.64
(
2
.55
)
(
1
.91
)
(
0
.52
)
(
0
.12
)
(
0
.64
)
25
.54
5/31/21
20
.63
0
.36
7
.51
7
.87
(
0
.38
)
(
0
.03
)
(
0
.41
)
28
.09
5/31/20
19
.65
0
.44
1
.01
1
.45
(
0
.45
)
(
0
.02
)
(
0
.47
)
20
.63
Class
R6:
11/30/24
#
30
.12
0
.04
2
.91
2
.95
—
—
—
33
.07
5/31/24
25
.37
0
.59
4
.77
5
.36
(
0
.58
)
(
0
.03
)
(
0
.61
)
30
.12
5/31/23
25
.69
0
.47
(
0
.23
)
0
.24
(
0
.47
)
(
0
.09
)
(
0
.56
)
25
.37
5/31/22
28
.25
0
.49
(
2
.37
)
(
1
.88
)
(
0
.56
)
(
0
.12
)
(
0
.68
)
25
.69
5/31/21
20
.75
0
.41
7
.53
7
.94
(
0
.41
)
(
0
.03
)
(
0
.44
)
28
.25
5/31/20
19
.75
0
.47
1
.03
1
.50
(
0
.48
)
(
0
.02
)
(
0
.50
)
20
.75
Retirement
Class:
11/30/24
#
29
.77
(
0
.00
)
d
2
.88
2
.88
—
—
—
32
.65
5/31/24
25
.09
0
.52
4
.70
5
.22
(
0
.51
)
(
0
.03
)
(
0
.54
)
29
.77
5/31/23
25
.41
0
.42
(
0
.25
)
0
.17
(
0
.40
)
(
0
.09
)
(
0
.49
)
25
.09
5/31/22
27
.95
0
.42
(
2
.35
)
(
1
.93
)
(
0
.49
)
(
0
.12
)
(
0
.61
)
25
.41
5/31/21
20
.54
0
.34
7
.45
7
.79
(
0
.35
)
(
0
.03
)
(
0
.38
)
27
.95
5/31/20
19
.56
0
.42
1
.01
1
.43
(
0
.43
)
(
0
.02
)
(
0
.45
)
20
.54
#
Unaudited
a
Based
on
average
shares
outstanding.
b
Total
returns
are
not
annualized.
c
Percentage
is
annualized.
d
Value
rounded
to
zero.
g
The
Fund's
expenses
include
the
expenses
of
the
Underlying
Funds.
j
Short-term
and
long-term
capital
gain
distributions
received
from
the
underlying
Funds
are
presented
in
net
realized
and
unrealized
gain
(loss)
on
total
investments
for
all
periods
presented.
See
Notes
to
Financial
Statements
Ratios
and
Supplemental
Data
Ratios
to
Average
Net
Assets
Total
Return
b
Net
Assets,
End
of
Period
(000)
Gross
Expenses
g
Net
Expenses
g
Net
Investment
Income
(Loss)
Portfolio
Turnover
Rate
9
.71
%
$
24,410
0
.27
%
c
0
.20
%
c
0
.15
%
c
3
%
21
.23
22,004
0
.27
0
.21
1
.98
7
0
.99
19,403
0
.27
0
.20
1
.96
8
(
7
.04
)
14,242
0
.27
0
.20
1
.75
11
38
.42
10,851
0
.27
0
.20
1
.30
9
7
.35
2,546
0
.28
0
.20
2
.41
5
9
.69
110,139
0
.32
c
0
.25
c
0
.09
c
3
21
.13
96,700
0
.32
0
.26
2
.03
7
0
.96
83,196
0
.32
0
.25
1
.79
8
(
7
.06
)
80,318
0
.32
0
.25
2
.20
11
38
.36
295,691
0
.33
0
.25
1
.47
9
7
.26
188,481
0
.34
0
.25
2
.11
5
9
.79
6,720,595
0
.17
c
0
.10
c
0
.24
c
3
21
.34
5,863,809
0
.17
0
.11
2
.12
7
1
.07
4,258,463
0
.17
0
.10
1
.93
8
(
6
.92
)
3,473,689
0
.17
0
.10
1
.75
11
38
.50
2,948,578
0
.18
0
.10
1
.63
9
7
.46
1,786,312
0
.19
0
.10
2
.26
5
9
.67
291,000
0
.42
c
0
.35
c
(
0
.01
)
c
3
21
.01
282,437
0
.42
0
.36
1
.91
7
0
.82
251,668
0
.42
0
.35
1
.74
8
(
7
.15
)
271,085
0
.42
0
.35
1
.52
11
38
.15
285,738
0
.43
0
.35
1
.41
9
7
.19
218,846
0
.45
0
.35
2
.04
5
Financial
Highlights
(continued)
See
Notes
to
Financial
Statements
Financial
Highlights
(continued)
Investment
Operations
Less
Distributions
Net
Asset
Value,
Beginning
of
Period
Net
Investment
Income
(Loss)
a
Net
Realized/
Unrealized
Gain
(Loss)
j
Total
From
Net
Investment
Income
From
Net
Realized
Gains
Total
Net
Asset
Value,
End
of
Period
15.1
Lifecycle
Index
2055
Class
I:
11/30/24
#
$
24
.30
$
0
.01
$
2
.37
$
2
.38
$
—
$
—
$
—
$
26
.68
5/31/24
20
.42
0
.42
3
.92
4
.34
(
0
.44
)
(
0
.02
)
(
0
.46
)
24
.30
5/31/23
20
.66
0
.36
(
0
.18
)
0
.18
(
0
.36
)
(
0
.06
)
(
0
.42
)
20
.42
5/31/22
22
.66
0
.38
(
1
.92
)
(
1
.54
)
(
0
.43
)
(
0
.03
)
(
0
.46
)
20
.66
5/31/21
16
.57
0
.29
6
.13
6
.42
(
0
.31
)
(
0
.02
)
(
0
.33
)
22
.66
5/31/20
15
.79
0
.35
0
.82
1
.17
(
0
.37
)
(
0
.02
)
(
0
.39
)
16
.57
Premier
Class:
11/30/24
#
24
.27
0
.01
2
.36
2
.37
—
—
—
26
.64
5/31/24
20
.39
0
.47
3
.86
4
.33
(
0
.43
)
(
0
.02
)
(
0
.45
)
24
.27
5/31/23
20
.63
0
.35
(
0
.19
)
0
.16
(
0
.34
)
(
0
.06
)
(
0
.40
)
20
.39
5/31/22
22
.62
0
.53
(
2
.07
)
(
1
.54
)
(
0
.42
)
(
0
.03
)
(
0
.45
)
20
.63
5/31/21
16
.54
0
.29
6
.11
6
.40
(
0
.30
)
(
0
.02
)
(
0
.32
)
22
.62
5/31/20
15
.76
0
.35
0
.81
1
.16
(
0
.36
)
(
0
.02
)
(
0
.38
)
16
.54
Class
R6:
11/30/24
#
24
.35
0
.03
2
.37
2
.40
—
—
—
26
.75
5/31/24
20
.46
0
.47
3
.90
4
.37
(
0
.46
)
(
0
.02
)
(
0
.48
)
24
.35
5/31/23
20
.70
0
.38
(
0
.19
)
0
.19
(
0
.37
)
(
0
.06
)
(
0
.43
)
20
.46
5/31/22
22
.70
0
.40
(
1
.92
)
(
1
.52
)
(
0
.45
)
(
0
.03
)
(
0
.48
)
20
.70
5/31/21
16
.59
0
.32
6
.14
6
.46
(
0
.33
)
(
0
.02
)
(
0
.35
)
22
.70
5/31/20
15
.80
0
.37
0
.82
1
.19
(
0
.38
)
(
0
.02
)
(
0
.40
)
16
.59
Retirement
Class:
11/30/24
#
24
.19
(
0
.01
)
2
.36
2
.35
—
—
—
26
.54
5/31/24
20
.33
0
.42
3
.87
4
.29
(
0
.41
)
(
0
.02
)
(
0
.43
)
24
.19
5/31/23
20
.57
0
.35
(
0
.20
)
0
.15
(
0
.33
)
(
0
.06
)
(
0
.39
)
20
.33
5/31/22
22
.56
0
.34
(
1
.91
)
(
1
.57
)
(
0
.39
)
(
0
.03
)
(
0
.42
)
20
.57
5/31/21
16
.50
0
.28
6
.08
6
.36
(
0
.28
)
(
0
.02
)
(
0
.30
)
22
.56
5/31/20
15
.73
0
.34
0
.79
1
.13
(
0
.34
)
(
0
.02
)
(
0
.36
)
16
.50
#
Unaudited
a
Based
on
average
shares
outstanding.
b
Total
returns
are
not
annualized.
c
Percentage
is
annualized.
g
The
Fund's
expenses
include
the
expenses
of
the
Underlying
Funds.
j
Short-term
and
long-term
capital
gain
distributions
received
from
the
underlying
Funds
are
presented
in
net
realized
and
unrealized
gain
(loss)
on
total
investments
for
all
periods
presented.
See
Notes
to
Financial
Statements
Ratios
and
Supplemental
Data
Ratios
to
Average
Net
Assets
Total
Return
b
Net
Assets,
End
of
Period
(000)
Gross
Expenses
g
Net
Expenses
g
Net
Investment
Income
(Loss)
Portfolio
Turnover
Rate
9
.79
%
$
21,226
0
.27
%
c
0
.20
%
c
0
.11
%
c
3
%
21
.49
19,948
0
.27
0
.20
1
.90
7
1
.02
16,680
0
.27
0
.20
1
.85
7
(
7
.00
)
12,050
0
.28
0
.20
1
.71
11
38
.98
8,251
0
.28
0
.20
1
.46
6
7
.24
1,534
0
.29
0
.20
2
.13
7
9
.77
48,127
0
.32
c
0
.25
c
0
.05
c
3
21
.47
41,614
0
.33
0
.26
2
.11
7
0
.95
37,212
0
.33
0
.25
1
.78
7
(
7
.02
)
33,219
0
.33
0
.25
2
.28
11
38
.91
142,662
0
.33
0
.25
1
.45
6
7
.19
79,521
0
.35
0
.26
2
.09
7
9
.86
4,141,693
0
.17
c
0
.10
c
0
.20
c
3
21
.61
3,521,489
0
.18
0
.11
2
.11
7
1
.10
2,428,738
0
.18
0
.10
1
.92
7
(
6
.91
)
1,822,272
0
.18
0
.10
1
.75
11
39
.14
1,478,111
0
.18
0
.10
1
.61
6
7
.37
801,496
0
.20
0
.11
2
.23
7
9
.71
176,915
0
.42
c
0
.35
c
(
0
.05
)
c
3
21
.32
165,330
0
.43
0
.36
1
.89
7
0
.85
135,316
0
.43
0
.35
1
.76
7
(
7
.13
)
149,174
0
.43
0
.35
1
.52
11
38
.76
149,564
0
.43
0
.35
1
.44
6
7
.05
114,986
0
.46
0
.36
2
.02
7
Financial
Highlights
(continued)
See
Notes
to
Financial
Statements
Financial
Highlights
(continued)
Investment
Operations
Less
Distributions
Net
Asset
Value,
Beginning
of
Period
Net
Investment
Income
(Loss)
a
Net
Realized/
Unrealized
Gain
(Loss)
j
Total
From
Net
Investment
Income
From
Net
Realized
Gains
Total
Net
Asset
Value,
End
of
Period
15.2
Lifecycle
Index
2060
Class
I:
11/30/24
#
$
18
.87
$
0
.01
$
1
.85
$
1
.86
$
—
$
—
$
—
$
20
.73
5/31/24
15
.81
0
.33
3
.09
3
.42
(
0
.34
)
(
0
.02
)
(
0
.36
)
18
.87
5/31/23
15
.98
0
.29
(
0
.15
)
0
.14
(
0
.27
)
(
0
.04
)
(
0
.31
)
15
.81
5/31/22
17
.51
0
.29
(
1
.48
)
(
1
.19
)
(
0
.33
)
(
0
.01
)
(
0
.34
)
15
.98
5/31/21
12
.75
0
.20
4
.81
5
.01
(
0
.24
)
(
0
.01
)
(
0
.25
)
17
.51
5/31/20
12
.15
0
.27
0
.62
0
.89
(
0
.28
)
(
0
.01
)
(
0
.29
)
12
.75
Premier
Class:
11/30/24
#
18
.84
0
.00
d
1
.85
1
.85
—
—
—
20
.69
5/31/24
15
.79
0
.34
3
.06
3
.40
(
0
.33
)
(
0
.02
)
(
0
.35
)
18
.84
5/31/23
15
.96
0
.27
(
0
.13
)
0
.14
(
0
.27
)
(
0
.04
)
(
0
.31
)
15
.79
5/31/22
17
.48
0
.40
(
1
.59
)
(
1
.19
)
(
0
.32
)
(
0
.01
)
(
0
.33
)
15
.96
5/31/21
12
.73
0
.22
4
.77
4
.99
(
0
.23
)
(
0
.01
)
(
0
.24
)
17
.48
5/31/20
12
.13
0
.27
0
.61
0
.88
(
0
.27
)
(
0
.01
)
(
0
.28
)
12
.73
Class
R6:
11/30/24
#
18
.89
0
.02
1
.86
1
.88
—
—
—
20
.77
5/31/24
15
.83
0
.36
3
.08
3
.44
(
0
.36
)
(
0
.02
)
(
0
.38
)
18
.89
5/31/23
15
.99
0
.29
(
0
.12
)
0
.17
(
0
.29
)
(
0
.04
)
(
0
.33
)
15
.83
5/31/22
17
.52
0
.30
(
1
.47
)
(
1
.17
)
(
0
.35
)
(
0
.01
)
(
0
.36
)
15
.99
5/31/21
12
.75
0
.25
4
.78
5
.03
(
0
.25
)
(
0
.01
)
(
0
.26
)
17
.52
5/31/20
12
.14
0
.28
0
.63
0
.91
(
0
.29
)
(
0
.01
)
(
0
.30
)
12
.75
Retirement
Class:
11/30/24
#
18
.79
(
0
.01
)
1
.85
1
.84
—
—
—
20
.63
5/31/24
15
.75
0
.32
3
.06
3
.38
(
0
.32
)
(
0
.02
)
(
0
.34
)
18
.79
5/31/23
15
.92
0
.27
(
0
.15
)
0
.12
(
0
.25
)
(
0
.04
)
(
0
.29
)
15
.75
5/31/22
17
.44
0
.26
(
1
.46
)
(
1
.20
)
(
0
.31
)
(
0
.01
)
(
0
.32
)
15
.92
5/31/21
12
.70
0
.22
4
.75
4
.97
(
0
.22
)
(
0
.01
)
(
0
.23
)
17
.44
5/31/20
12
.11
0
.26
0
.60
0
.86
(
0
.26
)
(
0
.01
)
(
0
.27
)
12
.70
#
Unaudited
a
Based
on
average
shares
outstanding.
b
Total
returns
are
not
annualized.
c
Percentage
is
annualized.
d
Value
rounded
to
zero.
g
The
Fund's
expenses
include
the
expenses
of
the
Underlying
Funds.
j
Short-term
and
long-term
capital
gain
distributions
received
from
the
underlying
Funds
are
presented
in
net
realized
and
unrealized
gain
(loss)
on
total
investments
for
all
periods
presented.
See
Notes
to
Financial
Statements
Ratios
and
Supplemental
Data
Ratios
to
Average
Net
Assets
Total
Return
b
Net
Assets,
End
of
Period
(000)
Gross
Expenses
g
Net
Expenses
g
Net
Investment
Income
(Loss)
Portfolio
Turnover
Rate
9
.86
%
$
14,344
0
.27
%
c
0
.20
%
c
0
.06
%
c
3
%
21
.83
13,382
0
.28
0
.21
1
.94
7
1
.05
10,940
0
.28
0
.20
1
.89
7
(
7
.01
)
9,092
0
.29
0
.20
1
.69
10
39
.51
5,527
0
.30
0
.20
1
.31
6
7
.21
1,292
0
.35
0
.20
2
.11
16
9
.82
30,787
0
.33
c
0
.25
c
0
.01
c
3
21
.74
25,989
0
.33
0
.26
1
.99
7
0
.99
21,158
0
.34
0
.25
1
.76
7
(
7
.01
)
15,601
0
.34
0
.25
2
.23
10
39
.44
40,943
0
.35
0
.25
1
.42
6
7
.17
17,927
0
.41
0
.26
2
.09
16
9
.95
2,351,866
0
.18
c
0
.10
c
0
.16
c
3
21
.91
1,951,599
0
.18
0
.11
2
.09
7
1
.20
1,257,068
0
.19
0
.10
1
.92
7
(
6
.93
)
828,871
0
.19
0
.10
1
.75
10
39
.68
600,348
0
.21
0
.10
1
.59
6
7
.36
267,485
0
.26
0
.11
2
.21
16
9
.79
95,083
0
.43
c
0
.35
c
(
0
.09
)
c
3
21
.62
87,137
0
.43
0
.36
1
.89
7
0
.90
63,746
0
.44
0
.35
1
.79
7
(
7
.11
)
67,009
0
.44
0
.35
1
.50
10
39
.33
55,903
0
.45
0
.35
1
.43
6
7
.01
37,293
0
.51
0
.36
2
.00
16
Financial
Highlights
(continued)
See
Notes
to
Financial
Statements
Financial
Highlights
(continued)
Investment
Operations
Less
Distributions
Net
Asset
Value,
Beginning
of
Period
Net
Investment
Income
(Loss)
a
Net
Realized/
Unrealized
Gain
(Loss)
j
Total
From
Net
Investment
Income
From
Net
Realized
Gains
Total
Net
Asset
Value,
End
of
Period
15.3
Lifecycle
Index
2065
Class
I:
11/30/24
#
$
13
.36
$
0
.00
d
$
1
.33
$
1
.33
$
—
$
—
$
—
$
14
.69
5/31/24
11
.17
0
.25
2
.19
2
.44
(
0
.24
)
(
0
.01
)
(
0
.25
)
13
.36
5/31/23
11
.27
0
.12
0
.00
d
0
.12
(
0
.20
)
(
0
.02
)
(
0
.22
)
11
.17
5/31/22
12
.46
0
.22
(
1
.04
)
(
0
.82
)
(
0
.36
)
(
0
.01
)
(
0
.37
)
11
.27
5/31/21
*
10
.00
0
.16
2
.48
2
.64
(
0
.18
)
—
(
0
.18
)
12
.46
Premier
Class:
11/30/24
#
13
.35
(
0
.00
)
d
1
.32
1
.32
—
—
—
14
.67
5/31/24
11
.16
0
.30
2
.14
2
.44
(
0
.24
)
(
0
.01
)
(
0
.25
)
13
.35
5/31/23
11
.26
0
.19
(
0
.08
)
0
.11
(
0
.19
)
(
0
.02
)
(
0
.21
)
11
.16
5/31/22
12
.46
0
.18
(
1
.01
)
(
0
.83
)
(
0
.36
)
(
0
.01
)
(
0
.37
)
11
.26
5/31/21
*
10
.00
0
.16
2
.48
2
.64
(
0
.18
)
—
(
0
.18
)
12
.46
Class
R6:
11/30/24
#
13
.53
0
.01
1
.35
1
.36
—
—
—
14
.89
5/31/24
11
.31
0
.26
2
.22
2
.48
(
0
.25
)
(
0
.01
)
(
0
.26
)
13
.53
5/31/23
11
.40
0
.21
(
0
.08
)
0
.13
(
0
.20
)
(
0
.02
)
(
0
.22
)
11
.31
5/31/22
12
.45
0
.21
(
1
.02
)
(
0
.81
)
(
0
.23
)
(
0
.01
)
(
0
.24
)
11
.40
5/31/21
*
10
.00
0
.15
2
.48
2
.63
(
0
.18
)
—
(
0
.18
)
12
.45
Retirement
Class:
11/30/24
#
13
.36
(
0
.01
)
1
.32
1
.31
—
—
—
14
.67
5/31/24
11
.17
0
.23
2
.20
2
.43
(
0
.23
)
(
0
.01
)
(
0
.24
)
13
.36
5/31/23
11
.27
0
.17
(
0
.07
)
0
.10
(
0
.18
)
(
0
.02
)
(
0
.20
)
11
.17
5/31/22
12
.44
0
.17
(
1
.04
)
(
0
.87
)
(
0
.29
)
(
0
.01
)
(
0
.30
)
11
.27
5/31/21
*
10
.00
0
.15
2
.46
2
.61
(
0
.17
)
—
(
0
.17
)
12
.44
#
Unaudited
*
The
Fund
commenced
operations
on
September
30,
2020.
a
Based
on
average
shares
outstanding.
b
Total
returns
are
not
annualized.
c
Percentage
is
annualized.
d
Value
rounded
to
zero.
g
The
Fund's
expenses
include
the
expenses
of
the
Underlying
Funds.
j
Short-term
and
long-term
capital
gain
distributions
received
from
the
underlying
Funds
are
presented
in
net
realized
and
unrealized
gain
(loss)
on
total
investments
for
all
periods
presented.
See
Notes
to
Financial
Statements
Ratios
and
Supplemental
Data
Ratios
to
Average
Net
Assets
Total
Return
b
Net
Assets,
End
of
Period
(000)
Gross
Expenses
g
Net
Expenses
g
Net
Investment
Income
(Loss)
Portfolio
Turnover
Rate
9
.96
%
$
3,921
0
.33
%
c
0
.20
%
c
0
.03
%
c
5
%
22
.08
3,787
0
.35
0
.19
2
.01
14
1
.22
2,377
0
.45
0
.18
1
.11
22
(
6
.83
)
716
0
.83
0
.13
1
.81
108
26
.48
626
4
.26
c
0
.25
c
2
.16
c
36
9
.89
3,367
0
.39
c
0
.25
c
(
0
.03
)
c
5
22
.03
2,811
0
.41
0
.26
2
.49
14
1
.11
1,229
0
.53
0
.25
1
.75
22
(
6
.90
)
808
0
.97
0
.25
1
.49
108
26
.48
637
4
.41
c
0
.25
c
2
.14
c
36
10
.05
445,313
0
.24
c
0
.10
c
0
.12
c
5
22
.12
322,206
0
.26
0
.11
2
.10
14
1
.29
119,873
0
.38
0
.10
1
.90
22
(
6
.70
)
44,526
0
.82
0
.11
1
.76
108
26
.45
7,131
3
.91
c
0
.10
c
2
.02
c
36
9
.81
12,833
0
.49
c
0
.35
c
(
0
.13
)
c
5
21
.93
10,219
0
.51
0
.36
1
.90
14
1
.03
4,689
0
.63
0
.35
1
.62
22
(
7
.26
)
1,740
1
.08
0
.36
1
.42
108
26
.35
693
4
.54
c
0
.35
c
2
.00
c
36
Notes
to
Financial
Statements
(Unaudited)
1.
General
Information
Trust
and
Fund
Information:
TIAA-CREF
Funds
(the
“Trust”)
is
an
open-end
management
investment
company
registered
under
the
Investment
Company
Act
of
1940,
(“1940
Act”),
as
amended.
The
Trust
is
comprised
of
the
following
(collectively
the
“Funds”
or
individually,
the
“Fund”),
among
others:
Current
Fiscal
Period:
The
end
of
the
reporting
period
for
the Funds
is
November
30,
2024,
and
the
period
covered
by
these
Notes
to
Financial
Statements
is
the
six
months
ended
November
30,
2024
(the
"current
fiscal
period").
Investment
Advisor:
Teachers
Advisors,
LLC
(the
"Adviser”),
a
wholly
owned
indirect
subsidiary
of
Teachers
Insurance
and
Annuity
Association
of
America
(“TIAA”),
is
registered
with
the
Securities
and
Exchange
Commission
(“SEC”)
as
an
investment
adviser
and
provides
investment
management
services
for
the
Funds.
Share
Classes
and
Sales
Charges:
Each
Fund
is
a
“fund
of
funds”
that
diversifies
its
assets
by
investing
in
Class
W
shares
of
other Nuveen
mutual
funds and
potentially
other
investment
pools
or
investment
products.
The
Funds
offer
Class
I,
Premier
Class,
Class
R6
and
Retirement
Class
shares.
Each
class
differs
by
the
allocation
of
class-specific
expenses
and
voting
rights
in
matters
affecting
a
single
class.
The
Funds
offer
their
shares,
without
a
sales
load,
through
their
principal
underwriter,
Nuveen
Securities,
LLC
(“Nuveen
Securities”),
which
is
a
wholly
owned
indirect
subsidiary
of
TIAA.
2.
Significant
Accounting
Policies
The
accompanying
financial
statements
were
prepared
in
accordance
with
accounting
principles
generally
accepted
in
the
United
States
of
America
(“U.S.
GAAP”),
which
may
require
the
use
of
estimates
made
by
management
and
the
evaluation
of
subsequent
events.
Actual
results
may
differ
from
those
estimates.
The Funds
are
investment
companies
and
follow
the
accounting
guidance
in
the
Financial
Accounting
Standards
Board
(“FASB”)
Accounting
Standards
Codification
946,
Financial
Services
—
Investment
Companies
. The net
asset
value
("NAV")
for
financial
reporting
purposes
may
differ
from
the NAV
for
processing
transactions.
The NAV
for
financial
reporting
purposes
includes
security
and shareholder
transactions
through
the
date
of
the
report.
Total
return
is
computed
based
on
the NAV
used
for
processing
transactions.
The
following
is
a
summary
of
the
significant
accounting
policies
consistently
followed
by
the
Funds.
Compensation:
The
Funds pay
the
members
of
the
Board
of
Trustees
("Board")
all
of
whom
are
independent,
certain
remuneration
for
their
services,
plus
travel
and
other
expenses.
The
Board
has
adopted
a
deferred
compensation
plan
for
independent
trustees
that
enables
trustees
to
elect
to
defer
receipt
of
all
or
a
portion
of
the
annual
compensation
they
are
entitled
to
receive
from
certain
Nuveen-advised
funds.
Under
the
plan,
deferred
amounts
are
treated
as
though
equal
dollar
amounts
had
been
invested
in
shares
of
select
Nuveen-advised
funds. Amounts
deferred
are
retained
by
the
Funds
until
paid.
Amounts
payable
to
the
trustees
for
compensation
are
included
separately
in the
accompanying
Statement
of
Assets
and
Liabilities.
Trustees’
fees,
including
any
deferred
compensation
incurred,
are
reflected
in
the
Statement
of
Operations.
Distributions
to
Shareholders:
Distributions
to
shareholders
are
recorded
on
the
ex-dividend
date.
The
amount,
character
and
timing
of
distributions
are
determined
in
accordance
with
federal
income
tax
regulations,
which
may
differ
from
U.S.
GAAP.
Fund
Name
Short
Name
Nuveen
Lifecycle
Index
Retirement
Income
Fund
Lifecycle
Index
Retirement
Income
Nuveen
Lifecycle
Index
2010
Fund
Lifecycle
Index
2010
Nuveen
Lifecycle
Index
2015
Fund
Lifecycle
Index
2015
Nuveen
Lifecycle
Index
2020
Fund
Lifecycle
Index
2020
Nuveen
Lifecycle
Index
2025
Fund
Lifecycle
Index
2025
Nuveen
Lifecycle
Index
2030
Fund
Lifecycle
Index
2030
Nuveen
Lifecycle
Index
2035
Fund
Lifecycle
Index
2035
Nuveen
Lifecycle
Index
2040
Fund
Lifecycle
Index
2040
Nuveen
Lifecycle
Index
2045
Fund
Lifecycle
Index
2045
Nuveen
Lifecycle
Index
2050
Fund
Lifecycle
Index
2050
Nuveen
Lifecycle
Index
2055
Fund
Lifecycle
Index
2055
Nuveen
Lifecycle
Index
2060
Fund
Lifecycle
Index
2060
Nuveen
Lifecycle
Index
2065
Fund
Lifecycle
Index
2065
Indemnification:
Under
the
Trust's
organizational
documents,
its
officers
and
trustees
are
indemnified
against
certain
liabilities
arising
out
of
the
performance
of
their
duties
to
the
Trust.
In
addition,
in
the
normal
course
of
business,
the
Trust
enters
into
contracts
that
provide
general
indemnifications
to
other
parties.
The
Trust's
maximum
exposure
under
these
arrangements
is
unknown
as
this
would
involve
future
claims
that
may
be
made
against
the
Trust
that
have
not
yet
occurred.
However,
the
Trust
has
not
had
prior
claims
or
losses
pursuant
to
these
contracts
and
expects
the
risk
of
loss
to
be
remote.
Investments
and
Investment
Income:
Securities
transactions
are
accounted
for
as
of
the
trade
date
for
financial
reporting
purposes.
Interest
income
is
recorded
on
an
accrual
basis
and
includes
accretion
of
discounts
and
amortization
of
premiums.
Dividend
income
is
recorded
on
the
ex-dividend
date. Realized
gains
and
losses
on
securities
transactions
are
based
upon
the
specific
identification
method.
Distributions
received
on
securities
that
represent
a
return
of
capital
or
capital
gains
are
recorded
as
a
reduction
of
cost
of
investments
and/or
as
a
realized
gain.
The
Funds
estimate
the
components
of
distributions
received
that
may
be
considered
return
of
capital
distributions
or
capital
gain
distributions.
Multiclass
Operations
and
Allocations:
Income, expenses,
realized
gains
and
losses
and
unrealized
appreciation
and
depreciation
of
a
Fund
are
allocated
on
a
pro
rata
basis
to
each
class
of
shares,
except
for
service
agreement
fees,
distribution
fees
and
transfer
agency
fees
and
expenses, which
are
unique
to
each
class
of
shares.
Most
expenses
of
the
Trust
can
be
directly
attributed
to
a
Fund.
Expenses
that
cannot
be
directly
attributed
are
allocated
to
each
Fund
in
the
Trust
based
upon
the
average
net
assets
of
each
Fund.
Netting
Agreements:
In
the
ordinary
course
of
business,
the Funds
may
enter
into
transactions
subject
to
enforceable
master
repurchase
agreements,
International
Swaps
and
Derivatives
Association,
Inc.
(ISDA)
master
agreements
or
other
similar
arrangements
(“netting
agreements”).
Generally,
the
right
to
offset
in
netting
agreements
allows
each Fund
to
offset
certain
securities
and
derivatives
with
a
specific
counterparty,
when
applicable,
as
well
as
any
collateral
received
or
delivered
to
that
counterparty
based
on
the
terms
of
the
agreements.
Generally,
each Fund
manages
its
cash
collateral
and
securities
collateral
on
a
counterparty
basis.
With
respect
to
certain
counterparties,
in
accordance
with
the
terms
of
the
netting
agreements,
collateral
posted
to
the Funds
is
held
in
a
segregated
account
by
the Funds'
custodian
and/or
with
respect
to
those
amounts
which
can
be
sold
or
repledged,
are
presented
in
the Funds'
Portfolio
of
Investments
or
Statement
of
Assets
and
Liabilities.
The Funds'
investments
subject
to
netting
agreements
as
of
the
end
of
the
reporting
period,
if
any,
are
further
described
later
in
these
Notes
to
Financial
Statements.
New
Accounting
Pronouncement:
In
November
2023,
the
FASB
issued
Accounting
Standard
Update
(“ASU”)
No.
2023-07,
Segment
Reporting
(Topic
280)
Improvements
to
Reportable
Segment
Disclosures
(“ASU
2023-07”).
The
amendments
in
ASU
2023-07
improve
reportable
segment
disclosure
requirements,
primarily
through
enhanced
disclosures
about
significant
segment
expenses.
ASU
2023-07
also
requires
a
public
entity
that
has
a
single
reportable
segment
to
provide
all
the
disclosures
required
by
the
amendments
in
ASU
2023-07
and
all
existing
segment
disclosures
in
Topic
280.
The
amendments
in
ASU
2023-07
are
effective
for
fiscal
years
beginning
after
December
15,
2023,
and
interim
periods
within
fiscal
years
beginning
after
December
15,
2024.
Early
adoption
is
permitted.
Management
has
assessed
the
new
guidance
and
determined
that
it
will
not
have
a
material
impact
on
the
financial
positions
or
results
of
operations
of
the
Funds.
3.
Investment
Valuation
and
Fair
Value
Measurements
The Funds'
investments
in
securities
are
recorded
at
their
estimated
fair
value
utilizing
valuation
methods
approved
by
the
Adviser,
subject
to
oversight
of
the
Board.
Fair
value
is
defined
as
the
price
that
would
be
received
upon
selling
an
investment
or
transferring
a
liability
in
an
orderly
transaction
to
an
independent
buyer
in
the
principal
or
most
advantageous
market
for
the
investment.
U.S.
GAAP
establishes
the
three-tier
hierarchy
that
is
used
to
maximize
the
use
of
observable
market
data
and
minimize
the
use
of
unobservable
inputs
and
to
establish
classification
of
fair
value
measurements
for
disclosure
purposes.
Observable
inputs
reflect
the
assumptions
market
participants
would
use
in
pricing
the
asset
or
liability.
Observable
inputs
are
based
on
market
data
obtained
from
sources
independent
of
the
reporting
entity.
Unobservable
inputs
reflect
management’s
assumptions
about
the
assumptions
market
participants
would
use
in
pricing
the
asset
or
liability.
Unobservable
inputs
are
based
on
the
best
information
available
in
the
circumstances.
The
following
is
a
summary
of
the
three-tiered
hierarchy
of
valuation
input
levels.
Level 1
–
Inputs
are
unadjusted
and
prices
are
determined
using
quoted
prices
in
active
markets
for
identical
securities.
Level
2
–
Prices
are
determined
using
other
significant
observable
inputs
(including
quoted
prices
for
similar
securities,
interest
rates,
credit
spreads,
etc.).
Level
3
–
Prices
are
determined
using
significant
unobservable
inputs
(including
management’s
assumptions
in
determining
the
fair
value
of
investments).
A
description
of
the
valuation
techniques
applied
to
the Funds'
major
classifications
of
assets
and
liabilities
measured
at
fair
value
follows:
Notes
to
Financial
Statements
(continued)
Exchange-traded
funds
listed
or
traded
on
a
national
market
or
exchange
are
valued
based
on
their
sale
price
at
the
official
close
of
business
of
such
market
or
exchange
on
the
valuation
date.
To
the
extent
these
securities
are
actively
traded
and
that
valuation
adjustments
are
not
applied,
they
are
generally
classified
as
Level
1.
Investments
in
investment
companies
are
valued
at
their
respective NAVs
or
share
price
on
the
valuation
date
and
are
generally
classified
as Level
1.
Repurchase
agreements
are
valued
at
contract
amount
plus
accrued
interest,
which
approximates
market
value.
These
securities
are
generally
classified
as
Level
2.
The
following
table
summarizes
the
market
value
of
the Funds’
investments
as
of
the
end
of
the
current
fiscal
period, based
on
the
inputs
used
to
value
them:
Fund
Level
1
Level
2
Level
3
Total
Lifecycle
Index
Retirement
Income
Registered
investment
companies
$698,053,549
$—
$—
$698,053,549
Short-term
investments
—
280,000
—
280,000
Total
$698,053,549
$280,000
$—
$698,333,549
1
1
1
1
1
Lifecycle
Index
2010
Registered
investment
companies
$658,362,015
$—
$—
$658,362,015
Short-term
investments
—
1,680,000
—
1,680,000
Total
$658,362,015
$1,680,000
$—
$660,042,015
1
1
1
1
1
Lifecycle
Index
2015
Registered
investment
companies
$1,058,165,583
$—
$—
$1,058,165,583
Short-term
investments
—
750,000
—
750,000
Total
$1,058,165,583
$750,000
$—
$1,058,915,583
1
1
1
1
1
Lifecycle
Index
2020
Registered
investment
companies
$3,112,390,818
$—
$—
$3,112,390,818
Short-term
investments
—
4,510,000
—
4,510,000
Total
$3,112,390,818
$4,510,000
$—
$3,116,900,818
1
1
1
1
1
Lifecycle
Index
2025
Registered
investment
companies
$6,188,236,447
$—
$—
$6,188,236,447
Short-term
investments
—
4,190,000
—
4,190,000
Total
$6,188,236,447
$4,190,000
$—
$6,192,426,447
1
1
1
1
1
Lifecycle
Index
2030
Registered
investment
companies
$8,696,641,952
$—
$—
$8,696,641,952
Short-term
investments
—
10,010,000
—
10,010,000
Total
$8,696,641,952
$10,010,000
$—
$8,706,651,952
1
1
1
1
1
Lifecycle
Index
2035
Registered
investment
companies
$9,327,442,838
$—
$—
$9,327,442,838
Short-term
investments
—
8,940,000
—
8,940,000
Total
$9,327,442,838
$8,940,000
$—
$9,336,382,838
1
1
1
1
1
Lifecycle
Index
2040
Registered
investment
companies
$9,854,488,387
$—
$—
$9,854,488,387
Short-term
investments
—
12,210,000
—
12,210,000
Total
$9,854,488,387
$12,210,000
$—
$9,866,698,387
1
1
1
1
1
Lifecycle
Index
2045
Registered
investment
companies
$8,368,535,834
$—
$—
$8,368,535,834
Short-term
investments
—
8,440,000
—
8,440,000
Total
$8,368,535,834
$8,440,000
$—
$8,376,975,834
1
1
1
1
1
Lifecycle
Index
2050
Registered
investment
companies
$7,134,237,913
$—
$—
$7,134,237,913
Short-term
investments
—
8,970,000
—
8,970,000
Total
$7,134,237,913
$8,970,000
$—
$7,143,207,913
1
1
1
1
1
Lifecycle
Index
2055
Registered
investment
companies
$4,381,354,918
$—
$—
$4,381,354,918
Short-term
investments
—
6,790,000
—
6,790,000
Total
$4,381,354,918
$6,790,000
$—
$4,388,144,918
1
1
1
1
1
Lifecycle
Index
2060
Registered
investment
companies
$2,487,057,204
$—
$—
$2,487,057,204
Short-term
investments
—
5,410,000
—
5,410,000
Total
$2,487,057,204
$5,410,000
$—
$2,492,467,204
1
1
1
1
1
4.
Portfolio
Securities
Repurchase
Agreements:
In
connection
with
transactions
in
repurchase
agreements,
it
is
the Fund’s policy
that
its
custodian
take
possession
of
the
underlying
collateral
securities,
the
fair
value
of
which
exceeds
the
principal
amount
of
the
repurchase
transaction,
including
accrued
interest,
at
all
times.
If
the
counterparty
defaults,
and
the
fair
value
of
the
collateral
declines,
realization
of
the
collateral
may
be
delayed
or
limited.
The
following
table
presents
the
repurchase
agreements
for
the Funds
that
are
subject
to
netting
agreements
as
of
the
end
of
the
reporting
period,
and
the
collateral
delivered
related
to
those
repurchase
agreements:
Purchases
and
Sales:
Long-term
purchases
and
sales
during
the
current
fiscal
period were
as
follows:
l
5.
Derivative
Investments
Each Fund is
authorized
to
invest
in
certain
derivative
instruments.
As
defined
by
U.S.
GAAP,
a
derivative is
a
financial
instrument
whose
value
is
derived
from
an
underlying
security
price,
foreign
exchange
rate,
interest
rate,
index
of
prices
or
rates,
or
other
variables.
Investments
in
derivatives
as
of
the
end
of
and/or
during
the
current
fiscal
period,
if
any,
are
included
within
the
Statement
of
Assets
and
Liabilities
and
the
Statement
of
Operations,
respectively.
Fund
Level
1
Level
2
Level
3
Total
Lifecycle
Index
2065
Registered
investment
companies
$463,509,535
$—
$—
$463,509,535
Short-term
investments
—
660,000
—
660,000
Total
$463,509,535
$660,000
$—
$464,169,535
1
1
1
1
1
Fund
Counterparty
Short-term
Investments,
at
Value
Collateral
Pledged
(From)
Counterparty
Lifecycle
Index
Retirement
Income
Fixed
Income
Clearing
Corporation
$
280,000
$
(285,643)
Lifecycle
Index
2010
Fixed
Income
Clearing
Corporation
1,680,000
(1,713,667)
Lifecycle
Index
2015
Fixed
Income
Clearing
Corporation
750,000
(765,227)
Lifecycle
Index
2020
Fixed
Income
Clearing
Corporation
4,510,000
(4,600,244)
Lifecycle
Index
2025
Fixed
Income
Clearing
Corporation
4,190,000
(4,273,959)
Lifecycle
Index
2030
Fixed
Income
Clearing
Corporation
10,010,000
(10,210,255)
Lifecycle
Index
2035
Fixed
Income
Clearing
Corporation
8,940,000
(9,118,820)
Lifecycle
Index
2040
Fixed
Income
Clearing
Corporation
12,210,000
(12,454,374)
Lifecycle
Index
2045
Fixed
Income
Clearing
Corporation
8,440,000
(8,608,976)
Lifecycle
Index
2050
Fixed
Income
Clearing
Corporation
8,970,000
(9,149,541)
Lifecycle
Index
2055
Fixed
Income
Clearing
Corporation
6,790,000
(6,925,838)
Lifecycle
Index
2060
Fixed
Income
Clearing
Corporation
5,410,000
(5,518,231)
Lifecycle
Index
2065
Fixed
Income
Clearing
Corporation
660,000
(673,370)
Fund
Non-U.S.
Government
Purchases
Non-U.S.
Government
Sales
14.1
Lifecycle
Index
Retirement
Income
$
56,846,270
$
100,674,669
14.2
Lifecycle
Index
2010
53,412,169
55,676,181
14.3
Lifecycle
Index
2015
53,890,931
98,392,190
14.4
Lifecycle
Index
2020
118,891,597
262,838,866
14.5
Lifecycle
Index
2025
275,995,968
412,279,528
14.6
Lifecycle
Index
2030
485,552,405
373,555,027
14.7
Lifecycle
Index
2035
588,369,650
375,569,395
14.8
Lifecycle
Index
2040
586,238,730
378,610,656
14.9
Lifecycle
Index
2045
542,049,935
284,712,306
15.01
Lifecycle
Index
2050
485,450,287
218,741,415
15.1
Lifecycle
Index
2055
393,830,183
130,655,894
15.2
Lifecycle
Index
2060
269,883,497
69,121,464
15.3
Lifecycle
Index
2065
110,469,225
20,379,593
Notes
to
Financial
Statements
(continued)
6.
Fund
Shares
Transactions
in
Fund
shares
during
the
current
and
prior
fiscal
period
were
as
follows:
Six
Months
Ended
11/30/24
Year
Ended
5/31/24
14.1
Lifecycle
Index
Retirement
Income
Shares
Amount
Shares
Amount
Subscriptions:
Class
I
5,235
$
86,526
20,845
$
319,031
Premier
Class
15,949
263,569
62,116
946,739
Class
R6
6,222,185
102,907,633
14,539,705
221,787,860
Retirement
Class
250,324
4,166,070
367,049
5,645,804
Total
subscriptions
6,493,693
107,423,798
14,989,715
228,699,434
Reinvestments
of
distributions:
Class
I
1,471
24,141
4,125
63,371
Premier
Class
871
14,277
2,394
36,756
Class
R6
411,447
6,755,302
1,046,305
16,082,188
Retirement
Class
21,010
344,106
58,205
892,097
Total
reinvestments
of
distributions
434,799
7,137,826
1,111,029
17,074,412
Redemptions:
Class
I
(22,257)
(368,671)
(28,956)
(447,686)
Premier
Class
(25,869)
(426,410)
(77,682)
(1,194,080)
Class
R6
(9,214,194)
(152,582,638)
(12,590,697)
(194,216,256)
Retirement
Class
(244,928)
(4,033,813)
(678,392)
(10,349,565)
Total
redemptions
(9,507,248)
(157,411,532)
(13,375,727)
(206,207,587)
Net
increase
(decrease)
from
shareholder
transactions
(2,578,756)
$
(42,849,908)
2,725,017
$
39,566,259
Six
Months
Ended
11/30/24
Year
Ended
5/31/24
14.2
Lifecycle
Index
2010
Shares
Amount
Shares
Amount
Subscriptions:
Class
I
3,234
$
55,560
10,131
$
162,221
Premier
Class
61,059
1,030,826
99,816
1,591,307
Class
R6
3,343,071
57,896,577
5,871,430
94,247,976
Retirement
Class
285,262
4,881,987
395,902
6,243,168
Total
subscriptions
3,692,626
63,864,950
6,377,279
102,244,672
Reinvestments
of
distributions:
Class
I
–
–
2,288
36,633
Premier
Class
–
–
38,146
608,042
Class
R6
–
–
1,146,232
18,328,254
Retirement
Class
–
–
108,050
1,712,599
Total
reinvestments
of
distributions
–
–
1,294,716
20,685,528
Redemptions:
Class
I
(14,722)
(256,468)
(70,280)
(1,115,621)
Premier
Class
(104,513)
(1,799,382)
(274,858)
(4,413,763)
Class
R6
(3,808,409)
(65,569,489)
(8,711,198)
(139,980,798)
Retirement
Class
(312,453)
(5,346,247)
(1,003,364)
(15,974,894)
Total
redemptions
(4,240,097)
(72,971,586)
(10,059,700)
(161,485,076)
Net
increase
(decrease)
from
shareholder
transactions
(547,471)
$
(9,106,636)
(2,387,705)
$
(38,554,876)
Six
Months
Ended
11/30/24
Year
Ended
5/31/24
14.3
Lifecycle
Index
2015
Shares
Amount
Shares
Amount
Subscriptions:
Class
I
4,198
$
76,281
54,921
$
937,881
Premier
Class
76,678
1,372,927
170,840
2,862,697
Class
R6
3,659,474
66,693,399
8,262,695
139,734,524
Retirement
Class
280,561
5,077,540
475,655
7,972,448
Total
subscriptions
4,020,911
73,220,147
8,964,111
151,507,550
Reinvestments
of
distributions:
Class
I
–
–
2,784
46,792
Premier
Class
–
–
62,007
1,038,002
Class
R6
–
–
2,139,222
35,981,708
Retirement
Class
–
–
193,088
3,222,645
Total
reinvestments
of
distributions
–
–
2,397,101
40,289,147
Redemptions:
Class
I
(9,563)
(175,954)
(89,142)
(1,505,944)
Premier
Class
(195,340)
(3,539,338)
(411,184)
(6,889,577)
Class
R6
(6,080,691)
(110,623,680)
(13,038,389)
(221,531,073)
Retirement
Class
(838,372)
(15,163,659)
(1,341,327)
(22,608,289)
Total
redemptions
(7,123,966)
(129,502,631)
(14,880,042)
(252,534,883)
Net
increase
(decrease)
from
shareholder
transactions
(3,103,055)
$
(56,282,484)
(3,518,830)
$
(60,738,186)
Six
Months
Ended
11/30/24
Year
Ended
5/31/24
14.4
Lifecycle
Index
2020
Shares
Amount
Shares
Amount
Subscriptions:
Class
I
19,171
$
381,642
74,262
$
1,367,596
Premier
Class
191,412
3,785,971
503,271
9,200,844
Class
R6
8,316,543
166,766,194
22,424,807
412,766,301
Retirement
Class
439,006
8,688,876
878,109
15,990,132
Total
subscriptions
8,966,132
179,622,683
23,880,449
439,324,873
Reinvestments
of
distributions:
Class
I
–
–
18,571
340,408
Premier
Class
–
–
125,315
2,288,248
Class
R6
–
–
4,926,275
90,397,138
Retirement
Class
–
–
354,735
6,456,174
Total
reinvestments
of
distributions
–
–
5,424,896
99,481,968
Redemptions:
Class
I
(74,487)
(1,474,746)
(228,419)
(4,229,709)
Premier
Class
(418,782)
(8,293,518)
(1,248,756)
(22,962,439)
Class
R6
(16,005,888)
(319,942,173)
(35,125,181)
(649,197,428)
Retirement
Class
(1,417,911)
(28,111,262)
(2,683,928)
(49,126,116)
Total
redemptions
(17,917,068)
(357,821,699)
(39,286,284)
(725,515,692)
Net
increase
(decrease)
from
shareholder
transactions
(8,950,936)
$
(178,199,016)
(9,980,939)
$
(186,708,851)
Six
Months
Ended
11/30/24
Year
Ended
5/31/24
14.5
Lifecycle
Index
2025
Shares
Amount
Shares
Amount
Subscriptions:
Class
I
40,266
$
898,404
243,371
$
4,930,631
Premier
Class
442,683
9,740,035
874,003
17,681,971
Class
R6
19,292,907
432,516,848
44,372,219
904,790,116
Retirement
Class
648,173
14,402,006
1,656,279
33,320,626
Total
subscriptions
20,424,029
457,557,293
47,145,872
960,723,344
Reinvestments
of
distributions:
Class
I
–
–
25,222
513,275
Premier
Class
–
–
121,096
2,459,456
Class
R6
–
–
6,156,947
125,540,155
Retirement
Class
–
–
454,869
9,192,902
Total
reinvestments
of
distributions
–
–
6,758,134
137,705,788
Redemptions:
Class
I
(167,207)
(3,767,945)
(437,995)
(8,805,941)
Premier
Class
(525,965)
(11,702,734)
(1,131,849)
(23,054,565)
Class
R6
(25,855,744)
(578,483,092)
(48,255,309)
(990,630,653)
Retirement
Class
(2,351,107)
(52,070,005)
(4,859,935)
(98,718,158)
Total
redemptions
(28,900,023)
(646,023,776)
(54,685,088)
(1,121,209,317)
Net
increase
(decrease)
from
shareholder
transactions
(8,475,994)
$
(188,466,483)
(781,082)
$
(22,780,185)
Six
Months
Ended
11/30/24
Year
Ended
5/31/24
14.6
Lifecycle
Index
2030
Shares
Amount
Shares
Amount
Subscriptions:
Class
I
43,951
$
1,084,845
213,738
$
4,741,727
Premier
Class
627,201
15,294,483
1,020,220
22,666,628
Class
R6
26,469,931
654,759,862
56,495,639
1,263,257,332
Retirement
Class
1,161,413
28,370,954
2,789,961
61,671,465
Total
subscriptions
28,302,496
699,510,144
60,519,558
1,352,337,152
Reinvestments
of
distributions:
Class
I
–
–
35,160
784,418
Premier
Class
–
–
147,576
3,280,625
Class
R6
–
–
7,037,023
157,277,461
Retirement
Class
–
–
454,647
10,065,889
Total
reinvestments
of
distributions
–
–
7,674,406
171,408,393
Redemptions:
Class
I
(118,100)
(2,918,775)
(361,218)
(8,039,837)
Premier
Class
(430,867)
(10,623,520)
(1,470,090)
(32,858,904)
Class
R6
(23,256,620)
(575,239,084)
(44,001,301)
(992,421,774)
Retirement
Class
(2,297,229)
(56,313,819)
(4,321,884)
(96,495,792)
Total
redemptions
(26,102,816)
(645,095,198)
(50,154,493)
(1,129,816,307)
Net
increase
(decrease)
from
shareholder
transactions
2,199,680
$
54,414,946
18,039,471
$
393,929,238
Notes
to
Financial
Statements
(continued)
Six
Months
Ended
11/30/24
Year
Ended
5/31/24
14.7
Lifecycle
Index
2035
Shares
Amount
Shares
Amount
Subscriptions:
Class
I
49,606
$
1,341,859
223,278
$
5,367,607
Premier
Class
515,901
13,839,759
1,092,292
26,324,023
Class
R6
26,665,856
727,628,476
59,806,250
1,455,487,593
Retirement
Class
1,021,566
27,569,771
2,642,003
63,631,827
Total
subscriptions
28,252,929
770,379,865
63,763,823
1,550,811,050
Reinvestments
of
distributions:
Class
I
–
–
23,238
564,445
Premier
Class
–
–
132,558
3,207,899
Class
R6
–
–
6,054,698
147,371,345
Retirement
Class
–
–
348,217
8,392,031
Total
reinvestments
of
distributions
–
–
6,558,711
159,535,720
Redemptions:
Class
I
(88,219)
(2,402,205)
(298,338)
(7,198,241)
Premier
Class
(513,559)
(13,884,613)
(1,153,621)
(28,015,020)
Class
R6
(19,740,372)
(538,118,073)
(36,581,391)
(902,421,312)
Retirement
Class
(2,011,829)
(54,282,210)
(3,995,570)
(97,312,404)
Total
redemptions
(22,353,979)
(608,687,101)
(42,028,920)
(1,034,946,977)
Net
increase
(decrease)
from
shareholder
transactions
5,898,950
$
161,692,764
28,293,614
$
675,399,793
Six
Months
Ended
11/30/24
Year
Ended
5/31/24
14.8
Lifecycle
Index
2040
Shares
Amount
Shares
Amount
Subscriptions:
Class
I
58,948
$
1,738,697
193,374
$
5,009,272
Premier
Class
426,571
12,465,974
1,120,144
28,921,233
Class
R6
24,124,262
714,067,984
54,222,650
1,413,783,568
Retirement
Class
822,695
24,118,461
1,996,846
51,631,155
Total
subscriptions
25,432,476
752,391,116
57,533,014
1,499,345,228
Reinvestments
of
distributions:
Class
I
–
–
20,577
535,204
Premier
Class
–
–
136,836
3,542,683
Class
R6
–
–
5,787,159
150,697,631
Retirement
Class
–
–
295,703
7,629,130
Total
reinvestments
of
distributions
–
–
6,240,275
162,404,648
Redemptions:
Class
I
(146,370)
(4,353,141)
(208,960)
(5,446,746)
Premier
Class
(554,534)
(16,305,354)
(1,439,064)
(37,749,387)
Class
R6
(17,344,462)
(511,915,958)
(31,691,130)
(841,845,215)
Retirement
Class
(1,435,187)
(42,178,458)
(3,604,077)
(94,931,430)
Total
redemptions
(19,480,553)
(574,752,911)
(36,943,231)
(979,972,778)
Net
increase
(decrease)
from
shareholder
transactions
5,951,923
$
177,638,205
26,830,058
$
681,777,098
Six
Months
Ended
11/30/24
Year
Ended
5/31/24
14.9
Lifecycle
Index
2045
Shares
Amount
Shares
Amount
Subscriptions:
Class
I
58,546
$
1,798,624
157,554
$
4,254,147
Premier
Class
554,042
16,928,508
993,274
26,788,207
Class
R6
21,745,029
675,922,550
52,266,925
1,418,998,974
Retirement
Class
692,319
21,299,691
1,731,177
46,548,337
Total
subscriptions
23,049,936
715,949,373
55,148,930
1,496,589,665
Reinvestments
of
distributions:
Class
I
–
–
18,683
505,761
Premier
Class
–
–
72,690
1,961,898
Class
R6
–
–
4,469,368
121,209,261
Retirement
Class
–
–
226,560
6,085,403
Total
reinvestments
of
distributions
–
–
4,787,301
129,762,323
Redemptions:
Class
I
(99,921)
(3,089,889)
(209,486)
(5,648,588)
Premier
Class
(226,016)
(6,960,670)
(753,142)
(20,519,310)
Class
R6
(13,623,153)
(423,256,005)
(26,078,253)
(721,370,997)
Retirement
Class
(1,329,766)
(40,895,860)
(2,562,142)
(70,174,828)
Total
redemptions
(15,278,856)
(474,202,424)
(29,603,023)
(817,713,723)
Net
increase
(decrease)
from
shareholder
transactions
7,771,080
$
241,746,949
30,333,208
$
808,638,265
Six
Months
Ended
11/30/24
Year
Ended
5/31/24
15.01
Lifecycle
Index
2050
Shares
Amount
Shares
Amount
Subscriptions:
Class
I
77,120
$
2,432,567
151,795
$
4,162,023
Premier
Class
283,355
8,876,405
511,652
14,049,166
Class
R6
19,395,546
613,692,751
44,172,380
1,217,859,238
Retirement
Class
577,879
18,143,847
1,408,038
38,375,294
Total
subscriptions
20,333,900
643,145,570
46,243,865
1,274,445,721
Reinvestments
of
distributions:
Class
I
–
–
15,170
416,566
Premier
Class
–
–
53,428
1,461,248
Class
R6
–
–
3,897,036
107,168,487
Retirement
Class
–
–
198,874
5,413,361
Total
reinvestments
of
distributions
–
–
4,164,508
114,459,662
Redemptions:
Class
I
(69,099)
(2,194,310)
(201,159)
(5,454,329)
Premier
Class
(159,966)
(5,001,770)
(633,130)
(17,514,976)
Class
R6
(10,846,103)
(343,407,998)
(21,224,260)
(597,384,005)
Retirement
Class
(1,150,616)
(36,057,876)
(2,151,001)
(59,646,290)
Total
redemptions
(12,225,784)
(386,661,954)
(24,209,550)
(679,999,600)
Net
increase
(decrease)
from
shareholder
transactions
8,108,116
$
256,483,616
26,198,823
$
708,905,783
Six
Months
Ended
11/30/24
Year
Ended
5/31/24
15.1
Lifecycle
Index
2055
Shares
Amount
Shares
Amount
Subscriptions:
Class
I
67,452
$
1,706,841
222,339
$
4,895,126
Premier
Class
209,688
5,315,172
480,554
10,667,739
Class
R6
19,453,431
497,689,670
41,577,792
926,627,050
Retirement
Class
659,657
16,778,570
1,482,023
32,716,115
Total
subscriptions
20,390,228
521,490,253
43,762,708
974,906,030
Reinvestments
of
distributions:
Class
I
–
–
15,953
353,668
Premier
Class
–
–
27,490
608,638
Class
R6
–
–
2,799,981
62,159,591
Retirement
Class
–
–
134,709
2,974,365
Total
reinvestments
of
distributions
–
–
2,978,133
66,096,262
Redemptions:
Class
I
(92,905)
(2,386,847)
(234,331)
(5,053,347)
Premier
Class
(117,976)
(2,992,703)
(617,905)
(13,841,189)
Class
R6
(9,253,244)
(237,277,034)
(18,474,311)
(419,542,678)
Retirement
Class
(829,014)
(21,141,984)
(1,437,927)
(32,034,509)
Total
redemptions
(10,293,139)
(263,798,568)
(20,764,474)
(470,471,723)
Net
increase
(decrease)
from
shareholder
transactions
10,097,089
$
257,691,685
25,976,367
$
570,530,569
Six
Months
Ended
11/30/24
Year
Ended
5/31/24
15.2
Lifecycle
Index
2060
Shares
Amount
Shares
Amount
Subscriptions:
Class
I
75,037
$
1,483,897
237,912
$
4,089,310
Premier
Class
247,793
4,913,621
554,364
9,509,531
Class
R6
18,587,041
368,388,419
38,177,375
660,894,255
Retirement
Class
559,225
11,055,217
1,278,732
21,923,193
Total
subscriptions
19,469,096
385,841,154
40,248,383
696,416,289
Reinvestments
of
distributions:
Class
I
–
–
13,932
239,498
Premier
Class
–
–
18,860
323,633
Class
R6
–
–
1,912,844
32,900,918
Retirement
Class
–
–
86,565
1,482,850
Total
reinvestments
of
distributions
–
–
2,032,201
34,946,899
Redemptions:
Class
I
(92,429)
(1,842,837)
(234,297)
(3,954,887)
Premier
Class
(139,634)
(2,741,862)
(533,454)
(9,078,713)
Class
R6
(8,649,547)
(172,068,577)
(16,178,367)
(283,863,945)
Retirement
Class
(587,923)
(11,669,879)
(774,205)
(13,334,770)
Total
redemptions
(9,469,533)
(188,323,155)
(17,720,323)
(310,232,315)
Net
increase
(decrease)
from
shareholder
transactions
9,999,563
$
197,517,999
24,560,261
$
421,130,873
Notes
to
Financial
Statements
(continued)
7.
Income
Tax
Information
Each
Fund
is
a
separate
taxpayer
for
federal
income
tax
purposes.
Each
Fund
intends
to
distribute
substantially
all
of
its
net
investment
income
and
net
capital
gains
to
shareholders
and
otherwise
comply
with
the
requirements
of
Subchapter
M
of
the
Internal
Revenue
Code
applicable
to
regulated
investment
companies.
Therefore,
no
federal
income
tax
provision
is
required.
Each
Fund
files
income
tax
returns
in
U.S.
federal
and
applicable
state
and
local
jurisdictions.
A
Fund’s
federal
income
tax
returns
are
generally
subject
to
examination
for
a
period
of
three
fiscal
years
after
being
filed.
State
and
local
tax
returns
may
be
subject
to
examination
for
an
additional
period
of
time
depending
on
the
jurisdiction.
Management
has
analyzed
each
Fund’s
tax
positions
taken
for
all
open
tax
years
and
has
concluded
that
no
provision
for
income
tax
is
required
in
the
Fund’s
financial
statements.
As
of
the
end
of
the
reporting
period,
the
aggregate
cost
and
the
net
unrealized
appreciation/(depreciation)
of
all
investments
for
federal
income
tax
purposes
were
as
follows:
For
purposes
of
this
disclosure,
tax
cost
generally
includes
the
cost
of
portfolio
investments
as
well
as
up-front
fees
or
premiums
exchanged
on
derivatives
and
any
amounts
unrealized
for
income
statement
reporting
but
realized
income
and/or
capital
gains
for
tax
reporting,
if
applicable.
As
of prior
fiscal
period
end,
the
components
of
accumulated
earnings
on
a
tax
basis
were
as
follows:
Six
Months
Ended
11/30/24
Year
Ended
5/31/24
15.3
Lifecycle
Index
2065
Shares
Amount
Shares
Amount
Subscriptions:
Class
I
48,677
$
679,997
113,763
$
1,384,830
Premier
Class
83,930
1,180,843
186,945
2,229,957
Class
R6
8,756,837
124,659,788
16,027,662
198,759,351
Retirement
Class
303,699
4,260,437
481,317
5,895,241
Total
subscriptions
9,193,143
130,781,065
16,809,687
208,269,379
Reinvestments
of
distributions:
Class
I
–
–
4,210
51,147
Premier
Class
–
–
3,300
40,099
Class
R6
–
–
355,871
4,380,766
Retirement
Class
–
–
10,884
132,344
Total
reinvestments
of
distributions
–
–
374,265
4,604,356
Redemptions:
Class
I
(65,165)
(917,008)
(47,321)
(585,953)
Premier
Class
(65,039)
(913,519)
(89,827)
(1,106,252)
Class
R6
(2,647,072)
(37,738,033)
(3,178,895)
(40,267,990)
Retirement
Class
(194,113)
(2,728,514)
(146,895)
(1,799,799)
Total
redemptions
(2,971,389)
(42,297,074)
(3,462,938)
(43,759,994)
Net
increase
(decrease)
from
shareholder
transactions
6,221,754
$
88,483,991
13,721,014
$
169,113,741
Fund
Tax
Cost
Gross
Unrealized
Appreciation
Gross
Unrealized
(Depreciation)
Net
Unrealized
Appreciation
(Depreciation)
14.1
Lifecycle
Index
Retirement
Income
$602,825,660
$134,067,930
$(38,560,041)
$95,507,889
14.2
Lifecycle
Index
2010
559,141,047
141,610,274
(40,709,306)
100,900,968
14.3
Lifecycle
Index
2015
864,867,068
261,033,747
(66,985,232)
194,048,515
14.4
Lifecycle
Index
2020
2,517,060,892
782,786,380
(182,946,454)
599,839,926
14.5
Lifecycle
Index
2025
4,941,761,727
1,566,407,157
(315,742,437)
1,250,664,720
14.6
Lifecycle
Index
2030
6,693,792,911
2,378,424,872
(365,565,831)
2,012,859,041
14.7
Lifecycle
Index
2035
6,894,557,356
2,753,490,784
(311,665,302)
2,441,825,482
14.8
Lifecycle
Index
2040
6,813,835,543
3,311,957,323
(259,094,479)
3,052,862,844
14.9
Lifecycle
Index
2045
5,785,836,791
2,755,636,162
(164,497,119)
2,591,139,043
15.01
Lifecycle
Index
2050
4,937,569,634
2,331,454,040
(125,815,761)
2,205,638,279
15.1
Lifecycle
Index
2055
3,174,381,444
1,275,161,897
(61,398,423)
1,213,763,474
15.2
Lifecycle
Index
2060
1,896,953,134
627,308,202
(31,794,132)
595,514,070
15.3
Lifecycle
Index
2065
385,084,383
81,217,124
(2,131,972)
79,085,152
As
of
prior
fiscal
period
end,
the
Funds
had
capital
loss
carryforwards,
which
will
not
expire:
8.
Investment
Adviser
and
Other
Transactions
with
Affiliates
Under
the
terms
of
its
Investment
Management
Agreement,
the
Adviser
is
entitled
to
a
fee
that
is
made
up
of
two
components,
which
are
added
together
to
create
the
total
investment
management
fee.
The
first
component,
the
asset
allocation
fee
rate,
is
an
annual
rate
of
0.10%
of
the
average
daily
net
assets
of
each
Fund.
The
second
component,
the
Underlying
Funds
fee
rate
is
calculated
as
follows:
for
each
Underlying
Fund
of
the
Trust
in
which
a
Fund
is
invested,
the
effective
Underlying
Fund’s
annual
investment
management
fee
rate,
as
determined
pursuant
to
its
investment
management
agreement,
net
of
any
fee
waivers
or
reimbursements
applicable
to
the
Underlying
Fund
(excluding
the
Class
W
shares
investment
management
fee
waiver
and/or
reimbursement),
in
proportion
to
the
percentage
of
the
Fund’s
net
assets
invested
in
the
Underlying
Fund,
applied
to
the
Fund’s
average
daily
net
assets.
The
Adviser
has
contractually
agreed
to
waive
a
portion
of
the
asset
allocation
fee
rate
equal
to,
on
an
annual
basis,
the
following
percentages
of
the
average
daily
net
assets
of
each
Fund.
As
of
the
end
of
the
current
fiscal
period,
the
Adviser
received
from
the
Funds
the
following
effective
annual
rate
as
a
percentage
of
average
daily
net
assets
of
each
Fund:
Fund
Undistributed
Ordinary
Income
Undistributed
Long-Term
Capital
Gains
Unrealized
Appreciation
(Depreciation)
Capital
Loss
Carryforwards
Late-Year
Loss
Deferrals
Other
Book-to-Tax
Differences
Total
14.1
Lifecycle
Index
Retirement
Income
$4,983,623
$568,458
$67,053,744
$–
$–
$(19,708)
$72,586,117
14.2
Lifecycle
Index
2010
5,477,181
12,662,365
76,865,925
–
–
(37,659)
94,967,812
14.3
Lifecycle
Index
2015
8,340,973
25,845,872
158,398,309
–
–
(65,640)
192,519,514
14.4
Lifecycle
Index
2020
22,468,089
62,312,834
480,657,395
–
–
(133,240)
565,305,078
14.5
Lifecycle
Index
2025
43,573,837
72,554,644
969,178,722
–
–
(173,117)
1,085,134,086
14.6
Lifecycle
Index
2030
50,705,956
25,205,720
1,493,628,409
–
–
(194,470)
1,569,345,615
14.7
Lifecycle
Index
2035
50,357,129
–
1,820,539,669
–
–
(185,715)
1,870,711,083
14.8
Lifecycle
Index
2040
19,756,044
–
2,304,588,247
(8,191,217)
–
(202,153)
2,315,950,921
14.9
Lifecycle
Index
2045
12,720,598
–
1,891,875,409
–
–
(129,059)
1,904,466,948
15.01
Lifecycle
Index
2050
7,651,387
–
1,590,280,216
–
–
(100,438)
1,597,831,165
15.1
Lifecycle
Index
2055
3,387,282
–
834,341,414
–
–
(45,602)
837,683,094
15.2
Lifecycle
Index
2060
1,209,407
–
380,037,876
–
–
(18,187)
381,229,096
15.3
Lifecycle
Index
2065
122,252
–
41,107,949
(70,267)
–
(1,182)
41,158,752
Fund
Short-Term
Long-Term
Total
14.1
Lifecycle
Index
Retirement
Income
$–
$–
$–
14.2
Lifecycle
Index
2010
–
–
–
14.3
Lifecycle
Index
2015
–
–
–
14.4
Lifecycle
Index
2020
–
–
–
14.5
Lifecycle
Index
2025
–
–
–
14.6
Lifecycle
Index
2030
–
–
–
14.7
Lifecycle
Index
2035
–
–
–
14.8
Lifecycle
Index
2040
–
8,191,217
8,191,217
14.9
Lifecycle
Index
2045
–
–
–
15.01
Lifecycle
Index
2050
–
–
–
15.1
Lifecycle
Index
2055
–
–
–
15.2
Lifecycle
Index
2060
–
–
–
15.3
Lifecycle
Index
2065
70,267
–
70,267
Notes
to
Financial
Statements
(continued)
The
Funds
have
entered
into
an
Administrative
Service
Agreement
with
the
Adviser
under
which
the
Funds
pay
the
Adviser
for
its
cost
in
providing
certain
administrative
and
compliance
services
to
the
Funds.
The
Adviser
has
agreed
to
gradually
reduce
expenses
allocated
to
the
Funds
under
the
Administrative
Service
Agreement
over
a
three-year
period
commencing
May
1,
2024.
After
the
expiration
of
this
three-year
period,
the
Adviser
will
no
longer
allocate
expenses
to
the
Funds
under
the
Administrative
Service
Agreement.
Under
the
terms
of
a
Retirement
Class
Service
Agreement
with
respect
to
each
Fund,
the
Retirement
Class
of
the
Fund
pays
the
Adviser
a
monthly
fee
based
on
the
annual
rate
of
0.25%
of
the
Fund’s
average
daily
net
assets
attributable
to
Retirement
Class
shares
of
the
Fund
for
providing
certain
administrative
services
related
to
the
maintenance
of
Retirement
Class
shares
on
retirement
plan
or
other
platforms.
Substantially
all
of
the
Retirement
Class
shareholder
servicing
fees
reported
on
the
Statements
of
operations
are
paid
to
the
Adviser
under
the
Service
Agreement.
Under
the
terms
of
a
distribution
Rule
12b-1
plan,
the
Premier
Class
of
the
Funds compensated
Nuveen
Securities
for
providing
distribution,
promotional
and/or
shareholder
services
to
the Premier
Class
at
the
annual
rate
of
0.15%
of
the
average
daily
net
assets
attributable
to
the
Retirement
Class
shares
and
Premier
Class
shares.
The
Adviser
has
agreed
to
reimburse
each
Fund
if
its
total
expense
ratio
(excluding
interest,
taxes,
brokerage
commissions
and
other
transactional
expenses,
acquired
fund
fees
and
expenses,
extraordinary
expenses
and
the
management
fees
and
certain
other
expenses
originally
attributable
to
Class
W
shares
of
the
affiliated
Nuveen
Funds)
exceeds
the
following
percentages
of
average
daily
net
assets
for
each
class:
The
Funds
are
permitted
to
purchase
or
sell
securities
from
or
to
certain
other
funds
or
accounts
managed
by
the
Adviser
or
by
an
affiliate
of
the
Adviser
(each
an,
"Affiliated
Entity")
under
specified
conditions
outlined
in
procedures
adopted
by
the
Board
("cross-
trade").
These
procedures
have
been
designed
to
ensure
that
any
cross-trade
of
securities
by
the
Fund
from
or
to
an
Affiliated
Entity
by
virtue
of
having
a
common
investment
adviser
(or
affiliated
investment
adviser),
common
officer
and/or
common
trustee
complies
with
Rule
17a-7
under
the
1940
Act.
These
transactions
are
affected
at
the
current
market
price
(as
provided
by
an
independent
pricing
service)
without
incurring
broker
commissions.
During
the
current
fiscal
period,
the
Funds
did
not
engage
in
cross-trades
pursuant
to
these
procedures.
There
were
no
funds’
shares
owned
by
TIAA
as
of
the
end
of
the
current
fiscal
period.
Investment
Management
Fee
Waiver
Fund
Investment
Management
Fee—Effective
Rate
Effective
10/1/24*
Prior
to
10/1/24
Lifecycle
Index
Retirement
Income
0.090%
0.081%
0.079%
Lifecycle
Index
2010
0.090
0.081
0.080
Lifecycle
Index
2015
0.090
0.079
0.077
Lifecycle
Index
2020
0.090
0.075
0.073
Lifecycle
Index
2025
0.090
0.070
0.068
Lifecycle
Index
2030
0.090
0.066
0.063
Lifecycle
Index
2035
0.090
0.062
0.058
Lifecycle
Index
2040
0.090
0.057
0.055
Lifecycle
Index
2045
0.090
0.057
0.054
Lifecycle
Index
2050
0.090
0.056
0.053
Lifecycle
Index
2055
0.090
0.056
0.053
Lifecycle
Index
2060
0.090
0.056
0.053
Lifecycle
Index
2065
0.090
0.057
0.055
*
These
waivers
will
remain
in
effect
through
September
30,
2025,
unless
changed
with
approval
of
the
Board
of
Trustees.
Maximum
Expense
Amounts
Class
I
Premier
Class
Class
R6
Retirement
Class
Fund
Effective
10/1/24*
Prior
to
10/1/24
Effective
10/1/24*
Prior
to
10/1/24
Effective
10/1/24*
Prior
to
10/1/24
Effective
10/1/24*
Prior
to
10/1/24
Lifecycle
Index
Retirement
Income
0.169%
0.171%
0.169%
0.171%
0.019%
0.021%
0.269%
0.271%
Lifecycle
Index
2010
0.169
0.170
0.169
0.170
0.019
0.020
0.269
0.270
Lifecycle
Index
2015
0.171
0.173
0.171
0.173
0.021
0.023
0.271
0.273
Lifecycle
Index
2020
0.175
0.177
0.175
0.177
0.025
0.027
0.275
0.277
Lifecycle
Index
2025
0.180
0.182
0.180
0.182
0.030
0.032
0.280
0.282
Lifecycle
Index
2030
0.184
0.187
0.184
0.187
0.034
0.037
0.284
0.287
Lifecycle
Index
2035
0.188
0.192
0.188
0.192
0.038
0.042
0.288
0.292
Lifecycle
Index
2040
0.193
0.195
0.193
0.195
0.043
0.045
0.293
0.295
Lifecycle
Index
2045
0.193
0.196
0.193
0.196
0.043
0.046
0.293
0.296
Lifecycle
Index
2050
0.194
0.197
0.194
0.197
0.044
0.047
0.294
0.297
Lifecycle
Index
2055
0.194
0.197
0.194
0.197
0.044
0.047
0.294
0.297
Lifecycle
Index
2060
0.194
0.197
0.194
0.197
0.044
0.047
0.294
0.297
Lifecycle
Index
2065
0.193
0.196
0.193
0.196
0.043
0.046
0.293
0.296
*
The
expense
reimbursement
agreements
will
continue
through
at
least
September
30,
2025,
unless
changed
with
approval
of
the
Board.
Investments
in
other
investment
companies
advised
by
the
Adviser
and
Nuveen
Fund
Advisors,
LLC
are
deemed
to
be
affiliated
investments.
Information
regarding
transactions
with
affiliated
companies
is
as
follows:
Issue
Value
at
5/31/24
Purchases
Cost
Sales
Proceeds
Realized
Gain
(Loss)
Change
in
Unrealized
Appreciation
(Depreciation)
Value
at
11/30/24
Shares
at
11/30/24
Dividend
Income
Lifecycle
Index
Retirement
Income
Nuveen
Funds:
Bond
Index,
Class
W
$
280,512,273
$
21,290,331
$
32,571,665
$
(3,987,972)
$
11,878,388
$
277,121,355
28,628,239
$
5,035,473
Emerging
Markets
Equity
Index,
Class
W
29,784,426
5,031,193
5,583,451
277,159
993,566
30,502,893
2,718,618
–
Equity
Index,
Class
W
184,679,945
9,340,287
34,496,887
12,764,095
14,919,070
187,206,510
4,353,640
–
Inflation
Linked
Bond,
Class
W
69,966,046
6,989,136
8,593,123
(666,401)
1,323,155
69,018,813
6,492,833
1,744,447
International
Equity
Index,
Class
W
69,559,068
6,543,577
10,201,468
1,201,382
(1,639,854)
65,462,705
2,801,143
–
Short
Term
Bond
Index,
Class
W
69,587,051
7,651,746
9,228,075
(249,269)
979,820
68,741,273
7,145,662
1,592,305
$704,088,809
$56,846,270
$100,674,669
$9,338,994
$28,454,145
$698,053,549
52,140,135
$8,372,225
Issue
Value
at
5/31/24
Purchases
Cost
Sales
Proceeds
Realized
Gain
(Loss)
Change
in
Unrealized
Appreciation
(Depreciation)
Value
at
11/30/24
Shares
at
11/30/24
Dividend
Income
Lifecycle
Index
2010
Nuveen
Funds:
Bond
Index,
Class
W
$
250,646,311
$
19,328,835
$
15,384,554
$
(1,807,484)
$
8,862,604
$
261,645,712
27,029,516
$
4,534,519
Emerging
Markets
Equity
Index,
Class
W
24,027,207
3,590,461
2,812,719
10,075
904,067
25,719,091
2,292,254
–
Equity
Index,
Class
W
149,441,507
7,128,826
21,796,916
9,209,269
13,270,943
157,253,629
3,657,061
–
Inflation
Linked
Bond,
Class
W
62,514,220
6,059,291
3,987,656
(321,961)
919,154
65,183,048
6,131,989
1,549,301
International
Equity
Index,
Class
W
56,100,514
5,222,377
5,663,360
566,344
(1,026,680)
55,199,195
2,361,968
–
Short
Term
Bond
Index,
Class
W
86,429,556
12,082,379
6,030,976
(224,574)
1,104,955
93,361,340
9,704,921
2,024,560
$629,159,315
$53,412,169
$55,676,181
$7,431,669
$24,035,043
$658,362,015
51,177,709
$8,108,380
Issue
Value
at
5/31/24
Purchases
Cost
Sales
Proceeds
Realized
Gain
(Loss)
Change
in
Unrealized
Appreciation
(Depreciation)
Value
at
11/30/24
Shares
at
11/30/24
Dividend
Income
Lifecycle
Index
2015
Nuveen
Funds:
Bond
Index,
Class
W
$
413,843,341
$
20,063,911
$
27,033,156
$
(3,213,951)
$
15,076,261
$
418,736,406
43,257,893
$
7,381,655
Emerging
Markets
Equity
Index,
Class
W
45,411,927
4,708,209
4,989,768
229,166
1,601,136
46,960,670
4,185,443
–
Equity
Index,
Class
W
282,379,879
5,253,891
41,359,175
23,074,729
18,836,797
288,186,121
6,702,003
–
Inflation
Linked
Bond,
Class
W
99,161,560
8,035,898
6,224,684
(528,971)
1,488,166
101,931,969
9,589,085
2,470,459
International
Equity
Index,
Class
W
105,995,276
6,663,114
11,104,415
1,931,230
(2,664,385)
100,820,820
4,314,113
–
Short
Term
Bond
Index,
Class
W
99,012,018
9,165,908
7,680,992
(279,567)
1,312,230
101,529,597
10,554,012
2,261,465
$1,045,804,001
$53,890,931
$98,392,190
$21,212,636
$35,650,205
$1,058,165,583
78,602,549
$12,113,579
Notes
to
Financial
Statements
(continued)
Issue
Value
at
5/31/24
Purchases
Cost
Sales
Proceeds
Realized
Gain
(Loss)
Change
in
Unrealized
Appreciation
(Depreciation)
Value
at
11/30/24
Shares
at
11/30/24
Dividend
Income
Lifecycle
Index
2020
Nuveen
Funds:
Bond
Index,
Class
W
$
1,186,678,917
$
40,809,917
$
62,265,432
$
(8,781,312)
$
42,743,131
$
1,199,185,221
123,882,771
$
21,210,186
Emerging
Markets
Equity
Index,
Class
W
149,761,057
13,980,101
14,539,327
477,980
5,468,921
155,148,732
13,827,873
–
Equity
Index,
Class
W
929,918,119
9,070,113
126,955,202
65,690,103
72,504,979
950,228,112
22,098,328
–
Inflation
Linked
Bond,
Class
W
230,625,827
18,185,603
13,021,089
(1,245,712)
3,483,171
238,027,800
22,392,079
5,751,654
International
Equity
Index,
Class
W
349,694,387
16,999,400
31,476,033
5,416,711
(7,953,476)
332,680,989
14,235,387
–
Short
Term
Bond
Index,
Class
W
229,455,593
19,846,463
14,581,783
(536,114)
2,935,805
237,119,964
24,648,645
5,283,020
$3,076,133,900
$118,891,597
$262,838,866
$61,021,656
$119,182,531
$3,112,390,818
221,085,083
$32,244,860
Issue
Value
at
5/31/24
Purchases
Cost
Sales
Proceeds
Realized
Gain
(Loss)
Change
in
Unrealized
Appreciation
(Depreciation)
Value
at
11/30/24
Shares
at
11/30/24
Dividend
Income
Lifecycle
Index
2025
Nuveen
Funds:
Bond
Index,
Class
W
$
2,191,184,253
$
114,558,373
$
71,956,661
$
(12,216,391)
$
74,879,347
$
2,296,448,921
237,236,459
$
39,877,399
Emerging
Markets
Equity
Index,
Class
W
324,474,809
32,520,915
26,067,145
284,054
12,614,418
343,827,051
30,644,122
–
Equity
Index,
Class
W
2,017,953,757
22,287,388
233,401,153
106,981,491
196,744,351
2,110,565,834
49,082,926
–
Inflation
Linked
Bond,
Class
W
327,086,205
32,581,212
12,420,393
(1,804,870)
5,014,187
350,456,341
32,968,612
8,211,561
International
Equity
Index,
Class
W
758,361,492
37,130,121
51,868,170
6,186,678
(11,910,247)
737,899,874
31,574,663
–
Short
Term
Bond
Index,
Class
W
325,302,754
36,917,959
16,566,006
(760,223)
4,143,942
349,038,426
36,282,581
7,641,180
$5,944,363,270
$275,995,968
$412,279,528
$98,670,739
$281,485,998
$6,188,236,447
417,789,363
$55,730,140
Issue
Value
at
5/31/24
Purchases
Cost
Sales
Proceeds
Realized
Gain
(Loss)
Change
in
Unrealized
Appreciation
(Depreciation)
Value
at
11/30/24
Shares
at
11/30/24
Dividend
Income
Lifecycle
Index
2030
Nuveen
Funds:
Bond
Index,
Class
W
$
2,630,315,393
$
215,313,966
$
43,772,243
$
(7,761,052)
$
83,321,770
$
2,877,417,834
297,253,908
$
49,004,837
Emerging
Markets
Equity
Index,
Class
W
504,049,697
63,694,580
29,834,571
(215,030)
20,006,013
557,700,689
49,705,944
–
Equity
Index,
Class
W
3,134,672,673
43,126,709
238,478,139
63,450,487
420,961,364
3,423,733,094
79,621,700
–
Inflation
Linked
Bond,
Class
W
281,618,454
41,297,161
5,205,636
(830,327)
3,653,629
320,533,281
30,153,648
7,184,942
International
Equity
Index,
Class
W
1,177,588,216
78,848,150
49,187,745
2,743,064
(11,960,847)
1,198,030,838
51,263,622
–
Short
Term
Bond
Index,
Class
W
280,123,645
43,271,839
7,076,693
(341,277)
3,248,702
319,226,216
33,183,598
6,793,400
$8,008,368,078
$485,552,405
$373,555,027
$57,045,865
$519,230,631
$8,696,641,952
541,182,420
$62,983,179
Issue
Value
at
5/31/24
Purchases
Cost
Sales
Proceeds
Realized
Gain
(Loss)
Change
in
Unrealized
Appreciation
(Depreciation)
Value
at
11/30/24
Shares
at
11/30/24
Dividend
Income
Lifecycle
Index
2035
Nuveen
Funds:
Bond
Index,
Class
W
$
2,360,140,621
$
268,343,135
$
31,137,253
$
(5,360,734)
$
72,752,825
$
2,664,738,594
275,282,913
$
44,681,011
Emerging
Markets
Equity
Index,
Class
W
609,344,574
80,189,662
30,493,731
(647,864)
24,473,788
682,866,429
60,861,536
–
Equity
Index,
Class
W
3,790,520,257
74,779,762
260,610,913
55,725,272
534,268,923
4,194,683,301
97,550,774
–
Inflation
Linked
Bond,
Class
W
129,622,682
30,389,289
1,566,635
(285,857)
1,594,302
159,753,781
15,028,578
3,362,501
International
Equity
Index,
Class
W
1,424,042,766
103,230,940
49,206,863
1,436,830
(13,253,071)
1,466,250,602
62,740,719
–
Short
Term
Bond
Index,
Class
W
128,954,834
31,436,862
2,554,000
(136,612)
1,449,047
159,150,131
16,543,673
3,259,608
$8,442,625,734
$588,369,650
$375,569,395
$50,731,035
$621,285,814
$9,327,442,838
528,008,193
$51,303,120
Issue
Value
at
5/31/24
Purchases
Cost
Sales
Proceeds
Realized
Gain
(Loss)
Change
in
Unrealized
Appreciation
(Depreciation)
Value
at
11/30/24
Shares
at
11/30/24
Dividend
Income
Lifecycle
Index
2040
Nuveen
Funds:
Bond
Index,
Class
W
$
1,770,958,941
$
230,918,001
$
19,823,903
$
(3,303,755)
$
53,930,922
$
2,032,680,206
209,987,625
$
33,785,190
Emerging
Markets
Equity
Index,
Class
W
741,903,559
108,079,450
36,549,391
(1,278,018)
30,281,852
842,437,452
75,083,552
–
Equity
Index,
Class
W
4,612,789,904
110,727,739
275,485,868
43,574,641
679,586,331
5,171,192,747
120,260,296
–
International
Equity
Index,
Class
W
1,733,019,627
136,513,540
46,751,494
920,816
(15,524,507)
1,808,177,982
77,371,758
–
$8,858,672,031
$586,238,730
$378,610,656
$39,913,684
$748,274,598
$9,854,488,387
482,703,231
$33,785,190
Issue
Value
at
5/31/24
Purchases
Cost
Sales
Proceeds
Realized
Gain
(Loss)
Change
in
Unrealized
Appreciation
(Depreciation)
Value
at
11/30/24
Shares
at
11/30/24
Dividend
Income
Lifecycle
Index
2045
Nuveen
Funds:
Bond
Index,
Class
W
$
958,784,380
$
134,613,294
$
12,755,466
$
(2,193,661)
$
29,734,917
$
1,108,183,464
114,481,763
$
18,398,407
Emerging
Markets
Equity
Index,
Class
W
674,877,461
110,789,507
30,253,270
(2,795,160)
29,216,076
781,834,614
69,682,229
–
Equity
Index,
Class
W
4,195,048,311
145,722,328
206,159,371
12,100,537
654,273,572
4,800,985,377
111,650,823
–
International
Equity
Index,
Class
W
1,575,669,972
150,924,806
35,544,199
442,731
(13,960,931)
1,677,532,379
71,781,445
–
$7,404,380,124
$542,049,935
$284,712,306
$7,554,447
$699,263,634
$8,368,535,834
367,596,260
$18,398,407
Issue
Value
at
5/31/24
Purchases
Cost
Sales
Proceeds
Realized
Gain
(Loss)
Change
in
Unrealized
Appreciation
(Depreciation)
Value
at
11/30/24
Shares
at
11/30/24
Dividend
Income
Lifecycle
Index
2050
Nuveen
Funds:
Bond
Index,
Class
W
$
602,273,775
$
77,204,048
$
7,928,269
$
(1,410,096)
$
18,648,655
$
688,788,113
71,155,797
$
11,474,031
Emerging
Markets
Equity
Index,
Class
W
592,118,473
102,047,903
22,166,742
(2,272,143)
25,396,578
695,124,069
61,954,017
–
Equity
Index,
Class
W
3,675,251,730
157,912,929
160,832,086
4,921,646
583,785,456
4,261,039,675
99,093,946
–
International
Equity
Index,
Class
W
1,380,953,944
148,285,407
27,814,318
333,648
(12,472,625)
1,489,286,056
63,726,404
–
$6,250,597,922
$485,450,287
$218,741,415
$1,573,055
$615,358,064
$7,134,237,913
295,930,164
$11,474,031
Notes
to
Financial
Statements
(continued)
9.
Inter-Fund
Lending
Program
Pursuant
to
an
exemptive
order
issued
by
the
SEC,
the
Funds may
participate
in
an
inter-fund
lending
program.
This
program
allows
the
Funds to
lend
cash
to
and/or
borrow
cash
from
certain
other
affiliated
Funds for
temporary
purposes,
(e.g.,
to
satisfy
redemption
requests
or
to
cover
unanticipated
cash
shortfalls).
The
program
is
subject
to
a
number
of
conditions,
including
the
requirement
that
no
Fund may
borrow
or
lend
money
under
the
program
unless
it
receives
a
more
favorable
interest
rate
than
is
available
from
a
bank
or
other
financial
institution
for
a
comparable
transaction.
In
addition,
a
Fund may
participate
in
the
program
only
if
its
participation
is
consistent
with
the
Fund’s investment
policies
and
limitations
and
authorized
by
its
portfolio
manager(s).
During the current
fiscal
period,
there
were
no
inter-fund
borrowing
or
lending
transactions.
10.
Line
of
Credit
The Funds
participated
in
a
$1
billion unsecured
revolving
credit
facility
that
can
be
used
for
temporary
purposes,
including,
without
limitation,
the
funding
of
shareholder
redemptions.
The
facility
was
entered
into
on
June
13,
2023,
and
expired
on
June
11,
2024.
Certain
affiliated
accounts,
each
of
which
is
managed
by the
Adviser,
or
an
affiliate
of
the
Adviser, also
participated
in
this
facility.
An
annual
commitment
fee
for
the
credit
facility
was
borne
by
the
participating
accounts
on
a
pro
rata
basis.
Interest
associated
with
any
borrowing
under
the
facility
was
charged
to
the
borrowing
accounts
at
a
specified
rate
of
interest.
The Funds were
not
liable
for
borrowings
under
the
facility
by
other
affiliated
accounts.
There
were
no
borrowings
under
this
credit
facility
by
the
Funds during
the
current fiscal
period.
Issue
Value
at
5/31/24
Purchases
Cost
Sales
Proceeds
Realized
Gain
(Loss)
Change
in
Unrealized
Appreciation
(Depreciation)
Value
at
11/30/24
Shares
at
11/30/24
Dividend
Income
Lifecycle
Index
2055
Nuveen
Funds:
Bond
Index,
Class
W
$
313,673,664
$
51,202,847
$
4,673,448
$
(813,538)
$
9,817,391
$
369,206,916
38,141,210
$
6,070,373
Emerging
Markets
Equity
Index,
Class
W
359,104,327
72,815,806
12,997,244
(1,471,289)
15,408,838
432,860,438
38,579,362
–
Equity
Index,
Class
W
2,229,867,872
155,392,955
95,801,505
645,717
361,828,389
2,651,933,428
61,672,870
–
International
Equity
Index,
Class
W
837,517,510
114,418,575
17,183,697
234,306
(7,632,558)
927,354,136
39,681,392
–
$3,740,163,373
$393,830,183
$130,655,894
$(1,404,804)
$379,422,060
$4,381,354,918
178,074,835
$6,070,373
Issue
Value
at
5/31/24
Purchases
Cost
Sales
Proceeds
Realized
Gain
(Loss)
Change
in
Unrealized
Appreciation
(Depreciation)
Value
at
11/30/24
Shares
at
11/30/24
Dividend
Income
Lifecycle
Index
2060
Nuveen
Funds:
Bond
Index,
Class
W
$
148,559,066
$
28,156,671
$
1,968,633
$
(335,656)
$
4,591,720
$
179,003,168
18,492,063
$
2,914,071
Emerging
Markets
Equity
Index,
Class
W
201,723,219
44,973,069
5,601,399
(634,976)
8,408,688
248,868,601
22,180,802
–
Equity
Index,
Class
W
1,251,362,297
120,433,514
52,548,697
123,439
206,894,830
1,526,265,383
35,494,544
–
International
Equity
Index,
Class
W
469,888,911
76,320,243
9,002,735
132,677
(4,419,044)
532,920,052
22,803,597
–
$2,071,533,493
$269,883,497
$69,121,464
$(714,516)
$215,476,194
$2,487,057,204
98,971,006
$2,914,071
Issue
Value
at
5/31/24
Purchases
Cost
Sales
Proceeds
Realized
Gain
(Loss)
Change
in
Unrealized
Appreciation
(Depreciation)
Value
at
11/30/24
Shares
at
11/30/24
Dividend
Income
Lifecycle
Index
2065
Nuveen
Funds:
Bond
Index,
Class
W
$
20,027,291
$
7,845,877
$
780,350
$
(70,648)
$
656,842
$
27,679,012
2,859,402
$
422,080
Emerging
Markets
Equity
Index,
Class
W
33,178,643
14,513,251
1,813,678
(109,266)
1,266,813
47,035,763
4,192,136
–
Equity
Index,
Class
W
205,393,136
60,114,400
14,182,248
(48,636)
36,879,688
288,156,340
6,701,310
–
International
Equity
Index,
Class
W
77,126,631
27,995,697
3,603,317
(54,452)
(826,139)
100,638,420
4,306,308
–
$335,725,701
$110,469,225
$20,379,593
$(283,002)
$37,977,204
$463,509,535
18,059,156
$422,080
Item
7.
Financial
Statements
and
Financial
Highlights
for
Open-
End
Management
Investment
Companies
Portfolio
of
Investments
November
30,
2024
See
Notes
to
Financial
Statements
(Unaudited)
SHARES
DESCRIPTION
VALUE
AFFILIATED
INVESTMENT
COMPANIES—99.9%(a)
FIXED
INCOME—39.9%
1,654,475
Nuveen
Core
Bond
Fund,
Class
R6
$
15,237,717
1,647,282
Nuveen
Core
Plus
Bond
Fund,
Class
R6
15,237,361
TOTAL
FIXED
INCOME
30,475,078
INTERNATIONAL
EQUITY—7.0%
113,819
Nuveen
Emerging
Markets
Equity
Fund,
Class
R6
935,592
161,993
Nuveen
International
Equity
Fund,
Class
R6
2,267,898
88,282
Nuveen
International
Opportunities
Fund,
Class
R6
1,363,953
67,543
Nuveen
Quant
International
Small
Cap
Equity
Fund,
Class
R6
749,050
TOTAL
INTERNATIONAL
EQUITY
5,316,493
SHORT-TERM
FIXED
INCOME—39.6%
2,997,480
Nuveen
Short
Term
Bond
Fund,
Class
R6
30,274,553
TOTAL
SHORT-TERM
FIXED
INCOME
30,274,553
U.S.
EQUITY—13.4%
88,547
Nuveen
Core
Equity
Fund,
Class
R6
1,515,047
22,253
Nuveen
Dividend
Growth
Fund,
Class
R6
1,508,961
91,722
Nuveen
Dividend
Value
Fund,
Class
R6
1,544,596
49,243
Nuveen
Growth
Opportunities
ETF
1,684,603
57,501
Nuveen
Large
Cap
Growth
Fund,
Class
R6
1,726,770
63,257
Nuveen
Large
Cap
Value
Fund,
Class
R6
1,551,065
15,143
Nuveen
Quant
Small
Cap
Equity
Fund,
Class
R6
335,867
22,831
Nuveen
Quant
Small/Mid
Cap
Equity
Fund,
Class
R6
405,472
TOTAL
U.S.
EQUITY
10,272,381
TOTAL
AFFILIATED
INVESTMENT
COMPANIES
(Cost
$73,753,875)
76,338,505
TOTAL
INVESTMENTS—99.9%
(Cost
$73,753,875)
76,338,505
OTHER
ASSETS
&
LIABILITIES,
NET—0.1%
41,464
NET
ASSETS—100.0%
$
76,379,969
ETF
Exchange
Traded
Fund
(a)
Affiliated
fund.
Portfolio
of
Investments
November
30,
2024
See
Notes
to
Financial
Statements
(Unaudited)
SHARES
DESCRIPTION
VALUE
AFFILIATED
INVESTMENT
COMPANIES—100.0%(a)
FIXED
INCOME—39.7%
3,414,725
Nuveen
Core
Bond
Fund,
Class
R6
$
31,449,615
10,189,863
Nuveen
Core
Plus
Bond
Fund,
Class
R6
94,256,231
TOTAL
FIXED
INCOME
125,705,846
INTERNATIONAL
EQUITY—13.9%
935,216
Nuveen
Emerging
Markets
Equity
Fund,
Class
R6
7,687,477
1,334,592
Nuveen
International
Equity
Fund,
Class
R6
18,684,282
735,700
Nuveen
International
Opportunities
Fund,
Class
R6
11,366,568
556,286
Nuveen
Quant
International
Small
Cap
Equity
Fund,
Class
R6
6,169,215
TOTAL
INTERNATIONAL
EQUITY
43,907,542
SHORT-TERM
FIXED
INCOME—19.7%
6,185,154
Nuveen
Short
Term
Bond
Fund,
Class
R6
62,470,055
TOTAL
SHORT-TERM
FIXED
INCOME
62,470,055
U.S.
EQUITY—26.7%
725,968
Nuveen
Core
Equity
Fund,
Class
R6
12,421,310
182,989
Nuveen
Dividend
Growth
Fund,
Class
R6
12,408,492
755,453
Nuveen
Dividend
Value
Fund,
Class
R6
12,721,830
410,775
Nuveen
Growth
Opportunities
ETF
14,052,613
469,319
Nuveen
Large
Cap
Growth
Fund,
Class
R6
14,093,660
521,126
Nuveen
Large
Cap
Value
Fund,
Class
R6
12,778,015
125,137
Nuveen
Quant
Small
Cap
Equity
Fund,
Class
R6
2,775,542
190,091
Nuveen
Quant
Small/Mid
Cap
Equity
Fund,
Class
R6
3,376,024
TOTAL
U.S.
EQUITY
84,627,486
TOTAL
AFFILIATED
INVESTMENT
COMPANIES
(Cost
$287,203,621)
316,710,929
PRINCIPAL
DESCRIPTION
RATE
MATURITY
VALUE
SHORT-TERM
INVESTMENTS—0.1%
REPURCHASE
AGREEMENT—0.1%
$300,000
(b)
Fixed
Income
Clearing
Corporation
4
.580
%
12/02/24
300,000
TOTAL
REPURCHASE
AGREEMENT
300,000
TOTAL
SHORT-TERM
INVESTMENTS
(Cost
$300,000)
300,000
TOTAL
INVESTMENTS—100.1%
(Cost
$287,503,621)
317,010,929
OTHER
ASSETS
&
LIABILITIES,
NET—(0.1)%
(
180,279
)
NET
ASSETS—100.0%
$
316,830,650
ETF
Exchange
Traded
Fund
(a)
Affiliated
fund.
(b)
Agreement
with
Fixed
Income
Clearing
Corporation,
4.580%
dated
11/29/24
to
be
repurchased
at
$300,115
on
12/2/24,
collateralized
by
Government
Agency
Securities,
with
coupon
rate
0.000%
and
maturity
date
11/28/25,
valued
at
$306,060.
Portfolio
of
Investments
November
30,
2024
See
Notes
to
Financial
Statements
(Unaudited)
SHARES
DESCRIPTION
VALUE
AFFILIATED
INVESTMENT
COMPANIES—99.9%(a)
FIXED
INCOME—39.4%
25,019,477
Nuveen
Core
Plus
Bond
Fund,
Class
R6
$
231,430,165
TOTAL
FIXED
INCOME
231,430,165
INTERNATIONAL
EQUITY—20.6%
2,584,138
Nuveen
Emerging
Markets
Equity
Fund,
Class
R6
21,241,618
3,678,794
Nuveen
International
Equity
Fund,
Class
R6
51,503,122
2,010,039
Nuveen
International
Opportunities
Fund,
Class
R6
31,055,101
1,534,291
Nuveen
Quant
International
Small
Cap
Equity
Fund,
Class
R6
17,015,290
TOTAL
INTERNATIONAL
EQUITY
120,815,131
U.S.
EQUITY—39.9%
2,009,791
Nuveen
Core
Equity
Fund,
Class
R6
34,387,529
505,931
Nuveen
Dividend
Growth
Fund,
Class
R6
34,307,202
2,088,202
Nuveen
Dividend
Value
Fund,
Class
R6
35,165,329
1,140,613
Nuveen
Growth
Opportunities
ETF
39,020,371
1,293,518
Nuveen
Large
Cap
Growth
Fund,
Class
R6
38,844,341
1,443,042
Nuveen
Large
Cap
Value
Fund,
Class
R6
35,383,384
345,083
Nuveen
Quant
Small
Cap
Equity
Fund,
Class
R6
7,653,945
520,277
Nuveen
Quant
Small/Mid
Cap
Equity
Fund,
Class
R6
9,240,114
TOTAL
U.S.
EQUITY
234,002,215
TOTAL
AFFILIATED
INVESTMENT
COMPANIES
(Cost
$496,663,894)
586,247,511
PRINCIPAL
DESCRIPTION
RATE
MATURITY
VALUE
SHORT-TERM
INVESTMENTS—0.1%
REPURCHASE
AGREEMENT—0.1%
$590,000
(b)
Fixed
Income
Clearing
Corporation
4
.580
%
12/02/24
590,000
TOTAL
REPURCHASE
AGREEMENT
590,000
TOTAL
SHORT-TERM
INVESTMENTS
(Cost
$590,000)
590,000
TOTAL
INVESTMENTS—100.0%
(Cost
$497,253,894)
586,837,511
OTHER
ASSETS
&
LIABILITIES,
NET—(0.0)%
(
232,327
)
NET
ASSETS—100.0%
$
586,605,184
ETF
Exchange
Traded
Fund
(a)
Affiliated
fund.
(b)
Agreement
with
Fixed
Income
Clearing
Corporation,
4.580%
dated
11/29/24
to
be
repurchased
at
$590,225
on
12/2/24,
collateralized
by
Government
Agency
Securities,
with
coupon
rate
0.000%
and
maturity
date
11/28/25,
valued
at
$601,815.
Portfolio
of
Investments
November
30,
2024
See
Notes
to
Financial
Statements
(Unaudited)
SHARES
DESCRIPTION
VALUE
AFFILIATED
INVESTMENT
COMPANIES—99.9%(a)
FIXED
INCOME—19.6%
6,773,451
Nuveen
Core
Plus
Bond
Fund,
Class
R6
$
62,654,421
TOTAL
FIXED
INCOME
62,654,421
INTERNATIONAL
EQUITY—27.3%
1,866,487
Nuveen
Emerging
Markets
Equity
Fund,
Class
R6
15,342,525
2,657,993
Nuveen
International
Equity
Fund,
Class
R6
37,211,899
1,447,101
Nuveen
International
Opportunities
Fund,
Class
R6
22,357,708
1,106,765
Nuveen
Quant
International
Small
Cap
Equity
Fund,
Class
R6
12,274,028
TOTAL
INTERNATIONAL
EQUITY
87,186,160
U.S.
EQUITY—53.0%
1,451,213
Nuveen
Core
Equity
Fund,
Class
R6
24,830,255
366,447
Nuveen
Dividend
Growth
Fund,
Class
R6
24,848,790
1,509,012
Nuveen
Dividend
Value
Fund,
Class
R6
25,411,756
821,279
Nuveen
Growth
Opportunities
ETF
28,095,955
936,138
Nuveen
Large
Cap
Growth
Fund,
Class
R6
28,112,209
1,039,749
Nuveen
Large
Cap
Value
Fund,
Class
R6
25,494,650
249,594
Nuveen
Quant
Small
Cap
Equity
Fund,
Class
R6
5,535,991
376,414
Nuveen
Quant
Small/Mid
Cap
Equity
Fund,
Class
R6
6,685,112
TOTAL
U.S.
EQUITY
169,014,718
TOTAL
AFFILIATED
INVESTMENT
COMPANIES
(Cost
$247,576,269)
318,855,299
PRINCIPAL
DESCRIPTION
RATE
MATURITY
VALUE
SHORT-TERM
INVESTMENTS—0.1%
REPURCHASE
AGREEMENT—0.1%
$300,000
(b)
Fixed
Income
Clearing
Corporation
4
.580
%
12/02/24
300,000
TOTAL
REPURCHASE
AGREEMENT
300,000
TOTAL
SHORT-TERM
INVESTMENTS
(Cost
$300,000)
300,000
TOTAL
INVESTMENTS—100.0%
(Cost
$247,876,269)
319,155,299
OTHER
ASSETS
&
LIABILITIES,
NET—(0.0)%
(
147,942
)
NET
ASSETS—100.0%
$
319,007,357
ETF
Exchange
Traded
Fund
(a)
Affiliated
fund.
(b)
Agreement
with
Fixed
Income
Clearing
Corporation,
4.580%
dated
11/29/24
to
be
repurchased
at
$300,115
on
12/2/24,
collateralized
by
Government
Agency
Securities,
with
coupon
rate
0.000%
and
maturity
date
11/28/25,
valued
at
$306,060.
Lifestyle
Aggressive
Growth
Portfolio
of
Investments
November
30,
2024
See
Notes
to
Financial
Statements
(Unaudited)
SHARES
DESCRIPTION
VALUE
AFFILIATED
INVESTMENT
COMPANIES—99.9%(a)
INTERNATIONAL
EQUITY—34.0%
1,905,665
Nuveen
Emerging
Markets
Equity
Fund,
Class
R6
$
15,664,569
2,720,912
Nuveen
International
Equity
Fund,
Class
R6
38,092,763
1,489,720
Nuveen
International
Opportunities
Fund,
Class
R6
23,016,177
1,131,924
Nuveen
Quant
International
Small
Cap
Equity
Fund,
Class
R6
12,553,036
TOTAL
INTERNATIONAL
EQUITY
89,326,545
U.S.
EQUITY—65.9%
1,485,398
Nuveen
Core
Equity
Fund,
Class
R6
25,415,159
375,959
Nuveen
Dividend
Growth
Fund,
Class
R6
25,493,782
1,545,327
Nuveen
Dividend
Value
Fund,
Class
R6
26,023,302
841,393
Nuveen
Growth
Opportunities
ETF
28,784,054
956,962
Nuveen
Large
Cap
Growth
Fund,
Class
R6
28,737,577
1,062,570
Nuveen
Large
Cap
Value
Fund,
Class
R6
26,054,210
255,645
Nuveen
Quant
Small
Cap
Equity
Fund,
Class
R6
5,670,208
385,996
Nuveen
Quant
Small/Mid
Cap
Equity
Fund,
Class
R6
6,855,280
TOTAL
U.S.
EQUITY
173,033,572
TOTAL
AFFILIATED
INVESTMENT
COMPANIES
(Cost
$190,023,682)
262,360,117
PRINCIPAL
DESCRIPTION
RATE
MATURITY
VALUE
SHORT-TERM
INVESTMENTS—0.1%
REPURCHASE
AGREEMENT—0.1%
$300,000
(b)
Fixed
Income
Clearing
Corporation
4
.580
%
12/02/24
300,000
TOTAL
REPURCHASE
AGREEMENT
300,000
TOTAL
SHORT-TERM
INVESTMENTS
(Cost
$300,000)
300,000
TOTAL
INVESTMENTS—100.0%
(Cost
$190,323,682)
262,660,117
OTHER
ASSETS
&
LIABILITIES,
NET—(0.0)%
(
115,026
)
NET
ASSETS—100.0%
$
262,545,091
ETF
Exchange
Traded
Fund
(a)
Affiliated
fund.
(b)
Agreement
with
Fixed
Income
Clearing
Corporation,
4.580%
dated
11/29/24
to
be
repurchased
at
$300,115
on
12/2/24,
collateralized
by
Government
Agency
Securities,
with
coupon
rate
0.000%
and
maturity
date
11/28/25,
valued
at
$306,060.
Portfolio
of
Investments
November
30,
2024
See
Notes
to
Financial
Statements
(Unaudited)
SHARES
DESCRIPTION
VALUE
AFFILIATED
INVESTMENT
COMPANIES—99.9%(a)
FIXED
INCOME—39.4%
38,775,656
Nuveen
Core
Plus
Bond
Fund,
Class
R6
$
358,674,819
TOTAL
FIXED
INCOME
358,674,819
INTERNATIONAL
EQUITY—20.6%
3,989,572
Nuveen
Emerging
Markets
Equity
Fund,
Class
R6
32,794,285
5,706,855
Nuveen
International
Equity
Fund,
Class
R6
79,895,976
3,129,801
Nuveen
International
Opportunities
Fund,
Class
R6
48,355,421
2,375,176
Nuveen
Quant
International
Small
Cap
Equity
Fund,
Class
R6
26,340,706
TOTAL
INTERNATIONAL
EQUITY
187,386,388
U.S.
EQUITY—39.9%
3,117,546
Nuveen
Core
Equity
Fund,
Class
R6
53,341,210
780,953
Nuveen
Dividend
Growth
Fund,
Class
R6
52,956,452
3,233,904
Nuveen
Dividend
Value
Fund,
Class
R6
54,458,943
1,759,396
Nuveen
Growth
Opportunities
ETF
60,188,937
2,005,245
Nuveen
Large
Cap
Growth
Fund,
Class
R6
60,217,495
2,237,600
Nuveen
Large
Cap
Value
Fund,
Class
R6
54,865,943
536,235
Nuveen
Quant
Small
Cap
Equity
Fund,
Class
R6
11,893,699
807,407
Nuveen
Quant
Small/Mid
Cap
Equity
Fund,
Class
R6
14,339,553
TOTAL
U.S.
EQUITY
362,262,232
TOTAL
AFFILIATED
INVESTMENT
COMPANIES
(Cost
$731,482,295)
908,323,439
PRINCIPAL
DESCRIPTION
RATE
MATURITY
VALUE
SHORT-TERM
INVESTMENTS—0.1%
REPURCHASE
AGREEMENT—0.1%
$810,000
(b)
Fixed
Income
Clearing
Corporation
4
.580
%
12/02/24
810,000
TOTAL
REPURCHASE
AGREEMENT
810,000
TOTAL
SHORT-TERM
INVESTMENTS
(Cost
$810,000)
810,000
TOTAL
INVESTMENTS—100.0%
(Cost
$732,292,295)
909,133,439
OTHER
ASSETS
&
LIABILITIES,
NET—(0.0)%
(
410,122
)
NET
ASSETS—100.0%
$
908,723,317
ETF
Exchange
Traded
Fund
(a)
Affiliated
fund.
(b)
Agreement
with
Fixed
Income
Clearing
Corporation,
4.580%
dated
11/29/24
to
be
repurchased
at
$810,309
on
12/2/24,
collateralized
by
Government
Agency
Securities,
with
coupon
rate
0.000%
and
maturity
date
11/28/25,
valued
at
$826,208.
Statement
of
Assets
and
Liabilities
See
Notes
to
Financial
Statements
November
30,
2024
(Unaudited)
16.1
Lifestyle
Income
16.2
Lifestyle
Conservative
16.3
Lifestyle
Moderate
16.4
Lifestyle
Growth
ASSETS
Affiliated
investments,
at
value
‡
$
76,338,505
$
316,710,929
$
586,247,511
$
318,855,299
Short-term
investments,
at
value
#
–
300,000
590,000
300,000
Cash
79,379
540
6,039
6,887
Receivables:
Dividends
215,557
678,625
847,801
230,302
Interest
–
76
150
76
Investments
sold
142,384
963,149
2,370,294
1,476,850
Reimbursement
from
Adviser
32,888
36,353
39,822
36,578
Shares
sold
1,779
110,788
29,005
16,764
Other
7,000
18,759
27,986
14,201
Total
assets
76,817,492
318,819,219
590,158,608
320,936,957
LIABILITIES
Due
to
affiliates
4,044
4,360
4,681
4,321
Cash
overdraft
–
–
–
–
Payables:
Management
fees
6,163
25,780
47,777
26,048
Investments
purchased
-
regular
settlement
345,101
1,577,389
3,165,554
1,677,902
Shares
redeemed
15,874
260,495
152,114
101,857
Service
agreement
fees
4,052
12,192
30,070
15,008
Accrued
expenses:
Custodian
fees
2,505
2,489
2,493
2,507
Professional
fees
7,144
7,194
7,249
7,193
Shareholder
reporting
expenses
14,664
23,391
36,199
24,133
Shareholder
servicing
agent
fees
2,197
5,531
–
7,334
Trustees
fees
7,335
20,127
30,469
15,549
12b-1
distribution
and
service
fees
9,267
41,712
74,341
41,143
Other
19,177
7,909
2,477
6,605
Total
liabilities
437,523
1,988,569
3,553,424
1,929,600
Net
assets
$
76,379,969
$
316,830,650
$
586,605,184
$
319,007,357
NET
ASSETS
CONSIST
OF:
Paid-in
capital
$
77,761,472
$
299,969,540
$
517,828,714
$
256,650,872
Total
distributable
earnings
(loss)
(
1,381,503
)
16,861,110
68,776,470
62,356,485
Net
assets
$
76,379,969
$
316,830,650
$
586,605,184
$
319,007,357
‡
Affiliated
investments,
cost
$
73,753,875
$
287,203,621
$
496,663,894
$
247,576,269
#
Short-term
investments,
cost
–
300,000
590,000
300,000
See
Notes
to
Financial
Statements
16.5
Lifestyle
Aggressive
Growth
18.1
Managed
Allocation
$
262,360,117
$
908,323,439
300,000
810,000
3,826
–
–
1,312,561
76
206
1,226,393
3,545,455
35,607
55,198
27,825
20,946
10,470
182,867
263,964,314
914,250,672
4,200
3,571
–
1,302
21,383
–
1,267,082
4,674,123
26,221
352,883
16,880
13,693
2,500
2,505
7,182
7,176
20,837
55,851
7,291
58,988
11,498
186,754
25,545
167,249
8,604
3,260
1,419,223
5,527,355
$
262,545,091
$
908,723,317
$
196,389,420
$
744,655,922
66,155,671
164,067,395
$
262,545,091
$
908,723,317
$
190,023,682
$
731,482,295
300,000
810,000
Statement
of
Assets
and
Liabilities
(continued)
See
Notes
to
Financial
Statements
Statement
of
Assets
and
Liabilities
(continued)
November
30,
2024
(Unaudited)
16.1
Lifestyle
Income
16.2
Lifestyle
Conservative
16.3
Lifestyle
Moderate
16.4
Lifestyle
Growth
CLASS
A:
Net
assets
$
45,236,204
$
205,177,680
$
365,137,146
$
200,639,965
Shares
outstanding
4,110,896
15,731,383
23,862,467
11,116,737
Net
asset
value
("NAV")
per
share
$
11
.00
$
13
.04
$
15
.30
$
18
.05
Maximum
sales
charge
5.75%
5.75%
5.75%
5.75%
Offering
price
per
share
(NAV
per
share
plus
maximum
sales
charge)
$
11
.67
$
13
.84
$
16
.23
$
19
.15
CLASS
I:
Net
assets
$
24,821
$
3,278,369
$
7,370,061
$
4,262,973
Shares
outstanding
2,258
250,900
480,682
234,614
NAV
and
offering
price
per
share
$
10
.99
$
13
.07
$
15
.33
$
18
.17
PREMIER
CLASS:
Net
assets
$
24,858
$
43,260
$
25,480
$
36,851
Shares
outstanding
2,257
3,304
1,650
2,023
NAV
and
offering
price
per
share
$
11
.01
$
13
.09
$
15
.44
$
18
.22
CLASS
R6:
Net
assets
$
10,242,680
$
59,125,714
$
93,181,381
$
54,158,565
Shares
outstanding
929,987
4,523,751
6,074,681
2,975,624
NAV
and
offering
price
per
share
$
11
.01
$
13
.07
$
15
.34
$
18
.20
RETIREMENT
CLASS:
Net
assets
$
20,851,406
$
49,205,627
$
120,891,116
$
59,909,003
Shares
outstanding
1,895,260
3,770,763
7,895,837
3,312,810
NAV
and
offering
price
per
share
$
11
.00
$
13
.05
$
15
.31
$
18
.08
Authorized
shares
-
per
class
Unlimited
Unlimited
Unlimited
Unlimited
Par
value
per
share
$
0
.0001
$
0
.0001
$
0
.0001
$
0
.0001
See
Notes
to
Financial
Statements
16.5
Lifestyle
Aggressive
Growth
18.1
Managed
Allocation
$
126,107,911
$
822,213,584
6,039,692
62,786,531
$
20
.88
$
13
.10
5.75%
5.75%
$
22
.15
$
13
.90
$
5,492,887
$
–
260,934
–
$
21
.05
$
–
$
26,065
$
–
1,234
–
$
21
.12
$
–
$
64,643,031
$
19,309,589
3,068,326
1,480,934
$
21
.07
$
13
.04
$
66,275,197
$
67,200,144
3,166,218
5,162,054
$
20
.93
$
13
.02
Unlimited
Unlimited
$
0
.0001
$
0
.0001
See
Notes
to
Financial
Statements
Six
Months
Ended
November
30,
2024
(Unaudited)
16.1
Lifestyle
Income
16.2
Lifestyle
Conservative
16.3
Lifestyle
Moderate
INVESTMENT
INCOME
Dividends
from
affiliated
investments
$
1,354,274
$
4,430,579
$
5,912,161
Interest
1,599
5,870
13,106
Total
investment
income
1,355,873
4,436,449
5,925,267
EXPENSES
Management
fees
37,864
157,687
289,134
12b-1
distribution
and
service
fees
—
Class
A
56,804
254,781
448,887
12b-1
distribution
and
service
fees
—
Premier
Class
106
137
143
Shareholder
servicing
agent
fees
—
Class
A
4,472
15,544
27,752
Shareholder
servicing
agent
fees
—
Class
I
21
2,040
4,421
Shareholder
servicing
agent
fees
—
Premier
Class
27
75
59
Shareholder
servicing
agent
fees
—
Class
R6
427
1,348
819
Shareholder
servicing
agent
fees
—
Retirement
Class
24,402
61,996
148,777
Administrative
service
fees
19,495
20,525
21,714
Trustees
fees
921
3,806
7,048
Custodian
expenses
3,756
3,743
3,741
Overdraft
expense
846
758
1,078
Professional
fees
7,649
7,713
7,830
Registration
fees
74,933
78,142
79,513
Shareholder
reporting
expenses
17,221
11,833
9,494
Other
9,323
9,550
9,962
Total
expenses
258,267
629,678
1,060,372
Expenses
reimbursed
by
the
investment
adviser
(
133,634
)
(
136,816
)
(
140,217
)
Net
expenses
124,633
492,862
920,155
Net
investment
income
(loss)
1,231,240
3,943,587
5,005,112
REALIZED
AND
UNREALIZED
GAIN
(LOSS)
Realized
gain
(loss):
Investments
9
–
27
Affiliated
investments
(
32,742
)
764,758
1,774,295
Net
realized
gain
(loss)
(
32,733
)
764,758
1,774,322
Change
in
unrealized
appreciation
(depreciation)
on:
Affiliated
investments
2,563,600
14,075,357
33,536,884
Net
change
in
unrealized
appreciation
(depreciation)
2,563,600
14,075,357
33,536,884
Net
realized
and
unrealized
gain
(loss)
2,530,867
14,840,115
35,311,206
Net
increase
(decrease)
in
net
assets
from
operations
$
3,762,107
$
18,783,702
$
40,316,318
See
Notes
to
Financial
Statements
16.4
Lifestyle
Growth
16.5
Lifestyle
Aggressive
Growth
18.1
Managed
Allocation
$
1,897,857
$
469,322
$
9,218,419
6,140
5,895
16,981
1,903,997
475,217
9,235,400
157,518
128,821
–
249,122
153,479
1,015,045
173
189
–
18,189
15,352
118,361
2,580
2,959
–
62
36
–
727
1,180
165
73,026
79,782
88,233
20,576
20,329
16,638
3,880
3,146
11,236
3,773
3,747
3,759
444
737
454
7,722
7,698
7,841
76,592
78,208
26,739
14,117
15,596
47,772
9,541
9,102
9,630
638,042
520,361
1,345,873
(
137,354
)
(
138,807
)
(
242,298
)
500,688
381,554
1,103,575
1,403,309
93,663
8,131,825
–
65
–
2,207,245
1,863,649
8,020,775
2,207,245
1,863,714
8,020,775
20,587,176
19,667,658
47,029,262
20,587,176
19,667,658
47,029,262
22,794,421
21,531,372
55,050,037
$
24,197,730
$
21,625,035
$
63,181,862
Statement
of
Changes
in
Net
Assets
See
Notes
to
Financial
Statements
16.1
Lifestyle
Income
16.2
Lifestyle
Conservative
Unaudited
Six
Months
Ended
11/30/24
Year
Ended
5/31/24
Unaudited
Six
Months
Ended
11/30/24
Year
Ended
5/31/24
OPERATIONS
Net
investment
income
(loss)
$
1,231,240
$
2,509,123
$
3,943,587
$
8,680,188
Net
realized
gain
(loss)
(
32,733
)
(
856,263
)
764,758
1,741,954
Net
change
in
unrealized
appreciation
(depreciation)
2,563,600
4,001,194
14,075,357
23,366,289
Net
increase
(decrease)
in
net
assets
from
operations
3,762,107
5,654,054
18,783,702
33,788,431
DISTRIBUTIONS
TO
SHAREHOLDERS
–
–
–
–
Dividends:
Class
A
(
741,558
)
(
1,479,675
)
(
2,509,435
)
(
5,739,986
)
Class
I
(
1,164
)
(
4,876
)
(
42,839
)
(
97,588
)
Premier
Class
(
2,078
)
(
9,509
)
(
1,963
)
(
7,602
)
Class
R6
(
187,161
)
(
466,864
)
(
792,993
)
(
1,696,086
)
Retirement
Class
(
317,285
)
(
543,140
)
(
612,130
)
(
1,390,953
)
Total
distributions
(
1,249,246
)
(
2,504,064
)
(
3,959,360
)
(
8,932,215
)
FUND
SHARE
TRANSACTIONS
Subscriptions
3,782,006
9,169,134
12,411,684
24,611,235
Reinvestments
of
distributions
1,213,235
2,442,009
3,910,756
8,813,774
Redemptions
(
6,048,921
)
(
18,516,223
)
(
23,615,458
)
(
52,166,608
)
Net
increase
(decrease)
from
Fund
share
transactions
(
1,053,680
)
(
6,905,080
)
(
7,293,018
)
(
18,741,599
)
Net
increase
(decrease)
in
net
assets
1,459,181
(
3,755,090
)
7,531,324
6,114,617
Net
assets
at
the
beginning
of
period
74,920,788
78,675,878
309,299,326
303,184,709
Net
assets
at
the
end
of
period
$
76,379,969
$
74,920,788
$
316,830,650
$
309,299,326
See
Notes
to
Financial
Statements
16.3
Lifestyle
Moderate
16.4
Lifestyle
Growth
16.5
Lifestyle
Aggressive
Growth
18.1
Managed
Allocation
Unaudited
Six
Months
Ended
11/30/24
Year
Ended
5/31/24
Unaudited
Six
Months
Ended
11/30/24
Year
Ended
5/31/24
Unaudited
Six
Months
Ended
11/30/24
Year
Ended
5/31/24
Unaudited
Six
Months
Ended
11/30/24
Year
Ended
5/31/24
$
5,005,112
$
12,830,477
$
1,403,309
$
5,326,359
$
93,663
$
2,812,722
$
8,131,825
$
20,741,733
1,774,322
4,861,127
2,207,245
4,472,657
1,863,714
4,811,304
8,020,775
16,006,242
33,536,884
60,395,683
20,587,176
42,815,745
19,667,658
42,366,607
47,029,262
86,868,015
40,316,318
78,087,287
24,197,730
52,614,761
21,625,035
49,990,633
63,181,862
123,615,990
–
–
–
–
–
–
–
–
(
3,036,677
)
(
8,545,628
)
–
(
3,861,856
)
–
(
1,701,101
)
(
7,351,578
)
(
19,854,680
)
(
72,464
)
(
211,620
)
–
(
92,759
)
–
(
91,561
)
–
–
(
1,369
)
(
7,125
)
–
(
7,061
)
–
(
5,903
)
–
–
(
901,849
)
(
2,194,647
)
–
(
1,029,842
)
–
(
1,053,881
)
(
201,292
)
(
529,165
)
(
1,016,458
)
(
2,805,427
)
–
(
1,107,250
)
–
(
895,387
)
(
639,140
)
(
1,844,718
)
(
5,028,817
)
(
13,764,447
)
–
(
6,098,768
)
–
(
3,747,833
)
(
8,192,010
)
(
22,228,563
)
29,230,253
59,049,624
9,374,960
26,535,770
13,835,321
24,964,128
13,159,042
21,050,277
4,948,355
13,602,369
–
6,044,076
–
3,691,534
7,894,723
21,516,639
(
45,821,340
)
(
88,468,216
)
(
20,815,955
)
(
45,183,083
)
(
20,765,965
)
(
39,101,550
)
(
48,427,052
)
(
85,680,824
)
(
11,642,732
)
(
15,816,223
)
(
11,440,995
)
(
12,603,237
)
(
6,930,644
)
(
10,445,888
)
(
27,373,287
)
(
43,113,908
)
23,644,769
48,506,617
12,756,735
33,912,756
14,694,391
35,796,912
27,616,565
58,273,519
562,960,415
514,453,798
306,250,622
272,337,866
247,850,700
212,053,788
881,106,752
822,833,233
$
586,605,184
$
562,960,415
$
319,007,357
$
306,250,622
$
262,545,091
$
247,850,700
$
908,723,317
$
881,106,752
See
Notes
to
Financial
Statements
The
following
data
is
for
a
share
outstanding
for
each
fiscal year
end
unless
otherwise
noted:
Investment
Operations
Less
Distributions
Net
Asset
Value,
Beginning
of
Period
Net
Investment
Income
(Loss)
a
Net
Realized/
Unrealized
Gain
(Loss)
j
Total
From
Net
Investment
Income
From
Net
Realized
Gains
Total
Net
Asset
Value,
End
of
Period
16.1
Lifestyle
Income
Class
A:
11/30/24
#
$
10
.64
$
0
.17
$
0
.37
$
0
.54
$
(
0
.18
)
$
—
$
(
0
.18
)
$
11
.00
5/31/24
10
.21
0
.33
0
.43
0
.76
(
0
.33
)
—
(
0
.33
)
10
.64
5/31/23
10
.64
0
.26
(
0
.27
)
(
0
.01
)
(
0
.25
)
(
0
.17
)
(
0
.42
)
10
.21
5/31/22
11
.96
0
.18
(
0
.96
)
(
0
.78
)
(
0
.22
)
(
0
.32
)
(
0
.54
)
10
.64
5/31/21
11
.21
0
.16
0
.99
1
.15
(
0
.23
)
(
0
.17
)
(
0
.40
)
11
.96
5/31/20
11
.01
0
.23
0
.33
0
.56
(
0
.24
)
(
0
.12
)
(
0
.36
)
11
.21
Class
I:
11/30/24
#
10
.65
0
.19
0
.36
0
.55
(
0
.21
)
—
(
0
.21
)
10
.99
5/31/24
10
.22
0
.35
0
.44
0
.79
(
0
.36
)
—
(
0
.36
)
10
.65
5/31/23
10
.65
0
.28
(
0
.26
)
0
.02
(
0
.28
)
(
0
.17
)
(
0
.45
)
10
.22
5/31/22
11
.96
0
.20
(
0
.95
)
(
0
.75
)
(
0
.24
)
(
0
.32
)
(
0
.56
)
10
.65
5/31/21
11
.22
0
.19
0
.98
1
.17
(
0
.26
)
(
0
.17
)
(
0
.43
)
11
.96
5/31/20
11
.02
0
.26
0
.33
0
.59
(
0
.27
)
(
0
.12
)
(
0
.39
)
11
.22
Premier
Class:
11/30/24
#
10
.66
0
.18
0
.37
0
.55
(
0
.20
)
—
(
0
.20
)
11
.01
5/31/24
10
.23
0
.33
0
.45
0
.78
(
0
.35
)
—
(
0
.35
)
10
.66
5/31/23
10
.66
0
.28
(
0
.27
)
0
.01
(
0
.27
)
(
0
.17
)
(
0
.44
)
10
.23
5/31/22
11
.98
0
.19
(
0
.96
)
(
0
.77
)
(
0
.23
)
(
0
.32
)
(
0
.55
)
10
.66
5/31/21
11
.23
0
.18
0
.98
1
.16
(
0
.24
)
(
0
.17
)
(
0
.41
)
11
.98
5/31/20
11
.02
0
.25
0
.34
0
.59
(
0
.26
)
(
0
.12
)
(
0
.38
)
11
.23
Class
R6:
11/30/24
#
10
.65
0
.19
0
.36
0
.55
(
0
.19
)
—
(
0
.19
)
11
.01
5/31/24
10
.22
0
.36
0
.43
0
.79
(
0
.36
)
—
(
0
.36
)
10
.65
5/31/23
10
.65
0
.29
(
0
.27
)
0
.02
(
0
.28
)
(
0
.17
)
(
0
.45
)
10
.22
5/31/22
11
.97
0
.21
(
0
.96
)
(
0
.75
)
(
0
.25
)
(
0
.32
)
(
0
.57
)
10
.65
5/31/21
11
.22
0
.20
0
.98
1
.18
(
0
.26
)
(
0
.17
)
(
0
.43
)
11
.97
5/31/20
11
.02
0
.26
0
.33
0
.59
(
0
.27
)
(
0
.12
)
(
0
.39
)
11
.22
Retirement
Class:
11/30/24
#
10
.64
0
.18
0
.36
0
.54
(
0
.18
)
—
(
0
.18
)
11
.00
5/31/24
10
.21
0
.33
0
.44
0
.77
(
0
.34
)
—
(
0
.34
)
10
.64
5/31/23
10
.64
0
.26
(
0
.26
)
—
(
0
.26
)
(
0
.17
)
(
0
.43
)
10
.21
5/31/22
11
.96
0
.18
(
0
.96
)
(
0
.78
)
(
0
.22
)
(
0
.32
)
(
0
.54
)
10
.64
5/31/21
11
.21
0
.17
0
.98
1
.15
(
0
.23
)
(
0
.17
)
(
0
.40
)
11
.96
5/31/20
11
.00
0
.24
0
.34
0
.58
(
0
.25
)
(
0
.12
)
(
0
.37
)
11
.21
#
Unaudited
a
Based
on
average
shares
outstanding.
b
Total
returns
are
at
NAV
and
do
not
include
any
sales
charge.
Total
returns
are
not
annualized.
c
Percentage
is
annualized.
e
The
Fund's
expenses
do
not
include
the
expenses
of
the
Underlying
Funds.
j
Short-term
and
long-term
capital
gain
distributions
received
from
the
underlying
Funds
are
presented
in
net
realized
and
unrealized
gain
(loss)
on
total
investments
for
all
periods
presented.
See
Notes
to
Financial
Statements
Ratios
and
Supplemental
Data
Ratios
to
Average
Net
Assets
Total
Return
b
Net
Assets,
End
of
Period
(000)
Gross
Expenses
e
Net
Expenses
e
Net
Investment
Income
(Loss)
Portfolio
Turnover
Rate
5
.09
%
$
45,236
0
.72
%
c
0
.37
%
c
3
.21
%
c
7
%
7
.61
44,780
0
.66
0
.38
3
.21
19
0
.05
47,233
0
.61
0
.38
2
.55
16
(
6
.73
)
55,202
0
.58
0
.35
1
.52
20
10
.21
58,046
0
.57
0
.38
1
.40
27
5
.23
50,890
0
.63
0
.38
2
.09
27
5
.16
25
0
.50
c
0
.15
c
3
.42
c
7
7
.85
101
0
.46
0
.19
3
.38
19
0
.30
105
0
.37
0
.15
2
.78
16
(
6
.55
)
120
0
.35
0
.15
1
.72
20
10
.48
133
0
.33
0
.14
1
.63
27
5
.47
110
0
.41
0
.15
2
.31
27
5
.16
25
0
.62
c
0
.25
c
3
.31
c
7
7
.76
213
0
.55
0
.25
3
.24
19
0
.18
366
0
.49
0
.25
2
.69
16
(
6
.61
)
349
0
.46
0
.25
1
.63
20
10
.32
361
0
.45
0
.25
1
.53
27
5
.47
313
0
.52
0
.25
2
.15
27
5
.24
10,243
0
.46
c
0
.10
c
3
.47
c
7
7
.91
10,985
0
.38
0
.10
3
.48
19
0
.34
13,663
0
.33
0
.10
2
.83
16
(
6
.56
)
15,247
0
.30
0
.10
1
.78
20
10
.58
15,514
0
.29
0
.10
1
.67
27
5
.53
8,234
0
.36
0
.10
2
.37
27
5
.10
20,851
0
.71
c
0
.35
c
3
.23
c
7
7
.65
18,842
0
.63
0
.35
3
.23
19
0
.08
17,310
0
.58
0
.35
2
.57
16
(
6
.71
)
20,443
0
.55
0
.35
1
.51
20
10
.23
26,139
0
.54
0
.35
1
.43
27
5
.35
19,742
0
.60
0
.35
2
.11
27
Financial
Highlights
(continued)
See
Notes
to
Financial
Statements
Financial
Highlights
(continued)
The
following
data
is
for
a
share
outstanding
for
each
fiscal year
end
unless
otherwise
noted:
Investment
Operations
Less
Distributions
Net
Asset
Value,
Beginning
of
Period
Net
Investment
Income
(Loss)
a
Net
Realized/
Unrealized
Gain
(Loss)
j
Total
From
Net
Investment
Income
From
Net
Realized
Gains
Total
Net
Asset
Value,
End
of
Period
16.2
Lifestyle
Conservative
Class
A:
11/30/24
#
$
12
.44
$
0
.16
$
0
.60
$
0
.76
$
(
0
.16
)
$
—
$
(
0
.16
)
$
13
.04
5/31/24
11
.47
0
.33
0
.98
1
.31
(
0
.34
)
—
(
0
.34
)
12
.44
5/31/23
12
.18
0
.26
(
0
.27
)
(
0
.01
)
(
0
.32
)
(
0
.38
)
(
0
.70
)
11
.47
5/31/22
14
.22
0
.20
(
1
.29
)
(
1
.09
)
(
0
.32
)
(
0
.63
)
(
0
.95
)
12
.18
5/31/21
12
.55
0
.18
2
.10
2
.28
(
0
.28
)
(
0
.33
)
(
0
.61
)
14
.22
5/31/20
12
.24
0
.25
0
.49
0
.74
(
0
.20
)
(
0
.23
)
(
0
.43
)
12
.55
Class
I:
11/30/24
#
12
.46
0
.17
0
.61
0
.78
(
0
.17
)
—
(
0
.17
)
13
.07
5/31/24
11
.49
0
.35
0
.98
1
.33
(
0
.36
)
—
(
0
.36
)
12
.46
5/31/23
12
.20
0
.29
(
0
.28
)
0
.01
(
0
.34
)
(
0
.38
)
(
0
.72
)
11
.49
5/31/22
14
.25
0
.22
(
1
.30
)
(
1
.08
)
(
0
.34
)
(
0
.63
)
(
0
.97
)
12
.20
5/31/21
12
.57
0
.21
2
.10
2
.31
(
0
.30
)
(
0
.33
)
(
0
.63
)
14
.25
5/31/20
12
.26
0
.30
0
.46
0
.76
(
0
.22
)
(
0
.23
)
(
0
.45
)
12
.57
Premier
Class:
11/30/24
#
12
.47
0
.16
0
.61
0
.77
(
0
.15
)
—
(
0
.15
)
13
.09
5/31/24
11
.50
0
.34
0
.98
1
.32
(
0
.35
)
—
(
0
.35
)
12
.47
5/31/23
12
.21
0
.28
(
0
.28
)
—
(
0
.33
)
(
0
.38
)
(
0
.71
)
11
.50
5/31/22
14
.26
0
.22
(
1
.30
)
(
1
.08
)
(
0
.34
)
(
0
.63
)
(
0
.97
)
12
.21
5/31/21
12
.58
0
.20
2
.11
2
.31
(
0
.30
)
(
0
.33
)
(
0
.63
)
14
.26
5/31/20
12
.27
0
.26
0
.49
0
.75
(
0
.21
)
(
0
.23
)
(
0
.44
)
12
.58
Class
R6:
11/30/24
#
12
.47
0
.17
0
.61
0
.78
(
0
.18
)
—
(
0
.18
)
13
.07
5/31/24
11
.49
0
.36
0
.99
1
.35
(
0
.37
)
—
(
0
.37
)
12
.47
5/31/23
12
.21
0
.30
(
0
.29
)
0
.01
(
0
.35
)
(
0
.38
)
(
0
.73
)
11
.49
5/31/22
14
.25
0
.24
(
1
.29
)
(
1
.05
)
(
0
.36
)
(
0
.63
)
(
0
.99
)
12
.21
5/31/21
12
.57
0
.22
2
.11
2
.33
(
0
.32
)
(
0
.33
)
(
0
.65
)
14
.25
5/31/20
12
.26
0
.28
0
.49
0
.77
(
0
.23
)
(
0
.23
)
(
0
.46
)
12
.57
Retirement
Class:
11/30/24
#
12
.45
0
.16
0
.60
0
.76
(
0
.16
)
—
(
0
.16
)
13
.05
5/31/24
11
.48
0
.33
0
.98
1
.31
(
0
.34
)
—
(
0
.34
)
12
.45
5/31/23
12
.19
0
.27
(
0
.28
)
(
0
.01
)
(
0
.32
)
(
0
.38
)
(
0
.70
)
11
.48
5/31/22
14
.23
0
.20
(
1
.29
)
(
1
.09
)
(
0
.32
)
(
0
.63
)
(
0
.95
)
12
.19
5/31/21
12
.55
0
.19
2
.10
2
.29
(
0
.28
)
(
0
.33
)
(
0
.61
)
14
.23
5/31/20
12
.25
0
.25
0
.48
0
.73
(
0
.20
)
(
0
.23
)
(
0
.43
)
12
.55
#
Unaudited
a
Based
on
average
shares
outstanding.
b
Total
returns
are
at
NAV
and
do
not
include
any
sales
charge.
Total
returns
are
not
annualized.
c
Percentage
is
annualized.
e
The
Fund's
expenses
do
not
include
the
expenses
of
the
Underlying
Funds.
j
Short-term
and
long-term
capital
gain
distributions
received
from
the
underlying
Funds
are
presented
in
net
realized
and
unrealized
gain
(loss)
on
total
investments
for
all
periods
presented.
See
Notes
to
Financial
Statements
Ratios
and
Supplemental
Data
Ratios
to
Average
Net
Assets
Total
Return
b
Net
Assets,
End
of
Period
(000)
Gross
Expenses
e
Net
Expenses
e
Net
Investment
Income
(Loss)
Portfolio
Turnover
Rate
6
.12
%
$
205,178
0
.45
%
c
0
.37
%
c
2
.45
%
c
5
%
11
.58
200,324
0
.45
0
.37
2
.77
13
0
.11
201,363
0
.44
0
.37
2
.30
19
(
8
.25
)
224,733
0
.43
0
.36
1
.49
21
18
.40
244,655
0
.44
0
.37
1
.36
35
6
.16
206,100
0
.45
0
.37
1
.99
29
6
.28
3,278
0
.31
c
0
.23
c
2
.59
c
5
11
.75
3,377
0
.28
0
.20
2
.94
13
0
.29
3,076
0
.27
0
.20
2
.48
19
(
8
.09
)
3,876
0
.26
0
.20
1
.62
21
18
.57
7,122
0
.26
0
.20
1
.54
35
6
.33
6,559
0
.29
0
.20
2
.45
29
6
.18
43
0
.41
c
0
.25
c
2
.54
c
5
11
.69
266
0
.36
0
.25
2
.89
13
0
.23
249
0
.34
0
.25
2
.43
19
(
8
.14
)
262
0
.32
0
.25
1
.60
21
18
.49
774
0
.32
0
.25
1
.48
35
6
.27
665
0
.35
0
.25
2
.05
29
6
.25
59,126
0
.19
c
0
.10
c
2
.71
c
5
11
.96
56,552
0
.18
0
.10
3
.05
13
0
.31
51,084
0
.17
0
.10
2
.57
19
(
7
.99
)
55,791
0
.16
0
.10
1
.77
21
18
.77
53,420
0
.17
0
.10
1
.63
35
6
.44
34,603
0
.19
0
.10
2
.25
29
6
.13
49,206
0
.44
c
0
.35
c
2
.46
c
5
11
.60
48,781
0
.43
0
.35
2
.80
13
0
.13
47,413
0
.42
0
.35
2
.32
19
(
8
.17
)
56,686
0
.41
0
.35
1
.50
21
18
.44
63,022
0
.41
0
.34
1
.39
35
6
.11
46,255
0
.43
0
.33
1
.98
29
Financial
Highlights
(continued)
See
Notes
to
Financial
Statements
Financial
Highlights
(continued)
The
following
data
is
for
a
share
outstanding
for
each
fiscal year
end
unless
otherwise
noted:
Investment
Operations
Less
Distributions
Net
Asset
Value,
Beginning
of
Period
Net
Investment
Income
(Loss)
a
Net
Realized/
Unrealized
Gain
(Loss)
j
Total
From
Net
Investment
Income
From
Net
Realized
Gains
Total
Net
Asset
Value,
End
of
Period
16.3
Lifestyle
Moderate
Class
A:
11/30/24
#
$
14
.39
$
0
.13
$
0
.91
$
1
.04
$
(
0
.13
)
$
—
$
(
0
.13
)
$
15
.30
5/31/24
12
.77
0
.31
1
.65
1
.96
(
0
.34
)
—
(
0
.34
)
14
.39
5/31/23
13
.71
0
.27
(
0
.31
)
(
0
.04
)
(
0
.29
)
(
0
.61
)
(
0
.90
)
12
.77
5/31/22
16
.64
0
.23
(
1
.70
)
(
1
.47
)
(
0
.44
)
(
1
.02
)
(
1
.46
)
13
.71
5/31/21
13
.82
0
.20
3
.46
3
.66
(
0
.34
)
(
0
.50
)
(
0
.84
)
16
.64
5/31/20
13
.52
0
.27
0
.67
0
.94
(
0
.25
)
(
0
.39
)
(
0
.64
)
13
.82
Class
I:
11/30/24
#
14
.42
0
.14
0
.91
1
.05
(
0
.14
)
—
(
0
.14
)
15
.33
5/31/24
12
.80
0
.35
1
.63
1
.98
(
0
.36
)
—
(
0
.36
)
14
.42
5/31/23
13
.74
0
.30
(
0
.31
)
(
0
.01
)
(
0
.32
)
(
0
.61
)
(
0
.93
)
12
.80
5/31/22
16
.67
0
.26
(
1
.70
)
(
1
.44
)
(
0
.47
)
(
1
.02
)
(
1
.49
)
13
.74
5/31/21
13
.84
0
.23
3
.47
3
.70
(
0
.37
)
(
0
.50
)
(
0
.87
)
16
.67
5/31/20
13
.55
0
.37
0
.58
0
.95
(
0
.27
)
(
0
.39
)
(
0
.66
)
13
.84
Premier
Class:
11/30/24
#
14
.47
0
.13
0
.92
1
.05
(
0
.08
)
—
(
0
.08
)
15
.44
5/31/24
12
.84
0
.33
1
.66
1
.99
(
0
.36
)
—
(
0
.36
)
14
.47
5/31/23
13
.78
0
.28
(
0
.30
)
(
0
.02
)
(
0
.31
)
(
0
.61
)
(
0
.92
)
12
.84
5/31/22
16
.72
0
.26
(
1
.72
)
(
1
.46
)
(
0
.46
)
(
1
.02
)
(
1
.48
)
13
.78
5/31/21
13
.87
0
.23
3
.48
3
.71
(
0
.36
)
(
0
.50
)
(
0
.86
)
16
.72
5/31/20
13
.58
0
.24
0
.70
0
.94
(
0
.26
)
(
0
.39
)
(
0
.65
)
13
.87
Class
R6:
11/30/24
#
14
.43
0
.15
0
.91
1
.06
(
0
.15
)
—
(
0
.15
)
15
.34
5/31/24
12
.80
0
.36
1
.65
2
.01
(
0
.38
)
—
(
0
.38
)
14
.43
5/31/23
13
.74
0
.30
(
0
.30
)
—
(
0
.33
)
(
0
.61
)
(
0
.94
)
12
.80
5/31/22
16
.68
0
.28
(
1
.71
)
(
1
.43
)
(
0
.49
)
(
1
.02
)
(
1
.51
)
13
.74
5/31/21
13
.84
0
.25
3
.47
3
.72
(
0
.38
)
(
0
.50
)
(
0
.88
)
16
.68
5/31/20
13
.55
0
.29
0
.67
0
.96
(
0
.28
)
(
0
.39
)
(
0
.67
)
13
.84
Retirement
Class:
11/30/24
#
14
.40
0
.13
0
.91
1
.04
(
0
.13
)
—
(
0
.13
)
15
.31
5/31/24
12
.78
0
.32
1
.64
1
.96
(
0
.34
)
—
(
0
.34
)
14
.40
5/31/23
13
.72
0
.27
(
0
.30
)
(
0
.03
)
(
0
.30
)
(
0
.61
)
(
0
.91
)
12
.78
5/31/22
16
.65
0
.23
(
1
.70
)
(
1
.47
)
(
0
.44
)
(
1
.02
)
(
1
.46
)
13
.72
5/31/21
13
.82
0
.21
3
.47
3
.68
(
0
.35
)
(
0
.50
)
(
0
.85
)
16
.65
5/31/20
13
.53
0
.25
0
.68
0
.93
(
0
.25
)
(
0
.39
)
(
0
.64
)
13
.82
#
Unaudited
a
Based
on
average
shares
outstanding.
b
Total
returns
are
at
NAV
and
do
not
include
any
sales
charge.
Total
returns
are
not
annualized.
c
Percentage
is
annualized.
e
The
Fund's
expenses
do
not
include
the
expenses
of
the
Underlying
Funds.
j
Short-term
and
long-term
capital
gain
distributions
received
from
the
underlying
Funds
are
presented
in
net
realized
and
unrealized
gain
(loss)
on
total
investments
for
all
periods
presented.
See
Notes
to
Financial
Statements
Ratios
and
Supplemental
Data
Ratios
to
Average
Net
Assets
Total
Return
b
Net
Assets,
End
of
Period
(000)
Gross
Expenses
e
Net
Expenses
e
Net
Investment
Income
(Loss)
Portfolio
Turnover
Rate
7
.23
%
$
365,137
0
.41
%
c
0
.37
%
c
1
.68
%
c
6
%
15
.55
350,208
0
.43
0
.36
2
.33
15
0
.09
333,435
0
.42
0
.33
2
.09
19
(
9
.78
)
367,073
0
.41
0
.36
1
.46
21
27
.02
410,533
0
.42
0
.36
1
.32
47
7
.01
330,823
0
.43
0
.37
1
.95
31
7
.31
7,370
0
.27
c
0
.22
c
1
.84
c
6
15
.72
7,868
0
.25
0
.18
2
.56
15
0
.30
7,294
0
.23
0
.14
2
.31
19
(
9
.60
)
10,895
0
.22
0
.18
1
.64
21
27
.29
13,719
0
.23
0
.17
1
.50
47
7
.12
12,977
0
.26
0
.20
2
.64
31
7
.28
25
0
.35
c
0
.25
c
1
.76
c
6
15
.68
289
0
.32
0
.24
2
.46
15
0
.20
257
0
.31
0
.22
2
.21
19
(
9
.64
)
276
0
.30
0
.25
1
.60
21
27
.22
689
0
.31
0
.24
1
.45
47
7
.03
557
0
.32
0
.25
1
.72
31
7
.36
93,181
0
.15
c
0
.10
c
1
.95
c
6
15
.90
88,282
0
.15
0
.09
2
.63
15
0
.38
68,231
0
.15
0
.06
2
.36
19
(
9
.58
)
76,453
0
.14
0
.10
1
.75
21
27
.47
77,429
0
.15
0
.09
1
.58
47
7
.23
52,090
0
.16
0
.10
2
.10
31
7
.24
120,891
0
.40
c
0
.35
c
1
.70
c
6
15
.56
116,313
0
.40
0
.34
2
.36
15
0
.12
105,238
0
.40
0
.31
2
.11
19
(
9
.77
)
114,335
0
.39
0
.35
1
.48
21
27
.12
121,361
0
.40
0
.34
1
.35
47
6
.95
93,587
0
.41
0
.35
1
.81
31
Financial
Highlights
(continued)
See
Notes
to
Financial
Statements
Financial
Highlights
(continued)
The
following
data
is
for
a
share
outstanding
for
each
fiscal year
end
unless
otherwise
noted:
Investment
Operations
Less
Distributions
Net
Asset
Value,
Beginning
of
Period
Net
Investment
Income
(Loss)
a
Net
Realized/
Unrealized
Gain
(Loss)
j
Total
From
Net
Investment
Income
From
Net
Realized
Gains
Total
Net
Asset
Value,
End
of
Period
16.4
Lifestyle
Growth
Class
A:
11/30/24
#
$
16
.71
$
0
.07
$
1
.27
$
1
.34
$
—
$
—
$
—
$
18
.05
5/31/24
14
.23
0
.28
2
.52
2
.80
(
0
.32
)
—
(
0
.32
)
16
.71
5/31/23
15
.24
0
.23
(
0
.19
)
0
.04
(
0
.23
)
(
0
.82
)
(
1
.05
)
14
.23
5/31/22
18
.87
0
.22
(
1
.94
)
(
1
.72
)
(
0
.56
)
(
1
.35
)
(
1
.91
)
15
.24
5/31/21
14
.79
0
.18
4
.97
5
.15
(
0
.37
)
(
0
.70
)
(
1
.07
)
18
.87
5/31/20
14
.58
0
.27
0
.74
1
.01
(
0
.23
)
(
0
.57
)
(
0
.80
)
14
.79
Class
I:
11/30/24
#
16
.81
0
.09
1
.27
1
.36
—
—
—
18
.17
5/31/24
14
.31
0
.31
2
.54
2
.85
(
0
.35
)
—
(
0
.35
)
16
.81
5/31/23
15
.33
0
.26
(
0
.20
)
0
.06
(
0
.26
)
(
0
.82
)
(
1
.08
)
14
.31
5/31/22
18
.96
0
.26
(
1
.94
)
(
1
.68
)
(
0
.60
)
(
1
.35
)
(
1
.95
)
15
.33
5/31/21
14
.86
0
.22
4
.98
5
.20
(
0
.40
)
(
0
.70
)
(
1
.10
)
18
.96
5/31/20
14
.65
0
.38
0
.66
1
.04
(
0
.26
)
(
0
.57
)
(
0
.83
)
14
.86
Premier
Class:
11/30/24
#
16
.86
0
.08
1
.28
1
.36
—
—
—
18
.22
5/31/24
14
.35
0
.30
2
.55
2
.85
(
0
.34
)
—
(
0
.34
)
16
.86
5/31/23
15
.36
0
.25
(
0
.20
)
0
.05
(
0
.24
)
(
0
.82
)
(
1
.06
)
14
.35
5/31/22
18
.97
0
.26
(
1
.93
)
(
1
.67
)
(
0
.59
)
(
1
.35
)
(
1
.94
)
15
.36
5/31/21
14
.87
0
.20
4
.99
5
.19
(
0
.39
)
(
0
.70
)
(
1
.09
)
18
.97
5/31/20
14
.65
0
.25
0
.79
1
.04
(
0
.25
)
(
0
.57
)
(
0
.82
)
14
.87
Class
R6:
11/30/24
#
16
.83
0
.10
1
.27
1
.37
—
—
—
18
.20
5/31/24
14
.33
0
.32
2
.55
2
.87
(
0
.37
)
—
(
0
.37
)
16
.83
5/31/23
15
.34
0
.27
(
0
.19
)
0
.08
(
0
.27
)
(
0
.82
)
(
1
.09
)
14
.33
5/31/22
18
.98
0
.27
(
1
.94
)
(
1
.67
)
(
0
.62
)
(
1
.35
)
(
1
.97
)
15
.34
5/31/21
14
.87
0
.23
4
.99
5
.22
(
0
.41
)
(
0
.70
)
(
1
.11
)
18
.98
5/31/20
14
.66
0
.28
0
.78
1
.06
(
0
.28
)
(
0
.57
)
(
0
.85
)
14
.87
Retirement
Class:
11/30/24
#
16
.74
0
.08
1
.26
1
.34
—
—
—
18
.08
5/31/24
14
.26
0
.28
2
.53
2
.81
(
0
.33
)
—
(
0
.33
)
16
.74
5/31/23
15
.27
0
.24
(
0
.20
)
0
.04
(
0
.23
)
(
0
.82
)
(
1
.05
)
14
.26
5/31/22
18
.90
0
.22
(
1
.93
)
(
1
.71
)
(
0
.57
)
(
1
.35
)
(
1
.92
)
15
.27
5/31/21
14
.81
0
.18
4
.98
5
.16
(
0
.37
)
(
0
.70
)
(
1
.07
)
18
.90
5/31/20
14
.60
0
.23
0
.78
1
.01
(
0
.23
)
(
0
.57
)
(
0
.80
)
14
.81
#
Unaudited
a
Based
on
average
shares
outstanding.
b
Total
returns
are
at
NAV
and
do
not
include
any
sales
charge.
Total
returns
are
not
annualized.
c
Percentage
is
annualized.
e
The
Fund's
expenses
do
not
include
the
expenses
of
the
Underlying
Funds.
j
Short-term
and
long-term
capital
gain
distributions
received
from
the
underlying
Funds
are
presented
in
net
realized
and
unrealized
gain
(loss)
on
total
investments
for
all
periods
presented.
See
Notes
to
Financial
Statements
Ratios
and
Supplemental
Data
Ratios
to
Average
Net
Assets
Total
Return
b
Net
Assets,
End
of
Period
(000)
Gross
Expenses
e
Net
Expenses
e
Net
Investment
Income
(Loss)
Portfolio
Turnover
Rate
8
.02
%
$
200,640
0
.45
%
c
0
.37
%
c
0
.84
%
c
5
%
19
.91
194,578
0
.46
0
.31
1
.80
15
0
.71
175,919
0
.46
0
.29
1
.64
20
(
10
.17
)
190,045
0
.44
0
.34
1
.25
26
35
.45
212,617
0
.46
0
.37
1
.05
54
6
.85
162,347
0
.48
0
.38
1
.79
35
8
.09
4,263
0
.30
c
0
.22
c
0
.99
c
5
20
.15
4,432
0
.29
0
.13
1
.98
15
0
.85
3,807
0
.27
0
.11
1
.82
20
(
10
.00
)
5,138
0
.25
0
.16
1
.44
26
35
.72
7,976
0
.26
0
.17
1
.28
54
7
.03
8,870
0
.30
0
.20
2
.57
35
8
.07
37
0
.38
c
0
.25
c
0
.91
c
5
20
.09
347
0
.36
0
.18
1
.94
15
0
.78
296
0
.34
0
.18
1
.78
20
(
9
.93
)
316
0
.32
0
.23
1
.41
26
35
.62
2,022
0
.33
0
.24
1
.18
54
7
.02
1,356
0
.36
0
.25
1
.64
35
8
.14
54,159
0
.19
c
0
.10
c
1
.11
c
5
20
.24
50,686
0
.19
0
.03
2
.04
15
1
.01
43,616
0
.18
0
.01
1
.91
20
(
9
.96
)
47,024
0
.16
0
.08
1
.50
26
35
.87
48,422
0
.18
0
.09
1
.34
54
7
.18
33,985
0
.21
0
.10
1
.87
35
8
.00
59,909
0
.44
c
0
.35
c
0
.86
c
5
19
.90
56,207
0
.44
0
.28
1
.84
15
0
.73
48,701
0
.43
0
.26
1
.67
20
(
10
.12
)
56,946
0
.41
0
.33
1
.26
26
35
.51
59,232
0
.43
0
.34
1
.07
54
6
.87
42,326
0
.45
0
.35
1
.55
35
Financial
Highlights
(continued)
See
Notes
to
Financial
Statements
Financial
Highlights
(continued)
The
following
data
is
for
a
share
outstanding
for
each
fiscal year
end
unless
otherwise
noted:
Investment
Operations
Less
Distributions
Net
Asset
Value,
Beginning
of
Period
Net
Investment
Income
(Loss)
a
Net
Realized/
Unrealized
Gain
(Loss)
j
Total
From
Net
Investment
Income
From
Net
Realized
Gains
Total
Net
Asset
Value,
End
of
Period
16.5
Lifestyle
Aggressive
Growth
Class
A:
11/30/24
#
$
19
.20
$
(
0
.00
)
d
$
1
.68
$
1
.68
$
—
$
—
$
—
$
20
.88
5/31/24
15
.69
0
.20
3
.58
3
.78
(
0
.27
)
(
0
.00
)
d
(
0
.27
)
19
.20
5/31/23
16
.91
0
.17
(
0
.07
)
0
.10
(
0
.25
)
(
1
.07
)
(
1
.32
)
15
.69
5/31/22
21
.19
0
.21
(
2
.19
)
(
1
.98
)
(
0
.64
)
(
1
.66
)
(
2
.30
)
16
.91
5/31/21
15
.46
0
.14
6
.61
6
.75
(
0
.45
)
(
0
.57
)
(
1
.02
)
21
.19
5/31/20
15
.33
0
.24
0
.82
1
.06
(
0
.13
)
(
0
.80
)
(
0
.93
)
15
.46
Class
I:
11/30/24
#
19
.34
0
.02
1
.69
1
.71
—
—
—
21
.05
5/31/24
15
.80
0
.23
3
.61
3
.84
(
0
.30
)
(
0
.00
)
d
(
0
.30
)
19
.34
5/31/23
17
.03
0
.21
(
0
.09
)
0
.12
(
0
.28
)
(
1
.07
)
(
1
.35
)
15
.80
5/31/22
21
.32
0
.26
(
2
.21
)
(
1
.95
)
(
0
.68
)
(
1
.66
)
(
2
.34
)
17
.03
5/31/21
15
.55
0
.18
6
.64
6
.82
(
0
.48
)
(
0
.57
)
(
1
.05
)
21
.32
5/31/20
15
.40
0
.37
0
.72
1
.09
(
0
.14
)
(
0
.80
)
(
0
.94
)
15
.55
Premier
Class:
11/30/24
#
19
.40
0
.01
1
.71
1
.72
—
—
—
21
.12
5/31/24
15
.86
0
.22
3
.62
3
.84
(
0
.30
)
(
0
.00
)
d
(
0
.30
)
19
.40
5/31/23
17
.08
0
.20
(
0
.08
)
0
.12
(
0
.27
)
(
1
.07
)
(
1
.34
)
15
.86
5/31/22
21
.37
0
.24
(
2
.20
)
(
1
.96
)
(
0
.67
)
(
1
.66
)
(
2
.33
)
17
.08
5/31/21
15
.59
0
.18
6
.64
6
.82
(
0
.47
)
(
0
.57
)
(
1
.04
)
21
.37
5/31/20
15
.43
0
.03
1
.06
1
.09
(
0
.13
)
(
0
.80
)
(
0
.93
)
15
.59
Class
R6:
11/30/24
#
19
.34
0
.03
1
.70
1
.73
—
—
—
21
.07
5/31/24
15
.81
0
.25
3
.60
3
.85
(
0
.32
)
(
0
.00
)
d
(
0
.32
)
19
.34
5/31/23
17
.03
0
.22
(
0
.08
)
0
.14
(
0
.29
)
(
1
.07
)
(
1
.36
)
15
.81
5/31/22
21
.32
0
.26
(
2
.19
)
(
1
.93
)
(
0
.70
)
(
1
.66
)
(
2
.36
)
17
.03
5/31/21
15
.55
0
.20
6
.64
6
.84
(
0
.50
)
(
0
.57
)
(
1
.07
)
21
.32
5/31/20
15
.40
0
.25
0
.87
1
.12
(
0
.17
)
(
0
.80
)
(
0
.97
)
15
.55
Retirement
Class:
11/30/24
#
19
.24
0
.00
d
1
.69
1
.69
—
—
—
20
.93
5/31/24
15
.73
0
.20
3
.59
3
.79
(
0
.28
)
(
0
.00
)
d
(
0
.28
)
19
.24
5/31/23
16
.95
0
.18
(
0
.08
)
0
.10
(
0
.25
)
(
1
.07
)
(
1
.32
)
15
.73
5/31/22
21
.23
0
.22
(
2
.19
)
(
1
.97
)
(
0
.65
)
(
1
.66
)
(
2
.31
)
16
.95
5/31/21
15
.49
0
.15
6
.62
6
.77
(
0
.46
)
(
0
.57
)
(
1
.03
)
21
.23
5/31/20
15
.35
0
.20
0
.87
1
.07
(
0
.13
)
(
0
.80
)
(
0
.93
)
15
.49
#
Unaudited
a
Based
on
average
shares
outstanding.
b
Total
returns
are
at
NAV
and
do
not
include
any
sales
charge.
Total
returns
are
not
annualized.
c
Percentage
is
annualized.
d
Value
rounded
to
zero.
e
The
Fund's
expenses
do
not
include
the
expenses
of
the
Underlying
Funds.
j
Short-term
and
long-term
capital
gain
distributions
received
from
the
underlying
Funds
are
presented
in
net
realized
and
unrealized
gain
(loss)
on
total
investments
for
all
periods
presented.
See
Notes
to
Financial
Statements
Ratios
and
Supplemental
Data
Ratios
to
Average
Net
Assets
Total
Return
b
Net
Assets,
End
of
Period
(000)
Gross
Expenses
e
Net
Expenses
e
Net
Investment
Income
(Loss)
Portfolio
Turnover
Rate
8
.75
%
$
126,108
0
.48
%
c
0
.38
%
c
(
0
.01
)
%
c
6
%
24
.30
118,311
0
.49
0
.39
1
.13
12
1
.17
102,309
0
.49
0
.35
1
.10
21
(
10
.59
)
106,104
0
.48
0
.32
1
.04
30
44
.41
117,922
0
.50
0
.38
0
.78
56
6
.80
83,795
0
.54
0
.40
1
.56
33
8
.84
5,493
0
.32
c
0
.21
c
0
.16
c
6
24
.55
5,423
0
.30
0
.20
1
.34
12
1
.33
4,908
0
.29
0
.15
1
.31
21
(
10
.40
)
6,248
0
.28
0
.13
1
.28
30
44
.68
9,163
0
.30
0
.18
0
.98
56
7
.01
7,051
0
.33
0
.19
2
.39
33
8
.81
26
0
.38
c
0
.25
c
0
.06
c
6
24
.39
389
0
.37
0
.25
1
.28
12
1
.29
320
0
.36
0
.22
1
.27
21
(
10
.43
)
342
0
.35
0
.20
1
.21
30
44
.54
427
0
.37
0
.23
0
.95
56
7
.00
313
0
.39
0
.25
0
.17
33
8
.95
64,643
0
.21
c
0
.10
c
0
.27
c
6
24
.58
63,319
0
.21
0
.10
1
.45
12
1
.46
51,862
0
.20
0
.05
1
.40
21
(
10
.32
)
50,497
0
.19
0
.04
1
.28
30
44
.79
45,923
0
.21
0
.08
1
.08
56
7
.14
26,474
0
.25
0
.10
1
.56
33
8
.78
66,275
0
.46
c
0
.35
c
0
.02
c
6
24
.29
60,408
0
.45
0
.35
1
.18
12
1
.20
52,655
0
.45
0
.31
1
.16
21
(
10
.54
)
56,152
0
.44
0
.29
1
.08
30
44
.47
65,640
0
.45
0
.33
0
.82
56
6
.85
42,644
0
.49
0
.35
1
.29
33
Financial
Highlights
(continued)
See
Notes
to
Financial
Statements
Financial
Highlights
(continued)
The
following
data
is
for
a
share outstanding
for
each
fiscal year
end
unless
otherwise
noted:
Investment
Operations
Less
Distributions
Net
Asset
Value,
Beginning
of
Period
Net
Investment
Income
(Loss)
a
Net
Realized/
Unrealized
Gain
(Loss)
j
Total
From
Net
Investment
Income
From
Net
Realized
Gains
Total
Net
Asset
Value,
End
of
Period
18.1
Managed
Allocation
Class
A:
11/30/24
#
$
12
.32
$
0
.11
$
0
.79
$
0
.90
$
(
0
.12
)
$
—
$
(
0
.12
)
$
13
.10
5/31/24
10
.93
0
.28
1
.41
1
.69
(
0
.30
)
—
(
0
.30
)
12
.32
5/31/23
11
.77
0
.24
(
0
.26
)
(
0
.02
)
(
0
.25
)
(
0
.57
)
(
0
.82
)
10
.93
5/31/22
14
.51
0
.22
(
1
.46
)
(
1
.24
)
(
0
.41
)
(
1
.09
)
(
1
.50
)
11
.77
5/31/21
12
.36
0
.20
3
.07
3
.27
(
0
.33
)
(
0
.79
)
(
1
.12
)
14
.51
5/31/20
12
.21
0
.25
0
.59
0
.84
(
0
.25
)
(
0
.44
)
(
0
.69
)
12
.36
Class
R6:
11/30/24
#
12
.26
0
.13
0
.78
0
.91
(
0
.13
)
—
(
0
.13
)
13
.04
5/31/24
10
.88
0
.31
1
.40
1
.71
(
0
.33
)
—
(
0
.33
)
12
.26
5/31/23
11
.73
0
.26
(
0
.26
)
—
(
0
.28
)
(
0
.57
)
(
0
.85
)
10
.88
5/31/22
14
.46
0
.25
(
1
.45
)
(
1
.20
)
(
0
.44
)
(
1
.09
)
(
1
.53
)
11
.73
5/31/21
12
.32
0
.23
3
.07
3
.30
(
0
.37
)
(
0
.79
)
(
1
.16
)
14
.46
5/31/20
12
.18
0
.28
0
.58
0
.86
(
0
.28
)
(
0
.44
)
(
0
.72
)
12
.32
Retirement
Class:
11/30/24
#
12
.24
0
.11
0
.79
0
.90
(
0
.12
)
—
(
0
.12
)
13
.02
5/31/24
10
.87
0
.28
1
.39
1
.67
(
0
.30
)
—
(
0
.30
)
12
.24
5/31/23
11
.71
0
.24
(
0
.26
)
(
0
.02
)
(
0
.25
)
(
0
.57
)
(
0
.82
)
10
.87
5/31/22
14
.44
0
.21
(
1
.45
)
(
1
.24
)
(
0
.40
)
(
1
.09
)
(
1
.49
)
11
.71
5/31/21
12
.31
0
.20
3
.05
3
.25
(
0
.33
)
(
0
.79
)
(
1
.12
)
14
.44
5/31/20
12
.16
0
.25
0
.59
0
.84
(
0
.25
)
(
0
.44
)
(
0
.69
)
12
.31
#
Unaudited
a
Based
on
average
shares
outstanding.
b
Total
returns
are
at
NAV
and
do
not
include
any
sales
charge.
Total
returns
are
not
annualized.
c
Percentage
is
annualized.
e
The
Fund's
expenses
do
not
include
the
expenses
of
the
Underlying
Funds.
j
Short-term
and
long-term
capital
gain
distributions
received
from
the
underlying
Funds
are
presented
in
net
realized
and
unrealized
gain
(loss)
on
total
investments
for
all
periods
presented.
See
Notes
to
Financial
Statements
Ratios
and
Supplemental
Data
Ratios
to
Average
Net
Assets
Total
Return
b
Net
Assets,
End
of
Period
(000)
Gross
Expenses
e
Net
Expenses
e
Net
Investment
Income
(Loss)
Portfolio
Turnover
Rate
7
.30
%
$
822,214
0
.31
%
c
0
.25
%
c
1
.80
%
c
4
%
15
.70
789,834
0
.32
0
.25
2
.44
11
0
.20
734,814
0
.32
0
.25
2
.17
19
(
9
.69
)
790,563
0
.31
0
.23
1
.59
23
27
.20
918,856
0
.31
0
.25
1
.48
42
6
.87
750,844
0
.32
0
.25
1
.97
27
7
.47
19,310
0
.03
c
0.00
c
2
.05
c
4
15
.97
18,769
0
.03
0.00
2
.68
11
0
.39
18,493
0
.03
0.00
2
.40
19
(
9
.45
)
24,214
0
.03
0.00
1
.84
23
27
.52
24,885
0
.02
0.00
1
.71
42
7
.09
16,997
0
.03
0.00
2
.21
27
7
.34
67,200
0
.28
c
0
.25
c
1
.80
c
4
15
.60
72,504
0
.28
0
.25
2
.44
11
0
.21
69,526
0
.28
0
.25
2
.18
19
(
9
.70
)
73,347
0
.28
0
.25
1
.56
23
27
.15
88,693
0
.27
0
.25
1
.48
42
6
.91
70,404
0
.28
0
.25
1
.98
27
Notes
to
Financial
Statements
(Unaudited)
1.
General
Information
Trust
and
Fund
Information:
TIAA-CREF
Funds
(the
“Trust”)
is
an
open-end
management
investment
company
registered
under
the
Investment
Company
Act
of
1940,
(“1940
Act”),
as
amended.
The
Trust
is
comprised
of
the
following
(collectively
the
“Funds”
or
individually,
the
“Fund”),
among
others:
Current
Fiscal
Period:
The
end
of
the
reporting
period
for
the Funds
is
November
30,
2024,
and
the
period
covered
by
these
Notes
to
Financial
Statements
is
the
six
months
ended
November
30,
2024
(the
"current
fiscal
period").
Investment
Advisor:
Teachers
Advisors,
LLC
(the
“Adviser”),
a
wholly
owned
indirect
subsidiary
of
Teachers
Insurance
and
Annuity
Association
of
America
(“TIAA”),
is
registered
with
the
Securities
and
Exchange
Commission
(“SEC”)
as
an
investment
adviser
and
provides
investment
management
services
for
the
Funds.
Share
Classes
and
Sales
Charges:
Each
Fund
is
a
“fund
of
funds”
that
diversifies
its
assets
by
investing
in
Class
R6
shares
of
other
Nuveen
mutual
funds
and
in
other
investment
pools
or
investment
products.
The
Funds
offer
Class
A,
Class
I,
Premier
Class,
Class
R6
and
Retirement
Class
shares.
Each
class
differs
by
the
allocation
of
class-specific
expenses
and
voting
rights
in
matters
affecting
a
single
class.
The
Funds
offer
their
shares
through
their
principal
underwriter,
Nuveen
Securities,
LLC
(“Nuveen
Securities”),
which
is
a
wholly
owned
indirect
subsidiary
of
TIAA.
A
sales
charge
is
imposed
on
purchases
of
Class
A
shares
of
the
Funds
of
less
than
certain
amounts,
as
set
forth
in
each
Fund’s
prospectus.
Shareholders
with
an
account
held
directly
with
a
Fund
that
held
Class
A
shares
of
the
Funds
prior
to
May
6,
2024
will
not
be
subject
to
the
sales
charge
on
any
future
purchases
or
redemptions
of
Class
A
shares
of
that
Fund
or
any
other
fund
that
is
a
series
of
the
TIAA-CREF
Funds
or
is
a
Nuveen
Fund
in
their
account.
Such
shareholders
will
be
able
to
purchase
Class
A
shares
at
net
asset
value
("NAV").
Class
A
Shares
purchases
of
$1
million
or
more
are
sold
at
NAV
without
an
up-front
sales
charge
buy
may
be
subject
to
a
contingent
deferred
sales
charge
(“CDSC”)
of
1%
if
redeemed
within
eighteen
months
of
purchase.
Class
I,
Premier
Class,
Class
R
and
Retirement
Class
shares
are
sold
without
an
up-front
sales
charge.
2.
Significant
Accounting
Policies
The
accompanying
financial
statements
were
prepared
in
accordance
with
accounting
principles
generally
accepted
in
the
United
States
of
America
(“U.S.
GAAP”),
which
may
require
the
use
of
estimates
made
by
management
and
the
evaluation
of
subsequent
events.
Actual
results
may
differ
from
those
estimates.
The Funds
are
investment
companies
and
follow
the
accounting
guidance
in
the
Financial
Accounting
Standards
Board
(“FASB”)
Accounting
Standards
Codification
946,
Financial
Services
—
Investment
Companies
. The net
asset
value
("NAV")
for
financial
reporting
purposes
may
differ
from
the NAV
for
processing
transactions.
The NAV
for
financial
reporting
purposes
includes
security
and shareholder
transactions
through
the
date
of
the
report.
Total
return
is
computed
based
on
the NAV
used
for
processing
transactions.
The
following
is
a
summary
of
the
significant
accounting
policies
consistently
followed
by
the
Funds.
Compensation:
The
Funds pay
the
members
of
the
Board
of
Trustees
("Board")
all
of
whom
are
independent,
certain
remuneration
for
their
services,
plus
travel
and
other
expenses.
The
Board
has
adopted
a
deferred
compensation
plan
for
independent
trustees
that
enables
trustees
to
elect
to
defer
receipt
of
all
or
a
portion
of
the
annual
compensation
they
are
entitled
to
receive
from
certain
Nuveen-advised
funds.
Under
the
plan,
deferred
amounts
are
treated
as
though
equal
dollar
amounts
had
been
invested
in
shares
of
select
Nuveen-advised
funds. Amounts
deferred
are
retained
by
the
Funds
until
paid.
Amounts
payable
to
the
trustees
for
compensation
are
included
separately
in the
accompanying
Statement
of
Assets
and
Liabilities.
Trustees’
fees,
including
any
deferred
compensation
incurred,
are
reflected
in
the
Statement
of
Operations.
Distributions
to
Shareholders:
Distributions
to
shareholders
are
recorded
on
the
ex-dividend
date.
The
amount,
character
and
timing
of
distributions
are
determined
in
accordance
with
federal
income
tax
regulations,
which
may
differ
from
U.S.
GAAP.
Fund
Name
Short
Name
Nuveen
Lifestyle
Income
Fund
Lifestyle
Income
Nuveen
Lifestyle
Conservative
Fund
Lifestyle
Conservative
Nuveen
Lifestyle
Moderate
Fund
Lifestyle
Moderate
Nuveen
Lifestyle
Growth
Fund
Lifestyle
Growth
Nuveen
Lifestyle
Aggressive
Growth
Fund
Lifestyle
Aggressive
Growth
Nuveen
Managed
Allocation
Fund
Managed
Allocation
Indemnification:
Under
the
Trust's
organizational
documents,
its
officers
and
trustees
are
indemnified
against
certain
liabilities
arising
out
of
the
performance
of
their
duties
to
the
Trust.
In
addition,
in
the
normal
course
of
business,
the
Trust
enters
into
contracts
that
provide
general
indemnifications
to
other
parties.
The
Trust's
maximum
exposure
under
these
arrangements
is
unknown
as
this
would
involve
future
claims
that
may
be
made
against
the
Trust
that
have
not
yet
occurred.
However,
the
Trust
has
not
had
prior
claims
or
losses
pursuant
to
these
contracts
and
expects
the
risk
of
loss
to
be
remote.
Investments
and
Investment
Income:
Securities
transactions
are
accounted
for
as
of
the
trade
date
for
financial
reporting
purposes.
Interest
income
is
recorded
on
an
accrual
basis
and
includes
accretion
of
discounts
and
amortization
of
premiums.
Dividend
income
is
recorded
on
the
ex-dividend
date. Realized
gains
and
losses
on
securities
transactions
are
based
upon
the
specific
identification
method.
Distributions
received
on
securities
that
represent
a
return
of
capital
or
capital
gains
are
recorded
as
a
reduction
of
cost
of
investments
and/or
as
a
realized
gain.
The
Funds
estimate
the
components
of
distributions
received
that
may
be
considered
return
of
capital
distributions
or
capital
gain
distributions.
Multiclass
Operations
and
Allocations:
Income, expenses,
realized
gains
and
losses
and
unrealized
appreciation
and
depreciation
of
a
Fund
are
allocated
on
a
pro
rata
basis
to
each
class
of
shares,
except
for
service
agreement
fees,
distribution
fees
and
transfer
agency
fees
and
expenses, which
are
unique
to
each
class
of
shares.
Most
expenses
of
the
Trust
can
be
directly
attributed
to
a
Fund.
Expenses
that
cannot
be
directly
attributed
are
allocated
to
each
Fund
in
the
Trust
based
upon
the
average
net
assets
of
each
Fund.
Netting
Agreements:
In
the
ordinary
course
of
business,
the Funds
may
enter
into
transactions
subject
to
enforceable
master
repurchase
agreements,
International
Swaps
and
Derivatives
Association,
Inc.
(ISDA)
master
agreements
or
other
similar
arrangements
(“netting
agreements”).
Generally,
the
right
to
offset
in
netting
agreements
allows
each Fund
to
offset
certain
securities
and
derivatives
with
a
specific
counterparty,
when
applicable,
as
well
as
any
collateral
received
or
delivered
to
that
counterparty
based
on
the
terms
of
the
agreements.
Generally,
each Fund
manages
its
cash
collateral
and
securities
collateral
on
a
counterparty
basis.
With
respect
to
certain
counterparties,
in
accordance
with
the
terms
of
the
netting
agreements,
collateral
posted
to
the Funds
is
held
in
a
segregated
account
by
the Funds'
custodian
and/or
with
respect
to
those
amounts
which
can
be
sold
or
repledged,
are
presented
in
the Funds'
Portfolio
of
Investments
or
Statement
of
Assets
and
Liabilities.
The Funds'
investments
subject
to
netting
agreements
as
of
the
end
of
the
reporting
period,
if
any,
are
further
described
later
in
these
Notes
to
Financial
Statements.
New
Accounting
Pronouncement:
In
November
2023,
the
FASB
issued
Accounting
Standard
Update
(“ASU”)
No.
2023-07,
Segment
Reporting
(Topic
280)
Improvements
to
Reportable
Segment
Disclosures
(“ASU
2023-07”).
The
amendments
in
ASU
2023-07
improve
reportable
segment
disclosure
requirements,
primarily
through
enhanced
disclosures
about
significant
segment
expenses.
ASU
2023-07
also
requires
a
public
entity
that
has
a
single
reportable
segment
to
provide
all
the
disclosures
required
by
the
amendments
in
ASU
2023-07
and
all
existing
segment
disclosures
in
Topic
280.
The
amendments
in
ASU
2023-07
are
effective
for
fiscal
years
beginning
after
December
15,
2023,
and
interim
periods
within
fiscal
years
beginning
after
December
15,
2024.
Early
adoption
is
permitted.
Management
has
assessed
the
new
guidance
and
determined
that
it
will
not
have
a
material
impact
on
the
financial
positions
or
results
of
operations
of
the
Funds.
3.
Investment
Valuation
and
Fair
Value
Measurements
The Funds'
investments
in
securities
are
recorded
at
their
estimated
fair
value
utilizing
valuation
methods
approved
by
the
Adviser,
subject
to
oversight
of
the
Board.
Fair
value
is
defined
as
the
price
that
would
be
received
upon
selling
an
investment
or
transferring
a
liability
in
an
orderly
transaction
to
an
independent
buyer
in
the
principal
or
most
advantageous
market
for
the
investment.
U.S.
GAAP
establishes
the
three-tier
hierarchy
that
is
used
to
maximize
the
use
of
observable
market
data
and
minimize
the
use
of
unobservable
inputs
and
to
establish
classification
of
fair
value
measurements
for
disclosure
purposes.
Observable
inputs
reflect
the
assumptions
market
participants
would
use
in
pricing
the
asset
or
liability.
Observable
inputs
are
based
on
market
data
obtained
from
sources
independent
of
the
reporting
entity.
Unobservable
inputs
reflect
management’s
assumptions
about
the
assumptions
market
participants
would
use
in
pricing
the
asset
or
liability.
Unobservable
inputs
are
based
on
the
best
information
available
in
the
circumstances.
The
following
is
a
summary
of
the
three-tiered
hierarchy
of
valuation
input
levels.
Level 1
–
Inputs
are
unadjusted
and
prices
are
determined
using
quoted
prices
in
active
markets
for
identical
securities.
Level
2
–
Prices
are
determined
using
other
significant
observable
inputs
(including
quoted
prices
for
similar
securities,
interest
rates,
credit
spreads,
etc.).
Level
3
–
Prices
are
determined
using
significant
unobservable
inputs
(including
management’s
assumptions
in
determining
the
fair
value
of
investments).
A
description
of
the
valuation
techniques
applied
to
the Funds'
major
classifications
of
assets
and
liabilities
measured
at
fair
value
follows:
Notes
to
Financial
Statements
(continued)
Exchange-traded
funds
listed
or
traded
on
a
national
market
or
exchange
are
valued
based
on
their
sale
price
at
the
official
close
of
business
of
such
market
or
exchange
on
the
valuation
date.
To
the
extent
these
securities
are
actively
traded
and
that
valuation
adjustments
are
not
applied,
they
are
generally
classified
as
Level
1.
Investments
in
investment
companies
are
valued
at
their
respective NAVs
or
share
price
on
the
valuation
date
and
are
generally
classified
as Level
1.
Repurchase
agreements
are
valued
at
contract
amount
plus
accrued
interest,
which
approximates
market
value.
These
securities
are
generally
classified
as
Level
2.
The
following
table
summarizes
the
market
value
of
the Funds’
investments
as
of
the
end
of
the
current
fiscal
period, based
on
the
inputs
used
to
value
them:
4.
Portfolio
Securities
Repurchase
Agreements:
In
connection
with
transactions
in
repurchase
agreements,
it
is
the Fund’s policy
that
its
custodian
take
possession
of
the
underlying
collateral
securities,
the
fair
value
of
which
exceeds
the
principal
amount
of
the
repurchase
transaction,
including
accrued
interest,
at
all
times.
If
the
counterparty
defaults,
and
the
fair
value
of
the
collateral
declines,
realization
of
the
collateral
may
be
delayed
or
limited.
The
following
table
presents
the
repurchase
agreements
for
the Funds
that
are
subject
to
netting
agreements
as
of
the
end
of
the
reporting
period,
and
the
collateral
delivered
related
to
those
repurchase
agreements:
Purchases
and
Sales:
Long-term
purchases
and
sales
during
the
current
fiscal
period were
as
follows:
Fund
Level
1
Level
2
Level
3
Total
Lifestyle
Income
Registered
investment
companies
$76,338,505
$—
$—
$76,338,505
Total
$76,338,505
$—
$—
$76,338,505
1
1
1
1
1
Lifestyle
Conservative
Registered
investment
companies
$316,710,929
$—
$—
$316,710,929
Short-term
investments
—
300,000
—
300,000
Total
$316,710,929
$300,000
$—
$317,010,929
1
1
1
1
1
Lifestyle
Moderate
Registered
investment
companies
$586,247,511
$—
$—
$586,247,511
Short-term
investments
—
590,000
—
590,000
Total
$586,247,511
$590,000
$—
$586,837,511
1
1
1
1
1
Lifestyle
Growth
Registered
investment
companies
$318,855,299
$—
$—
$318,855,299
Short-term
investments
—
300,000
—
300,000
Total
$318,855,299
$300,000
$—
$319,155,299
1
1
1
1
1
Lifestyle
Aggressive
Growth
Registered
investment
companies
$262,360,117
$—
$—
$262,360,117
Short-term
investments
—
300,000
—
300,000
Total
$262,360,117
$300,000
$—
$262,660,117
1
1
1
1
1
Managed
Allocation
Registered
investment
companies
$908,323,439
$—
$—
$908,323,439
Short-term
investments
—
810,000
—
810,000
Total
$908,323,439
$810,000
$—
$909,133,439
1
1
1
1
1
Fund
Counterparty
Short-term
Investments,
at
Value
Collateral
Pledged
(From)
Counterparty
Lifestyle
Conservative
Fixed
Income
Clearing
Corporation
$
300,000
$
(306,060)
Lifestyle
Moderate
Fixed
Income
Clearing
Corporation
590,000
(601,815)
Lifestyle
Growth
Fixed
Income
Clearing
Corporation
300,000
(306,060)
Lifestyle
Aggressive
Growth
Fixed
Income
Clearing
Corporation
300,000
(306,060)
Managed
Allocation
Fixed
Income
Clearing
Corporation
810,000
(826,208)
5.
Derivative
Investments
Each Fund is
authorized
to
invest
in
certain
derivative
instruments.
As
defined
by
U.S.
GAAP,
a
derivative is
a
financial
instrument
whose
value
is
derived
from
an
underlying
security
price,
foreign
exchange
rate,
interest
rate,
index
of
prices
or
rates,
or
other
variables.
Investments
in
derivatives
as
of
the
end
of
and/or
during
the
current
fiscal
period,
if
any,
are
included
within
the
Statement
of
Assets
and
Liabilities
and
the
Statement
of
Operations,
respectively.
6.
Fund
Shares
Transactions
in
Fund
shares
during
the
current
and
prior
fiscal
period
were
as
follows:
Fund
Non-U.S.
Government
Purchases
Non-U.S.
Government
Sales
16.1
Lifestyle
Income
$
4,934,678
$
6,056,734
16.2
Lifestyle
Conservative
15,198,297
22,478,925
16.3
Lifestyle
Moderate
34,687,779
46,432,402
16.4
Lifestyle
Growth
14,276,727
24,871,179
16.5
Lifestyle
Aggressive
Growth
14,833,995
21,944,545
18.1
Managed
Allocation
34,578,343
62,643,609
Six
Months
Ended
11/30/24
Year
Ended
5/31/24
16.1
Lifestyle
Income
Shares
Amount
Shares
Amount
Subscriptions:
Class
A
80,844
$
877,179
116,893
$
1,205,317
Class
I
–
–
18,224
191,218
Premier
Class
–
–
1,217
12,407
Class
R6
57,421
622,359
323,324
3,335,953
Retirement
Class
209,122
2,282,468
420,617
4,424,239
Total
subscriptions
347,387
3,782,006
880,275
9,169,134
Reinvestments
of
distributions:
Class
A
65,397
708,976
137,970
1,428,697
Class
I
–
–
141
1,495
Premier
Class
–
–
247
2,513
Class
R6
17,245
187,064
45,041
466,501
Retirement
Class
29,266
317,195
52,373
542,803
Total
reinvestments
of
distributions
111,908
1,213,235
235,772
2,442,009
Redemptions:
Class
A
(242,344)
(2,632,775)
(674,726)
(6,981,790)
Class
I
(7,202)
(79,719)
(19,154)
(202,925)
Premier
Class
(17,744)
(196,600)
(17,246)
(178,495)
Class
R6
(175,705)
(1,909,141)
(674,213)
(7,044,483)
Retirement
Class
(113,501)
(1,230,686)
(398,295)
(4,108,530)
Total
redemptions
(556,496)
(6,048,921)
(1,783,634)
(18,516,223)
Net
increase
(decrease)
from
shareholder
transactions
(97,201)
$
(1,053,680)
(667,587)
$
(6,905,080)
Notes
to
Financial
Statements
(continued)
Six
Months
Ended
11/30/24
Year
Ended
5/31/24
16.2
Lifestyle
Conservative
Shares
Amount
Shares
Amount
Subscriptions:
Class
A
261,599
$
3,349,604
611,170
$
7,244,176
Class
I
28,315
364,409
57,909
684,642
Premier
Class
–
–
–
–
Class
R6
376,648
4,852,564
1,011,683
12,039,211
Retirement
Class
299,814
3,845,107
394,823
4,643,206
Total
subscriptions
966,376
12,411,684
2,075,585
24,611,235
Reinvestments
of
distributions:
Class
A
193,152
2,464,030
474,106
5,633,793
Class
I
3,256
41,569
7,828
93,172
Premier
Class
16
200
44
522
Class
R6
62,051
792,906
142,418
1,695,676
Retirement
Class
47,983
612,051
116,942
1,390,611
Total
reinvestments
of
distributions
306,458
3,910,756
741,338
8,813,774
Redemptions:
Class
A
(826,879)
(10,557,760)
(2,536,609)
(30,167,425)
Class
I
(51,581)
(655,746)
(62,529)
(740,166)
Premier
Class
(18,080)
(235,217)
(345)
(4,078)
Class
R6
(451,490)
(5,821,017)
(1,061,988)
(12,649,170)
Retirement
Class
(496,398)
(6,345,718)
(723,725)
(8,605,769)
Total
redemptions
(1,844,428)
(23,615,458)
(4,385,196)
(52,166,608)
Net
increase
(decrease)
from
shareholder
transactions
(571,594)
$
(7,293,018)
(1,568,273)
$
(18,741,599)
Six
Months
Ended
11/30/24
Year
Ended
5/31/24
16.3
Lifestyle
Moderate
Shares
Amount
Shares
Amount
Subscriptions:
Class
A
887,422
$
13,204,760
1,246,873
$
16,827,918
Class
I
67,892
1,014,628
138,315
1,859,642
Premier
Class
–
–
–
–
Class
R6
530,903
7,895,056
1,961,198
26,382,636
Retirement
Class
476,172
7,115,809
1,024,366
13,979,428
Total
subscriptions
1,962,389
29,230,253
4,370,752
59,049,624
Reinvestments
of
distributions:
Class
A
201,511
2,992,315
622,317
8,401,316
Class
I
4,678
69,542
15,083
204,023
Premier
Class
–
–
–
–
Class
R6
58,463
870,104
161,895
2,192,609
Retirement
Class
68,413
1,016,394
207,562
2,804,421
Total
reinvestments
of
distributions
333,065
4,948,355
1,006,857
13,602,369
Redemptions:
Class
A
(1,560,221)
(23,265,169)
(3,644,375)
(49,067,532)
Class
I
(137,406)
(2,043,279)
(177,843)
(2,433,831)
Premier
Class
(18,350)
(278,000)
–
–
Class
R6
(633,922)
(9,463,061)
(1,334,074)
(18,140,742)
Retirement
Class
(725,620)
(10,771,831)
(1,390,479)
(18,826,111)
Total
redemptions
(3,075,519)
(45,821,340)
(6,546,771)
(88,468,216)
Net
increase
(decrease)
from
shareholder
transactions
(780,065)
$
(11,642,732)
(1,169,162)
$
(15,816,223)
Six
Months
Ended
11/30/24
Year
Ended
5/31/24
16.4
Lifestyle
Growth
Shares
Amount
Shares
Amount
Subscriptions:
Class
A
222,766
$
3,899,167
455,430
$
7,012,826
Class
I
13,673
243,831
46,333
709,977
Premier
Class
–
–
–
–
Class
R6
151,791
2,660,033
563,669
8,863,216
Retirement
Class
147,138
2,571,929
650,306
9,949,751
Total
subscriptions
535,368
9,374,960
1,715,738
26,535,770
Reinvestments
of
distributions:
Class
A
–
–
248,632
3,818,993
Class
I
–
–
5,725
88,391
Premier
Class
–
–
13
204
Class
R6
–
–
66,639
1,029,567
Retirement
Class
–
–
71,971
1,106,921
Total
reinvestments
of
distributions
–
–
392,980
6,044,076
Redemptions:
Class
A
(749,942)
(13,087,182)
(1,423,342)
(21,981,315)
Class
I
(42,719)
(751,297)
(54,370)
(847,086)
Premier
Class
(18,585)
(328,400)
(1)
(18)
Class
R6
(187,979)
(3,302,159)
(662,750)
(10,267,541)
Retirement
Class
(191,531)
(3,346,917)
(781,469)
(12,087,123)
Total
redemptions
(1,190,756)
(20,815,955)
(2,921,932)
(45,183,083)
Net
increase
(decrease)
from
shareholder
transactions
(655,388)
$
(11,440,995)
(813,214)
$
(12,603,237)
Six
Months
Ended
11/30/24
Year
Ended
5/31/24
16.5
Lifestyle
Aggressive
Growth
Shares
Amount
Shares
Amount
Subscriptions:
Class
A
163,447
$
3,276,377
381,029
$
6,618,304
Class
I
16,895
349,399
33,839
589,855
Premier
Class
–
–
21
399
Class
R6
269,710
5,468,996
623,063
10,944,045
Retirement
Class
236,468
4,740,549
395,031
6,811,525
Total
subscriptions
686,520
13,835,321
1,432,983
24,964,128
Reinvestments
of
distributions:
Class
A
–
–
97,368
1,682,526
Class
I
–
–
3,522
61,249
Premier
Class
–
–
–
–
Class
R6
–
–
60,584
1,053,560
Retirement
Class
–
–
51,628
894,199
Total
reinvestments
of
distributions
–
–
213,102
3,691,534
Redemptions:
Class
A
(286,986)
(5,756,748)
(834,812)
(14,401,815)
Class
I
(36,424)
(724,764)
(67,434)
(1,197,770)
Premier
Class
(18,789)
(380,840)
(199)
(3,427)
Class
R6
(474,994)
(9,654,437)
(690,856)
(12,210,477)
Retirement
Class
(209,696)
(4,249,176)
(654,883)
(11,288,061)
Total
redemptions
(1,026,889)
(20,765,965)
(2,248,184)
(39,101,550)
Net
increase
(decrease)
from
shareholder
transactions
(340,369)
$
(6,930,644)
(602,099)
$
(10,445,888)
Six
Months
Ended
11/30/24
Year
Ended
5/31/24
18.1
Managed
Allocation
Shares
Amount
Shares
Amount
Subscriptions:
Class
A
676,472
$
8,608,754
1,489,713
$
17,204,822
Class
R6
81,115
1,028,829
72,534
831,096
Retirement
Class
278,567
3,521,459
256,120
3,014,359
Total
subscriptions
1,036,154
13,159,042
1,818,367
21,050,277
Reinvestments
of
distributions:
Class
A
555,255
7,055,030
1,657,333
19,142,884
Class
R6
15,890
201,011
46,043
529,037
Retirement
Class
50,623
638,682
160,617
1,844,718
Total
reinvestments
of
distributions
621,768
7,894,723
1,863,993
21,516,639
Redemptions:
Class
A
(2,574,297)
(32,775,586)
(6,252,499)
(72,177,956)
Class
R6
(146,515)
(1,856,582)
(287,327)
(3,240,630)
Retirement
Class
(1,088,715)
(13,794,884)
(893,214)
(10,262,238)
Total
redemptions
(3,809,527)
(48,427,052)
(7,433,040)
(85,680,824)
Net
increase
(decrease)
from
shareholder
transactions
(2,151,605)
$
(27,373,287)
(3,750,680)
$
(43,113,908)
Notes
to
Financial
Statements
(continued)
7.
Income
Tax
Information
Each
Fund
is
a
separate
taxpayer
for
federal
income
tax
purposes.
Each
Fund
intends
to
distribute
substantially
all
of
its
net
investment
income
and
net
capital
gains
to
shareholders
and
otherwise
comply
with
the
requirements
of
Subchapter
M
of
the
Internal
Revenue
Code
applicable
to
regulated
investment
companies.
Therefore,
no
federal
income
tax
provision
is
required.
Each
Fund
files
income
tax
returns
in
U.S.
federal
and
applicable
state
and
local
jurisdictions.
A
Fund’s
federal
income
tax
returns
are
generally
subject
to
examination
for
a
period
of
three
fiscal
years
after
being
filed.
State
and
local
tax
returns
may
be
subject
to
examination
for
an
additional
period
of
time
depending
on
the
jurisdiction.
Management
has
analyzed
each
Fund’s
tax
positions
taken
for
all
open
tax
years
and
has
concluded
that
no
provision
for
income
tax
is
required
in
the
Fund’s
financial
statements.
As
of
the
end
of
the
reporting
period,
the
aggregate
cost
and
the
net
unrealized
appreciation/(depreciation)
of
all
investments
for
federal
income
tax
purposes
were
as
follows:
For
purposes
of
this
disclosure,
tax
cost
generally
includes
the
cost
of
portfolio
investments
as
well
as
up-front
fees
or
premiums
exchanged
on
derivatives
and
any
amounts
unrealized
for
income
statement
reporting
but
realized
income
and/or
capital
gains
for
tax
reporting,
if
applicable.
As
of prior
fiscal
period
end,
the
components
of
accumulated
earnings
on
a
tax
basis
were
as
follows:
As
of
prior
fiscal
period
end,
the
Funds
had
capital
loss
carryforwards,
which
will
not
expire:
8.
Investment
Adviser
and
Other
Transactions
with Affiliates
Under
the
terms
of
its
Investment
Management
Agreement,
each
Fund
(except
for
Managed
Allocation)
pays
the
Adviser
a
monthly
fee
based
on
the
annual
rate
of
0.10%
of
the
Fund’s
average
daily
net
assets
for
the
management
of
the
Fund’s
investment
portfolio.
The
Funds
have
entered
into
an
Administrative
Service
Agreement
with
the
Adviser
under
which
the
Funds
pay
the
Adviser
for
its
costs
in
providing
certain
administrative
and
compliance
services
to
the
Funds.
The
Adviser
has
agreed
to
gradually
reduce
expenses
allocated
to
the
Funds
under
the
Administrative
Services
Agreement
over
a
three-year
period
commencing
May
1,
2024.
After
the
expiration
of
this
three-year
period,
the
Adviser
will
no
longer
allocate
expenses
to
the
Funds
under
the
Administrative
Service
Agreement.
Fund
Tax
Cost
Gross
Unrealized
Appreciation
Gross
Unrealized
(Depreciation)
Net
Unrealized
Appreciation
(Depreciation)
16.1
Lifestyle
Income
$76,568,472
$5,284,183
$(5,514,150)
$(229,967)
16.2
Lifestyle
Conservative
299,952,844
41,047,834
(23,989,749)
17,058,085
16.3
Lifestyle
Moderate
519,434,740
106,067,044
(38,664,273)
67,402,771
16.4
Lifestyle
Growth
261,213,866
75,148,483
(17,207,050)
57,941,433
16.5
Lifestyle
Aggressive
Growth
200,254,701
72,336,435
(9,931,019)
62,405,416
18.1
Managed
Allocation
760,652,450
200,523,515
(52,042,526)
148,480,989
Fund
Undistributed
Ordinary
Income
Undistributed
Long-Term
Capital
Gains
Unrealized
Appreciation
(Depreciation)
Capital
Loss
Carryforwards
Late-Year
Loss
Deferrals
Other
Book-to-Tax
Differences
Total
16.1
Lifestyle
Income
$433,189
$–
$(2,793,568)
$(1,527,762)
$–
$(6,224)
$(3,894,365)
16.2
Lifestyle
Conservative
1,286,988
–
2,982,728
(2,216,554)
–
(16,393)
2,036,769
16.3
Lifestyle
Moderate
1,514,876
–
33,865,887
(1,867,614)
–
(24,180)
33,488,969
16.4
Lifestyle
Growth
1,055,701
–
37,354,257
(238,986)
–
(12,217)
38,158,755
16.5
Lifestyle
Aggressive
Growth
–
1,801,763
42,737,758
–
–
(8,885)
44,530,636
18.1
Managed
Allocation
2,571,157
5,207,406
101,451,727
–
–
(152,747)
109,077,543
Fund
Short-Term
Long-Term
Total
16.1
Lifestyle
Income
$474,990
$1,052,772
$1,527,762
16.2
Lifestyle
Conservative
2,216,554
–
2,216,554
16.3
Lifestyle
Moderate
1,867,614
–
1,867,614
16.4
Lifestyle
Growth
238,986
–
238,986
16.5
Lifestyle
Aggressive
Growth
–
–
–
18.1
Managed
Allocation
–
–
–
Under
the
terms
of
a
Retirement
Class
Service
Agreement
with
respect
to
each
Fund,
the
Retirement
Class
of
the
Fund
pays
the
Adviser
a
monthly
fee
based
on
the
annual
rate
of
0.25%
of
a
Fund’s
average
daily
net
assets
attributable
to
Retirement
Class
shares
of
a
Fund
for
providing
certain
administrative
services
related
to
the
maintenance
of
Retirement
Class
shares
on
retirement
plan
or
other
platforms.
Substantially,
all
of
the
Retirement
Class
shareholder
servicing
fees
reported
on
the
Statements
of
Operations
are
paid
to
the
Adviser
under
the
Service
Agreement.
Nuveen
Securities,
which
is
a
wholly
owned
indirect
subsidiary
of
TIAA,
distributes
the
Funds’
shares.
Under
the
terms
of
the
distribution
agreement,
Nuveen
Securities
is
not
compensated.
Nuveen
Securities
does
not
currently
enter
into
agreements,
or
otherwise
pay,
other
intermediaries
to
sell
shares
of
the
Funds.
Under
the
terms
of
a
distribution
Rule
12b-
1
plan,
Class
A
shares
of
each
Fund
compensates
Nuveen
Securities
for
providing
distribution,
promotional
and/or
shareholder
services
to
Class
A
shares
of
the
Fund
at
the
annual
rate
of
0.25%
of
the
average
daily
net
assets
attributable
to
the
Fund’s
Class
A
shares.
The
Premier
Class
of
each
Fund
is
subject
to
a
distribution
Rule
12b-1
plan
that
compensates
Nuveen
Securities
for
providing
distribution,
promotional
and/or
shareholder
services
to
the
Premier
Class
of
the
Fund
at
the
annual
rate
of
0.15%
of
the
average
daily
net
assets
attributable
to
the
Fund’s
Premier
Class.
The
Adviser
has
agreed
to
reimburse
each
Fund
if
its
total
expense
ratio
(excluding
interest,
taxes,
brokerage
commissions
and
other
transactional
expenses,
acquired
fund
fees
and
expenses
and
extraordinary
expenses)
exceeds
certain
percentages.
As
of the
end
of
the
current
fiscal
period,
the
investment
management
fee
and
maximum
expense
amounts
(after
waivers
and
reimbursements)
are
equal
to
the
following
noted
annual
percentage
of
average
daily
net
assets
for
each
class:
The Funds are
permitted
to
purchase
or
sell securities
from
or
to
certain
other
funds
or
accounts
managed
by
the
Adviser
or
by
an
affiliate
of
the
Adviser
(each
an,
"Affiliated
Entity")
under
specified
conditions
outlined
in
procedures
adopted
by
the
Board
("cross-
trade").
These
procedures
have
been
designed
to
ensure
that
any
cross-trade
of
securities
by
the
Fund from
or
to
an
Affiliated
Entity
by
virtue
of
having
a
common
investment
adviser
(or
affiliated
investment
adviser),
common
officer
and/or
common
trustee complies
with
Rule
17a-7
under
the
1940
Act.
These
transactions
are
affected
at
the
current
market price
(as
provided
by
an
independent
pricing
service) without
incurring
broker
commissions.
During
the
current
fiscal
period,
the
Funds
engaged
in
the
following
security
transactions
with
affiliated
entities:
Investments
in
other
investment
companies
advised
by
the
Adviser
and
Nuveen
Fund
Advisors,
LLC
are
deemed
to
be
affiliated
investments.
Information
regarding
transactions
with
affiliated
companies
is
as
follows:
Investment
Management
Fee-
Effective
Rate
Maximum
Expense
Amounts‡
Fund
Class
A
Class
I
Premier
Class
Class
R6
Retirement
Class
16.1
Lifestyle
Income
0.100%
0.450
%
0.250
%
0.250
%
0.100
%
0.350
%
16.2
Lifestyle
Conservative
0.100
0.450
0.250
0.250
0.100
0.350
16.3
Lifestyle
Moderate
0.100
0.450
0.250
0.250
0.100
0.350
16.4
Lifestyle
Growth
0.100
0.450
0.250
0.250
0.100
0.350
16.5
Lifestyle
Aggressive
Growth
0.100
0.450
0.250
0.250
0.100
0.350
18.1
Managed
Allocation
–
0.250
–
–
–
0.250
‡
Maximum
expense
amounts
reflect
all
expenses
excluding
interest,
taxes,
brokerage
commissions
or
other
transactional
expenses,
Acquired
fund
fees
and
expenses
and
extraordinary
expenses.
The
expense
reimbursement
arrangements
will
continue
through
at
least
September
30,
2025.
The
reimbursement
arrangements
can
only
be
changed
with
the
approval
of
the
Board.
Fund
Purchases
Sales
Realized
Gain
(Loss)
Lifestyle
Income
$
–
$
49,614
$
6,930
Lifestyle
Conservative
–
128,301
16,242
Lifestyle
Moderate
341,503
225,389
27,913
Lifestyle
Growth
47,312
219,667
36,941
Lifestyle
Aggressive
Growth
30,830
119,550
14,643
Managed
Allocation
–
1,033,459
178,327
Notes
to
Financial
Statements
(continued)
Issue
Value
at
5/31/24
Purchases
Cost
Sales
Proceeds
Realized
Gain
(Loss)
Change
in
Unrealized
Appreciation
(Depreciation)
Value
at
11/30/24
Dividend
Income
Lifestyle
Income
Nuveen
Funds:
Core
Bond,
Class
R6
$
14,965,769
$
746,345
$
896,624
$
(135,676)
$
557,903
$
15,237,717
$
323,680
Core
Equity,
Class
R6
1,450,274
61,329
173,920
26,420
150,944
1,515,047
7,709
Core
Plus
Bond,
Class
R6
14,982,396
715,196
880,179
(131,383)
551,331
15,237,361
346,208
Dividend
Growth,
Class
R6
1,452,078
72,891
210,595
31,286
163,301
1,508,961
8,751
Dividend
Value,
Class
R6
1,396,945
200,269
188,163
9,695
125,850
1,544,596
11,226
Emerging
Markets
Equity,
Class
R6
877,518
148,053
110,689
2,729
17,981
935,592
–
Growth
Opportunities
ETF
1,757,830
32,676
355,041
66,525
182,613
1,684,603
–
International
Equity,
Class
R6
2,312,964
236,880
244,696
27,248
(64,498)
2,267,898
–
International
Opportunities,
Class
R6
1,367,184
159,194
167,523
(990)
6,088
1,363,953
–
Large
Cap
Growth,
Class
R6
1,706,749
139,483
347,310
76,350
151,498
1,726,770
–
Large
Cap
Value,
Class
R6
1,402,942
144,943
171,391
20,133
154,438
1,551,065
–
Quant
International
Small
Cap
Equity,
Class
R6
744,031
75,827
75,099
2,846
1,445
749,050
–
Quant
Small
Cap
Equity,
Class
R6
333,618
18,984
69,648
18,049
34,864
335,867
–
Quant
Small/Mid
Cap
Equity,
Class
R6
396,047
12,831
66,642
13,907
49,329
405,472
–
Short
Term
Bond,
Class
R6
29,783,358
2,169,777
2,099,214
(59,881)
480,513
30,274,553
656,700
$74,929,703
$4,934,678
$6,056,734
$(32,742)
$2,563,600
$76,338,505
$1,354,274
Issue
Value
at
5/31/24
Purchases
Cost
Sales
Proceeds
Realized
Gain
(Loss)
Change
in
Unrealized
Appreciation
(Depreciation)
Value
at
11/30/24
Dividend
Income
Lifestyle
Conservative
Nuveen
Funds:
Core
Bond,
Class
R6
$
30,779,360
$
1,186,869
$
1,381,313
$
(212,738)
$
1,077,437
$
31,449,615
$
673,332
Core
Equity,
Class
R6
11,935,559
84,324
1,074,817
206,399
1,269,845
12,421,310
64,592
Core
Plus
Bond,
Class
R6
92,398,628
3,248,811
3,975,614
(648,133)
3,232,539
94,256,231
2,160,332
Dividend
Growth,
Class
R6
11,932,905
503,641
1,640,967
219,162
1,393,751
12,408,492
72,731
Dividend
Value,
Class
R6
11,486,597
1,264,405
1,160,028
59,410
1,071,446
12,721,830
93,456
Emerging
Markets
Equity,
Class
R6
7,237,917
861,991
585,588
(18,233)
191,390
7,687,477
–
Growth
Opportunities
ETF
14,219,760
150,995
2,357,076
434,214
1,604,720
14,052,613
–
International
Equity,
Class
R6
19,025,046
1,133,259
1,153,625
107,988
(428,386)
18,684,282
–
International
Opportunities,
Class
R6
11,259,106
866,436
802,385
(46,119)
89,530
11,366,568
–
Large
Cap
Growth,
Class
R6
14,082,171
174,795
2,069,426
420,504
1,485,616
14,093,660
–
Large
Cap
Value,
Class
R6
11,526,542
922,870
1,127,235
120,575
1,335,263
12,778,015
–
Quant
International
Small
Cap
Equity,
Class
R6
6,116,404
386,145
366,897
8,742
24,821
6,169,215
–
Quant
Small
Cap
Equity,
Class
R6
2,701,026
96,353
464,186
110,893
331,456
2,775,542
–
Quant
Small/Mid
Cap
Equity,
Class
R6
3,213,194
53,832
421,200
99,433
430,765
3,376,024
–
Short
Term
Bond,
Class
R6
61,237,227
4,263,571
3,898,568
(97,339)
965,164
62,470,055
1,366,136
$309,151,442
$15,198,297
$22,478,925
$764,758
$14,075,357
$316,710,929
$4,430,579
Issue
Value
at
5/31/24
Purchases
Cost
Sales
Proceeds
Realized
Gain
(Loss)
Change
in
Unrealized
Appreciation
(Depreciation)
Value
at
11/30/24
Dividend
Income
Lifestyle
Moderate
Nuveen
Funds:
Core
Equity,
Class
R6
$
32,429,662
$
692,729
$
2,815,065
$
460,654
$
3,619,549
$
34,387,529
$
177,172
Core
Plus
Bond,
Class
R6
223,324,907
12,505,296
10,686,687
(1,800,967)
8,087,616
231,430,165
5,277,934
Dividend
Growth,
Class
R6
32,459,244
1,322,610
3,914,815
514,350
3,925,813
34,307,202
199,578
Dividend
Value,
Class
R6
31,211,857
3,647,756
2,813,469
123,580
2,995,605
35,165,329
257,477
Emerging
Markets
Equity,
Class
R6
19,651,235
2,840,514
1,730,599
(122,637)
603,105
21,241,618
–
Growth
Opportunities
ETF
38,650,086
742,632
5,983,016
941,478
4,669,191
39,020,371
–
International
Equity,
Class
R6
51,644,687
4,147,557
3,414,001
137,311
(1,012,432)
51,503,122
–
International
Opportunities,
Class
R6
30,587,191
3,243,714
2,890,256
(350,910)
465,362
31,055,101
–
Large
Cap
Growth,
Class
R6
38,579,738
1,277,202
6,290,531
1,005,013
4,272,919
38,844,341
–
Large
Cap
Value,
Class
R6
31,320,692
2,531,319
2,484,499
250,208
3,765,664
35,383,384
–
Quant
International
Small
Cap
Equity,
Class
R6
16,657,337
1,206,373
934,981
3,109
83,452
17,015,290
–
Quant
Small
Cap
Equity,
Class
R6
7,368,029
318,095
1,249,208
356,242
860,787
7,653,945
–
Quant
Small/Mid
Cap
Equity,
Class
R6
8,796,290
211,982
1,225,275
256,864
1,200,253
9,240,114
–
$562,680,955
$34,687,779
$46,432,402
$1,774,295
$33,536,884
$586,247,511
$5,912,161
Issue
Value
at
5/31/24
Purchases
Cost
Sales
Proceeds
Realized
Gain
(Loss)
Change
in
Unrealized
Appreciation
(Depreciation)
Value
at
11/30/24
Dividend
Income
Lifestyle
Growth
Nuveen
Funds:
Core
Equity,
Class
R6
$
23,503,894
$
152,889
$
1,799,724
$
372,325
$
2,600,871
$
24,830,255
$
128,917
Core
Plus
Bond,
Class
R6
60,684,043
2,705,680
2,424,595
(411,906)
2,101,199
62,654,421
1,436,770
Dividend
Growth,
Class
R6
23,479,835
505,329
2,366,553
276,273
2,953,906
24,848,790
145,219
Dividend
Value,
Class
R6
22,647,175
2,280,500
1,787,909
102,482
2,169,508
25,411,756
186,951
Emerging
Markets
Equity,
Class
R6
14,223,664
1,819,104
1,055,064
(66,722)
421,543
15,342,525
–
Growth
Opportunities
ETF
27,986,147
126,454
4,087,362
726,557
3,344,159
28,095,955
–
International
Equity,
Class
R6
37,497,445
2,389,145
2,026,892
65,196
(712,995)
37,211,899
–
International
Opportunities,
Class
R6
22,173,300
1,806,105
1,708,446
(210,775)
297,524
22,357,708
–
Large
Cap
Growth,
Class
R6
27,929,733
179,699
3,829,522
758,593
3,073,706
28,112,209
–
Large
Cap
Value,
Class
R6
22,736,243
1,592,961
1,752,370
137,044
2,780,772
25,494,650
–
Quant
International
Small
Cap
Equity,
Class
R6
12,070,960
541,743
403,801
(1,949)
67,075
12,274,028
–
Quant
Small
Cap
Equity,
Class
R6
5,353,360
140,230
844,901
276,528
610,774
5,535,991
–
Quant
Small/Mid
Cap
Equity,
Class
R6
6,369,531
36,888
784,040
183,599
879,134
6,685,112
–
$306,655,330
$14,276,727
$24,871,179
$2,207,245
$20,587,176
$318,855,299
$1,897,857
Issue
Value
at
5/31/24
Purchases
Cost
Sales
Proceeds
Realized
Gain
(Loss)
Change
in
Unrealized
Appreciation
(Depreciation)
Value
at
11/30/24
Dividend
Income
Lifestyle
Aggressive
Growth
Nuveen
Funds:
Core
Equity,
Class
R6
$
23,687,152
$
439,992
$
1,743,354
$
218,452
$
2,812,917
$
25,415,159
$
130,953
Dividend
Growth,
Class
R6
23,690,114
757,999
2,254,783
169,654
3,130,798
25,493,782
147,923
Dividend
Value,
Class
R6
22,838,355
2,857,795
1,997,472
72,010
2,252,614
26,023,302
190,446
Emerging
Markets
Equity,
Class
R6
14,333,131
2,353,157
1,376,424
(115,791)
470,496
15,664,569
–
Growth
Opportunities
ETF
28,176,762
183,583
3,709,153
628,925
3,503,937
28,784,054
–
International
Equity,
Class
R6
37,757,347
2,565,597
1,566,482
7,428
(671,127)
38,092,763
–
International
Opportunities,
Class
R6
22,341,793
2,322,279
1,747,440
(225,769)
325,314
23,016,177
–
Large
Cap
Growth,
Class
R6
28,171,028
506,830
3,834,227
697,089
3,196,857
28,737,577
–
Large
Cap
Value,
Class
R6
22,876,210
1,840,429
1,654,005
121,544
2,870,032
26,054,210
–
Quant
International
Small
Cap
Equity,
Class
R6
12,173,739
848,925
534,266
(27,699)
92,337
12,553,036
–
Quant
Small
Cap
Equity,
Class
R6
5,435,340
93,753
771,180
155,139
757,156
5,670,208
–
Quant
Small/Mid
Cap
Equity,
Class
R6
6,458,389
63,656
755,759
162,667
926,327
6,855,280
–
$247,939,360
$14,833,995
$21,944,545
$1,863,649
$19,667,658
$262,360,117
$469,322
Issue
Value
at
5/31/24
Purchases
Cost
Sales
Proceeds
Realized
Gain
(Loss)
Change
in
Unrealized
Appreciation
(Depreciation)
Value
at
11/30/24
Dividend
Income
Managed
Allocation
Nuveen
Funds:
Core
Equity,
Class
R6
$
50,795,172
$
195,455
$
4,015,495
$
834,850
$
5,531,228
$
53,341,210
$
276,574
Core
Plus
Bond,
Class
R6
349,790,789
12,100,537
12,990,973
(1,692,044)
11,466,510
358,674,819
8,228,120
Dividend
Growth,
Class
R6
50,789,873
718,220
5,496,795
909,522
6,035,632
52,956,452
312,296
Dividend
Value,
Class
R6
48,945,705
4,593,796
3,945,933
231,845
4,633,530
54,458,943
401,429
Emerging
Markets
Equity,
Class
R6
30,757,188
3,201,991
1,931,780
(127,818)
894,704
32,794,285
–
Growth
Opportunities
ETF
60,532,824
–
9,104,261
1,682,719
7,077,655
60,188,937
–
International
Equity,
Class
R6
81,032,462
4,469,810
4,240,637
371,067
(1,736,726)
79,895,976
–
International
Opportunities,
Class
R6
47,857,439
3,814,754
3,520,930
(186,467)
390,625
48,355,421
–
Large
Cap
Growth,
Class
R6
60,340,876
684,049
8,985,502
4,067,716
4,110,356
60,217,495
–
Large
Cap
Value,
Class
R6
49,064,463
3,319,408
3,768,048
686,061
5,564,059
54,865,943
–
Quant
International
Small
Cap
Equity,
Class
R6
26,076,354
1,216,047
1,088,849
13,300
123,854
26,340,706
–
Quant
Small
Cap
Equity,
Class
R6
11,540,416
235,383
1,780,126
595,187
1,302,839
11,893,699
–
Quant
Small/Mid
Cap
Equity,
Class
R6
13,815,107
28,893
1,774,280
634,837
1,634,996
14,339,553
–
$881,338,668
$34,578,343
$62,643,609
$8,020,775
$47,029,262
$908,323,439
$9,218,419
Notes
to
Financial
Statements
(continued)
9.
Inter-Fund
Lending
Program
Pursuant
to
an
exemptive
order
issued
by
the
SEC,
the
Funds may
participate
in
an
inter-fund
lending
program.
This
program
allows
the
Funds to
lend
cash
to
and/or
borrow
cash
from
certain
other
affiliated
Funds for
temporary
purposes,
(e.g.,
to
satisfy
redemption
requests
or
to
cover
unanticipated
cash
shortfalls).
The
program
is
subject
to
a
number
of
conditions,
including
the
requirement
that
no
Fund may
borrow
or
lend
money
under
the
program
unless
it
receives
a
more
favorable
interest
rate
than
is
available
from
a
bank
or
other
financial
institution
for
a
comparable
transaction.
In
addition,
a
Fund may
participate
in
the
program
only
if
its
participation
is
consistent
with
the
Fund’s investment
policies
and
limitations
and
authorized
by
its
portfolio
manager(s).
During the current
fiscal
period,
there
were
no
inter-fund
borrowing
or
lending
transactions.
10.
Line
of
Credit
The Funds
participated
in
a
$1
billion unsecured
revolving
credit
facility
that
could
be
used
for
temporary
purposes,
including,
without
limitation,
the
funding
of
shareholder
redemptions.
The
facility
was
entered
into
on
June
13,
2023,
and
expired
on
June
11,
2024.
Certain
affiliated
accounts,
each
of
which
is
managed
by the
Adviser,
or
an
affiliate
of
the
Adviser, also
participated
in
this
facility.
An
annual
commitment
fee
for
the
credit
facility
was
borne
by
the
participating
accounts
on
a
pro
rata
basis.
Interest
associated
with
any
borrowing
under
the
facility
was
charged
to
the
borrowing
accounts
at
a
specified
rate
of
interest.
The Funds were
not
liable
for
borrowings
under
the
facility
by
other
affiliated
accounts.
There
were
no
borrowings
under
this
credit
facility
by
the
Funds during
the
current fiscal
period.
| Item 8. | Changes in and Disagreements with Accountants for Open-End Management Investment Companies. |
Not applicable.
| Item 9. | Proxy Disclosures for Open-End Management Investment Companies. |
Not applicable.
| Item 10. | Remuneration Paid to Directors, Officers, and Others of Open-End Management Investment Companies. |
Remuneration paid to directors, officers and others is included in the Statement of Operations under the line items “Trustee Fees” and “Management Fees” as part of the financial statements filed under Item 7 of this Form N-CSR.
| Item 11. | Statement Regarding Basis for Approval of Investment Advisory Contract. |
Not applicable to this filing.
| Item 12. | Disclosure of Proxy Voting Policies and Procedures for Closed-End Management Investment Companies. |
Not applicable to open-end investment companies.
| Item 13. | Portfolio Managers of Closed-End Management Investment Companies. |
Not applicable to open-end investment companies.
| Item 14. | Purchases of Equity Securities by Closed-End Management Investment Company and Affiliated Purchasers. |
Not applicable to open-end investment companies.
| Item 15. | Submission of Matters to a Vote of Security Holders. |
There have been no material changes to the procedures by which shareholders may recommend nominees to the registrant’s Board of Trustees implemented after the registrant last provided disclosure in response to this Item.
| Item 16. | Controls and Procedures. |
| (a) | The registrant’s principal executive and principal financial officers, or persons performing similar functions, have concluded that the registrant’s disclosure controls and procedures (as defined in Rule 30a-3(c) under the Investment Company Act of 1940, as amended (the “1940 Act”) (17 CFR 270.30a-3(c))) are effective, as of a date within 90 days of the filing date of this report that includes the disclosure required by this paragraph, based on their evaluation of the controls and procedures required by Rule 30a-3(b) under the 1940 Act (17 CFR 270.30a-3(b)) and Rules 13a-15(b) or 15d-15(b) under the Securities Exchange Act of 1934, as amended (the “Exchange Act”) (17 CFR 240.13a-15(b) or 240.15d-15(b)). |
| (b) | There were no changes in the registrant’s internal control over financial reporting (as defined in Rule 30a-3(d) under the 1940 Act (17 CFR 270.30a-3(d)) that occurred during the period covered by this report that has materially affected, or is reasonably likely to materially affect, the registrant’s internal control over financial reporting. |
| Item 17. | Disclosure of Securities Lending Activities for Closed-End Management Investment Companies. |
| (a) | Not applicable to open-end investment companies. |
| (b) | Not applicable to open-end investment companies. |
| Item 18. | Recovery of Erroneously Awarded Compensation. |
SIGNATURES
Pursuant to the requirements of the Securities Exchange Act of 1934 and the Investment Company Act of 1940, the registrant has duly caused this report to be signed on its behalf by the undersigned, thereunto duly authorized.
TIAA-CREF Funds
| | | | | | | | |
Date: February 5, 2025 | | | | By: | | /s/ Jordan M. Farris Jordan M. Farris Chief Administrative Officer | | |
Pursuant to the requirements of the Securities Exchange Act of 1934 and the Investment Company Act of 1940, this report has been signed below by the following persons on behalf of the registrant and in the capacities and on the dates indicated.
| | | | | | | | |
Date: February 5, 2025 | | | | By: | | /s/ Jordan M. Farris Jordan M. Farris Chief Administrative Officer (principal executive officer) | | |
| | | | |
Date: February 5, 2025 | | | | By: | | /s/ Marc Cardella Marc Cardella Vice President and Controller (principal financial officer) | | |