PROSPECTUS | Filed pursuant to Rule 424(b)(3) Registration Number 333-170769 |

67,061,083 Shares of
Common Stock
This prospectus relates to the sale of up to a total of 67,061,083 shares of common stock of Elephant Talk Communications, Inc., a California corporation, that may be sold from time to time by the selling stockholders named in this prospectus and their successors and assigns. The shares of common stock subject to this prospectus include: (i) 29,421,614 shares of common stock issued in the 2010 private placement offering (including (a) 17,754,928 as part of the initial offering (b) 11,666,686 as a result of the exercise of the warrants issued as part of the units issued to the investors participating the 2010 Private Placement offering, (ii) 5,493,988 shares of common stock issued in the 2010 bridge offering (including) (a) 1,885,000 shares of common stock issued and (b) 2,883,988 shares of common stock as a result of the mandatory exercise of ‘the “A” warrants’ issued as part of the units sold in the 2010 bridge offering and (c) 725,000 shares of common stock as a result of the voluntary exercise of ‘the “B” warrants’ issued as part of the units sold in the 2010 bridge offering, (iii) 11,797,701 shares of common stock issuable in connection with 11,797,701 remaining warrants outstanding issued in connection with the 2010 private placement (including (a) 6,771,311 warrants underlying automatic conversions of certain notes and loans by QAT II Investments, SA (“QAT II”) and (b) 5,026,390 warrants issued in connection with the amendment to certain loans from QAT II), (iv) 2,160,000 shares of common stock underlying 2,160,000 shares of common stock issued as “B” warrants which were offered in the 2010 bridge offering, (v) 11,543,020 shares of common stock underlying 11,543,020 warrants issued in connection with the 2009 private placement, (vi) 2,100,000 shares of common stock underlying issued to Dawson James Securities, Inc. (“Dawson James”), a FINRA registrant broker-dealer for acting as selling agent in connection with the 2010 private placement offering (including (a) 1,284,563 remaining outstanding warrants and (b) 815,437 shares of common stock as a result of voluntary exercised warrants) (vii) 387,333 shares of common stock underlying shares and warrants issued to Sandgrain Securities and Quercus Management Group NV (“QMG”) for acting as selling agent in connection with the 2010 bridge offering (including (a) 219,933 shares of common stock as a result of the voluntary exercise of “A” warrants and “B” warrants and (b) 167,400 remaining outstanding “B” warrants), (viii) 1,644,232 shares of common stock underlying shares and warrants issued to Dawson James and QMG for acting as selling agents in connection with the 2009 convertible note offering (including (a) 1,547,943 remaining outstanding warrants and (b) 96,289 shares of common stock as a result of the voluntary exercise of warrants (ix) 2,513,195 shares of common stock underlying 2,513,195 warrants issued to QAT II in connection with certain loans made to the Company. The securities offered for resale hereby were issued to the applicable selling stockholders in private placement or other exempt transactions completed prior to the filing of the registration statement of which this prospectus is a part.
The selling shareholders may sell all or a portion of the shares of common stock held by them and offered hereby from time to time directly or through one or more underwriters, broker-dealers or agents. If the shares of common stock are sold through underwriters or broker-dealers, the selling shareholders will be responsible for underwriting discounts or commissions or agent’s commissions.
The shares of common stock may be sold in one or more transactions at fixed prices, at prevailing market prices at the time of the sale, at varying prices determined at the time of sale or at negotiated prices. See “Plan of Distribution” beginning on page 76 of this prospectus.
Our common stock is quoted on the OTC Bulletin Board under the symbol “ETAK”. The closing price for our common stock on August 29, 2011 was $3.20 per share.
Investing in our common stock involves risk. You should carefully consider the risk factors beginning on page 4 of this prospectus before making a decision to invest in our common stock.
You should rely only on the information contained in this prospectus. We have not authorized anyone to provide you with information different from that contained in this prospectus or any prospectus supplement. This prospectus is not an offer of these securities in any jurisdiction where an offer and sale is not permitted.
NEITHER THE SEC NOR ANY STATE SECURITIES COMMISSION HAS APPROVED OR DISAPPROVED OF THESE SECURITIES OR PASSED UPON THE ACCURACY OR ADEQUACY OF THIS PROSPECTUS. ANY REPRESENTATION TO THE CONTRARY IS A CRIMINAL OFFENSE.
The date of this prospectus is October 19, 2011
TABLE OF CONTENTS
Page Number | ||
| About This Prospectus | i | |
| Prospectus Summary | 1 | |
| Cautionary Note Regarding Forward-Looking Statements | 3 | |
| Risk Factors | 4 | |
| Use Of Proceeds | 14 | |
| Determination Of Offering Price | 14 | |
| Management’s Discussion And Analysis Of Financial Condition And Results Of Operations | 15 | |
| Compensation | 62 | |
| Security Ownership of Certain Beneficial Owners and Management | 68 | |
| Certain Relationships and Related Transactions | 70 | |
| Selling Stockholders | 74 | |
| Plan of Distribution | 83 | |
| Market for Common Equity and Related Shareholder Matters | 85 | |
| Legal Matters | 86 | |
| Experts | 86 | |
| Where You Can Find More Information | 87 | |
| Index To Financial Statements | F-1 |
This prospectus is part of a registration statement we filed with the SEC. You should rely only on the information provided in this prospectus and any document incorporated by reference in this prospectus. We have not authorized anyone to provide you with information different from that contained in or incorporated by reference into this prospectus. This prospectus does not constitute an offer to sell or a solicitation of an offer to buy any securities other than the common stock offered by this prospectus. This prospectus does not constitute an offer to sell or a solicitation of an offer to buy any common stock in any circumstances in which such offer or solicitation is unlawful. The selling stockholders are offering to sell, and seeking offers to buy, shares of common stock only in jurisdictions where offers and sales are permitted.
Neither the delivery of this prospectus nor any sale made in connection with this prospectus shall, under any circumstances, create any implication that there has been no change in our affairs since the date of this prospectus or that the information contained by reference to this prospectus is correct as of any time after its date. The information in this prospectus is accurate only as of the date of this prospectus, regardless of the time of delivery of this prospectus or of any sale of common stock. The rules of the SEC may require us to update this prospectus in the future.
i
PROSPECTUS SUMMARY
The following summary highlights selected information contained in this prospectus. This summary does not contain all the information you should consider before investing in the securities. Before making an investment decision, you should read the entire prospectus carefully, including the information set forth under the headings “Risk Factors” and “Management’s Discussion and Analysis of Financial Condition and Results of Operations,” and the financial statements and the notes to the financial statements included in this prospectus.
As used throughout this prospectus, the terms “ETAK”, “Company”, “we,” “us,” or “our” refer to Elephant Talk Communications, Inc., a California corporation, together with its subsidiaries.
Our Company
We are an international provider of business software and services to the telecommunications and financial services industry. We enable both mobile carriers and virtual operators to offer a full suite of products, delivery platforms, support services, superior industry expertise and high quality customer service without substantial upfront investments from clients. We provide to global telecommunication companies, mobile network operators, banks, supermarkets, consumer product companies, media firms, and other businesses a full suite of products and services that enable them to fully provide telecom services as part of their business offerings. We offer various dynamic products that include remote health care, credit card fraud prevention, mobile internet ID security, multi-country discounted phone services, loyalty management services, and a whole range of other emerging customized mobile services.
Converged telecommunication services – full MVNE solutions.
We are a niche player in the converged telecommunications market, providing traffic and network services as a licensed operator, and specializing in carrier grade mobile enabling platforms to provide outsourced solutions to the various players in the telecommunications’ value chain, including Mobile Network Operators or MNOs, Mobile Virtual Network Operators or MVNOs and non-operator companies in need of both mobile as well as specialized land-line telecommunication services. In this chain, we position ourselves as a Full Mobile Virtual Network Enabler or MVNE, including offering customized mobile services such as our network integrated ValidSoft security and fraud prevention solutions.
ValidSoft – electronic fraud prevention
Our wholly owned subsidiary, ValidSoft Ltd. (“ValidSoft”) gives us a position in providing solutions to counter electronic fraud relating to card, the internet, and telephone channels. ValidSoft is a market leader in providing solutions to counter electronic fraud relating to credit or debit cards, the internet, and telephone channels. ValidSoft solutions are telecommunications based and are at the cutting edge of the market, utilizing access to the most sophisticated global telecommunications networks and expertise. The solutions are used to combat card-present and card-not-present fraud as well as electronic fraud on all channels, including the most advanced fraudulent attacks such as Man-in-the-Browser. The solutions are designed to have ease of use, mass-market application, to be cost effective and secure, be intuitive and to allow leveraging with most ubiquitous telecommunication devices available. Our product, VALid-POS®, was awarded the European Privacy Seal in March 2010, certifying its compliance with European Data Protection law. ValidSoft is the only Security Software company in the world to be certified to EuroPriSe standards.
Landline network outsourcing services
Through our fixed line telecom infrastructure and our centrally operated and managed IN-CRM-Billing platform, we also provide traditional telecom services like Carrier Select and Carrier Pre-Select Services, Toll Free and Premium Rate Services to the business market.
1
Recent Events
On July 27, 2011, we filed a definitive proxy statement on Schedule 14A relating to our proposed reincorporation from the State of California to Delaware. The change in state of incorporation will be accomplished through our merger with and into our wholly owned subsidiary, Elephant Talk Communications Corp., a Delaware corporation or ETAK DE, recently established to effect the reincorporation. ETAK DE will survive the merger and issue one share of its common stock for each outstanding share of our common stock in connection with the merger. The name of the surviving corporation will be Elephant Talk Communication Corp. Our board of directors believes that the reincorporation in Delaware will give us a greater measure of flexibility in corporate governance than is currently available under California law, and will help us attract and retain directors and officers. Our board of directors also believes Delaware’s corporate laws are generally more modern, flexible, highly developed and more predictable than California’s corporate laws. Delaware corporate laws are also periodically revised to be responsive to the changing legal and business needs of corporations.
Corporate Information
Our European executive office is located at Schiphol Boulevard 249, 1118 BH Luchthaven Schiphol, the Netherlands and our U.S. executive office is located at 19103 Centre Rose Boulevard, Lutz, Florida 33558.
THE OFFERING
| Common stock outstanding before the offering | 109,026,881(1) |
| Common stock offered by selling stockholders | Up to 67,061,083 shares of common stock held by the selling stockholders or underlying securities held by the selling stockholders. |
| Common stock to be outstanding after the offering | Up to 140,040,703 shares, assuming full exercise of the warrants. |
| OTCBB Symbol | ETAK |
| Use of proceeds | We will not receive any proceeds from the sale of the common stock offered hereby. However, we may receive up to a maximum of approximately $66 million of proceeds from the exercise of the warrants held by certain selling stockholders, which proceeds we would expect to use for general working capital. No assurances can be given, however, that all or any portion of such warrants will ever be exercised. |
| (1) | As of August 26, 2011. |
2
CAUTIONARY NOTE REGARDING FORWARD-LOOKING STATEMENTS
This prospectus includes forward-looking statements. We have based these forward-looking statements on our current expectations and projections about future events. Our actual results may differ materially from those discussed herein, or implied by, these forward-looking statements. Forward-looking statements are generally identified by words such as “believe,” “expect,” “anticipate,” “intend,” “estimate,” “plan,” “project” and other similar expressions. In addition, any statements that refer to expectations or other characterizations of future events or circumstances are forward-looking statements. Forward-looking statements included in this Report or our other filings with the SEC include, but are not necessarily limited to, those relating to:
| ¨ | risks and uncertainties associated with the integration of the assets and operations we have acquired and may acquire in the future; |
| ¨ | our possible inability to raise or generate additional funds that will be necessary to continue and expand our operations; |
| ¨ | our potential lack of revenue growth; |
| ¨ | our potential inability to add new products and services that will be necessary to generate increased sales; |
| ¨ | our potential lack of cash flows; |
| ¨ | our potential loss of key personnel; |
| ¨ | the availability of qualified personnel; |
| ¨ | international, national regional and local economic political changes; |
| ¨ | general economic and market conditions; |
| ¨ | increases in operating expenses associated with the growth of our operations; |
| ¨ | the possibility of telecommunications rate changes and technological changes; |
| ¨ | the potential for increased competition; and |
| ¨ | other unanticipated factors. |
The foregoing does not represent an exhaustive list of possibilities that would effect forward-looking statements. Please see “Risk Factors” for additional risks which could adversely impact our business and financial performance and expectations and projections. Moreover, new risks emerge from time to time and it is not possible for our management to predict all risks, nor can we assess the impact of all risks on our business or the extent to which any risk, or combination of risks, may cause actual results to differ from those contained in any forward-looking statements. All forward-looking statements included in this prospectus are based on information available to us on the date of this prospectus. Except to the extent required by applicable laws or rules, we undertake no obligation to publicly update or revise any forward-looking statement, whether as a result of new information, future events or otherwise. All subsequent written and oral forward-looking statements attributable to us or persons acting on our behalf are expressly qualified in their entirety by the cautionary statements contained throughout this prospectus.
3
RISK FACTORS
Investing in our shares of common stock is very risky. Before making an investment decision, you should carefully consider all of the risks described in this prospectus. If any of the risks discussed in this prospectus actually occur, our business, financial condition and results of operations could be materially and adversely affected, the price of our shares could decline significantly, and you might lose all or a part of your investment. The risk factors described below are not the only ones that may affect us. Our forward-looking statements in this prospectus are also subject to the following risks and uncertainties. In deciding whether to purchase our shares, you should carefully consider the following factors, among others, as well as information contained in this prospectus.
Risks Related to Our Company
Our substantial and continuing losses, coupled with significant ongoing operating expenses, raise doubt about our ability to continue as a going concern.
We have incurred losses since our inception resulting in an accumulated deficit of $166,253,083 as of June 30, 2011 and we anticipate further losses as we continue to develop our business. Our ability to continue as a going concern is dependent upon our ability to generate profitable operations in the future and/or to obtain the necessary financing we need to meet our obligations and repay our liabilities arising from normal business operations when they come due. We plan to finance our operating costs over the next twelve months with existing cash on hand and the proceeds from the July 28, 2011 redemption notice of common stock warrants issued to certain investors. We believe we have sufficient cash to meet our needs for the next 12 months. In the event that the anticipated revenues are not realized or are less than anticipated and additional cash is required, we expect to seek additional financing and/or reduce costs expended on our research and development efforts.
Recent economic events and, in particular, the “credit crisis” may have an adverse effect in the markets in which we operate.
Much of our business is consumer driven, and to the extent there is a decline in consumer spending, we could experience a reduction in the demand for our services and a decrease in our revenues, net income and an increase in bad debts arising from non-payment of our trade receivables. Although we have seen a slow-down in our existing revenues, it is too early to predict what effect the current “credit crisis” may have on us and we will need to carefully monitor our operating costs as the effects of the current economic issues become known.
We currently derive a large part of our revenue from the premium rate services business activity.
Although our revenue mix is changing and our new mobile services are improving operating margins, our premium rate services currently generate our largest source of revenue. If significant changes occur in market conditions pertaining to this type of service it could have an adverse impact on our business, results of operations and financial condition.
We have recently shifted our business strategy, and we may not prove successful in our new focus.
In 2006, we began to expand our focus from the market of landline telecommunication services to mobile telecommunication and system services, including substantial increases of investment in software engineering, systems integration and mobile components. Even though we have built experience in serving mobile customers since 2008, we have limited large-scale experience in these areas, therefore we may not be able to enter and compete in these markets, or achieve profitability.
We did not maintain effective financial reporting processes due to lack of personnel and technological resources.
We have a small number of employees dealing with general administrative and financial matters as well as with matters relating to the reporting requirements of the Securities Exchange Act of 1934. This constitutes a weakness in our internal controls over financial reporting.
At present, our ability to rectify the weaknesses relating to our internal controls over financial reporting is limited due to budgetary constraints. If we cannot rectify these material weaknesses through remedial measures and improvements to our systems and procedures, management may encounter difficulties in timely assessing business performance and identifying incipient strategic and oversight issues. Management is implementing possible improvements to internal controls, and compensating controls, and this focus will require management from time to time to devote its attention away from other planning, oversight and performance functions.
4
These efforts may not result in an improvement to our internal controls over financial reporting. We cannot be certain that any measures we take will ensure that we implement and maintain adequate internal controls in the future. Any failure to implement required new or improved controls, or difficulties encountered in their implementation, could harm our operating results or cause us to fail to meet our reporting obligations.
We may not be able to integrate new technologies and provide new services in a cost-efficient manner.
The telecommunications industry is subject to rapid and significant changes in technology, frequent new service introductions and evolving industry standards. We cannot predict the effect of these changes on our competitive position, our profitability or the industry generally. Technological developments may reduce the competitiveness of our networks and our software solutions and require additional capital expenditures or the procurement of additional products that could be expensive and time consuming. In addition, new products and services arising out of technological developments may reduce the attractiveness of our services. If we fail to adapt successfully to technological advances or fail to obtain access to new technologies, we could lose customers and be limited in our ability to attract new customers and/or sell new services to our existing customers. In addition, delivery of new services in a cost-efficient manner depends upon many factors, and we may not generate anticipated revenue from such services.
Disruptions in our networks and infrastructure may cause us to lose customers and incur additional expenses.
To be successful, we will need to continue to provide our customers with reliable and timely service over our networks. We face the following risks to our networks, infrastructure and software applications:
| • | parts of our territory of operations can have significant weather events which can physically damage access lines; |
| • | power surges and outages, computer viruses or hacking, and software or hardware defects which are beyond our control; and |
| • | unusual spikes in demand or capacity limitations in our or our suppliers’ networks. |
Disruptions may cause interruptions in service or reduced capacity for customers, either of which could cause us to lose customers and/or incur expenses, and thereby adversely affect our business, revenue and cash flow.
Integration of acquisitions ultimately may not provide the benefits originally anticipated by management and may distract the attention of our personnel from the operation of our business.
We strive to broaden our solutions offerings as well as to increase the volume of voice, data and media traffic that we carry over our existing global network in order to reduce transmission costs and other operating costs as a percentage of net revenue, improve margins, improve service quality and enhance our ability to introduce new products and services. We recently acquired ValidSoft and we may pursue additional acquisitions in the future to further our strategic objectives. Acquisitions of businesses and customer lists involve operational risks, including the possibility that an acquisition may not ultimately provide the benefits originally anticipated by management. Moreover, we may not be successful in identifying attractive acquisition candidates, completing and financing additional acquisitions on favorable terms, or integrating the acquired business or assets into our own. There may be difficulty in integrating technologies and solutions, in migrating customer bases and in integrating the service offerings, distribution channels and networks gained through acquisitions with our own. Successful integration of operations and technologies requires the dedication of management and other personnel, which may distract their attention from the day-to-day business, the development or acquisition of new technologies, and the pursuit of other business acquisition opportunities. Therefore, successful integration may not occur in light of these factors.
5
Uncertainties and risks associated with international markets could adversely impact our international operations.
We have significant international operations in Europe and to a lesser extent in the Middle East and the Far East. There can be no assurance that we will be able to obtain the permits and operating licenses required for us to operate, obtain access to local transmission facilities on economically acceptable terms, or market services in international markets. In addition, operating in international markets generally involves additional risks, including unexpected changes in regulatory requirements, taxes, tariffs, customs, duties and other trade barriers, difficulties in staffing and managing foreign operations, problems in collecting accounts receivable, political risks, fluctuations in currency exchange rates, restrictions associated with the repatriation of funds, technology export and import restrictions, and seasonal reductions in business activity. Our ability to operate and grow our international operations successfully could be adversely impacted by these risks.
Because most of our business is conducted outside the United States, fluctuations in foreign currency exchange rates versus the United States Dollar could adversely affect our (reported) results of operations.
Currently all of our net revenue is derived from sales and operations outside the United States whereas the reporting currency for our consolidated financial statements is the United States Dollar or USD. The local currency of each country is the functional currency for each of our respective entities operating in that country, where the Euro is the predominant currency. Considering the fact that most income and expenses are not subject to relevant exchange rate differences, it is only at a reporting level that the translation needs to be made to the reporting unit of USD. In the future, we expect to continue to derive a significant portion of our net revenue and incur a significant portion of our operating costs outside the United States, and changes in exchange rates have had and may have a significant, and potentially distorting effect (either negative or positive) on the reported results of operations, not necessarily being the result of operations in real terms. However, our recent private placements have been in USD, increasing the risk of exchange rate differences in real terms. Our primary risk of loss regarding foreign currency exchange rate risk is caused by fluctuations in the following exchange rates: USD/EUR, USD/CHF, USD/HKD, USD/CNY and USD/BHD.
We historically have not engaged in hedging transactions since we primarily operate in same currency countries, currently being the Euro. However, the operations of affiliates and subsidiaries in non-US countries have been funded with investments and other advances denominated in foreign currencies and more recently in USD. Historically, such investments and advances have been long-term in nature, and we accounted for any adjustments resulting from currency translation as a charge or credit to accumulate other comprehensive loss within the shareholders’ deficit section of our consolidated balance sheets. Although we have not engaged in hedging so far we continue to assess on a regular basis the possible need for hedging.
We are substantially smaller than our major competitors, whose marketing and pricing decisions, and relative size advantage, could adversely affect our ability to attract and retain customers and are likely to continue to cause significant pricing pressures that could adversely affect our net revenues, results of operations and financial condition.
The market for telecommunications (traffic) services is significantly influenced by the marketing and pricing decisions of the larger long distance, Internet access, broadband, DSL and mobile business participants. Prices in the land-line and mobile communication industries have continued to decline in recent years, and as competition continues to increase, we believe that prices are likely to continue decreasing. Customers frequently change long distance, wireless and broadband providers, and ISPs in response, are offering of lower rates or promotional incentives, increasingly as a result of bundling of various services by competitors. Moreover, our competitors’ voice over internet protocol or VOIP and broadband product rollouts have added further customer choice and pricing pressure. As a result, generally, customers can switch carriers and service offerings at any time. Competition in all of our traffic services markets is likely to remain intense or even increase in intensity and, as deregulatory influences are experienced in markets outside the United States, competition in non-United States markets is becoming similar to the intense competition in the United States. Many of our competitors are the principal or incumbent carriers in a country and are significantly larger than us and have substantially greater financial, technical and marketing resources, larger networks, a broader portfolio of service offerings, greater control over network and transmission lines, stronger name recognition and customer loyalty, long-standing relationships with our target customers, and lower debt leverage ratios. As a result, our ability to attract and retain customers in the traffic services may be adversely affected. Many of our competitors enjoy economies of scale that result in low cost structures for transmission and related costs that could cause significant pricing pressures within the industry. We compete based on price, particularly with respect to our sales to other carriers, and also based on customer service and our ability to provide a variety of telecommunications products and services. If such price pressures and bundling strategies intensify, we may not be able to compete successfully in the future, may face quarterly revenue and operating results variability, and may have heightened difficulty in estimating future revenues or results.
6
Our services related to communications software and information systems, outsourced solutions and value added (communication) services, including our ValidSoft fraud prevention and resolution products are highly competitive and fragmented, and we expect competition to continue to increase. We compete with telecom solution providers, independent software and service providers and the in-house IT and network departments of communications companies as well as firms that provide IT services (including consulting, systems integration and managed services), software vendors that sell products for particular aspects of a total information system, software vendors that specialize in systems for particular communications services (such as Internet, land-line and mobile services, cable, satellite and service bureaus) and companies that offer software systems in combination with the sale of network equipment. In addition, in this more fragmented market, larger players exist with associated advantages described earlier which we need to compete against.
Our positioning in the marketplace as a smaller provider places a significant strain on our resources, and if not managed effectively, could result in operational inefficiencies and other difficulties.
Our positioning in the marketplace may place a significant strain on our management, operational and financial resources, and increase demand on our systems and controls. To manage this position effectively, we must continue to implement and improve our operational and financial systems and controls, invest in development & engineering, critical systems and network infrastructure to maintain or improve our service quality levels, purchase and utilize other system and solutions, and train and manage our employee base. As we proceed with our development operational difficulties could arise from additional demand placed on customer provisioning and support, billing and management information systems, product delivery and fulfillment, sales and marketing and administrative resources.
For instance, we may encounter delays or cost overruns or suffer other adverse consequences in implementing new systems when required. In addition, our operating and financial control systems and infrastructure could be inadequate to ensure timely and accurate financial reporting.
We could suffer adverse tax and other financial consequences if U.S. or foreign taxing authorities do not agree with our interpretation of applicable tax laws.
Our corporate structure is based, in part, on assumptions about the various tax laws, including withholding tax, and other relevant laws of applicable non-U.S. jurisdictions. Foreign taxing authorities may not agree with our interpretations or reach different conclusions. Our interpretations are not binding on any taxing authority and, if these foreign jurisdictions were to change or to modify the relevant laws, we could suffer adverse tax and other financial consequences or have the anticipated benefits of our corporate structure materially impaired.
We must attract and retain skilled personnel. If we are unable to hire and retain technical, technical sales and operational employees, our business could be harmed.
Our ability to manage our growth will be particularly dependent on our ability to develop and retain an effective sales force and qualified technical and managerial personnel. We intend to hire additional employees, including software engineers, communication engineers, project managers, sales consultants, employees and operational employees. The competition for qualified technical sales, technical, and managerial personnel in the communications and software industry is intense, and we may not be able to hire and retain sufficient qualified personnel. In addition, we may not be able to maintain the quality of our operations, control our costs, maintain compliance with all applicable regulations, and expand our internal management, technical, information and accounting systems in order to support our desired growth, which could have an adverse impact on our operations.
7
If we are not able to use and protect our intellectual property domestically and internationally, it could have a material adverse effect on our business.
Our ability to compete depends, in part, on our ability to use our intellectual property internationally. We rely on a combination of patents, trade secrets, trademarks and licenses to protect our intellectual property. We are also subject to the risks of claims and litigation alleging infringement of the intellectual property rights of others. The telecommunications industry is subject to frequent litigation regarding patent and other intellectual property rights. We rely upon certain technology, including hardware and software, licensed from third parties. The technology licensed by us may not continue to provide competitive features and functionality. Licenses for technology currently used by us or other technology that we may seek to license in the future may not be available to us on commercially reasonable terms or at all.
Our revenue, earnings and profitability are affected by the length of our sales cycle as well as the length of our strategic mobile partnership cycle, and longer cycles could adversely affect our results of operations and financial condition.
Our business is directly affected by the length of our sales cycle and strategic mobile partnership cycles with mobile operators or MNOs. Both our telecommunications traffic services as well as our communications information systems, outsourced solutions and value added (communication) services, including our ValidSoft security solutions are relatively complex and their purchase generally involves a significant commitment of capital, with attendant delays frequently associated with large capital expenditures and procurement procedures within an organization. In particular, our Valid-POS fraud solution software from Validsoft is highly dependent on closing MNO contracts to be able to operate this Valid-POS solution. The purchase of these types of products typically also requires coordination and agreement across many departments within a potential customer or MNO organization. Delays associated with such timing factors could have a material adverse effect on our results of operations and financial condition. In periods of economic slowdown in the communications industry, which may recur in the current economic climate, our typical sales cycle lengthens, which means that the average time between our initial contact with a prospective customer or MNO and the signing of a sales contract or MNO increases. The lengthening of our sales and strategic mobile partnership cycle could reduce growth in our revenue in the future. In addition, the lengthening of our sales and strategic mobile partnership cycle contributes to an increased cost of sales, thereby reducing our profitability.
We are dependent on a significant customer for our Premium Rate Services business and the loss of this customer could have an adverse effect on our business, results of operations and financial condition.
Through June 30, 2011, one customer in the Netherlands accounted for premium rate services revenue of $10,329,207 or 63% of our total revenue. The same customer accounted for revenues of $22,439,478 or 64% for the year ended December 31, 2010. Through June 30, 2010, this same customer accounted for $13,062,244 or 67% of our total revenue and $21,905,840 or 50% for the year ended December 31, 2009. If this significant customer discontinues its relationship with us for any reason, or reduces or postpones current or expected revenues, it could have an adverse impact on our business, results of operations and financial condition although this impact is smaller than the revenue shows because of the low margin contribution of upon landline premium rate service business.
Risks Related to Our Industry
Changes in the regulation of the telecommunications industry could adversely affect our business, revenue or cash flow.
We operate in a heavily regulated industry. As a multinational telecommunications company or provider of services to carriers and operators, we are directly and indirectly subject to varying degrees of regulation in each of the jurisdictions in which we provide our services. Local laws and regulations, and the interpretation of such laws and regulations, differ significantly among the jurisdictions in which we operate. Enforcement and interpretations of these laws and regulations can be unpredictable and are often subject to the informal views of government officials. Certain European, foreign, federal, and state regulations and local franchise requirements have been, are currently, and may in the future be, the subject of judicial proceedings, legislative hearings and administrative proposals. Such proceedings may relate to, among other things, the rates we may charge for our local, network access and other services, the manner in which we offer and bundle our services, the terms and conditions of interconnection, unbundled network elements and resale rates, and could change the manner in which telecommunications companies operate. We cannot predict the outcome of these proceedings or the impact they will have on our business, revenue and cash flow.
8
There can be no assurance that future regulatory changes will not have a material adverse effect on us, or that regulators or third parties will not raise material issues with regard to our compliance or noncompliance with applicable regulations, any of which could have a material adverse effect upon us.. Potential future regulatory, judicial, legislative, and government policy changes in jurisdictions where we operate could have a material adverse effect on us. Domestic or international regulators or third parties may raise material issues with regard to our compliance or noncompliance with applicable regulations, and therefore may have a material adverse impact on our competitive position, growth and financial performance.
If competitive pressures continue or intensify and/or the success of our new products is not adequate in amount or timing to offset the decline in results from our legacy businesses, we may not be able to service our debt or other obligations .
There are substantial risks and uncertainties in our future operating results, particularly as aggressive pricing and bundling strategies by certain incumbent carriers and incumbent local exchange carriers have intensified competitive pressures in the markets where we operate, and/or if we have insufficient financial resources to market our services. The aggregate anticipated margin contribution from our new Mobile solutions may not be adequate in amount or timing to offset the declines in margin from our traditional landline telecommunications services.
We experience intense domestic and international competition in our telecommunications traffic business which may adversely affect our results of operations and financial condition.
Both the landline and mobile traffic business are intensely competitive with relatively limited barriers to entry in the more deregulated countries in which we operate and with numerous entities competing for the same customers. Recent and pending deregulation in various countries may encourage new entrants to compete, including ISPs, MNOs, cable television companies, who would offer voice, broadband, Internet access and television, and electric power utilities who would offer voice and broadband Internet access. As competition intensifies as a result of deregulatory, market or technological developments, our results of operations and financial condition could be adversely affected, since the traffic business still constitutes a sizeable portion of our total business.
Deterioration in our relationships with facilities-based carriers could have a material adverse effect upon our telecommunications traffic business.
In our telecommunication traffic business, we primarily connect our customers’ telephone calls and data/Internet needs through access agreements with facilities-based MNOs and landline carriers. Many of these carriers are, or may become, our competitors. Our ability to maintain and expand our business depends on our ability to maintain favorable relationships with the facilities-based carriers from which we lease transmission lines. If our relationship with one or more of these carriers were to deteriorate or terminate, it could have a material adverse effect upon our cost structure, service quality, network diversity, results of operations and financial condition. If we experience difficulties with our third-party providers, we may not achieve desired economies of scale or otherwise be successful in growing our business.
The telecommunications industry is rapidly changing, and if we are not able to adjust our strategy and resources effectively in the future to meet changing market conditions, we may not be able to compete effectively.
The telecommunications industry is changing rapidly due to deregulation, privatization, consolidation, technological improvements, availability of alternative services such as mobile, broadband, DSL, Internet, VOIP, and wireless DSL through use of the fixed wireless spectrum, and the globalization of the world’s economies. In addition, alternative services to traditional landline services, such as mobile, broadband, Internet and VOIP services, are a substantial competitive threat to our legacy landline traffic business. If we do not continue to invest and exploit our contemplated plan of development of our communications information systems, outsourced solutions and value added (communication) services to meet changing market conditions, or if we do not have adequate resources, we may not be able to compete effectively. The telecommunications industry is marked by the introduction of new product and service offerings and technological improvements. Achieving successful financial results will depend on our ability to anticipate, assess and adapt to rapid technological changes, and offer, on a timely and cost-effective basis, services including the bundling of multiple services that meet evolving industry standards. If we do not anticipate, assess or adapt to such technological changes at a competitive price, maintain competitive services or obtain new technologies on a timely basis or on satisfactory terms, our financial results may be materially and adversely affected.
9
If we are not able to operate a cost-effective network, we may not be able to grow our business successfully.
Our long-term success depends on our ability to design, implement, operate, manage and maintain a reliable and cost-effective network. In addition, we rely on third parties to enable us to expand and manage our global network and to provide local, broadband Internet and mobile services.
Risks Related to Our Capital Stock
We could issue additional common stock, which might dilute the book value of our capital stock.
Our board of directors has authority, without action or vote of our shareholders, to issue all or a part of our authorized but unissued shares of common stock. Any such stock issuance could be made at a price that reflects a discount or a premium to the then-current trading price of our common stock. In addition, in order to raise future capital, we may need to issue securities that are convertible into or exchangeable for a significant amount of our common stock. These issuances, if any, would dilute your percentage ownership interest in the company, thereby having the effect of reducing your influence on matters on which shareholders vote. You may incur additional dilution if holders of stock options, whether currently outstanding or subsequently granted, exercise their options, or if warrant holders exercise their warrants to purchase shares of our common stock. As a result, any such issuances or exercises would dilute your interest in the company and the per share book value of the common stock that you owned, either of which could negatively affect the trading price of our common stock and the value of your investment.
Our board of directors has the power to designate a series of preferred stock without shareholder approval that could contain conversion or voting rights that adversely affect our common shareholders.
Our articles of incorporation authorize the issuance of capital stock including 50,000,000 undesignated preferred shares, and empowers our board of directors to prescribe by resolution and without shareholder approval a class or series of such preferred shares, including the number of shares in the class or series and the voting powers, designations, rights, preferences, restrictions and the relative rights in each such class or series thereof. The creation and issuance of any such preferred shares could dilute your voting and ownership interest in the company, the value of your investment, the trading price of our stock and any cash (or other form of consideration) that you would otherwise receive upon the liquidation of the company.
If we issue additional shares of common stock in connection with subsequent financings, this will have a dilutive effect on your voting rights.
We are authorized to issue 300,000,000 shares of capital stock, including 250,000,000 shares of common stock and 50,000,000 shares of preferred stock, of which 109,026,881 shares of common stock were issued and outstanding as of August 29, 2011.
Furthermore, should we decide to seek financing through the issuance of additional common stock or preferred stock, this may have a dilutive effect on your voting rights, the value of your investment and the trading price of our common stock. If we issue more than 20% of our outstanding common stock in any equity-based financing, we may be required to call a special meeting of our shareholders to authorize the issuance of such additional shares before undertaking the issuance. As a result, we cannot assure you that our shareholders would authorize such issuance and the company could be required to seek necessary capital in an alternative manner, which may not be available on commercially reasonable terms, if at all. If the company is unable to adequately fund itself, through its operations or equity/debt financing, this would have a material adverse affect on the company as a going concern.
As a “thinly-traded” stock, large sales can place downward pressure on our stock price.
Our stock experiences periods when it could be considered “thinly traded.” Financing transactions resulting in a large number of newly issued shares that become readily tradable, or other events that cause current shareholders to sell shares, could place downward pressure on the trading price of our stock. In addition, the lack of a robust resale market may require a shareholder who desires to sell a large number of shares to sell the shares in increments over time to mitigate any adverse impact of the sales on the market price of our stock.
10
Shares eligible for future sale may adversely affect the market for our common stock.
At August 29, 2011, we have 3,966,946 options and 51,128,503 warrants to purchase shares of our common stock outstanding. If and when these securities are exercised into shares of our common stock, the number of our shares of common stock outstanding will increase. Such increase in our outstanding share, and any sales of such shares, could have a material adverse effect on the market for our common stock and the market price of our common stock. The availability of the 2010 Registration Statement may cause the warrants may be more likely to be exercised now.
In addition, from time to time, certain of our shareholders may be eligible to sell all or some of their shares of common stock by means of ordinary brokerage transactions in the open market pursuant to Rule 144, promulgated under the Securities Act of 1933, which we refer to in this prospectus as the Securities Act, subject to certain limitations. In general, pursuant to Rule 144, after satisfying a six month holding period: (i) affiliated shareholders (or shareholders whose shares are aggregated) may, under certain circumstances, sell within any three month period a number of securities which does not exceed the greater of 1% of the then outstanding shares of common stock or the average weekly trading volume of the class during the four calendar weeks prior to such sale and (ii) non-affiliated shareholders may sell without such limitations, provided we are current in our public reporting obligations. Rule 144 also permits the sale of securities by non-affiliates that have satisfied a one year holding period without any limitation or restriction. Any substantial sale of our common stock pursuant to Rule 144 or pursuant to any resale prospectus may have a material adverse effect on the market price of our securities.
Warrants will dilute your interest in the Company.
Throughout the years we have issued warrants in conjunction with certain private placements and other financing.
As a result, the voluntary (or mandatory) exercise of the warrants issued will significantly dilute your interest in our securities and could have a material adverse effect on the trading price of our common stock and the value of your investment.
Because our executive officers, directors and their affiliates own a large percentage of our voting stock, other shareholders’ voting power may be limited.
As of August 29, 2011, Steven van der Velden, Martin Zuurbier, Johan Dejager, Mark Nije, Roderick de Greef, Phil Hickman, Rijkman Groenink and Jacques D. Kerrest, our executive officers and directors, beneficially owned or controlled approximately 14.12% of our outstanding common stock. In particular, as of August 29, 2011, Rising Water Capital AG, an entity affiliated with the certain of the aforementioned individuals, beneficially owned 25% of our common stock and QAT Investments, SA, another entity affiliated with certain of our officers and directors and the owner of 51.3% of Rising Water Capital, beneficially owned 12.9% of our common stock. Further, Q.A.T. II Investments SA, an entity affiliated with certain of our directors and officers, beneficially owned 5.7% of our common stock, and Patrick Carroll, Willem van den Brink and Alex Vermeulen, respectively, the CEO of our ValidSoft subsidiary, the Chief Commercial Officer and our General Counsel, beneficially own less than 1% each of our common stock. If those shareholders act together, they will have the ability to control matters submitted to our shareholders for approval, including the election and removal of directors and the approval of any merger, consolidation or sale of all or substantially all of our assets. As a result, our other shareholders may have little or no influence over matters submitted for shareholder approval. In addition, the ownership of such shareholders could preclude any unsolicited acquisition of us, and consequently, materially adversely affect the price of our common stock. These shareholders may make decisions that are adverse to your interests.
We have no dividend history and have no intention to pay dividends in the foreseeable future.
We have never paid dividends on or in connection with our common stock and do not intend to pay any dividends to common shareholders for the foreseeable future.
11
Our common stock is considered a penny stock and penny stocks are subject to special regulations which may make them more difficult to trade on the open market .
Securities in the OTC market are generally more difficult to trade than those on the New York Stock Exchange, NASDAQ Markets, or the major world exchanges (e.g. London Stock Exchange, Toronto Stock Exchange, etc.). In addition, accurate price quotations are also more difficult to obtain. The trading market for our common stock is subject to special regulations governing the sale of penny stock.
A “penny stock” is defined by regulations of the Securities and Exchange Commission as an equity security with a market price of less than $5.00 per share. The market price of our common stock has been less than $5.00 for several years.
If you buy or sell a penny stock, these regulations require that you receive, prior to the transaction, a disclosure explaining the penny stock market and associated risks. Furthermore, trading in our common stock would be subject to Rule 15g-9 of the Exchange Act, which relates to non-NASDAQ and non-exchange listed securities. Under this rule, broker-dealers who recommend our securities to persons other than established customers and accredited investors must make a special written suitability determination for the purchaser and receive the purchaser's written agreement to a transaction prior to sale. Securities are exempt from this rule if their market price is at least $5.00 per share.
Penny stock regulations will tend to reduce market liquidity of our common stock, because they limit the broker-dealers' ability to trade, and a purchaser's ability to sell the stock in the secondary market. The low price of our common stock will have a negative effect on the amount and percentage of transaction costs paid by individual shareholders. The low price of our common stock may also limit our ability to raise additional capital by issuing additional shares. There are several reasons for these effects. First, the internal policies of many institutional investors prohibit the purchase of low-priced stocks. Second, many brokerage houses do not permit low-priced stocks to be used as collateral for margin accounts or to be purchased on margin. Third, some brokerage house policies and practices tend to discourage individual brokers from dealing in low-priced stocks. Finally, broker's commissions on low-priced stocks usually represent a higher percentage of the stock price than commissions on higher priced stocks. As a result, our shareholders will pay transaction costs that are a higher percentage of their total share value than if our share price were substantially higher.
12
SPECIAL NOTE REGARDING FORWARD-LOOKING STATEMENTS
This prospectus includes forward-looking statements. All statements, other than statements of historical fact, contained in this prospectus constitute forward-looking statements. In some cases, you can identify forward-looking statements by terms such as “may”, “intend”, “might”, “will”, “should”, “could”, “would”, “expect”, “believe”, “estimate”, “anticipate”, “predict”, “project”, “potential”, or the negative of these terms and similar expressions intended to identify forward-looking statements.
Forward-looking statements are based on assumptions and estimates and are subject to risks and uncertainties. We have identified in this prospectus some of the factors that may cause our actual results to differ materially from those expressed or assumed in any of our forward-looking statements. There may be other factors not so identified. You should not place undue reliance on our forward-looking statements. As you read this prospectus, you should understand that these statements are not guarantees of performance or results. Further, any forward-looking statement speaks only as of the date on which it is made and, except as required by law, we undertake no obligation to update any forward-looking statement to reflect events or circumstances after the date on which it is made or to reflect the occurrence of anticipated events or circumstances. New factors emerge from time to time that may cause our business not to develop as we expect and it is not possible for us to predict all of them. Factors that may cause actual results to differ materially from those expressed or implied by our forward-looking statements include, but are not limited to, those described under the heading “Risk Factors” beginning on page 4.
13
USE OF PROCEEDS
This prospectus relates to shares of our common stock that may be offered and sold from time to time by the selling stockholders named herein. There will be no proceeds to us from the sale of shares of common stock in this offering.
We will not receive any proceeds from the sale of shares by the selling stockholders other than the exercise price of any warrants that are exercised by the applicable selling stockholders who do not conduct cashless exercises, the proceeds of which we expect to use for our general working capital. If all of these warrants are exercised for cash, then we will receive gross proceeds of approximately $66 million. No assurances can be given, however, that all or any portion of such warrants will ever be exercised.
DETERMINATION OF OFFERING PRICE
The selling stockholders may sell these shares in the over-the-counter market or otherwise, at market prices prevailing at the time of sale, at prices related to the prevailing market price, or at negotiated prices. We will not receive any proceeds from the sale of shares by the selling stockholders but we may receive proceeds upon the exercise, if any, of the warrants.
14
MANAGEMENT’S DISCUSSION AND ANALYSIS OF FINANCIAL CONDITION AND RESULTS OF OPERATIONS
Forward-Looking Statements
Any forward-looking statements made herein are based on current expectations of the Company, involve a number of risks and uncertainties and should not be considered as guarantees of future performance. The factors that could cause actual results to differ materially include: interruptions or cancellation of existing contracts, inability to integrate acquisitions, impact of competitive products and pricing, product demand and market acceptance risks, the presence of competitors with greater financial resources than the Company, product development and commercialization risks, changes in governmental regulations, and changing economic conditions in developing countries and an inability to arrange additional debt or equity financing.
Overview
The following discussion and analysis of our financial condition and results of operations should be read in conjunction with our financial statements and notes thereto and the other financial information included elsewhere in this document.
Services and Solutions
Full-MVNE/MVNO Mobile Services – wholesale services and managed services to Mobile Network Operators and Virtual Network Operators.
As of 2007, we positioned ourselves as a mobile virtual network enabler or MVNE to mobile network operators or MNOs and mobile virtual network operators or MVNOs offering a wide range of mobile enabling/enhancing services through sophisticated, proprietary technology supported by multi-country operations with a focus on business to business, outsourcing /partnering strategy. Important milestones in this respect are:
| ¨ | On September 17, 2008, a hosting agreement was signed between T-Mobile Netherlands BV and Elephant Talk Holding AG, a 100% affiliate of Elephant Talk Europe Holding BV. T-Mobile is one of the three MNOs in the Netherlands. Elephant Talk will, as exclusive MVNE for T-Mobile, connect MVNOs in the Netherlands to its platform, making use of the mobile network of T-Mobile. |
| ¨ | In June 2009, we signed a hosting agreement with Vizzavi Spain (part of Vodafone Group) pursuant to which we will be the exclusive provider of MVNE services to Vizzavi in Spain. |
| ¨ | In the course of 2010, we signed a framework hosting agreement with KPN Group Belgium NV. In accordance with the agreement, we will connect MVNOs in Belgium to the KPN Group platform, making use of the mobile network of KPN in Belgium. We are currently in the process of implementing this platform in Belgium. |
| ¨ | Following the start of our MVNE services in the Netherlands in the fourth quarter of 2008, we entered into heads of terms agreements with MVNOs for wholesale services in the Netherlands and started servicing these companies while we are concurrently implementing additional MVNE services. By the end of the third quarter of 2010, we successfully implemented and brought live for T-Mobile one of their best known brands in the Netherlands. |
| ¨ | In 2011 we closed a contract with Zain KSA in Saudi Arabia to provide our mobile platform which is planned to be operational in the course of 2011. |
15
Customized Mobile Solutions – integrated fraud and security solutions (ValidSoft) to financial institutions
In line with our strategy to develop and market customized mobile solutions, we acquired ValidSoft on March 17, 2010. ValidSoft provides strong authentication and transaction verification capabilities that allow organizations to quickly implement solutions that protect against certain of the latest forms of credit and debit card fraud and on-line transaction and identity theft. By correlating the relative location of a person’s credit card with the location of their mobile phone, this service can, for example, tell a bank or card issuer in real-time if the transaction is likely genuine or fraudulent. We anticipate generating revenues on a per transaction basis (per verification). This acquisition combines what we believe to be ValidSoft’s best in class proprietary software with our telecommunication platform to create what we believe is the best integrated electronic fraud prevention solution available. A number of milestones:
| ¨ | At the end of 2010, ValidSoft entered into a contractual arrangement with Visa Europe for the use of ValidSoft’s fraud-prevention solutions, VALid-POS® and VALid®. |
| ¨ | ValidSoft has been granted the European Privacy Seal in regards to its anti-fraud technology software, VALid-POS®, which is designed to detect and prevent card related fraud, a global multibillion dollar problem for financial institutions. |
| ¨ | We launched VALid-SVP™ (Speaker Verification Platform), a voice biometric technology to improve secure authentication. |
| ¨ | We announced in June 2011 an agreement with Sogeti BeLux (www.sogeti.be), a prominent provider of IT services in Belgium and Luxembourg. Sogeti BeLux will be the first reseller partner in continental Europe to provide ValidSoft's suite of multi-layered security products with strong, built-in privacy protections. |
| ¨ | ValidSoft was successful in a joint bid for the provision of a Self Certification project to an EU Government in the area of citizen benefit payments. The customer will evaluate and, to the extent satisfied, incorporate ValidSoft’s Speaker Verification Platform, VALid-SVP™, to provide automation in the processing of citizen benefits with a view to achieving cost reduction and efficiencies. |
| ¨ | ValidSoft has filed applications for two new patents in the Card Not Present fraud prevention area. |
| ¨ | ValidSoft announced an agreement with Cumberland Building Society (www.cumberland.co.uk), the 15th largest building society in the UK with assets exceeding £1.5billion, to incorporate ValidSoft's VALid® solution technology into a new secure transaction service (Cumberland Building Society is a mutual organization owned by its current account holders, and borrowers which follows a similar model of community banks in the US). |
Landline network outsourcing services
Through our fixed line telecom infrastructure and our centrally operated and managed IN-CRM-Billing platform, we also provide traditional landline services like Carrier Select and Carrier Pre-Select Services, Toll Free and Premium Rate Services to the business market.
Support technology
Business Support and Operational Support System (“ET BOSS”) and Intelligent Network – IN – (“Infitel”)
Through our European and Chinese development centers, we develop in-house telecom and media related systems and software, centered around two of our proprietary platforms ET BOSS and Infitel.
Electronic fraud prevention products: VALid-POS®, VALid® and VALid-VSG™.
The recent acquisition of ValidSoft has given us ownership of technology and intellectual property to combat fraud relating to credit/debit card, the internet, and telephone channels. ValidSoft solutions are marketed under VALid-POS® and VALid® and its biometrics based product is marketed under VALid-VSG™.
16
Telecom infrastructure & network
We currently operate a switch-based telecom network with national licenses and direct fixed line interconnects with the Incumbents/National Telecom Operators in seven (7) European countries, one (1) in the Middle East (Bahrain), and partnerships with telecom operators in Scandinavia, Poland and Germany, and France. To this, we have added mobile access coverage in order to cater for our mobile services and solutions. Our first mobile partners are T-Mobile in the Netherlands, Vizzavi (a Vodafone company) in Spain and KPN in Belgium.
Results of Operations
Introduction
Although the vast majority of our business activities are carried out in Euros, we report our financial statements in US dollars or USD. The conversion of Euros and USD leads to periodic fluctuations in our reported USD results arising from changes in the exchange rate between the USD and the Euro. Generally, when the USD strengthens relative to the Euro, it has an unfavorable impact on our reported revenue and income and a favorable impact on our reported expenses. Conversely, when the USD weakens relative to the Euro, it produces a favorable impact on our reported revenue and income, and an unfavorable impact on our reported expenses. The fluctuations in the USD/Euro exchange rate which results in currency translation effects (not to be confused with real currency exchange effects), which impact our reported USD results which may make it difficult to determine actual increases and decreases in our revenue and expenses which are attributable to our actual operating activities. In addition to reporting changes in our financial statements in USD as required by the United States generally accepted accounting principles or US GAAP, we also highlight the impact of any material currency translation effect by providing a comparison between periods on a constant currency basis, where the most recent USD/Euro exchange rate is applied to previous periods. Management believes that this allows for greater insight into the trends and changes in our business for the reported periods. In addition, since we carry out our business activities primarily in Euros we do not currently engage in hedging activities.
Our business is primarily related to mobile and security related solutions. By far the majority of investments and activities of our employees and long term consultants are geared towards these types of business. This needs to be kept in mind when reading our financial statements and the management discussion and analysis.
Six months ended June 30, 2011 compared to the six months ended June 30, 2010
In the first six months of 2011, most of our revenues were generated by our landline business (premium rate services, calling cards, Middle East and other revenue), but that business only requires a very small amount of our resources both in terms of human resources, facilities as well as capital expenditures. Even though our revenues in the first six months of 2011 were 90% generated by our landline business, our margin contribution largely comes from our mobile and security solutions business. Within the mobile segment, we distinguish between our wholesale service and managed service businesses. Our wholesale service business generates higher revenues than our managed services business, since wholesale services includes the sale of airtime. However, though our managed services generate lower revenues, we have lower cost of services compared to those for our wholesale services business.
Our results of operations for the quarter ended June 30, 2011, consisted of the operations of Elephant Talk Communications Inc., its wholly owned subsidiaries, Elephant Talk Limited and its subsidiaries, Elephant Talk Europe Holding BV and its subsidiaries, Elephant Talk Global Holding BV and its subsidiaries and ValidSoft Ltd and its subsidiaries
Adjusted EBITDA
We employ Adjusted EBITDA, defined as earnings, income taxes, depreciation and amortization and stock-based compensation, for several purposes, including as a measure of our operating performance. We use Adjusted EBITDA because it removes the impact of items not directly resulting from our core operations, thus allowing us to better assess whether the elements of our growth strategy are yielding positive results.
17
A reconciliation of Adjusted EBITDA to net loss for each of the fiscal periods indicated is as follows:
| Six months ended | ||||||||||||
| June, 30 | ||||||||||||
| 2010 in | ||||||||||||
| constant | ||||||||||||
| 2011 | 2010 | currency | ||||||||||
| (unaudited) | (unaudited) | (unaudited) | ||||||||||
| Net loss | $ | (11,434,647 | ) | $ | (26,696,719 | ) | $ | (26,938,975 | ) | |||
| Provision for income taxes | 800 | 800 | 800 | |||||||||
| Net loss attributable to noncontrolling interest | - | 2,283 | 756 | |||||||||
| Depreciation and amortization | 2,640,450 | 2,360,122 | 2,478,698 | |||||||||
| Stock-based compensation | 3,167,966 | 3,253,669 | 3,253,669 | |||||||||
| Other income & expenses | (368,856 | ) | 18,333,444 | 18,316,096 | ||||||||
| Adjusted EBITDA | $ | (5,994,287 | ) | $ | (2,746,401 | ) | $ | (2,888,956 | ) | |||
(Note to Adjusted EBITDA table: 2010 figures only include three months ValidSoft financials)
Impact of inclusion of ValidSoft financials for the six months ended June 30, 2010 – constant currency –:
Since ValidSoft only started to be consolidated into our financials as of April 1, 2010, ValidSoft financials for the first quarter of 2010 are not included in our financial reports.
The adjusted EBITDA for ValidSoft in the previous year (first quarter of 2010) was ($907,693), comprising of net loss ($966,328), adjusted for depreciation of $5,827 and interest income and expenses of $52,808.
For comparison, if we include first quarter of 2010 adjusted EBITDA of ValidSoft into our 2010 financials, the six months ended June 30, 2010 would show an adjusted EBITDA of ($3,796,649).
Revenue
Revenue for the three months ended June 30, 2011 was $7,790,976, a decrease of $ 1,882,849 or 19.5%, compared to $9,673,825 for the three months ended June 30, 2010. Revenue for the six months ended June 30, 2011 was $16,298,990, a decrease of $3,318,600 or 16.9%, compared to $19,617,590 for the six months ended June 30, 2010.
Revenue - Constant currency
In constant currency, our revenue for the three months ended June 30, 2011 decreased by $3,069,049 or 28.8% compared to the same period in 2010.
In constant currency, our revenue for the six months ended June 30, 2011 decreased by $4,406,617 or 21.3% compared to the same period in 2010. The decrease in revenue was the result of a continued decrease in our low margin legacy landline business by $5,121,779, which was partly off-set by the increase in our higher margin mobile and security solutions business of $715,162 compared to the same period in 2010.
| Variance 2011 | ||||||||||||||||
| June 30, 2010 | versus 2010 | |||||||||||||||
| Revenue | June 30, 2011 | June 30, 2010 | constant currency | constant currency | ||||||||||||
| Landline Services | $ | 13,838,888 | $ | 17,966,458 | $ | 18,960,667 | $ | (5,121,779 | ) | |||||||
| Mobile & Security Solutions | 2,460,102 | 1,651,132 | 1,744,940 | 715,162 | ||||||||||||
| Total Revenue | $ | 16,298,990 | $ | 19,617,590 | $ | 20,705,607 | $ | (4,406,617 | ) | |||||||
18
Cost of service
Cost of service includes origination, termination, network and billing charges from telecommunications operators, out payment costs to content and information providers, network costs, data center costs, facility cost of hosting network and equipment and cost in providing resale arrangements with long distance service providers, cost of leasing transmission facilities, international gateway switches for voice, and data transmission services.
Cost of service for the three months ended June 30, 2011 was $7,494,679, a decrease of $1,510,715 or 16.8%, compared to $9,005,394 for the three months ended June 30, 2010. Cost of service for the six months ended June 30, 2011 was $15,052,164, a decrease of $3,327,118 or 18.1%, compared to $18,379,282 for the six months ended June 30, 2010. The decrease in cost of service was mainly caused by the decrease in revenues in our low margin legacy landline business.
Cost of service – constant currency
In constant currency, the cost of service for the three months ended June 30, 2011, decreased by $2,616,479 or 26.4% compared to the same period in 2010, primarily as a result of lower levels of landline revenue. Cost of service, as a percent of revenue, expressed in constant dollar terms was 96.4% and 93.2% for the three months ended June 30, 2011 and 2010, respectively.
In constant currency, the cost of service for the six months ended June 30, 2011, decreased by $4,351,126 or 22.4% compared to the same period in 2010, primarily as a result of lower levels of landline revenue. Cost of service, as a percent of revenue, expressed in constant dollar terms was 92.4% and 93.7% for the six months ended June 30, 2011 and 2010, respectively.
Despite the increase of cost of service in the second quarter 2011 following the fact that little revenues were generated by one-off mobile fees during that period, management expects cost of service as a percent of revenue to decline in the future as a greater proportion of future revenue is comprised of our mobile services and ValidSoft security solutions, which have a substantially lower cost of service than our traditional PRS business.
Selling, general and administrative
Selling, general and administrative (“SG&A”) expense for the three months ended June 30, 2011 and 2010 were $3,824,756 and $2,079,359, respectively. SG&A expenses increased by $1,745,397, or 83.9%, in 2011 compared to 2010.
SG&A expense for the six months ended June 30, 2011 and 2010 were $7,241,113 and $3,984,709, respectively. SG&A expenses increased by $3,256,404, or 81.7%, in 2011 compared to 2010.
For explanation of the variances see section “constant currency” below.
Selling, general and administrative – constant currency
In constant currency, SG&A for the three months ended June 30, 2011 increased by $1,496,392, or 65.9%, compared to the same period in 2010. This was led by an increase of 23.4% in our staffing levels on June 30, 2011 compared to June 30, 2010, largely in sales and European hires, as well as by higher marketing and selling costs.
In constant currency, SG&A for the six months ended June 30, 2011 increased by $3,049,835, or 72.8%, compared to the same period in 2010. This increase was for 44.6% caused by the fact that the Validsoft first quarter financials were not included in the six months ended June 30, 2010. The remainder of the increase was the result of the previously mentioned growth of the organization.
19
Non-cash compensation to officers, directors, consultants and employees
Non-cash compensation for the three and six months ended June 30, 2011 was $2,037,903 and $3,167,966, respectively, compared to $2,712,756 and 3,253,669, for the corresponding 2010 periods. The high compensation level reflected in the second quarter of 2010 was primarily attributable to the non-cash compensation for directors and executive officers related to first quarter of 2010 being accounted for in the second quarter of 2010.
Non-cash compensation is comprised of:
| · | The expense related to shares of restricted common stock that were issued to management in lieu of cash compensation; |
| · | The 2006 Non-Qualified Stock and Option Compensation Plan and the 2008 Long-Term Incentive Plan; and |
| · | The expense related to shares issued to consultants for services. |
Since non-cash compensation comprises United States Dollar denominated shares, options and warrants, a constant currency analysis is not applicable.
Depreciation and amortization
Depreciation and amortization for the three and six months ended June 30, 2011 was $ 1,337,775 and $ 2,640,450, respectively, compared to $1,515,428 and $2,360,122 in the corresponding 2010 periods. In the three month ended June 30, 2011, depreciation and amortization decreased by $177,653 or 11.7% compared to the same period 2010. In the six month ended June 30, 2011, depreciation and amortization increased by $280,328 or 11.9% compared to the same period 2010.
Depreciation and amortization – constant currency
In constant currency, the depreciation and amortization expenses for the three months ended June 30, 2011 decreased by $318,819 or 19.6% compared to the same period in 2010. In constant currency, the depreciation and amortization expenses for the six months ended June 30, 2011 increased by $161,753 or 6.5% compared to the same period in 2010.
Other Income and Expenses
Interest income was $24,145 and $32,520 for the three months ended June 30, 2011 and 2010 respectively. Interest income was $47,131 and $65,119 for the six months ended June 30, 2011 and 2010 respectively. Interest income was interest received on bank balances.
Interest expense was $71,511 and $535,887 for the three months ended June 30, 2011 and 2010 respectively. Interest expense was $138,275 and $982,427 for the six months ended June 30, 2011 and 2010 respectively. High levels of interest expense in 2010 were due to higher levels of debt financing and less favorable interest rates. Interest charges decreased with the automatic conversion of the QAT 2010 bridge loan and 2009 promissory notes on November 19, 2010.
Other income was $230,000 and $0 for the three months ended June 30, 2011 and 2010 respectively, and $460,000 and $0 for the six months ended June 30, 2011 and 2010 respectively. Other income was the result of the release of a FIN48 provision following a successful abatement request with the IRS for the year 2007. Following this successful abatement, we also decided to release a similar provision we had made for a potential IRS fine for the year 2008.
Interest expense related to amortization of debt discount on promissory notes was $0 and $4,959,044 for the three months ended June 30, 2011 and 2010 respectively. In the six months ended June 30, 2011 and 2010, interest expenses related to amortization of debt discount on promissory notes were $0 and $7,545,823 respectively. The decrease was the result of the conversion of the 2009 Promissory Notes into equity in the fourth quarter 2010.
20
Non-controlling Interest
Our majority owned subsidiaries are Elephant Talk Communications PRS U.K. Limited, Elephant Talk Communications Premium Rate Services Netherlands B.V., Elephant Talk Middle East & Africa (Holding) W.L.L., Elephant Talk Middle East & Africa (Holding) Jordan L.L.C., Elephant Talk Middle East & Africa Bahrain W.L.L., Elephant Talk Middle East & Africa FZ-LLC and ET-UTS NV.
During the three and six months ended June 30, 2011, we incurred a non-controlling interest income attributable to minority shareholders of $80 and $0 respectively. During the same period in 2010, we incurred a non-controlling interest charge of $1,785 and $2,283.
Net Loss
Net Income/(Loss) was $(6,721,423) and $(14,358,524) for the three months ended June 30, 2011 and 2010 respectively, and $(11,434,647) and $(26,696,719) for the six months ended June 30, 2011 and 2010 respectively.
Other Comprehensive Income/(Loss)
We record foreign currency translation gains and losses as comprehensive income or loss. Comprehensive Income/(Loss) for the six months ended June 30, 2011 and 2010 were $3,257,603 and $(3,690,746) respectively. This change is primarily attributable to the translation effect resulting from the substantial fluctuations in the USD/Euro exchange rates.
Liquidity and Capital Resources
We have an accumulated deficit of $166,253,083 as of June 30, 2011. Historically, we have relied on a combination of debt and equity financings to fund our ongoing cash requirements. In the first six months 2011 we received a total of $13,587,674 in gross proceeds from exercised warrants. In the period subsequent to June 30, 2011 until August 12, 2011, we received an additional $ 2,226,024 from the exercise of warrants and employee options.
Management plans to finance operating costs over the next twelve months with existing cash on hand, the proceeds from the July 28, 2011 redemption notice of common stock warrants issued to investors and therefore management believes they have sufficient cash to meet their needs for the next 12 months.
| Cash and cash equivalents as of June 30, 2011 | $ | 4,652,182 | |||
| Subsequent voluntary exercise of 400,000 warrants related to the placement of the 2009 Promissory Notes. | $ | 400,000 | |||
| Subsequent voluntary exercise of 227,293 warrants issued as part of the consideration for services provided by the placement agent for their 2010 placement activities | 340,940 | ||||
| Subsequent voluntary exercise of 870,834 warrants issued as part of the placement of shares under the Private Placement (PIPE) in 2010 | 1,306,251 | ||||
| Subsequent exercise of 110,837 employee options at various exercise prices | 178,833 | ||||
| Expected exercise of 6.8 million called warrants ($1.50) issued as part of the placement of shares under the Private Placement (PIPE) in 2010 | 10,200,000 | 1) see important note below | |||
| Total expected subsequent proceeds from warrant & option exercises in July / August | 12,426,024 |
21
1) On July 28, 2011, we sent out a notice of redemption of warrant to all the record holders of certain issued and outstanding common stock purchase warrants which were originally issued in connection with the private placement of units pursuant to that certain confidential private placement memorandum dated May 26, 2010. The redemption notice informed the warrant holders that pursuant to the terms of the warrant agreement, their warrants will be redeemed for cash at the redemption price of 0.001 per warrant on August 29, 2011. Accordingly, after the redemption date, the warrants will no longer be exercisable for our common stock and the holders will only have the right to receive the redemption price. We cannot fully forecast the total number of warrants that will be exercised.
In the event the anticipated revenues are delayed or are less than we anticipated and additional cash is required, we expect to seek additional financing and/or reduce costs expended on its research and development efforts.
Operating activities
Net cash used in operating activities for the six months ended June 30, 2011 was $6,031,323 compared to $6,841,983 in the six months ended June 30, 2010, a decrease of $810,660. The reasons for the decrease in net cash used are increased accounts payable and accrued expenses caused by extending payment terms or delayed invoicing by suppliers. This offset the increased net cash used.
Investment activities
Net cash used in investment activities for the six months ended June 30, 2011 was $5,754,870, an increase of $4,589,181 (or 393.7%) compared to $1,165,689 for the six months ended June 30, 2010. The increase was primarily attributable to the purchase of telecommunication equipment, systems and software for planned customer rollouts.
Financing activities
Net cash received by financing activities for the six months ended June 30, 2011 was $13,597,666.
As a result of the above activities, we had the cash and cash equivalents balance of $4,652,182 as of June 30, 2011, a net increase in cash and cash equivalents of $2,406,485 compared to June 30, 2010.
Off- Balance Sheet Arrangements
We did not have any off-balance sheet arrangements that have or are reasonably likely to have a current or future effect on our financial condition, changes in financial condition, revenues or expenses, results of operations, liquidity, capital expenditures or capital resources that is material to investors.
Application of Critical Accounting Policies and Estimates
Revenue Recognition and Deferred Revenue
Our revenue recognition policies are in compliance with ASC 605, Revenue Recognition (“ASC 605”) (formerly, Staff Accounting Bulletin (SAB) 104). Revenue is recognized only when the price is fixed or determinable, persuasive evidence of arrangement exists, the service is performed and the collectability of the resulting receivable is reasonably assured. We derive revenue from activities as a fixed-line and mobile services provider with our network and our own switching technology. Revenue represents amounts earned for telecommunication services provided to customers (net of value added tax and inter-company revenue). We recognize revenue from prepaid calling cards as the services are provided. We record payments received before all of the relevant criteria for revenue recognition are satisfied as deferred revenue. Deferred revenue represents amounts received from the customers against future sales of services since the Company recognizes revenue upon performing the services.
22
Stock-based Compensation
Effective January 1, 2006, we adopted the provisions of ASC 718 “Compensation-Stock Compensation”, using the prospective approach. As a result, we recognize stock-based compensation expense for only those awards that are granted subsequent to December 31, 2005 and any previously existing awards that are subject to variable accounting, including certain stock options that were exercised with notes in 2003, until the awards are exercised, forfeited, or contractually expire in accordance with the prospective method and the transition rules of ASC 718. Under ASC 718, stock-based awards granted after December 31, 2005, are recorded at fair value as of the grant date and recognized as expense over the employee’s requisite service period (the vesting period, generally three years), which we have elected to amortize on a straight-line basis.
We use the purchase method of accounting for business combinations and the results of the acquired businesses are included in the income statement from the date of acquisition. The purchase price includes the direct costs of the acquisition. However, beginning in fiscal 2009, acquisition-related costs will be expensed as incurred, in accordance with Financial Accounting Standards Board (FASB) issued revision to Statement of Financial Accounting Standards No. 141R, “Business Combinations”. Amounts allocated to intangible assets are amortized over their estimated useful lives; no amounts are allocated to in-progress research and development. Goodwill represents the excess of consideration paid over the net identifiable business assets acquired.
Intangible Assets and Impairment of long Lived Assets
In accordance with ASC 350, intangible assets are carried at cost less accumulated amortization and impairment charges. Intangible assets are amortized on a straight-line basis over the expected useful lives of the assets, between three and ten years. Other intangible assets are reviewed for impairment in accordance with ASC 360, “Property, Plant, and Equipment”, annually, or whenever events or changes in circumstances indicate that the carrying amount of such assets may not be recoverable. Measurement of any impairment loss for long-lived assets and identifiable intangible assets that management expects to hold and use is based on the amount of the carrying value that exceeds the fair value of the asset.
Impact of Accounting Pronouncements
In October 2009, the FASB issued amendments to ASC Topic 605, with respect to accounting and reporting guidance for revenue generating arrangements with multiple deliverables, which (a) amend the requirements entities must meet in order for elements to be considered separate units of accounting; (b) eliminate the requirement that entities have objective and reliable evidence of fair value for undelivered items in order to separate them from other elements in the arrangements; and (c) replace the residual method of allocating consideration with the relative selling price method. Under the relative selling price method for allocating consideration, entities must establish an estimated selling price for any units for which objective and reliable evidence of fair value or third party evidence of selling price is not determinable. ASC Topic 605 expands the qualitative and (if adoption impacts are significant) quantitative information required to be disclosed concerning revenue-generating arrangements with multiple deliverables.
This amended accounting guidance is effective for fiscal years beginning after June 15, 2010, with early adoption, as of the first fiscal year beginning after issuance of the amendments, permitted. It may be adopted prospectively to all new or significantly modified arrangements or retrospectively to all arrangements. We have not opted early adoption and will evaluate the impact on our operations beginning in fiscal 2011.
In January, 2010, the FASB issued ASU 2010-06, Improving Disclosures about Fair Value Measurements. The standard amends ASC Topic 820, Fair Value Measurements and Disclosures, to require additional disclosures related to transfers in and out of Levels 1 and 2 and for activity in Level 3 and clarifies other existing disclosures requirements. The Company adopted ASU 2010-06 beginning January 1, 2010. This update had no impact on the Company’s financial statements.
23
In April 2010, the FASB issued Accounting Standard Update (“ASU”) No. 2010-17, Milestone Method of Revenue Recognition, which provides guidance on applying the milestone method to milestone payments for achieving specified performance measures when those payments are related to uncertain future events. However, the FASB clarified that, even if the requirements in this ASU are met, entities would not be precluded from making an accounting policy election to apply another appropriate accounting policy that results in the deferral of some portion of the arrangement consideration. The ASU is effective for periods beginning on or after June 15, 2010. Entities can apply this guidance retrospectively as well as prospectively to milestones achieved after adoption. This update is expected to have no impact on the Company’s financial statements.
ASU 2010-13, Effect of Denominating the Exercise Price of a Share-Based Payment Award in the Currency of the Market in Which the Underlying Equity Security Trades, amends Topic 718 to clarify that an employee share-based payment award with an exercise price denominated in the currency of a market in which a substantial portion of the entity’s equity securities trades should not be considered to contain a condition that is not a market, performance, or service condition. Therefore, an entity would not classify such an award as a liability if it otherwise qualifies as equity. It is effective for fiscal years, and interim periods within those fiscal years, beginning on or after December 15, 2010. The amendments should be applied by recording a cumulative-effect adjustment to the opening balance of retained earnings. The cumulative-effect adjustment should be calculated for all awards outstanding as of the beginning of the year in which the amendments are initially applied, as if the amendments had been applied consistently since the inception of the award. Earlier application is permitted. We are currently evaluating the impact of this provision.
ASU 2010-09, Subsequent Events, amends FASB ASC 855-10 to clarify that whereas SEC filers and conduit debt obligors for publicly-traded conduit debt securities must evaluate subsequent events through the date that the financial statements are issued, SEC filers need not disclose the date through which subsequent events have been evaluated. Non-SEC filers must evaluate subsequent events through the date the financial statements are available to be issued, and continue to be required to disclose that date. The ASU also clarifies that reissuances for which a subsequent events evaluation is required are limited to “revised” financial statements (as defined in the ASU). The amendments are effective upon issuance (February 2010), except as relating to conduit debt obligors, for which the effective date is interim or annual periods ending after June 15, 2010. We adopted the provisions of ASU 2010-09 as required.
In December 2010, the FASB issued ASU 2010-28, “When to Perform Step 2 of the Goodwill Impairment Test for Reporting Units with Zero or Negative Carrying Amounts.” The amendments in this ASU modify Step 1 of the goodwill impairment test for reporting units with zero or negative carrying amounts. For those reporting units, an entity is required to perform Step 2 of the goodwill impairment test if it is more likely than not that a goodwill impairment exists. For public entities, the amendments in this Update are effective for fiscal years, and interim periods within those years, beginning after December 15, 2010. Early adoption is not permitted. We will adopt this guidance on January 1, 2011 and apply it prospectively.
In June 2011, the FASB issued ASU 2011-05, Comprehensive Income (Topic 220): Presentation of Comprehensive Income. ASU 2011-05 increases the prominence of other comprehensive income in financial statements. Under ASU 2011-05, companies will have the option to present the components of net income and comprehensive income in either one or two consecutive financial statements. ASU 2011-05 eliminates the option to present other comprehensive income in the statement of changes in equity and is applied retrospectively. For public companies, ASU 2011-05 is effective for fiscal years, and interim periods within those years, beginning after December 15, 2011.The Company does not expect this to have a material impact on its financial statements.
In May 2011, the FASB issued additional guidance on fair value measurements that clarifies the application of existing guidance on disclosure requirements, changes certain fair value measurement principles and requires additional disclosures about fair value measurements. The updated guidance is effective on a prospective basis for financial statements issued for fiscal years, and interim periods within those fiscal years, beginning after December 15, 2011. The Company does not expect this to have a material impact on its financial statements.
There have been no new accounting pronouncements issued during the six months ending June 30, 2011 that are of significance, or potential significance, to the Company.
24
Year Ended December 31, 2010 compared to December 31, 2009
In 2010, most of our revenue was generated through our landline business (premium Rate Services, calling cards, Middle East and other revenue). Our landline business, however, only requires a minimal amount of resources in terms of human resources, facilities as well as capital expenditures. Even though 90% of our revenues in 2010 were generated from our landline business, the margin contribution of almost 60% came from our mobile and security solution businesses. Within the mobile segment, we distinguish between wholesale services and managed services. Our wholesale services generate higher revenues than our managed services business, since wholesale services includes the sale of airtime. However, though our managed services generate lower revenues, it has lower cost of service compared to wholesale services business.
Adjusted EBITDA
A reconciliation of Adjusted EBITDA to net loss, the most directly comparable measure under U.S. GAAP, for each of the fiscal periods indicated, is as follows:
| year ended | ||||||||||||
| December, 31 | ||||||||||||
| 2010 | 2009 | 2009 in constant currency | ||||||||||
| (unaudited) | (unaudited) | (unaudited) | ||||||||||
| Net loss | $ | (92,483,360 | ) | $ | (17,299,884 | ) | $ | (17,023,110 | ) | |||
| Provision for income taxes | 800 | 800 | 800 | |||||||||
| Net loss attributable to noncontrolling interest | 5,046 | 1,771 | 1,771 | |||||||||
| Depreciation and amortization | 5,312,469 | 3,051,461 | 2,940,975 | |||||||||
| Stock-based compensation | 5,588,392 | 1,727,870 | 1,727,870 | |||||||||
| Interest income and expenses | 1,563,091 | 778,092 | 776,688 | |||||||||
| Other non-cash financing charges | 72,440,675 | 5,499,275 | 5,499,275 | |||||||||
| Adjusted EBITDA | $ | (7,572,887 | ) | $ | (6,240,615 | ) | $ | (6,075,731 | ) | |||
(Note to Adjusted EBITDA: 2010 figures include ValidSoft as of 1 April 2010. In 2009 ValidSoft not in figures.)
Revenue
Revenue for the year ended December 31, 2010 was $37,168,351, a decrease of $6,482,606 or 14.9%, compared to $43,650,957 for the year ending December 31, 2009. $2,008,830 of the decrease was a result of an unfavorable impact of the currency translation effect arising from a lower USD/Euro exchange rate.
Revenue - Constant currency
In constant currency, our revenue decreased by $4,473,776 or 10.7% compared to the same period in in 2009, and was attributable to a decrease in our mobile revenue of $2,739,253, Middle East pre-paid calling cards revenue of $584,135 and premium rate services revenue of $1,052,625. Other revenue (including ValidSoft) decreased by $97,763 compared to the same period in 2009 because of decreasing landline revenues.
We had new mobile customers in 2010, especially in the lower revenue (but higher margin) managed service segment, but still experienced delays in the roll-out of other mobile customers, with the result that these new revenues could not compensate yet for the loss in wholesale revenue following the departure of an early stage mobile customer in financial disarray as well as a one-off project the company completed in 2009.
25
Despite these revenue declines, Revenue minus Cost of Service remained at a level just below that of 2009, because of the higher margin in the mobile managed service segment as well as initial revenues from the high margin Validsoft business.
| Revenue | 2010 | 2009 constant currency | variance 2010 v 2009 constant currency | |||||||||
| Premium Rate Services | $ | 32,632,140 | $ | 33,684,765 | $ | (1,052,625 | ) | |||||
| Mobile Services | 2,826,625 | 5,565,878 | (2,739,253 | ) | ||||||||
| Middle East Calling Cards | 622,813 | 1,206,948 | (584,135 | ) | ||||||||
| Other revenue | 1,086,773 | 1,184,536 | (97,763 | ) | ||||||||
| Total Revenue | $ | 37,168,351 | $ | 41,642,127 | $ | (4,473,776 | ) | |||||
Cost of service
Cost of service includes origination, termination, network and billing charges from telecommunications operators, out payment costs to content and information providers, network costs, data center costs, facility cost of hosting network and equipment and cost in providing resale arrangements with long distance service providers, cost of leasing transmission facilities, international gateway switches for voice, and data transmission services.
Cost of service for the year ended December 31, 2010 was $35,120,916, a decrease of $6,331,723 or 15.3%, compared to $ 41,452,639 for the year ended December 31, 2009. $1,913,634 of the decrease was a result of a favorable impact of the currency translation effect arising from a lower USD/Euro exchange rate. $4,418,087 of the decrease was the result of lower revenues, combined with lower cost of service associated with the mobile managed services and Validsoft business.
Cost of service– constant currency
In constant currency, our cost of service decreased by $4,418,087 or 11.2% compared to the same period in 2009, primarily because of lower levels of revenue and the lower cost of service associated with the mobile managed services and Validsoft business.
Cost of service, as a percent of revenue, expressed in constant dollar terms was 94.5% and 95.0% for the years ended December 31, 2010 and 2009, respectively. Management expects cost of service to decline further as a percent of revenue as a greater proportion of future revenue is comprised of our mobile services and ValidSoft solutions, which have a substantially lower cost of service than our traditional PRS business.
Selling, general and administrative
Selling, general and administrative or SG&A expense for the years ended December 31, 2010 and 2009, were $9,620,322 and $7,958,933, respectively. SG&A expenses increased by $1,661,389, or 20.9%, in 2010 compared to 2009.
Selling, general and administrative – constant currency
In constant currency, SG&A increased by $1,921,469, or 25.0%, compared to the same period in 2009. The increase in expenses was mainly attributable to increased staffing levels and the inclusion of ValidSoft into our financials as of April 1, 2010.
Non-cash compensation to officers, directors, consultants and employees
Non-cash compensation for the years ended December 31, 2010 and 2009, was $5,588,392 and $1,727,870, respectively. The increase is primarily attributable to higher staffing levels and the inclusion of ValidSoft.
Non-cash compensation is comprised of:
26
| · | the expense related to shares of restricted common stock that were issued to management in lieu of cash compensation; |
| · | the 2006 Non-Qualified Stock and Option Compensation Plan and the 2008 Long-Term Incentive Plan; and |
| · | the expense related to shares issued to consultants for services. |
Since non-cash compensation comprises United States Dollars denominated shares, options and warrants, a constant currency analysis is not applicable.
Depreciation and amortization
Depreciation and amortization for the years ended December 31, 2010 and 2009, was $5,312,469 and $3,051,461 respectively. Depreciation and amortization expenses increased by $2,261,008 or 74.1% in 2010 compared to 2009. The increase of the amortization was primarily due to the amortization of the acquired intangible assets of Validsoft in 2010.
Depreciation and amortization – constant currency
In constant currency, the depreciation and amortization expenses increased by $2,371,495 or 80.6% compared to the same period in 2009. The increase of the amortization was primarily due to the amortization of the acquired intangible assets of Validsoft in 2010.
Intangible assets impairment charge
Our December 31, 2010 consolidated balance sheet includes $16.3 million of intangible assets, net, and $3.2 million of goodwill. Management updated its analysis of intangible assets and long-lived assets as of December 31, 2010 and we determined that for 2010 no asset impairment charges are necessary.
We have acquired several companies in the last few years and our current business strategy includes continuing to make additional acquisitions in the future. These acquisitions may continue to give rise to goodwill and other intangible assets which will need to be assessed for impairment from time to time.
Other Income and Expenses
Interest income was $239,713 and $160,535 for the years ended December 31, 2010 and 2009 respectively. Interest income was interest received on bank balances.
Interest expense was $1,802,804 and $938,627 for the years ended December 31, 2010 and 2009 respectively. The increase in interest expenses of $864,177 compared to 2009 was related to higher levels of debt financing and less favorable interest rates. With the automatic conversion of the QAT 2010 bridge loan and 2009 promissory notes on November 19, 2010 future interest charges will be limited.
Other expenses were $0 and $480,000 for the years ended December 31, 2010 and 2009 respectively. We accrued in 2009, a FIN48 reserve of $480,000 for uncertain tax position, including interest and penalties.
In 2010, fair value expenses and amortizations related to certain convertible notes, associated warrants and deferred financing costs were $72,440,675 compared to $5,499,275 in 2009. The substantial increases in these expenses were primarily caused by the increase of our share price at the times when fair value calculations for reporting purposes were required, including the fair value calculations that were necessary upon the automatic conversion of all convertible notes and loans.
27
With the conversion in 2010 of all of the outstanding convertible loans into equity, there are no financial instruments left that require fair value measurements as of 2011, hence no more income statement impacts related to these types of instruments unless new financial instruments are issued that trigger liability accounting.
Non-controlling Interest
Our majority owned subsidiaries are Elephant Talk Communications PRS U.K. Limited, Elephant Talk Communications Premium Rate Services Netherlands B.V., Elephant Talk Middle East & Africa (Holding) W.L.L., Elephant Talk Middle East & Africa (Holding) Jordan L.L.C., Elephant Talk Middle East & Africa Bahrain W.L.L., Elephant Talk Middle East & Africa FZ-LLC and ET-UTS NV.
We incurred a non-controlling interest charge attributable to minority shareholders’ interest for the years ended December 31, 2010 and December 31, 2009 of $5,046 and $1,771 respectively.
Net Loss
Net Loss was $92,483,360 and $17,299,884 for the years ended December 31, 2010 and 2009 respectively. The deterioration of $75,183,476 was primarily the result of non-cash financing charges that increased in 2010 by $66,941,400 compared to 2009, The remaining $8,242,076 was the result of:
| - | increased depreciation and amortization of $2,261,008 compared to 2009 |
| - | increased SG&A expenses of $1,661,389 compared to 2009 |
| - | increased, stock based compensation expenses of $3,860,522 compared to 2009 |
| - | increased interest income and expenses of $784,999 compared to 2009 |
| - | decrease of margin of $150,883 compared to 2009 |
| - | decrease of other expenses of $476,725 compared to 2009 |
The Adjusted EBITDA (for definition see earlier section in the MD&A) for the years ended December 31, 2010 and 2009 was $(7,572,887) and $(6,240,615) respectively.
Comprehensive Income (Loss)
We record foreign currency translation gains and losses as comprehensive income or loss. Comprehensive Income (Loss) for the years ended December 31, 2010 and 2009 was ($1,655,917) and $190,063 respectively. This change is primarily attributable to the translation effect resulting from the substantial fluctuations in the USD/Euro exchange rates.
Sources of capital and capital requirements.
We currently have cash needs to cover operational losses and recurring capitalized internally developed software costs of approximately $900,000 (EUR/USD exchange rate used is 1.35) per month. This includes interest expenses and the operational losses of the recently acquired company ValidSoft Ltd. but excludes cash required for capital expenditures and the necessary reduction of our accounts payable and accrued expenses.
28
Following the delivery of our mobile platform and network and consequent commercialization plus the planned revenues from the integrated Elephant Talk/ValidSoft fraud solution management expects substantial revenue increases and margin improvements in 2011.
In addition to driving margin improvement, we are actively attempting to attract additional financing such as with the exercise of warrants already issued, the level of which depends on the speed and roll-out of commercial activities (including associated capital expenditures), acquisition activities and financial market conditions.
Our cash balance at December 31, 2010, in combination with the additional funding received from warrants exercised through March 2011 was $6,708,641. Cash generated from operations, expected additional revenues, reduction of accounts payable as well as continued investment in capital expenditures is expected to last us into the third quarter 2011. Considering our share price development and upcoming achievements we expect warrants to purchase our shares to continue to be exercised, which would provide us sufficient funds until at least fourth quarter of 2011. In the event warrants are not exercised to the extent expected, the company plans to seek alternative financing.
Although in the past we have been able to raise capital as needed, such capital may not continue to be available at all, or if available, on reasonable terms at the moments we need it. Further, the terms of such financing may be dilutive to existing shareholders or otherwise on terms not favorable to the Company or existing shareholders. The current global financial situation may offer additional challenges to raising the required capital. If we are unable to secure additional capital, as circumstances require, or do not succeed in meeting our sales objectives we may not be able to continue operations. As of December 31, 2010, these conditions raised substantial doubt from our auditors as to our ability to continue as a going concern.
Our financial statements assume that we will continue as a going concern. If we are unable to continue as a going concern, we may be unable to realize our assets and discharge our liabilities in the normal course of business. The financial statements do not include any adjustments relating to the recoverability and classification of recorded asset amounts or to the amounts and classification of liabilities that may be necessary should we be unable to continue as a going concern.
Operating activities
Net cash used in operating activities for the year ended December 31, 2010 was $14,107,838 compared to $5,329,837 in 2009, an increase of $8,778,001. This increase is primarily attributable to working capital changes such as reduction of accounts payable and secondly expenses and assumed liabilities related to the inclusion of ValidSoft as of April 1, 2010 into our financial statements.
Investment activities
Net cash used in investment activities for year ended December 31, 2010 was $3,187,762 a decrease of $2,418,236 or 43% compared to $5,605,998 in 2009. The decrease was primarily attributable to the elimination of the loans to ValidSoft following the consolidation of their financials into the company’s and a lower level of equipment and software purchases.
Financing activities
Net cash received by financing activities for the year ended December 31, 2010 was $17,899,518 compared to $10,799,201 for the year ended December 31, 2009. Please see footnotes 2 and 26 for more information.
As a result of the above activities, the Company had cash and cash equivalents balance of $2,245,697 as of December 31, 2010, a net increase in cash and cash equivalents of $787,797 compared to 2009.
29
Off- Balance Sheet Arrangements
We did not have any off-balance sheet arrangements that have or are reasonably likely to have a current or future effect on our financial condition, changes in financial condition, revenues or expenses, results of operations, liquidity, capital expenditures or capital resources that is material to investors.
Application of Critical Accounting Policies and Estimates
Revenue Recognition and Deferred Revenue
Our revenue recognition policies are in compliance with ASC 605, Revenue Recognition (“ASC 605”) (formerly, Staff Accounting Bulletin (SAB) 104). Revenue is recognized only when the price is fixed or determinable, persuasive evidence of arrangement exists, the service is performed and the collectability of the resulting receivable is reasonably assured. We derive revenue from activities as a fixed-line and mobile services provider with our network and our own switching technology. Revenue represents amounts earned for telecommunication services provided to customers (net of value added tax and inter-company revenue). We recognize revenue from prepaid calling cards as the services are provided. Payments received before all of the relevant criteria for revenue recognition are satisfied are recorded as deferred revenue. Deferred revenue represents amounts received from the customers against future sales of services since we recognize revenue upon performing the services.
Stock-based Compensation
Effective January 1, 2006, we adopted the provisions of ASC 718 “Compensation-Stock Compensation”,” (“ASC 718”) (formerly SFAS No. 123(R)), using the prospective approach. As a result, we recognize stock-based compensation expense for only those awards that are granted subsequent to December 31, 2005 and any previously existing awards that are subject to variable accounting, including certain stock options that were exercised with notes in 2003, until the awards are exercised, forfeited, or contractually expire in accordance with the prospective method and the transition rules of ASC 718. Under ASC 718, stock-based awards granted after December 31, 2005, are recorded at fair value as of the grant date and recognized as expense over the employee’s requisite service period (the vesting period, generally three years), which we have elected to amortize on a straight-line basis.
Business Combinations
We use the purchase method of accounting for business combinations and the results of the acquired businesses are included in the income statement from the date of acquisition. The purchase price includes the direct costs of the acquisition. However, beginning in fiscal 2009, acquisition-related costs will be expensed as incurred, in accordance with Financial Accounting Standards Board (FASB) issued revision to Statement of Financial Accounting Standards No. 141R, “Business Combinations”. Amounts allocated to intangible assets are amortized over their estimated useful lives; no amounts are allocated to in-progress research and development. Goodwill represents the excess of consideration paid over the net identifiable business assets acquired.
Intangible Assets and Impairment of long Lived Assets
In accordance with ASC 350 (formerly SFAS No. 142), intangible assets are carried at cost less accumulated amortization and impairment charges. Intangible assets are amortized on a straight-line basis over the expected useful lives of the assets, between three and ten years. Other intangible assets are reviewed for impairment in accordance with ASC 360, “Property, Plant, and Equipment” (formerly SFAS No. 144), annually, or whenever events or changes in circumstances indicate that the carrying amount of such assets may not be recoverable. Measurement of any impairment loss for long-lived assets and identifiable intangible assets that management expects to hold and use is based on the amount of the carrying value that exceeds the fair value of the asset.
30
Impact of Accounting Pronouncements
In October 2009, the FASB issued amendments to ASC Topic 605, with respect to accounting and reporting guidance for revenue generating arrangements with multiple deliverables, which (a) amend the requirements entities must meet in order for elements to be considered separate units of accounting; (b) eliminate the requirement that entities have objective and reliable evidence of fair value for undelivered items in order to separate them from other elements in the arrangements; and (c) replace the residual method of allocating consideration with the relative selling price method. Under the relative selling price method for allocating consideration, entities must establish an estimated selling price for any units for which objective and reliable evidence of fair value or third party evidence of selling price is not determinable. ASC Topic 605 expands the qualitative and (if adoption impacts are significant) quantitative information required to be disclosed concerning revenue-generating arrangements with multiple deliverables.
This amended accounting guidance is effective for fiscal years beginning after June 15, 2010, with early adoption, as of the first fiscal year beginning after issuance of the amendments, permitted. It may be adopted prospectively to all new or significantly modified arrangements or retrospectively to all arrangements. We have not opted early adoption and will evaluate the impact on our operations beginning in fiscal 2011.
In January 2010, the FASB issued ASU 2010-06, Improving Disclosures about Fair Value Measurements. The standard amends ASC Topic 820, Fair Value Measurements and Disclosures, to require additional disclosures related to transfers in and out of Levels 1 and 2 and for activity in Level 3 and clarifies other existing disclosures requirements. The Company adopted ASU 2010-06 beginning January 1, 2010. This update had no impact on the Company’s financial statements.
In April 2010, the FASB issued Accounting Standard Update (“ASU”) No. 2010-17, Milestone Method of Revenue Recognition, which provides guidance on applying the milestone method to milestone payments for achieving specified performance measures when those payments are related to uncertain future events. However, the FASB clarified that, even if the requirements in this ASU are met, entities would not be precluded from making an accounting policy election to apply another appropriate accounting policy that results in the deferral of some portion of the arrangement consideration. The ASU is effective for periods beginning on or after June 15, 2010. Entities can apply this guidance retrospectively as well as prospectively to milestones achieved after adoption. This update is expected to have no impact on the Company’s financial statements.
ASU 2010-13, Effect of Denominating the Exercise Price of a Share-Based Payment Award in the Currency of the Market in Which the Underlying Equity Security Trades, amends Topic 718 to clarify that an employee share-based payment award with an exercise price denominated in the currency of a market in which a substantial portion of the entity’s equity securities trades should not be considered to contain a condition that is not a market, performance, or service condition. Therefore, an entity would not classify such an award as a liability if it otherwise qualifies as equity. It is effective for fiscal years, and interim periods within those fiscal years, beginning on or after December 15, 2010. The amendments should be applied by recording a cumulative-effect adjustment to the opening balance of retained earnings. The cumulative-effect adjustment should be calculated for all awards outstanding as of the beginning of the year in which the amendments are initially applied, as if the amendments had been applied consistently since the inception of the award. Earlier application is permitted. We are currently evaluating the impact of this provision.
ASU 2010-09, Subsequent Events, amends FASB ASC 855-10 to clarify that whereas SEC filers and conduit debt obligors for publicly-traded conduit debt securities must evaluate subsequent events through the date that the financial statements are issued, SEC filers need not disclose the date through which subsequent events have been evaluated. Non-SEC filers must evaluate subsequent events through the date the financial statements are available to be issued, and continue to be required to disclose that date. The ASU also clarifies that reissuances for which a subsequent events evaluation is required are limited to “revised” financial statements (as defined in the ASU). The amendments are effective upon issuance (February 2010), except as relating to conduit debt obligors, for which the effective date is interim or annual periods ending after June 15, 2010. We adopted the provisions of ASU 2010-09 as required.
In December 2010, the FASB issued ASU 2010-28, “When to Perform Step 2 of the Goodwill Impairment Test for Reporting Units with Zero or Negative Carrying Amounts.” The amendments in this ASU modify Step 1 of the goodwill impairment test for reporting units with zero or negative carrying amounts. For those reporting units, an entity is required to perform Step 2 of the goodwill impairment test if it is more likely than not that a goodwill impairment exists. For public entities, the amendments in this Update are effective for fiscal years, and interim periods within those years, beginning after December 15, 2010. Early adoption is not permitted. We will adopt this guidance on January 1, 2011 and apply it prospectively.
31
Material Transactions
Acquisition of ValidSoft Ltd
On March 17, 2010, we completed the acquisition with ValidSoft. The acquisition will be effective as of April 1, 2010.
As part of the ValidSoft acquisition, we entered into two Sale and Purchase Agreements (each an “SPA” and, collectively, the “SPAs”) with the shareholders of ValidSoft Limited (“ValidSoft”), a company organized under the laws of the Republic of Ireland. The entry into the SPAs follows the parties’ execution of a Heads of Terms on November 2, 2009. The two SPAs were entered into because one SPA, entered into with shareholder Enterprise Ireland, an Irish agency, is to be governed by Irish law. The remaining shareholders entered into the other SPA, governed by New York law.
Pursuant to the SPAs, we acquired the securities of ValidSoft for consideration consisting of 20% of our issued and outstanding common stock as of February 1, 2009 and warrants to purchase our common stock equal to (i) 20% of our issued and outstanding warrants as of February 1, 2009; and (ii) 20% of our issued and outstanding options as of February 1, 2009. Twenty-five percent (25%) of the foregoing consideration was placed into escrow and, in the event certain revenue milestones (as set forth the in the SPAs) have not been achieved, is subject to forfeiture and cancellation.
In connection with the SPAs, the shareholders of ValidSoft entered into lock-up agreements restricting the sale, transfer and disposition of the unregistered common stock owned by such shareholders (i) for a period of 2 years from Completion (as defined in the SPAs) with respect to the shareholders who participate in our management and (ii) for a period of one (1) year from Completion or 6 months from the completion of a rights offering by ValidSoft, whichever is earlier, with respect to the non-management shareholders. See Note 9 of the Audited Financial Statements for details.
Financing related events in 2010
Loan conversions and Share Offerings
Below is a summary of the results of our efforts of the company to attract capital and also improve our balance sheet position by having all outstanding convertible loans and notes converted into equity. For further information see references to the Notes under Details in the table below.
| Financing | Principal amount | Type | Gross Proceeds 2010 | December 31st 2010 | Details | |||||||
| Convertible Note 2009 | $ | 12,333,015 | Convertible Loan | $ | - | All Converted into equity | Note 17,15,16 | |||||
| QAT II Loans 2010 | $ | 2,518,220 | Convertible Loan | $ | 2,518,220 | All Converted into Equity | Note 17,15,16 | |||||
| Bridge Offering 2010 | $ | 2,885,000 | Share Sale | $ | 2,885,000 | Note 18 | ||||||
| Private Placement 2010 | $ | 14,000,000 | Share Sale | $ | 14,000,000 | Note 18 | ||||||
| $ | 19,403,220 | |||||||||||
| Warrant exercises (Convertible Note 2009) | Warrant | $ | 502,621 | |||||||||
| 19,905,841 | ||||||||||||
32
Our Company
We are an international provider of business software and services to the telecommunications and financial services industries. We provide global telecommunication companies, mobile network operators, banks, supermarkets, consumer product companies, media firms, and other businesses a full suite of products and services that enables them to fully provide telecom services as part of their business offerings. The company offers various dynamic products that include remote health care, credit card fraud prevention, mobile internet ID security, multi-country discounted phone services, loyalty management services, and a whole range of other emerging customized mobile services.
Converged telecommunication services – full MVNE solutions.
We are a niche player in the converged telecommunications market, providing traffic and network services as a licensed operator, and specializing in carrier grade mobile enabling platforms to provide outsourced solutions to the various players in the telecommunications’ value chain, including MNOs, MVNOs and non-operator companies in need of both mobile as well as specialized land-line telecommunication services. In this chain we position ourselves as a Full Mobile Virtual Network Enabler or MVNE, including also customized mobile services such as our network integrated ValidSoft security and fraud prevention solutions.
ValidSoft – electronic fraud prevention
Our wholly owned subsidiary, ValidSoft Ltd. or ValidSoft gives us a position in providing solutions to counter electronic fraud relating to credit and/or debit cards, the internet, and telephone channels. ValidSoft is a market leader in providing solutions to counter electronic fraud relating to credit or debit cards, the internet, and telephone channels. ValidSoft solutions are telecommunications based and are at the cutting edge of the market, utilizing access to the most sophisticated global telecommunications networks and expertise. The solutions are used to combat card-present and card-not-present fraud as well as electronic fraud on all channels, including the most advanced fraudulent attacks such as Man-in-the-Browser. The solutions are designed to have ease of use, mass-market application, to be cost effective and secure, be intuitive and to allow leveraging with most ubiquitous telecommunication devices available. Our product, VALid-POS®, was awarded the European Privacy Seal in March 2010, certifying its compliance with European Data Protection law. ValidSoft is the only Security Software company in the world to be certified to EuroPriSe standards.
Landline network outsourcing services
Through our fixed line telecom infrastructure and our centrally operated and managed IN-CRM-Billing platform, we also provide traditional telecom services like Carrier Select and Carrier Pre-Select Services, Toll Free and Premium Rate Services to the business market.
Overview
We are an international provider of business software and services to the telecommunications and financial services industry. We install our operating software at the network operating centers of mobile carrier and receive a monthly fee per cell phone subscriber on the network. Currently the subscribers are wholesale customers of Vizzavi (a subsidiary of the Vodafone group) in Spain and T-Mobile in the Netherlands. Furthermore, we signed a framework hosting agreement with KPN Group Belgium NV to make use of their radio network for us to connect MVNO customers in Belgium. In 2011 we closed a contract with Zain KSA in Saudi Arabia to provide our mobile platform which is planned to be operational in the course of 2011. We typically sign a five-year exclusive agreement with one carrier per country. Negotiations with mobile carriers are currently under way in a number of other countries. We also operate landline telephony services in nine European countries and have a national interconnect in Bahrain. Our network components, hardware, software systems, telecom switches and interconnections with other telecom operators are located in secured data-centers in eight countries.
Our ET Boss software enables mobile carriers to outsource their entire back office to us. By outsourcing operations the mobile carriers can reduce the number of vendor software, employees, and consultants it utilizes. ET Boss reduces the number of software modules/vendors from over twenty to one. Additionally, ET Boss enables mobile virtual network operators or MVNOs to control their pricing and product offerings with the touch of a keypad from a Windows interface. This compares with the current situation often experienced by virtual operators whereby it can take up to six month to effect a change in their product offerings.
33
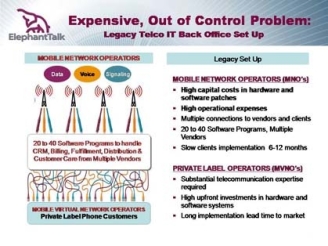
Due to the large operational expenditures required to operate and maintain switches and network infrastructure, due mostly to the very high levels of complexity, mobile network operations such as Sprint have already outsourced (to Ericsson) in an effort to reduce costs. Now we offer a comparable possibility of fully outsourcing the complete IT back office of any mobile operator. We believe that our software platform offers thereby not only a substantial reduction in cost, but also provides much higher service levels and flexibility. We are currently providing these services to Vodafone’s subsidiary in Spain and T-Mobile in the Netherlands, and will start to connect MVNOs in Belgium this year to the network of KPN Group in Belgium. We simply take three pipes from the mobile network operator (MNO) – voice, data, and signaling (see above) – and plug them into our ET Boss platform (see below).
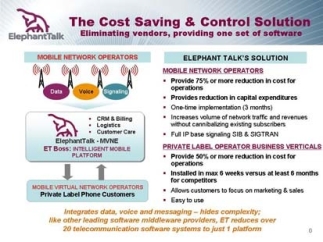
We are developing and acquiring application software to enable our virtual clients to offer various dynamic products that include remote health care monitoring on a watch or pendant, credit card fraud prevention, mobile internet ID security, multi-country discounted phone services, loyalty management services, and a whole range of other emerging customized mobile services. In line with our strategy to develop and market customized mobile solutions, we acquired ValidSoft, Ltd. on March 17, 2010. ValidSoft provides strong authentication and transaction verification capabilities that allow organizations to quickly implement solutions that protect against certain of the latest forms of credit and debit card fraud, and on-line transaction and identity theft. By correlating the relative location of a person’s credit card with the location of their mobile phone, this service can tell a bank in real-time if the transaction is likely genuine or fraudulent (see diagram below). We anticipate generating revenues on a per transaction verification fee from banks. This acquisition combines ValidSoft’s best in class proprietary software with our superior telecommunication platform to create what we believe is the best electronic fraud prevention total solution available.
34
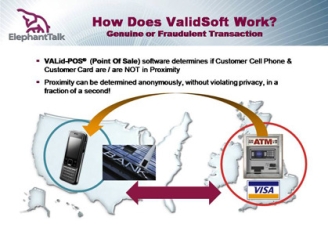
In 2010, we generated almost $40 million in revenues and employed 88 employees and retained 42 independent contractors on a long-term basis. Our principal offices are located in the Netherlands, Spain, China and London. Mobile services are currently provided in Spain and the Netherlands, whereas landline telephony services are provided in nine European countries and Bahrain. Our network components, hardware, software systems, telecom switches and interconnections with other telecom operators are located in secured data-centers in eight countries.
Background of Elephant Talk Communications, Inc.
Elephant Talk Communications Inc. was formed in 2001 as a result of a merger between Staruni Corporation (USA, 1962) and Elephant Talk Limited (Hong Kong, 1994). Staruni Corporation - named Altius Corporation, Inc., until 1997 - was a web developer and Internet Service Provider since 1997 following its acquisition of Starnet Universe Internet Inc. Elephant Talk Limited (Hong Kong) began operating in 1994 as an international long distance services provider, specializing in international call termination into China. In 2006 Elephant Talk Communications, Inc., decided to abandon its strategy of focusing on international calls into China.
In 2000, Staruni Corporation became a reporting company on the OTC Bulletin Board under the symbol “SRUN”, replaced by “ETLK” following the merger with Elephant Talk Limited (Hong Kong), and in turn changed to “ETAK” pursuant to a 2008 stock-split.
In January 2007, through our acquisition of Benoit Telecom (Switzerland), we established a foothold in the European telecommunications market, particularly within the market for Service Numbers (Premium Rate Services and Toll Free Services) and to a smaller extent Carrier (Pre) Select Services. Furthermore, through the human capital, IT resources and software acquired, we obtained the experience and expertise of individuals and software deeply connected to telecom and multi-media systems, telecom regulations and European markets.
In March 2010, we acquired ValidSoft. This acquisition is in line with our strategy to develop and market customized mobile solutions. ValidSoft provides strong authentication and transaction verification capabilities that allow organizations to quickly implement solutions which protect against the latest forms of credit and debit card fraud, on-line transaction and identity theft. This acquisition combines ValidSoft’s best in class proprietary software with our superior telecommunication platform to create the best electronic fraud prevention total solution available on the market today. Further details on the above acquisitions, other (smaller) acquisitions and incorporations can be found under “legal structure of the company”.
35
Product – Service Strategy
Our corporate strategy results in the following three main types of value propositions offered to the market, each building upon our converged network and access capabilities in combination with “ET Boss”, our proprietary telecommunications Operating Support System (OSS) and Business Support System (BSS):
| ¨ | Customized mobile services, such as our ValidSoft credit card fraud solution |
| ¨ | Mobile Enabling Platform (ET BOSS), including our MVNE/MVNO services |
| ¨ | Landline network outsourcing services |
Industry Developments
A number of relevant factors in the converging telecommunications industry, combined with consumers and businesses increasing adoption of mobile and wireless based applications, drive our investments and services, are as follow:
The mobile phone will become the channel of choice for consumers
We believe that the mobile phone will ultimately be the (handheld) device chosen by consumers and businesses to best bring personalized, contextual and time relevant services such as:
| ¨ | mobile banking |
| ¨ | telemedicine |
| ¨ | location based services |
| ¨ | use of near field communications for cashless payments, couponing, cashless tickets, vending machine payments, grocery store payments |
| ¨ | credit card applications |
| ¨ | communities; social, entertainment and loyalty |
| ¨ | customer profiling and data mining to support one-on-one marketing |
| ¨ | security and trust sensitive applications; the mobile phone as authenticator. |
Mobile operators need to reduce total cost of ownership (TCO) and increase utilization of their assets
Mobile Network Operators typically have twenty or more vendors for their software to handle Network Management, Customer Relationship Management or CRM, billing, fulfillment, distribution and customer care. This has resulted in legacy systems that are expensive to maintain and difficult to adapt to changing market conditions. In addition, MNOs are looking for new ways to attract traffic over their networks, since the traditional mass marketing of voice and messaging focused on end-users shows little or no growth. MNOs are required to shift their organization from a mass marketing oriented retail focus to a wholesale focus; thereby allowing other organizations such as MVNOs to serve smaller and specifically targeted end-user groups with specialized and converged solutions in order to increase traffic (e.g. voice, text, data or media) over the operator’s networks.
36
Trust and security aspects are increasingly important in a networked and digitalized environment
The open nature of the Internet as well as exponential digitalization and globalization of society has resulted in increased (international) fraud, attention for privacy intrusions and national security concerns.
MVNO telecommunication markets
By Informa
According to a report by Informa Telecom & Media called Extract Global MVNO Forecast to 2015 dated March 22, 2011, Western Europe and North America, which are both expected to grow in terms of MVNO subscription numbers, are not expected to see a radical shift in terms of market structure. The global MVNO market will reach 186 million subscriptions by the end of 2015 with North America and Western Europe still accounting for the vast majority. These two regions will remain the largest MVNO markets in terms of the number of subscriptions and players and will also continue to top the ranks in terms of MVNO penetration.
By Ovum
According to a report by Ovum dated August 31, 2010, Global MVNO connections are forecast to reach 85.6 million by 2015, and revenues are expected to be $9.5 billion. Over the next five years, new MVNO markets are expected to open up in South and Central America, Asia-Pacific, and in the Middle East. However, there are still regulatory and market challenges to overcome before these markets can offer an environment that can sustain MVNO activity. Therefore, we expect the bulk of MVNO connections and revenue growth from 2010–15 will come from established MVNO markets in Western Europe, Asia-Pacific, and North America.
Established MVNO markets will drive growth
Global MVNO connections are forecast to reach 85.6 million by 2015, and revenues are expected to be $9.5 billion. The bulk of global MVNO connections growth will come from established MVNO markets in Western Europe, Asia-Pacific, and North America.
In Western Europe, the fastest-growing MVNO markets are Germany, France, Italy, Spain, and the Netherlands. Germany and the Netherlands have been the largest MVNO markets (in terms of the number of MVNOs) for many years, and this will not change over the forecast period, especially as both markets are regarded as good testing grounds for MVNOs looking to trial new business models.
Emerging markets warming to MVNOs
While currently there are very few MVNOs in emerging markets, more markets are expected to introduce MVNOs over the forecast period. MVNOs are expected to move into markets in Brazil and Chile in South and Central America; Turkey in the Middle East; and India, Pakistan, and Vietnam in Asia-Pacific. Markets such as Brazil and India present an attractive opportunity for MVNOs, but there are still a number of obstacles impacting MVNO development in these markets including a lack of cooperation from mobile network operators (MNOs) and a lack of regulation to facilitate new MVNO entrants. Therefore, we expect the majority of new MVNO markets to remain relatively small and have minimal impact on global MVNO connections and revenues.
MVNO revenues to remain steady
Global revenues are forecast to remain steady over the next five years. Currently, Western Europe and the US account for over 84% of global MVNO revenues, and by 2015, we forecast that this figure will fall marginally to 80%. MVNO markets in South and Central America and the Middle East are expected to make up a greater share of global MVNO revenues over the forecast period. In 2009, South and Central America and the Middle East contributed approximately 1% to global MVNO revenues, and we forecast that this will increase to 6% by 2015.
MVNOs have explored numerous segments
MVNOs have been in operation for over a decade, and in this time it has become clear which business models have been successful and which have been failures. “Tried and tested” MVNO business models include targeting low-spending customers by offering no-frills domestic and international mobile services, and targeting businesses and households by offering mobile and fixed service bundles. MVNOs have also had success in other niche segments, such as focusing on the wealthy, charities, or offering gender-specific services. All of these models have proven lucrative for MVNOs and have presented them with good opportunities in most markets. However, while targeting the right segment is extremely important for MVNOs, their success is also dependent on market conditions, competition, and execution.
37
Electronic and card fraud markets
The solutions from Validsoft are targeted to combat electronic fraud across card, internet and the telephone channels. Card fraud in the US is estimated to be $100 billion per annum and $330 billion per annum globally with the other channels accounting for additional fraud of $50billion per annum and $150 billion per annum respectively. The total addressable market is $450 billion per annum whereby a recent report from the U.K. government on National Security Strategy even estimates cybercrime numbers of $1 trillion. Through the ValidSoft technology, the extent of this endemic problem can be reduced through reducing the direct impact of fraud, reducing operating costs and improving customer experience. These solutions also provide an environment which allows banks and other institutions to automate manual process safely and securely.
Summary Services and Solutions
ValidSoft: customized mobile solution for credit card fraud prevention
ValidSoft provides strong authentication and transaction verification capabilities, which allow organizations to quickly implement solutions that protect against the latest forms of credit and debit card fraud, on-line transaction and identity theft. ValidSoft’s advanced proprietary software combined with what we believe is a superior telecommunication platform to create a leading electronic fraud prevention total solution.
We believe the ValidSoft solution can have large cost reduction potential for financial institutions around the world that have losses associated with fraud losses, false positives and administration in connection with credit and debit card fraud. ValidSoft has successfully completed trials with four major commercial banks, has entered into an agreement with Visa Europe and is in advanced discussions with other leading global payment processors, international banks and credit card providers. ValidSoft was recently awarded the European Privacy Seal from EuroPrise, initiative led by the Unabhaengiges Landeszentrum fuer Datenschutz (“ULD”, Independent Centre for Privacy Protection), Germany, underscoring the prudent set-up of its systems as to privacy matters.
MVNE/MVNO
Since 2006, significant investments have been made in mobile enabling services and platforms. We invest and operate as a full mobile virtual network enabler or MVNE, offering MNOs various parts of the back office network including core network, messaging platforms, data platforms and billing solutions. As a result, we are positioning ourselves as the MVNE partner of choice for the larger, global MNOs, and a one-stop convergent solutions provider for specialized MVNO customers.
The first revenues from these mobile services began during the fourth quarter of 2008 with T-Mobile in the Netherlands and with Vizzavi (a subsidiary of Vodafone group) in Spain during 2009. Currently we have 8 MVNOs running on our platforms in the Netherlands and Spain, and are expanding our geographic service areas. Following the closing of a contract with Zain KSA in Saudi Arabia, we will be operational in the Middle East in the course of 2011 and we have planned an operational start in Belgium this year.
Currently we are negotiating agreements with various MNOs and MVNOs in numerous countries in order to realize our strong growth objectives, both in revenues and margin improvement.
38
Landline Outsourced solutions
At the base of our advanced mobile services, and currently still the largest revenue contributor (though not in terms of margin), is our landline services, which we offer in nine European countries and Bahrain. These services are provided by operating a switch-based telecom network with national licenses and direct landline interconnects with the Incumbents/National Telecom Operators. Together with our centrally operated and managed IN-CRM platform, we offer geographical, premium rate, toll free, personal, nomadic and Voice over Internet Protocol or VoIP services to our primarily business customers. We position our customers as if they are a fully networked telecommunications company themselves by providing them with the tools and resources necessary to manage their businesses, particularly the telecommunications segment, as an integrated component of their overall offering.
Network
Landline and Mobile Network
Our network is based on landline and MVNO telecommunications licenses, mobile access agreements and network interconnections. Our geographical cross-border footprint, established through existing relationships with national telecom incumbents, is well positioned for international traffic because we have established our own facilities-based infrastructure on two continents. Currently, as a fully licensed carrier, we are interconnected with incumbents in the Netherlands (KPN), Spain (Telefonica), Austria (Telekom Austria), Belgium (Belgacom), Switzerland (Swisscom), Italy (Telecom Italia), the United Kingdom (BT) and Bahrain (Batelco). Through partners, we have access to interconnections in France, Germany, Poland, Finland, Sweden, Norway and Ireland. For our premium rate services we added to our national interconnect with KPN a direct connection in the Netherlands with the mobile operators Vodafone and T-Mobile.
For our mobile services we need, in addition to the landline interconnections and switch facilities, mobile access coverage. In 2008, we entered into our first MVNE agreement with T-Mobile/Orange in the Netherlands where in 2010 we were servicing six of our own MVNOs. In 2009, we were awarded an MVNE agreement with Enabler (f/k/a Vizzavi) of Spain, and provide managed services for their MVNO portfolio, to be followed by the hosting of our own MVNOs. In 2010, we signed an MVNE framework hosting agreement with KPN Group Belgium NV with a start of service in 2011.
In order to reduce the investments required for our MVNOs, as well as increase our flexibility and depth of mobile service offerings to MVNOs and MNOs, we operate as a full MVNE; meaning that we procure, integrate and operate the relevant mobile components, including core network, application platform, subscriber management and MVNO billing and CRM.
Network Operations Center (NOC)
Our global 24/7 Network Operations Center is located in Gerona, Spain and Guangzhou, China and remotely monitors the quality of all landline, data and mobile services throughout our global clear bandwidth and IP network. Our datacenters, network and network nodes are primarily located in Europe.
Proprietary Software Technology
ET’s Business Operating Support System (“ET BOSS”)
| ¨ | To maintain flexibility and allow for growth, we have chosen to develop our own proprietary software and systems including: 1) a fully integrated rating, mediation, and provisioning CRM and billing system for multi-country and multimedia use, and applications, and 2) an advanced Infitel IN platform. |
39
| ¨ | Our internally developed customer provisioning, rating and billing system, also known as “ET BOSS”, ensures proper support for all of our services. We believe our network and system platforms are able to handle the high demands of national incumbents and other telecom operators on our globally interconnected network. The key component of our business strategy is the fully automated capturing and recording of any event on our global network through a standard Call Data Record, or CDR. CDRs are globally recognized and accepted by all of our suppliers and customers because of their high quality, reliability and consistency. As a result, on a real time/on-line basis, we believe our billing engine provides reliable inter-company payment overviews, and will continue to do so as we develop and implement our global network. |
| ¨ | The core modules have been designed to address all of our major business processes, and those of our partners in such a manner that the state of the art flexibility, level of integration and dynamic feature set ensures rapid and low-cost deployments. The core modules and their sub-modules include among others: |
| ¨ | Billing; (dynamic) rating management, bill mediation, invoicing and automatic payment script generation |
| ¨ | Payment; credit card, direct debit, PayPal etc. enabled functionalities |
| ¨ | Provisioning; switches, HLR, porting |
| ¨ | Self Care; mobile, carrier(pre)select, premium rate & toll free services |
| ¨ | CRM; trouble ticketing, customer management, provisioning |
| ¨ | Sales & Marketing; prospect management, sales management, analysis tools |
| ¨ | Revenue Collection Assurance; end-user credit management, credit control, fraud management, routing analysis |
| ¨ | Control; dashboard overview, reporting, quality analysis, quality control |
The sub-modules are unique and tailored to local situations.
Infitel Suite - IN Platform
In order to achieve real time session control, rating and charging, telecom value added applications as well as improved enrichment of data generated in and passing through our networks, we have acquired the carrier grade next generation IN (Intelligent Network) platform “Infitel”, including the source code and trademark. We own and develop this platform, thereby ensuring the flexibility and integration we strive for in and between all our software and network components.
Inficore is the core of the IN platform, defines the framework, administrative modules and Service Logic Processor or SLP that runs the scripts (call flows) created with Infiscript.
Infiscript is the Service Creation Environment or SCE this is a graphical suite with which the call flows and business logic can be developed and compiled to be distributed to running Inficore environments.
Infitel Suite comprises the applications and call-flows that are running on top of Inficore and that have been created with Infiscript, customized SIBs (C++ core code) and stored procedures.
40
The Infitel Suite comprises among others the following value added services:
Intelligent Call Routing, Service Numbers
| ¨ | Universal Prepaid (Residential, Phoneshop, Reseller) |
| ¨ | Flexible Number Portability |
| ¨ | EasyVote (Televoting) |
| ¨ | VPN/CUG |
| ¨ | Advanced Call Completion |
| ¨ | NJoy-Dial |
| ¨ | Personal Call Manager |
| ¨ | Advanced Business Communication |
| ¨ | Zonal Call Manager |
ValidSoft - Fraud Prevention and Security Software Solutions
In 2009, we began investing and developing the integration of our systems into those of (at that time still) joint venture partner ValidSoft, in order to be able to offer a full-fledged security solution over mobile networks. These investments in development were part of our overall strategy to becoming a leading player in the area of “Customized Mobile Solutions”.
ValidSoft, as a software engineering company, has made significant investments in intellectual property in processes and software pertaining to Intelligent Identity & Transaction Verification, and is considered to have developed thought leadership in countering electronic fraud. The essence of the ValidSoft product suite is in providing Card-(not) Present fraud prevention, on-line Banking fraud prevention, Strong Mutual Authentication (multi-channel), Transaction Verification (Out of Band – OOB), Identity Verification and Non-Repudiation.
The main components of the VALid® product suite are:
| ¨ | VALid-IVR is the Real-Time Interactive Voice Response or IVR Internet, Phone Banking and Call Center mutual authentication and transaction verification solution providing a holistic multi-channel approach to fraud prevention. VALid-IVR provides outbound and inbound telephony all with configurable Transaction Verification. VALid-IVR integrates with Text-To-Speech (TTS), Speech Recognition and Voice Biometrics functionality, providing a seamless and intuitive customer experience while delivering the most secure and functionally rich authentication capability available. |
| ¨ | VALid-SMS is the Store-and-Forward based protocol that provides Standard, Premium and Flash based messages, all with configurable Transaction Verification. Though SMS does not provide the multi-channel capability and real-time conversational functionality of voice services, it is a simple delivery mechanism for alerts, One Time Passcodes or OTP’s and lower priority messages, and provides a migration path strategy for organizations wishing to extend their existing SMS based solutions. |
41
| ¨ | VALid-SVP stands for Speaker Verification Platform and is the biometric voice verification capability of the VALid® platform. The VALid-SVP solution is based on a completely modular, plug-in based architecture that allows organizations to integrate their existing or preferred biometric engines into the VALid® framework. VALid-SVP supports text-dependent, text-independent and conversational voice verification models, all deliverable over multiple electronic channels. ValidSoft’s own biometric voice verification engine is based on Alize, a state-of-the-art speaker verification platform developed in the European Union. |
| ¨ | VALid-TDS is the Transaction Data Signing capability of VALid®, crucial in the provision of Non-Repudiation for Internet based financial transactions. VALid-TDS cryptographically ties the One Time Passcode (OTP) to the underlying transaction, as distinct to a randomly generated OTP. This enables the underlying transaction detail to be determined through the code, critical in proving or disproving transaction repudiation. VALid-TDS also interoperates with external tamper evident stores, storing the encrypted transaction data, authentication details and real-time call recording for further use in Non-Repudiation. |
| ¨ | VALid-POS® is the Card-Present fraud prevention solution from ValidSoft. VALid-POS® targets one of the fastest growing fraud threats; card skimming. VALid-POS® combines the functionality of VALid’s real-time Out-of-Band transaction verification capability with proximity based mathematical models that assists banks in determining whether the genuine customer is conducting the card-based transaction. Where in doubt, VALid® can contact the customer and resolve the potential threat in real-time, providing massive advantages to bank and their customers alike. |
VALid-ARM stands for Advanced Risk Management and provides organizations with a suite of tools to enhance their fraud prevention capability and increase the effectiveness of their risk management function. Included within VALid-ARM is the Risk Adjusted Rules Engine (RARE), real-time alerting, Panic-PIN, advanced voice analysis techniques such as voice pattern analysis and VALid’s proximity correlation tool VALid-POS. |
VALid-TTS - The pluggable Text-to-Speech option that can run in parallel with a Waveform Audio File format or WAV based voice service or replace it completely. VALid-TTS enables organizations to apply Transaction Integrity Verification or TIV to totally dynamic data such as individual or company names and address information. A classic example of a manual transaction that could be enabled for the web is an Address Change, where VALid-TTS would be used to perform the TIV function on the actual address detail. |
VALid-VPN - The Virtual Private Network client that allows users to gain secure remote access to an organization’s protected network. Remote network access is becoming a greater issue for many organizations through the growth of home working, remote workers, extended enterprise and disaster recovery and business disruption planning. VALid-VPN supports most of the major remote access solution providers, including Citrix, Juniper, Checkpoint and Cisco. The VALid-VPN solution has been designing as a generic solution enabling simple, low-cost integration into additional remote access technologies and providers, should this be necessary. |
VALid-ISA - VALid’s ISA integration provides secure access to applications accessed through ISA, e.g. Microsoft OWA. Currently many companies disallow remote access to ISA hosted applications (e.g. OWA) due to security concerns. VALid-ISA solves this problem and, through its zero client-footprint model, enables instant wide scale distribution. VALid-ISA also enables one secure point of access to any number of web based application sitting behind ISA. |
42
Products
Full MVNE
We are positioning ourselves as a complete MVNE with our own integrated platforms, switches and network capabilities for back-office and customer interaction solutions. The back-office services range from provisioning and administration to Operations Support Systems or OSS and Business Support Systems or BSS running on our global IN/CRM/Billing platform “ET BOSS”. Our “ET BOSS” platform is designed to provide an all-in-one solution for both the traditional MNOs: (i) the operators of large antenna networks and (ii) managers of wireless spectrum granted through licenses by national governments, as well as for MVNOs. MVNOs are generally fast-moving sales and marketing companies reselling refocused, re-priced, re-bundled and repackaged mobile telecom services. We partner with MNOs to bypass their legacy systems to profitably accommodate these wholesale MVNO customers with service levels and applications that satisfy the instant service flexibility, and pricing capability that MVNOs require to specifically address their niche markets. At the same time, we can offer additional market share to MNOs by marketing and contracting our own range of MVNOs that look for the very specific capabilities that our mobile service delivery platforms may offer. Bundled together with attractively priced wholesale airtime packages provided by our MNO partners, our MVNOs are positioned to run their operations effortlessly without the technical and financial burden associated with the development, maintenance and ownership of their own mobile network, while at the same time focusing on sales, marketing and distribution and the application of all elements required to be successful in these rapidly evolving consumer markets.
These in-depth MVNE platform services are now fully operational in the Netherlands as of the end of 2008 and since June 2009 in Spain with a planned operational start in Belgium this year. Following the closing of our contract with Zain KSA from Saudi Arabia, we will be operational in the Middle East in the course of 2011.
For companies that aspire to enter the mobile telephone market, the MVNO business model is attractive because it eliminates the expenses associated with establishing and managing a mobile network of their own. The initial capital expenditures required to enter the field are very low, as are the corresponding operational costs. Traditionally MNO and MVNO propositions required substantial capital and operational expenditures and attention to multiple technical components. Our business model offers a solution for MVNOs, which allows them to concentrate on sales and marketing, and which allows MNOs to cater to often smaller, niche market MVNOs without the cumbersome burden of their legacy systems and other resources, which are not designed to efficiently service such wholesale customers.
In addition to the more traditional voice and SMS services, we are focusing our MVNE platform on wireless data services, content, applications and E-commerce. The traditional voice services of MVNOs are likely to be marginalized over time and will follow a similar price erosion pattern as landline telecom services. Therefore, it is unlikely MVNOs will be able to effectively compete over time without value-added services. Moreover, the emerging market of 3G/3.5/4G mobile services, including WIFI, WIMAX and LTE, create great opportunities to attract new subscribers with new and improved business models. Mobile devices are an effective medium to communicate commercial messages to subscribers, especially if supported by legitimate customer profiling tools in combination with our IN/CRM/Billing platform “ET BOSS”. Mobile messages can be personalized per subscriber becoming contextually relevant, and thereby migrate from being perceived as intruding advertising to meaningful information, segmented within the client base or just to be used as a mass communication means. A mobile device is one of the most personal communication tools to connect with and stimulate customers, thus an MVNO channel might offer excellent opportunities to a variety of companies with a non-telecommunication core business, such as fast moving consumer goods companies looking to expand and broaden their markets, while at the same time creating focused marketing communication channels with their existing customer bases, providing these contextual services that, we believe, will be perceived as adding value to communications. We are well positioned to provide such market entrants with a one stop, full service and instantly available platform to effectively cater to these markets, and thereby support any application that might help our customers to quickly offer a truly differentiating service into the marketplace. We believe that many new business models, especially within security, logistics, heath care and banking, will become viable through a networked environment, thereby helping such businesses to enter such models without having to go through yearlong learning cycles to understand, master and manage all the relevant technologies. We are positioning ourselves as the enabling technology partner for these new entrants, covering all technology elements and deliver all the tools these future business partners require to drive these new business models successfully.
Through an integrated platform built around our network we offer our customers a turnkey solution for both pre-paid and post-paid mobile services, as well as more traditional landline telecommunication services like toll free, shared cost and premium rate services, supported by content and payment provisioning systems.
43
Our global network enables our customers to distribute all their information in a fully managed environment that we believe is more secure than the Internet. Together with a fully integrated back office system, we are opening up these networked platforms to our B2B customers, providing them with an efficient and effective tool designed to substantially improve their productivity. Additionally, through a customer friendly, web-based interface, our customers may run these networked delivery platforms as if they were their own. This feature will allow our B2B customers to see mobile, landline, Internet, WiFi, WiMax and local, regional or multi-country, as just one integrated network, with all of the advantages of one single network interface, centralized customer recognition and financial controls.
With the support of our back office system combined with our integrated “ET BOSS” system, we believe our B2B customers have all the necessary tools to create their own virtual telecom business environment; thereby enabling our customers to recognize and serve their own clients, employees, partners or affiliates through any device, at any place and at any time. Our vision is that access to our global network will revolve around our central data and information base, which will allow our customers to provide their clients with worldwide access authorization to our services through a familiar interface and/or workplace, preferred format and language.
Customized Mobile Solutions – ValidSoft Fraud prevention and security solutions
The essence of the ValidSoft product suite is in providing:
¨ Card-Present fraud prevention and resolution – Card Skimming is one of the fastest growing fraud threats. In the US alone, this type of fraud in 2008 was reported as costing the Financial Services Industry over $50 billion, and a leading research company is predicting that the cost of plastic card fraud will rise three-fold over the next 3 to 5 years. VALid-POS combines the functionality of VALid’s real-time Out-of-Band transaction verification capability with proximity based mathematical models that assists Issuing Banks in determining whether the genuine customer is conducting the card-based transaction. Where in doubt, VALid® can contact the customer and resolve the potential threat in real-time.
¨ Card-not-Present fraud prevention and resolution – Card-not-Present fraud, i.e. fraud associated with online retailing, is a significant problem worldwide. The vast majority of this type of fraud involves the use of card details that have been fraudulently obtained through methods such as skimming, data hacking or through unsolicited emails or telephone calls. The card details are then used to make fraudulent card-not-present transactions, most commonly via the Internet. As the number of Internet retailers has grown, fraudsters have increasingly targeted the online shopping environment. In the US alone, this type of fraud in 2008 was reported as costing the Financial Services Industry over $50 billion, and a leading research company is predicting that the cost of card-not-present fraud will rise three-fold over the next 3 to 5 years. VALid-POS combines the functionality of VALid’s real-time Out-of-Band transaction verification capability with proximity based mathematical models that assists retail providers in determining whether the genuine customer is conducting the online transaction. Where in doubt, VALid® can contact the customer and resolve the potential threat in real-time.
¨ Online Banking fraud prevention – Online banking fraud is a significant threat to the take-up of online banking worldwide. Fears concerning the safety of this type of banking transactions prevent banks from realizing the massive cost savings provided by self-service online banking. Globally less than 50% of internet users bank online and security fears remain the primary inhibitor of take-up. VALid’s real-time Out-of-Band strong mutual authentication and real-time transaction verification enables the bank to apply a real-time dynamic rules engine to identify anomalies and to contact the customer and verify the transaction in real-time.
¨ Strong Mutual Authentication (multi-channel) – the need for the customer to know that the bank is genuine is just as important as the need for the bank to know that it is transacting with the genuine customer - this is essential in terms of fostering consumer confidence, the lack of which is the single most significant deterrent in terms of the adoption of online commerce. This is termed “Mutual Authentication” and VALid® has one of the most intuitive and strongest forms of Mutual Authentication available;
¨ Transaction Verification (Out-of-Band – OOB) – even if both parties to a transaction are genuine there is no guarantee that the transaction will not be corrupted. A “Man-in-the-Middle” or “Man-in-the-Browser” attack will succeed no matter how strong the authentication process. Therefore banks need Transaction Verification. Most banks monitor transactions to identify anomalies. When an exception is detected, banks for the most part rely on a manual process of contacting the customer by phone to verify the legitimacy of the transaction – this is expensive and also prone to security risk itself as the customer is forced to reveal security credentials to unknown third parties. VALid® addresses this issue since it has the ability to verify the integrity of transactions in real-time and in a totally automated manner over a separate telecommunications channel. Real-time OOB Transaction Verification is regarded by Gartner as the only effective way to protect the integrity of a transaction carried out on the Internet.
44
¨ Identity Verification – In mass market and extranet situations, service providers are struggling to find a solution that does not require the distribution of hardware devices yet provides strong authentication and transaction verification in a cost effective and convenient manner. It is likely that going forward service providers will be expected to comply with increasing regulation in this area. ValidSoft, through its telephony based architecture enables service providers to implement the strongest form of mutual authentication and transaction verification available. Designed specifically for mass markets and extranet situations, VALid® combines ease-of-use, cost effectiveness and strong security, from challenge response up to and including conversational voice biometrics, to ensure that service providers can verify to non-repudiation level if required, the verification of identity of both internal employees, external contractors and customers who may have access to sensitive material and also conduct transactions electronically.
¨ Non-Repudiation – PKI (Digital Certificates), long regarded as a form of Non-Repudiation is now vulnerable to Man-in-the-Browser attacks. This means that PKI can no longer guarantee the integrity of transactions and therefore can be challenged in a Court of Law where PKI is presented as a case for Non-Repudiation. VALid® has been designed to address the issue of Non-Repudiation through its multi-layered approach, which includes elements such as: Transaction Verification; Transaction Data Signing (cryptographically linking a One Time Passcode to the underlying transaction); Voice Biometrics (or OOB challenge/response); Customer Authorization (Voice Recording) and Geometric Transaction Analysis, to achieve the highest level of non-repudiation capability, presented to the customer in an intuitive and easy-to-use manner.
¨ Business Enabling – financial institutions cannot leverage the full power and cost effectiveness of the Internet as a Business Enabling/Self-Service medium because of security concerns. Certain transactions requiring branch or telephone banking, or the completion of paper-based forms with signatures (e.g. Address change), are considered too high risk for Internet deployment, and as a consequence these transactions continue to be processed manually resulting in high cost, inefficiencies, poor quality data and customer inconvenience. VALid®, through the combination of OOB Strong Mutual Authentication and Transaction Verification, provides the capability to securely automate today’s manual processes resulting in: dramatic cost savings; customer empowerment; increasing the consistency, accuracy, timeliness and security of transactions; and creating competitive advantage through market differentiation.
Landline network outsourcing services
Even though the majority of our investments in the past years have been in (mobile) software development, mobile related acquisitions and implementing MNOs and MVNOs, our largest revenue stream is currently still generated by our traditional telecom services like Carrier Select and Carrier Pre-Select Services, and Toll Free and Premium Rate Services. These services formed the basis and gave us decade-long experience as an outsourcing partner in the field of telecommunications services managed by our propriety Intelligent Network/Customer Provisioning Management/Billing platform. This platform has always been designed to put our customers, who purposely chose to outsource their telecommunication requirements to a specialized company like us, in control. Our customers can work with our technology and our delivery platforms as if these are their own. We empower and likewise facilitate our customers to harness, to manage and to fully apply the power of some of the most powerful mobile/landline delivery systems in the world through a web-based self care user friendly interface, without the need to initiate, install, fund, operate and support those global systems on a 24/7 basis.
Growth Strategy
We are actively seeking additional MNO partners that understand the symbioses between a mobile network operator and an applications-focused enabler that brings the right services in the right format through a secure delivery platform within reach of all business customers that may require such services as part of their overall market and product strategy. We believe that over the next couple of years MNOs will proactively seek partners like us, as it will be the preferred way to successfully expand from retail focused markets to wholesale markets, thereby more effectively using the capacity of their core antenna networks and spectrum capabilities.
45
Especially in markets where direct retail customer penetration reaches 80% plus levels, MVNOs can enhance bring market penetration and network usage levels. However, only if these MVNOs are capable of bringing significantly differentiated service bundles into the market place - reflecting the specific requirements of individualized communities - will they be less vulnerable to what has been undermining the MNOs basic business models: churn. Most important to an operator’s success is to understand that a uniquely serviced community far outweighs the pricing alone of any basic underlying service.
The growing importance of converging services is an area where we see excellent possibilities to combine our decade long in-depth experience in landline services with our sophisticated mobile delivery platform. This will support both our MNO as well as our MVNO customers to bring newly bundled services into the marketplace through a single device that is capable of using landline, IP, mobile, and wireless connectivity for any voice, data and multi-media application. All this will be provisioned and managed through one single customer account and one integrated bill that is supported by any relevant payment mechanism.
We see opportunities in customized mobile service, combining the individual profile of a mobile customer and his or her exact location, with the “always-on” secured connectivity of a mobile network, supported by our powerful mobile delivery platforms. We believe these elements will create completely new business models for MNOs and MVNOs alike, bringing personalized, contextual and time-wise relevant services to billions of customers worldwide. One can easily think of new applications in the areas of security, protection and logistics of people, goods and services, remotely monitoring and escalating medical care, individualized and contextual marketing communications for broad ranges of goods and services, and supporting secure financial transactions.
Most of these new business models, driven by customized mobile services, will be created and operated by independent third party application providers that may be directly or indirectly connected to mobile service delivery platforms like our MVNE platform. In areas we see attractive opportunities to create, operate and market such services ourselves, we may actively invest in such developments or may acquire other companies that already have developed such applications. A good example of such a service is the fraud prevention application that ValidSoft offers, the company recently acquired by us.
Growth in Partnerships
As a result of the convergence of information technology and telecommunications solutions, our involvement with various partners has increased. On the supply side, we work with dozens of other carriers and content providers to either originate or terminate our traffic around the globe. On the customer side, resellers have evolved from indirect channels to true partners bringing specialized market knowledge, customer focus and a geographical reach to its activities.
As a key element of our low-cost and fast deployment strategy, we make use of partners in all layers of our distribution platform. Our partners typically come from the following disciplines:
Landline Network Interconnect Partners
As a fully licensed telecommunications carrier, we can be interconnected with a variety of incumbent operators and cable companies as well as more recently established telecom providers in over a dozen countries that provide both network origination and termination, mostly at regulated costs.
Mobile Network Partners
As a provider of full MVNE platforms, we partner with MVNO to strongly support them in better addressing the specific needs of MVNO, the sales, marketing and distribution organizations that (re)package, (re)bundle and (re)position mobile telecommunications as part of their overall service offering. Likewise, we help our partner MNOs to improve the usage of their networks by also directly contracting additional MVNOs for which we attractively bundle our systems capabilities with the partner MNOs airtime.
46
Content & Customized Mobile Services Partners
These partners can have a dual purpose whereby they are both a supplier as well as a marketing client. Essentially Content and Customized Mobile Services Partners provide a broad array of content and services available for distribution through our mobile and landline networks which are then promoted and sold by a variety of our marketing partners. However, at the same time we may also generate revenue from such Content and Customized Mobile Services Partners by providing them with all of the tools required to exploit and promote their content and services through our delivery platforms.
Roaming & LCR Wholesale Origination/Termination Partners
Our network is connected to over a dozen wholesale partners that work together on a commercial basis to provide each other with “Least Cost Routing” and roaming capabilities to globally originate and terminate landline and mobile calls at the best possible cost/quality levels.
Competition
We experience fierce competition in each of the market segments in which we operate.
Traditional Telecom Services
In all segments where we offer traditional telecom services like carrier (pre) select/dial around/2-stage dialing services, premium rate and toll free services, we encounter heavy competition. Our stiffest competition comes from each of the incumbent telecom operators such as BT, France Telecom, KPN, Telefonica, Telecom Italia and Telekom Austria. The strongest price competition usually comes from smaller, locally established and/or regional players, although newer Pan-European carriers like Colt Telecom position themselves as aggressively priced competition.
Mobile Services
We face competition from other MVNE’s, as well as from the traditional MNOs. An average MNO may have a few dozen technology suppliers; each may deliver a part of the overall network, switching, control and administrative systems comprising a mobile carrier’s infrastructure to service millions of retail customers. Likewise, many companies are aiming to become a vendor/partner of a MNO in order to assist the MNO to better service their wholesale business towards MVNOs. Some companies try to achieve this by selling various core components as a more traditional vendor: stand alone switching systems, billing systems, CRM systems, Intelligent Network systems, etc. Examples of our competition in this market are companies like Highdeal, Comverse, Geneva, Amdocs and Artilium. In such cases the MNO often contracts with a system integrator like Cap Gemini or Atos Origin to help them to integrate all these components into effectively working systems. Recently, more and more of these system integrators not only position themselves anymore as onetime integrators, but they are also looking to assume the role as an on-going service providers, keeping (part of) the system up and running on behalf of the MNO; examples are Cap Gemini, Atos Origin, EDS, Accenture, and IBM. Likewise, various vendors themselves assumed such roles of managing and operating the systems they supplied. As such, we also face competition from traditional telecom infrastructure companies like Nokia-Siemens, Ericsson and Alcatel.
As a consequence of these purchasing and outsourcing policies, many MNOs have over the years assembled large teams, sometimes as large as a dozen or more vendors/integrators/service providers, whereby each of them delivers a crucial part of the overall required capabilities. Not only have such larger teams, usually involving hundreds of full time consultants, been requiring very intense vendor management attention from the MNO to coordinate them, the result was often a very complex operational structure and work environment for both the MNO as well as the MVNO to work with. Instead of bringing superior, flexible services at affordable cost levels that were supposed to better position the MNO to easily go after MVNO business, the MNO is often struck with a whole range of hard to manage, inflexible and expensive (and sometimes even incompatible) platforms, that actually undermine the capability of the MNO to successfully and profitably compete for MVNO business. Existing MVNOs threaten to migrate to another network provider, while new prospect are lost to other MNOs that do provide more flexible and affordable service.
47
Being positioned for many years as an outsourcing partner for other businesses that require telecoms as a part of their overall service offering, we believe we can assist MNOs to simplify and streamline these outsourced system requirements. One of the key elements in our offering in landline telecommunications has always been that all network, switching, control and administrative elements would function within one system, and that our B2B customer would be able to self-manage such system through an easy to use web based interface. In designing its MVNE platform, our company has kept the same philosophy in place. As a result, a MNO would only require one managed service provider to fully offer any possible service requirement any type of MVNO may have. We therefore believe that we not only eliminate an intense and costly vendor management role, but at the same time offer flexible, superior service levels at a much lower operational cost.
Other companies that have positioned themselves as a MVNE platform provider, aiming to assume the same role of a one stop solution provider to MNOs, and as such are direct competitors of us, include Aspider, primarily active in the Netherlands, Vistream/Materna, primarily active in Germany, Effortel, primarily active in Belgium and Italy, Transatel, primarily active in France, Telcordia, primarily active in North America, Virtel, primarily active in Australia and the combination Artilium/Atos Origin, active throughout Europe. However, none of them cover the same depth and width of platform capabilities as we provide. On top of that, on the supplier/vendor side we believe we compete favorably with all the earlier mentioned telecom system vendors and integrators. Even though we believe our company has a very good offering at a competitive pricing level, many of our competitors may develop a comparable, fully integrated MVNE platform in the near future. As many of these competitors are much larger companies than ours, with much higher profiles, it may very well be that these competitors will successfully sell their higher priced, less capable solutions than our comparable systems.
Although we believe we will continue to create excellent opportunities for MNOs to increase the addressable market they can service profitably, many MNOs may still prefer to compete directly with us, not only for the business of larger MVNOs, but also in servicing the many smaller MVNOs. This situation may become more likely if new technologies make it easier for the MNOs to service both larger and smaller non-retail customers directly on a lower cost basis. Also, other MVNEs may create strong competition, especially if such new MVNEs will be created by competing MNOs as a consequence of our success in profitably cooperating with other MNOs that already have a successful MVNE relationship with us.
Fraud Prediction & Prevention Services
Our current (ValidSoft) Fraud Prediction & Prevention Services face competition from Authentify, Strikeforce, Finsphere, Tricipher for Out-of-Band (OBB), RSA, VASCO and others for Tokens, and Verisign and others for Digital Certificates.
We believe our advanced telecommunications platform complements ValidSoft’s products providing a state of the art combination and, currently, one of a kind in terms of being a total solution for payment card (debit and credit) fraud prevention.
More in particular for the ValidSoft part, VALid® combines strong authentication and transaction verification to counter not only the more traditional attacks, but also the latest in session hijacking (Man-in-the-Middle, Man-in-the-Browser) through its Transaction Integrity Verification (TIV) model. Alternative two factor authentication solutions such as hardware tokens are vulnerable to these types of threats. These vulnerabilities exist due to a number of issues and weaknesses. VALid® provides flexibility in allowing banks to authenticate at both the session and transaction level, with the device, protocol and even authentication behavior completely configurable. Use of the customers’ existing telephony devices, ensures complete interoperability between multiple banks, while providing the necessary branding through the use of the individual bank’s voice scripts. As VALid® supports remote access in a number of ways it operates in exactly the same manner for internal enterprise access. Managing conventional Two Factor authentication systems that use physical tokens carry significant overheads, such as the end user token distribution process (including retrieval and replacement), synchronization issues and time sequencing problems. Managing these tokens is also cumbersome as in some cases a master token must be used before an administrator can de-activate a token. VALid® does not have these issues and provides banks with the added benefit of a significant lower Total Cost of Ownership whilst dramatically improving security levels. A user can be added to the system using an intuitive web based system resulting in near real time for activation or deactivation.
48
Intellectual Property
We have a significant investment in our intellectual property, including:
| VALid® Patent Protected – ValidSoft own the UK Patent for authenticating a user access request to a secured service utilizing both a primary and secondary channel. This patent was renewed in March 2011. |
| VALid-POS® - Patent Pending (Card False Positive Prevention System) – ValidSoft are in a Patent Pending process for a Patent concerning a method where mathematically derived probability data determined from transaction feeds and telemetry services is used to identify and prevent a false positive anti-fraud results in financial transactions. |
| VALid-POS® - Patent Pending (ACS System) – ValidSoft has a Patent Pending for an invention concerning a method where data determined from financial transaction feeds and telemetry services is used to anonymously identify a fraudulent or false positive transaction. |
| ValidSoft has two newly filed patent applications, which are pending relating to securing the telecommunications channel in Out-Of-Band authentication systems. These are (i) Call-Forward Detection (VALid-CFD) and SIM-Card Swap Detection (VALid-SSD). |
| Significant investment in our own software, including: VALid-IVR; VALid-SMS; VALid-SVP; VALid-TDS; VALid-POS; VALid-ARM; VALid-TTS; VALid-VPN; VALid-ISA; VALid-FOB; VALid-SSD; VALid-CFD, UK-registered Trademarks VALid® and Trademarks VALid-POS®. ValidSoft has also applied for an additional UK and European Community trademarks in July and August 2011. |
Government Regulation
We operate in a heavily regulated industry. As a multinational telecommunications company or provider of services to carriers and operators, we are directly and indirectly subject to varying degrees of regulation in each of the jurisdictions in which we provide our services. Local laws and regulations, and the interpretation of such laws and regulations, differ significantly among the jurisdictions in which we operate. Enforcement and interpretations of these laws and regulations can be unpredictable and are often subject to the informal views of government officials. Certain European, foreign, federal, and state regulations and local franchise requirements have been, are currently, and may in the future be, the subject of judicial proceedings, legislative hearings and administrative proposals. Such proceedings may relate to, among other things, the rates we may charge for our local, network access and other services, the manner in which we offer and bundle our services, the terms and conditions of interconnection, unbundled network elements and resale rates, and could change the manner in which telecommunications companies operate. We cannot predict the outcome of these proceedings or the impact they will have on our business, revenue and cash flow.
Employees
As of August 1, 2011, we employed 103 people and retained on a long term basis, the services of 45 independent contractors. We consider relations with our employees and contractors to be good. Each of our current employees and contractors has entered into confidentiality and non-competition agreements with us. There are no collective bargaining contracts covering any of our employees.
49
Legal structure of the company
The following chart illustrates our company’s corporate structure as of August 29, 2011
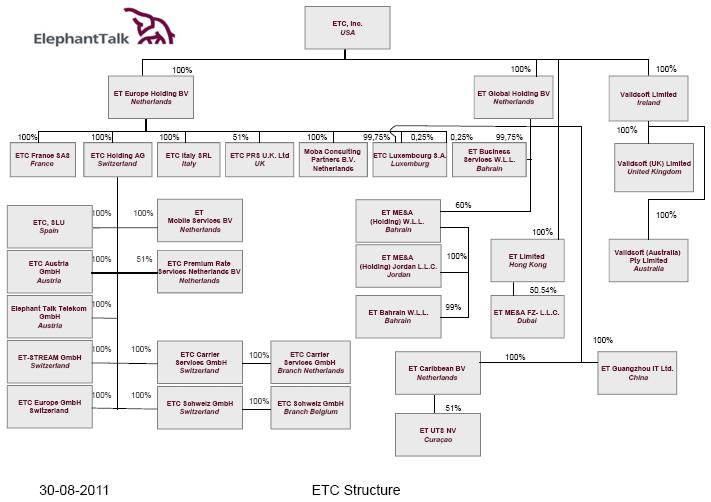
In 2007, we grew as a result of the acquisition, effective January 1, 2007, of Elephant Talk Communication Holding AG (formerly known as “Benoit Telecom Holding AG”) by Elephant Talk Europe Holding B.V. In addition to the Benoit Acquisition, on June 1, 2007, we acquired a French entity, 3U Telecom SrL, from 3U Telecom AG, a German company. The name of this entity was subsequently changed to Elephant Talk Communications France S.A.S. As a result of the preceding acquisitions, our corporate structure and breadth of operations significantly expanded.
In addition to the aforementioned acquisitions, we incorporated three new companies in 2007. On May 24, 2007, we established Elephant Talk Global Holding B.V (“ET Global”), a 100% Dutch subsidiary of Elephant Talk Communications, Inc. We originally created ET Global to act as the holding company for several of our worldwide subsidiaries, but are currently reviewing the overall structure of the group. On October 21, 2007, we incorporated Elephant Talk Business Services W.L.L., a Bahrain based company, to act as an intra-group service provider outside Europe (Elephant Talk Communication Carrier Services GmbH performs this activity within Europe). On December 27, 2007, we formed Elephant Talk Communications Luxembourg S.A. to initially focus on providing payment collection services for other group companies. On March 20, 2008, Elephant Talk Caribbean BV was incorporated in the Netherlands as a 100% subsidiary of ET Global. The purpose of this subsidiary is to act as the joint venture partner of United Telecommunication Services N.V. in the entity ET-UTS NV. ET-UTS NV was incorporated in Curacao, the Netherland Antilles, on April 9, 2008 as a 51% subsidiary of Elephant Talk Caribbean B.V. with the remaining 49% owned by our joint venture partner United Telecommunication Services N.V. The total issued capital amounts to one hundred thousand dollars ($100,000.00). The purpose of ET-UTS NV is to design, install, maintain and exploit WIFI and WIMAX networks in the Caribbean area and Surinam.
On August 14, 2008, we changed the name of Cardnet Clearing Services BV, a wholly-owned affiliate of Elephant Talk Europe Holding BV, to Elephant Talk Mobile Services BV. This company’s primary objective is to act as our vehicle to contract MVNOs in the Netherlands. On August 20, 2008, Elephant Talk Europe Holding BV signed an agreement for the acquisition of 100% of Moba Consulting Services BV. The effective date of the transaction was September 1, 2008 at an acquisition price of €1.00 plus 50,000 of our stock options. We acquired Moba Consulting Services BV to obtain expertise and manpower for certain aspects of the implementation of the Mobile Virtual Network Operators on our platform.
ValidSoft Acquisition
On March 17, 2010, we entered into two Sale and Purchase Agreements (each an “SPA” and, collectively, the “SPAs”) with the shareholders of ValidSoft Limited, a company organized under the laws of the Republic of Ireland. The entry into the SPAs follows the parties’ execution of a Heads of Terms on November 2, 2009. Two SPAs were entered into because one SPA, entered into with shareholder Enterprise Ireland, an Irish agency, is to be governed by Irish law. The remaining shareholders entered into the other SPA, governed by New York law.
50
Pursuant to the SPAs, we acquired the outstanding securities of ValidSoft for consideration consisting of 20% of our issued and outstanding common stock as of February 1, 2009 and warrants to purchase our common stock equal to the sum of (i) 20% of our issued and outstanding warrants as of February 1, 2009 and (ii) 20% of our issued and outstanding options as of February 1, 2009. Twenty-five percent of the foregoing consideration was placed into escrow and is subject to forfeiture and cancellation in the event certain revenue milestones are not achieved.
In connection with the SPAs, the shareholders of ValidSoft entered into lock-up agreements restricting the sale, transfer and disposition of the unregistered common stock owned by such shareholders (i) for a period of 2 years from Completion (as defined in the SPAs) with respect to the shareholders who participate in our management and (ii) for a period of 1 year from Completion or 6 months from the completion of a rights offering by ValidSoft, whichever is earlier, with respect to the non-management shareholders.
Properties
Our principal executive office is located at Schiphol Boulevard 249, 1118 BH Schiphol, the Netherlands. Our monthly rental is $9,088 and the lease is effect until June 2015. In September 2008, we entered into a lease for office space at Wattstraat 52, 1171 TR, Sassenheim, the Netherlands. We lease this office space for a monthly rental of $1,931.
Elephant Talk Communications S.L.U. is currently leasing office space at Paratge Bujonis, 17220 Sant Feliu de Guixols, (Girona) Spain, on a quarter-to-quarter lease, at a monthly rent of $3,824. In Guangzhou, China, we lease office space for a monthly rental of $6,348.
We also lease space for our telecom switches, servers and IT platforms at data centers (“co-locations”) at an aggregate monthly rent of $35,892. The various co-location spaces include Amsterdam, Madrid, Barcelona, Milan, Zurich, London, Paris, Vienna, Bahrain and other locations where our telecommunications equipment are located.
We believe the facilities currently under lease are adequate for our present activities and that additional facilities are available on competitive market terms to provide for such future expansion of our operations as may be warranted.
Legal Proceedings
(a) Manu Ohri Litigation
In March 2009, Manu Ohri or Ohri, the Company’s former chief financial officer from 2002 to 2006, commenced a lawsuit against the Company in the California Orange County Superior Court captioned Manu Ohri v. Elephant Talk Communications, Inc., Case No. 30-20009-00120609. Ohri alleges that the Company breached a 2006 written employment contract, a 2007 oral consulting contract, and otherwise owes him the reasonable value of consulting services rendered. Ohri seeks damages of $442,216 under the alleged employment contract, $56,951 under the alleged oral consulting agreement, stock options that he valued at $45,200 under the alleged oral consulting agreement, $14,316 for medical and dental insurance premiums, $4,226.40 for life and long term disability insurance premiums, pre-judgment interest, and costs of the litigation. The Company denies Ohri's allegations and asserts several affirmative defenses.
The Company commenced a cross-complaint against Ohri to, among other things, invalidate his alleged 2006 employment contract and stock bonus, and to recover the stock bonus or its fair market value.
Phase 1 of the trial took place without a jury between June 27 and July 13, 2011. The parties filed post-trial briefs, and are waiting for the court to announce its decision, which is expected within the next few weeks. Any claims remaining after the court’s decision in Phase 1 may be tried in a second phase with a jury.
51
(b) Chong Hing Bank Litigation
In December 2009, Chong Hing Bank Limited, f/k/a Liu Chong Hing Bank Limited, a foreign banking services company based in Hong Kong or the Bank, commenced a lawsuit in the California Orange County Superior Court captioned Chong Hing Bank Limited v. Elephant Talk Communications, Inc., Case No. 30-2009-00328467. The Bank alleges that it entered into various installment and term loan agreements and an overdraft account with Elephant Talk Limited (“ETL”), a Hong Kong subsidiary of the Company. The Bank claims that various former officers and directors of ETL personally guaranteed the loans and overdraft account. The Bank alleges that ETL is in default on the loans and overdraft account, and that approximately $1,536,792.28 plus continuing interest is due. The Bank further alleges that the Company is directly liable to repay the loans and overdraft account as a successor in interest to ETL. The Bank is suing the Company for breach of contract and common counts. The Company denies the Bank’s allegations and asserts several affirmative defenses. The Company contends that it has no direct, successor liability to the Bank, and that the Bank must pursue its recourse against ETL and its personal guarantors.
A trial is set to start on October 3, 2011.
(c) Rescission of the Purchase Agreement of May 24, 2004 of New Times Navigation Limited.
As previously described in our 2004 Annual Report we and New Times Navigation Limited mutually agreed to terminate this purchase agreement. We returned the received shares of New Times Navigation Limited to the concerned shareholders and received back 90,100 of our common stock out of the 204,000 issued by us for the purchase. In addition we issued 37 unsecured convertible promissory notes for a total amount of $3,600,000. On our request 21 notes were returned with a total value of $2,040,000.
We are presently seeking relief from the High Court of the Hong Kong Special Administrative Region against the holders of the unreturned shares to return a total of 113,900 common shares (valued at $381,565) and also to have them return the remaining 18 unsecured convertible promissory notes representing a total amount of $1,740,000 and rescind the purchase agreement. The case is currently pending.
52
GLOSSARY OF TERMS USED
Glossary
24/7 - Twenty four hours a days and seven day a week
B2B - Business to Business
BSS - Business Support System
BT - British Telecom, National Operator in the United Kingdom
BV - Besloten Vennootschap (Dutch type of: Limited Liability Company)
CPS - Carrier Pre Select
CRM - Customer relationship management
CS - Carrier Select
CUG - Closed user group (also: VPN)
DSL - Digital Subscriber Line, is a family of technologies that provides digital data transmission over the wires of a local telephone network
ET - Elephant Talk Communications Inc.
ET BOSS - “ET Boss”, Is a platform that is designed to provide an all-in-one solution for both the traditional Mobile Network Operator’s: (i) the operators of large Antenna Networks and (ii) managers of wireless spectrum granted through licenses by national governments, as well as for Mobile Virtual Network Operator’s
ETAK- Ticker Symbol of Elephant Talk Communications Inc.
HLR - Home Location Register, HLR is a database from a mobile network in which information from all mobile subscribers is stored
HOT - Heads of Terms Agreement
IN - Intelligent Network,
ISP - Internet Service Provider
IT - Information Technology
IP - Internet Protocol or Intellectual Property
IVR - Interactive Voice Response
LCR - Least Cost Routing
MNO - Mobile Network Operator
MVNE - Mobile Virtual Network Enabler, Party that enables the activities for and MVNO
MVNO - Mobile Virtual Network Operator, Operator that uses the mobile network of a MNO or MVNE
NASDAQ - National Association of Securities Dealers Automated Quotations, securities exchange
NOC - Network Operations Center
OOB - Out of Band
OSS - Operating Support System
OTC - Over the Counter, Shortname for the stock market: OTCBB
OTCBB - Over The Counter Bulletin Board, a securities exchange
PDA - Personal Digital Assistant
PKI - Digital Certificates
PRS - Premium Rate Services
REFI - Refinancing rate, Interest rate of the Central European bank
SAR - Stock Appreciation Right/ Option
SCE - Service Creation Environment
SEC - Securities and Exchange Commission
SG&A - Selling, General and Administrative Expenses
SLP - Service Logic Processor
SPA - Sales and Purchase Agreements
53
TCO - Total Cost Ownership
TIV - Transaction Integrity Verification
US - United States
VAT- Value Added Tax
VOIP - Voice over Internet Protocol
VPN - Virtual Private Network
WIFI - Connectivity technologies including wireless local area network (WLAN) based on the IEEE 802.11 standards
WIMAX - Worldwide Interoperability for Microwave Access, is a telecommunications protocol that provides fixed and fully mobile Internet access
Glossary of Currencies
BHD - Bahraini dinar, Local Currency of Bahrain
CHF - Swiss Franc, Local Currency of Switzerland
CNY - Renminbi, Local Currency of China
EUR - Euro, Currency of the Euro-zone
HKD - Hong Kong dollar, local currency of Hong Kong
USD - United States Dollar, Currency of the United States
54
DIRECTORS, EXECUTIVE OFFICERS AND CORPORATE GOVERNANCE
The following table sets forth the name, age, and position of our officers and directors as of the date of this prospectus. Each executive officer holds his office until he resigns, is removed by the Board, or his successor is elected and qualified. Directors are elected annually by our stockholders at the annual meeting. Each director holds his office until his successor is elected and qualified or his earlier resignation or removal.
Our directors and executive officers and their ages as of August 15, 2011 are as follows:
| Director | ||||||
| Name | Age | Position | Since | |||
| Steven van der Velden | 55 | Chairman of the Board President, Chief Executive Officer and Director | 2006 | |||
| Martin Zuurbier | 51 | Chief Operating Officer, Chief Technical Officer and Director | 2007 | |||
| Johan Dejager | 52 | Director | 2006 | |||
| Roderick de Greef (1)(2)(3) | 50 | Director | 2008 | |||
| Phil Hickman (1)(2)(3) | 61 | Director | 2010 | |||
| Rijkman Groenink (1)(2)(3) | 61 | Director | 2011 | |||
| Jacques D. Kerrest (1)(2)(3) | 64 | Director | 2011 | |||
| Mark Nije | 48 | Chief Financial Officer | n/a | |||
| Willem van der Brink | 53 | Chief Commercial Officer | n/a | |||
| Pat Carroll | 52 | Chief Executive Officer – Validsoft subsidiary | n/a | |||
| Alex Vermeulen | 57 | General Counsel | n/a |
| (1) | Member of Audit and Finance Committee. |
There are no arrangements between our directors and any other person pursuant to which our directors were nominated or elected for their positions. There are no family relationships between any of our directors or executive officers.
Except as set forth below, none of the Company’s directors or executive officers have been involved, in the past ten years and in a manner material to an evaluation of such director’s or officer’s ability or integrity to serve as a director or executive officer, in any of those “Certain Legal Proceedings” more fully detailed in Item 401(f) of Regulation S-K, which include but are not limited to, bankruptcies, criminal convictions and an adjudication finding that an individual violated federal or state securities laws.
Background
The following is a brief summary of the background of each Director of the Company:
Steven van der Velden has been a member of our board of directors since October 24, 2006 and our Chairman, President and Chief Executive Officer since October 30, 2006. Mr. van der Velden has experience in consultancy, logistics, real estate development, and telecommunications, e-commerce and investment management. He founded his first consultancy firm in 1983 and since then Mr. van der Velden has started over a dozen companies. Mr. van der Velden is involved in various Information Communication Technology ventures throughout Europe, North America and the Far East, and currently serves as Chairman of the Board of QAT Investments SA in Luxembourg. In 2000, he co-founded E-commerce Park NV, which has developed a 50,000 sq.ft. data centre and Internet hosting facility, located on top of the various fiber optic landing points in Curacao. In 1994, Mr. van der Velden co-founded the ITA International Telemedia Association, known today as the Network for Online Commerce, and served as its first Chairman. In the same year, he co-founded InTouch Telecom SA/NV to offer a wide range of business and consumer telecom applications to the Belgian Market, and served as its CEO until the company was sold to Global TeleSystems, Inc. in 1999. From 1988 until 1992 he served as the first Managing Director of Antillephone NV. Currently he is a Director of Unicom NV. Between 1986 and 1988, Mr. van der Velden co-headed a team of 16 consultants, which advised on and implemented a wide range of measures to balance budgets and to restructure the internal organizations of the Governments of both the Dutch Antilles and the island of Curacao. Mr. van der Velden earned his Master’s Degree in Business Administration from Rotterdam School of Management, the Netherlands, and a Master’s Degree in Law from Leiden University, the Netherlands. He splits his time between Curacao, Dutch Antilles and Brussels, Belgium. Mr. Van der Velden has extensive experience in the telecommunications industry and the business world in general. He has 30 years of experience in management, of which 20 years is in telecommunications. Mr. Van der Velden is also the Chief Executive Officer of the Company. As such, we believe that Mr. Van der velden is qualified to serve as a Director.
55
Martin Zuurbier has been responsible for Operations and Chief Technical Officer and has been a member of our board of directors since January 1, 2007. From January 2005 until January 1, 2007, Mr. Zuurbier had been the Chief Operating Officer and Chief Technology Officer of Benoit Telecom Holding AG, a telecom service provider in Europe that was acquired by us on January 1, 2007. From December 1999 to December 2004, Mr. Zuurbier served as director and was the founder of Vocalis Telecom Group located in The Netherlands and Switzerland. Mr. Zuurbier was responsible for building, maintaining and operating a telecommunications network spanning eight countries in Europe, including all back-office, billing and Client Provisioning Management systems. From January 1995 to June 1999, Mr. Zuurbier was directly involved in the telecommunications industry and was involved in the development of new switching technology in collaboration with hardware manufacturer Dialogic, implementation of the Amsterdam Carrier Ring in 1999 with COLT Telecom BV as the launch customer, and negotiating increased capacity on behalf of various international telecommunications companies. Prior to 1995, Mr. Zuurbier was involved in the production of television commercials for the European market. Mr. Zuurbier has extensive experience in telecommunications and the business world in general. Mr. Zuurbier is also the Chief Technology Officer of the Company. As such, we believe that Mr. Zuurbier is qualified to serve as a Director.
Johan Dejager has been a member of our board of directors since October 24, 2006. Mr. Dejager is managing director and owner of Osta Carpets, a specialized niche producer of area rugs with production plants in Belgium and a distribution center in Barcelona, and Gaverdal, a finishing plant for the carpet industry. He is also Managing Director of Ligne Pure, a company specialised in the design and manufacturing of handmade carpets for the decorator market. Mr. Dejager serves as a member of the board of directors of QAT Investments SA. In addition, he is a shareholder and director of Keyware, a provider of identity-related solutions and services, and of SPARNEX, an engineering company developing and industrializing DSL products for the telecom industry. Mr. Dejager is a member of the board of directors of FEBELTEX (the Federation of the Belgian Textile Companies). As Vice-President of the company, Mr. Dejager is in charge of the subdivision of interior textiles. Mr. Dejager holds a Bachelors degree (1981) and a Masters degree in Commercial Engineering from the University of Leuven, Belgium (1981) and an MBA from Insead Fontainebleau, France (1982). Mr. Dejager has extensive experience in the business world in general as well as serving as a director of companies including a company in the telecom industry. Mr. Dejager is also a representative of one of the larger shareholders of the Company, QAT Investments. As such, we believe that Mr. Dejager is qualified to serve as a Director.
Roderick de Greef has been a member of our board of directors since January 2008. Mr. de Greef is the principal of Taveyanne Capital Advisers, Inc., a firm providing corporate finance consulting services. Since November 2008, Mr. de Greef has been chairman of the board of Cambridge Heart, Inc. Previously Mr. de Greef has served as the Chief Financial Officer of Cambridge Heart from October 2005 to July 2007. Mr. de Greef served as the Executive Vice President, Chief Financial Officer and Secretary of Cardiac Science, Inc. from March 2001 to September 2005. From 1995 to 2001, Mr. de Greef provided corporate finance advisory services to a number of early stage companies including Cardiac Science, where he was instrumental in securing equity capital beginning in 1997, and advising on merger and acquisition activity. Mr. de Greef also serves on the board of directors of Endologix, Inc., a public medical device company located in Irvine, California, and BioLife Solutions, Inc., a public life sciences company based in Bothell, Washington. Mr. de Greef has extensive experience in corporate finance and the business world in general as well as serving as an officer and director of public companies. Mr. de Greef is also independent and qualifies as an audit committee financial expert. As such, we believe that Mr. de Greef is qualified to serve as a Director.
56
Phil Hickman has been a member of our board of directors since March 29, 2010. Mr. Hickman manages his own consultancy and advisory business in the fields of corporate strategy and organization, offshore banking, business process outsourcing (BPO), payment & cash management solutions, internet and telephony security, sales and marketing. Mr. Hickman is Chairman of ValidSoft, a member of the Elephant Talk Communications Group, and he is also a Director of Alfa Bank Holdings, the largest privately-owned bank in Russia and part of the Alfa Group. He also acts as an advisor with the Bank in Russia, Ukraine, Belarus and Kazakhstan. Mr. Hickman is also Chairman of Earthport plc, a publicly quoted company in the UK engaged in the Payments industry. Mr. Hickman spent 32 years in HSBC Bank plc and has been responsible for developing and implementing many areas of change and innovation both in the UK and around the world. Before leaving HSBC, Mr. Hickman was Head of Strategy & Planning HSBC Commercial Bank. Mr. Hickman has extensive experience in banking, corporate finance and the business world in general as well as serving as a director of other public companies. He also qualifies as an independent director. As such, we believe that Mr. Hickman is qualified to serve as a Director.
Rijkman Groenink, has been a member of our board of directors since April 1, 2011. Mr. Groenik’s career spans nearly 35 years at ABN Amro, starting in 1974 at Amro, prior to its merger with ABN. He served for more than seven years as Chairman of the Managing Board of ABN Amro Holding NV. Under Groenink’s leadership the bank has been streamlined to focus on its core activities, while bolstering its operations through successful acquisitions, such as Banco Sudameris de Brazil, Delbrück & Co. and Bethmann Maffei in Germany, Michigan National, and the acquisition of Banca Antonveneta. Mr. Groenink was elected European Banker of the Year 2005. In November 2007 he left as Chair at ABN Amro, following the acquisition of the bank by a consortium of banks, comprising of RBS, Fortis and Santander. He is currently a partner at Atlas N.V., an investment vehicle. Mr. Groenink received a law doctorate from the University of Utrecht, a Diploma in Business Administration from Manchester Business School, and a diploma Honoris Causa M.B.A. in International Business from the MIB School of Management in Trieste, Italy. Mr. Groenink received a royal knighthood, when he was appointed Officer in the Order of Oranje-Nassau by Her Majesty Queen Beatrix in 2006. Mr. Groenink has extensive experience in banking, corporate finance and the business world in general as well as serving as an officer and director of other public companies. He also qualifies as an independent director. As such, we believe that Mr. Groenink is qualified to serve as a Director.
Jacques D. Kerrest, has been a member of our board of directors since August 1, 2011. Mr. Kerrest recently served as Chief Operating Officer and Chief Financial Officer of ActivIdentity Corp, a security software company. Prior to that he was Chief Financial Officer of Virgin Media, Inc., a leading communications company (video, telephony, broadband and mobile) in the UK. He also served as Chief Financial Officer of Equant, Inc., Harte-Hanks, Inc., and Chancellor Broadcasting Company. Mr. Kerrest served as a Board member and Chairman of the Audit Committee of CKX, Inc., until the company was sold to a large private equity firm. As such, we believe that Mr. Kerrest is qualified to serve as a Director
Executive Officers
Mark Nije was general manager Europe since January 1 2007, a function he held since the end of 2004 within the acquired Benoit Telecom Group. Mr. Nije was appointed Chief Financial Officer on December 15, 2008. Mr. Nije has experience in finance, project management, business development, investment management, logistics and telecommunications. Mr. Nije started as project manager and management consultant for Tebodin Consulting Engineers and Reitsma & Wertheim M&A specialists, the Netherlands. In 1990 he co-founded Logistic Management International NV (LMI), an international cargo transportation and airport handling company at the airport of Curacao, Netherlands Antilles. During those years he served as a board member and vice-chairman of the Curacao Exporters Association. From 2000-2002 Mr. Nije was co-founder and director of PickYourGifts BV, an internet start-up. In 2003 he became partner of QAT Investments SA, the Luxemburg venture capital fund, where he has been active as investment manager and/or board member in various ICT related ventures of QAT. Currently he is member of the Dutch Association of CEO’s and Directors (NCD). Mr. Nije earned his Master’s Degree in Business Administration from the Rotterdam School of Management, the Netherlands, and a Bachelor of Science Degree in Building Construction Management from the University of Reading, United Kingdom.
Mr. Nije is a cousin of the wife of Mr. van der Velden. Other than the aforesaid, there are no family relationships between any director or executive officer.
57
Patrick Carroll is Founder and CEO of ValidSoft Limited, the company that was acquired in 2010 by Elephant Talk Communications. ValidSoft is a software engineering company that develops advanced security software solutions to help global institutions counter the most sophisticated Card and electronic fraud consistent with leading independent research thinking. Prior to founding ValidSoft, Mr. Carroll was employed as Head of Electronic Trading Technology in Europe for Goldman Sachs International where responsibilities included technical strategy related to Electronic Trading, Client Connectivity and Straight Through Processing (STP). Mr. Carroll has extensive Financial Services & technical experience (over 25 years) and has previously worked in a senior capacity with J.P Morgan, Credit Suisse Financial Products and Bankers Trust Company.
Willem van den Brink joined us on October 1, 2010, as our Chief Commercial Officer. Prior to joining Elephant Talk, Mr. Van den Brink served as Vice President New Business Development for KPN Mobile International, which operates in Germany, Belgium, France and Spain. Throughout his tenure, he generated new business developments via partnerships with non-telecommunications companies and created bottom-line value for KPN. Mr. Van den Brink also organized multi-country partnerships that accelerated revenue and margin growth. Prior to his role as Vice President New Business Development for KPN Mobile International, Mr. Van den Brink held a variety of senior management positions with KPN Netherlands, the leading telecom and ICT service provider in the Netherlands. Within his responsibilities he contributed to reorganizing businesses resulting in direct increase of the bottom-line and top-line results. He has extensive experience in restructuring sales from commodity sales to value-added consultative selling sales, focusing on ICT outsourcing, to aggressively grow the business. Mr. Van den Brink holds a Masters degree in Experimental Physics from Catholic University Nijmegen and a Ph.D. from the University of Utrecht.
Alexander Vermeulen has been our General Counsel since 2007. Mr. Vermeulen worked for twenty years as manager with ING, one of Europe’s leading financial groups. He served among others as General Manager for the Caribbean area and General Manager Postbank Insurances, a leading direct writer in the Dutch market. In Italy he was responsible for all the life insurance activities of ING and was director of various ING entities, among which the funds investment company. In 2003 Mr. Vermeulen started his own consultancy company in Italy, initially with advisory services in the life insurance market and broadening later on to other sectors. In 2006 Mr. Vermeulen started working for Elephant Talk as consultant. In 2007, he joined Elephant Talk full time as General Counsel. Mr. Vermeulen holds a Masters degree in Law from Leiden University, the Netherlands.
There are no arrangement between our directors and any other person pursuant to which our directors were nominated or elected for their positions other than the following:
We have agreed with Rising Water Capital, A.G., a large shareholder, and an entity in which QAT holds a 51% ownership interest, to use our best efforts to retain our current management, including Mr. van der Velden, pursuant to a settlement agreement dated May 13, 2008.
Officer and Director Qualifications
We have not formally established any specific, minimum qualifications that must be met by each of our officers or directors or specific qualities or skills that are necessary for one or more of our officers or members of the board of directors to possess. However, we generally evaluate the following qualities: educational background, diversity of professional experience, knowledge of our business, integrity, professional reputation, independence, wisdom, and ability to represent the best interests of our shareholders.
Our officers and board of directors are composed of a diverse group of leaders. In their prior positions they have gained experience in core management skills, such as strategic and financial planning, public company financial reporting, compliance, risk management, and leadership development. Most of our officers and directors also have experience serving on boards of directors and board committees of other public companies and private companies, and have an understanding of corporate governance practices and trends, which provides an understanding of different business processes, challenges, and strategies.
We, along with our officers and directors, believe that the above-mentioned attributes, along with the leadership skills and other experiences of our officers and board members described below, provide us with a diverse range of perspectives and judgment necessary to facilitate our goals of consummating a business transaction.
Steven van der Velden
Mr. van der Velden is well qualified to serve on our board because of his 30 years of experience in management of which 20 years in telecommunications. In addition, Mr. Van der Velden was selected because he is our Chief Executive Officer.
58
Martin Zuurbier
Mr. Zuurbier is well qualified to serve on our board because of his experience in telecommunication markets and technologies and because he is our Chief Technology Officer.
Johan Dejager
Mr. Dejager is well qualified to serve on our board because of his experience in private equity and as representative of our larger shareholder QAT Investments.
Roderick de Greef
Mr. de Greef is well qualified to serve on our board because of his experience with public companies and because he is independent.
Rijkman Groenink
Rijkman Groenink is well qualified to serve on our board because of his broad and excellent background in operating and managing large financial institutions.
Phil Hickman
Mr. Hickman is well qualified to serve on our board because of his experience in banking and because he is independent.
Jacques D. Kerrest
Mr. Kerrest is well qualified to serve on our board because his broad experience in global finance and the communications industry.
Meetings of the Board of Directors and Stockholders
Our board of directors met in person and telephonically five times during 2010 and also acted by unanimous written consent. Each member of our board of directors was present at eighty (80%) percent or more of the board of directors meetings held.
Board Committees
Our board of directors has established three standing committees—Audit, Compensation, and Nominating and Corporate Governance. All Committees operate under a charter that has been approved by the board.
Audit Committee
The members of the Audit Committee of our board of directors are Messrs. de Greef, Hickman, Groenink and Kerrest, all of whom are independent directors as defined in accordance with section 3(a)(58)(A) of the Exchange Act and the rules of NASDAQ. Mr. de Greef serves as chairman of the committee and has been selected as an “audit committee financial expert” as defined in Item 407(d)(5)(ii) of Regulation S-K. Except for Messrs. Groenink and Kerrest who became members of our board of directors in April and August 2011, respectively, each member of the Audit Committee was present at one hundred (100%) percent of the Audit Committee meetings held during such director’s tenure as a member of the Audit Committee.
Our Audit Committee oversees our corporate accounting, financial reporting practices and the audits of financial statements. For this purpose, the Audit Committee has a charter (which is reviewed annually) and performs several functions. The Audit Committee:
59
| • | evaluates the independence and performance of, and assesses the qualifications of, our independent auditor, and engages such independent auditor; |
| • | approves the plan and fees for the annual audit, quarterly reviews, tax and other audit-related services, and approves in advance any non-audit service to be provided by the independent auditor; |
| • | monitors the independence of the independent auditor and the rotation of partners of the independent auditor on our engagement team as required by law; |
| • | reviews the financial statements to be included in our Annual Report on Form 10-K and Quarterly Reports on Form 10-Q and reviews with management and the independent auditors the results of the annual audit and reviews of our quarterly financial statements; |
| • | oversees all aspects our systems of internal accounting control and corporate governance functions on behalf of the board; and |
| • | provides oversight assistance in connection with legal, ethical and risk management compliance programs established by management and the board, including Sarbanes-Oxley implementation, and makes recommendations to the board of directors regarding corporate governance issues and policy decisions. |
Nominating and Corporate Governance Committee
The members of the Nominating and Corporate Governance Committee of our board of directors are Messrs. Groenink, de Greef, Hickman and Kerrest. Mr. Groenink serves as the chairman of the committee. The Nominating and Corporate Governance Committee is charged with the responsibility of reviewing our corporate governance policies and with proposing new potential director nominees to the board of directors for consideration and has a charter which is reviewed annually. Except for Messrs. Groenink and Kerrest who became members of our board of directors in April and August 2011, respectively, each member of the Nominating and Corporate Governance Committee was present at one hundred (100%) percent of the Nominating and Corporate Governance Committee meetings held during such director’s tenure as a member of the Nominating and Corporate Governance Committee. All members of the Nominating and Corporate Governance Committee are independent directors as defined by the rules of the NASDAQ Stock Market. The Nominating and Corporate Governance Committee will consider director nominees recommended by security holders. To recommend a nominee please write to the Nominating and Corporate Governance Committee c/o Alex Vermeulen, Elephant Talk Communications Corp., 19103 Centre Rose Boulevard, Lutz, FL, 33558. The Nominating and Corporate Governance Committee will assess all director nominees using the same criteria. During 2011, we paid a fee of $75,000 to Bishop Partners to assist in the successful identification and retention of members for our board of directors. We have not received any director nominee suggestions from stockholders in 2011.
The Nominating and Corporate Governance Committee has not formally established any specific, minimum qualifications that must be met by each of our officers or directors or specific qualities or skills that are necessary for one or more of our officers or members of the board of directors to possess. However, the committee generally evaluates the following qualities: educational background, diversity of professional experience, knowledge of our business, integrity, professional reputation, independence, wisdom, and ability to represent the best interests of our shareholders.
Compensation Committee
Our board of directors also has a Compensation Committee, which reviews or recommends the compensation arrangements for our management and employees and also assists the board of directors in reviewing and approving matters such as company benefit and insurance plans and has a charter which is reviewed annually. The Compensation Committee has the following members Messrs. Hickman, de Greef, Groenink and Kerrest. Mr. Hickman acts as chairman of the committee. Except for Messrs. Groenink and Kerrest who became members of our board of directors in April and August 2011, respectively, each member of the Compensation Committee was present at one hundred (100%) percent of the Compensation Committee meetings held during such director’s tenure as a member of the Compensation Committee.
60
The Compensation Committee has the authority to directly engage, at our expense, any compensation consultants or other advisers as it deems necessary to carry out its responsibilities in determining the amount and form of employee, executive and director compensation. In 2010, the Compensation Committee did not engage any such compensation consultants or advisers.
Compensation Committee Interlocks and Insider Participation
None of our executive officers serves as a member of the Compensation Committee, or other committee serving an equivalent function. None of the members of our Compensation Committee has ever been our employee or one of our officers.
Board Leadership Structure and Role in Risk Oversight
Our board of directors determines what corporate leadership structure it deems appropriate for the Company based on factors such as the experience of the applicable individuals, the current business environment of the Company, the current stage of development and commercialization of our products and product candidates, as well as other relevant factors.
Our board of directors is also responsible for oversight of our risk management practices, while management is responsible for the day-to-day risk management processes.
Corporate Governance Guidelines
Our board of directors has adopted Corporate Governance Guidelines to which adherence is full commitment. The Corporate Governance Guidelines may be found on our website at www.elephanttalk.com . We intend to satisfy any disclosure requirement under Item 5.05 of Form 8-K regarding an amendment to, or waiver from, a provision of these guidelines by posting such information on our website, at the address specified above.
61
COMPENSATION
The following table sets forth all annualized compensation paid to our named executive officers at the end of the fiscal years ended December 31, 2010 and 2009. Individuals we refer to as our "named executive officers" include our Chief Executive Officer, Chief Technology Officer, Chief Financial Officer, Chief Commercial Officer, Chief Executive Officer of ValidSoft and General Counsel.
SUMMARY COMPENSATION TABLE
| Name and principle position | Year | Salary ($) | Bonus ($) | Stock Awards ($)(1) | Total ($) | ||||||||||
| Steven van der Velden | 2009 | $ | 0 | $ | $ | 193,380 | $ | 193,380 | |||||||
| (President and CEO) | 2010 | $ | 0 | $ | $ | 955,665 | (2) | $ | 955,661 | ||||||
| Martin Zuurbier | 2009 | $ | 216,920 | $ | $ | 118,500 | $ | 335,420 | |||||||
| (OPS, CTO) | 2010 | $ | 206,655 | $ | $ | 301,788 | (3) | $ | 508,443 | ||||||
| Mark Nije | 2009 | $ | 191,891 | $ | $ | 79,000 | $ | 270,891 | |||||||
| (Chief Financial Officer) | 2010 | $ | 182,811 | $ | $ | 301,788 | (4) | $ | 484,598 | ||||||
| Patrick Carroll | 2009 | $ | 0 | $ | $ | 0 | $ | 0 | |||||||
| (Chief Executive Officer of ValidSoft) | 2010 | $ | 182,811 | $ | $ | 301,788 | (5) | $ | 484,598 | ||||||
| Willem van den Brink | 2009 | $ | 0 | $ | $ | 0 | $ | 0 | |||||||
| (Chief Commercial Officer) | 2010 | $ | 59,612 | $ | $ | 21,343 | (6) | $ | 80,955 | ||||||
| Alex Vermeulen | 2009 | $ | 150,176 | $ | $ | 79,000 | $ | 229,176 | |||||||
| (General Counsel) | 2010 | $ | 143,069 | $ | $ | 150,894 | (7) | $ | 293,963 | ||||||
| (1) | The amounts included in these columns are the aggregate fair values of the awards granted by the Company to the executives in the fiscal year, valued in accordance with ASC 718 for the fiscal years ended December 31, 2009 and December 31, 2010. Pursuant to SEC rules, the amounts in this column exclude the impact of estimated forfeitures related to service-based vesting conditions. The share price used has been the share price at closing of the grant-date on April 1, 2010 ($1.75) except for the shares granted to Willem van den Brink who joined the Company on October 1, 2010. Mr. van den Brink shares were valued against $2.29 which had been the 10-day working average of the last quarter of 2010. Changes in compensation in the above table may arise as a result of exchange rate differences. |
| (2) | Comprised of 546,092 shares of restricted stock granted as salary in lieu of €228,000 cash; see note |
| (3) | Comprised of 172,450 shares of restricted stock granted as salary in lieu of €72,000 cash; see note |
| (4) | Comprised of 172,450 shares of restricted stock granted as salary in lieu of €72,000 cash; see note |
| (5) | Comprised of 172,450 shares of restricted stock granted as salary in lieu of €72,000 cash; see note |
| (6) | Comprised of 9,304 shares of restricted stock granted as salary in lieu of €12,000 cash. |
| (7) | Comprised of 86,225 shares of restricted stock granted as salary in lieu of €36,000 cash; see note |
Note to (2), (3), (4), (5) and (7):
In order to convert part of the agreed cash salaries into shares, we applied a valuation model based upon the conditions provided to investors of the 2009 Convertible Promissory Note. This resulted in the number of shares of stock issued to the executive officers. However, from an accounting point of view these shares had to be fair valued based on the share price of the date of grant, which translates into the (larger) amounts mentioned in the table compared to amounts as valued by us and as agreed in cash. The stock awards as mentioned for 2009 only include the bonus shares awarded to the executive officers and not their respective salary stock compensation in lieu of cash because these stock awards were already granted and vested in earlier years.
62
Employment Agreements
Except as set forth below, we currently have no written or unwritten employment agreements with any of our executive management or directors.
Steven van der Velden, President and Chief Executive Officer - We intend to enter into an employment agreement with Mr. van der Velden which will provide for his continued employment in his present capacity as President and Chief Executive Officer prior to the end of 2011. Mr. van der Velden is paid as base compensation €228,000 per annum, of which 100% is paid in the form of restricted common stock, which is consistent with prior years. Mr. Van der Velden receives no fees (cash or stock) for serving on our board of directors. All shares for Mr. Van der Velden were on his behalf issued to QAT II Investments.
Martin Zuurbier, Operations/Chief Technical Officer - We intend to enter into an employment agreement with Mr. Zuurbier which will provide for his continued employment in his present capacity as Chief Operating Officer and Chief Technical Officer prior to the end of 2011. Mr. Zuurbier is paid €228,000 per annum of which, until the third quarter of 2011, 31.5%, was paid in the form of restricted common stock, which is consistent with prior years. Mr. Zuurbier receives no fees (cash or stock) for serving on our board of directors. All shares for Mr. Zuurbier were on his behalf issued to Interact W.L.L.
Mark Nije, Chief Financial Officer - We intend to enter into an employment agreement with Mr. Nije which will provide for his continued employment in his present capacity as Chief Financial Officer prior to the end of 2011. Mr. Nije is paid € 210,000 per annum, of which 34% is paid in the form of restricted common stock, which is consistent with prior years. All the shares for Mr. Nije were on his behalf issued to LMI Europe B.V.
Patrick Carroll, Chief Executive Officer of ValidSoft, a 100% subsidiary of the Company- We intend to enter into an employment agreement with Mr. Carroll which will provide for his continued employment in his present capacity as Chief Executive Officer of ValidSoft prior to the end of 2011. Mr. Carroll is paid €210,000 per annum, of which 34% is paid in the form of restricted common stock, which is consistent with prior years.
Alex Vermeulen, Chief General Counsel - We intend to enter into an employment agreement with Mr. Vermeulen which will provide for his continued employment in his present capacity as Chief General Counsel prior to the end of 2011. Mr. Vermeulen is paid € 144,000 per annum of which, until the third quarter of 2011, 25% was paid in the form of restricted common stock, which is consistent with prior years. All the shares for Mr. Vermeulen were on his behalf issued to Scere Company Italy SRL.
Willem van den Brink, Chief Commercial Officer - On October 1, 2010, we entered into a written agreement with Mr. Van den Brink for the provision of his services as Chief Commercial Officer. The contract has a 4 year term. Annual compensation is €228,000, of which until January 1, 2012, 21% will be paid in shares of restricted common stock.
Administration
Our board of directors has established a compensation committee that, among other duties, administers our Incentive Plan. In connection with the administration of our Incentive Plan, the compensation committee, with respect to awards to be made to any person who is not one of our directors:
| · | determine which employees and other persons will be granted awards under our Incentive Plan; |
| · | grant the awards to those selected to participate; |
63
| · | determine the exercise price for options; and |
| · | prescribe any limitations, restrictions and conditions upon any awards, including the vesting conditions of awards. |
With respect to stock options or restricted stock awards to be made to any of our directors, the Compensation Committee will make recommendations to our board of directors as to:
| · | which of such persons should be granted stock options, restricted stock awards, performance units or stock appreciation rights; |
| · | the terms of proposed grants of awards to those selected by our board of directors to participate; |
| · | the exercise price for options; and |
| · | any limitations, restrictions and conditions upon any awards. |
Any grant of awards to any of directors under our Incentive Plan must be approved by our board of directors.
In addition, the compensation committee will:
| · | interpret our Incentive Plan; and |
| · | make all other determinations and take all other action that may be necessary or advisable to implement and administer our Incentive Plan. |
Types of Awards
Our Incentive Plan permits the Compensation Committee to grant the following types of awards.
Stock Options . Stock options are contractual rights entitling an optionee who has been granted a stock option to purchase a stated number of shares of our common stock at an exercise price per share determined at the date of the grant. Options are evidenced by stock option agreements with the respective optionees. The exercise price for each stock option granted under our Incentive Plan will be determined by our board of directors or a committee of the Board at the time of the grant, but will not be less than fair market value on the date of the grant. Our board of directors or a committee of the Board will also determine the duration of each option; however, no option may be exercisable more than ten years after the date the option is granted. Within the foregoing limitations, the board of directors or committee of the Board may, in its discretion, impose limitations on exercise of all or some options granted under our Incentive Plan, such as specifying minimum periods of time after grant during which options may not be exercised. Options granted under our Incentive Plan will vest at rates specified in the option agreement at the time of grant; however, all options granted under our Incentive Plan will vest upon the occurrence of a change of control, as defined in the Incentive Plan. Our Incentive Plan also contains provisions for our board of directors or a committee of the Board to provide in the participants’ option award agreements for accelerating the right of an individual employee to exercise his or her stock option or restricted stock award in the event of retirement or other termination of employment. No cash consideration is payable to us in exchange for the grant of options.
Our Incentive Plan provides that the stock options may either be Incentive Stock Options within the meaning of Section 422 of the Internal Revenue Code of 1986, as amended, or Non-Qualified Options, which are stock options other than Incentive Stock Options within the meaning of Sections 422 of the Code. Incentive Stock Options may be granted only to our employees or employees of our subsidiaries, and must be granted at a per share option price not less than the fair market value of our common stock on the date the Incentive Stock Option is granted. In the case of an Incentive Stock Option granted to a shareholder who owns shares of our outstanding stock of all classes representing more than 10% of the total combined voting power of all of our outstanding stock of all classes entitled to vote in the election of directors, the per share option price must be not less than 110% of the fair market value of one share of our common stock on the date the Incentive Stock Option is granted and the term of such option may not exceed five years. As required by the Code, the aggregate fair market value, determined at the time an Incentive Stock Option is granted, of our common stock with respect to which Incentive Stock Options may be exercised by an optionee for the first time during any calendar year under all of our incentive stock option plans may not exceed $100,000.
64
The exercise price for Non-Qualified Options may not be less than the fair market value of our common stock on the date the Non-Qualified Option is granted. Non-Qualified Options are not subject to any of the restrictions described above with respect to Incentive Stock Options. The exercise price of stock options may be paid in cash, in whole shares of our common stock, in a combination of cash and our common stock, or in such other form of consideration as our board of directors or the committee of the Board may determine, equal in value to the exercise price. However, only shares of our common stock which the option holder has held for at least six months on the date of the exercise may be surrendered in payment of the exercise price for the options. In no event may a stock option be exercised after the expiration of its stated term.
Stock Appreciation Rights . A stock appreciation right permits the grantee to receive an amount (in cash, common stock, or a combination thereof) equal to the number of stock appreciation rights exercised by the grantee multiplied by the excess of the fair market value of our common stock on the exercise date over the stock appreciation rights’ exercise price. Stock appreciation rights may or may not be granted in connection with the grant of an option. The exercise price of stock appreciation rights granted under the Incentive Plan will be determined by the board of directors or a committee of the Board; provided, however, that such exercise price cannot be less than the fair market value of a share of common stock on a date the stock appreciation right is granted (subject to adjustments). A stock appreciation right may be exercised in whole or in such installments and at such times as determined by the board of directors or a committee of the Board.
Restricted Stock . Restricted shares of our common stock may be granted under our Incentive Plan subject to such terms and conditions, including forfeiture and vesting provisions, and restrictions against sale, transfer or other disposition as the board of directors or a committee of the Board may determine to be appropriate at the time of making the award. In addition, the board of directors or a committee of the Board may direct that share certificates representing restricted stock be inscribed with a legend as to the restrictions on sale, transfer or other disposition, and may direct that the certificates, along with a stock power signed in blank by the grantee, be delivered to and held by us until such restrictions lapse. The board of directors or a committee of the Board, in its discretion, may provide in the award agreement for a modification or acceleration of shares of restricted stock in the event of permanent disability, retirement or other termination of employment or business relationship with the grantee.
Performance Units . The Incentive Plan permits grants of performance units, which are rights to receive cash payments equal to the difference (if any) between the fair market value of our common stock on the date of grant and its fair market value on the date of exercise of the award, except to the extent otherwise provided by the board of directors or a committee of the Board or required by law. Such awards are subject to the fulfillment of conditions that may be established by the board of directors or a committee of the Board including, without limitation, the achievement of performance targets based upon the factors described above relating to restricted stock awards.
Performance Bonus . The Incentive Plan permits grants of performance bonuses, which may be paid in cash, common stock or combination thereof as determined by the board of directors or a committee of the Board. The maximum value of performance bonus awards granted under the Incentive Plan shall be established by the compensation committee at the time of the grant. An employee’s receipt of such amount will be contingent upon achievement of performance targets during the performance period established by the compensation committee. The performance targets will be determined by the board of directors or a committee of the Board based upon the factors described above relating to restricted stock awards. Following the end of the performance period, the board of directors or a committee of the Board will determine the achievement of the performance targets for such performance period. Payment may be made within 60 days of such determination. Any payment made in shares of common stock will be based upon the fair market value of the common stock on the payment date.
65
DIRECTOR COMPENSATION
Compensation of Directors Summary Table
The following table represents compensation paid in 2010 to our directors who are not “named executive officers.”
| Name | Fees Earned or Paid in Cash ($) | Stock Award ($) | Option Awards ($) | Non-Equity Incentive Plan Compensation ($) | Non-Qualified Deferred Compensation Earnings ($) | All Other Compensation ($) | Total ($) | |||||||||||||||||||||
| Johan Dejager (1)(2) | $ | 0 | $ | 0 | $ | 0 | $ | 0 | $ | 0 | $ | 0 | $ | 0 | ||||||||||||||
| Yves van Sante (1)(2)(5) | $ | 0 | $ | 0 | $ | 0 | $ | 0 | $ | 0 | $ | 0 | $ | 0 | ||||||||||||||
| Roderick de Greef (3) | $ | 0 | $ | 256,729 | $ | 0 | $ | 0 | $ | 0 | $ | 0 | $ | 256,729 | ||||||||||||||
| Phil Hickman (4) | $ | 0 | $ | 172,898 | $ | 0 | $ | 0 | $ | 0 | $ | 0 | $ | 172,898 | ||||||||||||||
| Rijkman Groenink (6) | $ | 0 | 0 | 0 | 0 | 0 | 0 | 0 | ||||||||||||||||||||
| Jacques D. Kerrest (7) | $ | 0 | 0 | 0 | 0 | 0 | 0 | 0 | ||||||||||||||||||||
| (1) | In 2010 no compensation was paid to the above directors as a result of the fact that each of the above-named directors was granted shares of restricted common stock already in 2008, which vested immediately, for their continued service on our board of directors through December 31, 2010. As a result and in accordance with accounting rules, the table does not show compensation for 2010. |
| (2) | We granted to QAT Investments SA on behalf of each of Messrs. Dejager and van Sante, on November 17, 2008, respectively, 500,000 shares of our common stock for their continued service on our board of directors through December 31, 2010. |
| (3) | On April 1, 2010, we granted 146,702 shares of our common stock to Mr. de Greef for his continued service on our board of directors through December 31, 2010. The grant resulted from the agreement that Mr. de Greef was entitled to a cash compensation of €61,250. Based upon the calculation of a fair value equal to that cash compensation we adopted a valuation based upon the conditions provided to investors of the 2009 Convertible Promissory Note. Hence, the €61,250 translated into 146,702 shares. However, from an accounting point of view these shares had to be fair valued based on the share price of the date of grant. Consequently, we reported a value of $256,729 on the date of issuance which vested immediately. |
| (4) | Mr. Hickman was appointed to our board of directors on March 30, 2010. On April 1, 2010, we granted 98,977 shares of our common stock to PGH Business Solutions, Ltd. on behalf of Mr. Hickman for his service on our board of directors through December 31, 2010. The grant resulted from the agreement that Mr. Hickman was entitled to a cash compensation of €41,250. Based upon the calculation of a fair value equal to that cash compensation we adopted a valuation based upon the conditions provided to investors of the 2009 Convertible Promissory Note. Hence, the €41,250 translated into 98,977 shares. However, from an accounting point of view these shares had to be fair valued based on the share price of the date of grant. Consequently, we reported a value of $172,898 on the date of issuance which vested immediately. In addition, in 2010, Mr. Hickman was paid by Validsoft, Ltd., a subsidiary of the Company, £60,000 to PGH Business Solutions Ltd. for services provided during the year by Mr. Hickman to Validsoft. |
66
| (5) | Mr. van Sante resigned from our board of directors effective August 1, 2011. |
| (6) | Mr. Groenink was appointed to our board of directors effective April 1, 2011. |
| (7) | Mr. Kerrest was appointed to our board of directors effective August 1, 2011. |
67
The following table sets forth certain information as to the stock ownership of each person known by us to own beneficially five (5%) percent or more of the outstanding common stock, of each of our named officers and directors who owns any shares and of all officers and directors as a group as of August 29, 2011. In computing the outstanding shares of common stock, the Company has excluded all shares of common stock subject to options, warrants or other securities that are not currently exercisable or exercisable within 60 days and are therefore not deemed to be outstanding and beneficially owned by the person holding the options, warrants or other securities for the purpose of computing the number of shares beneficially owned and the percentage ownership of that person. Unless otherwise noted, each person or group identified possesses sole voting and investment power with respect to the shares, subject to community property laws were applicable. The mailing address of each beneficial owner, unless otherwise noted, is c/o Elephant Talk Communications, Inc., 19103 Center Rose Boulevard, Lutz, FL 33558.
Number of Shares of Common Stock Owned* | Percent of Class Common Stock Held | |||||||
| Rising Water Capital AG (1) | 32,084,518 | (2) | 29.43 | %(2) | ||||
| CMV Invest II CVA (3) | 8,689,660 | (4) | 7.97 | %(4) | ||||
| Patrick Carroll | 172,450 | ** | % | |||||
| Q.A.T. Investments SA | 32,127,430 | (5) | 29.47 | % | ||||
| Q.A.T. II Investments SA | 26,699,337 | (6)(7) | 24.49 | %(6)(7) | ||||
| Phil Hickman | 228,609 | (8) | ** | % | ||||
| Steven van der Velden | 10,210,827 | (9) | 9.37 | %(9) | ||||
| Johan Dejager | 3,405,087 | (10) | 3.12 | %(10) | ||||
| Martin Zuurbier | 855,573 | (12) | ** | % | ||||
| Mark Nije | 742,681 | (13) | ** | % | ||||
| Roderick de Greef | 512,664 | ** | % | |||||
| Alex Vermeulen | 295,977 | (14) | ** | % | ||||
| William Van den Brink | 18,699 | ** | % | |||||
| Rijkman Groenink | 0 | ** | % | |||||
| Jacques D. Kerrest | 0 | |||||||
| All Officers and Directors as a Group | 15,397,051 | 14.12 | % | |||||
| * | Calculated in accordance with Rule 13d-(3)(d)(1) under the Securities Exchange Act of 1934. |
| ** | less than one percent |
| (1) | Voting power and dispositive power over the shares held by RWC are under the control of its investment committee. To our knowledge, RWC’s address of record is Baarerstrasse 135, 6301 Zug, Switzerland. |
| (2) | Includes warrants to purchase 338,029 shares of our common stock at $1.05 per share, warrants to purchase 3,718,305 shares of our common stock at $1.26 per share, and warrants to purchase 1,859,153 shares of our common stock at $1.47 per share. |
| (3) | Mr. van der Velden owns a 40.75% ownership interest in CMV II Invest CVA (“CMV II”), and therefore controls shared voting and dispositive power over the securities held by this entity. To our knowledge, CMV II’s address of record is Rubensheide 73, 2950 Kappellen, Belgium. |
| (4) | Includes warrants to purchase 3,475,864 shares of our common stock at $1.26 per share, and warrants to purchase 1,737,932 shares of our common stock at $1.47 per share. |
| (5) | Includes 338,029 shares of common stock and the warrants disclosed in footnote (2). |
| (6) | Includes warrants to purchase 357,172 shares of our common stock at $1.05 per share, warrants to purchase 357,172 shares of our common stock at $1.26 per share, and warrants to purchase 178,586 shares of our common stock at $1.47 per share. |
| (7) | Includes warrants to purchase 6,414,786 shares of common stock at $1.00, warrants to purchase 1,466,325 shares of common stock at $1.50 per share, warrants to purchase 3,451,170 shares of common stock at $1.45 per share, warrants to purchase 609,840 shares of common stock at $1.61 per share, warrants to purchase 2,012,250 shares of common stock at $1.73 per share and warrants to purchase 167,400 shares of common stock at $2.00 per share. |
| (8) | Includes 115,917 shares of common stock held by PGH Business Soft Ltd., an entity 100% owned by Mr. Hickman and 42,373 warrants to purchase shares of common stock at an exercise price of $ . |
| (9) | Includes 1,728,697 shares of common stock held by CMV Invest CVA, an entity 27.25% owned by Mr. van der Velden, 3,475,864 shares of common stock held by CMV II, and 975, 744 shares of common stock held by Interfield Consultancy Ltd., an entity 100% owned by Mr. van der Velden and the warrants described in notes (3). |
| (10) | Includes warrants to purchase 1,329,584 shares of our common stock at an exercise price of $ . |
| (12) | Mr. Zuurbier owns 100% of Interact W.L.L. and therefore has voting and dispositive power of the shares of common stock held by this entity. |
68
| (13) | Includes 298,746 shares of common stock held by Logistic Management International NV, an entity 100% owned by Mr. Nije and therefore has voting and dispositive power of the shares of common stock held by this entity. |
| (14) | Includes 100,591 shares of common stock held by Scere Company Italy, an entity 100% owned by Mr. Vermeulen and therefore has voting and dispositive power of the shares of common stock held by this entity. |
Change in Control
There were no arrangements, known to us, including any pledge by any person of our securities the operation of which may at a subsequent date result in a change in control of our company.
69
CERTAIN RELATIONSHIPS AND RELATED TRANSACTIONS
On June 9, 2008, we entered into a settlement agreement with Rising Water Capital or RWC effective May 13, 2008 or the Settlement Agreement, whereby RWC agreed to convert certain notes held by it in the principal amount of $3,500,000 and accumulated interest of $889,881 into our common stock. As a result, total number of shares post reverse stock split issued as a result of the conversion was 5,017,007, based on a post reverse stock split conversion price of $0.875.
On May 26, 2006, we executed a second Convertible Promissory Note or the 2nd Note in the principal sum of $3,000,000 with RWC. The 2nd Note had a term of thirty (30) months, during which time interest on the principal amount would accrue from the date of this 2nd Note at an annual interest rate of 10%. The 2nd Note provided for a balloon payment of principal and interest accrued at maturity. The 2nd Note was also convertible during the term, in whole or in part, into common shares at a conversion price of seven cents ($0.07) (pre-split) per share. The 2nd Note did not have any beneficial conversion feature attached to it since the conversion rate was equal to the market price of the common stock of $0.07 (pre-split), on the closing of agreement. We recorded accrued interest of $549,289 and $417,321 as of December 31, 2008 and December 31, 2007 respectively.
On June 9, 2008, we entered into the Settlement Agreement whereby RWC agreed to convert the 2nd note principal amount of $3,000,000 and interest of $549,289 into our common stock. RWC also agreed to fund the remaining balance under the $3,000,000 note. In order to induce RWC to convert the promissory note, we agreed to reduce the conversion price of the $3,000,000 note to the price at which we offer our common stock in a subsequent financing with a minimum of $1,000,000 in gross proceeds. The conversion price was adjusted to reflect the reverse stock split. As a result, the total number of shares (pre Reverse Split 1:25) amounted to 84,506,891. The number of post Reverse Stock Split shares issued as a result of the conversion was 3,380,276 (post reverse stock split price of $1.05).
In connection with the conversion of the 2nd Note we originally recorded $1,200,000 as deemed dividend as a result of reduction in the conversion price from the original conversion price. However, in the third quarter we determined that in accordance with EITF 96-19 "Debtors Accounting for a Modification or Exchange of Debt Instruments" the $1,200,000 Beneficial Conversion feature should be expensed in the P&L, and this adjustment was recorded.
RWC is the beneficial holder of 26,659,031 shares of our common stock. Quercus Aimer Trust Investments SA (“QAT Investments”) holds a 50.3% ownership interest in RWC. Additionally, Mr. van der Velden, our President and Chief Executive Officer, who is also the chairman of QAT Investments and is on the management board of QAT Investments, holds a 30.79% ownership interest in QAT Investments and a 24.17% in QAT II Investments. Mr. Nije, our Chief Financial Officer, is a principal at QAT Investments and holds a 0.32% ownership interest in QAT Investments. Mr. Dejager, one of our directors, is on the management board of QAT Investments and holds a 4.77% ownership interest in QAT Investments and 4.02% In QAT II Investments. Interfield Consultancy SI Ltd., a company wholly-owned by Mr. van der Velden, holds a 34% interest in RWC, of which approximately 17% is held in a fiduciary capacity for the benefit of Mr. Zuurbier, our Chief Technical Officer and Director.
On August 22, 2007, our board of directors approved the sale of approximately 4,160,000 shares of restricted common stock to certain accredited investors. As part of the transaction, CMV Invest CVA or CMV agreed to purchase 1,728,697 shares of our restricted common stock. Mr. van der Velden holds a 27.25% ownership interest in CMV. CMV Invest II or CMV II holds 3,475,864 shares of our restricted common stock. Mr. Van der Velden holds a 40.75% ownership in CMV II.
On May 8, 2008, we entered into a placement agent agreement with Quercus Management Group N.V. or QMG and Amelia pursuant to which QMG and Amelia were each issued 16,667 shares of our common stock in connection with their participation in the financing (the “2008 Financing”). In addition, pursuant to the terms of the placement agent agreement, and as part of their compensation for acting as placement agent in a private offering of securities, QMG was paid a commission of $469,764 and issued warrants to purchase 357,172 shares of our common stock at $1.05 per share, warrants to purchase 357,172 shares of our common stock at $1.26 per share and warrants to purchase 178,586 shares of our common stock at $1.47 per share. QAT Investments owns 100% of the outstanding capital stock of QMG. Amelia was paid a commission of $458,231 and issued warrants to purchase 347,587 shares of our common stock at $1.05 per share, warrants to purchase 347,587 shares of our common stock at $1.26 per share and warrants to purchase 173,794 shares of the Company’s common stock at $1.47 per share.
70
Pursuant to the terms of the Settlement Agreement, upon conversion of the 2nd Note, we agreed to make an incentive payment to RWC, commensurate with any fees paid in connection with a financing, pro rata, based upon the aggregate amount raised in such financing, whether equity or debt, of at least $1.0 million (the “Incentive Payment”).
In the 2008 Financing, CMV Invest II CVA or CMV II purchased approximately 2,400,000 shares of our common stock for approximately $2.5 million. Additionally, CMV II holds warrants to purchase 3,475,864 shares of our common stock at $1.26 per share and warrants to purchase 1,737,932 shares of our common stock at $1.47 per share. Mr. van der Velden holds a 40.75% ownership interest in CMV II.
On January 27, 2009, QAT II Investments SA, a closed-end fund of QAT Investments, entered into a preliminary loan agreement with us whereby QAT II Investments will provide us with $1,300,000. According to the terms, the loan will bear interest at a rate of twelve percent (12%) per annum and shall be repaid either (1) if we enter into an investment agreement with QAT II Investments, the amount due under the loan will be reduced by the investment amount pursuant to the investment agreement, or (2) if no investment agreement is executed, the principal amount of the loan plus interest is due and payable by June 30, 2009. On February 15, 2009, February 23, 2009 and March 31, 2009, in connection with the above referenced agreement, QAT II Investments entered into three loan agreements with us whereby QAT II Investments agreed to provide us with $650,000, $650,000 and $650,000, respectively. The outstanding principal and interest shall become immediately due and payable in the event we fail to make required payments of principal and interest, or otherwise breaches the agreements and fails to cure such breach upon twenty (20) days notice, or if it disposes of its properties or assets without QAT II Investments’ prior consent, or if we file a petition for bankruptcy or otherwise resolves to wind up its affairs. All agreements and amounts were entered in euros with a conversion rate used above of 1.30 EUR/USD, deviations may occur with 8-K filings due to different exchange rate usage.
On February 3, 2009, 23,982 shares of common stock were issued to RWC as part of the Incentive Payment. As a result of our private placement of securities in excess of $1.0 million, RWC is additionally entitled, as an Incentive Payment, approximately $451,915 in cash and was issued warrants to purchase 338,029 shares of our common stock at $1.05 per share, warrants to purchase 338,029 shares of our common stock at $1.26 per share and warrants to purchase 169,015 shares of our common stock at $1.47 per share. In lieu of the cash payment to RWC was entitled it accepted 742,000 shares of our common stock, based on a conversion price of $0.60 per share. In connection with the loan agreements described above, on March 30, 2009 we entered into a security agreement (the “Security Agreement”) with QAT II. The Security Agreement granted QAT II a security interest in the revenues received by us under a Spanish MVNE Agreement which management expects to be entered into by the parties (the “MVNE Agreement”). The Security Agreement will terminate when all amounts due under the loan agreements have been paid in full by Registrant.
On June 30, 2009, we issued 124,800 shares of our common stock to QAT as consideration for the services provided by Steven van der Velden, our Chairman, President and Chief Executive Officer. The shares of common stock were issued directly to QAT pursuant to an agreement between QAT and Mr. van der Velden.
On July 1, 2009 and July 8, 2009, QAT II, a closed-end fund of QAT Investments, entered into a loan agreement with us whereby QAT II provided us with $213,795 and $142,530. According to the terms, the loans will bear interest at a rate of twelve percent (12%) per annum and shall be repaid either (1) if we enter into an investment agreement with QAT II, the amount due under the loan will be reduced by the investment amount pursuant to the investment agreement or (2) if no investment agreement is executed, the principal amount of the loan plus interest is due and payable by August 31, 2009. The agreement and amount were entered in Euros, which means that currency differences may occur in filings made and this Report.
On July 31, 2009, QAT II converted $4,100,000 provided under the loan agreements into $4,100,000 in notes and warrants as part of the first closing with respect to the 2009 private placement offering. On October 30, 2009, QAT II converted $1,332,383 into notes and warrants as part of the fifth closing with respect to the 2009 private placement offering.
71
QMG, an entity affiliated with certain of our officers and directors served as European placement agent for the 2009 private placement offering. In the aggregate, QMG raised $4,837,632, entitling it to 774,022 warrants (equal to 8% of the aggregate amount of notes and warrants sold in the 2009 private placement offering, including those notes and warrants sold to our affiliates), an 8% selling concession equal to $387,010.56 and 2% non-accountable expenses and fees equal to $96,752.64. Of the $4,837,632 raised by QMG, $4,399,995.10 (or 91% of the total) was raised from parties affiliated with us (including the $4,100,000 conversion by QAT II).
12% Secured convertible note
At our request on June 10, 2010, QAT II entered into an agreement with us that allowed the mandatory conversion of certain notes in favor of QAT II in the aggregate principal amount of $5.3 million ($4 million issued July 31, 2009 and $1.3 million issued October 31, 2009) for units. We agreed that, excluding any accrued but unpaid interest or other fees due on the notes, the principal unpaid amount due on the notes would be exchanged for units, at a price of $1.20 per unit and on the same terms and conditions as the units offered in the 2010 Private Placement Offering, if we raised an aggregate of $11 million in connection with the offering.
Loan agreements
On February 2, 2010, we entered into a loan agreement with QAT II. Pursuant to this loan agreement, QAT II agreed to lend to us the sum of €350,000 ($488,775 based on the February 2, 2010 exchange rate published in the Wall Street Journal). The proceeds were made available to us on February 2, 2010.
On February 24, 2010, we entered into a loan agreement with QAT II. Pursuant to this loan agreement, QAT II agreed to lend us the sum of €850,000 ($1,150,390 based on the February 24, 2010 exchange rate published in the Wall Street Journal). The proceeds of the loan agreement were made available to us on February 24, 2010.
On March 22, 2010, we entered into a loan agreement with QAT II. Pursuant to this loan agreement, QAT II agreed to lend us the sum of €150,000 ($203,280 based on the March 22, 2010 exchange rate published in the Wall Street Journal). The proceeds of the loan agreement were made available to us on March 22, 2010.
On March 30, 2010, we entered into a loan agreement with QAT II. Pursuant to the loan agreement, QAT II agreed to lend us the sum of €500,000 ($670,750 based on March 30, 2010 exchange rate published in the Wall Street Journal). The proceeds of the loan agreement were made available to us on March 30, 2010.
Each of the above mentioned loan agreement initially provided that we would pay QAT II interest at a rate of fourteen percent (14%) per annum on the outstanding balance and provided the principal and interest shall be due and payable on the earlier of: (i) within 180 days from the date of the loan or (ii) in the event we consummate a private placement. QAT II has the ability to convert the principal and accrued interest outstanding as of the date of the private placement into the same type of equity or debt securities issued by us and on the same terms and conditions offered to other investors in the private placement. The outstanding principal and interest becomes immediately due and payable in the event we fail to make required payments of principal and interest, or otherwise breach the loan agreement and fail to cure such breach upon twenty days notice, or if we dispose of our properties or assets without the prior consent of QAT II, or if we file a petition for bankruptcy or otherwise resolves to wind up our affairs.
In connection with the above-referenced loans, we also issued to QAT II warrants to purchase common stock in an amount equal to one warrant per each United States dollar loaned hereunder to the Company (using the Euro-United States dollar conversion rate published by the Wall Street Journal at the close of business of the loan date). Such warrants have a term of three years and an exercise price equal to the OTCBB closing price of our common stock on the loan date.
The loan agreements described above were amended on June 10, 2010. Pursuant to the amendment, QAT II agreed to extend the existing maturity dates of the loans to May 1, 2011. The amendment also provided for the conversion of the notes, as previously described. Additionally, QAT II was issued warrants to purchase common stock at an amount equal to two (2x) times the existing warrant coverage under the terms of such loan agreement.
72
In 2010, a total of 1,395,168 were issued in shares of our common stock in lieu of cash compensation for executive officers’ salaries and board compensation for the year 2010. These shares were issued in June 2010, vested immediately and were issued to Mr. van der Velden (546,092), Mr. Zuurbier (172,450), Mr. Nije (172,450), Mr. Carroll (172,450), Mr. De Greef (146,702), Mr. Hickman (98,799 and our general counsel Mr. Alex Vermeulen (86,225).
In connection with the final closing of the 2010 Private Placement, the convertible promissory notes owned by QAT II and the outstanding loans, including accrued interest, due QAT II automatically converted into units consisting of one share of common stock and one warrant to purchase one share of common stock at a price of $1.20 per unit. These units were issued on the same terms and conditions of those provided to investors in the 2010 private placement. In connection with the automatic conversion, 6,777,311 shares of common stock were issued, 6,771,311 warrants were issued and our long-term debt was reduced by $8,125,571.
All future transactions between us and our officers, directors or five percent shareholders, and respective affiliates will be on terms no less favorable than could be obtained from unaffiliated third parties and will be approved by a majority of our independent directors who do not have an interest in the transactions and who had access, at our expense, to our legal counsel or independent legal counsel.
To the best of our knowledge, other than as set forth above, there were no material transactions, or series of similar transactions, or any currently proposed transactions, or series of similar transactions, to which we were or are to be a party, in which the amount involved exceeds $120,000, and in which any director or executive officer, or any security holder who is known by us to own of record or beneficially more than 5% of any class of our common stock, or any member of the immediate family of any of the foregoing persons, has an interest.
73
We have entered into registration rights agreements with certain of the selling shareholders pursuant to which we have agreed to file a registration statement, of which this prospectus is a part, under the Securities Act of 1933, as amended (the “Securities Act”), registering the resale by the selling shareholders of the shares of common stock covered by this prospectus. We have also agreed to cause such registration statement to become effective, and to keep such registration statement effective. Our failure to satisfy the deadlines set forth in the registration rights agreements may subject us to payment of certain monetary penalties pursuant to the terms of the registration rights agreements. Additionally, some of the selling shareholders are registering their shares pursuant to piggyback rights granted by us.
We are registering the shares of common stock covered by this prospectus in order to permit the selling shareholders to offer the shares for resale from time to time.
The table below lists the selling shareholders and other information regarding the beneficial ownership (as determined under Section 13(d) of the Securities Exchange Act of 1934, as amended, and the rules and regulations thereunder) of the shares of common stock held by each of the selling shareholders. Except as indicated in the footnotes to the table below, the selling shareholders have not had any material relationship with us within the past three years, except for their ownership of our common stock.
The second column lists the number of shares of common stock beneficially owned by the selling shareholders, based on their approximate respective ownership of shares of common stock, as of August 29, 2011. This column includes the 36,047,261shares of common stock issued in the 2010 private placement, 2010 bridge offering, shares issued as a result of the warrant exercise of the 2010 bridge offering, shares issued as a result of the warrant exercise of agent warrants issued to Sandgrain, Dawson James and QMG but assumes the exclusion of the issuance of the 31,013,822 shares of common stock issuable upon (remaining) exercise of warrants issued in the 2010 bridge offering, 2010 QAT II loans, 2010 QAT II conversion agreement, 2009 private placement or any warrants issued to Dawson James, Sandgrain or QMG.
The third column lists the maximum number of shares of common stock being offered by the selling shareholders under this prospectus and does not take into account any limitations on or conditions to the issuance of the shares of common stock being registered.
The fourth and fifth columns assume the sale of all of the shares offered by the selling shareholders pursuant to this prospectus. The selling stockholders are not making any representation that any shares covered by this prospectus will be offered for sale. We believe that, based on information provided to us by each of the selling stockholders, the selling stockholders listed in the table have sole voting and investment powers with respect to the securities indicated. As indicated below, certain selling stockholders are broker-dealers or affiliates.
| Securities Included in Prospectus (1) | Shares Beneficially Owned Prior To Offering (2) | Percentage of Shares Before Offering (2) | Shares Beneficially Owned After Offering (3) | Percentage of Shares After Offering (3) | ||||||||||||||||
| Adam Linn | 50,000 | 50,000 | * | 0 | * | |||||||||||||||
| Alain DeCock | 147,500 | 258,544 | * | 111,044 | * | |||||||||||||||
| Alan & Anne R. Epstein, JTWROS | 40,000 | 40,000 | * | 0 | * | |||||||||||||||
| Alan Fein (4) | 50,000 | 50,000 | * | 0 | * | |||||||||||||||
| Albert Poliak (5) | 1,047,496 | 1,047,496 | 0 | * | ||||||||||||||||
| Andrew Horodowicz, IRA | 63,334 | 63,334 | * | 0 | * | |||||||||||||||
| Ann M. Angle | 360,000 | 384,173 | * | 0 | * | |||||||||||||||
| Anthony Athanas, Jr. | 400,000 | 400,000 | * | 0 | * | |||||||||||||||
| Anton Nader | 200,000 | 200,000 | * | 0 | * | |||||||||||||||
74
| Arthur Dunkin | 50,000 | 102,600 | * | 0 | * | |||||||||||||||
| Arthur Luxenberg | 150,000 | 150,000 | * | 0 | * | |||||||||||||||
| Axel Mehrle (4) | 5,000 | 5,000 | * | 0 | * | |||||||||||||||
| Bailey Family LP | 100,000 | 100,000 | * | 0 | * | |||||||||||||||
| Barry Davis, Roth IRA | 50,000 | 50,000 | * | 0 | * | |||||||||||||||
| Bernard Moncarey (6) | 150,000 | 499,500 | * | 349,500 | * | |||||||||||||||
| Brenda Forwood | 75,000 | 75,000 | * | 0 | * | |||||||||||||||
| Brett Shapiro (5) | 122,974 | 122,974 | * | 0 | * | |||||||||||||||
| Brian J. Gardinier | 41,670 | 41,670 | * | 0 | * | |||||||||||||||
| Bruce Michael Robinson | 125,000 | 219,105 | * | 94,105 | * | |||||||||||||||
| Bruce Michael Robinson, Sep IRA | 96,000 | 169,876 | * | 73,876 | * | |||||||||||||||
| Bruce Robinson, IRA | 150,000 | 150,000 | * | 0 | * | |||||||||||||||
| Cara N.V. (IMC Management (Anguilla) Ltd.) | 200,000 | 367,678 | * | 167,678 | * | |||||||||||||||
| Carianne A. Finch, IRA | 31,000 | 31,000 | * | 0 | * | |||||||||||||||
| Carl Martin, IRA | 100,000 | 100,000 | * | 0 | * | |||||||||||||||
| Carl Stevens, IRA | 200,000 | 200,000 | * | 0 | * | |||||||||||||||
| Cecelia Maben, IRA | 48,250 | 48,250 | * | 0 | * | |||||||||||||||
| Cedarview Opportunity Master Fund | 1,500,000 | 1,500,000 | 1.38 | % | 0 | * | ||||||||||||||
| Charles and Sandra Curtis, JTWROS | 400,000 | 400,000 | * | 0 | * | |||||||||||||||
| Charles Mcelheney | 53,334 | 53,334 | * | 0 | * | |||||||||||||||
| Charles Mcelheney, IRA | 160,000 | 160,000 | * | 0 | * | |||||||||||||||
| Cheryl Williams | 25,000 | 25,000 | * | 0 | * | |||||||||||||||
| Christina and Joseph C. Landsman JTWROS | 25,000 | 25,000 | * | 0 | * | |||||||||||||||
| Christine Marie Frankewich and John P. Christensen, JTTEN | 100,000 | 100,000 | * | 0 | * | |||||||||||||||
| Christopher Millard | 41,668 | 41,668 | * | 0 | * | |||||||||||||||
| Connie Colleen Hummer, IRA | 25,000 | 43,821 | * | 18,821 | * | |||||||||||||||
| Constantine Hagepanos | 50,000 | 50,000 | * | 0 | * | |||||||||||||||
| Constantine Hagepanos, IRA | 102,000 | 102,000 | * | 0 | * | |||||||||||||||
| Craig A. Lindberg | 50,000 | 50,000 | * | 0 | * | |||||||||||||||
| Craig S. Barkley and Sandra M. Barkley, JTWROS | 125,000 | 125,000 | * | 0 | * | |||||||||||||||
| Daniel A. Hudson, IRA | 60,000 | 60,000 | * | 0 | * | |||||||||||||||
| David B. Pautler | 25,000 | 25,000 | * | 0 | * | |||||||||||||||
| David Cohen | 41,668 | 41,668 | * | 0 | * | |||||||||||||||
| David Hansen | 200,000 | 200,000 | * | 0 | * | |||||||||||||||
| David Huebner | 50,000 | 50,000 | * | 0 | * | |||||||||||||||
| David Linker | 33,334 | 33,334 | * | 0 | * | |||||||||||||||
| David McClain | 86,200 | 86,200 | * | 0 | * | |||||||||||||||
| David Rampulla | 25,000 | 25,000 | * | 0 | * |
75
| David Silkworth, IRA | 25,000 | 25,000 | * | 0 | * | |||||||||||||||
| David Talesnick | 50,000 | 50,000 | * | 0 | * | |||||||||||||||
| David Weinstein (5) | 619,013 | 619,013 | * | 0 | * | |||||||||||||||
| David Yerg, IRA | 43,000 | 43,000 | * | 0 | * | |||||||||||||||
| Dawson James Securities, Inc. (7) | 503,005 | 503,005 | * | 0 | * | |||||||||||||||
| Deborah Dolan | 50,000 | 50,000 | * | 0 | * | |||||||||||||||
| Dharmesh Bhanushali | 25,000 | 25,000 | * | 0 | * | |||||||||||||||
| F. Richard Stark | 41,668 | 41,668 | * | 0 | * | |||||||||||||||
| Dillon C. Finch | 145,000 | 145,000 | * | 0 | * | |||||||||||||||
| Donald Darendinger | 80,000 | 186,000 | * | 80,000 | * | |||||||||||||||
| Dr. Carl Eric Mayer | 40,000 | 40,000 | * | 0 | * | |||||||||||||||
| Dr. Donald Myrtue | 20,000 | 20,000 | * | 0 | * | |||||||||||||||
| Dr. Robert F. Ryan & Dr. Qin C. Ryan | 100,000 | 175,284 | * | 75,284 | * | |||||||||||||||
| Duane P. Stout, IRA | 29,000 | 29,000 | * | 0 | * | |||||||||||||||
| Edith Bingle | 50,000 | 87,642 | * | 37,642 | * | |||||||||||||||
| Eduardo Diaz, IRA | 391,668 | 391,668 | * | 0 | * | |||||||||||||||
| Edward J. Kay and Cynthia E. Kay, JTWROS | 50,000 | 50,000 | * | 0 | * | |||||||||||||||
| Elizabeth Burrow Living Trust | 41,668 | 41,668 | * | 0 | * | |||||||||||||||
| Elizabeth Mary Sealy Burrow Living Trust | 25,000 | 25,000 | * | 0 | * | |||||||||||||||
| Elmer R. Salovich Revocable Living Trust | 100,000 | 100,000 | * | 0 | * | |||||||||||||||
| Eric Warm | 50,000 | 50,000 | * | 0 | * | |||||||||||||||
| Far Hills Capital, LLC | 200,000 | 369,322 | * | 169,322 | * | |||||||||||||||
| Francis & Jeffrey Chan, JTWROS | 50,000 | 50,000 | * | 0 | * | |||||||||||||||
| Francis Howard | 400,000 | 400,000 | * | 0 | * | |||||||||||||||
| Frank and Hope Patton, JTWROS | 75,000 | 75,000 | * | 0 | * | |||||||||||||||
| Frank Guy, IRA | 50,000 | 50,000 | * | 0 | * | |||||||||||||||
| Frank J. Garofalo | 300,000 | 350,384 | * | 350,384 | * | |||||||||||||||
| Fred G. Militello | 25,000 | 25,000 | * | 0 | * | |||||||||||||||
| Frederick Von Massey, IRA | 50,000 | 50,000 | * | 0 | * | |||||||||||||||
| Galt Asset Management | 500,000 | 500,000 | * | 0 | * | |||||||||||||||
| Gary and Arlene Falkin, JTWROS | 50,000 | 50,000 | * | 0 | * | |||||||||||||||
| Gary W. Kleinman | 250,000 | 374,074 | * | 124,074 | * | |||||||||||||||
| George Kafkarkou | 175,000 | 175,000 | * | 0 | * | |||||||||||||||
| George M. Abraham | 150,000 | 262,926 | * | 112,926 | * | |||||||||||||||
| Gerald and Seena Sperling | 166,668 | 166,668 | * | 0 | * | |||||||||||||||
| Gerald and Seena Sperling, JTWROS | 233,334 | 233,334 | * | 0 | * | |||||||||||||||
| Gilbert Ludwig, IRA | 41,668 | 41,668 | * | 0 | * | |||||||||||||||
| Gilya Alchits | 100,000 | 100,000 | * | 0 | * |
76
| Gregory Harrison | 533,334 | 1,289,000 | 1.18 | % | 855,666 | * | ||||||||||||||
| Guido Kibbelaar | 220,000 | 514,402 | * | 294,402 | * | |||||||||||||||
| Gunther Motor Company of Plantation, Inc. | 200,000 | 372,708 | * | 172,708 | * | |||||||||||||||
| Hanka Lew | 75,000 | 75,000 | * | 0 | * | |||||||||||||||
| Herman Spliethoff | 300,000 | 2,497,863 | 2.29 | % | 2,197,863 | 2.02 | % | |||||||||||||
| Howard & Arlene Berger, JTWROS | 100,000 | 100,000 | * | 0 | * | |||||||||||||||
| Howard Roth, IRA | 100,000 | 100,000 | * | 0 | * | |||||||||||||||
| Ian Hoffman, IRA | 80,000 | 80,000 | * | 0 | * | |||||||||||||||
| Ines Bahl & Burkhard Koder, JTWROS | 50,000 | 50,000 | * | 0 | * | |||||||||||||||
| Ines Bahl, IRA | 44,000 | 44,000 | * | 0 | * | |||||||||||||||
| Intelladon, LLC | 50,000 | 50,000 | * | 0 | * | |||||||||||||||
| IVM Productions, Inc. | 150,000 | 187,037 | * | 37,037 | * | |||||||||||||||
| Jeroen Kibbelaar | 600,000 | 1,088,093 | 1.00 | % | 488,093 | * | ||||||||||||||
| J. Paul Culotta, IRA | 25,000 | 25,000 | * | 0 | * | |||||||||||||||
| Jam-123, LLC | 31,500 | 31,500 | * | 0 | * | |||||||||||||||
| James E. Anderson | 475,038 | 575,038 | * | 475,038 | * | |||||||||||||||
| James Miller | 25,000 | 25,000 | * | 0 | * | |||||||||||||||
| James Narutowicz & Michael Narutowicz, JTWROS | 50,000 | 50,000 | * | 0 | * | |||||||||||||||
| James Walker | 200,000 | 200,000 | * | 100,000 | * | |||||||||||||||
| James Williams | 41,668 | 41,668 | * | 0 | * | |||||||||||||||
| Jason Curtis | 350,000 | 350,000 | * | 0 | * | |||||||||||||||
| Jason Paulley | 130,000 | 130,000 | * | 0 | * | |||||||||||||||
| Jason Paulley, IRA | 396,668 | 396,668 | * | 0 | * | |||||||||||||||
| Jason Paulley, Roth IRA | 50,000 | 50,000 | * | 0 | * | |||||||||||||||
| Jay Angle | 1,235,000 | 1,235,000 | 1.13 | % | 0 | * | ||||||||||||||
| Jean Yves Laurent | 142,637 | 250,020 | * | 107,383 | * | |||||||||||||||
| Jeannette Militello, IRA | 41,668 | 41,668 | * | 0 | * | |||||||||||||||
| Jeffrey E. Burt, IRA | 47,000 | 47,000 | * | 0 | * | |||||||||||||||
| Jennifer Zhu | 25,000 | 25,000 | * | 0 | * | |||||||||||||||
| Jericho Capital Corp, FBO Kenneth Greene SEP | 300,000 | 300,000 | * | 0 | * | |||||||||||||||
| Jim Williams, IRA | 37,000 | 37,000 | * | 0 | * | |||||||||||||||
| Joan P. Foley for Edward J. Foley, Lifetime Trust, Edward J. Foley, III, Trustee | 50,000 | 91,919 | * | 41,919 | * | |||||||||||||||
| Johan Dejager (8) | 1,198,988 | 2,425,503 | ||||||||||||||||||
| John & Yvonne Weatherford, JTWROS | 50,000 | 50,000 | * | 0 | * | |||||||||||||||
| John Alessandro | 41,668 | 41,668 | * | 0 | * | |||||||||||||||
| John Alessandro, IRA | 73,334 | 73,334 | * | 0 | * | |||||||||||||||
| John Anthony Gennaro | 100,000 | 100,000 | * | 0 | * | |||||||||||||||
| John Black | 86,668 | 86,668 | * | 0 | * |
77
| John Blum | 50,000 | 50,000 | * | 0 | * | |||||||||||||||
| John Blum, Jr. | 500,000 | 500,000 | * | 0 | * | |||||||||||||||
| John Donald Marks | 50,000 | 50,000 | * | 0 | * | |||||||||||||||
| John F. Bonner, III | 100,000 | 100,000 | * | 0 | * | |||||||||||||||
| John Grohe | 40,000 | 40,000 | * | 0 | * | |||||||||||||||
| John J. Buttrum | 30,000 | 30,000 | * | 0 | * | |||||||||||||||
| John J. Curley | 125,000 | 180,556 | * | 55,556 | * | |||||||||||||||
| John J. Shaw | 300,000 | 374,074 | * | 74,074 | * | |||||||||||||||
| John Key, IRA | 63,334 | 63,334 | * | 0 | * | |||||||||||||||
| John N. Alessandro | 50,000 | 50,000 | * | 0 | * | |||||||||||||||
| John Peter Christensen | 100,000 | 186,354 | * | 86,354 | * | |||||||||||||||
| John R. Rogers | 250,000 | 250,000 | * | 250,000 | * | |||||||||||||||
| John R. Rogers, IRA | 230,000 | 140,000 | * | 140,000 | * | |||||||||||||||
| John F. Sloan, Jr. | 105,000 | 105,000 | * | 0 | * | |||||||||||||||
| John F. Sloan, Jr. Roth IRA | 10,000 | 10,000 | * | 10,000 | * | |||||||||||||||
| John F. Sloan, Jr., IRA | 84,000 | 84,000 | * | 84,000 | * | |||||||||||||||
| John Robert Walker, IRA | 251,668 | 286,002 | * | 0 | * | |||||||||||||||
| John Walker, Roth IRA | 48,334 | 48,334 | * | 0 | * | |||||||||||||||
| John Weatherford | 62,000 | 62,000 | * | 0 | * | |||||||||||||||
| John Weatherford, IRA | 38,000 | 38,000 | * | 0 | * | |||||||||||||||
| Jordan Family LLC | 200,000 | 200,000 | * | 0 | * | |||||||||||||||
| Joseph Fusaro | 25,000 | 25,000 | * | 0 | * | |||||||||||||||
| Joseph Thomas Watters, III | 100,000 | 100,000 | * | 0 | * | |||||||||||||||
| Julie Coplan | 25,000 | 25,000 | * | 0 | * | |||||||||||||||
| Kenneth Greene fbo Colby J Greene | 150,000 | 150,000 | * | 0 | * | |||||||||||||||
| Kenneth Greene fbo Grant B Greene | 150,000 | 150,000 | * | 0 | * | |||||||||||||||
| Kent Jones | 75,000 | 75,000 | * | 25,000 | * | |||||||||||||||
| Kerry Staton | 390,000 | 390,000 | * | 0 | * | |||||||||||||||
| Kevin Charos | 150,000 | 100,000 | * | 100,000 | * | |||||||||||||||
| Lamar F. Callaway, IRA | 50,000 | 50,000 | * | 0 | * | |||||||||||||||
| Lawrence Paul Cake, Roth IRA | 25,000 | 43,000 | * | 30,500 | * | |||||||||||||||
| Larry Hopfenspirger | 666,668 | 666,668 | * | 0 | * | |||||||||||||||
| Lonnie & Haley Klein, JTTEN | 33,334 | 33,334 | * | 0 | * | |||||||||||||||
| Louis Daniele | 100,000 | 100,000 | * | 0 | * | |||||||||||||||
| Michel Casselman | 100,000 | 175,284 | * | 75,284 | * | |||||||||||||||
| Marc & Stacy Dorman, JTWROS | 80,000 | 80,000 | * | 0 | * | |||||||||||||||
| Marc Blumenthal | 75,000 | 75,000 | * | 0 | * | |||||||||||||||
| Marie Karanfilian | 25,000 | 45,960 | * | 20,960 | * |
78
| Marie Rutsaert | 147,500 | 258,544 | * | 111,044 | * | |||||||||||||||
| Mark Butt | 248,334 | 248,334 | * | 0 | * | |||||||||||||||
| Mark I. Lev (4) | 45,500 | 45,500 | * | 0 | * | |||||||||||||||
| Mark S. Wiley | 25,000 | 25,000 | * | 0 | * | |||||||||||||||
| Martha Blackwood Zeh | 53,334 | 87,372 | * | 34,038 | * | |||||||||||||||
| Martin Charles Yerg, IRA | 135,000 | 135,000 | * | 0 | * | |||||||||||||||
| Matthew Templeman | 50,000 | 50,000 | * | 0 | * | |||||||||||||||
| Michael J. & Deborah W. Picker, JTTEN | 50,000 | 50,000 | * | 0 | * | |||||||||||||||
| Michael J. & Deborah W. Picker, Tenants in Common | 100,000 | 100,000 | * | 0 | * | |||||||||||||||
| Michael Nimaroff | 75,000 | 75,000 | * | 0 | * | |||||||||||||||
| Michael Pantelis | 40,000 | 40,000 | * | 0 | * | |||||||||||||||
| Michael Seekins | 25,000 | 28,000 | * | 0 | * | |||||||||||||||
| Mitchell McClaren, IRA | 50,000 | 50,000 | * | 0 | * | |||||||||||||||
| MKM Opportunity Master Fund | 300,000 | 300,000 | * | 0 | * | |||||||||||||||
| Nathan Sugarman | 75,000 | 131,463 | * | 56,463 | * | |||||||||||||||
| Navitrade Holding NV | 2,000,000 | 4,380,953 | 0 | * | ||||||||||||||||
| Nazim Lokhandwala | 62,000 | 62,000 | * | 32,000 | * | |||||||||||||||
| Nextview Capital, LP | 490,000 | 622,644 | * | 132,644 | * | |||||||||||||||
| Nicos A. Kafkarkou | 50,000 | 50,000 | * | 0 | * | |||||||||||||||
| Nigel Francis Burrow Living Trust | 25,000 | 25,000 | * | 0 | * | |||||||||||||||
| Nigel Gregg | 75,000 | 75,000 | * | 0 | * | |||||||||||||||
| Pierre van Durme | 180,000 | 180,000 | * | 0 | * | |||||||||||||||
| Palmer & Majorie Kay Arnold, JTWROS | 100,000 | 100,000 | * | 0 | * | |||||||||||||||
| Palmer G. Arnold | 50,000 | 50,000 | * | 0 | * | |||||||||||||||
| Pamela Corson | 50,000 | 50,000 | * | 0 | * | |||||||||||||||
| Pamela Corson, IRA | 25,000 | 46,049 | * | 21,049 | * | |||||||||||||||
| Paul Erbe | 50,000 | 50,000 | * | 0 | * | |||||||||||||||
| Peter Kertes | 50,000 | 87,642 | * | 37,642 | * | |||||||||||||||
| Polly Ristaino | 25,000 | 25,000 | * | 0 | * | |||||||||||||||
| Prajeshkeamar and Monika Patel | 150,000 | 150,000 | * | 0 | * | |||||||||||||||
| QAT II Investments, SA (9) | 25,490,480 | 26,729,764 | 24.52 | % | 0 | * | ||||||||||||||
| Qin C. Ryan, IRA | 100,000 | 100,000 | * | 0 | * | |||||||||||||||
| Quercus Management Group, N.V. (10) | 1,137,375 | 1,137,375 | 1.04 | % | 0 | * | ||||||||||||||
| Randy W. Meeks | 35,000 | 35,000 | * | 0 | * | |||||||||||||||
| Raymond G. Tinney | 50,000 | 50,000 | * | 0 | * | |||||||||||||||
| Raymond McGill, IRA | 88,500 | 88,500 | * | 0 | * | |||||||||||||||
| Raymond Tinney | 200,000 | 200,000 | * | 0 | * | |||||||||||||||
| Rebecca Davis, IRA | 48,334 | 48,334 | * | 0 | * | |||||||||||||||
| Reese Freyer | 25,000 | 25,000 | * | 0 | * |
79
| Richard Curtis | 90,000 | 90,000 | * | 0 | * | |||||||||||||||
| Richard J. Fasman | 50,000 | 50,000 | * | 0 | * | |||||||||||||||
| Robert Deneke | 300,000 | 300,000 | * | 0 | * | |||||||||||||||
| Robert B. Stanger | 25,000 | 25,000 | * | 0 | * | |||||||||||||||
| Robert Bennet and Robert Bennett, Sr., JTWROS | 50,000 | 50,000 | * | 0 | * | |||||||||||||||
| Robert Bennett | 25,000 | 25,000 | * | 0 | * | |||||||||||||||
| Robert F. & Qin C. Ryan, JTWROS | 400,000 | 400,000 | * | 0 | * | |||||||||||||||
| Robert F. Ryan, IRA | 50,000 | 50,000 | * | 0 | * | |||||||||||||||
| Robert Gesemyer | 140,000 | 140,000 | * | 0 | * | |||||||||||||||
| Robert O'Mara | 100,000 | 175,284 | * | 75,284 | * | |||||||||||||||
| Robert Stanger | 28,334 | 28,334 | * | 0 | * | |||||||||||||||
| Robert Zens | 200,000 | 275,284 | * | 75,284 | * | |||||||||||||||
| Ronald Forstrom | 33,334 | 33,334 | * | 0 | * | |||||||||||||||
| Ronald Sauter | 40,000 | 40,000 | * | 0 | * | |||||||||||||||
| Ronniel Levy, Esq. (4) | 5,000 | 5,000 | * | 0 | * | |||||||||||||||
| Ross and Anita Gramstead, JTWROS | 50,000 | 50,000 | * | 0 | * | |||||||||||||||
| Roy E. & Melissa L. Reichbach, JTWROS | 100,000 | 100,000 | * | 0 | * | |||||||||||||||
| Ryan Michael Hogan | 150,000 | 150,000 | * | 0 | * | |||||||||||||||
| Saeid Banaei, IRA | 25,000 | 25,000 | * | 0 | * | |||||||||||||||
| Samax Family Limited Partnership | 225,000 | 70,834 | * | 0 | * | |||||||||||||||
| Sandgrain Securities, Inc. (11) | 20,000 | 20,000 | * | 0 | * | |||||||||||||||
| Sandor Capital Master Fund, LP | 500,000 | 250,000 | * | 0 | * | |||||||||||||||
| Sandra Diaz, IRA | 143,334 | 143,334 | * | 0 | * | |||||||||||||||
| Saskia van de Poel | 150,000 | 262,926 | * | 112,926 | * | |||||||||||||||
| Scott Bobbitt, IRA | 27,000 | 27,000 | * | 0 | * | |||||||||||||||
| Scott E. Douglas | 250,000 | 250,000 | * | 0 | * | |||||||||||||||
| Scott Hummer, IRRL | 25,000 | 25,000 | * | 0 | * | |||||||||||||||
| Scott S. Katz | 100,000 | 100,000 | * | 0 | * | |||||||||||||||
| Scott Stewart Katz | 25,000 | 25,000 | * | 0 | * | |||||||||||||||
| Sean and Alison Rivera, JTWROS | 40,000 | 40,000 | * | 0 | * | |||||||||||||||
| Seraz & Sabuhi Khan, JTWROS | 103,000 | 135,622 | * | 135,622 | * | |||||||||||||||
| Sharon Eshel Gloster | 50,000 | 50,000 | * | 0 | * | |||||||||||||||
| Sharon Gloster | 50,000 | 50,000 | * | 0 | * | |||||||||||||||
| Sheldon T. Fleck | 145,000 | 145,000 | * | 0 | * | |||||||||||||||
| Sheldon T. Fleck, Roth IRA | 100,000 | 100,000 | * | 0 | * | |||||||||||||||
| Sousan Doukas | 100,000 | 100,000 | * | 0 | * | |||||||||||||||
| Stacie Greene | 300,000 | 300,000 | * | 0 | * | |||||||||||||||
| Stephen Schell | 750,000 | 750,000 | * | 0 | * |
80
| Steve Elsey | 200,000 | 200,000 | * | 0 | * | |||||||||||||||
| Steve Wilson | 25,000 | 27,000 | * | 0 | * | |||||||||||||||
| Steven Boyce, IRA | 25,000 | 25,000 | * | 0 | * | |||||||||||||||
| Stephen E. Holzel | 125,000 | 143,519 | * | 18,519 | * | |||||||||||||||
| Steven Etra | 125,000 | 125,000 | * | 0 | * | |||||||||||||||
| Steven Gersten | 100,000 | 100,000 | * | 0 | * | |||||||||||||||
| Steven Mitchell Sack | 150,000 | 150,000 | * | 0 | * | |||||||||||||||
| Steven Mitchell Sack IRA | 100,000 | 100,000 | * | 0 | * | |||||||||||||||
| Steven Mitchell Sack PSP, Steven M. Sack, Trustee | 350,000 | 350,000 | * | 0 | * | |||||||||||||||
| Strive, Inc. Pension | 100,000 | 100,000 | * | 0 | * | |||||||||||||||
| Subhach C. Gulati | 100,000 | 100,000 | * | 0 | * | |||||||||||||||
| Super Angel Capitol, LLC | 166,668 | 166,668 | * | 0 | * | |||||||||||||||
| Tammy Eloshvili (4) | 5,000 | 5,000 | * | 0 | * | |||||||||||||||
| Tammy Sue McClain, IRA | 22,000 | 33,572 | * | 11,572 | * | |||||||||||||||
| Ted Vanvick | 41,668 | 41,668 | * | 0 | * | |||||||||||||||
| Tenura BV | 25,000 | 43,821 | * | 18,821 | * | |||||||||||||||
| Theo Olison, IRA | 35,000 | 35,000 | * | 0 | * | |||||||||||||||
| Tim Gillis | 50,000 | 50,000 | * | 0 | * | |||||||||||||||
| Todd Loudin | 50,000 | 50,000 | * | 0 | * | |||||||||||||||
| Tom Curtis (12) | 23,520 | 23,520 | * | 0 | * | |||||||||||||||
| Troy Scott | 48,334 | 48,334 | * | 0 | * | |||||||||||||||
| Umesh B. Malyavantham, IRA | 71,668 | 71,668 | * | 0 | * | |||||||||||||||
| Vincent P. Rose, Jr. | 25,000 | 25,000 | * | 23,500 | * | |||||||||||||||
| Vincent P. Rose, Jr., IRA | 100,000 | 100,000 | * | 100,000 | * | |||||||||||||||
| Vincent P. Rose, Sr., IRA | 25,000 | 25,000 | * | 0 | * | |||||||||||||||
| Virginia Cahal | 500,000 | 668,681 | * | 168,681 | * | |||||||||||||||
| Walter H. Sturm, M.D. and Sandra Sturm, JTWROS | 50,000 | 50,000 | * | 0 | * | |||||||||||||||
| Wardenburg 2009 Family Trust | 200,000 | 200,000 | * | 0 | * | |||||||||||||||
| Weigong Cao & Zhiging Ai, JTWROS | 25,000 | 25,000 | * | 0 | * | |||||||||||||||
| William A. Williams, IRA | 25,000 | 25,000 | * | 0 | * | |||||||||||||||
| William Curtis Kottke | 20,000 | 36,121 | * | 16,121 | * | |||||||||||||||
| William Kottke, IRA | 196,668 | 221,927 | * | 25,259 | * | |||||||||||||||
| William P. Mulligan, Jr. | 100,000 | 100,000 | * | 0 | * | |||||||||||||||
| William Turk | 42,000 | 42,000 | * | 0 | * | |||||||||||||||
| William Williams | 24,168 | 24,168 | * | 0 | * | |||||||||||||||
| Woody S. Byars | 25,000 | 38,287 | * | 0 | * | |||||||||||||||
| Wrayswood, LLLP | 90,000 | 90,000 | * | 0 | * | |||||||||||||||
| Yiotis A. Maouris | 50,000 | 50,000 | * | 0 | * | |||||||||||||||
| Total | 65,518,682 | 76,914,586 | 8,692,962 |
81
* Represents less than 1% of total outstanding common stock
(1) Includes shares of common stock being registered and shares of common stock being registered which are issuable upon the exercise of warrants issued to such person.
(2) Beneficial ownership is determined in accordance with Rule 13d-3 of the Exchange Act. In computing the number of shares beneficially owned by a person and the percentage ownership of that person, securities that are currently convertible or exercisable into shares of our common stock, or convertible or exercisable into shares of our common stock within 60 days of the date hereof are deemed outstanding. Such shares, however, are not deemed outstanding for the purpose of computing the percentage ownership of any other person. Except as indicated in the footnotes to the following table, each stockholder named in the table has sole voting and investment power with respect to the shares set forth opposite such stockholder’s name. The percentage of beneficial ownership of our common stock is determined based on 109,026,881 shares of common stock outstanding as of August 29, 2011.
(3) Assumes that all securities registered will be sold.
(4) Such persons are affiliated with Sandgrain Securities, Inc. and were issued “A” and “B” selling agent warrants in connection with the 2010 bridge offering. This includes the shares of common stock underlying such warrants.
(5) Such persons are affiliated with Dawson James Securities, Inc., a FINRA registered broker-dealer, and were issued selling agent warrants in connection with the 2010 private placement offering. This includes the shares of common stock underlying such warrants.
(6) Also includes 40,000 shares held by BMO & Associates.
(7) This includes the shares of common stock underlying 192,488 selling agent warrants issued to Dawson James in connection with the 2009 private placement offering and 310,517 selling agent warrants issued to Dawson James in connection with the 2010 private placement offering.
(8) Mr. Dejager is a member of our board of directors. His beneficial ownership also includes shares and warrants to purchase shares of our common stock held by other entities. Please see note 14 to our beneficial ownership table for more information.
(9) QAT II Investments is an investment entity related to certain of our officers and directors.
(10) Quercus Management Group, NV is a European financial advisory firm related to QAT Investments, which is related to certain of our officers and directors. This includes the shares of common stock underlying 802,575 selling agent warrants issued to QMG in connection with the 2009 private placement offering and 334,800 selling agent warrants (167,400 “A” warrants and 167,400 “B” warrants) issued to QMB in connection with the 2010 bridge offering.
(11) This includes the shares of common stock underlying 10,000 “A” and 10,000 “B” selling agent warrants issued to Sandgrain in connection with the 2010 bridge offering.
(12) This includes the shares of common stock underlying 23,520 selling agent warrants issued to such person in connection with the 2009 private placement offering. Such person is an affiliate of Dawson James.
82
The selling stockholders and any of their respective pledgees, donees, assignees and other successors-in-interest may, from time to time, sell any or all of their shares of common stock on any stock exchange, market or trading facility on which the shares are traded or in private transactions. These sales may be at fixed or negotiated prices. The selling stockholders may use any one or more of the following methods when selling shares:
| ¨ | ordinary brokerage transactions and transactions in which the broker-dealer solicits the purchaser; |
| ¨ | block trades in which the broker-dealer will attempt to sell the shares as agent but may position and resell a portion of the block as principal; |
| ¨ | facilitate the transaction; |
| ¨ | purchases by a broker-dealer as principal and resale by the broker-dealer for its account; |
| ¨ | an exchange distribution in accordance with the rules of the applicable exchange; |
| ¨ | privately-negotiated transactions; |
| ¨ | broker-dealers may agree with the selling stockholders to sell a specified number of such shares at a stipulated price per share; |
| ¨ | through the writing of options on the shares; |
| ¨ | a combination of any such methods of sale; and |
| ¨ | any other method permitted pursuant to applicable law. |
The selling stockholders may also sell shares under Rule 144 of the Securities Act of 1933, as amended (the “Securities Act”), if available, rather than under this prospectus. The selling stockholders shall have the sole and absolute discretion not to accept any purchase offer or make any sale of shares if it deems the purchase price to be unsatisfactory at any particular time.
The selling stockholders or their respective pledgees, donees, transferees or other successors in interest, may also sell the shares directly to market makers acting as principals and/or broker-dealers acting as agents for themselves or their customers. Such broker-dealers may receive compensation in the form of discounts, concessions or commissions from the selling stockholders and/or the purchasers of shares for whom such broker-dealers may act as agents or to whom they sell as principal or both, which compensation as to a particular broker-dealer might be in excess of customary commissions. Market makers and block purchasers purchasing the shares will do so for their own account and at their own risk. It is possible that a selling stockholder will attempt to sell shares of common stock in block transactions to market makers or other purchasers at a price per share which may be below the then existing market price. We cannot assure that all or any of the shares offered in this prospectus will be issued to, or sold by, the selling stockholders. The selling stockholders and any brokers, dealers or agents, upon effecting the sale of any of the shares offered in this prospectus, may be deemed to be “underwriters” as that term is defined under the Securities Act, the Exchange Act and the rules and regulations of such acts. In such event, any commissions received by such broker-dealers or agents and any profit on the resale of the shares purchased by them may be deemed to be underwriting commissions or discounts under the Securities Act.
We are required to pay all fees and expenses incident to the registration of the shares, including fees and disbursements of counsel to the selling stockholders, but excluding brokerage commissions or underwriter discounts.
83
The selling stockholders, alternatively, may sell all or any part of the shares offered in this prospectus through an underwriter. The selling stockholders have not entered into any agreement with a prospective underwriter and there is no assurance that any such agreement will be entered into.
The selling stockholders may pledge their shares to their brokers under the margin provisions of customer agreements. If a selling stockholder defaults on a margin loan, the broker may, from time to time, offer and sell the pledged shares. The selling stockholders and any other persons participating in the sale or distribution of the shares will be subject to applicable provisions of the Exchange Act, and the rules and regulations under such act, including, without limitation, Regulation M. These provisions may restrict certain activities of, and limit the timing of purchases and sales of any of the shares by, the selling stockholders or any other such person. In the event that any of the selling stockholders are deemed an affiliated purchaser or distribution participant within the meaning of Regulation M, then the selling stockholders will not be permitted to engage in short sales of common stock. Furthermore, under Regulation M, persons engaged in a distribution of securities are prohibited from simultaneously engaging in market making and certain other activities with respect to such securities for a specified period of time prior to the commencement of such distributions, subject to specified exceptions or exemptions. In addition, if a short sale is deemed to be a stabilizing activity, then the selling stockholders will not be permitted to engage in a short sale of our common stock. All of these limitations may affect the marketability of the shares.
If a selling stockholder notifies us that it has a material arrangement with a broker-dealer for the resale of the common stock, then we would be required to amend the registration statement of which this prospectus is a part, and file a prospectus supplement to describe the agreements between the selling stockholder and the broker-dealer.
84
DESCRIPTION OF SECURITIES TO BE REGISTERED
General
Our authorized capital consists of 250,000,000 shares of common stock and 50,000,000 shares of preferred stock. As of the date of this prospectus, we have 109,026,881 shares of common stock issued and outstanding (excluding approximately 3,564,306 shares of common stock issuable in connection with the automatic conversion of the notes issued in connection with the 2010 private placement offering). There are no outstanding shares of preferred stock as of the date of this prospectus.
As of August 29, 2011, there were:
| • | 109,026,881 shares of common stock issued and outstanding; |
| • | warrants to purchase 51,128,503 shares of common stock issued and outstanding; and |
| • | there were no shares of preferred stock issued and outstanding. |
Common Stock
All outstanding shares of common stock are of the same class and have equal rights and attributes. The holders of common stock are entitled to one vote per share on all matters submitted to a vote of shareholders of the Company. All shareholders are entitled to share equally in dividends, if any, as may be declared from time to time by the board of directors out of funds legally available. In the event of liquidation, the holders of common stock are entitled to share ratably in all assets remaining after payment of all liabilities. The shareholders do not have cumulative or preemptive rights.
Transfer Agent and Registrar
The transfer agent for our common stock is Continental Stock Transfer & Trust Company. Our transfer agent’s address is 17 Battery Place, New York, New York 10004.
MARKET FOR COMMON EQUITY AND RELATED SHAREHOLDER MATTERS
Our common stock is quoted on the OTC Bulletin Board, an electronic quotation service for securities traded over-the-counter, under the symbol “ETAK”. The following table sets forth the high and low closing sale prices of our common stock for the periods indicated.
| High | Low | |||||||
| 2009 | ||||||||
| First Quarter | $ | 1.16 | $ | 0.50 | ||||
| Second Quarter | 1.00 | 0.67 | ||||||
| Third Quarter | 1.50 | 0.80 | ||||||
| Fourth Quarter | 2.20 | 1.10 | ||||||
| 2010 | ||||||||
| First Quarter | $ | 1.80 | $ | 1.18 | ||||
| Second Quarter | 2.15 | 1.10 | ||||||
| Third Quarter | 2.65 | 1.50 | ||||||
| Fourth Quarter | 2.37 | 2.30 | ||||||
| 2011 | ||||||||
| First Quarter | $ | 2.70 | 2.60 | |||||
| Second Quarter | 3.38 | 2.14 | ||||||
85
Dividend Policy
We have not paid any cash dividends on our common stock to date, and we have no intention of paying cash dividends in the foreseeable future. Whether we will declare and pay dividends in the future will be determined by our board of directors at their discretion, subject to certain limitations imposed under California corporate law. The timing, amount and form of dividends, if any, will depend on, among other things, our results of operations, financial condition, cash requirements and other factors deemed relevant by our board of directors.
LEGAL MATTERS
The validity of our common stock offered hereby has been passed upon by Ellenoff Grossman & Schole LLP, New York, New York.
The financial statements as of December 31, 2010 and 2009 and for the periods included in this prospectus have been so included in reliance on the report of BDO USA, LLP (formerly known as BDO Seidman, LLP), an independent registered public accounting firm, the report on the financial statements contains an explanatory paragraph regarding the Company's ability to continue as a going concern, appearing elsewhere herein, given on the authority of said firm as experts in auditing and accounting.
86
This prospectus is part of a Registration Statement on Form S-1 we have filed with the SEC. We have not included in this prospectus all of the information contained in the Registration Statement and you should refer to our Registration Statement and its exhibits for further information.
We file annual, quarterly, and special reports, proxy statements, and other information with the SEC. You may read and copy any document we file at the SEC’s public reference room at 100 F Street, N.E., Washington, D.C. 20549. Copies of these materials may also be obtained from the SEC at prescribed rates by writing to the Public Reference Section of the SEC, 100 F. Street, N.E., Washington, D.C. 20549. You may obtain information about the operation of the SEC public reference room in Washington, D.C. by calling the SEC at 1-800-SEC-0330. Our filings are also available to the public from commercial document retrieval services and at the website maintained by the SEC at http://www.sec.gov.
DISCLOSURE OF COMMISSION POSITION ON INDEMNIFICATION FOR
SECURITIES ACT LIABILITIES
Our articles of incorporation and bylaws include provisions to: (i) eliminate the personal liability of our directors for monetary damages resulting from breaches of their fiduciary duty, to the extent permitted by California law and (ii) permit us to indemnify our directors and officers, employees and other agents to the fullest extent permitted by the California Corporations Code. Pursuant to Section 317 of the California Corporations Code, a corporation generally has the power to indemnify its present and former directors, officers, employees and agents against any expenses incurred by them in connection with any suit to which they are, or are threatened to be made, a party by reason of their serving in such positions so long as they acted in good faith and in a manner they reasonably believed to be in, or not opposed to, the best interests of a corporation and, with respect to any criminal action, they had no reasonable cause to believe their conduct was unlawful. We believe that these provisions are necessary to attract and retain qualified persons as directors and officers. These provisions do not eliminate liability for breach of the directors’ duty of loyalty to us or our shareholders, for acts or omissions not in good faith or involving intentional misconduct or knowing violations of law, for any transaction from which the director derived an improper personal benefit or for any willful or negligent payment of any unlawful dividend.
Insofar as indemnification for liabilities arising under the Securities Act of 1933 may be permitted to directors, officers or persons controlling the registrant pursuant to the foregoing provisions, the registrant has been informed that in the opinion of the Securities and Exchange Commission such indemnification is against public policy as expressed in the Securities Act and is therefore unenforceable.
87
ELEPHANT TALK COMMUNICATIONS, INC.
AND ITS SUBSIDIARIES
INDEX TO FINANCIAL STATEMENTS
F-1
ELEPHANT TALK COMMUNICATIONS, INC.
TABLE OF CONTENTS TO FINANCIAL STATEMENTS
| Page | ||
| For the six months ended June 30, 2011 | ||
| Consolidated Balance Sheets as of June 30, 2011 (Unaudited) and December 31, 2010 | F-3 | |
| Unaudited Consolidated Statements of Operations for the six months periods ended June 30, 2011 and 2010 | F-4 | |
| Unaudited Consolidated Statements of Cash Flows for the six months periods ended June 30, 2011 and 2010 | F-5 | |
| Notes to the Unaudited Consolidated Financial Statement | F-6 | |
| For the years ended December 31, 2010 and 2009 | ||
| Report of Independent Registered Public Accounting Firm, BDO USA, LLP | F-21 | |
| Consolidated Balance Sheets as of December 31, 2010 AND 2009 | F-22 | |
| Consolidated Statement of Operations for the years ended December, 2010 AND 2009 | F-24 | |
| Consolidated Statement of Changes in Shareholders’ Equity (Deficit) for the years ended December 31, 2010 AND 2009 | F-25 | |
| Consolidated Statements of Cash Flows for the years ended December 31, 2010 AND 2009 | F-26 | |
| Notes to Consolidated Financial Statements | F-27 |
F-2
Item 1. Consolidated Financial Statements
ELEPHANT TALK COMMUNICATIONS, INC. AND SUBSIDIARIES
CONSOLIDATED BALANCE SHEET
| Unaudited | Audited | |||||||
| June 30, | December 31, | |||||||
| 2011 | 2010 | |||||||
| ASSETS | ||||||||
| CURRENT ASSETS | ||||||||
| Cash and cash equivalents | $ | 4,652,182 | $ | 2,245,697 | ||||
| Restricted cash | 192,962 | 190,312 | ||||||
| Accounts receivable, net of an allowance for doubtful accounts of $102,101 and $119,044 at June 30, 2011 and December 31, 2010 respectively | 7,299,893 | 5,600,562 | ||||||
| Prepaid expenses and other current assets | 4,948,585 | 2,337,914 | ||||||
| Total Current Assets | 17,093,622 | 10,374,485 | ||||||
| LONG TERM DEPOSITS | 697,278 | 610,486 | ||||||
| PROPERTY AND EQUIPMENT, NET | 13,882,407 | 8,452,588 | ||||||
| INTANGIBLE ASSETS, NET | 16,053,305 | 16,253,587 | ||||||
| GOODWILL | 3,515,089 | 3,230,786 | ||||||
| TOTAL ASSETS | $ | 51,241,701 | $ | 38,921,932 | ||||
| LIABILITIES AND STOCKHOLDERS' EQUITY | ||||||||
| CURRENT LIABILITIES | ||||||||
| Overdraft | $ | 353,481 | $ | 356,738 | ||||
| Accounts payable and customer deposits | 6,940,243 | 4,703,875 | ||||||
| Deferred Revenue | 407,110 | — | ||||||
| Accrued expenses and other payables | 5,075,273 | 3,843,938 | ||||||
| Loans payable | 877,334 | 877,357 | ||||||
| Total Current Liabilities | 13,653,441 | 9,781,908 | ||||||
| LONG TERM LIABILITIES | ||||||||
| Loan from related party | 493,242 | 468,756 | ||||||
| Total Long term Liabilities | 493,242 | 468,756 | ||||||
| Total Liabilities | 14,146,683 | 10,250,664 | ||||||
| STOCKHOLDERS' EQUITY | ||||||||
| Common stock, no par value, 250,000,000 shares authorized, 101,101,456 issued and outstanding as of June 30, 2011 compared to 88,660,848 shares issued and outstanding as of December 31, 2010 | 200,414,451 | 183,825,665 | ||||||
| Accumulated other comprehensive income (loss) | 2,738,583 | (519,020 | ) | |||||
| Accumulated deficit | (166,253,083 | ) | (154,818,436 | ) | ||||
| Elephant Talk Communications, Inc. Stockholders' Equity | 36,899,951 | 28,488,209 | ||||||
| NON-CONTROLLING INTEREST | 195,067 | 183,059 | ||||||
| Total Stockholders' Equity | 37,095,018 | 28,671,268 | ||||||
| TOTAL LIABILITIES AND STOCKHOLDERS' EQUITY | $ | 51,241,701 | $ | 38,921,932 | ||||
The accompanying notes are an integral part of the unaudited consolidated financial statement
F-3
ELEPHANT TALK COMMUNICATIONS, INC. AND SUBSIDIARIES
CONSOLIDATED STATEMENT OF OPERATIONS AND COMPREHENSIVE LOSS
(UNAUDITED)
| For the Three Months | For the Six Months | |||||||||||||||
| Period ended, | Period ended, | |||||||||||||||
| 2011 | 2010 | 2011 | 2010 | |||||||||||||
| REVENUES | $ | 7,790,976 | $ | 9,673,825 | $ | 16,298,990 | $ | 19,617,590 | ||||||||
| COST AND OPERATING EXPENSES | ||||||||||||||||
| Cost of service | 7,494,679 | 9,005,394 | 15,052,164 | 18,379,282 | ||||||||||||
| Selling, general and administrative expenses | 3,824,756 | 2,079,359 | 7,241,113 | 3,984,709 | ||||||||||||
| Non cash compensation to officers, directors and employees | 2,037,903 | 2,712,756 | 3,167,966 | 3,253,669 | ||||||||||||
| Depreciation and amortization of intangibles assets | 1,337,775 | 1,515,428 | 2,640,450 | 2,360,122 | ||||||||||||
| Total cost and operating expenses | 14,695,113 | 15,312,937 | 28,101,693 | 27,977,782 | ||||||||||||
| LOSS FROM OPERATIONS | (6,904,137 | ) | (5,639,112 | ) | (11,802,703 | ) | (8,360,192 | ) | ||||||||
| OTHER INCOME (EXPENSE) | ||||||||||||||||
| Interest income | 24,145 | 32,520 | 47,131 | 65,119 | ||||||||||||
| Interest expense | (71,511 | ) | (535,887 | ) | (138,275 | ) | (982,427 | ) | ||||||||
| Other income | 230,000 | — | 460,000 | |||||||||||||
| Interest expense related to amortization of debt discount on promissory notes | — | (4,959,044 | ) | — | (7,545,823 | ) | ||||||||||
| Change in fair value of warrant liabilities | — | (2,660,727 | ) | — | (8,748,778 | ) | ||||||||||
| Amortization of deferred financing costs | — | (593,689 | ) | — | (1,121,535 | ) | ||||||||||
| Total other income (expense) | 182,634 | (8,716,827 | ) | 368,856 | (18,333,444 | ) | ||||||||||
| LOSS BEFORE PROVISION FOR INCOME TAXES | (6,721,503 | ) | (14,355,939 | ) | (11,433,847 | ) | (26,693,636 | ) | ||||||||
| Provision for income taxes | - | (800 | ) | (800 | ) | (800 | ) | |||||||||
| NET LOSS BEFORE NONCONTROLLING INTEREST | (6,721,503 | ) | (14,356,739 | ) | (11,434,647 | ) | (26,694,436 | ) | ||||||||
| Net (loss) income attributable to noncontrolling interest | 80 | (1,785 | ) | - | (2,283 | ) | ||||||||||
| NET LOSS | (6,721,423 | ) | (14,358,524 | ) | (11,434,647 | ) | (26,696,719 | ) | ||||||||
| OTHER COMPREHENSIVE (LOSS) INCOME | ||||||||||||||||
| Foreign currency translation gain (loss) | 938,039 | (3,168,961 | ) | 3,257,603 | (3,690,746 | ) | ||||||||||
| 938,039 | (3,168,961 | ) | 3,257,603 | (3,690,746 | ) | |||||||||||
| COMPREHENSIVE LOSS | $ | (5,783,384 | ) | $ | (17,527,485 | ) | $ | (8,177,044 | ) | $ | (30,387,465 | ) | ||||
| Net loss per common share and equivalents - basic and diluted | $ | (0.07 | ) | $ | (0.23 | ) | $ | (0.12 | ) | $ | (0.45 | ) | ||||
| Weighted average shares outstanding during the period - basic and diluted | 100,467,832 | 62,356,471 | 98,264,677 | 58,696,088 | ||||||||||||
The accompanying notes are an integral part of the unaudited consolidated financial statements
F-4
ELEPHANT TALK COMMUNICATIONS, INC. AND SUBSIDIARIES
CONSOLIDATED STATEMENTS OF CASH FLOWS
(UNAUDITED)
| for the six months period ended, | ||||||||
| June 30, | June 30, | |||||||
| 2011 | 2010 | |||||||
| CASH FLOWS FROM OPERATING ACTIVITIES: | ||||||||
| Net loss | $ | (11,434,647 | ) | $ | (26,696,719 | ) | ||
| Adjustments to reconcile net loss to net cash used in operating activities: | ||||||||
| Depreciation and amortization | 2,640,450 | 2,360,122 | ||||||
| Provision for doubtful accounts | (26,465 | ) | (57,474 | ) | ||||
| Stock based compensation | 2,881,617 | 2,876,951 | ||||||
| Noncontrolling interest | - | 2,283 | ||||||
| Amortization of Shares issued for Consultancy | 286,349 | 376,718 | ||||||
| Issuance of stock | — | 221,626 | ||||||
| Exercise of warrants (cash less) | — | 364,718 | ||||||
| Exercise of convertible note (cash less) | — | 112,443 | ||||||
| Change in fair value of warrant liabilities | — | 8,748,778 | ||||||
| Amortization of deferred financing costs | — | 1,121,535 | ||||||
| Interest expense relating to debt discount and conversion feature | — | 7,545,823 | ||||||
| Changes in operating assets and liabilities: | ||||||||
| Decrease (increase) in accounts receivable | (1,188,582 | ) | (1,342,543 | ) | ||||
| Decrease (Increase) in prepaid expenses, deposits and other assets | (2,409,125 | ) | 162,513 | |||||
| Increase (decrease) in accounts payable, proceeds from related parties and customer deposits | 1,835,548 | (1,789,851 | ) | |||||
| Increase (decrease) in deferred revenue | 396,484 | (131,835 | ) | |||||
| Increase (decrease) in accrued expenses and other payables | 987,048 | (717,070 | ) | |||||
| Net cash used in operating activities | (6,031,323 | ) | (6,841,983 | ) | ||||
| CASH FLOWS FROM INVESTING ACTIVITIES: | ||||||||
| Purchases of property and equipment | (5,754,894 | ) | (1,214,286 | ) | ||||
| Restricted cash | 24 | 20 | ||||||
| Cash received from acquisition of subsidiary | — | 48,577 | ||||||
| Net cash used in investing activities | (5,754,870 | ) | (1,165,689 | ) | ||||
| CASH FLOWS FROM FINANCING ACTIVITIES: | ||||||||
| Bank overdraft | (9,285 | ) | 18,721 | |||||
| Deferred financing costs | — | (205,326 | ) | |||||
| Loan from related party QAT Bridge Loan | 19,277 | 2,513,195 | ||||||
| Loan from related party Bridge SPA | — | 2,885,000 | ||||||
| Proceeds from Private Placement Offering | — | 6,459,800 | ||||||
| Exercise of warrants & options | 13,587,674 | 25,000 | ||||||
| Placement fees | — | (1,197,073 | ) | |||||
| Net cash provided by financing activities | 13,597,666 | 10,499,317 | ||||||
| EFFECT OF EXCHANGE RATES ON CASH AND CASH EQUIVALENTS | 595,012 | 327,169 | ||||||
| NET DECREASE IN CASH AND CASH EQUIVALENTS | 2,406,485 | 2,818,814 | ||||||
| CASH AND CASH EQUIVALENTS, BEGINNING OF THE PERIOD | 2,245,697 | 1,457,900 | ||||||
| CASH AND CASH EQUIVALENTS, END OF THE PERIOD | $ | 4,652,182 | $ | 4,276,714 | ||||
| SUPPLEMENTAL DISCLOSURES OF CASH FLOW INFORMATION: | ||||||||
| Cash paid during the period for interest | $ | — | $ | 473,824 | ||||
| June 30, | June 30, | |||||||
| 2011 | 2010 | |||||||
| SUPPLEMENTAL DISCLOSURES OF NON-CASH INVESTING & FINANCING ACTIVITIES: | ||||||||
| Increase in Share Capital due to Acquisitions and Non-Cash Compensation | $ | — | $ | 14,318,336 | ||||
| Increase in Share Capital due to Exercise of Warrants and Conversion of Notes | $ | — | $ | 346,564 | ||||
| $ | — | $ | 425 | |||||
| Increase of Warrants due to fundraising of Convertible notes | — | 7,539,585 | ||||||
The accompanying notes are an integral part of the unaudited consolidated financial statements
F-5
NOTES TO THE UNAUDITED CONSOLIDATED FINANCIAL STATEMENTS
Note 1. Organization and Nature of Operations
The Company
Elephant Talk Communications, Inc. (“Elephant Talk,” “we,” “us” or the “Company”), is an international provider of business software and services to the telecommunications and financial services industries. The Company enables both mobile network operators or MNOs and mobile virtual network operators or MVNOs to offer a full suite of products, delivery platforms, support services, superior industry expertise and high quality customer service without substantial upfront investments from clients. The Company provides global telecommunication companies, MNOs, banks, supermarkets, consumer product companies, media firms, and other businesses with a full suite of products and services that enables such entities to provide a full complement of telecom services as part of their business offerings. The Company offers various dynamic products that include remote health care, credit card fraud prevention, mobile internet ID security, multi-country discounted phone services, loyalty management services, and a whole range of other emerging customized mobile services.
Converged telecommunication services – full MVNE solutions
The Company is a niche player in the converged telecommunications market, providing traffic and network services as a licensed operator, and specializing in carrier grade mobile enabling platforms to provide outsourced solutions to the various players in the telecommunications value chain, including MNOs, MVNOs and non-operator companies in need of both mobile as well as specialized landline telecommunication services. In this chain, we position ourselves as a full mobile virtual network enabler or MVNE, including also customized mobile services such as our network integrated ValidSoft security and fraud prevention solutions.
ValidSoft – electronic fraud prevention
The acquisition of ValidSoft Ltd. (“ValidSoft”) gives us a position in providing solutions to counter electronic fraud relating to credit and/or debit cards, the internet, and telephone channels. ValidSoft products are used to verify the authenticity of both consumers and institutions (mutual authentication), and the integrity of transactions (transaction verification) for the mass market, in a highly cost effective and secure manner, yet easy to use and intuitive. ValidSoft products are marketed under VALid-POS® and VALid® trade names. ValidSoft biometrics product is marketed as VALid-SVP™.
Principles of Consolidation
The accompanying consolidated financial statements for June 30, 2011 and December 31, 2010 include the financial statements of Elephant Talk Communications Inc., including:
| · | its wholly-owned subsidiary Elephant Talk Europe Holding B.V., its wholly-owned subsidiary Elephant Talk Communication Holding AG, its wholly-owned subsidiaries Elephant Talk Communications S.L.U., Elephant Talk Mobile Services B.V., Elephant Talk Communication Austria GmbH, Elephant Talk Telekom GmbH (formerly Vocalis Austria GmbH), Elephant Talk Communications Italy S.R.L., ET-Stream GmbH, Elephant Talk Communication Carrier Services GmbH, Elephant Talk Communication (Europe) GmbH, Elephant Talk Communication Schweiz GmbH, Moba Consulting Partners B.V., Elephant Talk Communications France S.A.S., its majority owned (51%) subsidiary Elephant Talk Communications Premium Rate Services Netherlands B.V., its majority owned (51%) subsidiary Elephant Talk Communications PRS U.K. Limited, its wholly-owned subsidiary Elephant Talk Communications Luxembourg SA; |
| · | its wholly-owned subsidiary Elephant Talk Global Holding B.V., its wholly-owned subsidiary Elephant Talk Business Services W.L.L., its wholly-owned subsidiary Guangzhou Elephant Talk Information Technology Limited., its wholly-owned subsidiary Elephant Talk Caribbean B.V., its majority owned (51%) subsidiary ET-UTS N.V.; |
F-6
ELEPHANT TALK COMMUNICATIONS, INC. AND SUBSIDIARIES
NOTES TO THE UNAUDITED CONSOLIDATED FINANCIAL STATEMENTS
| · | its wholly-owned subsidiary Elephant Talk Limited, its majority owned (60%) subsidiary Elephant Talk Middle East & Africa (Holding) W.L.L., its majority owned (51%) subsidiary Elephant Talk Middle East & Africa (Holding) Jordan L.L.C., its majority owned (99%) subsidiary Elephant Talk Middle East & Africa Bahrain W.L.L and its majority owned (50.54%) subsidiary Elephant Talk Middle East & Africa FZ-LLC; and |
| · | its wholly-owned subsidiary ValidSoft Ltd and its wholly-owned subsidiaries ValidSoft (UK) Ltd & ValidSoft (Australia) Pty Ltd. |
Interim Financial Information
The accompanying unaudited consolidated financial statements have been prepared in accordance with U.S. generally accepted accounting principles for interim financial information and with the instructions to Form 10-Q. Accordingly, they do not include all of the information and footnotes required by generally accepted accounting principles for complete financial statements and related notes as included in our 2010 Form 10-K. These consolidated financial statements should be read in conjunction with the audited consolidated financial statements in our Form 10-K. In the opinion of management, the accompanying unaudited consolidated financial statements have been prepared on the same basis as the audited consolidated financial statements and contain all adjustments (which include only normal recurring adjustments) considered necessary for a fair presentation of our financial position, results of operations and cash flows as of and for the periods presented.
The results of operations for the six months ended June 30, 2011 are not necessarily indicative of the results to be expected for the entire year.
Going Concern
The financial statements have been prepared on a going concern basis which assumes the Company will be able to realize its assets and discharge its liabilities in the normal course of business for the foreseeable future. The Company has incurred losses since inception resulting in an accumulated deficit of $166,253,083 as of June 30, 2011 and further losses are anticipated in the development of its business. The ability to continue as a going concern is dependent upon the Company generating profitable operations in the future and/or to obtain the necessary financing to meet its obligations and repay its liabilities arising from normal business operations when they come due. Management plans to finance operating costs over the next twelve months with existing cash on hand, the proceeds from the July 28, 2011 redemption notice of common stock warrants issued to investors and therefore management believes they have sufficient cash to meet their needs for the next 12 months.
In the event the anticipated revenues are delayed or are less than anticipated and additional cash is required, the Company expects to seek additional financing and/or reduce costs expended on its research and development efforts.
Foreign Currency Translation
The functional currency is Euros for the Company’s wholly-owned subsidiary Elephant Talk Europe Holding B.V. and its subsidiaries, and Euros for its wholly-owned subsidiary Elephant Talk Global Holding B.V., and the Hong Kong Dollar for its wholly-owned subsidiary Elephant Talk Limited and the British Pound Sterling for its wholly-owned subsidiary ValidSoft (UK) Ltd. The financial statements of the Company were translated to USD using period-end exchange rates as to assets and liabilities and average exchange rates as to revenues and expenses, and capital accounts were translated at their historical exchange rates when the capital transaction occurred. In accordance with Accounting Standard Codification (“ASC”) 830, Foreign Currency Matters, net gains and losses resulting from translation of foreign currency financial statements are included in the statements of shareholder’s equity as other comprehensive income (loss). Foreign currency transaction gains and losses are included in consolidated income/(loss). The accumulated other comprehensive income/(loss) as of June 30, 2011 and December 31, 2010 was $2,738,583 and ($519,020), respectively. The foreign currency translation gain/(loss) for the six months ended June 30, 2011 and 2010 was $938,039 and ($3,168,961), respectively. The foreign currency translation gain/(loss) for the six months ended June 30, 2011 and 2010 were $3,257,603 and ($3,690,746), respectively.
F-7
ELEPHANT TALK COMMUNICATIONS, INC. AND SUBSIDIARIES
NOTES TO THE UNAUDITED CONSOLIDATED FINANCIAL STATEMENTS
Use of Estimates
The preparation of the accompanying financial statements conforms with accounting principles generally accepted in the United States of America and requires management to make certain estimates and assumptions that affect the reported amounts of assets and liabilities and disclosures of contingent assets and liabilities at the date of the financial statements, and the reported amounts of revenues and expenses during the reporting period. Actual results could differ materially from those estimates and assumptions.
Cash and Cash Equivalents
For purposes of the cash flow statements, the Company considers all highly liquid investments with original maturities of three months or less at the time of purchase to be cash equivalents.
Restricted Cash
Restricted cash represents cash deposited as bank guarantee for national interconnection agreements with telecom operators.
Accounts Receivables, net
The Company’s customer base consists of a geographically dispersed customer base. The Company maintains an allowance for potential credit losses on accounts receivable. Management reviews the composition of accounts receivable and analyzes historical bad debts, customer concentrations, customer credit worthiness, current economic trends and changes in customer payment patterns to evaluate the adequacy of these allowances. Allowances are recorded primarily on a specific identification basis. As of June 30, 2011 and December 31, 2010, the allowance for doubtful accounts was $102,101and $119,044, respectively.
Revenue Recognition and Deferred Revenue
The Company’s revenue recognition policies are in compliance with ASC 605, Revenue Recognition (“ASC 605”), (formerly, Staff Accounting Bulletin (“SAB104”). Revenue is recognized only when the price is fixed or determinable, persuasive evidence of arrangement exists, the service is performed and the collectability of the resulting receivable is reasonably assured. The Company derives revenue from activities as a landline and mobile services provider with its network and its own switching technology. Revenue represents amounts earned for telecommunication services provided to customers (net of value added tax and inter-company revenue). For its security solutions under the ValidSoft brand name and technologies revenue represents amounts earned for consultancy services, outsourcing, maintenance and licenses (net of value added tax and inter-company revenue).
Cost of Service
Cost of service includes origination, termination, network and billing charges from telecommunications operators, out payment costs to content and information providers, network costs, data center costs, facility costs of hosting network and equipment, and costs of providing resale arrangements with long distance service providers, costs of leasing transmission facilities and international gateway switches for voice and data transmission services.
Reporting Segments
ASC 820, Segment Reporting, defines operating segments as components of an enterprise about which separate financial information is available that is evaluated regularly by the chief operating decision maker in deciding how to allocate resources and in assessing performances. The Company allocates its resources and assesses the performance of its sales activities based upon geographic locations of its subsidiaries.
F-8
ELEPHANT TALK COMMUNICATIONS, INC. AND SUBSIDIARIES
NOTES TO THE UNAUDITED CONSOLIDATED FINANCIAL STATEMENTS
Stock-based Compensation
Effective January 1, 2006, we adopted the provisions of ASC 718 “Compensation-Stock Compensation”, (“ASC 718”), using the prospective approach. As a result, we recognize stock-based compensation expense for only those awards that are granted subsequent to December 31, 2005 and any previously existing awards that are subject to variable accounting, including certain stock options that were exercised with notes in 2003, until the awards are exercised, forfeited, or contractually expire in accordance with the prospective method and the transition rules of ASC 718. Under ASC 718, stock-based awards granted after December 31, 2005, are recorded at fair value as of the grant date and recognized as expense over the employee’s requisite service period (the vesting period, generally three years), which we have elected to amortize on a straight-line basis.
Income Taxes
The Company accounts for income taxes under ASC 740, “Accounting for Income Taxes” (“ASC 740”). This statement requires the recognition of deferred tax assets and liabilities for the future consequences of events that have been recognized in the Company’s financial statements or tax returns. The measurement of the deferred items is based on enacted tax laws. In the event the future consequences of differences between financial reporting bases and the tax bases of the Company’s assets and liabilities result in a deferred tax asset, ASC 740 requires an evaluation of the probability of being able to realize the future benefits indicated by such asset. A valuation allowance related to a deferred tax asset is recorded when it is more likely than not that some portion or the entire deferred tax asset will not be realized. As part of the process of preparing our consolidated financial statements, we are required to estimate our income tax expense in each of the jurisdictions in which we operate. In the ordinary course of a global business, there are many transactions and calculations where the ultimate tax outcome is uncertain. Some of these uncertainties arise as a consequence of revenue sharing and reimbursement arrangements among related entities, the process of identifying items of revenue and expenses that qualify for preferential tax treatment and segregation of foreign and domestic income and expense to avoid double taxation. We also assess temporary differences resulting from differing treatment of items, such as deferred revenue, for tax and accounting differences. These differences result in deferred tax assets and liabilities, which are included within our consolidated balance sheet. We may record a valuation allowance to reduce our deferred tax assets to the amount of future tax benefit that is more likely than not to be realized. Although we believe that our estimates are reasonable and that we have considered future taxable income and ongoing prudent and feasible tax strategies in estimating our tax outcome and in assessing the need for the valuation allowance, there is no assurance that the final tax outcome and the valuation allowance will not be different than those that are reflected in our historical income tax provisions and accruals.
ASC 740 prescribes a recognition threshold and measurement methodology to recognize and measure an income tax position taken, or expected to be taken, in a tax return. The evaluation of a tax position is based on a two-step approach. The first step requires an entity to evaluate whether the tax position would “more likely than not” be sustained upon examination by the appropriate taxing authority. The second step requires the tax position be measured at the largest amount of tax benefit that is greater than 50 percent likely of being realized upon ultimate settlement. In addition, previously recognized benefits from tax positions that no longer meet the new criteria would be derecognized.
The Company has filed or is in the process of filing tax returns that are subject to audit by the respective tax authorities. Although the ultimate outcome is unknown, we believe that any adjustments that may result from tax return audits are not likely to have a material, adverse effect on our consolidated results of operations, financial condition or cash flows.
Comprehensive Income/(Loss)
Comprehensive income/(loss) includes all changes in equity during a period from non-owner sources. Other comprehensive income refers to gains and losses that under accounting principles generally accepted in the United States are recorded as an element of shareholders’ equity but are excluded from net income. For the first six months of 2011 and 2010 the Company’s comprehensive income/(loss) consisted of its net loss and foreign currency translation adjustments.
F-9
ELEPHANT TALK COMMUNICATIONS, INC. AND SUBSIDIARIES
NOTES TO THE UNAUDITED CONSOLIDATED FINANCIAL STATEMENTS
Intangible Assets
In accordance with ASC 350, intangible assets are carried at cost less accumulated amortization and impairment charges. Intangible assets are amortized on a straight-line basis over the expected useful lives of the assets, between three and ten years. Other intangible assets are reviewed for impairment in accordance with ASC 360, Property, Plant, and Equipment,”, annually, or whenever events or changes in circumstances indicate that the carrying amount of such assets may not be recoverable. Measurement of any impairment loss for long-lived assets and identifiable intangible assets that management expects to hold and use is based on the amount of the carrying value that exceeds the fair value of the asset.
Property and Equipment, Internally Developed and Third Party Software
Property and equipment are initially recorded at cost. Additions and improvements are capitalized, while expenditures that do not enhance the assets or extend the useful life are charged to operating expenses as incurred. Included in property and equipment are certain costs related to the development of the Company’s internally developed software technology platform. The Company has adopted the provisions of ASC 985, Software (formerly the AICPA Statement of Position No. 98-1).
The Company has capitalized certain computer software development costs upon the establishment of technological feasibility. Technological feasibility is considered to have occurred upon completion of a detailed program design that has been confirmed by documenting the product specifications, or to the extent that a detailed program design is not pursued, upon completion of a working model that has been confirmed by testing to be consistent with the product design. Depreciation applied using the straight-line method over the estimated useful lives of the assets once the assets are placed in service. Once a new functionality or improvement is released for operational use, the asset is moved from the property and equipment category “projects under construction” to a property and equipment asset subject to depreciation in accordance with the principle described in the previous sentence.
Recently Issued Accounting Pronouncements
In June 2011, the FASB issued ASU 2011-05, Comprehensive Income (Topic 220): Presentation of Comprehensive Income. ASU 2011-05 increases the prominence of other comprehensive income in financial statements. Under ASU 2011-05, companies will have the option to present the components of net income and comprehensive income in either one or two consecutive financial statements. ASU 2011-05 eliminates the option to present other comprehensive income in the statement of changes in equity and is applied retrospectively. For public companies, ASU 2011-05 is effective for fiscal years, and interim periods within those years, beginning after December 15, 2011.The Company does not expect this to have a material impact on its financial statements.
In May 2011, the FASB issued additional guidance on fair value measurements that clarifies the application of existing guidance on disclosure requirements, changes certain fair value measurement principles and requires additional disclosures about fair value measurements. The updated guidance is effective on a prospective basis for financial statements issued for fiscal years, and interim periods within those fiscal years, beginning after December 15, 2011. The Company does not expect this to have a material impact on its financial statements.
There have been no new accounting pronouncements issued during the six months ending June 30, 2011 that are of significance, or potential significance, to the Company. Any recent accounting pronouncement that are of significance, or potential significance, to the company are set forth in the Company’s Annual report on Form 10K for the year ended December 31, 2010, filed with the SEC on March 31, 2011.
F-10
ELEPHANT TALK COMMUNICATIONS, INC. AND SUBSIDIARIES
NOTES TO THE UNAUDITED CONSOLIDATED FINANCIAL STATEMENTS
Note 3. Long Term Deposit
Long-term deposits to various telecom carriers during the course of its operations and a deposit towards the French Tax Authorities for the total amount of $697,278 as of June 30, 2011 compared with $610,486 as of December 31, 2010. The carrier deposits are refundable at the termination of the business relationship with the carriers.
Note 4. Prepaid Expenses and other Current Assets
Prepaid expenses and other current assets recorded at $4,948,585 as of June 30, 2011, compared with $2,337,914 as of December 31, 2010. The amount consists primarily of prepaid Value Added Tax (“VAT”) and prepaid Landline Customer Out-payments.
Note 5. Property & Equipment
The Company’s Property & Equipment also include the capitalization of its systems engineering and software programming activities. Typically, these investments pertain to the Company’s:
| · | Intelligent Network (IN) platform |
| · | CRM provisioning Software |
| · | Mediation, Rating & Pricing engine |
| · | ValidSoft security software applications |
| · | Operations and business support software |
| · | Network management tools |
Property and equipment at June 30, 2011 and December 31, 2010 consist of:
| Average | |||||||||||
| Estimated | |||||||||||
| Useful | June 30, | December 31, | |||||||||
| Lives | 2011 | 2010 | |||||||||
| Furniture and fixtures | 5 | 264,982 | 215,905 | ||||||||
| Computer, communication and network equipment | 3 - 10 | 15,379,482 | 9,724,189 | ||||||||
| Software | 5 | 4,483,209 | 4,187,523 | ||||||||
| Automobiles | 5 | 136,004 | 125,241 | ||||||||
| Construction in progress | 3,057,626 | 1,984,674 | |||||||||
| Total property and equipment | 23,321,303 | 16,237,531 | |||||||||
| Less: accumulated depreciation | (9,438,896 | ) | (7,784,943 | ) | |||||||
| Total property and equipment, Net | $ | 13,882,407 | $ | 8,452,588 | |||||||
Total depreciation expense for the six months ended in June 30, 2011 and 2010 was $558,047 and $488,669 respectively. Total depreciation for the six months ended in June 30, 2011 and 2010 was $1,088,235 and $1,149,056 respectively.
F-11
ELEPHANT TALK COMMUNICATIONS, INC. AND SUBSIDIARIES
NOTES TO THE UNAUDITED CONSOLIDATED FINANCIAL STATEMENTS
Intangible assets include customer contracts, telecommunication licenses and integrated, multi-country, centrally managed switch-based interconnects as well as ValidSoft Intellectual Property, including but not limited to software source codes, applications, customer list & pipeline, registration & licenses, patents and trademark/brands.
Intangible assets at June 30, 2011 and December 31, 2010 consist of:
| Average | June | December | |||||||||
| Estimated | 30, | 31, | |||||||||
| Useful Lives | 2011 | 2010 | |||||||||
| Customer Contracts, Licenses , Interconnect & Technology | 5-10 | $ | 12,361,019 | $ | 11,615,700 | ||||||
| ValidSoft IP & Technology | 1-10 | 16,983,259 | 15,639,154 | ||||||||
| Total intangible assets | 29,344,278 | 27,254,854 | |||||||||
| Less: Accumulated Amortization and impairment charges | (9,577,994 | ) | (8,684,964 | ) | |||||||
| Less: Accumulated Amortization ValidSoft IP & Technology | (3,712,980 | ) | (2,316,303 | ) | |||||||
| Total intangible assets, Net | $ | 16,053,305 | $ | 16,253,587 | |||||||
Total amortization expense for the six months ended June 30, 2011 totaled $779,728 compared to $1,026,759 for the same period of 2010. Amortization for the six months ended June 30, 2011 and 2010 totaled $ 1,552,215 and $1,211,066 respectively.
| Goodwill | June | December | ||||||
| 30, | 31, | |||||||
| 2010 | 2010 | |||||||
| Goodwill at acquisition of ValidSoft Ltd | $ | 3,433,833 | $ | 3,433,833 | ||||
| End of period exchange rate translation | 81,256 | (203,047 | ) | |||||
| Total | $ | 3,515,089 | $ | 3,230,786 | ||||
Estimated future amortization expense related to our intangible assets is:
| 2011 | 2012 | 2013 | 2014 | 2015 | 2016 | 2017 thereafter | ||||||||||||||||||||||
| Interconnect licenses and contracts | 697,808 | 745,749 | 664,447 | 505,755 | 86,227 | 5,798 | 25,437 | |||||||||||||||||||||
| ValidSoft IP & Technology | 2,270,396 | 2,270,396 | 2,270,396 | 2,270,396 | 2,118,829 | 2,068,307 | 853,446 | |||||||||||||||||||||
| 2,968,203 | 3,016,145 | 2,934,843 | 2,776,151 | 2,205,055 | 2,074,105 | 878,883 | ||||||||||||||||||||||
Note 7. Acquisition of ValidSoft Ltd
Following the acquisition of ValidSoft in 2010, the operating results of ValidSoft have been consolidated with those of the Company starting April 1, 2010.
F-12
ELEPHANT TALK COMMUNICATIONS, INC. AND SUBSIDIARIES
NOTES TO THE UNAUDITED CONSOLIDATED FINANCIAL STATEMENTS
Note 8. Overdraft
In 2004, Elephant Talk Ltd. executed a credit facility with a bank in Hong Kong pursuant to which Elephant Talk Ltd. borrowed funds. As of June 30, 2011, the overdraft balance, including accrued interest totaled, $294,539 compared to $278,637 as of December 31, 2010. The interest rate and default payment interest rate were charged at 2% and 6% per annum above the Hong Kong Dollar Prime Rate quoted by the bank from time to time. The Company has neither guaranteed the credit facility nor is it otherwise obligated to pay funds drawn upon it on behalf of Elephant Talk Ltd. As of June 30, 2011, Moba Consulting Partners B.V., a subsidiary of the Company, had an overdraft of $58,942 compared to $78,101 as of December 31, 2010 on one of the company’s bank accounts.
Note 9. Accrued Expenses
As of June 30, 2011 and December 31, 2010, the accrued expenses comprised of the following:
June 30, 2011 | December 31, 2010 | |||||||
| Accrued Selling, General & Administrative expenses | $ | 1,389,234 | $ | 1,494,218 | ||||
| Accrued cost of sales and network | 1,575,527 | 380,236 | ||||||
| Accrued taxes | 1,369,125 | 791,128 | ||||||
| Accrued interest payable | 722,095 | 653,146 | ||||||
| Other | 19,292 | 525,210 | ||||||
| Total accrued expenses | $ | 5,075,273 | $ | 3,843,938 | ||||
Note 10.Loans Payable
June 30, 2011 | December 31, 2010 | |||||||
| Installment loan payable due December 24, 2006, secured by personal guarantees of two shareholders, a former director, and a third party | $ | 319,174 | $ | 319,182 | ||||
| Installment loan payable, bank, monthly principal and interest payments of $2,798 including interest at bank’s prime rate plus 1.5% per annum, 8.25% at November 30, 2008, due December 24, 2011, secured by personal guarantees of three shareholders and a former director | 190,711 | 190,716 | ||||||
| Installment loan payable, bank, monthly principal and interest payments of $1,729 including interest at bank’s prime rate plus 1.5% per annum, 8.25% at November 24, 2008, due June 28, 2009, secured by personal guarantees of three shareholders and a former director | 84,797 | 84,799 | ||||||
| Term loan payable, bank, monthly payments of interest at bank’s prime rate, 7.0% at December 31, 2007 | 282,653 | 282,660 | ||||||
| Total | $ | 877,334 | $ | 877,357 | ||||
Elephant Talk Ltd has executed a credit facility with a bank in Hong Kong since June 29, 2004, under which Elephant Talk Ltd has borrowed funds from the bank under three installment loans and a term loan arrangement. Elephant Talk Ltd is in default of making loan payments on all the loans and has recorded an accrued interest amounting to $715,471 as of June 30, 2011. As a result of the default, the entire loan balance outstanding at June 30, 2011, totaling $877,334, is due and payable to the bank. Furthermore, Elephant Talk Ltd is obligated to pay a default interest rate at the rate of 4.25% per annum in addition to the prescribed interest rate of the installment loans and term loan. Elephant Talk Ltd has recorded $7,801 and $60,474 in interest expense and default interest expense, respectively, on loans payable as of June 30, 2011 and $4.787 and $37,655 in interest expense as of June 30, 2010. The Company has neither guaranteed the credit facility nor is it otherwise obligated to pay funds drawn upon it on behalf of Elephant Talk Ltd.
F-13
ELEPHANT TALK COMMUNICATIONS, INC. AND SUBSIDIARIES
NOTES TO THE UNAUDITED CONSOLIDATED FINANCIAL STATEMENTS
Note 11. Loan from related parties
The Company’s 51% owned subsidiary ET-UTS N.V. has received $493,242 in interest bearing (8% per annum) unsecured loans from United Telecommunication Services N.V., the 49% shareholder in the subsidiary. The amount is inclusive of accumulated accrued interest. No maturity date has been fixed.
Note 12. Stockholders’ Equity
(A) Common Stock
The Company is presently authorized to issue 250,000,000 shares common stock. The Company had 101,101,456 shares of common shares issued and outstanding as of June 30, 2011, an increase of 12,440,608 shares since December 31, 2010, due to the shares issued in connection with warrant exercises (9,326,423), delivery of shares in relation to the automatic note conversion in 2010 (2,210,367), non-cash compensation of Management and Board members (225,169) Employee Option exercises (406,477) and Other issues (purchase of assets and consultancy services) (272,172).
Reconciliation with stock transfer agent records:
The number101,101,456 of issued and outstanding common stock of the Company excludes the 245,900 unreturned and the 2,558,934 escrowed contingent shares (see below). The shares issued and outstanding as per June 30, 2011 according to the stock transfer agent’s records are therefore 103,906,290 and include 2,558,934 contingent shares for the ValidSoft acquisition and include 245,900 shares which were cancelled by the Company prior to 2006. However, the 245,900 shares were not returned to the stock transfer agent and never cancelled on the Company’s records. These shares have been blocked for trading by the stock transfer agent.
(B) Class B Preferred Stock
The Company’s Articles of Incorporation (“Articles”) authorize the issuance of 50,000,000 shares of no par value Class B Preferred Stock. No shares of Preferred Stock are currently issued and outstanding. Under the Company’s Articles, the board of directors has the power, without further action by the holders of the Common Stock, to designate the relative rights and preferences of the preferred stock, and issue the preferred stock in such one or more series as designated by the board of directors. The designation of rights and preferences could include preferences as to liquidation, redemption and conversion rights, voting rights, dividends or other preferences, any of which may be dilutive of the interest of the holders of the Common Stock or the Preferred Stock of any other series. The issuance of Preferred Stock may have the effect of delaying or preventing a change in control of the Company without further shareholder action and may adversely affect the rights and powers, including voting rights, of the holders of Common Stock. In certain circumstances, the issuance of preferred stock could depress the market price of the Common Stock.
During 2010 and in the first six months 2011 the Company did not issue any shares of Preferred Stock.
Note 13. Basic and Diluted Net Loss Per Share
Net loss per share is calculated in accordance with ASC 260, Earnings per Share. Basic net loss per share is based upon the weighted average number of common shares outstanding. Dilution is computed by applying the treasury stock method. Under this method, options and warrants are assumed to be exercised at the beginning of the period (or at the time of issuance, if later), and as if funds obtained thereby were used to purchase common stock at the average market price during the period. Weighted average number of shares used to compute basic and diluted loss per share is the same since the effect of dilutive securities is anti-dilutive.
F-14
ELEPHANT TALK COMMUNICATIONS, INC. AND SUBSIDIARIES
NOTES TO THE UNAUDITED CONSOLIDATED FINANCIAL STATEMENTS
Note 14. Employee Benefit Plan and Non-Qualified Stock Option and Compensation Plan
2006 Non-Qualified Stock and Option Compensation Plan
Under this plan there are, as of June 30, 2011, 222,867 stock options outstanding. There are 600,000 remaining shares and 177,133 stock options available for grant.
Options granted generally vest over a 3 year period. Options generally expire 2 years from the date of vesting.
Common stock purchase options and warrants consisted of the following as of June 30, 2011:
| Number of options | Exercise Price | Initial Fair Market Value | ||||||||||
| Options: | ||||||||||||
| Outstanding as of December 31, 2010 | 307,742 | $ | 2.25 | $ | 398,608 | |||||||
| Granted in 2011 | — | — | — | |||||||||
| Exercised | 84,875 | $ | 2.25 | $ | 131,120 | |||||||
| Cancelled/Forfeited/Returned to reserve | — | — | — | |||||||||
| Outstanding as of June 30, 2011 | 222,867 | $ | 2.25 | $ | 267,488 | |||||||
The options were granted with an exercise price of $2.25, the share closing price as of September 26, 2007. Most of the options have already vested, others will vest August 20, 2011 at the latest or earlier if there is a change of control in the Company.
The following is a summary of the status of options outstanding at June 30, 2011:
| Options outstanding | Options exercisable | |||||||||||||||||||
| Range of Exercise Prices | Total Options Outstanding | Weighted Average Remaining Life (Years) | Weighted Average Exercise Price | Options Exercisable | Weighted Average Exercise Price | |||||||||||||||
| $ | 2.25 | 222,867 | 0.84 years | $ | 2.25 | 147,867 | $ | 2.25 | ||||||||||||
At June 30, 2011, the total compensation cost related to unvested stock-based awards granted to employees under the provisions of ASC 718 and the Company’s 2006 stock award plan, but not yet recognized was approximately $2,504.
2008 Long-Term Incentive Plan
The 2008 plan was adopted on January 15, 2008, and approved by our shareholders on the same date at our annual meeting. This incentive plan authorizes awards of up to 5,000,000 shares of common stock, in the form of incentive and non-qualified stock options, stock appreciation rights, performance units, restricted stock awards and performance bonuses. The amount of common stock underlying the awards to be granted remained the same after the 25 to one reverse stock-split that was effectuated on June 11, 2008.
As of June 30, 2011, a total of 7,876,053 stock options, 325,000 restricted common stock and 507,300 shares of common stock had been granted under this plan. Options granted generally begin vesting over a three-year period after grant date although options have been granted with a shorter period than three years. Options granted in the beginning expire two years from the date of vesting but the latest in 2010 issued options remain exercisable for nine years from the first date of vesting. It is expected that future options will be awarded with the nine-year exercise period after first vesting.
F-15
ELEPHANT TALK COMMUNICATIONS, INC. AND SUBSIDIARIES
NOTES TO THE UNAUDITED CONSOLIDATED FINANCIAL STATEMENTS
Increase of shares issuable under the plan
On January 24, 2011, the board of directors of the Company passed a resolution to amend the 2008 Incentive Plan to increase the number of shares of common stock, no par value per share issuable under the 2008 Incentive Plan from 5,000,000 to 23,000,000. The Company shall present this amendment to the 2008 Incentive Plan for approval by its shareholders at its next annual meeting at September 14, 2011.
Common stock purchase options and warrants consisted of the following as of June 30, 2011:
Number of shares | Average Exercise Price | Initial Fair Market Value | ||||||||||
| Options: | ||||||||||||
| Outstanding as of December 31, 2010 | 4,083,100 | $ | 1.35 | $ | 5,002,238 | |||||||
| Granted in 2011 | 4,251,127 | $ | 2.51 | $ | 7,436,329 | |||||||
| Exercised | 354,792 | $ | 1.39 | $ | 462,431 | |||||||
| Cancelled/Forfeited/Returned unused | 103,382 | $ | 1.35 | $ | 163,149 | |||||||
| Outstanding as of June 30, 2011 | 7,876,053 | $ | 1.82 | $ | 11,812,987 | |||||||
The options granted in 2011 were granted with an average exercise price of $2.51. The initial fair market value of the options granted using the Black-Sholes options model for these options has been valued at $7,436,329 at their initial grant-date.
Following is a summary of the status of options outstanding at June 30, 2011:
| Options outstanding | Options exercisable | |||||||||||||||||||
| Range of Exercise Price | Total Options Outstanding | Weighted Average Remaining Life (Years) | Weighted Average Exercise Price | Options Exercisable | Weighted Average Exercise Price | |||||||||||||||
| $ | 0.60-2.80 | 7,876,053 | 8.46 years | $ | 1.822 | 1,010,376 | $ | 1.31 | ||||||||||||
The weighted average assumptions used so far for the options granted in 2011 using the Black-Scholes options model are: volatility of 64%, term of 9.68 years and a Risk Free Interest Rate assumption of 3.32%. The expected dividend yield is zero.
At June 30, 2011 the not yet expensed portion of stock-based awards granted to employees under the provisions of ASC 718 and the Company’s 2008 stock award plan, was approximately $7,562,435. The future expensing takes place proportionally to the vesting associated with each stock-award, adjusted for cancellations, forfeitures and returns.
Stock-Based Compensation Expense
Under the provisions of ASC 718, the Company recorded for the six months ended June 30, 2011, $1,944,308 in stock-based compensation expense for the Non-Qualified Stock and Option Compensation Plan, director and executive officers compensation in stock and stock-based compensation for consultancy services. For the comparable period in 2010 the expense was $1,235,328. The Company utilized the Black-Scholes valuation model for estimating the fair value of the stock-based compensation.
F-16
ELEPHANT TALK COMMUNICATIONS, INC. AND SUBSIDIARIES
NOTES TO THE UNAUDITED CONSOLIDATED FINANCIAL STATEMENTS
Note 15. Commitments
As of June 30 2011, commitments of the Company relating to leases, co-location and office rents, regulatory and interconnection fees are as follows:
| 2011 | 2,915,552 | |||
| 2012 | 3,158,895 | |||
| 2013 | 2,505,530 | |||
| 2014 | 589,415 | |||
| 2015 | 352,460 | |||
| Total | $ | 9,521,851 |
As of June 30, 2011 the commitments of the Company relating to purchase orders are valued at cost of $58,010.
Note 16. Non-controlling Interest
The Company had non-controlling interests in several of its subsidiaries. The balance of the non-controlling interests as of June 30, 2011 and December 31, 2010 were as follows:
| As of | As of | |||||||||||
| Subsidiary | Noncontrolling Interest % | June 30, 2011 | December 31, 2010 | |||||||||
| ETC PRS UK | 49 | % | $ | 10,559 | $ | 9,723 | ||||||
| ETC PRS Netherlands | 49 | % | 141,032 | 129,870 | ||||||||
| ET Bahrain WLL | 1 | % | 6,378 | 6,385 | ||||||||
| ET ME&A FZ LLC | 49.46 | % | 37,099 | 37,081 | ||||||||
| Total | $ | 195,067 | $ | 183,059 | ||||||||
Note 17. Litigation
(a) Manu Ohri Litigation
In March 2009, Manu Ohri or Ohri, the Company’s former chief financial officer from 2002 to 2006, commenced a lawsuit against the Company in the California Orange County Superior Court captioned Manu Ohri v. Elephant Talk Communications, Inc., Case No. 30-20009-00120609. Ohri alleges that the Company breached a 2006 written employment contract, a 2007 oral consulting contract, and otherwise owes him the reasonable value of consulting services rendered. Ohri seeks damages of $442,216 under the alleged employment contract, $56,951 under the alleged oral consulting agreement, stock options that he valued at $45,200 under the alleged oral consulting agreement, $14,316 for medical and dental insurance premiums, $4,226.40 for life and long term disability insurance premiums, pre-judgment interest, and costs of the litigation. The Company denies Ohri's allegations and asserts several affirmative defenses.
The Company commenced a cross-complaint against Ohri to, among other things, invalidate his alleged 2006 employment contract and stock bonus, and to recover the stock bonus or its fair market value.
Phase 1 of the trial took place without a jury between June 27 and July 13, 2011. The parties filed post-trial briefs, and are waiting for the court to announce its decision, which is expected within the next few weeks. Any claims remaining after the court’s decision in Phase 1 may be tried in a second phase with a jury.
F-17
ELEPHANT TALK COMMUNICATIONS, INC. AND SUBSIDIARIES
NOTES TO THE UNAUDITED CONSOLIDATED FINANCIAL STATEMENTS
(b) Chong Hing Bank Litigation
In December 2009, Chong Hing Bank Limited, f/k/a Liu Chong Hing Bank Limited, a foreign banking services company based in Hong Kong or the Bank, commenced a lawsuit in the California Orange County Superior Court captioned Chong Hing Bank Limited v. Elephant Talk Communications, Inc., Case No. 30-2009-00328467. The Bank alleges that it entered into various installment and term loan agreements and an overdraft account with Elephant Talk Limited (“ETL”), a Hong Kong subsidiary of the Company. The Bank claims that various former officers and directors of ETL personally guaranteed the loans and overdraft account. The Bank alleges that ETL is in default on the loans and overdraft account, and that approximately $1,536,792.28 plus continuing interest is due. The Bank further alleges that the Company is directly liable to repay the loans and overdraft account as a successor in interest to ETL. The Bank is suing the Company for breach of contract and common counts. The Company denies the Bank’s allegations and asserts several affirmative defenses. The Company contends that it has no direct, successor liability to the Bank, and that the Bank must pursue its recourse against ETL and its personal guarantors.
A trial is set to start on October 3, 2011.
(c) Rescission of the Purchase Agreement of May 24, 2004 of New Times Navigation Limited.
As previously described in our 2004 Annual Report we and New Times Navigation Limited mutually agreed to terminate this purchase agreement. We returned the received shares of New Times Navigation Limited to the concerned shareholders and received back 90,100 of our common stock out of the 204,000 issued by us for the purchase. In addition we issued 37 unsecured convertible promissory notes for a total amount of $3,600,000. On our request 21 notes were returned with a total value of $2,040,000.
We are presently seeking relief from the High Court of the Hong Kong Special Administrative Region against the holders of the unreturned shares to return a total of 113,900 common shares (valued at $381,565) and also to have them return the remaining 18 unsecured convertible promissory notes representing a total amount of $1,740,000 and rescind the purchase agreement. The case is currently pending.
Half year ended June 30, 2011
| EUROPE | ||||||||||||||||||||||||||||||||||||
| Netherlands | Spain | Switzerland | Others | Total | Far East Hong Kong / China | Middle East | The Americas | TOTAL | ||||||||||||||||||||||||||||
| Revenues from unaffiliated customers: | $ | 11,646,065 | 598,298 | 3,412,985 | 565,482 | $ | 16,222,830 | $ | - | $ | 20,506 | $ | 55,654 | $ | 16,298,990 | |||||||||||||||||||||
| Operating income (loss) | $ | (719,278 | ) | $ | (227,278 | ) | $ | (3,244,180 | ) | $ | (2,709,356 | ) | $ | (6,900,092 | ) | $ | (385,834 | ) | $ | (184,261 | ) | $ | (4,332,517 | ) | $ | (11,802,703 | ) | |||||||||
| Net income (loss): | $ | (697,382 | ) | $ | (227,278 | ) | $ | (3,238,320 | ) | $ | (2,793,279 | ) | $ | (6,956,259 | ) | $ | (860,389 | ) | $ | (184,261 | ) | $ | (3,433,737 | ) | $ | (11,434,647 | ) | |||||||||
| Identifiable assets | $ | 9,814,822 | $ | 1,378,108 | $ | 16,551,945 | $ | 19,563,064 | $ | 47,307,939 | $ | 174,528 | 563,756 | 3,195,478 | $ | 51,241,701 | ||||||||||||||||||||
| Depreciation and amortization | $ | (60,063 | ) | $ | (112,061 | ) | $ | (1,108,846 | ) | $ | (1,192,419 | ) | $ | (2,473,389 | ) | $ | (28,140 | ) | $ | (9,629 | ) | $ | (129,292 | ) | $ | (2,640,450 | ) | |||||||||
| Capital expenditure | $ | - | $ | 10,034 | $ | 5,596,821 | $ | 144,124 | $ | 5,750,979 | $ | - | $ | - | $ | 3,915 | $ | 5,754,894 | ||||||||||||||||||
F-18
ELEPHANT TALK COMMUNICATIONS, INC. AND SUBSIDIARIES
NOTES TO THE UNAUDITED CONSOLIDATED FINANCIAL STATEMENTS
Half year ended June 30, 2010
| EUROPE | ||||||||||||||||||||||||||||||||||||
| Netherlands | Spain | Switzerland | Others | Total | Far East Hong Kong / China | Middle East | The Americas | TOTAL | ||||||||||||||||||||||||||||
| Revenues from unaffiliated customers: | $ | 14,686,376 | $ | 845,412 | $ | 3,390,316 | $ | 171,730 | $ | 19,093,835 | $ | - | $ | 498,243 | $ | 25,512 | $ | 19,617,590 | ||||||||||||||||||
| Operating income (loss) | $ | (1,144,634 | ) | $ | (150,455 | ) | $ | (1,378,778 | ) | $ | (1,617,320 | ) | $ | (4,291,188 | ) | $ | (110,673 | ) | $ | 83,000 | $ | (4,041,332 | ) | $ | (8,360,192 | ) | ||||||||||
| Net income (loss): | $ | (1,128,465 | ) | $ | (150,455 | ) | $ | (1,374,717 | ) | $ | (1,634,220 | ) | $ | (4,287,858 | ) | $ | (568,246 | ) | $ | 83,000 | $ | (21,923,616 | ) | $ | (26,696,719 | ) | ||||||||||
| Identifiable assets | $ | 7,548,577 | $ | 1,136,100 | $ | 9,391,821 | $ | 17,779,896 | $ | 35,856,394 | $ | 550,564 | $ | 524,086 | $ | 4,456,005 | $ | 41,387,048 | ||||||||||||||||||
| Depreciation and amortization | $ | (57,131 | ) | $ | (106,945 | ) | $ | (1,011,735 | ) | $ | (857,114 | ) | $ | (2,032,925 | ) | $ | (27,709 | ) | $ | (16,481 | ) | $ | (283,007 | ) | $ | (2,360,122 | ) | |||||||||
| Capital expenditure | $ | 1,446 | $ | 1,989 | $ | 1,215,023 | $ | - | $ | 1,218,458 | $ | (20,781 | ) | $ | - | $ | 16,609 | $ | 1,214,286 | |||||||||||||||||
Note 19. Related Party Transactions
None.
Note 20. Subsequent Events
The Company’s management evaluated subsequent events through August 12, 2011.
Between July 1, 2011 and August 12, 2011, we received a total of $2,047,191 in gross proceeds from exercised warrants. For these proceeds we will issue a total of 1,498,127 shares of common stock. Portions of these share issuances have already taken place.
F-19
On July 28, 2011, the Company sent out a Notice of Redemption of Warrant to all the record holders of certain issued and outstanding common stock purchase warrants which were originally issued in connection with the private placement of units pursuant to that certain confidential private placement memorandum dated May 26, 2010. The redemption notice informed the warrant holders that pursuant to the terms of the warrants, the warrants will be redeemed for cash at the redemption price of 0.001 per warrant on August 29, 2011. Accordingly, after the redemption date, the warrants will no longer be exercisable for common stock of the Company and the holders will only have the right to receive the redemption price.
On August 1, 2011, Jacques D. Kerrest was appointed as a member of the board of directors. On the same date Yves van Sante who had been a representative of Elephant Talk’s major shareholder QAT Investments SA resigned from the board. Mr. van Sante will maintain an affiliation with the Company’s board of directors as an observer.
Actual issuances of shares in accordance with our stock transfer agents records between July 1, 2011 and August 12, 2011 were in total 1,792,561 shares as per below details:
| · | 400,000 shares were issued relating to a cash exercise of warrants which had been issued as part of the placement of the 2009 Promissory Note. Proceeds of $400,000 were received in July 2011. |
| · | 870,834 shares were issued relating to the cash exercise of warrants which had been issued as part of the placement of shares under the private placement in 2010. Proceeds received in July and August was $1,306,251. |
| · | 227,293 shares were issued relating to the cash exercise of warrants which had been issued as part of the consideration for services provided by the placement agent for their 2010 placement activities. Proceeds of $340,940 we're received in July 2011. |
| · | 7,548 shares were issued as consideration for services provided following the terms of the agreement. No proceeds were received. |
| · | 152,261 shares were issued as regular agreed non-cash compensation for directors and executive officers. No proceeds were received. |
| · | 23,788 restricted shares were issued pursuant the settlement of an employee of the Company. No proceeds were received. |
| · | 110,837 shares were issued to the cash exercise of employee options at various exercise prices, the total proceed was $178,833. |
The Company announced a joint venture with Meco Communication Holding AG (www.mecogroups.com) to launch mobile venture network enabler platforms in the UK, Europe, and Canada. As a first step, parties have agreed to conclude the joint venture agreement for Italy on September 2, 2011. The Italy joint venture comprises the sale by the Company of 49% of the ownership in Elephant Talk Communications Italy SrL to Meco Communication Holding AG (Meco) for the amount of Euro 1,225,000. The Italy joint venture will have 5 directors, three to be appointed by the company and two by Meco. The transaction allows the Company to keep control of the subsidiary.
F-20
Independent Auditors’ Report
Board of Directors
Elephant Talk Communication Inc
We have audited the accompanying consolidated balance sheets of Elephant Talk Communication Inc., as of December 31, 2009 and 2010 and the related consolidated statements of income and comprehensive loss, stockholders’ equity, and cash flows for the years then ended. These financial statements are the responsibility of the Company’s management. Our responsibility is to express an opinion on these financial statements based on our audits.
We conducted our audits in accordance with auditing standards generally accepted in the United States of America. Those standards require that we plan and perform the audit to obtain reasonable assurance about whether the financial statements are free of material misstatement. An audit includes examining, on a test basis, evidence supporting the amounts and disclosures in the financial statements, assessing the accounting principles used and significant estimates made by management, as well as evaluating the overall financial statement presentation. We believe that our audits provide a reasonable basis for our opinion.
In our opinion, the consolidated financial statements referred to above present fairly, in all material respects, the financial position of Elephant Talk Communication Inc., at December 31, 2009 and 2010, and the results of its operations and its cash flows for the years then ended in conformity with accounting principles generally accepted in the United States of America.
The accompanying financial statements have been prepared assuming that the Company will continue as a going concern. As discussed in Note 2 to the financial statements, the Company has suffered recurring losses from operations and has a net capital deficiency that raise substantial doubt about its ability to continue as a going concern. As of December 31, 2010, the Company incurred a net loss of $92.5 million, used cash in operations of $14.1 million and had an accumulated deficit of $154.8 million. Management’s plans in regard to these matters are also described in Note 2. The financial statements do not include any adjustments that might result from the outcome of this uncertainty.
/s/ BDO USA, LLP
March 30, 2011
F-21
ELEPHANT TALK COMMUNICATIONS, INC AND SUBSIDIARIES
CONSOLIDATED BALANCE SHEETS
AS AT DECEMBER 31, 2010 AND 2009
(AUDITED)
| December 31, | December 31, | |||||||
| 2010 | 2009 | |||||||
| ASSETS | ||||||||
| CURRENT ASSETS | ||||||||
| Cash and cash equivalents | $ | 2,245,697 | $ | 1,457,900 | ||||
| Restricted cash | 190,312 | 192,116 | ||||||
| Accounts receivable, net of an allowance for doubtful accounts of $119,044 and $764,302 at December 31, 2010 and December 31, 2009 respectively | 5,600,562 | 5,071,293 | ||||||
| Prepaid expenses and other current assets | 2,337,914 | 2,657,019 | ||||||
| Total Current Assets | 10,374,485 | 9,378,328 | ||||||
| LONG TERM DEPOSITS | 610,486 | 330,946 | ||||||
| DEFERRED FINANCING COSTS | — | 3,033,277 | ||||||
| PROPERTY AND EQUIPMENT, NET | 8,452,588 | 7,773,862 | ||||||
| INTANGIBLE ASSETS, NET | 16,253,587 | 3,910,363 | ||||||
| GOODWILL | 3,230,786 | — | ||||||
| TOTAL ASSETS | $ | 38,921,932 | $ | 24,426,776 | ||||
| LIABILITIES AND STOCKHOLDERS' EQUITY (DEFICIT) | ||||||||
| CURRENT LIABILITIES | ||||||||
| Overdraft | $ | 356,738 | $ | 351,589 | ||||
| Accounts payable and customer deposits | 4,703,875 | 6,475,074 | ||||||
| Deferred revenue | — | 132,205 | ||||||
| Accrued expenses and other payables | 3,843,938 | 2,738,998 | ||||||
| Advances from related parties | — | 13,287 | ||||||
| Loans payable | 877,357 | 880,536 | ||||||
| Total Current Liabilities | 9,781,908 | 10,591,689 | ||||||
| LONG TERM LIABILITIES | ||||||||
| Loan from related party | 468,756 | 437,161 | ||||||
| Warrant liabilities | — | 16,626,126 | ||||||
| Conversion feature | — | 2,899,801 | ||||||
| Total Long term Liabilities | 468,756 | 19,963,088 | ||||||
| Total Liabilities | 10,250,664 | 30,554,777 | ||||||
F-22
ELEPHANT TALK COMMUNICATIONS, INC. AND SUBSIDIARIES
NOTES TO THE UNAUDITED CONSOLIDATED FINANCIAL STATEMENTS
| STOCKHOLDERS' EQUITY (DEFICIT) | ||||||||
| Common stock, no par value, 250,000,000 shares authorized, 88,660,848 issued and outstanding as of December 31, 2010 compared to 53,695,984 shares issued and outstanding as of December 31, 2009 | 183,825,665 | 54,880,778 | ||||||
| Accumulated other comprehensive income (loss) | (519,020 | ) | 1,136,897 | |||||
| Accumulated deficit | (154,818,436 | ) | (62,335,076 | ) | ||||
| Elephant Talk Communications, Inc. Stockholders' Equity | 28,488,209 | (6,317,401 | ) | |||||
| NON-CONTROLLING INTEREST | 183,059 | 189,400 | ||||||
| Total Stockholders' Equity | 28,671,268 | (6,128,001 | ) | |||||
| TOTAL LIABILITIES AND STOCKHOLDERS' EQUITY (DEFICIT) | $ | 38,921,932 | $ | 24,426,776 | ||||
The accompanying notes are an integral part of these consolidated financial statements.
F-23
ELEPHANT TALK COMMUNICATIONS, INC AND SUBSIDIARIES
CONSOLIDATED STATEMENT OF OPERATIONS AND COMPREHENSIVE LOSS
FOR THE YEARS ENDED DECEMBER 31, 2010 AND 2009
(AUDITED)
| 2010 | 2009 | |||||||
| REVENUES | $ | 37,168,351 | $ | 43,650,957 | ||||
| COST AND OPERATING EXPENSES | ||||||||
| Cost of service | 35,120,916 | 41,452,639 | ||||||
| Selling, general and administrative expenses | 9,620,322 | 7,958,933 | ||||||
| Non cash compensation to officers, directors and employees | 5,588,392 | 1,727,870 | ||||||
| Depreciation and amortization of intangibles assets | 5,312,469 | 3,051,461 | ||||||
| Total cost and operating expenses | 55,642,099 | 54,190,903 | ||||||
| LOSS FROM OPERATIONS | (18,473,748 | ) | (10,539,946 | ) | ||||
| OTHER INCOME (EXPENSE) | ||||||||
| Interest income | 239,713 | 160,535 | ||||||
| Interest expense | (1,802,804 | ) | (938,627 | ) | ||||
| Other expenses | — | (480,000 | ) | |||||
| Interest expense related to amortization of debt discount on promissory notes | (21,094,104 | ) | (4,369,183 | ) | ||||
| Change in fair value of warrant liabilities | (48,107,969 | ) | (538,382 | ) | ||||
| Amortization of deferred financing costs | (3,238,602 | ) | (591,710 | ) | ||||
| Total other income (expense) | (74,003,766 | ) | (6,757,367 | ) | ||||
| LOSS BEFORE PROVISION FOR INCOME TAXES | (92,477,514 | ) | (17,297,313 | ) | ||||
| Provision for income taxes | (800 | ) | (800 | ) | ||||
| NET LOSS BEFORE NONCONTROLLING INTEREST | (92,478,314 | ) | (17,298,113 | ) | ||||
| Net (loss) income attributable to noncontrolling interest | (5,046 | ) | (1,771 | ) | ||||
| NET LOSS | (92,483,360 | ) | (17,299,884 | ) | ||||
| OTHER COMPREHENSIVE (LOSS) INCOME | ||||||||
| Foreign currency translation gain (loss) | (1,655,917 | ) | 190,063 | |||||
| (1,655,917 | ) | 190,063 | ||||||
| COMPREHENSIVE LOSS | $ | (94,139,277 | ) | $ | (17,109,821 | ) | ||
| Net loss per common share and equivalents - basic and diluted | $ | (1.31 | ) | $ | (0.32 | ) | ||
| Weighted average shares outstanding during the period - basic and diluted | 70,670,776 | 53,553,354 | ||||||
The accompanying notes are an integral part of these consolidated financial statements.
F-24
ELEPHANT TALK COMMUNICATIONS, INC. AND SUBSIDIARIES
CONSOLIDATED STATEMENTS OF CHANGES IN SHAREHOLDER’S EQUITY (DEFICIT)
FOR THE YEARS ENDED DECEMBER 31, 2010 AND 2009
(AUDITED)
| Description | Common Shares | Common Amount | Other comprehensive income (loss) | Accumulated Deficit | Total stockholders Equity (Deficit) | |||||||||||||||
| Balance - December 31, 2008 | 50,433,260 | $ | 52,933,208 | $ | 946,834 | $ | (45,035,192 | ) | $ | 8,844,850 | ||||||||||
| Shares issued, sold in 2008 | 476 | 500 | — | — | 500 | |||||||||||||||
| Shares issued for sign-in fee | 866,316 | 571,074 | — | — | 571,074 | |||||||||||||||
| Shares issued for directors compensation | 1,884,200 | 532,583 | — | — | 532,583 | |||||||||||||||
| Shares issued to consultants | 307,300 | 205,389 | — | — | 205,389 | |||||||||||||||
| Shares returned by former CFO | (420,368 | ) | (192,694 | ) | — | — | (192,694 | ) | ||||||||||||
| Shares issued for management compensation | 624,800 | 469,880 | — | — | 469,880 | |||||||||||||||
| Placement fees | — | (100,000 | ) | — | — | (100,000 | ) | |||||||||||||
| Amortization of Stock Options expense | — | 460,838 | — | — | 460,838 | |||||||||||||||
| Other comprehensive loss due to foreign exchange rate translation | — | — | 190,063 | — | 190,063 | |||||||||||||||
| Net Loss | — | — | — | (17,299,884 | ) | (17,299,884 | ) | |||||||||||||
| Balance - December 31, 2009 | 53,695,984 | $ | 54,880,778 | $ | 1,136,897 | $ | (62,335,076 | ) | $ | (6,317,401 | ) | |||||||||
| Shares issued for acquisitions | 7,682,869 | 16,008,172 | — | — | 16,008,172 | |||||||||||||||
| Shares issued for financing | 16,879,342 | 19,678,188 | — | — | 19,678,188 | |||||||||||||||
| Shares issued for management compensation | 1,395,168 | 2,441,544 | — | — | 2,441,544 | |||||||||||||||
| Shares issued for note conversions | 7,722,867 | 9,759,283 | — | — | 9,759,283 | |||||||||||||||
| Shares issued for warrant exercises | 1,087,809 | 2,237,897 | — | — | 2,237,897 | |||||||||||||||
| Shares issued to consultants | 195,876 | 293,371 | — | — | 293,371 | |||||||||||||||
| Shares issued for employee stock option exercises | 933 | - | — | — | - | |||||||||||||||
| Shares issued for sign-in fee | — | (85,974 | ) | — | — | (85,974 | ) | |||||||||||||
| Shares to be cancelled | — | (21,629 | ) | — | — | (21,629 | ) | |||||||||||||
| Shares to be issued | — | 3,461,865 | — | — | 3,461,865 | |||||||||||||||
| Placement fees | — | (1,839,765 | ) | — | — | (1,839,765 | ) | |||||||||||||
| Equity warrants | — | 49,929,012 | — | — | 49,929,012 | |||||||||||||||
| Amortization of Stock Options expense | — | 2,639,236 | — | — | 2,639,236 | |||||||||||||||
| Change in fair value of warrants | — | 24,443,689 | — | — | 24,443,689 | |||||||||||||||
| Other comprehensive loss due to foreign exchange rate translation | — | — | (1,655,917 | ) | — | (1,655,917 | ) | |||||||||||||
| Net Loss | — | — | — | (92,483,360 | ) | (92,483,360 | ) | |||||||||||||
| Balance - December 31, 2010 | 88,660,848 | $ | 183,825,664 | $ | (519,020 | ) | $ | (154,818,436 | ) | $ | 28,488,209 | |||||||||
The accompanying notes are an integral part of these consolidated financial statements.
F-25
ELEPHANT TALK COMMUNICATIONS, INC. AND SUBSIDIARIES
CONSOLIDATED STATEMENTS OF CASH FLOWS
FOR THE YEARS ENDED DECEMBER 31, 2010 AND 2009
(AUDITED)
| 2010 | 2009 | |||||||
| CASH FLOWS FROM OPERATING ACTIVITIES: | ||||||||
| Net loss | $ | (92,483,360 | ) | $ | (17,299,884 | ) | ||
| Adjustments to reconcile net loss to net cash used in operating activities: | ||||||||
| Depreciation and amortization | 5,312,469 | 3,051,461 | ||||||
| Provision for doubtful accounts | (584,722 | ) | 220,156 | |||||
| Stock based compensation | 5,080,783 | 1,561,378 | ||||||
| Noncontrolling interest | 5,046 | 1,771 | ||||||
| Amortization of Shares issued for Consultancy | 507,609 | 162,501 | ||||||
| Change in fair value of warrant liabilities | 48,167,991 | 538,382 | ||||||
| Interest expense relating to debt discount and conversion feature | 21,094,104 | 4,960,893 | ||||||
| Amortization of deferred financing costs | 3,238,602 | — | ||||||
| Changes in operating assets and liabilities: | ||||||||
| Decrease (increase) in accounts receivable | (238,523 | ) | (628,082 | ) | ||||
| Decrease (Increase) in prepaid expenses, deposits and other assets | 229,343 | 846,491 | ||||||
| Increase (decrease) in accounts payable, proceeds from related parties and customer deposits | (1,574,761 | ) | 602,179 | |||||
| Increase (decrease) in deferred revenue | (131,886 | ) | (87,853 | ) | ||||
| Increase (decrease) in accrued expenses and other payables | (2,730,533 | ) | 740,769 | |||||
| Net cash used in operating activities | (14,107,838 | ) | (5,329,837 | ) | ||||
| CASH FLOWS FROM INVESTING ACTIVITIES: | ||||||||
| Purchases of property and equipment | (3,246,057 | ) | (3,869,149 | ) | ||||
| Restricted cash | 42 | (93 | ) | |||||
| Cash received from acquisition of subsidiary | 58,253 | — | ||||||
| Loan to third party | — | (1,736,756 | ) | |||||
| Net cash used in investing activities | (3,187,762 | ) | (5,605,998 | ) | ||||
| CASH FLOWS FROM FINANCING ACTIVITIES: | ||||||||
| Bank overdraft | 13,769 | 27,125 | ||||||
| Deferred financing costs | (205,326 | ) | (1,495,674 | ) | ||||
| Loan from related party QAT Bridge Loan | 2,518,220 | — | ||||||
| Loan from related party Bridge SPA | 2,885,000 | — | ||||||
| Proceeds from Private Placement Offering | 14,000,000 | — | ||||||
| Exercise of warrants | 502,621 | — | ||||||
| Placement fees | (1,814,766 | ) | (100,000 | ) | ||||
| Proceeds from Convertible 12% secured note | — | 5,568,000 | ||||||
| Proceeds from Convertible 12% secured note - related parties | — | 6,765,015 | ||||||
| Loan from related party | — | 34,736 | ||||||
| Net cash provided by financing activities | 17,899,518 | 10,799,201 | ||||||
| EFFECT OF EXCHANGE RATES ON CASH AND CASH EQUIVALENTS | 183,879 | (62,012 | ) | |||||
| NET DECREASE IN CASH AND CASH EQUIVALENTS | 787,797 | (198,646 | ) | |||||
| CASH AND CASH EQUIVALENTS, BEGINNING OF THE PERIOD | 1,457,900 | 1,656,546 | ||||||
| CASH AND CASH EQUIVALENTS, END OF THE PERIOD | $ | 2,245,697 | $ | 1,457,900 | ||||
| SUPPLEMENTAL DISCLOSURES OF CASH FLOW INFORMATION: | ||||||||
| Cash paid during the period for interest | $ | 1,295,298 | $ | 21,965 | ||||
| 2010 | 2009 | |||||||
| SUPPLEMENTAL DISCLOSURES OF NON-CASH INVESTING & FINANCING ACTIVITIES: | ||||||||
| Shares issued to convert the notes payable and accrued interest | $ | 15,461,715 | $ | 532,583 | ||||
| Cash paid during the period for income taxes | $ | 800 | $ | 800 | ||||
| Warrants and derivative liabilities for issuance of 12% Promissory Notes are considered as discount of the Promissory Notes | $ | — | $ | 12,333,020 | ||||
| Warrants issued to placement agents for services, treated as deferred financing costs | $ | — | $ | 2,129,313 | ||||
| Increase in Share Capital due to Acquisitions and Non-cash Compensation | $ | 14,899,393 | $ | — | ||||
| Increase of Share Capital due to Exercise of Warrants and Conversion of Notes | $ | 9,457,044 | $ | — | ||||
| Warrants issued to placement agents for services, treated as deferred financing costs | 2,565,300 | — | ||||||
F-26
ELEPHANT TALK COMMUNICATIONS, INC. AND SUBSIDIARIES
NOTES TO THE AUDITED CONSOLIDATED FINANCIAL STATEMENTS
Note 1. Organization
Elephant Talk Communications, Inc. (“Elephant Talk,” “we,” “us” or the “Company”), is an international provider of business software and services to the telecommunications and financial services industries. The Company enables both mobile network operators or MNOs and mobile virtual network operators or MVNOs to offer a full suite of products, delivery platforms, support services, superior industry expertise and high quality customer service without substantial upfront investments from clients. The Company provides global telecommunication companies, MNOs, banks, supermarkets, consumer product companies, media firms, and other businesses with a full suite of products and services that enables such entities to provide a full complement of telecom services as part of their business offerings. The Company offers various dynamic products that include remote health care, credit card fraud prevention, mobile internet ID security, multi-country discounted phone services, loyalty management services, and a whole range of other emerging customized mobile services.
Converged telecommunication services – full MVNE solutions
The Company is a niche player in the converged telecommunications market, providing traffic and network services as a licensed operator, and specializing in carrier grade mobile enabling platforms to provide outsourced solutions to the various players in the telecommunications value chain, including MNOs, MVNOs and non-operator companies in need of both mobile as well as specialized landline telecommunication services. In this chain, we position ourselves as a full mobile virtual network enabler or MVNE, including also customized mobile services such as our network integrated ValidSoft security and fraud prevention solutions.
ValidSoft – electronic fraud prevention
The acquisition of ValidSoft Ltd. (“ValidSoft”) gives us a position in providing solutions to counter electronic fraud relating to card, the internet, and telephone channels. ValidSoft products are used to verify the authenticity of both consumers and institutions (mutual authentication), and the integrity of transactions (transaction verification) for the mass market, in a highly cost effective and secure manner, yet easy to use and intuitive. ValidSoft products are marketed under VALid-POS® and VALid® trade names. ValidSoft biometrics product is marketed as VALid-SVP™.
Note 2. Financial Condition and Going Concern
The Company has an accumulated deficit of $154,818,436 as of December 31, 2010. Historically, the Company has relied on a combination of debt and equity financings to fund our ongoing cash requirements. In 2010 we received a total of $19,905,841 in gross proceeds from the QAT 2010 convertible loan of $2,518,220, 2010 Bridge Share Purchase Agreement of $2,885,000, the 2010 Private Placement Offering of $14,000,000 and the exercised warrants for the amount of $502,621.
We believe that the combination of our cash balance at December 31, 2010, $6,708,641 received from warrants exercised in 2011, cash generated from operations, expected additional revenues, reduction of accounts payable as well as continued investment in capital expenditures will last us into the third quarter of 2011. Considering our share price and potential business development, we expect that warrants to purchase stock in the Company will continue to be exercised, which should provide us with sufficient funds until at least fourth quarter of 2011. In the event warrants are not exercised to the extent expected, we plan to seek alternative financing.
Although the Company has previously been able to raise capital as needed, such capital may not continue to be available at all, or if available, that the terms of such financing may be dilutive to existing shareholders or otherwise on terms not favorable to existing shareholders. Further, the current global financial situation may offer additional challenges to raising the required capital. If the Company is unable to secure additional capital, as circumstances require, it may not be able to continue operations.
As of December 31, 2010, these conditions raise substantial doubt about the Company’s ability to continue as a going concern. The financial statements do not include any adjustments that might result from the outcome of this uncertainty.
F-27
ELEPHANT TALK COMMUNICATIONS, INC. AND SUBSIDIARIES
NOTES TO THE AUDITED CONSOLIDATED FINANCIAL STATEMENTS
Note 3. Significant Accounting Policies
Principles of Consolidation
The accompanying consolidated financial statements for December 31, 2010 and December 31, 2009 include the accounts of Elephant Talk Communications Inc., including:
| ¨ | its wholly-owned subsidiary Elephant Talk Europe Holding B.V., its wholly-owned subsidiary Elephant Talk Communication Holding AG, its wholly-owned subsidiaries Elephant Talk Communications S.L.U., Elephant Talk Mobile Services B.V., Elephant Talk Communication Austria GmbH, Elephant Talk Telekom GmbH (formerly Vocalis Austria GmbH), Elephant Talk Communications Italy S.R.L., ET-Stream GmbH, Elephant Talk Communication Carrier Services GmbH, Elephant Talk Communication (Europe) GmbH, Elephant Talk Communication Schweiz GmbH, Moba Consulting Partners B.V., Elephant Talk Communications France S.A.S., its majority owned (51%) subsidiary Elephant Talk Communications Premium Rate Services Netherlands B.V., its majority owned (51%) subsidiary Elephant Talk Communications PRS U.K. Limited, its wholly-owned subsidiary Elephant Talk Communications Luxembourg SA; |
| ¨ | its wholly-owned subsidiary Elephant Talk Global Holding B.V., its wholly-owned subsidiary Elephant Talk Business Services W.L.L., its wholly-owned subsidiary Guangzhou Elephant Talk Information Technology Limited., its wholly-owned Elephant Talk Caribbean B.V., its majority owned (51%) subsidiary ET-UTS N.V.; |
| ¨ | its wholly-owned subsidiary Elephant Talk Limited, its majority owned (60%) subsidiary Elephant Talk Middle East & Africa (Holding) W.L.L., its majority owned (51%) subsidiary Elephant Talk Middle East & Africa (Holding) Jordan L.L.C., its majority owned (99%) subsidiary Elephant Talk Middle East & Africa Bahrain W.L.L and its majority owned (50.54%) subsidiary Elephant Talk Middle East & Africa FZ-LLC; and |
| ¨ | its wholly-owned subsidiary ValidSoft Ltd and its wholly-owned subsidiaries ValidSoft (UK) Ltd & ValidSoft (Australia) Pty Ltd.. |
Acquisitions.
On March 17, 2010, the Company acquired all of the assets of privately held ValidSoft Ltd, an Irish company (“ValidSoft”), for total consideration of $ 16,033,689, paid by the issuance of shares of the Company’s common stock, as well as warrants to purchase shares of common stock. This consideration excludes contingent consideration payable upon ValidSoft meeting certain performance targets. The opening balance sheet of ValidSoft has been recorded as of April 1 2010. The Consolidated Statement of Income ending December 31, 2010 includes the financial results of ValidSoft as of April 1 2010.
F-28
ELEPHANT TALK COMMUNICATIONS, INC. AND SUBSIDIARIES
NOTES TO THE AUDITED CONSOLIDATED FINANCIAL STATEMENTS
Foreign Currency Translation
The functional currency is Euros for the Company’s wholly-owned subsidiary, Elephant Talk Europe Holding B.V. and its subsidiaries, and Euros for its wholly-owned subsidiary, Elephant Talk Global Holding B.V., and the Hong Kong Dollar for its wholly-owned subsidiary, Elephant Talk Limited and the British Pound Sterling for its wholly-owned subsidiary, ValidSoft (UK) Ltd. The financial statements of the Company were translated to USD using period-end exchange rates as to assets and liabilities and average exchange rates as to revenues and expenses, and capital accounts were translated at their historical exchange rates when the capital transaction occurred. In accordance with Accounting Standard Codification (“ASC”) 830, Foreign Currency Matters, (formerly known as Statement of Financial Accounting Standards (“SFAS”) No. 52), net gains and losses resulting from translation of foreign currency financial statements are included in the statements of shareholder’s equity as other comprehensive income (loss). Foreign currency transaction gains and losses are included in consolidated income (loss). The accumulated other comprehensive income (loss) as of December 31, 2010 and December 31, 2009 was ($519,020) and $1,136,897, respectively. The foreign currency translation gain/(loss) for the years ended December 31, 2010 and 2009 was ($1,655,917) and $190,063, respectively.
Use of Estimates
The preparation of the accompanying financial statements conforms with accounting principles generally accepted in the United States of America and requires management to make certain estimates and assumptions that affect the reported amounts of assets and liabilities and disclosures of contingent assets and liabilities at the date of the financial statements, and the reported amounts of revenues and expenses during the reporting period. Actual results could differ materially from those estimates and assumptions.
Cash and Cash Equivalents
For purposes of the cash flow statements, the Company considers all highly liquid investments with original maturities of six months or less at the time of purchase to be cash equivalents.
Restricted Cash
Restricted cash represents cash deposited as bank guarantee for interconnects.
Accounts Receivables, net
The Company’s customer base consists of a geographically dispersed customer base. The Company maintains an allowance for potential credit losses on accounts receivable. Management reviews the composition of accounts receivable and analyzes historical bad debts, customer concentrations, customer credit worthiness, current economic trends and changes in customer payment patterns to evaluate the adequacy of these allowances. Allowances are recorded primarily on a specific identification basis. As of December 31, 2010 and 2009, the allowance for doubtful accounts was $119,044 and $764,302, respectively.
F-29
ELEPHANT TALK COMMUNICATIONS, INC. AND SUBSIDIARIES
NOTES TO THE AUDITED CONSOLIDATED FINANCIAL STATEMENTS
Revenue Recognition and Deferred Revenue
The Company’s revenue recognition policies are in compliance with ASC 605, Revenue Recognition (“ASC 605”), (formerly, Staff Accounting Bulletin (“SAB104”). Revenue is recognized only when the price is fixed or determinable, persuasive evidence of arrangement exists, the service is performed and the collectability of the resulting receivable is reasonably assured. The Company derives revenue from activities as a landline and mobile services provider with its network and its own switching technology. Revenue represents amounts earned for telecommunication services provided to customers (net of value added tax and inter-company revenue). The Company recognizes revenue from prepaid calling cards as the services are provided. Payments received before all of the relevant criteria for revenue recognition are satisfied are recorded as deferred revenue. Deferred revenue represents amounts received from the customers against future sales of services since the Company recognizes revenue upon performing the services. Deferred revenue was $0 and $132,205 as of December 31, 2010 and December 31, 2009, respectively.
Cost of Service
Cost of service includes origination, termination, network and billing charges from telecommunications operators, out payment costs to content and information providers, network costs, data center costs, facility costs of hosting network and equipment, and costs of providing resale arrangements with long distance service providers, costs of leasing transmission facilities and international gateway switches for voice and data transmission services.
Reporting Segments
ASC 820, Segment Reporting, (Formerly SFAS No.131), defines operating segments as components of an enterprise about which separate financial information is available that is evaluated regularly by the chief operating decision maker in deciding how to allocate resources and in assessing performances. The Company allocates its resources and assesses the performance of its sales activities based upon geographic locations of its subsidiaries.
Stock-based Compensation
Effective January 1, 2006, we adopted the provisions of ASC 718 “Compensation-Stock Compensation”, (“ASC 718”) (formerly SFAS No. 123(R)), using the prospective approach. As a result, we recognize stock-based compensation expense for only those awards that are granted subsequent to December 31, 2005 and any previously existing awards that are subject to variable accounting, including certain stock options that were exercised with notes in 2003, until the awards are exercised, forfeited, or contractually expire in accordance with the prospective method and the transition rules of ASC 718. Under ASC 718, stock-based awards granted after December 31, 2005, are recorded at fair value as of the grant date and recognized as expense over the employee’s requisite service period (the vesting period, generally three years), which we have elected to amortize on a straight-line basis.
F-30
ELEPHANT TALK COMMUNICATIONS, INC. AND SUBSIDIARIES
NOTES TO THE AUDITED CONSOLIDATED FINANCIAL STATEMENTS
Income Taxes
The Company accounts for income taxes under ASC 740, “Accounting for Income Taxes” (“ASC 740”) (formerly SFAS No. 109). This statement requires the recognition of deferred tax assets and liabilities for the future consequences of events that have been recognized in the Company’s financial statements or tax returns. The measurement of the deferred items is based on enacted tax laws. In the event the future consequences of differences between financial reporting bases and the tax bases of the Company’s assets and liabilities result in a deferred tax asset, ASC 740 requires an evaluation of the probability of being able to realize the future benefits indicated by such asset. A valuation allowance related to a deferred tax asset is recorded when it is more likely than not that some portion or the entire deferred tax asset will not be realized. As part of the process of preparing our consolidated financial statements, we are required to estimate our income tax expense in each of the jurisdictions in which we operate. In the ordinary course of a global business, there are many transactions and calculations where the ultimate tax outcome is uncertain. Some of these uncertainties arise as a consequence of revenue sharing and reimbursement arrangements among related entities, the process of identifying items of revenue and expenses that qualify for preferential tax treatment and segregation of foreign and domestic income and expense to avoid double taxation. We also assess temporary differences resulting from differing treatment of items, such as deferred revenue, for tax and accounting differences. These differences result in deferred tax assets and liabilities, which are included within our consolidated balance sheet. We may record a valuation allowance to reduce our deferred tax assets to the amount of future tax benefit that is more likely than not to be realized. Although we believe that our estimates are reasonable and that we have considered future taxable income and ongoing prudent and feasible tax strategies in estimating our tax outcome and in assessing the need for the valuation allowance, there is no assurance that the final tax outcome and the valuation allowance will not be different than those that are reflected in our historical income tax provisions and accruals.
ASC 740 prescribes a recognition threshold and measurement methodology to recognize and measure an income tax position taken, or expected to be taken, in a tax return. The evaluation of a tax position is based on a two-step approach. The first step requires an entity to evaluate whether the tax position would “more likely than not” be sustained upon examination by the appropriate taxing authority. The second step requires the tax position be measured at the largest amount of tax benefit that is greater than 50 percent likely of being realized upon ultimate settlement. In addition, previously recognized benefits from tax positions that no longer meet the new criteria would be derecognized.
The Company has filed or is in the process of filing tax returns that are subject to audit by the respective tax authorities. Although the ultimate outcome is unknown, we believe that any adjustments that may result from tax return audits are not likely to have a material, adverse effect on our consolidated results of operations, financial condition or cash flows.
Comprehensive Income/(Loss)
Comprehensive income (loss) includes all changes in equity during a period from non-owner sources. Other comprehensive income refers to gains and losses that under accounting principles generally accepted in the United States are recorded as an element of shareholders’ equity but are excluded from net income. For the 2010 and 2009 fiscal years, the Company’s comprehensive income/(loss) consisted of its net loss and foreign currency translation adjustments.
Intangible Assets
In accordance with ASC 350 (formerly SFAS No. 142), intangible assets are carried at cost less accumulated amortization and impairment charges. Intangible assets are amortized on a straight-line basis over the expected useful lives of the assets, between three and ten years. Other intangible assets are reviewed for impairment in accordance with ASC 360, Property, Plant, and Equipment,” (formerly SFAS No. 144), annually, or whenever events or changes in circumstances indicate that the carrying amount of such assets may not be recoverable. Measurement of any impairment loss for long-lived assets and identifiable intangible assets that management expects to hold and use is based on the amount of the carrying value that exceeds the fair value of the asset.
F-31
ELEPHANT TALK COMMUNICATIONS, INC. AND SUBSIDIARIES
NOTES TO THE AUDITED CONSOLIDATED FINANCIAL STATEMENTS
Property and Equipment, Internally Developed and Third Party Software
Property and equipment are initially recorded at cost. Additions and improvements are capitalized, while expenditures that do not enhance the assets or extend the useful life are charged to operating expenses as incurred. Included in property and equipment are certain costs related to the development of the Company’s internally developed software technology platform. The Company has adopted the provisions of ASC 985, Software (formerly the AICPA Statement of Position No. 98-1).
The Company has capitalized certain computer software development costs upon the establishment of technological feasibility. Technological feasibility is considered to have occurred upon completion of a detailed program design that has been confirmed by documenting the product specifications, or to the extent that a detailed program design is not pursued, upon completion of a working model that has been confirmed by testing to be consistent with the product design. Depreciation applied using the straight-line method over the estimated useful lives of the assets once the assets are placed in service. Once a new functionality or improvement is released for operational use, the asset is moved from the property and equipment category “projects under construction” to a property and equipment asset subject to depreciation in accordance with the principle described in the previous sentence.
Recently Issued Accounting Pronouncements
In January 2010, the FASB issued ASU 2010-06, Improving Disclosures about Fair Value Measurements. The standard amends ASC Topic 820, Fair Value Measurements and Disclosures, to require additional disclosures related to transfers in and out of Levels 1 and 2 and for activity in Level 3 and clarifies other existing disclosures requirements. The Company adopted ASU 2010-06 beginning January 1, 2010. This update had no impact on the Company’s financial statements.
In April 2010, the FASB issued Accounting Standard Update (“ASU”) No. 2010-17, Milestone Method of Revenue Recognition, which provides guidance on applying the milestone method to milestone payments for achieving specified performance measures when those payments are related to uncertain future events. However, the FASB clarified that, even if the requirements in this ASU are met, entities would not be precluded from making an accounting policy election to apply another appropriate accounting policy that results in the deferral of some portion of the arrangement consideration. The ASU is effective for periods beginning on or after June 15, 2010. Entities can apply this guidance retrospectively as well as prospectively to milestones achieved after adoption. This update is expected to have no impact on the Company’s financial statements.
ASU 2010-13, Effect of Denominating the Exercise Price of a Share-Based Payment Award in the Currency of the Market in Which the Underlying Equity Security Trades, amends Topic 718 to clarify that an employee share-based payment award with an exercise price denominated in the currency of a market in which a substantial portion of the entity’s equity securities trades should not be considered to contain a condition that is not a market, performance, or service condition. Therefore, an entity would not classify such an award as a liability if it otherwise qualifies as equity. It is effective for fiscal years, and interim periods within those fiscal years, beginning on or after December 15, 2010. The amendments should be applied by recording a cumulative-effect adjustment to the opening balance of retained earnings. The cumulative-effect adjustment should be calculated for all awards outstanding as of the beginning of the year in which the amendments are initially applied, as if the amendments had been applied consistently since the inception of the award. Earlier application is permitted. We are currently evaluating the impact of this provision.
ASU 2010-09, Subsequent Events, amends FASB ASC 855-10 to clarify that whereas SEC filers and conduit debt obligors for publicly-traded conduit debt securities must evaluate subsequent events through the date that the financial statements are issued, SEC filers need not disclose the date through which subsequent events have been evaluated. Non-SEC filers must evaluate subsequent events through the date the financial statements are available to be issued, and continue to be required to disclose that date. The ASU also clarifies that reissuances for which a subsequent events evaluation is required are limited to “revised” financial statements (as defined in the ASU). The amendments are effective upon issuance (February 2010), except as relating to conduit debt obligors, for which the effective date is interim or annual periods ending after June 15, 2010. We adopted the provision of ASU 2010-09 as required.
F-32
ELEPHANT TALK COMMUNICATIONS, INC. AND SUBSIDIARIES
NOTES TO THE AUDITED CONSOLIDATED FINANCIAL STATEMENTS
In December 2010, the FASB issued ASU 2010-29, “Disclosure of Supplementary Pro Forma Information for Business Combinations.” The guidance requires pro forma disclosure for business combinations that occurred in the current reporting period as though the acquisition date for all business combinations that occurred during the year had been as of the beginning of the annual reporting period. If comparative financial statements are presented, the pro forma information should be reported as though the acquisition date for all business combinations that occurred during the current year had been as of the beginning of the comparable prior annual reporting period. ASU 2010-29 is effective for business combinations for which the acquisition date is on or after the beginning of the first annual reporting period beginning on or after December 15, 2010. Early adoption is permitted. We will adopt this guidance on January 1, 2011 and apply it prospectively.
In December 2010, the FASB issued ASU 2010-28, “When to Perform Step 2 of the Goodwill Impairment Test for Reporting Units with Zero or Negative Carrying Amounts.” The amendments in this ASU modify Step 1 of the goodwill impairment test for reporting units with zero or negative carrying amounts. For those reporting units, an entity is required to perform Step 2 of the goodwill impairment test if it is more likely than not that a goodwill impairment exists. For public entities, the amendments in this Update are effective for fiscal years, and interim periods within those years, beginning after December 15, 2010. Early adoption is not permitted. We will adopt this guidance on January 1, 2011 and apply it prospectively.
Note 4. Long-term Deposit
Long-term earnest deposits to various telecom carriers during the course of its operations and a deposit towards the French Tax Authorities for the total amount of $610,486 as at December 31, 2010 compared with $330,946 as of December 31, 2009. The deposits are refundable at the termination of the business relationship with the carriers.
Note 5. Prepaid Expenses and Other Current Assets
Prepaid expenses and other current assets recorded at $2,337,914 as of December 31, 2010 compared with $2,657,019 as of December 31, 2009. The 2010 amount consists primarily of prepaid Value Added Tax.
Note 6. Deferred Financing Costs
Deferred financing costs consist of commissions, warrants issued to placement agents, associated expenses and legal fees for the convertible 12% secured notes. At December 31, 2010 and 2009 deferred financing costs were $0 and $3,033,277 respectively, and are amortized over the term of the convertible 12% secured notes.
F-33
ELEPHANT TALK COMMUNICATIONS, INC. AND SUBSIDIARIES
NOTES TO THE AUDITED CONSOLIDATED FINANCIAL STATEMENTS
Note 7. Property & Equipment
The Company’s Property & Equipment also include the capitalization of its systems engineering and software programming activities. Typically, these investments pertain to the Company’s:
| ¨ | Intelligent Network (IN) platform |
| ¨ | CRM software |
| ¨ | Mediation, Rating & Pricing engine |
| ¨ | Operations and Business Support software |
| ¨ | Network management tools |
Property and equipment at December 31, 2010 and December 31, 2009 consisted of:
Average Estimated Useful Lives | December 31, 2010 | December 31, 2009 | ||||||||
| Furniture and fixtures | 5 | 215,905 | 219,469 | |||||||
| Computer, communication and network equipment | 3 - 10 | 9,724,189 | 8,071,138 | |||||||
| Software | 5 | 4,187,523 | 4,410,714 | |||||||
| Automobiles | 5 | 125,241 | 135,455 | |||||||
| Construction in progress | 1,984,674 | 1,009,969 | ||||||||
| 16,237,531 | 13,846,745 | |||||||||
| Less: accumulated depreciation | (7,784,944 | ) | (6,072,833 | ) | ||||||
| $ | 8,452,587 | $ | 7,773,862 | |||||||
Total depreciation expense for the year ended December 31, 2010 totaled $2,260,489 compared to $2,246,669 for the same period of 2009.
Note 8. Intangible Assets - Customer Contracts, Licenses and Interconnects
Intangible assets include customer contracts, telecommunication licenses and integrated, multi-country, centrally managed switch-based interconnects as well as ValidSoft Intellectual Property, including but not limited to software source codes, applications, customer list & pipeline, registration & licenses, patents and trademark/brands.
F-34
ELEPHANT TALK COMMUNICATIONS, INC. AND SUBSIDIARIES
NOTES TO THE AUDITED CONSOLIDATED FINANCIAL STATEMENTS
Intangible assets as of December 31, 2010 and 2009 consisted of the following:
Average Estimated Useful Lives | December 31, 2010 | December 31, 2009 | ||||||||
| Customer Contracts, Licenses , Interconnect & Technology | 5 - 10 | $ | 11,615,700 | $ | 12,282,126 | |||||
| ValidSoft IP & Technology | 1 - 10 | 15,639,154 | — | |||||||
| 27,254,854 | 12,282,126 | |||||||||
| Less: Accumulated Amortization and impairment charges | (8,684,964 | ) | (8,371,763 | ) | ||||||
| Less: Accumulated Amortization ValidSoft IP & Technology | (2,316,303 | ) | — | |||||||
| $ | 16,253,587 | $ | 3,910,363 | |||||||
Total amortization expense for the year ended December 31, 2010 totaled $ 3,051,980 compared to $804,792 for the same period of 2009.
| Goodwill | December 31, 2010 | December 31, 2009 | ||||||
| Goodwill at acquisition (Note 9) | $ | 3,433,833 | — | |||||
| End of period exchange rate translation | (203,047 | ) | — | |||||
| $ | 3,230,786 | $ | 0 | |||||
Estimated future amortization expense related to our intangible assets is:
| 2011 | 2012 | 2013 | 2014 | 2015 | 2016 | 2017 thereafter | ||||||||||||||||||||||
| Interconnect licenses and contracts | 652,603 | 650,242 | 619,226 | 544,857 | 130,010 | 17,943 | 149,155 | |||||||||||||||||||||
| ValidSoft IP & Technology | 2,145,933 | 2,145,933 | 2,145,933 | 2,145,933 | 2,002,675 | 1,954,923 | 806,660 | |||||||||||||||||||||
| 2,798,536 | 2,796,175 | 2,765,159 | 2,690,790 | 2,132,685 | 1,972,866 | 955,815 | ||||||||||||||||||||||
Intangible Assets Impairment charge
The Company assessed the carrying value of its intangible assets as of December 31, 2010. As a result of this assessment, the Company determined that the value of certain specific intangible assets was not higher than the estimated recoverable value and therefore no impairment charge was recorded during 2009. In the evaluation of its Intangible Assets, the Company estimated the discounted future cash flows directly associated with the asset and compared these to the asset’s carrying amount.
F-35
ELEPHANT TALK COMMUNICATIONS, INC. AND SUBSIDIARIES
NOTES TO THE AUDITED CONSOLIDATED FINANCIAL STATEMENTS
Note 9. Acquisition of ValidSoft Ltd
On March 17, 2010, we issued 10,235,739 shares and 3,829,487 warrants as purchase price consideration following the completion of the acquisition of ValidSoft of which 2,558,937 shares and 957,373 warrants are contingent upon meeting specific targets following a stepped earn-out agreement. Based upon a number material contracts not having been concluded yet as of the date of this report, the Company does not expect that the targets set forth in the earn-out agreement, will be met at this point in time. Consequently, the total value for the consideration is $16,033,688 comprising the fair market value for the non-contingent shares of $12,129,352 and non-contingent warrants of $3,904,336. The contingent consideration is held in escrow. The Company will continue to monitor the progress made and determine quarterly to what extent the stepped targets are likely to be met.
| Consideration paid | Total Consideration | Non- Contingent Consideration | Contingent Consideration | |||||||||
| Number of shares | 10,235,739 | 7,676,805 | 2,558,934 | |||||||||
| Fair value (share price at March 17, 2010) | $ | 1,58 | $ | 12,129,352 | - | |||||||
| Number of warrants | 3,829,487 | 2,872,114 | 957,373 | |||||||||
| Fair Value (Black-Scholes) | $ | 3,904,336 | ||||||||||
| Total Consideration Paid | $ | 16,033,688 | ||||||||||
Following the valuation of ValidSoft, we allocated the above purchase price to the identifiable assets and liabilities of ValidSoft.
A summary of the assets acquired and liabilities assumed for ValidSoft are:
| Estimated fair values: | ||||
| Assets acquired | $ | 16,677,323 | ||
| Liabilities assumed | 4,077,467 | |||
| Net assets acquired | 12,599,856 | |||
| Consideration paid | 16,033,688 | |||
| Goodwill | $ | 3,433,832 | ||
F-36
ELEPHANT TALK COMMUNICATIONS, INC. AND SUBSIDIARIES
NOTES TO THE AUDITED CONSOLIDATED FINANCIAL STATEMENTS
The operating results of ValidSoft have been consolidated with those of the Company starting April 1, 2010.
UNAUDITED PRO FORMA CONSOLIDATED FINANCIAL INFORMATION DISCLOSURE FOR THE YEARS ENDED DECEMBER 31, 2010 AND 2009
The following unaudited pro forma consolidated financial information for the years ended December 31, 2010 and 2009, as presented below, reflects the results of operations of the Company assuming that the acquisition had occurred on January 1, 2010 and January 1, 2009, respectively, and after giving effect to the purchase accounting adjustments. These pro forma results have been prepared for information purposes only and do not purport to be indicative of what operating results would have been had the acquisitions actually taken place on January 1, 2010 and 2009 respectively, and may not be indicative of future operating results.
| Pro forma consolidated | December 31, | December 31, | ||||||
| 2010 | 2009 | |||||||
| Revenues | $ | 37,224,930 | $ | 43,789,341 | ||||
| Operating loss | (19,698,600 | ) | (17,367,988 | ) | ||||
| Net loss | (93,759,415 | ) | (24,313,619 | ) | ||||
| Loss per share - basic and fully diluted | $ | (1.33 | ) | $ | (0.40 | ) | ||
Note: The Company included the financial results of ValidSoft in its consolidated 2010 financial results from the date April 1, 2010 through December 31, 2010.
Further details on the acquisition of ValidSoft can be found in our Current Report on Form 8-K/A filed June 2, 2010.
Note 10. Overdraft
In 2004, Elephant Talk Ltd. executed a credit facility with a bank in Hong Kong pursuant to which Elephant Talk Ltd. borrowed funds. As of December 31, 2010, the overdraft balance, including accrued interest totaled, $278,637 compared to $250,022 as of December 31, 2009. The interest rate and default payment interest rate were charged at 2% and 6% per annum above the Hong Kong Dollar Prime Rate quoted by the bank from time to time.
The Company has neither guaranteed the credit facility nor is it otherwise obligated to pay funds drawn upon it on behalf of Elephant Talk Ltd. As of December 31, 2010, Moba Consulting Partners B.V., a subsidiary of the Company, had an overdraft of $78,101 compared to $101,567 as of December 31, 2009 on one of the Company’s bank accounts.
Note 11. Accrued Expenses
December 31, 2010 | December 31, 2009 | |||||||
| Accrued Selling, General & Administrative expenses | $ | 1,494,218 | $ | 589,630 | ||||
| Placement fees | - | - | ||||||
| Accrued cost of sales and network | 380,236 | 307,172 | ||||||
| Accrued taxes | 791,128 | 855,370 | ||||||
| Accrued interest payable | 653,146 | 552,393 | ||||||
| Other | 525,210 | 434,432 | ||||||
| Total accrued expenses | $ | 3,843,938 | $ | 2,738,998 | ||||
F-37
ELEPHANT TALK COMMUNICATIONS, INC. AND SUBSIDIARIES
NOTES TO THE AUDITED CONSOLIDATED FINANCIAL STATEMENTS
Note 12. Advances from Related Parties
As at December 31, 2010 and 2009 the Company had $0 and $13,287, respectively as payable to related parties.
Note 13.Loans Payable
Loans payable at December 31, 2010 and 2009 are summarized as follows:
December 31, 2010 | December 31, 2009 | |||||||
| Installment loan payable due December 24, 2006, secured by personal guarantees of two shareholders, a former director, and a third party | $ | 319,182 | $ | 320,339 | ||||
| Installment loan payable, bank, monthly principal and interest payments of $2,798 including interest at bank’s prime rate plus 1.5% per annum, 8.25% at November 30, 2008, due December 24, 2011, secured by personal guarantees of three shareholders and a former director | 190,716 | 191,407 | ||||||
| Installment loan payable, bank, monthly principal and interest payments of $1,729 including interest at bank’s prime rate plus 1.5% per annum, 8.25% at November 24, 2008, due June 28, 2009, secured by personal guarantees of three shareholders and a former director | 84,799 | 85,106 | ||||||
| Term loan payable, bank, monthly payments of interest at bank’s prime rate, 7.0% at December 31, 2007 | 282,660 | 283,684 | ||||||
| Total | $ | 877,357 | $ | 880,536 | ||||
Elephant Talk Ltd has executed a credit facility with a bank in Hong Kong since June 29, 2004, under which Elephant Talk Ltd has borrowed funds from the bank under three installment loans and a term loan arrangement. Elephant Talk Ltd is in default of making loan payments on all the loans and has recorded an accrued interest amounting to $655,015 as of December 31, 2010. As a result of the default, the entire loan balance outstanding at December 31, 2009 totaling $877,357, is due and payable to the bank. Furthermore, Elephant Talk Ltd is obligated to pay a default interest rate at the rate of 4.25% per annum in addition to the prescribed interest rate of the installment loans and term loan. Elephant Talk Ltd has recorded $4,716 and $100,084 in interest expense and default interest expense, respectively, on loans payable as of December 31, 2010 and $5,408 and $111,361 in interest expense as of December 31, 2009. The Company has neither guaranteed the credit facility nor is it otherwise obligated to pay funds drawn upon it on behalf of Elephant Talk Ltd.
Note 14. Loan from related parties
The Company’s 51% owned subsidiary ET-UTS N.V. has received $468,756 in interest bearing (8% per annum) unsecured loans from United Telecommunication Services N.V., the 49% shareholder in the subsidiary. No maturity date has been fixed.
Note 15. Convertible Notes/Loans
12% Secured Convertible Promissory Note 2009
On July 31, August 18, September 3, September 30 and October 30, 2009, the Company consummated closings of its private placement offerings of Units comprised of 12% secured convertible promissory notes (the ‘Notes”) and warrants to purchase shares of no par value common stock to accredited investors. The Securities were offered and sold pursuant to an exemption from registration under Section 4(2) of the Securities Act of 1933, as amended. The Company sold an aggregate of $12,333,020 principal amount of Notes and delivered Warrants to purchase an aggregate of 12,333,020 shares of the Company’s no par value common stock at a purchase price of $1.00 per share. The Company intends to use the net proceeds from the Offering primarily for working capital.
F-38
ELEPHANT TALK COMMUNICATIONS, INC. AND SUBSIDIARIES
NOTES TO THE AUDITED CONSOLIDATED FINANCIAL STATEMENTS
The Notes are convertible at the option of the holder into no par value common stock, of the Company at a conversion price equal to eighty five percent (85%) of the price at which shares are sold in a future public offering currently contemplated by the Company if consummated; provided, however, that if the public offering is not consummated on or before March 31, 2010, the conversion price shall be equal to eighty five percent (85%) of the twenty (20) day average closing price of the Common Stock for the twenty (20) trading days prior to March 31, 2010 (the “March 31, 2010 Conversion Price”); provided further, however, that if at any time following the earlier of the closing of the Public Offering or March 31,2010, the twenty (20) day average closing price of the Common Stock for any twenty (20) consecutive trading days exceeds two hundred percent (200%) of the Public Offering closing price or of the twenty (20) day average closing price of the Common Stock for the twenty (20) trading days prior to March 31, 2010, as applicable, that any Notes which remain unconverted shall automatically convert into shares of the Common Stock at the Conversion Price or the March 31, 2010 Conversion Price, as applicable. For further details see also Note 27.
The above terms and conditions resulted in a determination of the conversion price of the note in case of voluntary conversion of $1.35 per share (being 85% of $1.59). On November 19, 2010, the share price exceeded the two hundred percent of the (200%) of the twenty (20) day average closing price of the Common Stock for the twenty (20) trading days prior to March 31, 2010. When on November 19, 2010, the share price reached the twenty (20) day average closing price of 200% at $3.18, the notes automatically converted into shares. The Company notified the remaining note holders of this event and issues shares upon return by the noteholders of the original note and ‘Certification on Non-Affiliate Status’-form. As per December 31, 2010 the Company has not issued 2,210,552 corresponding shares pending the abovementioned documents. As a result, these 2,210,552 shares are not included in the number of shares outstanding as per December 31, 2010.
2010 QAT II Loans
On February 2, 2010, we entered into a loan agreement with QAT II. Pursuant to this loan agreement, QAT II Investments agreed to lend to us the sum of €350,000 ($488,775 based on the February 2, 2010 exchange rate published in the Wall Street Journal). The proceeds were made available to the Company on February 2, 2010.
On February 24, 2010, we entered into a loan agreement with QAT II. Pursuant to this loan agreement, QAT II Investments agreed to lend us the sum of €850,000 ($1,150,390 based on the February 24, 2010 exchange rate published in the Wall Street Journal). The proceeds of the loan agreement were made available to the Company on February 24, 2010.
On March 22, 2010, we entered into a loan agreement with QAT II. Pursuant to this loan agreement, QAT II Investments agreed to lend us the sum of €150,000 ($203,280 based on the March 22, 2010 exchange rate published in the Wall Street Journal). The proceeds of the loan agreement were made available to the Company on March 22, 2010
On March 30, 2010, we entered into a loan agreement with QAT II. Pursuant to the loan agreement, QAT II Investments agreed to lend us the sum of €500,000 ($670,750 based on March 30, 2010 exchange rate published in the Wall Street Journal). The proceeds of the loan agreement were made available to the Company on June 30, 2011.
Each of the above mentioned loan agreement initially provided that we would pay QAT II interest at a rate of fourteen percent (14%) per annum on the outstanding balance and provided the principal and interest shall be due and payable on the earlier of: (i) within 180 days from the date of the loan or (ii) in the event we consummate a Placement. QAT II has the ability to convert the principal and accrued interest outstanding as of the date of the Placement into the same type of equity or debt securities issued by us and on the same terms and conditions offered to other investors in the Placement. The outstanding principal and interest becomes immediately due and payable in the event we fail to make required payments of principal and interest, or otherwise breach the loan agreement and fail to cure such breach upon twenty days notice, or if we dispose of our properties or assets without QAT II’s prior consent, or if we file a petition for bankruptcy or otherwise resolves to wind up our affairs.
F-39
ELEPHANT TALK COMMUNICATIONS, INC. AND SUBSIDIARIES
NOTES TO THE AUDITED CONSOLIDATED FINANCIAL STATEMENTS
In connection with the above-referenced loans, we also issued to QAT II warrants to purchase common stock in an amount equal to one warrant per each United States dollar loaned hereunder to the Company (using the Euro-United States dollar conversion rate published by the Wall Street Journal at the close of business of the loan date). Such warrants have a term of three years and an exercise price equal to the OTCBB closing price of our common stock on the loan date.
The loan agreements described above were amended on June 10, 2010. Pursuant to the amendment, QAT II agreed to extend the existing maturity dates of the loans to May 1, 2011. The amendment also provides for the automatic conversion of the Notes if we raise at least $11 million in connection with the 2010 Private Placement Offering. The unpaid principal of such loans will convert into units consisting of common stock and warrants at a price of $1.20 per unit. Further, the units will be issued on the same terms and conditions as the units being offering in the 2010 Private Placement Offering. Accrued but unpaid interest due on the QAT II loans will also convert into units. As additional consideration for entering into the amendment, QAT II was issued warrants to purchase common stock at an amount equal to two (2x) the existing warrant coverage under the terms of such loan agreement.
On October 8, 2010 together with the fourth and final closing of the 2010 Private Placement Offering, in which the Company successfully raised $14 million and therefore met the $11 million condition, the QAT II loans totaling € 2,005,304 ($2,793,188) automatically converted into 2,327,657 shares of our common shares.
Note 16. Warrant liabilities
Investor and placement agent warrants – 12% secured convertible note 2009
We issued the warrants in connection with the 2009 private placement. The warrants include conversion provisions that require us to record them at fair value as a liability in accordance with ASC 815 (formerly EITF 00-19), with subsequent changes in fair value recorded as a non-operating gain or loss in our statement of operations. The fair value of the warrants is determined using a Black-Scholes option pricing model, and is affected by changes in inputs to that model including our stock price, expected stock price volatility, interest rates and expected term. The fair value of the warrants issued to investors and placement agents in connection with the 2009 private placement was $16,569,721 upon issuance.
During 2010, a number of the warrants relating to the 2009 private placement were exercised. The total outstanding number of warrants, including the warrants issued to the selling agents, decreased by 1,608,872. Including warrants issued to the selling agent in connection with the 2009 private placement, the total outstanding warrants as of December 31, 2010 was 12,504,399. The number of outstanding shares of common stock increased by 879,006 as a result of the foregoing exercises. The number of shares of common stock did not increase by the same number as the exercised warrants since the warrant agreement includes a cashless exercise option. Pursuant to the voluntary exercises of the notes we reclassified the fair value of the warrant liability of $3,905,572 into equity.
As a result of the automatic conversion of the 12% Secured Convertible Promissory notes (also see note 14), we reclassified the fair value of the warrants liability into equity. We calculated fair value at an aggregate amount of $13,033,503 at November 19, 2010.
At October 8, 2010, the outstanding notes held by QAT which were automatically converted into shares according to the terms and conditions of the 2010 Private Placement (PIPE) also resulted in the reclassification of the warrant liability into equity. The calculated fair value was $14,145,482 at October 8, 2010.
The various voluntary and finally the automatic conversion of the 12% Secured Convertible Promissory notes resulted in the accelerated amortization of the ‘Agent Warrants’ which had been accounted for as Debt Discount. The warrants issued to placement agents were capitalized as deferred financing costs (see note 6) and were valued using the Black-Scholes model and the inputs in accordance with ASC 505. During 2010, a total amount of $1,943,034 was accounted for as accelerated amortization on debt discount through our profit and loss account for this liability.
F-40
ELEPHANT TALK COMMUNICATIONS, INC. AND SUBSIDIARIES
NOTES TO THE AUDITED CONSOLIDATED FINANCIAL STATEMENTS
At December 31, 2010, all warrants were reclassified into equity or have been subject to accelerated amortization and will not be subject to further fair value calculations.
Warrants issued in connection with the 14% 2010 QAT II Loans
In connection with the above-referenced 14% 2010 QAT II loans, we also issued to QAT II warrants to purchase common stock in an amount equal to one warrant per each United States dollar lent hereunder to the Company (using the Euro-United States dollar conversion rate published by the Wall Street Journal at the close of business of the loan date). Such warrants have a term of three years and an exercise price equal to the OTCBB closing price of our common stock on the loan date.
| Number of | ||||||||
| Issue of Warrants relating to: | Exercise price | Issued Warrants | ||||||
| Loan granted February 2, 2010 | $ | 1.50 | 488,775 | |||||
| Loan granted February 24, 2010 | $ | 1.45 | 1,150,390 | |||||
| Loan granted March 22, 2010 | $ | 1.61 | 203,280 | |||||
| Loan granted March 30, 2010 | $ | 1.73 | 670,750 | |||||
| 2,513,195 | ||||||||
The warrants include conversion provisions that require us to record them at fair value as a liability in accordance with ASC 815 (formerly EITF 00-19), with subsequent changes in fair value recorded as a non-operating gain or loss in our statement of operations. The fair value of the warrants is determined using a Black-Scholes option pricing model, and is affected by changes in inputs to that model including our stock price, expected stock price volatility, interest rates and expected term. The initial fair value was determined at an aggregate amount of $2,401,571 at the various grant-dates. At October 8, 2010, the date of the final closing of the Private Placement (PIPE), the fair value of the warrants issued to QAT II were re-valued at $5,537,547 and reclassified in our accounts as equity due to the automatic conversion of the 14% 2010 QAT II Loans.
Warrants issued in connection with the amendment letter of the 14% 2010 QAT II Loans
The loan agreements described above were amended on June 10, 2010. Pursuant to the amendment, QAT II agreed to extend the existing maturity dates of the loans to May 1, 2011. As additional consideration for entering into the amendment, QAT II was issued warrants to purchase common stock at an amount of 5,026,390 warrants equal to two (2x) the existing warrant coverage under the terms of such loan agreement. The fair value of these warrants, calculated at June 30, 2010, of $5,718,467 had been accounted for as “interest expense related to amortization of debt discount on promissory notes” in the profit and loss account. An additional amendment the agreement provided for the automatic conversion of the notes if we raised at least $11 million in connection with the 2010 Private Placement Offering. The unpaid principal of such loans would convert into units consisting of common stock and warrants at a price of $1.20 per unit. Further, the units will be issued on the same terms and conditions as the units being offering in the 2010 Private Placement Offering. Accrued but unpaid interest due on the QAT II loans will also convert into units. Pursuant to the automatic conversion of the 14% 2010 QAT II Loans the fair value of the loan amendment warrants issued to QAT II were re-valued at $11,075,095 at October 8, 2010, the date of the final closing of the private placement and this value had been reclassified from warrant liability into equity.
F-41
ELEPHANT TALK COMMUNICATIONS, INC. AND SUBSIDIARIES
NOTES TO THE AUDITED CONSOLIDATED FINANCIAL STATEMENTS
Note 17. Conversion feature
12% Secured Convertible Promissory Note
A conversion feature (promissory noteholders will receive a discount of 15% when converting the principal into shares of common stock instead of cash repayment) was recognized at fair value on the respective issuance dates of the notes as a discount and will be amortized using the effective interest rate method from issuance to the maturity date of the respective notes. The fair value of the aggregate conversion feature was $2,899,801 as of December 31, 2009. The conversion feature has been marked to market each reporting date with subsequent changes in fair value recorded as a non-operating gain or loss in our statement of operations. Following these changes in fair value, certain voluntary conversions and the automatic conversion on November 19, 2010, the then existing liability of $19,555,610 was reclassified into equity.
14% 2010 QAT II Loans
The loans provided by QAT II during the first quarter of 2010 included the right to convert the loans including accrued interest into the same type of equity or debt securities issued by the Company under the placement of at least $5,000,000 and pursuant to the same placement terms and conditions offered to such other person or Company. The private placement met the conditions of such right of conversion and the outstanding principal and accrued interest was converted at the fourth and final closing of the ‘PIPE’. The calculated conversion feature at fair value as per October 8, 2010 amounted to $4,888,079 and was reclassified into equity.
Note 18. Shareholders’ equity
(A) Common Stock
The Company is presently authorized to issue 250,000,000 shares of common stock. The Company had 88,660,848 shares of common shares issued and outstanding as of December 31, 2010, an increase of 34,964,864 shares since December 31, 2009, largely due to the shares issued in connection with the ValidSoft acquisition (7,676,805), the Bridge Financing (2,885,000), shares issued in relation with the 2010 Private Placement Offering (11,666,685), shares issued as consideration for management and board compensation (1,395,168), warrant exercises (1,087,809), conversion of QAT II loans (2,327,657) and conversion of 12% secured convertible promissory notes (7,722,867).
The following table summarizes the shares issued for the year ended December 31, 2010:
| Number of shares | ||||
| Computation of Full Dilution - December 31, 2010 | issued | |||
| December 31, 2009 Total number of shares issued | 53,695,984 | |||
| Shares issued to consultants | 195,876 | |||
| Shares issued for management compensation | 1,395,168 | |||
| Shares issued for warrant exercises | 1,087,809 | |||
| Shares issued for acquisitions | 7,682,869 | |||
| Shares issued for financing | 16,879,342 | |||
| Shares issued for note conversions | 7,722,867 | |||
| Shares issued for employee stock option exercises | 933 | |||
| December 31, 2010 Total number of shares issued | 88,660,848 | |||
F-42
ELEPHANT TALK COMMUNICATIONS, INC. AND SUBSIDIARIES
NOTES TO THE AUDITED CONSOLIDATED FINANCIAL STATEMENTS
Reconciliation with stock transfer agent records:
The number of 88,660,848 excludes the 245,900 unreturned and the 2,558,934 escrowed contingent shares (see below). The shares issued and outstanding at December 31, 2010, according to the stock transfer agent’s records, was 91,465,684, which shares include 2,558,934 contingent shares for the ValidSoft acquisition and 245,900 shares which were cancelled by the Company prior to 2006. However, the 245,900 shares were not returned to the stock transfer agent and never cancelled on the Company’s records. These shares have been blocked for trading by the stock transfer agent. Finally, there is a rounding difference of two shares between the Company’s shares issued and the stock transfer agent’s records.
2010 Bridge Security Purchase Agreement
In May 2010, we sold 2,885,000 of units at price of $1.00 per unit, with each unit consisting of one share of our restricted common stock and two warrants to certain accredited investors in the United States and foreign countries (including to affiliates of the Company) in transactions exempt from registration under the Securities Act pursuant to Section 4(2), Regulation D and Regulation S (the “Sales”). In connection with the Sales, the purchasers received (i) warrants to purchase up to 2,885,000 of shares of our common stock, at an exercise price of $1.25 per share and (ii) warrants to purchase up to 2,885,000 of shares of our common stock, at an exercise price of $2.00 per share. None of the warrants contain cashless exercise provisions. Each warrant contains standard anti-dilution protection and may be cancelled upon the occurrence of the following: (i) with respect to the $1.25 warrant, in the event that the average of the last closing sale price of the common stock on the OTC Bulletin Board, or a national securities exchange, trading market or inter-dealer electronic quotation system, exceeds $3.00 for twenty (20) consecutive trading days and the holder fails to exercise within fifteen (15) days of receipt of notice this target was met, the warrants will expire worthless and (ii) with respect to the $2.00 warrant, in the event that the average of the last closing sale price of the common stock on the OTC Bulletin Board, or a national securities exchange, trading market or inter-dealer electronic quotation system, exceeds $4.00 for twenty (20) consecutive trading days and the holder fails to exercise within fifteen (15) days of receipt of notice this target was met, the warrants will expire worthless.
2010 Private Placement Offering
On October 8, 2010, we consummated the fourth and final closing of the 2010 Private Placement Offering to accredited investors. In a total of four closings we sold in 2010 units having an aggregate value of $14,000,000 at a price of $1.20 per unit and we delivered 11,666,667 shares of common stock and warrants to purchase up to 11,666,667 shares of common stock at $1.50 per share for a five year period.
The units, consisting of common stock and warrants, were offered and sold and/or converted pursuant to an exemption from registration under Section 4(2) of the Securities Act. The Company is obligated to register the common stock underlying the units and warrants on a registration statement to be filed after the final closing of the 2010 Private Placement Offering. The Registration Statement was subsequently filed and declared effective December 21, 2010.
In addition, the investors in the 2010 Private Placement Offering are entitled to unlimited piggy-back registration rights. We intend to use the net proceeds primarily for working capital.
The foregoing warrants and the 2,100,005 warrants issued to Dawson James in connection with the 2010 Private Placement, entitle the holders to purchase shares of common stock for a period of five years from the date of issuance and contain standard anti-dilution rights. In the event: (i) the trading price of our common stock exceeds $2.25 for twenty consecutive trading days and (ii) there is an effective registration statement with a current prospectus on file with the Securities and Exchange Commission, the Company has the option to redeem the warrants issued in the 2010 Private Placement Offering.
F-43
ELEPHANT TALK COMMUNICATIONS, INC. AND SUBSIDIARIES
NOTES TO THE AUDITED CONSOLIDATED FINANCIAL STATEMENTS
In the 2010 Private Placement Offering, the Company raised in the aggregate $22,125,571 in gross proceeds, including $14,000,000 in cash raised by Dawson James (with full exercise of the $3,000,000 over-allotment option) and $8,125,571 in automatic conversions by QAT II. After payment of commissions, non-accountable expenses and other fees and expenses, the Company received net cash proceeds of $12,340,908 (and the cancellation of $8,125,571 of promissory notes and loans held by QAT II). The Company delivered an aggregate of 14,437,997 shares of Common Stock and warrants to purchase an aggregate of 21,564,392 shares of Common Stock, including 17,515,552 warrants with an exercise price of $1.50, 2,300,780 warrants with an exercise price of $1.45, 406,560 warrants with an exercise price of $1.61 and 1,341,500 warrants with an exercise price of $1.73.
(B) Class B Preferred Stock
The Company’s articles of incorporation authorize the issuance of 50,000,000 shares of no par value Class B Preferred Stock. No shares of Preferred Stock are currently issued and outstanding. Under the articles of incorporation, the boards of directors have the power, without further action by the holders of the common stock, to designate the relative rights and preferences of the preferred stock, and issue the preferred stock in such one or more series as designated by the board of directors. The designation of rights and preferences could include preferences as to liquidation, redemption and conversion rights, voting rights, dividends or other preferences, any of which may be dilutive of the interest of the holders of common stock or the Preferred Stock of any other series. The issuance of Preferred Stock may have the effect of delaying or preventing a change in control of the Company without further shareholder action and may adversely affect the rights and powers, including voting rights, of the holders of common stock. In certain circumstances, the issuance of preferred stock could depress the market price of the common stock.
During 2009 or 2010, the Company did not issue any shares of Preferred Stock.
Note 19. Basic and diluted net loss per share
Net loss per share is calculated in accordance with ASC 260, Earnings per Share, (formerly SFAS No.128). Basic net loss per share is based upon the weighted average number of common shares outstanding. Dilution is computed by applying the treasury stock method. Under this method, options and warrants are assumed to be exercised at the beginning of the period (or at the time of issuance, if later), and as if funds obtained thereby were used to purchase common stock at the average market price during the period. Weighted average number of shares used to compute basic and diluted loss per share is the same since the effect of dilutive securities is anti-dilutive.
Note 20. Non-Qualified Stock and Option Compensation Plan and Long Term Incentive Plan
2006 Non-Qualified Stock and Option Compensation Plan
Under this plan there are, as of December 31, 2010, 307,742 stock options outstanding. There are 600,000 shares and 92,258 stock options available for grant.
Options granted generally vest over a 3 year period. Options generally expire 2 years from the date of vesting.
F-44
ELEPHANT TALK COMMUNICATIONS, INC. AND SUBSIDIARIES
NOTES TO THE AUDITED CONSOLIDATED FINANCIAL STATEMENTS
Common stock purchase options and warrants consisted of the following as of December 31, 2010:
Number of shares | Exercise Price | Initial Fair Market Value | ||||||||||
| Options: | ||||||||||||
| Outstanding as of December 31, 2009 | 344,342 | $ | 2.25 | $ | 453,917 | |||||||
| Granted in 2010 | — | — | — | |||||||||
| Exercised | 9,410 | — | 14,158 | |||||||||
| Cancelled/Forfeited/Returned to reserve | 27,190 | 2.25 | 41,151 | |||||||||
| Outstanding as of December 31, 2010 | 307,742 | $ | 2.25 | $ | 398,608 | |||||||
The options were granted with an exercise price of $2.25, the share closing price as of September 26, 2007. The options will generally vest on December 31, 2009, or if there is a change of control in the Company.
The options will expire on December 31, 2011 or later depending on granting date.
The ‘cancelled/forfeited/returned to reserve’ options during 2010 of 27,190 consisted of 22,206 options granted in 2007 and 4,984 in 2008.
Following is a summary of the status of options outstanding at December 31, 2010:
| Options outstanding | Options exercisable | ||||||||||||||||||
| Range of Exercise Prices | Total Options Outstanding | Weighted Average Remaining Life (Years) | Weighted Average Exercise Price | Options Exercisable | Weighted Average Exercise Price | ||||||||||||||
| $ | 2.25 | 307,742 | 1.25 years | $ | 2.25 | 232,742 | $ | 2.25 | |||||||||||
At December 31, 2010, the total compensation cost related to unvested stock-based awards granted to employees under the provisions of ASC 718 and the Company’s 2006 stock award plan, but not yet recognized was approximately $13,109.
2008 Long-Term Incentive Plan
The 2008 plan was adopted on January 15, 2008, and approved by our shareholders on the same date at our annual meeting. This incentive plan authorizes awards of up to 5,000,000 shares of common stock, in the form of incentive and non-qualified stock options, stock appreciation rights, performance units, restricted stock awards and performance bonuses. The amount of common stock underlying the awards to be granted remained the same after the 25 to one reverse stock-split that was effectuated on June 11, 2008. As of December 31, 2010, a total of 4,083,100 stock options, 325,000 restricted common stock and 507,300 shares of common stock had been granted under this plan. Options granted generally begin vesting over a three-year period after grant date although options have been granted with a shorter period than three years. Options granted in the beginning expire two years from the date of vesting but the latest in 2010 issued options remain exercisable for nine years from the date of vesting. It is expected that future options will be awarded with the nine-year exercise period after first vesting.
F-45
ELEPHANT TALK COMMUNICATIONS, INC. AND SUBSIDIARIES
NOTES TO THE AUDITED CONSOLIDATED FINANCIAL STATEMENTS
Common stock purchase options and warrants consisted of the following as of December 31, 2010:
Number of shares | Average Exercise Price | Initial Fair Market Value | ||||||||||
| Options: | ||||||||||||
| Outstanding as of December 31, 2009 | 976,000 | $ | 0.89 | $ | 758,900 | |||||||
| Granted in 2010 | 3,271,000 | $ | 1.49 | $ | 4,460,521 | |||||||
| Exercised | — | — | — | |||||||||
| Cancelled/Forfeited/Returned unused | 163,900 | $ | 1.48 | $ | 217,183 | |||||||
| Outstanding as of December 31, 2010 | 4,083,100 | $ | 1.35 | $ | 5,002,238 | |||||||
The options granted in 2010 were granted with an average exercise price of $1.492. The initial fair market value of the options granted using the Black-Sholes options model for these options has been valued at $4,460,521 at their initial grant-date.
Following is a summary of the status of options outstanding at December 31, 2010:
| Options outstanding | Options exercisable | ||||||||||||||||||
| Range of Exercise Price | Total Options Outstanding | Weighted Average Remaining Life (Years) | Weighted Average Exercise Price | �� | Options Exercisable | Weighted Average Exercise Price | |||||||||||||
| $ | 0.60-2.50 | 4,083,100 | 7.87 years | $ | 1.35 | 325,000 | $ | 1.09 | |||||||||||
The weighted average assumptions used so far for the options granted in 2010 using the Black-Scholes options model are: volatility of 137%, term of 9.95 years and a Risk Free Interest Rate assumption of 3.677%. The expected dividend yield is zero.
At December 31, 2010 the unexpensed portion of stock-based awards granted to employees under the provisions of ASC 718 and the Company’s 2008 stock award plan, was approximately $2,070,414. The future expensing takes place proportionally to the vesting associated with each stock-award, adjusted for cancellations, forfeitures and returns.
Stock-Based Compensation Expense
Under the provisions of ASC 718, the Company recorded for the year ended December 31, 2010, $5,588,392 in stock-based compensation expense for management shares, Non-Qualified Stock and Option Compensation Plan and shares issued for consultancy and employee compensation. For the comparable period in 2009 the expensing was $1,727,870. The Company utilized the Black-Scholes valuation model for estimating the fair value of the stock-based compensation granted after the adoption of SFAS 123(R).
F-46
ELEPHANT TALK COMMUNICATIONS, INC. AND SUBSIDIARIES
NOTES TO THE AUDITED CONSOLIDATED FINANCIAL STATEMENTS
Note 21. Income taxes
Income tax expense (benefit) for the year ended December 31, 2010 and 2009 is summarized as follows:
December 31, 2010 | December 31, 2009 | |||||||
| Current: | ||||||||
| Federal | $ | (7,894,958 | ) | $ | (5,881,961 | ) | ||
| State | (1,393,228 | ) | (1,037,993 | ) | ||||
| Deferred Taxes | 9,288,986 | 6,920,754 | ||||||
| Income tax expense | $ | 800 | $ | 800 | ||||
The following is a reconciliation of the provision for income taxes at the United States federal statutory rate to the foreign income tax rate at December 31, 2010:
| 2010 | 2009 | |||||||
| Tax expense (credit) at statutory rate-federal | (34 | )% | (34 | )% | ||||
| State tax expense net of federal tax | (6 | )% | (6 | )% | ||||
| Foreign income tax rate difference | 12,8 | % | 8,1 | % | ||||
| Change in valuation allowance | 27,2 | % | 31,9 | % | ||||
| Tax expense at actual rate | — | — | ||||||
The tax effects of temporary differences that gave rise to significant portions of deferred tax assets and liabilities at December 31, 2010 are as follows:
| Deferred tax assets: | 2010 | 2009 | ||||||
| Deferred Tax Asset | $ | 34,223,016 | $ | 24,934,030 | ||||
| Total gross deferred tax assets | 34,223,016 | 24,934,030 | ||||||
| Less: Valuation allowance | (34,223,016 | ) | (24,934,030 | ) | ||||
| Net deferred tax assets | $ | — | $ | — | ||||
At December 31, 2010, the Company had accumulated deficit carry forwards of approximately $ 85,555,541. The net change in the valuation allowance during the twelve months period ended December 31, 2010 was $ 9,288,986.
At December 31, 2009, the Company had accumulated deficit carry forwards of approximately $ 62,335,076.
The net change in the valuation allowance during the twelve months period ended December 31, 2009 was $6,920,274.
A valuation allowance of $ 34,223,016 and $ 24,934,030 at December 31, 2010 and 2009, respectively, has been recorded against deferred tax assets as the Company was unable to conclude that it is more likely than not that such deferred tax assets will be realized.
As of December 31, 2010, we had net federal operating loss carry forwards and state operating loss carry forwards of approximately $ 35,6 million. The net federal operating loss carry forwards begin to expire in 2018 and the net state operating loss carry forwards begin to expire in 2012. The net operating loss carry forwards for foreign countries amounts to approximately $ 48.9 million. In all foreign countries various periods of expiration dates are applicable.
F-47
ELEPHANT TALK COMMUNICATIONS, INC. AND SUBSIDIARIES
NOTES TO THE AUDITED CONSOLIDATED FINANCIAL STATEMENTS
Section 382 of the Internal Revenue Code limits the use of net operating loss and tax credit carry forwards in certain situations where changes occur in the stock ownership of a company. In the event we have a change in ownership, utilization of the carry forward could be restricted.”
In June 2006, the FASB issued FIN 48, which clarifies the accounting for uncertainty in income taxes. FIN 48 requires that companies recognize in the consolidated financial statements the impact of a tax position, if that position is more likely than not of being sustained on audit, based on the technical merits of the position. FIN 48 also provides guidance on de-recognition, classification, interest and penalties, accounting in interim periods and disclosure. The provisions of FIN 48 are effective for years beginning after December 15, 2006. We adopted FIN 48 on January 1, 2007 with no impact to our consolidated financial statements. We file income tax returns in the U.S. federal jurisdiction and various state and foreign jurisdictions. Due to the net operating loss, all the tax years are open for tax examination. As of December 31, 2009 and 2008, we accrued FIN48 reserve of $480,000 and $0, respectively for uncertain tax benefit, including interest and penalties.
Note 22. Non-controlling Interest
The Company had non-controlling interests in several of its subsidiaries. The balance of the non-controlling interests as of December 31, 2010 and December 31, 2009 were as follows
Noncontrolling interest Balance at | ||||||||||||
| Subsidiary | Noncontrolling Interest % | December 31, 2010 | December 31, 2009 | |||||||||
| ETC PRS UK | 49 | % | $ | 9,723 | $ | 10,516 | ||||||
| ETC PRS Netherlands | 49 | % | 129,870 | 140,462 | ||||||||
| ET ME&A Holding WLL | 49 | % | — | — | ||||||||
| ET Bahrain WLL | 1 | % | 6,385 | 3,180 | ||||||||
| ET ME&A FZ LLC | 49.46 | % | 37,081 | 35,242 | ||||||||
| ET UTS Curacao | 49 | % | — | — | ||||||||
| Total | $ | 183,059 | $ | 189,400 | ||||||||
Note 23. Commitments
Commitments of the Company relating to leases, co-location and office rents, regulatory and interconnection fees are as follows:
| Years ending December 31, | ||||
| 2010 | 3,479,844 | |||
| 2011 | 2,706,890 | |||
| 2012 | 2,342,679 | |||
| 2013 | 580,597 | |||
| 2014 | 580,597 | |||
| Total | $ | 9,690,607 | ||
As of December 31, 2010, the commitments of the Company relating to purchase orders are valued at cost of $ 681,876.
F-48
ELEPHANT TALK COMMUNICATIONS, INC. AND SUBSIDIARIES
NOTES TO THE AUDITED CONSOLIDATED FINANCIAL STATEMENTS
Note 24. Litigation
(a) Manu Ohri Litigation
In March 2009, Manu Ohri or Ohri, the Company’s former chief financial officer from 2002 to 2006, commenced a lawsuit against the Company in the California Orange County Superior Court captioned Manu Ohri v. Elephant Talk Communications, Inc., Case No. 30-20009-00120609. Ohri alleges that the Company breached a 2006 written employment contract, a 2007 oral consulting contract, and otherwise owes him the reasonable value of consulting services rendered. Ohri seeks damages of $442,216 under the alleged employment contract, $56,951 under the alleged oral consulting agreement, stock options that he valued at $45,200 under the alleged oral consulting agreement, $14,316 for medical and dental insurance premiums, $4,226.40 for life and long term disability insurance premiums, pre-judgment interest, and costs of the litigation. The Company denies Ohri's allegations and asserts several affirmative defenses.
The Company commenced a cross-complaint against Ohri to, among other things, invalidate his alleged 2006 employment contract and stock bonus, and to recover the stock bonus or its fair market value.
Phase 1 of the trial took place without a jury between June 27 and July 13, 2011. The parties filed post-trial briefs, and are waiting for the court to announce its decision, which is expected within the next few weeks. Any claims remaining after the court’s decision in Phase 1 may be tried in a second phase with a jury.
(b) Bruce Barren Litigation
In December 2009 Bruce Barren (“Barren”), a former director of the Company between January 2008 and May 2009, commenced a lawsuit in the California Los Angeles County Superior Court called Bruce Barren v. Elephant Talk Communications, Inc., Case No. BC429032. Barren alleged that the Company breached a restricted stock agreement, the implied covenant of good faith and fair dealing, an oral employment agreement, and otherwise owes him the reasonable value of consulting services rendered. The Company denied Barren’s allegations and asserted several affirmative defenses. The Company contended that Barren’s claims are without merit, and that a September 2009 settlement agreement and general release between Barren and the Company barred all of his claims as a matter of law.
In December 2010 the Court granted the Company’s motion for summary judgment and dismissed Barren’s entire case with prejudice. The Court awarded $2,714 in costs to the Company.
(c) Chong Hing Bank Litigation
In December 2009, Chong Hing Bank Limited, f/k/a Liu Chong Hing Bank Limited, a foreign banking services company based in Hong Kong or the Bank, commenced a lawsuit in the California Orange County Superior Court captioned Chong Hing Bank Limited v. Elephant Talk Communications, Inc., Case No. 30-2009-00328467. The Bank alleges that it entered into various installment and term loan agreements and an overdraft account with Elephant Talk Limited (“ETL”), a Hong Kong subsidiary of the Company. The Bank claims that various former officers and directors of ETL personally guaranteed the loans and overdraft account. The Bank alleges that ETL is in default on the loans and overdraft account, and that approximately $1,536,792.28 plus continuing interest is due. The Bank further alleges that the Company is directly liable to repay the loans and overdraft account as a successor in interest to ETL. The Bank is suing the Company for breach of contract and common counts. The Company denies the Bank’s allegations and asserts several affirmative defenses. The Company contends that it has no direct, successor liability to the Bank, and that the Bank must pursue its recourse against ETL and its personal guarantors.
A trial is set to start on October 3, 2011.
(d) Rescission of the Purchase Agreement of May 24, 2004 of New Times Navigation Limited.
As previously described in our 2004 Annual Report we and New Times Navigation Limited mutually agreed to terminate this purchase agreement. We returned the received shares of New Times Navigation Limited to the concerned shareholders and received back 90,100 of our common stock out of the 204,000 issued by us for the purchase. In addition we issued 37 unsecured convertible promissory notes for a total amount of $3,600,000. On our request 21 notes were returned with a total value of $2,040,000.
F-49
ELEPHANT TALK COMMUNICATIONS, INC. AND SUBSIDIARIES
NOTES TO THE AUDITED CONSOLIDATED FINANCIAL STATEMENTS
We are presently seeking relief from the High Court of the Hong Kong Special Administrative Region against the holders of the unreturned shares to return a total of 113,900 common shares (valued at $381,565) and also to have them return the remaining 18 unsecured convertible promissory notes representing a total amount of $1,740,000 and rescind the purchase agreement. The case is currently pending.
Note 25. Segment information
Year ended December 31, 2010
| EUROPE | Far East | |||||||||||||||||||||||||||||||||||
| Netherlands | Spain | Switzerland | Others | Total | Hong Kong / China | Middle East | The Americas | TOTAL | ||||||||||||||||||||||||||||
| Revenues from unaffiliated customers: | $ | 27,623,380 | 1,752,470 | 6,653,139 | 461,742 | $ | 36,490,732 | $ | - | $ | 622,813 | $ | 54,806 | $ | 37,168,351 | |||||||||||||||||||||
| Operating income (loss) | $ | (3,105,391 | ) | $ | (208,965 | ) | $ | (2,946,337 | ) | $ | (3,675,903 | ) | $ | (9,936,596 | ) | $ | (840,314 | ) | $ | (83,588 | ) | $ | (7,613,249 | ) | $ | (18,473,748 | ) | |||||||||
| Net income (loss): | $ | (3,154,172 | ) | $ | (208,951 | ) | $ | (2,935,071 | ) | $ | (3,659,588 | ) | $ | (9,957,781 | ) | $ | (1,778,949 | ) | $ | (83,588 | ) | $ | (80,663,042 | ) | $ | (92,483,360 | ) | |||||||||
| Identifiable assets | $ | 6,469,979 | $ | 1,202,064 | $ | 11,012,075 | $ | 18,379,628 | $ | 37,063,745 | $ | 223,329 | 552,100 | 1,082,758 | $ | 38,921,932 | ||||||||||||||||||||
| Depreciation and amortization | $ | (114,114 | ) | $ | (212,517 | ) | $ | (2,097,331 | ) | $ | (2,325,546 | ) | $ | (4,749,509 | ) | $ | (55,996 | ) | $ | (26,934 | ) | $ | (480,030 | ) | $ | (5,312,469 | ) | |||||||||
| Capital expenditure | $ | - | $ | 3,374 | $ | 2,861,906 | $ | 366,864 | $ | 3,232,144 | $ | - | $ | - | $ | 19,857 | $ | 3,252,002 | ||||||||||||||||||
F-50
ELEPHANT TALK COMMUNICATIONS, INC. AND SUBSIDIARIES
NOTES TO THE AUDITED CONSOLIDATED FINANCIAL STATEMENTS
Year ended December 31, 2009
| EUROPE | Far East | |||||||||||||||||||||||||||||||||||
| Netherlands | Spain | Switzerland | Others | Total | Hong Kong / China | Middle East | The Americas | TOTAL | ||||||||||||||||||||||||||||
| Revenues from unaffiliated customers: | $ | 33,610,555 | $ | 2,277,766 | $ | 6,117,537 | $ | 431,548 | $ | 42,437,406 | $ | 753 | $ | 1,207,298 | $ | - | $ | 43,645,457 | ||||||||||||||||||
| Operating income (loss) | $ | (2,242,451 | ) | $ | 306,505 | $ | (3,111,328 | ) | $ | (753,604 | ) | $ | (5,800,877 | ) | $ | (254,678 | ) | $ | (97,699 | ) | $ | (4,386,693 | ) | $ | (10,539,946 | ) | ||||||||||
| Net income (loss): | $ | (2,216,043 | ) | $ | 306,499 | $ | (3,110,907 | ) | $ | (752,157 | ) | $ | (5,772,607 | ) | $ | (1,204,025 | ) | $ | (98,887 | ) | $ | (10,224,365 | ) | $ | (17,299,884 | ) | ||||||||||
| Identifiable assets | $ | 5,156,354 | $ | 1,459,767 | $ | 11,066,207 | $ | 559,357 | $ | 18,241,686 | $ | 602,574 | $ | 518,745 | $ | 5,063,772 | $ | 24,426,776 | ||||||||||||||||||
| Depreciation and amortization | $ | (110,968 | ) | $ | (211,707 | ) | $ | (1,892,639 | ) | $ | (97,106 | ) | $ | (2,312,420 | ) | $ | (51,397 | ) | $ | (41,507 | ) | $ | (646,137 | ) | $ | (3,051,461 | ) | |||||||||
| Capital expenditure | $ | 103,893 | $ | 30,105 | $ | 3,082,942 | $ | - | $ | 3,214,940 | $ | 438,989 | $ | - | $ | 215,220 | $ | 3,869,149 | ||||||||||||||||||
Note 26 . Concentrations
Customers in excess of 10% of total revenues were as follows:
For the year ended December 31, 2010, one customer in the Netherlands which accounted for the Company’s Premium Rates Services revenue of $22,439,478 or (64% of the total revenue). For the same periods in 2009, this same customer accounted for $21,905,840 or (50% of total revenue).
Note 27. Loans and Convertible Notes (Private Placement 2009)
Automatic Conversion of 2009 12% Convertible Promissory Notes
On November 19, 2010, the twenty-day average closing price of the common stock of Elephant Talk Communications, Inc. (the “Company”) exceeded $3.18. As a result and pursuant to their terms, all outstanding 12% convertible promissory notes (the “Notes”) issued in connection with the Company’s 2009 private placement offering of units consisting of Notes and warrants to purchase shares of the Company’s common stock, no par value (the “Units”), plus all interest due the holder of the Note, automatically converted into common stock at the previously established conversion price of one (1) share of common stock per each $1.35 in principal plus interest due. The Units are more fully described in the Company’s Current Reports on Form 8-K filed with the Securities and Exchange Commission (the “Commission”) on August 6, 2009, August 24, 2009, September 10, 2009, October 5, 2009 and November 10, 2009 and in the Company’s quarterly filings on Form 10-Q and annual report for the year ended December 31, 2009 filed with the Commission on March 31, 2010.
F-51
ELEPHANT TALK COMMUNICATIONS, INC. AND SUBSIDIARIES
NOTES TO THE AUDITED CONSOLIDATED FINANCIAL STATEMENTS
As of November 20, 2010, the Notes only represented the right to receive such issuable shares of common stock. Further, upon the automatic conversion of the Notes and pursuant to the terms of the Notes, the amounts due thereunder were deemed fully paid and satisfied and there will be no further Notes outstanding. In connection with the automatic conversion of the Notes, the Company expects to issue approximately 3,644,775 shares of common stock. In aggregate, including shares previously issued upon conversion of a portion of the Notes, the Company will have issued 9,933,419 shares in connection with the conversion of all of the Notes.
2010 QAT II Loan agreements
See Note 28.
Note 28. Related Party Transactions
12% Secured convertible note 2009
On June 10, 2010, and at our request, QAT II entered into an agreement with us calling for the mandatory conversion of the total principal amounts outstanding under the Notes to QAT II ($4 million issued July 31, 2009 and $1.3 million issued October 31, 2009, totaling $ 5.3 million), in case the Company raises a minimum of $ 11 million in connection with the 2010 Private Placement Offering.
The Company and QAT II agreed the unpaid principal due pursuant to the Notes, excluding any accrued but unpaid interest or other fees due on such Notes, would be exchanged for units, at a price of $1.20 per unit and on the same terms and conditions as the 2010 Private Placement Offering, upon our raising an aggregate of $11 million in connection with our 2010 Private Placement Offering.
On October 8, 2010, together with the fourth and final closing of the 2010 Private Placement Offering, in which the Company successfully raised $14 million and therefore met the $11 million condition, the notes totaling $5.3 million automatically converted into 4,443,654 shares of our common shares.
QAT II Loan agreements 2010
On February 2, 2010, we entered into a loan agreement with QAT II. Pursuant to this loan agreement, QAT II Investments agreed to lend to us the sum of €350,000 ($488,775 based on the February 2, 2010 exchange rate published in the Wall Street Journal). The proceeds were made available to the Company on February 2, 2010.
On February 24, 2010, we entered into a loan agreement with QAT II. Pursuant to this loan agreement, QAT II Investments agreed to lend us the sum of €850,000 ($1,150,390 based on the February 24, 2010 exchange rate published in the Wall Street Journal). The proceeds of the loan agreement were made available to the Company on February 24, 2010.
On March 22, 2010, we entered into a loan agreement with QAT II. Pursuant to this loan agreement, QAT II Investments agreed to lend us the sum of €150,000 ($203,280 based on the March 22, 2010 exchange rate published in the Wall Street Journal). The proceeds of the loan agreement were made available to the Company on March 22, 2010.
23 On March 30, 2010, we entered into a loan agreement with QAT II. Pursuant to the loan agreement, QAT II Investments agreed to lend us the sum of €500,000 ($670,750 based on March 30, 2010 exchange rate published in the Wall Street Journal). The proceeds of the loan agreement were made available to the Company on March 31, 2010.
F-52
ELEPHANT TALK COMMUNICATIONS, INC. AND SUBSIDIARIES
NOTES TO THE AUDITED CONSOLIDATED FINANCIAL STATEMENTS
Each of the above mentioned loan agreement initially provided that we would pay QAT II interest at a rate of fourteen percent (14%) per annum on the outstanding balance and provided the principal and interest shall be due and payable on the earlier of: (i) within 180 days from the date of the loan or (ii) in the event we consummate a Placement. QAT II has the ability to convert the principal and accrued interest outstanding as of the date of the Placement into the same type of equity or debt securities issued by us and on the same terms and conditions offered to other investors in the Placement. The outstanding principal and interest becomes immediately due and payable in the event we fail to make required payments of principal and interest, or otherwise breach the loan agreement and fail to cure such breach upon twenty days notice, or if we dispose of our properties or assets without QAT II’s prior consent, or if we file a petition for bankruptcy or otherwise resolves to wind up our affairs.
In connection with the above-referenced loans, we also issued to QAT II warrants to purchase common stock in an amount equal to one warrant per each United States dollar loaned hereunder to the Company (using the Euro-United States dollar conversion rate published by the Wall Street Journal at the close of business of the loan date). Such warrants have a term of three years and an exercise price equal to the OTCBB closing price of our common stock on the loan date.
The loan agreements described above were amended on June 10, 2010. Pursuant to the amendment, QAT II agreed to extend the existing maturity dates of the loans to May 1, 2011. The amendment also provides for the automatic conversion of the Notes if we raise at least $11 million in connection with the 2010 Private Placement Offering. The unpaid principal of such loans will convert into units consisting of common stock and warrants at a price of $1.20 per unit. Further, the units will be issued on the same terms and conditions as the units being offering in the 2010 Private Placement Offering. Accrued but unpaid interest and any other fees due on the QAT II loans will not convert into units. As additional consideration for entering into the amendment, QAT II was issued warrants to purchase common stock at an amount equal to two (2x) the existing warrant coverage under the terms of such loan agreement.
On October 8, 2010 together with the fourth and final closing of the 2010 Private Placement Offering, in which the Company successfully raised $14 million and therefore met the $11 million condition, the loans totaling $2.8 million automatically converted into 2,327,657 shares of our common shares.
Compensation to QMG
During 2010 Quercus Management Group (‘QMG’) an entity affiliated with certain officers and directors of the Company received for their involvement in the loans raised from QAT II a fee equal to 8% of the granted loan amounts. The fee was paid in cash and amounted to €148,000 ($205,326). QMG also received a compensation for their placement agent activities relating the Bridge Securities Placement Agreement (‘Bridge SPA’) of $167,400 in cash representing an agreed fee of 9% of the proceed of the sale of common stock of the Company. Together with the cash compensation ‘QMG’ was also entitled to 9% of the number of common stock sold for a total number of 167,400 warrants on shares of our common stock. QMG did not receive any additional compensation at the effect of the automatic conversions of the ‘QAT II Loans’ or at the automatic conversions of the 12% Secured Convertible Promissory notes. Neither do they and will they receive compensation when any of the investors they have acquired, decides to exercise its warrants.
During 2010 Quercus Management Group (‘QMG’) an entity affiliated with certain officers and directors of the Company received for providing throughout the full year office space, back office support and car travel expenses invoices for the total amount of € 21,000 ($27,819).
Note 29. Subsequent Events
The Company’s management evaluated subsequent events through March 30, 2011, the date the financial statements were issued and filed with the Securities and Exchange Commission.
F-53
ELEPHANT TALK COMMUNICATIONS, INC. AND SUBSIDIARIES
NOTES TO THE AUDITED CONSOLIDATED FINANCIAL STATEMENTS
Following the Registration Statement 2010, conversions of the Convertible Notes 2009 and exercise of cash and cashless warrants, we have issued between January 1, 2011 and 24 March 2011 a total of 7,026,403 shares of common stock of which:
| - | 5,013,815 shares were issued upon cash exercise warrants with gross proceeds of $ 6,708,641 in 2011 |
| - | 2,012,588 shares were issued upon cashless exercise of warrants |
| - | 196,429 shares were issued upon cash exercise of warrants with gross proceeds of $ 220,001 that were already received by the Company in 2010. |
Further details in “Recent Sales of Unregistered Securities” above.
F-54
You should rely only on the information contained in this document. We have not authorized anyone to provide you with information that is different. This document may only be used where it is legal to sell these securities. The information in this document may only be accurate on the date of this document.
Additional risks and uncertainties not presently known or that are currently deemed immaterial may also impair our business operations. The risks and uncertainties described in this document and other risks and uncertainties which we may face in the future will have a greater impact on those who purchase our common stock. These purchasers will purchase our common stock at the market price or at a privately negotiated price and will run the risk of losing their entire investment.

ELEPHANT TALK COMMUNICATIONS, INC.
67,061,083 Shares of
Common Stock
PROSPECTUS
October 19, 2011