SECURITIES AND EXCHANGE COMMISSION
WASHINGTON, D.C. 20549
FORM 10-K
| x | ANNUAL REPORT PURSUANT TO SECTION 13 OR 15(d) OF THE SECURITIES EXCHANGE ACT OF 1934 |
For the fiscal year ended June 30, 2006
OR
| ¨ | TRANSITION REPORT PURSUANT TO SECTION 13 OR 15(d) OF THE SECURITIES EXCHANGE ACT OF 1934 |
Commission File No. 000-33471
YAK COMMUNICATIONS INC.
(Exact name of registrant as specified in its charter)
| | |
| Florida | | 98-0203422 |
(State or other jurisdiction of incorporation or organization) | | (I.R.S. Employer Identification No.) |
| |
| 300 Consilium Place, Suite 500, Toronto, Ontario | | M1H 3G2 |
| (Address of principal executive offices) | | (Zip Code) |
(647) 722-2752
(Registrant’s telephone number, including area code)
Securities registered pursuant to Section 12(b) of the Act:
| | |
Title of each class | | Name of each exchange on which registered |
| None | | N/A |
Securities registered pursuant to Section 12(g) of the Act:
Common Stock, no par value per share
(Title of class)
Indicate by check mark if the registrant is a well-known seasoned issuer, as defined in Rule 405 of the Securities Act. Yes ¨ No x
Indicate by check mark if the registrant is not required to file reports pursuant to Section 13 or Section 15(d) of the Act. Yes ¨ No x
Indicate by check mark whether the registrant (1) has filed all reports required to be filed by Section 13 or 15(d) of the Securities Exchange Act of 1934 during the preceding 12 months (or for such shorter period that the registrant was required to file such reports), and (2) has been subject to such filing requirements for the past 90 days. Yes x No ¨
Indicate by check mark if disclosure of delinquent filers pursuant to Item 405 of Regulation S-K is not contained herein, and will not be contained, to the best of the registrants’ knowledge, in definitive proxy or information statements incorporated by reference in Part III of this Form 10-K or any amendment to this Form 10-K. ¨
Indicate by check mark whether the registrant is a large accelerated filer, an accelerated filed, or a non-accelerated filer. See definition of “accelerated filer and large accelerated filer” in Rule 12b-2 of the Exchange Act.
Large accelerated file ¨ Accelerated filer¨ Non-accelerated filer x
Indicate by check mark whether the registrant is a shell company (as defined in Rule 12b-2 of the Exchange Act). Yes ¨ No x
Non-affiliates of YAK Communications Inc. held 8,586,383 shares of Common Stock as of December 30, 2005. The fair market value of the stock held by non-affiliates is $27.0 million based on closing sale price of the shares on December 30, 2005.
As of September 19, 2006, 12,965,250 shares of Common Stock, no par value per share, were outstanding.
DOCUMENTS INCORPORATED BY REFERENCE
None.
TABLE OF CONTENTS
Description
Part I
FORWARD-LOOKING STATEMENTS
This report contains certain “forward-looking statements” within the meaning of Section 27A of the Securities Act of 1933, as amended, and Section 21E of the Exchange Act of 1934, as amended, which are based on management’s exercise of business judgment as well as assumptions made by and information currently available to, management. When used in this document, the words “may”, “will”, “anticipate”, “believe”, “estimate”, “expect”, “intend” and words of similar import, are intended to identify any forward-looking statements. You should not place undue reliance on these forward-looking statements. These statements reflect our current view of future events and are subject to certain risks and uncertainties as described in this Annual Report on Form 10-K as well as other periodic reports, filed with the Securities and Exchange Commission, and as noted below. Should one or more of these risks or uncertainties materialize, or should underlying assumptions prove incorrect, our actual results could differ materially from those anticipated in these forward-looking statements. We undertake no obligation, and do not intend, to update, revise or otherwise publicly release any revisions to these forward-looking statements to reflect events or circumstances after the date hereof, or to reflect the occurrence of any unanticipated events. Although we believe that our expectations are based on reasonable assumptions, we can give no assurance that our expectations will materialize.
PART I
Material Subsequent Events
During the fourth quarter of the fiscal 2006, the Company’s Board of Directors determined that, in light of, among other things, rising costs and expenses associated with our remaining a public reporting company as compared to our revenue base, the need for additional investment in the Voice over Internet Protocol (VoIP) and Yak Communications (America) Inc. (“Yak America”) segments, the trading value of the Company and the actual performance of our core business as compared with projections, we should explore various strategic alternatives available to us to maximize shareholder value. To oversee this process, the Board has established an Independent Committee, consisting solely of independent directors of the Board (the “Committee”). The Board’s mandate to the Committee was, among other things, to (i) review, study, explore and analyze various strategic alternatives to maximize shareholder value including, without limitation, the potential sale of all or portions of the Company’s operations, (ii) consider all legal and regulatory requirements applicable to any strategic alternative, (iii) canvas the structuring of any strategic alternative, (iv) review the implementation of any strategic alternative, if approved by the Board, and (v) review our public disclosures with respect to any strategic alternative.
1
At the June 12, 2006 meeting, the Board approved the Committee’s recommendations to the Board. Among other things, the Committee recommended that various strategic alternatives to maximize our shareholder value should be reviewed, explored and analyzed, including, without limitation, the potential sale of all or portions of the Company’s operations. On June 29, 2006, the Board engaged the investment banking firm of Orion Securities Inc. to advise the Company with regard to our various strategic alternatives.
On September 20, 2006, following a rigorous auction process managed by the Independent Committee and based upon such Committee’s recommendation to the Board, the Board approved an all cash offer to acquire all outstanding shares of Yak’s common stock made by Globalive Communications Corp. (“Globalive”). The $5.25 per share offered by Globalive represents a premium of approximately 34.6% to the $3.90 closing price of our common stock on September 20, 2006. The transaction value is approximately $68 million.
Under the definitive merger agreement executed by Yak and Globalive as of September 20, 2006 (the “Merger Agreement”), the transaction has been structured as an all cash tender offer for 100% of Yak’s outstanding shares of common stock to be followed by the merger of Yak with and into a wholly-owned subsidiary of Globalive. Yak would cease being an Exchange Act reporting company as promptly as possible following the closing of the transaction.
Globalive intends to commence the offer for all of Yak’s outstanding shares of common stock shortly. A vote of shareholders on the merger will be required only if less than 80% of our common stock shares are tendered into the offer. Under the terms of the Merger Agreement, we have granted Globalive an option to acquire up to one share more than 80% of Yak’s issued and outstanding common stock shares that would become exercisable only upon the acceptance and payment for shares of common stock in the tender offer if more than 50% of the Yak common stock shares shall have been tendered and not withdrawn. The transaction is not subject to any financing contingencies and is expected to be completed before December 31, 2006, subject to certain conditions, including the receipt of regulatory approvals, the Board’s obtaining a fairness opinion from an independent third party not involved in the bidding process to date and other customary closing conditions. The focus of the fairness opinion is to determine whether the transaction was fair from a financial standpoint to all shareholders as a class.
On September 20, 2006, the Board unanimously approved the tender offer and the merger and determined that the tender offer and the Merger Agreement maximized shareholder value and are in the best interests of our shareholders. Our Board unanimously recommended that our shareholders acceptGlobalive’s offer and tender their shares.Individual shareholders, who hold approximately 51% ownership interest in our Company, have agreed to tender their shares in the offer.
YAK STOCKHOLDERS ARE URGED TO READ THE TENDER OFFER STATEMENT WHEN IT BECOMES AVAILABLE BECAUSE IT WILL CONTAIN IMPORTANT INFORMATION. YAK STOCKHOLDERS WILL BE ABLE TO OBTAIN FREE COPIES OF THE TENDER OFFER STATEMENT AND OTHER DOCUMENTS FILED BY GLOBALIVE COMMUNICATIONS CORP. OR ITS SUBSIDIARY, YAKQUISITION CORP., WITH THE SEC AT THE SEC’S WEBSITE ATWWW.SEC.GOV. IN ADDITION, DOCUMENTS FILED WITH THE SEC BY GLOBALIVE OR YAKQUISITION CORP. MAY BE OBTAINED FREE OF CHARGE FROM GLOBALIVE BY DIRECTING A REQUEST TO SUCH COMPANY AT (416) 640-1088.
Business Overview
Yak Communications Inc., through its wholly owned subsidiaries Yak Communications (Canada) Inc. (“Yak Canada”) and Yak Communications (America) Inc. (“Yak America” and collectively “Yak”, the “Company”, “we” or “us”) provides telecommunications services in Canada and the United States. Our primary service offering is discounted residential toll services in Canada provided through our Yak Canada subsidiary. Yak Canada has enjoyed success in this business and is now one of the largest independent (i.e. not affiliated with an incumbent carrier or cable operator) competitive telecommunications carriers in Canada. Yak Canada also provides a full range of telecommunications services to small and medium sized businesses in Canada through its Yak for Business division and Voice over Internet Protocol (“VoIP”) services in Canada and the United States through its WorldCity VoIP division. Contour Telecom Inc. (“Contour”), a wholly owned subsidiary of Yak Canada, provides managed telecommunications services to
2
businesses in Canada. Yak America provides discounted residential toll services to customers in the United States. As of June 30, 2006 we have approximately 827,000 recurring residential and small business customers measured by unique Automatic Number Identification (“ANIs”).
Yak is a registered reseller of telecommunications services with both the Canadian Radio-Television and Telecommunications Commission (“CRTC”) and the U.S. Federal Communications Commission (“FCC”). Yak Canada has been granted a Class A Basic International Telecommunications Services License by the CRTC.
Our head office is located in Toronto, Canada. We also have office locations in Miami, Florida and Brossard, Quebec, Canada. Most of our employees are located in our Toronto office.
We organize our operations into five business segments, as follows:
| | • | | Yak Canada: Using a facilities-based resale network, whereby we own and operate a Class 4/5 telecommunications switch and lease transmission facilities (both inter and intra-city) from leading Canadian facilities-based telecommunications carriers, such as Bell Canada and Telus Communications Inc. (“Telus”), we provide several long distance products to residential subscribers throughout Canada. |
| | • | | Yak for Business:This segment provides a variety of voice and data products, including local lines, long distance services, data and Internet services, to small and medium-sized businesses in Canada. We purchase wholesale services from a variety of carriers and customize these services to provide customized products to our end-users. |
| | • | | Contour: This segment provides managed telecommunications services from the review and technology planning stage, to the implementation and administration stage, to the support services stage which is often needed to facilitate day-to-day activity and changes experienced by medium and large business customers located across North America. |
| | • | | Yak America:This segment provides a variety of long distance voice products to residential customers located in the United States. We are authorized to provide interstate and intrastate (in the 48 continental states) residential long distance services. |
| | • | | WorldCity VoIP:This segment provides VoIP services to residential customers located in the United States, Canada and other international locations. |
3
Segment sales and profit data that follow are consistent with our current management reporting structure. The Yak Canada and Yak America segments provide products such as 10-10-Yak®, yakLongDistance™, yakCell®, yakCallingCard™ and LooneyCall®. Our selling, general and administrative expenses and cost of revenues, excluding corporate expenses are charged to each segment based on where the expenses are incurred. The following table sets forth segment results for the periods ended June 30, 2006, 2005 and 2004:
| | | | | | | | | | | | | | | | | | | | | | | | |
| | | Fiscal Year Ended June 30, 2006 | |
| | | Yak
Canada | | | Yak for
Business | | | Contour | | | Yak
America | | | WorldCity
VoIP | | | Total
Segments | | | Eliminations
and other | | | Total | |
| | | $ | | | $ | | | $ | | | $ | | | $ | | | $ | | | $ | | | $ | |
Net Revenue | | 68,883 | | | 13,024 | | | 4,901 | | | 5,236 | | | 353 | | | 92,397 | | | — | | | 92,397 | |
Cost of revenue (1) | | 36,430 | | | 9,282 | | | 3,741 | | | 5,423 | | | 428 | | | 55,304 | | | — | | | 55,304 | |
| | | | | | | | | | | | | | | | | | | | | | | | |
Contribution margin | | 32,453 | | | 3,742 | | | 1,160 | | | (187 | ) | | (75 | ) | | 37,093 | | | — | | | 37,093 | |
General and administrative | | 10,589 | | | 3,094 | | | 742 | | | 1,209 | | | 3,152 | | | 18,786 | | | 3,647 | | | 22,433 | |
Professional fees for related parties | | 137 | | | — | | | — | | | — | | | — | | | 137 | | | 104 | | | 241 | |
Stock-based compensation | | — | | | — | | | — | | | — | | | — | | | — | | | 303 | | | 303 | |
Bad debts expense | | 83 | | | 95 | | | (217 | ) | | 325 | | | — | | | 286 | | | — | | | 286 | |
Sales and marketing | | 2,449 | | | 1 | | | — | | | 3,271 | | | 1,111 | | | 6,832 | | | — | | | 6,832 | |
Other expenses | | (68 | ) | | (11 | ) | | (32 | ) | | (1 | ) | | — | | | (112 | ) | | (492 | ) | | (604 | ) |
Writedown of property and equipment | | 174 | | | — | | | — | | | — | | | 3,413 | | | 3,587 | | | — | | | 3,587 | |
Depreciation and amortization | | 2,088 | | | 649 | | | 36 | | | 115 | | | 334 | | | 3,222 | | | — | | | 3,222 | |
| | | | | | | | | | | | | | | | | | | | | | | | |
Segment earnings (loss) before income taxes | | 17,001 | | | (86 | ) | | 631 | | | (5,106 | ) | | (8,085 | ) | | 4,355 | | | (3,562 | ) | | 793 | |
| | | | | | | | | | | | | | | | | | | | | | | | |
Segment assets | | 43,044 | | | 6,307 | | | 3,703 | | | 2,369 | | | 2,190 | | | 57,613 | | | (8,087 | ) | | 49,526 | |
Long-lived assets | | 9,864 | | | 2,237 | | | 567 | | | 515 | | | 1,843 | | | 15,026 | | | — | | | 15,026 | |
Purchases of property and equipment | | 3,410 | | | 89 | | | 122 | | | — | | | 642 | | | 4,263 | | | — | | | 4,263 | |
| (1) | Excludes depreciation and amortization of $2,618 |
| | | | | | | | | | | | | | | | | | | | | | |
| | | Fiscal Year Ended June 30, 2005 | |
| | | Yak
Canada | | | Yak for
Business | | | Contour | | Yak
America | | | WorldCity
VoIP | | | Total
Segments | | Eliminations
and other | | | Total | |
| | | $ | | | $ | | | $ | | $ | | | $ | | | $ | | $ | | | $ | |
Net Revenue | | 72,194 | | | 11,753 | | | 5,557 | | 3,007 | | | 76 | | | 92,587 | | 113 | | | 92,700 | |
Cost of revenue (1) | | 41,899 | | | 8,416 | | | 4,085 | | 3,094 | | | 33 | | | 57,527 | | 109 | | | 57,636 | |
| | | | | | | | | | | | | | | | | | | | | | |
Contribution margin | | 30,295 | | | 3,337 | | | 1,472 | | (87 | ) | | 43 | | | 35,060 | | 4 | | | 35,064 | |
General and administrative | | 8,501 | | | 3,028 | | | 920 | | 1,380 | | | 1,216 | | | 15,045 | | 3,079 | | | 18,124 | |
Professional fees for related parties | | 171 | | | — | | | — | | — | | | — | | | 171 | | 287 | | | 458 | |
Stock-based compensation | | — | | | — | | | — | | — | | | — | | | — | | 81 | | | 81 | |
Bad debts expense | | 95 | | | (113 | ) | | 163 | | 228 | | | — | | | 373 | | — | | | 373 | |
Sales and marketing | | 1,900 | | | 8 | | | — | | 5,358 | | | — | | | 7,266 | | 27 | | | 7,293 | |
Other expenses | | (10 | ) | | 73 | | | 101 | | (126 | ) | | 390 | | | 428 | | (1,796 | ) | | (1,368 | ) |
Depreciation and amortization | | 2,077 | | | 556 | | | 17 | | 132 | | | 141 | | | 2,923 | | 20 | | | 2,943 | |
| | | | | | | | | | | | | | | | | | | | | | |
Segment earnings (loss) before income taxes | | 17,561 | | | (215 | ) | | 271 | | (7,059 | ) | | (1,704 | ) | | 8,854 | | (1,694 | ) | | 7,160 | |
| | | | | | | | | | | | | | | | | | | | | | |
Segment assets | | 34,269 | | | 7,382 | | | 2,409 | | 1,603 | | | 5,141 | | | 50,804 | | 2,434 | | | 53,238 | |
Long-lived assets | | 7,308 | | | 2,705 | | | 286 | | 629 | | | 5,139 | | | 16,067 | | — | | | 16,067 | |
Purchases of property and equipment | | 4,535 | | | 32 | | | — | | 618 | | | — | | | 6,077 | | — | | | 6,077 | |
| (1) | Excludes depreciation and amortization of $2,359 |
4
| | | | | | | | | | | | | | | | | | | | | |
| | | Fiscal Year Ended June 30, 2004 |
| | | Yak
Canada | | Yak for
Business | | | Contour | | | Yak
America | | | WorldCity
VoIP | | | Total
Segments | | Eliminations
and other | | | Total |
| | | $ | | $ | | | $ | | | $ | | | $ | | | $ | | $ | | | $ |
Net Revenue | | 62,228 | | 11,775 | | | 5,646 | | | 1,074 | | | — | | | 80,723 | | 79 | | | 80,802 |
Cost of revenue (1) | | 39,403 | | 8,647 | | | 4,018 | | | 1,048 | | | — | | | 53,116 | | 33 | | | 53,149 |
| | | | | | | | | | | | | | | | | | | | | |
Contribution margin | | 22,825 | | 3,128 | | | 1,628 | | | 26 | | | — | | | 27,607 | | 46 | | | 27,653 |
General and administrative | | 5,288 | | 2,918 | | | 964 | | | 231 | | | 172 | | | 9,573 | | 1,508 | | | 11,081 |
Professional fees for related parties | | 236 | | — | | | — | | | — | | | — | | | 236 | | — | | | 236 |
Stock-based compensation | | — | | — | | | — | | | — | | | — | | | — | | 26 | | | 26 |
Bad debts expense | | 34 | | 32 | | | — | | | 72 | | | — | | | 138 | | — | | | 138 |
Sales and marketing | | 3,571 | | 30 | | | — | | | 204 | | | — | | | 3,805 | | 89 | | | 3,894 |
Other expenses | | 2,221 | | 40 | | | (56 | ) | | (52 | ) | | — | | | 2,153 | | (1,203 | ) | | 950 |
Depreciation and amortization | | 2,372 | | 472 | | | 60 | | | 62 | | | — | | | 2,966 | | 14 | | | 2,980 |
| | | | | | | | | | | | | | | | | | | | | |
Segment earnings (loss) before income taxes | | 9,103 | | (364 | ) | | 660 | | | (491 | ) | | (172 | ) | | 8,736 | | (388 | ) | | 8,348 |
| | | | | | | | | | | | | | | | | | | | | |
Segment assets | | 29,891 | | 3,923 | | | 2,984 | | | 1,023 | | | 3,187 | | | 41,008 | | 12,642 | | | 53,650 |
Long-lived assets | | 5,323 | | 2,255 | | | 296 | | | 474 | | | 3,187 | | | 11,535 | | 102 | | | 11,637 |
Purchases of property and equipment | | 4,520 | | 396 | | | 3 | | | 9 | | | 566 | | | 5,494 | | 118 | | | 5,612 |
| (1) | Excludes depreciation and amortization of $2,767 |
5
| | | | | | | | | |
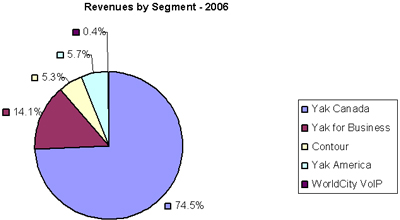
Revenues by Segment | | 2006 | | | 2005 | | | 2004 | |
Yak Canada | | 74.5 | % | | 78.0 | % | | 77.0 | % |
Yak for Business | | 14.1 | % | | 12.7 | % | | 14.6 | % |
Contour | | 5.3 | % | | 6.0 | % | | 7.0 | % |
Yak America | | 5.7 | % | | 3.2 | % | | 1.4 | % |
WorldCity VoIP | | 0.4 | % | | 0.1 | % | | — | |
Yak Canada
Yak Canada is our most established and successful business segment and generates approximately 74.5% of our total consolidated revenues. Yak Canada began operations in Toronto in July 1999. Since then, Yak Canada has expanded its scope of operations and provides service in all major urban centers in Canada.
Yak Canada’s primary product offering is 10-10-Yak®, a variable dial-around long distance product (also known as “casual calling”). Casual calling allows subscribers to place domestic and international long distance calls using Yak’s network by dialing around the subscriber’s existing long-distance carrier. Rather than dialing “1” plus the destination telephone number, subscribers dial 10-10-925 and their call is routed over Yak’s network. Our dial-around service offers very competitive per minute long distance rates, especially for international destinations. The CRTC mandates that local exchange carriers (“LECs”) must provide equal access to competitive long distance carriers such as Yak, including the support of dial-around services. The CRTC also requires LECs to offer billing and collection services to dial-around providers. As such, our dial-around subscribers do not have to pre-subscribe to use our service, rather our charges appear on the customer’s local phone bill. We have entered into billing and collection agreements with the major incumbent LECs (“ILECs”), Videotron Ltd. and Rogers Home Phone Inc. (formerly Call-Net Communications Inc.).
Yak Canada also provides the following product offerings:
| | • | | yakLongDistance: a “1+” pre-subscribed long distance service. Subscribers to this service select Yak as their pre-subscribed long distance carrier and all “1+” long distance calls they make are delivered over Yak’s network; |
| | • | | yakCell: a pre-subscribed two stage dialing service for cell-phone users. yakCell customers dial a local access number to have their long distance telephone calls routed over Yak’s long distance network rather than their cellular provider’s toll network; |
6
| | • | | yakCallingCard: a post-paid phone card service for travelers; and |
| | • | | LooneyCall: a flat-rate long distance dial-around service. aimed at customers who make long duration long distance calls. LooneyCall enables customers to purchase 60 minutes of long distance time for $1 (CAD) per call to anywhere in Canada, the U.S., China, and Hong Kong. |
In addition, to meet the changing demands of the telecommunications customer, we are continually striving to develop new products and services.
The CRTC’s 2006 Telecom Monitoring Report describes the size of the long distance market in Canada to be approximately $5.1 billion (CAD) for 2005, with the residential long distance market estimated at $2.68 billion (CAD), the business market estimated at $1.57 billion (CAD) and the long distance wholesale market approximately $0.858 billion (CAD). Competitors, such as Yak, have approximately 28% market share of the residential long distance market in Canada. Yak has approximately 10% market share of the 28% residential long distance market attributed to competitors. Almost 87% of Yak Canada’s revenues are generated by our 10-10-Yak dial-around product. At present, we estimate that Yak Canada has the largest market share in the dial-around segment in Canada, with about 75% market share. Nevertheless, we believe there is opportunity to gain further market share in the residential long distance market. Yak’s goal is to expand the size of the addressable Canadian marketplace by marketing our products to new urban centers and non-urban locations where we have not traditionally focused our efforts. Traditionally, we have focused our marketing efforts on ethnic communities who make a large proportion of international calls. However, more recently we have found that, as our brand recognition in Canada has increased, our services are attractive to a wide segment of the Canadian population. Further, over the past year we have placed more focus on cross-selling our other long distance products (yakLongDistance, yakCell and yakCallingCard) and have re-priced our domestic (i.e., calls to Canada and the U.S.) per minute rate at CAD 3.5 cents for pre-subscribed services. Our domestic and international rates are among the lowest of all Canadian long distance providers, however, due to decreased underlying carrier costs and improved processes and systems implemented by Yak to reduce network costs, Yak Canada’s products continue to be profitable.
Operational accomplishments and highlights of our 2006 fiscal year include:
| | • | | Commencing an advertising campaign on pre-subscription products to the Provinces of British Columbia, Alberta, Saskatchewan, Manitoba, Ontario and Quebec. The campaign began in the late second quarter. In total, we have increased our number of yakLongDistance customers by more than 38,000 or 458% as compared to fiscal year 2005; |
| | • | | Introduction of a new value-added feature which allows customers to view their account details online. Components of this new feature include account updates, invoice downloading and the status of any new services ordered; |
| | • | | Expansion of our local access footprint so that we will have more local access telephone numbers throughout Canada. This will enable us to more effectively offer our yakCell and yakCallingCard products on a wider geographic basis; |
| | • | | Due to increased competition and decreased marketing in the province of Ontario, revenues and minutes usage for our dial-around products have decreased; and |
| | • | | Addition of vital employees to the Company by making key management hires including the Chief Accounting Officer, Director of Audit and Financial Reporting, Vice President Network Operations and Engineering, Chief Architect, Director of Human Resources and Director of Marketing. |
Yak for Business
The Yak for Business segment provides a variety of voice and data products, including local lines, long distance services, and data and Internet services to small and medium-sized businesses in Canada. In July 2003, we acquired Argos Telecom Inc. (subsequently renamed Yak for Business). This segment purchases
7
wholesale services from a variety of underlying carriers and in turn customizes these services to provide customized products to our end-users.
Operational accomplishments and highlights of our 2006 fiscal year include making operational procedures more efficient in order to improve segment earnings before income tax. The number of billing cycles for voice products has been significantly reduced by 58%. Further, there have been efforts to migrate data customers without term commitments to one or three year contracts.
Contour
Contour Telecom Inc. was purchased from AT&T Canada in July, 2003 (in conjunction with Yak for Business (see above)) to sell telecommunications management services to medium and large enterprises across North America.
Contour provides outsourced telecom management services at all levels: planning, administration and support. Contour effectively becomes its client’s telecom department thereby allowing its clients to focus on their core business activity. Contour focuses on cost reduction, containment and consolidated billing processes, while striving to improve service levels via its support services which facilitate day-to-day activity and change. The result is active and objective management that saves its clients money through a centralized telecom operation.
Operational accomplishments and highlights for our 2006 fiscal year include an increase in net profit margins due to reductions in operational costs (primarily salaries) and a bad debt recovery. Overall, revenues decreased by $0.656 million or 11.8%. Long distance rates were reduced in order to stay competitive in the marketplace and, although we were successful in the renewal of significant contracts, we experienced some client turnover. The launch of our new billing system to 20% of our client base increased our expenses at the end of the fiscal year. We believe the launch of our new scalable billing and support system gives us a competitive advantage in the marketplace offering effective cost management controls, inventory management and on-line reporting. Further, this launch positions us to grow our business by eliminating manual business processes and driving efficiency gains for Contour.
Yak America
Through Yak America, we provide residential long distance services throughout the United States. We offer a similar product suite as Yak Canada, including 10-10-Yak, yakLongDistance, yakCell and yakCallingCard. We are authorized by the FCC to provide interstate and international services and have PUC licenses or authorizations to provide intra-state toll services in 48 states.
We continue to promote our dial around services in the United States, relying on our core strategy of niche marketing to ethnic communities to grow market share. However, we are also focusing on converting recurring dial-around subscribers to our 1+ service. We have an ongoing targeted marketing campaign to Hispanic markets in South Florida and Los Angeles. We have continued our relationship with a Hispanic celebrity spokesperson and we utilize print and outdoor media to attract customers. We maintain an office in Miami, Florida to support our strategic focus in the United States. We believe that through the implementation of our strategically focused approach an opportunity to grow this market exists.
To support our dial-around products in the United States, we have entered into an agreement with Billing Concepts, Inc., which specializes in inter-carrier clearinghouse operations, for handling, transporting and delivery of our billing records to the LEC for invoicing and collection purposes. This billing and collection arrangement is similar to those arrangements we have established in Canada, however, this agreement does not apply to most of the Competitive Local Exchange Carriers (“CLECs”) in the U.S. As a result, we do not process calls which originate from certain alternative local line carriers in the United States. We have developed software on our switching systems to block customers of CLECs for which we do not have billing and collection agreements in place. Unlike in Canada, CLECs represent a larger market share of calls originating in the U.S.
8
Operational highlights of our 2006 fiscal year include:
| | • | | The commencement of a telemarketing campaign to convert dial-around customers to the Yak Long Distance product (1+ service); and |
| | • | | Minutes for the fiscal year ended June 30, 2006 increased by 81%, as compared to the previous fiscal year. |
WorldCity VoIP
Internet-enabled voice services represent an important emerging market opportunity in the telecommunications industry. VoIP technology enables voice communications over broadband IP networks, including, but not limited to, the public Internet, instead of the traditional telephone network. When VoIP is used, a voice communication traverses at least a portion of its communications path in an IP packet format using IP technology and IP networks. Since VoIP providers bypass traditional circuit-switched networks, and in the case of many providers including Yak utilize the public Internet, they have the potential to significantly reduce voice communications costs for end-users. In addition, since VoIP service is IP-based there is a great potential to provide a wide array of value-added features. Currently, we own and operate the network, infrastructure and software to support a number of retail VoIP product offerings.
As part of our strategy to leverage our recurring cash flow from our dial-around business to transition into high growth and emerging markets, we launched our VoIP service in September 2004. Services are currently provided to residential customers in both the United States and Canada through the WorldCity VoIP segment. We believe that we have developed a compelling value proposition for retail consumers looking to maximize the benefits of their IP communications by offering a product that enables them to make a large amount of long distance calls – both domestic and international – at rates lower than traditional wireline long distance prices. Significant marketing efforts began in January 2005 and have continued throughout our 2006 fiscal year. We have increasingly focused our efforts on developing a robust and innovative software end user device enabled (softphone) peer-to-peer VoIP service, which bypasses the Public Switched Telephone Network (“PSTN”) entirely. yakForFree™ is a VoIP service which allows users to make free voice and video calls using the Internet to any other yakForFree subscriber.
We encourage our yakForFree subscribers to upgrade to one or more of our two paying services:
| | • | | yakToAnyone™, a prepaid VoIP service which allows users to make PC to PSTN Internet phone calls over a high-speed connection. yakToAnyone also supports video capabilities; and |
| | • | | yakUnlimited™, a pre-subscribed VoIP service which allows users to make 3,500 minutes of North American Internet phone calls for one monthly fee. yakUnlimited, a residential first line replacement or second line service, is available in certain locations in Canada and the United States (where E911 service is supported). yakUnlimited is a “nomadic” VoIP service (i.e., the subscriber can utilize the service wherever he/she has access to a broadband Internet connection and the service is not limited to a fixed location). We believe subscribers will see value in using both a softphone and phone adapter tied to a single account. The product offering also includes a competitive number of bundled local and North American long distance minutes and market-acceptable feature functionality. |
To support our VoIP products, we have entered into strategic arrangements with a number of innovative technology companies. These include Kayote Networks, Inc. (“Kayote”) and CounterPath Solutions, Inc. (“CounterPath”). Kayote provides recognized industry expertise to help define VoIP technology solutions and overcome typical interoperability issues that have previously inhibited the widespread acceptance of Internet based services. CounterPath provides softphones that allow customers to make and receive phone calls or video phone calls directly on their personal computer without the need of a regular analogue phone line. In January 2006, we re-launched our yakUnlimited service. Certain necessary back-office systems for the yakUnlimited service were outsourced to CommPartners Inc. of Las Vegas, NV.
9
Operational highlights of fiscal year 2006 include the launch of yakForFree and yakToAnyone in the second quarter, the re-launch of the yakUnlimited product in January 2006 and the roll-out of yakUnlimited to international customers. IT developmental programs to support web-based marketing initiatives also continued throughout fiscal year 2006.
In the fourth quarter, we discontinued our Yak Basic product, recording a write-down of the assets associated with that product totaling $3,413. Additionally, we reduced the size of the IT and product developments team based upon the completion of our VoIP platform and the President of VoIP Initiatives was terminated, his responsibilities were assumed by our Chief Executive Officer. During the fourth quarter, we signed a Software License and Distribution Agreement with Intel Corporation. Under this agreement, Yak is offering its WorldCity VoIP product suite in conjunction with the roll out of the Intel 600SM PCI Phone Adapter.
THE INDUSTRY AND COMPETITION
In both Canada and the U.S. there are several other residential long distance, including “dial-around”, companies competing against Yak in the marketplace. The VoIP marketplace is in its initial stages and is characterized by significant new entry.
Canada
Long Distance Services
Meaningful competition in long distance services in Canada has existed since the 1990s. Recognizing that the market had achieved sustainable competition, in 1997 the CRTC de-regulated the incumbent carriers’ (such as Bell Canada and Telus) retail long distance service offerings. New entries in the marketplace and the increased competition in the telecommunications industry has resulted from decreased termination costs and a proliferation of call routing options. Five very large providers of long distance services currently dominate the Canadian market: Bell Canada, Telus, Rogers Home Phone, MTS-Allstream and Primus Telecommunications Canada Inc. In addition, there are a variety of small long distance resellers with annual revenues of less than $10 million (CAD). Further, Canada’s major cable companies such as Videotron Ltd. and Shaw Communications Inc. have entered the residential telecommunications market and currently offer both local and long distance products. The cable companies are able to leverage their existing customer base and are currently offering bundled discounts across all lines of their communications base. In addition, pure VoIP carriers, such as Vonage Canada, have started offering bundled local/long distance services. Finally, we will increasingly face competition from mobile wireless service providers as wireless substitution grows. Statistics Canada recently reported, as of December 2005, that 4.8 percent of Canadian households had replaced their wireline services with wireless services.
The CRTC 2006 Telecom Monitoring Report estimated the size of the residential long distance market in Canada at approximately $2.68 billion (CAD) for 2005. Although the overall revenues in this market have decreased over the past years, the size of the market controlled by non-ILECs, such as Yak, has marginally increased. From 2004 to 2005, competitors’ revenues increased to $753 million from $721 million and the market share has increased to 23% from 16%, while ILECs revenues decreased to $1.92 billion from $2.14 billion and their market share decreased to 72% from 75%. Currently, non-ILECs have 28% of the residential long distance market share (23% resellers and 5% facilities-based). Of this 28% market share, Yak has approximately 10% market share. In the dial-around segment, our main competitor is Telehop Communications Inc.
One of the ways in which we differentiate ourself from competitors is that we do not offer multiple plans with potentially confusing time of day, weekday/weekend restrictions. Our product offerings combine a single domestic per-minute long distance rate that applies for anytime or any day and, unlike other long distance providers, we do not charge a network access fee nor do we charge minimum monthly
10
fees (with the exception of our VoIP product offerings). In our opinion, we offer a compelling value proposition for customers who desire simple, cost-effective long-distance plans.
United States
In the United States the communications industry is highly competitive. The deregulation of the United States telecommunications industry and the implementation of the Telecommunications Act of 1996 (the “Telecommunications Act”), has led to an overall increase in competition for local and long distance telecommunications services. Further, new technologies that imitate traditional telephony calling services have increased the number of participants in the communications industry, and have increased the market competition for local, long distance, calling card, and VoIP customers. Our competitors in these markets include the national ILECs (i.e., AT&T, Qwest, Verizon), established competitive carriers (i.e., Choice One, Level 3, US LEC), as well as a variety of small long distance resellers. Recently, major cable companies in the United States have entered the residential telecommunications market and offer local, long distance, broadband, and VoIP products (i.e., Comcast and Time Warner Cable). Further, pure VoIP providers that do not bundle broadband Internet access facilities with their VoIP offering but instead rely on the facilities of third parties(i.e, Lingo, SunRocket, Vonage), have also recently entered the market, and have provided products aimed at the traditional long distance telephony market through fixed service fee calling plans.
We believe the principal competitive factors affecting the communications industry in the United States are the quality and reliability of services, innovation, customer service and price. Our continued ability to compete effectively in this market will depend upon our capability to offer innovative, high-quality, market-driven services at prices generally equal to or below those charged by our competitors. Many of our current and potential competitors have an abundance of resources which may provide them with a competitive advantage. We anticipate competition to remain intense in all of our U.S. market segments, thus, limiting our ability to achieve significantly greater market share for any of our services.
Yak also offers calling card services. We believe that our success in providing these services is based on our ability to provide low rates and reliable service and to efficiently distribute our calling cards. The calling card industry is notable for its relative lack of regulation and ease of market entry. As a result, our competitors for this service include not only established interexchange and local exchange carriers, but also thousands of small, regional companies. As rates continue to decrease and competition increases, profitability for these services is likely to decrease and we may be forced to rely on our service quality and distribution efficiencies to remain competitive.
VoIP
Competition from traditional telecommunication companies and non-traditional start-ups entering the broadband VoIP telephony market is at a relatively early stage and, as such, no market models have emerged to properly gauge competition. Despite the start up nature of this market, several relatively small companies have begun to market innovative Internet telephone calling services including Primus Canada and a variety of U.S.-based companies, such as Vonage, 8x8, Inc., and SunRocket. There are numerous VoIP providers like Skype (recently acquired by eBay), Yahoo, Google, MSN and Gizmo that do not consider voice communications as their core business, but do consider it a part of their entire communications package.
STRATEGY
The core of our vision has been and remains to provide high quality and affordable communication services for our customers. We strive to accomplish this vision by providing our customers with simple, low risk and easy to use products and communications solutions. We distinguish ourselves from the competition by offering a single domestic per-minute long distance rate that applies to any time of the day, any day of the week. Unlike other long distance providers, we do not charge a network access fee nor do
11
we charge minimum monthly fees (with the exception of our VoIP product offerings). We aspire to provide exceptional and personalized customer service to all of our customers.
Over the past two years our strategy has been to leverage our revenues, positive net income and strong cash flow from our core Canadian dial-around business (10-10-Yak) to fund our growth of residential toll services in the United States and the expansion of our VoIP product offering. We have focused our advertising budget on these new products and geographic markets while decreasing our advertising budget in our Canadian markets. As a result, our brand strength and awareness in Canada has somewhat decreased and the revenues from our 10-10-Yak product have declined.
To address these challenges, in the fourth quarter of our 2006 fiscal year, we renewed our strategy which includes the following elements:
| | • | | re-connecting to our “Yak” brand in the Canadian residential long distance market – our most successful and profitable operating segment; |
| | • | | devoting the appropriate resources to regain lost market share and revenues with respect to our core product offering, 10-10-Yak in the Canadian market, while continuing to expand our other Canadian long distance products (e.g. yakLongDistance, LooneyCall, yakCallingCard and yakCell); and |
| | • | | developing new complimentary products and investigating the expansion into complimentary telecommunications markets where we can exploit our Yak brand to achieve market share and increased revenues. |
In light of the foregoing strategy renewal, we have rededicated greater marketing and advertising resources to our core Canadian markets. We have recently hired a Director of Marketing, based in Toronto, Canada, whose mandate is consistent with the above objectives. Operational resources will also be directed to new product and market development initiatives. These initiatives will be our key priorities throughout fiscal 2007.
Although the majority of our efforts will be re-focused on the Canadian market, we will continue marketing our products offered by our Yak America and VoIP WorldCity segments and will continue to investigate areas in which we can reduce costs in these segments. We will continue to maintain our Miami, FL office to support these initiatives.
NETWORK
Over the past five years, we have established and expanded our own private, leased line network throughout most of Canada. Currently, this coast-to-coast network delivers most of our voice telephony traffic. We have continued to expand the addressable market in Canada by interconnecting with CLEC’s and independent telephone companies and these initiatives will continue into fiscal 2007. In September 2003, we acquired a “state of the art” Tekelec/Santera switch and installed it in our network premises in Toronto. Subsequently, we have migrated our network traffic to this switch from our legacy switches. To support our network growth, we have continued to expand the Tekelec/Santera switch to 40,000 ports. The switch is expandable to 200,000 ports and, as such, we anticipate having significant switching capacity in the foreseeable future.
Our Tekelec/SanteraOne switch has positioned us to more efficiently accommodate the expansion of our customer base. The switch will act as a gateway to both traditional PSTN networks and IP networks. This switch is connected through leased lines to the Local Exchange Carriers’ (“LECs”) tandem and central offices by long haul diverse fiber, and also to interexchange carriers’ (“IXCs”) networks providing customers access to true “coast to coast” networks. Dedicated fiber transport is contracted from different carriers to provide us with the most competitive pricing. We have made an effort during the past year to utilize the IP portion of our switching platform and have connected to several IP network providers for a portion of our international traffic. Our primary concern when choosing interconnection partners is to
12
maintain optimal quality and the IP networks we use meet or exceed the standards of the traditional Time Division Multiplex (“TDM”) network providers we employ.
Our coast-to-coast leased line network in Canada allows us to originate and terminate the majority of our traffic on our own network, thereby reducing our overall switching costs. For calls that terminate outside of Canada, we have agreements with other “off net” International and cross border carriers, which are selected by running real time least cost routing algorithms. Our Carrier Relations team has made significant gains in renegotiating our bandwidth and switched minute agreements over the past year and have contributed to increasing our profit margins.
In the United States, we have achieved comparable network breadth by interconnecting with Wiltel Communications LLC (“Wiltel”), a major U.S. wholesale carrier (Wiltel was acquired by Level 3 Communications Inc. on December 23, 2005). Our Carrier Identification Codes (“CIC”) are programmed into Wiltel switches and therefore we take advantage of Wiltel’s extensive network access arrangements with the Regional Bell Operating Companies (“RBOC”s) and most major LECs. U.S. originated calls are hauled to our switch in Toronto and terminated on our Canadian network or routed “off net” if the calls terminate outside of Canada. Further, redundancy has been built in this U.S. network by connecting our switch to two independent major switching centers in New York City.
During the quarter ended December 31, 2005, a second switch was installed in the NAP of the Americas in Miami, FL and became fully operational in the quarter ended March 31, 2006. The system consists of a redundant Tekelec/Santera switch with 16,000 ports and a complete billing and fraud system. The system handles the daily overflow traffic from Canada and is capable of handling 70% of Yak’s traffic in the event of a catastrophic failure of the switch in Toronto.
We also own and operate several routers to support our VoIP network. The routers allow Yak to receive VoIP calls that are originated by our subscribers and routed over the public Internet, so that we may terminate these calls on the PSTN. Currently, we utilize our VoIP network facilities to support our yakForFree and yaktoAnyone products.
EMPLOYEES
As of June 30, 2006, we had a total of 161 employees. Our workforce included 98 employees employed in our Yak Canada segment, 23 employees in the Yak for Business segment, 16 employees in the Contour segment, 3 employees in the Yak America segment and 21 employees in the VoIP segment. Some of our employees employed in the Yak Canada segment perform management and administration duties and provide services to all our business segments.
We consider our relations with our employees to be excellent, and none of our employees are covered by a collective bargaining agreement.
GOVERNMENTAL REGULATION
As an international communications company providing telecommunications services in Canada and the United States, we are subject to varying degrees of regulation in each of the jurisdictions in which we provide services. Laws and regulations applicable to the provision of telecommunications services, and the interpretation of such laws and regulations, differ significantly among the jurisdictions in which we operate. The summary below describes the primary regulatory developments in the U.S. and Canada that may have a material adverse effect on our business.
In general, the regulation of the telecommunications industry continues to change rapidly both domestically and globally. In both the U.S. and Canada, telecommunications regulations are from time to time subject to judicial and administrative proceedings, as well as legislative and administrative hearings, in which proposals are made that, if adopted, could change the manner in which our industry operates. We cannot predict the outcome of these proceedings or their impact on us. There can be no assurance that future regulatory, judicial and legislative changes will not have a material adverse effect on us, or that domestic or international regulations or third parties will not raise material issues with adverse effect on us.
13
Canada
Yak is registered with the CRTC as a reseller of telecommunications services in Canada. This is a requirement that has been imposed by the CRTC on all persons that resell telecommunications services in Canada. Registration with the CRTC is the only requirement necessary to have the authorization to resell telecommunications services in Canada. The provision of certain services, however, requires additional licensing by the CRTC or is subject to certain rules and regulations, regardless of whether the services are provided on a resale or a facilities basis.
All persons who provide basic international telecommunications services (voice or data) must obtain a license from the CRTC for the provision of such services. Resellers who provide basic international telecommunications services must also obtain an international services license.
The international services licensing regime was established in part because of concerns relating to the potential for anti-competitive behavior involving foreign monopolists acting in conjunction with a resale affiliate based in Canada. The CRTC also wished to exercise some supervision over Canadian service providers, especially resale affiliates in Canada.
Yak Canada is required to, and holds, a Class A license from the CRTC as it operates telecommunications equipment that converts basic international traffic from circuit switched traffic to data. The CRTC issues international telecommunications service provider licenses for a period of ten years. Licensees who maintain their licenses in good standing may expect to have them renewed by the CRTC. Currently, there is no fee payable in order to obtain a basic international telecommunications services license.
A Class A licensee is required to advise the CRTC of any changes to the information about the licensee that has been previously filed with the CRTC. Licensees are also obliged to comply with the requirements of the Canadian contribution regime (see below) and file with the CRTC information pertaining to the telecommunications industry data collection process requirements. Yak Canada is currently in full compliance with all filing requirements of its Class A license.
As of June 30, 2006 the CRTC has not had any concerns regarding anti-competitive behavior on the part of the Company and since we do not provide services on a monopoly basis and we are not a resale affiliate, it is unlikely that the CRTC will have concerns in the future. In addition, because Yak does not own or operate the underlying transmission facilities used to provide telecommunications services to the public, it is not classified as a Canadian carrier. As such, Yak is not subject to the Canadian ownership and control requirements that apply to the facilities-based Canadian carriers.
Contribution Requirements
The CRTC has established a “contribution” regime (a universal access-type regime) which requires that a contribution be paid to the CRTC on the revenue from the widest possible range of services and service providers regulated by the CRTC. Thus, ILECs, long distance operators, CLEC’s, cellular operators, resellers such as Yak and others must all make contribution payments based on their Canadian telecommunications service revenues.
The calendar year interim contribution rate is 1.03%. This rate may be adjusted by the CRTC in the fourth quarter of calendar year 2006. For fiscal years 2005 and 2004, the contribution charge was 1.1% of “contribution-eligible” revenues.The rate is expected to remain stable or slightly decline in future years. Although Yak cannot predict whether the CRTC will change its method of contribution assessment and collection in the future, if the current approach remains unchanged and the overall contribution requirement declines as expected, the Company does not anticipate that its total contribution payments will become material in future years.
14
VoIP Regulation - Canada
The current position of the CRTC is that VoIP services that provide subscribers with access to and/or from the PSTN and the ability to make and/or receive local telephone calls are to be regulated as local exchange services. Therefore, existing regulatory requirements would apply depending on the class of service provider, i.e., ILECs, CLECs and resellers. This approach allows Yak to offer VoIP services as a local reseller with minimal regulatory requirements and Yak’s competitors in Canada, particularly the incumbent carriers, will be regulated to a much greater degree (e.g., ILECs are required to file tariffs and not price their service below cost). In addition, the CRTC enunciated that underlying broadband access providers should not discriminate against independent VoIP providers, such as Yak. Although Yak views this decision as positive, we were required to develop and implement local service features (such as basic 911) and network-based privacy obligations. The CRTC has directed the industry to identify methods to provide enhanced 911 for nomadic and non-native VoIP services, such as Yak. (Fixed native VoIP providers are currently required to provide enhanced 911 services.) In response to the CRTC directive an industry group will be working on developing one or more potential solutions in 2007.
The ILECs have appealed the CRTC’s ruling with respect to VoIP and a decision is pending. The ILECs argued that VoIP services are fundamentally different from current local voice services and it should be unregulated.
Other Regulatory Developments
On March 22, 2006, the Telecommunications Policy Review Panel (“Panel”) released its comprehensive report with recommendations to modify and amend Canada’s telecommunications policy. The Panel was established by the Canadian Ministry of Industry on April 11, 2005, to conduct a review of Canada’s telecommunications policy and regulatory framework. Among its over 120 recommendations, the Panel concluded that the scope of mandated wholesale access currently required by the CRTC is too broad and that it undermines incentives for competitive entry, investment and innovation. The Panel recommends that mandated access be restricted to essential facilities – as defined by Competition Law tests – and interconnection services (e.g. equal access). Yak’s network has been built through leasing facilities from other carriers, including the ILECs, and some of these facilities are obtained through CRTC mandated access requirements. As well, should mandated wholesale access be removed, opportunities to develop new services through resale (e.g. high-speed Internet resale) may be curtailed. The Panel also made some recommendations that would support competitive entry by removing barriers to entry, such as mandated access to multi-unit buildings. The Panel’s recommendations are being studied by the Ministry of Industry and recently the Ministry tabled a Policy Direction to the CRTC requiring the CRTC to rely on market forces to the maximum extent feasible and regulate, where there is still a need to do so, in a manner that interferes with market forces to the minimum extent necessary. The proposed Policy Direction is open for public comment and is not yet in force. We cannot predict whether these recommendations will be adopted by the government in whole or in part. Many competitive carriers are in the same position as Yak. Nonetheless, many industry players will be monitoring these developments closely and will attempt to influence the Canadian government to act (or not act) on some or all of the Panel’s recommendations. We will continue to consider the Panel’s recommendations and how they affect the operation of our business.
On April 27, 2006 the CRTC set the final switching and aggregation (“S&A”) rates. The final rates are effective May 30, 2002 with respect to Access Tandem rates and December 17, 2003 with respect to Direct Connect Rates. The final rates are approximately 10-20% lower than the interim rates. S&A charges are interconnect charges that an interexchange carrier (“IXC”) pays to the local exchange carrier (“LEC”) for each minute of traffic originated by the LEC and/or terminated by the LEC that is carried over the IXC’s network. The S&A charges relate to all associated switching, transport and signaling functions performed by the LEC at the originating or terminating end of a long-distance call. As of March, 2006, Yak typically paid $443,000 per month to the LECs for switching and aggregation. As of June 5, 2006, the Company requested that each applicable LEC provide it with its entitled rebate and sufficient information about the calculation of the rebate. While the Company acknowledges that LECs should eventually pay on account of S&A credits owed, the Company’s past experience indicates that measurement of the credits is likely to
15
be contested and timely repayments of the credits may not be assured, thereby creating uncertainty in the Company’s ability to reliably estimate the credit that will be realized. Additionally, timely repayment of the credits may not be assured. The Company therefore did not recognize an asset for the S&A receivable at June 30, 2006.
United States
Increasingly complex federal and state regulation in the United States also affects Yak’s business. In the United States, our long distance telecommunications services are subject to federal regulation under the Telecommunications Act and Federal Communications Commission (FCC) regulations and state regulation under applicable laws and regulations of the various states and state regulatory commissions. At the FCC, we are considered a non-dominant domestic interstate telecommunications carrier and we are authorized by Section 214 of the Act to operate as a non-dominant international carrier. We also hold certificates of public convenience and necessity from multiple state regulatory commissions authorizing us to provide intrastate telecommunications services or operate on an intrastate basis pursuant to tariff, registration or on a deregulated basis.
The degree of FCC regulation depends on the amount of market power a particular provider possesses. The FCC imposes less regulation on non-dominant telecommunications carriers like Yak. As a non-dominant interstate telecommunications carrier, we are not required to obtain FCC authority to initiate or expand our domestic interstate operations but we are required to obtain prior FCC approval to transfer legal or actual control or discontinue service. Our telecommunications services are subject to common carrier telecommunications requirements set forth in the Act and the FCC’s rules, including the requirement to offer service on a nondiscriminatory basis at just and reasonable rates. Further, we are subject to requirements regarding unauthorized changes in a customers’ preferred carrier (i.e., “anti-slamming” provisions), the FCC’s Do Not Call telemarketing rules, and various consumer information privacy requirements. As a common carrier of telecommunications services, we must abide by the Communications Assistance for Law Enforcement Act (“CALEA”) and certain FCC regulations which require carriers to modify their networks and institute procedures to enable law enforcement authorities to perform electronic surveillance. According to the FCC, the Act’s requirement that common carrier practices shall be “just and reasonable” require carriers like Yak providing dial-around, calling card and other long distance services to ensure that its marketing practices are not unfair and deceptive. In administering these requirements, the FCC imposes truth-in-advertising principles regarding disclosure of material information and restrictions, clear and conspicuous language, etc. We are also required to file various reports and pay various fees, including annual FCC regulatory fees and Universal Service Fund contribution.
In addition, we are subject to the FCC’s common carrier complaint jurisdiction which enables consumers to file complaints against us at the FCC for alleged violations of the Act or the FCC’s rules. The FCC has broad authority to commence investigations and to impose monetary and other penalties and conditions on us for violations of regulatory requirements.
Our intrastate telecommunications offerings are subject to state regulation under applicable laws and rules promulgated by state regulatory commissions. We are certified to provide intrastate residential toll services in 48 states. We are required to maintain in most jurisdictions, certification and to file tariffs. Some states also require us to file periodic reports, pay various fees and surcharges, and to comply with service standards and consumer protection rules. States often require prior approval or notification for certain stock or asset transfers or, in several states, for the issuance of securities, debt or for name changes. As a certificated carrier, consumers may file complaints against us at the public service commission and state agencies have the authority to impose a range of penalties on us for regulatory noncompliance. Yak’s marketing practices for its long-distance services are also subject to various state laws regarding marketing disclosures.
The FCC and state commissions may develop rules, and federal and state legislators may pass laws that change the regulatory requirements applicable to our services in a way that significantly raises our costs, makes compliance more burdensome, or otherwise adversely affects our telecommunications business.
16
Our costs for providing long distance services depends on the rates imposed on us by other local carriers for the termination and origination of traffic over local facilities. The rates that competitive and incumbent local carriers can charge for the use of local facilities is capped by the FCC and, in some instances, the relevant state regulatory authority. The FCC has been granting local carriers greater flexibility and relaxing regulations in markets where there are multiple providers of local origination and termination services. Depending on the number of competitors in a particular market and the trend to deregulate traditional monopoly providers of local telecommunications services, we could be subject to an increase in our termination and origination costs reducing our profitability or our ability to offer competitive rates for service.
VoIP Regulation – United States
We are a provider of “interconnected VoIP services” as that term is defined by the FCC. Laws, regulations and legal liability issues regarding VoIP services are evolving at a rapid pace. Measures under consideration by the FCC, Congress, the courts and/or other federal and state agencies include, without limitation, new laws and regulations, or the interpretation of existing laws and regulations, regarding access to telephone numbers, taxes, consumer protection rules, intercarrier compensation arrangements, consumer privacy, assistance to law enforcement, and the provision of E-911 services. Some or all of these measures, if adopted and determined to be applicable to our VoIP services, could make it significantly more expensive to operate our VoIP services and could cause us to cease operating or enhancing some or all of our VoIP services.
As a provider of interconnected VoIP services, Yak must offer E-911 services to all of its customers. We currently offer E911 services in the United States through a third-party vendor. That vendor, however, only offers E911 in limited areas in the United States. As such, to comply with the FCC’s E911 obligations, Yak was compelled to suspend marketing its VoIP service to new customers, and to modify its VoIP offering by making it available only to new customers in areas of the United States where Yak’s vendor is capable of providing VoIP E911 coverage. We expect our vendor to increase its E911 coverage area in the coming months, but cannot guarantee when full implementation of a comprehensive nationwide E911 solution will be in place. Along with a number of other VoIP providers, we have sought a waiver, of the FCC’s VoIP E-911 rules to provide Yak more time in which to implement E911 for its VoIP services. The FCC has not yet ruled on these requests and we cannot predict whether we will be subject to FCC enforcement actions concerning the offering of our VoIP service. Further, Yak cannot predict when it will be able to offer its VoIP products in the United States on a nationwide basis.
The FCC has also determined that interconnected VoIP providers are subject to CALEA which requires providers of communications services to modify their facilities in order to assist law enforcement agencies in conducting lawfully authorized electronic surveillance. Yak and other interconnected VoIP providers must comply with CALEA by May 17, 2007. As much of the standards work for CALEA is still ongoing, we cannot predict whether we will be able to meet this compliance deadline. On June 27, 2006, the FCC released an order requiring interconnected VoIP providers to contribute to the Universal Service Fund (“USF”). Interconnected VoIP providers are expected to submit their first filing on August 1, 2006, with USF contributions effective for the fourth quarter 2006. VoIP providers may rely on a “safe harbor” in reporting their interstate revenues which are used to calculate the amount due to the USF. The FCC established a safe harbor of 64.9% for interconnected VoIP providers (i.e. 64.9% of VoIP revenues can be considered interstate). Moreover, the VoIP USF order specifically states that any underlying telecommunications carrier who provides telecommunications components to a non-certificated interconnected VoIP provider, like Yak, must continue to pay USF on the sales to that VoIP provider through the first quarter 2007, for a total of two quarters, even if the VoIP carrier is themselves contributing to the USF directly. The FCC acknowledged that this may result in double payment by interconnected VoIP providers on an interim basis. Accordingly, Yak may have to pass through the fees imposed on the Company to its customers that would result in higher bills potentially making our service less competitive
17
with other communications service providers. Alternatively, we may choose to absorb the cost which would reduce the profitability associated with our VoIP service. We cannot predict whether VoIP providers in a similar situation will be subject to double collection for more than two quarters.
OTHER DEVELOPMENTS
Previously Reported Restatements
On May 31, 2005, we restated our financial statements for the fiscal years ended June 30, 2003 and 2004. Further, on September 27, 2005, we completed further adjustments to the above described restatement to correct for an error in the initial restatements. At that time, we made further amendments to our June 30, 2003 and 2004 annual reports. As a result of these corrections, we also amended our Annual Report filed on Form 10-K for the year ended June 30, 2005 to correct the amounts previously reported in our financial statements for fiscal years 2003 and 2004, as well as each of the quarters in fiscal year 2004 and for the first three quarters of fiscal year 2005.
On April 21, 2006, we filed Amendment No. 2 to our Annual Report on Form 10-K for the year ended June 30, 2005 and two amendments to our Quarterly Reports on Form 10-Q for the first and second quarters of our fiscal year 2006 ended September 30 and December 31, 2005, respectively, to correct for certain accounting errors and disclosure deficiencies in its previously issued public filings. We restated our previously issued financial statements to correct for the errors and deficiencies described below:
| | A. | To correct for the misapplication of SFAS 133, SFAS 150 and EITF 00-19 related to the 2004 issuance of detachable warrants (the “Warrants”); |
| | B. | To correct for segment disclosure deficiencies under SFAS 131; |
| | C. | To correct for errors in our Cash Flow Statements; and |
| | D. | To correct for the fiscal 2005 misclassification of financing expenses related to assignment of accounts receivable. |
The nature and details of the restatements are more fully disclosed in Note 5 to the financial statements included in our Form 10K/A Amendment No.2 filed on April 21, 2006.
On May 4, 2006, the SEC advised the Company that it completed its review of our restated filings and, at that time, did not have any further comments.
Additional Information About the Company
For further information about our Company, you may read the materials we have filed with the SEC without charge at the Public Reference Section of the SEC at Room 1024, Judiciary Plaza, 100 F Street, NE, Washington, D.C. 20549. You can also obtain copies of these materials at prescribed rates from the Public Reference Section of the SEC in Washington, D.C. 20549. Please call the SEC at 1-800-SEC-0330 for further information on the operation of the public reference rooms.
Our SEC filings and the registration statement can also be reviewed by accessing the SEC’s internet site at http://www.sec.gov, which contains reports, proxy and information statements and other information regarding registrants that are filed electronically with the SEC.
Our internet address is www.yak.ca. We maintain an external link on the “Investor Relations” section of our website which takes users directly to our filings with the SEC. All such filings are available free of charge.
18
Investing in our common stock involves a high degree of risk. You should carefully consider the following risks and all other information contained in our public filings before making an investment decision about our common stock. While the risks described below are the ones we believe are most important for you to consider, these risks are not the only ones that we face. If any of the following risks actually occurs, our business, operating results or financial condition could suffer, the market value of our common stock could decline and you could lose all or part of your investment.
Industry trends and specific risks may affect our future business and results. The matters discussed below could cause our future results to differ from past results or those described in forward-looking statements and could have a material adverse effect on our business, financial condition, results of operations and stock price.
Changes or new developments in the telecommunications regulatory environment in Canada and/or the United States may negatively impact our business.
Our retail services in Canada have been largely deregulated by the CRTC, however, our major competitors, the ILECs remain subject to CRTC regulation with respect to many of their services, including the requirement to provide certain access and wholesale services to competitors, like Yak, at cost-based prices. How the ILECs comply with regulation as well as how the CRTC enforces its regulation against the ILECs could impact our operations and financial condition. In addition, as noted above, in “Other Developments – Telecom Policy Review (Canada)”, the Panel is recommending that the CRTC limit mandated access requirements to essential facilities and interconnection services. If this recommendation is implemented it could negatively impact the range of current (in the case of Yak for Business) and potential services we are able to provide and increase our network facility costs. Any change in Canadian governmental or CRTC policy, regulations or interpretations could have a material adverse effect on our operations and financial condition and operating results.
Increasingly complex federal and state regulation in the United States also affects our business. In the United States, our long distance and local telecommunications services are subject to federal regulation and state regulation under applicable laws and regulations of the various states and state regulatory commissions. Our telecommunications services are subject to various specific common carrier telecommunications requirements set forth in the FCC’s rules, including operating, reporting and fee requirements. Both federal and state regulatory agencies have broad authority to commence investigations and impose monetary and other penalties on us for violations of regulatory requirements. The FCC and state commissions may develop rules, and federal and state legislators may pass laws that change the regulatory requirements applicable to our services in a way that significantly raises our costs, makes compliance more burdensome, or otherwise adversely affects our telecommunications business.
Existing regulatory requirements in Canada allow us to offer VoIP services as a local reseller with minimal regulatory requirements. Although this is a positive environment in which we can currently provide these services, we still are required to develop and implement local service features (such as basic 911 and privacy obligations) that will increase our costs to provide VoIP services.
In the United States most VoIP services are considered to be unregulated “information services” rather than “telecommunications services” under the Communications Act of 1934, as amended. However, the FCC has not made a final determination on this issue, and is currently conducting a rulemaking proceeding to consider whether to classify VoIP services as information or telecommunications services, and what federal regulatory requirements, if any, should be imposed on providers of such services. If the FCC determines that VoIP should be classified as a telecommunications service, additional regulatory requirements, fees, access charges, surcharges and/or required contribution to state and federal universal service funds may apply to our VoIP services. Such a decision could significantly raises our costs, make compliance more burdensome, or otherwise adversely affect our broadband business. Further, state legislators and/or regulators could determine that VoIP or VoIP service providers, such as Yak, are subject to local regulation, certification, fees, or other requirements which could impose material regulatory burdens and increased costs on Yak.
19
While the FCC has been considering whether to impose regulatory requirements on VoIP, it has taken steps to deregulate and promote broadband deployment. These actions may increase the ability of ILECs and cable TV companies to compete with Yak for the provision of broadband and IP-enabled services, such as VoIP.
Additionally, our ability to offer VoIP services outside North America is subject to the local regulatory environment, which may be unknown, complicated and often uncertain. Regulatory treatment of VoIP telephony outside North America varies from country to country. There is no assurance that we will immediately be in compliance with the applicable laws and regulations of the markets we have identified as promising for our VoIP services. Some countries may assert that we are required to register as a telecommunications service provider. Please refer to Item 1. Business—“Governmental Regulation” for further details.
Fluctuations in foreign currency exchange rates could adversely affect our results of operations.
The majority of our net revenue is derived from sales and operations located in Canada and we expect that this will continue to be the case in the future. The reporting currency for our consolidated financial statements is the United States dollar. As such, we expect that any changes in the exchange rate with respect to the Canadian dollar may have a significant, and potentially adverse, effect on our results of operations. We historically have not engaged in hedging transactions and do not currently contemplate engaging in hedging transactions to mitigate foreign exchange risks.
We have a significant dependence on large telephone companies who provide the Company with wholesale network and billing and collection services and through whom we interconnect to the public telephone network.
We primarily connect our customers’ telephone calls through transmission lines and interconnection arrangements that we obtain under a variety of arrangements with various facilities-based carriers. We also rely on facilities-based carriers to bill and collect from our customers for calls made through such interconnection arrangements. Many of these carriers are our competitors. Our ability to maintain and expand our business depends on our ability to maintain favorable relationships with these carriers. Where competition in the underlying facilities does not exist or is limited, regulators have historically mandated non-discriminatory access to such facilities. If our relationship with one or more of these carriers were to deteriorate or terminate, it could have a material adverse effect upon our cost structure, service quality, network diversity, results of operations and financial condition.
Our internal disclosure controls may not reduce to a relatively low level the risk that a material error in our financial statements may go undetected.
Our certifying officers are responsible for establishing and maintaining our disclosure controls and procedures (as defined in Exchange Act Rules 13a-15(e) and 15d-15(e)). Accordingly, the certifying officers designed such disclosure controls and procedures, or caused such disclosure controls and procedures to be designed under their supervision, to ensure that material information relating to Yak, including our consolidated subsidiaries, is made known to the certifying officers by others within those entities. We regularly evaluate the effectiveness of disclosure controls and procedures and report our conclusions about the effectiveness of the disclosure controls quarterly on our Form 10-Q and annually on our Form 10-K. In completing such reporting we disclose, as appropriate, any significant change in our internal control over financial reporting that occurred during our most recent fiscal period that has materially affected, or is reasonably likely to materially affect, our internal control over financial reporting. This disclosure, based on our most recent evaluation of our disclosure controls and procedures, is made to our auditors and the audit committee of our Board of Directors. All significant deficiencies and material weaknesses in the design or operation of internal control over financial reporting which are reasonably likely to adversely affect our ability to record, process, summarize and report financial information are reported in our public filings. Inferior internal controls could also cause investors to lose confidence in our reported financial information, which could have a negative effect on the trading price of our stock.
20
Additionally, any fraud, whether or not material, that involves management or other employees who have a significant role in our internal control over financial reporting is reported on such filings as applicable.
We reported control deficiencies at the end of the fiscal year ending June 30, 2005. We have and continue to undertake specific measures to cure or mitigate the ineffective controls and procedures identified in our filings. Such measures have included adding professionally designated accounting staff, systems, process and control changes. We believe that the changes made to date will resolve our control deficiencies in the near term. The details of the control deficiencies are outlined in the following filings:
| | • | | Form 10-K for the fiscal year ended June 30, 2005, as amended and for June 30, 2006; |
| | • | | Form 10-Q for the quarter ended September 30, 2005, as amended, for the quarter ended December 31, 2005 as amended, and for the quarter ended March 31, 2006. |
While management is responsible for ensuring an effective control environment and has taken steps to ensure that the internal control environment remains free of significant deficiencies and/or material weaknesses, the inherent nature of our business and rapidly changing environment may affect management’s ability to be successful with this initiative.
There can be no assurance that we will not have to restate our financial statements.
We have completed several restatements of previously reported financial results, affecting eleven separate reporting periods over the last four fiscal years. The details of these restatements covering the reporting periods are detailed in the following filings:
| | • | | Form 10-K for the fiscal year ended June 30, 2005, as amended; |
| | • | | Form 10-Q for the quarter ended September 30, 2005, as amended; and |
| | • | | Form 10-Q for the quarter ended December 31, 2005 as amended. |
In response to this situation, we have taken what we believe to be the necessary measures to ensure that restatements will not occur in the future. However, there can be no certainty that future restatements will not be necessary due to evolving policies, revised or new accounting pronouncements or otherwise.
The merger transaction involves risks and we might not be able to complete it as contemplated.
During the fourth quarter of the fiscal 2006, the Company’s Board of Directors determined that, in light of, among other things, rising costs and expenses associated with our remaining a public reporting company as compared to our revenue base, the need for additional investment in the Voice over Internet Protocol (VoIP) and Yak Communications (America) Inc. (“Yak America”) segments, the trading value of the Company and the actual performance of our core business as compared with projections, we should explore various strategic alternatives available to us to maximize shareholder value. To oversee this process, the Board has established an Independent Committee, consisting solely of independent directors of the Board (the “Committee”). The Board’s mandate to the Committee was, among other things, to (i) review, study, explore and analyze various strategic alternatives to maximize shareholder value including, without limitation, the potential sale of all or portions of the Company’s operations, (ii) consider all legal and regulatory requirements applicable to any strategic alternative, (iii) canvas the structuring of any strategic alternative, (iv) review the implementation of any strategic alternative, if approved by the Board, and (v) review our public disclosures with respect to any strategic alternative.
At the June 12, 2006 meeting, the Board approved the Committee’s recommendations to the Board. Among other things, the Committee recommended that various strategic alternatives to maximize our shareholder value should be reviewed, explored and analyzed, including, without limitation, the potential sale of all or portions of the Company’s operations. On June 29, 2006, the Board engaged the investment banking firm of Orion Securities Inc. to advise the Company with regard to our various strategic alternatives.
21
On September 20, 2006, following a rigorous auction process managed by the Independent Committee and based upon such Committee’s recommendation to the Board, the Board approved an all cash offer to acquire all outstanding shares of Yak’s common stock made by Globalive Communications Corp. (“Globalive”). The $5.25 per share offered by Globalive represents a premium of approximately 34.6% to the $3.90 closing price of our common stock on September 20, 2006. The transaction value is approximately $68 million.
Under the definitive merger agreement executed by Yak and Globalive as of September 20, 2006 (the “Merger Agreement”), the transaction has been structured as an all cash tender offer for 100% of Yak’s outstanding shares of common stock to be followed by the merger of Yak with and into a wholly-owned subsidiary of Globalive. Yak would cease being an Exchange Act reporting company as promptly as possible following the closing of the transaction.
Globalive intends to commence the offer for all of Yak’s outstanding shares of common stock shortly. A vote of shareholders on the merger will be required only if less than 80% of our common stock shares are tendered into the offer. Under the terms of the Merger Agreement, we have granted Globalive an option to acquire up to one share more than 80% of Yak’s issued and outstanding common stock shares that would become exercisable only upon the acceptance and payment for shares of common stock in the tender offer if more than 50% of the Yak common stock shares shall have been tendered and not withdrawn. The transaction is not subject to any financing contingencies and is expected to be completed before December 31, 2006, subject to certain conditions, including the receipt of regulatory approvals, the Board’s obtaining a fairness opinion from an independent third party not involved in the bidding process to date and other customary closing conditions. The focus of the fairness opinion is to determine whether the transaction was fair from a financial standpoint to all shareholders as a class.
On September 20, 2006, the Board unanimously approved the tender offer and the merger and determined that the tender offer and the Merger Agreement maximized shareholder value and are in the best interests of our shareholders. Our Board unanimously recommended that our shareholders acceptGlobalive’s offer and tender their shares.Individual shareholders, who hold approximately 51% ownership interest in our Company, have agreed to tender their shares in the offer.
The closing of this transaction is subject to certain conditions. We cannot assure you that we will be able to satisfy the conditions to closing of the acquisition. If we are unable to consummate the transaction, the price of our common stock could be adversely impacted. In addition, whatever the outcome of the foregoing process, it may require significant management time and commitment which may adversely affect the Company and its operations.
Our future growth depends on our ability to attract and retain customers.
Our future growth will depend on our ability to effectively anticipate and adapt to customer requirements and offer products and services that meet customer demands. Increasingly, our growth will depend on our ability to successfully fund, develop and introduce new and enhanced products. The development of new and enhanced products is a costly, complex and uncertain process. We cannot be sure whether our new product offerings will be successfully developed and introduced to the market on a timely basis, or at all.
Our business is dependent upon our ability to keep pace with the latest technological changes.
The international telecommunications industry is changing rapidly due to deregulation, technological improvements, expansion of telecommunications infrastructure, privatization and the globalization of national economies. The market for our services and the telecommunications industry generally is in a period of rapid technological evolution, marked by the introduction of new product and service offerings. Failure to respond in a timely and cost-effective way to these technological developments could result in serious harm to our business and operating results. We have derived, and we expect to continue to derive, a
22
substantial portion of our revenues from providing telecommunications services that are based upon current technologies which are capable of adapting to future technologies. As a result, our success will depend, in part, on our ability to afford the cost of acquiring new hardware and software associated with new technologies, develop and market service offerings that have significant customer demand, and respond in a timely manner to the technological advances of our customers, evolving industry standards and changing client preferences. There can be no assurance that we will be able to access or adapt to such technological changes at a competitive price, maintain competitive services or obtain new technologies on a timely basis or on satisfactory terms.
Our business is susceptible to severe pricing pressures from the larger carriers.
The long distance telecommunications industry is significantly impacted by the marketing campaigns and associated pricing decisions of the larger incumbent carriers. There has been downward pressure on prices in the industry in recent years, a trend that we expect to continue. We would also expect that the competition will be intense in certain emerging markets including those associated with our VoIP product. Many of our competitors are significantly larger than we are and have substantially greater financial, technical and marketing resources, larger networks, a broader portfolio of service offerings, greater control over transmission lines, stronger name recognition and customer loyalty, and long-standing relationships with our target customers. As a result, our ability to attract and retain customers particularly in the United States may be adversely affected.
Compliance with changing regulation of corporate governance and public disclosure may result in additional expenses.
Changing laws, regulations and standards relating to corporate governance and public disclosure, including the Sarbanes-Oxley Act of 2002, new SEC regulations and other trading market rules, are creating uncertainty for companies such as ours. We are committed to maintaining high standards of corporate governance and public disclosure. As a result, we intend to invest all appropriate resources to comply with evolving standards, and this investment may result in increased general and administrative expenses and a diversion of management time and attention from revenue-generating activities to compliance activities.
We have entered into outsourcing agreements related to key business operations.
We have entered into outsourcing agreements for processing and rating of billing functions, billing presentation, and billing and collection services. As a result, we must rely on third parties to execute our operational priorities and interface with our customers. Any difficulties experienced in these arrangements could result in additional expense, and loss of customers and revenues.
The success of our VoIP initiative is dependent on growth and public acceptance of IP telephony as well as our ability to adapt to rapid technological changes in IP telephony.
The development of VoIP services in Canada and the United States is in its early stages. It is uncertain as to how competition in our markets for telephony opportunities provided by VoIP services will develop. The financial models for return on pricing, capital expenditures and return on investment have not been fully developed so it is difficult to gauge what applications will be financially successful. The success of our VoIP initiative is dependent upon future demand for IP telephony systems and services which, in turn, will depend on a number of factors including IP telephony achieving a similar level of reliability that users of the public switched telephone network have come to expect from their telephone service. IP telephony service providers must offer cost and feature benefits to their customers that are sufficient to cause the customers to switch away from traditional telephony service providers. If any or all of these factors fail to occur, our VoIP business may not grow.
23
Our annual and periodic financial results may fluctuate causing our stock price to decline.
A number of factors, many of which are outside of our control, are likely to cause fluctuations in our annual and periodic financial results.
The factors outside of our control include:
| | • | | long distance telecommunications market conditions as well as economic conditions generally; |
| | • | | reductions in the prices of services offered by our competitors; and |
| | • | | costs of integrating new technologies into our businesses. |
The factors substantially within our control include:
| | • | | the timing of expansion into new markets, both domestically and internationally. |
Because our operating results may vary significantly from quarter to quarter due to the above factors, as well as any unforeseen factors, our operating results may not meet the expectations of securities analysts and investors, and our common stock could decline significantly. Should the price of our common stock decline we may be exposed to additional risks such as securities litigation, impairment of our ability to attract and retain qualified individuals using equity incentives and increased difficulty with respect to the completion of desired acquisitions using equity as consideration.
Our critical accounting policies and significant estimates made may not be appropriate or accurate.
We have selected accounting policies that we believe are appropriate for the business conducted and that comply with accounting policies generally accepted in the United States. Such accounting policies and their application may change from time to time, as new standards and interpretations emerge or the application of existing standards change. Additionally, financial statements involve the use of estimates and the application of professional judgment, which may be challenged by auditors, regulators and investors from time to time. Qualified people exercising due care, may make judgments at any point in time utilizing the best available information, including the use of subject matter experts, and may reach conclusions that are not appropriate. You are encouraged to read and obtain a full understanding of the financial statements and related notes contained in our securities filings and the related reports of the independent auditor. The critical accounting policies we selected and identified may require thorough study and assessment by you in order for you to reach a conclusion about the appropriateness and reasonableness of the policy or estimate, given the facts and circumstances. You should reach your own conclusion on the appropriateness, fairness and application of the accounting policies we have applied and estimates we have made in consultation with your financial and other advisors before making any decision to invest in us.
| ITEM 1B. | UNRESOLVED STAFF COMMENTS |
There are no material unresolved written comments that were received from the Securities and Exchange Commission’s staff 180 days or more before the end of our fiscal year relating to our periodic or current reports filed under the Securities Exchange Act of 1934.
As of June 30, 2006, we have a number of leases in place to support our business. In May 2004, we moved from our principal offices at 55 Town Centre Court to 300 Consilium Place, 5th Floor in Toronto, Canada, to gain the efficiencies of having the majority of our operations in one location, and consolidating the acquisitions of Yak for Business and Contour, which is located on the 12th Floor of 300 Consilium Place. The aggregate rent and annual occupancy costs of 300 Consilium Place are $267 and $500, respectively. During the 2005 fiscal year, we renewed our lease for our Brossard, Quebec office, which
24
supports the Quebec operations of Yak for Business, through December 2008. The annual rent and occupancy costs of our Brossard office are $71 and $90, respectively.
We currently lease space at 151 Front Street, Toronto, Ontario and 50 NE 9th Street, Miami, Florida, to house our telecommunication switches and cross-connect platforms. Both locations are in buildings which accommodate switches for many other telecommunications carriers. This provides us with the advantage of ease of access to other carriers. These switches are installed in rooms that are environmentally modified, cooled and designed for switching equipment. These facilities have full battery backup for 24 hours in the event of a power failure. Our current lease for the facility at 151 Front Street is for five years (which commenced in March 2002) with annual rent and occupancy costs of approximately $59 and $64, with an option to renew for a further 5 years at then-current rates. Our current lease for the facility at 50 NE 9th Street commenced in June 2005, for a three year term, and provides for annual rent and occupancy costs of approximately $60 and $118, respectively.
Our servers and other information technology related equipment is located at 1895 Williams Parkway East, Brampton, Ontario. Our current lease expires in June, 2009 and our annual rent and occupancy costs are approximately $13 and $136, respectively.
The following is a summary of our real property leases and our costs for our 2006 fiscal year (in dollars).
| | | | | | | | | | |
Location | | Square Feet | | Lease Term
Expiration | | Annual
Rent Costs | | Annual
Occupancy
Costs |
300 Consilium Place, 5th Floor, Toronto, Ontario | | 19,240 | | July ‘09 | | $ | 231,000 | | $ | 471,000 |
50 NE 9th Street, Miami, Florida | | 100 | | May ‘08 | | $ | 60,000 | | $ | 118,000 |
151 Front Street, Toronto, Ontario | | 1,000 | | February ’07 | | $ | 59,000 | | $ | 64,000 |
300 Consilium Place, 12th Floor, Toronto, Ontario | | 3,000 | | September ‘08 | | $ | 36,000 | | $ | 29,000 |
1 Place du Commerce, Suite 340, Brossard, Quebec | | 7,100 | | December ’08 | | $ | 71,000 | | $ | 90,000 |
20803 Biscayne Boulevard, Aventura (Miami), Florida | | 2,805 | | June ‘07 | | $ | 56,000 | | $ | 97,000 |
1895 Williams Parkway East, Brampton, Ontario | | 288 | | June ‘09 | | $ | 13,000 | | $ | 136,000 |
In the ordinary course of business, the Company is from time to time involved in various pending or threatened legal actions. In fiscal 2006 a claim in the amount of $716 (CAD) was asserted by a former supplier of professional services to us. We do not consider this claim to be material and have filed a Statement of Defense to this claim, in which it denies any liability to the supplier of professional services and that the plaintiff has not suffered the damages alleged in its claim and has failed to mitigate. On or about August 15, 2006, counsel for the plaintiff had the Company noted in default and a Judgment was subsequently entered on August 21, 2006. On September 20, 2006 an Order was obtained setting aside the default judgment. The legal process continues. In addition, there are various other non-material lawsuits and claims which are pending against us. Although the litigation process is inherently uncertain and it is possible that the resolution of such matters might have a material adverse effect upon the financial condition and/or results of operations of the Company, it is the opinion of the Company’s management, that the matters currently pending or threatened against us will not have a material adverse effect on our financial position or results of operations.
| ITEM 4. | SUBMISSION OF MATTERS TO A VOTE OF SECURITY HOLDERS |
No matters were submitted to a vote of security holders during the fourth quarter of fiscal year 2006.
25
PART II
| ITEM 5. | MARKET FOR REGISTRANT’S COMMON EQUITY AND RELATED STOCKHOLDER MATTERS |
Our common stock is currently quoted on the Nasdaq National Market under the symbol “YAKC”. Prior to February 9, 2005, our Common Stock was quoted on the Nasdaq SmallCap Market. The following table sets forth the range of the high and low bid quotations for our common stock for the periods indicated. Such market quotations reflect inter-dealer prices, without mark-up, mark-down or commission and may not necessarily represent actual transactions.
| | | | | | |
2006 | | High | | Low |
1stQuarter | | $ | 5.70 | | $ | 3.65 |
2nd Quarter | | | 4.54 | | | 2.90 |
3rd Quarter | | | 4.25 | | | 2.84 |
4th Quarter | | | 4.00 | | | 2.35 |
| | |
2005 | | High | | Low |
1stQuarter | | $ | 10.65 | | $ | 5.50 |
2nd Quarter | | | 8.55 | | | 5.61 |
3rd Quarter | | | 8.50 | | | 5.36 |
4th Quarter | | | 6.40 | | | 4.50 |
| | |
2004 | | High | | Low |
1st Quarter* | | $ | 6.97 | | $ | 5.72 |
2nd Quarter* | | | 9.99 | | | 6.08 |
3rd Quarter | | | 19.85 | | | 9.40 |
4th Quarter | | | 11.23 | | | 7.25 |
| * | Amounts have been restated for the 2:1 stock split effectuated on January 29, 2004 to shareholders of record on January 15, 2004. |
As of June 30, 2006, there were approximately 94 holders of record of our common stock including our directors and management. At June 30, 2006, the closing price of our common stock was $2.97 per share.
We have not paid any dividends on our common stock and we intend to retain all earnings for use in our operations and to finance the development and the expansion of our business. We do not anticipate paying any dividends on the common stock in the foreseeable future. The payment of dividends is within the discretion of our Board of Directors. Any future decision with respect to dividends will depend on future earnings, future capital needs and our operating and financial condition, among other factors.
| ITEM 6. | SELECTED FINANCIAL DATA |
The following sets forth our selected consolidated financial data for the fiscal years ended June 30, 2006, 2005, 2004, 2003 and 2002 as derived from our historical financial statements.
26
Statement of Operations Data:
| | | | | | | | | | | | | |
| | | Years Ended June 30, |
| (in $ thousands) | | 2006 | | | 2005 | | | 2004 | | | 2003 | | 2002 |
| | | $ | | | $ | | | $ | | | $ | | |
Net revenue | | 92,397 | | | 92,700 | | | 80,802 | | | 40,404 | | 24,492 |
Cost of revenue(1) | | 55,304 | | | 57,636 | | | 53,149 | | | 25,403 | | 17,711 |
| | | | | | | | | | | | | |
Contribution margin | | 37,093 | | | 35,064 | | | 27,653 | | | 15,001 | | 6,781 |
| | | | | | | | | | | | | |
Operating expenses | | | | | | | | | | | | | |
General and administrative | | 22,433 | | | 18,124 | | | 11,081 | | | 3,458 | | 2,273 |
Professional fees paid to related parties | | 241 | | | 458 | | | 236 | | | 231 | | 214 |
Stock-based compensation | | 303 | | | 81 | | | 26 | | | — | | — |
Bad debts expense | | 286 | | | 373 | | | 138 | | | 153 | | 94 |
Sales and marketing | | 6,832 | | | 7,293 | | | 3,894 | | | 4,207 | | 1,595 |
Depreciation and amortization | | 3,222 | | | 2,943 | | | 2,980 | | | 803 | | 463 |
Writedown of property and equipment and license fee | | 3,587 | | | — | | | 313 | | | 119 | | 68 |
| | | | | | | | | | | | | |
Total operating expenses | | 36,904 | | | 29,272 | | | 18,668 | | | 8,971 | | 4,707 |
| | | | | | | | | | | | | |
Income from operations | | 189 | | | 5,792 | | | 8,985 | | | 6,030 | | 2,074 |
Other expenses (income) | | | | | | | | | | | | | |
Interest expense | | 131 | | | 893 | | | 969 | | | 513 | | 659 |
Interest earned | | (419 | ) | | (406 | ) | | (159 | ) | | — | | — |
Long-term debt discount amortization | | — | | | 391 | | | 535 | | | — | | — |
Income from joint marketing agreement | | — | | | (421 | ) | | (539 | ) | | — | | — |
Gain on settlement | | — | | | (1,242 | ) | | — | | | — | | — |
Change in fair value of obligation under warrants | | (316 | ) | | (583 | ) | | (497 | ) | | — | | — |
Other expenses | | — | | | — | | | 328 | | | 29 | | — |
| | | | | | | | | | | | | |
| | (604 | ) | | (1,368 | ) | | 637 | | | 542 | | 659 |
| | | | | | | | | | | | | |
Earnings before income tax | | 793 | | | 7,160 | | | 8,348 | | | 5,488 | | 1,415 |
Provisions for income taxes | | 1,158 | | | 2,397 | | | 2,882 | | | 1,999 | | 204 |
| | | | | | | | | | | | | |
Net earnings | | (365 | ) | | 4,763 | | | 5,466 | | | 3,489 | | 1,211 |
| | | | | | | | | | | | | |
Basic Earnings (loss) per Share | | (0.03 | ) | | 0.37 | | | 0.51 | | | 0.37 | | 0.29 |
Diluted Earnings (loss) per Share | | (0.03 | ) | | 0.37 | | | 0.48 | | | 0.29 | | 0.20 |
| (1) | Excludes depreciation and amortization of $2,618, $2,359, $2,767, $687 and $448 respectively. |
27
Balance Sheet Data:
| | | | | | | | | | | | | | | |
(In Thousands) | | 2006 | | 2005 | | 2004 | | 2003 | | 2002 |
Total Assets | | $ | 49,526 | | $ | 53,238 | | $ | 53,650 | | $ | 26,744 | | $ | 8,809 |
Total Liabilities | | | 15,973 | | | 21,487 | | | 28,002 | | | 21,016 | | | 7,295 |
Total Long-Term Debt | | | 1,044 | | | 2,967 | | | 5,196 | | | 5,886 | | | 358 |
Stockholders’ Equity | | | 33,553 | | | 31,751 | | | 25,648 | | | 5,728 | | | 1,514 |
| ITEM 7. | MANAGEMENT’S DISCUSSION AND ANALYSIS OF FINANCIAL CONDITION AND RESULTS OF OPERATIONS |
Special Note About Forward Looking Statements
This report contains certain “forward-looking statements” within the meaning of Section 27A of the Securities Act of 1933, as amended, and Section 21E of the Exchange Act of 1934, as amended, which are based on management’s exercise of business judgment as well as assumptions made by and information currently available to, management. When used in this document, the words “may”, “will”, “anticipate”, “believe”, “estimate”, “expect”, “intend” and words of similar import, are intended to identify any forward-looking statements. You should not place undue reliance on these forward-looking statements. These statements reflect our current view of future events and are subject to certain risks and uncertainties as described in Item 1A – Risk Factors in this Annual Report on Form 10-K, along with the factors or risks outlined below. Should one or more of these risks or uncertainties materialize, or should underlying assumptions prove incorrect, our actual results could differ materially from those anticipated in these forward-looking statements. We undertake no obligation, and do not intend, to update, revise or otherwise publicly release any revisions to these forward-looking statements to reflect events or circumstances after the date hereof, or to reflect the occurrence of any unanticipated events. Although we believe that our expectations are based on reasonable assumptions, we can give no assurance that our expectations will materialize.
Factors or risks that could cause actual results or circumstances to differ materially from those set forth or contemplated in forward looking statements include, but are not limited to, the following:
| | • | | access to sufficient working capital to meet our operating and financial needs; |
| | • | | our ability to respond to growing competition in our markets for discount long distance services as well as the extent, timing and success of such competition; |
| | • | | our ability to expand into new markets and to effectively manage our growth; |
| | • | | profitability of our expansion into the U.S. market; |
| | • | | customer acceptance and effectiveness of us as a discount long distance provider and our ability to assimilate new technology and to adapt to technological change in the telecommunications industry; |
| | • | | our ability to develop and provide voice over Internet and Internet-based communications services; |
28
| | • | | changes in, or failure to comply with, applicable legislation or governmental regulation; |
| | • | | changes in tax laws or rates; |
| | • | | our reliance on our key personnel and the availability of qualified personnel; |
| | • | | general economic conditions or material adverse changes in markets we serve; |
| | • | | risk that our analyses of these risks could be incorrect and that the strategies developed to address them could be unsuccessful; |
| | • | | changes in our accounting assumptions that regulatory agencies, including the SEC, may require or that result from changes in the accounting rules or their application, which could result in an impact on our earnings; |
| | • | | successful deployment of new equipment and realization of material savings therefrom; and |
| | • | | various other factors discussed in this filing. |
The financial information in this section refers to our continuing operations and should be read in conjunction with the information contained in the audited consolidated financial statements of the Company and the related notes thereto, appearing elsewhere herein. All the amounts are in thousands of United States dollars ($U.S.) except for share and per share data.
Material Subsequent Events
During the fourth quarter of fiscal 2006, the Company’s Board of Directors determined that, in light of, among other things, rising costs and expenses associated with our remaining a public reporting company as compared to our revenue base, the need for additional investment in the Voice over Internet Protocol (VoIP) and Yak Communications (America) Inc. (“Yak America”) segments, the trading value of the Company and the actual performance of our core business as compared with projections, we should explore various strategic alternatives available to us to maximize shareholder value. To oversee this process, the Board has established an Independent Committee, consisting solely of independent directors of the Board (the “Committee”). The Board’s mandate to the Committee was, among other things, to (i) review, study, explore and analyze various strategic alternatives to maximize shareholder value including, without limitation, the potential sale of all or portions of our operations, (ii) consider all legal and regulatory requirements applicable to any strategic alternative, (iii) canvas the structuring of any strategic alternative, (iv) review the implementation of any strategic alternative, if approved by the Board, and (v) review our public disclosures with respect to any strategic alternative.
At the June 12, 2006 meeting, the Board approved the Committee’s recommendations to the Board. Among other things, the Committee recommended that various strategic alternatives to maximize our shareholder value should be reviewed, explored and analyzed, including, without limitation, the potential sale of all or portions of the Company’s operations. On June 29, 2006, the Board engaged the investment banking firm of Orion Securities Inc. to advise the Company with regard to our various strategic alternatives.
On September 20, 2006, following a rigorous auction process managed by the Independent Committee and based upon such Committee’s recommendation to the Board, the Board approved an all cash offer to acquire all outstanding shares of Yak’s common stock made by Globalive Communications Corp. (“Globalive”). The $5.25 per share offered by Globalive represents a premium of approximately 34.6% to the $3.90 closing price of our common stock on September 20, 2006. The transaction value is approximately $68 million.
Under the definitive merger agreement executed by Yak and Globalive as of September 20, 2006 (the “Merger Agreement”), the transaction has been structured as an all cash tender offer for 100% of Yak’s outstanding shares of common stock to be followed by the merger of Yak with and into a wholly-owned subsidiary of Globalive. Yak would cease being an Exchange Act reporting company as promptly as possible following the closing of the transaction.
Globalive intends to commence the offer for all of Yak’s outstanding shares of common stock shortly. A vote of shareholders on the merger will be required only if less than 80% of our common stock shares are tendered into the offer. Under the terms of the Merger Agreement, we have granted Globalive an option to acquire up to one share more than 80% of Yak’s issued and outstanding common stock shares that would become exercisable only upon the acceptance and payment for shares of common stock in the tender offer if more than 50% of the Yak common stock shares shall have been tendered and not withdrawn. The transaction is not subject to any financing contingencies and is expected to be completed before December 31, 2006, subject to certain conditions, including the receipt of regulatory approvals, the Board’s obtaining a fairness opinion from an independent third party not involved in the bidding process to date and other customary closing conditions. The focus of the fairness opinion is to determine whether the transaction was fair from a financial standpoint to all shareholders as a class.
29
On September 20, 2006, the Board unanimously approved the tender offer and the merger and determined that the tender offer and the Merger Agreement maximized shareholder value and are in the best interests of our shareholders. Our Board unanimously recommended that our shareholders accept Globalive’s offer and tender their shares. Individual shareholders, who hold approximately 51% ownership interest in our Company, have agreed to tender their shares in the offer.
YAK STOCKHOLDERS ARE URGED TO READ THE TENDER OFFER STATEMENT WHEN IT BECOMES AVAILABLE BECAUSE IT WILL CONTAIN IMPORTANT INFORMATION. YAK STOCKHOLDERS WILL BE ABLE TO OBTAIN FREE COPIES OF THE TENDER OFFER STATEMENT AND OTHER DOCUMENTS FILED BY GLOBALIVE COMMUNICATIONS CORP. OR ITS SUBSIDIARY, YAKQUISITION CORP., WITH THE SEC AT THE SEC’S WEBSITE ATWWW.SEC.GOV. IN ADDITION, DOCUMENTS FILED WITH THE SEC BY GLOBALIVE OR YAKQUISITION CORP. MAY BE OBTAINED FREE OF CHARGE FROM GLOBALIVE BY DIRECTING A REQUEST TO SUCH COMPANY AT (416) 640-1088.
Overview
Yak Communications Inc., through its wholly owned subsidiaries Yak Communications (Canada) Inc. (“Yak Canada”), Yak Communications (America) Inc. (“Yak America”) (collectively “Yak” or the “Company”) provides telecommunications services in Canada and the United States. Our primary service offering is discounted residential toll services in Canada provided through our Yak Canada subsidiary. Yak Canada has enjoyed tremendous success in this business and is now one of the largest independent (i.e. not affiliated with an incumbent carrier or cable operator) competitive telecommunications carriers in Canada. Yak Canada also provides a full range of telecommunications services to small and medium sized businesses through its Yak for Business division and VoIP services in Canada and the United States through its WorldCity VoIP division. Contour, a wholly-owned subsidiary of Yak Canada provides managed telecommunications services to businesses in Canada. Yak America provides discounted residential toll services to customers in the United States.
We organize our operations into five business segments, as follows:
| | • | | Yak Canada: Using a facilities-based resale network, whereby we own and operate a Class 4/5 telecommunications switch and lease transmission facilities (both inter and intra-city) from leading Canadian facilities-based telecommunications carriers, such as Bell Canada and Telus Communications Inc. (“Telus”), we provide several long distance products to residential subscribers throughout Canada; |
| | • | | Yak for Business:This segment provides a variety of voice and data products, including local lines, long distance services, data and Internet services, to small and medium-sized businesses in Canada. We purchase wholesale services from a variety of carriers and customize these services to provide customized products to our end-users; |
30
| | • | | Contour: This segment provides managed telecommunications services to medium and large business customers; |
| | • | | Yak America:This segment provides a variety of toll products to residential customers located in the United States; and |
| | • | | WorldCity VoIP:This segment provides VoIP services to residential customers located in the United States, Canada and to other international locations. |
Please refer to Item 1. Business – “Description of Company’s Products and Services” for a more detailed account of the products and services which we offer.
Network Facilities
Over the past five years, we have established and expanded our own private, leased line network throughout most of Canada. Currently, this coast-to-coast network delivers most of our voice telephony traffic. We have continued to expand the addressable market in Canada by interconnecting with CLEC’s and Independent Telephone companies and these initiatives will continue into fiscal 2007. In September 2003, we acquired a “state of the art” Tekelec/Santera switch and installed it in our network premises in Toronto. Subsequently, we have migrated our network traffic to this switch from our legacy switches. To support our network growth, we have continued to expand the Tekelec/Santera switch to forty thousand ports. The switch is expandable to two-hundred thousand ports and, as such, we anticipate having significant switching capacity in the foreseeable future.
Our Tekelec/SanteraOne switch has positioned us to more efficiently accommodate the expansion of our customer base. The switch will act as a gateway to both traditional PSTN networks and IP networks. This switch is connected through leased lines to the Local Exchange Carriers’ (“LECs”) tandem and central offices by long haul diverse fiber, and also to Interexchange Carriers’ (“IXCs”) networks providing customers access to true “coast to coast” networks. Dedicated fiber transport is contracted from different carriers to provide us with the most competitive pricing. We have made an effort during the past year to utilize the IP portion of our switching platform and have connected to several IP network providers for a portion of our international traffic. Our primary concern when choosing interconnection partners is to maintain optimal quality and the IP networks we use meet or exceed the standards of the traditional TDM network providers we employ.
Our coast-to-coast leased line network in Canada allows us to originate and terminate the majority of our traffic on our own network, thereby reducing our overall switching costs. For calls that terminate outside of Canada, we have agreements with other “off net” International and cross border carriers, which are selected by running real time least cost routing algorithms. Our Carrier Relations team has made significant gains in renegotiating our bandwidth and switched minute agreements over the past year and have contributed to increasing our profit margins.
In the United States, we have achieved comparable network breadth by interconnecting with Wiltel Communications LLC, a major U.S. wholesale carrier (Wiltel was acquired by Level 3 Communications Inc. on December 23, 2005). Our Carrier Identification Codes (“CIC”) are programmed into Wiltel switches and therefore we take advantage of Wiltel’s extensive network access arrangements with the Regional Bell Operating Companies (“RBOC”s) and most major LECs. U.S. originated calls are hauled to our switch in Toronto and terminated on our Canadian network or routed “off net” if the calls terminate outside of Canada. Further, redundancy has been built in this U.S. network by connecting our switch to two independent major switching centers in New York City.
During the quarter ended December 31, 2005, a second switch was installed in the NAP of the Americas in Miami, FL and became fully operational in this most recent quarter ended March 31, 2006. The system consists of a redundant Tekelec/Santera switch with sixteen thousand ports and a complete billing and fraud system. The system handles the daily overflow traffic from Canada and is capable of handling 70% of Yak’s traffic in the event of a catastrophic failure of the switch in Toronto.
31
We also own and operate several routers to support our VoIP network. The routers allow Yak to receive VoIP calls that are originated by our subscribers and routed over the public Internet, so that we may terminate these calls on the PSTN. Currently, we utilize our VoIP network facilities to support our yakForFree and yaktoAnyone products.
Cost Reduction Initiative
In addition to the direct cost savings associated with the migration to and operation of the Tekelec/SanteraOne platform, the transition has also afforded us the opportunity to reduce costs by bringing a greater portion of our traffic onto our network, i.e., on-net traffic. During the 2006 fiscal year, we routed a total of 700.3 million minutes on-net, being 59.7 million or 9.3% more than the previous fiscal year. We continually pursue other methods of reducing our variable direct costs such as employing least cost routing of our international traffic, negotiating lower variable costs with multiple carriers to multiple destinations to achieve the lowest available cost per minute, and continuing to expand the capacity of our network to accommodate the growing demand in certain areas of the markets we serve.
Foreign Currency
For the financial year ended June 30, 2006, 94.2% of our net revenue is derived from sales and operations in Canada. The functional currency for this revenue is the Canadian dollar; however, our reporting currency for our consolidated financial statements is the U.S. dollar. We expect that changing exchange rates may continue to have a significant, and sometimes adverse, effect on our results of operations.
We are exposed to financial statement gains and losses as a result of translating the operating results and financial position of our Canadian subsidiaries. We translate the local currency statements of operations of these foreign subsidiaries into U.S. dollars using the average exchange rate during the reporting period. Changes in foreign exchange rates affect the reported profits and losses and cash flows and may distort comparisons from year to year. For example, strengthening of the Canadian relative to the U.S. dollar could have a positive impact on our results of operations.
During the financial year ended June 30, 2006, the U.S. dollar weakened as compared to the Canadian dollar. As a result, although the revenues from our Canadian subsidiaries decreased $10,404 (or 9.3%) in Canadian dollars, we only experienced a net decrease of $2,376 (or 2.7%) when reported in U.S. dollars.
Competition
As described earlier in Item 1. Business – “Competition”, in both Canada and the U.S. there are several other residential long distance, including “dial-around”, companies competing against Yak in the marketplace. The VoIP marketplace is in its initial stages and is characterized by significant new entry and we expect to have increased competition in this area in the future. The trends and factors affecting the current telecommunications industry in North America, particularly those changes taking place in the regulatory sphere, are expected to continue and we will continue to focus on our strategies and plans to increase our share of the market in all of our product offerings.
Previously Reported Restatements
On May 31, 2005, the Company restated its financial statements for the fiscal years ended June 30, 2003 and 2004. Further, on September 27, 2005, we completed further adjustments to the above described restatement to correct for an error in the initial restatement. At that time, we made further amendments to its June 30, 2003 and 2004 annual reports. As a result of these corrections, we amended our Annual Report filed on Form 10-K/A for the fiscal year ended June 30, 2005 to correct the amounts previously reported in its financial statements for the fiscal years 2003 and 2004, as well as each of the quarters in fiscal years 2004 and for the first three quarters of fiscal year 2005.
On April 21, 2006, the Company filed Amendment No. 2 to its Annual Report on Form 10-K for the fiscal year ended June 30, 2005 and two Amendments to its Quarterly Reports on Form 10-Q for the first
32
and second quarters ended September 30 and December 31, 2005, respectively, to correct certain accounting errors and disclosure deficiencies in its previously issued public filings. We restated our previously issued financial statements to correct for the errors and deficiencies described below:
| | A. | To correct for the misapplication of SFAS 133, SFAS 150 and EITF 00-19 related to the 2004 issuance of detachable warrants (the “Warrants”); |
| | B. | To correct for disclosure deficiencies under SFAS 131; |
| | C. | To correct for errors in our Cash Flow Statements; and |
| | D. | To correct for the fiscal 2005 misclassification of financing expenses related to assignment of accounts receivable. |
The restated numbers are included in the three months ended and year to date results as presented in the accompanying condensed consolidated financial statements and comparative figures.
The nature and details of the accounting error are more fully disclosed in Note 5, to financial statements included on Form 10K/A No.2 for the year ended June 30, 2006, filed with the SEC.
33
Results of Operations for the fiscal year ended June 30, 2006 as compared to the fiscal year ended June 30, 2005.
The following table provides a summary of consolidated unaudited results of operations on a quarterly basis for the preceding eight quarters, as well as for the audited fiscal years ended June 30, 2005 and 2006.
| | | | | | | | | | | | | | | | | | | | | | | | | | | | | | |
| | | Fiscal 2005 | | | Fiscal 2006 | | | | | | | |
| | | Q1 | | | Q2 | | | Q3 | | | Q4 | | | Q1 | | | Q2 | | | Q3 | | | Q4 | | | Fiscal
Year
ended
June 30,
2005 | | | Fiscal
Year
ended
June 30,
2006 | |
Net revenue | | 21,197 | | | 24,153 | | | 23,850 | | | 23,500 | | | 23,508 | | | 24,029 | | | 22,656 | | | 22,204 | | | 92,700 | | | 92,397 | |
Cost of revenue(1) | | 13,758 | | | 14,621 | | | 14,798 | | | 14,459 | | | 14,375 | | | 14,447 | | | 13,854 | | | 12,628 | | | 57,636 | | | 55,304 | |
| | | | | | | | | | | | | | | | | | | | | | | | | | | | | | |
Contribution margin | | 7,439 | | | 9,532 | | | 9,052 | | | 9,041 | | | 9,133 | | | 9,582 | | | 8,802 | | | 9,576 | | | 35,064 | | | 37,093 | |
| | | | | | | | | | | | | | | | | | | | | | | | | | | | | | |
Operating expenses | | | | | | | | | | | | | | | | | | | | | | | | | | | | | | |
General and administrative | | 3,508 | | | 4,912 | | | 5,024 | | | 4,680 | | | 5,553 | | | 4,625 | | | 5,699 | | | 6,556 | | | 18,124 | | | 22,433 | |
Professional fees paid to related parties | | 48 | | | 61 | | | 46 | | | 303 | | | 86 | | | 65 | | | 51 | | | 39 | | | 458 | | | 241 | |
Stock-based compensation | | 13 | | | 14 | | | 15 | | | 39 | | | 62 | | | 62 | | | 65 | | | 114 | | | 81 | | | 303 | |
Bad debts expense | | 41 | | | 88 | | | 98 | | | 146 | | | 227 | | | 167 | | | 33 | | | (141 | ) | | 373 | | | 286 | |
Sales and marketing | | 991 | | | 1,699 | | | 1,941 | | | 2,662 | | | 1,895 | | | 1,627 | | | 1,978 | | | 1,332 | | | 7,293 | | | 6,832 | |
Depreciation and amortization | | 562 | | | 694 | | | 736 | | | 951 | | | 844 | | | 741 | | | 811 | | | 826 | | | 2,943 | | | 3,222 | |
Writedown of property and equipment | | — | | | — | | | — | | | — | | | — | | | 111 | | | 63 | | | 3,413 | | | — | | | 3,587 | |
| | | | | | | | | | | | | | | | | | | | | | | | | | | | | | |
Total operating expenses | | 5,163 | | | 7,468 | | | 7,860 | | | 8,781 | | | 8,667 | | | 7,398 | | | 8,700 | | | 12,139 | | | 29,272 | | | 36,904 | |
| | | | | | | | | | | | | | | | | | | | | | | | | | | | | | |
Income (loss) from operations | | 2,276 | | | 2,064 | | | 1,192 | | | 260 | | | 466 | | | 2,184 | | | 102 | | | (2,563 | ) | | 5,792 | | | 189 | |
Other expenses (income) | | (128 | ) | | (15 | ) | | (1,548 | ) | | 323 | | | (190 | ) | | (308 | ) | | 33 | | | (139 | ) | | (1,368 | ) | | (604 | ) |
| | | | | | | | | | | | | | | | | | | | | | | | | | | | | | |
Earnings (loss) before income tax | | 2,404 | | | 2,079 | | | 2,740 | | | (63 | ) | | 656 | | | 2,492 | | | 69 | | | (2,424 | ) | | 7,160 | | | 793 | |
| | | | | | | | | | | | | | | | | | | | | | | | | | | | | | |
Provision for (recovery of) income tax | | 734 | | | 689 | | | 822 | | | 152 | | | 333 | | | 1,306 | | | 476 | | | (957 | ) | | 2,397 | | | 1,158 | |
| | | | | | | | | | | | | | | | | | | | | | | | | | | | | | |
Net earnings (loss) | | 1,670 | | | 1,390 | | | 1,918 | | | (215 | ) | | 323 | | | 1,186 | | | (407 | ) | | (1,467 | ) | | 4,763 | | | (365 | ) |
| | | | | | | | | | | | | | | | | | | | | | | | | | | | | | |
Basic earnings (loss) per share | | 0.13 | | | 0.11 | | | 0.15 | | | (0.02 | ) | | 0.03 | | | 0.09 | | | (0.03 | ) | | (0.12 | ) | | 0.37 | | | (0.03 | ) |
| | | | | | | | | | | | | | | | | | | | | | | | | | | | | | |
Diluted earnings (loss) per share | | 0.13 | | | 0.11 | | | 0.15 | | | (0.02 | ) | | 0.03 | | | 0.09 | | | (0.03 | ) | | (0.12 | ) | | 0.37 | | | (0.03 | ) |
| | | | | | | | | | | | | | | | | | | | | | | | | | | | | | |
Weighted average number of common shares outstanding | | 12,893 | | | 12,897 | | | 12,897 | | | 12,897 | | | 12,897 | | | 12,898 | | | 12,905 | | | 12,905 | | | 12,895 | | | 12,902 | |
| | | | | | | | | | | | | | | | | | | | | | | | | | | | | | |
Weighted average number of common shares outstanding - diluted | | 12,984 | | | 12,905 | | | 12,902 | | | 12,901 | | | 12,897 | | | 12,898 | | | 12,905 | | | 12,905 | | | 12,901 | | | 12,902 | |
| | | | | | | | | | | | | | | | | | | | | | | | | | | | | | |
| (1) | Excludes depreciation and amortization |
34
The following tables provide a reconciliation between Yak Communications, Inc.’s unaudited results of operations by segment to the audited financial statements for the fiscal years ended June 30, 2006 and 2005 respectively.
| | | | | | | | | | | | | | | | | | | | | | | | |
| | | Fiscal Year Ended June 30, 2006 | |
| | | Yak
Canada | | | Yak for
Business | | | Contour | | | Yak
America | | | WorldCity
VoIP | | | Total
Segments | | | Eliminations
and other | | | Total | |
| | | $ | | | $ | | | $ | | | $ | | | $ | | | $ | | | $ | | | $ | |
Net Revenue | | 68,883 | | | 13,024 | | | 4,901 | | | 5,236 | | | 353 | | | 92,397 | | | — | | | 92,397 | |
Cost of revenue (1) | | 36,430 | | | 9,282 | | | 3,741 | | | 5,423 | | | 428 | | | 55,304 | | | — | | | 55,304 | |
| | | | | | | | | | | | | | | | | | | | | | | | |
Contribution margin | | 32,453 | | | 3,742 | | | 1,160 | | | (187 | ) | | (75 | ) | | 37,093 | | | — | | | 37,093 | |
General and administrative | | 10,589 | | | 3,094 | | | 742 | | | 1,209 | | | 3,152 | | | 18,786 | | | 3,647 | | | 22,433 | |
Professional fees for related parties | | 137 | | | — | | | — | | | — | | | — | | | 137 | | | 104 | | | 241 | |
Stock-based compensation | | — | | | — | | | — | | | — | | | — | | | — | | | 303 | | | 303 | |
Bad debts expense | | 83 | | | 95 | | | (217 | ) | | 325 | | | — | | | 286 | | | — | | | 286 | |
Sales and marketing | | 2,449 | | | 1 | | | — | | | 3,271 | | | 1,111 | | | 6,832 | | | — | | | 6,832 | |
Other expenses | | (68 | ) | | (11 | ) | | (32 | ) | | (1 | ) | | — | | | (112 | ) | | (492 | ) | | (604 | ) |
Writedown of property and equipment | | 174 | | | — | | | — | | | — | | | 3,413 | | | 3,587 | | | — | | | 3,587 | |
Depreciation and amortization | | 2,088 | | | 649 | | | 36 | | | 115 | | | 334 | | | 3,222 | | | — | | | 3,222 | |
| | | | | | | | | | | | | | | | | | | | | | | | |
Segment earnings (loss) before income taxes | | 17,001 | | | (86 | ) | | 631 | | | (5,106 | ) | | (8,085 | ) | | 4,355 | | | (3,562 | ) | | 793 | |
| | | | | | | | | | | | | | | | | | | | | | | | |
| (1) | Excludes depreciation and amortization of $2,618. |
| | | | | | | | | | | | | | | | | | | | | | |
| | | Fiscal Year Ended June 30, 2005 | |
| | | Yak
Canada | | | Yak for
Business | | | Contour | | Yak
America | | | WorldCity
VoIP | | | Total
Segments | | Eliminations
and other | | | Total | |
| | | $ | | | $ | | | $ | | $ | | | $ | | | $ | | $ | | | $ | |
Net Revenue | | 72,194 | | | 11,753 | | | 5,557 | | 3,007 | | | 76 | | | 92,587 | | 113 | | | 92,700 | |
Cost of revenue (1) | | 41,899 | | | 8,416 | | | 4,085 | | 3,094 | | | 33 | | | 57,527 | | 109 | | | 57,636 | |
| | | | | | | | | | | | | | | | | | | | | | |
Contribution margin | | 30,295 | | | 3,337 | | | 1,472 | | (87 | ) | | 43 | | | 35,060 | | 4 | | | 35,064 | |
General and administrative | | 8,501 | | | 3,028 | | | 920 | | 1,380 | | | 1,216 | | | 15,045 | | 3,079 | | | 18,124 | |
Professional fees for related parties | | 171 | | | — | | | — | | — | | | — | | | 171 | | 287 | | | 458 | |
Stock-based compensation | | — | | | — | | | — | | — | | | — | | | — | | 81 | | | 81 | |
Bad debts expense | | 95 | | | (113 | ) | | 163 | | 228 | | | — | | | 373 | | — | | | 373 | |
Sales and marketing | | 1,900 | | | 8 | | | — | | 5,358 | | | — | | | 7,266 | | 27 | | | 7,293 | |
Other expenses | | (10 | ) | | 73 | | | 101 | | (126 | ) | | 390 | | | 428 | | (1,796 | ) | | (1,368 | ) |
Depreciation and amortization | | 2,077 | | | 556 | | | 17 | | 132 | | | 141 | | | 2,923 | | 20 | | | 2,943 | |
| | | | | | | | | | | | | | | | | | | | | | |
Segment earnings (loss) before income taxes | | 17,561 | | | (215 | ) | | 271 | | (7,059 | ) | | (1,704 | ) | | 8,854 | | (1,694 | ) | | 7,160 | |
| (1) | Excludes depreciation and amortization of $2,359 |
35
Consolidated Results
Our net earnings declined by 108%, or $5,128, to loss of $365 for the fiscal year ended June 30, 2006 as compared to earnings of $4,763 for the fiscal year ended June 30, 2005. Our profits declined primarily because revenues from our principal segment – Yak Canada – declined by 4.6% due to customer loss, consolidated general and administrative expenses increased by 23.78% and we had a $3,400 write-off relating to software assets used to support our initial WorldCity VoIP products.
Despite the decrease in revenues, the Yak Canada segment remained profitable and achieved segment earnings before income tax of $17,001. However, our Yak America and WorldCity VoIP segments experienced segment losses before income tax of $5,106 and $8,085 respectively. Yak America losses decreased from $7,059 from the fiscal year ended June 30, 2005. However contribution margins continued to be negative and in fact slightly worsened due to increased costs for network security and the implementation of back-up access lines. WorldCity VoIP losses increased from $1,704 for the fiscal year ended June 30, 2005. The increased loss was primarily due to higher operating costs, the write-off relating to our software asset, the impairment of YakBasic inventory and costs associated with the development of new VoIP products. Contour and Yak for Business segment earnings remained relatively unchanged from last year. A full description and analysis of each segment’s results is presented in the sections below.
In response to these results, we have embarked in the fourth quarter of our 2006 fiscal year, on a process of strategy renewal which includes the following elements:
| | • | | re-connecting to our “yak” brand in the Canadian residential long distance market – our most successful and profitable operating segment. |
| | • | | devoting the appropriate resources to regain lost market share and revenues with respect to our core product offering – 10-10-Yak in the Canadian market – while continuing to expand our other Canadian long distance products (e.g. yakLongDistance, LooneyCall, yakCallingCard and yakCell). |
36
| | • | | developing new complimentary telephony products and investigating the expansion into complimentary telecommunications markets where we can exploit our yak brand to achieve market share and increase revenues. |
We intend to implement this strategy by focusing greater marketing and advertising resources on our core Canadian markets. We have recently hired a Director of Marketing, based in Toronto, Canada, whose mandate is consistent with the above objectives. Operational resources will also be directed to new product and market development initiatives. These initiatives will be our key priorities throughout fiscal 2007.
Although the majority of our efforts will be re-focused on the Canadian market, we will continue marketing our products offered by our Yak America and VoIP WorldCity segments, but with a focus on more profitable markets. As well, we will investigate areas where we can reduce operating and administrative costs in these segments.
Revenues
Net revenues decreased by 0.3%, or $303, to $92,397 for the fiscal year ended June 30, 2006 as compared to $92,700 for the fiscal year ended June 30, 2005. This decrease was primarily due to a decline in customers of the Company’s dial-around products (10-10-Yak and LooneyCall) for Yak Canada. However, the decrease in net revenues was partially offset by increased customer uptake of yakLong Distance and Yak Cell for Yak Canada and a general increase in usage for our Yak America products. Further, the decline in usage and net revenues was offset by a favorable currency exchange (i.e., a strengthening of the Canadian dollar relative the U.S. dollar). Our overall minute usage for our core products decreased by approximately 51 million, or 4.4%, for the year ended June 30, 2006 as compared to our prior fiscal year.
Cost of Revenues and Contribution Margin
Cost of revenues decreased by $2,332, or 4.0%, to $55,304 for the fiscal year ended June 30, 2006 as compared to $57,636 for the fiscal year ended June 30, 2005. This decrease was primarily the result of lower carrier and access and facility costs through favorable CRTC decisions and negotiating lower access and facility costs with underlying carriers. As a result of these efforts, contribution margin for the year ended June 30, 2006, increased by 2.4% (from 37.8% to 40.2%) as compared to the previous fiscal year.
Expenses
Expenses increased by $8,396, or 30.1%, to $36,300 for the fiscal year ended June 30, 2006, as compared to $27,904 for the fiscal year ended June 30, 2005. This increase was primarily attributable to the costs associated with expansion and developmental costs for our WorldCity VoIP segment, costs associated with the enhancement and continued maintenance of an additional switch in Miami, including costs related to improving network efficiency and security. In addition, expenses increased due to legal, audit and consulting expenses associated with the restatements of the Company’s financial statements for the fiscal years ended June 30, 2005, 2004, 2003 and the quarters ended September 30 and December 31, 2005. Finally, the Company recorded an asset write-off charge of approximately $3,413 in order to reduce the value of certain WorldCity VoIP software.
Yak Canada
The following table provides a summary of Yak Canada’s unaudited results of operations on a quarterly basis for the preceding eight quarters, as well as for the audited fiscal years ended June 30, 2005 and 2006.
37
| | | | | | | | | | | | | | | | | | | | | | | | | | |
| | | Yak Canada | |
| | | Fiscal 2005 | | Fiscal 2006 | | | | | | | |
| | | Q1 | | | Q2 | | Q3 | | | Q4 | | Q1 | | Q2 | | Q3 | | | Q4 | | | Fiscal
year
ended
June 30,
2005 | | | Fiscal
year
ended
June 30,
2006 | |
| | | $ | | | $ | | $ | | | $ | | $ | | $ | | $ | | | $ | | | $ | | | $ | |
Revenues | | 16,838 | | | 19,318 | | 18,592 | | | 17,446 | | 17,702 | | 18,011 | | 16,557 | | | 16,613 | | | 72,194 | | | 68,883 | |
Cost of revenues(1) | | 10,430 | | | 10,956 | | 10,519 | | | 9,994 | | 9,708 | | 9,026 | | 9,047 | | | 8,649 | | | 41,899 | | | 36,430 | |
| | | | | | | | | | | | | | | | | | | | | | | | | | |
Contribution margin | | 6,408 | | | 8,362 | | 8,073 | | | 7,452 | | 7,994 | | 8,985 | | 7,510 | | | 7,964 | | | 30,295 | | | 32,453 | |
General and administrative | | 1,430 | | | 1,615 | | 2,851 | | | 2,605 | | 2,781 | | 2,018 | | 2,670 | | | 3,120 | | | 8,501 | | | 10,589 | |
Professional fees for related parties | | 42 | | | 46 | | 32 | | | 51 | | 34 | | 45 | | 25 | | | 33 | | | 171 | | | 137 | |
Bad debts expense | | 15 | | | 26 | | 40 | | | 14 | | 10 | | 42 | | 11 | | | 20 | | | 95 | | | 83 | |
Sales and marketing | | 710 | | | 374 | | 403 | | | 413 | | 342 | | 355 | | 1,147 | | | 605 | | | 1,900 | | | 2,449 | |
Other expenses (income) | | (187 | ) | | 869 | | (1,159 | ) | | 467 | | 23 | | 7 | | (81 | ) | | (17 | ) | | (10 | ) | | (68 | ) |
Writedown of property and equipment | | — | | | — | | — | | | — | | — | | 111 | | 63 | | | — | | | — | | | 174 | |
Depreciation and amortization | | 400 | | | 478 | | 476 | | | 723 | | 562 | | 451 | | 532 | | | 543 | | | 2,077 | | | 2,088 | |
| | | | | | | | | | | | | | | | | | | | | | | | | | |
Segment earnings (loss) before income tax | | 3,998 | | | 4,954 | | 5,430 | | | 3,179 | | 4,242 | | 5,956 | | 3,143 | | | 3,660 | | | 17,561 | | | 17,001 | |
| | | | | | | | | | | | | | | | | | | | | | | | | | |
Segment assets | | 40,616 | | | 37,580 | | 33,244 | | | 34,269 | | 33,572 | | 34,332 | | 35,892 | | | 43,044 | | | 34,269 | | | 43,044 | |
Long-Lived assets | | 7,968 | | | 9,341 | | 6,760 | | | 7,308 | | 8,043 | | 8,143 | | 9,314 | | | 9,864 | | | 7,308 | | | 9,864 | |
| (1) | Excludes depreciation and amortization |
Revenues
Net revenues decreased by approximately $3,311, or 4.6%, to $68,883 for the fiscal year ended June 30, 2006, as compared to $72,194 for the fiscal year ended June 30, 2005. This decrease is attributable to a customer loss for our Canadian dial-around products (10-10-Yak and LooneyCall). Total minutes for the 10-10-Yak and LooneyCall decreased by 8.7% and 31.3% respectively as compared to our previous fiscal year. This decrease was somewhat offset by the success of new marketing campaigns to promote our subscription products (yakLongDistance, yakCell and yakCallingCards) beginning in the second quarter in the Provinces of British Columbia, Alberta, Saskatchewan, Manitoba, Ontario and Quebec. These marketing campaigns generated a 458% increase in the number of customers for yakLongDistance. Net revenue declines were also offset by favorable currency exchange (i.e., strengthening of the Canadian dollar relative the U.S. dollar).
Cost of Revenues
Cost of revenues for the fiscal year ended June 30, 2006 decreased by $5,469, or 13.1%, to $36,430 for the fiscal year ended June 30, 2006 from $41,899 for the fiscal year ended June 30, 2005. This positive development is primarily a result of lower carrier and access and facility costs obtained through favorable
38
CRTC decisions (ie., lower switching and aggregation charges) and negotiating lower access and facility costs with underlying carriers. This decrease was, however, partially offset by new network costs to develop a fully redundant network to interconnect the switches located in Toronto, Ontario and Miami, Florida. We expect that implementing a fully redundant network will decrease our exposure to risks independent of our business, such as power and network interruptions, and will increase our capacity to deliver continuous high quality service to our customers. In fiscal year 2007, we expect to fully realize the benefits of the CRTC’s decision to lower the LEC’s switching and aggregation charges.
Contribution Margin
Contribution margin increased by $2,158, or 5.1%, to $32,453 for the fiscal year ended June 30, 2006, from $30,295 for the fiscal year ended June 30, 2005 (from 42.0% to 47.1%). This increase in contribution margin was attributable primarily to favorable CRTC decisions, negotiating lower access and network costs with our underlying carriers and a more efficient utilization of our network.
Sales and Marketing
Sales and marketing costs increased by approximately $549, or 28.9%, to $2,449 for the fiscal year ended June 30, 2006, from $1,900 for the fiscal year ended June 30, 2005 (from 26.5% to 23.7%). The increase in the sales and marketing costs was largely attributable to the new marketing campaigns for our subscription products. During fiscal 2006, we launched new advertising campaigns in the Provinces of Alberta, British Columbia and Saskatchewan and during the end of the third quarter continued to market our subscription products in our established markets in Ontario and Quebec. For fiscal year 2007, we expect to increase our sales and marketing spending for Yak Canada – both for the subscription products and our core dial-around services (10-10-Yak and LooneyCall).
General and Administrative
General and administrative expenses increased by approximately $2,088, or 24.6%, to $10,589 for the fiscal year ended June 30, 2006 from $8,501 for the previous fiscal year. This increase was primarily due to the additional expense of $764 in consulting fees, $419 in tax penalties and interest associated with the re-filing of amended tax returns following the restatement of financial results for the three prior fiscal years, as well as approximately $207 in severance payments for former employees. The consulting fees incurred included fees for the implementation of monitoring tools for our IT infrastructure as well as fees associated with Sarbanes-Oxley Act compliance efforts.
39
Yak for Business
The following table provides a summary of Yak for Business unaudited results of operations on a quarterly basis for the preceding eight quarters, as well as for the fiscal years ended June 30, 2005 and 2006.
| | | | | | | | | | | | | | | | | | | | | | | | | | | | | |
| | | Yak for Business | |
| | | Fiscal 2005 | | Fiscal 2006 | | | | | | | |
| | | Q1 | | | Q2 | | | Q3 | | | Q4 | | Q1 | | | Q2 | | | Q3 | | | Q4 | | | Fiscal
year
ended
June 30,
2005 | | | Fiscal
year
ended
June 30,
2006 | |
| | | $ | | | $ | | | $ | | | $ | | $ | | | $ | | | $ | | | $ | | | $ | | | $ | |
Revenues | | 2,708 | | | 2,823 | | | 2,778 | | | 3,444 | | 3,360 | | | 3,341 | | | 3,187 | | | 3,136 | | | 11,753 | | | 13,024 | |
Cost of revenues(1) | | 2,049 | | | 1,946 | | | 2,199 | | | 2,222 | | 2,384 | | | 2,731 | | | 2,222 | | | 1,945 | | | 8,416 | | | 9,282 | |
| | | | | | | | | | | | | | | | | | | | | | | | | | | | | |
Contribution margin | | 659 | | | 877 | | | 579 | | | 1,222 | | 976 | | | 610 | | | 965 | | | 1,191 | | | 3,337 | | | 3,742 | |
General and administrative | | 701 | | | 759 | | | 753 | | | 815 | | 830 | | | 864 | | | 806 | | | 594 | | | 3,028 | | | 3,094 | |
Bad debts expense | | (11 | ) | | (26 | ) | | (86 | ) | | 10 | | 118 | | | — | | | 37 | | | (60 | ) | | (113 | ) | | 95 | |
Sales and marketing | | 6 | | | 2 | | | — | | | — | | — | | | — | | | — | | | 1 | | | 8 | | | 1 | |
Other expenses (income) | | — | | | (6 | ) | | 7 | | | 72 | | (6 | ) | | (2 | ) | | (1 | ) | | (2 | ) | | 73 | | | (11 | ) |
Depreciation and amortization | | 124 | | | 132 | | | 137 | | | 163 | | 173 | | | 172 | | | 152 | | | 152 | | | 556 | | | 649 | |
| | | | | | | | | | | | | | | | | | | | | | | | | | | | | |
Segment earnings (loss) before income tax | | (161 | ) | | 16 | | | (232 | ) | | 162 | | (139 | ) | | (424 | ) | | (29 | ) | | 506 | | | (215 | ) | | (86 | ) |
| | | | | | | | | | | | | | | | | | | | | | | | | | | | | |
Segment assets | | 4,298 | | | 4,405 | | | 6,815 | | | 7,382 | | 6,595 | | | 5,861 | | | 5,880 | | | 6,307 | | | 7,382 | | | 6,307 | |
Long-Lived assets | | 2,289 | | | 2,330 | | | 3,441 | | | 2,705 | | 2,847 | | | 2,582 | | | 2,434 | | | 2,237 | | | 2,705 | | | 2,237 | |
| (1) | Excludes depreciation and amortization |
Revenues
Net revenues increased by $1,271, or 10.8%, to $13,024 for the fiscal year ended June 30, 2006, as compared to $11,753 for the fiscal year ended June 30, 2005. This increase is attributable to our acquiring a portion of the assets and the Ontario and Quebec customer base of Navigata Communications Ltd. (“Navigata”) in March 2005. The increase in revenues derived from the Navigata customer base was $2,268 for the 2006 fiscal year. This increase was however, partially offset by a decrease in the overall revenues derived from local line services. The decrease in revenues from local line services was attributable to increased competition by large telephone companies on the small and medium-sized business markets and advertising and marketing resources being focused on other segments.
Cost of Revenues
Costs of revenues increased by $866, or 10.3%, to $9,282 for the year ended June 30, 2006 from $8,416 for the fiscal year ended June 30, 2005. The increased costs were primarily associated with servicing of the customer base acquired from Navigata. This increase was, however, partially offset by cost savings in providing local lines services, including increased cost efficiency through streamlining purchasing policies and eliminating excess costs. Supplier over-billings and subsequent credits contributed to significant fluctuations in costs of revenues from quarter to quarter during the fiscal year ended June 30, 2006.
Contribution Margin
Contribution margin for the year ended June 30, 2006 increased $405, or 0.3%, to $3,742 for the fiscal year ended June 30, 2006 from $3,337 for the fiscal year ended June 30, 2005 (from 28.4% to 28.7%) as compared to the previous fiscal year. This increase is primarily due to improved contribution margins associated with the Navigata customer base.
General and Administrative
General and administrative expenses remained consistent in the year ended June 30, 2006, having increased by $66, or 2.2%, to $3,094 from $3,028 for the fiscal year ended June 30, 2005. Increased general and administrative costs were primarily the result of higher employee salaries and benefits which was partly offset by a decrease in commission expenses due to the restructuring of commission agreements with our agents.
40
Contour
The following table provides a summary of Contour’s unaudited results of operations on a quarterly basis for the preceding eight quarters, as well as for the fiscal years ended June 30, 2005 and 2006.
| | | | | | | | | | | | | | | | | | | | | | | | | | |
| | | Contour | |
| | | Fiscal 2005 | | Fiscal 2006 | | | | | | |
| | | Q1 | | Q2 | | Q3 | | | Q4 | | Q1 | | | Q2 | | | Q3 | | | Q4 | | | Fiscal
year
ended
June 30,
2005 | | Fiscal
year
ended
June 30,
2006 | |
| | | $ | | $ | | $ | | | $ | | $ | | | $ | | | $ | | | $ | | | $ | | $ | |
Revenues | | 1,387 | | 1,520 | | 1,361 | | | 1,289 | | 1,219 | | | 1,262 | | | 1,229 | | | 1,191 | | | 5,557 | | 4,901 | |
Cost of revenues(1) | | 1,000 | | 1,177 | | 1,010 | | | 898 | | 931 | | | 957 | | | 942 | | | 911 | | | 4,085 | | 3,741 | |
| | | | | | | | | | | | | | | | | | | | | | | | | | |
Contribution margin | | 387 | | 343 | | 351 | | | 391 | | 288 | | | 305 | | | 287 | | | 280 | | | 1,472 | | 1,160 | |
General and administrative | | 208 | | 251 | | 182 | | | 279 | | 114 | | | 143 | | | 250 | | | 235 | | | 920 | | 742 | |
Bad debts expense | | 20 | | 55 | | 80 | | | 8 | | 3 | | | (24 | ) | | (49 | ) | | (147 | ) | | 163 | | (217 | ) |
Sales and marketing | | — | | — | | — | | | — | | — | | | — | | | — | | | — | | | — | | — | |
Other expenses (income) | | 5 | | — | | (4 | ) | | 100 | | (3 | ) | | (9 | ) | | (7 | ) | | (13 | ) | | 101 | | (32 | ) |
Depreciation and amortization | | 4 | | 5 | | 5 | | | 3 | | 5 | | | 8 | | | 10 | | | 13 | | | 17 | | 36 | |
| | | | | | | | | | | | | | | | | | | | | | | | | | |
Segment earnings (loss) before income tax | | 150 | | 32 | | 88 | | | 1 | | 169 | | | 187 | | | 83 | | | 192 | | | 271 | | 631 | |
| | | | | | | | | | | | | | | | | | | | | | | | | | |
Segment assets | | 2,837 | | 2,906 | | 2,525 | | | 2,409 | | 2,785 | | | 2,964 | | | 2,980 | | | 3,703 | | | 2,409 | | 3,703 | |
Long-Lived assets | | 310 | | 324 | | 87 | | | 286 | | 108 | | | 200 | | | 201 | | | 567 | | | 286 | | 567 | |
| (1) | Excludes depreciation and amortization |
Revenues
Net revenues decreased by $656, or 11.8%, to $4,901 for the year ended June 30, 2006, from $5,557 for the year ended June 30, 2005. This decrease is primarily due to a number of Contour’s customers negotiating lower prices for services provided by Contour during the contract renegotiation process in an increasingly competitive marketplace.
Cost of Revenues
Costs of revenues decreased by $344, or 8.4%, to $3,741 for the fiscal year ended June 30, 2006, as compared to $4,085 for the fiscal year ended June 30, 2005. This decrease was a result of reducing costs such as long-distance rates due to lower negotiated prices with vendors while continuing to provide high-quality services to our customers.
Contribution Margin
Contribution margin decreased $312, or 2.8%, to $1,160 for the fiscal year ended June 30, 2006 from $1,472 for the fiscal year ended June 30, 2005 (from 26.5% to 23.7%). This decrease is primarily attributable to a decrease in our
41
revenues due to lower pricing of services offered to Contour’s customers. While we have been diligent in our efforts to decrease our costs of providing service, the proportional decrease in net revenues was greater than the decrease in costs that we negotiated with our suppliers.
General and Administrative
General and administrative expenses decreased approximately $178, or 19.3%, to $742 for the fiscal year ended June 30, 2006, from $920 for the year ended June 30, 2005. This decrease is primarily attributable to the decline in salaries and benefits.
Yak America
The following table provides a summary of Yak America’s unaudited results of operations on a quarterly basis for the preceding eight quarters, as well as for the fiscal years ended June 30, 2005 and 2006.
| | | | | | | | | | | | | | | | | | | | | | | | | | | | | | |
| | | Yak America | |
| | | Fiscal 2005 | | | Fiscal 2006 | | | | | | | |
| | | Q1 | | | Q2 | | | Q3 | | | Q4 | | | Q1 | | | Q2 | | | Q3 | | | Q4 | | | Fiscal
year
ended
June 30,
2005 | | | Fiscal
year
ended
June 30,
2006 | |
| | | $ | | | $ | | | $ | | | $ | | | $ | | | $ | | | $ | | | $ | | | $ | | | $ | |
Revenues | | 221 | | | 447 | | | 1,070 | | | 1,269 | | | 1,227 | | | 1,400 | | | 1,438 | | | 1,171 | | | 3,007 | | | 5,236 | |
Cost of revenues(1) | | 246 | | | 488 | | | 925 | | | 1,435 | | | 1,344 | | | 1,714 | | | 1,312 | | | 1,053 | | | 3,094 | | | 5,423 | |
| | | | | | | | | | | | | | | | | | | | | | | | | | | | | | |
Contribution margin | | (25 | ) | | (41 | ) | | 145 | | | (166 | ) | | (117 | ) | | (314 | ) | | 126 | | | 118 | | | (87 | ) | | (187 | ) |
General and administrative | | 252 | | | 279 | | | 200 | | | 649 | | | 261 | | | 283 | | | 250 | | | 415 | | | 1,380 | | | 1,209 | |
Bad debts expense | | 17 | | | 33 | | | 64 | | | 114 | | | 96 | | | 149 | | | 34 | | | 46 | | | 228 | | | 325 | |
Sales and marketing | | 185 | | | 1,383 | | | 1,538 | | | 2,252 | | | 1,465 | | | 904 | | | 499 | | | 403 | | | 5,358 | | | 3,271 | |
Other expenses (income) | | (19 | ) | | (46 | ) | | 65 | | | (126 | ) | | (43 | ) | | (13 | ) | | 56 | | | (1 | ) | | (126 | ) | | (1 | ) |
Depreciation and amortization | | 29 | | | 36 | | | 34 | | | 33 | | | 31 | | | 30 | | | 27 | | | 27 | | | 132 | | | 115 | |
| | | | | | | | | | | | | | | | | | | | | | | | | | | | | | |
Segment earnings (loss) before income tax | | (489 | ) | | (1,726 | ) | | (1,756 | ) | | (3,088 | ) | | (1,927 | ) | | (1,667 | ) | | (740 | ) | | (772 | ) | | (7,059 | ) | | (5,106 | ) |
| | | | | | | | | | | | | | | | | | | | | | | | | | | | | | |
Segment assets | | 1,498 | | | 1,546 | | | 1,985 | | | 1,603 | | | 5,973 | | | 3,352 | | | 4,237 | | | 2,369 | | | 1,603 | | | 2,369 | |
Long-Lived assets | | 697 | | | 696 | | | 662 | | | 629 | | | 598 | | | 569 | | | 541 | | | 515 | | | 629 | | | 515 | |
| (1) | Excludes depreciation and amortization |
42
Revenues
Net revenues increased $2,229, or 74.1%, to $5,236 for the fiscal year ended June 30, 2006 from $3,007 for the fiscal year ended June 30, 2005. This increase was primarily due to the Company’s significant marketing efforts in the period from October 2004 to September 2005, which contributed to an increase in the awareness of our brand in the United States that continued through fiscal year 2006. Minute usage in the 2006 fiscal year increased 81% compared to the prior fiscal year.
Cost of Revenues
Cost of revenues increased by $2,329, or 75.3%, to $5,423 for the fiscal year ended June 30, 2006 from $3,094 for the fiscal year ended June 30, 2005. As Yak America’s contribution margin is negative, the increase in revenues also resulted in increased cost of revenues. As well, we incurred additional costs stemming from improvements to network security and the implementation of back-up access lines.
Contribution Margin
Contribution margin decreased by $100, or 0.7%, to ($187) for the fiscal year ended June 30, 2006 from ($87) for the fiscal year ended June 30, 2005 (negative 3.6% from negative 2.9%). Increased revenues and usage were offset by costs associated with network security and network expansion .
Sales and marketing
Sales and marketing costs decreased by $2,087, or 39.0%, to $3,271 for the fiscal year ended June 30, 2006, from $5,358 for the fiscal year ended June 30, 2005. These cost savings were attributable to Yak America discontinuing its television advertising campaign at the end of December 2005 and a renewed focus on less expensive advertising methods, such as direct mail. For fiscal year 2007, we will continue our Yak America marketing efforts but in a more measured way, using less expensive advertising methods and with a focus on more profitable markets.
WorldCity VoIP
The following table provides a summary of WorldCity VoIP’s unaudited results of operations on a quarterly basis for the preceding eight quarters, as well as for the fiscal years ended June 30, 2005 and 2006.
| | | | | | | | | | | | | | | | | | | | | | | | | | | | | | |
| | | World City VoIP | |
| | | Fiscal 2005 | | | Fiscal 2006 | | | | | | | |
| | | Q1 | | | Q2 | | | Q3 | | | Q4 | | | Q1 | | | Q2 | | | Q3 | | | Q4 | | | Fiscal
Year
ended
June 30,
2005 | | | Fiscal
Year
ended
June 30,
2006 | |
| | | $ | | | $ | | | $ | | | $ | | | $ | | | $ | | | $ | | | $ | | | $ | | | $ | |
Revenues | | 3 | | | 11 | | | 14 | | | 48 | | | — | | | 15 | | | 245 | | | 93 | | | 76 | | | 353 | |
Cost of revenues(1) | | — | | | 4 | | | 80 | | | (51 | ) | | 8 | | | 19 | | | 331 | | | 70 | | | 33 | | | 428 | |
| | | | | | | | | | | | | | | | | | | | | | | | | | | | | | |
Contribution margin | | 3 | | | 7 | | | (66 | ) | | 99 | | | (8 | ) | | (4 | ) | | (86 | ) | | 23 | | | 43 | | | (75 | ) |
General and administrative | | 638 | | | 272 | | | 120 | | | 186 | | | 344 | | | 631 | | | 1,090 | | | 1,087 | | | 1,216 | | | 3,152 | |
Bad debts expense | | — | | | — | | | — | | | — | | | — | | | — | | | — | | | — | | | — | | | — | |
Sales and marketing | | — | | | — | | | — | | | — | | | 88 | | | 368 | | | 332 | | | 323 | | | — | | | 1,111 | |
Other expenses (income) | | 12 | | | 12 | | | (25 | ) | | 391 | | | (9 | ) | | 14 | | | (5 | ) | | — | | | 390 | | | — | |
Writedown of property and equipment | | — | | | — | | | — | | | — | | | — | | | — | | | — | | | 3,413 | | | — | | | 3,413 | |
Depreciation and amortization | | — | | | 38 | | | 79 | | | 24 | | | 73 | | | 80 | | | 90 | | | 91 | | | 141 | | | 334 | |
| | | | | | | | | | | | | | | | | | | | | | | | | | | | | | |
Segment earnings (loss) before income tax | | (647 | ) | | (315 | ) | | (240 | ) | | (502 | ) | | (504 | ) | | (1,097 | ) | | (1,593 | ) | | (4,891 | ) | | (1,704 | ) | | (8,085 | ) |
| | | | | | | | | | | | | | | | | | | | | | | | | | | | | | |
Segment assets | | 2,560 | | | 1,754 | | | 2,694 | | | 5,141 | | | 5,484 | | | 5,608 | | | 5,422 | | | 2,190 | | | 5,141 | | | 2,190 | |
Long-Lived assets | | 2,560 | | | 1,723 | | | 2,676 | | | 5,139 | | | 5,388 | | | 5,494 | | | 5,201 | | | 1,843 | | | 5,139 | | | 1,843 | |
| (1) | Excludes depreciation and amortization |
43
Revenues
Net revenues increased by $277, or 364%, to $353 for the fiscal year ended June 30, 2006, from $76 for the fiscal year ended June 3, 2005. This increase is attributable to increased sales of the Company’s VoIP products. Further, we recognized revenue for the yakBasic product when the cash was collected not billed, as the collectability of the billings associated with this product was not assured. The increase in overall net revenue during the third quarter was primarily attributable to the collection of outstanding accounts receivable balances from yakBasic customers. This product was discontinued in the fourth quarter of the 2006 fiscal year and the customers were transferred to other VoIP services or discontinued.
Costs of Revenues
The cost of revenues increased by $395, or 1196%, to $428 for the fiscal year ended June 30, 2006, from $33 for the previous fiscal year. This increase was primarily the result of an impairment reserve for inventory related to yakBasic service, with the remainder due to increased costs of customer transfer and operation of the current VoIP delivery platforms.
Contribution Margin
The contribution margin decreased by ($118), or 77.8%, to ($75) for the fiscal year ended June 30, 2006 from $43 for the fiscal year ended June 30, 2005 (negative 21.2% from 56.6%). This decrease was primarily due to the impairment of yakBasic inventory.
Sales and marketing
Sales and marketing expenses increased to $1,111 for the year ended June 30, 2006, from $0 for the year ended June 30, 2005. This increase is attributable to increased advertising costs through multiple distribution channels (ie., Internet marketing, television advertising, telemarketing) as we initiated several marketing campaigns, primarily in the United States, to aggressively promote and sell our WorldCity VoIP products.
General and Administrative
General and administrative expenses increased by $1,936, or 159.2%, to $3,152 for the year ended June 30, 2006 from $1,216 for the fiscal year ended June 30, 2005. This increase is primarily attributable to increased salaries and benefits. The Company launched two new VoIP products (yakforFree and yaktoAnyone) and re-launched the Yak Unlimited product during the third quarter of the 2006 fiscal year. Accordingly, we hired additional staff to support the launch and to maintain these products, beginning in the second quarter.
44
Write-down of WorldCity VoIP Assets
On June 20, 2003, Yak Canada acquired certain telecommunications software (the Software) from Consortio, Inc., a Delaware corporation and Convenxia Limited, a corporation organized under the laws of the United Kingdom (collectively, the “Sellers”), pursuant to the terms and conditions of a Software Acquisition Agreement. The Software required further development over the next two years to become fully functional in order to be used in the new VoIP platform for the provision of internet telephony services. VoIP services were eventually launched in September of 2004 with the ‘yakBasic’ service, a plan for low-cost outbound calls to regular phone numbers and free member-to-member calling for Yak VoIP subscribers and yakUnlimited a PSTN inbound and outbound service. The Software was essential to the performance of these services. During the fourth quarter of the fiscal year ended June 30, 2006 the Company transferred ‘yakBasic’ legacy users to other Yak services or terminated customer accounts altogether and discontinued the product offering. Further, the underlying customer sign-up and network functions for yakUnlimited were outsourced to CommPartners. In conjunction with these decisions, the Company recorded an asset write-off charge of approximately $3,413 in order to reduce the software’s carrying value to nil.
Results of Operations for the fiscal year ended June 30, 2005 as compared to the fiscal year ended June 30, 2004.
Revenue
Net revenue increased $11,900, or 15%, to $92,700 for the fiscal year ended June 30, 2005, from $80,800 for the fiscal year ended June 30, 2004. We experienced growth of $11,400 in dial-around revenue, primarily as a result of our advertising campaigns and the expansion of our network capability from coast to coast in the Canadian and American markets. The balance of the increase was predominantly due to our “1+” product which added revenues of $900 for the period ended June 30, 2005, which were partially offset by a decrease in revenues from our “LooneyCall” product of $700.
We achieved significant growth in the U.S market during this fiscal year, with revenue in our U.S. operating territories increasing by $2.0 million. This was achieved by successfully implementing our plan in the U.S, which included actions such as:
| | • | | Completion of the loading of our CIC access codes in the 48 mainland states; |
| | • | | Launch of our 1+ product in the fall of 2004; and |
| | • | | Targeted marketing campaigns using a variety of media including; the internet, newspaper advertisements, flyers and commercials featuring various spokespeople |
The balance of our revenue was derived from our Yak for Business division and Contour Telecom Inc. subsidiary. The contributed revenue for Yak for Business was essentially unchanged at $11,800 (unadjusted for foreign exchange) for the fiscal year ended June 30, 2005, when compared to revenue for the fiscal year ended June 30, 2004. Yak for Business intends to continue to focus on our growth opportunities in the small and medium business markets. Contour Telecom contributed revenue of approximately $5,600 for the fiscal year ended June 30, 2005 which represented a decrease of $100 from the comparable period in 2004 when unadjusted for the foreign exchange rate.
Cost of Revenus
Cost of revenue increased $4,500, or 8.5%, to $57,600 for the fiscal year ended June 30, 2005, from $53,100 for the fiscal year ended June 30, 2004. The overall cost of revenue decreased to 62.2% of sales for the fiscal year ended June 30, 2005, from 65.8% of sales for the fiscal year ended June 30, 2004. Margins improved primarily as a result of the increased utilization of our leased line network. We continue to “build out” our Canadian network, which enables us to bring a greater share of traffic onto our own network, resulting in a higher utilization of fixed-cost access lines. As a result of the continued downward pressure on the price of long distance telephony, we are utilizing real-time, least cost routing algorithms and contracting with various carriers to efficiently and effectively manage direct costs.
45
Cost of revenue in our dial-around business is comprised primarily of the cost of long distance services, fees for the processing and transporting of our calls and fixed and variable line access costs. The cost of the pure long distance component of services has decreased to $20,800, or 27.6%, for the fiscal year ended June 30, 2005, from $22,500, or 35.6%, for the fiscal year ended June 30, 2004. The decrease in the relative percentage of revenue is a result of actively seeking competitive routes and the effect of deregulation on the cost of long distance in other international markets.
Contribution Margins
Our overall contribution margin increased to 37.8% for the fiscal year ended June 30, 2005, from 34.2% for the fiscal year ended June 30, 2004. The increase in margin can be mainly attributed to efficiently employing real-time least cost routing algorithms and contracting with various carriers in order to manage the direct costs as efficiently as possible.
General & Administrative Expenses
General and administrative expenses (“G&A”) increased $7,500, or 65.2%, to $19,000 for the fiscal year ended June 30, 2005, from $11,500 for the fiscal year ended June 30, 2004. Of this increase, $3,600 can be attributed mainly to salaries and benefits. The remaining increase of G&A of $3,900 can be mainly attributed to increases in legal and consulting fees ($1,200), the establishment of an impairment reserve relating to the joint venture in Peru ($500), bad debts ($0.4 million), and occupancy costs ($0.3 million).
The largest component of the increase in G&A was salaries. This was a result of hiring additional senior management (including several executives with extensive telecommunications experience) and customer service representatives to facilitate the future growth of our business. Additionally, as we moved into new markets and introduce new products, we have invested in our front-line customer support organization. We believe that customer service has been a key differentiating factor for us and we expect that this will continue in the future.
Legal and consulting expenses increased $1,200, or 87%, to $2,500 for fiscal year ended June 30, 2005. The increase in expense is primarily a result of tax compliance and other legal matters related to the introduction of our products into the U.S. market; costs incurred due to the accounting restatement with respect to an historical software transaction; fees incurred for Sarbanes-Oxley compliance; as well as fees in connection with regulatory matters and the fees associated with due diligence efforts associated with certain acquisition opportunities.
We entered into a commercial services and marketing agreement with a joint venture participant in Peru for which an impairment reserve was taken during the fiscal year. Initially, we provided financing to assist in the joint venture’s development of dial-around long-distance service for which we would process the joint venture’s international traffic and earn 50% of the profits generated by the business. During the fiscal year, an independent evaluation was obtained and an impairment on the loan for its full value of $500 was recorded leaving a balance at June 30, 2005 of nil. At June 30, 2005, 2004 and 2003, we had made advances of $100, $300 and $100 respectively under this agreement of which nil is a loan receivable.
Expenditures for occupancy increased by $300 for the fiscal year ended June 30, 2005, as a result of the consolidation to our new offices at 300 Consilium Place in Toronto, Ontario and the additional locations related to our purchase of Yak for Business and Contour.
Organizational and start-up costs for the continued development of our VoIP initiative were $500 for the year ended June 30, 2005. These costs were composed primarily of employee-related expenses ($300), occupancy and office related expenses ($100), and legal fees ($100).
46
Sales & Marketing
Overall, sales and marketing expenses increased $3,400, or 87%, to $7,300 for the fiscal year ended June 30, 2005, from $3,900 for the fiscal year ended June 30, 2004. However, in our Canadian territory, the cost of advertising decreased by $1,700 to $1,900 for the fiscal year ended June 30, 2005, primarily due to decreased direct mail and promotional activities for our dial-around product in Ontario and cost reductions resulting from a switch in advertising agencies. Advertisement spending of $5,300 in our U.S. markets began in the current calendar year. Upon entering the U.S. market, we invested advertising dollars in certain specific metropolitan areas in order to increase our brand awareness. The significant increase in the amount of advertising in the U.S. market was to support the launch of our dial-around and 1+ service through a focused campaign of flyers, TV commercials and internet-based advertising.
Depreciation & Amortization
Depreciation and amortization remained flat at $2,900 for the fiscal year ended June 30, 2005, when compared to the fiscal year ended June 30, 2004. This was due to minimal new capital expenditures and the continued amortization of the property and equipment that have been capitalized on the balance sheet.
Interest Expense
On June 20, 2003, we purchased certain “next generation” telecommunications software from an unrelated third party for $9,500. The consideration paid by Yak was $600 in cash, a non-interest bearing short-term promissory note of $400 and the balance was evidenced by a long-term promissory note in the amount of $8,500. This long-term note bore interest at 7.25% per annum and required quarterly payments of principal and interest of $200 and was due July 15, 2012. The sole recourse by the holder of this long-term note was the software. On March 3, 2005, we entered into a settlement agreement with the sellers of the subject software. Pursuant to the settlement agreement, Yak paid $150 to the sellers and committed to complete further development of the software in an amount of $350 over a four-month period. In exchange we received a discharge of any further obligation under the long-term promissory note which had an outstanding principal amount of $8,440 at December 31, 2004. All guaranteed payments made under the joint venture agreement were also terminated.
Accounts receivable financing costs relating to the factoring of our trade accounts receivable decreased to $400 for the fiscal year ended June 30, 2005, compared with $500 for the fiscal year ended June 30, 2004. Given the amount of cash on hand, it was determined that financing our receivables was not necessary, and therefore, we fully paid down our factoring facility in March 2005.
Liquidity and Capital Resources
Our liquidity requirements arise from cash used in operating activities, purchases of capital assets and interest and principal payments on outstanding indebtedness. To date, we have financed our growth through the private placement of equity securities, borrowings, accounts receivable financing, vendor financing and capital lease financing.
For the fiscal year ended June 30, 2006, there was a decrease in cash and cash equivalents of $911 compared with the $5,398 decrease in the prior fiscal year. Net cash provided from operating activities during the fiscal year generated an increase of $3,758, as compared to an increase of $2,564 for the fiscal year ended June 30, 2005. This change was primarily due to an increase in contribution margins of $2,029, a decrease in accounts payable of $2,514 and a favorable change of $354 in other income and expense items, offset by an increase in operating expenses of $3,677. Accounts payable decreased due to improvements in the cost of sales, as well as the timing of payments at the end of the fiscal year. The increase in operating expenses is attributable to costs associated with expansion of our WorldCity VoIP segment, costs associated with the enhancement and continued maintenance of an additional switch in Miami, efforts to increase network efficiency and security, as well as the costs incurred by us associated with restatements of its financial statements for the fiscal years ended June 30, 2005, 2004, 2003 and the quarters ended September 30 and December 31, 2005.
47
Net cash used in investing activities was $4,156 for the fiscal year ended June 30, 2006, which is $2,675 lower when compared to the $6,831 for the prior fiscal year. Capital expenditures of $4,263 were primarily for costs related to investments in our new VoIP initiatives and the Tekelec/Santera switch in Miami, Florida. A $107 refund on the acquisition of customer lists was received during the second quarter, as the purchase price of the list was finalized based on the number of customer lines transferred.
Net cash used by financing activities was $927 for the fiscal year ended June 30, 2006, as compared to $1,614 used by financing activities for the prior fiscal year. The financing activity was related to capital lease payments and the full repayment of advances from Telus Communications Inc., in connection with a prior commitment ended October 2005 to promote, advertise and market Telus’ services in exchange for a deferral of payments otherwise due to Telus.
It is expected that we will continue to add to our network and network equipment in the coming year to support the growth of the business.
We believe we have sufficient fixed network capacity to meet our anticipated volume of telephony traffic in both Canada and the U.S. during fiscal 2007. Based on our current products, we do not anticipate spending additional capital on our Canadian switching platform.
For the year ended June 30, 2006, Yak for Business had revenue of $13,024 and, Contour had revenue of $4,901. We expect these amounts to be substantially equal for the next 12 months. Having now launched our VoIP product, we will investigate releasing additional products aimed specifically at the small and medium business customer. As a result, we may experience top-line revenue growth and margin improvement in Yak for Business in the future.
As a result of the continued convergence of voice and data, the release of our VoIP product is a significant event because it provides us with a vehicle for potential future growth. We plan to continue to research augmenting our WorldCity VoIP services with value-added services that are priced competitively and address the demands of the market.
We believe that our current operations will be able to continue to generate sufficient cash to meet our current obligations and support the growth of our business through new product introductions. In fiscal 2007, primarily with respect to Yak Canada, we will investigate developing new complimentary products and investigate the expansion into complimentary telecommunications markets where we can exploit our Yak brand to achieve market share and increased revenues. We may seek to obtain additional funds from public or private equity or debt offerings to fund new opportunities that may arise.
Significant commitments that will require the use of cash in future periods include obligations under operating leases, capital leases, advances under contract and other agreements, as shown in the following table (in millions):
Payments Due by Period
| | | | | | | | | | | | | | | |
Contractual Obligations | | Total | | Less Than
1 Year | | 1-3 Years | | 3-5 Years | | More Than
5 Years |
Carrier Commitments | | $ | 6.3 | | $ | 4.9 | | $ | 1.4 | | | — | | | — |
Capital Leases | | $ | 1.2 | | $ | 0.9 | | $ | 0.3 | | | — | | | — |
Other Commitments | | $ | 2.2 | | $ | 1.1 | | $ | 1.1 | | | — | | | — |
Total | | $ | 9.7 | | $ | 6.9 | | $ | 2.8 | | $ | — | | $ | — |
48
For the fiscal year ended June 30, 2005, there was a decrease in cash and cash equivalents of $5,398, compared to an increase of $16,706 in the prior fiscal year. Net cash provided from operating activities during the 2005 fiscal year decreased to $2,564, as compared to $12,108 for the fiscal year ended June 30, 2004. This was primarily due to our pay-down of the receivable factoring facility (in the approximate amount of $6,245) and the decrease in deferred income taxes ($3,117 from the prior fiscal year).
Net cash used in investing activities decreased to $6,831 for the fiscal year ended June 30, 2005, as compared to $10,808 for the fiscal year ended June 30, 2004. For the fiscal year ended June 30, 2005, we used cash for acquisition of property and equipment of $6,077, primarily for our “next generation” software and broadband equipment.
Net cash used by financing activities was $1,614 for the fiscal year ended June 30, 2005, as compared to $15,567 provided by financing activities for the fiscal year ended June 30, 2004. During 2005, $1,333 was used to reduce our long term debt owed to long distance carriers, whereas money was previously raised via the issuance of common shares in the third quarter of fiscal 2004.
Inflation.
Inflation did not have a significant impact on our results during fiscal 2006.
Off-Balance Sheet Transactions.
We do not engage in any material off-balance sheet transactions.
Critical Accounting Policies
To aid in the understanding of our financial reporting, a summary of significant accounting policies are described below. These policies may potentially have a significant impact on our financial statements, either because of the significance of the financial statement item to which they relate, or because they require judgment and estimation due to the uncertainty involved in measuring, at a specific point in time, events which are continuous in nature.
Revenue Recognition
Revenue is recognized when persuasive evidence of an arrangement exists, delivery has occurred or services have been rendered, the Company’s price to the customer is fixed and determinable, and collection of the resulting receivable is reasonably assured. Revenue is derived from telecommunications usage based on minutes of use. Revenue derived from usage is recognized as services are provided, based on agreed upon usage rates. Revenue is recorded net of estimated customer credits and rejected calls, which are recorded at the same time the corresponding revenue is recognized. Revenue from billings for services rendered where collectibility is not assured is recognized when the cash is collected.
Allowance for Doubtful Accounts
As of June 30, 2006, we had $15,759 of net trade accounts receivable, inclusive of a recorded allowance for doubtful accounts of approximately $460. We review the adequacy of our allowance for doubtful accounts on an ongoing basis, using historical collection trends, analyses of receivable portfolios by business unit and by reviewing specific accounts and make adjustments in the allowance as necessary. Changes in economic conditions or dramatic changes in the telecommunications industry could have an impact on the collection of receivable balances or future allowance considerations.
Income Taxes
We account for income taxes in accordance with SFAS No. 109 “Accounting for Income Taxes” which requires an asset and liability approach to financial accounting and reporting for income taxes. We have generated deferred income tax liabilities primarily due to the accounting basis of our assets exceeding the tax basis of those same assets. These liabilities are offset by certain net operating loss carryforwards that are available for twenty years from the date incurred and which begin to expire in the year 2023. Our
49
ability to fully utilize these net operating loss carryforwards is highly dependent on our ability to implement identified tax planning strategies or to generate future income in the tax jurisdictions that the losses originated. If these estimates and assumptions change in the future, we will be required to adjust our deferred tax valuation allowances.
Our income tax accounts reflect estimates of the outcome or settlement of various asserted and unasserted income tax contingencies including tax audits and administrative appeals. At any point in time, several tax years may be in various stages of audit or appeals or could be subject to audit by various taxing jurisdictions. This requires a periodic identification and evaluation of significant doubtful or controversial issues. The results of these audits, appeals, or expiration of the statute of limitations could affect our prior estimates for income tax accounts.
The effective income tax rate in any period may be materially impacted by the overall level of income (loss) before income taxes, the jurisdictional mix and magnitude of income (loss), changes in the income tax laws (which may be retroactive), changes in the expected outcome or settlement of an income tax contingency, changes in the deferred tax valuation allowance, and adjustments of a deferred tax asset or liability for enacted changes in tax laws or rates.
Customer Lists
As of June 30, 2006, customer lists were recorded at a net book value of $1,497, representing the unamortized cost of customer lists purchased as part of the Argos (now Yak for Business) and Contour acquisitions in July 2003 as well as the customer base purchased from Navigata Communications Ltd. in March 2005. Customer lists are amortized on a straight-line basis over the estimated customer life-cycle in the telecom industry. If the retention rate for acquired customers is less than initially estimated, accelerated amortization or impairment may be necessary.
Impairment of Long-lived Assets and Goodwill
As of June 30, 2006, our long-lived assets were comprised primarily of $12,858 of property and equipment, $1,552 of intangibles and $529 of goodwill. We review the carrying value of long-lived assets and goodwill according to Statement of Financial Accounting Standard (“SFAS”) No. 144,Accounting for the Impairment or Disposal of Long-Lived Assetsand SFAS 142Goodwill and Other Intangible Assets. Our estimate of useful lives on property and equipment are based on assumptions using historical data and industry trends. Impairment is recorded on long-lived assets when assets are identified for disposal or other events suggesting impairment occur and if the carrying value of the long-lived asset exceeds its anticipated undiscounted future net cash flows. Impairment is recorded on goodwill when the carrying value of a reporting unit exceeds the anticipated undiscounted future net cash flows of that reporting unit. In each case, if an impairment loss is recognized, it is based on the difference between the asset’s fair value and its carrying value.
The determination and measurement of an impairment loss requires the continuous use of significant judgments and estimates. Our assumptions related to estimates of future cash flows are based on historical results of cash flows adjusted for management projections for future periods taking into account known conditions and planned future activities. Our assumptions regarding the fair value of our long-lived assets and goodwill are based on the discounted future cash flows. Future events may result in differences in management’s judgments and estimates. Factors that could result in increased future impairment charges include increases in interest rates, which would impact discount rates; unfavorable economic conditions or other factors, such as a change in our expectations for growth and public acceptance of IP telephony technology, which could decrease revenues and profitability; and changes in our cost structure.
Obligation Under Warrants and Registration Rights Agreement
The Company accounts for the detachable Warrants issued in 2004 in accordance with the provisions of SFAS No. 133 “Accounting for Derivative Instruments and Hedging Activities” (SFAS No. 133”) along with related interpretations EITF No. 00-19 “Accounting for Derivative Financial Instruments Indexed to, and Potentially Settled in, a Company’s Own Stock” (“EITF 00-19”) and EITF No. 05-2 “The Meaning of ‘Conventional Convertible Debt Instrument’ in Issue No. 00-19” (“EITF 05-2”). SFAS No. 133 requires
50
every derivative instrument (including certain derivative instruments embedded in other contracts) to be recorded in the Balance Sheet as either an asset or liability measured at its fair value, with changes in the derivative’s fair value recognized currently in earnings unless specific hedge accounting criteria are met. We made the determination that the detachable Warrants issued in 2004 are a derivative instrument and measured its value at $2,173 at inception. Additionally, at the end of each reporting period, the accounting standard requires the Company to record the outstanding derivatives at fair value, resulting in an adjustment to the recorded liability of the Warrants, and a gain or loss in the applicable reporting period. Since the inception of the Warrants, the fair value under the Black-Scholes method of valuation has declined and the Company has recorded a cumulative pre-tax gain of $1,396. The Company values the Warrants using the Black-Scholes option-pricing model to determine fair value. This model requires management to make assumptions on the expected volatility rates, risk-free interest rates and the instrument’s expected remaining life. These assumptions require significant management judgment.
Estimating Fair Value
We estimated the fair value of the assets and liabilities associated with the purchase of certain “next generation” telecommunications software from Consortio, Inc and Convenxia Limited noted above, based on the related estimated cash flows. Statement of Financial Accounting Concepts No. 7 (SFAC No. 7) provides a framework for using future cash flows and present value as the basis for accounting measurements of fair value. When observable marketplace-determined values are not available, discounted cash flows are often used to estimate fair value. Consistent with the methodology of SFAC No. 7, we used the expected cash flow approach to estimate fair value, focusing on explicit assumptions about the range of possible cash outcomes and their respective probabilities.
New Accounting Pronouncements
In December 2004, the Financial Accounting Standards Board (“FASB”) issued Statement No. 123(R) “Share-Based Payments”, which is a revision of FASB Statement No. 123, “Accounting for Stock-Based Compensation.” Statement 123 (R) supersedes Accounting Principal Board Opinion (“APB”) No. 25, “Accounting for Stock Issued to Employees”, and amends FASB No. 95, “Statement of Cash Flows”. Generally, the approach to accounting in Statement 123 (R) requires all share-based payments to employees, including grants of employee stock options, to be recognized in the financial statements based on their fair values. We adopted Statement 123(R) on July 1, 2005 using the modified prospective transition method. Prior to adoption, we accounted for these payments under the intrinsic value provisions of APB No. 25 with expense recognition in the financial statements for the difference between the strike price and market value on the date stock options were granted. Compensation cost increased $222 and basic and diluted earnings per share were $0.02 lower in the year ended June 30, 2006 as a result of adopting Statement 123 (R). As of June 30, 2006, there was $240 of total unrecognized compensation costs related to granted stock options. That cost is expected to be recognized over a weighted-average period of 1.5 years.
On June 7, 2005, the FASB issued Statement No. 154, “Accounting Changes and Error Corrections”, (“Statement 154”), a replacement of APB Opinion No. 20, “Accounting Changes”, and Statement No. 3, “Reporting Accounting Changes in Interim Financial Statements”. Statement 154 changes the requirements for the accounting for and reporting of a change in accounting principle. Previously, most voluntary changes in accounting principles required recognition of a cumulative effect adjustment within net income of the period of the change. Statement 154 requires retrospective application to prior periods’ financial statements, unless it is impracticable to determine either the period-specific effects or the cumulative effect of the change. Statement 154 is effective for accounting changes made in fiscal years beginning after December 15, 2005; however, the Statement does not change the transition provisions of any existing accounting pronouncements. We do not believe adoption of Statement 154 will have a material effect on our consolidated financial position, results of operations or cash flows.
In July 2006, the FASB issued FIN 48,Accounting for Uncertainty in Income Taxes(“FIN 48”). FIN 48 is an interpretation of SFAS No. 109,Accounting for Income Taxesand prescribes a recognition threshold and measurement attribute for the financial statement recognition and measurement of a tax position taken or expected to be taken in a tax return. This Interpretation also provides guidance on
51
derecognition, classification, interest, and penalties, accounting in interim periods, disclosure, and transition. FIN 48 also requires expanded disclosure with respect to the uncertainty incumbent in calculating income taxes. This Interpretation is effective for fiscal years beginning after December 15, 2006. We are currently evaluating the impact, if any, of FIN 48 on our financial position, results of operations, and cash flows.
| ITEM 7A. | QUANTITATIVE AND QUALITATIVE DISCLOSURES ABOUT MARKET RISK |
Our primary market risk exposures relate to changes in foreign currency exchange rates.
Foreign currency—In excess of 94.2% of our current revenue is derived from sales and operations in Canada. The reporting currency for our consolidated financial statements is the U.S. dollar. The functional currency for each of our operating entities is the respective local currency. In the future we expect to derive a greater proportion of our revenues outside of Canada; however, in the short-term, changes in the exchange rate may continue to have a significant, and potentially adverse effect on our results of operations. Our primary risk of loss regarding foreign currency exchange rate risk is caused by fluctuations in the U.S. dollar/Canadian dollar.
We are exposed to financial statement gains and losses as a result of translating the operating results and financial position of our Canadian subsidiary. We translate the Canadian dollar statements of operations into U.S. dollar using the average exchange rate during the reporting period. Changes in foreign exchange rates affect our reported profits and losses and cash flows and may distort comparisons from year to year. As an example, if the U.S. dollar were to strengthen relative to the Canadian dollar, it would take a greater amount of revenue and profits in Canadian dollars to achieve a similar level of results in U.S. dollars compared to the previous year.
During the financial year ended June 30, 2006, the U.S. dollar weakened compared to the Canadian dollar. As a result, although the revenues from our Canadian subsidiaries decreased $10,426 (or 9.3%) in Canadian dollars, we only experienced a net decrease of $2,419 (or 2.7%) when reported in U.S. dollars.
| ITEM 8. | FINANCIAL STATEMENTS AND SUPPLEMENTARY DATA |
The Company’s audited consolidated financial statements for the fiscal years ended June 30, 2006, June 30, 2005 and June 30, 2004, immediately follow the signature page to this Form 10-K.
| ITEM 9. | CHANGES IN AND DISAGREEMENTS WITH ACCOUNTANTS ON ACCOUNTING AND FINANCIAL DISCLOSURE |
None.
| ITEM 9A. | CONTROLS AND PROCEDURES |
Evaluation of Disclosure Controls and Procedures.
As of June 30, 2006, the end of the period covered by this Annual Report (the “Report”), our Chief Executive Officer and Principal Financial Officer (the “Certifying Officers”) conducted evaluations of our disclosure controls and procedures. As defined under Sections 13a-15(e) and 15d-15(e) of the Securities Exchange Act of 1934, as amended (the “Exchange Act”), the term “disclosure controls and procedures” means controls and other procedures of an issuer that are designed to ensure that information required to be disclosed by the issuer in the reports that it files or submits under the Exchange Act is
52
recorded, processed, summarized and reported, within the time periods specified in the Securities and Exchange Commission’s (“SEC”) rules and forms. Disclosure controls and procedures include, without limitation, controls and procedures designed to ensure that information required to be disclosed by an issuer in the reports that it files or submits under the Exchange Act is accumulated and communicated to the issuer’s management, including the Certifying Officers, to allow timely decisions regarding required disclosure. Based on this evaluation, the Certifying Officers have concluded that our disclosure controls and procedures were not effective to ensure that material information is recorded, processed, summarized and reported by our management on a timely basis in order to comply with our disclosure obligations under the Exchange Act, and the rules and regulations promulgated thereunder. The Company determined that this deficiency constituted a material weakness and detailed below are the circumstances surrounding this matter.
In our previously filed restated public filings (Amendment No. 2 to its Annual Report on Form 10-K for the year ended June 30, 2005 and Amendments to its Quarterly Reports on Form 10-Q for the first and second quarters ended September 30 and December 31, 2005, respectively) we provided detailed disclosures relating to all corrections of certain accounting errors and disclosure deficiencies. Following these restated filings, the Certifying Officers conducted another evaluation in connection with and as of the date of our Quarterly Report on Form 10-Q for the third quarter ended March 31, 2006. The Certifying Officers concluded that the controls and procedures were not effective since the remedial steps designed by the Company to address and remedy the existing deficiencies were not fully implemented at the time of the 3rd quarter Quarterly Report. The Company determined that this deficiency constituted a material weakness. The remedial steps identified to improve upon its disclosure controls and procedures, included (but were not limited to) hiring of additional personnel and education and development of an existing finance and accounting staff. We believed that these and other remedial steps would be sufficient to prevent a reoccurrence of the accounting errors underlying the restatements and would improve our internal controls over financial reporting.
As of the date of the evaluation, in connection with this Report, June 30, 2006, we have not completed implementing these remedial steps. In light of the ongoing nature of this effort, the Certifying Officers concluded that the disclosure controls and procedures were not effective as of the end of the reporting fiscal year. We will continue to evaluate our disclosure controls and procedures and to seek to both implement and improve, on a timely basis, changes to our disclosure controls and procedures that may be necessary to keep them effective in light of any changes in the nature of our business and any rapidly changing environment.
Changes in Internal Control over Financial Reporting.
There were no changes in our internal control over financial reporting during the fiscal period in question that has materially affected, or is reasonably likely to materially affect, our internal control over financial reporting.
| ITEM 9B. | OTHER INFORMATION |
None.
53
PART III
| ITEM 10. | DIRECTORS, EXECUTIVE OFFICERS AND CONTROL PERSONS OF THE COMPANY |
Board of Directors, Executive Officers and Significant Employees
Our executive officers and directors are as follows:
| | | | |
NAME | | AGE | | POSITION |
Charles Zwebner | | 47 | | Chairman, President, Chief Executive Officer and Director |
Anthony Greenwood | | 48 | | Director and Secretary |
Anthony Heller | | 55 | | Director |
Adrian Garbacz(1)(2)(4) | | 47 | | Director |
Gary Clifford(1)(4) | | 37 | | Director |
Joseph Grunwald(1)(2)(3)(4) | | 43 | | Director |
R. Gregory Breetz, Jr. (1)(2)(3)(4) | | 44 | | Director |
Kevin Crumbo(3) | | 40 | | Director |
Valerie Ferraro | | 55 | | President – Yak Communications (Canada) Inc. |
Paul Broude | | 27 | | Chief Accounting Officer and Principal Financial Officer |
David Hurwitz | | 43 | | President, VoIP Initiative |
Rajiv Jagota | | 35 | | Vice-President, Carrier Relations and Marketing |
Steven Kerr | | 40 | | Vice-President, Network Operations and Engineering |
| (1) | Member of Audit Committee. |
| (2) | Member of Governance and Nominating Committee. |
| (3) | Member of Compensation Committee. |
| (4) | Member of the Independent Committee. |
Below is a brief biography of each of the directors and executive officers of the Company
CHARLES ZWEBNER
Mr. Zwebner is the founder of our company, and has served as our President, Chief Executive Officer, and Chairman of our Board of Directors since our inception in December 1998. Prior to organizing our company, he served as the President of CardCaller Canada Inc. (1992-1998) and was a member of its Board of Directors. Mr. Zwebner founded CardCaller Canada in 1992, which developed the first Canadian fixed amount prepaid, multilingual telephone calling card. In June 1997, the shareholders, including Mr. Zwebner, of CardCall International Holdings, Inc. (“CIH”), the parent of CardCaller Canada, sold all of their shares in CIH to a U.S. public corporation. Mr. Zwebner continued as President and a director of CardCaller Canada until his resignation in August 1998. Prior to Mr. Zwebner’s resignation, the new owner of CIH disposed of substantially all of the assets of that company. Mr. Zwebner holds a B.A. in Computer Science and Business Administration from York University.
54
ANTHONY GREENWOOD
Mr. Greenwood has served as a Director of our company since December 2001. He is a Canadian attorney with Greenwoods Barristers & Solicitors. He was educated in Europe and North America, and practices law and acts as a consultant to both Canadian and U.S. private and public corporations in the area of business law, cross border financing, and dispute resolutions. He is a member of the International Law and Business Law sections of the American Bar Association and sits on several committees including the International Business Law Committee of the Section of Business Law. He is also a member of the Canadian Bar Association, the London, England-based International Bar Association, and the Tokyo-based Inter-Pacific Bar Association. Mr. Greenwood is an author of many academic articles in the areas of secured financing, corporate finance, financial service regulation, and international debt recovery & dispute resolution, and is an associate editor of the Canadian-based internationalBanking & Finance Law Review and an editor of the Australian-based international law publicationJournal of Banking and Finance, Law & Practice. Mr. Greenwood is also a part time lecturer at the Osgoode Hall Law School (Toronto, Canada).
ANTHONY HELLER.
Mr. Heller has served as a Director of our company since December 1998. He has served as the President of Plazacorp Investments Limited (a real estate development company based in Toronto, Canada) since 1994. Since 1994, Plazacorp has completed over $300 million worth of real estate developments principally in Canada. Mr. Heller has also been involved in venture capital financings and has consulted to both privately held and publicly traded companies in which he has invested.
ADRIAN GARBACZ
Mr. Garbacz has been a member of our board of directors since January 2003. Mr. Garbacz is currently self-employed in the real estate and development industry in New York. Previously, he was the Chief Executive Officer of The Grisdale Group of Companies in Queens, NY, which was also involved in the real estate development and finance industry. Mr. Garbacz received a B.A. in Accounting (1985) from Touro College and his certified public accountant designation in the state of New York in 1987. Mr. Garbacz is a member of the audit committee, the governance and nominating committee and the independent committee of our board of directors.
JOSEPH GRUNWALD
Mr. Grunwald has been a member of our board of directors since January 2003. Mr. Grunwald has been involved in the banking industry for over 15 years. He is currently a Vice-President of the HSBC Bank USA. Prior to that, Mr. Grunwald was a Senior Vice President with Safra Bank, New York, NY. Mr. Grunwald received a B.A. in Economics (1983) from the City University of New York and an M.B.A. from Long Island University (1986). Joseph Grunwald is a member of the audit committee, the governance and nominating committee, the compensation committee and the independent committee of our board of directors.
R. GREGORY BREETZ, JR.
Mr. Breetz has been a member of our board of directors since October, 2004. Mr. Breetz has served as a Director since 2004. He is currently an Executive-in-Residence for Dolphin Equity Partners, a New York City based venture capital fund. Dolphin Equity invests primarily in telecommunications and media companies. Prior to joining Dolphin, Mr. Breetz was with XO Communications and McCaw Cellular in various financial roles. Mr. Breetz has a BS in Accounting from the University of Kentucky and is a CPA. Mr. Breetz is a member of the audit committee, the governance and nominating committee, the compensation committee and the independent committee of our board of directors.
55
KEVIN CRUMBO
Mr. Crumbo has been a member of our board of directors since October 2004. Mr. Crumbo began his career in San Francisco at the tax practice of Coopers & Lybrand and subsequently moved into the financial analysis industry working for a Fortune 200 financial services firm. He later advanced into senior financial roles for bioscience and healthcare companies with highlights including successful turn-arounds, private placements, and various business combinations. Now leading Kraft Corporate Recovery Services, LLC, he assists clients in a variety of industries with turn-around management, corporate governance reviews, and litigation support. Telecommunications companies comprise a large portion of his consulting clients, and he has recently consulted with Yak on a variety of matters. Mr. Crumbo received a B.S. in Accounting from the University of Kentucky in 1988 and M.B.A. from Vanderbilt University in 1996. He holds certificates in public and forensic accounting. Though he does not practice as a certified public or other accountant, he has earned certificates in both public and forensic accounting. Mr. Crumbo is a member of the compensation committee of our board of directors.
GARY CLIFFORD
Mr. Clifford joined our board of directors in December 2005 and at that time became Chairman of the Audit Committee. Since May 2006, Mr. Clifford also chairs the Independent Committee of the Board of the Company. Mr. Clifford is presently Managing Director of Clifford Capital Corporation and currently serves as director and Chair of the Independent Committee and the Audit Committee for the company. He also serves as a director and Chair of the Audit Committee for Qustream Corporation (TSV:QVC). Mr. Clifford was previously Executive Vice President and Chief Financial Officer of Counsel Corporation (TSX:CXS) from September 2002 to December 2005. Mr. Clifford also served as Chief Financial Officer for C2 Global Technologies Inc. (OTC:COBT) from 2002 to 2005. Mr. Clifford served as an executive in various capacities with Leitch Technology Corporation from 1998 to 2002. Mr. Clifford is a Chartered Accountant and he holds a BA from the University of Toronto in Management.
VALERIE FERRARO
Ms. Ferraro joined Yak Communications in 2004 following a 30-year career with Bell Canada. She has extensive experience leading multi-discipline organizations in the small/medium and Enterprise-level business markets, and has directed Sales, Engineering and Project Management organizations in Voice, Data and Internet based technologies. A multi-year member of Bell Canada’s “President’s Club”, she pioneered the development of the company’s Wholesale division – the Carrier Services Group (CSG). As the Sr. Director, CSG, Ms. Ferraro held primary responsibility for the organizational design, marketing and sales strategy, regulatory compliance, customer and employee satisfaction, revenue growth and financial controls of the organization. Under her leadership, CSG experienced four digit increases in revenue growth and profitability increases, as the group mandate expanded to include National Canadian Wholesale, as well as United States and International markets. Ms. Ferraro holds a BA(Hon) and has completed numerous professional management and financial courses at the various Canadian universities.
PAUL BROUDE
Mr. Broude joined the Company in June, 2005 after being with PricewaterhouseCoopers as an Audit Manager. Having also worked in Bermuda and France, much of his auditing experience was in the financial and manufacturing industries using Canadian, U.S. and International auditing standards. Mr. Broude is a Chartered Accountant in Canada, a Certified Public Accountant (Illinois) and holds a Masters in Accounting degree from the University of Waterloo.
56
DAVID HURWITZ
Mr. Hurwitz joined the Company in November, 2003. He has over 18 years experience in the competitive telecommunications industry, encompassing business development, general management, strategic sales and marketing initiatives, and M&A. Prior to joining Yak, Mr. Hurwitz founded InTandem Communications, Inc., a telecommunications reseller acquired by Cognigen Networks In September of 2003. For 8 1/2 years prior to InTandem, Mr. Hurwitz served as COO and subsequently President & CEO of Capsule Communications, Inc., a publicly traded long distance carrier that was acquired by Covista Communications, Inc. in February of 2002. Mr. Hurwitz has also held management-level positions with RCN Corporation, InterNet Communications Services, Inc. and FiberNet, Inc. As of July 26, 2006, Mr. Hurwitz has separated from the Company.
RAJIV JAGOTA
Mr. Jagota joined the Company in October, 2004 after being with Bell Carrier Services for three years as Director of Sales Development where he built and managed an IDDD sales team. Accountability included development and implementation of sales and pricing strategies used to win and retain major Canadian carriers and resellers, while growing revenues by 25% year over year. Prior to Bell, Mr. Jagota was National Account Director with Teleglobe Canada for three years during the period when Teleglobe relinquished their monopoly. Mr. Jagota developed the strategic plan for building new business relationships with key clients and was instrumental in the design of bids, leading major sales presentations and closing contracts. His first role in the telecom industry was with ACC Corp. in the capacity of Manager of Direct Marketing, leading the development of affinity group programs with numerous government institutions and financial corporations.
STEVEN KERR
Mr. Kerr joined the Company in May, 2005. Mr. Kerr has over 16 years of experience in the telecom industry, the last 12 years of which were spent at Bell Canada in a variety of engineering, technical support and sales roles all within the competitive carrier arena. Most recently Mr. Kerr worked on large scale interconnection agreements with U.S. and International service providers. Prior to Bell Canada Mr. Kerr worked at National Telecom where he established a large data and voice network and the first commercial Frame Relay service in Canada.
Meetings of the Board of Directors
During the fiscal year ended June 30, 2006, there were 12 meetings of the Board. Each director attended in excess of 75% of the total number of meetings of the Board during fiscal year 2006. In addition, from time to time, the members of the Board acted by unanimous written consent pursuant to Florida law.
Board of Directors’ Committees
Audit Committee
The Board of Directors has an Audit Committee which currently consists of Messrs. Clifford, Garbacz, Grunwald and Breetz. The Audit Committee assists the Board of Directors in its oversight of the quality and integrity of our accounting, auditing and reporting practices. During the fiscal year ended June 30, 2006, the Audit Committee held 15 meetings. The Audit Committee has the authority and responsibility to hire one or more independent auditors to audit the Company’s books, records and financial statements and to review the Company’s systems of accounting (including its systems of internal control), to discuss with such independent auditors the results of such audit and review, to conduct periodic independent reviews of the systems of accounting (including systems of internal control), and to make reports periodically to the Board of Directors with respect to its findings. The Board of Directors has determined that each Audit Committee member has sufficient knowledge in financial and auditing matters to serve on the Committee.
All of the members of the Audit Committee are independent of the Company (as defined under Rule 4200(a)(15) of the Nasdaq Marketplace Rules). We consider Mr. Clifford a “financial expert” as defined under Item 401 of Regulation S-K.
57
Governance and Nominating Committee
The Governance and Nominating Committee consists of Messrs. Garbacz, Grunwald and Breetz, all of whom meet the independence requirements prescribed by the Marketplace Rules of the NASD. The committee is responsible for recommending candidates for election to the Board of Directors for approval and nomination by the Board of Directors. The committee is also responsible for making recommendations to the Board of Directors or otherwise acting with respect to corporate governance matters, including board size and membership qualifications, new director orientation, committee structure and membership, communications with shareholders, and board and committee self-evaluations. The Governance and Nominating Committee operates under a written mandate adopted by our Board of Directors.
Compensation Committee
The Compensation Committee consists of Messrs. Crumbo, Breetz and Grunwald, all of whom meet the independence requirements prescribed by the Marketplace Rules of the NASD. The committee is responsible for reviewing and approving, on behalf of our Board of Directors, management recommendations regarding all forms of compensation to be provided to our executive officers and directors, including stock compensation, and all bonus and stock compensation to all employees. The Compensation Committee operates under a written mandate adopted by our Board of Directors.
Independent Committee
The Independent Committee consists of Messrs. Clifford, Garbacz, Grunwald and Breetz, all of whom meet the Nasdaq Marketplace Rules with respect to director independence. The Board of Directors established the Committee on May 11, 2006. The Committee is in existence at the pleasure of and operates under a written mandate adopted by the Board to explore various strategic alternatives available to the Company to maximize shareholder value. The Committee’s responsibilities include, without limitations, to (i) review, study, explore and analyze various strategic alternatives to maximize shareholder value including, without limitation, the potential sale of all or portions of the Company’s operations, (ii) consider all legal and regulatory requirements applicable to any strategic alternative, (iii) canvas the structuring of any strategic alternative, (iv) review the implementation of any strategic alternative, if approved by the Board, and (v) review the Company’s public disclosures with respect to any strategic alternative. On June 29, 2006, the Committee engaged the investment banking firm of Orion Securities Inc. to advise the Company with regard to its various strategic alternatives, including the potential sale of the Company to maximize shareholder value. On September 20, 2006, following a rigorous auction process managed by the Independent Committee and based upon such Committee’s recommendation to the Board, the Board approved an all cash offer to acquire all outstanding shares of Yak’s common stock shares made by Globalive Communications Corp. (“Globalive”).For additional discussion of this matter please refer to the Material Subsequent Events discussions in this filing.
Personnel Conduct and Compliance
Code of Ethics
We have adopted a Code of Ethics applicable to all directors, officers and employees, including the chief executive officer, senior financial officers and other persons performing similar functions. The Code of Ethics is a statement of business practices and principles of behavior that support our commitment to conducting business while maintaining the highest standards of business conduct and ethics and is available for free upon request. Our Code of Ethics covers topics including, but not limited to, compliance resources, conflicts of interest, compliance with laws, rules and regulations, internal reporting of violations and accountability for adherence to the Code. Any amendment of the Code of Ethics or any waiver of its provisions for a director, executive officer or senior financial officer must be approved by the Board of
58
Directors. We will publicly disclose any such waivers or amendments pursuant to applicable SEC and Nasdaq Marketplace Rules and regulations.
Compliance with Section 16(a) of the Securities Exchange Act
Section 16(a) of the Securities Exchange Act of 1934 requires the Company’s executive officers and directors, and persons who beneficially own more than ten percent (10%) of a registered class of the Company’s equity securities (collectively “Reporting Persons”), to file reports of ownership and changes in ownership with the Securities and Exchange Commission. Reporting Persons are required by rules of the Securities and Exchange Commission to furnish the Company with copies of all Section 16(a) reports they file. Based solely upon a review of the copies of such forms furnished to the Company and written representations from the Reporting Persons, the Company believes that during the fiscal year ended June 30, 2006, all persons subject to the reporting requirements of Section 16(a) filed the required reports on a timely basis with the exception of the following:
| | • | | Mr. Anthony Heller was required to file a Form 4 with respect to the disposition of shares of our common stock. A holding company, over which Mr. Heller exercised control, disposed of 400,000 shares of our common stock as a result of its being wound up. The Form 4 report with respect to this transaction was not filed in a timely fashion. |
59
| ITEM 11. | EXECUTIVE COMPENSATION |
Compensation
The following table sets forth information about the compensation paid or accrued by the Company to the Company’s chief executive and accounting officers and the four most highly compensated named executive officers, other than the Chief Executive Officer, for the last three completed fiscal years:
SUMMARY COMPENSATION TABLE (ALL FIGURES IN $USD)
| | | | | | | | | | | | | | | |
| | | Annual Compensation | | Awards | |
Name and Principal Position | | Year | | Salary | | Bonus | | Securities
Underlying
Options | | | Other
Compensation | |
Charles Zwebner – | | 2006 | | $ | 344,000 | | $ | 100,000 | | — | | | | — | |
Chairman President, and Chief | | 2005 | | $ | 320,000 | | $ | 150,000 | | — | | | | — | |
Executive Officer | | 2004 | | $ | 210,000 | | $ | 67,000 | | — | | | $ | 12,815,000 | (1) |
Valerie Ferraro – President | | 2006 | | $ | 239,000 | | $ | 100,000 | | — | | | | — | |
– Yak Communications (Canada) Inc. | | 2005 | | $ | 194,000 | | $ | 76,000 | | 50,000 | (2) | | | — | |
| | 2004 | | $ | 56,000 | | $ | — | | — | | | | — | |
David Hurwitz – President, | | 2006 | | $ | 222,000 | | $ | 100,000 | | — | | | | — | |
VOIP Initiative(5) | | 2005 | | $ | 222,000 | | $ | 40,000 | | — | | | | — | |
| | 2004 | | $ | 102,000 | | $ | — | | 130,000 | (3) | | | — | |
Rajiv Jagota – Vice President, | | 2006 | | $ | 145,000 | | $ | 43,000 | | — | | | | — | |
Carrier Relations and Marketing | | 2005 | | $ | 84,000 | | $ | 56,000 | | 50,000 | (4) | | | — | |
| | 2004 | | $ | — | | $ | — | | — | | | | — | |
Steven Kerr – Vice President, Network Operations and Engineering | | 2006
2005
2004 | | $
$
$ | 144,000
18,000
— | | $
$
$ | 21,000
—
— | | —
—
— |
| |
| —
—
— |
|
Paul Broude – Chief Accounting Officer | | 2006
2005
2004 | | $
$
$ | 131,000
1,200
— | | $
$
$ | 5,000
—
— | | —
—
— |
| |
| —
—
— |
|
| (1) | On December 31, 2003, the Company issued 2,260,934 shares of its common stock to Mr. Zwebner in connection with the exchange of an option to purchase 2,568,000 held by Mr. Zwebner. Such shares of common stock were valued at an aggregate of $12,815,000, or 2,260,934 shares of common stock assuming a discounted market price of $5.67 per share as of November 30, 2003. See “Employment Contracts” below. |
| (2) | These options were granted on May 11, 2004 at an exercise price of $6.57 and vest at the rate of 25% of the number of shares granted on each of the first four anniversaries of the grant date. |
| (3) | These options were granted on November 17, 2003 at an exercise price of $6.50 and vest at the rate of 25% of the number of shares granted on each of the first four anniversaries of the grant date. |
| (4) | These options were granted on September 7, 2004 at an exercise price of $6.41 and vest on equal amounts over four years commencing on September 7, 2005 and expiring on September 7, 2009. |
| (5) | David Hurwitz ceased to be an employee of the Company on July 26, 2006. |
Stock Option Plan
In June 1999, we established a Stock Option Plan for key employees which covers up to 640,000 shares of our common stock. As disclosed above there are currently only three executive officers with outstanding options. None of the executive officers’ outstanding options were granted in fiscal 2006, and none of the outstanding and vested options were exercised in our fiscal 2006 year.
Aggregated Option/SAR Exercises in Last Fiscal Year
and FY-End Option/SAR Values
| | | | | | | | |
Name | | Shares
Acquired on
Exercise | | Value
Realized ($) | | Number of Securities
Underlying Unexercised
Options at June 30, 2006
Exercisable/Unexerciseable | | Value of Unexercised
In-the-Money Options at
June 30, 2006
Exercisable/Unexercisaeable |
Valerie Ferraro | | NIL | | NIL | | 25,000 / 25,000 | | NIL / NIL |
Rajiv Jagota | | NIL | | NIL | | 12,500 / 37,500 | | NIL / NIL |
David Hurwitz | | NIL | | NIL | | 97,500 / NIL | | NIL / NIL |
Compensation of Directors
The compensation plan for each independent director in 2006 was: (i) $3,000 per quarter; and (ii) $6,000 per annum (in addition to items (i) and (iii) hereof); and (iii) $3,000 for attendance at the Company’s annual meeting of shareholders, along with travel expenses related thereto; and (iv) issuance of 2,000 shares of the common stock of the Company per annum for continued service on the Board of Directors.
In addition to the foregoing, the members of our Audit Committee received additional compensation for their extraordinary services in connection with the restatement of certain of our historical financial statements (see “Significant Transactions, Subsequent Events and Financial Restatements”). The members
60
of the Audit Committee received fees of $17,000 each and the Chairman received fees of $50,000. These amounts were reviewed by the Compensation Committee and recommended to the full Board of Directors which approved the amounts and payment of the fees.
In addition, at its meeting of June 12, 2006 the Board of Directors approved the following compensation for independent Board members including compensation for their service on various committees, effective for fiscal year 2007. The compensation plan for each independent director is: (i) $20,000 per annum, and (ii) issuance of 10,000 shares of the common stock of the Company per annum for continued service on the Board of Directors. Each independent Director will receive $1,000 per Board (or committee) meeting which is attended in person and $500/meeting for each such meeting which is attended telephonically.
In addition to the foregoing, the members of our Audit Committee will receive $5,000 per annum and the chairman will receive $10,000 per annum. The chair of all other committees will receive $2,000/annum for their service.
Any special work by the independent directors, which must be approved by the Board, will be paid at the rate of $200/hour.
The foregoing compensation changes were approved and recommended by the Compensation Committee and recommended to the full Board of Directors which approved the amounts and payment of the fees, as well as the issuance of shares.
At its meeting of June 12, 2006, the Board of Directors also approved the following compensation for the Independent Committee members, which committee was established in May 2006. The compensation plan is: i) $15,000 for each committee member other than the Chair of the Independent Committee; (ii) $25,000 for the Chair of the Independent Committee; and (iii) $200 per hour per diem fee for time spent on Independent Committee matters. In addition, each Independent Committee member will receive $1,000 per Independent Committee meeting.
Pursuant to action of our Board of Directors taken by unanimous written consent on August 10, 2006, which was in furtherance of actions approved at a meeting of the Board on June 12, 2006, we issued 12,000 shares of the Company’s common stock to each of our independent directors, Messrs Breetz, Clifford, Crumbo, Grunwald, and Garbacz. 2,000 shares were issued as compensation for their service during the 2006 fiscal year and 10,000 shares were issued for their continued service in the 2007 fiscal year.
Employment Contracts
We have employment agreements with both Charles Zwebner and Valerie Ferraro.
Mr. Zwebner’s employment agreement was effective January 1, 2004 and is for a term of three years ending on December 31, 2006. Mr. Zwebner’s employment with the Company will expire on December 31, 2006, unless the Company and Mr. Zwebner enter into a new employment contract or arrangement. Mr. Zwebner is required to devote all of his time and efforts to the Company as Chairman of the Board, President and CEO. We are required to compensate Mr. Zwebner at an annual base salary of $300,000 (which is to be reviewed annually by the board of directors) and a bonus of up to 50% of his annual base salary. Mr. Zwebner is entitled to participate in any stock option, savings, incentive, or employee benefits plans offered to senior executives of the Company. The Company may terminate the employment agreement at any time in the event of his disability or for cause and may do so without cause upon giving no less than 30 days notice. Mr. Zwebner may resign from the Company with 30 days written notice with or without Good Reason (as that term is defined in the agreement). If the Company terminates Mr. Zwebner for disability or without cause or Mr. Zwebner terminates the agreement with Good Reason, Mr. Zwebner is entitled to (i) his base annual salary up until the effective date of termination; (ii) an amount equal to his previous year’s annual bonus divided by 12 and multiplied by the number of months of service during the termination year; (iii) any accrued but unused vacation pay; and (iv) a lump sum severance
61
payment equal to twice the amount of his annual base salary. In addition, all benefits to which Mr. Zwebner was entitled shall continue for a period of two years. In the event of the death of Mr. Zwebner, his estate will receive the forgoing items listed in clauses (i) – (iv) above, his spouse and minor children will receive benefits for a period of two years and any stock options which were granted to Mr. Zwebner would immediately vest and may be exercised by his heirs or executors. If the Company terminates the agreement for cause or if Mr. Zwebner terminates the agreement without Good Reason, Mr. Zwebner is only entitled to any accrued but unpaid base annual salary and benefits due thereunder. Upon the change of control of the Company (as that term is defined in the agreement), Mr. Zwebner may terminate his employment, and it will be considered termination with Good Reason, for any reason or no reason, upon his own initiative and at any time during the six month period beginning on the effective date of a change of control or if Mr. Zwebner is required to relocate more than sixty (60) kilometers from his current place of employment in Toronto, Ontario without his consent. Regardless of the form of termination of the employment agreement, all stock options that would have become vested during the two years following the termination, shall become vested immediately upon termination and shall remain exercisable for such period that would have been applicable if Mr. Zwebner had remained employed for the two years following the termination date. Mr. Zwebner may not engage in or become associated with any business or other endeavor whose primary business is long distance telecommunication services in Canada or the United States to residential and small to medium business enterprises for a period of two years after the termination date of the agreement. On September 6, 2006, the Company and Mr. Zwebner reached an agreement whereby Mr. Zwebner agreed not to seek any compensation pursuant to the change of control provisions of his employment agreement.
Ms. Ferraro’s current employment agreement was effective January 1, 2006 and is for a term of three years ending on December 31, 2008. Ms. Ferraro is required to devote all of her time and efforts to the Company as President of Yak Communications (Canada) Inc. The Company is required to compensate Ms. Ferraro at an annual base salary of $300,000 (which is to be reviewed annually by the CEO) and a bonus of up to 50% of her annual base salary. Ms. Ferraro is entitled to participate in any stock option plan or employee benefit plans made available to senior executives of the Company. Ms. Ferraro was granted 50,000 stock options vesting over a period of four years starting on May 11, 2005 at an exercise price of $6.57 and expiring May 11, 2009. The Company may terminate the employment agreement at any time for cause and upon 30 days notice without cause. Ms. Ferraro may terminate the agreement upon 30 days notice to the Company. In the event the Company terminates the agreement without cause, Ms. Ferraro is entitled to a lump sum payment of twelve months base salary and bonus and the continuation of benefits for a period of one year after the termination date. Ms. Ferraro is not required to mitigate any damages. All options held by Ms. Ferraro shall immediately vest upon termination of the agreement and shall expire on the later of 90 days after the termination date or the date set out under the applicable plan. In the event of the death of Ms. Ferraro the options shall expire one year after her death. Upon a change of control of the Company (as that term is defined in the agreement), Ms. Ferraro may elect to terminate her employment agreement and shall be entitled to twelve months base salary and bonus and the continuation of her benefits for a period of one year.
On August 4, 2006, Yak Communications (Canada) Inc. (“Yak Canada”) entered into a First Amendment to Employment Agreement (the “Amendment”) with Valerie Ferraro, the President of Yak Canada. The Amendment provides, among other things, that (i) Ms. Ferraro is subject to a one-year covenant not to compete in the event her employment is terminated under certain circumstances, (ii) in the event of a “change of control” of Yak Communications Inc., Ms. Ferraro will be entitled to receive a bonus of $250,000 (CDN) upon the closing of the change of control transaction and (iii) in the event of any “change of control” any unexercised stock options held by Ms. Ferraro will be terminated without further payment to her. In addition, under the Amendment Ms. Ferraro is entitled to an additional bonus of $150,000 (CDN) if at the end of the six month period following the closing of a change of control transaction Ms. Ferraro has not voluntarily terminated her employment and has not been terminated “for cause.” The Amendment was negotiated and recommended by the Independent and Compensation Committees of our Board of Directors, approved by our Board of Directors, and was adopted in recognition of the additional responsibilities which Ms. Ferraro would likely be required to assume in the event of a change of control transaction and the subsequent transition period. A copy of the Amendment is filed as Exhibit 10.1 to our Current Report on Form 8-K filed on August 15, 2006 and is incorporated by reference herein.
62
Senior Management Change in Control Bonus Plan
On August 9, 2006, we adopted a Change in Control Bonus Plan (the “Plan”) for members of senior management, excluding the CEO and President of Yak Canada. Mr. Paul Broude, the Chief Accounting Officer of the Company, is a participant in the Plan. The Plan was authorized in principle by the Board on August 1, 2006. The Plan provides for the payment of an aggregate of $270,000 (CDN) to nine designated employees upon the occurrence of a “change in control” of the Company (as defined therein) and upon the occurrence of one of the three following conditions: (i) the failure of the designated employee to receive substantially equivalent employment by the Company or successor employer; (ii) the employee’s employment is involuntarily terminated within six months following such change in control, for any reason other than “cause”; or (iii) the employee remains employed by the Company or successor employer for at least six months following such change in control. In addition, entitlement to the bonus is conditional on any applicable designated employee immediately after a change in control no longer holding any employee stock options (either because the employee exercised such options in accordance with their terms or surrendered them). One half of the bonus is due within 10 days following the change in control and the balance is due upon the satisfaction of the conditions described above with first payment subject to return is the conditions are not satisified. A copy of the Plan is filed as Exhibit 10.15 to our Current Report on Form 8-K filed on August 15, 2006 and is incorporated by reference herein.
Compensation Committee Interlocks and Insider Participation
No information is required by this item regarding compensation committee interlocks.
Board Compensation Committee Report on Executive Compensation
The Compensation Committee consists of Messrs. Crumbo, Grunwald and Breetz. Set forth below is the full report of the Compensation Committee regarding the compensation of executive officers on account of fiscal year 2006. Notwithstanding anything to the contrary set forth in any of the Company’s filings under the Securities Act of 1933 or the Securities Exchange Act of 1934 that might incorporate SEC filings, in whole or in part, this Compensation Committee Report on Executive Compensation will not be incorporated by reference into any such filings.
General
During fiscal year 2006, the compensation of the executive officers was administered and determined by the Compensation Committee of the Board of Directors.
Executive Compensation Policy and Philosophy
Total compensation refers to the total value of the company benefit and compensation programs to an employee. These are valued and compared to the marketplace so the competitiveness of our programs can be established. Our compensation programs are designed to attract, motivate, and retain high caliber talent in order to drive our business forward and continually grow in our market as well as to maximize shareholder value by linking pay with the achievement of various objectives.
In exchange for consistently delivering performance and results, we provide an employee with compensation that is competitive for a similar position in our marketplace or otherwise sufficient to retain services desirable to the company.
Our executive pay programs are designed to facilitate the pay-for-performance philosophy by establishing an appropriate mix of salary and incentive pay which is both competitive to similar peer groups within the industry and which establishes a direct relationship with the achievement of business objectives and company growth. Because the executives have greater potential to drive the business
63
forward and add value to the shareholders, a greater portion of their pay is considered “at risk” in the form of incentive pay than the general employee base. The incentive programs are intended to motivate and reward executives for short-term success, as well as to reward and retain them in achieving long term growth and success. Thus a combination of base pay, bonus and stock options are the appropriate and competitive executive compensation mix for us in order to lead the creation of value for the Company’s shareholders and expansion of management’s stake in the long-term performance and success of the Company. The Compensation Committee reviews all elements of compensation including market pricing and individual performance when considering the appropriate individual compensation components.
The Compensation Committee believes that leadership and motivation of the Company’s employees are critical to achieving the objectives of the Company. The Compensation Committee is responsible for ensuring that its executive officers are compensated in a way that furthers the Company’s business strategies and which aligns their interests with those of the stockholders. To support this philosophy, the following principles provide a framework for executive compensation: (i) offer compensation opportunities that attract the best talent to the Company; (ii) motivate individuals to perform at their highest levels; (iii) reward outstanding achievement; (iv) retain those with leadership abilities and skills necessary for building long-term stockholder value; (v) maintain a significant portion of executives’ total compensation at-risk, tied to financial performance of the Company and the creation of stockholder value; and (vi) encourage executives to manage from the perspective of owners with an equity stake in the Company.
Executive Compensation Components
Our executive pay programs are designed to facilitate the pay-for-performance philosophy by establishing an appropriate mix of salary and incentive pay that is both competitive to similar peer groups within the industry and that establishes a direct relationship with the achievement of business deliverables and company growth. Because the executives have greater potential to drive the business forward and add value to the shareholders, a greater portion of their pay is considered “at risk” in the form of incentive pay than the general employee base. The incentive programs are intended to motivate and reward executives for short-term success, as well as to reward and retain them for achieving long term growth and success. Thus, a combination of base pay, bonus and stock options are the appropriate and competitive executive compensation mix for us in order to lead the creation of value for the Company’s shareholders and expansion of management’s stake in the long-term performance and success of the Company. The Compensation Committee reviews all elements of compensation, including market pricing and individual performance when considering the appropriate individual compensation components.
CEO Compensation
The Compensation Committee believes that Charles Zwebner, the Company’s Chief Executive Officer, provides valuable services to the Company and that his compensation should therefore be competitive with that paid to executives at comparable companies or otherwise sufficient to retain his services. In addition, the Compensation Committee believes that an important portion of his compensation should be based on performance.
Performance Graph
The graph below compares the performance of our common stock for the period September 10, 2002 (the first day our common stock was quoted on the OTC Bulletin Board) to June 30, 2006. Our common stock is compared to the Russell Microcap Index and a peer group. The peer group is comprised of the following companies: Boston Communications Group Inc., Impsat Fiberr Networks, Inc., ITC Deltacom, Inc., LCC International, Inc., Lynch Interactive Corp., Moscow Cablecom Corp., Multiband Corporation, PAC-West Telecom, Inc., Primus Telecommunications Group, Inc. and US LEC Corp. The Graph assumes that the value of the investment in our common stock and of each the named indices was $100 at September 10, 2002 and that all dividends were reinvested. The information contained in this graph is not necessarily indicative of our future performance.
64
COMPARISON OF 45 MONTH CUMULATIVE TOTAL RETURN*
AMONG YAK COMMUNICATIONS, INC., THE RUSSELL MICROCAP INDEX
AND A PEER GROUP
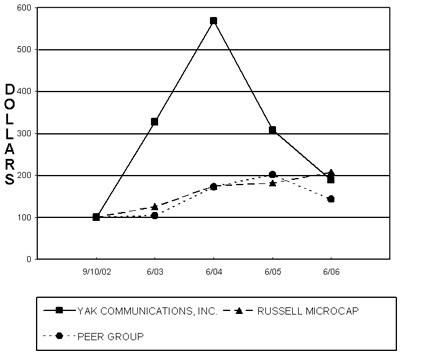
| * | $100 invested on 9/10/02 in stock or index-including reinvestment of dividends. Fiscal year ending June 30. |
| ITEM 12. | SECURITY OWNERSHIP OF CERTAIN BENEFICIAL OWNERS AND MANAGEMENT |
The following table sets forth the beneficial ownership of shares of our common stock by each person who is known to us to be the beneficial owner of more than 5% of our common stock.
| | | | |
Name and Address of Beneficial Owners | | Number of Shares | | Percent of Class |
Wynnefield Capital Management LLC 450 Seventh Avenue, Suite 509 New York, New York 10123 | | 1,008,750 | | 7.8 |
The following table sets forth the beneficial ownership of shares of our common stock by each director and named executive officer individually as of August 20, 2006, and the total of shares held by all directors and executive officers. Beneficial ownership of common stock has been determined for this purpose in
65
accordance with Rules 13d-3 and 13d-5 of the Securities and Exchange Commission, under the Securities Exchange Act of 1934, as amended, which provide, among other things, that a person is deemed to be the beneficial owner of common stock if such person, directly or indirectly, has or shares voting power or investment power with respect to the common stock or has the right to acquire such ownership within sixty days after the date of this registration statement.
| | | | | |
Name and Address of Beneficial Owners | | Number of Shares | | | Percent of
Class (1) |
Directors and Executive Officers | | | | | |
Charles Zwebner | | 3,189,734 | (2) | | 24.6 |
Anthony Heller | | 798,133 | (3) | | 6.2 |
Anthony Greenwood | | 15,000 | | | * |
Adrian Garbacz | | 18,000 | | | * |
Joseph Grunwald | | 18,000 | | | * |
Gregory Breetz Jr. | | 14,000 | | | * |
Gary M. Clifford | | 22,000 | * | | |
Kevin Crumbo | | 14,000 | * | | |
Valerie Ferraro | | 50,000 | (4) | | * |
Rajiv Jagota | | 50,000 | (4) | | * |
David Hurwitz(5) | | 130,000 | (4) | | 1.0 |
Total of all Directors and Executive Officers (11 persons) | | 4,318,867 | | | 33.2 |
| (1) | Based on the total number of shares of common stock outstanding as of June 30, 2006, being 12,905,250. |
| (2) | Includes 1,523,800 shares of common stock currently held in the name of 1231912 Ontario, Inc., a corporation controlled by Charles Zwebner. |
| (3) | Includes 254,000 shares of common stock currently held in the name of Helmsbridge Holdings, Ltd. and 253,333 shares of common stock currently held in the name of Rushdale Investments Limited, corporations controlled by Anthony Heller. |
| (4) | Options granted as described in Item 11. |
| (5) | David Hurwitz ceased to be an employee of the Company on July 26, 2006. |
66
| ITEM 13. | CERTAIN RELATIONSHIPS AND RELATED TRANSACTIONS |
We paid professional fees for legal services for the years ending June 30, 2006, 2005 and 2004 of $137,000, $171,000 and $251,000 respectively to Greenwoods Barristers and Solicitors, of which Anthony Greenwood is a director and minority shareholder. These legal services were provided pursuant to a standard engagement agreement between us and Greenwoods Barristers and Solicitors. This engagement agreement was approved by our Audit Committee. For the fiscal years ended June 30, 2006, 2005 and 2004 there was no balance owing.
We paid professional fees for consulting and executive search services for the current year of $263,000 to Kraft Corporate Recovery Services, LLC (“Kraft”) and Kraft Search Associates, LLC. Mr. Crumbo, a member of our Board of Directors, is a principal and employee of Kraft. This director became a related party in October 2004 and as of June 30, 2006 there was a balance of $23,000 owing. These services were provided pursuant to written agreements copies of which are included in our Form 8-K filed on April 6, 2005. These agreements were approved by our Audit Committee.
| ITEM 14. | PRINCIPAL ACCOUNTANT FEES AND SERVICES. |
The following table summarizes the aggregate fees billed and expected to be billed to us by Ernst & Young LLP for fiscal year ended June 30, 2006, and Horwath Orenstein LLP for the fiscal years ended June 30, 2005, and 2004:
Principal Accountant Fees and Services
| | | | | | | |
| | | 2006 | | 2005 | | 2004 |
| | | ($) | | ($) | | ($) |
Audit Fees(a) | | | 310,000 | | 168,000 | | 100,000 |
Audit-Related Fees(b) | | | 127,000 | | 84,000 | | 30,000 |
Tax Fees(c) | | | 281,000 | | 16,000 | | 12,000 |
All Other Fees(d) | | | — | | 22,000 | | 93,000 |
| | | | | | | |
Total | | $ | 718,000 | | 290,000 | | 235,000 |
| | | | | | | |
| (a) | Audit Fees include the aggregate fees billed by our auditors, for professional services rendered for the audit of the Company’s annual financial statement, along with fees for the reviews of the financial statements included in the Company’s Quarterly Reports on Form 10-QSB during that fiscal. |
| (b) | Audit Related Fees include the aggregate of fees billed for services related to the Company’s SEC and Nasdaq filings and applications and preparation of special audit reports filed with the CRTC. |
| (c) | Tax Fees include the aggregate fees billed by our auditors for taxation compliance related services. |
| (d) | All Other Fees include the aggregate fees billed by our auditors for services rendered to the Company, other than the services covered in “Audit Fees”. These fees primarily related to non-audit acquisition services relating to the Company’s due diligence review and other due diligence engagements. |
Audit Committee Pre-Approval Policies and Procedures
The Audit Committee on an annual basis reviews audit and non-audit services performed by the independent auditors. All audit and non-audit services are pre-approved by the Audit Committee, which considers, among other things, the possible effect of the performance of such services on the auditors’ independence.
67
PART IV
| ITEM 15. | EXHIBITS, FINANCIAL STATEMENT SCHEDULE, AND REPORTS ON FORM 8-K |
| | |
EXHIBIT NO. | | DESCRIPTION OF DOCUMENT |
| 3.1(1) | | Articles of Incorporation of the Company, as filed on December 24, 1998, with the Secretary of State of the State of Florida. |
| |
| 3.2(1) | | Articles of Amendment to the Articles of Incorporation of the Company, increasing the number of authorized common stock from 50 million shares to 100 million shares, as filed on June 4, 1999, with the Secretary of State of the State of Florida. |
| |
| 3.3(1) | | Articles of Amendment to the Articles of Incorporation of the Company, designating Series A Convertible Preferred Stock, as filed on July 27, 1999, with the Secretary of State of the State of Florida. |
| |
| 3.4(1) | | Bylaws of the Company. |
| |
| 10.1(5) | | EMI Translation Service Agreement, dated October 24, 2004, between Telus Communications, Inc. and the Company. |
| |
| 10.2(5) | | Invoice Ready Billing and Information Management Services Agreement, extended April 21, 2005, between Yak Communications (America) Inc. and Billing Concepts, Inc. |
| |
| 10.3(5) | | Lease of Office Space Agreement, dated November 6, 2003, between Yak Communications (Canada) Inc. and Oxford Properties Group Inc. |
| |
| 10.4(2) | | Employment Agreement between the Company, Yak Communications (Canada), Inc. and Charles Zwebner dated and effective as of January 1, 2004 |
| |
| 10.5(6) | | Employment Agreement between Yak Communications (Canada), Inc. and Valerie Ferraro dated December 21, 2005 and effective as of January 1, 2006. |
| |
| 10.6(1) | | 1999 Stock Option Plan. |
| |
| 10.7(1) | | Billing and Collection Services Agreement, dated August 8, 2000, between the Company and Telus Corporation. |
| |
| 10.8(3) | | Billing and Collection Services Agreement, dated November 1, 2001, between the Company and Bell Canada. |
| |
| 10.9(4) | | Engagement Letter with Kraft Corporate Recovery Services, LLC, dated March 31, 2005. |
| |
| 10.10(4) | | Search Assignment Agreement with Kraft Search Associates, LLC, dated March 31, 2005. |
| |
| 10.11 | | Internet Infrastructure Services Agreement with Q9 Networks Inc. dated June 21, 2006. |
68
| | |
| 10.12 | | Settlement Agreement with Digital Way S.A. dated July 25, 2005. |
| |
| 10.13 | | Fiscal Advisory Agreement with Orion Securities Inc. dated June 25, 2006. |
| |
| 10.14(7) | | First Amendment to the Employment Agreement between Yak Communications (Canada) Inc. and Valerie Ferraro, dated August 4, 2006. |
| |
| 10.15(7) | | Change of Control Bonus Plan |
| |
| 10.16 | | First Amendment to the Employment Agreement between Yak Communications (Canada), Inc. and Charles Zwebner, dated September 6, 2006. |
| |
| 21 | | Subsidiaries. |
| |
| 23.1 | | Consent of Ernst & Young LLP. |
| |
| 23.2 | | Consent of Horwath Orenstein LLP |
| |
| 31.1 | | Rule 13a-14(a)/15d-14(a) Certification of Chief Executive Officer |
| |
| 31.2 | | Rule 13a-14(a)/15d-14(a) Certification of Principal Financial Officer |
| |
| 32.1 | | Certification of Chief Executive Officer Pursuant to 18 U.S.C. Section 1350, as adopted pursuant to Section 906 of the Sarbanes-Oxley Act of 2002. |
| |
| 32.2 | | Certification of Principal Financial Officer Pursuant to 18 U.S.C. Section 1350, as adopted pursuant to Section 906 of the Sarbanes-Oxley Act of 2002. |
| (1) | Incorporated by reference from our Registration Statement on Form 10SB, as filed with the SEC on January 3, 2002. |
| (2) | Incorporated by reference from our Annual Report on Form 10-KSB as filed with the SEC on September 27, 2004. |
| (3) | Incorporated by reference from our Annual Report on Form 10-KSB as filed with the SEC on September 27, 2002. |
| (4) | Incorporated by reference from our Current Report on Form 8-K as filed with the SEC on April 6, 2005. |
| (5) | Incorporated by reference from our Annual Report on Form 10-K for the financial year ended June 30, 2005 as filed with the SEC on September 28, 2005. |
| (6) | Incorporated by reference from our Quarterly Report on Form 10-Q for the second quarter ended December 31, 2005 as filed with the SEC on February 14, 2006. |
| (7) | Incorporated by reference from our Current Report on Form 8-K as filed with the SEC on August 15, 2006. |
None.
69
SIGNATURES
Pursuant to the requirements of Section 13 or 15(d) of the Securities Exchange Act of 1934, the Registrant caused this report to be signed on its behalf by the undersigned, thereunto duly authorized.
| | | | | | | | |
| | | | Yak Communications Inc. |
| | | |
| Date: September 21, 2006 | | | | By: | | /s/ CHARLES ZWEBNER |
| | | | | | | | Charles Zwebner, Chairman, President &
Chief Executive Officer |
| | | |
| | | | By: | | /s/ PAUL BROUDE |
| | | | | | | | Paul Broude, Chief Accounting Officer and
Principal Financial Officer |
| | | |
| | | | By: | | /s/ ADRIAN GARBACZ |
| | | | | | | | Adrian Garbacz, Director |
| | | |
| | | | By: | | /s/ ANTHONY GREENWOOD |
| | | | | | | | Anthony Greenwood, Director |
| | | |
| | | | By: | | /s/ ANTHONY HELLER |
| | | | | | | | Anthony Heller, Director |
| | | |
| | | | By: | | /s/ JOSEPH GRUNWALD |
| | | | | | | | Joseph Grunwald, Director |
| | | |
| | | | By: | | /s/ KEVIN CRUMBO |
| | | | | | | | Kevin Crumbo, Director |
| | | |
| | | | By: | | /s/ R. GREGORY BREETZ |
| | | | | | | | R. Gregory Breetz, Director |
| | | |
| | | | By: | | /s/ GARY M. CLIFFORD |
| | | | | | | | Gary M. Clifford, Director |
CONSOLIDATED
FINANCIAL STATEMENTS
YAK COMMUNICATIONS INC. AND SUBSIDIARIES
For the years ended June 30, 2006 and 2005
Report of Independent Registered Public Accounting Firm
To The Board of Directors and Stockholders of
Yak Communications Inc.
We have audited the accompanying consolidated balance sheet of Yak Communications Inc. and subsidiaries as of June 30, 2006, and the related consolidated statements of income and comprehensive income, stockholders’ equity, and cash flows for the year ended June 30, 2006. These financial statements are the responsibility of the Company’s management. Our responsibility is to express an opinion on these financial statements based on our audit.
We conducted our audit in accordance with the standards of the Public Company Accounting Oversight Board (United States). Those standards require that we plan and perform the audit to obtain reasonable assurance about whether the financial statements are free of material misstatement. We were not engaged to perform an audit of the Company’s internal control over financial reporting. Our audit included consideration of internal control over financial reporting as a basis for designing audit procedures that are appropriate in the circumstances, but not for the purpose of expressing an opinion on the effectiveness of the Company’s internal control over financial reporting. Accordingly, we express no such opinion. An audit also includes examining, on a test basis, evidence supporting the amounts and disclosures in the financial statements, assessing the accounting principles used and significant estimates made by management, and evaluating the overall financial statement presentation. We believe that our audit provides a reasonable basis for our opinion.
In our opinion, the financial statements referred to above present fairly, in all material respects, the consolidated financial position of Yak Communications Inc. and subsidiaries at June 30, 2006, and the consolidated results of their operations and their cash flows for the year ended June 30, 2006, in conformity with U.S. generally accepted accounting principles.
| | | | |
Toronto, Canada September 1, 2006, except for Note 17
which is as of September 20, 2006. | | | | /s/ Ernst & Young LLP Chartered Accountants |
F-1

REPORT OF INDEPENDENT REGISTERED PUBLIC ACCOUNTING FIRM
To the Board of Directors and Stockholders of
Yak Communication Inc. and Subsidiaries
We have audited the accompanying consolidated balance sheets ofYak Communication Inc. and Subsidiaries (the“Company”)as of June 30, 2005 and 2004 and the related consolidated statements of income and comprehensive income, stockholders’ equity and cash flows for each of the years in the two-year period ended June 30, 2005. These consolidated financial statements are the responsibility of the Company’s management. Our responsibility is to express an opinion on these consolidated financial statements based on our audits.
We conducted our audits in accordance with auditing standards generally accepted in the United States of America including the standards of the Public Company Accounting Oversight Board. Those standards require that we plan and perform the audit to obtain reasonable assurance about whether the consolidated financial statements are free of material misstatement. An audit includes examining, on a test basis, evidence supporting the amounts and disclosures in the financial statements. An audit also includes assessing the accounting principles used and significant estimates made by management, as well as evaluating the overall consolidated financial statement presentation. We believe that our audits provide a reasonable basis for our opinion.
In our opinion, such consolidated financial statements referred to above present fairly, in all material respects, the financial position of Yak Communication Inc. and Subsidiaries as of June 30, 2005 and 2004 and the results of their operations and their cash flows for each of the two years in the period ended June 30, 2005, in conformity with accounting principles generally accepted in the United States of America.
/s/ Horwath Orenstein LLP
Chartered Accountants
Toronto, Canada
March 31, 2006
F-2
YAK COMMUNICATIONS INC. AND SUBSIDIARIES
CONSOLIDATED BALANCE SHEETS
| | | | | | |
(in $ thousands) | | June 30, 2006 | | | June 30, 2005 | |
| | | $ | | | $ | |
ASSETS | | | | | | |
Current | | | | | | |
Cash and cash equivalents | | 15,840 | | | 16,751 | |
Accounts receivable | | 16,219 | | | 16,709 | |
Less: Allowance for doubtful accounts | | (460 | ) | | (489 | ) |
Prepaid expenses and other assets | | 883 | | | 1,413 | |
| | | | | | |
Total current assets | | 32,482 | | | 34,384 | |
Property and equipment, net | | 12,977 | | | 13,559 | |
Deferred income taxes | | 2,018 | | | 2,787 | |
Intangibles, net | | 1,497 | | | 2,005 | |
Goodwill | | 552 | | | 503 | |
| | | | | | |
| | 49,526 | | | 53,238 | |
| | | | | | |
LIABILITIES | | | | | | |
Current | | | | | | |
Accounts payable | | 8,067 | | | 9,614 | |
Accrued liabilities | | 1,899 | | | 2,477 | |
Due to related party | | 23 | | | 182 | |
Unearned revenue | | 811 | | | 1,096 | |
Income taxes payable | | 2,529 | | | 3,547 | |
Current portion of obligations under capital leases | | 823 | | | 511 | |
Obligations under warrants | | 777 | | | 1,093 | |
| | | | | | |
Total current liabilities | | 14,929 | | | 18,520 | |
Non-current liabilities | | | | | | |
Deferred income taxes | | 796 | | | 1,990 | |
Obligations under capital leases | | 248 | | | 977 | |
| | | | | | |
| | 15,973 | | | 21,487 | |
Commitments and contingencies | | | | | | |
STOCKHOLDERS’ EQUITY | | | | | | |
Common stock, no par value per share: authorized 100,000,000 shares, issued and outstanding 12,905,250 shares (12,897,250 in 2005) | | 225 | | | 225 | |
Additional paid-in capital | | 17,314 | | | 16,952 | |
Accumulated other comprehensive income | | 3,148 | | | 1,343 | |
Retained earnings | | 12,866 | | | 13,231 | |
| | | | | | |
| | 33,553 | | | 31,751 | |
| | | | | | |
| | 49,526 | | | 53,238 | |
| | | | | | |
The accompanying notes are an integral part of these consolidated financial statements.
F-3
YAK COMMUNICATIONS INC. AND SUBSIDIARIES
CONSOLIDATED STATEMENTS OF STOCKHOLDERS’ EQUITY
| | | | | | | | | | | | | | | | |
(in thousands) | | —Common stock—1, 2 | | Additional
paid-in capital | | | Accumulated other comprehensive income | | | Retained earnings | | | Total stockholders’ equity | |
| | Shares | | Amount | | | | |
| | | | | $ | | $ | | | $ | | | $ | | | $ | |
Balance, June 30, 2003 | | 9,133 | | 199 | | 2,050 | | | 477 | | | 3,002 | | | 5,728 | |
Foreign currency translation adjustment | | — | | — | | — | | | (364 | ) | | — | | | (364 | ) |
Common stock issued to obtain note payable | | 20 | | — | | 90 | | | — | | | — | | | 90 | |
Common stock issued in exchange for stock options surrendered | | 2,261 | | 11 | | (11 | ) | | — | | | — | | | — | |
Common stock issued for services rendered | | 9 | | — | | 51 | | | — | | | — | | | 51 | |
Stock-based compensation expense | | — | | — | | 26 | | | — | | | — | | | 26 | |
Common stock issued for cash | | 1,470 | | 15 | | 14,636 | | | — | | | — | | | 14,651 | |
Net earnings | | — | | — | | — | | | — | | | 5,466 | | | 5,466 | |
| | | | | | | | | | | | | | | | |
Balance, June 30, 2004 | | 12,893 | | 225 | | 16,842 | | | 113 | | | 8,468 | | | 25,648 | |
Foreign currency translation adjustment | | — | | — | | — | | | 1,230 | | | — | | | 1,230 | |
Common stock issued for services rendered | | 4 | | — | | 29 | | | — | | | — | | | 29 | |
Stock-based compensation expense | | — | | — | | 81 | | | — | | | — | | | 81 | |
Net earnings | | — | | — | | — | | | — | | | 4,763 | | | 4,763 | |
| | | | | | | | | | | | | | | | |
Balance, June 30, 2005 | | 12,897 | | 225 | | 16,952 | | | 1,343 | | | 13,231 | | | 31,751 | |
Foreign currency translation adjustment | | — | | — | | — | | | 1,805 | | | — | | | 1,805 | |
Common stock issued for services rendered | | 8 | | — | | 29 | | | — | | | — | | | 29 | |
Accrued share-based compensation4 | | — | | — | | 30 | | | — | | | — | | | 30 | |
Stock-based compensation expense | | — | | — | | 303 | | | — | | | — | | | 303 | |
Net earnings (loss) | | — | | — | | — | | | — | | | (365 | ) | | (365 | ) |
| | | | | | | | | | | | | | | | |
Balance, June 30, 2006 | | 12,905 | | 225 | | 17,314 | | | 3,148 | | | 12,866 | | | 33,553 | |
| | | | | | | | | | | | | | | | |
| (1) | On January 29, 2004 a two-for-one stock split of the Company’s outstanding shares occurred. The common share figures presented reflect the two-for-one split as if it had occurred as of June 30, 2003. |
| (2) | Common stock, with no par value, 100,000,000 shares authorized. |
| (3) | Series A Preferred Stock, with no par value, 1,000,000 shares authorized, nil issued. |
| (4) | Amount accrued for 10,000 shares authorized and not issued, valued at the market closing price on June 30, 2006. |
| (5) | Subsequent to year-end, 60,000 shares were issued to the Board of Directors, including the 10,000 authorized and accrued at year-end. |
The accompanying notes are an integral part of these consolidated financial statements.
F-4
YAK COMMUNICATIONS INC. AND SUBSIDIARIES
CONSOLIDATED STATEMENTS OF INCOME AND COMPREHENSIVE INCOME
| | | | | | | | | |
(in $ thousands) | | Year Ended
June 30,
2006 | | | Year Ended
June 30,
2005 | | | Year Ended June 30, 2004 | |
| | | $ | | | $ | | | $ | |
Net revenue | | 92,397 | | | 92,700 | | | 80,802 | |
Cost of revenue¹ | | 55,304 | | | 57,636 | | | 53,149 | |
| | | | | | | | | |
Contribution margin | | 37,093 | | | 35,064 | | | 27,653 | |
| | | | | | | | | |
Operating expenses | | | | | | | | | |
General and administration | | 22,433 | | | 18,124 | | | 11,081 | |
Professional fees for related parties | | 241 | | | 458 | | | 236 | |
Stock-based compensation | | 303 | | | 81 | | | 26 | |
Bad debt expense | | 286 | | | 373 | | | 138 | |
Sales and marketing | | 6,832 | | | 7,293 | | | 3,894 | |
Depreciation and amortization | | 3,222 | | | 2,943 | | | 2,980 | |
Writedown of property and equipment | | 3,587 | | | — | | | 313 | |
| | | | | | | | | |
Total operating expenses | | 36,904 | | | 29,272 | | | 18,668 | |
| | | | | | | | | |
Income from operations | | 189 | | | 5,792 | | | 8,985 | |
| | | | | | | | | |
Other expenses (income) | | | | | | | | | |
Interest expense | | 131 | | | 893 | | | 969 | |
Interest earned | | (419 | ) | | (406 | ) | | (159 | ) |
Long–term debt discount amortization | | — | | | 391 | | | 535 | |
Income from joint marketing agreement | | — | | | (421 | ) | | (539 | ) |
Gain on settlement of note payable | | — | | | (1,242 | ) | | — | |
Change in fair value of obligation under warrants | | (316 | ) | | (583 | ) | | (497 | ) |
Other expenses | | — | | | — | | | 328 | |
| | | | | | | | | |
| | (604 | ) | | (1,368 | ) | | 637 | |
| | | | | | | | | |
Earnings before income taxes | | 793 | | | 7,160 | | | 8,348 | |
Provision for income taxes | | 1,158 | | | 2,397 | | | 2,882 | |
| | | | | | | | | |
Net earnings (loss) | | (365 | ) | | 4,763 | | | 5,466 | |
Other comprehensive income | | 1,805 | | | 1,230 | | | (364 | ) |
| | | | | | | | | |
Comprehensive income | | 1,440 | | | 5,993 | | | 5,102 | |
| | | | | | | | | |
Basic earnings (loss) per share | | (0.03 | ) | | 0.37 | | | 0.51 | |
| | | | | | | | | |
Diluted earnings (loss) per share | | (0.03 | ) | | 0.37 | | | 0.48 | |
| | | | | | | | | |
Weighted average number of common shares outstanding – basic | | 12,902 | | | 12,895 | | | 10,706 | |
| | | | | | | | | |
Weighted average number of common shares – diluted | | 12,902 | | | 12,901 | | | 11,405 | |
| | | | | | | | | |
| (1) | Excludes depreciation and amortization of $2,618, $2,359 and $2,767 respectively. |
The accompanying notes are an integral part of these consolidated financial statements.
F-5
YAK COMMUNICATIONS INC. AND SUBSIDIARIES
CONSOLIDATED STATEMENTS OF CASH FLOWS
| | | | | | | | | |
(in $ thousands) | | Year Ended June 30, 2006 | | | Year Ended June 30, 2005 | | | Year Ended June 30, 2004 | |
| | | $ | | | $ | | | $ | |
CASH FLOWS FROM (USED IN) OPERATING ACTIVITIES | | | | | | | | | |
Net earnings (loss) | | (365 | ) | | 4,763 | | | 5,466 | |
Adjustments for | | | | | | | | | |
Amortization of discount on note payable | | — | | | 391 | | | 535 | |
Depreciation and amortization | | 3,222 | | | 2,943 | | | 2,980 | |
Foreign exchange loss | | 429 | | | — | | | — | |
Deferred income taxes | | (1,727 | ) | | (527 | ) | | 2,590 | |
Writedown of property and equipment | | 3,587 | | | — | | | 313 | |
Impairment of loan receivable | | — | | | 499 | | | — | |
Gain on settlement of note payable | | — | | | (1,242 | ) | | — | |
Stock-based compensation expense | | 333 | | | 81 | | | 26 | |
Loss on impairment of joint venture receivable | | — | | | — | | | 277 | |
Loss on sale of property, equipment and software | | — | | | 93 | | | — | |
Common stock issued through business operations | | 29 | | | 29 | | | 141 | |
Share of net (gain)/loss of affiliate | | — | | | — | | | (39 | ) |
Change in fair value of obligation under warrants | | (316 | ) | | (583 | ) | | (497 | ) |
Changes in assets and liabilities | | (1,434 | ) | | (3,883 | ) | | 316 | |
| | | | | | | | | |
Cash from operating activities | | 3,758 | | | 2,564 | | | 12,108 | |
| | | | | | | | | |
CASH FLOWS FROM (USED IN) INVESTING ACTIVITIES | | | | | | | | | |
Purchase of property and equipment | | (4,263 | ) | | (6,077 | ) | | (5,612 | ) |
Purchase of intangibles | | — | | | (713 | ) | | — | |
Refund on customer list | | 107 | | | — | | | — | |
Proceeds from sale of property, equipment, and software | | — | | | 13 | | | — | |
Purchase of shares of Contour Telecom | | — | | | — | | | (5,473 | ) |
Return of capital from investment in Odyssey Management Group, Inc | | — | | | — | | | 510 | |
Foreign exchange difference on purchase of shares of Contour Telecom | | — | | | — | | | 52 | |
Loan receivable | | — | | | (54 | ) | | (285 | ) |
| | | | | | | | | |
Cash used in investing activities | | (4,156 | ) | | (6,831 | ) | | (10,808 | ) |
| | | | | | | | | |
CASH FLOWS FROM (USED IN) FINANCING ACTIVITIES | | | | | | | | | |
Issuance of common shares | | — | | | — | | | 16,823 | |
Repayments on obligations under capital leases | | (532 | ) | | (496 | ) | | (35 | ) |
Repayments on advances from TELUS Communications Inc | | (395 | ) | | (1,333 | ) | | (1,028 | ) |
Repayments on notes payable | | — | | | — | | | (567 | ) |
Receipt of principal portion of joint venture receivable | | — | | | 215 | | | 374 | |
| | | | | | | | | |
Cash from (used in) financing activities | | (927 | ) | | (1,614 | ) | | 15,567 | |
| | | | | | | | | |
EFFECT OF EXCHANGE RATE CHANGES ON CASH AND CASH EQUIVALENTS | | 414 | | | 483 | | | (161 | ) |
| | | | | | | | | |
(DECREASE) INCREASE IN CASH AND CASH EQUIVALENTS | | (911 | ) | | (5,398 | ) | | 16,706 | |
CASH AND CASH EQUIVALENTS, BEGINNING OF PERIOD | | 16,751 | | | 22,149 | | | 5,443 | |
| | | | | | | | | |
CASH AND CASH EQUIVALENTS, END OF PERIOD | | 15,840 | | | 16,751 | | | 22,149 | |
| | | | | | | | | |
Supplemental disclosure of cash flow information: | | | | | | | | | |
Interest paid | | 132 | | | 893 | | | 1,646 | |
Taxes paid | | 4,047 | | | 736 | | | 1,361 | |
Supplemental disclosure of non–cash investing and financing activities: | | | | | | | | | |
Capital leases for acquisition of furniture and equipment | | — | | | 312 | | | 1,473 | |
Accrued purchases of property, plant and equipment | | 210 | | | 365 | | | 444 | |
The accompanying notes are an integral part of these consolidated financial statements.
F-6
YAK COMMUNICATIONS INC. AND SUBSIDIARIES
NOTES TO CONSOLIDATED FINANCIAL STATEMENTS
(in thousands, except share and per share data)
Note 1 – Description of business and principles of consolidation
The consolidated financial statements include the accounts of Yak Communications Inc. and its wholly owned subsidiaries Yak Communications (Canada) Inc., Yak Communications (America) Inc. and Contour Telecom Inc. These entities combined are referred to as “Yak” or the “Company” in these consolidated financial statements. Yak Communications Inc. was incorporated in the State of Florida on December 24, 1998 and operates as a holding company of its wholly-owned subsidiaries in the United States and Canada.
Yak is a switch-based reseller providing a variety of discount long distance services primarily in Canada and to a lesser degree the United States, to residential and small business markets, as well as telecommunications management services to large enterprises in Canada. The Company also provides Voice over Internet Protocol (“VoIP”) services to customers in Canada, the United States and internationally.
The Company began offering its services to consumers in Canada in July 1999 and in the United States commencing December 2001.
The Board of Directors of the Company have determined that the Company should explore various strategic alternatives available to the Company to maximize shareholder value. Subsequent to the year end, the Company entered into a definitive merger agreement with an independent third party. See Note 17.
Note 2 – Previously reported restatements
On May 31, 2005, the Company restated its consolidated financial statements for the fiscal years ended June 30, 2003 and 2004. Further, on September 27, 2005, the Company completed further adjustments to the above described restatement to correct for an error in the initial restatement. At that time, the Company made further amendments to its June 30, 2003 and 2004 annual reports. As a result of these corrections, the Company amended its Annual Report filed on Form 10-K/A for the year ended June 30, 2005 to correct the amounts previously reported in its consolidated financial statements for fiscal years 2003 and 2004, as well as each of the quarters in fiscal years 2004 and for the first three quarters of fiscal 2005.
On April 21, 2006, the Company filed Amendment No. 2 to its Annual Report on Form 10-K for the year ended June 30, 2005 and amendments to its Quarterly Reports on Form 10-Q for the first and second quarters ended September 30 and December 31, 2005, respectively, to correct certain accounting errors and disclosure deficiencies in its previously issued public filings. The Company restated its previously issued financial statements (including the comparative years of 2003 and 2004) to correct for the errors and deficiencies described below:
| | A. | To correct for the misapplication of SFAS 133, SFAS 150 and EITF 00-19 related to the 2004 issuance of detachable warrants (the “Warrants”); |
| | B. | To correct for segment disclosure deficiencies under SFAS 131; |
| | C. | To correct for errors in its Cash Flow Statements; and |
| | D. | To correct for the fiscal 2005 misclassification of financing expenses related to assignment of accounts receivable. |
The nature and details of the restatements are more fully disclosed in note 5 to consolidated financial statements included in its Form 10K/A No.2 for the year ended June 30, 2005, filed with the SEC.
F-7
Note 3 – Summary of significant accounting policies
Basis of presentation
The accompanying consolidated financial statements have been prepared in U.S. dollars, in accordance with generally accepted accounting principles in the United States (“U.S. GAAP”) for financial reporting.
All inter-company accounts and transactions have been eliminated upon consolidation.
Certain balances in the financial statements as of and for the years ended June 30, 2005 and 2004 have been reclassified to conform to the current period’s presentation. These changes had no effect on the previously reported net loss, total assets, liabilities or stockholders’ equity.
Revenue recognition
Revenue is recognized when persuasive evidence of an arrangement exists, delivery has occurred or services have been rendered, the Company’s price to the customer is fixed and determinable, and collection of the resulting receivable is reasonably assured. Revenue is derived from telecommunications usage based on minutes of use. Revenue derived from usage is recognized as services are provided, based on agreed upon usage rates. Revenue is recorded net of estimated customer credits and rejected calls, which are recorded at the same time the corresponding revenue is recognized. Revenue from billings for services rendered where collectibility is not assured is recognized when the cash is collected.
Cash and cash equivalents
The Company considers all highly liquid investments with an original maturity at acquisition of three months or less to be cash equivalents. The Company maintains its cash and cash equivalents primarily with financial institutions in Toronto, Canada. These accounts may from time to time exceed federally insured limits. The Company has not experienced any losses on such accounts.
Allowance for doubtful accounts
The Company evaluates the collectibility of its receivables at least quarterly, based upon various factors including the financial condition and payment history of major customers, and overall review of collections experience on other accounts and economic factors or events expected to affect the Company’s future collections experience.
Property and equipment
Property and equipment including software (including assets under capital leases) is stated at cost less accumulated amortization. Amortization is computed on individual assets using the declining balance method as follows:
| | | |
Telecommunication switching systems | | 11% to 20 | % |
Billing, administration and customer service systems | | 20 | % |
Office furniture and equipment | | 20 | % |
Installed lines | | 20 | % |
Carrier identification codes | | 20 | % |
Leasehold improvements are amortized over the initial term of the lease.
Cost includes major expenditures for improvements and replacements which extend useful lives or increase capacity of assets as well as expenditures necessary to place assets into readiness for use. Expenditures for maintenance and repairs are expensed as incurred. In accordance with Statement of Position 98-1,Accounting for the Costs of Computer Software Developed or Obtained for Internal Use(“SOP 98-1”), costs for internal use software that are incurred in the preliminary project stage and in the post-implementation stage are expensed as incurred. Costs incurred during the application development stage are capitalized and amortized over the estimated useful life of the software, beginning when the software is placed into use.
F-8
Impairment of long-lived assets
In accordance with Statement of Financial Accounting Standard (“SFAS”) No. 144,Accounting for the Impairment or Disposal of Long-Lived Assets(“SFAS No. 144”), the Company reviews long-lived assets for impairment whenever facts and circumstances indicate that the carrying amounts of such assets may not be recoverable. An impairment loss is recognized only if the carrying amount of the asset is not recoverable and exceeds its fair value. Recoverability of assets to be held and used is assessed by comparing the carrying amount of an asset to the estimated undiscounted future net cash flows expected to be generated by the asset. If the asset’s carrying value is not recoverable, an impairment charge is recognized for the amount by which the carrying amount of the asset exceeds its fair value. Fair values are determined by using a combination of comparable market values and discounted cash flows as appropriate.
Goodwill and intangible assets
The Company accounts for goodwill and intangible assets in accordance with SFAS No. 141,Business Combinations(“SFAS 141”), and SFAS No. 142,Goodwill and Other Intangible Assets (“SFAS 142”). All business combinations are accounted for using the purchase method. Goodwill is not amortized, but is tested for impairment at least annually. Intangible assets are recorded based on estimates of fair value at the time of the acquisition and finite life intangibles are amortized over their estimated useful lives.
The Company assesses the fair value of goodwill based upon a discounted cash flow methodology. If the carrying amount of the net assets of the reporting unit to which the goodwill relates exceeds the estimated fair value of the reporting unit determined through the discounted cash flow analysis, goodwill impairment may be present. The Company would measure the goodwill impairment loss based upon the fair value of the underlying assets and liabilities, and estimate the implied fair value of goodwill. An impairment loss would be recognized to the extent that the recorded value of goodwill exceeded the implied fair value of goodwill. The Company tests for impairment annually at June 30 of each year. No impairment was present upon the performance of these tests in 2006, 2005 and 2004. We cannot predict the occurrence of future events that might adversely affect the reported value of goodwill. Such events may include, but are not limited to, strategic decisions made in response to economic and competitive conditions, and judgments on the validity of the Company’s prospects or due to other factors not known to management at this time.
Advertising costs
Advertising production costs are expensed the first time the advertisement is run. Media (television and print) placement costs are expensed in the month the advertising appears. The Company expensed $6,476, $6,510 and $3,213 in advertising costs for the years ended June 30, 2006, 2005 and 2004, respectively.
Income taxes
The Company records deferred taxes in accordance with SFAS No. 109,Accounting for Income Taxes (“SFAS 109”). The statement requires recognition of deferred tax assets and liabilities for temporary differences between the tax bases of assets and liabilities and the amounts at which they are carried in the financial statements, based upon the enacted tax rates in effect for the year in which the differences are expected to reverse. A valuation allowance is established when necessary to reduce deferred tax assets to the amount expected to be realized.
The Company operates throughout North America and is therefore subject to income taxes in multiple jurisdictions. The income tax expense reported in the statement of operations is based on a number of different estimates made by management. The effective tax rate can change from year to year based on the mix of income or loss among the different jurisdictions in which the Company operates, changes in tax laws in these jurisdictions, and changes in the estimated realizable values of deferred tax assets and liabilities recorded on the balance sheet. The income tax expense reflects an estimate of cash taxes expected to be paid in the current year, as well as a provision for changes arising in the value of deferred tax assets and liabilities. The likelihood of recovering value from deferred tax assets such as loss carryforwards and the future tax depreciation of capital assets are assessed at each quarter-end and a valuation allowance may be established or modified. Changes in the amount of the valuation allowance required can materially
F-9
increase or decrease the tax expense in a period. Significant judgment is applied to determine the appropriate amount of valuation allowance to record.
Foreign currency translation and foreign assets
In accordance with SFAS No. 52,Foreign Currency Translation(“SFAS 52”), assets and liabilities of the Company’s foreign subsidiary are translated into United States dollars at the exchange rates in effect on the reporting date. Income and expenses are translated at an average exchange rate for the respective period. For the foreign subsidiary, which utilizes its local currency as its functional currency, the resulting translation gains and losses are included in other comprehensive income. Other gains or losses resulting from foreign currency transactions are reflected in earnings.
Stock-based compensation
At June 30, 2006, the Company has a stock-based compensation plan, which is described more fully in these notes to the financial statements. Prior to July 1, 2005, the Company accounted for stock based compensation under the recognition and measurement provisions of APB Opinion No. 25,Accounting for Stock Issued to Employees, and related Interpretations (“Opinion 25”), as permitted by SFAS No. 123,Accounting for Stock-Based Compensation (SFAS 123”).
Effective July 1, 2005, the Company adopted the fair value recognition provisions of SFAS 123(R),Share Based Payment (“SFAS 123 (R)”), using the modified-prospective-transition method. Under that transition method, compensation cost recognized in fiscal 2006 includes: (a) compensation cost for all share-based payments granted prior to, but not yet vested as of July 1, 2005, based on the grant date fair value estimated in accordance with the original provisions of SFAS 123, and (b) compensation cost for all share-based payments granted, modified, repurchased, or cancelled subsequent to July 1, 2005. Results for prior periods are not restated. No options were granted, modified or repurchased and 50,000 options were forfeited during the twelve months ended June 30, 2006.
As a result of adopting SFAS 123(R) on July 1, 2005, the Company’s income before income taxes and net income for the year ended June 30, 2006 are lower by $222. The tax effect of the adoption of SFAS 123(R) on the Company’s net income is not considered significant. Basic and diluted earnings per share for the twelve months ended June 30, 2006 are $0.02 lower than if the Company had continued to account for share-based compensation under Opinion 25.
Prior to the adoption of SFAS 123(R), the Company was required to present all tax benefits of deductions resulting from the exercise of stock options as operating cash flows in the Statement of Cash Flows. SFAS 123(R) requires the cash flows from the tax benefits resulting from tax deductions in excess of the compensation cost recognized for those options (excess tax benefits) to be classified as financing cash flows.
The following table illustrates the effect on net income and earnings per share if the Company had applied the fair value recognition provisions of SFAS 123 to options granted under the Company’s stock option plans in all periods presented. For purposes of this pro forma disclosure, the value of the options is estimated using a Black-Scholes-Merton option pricing formula and amortized to expense over the options’ vesting periods.
F-10
| | | | | | | | |
| | | Year Ended June 30, 2005 | | | Year Ended June 30, 2004 | |
Net earnings | | $ | 4,763 | | | $ | 5,466 | |
Add: Stock-based employee compensation expense included in reported net earnings, net of related tax effects. | | | 81 | | | | 26 | |
Deduct: Total stock-based employee compensation expense determined under fair value based method for all awards, net of related tax effects | | | (210 | ) | | | (162 | ) |
| | | | | | | | |
Pro forma net earnings | | $ | 4,634 | | | $ | 5,330 | |
| | | | | | | | |
Earnings per share | | | | | | | | |
Basic — as reported | | $ | 0.37 | | | $ | 0.51 | |
| | | | | | | | |
Basic — pro forma | | $ | 0.36 | | | $ | 0.49 | |
| | | | | | | | |
Diluted — as reported | | $ | 0.37 | | | $ | 0.48 | |
| | | | | | | | |
Diluted — pro forma | | $ | 0.36 | | | $ | 0.47 | |
| | | | | | | | |
Fair value of financial instruments
The carrying amounts of cash and cash equivalents, accounts receivable, accounts payable, income taxes payable, due to related party and accrued liabilities approximate fair value because of their generally short maturities. The carrying value of the capital leases is a reasonable estimate of their fair value based on current rates for equipment obligations. The liability for detachable warrants outstanding is adjusted to fair value at the end of each period in accordance with SFAS No. 133,Accounting for Derivative Instruments and Hedging Activities, with the applicable gain or loss recorded in the earnings of that period.
Obligation under warrants and registration rights agreement
On March 16, 2004, the Company entered into a Securities Purchase Agreement regarding the sale of 1,470,000 newly-issued shares of the Company’s common stock to a small number of institutional and other accredited investors (the “Investors”). In connection with this share issuance, the Company issued common stock purchase warrants (“Warrants”) entitling the Investors to acquire up to 367,500 shares of common stock through March 16, 2010, subject to adjustment (i.e., anti-dilution provisions). The exercise price is $17.00 per share subject to adjustment as set forth in the Warrant Document. The exercise methods are as follows:
| | • | | Physical settlement: The Investors may exercise the Warrants in whole or in part by paying the exercise price in cash. Upon payment of the exercise price, the Company is required to deliver the number of shares of common stock purchased; |
| | • | | Net-share settlement or cashless exercise: In certain circumstances, the Investors have the option to exercise the Warrants on a net-share/cashless basis. The Company would then be required to deliver the net number of shares of common stock based on a specified formula; |
| | • | | Net-cash settlement: The Investors would receive a net cash settlement from the Company equal to the fair value of the warrants at the time of settlement under certain circumstances (merger or consolidation of the Company, sale of all or substantially all of its assets, tender offer or exchange offer, reclassification of the Common Stock, or any compulsory share exchange pursuant to which the Common Stock is effectively converted into or exchanged for other securities, cash or property) and no shares are exchanged between the two parties; and |
| | • | | The Investors are limited with respect to the exercise of the Warrants, if such exercise would result in their ownership of the Company’s common stock exceeding 9.999%. |
If, at any time while the Warrants are outstanding and the Company effects any “Fundamental Transaction” (including, merger, consolidation, sale of all or substantially all of its assets in one or a series of related transactions or tender offer or exchange offer) then the Holder shall have the right to purchase and receive upon exercise of the Warrant, such shares of stock, securities or assets as would have been issuable upon exercise had such a Fundamental Transaction not taken place or, require the repurchase of the Warrant for a purchase price, equal to the Black Scholes value of the remaining unexercised portion of the Warrant on the date of such request.
The Company accounts for the detachable Warrants issued in 2004 in accordance with the provisions of SFAS No. 150,Accounting for Certain Financial Instruments with Characteristics of both Liabilities and Equity (“SFAS No. 150”), SFAS No. 133,Accounting for Derivative Instruments and Hedging Activities (“SFAS No. 133”) along with the related interpretations in EITF No. 00-19,Accounting for Derivative Financial Instruments Indexed to, and Potentially Settled in, a Company’s Own Stock (“EITF 00-19”). SFAS No. 133 requires every derivative instrument (including certain derivative instruments embedded in other contracts) to be recorded as either an asset or liability measured at their fair value, with changes in the derivative’s fair value recognized in earnings. The Company made the determination that the detachable
F-11
Warrants issued in 2004 are a derivative instrument and measured its fair value at $2,173 at inception. Additionally, at the end of each reporting period, the accounting standard requires the Company to record the outstanding derivatives at fair value, resulting in an adjustment to the recorded liability related to the Warrants, and a gain or loss in the applicable reporting period. Since the inception of the Warrants, the fair value measured using the Black-Scholes model has declined and the Company has recorded a cumulative pre-tax gain of $1,396. The Black-Scholes option-pricing model requires management to make assumptions on the expected volatility, the risk-free interest rate and the instrument’s expected remaining life. These assumptions require significant management judgment.
Use of estimates
The preparation of financial statements in conformity with U.S. GAAP requires management to make estimates and assumptions that affect the reported amounts of assets and liabilities and the disclosure of contingent assets and liabilities at the date of the financial statements and the reported amounts of revenues and expenses during the reporting period. Actual results could differ from those estimates.
Significant estimates include revenue recognition, the allowance for doubtful accounts, fair value estimates necessary in purchase accounting and the ultimate recoverability of intangibles and other long-lived assets, valuation of deferred tax assets, accrued obligations and contingencies surrounding litigation, share based compensation and the fair value of the warrants. These estimates have the potential to have a significant impact on our financial statements, either because of the significance of the financial statement item to which they relate, or because they require judgment and estimation due to the uncertainty involved in measuring, at a specific point in time, events which are continuous in nature.
The Company is involved from time to time in various legal matters arising out of its operations in the normal course of business. On a case by case basis, the Company evaluates the likelihood of possible outcomes for this litigation. Based on this evaluation, the Company determines whether the recognition of a liability is appropriate. If the likelihood of a negative outcome is probable, and the amount is estimable, the Company accounts for the liability in the current period. A change in the circumstances surrounding any current litigation could have a material impact on the financial statements.
For the purposes of the Canadian Radio-television and Telecommunications Commission (“CRTC”), the Company is an inter-exchange carrier (“IXC”). As part of normal business operations, the Company incurs switching and aggregation charges (“S&A”). S&A represents the interconnect charges the IXC pays to the local exchange carrier (LEC) for each minute of traffic carried over the IXC’s network that originated with, or was terminated by, the LEC. S&A charges are set by the CRTC based on the underlying LEC costs for performing the service. In Telecom Decision CRTC 2002-34 (May 30, 2002), the CRTC declared the S&A charges ‘interim’ and requested all Incumbent Local Exchange Carriers (“ILECs”) to file updated cost studies and revised rates for S&A services. As a result of the interim status, IXCs became entitled to retroactive adjustments for all S&A charges paid subsequent to May 30, 2002. The interim rates were adjusted in Order 2002-384 (September 2002), and 2002-412 (October 2002) and finalized on April 27, 2006 in CRTC decisions 2006-22 and 2006-23. As of June 5, 2006, the Company requested that each applicable LEC provide it with its entitled rebate and sufficient information about the calculation of the rebate. While the Company acknowledges that LECs should eventually pay on account of S&A credits owed, the Company’s past experience indicates that measurement of the credits is likely to be contested and timely repayment of the credits may not be assured, thereby creating uncertainty in the Company’s ability to reliably estimate the credit that will be realized. The Company therefore did not recognize an asset for the S&A receivable at June 30, 2006.
Concentrations
Concentrations of risk with third party providers:
The Company utilizes the services of certain local exchange carriers (“LECs”) to bill and collect from customers for a significant portion of its revenues. If the LECs were unable or unwilling to provide such services in the future, the Company would be required to significantly enhance its billing and collection capabilities in a short amount of time and its collection experience may be adversely affected during this transition period. If the LECs were unable to remit payments received from their customers relating to the Company’s billings, the Company’s operations and cash position may be adversely affected.
F-12
The Company depends on certain large telecommunications carriers to provide network services for significant portions of the Company’s telecommunications traffic. If these carriers were unwilling or unable to provide such services in the future, the Company’s ability to provide services to its customers may be adversely affected and the Company might not be able to obtain similar services from alternative carriers on a timely basis or on terms favorable to the Company.
Concentrations of credit risk
The Company’s retail telecommunications subscribers are primarily residential and small business subscribers in Canada and the United States. The Company’s customers are generally concentrated in the areas of highest population in Canada and the United States. No single customer accounted for over 10% of revenues in the years ended June 30, 2006, 2005 or 2004. The Company monitors the credit worthiness of its larger carriers and retail business customers.
Recent accounting pronouncements
On June 7, 2005, the FASB issued Statement No. 154,Accounting Changes and Error Corrections, (“SFAS 154”), a replacement of APB Opinion No. 20,Accounting Changes, and Statement No. 3,Reporting Accounting Changes in Interim Financial Statements. SFAS 154 changes the requirements for the accounting for and reporting of a change in accounting principle. Previously, most voluntary changes in accounting principles required recognition of a cumulative effect adjustment within net income of the period of the change. SFAS 154 requires retrospective application to prior periods’ financial statements, unless it is impracticable to determine either the period-specific effects or the cumulative effect of the change. SFAS 154 is effective for accounting changes made in fiscal years beginning after December 15, 2005; however, the statement does not change the transition provisions of any existing accounting pronouncements. We do not believe adoption of SFAS 154 will have a material effect on our consolidated financial position, results of operations or cash flows.
In July 2006, the FASB issued FIN 48,Accounting for Uncertainty in Income Taxes(“FIN 48”). FIN 48 is an interpretation of SFAS 109, and prescribes a recognition threshold and measurement attribute for the financial statement recognition and measurement of a tax position taken or expected to be taken in a tax return. This Interpretation also provides guidance on derecognition, classification, interest and penalties, accounting in interim periods, disclosure and transition. FIN 48 also requires expanded disclosure with respect to the uncertainty incumbent in calculating income taxes. This Interpretation is effective for fiscal years beginning after December 15, 2006. We are currently evaluating the impact, if any, of FIN 48 on our financial position, results of operations, and cash flows.
F-13
Note 4 – Property and equipment
| | | | | | | | | | | | | | | | | | | | | |
| | | Yak Canada | | | Yak for Business | | | Contour | | | Yak America | | | WorldCity VoIP | | | June 30, 2006 | | | June 30, 2005 | |
Telecommunication switching systems | | 9,524 | | | 712 | | | — | | | 9 | | | 1,494 | | | 11,739 | | | 8,353 | |
Telecommunication software | | — | | | — | | | — | | | — | | | — | | | — | | | 4,067 | |
Billing, administration and customer service systems | | 3,296 | | | 646 | | | 544 | | | 25 | | | 14 | | | 4,525 | | | 3,657 | |
Office furniture and equipment | | 1,479 | | | 1,529 | | | 363 | | | 7 | | | 882 | | | 4,260 | | | 3,329 | |
Installed lines | | 2,477 | | | — | | | — | | | — | | | — | | | 2,477 | | | 1,963 | |
Leasehold improvements | | 763 | | | 103 | | | 73 | | | — | | | — | | | 939 | | | 723 | |
Carrier identification codes | | — | | | — | | | — | | | 834 | | | — | | | 834 | | | 834 | |
| | | | | | | | | | | | | | | | | | | | | |
Total Cost | | 17,539 | | | 2,990 | | | 980 | | | 875 | | | 2,390 | | | 24,774 | | | 22,926 | |
Accumulated Amortization | | (7,676 | ) | | (2,481 | ) | | (734 | ) | | (360 | ) | | (546 | ) | | (11,797 | ) | | (9,367 | ) |
| | | | | | | | | | | | | | | | | | | | | |
Net Book Value | | 9,863 | | | 509 | | | 246 | | | 515 | | | 1,844 | | | 12,977 | | | 13,559 | |
| | | | | | | | | | | | | | | | | | | | | |
Telecom switching systems include assets under capital leases having gross values of approximately $1,715 and net book values of approximately $1,262 as at June 30, 2006 and $1,756 and $1,463 as at June 30, 2005, respectively. Office furniture and equipment includes assets under capital leases having a gross value of approximately $402 and a net book value of approximately $269 as at June 30, 2006. At June 30, 2005 these office furniture and equipment leases had a gross value of approximately $366 and a net book value of approximately $300. Amortization charges for assets under capital leases are included in depreciation expense.
Note 5 – Write-down of VoIP assets
On June 20, 2003, the Company’s wholly-owned subsidiary, Yak Communications (Canada) Inc. (“Yak Canada”), acquired certain telecommunications software (the “Software”) from Consortio, Inc., a Delaware corporation and Convenxia Limited, a corporation organized under the laws of the United Kingdom (collectively, the “Sellers”), pursuant to the terms and conditions of a Software Acquisition Agreement. The Software required further development over the following two years to become fully functional in order to be used in the new VoIP platform for the provision of internet telephony services. VoIP services were eventually launched in September of 2004 with the ‘yakBasic’ service, a plan for low-cost outbound calls to regular phone numbers and free member-to-member calling for Yak VoIP subscribers. The Software was essential to the performance of this particular service. During the fourth quarter of the fiscal year ended June 30, 2006 the Company discontinued ‘yakBasic’ services and transferred ‘yakBasic’ legacy users to other Yak VoIP services. In conjunction with this decision, the Company recorded in Yak Canada an asset write-off charge of approximately $3,413 in order to reduce the Software’s carrying value to nil.
Note 6 – Goodwill and intangible assets
Goodwill and other intangible assets have arisen from business acquisitions. Goodwill represents the excess of the purchase price over the fair value of identifiable net assets acquired. Other intangible assets include customer lists. The fair value of intangible assets is estimated based upon discounted future cash flow projections and amortized over their estimated economic lives.
The straight-line method of amortization reflects an appropriate allocation of the cost of the intangible assets to earnings in proportion to the amount of economic benefits obtained by the Company in each reporting period. Amortization expense related to intangible assets during the years ended June 30, 2006, 2005 and 2004 were $572, $475 and $400, respectively. Accumulated amortization on intangible assets as at June 30, 2006 was $1,552. Estimated amortization expense for intangible assets for each of the five succeeding fiscal years is as follows:
F-14
| | | |
Years Ended June 30, | | Amount |
2007 | | $ | 545 |
2008 | | $ | 545 |
2009 | | $ | 55 |
2010 | | $ | 55 |
2011 | | $ | 55 |
During the year ended June 30, 2006, the Company extended the estimated useful life of certain intangible assets from four to ten years. This change in estimated life was made due to the Company’s established trend in the determination of the remaining useful life of these assets. As a result of this change in estimate, amortization expense declined by $39.
In March 2005, YFB purchased a customer base from Navigata Communications. The purchase price was determined initially based on a preliminary count of the customer lines transferred, and was to be adjusted six months after the purchase date to reflect the actual number of lines acquired. The transaction was finalized in November 2005 and resulted in a decrease to the cost of customer lists of $107, recorded in the second quarter of the year.
Note 7 – Obligations under capital leases
The Company leases telecommunications equipment, office furniture and computer equipment under capital lease agreements which expire at various dates through 2009. The Company’s capital leases range in terms of 24 to 60 months at annual interest rates ranging from 9.25% to 15.00%.
Future minimum lease payments for the assets under capital leases at June 30, 2006 are as follows:
| | |
For the years ended, | | $ |
June 30, 2007 | | 898 |
June 30, 2008 | | 196 |
June 30, 2009 | | 68 |
June 30, 2010 | | — |
June 30, 2011 | | — |
| | |
Total minimum obligations | | 1,162 |
Interest | | 91 |
| | |
Present value of net minimum obligations | | 1,071 |
Current portion | | 823 |
| | |
Long-term obligations | | 248 |
| | |
Note 8 – Stock option plan
Effective June 30, 1999, the Company adopted a Stock Option Plan (the “Plan”) which permits the issuance of stock options to selected employees and directors. As indicated in Note 2, the Company adopted the fair value recognition provisions of SFAS 123(R) on July 1, 2005. The compensation cost that was recorded for the year ended June 30, 2006 was $303, pursuant to the transition provisions of SFAS 123 (R), and $81 and $26, respectively, pursuant to Opinion 25 for the years ended June 30, 2005 and 2004. The total income tax benefit recognized in the income statement related to options issued under the Plan was insignificant for the years ended June 30, 2006, 2005 and 2004, respectively.
The Company reserved 640,000 shares of common stock for grant under the Plan. The Company’s policy is to issue new shares to satisfy stock option exercises. Options granted may be either nonqualified or incentive stock options and will expire no later than 20 years from the date of grant (10 years for incentive options). Options generally vest over four years, with an equal percentage of options vesting each year. The straight-line recognition method is used to recognize compensation expense over the vesting period. Compensation expense for the year ended June 30, 2006 is based on the fair value of the options on the date of grant, estimated using a Black-Scholes-Merton option-pricing formula and the following assumptions:
| | • | | Risk free interest rate of 3.0% based on the Federal Reserve rates at the time of option grants; |
| | • | | Historical volatility of 79.3% and 60.0% for the years ended June 30, 2005 and 2004, respectively; |
F-15
| | • | | Dividend yield of 0% since dividend payments have never occurred and are not anticipated; and |
| | • | | Expected life of the option equal to its term of 5 years as all options granted were out of the money upon adoption of SFAS 123 (R). |
No options were granted or exercised and 50,000 options have been forfeited since the beginning of the fiscal year.
Information relating to options outstanding as of June 30, 2006, which are vested or expected to vest, is as follows:
| | | | | | | | | | | | | |
| Options Outstanding | | Options Exercisable |
| Exercise Price | | Number
Outstanding | | Weighted-Average
Remaining Contractual
Life (Years) | | Weighted-Average
Exercise Price | | Number Exercisable | | Weighted-Average Exercise Price |
| $ | 6.41 | | 50,000 | | 3.17 | | $ | 6.41 | | 12,500 | | $ | 6.41 |
| $ | 6.50 | | 97,500 | | 0.33 | | $ | 6.50 | | 97,500 | | $ | 6.50 |
| $ | 6.57 | | 50,000 | | 2.83 | | $ | 6.57 | | 25,000 | | $ | 6.57 |
| | | | | | | | | |
| | | Shares | | | Weighted Average Exercise Price | | Weighted Average Remaining Contractual Term (Years) | | Aggregate Intrinsic Value |
| | | | | | $ | | | | $ |
Outstanding, June 30, 2003 | | — | | | — | | — | | — |
Granted (Fair value of stock upon issuance was $7.25) | | 280 | | | 6.51 | | 5.00 | | — |
Exercised | | — | | | — | | — | | — |
Forfeited/expired | | — | | | — | | — | | — |
| | | | | | | | | |
Outstanding, June 30, 2004 | | 280 | | | 6.51 | | 4.38 | | — |
Granted (Fair value of stock upon issuance was $7.30) | | 50 | | | 6.41 | | 5.00 | | — |
Exercised | | — | | | — | | — | | — |
Forfeited/expired | | (50 | ) | | 6.50 | | 3.87 | | — |
| | | | | | | | | |
Outstanding, June 30, 2005 | | 280 | | | 6.50 | | 3.40 | | — |
Granted | | — | | | — | | — | | — |
Exercised | | — | | | — | | — | | — |
Forfeited/expired | | (82.5 | ) | | 6.50 | | 2.59 | | — |
| | | | | | | | | |
Outstanding, June 30, 2006 | | 197,5 | | | 6.49 | | 1.68 | | — |
Exercisable, June 30, 2006 | | 135 | | | 6.50 | | 1.06 | | — |
As of June 30, 2005, there were 58,000 options exercisable with a weighted average exercise price of $6.52 and a weighted average remaining contractual term of 3.47 years.
As of June 30, 2006, there was $240 of total unrecognized compensation costs related to stock options granted under the Plan. This cost is expected to be recognized over a weighted average period of 1.5 years.
In addition to these Stock Option Plans, on December 21, 2000, nonqualified options for 2,568,000 common shares were granted to an individual who is a director and chief executive officer and are exercisable at $0.78 per share on or before December 31, 2003, or upon the sale of the Company. These options were exchanged for 2,260,934 shares of Common Stock on December 30, 2003.
F-16
Note 9 – Income taxes
The domestic and international components of earnings (loss) before income taxes are as follows:
| | | | | | | | | |
| | | 2006 | | | 2005 | | | 2004 | |
| | | $ | | | $ | | | $ | |
Earnings (loss) before income taxes | | | | | | | | | |
Canada | | 9,461 | | | 15,984 | | | 9,518 | |
United States | | (8,668 | ) | | (8,430 | ) | | (1,167 | ) |
International | | — | | | (394 | ) | | (3 | ) |
| | | | | | | | | |
| | 793 | | | 7,160 | | | 8,348 | |
| | | | | | | | | |
The Company’s income tax provision differs from the income tax expense computed at statutory rates as follows:
| | | | | | | | | |
| | | June 30, 2006 | | | June 30, 2005 | | | June 30, 2004 | |
| | | $ | | | $ | | | $ | |
Earnings before income taxes | | 793 | | | 7,160 | | | 8,348 | |
| | | | | | | | | |
Income tax expense, based on a statutory income tax rate of 34% | | 270 | | | 2,434 | | | 2,838 | |
Increase (decrease) in income taxes resulting from: | | | | | | | | | |
Penalties | | 142 | | | — | | | — | |
Foreign tax differential | | 50 | | | 331 | | | 202 | |
Impact of tax rate changes | | (136 | ) | | — | | | (57 | ) |
Other non-taxable items | | (49 | ) | | (396 | ) | | (110 | ) |
Stock options | | 103 | | | 28 | | | 9 | |
Change in valuation allowance | | 778 | | | — | | | — | |
| | | | | | | | | |
Actual income tax provision | | 1,158 | | | 2,397 | | | 2,882 | |
| | | | | | | | | |
Represented by: | | | | | | | | | |
Current income tax provision | | 2,885 | | | 3,147 | | | 752 | |
Deferred income tax provision | | (1,727 | ) | | (750 | ) | | 2,130 | |
| | | | | | | | | |
Provision for Income Taxes | | 1,158 | | | 2,397 | | | 2,882 | |
| | | | | | | | | |
The components of the income tax expense are as follows:
| | | | | | | | | |
| | | 2006 | | | 2005 | | | 2004 | |
| | | $ | | | $ | | | $ | |
Current | | | | | | | | | |
United States | | — | | | — | | | — | |
Foreign | | 2,885 | | | 3,147 | | | 752 | |
Deferred | | | | | | | | | |
United States | | (465 | ) | | (2,455 | ) | | (412 | ) |
Foreign | | (1,262 | ) | | 1,705 | | | 2,542 | |
| | | | | | | | | |
Income tax expense | | 1,158 | | | 2,397 | | | 2,882 | |
| | | | | | | | | |
F-17
Deferred tax asset (liability):
| | | | | | |
| | | As at June 30, 2006 | | | As at June 30, 2005 | |
United States | | | | | | |
Accounting value of United States property and equipment in excess of tax basis | | 120 | | | — | |
Unrealized United States tax loss carryforward | | 2,801 | | | 2,787 | |
Less: Valuation allowance | | (903 | ) | | — | |
| | | | | | |
| | 2,018 | | | 2,787 | |
Canada | | | | | | |
Accounting value of Canadian property and equipment in excess of tax basis | | (796 | ) | | (1,990 | ) |
| | | | | | |
Net deferred tax asset (liability) | | 1,222 | | | 797 | |
| | | | | | |
The recognized loss carry forward benefits for the years ended June 30, 2006 and June 30, 2005, are $2,018 and $2,787, respectively. The unrecorded loss carry forwards as at June 30, 2006 and June 30, 2005 were $903 and NIL respectively.
U.S. income taxes and foreign withholding taxes are not provided for on undistributed earnings of foreign subsidiaries, as the earnings are considered to be indefinitely reinvested in the operations of such subsidiaries.
The Company has losses of approximately $8,237 available to reduce future taxable income. The losses will expire as follows:
| | |
| | | $ |
2015 | | 53 |
2016 | | 202 |
2017 | | 169 |
2018 | | 393 |
2024 | | 1,287 |
2025 | | 2,452 |
2026 | | 3,681 |
| | |
| | 8,237 |
| | |
Note 10 – Related party transactions
For the years ended June 30, 2006, 2005 and 2004 the Company paid $137, $171 and $251, respectively, for professional legal fees to a director and minority shareholder. A balance of $nil was owed as of June 30, 2006, 2005 and 2004.
The Company paid professional fees for consulting and executive search services to a company in which a director and minority shareholder is a principal and an employee. The amounts paid for the years ended June 30, 2006 and 2005 were $263 and $105, respectively. This director became a related party in October 2004. As of June 30, 2006 and 2005, the Company owed this director an amount of $23 and $182, respectively.
These transactions have all been accounted for at their exchange amounts.
F-18
Note 11 – Commitments and contingencies
Commitments
The Company has operating lease commitments for its premises, service vehicles and operating lease commitments for its network access lines which expire at various dates through June 2008. The future minimum lease payments (exclusive of operating costs and payments for additional usage) as at June 30, 2006 for the years ended June 30, are as follows:
| | | | | | | | | |
Expiring through | | Telecom Obligations | | Facility/Rent Obligations | | Other Commitments |
2007 | | $ | 4,864 | | $ | 637 | | $ | 396 |
2008 | | | 1,402 | | | 415 | | | 192 |
2009 | | | — | | | 246 | | | 52 |
2010 | | | — | | | 17 | | | 7 |
2011 | | | — | | | — | | | 5 |
Legal proceedings
A claim in the amount of $639 has been asserted by a former supplier of professional services to the Company. The claim is in its initial stages and the Company has filed a Notice of Intent to defend the claim and has included appropriate provisions in its current liabilities with respect to this matter. On or about August 15, 2006, counsel for the plaintiff had the Company noted in default and a Judgment was subsequently entered on August 21, 2006. On September 20, 2006 an Order was obtained setting aside the default judgment. The legal process continues. In addition, there are various other lawsuits and claims arising out of the normal course of business which are pending against the Company and estimated provisions have been included in current liabilities where appropriate. Management believes, none of these claims, individually or in the aggregate, are expected to have a material adverse effect on the Company.
Note 12 – Penalty on termination of carrier contract
The Company incurred a penalty for $155, which was recognized during the fourth quarter of 2006 relating to the cancellation of services on its network. The amount was included in cost of revenue.
Note 13 – Earnings per share
Basic earnings per share is determined by dividing net earnings applicable to common stockholders by the weighted average number of common shares outstanding for the period. Diluted earnings per share amounts are similarly computed, but include the effect, when dilutive, of the Company’s stock options and warrants outstanding determined using the treasury stock method.
Earnings per share for the years ended June 30, 2006, 2005 and 2004 are calculated as follows:
| | | | | | | |
| | | 2006 | | | 2005 | | 2004 |
| | | $ | | | $ | | $ |
Net earnings (loss) applicable to common stockholders – basic | | (365 | ) | | 4,763 | | 5,466 |
| | | | | | | |
Net earnings (loss) applicable to common stockholders – diluted | | (365 | ) | | 4,763 | | 5,466 |
| | | | | | | |
Average shares outstanding: | | | | | | | |
Weighted average number of common shares outstanding – basic | | 12,902 | | | 12,895 | | 10,706 |
Effect of dilutive securities: | | | | | | | |
Stock options | | — | | | 6 | | 699 |
| | | | | | | |
| | 12,902 | | | 12,901 | | 11,405 |
| | | | | | | |
Basic earnings per share | | (0.03 | ) | | 0.37 | | 0.51 |
| | | | | | | |
Diluted earnings per share | | (0.03 | ) | | 0.37 | | 0.48 |
| | | | | | | |
There were no incremental shares in the diluted earnings per share calculation during the year ended June 30, 2006 as the outstanding stock options and warrants currently have no intrinsic value.
F-19
Note 14 – Consolidated statement of cash flows
The following table presents the details of the net changes in non-cash working capital presented in the statements of cash flows for the years ended June 30, 2006, 2005 and 2004:
| | | | | | | | | |
| | | June 30, 2006 | | | June 30, 2005 | | | June 30, 2004 | |
| | | $ | | | $ | | | $ | |
Decrease (increase) in: | | | | | | | | | |
Accounts receivable | | 1,862 | | | (7,966 | ) | | (4,276 | ) |
Factored accounts receivable | | — | | | 8,838 | | | (2,033 | ) |
Prepaid expenses and sundry | | 419 | | | (615 | ) | | (14 | ) |
Increase (decrease) in: | | | | | | | | | |
Unearned revenue | | (371 | ) | | 56 | | | 952 | |
Accounts payable and accrued liabilities | | (2,514 | ) | | (219 | ) | | 3,966 | |
Income taxes payable | | (830 | ) | | 2,268 | | | (537 | ) |
Due to Factor | | — | | | (6,245 | ) | | 962 | |
Add: Net current assets acquired from Contour | | — | | | — | | | 1,296 | |
| | | | | | | | | |
| | (1,434 | ) | | (3,883 | ) | | 316 | |
| | | | | | | | | |
Note 15 – Segment reporting
The Company has five reportable segments: Yak Canada, Yak for Business, Contour, Yak America and WorldCity VoIP. The segment sales and profit data that follow are consistent with the Company’s current management reporting structure. The Yak Canada and Yak America segments provide the following products: 10-10 Yak, yakLongDistance, LooneyCall, yakCell and yakCallingCard. The Yak for Business segment provides voice and data products, including local lines, long distance, data management and point-to-point private lines to small and medium-sized business customers in Canada. The Contour segment provides telecommunication management services. The WorldCity VoIP segment provides VoIP services to residential customers. The Eliminations and other column includes corporate head office assets, management fees, interest income, warrant revaluation, and any other costs and expenses not allocated to individual segments. The Company’s selling, general and administrative expenses and cost of revenues, excluding corporate expense, are charged to each segment based on where the expenses are incurred. Segment results for the years ended June 30, 2006, 2005 and 2004 are as follows:
| | | | | | | | | | | | | | | | | | | | | | | | |
| | | Fiscal Year Ended June 30, 2006 | |
| | | Yak
Canada | | | Yak for
Business | | | Contour | | | Yak
America | | | WorldCity
VoIP | | | Total
Segments | | | Eliminations
and other | | | Total | |
| | | $ | | | $ | | | $ | | | $ | | | $ | | | $ | | | $ | | | $ | |
Net Revenue | | 68,883 | | | 13,024 | | | 4,901 | | | 5,236 | | | 353 | | | 92,397 | | | — | | | 92,397 | |
Cost of revenue (1) | | 36,430 | | | 9,282 | | | 3,741 | | | 5,423 | | | 428 | | | 55,304 | | | — | | | 55,304 | |
| | | | | | | | | | | | | | | | | | | | | | | | |
Contribution margin | | 32,453 | | | 3,742 | | | 1,160 | | | (187 | ) | | (75 | ) | | 37,093 | | | — | | | 37,093 | |
General and administration | | 10,589 | | | 3,094 | | | 742 | | | 1,209 | | | 3,152 | | | 18,786 | | | 3,647 | | | 22,433 | |
Professional fees for related parties | | 137 | | | — | | | — | | | — | | | — | | | 137 | | | 104 | | | 241 | |
Stock-based compensation | | — | | | — | | | — | | | — | | | — | | | — | | | 303 | | | 303 | |
Bad debts expense | | 83 | | | 95 | | | (217 | ) | | 325 | | | — | | | 286 | | | — | | | 286 | |
Sales and marketing | | 2,449 | | | 1 | | | — | | | 3,271 | | | 1,111 | | | 6,832 | | | — | | | 6,832 | |
Other expenses | | (68 | ) | | (11 | ) | | (32 | ) | | (1 | ) | | — | | | (112 | ) | | (492 | ) | | (604 | ) |
Writedown of property and equipment | | 174 | | | — | | | — | | | — | | | 3,413 | | | 3,587 | | | — | | | 3,587 | |
Depreciation and amortization | | 2,088 | | | 649 | | | 36 | | | 115 | | | 334 | | | 3,222 | | | — | | | 3,222 | |
| | | | | | | | | | | | | | | | | | | | | | | | |
Segment earnings (loss) before income taxes | | 17,001 | | | (86 | ) | | 631 | | | (5,106 | ) | | (8,085 | ) | | 4,355 | | | (3,562 | ) | | 793 | |
| | | | | | | | | | | | | | | | | | | | | | | | |
Segment assets | | 43,044 | | | 6,307 | | | 3,703 | | | 2,369 | | | 2,190 | | | 57,613 | | | (8,087 | ) | | 49,526 | |
Long-lived assets | | 9,864 | | | 2,237 | | | 567 | | | 515 | | | 1,843 | | | 15,026 | | | — | | | 15,026 | |
Purchases of property and equipment | | 3,410 | | | 89 | | | 122 | | | — | | | 642 | | | 4,263 | | | — | | | 4,263 | |
| (1) | Excludes depreciation and amortization of $2,618. |
F-20
| | | | | | | | | | | | | | | | | | | | | | |
| | | Fiscal Year Ended June 30, 2005 | |
| | | Yak
Canada | | | Yak for
Business | | | Contour | | Yak
America | | | WorldCity
VoIP | | | Total
Segments | | Eliminations
and other | | | Total | |
| | | $ | | | $ | | | $ | | $ | | | $ | | | $ | | $ | | | $ | |
Net Revenue | | 72,194 | | | 11,753 | | | 5,557 | | 3,007 | | | 76 | | | 92,587 | | 113 | | | 92,700 | |
Cost of revenue (1) | | 41,899 | | | 8,416 | | | 4,085 | | 3,094 | | | 33 | | | 57,527 | | 109 | | | 57,636 | |
| | | | | | | | | | | | | | | | | | | | | | |
Contribution margin | | 30,295 | | | 3,337 | | | 1,472 | | (87 | ) | | 43 | | | 35,060 | | 4 | | | 35,064 | |
General and administration | | 8,501 | | | 3,028 | | | 920 | | 1,380 | | | 1,216 | | | 15,045 | | 3,079 | | | 18,124 | |
Professional fees for related parties | | 171 | | | — | | | — | | — | | | — | | | 171 | | 287 | | | 458 | |
Stock-based compensation | | — | | | — | | | — | | — | | | — | | | — | | 81 | | | 81 | |
Bad debts expense | | 95 | | | (113 | ) | | 163 | | 228 | | | — | | | 373 | | — | | | 373 | |
Sales and marketing | | 1,900 | | | 8 | | | — | | 5,358 | | | — | | | 7,266 | | 27 | | | 7,293 | |
Other expenses | | (10 | ) | | 73 | | | 101 | | (126 | ) | | 390 | | | 428 | | (1,796 | ) | | (1,368 | ) |
Depreciation and amortization | | 2,077 | | | 556 | | | 17 | | 132 | | | 141 | | | 2,923 | | 20 | | | 2,943 | |
| | | | | | | | | | | | | | | | | | | | | | |
Segment earnings (loss) before income taxes | | 17,561 | | | (215 | ) | | 271 | | (7,059 | ) | | (1,704 | ) | | 8,854 | | (1,694 | ) | | 7,160 | |
| | | | | | | | | | | | | | | | | | | | | | |
Segment assets | | 34,269 | | | 7,382 | | | 2,409 | | 1,603 | | | 5,141 | | | 50,804 | | 2,434 | | | 53,238 | |
Long-lived assets | | 7,308 | | | 2,705 | | | 286 | | 629 | | | 5,139 | | | 16,067 | | — | | | 16,067 | |
Purchases of property and equipment | | 4,535 | | | 32 | | | — | | 618 | | | — | | | 6,077 | | — | | | 6,077 | |
| (1) | Excludes depreciation and amortization of $2,359. |
| | | | | | | | | | | | | | | | | | | | | |
| | | Fiscal Year Ended June 30, 2004 |
| | | Yak
Canada | | Yak for
Business | | | Contour | | | Yak
America | | | WorldCity
VoIP | | | Total
Segments | | Eliminations
and other | | | Total |
| | | $ | | $ | | | $ | | | $ | | | $ | | | $ | | $ | | | $ |
Net Revenue | | 62,228 | | 11,775 | | | 5,646 | | | 1,074 | | | — | | | 80,723 | | 79 | | | 80,802 |
Cost of revenue (1) | | 39,403 | | 8,647 | | | 4,018 | | | 1,048 | | | — | | | 53,116 | | 33 | | | 53,149 |
| | | | | | | | | | | | | | | | | | | | | |
Contribution margin | | 22,825 | | 3,128 | | | 1,628 | | | 26 | | | — | | | 27,607 | | 46 | | | 27,653 |
General and administration | | 5,288 | | 2,918 | | | 964 | | | 231 | | | 172 | | | 9,573 | | 1,508 | | | 11,081 |
Professional fees for related parties | | 236 | | — | | | — | | | — | | | — | | | 236 | | — | | | 236 |
Stock-based compensation | | — | | — | | | — | | | — | | | — | | | — | | 26 | | | 26 |
Bad debts expense | | 34 | | 32 | | | — | | | 72 | | | — | | | 138 | | | | | 138 |
Sales and marketing | | 3,571 | | 30 | | | — | | | 204 | | | — | | | 3,805 | | 89 | | | 3,894 |
Other expenses | | 2,221 | | 40 | | | (56 | ) | | (52 | ) | | — | | | 2,153 | | (1,203 | ) | | 950 |
Depreciation and amortization | | 2,372 | | 472 | | | 60 | | | 62 | | | — | | | 2,966 | | 14 | | | 2,980 |
| | | | | | | | | | | | | | | | | | | | | |
Segment earnings (loss) before income taxes | | 9,103 | | (364 | ) | | 660 | | | (491 | ) | | (172 | ) | | 8,736 | | (388 | ) | | 8,348 |
| | | | | | | | | | | | | | | | | | | | | |
Segment assets | | 29,891 | | 3,923 | | | 2,984 | | | 1,023 | | | 3,187 | | | 41,008 | | 12,642 | | | 53,650 |
Long-lived assets | | 5,323 | | 2,255 | | | 296 | | | 474 | | | 3,187 | | | 11,535 | | 102 | | | 11,637 |
Purchases of property and equipment | | 4,520 | | 396 | | | 3 | | | 9 | | | 566 | | | 5,494 | | 118 | | | 5,612 |
| (1) | Excludes depreciation and amortization of $2,767. |
F-21
The Company operates, offering discounted long-distance services, in two geographic regions—Canada and the United States. For the year ended June 30, 2005, the Company also provided services to a third geographic region (primarily Peru). Summary information with respect to the Company’s operations by geographic regions is as follows:
| | | | | | | | | |
| | | 2006 | | | 2005 | | | 2004 | |
| | | $ | | | $ | | | $ | |
Net revenue | | | | | | | | | |
Canada | | 86,993 | | | 89,434 | | | 79,569 | |
United States | | 5,404 | | | 3,036 | | | 1,074 | |
International | | — | | | 230 | | | 159 | |
| | | | | | | | | |
| | 92,397 | | | 92,700 | | | 80,802 | |
| | | | | | | | | |
Earnings (loss) before income taxes | | | | | | | | | |
Canada | | 9,461 | | | 15,984 | | | 9,518 | |
United States | | (8,668 | ) | | (8,430 | ) | | (1,167 | ) |
International | | — | | | (394 | ) | | (3 | ) |
| | | | | | | | | |
| | 793 | | | 7,160 | | | 8,348 | |
| | | | | | | | | |
F-22
| | | | |
| | | 2006 | | 2005 |
| | | $ | | $ |
Long-lived Assets | | | | |
Canada | | 12,786 | | 15,438 |
United States | | 2,240 | | 629 |
International | | — | | — |
| | | | |
| | 15,026 | | 16,067 |
| | | | |
The Canadian assets of Yak for Business as at June 30, 2006 and June 30, 2005 include goodwill of $276 and $252, respectively and other intangibles of $1,452 and $1,965, respectively.
The Canadian assets of Contour as at June 30, 2006 and June 30, 2005 include goodwill of $276 and $251, respectively and other intangibles of $45 and $40, respectively.
Loss before income taxes in the United States includes corporate head office costs and expenses not allocated to segments.
Note 16 – Quarterly results of operations (unaudited)
The following table provides a summary of consolidated unaudited results of operations on a quarterly basis for the preceding eight quarters.
| | | | | | | | | | | | | | | | | | | | | | | | |
| | | Fiscal 2005 | | | Fiscal 2006 | |
| | | Q1 | | | Q2 | | | Q3 | | | Q4 | | | Q1 | | | Q2 | | | Q3 | | | Q4 | |
Net revenue | | 21,197 | | | 24,153 | | | 23,850 | | | 23,500 | | | 23,508 | | | 24,029 | | | 22,656 | | | 22,204 | |
Cost of revenue (1) | | 13,758 | | | 14,621 | | | 14,798 | | | 14,459 | | | 14,375 | | | 14,447 | | | 13,854 | | | 12,628 | |
| | | | | | | | | | | | | | | | | | | | | | | | |
Contribution margin | | 7,439 | | | 9,532 | | | 9,052 | | | 9,041 | | | 9,133 | | | 9,582 | | | 8,802 | | | 9,576 | |
| | | | | | | | | | | | | | | | | | | | | | | | |
Operating expenses | | | | | | | | | | | | | | | | | | | | | | | | |
General and administration | | 3,508 | | | 4,912 | | | 5,024 | | | 4,680 | | | 5,553 | | | 4,625 | | | 5,699 | | | 6,556 | |
Professional fees paid to related parties | | 48 | | | 61 | | | 46 | | | 303 | | | 86 | | | 65 | | | 51 | | | 39 | |
Stock-based compensation | | 13 | | | 14 | | | 15 | | | 39 | | | 62 | | | 62 | | | 65 | | | 114 | |
Bad debts expense | | 41 | | | 88 | | | 98 | | | 146 | | | 227 | | | 167 | | | 33 | | | (141 | ) |
Sales and marketing | | 991 | | | 1,699 | | | 1,941 | | | 2,662 | | | 1,895 | | | 1,627 | | | 1,978 | | | 1,332 | |
Depreciation and amortization | | 562 | | | 694 | | | 736 | | | 951 | | | 844 | | | 741 | | | 811 | | | 826 | |
Writedown of property and equipment | | — | | | — | | | — | | | — | | | — | | | 111 | | | 63 | | | 3,413 | |
| | | | | | | | | | | | | | | | | | | | | | | | |
Total operating expenses | | 5,163 | | | 7,468 | | | 7,860 | | | 8,781 | | | 8,667 | | | 7,398 | | | 8,700 | | | 12,139 | |
| | | | | | | | | | | | | | | | | | | | | | | | |
Income (loss) from operations | | 2,276 | | | 2,064 | | | 1,192 | | | 260 | | | 466 | | | 2,184 | | | 102 | | | (2,563 | ) |
Other expenses (income) | | (128 | ) | | (15 | ) | | (1,548 | ) | | 323 | | | (190 | ) | | (308 | ) | | 33 | | | (139 | ) |
| | | | | | | | | | | | | | | | | | | | | | | | |
Earnings (loss) before income tax | | 2,404 | | | 2,079 | | | 2,740 | | | (63 | ) | | 656 | | | 2,492 | | | 69 | | | (2,424 | ) |
| | | | | | | | | | | | | | | | | | | | | | | | |
Provision for (recovery of) income tax | | 734 | | | 689 | | | 822 | | | 152 | | | 333 | | | 1,306 | | | 476 | | | (957 | ) |
| | | | | | | | | | | | | | | | | | | | | | | | |
Net earnings (loss) | | 1,670 | | | 1,390 | | | 1,918 | | | (215 | ) | | 323 | | | 1,186 | | | (407 | ) | | (1,467 | ) |
| | | | | | | | | | | | | | | | | | | | | | | | |
Basic earnings (loss) per share | | 0.13 | | | 0.11 | | | 0.15 | | | (0.02 | ) | | 0.03 | | | 0.09 | | | (0.03 | ) | | (0.12 | ) |
| | | | | | | | | | | | | | | | | | | | | | | | |
Diluted earnings (loss) per share | | 0.13 | | | 0.11 | | | 0.15 | | | (0.02 | ) | | 0.03 | | | 0.09 | | | (0.03 | ) | | (0.12 | ) |
| | | | | | | | | | | | | | | | | | | | | | | | |
Weighted average number of common shares outstanding | | 12,893 | | | 12,897 | | | 12,897 | | | 12,897 | | | 12,897 | | | 12,898 | | | 12,905 | | | 12,905 | |
| | | | | | | | | | | | | | | | | | | | | | | | |
Weighted average number of common shares outstanding - diluted | | 12,984 | | | 12,905 | | | 12,902 | | | 12,901 | | | 12,897 | | | 12,898 | | | 12,905 | | | 12,905 | |
| | | | | | | | | | | | | | | | | | | | | | | | |
| (1) | Excludes depreciation and amortization |
F-23
Note 17 – Material Subsequent Events
On September 20th, 2006, the Company and Globalive Communications Corp., entered into a definitive merger agreement following a public auction process managed by the Independent Committee consisting of independent directors of the Board of Directors of the Company. As contemplated in the merger agreement, Globalive will purchase up to 100% (but no less than 80%) of the Company’s common stock shares at a price of $5.25 per share, for an estimated consideration of $68,068. Following the all cash tender offer, Yak will merge with and into a wholly-owned subsidiary of Globalive.
The transaction is subject to certain conditions, including the receipt of regulatory and vendor approvals, the Board’s obtaining a fairness opinion from an independent third party not involved in the bidding process to date and other customary closing conditions.
F-24
Exhibit Index
| | |
| Exhibit Number | | Description |
| 10.11 | | Internet Infrastructure Services Agreement with Q9 Networks Inc. dated June 21, 2006. |
| |
| 10.12 | | Settlement Agreement with Digital Way S.A. dated July 25, 2005. |
| |
| 10.13 | | Fiscal Advisory Agreement with Orion Securities Inc. dated June 25, 2006. |
| |
| 10.16 | | First Amendment to the Employment Agreement between Yak Communications (Canada), Inc. and Charles Zwebner, dated September 6, 2006. |
| |
| 21 | | Subsidiaries. |
| |
| 23.1 | | Consent of Ernst & Young LLP. |
| |
| 23.2 | | Consent of Horwath Orenstein LLP |
| |
| 31.1 | | Rule 13a-14(a)/15d-14(a) Certification of Chief Executive Officer |
| |
| 31.2 | | Rule 13a-14(a)/15d-14(a) Certification of Principal Financial Officer |
| |
| 32.1 | | Certification of Chief Executive Officer Pursuant to 18 U.S.C. Section 1350, as adopted pursuant to Section 906 of the Sarbanes-Oxley Act of 2002. |
| |
| 32.2 | | Certification of Principal Financial Officer Pursuant to 18 U.S.C. Section 1350, as adopted pursuant to Section 906 of the Sarbanes-Oxley Act of 2002. |