Table of Contents
SECURITIES AND EXCHANGE COMMISSION
| þ | QUARTERLY REPORT PURSUANT TO SECTION 13 OR 15(d) OF THE SECURITIES EXCHANGE ACT OF 1934 |
| o | TRANSITION REPORT PURSUANT TO SECTION 13 OR 15(d) OF THE SECURITIES EXCHANGE ACT OF 1934 |
| Delaware | 95-4719745 | |
| (State or other jurisdiction of incorporation or organization) | (I.R.S. Employer Identification No.) | |
| 520 Madison Avenue, 10th Floor, New York, New York | 10022 | |
| (Address of principal executive offices) | (Zip Code) |
Yesþ Noo
Yesþ Noo
Large accelerated filerþ | Accelerated filero | Non-accelerated filero | Smaller reporting companyo | |||
| (Do not check if a smaller reporting company) |
Yeso Noþ
INDEX TO QUARTERLY REPORT ON FORM 10-Q
FEBRUARY 28, 2011
Page 2 of 86
Table of Contents
| February 28, | November 30, | |||||||
| 2011 | 2010 | |||||||
ASSETS | ||||||||
| Cash and cash equivalents (including $282,491 and $202,565 at February 28, 2011 and November 30, 2010, respectively, from VIEs) | $ | 1,164,333 | $ | 2,188,998 | ||||
| Cash and securities segregated and on deposit for regulatory purposes or deposited with clearing and depository organizations | 1,794,503 | 1,636,755 | ||||||
| Financial instruments owned, at fair value, including securities pledged of $15,024,808 and $12,338,728 in 2011 and 2010, respectively: | ||||||||
| Corporate equity securities (including $176,815 and $120,606 at February 28, 2011 and November 30, 2010, respectively, from VIEs) | 2,173,967 | 1,565,793 | ||||||
| Corporate debt securities (including $360,868 and $462,462 at February 28, 2011 and November 30, 2010, respectively, from VIEs) | 4,236,560 | 3,630,616 | ||||||
| Government, federal agency and other sovereign obligations | 5,875,860 | 5,191,973 | ||||||
| Mortgage- and asset-backed securities (including $40,372 and $43,355 at February 28, 2011 and November 30, 2010, respectively, from VIEs) | 5,371,708 | 4,921,565 | ||||||
| Loans and other receivables (including $297,398 and $362,465 at February 28, 2011 and November 30, 2010, respectively, from VIEs) | 444,205 | 434,573 | ||||||
| Derivatives (including $16,274 and $7,579 at February 28, 2011 and November 30, 2010, respectively, from VIEs) | 82,608 | 119,268 | ||||||
| Investments, at fair value (including $17,478 and $15,612 at February 28, 2011 and November 30, 2010, respectively, from VIEs) | 68,291 | 77,784 | ||||||
| Total financial instruments owned, at fair value (including $909,205 and $1,012,079 at February 28, 2011 and November 30, 2010, respectively, from VIEs) | 18,253,199 | 15,941,572 | ||||||
| Investments in managed funds | 136,727 | 131,585 | ||||||
| Other investments | 387,288 | 220,323 | ||||||
| Securities borrowed | 8,137,278 | 8,152,678 | ||||||
| Securities purchased under agreements to resell | 3,402,301 | 3,252,322 | ||||||
| Securities received as collateral | 30,768 | 48,616 | ||||||
| Receivables: | ||||||||
| Brokers, dealers and clearing organizations (including $91,806 and $195,485 at February 28, 2011 and November 30, 2010, respectively, from VIEs) | 3,694,820 | 2,550,234 | ||||||
| Customers | 1,868,021 | 1,328,365 | ||||||
| Fees, interest and other (including $6,655 and $127 at February 28, 2011 and November 30, 2010, respectively, from VIEs) | 240,819 | 165,603 | ||||||
| Premises and equipment | 146,683 | 142,729 | ||||||
| Goodwill | 366,500 | 364,964 | ||||||
| Other assets (including $212 and $370 at February 28, 2011 and November 30, 2010, respectively, from VIEs) | 804,910 | 601,799 | ||||||
| Total assets (including $1,290,369 and $1,410,626 at February 28, 2011 and November 30, 2010, respectively, from VIEs) | $ | 40,428,150 | $ | 36,726,543 | ||||
Page 3 of 86
Table of Contents
CONSOLIDATED STATEMENTS OF FINANCIAL CONDITION (UNAUDITED) — CONTINUED
(Dollars in thousands, except per share amounts)
| February 28, | November 30, | |||||||
| 2011 | 2010 | |||||||
LIABILITIES AND STOCKHOLDERS’ EQUITY | ||||||||
| Financial instruments sold, not yet purchased, at fair value: | ||||||||
| Corporate equity securities (including $1,121 and $2,708 at February 28, 2011 and November 30, 2010, respectively, from VIEs) | $ | 1,989,199 | $ | 1,638,372 | ||||
| Corporate debt securities (including $366,331 and $443,100 at February 28, 2011 and November 30, 2010, respectively, from VIEs) | 2,295,374 | 2,375,925 | ||||||
| Government, federal agency and other sovereign obligations | 5,510,010 | 4,735,288 | ||||||
| Mortgage- and asset-backed securities | 119,849 | 129,384 | ||||||
| Loans (including $59,826 and $150,100 at February 28, 2011 and November 30, 2010, respectively, from VIEs) | 70,062 | 171,278 | ||||||
| Derivatives (including $-0- and $136 at February 28, 2011 and November 30, 2010, respectively, from VIEs) | 71,263 | 59,552 | ||||||
| Total financial instruments sold, not yet purchased, at fair value (including $427,278 and $596,044 at February 28, 2011 and November 30, 2010, respectively, from VIEs) | 10,055,757 | 9,109,799 | ||||||
| Securities loaned | 3,030,690 | 3,108,977 | ||||||
| Securities sold under agreements to repurchase | 11,940,684 | 10,684,056 | ||||||
| Obligation to return securities received as collateral | 30,768 | 48,616 | ||||||
| Payables: | ||||||||
| Brokers, dealers and clearing organizations (including $68,799 and $157,134 at February 28, 2011 and November 30, 2010, respectively, from VIEs) | 3,076,859 | 1,885,357 | ||||||
| Customers | 4,263,789 | 3,716,357 | ||||||
| Accrued expenses and other liabilities (including $121,046 and $94,402 at February 28, 2011 and November 30, 2010, respectively, from VIEs) | 865,730 | 1,142,850 | ||||||
| Long-term debt | 3,780,304 | 3,778,681 | ||||||
| Mandatorily redeemable convertible preferred stock | 125,000 | 125,000 | ||||||
| Mandatorily redeemable preferred interest of consolidated subsidiaries (including $332,258 and $315,885 at February 28, 2011 and November 30, 2010, respectively, from VIEs) | 332,258 | 315,885 | ||||||
| Total liabilities (including $949,381 and $1,163,465 at February 28, 2011 and November 30, 2010, respectively, from VIEs) | 37,501,839 | 33,915,578 | ||||||
STOCKHOLDERS’ EQUITY | ||||||||
| Common stock, $.0001 par value. Authorized 500,000,000 shares; issued 207,386,635 shares in 2011 and 200,301,656 shares in 2010 | 21 | 20 | ||||||
| Additional paid-in capital | 2,275,107 | 2,218,123 | ||||||
| Retained earnings | 922,478 | 850,654 | ||||||
| Less: | ||||||||
| Treasury stock, at cost, 30,318,925 shares in 2011 and 28,607,510 shares in 2010 | (583,137 | ) | (539,530 | ) | ||||
| Accumulated other comprehensive loss: | ||||||||
| Currency translation adjustments | (28,347 | ) | (42,859 | ) | ||||
| Additional minimum pension liability | (8,419 | ) | (8,419 | ) | ||||
| Total accumulated other comprehensive loss | (36,766 | ) | (51,278 | ) | ||||
| Total common stockholders’ equity | 2,577,703 | 2,477,989 | ||||||
| Noncontrolling interests | 348,608 | 332,976 | ||||||
| Total stockholders’ equity | 2,926,311 | 2,810,965 | ||||||
| Total liabilities and stockholders’ equity | $ | 40,428,150 | $ | 36,726,543 | ||||
Page 4 of 86
Table of Contents
| Three Months Ended | ||||||||
| February 28, 2011 | March 31, 2010 | |||||||
Revenues: | ||||||||
| Commissions | $ | 119,921 | $ | 134,438 | ||||
| Principal transactions | 290,151 | 150,380 | ||||||
| Investment banking | 239,059 | 198,337 | ||||||
| Asset management fees and investment income from managed funds | 23,868 | 6,599 | ||||||
| Interest | 273,216 | 218,935 | ||||||
| Other | 20,461 | 16,679 | ||||||
| Total revenues | 966,676 | 725,368 | ||||||
| Interest expense | 208,294 | 145,313 | ||||||
| Net revenues | 758,382 | 580,055 | ||||||
| Interest on mandatorily redeemable preferred interest of consolidated subsidiaries | 16,438 | 2,048 | ||||||
| Net revenues, less mandatorily redeemable preferred interest | 741,944 | 578,007 | ||||||
Non-interest expenses: | ||||||||
| Compensation and benefits | 442,892 | 319,801 | ||||||
| Floor brokerage and clearing fees | 28,132 | 30,729 | ||||||
| Technology and communications | 43,675 | 40,209 | ||||||
| Occupancy and equipment rental | 17,979 | 19,706 | ||||||
| Business development | 19,938 | 13,361 | ||||||
| Professional services | 13,276 | 14,423 | ||||||
| Other | 13,121 | 17,322 | ||||||
| Total non-interest expenses | 579,013 | 455,551 | ||||||
| Earnings before income taxes | 162,931 | 122,456 | ||||||
| Income tax expense | 60,886 | 46,369 | ||||||
| Net earnings | 102,045 | 76,087 | ||||||
| Net earnings to noncontrolling interests | 14,704 | 3,943 | ||||||
| Net earnings to common shareholders | $ | 87,341 | $ | 72,144 | ||||
| Earnings per common share: | ||||||||
| Basic | $ | 0.42 | $ | 0.35 | ||||
| Diluted | $ | 0.42 | $ | 0.35 | ||||
| Weighted average common share: | ||||||||
| Basic | 199,141 | 198,507 | ||||||
| Diluted | 203,257 | 202,630 | ||||||
Page 5 of 86
Table of Contents
| Three Months Ended | Eleven Months Ended | |||||||
| February 28, 2011 | November 30, 2010 | |||||||
Common stock, par value $0.0001 per share | ||||||||
| Balance, beginning of period | $ | 20 | $ | 19 | ||||
| Issued | 1 | 1 | ||||||
| Balance, end of period | 21 | 20 | ||||||
Additional paid-in capital | ||||||||
| Balance, beginning of period | 2,218,123 | 2,036,087 | ||||||
| Benefit plan share activity (1) | 6,648 | 19,230 | ||||||
| Share-based expense, net of forfeitures and clawbacks | 15,427 | 149,799 | ||||||
| Proceeds from exercise of stock options | — | 108 | ||||||
| Acquisitions and contingent consideration | 419 | 419 | ||||||
| Tax benefit for issuance of share-based awards | 32,368 | 2,965 | ||||||
| Dividend equivalents on share-based plans | 2,122 | 9,515 | ||||||
| Balance, end of period | 2,275,107 | 2,218,123 | ||||||
Retained earnings | ||||||||
| Balance, beginning of period | 850,654 | 688,039 | ||||||
| Net earnings to common shareholders | 87,341 | 223,666 | ||||||
| Dividends | (15,517 | ) | (61,051 | ) | ||||
| Balance, end of period | 922,478 | 850,654 | ||||||
Treasury stock, at cost | ||||||||
| Balance, beginning of period | (539,530 | ) | (384,379 | ) | ||||
| Purchases | (37,761 | ) | (140,071 | ) | ||||
| Returns / forfeitures | (5,846 | ) | (15,080 | ) | ||||
| Balance, end of period | (583,137 | ) | (539,530 | ) | ||||
Accumulated other comprehensive (loss) income | ||||||||
| Balance, beginning of period | (51,278 | ) | (41,626 | ) | ||||
| Currency adjustment | 14,512 | (8,490 | ) | |||||
| Pension adjustment, net of tax | — | (1,162 | ) | |||||
| Balance, end of period | (36,766 | ) | (51,278 | ) | ||||
Total common stockholders’ equity | 2,577,703 | 2,477,989 | ||||||
Noncontrolling interests | ||||||||
| Balance, beginning of period | 332,976 | 321,538 | ||||||
| Net earnings to noncontrolling interests | 14,704 | 16,601 | ||||||
| Contributions | 1,013 | 12,433 | ||||||
| Distributions | (85 | ) | (15,177 | ) | ||||
| Deconsolidation of asset management entity | — | (5,477 | ) | |||||
| Adoption of accounting changes to ASC 810 | — | 3,058 | ||||||
| Balance, end of period | 348,608 | 332,976 | ||||||
Total stockholders’ equity | $ | 2,926,311 | $ | 2,810,965 | ||||
| (1) | Includes grants related to the Incentive Plan, Deferred Compensation Plan and Directors’ Plan. |
Page 6 of 86
Table of Contents
| Three Months Ended | ||||||||
| February 28, | March 31, | |||||||
| 2011 | 2010 | |||||||
| Net earnings to common shareholders | $ | 87,341 | $ | 72,144 | ||||
| Other comprehensive income (loss): | ||||||||
| Currency translation adjustment | 14,512 | (18,118 | ) | |||||
| Total other comprehensive income (loss) (1) | 14,512 | (18,118 | ) | |||||
| Comprehensive income | $ | 101,853 | $ | 54,026 | ||||
| (1) | Total other comprehensive income (loss), net of tax, is attributable to common shareholders. No other comprehensive income (loss) is attributable to noncontrolling interests. |
Page 7 of 86
Table of Contents
| Three Months Ended | ||||||||
| February 28, 2011 | March 31, 2010 | |||||||
| Cash flows from operating activities: | ||||||||
| Net earnings | $ | 102,045 | $ | 76,087 | ||||
| Adjustments to reconcile net earnings to net cash used in operating activities: | ||||||||
| Depreciation and amortization | 12,841 | 7,859 | ||||||
| Fees related to assigned management agreements | (740 | ) | (920 | ) | ||||
| Interest on mandatorily redeemable preferred interests of consolidated subsidiaries | 16,438 | 2,048 | ||||||
| Accruals related to various benefit plans and stock issuances, net of estimated forfeitures | 16,230 | 10,129 | ||||||
| Increase in cash and securities segregated and on deposit for regulatory purposes or deposited with clearing and depository organizations | (157,690 | ) | (241,158 | ) | ||||
| Increase in receivables: | ||||||||
| Brokers, dealers and clearing organizations | (1,110,309 | ) | (594,811 | ) | ||||
| Customers | (537,179 | ) | (226,101 | ) | ||||
| Fees, interest and other | (73,977 | ) | (3,029 | ) | ||||
| Decrease (increase) in securities borrowed | 43,413 | (1,201,770 | ) | |||||
| Increase in financial instruments owned | (2,198,779 | ) | (3,454,521 | ) | ||||
| Increase in other investments | (167,169 | ) | (12,635 | ) | ||||
| Increase in investments in managed funds | (5,142 | ) | (5,406 | ) | ||||
| Increase in securities purchased under agreements to resell | (130,021 | ) | (1,121,664 | ) | ||||
| Increase in other assets | (195,096 | ) | (36,032 | ) | ||||
| Increase in payables: | ||||||||
| Brokers, dealers and clearing organizations | 1,179,043 | 970,374 | ||||||
| Customers | 546,704 | 135,803 | ||||||
| (Decrease) increase in securities loaned | (101,186 | ) | 1,009,884 | |||||
| Increase in financial instruments sold, not yet purchased | 834,651 | 1,977,040 | ||||||
| Increase in securities sold under agreements to repurchase | 1,232,264 | 2,272,072 | ||||||
| Decrease in accrued expenses and other liabilities | (306,560 | ) | (318,300 | ) | ||||
| Net cash used in operating activities | (1,000,219 | ) | (755,051 | ) | ||||
| Cash flows from investing activities: | ||||||||
| Net payments on premises and equipment | (14,104 | ) | (4,474 | ) | ||||
| Cash received from contingent consideration | 748 | 656 | ||||||
| Cash paid for contingent consideration | — | (6,997 | ) | |||||
| Net cash used in investing activities | (13,356 | ) | (10,815 | ) | ||||
Page 8 of 86
Table of Contents
CONSOLIDATED STATEMENTS OF CASH FLOWS — CONTINUED (Unaudited)
(Dollars in thousands)
| Three Months Ended | ||||||||
| February 28, 2011 | March 31, 2010 | |||||||
| Cash flows from financing activities: | ||||||||
| Excess tax benefits from the issuance of share-based awards | $ | 33,763 | $ | 18,475 | ||||
| Gross proceeds from short-term borrowings | 907,000 | 1,099,000 | ||||||
| Gross payments on short-term borrowings | (907,000 | ) | (1,099,000 | ) | ||||
| Net (payments on) proceeds from: | ||||||||
| Mandatorily redeemable preferred interest of consolidated subsidiaries | (65 | ) | (37 | ) | ||||
| Noncontrolling interest | 928 | (199 | ) | |||||
| Repurchase of common stock | (37,761 | ) | (63,220 | ) | ||||
| Dividends | (13,395 | ) | (12,957 | ) | ||||
| Exercise of stock options, not including tax benefits | — | 56 | ||||||
| Net cash used in financing activities | (16,530 | ) | (57,882 | ) | ||||
| Effect of foreign currency translation on cash and cash equivalents | 5,440 | (4,031 | ) | |||||
| Net decrease in cash and cash equivalents | (1,024,665 | ) | (827,779 | ) | ||||
| Cash and cash equivalents at beginning of period | 2,188,998 | 1,853,167 | ||||||
| Cash and cash equivalents at end of period | $ | 1,164,333 | $ | 1,025,388 | ||||
| Supplemental disclosures of cash flow information: | ||||||||
| Cash paid during the year for: | ||||||||
| Interest | $ | 195,739 | $ | 153,855 | ||||
| Income taxes, net | 55,263 | 59,791 | ||||||
Page 9 of 86
Table of Contents
| Page | ||||
| Note 1. Organization and Basis of Presentation | 11 | |||
| Note 2. Summary of Significant Accounting Policies | 13 | |||
| Note 3. Cash, Cash Equivalents and Short-Term Investments | 19 | |||
| Note 4. Financial Instruments | 20 | |||
| Note 5. Derivative Financial Instruments | 30 | |||
| Note 6. Collateralized Transactions | 33 | |||
| Note 7. Securitization Activities and Variable Interest Entities | 34 | |||
| Note 8. Jefferies Finance LLC | 40 | |||
| Note 9. Acquisitions | 41 | |||
| Note 10. Short-Term Borrowings | 42 | |||
| Note 11. Long-Term Debt | 43 | |||
| Note 12. Mandatorily Redeemable Convertible Preferred Stock | 43 | |||
| Note 13 Noncontrolling Interest and Mandatorily Redeemable Preferred Interests of Consolidated Subsidiaries | 44 | |||
| Note 14. Benefit Plans | 45 | |||
| Note 15. Compensation Plans | 45 | |||
| Note 16. Earnings Per Share | 50 | |||
| Note 17. Income Taxes | 51 | |||
| Note 18. Commitments, Contingencies and Guarantees | 51 | |||
| Note 19. Net Capital Requirements | 54 | |||
| Note 20. Segment Reporting | 54 | |||
| Note 21. Related Party Transactions | 56 | |||
Page 10 of 86
Table of Contents
NOTES TO CONSOLIDATED FINANCIAL STATEMENTS — CONTINUED
(Unaudited)
Page 11 of 86
Table of Contents
NOTES TO CONSOLIDATED FINANCIAL STATEMENTS — CONTINUED
(Unaudited)
| Three Months Ended | ||||
| March 31, 2010 | ||||
| Previously reported Net earnings to common shareholders | $ | 74,066 | ||
| Netting of interest revenues and expense | — | |||
| Differences with clearing bank | (1,288 | ) | ||
| Other items (1) | (634 | ) | ||
| Total adjustments | (1,922 | ) | ||
| Adjusted Net earnings to common shareholders | $ | 72,144 | ||
| (1) | Other items — Includes the effect of certain other immaterial adjustments. |
Page 12 of 86
Table of Contents
NOTES TO CONSOLIDATED FINANCIAL STATEMENTS — CONTINUED
(Unaudited)
| Three Months Ended | ||||||||
| March 31, 2010 | ||||||||
| As Previously | ||||||||
| Reported | Adjusted | |||||||
| Principal transactions | $ | 152,546 | $ | 150,380 | ||||
| Interest | 150,020 | 218,935 | ||||||
| Total revenues | 658,619 | 725,368 | ||||||
| Interest expense | 75,377 | 145,313 | ||||||
| Net revenues | 583,242 | 580,055 | ||||||
| Net revenues, less mandatorily redeemable perferred interest | 581,194 | 578,007 | ||||||
| Floor brokerage and clearing fees | 30,730 | 30,729 | ||||||
| Total non-interest expenses | 455,644 | 455,551 | ||||||
| Earnings before income taxes | 125,550 | 122,456 | ||||||
| Income tax expense | 47,541 | 46,369 | ||||||
| Net earnings | 78,009 | 76,087 | ||||||
| Net earnings to common shareholders | 74,066 | 72,144 | ||||||
| Earnings per common share: | ||||||||
| Basic | $ | 0.36 | $ | 0.35 | ||||
| Diluted | $ | 0.36 | $ | 0.35 | ||||
Page 13 of 86
Table of Contents
NOTES TO CONSOLIDATED FINANCIAL STATEMENTS — CONTINUED
(Unaudited)
Page 14 of 86
Table of Contents
NOTES TO CONSOLIDATED FINANCIAL STATEMENTS — CONTINUED
(Unaudited)
| Level 1: | Quoted prices are available in active markets for identical assets or liabilities as of the reported date. |
| Level 2: | Pricing inputs are other than quoted prices in active markets, which are either directly or indirectly observable as of the reported date. The nature of these financial instruments include cash instruments for which quoted prices are available but traded less frequently, derivative instruments whose fair value have been derived using a model where inputs to the model are directly observable in the market, or can be derived principally from or corroborated by observable market data, and instruments that are fair valued using other financial instruments, the parameters of which can be directly observed. |
| Level 3: | Instruments that have little to no pricing observability as of the reported date. These financial instruments are measured using management’s best estimate of fair value, where the inputs into the determination of fair value require significant management judgment or estimation. |
Page 15 of 86
Table of Contents
NOTES TO CONSOLIDATED FINANCIAL STATEMENTS — CONTINUED
(Unaudited)
Page 16 of 86
Table of Contents
NOTES TO CONSOLIDATED FINANCIAL STATEMENTS — CONTINUED
(Unaudited)
Page 17 of 86
Table of Contents
NOTES TO CONSOLIDATED FINANCIAL STATEMENTS — CONTINUED
(Unaudited)
Page 18 of 86
Table of Contents
NOTES TO CONSOLIDATED FINANCIAL STATEMENTS — CONTINUED
(Unaudited)
| February 28, | November 30, | |||||||
| 2011 | 2010 | |||||||
| Cash and cash equivalents: | ||||||||
| Cash in banks | $ | 406,048 | $ | 325,227 | ||||
| Money market investments | 758,285 | 1,863,771 | ||||||
| Total cash and cash equivalents | $ | 1,164,333 | $ | 2,188,998 | ||||
| Cash and securities segregated (1) | $ | 1,794,503 | $ | 1,636,755 | ||||
| (1) | Consists of deposits at exchanges and clearing organizations, as well as deposits in accordance with Rule 15c3-3 of the Securities Exchange Act of 1934, which subjects Jefferies, as a broker dealer carrying client accounts, to requirements related to maintaining cash or qualified securities in a segregated reserve account for the exclusive benefit of its clients. |
Page 19 of 86
Table of Contents
NOTES TO CONSOLIDATED FINANCIAL STATEMENTS — CONTINUED
(Unaudited)
| As of February 28, 2011 | ||||||||||||||||||||
| Counterparty | ||||||||||||||||||||
| and Cash | ||||||||||||||||||||
| Collateral | ||||||||||||||||||||
| Level 1 (3) | Level 2 (3) | Level 3 | Netting (2) | Total | ||||||||||||||||
Assets: | ||||||||||||||||||||
| Financial instruments owned: | ||||||||||||||||||||
| Corporate equity securities | $ | 1,790,938 | $ | 349,748 | $ | 33,281 | $ | — | $ | 2,173,967 | ||||||||||
| Corporate debt securities | 6,011 | 4,155,565 | 74,984 | — | 4,236,560 | |||||||||||||||
| Collateralized debt obligations | — | 79,276 | 102,946 | — | 182,222 | |||||||||||||||
| U.S. government and federal agency securities | 1,762,559 | 251,107 | — | — | 2,013,666 | |||||||||||||||
| Municipal securities | — | 469,006 | 799 | — | 469,805 | |||||||||||||||
| Sovereign obligations | 2,442,345 | 950,044 | — | — | 3,392,389 | |||||||||||||||
| Residential mortgage-backed securities | — | 4,439,890 | 97,109 | — | 4,536,999 | |||||||||||||||
| Commercial mortgage-backed securities | — | 430,879 | 6,301 | — | 437,180 | |||||||||||||||
| Other asset-backed securities | — | 203,855 | 11,452 | — | 215,307 | |||||||||||||||
| Loans and other receivables | — | 226,454 | 217,751 | — | 444,205 | |||||||||||||||
| Derivatives | 208,432 | 163,593 | — | (289,417 | ) | 82,608 | ||||||||||||||
| Investments at fair value | 457 | — | 67,834 | — | 68,291 | |||||||||||||||
| Total financial instruments owned | $ | 6,210,742 | $ | 11,719,417 | 612,457 | $ | (289,417 | ) | $ | 18,253,199 | ||||||||||
| Level 3 assets for which the firm does not bear economic exposure (1) | (209,843 | ) | ||||||||||||||||||
| Level 3 assets for which the firm bears economic exposure | $ | 402,614 | ||||||||||||||||||
Liabilities: | ||||||||||||||||||||
| Financial instruments sold, not yet purchased: | ||||||||||||||||||||
| Corporate equity securities | $ | 1,747,182 | $ | 241,979 | $ | 38 | $ | — | $ | 1,989,199 | ||||||||||
| Corporate debt securities | 2,823 | 2,292,551 | — | — | 2,295,374 | |||||||||||||||
| U.S. government and federal agency securities | 1,688,584 | 7,278 | — | — | 1,695,862 | |||||||||||||||
| Municipal securities | — | 35 | — | — | 35 | |||||||||||||||
| Sovereign obligations | 2,635,744 | 1,178,369 | — | — | 3,814,113 | |||||||||||||||
| Residential mortgage-backed securities | — | 119,439 | — | — | 119,439 | |||||||||||||||
| Commercial mortgage-backed securities | — | 389 | — | — | 389 | |||||||||||||||
| Other asset-backed securities | — | 21 | — | — | 21 | |||||||||||||||
| Loans | — | 52,286 | 17,776 | — | 70,062 | |||||||||||||||
| Derivatives | 194,648 | 286,078 | 4,957 | (414,420 | ) | 71,263 | ||||||||||||||
| Total financial instruments sold, not yet purchased | $ | 6,268,981 | $ | 4,178,425 | $ | 22,771 | $ | (414,420 | ) | $ | 10,055,757 | |||||||||
| (1) | Consists of Level 3 assets which are either financed by nonrecourse secured financings or attributable to third party or employee noncontrolling interests in certain consolidated entities. | |
| (2) | Represents counterparty and cash collateral netting across the levels of the fair value hierarchy for positions with the same counterparty. | |
| (3) | There were no significant transfers between Level 1 and Level 2 for the three-months ended February 28, 2011. |
Page 20 of 86
Table of Contents
NOTES TO CONSOLIDATED FINANCIAL STATEMENTS — CONTINUED
(Unaudited)
| As of November 30, 2010 | ||||||||||||||||||||
| Counterparty | ||||||||||||||||||||
| and Cash | ||||||||||||||||||||
| Collateral | ||||||||||||||||||||
| Level 1 | Level 2 | Level 3 | Netting (2) | Total | ||||||||||||||||
Assets: | ||||||||||||||||||||
| Financial instruments owned: | ||||||||||||||||||||
| Corporate equity securities | $ | 1,453,744 | $ | 89,430 | $ | 22,619 | $ | — | $ | 1,565,793 | ||||||||||
| Corporate debt securities | 25 | 3,557,183 | 73,408 | — | 3,630,616 | |||||||||||||||
| Collateralized debt obligations | — | 27,863 | 31,121 | — | 58,984 | |||||||||||||||
| U.S. government and federal agency securities | 2,322,204 | 210,422 | — | — | 2,532,626 | |||||||||||||||
| Municipal securities | — | 477,462 | 472 | — | 477,934 | |||||||||||||||
| Sovereign obligations | 1,600,762 | 580,651 | — | — | 2,181,413 | |||||||||||||||
| Residential mortgage-backed securities | — | 3,912,708 | 132,359 | — | 4,045,067 | |||||||||||||||
| Commercial mortgage-backed securities | — | 524,614 | 6,004 | — | 530,618 | |||||||||||||||
| Other asset-backed securities | — | 286,329 | 567 | — | 286,896 | |||||||||||||||
| Loans and other receivables | — | 206,977 | 227,596 | — | 434,573 | |||||||||||||||
| Derivatives | 279,811 | 176,069 | — | (336,612 | ) | 119,268 | ||||||||||||||
| Investments at fair value | — | — | 77,784 | — | 77,784 | |||||||||||||||
| Total financial instruments owned | $ | 5,656,546 | $ | 10,049,708 | 571,930 | $ | (336,612 | ) | $ | 15,941,572 | ||||||||||
| Level 3 assets for which the firm does not bear economic exposure (1) | (204,139 | ) | ||||||||||||||||||
| Level 3 assets for which the firm bears economic exposure | $ | 367,791 | ||||||||||||||||||
Liabilities: | ||||||||||||||||||||
| Financial instruments sold, not yet purchased: | ||||||||||||||||||||
| Corporate equity securities | $ | 1,554,489 | $ | 83,845 | $ | 38 | $ | — | $ | 1,638,372 | ||||||||||
| Corporate debt securities | — | 2,375,925 | — | — | 2,375,925 | |||||||||||||||
| U.S. government and federal agency securities | 1,688,684 | 51,604 | — | — | 1,740,288 | |||||||||||||||
| Municipal securities | — | 170 | — | — | 170 | |||||||||||||||
| Sovereign obligations | 2,180,667 | 814,163 | — | — | 2,994,830 | |||||||||||||||
| Residential mortgage-backed securities | — | 127,547 | — | — | 127,547 | |||||||||||||||
| Commerical mortgage-backed securities | — | 1,837 | — | — | 1,837 | |||||||||||||||
| Loans | — | 124,050 | 47,228 | — | 171,278 | |||||||||||||||
| Derivatives | 241,860 | 240,866 | 2,346 | (425,520 | ) | 59,552 | ||||||||||||||
| Total financial instruments sold, not yet purchased | $ | 5,665,700 | $ | 3,820,007 | $ | 49,612 | $ | (425,520 | ) | $ | 9,109,799 | |||||||||
| (1) | Consists of Level 3 assets which are either financed by nonrecourse secured financings or attributable to third party or employee noncontrolling interests in certain consolidated entities. | |
| (2) | Represents counterparty and cash collateral netting across the levels of the fair value hierarchy for positions with the same counterparty. |
Page 21 of 86
Table of Contents
NOTES TO CONSOLIDATED FINANCIAL STATEMENTS — CONTINUED
(Unaudited)
| • | Exchange Traded Equity Securities: Exchange-traded equity securities are measured based on quoted exchange prices, which are generally obtained from pricing services, and are categorized as Level 1 in the fair value hierarchy. |
| • | Non-exchange Traded Equity Securities: Non-exchange traded equity securities are measured primarily using broker quotations, pricing service data from external providers and prices observed for recently executed market transactions and are categorized within Level 2 of the fair value hierarchy. Where such information is not available, non-exchange traded equity securities are categorized as Level 3 financial instruments and measured using valuation techniques involving quoted prices of or market data for comparable companies, similar company ratios and multiples (e.g., price/EBITDA, price/book value), discounted cash flow analyses and transaction prices observed for subsequent financing or capital issuance by the company. When using pricing data of comparable companies, judgment must be applied to adjust the pricing data to account for differences between the measured security and the comparable security (e.g., issuer market capitalization, yield, dividend rate, geographical concentration). |
| • | Equity warrants: Non-exchange traded equity warrants are generally classified within Level 3 of the fair value hierarchy and are measured using the Black-Scholes model with key inputs impacting the valuation including the underlying security price, implied volatility, dividend yield, interest rate curve, strike price and maturity date. |
| • | Corporate Bonds: Corporate bonds are measured primarily using broker quotations and pricing service data from external providers, where available, prices observed for recently executed market transactions of comparable size, and bond spreads or credit default swap spreads of the issuer adjusted for basis differences between the swap curve and the bond curve. Corporate bonds measured using these valuation methods are categorized within Level 2 of the fair value hierarchy. If broker quotes, pricing data or spread data is not available, alternative valuation techniques are used including cash flow models incorporating interest rate curves, single name or index credit default swap curves for comparable issuers and recovery rate assumptions. Corporate bonds measured using alternative valuation techniques are classified within Level 3 of the fair value hierarchy and comprise a limited portion of our corporate bonds. |
| • | High Yield Corporate and Convertible Bonds: A significant portion of our high yield corporate and convertible bonds are classified within Level 2 of the fair value hierarchy and are measured primarily using broker quotations and pricing service data from external providers, where available, and prices observed for recently executed market transactions of comparable size. Where pricing data is less observable, valuations are classified in Level 3 and are based on pending transactions involving the issuer or comparable issuers, prices implied from an issuer’s subsequent financings or recapitalizations, models incorporating financial ratios and projected cash flows of the issuer and market prices for comparable issuers. |
| • | Auction Rate Securities: Auction rate securities (“ARS”) included within corporate debt securities include ARS backed by pools of student loans and auction rate preferred securities issued by closed end mutual funds. ARS are measured using market data provided by external service providers, as available. The fair value of ARS is |
Page 22 of 86
Table of Contents
NOTES TO CONSOLIDATED FINANCIAL STATEMENTS — CONTINUED
(Unaudited)
| also determined by benchmarking to independent market data and adjusting for projected cash flows, level of seniority in the capital structure, leverage, liquidity and credit rating, as appropriate. ARS are classified within Level 3 of the fair value hierarchy based on our assessment of the transparency of the external market data received. |
| • | U.S. Treasury Securities: U.S. Treasury securities are measured based on quoted market prices and categorized in Level 1 of the fair value hierarchy. |
| • | U.S. Agency Issued Debt Securities: Callable and non-callable U.S. agency issued debt securities are measured primarily based on quoted market prices obtained from external pricing services. Non-callable U.S. agency securities are generally classified within Level 1 of the fair value hierarchy and callable U.S. agency securities are classified within Level 2. |
| • | G-7 Government and non-G-7 Government Bonds: G-7 government and non-G-7 government bonds are measured based on quoted market prices obtained from external pricing services. G-7 government bonds are categorized within Level 1 of the fair value hierarchy and non-G-7 government bonds are categorized within Level 2. |
| • | Emerging Market Sovereign Debt Securities: Valuations are primarily based on market price quotations from external data providers, where available, or recently executed independent transactions of comparable size. To the extent market price quotations are not available or recent transactions have not been observed, valuation techniques incorporating foreign currency curves, interest rate yield curves and country spreads for bonds of similar issuers, seniority and maturity are used to determine fair value. Emerging market sovereign debt securities are generally classified within Level 2 of the fair value hierarchy. |
| • | Agency Residential Mortgage-Backed Securities: Agency residential mortgage-backed securities include mortgage pass-through securities (fixed and adjustable rate), collateralized mortgage obligations, interest-only and principal-only securities and to-be-announced securities and are generally measured using market price quotations from external data providers and categorized within Level 2 of the fair value hierarchy. |
| • | Agency Residential Inverse Interest-Only Securities (“Agency Inverse IOs”): The fair value of agency inverse IOs is estimated using expected future cash flow techniques that incorporate prepayment models and other prepayment assumptions to amortize the underlying mortgage loan collateral. We use prices observed for recently executed transactions to develop market-clearing spread and yield curve assumptions. Valuation inputs with regard to underlying collateral incorporate weighted average coupon, loan-to-value, credit scores, geographic location, maximum and average loan size, originator, servicer, and weighted average loan age. Agency inverse |
Page 23 of 86
Table of Contents
NOTES TO CONSOLIDATED FINANCIAL STATEMENTS — CONTINUED
(Unaudited)
| IOs are categorized within Level 2 of the fair value hierarchy. We also use vendor data in developing assumptions, as appropriate. |
| • | Non-Agency Residential Mortgage-Backed Securities: Fair values are determined primarily using discounted cash flow methodologies and securities are categorized within Level 2 or Level 3 of the fair value hierarchy based on the observability of the pricing inputs used. Performance attributes of the underlying mortgage loans are evaluated to estimate pricing inputs, such as prepayment rates, default rates and the severity of credit losses. Attributes of the underlying mortgage loans that affect the pricing inputs include, but are not limited to, weighted average coupon; average and maximum loan size; loan-to-value; credit scores; documentation type; geographic location; weighted average loan age; originator; servicer; historical prepayment, default and loss severity experience of the mortgage loan pool; and delinquency rate. Yield curves used in the discounted cash flow models are based on observed market prices for comparable securities and published interest rate data to estimate market yields. |
| • | Agency Commercial Mortgage-Backed Securities: GNMA project loan bonds and FNMA DUS mortgage-backed securities are generally measured by using prices observed for recently executed market transactions to estimate market-clearing spread levels for purposes of estimating fair value. GNMA project loan bonds and FNMA DUS mortgage-backed securities are categorized within Level 2 of the fair value hierarchy. |
| • | Non-Agency Commercial Mortgage-Backed Securities: Non-agency commercial mortgage-backed securities are measured using pricing data obtained from third party services and prices observed for recently executed market transactions and are categorized within Level 2 and Level 3 of the fair value hierarchy. |
| • | Corporate Loans: Corporate loans categorized within Level 2 of the fair value hierarchy are measured based on market price quotations from external data providers where sufficient observability exists as to the extent of market transaction data supporting the pricing data. Corporate loans categorized within Level 3 are measured based on market price quotations that are considered to be less transparent, market prices for debt securities of the same creditor, and estimates of future cash flow incorporating assumptions regarding creditor default and recovery rates and consideration of the issuer’s capital structure. |
| • | Participation Certificates in GNMA Project and Construction Loans: Valuations of participation certificates in GNMA project and construction loans are based on observed market prices of recently executed purchases of similar loans which are then used to derive a market implied spread. The market implied spread is used as the primary input in estimating the fair value of loans at the measurement date. The loan participation certificates are categorized within Level 2 of the fair value hierarchy given the observability and volume of recently executed transactions. |
| • | Project Loans: Valuation of project loans are based on bench marks of prices for recently executed transactions of related realized collateralized securities and are classified within Level 3 of the fair value hierarchy. |
| • | Escrow and Trade Claim Receivables: Escrow and trade claim receivables are categorized within Level 3 of the fair value hierarchy with fair value estimated based on reference to market prices and implied yields of debt securities of the same or similar issuers. |
Page 24 of 86
Table of Contents
NOTES TO CONSOLIDATED FINANCIAL STATEMENTS — CONTINUED
(Unaudited)
| • | Listed Derivative Contracts: Listed derivative contracts are measured based on quoted exchange prices, which are generally obtained from pricing services, and are categorized as Level 1 in the fair value hierarchy. |
| • | OTC Derivative Contracts: OTC derivative contracts are generally valued using models, whose inputs reflect assumptions that we believe market participants would use in valuing the derivative in a current period transaction. Inputs to valuation models are appropriately calibrated to market data. For many OTC derivative contracts, the valuation models do not involve material subjectivity as the methodologies do not entail significant judgment and the inputs to valuation models do not involve a high degree of subjectivity as the valuation model inputs are readily observable or can be derived from actively quoted markets. OTC derivative contracts are primarily categorized in Level 2 of the fair value hierarchy given the observability of the inputs to the valuation models. |
| OTC options include OTC equity and commodity options measured using Black-Scholes models with key inputs impacting the valuation including the underlying security or commodity price, implied volatility, dividend yield, interest rate curve, strike price and maturity date. Discounted cash flow models are utilized to measure certain OTC derivative contracts including the valuations of our interest rate swaps, which incorporate observable inputs related to interest rate curves, and valuations of our foreign exchange forwards and swaps, which incorporate observable inputs related to foreign currency spot rates and forward curves. Credit defaults swaps include both index and single-name credit default swaps. External prices are available as inputs in measuring index credit default swaps. For single-name credit default swaps, fair value is determined based on valuation statements provided by the counterparty. For commodity and equity total return swaps, market prices are observable for the underlying asset and used as the basis for measuring the fair value of the derivative contracts. Total return swaps executed on other underlyings are measured based on valuations received from third parties. |
| February 28, 2011 | ||||||||||||
| Unfunded | Redemption Frequency | |||||||||||
| Fair Value (f) | Commitments | (if currently eligible) | ||||||||||
Equity Long/Short Hedge Funds(a) | $ | 22,318 | $ | 10,000 | Quarterly, Semiannually | |||||||
High Yield Hedge Funds(b) | 1,545 | — | — | |||||||||
Fund of Funds(c) | 1,195 | 129 | Annually | |||||||||
Private Equity Funds(d) | 23,167 | 6,651 | — | |||||||||
Other Investments(e) | 37 | — | At Will | |||||||||
Total(g) | $ | 48,263 | $ | 16,780 | ||||||||
Page 25 of 86
Table of Contents
NOTES TO CONSOLIDATED FINANCIAL STATEMENTS — CONTINUED
(Unaudited)
| November 30, 2010 | ||||||||||||
| Unfunded | Redemption Frequency | |||||||||||
| Fair Value (f) | Commitments | (if currently eligible) | ||||||||||
Equity Long/Short Hedge Funds(a) | $ | 19,865 | $ | — | Quarterly, Semiannually | |||||||
High Yield Hedge Funds(b) | 1,561 | — | — | |||||||||
Fund of Funds(c) | 2,622 | 131 | Annually | |||||||||
Private Equity Funds(d) | 26,567 | 6,792 | — | |||||||||
Other Investments(e) | 287 | — | At Will | |||||||||
Total(g) | $ | 50,902 | $ | 6,923 | ||||||||
| (a) | This category includes investments in hedge funds that invest in both long and short equity securities in domestic and international markets in both public and private sectors. At February 28, 2011 and November 30, 2010, investments representing approximately 97% and 67%, respectively, of the fair value in this category are redeemable with 60 — 90 days prior written notice. At November 30, 2010, investments representing approximately 30% of fair value cannot be redeemed until the lock-up period expired on December 31, 2010. At February 28, 2011 and November 30, 2010, investments representing approximately 3% of fair value cannot be redeemed as they are in liquidation and distributions will be received through the liquidation of the underlying assets of the funds. We are unable to estimate when the underlying assets will be liquidated. At February 28, 2011 and November 30, 2010, an investment representing less than 1% of fair value has no redemption provisions; distributions are received through the liquidation of the underlying assets of the fund which is estimated to be within one to two years. | |
| (b) | This category includes investments in funds that invest in domestic and international public high yield debt, private high yield investments, senior bank loans, public leveraged equities, distressed debt, and private equity investments. There are no redemption provisions and distributions are received through the liquidation of the underlying assets of the funds. At February 28, 2011 and November 30, 2010, these investments are currently in liquidation and we are unable to estimate when the underlying assets will be fully liquidated. | |
| (c) | This category includes investments in fund of funds that invest in various private equity funds. At February 28, 2011 and November 30, 2010, approximately 95% and 41%, respectively, of the fair value of investments in this category is managed by us and has no redemption provisions. Distributions are received through the liquidation of the underlying assets of the fund of funds, which are estimated to be liquidated in one to three years. At February 28, 2011 we requested redemption for investments representing approximately 5% of fair value at February 28, 2011, however we are unable to estimate when these funds will be returned. At November 30, 2010, investments representing approximately 59% of the fair value were approved for redemption and the funds’ net asset values were received in the first quarter of 2011. | |
| (d) | At February 28, 2011 and November 30, 2010, investments representing approximately 81% and 74% respectively, include investments in private equity funds that invest in the equity of various private companies in the energy, technology, internet service and telecommunication service industries including acquired or restructured companies. These investments cannot be redeemed; distributions are received through the liquidation of the underlying assets of the funds and are expected to liquidate in one to eleven years. Investments in this category at February 28, 2011 and November 30, 2010, representing approximately 19% and 26%, respectively, are investments in closed-ended funds that invest in Croatian and Vietnamese companies. | |
| (e) | This category includes investments in closed-ended funds that invest in Vietnamese equity and debt instruments. | |
| (f) | Fair value has been estimated using the net asset value derived from each of the funds’ partner capital statements. | |
| (g) | Investments at fair value, in the Consolidated Statements of Financial Condition at February 28, 2011 and November 30, 2010 include $20.0 million and $26.9 million, respectively, of direct investments which are not investment companies and therefore are not part of this disclosure table. |
Page 26 of 86
Table of Contents
NOTES TO CONSOLIDATED FINANCIAL STATEMENTS — CONTINUED
(Unaudited)
| February 28, 2011 | November 30, 2010 | |||||||||||||||
| Financial | Financial | |||||||||||||||
| Financial | Instruments Sold, | Financial | Instruments Sold, | |||||||||||||
| Instruments | Not Yet | Instruments | Not Yet | |||||||||||||
| Owned | Purchased | Owned | Purchased | |||||||||||||
| Exchange closing prices | 10 | % | 17 | % | 9 | % | 17 | % | ||||||||
| Recently observed transaction prices | 1 | % | 0 | % | 5 | % | 2 | % | ||||||||
| Data providers/pricing services | 67 | % | 65 | % | 65 | % | 60 | % | ||||||||
| Broker quotes | 8 | % | 16 | % | 12 | % | 19 | % | ||||||||
| Valuation techniques | 14 | % | 2 | % | 9 | % | 2 | % | ||||||||
| 100 | % | 100 | % | 100 | % | 100 | % | |||||||||
Page 27 of 86
Table of Contents
NOTES TO CONSOLIDATED FINANCIAL STATEMENTS — CONTINUED
(Unaudited)
| Three Months Ended February 28, 2011 | ||||||||||||||||||||||||||||
| Change in | ||||||||||||||||||||||||||||
| Total gains/ | Purchases, | unrealized gains/ | ||||||||||||||||||||||||||
| losses | sales, | (losses) relating to | ||||||||||||||||||||||||||
| Balance, | (realized and | settlements, | Transfers | Transfers | Balance, | instruments still held | ||||||||||||||||||||||
| November 30, | unrealized) | and issuances, | into | out of | February 28, | at February 28, 2011 | ||||||||||||||||||||||
| 2010 | (1) | net | Level 3 | Level 3 | 2011 | (1) | ||||||||||||||||||||||
Assets: | ||||||||||||||||||||||||||||
| Financial instruments owned: | ||||||||||||||||||||||||||||
| Corporate equity securities | $ | 22,619 | $ | 5,167 | $ | 6,772 | $ | — | $ | (1,277 | ) | $ | 33,281 | $ | 4,581 | |||||||||||||
| Corporate debt securities | 73,408 | 2,283 | (293 | ) | 106 | (520 | ) | 74,984 | 816 | |||||||||||||||||||
| Collateralized debt obligations | 31,121 | 10,310 | 60,299 | 1,216 | — | 102,946 | 10,087 | |||||||||||||||||||||
| U.S. issued municipal securities | 472 | 19 | 308 | — | — | 799 | 19 | |||||||||||||||||||||
| Residential mortgage-backed securities | 132,359 | 16,205 | (64,301 | ) | 12,886 | (40 | ) | 97,109 | (2,745 | ) | ||||||||||||||||||
| Commercial mortgage-backed securities | 6,004 | 222 | 2,804 | — | (2,729 | ) | 6,301 | (824 | ) | |||||||||||||||||||
| Other asset-backed securities | 567 | (215 | ) | 617 | 11,050 | (567 | ) | 11,452 | (469 | ) | ||||||||||||||||||
| Loans and other receivables | 227,596 | 5,974 | (17,025 | ) | 1,574 | (368 | ) | 217,751 | 3,021 | |||||||||||||||||||
| Investments at fair value | 77,784 | 108 | (7,010 | ) | — | (3,048 | ) | 67,834 | 626 | |||||||||||||||||||
Liabilities: | ||||||||||||||||||||||||||||
| Financial instruments sold, not yet purchased: | ||||||||||||||||||||||||||||
| Corporate equity securities | $ | 38 | $ | — | $ | — | $ | — | $ | — | $ | 38 | $ | — | ||||||||||||||
| Net derivatives (2) | 2,346 | 2,611 | — | — | — | 4,957 | 2,611 | |||||||||||||||||||||
| Loans | 47,228 | — | (29,452 | ) | — | — | 17,776 | — | ||||||||||||||||||||
| (1) | Realized and unrealized gains/ losses are reported in Principal transactions in the Consolidated Statements of Earnings. | |
| (2) | Net derivatives represent Financial instruments owned — Derivatives and Financial instruments sold, not yet purchased — Derivatives. |
| • | Non-agency residential mortgage-backed securities and other asset-backed securities for which no recent trade activity was observed for purposes of determining observable inputs. |
| • | Commercial mortgage-backed securities, for which market trades were observed in the period for either identical or similar securities; and |
| • | Corporate equity securities, for which market transactions were announced or market data on comparable securities used as a benchmark became more observable. |
Page 28 of 86
Table of Contents
NOTES TO CONSOLIDATED FINANCIAL STATEMENTS — CONTINUED
(Unaudited)
| Three Months Ended March 31, 2010 | ||||||||||||||||||||||||||||
| Change in unrealized | ||||||||||||||||||||||||||||
| Purchases, | gains/ (losses) | |||||||||||||||||||||||||||
| Total gains/ | sales, | relating to | ||||||||||||||||||||||||||
| Balance, | losses (realized | settlements, | Transfers | Transfers | Balance, | instruments still held | ||||||||||||||||||||||
| December 31, | and unrealized) | and | into | out of | March 31, | at March 31, 2010 | ||||||||||||||||||||||
| 2009 | (1) | issuances, net | Level 3 | Level 3 | 2010 | (1) | ||||||||||||||||||||||
Assets: | ||||||||||||||||||||||||||||
| Financial instruments owned: | ||||||||||||||||||||||||||||
| Corporate equity securities | $ | 43,042 | $ | (6,605 | ) | $ | 3,361 | $ | 71 | $ | (2,803 | ) | $ | 37,066 | $ | (6,378 | ) | |||||||||||
| Corporate debt securities | 116,648 | (1,318 | ) | (5,163 | ) | 50 | (753 | ) | 109,464 | 937 | ||||||||||||||||||
| Collateralized debt obligations | 9,570 | 3,935 | — | — | — | 13,505 | 3,935 | |||||||||||||||||||||
| U.S. issued municipal securities | 420 | 5 | — | — | — | 425 | 5 | |||||||||||||||||||||
| Sovereign obligations | 196 | — | — | — | (196 | ) | — | — | ||||||||||||||||||||
| Residential mortgage-backed securities | 136,496 | 5,345 | 23,248 | 5,397 | (3,950 | ) | 166,536 | 392 | ||||||||||||||||||||
| Commercial mortgage-backed securities | 3,215 | (226 | ) | 12,450 | 858 | (1,331 | ) | 14,966 | (303 | ) | ||||||||||||||||||
| Other asset-backed securities | 110 | — | — | — | — | 110 | — | |||||||||||||||||||||
| Loans and other receivables | 506,542 | 6,735 | (44,488 | ) | — | (232,559 | ) | 236,230 | 4,025 | |||||||||||||||||||
| Investments at fair value | 65,564 | 282 | 38 | 4,285 | — | 70,169 | (313 | ) | ||||||||||||||||||||
| Investments in managed funds | — | 1,106 | 7,272 | — | — | 8,378 | 1,106 | |||||||||||||||||||||
Liabilities: | ||||||||||||||||||||||||||||
| Financial instruments sold, not yet purchased: | ||||||||||||||||||||||||||||
| Corporate equity securities | $ | — | $ | — | $ | — | $ | 38 | $ | — | $ | 38 | $ | — | ||||||||||||||
| Corporate debt securities | — | (6 | ) | 230 | — | — | 224 | (5 | ) | |||||||||||||||||||
| Net Derivatives (2) | 3,017 | (3,409 | ) | — | — | 1,909 | 1,517 | (3,409 | ) | |||||||||||||||||||
| Loans | 352,420 | — | (48,282 | ) | — | (127,841 | ) | 176,297 | — | |||||||||||||||||||
| (1) | Realized and unrealized gains/ losses are reported in Principal transactions in the Consolidated Statements of Earnings. | |
| (2) | Net derivatives represent Financial instruments owned — Derivatives and Financial instruments sold, not yet purchased — Derivatives. |
Page 29 of 86
Table of Contents
NOTES TO CONSOLIDATED FINANCIAL STATEMENTS — CONTINUED
(Unaudited)
Page 30 of 86
Table of Contents
NOTES TO CONSOLIDATED FINANCIAL STATEMENTS — CONTINUED
(Unaudited)
| February 28, 2011 | ||||||||||||||||
| Assets | Liabilities | |||||||||||||||
| Number of | Number of | |||||||||||||||
| Fair Value | Contracts | Fair Value | Contracts | |||||||||||||
| Interest rate contracts | $ | 95,383 | 42,887 | $ | 117,146 | 59,632 | ||||||||||
| Foreign exchange contracts | 8,421 | 1,038 | 19,953 | 510 | ||||||||||||
| Equity contracts | 205,186 | 6,463,270 | 209,540 | 7,535,954 | ||||||||||||
| Commodity contracts | 33,906 | 78,097 | 108,843 | 37,263 | ||||||||||||
| Credit contracts | 29,129 | 21 | 30,201 | 23 | ||||||||||||
| Total | 372,025 | 6,585,313 | 485,683 | 7,633,382 | ||||||||||||
| Counterparty/cash-collateral netting | (289,417 | ) | (414,420 | ) | ||||||||||||
| Total per Consolidated Statement of Financial Condition | $ | 82,608 | $ | 71,263 | ||||||||||||
| November 30, 2010 | ||||||||||||||||
| Assets | Liabilities | |||||||||||||||
| Number of | Number of | |||||||||||||||
| Fair Value | Contracts | Fair Value | Contracts | |||||||||||||
| Interest rate contracts | $ | 77,295 | 41,166 | $ | 126,281 | 43,243 | ||||||||||
| Foreign exchange contracts | 20,263 | 1,165 | 17,004 | 290 | ||||||||||||
| Equity contracts | 275,760 | 1,226,025 | 249,229 | 2,333,252 | ||||||||||||
| Commodity contracts | 62,727 | 103,562 | 76,911 | 35,071 | ||||||||||||
| Credit contracts | 19,835 | 18 | 15,647 | 15 | ||||||||||||
| Total | 455,880 | 1,371,936 | 485,072 | 2,411,871 | ||||||||||||
| Counterparty/cash-collateral netting | (336,612 | ) | (425,520 | ) | ||||||||||||
| Total per Consolidated Statement of Financial Condition | $ | 119,268 | $ | 59,552 | ||||||||||||
| Three Months Ended | ||||||||
| February 28, | March 31, | |||||||
| 2011 | 2010 | |||||||
| Interest rate contracts | $ | 6,808 | $ | 21,257 | ||||
| Foreign exchange contracts | (5,025 | ) | (871 | ) | ||||
| Equity contracts | (60,917 | ) | (5,936 | ) | ||||
| Commodity contracts | 20,531 | (2,845 | ) | |||||
| Credit contracts | (2,441 | ) | (19,048 | ) | ||||
| Total | $ | (41,044 | ) | $ | (7,443 | ) | ||
Page 31 of 86
Table of Contents
NOTES TO CONSOLIDATED FINANCIAL STATEMENTS — CONTINUED
(Unaudited)
| OTC derivative assets (1) (2) (4) | ||||||||||||||||||||
| Greater Than | Cross-Maturity | |||||||||||||||||||
| 0 – 12 Months | 1 – 5 Years | 5 Years | Netting (3) | Total | ||||||||||||||||
| Commodity swaps | $ | 513 | $ | — | $ | — | $ | — | $ | 513 | ||||||||||
| Commodity options | 21,776 | — | — | — | 21,776 | |||||||||||||||
| Equity options | 10,719 | — | — | — | 10,719 | |||||||||||||||
| Credit default swaps | — | 21,125 | 5,614 | (1,000 | ) | 25,739 | ||||||||||||||
| Total return swaps | 602 | 1,389 | — | — | 1,991 | |||||||||||||||
| Foreign currency forwards and swaps | 3,374 | 53 | — | — | 3,427 | |||||||||||||||
| Fixed income forwards | 92 | — | — | — | 92 | |||||||||||||||
| Interest rate swaps and caps | 360 | 11,966 | 31,434 | (362 | ) | 43,398 | ||||||||||||||
| Total | $ | 37,436 | $ | 34,533 | $ | 37,048 | $ | (1,362 | ) | 107,655 | ||||||||||
| Cross product counterparty netting | (25,236 | ) | ||||||||||||||||||
| Total OTC derivative assets included in Financial instruments owned | $ | 82,419 | ||||||||||||||||||
| (1) | At February 28, 2011, we held exchange traded derivative assets and other credit enhancements of $12.4 million. | |
| (2) | OTC derivative assets in the table above are gross of collateral received. OTC derivative assets are recorded net of collateral received on the Consolidated Statements of Financial Condition. At February 28, 2011, cash collateral received was $12.2 million. | |
| (3) | Amounts represent the netting of receivable balances with payable balances within product category for the same counterparty across maturity categories. | |
| (4) | Derivative fair values include counterparty netting within product category. |
| OTC derivative liabilities (1) (2) (4) | ||||||||||||||||||||
| Greater Than | Cross-Maturity | |||||||||||||||||||
| 0 – 12 Months | 1 – 5 Years | 5 Years | Netting (3) | Total | ||||||||||||||||
| Commodity swaps | $ | 61,576 | $ | — | $ | — | $ | — | $ | 61,576 | ||||||||||
| Commodity options | 40,496 | — | — | — | 40,496 | |||||||||||||||
| Equity options | 7,971 | 3,418 | — | — | 11,389 | |||||||||||||||
| Credit default swaps | 1,862 | 19,773 | 6,026 | (1,000 | ) | 26,661 | ||||||||||||||
| Total return swaps | 6 | 12 | — | — | 18 | |||||||||||||||
| Foreign currency forwards and swaps | 14,821 | 137 | — | — | 14,958 | |||||||||||||||
| Interest rate swaps and caps | 847 | 38,332 | 31,931 | (362 | ) | 70,748 | ||||||||||||||
| Total | $ | 127,579 | $ | 61,672 | $ | 37,957 | $ | (1,362 | ) | 225,846 | ||||||||||
| Cross product counterparty netting | (25,236 | ) | ||||||||||||||||||
| Total OTC derivative liabilities included in Financial instruments sold, not yet purchased | $ | 200,610 | ||||||||||||||||||
| (1) | At February 28, 2011, we held exchange traded derivative liabilities and other credit enhancements of $7.9 million. |
Page 32 of 86
Table of Contents
NOTES TO CONSOLIDATED FINANCIAL STATEMENTS — CONTINUED
(Unaudited)
| (2) | OTC derivative liabilities in the table above are gross of collateral pledged. OTC derivative liabilities are recorded net of collateral pledged on the Consolidated Statements of Financial Condition. At February 28, 2011, cash collateral pledged was $137.2 million. | |
| (3) | Amounts represent the netting of receivable balances with payable balances within product category for the same counterparty across maturity categories. | |
| (4) | Derivative fair values include counterparty netting within product category. |
| Counterparty credit quality: | ||||
| A or higher | $ | 68,989 | ||
| B to BBB | 1 | |||
| Unrated | 13,429 | |||
| Total | $ | 82,419 | ||
Page 33 of 86
Table of Contents
NOTES TO CONSOLIDATED FINANCIAL STATEMENTS — CONTINUED
(Unaudited)
Page 34 of 86
Table of Contents
NOTES TO CONSOLIDATED FINANCIAL STATEMENTS — CONTINUED
(Unaudited)
| Assets obtained | As of February 28, 2011 | |||||||||||
| Securitization Type | as proceeds | Total Assets (6) | Assets Retained | |||||||||
| Residential mortgage-backed securities | $ | 455.2 | (3) | $ | 5,753.7 | $ | 657.0 | (1)(2) | ||||
| Commercial mortgage-backed securities | 62.6 | (3) | 2,798.7 | 71.3 | (1)(2) | |||||||
| Project loans | 0.1 | (4) | 107.8 | 0.1 | (5) | |||||||
| (1) | At February 28, 2011, the securities issued in these securitizations are comprised of government agency-backed securities. | |
| (2) | A significant portion of these securities have been subsequently sold in secondary-market transactions to third parties. As of April 4, 2011, we continue to hold approximately $541.9 million and $42.9 million of these Residential mortgage-backed securities and Commercial mortgage-backed securities, respectively, in inventory. | |
| (3) | Initial fair value of securities received on date of asset transfer that were issued by securitization vehicles. | |
| (4) | Initial fair value of servicing rights received on transferred project loans. | |
| (5) | Represents amortized servicing rights on transferred project loans. | |
| (6) | Represents unpaid principal amount of assets in the securitization vehicles. |
| Assets obtained | As of November 30, 2010 | |||||||||||
| Securitization Type | as proceeds | Total Assets (6) | Assets Retained | |||||||||
| Residential mortgage-backed securities | $ | 2,203.1 | (3) | $ | 6,549.5 | $ | 684.7 | (1)(2) | ||||
| Commercial mortgage-backed securities | 105.7 | (3) | 2,005.4 | 40.4 | (1)(2) | |||||||
| Project loans | 0.1 | (4) | 107.8 | 0.1 | (5) | |||||||
| (1) | At November 30, 2010, the securities issued in these securitizations are comprised of government agency-backed securities. | |
| (2) | A significant portion of these securities have been subsequently sold in secondary-market transactions to third parties. As of April 4, 2011, we continue to hold approximately $225.8 million and $29.6 million of these Residential mortgage-backed securities and Commercial mortgage-backed securities, respectively, in inventory. | |
| (3) | Initial fair value of securities received on date of asset transfer that were issued by securitization vehicles. | |
| (4) | Initial fair value of servicing rights received on transferred project loans. | |
| (5) | Represents amortized servicing rights on transferred project loans. | |
| (6) | Represents unpaid principal amount of assets in the securitization vehicles. |
| Three Months Ended | ||||||||
| February 28, | March 31, | |||||||
| 2011 (1) | 2010 (1) | |||||||
| Residential mortgage-backed securities | $ | 17.4 | $ | 6.2 | ||||
| Commercial mortgage-backed securities | 2.0 | — | ||||||
| (1) | Cash flows received on beneficial interests in securitization vehicles of project loans were de minimus for the three months ended February 28, 2011. No project loans were held during the three months ended March 31, 2010. |
Page 35 of 86
Table of Contents
NOTES TO CONSOLIDATED FINANCIAL STATEMENTS — CONTINUED
(Unaudited)
Page 36 of 86
Table of Contents
NOTES TO CONSOLIDATED FINANCIAL STATEMENTS — CONTINUED
(Unaudited)
| February 28, 2011 | November 30, 2010 | |||||||||||||||||||||||
| Mortgage- and | Mortgage- and | |||||||||||||||||||||||
| Asset-backed | Asset-backed | |||||||||||||||||||||||
| High Yield | Securitizations | Other | High Yield | Securitizations | Other | |||||||||||||||||||
| Cash | $ | 282.5 | $ | — | $ | — | $ | 202.6 | $ | — | $ | — | ||||||||||||
| Financial instruments owned | 782.3 | 104.0 | 22.9 | 889.8 | 101.4 | 21.0 | ||||||||||||||||||
| Securities borrowed | 391.0 | — | — | 455.8 | — | — | ||||||||||||||||||
| Receivable from brokers and dealers | 91.8 | — | — | 195.5 | — | — | ||||||||||||||||||
| Other | 17.5 | 0.2 | — | 11.6 | 0.1 | — | ||||||||||||||||||
| $ | 1,565.1 | $ | 104.2 | $ | 22.9 | $ | 1,755.3 | $ | 101.5 | $ | 21.0 | |||||||||||||
| Financial instruments sold, not yet purchased | $ | 442.4 | $ | — | $ | — | $ | 602.6 | $ | — | $ | — | ||||||||||||
| Payable to brokers and dealers | 68.8 | — | — | 157.1 | — | — | ||||||||||||||||||
| Mandatorily redeemable interests (1) | 1,010.1 | — | — | 1,047.9 | — | — | ||||||||||||||||||
| Promissory note (2) | — | — | 4.1 | — | — | 4.4 | ||||||||||||||||||
| Secured financing (3) | — | 104.0 | — | — | 101.4 | — | ||||||||||||||||||
| Other | 44.9 | 0.2 | — | 36.3 | 0.1 | — | ||||||||||||||||||
| $ | 1,566.2 | $ | 104.2 | $ | 4.1 | $ | 1,843.9 | $ | 101.5 | $ | 4.4 | |||||||||||||
| (1) | After consolidation, which eliminates our interests and the interests of our consolidated subsidiaries, JSOP and JESOP, the carrying amount of the mandatorily redeemable financial interests pertaining to the above VIEs included within Mandatorily redeemable preferred interests of consolidated subsidiaries in the Consolidated Statements of Financial Condition was approximately $332.3 million and $315.9 million at February 28, 2011 and November 30, 2010, respectively. | |
| (2) | The promissory note represents an amount due to us and is eliminated in consolidation. | |
| (3) | Secured financing is included within Accrued expenses and other liabilities in the Consolidated Statements of Financial Condition. Approximately $6.3 million and $15.7 million of the secured financing represents an amount held by us in inventory and is eliminated in consolidation at February 28, 2011 and November 30, 2010, respectively. |
Page 37 of 86
Table of Contents
NOTES TO CONSOLIDATED FINANCIAL STATEMENTS — CONTINUED
(Unaudited)
| February 28, 2011 | ||||||||||||
| Maximum exposure to | ||||||||||||
| loss in non- | ||||||||||||
| VIE Assets | consolidated VIEs | Carrying Amount | ||||||||||
| Collateralized loan obligations | $ | 1,982.3 | $ | 44.7 | (2) | $ | 44.7 | |||||
| Mortgage- and asset-backed vehicles — Non-agency (1) | 78,713.7 | 1,138.9 | (2) | 1,138.9 | ||||||||
| Mortgage- and asset-backed vehicles — Agency (1) | 2,104.1 | 479.0 | (2) | 479.0 | ||||||||
| Asset management vehicle | 1,112.3 | 20.2 | (2) | 20.2 | ||||||||
| Private equity vehicles | 73.3 | 131.0 | 53.5 | |||||||||
| Total | $ | 83,985.7 | $ | 1,813.8 | $ | 1,736.3 | ||||||
| (1) | VIE assets represent the unpaid principal balance of the assets in these vehicles at February 28, 2011. | |
| (2) | Our maximum exposure to loss in these non-consolidated VIEs is limited to our investment. |
Page 38 of 86
Table of Contents
NOTES TO CONSOLIDATED FINANCIAL STATEMENTS — CONTINUED
(Unaudited)
| November 30, 2010 | ||||||||||||
| Maximum exposure to | ||||||||||||
| loss in non- | ||||||||||||
| VIE Assets | consolidated VIEs | Carrying Amount | ||||||||||
| Collateralized loan obligations | $ | 1,937.8 | $ | 35.3 | (2) | $ | 35.3 | |||||
| Mortgage- and asset-backed vehicles — Non-agency (1) | 91,285.1 | 852.1 | (2) | 852.1 | ||||||||
| Mortgage- and asset-backed vehicles — Agency (1) | 7,464.8 | 1,840.9 | (2) | 1,840.9 | ||||||||
| Asset management vehicle | 760.4 | 18.1 | (2) | 18.1 | ||||||||
| Private equity vehicles | 63.9 | 131.0 | 49.7 | |||||||||
| Total | $ | 101,512.0 | $ | 2,877.4 | $ | 2,796.1 | ||||||
| (1) | VIE assets represent the unpaid principal balance of the assets in these vehicles at November 30, 2010. | |
| (2) | Our maximum exposure to loss in these non-consolidated VIEs is limited to our investment. |
Page 39 of 86
Table of Contents
NOTES TO CONSOLIDATED FINANCIAL STATEMENTS — CONTINUED
(Unaudited)
Page 40 of 86
Table of Contents
NOTES TO CONSOLIDATED FINANCIAL STATEMENTS — CONTINUED
(Unaudited)
| February 28, | November 30, | |||||||
| 2011 | 2010 | |||||||
| Total assets | $ | 1,043.5 | $ | 890.4 | ||||
| Total liabilities | 691.8 | 566.4 | ||||||
| Total equity | 351.7 | 324.0 | ||||||
| Our total equity balance | 175.9 | 162.0 | ||||||
| Three Months | ||||
| Ended | ||||
| February 28, 2011 | ||||
| Balance, at beginning of period | $ | 364,964 | ||
| Add: Contingent consideration | 825 | |||
| Add: Translation adjustments | 711 | |||
| Balance, at end of period | $ | 366,500 | ||
Page 41 of 86
Table of Contents
NOTES TO CONSOLIDATED FINANCIAL STATEMENTS — CONTINUED
(Unaudited)
| Three Months | Eleven Months | |||||||
| Ended | Ended | |||||||
| February 28, 2011 | November 30, 2010 | |||||||
| Balance, beginning of period | $ | 8,263 | $ | 8,500 | ||||
| Add: Acquisition | 68 | 87 | ||||||
| Less: Amortization | (91 | ) | (324 | ) | ||||
| Balance, end of period | $ | 8,240 | $ | 8,263 | ||||
Page 42 of 86
Table of Contents
NOTES TO CONSOLIDATED FINANCIAL STATEMENTS — CONTINUED
(Unaudited)
| February 28, | November 30, | |||||||
| 2011 | 2010 | |||||||
| 7.75% Senior Notes, due 2012 (effective interest rate of 8.08%) | $ | 305,728 | $ | 305,969 | ||||
| 5.875% Senior Notes, due 2014 (effective interest rate of 6.00%) | 249,109 | 249,048 | ||||||
| 3.875% Senior Note, due 2015 (effective interest rate of 3.92%) | 499,046 | 499,000 | ||||||
| 5.5% Senior Notes, due 2016 (effective interest rate of 5.57%) | 348,901 | 348,854 | ||||||
| 8.5% Senior Notes, due 2019 (effective interest rate of 8.31%) | 708,348 | 708,529 | ||||||
| 6.875% Senior Note, due 2021 (effective interest rate of 6.99%) | 545,584 | 545,510 | ||||||
| 6.45% Senior Debentures, due 2027 (effective interest rate of 6.55%) | 346,573 | 346,544 | ||||||
| 3.875% Convertible Senior Debentures, due, 2029 (effective interest rate of 7.20%) | 284,335 | 282,577 | ||||||
| 6.25% Senior Debentures, due 2036 (effective interest rate of 6.37%) | 492,680 | 492,650 | ||||||
| $ | 3,780,304 | $ | 3,778,681 | |||||
Page 43 of 86
Table of Contents
NOTES TO CONSOLIDATED FINANCIAL STATEMENTS — CONTINUED
(Unaudited)
| February 28, 2011 | November 30, 2010 | |||||||
| JSOP | $ | 295.0 | $ | 282.5 | ||||
| JESOP | 34.2 | 32.6 | ||||||
| Other (1) | 19.4 | 17.9 | ||||||
| Noncontrolling interests | $ | 348.6 | $ | 333.0 | ||||
| (1) | Other includes consolidated asset management entities and investment vehicles set up for the benefit of our employees or clients. |
Page 44 of 86
Table of Contents
NOTES TO CONSOLIDATED FINANCIAL STATEMENTS — CONTINUED
(Unaudited)
| Three Months Ended | ||||||||
| February 28, 2011 | March 31, 2010 | |||||||
| Net pension cost included the following components: | ||||||||
| Service cost (1) | $ | 50 | $ | 50 | ||||
| Interest cost on projected benefit obligation | 590 | 616 | ||||||
| Expected return on plan assets | (647 | ) | (656 | ) | ||||
| Net amortization | 216 | 176 | ||||||
| Net periodic pension cost | $ | 209 | $ | 186 | ||||
| (1) | Service cost relates to administrative expenses incurred during the periods. |
Page 45 of 86
Table of Contents
NOTES TO CONSOLIDATED FINANCIAL STATEMENTS — CONTINUED
(Unaudited)
Page 46 of 86
Table of Contents
NOTES TO CONSOLIDATED FINANCIAL STATEMENTS — CONTINUED
(Unaudited)
| Weighted | ||||||||
| Three Months Ended | Average Grant | |||||||
| February 28, 2011 | Date Fair Value | |||||||
| (Shares in 000s) | ||||||||
Restricted stock | ||||||||
| Balance, beginning of period | 4,918 | $ | 22.82 | |||||
| Grants (1) | 607 | $ | 24.78 | |||||
| Forfeited | (10 | ) | $ | 24.25 | ||||
| Fulfillment of service requirement (1) | (513 | ) | $ | 22.31 | ||||
| Balance, end of period (2) | 5,002 | $ | 23.11 | |||||
| (1) | Includes approximately 164,000 shares of restricted stock granted with no future service requirements during the three months ended February 28, 2011. These shares are shown as granted and vested during the period. The weighted average grant date fair value of these shares was approximately $25.27. | |
| (2) | Represents restricted stock with a future service requirement. |
| Weighted | ||||||||||||||||
| Three Months Ended | Average Grant | |||||||||||||||
| February 28, 2011 | Date Fair Value | |||||||||||||||
| (Shares in 000s) | ||||||||||||||||
| Future | No Future | Future | No Future | |||||||||||||
| Service | Service | Service | Service | |||||||||||||
| Required | Required | Required | Required | |||||||||||||
Restricted stock units | ||||||||||||||||
| Balance, beginning of period | 3,998 | 24,730 | $ | 24.04 | $ | 14.74 | ||||||||||
| Grants | 201 | 81 | (1) | $ | 20.57 | $ | 24.26 | |||||||||
| Distribution of underlying shares | — | (970 | ) | $ | — | $ | 3.87 | |||||||||
| Forfeited | (7 | ) | (55 | ) | $ | 18.44 | $ | 15.56 | ||||||||
| Fulfillment of service requirement | (190 | ) | 190 | $ | 21.54 | $ | 21.54 | |||||||||
| Balance, end of period | 4,002 | 23,976 | $ | 23.99 | $ | 15.26 | ||||||||||
| (1) | Includes approximately 81,000 dividend equivalents declared on restricted stock units during the three months ended February 28, 2011. The weighted average grant date fair value of these dividend equivalents was approximately $24.27. |
Page 47 of 86
Table of Contents
NOTES TO CONSOLIDATED FINANCIAL STATEMENTS — CONTINUED
(Unaudited)
| Three Months Ended | ||||||||
| February 28, 2011 | ||||||||
| Weighted Average | ||||||||
| (Shares in 000s) | Options | Exercise Price | ||||||
| Outstanding at beginning of period | 26 | $ | 9.89 | |||||
| Outstanding at end of period | 26 | 9.89 | ||||||
| Options exercisable at end of period | 26 | 9.89 | ||||||
| Dollars and shares in thousands, except per share data | Outstanding, | |||||||
| Net of Expected | Options | |||||||
| February 28, 2011 | Forfeitures | Exercisable | ||||||
| Number of options | 26 | 26 | ||||||
| Weighted-average exercise price | $ | 9.89 | $ | 9.89 | ||||
| Aggregate intrinsic value | $ | 366 | $ | 366 | ||||
| Weighted-average remaining contractual term, in years | 1.00 | 1.00 | ||||||
Page 48 of 86
Table of Contents
NOTES TO CONSOLIDATED FINANCIAL STATEMENTS — CONTINUED
(Unaudited)
Page 49 of 86
Table of Contents
NOTES TO CONSOLIDATED FINANCIAL STATEMENTS — CONTINUED
(Unaudited)
| Three Months Ended | ||||||||
| February 28, 2011 | March 31, 2010 | |||||||
Earnings for basic earnings per common share: | ||||||||
| Net earnings | $ | 102,045 | $ | 76,087 | ||||
| Net earnings to noncontrolling interests | 14,704 | 3,943 | ||||||
| Net earnings to common shareholders | 87,341 | 72,144 | ||||||
| Less: Allocation of earnings to participating securities (1) | 3,925 | 2,108 | ||||||
| Net earnings available to common shareholders | $ | 83,416 | $ | 70,036 | ||||
Earnings for diluted earnings per common share: | ||||||||
| Net earnings | $ | 102,045 | $ | 76,087 | ||||
| Net earnings to noncontrolling interests | 14,704 | 3,943 | ||||||
| Net earnings to common shareholders | 87,341 | 72,144 | ||||||
| Add: Convertible preferred stock dividends | 1,016 | 1,016 | ||||||
| Less: Allocation of earnings to participating securities (1) | 3,907 | 2,104 | ||||||
| Net earnings available to common shareholders | $ | 84,450 | $ | 71,056 | ||||
Shares: | ||||||||
| Average common shares used in basic computation | 199,141 | 198,507 | ||||||
| Stock options | 11 | 18 | ||||||
| Mandatorily redeemable convertible preferred stock | 4,105 | 4,105 | ||||||
| Convertible debt | — | — | ||||||
| Average common shares used in diluted computation | 203,257 | 202,630 | ||||||
Earnings per common share: | ||||||||
| Basic | $ | 0.42 | $ | 0.35 | ||||
| Diluted | $ | 0.42 | $ | 0.35 | ||||
| (1) | Represents dividends declared during the period on participating securities plus an allocation of undistributed earnings to participating securities. Losses are not allocated to participating securities. Participating securities represent restricted stock and restricted stock units for which requisite service has not yet been rendered and amounted to weighted average shares of 9,403,000 and 5,815,000 for the three months ended February 28, 2011 and March 31, 2010, respectively. Dividends declared on participating securities during the three months ended February 28, 2011 and March 31, 2010 amounted to approximately $686,000 and $494,000, respectively. Undistributed earnings are allocated to participating securities based upon their right to share in earnings as if all earnings for the period had been distributed. |
| 1st Quarter | ||||
| 2011 | $ | 0.075 | ||
| 2010 | $ | 0.075 | ||
Page 50 of 86
Table of Contents
NOTES TO CONSOLIDATED FINANCIAL STATEMENTS — CONTINUED
(Unaudited)
| Jurisdiction | Tax Year | |||
| United States | 2006 | |||
| United Kingdom | 2008 | |||
| New Jersey | 2006 | |||
| New York State | 2001 | |||
| New York City | 2003 | |||
| Expected Maturity Date | ||||||||||||||||||||||||
| 2013 | 2015 | 2017 | Notional/ | |||||||||||||||||||||
| and | and | and | Maximum | |||||||||||||||||||||
| 2011 | 2012 | 2014 | 2016 | Later | Payout | |||||||||||||||||||
| Equity commitments | $ | 0.5 | $ | 0.2 | $ | 8.7 | $ | 3.2 | $ | 731.9 | $ | 744.5 | ||||||||||||
| Loan commitments | — | 12.8 | 83.6 | 30.2 | 350.0 | 476.6 | ||||||||||||||||||
| Mortgage-related commitments | 881.9 | 214.2 | 129.5 | — | — | 1,225.6 | ||||||||||||||||||
| Forward starting repos | 676.5 | — | — | — | — | 676.5 | ||||||||||||||||||
| Derivative contracts: | ||||||||||||||||||||||||
| Derivative contracts — non credit related | 40,525.7 | 10,534.0 | 8.7 | — | 1.7 | 51,070.1 | ||||||||||||||||||
| Derivative contracts — credit related | — | — | 37.6 | 163.4 | 40.0 | 241.0 | ||||||||||||||||||
| Total derivative contracts | 40,525.7 | 10,534.0 | 46.3 | 163.4 | 41.7 | 51,311.1 | ||||||||||||||||||
| $ | 42,084.6 | $ | 10,761.2 | $ | 268.1 | $ | 196.8 | $ | 1,123.6 | $ | 54,434.3 | |||||||||||||
Page 51 of 86
Table of Contents
NOTES TO CONSOLIDATED FINANCIAL STATEMENTS — CONTINUED
(Unaudited)
| External Credit Rating | ||||||||||||||||||||||||
| Below | Notional/ | |||||||||||||||||||||||
| AAA/ | Investment | Maximum | ||||||||||||||||||||||
| Aaa | AA/Aa | BBB/Baa | Grade | Unrated | Payout | |||||||||||||||||||
| Loan commitments | $ | — | $ | — | $ | 78.0 | $ | — | $ | 398.6 | $ | 476.6 | ||||||||||||
| Derivative contracts- credit related: | ||||||||||||||||||||||||
| Single name credit default swaps | — | — | — | 5.0 | — | 5.0 | ||||||||||||||||||
| Index credit default swaps | 20.0 | 10.0 | 10.0 | 196.0 | — | 236.0 | ||||||||||||||||||
| Total derivative contracts — credit related | 20.0 | 10.0 | 10.0 | 201.0 | — | 241.0 | ||||||||||||||||||
| Total credit related commitments | $ | 20.0 | $ | 10.0 | $ | 88.0 | $ | 201.0 | $ | 398.6 | $ | 717.6 | ||||||||||||
| Total | Corporate | Corporate | ||||||||||||||||||
| Corporate | Lending | Lending | ||||||||||||||||||
| Greater Than | Lending | Exposure at | Commitments | |||||||||||||||||
| Credit Ratings | 1-5 Years | 5 Years | Exposure (1) | Fair Value (2) | (3) | |||||||||||||||
| BBB | $ | 76.6 | $ | — | $ | 76.6 | $ | (1.4 | ) | $ | 78.0 | |||||||||
| Unrated | 126.1 | 500.0 | 626.1 | 227.5 | 398.6 | |||||||||||||||
| Total | $ | 202.7 | $ | 500.0 | $ | 702.7 | $ | 226.1 | $ | 476.6 | ||||||||||
| (1) | Total corporate lending exposure represents the potential loss assuming the fair value of funded loans and lending commitments were zero. | |
| (2) | The corporate lending exposure carried at fair value includes $227.6 million of funded loans included in Financial instruments owned — Loans and $(1.5) million of lending commitments recorded in Financial instruments sold — Derivatives in the Consolidated Statement of Financial Condition as of February 28, 2011. | |
| (3) | Amounts represent the notional amount of lending commitments less the amount of funded commitments reflected in the Consolidated Statements of Financial Condition. |
Page 52 of 86
Table of Contents
NOTES TO CONSOLIDATED FINANCIAL STATEMENTS — CONTINUED
(Unaudited)
Page 53 of 86
Table of Contents
NOTES TO CONSOLIDATED FINANCIAL STATEMENTS — CONTINUED
(Unaudited)
| Net Capital | Excess Net Capital | |||||||
| Jefferies | $ | 514,817 | $ | 426,180 | ||||
| Jefferies Execution | $ | 13,852 | $ | 13,602 | ||||
| Jefferies High Yield Trading | $ | 528,793 | $ | 528,543 | ||||
| • | Net revenues and expenses directly associated with each reportable business segment are included in determining earnings before taxes. |
Page 54 of 86
Table of Contents
NOTES TO CONSOLIDATED FINANCIAL STATEMENTS — CONTINUED
(Unaudited)
| • | Net revenues and expenses not directly associated with specific reportable business segments are allocated based on the most relevant measures applicable, including each reportable business segment’s net revenues, headcount and other factors. | |
| • | Reportable business segment assets include an allocation of indirect corporate assets that have been fully allocated to our reportable business segments, generally based on each reportable business segment’s capital utilization. |
| Capital | Asset | |||||||||||
| Markets | Management | Total | ||||||||||
Three months ended February 28, 2011 | ||||||||||||
| Net revenues | $ | 734.5 | $ | 23.9 | $ | 758.4 | ||||||
| Expenses | $ | 569.6 | $ | 9.4 | $ | 579.0 | ||||||
| Segment assets | $ | 40,208.1 | $ | 220.1 | $ | 40,428.2 | ||||||
Three months ended March 31, 2010 | ||||||||||||
| Net revenues | $ | 573.5 | $ | 6.6 | $ | 580.1 | ||||||
| Expenses | $ | 446.1 | $ | 9.5 | $ | 455.6 | ||||||
| Segment assets | $ | 33,898.4 | $ | 125.0 | $ | 34,023.4 | ||||||
| Three Months Ended | ||||||||
| February 28, | March 31, | |||||||
| 2011 | 2010 | |||||||
| Americas (1) | $ | 653,896 | $ | 490,711 | ||||
| Europe (2) | 110,225 | 90,107 | ||||||
| Asia (including Middle East) | (5,739 | ) | (763 | ) | ||||
| Net Revenues | $ | 758,382 | $ | 580,055 | ||||
| (1) | Substantially all relates to U.S. results. | |
| (2) | Substantially all relates to U.K. results. |
Page 55 of 86
Table of Contents
NOTES TO CONSOLIDATED FINANCIAL STATEMENTS — CONTINUED
(Unaudited)
Page 56 of 86
Table of Contents
Condition and Results of Operations
| • | the description of our business and risk factors contained in our Transition Report on Form 10-K for the transition period from January 1, 2010 to November 30, 2010 and filed with the SEC on February 2, 2011; | ||
| • | the discussion of our analysis of financial condition and results of operations contained in this report under the caption “Management’s Discussion and Analysis of Financial Condition and Results of Operations”; | ||
| • | the notes to the consolidated financial statements contained in this report; and | ||
| • | cautionary statements we make in our public documents, reports and announcements. |
Page 57 of 86
Table of Contents
| (Dollars in thousands, except for per share | Three Months Ended | |||||||
| amounts) | February 28, 2011 | March 31, 2010 | ||||||
| Net revenues, less mandatorily redeemable preferred interest | $ | 741,944 | $ | 578,007 | ||||
| Non-interest expenses | 579,013 | 455,551 | ||||||
| Earnings before income taxes | 162,931 | 122,456 | ||||||
| Income tax expense | 60,886 | 46,369 | ||||||
| Net earnings | 102,045 | 76,087 | ||||||
| Net earnings to noncontrolling interests | 14,704 | 3,943 | ||||||
| Net earnings to common shareholders | 87,341 | 72,144 | ||||||
| Earnings per diluted common share | $ | 0.42 | $ | 0.35 | ||||
| Effective tax rate | 37 | % | 38 | % | ||||
Page 58 of 86
Table of Contents
| Three Months Ended | ||||||||||||||||
| February 28, 2011 | March 31, 2010 | |||||||||||||||
| % of Net | % of Net | |||||||||||||||
| Amount | Revenues | Amount | Revenues | |||||||||||||
| Equities | $ | 177,358 | 23 | % | $ | 174,299 | 30 | % | ||||||||
| Fixed income | 318,097 | 42 | 200,820 | 35 | ||||||||||||
| Total sales and trading | 495,455 | 65 | 375,119 | 65 | ||||||||||||
| Equity | 49,684 | 7 | 34,217 | 6 | ||||||||||||
| Debt | 62,967 | 8 | 101,846 | 18 | ||||||||||||
| Capital markets | 112,651 | 15 | 136,063 | 23 | ||||||||||||
| Advisory | 126,408 | 17 | 62,274 | 11 | ||||||||||||
| Investment banking | 239,059 | 32 | 198,337 | 34 | ||||||||||||
| Asset management fees and investment income from managed funds: | ||||||||||||||||
| Asset management fees | 16,117 | 2 | 4,017 | 1 | ||||||||||||
| Investment income from managed funds | 7,751 | 1 | 2,582 | — | ||||||||||||
| Total | 23,868 | 3 | 6,599 | 1 | ||||||||||||
| Net revenues | 758,382 | 100 | % | 580,055 | 100 | % | ||||||||||
| Interest on mandatorily redeemable preferred interest of consolidated subsidiaries | 16,438 | 2,048 | ||||||||||||||
| Net revenues, less mandatorily redeemable preferred interest | $ | 741,944 | $ | 578,007 | ||||||||||||
Page 59 of 86
Table of Contents
| Three Months Ended | Three Months Ended | |
| February 28, 2011 | March 31, 2010 | |
| 61 days | 61 days |
Page 60 of 86
Table of Contents
| Three Months Ended | ||||||||||||
| February 28, 2011 | March 31, 2010 | % Change | ||||||||||
| Equity | $ | 49,684 | $ | 34,217 | 45 | % | ||||||
| Debt | 62,967 | 101,846 | -38 | % | ||||||||
| Capital markets | 112,651 | 136,063 | -17 | % | ||||||||
| Advisory | 126,408 | 62,274 | 103 | % | ||||||||
| Total | $ | 239,059 | $ | 198,337 | 21 | % | ||||||
Page 61 of 86
Table of Contents
| Three Months Ended | ||||||||
| February 28, 2011 | March 31, 2010 | |||||||
| Asset management fees: | ||||||||
| Fixed Income | $ | 740 | $ | 920 | ||||
| Equities | 1,850 | 466 | ||||||
| Convertibles | 10,825 | 1,806 | ||||||
| Commodities | 2,702 | 825 | ||||||
| 16,117 | 4,017 | |||||||
| Investment income from managed funds (1) | 7,751 | 2,582 | ||||||
| Total | $ | 23,868 | $ | 6,599 | ||||
| (1) | Of the total investment income from managed funds, $0.07 million and $(0.2) million is attributed to noncontrolling interest holders for the three months ended February 28, 2011 and March 31, 2010, respectively. |
| Three Months Ended | ||||||||
| February 28, 2011 | March 31, 2010 | |||||||
| Assets under management (1)(3): | ||||||||
| Equities | $ | 88 | $ | 79 | ||||
| Convertibles | 2,376 | 1,760 | ||||||
| Real Assets | 76 | — | ||||||
| 2,540 | 1,839 | |||||||
| Assets under management by related parties (2): | ||||||||
| Private Equity (4) | 624 | 600 | ||||||
| 624 | 600 | |||||||
| Total | $ | 3,164 | $ | 2,439 | ||||
| (1) | Assets under management include assets actively managed by us including hedge funds and managed accounts. Assets under management do not include the assets of funds that are consolidated due to the level or nature of our investment in such funds. | |
| (2) | Related party managed funds in which we have a 50% or less interest in the entities that manage these assets or otherwise receive a portion of the management fees. | |
| (3) | Assets under management are based on the fair value of the assets. | |
| (4) | Assets under management represent either the capital commitment to a fund or carrying value of a fund depending on how management fees are calculated as governed by the partnership or management agreement. |
Page 62 of 86
Table of Contents
| Three Months Ended | % | |||||||||||
| (in millions) | February 28, 2011 | March 31, 2010 | Change | |||||||||
| Balance, beginning of period | $ | 2,556 | $ | 4,024 | -36 | % | ||||||
| Net cash flow in (out) | 361 | (1,684 | ) | |||||||||
| Net market appreciation | 247 | 99 | ||||||||||
| 608 | (1,585 | ) | ||||||||||
| Balance, end of period | $ | 3,164 | $ | 2,439 | 30 | % | ||||||
| (notional account value) | ||||||||
| (in millions) | February 28, 2011 | March 31, 2010 | ||||||
| Managed Accounts: | ||||||||
| Equities | $ | 148 | $ | 100 | ||||
| Commodities | 916 | 492 | ||||||
| $ | 1,064 | $ | 592 | |||||
| (notional account value) | Three Months Ended | |||||||
| (in millions) | February 28, 2011 | March 31, 2010 | ||||||
| Balance, beginning of period | $ | 949 | $ | 560 | ||||
| Net account (deletions) additions | (12 | ) | 49 | |||||
| Net account appreciation (depreciation) | 127 | (17 | ) | |||||
| Balance, end of period | $ | 1,064 | $ | 592 | ||||
Page 63 of 86
Table of Contents
| Three Months | Eleven Months | |||||||
| Ended | Ended | |||||||
| February 28, 2011 | November 30, 2010 | |||||||
| Unconsolidated funds (1) | $ | 136,211 | $ | 131,024 | ||||
| Consolidated funds (2) | 55,426 | 53,843 | ||||||
| Total | $ | 191,637 | $ | 184,867 | ||||
| (1) | Our invested capital in unconsolidated funds is reported within Investments in managed funds on the Consolidated Statement of Financial Condition. | |
| (2) | Assets under management include assets actively managed by us and third parties including hedge funds, CLOs, managed accounts and other private investment funds. Due to the level or nature of our investment in such funds, certain funds are consolidated and the assets and liabilities of these funds are reflected in our consolidated financial statements primarily within Financial instruments owned. We do not recognize asset management fees for funds that we have consolidated. |
Page 64 of 86
Table of Contents
Page 65 of 86
Table of Contents
| February 28, 2011 | November 30, 2010 | |||||||||||||||
| Financial | Financial | |||||||||||||||
| Instruments | Instruments | |||||||||||||||
| Financial | Sold, | Financial | Sold, | |||||||||||||
| Instruments | Not Yet | Instruments | Not Yet | |||||||||||||
| Owned | Purchased | Owned | Purchased | |||||||||||||
| Corporate equity securities | $ | 2,173,967 | $ | 1,989,199 | $ | 1,565,793 | $ | 1,638,372 | ||||||||
| Corporate debt securities | 4,236,560 | 2,295,374 | 3,630,616 | 2,375,925 | ||||||||||||
| Government, federal agency and other sovereign obligations | 5,875,860 | 5,510,010 | 5,191,973 | 4,735,288 | ||||||||||||
| Mortgage and asset-backed securities | 5,371,708 | 119,849 | 4,921,565 | 129,384 | ||||||||||||
| Loans and other receivables | 444,205 | 70,062 | 434,573 | 171,278 | ||||||||||||
| Derivatives | 82,608 | 71,263 | 119,268 | 59,552 | ||||||||||||
| Investments | 68,291 | — | 77,784 | — | ||||||||||||
| $ | 18,253,199 | $ | 10,055,757 | $ | 15,941,572 | $ | 9,109,799 | |||||||||
Page 66 of 86
Table of Contents
| Financial Instruments Sold, | ||||||||||||||||
| Financial Instruments Owned | Not Yet Purchased | |||||||||||||||
| February 28, | November 30, | February 28, | November 30, | |||||||||||||
| 2011 | 2010 | 2011 | 2010 | |||||||||||||
| Loans and other receivables | $ | 217,751 | $ | 227,596 | $ | 17,776 | $ | 47,228 | ||||||||
| Collateralized debt obligations | 102,946 | 31,121 | — | — | ||||||||||||
| Residential mortgage-backed securities | 97,109 | 132,359 | — | — | ||||||||||||
| Corporate debt securities | 74,984 | 73,408 | — | — | ||||||||||||
| Investments | 67,834 | 77,784 | — | — | ||||||||||||
| Corporate equity securities | 33,281 | 22,619 | 38 | 38 | ||||||||||||
| Other asset-backed securities | 11,452 | 567 | — | �� | ||||||||||||
| Commercial mortgage-backed securities | 6,301 | 6,004 | — | — | ||||||||||||
| U.S. issued municipal securities | 799 | 472 | — | — | ||||||||||||
| Derivatives | — | — | 4,957 | 2,346 | ||||||||||||
| Total Level 3 assets | 612,457 | 571,930 | 22,771 | 49,612 | ||||||||||||
| Level 3 assets for which the firm bears no economic exposure (1) | (209,843 | ) | (204,139 | ) | — | — | ||||||||||
| Level 3 assets for which the firm bears economic exposure | $ | 402,614 | $ | 367,791 | $ | 22,771 | $ | 49,612 | ||||||||
| Total Level 3 as a percentage of Total financial instruments | 3 | % | 4 | % | 0.2 | % | 0.5 | % | ||||||||
| (1) | Consists of Level 3 assets which are financed by nonrecourse secured financing or attributable to third party or employee noncontrolling interests in certain consolidated entities. |
| Three Months | Three Months | |||||||
| Ended | Ended | |||||||
| February 28, 2011 | March 31, 2010 | |||||||
| Assets: | ||||||||
| Transfers from Level 3 to Level 2 | $ | 8.5 | $ | 241.6 | ||||
| Transfers from Level 2 to Level 3 | 26.8 | 10.7 | ||||||
| Net gains | 40.1 | 9.3 | ||||||
| Liabilities: | ||||||||
| Transfers from Level 3 to Level 2 | $ | — | $ | 129.8 | ||||
| Transfers from Level 2 to Level 3 | — | 0.04 | ||||||
| Net (losses) gains | (2.6 | ) | 3.4 | |||||
Page 67 of 86
Table of Contents
Page 68 of 86
Table of Contents
| February 28, | November 30, | |||||||
| 2011 | 2010 | |||||||
| Cash and cash equivalents: | ||||||||
| Cash in banks | $ | 406,048 | $ | 325,227 | ||||
| Money market investments | 758,285 | 1,863,771 | ||||||
| Total cash and cash equivalents | $ | 1,164,333 | $ | 2,188,998 | ||||
| February 28, 2011 | November 30, 2010 | |||||||||||||||
| Unencumbered | Unencumbered | |||||||||||||||
| Liquid Financial | Liquid Financial | Liquid Financial | Liquid Financial | |||||||||||||
| Instruments | Instruments | Instruments | Instruments | |||||||||||||
| Corporate equity securities | $ | 1,790,938 | $ | 273,295 | $ | 1,453,744 | $ | 264,603 | ||||||||
| Corporate debt securities | 3,327,097 | 68,251 | 2,813,465 | 223,455 | ||||||||||||
| Government, federal agency and other sovereign obligation | 5,875,878 | 376,670 | 5,159,605 | 168,523 | ||||||||||||
| Mortgage- and asset-backed securities | 3,994,113 | 14,286 | 3,607,895 | — | ||||||||||||
| $ | 14,988,026 | $ | 732,502 | $ | 13,034,709 | $ | 656,581 | |||||||||
Page 69 of 86
Table of Contents
| • | Contingency Funding Plan.Our Contingency Funding Plan is designed based on a model of a potential liquidity contraction over a one year time period. This incorporates potential cash outflows during a liquidity stress event, including, but not limited to, the following: (a) repayment of all unsecured debt maturing within one year and no incremental unsecured debt issuance; (b) maturity rolloff of outstanding letters of credit with no further issuance and replacement with cash collateral; (c) higher margin requirements than currently existing on assets in securities financing activity, including repurchase agreements, (d) lower availability of secured funding; (e) client cash withdrawals; (f) the anticipated funding of outstanding investment commitments and (g) certain accrued expenses and other liabilities and fixed costs. | |
| • | Cash Capital Policy.We maintain a cash capital model that measures long-term funding sources against requirements. Sources of cash capital include our equity, preferred stock and the noncurrent portion of long-term borrowings. Uses of cash capital include the following: (a) illiquid assets such as equipment, goodwill, net intangible assets, exchange memberships, deferred tax assets and certain investments; (b) a portion of securities inventory that is not expected to be financed on a secured basis in a credit stressed environment (i.e., margin requirements) and (c) drawdowns of unfunded commitments. To ensure that we do not need to liquidate inventory in the event of a funding crisis, we seek to maintain surplus cash capital, which is reflected in the leverage ratios we maintain. Our total capital of $7.2 billion as of February 28, 2011 exceeded our cash capital requirements. |
Page 70 of 86
Table of Contents
| February 28, | November 30, | |||||||||||
| 2011 | 2010 | % Change | ||||||||||
| Total assets | $ | 40,428.2 | $ | 36,726.5 | 10 | % | ||||||
| Financial instruments owned | 18,253.2 | 15,941.6 | 15 | % | ||||||||
| Financial instruments sold, not yet purchased | 10,055.8 | 9,109.8 | 10 | % | ||||||||
| Total Level 3 assets | 612.5 | 571.9 | 7 | % | ||||||||
| Level 3 assets for which we have economic exposure | 402.6 | 367.8 | 9 | % | ||||||||
| Securities borrowed | 8,137.3 | 8,152.7 | 0 | % | ||||||||
| Securities purchased under agreements to resell | 3,402.3 | 3,252.3 | 5 | % | ||||||||
| Total securities borrowed and securities purchased under agreements to resell | $ | 11,539.6 | $ | 11,405.0 | 1 | % | ||||||
| Securities loaned | $ | 3,030.7 | $ | 3,109.0 | -3 | % | ||||||
| Securities sold under agreements to repurchase | 11,940.7 | 10,684.1 | 12 | % | ||||||||
| Total securities loaned and securities sold under agreements to repurchase | $ | 14,971.4 | $ | 13,793.1 | 9 | % | ||||||
Page 71 of 86
Table of Contents
| Three Months Ended | Eleven Months Ended | |||||||
| February 28, 2011 | November 30, 2010 | |||||||
| Securities Purchased Under Agreements to Resell | ||||||||
| Period end | 3,402 | 3,252 | ||||||
| Period average | 3,949 | 3,769 | ||||||
| Maximum month end | 5,038 | 4,983 | ||||||
| Securities Sold Under Agreements to Repurchase | ||||||||
| Period end | 11,941 | 10,684 | ||||||
| Period average | 12,398 | 11,464 | ||||||
| Maximum month end | 14,957 | 14,447 | ||||||
Page 72 of 86
Table of Contents
| February 28, | November 30, | |||||||
| 2011 | 2010 | |||||||
| Total assets | $ | 40,428,150 | $ | 36,726,543 | ||||
| Deduct: Securities borrowed | (8,137,278 | ) | (8,152,678 | ) | ||||
| Securities purchased under agreements to resell | (3,402,301 | ) | (3,252,322 | ) | ||||
| Add: Financial instruments sold, not yet purchased | 10,055,757 | 9,109,799 | ||||||
| Less derivative liabilities | (71,263 | ) | (59,552 | ) | ||||
| Subtotal | 9,984,494 | 9,050,247 | ||||||
| Deduct: Cash and securities segregated and on deposit for regulatory purposes or deposited with clearing and depository organizations | (1,794,503 | ) | (1,636,755 | ) | ||||
| Goodwill and intangible assets | (369,414 | ) | (368,078 | ) | ||||
| Adjusted assets | $ | 36,709,148 | $ | 32,366,957 | ||||
| Total stockholders’ equity | $ | 2,926,311 | $ | 2,810,965 | ||||
| Deduct: Goodwill and intangible assets | (369,414 | ) | (368,078 | ) | ||||
| Tangible stockholders’ equity | $ | 2,556,897 | $ | 2,442,887 | ||||
| Leverage ratio (1) | 13.8 | 13.1 | ||||||
| Adjusted leverage ratio (2) | 14.4 | 13.2 | ||||||
| (1) | Leverage ratio equals total assets divided by total stockholders’ equity. | |
| (2) | Adjusted leverage ratio equals adjusted assets divided by tangible stockholders’ equity. |
Page 73 of 86
Table of Contents
| February 28, | November 30, | |||||||
| 2011 | 2010 | |||||||
| Long-Term Debt | $ | 3,780,304 | $ | 3,778,681 | ||||
| Mandatorily Redeemable Convertible Preferred Stock | 125,000 | 125,000 | ||||||
| Mandatorily Redeemable Preferred Interest of Consolidated Subsidiaries | 332,258 | 315,885 | ||||||
| Total Stockholders’ Equity | 2,926,311 | 2,810,965 | ||||||
| Total Capital | $ | 7,163,873 | $ | 7,030,531 | ||||
| Rating | Outlook | |||||||
| Moody’s Investors Service | Baa2 | Stable | ||||||
| Standard and Poor’s | BBB | Stable | ||||||
| Fitch Ratings | BBB | Stable | ||||||
Page 74 of 86
Table of Contents
| Expected Maturity Date | ||||||||||||||||||||||||
| 2013 | 2015 | 2017 | ||||||||||||||||||||||
| and | and | and | ||||||||||||||||||||||
| 2011 | 2012 | 2014 | 2016 | Later | Total | |||||||||||||||||||
Debt obligations: | ||||||||||||||||||||||||
| Senior notes (contractual principal payments net of unamortized discounts and premiums) | $ | — | $ | 305.7 | $ | 249.1 | $ | 847.9 | $ | 2,377.6 | $ | 3,780.3 | ||||||||||||
| Interest payment obligations on senior notes | 241.4 | 224.7 | 428.6 | 372.1 | 1,169.1 | 2,435.9 | ||||||||||||||||||
| Mandatorily redeemable convertible preferred stock | — | — | — | — | 125.0 | 125.0 | ||||||||||||||||||
| Interest payment obligations on Mandatorily redeemable convertible preferred stock | 4.1 | 4.1 | 8.1 | 8.1 | 77.7 | 102.1 | ||||||||||||||||||
| 245.5 | 534.5 | 685.8 | 1,228.1 | 3,749.4 | 6,443.3 | |||||||||||||||||||
Commitments and guarantees: | ||||||||||||||||||||||||
| Equity commitments | 0.5 | 0.2 | 8.7 | 3.2 | 731.9 | 744.5 | ||||||||||||||||||
| Loan commitments | — | 12.8 | 83.6 | 30.2 | 350.0 | 476.6 | ||||||||||||||||||
| Mortgage-related commitments | 881.9 | 214.2 | 129.5 | — | — | 1,225.6 | ||||||||||||||||||
| Forward starting repos | 676.5 | — | — | — | — | 676.5 | ||||||||||||||||||
| Derivative contracts: | ||||||||||||||||||||||||
| Derivative contracts — non credit related | 40,525.7 | 10,534.0 | 8.7 | — | 1.7 | 51,070.1 | ||||||||||||||||||
| Derivative contracts — credit related | — | — | 37.6 | 163.4 | 40.0 | 241.0 | ||||||||||||||||||
| 42,084.6 | 10,761.2 | 268.1 | 196.8 | 1,123.6 | 54,434.3 | |||||||||||||||||||
| $ | 42,330.1 | $ | 11,295.7 | $ | 953.9 | $ | 1,424.9 | $ | 4,873.0 | $ | 60,877.6 | |||||||||||||
Page 75 of 86
Table of Contents
| February 28, 2011 | November 30, 2010 | |||||||
| Common stockholders’ equity | $ | 2,577,703 | $ | 2,477,989 | ||||
| Less: Goodwill and intangible assets | (369,414 | ) | (368,078 | ) | ||||
| Tangible common stockholders’ equity | $ | 2,208,289 | $ | 2,109,911 | ||||
| Common stockholders’ equity | $ | 2,577,703 | $ | 2,477,989 | ||||
| Add: Unrecognized compensation (6) | 159,508 | 160,960 | ||||||
| Adjusted common stockholders’ equity | $ | 2,737,211 | $ | 2,638,949 | ||||
| Tangible common stockholders’ equity | $ | 2,208,289 | $ | 2,109,911 | ||||
| Add: Unrecognized compensation (6) | 159,508 | 160,960 | ||||||
| Adjusted tangible common stockholders’ equity | $ | 2,367,797 | $ | 2,270,871 | ||||
| Shares outstanding | 177,067,710 | 171,694,146 | ||||||
| Outstanding restricted stock units (5) | 27,978,062 | 28,734,563 | ||||||
| Adjusted shares outstanding | 205,045,772 | 200,428,709 | ||||||
| Common book value per share (1) | $ | 14.56 | $ | 14.43 | ||||
| Adjusted common book value per share (2) | $ | 13.35 | $ | 13.17 | ||||
| Tangible common book value per share (3) | $ | 12.47 | $ | 12.29 | ||||
| Adjusted tangible common book value per share (4) | $ | 11.55 | $ | 11.33 | ||||
| (1) | Common book value per share equals common stockholders’ equity divided by common shares outstanding. | |
| (2) | Adjusted common book value per share equals adjusted common stockholders’ equity divided by adjusted shares outstanding. | |
| (3) | Tangible common book value per share equals tangible common stockholders’ equity divided by common shares outstanding. | |
| (4) | Adjusted tangible common book value per share equals adjusted tangible common stockholders’ equity divided by adjusted shares outstanding. | |
| (5) | Outstanding restricted stock units, which give the recipient the right to receive common shares at the end of a specified deferral period, are granted in connection with our share-based employee incentive plans and include both awards that contain future service requirements and awards for which the future service requirements have been met. |
Page 76 of 86
Table of Contents
| (6) | Unrecognized compensation relates to granted restricted stock and restricted stock units which contain future service requirements. |
| Excess Net | ||||||||
| Net Capital | Capital | |||||||
| Jefferies | $ | 514,817 | $ | 426,180 | ||||
| Jefferies Execution | $ | 13,852 | $ | 13,602 | ||||
| Jefferies High Yield Trading | $ | 528,793 | $ | 528,543 | ||||
Page 77 of 86
Table of Contents
Page 78 of 86
Table of Contents
Page 79 of 86
Table of Contents
| • | inventory position and exposure limits, on a gross and net basis; | ||
| • | scenario analyses, stress tests and other analytical tools that measure the potential effects on our trading net revenues of various market events, including, but not limited to, a large widening of credit spreads, a substantial decline in equities markets and significant moves in selected emerging markets; and | ||
| • | risk limits based on a summary measure of risk exposure referred to as Value-at-Risk. |
| Daily VaR(1) | ||||||||||||||||||||||||
| (In Millions) | ||||||||||||||||||||||||
| Value-at-Risk in trading portfolios | ||||||||||||||||||||||||
| VaR at | Average VaR Three Months Ended | |||||||||||||||||||||||
| Risk Categories | 2/28/11 | 11/30/10 | 8/31/10 | 2/28/11 | 11/30/10 | 8/31/10 | ||||||||||||||||||
| Interest Rates | $ | 7.81 | $ | 4.24 | $ | 7.85 | $ | 6.32 | $ | 5.75 | $ | 6.03 | ||||||||||||
| Equity Prices | $ | 3.18 | $ | 3.38 | $ | 4.92 | $ | 5.55 | $ | 3.50 | $ | 4.26 | ||||||||||||
| Currency Rates | $ | 0.50 | $ | 0.39 | $ | 0.47 | $ | 0.56 | $ | 0.39 | $ | 0.36 | ||||||||||||
| Commodity Prices | $ | 2.04 | $ | 2.20 | $ | 1.91 | $ | 1.45 | $ | 1.29 | $ | 1.56 | ||||||||||||
Diversification Effect2 | $ | -4.14 | $ | -2.94 | $ | -7.46 | $ | -3.37 | $ | -4.48 | $ | -3.57 | ||||||||||||
| Firmwide | $ | 9.39 | $ | 7.27 | $ | 7.69 | $ | 10.51 | $ | 6.45 | $ | 8.64 | ||||||||||||
Page 80 of 86
Table of Contents
| Daily VaR(1) | ||||||||||||||||||||||||
| (In Millions) | ||||||||||||||||||||||||
| Value-at-Risk Highs and Lows for Three Months Ended | ||||||||||||||||||||||||
| 2/28/11 | 11/30/10 | 8/31/10 | ||||||||||||||||||||||
| Risk Categories | High | Low | High | Low | High | Low | ||||||||||||||||||
| Interest Rates | $ | 9.99 | $ | 3.26 | $ | 8.99 | $ | 2.90 | $ | 8.39 | $ | 4.46 | ||||||||||||
| Equity Prices | $ | 9.36 | $ | 3.13 | $ | 5.61 | $ | 2.38 | $ | 7.76 | $ | 2.90 | ||||||||||||
| Currency Rates | $ | 1.20 | $ | 0.10 | $ | 0.74 | $ | 0.18 | $ | 0.79 | $ | 0.09 | ||||||||||||
| Commodity Prices | $ | 2.90 | $ | 0.53 | $ | 2.35 | $ | 0.64 | $ | 2.48 | $ | 0.82 | ||||||||||||
| Firmwide | $ | 13.56 | $ | 7.65 | $ | 9.02 | $ | 4.05 | $ | 13.42 | $ | 5.90 | ||||||||||||
| (1) | VaR is the potential loss in value of our trading positions due to adverse market movements over a defined time horizon with a specific confidence level. For the VaR numbers reported above, a one-day time horizon and 95% confidence level were used. | |
| (2) | Equals the difference between firmwide VaR and the sum of the VaRs by risk categories. This effect is due to the market categories not being perfectly correlated. |
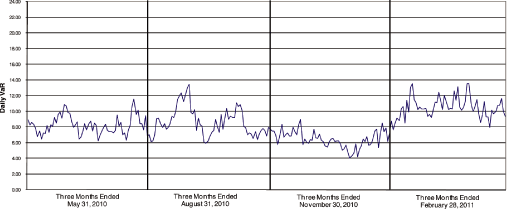
Page 81 of 86
Table of Contents
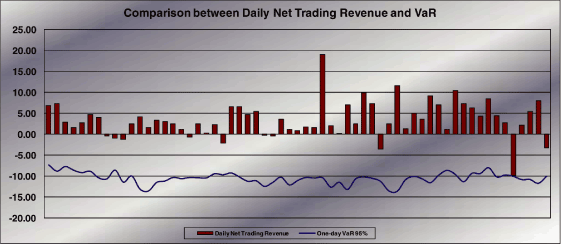
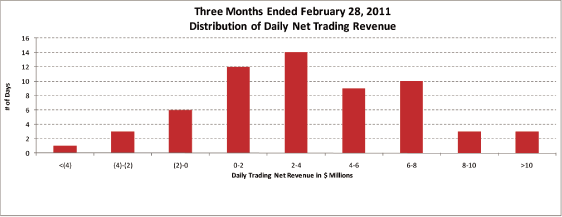
Page 82 of 86
Table of Contents
Page 83 of 86
Table of Contents
| (c) Total Number of | (d) Maximum Number | |||||||||||||||
| (a) Total | Shares Purchased as | of Shares that May | ||||||||||||||
| Number of | (b) Average | Part of Publicly | Yet Be Purchased | |||||||||||||
| Shares | Price Paid per | Announced Plans or | Under the Plans or | |||||||||||||
| Period | Purchased (1) | Share | Programs (2) | Programs | ||||||||||||
| December 1 – December 31, 2010 | 11,409 | $ | 26.51 | — | 10,000,000 | |||||||||||
| January 1 – January 31, 2011 | 43,690 | 26.50 | — | 10,000,000 | ||||||||||||
| February 1 – February 28, 2011 | 1,427,380 | 25.43 | 340,560 | 9,659,440 | ||||||||||||
| Total | 1,482,479 | 340,560 | ||||||||||||||
| (1) | We repurchased an aggregate of 1,141,919 shares other than as part of a publicly announced plan or program. We repurchased these securities in connection with our stock compensation plans which allow participants to use shares to satisfy certain tax liabilities arising from the vesting of restricted stock or the distribution of restricted stock units. The number above does not include unvested shares forfeited back to us pursuant to the terms of our stock compensation plans. | |
| (2) | On December 14, 2009 we announced the authorization by our Board of Directors of the repurchase, from time to time, of up to an aggregate of 15,000,000 shares of our common stock, inclusive of prior authorizations. |
Page 84 of 86
Table of Contents
| Exhibits | ||
| 3.1 | Amended and Restated Certificate of Incorporation of Jefferies Group, Inc. is incorporated herein by reference to Exhibit 3 of the Registrant’s Form 8-K filed on May 26, 2004. | |
| 3.2 | Certificate of Designations of 3.25% Series A Cumulative Convertible Preferred Stock is incorporated herein by reference to Exhibit 3.1 of the Registrant’s Form 8-K filed on February 21, 2006. | |
| 3.3 | By-Laws of Jefferies Group, Inc are incorporated herein by reference to Exhibit 3 of Registrant’s Form 8-K filed on December 4, 2007. | |
| 10.1 | Summary of 2011 and 2012 executive compensation program for Messrs. Handler and Friedman is incorporated herein by reference to Exhibit 10 of Registrant’s Form 8-K filed on January 20, 2010. | |
| 10.2* | Summary of the 2011 Executive Compensation Program for Messrs. Broadbent and Hendrickson | |
| 10.3 | ||
| 10.4 | Agreement between Jefferies Group, Inc. and Michael J. Sharp dated July 12, 2010 is incorporated herein by reference to Exhibit 10.11 of Registrant’s Form 10-K filed on February 2, 2011. | |
| 31.1* | Rule 13a-14(a)/15d-14(a) Certification by the Chief Financial Officer. | |
| 31.2* | Rule 13a-14(a)/15d-14(a) Certification by the Chief Executive Officer. | |
| 32* | Rule 13a-14(b)/15d-14(b) and Section 1350 of Title 18 U.S.C. Certification by the Chief Executive Officer and Chief Financial Officer. | |
| 101** | Interactive data files pursuant to Rule 405 of Regulation S-T: (i) the Consolidated Statements of Financial Condition at February 28, 2011 and November 30, 2010 (ii) the Consolidated Statements of Earnings for the Three Months Ended February 28, 2011 and March 31, 2010 (iii) the Consolidated Statements of Changes in Stockholders’ Equity for the Three Months Ended February 28, 2011 and the Eleven Months Ended November 30, 2010, (iv) the Consolidated Statements of Comprehensive Income for the Three Months Ended February 28, 2011 and March 31, 2010, (v) the Consolidated Statements of Cash Flows for the Three Months Ended February 28, 2011 and March 31, 2010, and (vi) Notes to Consolidated Financial Statements. |
| * | Filed herewith. | |
| ** | Furnished herewith. |
Page 85 of 86
Table of Contents
| JEFFERIES GROUP, INC. (Registrant) | ||||
| Date: April 6, 2011 | By: | /s/ Peregrine C. Broadbent | ||
| Peregrine C. Broadbent | ||||
| Chief Financial Officer (duly authorized officer) | ||||
Page 86 of 86