Exhibit 99
|
Exhibit 99
Jefferies Group
2013 Fixed Income Investor Day
October 10, 2013
|
Note on Forward Looking Statements
This document contains “forward looking statements” within the meaning of the safe harbor provisions of Section 27A of the Securities Act of 1933 and Section 21E of the Securities Exchange Act of 1934. Forward looking statements include statements about our future and statements that are not historical facts. These forward looking statements are usually preceded by the words “should,” “expect,” “intend,” “may,” “will,” or similar expressions. Forward looking statements may contain expectations regarding revenues, earnings, operations, and other results, and may include statements of future performance, plans, and objectives. Forward looking statements also include statements pertaining to our strategies for future development of our business and products. Forward looking statements represent only our belief regarding future events, many of which by their nature are inherently uncertain. It is possible that the actual results may differ, possibly materially, from the anticipated results indicated in these forward-looking statements. Information regarding important factors, including our Risk Factors, that could cause actual results to differ, perhaps materially, from those in our forward looking statements is contained in reports we file with the SEC. You should read and interpret any forward looking statement together with reports we file with the SEC.
i
|

Agenda
Section
Leucadia Overview 1 Jefferies Overview 2 Jefferies Business Review 3 Jefferies Operating Results 4 Risk Management 5 Capital and Liquidity Management 6
1 |
|
|

Leucadia Overview
2 |
|
|
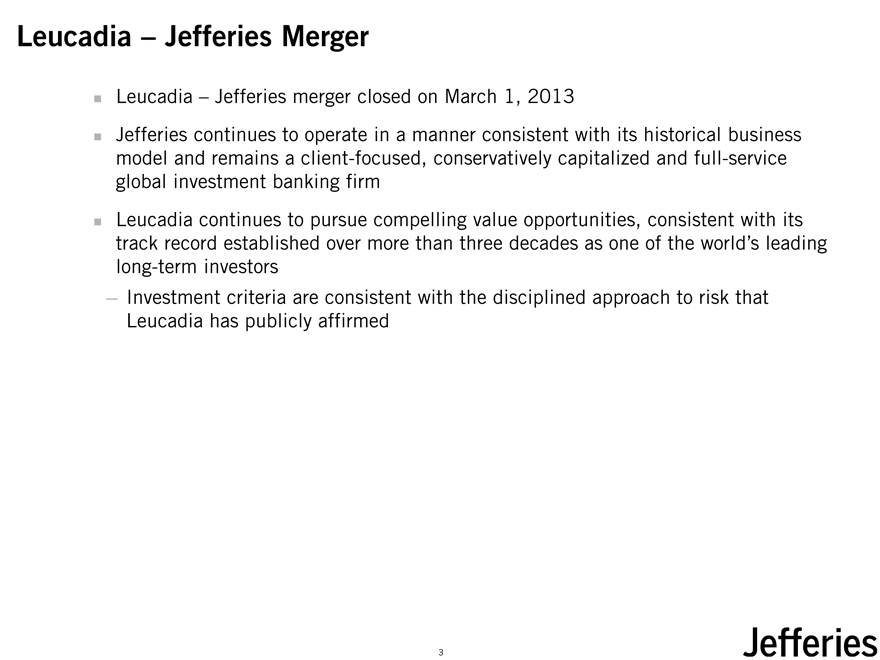
Leucadia – Jefferies Merger
Leucadia – Jefferies merger closed on March 1, 2013
Jefferies continues to operate in a manner consistent with its historical business model and remains a client-focused, conservatively capitalized and full-service global investment banking firmLeucadia continues to pursue compelling value opportunities, consistent with its track record established over more than three decades as one of the world’s leading long-term investors
Investment criteria are consistent with the disciplined approach to risk that Leucadia has publicly affirmed
3 |
|
|
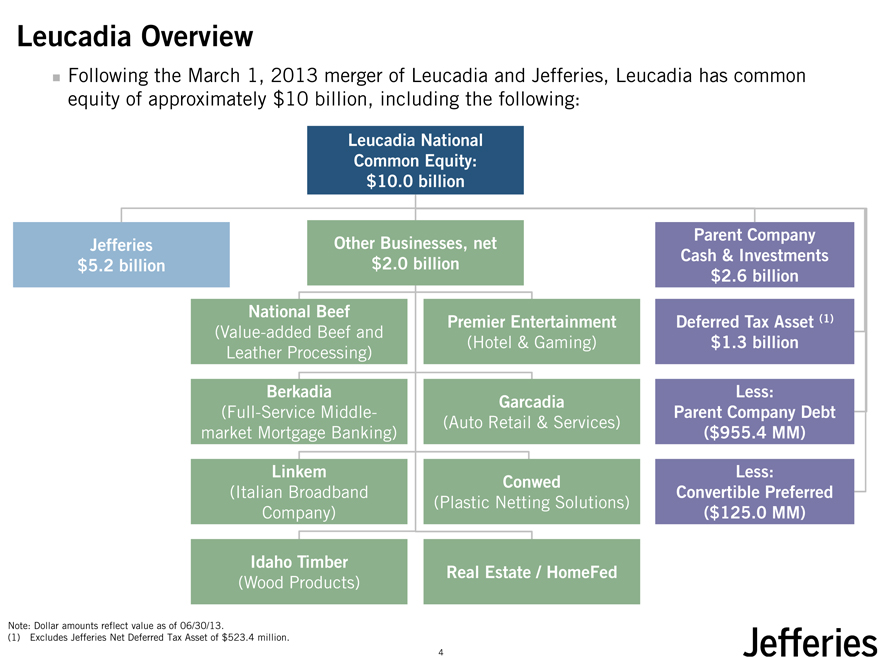
Leucadia Overview
Following the March 1, 2013 merger of Leucadia and Jefferies, Leucadia has common equity of approximately $10 billion, including the following:
Leucadia National Common Equity:
$10.0 billion
Jefferies Other Businesses, net
$5.2 billion $2.0 billion
National Beef
Premier Entertainment
(Value-added Beef and
(Hotel & Gaming) Leather Processing)
Berkadia
Garcadia
(Full-Service Middle-
(Auto Retail & Services) market Mortgage Banking)
Linkem
Conwed
(Italian Broadband
(Plastic Netting Solutions) Company)
Idaho Timber
Real Estate / HomeFed
(Wood Products)
Note: Dollar amounts reflect value as of 06/30/13.
(1) |
| Excludes Jefferies Net Deferred Tax Asset of $523.4 million. |
Parent Company Cash & Investments
$2.6 billion
Deferred Tax Asset (1)
$1.3 billion
Less: Parent Company Debt
($955.4 MM)
Less: Convertible Preferred
($125.0 MM)
4 |
|
|
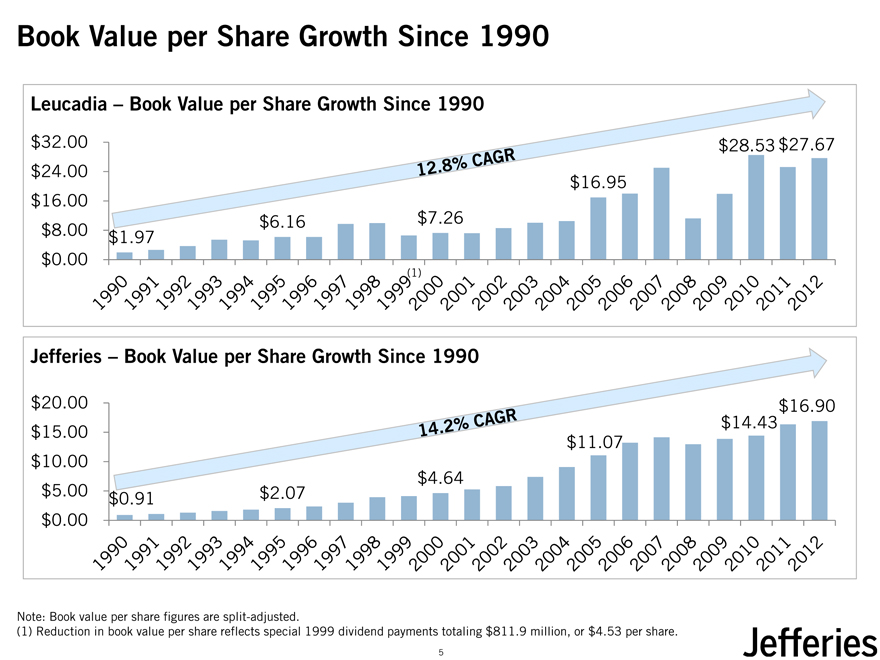
Book Value per Share Growth Since 1990
Leucadia – Book Value per Share Growth Since 1990
$32.00 $28.53 $27.67
$24.00
$16.95
$16.00
$6.16 $7.26
$8.00 $1.97
$0.00 (1)
Jefferies – Book Value per Share Growth Since 1990
$20.00 $16.90
$14.43
$15.00
$11.07
$10.00 $4.64
$5.00 $0.91 $2.07
$0.00
Note: Book value per share figures are split-adjusted.
(1) Reduction in book value per share reflects special 1999 dividend payments totaling $811.9 million, or $4.53 per share.
5 |
|
|
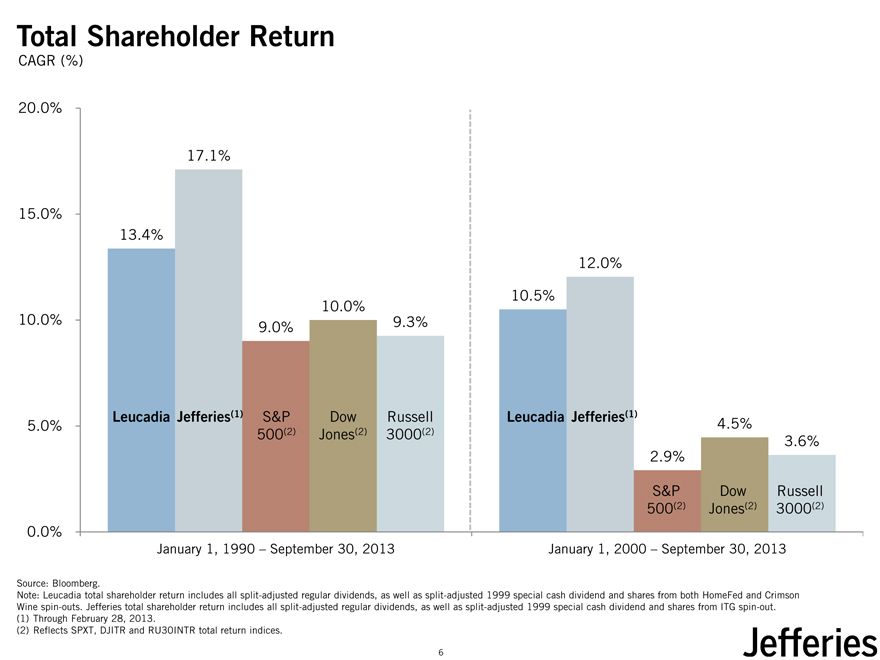
Total Shareholder Return
CAGR (%)
20.0%
17.1%
15.0%
13.4%
12.0%
10.5%
10.0% 10.0%
9.0% 9.3%
Leucadia Jefferies(1) S&P Dow Russell Leucadia Jefferies(1)
5.0% 4.5% 500(2) Jones(2) 3000(2)
3.6%
2.9%
S&P Dow Russell 500(2) Jones(2) 3000(2)
0.0%
January 1, 1990 – September 30, 2013 January 1, 2000 – September 30, 2013
Source: Bloomberg.
Note: Leucadia total shareholder return includes all split-adjusted regular dividends, as well as split-adjusted 1999 special cash dividend and shares from both HomeFed and Crimson Wine spin-outs. Jefferies total shareholder return includes all split-adjusted regular dividends, as well as split-adjusted 1999 special cash dividend and shares from ITG spin-out.
(1) |
| Through February 28, 2013. |
(2) |
| Reflects SPXT, DJITR and RU30INTR total return indices. |
6 |
|
|
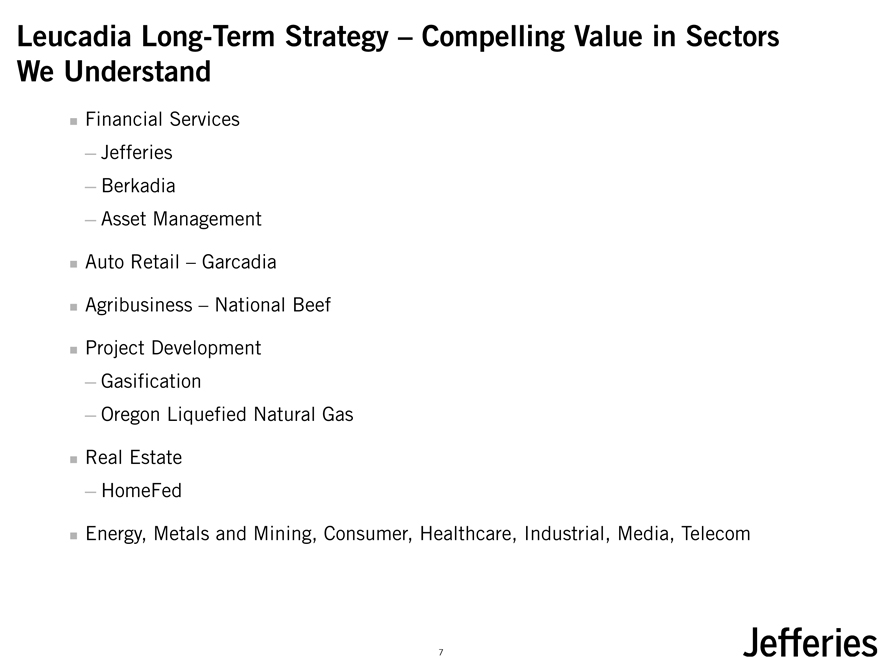
Leucadia Long-Term Strategy – Compelling Value in Sectors We Understand
Financial Services
Jefferies
Berkadia
Asset ManagementAuto Retail – GarcadiaAgribusiness – National Beef
Project Development
Gasification
Oregon Liquefied Natural Gas
Real Estate
HomeFed
Energy, Metals and Mining, Consumer, Healthcare, Industrial, Media, Telecom
7 |
|
|
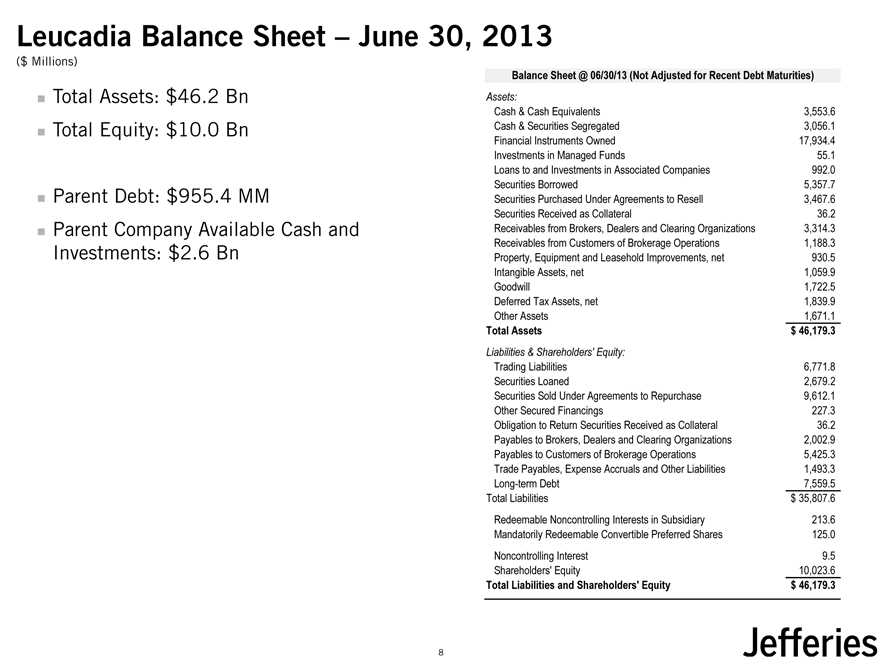
Leucadia Balance Sheet – June 30, 2013
($ Millions)
Total Assets: $46.2 BnTotal Equity: $10.0 Bn
Parent Debt: $955.4 MM
Parent Company Available Cash and Investments: $2.6 Bn
Balance Sheet @ 06/30/13 (Not Adjusted for Recent Debt Maturities)
Assets:
Cash & Cash Equivalents 3,553.6 Cash & Securities Segregated 3,056.1 Financial Instruments Owned 17,934.4 Investments in Managed Funds 55.1 Loans to and Investments in Associated Companies 992.0 Securities Borrowed 5,357.7 Securities Purchased Under Agreements to Resell 3,467.6 Securities Received as Collateral 36.2 Receivables from Brokers, Dealers and Clearing Organizations 3,314.3 Receivables from Customers of Brokerage Operations 1,188.3 Property, Equipment and Leasehold Improvements, net 930.5 Intangible Assets, net 1,059.9 Goodwill 1,722.5 Deferred Tax Assets, net 1,839.9 Other Assets 1,671.1
Total Assets $ 46,179.3
Liabilities & Shareholders’ Equity:
Trading Liabilities 6,771.8 Securities Loaned 2,679.2 Securities Sold Under Agreements to Repurchase 9,612.1 Other Secured Financings 227.3 Obligation to Return Securities Received as Collateral 36.2 Payables to Brokers, Dealers and Clearing Organizations 2,002.9 Payables to Customers of Brokerage Operations 5,425.3 Trade Payables, Expense Accruals and Other Liabilities 1,493.3 Long-term Debt 7,559.5 Total Liabilities $ 35,807.6 Redeemable Noncontrolling Interests in Subsidiary 213.6 Mandatorily Redeemable Convertible Preferred Shares 125.0 Noncontrolling Interest 9.5 Shareholders’ Equity 10,023.6
Total Liabilities and Shareholders’ Equity $ 46,179.3
8 |
|
|
Liquid Assets Overview
($ Millions)
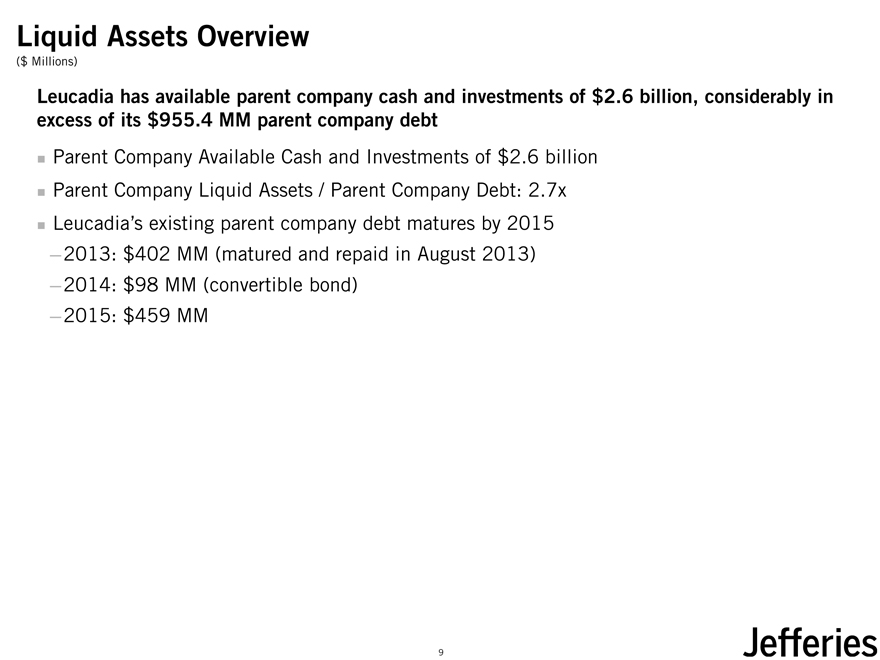
Leucadia has available parent company cash and investments of $2.6 billion, considerably in excess of its $955.4 MM parent company debt
Parent Company Available Cash and Investments of $2.6 billionParent Company Liquid Assets / Parent Company Debt: 2.7xLeucadia’s existing parent company debt matures by 2015
2013: $402 MM (matured and repaid in August 2013)
2014: $98 MM (convertible bond)
2015: $459 MM
9
|
Ongoing Annual Cash-Flow
($ Millions)
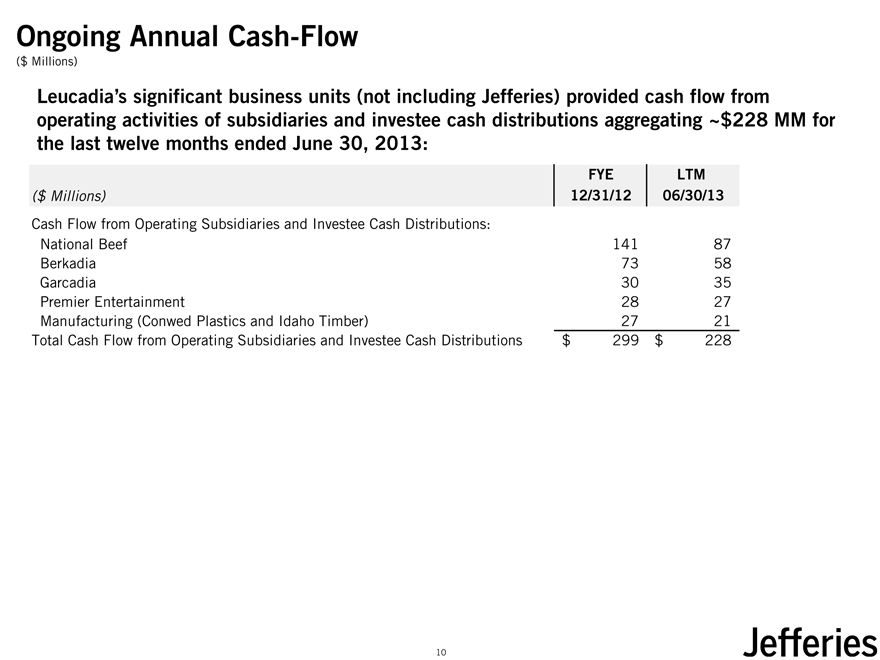
Leucadia’s significant business units (not including Jefferies) provided cash flow from operating activities of subsidiaries and investee cash distributions aggregating ~$228 MM for the last twelve months ended June 30, 2013:
FYE LTM
($ Millions) 12/31/12 06/30/13
Cash Flow from Operating Subsidiaries and Investee Cash Distributions:
National Beef 141 87 Berkadia 73 58 Garcadia 30 35 Premier Entertainment 28 27 Manufacturing (Conwed Plastics and Idaho Timber) 27 21 Total Cash Flow from Operating Subsidiaries and Investee Cash Distributions $ 299 $ 228
10
|
Leucadia Risk Management
Leucadia targets specific concentration, liquidity and leverage principles
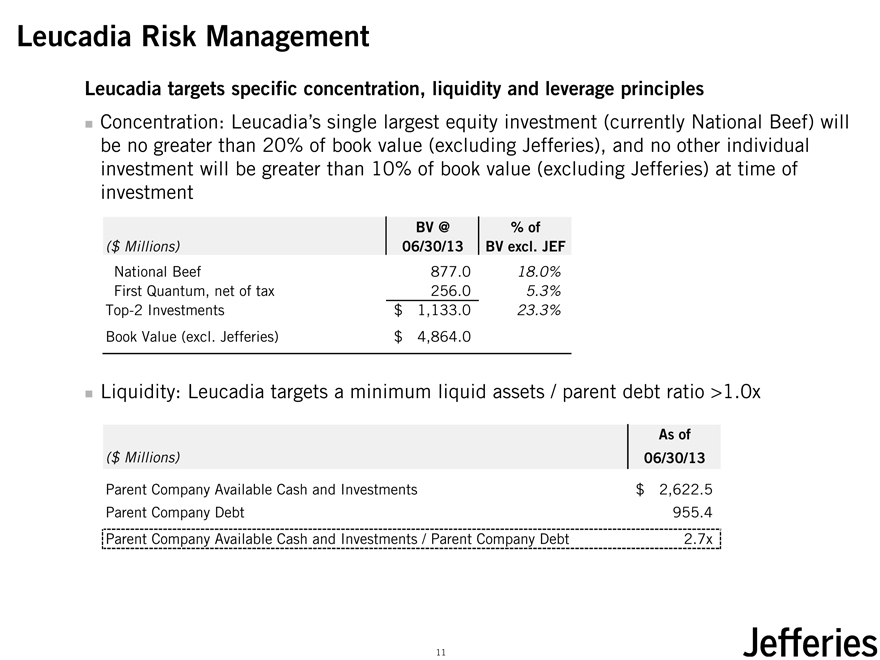
Concentration: Leucadia’s single largest equity investment (currently National Beef) will be no greater than 20% of book value (excluding Jefferies), and no other individual investment will be greater than 10% of book value (excluding Jefferies) at time of investment
BV @ % of
($ Millions) 06/30/13 BV excl. JEF
National Beef 877.0 18.0% First Quantum, net of tax 256.0 5.3% Top-2 Investments $ 1,133.0 23.3% Book Value (excl. Jefferies) $ 4,864.0
Liquidity: Leucadia targets a minimum liquid assets / parent debt ratio >1.0x
As of
($ Millions) 06/30/13
Parent Company Available Cash and Investments $ 2,622.5 Parent Company Debt 955.4 Parent Company Available Cash and Investments / Parent Company Debt 2.7x
11
|
Leucadia Risk Management (Continued)
Leucadia targets specific concentration, liquidity and leverage principles
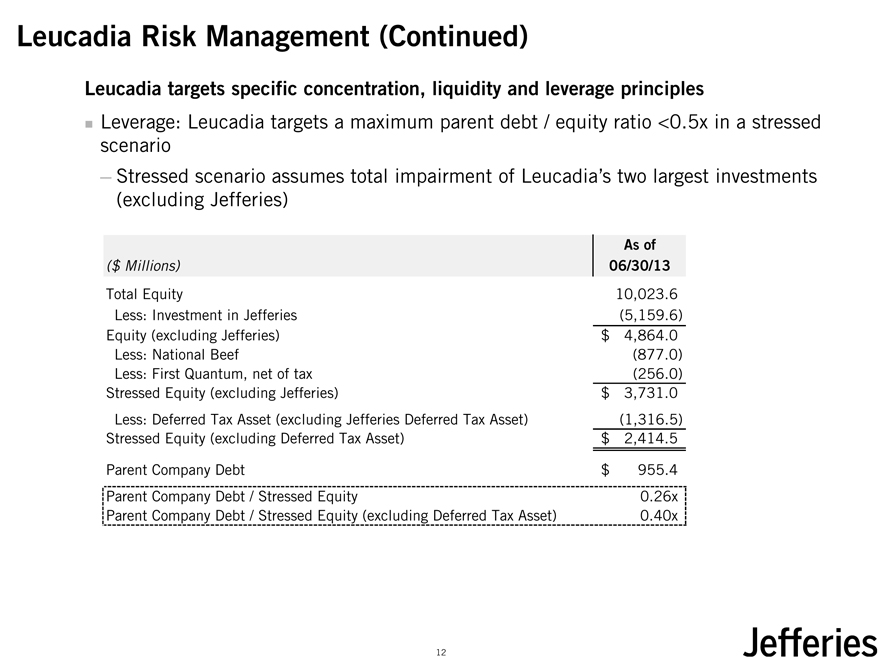
Leverage: Leucadia targets a maximum parent debt / equity ratio <0.5x in a stressed scenario
Stressed scenario assumes total impairment of Leucadia’s two largest investments (excluding Jefferies)
As of
($ Millions) 06/30/13
Total Equity 10,023.6 Less: Investment in Jefferies (5,159.6) Equity (excluding Jefferies) $ 4,864.0 Less: National Beef (877.0) Less: First Quantum, net of tax (256.0) Stressed Equity (excluding Jefferies) $ 3,731.0 Less: Deferred Tax Asset (excluding Jefferies Deferred Tax Asset) (1,316.5) Stressed Equity (excluding Deferred Tax Asset) $ 2,414.5 Parent Company Debt $ 955.4 Parent Company Debt / Stressed Equity 0.26x Parent Company Debt / Stressed Equity (excluding Deferred Tax Asset) 0.40x
12
|
National Beef – Overview
Company Overview
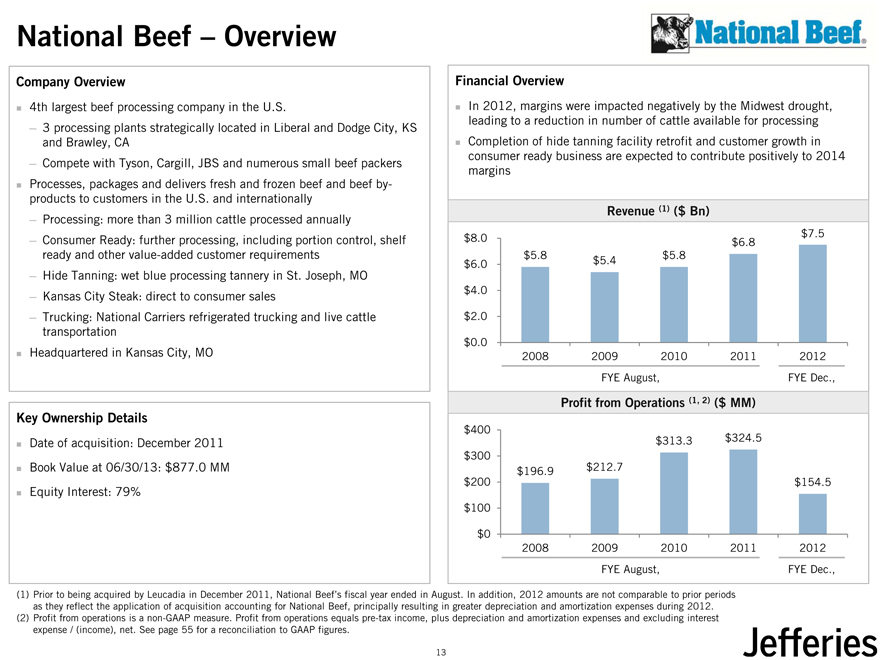
4th largest beef processing company in the U.S.
3 processing plants strategically located in Liberal and Dodge City, KS and Brawley, CA
Compete with Tyson, Cargill, JBS and numerous small beef packersProcesses, packages and delivers fresh and frozen beef and beef by-products to customers in the U.S. and internationally
Processing: more than 3 million cattle processed annually
Consumer Ready: further processing, including portion control, shelf ready and other value-added customer requirements
Hide Tanning: wet blue processing tannery in St. Joseph, MO
Kansas City Steak: direct to consumer sales
Trucking: National Carriers refrigerated trucking and live cattle transportationHeadquartered in Kansas City, MO
Key Ownership Details
Date of acquisition: December 2011Book Value at 06/30/13: $877.0 MM
Equity Interest: 79%
Financial Overview
In 2012, margins were impacted negatively by the Midwest drought, leading to a reduction in number of cattle available for processing Completion of hide tanning facility retrofit and customer growth in consumer ready business are expected to contribute positively to 2014 margins
Revenue (1) ($ Bn)
$8.0 $7.5
$6.8
$5.8 $5.4 $5.8
$6.0
$4.0
$2.0
$0.0
2008 2009 2010 2011 2012 FYE August, FYE Dec.,
Profit from Operations (1, 2) ($ MM)
$400 $313.3 $324.5 $300 $196.9 $212.7 $200 $154.5
$100
$0
2008 2009 2010 2011 2012 FYE August, FYE Dec.,
(1) Prior to being acquired by Leucadia in December 2011, National Beef’s fiscal year ended in August. In addition, 2012 amounts are not comparable to prior periods as they reflect the application of acquisition accounting for National Beef, principally resulting in greater depreciation and amortization expenses during 2012. (2) Profit from operations is a non-GAAP measure. Profit from operations equals pre-tax income, plus depreciation and amortization expenses and excluding interest expense / (income), net. See page 55 for a reconciliation to GAAP figures.
13
|
Berkadia – Overview
Company Overview
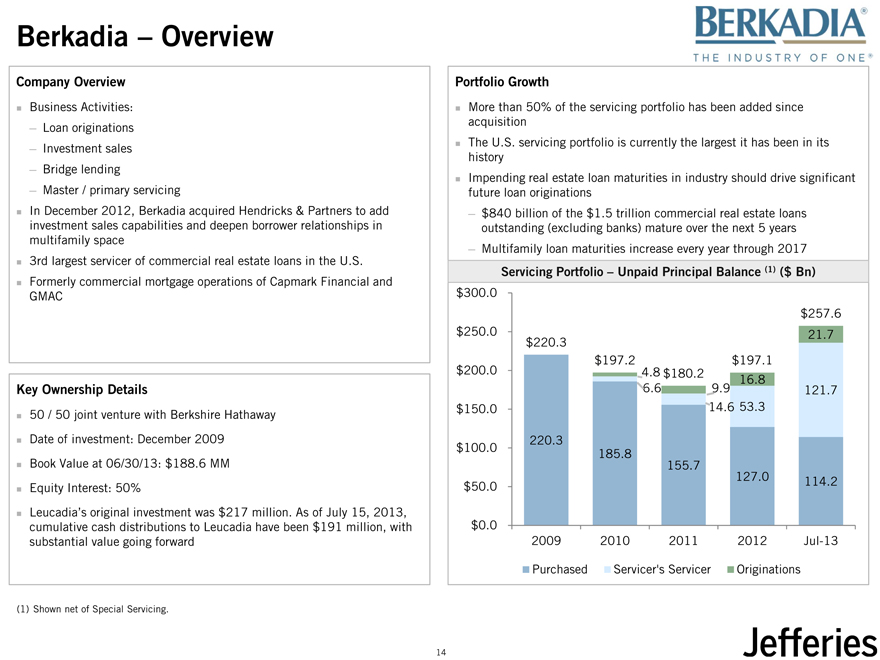
Business Activities:
Loan originations
Investment sales
Bridge lending
Master / primary servicing
In December 2012, Berkadia acquired Hendricks & Partners to add investment sales capabilities and deepen borrower relationships in multifamily space3rd largest servicer of commercial real estate loans in the U.S. Formerly commercial mortgage operations of Capmark Financial and GMAC
Key Ownership Details
50 / 50 joint venture with Berkshire HathawayDate of investment: December 2009Book Value at 06/30/13: $188.6 MMEquity Interest: 50%
Leucadia’s original investment was $217 million. As of July 15, 2013, cumulative cash distributions to Leucadia have been $191 million, with substantial value going forward
(1) |
| Shown net of Special Servicing. |
Portfolio Growth
More than 50% of the servicing portfolio has been added since acquisitionThe U.S. servicing portfolio is currently the largest it has been in its historyImpending real estate loan maturities in industry should drive significant future loan originations
$840 billion of the $1.5 trillion commercial real estate loans outstanding (excluding banks) mature over the next 5 years
Multifamily loan maturities increase every year through 2017
Servicing Portfolio – Unpaid Principal Balance (1) ($ Bn) $300.0 $257.6 $250.0 21.7 $220.3 $197.2 $197.1 $200.0 4.8 $180.2
16.8
6.6 9.9 121.7 $150.0 14.6 53.3
220.3 $100.0
185.8 155.7
127.0 114.2
$50.0
$0.0
2009 2010 2011 2012 Jul-13
Purchased Servicer’s Servicer Originations
14
|
Garcadia – Overview
Company Overview
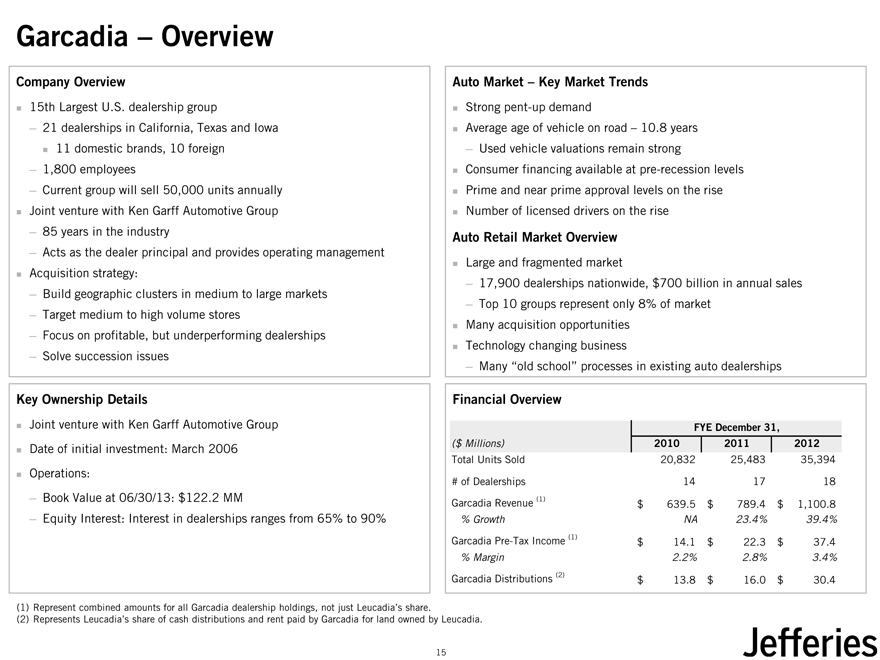
15th Largest U.S. dealership group
21 dealerships in California, Texas and Iowa11 domestic brands, 10 foreign
1,800 employees
Current group will sell 50,000 units annuallyJoint venture with Ken Garff Automotive Group
85 years in the industry
Acts as the dealer principal and provides operating managementAcquisition strategy:
Build geographic clusters in medium to large markets
Target medium to high volume stores
Focus on profitable, but underperforming dealerships
Solve succession issues
Key Ownership Details
Joint venture with Ken Garff Automotive GroupDate of initial investment: March 2006Operations:
Book Value at 06/30/13: $122.2 MM
Equity Interest: Interest in dealerships ranges from 65% to 90%
Auto Market – Key Market Trends
Strong pent-up demand
Average age of vehicle on road – 10.8 years
Used vehicle valuations remain strong
Consumer financing available at pre-recession levelsPrime and near prime approval levels on the riseNumber of licensed drivers on the rise
Auto Retail Market Overview
Large and fragmented market
17,900 dealerships nationwide, $700 billion in annual sales
Top 10 groups represent only 8% of marketMany acquisition opportunitiesTechnology changing business
Many “old school” processes in existing auto dealerships
Financial Overview
FYE December 31,
($ Millions) 2010 2011 2012
Total Units Sold 20,832 25,483 35,394 # of Dealerships 14 17 18 Garcadia Revenue (1) $ 639.5 $ 789.4 $ 1,100.8
% Growth NA 23.4% 39.4%
Garcadia Pre-Tax Income (1) $ 14.1 $ 22.3 $ 37.4
% Margin 2.2% 2.8% 3.4%
Garcadia Distributions (2) $ 13.8 $ 16.0 $ 30.4
(1) |
| Represent combined amounts for all Garcadia dealership holdings, not just Leucadia’s share. |
(2) |
| Represents Leucadia’s share of cash distributions and rent paid by Garcadia for land owned by Leucadia. |
15
|
Other Businesses
Premier Entertainment
Hard Rock Hotel & Casino Biloxi, MS – 325 room hotel with 50,000 square feet of gamingCurrently constructing a 154-room tower addition to hotel06/30/13 LTM Cash Flow from Operating Activities: $26.5 MM
Manufacturing (Conwed Plastics and Idaho Timber)
06/30/13 LTM Cash Flow from Operating Activities: $21.4 MM
Conwed Plastics
A market leader in lightweight oriented and extruded plastic netting
Partners with customers to customize core technology into innovative solutions
Idaho Timber
Wood product manufacture and distribution
Operations in primary milling, clear boards and dimensional lumber remanufacturing
Linkem
Acquired wireless spectrum licenses in 2008 at highly attractive pricing
Wireless broadband services provider in Italy
Real Estate / HomeFed
Residential and commercial U.S. real estate portfolio
HomeFed is a developer of residential real estate projects
16
|
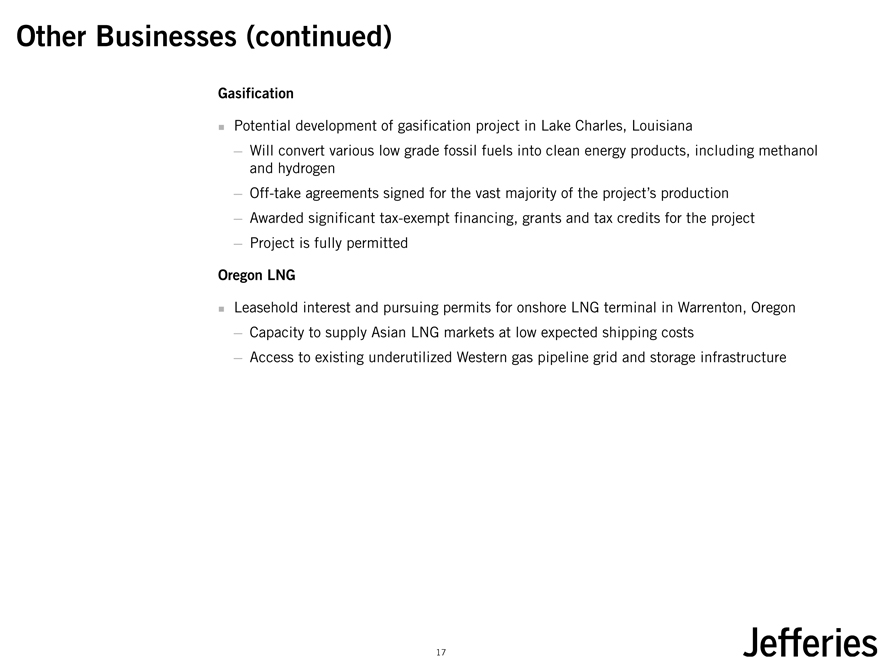
Other Businesses (continued)
Gasification
Potential development of gasification project in Lake Charles, Louisiana
Will convert various low grade fossil fuels into clean energy products, including methanol and hydrogen
Off-take agreements signed for the vast majority of the project’s production
Awarded significant tax-exempt financing, grants and tax credits for the project
Project is fully permitted
Oregon LNG
Leasehold interest and pursuing permits for onshore LNG terminal in Warrenton, Oregon
Capacity to supply Asian LNG markets at low expected shipping costs
Access to existing underutilized Western gas pipeline grid and storage infrastructure
17
|

Jefferies Overview
18
|
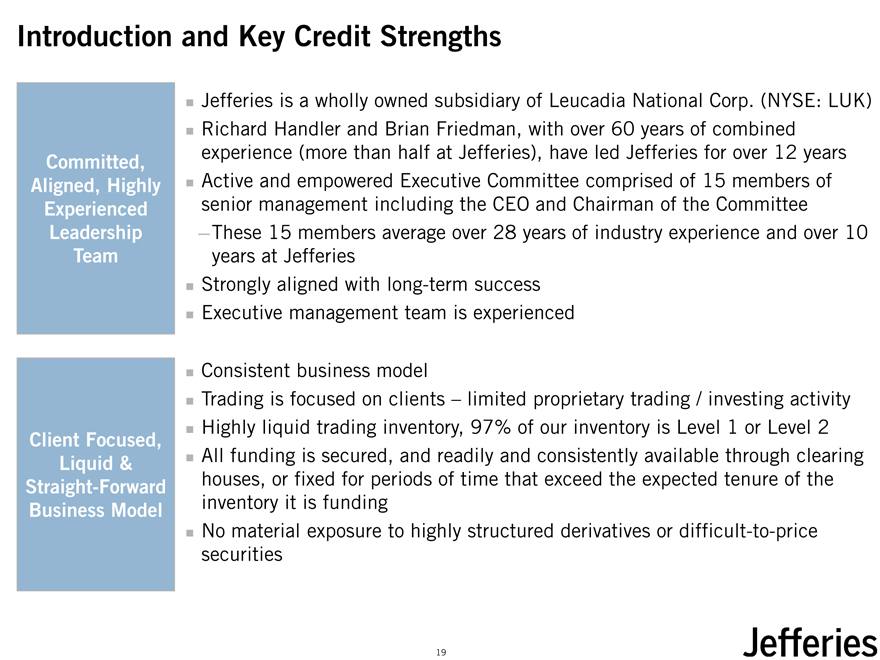
Introduction and Key Credit Strengths
Jefferies is a wholly owned subsidiary of Leucadia National Corp. (NYSE: LUK)Richard Handler and Brian Friedman, with over 60 years of combined experience (more than half at Jefferies), have led Jefferies for over 12 years Committed, and empowered Executive Committee comprised of 15 members of
Aligned, Highly Active
Experienced senior management including the CEO and Chairman of the Committee Leadership These 15 members average over 28 years of industry experience and over 10 Team years at JefferiesStrongly aligned with long-term successExecutive management team is experienced
Consistent business model
Trading is focused on clients – limited proprietary trading / investing activityHighly liquid trading inventory, 97% of our inventory is Level 1 or Level 2
Client Focused,
Liquid & All funding is secured, and readily and consistently available through clearing Straight-Forward houses, or fixed for periods of time that exceed the expected tenure of the Business Model inventory it is fundingNo material exposure to highly structured derivatives or difficult-to-price securities
19
|
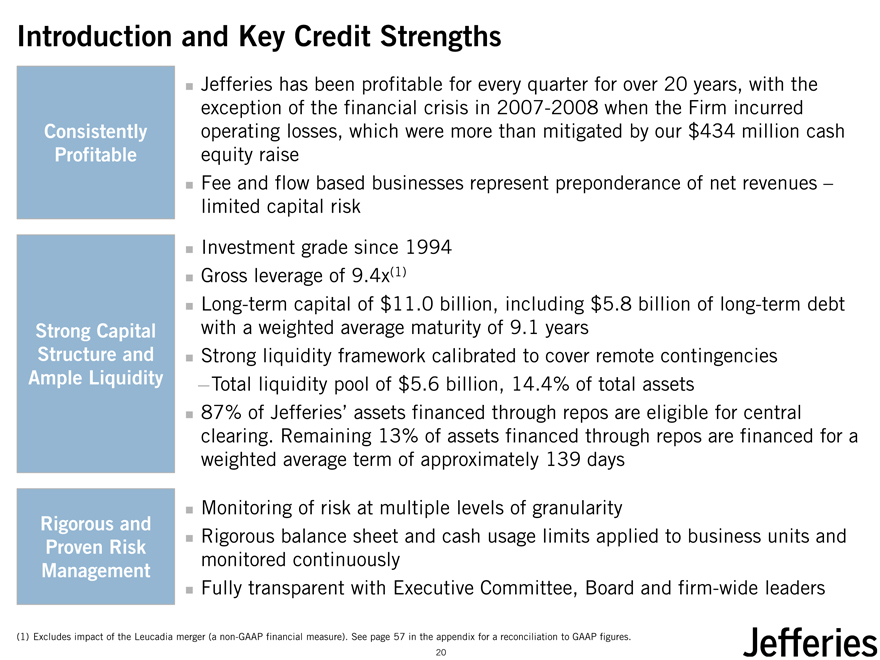
Introduction and Key Credit Strengths
Jefferies has been profitable for every quarter for over 20 years, with the exception of the financial crisis in 2007-2008 when the Firm incurred Consistently operating losses, which were more than mitigated by our $434 million cash Profitable equity raiseFee and flow based businesses represent preponderance of net revenues –limited capital riskInvestment grade since 1994 Gross (1) leverage of 9.4xLong-term capital of $11.0 billion, including $5.8 billion of long-term debt Strong Capital with a weighted average maturity of 9.1 years Structure and Strong liquidity framework calibrated to cover remote contingencies Ample Liquidity Total liquidity pool of $5.6 billion, 14.4% of total assets87% of Jefferies’ assets financed through repos are eligible for central clearing. Remaining 13% of assets financed through repos are financed for a weighted average term of approximately 139 days
Monitoring of risk at multiple levels of granularity
Rigorous and
Rigorous balance sheet and cash usage limits applied to business units and
Proven Risk monitored continuously
Management
Fully transparent with Executive Committee, Board and firm-wide leaders
(1) Excludes impact of the Leucadia merger (a non-GAAP financial measure). See page 57 in the appendix for a reconciliation to GAAP figures.
20
|
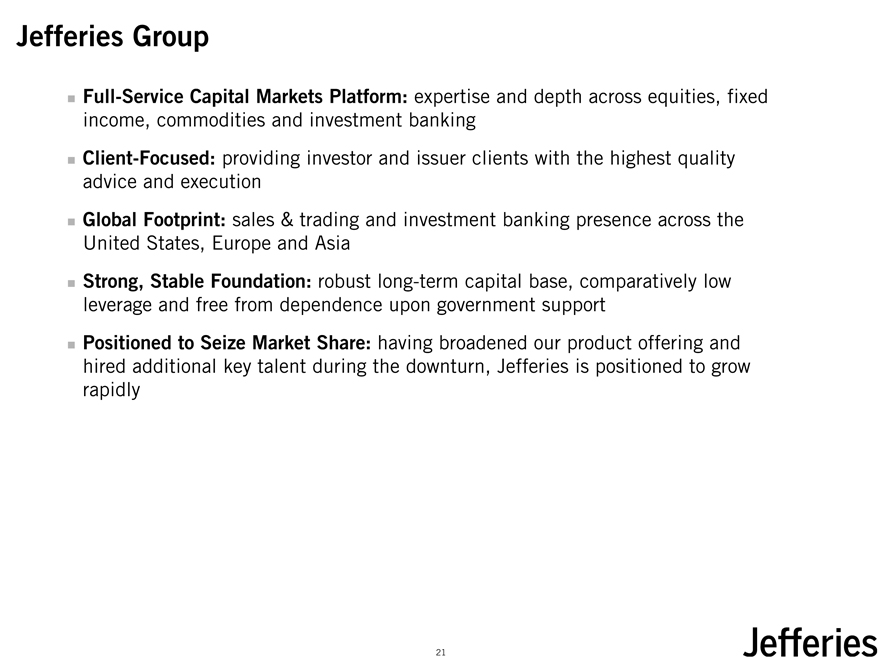
Jefferies Group
Full-Service Capital Markets Platform: expertise and depth across equities, fixed income, commodities and investment bankingClient-Focused: providing investor and issuer clients with the highest quality advice and executionGlobal Footprint: sales & trading and investment banking presence across the United States, Europe and AsiaStrong, Stable Foundation: robust long-term capital base, comparatively low leverage and free from dependence upon government supportPositioned to Seize Market Share: having broadened our product offering and hired additional key talent during the downturn, Jefferies is positioned to grow rapidly
21
|
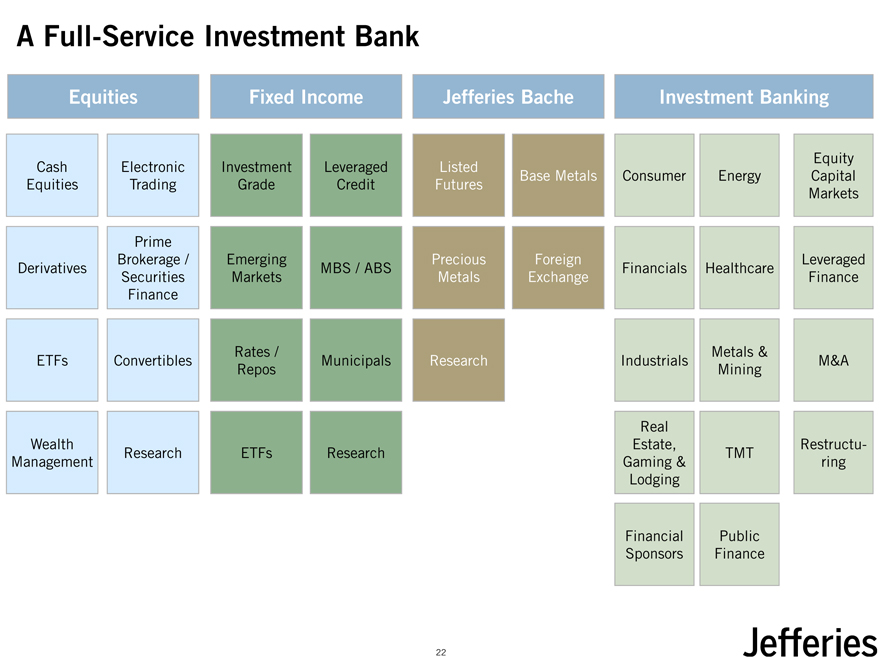
A Full-Service Investment Bank
Equities Fixed Income Jefferies Bache Investment Banking
Equity Cash Electronic Investment Leveraged Listed Base Metals Consumer Energy Capital Equities Trading Grade Credit Futures Markets
Prime
Brokerage / Emerging Precious Foreign Leveraged Derivatives MBS / ABS Financials Healthcare Securities Markets Metals Exchange Finance Finance
Rates / Metals &
ETFs Convertibles Municipals Research Industrials M&A Repos Mining
Real
Wealth Estate, Restructu-Research ETFs Research TMT
Management Gaming & ring Lodging
Financial Public Sponsors Finance
22
|
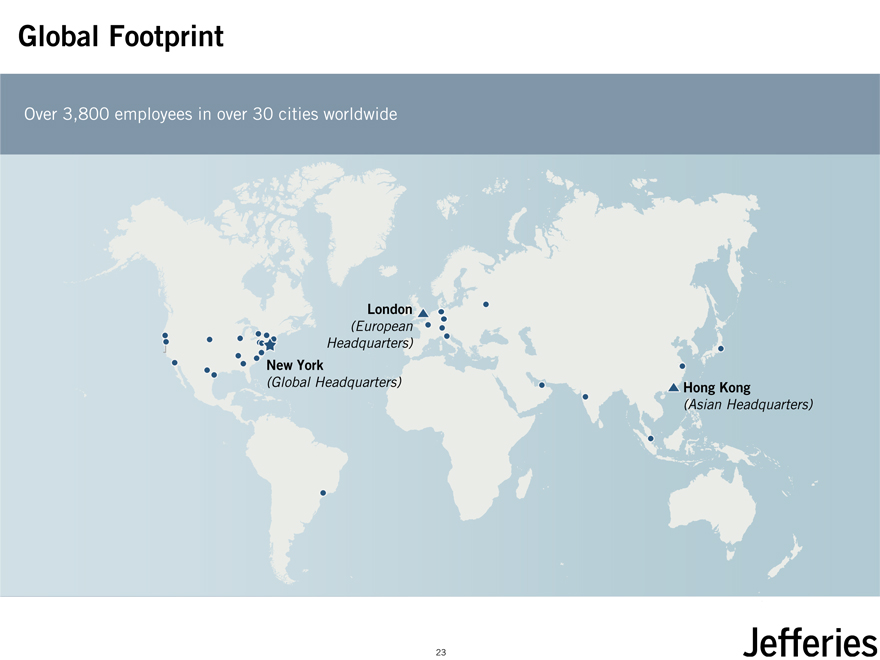
Global Footprint
Over 3,800 employees in over 30 cities worldwide
London
(European Headquarters)
New York
(Global Headquarters) Hong Kong
(Asian Headquarters)
23
|
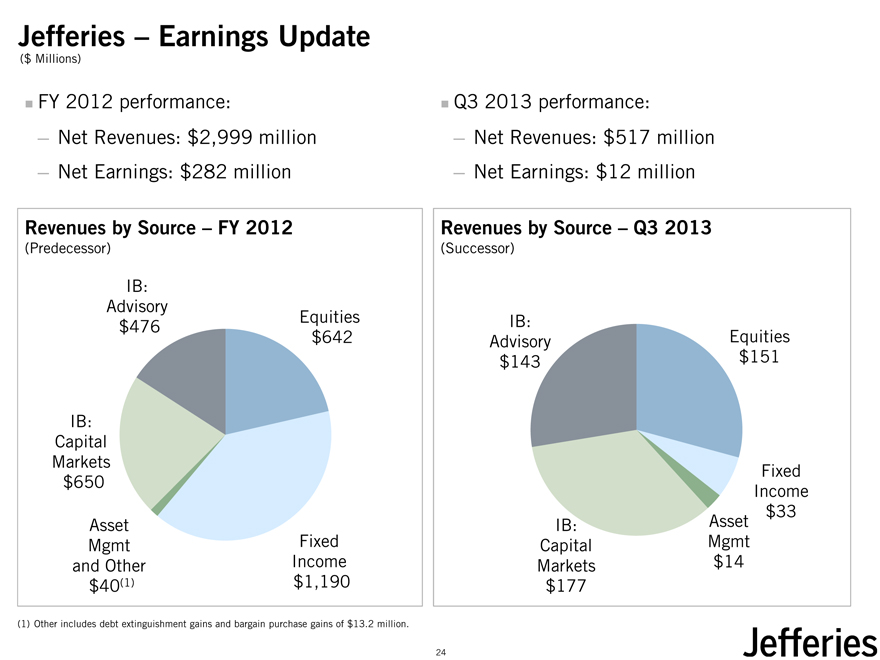
Jefferies – Earnings Update
($ Millions)
FY 2012 performance:
Net Revenues: $2,999 million
Net Earnings: $282 million
Revenues by Source – FY 2012
(Predecessor)
IB: Advisory
Equities $476 $642
IB: Capital Markets $650
Asset Fixed Mgmt Income and Other
$40(1) $1,190
(1) |
| Other includes debt extinguishment gains and bargain purchase gains of $13.2 million. |
Q3 2013 performance:
Net Revenues: $517 million
Net Earnings: $12 million
Revenues by Source – Q3 2013
(Successor)
IB:
Advisory Equities $143 $151
Fixed Income $33 IB: Asset Capital Mgmt Markets $14 $177
24
|
Jefferies Strategic Outlook
Post the Leucadia merger, Jefferies remains one of the world’s best capitalized investment banking firmsJefferies continues to win market share and deliver consistent profitability
Investment Banking revenues underline the quality and durability of Jefferies’ platform
Solid growth in Equities revenues (new senior leadership)
Durable Fixed Income, Commodities and Currencies platforms, despite recent market volatilityContinued emphasis on earnings growth through increased employee productivity and cross-product client penetrationFull-service capabilities and momentum outside the U.S. present a significant growth opportunityWell-positioned to capitalize on ongoing regulatory and business challenges faced by our competitors
25
|

Jefferies Business Review
26
|
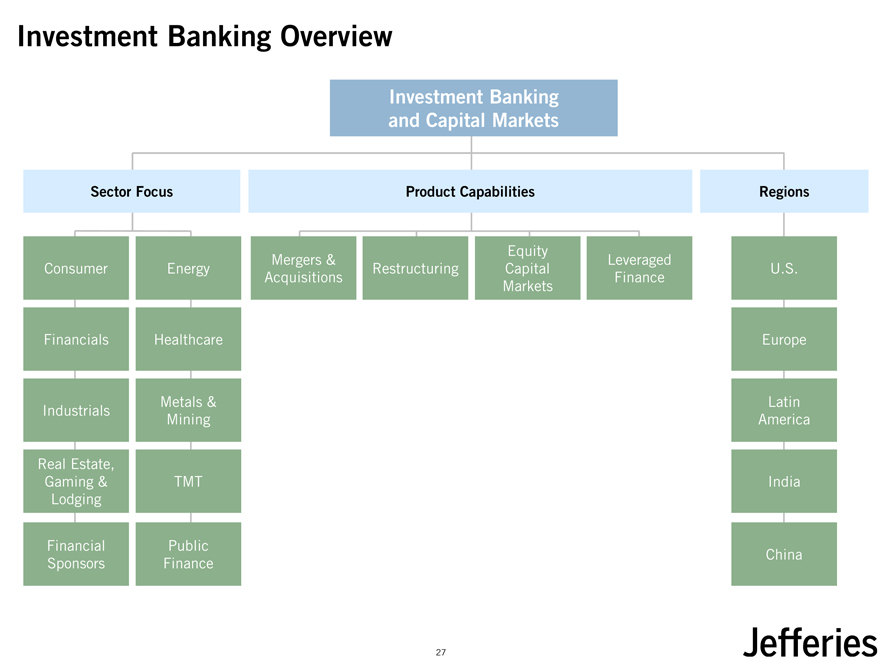
Investment Banking Overview
Investment Banking and Capital Markets
Sector Focus Product Capabilities Regions
Equity
Mergers & Leveraged
Consumer Energy Restructuring Capital U.S. Acquisitions Finance Markets
Financials Healthcare Europe
Metals & Latin Industrials Mining America
Real Estate,
Gaming & TMT India Lodging
Financial Public
China Sponsors Finance
27
|
Investment Banking – Strategic Priorities
Continue to increase productivity
Productivity has increased steadily
Further productivity increases expected as recent senior hires reach targeted productivity levels
Increase U.S. market share across investment banking
Significant incremental opportunity in TMT, Consumer, Industrials, FIG and Real Estate
Capitalize on full-service capabilities and momentum in Europe and Asia
192 investment bankers in Europe and Asia
Strong presence in Healthcare, Energy, TMT and Consumer
Significant momentum in local debt and equity capital markets
28
|
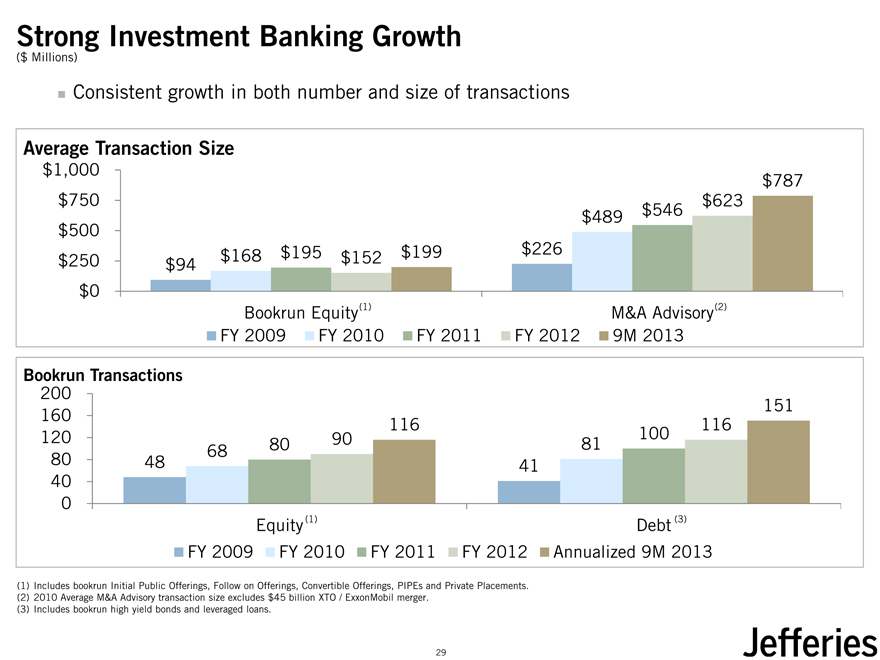
Strong Investment Banking Growth
($ Millions)
Consistent growth in both number and size of transactions
Average Transaction Size
$1,000 $787 $750 $623 $489 $546 $500 $168 $195 $199 $226 $250 $94 $152 $0 Bookrun Equity(1) M&A Advisory(2) FY 2009 FY 2010 FY 2011 FY 2012 9M 2013
Bookrun Transactions
200
151 160 116 116 120 90 100
68 80 81
80 48 41 40 0
Equity(1) Debt (3) FY 2009 FY 2010 FY 2011 FY 2012 Annualized 9M 2013
(1) Includes bookrun Initial Public Offerings, Follow on Offerings, Convertible Offerings, PIPEs and Private Placements. (2) 2010 Average M&A Advisory transaction size excludes $45 billion XTO / ExxonMobil merger.
(3) |
| Includes bookrun high yield bonds and leveraged loans. |
29
|
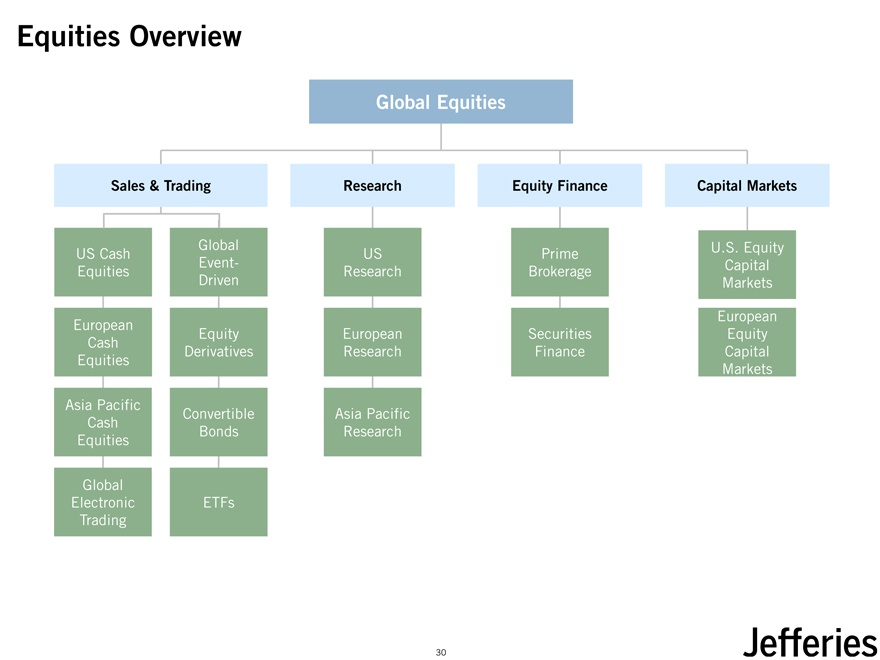
Equities Overview
Global Equities
Sales & Trading Research Equity Finance Capital Markets
Global U.S. Equity US Cash US Prime Event- Capital Equities Research Brokerage Driven Markets European European Equity European Securities Equity Cash Derivatives Research Finance Capital Equities Markets
Asia Pacific
Convertible Asia Pacific Cash Bonds Research Equities
Global
Electronic ETFs Trading
30
|
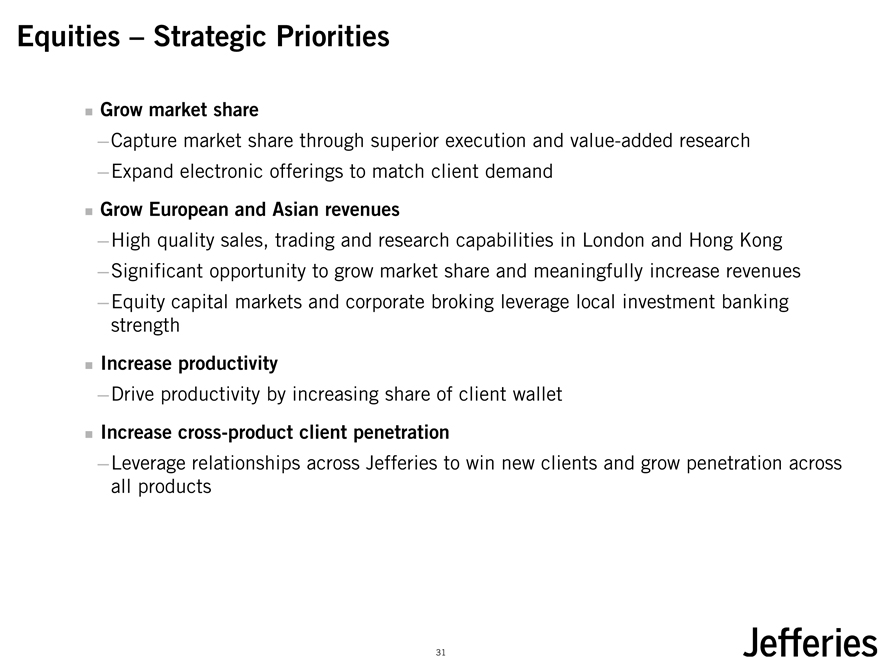
Equities – Strategic Priorities
Grow market share
Capture market share through superior execution and value-added research
Expand electronic offerings to match client demand
Grow European and Asian revenues
High quality sales, trading and research capabilities in London and Hong Kong
Significant opportunity to grow market share and meaningfully increase revenues
Equity capital markets and corporate broking leverage local investment banking strength
Increase productivity
Drive productivity by increasing share of client wallet
Increase cross-product client penetration
Leverage relationships across Jefferies to win new clients and grow penetration across all products
31
|
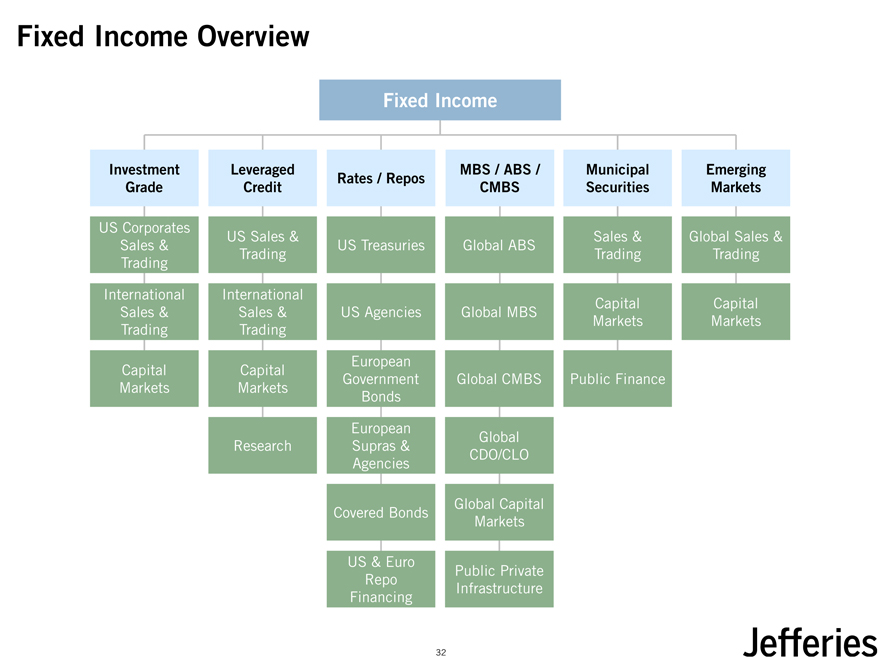
Fixed Income Overview
Fixed Income
Investment Leveraged
Rates / Repos Grade Credit
US Corporates
US Sales &
Sales & US Treasuries Trading Trading International International Sales & Sales & US Agencies Trading Trading European Capital Capital Government Markets Markets Bonds European Research Supras & Agencies
Covered Bonds
US & Euro Repo Financing
MBS / ABS / Municipal Emerging CMBS Securities Markets
Sales & Global Sales & Global ABS
Trading Trading
Capital Capital Global MBS
Markets Markets
Global CMBS Public Finance
Global CDO/CLO
Global Capital Markets
Public Private Infrastructure
32
|
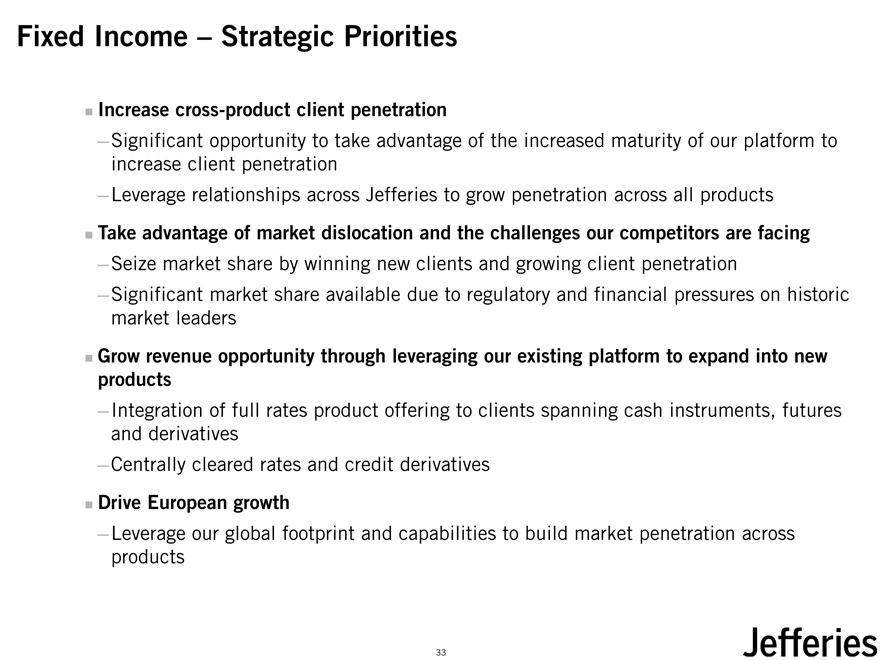
Fixed Income – Strategic Priorities
Increase cross-product client penetration
Significant opportunity to take advantage of the increased maturity of our platform to increase client penetration
Leverage relationships across Jefferies to grow penetration across all products
Take advantage of market dislocation and the challenges our competitors are facing
Seize market share by winning new clients and growing client penetration
Significant market share available due to regulatory and financial pressures on historic market leaders
Grow revenue opportunity through leveraging our existing platform to expand into new products
Integration of full rates product offering to clients spanning cash instruments, futures and derivatives
Centrally cleared rates and credit derivatives
Drive European growth
Leverage our global footprint and capabilities to build market penetration across products
33
|
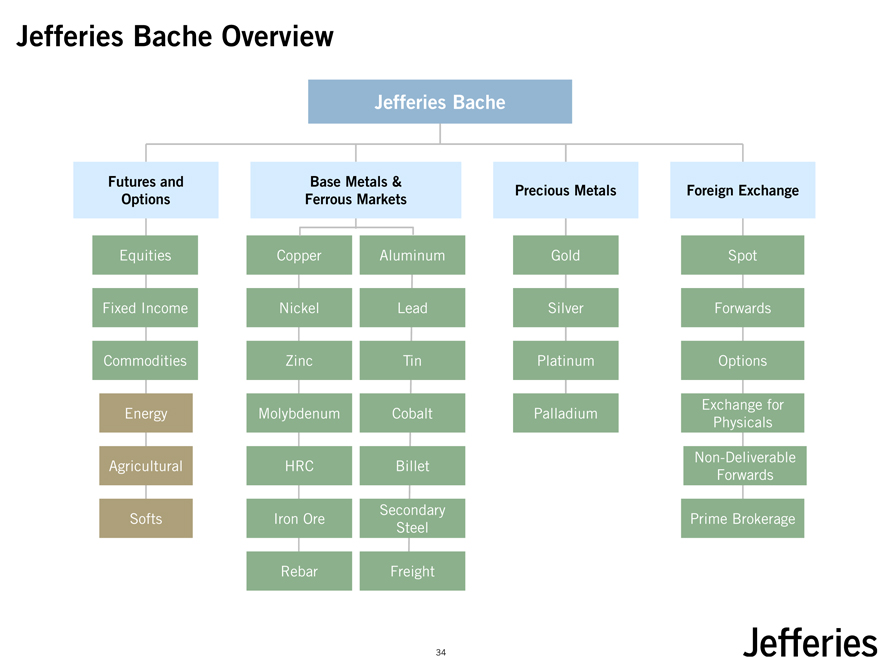
Jefferies Bache Overview
Jefferies Bache
Futures and Base Metals &
Precious Metals Foreign Exchange Options Ferrous Markets
Equities Copper Aluminum Gold Spot Fixed Income Nickel Lead Silver Forwards Commodities Zinc Tin Platinum Options
Exchange for Energy Molybdenum Cobalt Palladium Physicals
Non-Deliverable Agricultural HRC Billet Forwards
Secondary
Softs Iron Ore Prime Brokerage Steel
Rebar Freight
34
|
Jefferies Bache – Strategic Priorities
Capture secular growth trends in listed futures
Implementation of Dodd-Frank will result in OTC securities and commodities increasingly moving onto exchange
Growing institutional trading of listed futures
Increase in high-frequency algorithmic trading in futures markets
Grow customer base
Opportunity to materially grow customer base through cross-selling across Jefferies
Take market share
Significant market share available amongst FCMs
35
|
Regional Positioning
Jefferies is growing market share in Europe
Full-service European capabilities; 950 professionals in the UK and Continental Europe
Investment Banking: significant growth in advisory and capital markets issuance, materially enhanced by the acquisition of Hoare Govett in February 2012
Equities: client momentum and recovering European markets are driving growth
Fixed Income: strong local presence and the ability to capitalize on ongoing volatility in European credit markets
Strong momentum in Asia
Strong local investment banking presence
Full-service equity sales, trading and research capabilities across Asia Pacific
36
|
Regulatory Outlook
Jefferies is well-positioned to capitalize on upcoming global regulatory change
Unlike many of our competitors, Jefferies is client-focused and not materially leveraged to earnings from proprietary activities
Since Jefferies is not a bank holding company, it is less impacted by the provisions of the Dodd-Frank Act
Jefferies expects to benefit from regulatory changes in both the U.S. and Europe
In the U.S., Jefferies is well-positioned to take market share from competitors scaling down or exiting from trading activities, particularly in fixed income
In Europe, regulatory pressure has forced major banks to re-evaluate capital markets platforms and has led several banks to exit certain businesses
OTC swaps moving on to exchange will meaningfully expand Jefferies’ revenue opportunity
Jefferies anticipates actively participating in centrally cleared exchange traded swap and other derivative markets
37
|
Jefferies Operating Results
38
|
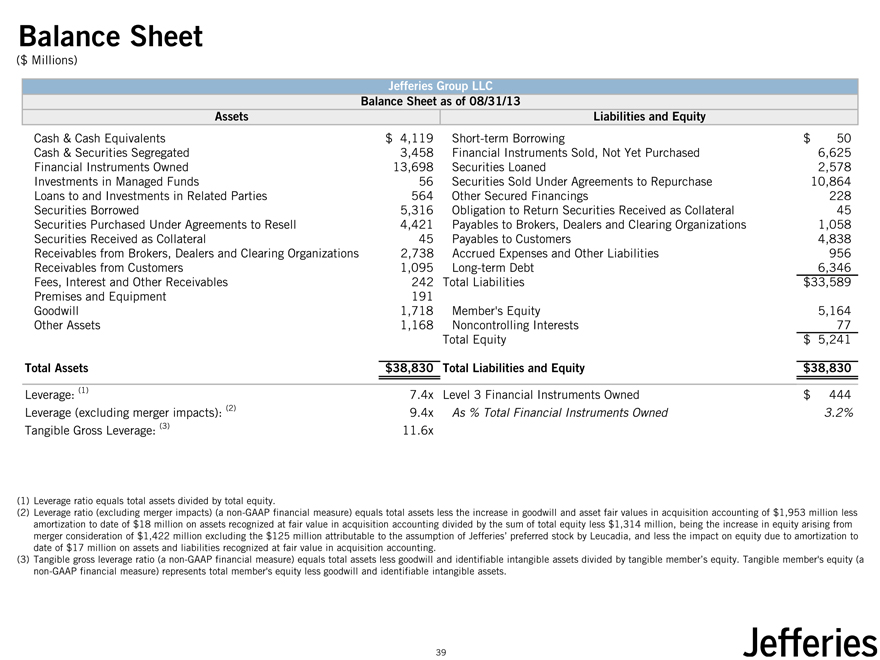
Balance Sheet
($ Millions)
Jefferies Group LLC Balance Sheet as of 08/31/13
Assets Liabilities and Equity
Cash & Cash Equivalents $ 4,119 Short-term Borrowing $ 50 Cash & Securities Segregated 3,458 Financial Instruments Sold, Not Yet Purchased 6,625 Financial Instruments Owned 13,698 Securities Loaned 2,578 Investments in Managed Funds 56 Securities Sold Under Agreements to Repurchase 10,864 Loans to and Investments in Related Parties 564 Other Secured Financings 228 Securities Borrowed 5,316 Obligation to Return Securities Received as Collateral 45 Securities Purchased Under Agreements to Resell 4,421 Payables to Brokers, Dealers and Clearing Organizations 1,058 Securities Received as Collateral 45 Payables to Customers 4,838 Receivables from Brokers, Dealers and Clearing Organizations 2,738 Accrued Expenses and Other Liabilities 956 Receivables from Customers 1,095 Long-term Debt 6,346 Fees, Interest and Other Receivables 242 Total Liabilities $33,589 Premises and Equipment 191 Goodwill 1,718 Member’s Equity 5,164 Other Assets 1,168 Noncontrolling Interests 77 Total Equity $ 5,241
Total Assets $38,830 Total Liabilities and Equity $38,830
Leverage: (1) 7.4x Level 3 Financial Instruments Owned $ 444 Leverage (excluding merger impacts): (2) 9.4x As % Total Financial Instruments Owned 3.2%
Tangible Gross Leverage: (3) 11.6x
(1) |
| Leverage ratio equals total assets divided by total equity. |
(2) Leverage ratio (excluding merger impacts) (a non-GAAP financial measure) equals total assets less the increase in goodwill and asset fair values in acquisition accounting of $1,953 million less amortization to date of $18 million on assets recognized at fair value in acquisition accounting divided by the sum of total equity less $1,314 million, being the increase in equity arising from merger consideration of $1,422 million excluding the $125 million attributable to the assumption of Jefferies’ preferred stock by Leucadia, and less the impact on equity due to amortization to date of $17 million on assets and liabilities recognized at fair value in acquisition accounting.
(3) Tangible gross leverage ratio (a non-GAAP financial measure) equals total assets less goodwill and identifiable intangible assets divided by tangible member’s equity. Tangible member’s equity (a non-GAAP financial measure) represents total member’s equity less goodwill and identifiable intangible assets.
39
|
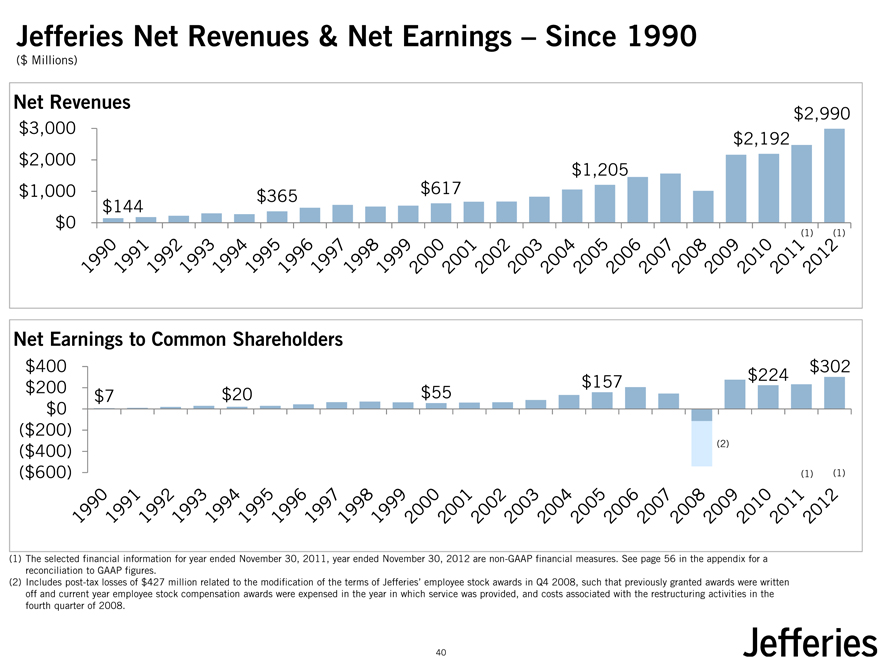
Jefferies Net Revenues & Net Earnings – Since 1990
($ Millions)
Net Revenues
$2,990 $3,000 $2,192 $2,000 $1,205 $1,000 $365 $617
$0 $144
(1) |
| (1) |
Net Earnings to Common Shareholders
$400 $302 $157 $224 $200 $20 $55 $7 $0
($200)
($400) (2)
($600) (1) (1)
(1) The selected financial information for year ended November 30, 2011, year ended November 30, 2012 are non-GAAP financial measures. See page 56 in the appendix for a reconciliation to GAAP figures.
(2) Includes post-tax losses of $427 million related to the modification of the terms of Jefferies’ employee stock awards in Q4 2008, such that previously granted awards were written off and current year employee stock compensation awards were expensed in the year in which service was provided, and costs associated with the restructuring activities in the fourth quarter of 2008.
40
|
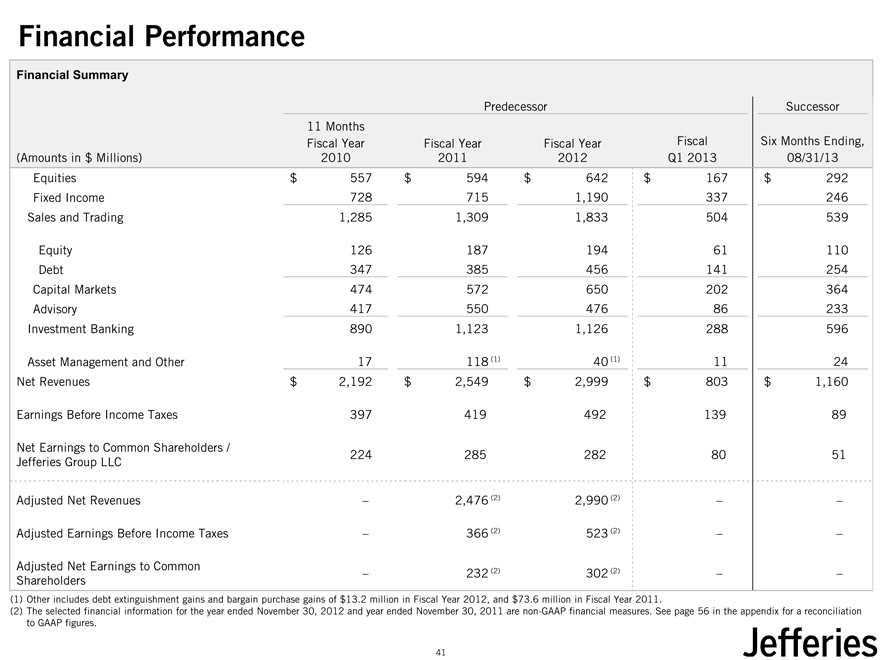
Financial Performance
Financial Summary
Predecessor Successor
11 Months
Fiscal Year Fiscal Year Fiscal Year Fiscal Six Months Ending, (Amounts in $ Millions) 2010 2011 2012 Q1 2013 08/31/13 Equities $ 557 $ 594 $ 642 $ 167 $ 292 Fixed Income 728 715 1,190 337 246 Sales and Trading 1,285 1,309 1,833 504 539
Equity 126 187 194 61 110 Debt 347 385 456 141 254 Capital Markets 474 572 650 202 364 Advisory 417 550 476 86 233 Investment Banking 890 1,123 1,126 288 596
Asset Management and Other 17 118 (1) 40 (1) 11 24 Net Revenues $ 2,192 $ 2,549 $ 2,999 $ 803 $ 1,160
Earnings Before Income Taxes 397 419 492 139 89
Net Earnings to Common Shareholders /
224 285 282 80 51 Jefferies Group LLC
Adjusted Net Revenues – 2,476 (2) 2,990 (2) – –
Adjusted Earnings Before Income Taxes – 366 (2) 523 (2) – –
Adjusted Net Earnings to Common (2) (2)
– 232 302 – – Shareholders
(1) Other includes debt extinguishment gains and bargain purchase gains of $13.2 million in Fiscal Year 2012, and $73.6 million in Fiscal Year 2011.
(2) The selected financial information for the year ended November 30, 2012 and year ended November 30, 2011 are non-GAAP financial measures. See page 56 in the appendix for a reconciliation to GAAP figures.
41
|
Compensation Overview
Jefferies has taken advantage of the challenges faced by our competitors by upgrading talent across our firm
Many competitors have significantly reduced compensation levels, leading to an exodus of talentOur new professionals have been a key driver of growthLag between hiring senior employees and their achieving run-rate revenue production has elevated Jefferies’ compensation ratio
This lag particularly impacts senior investment bankers, who have comprised a meaningful portion of Jefferies’ senior hiring since 2010Although Jefferies has successfully remained within our stated upper-bound 60% compensation ratio, we expect the ratio to decline over time as our hires reach their targeted productivity, net revenue grows and start-up amortization declines Over the past two years, compensation has also been impacted by amortization of certain compensation expenses typically associated with senior hires
Amortization expense is expected to decline significantly over the next three years, reducing the firm’s overall compensation ratio
42
|

Risk Management
43
|
Risk Principles
Jefferies’ comprehensive risk management framework has been a foundation for our success across market cycles
Culture
We are all risk managers. Our firm is built on every individual taking responsibility for risk management, including our senior management
Hands-on
Our senior management is deeply involved in the “nuts and bolts” of how and where we are taking risks across the firm
Integrated
Our risk management group and our business leaders are deeply integrated into our trading desks, ensuring a clear and comprehensive view of the firm’s risk
Asset Quality
Jefferies is dedicated to serving our clients in liquid, transparent products. We limit illiquid assets and derivatives to ensure the overall liquidity and health of our balance sheet
44
|
Risk Management Governance and Structure
Jefferies has a comprehensive risk management approach, with a formal governance structure and processes to identify, assess, monitor, and manage risk
Board of Directors and Audit Committee of the Board of Directors
Board of Directors comprised of 3 executive officers and 4 independent outside directors
Audit Committee of the Board of Directors comprised of 4 independent outside directorsResponsible for discussing with management the Jefferies’ major financial risk exposures and the steps management has taken to monitor and control such exposures, including the Jefferies’ risk assessment and risk management policies (from the Charter of the Audit Committee)
Risk Oversight Structure (Committees)
Risk Management
Executive
Operating
Market Risk Management
Credit Risk Management
Margin Oversight
New Business
Capital Commitment
Asset / Liability and Liquidity Management
45
|
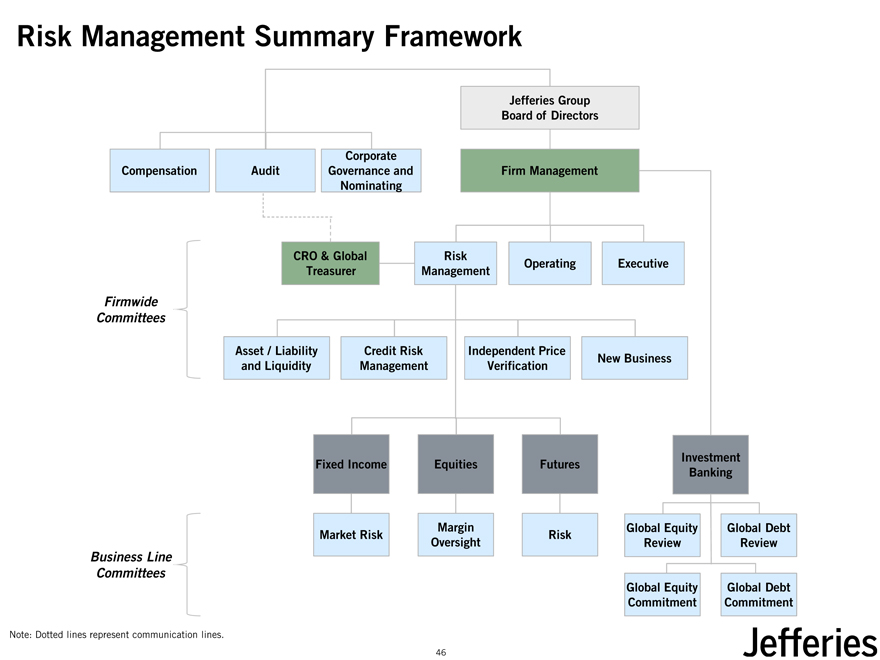
Risk Management Summary Framework
Jefferies Group Board of Directors
Corporate
Compensation Audit Governance and Firm Management Nominating
Firmwide
Committees
CRO & Global Risk
Operating Executive Treasurer Management
Asset / Liability Credit Risk Independent Price
New Business and Liquidity Management Verification
Investment Fixed Income Equities Futures Banking
Margin Global Equity Global Debt Market Risk Risk Oversight Review Review
Business Line Committees
Global Equity Global Debt Commitment Commitment
Note: Dotted lines represent communication lines.
46
|

Capital and Liquidity Management
47
|
Liquidity and Funding Principles
Jefferies’ long-standing liquidity and funding principles have maintained the strength and soundness of our platform across market cycles
Owning inventory that is composed of liquid assets that turn over regularly, with a minimal amount of Level 3 AssetsMaintaining a sound, long-term capital base and reasonable leverage relative to our business activityNo material reliance on short-term unsecured funding or customer balancesShort term secured funding that is readily and consistently available through clearing houses, or fixed for periods of time that exceed the expected tenure of the inventory they are fundingAssessing capital reserves and maintaining liquidity (including intraday liquidity) to withstand adverse changes in the trading or financing marketsWhere appropriate, entering into partnerships and joint ventures with complementary long-term partners to pursue business opportunities that otherwise will exceed our capital capacity or risk tolerance
48
|
Strong Capital Structure and Ample Liquidity
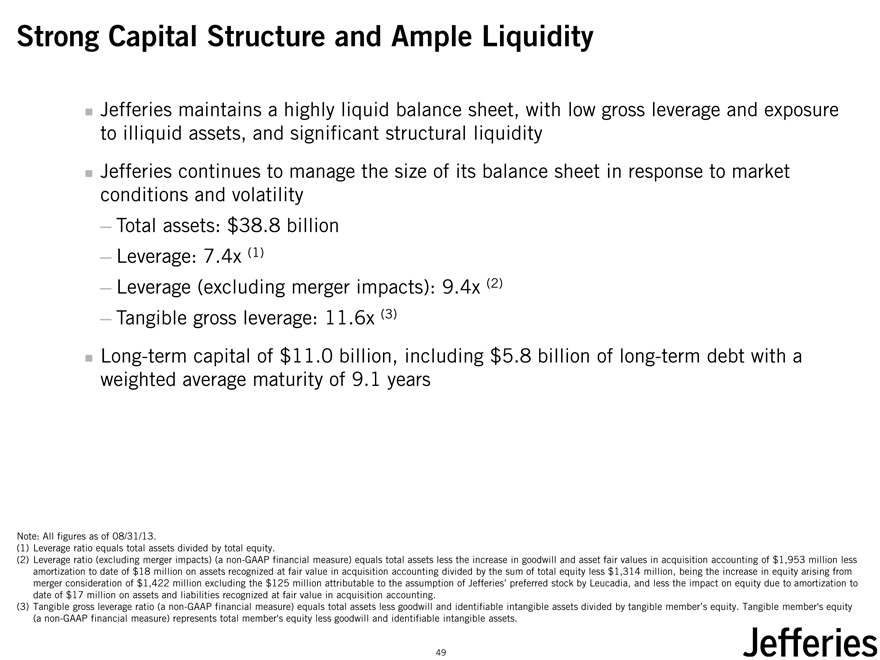
Jefferies maintains a highly liquid balance sheet, with low gross leverage and exposure to illiquid assets, and significant structural liquidityJefferies continues to manage the size of its balance sheet in response to market conditions and volatility
Total assets: $38.8 billion
Leverage: 7.4x (1)
Leverage (excluding merger impacts): 9.4x (2)
Tangible gross leverage: 11.6x (3)
Long-term capital of $11.0 billion, including $5.8 billion of long-term debt with a weighted average maturity of 9.1 years
Note: All figures as of 08/31/13.
(1) |
| Leverage ratio equals total assets divided by total equity. |
(2) Leverage ratio (excluding merger impacts) (a non-GAAP financial measure) equals total assets less the increase in goodwill and asset fair values in acquisition accounting of $1,953 million less amortization to date of $18 million on assets recognized at fair value in acquisition accounting divided by the sum of total equity less $1,314 million, being the increase in equity arising from merger consideration of $1,422 million excluding the $125 million attributable to the assumption of Jefferies’ preferred stock by Leucadia, and less the impact on equity due to amortization to date of $17 million on assets and liabilities recognized at fair value in acquisition accounting.
(3) Tangible gross leverage ratio (a non-GAAP financial measure) equals total assets less goodwill and identifiable intangible assets divided by tangible member’s equity. Tangible member’s equity (a non-GAAP financial measure) represents total member’s equity less goodwill and identifiable intangible assets.
49
|
Limited Leverage
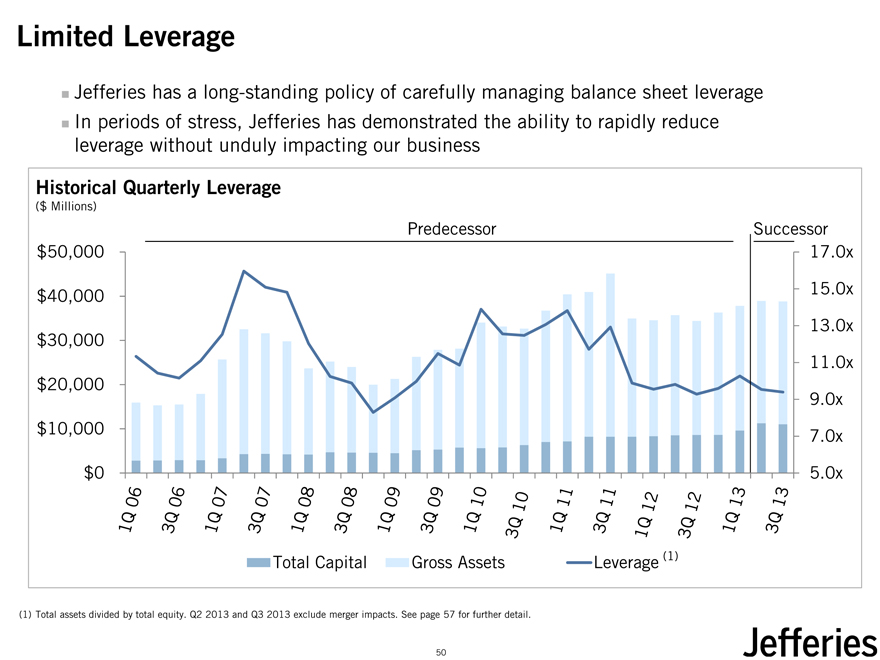
Jefferies has a long-standing policy of carefully managing balance sheet leverageIn periods of stress, Jefferies has demonstrated the ability to rapidly reduce leverage without unduly impacting our business
Historical Quarterly Leverage
($ Millions)
Predecessor Successor $50,000 17.0x $40,000 15.0x
13.0x $30,000
11.0x $20,000
9.0x $10,000 7.0x
$0 5.0x
Total Capital Gross Assets Leverage (1)
(1) |
| Total assets divided by total equity. Q2 2013 and Q3 2013 exclude merger impacts. See page 57 for further detail. |
50
|
Level 3 Trading Assets Overview
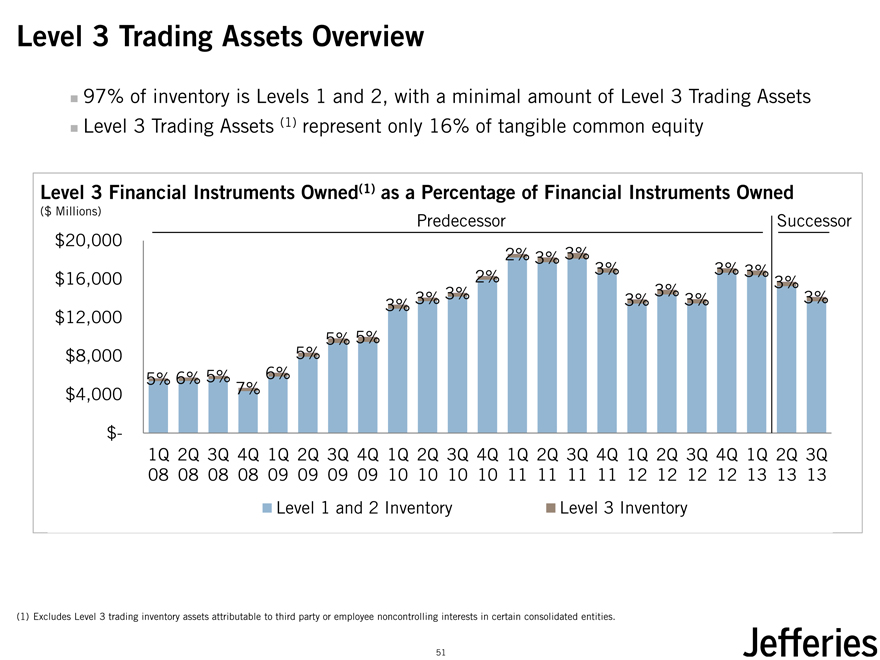
97% of inventory is Levels 1 and 2, with a minimal amount of Level 3 Trading Assets Level 3 Trading Assets (1)represent only 16% of tangible common equity
Level 3 Financial Instruments Owned(1) as a Percentage of Financial Instruments Owned
($ Millions)
Predecessor Successor $20,000
2% 3% 3%
2% 3% 3% 3% $16,000 3%
3% 3% 3% 3%
3% 3% 3% $12,000
5% 5% 5% $8,000
5% 6% 5% 6% $4,000 7% $-
1Q 2Q 3Q 4Q 1Q 2Q 3Q 4Q 1Q 2Q 3Q 4Q 1Q 2Q 3Q 4Q 1Q 2Q 3Q 4Q 1Q 2Q 3Q
08 08 08 08 09 09 09 09 10 10 10 10 11 11 11 11 12 12 12 12 13 13 13
Level 1 and 2 Inventory
Level 3 Inventory
(1) Excludes Level 3 trading inventory assets attributable to third party or employee noncontrolling interests in certain consolidated entities.
51
|
Liquidity Pool
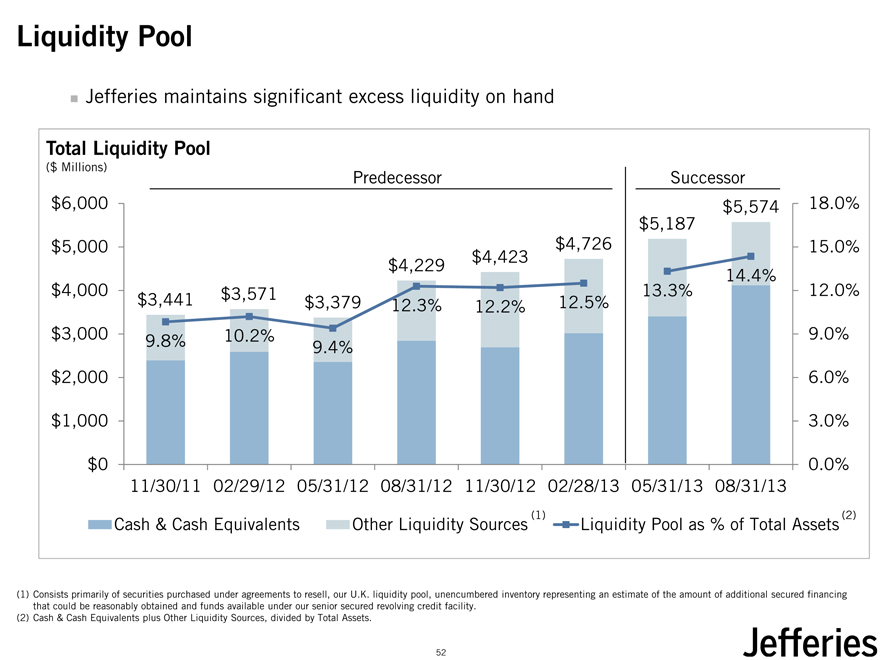
Jefferies maintains significant excess liquidity on hand
Total Liquidity Pool
($ Millions)
Predecessor Successor $6,000 $5,574 18.0% $5,187 $5,000 $4,726 15.0% $4,423 $4,229
14.4% $4,000 $3,571 13.3% 12.0% $3,441 $3,379 12.3% 12.2% 12.5% $3,000 9.8% 10.2% 9.0%
9.4% $2,000 6.0%
$1,000 3.0%
$0 0.0% 11/30/11 02/29/12 05/31/12 08/31/12 11/30/12 02/28/13 05/31/13 08/31/13
(1) |
| (2) |
Cash & Cash Equivalents Other Liquidity Sources Liquidity Pool as % of Total Assets
(1) Consists primarily of securities purchased under agreements to resell, our U.K. liquidity pool, unencumbered inventory representing an estimate of the amount of additional secured financing that could be reasonably obtained and funds available under our senior secured revolving credit facility.
(2) |
| Cash & Cash Equivalents plus Other Liquidity Sources, divided by Total Assets. |
52
|
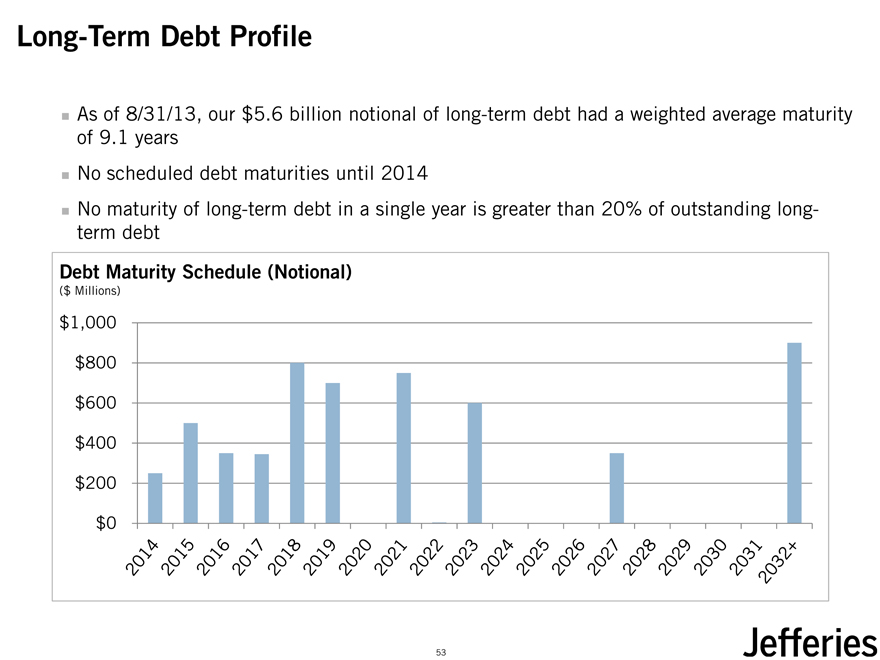
Long-Term Debt Profile
As of 8/31/13, our $5.6 billion notional of long-term debt had a weighted average maturity of 9.1 yearsNo scheduled debt maturities until 2014No maturity of long-term debt in a single year is greater than 20% of outstanding long-term debt
Debt Maturity Schedule (Notional)
($ Millions)
$1,000 $800 $600 $400 $200 $0
53
|

Appendix
54
|
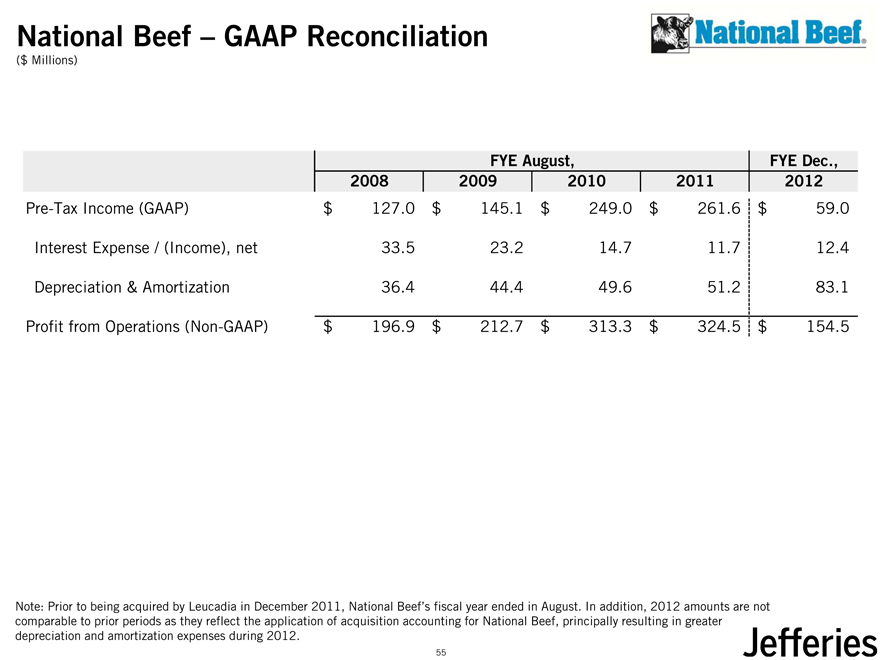
National Beef – GAAP Reconciliation
($ Millions)
FYE August, FYE Dec., 2008 2009 2010 2011 2012
Pre-Tax Income (GAAP) $ 127 .0 $ 145.1 $ 249.0 $ 261.6 $ 59.0 Interest Expense / (Income), net 33.5 23.2 14.7 11.7 12.4 Depreciation & Amortization 36.4 44.4 49.6 51.2 83.1 Profit from Operations (Non-GAAP) $ 196.9 $ 212.7 $ 313.3 $ 324.5 $ 154.5
Note: Prior to being acquired by Leucadia in December 2011, National Beef’s fiscal year ended in August. In addition, 2012 amounts are not comparable to prior periods as they reflect the application of acquisition accounting for National Beef, principally resulting in greater depreciation and amortization expenses during 2012.
55
|
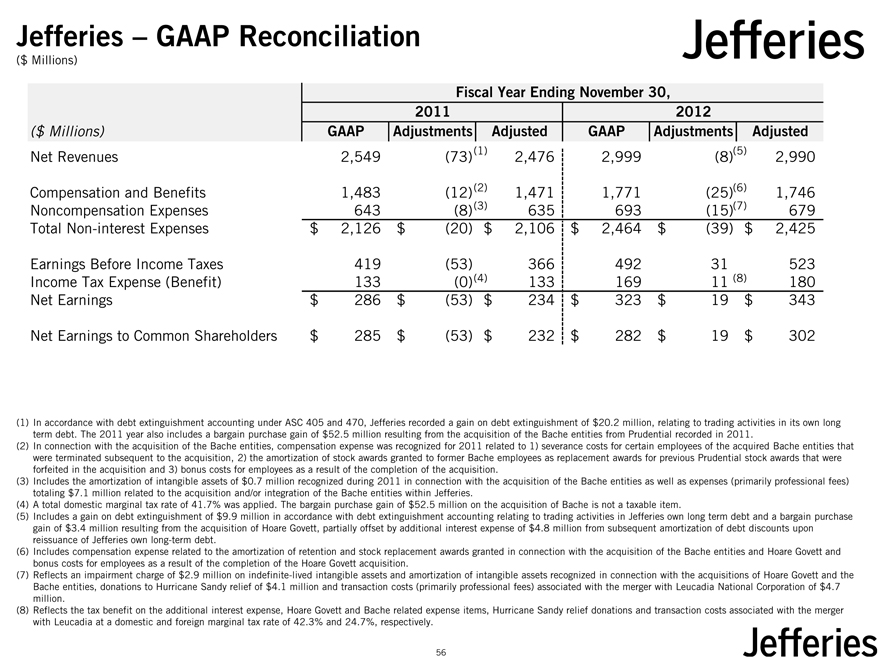
Jefferies – GAAP Reconciliation
($ Millions)
Fiscal Year Ending November 30, 2011 2012
($ Millions) GAAP Adjustments Adjusted GAAP Adjustments Adjusted
Net Revenues 2,549 (73)(1) 2,476 2,999 (8)(5) 2,990 Compensation and Benefits 1,483 (12)(2) 1,471 1,771 (25)(6) 1,746 Noncompensation Expenses 643 (8)(3) 635 693 (15)(7) 679 Total Non-interest Expenses $ 2,126 $ (20) $ 2,106 $ 2,464 $ (39) $ 2,425
Earnings Before Income Taxes 419 (53) 366 492 31 523 Income Tax Expense (Benefit) 133 (0)(4) 133 169 11 (8) 180 Net Earnings $ 286 $ (53) $ 234 $ 323 $ 19 $ 343
Net Earnings to Common Shareholders $ 285 $ (53) $ 232 $ 282 $ 19 $ 302
(1) In accordance with debt extinguishment accounting under ASC 405 and 470, Jefferies recorded a gain on debt extinguishment of $20.2 million, relating to trading activities in its own long term debt. The 2011 year also includes a bargain purchase gain of $52.5 million resulting from the acquisition of the Bache entities from Prudential recorded in 2011.
(2) In connection with the acquisition of the Bache entities, compensation expense was recognized for 2011 related to 1) severance costs for certain employees of the acquired Bache entities that were terminated subsequent to the acquisition, 2) the amortization of stock awards granted to former Bache employees as replacement awards for previous Prudential stock awards that were forfeited in the acquisition and 3) bonus costs for employees as a result of the completion of the acquisition.
(3) Includes the amortization of intangible assets of $0.7 million recognized during 2011 in connection with the acquisition of the Bache entities as well as expenses (primarily professional fees) totaling $7.1 million related to the acquisition and/or integration of the Bache entities within Jefferies.
(4) A total domestic marginal tax rate of 41.7% was applied. The bargain purchase gain of $52.5 million on the acquisition of Bache is not a taxable item.
(5) Includes a gain on debt extinguishment of $9.9 million in accordance with debt extinguishment accounting relating to trading activities in Jefferies own long term debt and a bargain purchase gain of $3.4 million resulting from the acquisition of Hoare Govett, partially offset by additional interest expense of $4.8 million from subsequent amortization of debt discounts upon reissuance of Jefferies own long-term debt.
(6) Includes compensation expense related to the amortization of retention and stock replacement awards granted in connection with the acquisition of the Bache entities and Hoare Govett and bonus costs for employees as a result of the completion of the Hoare Govett acquisition.
(7) Reflects an impairment charge of $2.9 million on indefinite-lived intangible assets and amortization of intangible assets recognized in connection with the acquisitions of Hoare Govett and the Bache entities, donations to Hurricane Sandy relief of $4.1 million and transaction costs (primarily professional fees) associated with the merger with Leucadia National Corporation of $4.7 million.
(8) Reflects the tax benefit on the additional interest expense, Hoare Govett and Bache related expense items, Hurricane Sandy relief donations and transaction costs associated with the merger with Leucadia at a domestic and foreign marginal tax rate of 42.3% and 24.7%, respectively.
56
|
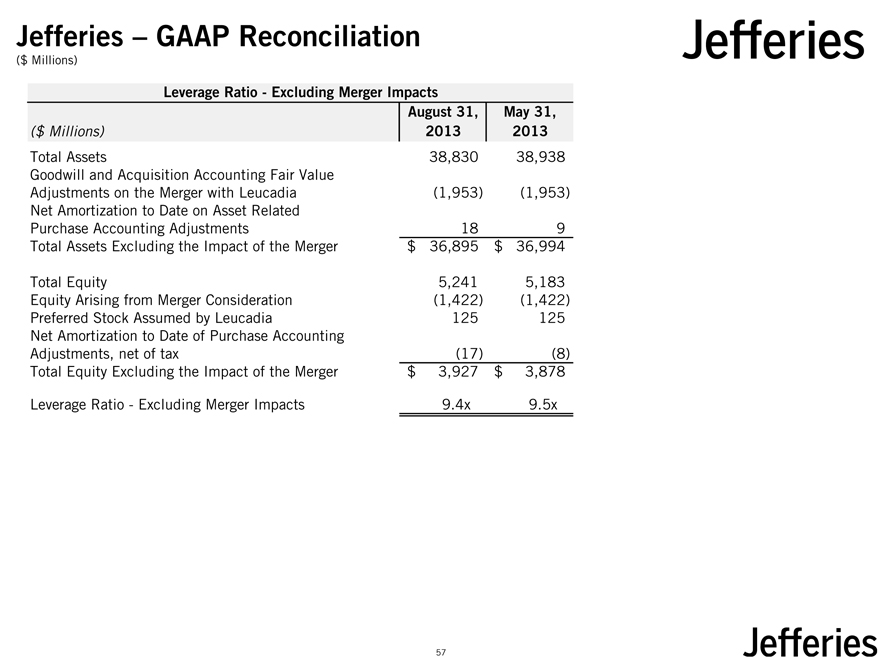
Jefferies – GAAP Reconciliation
($ Millions)
Leverage Ratio—Excluding Merger Impacts
August 31, May 31,
($ Millions) 2013 2013
Total Assets 38,830 38,938 Goodwill and Acquisition Accounting Fair Value Adjustments on the Merger with Leucadia (1,953) (1,953) Net Amortization to Date on Asset Related Purchase Accounting Adjustments 18 9 Total Assets Excluding the Impact of the Merger $ 36,895 $ 36,994
Total Equity 5,241 5,183 Equity Arising from Merger Consideration (1,422) (1,422) Preferred Stock Assumed by Leucadia 125 125 Net Amortization to Date of Purchase Accounting Adjustments, net of tax (17) (8) Total Equity Excluding the Impact of the Merger $ 3,927 $ 3,878
Leverage Ratio—Excluding Merger Impacts 9.4x 9.5x
57
|
Jefferies Group
2013 Fixed Income Investor Day
October 10, 2013