SECURITIES & EXCHANGE COMMISSION
Washington D.C. 20549
FORM 10-K
[ X ] ANNUAL REPORT PURSUANT TO SECTION 13 OR 15(d) OF THE SECURITIES EXCHANGE ACT OF 1934.
[ ] TRANSITION REPORT PURSUANT TO SECTION 13 OR 15(d) OF THE SECURITIES EXCHANGE ACT OF 1934
FOR THE FISCAL YEAR ENDED DECEMBER 31, 2006
COMMISSION FILE NUMBER 0-30106
PACIFIC CONTINENTAL CORPORATION
(Exact name of registrant as specified in its charter)
OREGON 93-1269184
(State of Incorporation) (IRS Employer Identification No)
111 West 7th Avenue
Eugene, Oregon 97401
(Address of principal executive offices)
(541) 686-8685
(Registrant’s telephone number)
Securities registered pursuant to 12(b) of the Act: None
Securities registered pursuant to 12(g) of the Act:
No Par Value Common Stock
Indicate by check mark if the registrant is a well-known seasoned issuer, as defined in Rule 405 of the Securities Act Yes __ No X
Indicate by check mark if the registrant is not required to file report pursuant to Section 13 or Section 15(d) of the Act Yes __ No X
Check whether the registrant (1) has filed all reports required to be filed by Section 13 or 15(d) of the Securities Exchange Act of 1934 during the preceding 12 months (or for such shorter period that the registrant was required to file such reports), and (2) has been subject to such filing requirements for the past 90 days. Yes X No ___
Check if there is no disclosure of delinquent filers in response to item 405 of Regulation S-K contained in this form, and no disclosure will be contained, to the best of the registrant’s knowledge, in definitive proxy or information statements incorporated by reference in Part III of this form 10-K or any amendment to this Form 10-K. ( X )
Indicate by check mark whether the Registrant is a large accelerated filer, an accelerated filer, or a non-accelerated filer.
Large accelerated filer __ Accelerated filer X Non-accelerated filer __
Indicate by check mark whether the registrant is registrant is a shell company (as defined in Rule 12b-2 of the Exchange Act Yes __ No X
The aggregate market value of the voting stock held by non-affiliates of the Registrant at June 30, 2006 (the last business day of the most recent second quarter) was $173,926,000 based on the closing price as quoted on the NASDAQ National Market on that date.
The number of shares outstanding of each of the registrant’s classes of common stock, as of March 9, 2007, was 10,720,384 shares of no par value Common Stock.
DOCUMENTS INCORPORATED BY REFERENCE
Part III incorporates by reference information from the registrant’s definitive proxy statement for the 2007 annual meeting of shareholders.
PACIFIC CONTINENTAL CORPORATION
FORM 10-K
ANNUAL REPORT
TABLE OF CONTENTS
PART 1 | | Page |
| | |
| | |
| | |
| | |
| | |
| | |
PART II | | |
| | |
| | |
| | |
| | |
| | |
| | |
| | |
| | |
PART III | (Items 10 through 14 are incorporated by reference from Pacific Continental Corporation’s definitive proxy statement for the annual meeting of shareholders scheduled for April 24, 2007) | |
| | |
| | |
| | |
| | |
| | |
PART IV | | |
| | |
| | |
| | |
PART I
General
Pacific Continental Corporation (the “Company” or the “Registrant”) is an Oregon corporation and registered bank holding company located in Eugene, Oregon. The Company was organized on June 7, 1999, pursuant to a holding company reorganization of Pacific Continental Bank, its wholly owned subsidiary.
The Company’s principal business activities are conducted through its full-service commercial bank subsidiary, Pacific Continental Bank (the “Bank”), an Oregon state-chartered bank with deposits insured by the Federal Deposit Insurance Corporation (“FDIC”). The Bank has two subsidiaries, PCB Service Corporation (presently inactive), which holds and manages Bank property, and PCB Loan Services (presently inactive), which manages certain other real estate owned.
On November 30, 2005, the Company acquired NWB Financial Corporation (“NWBF”) for a combination of stock and cash and entered the metropolitan Seattle market in the State of Washington. Combined, the stock and cash transaction was valued at approximately $40.4 million. The acquisition was accounted for under the purchase method of accounting and, accordingly, the results of operations of NWBF have been included in the consolidated financial statements only since the date of acquisition. For more information regarding the Company’s acquisition of NWBF see “Management’s Discussion and Analysis of Financial Condition and Results of Operations” and “Financial Statements and Supplementary Data” in Items 7 and 8 of this Form 10-K.
With the acquisition of NWBF, the Bank now operates in three primary markets: Portland, Oregon / Southwest Washington market; Seattle, Washington market; and Lane County, Oregon market. The Bank opened its fifth full-service office in the Portland / Southwest Washington market in Vancouver, Washington during the second quarter 2006. At December 31, 2006, the Bank operated fourteen full-service offices and two consumer finance lending offices in seven Oregon and two Washington cities. During the fourth quarter 2006, the Bank lost the use of its office in Bellevue, Washington due to an accident at a nearby construction site, which severely damaged the Bank’s facility. The Bank expects to open a temporary office in the Bellevue market during first quarter 2007 and will use a temporary facility until the original office location is repaired, which is expected during third quarter 2007. The Bank has not lost any clients due to the temporary closure of the Bellevue office and is fully insured for any damage to its facility.
Subsequent to December 31, 2006, the Bank announced it would close its existing Tualatin, Oregon office and relocate to a new highly visible site on I-5, approximately one mile from the current office location. Construction of the new Tualatin, Oregon office is expected to be completed during the fourth quarter 2007.
Results
For the year ended December 31, 2006, the consolidated net income of the Company was $12.7 million or $1.18 per diluted share. At December 31, 2006, the consolidated equity of the Company was $95.7 million with 10.6 million shares outstanding and a book value of $8.99 per share. Total assets were $885.4 million. Loans, including loans held for sale, net of allowance for loan losses, were $761.0 million at December 31, 2006 and represented 86% of total assets. Deposits totaled $641.3 million at year-end 2006. For more information regarding the Company’s financial condition and results of operations, see “Management’s Discussion and Analysis of Financial Condition and Results of Operations” and “Financial Statements and Supplementary Data” in sections 7 and 8 of this Form 10-K.
THE BANK
General
The Bank commenced operations on August 15, 1972. At December 31, 2006, the Bank operated fourteen banking offices and two consumer finance lending offices in Oregon and Washington. The primary business strategy of the Bank is to provide comprehensive banking and related services tailored to community-based business, not-for-profits, professional service providers and private banking services for business owners and executives. The Bank emphasizes the diversity of its product lines, high levels of personal service, and through technology, offers convenient access typically associated with larger financial institutions, while maintaining local decision-making authority and market knowledge, typical of a local community bank. More information on the Bank and its banking services can be found on its website www.therightbank.com. The Bank operates under the banking laws of the State of Oregon, State of Washington and the rules and regulations of the FDIC and the Federal Reserve Bank of San Francisco.
Primary Market Area
The Bank’s primary markets consist of the metropolitan Portland, which includes Southwest Washington, and Eugene areas in the State of Oregon and the metropolitan Seattle area in the State of Washington. The Bank has five full-service banking offices in the metropolitan Portland and Southwest Washington area, seven full-service banking offices in the metropolitan Eugene area, and two full-service offices in the metropolitan Seattle area. In addition, the Bank operates consumer finance lending offices in the Oregon cities of Eugene and Coos Bay. The Bank has its headquarters and administrative office in the city of Eugene.
Competition
Commercial banking in the state of Oregon and Washington is highly competitive with respect to providing banking services, including making loans and attracting deposits. The Bank competes with other banks, as well as with savings and loan associations, savings banks, credit unions, mortgage companies, investment banks, insurance companies, and other financial institutions. Banking in Oregon and Washington is dominated by several large banking institutions, including U.S. Bank, Wells Fargo Bank, Bank of America, and Washington Mutual Bank, which together account for a majority of the total commercial and savings bank deposits in Oregon and Washington. These competitors have significantly greater financial resources and offer a much greater number of branch locations. The Bank has attempted to offset the advantage of the larger competitors by focusing on certain market segments, providing high levels of customization and personal service, and tailoring its technology, products, and services to the specific market segments that the Bank serves.
In addition to larger institutions, numerous “community” banks or credit unions have been formed, expanded or moved into the Bank’s three primary areas and have developed a similar focus to the Bank. These institutions have further increased competition in all three of the Bank’s primary markets. This growing number of similar financial institutions and an increased focus by larger institutions in the Bank’s primary markets has led to intensified competition in all aspects of the Banks business, particularly in the area of deposits.
The adoption of the Gramm-Leach-Bliley Act of 1999 (the “GLB Act”) has led to further intensification of competition in the financial services industry. The GLB Act has eliminated many of the barriers to affiliation among providers of various types of financial services and has permitted business combinations among financial service providers such as banks, insurance companies, securities or brokerage firms, and other financial service providers. Additionally, the rapid adoption of financial services through the Internet has reduced or even eliminated many barriers to entry by financial services providers physically located outside our market area. For example, remote deposit services, partly developed in response to the recently adopted Check 21 law, allow depository companies physically located in other geographical markets to service local businesses with minimal cost of entry. Although the Bank has been able to compete effectively in the financial services business in its markets to date, there can be no assurance that it will be able to continue to do so in the future.
The financial services industry has experienced widespread consolidation over the last decade. The Company anticipates that consolidation among financial institutions in its market area will continue. The Company seeks acquisition opportunities, from time to time, in its existing markets and in new markets of strategic importance to it. However, other financial institutions aggressively compete against the Bank in the acquisition market. Some of these institutions may have greater access to capital markets, larger cash reserves, and stock for use in acquisitions that is more liquid and more highly valued by the market.
Services Provided
Lending Activities
The Bank emphasizes specific areas of lending within its primary market areas: loans to community-based businesses, including professional service providers, not-for-profit organizations and private banking services for business owners and executives.
Commercial loans, secured and unsecured, are made primarily to professionals, community-based businesses, and not-for-profit organizations. These loans are available for general operating purposes, acquisition of fixed assets, purchases of equipment and machinery, financing of inventory and accounts receivable, and other business purposes. The Bank also originates Small Business Administration (“SBA”) loans and enjoys a national preferred lender status with the SBA.
Within its primary markets, the Bank also concentrates on construction loan financing for commercial facilities and for pre-sold, custom, and speculative home construction. The major thrust of residential construction lending is for the construction of single-family residences. The Bank also finances requests for multi-family residences.
Fixed-rate and variable rate residential mortgage loans are offered through the Bank’s mortgage loan department. Most residential mortgage loans originated are sold in the secondary market along with the mortgage loan servicing rights.
The Bank makes secured and unsecured loans to individuals for various purposes including purchases of automobiles, mobile homes, boats, and other recreational vehicles, home improvements, education, and personal investment.
The Bank offers credit card services to its business customers and uses an outside vendor for credit card processing. In addition, the Bank provides merchant bankcard processing services, through an outside processor, for its business customers.
The Board of Directors has approved specific lending policies and procedures for the Bank and management is responsible for implementation of the policies. The lending policies and procedures include guidelines for loan term, loan-to-value ratios, collateral appraisals, and cash flow coverage. The loan policies also vest varying levels of loan authority in management, the Bank’s Loan Committee, and the Board of Directors. Bank management monitors lending activities through management meetings, weekly loan committee meetings, monthly reporting, and periodic review of loans by third-party contractors.
The Bank has a Consumer Finance Division which operates under the business name Pacific Continental Finance. At December 31, 2006, this Division had approximately $11.1 million in outstanding loans which are primarily secured loans to individuals for various purposes including automobiles, mobile homes, boats, and home improvements or home equity loans. At December 31, 2006, approximately 84% of Consumer Finance loans were secured by real estate. A small percentage of loans made by this division are unsecured. The majority of loans made by the Consumer Finance Division are classified as sub-prime lending and have yields appropriate to the credit risk assumed.
Deposit Services
The Bank offers a full range of deposit services that are typically available in most banks and savings banks, including checking, savings, money market accounts, and time deposits. The transaction accounts and time deposits are tailored to the Bank’s primary markets and market segments at rates competitive with those offered in the area. Additional deposits are generated through national networks for institutional deposits and the State of Oregon and State of Washington for public time deposits. All deposit accounts are insured by the FDIC to the maximum amount permitted by law.
The Bank has invested continuously in image technology since 1994 for the processing of checks. The Bank was the first financial institution in Lane, Multnomah, Clackamas, and Washington Counties to offer this service. In addition, the Bank provides on-line banking services to businesses and consumers and allows 24-hour customer access to deposit and loan information via telephone and on-line cash management products.
Merchant Card Services
The Bank provides merchant card services to its clients, which includes processing of credit card transactions and issuance of business credit cards. This service is an integral part of the Bank’s business focus to market to community-based business, not-for-profits, and service providers. During 2006, the Company processed approximately $150 million in credit card transactions for its merchant clients.
Other Services
The Bank provides other traditional commercial and consumer banking services, including cash management products for businesses, on-line banking, safe deposit services, debit and ATM cards, ACH transactions, savings bonds, cashier’s checks, travelers checks, notary services and others. The Bank is a member of numerous ATM networks and utilizes an outside processor for the processing of these automated transactions.
Employees
At December 31, 2006, the Bank employed 257 full-time equivalent employees with 226 in Oregon and 31 in Washington. None of these employees are represented by labor unions, and management believes that the Company’s relationship with employees is good. The Company emphasizes a positive work environment for its employees, which is validated by recognition from independent third parties. The Bank was recognized for the fifth consecutive year by Oregon Business Magazine as one of Oregon’s Best 100 Companies for which to work. In addition, in 2004, the Bank was named as the number one small company (employees under 250) to work for in the State of Oregon by Oregon Business Magazine. Management continually strives to retain and attract top talent as well as provide career development opportunities to enhance skill levels. A number of benefit programs are available to eligible employees, including group medical plans, paid sick leave, paid vacation, group life insurance, 401(k) plans, and equity compensation plans.
Supervision and Regulation
General
The following discussion describes elements of the extensive regulatory framework applicable to the Company and the Bank. This regulatory framework is primarily designed for the protection of depositors, federal deposit insurance funds and the banking system as a whole rather than specifically for the protection of shareholders. Due to the breadth of this regulatory framework, our costs of compliance continue to increase in order to monitor and satisfy these requirements.
To the extent that this section describes statutory and regulatory provisions, it is qualified in its entirety by reference to those provisions. Those statutes and regulations, as well as related policies, are subject to change by Congress, state legislatures and federal and state regulators. Changes in statutes, regulations or regulatory policies applicable to the Company, including interpretation or implementation thereof, could have a material effect on the Company’s business or operations.
Federal Bank Holding Company Regulation
General. The Company is a bank holding company as defined in the Bank Holding Company Act of 1956, as amended (“BHCA”), and is therefore subject to regulation, supervision and examination by the Federal Reserve. In general, the BHCA limits the business of bank holding companies to owning or controlling banks and engaging in other activities closely related to banking. The Company must file reports with and provide the Federal Reserve with such additional information as it may require.
Holding Company Bank Ownership. The BHCA requires every bank holding company to obtain the prior approval of the Federal Reserve before (1) acquiring, directly or indirectly, ownership or control of any voting shares of another bank or bank holding company if, after such acquisition, it would own or control more than 5% of such shares, (2) acquiring all or substantially all of the assets of another bank or bank holding company, or (3) merging or consolidating with another bank holding company.
Holding Company Control of Nonbanks. With some exceptions, the Bank Holding Company Act also prohibits a bank holding company from acquiring or retaining direct or indirect ownership or control of more than 5% of the voting shares of any company which is not a bank or bank holding company, or from engaging directly or indirectly in activities other than those of banking, managing or controlling banks, or providing services for its subsidiaries. The principal exceptions to these prohibitions involve certain non-bank activities that, by statute or by Federal Reserve regulation or order, have been identified as activities closely related to the business of banking or of managing or controlling banks.
Transactions with Affiliates. Subsidiary banks of a bank holding company are subject to restrictions imposed by the Federal Reserve Act on extensions of credit to the holding company or its subsidiaries, on investments in their securities and on the use of their securities as collateral for loans to any borrower. These regulations and restrictions may limit the Company’s ability to obtain funds from the Bank for its cash needs, including funds for payment of dividends, interest and operational expenses.
Tying Arrangements. The Company is prohibited from engaging in certain tie-in arrangements in connection with any extension of credit, sale or lease of property or furnishing of services. For example, with certain exceptions, neither the Company nor its subsidiaries may condition an extension of credit to a customer on either (1) a requirement that the customer obtain additional services provided by us or (2) an agreement by the customer to refrain from obtaining other services from a competitor.
Support of Subsidiary Banks. Under Federal Reserve policy, the Company is expected to act as a source of financial and managerial strength to the Bank. This means that the Company is required to commit, as necessary, resources to support the Bank. Any capital loans a bank holding company makes to its subsidiary banks are subordinate to deposits and to certain other indebtedness of those subsidiary banks.
State Law Restrictions. As an Oregon corporation, the Company is subject to certain limitations and restrictions under applicable Oregon corporate law. For example, state law restrictions in Oregon include limitations and restrictions relating to lending limits related to individual borrowers, indemnification of directors, distributions to shareholders, transactions involving directors, officers or interested shareholders, maintenance of books, records, and minutes, and observance of certain corporate formalities.
Federal and State Regulation of Pacific Continental Bank
General. The Bank is an Oregon commercial bank operating in Oregon and Washington with deposits insured by the FDIC. As a result, the Bank is subject to supervision and regulation by the Oregon Department of Consumer and Business Services and the FDIC. These agencies have the authority to prohibit banks from engaging in what they believe constitute unsafe or unsound banking practices. Additionally, the Bank’s branches in Washington are subject to supervision and regulation by the Washington Department of Financial Institutions and must comply with applicable Washington laws regarding community reinvestment, consumer protection, fair lending and intrastate branching.
Community Reinvestment. The Community Reinvestment Act of 1977 requires that, in connection with examinations of financial institutions within their jurisdiction, the Federal Reserve or the FDIC evaluate the record of the financial institution in meeting the credit needs of its local communities, including low and moderate income neighborhoods, consistent with the safe and sound operation of the institution. A bank’s community reinvestment record is also considered by the applicable banking agencies in evaluating mergers, acquisitions and applications to open a branch or facility.
Insider Credit Transactions. Banks are also subject to certain restrictions imposed by the Federal Reserve Act on extensions of credit to executive officers, directors, principal shareholders or any related interests of such persons. Extensions of credit (1) must be made on substantially the same terms, including interest rates and collateral, and follow credit underwriting procedures that are at least as stringent, as those prevailing at the time for comparable transactions with persons not covered above and who are not employees; and (2) must not involve more than the normal risk of repayment or present other unfavorable features. Banks are also subject to certain lending limits and restrictions on overdrafts to insiders. A violation of these restrictions may result in the assessment of substantial civil monetary penalties, the imposition of a cease and desist order, and other regulatory sanctions.
Regulation of Management. Federal law (1) sets forth circumstances under which officers or directors of a bank may be removed by the institution's federal supervisory agency; (2) places restraints on lending by a bank to its executive officers, directors, principal shareholders, and their related interests; and (3) prohibits management personnel of a bank from serving as a director or in other management positions of another financial institution whose assets exceed a specified amount or which has an office within a specified geographic area.
Safety and Soundness Standards. Federal law imposes certain non-capital safety and soundness standards upon banks. These standards cover internal controls, information systems and internal audit systems, loan documentation, credit underwriting, interest rate exposure, asset growth, compensation, fees and benefits, such other operational and managerial standards as the agency determines to be appropriate, and standards for asset quality, earnings and stock valuation. An institution that fails to meet these standards must develop a plan acceptable to its regulators, specifying the steps that the institution will take to meet the standards. Failure to submit or implement such a plan may subject the institution to regulatory sanctions.
Interstate Banking And Branching
The Riegle-Neal Interstate Banking and Branching Efficiency Act of 1994 ("Interstate Act") permits nationwide interstate banking and branching under certain circumstances. This legislation generally authorizes interstate branching and relaxes prior interstate branching restrictions under federal law. Generally, bank holding companies may purchase banks in any state, and states may not prohibit these purchases. Additionally, banks are permitted to merge with banks in other states, as long as the home state of neither merging bank has opted out under the legislation. The Interstate Act requires regulators to consult with community organizations before permitting an interstate institution to close a branch in a low-income area. Federal banking agency regulations prohibit banks from using their interstate branches primarily for deposit production and they have each implemented a loan-to-deposit ratio screen to ensure compliance with this prohibition.
Oregon and Washington have both enacted “opting in” legislation in accordance with the Interstate Act provisions allowing banks to engage in interstate merger transactions, subject to certain “aging” requirements. Oregon restricts an out-of-state bank from opening de novo branches. However, once an out-of-state bank has acquired a bank within Oregon, either through merger or acquisition of all or substantially all of the bank's assets, the out-of-state bank may open additional branches within Oregon. Under Washington law, an out-of-state bank may, subject to Department of Financial Institutions’ approval, open de novo branches in Washington or acquire an in-state branch so long as the home state of the out-of-state bank has reciprocal laws with respect to de novo branching or branch acquisitions.
Deposit Insurance
In February 2006, the President signed federal deposit insurance reform legislation. The legislation (i) required the FDIC to merge the Bank Insurance Fund and the Savings Association Insurance Fund into a newly created Deposit Insurance Fund, which was completed in 2006; (ii) increases the amount of deposit insurance coverage for retirement accounts; (iii) allows for deposit insurance coverage on individual accounts to be indexed for inflation starting in 2010; (iv) provides the FDIC more flexibility in setting and imposing deposit insurance assessments; and (v) provides eligible institutions, such as the Company’s banking subsidiaries, credits on future assessments.
The Bank’s deposits are currently insured to a maximum of $100,000 per depositor through the Deposit Insurance Fund. The Bank is required to pay deposit insurance premiums, which are assessed and paid regularly. The premium amount is based upon a risk classification system established by the FDIC. Banks with higher levels of capital and a low degree of supervisory concern are assessed lower premiums than banks with lower levels of capital or a higher degree of supervisory concern.
Dividends
The principal source of the Company’s cash reserves is dividends received from the Bank and the payment of these dividends is subject to government regulation. Regulatory authorities may prohibit banks and bank holding companies from paying dividends in a manner that would constitute an unsafe or unsound banking practice. In addition, a bank may not pay cash dividends if doing so would reduce the amount of its capital below that necessary to meet minimum applicable regulatory capital requirements. State laws also limit a bank's ability to pay dividends.
Capital Adequacy
Regulatory Capital Guidelines. Federal bank regulatory agencies use capital adequacy guidelines in the examination and regulation of bank holding companies and banks. The guidelines are “risk-based,” meaning that they are designed to make capital requirements more sensitive to differences in risk profiles among banks and bank holding companies.
Tier I and Tier II Capital. Under the guidelines, an institution’s capital is divided into two broad categories, Tier I capital and Tier II capital. Tier I capital generally consists of common stockholders’ equity, surplus and undivided profits. Tier II capital generally consists of the allowance for loan losses, hybrid capital instruments, and subordinated debt. The sum of Tier I capital and Tier II capital represents an institution’s total capital. The guidelines require that at least 50% of an institution’s total capital consist of Tier I capital.
Risk-based Capital Ratios. The adequacy of an institution’s capital is gauged primarily with reference to the institution’s risk-weighted assets. The guidelines assign risk weightings to an institution’s assets in an effort to quantify the relative risk of each asset and to determine the minimum capital required to support that risk. An institution’s risk-weighted assets are then compared with its Tier I capital and total capital to arrive at a Tier I risk-based ratio and a total risk-based ratio, respectively. The guidelines provide that an institution must have a minimum Tier I risk-based ratio of 4% and a minimum total risk-based ratio of 8%.
Leverage Ratio. The guidelines also employ a leverage ratio, which is Tier I capital as a percentage of average total assets, less intangibles. The principal objective of the leverage ratio is to constrain the maximum degree to which a bank holding company may leverage its equity capital base. The minimum leverage ratio is 3%; however, for all but the most highly rated bank holding companies and for bank holding companies seeking to expand, regulators expect an additional cushion of at least 1% to 2%.
Prompt Corrective Action. Under the guidelines, an institution is assigned to one of five capital categories depending on its total risk-based capital ratio, Tier I risk-based capital ratio, and leverage ratio, together with certain subjective factors. The categories range from “well capitalized” to “critically undercapitalized.” Institutions that are "undercapitalized" or lower are subject to certain mandatory supervisory corrective actions.
In 2006, the federal banking agencies, including the FDIC and the Federal Reserve, provided notice of proposed rulemaking that would change the existing risk-based capital framework by enhancing its risk sensitivity. Whether such revisions are implemented or what effect they might have on the Company or the Bank cannot be predicted at this time, but we do not expect our operations to be significantly impacted.
Corporate Governance and Accounting Legislation
Sarbanes-Oxley Act of 2002. The Sarbanes-Oxley Act of 2002 (the “Act”) addresses, among other things, corporate governance, auditing and accounting, enhanced and timely disclosure of corporate information, and penalties for non-compliance. Generally, the Act (i) requires chief executive officers and chief financial officers to certify to the accuracy of periodic reports filed with the Securities and Exchange Commission (the “SEC”); (ii) imposes specific and enhanced corporate disclosure requirements; (iii) accelerates the time frame for reporting of insider transactions and periodic disclosures by public companies; (iv) requires companies to adopt and disclose information about corporate governance practices, including whether or not they have adopted a code of ethics for senior financial officers and whether the audit committee includes at least one “audit committee financial expert;” and (v) requires the SEC, based on certain enumerated factors, to regularly and systematically review corporate filings.
To deter wrongdoing, the Act: (i) subjects bonuses issued to top executives to disgorgement if a restatement of a company's financial statements was due to corporate misconduct; (ii) prohibits an officer or director misleading or coercing an auditor; (iii) prohibits insider trades during pension fund “blackout periods”; (iv) imposes new criminal penalties for fraud and other wrongful acts; and (v) extends the period during which certain securities fraud lawsuits can be brought against a company or its officers.
As a publicly reporting company, we are subject to the requirements of the Act and related rules and regulations issued by the SEC and NASDAQ. After enactment, we updated our policies and procedures to comply with the Act’s requirements and have found that such compliance, including compliance with Section 404 of the Act relating to management control over financial reporting, has resulted in significant additional expense for the Company. We anticipate that we will continue to incur such additional expense in our ongoing compliance.
Anti-terrorism Legislation
USA Patriot Act of 2001. The Uniting and Strengthening America by Providing Appropriate Tools Required to Intercept and Obstruct Terrorism Act of 2001, intended to combat terrorism, was renewed with certain amendments in 2006 (the “Patriot Act”). Certain provisions of the Patriot Act were made permanent and other sections are now subject to extended “sunset” provisions. The Patriot Act, in relevant part, (1) prohibits banks from providing correspondent accounts directly to foreign shell banks; (2) imposes due diligence requirements on banks opening or holding accounts for foreign financial institutions or wealthy foreign individuals (3) requires financial institutions to establish an anti-money-laundering compliance program, and (4) eliminates civil liability for persons who file suspicious activity reports. The Act also includes provisions providing the government with power to investigate terrorism, including expanded government access to bank account records. While the Patriot Act has had minimal affect on our record keeping and reporting expenses, we do not believe that the renewal and amendment will have a material adverse effect on our business or operations.
Financial Services Modernization
Gramm-Leach-Bliley Act of 1999. The Gramm-Leach-Bliley Financial Services Modernization Act of 1999 brought about significant changes to the laws affecting banks and bank holding companies. Generally, the Act (i) repeals the historical restrictions on preventing banks from affiliating with securities firms, (ii) provides a uniform framework for the activities of banks, savings institutions and their holding companies, (iii) broadens the activities that may be conducted by national banks and banking subsidiaries of bank holding companies, (iv) provides an enhanced framework for protecting the privacy of consumer information and requires notification to consumers of bank privacy policies and (v) addresses a variety of other legal and regulatory issues affecting both day-to-day operations and long-term activities of financial institutions. Bank holding companies that qualify and elect to become financial holding companies can engage in a wider variety of financial activities than permitted under previous law, particularly with respect to insurance and securities underwriting activities.
Recent Legislation
Financial Services Regulator Relief Act of 2006. In October 2006, the President signed the Financial Services Regulatory Relief Act of 2006 into law (the “Relief Act”). The Relief Act amends several existing banking laws and regulations. It eliminates some unnecessary and overly burdensome regulations of depository institutions and clarifies several existing regulations. The Relief Act, among other things, (i) authorizes the Federal Reserve Board to set reserve ratios; (ii) amends national bank regulations relating to shareholder voting and granting of dividends; (iii) amends several provisions relating to such issues as loans to insiders, regulatory applications, privacy notices, and golden parachute payments; and (iv) expands and clarifies the enforcement authority of federal banking regulators. It is too early to predict the impact this legislation may have on us, but we do not expect our business, expenses, or operations will be significantly impacted.
Effects Of Government Monetary Policy
Our earnings and growth are affected not only by general economic conditions, but also by the fiscal and monetary policies of the federal government, particularly the Federal Reserve. The Federal Reserve implements national monetary policy for such purposes as curbing inflation and combating recession, but its open market operations in U.S. government securities, control of the discount rate applicable to borrowings from the Federal Reserve, and establishment of reserve requirements against certain deposits, influence the growth of bank loans, investments and deposits, and also affect interest rates charged on loans or paid on deposits. The nature and impact of future changes in monetary policies and their impact on us cannot be predicted with certainty.
Statistical Information
Selected Quarterly Information
The following chart contains data for the last eight quarters ending December 31, 2006. All data, except per share data, is in thousands of dollars.
YEAR | | | | | | 2006 | | | | | | 2005 | | | | | |
QUARTER | | Fourth | | Third | | Second | | First | | Fourth | | Third | | Second | | First | |
| Interest income | | $ | 16,743 | | $ | 16,062 | | $ | 15,165 | | $ | 14,002 | | $ | 11,697 | | $ | 9,791 | | $ | 9,432 | | $ | 8,673 | |
| Interest expense | | | 6,139 | | | 5,865 | | | 5,269 | | | 4,642 | | | 3,150 | | | 2,323 | | | 2,111 | | | 1,769 | |
| Net interest income | | | 10,604 | | | 10,197 | | | 9,896 | | | 9,360 | | | 8,547 | | | 7,468 | | | 7,321 | | | 6,904 | |
| Provision for loan loss | | | - | | | 150 | | | 200 | | | 250 | | | 300 | | | 250 | | | 325 | | | 225 | |
| Noninterest income | | | 1,033 | | | 1,354 | | | 1,056 | | | 957 | | | 970 | | | 1,050 | | | 1,091 | | | 972 | |
| Noninterest expense | | | 6,590 | | | 6,109 | | | 5,704 | | | 5,389 | | | 5,191 | | | 4,253 | | | 4,360 | | | 4,330 | |
| Net income | | | 3,093 | | | 3,441 | | | 3,188 | | | 2,932 | | | 2,754 | | | 2,469 | | | 2,305 | | | 2,050 | |
| | | | | | | | | | | | | | | | | | | | | | | | | | |
| PER COMMON | | | | | | | | | | | | | | | | | | | | | | | | | |
| SHARE DATA | | | | | | | | | | | | | | | | | | | | | | | | | |
| Net income (basic) | | $ | 0.29 | | $ | 0.32 | | $ | 0.30 | | $ | 0.28 | | $ | 0.30 | | $ | 0.28 | | $ | 0.26 | | $ | 0.24 | |
| Net income (diluted) | | $ | 0.29 | | $ | 0.32 | | $ | 0.30 | | $ | 0.28 | | $ | 0.29 | | $ | 0.27 | | $ | 0.26 | | $ | 0.23 | |
| Cash dividends | | $ | 0.08 | | $ | 0.08 | | $ | 0.08 | | $ | 0.08 | | $ | 0.07 | | $ | 0.07 | | $ | 0.07 | | $ | 0.07 | |
| | | | | | | | | | | | | | | | | | | | | | | | | | |
| WEIGHTED AVERAGE SHARES OUTSTANDING | | | | | | | | | | | | | | | | | | | | | | | | | |
| Basic | | | 10,630,313 | | | 10,592,960 | | | 10,525,387 | | | 10,379,908 | | | 9,307,691 | | | 8,782,476 | | | 8,747,028 | | | 8,697,517 | |
| Diluted | | | 10,833,801 | | | 10,703,864 | | | 10,710,295 | | | 10,566,140 | | | 9,591,642 | | | 9,002,313 | | | 8,990,960 | | | 8,955,573 | |
Investment Portfolio
The following chart contains information regarding the Company’s investment portfolio. All of the Company’s investment securities are accounted for as available-for-sale and are reported at estimated fair value. The difference between estimated fair value and amortized cost, net of deferred taxes, is recorded as a separate component of stockholders’ equity.
INVESTMENT PORTFOLIO
ESTIMATED FAIR VALUE
(dollars in thousands)
| | | | | | | December 31, | | | | |
| | | | 2006 | | | 2005 | | | 2004 | |
| US Treasury, US Government agencies and corporations, and | | | | | | | | | | |
| agency mortgagebacked securities | | $ | 14,501 | | $ | 16,757 | | $ | 6,390 | |
| Obligations of states and political subdivisions | | | 5,596 | | | 4,820 | | | 3,059 | |
| Other mortgage-backed securities | | | 18,686 | | | 17,768 | | | 18,109 | |
| Total | | $ | 38,783 | | $ | 39,345 | | $ | 27,558 | |
| | | | | | | | | | | |
The following chart presents the fair value of each investment category by maturity date and includes a weighted average yield for each period. Mortgage-backed securities have been classified based on their December 31, 2006 projected average life.
SECURITIES AVAILABLE-FOR-SALE
(dollars in thousands)
| | Within One Year | | | | After One Year But Within five Years | | | | After Five Years But Within Ten Years | | | | After Ten Years | | | |
| | | | Amount | | | Yield | | | Amount | | | Yield | | | Amount | | | Yield | | | Amount | | | Yield | |
| US Treasury, US Government | | | | | | | | | | | | | | | | | | | | | | | | | |
| agencies and agency mortgage- | | | | | | | | | | | | | | | | | | | | | | | | | |
| backed securities | | $ | 4,593 | | | 5.27 | % | $ | 26,072 | | | 5.25 | % | $ | 497 | | | 5.29 | % | $ | 2,026 | | | 5.49 | % |
| Obligations of states and political | | | | | | | | | | | | | | | | | | | | | | | | | |
| subdivisions | | | 476 | | | 5.43 | % | | 997 | | | 5.20 | % | | 3,225 | | | 4.04 | % | | 897 | | | 3.93 | % |
| Total | | $ | 5,069 | | | 5.29 | % | $ | 27,069 | | | 5.25 | % | $ | 3,722 | | | 4.20 | % | $ | 2,923 | | | 5.01 | % |
Loan Portfolio
Loans represent a significant portion of the Company’s total assets. Average balance and average rates paid by category of loan is included in Table I, “Average Balance Analysis of Net Interest Earnings”, on page 29 of the Company’s “Management’s Discussion and Analysis of Financial Condition and Results of Operations” included later in this report. The following tables contain information related to the Company’s loan portfolio, including loans held for sale, for the five-year period ended December 31, 2006.
LOAN PORTFOLIO
(dollars in thousands)
| | | | | | | December 31, | | | | | |
| | | | 2006 | | | 2005 | | | 2004 | | | 2003 | | | 2002 | |
| Commercial Loans | | $ | 169,566 | | $ | 160,988 | | $ | 107,538 | | $ | 89,127 | | $ | 94,345 | |
| Real Estate Loans | | | 590,855 | | | 507,479 | | | 341,111 | | | 255,150 | | | 222,727 | |
| Loans held for sale | | | 2,140 | | | 642 | | | 2,072 | | | 1,958 | | | 5,546 | |
| Consumer Loans | | | 9,168 | | | 12,463 | | | 10,380 | | | 11,424 | | | 9,579 | |
| | | | 771,729 | | | 681,572 | | | 461,101 | | | 357,659 | | | 332,197 | |
| Deferred loan origination fees | | | (2,489 | ) | | (2,609 | ) | | (2,061 | ) | | (1,582 | ) | | (1,394 | ) |
| | | | 769,240 | | | 678,963 | | | 459,040 | | | 356,077 | | | 330,803 | |
| Allowance for loan losses | | | (8,284 | ) | | (7,792 | ) | | (5,224 | ) | | (5,225 | ) | | (4,403 | ) |
| | | $ | 760,956 | | $ | 671,171 | | $ | 453,816 | | $ | 350,852 | | $ | 326,400 | |
| | | | | | | | | | | | | | | | | |
The following table presents loan portfolio information by loan category related to maturity and repricing sensitivity. Variable rate loans are included in the time frame in which the interest rate on the loan could be first adjusted. Loans held for sale of $2,140 are included in the Real Estate category.
MATURITY AND REPRICING DATA FOR LOANS
(dollars in thousands)
| | | Commercial | | Real Estate | | Consumer | | Total | |
| Three months or less | | $ | 101,367 | | $ | 261,139 | | $ | 5,748 | | $ | 368,254 | |
| Over three months through 12 months | | | 8,273 | | | 38,618 | | | 478 | | | 47,369 | |
| Over 1 year through 3 years | | | 13,474 | | | 114,851 | | | 1,023 | | | 129,348 | |
| Over 3 years through 5 years | | | 32,167 | | | 119,039 | | | 852 | | | 152,058 | |
| Over 5 years through 15 years | | | 14,285 | | | 59,348 | | | 1,067 | | | 74,700 | |
| Total loans | | $ | 169,566 | | $ | 592,995 | | $ | 9,168 | | $ | 771,729 | |
Loan Concentrations
At December 31, 2006, residential construction loans totaled $100,996 and represented 13.1% of outstanding loans. In addition, at December 31, 2006, unfunded loan commitments for residential construction totaled approximately $59,642. At year end there were no nonaccrual loans and no impaired loans in this industry. No other single industry group represents more than 10% of outstanding loans. Approximately 77% of the Bank’s loans are secured by real estate. The granular nature of the portfolio, both from industry mix and loan size, continues to disburse risk concentration.
Within the loan portfolio, loans in the hotel/motel industry account for 3.3% of the total loan portfolio at December 31, 2006. There were no foreclosed or non-accrual hotel/motel properties as of year end December 31, 2006. All hotel/motel loans are performing according to their contractual terms. In view of the uncertainties in this industry, the Company continues to carefully monitor loans made by the Bank in this industry.
NONPERFORMING ASSETS
(dollars in thousands)
| | | | | | | | | | December 31, | | | | | | | |
| | | | 2006 | | | 2005 | | | 2004 | | | 2003 | | | 2002 | |
| Nonaccrual loans | | $ | - | | $ | 180 | | $ | 1,004 | | $ | 1,506 | | $ | 6,176 | |
| 90 or more days past due and still accruing | | | - | | | - | | | 213 | | | 545 | | | 359 | |
| Total nonperforming loans | | | - | | | 180 | | | 1,217 | | | 2,051 | | | 6,535 | |
| Government guarantees | | | - | | | (28 | ) | | (101 | ) | | (233 | ) | | (1,563 | ) |
| Net nonperforming loans | | | - | | | 152 | | | 1,116 | | | 1,818 | | | 4,972 | |
| Foreclosed assets | | | - | | | 131 | | | 262 | | | 411 | | | 864 | |
| Total nonperforming assets | | $ | - | | $ | 283 | | $ | 1,378 | | $ | 2,229 | | $ | 5,836 | |
| | | | | | | | | | | | | | | | | |
| Nonperforming assets as a percentage of | | | | | | | | | | | | | | | | |
| of total assets | | | 0.00 | % | | 0.04 | % | | 0.27 | % | | 0.52 | % | | 1.54 | % |
| | | | | | | | | | | | | | | | | |
If interest on nonaccrual loans had been accrued, such income would have been approximately $14, $89, and $98, respectively, for years 2006, 2005 and 2004.
Allowance for Loan Loss
The following chart presents information about the Company’s allowances for loan losses. Management evaluates the allowance monthly and considers the amount to be adequate to absorb possible loan losses.
ALLOWANCE FOR LOAN LOSS
(dollars in thousands)
| | | | | | | | | | December 31, | | | | | | | |
| | | | 2006 | | | 2005 | | | 2004 | | | 2003 | | | 2002 | |
| Balance at beginning of year | | $ | 7,792 | | $ | 5,224 | | $ | 5,225 | | $ | 4,403 | | $ | 3,418 | |
| Charges to the allowance | | | | | | | | | | | | | | | | |
| Real estate loans | | | - | | | (214 | ) | | (79 | ) | | (843 | ) | | (4,138 | ) |
| Consumer loans | | | (71 | ) | | (106 | ) | | (269 | ) | | (104 | ) | | (123 | ) |
| Commercial | | | (152 | ) | | (316 | ) | | (168 | ) | | (238 | ) | | (542 | ) |
| Total charges to the allowance | | | (223 | ) | | (636 | ) | | (516 | ) | | (1,185 | ) | | (4,803 | ) |
| Recoveries against the allowance | | | | | | | | | | | | | | | | |
| Real estate loans | | | 4 | | | 37 | | | 73 | | | 799 | | | 49 | |
| Consumer loans | | | 20 | | | 56 | | | 54 | | | 15 | | | 10 | |
| Commercial | | | 91 | | | 31 | | | 70 | | | 103 | | | 69 | |
| Total recoveries against the allowance | | | 115 | | | 124 | | | 197 | | | 917 | | | 128 | |
| | | | | | | | | | | | | | | | | |
| Acquisition | | | - | | | 2,014 | | | - | | | 190 | | | - | |
| Provisions | | | 600 | | | 1,100 | | | 500 | | | 900 | | | 5,660 | |
| Unfunded commitments * | | | - | | | (34 | ) | | (182 | ) | | - | | | - | |
| Balance at end of the year | | $ | 8,284 | | $ | 7,792 | | $ | 5,224 | | $ | 5,225 | | $ | 4,403 | |
| | | | | | | | | | | | | | | | | |
| | | | | | | | | | | | | | | | | |
| Net charge offs as a percentage of total | | | | | | | | | | | | | | | | |
| average loans | | | 0.01 | % | | 0.10 | % | | 0.08 | % | | 0.08 | % | | 1.62 | % |
| | | | | | | | | | | | | | | | | |
* Allowance for unfunded commitments is presented as part of the other liabilities in the balance sheet.
The following table sets forth the allowance for loan losses allocated by loan type at December 31, 2006:
| Real estate loans | | $ | 5,749 | |
| Consumer loans | | | 149 | |
| Commercial | | | 2,306 | |
| Unallocated | | | 80 | |
| | | | | |
| Allowance for loan losses | | $ | 8,284 | |
| | | | | |
During 2006, the Bank recorded a provision for loan losses of $600 compared to $1,100 for the year 2005. The decrease in the loan loss provision reflected improvement in credit quality throughout the year 2006 and is reflective of the fact that at December 31, 2006, the Bank has no nonperforming loans or assets. At December 31, 2006, the recorded investment in certain loans totaling $496 was considered impaired. Impaired loans at December 31, 2006 consist of two loans to a single borrower totaling $496 that are performing under revised terms. A specific reserve of $109 is provided for these loans and is included in the $8,284 allowance for loan losses at December 31, 2006.
Deposits
Deposits represent a significant portion of the Company’s liabilities. Average balance and average rates paid by category of deposit is included in Table I, “Average Balance Analysis of Net Interest Earnings”, within the Company’s “Management’s Discussion and Analysis of Financial Condition and Results of Operations” included on page 30 of this report. The chart below details the Company’s time deposits at December 31, 2006. The Company does not have any foreign deposits. Variable rate deposits are listed by first repricing opportunity.
TIME DEPOSITS
(dollars in thousands)
| | | Time Deposits | | Time Deposits | | | |
| | of $100,000 | | of less than | | Total | |
| | Or more | | $100,000 | | Time Deposits | |
| Three months or less | | $ | 24,782 | | $ | 23,909 | | $ | 48,691 | |
| Over three months through twelve months | | | 17,281 | | | 20,446 | | | 37,727 | |
| Over one year through three years | | | 6,365 | | | 3,904 | | | 10,269 | |
| Over three years | | | 448 | | | 440 | | | 888 | |
| | | $ | 48,876 | | $ | 48,699 | | $ | 97,575 | |
Short-term Borrowings
The Company uses short-term borrowings to fund fluctuations in deposits and loan demand. The Company’s only subsidiary, Pacific Continental Bank, has access to both secured and unsecured overnight borrowing lines. At December 31, 2006, the Bank had unsecured and secured borrowing lines totaling approximately $370,000. At December 31, 2006, available unsecured borrowing lines with various correspondent banks and a secured line with the Federal Reserve Bank of San Francisco was approximately $104,000. The Federal Home Loan Bank of Seattle (FHLB) also provides a secured borrowing line using a blanket pledge of commercial real estate loans. The Bank’s FHLB borrowing limit at December 31, 2006 was 30% of assets or $266,000, subject to sufficient collateral and stock investment.
SHORT-TERM BORROWINGS
(dollars in thousands)
| | | | 2006 | | | 2005 | | | 2004 | |
| Federal Funds Purchased, FHLB CMA & Short Term Advances | | | | | | | | | | |
| Average interest rate | | | | | | | | | | |
| At year end | | | 5.55 | % | | 4.33 | % | | 2.75 | % |
| For the year | | | 5.31 | % | | 3.35 | % | | 2.46 | % |
| Average amount outstanding for the year | | $ | 73,171 | | $ | 17,693 | | $ | 12,596 | |
| Maximum amount outstanding at any month end | | $ | 99,410 | | $ | 34,825 | | $ | 31,790 | |
| Amount outstanding at year end | | $ | 99,410 | | $ | 24,000 | | $ | 31,790 | |
| | | | | | | | | | | |
In addition to these borrowings at December 31, 2006, the Bank had other FHLB borrowings in the amount of $36,804 with a weighted average remaining maturity of 2 years.
Long-term Borrowings
The Company acquired $8,248 in junior subordinated debentures on November 28, 2005, due on January 7, 2036, to help fund the acquisition of NWBF. These debentures are priced at 6.265% for five years and then convert to a floating rate instrument at 135 basis points over the 3-month LIBOR.
Our business exposes us to certain risks. The following is a discussion of the most significant risks and uncertainties that may affect our business, financial condition and future results.
Fluctuating interest rates can adversely affect our profitability
Our profitability is dependent to a large extent upon net interest income, which is the difference (or “spread”) between the interest earned on loans, securities and other interest-earning assets and interest paid on deposits, borrowings, and other interest-bearing liabilities. Because of the differences in maturities and repricing characteristics of our interest-earning assets and interest-bearing liabilities, changes in interest rates do not produce equivalent changes in interest income earned on interest-earning assets and interest paid on interest-bearing liabilities. Accordingly, fluctuations in interest rates could adversely affect our interest rate spread, and, in turn, our profitability. Because our Company is asset sensitive, we seek to manage our interest rate risk within well established guidelines. Generally, the Company seeks an asset and liability structure that insulates net interest income from large deviations attributable to changes in market rates.
Our allowance for loan losses may not be adequate to cover actual loan losses, which could adversely affect our earnings
We maintain an allowance for loan losses in an amount that we believe is adequate to provide for losses inherent in the portfolio. While we strive to carefully manage and monitor credit quality and to identify loans that may become nonperforming, at any time there are loans included in the portfolio that will result in losses, but that have not been identified as nonperforming or potential problem loans. By managing our credit quality, we attempt to identify deteriorating loans before they become nonperforming assets and adjust the loan loss reserve accordingly. However, because future events are uncertain, there may be loans that deteriorate to a nonperforming status in a relatively short time frame. As a result of these types of situations, future additions to the allowance may be necessary. Because the loan portfolio contains a significant number of commercial and commercial real estate loans with relatively large balances, the deterioration of one or a few of these loans may cause a significant increase in nonperforming loans, requiring an increase to the loan loss allowance. Additionally, future additions to the allowance may be required based on changes in the loans comprising the portfolio and changes in the financial condition of borrowers, such as may result from changes in economic conditions, or as a result of incorrect assumptions by management in determining the allowance. Additionally, federal banking regulators, as an integral part of their supervisory function, periodically review our allowance for loan losses. These regulatory agencies may require us to recognize further loan loss provisions or charge-offs based upon their judgments, which may be different from ours. Any increase in the allowance for loan losses could have a negative effect on our financial condition and results of operation.
An economic downturn in the market areas we serve may cause us to have lower earnings and could increase our credit risk associated with our loan portfolio
The inability of borrowers to repay loans can erode our earnings. Substantially all of our loans are to businesses and individuals in Oregon and Washington, and any decline in the economy of these market areas could impact us adversely. As a lender, we are exposed to the risk that our customers will be unable to repay their loans in accordance with their terms, and that any collateral securing the payment of their loans may not be sufficient to assure repayment.
None
The principal properties of the registrant are comprised of the banking facilities owned by the Bank. The Bank operates fourteen full service facilities and two consumer finance offices. The Bank owns a total of seven buildings and, with the exception of one building, owns the land on which these buildings are situated. Significant properties owned by the Bank are as follows:
| 1) | Three-story building and land with approximately 30,000 square feet located on Olive Street in Eugene, Oregon. |
| 2) | Building with approximately 4,000 square feet located on West 11th Avenue in Eugene, Oregon. The building is on leased land. |
| 3) | Building and land with approximately 8,000 square feet located on High Street in Eugene, Oregon. |
| 4) | Three-story building and land with approximately 31,000 square feet located in the Gateway area of Springfield, Oregon. The Bank occupies approximately 5,500 square feet of the first floor and approximately 5,900 square feet on the second floor and leases out, or is seeking to lease out, the remaining space. |
| 5) | Building and land with approximately 3,500 square feet located in Beaverton, Oregon. |
| 6) | Building and land with approximately 2,000 square feet located in Junction City, Oregon. |
| 7) | Building and land with approximately 5,000 square feet located in Portland, Oregon. |
The Bank leases facilities for branch offices in Seattle, Washington, Bellevue, Washington, Portland, Oregon, Vancouver, Washington, and Tualatin, Oregon; two branch offices and one consumer finance lending office located in Eugene, Oregon and one consumer finance office in Coos Bay, Oregon. In addition, the Bank leases a portion of an adjoining building to the High Street office for administrative and training functions. Management considers all owned and leased facilities adequate for current use. The Bank is presently investigating additional space in Eugene, Oregon to house various Bank administrative departments.
During the fourth quarter 2006, the Bank lost the use of its office in Bellevue, Washington due to an accident at a nearby construction site, which severely damaged the Bank’s facility. The Bank expects to open a temporary office in the Bellevue market during first quarter 2007 and will use the temporary facility until the original office location is repaired, which is expected during third quarter 2007. The Bank has not lost any clients due to the temporary closure of the Bellevue office and is fully insured for any damage to its facility.
Subsequent to December 31, 2006, the Bank announced it would close its existing Tualatin, Oregon office and relocate to a new highly visible site on I-5, approximately one mile from the current office location. Construction of the new Tualatin, Oregon office is expected to be completed during the fourth quarter 2007.
As of the date of this report, neither the Company nor the Bank or any of its subsidiaries is party to any material pending legal proceedings, including proceedings of governmental authorities, other than ordinary routine litigation incidental to the business of the Bank.
There were no matters submitted to a vote of security holders during the fourth quarter of 2006.
PART II
Issuer Purchases of Securities
The Company did not repurchase any shares of its common stock during the fourth quarter of 2006. The Company had no sales of securities during the past three years, other than those issued pursuant to its stock option plans.
Dividends
The Company pays cash dividends on a quarterly basis, typically in March, June, September and December of each year. The Board of Directors considers the dividend amount quarterly and takes a broad perspective in its dividend deliberations including a review of recent operating performance, capital levels, and growth projections. The Board also considers dividend payout ratios, dividend yield, and other financial metrics in setting the quarterly dividend. The Company declared and paid cash dividends of $0.32 per share for the year 2006. That compares to cash dividends of $0.28 per share paid for the year 2005.
Equity Compensation Plan Information
| | Year Ended December 31, 2006 |
| | Number of Shares to be Issued Upon Exercise of Outstanding Options, Warrants and Rights (2)(3) | Weighted-Average Exercise Price of Outstanding Options, Warrants and Rights (3) | Number of Shares Remaining Available for Future Issuance Under Equity Compensation Plans (2) |
Equity compensation plans approved by security holders(1) | 780,932 | $ 13.56 | 404,950 |
| | | | |
Equity compensation plans not approved by security holders | 0 | $0 | 0 |
| (1) | Under the Company’s respective equity compensation plans, the Company may grant incentive stock options and non-qualified stock options, restricted stock, restricted stock units and stock appreciation rights to its employees and directors, however only employees may receive incentive stock options. |
| (2) | All amounts have been adjusted to reflect subsequent stock splits and stock dividends. |
| (3) | Includes 21,140 shares reserved for issuance under the NWBF Plans that were assumed by the Company in |
connection with the acquisition of NWB Financial Corporation in November 2005. No additional shares are available for future issuance under these plans.
Market Information
The Company’s common stock trades on the NASDAQ Global Market under the symbol PCBK. At March 9, 2007, the Company had 10,720,384 shares of common stock outstanding held by approximately 669 shareholders.
The high, low and closing sales prices (based on daily closing price) for the last eight quarters are shown in the table below.
YEAR | | 2006 | | | | | 2005 | | |
QUARTER | Fourth | Third | Second | First | | Fourth | Third | Second | First |
| Market value: | | | | | | | | | |
| High | $19.60 | $18.25 | $17.35 | $17.50 | | $16.20 | $16.30 | $16.25 | $16.25 |
| Low | 18.08 | 15.75 | 16.01 | 15.50 | | 15.10 | 13.75 | 15.00 | 15.45 |
| Close | 19.45 | 18.24 | 16.50 | 16.70 | | 15.89 | 15.75 | 15.20 | 15.75 |
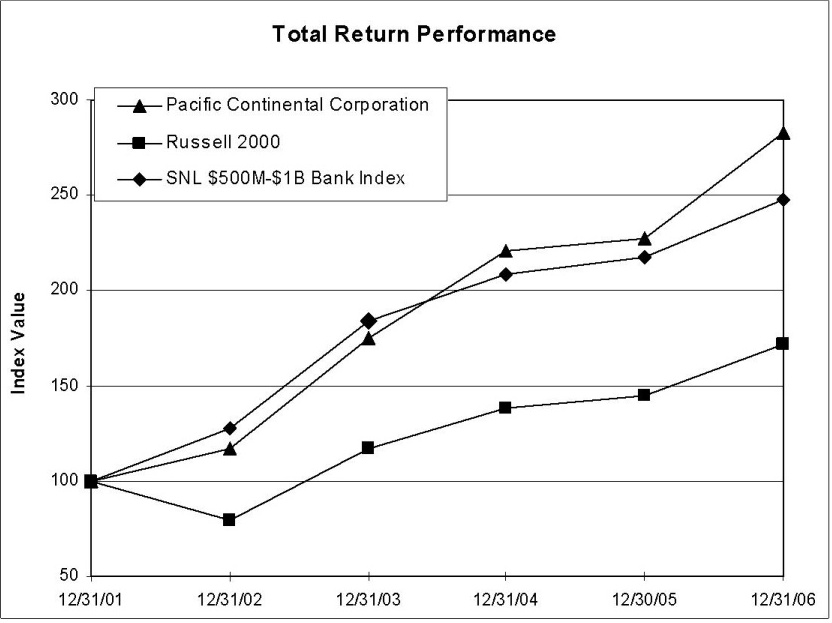
The information contained in the following chart entitled “Total Return Performance” is not considered to be “soliciting material”, or “filed”, or incorporated by reference in any past or future filing by the Company under the Securities Exchange Act of 1934 or the Securities Act of 1933 unless and only to the extent that the Company specifically incorporates it by reference.
STOCK PERFORMANCE GRAPH
The above graph and following table compares the total cumulative shareholder return on the Company’s Common Stock, based on reinvestment of all dividends, to the cumulative total returns of the Russell 2000 Index and SNL Securities $500 to $1 Billion Bank Asset Size Index. The graph assumes $100 invested on December 31, 2001, in the Company’s Common Stock and each of the indices.
| | | | | | | Period Ending | | | | | | | |
| Index | | 12/31/01 | | 12/31/02 | | 12/31/03 | | 12/31/04 | | 12/30/05 | | 12/31/06 | |
| Pacific Continental Corporation | | | 100.00 | | | 117.16 | | | 175.00 | | | 221.05 | | | 226.95 | | | 282.91 | |
| Russell 2000 | | | 100.00 | | | 79.52 | | | 117.09 | | | 138.55 | | | 144.86 | | | 171.47 | |
| SNL $500M-$1B Bank Index | | | 100.00 | | | 127.67 | | | 184.09 | | | 208.62 | | | 217.57 | | | 247.44 | |
| | | | | | | | | | | | | | | | | | | | |
Selected financial data for the past five years is shown in the table below.
($ in thousands, except for per share data)
| | | 2006 | | 2005 | | 2004 | | 2003 | | 2002 | |
| For the year | | | | | | | | | | | | | | | | |
| Net interest income | | $ | 40,057 | | $ | 30,240 | | $ | 24,952 | | $ | 22,220 | | $ | 19,689 | |
| Provision for loan losses | | $ | 600 | | $ | 1,100 | | $ | 500 | | $ | 900 | | $ | 5,660 | |
| Noninterest income | | $ | 4,401 | | $ | 4,083 | | $ | 4,463 | | $ | 4,946 | | $ | 4,200 | |
| Noninterest expense | | $ | 23,791 | | $ | 18,134 | | $ | 16,041 | | $ | 15,202 | | $ | 12,594 | |
| Income taxes | | $ | 7,412 | | $ | 5,510 | | $ | 4,925 | | $ | 4,233 | | $ | 2,181 | |
| Net income | | $ | 12,655 | | $ | 9,578 | | $ | 7,948 | | $ | 6,831 | | $ | 3,454 | |
| Cash dividends | | $ | 3,381 | | $ | 2,556 | | $ | 2,164 | | $ | 1,841 | | $ | 1,610 | |
| | | | | | | | | | | | | | | | | |
| Per common share data (1) | | | | | | | | | | | | | | | | |
| Net income: | | | | | | | | | | | | | | | | |
| Basic | | $ | 1.20 | | $ | 1.08 | | $ | 0.93 | | $ | 0.81 | | $ | 0.41 | |
| Diluted | | $ | 1.18 | | $ | 1.05 | | $ | 0.90 | | $ | 0.79 | | $ | 0.41 | |
| Cash dividends | | $ | 0.32 | | $ | 0.28 | | $ | 0.25 | | $ | 0.22 | | $ | 0.19 | |
| Market value, end of year | | $ | 19.45 | | $ | 15.89 | | $ | 15.75 | | $ | 12.71 | | $ | 8.70 | |
| | | | | | | | | | | | | | | | | |
| At year end | | | | | | | | | | | | | | | | |
| Assets | | $ | 885,351 | | $ | 791,794 | | $ | 516,630 | | $ | 425,799 | | $ | 379,846 | |
| Loans, less allowance for loan loss (2) | | $ | 760,957 | | $ | 671,171 | | $ | 453,817 | | $ | 350,852 | | $ | 326,400 | |
| Deposits | | $ | 641,272 | | $ | 604,271 | | $ | 403,791 | | $ | 356,099 | | $ | 309,909 | |
| Shareholders' equity | | $ | 95,735 | | $ | 81,412 | | $ | 49,392 | | $ | 42,234 | | $ | 36,698 | |
| | | | | | | | | | | | | | | | | |
| Average for the year | | | | | | | | | | | | | | | | |
| Assets | | $ | 825,671 | | $ | 573,717 | | $ | 463,509 | | $ | 402,195 | | $ | 337,258 | |
| Earning assets | | $ | 755,680 | | $ | 533,930 | | $ | 431,374 | | $ | 369,574 | | $ | 305,763 | |
| Loans, less allowance for loan losses | | $ | 712,563 | | $ | 501,541 | | $ | 398,739 | | $ | 342,192 | | $ | 284,614 | |
| Deposits | | $ | 605,814 | | $ | 461,013 | | $ | 379,618 | | $ | 329,157 | | $ | 271,765 | |
| Interest-paying liabilities | | $ | 567,708 | | $ | 372,880 | | $ | 290,569 | | $ | 256,441 | | $ | 211,745 | |
| Shareholders' equity | | $ | 90,238 | | $ | 54,528 | | $ | 46,043 | | $ | 39,758 | | $ | 36,117 | |
| | | | | | | | | | | | | | | | | |
| Financial ratios | | | | | | | | | | | | | | | | |
| Return on average: | | | | | | | | | | | | | | | | |
| Assets | | | 1.53 | % | | 1.67 | % | | 1.71 | % | | 1.70 | % | | 1.02 | % |
| Equity | | | 14.02 | % | | 17.57 | % | | 17.26 | % | | 17.18 | % | | 9.56 | % |
| Avg shareholders' equity / avg assets | | | 10.93 | % | | 9.50 | % | | 9.93 | % | | 9.89 | % | | 10.71 | % |
| Dividend payout ratio | | | 26.72 | % | | 26.69 | % | | 27.23 | % | | 26.95 | % | | 46.61 | % |
| Risk-based capital: | | | | | | | | | | | | | | | | |
| Tier I capital | | | 9.93 | % | | 9.32 | % | | 10.19 | % | | 10.95 | % | | 10.23 | % |
| Tier II capital | | | 10.98 | % | | 10.48 | % | | 11.29 | % | | 12.20 | % | | 11.47 | % |
| | | | | | | | | | | | | | | | | |
(1) Per common share data is retroactively adjusted to reflect the 5-for-4 stock split, and 4-for-3 stock split of 2004 and 2003, respectively. | | | | | | | | | | | | | | | | |
| | | | | | | | | | | | | | | | | |
| (2) Outstanding loans include loans held for sale. | | | | | | | | | | | | | | | | |
| | | | | | | | | | | | | | | | | |
The following discussion is intended to provide a more comprehensive review of the Company’s operating results and financial condition than can be obtained from reading the Consolidated Financial Statements alone. The discussion should be read in conjunction with the audited financial statements and the notes included later in this report. All numbers, except per share data, are expressed in thousands of dollars.
In addition to historical information, this report contains "forward-looking statements" within the meaning of the Private Securities Litigation Reform Act of 1995 ("PSLRA"). Such forward-looking statements are subject to risks and uncertainties that may cause actual results to differ materially from those projected, including but not limited to the following: the concentration of loans of the company's banking subsidiary, particularly with respect to commercial and residential real estate lending; changes in the regulatory environment and increases in associated costs, particularly ongoing compliance expenses and resource allocation needs in response to the Sarbanes-Oxley Act and related rules and regulations; vendor quality and efficiency; employee recruitment and retention, specifically in the Bank's Portland and Seattle markets; the company's ability to control risks associated with rapidly changing technology both from an internal perspective as well as for external providers; increased competition among financial institutions; fluctuating interest rate environments; and similar matters. Regarding the acquisition of Northwest Business Bank, completed on November 30, 2005, the combined company may fail to realize the projected cost savings, revenue enhancement, and accretive earnings. Readers are cautioned not to place undue reliance on the forward-looking statements. Pacific Continental Corporation undertakes no obligation to publicly revise or update the forward-looking statements to reflect events or circumstances that arise after the date of this release. Readers should carefully review any risk factors described in Pacific Continental’s Annual Report on Form 10-K, Quarterly Reports on Form 10-Q and other documents, including any Current Reports on Form 8-K furnished to or filed from time to time with the Securities Exchange Commission. This statement is included for the express purpose of invoking PSLRA's safe harbor provisions.
HIGHLIGHTS
| | | 2006 (2) | | 2005 (2) | | % Change 2006 vs. 2005 | | 2004 | | % Change 2005 vs. 2004 | |
Operating revenue (1) | | $ | 44,458 | | $ | 34,323 | | | 30 | % | $ | 29,415 | | | 17 | % |
| Net income | | $ | 12,655 | | $ | 9,578 | | | 32 | % | $ | 7,948 | | | 21 | % |
| | | | | | | | | | | | | | | | | |
Earnings per share (3) | | | | | | | | | | | | | | | | |
| Basic | | $ | 1.20 | | $ | 1.08 | | | 11 | % | $ | 0.93 | | | 16 | % |
| Diluted | | $ | 1.18 | | $ | 1.05 | | | 12 | % | $ | 0.90 | | | 17 | % |
| Assets, period-end | | $ | 885,351 | | $ | 791,794 | | | 12 | % | $ | 516,630 | | | 53 | % |
| Deposits, period-end | | $ | 641,272 | | $ | 604,271 | | | 6 | % | $ | 403,791 | | | 50 | % |
| | | | | | | | | | | | | | | | | |
| Return on assets | | | 1.53 | % | | 1.67 | % | | | | | 1.71 | % | | | |
| Return on equity | | | 14.02 | % | | 17.57 | % | | | | | 17.26 | % | | | |
Return on tangible equity (4) | | | 19.12 | % | | 18.25 | % | | | | | 17.26 | % | | | |
| (1) | Operating income is defined as net interest income plus noninterest income. |
| (2) | On November 30, 2005, the Company acquired NWBF for a combination of stock and cash. Combined, the stock and cash transaction was valued at approximately $40,434. The acquisition was accounted for under the purchase method of accounting and accordingly, the results of operations of NWBF have been included in the consolidated financial statement only since the date of acquisition. |
| (3) | Per share data for 2004 was retroactively adjusted to reflect the 5-for 4 stock split declared in September 2004. |
| (4) | Tangible equity excludes goodwill and core deposit intangible related to acquisitions. |
The Company earned $12,655 in 2006 compared to $9,578 in 2005. Growth in operating revenue, which consists of net interest income plus noninterest income was primarily responsible for the increased earnings in 2006 over 2005. Operating revenues were $44,458 in 2006, up $10,135 or 30% over 2005. Operating revenue growth was driven by a 42% increase in average earning assets resulting in a $9,817 increase in net interest income. Growth in earning assets was due to the full year effect of assets acquired in the NWBF transactions and organic growth.
When comparing 2006 and 2005 results, it is also fair to consider the effects of several unusual transactions and the adoption of new accounting standards. Effective January 1, 2006, the Company implemented FAS 123(R),” Share-Based Payment,” which requires the expensing of stock-based compensation. The Company elected to implement FAS 123(R) using the modified prospective method, meaning there was no restatement of prior periods. For the year ended December 31, 2006, the Company recognized $586 in stock-based compensation expense within the income statement. Had the accounting principle been effective in 2005, the Company would have recognized $515 in stock-based compensation expense which would have reduced full year 2005 diluted earnings per share by $0.06. Also during 2005 the Oregon legislature, as required in the Oregon Constitution, refunded to the Company a state income tax “kicker” reducing 2005 state income taxes by $241 which was recognized by the Company in the fourth quarter, increasing diluted earnings per share for the year 2005 by $0.02.
During the third quarter 2006, the Company sold two rental properties that the Bank had purchased in 1988 and held for possible office expansion. The sale resulted in a pretax non-interest income gain of $335. In addition, during the third quarter 2006, the Bank expensed the remaining unamortized loan premium of $101 from its 2003 purchase of the Coos Bay consumer finance office. The net after-tax gain associated with these two unusual transactions resulted in a $0.01 per diluted share contribution to full year 2006 earnings.
The Company earned $9,578 in 2005 compared to $7,948 in 2004. Growth in operating revenue was primarily responsible for the increased earnings in 2005 over 2004. Operating revenues in 2005 grew by $4,908 or 17% over 2004. Operating revenue growth was driven by a 24% increase in average earning assets resulting in a 21% increase in net interest income. The increase in net interest income was partially offset by a 9% decline in noninterest income due to lower service charges on deposit accounts, other deposit related service fees, and income from the origination of residential mortgages.
Period-end assets at December 31, 2006 were $885,351, compared to $791,794 at December 31, 2005. Core deposits, which are defined as demand deposits, interest checking, money market accounts, and local time deposits (including local time deposits over $100 thousand) constitute 90% of December 31, 2006 outstanding deposits. Demand deposits were $187,834 or 29% of total deposits at year-end December 31, 2006.
During 2007, the Company believes the following factors could impact reported financial results:
| § | A flat or inverted yield curve that would reduce spreads between the Bank’s yield on fixed rate loans and the Bank’s short-term borrowing costs and costs of core deposits, which could negatively affect the net interest margin and revenue growth. |
| § | The ability to manage noninterest expense growth in light of expected slow revenue growth. |
| § | The ability to grow core deposits, to fund expected loan growth during 2007. |
| § | The local and regional economies and their effect on loan demand, the credit quality of existing clients with lending relationships, and vacancy rates of commercial real estate properties, since a significant portion of our loan portfolio is secured by real estate. |
| § | Increases in long-term interest rates and their impact on residential construction, residential mortgage lending, and refinancing activities of existing homeowners. |
| § | Increased expenses related to personnel costs and the rising costs of providing employee benefits, plus staffing, consulting, audit fees, and other expenses related to internal auditing and ongoing compliance with Section 404 of the Sarbanes-Oxley Act. |
| § | The ability to attract and retain qualified and experienced commercial bankers in all markets. |
| § | The performance of new and relocated offices in the metropolitan Portland area. |
| § | The performance and growth of loans and deposits in the metropolitan Seattle area. |
SUMMARY OF CRITICAL ACCOUNTING POLICIES
The SEC defines “critical accounting policies” as those that require the application of management’s most difficult, subjective, or complex judgments, often as a result of the need to make estimates about the effect of matters that are inherently uncertain and may change in future periods. Significant accounting policies are described in Note 1 of the Notes to Consolidated Financial Statements for the year ended December 31, 2006 in Item 8 of this report. Management believes that the following policies and those disclosed in the Notes to Consolidated Financial Statements should be considered critical under the SEC definition:
Allowance for Loan Losses and Reserve for Unfunded Commitments
The allowance for outstanding loans is classified as a contra-asset account offsetting outstanding loans, and the allowance for unfunded commitments is classified as an “other” liability on the balance sheet. The allowance for loan losses is established through a provision for loan losses charged against earnings. The balances of the allowance for loan losses for outstanding loans and unfunded commitments are maintained at an amount management believes will be adequate to absorb known and inherent losses in the loan portfolio and commitments to loan funds. The appropriate balance of the allowance for loan losses is determined by applying loss factors to the credit exposure from outstanding loans and unfunded loan commitments. Estimated loss factors are based on subjective measurements including management’s assessment of the internal risk classifications, changes in the nature of the loan portfolios, industry concentrations, and the impact of current local, regional, and national economic factors on the quality of the loan portfolio. Changes in these estimates and assumptions are reasonably possible and may have a material impact on the Company’s consolidated financial statements, results of operations, or liquidity.
Goodwill and Intangible Assets
At December 31, 2006, the Company had $23,626 in goodwill and other intangible assets. In accordance with Financial Accounting Standard 142, Goodwill and Other Intangible Assets, assets with indefinite lives are no longer amortized, but instead are periodically tested for impairment. Management performs an impairment analysis of the intangible assets with indefinite lives at least annually and has determined that there was no impairment as of December 31, 2006 and 2005.
Share-based Compensation
In December 2004, the Financial Accounting Standards Board (“FASB”) issued FAS 123(R), Share Based Payment, a revision to the previously issued guidance on accounting for stock options and other forms of equity-based forms of compensation issued to employees. This standard became effective in the first quarter of 2006.
The method for determining the grant date fair value of equity based payments under FAS 123(R) is the same as the method used by the Company to calculate the pro forma impact on 2005 and 2004 net income and earnings per share as presented in Note 1 of the Notes to Consolidated Financial Statements in Item 8 below.
The Company adopted FAS 123(R) using the modified prospective method. Therefore, previously reported financial data was not restated, and expenses related to equity-based payments granted and vesting during 2006 were recorded as compensation expense.
Recent Accounting Pronouncements
Recent accounting pronouncement are discussed in Note 1 of the Notes to the Consolidated Financial Statements for the year ended December 31, 2006 in item 8 of this report. None of these pronouncements are expected to have a significant effect on the Company’s financial condition or results of operations.
RESULTS OF OPERATIONS
Net Interest Income
The largest component of the Company’s earnings is net interest income. Net interest income is the difference between interest income derived from earning assets, principally loans, and the interest expense associated with interest-bearing liabilities, principally deposits. The volume and mix of earning assets and funding sources, market rates of interest, demand for loans, and the availability of deposits affect net interest income.
Two tables follow which analyze the changes in net interest income for 2006, 2005, and 2004. Table I, “Average Balance Analysis of Net Interest Earnings”, provides information with regard to average balances of assets and liabilities, as well as associated dollar amounts of interest income and interest expense, relevant average yields or rates, and net interest income as a percent of average earning assets. Table II, “Analysis of Changes in Interest Income and Interest Expense”, shows the increase (decrease) in the dollar amount of interest income and interest expense and the differences attributable to changes in either volume or rates. Changes not solely due to volume or rate are allocated to rate.
2006 Compared to 2005
Net interest income for 2006 was $40,057, an increase of $9,817 over 2005 net interest income of $30,240. The growth in net interest income in 2006 over 2005 was attributable to a $221,750 or 42% increase in earning assets. The acquisition of NWBF in November 30, 2005 was accounted for under the purchase method of accounting, thus the assets acquired and liabilities assumed have been included in the balance sheet only since the date of acquisition. The earning assets acquired in this transaction accounted for approximately $145,000 of the growth in earning assets in 2006 when compared to 2005. For the year 2006, the net interest income as a percentage of earning assets decreased by 36 basis points from 5.66% to 5.30%. Much of the decline in the net interest margin in 2006 when compared to 2005 can be attributed to the acquisition of NWBF, which had a much lower net interest margin at 4.20% than the Bank’s net interest margin of approximately 5.68% prior to the acquisition. The Bank’s net interest margin when adjusted for the unusual accelerated amortization of the Coos Bay loan premium (described in the “Highlights” above) was very stable and improved throughout the year as evidenced by sequential margins beginning with first quarter 2006 of 5.25%, and increasing each quarter to 5.28%, 5.34%, and 5.35%, respectively. This improvement in the quarterly net interest margin can be attributed to core deposit growth, which accelerated during the last nine months of the year.
For 2006, interest and fees earned on earning assets increased by $22,379 over 2005. Referring to Table II, total interest income and fees improved by $16,566 due to increased earning asset volumes and improved $5,813 due to higher yields on earning assets. Average earning assets for 2006 were $755,681, a 42% increase over 2005 average earning assets. Growth in earning assets was primarily attributable to loan growth as average loans, net of the allowance for loan losses for the year 2006, were up $211,022 or 42% over 2005. The acquisition of NWBF increased average loans by approximately $145,000 in 2006 when compared to 2005. Referring to Table I, earning asset yields increased by 78 basis points, from 7.42% in 2005 to 8.20% in 2006. The improvement in earning asset yield was primarily due to increased loan yields, which were up 78 basis points in 2006 over 2005. The increase in loan yields is reflective of the consistent increase in the prime-lending rate throughout the first six months of 2006.
Interest expense on interest-bearing liabilities during 2006 increased by $12,562 or over 2005. Referring to Table I, overall average interest-bearing liabilities in 2006 increased by $194,828 over 2005, while the average rate paid on interest-bearing liabilities increased by 135 basis points from 2.51% to 3.86%. The acquisition of NWBF accounted for a substantial portion of the growth in interest-bearing deposits in addition to the organic growth from the two Oregon markets. Referring to Table II, interest expense increased by $5,874 due to the change in the mix and increased volumes of interest-bearing liabilities. Table II also indicates that interest expense for the year increased an additional $6,688 due to higher rates, a direct result of the increase in short-term market interest rates during the first six months of 2006. Table II shows the increase in the average volumes of money market and NOW accounts, time deposits, and FHLB borrowings, were primarily responsible for the increase in interest expense due to higher volumes for 2006 when compared to 2005. The increase in interest expense for the year 2006 over 2005 resulting from higher rates was primarily due to increased volumes and higher rates paid on money market and NOW accounts, time deposits, and FHLB borrowings. Table I shows the 2006 average volume of money market and NOW accounts increased $87,073 or 40%, and average time deposit volume increased $38,360 or 51% over 2005 average volumes, while the rate on these deposits increased 124 basis points and 132 basis points, respectively. Tables I and II shows that the increase in the average volume of FHLB term borrowings increased $59,654 and accounted for $2,244 or 38% of the total increase in interest expense for the year 2006 over 2005 that was related to volume. The average volume of trust preferred securities increased by $7,480 in 2006 over 2005, which resulted in $462 additional interest expense in 2006 over 2005. The Trust preferred securities were issued in conjunction with the acquisition of NWBF and thus were only included in the 2005 average balance sheet since the date of acquisition on November 30, 2005.
The Company’s 2006 net interest margin benefited from growth in noninterest-bearing deposits. For the year 2006, average noninterest-bearing deposits grew by $19,958 or 14% over 2005. Average noninterest-bearing deposits funded 20% of total average assets for the year 2006.
During the first six months of 2006, the Federal Reserve increased short-term rates by 100 basis points in a continuation of rising interest rates that began in June 2004. Since June 29, 2006, the Federal Reserve has held short-term market interest rates steady with the overnight Fed Funds rate at approximately 5.25% and the prime-lending rate at 8.25%. Although the Bank is asset sensitive, meaning the net interest margin should improve during a rising rate environment, the increases in market interest rates during 2005 and 2006 had little positive effect on the net interest margin. This was primarily the result of two factors. First, a flat and inverted yield curve, where long-term rates rose at a much slower pace than short-term rates kept the yields on fixed rate loans low, thus narrowing the spread between the Bank’s borrowing and core deposit costs and the yield on its new and existing fixed rate loan portfolio. Second, consistently throughout the first six months of 2006, there was a timing lag between the increases in short-term money market rates, which moved borrowing costs and deposit rates up in advance of the Bank’s prime-lending rate also creating margin compression.
Looking forward to the first quarter 2007, the Company expects the net interest margin to be flat to down slightly from the 5.35% net interest margin recorded for the fourth quarter 2006. Historically, the Bank’s Oregon market experiences flat to negative growth in its core deposit base during the first quarter of each year, while loan activity remains strong. This would potentially decrease the Bank’s net interest margin as the reduction in core deposits typically occurs in lower cost demand and commercial money market accounts.
The Company believes there are opportunities during 2007 to improve the net interest margin through core deposit growth. Steady growth is expected in the Bank’s Lane County market, while growth in the Seattle area is expected to markedly improve. In addition, the relatively new Vancouver, Washington office and the relocation of the Tualatin office in the Bank’s Portland market is expected to contribute to core deposit growth in Oregon during 2007. However, any improvement the Bank’s net interest margin during 2007 is highly dependent upon core deposit growth.
2005 Compared to 2004
Net interest income for 2005 was $30,240, an increase of $5,288 over 2004 net interest income of $24,952. For the year 2005, the net interest income as a percentage of earning assets decreased by 12 basis points from 5.78% to 5.66%. Generally, the decline in the net interest margin in 2005 when compared to 2004 can be attributed to the Bank’s cost of funds rising faster than the yield on its loan portfolio.
For the year 2005, interest and fees earned on earning assets increased by $10,168 or 35% over 2004. Referring to Table II, total interest income and fees improved by $7,329 due to increased earning asset volumes and improved $2,839 due to higher yields on earning assets. Average earning assets for 2005 were $533,930, a 24% increase over 2004 average earning assets. Growth in earning assets was primarily attributable to loan growth as average loans, net of the allowance for loan losses for the year 2005, were up $102,802 or 26% over 2004. Referring to Table I, earning asset yields increased by 60 basis points, from 6.82% in 2004 to 7.42% in 2005. The improvement in earning asset yield was primarily due to increased loan yields, which were up 55 basis points in 2005 over 2004. The increase in loan yields is reflective of the consistent increase in the prime-lending rate throughout the year 2005.
Interest expense on interest-bearing liabilities during 2005 increased by $4,880 or 109% over 2004. Referring to Table I, overall average interest-bearing liabilities in 2005 increased by $82,311 or 28% over 2004, while the average rate paid on interest-bearing liabilities increased by 97 basis points from 1.54% to 2.51%. Referring to Table II, interest expense increased by $1,901 due to the change in the mix and increased volumes of interest-bearing liabilities. Table II also indicates that interest expense for the year increased an additional $2,979 due to higher rates, a direct result of the increase in short-term market interest rates throughout the year 2005. Table II shows the increase in the average volumes of money market and NOW accounts, time deposits, and FHLB borrowings, were primarily responsible for the increase in interest expense due to higher volumes for 2005 when compared to 2004. Again referring to Table II, the increase in interest expense for the year 2005 over 2004 resulting from higher rates was primarily due to increased rates paid on money market and NOW accounts and time deposits. Table I shows the 2005 average volume of money market and NOW accounts increased $41,166 or 23% and average time deposit volume increased $20,584 or 38% over 2004 average volumes, while the rate on these deposits increased 110 basis points and 97 basis points, respectively. The increase in time deposit volume primarily involved local market time deposits in excess of $100, national time deposits, and public deposits. Table II shows that the increase in the average volume of FHLB term borrowings accounted for $1,084 or 57% of the total increase in interest expense for the year 2005 over 2004 that was related to volume. However, lower rates paid on FHLB advances during the year 2005 when compared to 2004 mitigated a portion of the increase in interest expense from the higher usage of FHLB advances.
The Company’s 2005 net interest margin benefited from growth in noninterest-bearing deposits. For the year 2005, average noninterest-bearing deposits grew by $16,962 or 14% over 2004. Average noninterest-bearing deposits funded 25% of total average assets for the year 2005.
During 2005, the Federal Reserve increased short-term rates as they did during the last six months of 2004. From January 2005 through December 2005, the Federal Reserve increased short-term interest rates by 200 basis points on top of the 125 basis point increase in short-term rates during the last six months of 2004. The increase in market interest rates during 2005 increased the Bank’s prime-lending rate from 5.25% at the beginning of the year to 7.25% at year end 2005. Although the Bank was asset sensitive, meaning the net interest margin would improve during a rising rate environment, the increases in market interest rates during 2005 had little positive effect on the net interest margin. This was primarily the result of two factors. First, a flattening yield curve, where long-term rates rose at a much slower pace than short-term rates keeping the yields on fixed rate loans low, thus narrowing the spread between the Bank’s borrowing and core deposit costs and the yield on its fixed rate loan portfolio. Second, consistently throughout the year 2005, there was a timing lag between the increases in short-term money market rates, which moved borrowing costs and deposit rates up in advance of the Bank’s prime-lending rate also creating margin compression.
Table I
Average Balance Analysis of Net Interest Earnings
(dollars in thousands)
| | | | | | | 2006 | | | | | | | | | 2005 | | | | | | | | | 2004 | | | | |
| | | Average | | | Interest | | | Average | | | Average | | | Interest | | | Average | | | Average | | | Interest | | | Average | |
| | | Balance | | | Income/(Expense) | | | Yield/(Cost) | | | Balance | | | Income/(Expense) | | | Yield/(Cost) | | | Balance | | | Income/(Expense) | | | Yield/(Cost) | |
Interest Earning Assets | | | | | | | | | | | | | | | | | | | | | | | | | | | | |
| Federal funds sold and interest- | | | | | | | | | | | | | | | | | | | | | | | | | | | | |
| bearing deposits in banks | | $ | 960 | | $ | 44 | | | 4.62 | % | $ | 1,002 | | $ | 26 | | | 2.62 | % | $ | 1,248 | | $ | 15 | | | 1.24 | % |
| Securities available for sale: | | | | | | | | | | | | | | | | | | | | | | | | | | | | |
| Taxable (1) | | | 38,855 | | | 1,546 | | | 3.98 | % | | 29,142 | | | 965 | | | 3.31 | % | | 30,009 | | | 936 | | | 3.12 | % |
| Tax-exempt | | | 3,302 | | | 125 | | | 3.79 | % | | 2,245 | | | 82 | | | 3.64 | % | | 1,378 | | | 50 | | | 3.61 | % |
| Loans, net of allowance for loan | | | | | | | | | | | | | | | | | | | | | | | | | | | | |
| losses(2)(3)(4) | | | 712,563 | | | 60,257 | | | 8.46 | % | | 501,541 | | | 38,520 | | | 7.68 | % | | 398,739 | | | 28,424 | | | 7.13 | % |
| | | | | | | | | | | | | | | | | | | | | | | | | | | | | |
| Total interest earning assets | | | 755,680 | | | 61,972 | | | 8.20 | % | | 533,930 | | | 39,593 | | | 7.42 | % | | 431,374 | | | 29,425 | | | 6.82 | % |
| | | | | | | | | | | | | | | | | | | | | | | | | | | | | |
Non Earning Assets | | | | | | | | | | | | | | | | | | | | | | | | | | | | |
| Cash and due from banks | | | 23,272 | | | | | | | | | 19,324 | | | | | | | | | 16,523 | | | | | | | |
| Premises and equipment | | | 17,694 | | | | | | | | | 14,923 | | | | | | | | | 12,898 | | | | | | | |
| Interest receivable and other | | | 29,025 | | | | | | | | | 5,540 | | | | | | | | | 2,714 | | | | | | | |
| Total non interest earning assets | | | 69,991 | | | | | | | | | 39,787 | | | | | | | | | 32,135 | | | | | | | |
| | | | | | | | | | | | | | | | | | | | | | | | | | | | | |
| Total assets | | $ | 825,671 | | | | | | | | $ | 573,717 | | | | | | | | $ | 463,509 | | | | | | | |
| | | | | | | | | | | | | | | | | | | | | | | | | | | | | |
Interest-Bearing Liabilities | | | | | | | | | | | | | | | | | | | | | | | | | | | | |
| Money market and NOW accounts | | $ | 307,054 | | $ | (10,551 | ) | | -3.44 | % | $ | 219,981 | | $ | (4,840 | ) | | -2.20 | % | $ | 178,815 | | $ | (1,960 | ) | | -1.10 | % |
| Savings deposits | | | 23,559 | | | (360 | ) | | -1.53 | % | | 24,148 | | | (222 | ) | | -0.92 | % | | 21,465 | | | (130 | ) | | -0.61 | % |
| Time deposits | | | 112,943 | | | (4,970 | ) | | -4.40 | % | | 74,583 | | | (2,299 | ) | | -3.08 | % | | 53,999 | | | (1,142 | ) | | -2.11 | % |
| Federal funds purchased | | | 7,580 | | | (380 | ) | | -5.01 | % | | 4,730 | | | (113 | ) | | -2.39 | % | | 12,596 | | | (213 | ) | | -1.69 | % |
| FHLB borrowings | | | 108,324 | | | (5,144 | ) | | -4.75 | % | | 48,670 | | | (1,831 | ) | | -3.76 | % | | 23,694 | | | (1,028 | ) | | -4.34 | % |
| Trust preferred | | | 8,248 | | | (510 | ) | | -6.18 | % | | 768 | | | (48 | ) | | -6.27 | % | | - | | | - | | | | |
| | | | | | | | | | | | | | | | | | | | | | | | | | | | | |
| Total interest-bearing liabilities | | | 567,708 | | | (21,915 | ) | | -3.86 | % | | 372,880 | | | (9,353 | ) | | -2.51 | % | | 290,569 | | | (4,473 | ) | | -1.54 | % |
| | | | | | | | | | | | | | | | | | | | | | | | | | | | | |
Noninterest-Bearing Liabilities | | | | | | | | | | | | | | | | | | | | | | | | | | | | |
| Demand deposits | | | 162,259 | | | | | | | | | 142,301 | | | | | | | | | 125,339 | | | | | | | |
| Interest payable and other | | | 5,466 | | | | | | | | | 4,008 | | | | | | | | | 1,558 | | | | | | | |
| Total noninterest-bearing liabilities | | | 167,725 | | | | | | | | | 146,309 | | | | | | | | | 126,897 | | | | | | | |
| Total liabilities | | | 735,433 | | | | | | | | | 519,189 | | | | | | | | | 417,466 | | | | | | | |
| Stockholders' equity | | | 90,238 | | | | | | | | | 54,528 | | | | | | | | | 46,043 | | | | | | | |
| Total liabilities and stockholders' equity | | $ | 825,671 | | | | | | | | $ | 573,717 | | | | | | | | $ | 463,509 | | | | | | | |
| | | | | | | | | | | | | | | | | | | | | | | | | | | | | |
Net Interest Income | | | | | $ | 40,057 | | | | | | | | $ | 30,240 | | | | | | | | $ | 24,952 | | | | |
| | | | | | | | | | | | | | | | | | | | | | | | | | | | | |
Net Interest Income as a Percent of | | | | | | | | | | | | | | | | | | | | | | | | | | | | |
Earning Assets | | | | | | 5.30 | % | | | | | | | | 5.66 | % | | | | | | | | 5.78 | % | | | |
| | | | | | | | | | | | | | | | | | | | | | | | | | | | | |
| (1) Federal Home Loan Bank stock is included in securities available for sale. | | | | | | | | | | | | | | | | | | | | | | | | | | | | |
| (2) Nonaccrual loans have been included in average balance totals. | | | | | | | | | | | | | | | | | | | | | | | | | | | | |
| (3) Interest income includes recognized loan origination fees of $2,099, $1,642 and $1,295 for the years ended 2006, 2005, and 2004, respectively. | | | | | | | | | | | | | | | | | | | | | | | | | | | | |
| (4) Total includes loans held for sale. | | | | | | | | | | | | | | | | | | | | | | | | | | | | |
Table II
Analysis of Change in Interest Income and Interest Expense
(dollars in thousands)
| | | | | | | 2006 compared to 2005 Increase (decrease) due to | | | | | | | | | 2005 compared to 2004 Increase (decrease) due to | | | | |
| | | | Volume | | | Rate | | | Net | | | Volume | | | Rate | | | Net | |
Interest earned on: | | | | | | | | | | | | | | | | | | | |
| Federal funds sold and interest | | | | | | | | | | | | | | | | | | | |
| bearing deposits in banks | | $ | (1 | ) | $ | 19 | | $ | 18 | | $ | (3 | ) | $ | 13 | | $ | 10 | |
| Securities available-for-sale: | | | | | | | | | | | | | | | | | | | |
| Taxable | | | 322 | | | 259 | | | 581 | | | (27 | ) | | 57 | | | 30 | |
| Tax-exempt | | | 38 | | | 5 | | | 43 | | | 31 | | | 1 | | | 32 | |
| Loans, net of allowance for loan | | | | | | | | | | | | | | | | | | | |
| losses | | | 16,207 | | | 5,530 | | | 21,737 | | | 7,328 | | | 2,768 | | | 10,096 | |
| | | | | | | | | | | | | | | | | | | | |
| Total interest income | | | 16,566 | | | 5,813 | | | 22,379 | | | 7,329 | | | 2,839 | | | 10,168 | |
| | | | | | | | | | | | | | | | | | | | |
Interest paid on: | | | | | | | | | | | | | | | | | | | |
| Money market and NOW accounts | | | (1,915 | ) | | (3,796 | ) | | (5,711 | ) | | (451 | ) | | (2,429 | ) | | (2,880 | ) |
| Savings deposits | | | 5 | | | (142 | ) | | (137 | ) | | (16 | ) | | (76 | ) | | (92 | ) |
| Time deposits | | | (1,183 | ) | | (1,489 | ) | | (2,672 | ) | | (435 | ) | | (722 | ) | | (1,157 | ) |
| Federal funds purchased | | | (68 | ) | | (236 | ) | | (304 | ) | | 133 | | | (33 | ) | | 100 | |
| FHLB borrowings | | | (2,244 | ) | | (1,032 | ) | | (3,276 | ) | | (1,084 | ) | | 281 | | | (803 | ) |
| Trust preferred | | | (469 | ) | | 7 | | | (462 | ) | | (48 | ) | | - | | | (48 | ) |
| | | | | | | | | | | | | | | | | | | | |
| Total interest expense | | | (5,874 | ) | | (6,688 | ) | | (12,562 | ) | | (1,901 | ) | | (2,979 | ) | | (4,880 | ) |
| | | | | | | | | | | | | | | | | | | | |
| Net interest income | | $ | 10,692 | | $ | (875 | ) | $ | 9,817 | | $ | 5,428 | | $ | (140 | ) | $ | 5,288 | |
| | | | | | | | | | | | | | | | | | | | |
Provision for Possible Loan Losses
Management provides for possible loan losses by maintaining an allowance. The level of the allowance is determined based upon judgments regarding the size and nature of the loan portfolio, historical loss experience, the financial condition of borrowers, the level of nonperforming loans, and current general economic conditions. Additions to the allowance are charged to expense. Loans are charged against the allowance when management believes the collection of principal is unlikely.
The provision for loan losses totaled $600 in 2006, $1,100 in 2005, and $500 in 2004. The lower provision for 2006 when compared to 2005 resulted from improvement in credit quality throughout the year 2006. The higher provision for 2005 over 2004 reflected growth in the Bank’s outstanding loans during the year.
At December 31, 2006, the Bank had no nonperforming assets, nonaccrual loans, loans 90 days or more past due and still accruing interest, or foreclosed property. That compares to $283 of nonperforming assets at December 31, 2005 or 0.04% of year-end assets.
The allowance for loan losses at December 31, 2006 was $8,284 (1.08% of outstanding loans) compared to $7,792 (1.15% of loans) and $5,224 (1.14% of loans) at years end 2005 and 2004, respectively. The December 31, 2005 allowance for loan losses included $2,014 in allowance added through the acquisition of NWBF. At December 31, 2006, the Bank also has reserved $151 for possible losses on unfunded loan commitments, which is classified in other liabilities. The 2006 ending allowance includes $109 in specific allowance for $496 in impaired loans consisting of two loans to a single borrower that are both performing under revised terms. At December 31, 2005, the Company had $676 of impaired loans (net of government guarantees) with a specific allowance assigned of $238.
Net loan charge offs were $108 in 2006 compared to $512 in 2005, and $319 in 2004. Net charge offs as a percentage of average loans were 0.01%, 0.10%, and 0.08% for 2006, 2005, and 2004, respectively.
Looking forward, the 2007 provision for loans losses will be contingent on current economic and market conditions, and overall loan growth, as there is virtually no benefit available from further improvement in the loan portfolio credit statistics.
Management believes that the allowance for loan losses is adequate for estimated loan losses in the portfolio at year-end based on management’s assessment of various factors including past due and impaired loans, past history and loss experience, loan concentrations in specific industries, and current economic conditions.
Noninterest Income
Noninterest income is derived from sources other than fees and interest on earning assets. The Company’s primary sources of noninterest income are service charge fees on deposit accounts, merchant bankcard activity, income derived from mortgage banking services, and gains on the sale of loans.
2006 Compared to 2005
Noninterest income in 2006 was $4,401, up $318 or 8% from 2005. Excluding the nonrecurring gain on the sale of property of $335, noninterest income was down $17 from 2005. Total noninterest income through December 31, 2006 included approximately $70 of revenues from the Seattle market not included in 2005 results. The decrease in noninterest income (excluding the nonrecurring gain on sale of property) was primarily due to lower account service charges, mortgage banking revenues, and loan servicing income. Account service charges were down $44 or 3% from last year as the increased earnings credit on analyzed business accounts lowered fee income. Mortgage banking revenues were down $118 or 13% from 2005 as higher long-term interest rates slowed the level of mortgage loan originations and the service release premium on loans sold. Loan servicing income was down $43 or 29% from 2005 as the average volume of loans serviced declined in 2006 from 2005. Declines in these categories of noninterest income was partially offset by $110 increase in merchant bankcard fee income and a $67 increase in the other income category. The increase in merchant bankcard revenues resulted from an 83% increase in sales transaction volume. The increase in the other income category was due to lockbox fees and sundry recoveries.
2005 Compared to 2004
Noninterest income in 2005 was $4,083, a decrease of $380 or 9% from 2004. The decline in noninterest income was primarily due to five categories: account service charges; NSF/OD fees; residential mortgage revenues; merchant bankcard fees; and loan servicing fees. Account service charges were down $168 or 24% from 2004 as the increase in the 91-day Treasury bill rate increased the earnings credit on analyzed business demand accounts, which lowered fee income on these accounts. NSF/OD fees in 2005 dropped $92 or 14% from 2004 due to lower transaction volume. Revenues from the origination of residential mortgages were down $79 or 8% from 2004 as a result of higher long-term interest rates during the year that slowed loan originations. The merchant bankcard division achieved a 14% growth in sales transaction volume in 2005 over 2004. However, competitive pricing pressures resulted in a lower profit margin, thus reducing noninterest income from this division by $58 or 5% from 2004. Loan servicing fees in 2005 declined by $31 or 17% from 2004 due to a decline in the level of loans serviced for and participated to other financial institutions. Other revenue sources accounted for a $48 increase in noninterest revenue compared to 2004.
Noninterest Expense
Noninterest expense represents all expenses other than the provision for loan losses and interest costs associated with deposits and other interest-bearing liabilities. It incorporates personnel, premises and equipment, data processing and other operating expenses.
2006 Compared to 2005
Noninterest expense in 2006 was $23,791, up $5,657 or 31% over 2005 with every expense category up in 2006 when compared to 2005. Total noninterest expense in 2006 includes $3,114 of expenses from the Seattle market not included in 2005 results. In addition, the Company implemented FAS 123(R) in 2006, which required the expensing of equity-based compensation. The Company implemented this new accounting principle using the modified prospective basis, meaning there was no restatement of prior periods. For the year 2006, the Company recognized $586 more in equity compensation expense than was recorded during 2005. Excluding the $3,114 increase due to Seattle market expenses and equity-based compensation of $586, noninterest expense in 2006 increased $1,957 or 11% over 2005. Increased personnel expense accounted for the majority of the total increase in noninterest expense. Total personnel expense was up $3,380 and accounted for 60% of the total increase in noninterest expense. The increase in personnel expense in 2006 over 2005 reflects the addition of the Seattle market, increased staffing in the Portland market where two new offices were opened, and increased administrative staff. Premises and equipment expense was up $911 or 42% and reflects the new costs in the Seattle market, plus additional expense related to new offices in the Portland market. The other expense category was up $1,161 or 38% primarily due to higher professional services including legal fees, consulting fees, and fees related to compliance with Section 404 of The Sarbanes-Oxley Act.
During 2006, the Company made significant investments in people and facilities in all markets, establishing a foundation for growth in 2007. During 2007, the Company expects noninterest expense growth to abate from the 2006 growth rate. In addition, on a sequential quarter or linked quarter basis in 2007, relatively small increases in expenses are expected. The Company does expect certain expense categories to increase in 2007 over 2006, such as the new FDIC insurance assessment, which is expected to add approximately $300 to noninterest expense in 2007 when compared to 2006.
2005 Compared to 2004
Noninterest expense in 2005 was $18,134, up $2,093 or 13% over 2004. The acquisition of NWBF accounted for approximately $133 of the total expense increase. In addition, the Bank incurred approximately $35 in merger related expenses that was ultimately eliminated following the systems conversion in the first quarter 2006. The increase in expenses in 2005 over 2004 resulted primarily from increased personnel expense, premises and equipment expense, advertising, and various other expenses. Personnel expenses were up $1,234 or 12% in 2005 over 2004 reflecting increased staffing, increased accruals for incentive compensation, and higher group insurance costs. Group insurance expense accounted for $179 of the total increase in personnel cost for the year 2005. Occupancy and equipment expense in 2005 was up $273 or 15% over 2004 reflecting remodeling costs of the Bank’s Olive Street office in Eugene, Oregon, elimination of rental income from the Bank’s Olive Street office, and rent expense for the Seattle market offices. The increase in business development expense of $246 in 2005 over 2004 was primarily the result of a planned increase in advertising expense related to production costs of new media campaigns and increased media and specialty advertising in the Portland market. Various other expense categories, primarily sundry losses, travel, and subscription expenses, accounted for the increase in the other expense category.
BALANCE SHEET
Loans
At December 31, 2006 outstanding loans, net of deferred loan fees and excluding loans held for sale, were $767,100, up $88,779 over outstanding loans of $678,321 at December 31, 2005. A summary of loan growth by market for the year 2006 follows:
| Outstanding loans January 1, 2006 | | $ | 678,321 | |
| Portland | | | 84,534 | |
| Lane County | | | 922 | |
| Seattle | | | 3,323 | |
| Outstanding loans December 31, 2006 | | $ | 767,100 | |
Loan growth rates in 2006 over 2005 for Portland, Lane County, and Seattle were 29%, 0%, and 2%, respectively. More information on the loan portfolio can be found in statistical information in Item 1 and in Note 4 of the Notes to Consolidated Financial Statements in Item 8 below.
Goodwill and Intangible Assets
At December 31, 2006, the Company had a recorded balance of $22,306 goodwill of which $22,031 is from the November 30, 2005 acquisition of NWBF and $275 from the 2003 acquisition of the Coos Bay consumer finance office. In addition, at December 31, 2006 the Company had $1,320 core deposit intangible assets resulting from the acquisition of NWBF. The core deposit intangible was determined to have an expected life of approximately seven years and is being amortized over that period using the straight-line method. During 2006, the Company amortized $223 of the core deposit intangible. In accordance with Financial Accounting Standard (“FAS”) 142, Goodwill and Other Intangible Assets, the Company does not amortize goodwill or other intangible assets with indefinite lives, but instead periodically tests these assets for impairment. Management did perform an impairment analysis at December 31, 2006 and determined there was no impairment of the goodwill at the time of the analysis.
Deposits
Outstanding deposits at December 31, 2006 were $641,272, an increase of $37,001 over outstanding deposits of $604,271 at December 31, 2005. Core deposits, which are defined by the Company as demand, interest checking, money market, savings, and local time deposits, including local time deposits in excess of $100 thousand, were $580,210 and $529,794 at December 31, 2006 and 2005, respectively, and represented 90% and 88% of total deposits, respectively. A summary of deposit growth by market for the year 2006 follows:
| Outstanding deposits January 1, 2006 | | $ | 604,271 | |
| Portland | | | 41,301 | |
| Lane County | | | 13,951 | |
| Seattle | | | (4,836 | ) |
| Wholesale deposits | | | (13,415 | ) |
| Outstanding deposits December 31, 2006 | | $ | 641,272 | |
Core deposit growth rates for Portland, Lane County, and Seattle markets were 50%, 4%, and (7%), respectively.
Junior Subordinated Debentures
The Company had $8,248 in junior subordinated debentures at December 31, 2006, which were issued in conjunction with the acquisition of NWBF. At December 31, 2006, the entire $8,248 in junior subordinated debentures had an interest rate of 6.265% that is fixed for a five year period. As of December 31, 2006, the entire balance of the junior subordinated debentures qualified as Tier 1 capital under regulatory capital purposes. Additional information regarding the terms of the junior subordinated debentures, including maturity/repricing dates and interest rate, is included in Note 12 of the Notes to Consolidated Financial Statements in Item 8 below.
CAPITAL RESOURCES
Capital is the shareholders’ investment in the Company. Capital grows through the retention of earnings and the issuance of new stock through the exercise of stock options. Capital formation allows the Company to grow assets and provides flexibility in times of adversity.
Shareholders’ equity at December 31, 2006 was $95,735, an increase of $14,323 or 18% from December 31, 2005. The increase in shareholders’ equity during 2006 was principally due to the retention of approximately $9,273 net income for the year and the exercise of stock options and the related tax benefit accounted for another $3,547.
The Federal Reserve Board and the FDIC has in place guidelines for risk-based capital requirements applicable to U.S. banks and bank holding companies. These risk-based capital guidelines take into consideration risk factors, as defined by regulation, associated with various categories of assets, both on and off-balance sheet. Under the guidelines, capital strength is measured in two tiers, which are used in conjunction with risk-adjusted assets to determine the risk-based capital ratios. These guidelines require a minimum of 8% total risk-based capital ratio, of which 4% must be Tier I capital. The regulations also specify that a 10% total risk-based capital ratio is required to be designated “well-capitalized” (the highest FDIC capital rating) by the FDIC. The Company’s Tier I capital, which consists of shareholders’ equity and qualifying trust preferred securities, less other comprehensive income, goodwill, and deposit-based intangibles, totaled $80,058 at December 31, 2006. Tier II capital components include all, or a portion of the allowance for loan losses and the portion of trust preferred securities in excess of Tier I statutory limits. The total of Tier I and Tier II capital components is referred to as Total Risk-Based Capital, and was $88,493 at December 31, 2006. The Company’s total risk-based capital ratio was 10.98%, compared to 10.48% at December 31, 2005.
The Company pays cash dividends on a quarterly basis, typically in March, June, September and December of each year. The Board of Directors considers the dividend amount quarterly and takes a broad perspective in its dividend deliberations including a review of recent operating performance, capital levels, and growth projections. The Board also considers dividend payout ratios, dividend yield, and other financial metrics in setting the quarterly dividend. The Company declared and paid cash dividends of $0.32 per share for the year 2006. That compares to cash dividends of $0.28 paid during 2005.
The Board of Directors, at its February 13, 2007 meeting, approved a dividend of $0.09 per share for shareholders of record as of February 28, 2007.
The Company projects that earnings retention and existing capital will be sufficient to fund anticipated asset growth, while maintaining a well-capitalized designation from all regulatory agencies.
OFF-BALANCE SHEET ARRANGEMENTS AND COMMITMENTS
In the normal course of business, the Bank commits to extensions of credit and issues letters of credit. The Bank uses the same credit policies in making commitments to lend funds and conditional obligations as it does for other credit products. In the event of nonperformance by the customer, the Bank’s exposure to credit loss is represented by the contractual amount of the instruments. Commitments to extend credit are agreements to lend to a customer as long as there is no violation of any condition established by the contract. Since some commitments may expire without being drawn upon, the total commitment amounts do not necessarily represent future cash requirements. At December 31, 2006, the Bank had $196,033 in commitments to extend credit.
Letters of credit written are conditional commitments issued by the Bank to guarantee performance of a customer to a third party. The credit risk involved is essentially the same as that involved in extending loan facilities to customers. At December 31, 2006, the Bank had $6,720 in letters of credit and financial guarantees written.
The Bank also has internal guidance lines of credit established for certain borrowers, primarily in the residential construction industry. These guidance lines are not contractual commitments to extend credit, and may be terminated by the Bank for any reason without any obligation to the borrower. These lines provide the Bank’s lenders limits on future extensions of credit to certain borrowers. The Bank uses the same credit policies in establishing internal guidance lines as it does for other credit products. At December 31, 2006, the Bank had established unused and uncommitted guidance lines totaling approximately $56,572.
The Company has certain other financial commitments. These future financial commitments are outlined below:
Contractual Obligations | | | | | | | | | | | | | | | | |
| (dollars in thousands) | | | Total | | | Less than One Year | | | 1 - 3 Years | | | 3 - 5 Years | | | More than 5 Years | |
| Junior subordinated debenture | | $ | 8,248 | | $ | - | | $ | - | | $ | - | | $ | 8,248 | |
| FHLB borrowings | | | 131,804 | | | 109,804 | | | 15,500 | | | 4,500 | | | 2,000 | |
| Time Deposits | | | 97,575 | | | 86,418 | | | 10,270 | | | 887 | | | - | |
| Operating lease obligations | | | 2,898 | | | 646 | | | 1,096 | | | 721 | | | 435 | |
| | | $ | 240,525 | | $ | 196,868 | | $ | 26,866 | | $ | 6,108 | | $ | 10,683 | |
LIQUIDITY
Liquidity is the term used to define the Company’s ability to meet its financial commitments. The Company maintains sufficient liquidity to ensure funds are available for both lending needs and the withdrawal of deposit funds. The Company derives liquidity through core deposit growth, maturity of investment securities, and loan payments. Core deposits include demand, interest checking, money market, savings, and local time deposits, including local time deposits in excess of $100. Additional liquidity and funding sources are provided through the sale of loans, sales of securities, access to national CD markets, and both secured and unsecured borrowings.
Core deposits at December 31, 2006 were 90% of total deposits compared to 88% at December 31, 2005. Core deposit growth of $50,416 in all markets funded 57% of loan growth during the year 2006. The remainder of loan growth was funded through alternative funding sources, including overnight borrowed funds, Federal Home Loan Bank term advances, public deposits available from the State of Oregon, State of Washington, and national market time deposits.
The Company has deposit relationships with several large clients, which are closely monitored by Bank officers. At December 31, 2006, thirteen large deposit relationships with the Bank account for $152,461 or 24% of total deposits. The single largest client represented 6% of total deposits at December 31, 2006. The loss of this deposit relationship or other large deposit relationships could cause an adverse effect on short-term liquidity. The Company expects to maintain these relationships and believes it has sufficient sources of liquidity to mitigate the loss of one or more of these clients.
Borrowing lines have been established at various correspondent banks, the Federal Home Loan Bank of Seattle and with the Federal Reserve Bank of San Francisco. At December 31, 2006, the Bank had secured and unsecured borrowing lines totaling approximately $370,000 consisting of $266,000 with the Federal Home Loan Bank of Seattle, $98,000 with various correspondent banks, and $6,000 with the Federal Reserve Bank of San Francisco. The Federal Home Loan Bank borrowing line is limited to the amount of collateral pledged. At December 31, 2006, the Bank had approximately $277,000 in commercial real estate loans pledged as collateral (discounted collateral value of $157,500) for this line. The $6,000 borrowing line with the Federal Reserve Bank of San Francisco is also secured. The $98,000 in borrowing lines with correspondent banks is unsecured. At December 31, 2006, the Bank had $131,804 in borrowings outstanding all from the FHLB of Seattle and $4,410 outstanding on its overnight correspondent bank lines. In addition, the Bank is part of the State of Oregon and State of Washington community bank time deposit program and at December 31, 2006 had $4,500 available from these sources. The Bank’s loan portfolio also contains approximately $29,138 in guaranteed government loans, which can be sold on the secondary market.
INFLATION
Substantially all of the assets and liabilities of the Company are monetary. Therefore, inflation has a less significant impact on the Company than does fluctuation in market interest rates. Inflation can lead to accelerated growth in noninterest expenses, which impacts net earnings. During the last two years, inflation, as measured by the Consumer Price Index, has not changed significantly. The effects of this inflation have not had a material impact on the Company.
The Company’s results of operations are largely dependent upon its ability to manage market risks. Changes in interest rates can have a significant effect on the Company’s financial condition and results of operations. Although permitted by its funds management policy, the Company does not presently use derivatives such as forward and futures contracts, options, or interest rate swaps to manage interest rate risk. Other types of market risk such as foreign currency exchange rate risk and commodity price risk do not arise in the normal course of the Company’s business activities.
Interest rate risk generally arises when the maturity or repricing structure of the Company’s assets and liabilities differ significantly. Asset and liability management, which among other things addresses such risk, is the process of developing, testing and implementing strategies that seek to maximize net interest income while maintaining sufficient liquidity. This process includes monitoring contractual maturity and prepayment expectations together with expected repricing of assets and liabilities under different interest rate scenarios. Generally, the Company seeks a structure that insulates net interest income from large deviations attributable to changes in market rates.
Interest rate risk is managed through the monitoring of the Company’s balance sheet by subjecting various asset and liability categories to interest rate shocks and gradual interest rate movements over a one-year period of time. Interest rate shocks use an instantaneous adjustment in market rates of large magnitudes on a static balance sheet to determine the effect such a change in interest rates would have on the Company’s net interest income and capital for the succeeding twelve-month period. Such an extreme change in interest rates and the assumption that management would take no steps to restructure the balance sheet does limit the usefulness of this type of analysis. This type of analysis tends to provide a best-case or worst-case scenario. In addition to the interest rate shock analysis, the company also prepares a rolling four quarter forecast of the balance sheet and income statement using a flat rate scenario i.e. rates unchanged and a most-likely rate scenario where rates are projected to change based on management’s analysis of expected economic conditions and interest rate environment. This analysis takes into account growth in loans and deposits and management strategies that could be employed to maximize the net interest margin and net interest income.
The Company utilizes in-house asset/liability modeling software, ProfitStar to determine the effect changes in interest rates have on net interest income. Interest rate shock scenarios are modeled in 100 basis point increments (plus or minus) in the federal funds rate. Although certain assets and liabilities may have similar repricing characteristics, they may not react correspondingly to changes in market interest rates. In the event of a change in interest rates, prepayment of loans and early withdrawal of time deposits would likely deviate from those previously assumed. Increases in market rates may also affect the ability of certain borrowers to make scheduled principal payments.
The model attempts to account for such limitations by imposing weights on the differences between repricing assets and repricing liabilities within each time segment. These weights are based on the ratio between the amount of rate change of each category of asset or liability, and the amount of change in the federal funds rate. Certain non-maturing liabilities such as checking accounts and money market deposit accounts are allocated among the various repricing time segments to meet local competitive conditions and management’s strategies.
During 2006, the model indicated that the Company continued to be asset sensitive and projects rising margins in a rising rate environment and declining margins in a falling rate environment. However, like many banks showing an asset sensitive position, the Bank’s net interest margin did not materially improve during 2006 despite the increase in short-term interest rates as a result of the flat and inverted yield curve that existed throughout the year. The following table shows the estimated impact of interest rate changes plus 300 basis point and minus 300 basis points on net interest income in 100 basis point increments. The table indicates that the Bank’s net interest income does not materially change in rapidly rising or falling interest rate environments, thus indicating a relatively balanced interest rate risk position. The base figure of $40,057 used in the analysis represents actual net interest income for the year 2006. Due to the various assumptions used for this modeling, no assurance can be given that projections will reflect actual results.
Interest Rate Shock Analysis
Net Interest Income and Market Value Performance
($ in thousands)
| | Projected | | Net Interest Income | |
| | Interest | | Estimated | $ Change | % Change | |
| | Rate Change | | Value | From Base | From Base | |
| | +300 | | $ 42,553 | $ 2,496 | 6.23% | |
| | +200 | | 41,896 | 1,839 | 4.59% | |
| | +100 | | 41,030 | 973 | 2.43% | |
| | Base | | 40,057 | 0 | 0.00% | |
| | -100 | | 39,204 | (853) | (2.13)% | |
| | -200 | | 38,563 | (1,494) | (3.73)% | |
| | -300 | | 37,930 | (2,127) | (5.31)% | |
Report of Independent Registered Public Accounting Firm
To the Board of Directors and Stockholders
Pacific Continental Corporation and Subsidiary
We have audited the accompanying consolidated balance sheets of Pacific Continental Corporation and Subsidiary (Company) as of December 31, 2006 and 2005, and the related consolidated statements of income, changes in stockholders’ equity, comprehensive income and cash flows for the years ended December 31, 2006 and 2005. We also have audited management’s assessment included in the accompanying Management Report on Internal Control over Financial Reporting that the Company maintained effective internal control over financial reporting as of December 31, 2006, based on criteria established in Internal Control - Integrated Framework issued by the Committee of Sponsoring Organizations of the Treadway Commission (COSO). The Company’s management is responsible for these financial statements, for maintaining effective internal control over financial reporting, and for its assessment of the effectiveness of internal control over financial reporting. Our responsibility is to express an opinion on these financial statements, an opinion on management's assessment, and an opinion on the effectiveness of the Company's internal control over financial reporting based on our audit.
We conducted our audit in accordance with auditing standards of the Public Company Accounting Oversight Board (United States). Those standards require that we plan and perform the audits to obtain reasonable assurance about whether the financial statements are free of material misstatement and whether effective internal control over financial reporting was maintained in all material respects. Our audit of the financial statements included examining, on a test basis, evidence supporting the amounts and disclosures in the financial statements, assessing the accounting principles used and significant estimates made by management, and evaluating the overall financial statement presentation. Our audit of internal control over financial reporting included obtaining an understanding of internal control over financial reporting, evaluating management's assessment, testing and evaluating the design and operating effectiveness of internal control, and performing such other procedures as we considered necessary in the circumstances. We believe that our audits provide a reasonable basis for our opinions.
The Company’s internal control over financial reporting is a process designed to provide reasonable assurance regarding the reliability of financial reporting and the preparation of financial statements for external purposes in accordance with generally accepted accounting principles. The Company’s internal control over financial reporting includes those policies and procedures that (1) pertain to the maintenance of records that, in reasonable detail, accurately and fairly reflect the transactions and dispositions of the assets of the Company; (2) provide reasonable assurance that transactions are recorded as necessary to permit preparation of financial statements in accordance with generally accepted accounting principles, and that receipts and expenditures of the Company are being made
Report of Independent Registered Public Accounting Firm - Page Two
only in accordance with authorizations of management and Directors of the Company; and (3) provide reasonable assurance regarding prevention or timely detection of unauthorized acquisition, use, or disposition of the Company's assets that could have a material effect on the financial statements.
Because of its inherent limitations, internal control over financial reporting may not prevent or detect misstatements. Also, projections of any evaluation of effectiveness to future periods are subject to the risk that controls may become inadequate because of changes in conditions, or that the degree of compliance with the policies or procedures may deteriorate.
In our opinion, the consolidated financial statements referred to above present fairly, in all material respects, the consolidated financial position of Pacific Continental Corporation and Subsidiary as of December 31, 2006 and 2005, and the results of their operations and their cash flows for the years ended December 31, 2006 and 2005, in conformity with accounting principles generally accepted in the United States of America. Also in our opinion, management’s assessment that Pacific Continental Corporation and Subsidiary maintained effective internal control over financial reporting as of December 31, 2006 is fairly stated, in all material respects, based on criteria established in Internal Control - Integrated Framework issued by the Committee of Sponsoring Organizations of the Treadway Commission (COSO). Furthermore, in our opinion, Pacific Continental Corporation and Subsidiary maintained, in all material respects, effective internal control over financial reporting as of December 31, 2006 based on criteria established in Internal Control - Integrated Framework issued by the Committee of Sponsoring Organizations of the Treadway Commission (COSO).

Portland, Oregon
March 12, 2007
ZIRKLE, LONG, TRIGUEIRO & WARD, L.L.C.
CERTIFIED PUBLIC ACCOUNTANTS
Eugene, Oregon 97401
Report of Independent Registered Public Accounting Firm
The Board of Directors and Stockholders
Pacific Continental Corporation and Subsidiaries:
We have audited the accompanying consolidated balance sheets of Pacific Continental Corporation and Subsidiaries as of December 31, 2004 and 2003, and the related consolidated statements of income, changes in stockholders’ equity, and cash flows for each of the three years in the period ended December 31, 2004. We have also audited management’s assessment, included in management’s report at page 55, that the Company maintained effective control over financial reporting as of December 31, 2004, based on “criteria established in Internal Control - Integrated Framework issued by the Committee of Sponsoring Organizations of the Treadway Commission (COSO)”. The Company’s management is responsible for these consolidated financial statements, for maintaining effective internal control over financial reporting, and for its assessment of the effectiveness of internal control over financial reporting. Our responsibility is to express an opinion on these consolidated financial statements, an opinion on management’s assessment, and an opinion of the effectiveness of the Company’s internal control over financial reporting based on our audits.
We conducted our audits in accordance with the standards of the Public Company Accounting Oversight Board (United States of America). Those standards require that we plan and perform the audits to obtain reasonable assurance about whether the consolidated financial statements are free of material misstatement and whether effective internal control over financial reporting was maintained in all material respects. Our audit of the financial statements included examining, on a test basis, evidence supporting the amounts and disclosures in the financial statements. The audit also included assessing the accounting principles used and significant estimates made by management, as well as evaluating the overall financial statement presentation. Our audit of internal control over financial reporting included obtaining an understanding of internal control over financial reporting, evaluating management’s assessment, testing and evaluating the design and operating effectiveness of internal control, and performing such other procedures as we considered necessary in the circumstances. We believe that our audits provide a reasonable basis for our opinions.
A company’s internal control over financial reporting is a process designed to provide reasonable assurance regarding the reliability of financial reporting and the preparation of financial statements for external purposes in accordance with generally accepted accounting principles (GAAP). A company’s internal control over financial reporting includes those policies and procedures that (1) pertain to the maintenance of records that, in reasonable detail, accurately reflect the transactions and dispositions of the assets of the company; (2) provide reasonable assurance that transactions are recorded as necessary to permit preparation of financial statements in accordance with GAAP, and that receipts and expenditures of the company are being made only in accordance with authorization of management and directors of the company; and (3) provide reasonable assurance regarding prevention or timely detection of unauthorized acquisition, use, or disposition of the company’s assets that could have a material effect on the financial statements.
Because of its inherent limitations, internal control over financial reporting may not prevent or detect misstatements. Also, projections of any evaluation of effectiveness to future periods are subject to the risk that controls may become inadequate because of changes in conditions, or that the degree of compliance with the policies or procedures may deteriorate.
In our opinion, the consolidated financial statements referred to above present fairly, in all material respects, the financial position of Pacific Continental Corporation and Subsidiaries as of December 31, 2004 and 2003, and the results of their operations and their cash flows for each of the three years in the period ended December 31, 2004 in conformity with accounting principles generally accepted in the United States of America. Also in our opinion, management’s assessment that the Company maintained effective internal control over financial reporting as of December 31, 2004, is fairly stated, in all material respects, based on “criteria established in Internal Control - Integrated Framework issued by the Committee of Sponsoring Organizations of the Treadway Commission (COSO)”. Furthermore, in our opinion the Company maintained , in all material respects, effective control over financial reporting as of December 31, 2004, based on “criteria established in Internal Control - Integrated Framework issued by the Committee of Sponsoring Organizations of the Treadway Commission (COSO)”.
Zirkle, Long, Trigueiro & Ward, L.L.C.
Eugene, Oregon
January 31, 2005
Pacific Continental Corporation and Subsidiaries
Consolidated Balance Sheets
| | | December 31 | | | |
| | | 2006 | | 2005 | |
ASSETS | | | | | | | |
| Cash and due from banks | | $ | 32,322,704 | | $ | 27,519,763 | |
| Interest-bearing deposits with banks | | | 405,759 | | | 500,000 | |
| Federal funds sold | | | 49,520 | | | 3,823,583 | |
| | | | | | | | |
| Total cash and cash equivalents | | | 32,777,983 | | | 31,843,346 | |
| | | | | | | | |
| Securities available-for-sale, at fair value | | | 38,783,063 | | | 39,344,924 | |
| Loans held for sale | | | 2,140,417 | | | 642,180 | |
| Loans, less allowance for loan losses and unearned fees | | | 758,816,132 | | | 670,529,157 | |
| Interest receivable | | | 3,998,139 | | | 3,343,920 | |
| Federal Home Loan Bank stock | | | 3,479,900 | | | 3,479,900 | |
| Property, net of accumulated depreciation and amortization | | | 18,591,317 | | | 17,002,931 | |
| Goodwill and other intangible assets | | | 23,625,699 | | | 24,201,458 | |
| Other assets | | | 3,138,058 | | | 1,406,366 | |
| | | | | | | | |
| Total assets | | $ | 885,350,708 | | $ | 791,794,182 | |
| | | | | | | | |
| | | | | | | | |
| | | | | | | | |
LIABILITIES and STOCKHOLDERS' EQUITY | | | | | | | |
| Liabilities: | | | | | | | |
| Deposits: | | | | | | | |
| Noninterest-bearing | | $ | 187,833,848 | | $ | 164,625,571 | |
| Savings and interest-bearing demand | | | 355,863,095 | | | 311,308,780 | |
| Time, $100,000 and over | | | 48,875,678 | | | 65,122,341 | |
| Other time | | | 48,699,403 | | | 63,213,928 | |
| | | | | | | | |
| | | | 641,272,024 | | | 604,270,620 | |
| | | | | | | | |
| Federal funds purchased | | | 4,410,000 | | | - | |
| Federal Home Loan Bank borrowings | | | 131,803,763 | | | 80,803,763 | |
| Junior subordinated debentures | | | 8,248,000 | | | 8,248,000 | |
| Accrued merger consideration liability | | | 256,360 | | | 13,005,313 | |
| Accrued interest and other liabilities | | | 3,625,780 | | | 4,054,492 | |
| | | | | | | | |
| Total liabilities | | | 789,615,927 | | | 710,382,188 | |
| | | | | | | | |
| Commitments and contingencies (Notes 6, 17 and 19) | | | | | | | |
| | | | | | | | |
| Stockholders' equity: | | | | | | | |
| Common stock, no par value; 25,000,000 shares | | | | | | | |
| authorized; 10,647,264 and 10,233,580 shares | | | | | | | |
| outstanding in 2006 and 2005, respectively | | | 58,254,777 | | | 53,318,970 | |
| Retained earnings | | | 37,725,453 | | | 28,452,155 | |
| Accumulated other comprehensive loss | | | (245,449 | ) | | (359,131 | ) |
| | | | | | | | |
| Total stockholders' equity | | | 95,734,781 | | | 81,411,994 | |
| | | | | | | | |
| Total liabilities and stockholders' equity | | $ | 885,350,708 | | $ | 791,794,182 | |
| | | | | | | | |
| The accompanying notes are an integral part of these consolidated financial statements. | | | | | | | |
Pacific Continental Corporation and Subsidiaries
Consolidated Statements of Income
| | | | | Year Ended December 31 | | | |
| | | 2006 | | 2005 | | 2004 | |
| Interest income: | | | | | | | | | | |
| Loans | | $ | 60,256,669 | | $ | 38,519,936 | | $ | 28,423,964 | |
| Investment securities | | | 1,667,468 | | | 1,058,761 | | | 892,503 | |
| Federal funds sold and FHLB stock dividends | | | 47,822 | | | 14,599 | | | 108,486 | |
| | | | | | | | | | | |
| | | | 61,971,959 | | | 39,593,296 | | | 29,424,953 | |
| | | | | | | | | | | |
| Interest expense: | | | | | | | | | | |
| Deposits | | | 15,881,357 | | | 7,361,230 | | | 3,232,397 | |
| Federal Home Loan Bank borrowings | | | 5,144,325 | | | 1,830,984 | | | 1,027,525 | |
| Federal funds purchased and junior subordinated debentures | | | 889,436 | | | 161,002 | | | 213,174 | |
| | | | | | | | | | | |
| | | | 21,915,118 | | | 9,353,216 | | | 4,473,096 | |
| | | | | | | | | | | |
| Net interest income | | | 40,056,841 | | | 30,240,080 | | | 24,951,857 | |
| | | | | | | | | | | |
| Provision for loan losses | | | 600,000 | | | 1,100,000 | | | 500,000 | |
| | | | | | | | | | | |
| Net interest income after provision for | | | | | | | | | | |
| loan losses | | | 39,456,841 | | | 29,140,080 | | | 24,451,857 | |
| | | | | | | | | | | |
| Noninterest income: | | | | | | | | | | |
| Service charges on deposit accounts | | | 1,333,421 | | | 1,377,695 | | | 1,603,440 | |
| Other fee income, principally bankcard processing | | | 1,494,764 | | | 1,384,728 | | | 1,409,283 | |
| Loan servicing | | | 108,644 | | | 151,878 | | | 183,267 | |
| Mortgage banking income and gains on sales | | | | | | | | | | |
| of loans | | | 805,234 | | | 922,991 | | | 1,006,920 | |
| Losses on sales of securities | | | - | | | (10,674 | ) | | (12,820 | ) |
| Gain on sale of property | | | 335,341 | | | - | | | - | |
| Other | | | 323,295 | | | 256,214 | | | 272,579 | |
| | | | | | | | | | | |
| | | | 4,400,699 | | | 4,082,832 | | | 4,462,669 | |
| | | | | | | | | | | |
| Noninterest expense: | | | | | | | | | | |
| Salaries and employee benefits | | | 14,577,938 | | | 11,197,445 | | | 9,963,554 | |
| Premises and equipment | | | 3,064,930 | | | 2,153,967 | | | 1,881,202 | |
| Bankcard processing | | | 509,461 | | | 485,327 | | | 475,639 | |
| Business development | | | 1,444,176 | | | 1,263,467 | | | 1,017,214 | |
| Other | | | 4,194,229 | | | 3,033,931 | | | 2,703,163 | |
| | | | | | | | | | | |
| | | | 23,790,734 | | | 18,134,137 | | | 16,040,772 | |
| | | | | | | | | | | |
| Income before income taxes | | | 20,066,806 | | | 15,088,774 | | | 12,873,753 | |
| | | | | | | | | | | |
| Provision for income taxes | | | 7,412,288 | | | 5,510,475 | | | 4,925,000 | |
| | | | | | | | | | | |
| Net income | | $ | 12,654,518 | | $ | 9,578,299 | | $ | 7,948,752 | |
| | | | | | | | | | | |
| | | | | | | | | | | |
| Earnings per share: | | | | | | | | | | |
| Basic | | $ | 1.20 | | $ | 1.08 | | $ | .93 | |
| Diluted | | $ | 1.18 | | $ | 1.05 | | $ | .90 | |
| | | | | | | | | | | |
| | | | | | | | | | | |
| The accompanying notes are an integral part of these consolidated financial statements. | | | | | | | | | | |
Pacific Continental Corporation and Subsidiaries
Consolidated Statements of Changes in Stockholders’ Equity
For the Years Ended December 31, 2006, 2005, and 2004
| | | | | | | | | Accumulated | | | |
| | | | | | | | Other | | | |
| | Number | | Common | | Retained | | Comprehensive | | | |
| | of Shares | | Stock | | Earnings | | Income (Loss) | | Total | |
| | | | | | | | | | | | |
| Balance, January 1, 2004 | | | 6,789,787 | | $ | 26,619,206 | | $ | 15,644,669 | | $ | (30,025 | ) | $ | 42,233,850 | |
| | | | | | | | | | | | | | | | | |
| Net income | | | | | | | | | 7,948,752 | | | | | | 7,948,752 | |
| Other comprehensive loss: | | | | | | | | | | | | | | | | |
| Unrealized losses on securities | | | | | | | | | | | | (148,568 | ) | | | |
| Reclassification of net losses realized | | | | | | | | | | | | 12,820 | | | | |
| Deferred income taxes | | | | | | | | | | | | 52,072 | | | | |
| | | | | | | | | | | | | | | | | |
| Other comprehensive loss | | | | | | | | | | | | (83,676 | ) | | (83,676 | ) |
| | | | | | | | | | | | | | | | | |
| Comprehensive income | | | | | | | | | | | | | | | 7,865,076 | |
| Stock options exercised and related | | | | | | | | | | | | | | | | |
| tax benefit | | | 141,360 | | | 1,459,879 | | | | | | | | | 1,459,879 | |
| Stock split (5 shares for 4) | | | 1,724,586 | | | | | | | | | | | | | |
| Cash dividends | | | | | | | | | (2,163,788 | ) | | | | | (2,163,788 | ) |
| Shares repurchased and retired | | | (198 | ) | | (2,960 | ) | | | | | | | | (2,960 | ) |
| | | | | | | | | | | | | | | | | |
| Balance, December 31, 2004 | | | 8,655,535 | | | 28,076,125 | | | 21,429,633 | | | (113,701 | ) | | 49,392,057 | |
| | | | | | | | | | | | | | | | | |
| Net income | | | | | | | | | 9,578,299 | | | | | | 9,578,299 | |
| Other comprehensive loss: | | | | | | | | | | | | | | | | |
| Unrealized losses on securities | | | | | | | | | | | | (408,817 | ) | | | |
| Reclassification of net losses realized | | | | | | | | | | | | 10,674 | | | | |
| Deferred income taxes | | | | | | | | | | | | 152,713 | | | | |
| | | | | | | | | | | | | | | | | |
| Other comprehensive loss | | | | | | | | | | | | (245,430 | ) | | (245,430 | ) |
| | | | | | | | | | | | | | | | | |
| Comprehensive income | | | | | | | | | | | | | | | 9,332,869 | |
| Stock options exercised and related | | | | | | | | | | | | | | | | |
| tax benefit | | | 166,615 | | | 1,363,033 | | | | | | | | | 1,363,033 | |
| Stock issued in NWBF acquisition | | | 1,411,430 | | | 23,879,812 | | | | | | | | | 23,879,812 | |
| Cash dividends | | | | | | | | | (2,555,777 | ) | | | | | (2,555,777 | ) |
| | | | | | | | | | | | | | | | | |
| Balance, December 31, 2005 | | | 10,233,580 | | | 53,318,970 | | | 28,452,155 | | | (359,131 | ) | | 81,411,994 | |
| | | | | | | | | | | | | | | | | |
| Net income | | | | | | | | | 12,654,518 | | | | | | 12,654,518 | |
| Other comprehensive loss: | | | | | | | | | | | | | | | | |
| Unrealized losses on securities | | | | | | | | | | | | 184,430 | | | | |
| Deferred income taxes | | | | | | | | | | | | (70,748 | ) | | | |
| | | | | | | | | | | | | | | | | |
| Other comprehensive loss | | | | | | | | | | | | 113,682 | | | 113,682 | |
| | | | | | | | | | | | | | | | | |
| Comprehensive income | | | | | | | | | | | | | | | 12,768,200 | |
| Stock options exercised and related | | | | | | | | | | | | | | | | |
| tax benefit | | | 413,684 | | | 4,349,887 | | | | | | | | | 4,349,887 | |
| Stock-based compensation | | | | | | 585,920 | | | | | | | | | 585,920 | |
| Cash dividends | | | | | | | | | (3,381,220 | ) | | | | | (3,381,220 | ) |
| | | | | | | | | | | | | | | | | |
| Balance, December 31, 2006 | | | 10,647,264 | | $ | 58,254,777 | | $ | 37,725,453 | | $ | (245,449 | ) | $ | 95,734,781 | |
| | | | | | | | | | | | | | | | | |
| | | | | | | | | | | | | | | | | |
| The accompanying notes are an integral part of these consolidated financial statements. | | | | | | | | | | | | | | | | |
Pacific Continental Corporation and Subsidiaries
Consolidated Statements of Cash Flows
| | | | | | | | |
| | | | | Years Ended December 31, | | | |
| | | 2006 | | 2005 | | 2004 | |
| | | | | | | | |
| Cash flows from operating activities: | | | | | | | | | | |
| Net income | | $ | 12,654,518 | | $ | 9,578,299 | | $ | 7,948,752 | |
| | | | | | | | | | | |
| Adjustments to reconcile net income to net cash | | | | | | | | | | |
| from operating activities: | | | | | | | | | | |
| Depreciation and amortization | | | 1,673,173 | | | 1,169,809 | | | 1,348,101 | |
| Gain on sale of property | | | (335,341 | ) | | - | | | - | |
| Loss on sale or write-down of property and equipment | | | 5,641 | | | - | | | - | |
| Provision for loan losses | | | 600,000 | | | 1,100,000 | | | 500,000 | |
| (Gains) losses on foreclosed assets | | | (42,091 | ) | | (60,391 | ) | | 1,643 | |
| Deferred income taxes | | | (1,049,000 | ) | | 33,000 | | | 44,000 | |
| Losses on sale of securities | | | - | | | 10,674 | | | 12,820 | |
| Federal Home Loan Bank stock dividend | | | - | | | (11,200 | ) | | (91,900 | ) |
| Shared-based compensation | | | 585,920 | | | - | | | - | |
| Excess tax benefit of stock options exercised | | | (272,000 | ) | | - | | | - | |
| Change in: | | | | | | | | | | |
| Interest receivable | | | (654,219 | ) | | (620,238 | ) | | (383,226 | ) |
| Deferred loan fees | | | (120,525 | ) | | 548,177 | | | 478,454 | |
| Capitalized loan servicing rights | | | 4,714 | | | 23,098 | | | 50,633 | |
| Production of mortgage loans held-for-sale | | | (31,988,422 | ) | | (36,719,062 | ) | | (41,630,720 | ) |
| Proceeds from the sale of mortgage loans held-for-sale | | | 30,490,185 | | | 38,149,233 | | | 41,516,039 | |
| Accrued interest payable and other liabilities | | | (1,157,061 | ) | | 167,955 | | | 242,401 | |
| Income taxes payable | | | 890,707 | | | (39,288 | ) | | 1,167,680 | |
| Other assets | | | (231,731 | ) | | (212,046 | ) | | 23,040 | |
| | | | | | | | | | | |
| Net cash provided by operating activities | | | 11,054,468 | | | 13,118,020 | | | 11,227,717 | |
| | | | | | | | | | | |
| Cash flow from investing activities: | | | | | | | | | | |
| Proceeds from sales and maturities of investment securities | | | 6,685,618 | | | 8,148,608 | | | 8,126,633 | |
| Purchase of investment securities | | | (6,166,764 | ) | | (10,092,408 | ) | | (6,193,678 | ) |
| Loans made net of principal collections received | | | (86,667,223 | ) | | (72,806,087 | ) | | (103,131,306 | ) |
| Proceeds from sales of loans | | | 4,232,122 | | | - | | | 595,153 | |
| Purchase of loans | | | (6,314,912 | ) | | (7,715,383 | ) | | (1,372,313 | ) |
| Cash paid for acquisitions | | | (12,748,953 | ) | | 3,003,468 | | | - | |
| Purchase of property | | | (2,905,826 | ) | | (4,208,717 | ) | | (1,058,764 | ) |
| Proceeds from sale of property | | | 403,007 | | | | | | | |
| Proceeds on sale of foreclosed assets | | | 194,405 | | | 880,281 | | | 409,118 | |
| Purchase of equity investments | | | - | | | (258,000 | ) | | - | |
| | | | | | | | | | | |
| Net cash provided by investing activities | | | (103,288,526 | ) | | (83,048,238 | ) | | (102,625,157 | ) |
| | | | | | | | | | | |
| Cash flow from financing activities: | | | | | | | | | | |
| Change in deposits | | | 37,321,028 | | | 76,663,834 | | | 47,692,238 | |
| Change in federal funds purchased and FHLB CMA | | | 28,410,000 | | | (10,290,000 | ) | | 31,790,000 | |
| Proceeds from FHLB term advances originated | | | 489,002,006 | | | 60,088,197 | | | 16,502,004 | |
| FHLB term advances paid-off | | | (462,002,006 | ) | | (47,502,005 | ) | | (13,002,004 | ) |
| Change in junior subordinated debentures | | | - | | | 8,248,000 | | | - | |
| Proceeds from stock options exercised | | | 3,546,887 | | | 1,039,033 | | | 1,127,879 | |
| Excess tax benefit of stock options exercised | | | 272,000 | | | - | | | - | |
| Dividends paid | | | (3,381,220 | ) | | (2,555,777 | ) | | (2,163,789 | ) |
| Repurchase of Company shares | | | - | | | - | | | (2,960 | ) |
| | | | | | | | | | | |
| Net cash provided by financing activities | | | 93,168,695 | | | 85,691,282 | | | 81,943,368 | |
| | | | | | | | | | | |
| Net increase (decrease) in cash and cash equivalents | | | 934,636 | | | 15,761,064 | | | (9,454,072 | ) |
| | | | | | | | | | | |
| Cash and cash equivalents, beginning of year | | | 31,843,346 | | | 16,082,282 | | | 25,536,354 | |
| | | | | | | | | | | |
| Cash and cash equivalents, end of year | | $ | 32,777,982 | | $ | 31,843,346 | | $ | 16,082,282 | |
| | | | | | | | | | | |
| Supplemental information: | | | | | | | | | | |
| Noncash investing and financing activities: | | | | | | | | | | |
| Transfers of loans to foreclosed assets | | $ | 21,557 | | $ | 508,501 | | $ | 262,071 | |
| Change in unrealized gain on securities, net of deferred income taxes | | | (113,682 | ) | | 245,430 | | | 83,676 | |
| Adjustment to goodwill resulting from NWBF acquisition | | | (353,007 | ) | | | | | | |
| Cash paid during the year for: | | | | | | | | | | |
| Income taxes | | $ | 7,324,581 | | $ | 5,429,003 | | $ | 3,713,320 | |
| Interest | | $ | 21,792,827 | | $ | 9,005,443 | | $ | 4,468,436 | |
| Acquisitions: | | | | | | | | | | |
| Assets acquired | | | | | $ | (177,072,077 | ) | | | |
| Goodwill and core deposit intangible | | | | | | 23,944,489 | | | | |
| Liabilities assumed | | | | | | 142,085,273 | | | | |
| Compensation due NWBF shareholders, deferred taxes , other liab. | | | | | | 14,045,783 | | | | |
| | | | | | | | | | | |
| Net cash received (paid) | | | | | $ | 3,003,468 | | | | |
| | | | | | | | | | | |
| | | | | | | | | | | |
| The accompanying notes are an integral part of these consolidated financial statements. | | | | | | | | | | |
Pacific Continental Corporation and Subsidiaries
Notes to Consolidated Financial Statements
1. Summary of Significant Accounting Policies:
Principles of Consolidation - The consolidated financial statements include the accounts of Pacific Continental Corporation (the “Company”), a bank holding company, and its wholly-owned subsidiary, Pacific Continental Bank (the “Bank”) and the Bank’s wholly-owned subsidiaries, PCB Service Corporation (which owns and operates bank-related real estate but is currently inactive) and PCB Loan Services Corporation (which owns and operates certain repossessed or foreclosed collateral but is currently inactive). The Bank provides commercial banking, financing, mortgage lending and other services in Western Oregon and Western Washington. All significant intercompany accounts and transactions have been eliminated in consolidation.
In November 2005, the Company formed a wholly-owned Delaware statutory business trust subsidiary, Pacific Continental Corporation Capital Trust (the “Trust”), which issued $8,248,000 of guaranteed undivided beneficial interests in the Pacific Continental’s Junior Subordinated Deferrable Interest Debentures (“Trust Preferred Securities”). Pacific Continental has not consolidated the accounts of the Trust in its consolidated financial statements in accordance with FASB FIN 46R, Consolidation of Variable Interest Entities. As a result, the junior subordinated debentures issued by Pacific Continental to the issuer trust, totaling $8,248,000, are reflected on Pacific Continental’s consolidated balance sheet at December 31, 2006, under the caption, “Junior Subordinated Debentures”. Pacific Continental also recognized its $248,000 investment in the Trust, which is recorded among “Other Assets” in its consolidated balance sheet at December 31, 2006.
Use of Estimates - The preparation of financial statements in conformity with generally accepted accounting principles requires management to make estimates and assumptions that affect the reported amounts of assets and liabilities and disclosure of contingent assets and liabilities at the date of the financial statements, and the reported amounts of revenues and expenses during the reporting period. Actual results could differ from those estimates. The most significant estimations made by management involve fair value calculations made in connection with accounting for business combinations, the calculation of the allowance for loan losses, the fair value of investment securities, and the impairment calculation for goodwill.
Cash and Cash Equivalents - For purposes of reporting cash flows, cash and cash equivalents include cash on hand, amounts due from or deposited with banks, interest-bearing balances due from banks, and federal funds sold. Generally, federal funds are sold for one-day periods.
The Bank is required to maintain certain reserves as defined by regulation. Such reserves totaling $1,411,000 and $1,616,000 were maintained in cash at December 31, 2006 and 2005, respectively.
Securities Available-for-Sale - Securities available-for-sale are held for indefinite periods of time and may be sold in response to movements in market interest rates, changes in the maturity or mix of Bank assets and liabilities or demand for liquidity. Although management determines the appropriate classification of securities at the time of purchase, the Bank classified all securities as available-for-sale throughout 2006 and 2005. Securities classified as available-for-sale are reported at estimated fair value. The difference between estimated fair value and amortized cost is recorded as a separate component of stockholders’ equity (accumulated other comprehensive income). Fair values for these investment securities are based on available market prices. Gains and losses on the sale of available-for-sale securities are determined using the specific-identification method. Interest income on securities available-for-sale is included in income using the level yield method.
Declines in fair value of individual available-for-sale securities below their cost that are other than temporary would result in write-downs of the individual securities to their fair value. The related write-downs would be included in earnings as realized losses. Management believes that all unrealized losses on investment securities at December 31, 2006 and 2005 are temporary.
Loans Held for Sale and Mortgage Banking Activities - The Bank originates residential real estate loans for resale in the secondary market. Sales are without recourse and the Bank generally does not retain mortgage servicing rights. Loans held for sale are carried at the lower of cost or market. Market value is determined on an aggregate loan basis.
Loans and Income Recognition - Loans are stated at the amount of unpaid principal plus loan premiums for purchased loans, reduced by net deferred loan origination fees, discounts associated with retained portions of loans sold, and an allowance for loan losses. Interest on loans is calculated using the simple-interest method on daily balances of the principal amount outstanding. Accrual of interest is discontinued on contractually delinquent loans when management believes, after considering economic and business conditions and collection efforts that the borrower’s financial condition is such that collection of the interest is doubtful. Interest income is subsequently recognized only to the extent cash payments are received or the principal balance of the loan is brought current. Loan origination fees, net of origination costs and discounts, are amortized over the lives of the loans as adjustments to yield.
Allowance for Loan Losses - The allowance for loan losses is established through a provision for loan losses charged to expense. Loans are charged against the allowance for loan losses when management believes that the collectibility of principal is unlikely. The allowance is an amount that management considers adequate to absorb possible losses on existing loans that may become uncollectible based on evaluations of the collectibility of loans and prior loss experience. The evaluations take into consideration such factors as changes in the nature of the loan portfolio, overall portfolio quality, review of specific loans, estimated value of underlying collateral, and current economic conditions that may affect the borrower’s ability to pay. This evaluation is inherently subjective as it requires estimates that are susceptible to significant subsequent revision as more information becomes available.
A loan is considered impaired when management believes that it is probable that all amounts will not be collected according to the contractual terms. An impaired loan is valued using the present value of expected cash flows discounted at the loan’s effective interest rate, the observable market price of the loan or the estimated fair value of the loan’s collateral or related guaranty. Loans deemed impaired are specifically allocated for in the allowance for loan losses.
Federal Home Loan Bank Stock - The investment in Federal Home Loan Bank (“FHLB”) stock is carried at par value, which approximates its fair value. As a member of the FHLB system, the Bank is required to maintain a minimum level of investment in FHLB stock based on specific percentages of its outstanding mortgages, total assets or FHLB advances. As of December 31, 2006, the minimum required investment was approximately $3,479,900. The Bank may request redemption at par value of any stock in excess of the amount the Bank is required to hold. Stock redemptions are at the discretion of the FHLB.
Foreclosed Assets - Assets acquired through foreclosure, or deeds in lieu of foreclosure, are initially recorded at fair value, less the estimated cost of disposal, at the date of foreclosure. Any excess of the loan’s balance over the fair value of its foreclosed collateral is charged to the allowance for loan losses.
Improvements to foreclosed assets are capitalized. Subsequent to foreclosure, management performs periodic valuations and the assets’ carrying value may be adjusted to the lower of carrying amount or fair value, less costs to sell. Write downs to net realizable value, if any, or any disposition gains or losses are included in noninterest income or expense.
Property - Property is stated at cost, net of accumulated depreciation and amortization. Additions, betterments and replacements of major units are capitalized. Expenditures for normal maintenance, repairs and replacements of minor units are charged to expense as incurred. Gains or losses realized from sales or retirements are reflected in operations currently.
Depreciation and amortization is computed by the straight-line method over the estimated useful lives of the assets. Estimated useful lives are 30 to 40 years for buildings, 3 to 10 years for furniture and equipment, and up to the lesser of the useful life or lease term for leasehold improvements.
Goodwill and Other Intangible Assets- Goodwill represents the excess of cost over the fair value of net assets acquired in business combinations. Under Statement of Financial Accounting Standard (SFAS) No. 142, Goodwill and Other Intangible Assets, the Bank does not amortize the balance of goodwill, but completes periodic assessments of goodwill impairment. Goodwill impairment is deemed to exist if the net book value of a reporting unit giving rise to the recognition of goodwill exceeds estimated fair value. The Bank’s assessments have not identified impairment of goodwill such that the net book value of the applicable reporting unit exceeded its estimated fair value as of December 31, 2006 and 2005.
Advertising - Advertising costs are charged to expense during the year in which they are incurred. Advertising expenses were $845,136 and $780,033 and $621,419 for the years ended December 31, 2006, 2005 and 2004, respectively.
Income Taxes - Income taxes are accounted for using the asset and liability method. Deferred tax assets and liabilities are recognized for the expected future tax consequences attributable to differences between financial statement carrying amounts of existing assets and liabilities and their respective tax bases. Deferred tax assets and liabilities are calculated using tax rates in effect for the year in which the differences are expected to reverse. Valuation allowances are established to reduce the net carrying amount of deferred tax assets if it is determined to be more likely than not, that all or some of the potential deferred tax asset will not be realized.
Earnings Per Share - Basic earnings per share are computed by dividing net income by the weighted average number of shares outstanding during the period. Diluted earnings per share include the effect of common stock equivalents that would arise from the exercise of stock options discussed in Note 15. Weighted shares outstanding are adjusted retroactively for the effect of stock dividends.
Weighted average shares outstanding at December 31 are as follows:
| | | 2006 | | 2005 | | 2004 | |
| | | | | | | | | | | |
| Basic | | | 10,532,995 | | | 8,885,181 | | | 8,572,526 | |
| Common stock equivalents attributable | | | | | | | | | | |
| to stock-based compensation plans | | | 164,436 | | | 255,576 | | | 235,623 | |
| | | | | | | | | | | |
| Diluted | | | 10,697,431 | | | 9,140,757 | | | 8,808,149 | |
As of December 31, 2006, 315,405 outstanding options to purchase stock were excluded from the dilutive shares calculation because of the current anti-dilutive nature of these options. No material effect on diluted earnings per share was recognized as a result of anti-dilutive options during 2005 and 2004.
Share-Based Payment Plans - Prior to 2006, the Company applied the recognition and measurement principles of APB Opinion No. 25, Accounting for Stock Issued to Employees, and related Interpretations in accounting for its stock option plans. No stock-based employee compensation expense was reflected in net income as all option grants under those plans had an exercise price equal to the market value of the underlying common stock on the date of grant. The Company adopted FASB Statement No. 123(R), “Share-Based Payment” (“FAS 123R”), effective January 1, 2006. The Company applies the recognition and measurement principles of this statement in accounting for its various equity compensation plans. The following table illustrates the effects on net income and earnings per share if the Company had applied “FAS123R” to stock-based employee compensation in years prior to 2006.
| | | | | Year Ended December 31 | | | |
| | | 2006 | | 2005 | | 2004 | |
| Net income - as reported | | $ | 12,654,518 | | $ | 9,578,299 | | $ | 7,948,752 | |
| Deduct total stock-based | | | | | | | | | | |
| employee compensation | | | | | | | | | | |
| expense determined under | | | | | | | | | | |
| fair value method for all | | | | | | | | | | |
| awards, net of related tax | | | | | | | | | | |
| effects | | | - | | | (514,866 | ) | | (429,832 | ) |
| | | | | | | | | | | |
| Net income - pro forma | | $ | 12,654,518 | | $ | 9,063,433 | | $ | 7,518,920 | |
| Earnings per share: | | | | | | | | | | |
| Basic - as reported | | | 1.20 | | | 1.08 | | | 0.93 | |
| Basic - pro forma | | | - | | | 1.02 | | | 0.88 | |
| Diluted - as reported | | | 1.18 | | | 1.05 | | | 0.90 | |
| Diluted - pro forma | | | - | | | 0.99 | | | 0.85 | |
Recently Issued Accounting Pronouncements - In February 2006, the Financial Accounting Standards Board (“FASB”) issued Statement No. 155, Accounting for Certain Hybrid Financial Instruments. This Statement amends FASB Statements No. 133, Accounting for Derivative Instruments and Hedging Activities, and No. 140, Accounting for Transfers and Servicing of Financial Assets and Extinguishments of Liabilities. FAS 155, which is effective for the Company beginning in 2007, addresses hybrid financial instruments with embedded derivatives, securitized financial assets, and qualifying special-purpose entities holding derivative financial instruments. Implementation of this Statement is not expected to have a significant impact on the Company’s consolidated financial condition or results of operations.
In March 2006, the Financial Accounting Standards Board (“FASB”) issued Statement No. 156, Accounting for Servicing of Financial Assets - An Amendment of FASB Statement No. 140. This Statement amends FASB Statement No. 140, Accounting for Transfers and Servicing of Financial Assets and Extinguishments of Liabilities, with respect to the accounting for separately recognized servicing assets and servicing liabilities. FAS 156 is effective for the Company beginning in 2007. This Statement is not expected to have a significant impact on the Company’s consolidated financial condition or results of operations.
In early July 2006, the Financial Accounting Standards Board (“FASB”) issued FASB Interpretation (FIN) No. 48, Accounting for Uncertainty in Income Taxes—an Interpretation of Statement No. 109. FIN 48 establishes a recognition threshold and measurement for income tax positions recognized in an enterprise’s financial statements in accordance with FASB Statement No. 109, Accounting for Income Taxes. FIN 48 also prescribes a two-step evaluation process for tax positions. The first step is recognition and the second is measurement. For recognition, an enterprise judgmentally determines whether it is more-likely-than-not that a tax position will be sustained upon examination based on the technical merits of the position. If the tax position meets the more-likely-than-not recognition threshold, it is measured and recognized in the financial statements. If a tax position does not meet the more-likely-than-not recognition threshold, the benefit of that position is not recognized in the financial statements. Tax positions that meet the more-likely-than-not recognition threshold at the effective date of FIN 48 may be recognized or, continue to be recognized, upon adoption of this Interpretation. The cumulative effect of applying the provisions of FIN 48 shall be reported as an adjustment to the opening balance of retained earnings for that fiscal year. FIN 48 is effective for the Company beginning in 2007. The Company is evaluating the impact of adoption of FIN 48 and at this time does not believe it will have a material impact on the Company’s consolidated financial condition or results of operations.
In September 2006, the Financial Accounting Standards Board (“FASB”) issued Statement 157, “Fair Value Measurement.” Defining fair value, establishing a framework for measuring fair value in generally accepted accounting principles, and expanding disclosures about fair value measurements. FAS 157 is effective for the Company beginning in 2008, The Company is currently evaluating the impact of the adoption of SFAS No. 157.
In September 2006, the Financial Accounting Standards Board (“FASB”) issued Statement 158, “Employers’ Accounting for Defined Benefit Pension and Other Post Retirement Plans” an amendment of FASB Statements No. 87, 88, 106, and 132(R) (“SFAS 158”). This standard requires employers to recognize the underfunded or overfunded status of a defined benefit postretirement plan as an asset or liability in its statement of financial position and to recognize changes in the funded status in the year in which the changes occur through accumulated other comprehensive income. The new reporting requirements and related new footnote disclosure rules of SFAS 158 are effective for fiscal years ending after December 15, 2006, and are not expected to have a material impact on our financial statements as the Company does not currently offer a defined benefit plan for its employees.
Reclassifications - Certain amounts contained in the 2005 and 2004 consolidated financial statements have been reclassified where appropriate to conform with the financial statement presentation used in 2006. These reclassifications had no effect on previously reported net income.
2. Acquisition NWB Financial Corporation:
On November 30, 2005, Pacific Continental Corporation acquired NWB Financial Corporation and its wholly-owned subsidiary Northwest Business Bank. The aggregate purchase price was $40,433,525 and included 1,411,430 shares of common stock, stock options valued at $1,760,737, cash of $15,472,364, and direct merger costs of $970,402. The value of the 1,411,430 was determined based on the $15.75 average closing market price of the Company’s common stock, on August 17, 2005 when the merger agreement was announced.
The fair values of the NWB Financial Corporation assets acquired and liabilities assumed as of November 30, 2005 were recorded as follows:
| Assets | | | | |
| Cash and due from banks | | $ | 5,446,721 | |
| Investment securities | | | 11,122,138 | |
| Loans, net of allowance for loan losses | | | 140,566,274 | |
| Property and equipment | | | 554,233 | |
| Goodwill and core deposit intangible | | | 23,944,489 | |
| Other assets | | | 884,942 | |
| | | | | |
| Total assets acquired | | $ | 182,518,797 | |
| | | | | |
| Liabilities | | | | |
| Deposits | | $ | 123,815,478 | |
| Borrowings | | | 17,217,571 | |
| Other liabilities | | | 1,052,223 | |
| | | | | |
| Total liabilities assumed | | | 142,085,272 | |
| Net assets acquired | | | 40,433,525 | |
| | | | | |
| Total liabilities assumed and net assets acquired | | $ | 182,518,797 | |
| | | | | |
| The acquisition cost of the net assets acquired are summarized as follows: | | | | |
| | | | | |
| Fair value of common stock issued to | | $ | 22,230,023 | |
| NWBF shareholders | | | | |
| Fair value of stock options | | | 1,760,737 | |
| Cash paid to NWBF shareholders | | | 2,467,051 | |
| Cash payable to NWBF shareholders | | | 13,005,313 | |
| Direct transaction costs incurred | | | 404,360 | |
| Restructuring charges in the form of | | | | |
| severance and other payments | | | 566,041 | |
| | | | | |
| Total acquisition cost | | $ | 40,433,525 | |
Goodwill of $22,383,545 was originally recognized at the time of acquisition but was adjusted to a balance of $22,030,538 during 2006. The adjustment of $353,007 is the result of derecognition of estimated liabilities recorded as of the acquisition date.
The following information presents unaudited pro forma results of operations for the years ended December 31, 2005 and 2004, as though the NWB Financial Corporation acquisition had occurred on January 1, 2004. The pro forma results do not necessarily indicate the results that would have been obtained had the acquisition actually occurred on January 1, 2004.
| | | Years Ended December 31 | | | |
| | | | 2005 | | | 2004 | |
| | | | | | | | |
| Total interest income and noninterest income | | $ | 44,100,000 | | $ | 37,450,000 | |
| Net income | | $ | 11,774,700 | | $ | 10,007,000 | |
| | | | 26.70 | % | | | |
| Basic earnings per share | | $ | 1.16 | | $ | 1.00 | |
| Diluted earnings per share | | $ | 1.12 | | $ | 0.97 | |
| | | | | | | | |
| Basic shares outstanding | | | 10,172,869 | | | 9,980,789 | |
| Diluted shares outstanding | | | 10,529,280 | | | 10,323,607 | |
The following table summarizes activity in the Company’s accrued restructuring charges:
| | | | Years Ended December 31 | | | | |
| | | | 2006 | | | 2005 | |
| | | | | | | | |
| Restructuring charge liability balance, beginning of year | | $ | 453,745 | | $ | 566,041 | |
| Payments made for restructuring charges | | | (420,362 | ) | | (112,296 | ) |
| Adjustment to goodwill | | | (33,383 | ) | | - | |
| | | | | | | | |
| Restructuring charge liability balance, end of year | | $ | - | | $ | 453,745 | |
3. Securities Available-for-Sale:
The amortized cost and estimated fair values of securities available-for-sale at December 31, 2006 are as follows:
| | | | | | | | | | | | | | | | Securities in | | | Securities in | |
| | | | | | | | | | | | | | | | Continuous | | | Continuous | |
| | | | | | | | | | | | | | | | Unrealized | | | Unrealized | |
| | | | | | | | | | | | | | | | Loss | | | Loss | |
| | | | | | | Gross | | | Gross | | | Estimated | | | Position for | | | Position For | |
| | | | Amortized | | | Unrealized | | | Unrealized | | | Fair | | | Less Than | | | 12 Months | |
Unrealized Loss Positions | | | Cost | | | Gains | | | Losses | | | Value | | | 12 Months | | | or Longer | |
| Obligations of U.S. | | | | | | | | | | | | | | | | | | | |
| Government agencies | | $ | 14,693,191 | | $ | - | | $ | 191,895 | | $ | 14,501,296 | | $ | 338,079 | | $ | 14,163,218 | |
| Obligations of states and | | | | | | | | | | | | | | | | | | | |
| political subdivisions | | | 4,760,396 | | | - | | | 85,575 | | | 4,674,821 | | | - | | | 4,674,821 | |
| Mortgage-backed securities | | | 15,162,279 | | | - | | | 201,765 | | | 14,960,514 | | | 3,257,680 | | | 11,702,833 | |
| | | | | | | | | | | | | | | | | | | | |
| | | $ | 34,615,866 | | $ | - | | $ | 479,235 | | $ | 34,136,631 | | $ | 3,595,759 | | $ | 30,540,872 | |
| | | | | | | | | | | | | | | | | | | | |
Unrealized Gain Positions | | | | | | | | | | | | | | | | | | | |
| | | | | | | | | | | | | | | | | | | | |
| Obligations of U.S. | | | | | | | | | | | | | | | | | | | |
| Government agencies | | $ | - | | $ | - | | $ | - | | $ | - | | | | | | | |
| Obligations of states and | | | | | | | | | | | | | | | | | | | |
| political subdivisions | | | 858,271 | | | 62,562 | | | - | | | 920,833 | | | | | | | |
| Mortgage-backed securities | | | 3,707,123 | | | 18,476 | | | - | | | 3,725,599 | | | | | | | |
| | | | | | | | | | | | | | | | | | | | |
| | | | 4,565,394 | | | 81,038 | | | - | | | 4,646,432 | | | | | | | |
| | | | | | | | | | | | | | | | | | | | |
| | | $ | 39,181,260 | | $ | 81,038 | | $ | 479,235 | | $ | 38,783,063 | | | | | | | |
At December 31, 2006, there were 69 investment securities in unrealized loss positions. The decline in value of these securities has resulted from increases in market interest rates subsequent to the purchase of the securities. The projected average life of the securities portfolio is approximately three years. Although yields on these securities may be below market rates during that period, no loss of principal is expected.
The amortized cost and estimated fair values of securities available-for-sale at December 31, 2005 are as follows:
| | | | | | | Gross | | | Gross | | | Estimated | |
| | | | Amortized | | | Unrealized | | | Unrealized | | | Fair | |
| | | | Cost | | | Gains | | | Losses | | | Value | |
| | | | | | | | | | | | | | |
| Obligations of U.S | | | | | | | | | | | | | |
| Government agencies | | $ | 16,967,208 | | $ | 368 | | $ | 210,374 | | $ | 16,757,202 | |
| Obligation of states and | | | | | | | | | | | | | |
| political subdivisions | | | 4,957,016 | | | - | | | 136,731 | | $ | 4,820,285 | |
| Mortgage-backed securities | | | 18,003,289 | | | 6,191 | | | 242,043 | | | 17,767,437 | |
| | | | | | | | | | | | | | |
| | | $ | 39,927,513 | | $ | 6,559 | | $ | 589,148 | | $ | 39,344,924 | |
The amortized cost and estimated fair value of securities at December 31, 2006 and 2005 by contractual maturity, are shown below. Expected maturities will differ from contractual maturities because issuers may have the right to call or prepay obligations.
| | | | 2006 | | | | | | 2005 | | | | |
| | | | | | Estimated | | | | | | Estimated | |
| | | Amortized | | | Fair | | | Amortized | | | Fair | |
| | | | Cost | | | Value | | | Cost | | | Value | |
| Due in one year or less | | $ | 4,476,088 | | $ | 4,431,025 | | $ | 1,871,416 | | $ | 1,871,058 | |
| Due after one year through 5 years | | | 11,739,692 | | | 11,543,625 | | | 16,606,177 | | | 16,342,251 | |
| Due after 5 years through 10 years | | | 3,192,889 | | | 3,224,696 | | | 1,163,280 | | | 1,140,967 | |
| Due after 10 years | | | 903,189 | | | 897,605 | | | 2,283,351 | | | 2,223,211 | |
| Mortgage-backed securities | | | 18,869,402 | | | 18,686,112 | | | 18,003,289 | | | 17,767,437 | |
| | | | | | | | | | | | | | |
| | | $ | 39,181,260 | | $ | 38,783,063 | | $ | 39,927,513 | | $ | 39,344,924 | |
No securities were sold in 2006. Gross realized losses on the sale of investment securities were $10,674 in 2005 and $12,820 in 2004.
At December 31, 2006, securities with amortized costs of $9,580,104 (estimated market values of $9,422,607) were pledged to secure certain Treasury and public deposits as required by law.
4. Loans:
Major classifications of loans at December 31 are as follows:
| | | | 2006 | | | 2005 | |
| Commercial loans | | $ | 169,565,740 | | $ | 160,988,179 | |
| Real estate loans | | | 590,854,899 | | | 507,479,398 | |
| Consumer loans | | | 9,167,936 | | | 12,462,830 | |
| | | | | | | | |
| | | | 769,588,575 | | | 680,930,407 | |
| Deferred loan origination fees | | | (2,488,600 | ) | | (2,609,125 | ) |
| | | | | | | | |
| | | | 767,099,975 | | | 678,321,282 | |
| Allowance for loan losses | | | (8,283,843 | ) | | (7,792,125 | ) |
| | | | | | | | |
| | | $ | 758,816,132 | | $ | 670,529,157 | |
Scheduled maturities or repricing, if earlier, of loans at December 31, 2006 are as follows:
| Three months or less | | $ | 366,113,263 | |
| Three months to one year | | | 47,369,207 | |
| One year to three years | | | 129,348,480 | |
| Three years to five years | | | 152,057,873 | |
| Thereafter | | | 74,699,752 | |
| | | | | |
| | | $ | 769,588,575 | |
Allowance for Loan Losses:
| | | | 2006 | | | 2005 | | | 2004 | |
| Balance, beginning of year | | $ | 7,792,125 | | $ | 5,223,979 | | $ | 5,225,331 | |
| Provision charged to income | | | 600,000 | | | 1,100,000 | | | 500,000 | |
| Loans charged against the allowance | | | (222,802 | ) | | (636,267 | ) | | (516,071 | ) |
| Recoveries credited to allowance | | | 114,520 | | | 123,789 | | | 196,719 | |
| Reclassify unfunded loan commitments | | | - | | | (34,000 | ) | | (182,000 | ) |
| Additional allowance resulting from acquisition | | | - | | | 2,014,624 | | | - | |
| | | | | | | | | | | |
| Balance, end of year | | $ | 8,283,843 | | $ | 7,792,125 | | $ | 5,223,979 | |
It is management’s opinion that the allowance for loan losses is adequate to absorb known and inherent risks in the loan portfolio. However, actual results may differ from estimates.
Restructured and other loans considered impaired, including all nonaccrual loans, totaled $495,843, $675,714, and $2,799,762 at December 31, 2006, 2005, and 2004, respectively. At December 31, 2006 there were no nonaccrual loans included in impaired loans. Impaired loans at December 31, 2006 represented two loans to a single borrower which are both performing under revised terms. The specific valuation allowance for loan losses related to these impaired loans was approximately $109,000, $238,000, and $510,000 at December 31, 2006, 2005, and 2004, respectively. The average recorded investment in impaired loans was approximately $637,000, $1,218,000, and $3,206,000 in 2006, 2005, and 2004, respectively. Interest income recognized on impaired loans during 2006, 2005, and 2004 was approximately $72,000, $103,000, and $120,000, respectively. Additional interest income which would have been realized on nonaccrual and impaired loans if they had remained current and still accruing interest would have been approximately $14,000, $89,000, and $98,000 in 2006, 2005 and 2004, respectively. There were no loans 90 days contractually past due and continuing to accrue interest as of December 31, 2006, and 2005, respectively. Loans contractually past due 90 days or more on which interest continued to accrue totaled approximately $213,000 at December 31, 2004.
A substantial portion of the loan portfolio is collateralized by real estate and is, therefore, susceptible to changes in local market conditions. However, management believes that the loan portfolio is diversified among industry groups. At December 31, 2006, outstanding residential construction loans totaled approximately $100,996,000 and represented 13.1% of total outstanding loans. In addition, at December 31, 2006, unfunded loan commitments for residential construction totaled approximately $59,642,000. At year end there were no nonaccrual or impaired residential construction loans. There are no other industry concentrations in excess of 10% of the total loan portfolio.
5. Loan Participations and Servicing:
In the normal course of business, the Bank has sold portions of loans to other institutions in order to extend the Bank’s lending capacity or to mitigate risk. Servicing rights are retained for these loan participations and are recognized in income as earned. The unpaid principal balances of these serviced loans at December 31, 2006 and 2005 were $20,515,848 and $17,807,942, respectively. These loans are not included in the accompanying consolidated balance sheets. The balance of capitalized loan servicing rights, net of valuation allowances, included in other assets was $45 and $4,759 at December 31, 2006 and 2005, respectively.
6. Property:
The balance of property and accumulated depreciation and amortization at December 31 consists of the following:
| | | | 2006 | | | 2005 | |
| Land | | $ | 3,833,651 | | $ | 3,898,164 | |
| Buildings and improvements | | | 15,049,848 | | | 13,537,177 | |
| Furniture and equipment | | | 8,804,058 | | | 7,502,537 | |
| | | | | | | | |
| | | | 27,687,557 | | | 24,937,878 | |
| Less accumulated depreciation & amortization | | | 9,096,240 | | | 7,934,947 | |
| | | | | | | | |
| | | $ | 18,591,317 | | $ | 17,002,931 | |
Lease Commitments - The Bank leases certain facilities for office locations under noncancellable operating lease agreements expiring through 2020. Rent expense related to these leases totaled $711,703, $387,562, and $366,716 in 2006, 2005 and 2004, respectively.
Property Leased to Others - The Bank leases approximately 59% of its Springfield Gateway building to others under noncancellable operating lease agreements extending through 2012.
Future minimum payments required and anticipated lease revenues under these leases are:
| | | | | | | Property | |
| | | Lease | | | Leased | |
| | | | Commitments | | | to Others | |
| 2007 | | $ | 645,546 | | $ | 319,079 | |
| 2008 | | | 568,128 | | | 300,224 | |
| 2009 | | | 527,649 | | | 264,418 | |
| 2010 | | | 425,111 | | | 254,601 | |
| 2011 | | | 296,265 | | | 193,844 | |
| Thereafter | | | 435,294 | | | 150,590 | |
| | | | | | | | |
| | | $ | 2,897,993 | | $ | 1,482,756 | |
Depreciation expense was $1,244,134, $942,426 and $936,319 for the years ended December 31, 2006, 2005 and 2004, respectively.
The Bank capitalized $36,853 and $10,110 of interest expense related to property additions during 2006 and 2005, respectively. No interest expense was capitalized during 2004.
7. Goodwill and Core Deposit Intangibles:
The following table summarizes the changes in the Company’s goodwill and core deposit intangible asset for the year ended December 31, 2006.
| | | | | | | Core | | | | |
| | | | | | | Deposit | | | Total | |
| | | | Goodwill | | | Intangible | | | Intangibles | |
| Balance, December 31, 2004 | | $ | 275,552 | | $ | - | | $ | 275,552 | |
| Acquisitions | | | 22,383,545 | | | 1,560,944 | | | 23,944,489 | |
| Amortization | | | | | | (18,583 | ) | | (18,583 | ) |
| | | | | | | | | | | |
| Balance, December 31, 2005 | | $ | 22,659,097 | | $ | 1,542,361 | | $ | 24,201,458 | |
| Adjustment | | | (353,007 | ) | | - | | | (353,007 | ) |
| Amortization | | | - | | | (222,752 | ) | | (222,752 | ) |
| | | | | | | | | | | |
| Balance, December 31, 2006 | | $ | 22,306,090 | | $ | 1,319,609 | | $ | 23,625,699 | |
The goodwill and core deposit intangible asset additions in 2005 were related to the NWBF acquisition which is more fully described in Note 2. The adjustment to goodwill in 2006 is also described more fully in Note 2. In accordance with SFAS No. 142, Goodwill and Other Intangible Assets, the Company does not recognize amortization expense related to its goodwill but completes periodic assessments of goodwill impairment. Impairment, if deemed to exist, would be charged to noninterest expense in the period identified.
Forecasted amortization expense is $222,752 per year from 2007 through 2012 for the core deposit intangible assets acquired during 2005.
8. Other Assets:
Other assets are comprised of the following for the periods indicated:
| | | | 2006 | | | 2005 | |
| Foreclosed assets | | $ | - | | $ | 130,758 | |
| Servicing asset | | | 45 | | | 4,759 | |
| Deferred taxes | | | 1,652,276 | | | - | |
| Prepaid expenses and other | | | 1,485,737 | | | 1,270,849 | |
| | | | | | | | |
| | | $ | 3,138,058 | | $ | 1,406,366 | |
9. Deposits:
Scheduled maturities or repricing of time deposits at December 31 are as follows:
| | | | 2006 | | | 2005 | |
| Less than three months | | $ | 48,690,728 | | $ | 52,366,906 | |
| Three months to one year | | | 37,727,414 | | | 48,256,863 | |
| One to three years | | | 10,269,412 | | | 21,324,757 | |
| Thereafter | | | 887,527 | | | 6,387,743 | |
| | | | | | | | |
| | | $ | 97,575,081 | | $ | 128,336,269 | |
10. Federal Funds Purchased:
The Bank has unsecured federal funds borrowing lines with correspondent banks totaling $98,000,000 at December 31, 2006 of which $4,410,000 was outstanding as of December 31, 2006. The outstanding balance of these overnight funds was due January 2, 2007 and carried an interest rate of 5.75%. There were no borrowings against these lines at December 31, 2005.
The Bank also has a secured federal funds borrowing line with the Federal Reserve Bank totaling $6,000,000 at December 31, 2006. No balance was outstanding against this line as of December 31, 2006 or December 31, 2005.
11. Federal Home Loan Bank Borrowings:
The Bank has a borrowing limit with the FHLB equal to 30% of total assets, subject to discounted collateral. At December 31, 2006, the borrowing line was approximately $266,000,000. At December 31, 2006, there was $131,803,763 borrowed on this line, including an overnight $48,000,000 Cash Management Advance and $83,803,763 in term advances. FHLB stock, funds on deposit with FHLB, and loans are pledged as collateral for borrowings from FHLB. At December 31, 2006, the Bank had pledged approximately $277,000,000 in real estate loans to the FHLB ($157,000,000 in discounted pledged collateral).
Federal Home Loan Bank borrowings by year of maturity and applicable interest rate are summarized as follows as of December 31:
| | | | Rate | | | 2006 | | | 2005 | |
| Cash Management Advance | | | 5.625 | | $ | 48,000,000 | | $ | 24,000,000 | |
| 2006 | | | 2.56 - 4.70 | % | | - | | | 23,500,000 | |
| 2007 | | | 2.91 - 5.48 | % | | 61,803,763 | | | 11,303,763 | |
| 2008 | | | 2.99 - 3.94 | % | | 9,500,000 | | | 10,500,000 | |
| 2009 | | | 3.78 - 4.04 | % | | 6,000,000 | | | 7,000,000 | |
| 2010 | | | 4.12 - 4.96 | % | | 4,500,000 | | | 4,500,000 | |
| 2016 | | | 5.05 - 5.05 | % | | 2,000,000 | | | - | |
| | | | | | | | | | | |
| | | | | | $ | 131,803,763 | | $ | 80,803,763 | |
12. Junior Subordinated Debentures:
In November 2005, the Company formed a wholly-owned Delaware statutory business trust subsidiary, Pacific Continental Corporation Capital Trust (the “Trust”), which issued $8,248,000 of guaranteed undivided beneficial interests in the Pacific Continental’s Junior Subordinated Deferrable Interest Debentures (“Trust Preferred Securities”). These debentures qualify as Tier 1 capital under Federal Reserve Board guidelines. All of the common securities of the Trust are owned by Pacific Continental. The proceeds from the issuance of the common securities and the Trust Preferred Securities were used by the Trust to purchase $8,248,000 of junior subordinated debentures of the Company. The debentures which represent the sole asset of the Trust accrue and pay distributions quarterly at a fixed rate of 6.265% per annum of the stated liquidation value of $1,000 per capital security.
Pacific Continental has entered into contractual arrangements which, taken collectively, fully and unconditionally guarantee payment of: (1) accrued and unpaid distributions required to be paid on the Trust Preferred Securities, (2) the redemption price with respect to any Trust Preferred Securities called for redemption by the Trust, and (3) payments due upon a voluntary or involuntary dissolution, winding up, or liquidation of the Trust. The Trust Preferred Securities are mandatorily redeemable upon maturity of the debentures on January 7, 2036, or upon earlier redemption as provided in the indenture. Pacific Continental has the right to redeem the debentures purchased by the Trust in whole or in part, on or after, January, 7, 2011. As specified in the indenture, if the debentures are redeemed prior to maturity, the redemption price will be the principal amount and any accrued interest. For the years ended December 31, 2006 and 2005, the Company recognized net interest expense of $510,000 and $48,000, respectively, related to the Trust Preferred Securities.
In accordance with provision of FIN 46R, the Trust has not been consolidated in these financial statements. As a result, the junior subordinated debentures, totaling $8,248,000, are reflected on the Company’s consolidated balance sheet at December 31, 2006, under the caption, “Junior Subordinated Debentures”. The Company’s $248,000 investment in the Trust is recorded in “Other Assets” in its consolidated balance sheet at December 31, 2006.
13. Income Taxes:
The provision for income taxes for the years ended December 31 consists of the following:
| | | | 2006 | | | 2005 | | | 2004 | |
| Currently payable: | | | | | | | | | | |
| Federal | | $ | 7,626,000 | | $ | 4,862,000 | | $ | 4,033,000 | |
| State | | | 835,000 | | | 615,000 | | | 848,000 | |
| | | | 8,461,000 | | | 5,477,000 | | | 4,881,000 | |
| Deferred: | | | | | | | | | | |
| Federal | | | (905,000 | ) | | 29,000 | | | 36,000 | |
| State | | | (144,000 | ) | | 4,000 | | | 8,000 | |
| | | | (1,049,000 | ) | | 33,000 | | | 44,000 | |
| Total provision for income taxes | | $ | 7,412,000 | | $ | 5,510,000 | | $ | 4,925,000 | |
The provision for deferred income taxes results from timing differences in the recognition of revenue and expenses for financial statement and tax purposes. The nature and tax effect of these differences for the years ended December 31 are as follows:
| | | | 2006 | | | 2005 | | | 2004 | |
| Loan fees and other loan basis adjustment | | | | | | | | | | |
| differences between financial | | | | | | | | | | |
| statement and tax purposes | | $ | 142,184 | | $ | 192,242 | | $ | 92,618 | |
| Loan loss deduction for tax purposes | | | | | | | | | | |
| more (less) than provision for financial | | | | | | | | | | |
| reporting purposes | | | (1,132,008 | ) | | (255,356 | ) | | (89,962 | ) |
| Depreciation deduction differences | | | | | | | | | | |
| between financial statement and | | | | | | | | | | |
| tax purposes | | | (14,917 | ) | | (16,637 | ) | | 8,878 | |
| Federal Home Loan Bank stock dividends | | | - | | | 4,322 | | | 35,249 | |
| Reserve for self-funded health insurance | | | 3,094 | | | (44,270 | ) | | (28,350 | ) |
| Prepaid expenses | | | 34,174 | | | 127,070 | | | - | |
| Nonqualified stock options benefit | | | (37,326 | ) | | | | | | |
| Other | | | (44,201 | ) | | 25,629 | | | 25,567 | |
| | | | | | | | | | | |
| | | $ | (1,049,000 | ) | $ | 33,000 | | $ | 44,000 | |
The provision for income taxes results in effective tax rates which are different than the federal income tax statutory rate. The nature of the differences for the years ended December 31 was as follows:
| | | | 2006 | | | | | | 2005 | | | | | | 2004 | | | | |
| Expected federal income | | | | | | | | | | | | | | | | | | | |
| tax provision at 34% | | $ | 7,023,000 | | | 35.00 | % | $ | 5,130,000 | | | 34.00 | % | $ | 4,377,000 | | | 34.00 | % |
| State income tax, net of | | | | | | | | | | | | | | | | | | | |
| federal income tax effect | | | 726,000 | | | 3.62 | % | | 402,000 | | | 2.66 | % | | 521,000 | | | 4.05 | % |
| Municipal securities tax benefit | | | (42,000 | ) | | -0.21 | % | | (32,000 | ) | | -0.21 | % | | (14,000 | ) | | -0.11 | % |
| ISO expense | | | 184,000 | | | 0.92 | % | | - | | | | | | - | | | | |
| Benefit of purchased tax credits | | | (231,000 | ) | | -1.15 | % | | (42,000 | ) | | -0.28 | % | | - | | | | |
| Deferred tax rate adjustments | | | | | | | | | | | | | | | | | | | |
| and other | | | (248,000 | ) | | -1.24 | % | | 52,000 | | | 0.35 | % | | 41,000 | | | 0.32 | % |
| | | | | | | | | | | | | | | | | | | | |
| Provision for income taxes | | $ | 7,412,000 | | | 36.94 | % | $ | 5,510,000 | | | 36.52 | % | $ | 4,925,000 | | | 38.26 | % |
The tax benefit associated with stock option plans reduced taxes payable by $803,000, $324,000 and $332,000 at December 31, 2006, 2005 and 2004, respectively. Such benefit is credited to additional paid-in capital.
The components of deferred tax assets and liabilities at December 31 are as follows:
| | | | 2006 | | | 2005 | | | 2004 | |
| Assets: | | | | | | | | | | |
| Allowance for loan losses | | $ | 2,810,785 | | $ | 2,027,720 | | $ | 1,390,044 | |
| Basis adjustments on loans | | | 200,390 | | | 47,579 | | | 59,310 | |
| Reserve for self-funded insurance | | | 70,216 | | | 71,568 | | | 28,350 | |
| Oregon purchased tax credits | | | 886,992 | | | 104,131 | | | | |
| Nonqualified stock options | | | 37,326 | | | - | | | - | |
| Net unrealized losses on securities | | | 152,748 | | | 223,496 | | | 70,758 | |
| Other | | | - | | | - | | | 5,626 | |
| | | | | | | | | | | |
| Total deferred tax assets | | | 4,158,457 | | | 2,474,494 | | | 1,554,088 | |
| | | | | | | | | | | |
| Liabilities: | | | | | | | | | | |
| Federal Home Loan Bank stock dividends | | | 597,483 | | | 579,329 | | | 575,033 | |
| Excess tax over book depreciation | | | 329,944 | | | 339,222 | | | 352,905 | |
| Prepaid expenses | | | 179,226 | | | 127,070 | | | - | |
| NWBF acquisition adjustments | | | 571,965 | | | 587,439 | | | - | |
| Other, principally loan orig. costs and deferred fees | | | 827,563 | | | 950,433 | | | 368,336 | |
| | | | | | | | | | | |
| Total deferred tax liabilities | | | 2,506,181 | | | 2,583,493 | | | 1,296,274 | |
| | | | | | | | | | | |
| Net deferred tax assets/(liabilities) | | $ | 1,652,276 | | $ | (108,999 | ) | $ | 257,814 | |
The Company has unused purchased energy tax credits of $886,992 as of December 31, 2006. These tax credits are expected to provide state income tax benefits of $350,632, $185,729, $185,729 and $164,902 in years 2007, 2008, 2009 and 2010, respectively. Based on the Company's historical performance, these energy tax credits will be realized in the normal course of operations and, accordingly, Management has not reduced these deferred tax assets by a valuation allowance. Management also believes that all other net deferred tax assets will be recognized in the normal course of operations and, accordingly, they have not been reduced by a valuation allowance.
14. Retirement Plan:
The Bank has a 401(k) profit sharing plan covering substantially all employees. The plan provides for employee and employer contributions. The total plan expenses, including employer contributions, were $747,748, $532,251 and $503,586 in 2006, 2005 and 2004, respectively.
15. Stock Option Plans:
Pursuant to the Company’s 1999 Employees’ Stock Option Plan, as amended (the “1999 ESOP Plan”), either incentive stock option or non-qualified option awards have been granted to employees. Subsequent to the annual shareholders’ meeting in April 2006, all shares available for future grants under this plan have been deregistered and are no longer available for future grants. Stock options in the past have been granted at exercise prices not less than 100% of the fair market value of our common stock at the grant date. The Compensation Committee or the Board of Directors determined vesting provisions when stock options were granted, and stock options granted generally vested over three or four years. The maximum life of stock options granted under this plan was ten years from the grant date. For the year ended December 31, 2006, the Company recognized $447,533 of compensation expense (included in salaries and employee benefits) from stock options vesting during the period, with no associated income tax benefits. Although compensation expense related to stock options granted to employees was not directly recognized in the results of operations during years ended December 31, 2005 and 2004, respectively, it was disclosed in a pro forma presentation as previously required by FAS 123.
Pursuant to the Company’s 1999 Directors’ Stock Option Plan, as amended (the “1999 DSOP Plan”), non-qualified options awards have been granted to directors. Subsequent to the annual shareholders’ meeting in April 2006, all shares available for future grants under this plan have been deregistered and are no longer available for future grants. Stock options had been granted at exercise prices of not less than 100% of the fair market value of our common stock at the grant date. The maximum life of options granted under this plan was ten years from the grant date. The options granted over the last two years have vesting schedules of two to three years. Prior to those grants, the options vested immediately upon grant. For the year ended December 31, 2006, the Company recognized $67,017 of compensation expense (included in salaries and employee benefits) from stock options vesting during the period, with an associated income tax benefit of $25,705. Although compensation expense related to stock options granted to directors was not directly recognized in the results of operations during years ended December 31, 2005 and 2004, respectively, it was disclosed in a pro forma presentation as previously required by FAS 123.
At the annual shareholders’ meeting in April 2006, shareholders approved the 2006 Stock Option and Equity Compensation Plan (the “2006 SOEC Plan”). Pursuant to this approval, incentive stock options, nonqualified stock options, restricted stock, restricted stock units, or stock appreciation rights may be awarded to attract and retain the best available personnel for positions of responsibility with the corporation and its subsidiaries. The exercise price for shares of common stock subject to an option shall not be less than 100% of the fair market value of a share of common stock as of the date of grant of the option; provided, however, that in the case of an incentive stock option granted to an employee who immediately before the grant of such incentive stock option is a shareholder-employee, the incentive stock option exercise price shall be at least 110% of the fair value of the common stock as of the date of grant of the incentive stock option. The Compensation Committee of the Board of Directors may impose any terms and conditions on the vesting of an award that it determines to be appropriate. The Company issued 59,950 incentive stock options to selected employees during the third and fourth quarters of 2006, which resulted in the recognition of $19,609 in compensation expense, with no associated income tax benefit, for the year ended December 31, 2006.
Pursuant to the Company’s 2006 SOEC Plan, stock appreciation rights (SARs) may be granted to employees. The stock appreciation rights may be settled in cash or cash and common stock as determined at the date of issuance. The Compensation Committee or the Board of Directors determines vesting provisions when awards are granted, and the awards granted generally vest over three or four years and have a maximum life of ten years. SARs settled in stock are recognized as equity-based awards while SARs settled in cash are recognized on the balance sheet as liability-based awards, both of which are granted at the fair market value of our common stock at the grant date. The grant-date fair value of the liability based awards vesting in the current period, along with the change in fair value of the awards during the period, are recognized as compensation expense and as an adjustment to the recorded liability. On September 19, 2006, 122,690 SARs were issued at a fair value of $4.27 per unit. Of the 122,690 SARs issued, 54,830 are to be settled in cash, while 67,860 are to be settled in stock. The conversion of SARs, to be settled in stock, is estimated to be one share of common stock for every 4.27 SARs. Therefore, we expect to issue 15,900 shares of common stock if all 67,860 SARs are settled. During 2006, the Company recognized $23,328 of compensation expense, with an associated income tax benefit of approximately $8,600 for the liability based awards. The Company also recognized $23,834 in compensation expense, with no income tax benefit, during 2006 related to the issuance of SARs settled in stock.
Also, pursuant to the Company’s 2006 SOEC Plan, non-qualified options awards have been granted to directors. Stock options have been granted at exercise prices of not less than 100% of the fair market value of our common stock at the grant date. The maximum life of options granted under this plan is ten years from the grant date. For the year ending December 31, 2006, the Company recognized $4,599 of compensation expense (included in salary and employee benefits) from stock options vesting during the periods, with associated income tax benefits of $1,702.
The Company exchanged option grants issued pursuant to the NWBF Employee and Nonemployee Director Stock Option Plans with options under the Company’s plans as a result of the NWBF acquisition. All outstanding options became 100% vested as of the merger date, November 30, 2005.
Stock Options -
The following table provides the weighted-average fair values for stock options, exclusive of the options issued as a result of the NWBF acquisition, granted during the last three years. These values were estimated using the Black-Scholes option valuation model with the following weighted-average assumptions:
| | | | | | | Year Ended December 31, | | | | |
| | | | 2006 | | | 2005 | | | 2004 | |
| Expected life in years (1) | | | 5.26 | | | 4.00 | | | 4.00 | |
| Volatility (1) | | | 17.97 | % | | 19.20 | % | | 22.57 | % |
| Interest Rate (2) | | | 4.70 | % | | 4.22 | % | | 3.23 | % |
| Yield Rate (3) | | | 1.77 | % | | 1.77 | % | | 1.92 | % |
| | | | | | | | | | | |
| Average Fair-Value | | $ | 3.78 | | $ | 2.90 | | $ | 2.86 | |
| (1) | Estimate based on historical experience. Volatility is based on historical experience over a period equivalent to the expected life in years. |
| (2) | Based on the U.S. Treasury constant maturity interest rate with a term consistent with the expected life of the options granted. |
| (3) | The Company has paid cash dividends on common stock since 1985. Each grant’s dividend yield is calculated by annualizing the most recent quarterly cash dividend and dividing that amount by the market price of the Company’s common stock as of the grant date. |
For any future grants, as required by FAS 123R, the Company will estimate the impact of forfeitures based on our historical experience with previously granted stock options, and consider the impact of the forfeitures when determining the amount of expense to record for the stock options granted. For stock options issued prior to the adoption of FAS 123R, forfeitures were recognized when the stock option was actually forfeited. The Company generally issues new shares of common stock to satisfy stock option exercises.
A summary of stock option activity for all Company plans during the current fiscal year is presented below:
| Total Stock Options | | | Shares | | | Average Price Per Share | | | Weighted-Average Remaining Contractual Life | | | Aggregate Intrinsic Value | |
| Outstanding at December 31, 2005 | | | 1,114,232 | | $ | 10.82 | | | | | | | |
| Granted | | | 87,150 | | | 17.93 | | | | | | | |
| Exercised | | | (413,670 | ) | | 8.48 | | | | | | | |
| Forfeited or expired | | | (22,680 | ) | | 12.64 | | | | | | | |
Outstanding at December 31, 2006 | | | 765,032 | | $ | 12.85 | | | 3.13 | | $ | 5,050,996 | |
| | | | | | | | | | | | | | |
Exercisable at December 31, 2006 | | | 481,923 | | $ | 11.17 | | | 2.43 | | $ | 3,989,518 | |
A summary of value received by employees and directors exercising stock options over the last three years is presented below:
| | | | | | Year Ended December 31 | | | | |
| | | | 2006 | | | 2005 | | | 2004 | |
| Total intrinsic value of | | | | | | | | | | |
| stock options exercised | | $ | 2,883,349 | | $ | 1,572,657 | | $ | 1,090,008 | |
Stock Appreciation Rights -
The following table provides the weighted-average fair values for stock appreciation rights (SARs) to be settled in stock. These are considered to be equity-based awards. No activity was recognized during the years ended 2005 and 2004, respectively, because this type of award was first introduced in 2006. The values were estimated using the Black-Scholes option valuation model with the following weighted-average assumptions:
| | | | 2006 | |
| Expected life in years (1) | | | 6.00 | |
| Volatility (1) | | | 19.51 | % |
| Interest Rate (2) | | | 4.72 | % |
| Yield Rate (3) | | | 1.78 | % |
| | | | | |
| Average Fair-Value | | $ | 4.27 | |
| (1) | Estimate based on historical experience. Volatility is based on historical experience over a period equivalent to the expected life in years. |
| (2) | Based on the U.S. Treasury constant maturity interest rate with a term consistent with the expected life of the options granted. |
| (3) | The Company has paid cash dividends on common stock since 1985. Each grant’s dividend yield is calculated by annualizing the most recent quarterly cash dividend and dividing that amount by the market price of the Company’s common stock as of the grant date. |
For any future grants, as required by FAS 123R, the Company will estimate the impact of forfeitures based on our historical experience with previously granted stock options, and consider the impact of the forfeitures when determining the amount of expense to record. The Company will generally issue new shares of common stock as these stock appreciation rights are exercised.
A summary of SAR - stock awards activity during the current fiscal year is presented below:
Total SAR - Stock Awards | | | Awards | | | Average Price Per Award | | | Weighted-Average Remaining Contractual Life | | | Aggregate Intrinsic Value | |
| Outstanding at December 31, 2005 | | | - | | $ | - | | | | | | | |
| Granted | | | 67,860 | | | 17.97 | | | | | | | |
| Exercised | | | - | | | - | | | | | | | |
| Forfeited or expired | | | - | | | - | | | | | | | |
Outstanding at December 31, 2006 | | | 67,860 | | $ | 17.97 | | | 9.72 | | $ | 100,433 | |
| | | | | | | | | | | | | | |
Exercisable at December 31, 2006 | | | - | | $ | 17.97 | | | 9.72 | | $ | - | |
The stock appreciation rights (SARs) to be settled in cash awarded September 19, 2006 have the same weighted -average fair values as the SARs settled in stock mentioned above because the Black-Scholes option valuation model weighted-average assumptions were the same. The SARs settled in cash are considered to be liability- based awards. No activity is recognized in 2005 and 2004, respectively, because this type of award was first introduced in 2006.
For any future grants, as required by FAS 123R, the Company will estimate the impact of forfeitures based on our historical experience with previously granted stock options, and consider the impact of the forfeitures when determining the amount of expense to record..
A summary of SAR - cash awards activity during the current fiscal year is presented below:
Total SAR - Cash Awards | | | Shares | | | Average Price Per Share | | | Weighted-Average Remaining Contractual Life | | | Aggregate Intrinsic Value | |
| Outstanding at December 31, 2005 | | | - | | $ | - | | | | | | | |
| Granted | | | 54,830 | | | 17.97 | | | | | | | |
| Exercised | | | - | | | - | | | | | | | |
| Forfeited or expired | | | - | | | - | | | | | | | |
Outstanding at December 31, 2006 | | | 54,830 | | $ | 17.97 | | | 9.73 | | $ | 81,148 | |
| | | | | | | | | | | | | | |
Exercisable at December 31, 2006 | | | - | | $ | 17.97 | | | 9.73 | | $ | - | |
At December 31, 2006, the Company has estimated unrecognized compensation expense of $734,000, $212,000 and $172,000 for unvested stock options, SAR - stock awards and SAR - cash awards, respectively. These amounts are based on forfeiture rates of 10%, 20% and 20% for stock option, SAR - stock and SAR - cash awards, respectively. The weighted-average period of time the unrecognized compensation expense will be recognized for the unvested stock options, SAR - stock awards and SAR - cash awards is approximately 2.5, 3.7 and 3.7 years, respectively.
16. Transactions with Related Parties:
The Bank has granted loans to officers and directors and to companies with which they are associated. Such loans are made on substantially the same terms, including interest rates and collateral, as those prevailing at the time for comparable transactions with unrelated parties. Activity with respect to these loans during the year ended December 31 was as follows:
| | | | 2006 | | | 2005 | |
| Balance, beginning of year | | $ | 771,001 | | $ | 710,346 | |
| | | | | | | | |
| Additions or renewals | | | 1,696,178 | | | 122,430 | |
| Amounts collected | | | (225,985 | ) | | (61,775 | ) |
| | | | | | | | |
| Balance, end of year | | $ | 2,241,194 | | $ | 771,001 | |
In addition, there were $208,815 in commitments to extend credit to directors and officers at December 31, 2006, which are included among loan commitments disclosed Note 17.
Real estate management fees of $3,287 and $24,956 were paid to a director, during 2005 and 2004, respectively. There were no similar fees paid to the director in 2006.
17. Financial Instruments with Off-Balance-Sheet Credit Risk:
In order to meet the financing needs of its clients, the Bank commits to extensions of credit and issues letters of credit. The Bank uses the same credit policies in making commitments and conditional obligations as it does for other products. In the event of nonperformance by the client, the Bank’s exposure to credit loss is represented by the contractual amount of the instruments. The Bank’s collateral policies related to financial instruments with off-balance-sheet risk conform with its general underwriting guidelines.
Commitments to extend credit are agreements to lend to a client as long as there is no violation of any condition established in the contract. Commitments generally have expiration dates or other termination clauses and may require payment of a fee. Since some of the commitments may expire without being drawn upon, the total commitment amounts do not necessarily represent future cash requirements.
Letters of credit written are conditional commitments issued by the Bank to guarantee the performance of a client to a third party. The credit risk involved in issuing letters of credit is essentially the same as that involved in extending loan facilities to clients.
Off-balance-sheet instruments at December 31 consist of the following:
| | | | 2006 | | | 2005 | |
| Commitments to extend credit (principally | | | | | | | |
| variable rate) | | $ | 196,033,000 | | $ | 175,922,000 | |
| Letters of credit and financial guarantees written | | | 6,720,000 | | | 6,168,000 | |
18. Fair Value Disclosures of Financial Instruments:
The following disclosures are made in accordance with provisions of SFAS No. 107, Disclosures About Fair Value of Financial Instruments. The use of different assumptions and estimation methods could have a significant effect on fair value amounts. Accordingly, the estimates of fair value herein are not necessarily indicative of the amounts that might be realized in a current market exchange.
The estimated fair values of the financial instruments at December 31 are as follows:
| | | | 2006 | | | | | | 2005 | | | | |
| | | | Carrying Amount | | | Fair Value | | | Carrying Amount | | | Fair Value | |
| Financial assets: | | | | | | | | | | | | | |
| Cash and cash equivalents | | $ | 32,777,983 | | $ | 32,777,983 | | $ | 31,843,346 | | $ | 31,843,346 | |
| Securities | | | 38,783,063 | | | 38,783,063 | | | 39,344,924 | | | 39,344,924 | |
| Loans held for sale | | | 2,140,417 | | | 2,140,417 | | | 642,180 | | | 642,180 | |
| Loans, net of allowance | | | | | | | | | | | | | |
| for loan losses | | | 758,816,132 | | | 748,030,182 | | | 670,529,157 | | | 662,446,824 | |
| Interest receivable | | | 3,998,139 | | | 3,998,139 | | | 3,343,920 | | | 3,343,920 | |
| Federal Home Loan | | | | | | | | | | | | | |
| Bank stock | | | 3,479,900 | | | 3,479,900 | | | 3,479,900 | | | 3,479,900 | |
| | | | | | | | | | | | | | |
| Financial liabilities: | | | | | | | | | | | | | |
| Deposits | | | 641,272,024 | | | 640,583,922 | | | 604,270,620 | | | 603,200,365 | |
| Federal funds purchased | | | 4,410,000 | | | 4,410,000 | | | - | | | - | |
| Federal Home Loan | | | | | | | | | | | | | |
| Bank borrowings | | | 131,803,763 | | | 131,049,652 | | | 80,803,763 | | | 79,822,626 | |
| Junior subordinated debentures | | | 8,248,000 | | | 8,152,162 | | | 8,248,000 | | | 8,248,000 | |
| Accrued interest payable | | | 551,976 | | | 551,976 | | | 1,062,828 | | | 1,062,828 | |
Cash and Cash Equivalents - The carrying amount approximates fair value.
Securities and Federal Home Loan Bank stock - Fair value is based on quoted market prices. If a quoted market price is not available, fair value is estimated using quoted market prices for similar securities. FHLB stock is valued based on the most recent redemption price.
Loans Held for Sale - Fair value represents the anticipated proceeds from the sale of related loans.
Loans - For variable-rate loans that reprice frequently and have no significant change in credit risk, fair values are based on carrying values. Fair value of fixed-rate loans is estimated by discounting the future cash flows using current rates at which similar loans would be made to borrowers with similar credit ratings and for the same remaining maturities. Fair values for impaired loans are estimated using discounted cash flow analyses or underlying collateral values, where applicable.
Long Term Debt - The fair values of the Company’s long term debt is estimated using discounted cash flow analyses based on the Company’s current incremental borrowing rate for similar type of borrowing arrangements.
Interest receivable and payable - The carrying amounts of accrued interest receivable and payable approximate their fair value.
Deposits - Fair value of demand, interest-bearing demand and savings deposits is the amount payable on demand at the reporting date. Fair value of time deposits is estimated using the interest rates currently offered for deposits of similar remaining maturities.
Federal Funds Purchased - The carrying amount is a reasonable estimate of fair value because of the short-term nature of these borrowings.
Federal Home Loan Bank Borrowings - Fair value of Federal Home Loan Bank borrowings is estimated by discounting future cash flows at rates currently available for debt with similar terms and remaining maturities.
Off-Balance-Sheet Financial Instruments - The carrying amount and fair value are based on fees charged for similar commitments and are not material.
19. Commitments and Legal Contingencies:
The Company has entered into employment agreements with three key executive officers. The employment agreements provide for minimum aggregate annual base salaries of $615,000, plus performance adjustments, life insurance coverage, and other perquisites commonly found in such agreements. One agreement expires in 2007, while the other two employee agreements expire in 2009 unless extended or terminated earlier.
Various legal claims arise from time to time in the normal course of business. Based upon analysis of management, in consultation with the Company’s legal counsel, there are no current legal matters which are expected to have a material effect on the Company’s consolidated financial statements.
20. Regulatory Matters:
The Company and the Bank are subject to the regulations of certain federal and state agencies and receive periodic examinations by those regulatory authorities. In addition, they are subject to various regulatory capital requirements administered by federal banking agencies. Failure to meet minimum capital requirements can initiate certain mandatory - and possibly additional discretionary - actions by regulators that, if undertaken, could have a direct material effect on the consolidated financial statements. Under capital adequacy guidelines and the regulatory framework for prompt corrective action, the Bank must meet specific capital guidelines that involve quantitative measures of the Bank’s assets, liabilities, and certain off-balance-sheet items as calculated under regulatory accounting practices. The Company and the Bank’s capital amounts and classification are also subject to qualitative judgments by the regulators about components, risk weightings and other factors.
Quantitative measures established by regulation to ensure capital adequacy require the Company and the Bank to maintain minimum amounts and ratios of Total and Tier I capital to risk-weighted assets, and of Tier I capital to leverage assets. Management believes, as of December 31, 2006, that the Company and the Bank meet all capital adequacy requirements to which they are subject.
As of December 31, 2006 and according to FDIC guidelines, the Bank is considered to be well capitalized. To be categorized as well capitalized, the Bank must maintain minimum Total risk-based, Tier I risk-based, and Tier I leverage ratios as set forth in the following table. There are no conditions or events since that notification that management believes have changed the institution’s category.
The Bank’s actual capital amounts and ratios are presented in the table (the Company’s capital ratios do not differ significantly from those of the Bank).
| | | | | | | | | | | | | | | | To Be Well | | | | |
| | | | | | | | | | | | | | | | Capitalized Under | | | | |
| | | | | | | | | | | | | | | | Prompt Corrective | | | | |
| | | | Actual | | | | | | Adequacy Purposes | | | | | | Action Provision | | | | |
| | | | Amount | | | Ratio | | | Amount | | | Ratio | | | Amount | | | Ratio | |
| As of December 31, 2006: | | | | | | | | | | | | | | | | | | | |
| Total capital (to risk | | | | | | | | | | | | | | | | | | | |
| weighted assets) | | $ | 88,493,000 | | | 10.98 | % | $ | 64,471,280 | | | 8 | % | $ | 80,589,100 | | | 10 | % |
| Tier I capital (to risk | | | | | | | | | | | | | | | | | | | |
| weighted assets) | | | 80,058,000 | | | 9.93 | % | | 32,235,640 | | | 4 | % | | 48,353,460 | | | 6 | % |
| Tier I capital (to leverage | | | | | | | | | | | | | | | | | | | |
| assets) | | | 80,058,000 | | | 9.56 | % | | 33,503,480 | | | 4 | % | | 41,879,350 | | | 5 | % |
| | | | | | | | | | | | | | | | | | | | |
| As of December 31, 2005: | | | | | | | | | | | | | | | | | | | |
| Total capital (to risk | | | | | | | | | | | | | | | | | | | |
| weighted assets) | | $ | 73,050,575 | | | 10.48 | % | $ | 55,744,800 | | | 8 | % | $ | 69,681,000 | | | 10 | % |
| Tier I capital (to risk | | | | | | | | | | | | | | | | | | | |
| weighted assets) | | | 64,957,450 | | | 9.32 | % | | 27,872,400 | | | 4 | % | | 41,808,600 | | | 6 | % |
| Tier I capital (to leverage | | | | | | | | | | | | | | | | | | | |
| assets) | | | 64,957,450 | | | 10.32 | % | | 25,188,400 | | | 4 | % | | 31,485,500 | | | 5 | % |
21. Parent Company Financial Information:
Financial information for Pacific Continental Corporation (Parent Company only) is presented below:
BALANCE SHEETS
December 31
| | | | 2006 | | | 2005 | |
| Assets: | | | | | | | |
| Cash deposited with the Bank | | $ | 414,565 | | $ | 660,335 | |
| Prepaid expenses | | | 4,324 | | | - | |
| Deferred income taxes | | | - | | | - | |
| Equity in Trust | | | 248,000 | | | 248,000 | |
| Investment in the Bank, at cost plus equity | | | | | | | |
| in earnings | | | 103,439,335 | | | 88,799,776 | |
| | | | | | | | |
| | | $ | 104,106,224 | | $ | 89,708,111 | |
| | | | | | | | |
| Liabilities and stockholders' equity: | | | | | | | |
| Liabilities | | $ | 123,443 | | $ | 48,117 | |
| Junior subordinated debentures | | | 8,248,000 | | | 8,248,000 | |
| Stockholders' equity | | | 95,734,781 | | | 81,411,994 | |
| | | | | | | | |
| | | $ | 104,106,224 | | $ | 89,708,111 | |
STATEMENTS OF INCOME
For the Periods Ended December 31
| | | | 2006 | | | 2005 | | | 2004 | |
| Income: | | | | | | | | | | |
| Cash dividends from the Bank | | $ | - | | $ | 2,495,000 | | $ | 1,280,000 | |
| | | | | | | | | | | |
| | | | - | | | 2,495,000 | | | 1,280,000 | |
| Expenses: | | | | | | | | | | |
| Interest expense | | | 509,699 | | | 48,117 | | | - | |
| Investor relations | | | 84,760 | | | 86,381 | | | 61,937 | |
| Legal, registration expense, and other | | | 80,114 | | | 55,009 | | | 71,549 | |
| Personnel costs paid to Bank | | | 95,327 | | | 267,698 | | | 63,781 | |
| | | | | | | | | | | |
| | | | 769,900 | | | 457,205 | | | 197,267 | |
| | | | | | | | | | | |
| Income before income tax benefit | | | | | | | | | | |
| and equity in undistributed | | | | | | | | | | |
| earnings of the Bank | | | (769,900 | ) | | 2,037,795 | | | 1,082,733 | |
| | | | | | | | | | | |
| Income tax benefit | | | - | | | - | | | 77,000 | |
| Equity in undistributed earnings of the Bank | | | 13,424,418 | | | 7,540,504 | | | 6,789,019 | |
| | | | | | | | | | | |
| Net income | | $ | 12,654,518 | | $ | 9,578,299 | | $ | 7,948,752 | |
STATEMENTS OF CASH FLOWS
For the Periods Ended December 31
| | | | 2006 | | | 2005 | | | 2004 | |
| Cash flows from operating activities: | | | | | | | | | | |
| Net income | | $ | 12,654,518 | | $ | 9,578,299 | | $ | 7,948,752 | |
| Adjustments to reconcile net income | | | | | | | | | | |
| to net cash provided by operating | | | | | | | | | | |
| activities: | | | | | | | | | | |
| Equity in undistributed earnings of | | | (13,424,418 | ) | | (7,540,504 | ) | | (6,789,069 | ) |
| the Bank | | | | | | | | | | |
| Other, net | | | 358,463 | | | (154,572 | ) | | (77,000 | ) |
| | | | | | | | | | | |
| Net cash provided by operating activities | | | (411,437 | ) | | 1,883,223 | | | 1,082,683 | |
| | | | | | | | | | | |
| Cash flows from investing activities: | | | | | | | | | | |
| Dividend received from bank subsidiary | | | - | | | 2,495,000 | | | - | |
| Cash paid to shareholders of NWBF | | | - | | | (2,467,051 | ) | | - | |
| Investment in subsidiary | | | - | | | (8,000,000 | ) | | - | |
| Investment in Trust | | | - | | | (248,000 | ) | | - | |
| | | | | | | | | | | |
| Net cash used in investing activities | | | - | | | (8,220,051 | ) | | - | |
| | | | | | | | | | | |
| Cash flows from financing activities: | | | | | | | | | | |
| Proceeds from stock options exercised | | | 3,546,887 | | | 1,039,033 | | | 1,127,879 | |
| Dividends paid | | | (3,381,220 | ) | | (2,555,777 | ) | | (2,163,789 | ) |
| Issuance of trust preferreds | | | - | | | 8,248,000 | | | | |
| Shares repurchased and retired | | | - | | | - | | | (2,960 | ) |
| | | | | | | | | | | |
| Net cash provided (used in) financing activities | | | 165,667 | | | 6,731,256 | | | (1,038,870 | ) |
| | | | | | | | | | | |
| Net (decrease) increase in cash | | | (245,770 | ) | | 394,428 | | | 43,813 | |
| | | | | | | | | | | |
| Cash, beginning of period | | | 660,335 | | | 265,907 | | | 222,094 | |
| | | | | | | | | | | |
| Cash, end of period | | $ | 414,565 | | $ | 660,335 | | $ | 265,907 | |
None
Evaluation of Disclosure Controls and Procedures
An evaluation was carried out under the supervision and with the participation of the Company’s management, including the Chief Executive Officer (“CEO”) and Chief Financial Officer (“CFO”), of the effectiveness of our disclosure controls and procedures, as required by Rule 13a-15(b) of the Securities Exchange Act of 1934. Based on that evaluation, the CEO and CFO have concluded that as of the end of the period covered by this report, our disclosure controls and procedures are effective to provide reasonable assurance that information required to be disclosed by us in reports that we file or submit under the Securities Exchange Act of 1934 is recorded, processed, summarized, and timely reported as provided in the SEC rules and forms. As a result of this evaluation, there were no significant changes in our internal control over financial reporting during the three months ended December 31, 2006 that have materially affected, or are reasonably likely to materially affect, our internal control over financial reporting.
Management’s Report on Internal Control Over Financial Reporting
The management of the Company is responsible for establishing and maintaining adequate internal control over financial reporting. This internal control system has been designed to provide reasonable assurance to the Company’s management and board of directors regarding the preparation and fair presentation of the Company’s published financial statements.
All internal control systems, no matter how well designed, have inherent limitations. Therefore, even those systems determined to be effective can provide only reasonable assurance with respect to financial statement preparation and presentation.
The management of Pacific Continental Corporation has assessed the effectiveness of its internal control over financial reporting at December 31, 2006. To make this assessment, the Company used the criteria for effective internal control over financial reporting described in Internal Control - Integrated Framework, issued by the Committee of Sponsoring Organizations of the Treadway Commission. Based on this assessment, the Company believes that as of December 31, 2005, the internal control system over financial reporting met those criteria.
The Company’s independent auditors, Moss Adams, L.L.P., have issued an attestation report on the Company’s internal control over financial reporting. The attestation report can be found on pages 35 and 36 of this document.
None
PART III
The information regarding “Directors and Executive Officers of the Registrant” of the Bank is incorporated by reference from the sections entitled “ELECTION OF DIRECTORS—Nominees for Director and Continuing Directors,” “MANAGEMENT” and “COMPLIANCE WITH SECTION 16(a) FILING REQUIREMENTS” of the Company’s 2007 Annual Meeting Proxy Statement (the “Proxy Statement”).
Information regarding the Company’s Audit Committee financial expert appears under the section entitled “INFORMATION REGARDING THE BOARD OF DIRECTORS AND ITS COMMITTEES - Certain Committees of the Board of Directors” in the Company’s Proxy Statement and is incorporated by reference.
In September of 2003, consistent with the requirements of The Sarbanes-Oxley Act, the Company adopted a Code of Ethics applicable to senior financial officers including the principal executive officer. There have been no changes in the Code of Ethics since that time. The Code of Ethics was filed as Exhibit 14 to the Company’s Annual Report on Form 10-K for the year-end December 31, 2003. The Code of Ethics can also be accessed electronically by visiting the Company’s website at www.therightbank.com.
The information regarding “Executive Compensation” is incorporated by reference from the sections entitled “COMPENSATION DISCUSSION AND ANALYSIS,” “EXECUTIVE COMPENSATION” and “DIRECTOR COMPENSATION” of the Proxy Statement.
The information regarding “Security Ownership of Certain Beneficial Owners and Management” is incorporated by reference from the section entitled “SECURITY OWNERSHIP OF CERTAIN BENEFICIAL OWNERS AND MANAGEMENT” of the Proxy Statement.
The information regarding “Certain Relationships and Related Transactions” is incorporated by reference from the section entitled “TRANSACTIONS WITH MANAGEMENT” of the Proxy Statement.
For information concerning principal accountant fees and services as well as related pre-approval policies, see “AUDITORS - Fees Paid to Independent Accountants” in the Company’s Proxy Statement, which is incorporated by reference.
(a)(1) See Index to Consolidated Financial Statements filed under item 8 of this report.
All other schedules to the financial statements required by Regulation S-X are omitted because they are not applicable, not material, or because the information is included in the financial statements or related notes
(a)(2) Exhibit Index
Exhibit
| 3.1 | Amended Articles of Incorporation (1) |
| 3.2 | Amended and Restated Bylaws (2) |
10.1 1999 Employee Stock Option Plan (3)
10.2 1999 Director’s Stock Option Plan (3)
10.3 2006 Stock Option and Equity Compensation Plan (4)
10.4 Form of Restricted Stock Award Agreement (4)
10.5 Form of Stock Option Award Agreement (4)
10.6 Form of Restricted Stock Unit Agreement (4)
10.7 Form of Stock Appreciation Rights Agreement (4)
10.8 Executive Severance/Change of Control Agreement for Mitch Hagstrom (2)
10.9 Executive Severance/Change of Control Agreement for Daniel Hempy (2)
10.10 Executive Severance/Change of Control Agreement for Michael Reynolds (2)
10.11 Executive Employment Agreement for Roger Busse
10.12 Executive Employment Agreement for Hal Brown (5)
10.13 Director Fee Schedule, Effective January 1, 2005 (2)
10.14 NWB Financial Corporation Employee Stock Option Plan (6)
10.15 NWB Financial Corporation Director Stock Option Plan (6)
10.16 Director Fee Schedule, Effective January 1, 2007
14 Code of Ethics for Senior Financial Officers and
Principal Executive Officer (7)
23.1 Accountants Consent of Moss Adams L.L.P.
23.2 Accountants Consent of Isler CPA successor to Zirkle Long Trigueiro & Ward L.L.C.
31.1 302 Certification, Hal Brown, President and Chief Executive Officer
31.2 302 Certification, Michael A. Reynolds, Executive Vice President and
Chief Financial Officer
32 Certifications Pursuant to 18 U.S.C. Section 1350
| (1) | Incorporated by reference to Exhibit 3.1 of the Company’s Quarterly Report on 10-Q for the Quarter ended March 31, 2004. |
| (2) | Incorporated by reference to Exhibit 3.1, 10.1, 10.2, 10.3, 10.4, and 10.5 of the Company’s Quarterly |
Report on 10-Q for the Quarter ended March 31, 2005.
| (3) | Incorporated by reference to Exhibits 99.1 - 99.4 of the Company’s S-8 Registration Statement (File No. 333-109501). |
| (4) | Incorporated by reference to Exhibits 91.1 - 91.5 of the Company’s S-8 Registration Statement (File No. 333-134702). |
| (5) | Incorporated by reference to Exhibit 10.8 of the Company’s Annual Report on Form 10-K for the year ended December 31, 2002. |
| (6) | Incorporated by reference to Exhibits 99.1 and 99.2 of the Company’s S-8 Registration Statement (File No. 333-130886). |
| (7) | Incorporated by reference to Exhibit 14 of the Company’s Annual Report on 10-K for the year ended December 31, 2003. |
| | (a)(3) | Financial Statement Schedules |
Pursuant to the requirements of Section 13 or 15(d) of the Securities Exchange Act of 1934, the registrant has duly caused this report to be signed on its behalf by the undersigned on March 12, 2007.
PACIFIC CONTINENTAL CORPORATION
(Company)
By: /s/ Hal M. Brown
Hal Brown
President and Chief Executive Officer
Pursuant to the requirements of the Securities Exchange Act of 1934, this report has been signed below by the following persons on behalf of the Company and in the capacities indicated on the 12th day of March, 2007.
Principal Executive Officer | |
| | |
| | |
By /s/ Hal M. Brown | President and Chief Executive Officer |
Hal Brown | and Director |
| | |
Principal Financial and Accounting Officer | |
| | |
| | |
By /s/ Michael A. Reynolds | Executive Vice President and |
Michael A. Reynolds | Chief Financial Officer |
Remaining Directors | | | |
| | | | |
| | | | |
By /s/ Robert A. Ballin | Chairman of the Board | | |
| Robert A. Ballin | | | |
| | | | |
By /s/ Donald G. Montgomery | Vice Chairman | By /s/ Michael D. Holzgang | Director |
| Donald G. Montgomery | | Michael D. Holzgang | |
| | | | |
| | | | |
By /s/ Larry G. Campbell | Director | By /s/ Donald L. Krahmer, Jr. | Director |
| Larry G. Campbell | | Donald L. Krahmer, Jr. | |
| | | | |
| | | | |
By /s/ Cathi Hatch | Director | By /s/ John H. Rickman | Director |
| Cathi Hatch | | John H. Rickman | |
| | | | |
| | | | |
By /s/ Michael S. Holcomb | Director | By /s/ R. Jay Tejera | Director |
Michael S. Holcomb | | R. Jay Tejera | |
| | | | |
| | | | |
By /s/ Michael E. Heijer | Director | | |
Michael E. Heijer | | | |
I, Hal Brown, certify that:
| 1. | I have reviewed this Form 10-K of Pacific Continental Corporation; |
| 2. | Based on my knowledge, this report does not contain any untrue statement of a material fact or omit to state a material fact necessary to make the statements made, in light of the circumstances under which such statements were made, not misleading with respect to the period covered by this report; |
| 3. | Based on my knowledge, the financial statements, and other financial information included in this report, fairly present in all material respects the financial condition, results of operations and cash flows of the registrant as of, and for, the periods presented in this report; |
| 4. | The registrant's other certifying officer(s) and I are responsible for establishing and maintaining disclosure controls and procedures (as defined in Exchange Act Rules 13a-15(e) and 15d-15(e)) and internal control over financial reporting (as defined in Exchange Act Rules 13a-15(f) and 15d-15(f)) for the registrant and have: |
| | (a) | Designed such disclosure controls and procedures, or caused such disclosure controls and procedures to be designed under our supervision, to ensure that material information relating to the registrant, including its consolidated subsidiaries, is made known to us by others within those entities, particularly during the period in which this report is being prepared; |
| | (b) | Designed such internal control over financial reporting, or caused such internal control over financial reporting to be designed under our supervision, to provide reasonable assurance regarding the reliability of financial reporting and the preparation of financial statements for external purposes in accordance with generally accepted accounting principles; |
| | (c) | Evaluated the effectiveness of the registrant's disclosure controls and procedures and presented in this report our conclusions about the effectiveness of the disclosure controls and procedures, as of the end of the period covered by this report based on such evaluation; and |
| | (d) | Disclosed in this report any change in the registrant’s internal control over financial reporting that occurred during the registrant’s most recent fiscal quarter (the registrant’s fourth fiscal quarter in the case of an annual report) that has materially affected, or is reasonably likely to materially affect, the registrant’s internal control over financial reporting; and |
| 5. | The registrant's other certifying officer(s) and I have disclosed, based on our most recent evaluation of internal control over financial reporting, to the registrant's auditors and the audit committee of the registrant's board of directors (or persons performing the equivalent functions): |
| | (a) | All significant deficiencies and material weaknesses in the design or operation of internal control over financial reporting which are reasonably likely to adversely affect the registrant’s ability to record, process, summarize and report financial information; and |
| | (b) | Any fraud, whether or not material, that involves management or other employees who have a significant role in the registrant's internal control over financial reporting. |
| Date: March 12, 2007 | /s/ Hal Brown |
| | Hal Brown, President & CEO |
CERTIFICATION
I, Michael A. Reynolds, certify that:
| 1. | I have reviewed this Form 10-K of Pacific Continental Corporation; |
| 2. | Based on my knowledge, this report does not contain any untrue statement of a material fact or omit to state a material fact necessary to make the statements made, in light of the circumstances under which such statements were made, not misleading with respect to the period covered by this report; |
| 3. | Based on my knowledge, the financial statements, and other financial information included in this report, fairly present in all material respects the financial condition, results of operations and cash flows of the registrant as of, and for, the periods presented in this report; |
| 4. | The registrant's other certifying officer(s) and I are responsible for establishing and maintaining disclosure controls and procedures (as defined in Exchange Act Rules 13a-15(e) and 15d-15(e)) and internal control over financial reporting (as defined in Exchange Act Rules 13a-15(f) and 15d-15(f)) for the registrant and have: |
| | (a) | Designed such disclosure controls and procedures, or caused such disclosure controls and procedures to be designed under our supervision, to ensure that material information relating to the registrant, including its consolidated subsidiaries, is made known to us by others within those entities, particularly during the period in which this report is being prepared; |
| | (b) | Designed such internal control over financial reporting, or caused such internal control over financial reporting to be designed under our supervision, to provide reasonable assurance regarding the reliability of financial reporting and the preparation of financial statements for external purposes in accordance with generally accepted accounting principles; |
| | (c) | Evaluated the effectiveness of the registrant's disclosure controls and procedures and presented in this report our conclusions about the effectiveness of the disclosure controls and procedures, as of the end of the period covered by this report based on such evaluation; and |
| | (d) | Disclosed in this report any change in the registrant’s internal control over financial reporting that occurred during the registrant’s most recent fiscal quarter (the registrant’s fourth fiscal quarter in the case of an annual report) that has materially affected, or is reasonably likely to materially affect, the registrant’s internal control over financial reporting; and |
| 5. | The registrant's other certifying officer(s) and I have disclosed, based on our most recent evaluation of internal control over financial reporting, to the registrant's auditors and the audit committee of the registrant's board of directors (or persons performing the equivalent functions): |
| | (a) | All significant deficiencies and material weaknesses in the design or operation of internal control over financial reporting which are reasonably likely to adversely affect the registrant’s ability to record, process, summarize and report financial information; and |
| | (b) | Any fraud, whether or not material, that involves management or other employees who have a significant role in the registrant's internal control over financial reporting. |
Date: March 12, 2007 /s/ Michael A. Reynolds
� 60; Michael A. Reynolds, Executive Vice President & CFO
CERTIFICATION PURSUANT TO
18 U.S.C. SECTION 1350,
AS ADOPTED PURSUANT TO
SECTION 906 OF THE SARBANES-OXLEY ACT OF 2002
In connection with the Annual Report of Pacific Continental Corporation (the “Company”) on Form 10-K for the period ending December 31, 2006 as filed with the Securities and Exchange Commission on the date hereof (the “Report”), we, Hal M. Brown, Chief Executive Officer, and Michael A. Reynolds, Chief Financial Officer, certify, pursuant to 18 U.S.C. Section 1350, as adopted pursuant to Section 906 of the Sarbanes-Oxley Act of 2002, that:
| (1) | The Report fully complies with the requirements of Section 13(a) or 15(d) of the Securities Exchange Act of 1934; and |
| (2) | The information contained in the Report fairly presents, in all material respects, the financial condition and results of operations of the Company. |
/s/ Hal M. Brown | /s/ Michael A. Reynolds |
Hal M. Brown | Michael A. Reynolds |
Chief Executive Officer | Chief Financial Officer |
Dated: March 12, 2007