
Encore Capital Group, Inc. 2014 Investor Day New York, NY June 5, 2014 Exhibit 99.1
PROPRIETARY SAFE HARBOR The statements in this presentation that are not historical facts, including, most importantly, those statements preceded by, or that include, the words “will,” “may,” “believe,” “projects,” “expects,” “anticipates” or the negation thereof, or similar expressions, constitute “forward-looking statements” within the meaning of the Private Securities Litigation Reform Act of 1995 (the “Reform Act”). These statements may include, but are not limited to, statements regarding our future operating results, shareholder return, capital deployment and growth. For all “forward-looking statements,” the Company claims the protection of the safe harbor for forward-looking statements contained in the Reform Act. Such forward-looking statements involve risks, uncertainties and other factors which may cause actual results, performance or achievements of the Company and its subsidiaries to be materially different from any future results, performance or achievements expressed or implied by such forward-looking statements. These risks, uncertainties and other factors are discussed in the reports filed by the Company with the Securities and Exchange Commission, including its most recent report on Form 10-K, and its subsequent reports on Form 10-Q, as they may be amended from time to time. The Company disclaims any intent or obligation to update these forward-looking statements. 2

PROPRIETARY PRESENTING TODAY Ken Vecchione CEO, Encore Capital Paul Grinberg CFO, Encore Capital Ken Stannard CEO, Cabot Credit Management Kevin Fuller CEO, Grove Capital Management Kenneth Mendiwelson CEO, Refinancia Manu Rikhye Managing Director, Encore India 3

PROPRIETARY Ken Vecchione President and CEO 4
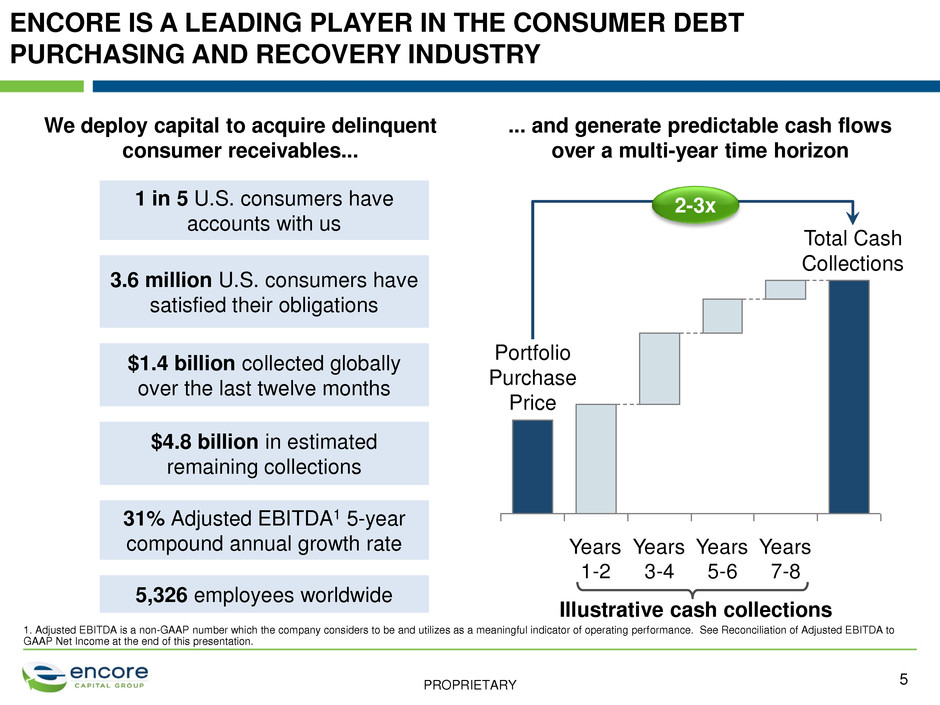
PROPRIETARY ENCORE IS A LEADING PLAYER IN THE CONSUMER DEBT PURCHASING AND RECOVERY INDUSTRY ... and generate predictable cash flows over a multi-year time horizon Total Cash Collections Portfolio Purchase Price Illustrative cash collections 2-3x Years 1-2 Years 3-4 Years 5-6 Years 7-8 We deploy capital to acquire delinquent consumer receivables... 1 in 5 U.S. consumers have accounts with us 3.6 million U.S. consumers have satisfied their obligations $4.8 billion in estimated remaining collections 31% Adjusted EBITDA1 5-year compound annual growth rate 5,326 employees worldwide $1.4 billion collected globally over the last twelve months 5 1. Adjusted EBITDA is a non-GAAP number which the company considers to be and utilizes as a meaningful indicator of operating performance. See Reconciliation of Adjusted EBITDA to GAAP Net Income at the end of this presentation.

PROPRIETARY WE ARE PART OF A DEBT COLLECTION INDUSTRY WHICH CREATES VALUE BENEFITING STAKEHOLDERS IN MULTIPLE INDUSTRIES 6 • Reduces creditor losses from delinquent debt, contributing to profitability and solvency • Enables creditors to serve a large consumer base at lower prices • Enhances access to credit at lower prices • Supports consumers in rehabilitating their credit history • Increases number and variety of lenders available to consumers • Enhances resilience of financial system by helping enforce contracts • Contributes to economic growth by servicing healthcare providers, utilities, retailers, etc. • Reduces need for fiscal austerity by supporting local governments Debt Collection Industry re-injected $47B into the U.S. financial system in 2013 Role in financial industry Consumer benefit Socio-economic benefit Source: Company reports
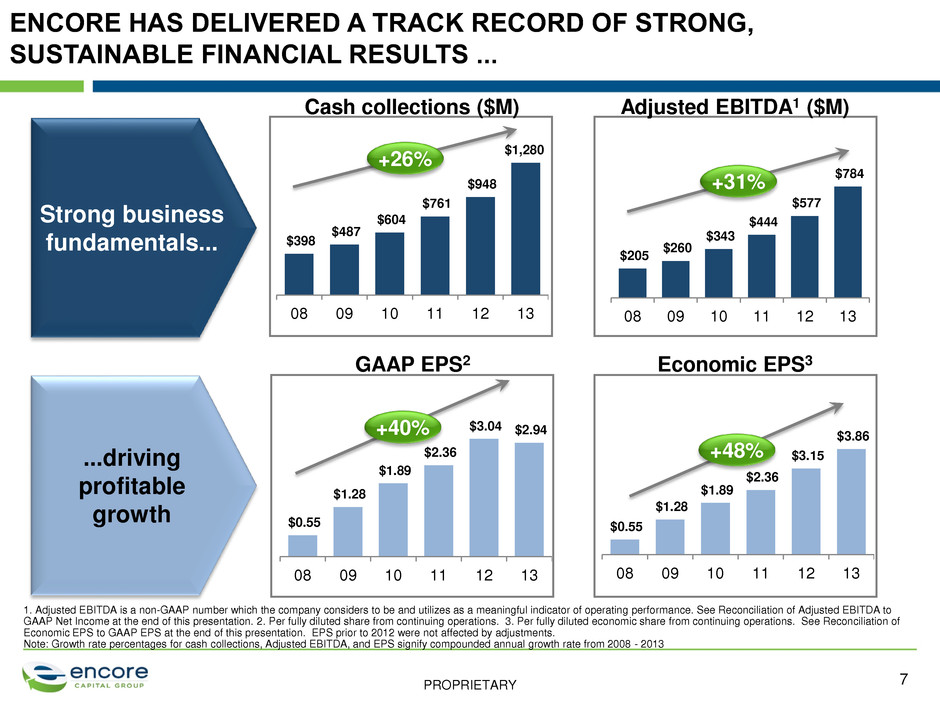
PROPRIETARY $205 $260 $343 $444 $577 $784 08 09 10 11 12 13 $0.55 $1.28 $1.89 $2.36 $3.04 $2.94 08 09 10 11 12 13 $398 $487 $604 $761 $948 $1,280 08 09 10 11 12 13 $0.55 $1.28 $1.89 $2.36 $3.15 $3.86 08 09 10 11 12 13 ENCORE HAS DELIVERED A TRACK RECORD OF STRONG, SUSTAINABLE FINANCIAL RESULTS ... 7 1. Adjusted EBITDA is a non-GAAP number which the company considers to be and utilizes as a meaningful indicator of operating performance. See Reconciliation of Adjusted EBITDA to GAAP Net Income at the end of this presentation. 2. Per fully diluted share from continuing operations. 3. Per fully diluted economic share from continuing operations. See Reconciliation of Economic EPS to GAAP EPS at the end of this presentation. EPS prior to 2012 were not affected by adjustments. Note: Growth rate percentages for cash collections, Adjusted EBITDA, and EPS signify compounded annual growth rate from 2008 - 2013 Strong business fundamentals... Cash collections ($M) +26% Adjusted EBITDA1 ($M) ...driving profitable growth GAAP EPS2 Economic EPS3 +40% +31% +48%

PROPRIETARY 0 100 200 300 400 500 600 700 800 2008 2009 2010 2011 2012 2013 ... AND HAS DELIVERED MARKET LEADING TOTAL SHAREHOLDER RETURN OVER THE PAST FIVE YEARS Total Shareholder Return (Dec. 2008 – Dec. 2013) NASDAQ Financial 100 Encore Capital S&P SmallCap 600 ($) Russell 2000 8 NASDAQ Financial 100: Encore Capital: S&P SmallCap 600: Russell 2000: 42% 64% 41% 39% 1 Year 14% 29% 18% 16% 3 Years 12% 47% 21% 20% 5 Years CAGR by year Note: Assumes $100 was invested in December 2008 Source: Bloomberg

PROPRIETARY WITH OUR GROWTH HAS COME SIGNIFICANT GEOGRAPHIC DIVERSIFICATION West Malling UKH Costa Rica New Delhi, India London, UK Worthing, UK Dublin, Ireland Encore India St. Cloud, MN San Antonio, TX Warren , MI San Diego, CA 9 Phoenix, AZ Colombia and Peru
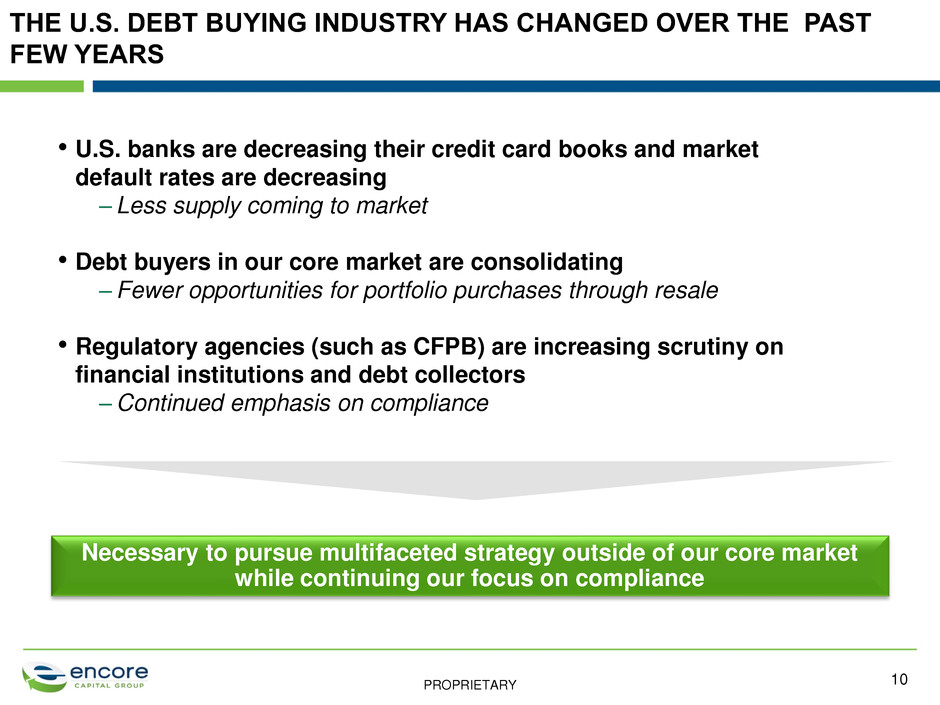
PROPRIETARY THE U.S. DEBT BUYING INDUSTRY HAS CHANGED OVER THE PAST FEW YEARS 10 • U.S. banks are decreasing their credit card books and market default rates are decreasing – Less supply coming to market • Debt buyers in our core market are consolidating –Fewer opportunities for portfolio purchases through resale • Regulatory agencies (such as CFPB) are increasing scrutiny on financial institutions and debt collectors –Continued emphasis on compliance Necessary to pursue multifaceted strategy outside of our core market while continuing our focus on compliance

PROPRIETARY REGULATORY ACTIVITY REMAINS HIGH, REINFORCING THE IMPORTANCE OF OUR SIGNIFICANT INVESTMENTS IN COMPLIANCE 11 CFPB Rulemaking, Supervision & Enforcement • Rulemaking likely to result in new standards in 2015 • Activity in aggressive enforcement and supervision already driving change in credit issuer and recovery spaces Potential Impacts of Regulatory Activity • Standardized and increased access to documentation for debt sales • Heightened consumer disclosures and standards for underlying issuer documentation • Continuing investments in improved compliance infrastructure Encore Aligned with Current Emphasis • Introduced Consumer Bill of Rights in 2011 • Established Consumer Credit Research Institute to better understand the financially distressed consumer • Founded Consumer Experience Council • Provided comments to CFPB on ANPR
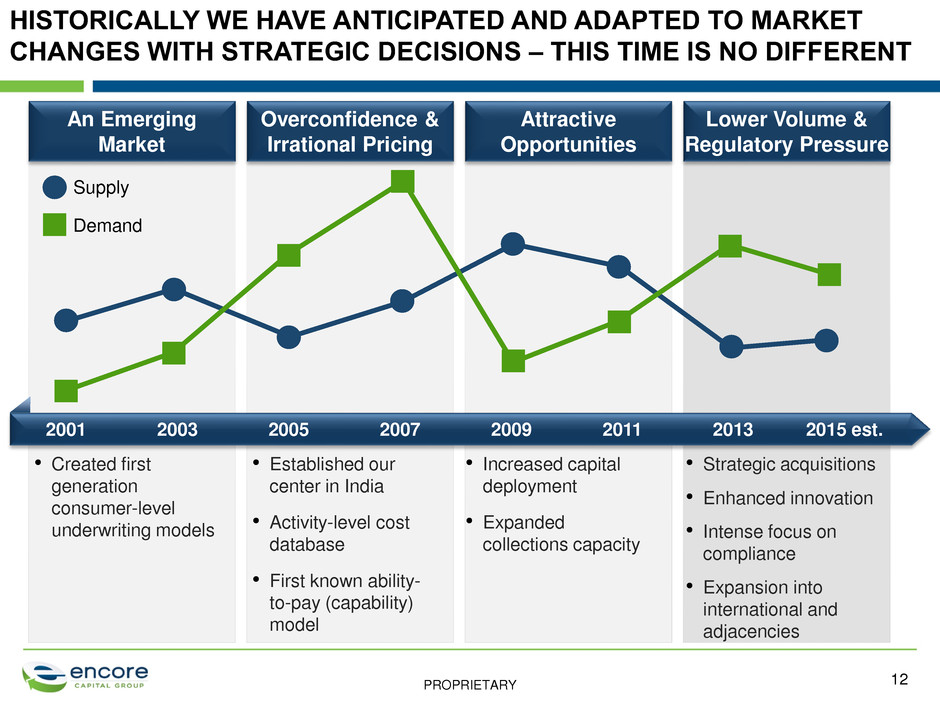
PROPRIETARY Lower Volume & Regulatory Pressure Attractive Opportunities Overconfidence & Irrational Pricing An Emerging Market 12 HISTORICALLY WE HAVE ANTICIPATED AND ADAPTED TO MARKET CHANGES WITH STRATEGIC DECISIONS – THIS TIME IS NO DIFFERENT • Established our center in India • Activity-level cost database • First known ability- to-pay (capability) model 2005 2007 • Created first generation consumer-level underwriting models Demand Supply 2001 2003 2009 2011 • Increased capital deployment • Expanded collections capacity 2013 2015 est. • Strategic acquisitions • Enhanced innovation • Intense focus on compliance • Expansion into international and adjacencies
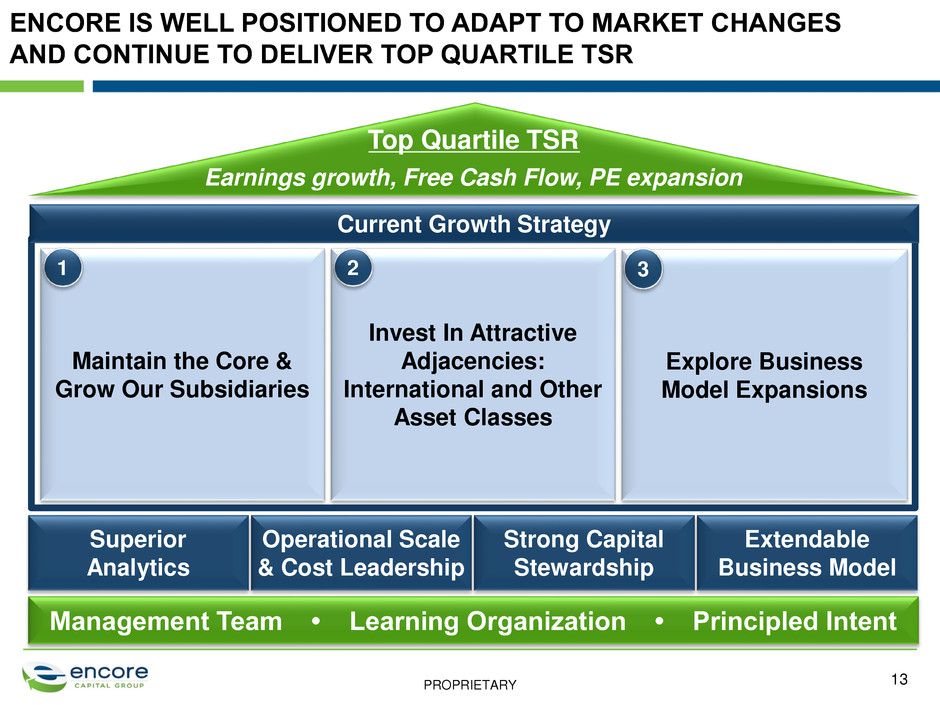
PROPRIETARY ENCORE IS WELL POSITIONED TO ADAPT TO MARKET CHANGES AND CONTINUE TO DELIVER TOP QUARTILE TSR 13 Management Team • Learning Organization • Principled Intent Top Quartile TSR Earnings growth, Free Cash Flow, PE expansion Operational Scale & Cost Leadership Strong Capital Stewardship Superior Analytics Extendable Business Model Current Growth Strategy Maintain the Core & Grow Our Subsidiaries 1 Invest In Attractive Adjacencies: International and Other Asset Classes 2 Explore Business Model Expansions 3

PROPRIETARY OUR CURRENT GROWTH STRATEGY IS TAILORED TO ADDRESS OUR MARKET'S EVOLVING DYNAMICS 14 Current Growth Strategy • International – India – Europe – Latin America – Australia – Others • New debt verticals – Government – Medical – Others Invest In Attractive Adjacencies: International and Other Asset Classes 2 • M&A opportunities in related spaces – Tax Liens – Debt Servicing – Others • Monetization of existing data and capabilities • Funding & incubation of new businesses Explore Business Model Expansions 3 • Core – Core cards direct – Resale – Bankruptcy • Subsidiaries – Cabot – Propel – Grove – Refinancia Maintain the Core and Grow Our Subsidiaries 1
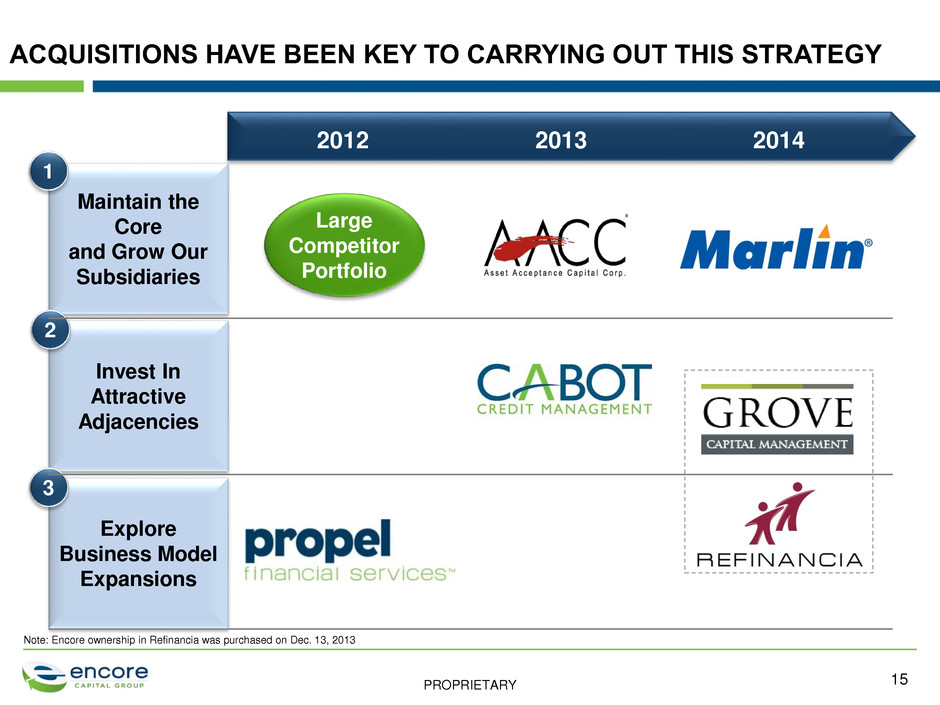
PROPRIETARY ACQUISITIONS HAVE BEEN KEY TO CARRYING OUT THIS STRATEGY 15 2013 Maintain the Core and Grow Our Subsidiaries 1 Invest In Attractive Adjacencies Explore Business Model Expansions 2012 Large Competitor Portfolio 2 3 2014 Note: Encore ownership in Refinancia was purchased on Dec. 13, 2013
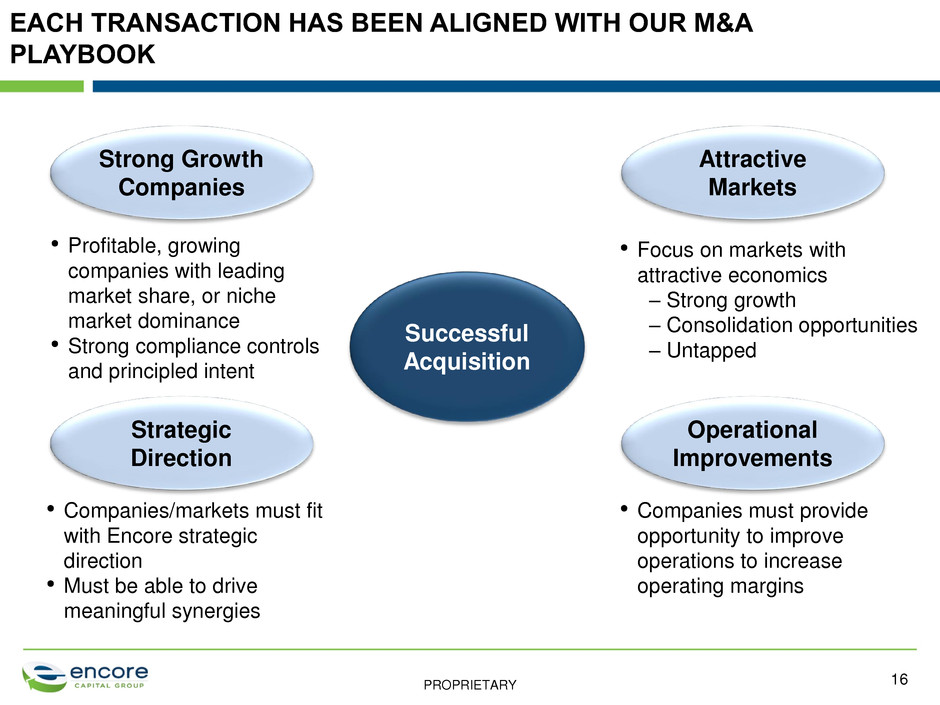
PROPRIETARY EACH TRANSACTION HAS BEEN ALIGNED WITH OUR M&A PLAYBOOK 16 Strong Growth Companies Strategic Direction Operational Improvements Attractive Markets Successful Acquisition • Profitable, growing companies with leading market share, or niche market dominance • Strong compliance controls and principled intent • Focus on markets with attractive economics – Strong growth – Consolidation opportunities – Untapped • Companies/markets must fit with Encore strategic direction • Must be able to drive meaningful synergies • Companies must provide opportunity to improve operations to increase operating margins
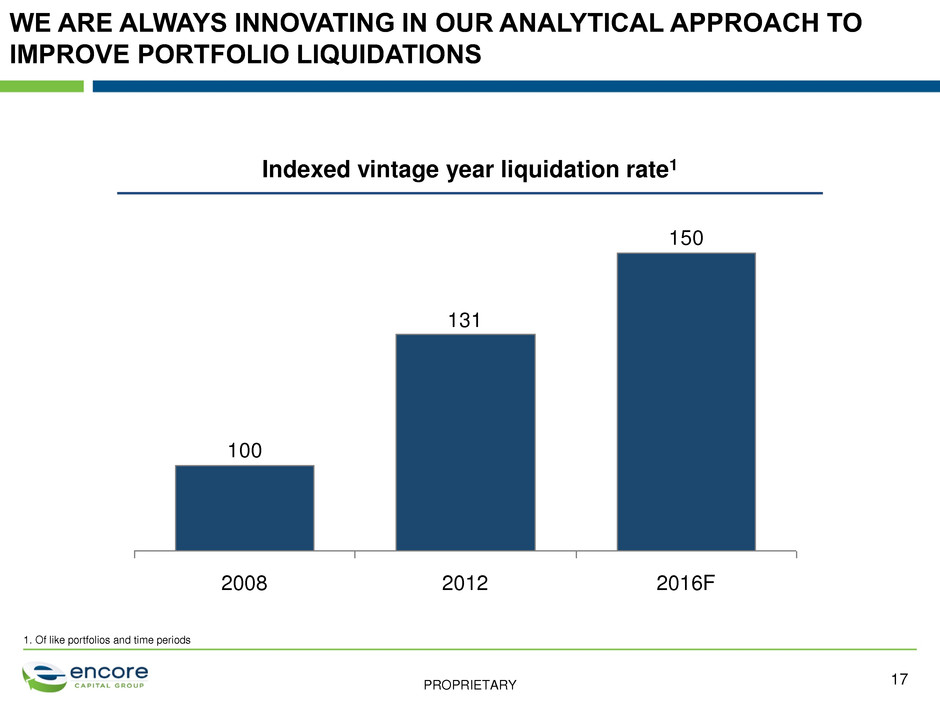
PROPRIETARY WE ARE ALWAYS INNOVATING IN OUR ANALYTICAL APPROACH TO IMPROVE PORTFOLIO LIQUIDATIONS 17 Indexed vintage year liquidation rate1 1. Of like portfolios and time periods 150 131 100 2012 2008 2016F

PROPRIETARY Paul Grinberg CFO, Encore Capital 18

PROPRIETARY THERE ARE MANY ALTERNATIVES FOR DEPLOYING OUR CAPITAL 19 Lower Returns Higher Returns • Little upside Acquisitions Dividend & Share Repurchase Repay Debt Keep Excess Cash • Reduced capital base and enhanced pre-tax earnings • Return excess capital to shareholders assuming capital redeployed with similar cost financing • Deploy capital into transformational and/or bolt-on acquisitions Organic Growth • Depending on the return, reinvest in core business and/or direct capital to new projects and product lines

PROPRIETARY 2015 Expected Core US Propel Cabot Grove India Refinancia $500-600M $170-200M $350-400M $110-120M $40-50M $30-40M $1,200-1,410M 2014 Expected Core US Propel abot Grove India Refinancia $500-600M $150-170M $300-350M $60-70M $30-40M $1,040-1,230M $555M $145M $20M 2013 $780M $60M Core US Propel Cabot Grove India Refinancia Encore capital deployment (2013-2015) Core US Propel abot Grove India Refinancia WE ARE GROWING AND DIVERSIFYING OUR CAPITAL DEPLOYMENT ACROSS OUR DIFFERENT BUSINESSES 20

PROPRIETARY WE HAVE ALSO FOUND OPPORTUNITIES TO RETURN CAPITAL TO SHAREHOLDERS VIA SHARE REPURCHASES 21 Encore share repurchases 2012-2014 Price per Share1: $26 $42 1. Weighted average repurchase price for the period 2015 and beyond • Repurchases to cover employee equity grant dilution • Opportunistic repurchases 40 0 20 60 YTD 2014 17 2012-2013 50 $M
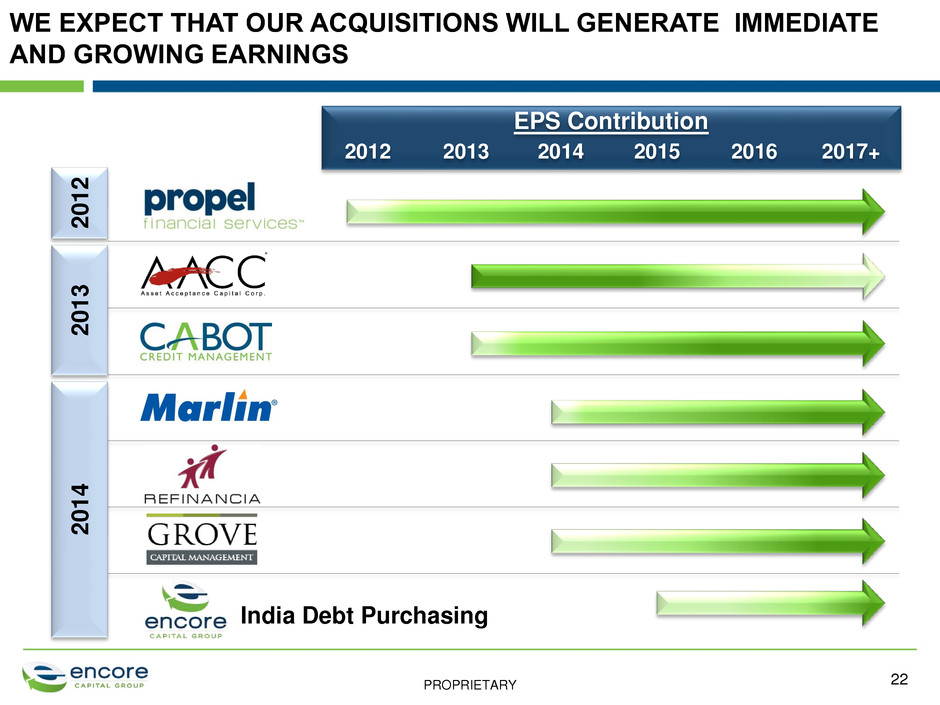
PROPRIETARY WE EXPECT THAT OUR ACQUISITIONS WILL GENERATE IMMEDIATE AND GROWING EARNINGS 22 2 0 1 2 2 0 1 3 2 0 1 4 India Debt Purchasing 2013 2014 2015 2014 2015 2016 2017+ 2013 2012 EPS Contribution
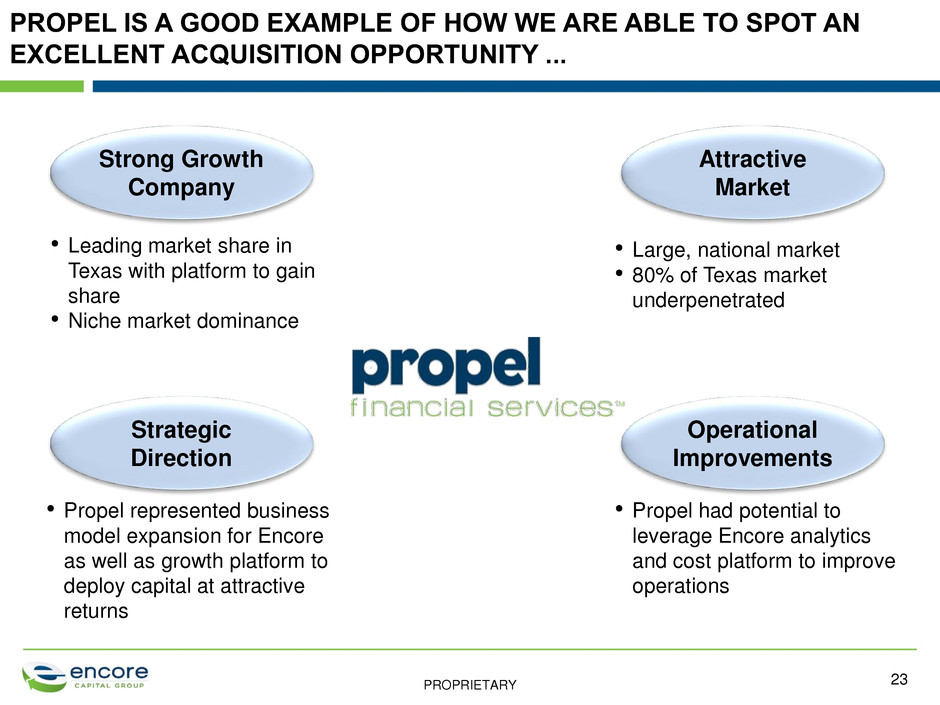
PROPRIETARY PROPEL IS A GOOD EXAMPLE OF HOW WE ARE ABLE TO SPOT AN EXCELLENT ACQUISITION OPPORTUNITY ... 23 Strong Growth Company • Leading market share in Texas with platform to gain share • Niche market dominance Attractive Market • Large, national market • 80% of Texas market underpenetrated Strategic Direction • Propel represented business model expansion for Encore as well as growth platform to deploy capital at attractive returns Operational Improvements • Propel had potential to leverage Encore analytics and cost platform to improve operations
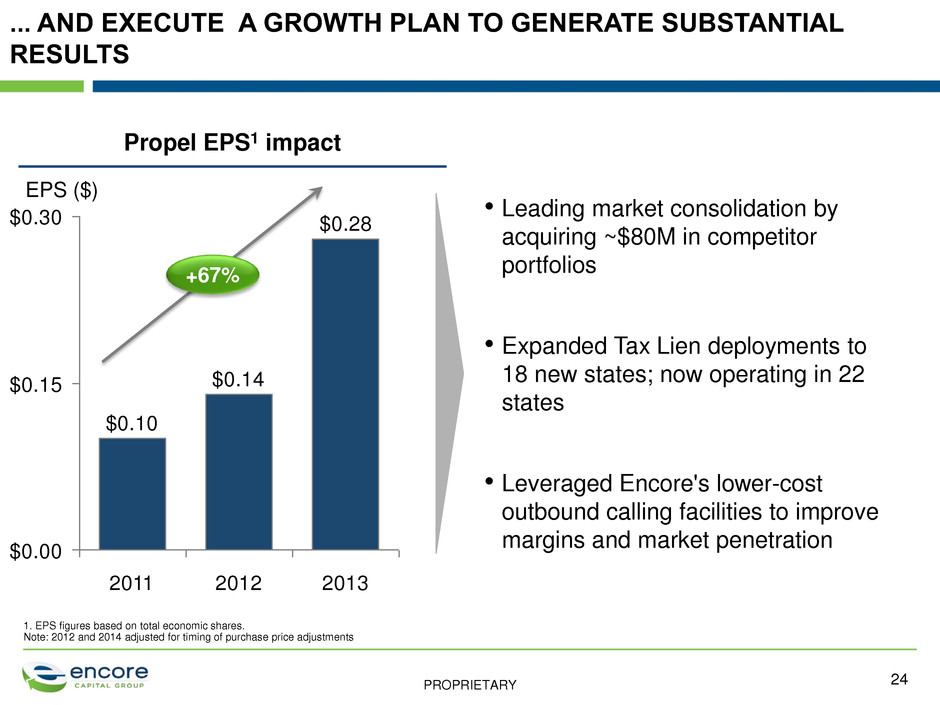
PROPRIETARY ... AND EXECUTE A GROWTH PLAN TO GENERATE SUBSTANTIAL RESULTS 24 • Leading market consolidation by acquiring ~$80M in competitor portfolios • Expanded Tax Lien deployments to 18 new states; now operating in 22 states • Leveraged Encore's lower-cost outbound calling facilities to improve margins and market penetration EPS ($) $0.28 $0.14 $0.10 $0.15 $0.30 $0.00 2011 2012 2013 Propel EPS1 impact +67% 1. EPS figures based on total economic shares. Note: 2012 and 2014 adjusted for timing of purchase price adjustments

PROPRIETARY Ken Stannard CEO, Cabot Credit Management 25

PROPRIETARY • Purchases charged off consumer receivables in UK • UK leader with $2.3B in ERC • Invested $1.7B to acquire $18B in face value of debt since inception • Acquired more than 1,035 portfolios since inception, representing more than 4.4 million accounts • 950 employees 26 CABOT CREDIT MANAGEMENT LEADS THE UK DEBT PURCHASING MARKET

PROPRIETARY 27 2.6 1.3 0.0 Paying Non- Paying 17F 2.1 1.1 1.0 16F 1.9 1.0 0.9 15F 1.8 1.0 0.7 14F 1.6 1.0 0.7 13A 1.5 0.9 0.6 12A 1.4 0.9 0.6 +9% 13A – 17F CAGR +12% +6% Capital Deployment Drivers of success • Vendor panel membership • Competitive funding and cost • Investments in data and analytics • Compliance with regulation • Achieving scale Source: OC&C industry analysis $B THE MARKET IS GROWING STRONGLY WITH CABOT WELL POSITIONED TO CAPITALIZE ON THIS GROWTH
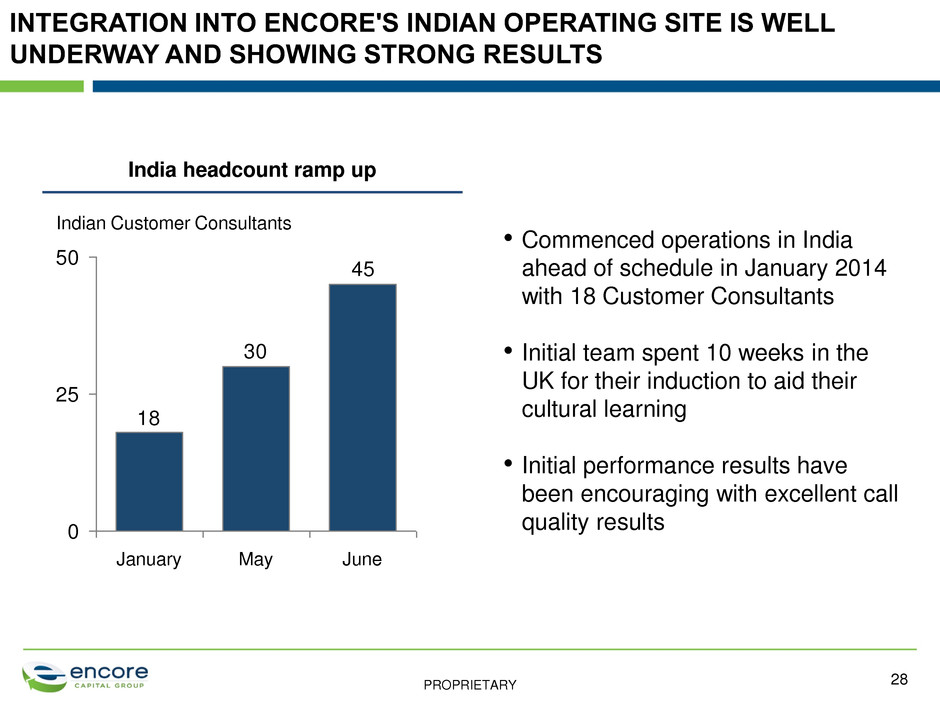
PROPRIETARY 28 45 30 18 0 25 50 June January Indian Customer Consultants May India headcount ramp up • Commenced operations in India ahead of schedule in January 2014 with 18 Customer Consultants • Initial team spent 10 weeks in the UK for their induction to aid their cultural learning • Initial performance results have been encouraging with excellent call quality results INTEGRATION INTO ENCORE'S INDIAN OPERATING SITE IS WELL UNDERWAY AND SHOWING STRONG RESULTS
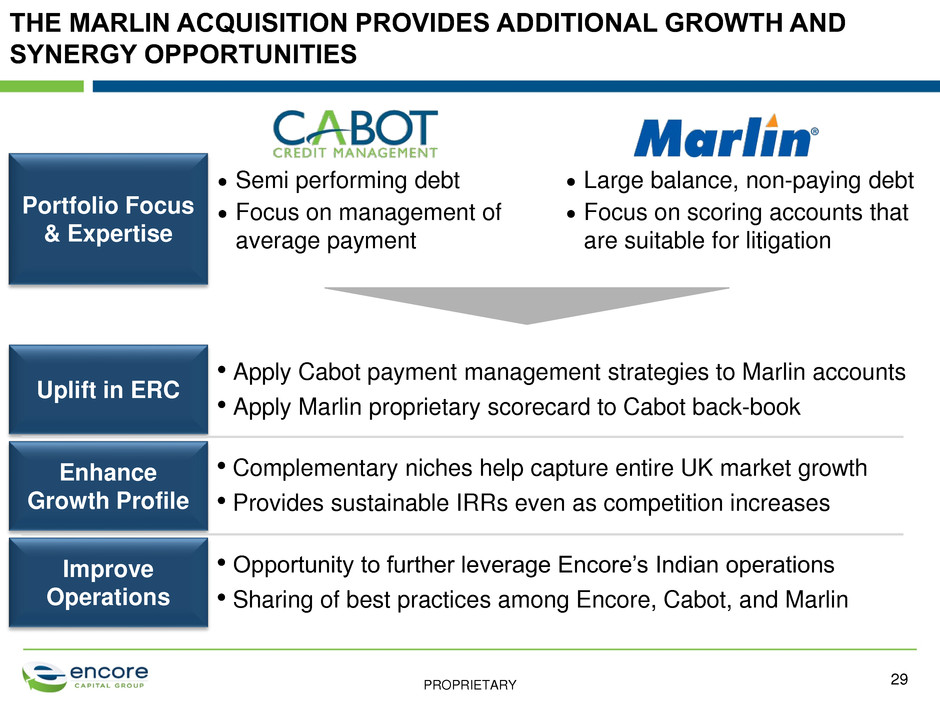
PROPRIETARY 29 Uplift in ERC • Apply Cabot payment management strategies to Marlin accounts • Apply Marlin proprietary scorecard to Cabot back-book Semi performing debt Focus on management of average payment Large balance, non-paying debt Focus on scoring accounts that are suitable for litigation Portfolio Focus & Expertise Enhance Growth Profile Improve Operations • Opportunity to further leverage Encore’s Indian operations • Sharing of best practices among Encore, Cabot, and Marlin • Complementary niches help capture entire UK market growth • Provides sustainable IRRs even as competition increases THE MARLIN ACQUISITION PROVIDES ADDITIONAL GROWTH AND SYNERGY OPPORTUNITIES

PROPRIETARY (1.0)x 0.0 x 1.0 x 2.0 x 3.0 x 4.0 x 5.0 x 6.0 x 0 12 24 36 48 60 72 84 96 108120 Marlin scorecard Bureau scorecard 30 • Marlin scorecard predicted to enhance recoveries by 41% on eligible portfolios • Cabot has already identified uplift in ERC using Marlin scorecard • Marlin scorecard will enhance potential value on portfolio purchases going forward Net Mone y Mu lt ip le Expected returns: Marlin scorecard vs. Bureau scorecard¹ Months 1. Based on a sample of approximately 300,000 customers, assumes all accounts non-paying and follow the 10-year non-paying recovery profile used in pricing, also assumes a purchase cost of $0.08 per $1.00 face value for each account +41% MARLIN'S SCORECARD IS PROVIDING UPLIFT TO CABOT'S ERC
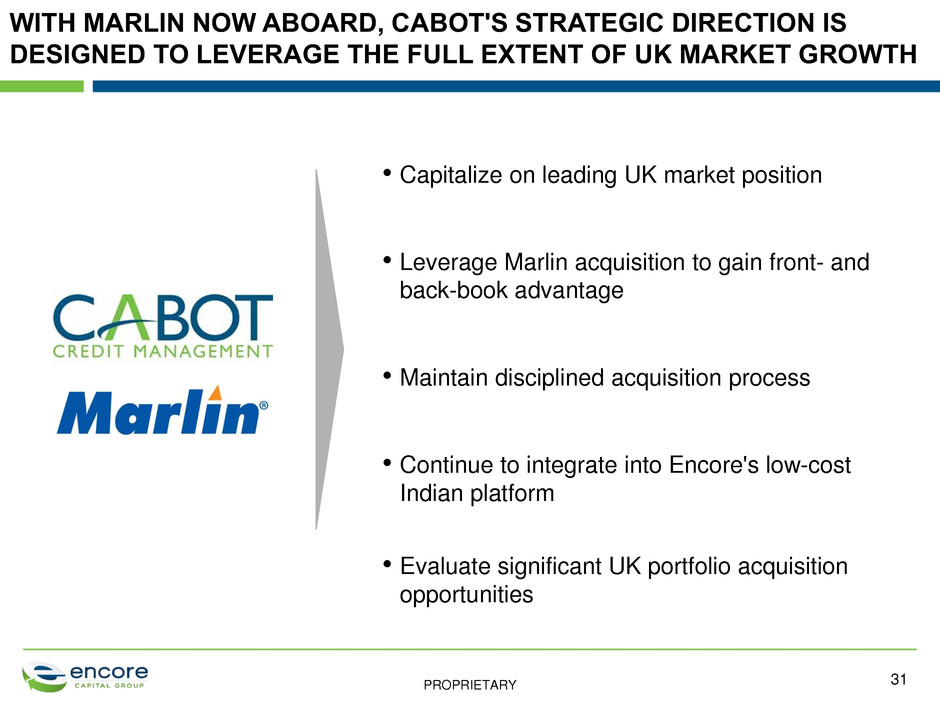
PROPRIETARY 31 • Capitalize on leading UK market position • Leverage Marlin acquisition to gain front- and back-book advantage • Maintain disciplined acquisition process • Continue to integrate into Encore's low-cost Indian platform • Evaluate significant UK portfolio acquisition opportunities WITH MARLIN NOW ABOARD, CABOT'S STRATEGIC DIRECTION IS DESIGNED TO LEVERAGE THE FULL EXTENT OF UK MARKET GROWTH

PROPRIETARY Kevin Fuller CEO, Grove Capital Management 32
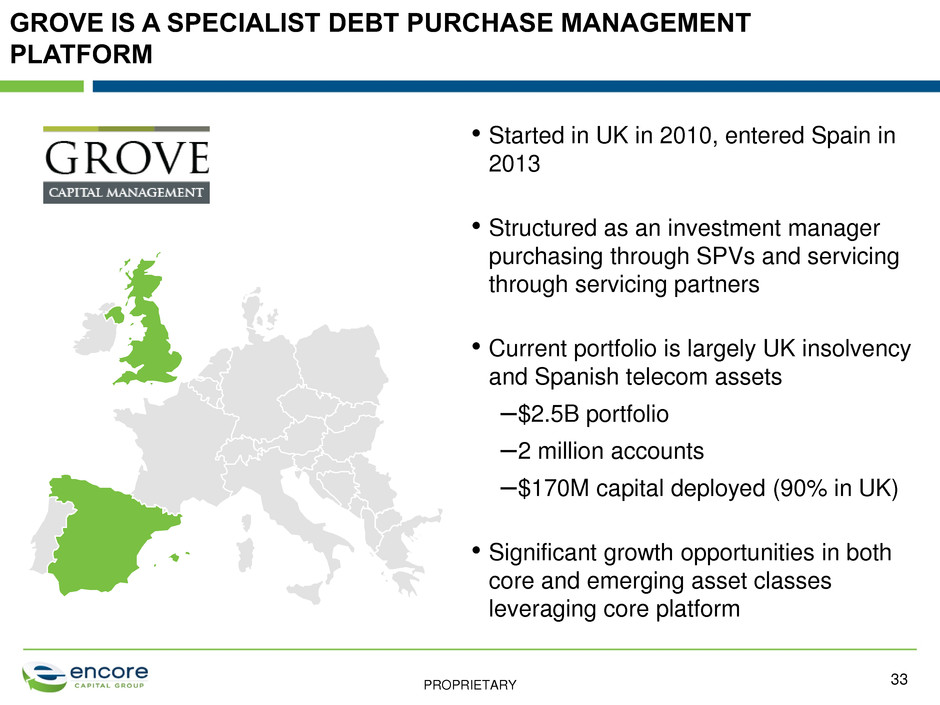
PROPRIETARY • Started in UK in 2010, entered Spain in 2013 • Structured as an investment manager purchasing through SPVs and servicing through servicing partners • Current portfolio is largely UK insolvency and Spanish telecom assets –$2.5B portfolio –2 million accounts –$170M capital deployed (90% in UK) • Significant growth opportunities in both core and emerging asset classes leveraging core platform 33 GROVE IS A SPECIALIST DEBT PURCHASE MANAGEMENT PLATFORM
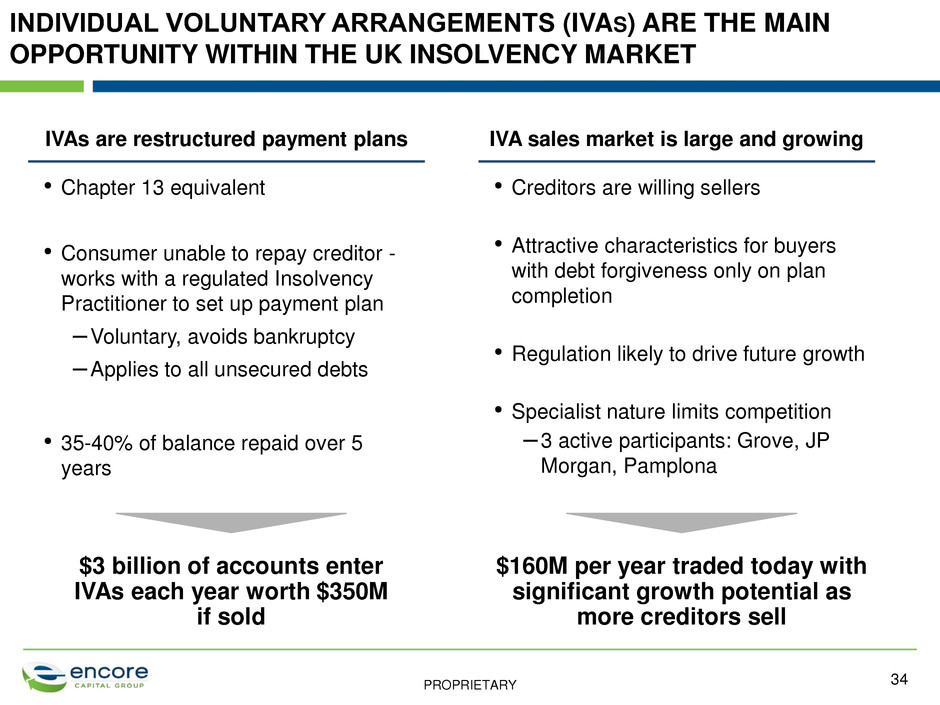
PROPRIETARY 34 • Chapter 13 equivalent • Consumer unable to repay creditor - works with a regulated Insolvency Practitioner to set up payment plan –Voluntary, avoids bankruptcy –Applies to all unsecured debts • 35-40% of balance repaid over 5 years $3 billion of accounts enter IVAs each year worth $350M if sold • Creditors are willing sellers • Attractive characteristics for buyers with debt forgiveness only on plan completion • Regulation likely to drive future growth • Specialist nature limits competition – 3 active participants: Grove, JP Morgan, Pamplona $160M per year traded today with significant growth potential as more creditors sell IVAs are restructured payment plans IVA sales market is large and growing INDIVIDUAL VOLUNTARY ARRANGEMENTS (IVAS) ARE THE MAIN OPPORTUNITY WITHIN THE UK INSOLVENCY MARKET

PROPRIETARY Market Knowledge & Relationship Servicing Partnerships Funding & Structuring Flexibility 35 Data & Analytics Deal Sourcing Evaluation Performance Optimization Portfolio Management Structuring GROVE HAS BUILT A SCALABLE DATA-BASED PURCHASING PLATFORM THAT SUPPORTS GROWTH INTO NEW ASSET CLASSES

PROPRIETARY LEVERAGING OUR PLATFORM AND SERVICER RELATIONSHIPS WE ENTERED SPAIN IN 2013 AND ARE NOW READY TO START SCALING 36 2013-14: Establish Base • Started in telecom debt where competition is lower • Large and growing dataset – 1.7 million consumer accounts • Actively managing debt with 10 collection agencies 2014-15: Scale Portfolio • Maintain focus on telecom, media and utilities is an initial $70 million annual deployment opportunity • Make test investments in bank debt 2016: Move Into Financial Services • $400 million annual deployment opportunity • Leverage data and servicing platform • Actively seek retrade opportunities

PROPRIETARY • SPVs/licensing • Commercial structures • Technology • Processes SPAIN ALLOWED US TO REFINE OUR MARKET ENTRY MODEL WHICH WILL DRIVE GROWTH INTO NEW SEGMENTS 37 Find Servicing Partners Make Test Investments Scale Portfolio Establish Local Team Optimize Collections Strategy Leverage Core Purchasing Platform Leveraging the core platform capabilities Active evaluation of markets with annual spend opportunities in excess of $400 million • Italy • Portugal • Ireland

PROPRIETARY GROWTH OPPORTUNITIES EXPECTED TO INCREASE ANNUAL SPEND FROM $50M TO $160M BY 2016 38 UK Insolvency • Opportunity is $600M in existing issuer unsold inventory + annual volume worth $350M • Creditors shifting towards flow sales $80M target annual spend by 2016 1 Spain • Continued delevering of banks & other creditors • $400M+ annual capital deployment opportunity • Significant opportunities for servicing optimization $50M 2 New Markets • Significant opportunities across Europe • Experience in Spain established market entry model $30M 3

PROPRIETARY GROVE AND ENCORE ARE ALIGNED STRATEGIC PARTNERS 39 • Combines Encore's capital resources with Grove's established market positions • Leverages Encore’s deep collections experience and operational performance best practices to continue to improve performance • Enhances Grove's ability to rapidly enter new markets

PROPRIETARY Kenneth Mendiwelson CEO, Refinancia 40
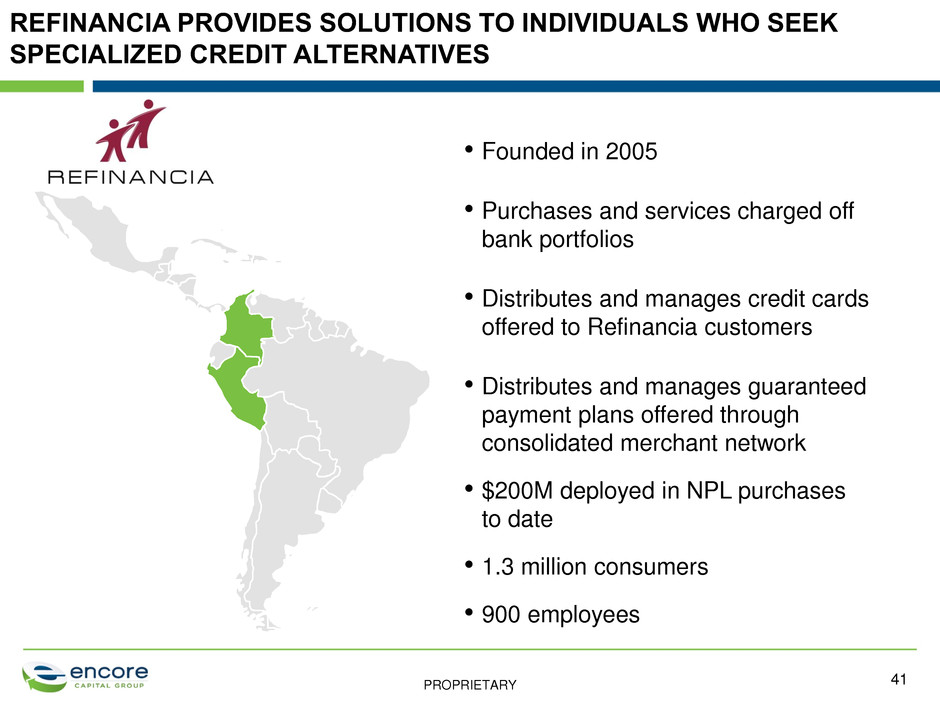
PROPRIETARY REFINANCIA PROVIDES SOLUTIONS TO INDIVIDUALS WHO SEEK SPECIALIZED CREDIT ALTERNATIVES 41 • Founded in 2005 • Purchases and services charged off bank portfolios • Distributes and manages credit cards offered to Refinancia customers • Distributes and manages guaranteed payment plans offered through consolidated merchant network • $200M deployed in NPL purchases to date • 1.3 million consumers • 900 employees

PROPRIETARY - 50 100 150 200 250 300 2008 2009 2010 2011 2012 2013 Argentina Brazil Chile Colombia Mexico Peru 15% 5% 15% 8% 14% 26% CAGR THE CONSUMER CREDIT MARKET IN LATIN AMERICA HAS EXPERIENCED SOLID GROWTH Consumer Credit: Outstanding Balance ($B) 42 Source: Euromonitor: Consumer Lending in Argentina (Feb 2014), Brazil (Mar 2014), Chile (Jan 2014) and Mexico (Apr 2014); Superintendencia de Banca y Seguros y AFP for Peru information; Superintendencia Financiera de Colombia for Colombia information

PROPRIETARY REFINANCIA MANAGES FOUR BUSINESSES WHERE COLLECTIONS AND ANALYTICS PLAY A FUNDAMENTAL ROLE • Purchase and collection of charged-off portfolios from large banks • Management and collection of charged-off pools from banks • In many cases leads to portfolio purchase • Management of credit cards offered to Refinancia consumers who have settled their debt • Credit risk is taken by partner bank • Management of guaranteed payment plans • Collection of defaulted payment plans NPL Purchase and Recovery Collection Outsourcing Credit Card Pilot Guarantee Services for Merchants 43

PROPRIETARY EACH BUSINESS IS GROWING 2013A 2014F Growth Deployed ($M) Unpaid balance managed ($M)1 Outstanding balance managed ($M) Guaranteed/Year ($M) 19 40 109% 330 445 35% 0.8 4.1 410% 306 320 5% NPL Purchase and Recovery Collection Outsourcing Credit Card Pilot Guarantee Services for Merchants 1. Cumulative figures 44
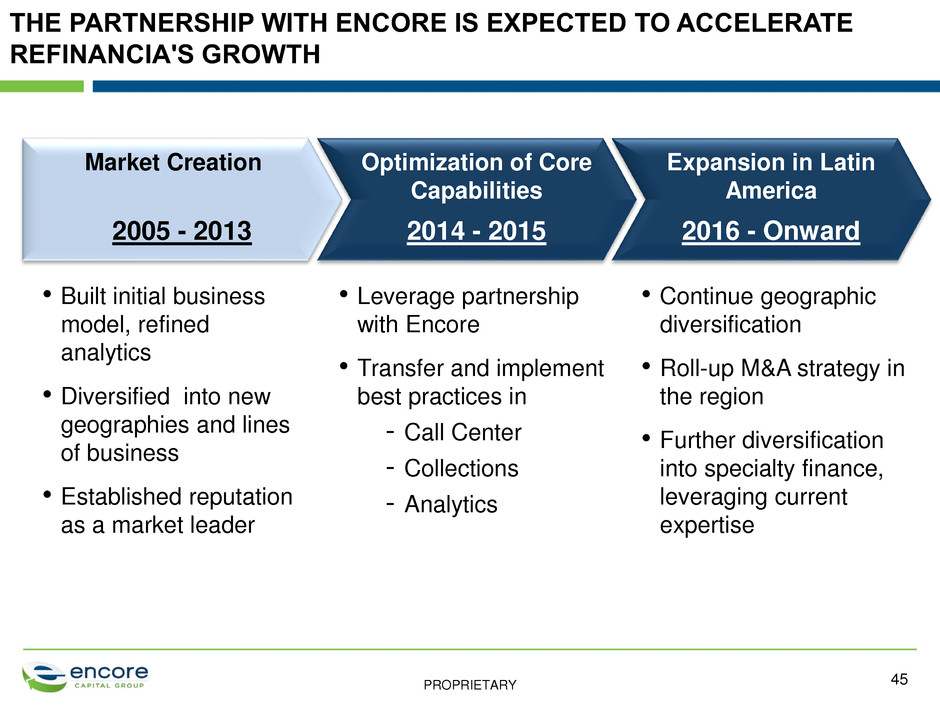
PROPRIETARY THE PARTNERSHIP WITH ENCORE IS EXPECTED TO ACCELERATE REFINANCIA'S GROWTH • Built initial business model, refined analytics • Diversified into new geographies and lines of business • Established reputation as a market leader • Leverage partnership with Encore • Transfer and implement best practices in - Call Center - Collections - Analytics • Continue geographic diversification • Roll-up M&A strategy in the region • Further diversification into specialty finance, leveraging current expertise 2005 - 2013 2014 - 2015 2016 - Onward Market Creation Optimization of Core Capabilities Expansion in Latin America 2 05 - 2013 2014 - 2015 - r 45
PROPRIETARY REFINANCIA AND ENCORE ARE ALIGNED STRATEGIC PARTNERS 46 • Combines Encore's capital resources with Refinancia's growing markets • Improvements in call center operational processes and technology • Applying best-in-class Decision Science methodologies • Provides testing ground for specialty finance
PROPRIETARY Manu Rikhye Managing Director, Encore India 47

PROPRIETARY ENCORE INDIA 48 • Established in 2005, today a key driver of Encore’s competitive advantage • Evolved as a strategic partner and diversified business with significant depth and broad service offerings • Contributed ~50% of global call center collections in 2013 • Named in the Top 50 GPTW in India for ‘11, ‘12 & ’13 • Replicating similar success in other business operations like Cabot • 2,000 employees
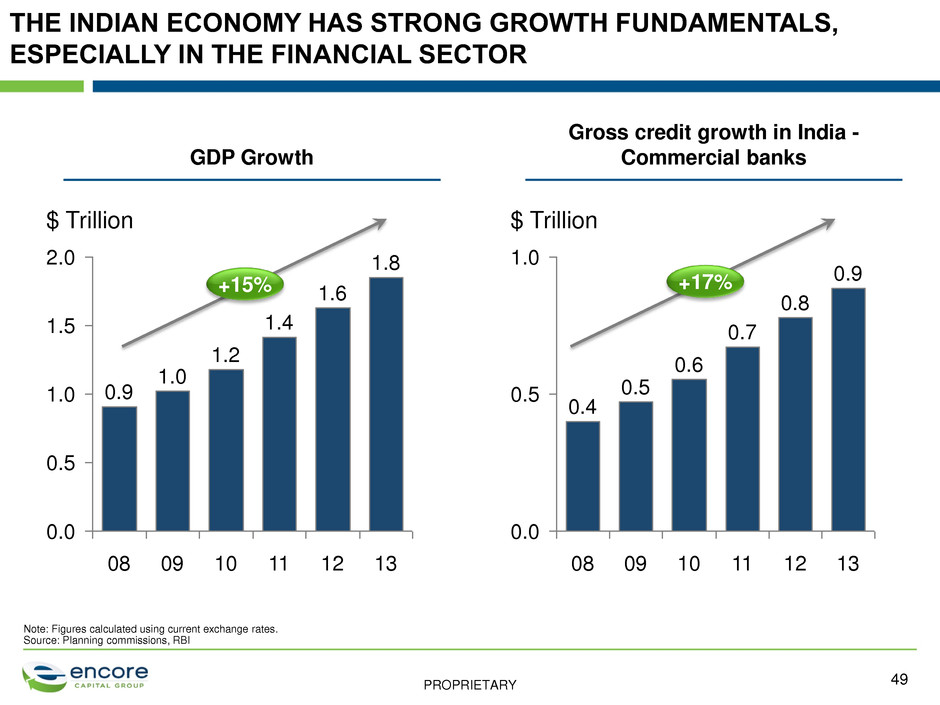
PROPRIETARY THE INDIAN ECONOMY HAS STRONG GROWTH FUNDAMENTALS, ESPECIALLY IN THE FINANCIAL SECTOR 1.0 0.0 0.5 1.5 2.0 1.8 1.6 $ Trillion 09 1.4 1.2 1.0 08 0.9 13 12 11 10 1.0 0.0 0.5 $ Trillion 13 0.9 12 0.8 11 0.7 10 0.6 09 0.5 08 0.4 GDP Growth Gross credit growth in India - Commercial banks Note: Figures calculated using current exchange rates. Source: Planning commissions, RBI +15% +17% 49

PROPRIETARY THERE IS A LARGE GAP BETWEEN SUPPLY AND DEMAND, THOUGH SEVERAL FACTORS ARE LIKELY TO INCREASE CHARGE-OFF SALES $35 $26 $18 $15 $12 4%5% 13%13%15% 2012 2011 2013 2010 2009 Gross Bank Charge-Offs ($B)2 Sale of Charge-Offs to ARCs1 Market supply and demand for bank charge-offs • Most banks lack skill set for optimal resolution of charge-offs • Favorable regulatory amendments (such as easier debt aggregation, revised norms of asset sale) are expected to continue • Implementation of Basel III should drive banks to sell their charge-off portfolios 1. Asset Reconstruction Company 2. Gross charge-offs at the end of the year = Gross charge-offs at the beginning of the year + incremental charge-offs added during the year - resolution done by banks internally and sale of assets by them during the year 50
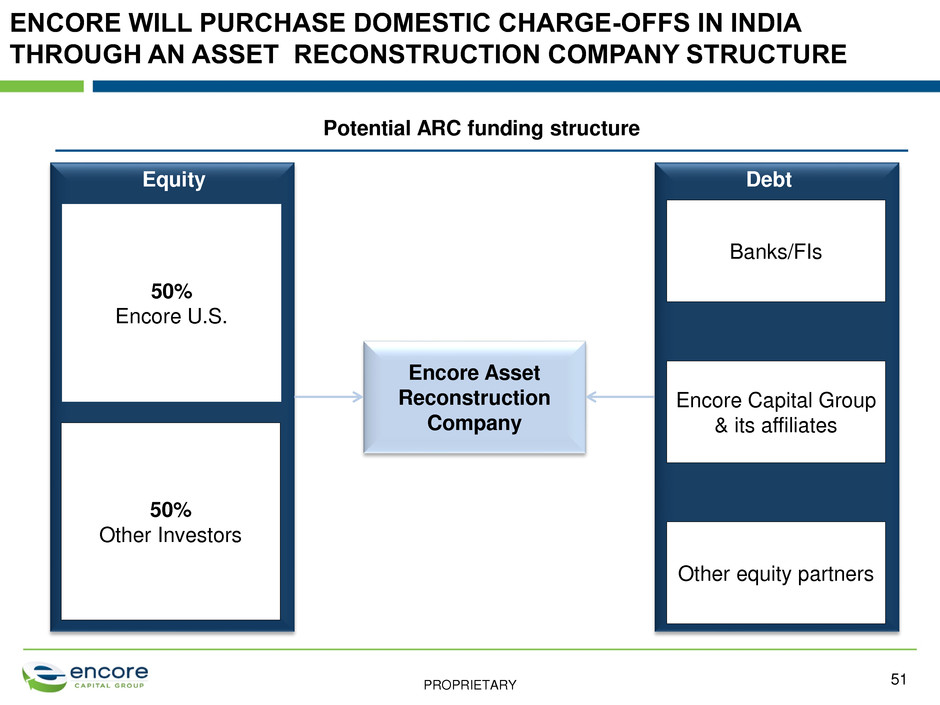
PROPRIETARY ENCORE WILL PURCHASE DOMESTIC CHARGE-OFFS IN INDIA THROUGH AN ASSET RECONSTRUCTION COMPANY STRUCTURE Banks/FIs Other equity partners Encore Capital Group & its affiliates 50% Encore U.S. Encore Asset Reconstruction Company 50% Other Investors Equity Debt Potential ARC funding structure 51

PROPRIETARY WE ARE WORKING EXPEDITIOUSLY TO ACHIEVE OUR LAUNCH IN EARLY 2015 Oct’13 Jan’14 Apr’14 Jul’14 Oct’14 Entity creation & partner finalization Operational planning and readiness Regulatory approvals Hiring key positions Jan’15 Apr’15 Launch 52
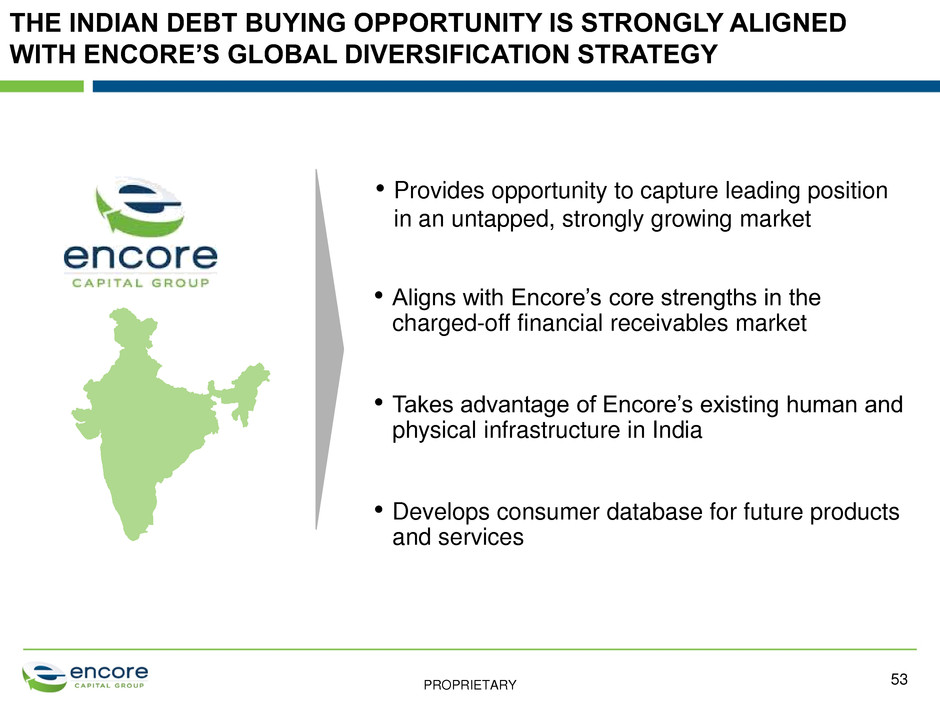
PROPRIETARY THE INDIAN DEBT BUYING OPPORTUNITY IS STRONGLY ALIGNED WITH ENCORE’S GLOBAL DIVERSIFICATION STRATEGY • Aligns with Encore’s core strengths in the charged-off financial receivables market • Develops consumer database for future products and services • Takes advantage of Encore’s existing human and physical infrastructure in India • Provides opportunity to capture leading position in an untapped, strongly growing market 53
PROPRIETARY Ken Vecchione President and CEO 54

PROPRIETARY Q&A 55
PROPRIETARY 56 APPENDIX
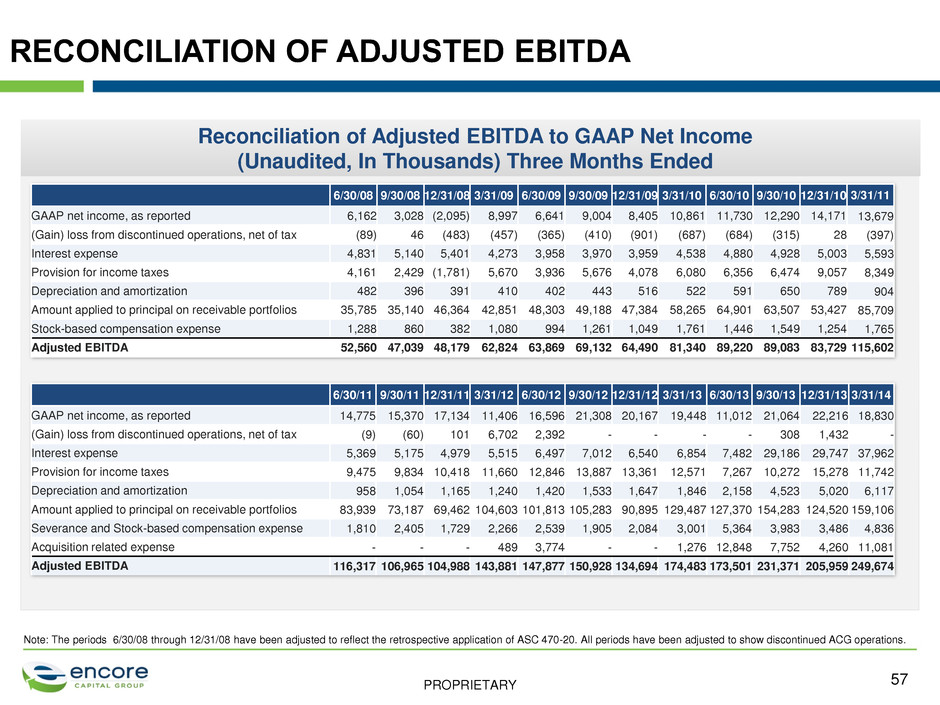
PROPRIETARY Reconciliation of Adjusted EBITDA to GAAP Net Income (Unaudited, In Thousands) Three Months Ended 6/30/08 9/30/08 12/31/08 3/31/09 6/30/09 9/30/09 12/31/09 3/31/10 6/30/10 9/30/10 12/31/10 3/31/11 GAAP net income, as reported 6,162 3,028 (2,095) 8,997 6,641 9,004 8,405 10,861 11,730 12,290 14,171 13,679 (Gain) loss from discontinued operations, net of tax (89) 46 (483) (457) (365) (410) (901) (687) (684) (315) 28 (397) Interest expense 4,831 5,140 5,401 4,273 3,958 3,970 3,959 4,538 4,880 4,928 5,003 5,593 Provision for income taxes 4,161 2,429 (1,781) 5,670 3,936 5,676 4,078 6,080 6,356 6,474 9,057 8,349 Depreciation and amortization 482 396 391 410 402 443 516 522 591 650 789 904 Amount applied to principal on receivable portfolios 35,785 35,140 46,364 42,851 48,303 49,188 47,384 58,265 64,901 63,507 53,427 85,709 Stock-based compensation expense 1,288 860 382 1,080 994 1,261 1,049 1,761 1,446 1,549 1,254 1,765 Adjusted EBITDA 52,560 47,039 48,179 62,824 63,869 69,132 64,490 81,340 89,220 89,083 83,729 115,602 6/30/11 9/30/11 12/31/11 3/31/12 6/30/12 9/30/12 12/31/12 3/31/13 6/30/13 9/30/13 12/31/13 3/31/14 GAAP net income, as reported 14,775 15,370 17,134 11,406 16,596 21,308 20,167 19,448 11,012 21,064 22,216 18,830 (Gain) loss from discontinued operations, net of tax (9) (60) 101 6,702 2,392 - - - - 308 1,432 - Interest expense 5,369 5,175 4,979 5,515 6,497 7,012 6,540 6,854 7,482 29,186 29,747 37,962 Provision for income taxes 9,475 9,834 10,418 11,660 12,846 13,887 13,361 12,571 7,267 10,272 15,278 11,742 Depreciation and amortization 958 1,054 1,165 1,240 1,420 1,533 1,647 1,846 2,158 4,523 5,020 6,117 Amount applied to principal on receivable portfolios 83,939 73,187 69,462 104,603 101,813 105,283 90,895 129,487 127,370 154,283 124,520 159,106 Severance and Stock-based compensation expense 1,810 2,405 1,729 2,266 2,539 1,905 2,084 3,001 5,364 3,983 3,486 4,836 Acquisition related expense - - - 489 3,774 - - 1,276 12,848 7,752 4,260 11,081 Adjusted EBITDA 116,317 106,965 104,988 143,881 147,877 150,928 134,694 174,483 173,501 231,371 205,959 249,674 RECONCILIATION OF ADJUSTED EBITDA 57 Note: The periods 6/30/08 through 12/31/08 have been adjusted to reflect the retrospective application of ASC 470-20. All periods have been adjusted to show discontinued ACG operations.

PROPRIETARY RECONCILIATION OF ADJUSTED INCOME AND ADJUSTED/ECONOMIC EPS Reconciliation of Adjusted Income and Adjusted/Economic EPS to GAAP EPS (Unaudited, in thousands, except per share amounts), Full Year 2013 2012 $ Per Diluted Share – Accounting Per Diluted Share – Economic1 $ Per Diluted Share – Accounting Per Diluted Share – Economic Net income from continuing operations attributable to Encore2 77,039 $2.94 $3.01 78,571 $3.04 $3.04 Adjustments: Net non-cash interest and issuance cost amortization, net of tax 3,274 $0.12 $0.13 191 $0.01 $0.01 Acquisition related legal and advisory fees, net of tax 12,981 $0.50 $0.51 2,567 $0.10 $0.10 Acquisition related integration and consulting fees, net of tax 3,304 $0.13 $0.13 - - - Acquisition related other expenses, net of tax 2,198 $0.08 $0.08 - - - Adjusted income from continuing operations attributable to Encore 98,796 $3.77 $3.86 $81,329 $3.15 $3.15 58 1. Excludes approximately 595,000 shares issuable upon the conversion of the company’s convertible senior notes due 2017 that are included for accounting purposes but will not be issued due to certain hedge and warrant transactions 2. Excludes net loss attributable to non-controlling interest of $1,559 in 2013

Encore Capital Group, Inc. 2014 Investor Day New York, NY June 5, 2014


